Poverty and Distributional Effects of COVID-19 on Households ...
Upload
khangminh22Category
view
0download
0
Proceedings of the Society for Computation in Linguistics Proceedings of the Society for Computation in Linguistics
Volume 3 Article 6
2020
Where New Words Are Born: Distributional Semantic Analysis of Where New Words Are Born: Distributional Semantic Analysis of
Neologisms and Their Semantic Neighborhoods Neologisms and Their Semantic Neighborhoods
Maria Ryskina Carnegie Mellon University, [email protected]
Ella Rabinovich University of Toronto, [email protected]
Taylor Berg-Kirkpatrick University of California, San Diego, [email protected]
David R. Mortensen Carnegie Mellon University, [email protected]
Yulia Tsvetkov Carnegie Mellon University, [email protected]
Follow this and additional works at: https://scholarworks.umass.edu/scil
Part of the Computational Linguistics Commons
Recommended Citation Recommended Citation Ryskina, Maria; Rabinovich, Ella; Berg-Kirkpatrick, Taylor; Mortensen, David R.; and Tsvetkov, Yulia (2020) "Where New Words Are Born: Distributional Semantic Analysis of Neologisms and Their Semantic Neighborhoods," Proceedings of the Society for Computation in Linguistics: Vol. 3 , Article 6. DOI: https://doi.org/10.7275/1jra-8m83 Available at: https://scholarworks.umass.edu/scil/vol3/iss1/6
This Paper is brought to you for free and open access by ScholarWorks@UMass Amherst. It has been accepted for inclusion in Proceedings of the Society for Computation in Linguistics by an authorized editor of ScholarWorks@UMass Amherst. For more information, please contact [email protected].
Where New Words Are Born: Distributional Semantic Analysis ofNeologisms and Their Semantic Neighborhoods
Maria Ryskina1 Ella Rabinovich2 Taylor Berg-Kirkpatrick3
David R. Mortensen1 Yulia Tsvetkov1
1Language Technologies Institute, Carnegie Mellon University,{mryskina,dmortens,ytsvetko}@cs.cmu.edu
2Department of Computer Science, University of Toronto, [email protected] Science and Engineering, University of California, San Diego, [email protected]
Abstract
We perform statistical analysis of the phe-nomenon of neology, the process by whichnew words emerge in a language, using largediachronic corpora of English. We investigatethe importance of two factors, semantic spar-sity and frequency growth rates of semanticneighbors, formalized in the distributional se-mantics paradigm. We show that both factorsare predictive of word emergence although wefind more support for the latter hypothesis. Be-sides presenting a new linguistic applicationof distributional semantics, this study tacklesthe linguistic question of the role of language-internal factors (in our case, sparsity) in lan-guage change motivated by language-externalfactors (reflected in frequency growth).1
1 Introduction
Natural languages are constantly changing as thecontext of their users changes (Aitchison, 2001).Perhaps the most obvious type of change is the in-troduction of new lexical items, or neologisms (aprocess called “neology”). Neologisms have var-ious sources. They are occassionally coined outof whole cloth (grok). More frequently, they areloanwords from another language (tahini), derivedwords (unfriend), or existing words that have ac-quired new senses (as when web came to mean‘World Wide Web’ and then ‘the Internet’). Whileneology has long been of interest to linguists (§2),there have been relatively few attempts to study itas a global, systemic phenomenon. Computationalmodeling and analysis of neology is the focus ofour work.
What are the factors that predict neology? Cer-tainly, social context plays a role. Close interac-tion between two cultures, for example, may re-sult in increased borrowing (Appel and Muysken,
1The code and word lists are available at https://github.com/ryskina/neology
2006). We hypothesize, though, that there areother factors involved—factors that can be mod-eled more directly. These factors can be under-stood in terms of supply and demand.
Breal (1904) introduced the idea that the dis-tribution of words in semantic space tends to-wards uniformity. This framework predicts thatnew words would emerge where they would re-pair uniformity—where there was a space not oc-cupied by a word. This could be viewed as supply-driven neology. Next, demand plays a role as wellas supply (Campbell, 2013): new words emergein “stylish” neighborhoods, corresponding to do-mains of discourse that are increasing in impor-tance (reflected by the increasing frequency of thewords in those neighborhoods).
We operationalize these ideas using distribu-tional semantics (Lenci, 2018). To formalize thehypothesis of supply-driven neology for compu-tational analysis, we measure sparsity of areasin the word embedding space where neologismswould later emerge. The demand-driven view ofneology motivates our second hypothesis: neigh-borhoods in the embedding space containingwords rapidly growing in frequency are morelikely to produce neologisms. Both hypotheses aredefined more formally in §3.
Having formalized our hypotheses in terms ofword embeddings, we test them by comparing thedistributions of the corresponding metrics for a setof automatically identified neologisms and a con-trol set. Methodology of the word selection andhypothesis testing is detailed in §4. We discuss theresults in §5, demonstrating evidence for both hy-potheses, although the demand-driven hypothesishas more significant support.
2 Background
Neology Specific sources of neologisms have beenstudied: lexical borrowing (Taylor and Grant,
43Proceedings of the Society for Computation in Linguistics (SCiL) 2020, pages 43-52.
New Orleans, Louisiana, January 2-5, 2020
2014; Daulton, 2012), morphological derivation(Lieber, 2017), blends or portmanteaus (Cook,2012; Renner et al., 2012), clippings, acronyms,analogical coinages, and arbitrary coinages, butthese studies have tended to look at neologismsatomistically, or to explicate the social conditionsunder which a new word entered a language ratherthan looking at neologisms in systemic context.
To address this deficit, we look back to the sem-inal work of Michel Breal, who introduced theidea that words exist in a semantic space. Hiswork implies that, other things being equal, thesemantic distribution of words tends towards uni-formity (Breal, 1904). This is most explicit in hislaw of differentiation, which states that near syn-onyms move apart in semantic space, but has otherimplications as well. For example, this principlepredicts that new words are more likely to emergewhere they would increase uniformity. This couldbe viewed as supply-driven neology—new wordsappear to fill gaps in semantic space (to expressconcepts that are not currently lexicalized).
In linguistic literature neology is often associ-ated with new concepts or domains of increasingimportance (Campbell, 2013). Just as there arefactors that predict where houses are built otherthan the availability of land, there are factors thatpredict where new words emerge other than theavailability of semantic space. Demand, we hy-pothesize, plays a role as well as supply.
Most existing computational research on themechanisms of neology focuses on discoveringsociolinguistic factors that predict acceptance ofemerging words into the mainstream language andgrowth of their usage, typically in online socialcommunities (Del Tredici and Fernandez, 2018).The sociolinguistic factors can include geogra-phy (Eisenstein, 2017), user demographics (Eisen-stein et al., 2012, 2014), diversity of linguisticcontexts (Stewart and Eisenstein, 2018) or wordform (Kershaw et al., 2016). To the best of ourknowledge, there is no prior work focused ondiscovering factors predictive of the emergenceof new words rather than modeling their lifecy-cle. We model language-external processes indi-rectly through their reflection in language, therebycapturing phenomena evident of our hypothesesthrough linguistic analysis.
Distributional semantics and language changeWord embeddings have been successfully used fordifferent applications of the diachronic analysis
of language (Tahmasebi et al., 2018). The clos-est task to ours is analyzing meaning shift (track-ing changes in word sense or emergence of newsenses) by comparing word embedding spacesacross time periods (Kulkarni et al., 2015; Xu andKemp, 2015; Hamilton et al., 2016; Kutuzov et al.,2018). Typically, embeddings are learned for dis-crete time periods and then aligned (but see Bam-ler and Mandt, 2017). There has also been workon revising the existing methodology, specificallyaccounting for frequency effects in embeddingswhen modeling semantic shift (Dubossarsky et al.,2017).
Other related questions where distributional se-mantics proved useful were exploring the evolu-tion of bias (Garg et al., 2018) and the degrada-tion of age- and gender-predictive language mod-els (Jaidka et al., 2018).
3 Hypotheses
This section outlines the two hypotheses we intro-duced earlier from the linguistic perspective, for-malized in terms of distributional semantics.
Hypothesis 1 Neologisms are more likely toemerge in sparser areas of the semantic space.This corresponds to the supply-driven neologyhypothesis: we assume that areas of the spacethat contain fewer semantically related words arelikely to give birth to new ones so as to fill inthe ‘semantic gaps’. Word embeddings give usa natural way of formalizing this: since seman-tically related words have been shown to popu-late the same regions in embeddings spaces, wecan approximate semantic sparsity (or density) ofa word’s neighborhood as the number of word vec-tors within a certain distance of its embedding.
Hypothesis 2 Neologisms are more likely toemerge in semantic neighborhoods of growingpopularity. Here we formalize our demand-drivenview of neology, which assumes that growing fre-quency of words in a semantic area is a reflectionof its growing importance in discourse, and thatthe latter is in turn correlated with emergence ofneologisms in that area. In terms of word em-beddings, we again consider nearest word vectorsas the word’s semantic neighbors and quantify therate at which their frequencies grow over decades(formally defined in §4.4).
44
4 Methodology
Our analysis is based on comparing embeddingspace neighborhoods of neologism word vectorsand neighborhoods of embeddings of words froman alternative set. Automatic selection of neolo-gisms is described in §4.2, and in §4.4 we detailthe factors we control for when selecting the alter-native set. In §4.1 we describe the datasets used inour experiments. Our data is split into two largecorpora, HISTORICAL and MODERN; we addition-ally require the HISTORICAL corpus to be split intosmaller time periods so that we can estimate wordfrequency change rate. Embedding models aretrained on each of the two corpora, as described in§4.3. We compare the neighborhoods in the HIS-TORICAL embedding space, but due to the natureof our neologism selection process, many neolo-gisms might not exist in the HISTORICAL vocab-ulary. To locate their neighborhoods, we adaptan approach from prior work in diachronic anal-ysis with word embeddings: we learn an orthog-onal projection between HISTORICAL and MOD-ERN embeddings to align the two spaces in or-der to make them comparable (see Hamilton et al.,2016), and use projected vectors to represent ne-ologisms in the HISTORICAL space. Finally, §4.5describes the details of hypothesis testing: statis-tics we choose to quantify our two hypotheses andhow their distributions are compared.
4.1 Datasets
We use the Corpus of Historical American English(COHA, Davies, 2002) and the Corpus of Contem-porary American English (COCA, Davies, 2008),large diachronic corpora balanced by genre to re-flect the variety in word usage. COHA data is splitinto decades; we group COHA documents from18 decades (1800-1989) to represent the HISTOR-ICAL English collection and use full COCA 1990-2012 corpus as MODERN.
The obtained HISTORICAL split contains 405Mtokens of 2M types, and MODERN contains 547Mtokens of 3M types.2
4.2 Neologism selection
We rely on a usage-based approach to extract theset of neologisms for our analysis, choosing the
2Statistics accompanying the corpora state that entireCOHA dataset contains 385M words, and COCA contains440M words; we assume the discrepancy is explained by to-kenization differences.
words based on their patterns of occurrence in ourdatasets. It can be seen as an approximation to se-lecting words based on their earliest recorded usedates, as these dates are also determined based onthe words’ usage in historical corpora. This anal-ogy is supported by the qualitative analysis of theobtained set of neologisms, as discussed in §6.
We limit our analysis to nouns, an open-classlexical category. We identify nouns in our cor-pora using a part-of-speech dictionary, collectedfrom a POS-tagged corpus of English Wikipediadata (Wikicorpus, Reese et al., 2010), and selectwords that are most frequently tagged as ‘NN’.
We additionally filter candidate neologisms toexclude words that occur more frequently in cap-italized than lowercased form; this heuristic helpsus remove proper nouns missed by the POS tagger.
We select a set of neologisms by picking wordsthat are substantially more frequent in the MOD-ERN corpus than in the HISTORICAL one. It isimportant to note that while we use the term “ne-ologism,” implying a word at the early stages ofemergence, with this method we select words thathave entered mainstream vocabulary in MODERN
time but might have been coined prior to that. Weconsider a word w to be a neologism if its ra-tio fm(w)/fh(w) is greater than a certain thresh-old; here fm(·) and fh(·) denote word frequencies(normalized counts) in MODERN and HISTORI-CAL data respectively. Empirically we set the fre-quency ratio threshold equal to 20.
We rank words satisfying these criteria by theirfrequency in the MODERN corpus and select thefirst 1000 words to be our neologism set; this isto ensure that we only analyze words that subse-quently become mainstream and not misspellingsor other artifacts of the data.
4.3 Embeddings
Our hypothesis testing process involves inspectingsemantic neighborhoods of neologisms in the HIS-TORICAL embedding space. However, many neol-ogisms are very infrequent or nonexistent in theHISTORICAL data, so we approximate their vec-tors in the HISTORICAL space by projecting theirMODERN embeddings into the same coordinateaxes.
We learn Word2Vec Skip-Gram embed-dings3 (Mikolov et al., 2013) of the two corpora
3Hyperparameters: vector dimension 300, window size 5,minimum count 5.
45
and use orthogonal Procrustes to learn the aligningtransformation:
R = arg min⌦
k⌦W(m) � W(h)k,
where W(h),W(m) 2 R|V |⇥d are the word em-bedding matrices learned on the HISTORICAL andMODERN corpora respectively, restricted to the in-tersection of the vocabularies of the two corpora(i.e. every word embedding present in both spacesis used as an anchor). To project MODERN wordembeddings into the HISTORICAL space, we mul-tiply them by the obtained rotation matrix R.
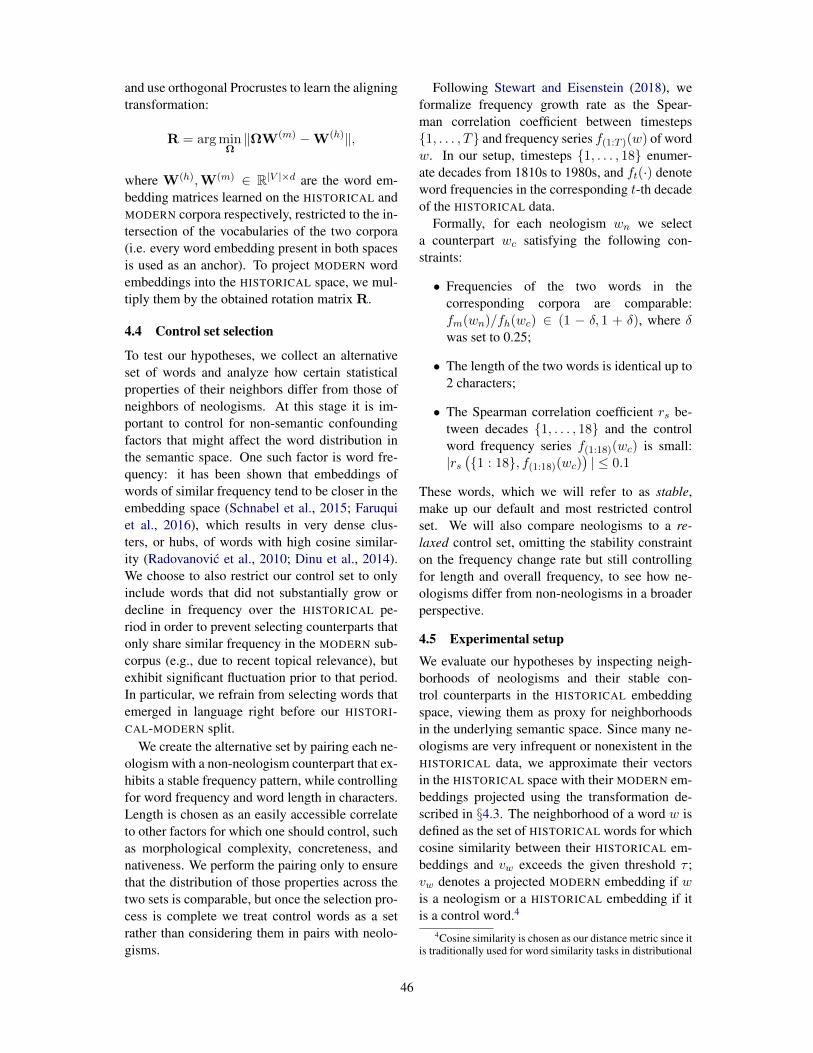
4.4 Control set selection
To test our hypotheses, we collect an alternativeset of words and analyze how certain statisticalproperties of their neighbors differ from those ofneighbors of neologisms. At this stage it is im-portant to control for non-semantic confoundingfactors that might affect the word distribution inthe semantic space. One such factor is word fre-quency: it has been shown that embeddings ofwords of similar frequency tend to be closer in theembedding space (Schnabel et al., 2015; Faruquiet al., 2016), which results in very dense clus-ters, or hubs, of words with high cosine similar-ity (Radovanovic et al., 2010; Dinu et al., 2014).We choose to also restrict our control set to onlyinclude words that did not substantially grow ordecline in frequency over the HISTORICAL pe-riod in order to prevent selecting counterparts thatonly share similar frequency in the MODERN sub-corpus (e.g., due to recent topical relevance), butexhibit significant fluctuation prior to that period.In particular, we refrain from selecting words thatemerged in language right before our HISTORI-CAL-MODERN split.
We create the alternative set by pairing each ne-ologism with a non-neologism counterpart that ex-hibits a stable frequency pattern, while controllingfor word frequency and word length in characters.Length is chosen as an easily accessible correlateto other factors for which one should control, suchas morphological complexity, concreteness, andnativeness. We perform the pairing only to ensurethat the distribution of those properties across thetwo sets is comparable, but once the selection pro-cess is complete we treat control words as a setrather than considering them in pairs with neolo-gisms.
Following Stewart and Eisenstein (2018), weformalize frequency growth rate as the Spear-man correlation coefficient between timesteps{1, . . . , T} and frequency series f(1:T )(w) of wordw. In our setup, timesteps {1, . . . , 18} enumer-ate decades from 1810s to 1980s, and ft(·) denoteword frequencies in the corresponding t-th decadeof the HISTORICAL data.
Formally, for each neologism wn we selecta counterpart wc satisfying the following con-straints:
• Frequencies of the two words in thecorresponding corpora are comparable:fm(wn)/fh(wc) 2 (1 � �, 1 + �), where �was set to 0.25;
• The length of the two words is identical up to2 characters;
• The Spearman correlation coefficient rs be-tween decades {1, . . . , 18} and the controlword frequency series f(1:18)(wc) is small:|rs
�{1 : 18}, f(1:18)(wc)
�| 0.1
These words, which we will refer to as stable,make up our default and most restricted controlset. We will also compare neologisms to a re-laxed control set, omitting the stability constrainton the frequency change rate but still controllingfor length and overall frequency, to see how ne-ologisms differ from non-neologisms in a broaderperspective.
4.5 Experimental setup
We evaluate our hypotheses by inspecting neigh-borhoods of neologisms and their stable con-trol counterparts in the HISTORICAL embeddingspace, viewing them as proxy for neighborhoodsin the underlying semantic space. Since many ne-ologisms are very infrequent or nonexistent in theHISTORICAL data, we approximate their vectorsin the HISTORICAL space with their MODERN em-beddings projected using the transformation de-scribed in §4.3. The neighborhood of a word w isdefined as the set of HISTORICAL words for whichcosine similarity between their HISTORICAL em-beddings and vw exceeds the given threshold ⌧ ;vw denotes a projected MODERN embedding if wis a neologism or a HISTORICAL embedding if itis a control word.4
4Cosine similarity is chosen as our distance metric since itis traditionally used for word similarity tasks in distributional
46

Ave
rage
num
ber o
f nei
ghbo
rs
0
700
1400
2100
2800
3500
Cosine similarity threshold
0.55 0.525 0.5 0.475 0.45 0.425 0.4 0.375 0.35
Neighborhoods of neologismsNeighborhoods of stable control words
Ave
rage
gro
wth
cor
rela
tion
0
0.12
0.24
0.36
0.48
0.6
Cosine similarity threshold
0.55 0.525 0.5 0.475 0.45 0.425 0.4 0.375 0.35
Neighborhoods of neologismsNeighborhoods of stable control words
(a) Semantic neighborhood of the word renewables.
Ave
rage
num
ber o
f nei
ghbo
rs
0
700
1400
2100
2800
3500
Cosine similarity threshold
0.55 0.525 0.5 0.475 0.45 0.425 0.4 0.375 0.35
Neighborhoods of neologismsNeighborhoods of stable control words
Ave
rage
gro
wth
cor
rela
tion
0
0.12
0.24
0.36
0.48
0.6
Cosine similarity threshold
0.55 0.525 0.5 0.475 0.45 0.425 0.4 0.375 0.35
Neighborhoods of neologismsNeighborhoods of stable control words
(b) Semantic neighborhood of the word pesto.
Figure 1: Neighborhoods of projected MODERN embeddings of two neologisms (shown in red), renewables andpesto, in the HISTORICAL embedding space, visualized using t-SNE (Maaten and Hinton, 2008). Figure 1a showsan example of a neighborhood exhibiting frequency growth: words like synfuel or privatization have been usedmore towards the end of the HISTORICAL period. The neighborhood also includes natural-gas that can be seen asrepresenting a concept to be replaced by renewables. The word pesto (Figure 1b) is projected into a neighborhoodof other food-related words, most of which are also loanwords, several from the same language; it also has itshypernym sauce as one of its neighbors.
The two factors we need to formalize are se-mantic sparsity of the neighborhoods and increaseof popularity of the topic that the neighborhoodrepresents. We use sparsity in the embeddingspace as a proxy for semantic sparsity and ap-proximate growth of interest in a topic with fre-quency growth of words belonging to it (i.e. em-bedded into the corresponding neighborhood). Forthe neighborhood of each word w, we compute thefollowing statistics, corresponding to our two hy-potheses:
1. Density of a neighborhood d(w, ⌧): num-ber of words that fall into this neighborhoodd(w, ⌧) = |{u : cosine(vw, vu) � ⌧}|
2. Average frequency growth rate of a neigh-borhood r(w, ⌧): as defined in the previoussubsection, we compute the Spearman corre-lation coefficient between timesteps and fre-quency series for each word in the neighbor-hood and take their mean:
r(w, ⌧) =1
d(w, ⌧)⇥
⇥X
u:cosine(vw,vu)�⌧
rs
�{1 : 18}, f(1:18)(u)
�
In our tests, we compare the values of thosemetrics for neighborhoods of neologisms and
semantics (Lenci, 2018). We have also observed the sameresults when repeating the experiments with the Euclideandistance metric.
neighborhoods of control words and estimate thesignificance of each of the two factors for a rangeof neighborhood sizes defined by the threshold ⌧ .We test whether means of the distributions of thosestatistics for the neologism and the control set dif-fer and whether each of the two is significant forclassifying words into neologisms and controls.
As mentioned in §4.2, our vocabulary is re-stricted to nouns, and we only consider vocab-ulary noun neighbors when evaluating the statis-tics.5 Since we project all neologism word vectorsfrom MODERN to HISTORICAL embedding space,for neologisms occurring in the HISTORICAL cor-pus we might find a HISTORICAL vector of the ne-ologism itself among the neighbors of its projec-tion; we exclude such neighbors from our analy-sis. We cap the number of nearest neighbors toconsider at 5,000, to avoid estimating statistics onoverly large sets of possibly less relevant neigh-bors.
5 Results
Following the experimental setup described in§4.5, we estimate the contribution of each ofthe hypothesized factors employing strictly con-strained and relaxed control sets. We start by ana-lyzing how the distributions of those statistics dif-fer for neologisms and stable controls, both by
5Here we refer to the vocabulary of words participating inour analysis, not the embedding model vocabulary; embed-dings are trained on the entire corpora.
47

Ave
rage
num
ber o
f nei
ghbo
rs
0
700
1400
2100
2800
3500
Cosine similarity threshold
0.55 0.525 0.5 0.475 0.45 0.425 0.4 0.375 0.35
Neighborhoods of neologismsNeighborhoods of stable control words
(a) Average HISTORICAL word vector density in the neigh-borhoods of neologisms and stable control set words.
Ave
rage
gro
wth
cor
rela
tion
0
0.12
0.24
0.36
0.48
0.6
Cosine similarity threshold
0.55 0.525 0.5 0.475 0.45 0.425 0.4 0.375 0.35
Neighborhoods of neologismsNeighborhoods of stable control words
(b) Average frequency growth rate of HISTORICAL wordvectors in the neighborhoods of neologisms and stable con-trol set words.
Figure 2: Number of HISTORICAL word vectors within a certain cosine distance of a word and average growthrate of frequency (represented by Spearman correlation coefficient) of those HISTORICAL words, averaged acrossneologism (darker) and stable control word (lighter) sets. Projected neologism vectors appear in lower-densityneighborhoods compared to control words, and neighbors of neologisms exhibit a stronger growth trend than thoseof the control words, especially in smaller neighborhoods.
comparing their sample means and by more rigor-ous statistical testing. We also evaluate the signifi-cance of the factors using generalized linear mod-els for both stable and relaxed control sets.
5.1 Comparison to stable control set
First, we test our hypotheses on 720 neologism-stable control word pairs (not all words are pairedin the stable control setting due to its restrictive-ness).
Figure 2 demonstrates the values of density andfrequency growth rate for a range of neighborhoodsizes, averaged over neologism and control sets.Both results conform with our hypotheses: Fig-ure 2a shows that on average the projected neol-ogism has fewer neighbors than its stable coun-terpart, especially for larger neighborhoods, andFigure 2b shows that, on average, frequenciesof neighbors of a projected neologism grow at afaster rate than those of a counterpart. Interest-ingly, we find that neighbors of stable controls stilltend to exhibit small positive growth rate. We at-tribute it to the general pattern that we observed:about 70% of words in our vocabulary have posi-tive frequency growth rate. We believe this mightbe explained by the imbalance in the amount ofdata between decades (e.g. 1980s sub-corpus has20 times more tokens than 1810s): some wordsmight not occur until later in the corpus because ofthe relative sparsity of data in the early decades.
As we can see from Figure 2a, neighborhoodsof larger sizes (corresponding to lower values of
the threshold) may contain thousands of words, sothe statistics obtained from those neighborhoodsmight be less relevant; we might only want toconsider the immediate neighborhoods, as thosewords are more likely to be semantically related tothe central word. It is notable that the difference inthe growth trends of the neighbors is substantiallymore prominent for smaller neighborhoods (Fig-ure 2b): average correlation coefficient of immedi-ate neighbors of stable words also falls into stablerange as we defined it, while immediate neighborsof neologisms exhibit rapid growth.
5.2 Statistical significanceTo estimate the significance and relative contribu-tion of the two factors, we fit a generalized lin-ear model (GLM) with logistic link function to thecorresponding features of neologism and controlword neighborhoods:6
y(w) ⇠ (1 + exp(��(⌧)0 �
� �(⌧)d · d(w, ⌧) � �(⌧)
r · r(w, ⌧)))�1
where y is a Bernoulli variable indicating whetherthe word w belongs to the neologism set (1) orthe control set (0), and ⌧ is the cosine similaritythreshold defining the neighborhood size.
Table 1 shows how the coefficients and p-valuesfor the two statistics change with the neighbor-hood size. We found that when comparing with
6We use the implementation provided in the MATLABStatistics and Machine Learning Toolbox.
48

Neighborhood sizeStable control set Relaxed control set
Density Growth Density Growth
�(⌧)d ⇥ 104 p-value �
(⌧)r ⇥ 10 p-value �
(⌧)d ⇥ 104 p-value �
(⌧)r p-value
Large (⌧ = 0.35) 1.98 8.25 ⇥ 10�5 1.84 2.35 ⇥ 10�80 �1.07 5.63 ⇥ 10�4 0.61 2.83 ⇥ 10�34
Medium (⌧ = 0.45) 0.20 8.29 ⇥ 10�1 1.16 2.92 ⇥ 10�80 �3.67 4.00 ⇥ 10�10 0.46 6.19 ⇥ 10�46
Small (⌧ = 0.55) 6.90 2.90 ⇥ 10�2 0.70 1.61 ⇥ 10�68 �8.92 4.01 ⇥ 10�5 0.28 1.19 ⇥ 10�36
Table 1: Values of the GLM coefficients and their p-values for different neighborhood cosine similarity thresholds⌧ . �(⌧)
d and �(⌧)r denote the coefficients for density and average frequency growth respectively for neighborhoods
defined by ⌧ . Comparing the results for the stable and relaxed control sets, we find that for the stable controlsdensity is only significant in larger neighborhoods, but without the stability constraint both factors are significantfor all neighborhood sizes.
the stable control set, average frequency growthrate of the neighborhood was significant for allsizes, but neighborhood density was significant atlevel p < 0.01 only for the largest ones.7 We at-tribute this to the effect discussed in the previoussection: difference in average frequency growthrate between neighbors of neologisms and stablewords shrinks as we include more remote neigh-bors (Figure 2b), so for large neighborhoods fre-quency growth rate by itself is no longer predictiveenough.
We also evaluate the significance of featuresfor the relaxed control set without the stabilityconstraint on 1000 neologism-control pairs. Wehave repeated the experiment with 5 different ran-domly sampled relaxed control sets (results forone showed in Table 1). For medium-sized neigh-borhoods (0.4 ⌧ 0.5) density variable isalways significant at p < 0.01, but densities oflargest and smallest neighborhoods were rejectedin several runs. With more variance in the con-trol set, differences in neighborhood frequencygrowth rate between neologisms and controls areless prominent than in the stable setting, so densityplays a more important role in prediction.8
Growth feature weights �(⌧)r are always positive
and density feature weights �(⌧)d are negative in the
relaxed setting (where density is significant). Thismatches our intuition that neighborhood frequencygrowth and sparsity are predictive of neology.
Comparing sample means of density and growthrates between neologisms and each of the 5 ran-domly selected relaxed control sets (as we did
7Applying Wilcoxon signed-rank test to the series ofneighborhood density and frequency growth values for ne-ologism and stable control sets showed the same results.
8Detailed results of the regression analysis and collinear-ity tests can be found in the repository. No evidence ofcollinearity was found in any of the experiments.
for stable controls in Figure 2) demonstrated thatneologisms still appear in sparser neighborhoodsthan the controlled counterparts. The differencein frequency growth rate between the neologismand control word neighborhoods is also observedfor all control sets (although it varies noticeablybetween sets), but it no longer exhibits an inversecorrelation with neighborhood size.
6 Discussion
We have demonstrated that our two hypotheseshold for the set of words we automatically se-lected to represent neologisms. To establish va-lidity of our results, we qualitatively examine theobtained word list to see if the words are in factrecent additions to the language. We randomlysample 100 words out of the 1000 selected ne-ologisms and look up their earliest recorded usein the Oxford English Dictionary Online (OED,2018). Of those 100 words, eight are not definedin the dictionary: they only appear in quotationsin other entries (bycatch (quotation from 1995),twentysomething (1997), cross-sex (1958), etc.) ordo not occur at all (all-mountain, interobserver,off-task). Of the remaining 92 words, 78 have beenfirst recorded after the year 1810 (i.e. since the be-ginning of the HISTORICAL timeframe), 44 havebeen first recorded in the twentieth century, and21 words since 1950. However, some of the wordsdating back to before 19th century have only beenrecorded in their earlier, possibly obsolete sense:for example, while there is evidence of the wordsoftware being used in 18th century, this usagecorresponds to its obsolete meaning of ‘textiles,fabrics’, while the first recorded use in its currentlydominant sense of ‘programs essential to the oper-ation of a computer system’ is dated 1958. To ac-count for such semantic neologisms, we can count
49

the first recorded use of the newest sense of theword; that gives us 82, 58 and 31 words appear-ing since 1810, 1900 and 1950 respectively.9 Thisleads us to assume that most words selected forour analysis have indeed been neologisms some-time over the course of the HISTORICAL time.
We would also like to note that the results ofthis examination may be skewed due to factorsfor which lexicography may not account: for ex-ample, many words identified as neologisms arecompound nouns like countertop or soundtrackthat have been written as two separate words orjoined with a hyphen in earlier use. There isalso considerable spelling variation in loanwords,e.g. cuscusu, cooscoosoos, kesksoo were used in-terchangeably before the form couscous was ac-cepted as the standard spelling. Specific wordforms might also have different life cycles: whilethe word music existed in Middle English, the plu-ral form musics in a particular sense of ‘genres,styles of music’ is much more recent.
Qualitative examination of the neologism set re-veals that new words tend to appear in the sametopics; for example, many words in our set wererelated to food, technology, or medicine. Thisindirectly supports our second hypothesis: rapidchange in these spheres makes it likely for relatedterms to substantially grow in frequency over ashort period of time. One example of such a neigh-borhood is shown in Figure 1a: the neologism re-newables appeared in a cluster of words relatedto energy sources — a topic that has been morediscussed recently. There is also some correlationbetween the topic and how new words are formedin it: most food neologisms are so-called culturalborrowings (Weinreich, 2010), when the namegets loaned from another culture together with theconcept itself (e.g. pesto, salsa, masala), whilemany technology neologisms are compounds ofexisting English morphemes (e.g. cyber+space,cell+phone, data+base).
We also consider nearest neighbors(HISTORICAL words with highest cosine sim-ilarity) of the neologisms to ensure that theyare projected into the appropriate parts of theembedding space. Examples of nearest neighborsare shown in Table 2. We saw different patternsof how the concept represented by the neologism
9For all words that have one or more senses marked asa noun, we only consider those senses. Out of the 92 listedwords, only three do not have nominal senses, and for twomore usage as a noun is marked to be rare.
Neologism Nearest HISTORICAL neighborsemail telegram letterpager beeper phone
blogger journalist columnistsitcom comedy movie
spokeswoman spokesman directorsushi caviar risottorehab detoxification aftercare
Table 2: Nearest HISTORICAL neighbors of projectedMODERN embeddings for a sample of emerging words.We can see that words get projected into semanti-cally relevant neighborhoods, and nearest neighborscan even be useful for observing the evolution of a con-cept (e.g. pager:beeper).
relates to concepts represented by its neighbors.For example, some terms for new conceptsappear next to related concepts they succeededand possibly made obsolete: e.g. email:letter,e-book:paperback, database:card-index. Otherneologisms emerge in clusters of related conceptsthey still equally coexist with: hip-hop:jazz,hoodie:turtleneck; most cultural borrowings fallunder this type (see the neighborhood of pesto inFigure 1b). Both those patterns can be viewed asexamples of a more general trend: one concepttakes place of another related one, whether interms of fully replacing it or just taking its placeas the dominant form.
Other interesting effects we observed includelexical replacement (a new word form replacingan old one without a change in meaning, e.g.vibe:ambience), tendency to abbreviate terms asthey become mainstream (biotech:biotechnology,chemo:chemotherapy), and the previously men-tioned changes in spellings of compounds(lifestyle:life-style, daycare:day-care).
7 Conclusion
We have shown that our two hypothesized fac-tors, semantic neighborhood sparsity and its aver-age frequency growth rate, play a role in determin-ing in what semantic neighborhoods new wordsare likely to emerge. Our analyses provide moresupport for the latter, conforming with prior lin-guistic intuition of how language-external factors(which this factor implicitly represents) affect lan-guage change. We also found evidence for the for-mer, although it was found less significant.
Our contributions are manifold. From a com-putational perspective, we extend prior research
50
on meaning change to a new task of analyzingword emergence, proposing another way to ob-tain linguistic insights from distributional seman-tics. From the point of view of linguistics, weapproach an important question of whether lan-guage change is affected by not only language-external factors but language-internal factors aswell. We show that internal factors—semanticsparsity, specifically—contribute to where in se-mantic space neologisms emerge. To the bestof our knowledge, our work is the first to useword embeddings as a way of quantifying seman-tic sparsity. We have also been able to operational-ize one kind of external factor, technological andcultural change, as something that can been mea-sured in corpora and word embeddings, paving theway to similar work with other kinds of language-external factors in language change.
An admittable limitation of our analysis liesin its restricted ability to account for polysemy,which is a pervasive issue in distributional seman-tics studies (Faruqui et al., 2016). As such, se-mantic neologisms (existing words taking on anovel sense) were not a subject of this study, butthey introduce a potential future direction. Addi-tional properties of word’s neighbors can also becorrelated with word emergence, both language-internal (word abstractness or specificity) and ex-ternal; these can also be promising directions forfuture work. Finally, our future plans includeexploration of how features of semantic neigh-borhoods are correlated with word obsolescence(gradual decline in usage), using similar semanticobservations.
Acknowledgments
We thank the BergLab members for helpful dis-cussion, and the anonymous reviewers for theirvaluable feedback. This work was supported inpart by NSF grant IIS-1812327.
References
Jean Aitchison. 2001. Language Change: Progress OrDecay? Cambridge University Press.
Rene Appel and Pieter Muysken. 2006. Language con-tact and bilingualism. Amsterdam University Press.
Robert Bamler and Stephan Mandt. 2017. Dynamicword embeddings. In International Conference onMachine Learning, pages 380–389.
Michel Breal. 1904. Essai de semantique:(science dessignifications). Hachette.
Lyle Campbell. 2013. Historical Linguistics: an Intro-duction. MIT Press, Cambridge, MA.
Paul Cook. 2012. Using social media to find Englishlexical blends. In Proceedings of the 15th EU-RALEX International Congress (EURALEX 2012),pages 846–854, Oslo, Norway.
Frank E. Daulton. 2012. Lexical borrowing. In TheEncyclopedia of Applied Linguistics. American Can-cer Society.
Mark Davies. 2002. The Corpus of Historical Amer-ican English (COHA): 400 million words, 1810-2009. Brigham Young University.
Mark Davies. 2008. The corpus of contemporaryAmerican English. BYE, Brigham Young Univer-sity.
Marco Del Tredici and Raquel Fernandez. 2018. Theroad to success: Assessing the fate of linguistic in-novations in online communities. In Proceedings ofthe 27th International Conference on ComputationalLinguistics, pages 1591–1603.
Georgiana Dinu, Angeliki Lazaridou, and Marco Ba-roni. 2014. Improving zero-shot learning bymitigating the hubness problem. arXiv preprintarXiv:1412.6568.
Haim Dubossarsky, Daphna Weinshall, and EitanGrossman. 2017. Outta control: Laws of semanticchange and inherent biases in word representationmodels. In Proceedings of the 2017 conference onempirical methods in natural language processing,pages 1136–1145.
Jacob Eisenstein. 2017. Identifying regional dialects inon-line social media. The Handbook of Dialectol-ogy, pages 368–383.
Jacob Eisenstein, Brendan O’Connor, Noah A Smith,and Eric P Xing. 2012. Mapping the geographicaldiffusion of new words. In NIPS Workshop on So-cial Network and Social Media Analysis.
Jacob Eisenstein, Brendan O’Connor, Noah A Smith,and Eric P Xing. 2014. Diffusion of lexical changein social media. PloS one, 9(11):e113114.
Manaal Faruqui, Yulia Tsvetkov, Pushpendre Rastogi,and Chris Dyer. 2016. Problems with evaluationof word embeddings using word similarity tasks.In Proceedings of the 1st Workshop on EvaluatingVector-Space Representations for NLP, pages 30–35.
Nikhil Garg, Londa Schiebinger, Dan Jurafsky, andJames Zou. 2018. Word embeddings quantify100 years of gender and ethnic stereotypes. Pro-ceedings of the National Academy of Sciences,115(16):E3635–E3644.
51
William L Hamilton, Jure Leskovec, and Dan Jurafsky.2016. Diachronic word embeddings reveal statisti-cal laws of semantic change. In Proceedings of the54th Annual Meeting of the Association for Compu-tational Linguistics (Volume 1: Long Papers), vol-ume 1, pages 1489–1501.
Kokil Jaidka, Niyati Chhaya, and Lyle Ungar. 2018.Diachronic degradation of language models: In-sights from social media. In Proceedings of the56th Annual Meeting of the Association for Compu-tational Linguistics (Volume 2: Short Papers), vol-ume 2, pages 195–200.
Daniel Kershaw, Matthew Rowe, and Patrick Stacey.2016. Towards modelling language innovation ac-ceptance in online social networks. In Proceedingsof the Ninth ACM International Conference on WebSearch and Data Mining, pages 553–562. ACM.
Vivek Kulkarni, Rami Al-Rfou, Bryan Perozzi, andSteven Skiena. 2015. Statistically significant de-tection of linguistic change. In Proceedings of the24th International Conference on World Wide Web,pages 625–635. International World Wide Web Con-ferences Steering Committee.
Andrey Kutuzov, Lilja Øvrelid, Terrence Szymanski,and Erik Velldal. 2018. Diachronic word embed-dings and semantic shifts: a survey. In Proceedingsof the 27th International Conference on Computa-tional Linguistics, pages 1384–1397.
Alessandro Lenci. 2018. Distributional models of wordmeaning. Annual review of Linguistics, 4:151–171.
Rochelle Lieber. 2017. Derivational morphology.
Laurens van der Maaten and Geoffrey Hinton. 2008.Visualizing data using t-SNE. Journal of machinelearning research, 9(Nov):2579–2605.
Tomas Mikolov, Ilya Sutskever, Kai Chen, Greg S Cor-rado, and Jeff Dean. 2013. Distributed representa-tions of words and phrases and their compositional-ity. In Advances in neural information processingsystems, pages 3111–3119.
Michael Proffitt, editor. 2018. OED Online. OxfordUniversity Press. http://www.oed.com/.
Milos Radovanovic, Alexandros Nanopoulos, and Mir-jana Ivanovic. 2010. Hubs in space: Popular nearestneighbors in high-dimensional data. Journal of Ma-chine Learning Research, 11(Sep):2487–2531.
Samuel Reese, Gemma Boleda, Montse Cuadros, LluısPadro, and German Rigau. 2010. Wikicorpus: Aword-sense disambiguated multilingual Wikipediacorpus. In Proceedings of the Seventh conferenceon International Language Resources and Evalua-tion (LREC’10).
Vincent Renner, Franois Maniez, and Pierre Arnaud,editors. 2012. Cross-disciplinary perspectives onlexical blending. De Gruyter Mouton, Berlin.
Tobias Schnabel, Igor Labutov, David Mimno, andThorsten Joachims. 2015. Evaluation methods forunsupervised word embeddings. In Proceedings ofthe 2015 Conference on Empirical Methods in Nat-ural Language Processing, pages 298–307.
Ian Stewart and Jacob Eisenstein. 2018. Making”fetch” happen: The influence of social and linguis-tic context on nonstandard word growth and decline.In Proceedings of the 2018 Conference on Empiri-cal Methods in Natural Language Processing, pages4360–4370.
Nina Tahmasebi, Lars Borin, and Adam Jatowt.2018. Survey of computational approaches todiachronic conceptual change. arXiv preprintarXiv:1811.06278.
John R Taylor and Anthony P. Grant. 2014. LexicalBorrowing. Oxford University Press, Oxford.
Uriel Weinreich. 2010. Languages in contact: Find-ings and problems. Walter de Gruyter, The Hague.
Yang Xu and Charles Kemp. 2015. A computationalevaluation of two laws of semantic change. InCogSci.
52
Copyright © 2022 FDOKUMEN