THE ROLE OF EDAPHIC AND VEGETATION FACTORS IN ...
27
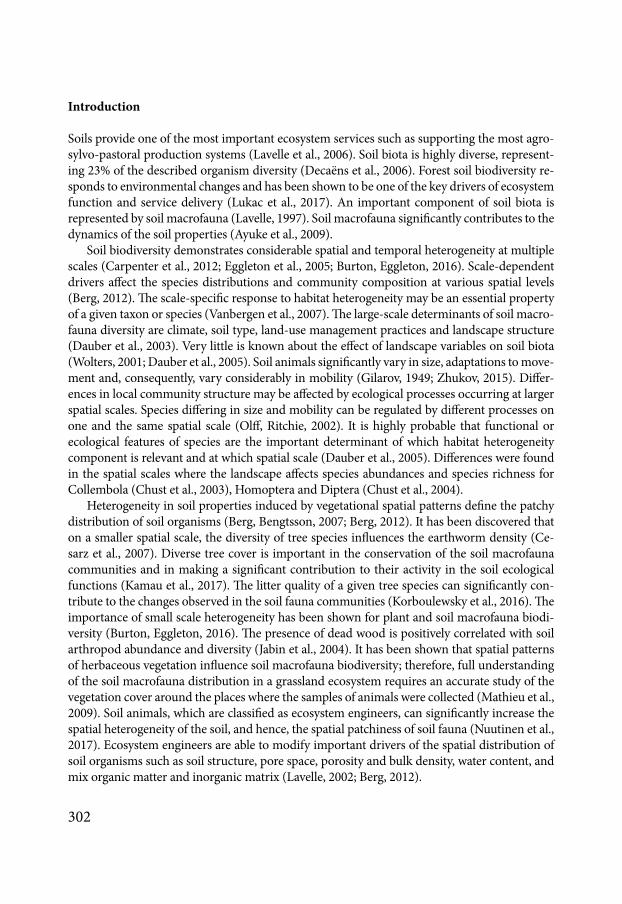
Ekológia (Bratislava) 301 THE ROLE OF EDAPHIC AND VEGETATION FACTORS IN STRUCTURING BETA DIVERSITY OF THE SOIL MACROFAUNA COMMUNITY OF THE DNIPRO RIVER ARENA TERRACE OLEXANDER ZHUKOV 1 , OLGA KUNAH 1 , YULIA DUBININA 2 , VICTORIA NOVIKOVA 1 1 Department of Zoology and Ecology, Oles Honchar Dnipro National University, pr. Gagarina, 72, 49010 Dnipro, Ukraine; e-mail: [email protected] 2 Department of Ecology and Information Technologies, Melitopol Institute of Ecology and Social Technologies of the Open International University of Human Development ‘Ukraine’, Interculturnaya St., 380, 72316 Melitopol, Ukraine; e-mail: [email protected] Abstract Zhukov O., Kunah O., Dubinina Y., Novikova V.: e role of edaphic and vegetation factors in structuring beta diversity of the soil macrofauna community of the Dnipro river arena terrace. Ekológia (Bratislava), Vol. 37, No. 4, p. 301–327, 2018. e article presents the results of evaluation of the role of edaphic and vegetation factors on beta diversity of soil macrofauna by means of the MDM-approach. e multinomial diversity model (MDM) is a method for relating the Shannon diversity to ecological factors. e research was conducted in the ‘Dnipro-Orils’kiy’ Nature Reserve (Ukraine). e research polygon was laid in the forest within the Orlova ravine (48º31’13 “N, 34º48”15 “E). e study site comprises 1.0 ha of deciduous woodland bordered by an area of herbaceous cover within the ravine. In the soil of the studied polygon, 38 species of soil invertebrates were identified, which characterizes the gamma diversity. Alpha diversity, or the number of species on average at each sample point is 4.3. Beta diversity is 8.8. e principal component analysis of the edaphic parameters revealed four statistically significant principal components. For vegetation characteristics, six statistically significant principal components were identified. e sequential analysis of the effects shows that edaphic factors accounted for 20.9% (0.81 bit) of the available entropy (1.71–0.91). e largest decrease in the community entropy takes place under the action of the principal components 2 and 3 (0.06 bit and 0.05, respectively). A permutation test showed that these effects are statistically significant. In turn, 28.4% of the community β-diversity is attributable to vegetation factors. e greatest decrease in community entropy is related to the principal vegetation components 1, 3 and 4 (0.07, 0.05 and 0.04 bits, respectively). A permutation test indicated that this effect is statistically reliable. Geostatistical models substantially describe the varying effects on the beta-diversity of edaphic principal components 1 and 2, and the vegetation principal components 1 and 3. It was found that edaphic and plant factors play an important role in structuring the communities of soil macrofauna on the level of beta diversity. Community sensitivity to environmental factors varies in space and is spatially structured. For different environmental factors, specific spatial patterns of community sensitivity are allocated. Beta diversity may be due to the fact that the species of soil macrofauna communities also vary in the degree of sensitivity to various environmental factors. e species of soil microfauna are also divided according to their extent of sensitivity to different ecological factors. Key words: diversity, ecological factors, spatial patterns, variogram, Mattern model. Vol. 37, No. 4, p. 301–327, 2018 DOI:10.2478/eko-2018-0023
-
Upload
khangminh22 -
Category
Documents
-
view
2 -
download
0
Transcript of THE ROLE OF EDAPHIC AND VEGETATION FACTORS IN ...
Ekoloacutegia (Bratislava)
301
THE ROLE OF EDAPHIC AND VEGETATION FACTORS IN STRUCTURING BETA DIVERSITY OF THE SOIL MACROFAUNA COMMUNITY OF THE DNIPRO RIVER ARENA TERRACE
OLEXANDER ZHUKOV1 OLGA KUNAH1 YULIA DUBININA2 VICTORIA NOVIKOVA1
1Department of Zoology and Ecology Oles Honchar Dnipro National University pr Gagarina 72 49010 Dnipro Ukraine e-mail zhukov_dniproukrnet
2Department of Ecology and Information Technologies Melitopol Institute of Ecology and Social Technologies of the Open International University of Human Development lsquoUkrainersquo Interculturnaya St 380 72316 Melitopol Ukraine e-mail dubinina4884yaru
Abstract
Zhukov O Kunah O Dubinina Y Novikova V The role of edaphic and vegetation factors in structuring beta diversity of the soil macrofauna community of the Dnipro river arena terrace Ekoloacutegia (Bratislava) Vol 37 No 4 p 301ndash327 2018
The article presents the results of evaluation of the role of edaphic and vegetation factors on beta diversity of soil macrofauna by means of the MDM-approach The multinomial diversity model (MDM) is a method for relating the Shannon diversity to ecological factors The research was conducted in the lsquoDnipro-Orilsrsquokiyrsquo Nature Reserve (Ukraine) The research polygon was laid in the forest within the Orlova ravine (48ordm31rsquo13 ldquoN 34ordm48rdquo15 ldquoE) The study site comprises 10 ha of deciduous woodland bordered by an area of herbaceous cover within the ravine In the soil of the studied polygon 38 species of soil invertebrates were identified which characterizes the gamma diversity Alpha diversity or the number of species on average at each sample point is 43 Beta diversity is 88 The principal component analysis of the edaphic parameters revealed four statistically significant principal components For vegetation characteristics six statistically significant principal components were identified The sequential analysis of the effects shows that edaphic factors accounted for 209 (081 bit) of the available entropy (171ndash091) The largest decrease in the community entropy takes place under the action of the principal components 2 and 3 (006 bit and 005 respectively) A permutation test showed that these effects are statistically significant In turn 284 of the community β-diversity is attributable to vegetation factors The greatest decrease in community entropy is related to the principal vegetation components 1 3 and 4 (007 005 and 004 bits respectively) A permutation test indicated that this effect is statistically reliable Geostatistical models substantially describe the varying effects on the beta-diversity of edaphic principal components 1 and 2 and the vegetation principal components 1 and 3 It was found that edaphic and plant factors play an important role in structuring the communities of soil macrofauna on the level of beta diversity Community sensitivity to environmental factors varies in space and is spatially structured For different environmental factors specific spatial patterns of community sensitivity are allocated Beta diversity may be due to the fact that the species of soil macrofauna communities also vary in the degree of sensitivity to various environmental factors The species of soil microfauna are also divided according to their extent of sensitivity to different ecological factors
Key words diversity ecological factors spatial patterns variogram Mattern model
Vol 37 No 4 p 301ndash327 2018DOI102478eko-2018-0023
302
Introduction
Soils provide one of the most important ecosystem services such as supporting the most agro-sylvo-pastoral production systems (Lavelle et al 2006) Soil biota is highly diverse represent-ing 23 of the described organism diversity (Decaeumlns et al 2006) Forest soil biodiversity re-sponds to environmental changes and has been shown to be one of the key drivers of ecosystem function and service delivery (Lukac et al 2017) An important component of soil biota is represented by soil macrofauna (Lavelle 1997) Soil macrofauna significantly contributes to the dynamics of the soil properties (Ayuke et al 2009)
Soil biodiversity demonstrates considerable spatial and temporal heterogeneity at multiple scales (Carpenter et al 2012 Eggleton et al 2005 Burton Eggleton 2016) Scale-dependent drivers affect the species distributions and community composition at various spatial levels (Berg 2012) The scale-specific response to habitat heterogeneity may be an essential property of a given taxon or species (Vanbergen et al 2007) The large-scale determinants of soil macro-fauna diversity are climate soil type land-use management practices and landscape structure (Dauber et al 2003) Very little is known about the effect of landscape variables on soil biota (Wolters 2001 Dauber et al 2005) Soil animals significantly vary in size adaptations to move-ment and consequently vary considerably in mobility (Gilarov 1949 Zhukov 2015) Differ-ences in local community structure may be affected by ecological processes occurring at larger spatial scales Species differing in size and mobility can be regulated by different processes on one and the same spatial scale (Olff Ritchie 2002) It is highly probable that functional or ecological features of species are the important determinant of which habitat heterogeneity component is relevant and at which spatial scale (Dauber et al 2005) Differences were found in the spatial scales where the landscape affects species abundances and species richness for Collembola (Chust et al 2003) Homoptera and Diptera (Chust et al 2004)
Heterogeneity in soil properties induced by vegetational spatial patterns define the patchy distribution of soil organisms (Berg Bengtsson 2007 Berg 2012) It has been discovered that on a smaller spatial scale the diversity of tree species influences the earthworm density (Ce-sarz et al 2007) Diverse tree cover is important in the conservation of the soil macrofauna communities and in making a significant contribution to their activity in the soil ecological functions (Kamau et al 2017) The litter quality of a given tree species can significantly con-tribute to the changes observed in the soil fauna communities (Korboulewsky et al 2016) The importance of small scale heterogeneity has been shown for plant and soil macrofauna biodi-versity (Burton Eggleton 2016) The presence of dead wood is positively correlated with soil arthropod abundance and diversity (Jabin et al 2004) It has been shown that spatial patterns of herbaceous vegetation influence soil macrofauna biodiversity therefore full understanding of the soil macrofauna distribution in a grassland ecosystem requires an accurate study of the vegetation cover around the places where the samples of animals were collected (Mathieu et al 2009) Soil animals which are classified as ecosystem engineers can significantly increase the spatial heterogeneity of the soil and hence the spatial patchiness of soil fauna (Nuutinen et al 2017) Ecosystem engineers are able to modify important drivers of the spatial distribution of soil organisms such as soil structure pore space porosity and bulk density water content and mix organic matter and inorganic matrix (Lavelle 2002 Berg 2012)
303
Diversity is the most important aspect of the community structure Diversity can be seen in terms of three components alpha beta and gamma Alpha diversity is the species diversity at individual sites Gamma diversity is that of the whole region of interest of the study Beta diversity is the variation in species composition among sites within the geographic area of inter-est (Legendre et al 2005) Variation of biological communities across space or time (ie beta diversity) has attracted increasing attention (Alahuhta et al 2017 Viana et al 2016) Beta-diversity partition may provide additional insights into the causes of spatial variability in biotic communities compared to the total beta diversity itself (Soininen et al 2017) Beta diversity can reflect two different phenomena nestedness and spatial turnover (Baselga 2010) The prin-cipal current hypotheses about the origin of beta diversity are as follows 1) species composition is uniform in large areas 2) species composition fluctuates in a random autocorrelated way 3) species distributions are related to environmental conditions (Legendre et al 2005) Obviously all these mechanisms may occur in relation to soil macrofauna communities It is important to directly relate community beta-diversity to multiple environmental factors This problem may be resolved by means of the multinomial diversity model (MDM) This approach can divide community entropy and diversity within and between sites species and models and changes in entropy or diversity can be attributed to model predictors (Dersquoath 2012)
The aim of our work is to define the role of edaphic and vegetation factors in the partition-ing of beta diversity of the soil macrofauna community
Material and methods
Site description
Studies were conducted in the lsquoDnipro-Orilsrsquokiyrsquo Nature Reserve (Ukraine) The research polygon was laid in the forest within the Orlova ravine (48ordm31rsquo13 ldquoN 34ordm48rdquo 15 ldquoE) The territory has a temperate-continental climate with an annual mean maximum decade temperature of 257 ordmC and a minimum of ndash100 ordmC and with a mean annual precipitation of approximately 565 mm (20-year average according to the data of the Dnipro meteorological station)
The study site comprises 10 ha of deciduous woodland bordered by grassland valley territory (Fig 1) Forests in the steppe zone of Ukraine have a very restricted distribution and usually have an island status To the east the natural forest of the site borders an artificial pine plantation The soils are fertile sandy loam with the underlying geology comprising quaternary aeolian sandy sediments The site consists of 7 transects Each transect is made up of 15 test points The distance between rows in the site is 3 m
Sampling methods
Soil macrofauna was defined as invertebrates visible to the naked eye (macroscopic organisms) (Warren Zou 2002) Geobionts (large soil invertebrates that permanently inhabit the soil) and geophiles (organisms that live in the soil only for some phase of their life) (Krivolutsky 1994 Gholami et al 2016) were assessed Sampling was carried out during May 2016 Samples consisted of a single block of soil 25times25times30 cm3 deep dug out quickly A quadrat was fixed on the soil surface prior to taking the soil samples The litter macrofauna was collected from the soil samples hand The soil macrofauna were sorted and the animals were stored in 4 formaldehyde (Mathieu et al 2004)
Vegetation survey
This was carried out in 9 m2 quadrats in the centre of which the macrofauna samples were collected The projec-tive cover of plant species was recorded at ground level the understory (up to 2 m height) and canopy (above 2 m height) We were able to make species level identification for all the quadrats Within the studied polygon 48 species of plants were found The forest stand was dominated by Quercus robur L and Pyrus communis L Sambucus nigra L
304
Fig 1 Placing of experimental polygon and the sampling points
305
Acer tataricum L and Crataegus fallacina Klokov predominated among the bushes The herbaceous layer was domi-nated by Urtica dioica L Anthriscus sylvestris (L) Hoffm Chelidonium majus L Glechoma hederacea L and Vince-toxicum hirundinaria Medikus In syntaxonomic aspect the vegetation can be identified as follows (Sokolova 2011)Class Querco-Fagetea Br-Bl et Vlieger in Vlieger 1937Ordo Quercetalia pubescenti-petraeae Klika 1933Union Aceri tatarici-Quercion Zolyomi 1957Ass Vincetoxico hirundinariae-Quercetum roboris Sokolova 2011
Environmental variables
Based on the geobotanical descriptions phytoindicative assessment of environmental factors according to Belgard (1950 1971) Didukh (2011 2012) and Ellenberg (1974) was made
A system of plant ecomorphs was used according to Belgard (1950) and Tarasov (2012) Hygromorphs are rep-resented by xerophytes (humidity level 1) mesoxerophytes (humidity level 2) xeromesophytes (humidity level 3) mesophytes (humidity level 4) hygromesophytes (humidity level 5) The humidity level by hygromorphic structure (Hygr) is calculated as
where i is the moisture level Pi is the projective cover of plants of the corresponding hygromorph (Zhukov Za-dorozhnaya 2016)
Trophomorphs are represented by oligotrophs (trophy level 1) mesotrophs (level of trophy 2) and megatrophs (trophy level 3) Nutrient status level by trophomorphic structure (Troph) is calculated as
where j is the level of trophicity Pj is the projective cover of plants of the corresponding trophomorphHeliomorphs are represented by heliosciophytes (level of light 2) scioheliophytes (level of light 3) helophytes
(level of light 4) The level of illumination by the heoliomorphic structure (Hel) is estimated as
where z is level of light Pz is the projective cover of plants of the corresponding heliomorphDidukh phytoindication scales (2011 2012) include edaphic and climatic scales The edaphic phytoindication
scales include the soil water regime (Hd) the variability of damping (fH) the soil aeration (Ae) the soil acidity (Rc) the total salt regime (Sl) the carbonate content in the soil (Ca) and nitrogen content in the soil (Nt) The climatic scales include the parameters of the thermal climate (thermoregime Tm) humidity (Om) cryo-climate (Cr) and the continentality of climate (Kn) In addition to these the lighting scale (Lc) is highlighted which is characterized as a microclimate scale Thermal properties of soils are indicated by a scale of the thermal regime and hydrothermal is the scale of ombro mode Phytoindicational evaluation of the environmental factors is performed by the ideal indicator method of Buzuk (2017)
Ellenberg indicator values (1974) include L-scale of illuminationshading (9 classes Light Regime) T-scale of thermo climate (9 classes Temperatures) K-scale of climate continentality (9 classes Continentality of Climate) F-scale of soil moisture (9 classes Humidity) R-scale of soil acidity (9 classes Acidity) and N-scale of soil nitrogen (9 classes Nutrients Availability) Calculation of values of environmental factors was carried out using the method of average weighted values of indicator scales taking into account the projective cover of plants
Measurement of soil mechanical impedance was carried out in the field using a hand penetrometer Eijkelkamp to a depth of 100 cm with an interval of 5 cm The average error of the measurement results of the device is plusmn 8 The measurements were made by a cone with a cross-sectional dimension of 2 cm2 Within each measurement point the mechanical impedance of the soil was made in a single repeatability
To measure the electrical conductivity of the soil in situ a sensor HI 76305 was used (Hanna Instruments Woonsocket R I) This sensor works in conjunction with the portable device HI 993310 The tester estimates the total electrical conductivity of the soil that is combined conductivity of soil air water and particles The results of measurements of the device are presented in the units of saturation of the soil solution with salts is gl Comparison
119867119867119867119867119867119867119867119867 = sum (119894119894 times 119875119875119894119894)119894119894=119873119873
119894119894=1100
119879119879119879119879119879119879119879119879ℎ = sum (119895119895 times 119875119875119895119895)119895119895=119873119873
119895119895=1100
119867119867119867119867119867119867 = sum (119911119911 times 119875119875119911119911)119911119911=119873119873
119911119911=1100
306
of measurement results of HI 76305 with laboratory data allowed us to estimate the conversion factor of units as 1 dSm = 155 mgl (Pennisi van Iersel 2002)
The aggregate structure was evaluated by the dry sieving method according to Savinov (Vadunina Korchagina 1986) The percentage content of such fractions is established lt 025 025ndash05 05ndash1 1ndash2 2ndash3 3ndash5 5ndash7 7ndash10 gt 10 mm and plant roots The soil bulk density was estimated by Kachinskiy and the soil moisture by weight method (Vadunina Korchagina 1986)
Soil macrofauna identification
Adult and larvae specimens were counted and identified to species level Earthworms were identified using Perel (1978) Vsevolodova-Perel (1997) and Kunah et al (2010) Lithobiomorpha with Zalesskaya (1978) Geophilo-morpha using Bonato et al (2014) Diplopoda using Cherny and Golovach (1993) imago ground beetles using Kryzhanovsky (1964) larvae of ground beetles using Gilyarov (1964) Dolin (1978) Andreeva (1990) Kabakov (2006) and Krivosheina (2012) woodlice using Schmolzer (1965) molluscs using Gural-Sverlova and Gural (2012)
Statistical analysis
Statistical calculations were performed using the Statistica 70 program and the Project R lsquoR software shell A Lan-guage and Environment for Statistical Computingrsquo (httpwwwR-projectorg) Estimation of confidence intervals and the standard deviation of the number of soil animals was made using a bootstrap approach and implemented by means of the bootES package (Kirby Gerlanc 2013)
The assessment of the soil macrofauna community biodiversity and 95 of their confidence intervals and its partitioning on alpha beta and gamma diversity was done by using the entropart package (Marcon Herault 2015) Environmental variables were studied through the analysis of principal component using the package vegan (Ok-sanen et al 2017) The number of significant principal components was calculated on the basis of the Horn pro-cedure (Horn 1965) The operation was completed using the paran package (Dinno 2012) The partitioning of beta-diversity in relation to external predictors was conducted using multinomial diversity models with the help of MDM (Dersquoath 2012 2013) Spatial variation of differential entropy was displayed using the lsquoSurferreg 12 from Golden Software LLC (wwwgoldensoftwarecom)rsquo
Geostatistical analysis
Kriging is an important tool in geostatistics Kriging is a linear predictor by the method of the least squares (Minasny Mc-Bratney 2005) The variogram is a key concept in geostatistics Knowledge of the exact mathematical form of the variogram allows one to quantify spatial variation (McBratney Pringle 1999) as well as the prediction of soil properties on a local or re-gional level (Minasny McBratney 2005) A variogram is usually calculated using spatial data using the method of moments and subsequent fitting to the theoretical model of empirical variogram using a nonlinear least-squares method (Webster Oliver 2001) It is customary to refer to the intercept of the variogram model curve as the nugget (τ2) the difference between the asymptote and the nugget as the sill (σ2) and the distance at which the theoretical variogram curve reaches its maximum as the range For models with an infinite range the value at which the variogram reaches 95 of the asymptote is called the practical range These names correspond to the parameters τ2 σ2 and φ respectively where the latter is usually multiplied by a constant depending on the model For instance the practical range is 3φ for the exponential radic3φ for the Gaussian 4φ and 5φ for the Mattern model with κ = 1 and 2 respectively and equals φ for the spherical model (Ribeiro et al 2003)
However the method of moments can give erroneous results as commonly used variogram models (spherical exponential and gauss) are characterized by lack of flexibility (Stein 1999) As an alternative one can consider the Mattern variogram class of models (Matern 1986) Mattern models have considerable flexibility for modelling the spatial covariance and are able to describe a wide variety of local spatial processes Based on this the Mattern model is proposed to be used as a general approach for the simulation of soil properties (Minasny McBratney 2005) Mat-tern isotropic covariance function has the form (Handcock Stein 1993 Stein 1999)
where h is the separation distance Kν is the modified Bessel function of the second kind of order κ (Abramowitz Stegun 1972) Г is the gamma function φ is the range or distance parameter (φ gt 0) which measures how fast cor-
119865119865(ℎ) = 12120581120581minus1Γ(120581120581) (
ℎ120593120593)
120581120581119870119870120584120584 (
ℎ120593120593)
307
relation decays with distance κ is the smoothness parameter The Mattern model is characterized by high flexibility compared with conventional geostatistical models in view of the smoothing parameter κ When the κ parameter is small (κ rarr 0) the model assumes a rough spatial process if the κ parameter is large (κ rarr infin) it assumes a smoothed spatial process (Minasny McBratney 2005) When the parameter κ = 05 the Mattern model fully corresponds to an exponential model When κ rarr infin the Mattern model corresponds to a Gaussian model If κ = 1 it corresponds to a Whittlersquos function (Whittle 1954 Webster Oliver 2001 Minasny McBratney 2005) If the range parameter r is large (r rarr infin) then the spatial process is approximated by the power function when κ gt 0 and a log function or de Wijs function if κ rarr 0 (de Wijs 1951 1953) Calculations are made using geoR library (Paulo et al 2016 )
The nugget to sill ratio is an indicator of the strength of the spatial autocorrelation A variable is considered to have a strong spatial dependence if the ratio is less than 25 and has a moderate spatial dependence if the ratio is between 25 and 75 otherwise the variable has a weak spatial dependence (Sun et al 2003)
Map accuracy cross-validation ME NRMSE and MSDR
To measure the accuracy of differential entropy maps we use the cross-validation procedure and consequently we compute the normalized root mean squared error (NRMSE) mean error (ME) and mean squared deviation ratio (MSDR) (Vašaacutet et al 2013) Mean squared error (RMSE) was calculated as follows
Normalized root mean squared error (NRMSE) was calculated as follows
Mean error (ME) was calculated as follows
Mean squared deviation ratio (MSDR) was calculated as follows
Where x1 is a prediction of the variable X x2 is a measure of that variable n is the number of records var is a kriging variance The smaller the NRMSE and ME values the more accurate the map The MSDR indicates whether the variance of measurement data is well reproduced with the kriging interpolation and ideally it equals to 1 (Vašaacutet et al 2013) The R-squared of the regression between the observed and predicted after cross validation values was used as they are very intuitive Cross-validation procedure was performed using the function xvalid from the pack-age geoR library (Ribeiro Diggle 2016)
Results
In the soil of the studied polygon 38 species of soil invertebrates were found which char-acterises the gamma diversity (25 quantile is 342 975 quantile is 412) (Fig 2) Alpha diversity or the number of species on average in each sampling point is 43 (25 quantile is 42 975 quantile is 45) Beta diversity is 88 (25 quantile is 80 975 quantile is 96)
The abundance of soil macrofauna was 1978 plusmn 279 indm2 (Table 1) The endogeic earth-worm Aporrectodea rosea was the dominant species in the macrofauna community Endogeic A trapezoides epigeic Dendrobaena octaedra and anecic Octodrilus transpadanus were rep-resented in the community Millipedes were represented by four species with domination of endogeic Geophilidae compared to epigeic Lithobiidae There was a variety of soil insects
119877119877119877119877119877119877119877119877 = radicsum (1199091199091119894119894 minus 1199091199092119894119894)2119899119899119894119894=1
119899119899
119873119873119873119873119873119873119873119873119873119873 = 1198731198731198731198731198731198731198731198731199091199091119898119898119898119898119898119898 minus 1199091199091119898119898119898119898119898119898
119872119872119872119872 =sum (1199091199091119894119894 minus 1199091199092119894119894)119899119899119894119894=1
119899119899
119872119872119872119872119872119872119872119872 =sum [(1199091199091119894119894 minus 1199091199092119894119894)2
119907119907119907119907119907119907119894119894 ]119899119899119894119894=1
119899119899
308
among which were both imagoes and larvae Molluscs were represented by five species but their abundance was not great
Beta diversity of the community may be affected by edaphic and (or) vegetation factors Principal component analysis of the edaphic indicators revealed 9 principal components having eigenvalues greater than 1 Using the Horn procedures we found that the first four principal components are statistically significant These components describe 642 of the total variation of the edaphic indicators Principal component 1 is correlated with the soil mechanical impedance at a depth of 35minus100 cm litter depth density and electric conductiv-ity of the soil and the content of the roots and aggregate fractions of size lt 025minus1 mm and 5minus10 mm (Table 2) Principal component 2 is correlated with the soil mechanical impedance
Fig 2 Alpha beta and gamma diversity of soil macrofauna
309
TaxonsDensity
indm2 plusmn st errorPhylum AnnelidaeClass OligohaetaOrder Haplotaxida
Family Lumbricidae
Aporrectodea caliginosa trapezoides (Duges 1828) 990 plusmn 139Aporrectodea rosea rosea (Savigny 1826) 11749 plusmn 815Dendrobaena octaedra (Savigny 1826) 1554 plusmn 227Octodrilus transpadanus (Rosa 1884) 564 plusmn 117
Order TubificidaFamily Enchytraeidae Enchytraeus albidus Henle 1837 792 plusmn 156Phylum ArthropodaClass ArachnidaOrder AraneaeFamily Lycosidae Pardosa lugubris (Walckenaer 1802) 091 plusmn 042Class ChilopodaOrder Geophilomorpha
Family Geophilidae Geophilus proximus CLKoch 1847 396 plusmn 100Pachymerium ferrugineum (CLKoch 1835) 183 plusmn 056
Order Lithobiomorpha
Family Lithobiidae Lithobius (Monotarsobius) aeruginosus L Koch 1862 091 plusmn 042Lithobius (Monotarsobius) curtipes CL Koch 1847 183 plusmn 059
Class InsectaOrder Coleoptera
Family Carabidae
Amara (Amara) aenea (De Geer 1774) 015 plusmn 015Amara similata (Gyllenhal 1810) 229 plusmn 085Calathus (Calathus) fuscipes (Goeze 1777) 015 plusmn 015Carabus (Cancellocarabus) cancellatus Illiger 1798 030 plusmn 030
Family Cetoniidae Cetonia aurata (Linnaeus 1761) (larvae) 046 plusmn 033Family Chrysomelidae Chrysolina (Fastuolina) fastuosa (Scopoli 1763) (larvae) 076 plusmn 032Family Curculionidae Otiorhynchus (Cryphiphorus) ligustici (Linnaeus 1758) (larvae) 030 plusmn 021Family Elateridae Athous (Athous) haemorrhoidalis (Fabricius 1801) (larvae) 670 plusmn 118
Agriotes (Agriotes) lineatus (Linnaeus 1767) (larvae) 015 plusmn 015Cardiophorus rufipes (Goeze 1777) (larvae) 046 plusmn 026
Family Staphylinidae Othius angustus angustus Stephens 1833 (larvae) 015 plusmn 015Othius punctulatus (Goeze 1777) (larvae) 015 plusmn 015
Family Tenebrionidae Helops coeruleus (Linnaeus 1758) (larvae) 030 plusmn 022
Family MelolonthidaeAnoxia pilosa (Fabricius 1792) (larvae) 030 plusmn 021Melolontha melolontha (Linnaeus 1758) (larvae) 229 plusmn 058Serica brunnea (Linnaeus 1758) (larvae) 046 plusmn 026
Order DermapteraFamily Forficulidae Forficula auricularia Linnaeus 1758 061 plusmn 031Order DipteraFamily Rhagionidae Rhagio scolopaceus (Linnaeus 1758) (larvae) 488 plusmn 121Family Stratiomyidae Stratiomys longicornis (Scopoli 1763) (larvae) 015 plusmn 015Family Tabanidae Tabanus bromius Linnaeus 1758 (larvae) 030 plusmn 021Family Tipulidae Tipula (Lunatipula) lunata Linnaeus 1758 (larvae) 366 plusmn 073Order LepidopteraFamily Noctuidae Agrotis clavis (Hufnagel 1766) (larvae) 503 plusmn 107Class MalacostracaOrder IsopodaFamily Trachelipodidae Trachelipus rathkii (Brandt 1833) 015 plusmn 015Phylum MolluscaClass GastropodaOrder PulmonataFamily Cochlicopidae Cochlicopa lubrica (OF Muller 1774) 015 plusmn 015Family Helicidae Cepaea (Austrotachea) vindobonensis (C Pfeiffer 1828) 015 plusmn 015Family Succineidae Succinella oblonga (Draparnaud 1801) 061 plusmn 030Family Valloniidae Vallonia pulchella (OF Muller 1774) 015 plusmn 015Family Vitrinidae Vitrina pellucida (OF Muller 1774) 061 plusmn 030
T a b l e 1 Taxonomic composition and abundance of soil macrofauna
310
T a b l e 2 Descriptive statistics and principal component analysis of the edaphic parameters (presenting statistically significant correlation coefficients with p lt 005)
Parameters mean plusmn st errorPrincipal components
1 2 3 4Soil mechanical impedance at depth МPа
0ndash5 cm 065 plusmn 001 ndash ndash055 ndash ndash5ndash10 cm 076 plusmn 002 ndash ndash076 ndash ndash10ndash15 cm 089 plusmn 004 ndash ndash090 ndash ndash15ndash20 cm 096 plusmn 004 ndash ndash091 ndash ndash20ndash25 cm 098 plusmn 004 ndash ndash089 ndash ndash25ndash30 cm 095 plusmn 004 020 ndash084 ndash ndash30ndash35 cm 094 plusmn 003 ndash ndash078 ndash ndash35ndash40 cm 104 plusmn 003 ndash041 ndash059 ndash026 ndash40ndash45 cm 131 plusmn 003 ndash050 ndash042 ndash047 ndash45ndash50 cm 156 plusmn 003 ndash066 ndash032 ndash032 ndash50ndash55 cm 181 plusmn 004 ndash072 ndash033 ndash023 ndash55ndash60 cm 202 plusmn 004 ndash082 ndash024 ndash ndash60ndash65 cm 228 plusmn 005 ndash079 ndash021 ndash ndash65ndash70 cm 241 plusmn 005 ndash087 ndash ndash ndash70ndash75 cm 253 plusmn 005 ndash090 ndash ndash ndash75ndash80 cm 259 plusmn 005 ndash089 ndash ndash ndash80ndash85 cm 269 plusmn 006 ndash087 ndash ndash ndash85ndash90 cm 272 plusmn 006 ndash090 ndash ndash ndash90ndash95 cm 274 plusmn 007 ndash091 ndash ndash ndash95ndash100 cm 284 plusmn 008 ndash084 ndash ndash ndash
Other edaphic parametersLitter depth cm 340 plusmn 010 ndash035 055 ndash ndashMoisture 3096 plusmn 069 ndash ndash059 ndash ndashBulk density gcm3 098 plusmn 001 ndash071 058 ndash ndashElectrical conductivity dSmм 021 plusmn 001 ndash035 055 ndash ndash
Aggregate fractions (mm) and plant roots content gt 10 1291 plusmn071 ndash ndash 086 ndash7ndash10 728 plusmn 028 ndash024 ndash 064 ndash5ndash7 981 plusmn 035 ndash026 ndash ndash 0523ndash5 2313 plusmn 085 ndash ndash ndash054 0582ndash3 2768 plusmn 082 ndash ndash ndash079 ndash1ndash2 1396 plusmn 086 ndash ndash ndash066 ndash04105ndash1 137 plusmn 012 027 ndash ndash044 ndash060025ndash05 229 plusmn 029 022 ndash ndash035 ndash061lt 025 061 plusmn 009 037 ndash ndash027 ndash066Roots 095 plusmn 008 025 ndash ndash 036Eigen values 942 672 323 247 total variation 2771 1977 950 727
Notes Litter ndash thickness cm Moisture ndash moisture of soil Density ndash soil density gcm3 E ndash electronic conductiv-ity of the soil d SmM
311
T a b l e 3 Descriptive statistics and principal component analysis of the vegetation parameters (presenting statisti-cally significant correlation coefficients with p lt 005)
Parameters mean plusmn st errorPrincipal components
1 2 3 4 5 6
Diduh scales
Hd 920 plusmn 013 ndash021 ndash ndash069 ndash ndash ndashfH 516 plusmn 010 ndash053 050 ndash024 037 ndash ndashRc 611 plusmn 014 ndash039 ndash ndash026 026 ndash050 ndash047Sl 710 plusmn 010 ndash ndash049 ndash 041 ndash065 ndashCa 497 plusmn 023 ndash084 ndash 021 ndash ndash ndashNt 1221 plusmn 012 060 ndash 019 ndash053 ndash033 ndash020Ae 550 plusmn 016 ndash 037 ndash051 ndash036 ndash ndashTm 1118 plusmn 006 038 ndash 048 ndash ndash ndashOm 1256 plusmn 013 071 021 ndash049 ndash ndash ndashKn 705 plusmn 020 ndash086 ndash 030 ndash ndash022 ndashCr 993 plusmn 010 027 056 ndash 043 ndash 030Lc 530 plusmn 015 ndash072 ndash ndash021 ndash ndash ndash026
Indexes based on Belgardrsquos ecomorphsTroph 228 plusmn 002 ndash026 057 ndash ndash046 ndash039 032Hygr 323 plusmn 003 025 ndash 084 ndash ndash ndashHel 300 plusmn 001 ndash078 ndash031 ndash ndash 040 ndash
Ellenberg scalesLight Regime 679 plusmn 003 ndash052 ndash066 ndash ndash 034 ndashTemperatures 580 plusmn 002 ndash070 ndash ndash ndash033 ndash045 ndashContinentality of Climate 531 plusmn 004 ndash081 ndash037 ndash ndash ndash 024Humidity 515 plusmn 002 071 ndash033 ndash 023 ndash 029Acidity 602 plusmn 002 ndash ndash051 069 029 ndash ndash023Nutrients Availability 674 plusmn 008 089 ndash 023 ndash 020 ndash
Raunkiaerrsquos life formsPh 034 plusmn 0011 020 ndash030 ndash078 ndash ndash022 040nPh 027 plusmn 0011 ndash ndash084 ndash ndash ndash ndash040HKr 028 plusmn 0012 ndash 059 050 042 ndash 022T 010 plusmn 0007 ndash 062 031 ndash044 014 ndash028G 001 plusmn 0002 ndash032 044 ndash039 ndash 029 ndash028Eigen values 719 421 396 201 177 148 total variation 2764 1619 1522 774 679 56
Notes Hd ndash soil water regime fH ndash variability of damping Rc ndash soil acidity Sl ndash total salt regime Ca ndash carbonate content in soil Nt ndash nitrogen content in soil Ae ndash soil aeration Tm ndash thermoregime Om ndash humidity Kn ndash conti-nentality of climate Cr ndash cryo-climate Lc ndash lighting scale Hygr ndash humidity level by hygromorphic structure Troph ndash nutrient status level by trophomorphic structure Hel ndash level of illumination by the geoliomorphic Ph ndash phanero-phytes nPh ndash nanophanerophytes HKr ndash hemicryptophytes T ndash therophytes G ndash geophytes
312
at a depth of 0minus65 cm and some other edaphic parameters Principal component 3 correlated with soil mechanical impedance at a depth of 35minus55 cm and a content of aggregate fractions of size lt 025minus5 7minus10 and gt 10 mm Principal component 4 is correlated with the content of roots and aggregate fractions lt 025minus2 and 37 mm
Principal component analysis of plant indicators identified 7 principal components the eigenvalues of which are greater than 1 Using the Horn procedure we found that the first six principal components were statistically significant These components describe 736 of the total variation in the vegetation indicators (Table 3) The first principal component is charac-terized by the greatest correlation with the level of carbonates in the soil as well as scales of continentality and illumination This component is meaningful and can be interpreted as the ecotone effect Principal component 2 is characterized by a positive correlation with phan-erophites and nanophanerophites and negative correlation with other life forms according to Raunkiaerrsquos classification Thus the principal component 2 represents the ratio between the herbaceous layer on the one hand and the shrub layer (to a lesser extent with forest stands) on the other hand Correlation with other environmental factors reveals the contents of the processes associated with the specified value The principal component 3 is correlated with phanerophytes this allows us to interpret it as the forest stand density The humidity acidity ecotope aeration as well as some other ecological factors are connected with forest stand density The principal component 4 is characterized by the greatest correlation with soil nitrogen content The principal component 5 can be interpreted as the mineralization of the soil solution The principal component 6 most likely represents the level of soil solution acidity
The principal components are orthogonal that is mutually independent However veg-etation and edaphic principal components can be correlated (Table 4) Only the principal component 6 is independent and reflects plant community properties only since it is not correlated with the edaphic principal components The edaphic principal components always correlate with vegetation principal components These results indicate the complexity of the interaction between soil and vegetation
On the basis of the MDM-approach we evaluated the role of edaphic principal compo-nents in the partitioning of the macrofauna community β-diversity (Table 5) The results indicate that the γ-diversity is 171 bits and а α-diversity is 091 bit We found that 209 (081 bit) of β-diversity was caused by the edaphic factors The largest decrease in community entropy took place under the action of principal components 2 and 3 (006 bit and 005 bit respectively) The permutation test reveals that these effects are statistically significant The influence of the principal component 1 and 4 is lower and is not statistically significant
In turn 284 of community β-diversity was caused by the plant factors (Table 6) The greatest decrease in community entropy is related to vegetation principal components 1 3 and 4 (007 005 004 bits respectively) The permutation test reveals that these effects are statistically significant The effect of principal components 2 5 and 6 are not statistically significant
The effect of ecological factors leads to a change in the entropy of the community This change can be positive and then the factor information is transferred to the community Or a change can be negative and then the community is sent misinformation Between the
313
T a b l e 4 Correlation matrix of the edaphic and vegetation principal components (presenting statistically signifi-cant correlation coefficients with p lt 005)
Vegetation principal components
Ph_1 Ph_2 Ph_3 Ph_4 Ph_5 Ph_6
Edaphic principal components
Ed_1 ndash ndash020 ndash048 ndash ndash ndash
Ed_2 037 ndash021 037 ndash ndash034 ndash
Ed_3 ndash ndash 020 ndash ndash ndash
Ed_4 ndash ndash ndash 022 ndash024 ndash
T a b l e 5 The analysis of deviance entropy and diversity under edaphic impact on macrofauna on the basis of MDM-approach
Notes Ed1ndash4 ndash edaphic principal components df ndash degrees of freedom Δdf ndash changes in df Dev ndash deviance ΔDiff ndash changes in deviance Ent ndash entropy ΔEnt ndash changes in entropy pndashlevel ndash the significance level based on sequential permutation tests Div ndash diversity ΔD ndash proportional change in diversity
Model df Δdf Dev ΔDev Ent ΔEnt pndashlevel Div ΔDγ-diversity 3432 ndash 3595 ndash 171 ndash ndash 554 ndashEd1 3399 33 3538 574 169 003 037 539 103Ed1+Ed2 3366 33 3408 1296 162 006 000 507 106Ed1+Ed2+Ed3 3333 33 3306 1027 157 005 000 483 105Ed1+Ed2+Ed3+Ed4 3300 33 3243 625 154 003 029 469 103α-diversity 0 3300 1902 13418 091 064 001 247 189
Notes Ph1ndashPh6 ndash edaphic principal components df ndash degrees of freedom Δdf ndash changes in df Dev ndash deviance ΔDiff ndash changes in deviance Ent ndash entropy ΔEnt ndash changes in entropy pndashlevel ndash the significance level based on sequential permutation tests Div ndash diversity ΔD ndash proportional change in diversity
T a b l e 6 The analysis of deviance entropy and diversity under vegetation impact on macrofauna on the basis of MDM-approach
Model df Δdf Dev ΔDev Ent ΔEnt pndashlevel Div ΔDγ- diversity 3432 ndash 3595 ndash 171 ndash ndash 554 ndashPh1 3399 33 3441 1548 164 007 001 515 108Ph1+Ph2 3366 33 3379 620 161 003 028 500 103Ph1+Ph2+Ph3 3333 33 3283 956 156 005 002 478 105Ph1+Ph2+Ph3+Ph4 3300 33 3201 816 152 004 005 459 104Ph1+Ph2+Ph3+Ph4+Ph5 3267 33 3163 384 151 002 087 451 102Ph1+Ph2+Ph3+Ph4+Ph5+Ph6 3234 33 3114 490 148 002 057 441 102α-diversity 0 3234 1902 12125 091 058 001 247 178
314
Fig 3 Dependence of differential entropy on edaphic principal component scores
values of the edaphic principal components which reflect the cumulative variation of soil properties and changes of entropy in each site there is a dependency (Fig 3) For example the positive values of the principal components 1 lead to misinformation of the community On the other hand negative values are perceived by the community as an organization fac-tor Thus the effects of ecological factors on the macrofauna community do not occur across the full range of values of the ecological factors All dependencies are nonlinear indicating that the there is a range of values of the principal components when the highest amount of information is transmitted In other words when the community is most sensitive to the cor-responding principal components
Similar results were obtained for the dependence of entropy change of the vegetation principal component values (Fig 4) All principal components have a range of values of the principal component when the community receives misinformation Also for certain values of principal components the transmitted information reaches the maximum values
The MDM-approach evaluates the components of entropy by sites This provides a good opportunity to examine how changes in entropy vary in geographic space (Figs 5 6) Within the study area for each of the principal components areas can be distinguished within which
315
Fig 4 Dependence of differential entropy on vegetation principal component scores
316
Fig 5 Spatial variation of differential entropy under influence of the edaphic principal components
Fig 6 Spatial variation of differential entropy under influence of the vegetation principal components
317
the relevant ecological factor has a structuring effect on the macrofauna community Also there are areas within which the ecological factor transmits misinformation to the commu-nity The spatial patterns of the entropy changes are different under the influence of specific ecological factors
Geostatistical models best describe the variation of entropy change induced by edaphic principal components 1 and 2 (Table 7) These models respectively describe 61 and 49 of their variation The impact of principal component 1 on entropy change has a strong spatial dependence (SDL = 2390) The impact of principal component 2 has a moderate spa-tial dependence (SDL = 4141) The Mattern model can be regarded as a generalization of a number of theoretical variogram models (Minasny McBratney 2005) The geostatistical model of principal component 1 is closest to the Whittle function as in the general Mattern model kappa = 103 (for the Whittle model kappa = 1) (Whittle 1954) Spatial variation in differential entropy under the influence of the principal components 2 is best modelled by an exponential model for which kappa = 05 (Webster Oliver 2001 Minasny McBratney 2005) The effect on the community of edaphic components 3 and 4 has no significant spatial dependence or generally may be purely spatially modelled
The spatial model best describes the effect of the vegetation principal components 1 and 3 on the soil macrofauna community (R2 = 025 and 047 respectively) The impact of the vegetation principal components 1 and 3 on entropy change has a strong spatial dependence
T a b l e 7 Geostatistics of the spatial variation in the entropy change under the influence of edaphic and vegetation factors
Notes Phi is the range or distance parameter of the Mattern model Pr_Range is a practical range Kappa is a smoothing parameter the nugget is the y-intercept of the graph the sill is the semivariogram value (y value) where each graph becomes a plateau the range is the distance (x value) where the plateau begins and the spatial depend-ence level SDL ((Sill-Nugget)Sill) is the ratio of structural to population variance R2 of cross-validation
PC Phi Pr_Range Sill Nugget SDL Kappa NRMSEME10ndash
5MSDR R2
Edaphic principal componentsEd1 986 3998 003 00097 2392 103 011 550 038 061Ed2 367 1098 001 00064 4141 050 016 -244 056 049Ed3 155 1559 001 00271 7020 800 020 -253 095 005Ed4 2300 19615 004 00056 1115 560 012 -014 101 000
Alpha 020 012 013 00831 3864 003 018 000 101 000Vegetation principal components
Ph1 2269 11355 253 00029 011 170 013 449 079 025Ph2 566 3014 807 00000 000 197 009 -1599 144 009Ph3 2162 13525 7101 00002 000 283 006 438 055 047Ph4 2822 15039 9287 00004 000 197 021 2324 203 001Ph5 1933 6103 000 00025 8158 057 017 118 096 003Ph6 100 345 000 00001 383 070 011 020 101 000
Alpha 2767 4520 009 017 6676 013 019 655 099 001
318
Fig 7 Differential entropy for some species of soil invertebrates
319
Fig 8 Classification of macrofauna species on the basis of beta diversity transformation patterns under the influence of edaphic factors
Parameter kappa indicates that the spatial patterns for the principal components 1 and 3 are smoother than the Whittle pattern
The MDM-approach estimates the components of entropy by species (Fig 7) The cor-responding curves characterize the ecological features of the species that make up the com-munity According to the degree of similarity of these curves one can perform a classification of the community by cluster analysis (Fig 8) The cluster analysis of the species according to their response to the edaphic factors reveals four clusters It is possible to build the integral curves of reaction to the environmental factors of the species included in each cluster Cluster 1 combines the species for which edaphic factors have no effect on contribution to the total β-diversity of the community (Fig 9) Cluster 2 combines the species sensitive to the action of the principal components 1 and 2 Cluster 3 combines the species in the community that are sensitive to all the principal components Cluster 4 combines species sensitive to the ac-tion of principal components 3 and 4
With respect to the influence of vegetation factors the macrofauna species are classi-fied into four clusters (Fig 10) Cluster 1 combines species not susceptible to the action of
320
Fig 9 Differential entropy under the influence of edaphic factors for clusters
vegetation principal components within the studied site (Fig 11) Species that are included in cluster 2 are sensitive to all vegetation principal components Cluster 3 combines species sensitive to the action of vegetation principal components 1 and 2 Species included in cluster 4 are sensitive to principal components 1ndash5
Discussion
The overall inertia of the tables of species occurrence has been demonstrated to be capable of corresponding with common diversity indices of species richness such as the Simpson diversity or the Shannon information index This result allows one to examine from a general point of view the ordination techniques such as Correspondence Analysis Non-Symmetric
321
Correspondence Analysis Canonical Correspondence Analysis and Redundancy Analysis and provides greater insight into interrelations between the ordination methods and diver-sity indexes (Peacutelissier et al 2003) These interrelations explain why ordination techniques are widely used in studying beta diversity (Eggleton et al 2005 Carpenter et al 2012 Zbinden Matthews 2017) The multinomial diversity model (MDM) is a method for relating Shannon diversity to complex environmental spatial and temporal predictors (Dersquoath 2012)
In our work we established the influence of plant and edaphic factors on beta diversity of a macrofauna community Within the relatively restricted area of the studied polygon beta diversity of the soil macrofauna community is 88 (25 quantile-80 975-96) We have shown that the effect of plant factors on beta diversity is greater than the effect of edaphic fac-tors It is notable that the edaphic principal component 1 which is dominant on level of vari-ation has no statistically significant effect on beta diversity of the macrofauna community Probably the reason for this is that the variation of relevant properties of edaphic properties is perceived by the community as a source of information and as a source of misinformation Information increases the negative entropy and organizes community In turn the impact
Fig 10 Classification of macrofauna species on the basis of beta diversity transformation patterns under the influ-ence of vegetation factors
322
of misinformation increases entropy and disorder in the community Only negative values of edaphic principal components 1 pass information to the community whereas positive values are a source of misinformation The edaphic principal component 1 is characterized by correlation with indicators of soil mechanical impedance at a depth of 35ndash100 cm In the conditions of the floodplain at the specified depth variation of the soil mechanical imped-ance can be a consequence of the mobility of the parent deposition High soil mechanical impedance at relatively great depths may characterize the stable areas of the floodplain Low soil mechanical impedance can be the result of the fact that the soil pores and cracks within moving parts of the floodplain are filled with loose material Mechanical instability can lead to different scenarios of soil dynamics to which soil animals react as to factors of disorgani-zation of the community
The edaphic principal components 2 and 3 are sensitive to the variations of the soil me-chanical impedance at a depth of 0minus65 and 35minus55 cm These dynamics of soil properties may be due to spatial variation of the vegetation structure Plant and edaphic principal components are
Fig 11 Differential entropy under the influence of vegetation factors for clusters
323
correlated with each other Statistics cannot confirm a causal relationship but vegetation can be assumed to play a leading role in shaping soil ecological regimes at this scale level This is also in line with the views on the factors of soil formation that ascribe the leading role to vegetation (Dokuchaev 1883 Jenny 1941 Bockheim et al 2014)
The impact of vegetation principal components 1 3 and 4 on the beta diversity of soil mac-rofauna community is statistically significant Plants modify the microclimate in their vicin-ity by cooling down the soil and air in the shade of their leaves They also modify humidity by intercepting wind and rain and by absorbing water in the soil As a consequence vegeta-tion creates specific physical conditions for the survival of macrofauna and influences the food availability regime (Jackson Caldwell 1993) The principal component 3 reflects the varying ecological regimes associated with an abundance of woody plants There was a positive cor-relation between the diversity of the two groups but only at the local scale (single sample data) indicating that tree diversity can increase lumbricid diversity by the mechanism of creating small scale microhabitat diversity (Cesarz et al 2007 Migge-Kleian et al 2007)
The effect of vegetation principal component 2 on the soil macrofauna is not statistically sig-nificant This component mainly reflects the ratio between nanophanerophytes and hemicrypto-phytes Probably the nature of the impact of these plant ecological groups on the soil environment is uniform and does not find its specific response in the community structure of soil macrofauna The character of dependence of differential entropy on principal component 2 confirms this as-sumption (Fig 4) The vegetation principal components 5 and 6 do not provide statistically sig-nificant effects on beta diversity of the soil macrofauna in view of the low level of the variability
To determine the causes of community variation it is necessary to link the scales at which variation is measured to the scales at which the processes potentially affecting diversity actu-ally operate (Huston 1999) In this regard an important role is played by the spatial properties of the processes Geostatistics provides an opportunity to assess the spatial distribution of the variability of environmental properties and soil organisms (Rossi et al 1996 Rossi 2003) Geo-statistical models are sufficiently good at describing the varying effects on the beta-diversity of edaphic principal components 1 and 2 and the vegetation principal components 1 and 3 Effects of other principal components cannot be well described by geostatistical models in the framework of the chosen procedure It is likely that to identify the relevant patterns a detailed large-scale survey of the territory must be made
It is worth taking into account the indicator differential entropy This indicator reflects the sensitivity of beta-diversity of the community to the impact of external factors Most often attention is paid to the spatial characteristics of the soil properties (Jackson Caldwell 1993 1996 Reza et al 2016) or separate species (Gongalsky et al 2009) or the community of living organisms (Gongalsky et al 2008) Differential entropy characterizes the relationship between environmental factors and the community Spatial structuring of differential entropy indicates that the community sensitivity to environmental factors is not uniform in space (Figs 5 6)
In the framework of the MDM approach the effects of the model can be expressed as changes in entropy Entropy can be partitioned within and between sites species and models and changes in entropy can be attributed to model predictors (Dersquoath 2012) We have found that soil macrofauna species vary in sensitivity to action of edaphic and vegetation factors Sim-ilarities in these reactions serves as a basis for the classification of species A significant group
324
of species is insensitive to the action of both edaphic (16 species) and vegetation factors (16 species) 12 species within the community are not sensitive to the action of both edaphic and vegetation factors It can be assumed that these species are sensitive to these ecological factors on other spatial levels or that interspecies interaction plays an important role in the organiza-tion of the community represented by these species
Conclusion
We found that edaphic and vegetation factors play an important role in structuring the soil macrofauna community on the level of beta diversity The sensitivity of the community to envi-ronmental factors varies in space and is spatially structured For edaphic and vegetation factors specific spatial patterns of community sensitivity are allocated Beta diversity may be due to the fact that the species of soil macrofauna community also vary in the degree of sensitivity to vari-ous environmental factors A considerable part of the community is represented by the species indifferent to the impact of ecological factors within the studied spatial scale
References
Abramowitz M amp Stegun IE (1972) Handbook of mathematical functions with formulas graphs and mathematical tables Washington DC US Department of Commerce National Bureau of Standards
Alahuhta J Kosten S Akasaka M Auderset D Azzella MM Bolpagni R Bove CP Chambers PA Chappuis E Clayton J de Winton M Ecke F Gacia E Gecheva G Grillas P Hauxwell J Hellsten S Hjort J Hoyer MV Ilg C Kolada A Kuoppala M Lauridsen T Li EH Lukaacutecs BA Mjelde M Mikulyuk A Mormul RP Nishihiro J Oertli B Rhazi L Rhazi M Sass L Schranz C Soslashndergaard M Yamanouchi T Yu Q Wang H Willby N Zhang XK amp Heino J (2017) Global variation in the beta diversity of lake macrophytes is driven by environmental heterogeneity rather than latitude J Biogeogr 44 1758minus1769 DOI 101111jbi12978
Andreeva RV (1990) Identification key to gadfly larvae (in Russian) Kiev Naukova dumkaAyuke FO Karanja NK Muya EM Musombi BK Munyati J amp Nyamasyo GH (2009) Macrofauna diversity
and abundance across different land use systems in Embu Kenya Tropical and Subtropical Agroecosytems 11 371minus384
Baselga A (2010) Partitioning the turnover and nestedness components of beta diversity Glob Ecol Biogeogr 19 134minus143 DOI 101111j1466-8238200900490x
Belgard AL (1950) The forest vegetation of the south east of the Ukraine (in Russian) Kiev Kiev University PressBelgard AL (1971) Steppe forestry (in Russian) Moscow Forest IndustryBerg MP amp Bengtsson J (2007) Spatial and temporal variation in food web composition Oikos 116 1789minus1804
DOI 101111j0030-1299200715748xBerg MP (2012) Patterns of biodiversity at fine and small spatial scales In DH Wall RD Bardgett V Behan-Pelle-
tier JE Herrick TH Jones K Ritz J Six DR Strong amp WH van der Putten (Eds) Soil ecology and ecosystem services (pp 136minus152) Oxford Oxfod University Press
Bockheim JG Gennadiyev AN Hartemink AE amp Brevik EC (2014) Soil-forming factors and Soil Taxonomy Geoderma 226minus227 231minus237 DOI 101016jgeoderma201402016
Bonato L Minelli A Lopresti M amp Cerretti P (2014) ChiloKey an interactive identification tool for the geophilo-morph centipedes of Europe (Chilopoda Geophilomorpha) ZooKeys 443 1minus9 DOI 103897zookeys4437530
Burton VJ amp Eggleton P (2016) Microhabitat heterogeneity enhances soil macrofauna and plant species diversity in an Ash - Field Maple woodland Eur J Soil Biol 75 97minus106 DOI 101016jejsobi201604012
Buzuk GN (2017) Phytoindication using ecological scales and regression analysis ecological index (in Russian) Vestnik Farmacii 2(76) 31minus37
Carpenter D Hammond PM Sherlock E Lidgett A Leigh K amp Eggleton P (2012) Biodiversity of soil macrofauna in the New Forest a benchmark study across a national park landscape Biodivers Conserv 21 3385minus3410 DOI 101007s10531-012-0369-0
325
Cesarz S Fahrenholz N Migge-Kleian S Platner C amp Schaefer M (2007) Earthworm communities in relation to tree diversity in a deciduous forest Eur J Soil Biol 43 S61minusS67 DOI 101016jejsobi200708003
Cherny NG amp Golovach SJ (1993) Millipedes of the lowland territory of Ukraine (in Russian) KievChust G Pretus JL Ducrot D Bedo`s A amp Deharveng L (2003) Response of soil fauna to landscape heterogene-
ity determining optimal scales for biodiversity modeling Conserv Biol 17 1712minus1723 DOI 101111j1523-1739200300564x
Chust G Pretus JL Ducrot D amp Ventura D (2004) Scale dependency of insect assemblages in response to land-scape pattern Landsc Ecol 19 41minus57 DOI 101023BLAND000001836899833f2
Dauber J Hirsch M Simmering D Waldhardt R Otte A amp Wolters V (2003) Landscape structure as an indica-tor of biodiversity matrix effects on species richness Agric Ecosyst Environ 98 321minus329 DOI 101016S0167-8809(03)00092-6
Dauber J Purtauf T Allspach A Frisch J Voigtlander K amp Wolters V (2005) Local vs landscape controls on diversity a test using surface-dwelling soil macroinvertebrates of different mobility Glob Ecol Biogeogr 14 213minus221 DOI 101111j1466-822X200500150x
de Wijs HJ (1951) Statistics of ore distribution Part I Frequency distribution of assay values Journal of the Royal Netherlands Geological and Mining Society New Series 13 365minus375
de Wijs HJ (1953) Statistics of ore distribution Part II Theory of binomial distribution applied to sampling and engineering problems Journal of the Royal Netherlands Geological and Mining Society New Series 15 12minus24
Dersquoath G (2012) The multinomial diversity model Linking shannon diversity to multiple predictors Ecology 323 116minus119 DOI 10189011-21551
Dersquoath G (2013) Code for mdm was adapted from multinom in the nnet package MDM Multinomial Diversity Model R package version 13 httpsCRANR-projectorgpackage=MDM
Decaeumlns T Jimeacutenez JJ Gioia C Measey GJ amp Lavelle P (2006) The values of soil animals for conservation biology Eur J Soil Biol 42(1) S23minusS38 DOI 101016jejsobi200607001
Didukh YaP (2011) The ecological scales for the species of Ukrainian flora and their use in synphytoindication Kiev Phytosociocentre
Didukh YaP (2012) The principles of the bioindication (in Ukranian) Kiev Naukova dumkaDinno A (2012) Paran Hornrsquos Test of Principal ComponentsFactors R package version 151 httpsCRANR-project
orgpackage=paranDokuchaev VV (1883) Russian Chernozem Selected works of VV Dokuchaev vol I Israel Program for Scientific
Translations Jerusalem (translated in 1967)Dolin VG (1978) Identification key to larvae of click beetles fauna of the USSR (in Russian) Kiev UrozhayEggleton P Vanbergen AJ Jones DT Lambert MC Rockett C Hammond PM Beccaloni J Marriott D Ross
E amp Giusti A (2005) Assemblages of soil macrofauna across a Scottish landuse intensification gradient influences of habitat quality heterogeneity and area J Appl Ecol 42 1153minus1164 DOI 101111j1365-2664200501090x
Ellenberg H (1974) Zeigerwerte der Gefaumlsspflanzen Mitteleuropas Scripta Geobotanica 9 197Gholami S Sayad E Gebbers R Schirrmann M Joschko M amp Timmer J (2016) Spatial analysis of riparian
forest soil macrofauna and its relation to abiotic soil properties Pedobiologia 59(1) 27minus36 DOI 101016jpedo-bi201512003
Gilarov MS (1949) Pecularities of the soil as environment and its role in the evolution of insects (in Russian) MoscowGilyarov MS (Ed) (1964) Identification key to soil-inhabiting insect larvae (in Russian) Moscow NaukaGongalsky KB Gorshkova IA Karpov AI amp Pokarzhevskii AD (2008) Do boundaries of soil animal and plant
communities coincide A case study of a Mediterranean forest in Russia Eur J Soil Biol 44(4) 355minus363 DOI 101016jejsobi200804004
Gongalsky KB Zaytsev AS amp Savin FA (2009) Spatial distribution of soil animals a geostatistical approach Biology Bulletin Reviews 70(6) 484minus494
Gural-Sverlova NV amp Gural RI (2012) Identification book of the terrestrial molluscs of Ukraine (in Ukranian) LvivHandcock MS amp Stein ML (1993) A Bayesian analysis of kriging Technometrics 35 403minus410 DOI 1023071270273Horn JL (1965) A rationale and a test for the number of factors in factor analysis Psychometrika 30 179minus185 DOI
101007BF02289447Huston MA (1999) Local processes and regional patterns appropriate scales for understanding variation in the di-
versity of plants and animals Oikos 86 393minus 401 DOI 1023073546645Jabin M Mohr D Kappes H amp Topp W (2004) Influence of deadwood on density of soil macro-arthropods in a
managed oakebeech forest For Ecol Manag 194 61minus69 DOI 101016jforeco200401053
326
Jackson RB amp Caldwell MM (1993) Geostatistical patterns of soil heterogeneity around individual perennial plants J Ecol 81(4) 683minus692 DOI 1023072261666
Jackson RB amp Caldwell MM (1996) Integrating resource heterogeneity and plant plasticity modeling nitrate and phosphate uptake in a patchy soil environment J Ecol 84 891minus903 DOI 1023072960560
Jenny H (1941) Factors of soil formation A system of quantitative pedology New York McGraw-HillKabakov ON (2006) Scarab beetles of the subfamily Scarabaeinae (Coleoptera Scarabaeidae) of Russia and adjacent
countries (in Russian) Moscow Partnership Scientific Publications KMKKamau S Barrios E Karanja NK Ayuke FO amp Lehmann J (2017) Soil macrofauna abundance under domi-
nant tree species increases along a soil degradation gradient Soil Biol Biochem 112 35minus46 DOI 101016jsoil-bio201704016
Kirby KN amp Gerlanc D (2013) BootES An R package for bootstrap confidence intervals on effect sizes Behavior Research Methods 45 905minus927 DOI 103758s13428-013-0330-5
Korboulewsky NB Pereza G amp Chauvat M (2016) How tree diversity affects soil fauna diversity a review Soil Biol Biochem 94 94minus106 DOI 101016jsoilbio20151102
Krivolutsky DA (1994) Soil fauna in ecological control (in Russian) Moscow NaukaKrivosheina MG (2012) Identification book of the families and genera of Palaearctic dipteran insects of the suborder
Nematocera based on larvae (in Russian) Moscow Partnership Scientific Publications KMKKryzhanovsky OL (1964) Carabidae - Ground Beetles (in Russian) In GA Bey-Bienko (Ed) Insects of the European
part of the USSR V 5 Beetles and Strepsiptera (pp 23minus68)Kunah ON Zhukov OV amp Pahomov AY (2010) Earthworm morphology (Lumbricidae) (in Ukranian) DnipropetrovskLavelle P (1997) Faunal activities and soil processes adaptive strategies that determine ecosystem function Adv Ecol
Res 27 93minus132Lavelle P (2002) Functional domains in soils Ecol Res 17 441minus450 DOI 101046j1440-1703200200509xLavelle P Decaeumlns T Aubert M Barota S Blouin M Bureau F Margerie P Mora P amp Rossi J-P (2006) Soil
invertebrates and ecosystem services Eur J Soil Biol 42(1) S3minusS15 DOI 101016jejsobi200610002Legendre P Borcard D amp Peres-Neto PR (2005) Analyzing beta diversity Partitioning the spatial variation of com-
munity composition data Ecol Monogr 75 435minus450 DOI 10189005-0549Lukac M (2017) Soil biodiversity and environmental change in European forests Central European Forestry Journal
63 59minus65 DOI 101515forj-2017-0010Marcon E amp Herault B (2015) Entropart An R Package to Measure and Partition Diversity Journal of Statistical
Software 67(8) 1minus26 DOI 1018637jssv067i08Matern B (1986) Spatial variation Lecture notes in statistics New York SpringerMathieu J Grimaldi M Jouquet P Rouland C Lavelle P Desjardins T amp Rossi JP (2009) Spatial patterns of
grasses influence soil macrofauna biodiversity in Amazonian pastures Soil Biol Biochem 41 586minus593 DOI 101016jsoilbio200812020
Mathieu J Rossi JP Grimaldi M Mora P Lavelle P amp Rouland C (2004) Biol Fertil Soils 40 300 DOI 101007s00374-004-0777-8
McBratney AB amp Pringle MJ (1999) Estimating average and proportional variograms of soil properties and their potential use in precision agriculture Precision Agriculture 1 125minus152 DOI 101023A1009995404447
Migge-Kleian S Cesarz S Fahrenholz N Platner C amp Schaefer M (2007) Earthworm communities in relation to tree diversity in a deciduous forest Eur J Soil Biol 43 61minus67
Minasny B amp McBratney AB (2005) The matern function as a general model for soil variograms Geoderma 128 192minus207 DOI 101016jgeoderma200504003
Nuutinen V Butt KR Hyvaumlluoma J Ketoja E amp Mikola J (2017) Soil faunal and structural responses to the settle-ment of a semi-sedentary earthworm Lumbricus terrestris in an arable clay field Soil Biol Biochem 115 285minus296 DOI 101016jsoilbio201709001
Oksanen J Blanchet FG Kindt R Legendre P Minchin PR OrsquoHara RB Simpson GL Solymos P Stevens MHH amp Wagner H (2017) Community ecology package R package version 24-5 httpsCRANR-projectorgpackage=vegan
Olff H amp Ritchie ME (2002) Fragmented nature consequences for biodiversity Landsc Urban Plann 58 83minus92 DOI 101016S0169-2046(01)00211-0
Peacutelissier R Couteron P Dray S amp Sabatier D (2003) Consistency between ordination techniques and diversity measure-ments two strategies for species occurrence data Ecology 84 242minus251 DOI 1018900012-9658(2003)084[0242CBOTAD]20CO2
327
Pennisi BV amp van Iersel M (2002) 3 ways to measure medium EC GMPro 22(1) 46minus48Perel TS (1979) Spread and regularity of the distribution of the earthworms of the USSR fauna (in Russian) Moscow
NaukaReza SK Nayak DC Chattopadhyay T Mukhopadhyay S Singh SK amp Srinivasan R (2016) Spatial distribution
of soil physical properties of alluvial soils a geostatistical approach Archives of Agronomy and Soil Science 62(7) 972minus981 DOI 1010800365034020151107678
Ribeiro PJ Christensen OF amp Diggle PJ (2003) Geostatistical software - geoR and geoRglm DSC 2003 Working Papers Available from httpswwwr-projectorgconferencesDSC-2003ProceedingsRibeiroEtAlpdf
Ribeiro PJ Jr amp Diggle PJ (2016) geoR Analysis of geostatistical data R package version 17-52 httpsCRANR-projectorgpackage=geoR
Rossi JP (2003) Clusters in earthworm spatial distribution Pedobiologia 47(5minus6) 490minus496 DOI 1010780031-4056-00218
Rossi J-R Lavelle P amp Tondoh JE (1996) Statistical tool for soil biology XI Autocorrelogram and Mantel test European J Soil Biol 32 195minus203
Schmolzer K (1965) Ordnung Isopoda (Landasseln) Liferung 4 186 S Liferung 5 468 S Berlin Akademie-VerlagSoinenen J Lennon JJ amp Hillebrand H (2007) A multivariate analysis of beta diversity across organisms and envi-
ronments Ecology 88 2830minus2838 DOI 10189006-17301Soininen J Heino J amp Wang J (2017) A meta-analysis of nestedness and turnover components of beta diversity
across organisms and ecosystems Glob Ecol Biogeogr 27 96minus109 DOI 101111geb12660Sokolova TA (2011) Rare plant communities of steppe sandy forests vegetation in the north of the Rostov region
Southern scientific center of the Russian Academy of Sciences 7(4) 66minus69Stein ML (1999) Interpolation of spatial data Some theory for Kriging New York SpringerSun B Zhou S amp Zhao Q (2003) Evaluation of spatial and temporal changes of soil quality based on geostatistical
analysis in the hill region of subtropical China Geoderma 115 85minus99 DOI 101016S0016-7061(03)00078-8Tarasov VV (2012) Flora of Dnipropetrovsk and Zaporozhie regions (in Ukranian) Dnipropetrovs Second ed LiraVadunina AF amp Korchagina SA (1986) Methods for research of physical properties of the soil (in Russian) Moscow
AgropromizdatVanbergen AJ Watt AD Mitchell R Truscott AM Palmer SC Ivits E Eggleton P Jones TH amp Sousa JP
(2007) Scale-specific correlations between habitat heterogeneity and soil fauna diversity along a landscape struc-ture gradient Oecologia 153(3) 713minus725 DOI 101007s00442-007-0766-3
Vašaacutet R Pavlů L Borůvka L Draacutebek O amp Nikodem A (2013) Mapping the topsoil pH and humus quality of forest soils in the North Bohemian Jizerskeacute hory Mts region with ordinary universal and regression kriging cross-validation comparison Soil and Water Research 8 97minus104
Viana DS Figuerola J Schwenk K Manca M Hobaeligk A Mjelde M Preston C D Gornall RJ Croft JM King RA Green AJ amp Santamariacutea L (2016) Assembly mechanisms determining high species turnover in aquatic communities over regional and continental scales Ecography 39 281minus288 DOI 101111ecog01231
Vsevolodova-Perel TS (1997) Earthworms of the Russian fauna (in Russian) Moscow NaukaWarren MW amp Zou X (2002) Soil macrofauna and litter nutrients in three tropical tree plantations on a disturbed site
in Puerto Rico For Ecol Manag 170 161minus171 DOI 101016S0378-1127(01)00770-8Webster R amp Oliver MA (2001) Geostatistics for environmental scientists Chichester John Wiley SonsWhittle P (1954) On stationary processes in the plane Biometrika 41 434minus449 DOI 101093biomet413-4434Wolters V (2001) Biodiversity of soil fauna and its function Eur J Soil Biol 37(4) 221minus227 DOI101016S1164-
5563(01)01088-3Zalesskaya NT Identification key of centipedes of the USSR (in Russian) Moscow NaukaZbinden ZD amp Matthews WJ (2017) Beta diversity of stream fish assemblages partitioning variation between spatial
and environmental factors Freshw Biol 62 1460minus1471 DOI 101111fwb12960Zhukov AV (2015) Phoromorphs in ecomorphs system of soil animals The Journal of VNKarazin Kharkiv National
UniversitySeries Biology 25 254minus266Zhukov A amp Zadorozhnaya G (2016) Spatial heterogeneity of mechanical impedance of a typical chernozem the
ecological approach Ekoloacutegia (Bratislava) 35 263minus278 DOI 101515eko-2016-0021
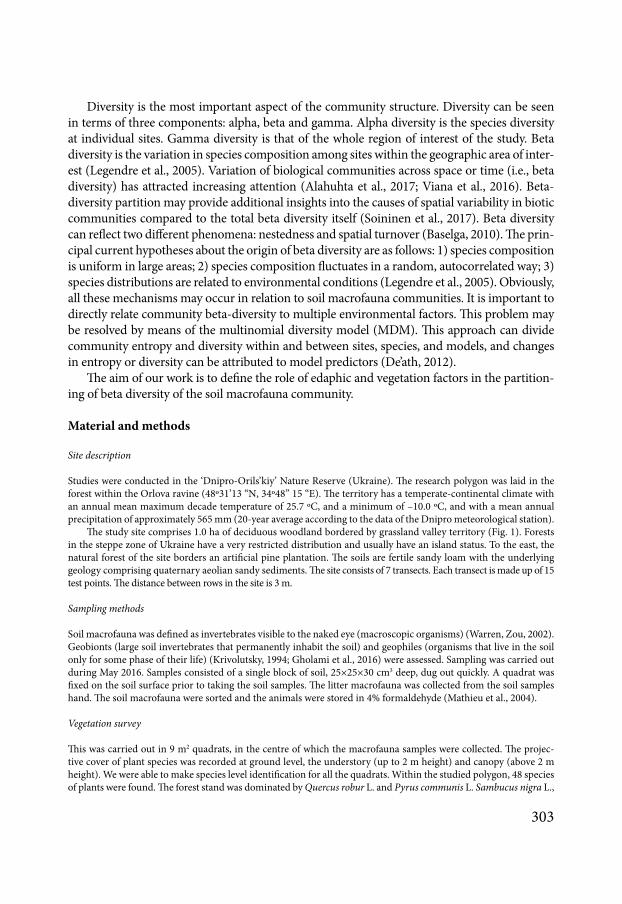
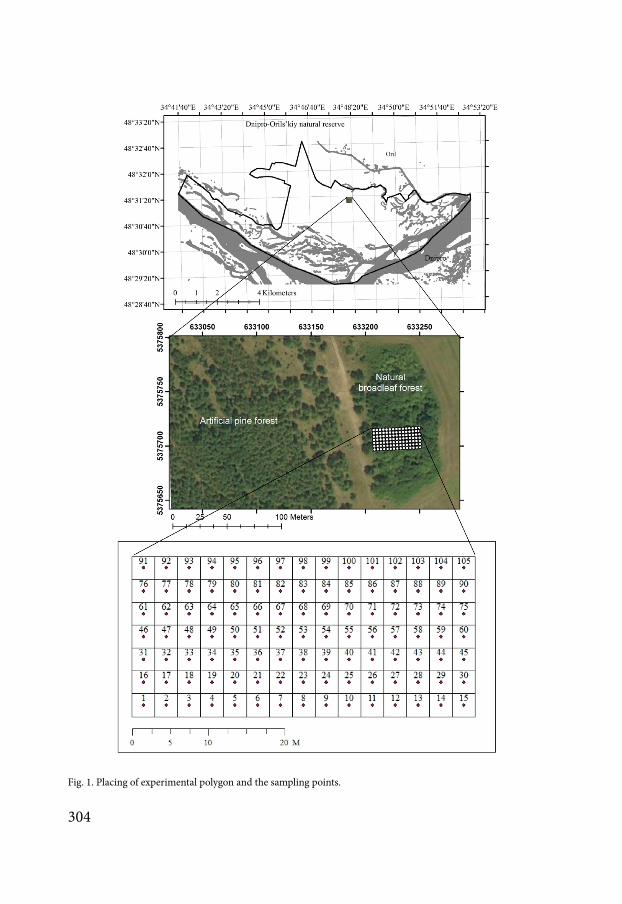
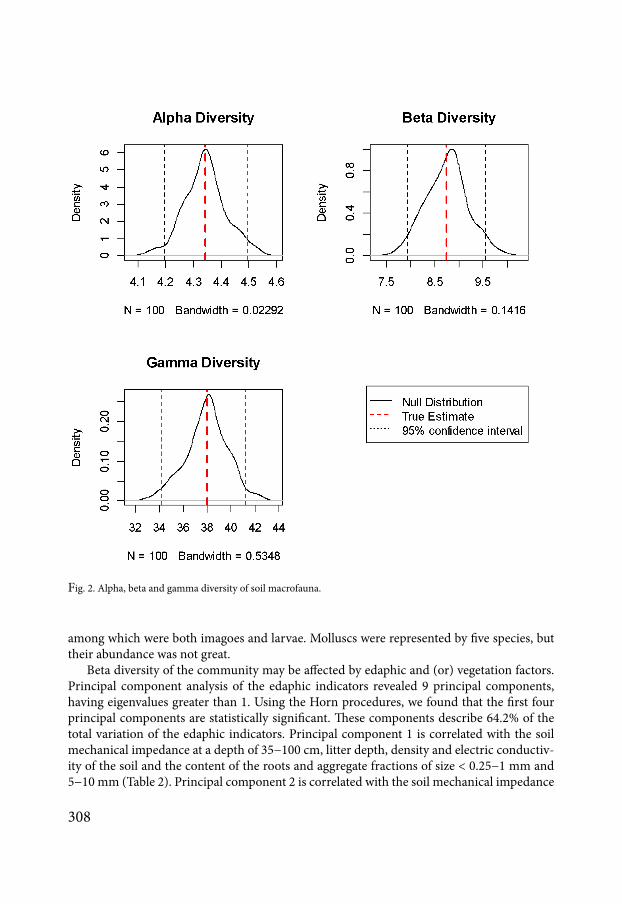
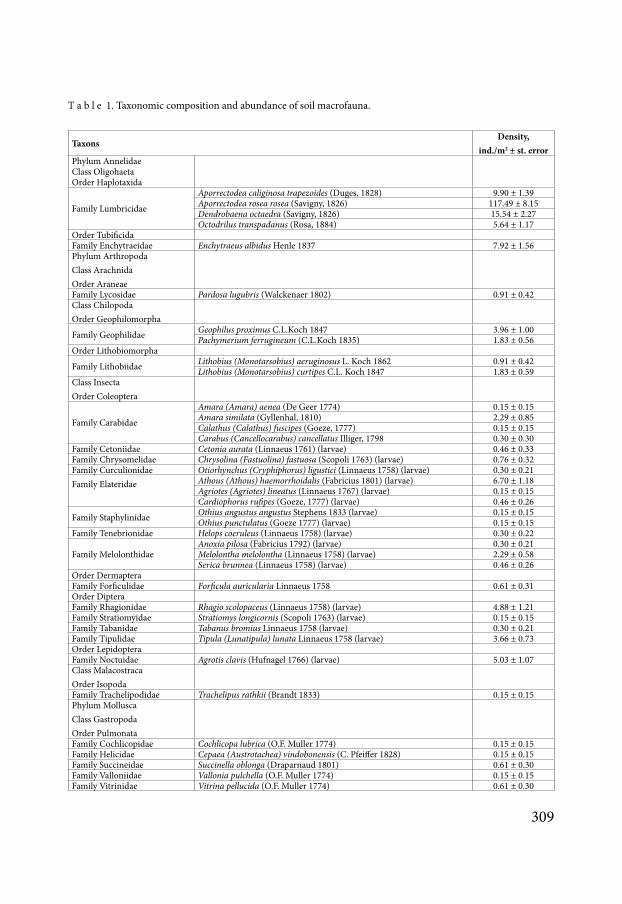
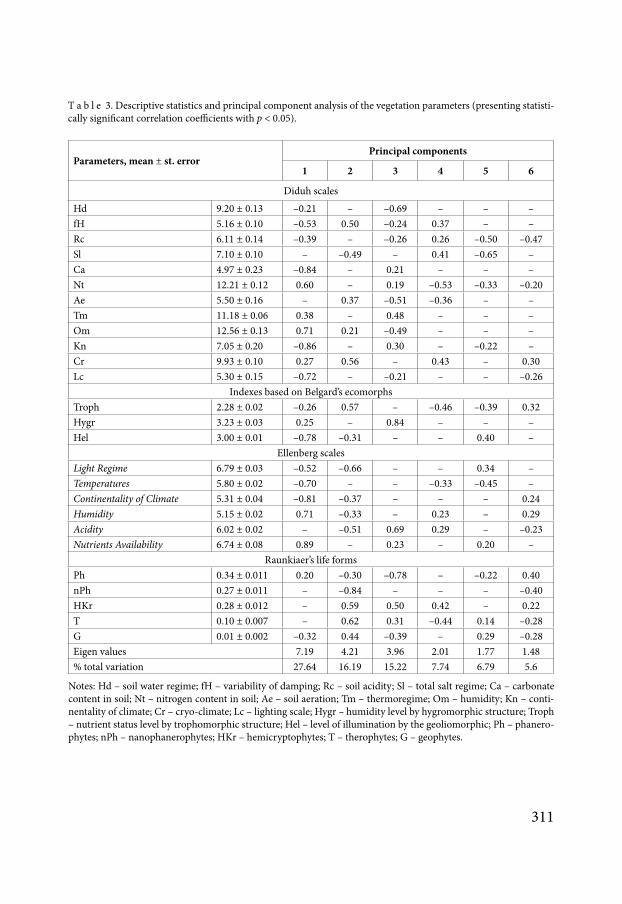
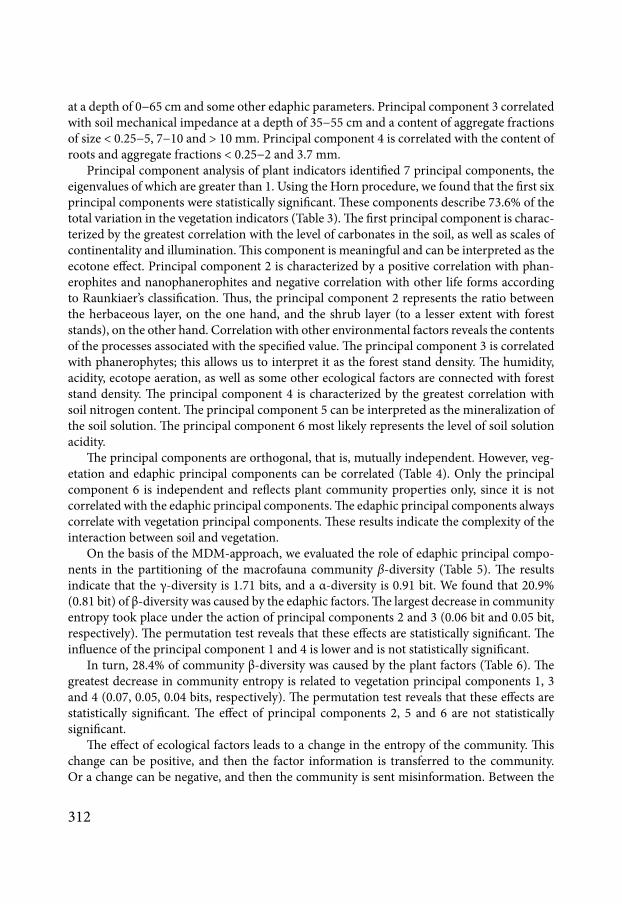
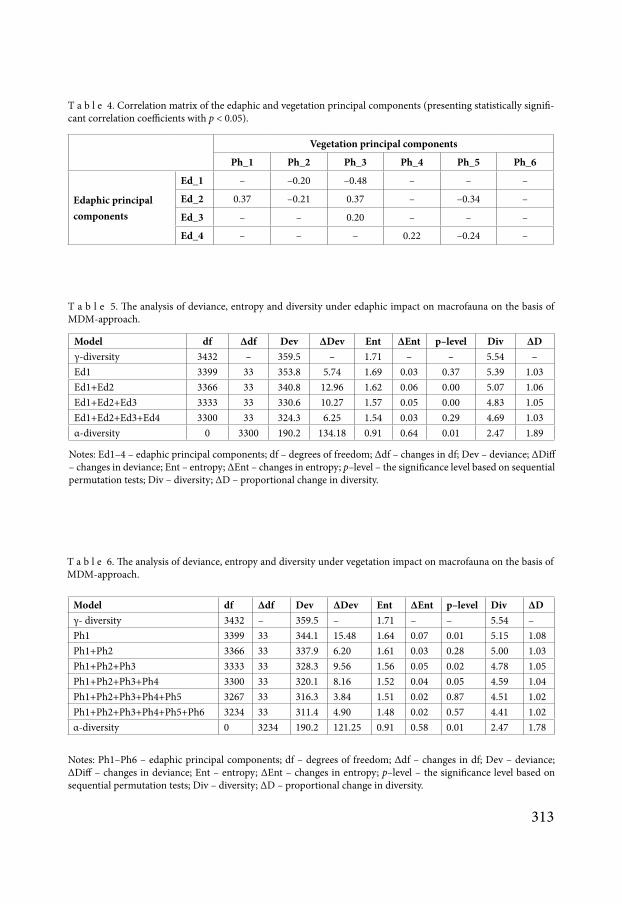
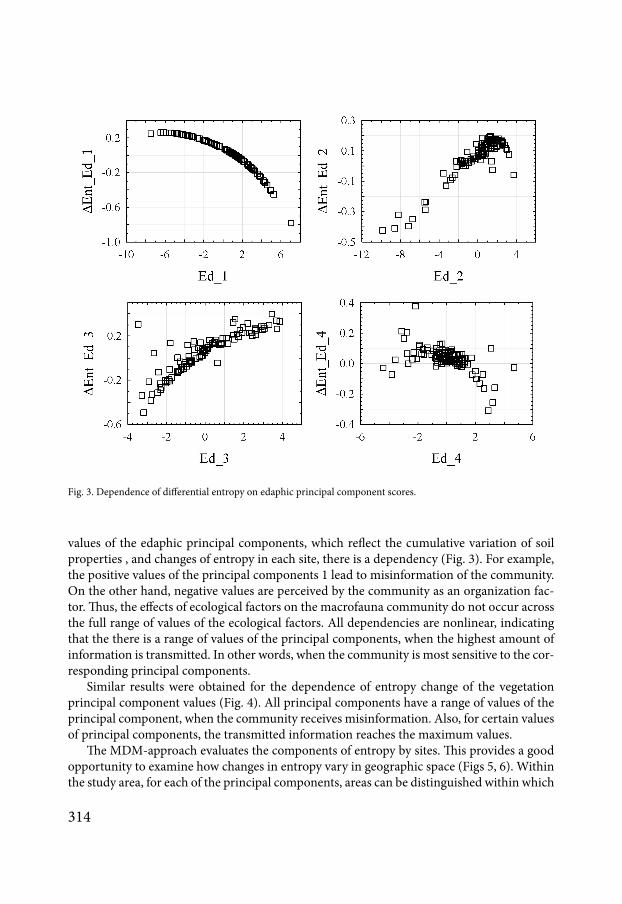
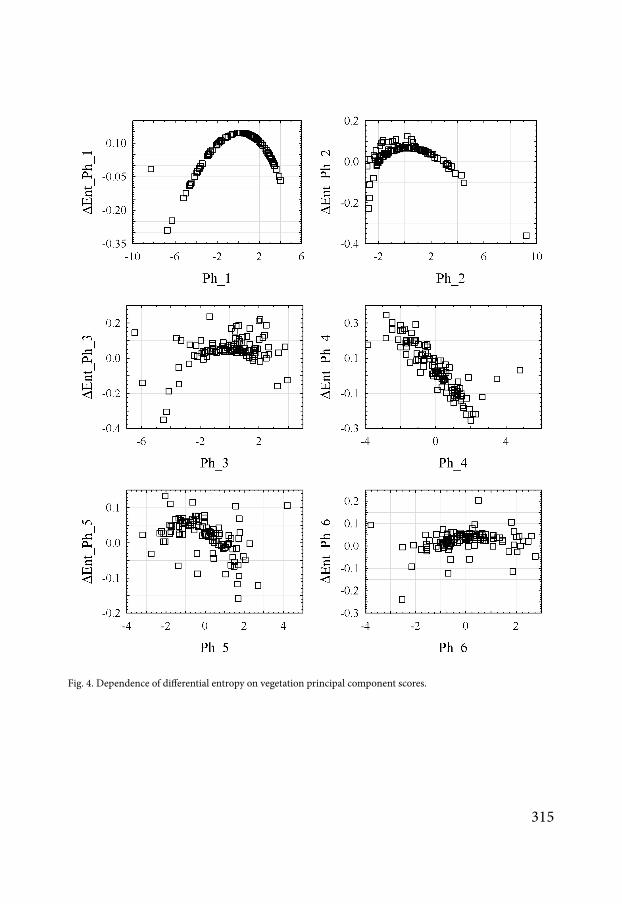
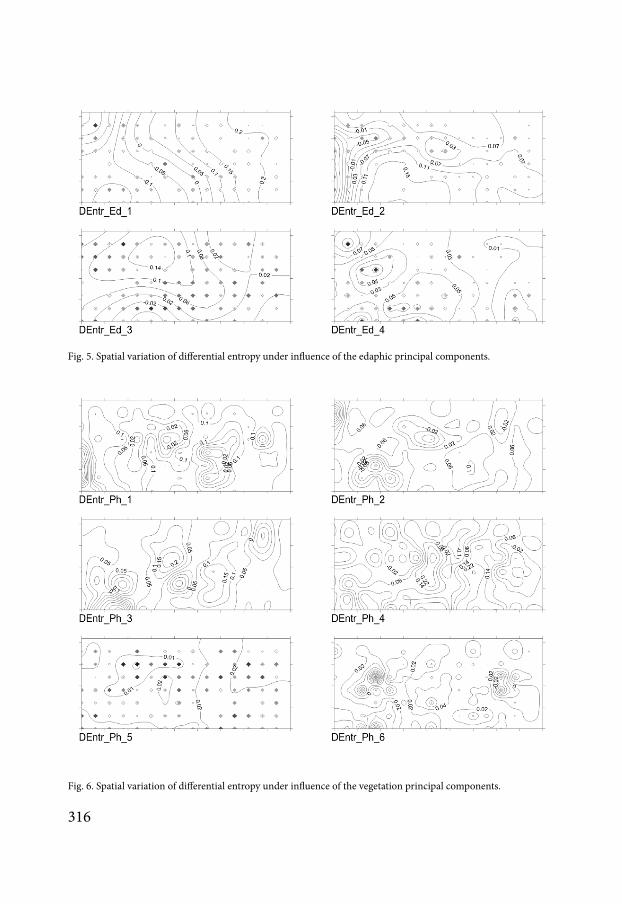
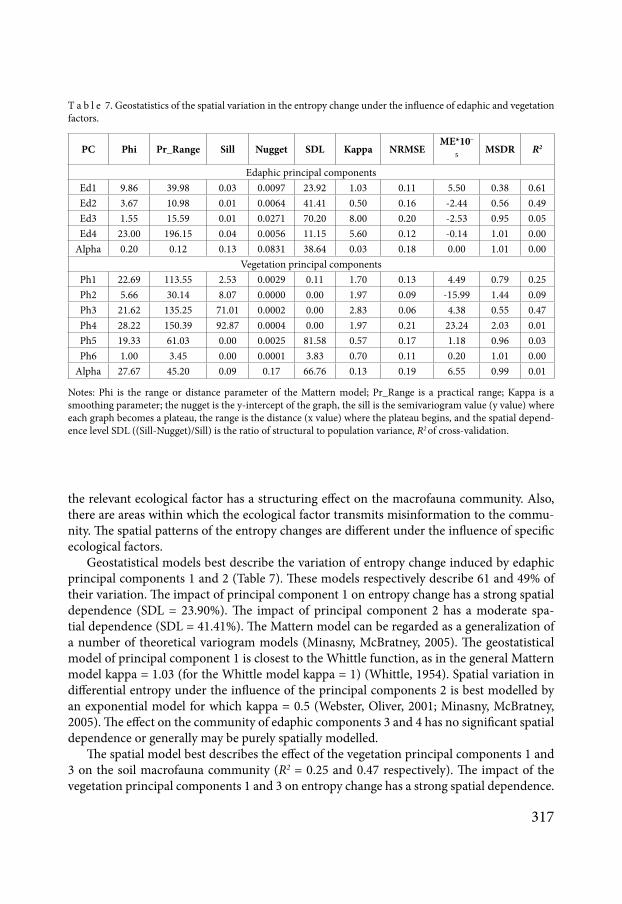
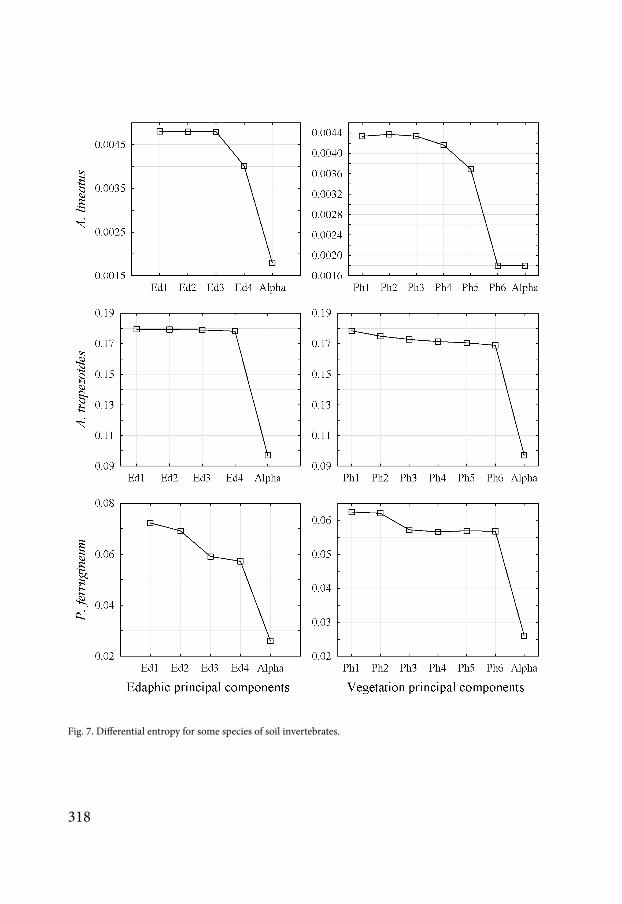
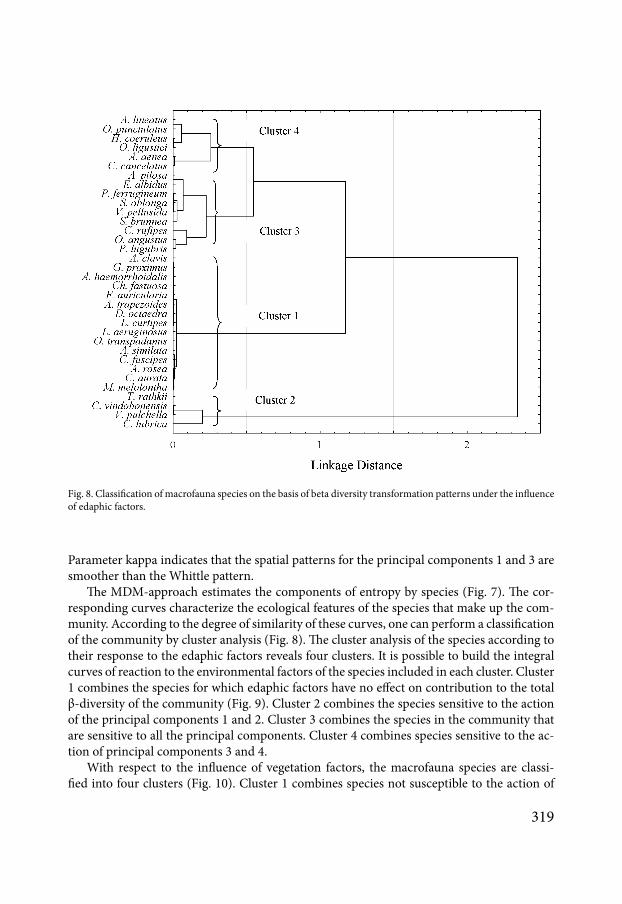
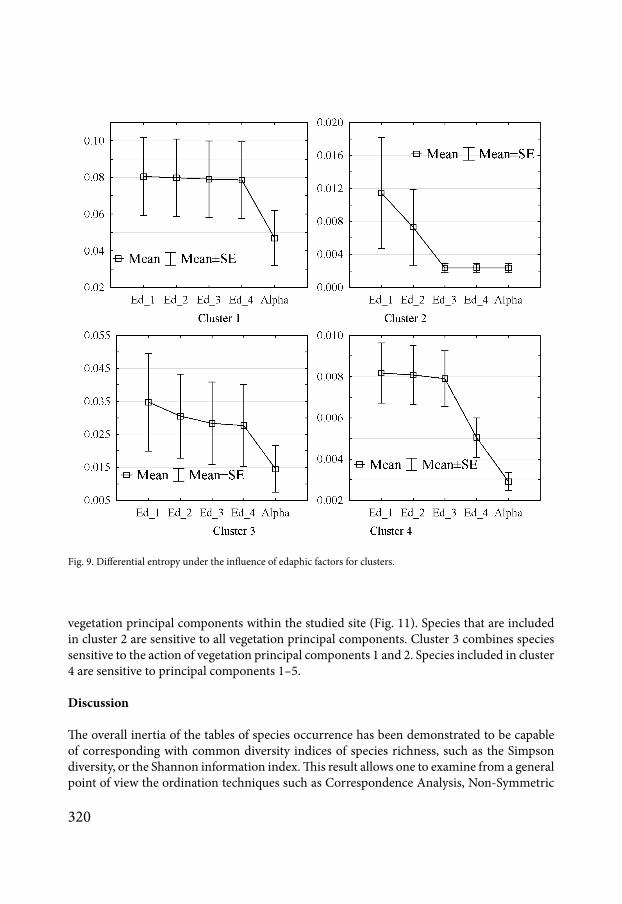
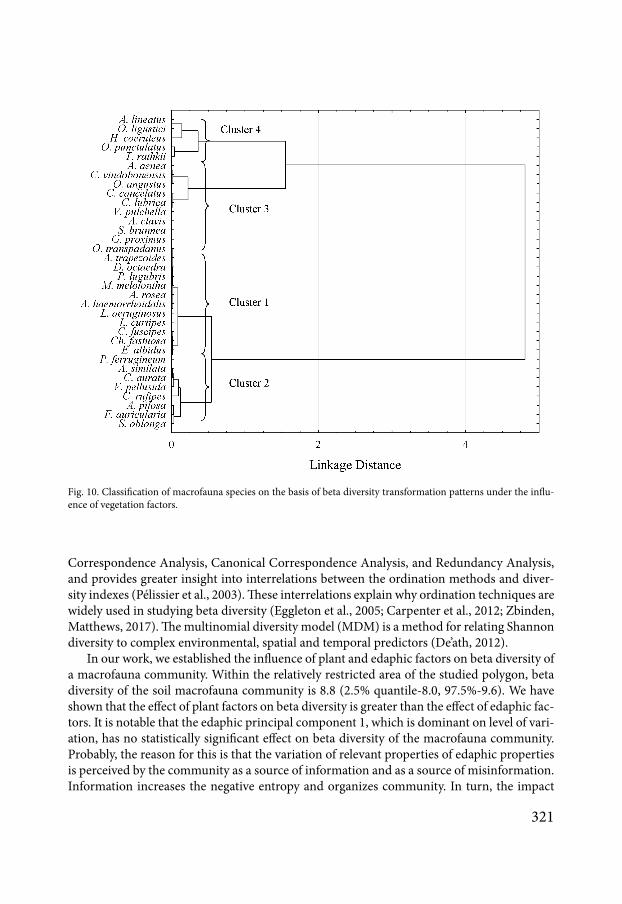
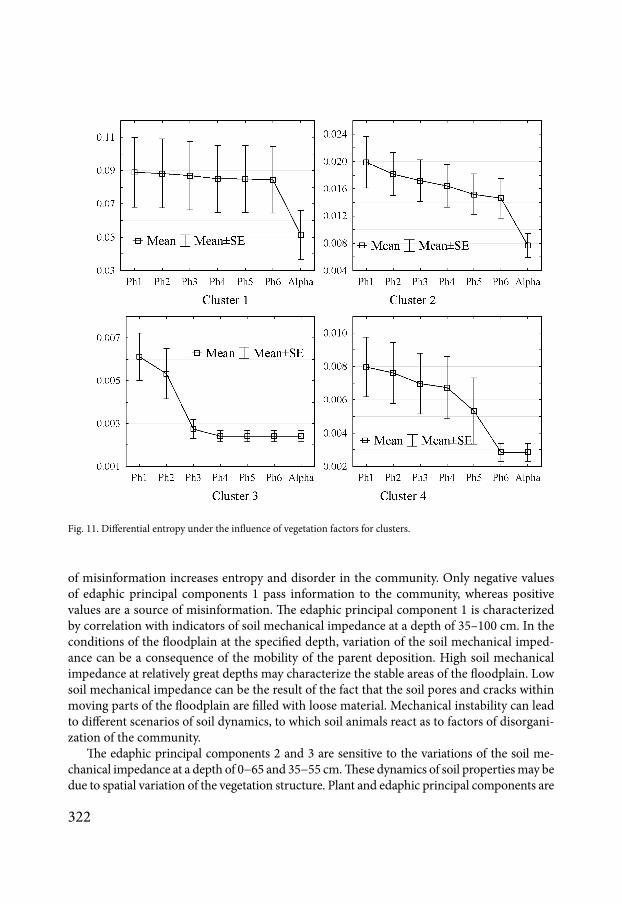
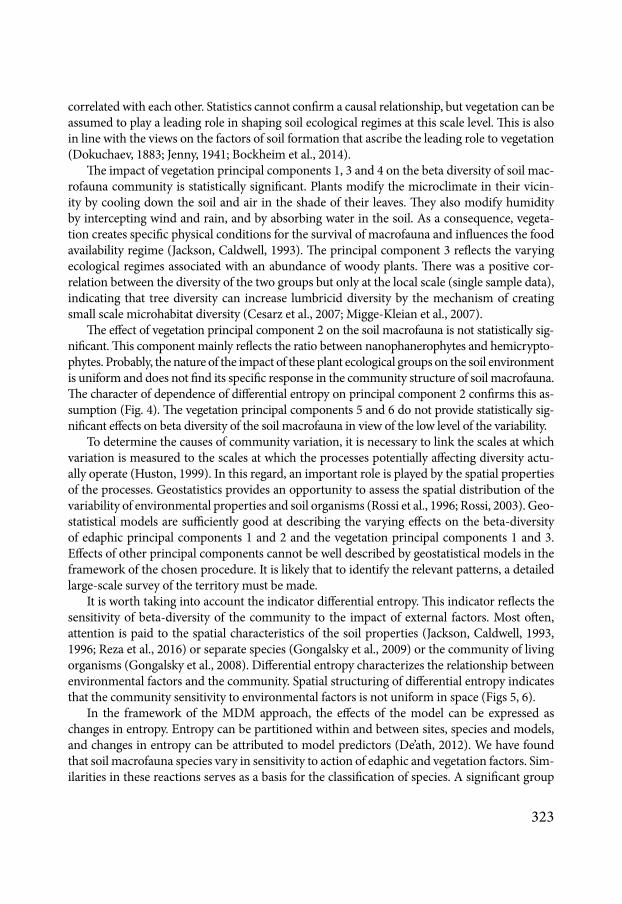
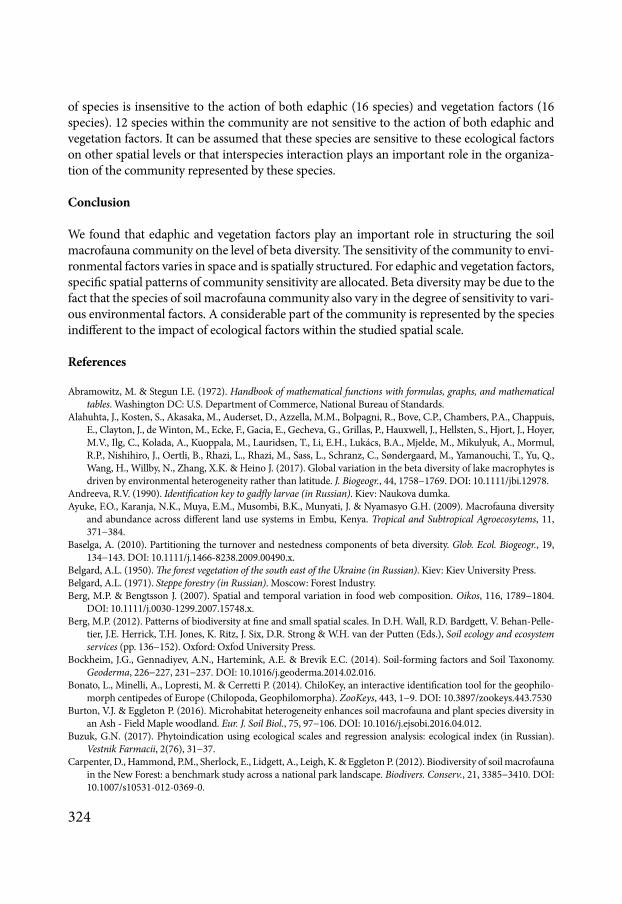