ethno-floristic study, vegetation structure and nutraceutical ...
270
ETHNO-FLORISTIC STUDY, VEGETATION STRUCTURE AND NUTRACEUTICAL ASPECT OF SELECTED PLANTS OF DISTRICT BANNU, PAKISTAN Ph.D THESIS BY IHSAN ULLAH DEPARTMENT OF BOTANY UNIVERSITY OF PESHAWAR
-
Upload
khangminh22 -
Category
Documents
-
view
1 -
download
0
Transcript of ethno-floristic study, vegetation structure and nutraceutical ...

ETHNO-FLORISTIC STUDY, VEGETATION
STRUCTURE AND NUTRACEUTICAL ASPECT OF
SELECTED PLANTS OF DISTRICT BANNU, PAKISTAN
Ph.D THESIS
BY
IHSAN ULLAH
DEPARTMENT OF BOTANY
UNIVERSITY OF PESHAWAR

2012-2015

ETHNO-FLORISTIC STUDY, VEGETATION
STRUCTURE AND NUTRACEUTICAL ASPECT OF
SELECTED PLANTS OF DISTRICT BANNU, PAKISTAN
A Thesis Submitted to the Department of Botany, University of Peshawar,
Peshawar, Pakistan in Partial fulfillment for the
Award of Degree of
DOCTER OF PHILOSOPHY
IN
BOTANY
BY
IHSAN ULLAH
DEPARTMENT OF BOTANY
UNIVERSITY OF PESHAWAR

2012-2015


DECLARATION
The materials contained within this thesis are my original work and have not
been previously submitted to this or any other university.
IHSAN ULLAH


DEDICATION
Sincerely dedicated to
My parents and teachers

CONTENTS
S. No. Title Page No.
Acknowledgement i
Abstract ii
CHAPTER-1 INTRODUCTION
1.1 Area Introduction 1
1.2 Introduction to Ethno botany 3
1.3 Floristic study 6
1.4 Nutraceutical Aspects 7
Aims and Objectives 8
CHAPTER-2 REVIEW OF LITERATURE
2.1 Ethnobotany Review 9
2.2 Floristic study Review 14
2.3 Vegetation Structure Review 19
2.4 Nutraceutical Review 25
CHAPTER-3 MATERIALS AND METHODS
3.1 Ethnobotanical Study 31
3.1.1 Field Equipment 31
3.1.2 Ethnobotanical data collection 31
3.1.3 Plant Sampling and Photography 32
3.1.4 Plants Preservation 32
3.1.5 Taxonomic Identification 32
3.1.6 Morphological Description 32
3.2 Floristic Structure and Ecological Characteristics 32
3.2.1 Biological Spectra 33
3.2.2 Morphological Description 34
3.2.3 Phytosociology/Vegetation Structure 35

3.2.3.1 Density 35
3.2.3.2 Herbage Cover 36
3.2.3.3 Frequency 36
3.2.3.4 Importance Values 37
3.2.3.5 Family importance Value 37
3.2.3.6 Determination of Similarity Index 37
3.2.3.7 Species Diversity 37
3.2.3.8 Species Richness 38
3.3 Multiple Correlations 38
3.4 Edaphology 39
3.4.1 Soil Texture 39
3.4.2 Organic matter 39
3.4.3 Nitrogen 39
3.4.4 Phosphorus 39
3.4.5 Potassium 39
3.4.6 pH 39
3.4.7 Electrical Conductivity 39
3.5 Palatability of Vegetation 40
3.6 Elemental analysis 40
3.6.1 Reagents and Equipment 40
3.6.2 Sample Preparation 41
3.6.3 Procedure 41
3.7 Nutritional investigation 42
3.7.1 Proximate analysis 42
3.7.2 Determination of moisture 43
3.7.3 Determination of ash 43
3.7.4 Determination of Protein by “Macrojeldahl distillation method” 44
3.7.5 Determination of fats (ether extract) 45

3.7.6 Determination of crude fiber 46
3.7.7 Carbohydrates contents 47
3.7.8 Gross energy 47
CHAPTER-4 RESULTS AND DISCUSSION
4.1 Floristic Studyq 48
4.2 Ethnobotany 66
4.3 Phytosociology 77
4.4 Shannon diversity index and species richness 103
4.5 Effect of rain on density, frequency, cover and importance values 104
4.6 Edaphology 106
4.6.1 Principal correlation analysis among the soil variables 109
4.6.2 Correlation of different soil variables in three different sites with
total values
112
4.6.2.1 Correlation of different soil variables in three different sites
with total density
112
4.6.2.2 Correlation of different soil variables in three different sites
with total frequency.
112
4.6.2.3 Correlation of different soil variables in three different sites
with total cover.
113
4.6.2.4 Correlation of different soil variables in three different sites
with total importance values
113
4.6.3 Multiple correlation of different soil variables in three different
sites of herbs in spring season.
124
4.6.3.1 Multiple correlation of different soil variables in three different
sites of herbs in spring season with density.
124
4.6.3.2 Multiple correlation of different soil variables in three different
sites of herbs in spring season with frequency.
124
4.6.3.3 Multiple correlation of different soil variables in three different
sites of herbs in spring season with cover.
125

4.6.3.4 Multiple correlation of different soil variables in three different
sites of herbs in spring season with importance values.
125
4.6.4 Multiple correlation of different soil variables in three different
sites of herbs in autumn season.
136
4.6.4.1 Multiple correlation of different soil variables in three different
sites of herbs in autumn season with density.
136
4.6.4.2 Multiple correlation of different soil variables in three different
sites of herbs in autumn season with frequency.
136
4.6.4.3 Multiple correlation of different soil variables in three different
sites of herbs in autumn season cover.
136
4.6.4.4 Multiple correlation of different soil variables in three different
sites of herbs in autumn season with importance values.
136
4.6.5 Multiple correlation of different soil variables in three different
sites of herbs in winter season.
147
4.6.5.1 Multiple correlation of different soil variables in three different
sites of herbs in winter season with density.
147
4.6.5.2 Multiple correlation of different soil variables in three different
sites of herbs in winter season with frequency.
147
4.6.5.3 Multiple correlation of different soil variables in three different
sites of herbs in winter season with cover.
147
4.6.5.4 Multiple correlation of different soil variables in three different
sites of herbs in winter season with importance values.
148
4.6.6 Multiple correlation of different soil variables in three different
sites of herbs in summer season.
159
4.6.6.1 Multiple correlation of different soil variables in three different
sites of herbs in summer season with density.
159
4.6.6.2 Multiple correlation of different soil variables in three different
sites of herbs in summer season with frequency.
159
4.6.6.3 Multiple correlation of different soil variables in three different
sites of herbs in summer season with cover.
159

4.6.6.4 Multiple correlation of different soil variables in three different
sites of herbs in summer season with importance values.
160
4.7 Palatability 170
4.8 Nutraceutical aspect of selected plants species. 183
Aristida adscensionis 183
Dichanthium annulantum 183
Polypogon mospeliensis 184
Bromus pectinatus 184
Rostraria cristata 185
Farsetia jacquemontii 185
Astragalus scorpiurus 185
Euphorbia dracunculoides 186
Plates 188
Conclusions 206
Recommendations and suggestions 208
References 209

LIST OF TABLES
Table No. Title Page No.
Table 1. Rainfall data during the 2012-2014. 2
Table 2. Ten density classes were established as follows; and the mid
points were used for calculations
35
Table 3. Ten cover classes were established for estimating plant cover.
Mid-point values were used for calculation
36
Table 4. Optimal analytical conditions for the elemental analysis using
air-acetylene flame on atomic absorption spectrophotometer
42
Table 5. Floristic list of plant Species of District Bannu 51
Table 6 Percentage of family, genera, and species in the study area 61
Table 7. Distribution of plant species in the various habitats 63
Table 8. Distribution of plant species in the various aspects 63
Table 9. Distribution of plant species in the various life form spectra 63
Table 10. Comparison of Biological spectrum of the area with Raunkiaer’s
standard Biological Spectrum (SBS).
64
Table 11. Distribution of plant species according to leaf size spectra 64
Table 12. Distribution of plant species according to lamina shape 64
Table 13. Ethno botanical important plant list used in District Bannu 68
Table 14. Genera and species distribution in different families 73
Table 15 Classification of plants on the basis of their uses 74
Table 16. Classification of plants on the basis of their habit 76
Table 17. Classification of plants on the basis of their parts used 76
Table 18. Phytosociological attributes of plant community in Site I 36
Table 19. Phytosociological attributes of plant community in Site II 90
Table 20 Phytosociological attributes of plant community in Site III 94
Table 21. Family importance values in Site I 100
Table 22. Family importance values in Site II 101

Table 23 Family importance values in Site III 102
Table. 24. Shannon diversity index and species richness in three sites 104
Table 25 Rain effect on total values of three sites 105
Table 26. Soil elements in three sites 108
Table 27. Principal Component Analysis table 110
Table 28. Correlation of different soil variables in three different sites with
total density
115
Table 29. Correlation of different soil variables in three different sites with
total frequency
116
Table 30. Correlation of different soil variables in three different sites with
total cover
117
Table 31. Correlation of different soil variables in three different sites with
total importance values
118
Table 32. Multiple correlation of different soil variables in three different
sites of herbs in spring season with density
127
Table 33. Multiple correlation of different soil variables in three different
sites of herbs in spring season with frequency
128
Table 34. Multiple correlation of different soil variables in three different
sites of herbs in spring season with cover
129
Table 35. Multiple correlation of different soil variables in three different
sites of herbs in spring season with importance values
130
Table 36. Multiple correlation of different soil variables in three different
sites of herbs in autumn season with density
138
Table 37. Multiple correlation of different soil variables in three different
sites of herbs in autumn season with frequency
139
Table 38. Multiple correlation of different soil variables in three different
sites of herbs in autumn season with cover
140
Table 39. Multiple correlation of different soil variables in three different
sites of herbs in autumn season with importance values
141
Table 40. Multiple correlation of different soil variables in three different
sites of herbs in winter season with density
150

Table 41. Multiple correlation of different soil variables in three different
sites of herbs in winter season with frequency
151
Table 42. Multiple correlation of different soil variables in three different
sites of herbs in winter season with cover
152
Table 43. Multiple correlation of different soil variables in three different
sites of herbs in winter season with importance value
153
Table 44. Multiple correlation of different soil variables in three different
sites of herbs in summer season with density
161
Table 45. Multiple correlation of different soil variables in three different
sites of herbs in summer season with frequency
162
Table 46. Multiple correlation of different soil variables in three different
sites of herbs in summer season with cover
163
Table 47. Multiple correlation of different soil variables in three different
sites of herbs in summer season with importance value
164
Table 48. Palatability, part used, condition and animal preferences of
forage plants in district Bannu
172
Table 49. Nutritional values of selected plant species 187

LIST OF FIGURES
Figure No. Title Page No.
Figure 1. Map of the study area 3
Figure 2. Habitat 65
Figure 3. Aspect 65
Figure 4. Life form spectra 65
Figure 5. Leaf size spectra 65
Figure 6. Lamina shape 65
Figure 7. Species richness and diversity 104
Figure 8. Rain effect on total values of density, frequency, cover and
IV of plant community
105
Figure 9. Principal component analysis 111
Figure 10. Spectras of linear correlation of total density of plant
community with soil variables
120
Figure 11. Spectras of linear correlation of total frequency of plant
community with soil variables
121
Figure 12. Spectras of linear correlation of total cover of plant
community with soil variables
122
Figure 13. Spectras of linear correlation of total IV of plant community
with soil variables
123
Figure 14. Spectras of linear correlation of herbaceous density with soil
variables in spring season
132
Figure 15. Spectras of linear correlation of herbaceous frequency with
soil variables in spring season
133
Figure 16. Spectras of linear correlation of herbage cover with soil
variables in spring season
134
Figure 17. Spectras of linear correlation of herbaceous IV with soil
variables in spring season
135
Figure 18. Spectras of linear correlation of herbaceous density with soil
variables in autumn season
142

Figure 19. Spectras of linear correlation of herbaceous frequency with
soil variables in autumn season
144
Figure 20. Spectras of linear correlation of herbage cover with soil
variables in autumn season
145
Figure 21. Spectras of linear correlation of herbaceous IV with soil
variables in autumn season
146
Figure 22. Spectras of linear correlation of herbaceous density with
soil variables in winter season
155
Figure 23. Spectras of linear correlation of herbaceous frequency with
soil variables in winter season
156
Figure 24. Spectras of linear correlation of herbage cover with soil
variables in winter season
157
Figure 25 Spectras of linear correlation of herbaceous IV with soil
variables in winter season
158
Figure 26. Spectras of linear correlation of herbaceous density with soil
variables in summer season
166
Figure 27. Spectras of linear correlation of herbaceous frequency with
soil variables in summer season
167
Figure 28. Spectras of linear correlation of herbage cover with soil
variables in summer season
168
Figure 29. Spectras of linear correlation of herbaceous IV with soil
variables in summer season
169
i
ACKNOWLEDGEMENT
All praises be to Allah, The Almighty, The Omnipotent, The most Compassionate,
Who bestowed me with the potential and ability to successfully complete the present
work. Without Allah’s divine help, I would not have been able to achieve anything in
my life. All respects to Holy Prophet Hazrat Muhammad (P.B.U.H), the most
perfect among all human beings ever born on the surface of the earth, who is forever a
source of guidance and knowledge for the humanity of all times.
In the first place, I would like to record my gratitude to my honorable teacher and
worthy research supervisor Professor Dr. Siraj ud Din for his supervision, advice
and guidance for each and every stage of this research. Moreover, he provided me
with unflinching encouragement and support in multiform. His truly scientific
intuition has made him an oasis of ideas that enriched my growth as a student.
I feel highly privileged to express my profound gratitude to Prof. Dr. Muhammad
Ibrar Department of Botany, University of Peshawar and to Prof. Dr. Sultan
Mehmood Wazir for their devotion, creativity and cooperation in my work.
I would to extend my appreciation to Dr. Nadeem Ahmad, Dr. Zahir Muhammad, Dr.
Ghulam Dastagir, Dr. Lal Badshah, Dr. Barkat Ullah, Mr. Rehman Ullah and Mr.
Ghulam Jelani for their support and helping attitude.
I am very thankful to Prof. Dr. Sajida Parveen and Dr. Asim Muhammad Department
of Soil Sciences, Agriculture University of Peshawar who helped me in the soil
analysis. No words in any dictionary of the world can express thanks my parents
whose prayers, love and affections have always been a source of strength for me in
every step of life and who encouraged me when I was discouraged by others
I would like to extend my thanks to Mr. Saad Ullah Khan, Lecturer in Department of
Botany, University of Science and Technology Bannu.
I express sincere thanks to Dr. Zulqarnain Department of Botany GPGC Karak and
Dr. Faizan Ullah Department of Botany, University of Science and Technology
Bannu. Words are inadequate to express my thanks to my friends and colleagues Mr.
Alamgir khan, Miss Sumaira Shah, Mr. Inam Ullah khan, Mr. Yousaf Khan, Mr. Atif
Jalil khan, Mr. Yasir Nadeem and Haroon Rashid. The good time spent with them can
never be erased from my memories.

ii
Ihsan Ullah
ABSTRACT
In the present ethno-floristic study, vegetation structure and nutraceutical aspect, 193
plant species of 155 genera belonging to 54 families of district Bannu were recorded.
Out of 193 species, 146 species were dicotyledons and 47 species of monocotyledons.
Poaceae was the leading family and having highest number of species (19.16%) while
the lowest percentage was found in numbers of families having only one species.
Seasonal variation showed that spring season was floristically rich having 156 species
(41.37%) as compared to the other seasons. Therophytes (60.62%) were dominant
plants in the area. Leaf size spectra showed that the plants with nanophyllous leaves
were dominant (48.18%). The plants having simple leaves were dominant (76.16%).
Spiny species were (9.32%) while non-spiny were (90.69%) in the area.
Ethnobotanical analysis showed that fifty eight species are used for different
medicinal purposes. Which were being used conventionally for several daily life
needs. Asteraceae was the leading family (7 spp.) while the rest of families have only
one species. Out of 58 plants 14(12.73%) are used as fodder, 8(7.3%) as astringent,
6(5.45%) as diuretic, 6(5.45%) as urinary problems, 5(4.45%) as purgative, 5(4.45%)
as cooling agents, 4(3.63%) as diarrhea, dysentery, inflammation, stomach problems,
asthma, and tonic. While 3(2.73%) pants were being used for vomiting, furniture,
laxative, kidney problems, rheumatism, skin diseases, expectorant, pain of joints and
ornamental purposes. Two species (1.81%) used for antiseptic, epilepsy, carminative,
vegetables, constipation and heart diseases and 1(0.90%) are used for hair loss,
diabetes, night blindness and earache.
On the basis of soil variables and their macro and micro elemental composition, the
area was divided into three sites. In each site, pH, electric conductivity (EC), organic
matter, macro and micro elements were studied. Six different plants communities
were established in each site. At site one 60 plant species of 29 families with species
diversity (3.814) and species richness (54) were listed. At site two total 65 plant
species of 26 families with species diversity (3.74) and species richness (51) were
recorded. Similarly, at site three total 85 plant species of 28 families with species
diversity (4.083) and species richness (72) were recorded. Density, frequency, cover
and importance values (IV) of area increased with rain fall. It is evident from
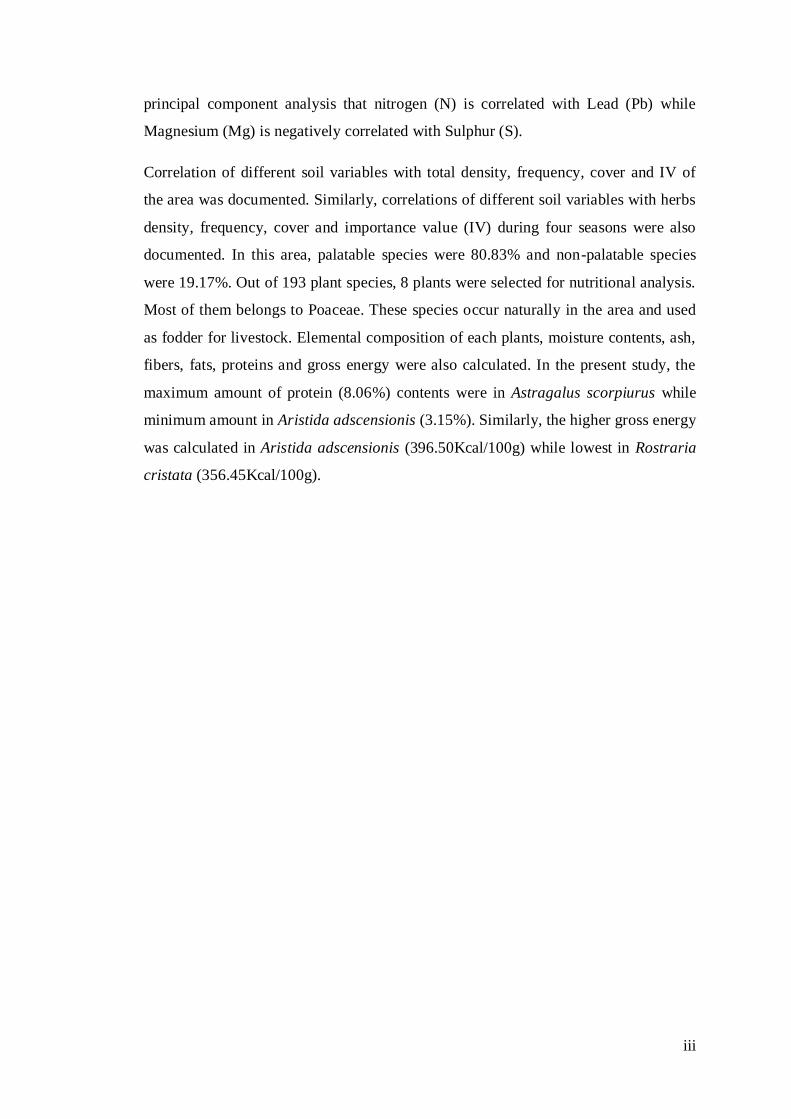
iii
principal component analysis that nitrogen (N) is correlated with Lead (Pb) while
Magnesium (Mg) is negatively correlated with Sulphur (S).
Correlation of different soil variables with total density, frequency, cover and IV of
the area was documented. Similarly, correlations of different soil variables with herbs
density, frequency, cover and importance value (IV) during four seasons were also
documented. In this area, palatable species were 80.83% and non-palatable species
were 19.17%. Out of 193 plant species, 8 plants were selected for nutritional analysis.
Most of them belongs to Poaceae. These species occur naturally in the area and used
as fodder for livestock. Elemental composition of each plants, moisture contents, ash,
fibers, fats, proteins and gross energy were also calculated. In the present study, the
maximum amount of protein (8.06%) contents were in Astragalus scorpiurus while
minimum amount in Aristida adscensionis (3.15%). Similarly, the higher gross energy
was calculated in Aristida adscensionis (396.50Kcal/100g) while lowest in Rostraria
cristata (356.45Kcal/100g).

1
CHAPTER – 1
INTRODUCTION
1.1 Study area
Bannu is one of the Southern district at distance (197.5 km) from the capital of
Khyber Pakhtunkhwa, Pakistan. It is located in between 32.43° to 33.06° North latitude
and from 70.22° to 70.57° East longitude and surrounded at North by Frontier Region
of Bannu and adjacent to the North Waziristan agency, at East by District Karak, at
South-East by Lakki Marwat and at South-West by South Waziristan Agency. The
total area of Bannu is 1,227 Km2 (Population Census report, 1999) (Fig. 01).
i. Demography
Bannuchi and Wazir are the main tribes of District Bannu. The other tribes of the area
are Marwat, Dawar, Mehsood, Khattak, Bettani, Bangush and Hindus. Total
population of the area is 677,346 (Population Census report, 1999).
ii. Rivers and streams
The general slope of the area is from North to the South-west side. There are two
main rivers, one is called Kurram River and the other is Tochi River. Most of the area
of District Bannu is irrigated from these two rivers. Kurram River enters at North-
Western side to the district and passes through the area in South-East direction. Tochi
River enters in south side of the district and flow out first to east and then to South-
Eastern direction. The area, between these two rivers is known as Doab. Canal
systems is used for irrigation of Doad. The well-known tributaries, which are joining
to Kurram on its side are Tarkhobi Algad, Khalboi Khawara, Nallah Kashoo, Tangai
Algad. Baran are the prominent Nallah of the district, which is halfway to between
Touchi and Kurram rivers. A large number of small hill-streams also irrigate the
district and join the Kurram River. The stream, which flows in this area has wide
channels, filled the valley with deposits from clay to boulders.
iii. Agriculture
The irrigated Portion of the district Bannu through canal is about 45% of total area.
While remaining portion is of rain fed. There is patchy type of vegetation.
2
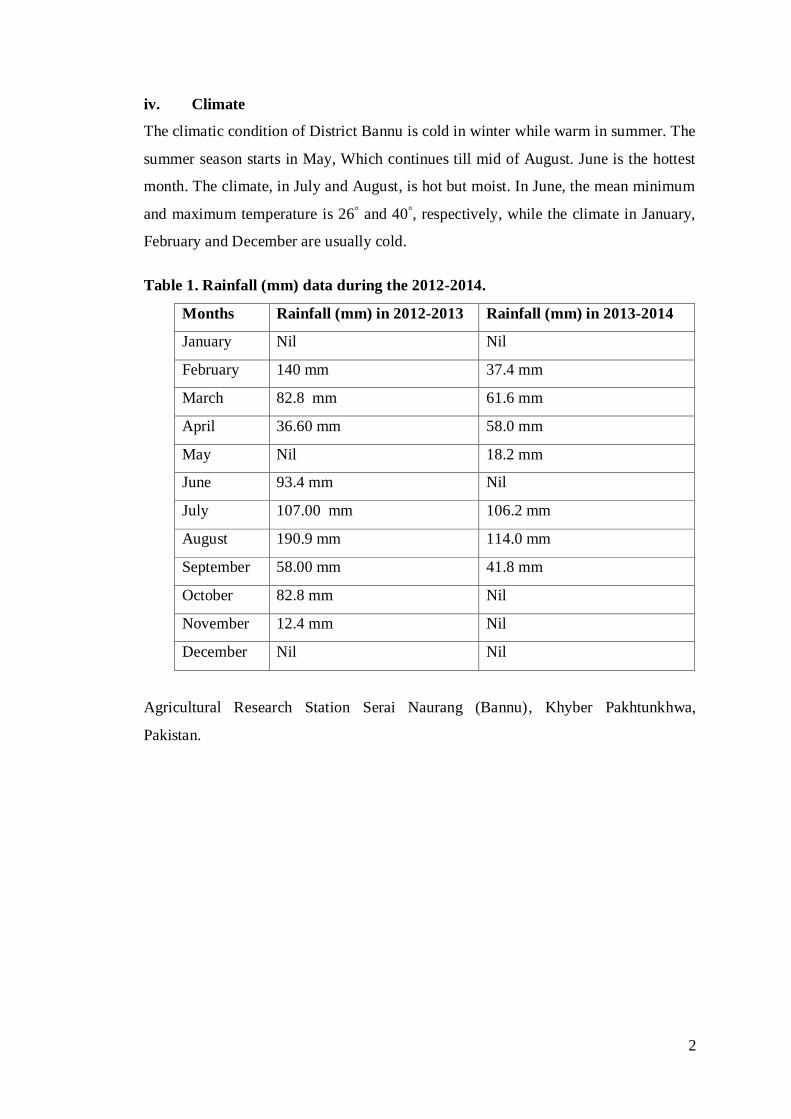
iv. Climate
The climatic condition of District Bannu is cold in winter while warm in summer. The
summer season starts in May, Which continues till mid of August. June is the hottest
month. The climate, in July and August, is hot but moist. In June, the mean minimum
and maximum temperature is 26° and 40°, respectively, while the climate in January,
February and December are usually cold.
Table 1. Rainfall (mm) data during the 2012-2014.
Months Rainfall (mm) in 2012-2013 Rainfall (mm) in 2013-2014
January Nil Nil
February 140 mm 37.4 mm
March 82.8 mm 61.6 mm
April 36.60 mm 58.0 mm
May Nil 18.2 mm
June 93.4 mm Nil
July 107.00 mm 106.2 mm
August 190.9 mm 114.0 mm
September 58.00 mm 41.8 mm
October 82.8 mm Nil
November 12.4 mm Nil
December Nil Nil
Agricultural Research Station Serai Naurang (Bannu), Khyber Pakhtunkhwa,
Pakistan.

3
Fig 01: Map of District Bannu
1.2 Introduction to Ethnobotany
The term Ethnobotany was coined in 1895 by the U.S. Botanist (J. W. Harshberger,
1896). An Ethnobotany is the scientific study of people and plant relationships. An
ethno-botanist tries to document, explain and clarify the relationships between people
and plants for food, medicine, dye, construction, clothing, cosmetics, currency and a
lot more (Deepak and Anshu, 2008). Common medicinal plants of Humzoni, their
ethnobotany and indigenous knowledge for various purposes i.e. food, fodder, fuel,
timber and agriculture purposes were documented by Rehman et al. (2013).
Similarly, medicinal plants of Bannu were reported by Khan et al. (2013). The
traditional uses of medicinal plants, in Pakistan, have been increasing during the last

4
few years. Medicinal plants have been reported from different parts of Khyber
Pakhtunkhwa (Zabihullah et al., 2006; Khan and Khatoon, 2008 and Abbasi et al.,
2009).
The link between plants and human ethos is not partial to the use of plants for diet,
outfit and housing but also includes their use for religious formalities, decoration and
health carefulness (Schultes, 1992).
In the earlier, ethnobotanical research was predominately, a review of the plants used
by inhabitants. A skilled botanist would identify plants and documented their usages.
Occasionally an anthropologist was present to translate the disease explanations, but
seldom was a physician accessible to detect the disease. The results made a list of
plants and their usages which was printed in a specialized paper, usually in the state of
the researcher. Nothing was connected or returned to the social set in discussion for
their contribution in the study, neither any environmental nor traditional status and
concerns, comprised in the survey were carried. Basic numerical and experimental
ethnobotany contains basic records, quantitative evaluation of use and supervision and
experimental calculation. Nowadays, ethnobotanical surveys contain practical
schemes that have the prospective to ameliorate poverty levels of these people,
allowing them to make more educated assessments about their future guidelines.
These new attitudes improve the excellence of the science, deliver advantages for the
cultural assemblages and take into account of ecological concerns. This new tactic is
based on an interdisciplinary team, typically composed of an ethnobotanist, an
anthropologist, an ecologist and a physician. Some of these group members are from
remote area colleagues who have prepared the particulars of the expedition as well as
the contractual arrangements for mutual programs of the village or community.
i. Brief history of ethnobotany
Harshberger, (1896) defined Ethno botany as “the study of the utilitarian relationship
between human beings and vegetation in their environment, including medicinal
uses”. Though the term "ethnobotany" was coined in 1895 by the US botanist John
William Harshberger, the history of the field begins long before that. In 77 AD, the
Greek surgeon Dioscorides published "De Materia Medica", which was a catalogue of
about 600 plants in the Mediterranean. It also comprised information on how the
Greeks used the plants, especially for medical purposes. This demonstrated herbal
5
contained information on how and when each plant was collected, whether or not
it was noxious, its authentic use and whether or not it was edible (it even provided
recipes). Dioscorides stressed the economic prospective of plants but did not really
venture into the field till after the middle ages. In 1542, Leonhart Fuchs, a
Renaissance artist, led the way back into the field. His "De Historia Stirpium"
cataloged 400 plants native to Germany and Austria. John Ray (1686-1704) delivered
the first demarcation of "species" in his "Historia Plantarum": a species is a set of
individuals who give rise through reproduction to new individuals similar to
themselves. In 1753, Carl Linnaeus wrote "Species Plantarum", which comprised
information about 5,900 plants. Linnaeus is famous for developing the binomial
method of nomenclature, in which all species get a two portion name (genus, species).
The 19th century saw the peak of botanical investigation. Alexander von Humboldt
collected data from the new world and the well-known Captain Cook brought back
information on plants from the South Pacific. At this time major botanical gardens
were going on, for instance, the Royal Botanic Gardens, Kew. Edward Palmer
collected artifacts and botanical specimens from peoples in the North American West
(Great Basin) and Mexico from the 1860s to the 1890s. Once enough data happened,
the field of "aboriginal botany" was founded. Aboriginal botany is the study of all
forms of the vegetable world which aboriginal peoples use for food, medicine,
textiles, ornaments, etc.
The first individual who studied, the emic perspective of the plant world was a
German physician working in Sarajevo at the end of 19th Century: Leopold Glueck.
His publication work on traditional medical uses of plants was done by rural people in
Bosnia (1896), has to be deliberated the first modern ethnobotanical work. At the
outset of 20th century, the field of ethnobotany witnessed a shift from the raw
accumulation of data to a greater methodological and conceptual reorientation. This
was also the beginning of academic ethnobotany. The founding father of this
discipline is Richard Evans Schultes. Today, the field of ethnobotany needs a
variety of skills, botanical training for the identification and preservation of plant
specimens, anthropological training to appreciate the cultural concepts around the
perception of plants, dialectal training, at least, enough to transcribe local terms and
know native morphology, composition and semantics. Native homoeopaths are often
reluctant to share correctly their knowledge to foreigners (Martin, 1983). The

6
biological diversity of our world is great and we have only begun to explore her
potential. In some areas, diversity may be more valued in its natural state than when
used for grassland or timber (Peters, 1989). Methods to identify medicinal plant
include accidental screening, taxonomic collecting (sampling by botanical family), or
ethnobotanical collecting. It has been revealed that ethno botanically derived
compounds have superior activity than compounds derived from random screening
and therefore, a greater potential for product growth.
Another scholar, James W. Herrick, who studied under ethnologist, William N.
Fenton, in his work, Iroquois Medical Ethnobotany, (1995) with Dean R. Snow
(editor), professor of Anthropology at Penn State, explained that understanding herbal
medicines in traditional Iroquois cultures is rooted in a solid and ancient cosmological
acceptance system. Their work provides observations and conceptions of illness and
differences which can clear in physical forms from benign maladies to serious
diseases. It also contains a large compilation of Herrick’s field work from numerous
Iroquois authorities of over 450 names, uses, and provisions of plants for various
ailments. Traditional Iroquois practitioners had (and have) a sophisticated viewpoint
on the plant world that contrast strikingly with that of new medical science (Herrick,
1995).
1.3 Floristic
The word floristic is derived from flora, which means to list all types of plant species
or plant taxa within specific geographic area. Flora of an area includes all types of
plants either wild or cultivated one while vegetation refer to the numbers of
individuals, their distribution pattern, size, relationship and their relative importance
(Ali, 2008). Plant ecology is the branch of ecology which deals of the distribution
pattern, relative abundance of plant species, environmental effects, interaction among
themselves and other organism (Keddy, 2007). Phenology is the study of regular
seasonal occurrence of various processes such as vegetative growth, photosynthesis,
pollination, flowering, fruit formation, vegetation, their types, and diversity, inter
relationships and productivity of vegetation (Campbell, 2006 and Wang et al., 2013).
Phytosociology is that branch of Ecology which deals with the plant communities,
relationships among the plant species, their development and composition. The
phytosociological system is specified for classifying the plant communities

7
(Rabotnov, 1970-1979). The study of flora is a common practice and plant
taxonomists have the information about the plants throughout the world. Flora is a
floristic checklist, complete taxonomic treatment with key, and morphological
information of plant species growing in specific geographic area. The valuable data is
collected through this practice for reference of future studies. The world is
climatically diverse (Qureshi et al., 2011).
1.4 Nutraceutical Aspects
DE Felice, in 1989, used the words “Nutraceutical for nutrition and pharmaceutical
(Kalra, 2003). This term is applied to the products from isolated nutrient, dietary
supplement and herbal yields, processed food e.g. cereals products, soups and
beverages. Nutraceutical aspect is nonspecific biological interventions used for health
encouragements, to protect the malignant processes and to control the symptoms. Due
to their safety and possible nutritional and therapeutic values, nutraceuticals have
attracted significant importance. Supplements are that products, which are derived
from natural sources and incorporated with the diet with ingredient e.g. Vitamins,
minerals, amino acids without any therapeutic property. The advantage of
nutraceuticals is that they prevent the diseases and can be used as a usual food. The
following, eleven elements (K, Ca, Zn, Cu, Fe, Mn, Cr, Ni, Br, Rb and Zr) were
determined with Energy Dispersive X-ray Fluorescence (EDXRF) in selected
Sudanese medicinal plants (Yagi et al., 2013). The human body requires a number of
minerals in order to retain good health (Ajasa et al., 2004). Macro- and microelements
control biochemical processes in the human organism (Kolasani et al., 2011).
Medicinal plants have their active constituent’s metabolic product of plant cells and a
numbers of Mineral elements which play an important role in metabolism (Choudhury
et al., 2007). Some minerals act like chelate with the organic ligands and make them
bioavailable to the body system. Some of the plants have their medicinal value and
usually used in homeopathic system due to presences of Ca, Cr, Fe, Mg, K, and Zn
(Vartika et al., 2001.). The mineral elements present in plant play an important role in
quality of food. The quality of medicine also depends upon mineral contents (Bahadur
et al., 2001) Malnutrition in tropical countries as well as in developing countries is
due to deficiency essential nutrients. Excess of essential elements also causes
disorders. Anemia is due to Iron deficiency, is one third of the world population
(Leterme et al., 2006) Zn deficiency can accelerate the pathogenesis of lungs cancer

8
(Cobanoglu et al., 2010) The patients of breast cancer had low levels of Zn, Mn, Fe,
Ca, Cu and Mg in their hair (Joo et al., 2009).
Aims and Objectives
The purpose of this research work is;
To list the flora of the selected areas of district Bannu.
To study the ecological characteristics of plant communities.
To carry out the soil analysis of plant communities.
To list the medicinal plant species, used by local communities.
To know the palatability of plants of the area.
To study nutritional values of selected plants.
To investigate elemental composition of the selected plants.

9
CHAPTER – 2
REVIEW OF LITERATURE
Ethnobotany
Kappelle et al. (2000) reported 590 plant species from Costa Rican Montane. Out of
them, 23.8% of (189) plant species were used for remedial purposes, 39.7% for diet,
and 24.3% for structure and equal amount as fuel wood. Less important uses included
dye, decorative, fodder, gum, oil, and poisonous. A overall of 61.9% of the plants
were used for one purpose only.
Gillani et al. (2003) listed 54 medicinal plant species from Kurram agency which had
numerous local uses. Most of them were described as first relief for stomach diseases.
They also recounted that during winter, nearly all the people in the area used Afghan
fuel wood.
Macia (2004) stated that 37 palm species used by the Huaoranis in Huaorani in
Amazonian Ecuador. Palm species used for different purposes and recorded in eight
ethnobotanical groups. Among these (64.9%) were used for house building and
human nutrition. Half of these species were used for home utensils (59.4%), for
hunting and fishing trappings (54.6%).
Hussain et al. (2004) noted that 11 plants species were used for several timber
purposes in South Waziristan agency Pakistan. Populus afghanica, Cedrus deodara,
and Pinus wallichiana were declared as the top timber wood in South Waziristan
Agency.
Wazir et al. (2004) reported 41 specie, of 29 families of an ethno-botanical
significance from in Chapursan Valley Gilgit. The core objective of this paper was to
explore the medicinal plants. Many herbs, shrubs and trees, were used for medicinal
purposes by the populations in the valley.
Ahmad et al. (2004) noticed that the native people of Galliyat areas preferably use
remedial plants for treating their common diseases by traditional approaches. They
observed 41 wild plants species of 33 families used by local populations for
homeopathic purposes.
10
Jabbar et al. (2006) reported 29 species among them Lamium amplexicaule L.,
Mallotus philippinensis, Withania somnifera, Azadirachta indica and Citrullus
colocynthis were used to treat helminthosis in ruminants from southern Punjab,
Pakistan
Tardio et al. (2006) collected 419 plant species of 67 families in Spain. A list of
species, plant parts used, localization and process of depletion and harvesting time is
presented. These plants were used in seven different food classes like; green
vegetables were the prime group followed by plants used to make beverages, wild
fruits, and plants used for seasoning, sweets, preservatives, and etc.
Wazir et al. (2007) observed 20 different medicinal halophytes plants belonging to 18
families found in District Karak and its adjacent area. These medicinal halophytes
were used by the local inhabitant of the area.
Manan et al. (2007) reported that 52 plants of 35 families were used for different
diseases in Upper Dir and have substantial role in the primary health care of area.
Arenas & Scarpa (2007) observed that Chorote folks use 57 plant species as a source
of diet, which they consume in 118 different ways. A cross-cultural assessment with
4-neighboring ethnic groups revealed that one third of their plant foods were
exclusive to the Chorote people, despite the fact that they share most of their palatable
plants with the other groups.
Mizaraite et al. (2007) reported that the potentials of increasing the use of timber from
private forests in Lithuania for bioenergy drive. Potential wood fuel supply and
feeding were examined using a literature review and study of statistical data. Prices of
wood chips manufacture were designed applying economic simulation.
Okello & Ssegawa (2007) reported during the ethnobotanical review in Ngai
subcounty and identified that roots were the most commonly harvested portions which
have seriously affected the regereration of medicinal plants. It was supposed that only
the wild plants were effective. Though not intentional, plant parts not used for
remedial purposes are sometimes damaged in the process of harvesting.
Khan & Khatoon (2007) reported that in Bugrote Valleys 48 plant species of trees and
shrubs were used in ordinary life for medication, housing, agricultural tools and
11
firewood. The population of the region mainly depended upon plants for their
livelihood.
Shah & Hussain (2008) noted that 76 plant species of 52 families were used for
several purposes in Mount Elum, District Bunir. Among these 47 % plants were used
for medicinal purposes, 21 % for fuel wood, 9 % for fruit species, 19 % for honeybee
species, 20 % for wood yielding species and 4 % for poisonous species.
Qureshi & Bhatti (2008a) observed 51 plant species were distributed across 28
families to have medicinal uses by local populations of the Nara Desert. 21 plants of
these species are suggested to have new uses not recorded in the Indo-Pak folk herbal
medicinal literature. Boraginaceae and Amaranthaceae were the most leading
families.
Khan et al. (2009) reported that 50 plant species were used locally for remedial and
other purposes in FR Bannu. The leading families were Poaceae and Moraceae each
with 5 species.
Akhtar & Begum (2009) recorded that 55 plant species of 38 families were used for
more than 42 diseases in Jalala area District Mardan. Calotropis procera and
Boerhavia diffusa had flexible medicinal uses. The information recounted is purely
based on the knowledge of local populations without any scientific certification.
Sardar & Khan (2009) noted that 102 species of 62 families from Shakargarh,
District Narowal, which were used by indigenous inhabitants as fuel, furniture,
fodder, making baskets and mats, brushing teeth, remedial, vegetables and eatable
fruits.
Kamal et al. (2009) reported that 50 plant species of 30 families are used medicinally
and for other purposes in Bannu for curing several diseases like cough, diarrhea,
dysentery, constipation and stomach complications etc.
Hazrat et al. (2010) conducted that ethnobotanical research in Usherai Valley and
recorded 50 species of 32 families of wild herbs, shrubs and trees which were used as
remedial plants by the people in the valley.

12
Ajaib et al. (2010) documented 38 species of 25 families from District Kotli, Azad
Jammu & Kashmir, Pakistan, of economics rank. The local people used them as
remedial, fuel, shelter, and in making agricultural utensils.
Tareen et al. (2010) reported that 61 species of 34 families from Kalat and Khuzdar,
Baluchistan are conventionally used as medicines by the women for cure of various
ailments. Maximum number of species belongs to family Lamiaceae (9 spp.) followed
by Asteraceae (7 spp), Apiaceae, Papilionaceae, Solanaceae and Zygophyllaceae (3
spp. each).
Qasim et al. (2010) reported 48 wild plant species from 26 families used in Hub,
Lasbela District, and Baluchistan for twelve diverse purposes. Plants were used, 56 %
for fodder, 22% for medicine, 5% for food, 5% for household utensils, 3% for
increasing milk production in cattle and 8% for other purposes. Most commonly used
species were from Poaceae (29%) monitored by Amaranthaceae & Chenopodiaceae)
(10%), Mimosaceae and Convolvulaceae (6%).
Shinwari et al. (2011) purposed of this study was to collect evidence on how people
of a specific culture and area make use of native plants. For this determination, an
ethno botanical study was directed in Kohat Pass, KP, and Pakistan. The study
showed that there were 60 plants of 30 families which were used to overcome six use
classes by the natives. Most of the species (90%) were used as medication, followed
by nourishment (31.7%) and food & fuel (25%).
Sher et al. (2013) documented the ethno botanical values of the most frequently used
plants of the Humzoni (North Waziristan Agency), Pakistan and reported on the local
knowledge of diverse communities of the study area. A total of 51 species of 32
families were found to be valuable for remedial, diet, fodder/forage, fuel, wood,
housing and agricultural tenacities. Local people used native plants for their
communal day diseases. The largest families among these were Rosaceae. It was
noted that most common part of the plant used were leaves and fruit. There is no
tendency of farming of medicinal plants in this area.
Shahzeb et al. (2013) documented 35 Unani medicines and arranged systematically
along with name of product, available form, company name, name of the plants/parts
used in the drugs, family name and purpose of uses. Plants which were used

13
frequently in these medicines are Ziziphus jujuba, Foeniculum vulgare, Solanum
nigrum, Ocimum cannum and Zingber officinale. It was noted that these products are
generally available in syrup form. It is commonly assumed that these medicines have
no side outcome. Fascinatingly one medicine is suggested for many diseases.
Daud et al. (2013) reported the 11 plants species of gymnosperms from North
Waziristan agency.The aboriginal knowledge of local folks about the use of these
native and cultivated plants were collected through interview during field visits by
using questionnaire. During visits, it was found that the people of the area used these
plants for diet forage, protections, manufacture and fuel purposes and also consumed
as a medication and detergents.
Khan et al. (2013) reported the plants species which were used for treatment of
diarrhea and dysentery in district Bannu. These plants were from the following
families, Apiaceae, Myrtaceae, Mimosaceae, Alliaceae, Lamiaceae, Rutaceae,
Plantaginaceae, Amaranthaceae having 2 species each. While Euphorbiaceae,
Moraceae, Rhamnaceae, Astraceae, Solonaceae, Cypraceae, Meliaceae,
Oxaladaceae, Punicaceae, Poaceae, Chenopodiaceae and Caesalpinaceae were with
single species each. Out of these, 16 plant species were used for treatment dysentery
and 8 plants were used for diarrhea and 4 plants were used for both diarrhea and
dysentery.
Amjad et al. (2015) documented ethno botanical uses of 104 plant species of 51
families. Results revealed that most the plant species were used as medicinally.
Leaves were found to be the most commonly used part for the preparation of local
recipes and fodder.
Koleva et al. (2015) reported a broader ethno botanical survey conducted in diverse
localities of Bulgaria during May-July 2013. The survey was carried out with 255
people by using the face-to-face interview method. The members were asked: 1) to
list five used by them curative plants (excluding Achillea millefolium, Hypericum
perforatum, Thymus sp., Melissa officinalis L., Origanum vulgare L.) and to present
detailed information about local names of plants listed, ethno botanical use and the
manner of use. Totally, 62 plant species were recorded by respondents.

14
Floristic
Mark et al. (2001) worked out on alpine zone at meso- and micro- scales in southern
Tierra collected data on plant cover and life form. They specified that the richness of
80 local vascular taxa (18.6% of the regional flora), reduced with increasing altitude
and also observed that chamaephytes and hemicryptophytes dominated throughout but
microphenerophyte and megaphanerophtes were clearly lacking.
Antje (2002) explored the relationship between Inselberg floras in floristic and
functional terms and their correlation with environmental variables at Macro-scale
and landscape level. He decided that neither growth form nor dispersion spectra
closely looked like the pattern that arose in the ordination of floristic composition.
The effect of geographical position reduced when functional rather than floristic
measures were introduced in the analysis.
Batalha & Fernando (2002) reported a extensive physiognomic range, from grasslands
to tall woodlands in Brazil. They compiled Raunkiaer’s life-form spectra. They
indicated that in all Cerrado life-form spectra, the chief life-form classes were the
hemicryptophytes and the phanerophytes, the former dominant in sites with open
physiognomies and the latter prevailing in sites with closed physiognomies. The
Cerrado sites illustrated themselves from the savanna sites by their under-
representation of therophytes.
Gutkowski et al. (2002) noted 69 species with geobotanical significance from Dynów
foothills, Poland. It comprised 14 mountain species (7 montane, 6 multizonal
mountain species and 1 sub-montane species) and 7 species not native to the area (3
archaeophytes, 1 epeokophytes, 1 apophytes, 1 hemiagriophytes and 1 of unclear
status).
Luis et al. (2002) reported that 46 vascular plant species, 32 being growing
macrophytes, mostly Gramineae and Cyperaceae, five floating-leaved, three
submerged, and one surface-floating and also five shrubs. Cluster analysis of the
floristic data presented two main groups of inventories in both seasons.
Antje et al. (2003) noted the floristic composition of 14 mesas in southern African
Nama Karoo along a latitude gradient. They indicated that mesas can act as sources
for re-colonization as well as havens for species adjusted to mountain habitats and

15
that mesa habitats were richer in species than plains in the northern These findings
stress the importance for the protection of mesa habitats in opinion of increasing
human pressure on mountain habitats.
Musila et al. (2003) documented 156 plant species from coastal area of Kenya.
Among them 60 families were recorded with Gramineae (17 spp.) and Papilionaceae
(16 spp.) were dominant family in terms of species numbers.
Eilu et al. (2004) described a total of 5747 plant species, trees in 53 families, 159
genera, and 212 (spp). 22 families had only one species each, while the rest had
between 2 and 25 species. Euphorbiaceae is one of the leading family having (25 spp)
followed by Meliaceae and Rubiaceae (16 spp) each. Grounded on Rabinowitz's
forms of rarity, 93% of the species were geographically well-known, 47% were
limited to a single forest type, while 41% happened at densities of <1 individual ha -1.
Durrani et al. (2005) reported 202 plant species of 45 families from Harboi rangeland
Kalat. Asteraceae, Papilionaceae, Poaceae, Brassicaceae and Lamiaceae were the
prominent families. Juniperus macropoda was the only tree species. They also
indicated that the dominant life forms were therophyte and hemicryptophyte while
nanophylls, microphylls and leptophylls were dominant leaf sizes. Some 83.6% plant
species flowered during April to June while 63.3% plants bloomed during July to
September.
Golluscio et al. (2005) documented that plant phenology and life form regulate the
capability to use resources. The phenological heterogeneity within and among life
forms of a single community may reveal key features of community organization,
such as temporal niche separation within life forms or convergence of phenological
and life form patterns. Grasses had higher autumn-winter phenological action than
non-grass groups which differed in the date of beginning of vegetative growth and
finish of the reproductive growth.
Muoghalu & Okeesan (2005) noted that 49 climber species containing of 35 liana
(34%) and 49 (spp) were distributed over 28 families. Climber basal area, density,
number of species, genera and families increased with height. Forty-two per cent of
the trees in the forest carried climbers.

16
Muthuramkumar et al. (2006) reported the changes in tree, liana, and under story
plant diversity and community structure in 5 tropical rain forest fragments in the
Valparai plateau, Western Ghats. There were 312 (spp.) in 103 families: 1968 trees
(144 spp.), 2250 lianas (60 spp.), and 6123 understory plants (108 spp.). Understory
species density was highest in the highly disturbed portion, due to weedy invasive
species occurring with rain forest plants.
Segawa & Nkuutu (2006) reported that 179 (spp.) of 70 families from Lake Victotia
Central Uganda. Out of these, Rubiaceae was the richest with 40 species followed by
Euphorbiaceae (13 spp.), Apocynaceae (10 spp.) and Moraceae (9 spp.). 58
herbaceous species, 39 lianas, 10 shrubs and 72 species of trees were noted.
Laidlaw et al. (2007) observed that local and regional variation in tropical rainforest
and showed that the common families were Meliaceae, Euphorbiaceae, Lauraceae,
Myrtaceae and Apocynaceae. The most common species were Cleistanthus
myrianthus, Alstonia scholaris, Myristica insipida, Normanbya normanbyi and
Rockinghamia angustifolia.
Yadav & Gupta (2007) counted the diversity of herbaceous species in relative to
various micro-environmental settings and human disruption in the Sariska Tiger
Project in Rajasthan, India. Several species sensitive to human disturbance have
extinct from the disturbed areas. The species diversity index in the undisturbed Slopka
forest was 3.051, followed by the Kalighati forest (3.415) and the Bharthari forest
(3.027). However, in the Hajipur forest, species diversity index was high (3.564), due
to the rise in species richness. It is proposed that the rich species diversity of the
herbaceous vegetation of the Sariska Tiger Project may be sheltered only by in situ
conservation.
Perveen et al. (2008) noted that the 79 plant species from Dureji Game Reserve that
belonged to 32 families, which also comprised 3 rare species. Phenology and
quantitative analysis of species diversity and phytosociological attributes were noted.
Francisco et al. (2009) prepared a checklist of Commelinaceae of Equatorial Guinea,
comprising of 46 taxa in 12 genera. The largest genus was Palisota, with 11 (spp.).
Commelinaceae having 11 (spp.) were noted for the first time in the country.

17
Hussain et al. (2009) described the 69 plant species of 29 families from District
Chakwal. The vegetation transects in 4-sites of the rangelands comprised 20 species
of grasses, 12 species of trees, 31 species of shrubs and 6 species of under shrubs and
herbs.
Manhas et al. (2010) documented that the 206 species of 59 families from Pathankot,
Hoshiarpur and Garhshanker, India. The contribution of dicot, monocotyledons and
pteridophytes were 77.7%, 20.4% and 1.9%, respectively. Ipomoea was the most
leading genus. Biological spectrum of the study site presented that therophytes (52%)
were the most prevailing life form followed by phanerophytes (27%).
Durrani et al. (2010) calculated floristic composition and its ecological appearances in
Aghberg range lands of Quetta Pakistan. The study indicated that the protected sites
supported 123 plant species of 36 families, while unprotected sites had only 28
species. Asteraceae, Fabaceae, Poaceae, Brassicaceae, Lamiaceae and Boraginaceae
were significant families in the protected area.
Jankju et al. (2011) reported that the flora of a region is fundamental for attaining
other practical researches in biology. Different ecological and climatically conditions
generate unique habitats which make it significant for floristic studies in Khorasan
Province of Iran. Floristic list of the study area is valuable for protecting the natural
resources and sustainable use of medicinal plants
Xu et al. (2014) noted that Sapium baccatum is measured a pioneer species. The
Sapium baccatum - Baccaurea ramiflora forest in the low altitude zone shows that the
vegetation of the nature reserve was also historically disturbed by anthropogenic
activities such as traditional swidden practices. Before the Bulong Nature Reserve
was recognized, the region had undergone rapid deforestation, with a massive
proliferation in monoculture rubber tree plantations since the 1980s, as in other parts
of the region.
Zhu et al. (2015) carried out floristic and vegetation surveys in a newly recognized
nature reserve on a tropical mountain in southern Yunnan. Three vegetation types in
3-altitudinal zones were documented: a tropical seasonal rain forest under 1,100 m; a
lower montane evergreen broad leaved forest at 1,100-1,600 m; and a montane rain
forest above 1,600 m. A total of 1,657 species of seed plants in 758 genera and 146

18
families were documented from the nature reserve. Tropical families (61%) and
genera (81%) contain the majority of the flora, and tropical Asian genera make up the
maximum percentage, showing the close affinity of the flora with the tropical Asian
flora, despite the high latitude (22oN). Floristic fluctuations with altitude are obvious.
The transition from lowland tropical seasonal rain forest dominated by mixed tropical
families to lower montane forest dominated by Fagaceae and Lauraceae occurs at
1,100 -1,150 m. Although the middle montane forests above 1,600 m have ‘oak-laurel’
grouping appearances, the temperate families Magnoliaceae and Cornaceae become
dominant. Both the tree species diversities and the numbers of genera and families are
higher in the lowlands and middle montane zones than in the lower montane. The
lower diversity in the lower montane zone could reflect less precipitation and frequent
fires in the historical past. The species structures of samples within each altitudinal
zone show better horizontal turnover (β diversity) in the lowlands. Conservation
struggles should focus on the species-rich lowland and middle montane forests.
Mashayekhan et al. (2015) reported that the floristic study of plants in each site is one
the most central role in protection natural resources of each country. Plant species
were composed from field sites that representing major habitats of study area. Surveys
were achieved during active growth periods in 2013-2014. A total of 140 medicinal
plant species were recognized. These species were distributed in 39 families.
Lamiaceae is one of the leading family and having 26 species followed by Asteraceae
with 21 species and Rosaceae with 13 species were the most prevailing families of
medicinal plants in the study area. Hemicryphtophytes with 40%, therophytes with
18.4%, geophytes with 14.25%, phanerophytes with 13.57% and chamaephytes with
6.42%. These species belonged to the Irano-Turanian, Euro-Siberian and
Mediterranean regions. The consequences of the present study indicated that
medicinal plants and wild fruit as Non Timber Forest Products (NTFPs) recognized in
this study, play significant role in the rural community well-being and ecological
forest management.
Karthik et al. (2015) documented totally, 185 plant species of 158 genera and 58
families. These plant species were counted in this sacred grove and followed by
Angiosperm phylogeny Group III classification. The most leading families found
were Fabaceae (24 spp.), Apocynaceae (13 spp.), Malvaceae (9 spp.), Rubiaceae (8
spp.), Convolvulaceae (8 spp.) and Rutaceae (8 spp.). Rich biodiversity is present in
19
the sacred grove. This has confirmed the protection and preservation of the vegetation
of the sacred grove.
Vegetation structure
Claros (2003) observed that variations in forest structure and species diversity during
secondary succession at two sites in the Bolivian Amazon. Canopy height species
diversity and basal area improved with stand age, specifying that secondary forests
rapidly achieve a forest structure. A total of 250 species were recorded of which 50
percent made up 87 percent of the sampled individuals. Species diversity increased
with the lowest diversity in the canopy. The results of the correspondence analysis
showed that species structure varied with stand age, forest layer, and site. The species
composition of established forests recovered at different rates in the different forest
layers, being the slowest in the canopy layer.
Kennedy et al. (2003) studied the link between grass species richness and ecosystem
constancy in the Kruger National Park. A total of 135 to 489 individual grasses were
recognized from 189 sites. After the drought had approved species richness, standing
crop and percentage abundance recovered to 92.1%, 113.8% and 92.8% of their pre-
perturbation values, respectively. The findings suggest that ecosystem stability may
be negatively related to grass species richness in South African savanna grasslands.
Hurka (2004) examined plant species diversity and structure of life form categories in
a tropical dry forest in Northwestern Costa Rica. The results accepted 328 plant
species in 79 families and 247 genera of grasses, herbs, shrubs, lianas and trees.
Species richness was highest after 15 years and declined significantly in older plots.
The number of non-woody species was maximum after 3-years of succession.
Jorge et al. (2005) studied the vegetation structure and species richness through a 56-
years Chrono sequence of 6-replicated age classes of dry tropical forest on the island
of Providencia, Colombia, in the Southwest. They stated that woody species density
touched a peak in stands from 32 to 56 years old while rarefaction analysis indicated
that species richness increased linearly with stand age and was maximum in stands 56
years old or greater. Basal area and mean tree height were absolutely associated with
age since rejection, while sprouting capacity indicated a negative relationship.

20
Karsten et al. (2005) determined the classification of 549 phytosociological relieves
and gave 4-groups including of 39 plant communities. With declining moisture looked
desert steppes with Stipa glareosa and Allium polyrrhizum and the desert steppe were
diverse with lot of semi-desert scrub sparse dwarf Anabasis brevifolia, Salsola
passerina, Zygophyllum xanthoxylon and Haloxylon ammodendron.
Malik & Hussain (2006) indicated that characteristic plant species of each community
type are presented together with the evidence on dominance and sub-dominance
species. Four plant communities were documented. Classification and ordination
techniques providing very similar results based on the floristic composition. The
results formed the base for the mapping spatial distribution of vegetation communities
using image analysis techniques.
Gould et al. (2006) measured the species composition, diversity, conservation status,
and ecological attributes of eight mature tropical forest plants. There were 374
species; 92% were native, 14% endemic, and 4% critical elements (locally
endangered) to the island. The lowland moist forest communities, occurring within a
matrix of urbanization, agriculture, and disturbance, had the highest degree of
invasion by exotics. Community descriptions were nested within a change of
hierarchies to facilitate extrapolation of community characteristics to larger ecosystem
units.
Tripathi & Shukla (2007) designated two grassland communities of Gorakhpur, one
on the managed and sheltered site and the other moderately grazed, open natural site
of University campus for the comparison of various vegetation parameters. Out of the
total 100 species, 65 were common to both sites, 9 species occurred exclusively at site
I and 26 species at site II. Cassia absus, Cassia tora and Hyptissu aveolens were rare
in abundance at managed site while Coccinia indica and Crotalaria ferugenia were
rare at natural site.
Ahmad et al. (2008a) detailed the vegetation data during all the 4-seasons (autumn,
winter, spring and summer) using quadrat method in Knotti Garden and Dape Sharif.
Soil physical and chemical properties of each site had their own impacts on the
species association. Most of the herbaceous species were common during summer and
autumn due to appropriate temperature and accessibility of moisture and nutrients.

21
However, during winter sparse vegetation did not display grouping of plants due to
severe cold temperature.
Arshad et al. (2008) studied vegetation types for density, frequency, and cover and
importance value index in rangelands of the Cholistan desert. The association of
certain plant species to certain soil types was common showing the influence of
chemical composition of the soils. The result indicated marked important relations
between soil physiognomies and plant species. Suaeda fruticosa and Haloxylon
recurvum the high salinity levels and low organic matter. Calligonum polygonoides,
Aerva javanica, Dipterygium glaucum, Capparis decidua and Haloxylon salicornicum
indicated better organic matter.
Wahab et al. (2008) experimented vegetation structure, age and growth in 5-places of
Dangam District of Afghanistan. Vegetation compositions of non-tree species were
also presented. On the basis of floristic composition and importance value index of
tree species, two mono-specific and one bispecific communities were documented in
the study area. It is shown that in Picea smithiana (Wall.) Boiss dbh, age and growth
rates were not significantly interrelated. Lack of tree seedlings specified poor
regeneration status of the forests.
Guo et al. (2009) functioned on the, the biological spectrum and hierarchical-synusia
structure of T. sutchuenensis community. There were 73.2% phanerophyte, 18%
hemicryptophyte, 6% geophyte, 2% chamaephyte, and 0.8% annual plants. The
leading leaf size was microphyllous (60.8%), and foremost leaf form was simple
(86%).
Saima et al. (2009) reported that the floristic difference in Himalayan moist temperate
coniferous forests in Pakistan is poorly assumed. Wet temperate forests of Pakistan
are remarkable because at suitable heights it merge downward with the tropical thorn
forests and uphill with the alpine meadows. The very condition of these forests thus
make making them a kind of enclave in which the variety of natural sites has
acceptable a number of relict species to persevere. We noted the vegetation pattern
along a constant 18 Km long transect that crossed a mixed coniferous forest.
Vegetation data was examined by multivariate statistics with cluster analysis,
Detrended Correspondence Analysis (DCA) and Spearman’s Rank Correlation
Coefficient to detect relationship between environmental factors and species dispersal.

22
Soils were physically and chemically examined. Soil texture, pH and tree density
were the major determinant of vegetation pattern in these forests. Plant diversities and
accumulation with respect to environmental features in these broad forest categories
were deliberated.
Ali & Malik (2010) calculated the vegetation communities of the exposed urban
spaces viz., green belts, gardens and parks of Islamabad city. TWINSPAN classified
the floristic species composition into four-major community types which exposed
some overlap in an ordination space, reflecting relatively homogenous nature of the
vegetation. Pinus roxburghii and Grewia asiatica were more predominant in green
belts while native vegetation dominated by Dalbergia sissoo and Acacia nilotica were
present in uninterrupted green spaces. Broussonetia papyrifera and Populus
euphratica indicated distribution along the drains/nullahs in the city.
Adam & Crow (2010) using TWINSPAN examined the abundance and frequency
data noted from 106 study plots. Six-cover types (CT) were defined: Pinus strobus–
Gaylussacia baccata CT, Fagus grandifolia–Ostrya virginiana CT, Pinus resinosa–
Gaylussacia baccata–Vaccinium angustifolium CT, Tsuga canadensis CT, Acer
rubrum–Dulichium arundinaceum CT, and Ruderal CT. Sorensen‟s Index showed a
50.0% similarity with Bear Island, 51.1% with Rattlesnake Island, and 52.7% with
Three Mile Island. The Simple Matching Index presented advanced levels of
similarity.
Hussain et al. (2010) A study was carried out to assess the phytosocology and
structures of National Park. For tree species, point center quarter method (PCQ) and
understorey vegetation, 1.5m circular plot at each PCQ point, while for bushes 20
quadrats 3x5 m were used. Five-stands lead by trees and eight-stands of bushes were
noted. Picea smithiana and Pinus wallichiana form a community in two sites, related
with Juniperus excelsa. These pine tree species were also spread as a pure stands in
different sites with higher density and basal area. In pure stands, Juniperus excelsa
attained lowest density ha with highest basal area m ha. Stands 1 21 of mixed species
stands indication considerable low basal area. Diameter size class structure of tree
species and bushes give the current status and future trend of these forests. These
forests expression irregular and misbalanced size class distribution, therefore need
special care to save and defend these forests and vegetation.

23
Sher et al. (2011) Reported that 40 species related to 21 families were identified as the
weeds of wheat from village Lahor, District Swabi during 2005. The most common
species with more than 45% average frequency were Anagallis arvensis L., Arenaria
serphyllifolia L., Chenpodium album L., Fumaria indica (Hausskn) H. N. Pugsley.,
Melilotus indica (L.) All., Rumex dentatus (Meissn) Rich., and Linn. Based on
importance value of 4 communities viz., Arenaria -Anagallis-Chenopodium,
Fumaria-Rumex-Chenopodium, Fumaria-ChenopodiumAnagallis, Arenaria-Fumaria-
Chenopodium were formed. Caryophyllaceae, Fumariaceae, Chenopodiaceae,
Fabaceae, Poaceae and Primulaceae were the leading families on the basis of family
importance values. The biological spectrum indicated that there were 82.5%
therophytes and 12.5% hemicryptophytes. Geophytes and chamaephytes were
characterized by one species each. Leaf spectra consisted of 42.5% microphylls, 35%
nanophylls and 22.5% leptophylls. Biomass of the forbs was greater than the grasses.
Species diversity was higher in Koz Mulk and Pani owing to crop rotation.
Robert et al. (2011) described that the rapid progress is being made in North
American vegetation science through new progresses within the U.S. National
Vegetation Classification (USNVC). Central to these developments are sharing,
archiving, and distributing field plot data, the central data required for describing and
accepting vegetation communities. Veg. Bank (GIVD ID NA-US-002) is the
vegetation plot database of the Panel on Vegetation Classification of the Ecological
Society of America. Veg. Bank is a stand-alone, Internet accessible, vegetation plot
archive designed to permit users to simply submit, search, opinion, and note, cite, and
download various types of vegetation data. The archive also contains inserted
databases that comprise classifications of vegetation and individual organisms,
designed and applied to pathway the many-to-many relationship between names and
plant or community concepts, as well as other party perspectives on conventional
taxa. The Veg. Bank data model is also applied in Veg. Branch, a desktop tool for
data organization and for uploading to and downloading from Veg. Bank.
Rao et al. (2013) reported that total number of plant species observed was 105 plant
species of 41 families. The maximum number of plant species observed belongs to
Fabacea family. According to the IVI values observed Tephrosea purpurea in herbs,
Lantana camara in shrubs & climbers, and Anacardium occidentale in trees showing
the maximum IVI value and these are considered as important dominants and

24
Acalypha alnifolia in herbs, Atylosia scaraeboides, Waltheria indica in shrubs and
climbers and Sapindus emarginatus in tree species are measured as rare species to the
study area, because these species having the least IVI values. The results in the chief
nutrients N, P, K levels are discouraging though the presences of these nutrients are
relatively very low in the corresponding coastal area. Aristida adscensionis and
Cynodon doctylon are the effective, indigenous and suggested grasses to check the
erosion in the study area.
Scheiter et al. (2013) reported the dynamic global vegetation models (DGVMs) are
dominant tools to project past, current and future vegetation designs and linked
biogeochemical cycles. However, most models are incomplete by how they define
vegetation and by their simplistic representation of race. We discuss how ideas from
community assembly theory and coexistence theory can help to advance vegetation
models. We further present a trait- and individual-based vegetation model (aDGVM2)
that permits individual plants to assume a unique combination of trait values. These
traits define how individual plants grow and compete. A genetic optimization
algorithm is used to simulate trait inheritance and reproductive isolation between
individuals. These model properties allow the assembly of plant communities that are
modified to a site’s biotic and abiotic conditions. The aDGVM2 simulates how
environmental settings influence the trait spectra of plant communities; that fire
selects for traits that improve fire defense and reduces trait diversity; and the
emergence of life-history policies that are allusive of colonization–competition trade-
offs. The aDGVM2 deals with functional diversity and struggle fundamentally
differently from current DGVMs. This approach may yield novel visions as to how
vegetation may respond to climate variation and we believe it could foster
collaborations between functional plant biologists and vegetation modelers
Coskun Saglam (2013) reported the phytosociological properties of the forest, shrub,
and steppe vegetation of Kizildag (Isparta province) were explored in 2010 and 2011.
The vegetation of the area was analyzed using a 3-dimensional ordination technique
based on the Braun-Blanquet method. As a result, 5 new plant associations were
determined as belonging to forest, shrub, and steppe vegetation and categorized
syntaxonomically. The associations and their higher units are as follows. Quercetea-
Pubescentis Doing-Kraft ex Scamoni & Passarage 1959. Querco-Cedretalia libani
Barbéro, Loisel & Quézel 1974. Meliloto bicoloris-Quercetum cocciferae ass. nova.

25
Hyperico heterophylli-Cistetum laurifolii ass. nova. Atraphaxo billardieri-
Amygdaletum orientalii ass. nova. Abieto-Cedrion Akman, Barbéro & Quézel 1977.
Veronico isauricae-Cedretum libani ass. nova. Astragalo-Brometea Quézel 1973 em.
Parolly. Onobrychido armenaeThymetalia leucostomi Akman, Ketenoğlu, Quézel &
Demirörs 1984. Phlomido armeniacae-Astragalion microcephali Ketenoğlu, Akman,
Quézel & Demirörs 1984. Centauro detonsae-Thymetum sipylei ass. nova
Gul et al. (2014) reported that this present research work was conceded out in
September and October 2013 to examine the vegetation of Latamber and its outskirts
of District Karak by quadrate method. The research area was distributed mainly into
3-stands on the basis morphology and edaphic factors of the research area. i.e Plain
area, Floody sandy area and Mountain area. The plain area was examined by quadrate
method and taken 40-quadrates and the leading community was Cynodon-Nerium-
Community on the basis of IVI. In the floody sandy area total 30-quadrates were
thrown randomly and the dominant community was Eucalyptus-Saccharum-
Community on the basis of IVI. The vegetation of mountain area was studied also by
using total 30-quadrates which show the dominant community of Cymbopogon-
Nerium-Community on the basis of IVI. After completing the whole vegetation
analysis of the area; it was concluded that the community Cynodon-Nerium found to
be the most dominant in plain area with 28.83 % Cynodon dactylon and 25.55 %
Nerium indicum, while in the foothill area the dominant community was
Cymbopogon nerium with this percentage, Cymbopogon distense 30.63 % and
Nerium indicum 27.37 %. Similarly, the floody sandy area was dominated by
Eucalyptus-Saccharumcommunity with 30.63 % eucalyptus species and 29 %
Saccharum spontanum.
Nutraceutical
Enujiugha (2003) described that the proximate chemical composition of freshly
harvested mature conophor nut (Tetratcarpidium conophorum) had 29.09% protein,
6.34% fiber, 48.9% oil, 3.09% ash and 12.58% carbohydrates on a dry weight base.
The elemental applications in the uncooked conophor nut had high phosphorus
content (465.95 mg/100g) while cadmium and nickel were very low (0.01 and 0.38
mg/100g, respectively).

26
Coskun et al. (2004) expected the metabolized energy applications of the total plant,
leaves and stems to be 12.2, 11.9 and 12.7 kg-1 dry matter (DM), separately. This
compared satisfactorily with high value forages commonly used in ruminant
nurturing. The results displayed that Prangos ferulacea may be observed as high
energy forage, but further research is required on its consumption characteristics and
the levels of animal performance.
Starks et al. (2004) reported that possibility of estimating concentrations of nitrogen
(N), neutral detergent fiber (NDF) and acid detergent fiber (ADF) of live, upright
forages. It was exposed that estimates of N, NDF, and ADF from the radiometer
clarified from 63 to 76 percent of the variability expressed in the laboratory data, and
were equivalent to those assessments derived from the NIRS. Such a distant sensing
attitude would allow real-time valuation of forage quality, would permit mapping of
the nutritional landscape could be used as a tool to improved manage pastures and
supplements, and would promotion in making harvesting assessments.
Cherney & Cherney (2005) stated that species selection, fertilization and yield
management had a major impact on forage K concentration and low K was critical for
non-lactating dairy cow feed. Yield of dry matter was 5.6% higher under split
applications of K fertilizer associated with the K fertilizer treatments. Forage quality
was not really impacted by K fertilization although the K concentration of forage
improved by 12% due to K fertilization.
Smith et al. (2005) inspected that indehiscent fruits of 6-tree species, common in
Matabeleland were in-vitro trials. Acacia nilotica ssp. nilotica limited more total
phenolics than D. cinerea, but less nitrogen (N) and fiber (ADF and NDF. However,
when nourished a supplement of D. cinerea untreated or pickled with PEG or NaOH,
digestibility and N-retention were highest and similar to a commercial goat meal, with
the natural fruit.
Starks et al. (2006) reported that seasonal deviation in herbage mass, neutral-
detergent fiber (NDF), acid-detergent fiber (ADF) and simple protein (CP)
concentrations of herbage and canopy reflectance of grasslands of genotypes Cynodon
dactylon and to examine the associations between these descriptors of nutritive value
of herbage.
27
Choudhury and Garg (2007) worked on mineral composition of 15-wild herbs. Some
herbs were supplemented in Ca, Co, Cu, Mg, P, Fe, Mn and Zn. often used as
antibacterial, antipyretic and heart tonic. These were also used as feedstuff fodder. An
effort was made to relate elemental fillings with the therapeutic importance of many
herbs.
Phillips et al. (2007) described that performance of calves grazing warm-season grass
pastures was typically reduced during the previous half of the summer as associated to
the first half, because as the plant established the concentration of protein in the plants
decreases under the dietary nutrient requisite needed to keep animal growth. If
supplemental protein to calves during the last half of the summer grazing season can
increase animal performance, but knowing when to begin supplementation is difficult.
Kiyani et al. (2007) reported that alkaloids, saponins, tannins and quantification of
total phenolic insides in plants of Hazarganji Chiltan National Park Quetta. Caragana
ambigua, Clematis graveolens, Juniperus excelsa and Pistacia khinjak confined all 3-
secondary metabolites while these 3-secondary metabolites in Chrysopogon aucheri,
Ferula oopoda, Fraxinus xanthoxyloides, Pennisetum orientale, Saccharum griffithii
and Verbascum erianthum were absent
Sultan et al. (2007) recognized that the mean in-vitro dry matter digestibility
(IVDMD) and metabolizable energy (ME) of marginal land grasses at early blossom
stage were 58.4±2.05% and 7.74±0.29 MJ/kg DM, correspondingly, whereas, mean
IVDMD and ME at advanced stage were 43.3±1.89% and 5.64±0.25 MJ/kg DM,
separately. The chemical and structural composition, IVDMD, RP and PIR values
designate that marginal land grasses be nourished to livestock with some
supplementation for different levels of production and forms of livestock.
Khan et al. (2007) studied the levels of Ca, Na, Cu, and Zn in forage plants Punjab,
Pakistan. They initiate that minerals were considerably improved, generally with plant
development from summer to winter. Grazing ruminants in the grasses might possibly
be lacking in most minerals and these grazing pastures are not providing satisfactory
levels of the minerals to the livestock grazing therein. Supplementation was
commonly higher in the foliage of naturally growing.

28
Chiesa et al. (2008) stated that organic matter, neutral detergent fiber and nitrogen
consumption, as well as rumen ammonia-N concentration, reduced linearly with age
of regrowth. Acid-detergent fiber and indigestible consumptions were similar for all
treatments. Apparent digestibility of organic matter NDF and N, as well as true
digestibility of OM, microbial protein production in the rumen, N retention, pH of
rumen fluid and sugars, amino acids and peptide concentrations in rumen fluid were
alike for all treatments.
Zhao et al. (2008) described that fodder nitrogen (N) and non-structural carbohydrate
(NSC) concentrations were important indicators of feed quality, and knowledge of N
and NSC difference among grass germplasm is one element to consider in increasing
effective fodder and livestock management program. The applications of N, neutral
detergent fiber (NDF), acid detergent fiber (ADF), glucose, fructose, sucrose,
fructans, and starch in 13 perennial cool-season grass.
Rahim et al. (2008) examined the nutritive value of 12 marginal land grasses of
Himalayan Pakistan. The mean in vitro dry substance digestibility (IVDMD) and
metabolizable energy (ME) of marginal land grasses at early blossom stage were
58.4±2.05% and 7.74±0.29 MJ/kg DM, respectively, whereas, at developed stage
were 43.3±1.89% and 5.64±0.25 MJ/kg DM, respectively. It was recommended that
the macro and micro mineral arrangement, IVDMD, RP and PIR values of marginal
land grasses are suitable for nursing to livestock with some supplementation for
dissimilar levels of production and classes of livestock.
Cheema et al. (2010) stated that dry matter (TDM), crop growing rate (CGR), leaf
area duration (LAD), seed yield; oil yield and protein content were meaningfully
affected by dissimilar nitrogen tariffs. The highest N level (120 kg ha-1) shaped
maximum values for all these traits as equated to minimum in control during both
years of study. Time of nitrogen application did not meaningfully affect TDM, CGR,
protein and oil contents however, split presentation of nitrogen (½ at sowing + ½ at
branching or flowering) fashioned suggestively higher seed and oil yield than full
nitrogen at sowing or its split application as ½ at branching + ½ at flowering.
Pandey et al. (2011) reported that nutritional therapy and phyto-therapy have
appeared as new concepts of health relief in recent years. Strong references for
ingesting of nutraceuticals from plant origin have become increasingly popular to

29
recover health, and to check and treat diseases. Nutraceuticals are "naturally derived
bioactive complexes that originate in foods, dietary supplements and herbal products,
and have health encouraging, disease avoiding and medicinal properties." Plant
consequent Nutraceuticals/functional foods have established considerable attention
because of their supposed safety and potential nutritional and therapeutic properties.
Some popular phyto-nutraceuticals contain glucosamine from ginseng, Omega-3 fatty
acids from linseed, Epigallocatechin gallate from green tea, lycopene form tomato etc.
Majority of the nutraceuticals are requested to own multiple therapeutic benefits
though substantial suggestion is lacking for the benefits as well as undesirable effects.
With these trends, development of the dietary nourishing values of fruits, vegetables
and other crops or improvement of the bioactive components in folk herbals have
become the targets of flourishing plant biotechnology industry. The present analysis
has been devoted towards better understanding of the phyto-nutraceuticals from
different medicinal plants based on their disease specific suggestions.
Ranfa et al. (2013) reported the importance of wild plants for their worth in human
nutrition. Data on the practice of 50 species were collected through informed consent
semi-structured interviews with local informants. They were consumed raw in salads
(43%), boiled (35%), as ravioli filling (10%), cooked without or with eggs (8%) and
in vegetable soup (4%). Moreover, the nutraceutical analysis centered on four of the
generally used wild edible plants determined how these species contain many of the
so-called slight nutrients, such as antioxidising vitamins and polyphenols, which were
maximum in Sanguisorba minor L.
Kaur et al. (2015) reported that metabolic syndrome has developed a worldwide
health problem and it touches a wide variety of population. It is a situation that
includes a cluster of complaints such as obesity, diabetes, hypertension,
hyperlipidemia etc. mainly due to deprived nutrition. In order to agreement with this
syndrome, researchers have made various interferences in the treatment methods as
well in terms of nutrition. The term nutraceutical comprised nutritional and
pharmaceutical aspects that worked for the prevention and treatment of diseases and
afford health and medicinal benefits. Researchers have acknowledged presence of a
wide range of phytoconstituents present in several traditional plants and spices.

30
Certain plants such as Lagenaria siceraria, Trigonella foenum graecum, Curcuma
longa, Vigna mungo etc. shows admirable properties in curing hypertension, obesity,
diabetes and hypercholestromia. The current article reviews the rank of various
nutraceuticals that we devour in our daily food and their involvement in treating the
metabolic syndrome.

31
CHAPTER – 3
MATERIALS AND METHODS
3.1 Ethnobotanical Study
i. Field Equipment
Before starting the ethno botanical research work common data about the area was
collected. All the essential equipment like Altitude meter, compass, note book, maps
pencils, markers plant presser, scale blotting papers, tags polythene bags, knife, cutter,
digger, rope, digital camera, questionnaires, measuring tape, leather gloves, water
bottle, food and iron bar were carried to the site.
ii. Ethnobotanical Data Collection
Prior to undertaking laboratory study of wild edible fruits and vegetables samples,
ethno botanical information was obtained through semi structured interviews,
questionnaires, market survey and motivation group conversation with key
respondents having complete customary knowledge of useful remote edible plants
(Menendez- Baceta et al., 2014; Anely Nedelcheva, 2013; Stevens 2013; Kalle and
Soukand 2012; Luczaj et al., 2012; Martin, 1995; Cotton, 1996). Unceremonious
dialogue and village walks with key information (190) containing farmers, herdsmen,
shepherds, housewives, school boys and children were held to improve understanding
and collected information about diverse species of wild food plants available around
the village. Adult female members from the household responsible for food
preparation, were considered as the respondents with additional information from
children and adults which, contribution in collection and handling of wild leafy
vegetables and fruits (Misra et al., 2008). The age of accused ranged from 10 to 70
years. The answers were noted precisely (Mengistu and Hager, 2008). Data were also
collected on informant’s features such as age, gender, educational status and number
of children. This was done to narrate their social status with their species
competencies. Reflections on species inclinations of people were measured both
through separate interviews of informants and in groups, of which the latter trained
pair-wise ranking (Maundu, 1995). Complete information about the local name of a
plant, part used, flowering/ fruiting periods, season/ quantity of collection, cooking
recipe (for culinary vegetables), medicinal uses (method of preparation, mode of
application, diseases cured), other ethno botanical uses as (food, fuel, decorative

32
purposes, fencing, construction etc.) were continuously recorded. In most of the cases,
the data collected was also cross checked at different villages from native names or
showing field photographs to the informants to confirm the reality of the claims.
vi. Plant Sampling and Photography
A total 193 plant species of 54 families were recorded (Table 2). The wild medicinal
plants were composed during the survey in different seasons and temporarily stored
and categorized polythene bags to prevent the loss of moisture and prior to being
brought to the laboratory (Plates C and D). About 5 to 10 samples of each plant were
collected during the study. The photography of the plant was completed by using a
Sony Digital Camera (W-50).
v. Plants Preservation
The plant specimen were properly pressed, dried and attached on herbarium sheets
(41 × 29 cm). Name of genus, species, authority citation, family, area, name of
collector and identifier were documented on label. The voucher specimens were
placed in the Herbarium (PUP), Department of Botany, and University of Peshawar.
vi. Taxonomic Identification
Taxonomic identification of the collected plant samples was carried out with the help
of Flora of Pakistan (Ali & Qaiser, 1995-2009; Kukkonen, 2001; Chen et al., 2006;
Barkworth et al., 2003, 2007).) Identified voucher specimens were deposited in
Herbarium of department of Botany, university of Peshawar.
vii. Morphological Description
For morphological account with both vegetative and reproductive structures, 3 to 5
specimens per species were studied under the binocular microscope (Kyowa SZE,
0.75x - 3.4X). The morphological characters comprised of both vegetative and
reproductive parts that were confirmed by using Flora of Pakistan (Ali and Qaiser,
1995-2009).
3.2 Floristic Structure and Ecological Characteristics
Floristic survey was carried out throughout district Bannu during 2013 - 2015 in
different seasons. Plants from different localities were collected, preserved and
identified with the help of Flora of Pakistan (Nasir & Ali, 1971-2007; Ali & Qaisar,
33
1995-2009; Kukkonen, 2001; Chen et al., 2006; Barkworth et al., 2003, 2007). The
documentation was later on confirmed at Herbarium (PUP), Department of Botany,
University of Peshawar, Herbarium, National Agriculture Research Council,
Islamabad, and Herbarium, Pakistan Museum of Natural History, Islamabad and
Herbarium, Department of Botany, University of Karachi.
A whole floristic list was alphabetically compiled. The voucher specimens were
numbered and placed in Herbarium (PUP), Department of Botany, and University of
Peshawar.
3.2.1 Biological Spectra
Plants were classified into several Life-form classes following Raunkiaer (1936) and
Hussain (1989) as follows:
a. Therophytes (Th.) these are the annual Plants, bearing seeds and complete their
life cycle in one season and over winter the disapproving seasons by means of
seeds and spores.
b. Geophytes (G.) These are plants, in which the perennating buds are located
underneath the surface of soil and contain plants with deep rhizomes, bulbs, corms
and tubers. These may also include hydrophytes which may be submerged, partly
submerged and free-floating.
c. Hemicryptophytes (H.) Herbaceous perennials plants are categorized under
hemicryptophytes. The aerial portions of the plants die at the end of budding
seasons leaving a parenting bud at or just beneath the ground surface may be
covered by litter
d. Chamaephytes (Ch) In which, perennating buds are situated near to the ground
surface under the height of 25cm.
e. Phanerophytes
i. Nanophanerophytes (NP) Their perennating sprouts are borne, on aerial
shoots from 0.25 m (25 cm) up to 2 m (0.8 ft. to 6 ft.) above the ground surface.
ii. Microphanerophytes (MicP.) The shrubby plant species with perennating
shoots situated above 2 to 7.5 m (6 to 25 ft.) height.

34
iii. Mesophanerophytes (MesP.) These are small trees with their perennating
buds are found from 7.5 to 30 m (25 to 100 ft.) height.
iv. Megaphanerophytes (MgP.) these are tree species whose perennating buds
are located above the height of 30 m (100 ft).
3.2.2 Raunkiaerian and quantitative spectra were calculated as fallows.
= No. of sp. falling in a particular life form class
𝑇𝑜𝑡𝑎𝑙 𝑛𝑢𝑚𝑏𝑒𝑟 𝑜𝑓 𝑎𝑙𝑙 𝑡ℎ𝑒 𝑠𝑝𝑒𝑐𝑖𝑒𝑠 × 100
Raunkiarean Life form spectrum, Quantitative life form spectra were calculated on the
basis of importance values of each species encountered in sampling through quadrats
by following Cain and Castro (1956) and Qadir and Shetvy (1986).
Leaf size spectra of plants were classified into various Raunkiaerian groups
(Raunkiaer, 1934) and quantitative leaf sizes as follows:
Leaf size class Leaf area up to mm2
Leptophyll (L.) 25 mm2
Nanophyll (N.) 9 × 25 mm2
Microphyll (Mic.) 92 × 25 mm2
Mesophyll (Mes.) 93 ×25 mm2
Macrophyll (Mac.) 94 × 25 mm2
Megaphyll (Meg.) Larger than macrophyll.
Raunkiaerian spectrum was calculated as follows
Leaf size spectrum = 𝑁𝑢𝑚𝑏𝑒𝑟 𝑜𝑓 𝑠𝑝𝑒𝑐𝑖𝑒𝑠 𝑓𝑎𝑙𝑙𝑖𝑛𝑔 𝑖𝑛 𝑎 𝑝𝑎𝑟𝑡𝑖𝑐𝑢𝑙𝑎𝑟 𝑙𝑒𝑎𝑓−𝑠𝑖𝑧𝑒 𝑐𝑙𝑎𝑠𝑠
𝑇𝑜𝑡𝑎𝑙 𝑛𝑢𝑚𝑏𝑒𝑟 𝑜𝑓 𝑎𝑙𝑙 𝑠𝑝𝑒𝑐𝑖𝑒𝑠 𝑓𝑜𝑟 𝑡ℎ𝑎𝑡 𝑐𝑜𝑚𝑚𝑢𝑛𝑖𝑡𝑦 × 100
Quantitative leaf size spectra were calculated using importance value indices of plant
species following Cain & Castro, (1956).

35
3.2.3 Phytosociology/Vegetation structure
Phytosociological studies were carried out in three representative designated sites.
These sites were selected on the basis of soil mineral and elemental composition,
species composition, habitats, and physiognomic contrast. Vegetation was studied by
using 10 x 10 m quadrates for trees, 5 x 5 m quadrats for shrubs and 1x1 m quadrats
for herbs in respectively each sites. Density, cover and frequency of each species were
measured and values were changed to relative values. The plant communities were
established on the basis of highest importance values.
i. Density
Density is the average number of individuals of a species in unit / area
Density = 𝑁𝑜. 𝑜𝑓 𝑖𝑛𝑑𝑖𝑣𝑖𝑑𝑢𝑎𝑙𝑠 𝑜𝑓 𝑎 𝑠𝑝𝑒𝑐𝑖𝑒𝑠
𝐴𝑟𝑒𝑎 𝑠𝑎𝑚𝑝𝑙𝑒𝑑(𝑇𝑜𝑡𝑎𝑙 𝑛𝑜.𝑜𝑓 𝑄𝑢𝑎𝑑𝑟𝑎𝑡𝑠 𝑠𝑎𝑚𝑝𝑙𝑒)
Relative density = 𝐷𝑒𝑛𝑠𝑖𝑡𝑦 𝑜𝑓 𝑎 𝑝𝑎𝑟𝑡𝑖𝑐𝑢𝑙𝑎𝑟 𝑠𝑝𝑒𝑐𝑖𝑒𝑠
𝑇𝑜𝑡𝑎𝑙 𝑑𝑒𝑛𝑠𝑖𝑡𝑖𝑒𝑠 𝑓𝑜𝑟 𝑎𝑙𝑙 𝑠𝑝𝑒𝑐𝑖𝑒𝑠 × 100
Table 2. Ten density classes were established as follows; and the mid points were
used for calculations:
Class Range (No. of individual) Mid-point Value
1 Up to 10 5
2 11-20 15
3 21-30 25
4 31-40 35
5 41-50 45
6 51-60 55
7 61-70 65
8 71-80 75
9 81-90 85
10 91-100 95

36
ii. Herbage cover
Cover is the vertical projection of foliage shoots/crown of a species to the ground
surface expressed as fraction or percentage of a surface area. For low shrubs and
herbaceous vegetation the cover may be determined visually be estimating how much
percent of an area of the quadrat is covered or shaded by all the individuals or a
particular species as viewed from above.
Coverage = 𝑇𝑜𝑡𝑎𝑙 𝑐𝑜𝑣𝑒𝑟𝑎𝑔𝑒 𝑜𝑓 𝑎 𝑠𝑝𝑒𝑐𝑖𝑒𝑠
𝑆𝑎𝑚𝑝𝑙𝑒𝑑 𝑎𝑟𝑒𝑎
Relative coverage = 𝐶𝑜𝑣𝑒𝑟𝑎𝑔𝑒 𝑜𝑓 𝑎 𝑝𝑎𝑟𝑡𝑖𝑐𝑢𝑙𝑎𝑟 𝑠𝑝𝑒𝑐𝑖𝑒𝑠
𝑇𝑜𝑡𝑎𝑙 𝑐𝑜𝑣𝑒𝑟𝑎𝑔𝑒 𝑓𝑜𝑟 𝑎𝑙𝑙 𝑠𝑝𝑒𝑐𝑖𝑒𝑠 × 100
Table 3. ten cover classes were established for estimating plant cover. Mid-point
values were used for calculation.
Class Range (No. of individual) Mid-point Value
1 Up to 10 5
2 11-20 15
3 21-30 25
4 31-40 35
5 41-50 45
6 51-60 55
7 61-70 65
8 71-80 75
9 81-90 85
10 91-100 95
iii. Frequency
It is the percentage of quadrats in which species are recorded. It shows how
a species is distributed within the stand. It is determined by just recording the
existence of a species within the sampling unit regardless of its density and coverage.

37
Frequency = 𝑁𝑜. 𝑜𝑓 𝑞𝑢𝑎𝑑𝑟𝑎𝑡𝑠 𝑖𝑛 𝑤ℎ𝑖𝑐ℎ 𝑎 𝑠𝑝𝑒𝑐𝑖𝑒𝑠 𝑜𝑐𝑐𝑢𝑟
𝑇𝑜𝑡𝑎𝑙 𝑛𝑢𝑚𝑏𝑒𝑟 𝑜𝑓 𝑞𝑢𝑎𝑑𝑟𝑎𝑡𝑠 𝑠𝑎𝑚𝑝𝑙𝑒𝑑 × 100
Relative frequency = 𝐹𝑟𝑒𝑞𝑢𝑒𝑛𝑐𝑦 𝑣𝑎𝑙𝑢𝑒 𝑜𝑓 𝑎 𝑝𝑎𝑟𝑡𝑖𝑐𝑢𝑙𝑎𝑟 𝑠𝑝𝑒𝑐𝑖𝑒𝑠
𝑇𝑜𝑡𝑎𝑙 𝑓𝑟𝑒𝑞𝑢𝑒𝑛𝑐𝑦 𝑣𝑎𝑙𝑢𝑒 𝑓𝑜𝑟 𝑎𝑙𝑙 𝑠𝑝𝑒𝑐𝑖𝑒𝑠 𝑖𝑛 𝑎 𝑠𝑡𝑎𝑛𝑑 × 100
iv. Importance value
The relative values of each parameter for species were added to become the
importance values. The community was named after the three foremost species having
the highest importance values as follows.
𝐼𝑉 = 𝑅𝐷 + 𝑅𝐶 + 𝑅𝐹
v. Family importance value
Importance value of each species in a particular families was added together to give
rise family importance value for all the quantitatively documented families.
vi. Determination of similarity index
Similarity index was determined by using Sorensen’s index (Sorensen, 1948).
Which are used quantitative value relatively than simply computing presence or
absence of species. The similarities among the stands were compared.
ISMO = 2𝑊
𝐴+𝐵 × 100
Where
W = Sum of lowermost quantitative value of spp. common to both the
communities/stand
A = Sum of quantitative value of all spp. in stand/community A,
B = Sum of quantitative value of all spp.in stand/community B
Index of dissimilarity was calculated as, ID = 100 - Index of Similarity
vii. Species diversity
Species diversity was calculated by Simpson’s index of diversity (Simpson, 1949).
D = 𝑁(𝑁−1)
∑ 𝑛(𝑛−1)

38
Where
D = Diversity index,
N = Total number of individuals of all species,
n = Number of individuals of a species.
vii. Species richness
Species richness was determined by using following Menhinick (1964).
D= 𝑆/√𝑁
Where
S = Total number of species in the stand
N = Total number of individuals in the stand and
d = species richness.
3.3 Multiple correlations
Correlation is a bivariate study that measures the strengths of relationship between 2-
variables. In statistics, the value of the correlation coefficient varies among +1 and -1.
When the value of correlation coefficient lies about ±1, then it said to be perfect
degree of association between the two variables. As the correlation coefficient value
goes to 0, the association between the two variables will be weaker. Frequently in
statistics, we measure three types of correlation: Person correlation, Kendall rank
correlation and Sperarman correlation.
Multiple correlation of different soil variables in relation to the total Density,
Frequency, Cover and importance values in different season were studied. For this
purpose, SAM v 4.0 software was used.
SAM (Spatial Analysis in Macro-ecology) is a program designed as a package of
tackles for spatial statistical analysis; generally for applications in surface pattern
spatial Analysis. SAM is frequently used in the fields of Macro-ecology and Bio-
geography, but also in Conservation-iology, Community and Ecology, Geography,
Geology, Demography, Econometrics, and Epidemiology.

39
SAM is used worldwide by thousands of scientists, in more than 50 countries, as their
primary instrument for statistical analysis. In detail, a paper published in Global
Ecology and Biogeography to announce SAM for the scientific community has a
citation rate of ~50 new citations per year. It shows how much SAM is accepted and
used as a valuable investigative tool in science.
3.4 Edaphology
Soil samples were collected in March and August, 2012-2014, from 0-6 cm depth at 3
multiple of 3 different sites and analyzed for elemental composition and physico-
chemical characteristics (Bao, 1999; Anon, 1978 and Collison, 1977).
i. Soil texture
A soil texture was determined by Hydrometer method (Bouyoucos, 1936) and textural
classes were determined with the help of textural triangle (Brady, 1990).
ii. Organic matter
Soil organic matter was determined by oxidation with potassium dichromate in
sulphuric acid medium under standard wet burning method followed by (Rayan et al.,
1997).
iii. Nitrogen
Total Nitrogen was determined by the Kjeldahl method of (Bremner &
Mulvaney, 1982).
iv. Phosphorus
Phosphorus was determined after Olsen & Sommers (1982).
v. Potassium
Potassium was determined by flame emission spectroscopy (Rhoades, 1982).
vi. pH
Soil pH was measured in 1:5 soil water suspensions with a pH meter (Jackson, 1962).
vii. Electrical conductivity
Electrical conductivity of the soil was determined in 1: 5 soil water interruptions with
EC meter.

40
3.5 Palatability of vegetation
The degree of palatability of plant species was documented by observing the grazing
livestock in the field. Cattle, goats and sheep were usually observed to determine their
preferences. Information was collected through survey in different season and also
from local people of the area. Plants were categorized into palatable and non-palatable
plants species in the area following Hussain & Durani (2009); Hardison et al. (1954);
Heady, (1964) and Jonstone-W & Kennedy, (1944).
Palatable plants were classified by animal preference; parts used and season of
availability. Palatable plant species were classified as follows following Hussain &
Durani (2009).
a. Non palatable.
b. Highly Palatable
c. Mostly Palatable.
d. Less Palatable.
e. Rarely Palatable.
3.6 Elemental analysis
Elemental analysis of powder form the selected plants were carried out with atomic
absorption spectrophotometery for the following elements.
Nitrogen (N), Phosphorus (Ph), Potassium (K), Magnesium (Mg), Calcium (Ca),
Sulphur (S), Manganese (Mn), Silicon (Si), Iron (Fe), Copper (Cu), Zinc (Zn), Cobalt
(Co), Lead (Pb), Nickel (Ni), Chromium (Cr) and Cadmium (Cd).
i. Reagents and equipment
Double distilled water, Nitric acid (HNO3), Sulphuric acid (H2 SO4), Hydrogen per
oxide (H2O2), Hydrogen Fluoride (HF), per chloric Acid (HClO4) and Hydrochloric
acid (HCl). The total reagents used were from Merk (Darmstadt, Germany). Pb, Cd,
Co and Mn sigma prepared and Cu, Zn and Fe Aldrich made. Glassware’s and plastic
apparatus were thoroughly washed away with water, followed by cleaning with
distilled water prior to use.

41
ii. Sample preparation
Samples were prepared by wet digestion process (Hseu, 2004). For this purpose 01g
of the particular powder drug was occupied in a conical flask and then added 10 ml of
concentrated HNO3 (67%) and preserved overnight (24 h) at room temperature,
monitored by the adding of 4 ml of HClO4 (67%). After 30 minutes, the substances of
each flask were heated on hot plate to vaporize, until a clear solution of about 1 ml
was left. After cooling that, solution was prepared to a final volume of 100 ml by
adding of double distilled water and sifted through what-man # 42 filter-papers. The
filtrate worked as stock solution for all sample. The samples were stored in airtight
bottles for elemental analysis through atomic absorption spectrophotometer (Eslami et
al., 2007). All samples were then examined by flame atomic absorption
spectrophotometer (Polarized Zeeman Hitachi 2000) and flame photometer (Jenway
PFP7, UK) in triplicate. Calibration standard of each metal was arranged by suitable
of stock solutions (Saeed et al., 2010).
iii. Procedure
The corresponding cathode lamp for each element was rotated on and permitted to
warm up for 10 minutes after regulating the instrument according to the situations
given in the table below. After heating, cathode lamp the air acetylene flame was
ignited. The instrument was calibrated and standardized with working standards
values of 2.5, 5, and 10 ppm for particular element. The element standard solution
used for calibration were set by diluting a stock solution of Pb, Co, Mn, Cr, K
(sigma), Fe, Na, Cu (Aldrich), Zn and Ni (Parkin Elmer) working standard was sought
into the flame and the concentration in pmm of each element was intended by
comparing with the standard curve of individual metal (Tuzen, 2003; Isildak et al.,
2004; Soylak et al., 2005; Svoboda et al., 2006 and Elekes et al., 2010).

42
Table 4. Optimal analytical conditions for the elemental analysis using air-acetylene
flame on atomic absorption spectrophotometer.
Elements Wavelength
(nm)
HC Lamp
Current
(mA)
Slit width
(nm)
Fuel-gas
flow rate
(L/min)
Detection
limit (µg/L)
Ca 422.7 6.0 0.5 2.0 4
Cd 228.8 4.0 0.3 1.8 4
Co 240.7 6.0 0.2 2.2 5
Cr 357.9 5.0 0.5 2.6 6
Cu 324.8 3.0 0.5 1.6 4
Fe 248.3 8.0 0.2 2.0 6
K 766.5 5.0 0.5 1.9 4
Mg 285.2 4.0 0.5 1.6 1
Mn 279.5 5.0 0.4 1.9 3
Pb 217.0 7.0 0.3 1.8 10
Zn 213.9 4.0 0.5 2.0 2
3.7 Nutritional investigation
Plants offer nutritional requirements as they comprise protein, carbohydrates, fats and
other nutrients, mandatory for growth and development of human (Aruoma, 2003).
The subsequent parameters were estimated in the proposed plants.
Proximate analysis
The plant samples were examined in tri-plicate for their moisture, ash, dry matters,
crude proteins, crude fats, crude fibers, carbohydrates and gross energy value using
standard methods as outlined by Association of Official Analytical Chemists (A. O.
A. C, 1990, 1999 and 2000) and Association of American Oil Chemists (A. O.C. S,
2005).

43
i. Determination of the moisture
Equipment and glassware
Electric Oven, Petri dishes, desiccators and electric balance.
Procedure
About 2 gram of respective plant material was taken in a known weight Petri-dish
(W1). The petri-dishes were moderately enclosed with lid, kept in oven at temperature
of 1050C for 4-6 hours, till constant weight was achieved and was then transferred and
down for 30 minutes; after that the Petri-dishes were weighted again (W2). Percentage
moisture content were calculated by the following formula (A.O.A.C, 2000)
% Moisture = X
Wt of Sample × 100
Where
X = Weight of the sample (after heating) = W2- W1
W2 = Weight of the empty Petri dish + sample (after heating)
W1 = Weight of the empty Petri dish.
ii. Determination of ash
Equipment’s and glassware
Muffle furnace, silica-dish, electric-balance, desiccators, and benzene burner. Ash
was determined by heating at 5500C in muffle furnace. The method is given below.
Procedure
Kept flat bottomed silica dish in a burner lame just for 1 minute, transfer it to a
desiccators then cool down, and weight it (W). Weight out suitable quantity of the
plants materials into a silica dish (W) and heat it gradually on the Bunsen burner and
charred mass is in an appropriate condition for transfer to a muffle furnace at 5500 C
(A. O. A. C, 2000).
Continue the heating until the carbon has been burnt away. Transfer the dishes plus
ash to desiccators, cool down, and weight it (W2).

44
Weight of the empty dish = W
Weight of the empty dish + sample = W1
Weight of the empty dish + ash = W2
Formula:
% Ash = W1−W2
Wt of the sample× 100
iii. Determination of Protein by “Macarojeldahl distillation method”
Reagents
Concentrated H2SO4, 32% NaOH, 4% Boric Acid K2SO4, CuSO4 and 0.1 N standard
HCL solution.
Mixed indicators
Prepared by mixing 0.01g of methyl red and 0.03g of bromo-cresol green in 100 ml of
alcohol.
Apparatus
Kjeladhl flask, digestion and distillation apparatus and burette etc.
Procedure
Protein (% N ×6.25) was determined by Macro Kjeldahl distillation method. The
method is given below.
Put 0.5 gram of dry ground sample in digestion flask. Digestion mixture (Copper
sulphate (5 gram), Potassium sulphate (94 gram) and ferrous sulphate (1 gram) and 25
ml con. Sulphuric acid were added to the flask and digested in digestion flask for 6
hours. The flask was then detached, cool down and the contents were then shifted to
250 ml flask. Small quantities of distilled water were added to make the volume to the
level 50 ml of the above solution. 10 ml of strong alkali was added to make it basic.
About 50 ml of 4% Boric acid solution was putted to the distillation flask along with
3-5 drops of mixed indicator. 50 ml of water and 60 ml of 32% NaOH solutions were
then added to it. Afterward distillation, it was then collected in flask for titration.
Titration was completed by noted and the percentage of protein was determined using
the following formulae (A. O. A. C., 2000).

45
(N %) = (𝑉1−𝑉2)×14.01 ×0.5×100
(𝑆𝑎𝑚𝑝𝑙𝑒 𝑖𝑛 𝑚𝑔)
V1 = titration reading of sample
V2 = titration reading of blank
14.01 = Atomic weight of Nitrogen (N)
Crude percent protein contents were calculated for all samples by multiplying the
nitrogen (N) content of the sample by 6.25.
Protein (%) = % Nitrogen × 6.25.
iv. Determination of Fats (ether extract)
Equipments, chemicals and glassware
Petroleum ether B.P (40-600C) H.T (Tecator).
Procedure
Soxhlet apparatus was used for the extraction of crude fats (Zarnowski & Suzuki,
2004). 2 gram of respective samples was packed in cellulose extraction thimble
prepared of filter-paper which was kept in extraction chamber of the apparatus. A
clean and dried pre-weight 250 ml round bottom flask was filled with petroleum ether
and connected to the extraction tube containing thimble. The Soxhlet apparatus was
run for 6-hours. The solvent from the extract in the round bottom flask was
evaporated using water bath and weighted (W2). Fats percentage was then calculated
by the following standard method (A.O.A.C., 2000).
% Fats (Ether extract) = X
Wt of Sample × 100
Where
X = Weight of the fats = W2 –W1
W1= Weight of the empty flask
W2= Weight of the empty flask + sample after evaporation of solvent.

46
v. Determination of crude fiber
Equipment’s and glassware
Crude fiber extraction apparatus (Fiber Tec System M. Tecator), Suction pump,
Muffle furnace, oven.
Reagents
Sulphuric acid – 0.255N
Sodium hydroxide – 0.313
Asbestose, petroleum ether, ethyl alcohol
Procedure
Three gram of the respective sample was dried out in the oven to constant weight.
Two gram of this material was extracted with Petroleum ether to remove crude fats.
The residue material was shifted to digestion flask along with asbestos (0.5 g). To
this, about 200 ml boiling 0.255 N, H2 SO4 was added. The flask was attached to the
condenser and boiled for 30 minutes. The contents were then filtered through lien
cloth in fluted funnel. The residue was wash to remove the acids and transferred again
to the digestion flask with boiling 0.313 N NaOH. Adding of NaOH was continued till
the volume to accurately 200 ml. the flask was then connected to the reflux condenser
and boil for 30 minutes. This hot material was then filtered through Gooch crucible
prepared with asbestose-mat. It was carefully washed with boiling water monitored by
15 ml of ethyl alcohol. The substances were then taken to a crucible and dried at
1100C in hot air oven till constant (W1). The crucible was then shifted to the muffle
furnace, ignited till white and weighted (W2) crude fiber were then calculated (A.O.
A. C., 2000).
% Crude Fiber = 𝑊2−𝑊1
𝑊𝑒𝑖𝑔ℎ𝑡 𝑜𝑓 𝑆𝑎𝑚𝑝𝑙𝑒 × 100
Where
W2 –W1 = Crude fiber

47
vi. Carbohydrates contents
Carbohydrates contents were calculated by subtracting the sum of the weight of
proteins, fats, crude fibers, ash, and moisture contents from 100 (Merril and Watt,
1973).
% Carbohydrates = 100 – (Proteins + Fats + Crude Fibers + Ash + Moisture contents)
vii. Gross energy
The gross energy of proteins, fats, fibers and carbohydrates were find out through
(A.O. A. C., 2000) method. Following formula is used to study the total gross energy
of proteins, fats, fibers and carbohydrates in a particular plant parts. We can the gross
energy individual plants species as well for each of the nutrients independently.
Formula:
Energy value (K cal/100g = (2.62 × % Proteins) + (8.37 × % fats) + (4.2 × %
Carbohydrates) + (4.6 × fibers) (Umerie et al. 2010).

48
CHAPTER – 4
RESULTS AND DISCUSSION
4.1 Floristic Study
Floristic diversity of a region is the total numbers of the species within its specific
boundaries, weather wild or cultivated, which is an image of vegetation and plant
resources. Plant resources are affected by agriculture, over grazing, deforestation,
anthropogenic interaction and natural disasters. The research area was frequently
visited and plants were collected during 2012-2014. In the present research study, the
flora of District Bannu consists of 193 plant species of 155 genera belonging to 54
families (Table 5). Out of them 145 species belong to Dicotyledons and 48 species to
Monocotyledons. Poaceae was the dominant family with 37 species followed by
Asteraceae with 17 species, Papilionaceae with 15 species, Solanaceae 9 species,
Brassicaceae 8 species, Cucurbitaceae 7 species, Amaranthaceae 6 species,
Boraginaceae 6 species, Chenopodiaceae 5 species, Euphorbiaceae 5 species,
Mimosaceae 5 species, Polygonaceae 5 species, Malvaceae 4 species, Moraceae 4
species, Zygophyllaceae 3 species, Alliaceae, Apocynaceae, Aslepiadaceae,
Caryophyllaceae, Convolvulaceae, Cyperaceae, Myrtaceae, Ranunculaceae, Rutaceae,
Typhaceae, Tamaricaeae and Verbenaceae having (2 spp.) each. While the rest of all
Anacardiaceae, Arecaceae, Aizoaceae, Capparidaceae, Cuscutaceae, Fumariaceae,
Gentianaceae, Iridaceae, Juncaceae, Linaceae, Meliaceae, Nyctaginaceae,
Orobanchaceae, Oxalidaceae, Papaveraceae, Primulaceae, Resedaceae, Rhamnaceae,
Rubiaceae, Scrophulariaceae, Tiliaceae, Violaceae and Vitaceae families are
monospecific. Our results are accordance with the work of Badshah et al. (2013;
Ihsan et al. (2011) and Malik & Malik, (2004). Flora of Pakistan (Ali & Qaisar,
1995-2009) and abroad (Antije et al., 2003; Eilu et al., 2004) also indicated similar
result.
The highest species percentage was recorded in family Poaceae (19.17%) while
lowest is 0.52% is found in monospecific families (Table 6). Poaceae was dominant
family and having large numbers of species which are consistently supported by
Parveen et al. (2008); Qureshi & Bhatti, (2008) and Hussain et al. (2009).
The habitat conditions of (Figure 2) showed that dry habitat condition was dominant
(45.07%) followed by wet (34.71%), cultivated (18.13%) and both wet and dry

49
(2.07%). Dry area have greater diversity as compared to wet moist and cultivated
habitat in the study area. Wild xerophyte were dominant in the research area. Similar
results were obtained by Musila et al. (2003) and Gimenez et al. (2004).
Seasonal variation (Figure 3) showed that spring had 156 species (41.37%), followed
by summer with 94 species (24.93%), winter 74 species (19.62%) and autumn 53
species (14.05%). The research area was clearly classified in four aspects i.e. spring,
summer, winter and autumn. Durrani et al. (2010) and Ahmad et al. (2009) have
reported that vernel and aestival aspects have higher numbers of species than any
other aspect.
The biological spectrum of the research area (Figure 4) showed that Therophytes were
dominant (60.62%) followed by Hemi-cryptophytes (9.84%), Chamaephytes (7.25%),
Geophytes (9.84%), Microphenerophytes (6.73%), Nanophenerophytes (5.69%) and
Parasites (0.52%). Life form of Raunkiaer, (1934) classification is more reliable,
which is based upon the principal of position and degree of protection to perennating
bud during the unfavorable or adverse condition. Raunkiaer, (1934) distinguished
three main phytoclimates on the basis of life form. It includes phanerophytic climate
in the tropics, therophytic in deserts and hemicryptophytic in the greater part of cold
temperate zone. Therophytic flora was dominant in research area. Biological spectra
are important in comparing geographically and habitually widely separated plant
communities and are also considered as an indicator of prevailing environmental
condition. Biological spectra changes due to biotic influences like agricultural
practices, grazing, deforestation, trampling and climatic changes Hussain, (1989).
The leaf size spectra (Figure 5) expressed that the plants with Nanophyll leaves were
dominant (48.18%) followed by Leptophyll (21.24%), Microphyll (19.17%),
Mesophyll (9.84%), and Aphyllous (1.55%). Nanophyll species and leptophyll
species are characteristic of hot desert while microphyll is the characteristic of steppes
(Khan et al., 2013; Tareen & Qadir, 1993,). Similarly, Sher & Khan (2007) reported
high percentage of leptophylls and nanophylls from Chagarzai area. Species with
small leaves are generally characteristics of dry and adverse habitats adapted to arid
region (Nasir & Sultan, 2002). Hussain & Chudhary, (2009) reported higher
percentage of microphyllous in contrast to our findings owing to moist environmental
condition in Azad Kashmir. In dry habitats soil generally have poor nutrient contents
50
due to which roots feel difficulty in absorbing soil moisture as in the present study,
encouraging leptophyllous and nanophyllous vegetation.
Plants with simple leaves (Figure 6) were dominant (76.16%) followed by compound
leaves (11.39%), dissected leaves (11.39%) and leafless type (1.03%).
During present investigation, 18 species (9.32%) were spiny and 175 species
(90.67%) were non- spiny in nature. Spinescence is also indicator of dry soil and
environment. The leaf lamina was simple in 147 species (76.16%), 2 species (1.03%)
were leafless; while in the remaining 44 species (23.79%) leaves were compound or
divided leaves. Same species have been described from other parts of Pakistan by
Badshah et al. (2013) and Durrani et al. (2010).
Although 193 species were listed from the district Bannu, however, quantitatively
they had limited distribution in the study area. A rich flora is that one which has high
species diversity and species richness. Floristic composition of flora is a qualitative
feature that alone cannot reflect the true picture of this area. Thus there is a need of
quantitative consideration of the vegetation resources. It helps in the recognition of
ecological elucidation of vegetation.

51
Table 5. Floristic list of plant Species of District Bannu.
S/No. Plant species Name Family Habitat Seasonality Life
Form
Leaf
Size Lamina Spinescence A W S Sm
01 Abelmoschus esculentus (Linn.)Moench. Malvaceae C - - - + Th Mic S -
02 Achyranthes aspera L. Amaranthaceae W + - - - Th N S Sp
03 Acacia modesta Wall. Mimosaceae D + + + + Mp L Com Sp
04 Acacia nilotica (L.) Wild.ex Delile Mimosaceae D + + + + Mp L Com Sp
05 Aerva javanica (Burm. F.) Juss. Amaranthaceae W + + + + Ch L S -
06 Albiza lebbeck (L.) Benth Mimosaceae W + + + + Mp L Com -
07 Alhagi maurorum Medic. Papilionaceae W - - - + H L Dis Sp
08 Allium sativum L. Alliaceae C - + + - G N S -
09 Allium cepa L. Alliaceae C - + + - G N S -
10 Alopecurus nepalensis Trin.Ex Steud. Poaceae W - - + - Th Mic S -
11 Aloe vera (L.) Brum Asphodelaceae D + + + + Th Mic S -
12 Anagallis arvensis L. Primulaceae W - - + - Th N S -
13 Amaranthus blitoides S. Watson Amaranthaceae W - - + - Th N S -
14 Amaranthus viridis L. Amaranthaceae W + - - - Th N S -
15 Aristida adscensionis L. Poaceae D + - - - H Mic S -
16 Aristida cyanantha Nees ex Steud. Poaceae D - - - + H Mic S -
17 Arnebia hispidissima (Lehm.) A. DC. Boraginaceae W - - + - Th L S -

52
18 Asphadelus tunifolius Caven. Asphodelaceae W - + + - G L S -
19 Astragalus scorpiurus Bunge. Papilionaceae D - - + + Ch L Com -
20 Atriplex stocksii Boiss Chenopodiaceae W - + + + Np N S -
21 Avena fatua L. Poaceae W - + - - Th N S -
22 Boerhavia procumbens Banks ex Roxb Nyctaginaceae D + - - - H N S -
23 Brassica campestris L. Brassicaceae C - + + - Th N Dis -
24 Brassica tournefortii Gouan Brassicaceae W - + + - Th N Dis -
25 Bromus pectinatus Thunb. Poaceae W - - + - Th N S -
26 Calendula officinalis L. Asteraceae W - - + - Th N S -
27 Calligonum polygonoides L. Polygonaceae W + + + + Np L S -
28 Calotropis procera (Willd.) R. Br. Asclepiadaceae D + + + + Ch Mes S -
29 Capsicum annuum L. Solanaceae C - - + + Th N S -
30 Capparis decidua (Frossk.) Edgew. Capparidaceae D + + + + Np Ap Abs Sp
31 Carduus argentatus L. Asteraceae D - - + - Th Mic S -
32 Carthamus persicus Willd. Asteraceae D - - + + Th Mic S -
33 Carthamus tinctorus L. Asteraceae D - - + + Th Mic S Sp
34 Celosia argentea L. Amaranthaceae W - - + - Th N S -
35 Cenchrus biflorus Roxb. Poaceae D - - - + H L S -
36 Cenchrus ciliaris L. Poaceae D - + - + H L S -
37 Centaurea iberica Spreng. Asteraceae D - - + - Th N Dis Sp

53
38 Centaurium pulchellum (Sw.) Druce Gentianaceae W - - + - Th N Dis -
38 Chenopodium album L. Chenopodiaceae D - + + - Th N S -
40 Chenopodium murale L. Chenopodiaceae D + - - - Th L S -
41 Chrozophora tinctoria (L.) Raf. Euphorbiaceae D - - - + Th N S -
42 Cicer arietinum L. Papilionaceae C - - + - Th L Com -
43 Cirsium arvense (L.) Scop. Asteraceae W - - + - Th Mic S -
44 Cistanche tubulosa (Schrenk.) Hook. f. Orobanchaceae D - - + - G L S -
45 Citrullus colocynthis (L.) Shred. Cucurbitaceae D + - - - Th Mic Dis -
46 Citrus limon (L.)Burm.f Rutaceae C + + + + Th N S Sp
47 Citrus reticulata Blanco Rutaceae C + + + + Th N S -
48 Convolvulus arvensis L. Convolvulaceae D - + + - Th N S -
49 Convolvulus spicatus Hallier f. Convolvulaceae D - - + + Th N S -
50 Conyza bonariensis (L.) Cronquist Asteraceae D - - + + Th Mic S -
51 Corchorus depressus (L.) Tiliaceae W + - - - Th L S -
52 Croton bonplandianus Bat. Euphorbiaceae D - - + - Th N S -
53 Cucumis sativus L. Cucurbitaceae C - - - + Th Mic S -
54 Cucurbita maxima Duch Ex. Lam. Cucurbitaceae C - - - + Th Mes S -
55 Cucurbita pepo L. Cucurbitaceae C - - - + Th Mes S -
56 Cuscuta reflexa Roxb. Cuscutaceae D + + + + P Ap Dis -
57 Cymbopogon distans Schutt. Poaceae D - - + - H N S -
58 Cyamopsis tetragonoloba (L.) Taubert Papilionaceae C - - - + Th N Com -

54
59 Cynodon dactylon (L.) Pers. Poaceae D &W + + + + H L S -
60 Cyperus difformis L. Cyperaceae W - + + - G N S -
61 Cyperus rotundus L. Cyperaceae W + + - + G N S -
62 Dalbergia sissoo Roxb. Papilionaceae W&D + + + + Mp N Com -
63 Datura alba Nees. Solanaceae D - - + - Th Mic S Sp
64 Desmostachya bipinnata (L.)Stapf. Poaceae D & W + - + - H N S -
65 Dichanthium annulatum Forssk. Poaceae D - + - - H N S -
66 Digera muricata (L.) Mart Amaranthaceae D - - + - Th N S -
67 Dinebra retroflexa (Vahl) Panzer. Poaceae D - - + - Th N S -
68 Daucus carota Linn. Apiaceae C - + + - Th L Dis -
69 Echinochloa crus-galli (L.) P. Beauv. Poaceae D - - - + Th N S -
70 Echinops echinatus L. Asteraceae D - - + + Th N Dis Sp
71 Eleusine indica (L.) Gaertn. Poaceae D - - - + Th N S -
72 Eragrostis pilosa (L.)P. Beauv. Poaceae D - - + + H N S -
73 Eragrostis minor Host. Poaceae D - - + + H N S -
74 Eruca sativa Mill. Brassicaceae C - + + - Th N Dis -
75 Eucalyptus camaldulaensis Dehnh. Myrtaceae C + + + + Mp N S -
76 Euphobia dracunculoides Lam. Euphorbiaceae D - + + - Th N S -
77 Euphorbia helioscopia L. Euphorbiaceae D - - + - Th N S -
78 Euphorbia prostrata Ait. Euphorbiaceae D - - + + Th L S -
79 Fagonia indica L. Zygophyllaceae D - - + + Th L S Sp

55
80 Farsetia jacquemontii (Hook. F. & thoms.)
Jafri
Brassicaceae D - - + + Th N S -
81 Ficus carica L. Moraceae D + + + + Np Mes S -
82 Ficus religiosa L. Moraceae C + + + + Np Mes S -
83 Filago pyramidata L. Asteraceae D - - + - Th L S -
84 Fumaria indica Hausskn. Fumariaceae D - + + - Th N Dis -
85 Galium tricorne Stokes Rubiaceae W - - + - Th N S
86 Heliotropium crispum Desf. Boraginaceae D - - + - Th Mic S -
87 Heliotropium europaeum (F. & M.) Kazmi Boraginaceae D - - + - Th Mic S -
88 Heliotropium strigosum Wild Boraginaceae D - - + - Th Mic S -
89 Hibiscus rosa-sinensis Linn. Malvaceae C + + + + Th Mic S -
90 Hordeum vulgare L. Poaceae C - - + - Th Mic S -
91 Hypecoum pendulum L. Papaveraceae D - - + + Th L Dis -
92 Hyoscyamus niger L. Solanaceae D - - + _ Th Mic S Sp
93 Juncus inflexus L. Juncaceae W - - + + G L S -
94 Ifloga spicata Forssk. Asteraceae D - - + - Th L S -
95 Iris lactea Pallas Iridaceae W - _ + _ G N S -
96 Lactuca serriola L. Asteraceae D - - + - Th Mic S -
97 Lathyrus aphaca L. Papilionaceae W - - + - Th N Com -
98 Lathyrus sativus L. Papilionaceae W - - + + Th N Com -
99 Launaea angustifolia (Desf.) Kuntze Asteraceae D - - + - Th Mes S -

56
100 Launaea procumbens Pravin Kawale Asteraceae D - - + - Th Mes S -
101 Leptochloa panicea Retz Poaceae D - + + - Th N S -
102 Linum corymbulosum Reichenb. Linaceae D - - + - Th N S -
103 Luffa aegyptica Mill. Cucurbitaceae C - - - + Th N S -
104 Lycopersicon esculentum Miller Solanaceae C - - + + Th Mic Com -
105 Magifera indica L. Anacardiaceae C + + + + Mp Mic S -
106 Malcolmia africana (L.) R.Br. Brassicaceae D - - + - Th N S -
107 Malva neglecta Wallr. Malvaceae D - + + + Th Mic S -
108 Malvastrum coromendelianum (L.) Gracke Malvaceae D - - + - H N S -
109 Mentha longifolia L. Lamiaceae W - + + - G N S -
110 Mentha spicata (L.) L. Lamiaceae W - + + - G N S -
111 Momordica charantia L. Cucurbitaceae C - - - + Th N S -
112 Medicago polymorpha L. Papilionaceae D - - + - Th N Com -
113 Melia azedarach L. Meliaceae C + + + + Ph N Com -
114 Melilotus alba Desr. Papilionaceae D - - + + Th L S -
115 Melilotus indica (L.) All. Papilionaceae D - + + - Th N S -
116 Morus alba L. Moraceae D + + + + Mp Mes S -
117 Morus nigra L. Moraceae D + + + + Mp Mes S -
118 Nerium indicum Mill. Apocynaceae D + + + + Np Mic S -
119 Neslia apiculata Fisch. Brassicaceae W - - + - Th N S -
120 Nicotiana plumbaginifolia Viv. Solanaceae W - - + - Th N S -

57
121 Nonea edgeworthii A. DC. Boraginaceae W - - + - Th L S -
122 Nonea pulla (L.) DC. Boraginaceae W - - + - Th L S -
123 Oligomeris linifolia (Vahl.) Macbride Resedaceae D - - + - Th N S -
124 Hordeum murinum Sub. Glacum (Steud)
Tzveleve
Poaceae W - - + - Th L S -
125 Oryza sativa L. Poaceae C - - - + Th Mic S -
126 Ocimum basilicum L. Lamiaceae D + + + + Ch N S -
127 Oxalis corniculata L. Oxalidaceae W - - + + Th N Com -
128 Oxyria digyna (L.) Hill. Polygonaceae D - - + - Th N S -
129 Pennisetum glaucum Linn. Poaceae C - - - + Th Mic S -
130 Parthenium hysterophorus L. Asteraceae D - - + + Th Mic Dis -
131 Pegnum harmala L. Zygophyllaceae D - - + + H L S -
132 Periploca aphylla Decne. Asclepiadaceae D + + + + Np Ap Abs -
133 Phalaris minor Retz. Poaceae D - - + - G N S -
134 Phoenix dactylifera L. Arecaceae W & D + + + + Mp Mes Com -
135 Phragmites karka (Retz.) Trimn.ex Steud. Poaceae W + - + + Ch Mes S -
136 Plantago lanceolata L. Plantaginaceae W - - + + Th N S -
137 Plantago ovata Frossk. Plantaginaceae W - - + + Th N S -
138 Poa annua L. Poaceae W - + + - Th L S -
139 Poa botryoides (Trin. Ex Griseb.) Kom. Poaceae W - + + - Th L S -
140 Poa bulbosa L. Poaceae W - + + - Th L S -

58
141 Polygonum biaristatum Aitch. & Hemsl. Polygonaceae D - + + - Th N S -
142 Polygonum plebejum R.Br Polygonaceae W - + + - H N S
143 Polypogon monspeliensis (L.) Desf. Poaceae W - - + - Th N S -
144 Portulaca oleracea Linn. Azioaceae D - - + + Th N S -
145 Psammogeton biternatum Edgew. Apiaceae W - - + + Th L Dis -
146 Psidium guajava Linn. Myrtaceae C + + + + Th Mes S -
147 Prosopis cineraria L. Mimosaceae D + + + + Np L Com Sp
148 Prosopis juliflora Swartz. Mimosaceae D + + + + Np L Com Sp
149 Raphanus sativus Linn. Brassicaceae C - + - - Th N Dis -
150 Ranunculus muricatus L. Ranunculaceae W - - + + G Mic Dis -
151 Ranunculus sceleratus L. Ranunculaceae W - - + - G Mic Dis -
152 Rostraria cristata Linn. Poaceae W - - + - H N S -
153 Rostraria pumila (Desf.) Tzvelev. Poaceae W - - + - H N S -
154 Rhazya stricta Decne. Apocynaceae D - - + + Ch N S -
155 Rumex dentatus (Meisn.) Rech.f. Polygonaceae W - - + + G Mes S -
156 Saccharum bengalense Retz. Poaceae D + - + + Ch N S -
157 Saccharum officinarum Linn. Poaceae C + + + + Ch Mic S -
158 Saccharum spontaneum Linn. Poaceae D - + - - Ch N S -
159 Salsola foetida Del.ex Spreng. Chenopodiaceae D + + + + Ch L S -
160 Setaria pumila (Poir.) Roem. Poaceae D - - + - Th L S -
161 Silene vulgaris (Moench) Garcke. Caryophyllaceae W - - + - Th N S -

59
162 Sesbenia sesban (L.)Merrill. Papilionaceae C - - - + Th Mes Com -
163 Sisymbrium irio L Brassicaceae W - - + + Th N Dis -
164 Sonchus asper (L.) Hill. Asteraceae W - + + - Th Mic Dis -
165 Solanum nigrum L. Solanaceae W - - + - Th Mic S -
166 Solanum surattense Burm.f. Solanaceae D + - - - H N S Sp
167 Sorghum halepense (L.) Pers. Poaceae W - - + + Ch N S -
168 Sorghum bicolor (Linn.)Moench. Poaceae C - - - + Th Mes S -
169 Spergula fallax (Lowe) E.H.L. Krause Caryophyllaceae W - - + - Th N S -
170 Suaeda fruticosa Forssk.ex J.F. Gmelin. Chenopodiaceae D + + + + Ch L S -
171 Taraxacum officinale F.H. Wiggers Asteraceae W - - + + Th Mic S -
172 Tamarix aphylla (L.) Karst Tamaricaceae D + + + + Mp L S -
173 Tamarix dioica Roxb. Ex Roth. Tamaricaceae W + + + + Mp L S -
174 Torilis nodosa (L.) Gaertn. Apiaceae W - - + - Th N Dis -
175 Tribulus terrestris L. Zygophyllaceae D + - - - H L Com Sp
176 Trichosanthes dioica Rxb. Cucurbitaceae W - - + - Th N Dis -
177 Trifolium alexandrianum L. Papilionaceae C - + + - Th N Com -
178 Trifolium repens L. Papilionaceae C - + + - Th N Com -
179 Trigonella crassipes Boiss. Papilionaceae W - - + - Th N S -
180 Triticum aestivum L Poaceae C - + + + Th Mic S -
181 Typha latifolia L. Typhaceae W + + + + G Mes S -
182 Typha minima Frunck ex Hoppe Typhaceae W + - - + G Mes S -

60
183 Verbena officinalis L. Verbenaceae W - - + - Th N S -
184 Veronica aqutica Bern. Scrophulariaceae W - - + - G N Dis -
185 Vicia hirsuta (L.) S.F. Gray, Nat. Papilionaceae W - - + - Th N Com -
186 Vitex negundo L. Verbenaceae W + + + + Np N Com -
187 Vitis vinifera L. Vitaceae C + + + + Np Mes S -
188 Viola stockii Boiss. Violaceae W + - - - G Mic S -
189 Withania coagulans Dunal. Solanaceae D + + + + Ch Mic S -
190 Withania somnifera L. Solanaceae D - - + + Ch Mic S -
191 Xanthium strumarium L. Asteraceae D - - + - Th N S Sp
192 Zea mays L. Poaceae C - - - + Th Mes S -
193 Ziziphus jujuba Mill. Rhamnaceae D + + + + Mp N S Sp
Key: D = Dry, W = Wet, C = Cultivated, A = Autumn, S = Spring, W = Winter, Sm = Summer, Th = Therophytes, H = Hemicryptophytes, Ch =
Chamaephytes, G = Geophytes, Np = Nanophanerophytes, Mp = Microphanerophytes, P = Parasites, L = Leptophyll, N = Nanophyll, Mic =
Microphyll, Mes = Mesophyll, Ap = Aphyllous, S = Simple, Dis = Dissected, Com = Compound, Abs = Absent and Sp = Spiny.
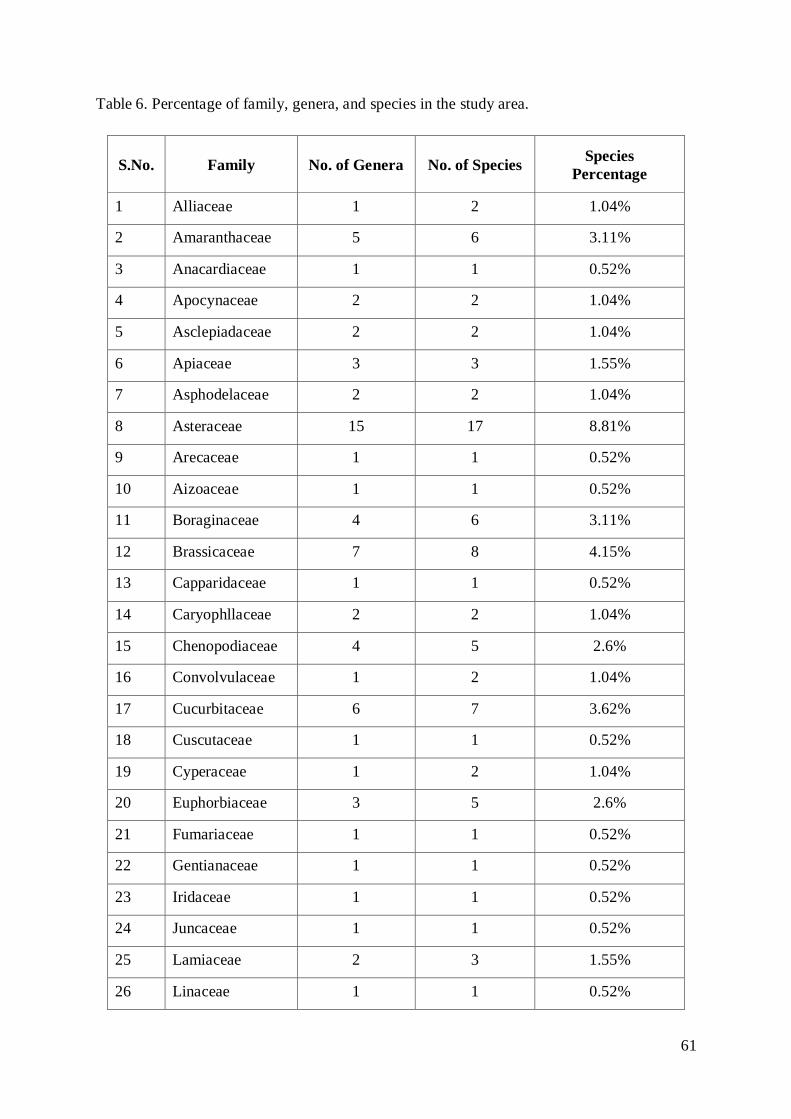
61
Table 6. Percentage of family, genera, and species in the study area.
S.No. Family No. of Genera No. of Species Species
Percentage
1 Alliaceae 1 2 1.04%
2 Amaranthaceae 5 6 3.11%
3 Anacardiaceae 1 1 0.52%
4 Apocynaceae 2 2 1.04%
5 Asclepiadaceae 2 2 1.04%
6 Apiaceae 3 3 1.55%
7 Asphodelaceae 2 2 1.04%
8 Asteraceae 15 17 8.81%
9 Arecaceae 1 1 0.52%
10 Aizoaceae 1 1 0.52%
11 Boraginaceae 4 6 3.11%
12 Brassicaceae 7 8 4.15%
13 Capparidaceae 1 1 0.52%
14 Caryophllaceae 2 2 1.04%
15 Chenopodiaceae 4 5 2.6%
16 Convolvulaceae 1 2 1.04%
17 Cucurbitaceae 6 7 3.62%
18 Cuscutaceae 1 1 0.52%
19 Cyperaceae 1 2 1.04%
20 Euphorbiaceae 3 5 2.6%
21 Fumariaceae 1 1 0.52%
22 Gentianaceae 1 1 0.52%
23 Iridaceae 1 1 0.52%
24 Juncaceae 1 1 0.52%
25 Lamiaceae 2 3 1.55%
26 Linaceae 1 1 0.52%

62
27 Malvaceae 4 4 2.07%
28 Meliaceae 1 1 0.52%
29 Mimosaceae 3 5 2.6%
30 Moraceae 2 4 2.1%
31 Myrtaceae 2 2 1.04%
32 Nyctaginaceae 1 1 0.52%
33 Orobanchaceae 1 1 0.52%
34 Oxalidaceae 1 1 0.52%
35 Papilionaceae 13 15 7.8%
36 Papaveraceae 1 1 0.52%
37 Plantaginaceae 1 2 1.04%
38 Poaceae 27 37 19.17%
39 Polygonaceae 4 5 2.6%
40 Primulaceae 1 1 0.52%
41 Ranunculaceae 1 2 1.04%
42 Resedaceae 1 1 0.52%
43 Rhamnaceae 1 1 0.52%
44 Rubiaceae 1 1 0.52%
45 Rutaceae 1 2 1.04%
46 Scrophulariaceae 1 1 0.52%
47 Solanaceae 7 9 4.7%
48 Tiliaceae 1 1 0.52%
49 Typhaceae 1 2 1.04%
50 Tamaricaceae 1 2 1.04%
51 Verbenaceae 2 2 1.04%
52 Violaceae 1 1 0.52%
53 Vitaceae 1 1 0.52%
54 Zygophyllaceae 3 3 1.55%
Total 155 193

63
Table 7. Distribution of plant species in the various habitats
S. No. Habitat No. of plant species Percentage
1 Wet 67 34.715%
2 Dry 87 45.077%
3 Both 4 2.072%
4 Cultivated 35 18.134%
Table 8. Distribution of plant species in the various aspects
S. No. Aspect No. of plant species Percentage
1 Autumn 53 14.058%
2 Hibernal 74 19.628%
3 Vernal 156 41.379%
4 Astival 95 24.933%
Table 9. Distribution of plant species in the various life form spectra
S. No. Life form No. of plant species Percentage
1 Therophytes 117 60.621%
2 Hemi-cryptophytes 19 9.844%
3 Chamaephytes 14 7.253%
4 Geophytes 18 9.844%
5 Microphanerophytes 13 6.735%
6 Nanophanerophytes 11 5.699%
7 Parasite 1 0.518%

64
Table 10. Comparison of Biological spectrum of the area with Raunkiaer’s standard
Biological Spectrum (SBS).
Spectrum PP ChP TP HP CrP Total
RSBS 46 26 13 9 6 100
Current study 12.434 7.253 60.621 9.844 9.844 100
Deviation 33.369 18.632 -47.526 -0.473 -3.473 0
PP = Phenerophytes, ChP = Chamaephytes, TP = Therophytes, HP = Hemiphytes. CrP =
Cryptophytes
Table 11. Distribution of plant species according to leaf size spectra
S.No. Leaf size No. of plant species Percentage
1 Leptophyll 41 21.243%
2 Nanophyll 93 48.186%
3 Microphyll 37 19.170%
4 Mesophyll 19 9.844%
5 Aphyllous 3 1.554%
Table 12. Distribution of plant species according to lamina shape
S.No. Lamina shape No. of plant species Percentage
1 Simple 147 76.165%
2 Compound 22 11.398%
3 Dissected 22 11.398%
4 Absent 2 1.036%

65
Fig 2. Habitat Fig 3. Aspect
Fig 4. Life form spectra Fig 5. Leaf size spectra
Fig 6. Lamina shape
34.72%
45.08%
2.07%
18.13%
Autumn Winter Spring Summer
14.06%19.63%
41.38%
24.93%
60.62%
9.84%7.25%9.84%6.74%5.70%0.52%21.24%
48.19%
19.17%
9.84%
1.55%
76.17%
11.40% 11.40%1.04%

66
4.2 Ethnobotany
During these study a total of 58 plant species of 34 families were recognized for medicinal
properties in the distict Bannu (Table.13) which were being used conventionally for several
daily life needs. These species belonged to the following families, Asteraceae was the leading
family (7 spp.) followed by Solonaceae and Poaceae (4 spp. each), Mimosaceae,
Zygophyllaceae, Amaranthaceae and Euphorbiaceae (3 spp. each), Chenopodiaceae,
Moraceae, Rhamnaceae and Papilionaceae (2 spp. each), while the rest of all Convolvulaceae,
Boraginaceae, Apocyanaceae, Rosaceae, Asclepidiaceae, Papilionaceae, Cucurbitaceae,
Lamiaceae, Asphodelaceae, Primulaceae, Nyctaginaceae, Plantaginaceae, Malvaceae,
Capparidaceae, Cyperaceae, Sapindaceae, Brassicaceae, Oxalidaceae, Tamaricaceae,
Myrtaceae, Portulaceae, Meliaceae and Rannunculaceae families have only one species each
(Table 14). It was found that the native communities had diffident skill about the uses of
medicinal plant and their suitable time of collection. The maximum number of species were
used for remedial purpose. They were used for various diseases, food, fodder & fuel and
ornamental. Simillar results were shown by Ankli et al. (1999); Bennett & Prance, (2000);
Shuaib et al. (2014) and Qureshi et al. (2007).The plant parts like stem, roots, leaves, flowers,
fruits and seeds were used for remedial purposes according to Sardar & khan, (2009). To
promote the significance of medicinal plants used in the area, locale consume values were
considered for the process described by Phillip et al. (1994).
Out of 58 plants 14(12.73%) are used as fodder, 8(7.3%) as astringent, 6(5.45%) as diuretic,
6(5.45%) as urinary problems, 5(4.45%) as purgative, 5(4.45%) as cooling agents, 4(3.63%)
as diarrhea, dysentery, inflammation, stomach problems, Astama, and tonic. While 3(2.73%)
pants were being used for vomiting, furniture, laxative, kidney problems, rheumatism, skin
diseases, expectorant, pain of joints and ornamental purposes. Two species (1.81%) used for
antiseptic, epilepsy, carminative, vegetables, constipation and heart diseases and 1(0.90%)
are used for hair loss, diabetes, night blindness and arache (Table.15). These plants are used
to treat different diseases. Amongst assorted classes of home-grown uses, all crossways the
earth, dissimilar types of gastrointestinal disorders are largest, for the removal of such
problems different plants are used by tribal communities (Ankli et al., 1999; Bennett &
Prance, 2000). Current study recognized that these plants are used in the fashion of
conventional healers otherwise they may affect harsh. For example the extract of Cyperus

67
rotundus if dropped in the eyes then it can cause serious problems (Qureshi et al., 2007). In
these study, herbs dominated (56.896%) followed by trees (22.415%) and shrubs (20.689%)
(Table. 16). These plants were used for different purposes in the area. These results were
according to Khan et al. (2013).
Among plant parts used for indigenous medicines, whole plants are used as (52.63%),
followed by stem and leaves (10.53%), fruits (9.21%), roots (7.9%), seeds (5.26%), latex,
flowers and gums are used (1.31%) each (Table 17). some plant species such as Acyranthes
aspera and Albizia lebeck are used in resistance to nausea. Similarly, for maintenance of
medicinal valuable plant species has become vital for upcoming generations (Dhar et al.,
2000). Owing to developing care in herbal drugs for bodily state care all across all over the
earth (Franz, 1993).

68
Table 13. Ethno botanical important plant list used in District Bannu.
S.N Plant Name Family Local name Habit Parts used Uses
1 Achranthes aspera L. Amaranthaceae Aghzikai Herb Whole plant Vomiting, Heart diseases and Ulcers
2 Acacia modesta Wall. Mimosaceae Palosa Tree Whole plant Gum is restorative
3 Acacia nilotica (Linn) Delite Mimosaceae Kikar Tree Stem, Gum, roots Diarrhea and Dysentery
4 Aerva javanica (Burm.) Juss Amaranthaceae Kharvorrh Herb Whole plant Diuretic, Emetic and Purgative
5 Albizia lebbek (L.) Bth Mimosaceae Sreen Tree Roots, Stem, Leaves,
Flowers
Diarrhea, Fodder and Night blindness
6 Amaranthus viridis L. Amaranthaceae Ranzaka Herb Whole plant Laxative, Diuretic, Blood diseases,
Antipyretic, Stomachic and Leprosy
7 Asphodelus tenuifolius Cavan Asphodelaceae Lewanai Piaz Herb Whole plant Diuretic, Ulcers and Inflammation
8 Avena sativa L. Poaceae Javdar Herb Whole plant Tonic and Stimulant
9 Anagalis arvensis Primulaceae Khoso beta Herb Whole plant Inflammation, Kidney pains, Improves eye sight, Epilepsy and Dropsy
10 Alhagi mauroram Meddic. Papilionaceae Tandah Shrub Whole plant Rheumatism and Piles
11 Boerhavia procumbens Banks ex Roxb
Nyctaginaceae Pandrawash Herb Whole plant Opthalmia, Pains of joints, Toxic, Expectorant and Carminative
12 Calatropis procera (willd) R.Br (AC)
Asclepiadaceae Spalmaka Shrub Latex Dog bites, Asthma, Cough and Skin diseases

69
13 Convolvulus arvensis L. Convolvulaceae Parwatye Herb Whole plant Skin disorders and purgative
14 Carthamus oxycantha M.B Asteraceae Conzali Herb Whole plant Hair loss and Painful joints
15 Capparis decidua Edgew. Capparidaceae Taph Tree Fruits, Stem, roots Vegetables and Boats planks
16 Chenopodium murale L. Chenopodiaceae Surma Herb Whole plant Fodder and vegetable
17 Citrullus colocynthis (L)
Schrad.
Cucurbitceae maragenye Herb Whole plant Intestinal disorders, Dropsy, Urinary diseases
and Snake bites
18 Cynodon dactylon (L.) Pers. Poaceae Barawa Herb Whole plant Fodder, Jaundice and Dysentery
19 Cyperus rotundus L. Cyperaceae Delai Herb Whole plant Fodder
20 Chenopodium album L Chenopodiaceae Spen surma Herb Whole plant Fodder
21 Cymbopogon distans Schutt. Poaceae Sargaraya Herb Whole plant Fodder, Mats
22 Datura metal Nees Solonaceae Barbaka Shrub Whole plant Rheumatisms, Emollients and Mydriatic
23 Dalbergia sissoo Roxb. Papilionaceae Shawa Tree Stem, roots, leaves Gonorrhea, Leprosy, Vomiting and Furniture
24 Dodonaea viscosa (L.) Jacq Sapindaceae Sanata Shrub Whole plant Ornamental, Rheumatisms and Astringent
25 Echinops echinatus L. Asteraceae Azghai Shrub Whole plant Reduce pain and Kidney pain
26 Eruca sativa Mill. Brassicaceae Shersham Herb Whole plant Fodder, Pickles, Purgative, Epilepsy, Ulcers
and Vomiting
27 Euphorbia helioscopia L. Euphorbiaceae Purparie Herb Whole plant Anthelmintic and Eruptions

70
28 Euphorbia prostrata Ait. Euphorbiaceae Speni wana Herb Whole plant Cholera
29 Eucalyptus camaldulaensis
Dehnh.
Myrtaceae Lochai Tree Whole plant Furniture, Burning purposes and Antiseptic
30 Fagonia indica L.
Zygophyllaceae
Spelagzai Herb Whole plant Fever, Dysentery, Urinary discharges,
Reduces tumors, Cooling agent and Blood purifier
31 Heliotropium europaeum (F.
& M.) Kazmi
Boraginaceae Harponai Herb Whole plant Fodder for camels
32 Helianthus annuus L. Asteraceae Mer Gul Herb Seeds Rheumatic pains, Edible seeds and
Constipation
33 Launaea procumbens Pravin
Kawale.
Asteraceae Piawarie Herb Whole plant Fodder
34 Malva neglecta L. Malvaceae Peskie Herb Whole plant Chronic bronchitis, Inflammation and Urinary
discharges
35 Morus alba L. Moraceae Speen teet Tree Fruits, leaves, stem Throat infection, Astringent, Anthelmintic,
Laxative, Purgative and Fodder
36 Morus nigra L. Moraceae Tor Teet Tree Fruits, leaves, stem Throat infection, Astringent, Anthelmintic,
Laxative, Purgative and Fodder
37 Melia azedrach L. Meliaceae Bakana Tree Stem, leaves Emetic, Poultice, Hysteria, Diabetes,
Furniture and Fodder
38 Nerium odorum Soland Apocynaceae Gandarie Shrub Whole plant Hair loss, Ornamental and Poisonous
39 Oxalis corriculata L. Oxalidaceae Herb Whole plant Dysentery, Astringent, Diarrhea, Scabies and
Diuretic

71
40 Ocimum basilicum L. Lamiaceae Bobrai Shrub Whole plant Ornamental, Fragrant and Ear ache
41 Parthenium hysterophorus L. Asteraceae Kherbotta Herb Whole plant Leucoderma, Tonic and Anticancer
42 Peganum harmala L. Zygophyllaceae Sponda Herb Seeds Parkinsonism, Narcotic, Antiseptic and
Hypnotic
43 Portulaca oleracea L. Portulaceae Warhorai Herb Leaves Refrigerant, Kidney Problems, Urinary
Problems and Lungs Problems
44 Plantago lanceolata L. Plantaginaceae Speghol Herb Seeds Constipation, Stomached and Digestive
45 Phoenix dactylifera L. Arecaceae Hajeera Tree Fruits Edible, Hand fans and mats, Urinary diseases
and Expectorants
46 Rosa indica (Willd) Koehne Rosaceae Ghulab Shrub Whole plant Wounds, Tonic, Astringent and Ornamental
47 Ricinus communis L. Euphorbiaceae Arandah Shrub Seeds Asthma and skin diseases
48 Ranunculus muricatus L. Ranunculaceae Zerri gul Herb Whole plant Tonic and Astringent
49 Solanum nigrum L. Solanaceae Herb Whole plant Diuretic, Heart & eye diseases and Laxative
50 Solanum surrattense Burn F. Solanaceae Warekye
Marraghenye
Herb Whole plant Cough, Asthma, Demulcents and Expectorants
51 Saccharum arundinaceum
H. K. F
Poaceae Kana Shrub Whole plant Fodder, Baskets and Binders
52 Tribulus terrestris L. Zygophyllaceae Malkendye Herb Whole plant Cooling, Tonic, Astringent and Urinary
53 Tamarix aphylla (L.) Karst Tamariaceae Ghaz Tree Whole plant Astringent, Flue and Aphrodisic

72
54 Trigonella crassipes L. Fabaceae Spistherlia Herb Whole plant Fodder
55 Withania coagulans Dunal. Solanaceae Shapyanga Shrub Fruits Asthma and Digestive problems
56 Xanthium strumarium L. Asteraceae Babar azgai Shrub Whole plant Cooling and Small pox
57 Ziziphus jujuba Mill. Rhamnaceae Bera Tree Fruits, Stem, Leaves,
Roots
Blood Purifier, Improves digestion, Bronchitis
and Cough & cold
58 Ziziphus nummularia
(Burm.f.) Wt. & Arn.
Rhamnaceae Karkana bera Tree Fruits, Stem, Leaves,
Roots
Cough & cold, Blood Purifier, Improves
digestion and Bronchitis

73
Table 14. Genera and species distribution in different families.
S.No Name of Family Species/Genera
1. Asteraceae 07
2. Solanaceae 04
3. Poaceae 04
4. Mimosaceae 03
5. Zygophyllaceae 03
6. Amaranthaceae 03
7. Euphorbiaceae 03
8. Chenopodiaceae 02
9. Moraceae 02
10. Rhamnaceae 02
11. Papilionaceae 02
12. Convolvulaceae 01
13. Boraginaceae 01
14. Apocyanaceae 01
15. Rosaceae 01
16. Asclepidiaceae 01
17. Papilionaceae 01
18. Cucurbitaceae 01
19. Lamiaceae 01
20. Asphodelaceae 01
21. Primulaceae 01
22. Nyctaginaceae 01

74
23. Plantaginaceae 01
24. Malvaceae 01
25. Capparidaceae 01
26. Cyperaceae 01
27. Sapindaceae 01
28. Brassicaceae 01
29. Oxalidaceae 01
30. Tamaricaceae 01
31. Myrtaceae 01
32. Portulaceae 01
33. Meliaceae 01
34. Rannunculaceae 01
Total 34 Families 58 species
Table 15. Classification of plants on the basis of their uses
S.No Diseases No. of plants used Percentage (%)
1 Fodder 14 12.73%
2 Astringent 8 7.27%
3 Diuretic 6 5.45%
4 Urinary problems 6 5.45%
5 Purgative 5 4.54%
6 Cooling agent 5 4.54%
7 Diarrhea 4 3.63%
8 Dysentery 4 3.63%

75
9 Inflammation 4 3.63%
10 Stomach problems 4 3.63%
11 Asthma 4 3.63%
12 Tonic 4 3.63%
13 Vomiting 3 2.73%
14 Furniture 3 2.73%
15 Laxative 3 2.73%
16 Kidney problems 3 2.73%
17 Rheumentism 3 2.73%
18 Skin diseases 3 2.73%
19 Expectorant 3 2.73%
20 Pains of joints 3 2.73%
21 Ornmental 3 2.73%
22 Antiseptic 2 1.82%
23 Epilepsy 2 1.82%
24 Carminative 2 1.82%
25 Vegetables 2 1.82%
26 Constipation 2 1.82%
27 Heart diseases 1 0.91%
28 Hair loss 1 0.91%
29 Diabetes 1 0.91%
30 Night blindness 1 0.91%
31 Earache 1 0.91%

76
Table 16. Classification of plants on the basis of their habit
Habit No. of plants Percentage (%)
Herbs 33 56.896%
Shrubs 12 20.689%
Trees 13 22.413%
Table 17. Classification of plants on the basis of their parts used
Part used No. of genera Percentage (%)
Whole plant 40 52.63%
Stem 8 10.53%
Leaves 8 10.53%
Roots 6 7.9%
Fruits 7 9.21%
Seeds 4 5.26%
Latex 1 1.31%
Flowers 1 1.31%
Gums 1 1.31%

77
4.3 Phytosociology
On the basis of soil variable and their macro and micro-elemental composition the
area was divided into three sites. These study concludes that there could possibly 18
different plants communities during four seasons in the area. In each sites, six
different plant communities were established on the basis of their highest importance
values.
Community structure
The vegetation, climate and soil are complexly interrelated to each other. The
deviation in anyone of these components might cause a variation in the other related
components. By knowing two of the factors, forecast about the third might be possible
within certain boundaries. The survival and establishing of community mirrors the
plant type and habitat form under which they grow. Biotic factors, particularly human
interface shape the course of sequence of a community or vegetation type (Grubb,
1987; Badshah et al., 2010). A community is distinct as a collective of living plants
having mutual relationships among themselves and to the environment, or a collection
of plant population found in one habitat type in one area and joined to a degree by a
competition complementarities and reliance (Hussain & Badshah, 1998; Ahmad et al.,
2006). Some of the chief environmental factors that affect the vegetation and parts
there are deforestation, overgrazing, crushing, erosion and other ecological factors.
The investigated area is nearly flat plains with a semiarid climate. The present study
distinguishes different plant communities based on quantitative values which as whole
link up the major vegetation type. Usually the cultivated land possesses low wild
plants due to anthropogenic interference (Devineau & Fournier, 2007; Frances &
Shahroukh, 2006). The present study recognizes different plant communities were
established on basis of soil micro and macro elemental status. The plant communities
arranged on quantitative values which as whole link up the major vegetation type/unit.
The present study concludes that there could possibly be 18 different plant
communities during four seasons in 3-sites of the area. In each sites, 6 different plants
communities separately established i.e. trees, shrubs and herbs in different seasons of
the area.

78
Site I
These is dry area of district Bannu and consist of many villages such as Landi
Jhalander, Bandaar killa, Azim killa, Barmi khel, Topen killa, Umer zai, Sirki khel,
Marghalie Peerba khel and Oligie Mosa khel. In these areas only the natural flora
occurred on Umer zai, Sirki khel, and Nalla Kashoo and Oligie Mosa Khel sites. At
site I, dry habitats had sandy soil with pH (8.03), EC (0.018 Sdm-1) nitrogen contents
(0.32%), low phosphorus (1.23 µg/gm) and potassium contents were 8%. The organic
matter was less (1.55%) but sulphur (913 µg/gm), silicon (45 µg/gm), ferrous (1.06
µg/gm), Cu (0.092 µg/gm), Zn (1.98 µg/gm) and Ca (95.14 µg/gm) were high. Mg
(113.98 µg/gm), Pb (0.014 µg/gm), Cd (0.44 µg/gm), Ni (1.22 µg/gm), Cr (4.4
µg/gm) and Mn were (1.568 µg/gm) reported at the site I (Table. 26). During
quantitative analysis of vegetation in these areas, 60 plant species of 29 families were
listed at site I (Table. 18). On the basis of total family importance values at the site I,
Poaceae was dominant family with family importance values (483.4) followed by
Chenopodiaceae (136.2), Mimosaceae (133.76), Tamaricaceae (107.29), Cyperaceae
(101.14), Polygonaceae (97.25), Papilionaceae (66.66), Rhamnaceae (61.20) (Table
21). On the basis of micro and macro elements in the soil of these site, six different
plants communities have been recognized in different seasons. These plant
communities established each categories separately i.e. trees, shrubs and herbs at the
site. These plants communities were as follows.
1. Prosopis-tamarix-Zizyphus community (PTZ)
This community was confined to trees at site I in spring season. At this site, Prosopis
cineraria, Tamarix aphylla and Zizyphus jujuba were dominant from trees side. On
the basis of importance values, Prosopis cineraria had maximum value (77.55)
followed by Tamarix aphylla (62.44), Zizyphus jujuba (61.20), Acacia nilotica
(56.19), and Cappris decidua (42.62) (Table.18). Most of the plants of this
community were palatable. These findings agree with Hadi et al. (2009) who reported
Tamarix and Capparis community from Peshawar. Similarly, Ahmad et al. (2009)
reported ten Olea communities from Dir Khyber Pakhtunkhwa, which are in
agreement with the present results.

79
2. Calligonum-Periploca-Tamarix community (CPT)
This community was confined to shrubs at site I in spring season. At this site,
Calligonum polygonoides, Periploca aphylla and Tamarix dioica were dominant
(Table.18). On the basis of importance values, Calligonum polygonoides had
maximum value with (87.4) importance values followed by Periploca aphylla
(52.03), Tamarix dioica (44.85), Rhazya stricta (44.18), Cistanche tubulosa (37.89)
and Echinops echinatus (33.63). The plant species of these community were slightly
palatable. Similar report was also made by Malik & Malik (2004), Ahmad et al.
(2006), Perveen & Hussain (2007) and Badshah et al. (2010).
3. Cymbopogon-Chenrus-Cynodon community (CCC)
This community was confined to herbs at site I in spring season. At this site,
Cymbopogon distense, Chenrus cilairus and Cynodon dactylon were dominant. On
the basis of importance values of herbs in spring season, Cymbopogon distense with
importance value (32.96) followed by Chenrus cilairus (19.72, Cynodon dactylon
(18.5), Astragalus scorpiurus (16.58) and etc. the detail have been given in
(Table.18). Most of the plant species of these community were palatable. Similar
trend was reported by Arshad (2003) and Malik & Hussain (2006) from other areas of
Pakistan. Similarly, Shukla & Mishra (2006) stated that highest therophytes
occurrence followed by chamaephytes. This finding favours the present results.
4. Cynodon-Aristida-Eragrostis community (CAE)
This community was confined to herbs at site I in summer season. At this site,
Cynodon dactylon, Aristida cynantha and Eragrostis pilosa were dominant plant
community respectivelly. On the basis of importance values of herbs in summer
season, Cynodon dactylon with importance value (35.09) followed by Aristida
cynantha with (28.57), Eragrostis pilosa with (26.72), Alhagi maurorum with (24.94)
and etc. the detail have been given in (Table.18). Cynodon is palatable species while
the two species are slightly palatable. Malik & Husain (2006 and 2008), Peer et al.
(2007), Ahmad et al. (2008) also reported the dominance of Poaceae and Asteraceae
from other areas of Pakistan which are similar to our findings.

80
5. Chenopodium-Cynodon-Cenchrus community (CCC)
This community was confined to herbs at site I in autumn season. At this site,
Chenopodium murale, Cynodon dactylon, and Chenchrus biflorus were dominant
plant community. On the basis of importance values of herbs in autumn season,
Chenopodium murale is leading plant community with (85.88), Cynodon dactylon
with (84.77), Chenchrus biflorus with (73.4) and Cyperus rotundus with (55.90). The
detail is given in (Table.18). These findings agree with Hadi et al. (2009) who
reported Tamarix and Capparis community from Peshawar. Similarly, Ahmad et al.
(2009) reported ten Olea communities from Dir Khyber Pakhtunkhwa, which are in
agreement with the present results.
6. Cynodon-Asphadelus-Diachanthium community (CAD)
This community was confined to herbs in site I in winter season. At these site
Cynodon dactylon, Asphadelus tunifolius, Diachanthium annulatum were dominant
plant community. The basis of importance values of herbs in winter season, Cynodon
dactylon with importance value (51.49) was leading community followed by
Asphadelus tunifolius with (43.94), Diachanthium annulatum with (38.91) were
dominated. The detail is present in (Table. 18). In these community Asphadelus
tunifolius is harmful weed and having no forage value. Similar dynamics of the
community was also reported by Tabanez & Viana (2000), Malik & Malik (2004) and
Ahmad et al. (2007).
Site II
This site consists of Painda khel, Sada khel, Spark waziran, Amal khel, Nadar Bodin
khel, Domel area, Tazeree Benzen khel, Saed khel and Jhando khel etc. The natural
flrora are found along Sada khel, Painda khel and Jhando khel area. In site II, dry
habitats had sandy soil with pH (8.13), EC (0.002 Sdm-1) nitrogen contents (0.42%),
low phosphorus (1.99 µg/gm) and potassium contents were 5%. The organic matter
was 1.04% but sulphur (177 µg/gm), silicon (38 µg/gm), ferrous (0.58 µg/gm), Cu
(0.042 µg/gm), Zn (1.77 µg/gm) and Ca (91.42 µg/gm) were high. Mg (117.98
µg/gm), Pb (0.06 µg/gm), Cd (0.053 µg/gm), Ni (1.78 µg/gm), Cr (10.4 µg/gm) and
Mn were (1.488 µg/gm) reported (Table. 26). During quantitative analysis of
vegetation in this area, 65 plant species of 26 families were listed (Table.19). On the
basis of total family importance value at this, Poaceae was dominant family with total

81
family importance values (472.42) followed by Mimosaceae (206), Asteraceae
(128.82), Chenopodiaceae (99.13) and Amranthaceae (94.56) (Table. 22). On the
basis of micro and macro elements of soil at these site, six different plants
communities were recognized in different season. These plant communities
established separately each categories i.e. trees, shrubs and herbs in the site. These
plants communities were as follows.
1. Tamarix-Prosopis-Phoenix community (TPP)
This community was confined to trees at site II in spring season. At this site II,
Tamarix aphylla, Prosopis cineraria and Phoenix dactylifera were dominant
community (Table. 19). On the basis of importance values, Tamarix aphylla had
maximum value with (66.96) followed by Prosopis cineraria with (57.26), Phoenix
dactylifera with (52.55), Ziziphus jujuba with (43.64), Acacia nilotica with (41.72)
and Acacia modesta with (37.87). Plant species of these community are slightly
palatable and most of them used in furniture. These results are in agree with Manhas
et al. (2010) and Bocuk et al. (2009) recorded therophytes and leptophylls from Kandi
region India.
2. Prosopis-Tamarix-Rhazya community (PTA)
This community was confined to shrubs at site II in spring season. At this site,
Prosopis juliflora, Tamarix dioica and Rhazya stricta were dominant community
(Table. 19). On the basis of importance values, Prosopis juliflora with importance
value (69.22) followed by Tamarix dioica with (44.81), Rhazya stricta with (34.81)
and Aerva javanica with (32.05). This community had fewer numbers of species due
to dry soil. Only few shrubby species occurred. Our results were agree with workers
like Badshah et al. (2010) from nearby Waziristan and Qureshi et al. (2008) form
Nara desert (Sindh) which valued our present results.
3. Cymbopogon-Cynodon-Cenchrus community (CCC)
This community was confined to herbs at site II in spring season. At this site,
Cymobopogon distance maximum values with (31.66) followed by Cynodon dactylon
(24.57), Cenchrus ciliaris (20.66) were dominant plant community (Table. 19).
Cymbopogon-Cynodon-Cenchrus community confine only on grasses and palatable.

82
These results were according with Malik & Hussain (2006), Sher & Khan (2007) and
Bocuk et al. (2009).
4. Eleusine-Bromus-Cynodon community (EBC)
This community was confined to herbs at site II in summer season. At this site,
Eleusine indica, Bromus pectinatus and Cynodon dactylon were dominant plant
community in summer season. On the basis of importance values of herbs in summer
season, Eleusine indica (31.32), Bromus pectinatus (29.4), Cynodon dactylon (28.06),
Pegnum harmala (25.42) and the detail is present in (Table. 19). Eleusine-Bromus-
Cynodon community is also consisted on grasses. Eleusine and Cynodon species are
palatable and having forage value for domesticate animals in the area. These results
were agree with earlier co-worker like Bocuk et al. (2009); Ture & Tokur, (2000) and
Wahab et al. (2008).
5. Cynodon- Bromus-Citrullus community (CBC)
This community was confined to herbs at site II in autumn season. At this site,
Cynodon dactylon, Bromus pectinatus and Citrullus colocynthis were dominated due
to their importance values in autumn season. On the basis of highest importance
values Cynodon dactylon with (46.42) followed by Bromus pectinatus with (40.61)
and Citrullus colocynthis with (34.53) the detail is given in (Table.19). Poaceae
member having forage while Citrullus is medicinal plant occurred in this site and used
as anthelmintic to Cow and Buffalo. These result compared with earlier Kareston et
al. (2005); Costa et al. (2006); Parveen & Hussain, (2007).
6. Chenopodium-Cynodon-Sonchus community (CCS)
This community was confined to herbs at site II in winter season. At this site,
Chenopodium album, Cynodon dactylon and Sonchus asper were dominated in winter
season due to importance value. On the basis of highest importance value
Chenopodium album with (51.52) followed by Cynodon dactylon with (42.27), and
Sonchus asper with (39.9) and the detail is given in the (Table. 19). Cynodon is one
the grass which is usually occurred in the area and used as food for livestock in daily
life. These results agree with Hadi et al. (2009), Ahmad et al. (2009) described ten
Olea communities from Dir Khyber Pakhtunkhwa, which are in agreement with the

83
current results. Dasti et al. (2010) while functioning on the vegetation of Suleiman
ranges.
Site III
This sites includes Baka khel, Sardi khel and Jani khel. During quantitative analysis
of vegetation in these areas, 85 plant species of 28 families were listed (Table. 20). In
site III, dry habitats had sandy soil with pH (8.04), EC (0.005 Sdm-1) nitrogen
contents (0.35%), low phosphorus (1.34 µg/gm) and potassium contents were studied
(4%). The organic matter was 1.35% but sulphur (295 µg/gm), silicon (34 µg/gm),
ferrous (4.28 µg/gm), Cu (0.318 µg/gm), Zn (0.206 µg/gm) and Ca (102.66 µg/gm)
were higher as compared with sites I and II. Mg (120.94 µg/gm), Pb (0.006 µg/gm),
Cd (0.08 µg/gm), Ni (0.68 µg/gm), Cr (52 µg/gm) and Mn were (1.998 µg/gm)
reported at the site III (Table. 26). On the basis of family importance value in the site
III, Poaceae was dominant family with total family importance values (472.47)
followed by Mimosaceae (267.13), Amranthaceae (128.42) Papilionaceae (121.19),
Solanaceae (90.17) and Asteraceae (88.79) (Table 23). On the basis of soil six
different plants communities have been recognized in different season. These plants
communities were as follows.
1. Tamarix-Acacia-Acacia community (TAA)
This community was confined to trees at site III in spring season. At this site, Tamarix
aphylla, Acacia nilotica and Acacia modesta community was dominant. On the basis
of maximum values Tamarix aphylla with (81.17) followed by Acacia nilotica with
(76.60), Acacia modesta with (61.42), Ziziphus jujuba with (55.29) and Prosopis
cineraria with (25.50) in the site (Table. 20). These results agree with Salvatori et al.
(2003) while studying the vegetation observed that 46% of the area was converted
from wood land to scrub and grassland. These result are in line to the extent that have
similar results (Patrick et al., 2004; Walepole et al., 2004; Jorge et al., 2005) in the
area of investigation.
2. Prosopis-Withania-Aerva community (PWA)
This community was confined to shrubs at site III in spring season. At this site,
Prosopis juliflora, Withania coagulans and Aerva javanica community was dominant.
On the basis of importance values Prosopis juliflora had maximum values with
(103.61) followed by Withania coagulans with (55.65), Aerva javanica with (51.14),

84
Calotropis procera with (47.96) and Rhazya stricta (41.65) in the site (Table. 20).
These results are according to Kennedy et al. (2003); Malik & Malik, (2004); and
Hussain et al. (2005) also reported similar changes in dominance with the season and
temperature. Shah and Hussain, (2008) reported similar vegetation for wet lands of
Akbar pura Peshawar.
3. Cynodon-Euphorbia-Poa community (CEP)
This community was confined to herbs at site III in spring. At this site, Cynodon
dactylon, Euphorbia helioscopia and Poa annua were dominant. On the basis of
importance values Cynodon dactylon (17.21) followed by Euphorbia helioscopia with
(15.24), Poa annua with (12.95) (Table. 20). This community have forage value in the
area. Generally spring is the most favourable growing season for most plants in
Pakistan by Wazir et al. (2008); Ahmad et al. (2008) and Arshad et al. (2008).
4. Alhagi-Cynodon-Polypogon community (ACP)
This community was confined to herbs at site III in summer season. At this site,
Alhagi maurorum, Cynodon dactylon and Polypogon pectinatus were dominant due to
their importance values. On the basis of highest importance values Alhagi maurorum
with (52.15) followed by Cynodon dactylon with (50.7) and Polypogon pectinatusi
with (41.31) in the site (Table. 20). Cynodon is one of the grass which is constantly
found in the area and usually used as food for cow while Alhagi is used as a food for
Camel. These results were according to Malik & Hussain (2006 and 2008), Peer et al.
(2007). Ahmad et al. (2008) also reported the dominance of Poaceae and Asteraceae
from other areas of Pakistan which are similar to our findings.
5. Chenopodium-Amaranthus-Achyranthes community (CAA)
This community was also confined to herbs at site III in autumn season. At this site,
Chenopodium murale, Amaranthus viridus and Achyranthes aspera were dominant
plant species due to importance values. On the basis of highest importance values
Chenopodium murale (43.22) followed by Amaranthus viridus (39.14) and
Achyranthes aspera (38.07) in the site (Table. 20). These results agree with earlier co-
worker like Malik & Hussain (2008) and Perveen et al. (2008) who reported plants
communities of annual herbs in their respective study sites.

85
6. Euphorbia-Cynodon-Dichanthium community (ECD)
This community confined to herbs at site III in winter seasons. At this site, Euphorbia
helioscopia, Cynodon dactylon and Dichanthium annulatum were dominant due to
importance value respectively. On the basis of highest importance values Euphorbia
helioscopiai with (52.64) followed by Cynodon dactylon (45.37) and Dichanthium
annulatumi (39.19) in the site (Table. 20). These results agree with earlier workers in
their studies (Enright et al., 2005; Badshah et al., 2010; Claros, 2003) who studied a
related situation has been described.

86
Table 18. Phytosociological attributes of plant community at site I
SNo Name of plant Family R/Density R/Frequency R/Cover Importance value
During spring, trees
1 Acacia nilotica (L.) Wild.ex Delile Mimosaceae 13.16 19.51 23.52 56.19
2 Capparis decidua (Frossk.) Edgew. Cappridaceae 15.79 12.19 14.63 42.62
3 Prosopis cineraria L. Mimosaceae 28.94 26.83 21.78 77.55
4 Tamarix aphylla (L.) Karst Tamaricaceae 22.37 21.95 18.12 62.44
5 Ziziphus jujuba Mill Rhamnaceae 19.74 19.51 21.95
61.20
During spring, shrubs
6 Calligonum polygonoides L. Polygonaceae 26.79 23.08 37.53 87.4
7 Periploca aphylla Decne. Asclepiadaceae 13.39 19.23 19.41 52.03
8 Tamarix dioica Roxb. Ex Roth. Tamaricaceae 19.64 13.46 11.75 44.85
9 Rhazya stricta Decne. Apocynaceae 12.5 15.38 1.30 44.18
10 Echinops echinatus L. Asteraceae 8.92 15.38 9.32 33.63
11 Cistanche tubulosa (Shehenk.) Orobancheaceae 18.75 13.46 5.68 37.89

87
During spring, herbs
12 Arnebia hispidissima (Lehm.) A. DC. Boraginaceae 4.21 4.66 4.25 13.12
13 Astragalus scorpiurus Bunge. Papilionaceae 5.68 6 4.90 16.58
14 Boerhavia procumbens Banks ex Roxb Nyctaginaceae 2.94 5.33 5.96 14.23
15 Cenchrus ciliaris L. Poaceae 6.73 5.33 7.66 19.72
16 Chenopodium album L. Chenopodiaceae 4.42 4.66 6.30 15.38
17 Convolvulus arvensis L. Convolvulaceae 3.36 4.66 3.780 11.8
18 Cymbopogon distans Schutt. Poaceae 9.47 8 15.49 32.96
19 Cynodon dactylon (L.) Pers. Poaceae 6.52 4.66 7.32 18.5
20 Euphobia dracunculoides Lam. Euphorbiaceae 5.05 3.33 2.99 11.37
21 Farsetia jacquemontii (Hook. F. & thoms.) Jafri
Brassicaceae 2.73 3.33 2.55 8.61
22 Heliotropium europaeum (F. & M.)
Kazmi Boraginaceae 2.31 3.33 3.23 8.87
23 Hypecoum pendulum L. Papaveraceae 3.36 4 1.90 9.26
24 Launaea procumbens Pravin Kawale. Asteraceae 4 4.66 3.95 12.61
25 Melilotus indica (L.) All. Papilionaceae 3.78 4 1.90 9.68
26 Oligomeris linifolia (Vahl.) Macbride Resedaceae 2.10 2.66 1.53 6.29

88
27 Plantago lanceolata L. Plantaginaceae 4 4 1.19 9.19
28 Plantago ovata Frossk. Plantaginaceae 2.94 3.33 1.87 7.98
29 Psammogeton biternatum Edgew. Apiaceae 3.78 3.33 2.21 9.32
30 Rostraria cristata Linn. Poaceae 6.94 6 1.19 14.13
31 Rumex dentatus (Meisn.) Rech.f. Polygonaceae 2.94 2.66 4.25 9.85
32 Silene vulgaris (Moench) Garcke. Caryophyllaceae 3.57 4.66 4.25 12.48
33 Sisymbrium irio L Brassicaceae 4.21 2.66 5.27 12.14
34 Trigonella crassipes Boiss. Papilionaceae 4.84 4.66 5.96 15.46
During summer, herbs
35 Alhagi maurorum Medic. Papilionaceae 5.88 10.84 8.21 24.94
36 Amaranthus viridis L. Amaranthaceae 8.14 8.43 5.35 21.92
37 Aristida cynantha L. Poaceae 8.59 9.63 10.35 28.57
38 Carthamus persicus Willd. Asteraceae 7.69 7.22 5.35 20.26
39 Chrozophora tinctoria (L.) Raf. Euphorbiaceae 6.78 6.02 5.71 18.51
40 Citrullus colocynthis (L.) Shred. Cucurbitaceae 4.52 6.02 7.07 17.61
41 Cynodon dactylon (L.) Pers. Poaceae 12.66 7.22 13.21 35.09
42 Cyperus rotundus L. Cyperaceae 6.78 6.02 6.07 18.87
43 Eragrostis pilosa (L.)P. Beauv. Poaceae 9.50 7.22 10 26.72

89
44 Eragrostis minor Host. Poaceae 7.69 7.22 6.07 20.98
45 Euphorbia prostrata Ait. Euphorbiaceae 5.42 6.02 6.78 18.22
46 Fagonia indica L. Zygophyllaceae 6.78 7.22 7.92 21.92
47 Plantago ovata Frossk. Plantaginaceae 4.97 6.02 3.21 14.2
48 Portulaca oleraceae Linn. Aizoaceae 4.52 4.81 4.64 13.97
During autumn, herbs
49 Cenchrus bifolrus Roxb. Poaceae 22.05 21.73 29.62 73.4
50 Chenopodium murale L. Chenopodiaceae 26.47 26.08 33.33 85.88
51 Cynodon dactylon (L.) Pers. Poaceae 30.88 30.43 23.45 84.77
52 Cyperus rotundus L. Cyperaceae 20.58 21.73 13.58 55.90
During winter, herbs
53 Asphadelus tunifolius Caven. Asphodelaceae 20.19 14.28 9.44 43.91
54 Aristida adscensionis L. Poaceae 20.19 8.92 9.05 38.16
55 Chenopodium album L. Chenopodiaceae 15.38 8.92 10.62 34.94
56 Cynodon dactylon (L.) Pers. Poaceae 7.28 14.28 29.52 51.49
57 Cyperus rotundus L. Cyperaceae 10.57 7.14 8.66 26.37
58 Dichanthium annulatum Frossk Poaceae 5.76 10.71 22.44 38.91
59 Launaea angustifolia (Desf.) Kuntze Asteraceae 11.53 10.71 5.11 27.35
60 Malva neglecta Wallr. Malvaceae 8.65 25 5.11 38.76

90
Table 19. Phytosociological attributes of plant community at site II
S.No Name of plants Family R/Density R/Frequency R/Cover Importance value
During spring, trees
1 Acacia modesta Wall. Mimosaceae 10.68 14.28 12.89 37.87
2 Acacia nilotica (L.) Wild.ex Delile Mimosaceae 8.39 15.87 17.45 41.72
3 Phoenix dactylifera L. Araceae 19.08 19.04 14.41 52.55
4 Prosopis cineraria L. Mimosaceae 20.61 19.05 17.60 57.26
5 Tamarix aphylla (L.) Karst Tamaricaceae 30.53 17.46 18.97 66.96
6 Ziziphus jujuba Mill. Rhamnaceae 10.68 14.28 68.66 43.64
During spring, shrubs
7 Aerva javanica (Burm. F.) Juss. Amaranthaceae 11.18 16.67 4.21 32.05
8 Calotropis procera (Willd.) R. Br. Asclepiadaceae 7.65 12.12 11.97 31.74
9 Cistanche tubulosa (Shehenk.) Orobanchaceae 13.53 9.09 6.15 28.77
10 Prosopis juliflora Swartz. Mimosaceae 17.05 18.18 33.98 69.22
11 Rhazya stricta Decne. Apocynaceae 10 10.60 14.24 34.84
12 Tamarix dioica Roxb. Ex Roth. Tamaricaceae 23.53 10.60 10.68 44.81
13 Vitex negundo L. Vitaceae 7.06 9.09 8.09 24.24
14 Withania coagulans Dunal. Solanaceae 10 13.63 10.67 34.31

91
During spring, herbs
15 Anagallis arvensis L. Primulaceae 5.34 6.09 2.65 14.08
16 Avena fatua L. Poaceae 2.56 6.09 1.59 10.24
17 Calendula officinalis L. Asteraceae 2.77 4.87 3.00 10.64
18 Carthamus persicus Willd. Asteraceae 4.27 3.65 4.06 11.98
19 Cenchrus ciliaris L. Poaceae 9.61 4.87 6.18 20.66
20 Chenopodium album L. Chenopodiaceae 4.91 5.48 7.59 17.98
21 Convolvulus arvensis L. Convolvulaceae 3.20 3.65 3.35 10.22
22 Cymbopogon distanse Schutt. Poaceae 5.55 7.92 18.19 31.66
23 Cynodon dactylon (L.) Pers. Poaceae 7.90 7.31 9.36 24.57
24 Datura alba Nees. Solanaceae 4.059 4.87 4.41 13.33
25 Euphorbia helioscopia L. Euphorbiaceae 2.35 3.65 3.35 9.35
26 Heliotropium europaeum (F. & M.) Kazmi Boraginaceae 2.77 3.65 4.41 10.83
27 Malcolmia Africana (L.) R.Br. Malvaceae 9.61 6.70 4.06 20.37
28 Oligomeris linifolia (Vahl.) Macbride Resedaceae 2.56 4.26 2.29 9.12
29 Pegnum harmala L. Zygophyllaceae 4.27 5.48 6.53 16.26
30 Polygonum plebejum R.Br Polygonaceae 3.20 3.04 2.29 8.83
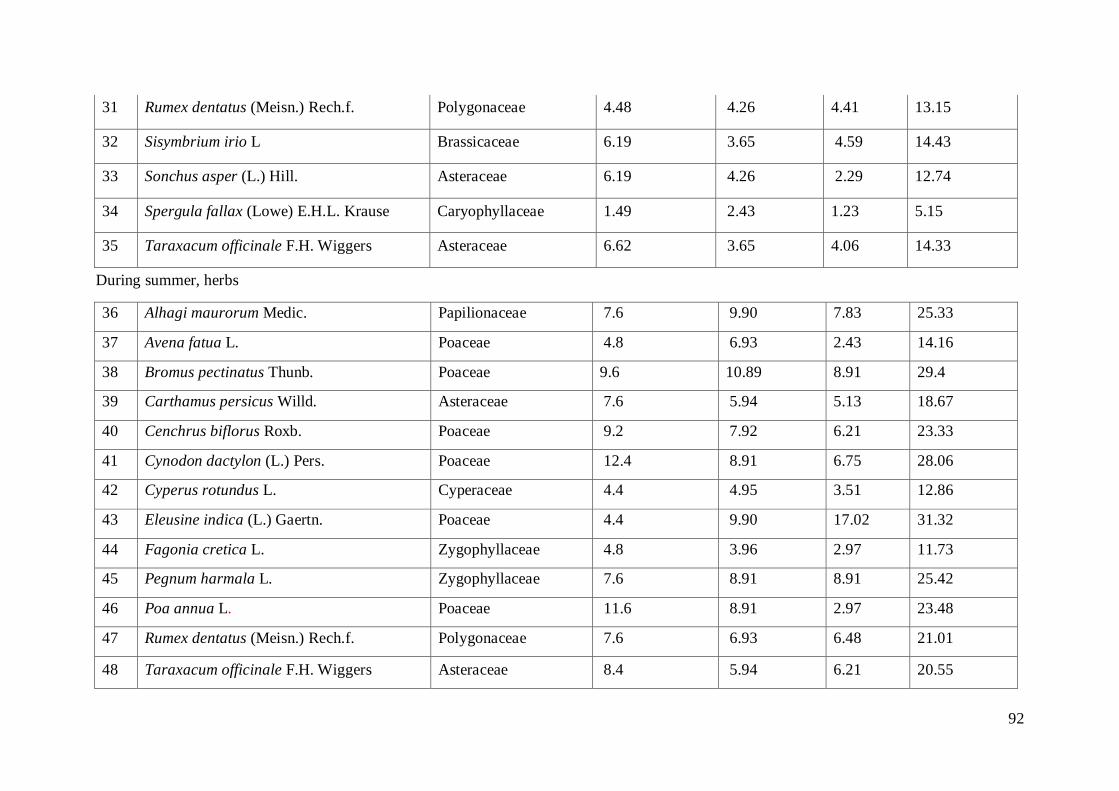
92
31 Rumex dentatus (Meisn.) Rech.f. Polygonaceae 4.48 4.26 4.41 13.15
32 Sisymbrium irio L Brassicaceae 6.19 3.65 4.59 14.43
33 Sonchus asper (L.) Hill. Asteraceae 6.19 4.26 2.29 12.74
34 Spergula fallax (Lowe) E.H.L. Krause Caryophyllaceae 1.49 2.43 1.23 5.15
35 Taraxacum officinale F.H. Wiggers Asteraceae 6.62 3.65 4.06 14.33
During summer, herbs
36 Alhagi maurorum Medic. Papilionaceae 7.6 9.90 7.83 25.33
37 Avena fatua L. Poaceae 4.8 6.93 2.43 14.16
38 Bromus pectinatus Thunb. Poaceae 9.6 10.89 8.91 29.4
39 Carthamus persicus Willd. Asteraceae 7.6 5.94 5.13 18.67
40 Cenchrus biflorus Roxb. Poaceae 9.2 7.92 6.21 23.33
41 Cynodon dactylon (L.) Pers. Poaceae 12.4 8.91 6.75 28.06
42 Cyperus rotundus L. Cyperaceae 4.4 4.95 3.51 12.86
43 Eleusine indica (L.) Gaertn. Poaceae 4.4 9.90 17.02 31.32
44 Fagonia cretica L. Zygophyllaceae 4.8 3.96 2.97 11.73
45 Pegnum harmala L. Zygophyllaceae 7.6 8.91 8.91 25.42
46 Poa annua L. Poaceae 11.6 8.91 2.97 23.48
47 Rumex dentatus (Meisn.) Rech.f. Polygonaceae 7.6 6.93 6.48 21.01
48 Taraxacum officinale F.H. Wiggers Asteraceae 8.4 5.94 6.21 20.55

93
During autumn, herbs
49 Achyranthes aspera L. Amaranthaceae 12.68 14.51 7.28 34.47
50 Amaranthus viridis L. Amaranthaceae 10.44 11.29 6.31 28.04
51 Boerhavia procumbens Banks ex Roxb Nyctaginaceae 11.19 8.06 9.22 28.47
52 Bromus pectinatus thumb. Poaceae 5.22 9.67 25.72 40.61
53 Chenopodium murale L. Chenopodiaceae 12.68 9.67 7.28 29.63
54 Citrullus colocynthis (L.) Shred. Cucurbitaceae 8.20 11.29 15.04 34.53
55 Cynodon dactylon (L.) Pers. Poaceae 18.65 16.12 11.65 46.42
56 Cyperus rotundus L. Cyperaceae 12.68 11.29 6.31 30.28
57 Solanum surattense Burm.f. Solanaceae 8.20 8.06 11.16 27.42
During winter, herbs
58 Aristida adscensionis L. Poaceae 8.94 13.46 11.45 33.85
59 Chenopodium album L. Chenopodiaceae 12.19 15.38 23.95 51.52
60 Convolvulus arvensis L. Convolvulaceae 8.94 9.61 15.62 34.17
61 Cynodon dactylon (L.) Pers. Poaceae 15.44 15.38 11.45 42.27
62 Dichanthium annulatum Forssk. Poaceae 10.56 11.53 10.41 32.5
63 Poa annua L. Poaceae 17.07 13.46 9.375 39.8
64 Polygonum plebejum R.Br Polygonaceae 9.75 7.69 8.33 25.77
65 Sonchus asper (L.) Hill. Asteraceae 17.07 13.46 9.37 39.9

94
Table 20. Phytosociological attributes of plant community at site III
S.No Name of Plants Family R/Density R/Frequency R/Cover Importance
value
During spring, trees
1 Acacia modesta Wall. Mimosaceae 20.98 22 18.44 61.42
2 Acacia nilotica (L.) Wild.ex Delile Mimosaceae 25.92 24 26.68 76.60
3 Tamarix aphylla (L.) Karst Tamariaceae 34.57 26 20.60 81.17
4 Ziziphus jujuba Mill. Rhamnaceae 12.34 18 24.94 55.29
5 Prosopis cineraria L. Mimosaceae 6.17 10 9.33 25.50
During spring, shrubs
6 Aerva javanica (Burm. F.) Juss. Amaranthaceae 21.24 21.05 8.84 51.14
7 Calotropis procera (willd.) R. Br. Capparidaceae 13.27 19.29 15.38 47.96
8 Prosopis juliflora Swartz. Mimosaceae 30.97 26.56 48.08 103.61
9 Rhazya stricta Decne. Apocynaceae 14.16 14.03 13.46 41.65
10 Withania coagulans Dunal. Solanaceae 20.35 21.05 14.23 55.65
During spring, herbs
11 Alopecurus nepalensis Trin.Ex Steud. Poaceae 2.10 1.84 1.51 5.45
12 Anagallis arvensis L. Primulaceae 3.00 3.69 2.34 9.03
13 Atriplex stocksii Boiss Chenopodiaceae 1.70 2.46 2.34 6.5
14 Calendula officinalis L. Asteraceae 2.90 3.69 3.45 10.04

95
15 Carduus argentatus L. Asteraceae 1.50 1.84 2.07 5.41
16 Cirsium arvense (L.) Scop. Asteraceae 2.30 2.46 1.79 6.55
17 Convolvulus arvensis L. Convolvulaceae 3.51 3.07 3.17 9.75
18 Conyza bonariensis (L.) Cronquist Asteraceae 1.90 1.84 1.51 5.25
19 Cymbopogon distans Schutt. Poaceae 1.30 2.76 4.00 8.06
20 Cynodon dactylon (L.) Pers. Poaceae 4.51 4 8.70 17.21
21 Datura alba Nees. Solanaceae 2.10 1.84 2.07 6.01
22 Dinebra retroflexa (Vahl) Panzer. Poaceae 0.90 1.84 0.69 3.43
23 Echinochloa crus-galli (L.) P. Beauv. Poaceae 1.40 2.15 0.82 4.37
24 Euphorbia helioscopia L. Euphorbiaceae 5.61 3.69 5.94 15.24
25 Euphorbia prostrata Ait. Euphorbiaceae 3.10 1.84 3.15 8.09
26 Fagonia indica L. Zygophyllaceae 2.70 2.15 3.17 8.02
27 Filago pyramidata L. Asteraceae 0.90 1.53 0.96 3.39
28 Fumeria indica Hausskn. Fumariaceae 2.90 2.46 3.73 9.09
29 Heliotropium crispum Desf. Boraginaceae 1.30 1.84 0.69 3.83
30 Lactuca serriola L. Asteraceae 1.90 2.15 1.24 5.29
31 Lathyrus aphaca L. Papilionaceae 1.40 1.53 0.55 3.89
32 Launaea procumbens Pravin Kawale Asteraceae 1.10 1.53 0.96 3.18

96
33 Leptochloa panacea Retz Poaceae 1.70 2.15 0.55 4.4
34 Malva neglecta Wallr. Malvaceae 1.50 1.53 0.82 3.85
35 Medicago polymorpha L. Papilionaceae 2.40 2.46 2.07 6.93
36 Melilotus alba Desr. Papilionaceae 1.30 1.53 0.69 3.52
37 Melilotus indica (L.) All. Papilionaceae 2.30 2.15 0.96 5.41
38 Neslia apiculata Fisch. Brassicaceae 1.10 1.23 1.10 3.43
39 Nicotiana plumbaginifolia Viv. Solanaceae 1.50 1.53 0.96 4.01
40 Oxalis corniculata L. Oxalidaceae 2.30 1.84 0.55 4.69
41 Phalaris minor Retz. Poaceae 1.80 1.84 0.96 4.6
42 Plantago lanceolata L. Plantaginaceae 3.00 2.76 1.51 7.27
43 Poa annua L. Poaceae 4.71 3.69 4.55 12.95
44 Poa botryoides (Trin. Ex Griseb.)
Kom. Poaceae 2.10 1.84 1.24 5.18
45 Polygonum plebejum R.Br Polygonaceae 1.10 1.53 2.07 4.7
46 Ranunculus sceleratus L. Ranunculaceae 1.30 1.53 0.96 3.79
47 Rumex dentatus (Meisn.) Rech.f. Polygonaceae 1.10 1.23 1.79 4.12
48 Polypogon monspeliensis (L.) Desf. Poaceae 1.00 2.46 5.94 9.4
49 Sisymbrium irio L Brassicaceae 3.10 2.15 3.17 8.42
50 Sonchus asper (L.) Hill. Asteraceae 2.90 3.07 1.93 7.9

97
51 Solanum nigrum L. Solanaceae 1.00 1.84 0.96 3.8
52 Taraxacum officinale F.H. Wiggers Asteraceae 3.51 2.15 3.31 8.97
53 Torilis nodosa (L.) Gaertn. Apiaceae 2.30 1.53 2.07 5.9
54 Trigonella crassipes Boiss. Papilionaceae 3.10 2.15 2.07 7.32
55 Verbena officinalis L. Verbenaceae 1.70 1.84 1.51 5.05
56 Xanthium strumarium L. Asteraceae 1.90 1.53 3.17 6.6
During summer, herbs
57 Alhagi maurorum Medic. Papilionaceae 17.1 15.94 19.02 52.15
58 Aristida cyanantha Nees ex Steud. Poaceae 7.00 8.69 7.06 22.75
59 Cenchrus ciliaris L. Poaceae 10.82 13.04 5.97 29.83
60 Conyza bonariensis (L.) Cronquist Asteraceae 9.55 10.14 6.52 26.21
61 Cynodon dactylon (L.) Pers. Poaceae 17.19 14.49 19.02 50.7
62 Cyperus rotundus L. Cyperaceae 12.10 10.14 8.15 30.39
63 Fagonia cretica L. Zygophyllaceae 12.10 8.69 7.06 27.85
64 Heliotropium strigosum Wild Boraginaceae 7.64 7.24 3.80 18.68
65 Polypogon monspeliensis (L.) Desf. Poaceae 6.36 11.59 23.36 41.31

98
During autumn, herbs
66 Achyranthes aspera L. Amaranthaceae 13.60 12.65 11.82 38.07
67 Amaranthus viridis L. Amaranthaceae 14.20 12.65 12.36 39.21
68 Boerhavia procumbens Banks ex Roxb Nyctaginaceae 7.69 7.59 5.91 21.19
69 Chenopodium murale L. Chenopodiaceae 14.79 13.92 14.51 43.22
70 Corchorus depressus (L.) Tiliaceae 5.91 6.32 4.83 17.06
71 Cynodon dactylon (L.) Pers. Poaceae 12.42 11.39 13.97 37.78
72 Cyperus rotundus L. Cyperaceae 9.46 8.86 4.83 23.15
73 Polypogon monspeliensis (L.) Desf. Poaceae 5.91 10.12 23.11 39.14
74 Solanum surattense Burm.f. Solanaceae 8.28 7.59 4.83 20.7
75 Tribulus terrestris L. Zygophyllaceae 7.69 8.86 3.76 20.31
During winter, herbs
76 Avena fatua L. Poaceae 7.98 10.81 5.18 23.97
77 Convolvulus arvensis L. Convolvulaceae 11.73 9.45 8.14 29.32
78 Cynodon dactylon (L.) Pers. Poaceae 11.73 12.16 21.48 45.37
79 Dichanthium annulatum Forssk. Poaceae 9.85 10.81 18.51 39.17
80 Euphorbia helioscopia L. Euphorbiaceae 16.43 16.21 20 52.64
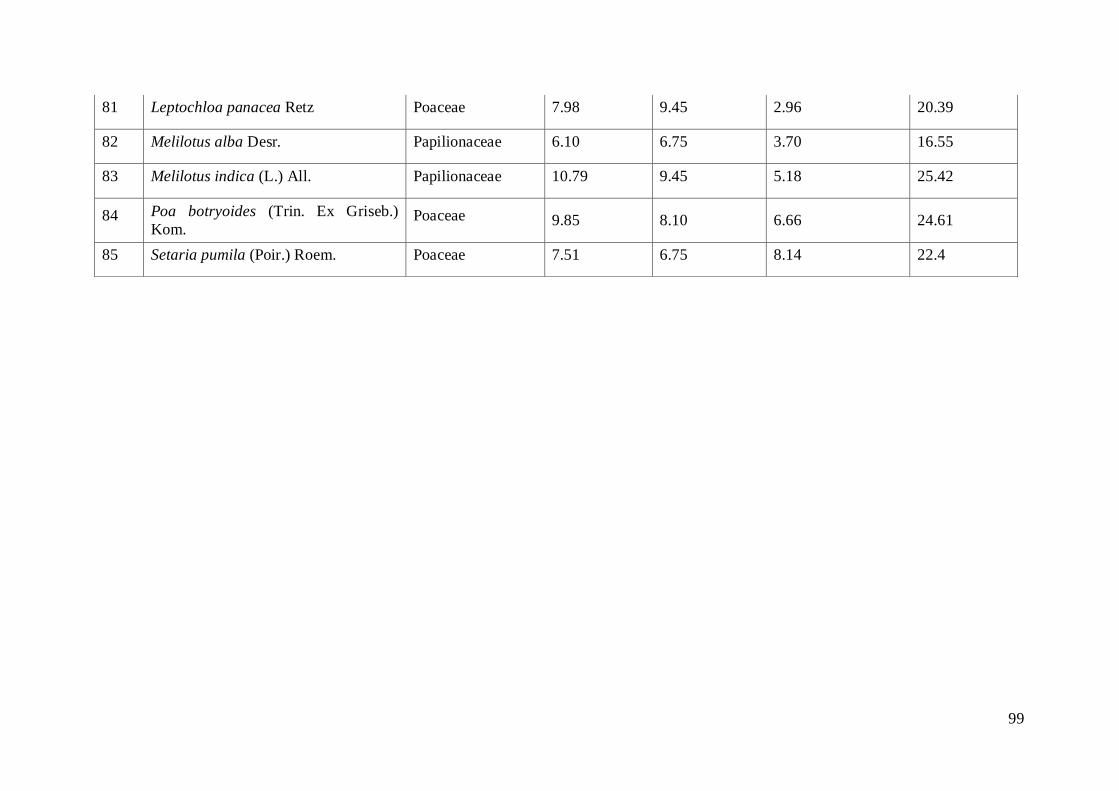
99
81 Leptochloa panacea Retz Poaceae 7.98 9.45 2.96 20.39
82 Melilotus alba Desr. Papilionaceae 6.10 6.75 3.70 16.55
83 Melilotus indica (L.) All. Papilionaceae 10.79 9.45 5.18 25.42
84 Poa botryoides (Trin. Ex Griseb.)
Kom. Poaceae 9.85 8.10 6.66 24.61
85 Setaria pumila (Poir.) Roem. Poaceae 7.51 6.75 8.14 22.4

100
Table 21. Family importance values at site I
S.No. Family Total importance value of
Family
1 Amaranthaceae 21.92
2 Apocynaceae 44.18
3 Asclepiadaceae 52.03
4 Apiaceae 9.32
5 Asphodelaceae 43.91
6 Asteraceae 93.85
7 Aizoaceae 13.97
8 Boraginaceae 21.99
9 Brassicaceae 20.73
10 Capparidaceae 42.62
11 Caryophyllaceae 12.48
12 Chenopodiaceae 136.2
13 Convolvulaceae 11.8
14 Cucurbitaceae 17.61
15 Cyperaceae 101.14
16 Euphorbiaceae 48.4
17 Malvaceae 38.76
18 Mimosaceae 133.74
19 Nyctaginaceae 14.23
20 Orobanchaceae 37.89
21 Papaveraceae 9.26
22 Papilionaceae 66.66
23 Plantaginaceae 31.37
24 Polygonaceae 97.25
25 Poaceae 483.4
26 Resedaceae 6.29
27 Rhamnaceae 61.20
28 Tamaricaceae 107.29
29 Zygophyllaceae 21.92

101
Table 22. Family importance values at site II.
S.No. Family Total importance value of
family
1 Amaranthaceae 94.56
2 Apocynaceae 34.84
3 Asclepiadaceae 31.74
4 Asteraceae 128.82
5 Araceae 52.55
6 Boraginaceae 10.83
7 Brassicaceae 14.43
8 Caryophyllaceae 5.15
9 Chenopodiaceae 99.13
10 Convolvulaceae 44.39
11 Cucurbitaceae 34.53
12 Cyperaceae 43.14
13 Euphorbiaceae 9.35
14 Malvaceae 20.37
15 Mimosaceae 206
16 Nyctaginaceae 28.47
17 Orobanchaceae 28.77
18 Papilionaceae 25.53
19 Poaceae 472.43
20 Polygonaceae 55.61
21 Primulaceae 27.23
22 Resedaceae 9.12
23 Rhamnaceae 43.64
24 Solanaceae 56.76
25 Tamaricaceae 88.45
26 Vitaceae 24.24
27 Zygophyllaceae 53.41

102
Table 23. Family importance valuesat site III
S.No Family Total Family importance value
1 Amaranthaceae 128.42
2 Apocynaceae 41.65
3 Apiaceae 5.9
4 Asteraceae 88.79
5 Boraginaceae 22.51
6 Brassicaceae 11.85
7 Capparidaceae 47.96
8 Chenopodiaceae 49.72
9 Convolvulaceae 39.07
10 Cyperaceae 53.89
11 Euphorbiaceae 75.97
12 Fumariaceae 9.09
13 Malvaceae 3.85
14 Mimosaceae 267.13
15 Nyctaginaceae 21.19
16 Oxalidaceae 4.9
17 Papilionaceae 121.19
18 Plantaginaceae 7.27
19 Poaceae 472.47
20 Polygonaceae 8.19
21 Primulaceae 9.03
22 Ranunculaceae 3.79
23 Rhamnaceae 55.29
24 Solanaceae 90.17
25 Tiliaceae 17.06
26 Tamaricaceae 81.17
27 Verbenaceae 5.05
28 Zygophyllaceae 56.18

103
4.4 Shannon Diversity Index and Species richness.
Shannon diversity index of plant communities at three sites (I, II, III) in given (Table
24). Species diversity is one of the key characters of any vegetation that not only
reflects the health of vegetation but also its productivity. Index of diversity is the
degree of complexity of form and function in a community. Its specific measurement
leads to understanding of process involved in the developing changes and group of
communities (Shoukat et al., 1978; Malik & Hussain, 2006). Species diversity reflects
the influence of diverse factors such as over grazing, deforestation, and environmental
stress as vulnerability of species to these factors, lowers the species diversity
(Willoughby & Alexander, 2000, 2005). Shannon diversity index at site I was 3.814,
at site II, 3.74 and at site III, 4.083 among plant communities in the area. These
results are in line with those of Adhikari et al. (1991) and Badshah et al. (2013) who
described high diversity near water courses similar to the present trends. Malik et al.
(2001) documented high species diversity in the upper reaches of vegetation of Dao
Khun while low diversity at lower altitude. Similarly, during the present study high
species diversity was found at site III, based on habitat feature, water contents and
climate.
Species richness was recorded at each sites of the area. At site-I, the species richness
was 54 that gradually decreased to 51 at site-III while highest species richness was 72
species at site III (Table. 24). The high richness may be due to different habitats and
appropriate edaphic and climatic factors supporting growth and survival of the
species. This is also true in the present case where favorable temperature made the
habitat suitable for plants (Samant et al. 2007). Central Himalayan area which are
most arid cool have species richness from 11 - 106 (Rikhari et al., 1997; Ram et al.,
2004). At site-I and site-II high deforestation, erosion and overgrazing have created
aridity. The overall high species richness was observed at site-III. The high
herbaceous richness value were stated in dry habitats by former workers varied from
34 - 414 (Kharkwal et al., 2005 and Badsha et al., 2010) and their values were greater
than the present study.

104
Table 24. Shannon diversity index and species richness at three sites
Site I Site II Site III
Shannon Diversity 3.814 3.742 4.083
Species Richness 54 51 72
Figure 7. Species richness and diversity
4.5 Effect of rain on density, frequency, cover and Importance Values.
The effect of rain on density, frequency, cover and importance value of plant
community at three sites is expressed in (Table 25). This study was conducted in dry
and xeric habitat of district Bannu. The annual precipitation had direct effect on the
total values of density, frequency, cover and importance values of plant community in
dry area. There was linear correlation among the rain fall and density, frequency,
cover and importance value of plant community in the area. It is quite evident from
the (Fig. 8) values that the density, frequency, cover and importance values of plant
communities increased with precipitation in the area. The xeric and dried habitat’s
biomes may responces positively to precipitation. Primary productivity of plant
communities increased with precipitation in the area (Zeppel et al., 2014). Moreover,
seasonal variation in rain fall during warm or dry seasons may have larger effects than
changes during cool or wet seasons. This shows similarity with the study of Volder et
al. (2010, 2013); Reyer et al. (2012) and Misson et al. (2011).

105
Table 25. Effect of rain on total values of three sites.
Estimate Standard
Error
T Value P Value
Density 0.1975
0.3883 0.509 0.662
Frequency 7.073
13.922 0.508 0.662
Cover 0.1585
0.6923 0.229 0.849
IV 1.297
3.369 0.385 0.737
Figure 8. Effect of rain on total values of density, frequency, cover and importance
value of plant community.
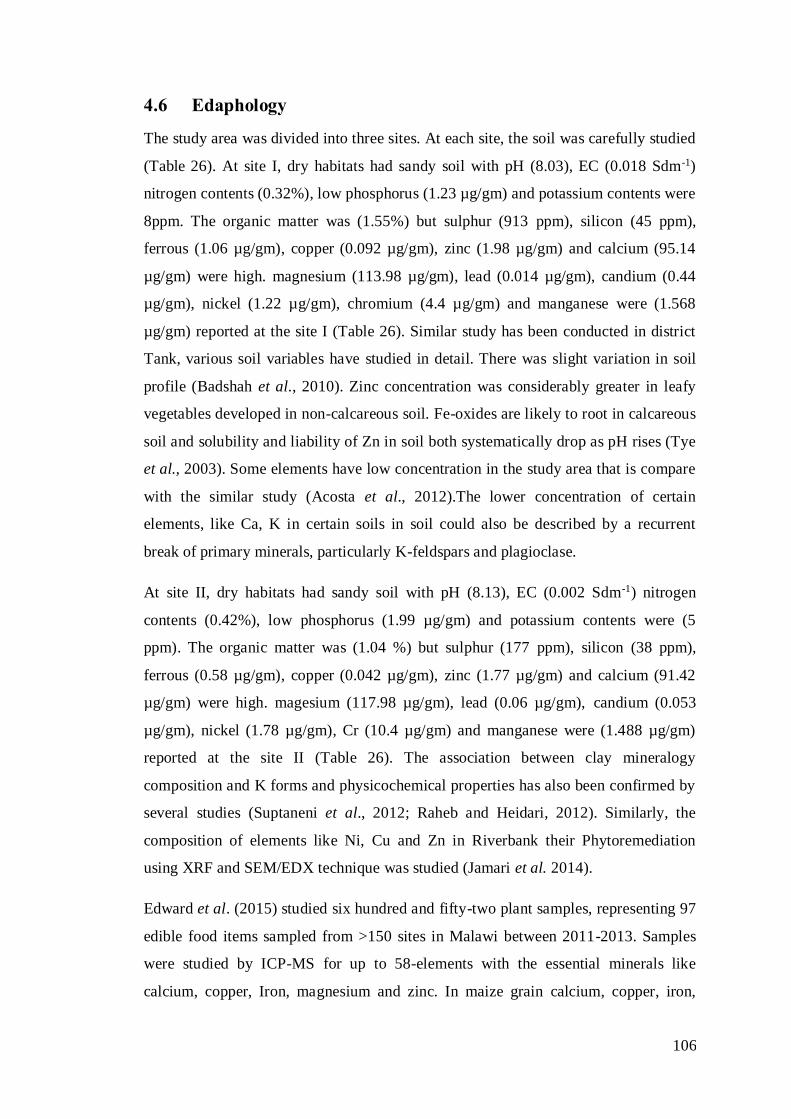
106
4.6 Edaphology
The study area was divided into three sites. At each site, the soil was carefully studied
(Table 26). At site I, dry habitats had sandy soil with pH (8.03), EC (0.018 Sdm-1)
nitrogen contents (0.32%), low phosphorus (1.23 µg/gm) and potassium contents were
8ppm. The organic matter was (1.55%) but sulphur (913 ppm), silicon (45 ppm),
ferrous (1.06 µg/gm), copper (0.092 µg/gm), zinc (1.98 µg/gm) and calcium (95.14
µg/gm) were high. magnesium (113.98 µg/gm), lead (0.014 µg/gm), candium (0.44
µg/gm), nickel (1.22 µg/gm), chromium (4.4 µg/gm) and manganese were (1.568
µg/gm) reported at the site I (Table 26). Similar study has been conducted in district
Tank, various soil variables have studied in detail. There was slight variation in soil
profile (Badshah et al., 2010). Zinc concentration was considerably greater in leafy
vegetables developed in non-calcareous soil. Fe-oxides are likely to root in calcareous
soil and solubility and liability of Zn in soil both systematically drop as pH rises (Tye
et al., 2003). Some elements have low concentration in the study area that is compare
with the similar study (Acosta et al., 2012).The lower concentration of certain
elements, like Ca, K in certain soils in soil could also be described by a recurrent
break of primary minerals, particularly K-feldspars and plagioclase.
At site II, dry habitats had sandy soil with pH (8.13), EC (0.002 Sdm-1) nitrogen
contents (0.42%), low phosphorus (1.99 µg/gm) and potassium contents were (5
ppm). The organic matter was (1.04 %) but sulphur (177 ppm), silicon (38 ppm),
ferrous (0.58 µg/gm), copper (0.042 µg/gm), zinc (1.77 µg/gm) and calcium (91.42
µg/gm) were high. magesium (117.98 µg/gm), lead (0.06 µg/gm), candium (0.053
µg/gm), nickel (1.78 µg/gm), Cr (10.4 µg/gm) and manganese were (1.488 µg/gm)
reported at the site II (Table 26). The association between clay mineralogy
composition and K forms and physicochemical properties has also been confirmed by
several studies (Suptaneni et al., 2012; Raheb and Heidari, 2012). Similarly, the
composition of elements like Ni, Cu and Zn in Riverbank their Phytoremediation
using XRF and SEM/EDX technique was studied (Jamari et al. 2014).
Edward et al. (2015) studied six hundred and fifty-two plant samples, representing 97
edible food items sampled from >150 sites in Malawi between 2011-2013. Samples
were studied by ICP-MS for up to 58-elements with the essential minerals like
calcium, copper, Iron, magnesium and zinc. In maize grain calcium, copper, iron,

107
magnesium and zinc results showed that concentrations were greater from plants
grown on calcareous soils than those from the more common low pH soils.
At site III, dry habitats had sandy soil with pH (8.04), EC (0.005 Sdm-1) nitrogen
contents (0.35%), low phosphorus (1.34 µg/gm) and potassium contents were studied
(4 ppm). The organic matter was (1.35%) but sulphur (295 ppm), silicon (34 ppm),
ferrous (4.28 µg/gm), copper (0.318 µg/gm), zinc (0.206 µg/gm) and calcium (102.66
µg/gm) were high. magnesium (120.94 µg/gm), lead (0.006 µg/gm), candium (0.08
µg/gm), nickel (0.68 µg/gm), chromium (52 µg/gm) and manganese were (1.998
µg/gm) reported in the site III (Table 26). This is due to statement that variation in the
concentrations of soil chemical elements are determined from changes in the
arrangement of the parent material and from fluxes of matter and energy into or from
soils over time (Helmke, 2000; Rawlims et al., 2012).
The nature of the key variables explanation ecological diversity of soils can be
connected to the mineralogy of parent rock and though these relation-ships have
indirect, mineralogy of parent rock is a chief factor regulates spatial patterns of land
resources (Voortman, 2011). Generally the study area soils varied slightly in pH i.e.
from 8.03-8.13 to 8.04, EC from 0.018-0.002 Sdm-1 to 0.005 dSm-1. Organic matter
were adequate amount i.e. from 1.55-1.04 % to 1.35%. NPK and other macro and
microelements which were essential for plant growth and development were also
studied in (Table 26).
According to Towett et al. (2015) the variation in whole elements concentration is
vital especially in the sub-saharan Africa soil setting for agricultural and
environmental, management at big scale. With and between the sites forms of
variation in total elements structure of 17-elements; Al, P, K, Ca, Ti, V, Cr, Mn, Fe,
Ni, Cu, Zn, Ga, Sr, Y, Ta and Pb were explored. Total elements concentration
standards were within the range reported globally for soil Cr, Mn, Zn, Ni, V, Sr, and
Y and higher than reported range for Al, Cu, Ta, Pb and Ca. these were important
variations (< 0.005) in total element composition within and between the sites for the
elements examined with the highest proportion of total variation and member of
significant variance constituents occurring at the site (55-88%) monitored by the
cluster nested with site (10-40%) levels.

108
Table 26. Soil elements in three sites.
S/No Elements Site I Site II Site III
1 pH 8.03 8.13 8.04
2 EC in (dScm-1) 0.018(dScm-1) 0.002(dScm-1) 0.005(dScm-1)
3 OM in % 1.55% 1.04% 1.35%
4 Soil texture Sandy Loam Sandy Loam Sandy Loam
5 Nitrogen as N 0.32% 0.42% 0.35%
6 Phosphorus as P 1.23 µg/gm 1.99 µg/gm 1.34 µg/gm
7 Potassium as K 8 ppm 5 ppm 4 ppm
8 Mg 113.98 µg/gm 117.52 µg/gm 120.94 µg/gm
9 Ca 95.14 µg/gm 91.42 µg/gm 102.94 µg/gm
10 Sulphur as S 913 ppm 177 ppm 295 ppm
11 Ferrous 1.06 µg/gm 0.58 µg/gm 4.28 µg/gm
12 Mn 1.568 µg/gm 1.488 µg/gm 1.998 µg/gm
13 Cu 0.092 µg/gm 0.042 µg/gm 0.318 µg/gm
14 Zn 1.98 µg/gm 1.77 µg/gm 0.206 µg/gm
15 Si 45 ppm 38 ppm 34 ppm
16 Pb 0.014 µg/gm 0.06 µg/gm 0.006 µg/gm
17 Ni 1.22 µg/gm 1.75 µg/gm 0.68 µg/gm
18 Cr 4.4 µg/gm 10.4 µg/gm 5.2 µg/gm
19 Cd 0.044 µg/gm 0.053 µg/gm 0.08 µg/gm

109
4.6.1 Principal component analysis among the soil variables
Soil is naturally composed of various degraded minerals and organic matter. It is
deposited by numerous natural actions such as mechanical and chemical weathering
on different types of rocks. The principal component among various soil variables are
expressed in Table 27. There is strong correlation between N and Pb in the soil. Their
probability value is 0.001. Similarly, there is negative correlation between Mg and S.
Its probability value is -0.023 in the area. While, no correlation is found in rest of
elements in the area (Fig. 9).
Soil pH and organic matter contents strongly affect soil function and plant nutrients
availability. Specially, pH affects chemical solubility and accessibility of plant
essential nutrient. To know plant nutrients availability and optimal growing
conditions for specific plant, it is essential to understand soil chemistry and
interrelating factors that affect soil pH (McCauley et. al., 2009). Therefore, the soil
pH is one of the influential factors in the plant nutrients availability in the soil. The
essential range of soil pH is 5.5 to 7.0 for the suitable growth and progress of most of
the plants (Singh, 1995). Most of the plant nutrients are accessible at somewhat acidic
to slightly alkaline soil (PH 6.5 to 7.5). A number of plant nutrients are inaccessible at
very acidic or extremely alkaline soils due to the altered reactions in the soil which fix
the nutrient and convert them to the state that is unavailable for the plants (Brady,
1984). Soil organic matter is defined as the summation of plants and animals residue
at various stages of decomposition, cell and tissue of soil organism, and well-
decomposed materials (Brady and Weil, 1999). Soil organic matter helps multiple
functions in the soil, counting nutrients storage and soil accretion. Soil organic matter
levels have weakened over the last century in some soils as a result of extreme
agricultural practices, overgrazing on grasslands, deforestation and change of forest to
tilled farmland. Soil organic matter content is up to 5 percent in agricultural soils
while it could be up to 30 percent in the organic soils (Brady and Weil, 2002).

110
Table 27. Soil variables obtained through Principal Component Analysis.
S.No Paramter 1 2 3 4 5 6 7 8 9 10 11 12 13 14 15 16 17 18
1 pH -0.778 0.629 0.895 0.802 -0.543 0.765 0.777 0.101 0.992 -0.993 -0.144 0.905 0.664 0.109 0.206 0.753 -0.67 -0.131
2 EC (dScm-1) 0.111 -0.994 -0.324 -0.99 -0.203 -0.092 -0.995 -0.771 -0.619 0.791 0.798 -0.943 0.052 0.62 0.541 -0.998 -0.045 0.79
3 OM % 0.55 -0.835 -0.718 -0.946 0.262 -0.533 -0.932 -0.398 -0.908 0.982 0.438 -0.991 -0.406 0.198 0.102 -0.917 0.412 0.426
4 Nitrogen -0.633 0.774 0.785 0.907 -0.36 0.618 0.889 0.302 0.946 -0.996 -0.343 0.973 0.498 -0.096 0.001 0.871 -0.504 -0.331
5 P -0.749 0.662 0.875 0.827 -0.506 0.737 0.804 0.144 0.986 -0.997 -0.186 0.922 0.631 0.066 0.163 0.781 -0.637 -0.174
6 K -0.303 -0.953 0.09 -0.848 -0.585 0.322 -0.869 -0.964 -0.245 0.474 0.974 -0.726 0.455 0.886 0.837 -0.887 -0.449 0.971
7 Mg 0.547 0.837 -0.353 0.675 0.781 -0.563 0.704 1 -0.023 -0.22 -0.999 0.515 -0.677 -0.978 -0.953 0.731 0.672 -1
8 Ca 0.992 0.127 0.941 -0.123 0.982 -0.994 -0.083 0.649 -0.775 0.599 -0.616 -0.317 -0.999 -0.794 -0.849 -0.045 1 -0.625
9 S 0.084 -0.996 -0.298 -0.986 -0.23 -0.065 -0.992 -0.788 -0.598 0.774 0.814 -0.934 0.08 0.642 0.564 -0.996 -0.073 0.806
10 Fe 0.943 0.332 -0.849 0.088 1 -0.949 0.128 0.794 -0.626 0.418 -0.767 -0.112 -0.985 -0.904 -0.941 0.165 0.984 -0.775
11 Mn 0.952 0.307 -0.863 0.061 1 -0.958 0.101 0.778 -0.646 0.442 -0.75 -0.138 -0.989 -0.892 -0.932 0.139 0.988 -0.758
12 Cu 0.959 0.283 -0.875 0.037 1 -0.964 0.077 0.762 -0.665 0.464 -0.733 -0.162 -0.992 -0.881 -0.922 0.115 0.992 -0.742
13 Zn -0.884 -0.537 0.707 -0.311 -0.969 0.854 -0.349 -0.911 0.433 -0.201 0.892 -0.116 0.92 0.977 0.993 -0.384 -0.917 0.898
14 Si -0.42 -0.908 0.213 -0.775 -0.681 0.437 -0.8 -0.989 -0.123 0.36 0.995 -0.635 0.562 0.937 0.899 -0.822 -0.556 0.993
15 Pb -0.9 0.436 0.973 0.646 -0.719 0.891 0.614 -0.127 0.995 -0.939 0.084 0.784 0.816 0.332 0.422 0.584 -0.82 0.097
16 Ni -0.998 0.06 0.988 0.306 -0.93 0.997 0.267 -0.496 0.879 -0.738 0.458 0.489 0.975 0.667 0.736 0.23 -0.976 0.469
17 Cr -0.757 0.654 0.881 0.821 -0.516 0.744 0.797 0.133 0.988 -0.996 -0.175 0.918 0.64 0.077 0.174 0.774 -0.645 -0.163
18 Cd 0.764 0.654 -0.607 0.435 0.927 -0.777 0.471 0.958 -0.309 0.069 -0.945 0.248 -0.86 -0.997 -1 0.504 0.856 -0.949

111
Figure 9. Principal component analysis
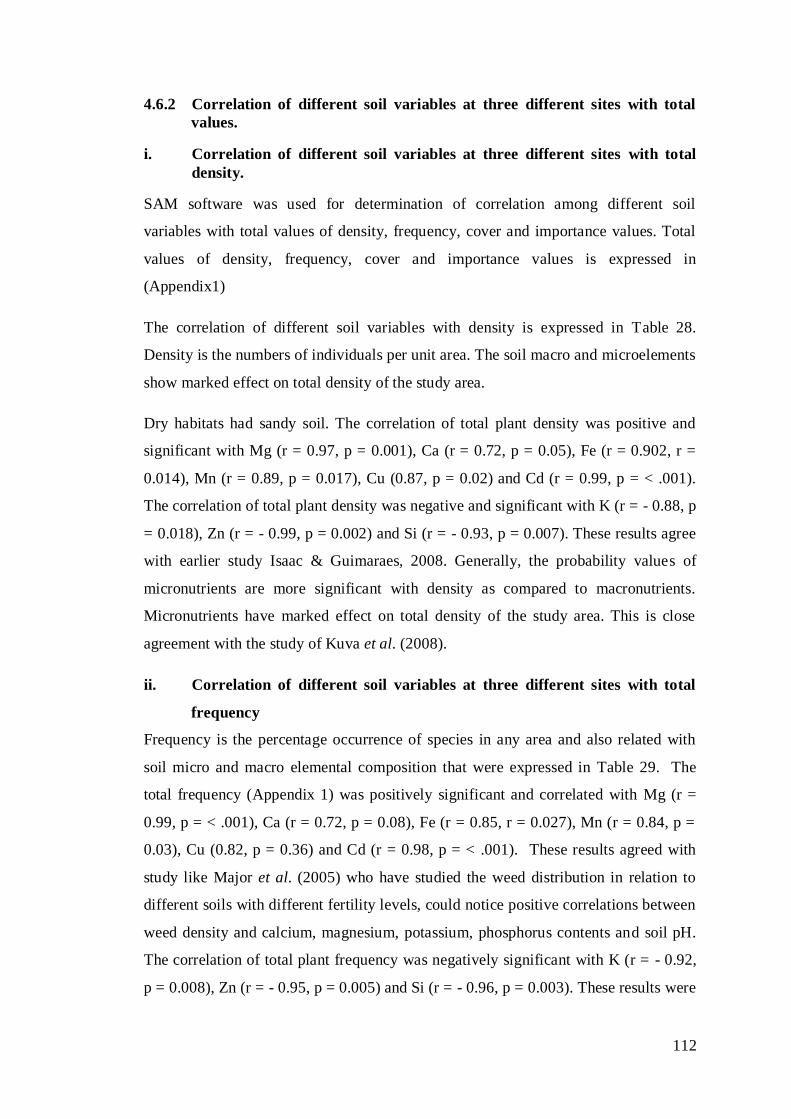
112
4.6.2 Correlation of different soil variables at three different sites with total
values.
i. Correlation of different soil variables at three different sites with total
density.
SAM software was used for determination of correlation among different soil
variables with total values of density, frequency, cover and importance values. Total
values of density, frequency, cover and importance values is expressed in
(Appendix1)
The correlation of different soil variables with density is expressed in Table 28.
Density is the numbers of individuals per unit area. The soil macro and microelements
show marked effect on total density of the study area.
Dry habitats had sandy soil. The correlation of total plant density was positive and
significant with Mg (r = 0.97, p = 0.001), Ca (r = 0.72, p = 0.05), Fe (r = 0.902, r =
0.014), Mn (r = 0.89, p = 0.017), Cu (0.87, p = 0.02) and Cd (r = 0.99, p = < .001).
The correlation of total plant density was negative and significant with K (r = - 0.88, p
= 0.018), Zn (r = - 0.99, p = 0.002) and Si (r = - 0.93, p = 0.007). These results agree
with earlier study Isaac & Guimaraes, 2008. Generally, the probability values of
micronutrients are more significant with density as compared to macronutrients.
Micronutrients have marked effect on total density of the study area. This is close
agreement with the study of Kuva et al. (2008).
ii. Correlation of different soil variables at three different sites with total
frequency
Frequency is the percentage occurrence of species in any area and also related with
soil micro and macro elemental composition that were expressed in Table 29. The
total frequency (Appendix 1) was positively significant and correlated with Mg (r =
0.99, p = < .001), Ca (r = 0.72, p = 0.08), Fe (r = 0.85, r = 0.027), Mn (r = 0.84, p =
0.03), Cu (0.82, p = 0.36) and Cd (r = 0.98, p = < .001). These results agreed with
study like Major et al. (2005) who have studied the weed distribution in relation to
different soils with different fertility levels, could notice positive correlations between
weed density and calcium, magnesium, potassium, phosphorus contents and soil pH.
The correlation of total plant frequency was negatively significant with K (r = - 0.92,
p = 0.008), Zn (r = - 0.95, p = 0.005) and Si (r = - 0.96, p = 0.003). These results were

113
also according to Moura et al. (2009) soil fertility affects the weed numbers and
biomass and more demanding than others in certain nutrients.
iii. Correlation of different soil variables at three different sites with total
cover.
Cover is the vertical projection of foliage shoots/crown of a species to the ground
surface expressed as fraction or percentage of a surface area. Soils ingredients have
mark effect on total cover of a study area were expressed in Table 30.
The total cover (Appendix 1) was positively significant and correlated with pH (r =
0.85, p = 0.002), P (r = 0.82, r = 0.03), Pb (r = 0.94, p = 0.005), Ni (0.99, p = <. 001)
and Cr (r = 0.83, p = 0.034). The results were compare with an earlier study (Iwara et
al., 2011) they detected that P influenced in a higher weed density. The authors
ascribed this result to the fact that P is a macroelement and, therefore, very essential
for most species because it directly effects their growth and development. It also
affects the plant cover of the area. Similarly, The correlation of total plant cover was
negative and significant with Ca (r = - 0.96, p = 0.003), Fe (r = - 0.89, p = 0.017), Mn
(r = - 0.9, p = 0.014) and Cu (r = - 0.91, p = 0.011).This was also compared with study
like Shiratsuchi et al. (2005), pointing to study the correlation between soil properties
negative correlation between the prevalence of Cyperus rotundus, Brachiaria
plantaginea and Commelina benghalensis with K and a negative correlation with pH,
Ca, Mg.
iv. Correlation of different soil variable at three different sites with total
importance value. The relative values of each parameter i.e. density, frequency and cover for species
were added to become the importance values (IV). The soil ingredients had effect on
the total importance values (Appendix 1) of the area expressed in Table 31.
OM (r = 0.926, p = 0.009) and Pb (r = 0.989, p = <. 001) were the soil variable that
have positively significant effect with total importance values (IV) of plant
community in the area.The results were compare with the study like Otto et al. (2007)
calculating the correlation of physio-chemical soil properties with emerged weed
density. He observed that Galinsoga parviflora and Chenopodium album had a more
number of individuals in low sand content, medium clay content and high silt content
areas. According to the authors, the relation with soil properties can define and
explain that why some species are spread through the area and others focus on precise
points.

114
The correlation of of total importance values (Appendix 1) of plant communities was
negative and significant with pH (r = - 0.997, p = < .001), N (r = - 0.96, p = 0.004), P
(r = - 0.993, p = < .001), Ni (r = - 0.857, p = 0.027) and Cr (r = - 0.994, p = < .001).
These results were also agreed with earlier study like Udoh et al. (2007) who studied
the effect of physical and chemical soil properties in the weed spreading in five
different soils in Nigeria. He observed that the distribution and existence of the
dominant species, Tridax procumbens was strongly influenced by soil properties,
counting C, K and high sand content.
Correlation of total density of plants community with different soil variables is
expressed in Figure 10. From these it is evident that Mg, Ca, Fe, Mn, Cu and Cd have
positive affects while K, Zn and Si have reciprocal affects on plants density in the
area. Correlation of total frequency of plant community with soil variables is
expressed in Figure 11. In these figure it is expressed that Mg, Ca, Fe, Mn, Cu and Cd
have linear correlation with frequency of plants community while K, Zn and Si have
negative significant affects on total plants frequency in the area. Correlation of the
total cover with soil variables is showed in Figure 12. In these figure values, it is clear
that pH, N, P, Pb, Ni and Cr have positive affects on the total cover values of plants
community while Ca, Fe, Mn and Cu have negative significant affects on total plants
cover in the area. Similarly, Correlation of total IV of plants community with different
soil variables is expressed in Figure 13. From these it is evident that organic matter
and Pb have positive affects on the total importance values of plants community while
pH, N, P, Ni, and Cr have reciprocal affects on total importance values of plant
community in the area. These results were also accordance to (Kuva et al., 2008;
Moura et al., 2009 and Shiratsuchi et al., 2005).

115
Table 28. Correlation of different soil variables at three different sites with total
density. Macroelements are from S/No 1-9 and microelements are from 10-18.
Significant P Value stands for probability and R for Pearson’s Co-efficient are bold.
DF stands for degree of freedom, R stands for Pearson's r, F stands for Pearson's F
and T stands for Spearman's t.
S/N Parameter R F T DF P
1 pH -0.107 0.02 1 1 0.81
2 EC in (dScm-1) -0.62 1.26 -1 1 0.14
3 OM in % -0.021 0.08 -1 1 0.65
4 N 0.09 0.02 1 1 0.82
5 P -0.06 0.008 1 1 0.88
6 K -0.88 7.42 -1 1 0.018
7 Mg 0.97 44.99 -1 1 0.001
8 Ca 0.72 3.36 1 1 0.05
9 S -0.64 1.41 -1 1 0.13
10 Fe 0.902 8.77 1 1 0.014
11 Mn 0.89 7.67 1 1 0.017
12 Cu 0.87 6.81 1 1 0.02
13 Zn -0.97 41.05 -1 1 0.002
14 Si -0.93 14.64 -1 1 0.007
15 Pb -0.32 0.24 -1 1 0.45
16 Ni -0.66 1.58 -1 1 0.11
17 Cr -0.075 0.011 1 1 0.86
18 Cd 0.99 287.51 -1 1 < .001

116
Table 29. Correlation of different soil variables at three different sites with total
frequency. Macroelements are from S/No 1-9 and microelements are from 10-18.
Significant P Value stands for probability and R for Pearson’s Co-efficient are bold. DF
stands for degree of freedom, R stands for Pearson's r, F stands for Pearson's F and T
stands for Spearman's t.
S/N Parameter R F T DF P
1 pH -0.008 < .001 1 1 0.98
2 EC in (dScm-1) -0.69 1.88 -1 1 0.09
3 OM in % -0.29 0.19 -1 1 0.503
4 N 0.19 0.08 1 1 0.65
5 P 0.035 0.002 1 1 0.93
6 K -0.92 12.5 -1 1 0.009
7 Mg 0.99 165.99 -1 1 < .001
8 Ca 0.72 2.25 1 1 0.08
9 S -0.71 2.1 -1 1 0.087
10 Fe 0.85 5.47 1 1 0.027
11 Mn 0.84 4.85 1 1 0.03
12 Cu 0.82 4.36 1 1 0.036
13 Zn -0.95 18.74 -1 1 0.005
14 Si -0.96 29.3 -1 1 0.003
15 Pb -0.23 0.11 -1 1 0.59
16 Ni -0.58 1.05 -1 1 0.173
17 Cr 0.024 0.001 1 1 0.95
18 Cd 0.98 59.27 -1 1 < .001

117
Table 30. Correlation of different soil variables at three different sites with total cover.
Macroelements are from S/No 1-9 and microelements are from 10-18. Significant P
Value stands for probability and R for Pearson’s Co-efficient are bold. DF stands for
degree of freedom, R stands for Pearson's r, F stands for Pearson's F and T stands for
Spearman's t.
S/N Parameter R F T DF P
1 pH 0.85 5.26 1 1 0.02
2 EC in (dScm-1) -0.23 0.11 -1 1 0.59
3 OM in % -0.65 1.47 -1 1 0.12
4 N 0.72 2.23 1 1 0.08
5 P 0.82 4.35 1 1 0.03
6 K 0.17 0.06 1 1 0.68
7 Mg -0.43 0.47 -1 1 0.32
8 Ca -0.96 29.44 -1 1 0.003
9 S -0.21 0.09 -1 1 0.63
10 Fe -0.89 7.89 -1 1 0.017
11 Mn -0.9 9.05 -1 1 0.014
12 Cu -0.91 10.3 -1 1 0.011
13 Zn 0.96 2.88 1 1 0.06
14 Si 0.3 0.19 1 1 0.49
15 Pb 0.94 17.76 -1 1 0.005
16 Ni 0.99 436.81 -1 1 < .001
17 Cr 0.83 4.56 1 1 0.034
18 Cd -0.67 1.68 -1 1 0.11

118
Table 31. Correlation of different soil variables at three different sites with total
importance values. Macroelements are from S/No 1-9 and microelements are from 10-
18. Significant P Value stands for probability and R for Pearson’s Co-efficient are
bold. DF stands for degree of freedom, R stands for Pearson's r, F stands for Pearson's
F and T stands for Spearman's t.
S/N Parameter R F T DF P
1 pH -0.997 321.265 -1 1 < .001
2 EC in (dScm-1) 0.654 1.496 -1 1 0.124
3 OM in % 0.926 12.004 -1 1 0.009
4 N -0.96 23.393 -1 1 0.004
5 P -0.993 132.734 -1 1 < .001
6 K 0.289 0.182 1 1 0.513
7 Mg -0.022 < .001 1 1 0.96
8 Ca 0.746 2.512 1 1 0.07
9 S 0.633 1.338 -1 1 0.139
10 Fe 0.59 1.068 1 1 0.171
11 Mn 0.611 1.194 1 1 0.155
12 Cu 0.631 1.32 1 1 0.141
13 Zn 0.392 0.363 1 1 0.373
14 Si 0.168 0.058 1 1 0.705
15 Pb 0.989 87.726 -1 1 < .001
16 Ni -0.857 5.537 -1 1 0.027
17 Cr -0.994 161.223 -1 1 < .001
18 Cd 0.266 0.152 -1 1 0.548

119
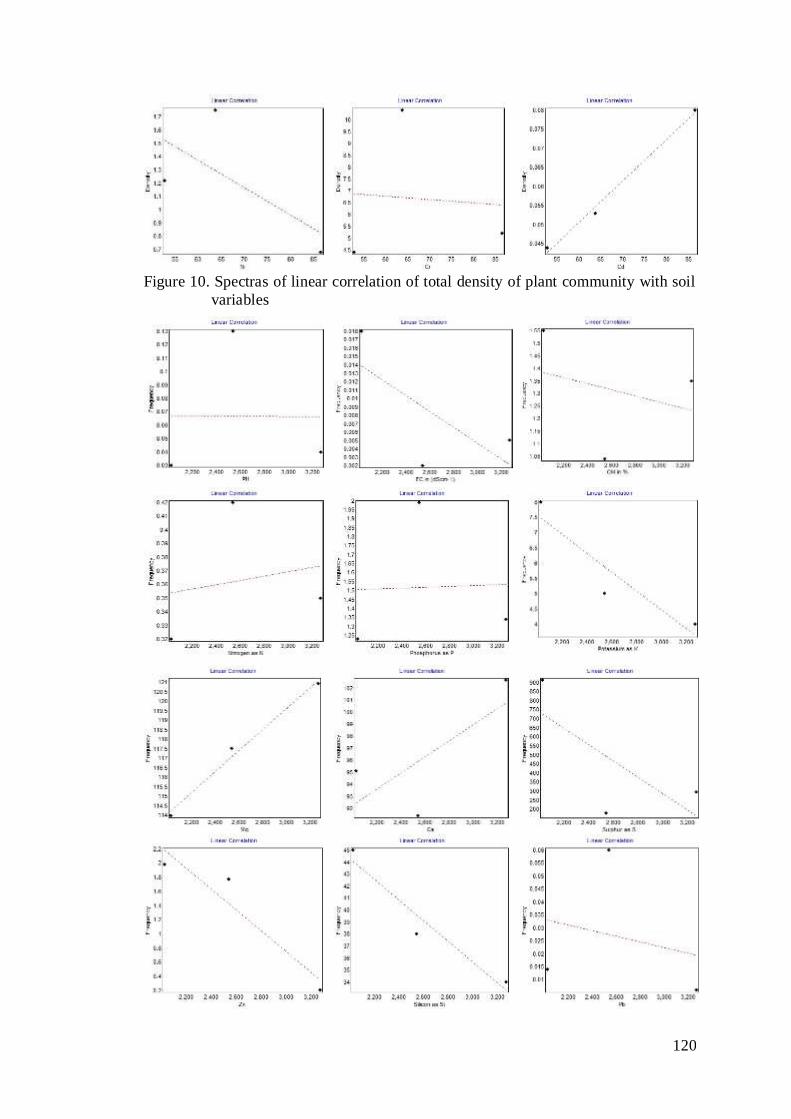
120
Figure 10. Spectras of linear correlation of total density of plant community with soil
variables

121
Figure 11. Spectras of linear correlation of total frequency of plant community with
soil variables

122
Figure 12. Spectras of linear correlation of total cover of plant community with soil
variables

123
Figure 13. Spectras of linear correlation of total IV of plant community with soil
variables

124
4.6.3 Multiple correlation of different soil variables at three different sites of
herbs in spring season
i. Multiple correlation of different soil variables at three different sites of
herbs in spring season with density.
The correlation of different soil variables with herbs density in spring season
(Appendix 2, 3, 4) is expressed in Table 32. Dry habitat had sandy soil with
probability values Mg (r = 0.855, p = 0.027), Ca (r = 0.949, p = 0.005), Fe (r = 0.994,
p = < .001), Mn (r = 0.991, p = < .001), Cu (r = 0.987, p = < .001) and Cd (r = 0.968,
p = 0.003) show that these were positively significant with herbs density in spring
season. These results were agreed with earlier study. That were the effect of soil
properties on the dispersal of flora. Aweto, (1981) and identified organic matter and
clay proportion as soil variables that exerted marked effect on the distribution and
abundance of tree species. The herbaceous density was negative and significant in the
spring season with Zn (r = - 0.993, p = < .001) and Ni (r = - 0.874, p = 0.022). These
were also according to Ukpong, (1994) who was identified nutrient and salinity as
factors amplification species variation in mangrove swamps. Similarly, John et al.
(2007) identified soil pH as the strongest soil feature that influenced the distribution
of species in three-tropical forest.
ii. Multiple correlation of different soil variables at three different sites of
herbs in spring season with frequency.
The correlation of different soil variables with herbs frequency in spring season
(Appendix 2, 3, 4) is expressed in Table 33. Dry habitats had sandy soil. The
correlation of herbaceous frequency in the spring season was positive and significant
with Mg (r = 0.895, p = 0.016), Ca (r = 0.92, p = 0.01), Fe (r = 0.982, p = 0 .001), Mn
(r = 0.976, p = 0.002), Cu (r = 0.971, p = 0.002) and Cd (r = 0.985, p = < .001). These
results accordance with earlier study like Udoh et al. (2007) that showed Mn, clay
content and TN as soil factors that influenced species distribution mostly weeds.
Similarly, Zare et al. (2011) also identified that soil texture, salinity, effective soil
depth, available nitrogen, potassium, organic matter, and lime and soil moisture as
chief soil factors responsible for variations in the pattern of vegetation. The
correlation of herbaceous frequency in the spring season was negative and significant
with Zn (r = - 0.999, p = < .001), Si (r = - 0.821, p = 0.039) and Ni (r = - 0.831, p =

125
0.035). These were also agreed with Cannone et al. (2008) who observed that
vegetation was related to the chemistry of the surface layer of soil, water content, and
also the active-layer depth.
iii. Multiple correlation of different soil variables at three different sites of
herbs in spring season with cover.
The correlations of different soil variables with herbage cover in spring season
(Appendix 2, 3, 4) is expressed in Table 34. Dry habitats had sandy soil and
probability values of different soil variables like Mg (r = 0.791, p = 0.005), Ca (r =
0.979, p = 0.001), Fe (r = 1, p = < .001), Mn (r = 1, p = < .001), Cu (r = 0.999, p = <
.001) and Cd (r = 0.934, p = 0.008) showed that these were positively significant with
herbage cover in spring season. These result were agreed with former study like
Medinski, (2007) who showed that clay + silt, EC and pH to effect the distribution
and life form richness. These results perhaps implicit that tree/shrub species were
selective of nutrients as well as depended totally on the spatial heterogeneity of soil in
nutrient distribution. Zn (r = - 0.973, p = 0.002) and Ni (r = - 0.923, p = 0.01) were the
soil variables and their probability values showed that these were nagetive and
significant effect on the herbage cover in spring season.The correlation of different
soil variables results agreed with previous study (Nagy and Proctor, 1997 and Martre
et al., 2002).
iv. Multiple correlation of different soil variables at three different sites of
herbs in spring season with importance value.
The correlation of different soil variables with herbage importance value in spring
season (Appendix 2, 3, 4) is expressed in Table 35. The correlation of herbs IVI in
spring season was positive and significant with Zn (r = 0.93, p = 0.008), Pb (r = 0.801,
p = 0.047) and Ni (r = 0.969, p = 0.002). Similarly, Ca (r = - 0.998, p = < .001), Fe (r
= - 0.989, p = < .001), Mn (r = - 0.993, p = < .001), Cu (r = - 0.995, p = < .001) and
Cd (r = - 0.873, p = 0.022) were the soil variables that have negatively significant
effect on the herbage IVI in the spring season. These result agrement with study
(Mulyanto et al., 1999: Akter and Akagi, 2005 and Bashan et al., 2006).
Correlation of herbaceous density with soil variables in spring season is expressed in
Figure 14. It showed that there is linear correlation of herbaceous density with soil

126
elements like Mg, Ca, Fe, Mn, Cu and Cd in the area. It is evident that these elements
have positive affects on herbaceous flora in spring season. While Zn and Ni are the
soil elements that have reciprocal affects on herbaceous density in the area.
Correlation of herbaceous frequency with soil variables in spring season is expressed
in Figure 15. From these figures it is expressed that Mg, Ca, Fe, Mn, Cu and Cd have
linear correlation with herbaceous frequency in spring season while Zn, Si and Ni are
also soil elements that have reciprocal affects on herbaceous frequency in spring
season. Correlation of the cover with soil variables in spring season is showed in
(Figure 16). In these figure values, it is clear that Mg, Ca, Fe, Mn, Cu and Cd have
positive affects on the herbaceous cover values while Zn and Ni have negative
significant affects on hercacous cover in the area. Similarly, Correlation of
importance values of herbaceous flora in spring season with different soil variables is
expressed in Figure 17. From these it is evident that Zn, Pb and Ni have positively
signifanct on the importance values of herbs while Ca, Fe, Mn, Cu and Cd also have
affects on importance values of herbaceous community in the area but these affects is
reciprocal. These results were also according to (John et al., 2007; Zare et al., 2011
and Martre et al., 2002).

127
Table 32. Multiple correlation of different soil variables at three different sites of herbs
in spring season with density. Macroelements are from S/No 1-9 and microelements
are from 10-18. Significant P Value stands for probability and R for Pearson’s Co-
efficient are bold. DF stands for degree of freedom, R stands for Pearson's r, F stands
for Pearson's F and T stands for Spearman's t.
S/N Parameter R F T DF P
1 pH -0.43 0.453 1 1 0.328
2 EC in (dScm-1) -0.329 0.242 1 1 0.457
3 OM in % 0.135 0.037 1 1 0.761
4 N -0.236 0.118 1 1 0.593
5 P -0.39 0.359 -1 1 0.376
6 K -0.685 1.768 -1 1 0.105
7 Mg 0.855 5.439 1 1 0.027
8 Ca 0.949 18.298 -1 1 0.005
9 S -0.354 0.287 1 1 0.422
10 Fe 0.994 170.029 -1 1 < .001
11 Mn 0.991 108.703 -1 1 < .001
12 Cu 0.987 77.485 -1 1 < .001
13 Zn -0.993 137.387 -1 1 < .001
14 Si -0.77 2.92 -1 1 0.06
15 Pb -0.623 1.27 -1 1 0.146
16 Ni -0.874 6.493 -1 1 0.022
17 Cr -0.4 0.382 -1 1 0.363
18 Cd 0.968 29.651 1 1 0.003

128
Table 33. Multiple correlation of different soil variables at three different sites of
herbs in spring season with frequency. Macroelements are from S/No 1-9 and
microelements are from 10-18. Significant P Value stands for probability and R for
Pearson’s Co-efficient are bold. DF stands for degree of freedom, R stands for
Pearson's r, F stands for Pearson's F and T stands for Spearman's t
S/N Parameter R F T DF P
1 pH -0.353 0.284 1 1 0.424
2 EC in (dScm-1) -0.406 0.395 -1 1 0.356
3 OM in % 0.052 0.005 -1 1 0.907
4 N -0.154 0.049 1 1 0.728
5 P -0.312 0.216 1 1 0.48
6 K -0.743 2.471 -1 1 0.072
7 Mg 0.895 8.086 -1 1 0.016
8 Ca 0.92 11.011 1 1 0.01
9 S -0.431 0.457 -1 1 0.326
10 Fe 0.982 53.144 1 1 0.001
11 Mn 0.976 40.604 1 1 0.002
12 Cu 0.971 32.579 1 1 0.002
13 Zn -0.999 1500.336 -1 1 < .001
14 Si -0.821 4.134 1 1 0.039
15 Pb -0.556 0.894 -1 1 0.2
16 Ni -0.831 4.456 -1 1 0.035
17 Cr -0.323 0.232 1 1 0.465
18 Cd 0.985 67.453 -1 1 < . 001

129
Table 34. Multiple correlation of different soil variables at three different sites of herbs
in spring season with cover. Macroelements are from S/No 1-9 and microelements are
from 10-18. Significant P Value stands for probability and R for Pearson’s Co-efficient
are bold. DF stands for degree of freedom, R stands for Pearson's r, F stands for
Pearson's F and T stands for Spearman's t.
S/N Parameter R F T DF P
1 pH -0.528 0.775 -1 1 0.225
2 EC in (dScm-1) -0.22 0.102 1 1 0.619
3 OM in % 0.245 0.128 1 1 0.579
4 N -0.344 0.268 -1 1 0.436
5 P -0.491 0.636 -1 1 0.261
6 K -0.599 1.118 -1 1 0.164
7 Mg 0.791 3.353 1 1 0.005
8 Ca 0.979 45.462 -1 1 0.001
9 S -0.247 0.13 1 1 0.576
10 Fe 1 98042.856 -1 1 < .001
11 Mn 1 4031.701 -1 1 < .001
12 Cu 0.999 913.848 -1 1 < .001
13 Zn -0.973 35.633 -1 1 0.002
14 Si -0.694 1.858 -1 1 0.099
15 Pb -0.707 2 -1 1 0.092
16 Ni -0.923 11.564 -1 1 0.01
17 Cr -0.501 0.67 -1 1 0.251
18 Cd 0.934 13.562 1 1 0.008

130
Table 35. Multiple correlation of different soil variables at three different sites of herbs
in spring season with importance values. Macroelements are from S/No 1-9 and
microelements are from 10-18. Significant P Value stands for probability and R for
Pearson’s Co-efficient are bold. DF stands for degree of freedom, R stands for
Pearson's r, F stands for Pearson's F and T stands for Spearman's t.
S/N Parameter R F T DF P
1 pH 0.644 1.417 1 1 0.131
2 EC in (dScm-1) 0.079 0.013 -1 1 0.858
3 OM in % -0.381 0.34 -1 1 0.387
4 N 0.474 0.58 1 1 0.279
5 P 0.61 1.186 1 1 0.156
6 K 0.479 0.595 1 1 0.274
7 Mg -0.696 1.883 -1 1 0.098
8 Ca -0.998 488.804 -1 1 < .001
9 S 0.107 0.023 -1 1 0.81
10 Fe -0.989 90.741 -1 1 < .001
11 Mn -0.993 136.18 -1 1 < .001
12 Cu -0.995 212.138 -1 1 < .001
13 Zn 0.93 12.871 1 1 0.008
14 Si 0.584 1.037 1 1 0.176
15 Pb 0.801 3.57 -1 1 0.047
16 Ni 0.969 30.358 -1 1 0.002
17 Cr 0.619 1.242 1 1 0.149
18 Cd -0.873 6.407 -1 1 0.022

131

132
Figure 14. Spectras of linear correlation of herbaceous density with soil variables in
spring season.

133
Figure 15. Spectras of linear correlation of herbaceous frequency with soil variables
in spring season.
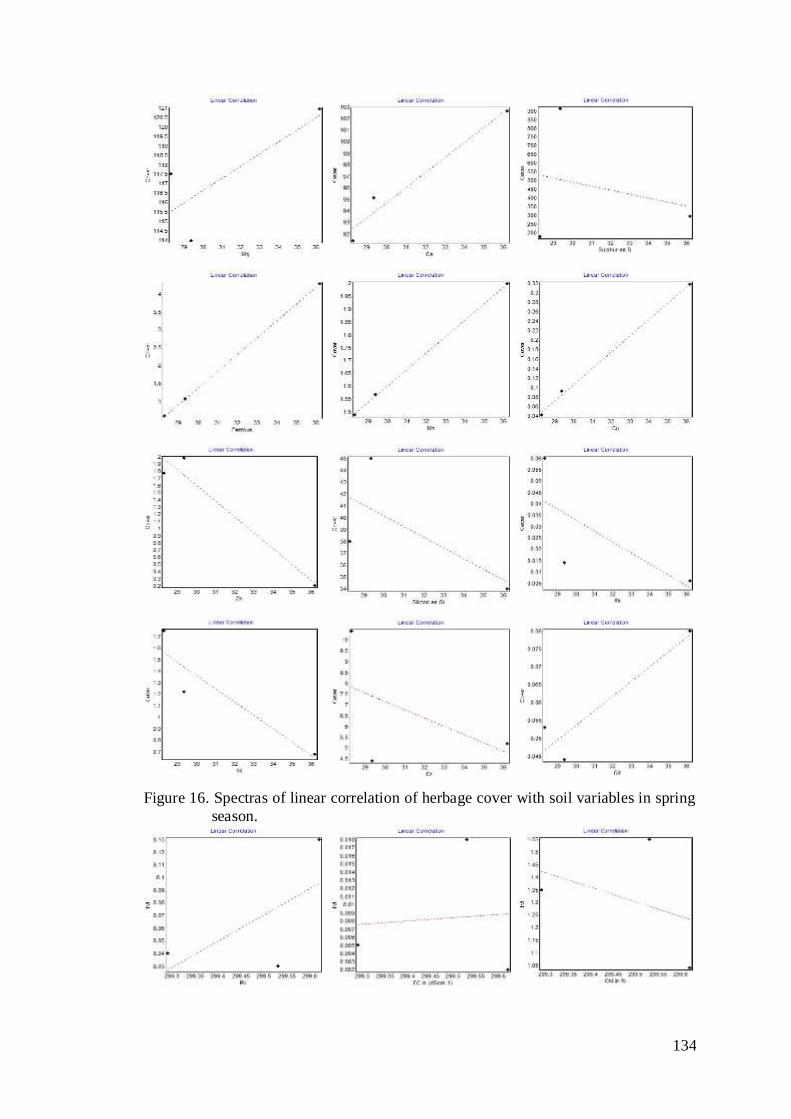
134
Figure 16. Spectras of linear correlation of herbage cover with soil variables in spring
season.

135
Figure 17. Spectras of linear correlation of herbaceous IV with soil variables in spring
season.

136
4.6.4 Multiple correlation of different soil variables at three different sites of
herbs in autumn season
i. Multiple correlation of different soil variable at three different sites of
herbs in autumn season with density.
The correlation of different soil variables with herbs density in autumn season
(Appendix 2, 3, 4) is expressed in Table 36. The correlation of herbs density in
autumn season was positive and significant with Mg (r = 0.986, p = < .001) and Cd (r
= 0.898, p = 0.015). Similarly, the correlation of herbs density in autumn season was
negative and significant with EC (r = - 0.865, p = 0.024), K (r = -0.994, p = < .001),
Zn (r = - 0.831, p = 0.035) and Si (r = - 1, p = < .001).These results are in agrement
with the previous study like Bashan et al. (2006) who studied the Plants settling
barren desert rocks have a significant ecological benefit over species incapable of
handling extreme substrate conditions.
ii. Multiple correlation of different soil variables at three different sites of
herbs in autumn season with frequency.
The correlation of different soil variables with herbs frequency in autumn season
(Appendix 2, 3, 4) is expressed in Table 37. The correlation of herbs frequency in
autumn season was positive and significant with Mg (r = 0.977, p = 0.001) and Cd (r
= 0.876, p = 0.021). Similarly, the correlation of herbs frequency in autumn season
was negative and significant with EC (r = - 0.888, p = 0.018), K (r = -0.998, p = <
.001), S (r = - 0.9, p = 0.015), Zn (r = - 0.803, p = 0.046) and Si (r = - 0.998, p = <
.001).These results also agreed with the earlier study Taiz and Zeiger, (2006).
iii. Multiple correlation of different soil variables at three different sites of
herbs in autumn season with cover.
The correlations of different soil variables with herbage cover in autumn season
(Appendix 2, 3, 4) is expressed in Table 38. The probability values of N (r = 0.825, p
= 0.037) and Mg (r = 0.788, p = 0.052) were positive and significant affect on the
herbage cover of plant community in autumn season of the area. Similarly, the
probability values of EC (r = -1, p = < .001), OM (r = -0.879, p = 0.02), K (r = -0.924,
p = 0.01), S (r = -1, p = < .001) and Si (r = -0.869, p = 0.023) were negatively
significant affect on the herbage cover of plant communities in autumn season.The

137
correlation of different soil variables result in autumn season agreed with previous
study (Nagy and Proctor, 1997 and Martre et al., 2002).
iv. Multiple correlation of different soil variables at three different sites of
herbs in autumn season with importance value.
The correlation of different soil variables with herbs IVI in autumn season (Appendix
2, 3, 4) is expressed in Table 39. The correlation of herbs IVI of plant community in
autumn season was positive and significant with EC (r = 0.984, p = < .001), K (r =
0.97, p = < .002) and Mg (r = 0.87, p = 0.023). Similarly, the correlation of herbs IVI
of plant community in autumn season was negative and significant with OM (r = -
0.798, p = 0.048), S (r = -0.989, p = < .001) and Si (r = - 0.933, p = 0.008). These
results were agreed with study (Mulyanto et al., 1999 and Akter and Akagi, 2005).
Correlation of herbaceous density with soil variables in autumn season is expressed in
Figure 18. It showed that there is linear correlation of herbaceous density with soil
elements like Mg and Cd in autumn season in the area. It is evident that these
elements have positive affects on herbaceous flora in autumn season while EC, K, Zn
and Si are the soil elements that have reciprocal affects on herbaceous density in
autumn season. Correlation of herbaceous frequency with soil variables in autumn
season is expressed in (Figure 19). From these figures it is expressed that Mg and Cd
have linear correlation with herbaceous frequency in autumn season while EC, K, S,
Zn and Si are also soil elements that have reciprocal affects on herbaceous frequency
in autumn season. Correlation of the cover with soil variables in autumn season is
showed in Figure 20. In these figure values, it is clear that N and Mg have positive
affects on the herbaceous cover values while EC, OM, K, S and Si have negative
significant affects on hercacous cover in the area. Similarly, Correlation of
importance values of herbaceous flora in spring autumn season with different soil
variables is expressed in Figure 21. From these it is evident that EC, K, Mg have
positively signifanct affects on the importance values of herbs in autumn season while
OM, S and Si also have affects on importance values of herbaceous community in the
area but these affects is reciprocal. These results were also according to (Bashan et
al., 2006; Zeiger et al., 2006; Nagy and Proctor, 1997 and Akter and Akagi, 2005).

138
Table 36. Multiple correlation of different soil variables at three different sites of
herbs in autumn season with density. Macroelements are from S/No 1-9 and
microelements are from 10-18. Significant P Value stands for probability and R for
Pearson’s Co-efficient are bold. DF stands for degree of freedom, R stands for
Pearson's r, F stands for Pearson's F and T stands for Spearman's t.
S/N Parameter R F T DF P
1 pH 0.263 0.149 1 1 0.552
2 EC in (dScm-1) -0.865 5.947 -1 1 0.024
3 OM in % -0.024 0.84 -1 1 0.211
4 N 0.455 0.521 1 1 0.3
5 P 0.305 0.205 1 1 0.49
6 K -0.994 177.852 -1 1 < .001
7 Mg 0.986 71.749 -1 1 < .001
8 Ca 0.515 0.722 1 1 0.238
9 S -0.879 6.765 -1 1 0.2
10 Fe 0.683 1.751 1 1 0.106
11 Mn 0.663 1.573 1 1 0.118
12 Cu 0.645 1.425 1 1 0.131
13 Zn -0.831 4.453 -1 1 0.035
14 Si -1 5418.964 -1 1 < .001
15 Pb 0.038 0.003 -1 1 0.932
16 Ni -0.346 0.273 -1 1 0.433
17 Cr 0.294 0.189 1 1 0.506
18 Cd 0.898 8.296 -1 1 0.015

139
Table 37. Multiple correlation of different soil variables at three different sites of herbs
in autumn season with frequency. Macroelements are from S/No 1-9 and
microelements are from 10-18. Significant P Value stands for probability and R for
Pearson’s Co-efficient are bold. DF stands for degree of freedom, R stands for
Pearson's r, F stands for Pearson's F and T stands for Spearman's t.
S/N Parameter R F T DF P
1 pH 0.309 0.211 1 1 0.485
2 EC in (dScm-1) -0.888 7.457 -1 1 0.018
3 OM in % -0.583 1.031 -1 1 0.177
4 N 0.497 0.655 1 1 0.256
5 P 0.35 0.279 1 1 0.428
6 K -0.998 593.352 -1 1 < .001
7 Mg 0.977 42.719 -1 1 0.001
8 Ca 0.474 0.578 1 1 0.279
9 S -0.9 8.555 -1 1 0.015
10 Fe 0.648 1.446 1 1 0.129
11 Mn 0.627 1.296 1 1 0.143
12 Cu 0.608 1.172 1 1 0.157
13 Zn -0.803 3.637 -1 1 0.046
14 Si -0.998 445.994 -1 1 < .001
15 Pb 0.085 0.015 -1 1 0.847
16 Ni -0.301 0.2 1 1 0.495
17 Cr 0.339 0.26 1 1 0.442
18 Cd 0.876 6.573 -1 1 0.021

140
Table 38. Multiple correlation of different soil variables at three different sites of
herbs in autumn season with cover. Macroelements are from S/No 1-9 and
microelements are from 10-18. Significant P Value stands for probability and R for
Pearson’s Co-efficient are bold. DF stands for degree of freedom, R stands for
Pearson's r, F stands for Pearson's F and T stands for Spearman's t.
S/N Parameter R F T DF P
1 pH 0.692 1.836 -1 1 0.101
2 EC in (dScm-1) -1 2585.262 -1 1 < .001
3 OM in % -0.879 6.766 -1 1 0.02
4 N 0.825 4.254 -1 1 0.037
5 P 0.722 2.184 -1 1 0.083
6 K -0.924 11.7 -1 1 0.01
7 Mg 0.788 3.278 1 1 0.052
8 Ca 0.043 0.004 -1 1 0.922
9 S -1 1×10ᶺ7 -1 1 < .001
10 Fe 0.252 0.135 -1 1 0.569
11 Mn 0.226 0.107 -1 1 0.61
12 Cu 0.202 0.085 -1 1 0.648
13 Zn -0.064 0.549 -1 1 0.289
14 Si -0.869 0.189 -1 1 0.023
15 Pb 0.51 0.704 1 1 0.242
16 Ni 0.144 0.044 1 1 0.746
17 Cr 0.715 2.088 -1 1 0.087
18 Cd 0.578 1.005 1 1 0.181

141
Table 39. Multiple correlation of different soil variables at three different sites of
herbs in autumn season with importance values. Significant values are bold.
Macroelements are from S/No 1-9 and microelements are from 10-18. Significant P
Value stands for probability and R for Pearson’s Co-efficient are bold. DF stands for
degree of freedom, R stands for Pearson's r, F stands for Pearson's F and T stands for
Spearman's t.
S/N Parameter R F T DF P
1 pH 0.577 1 -1 1 0.182
2 EC in (dScm-1) 0.984 3.511 -1 1 < .001
3 OM in % -0.798 3.511 -1 1 0.048
4 N 0.732 2.308 -1 1 0.078
5 P 0.612 1.199 -1 1 0.154
6 K 0.97 32.398 -1 1 0.002
7 Mg 0.87 6.256 1 1 0.023
8 Ca 0.191 0.075 -1 1 0.667
9 S -0.989 88.936 -1 1 < .001
10 Fe 0.392 0.364 -1 1 0.373
11 Mn 0.367 0.312 -1 1 0.405
12 Cu 0.345 0.269 -1 1 0.435
13 Zn -0.59 1.068 -1 1 0.171
14 Si -0.933 13.423 -1 1 0.008
15 Pb 0.377 0.332 1 1 0.392
16 Ni -0.004 < .001 1 1 0.992
17 Cr 0.603 1.145 -1 1 0.161
18 Cd 0.693 1.845 1 1 0.1

142
Figure 18. Spectras of linear correlation of herbaceous density with soil variables in
autumn season.

143

144
Figure 19. Spectras of linear correlation of herbaceous frequency with soil variables
in autumn season.

145
Figure 20. Spectras of linear correlation of herbage cover with soil variables in
autumn season.
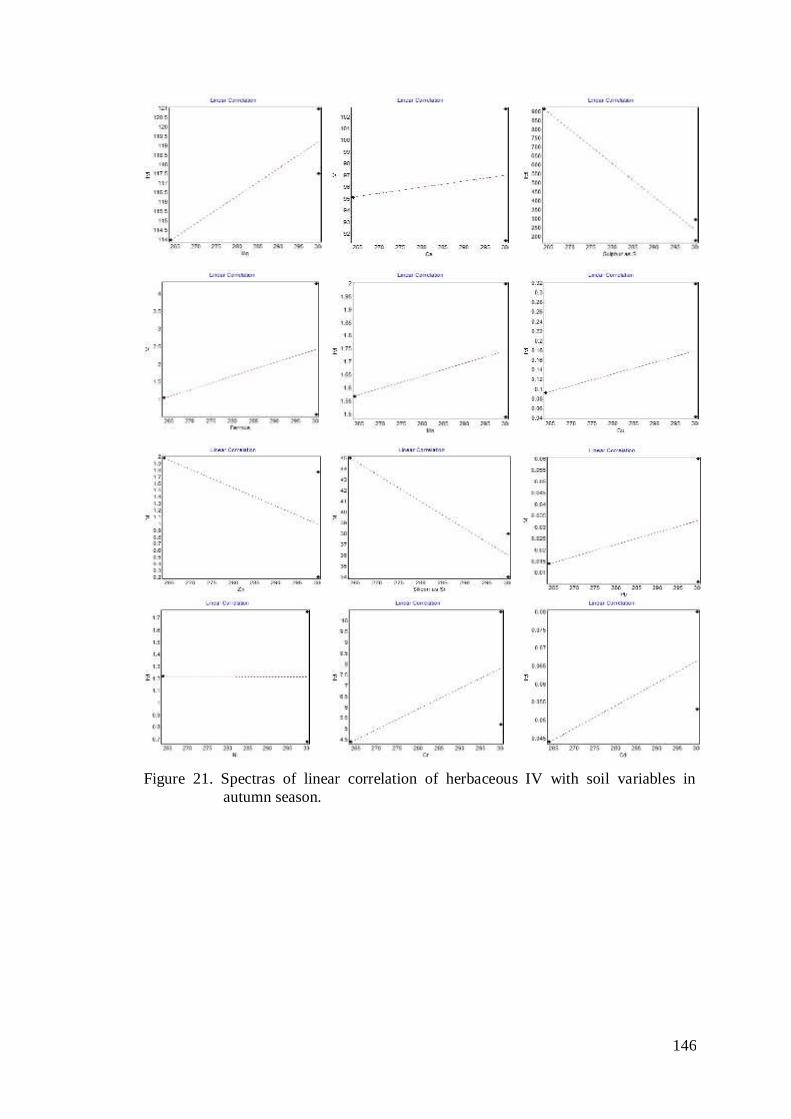
146
Figure 21. Spectras of linear correlation of herbaceous IV with soil variables in
autumn season.

147
4.6.5 Multiple correlation of different soil variables at three different sites of
herbs in winter season
i. Multiple correlation of different soil variables at three different sites of
herbs in winter season with density.
The correlation of different soil variables with herbs density in winter season
(Appendix 2, 3, 4) is expressed in Table 40. The correlation of herbs density of plant
communities were positive and significant with Mg (r = 0.932, p = 0.008), Ca (r =
0.88, p = 0.02), Fe (r = 0.96, p = 0.004), Mn (r = 0.952, p = 0.005), Cu (r = 0.945, p =
0.006) and Cd (r = 0.997, p = < .001). Similarly, the correlation of herbs density of
plant communities were negative and significant with K (r = - 0.802, p = 0.046), Zn (r
= - 0.998, p = <. 001), Si (r = - 0.87, p = 0.023) and Ni (r = - 0.776, p = 0.057). These
results agrement with earlier study who were described the cacti often growing on
rocky substrates in Mexico (Bashan et al., 2002 and Taiz & Zeiger 2006).
ii. Multiple correlation of different soil variables at three different sites of
herbs in winter season with frequency.
The correlation of different soil variables with herbs frequency in winter season
(Appendix 2, 3, 4) is expressed in Table 41. The probality value of soil varaibles like
Ca (r = 0.987, p = <. 001), Fe (r = 0.999, p = <. 001), Mn (r = 1, p = <. 001), Cu (r =
1, p = <. 001) and Cd (r = 0.91, p = <. 011) were positive and significant with
frequency of herbs communities in winter season of the area. Similarly, the
correlation of herbs frequency was negative and significant with Zn (r = -0.961, p =
0.003) and Ni (r = -0.94, p = 0.007). These results are in agrement with earlier studies
who described the correlation of different soil variables with the plant communities
(Martre et al., 2002; Nobel and Zutta, 2007; Nagy & Proctor, 1997and Martre et al.,
2002).
iii. Multiple correlation of different soil variables at three different sites of
herbs in winter season with cover.
The correlation of different soil variables with herbs cover in winter season
(Appendix 2, 3, 4) is expressed in Table 42. The correlation of herbage cover in
winter season was positive and significant with EC (r = 0.998, p = <. 001), OM (r =
0.918, p = 0.011), K (r = 0.886, p = 0.018), S (r = 0.996, p = <. 001) and (r = 0.822, p

148
= 0.039). These results compared with the study like Iwara et al. (2011) who were
also detected that P influenced in a higher weed density. The authors ascribed this
result to the fact that P is a macroelement and, therefore, very essential for most
species because it directly effects their growth and development. The correlation of
herbage cover in winter season was negative and significant with N (r = -0.872, p =
0.022), P (r = -0.782, p = 0.055) and Cr (r = -0.774, p = 0.058). There results also
agreed with earlier study like Shiratsuchi et al. (2005) who pointed and study the
correlation between soil properties and SSB, observed a positive correlation between
the prevalence of Cyperus rotundus, Brachiaria plantaginea and Commelina
benghalensis with K and a negative correlation with pH, Ca, Mg.
iv. Multiple correlation of different soil variables at three different sites of
herbs in winter season with importance value.
The correlation of different soil variables with herbs importance value in winter
season (Appendix 2, 3, 4) is expressed in Table 43. The correlation of importance
value (IV) of plants communities was positive and significant in winter season with K
(r = 0.97, p = 0.002) and Mg (r = 0.869, p = 0.023). These results were compared with
Mulyanto et al. (1999) and Akter and Akagi, (2005). Similarly, the correlation of IV
of plants communities was negatively significant in winter season with EC (r = -
0.985. p = <. 001), OM (r = - 0.8. p = 0.047), S (r = - 0.989. p = <. 001) and Si (r = -
0.932. p = 0.008). These results agreed with the earlier study (Nobel and Zutta, 2007)
who studied the physical factors and focus of specific minerals the degree of
weathering of rock minerals to clay minerals and salts availability of plant nutrients
may be vital factors affecting of plants distribution.
Correlation of herbaceous density with soil variables in winter season is expressed in
Figure 22. It showed that there is linear correlation of herbaceous density with soil
elements like Mg, Ca, Fe, Mn, Cu and Cd in winter season in the area. It is evident
that these elements have positive affects on herbaceous flora in autumn season while
K, Zn, Si and Si are the soil elements that have reciprocal affects on herbaceous
density in winter season. Correlation of herbaceous frequency with soil variables in
winter season is expressed in (Figure 23). From these figures it is expressed that Ca,
Fe, Mn, Cu and Cd have linear correlation with herbaceous frequency in winter
season while Zn and Ni are also soil elements that have reciprocal affects on

149
herbaceous frequency in winter season. Correlation of the cover with soil variables in
winter season is showed in Figure 24. In these figure values, it is clear that EC, OM,
K, S and Si have positive affects on the herbaceous cover values while N, P, and Cr
have negative significant affects on hercacous cover in the area. Similarly, correlation
of importance values of herbaceous flora in winter winter season with different soil
variables is expressed in Figure 25. From these it is evident that K and Mg have
positively signifanct affects on the importance values of herbs in winter season while
EC, OM, S and Si also have affects on importance values of herbaceous community in
the area but these affects is reciprocal. These results were also according to (Taiz &
Zeiger 2006; Nobel and Zutta 2007; Shiratsuchi et al., 2005 and Shiratsuchi et al.,
2005).

150
Table 40. Multiple correlation of different soil variables at three different sites of
herbs in winter season with density. Significant values are bold. Macroelements are
from S/No 1-9 and microelements are from 10-18. Significant P Value stands for
probability and R for Pearson’s Co-efficient are bold. DF stands for degree of
freedom, R stands for Pearson's r, F stands for Pearson's F and T stands for
Spearman's t.
S/N Parameter R F T DF P
1 pH -0.266 0.152 1 1 0.548
2 EC in (dScm-1) -0.488 0.626 -1 1 0.264
3 OM in % -0.04 0.003 -1 1 0.928
4 N -0.063 0.008 1 1 0.887
5 P -0.223 0.105 1 1 0.614
6 K -0.802 3.597 -1 1 0.046
7 Mg 0.932 13.321 -1 1 0.008
8 Ca 0.88 6.872 1 1 0.02
9 S -0.512 0.711 -1 1 0.24
10 Fe 0.96 23.569 1 1 0.004
11 Mn 0.952 19.459 1 1 0.005
12 Cu 0.945 16.533 1 1 0.006
13 Zn -0.998 651.489 -1 1 < .001
14 Si -0.87 6.219 -1 1 0.023
15 Pb -0.477 0.59 -1 1 0.276
16 Ni -0.776 3.032 -1 1 0.057
17 Cr -0.234 0.116 1 1 0.596
18 Cd 0.997 321.778 -1 1 < .001
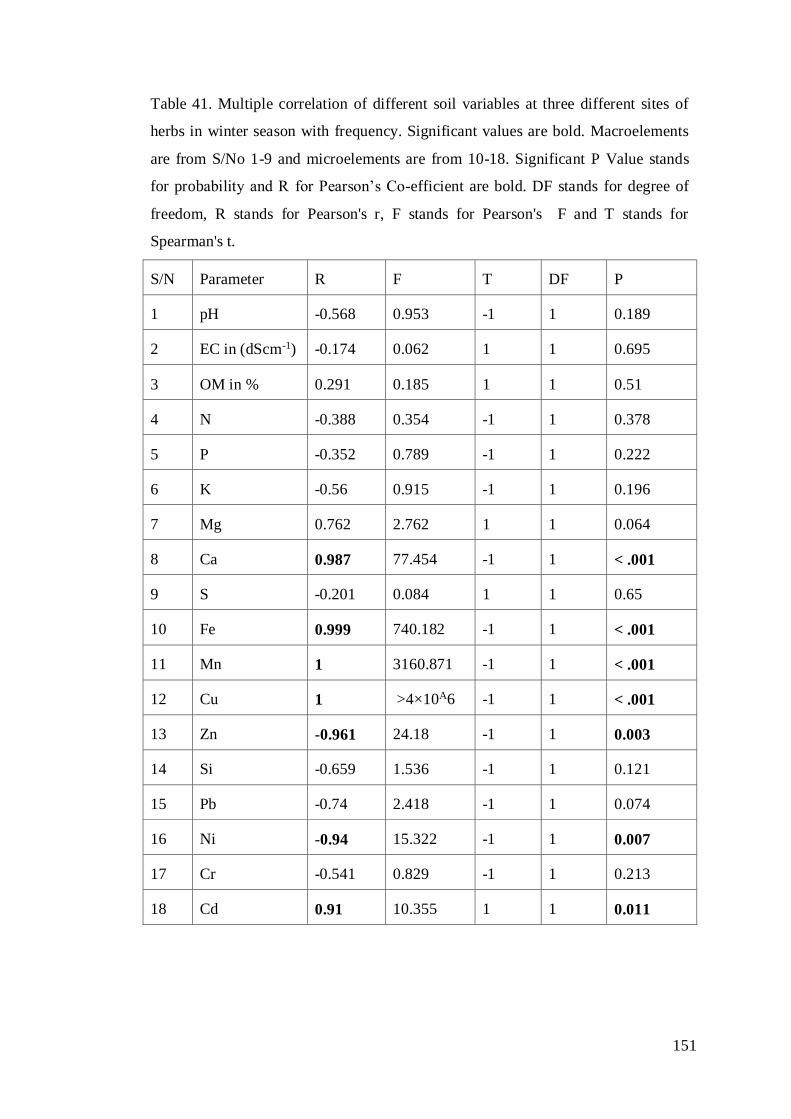
151
Table 41. Multiple correlation of different soil variables at three different sites of
herbs in winter season with frequency. Significant values are bold. Macroelements
are from S/No 1-9 and microelements are from 10-18. Significant P Value stands
for probability and R for Pearson’s Co-efficient are bold. DF stands for degree of
freedom, R stands for Pearson's r, F stands for Pearson's F and T stands for
Spearman's t.
S/N Parameter R F T DF P
1 pH -0.568 0.953 -1 1 0.189
2 EC in (dScm-1) -0.174 0.062 1 1 0.695
3 OM in % 0.291 0.185 1 1 0.51
4 N -0.388 0.354 -1 1 0.378
5 P -0.352 0.789 -1 1 0.222
6 K -0.56 0.915 -1 1 0.196
7 Mg 0.762 2.762 1 1 0.064
8 Ca 0.987 77.454 -1 1 < .001
9 S -0.201 0.084 1 1 0.65
10 Fe 0.999 740.182 -1 1 < .001
11 Mn 1 3160.871 -1 1 < .001
12 Cu 1 >4×10A6 -1 1 < .001
13 Zn -0.961 24.18 -1 1 0.003
14 Si -0.659 1.536 -1 1 0.121
15 Pb -0.74 2.418 -1 1 0.074
16 Ni -0.94 15.322 -1 1 0.007
17 Cr -0.541 0.829 -1 1 0.213
18 Cd 0.91 10.355 1 1 0.011

152
Table 42. Multiple correlation of different soil variables at three different sites of
herbs in winter season with cover. Significant values are bold. Macroelements are
from S/No 1-9 and microelements are from 10-18. Significant P Value stands for
probability and R for Pearson’s Co-efficient are bold. DF stands for degree of
freedom, R stands for Pearson's r, F stands for Pearson's F and T stands for
Spearman's t.
S/N Parameter R F T DF P
1 pH -0.754 2.631 -1 1 0.067
2 EC in (dScm-1) 0.998 520.677 -1 1 < .001
3 OM in % 0.918 10.687 -1 1 0.011
4 N -0.872 6.351 -1 1 0.022
5 P -0.782 3.138 -1 1 0.055
6 K 0.886 7.316 1 1 0.018
7 Mg -0.73 2.278 -1 1 0.079
8 Ca 0.046 0.004 1 1 0.917
9 S 0.996 249.028 -1 1 < .001
10 Fe -0.164 0.055 1 1 0.711
11 Mn -0.138 0.039 1 1 0.756
12 Cu -0.113 0.026 1 1 0.798
13 Zn 0.383 0.344 1 1 0.385
14 Si 0.822 4.154 1 1 0.039
15 Pb -0.585 1.042 -1 1 0.175
16 Ni -0.232 0.113 -1 1 0.601
17 Cr -0.774 2.998 -1 1 0.058
18 Cd -0.503 0.677 -1 1 0.249

153
Table 43. Multiple correlation of different soil variables at three different sites of
herbs in winter season with importance value. Significant values are bold.
Macroelements are from S/No 1-9 and microelements are from 10-18. Significant P
Value stands for probability and R for Pearson’s Co-efficient are bold. DF stands for
degree of freedom, R stands for Pearson's r, F stands for Pearson's F and T stands for
Spearman's t.
S/N Parameter R F T DF P
1 pH 0.58 1.014 -1 1 0.179
2 EC in (dScm-1) -0.985 65.526 -1 1 < .001
3 OM in % -0.8 3.561 -1 1 0.047
4 N 0.734 2.34 -1 1 0.077
5 P 0.615 1.216 -1 1 0.152
6 K 0.97 31.484 -1 1 0.002
7 Mg 0.869 6.158 1 1 0.023
8 Ca 0.187 0.073 -1 1 0.672
9 S -0.989 93.167 -1 1 < .001
10 Fe 0.389 0.357 -1 1 0.377
11 Mn 0.364 0.306 -1 1 0.409
12 Cu 0.341 0.264 -1 1 0.439
13 Zn -0.587 1.053 -1 1 0.174
14 Si -0.932 13.157 -1 1 0.008
15 Pb 0.38 0.338 1 1 0.388
16 Ni -0.001 < .001 1 1 0.998
17 Cr 0.606 1.161 -1 1 0.159
18 Cd 0.69 1.82 1 1 0.102

154

155
Figure 22. Spectras of linear correlation of herbaceous density with soil variables in
winter season.

156
Figure 23. Spectras of linear correlation of herbaceous frequency with soil variables
in winter season.

157
Figure 24. Spectras of linear correlation of herbage cover with soil variables in winter
season.

158
Figure 25. Spectras of linear correlation of herbaceous IV with soil variables in
winter season.

159
4.6.6 Multiple correlation of different soil variables at three different sites of
herbs in summer season
i. Multiple correlation of different soil variables at three different sites of
herbs in summer season with density.
The correlation of different soil variables with herbs density in summer season
(Appendix 2, 3, 4) is expressed in Table 44. The probality value of soil variables i.e.
Zn (r = 0.914, p = 0.012), Pb (r = 0.825, p = 0.037) and Ni (r = 0.978, p = 0.001) were
positive and significant affect with density of herbaceous communities in summer
season. Similarly, the correlation of herbaceous density in summer season was
negative and significant with Ca (r = - 1, p = <. 001), Fe (r = - 0.982, p = 0.001), Mn
(r = - 0.987, p = <. 001), Cu (r = - 0.99, p = <. 001), Si (r = - 0.988, p = <. 001) and
Cd (r = - 0.851, p = 0.028). These results compared with Valverde et al. (2004).
ii. Multiple correlation of different soil variables at three different sites of
herbs in summer season with frequency.
The correlation of different soil variables with herbs frequency in summer season
(Appendix 2, 3, 4) expressed in Table 45. The correlation of herbaceous frequency
was positive and significant in summer season with pH (r = 0.856, p = 0.027) P (r =
0.833, p = 0.034), Pb (r = 0.951, p = 0.005), Ni (r = 0.997, p = < .027) and Cr (r =
0.839, p = 0.03). Similarly, the correlation of herbs frequency in summer season was
negatively significant with Ca (r = - 0.965, p = 0.003), Fe (- 0.889, p = 0.018), Mn (r
= - 0.901, p = 0.015) and Cu (r = - 0.911, p = 0.012). These results were agreed with
ealierr study who described plants often developing on rocky substrates in Mexico
Bashan et al. (2002).
iii. Multiple correlation of different soil variables in three different sites of
herbs in summer season with cover.
The correlations of different soil variables with herbs cover in summer season
(Appendix 2, 3, 4) is expressed in Table 46. The correlation of herbage cover was
positive and significant in summer season with Pb (r = 0.801, p = 0.047) and Ni (r =
0.969, p = 0.002). Similarly, Ca (r = - 0.998, p = < .001), Mn (r = - 0.993, p = < .001),
Cu (r = - 0.995, p = < .001) and Cd (r = - 0.873, p = 0.022). These results were
compared with earlier studies who described the correlation of different soil variables
with the plant communities (Martre et al., 2002 and Nobel & Zutta 2007).

160
iv. Multiple correlation of different soil variables at three different sites of
herbs in summer season with importance value.
The correlation of different soil variables with herbs importance values in summer
season (Appendix 2, 3, 4) is expressed in Table 47. The probality values of different
soil variables i.e. EC (r = 0.898, p = 0.015), OM (r = 1, p = <. 001), P (r = 0.961, p =
0.003) and S (r = 0.886, p = 0.019) were positively significant affect on the herbs IVI
in summer season of the area. Similarly, the correlation of IVI of plant communities
were negative and significant with pH (r = - 0.948, p = 0.005), N (r = - 0.993, p =
<.001), Pb (r = - 0.851, p = 0.028) and Cr (r = - 0.958, p = 0.004). These results were
agreed and with compared Nobel and Zutta (2007) who stuied the physical factors, it
is known that the presence and focus of specific minerals the degree of weathering of
rock minerals to clay minerals and salts availability of plant nutrients may be vital
factors affecting of plants distribution.
Correlation of herbaceous density with soil variables in summer season is expressed
in Figure 26. It showed that there is linear correlation of herbaceous density with soil
elements like Zn, Pb and Ni in summer season in the area. It is evident that these
elements have positive affects on herbaceous flora in autumn season while Ca, Fe,
Mn, Cu, Si and Cd are the soil elements that have reciprocal affects on herbaceous
density in summer season. Correlation of herbaceous frequency with soil variables in
summer season is expressed in Figure 27. From these figures it is expressed that pH,
P, Pb, Ni and Cr have linear correlation with herbaceous frequency in summer season
while Ca, Fe, Mn and Cu are also soil elements that have reciprocal affects on
herbaceous frequency in summer season. Correlation of the cover with soil variables
in summer season is showed in (Figure 28). In these figure values, it is clear that Pb
and Ni have positive affects on the herbaceous cover values while Ca, Mn, Cu and Cd
have negative significant affects on hercacous cover in the area. Similarly, correlation
of importance values of herbaceous flora in summer season with different soil
variables is expressed in Figure 29. From these it is evident that EC, OM, P and S
have positively signifanct affects on the importance values of herbs in summer season
while pH, N, Pb and Cr also have affects on importance values of herbaceous
community in the area but these affects is reciprocal. These results were also
according to (Valverde et al., 2004; Martre et al., 2002 and Nobel & Zutta 2007).

161
Table 44. Multiple correlation of different soil variables at three different sites of
herbs in summer season with density. Significant values are bold. Macroelements are
from S/No 1-9 and microelements are from 10-18. Significant P Value stands for
probability and R for Pearson’s Co-efficient are bold. DF stands for degree of
freedom, R stands for Pearson's r, F stands for Pearson's F and T stands for
Spearman's t.
S/N Parameter R F T DF P
1 pH 0.676 1.683 1 1 0.11
2 EC in (dScm-1) 0.037 0.003 -1 1 0.934
3 OM in % -0.42 0.429 -1 1 0.339
4 N 0.511 0.708 1 1 0.241
5 P 0.643 1.413 1 1 0.132
6 K 0.441 0.482 1 1 0.315
7 Mg -0.665 1.586 -1 1 0.117
8 Ca -1 4452.241 -1 1 < .001
9 S 0.064 0.008 -1 1 0.885
10 Fe -0.982 54.031 -1 1 0.001
11 Mn -0.987 73.681 -1 1 < .001
12 Cu -0.99 102.469 -1 1 < .001
13 Zn 0.914 10.127 1 1 0.012
14 Si -0.988 80.667 -1 1 < .001
15 Pb 0.825 4.276
1 0.037
16 Ni 0.978 44.652 -1 1 0.001
17 Cr 0.652 1.478 1 1 0.126
18 Cd -0.851 5.268 -1 1 0.028

162
Table 45. Multiple correlation of different soil variables at three different sites of
herbs in summer season with frequency. Significant values are bold. Macroelements
are from S/No 1-9 and microelements are from 10-18. Significant P Value stands for
probability and R for Pearson’s Co-efficient are bold. DF stands for degree of
freedom, R stands for Pearson's r, F stands for Pearson's F and T stands for
Spearman's t.
S/N Parameter R F T DF P
1 pH 0.856 5.504 1 1 0.027
2 EC in (dScm-1) -0.247 0.13 -1 1 0.577
3 OM in % -0.659 1.536 -1 1 0.121
4 N 0.733 2.321 1 1 0.078
5 P 0.833 4.542 1 1 0.034
6 K 0.17 0.059 1 1 0.702
7 Mg -0.427 0.447 -1 1 0.331
8 Ca -0.965 27.197 -1 1 0.003
9 S -0.22 0.102 -1 1 0.619
10 Fe -0.889 7.522 -1 1 0.018
11 Mn -0.901 8.602 -1 1 0.015
12 Cu -0.911 9.774 -1 1 0.012
13 Zn 0.762 2.772 1 1 0.063
14 Si 0.291 0.185 1 1 0.51
15 Pb 0.951 18.982 -1 1 0.005
16 Ni 0.997 332.173 -1 1 < .001
17 Cr 0.839 4.77 1 1 0.032
18 Cd -0.669 1.619 -1 1 0.115

163
Table 46. Multiple correlation of different soil variables at three different sites of
herbs in summer season with cover. Significant values are bold. Macroelements are
from S/No 1-9 and microelements are from 10-18. Significant P Value stands for
probability and R for Pearson’s Co-efficient are bold. DF stands for degree of
freedom, R stands for Pearson's r, F stands for Pearson's F and T stands for
Spearman's t.
S/N Parameter R F T DF P
1 pH 0.644 1.417 1 1 0.131
2 EC in (dScm-1) 0.079 0.013 -1 1 0.858
3 OM in % -0.381 0.34 -1 1 0.387
4 N 0.474 0.58 1 1 0.279
5 P 0.61 1.186 1 1 0.156
6 K 0.479 0.595 1 1 0.274
7 Mg -0.696 1.883 -1 1 0.098
8 Ca -0.998 488.804 -1 1 < .001
9 S 0.107 0.023 -1 1 0.81
10 Fe 0.584 1.037 1 1 0.176
11 Mn -0.993 136.18 -1 1 < .001
12 Cu -0.995 215.138 -1 1 < .001
13 Zn 0.93 12.871 1 1 0.008
14 Si 0.584 1.037 1 1 0.176
15 Pb 0.801 3.57 -1 1 0.047
16 Ni 0.969 30.358 -1 1 0.002
17 Cr 0.619 1.242 1 1 0.149
18 Cd -0.873 6.407 -1 1 0.022

164
Table 47. Multiple correlation of different soil variables at three different sites of
herbs in summer season with importance value. Significant values are bold.
Macroelements are from S/No 1-9 and microelements are from 10-18. Significant
P Value stands for probability and R for Pearson’s Co-efficient are bold. DF stands
for degree of freedom, R stands for Pearson's r, F stands for Pearson's F and T
stands for Spearman's t.
S/N Parameter R F T DF P
1 pH -0.948 17.78 -1 1 0.005
2 EC in (dScm-1) 0.898 8.339 -1 1 0.015
3 OM in % 1 9127.347 -1 1 < .001
4 N -0.993 142.613 -1 1 < .001
5 P 0.961 24.151 -1 1 0.003
6 K 0.641 1.393 1 1 0.133
7 Mg -0.412 0.408 -1 1 0.349
8 Ca 0.426 443 1 1 0.332
9 S 0.886 0.277 -1 1 0.019
10 Fe 0.227 0.108 1 1 0.609
11 Mn 0.253 0.136 1 1 0.568
12 Cu 0.276 0.165 1 1 0.532
13 Zn < .001 < .001 1 1 1
14 Si 0.54 0.824 1 1 0.214
15 Pb -0.851 5.268 -1 1 0.028
16 Ni -0.587 1.051 -1 1 0.174
17 Cr -0.958 22.228 -1 1 0.004
18 Cd -0.133 0.036 -1 1 0.764

165

166
Figure 26. Spectras of linear correlation of herbaceous density with soil variables in
summer season.

167
Figure 27. Spectras of linear correlation of herbaceous frequency with soil variables
in summer season.

168
Figure 28. Spectras of linear correlation of herbage cover with soil variables in
summer season.

169
Figure 29. Spectras of linear correlation of herbaceous IV with soil variables in
summer season.

170
4.7 Palatability
Palatability is plant characteristic or plant condition that motivates the animal to graze
the plant (Hady, 1964). There were 193 plant species, which belonged to 54 families
of district Bannu. Out of them 37 species (19.17%) were non-palatable due to
poisonous in nature while 156 (80.83%) species were palatable due to various degree
of palatability in the area (Table 48). Palatability ratios of plant species were greater
than non-palatable ones in the area. Among the palatable plants there were 24 species
(12.43%) which were highly palatable. High palatable trees such as Acacia modesta,
Acacia nilotica, Cappris decidua and Ziziphus jujuba preferred by browsing animal.
Similarly, Amaranthus viridis, Cicer arietinum, Lathyrus aphaca, Trifolium species,
Triticum aestivum and Zea mays were usually grazed by rumminant (Akram et al.,
2009). There were 37 species (19.17%) which were mostly palatable. The mostly
palatable plant species were Boerhavia procumbens, Chenopodium album,
Convolvulus arvensis, Cyamopsis tetregonoloba, and Eruca sativa in the area (Karki
et al., 2000). There were 59 species (30.56%) which were less palatable to animal.
The less palatable plants were Abelmoschus esculentus, Achyranthes aspera, Arnebia
hispidissima, Atriplex stocksii, Brassica tournefortii, Bromus pectinatus, Calligonum
polygonoides, Carthamus tinctorus, Chrozophora plicata etc. When high palatable
plants are unavailable to animals then they on less palatable plant (Watson &smith,
2000).There were 35 species (18.13%) which were rarely palatable. Similarly, goat
and sheep also depend on these species for some extent (Neal & Miller, 2007).
Herbivory is intensely avoided due to spiny in nature or odorous of the plant species
(Lee et al., 2000).
On the basis of part used, it was found that shoot/whole were used 96 (61.53%). In 57
(37.17%) species leaves were used as a food for animal while in 3(1.92%) floral parts
were consumed (Table 48). Morphological feature of species reduce the palatability of
plants to animal (Milewsk & Madden, 2006) who studied the intensive browsing led
plants to produce thorn and showed resistance against browsing for their survival.
Chemical nature and nutrition also played role against the grazing.
On the basis of condition, 109 (68.98%) species were utilized in fresh condition and
16 (10.12%) in dry condition. While 32 (20%) were used in both dry and fresh
condition (Table 48). In the present study it was noted that Cattle utilize plant usually

171
in fresh condition. Similarly, cow preferred most of the grasses in fresh as well as in
dry condition (wheat straw) these finding are in accordance with Knop and Smith,
(2006).
The palatability of the plant stimulates the animal to select the plant as constituent of
its diet. In other words the reaction of stimulation is to graze the plant. The
stimulation-reaction relationship in food selection and acceptance is controlled by a
complex chain of events (Young, 1948). Among the palatable plants 50 (17.66%)
were grazed by cow, 92 (32.50%) were by goat and 90 (31.80%) by sheep. While 51
(18.02%) were browsed by camel (Table 48). Cattle usually preferred herbaceous
flora and also utilized shrubs to some extent. Cows mostly consumed mostly grasses
while camel utilized trees and spiny plants these finding were agreed with Durrani,
(2005) who found that cattle and sheep preferred forbs and camel preferred trees.

172
Table 48. Palatability, part used, condition and animal preferences of forage plants in District Bannu.
S/No. Plant name Palatability classes Part used Condition Livestock
NP P H M L R W L I F D B C G S Ca
01 Abelmoschus esculentus (Linn.)Moench. - + - - + - - + - + - - - + + +
02 Achyranthes aspera L. - + - - + - - + - + - - + - + -
03 Acacia modesta Wall. - + + - - - - + - + - - - + - +
04 Acacia nilotica (L.) Wild.ex Delile - + + - - - - + - + - - - + + +
05 Aerva javanica (Burm. F.) Juss. - + - - - + - + - - + - - + - +
06 Albiza lebbeck (L.) Benth - + - - - + - + - + - - - - - +
07 Alhagi maurorum Medic. - + - - - + + - - + - - - - - +
08 Allium sativum L. + - - - - - - - - - - - - - - -
09 Allium cepa L. + - - - - - - - - - - - - - - -
10 Alopecurus nepalensis Trin.Ex Steud. - + - - - + + - - + - - + - - -
11 Aloe vera (L.) Brum + - - - - - - - - - - - - - - -
12 Anagallis arvensis L. + - - - - - - - - - - - - - - -
13 Amaranthus blitoides S. Watson - + + + - - - + - + - - + - - -
14 Amaranthus viridis L. - + - + - - - + - + - - + - - +
15 Aristida adscensionis L. - + - + - - + - - + - - + + - -

173
16 Aristida cyanantha Nees ex Steud. - + - + - - + - - + - - + + - -
17 Arnebia hispidissima (Lehm.) A. DC. - + - - + - - - - + - - - - - +
18 Asphadelus tunifolius Caven. + - - - - - - - - - - - - - - -
19 Astragalus scorpiurus Bunge. - + - - - - + - - + - - + + + +
20 Atriplex stocksii Boiss - + - - + - - + - - - + - + - +
21 Avena fatua L. - + + - - - + - - + - - - + + -
22 Boerhavia procumbens Banks ex Roxb - + - + - - + - - + - - - - + -
23 Brassica campestris L. - + - + - - + - - + - - + + + +
24 Brassica tournefortii Gouan - + - - + - + - - + - - - - - +
25 Bromus pectinatus Thunb. - + - - + - + - - + - - + - - -
26 Calendula officinalis L. + - - - - - - - - - - - - - - -
27 Calligonum polygonoides L. - + - - + - - + - + - - - + - +
28 Calotropis procera (Willd.) R. Br. - + - - + - - + - + - - - + + -
29 Capsicum annuum L. - + - - + - + + - + - - - + + -
30 Cappris decidua (Frossk.) Edgew. - + + - - - + - - + - - - + - +
31 Carduus argentatus L. + - - - - - - - - - - - - - - -
32 Carthamus persicus Willd. - + - - + - + - - + - - - - - +
33 Carthamus tinctorus L. - + - - + - + - - + - - - - - +

174
34 Celosia argentea L. - + - - + - + - - + - - - + + -
35 Cenchrus bifolrus Roxb. - + - + - - + - - + - - - - + -
36 Cenchrus ciliaris L. - + - - - + + - - + - - + - - -
37 Centaurea iberica Spreng. - + - - + - - + - - + - - + - -
38 Centaurium pulchellum (Sw.) Druce - + - + - - + - - + - - - - + -
39 Chenopodium album L. - + - + - - + - - - - + - - + -
40 Chenopodium murale L. - + - + - - + - - + - - - - - +
41 Chrozophora tinctoris (L.) Raf. - + - - + - - + - + - - - - - +
42 Cicer arietinum L. - + + - - - + - - - - + + + + +
43 Cirsium arvense (L.) Scop. - + - - + - + - - + - - - + + -
44 Cistanche tubulosa (Schrenk.) Hook. f. + - - - - - - - - - - - - - - -
45 Citrullus colocynthis (L.) Shred. - + - - + - - - + - - + - - - +
46 Citrus limon (L.)Burm.f - + - - + - - + - + - - - + + -
47 Citrus reticulata Blanco - + - - + - - + - + - - - + - -
48 Convolvulus arvensis L. - + - + - - + - - + - - + + + -
49 Convolvulus spicatus Hallier f. - + - + - - + - - + - - + + + -
50 Conyza bonariensis (L.) Cronquist + - - - - - - - - - - - - - - -
51 Corchorus depressus (L.) - + - - + - + - - + - - - - + -

175
52 Croton bonplandianus Bat. - + - - + - + - - + - - + + + -
53 Cucumis sativus L. - + - + - - + - - + - - - + + -
54 Cucurbita maxima Duch Ex. Lam. + - - - - - - - - - - - - - - -
55 Cucurbita pepo L. + - - - - - - - - - - - - - - -
56 Cuscuta reflexa Roxb. + - - - - - - - - - - - - - - -
57 Cymbopogon distans Schutt. - + - - + - - - - - - + - + + -
58 Cyamopsis tetragonoloba (L.) Taubert - + - + - - + - - - - + + + + +
59 Cynodon dactylon (L.) Pers. - + - + - - + - - - - + + + + -
60 Cyperus difformis L. - + - - + - - + - + - - - + + -
61 Cyperus rotundus L. - + - - + - - + - + - - - + + -
62 Dalbergia sissoo Roxb. - + - - - + - + - + - - - + + +
63 Datura alba Nees. + - - - - - - - - - - - - - - -
64 Desmostachya bipinnata (L.)Stapf. - + - - - + - + - - + - + - - -
65 Dichanthium annulatum Forssk. - + + - - - + - - - - + + - - -
66 Digera muricata (L.) Mart - + - - - + - + - - + - - + + -
67 Dinebra retroflexa (Vahl) Panzer. + - - - - - - - - - - - - - - -
68 Daucus carota Linn. - + - - + - - - - + - - + + + -
69 Echinochloa crus-galli (L.) P. Beauv. - + - - - + - + - - + - + - - -

176
70 Echinops echinatus L. - + - - - - + - - + - - - - - +
71 Eleusine indica (L.) Gaertn. - + - - + - + - - + - - + - - -
72 Eragrostis pilosa (L.)P. Beauv. - + - - - + - + - - + - - + - -
73 Eragrostis minor Host. - + - - - + - + - - + - - + - -
74 Eruca sativa Mill. - + - + - - + - - + - - - + + +
75 Eucalyptus camaldulaensis Dehnh. - + - - + - - + - + - - - + + +
76 Euphorbia dracunculoides Lam. - + - - + - - + - - + - + + + -
77 Euphorbia helioscopia L. + - - - - - - - - - - - - - - -
78 Euphorbia prostrata Ait. - + - - - + + - - + - - + - - -
79 Fagonia indica L. - + - - + - + - - + - - - - - +
80 Farsetia jacquemontii (Hook. F. &
thoms.) Jafri
- + - - - + + - - + - - + + + +
81 Ficus carica L. - + - - + - - + - - + - - + - -
82 Ficus religiosa L. - + - - + - - + - - + - - + - -
83 Filago pyramidata L. - + - - - + + - - - + - - - + -
84 Fumaria indica Hausskn. - + - + - - - + + - - - - + - -
85 Galium tricorne Stokes + - - - - - - - - - - - - - - -
86 Heliotropium crispum Desf. - + - - + - + - - + - - - + + +
87 Heliotropium europaeum (F. & M.)
Kazmi
- + - - + - + - - + - - - - - +

177
88 Heliotropium strigosum Wild - + - - + - + - - + - - - - - +
89 Hibiscus rosa-sinensis Linn. - + - - + - - + - + - - - + + -
90 Hordeum vulgare L. - + - + - - + - - + - - + + + +
91 Hordeum murinum Sub. Glacum (Steud)
Tzveleve
+ - - - - - - - - - - - - - - -
92 Hypecoum pendulum L. - + - - + - + - - + - - + + + -
93 Hyoscyamus niger L. - + - - + - + - - + - - - + + +
94 Juncus inflexus L. + - - - - - - - - - - - - - - -
95 Ifloga spicata Forssk. - + - - - + + - - + - - - + + -
96 Iris lactea Pallas + - - - - - - - - - - - - - - -
97 Lactuca sarriola L. - + - - + - + - - + - - - + + -
98 Lathyrus aphaca L. - + + - - - + - - + - - - - + -
99 Lathyrus sativus L. - + - + - - - + - - + - + - - -
100 Launaea angustifolia (Desf.) Kuntze - + - - + - + - - + - - - + + -
101 Launaea procumbens Pravin Kawale - + - - + - + - - + - - - + + -
102 Leptochloa panicea Retz - + - - + - + - - + - - + + + -
103 Linum corymbulosum Reichenb. - + - - + - + - - + - - + + + -
104 Luffa aegyptica Mill. - + - - + - - + - + - - - + + -
105 Lycopersicun esculentum Miller - + - - + - + - - + - - - + + -

178
106 Magifera indica L. - + - - - + - + - + - - - + + -
107 Malcolmia africana (L.) R.Br. - + - - + - - + - + - - + + + -
108 Malva neglecta Wallr. - + - + - - + - - + - - - + + -
109 Malvastrum coromendelianum (L.)
Gracke
- + - - - + - + - + - - - + - -
110 Mentha longifolia L. + - - - - - - - - - - - - - - -
111 Mentha spicata (L.) L. + - - - - - - - - - - - - - - -
112 Momordica charantia L. + - - - - - - - - - - - - - - -
113 Medicago polymorpha L. - + + - - - + - - - - + + + + -
114 Melia azedarach L. - + - - - + - + - + - - - + - -
115 Melilotus alba Desr. - + - + - - - + - - - + + - + -
116 Melilotus indica (L.) All. - + + - - - + - - - - + - - + -
117 Morus alba L. - + + - - - - + - + - - - + + -
118 Morus nigra L. - + + - - - - + - + - - - + + -
119 Nerium indicum Mill. + - - - - - - - - - - - - - - -
120 Neslia apiculata Fisch. - + - - - + + - - + - - - + - -
121 Nicotiana plumbaginifolia Viv. - + - - + - + - - + - - - + + -
122 Nonea edgeworthii A. DC. - + - - - + + - - + - - - - - +
123 Nonea pulla (L.) DC. - + - - - + + - - + - - - - - +

179
124 Oligomeris linifolia (Vahl.) Macbride + - - - - - - - - - - - - - - -
125 Oryza sativa L. - + + - - - + - - - - + + + + +
126 Ocimum basilicum L. + - - - - - - - - - - - - - + -
127 Oxalis corniculata L. - + - - - + - + - - - + - - + -
128 Oxyria digyna (L.) Hill. - + - + - - + - - + - - - + + +
129 Pennisetum glaucum L - + - + - - + - - - - + - + - -
130 Parthenium hysterophorus L. + - - - - - - - - - - - - - - -
131 Pegnum harmala L. + - - - - - - - - - - - - - - -
132 Periploca aphylla Decne. - + - - - + + - - + - - - + - +
133 Phalaris minor Retz. - + - + - - + - - - + - - + - -
134 Phoenix dactylifera L. - + - - - + - + - + - - - + + -
135 Phragmites karka (Retz.) Trimn.ex
Steud.
+ - - - - - - - - - - - - - - -
136 Plantago lanceolata L. - + - - + - + - - - - + - - + -
137 Plantago ovata Frossk. - + - - + - + - - - - + - - + -
138 Poa annua L. - + + - - - + - - - - + - - + -
139 Poa botryoides (Trin. Ex Griseb.) Kom. - + + - - - + - - - - + - - + -
140 Poa bulbosa L. - + + - - - + - - - - + - - + -
141 Polygonum biaristatum Aitch. & Hemsl. + - - - - - - - - - - - - - - -

180
142 Polygonum plebejum R.Br + - - - - - - - - - - - - - - -
143 Polypogon monspeliensis (L.) Desf. - + + - - - - + - - - + + - - -
144 Portulaca oleracea Linn. - + - - - + + - - + - - - + + +
145 Psammogeton biternatum Edgew. + - - - - - - - - - - - - - - -
146 Psidium guajava Linn. - + - + - - - + - + - - - + - +
147 Prosopis cineraria L. - + - + - - - + - + - - - + - +
148 Prosopis juliflora Swartz. - + - + - - - + - + - - - + - +
149 Raphanus sativus Linn. - + - + - - + - - + - - + + + -
150 Ranunculus muricatus L. - + - - + - + - - + - - - + + -
151 Ranunculus scleratus L. - + - - + - + - - + - - - + + -
152 Rostraria cristata Linn. - + - - - + + - - + - - - + + -
153 Rostraria pumila (Desf.) Tzvelev. - + - - - + + - - + - - - + + -
154 Rhazya stricta Decne. - + - - - + - + - + - - - + - -
155 Rumex dentatus (Meisn.) Rech.f. - + - - + - + - - + - - + - - -
156 Saccharum bengalense Retz. - + + - - - - + - - - + + - - -
157 Saccharum officinarum Linn. - + - + - - - + - + - + + + + -
158 Saccharum spontaneum Linn. - + - - - + + + - - - - + - + -
159 Salsola foetida Del.ex Spreng. - + - + - - + - - + - - - + + +

181
160 Setaria pumila (Poir.) Roem. - + - + - - + - - - - + - - + -
161 Silene vulgaris (Moench) Garcke. - + - - + - + - - + - - - + + -
162 Sesbenia sesbans (L.)Merrill. - + - - + - - + - + - - + + + -
163 Sisymbrium irio L - + - + - - + - - + - - - + + -
164 Sonchus asper (L.) Hill. - + - - - + + - - + - - - + - +
165 Solanum nigrum L. - + - + - - + - - - - + + - + -
166 Solanum surattense Burm.f. - + - + - - + - - - - + - - - +
167 Sorghum halepense (L.) Pers. - + - + - - + - - + - + + + + -
168 Sorghum bicolor (Linn.)Moench. - + - - + - + - - + - + + + + -
169 Spergula fallax (Lowe) E.H.L. Krause - + - - + - - - + - + - - + - -
170 Suaeda fruticosa Forssk.ex J.F. Gmelin. - + - + - - + - - - - + - - - +
171 Taraxacum officinale F.H. Wiggers + - - - - - - - - - - - - - - -
172 Tamarix aphylla (L.) Karst - + - - - + - + - + - - - + - +
173 Tamarix dioica Roxb. Ex Roth. - + - - - + - + - + - - - + - +
174 Torilis nodosa (L.) Gaertn. - + - - + - + - - - - + - + - -
175 Tribulus terrestris L. - + + - - - + - - + - - - - + -
176 Trichosanthes dioica Rxb. - + - - + - + - - + - - - + + -
177 Trifolium alexandrianum L. - + + - - - + - - - - + + - - -
178 Trifolium repens L. - + + - - - + - - - - + + - - -
179 Trigonella crassipes Boiss. - + - + - - + - - + - - + + + -

182
180 Triticum aestivum L - + + - - - + - - + - + + + + -
181 Typha latifolia L. - + - - - + - + - + - - + - - -
182 Typha minima Frunck ex Hoppe - + - - - + - + - + - - + - - -
183 Verbena officinalis L. - + - - + - + - - + - - - + - +
184 Veronica aqutica Bern. + - - - - - - - - - - - - - - -
185 Vicia hirsuta (L.) S.F. Gray, Nat. - + - - + - - + - - + - - + - -
186 Vitex negundo L. + - - - - - - - - - - - - - - -
187 Vitis vinifera Linn. - + - - + - - + - + - - - + - +
188 Viola stockii Boiss. - + - - - + - + - - + - - - + -
189 Withania coagulans Dunal. + - - - - - - - - - - - - - - -
190 Withania somnifera L. + - - - - - - - - - - - - - - -
191 Xanthium strumarium L. + - - - - - - - - - - - - - - -
192 Zea mays L. - + + - - - + - - - - + + + + +
193 Ziziphus jujuba Mill. - + + - - - - + - + - - - + + +
Total 37 156 24 37 59 35 96 57 3 109 16 32 50 92 90 51
Percentage 19.17%
80.83%
12.43%
19.17%
30.56%
18.13%
61.53%
37.
17%
1.92%
68.98%
10.12%
20.88%
17.66%
32.50%
31.50%
18.02%
Key: Np = Non palatable; P = palatable; H = highly palatable; M = mostly palatable; L = less palatable; R = rarely palatable. W = whole plant;
L = leaves; I = inflorescence. F = fresh; D =dry; B = both. C = cow; G = goat; S = sheep and Ca = camel.

183
4.8 Nutrititional values of selected plants species
During the current study 193 plant species were studied in dried areas of district
Bannu. Among these, eight (08) plant species were selected for nutritional analysis in
Table 49. Most of them belong to Poaceae. These selected plant species occur
naturally in the area and used as a food for livestock. This was criteria for the
selection of plants for nutritional analysis.
1. Aristida adscensionis L. is common grass which occur naturally in Bannu and
used as food for cattle. This species has moisture contents (5.5%), Ash (10%), Fiber
(28%), Fats (8%), Proteins (3.15%), Carbohydrates (45.37%) and Gross energy is
396.50 Kcal/100g (Table 49). The results were compared with the similar studies like
Devi and Rehman, (2002) that the substances with well-known nutritional purposes,
such as carbohydrate, proteins, vitamins, minerals, amino acids and fatty acids
emanate under this category. The most frequently known nutrients are antioxidants,
vitamins and vital minerals. The macro and micro elemental status of this plant was
total nitrogen (0.50%), phosphorus (0.18 µg/gm), Potassium (6.895%), Calcium
(3.892 µg/gm), Mg (1.124 µg/gm), Fe (2.209 µg/gm), Zn (0.434 µg/gm), Pb (0.244
µg/gm), Cr (0.027 µg/gm), Cd (0.010 µg/gm) and Ni (0.026 µg/gm) (Table 49).
Similar results were displayed that macro and microelements are essential for growth
and development which were present in wild edible fruits and vegetable (Pandey et
al., 2011)
2. Dichanthium annulantum Forssk. belongs to family Poaceae and occurs
naturally in this area and used as food for cattle. This species has Moisture contents
(6%), Ash (11%), Fiber (34%), Fats (6%), Proteins (4.44%), Carbohydrates (38.56%)
and Gross energy is 380.20 Kcal/100g (Table 49). The Phyto-nutrients are ingredients
that occur obviously in plants, have been originate to hold specific and powerful
disease preventing potentials (Frasher, 2006). The macro and micro elemental status
of this plant was total nitrogen (0.71%), phosphorus (0.11 µg/gm), Potassium (6.802
%), Calcium (2.337 µg/gm), Mg (1.183 µg/gm), Fe (2.510 µg/gm), Zn (0.570 µg/gm),
Pb (0.281 µg/gm), Cr (0.024 µg/gm), Cd (0.002 µg/gm) and Ni (0.025 µg/gm) (Table
49). Similarly, Tucker (2003) reported that together essential and nonessential
nutrients should be measured as bioactive food components centered on the specific

184
physiological purpose they communicate, including characterization of their
metabolic and physiological utilities and related targets, and biomarkers.
3. Polypogon mospeliensis (L.) Desf. Belongs to Poaceae which occurs naturally
in this area and used as food for cattle’s and cows. This species has Moisture contents
(5%), Ash (12%), Fiber (4.4%), Fats (8%), Proteins (4.88%), Carbohydrates (65.12%)
and Gross energy is 373.94 Kcal/100g (Table 49). Ranfa et al., (2013) carefully
analyzed four plant species and showed the presence of all the dietary active
principles, although in different meditations. After water, carbohydrates made up the
superior part with values that sort from 1.0% in B. perennis to 6.0% in S. minor;
middle values were found in C. juncea and B. erucago, which limited 2.0% and 3.0%,
correspondingly. Protein content extended from 1.4% in B. perennis to 3.8g/100g of
edible portion in S. minor, with C. juncea (1.9g/100g) and B. erucago (2.2g/100g) in
an intermediary position. The total fat contents were very low in all four species,
under 1.0%. The macro and micro elemental status in Polypogon mospeliensis was
total nitrogen (0.78%), phosphorus (0.24 µg/gm), Potassium (6.982 %), Calcium
(4.029 µg/gm), Mg (1.338 µg/gm), Fe (10.30 µg/gm), Zn (0.540 µg/gm), Pb (0.206
µg/gm), Cr (0.057 µg/gm), Cd (0.004 µg/gm) and Ni (0.100 µg/gm) (Table 49).
4. Bromus pectinatus Thunb. Belongs to Poaceae which occur naturally in this
area and used as food for cattle. This species have Moisture contents (5.5%), Ash
(10%), Fiber (23.5%), Fats (5%), Proteins (4.18%), Carbohydrates (51.81%) and
Gross energy is 387.52 Kcal/100g (Table 49). Similarly, the beneficial effects of the
mediterranean diet on human health are well recognized, such as high fiber content,
vitamins with an antioxidant function, total polyphenols, vitamins and minerals were
reported (Vanzani et al., 2011). Bromus pectinatus have the following macro and
micro elemental status of this plant was total nitrogen (0.67%), phosphorus (0.23
µg/gm), Potassium (8.896 %), Calcium (3.055 µg/gm), Mg (1.044 µg/gm), Fe (2.585
µg/gm), Zn (0.500 µg/gm), Pb (0.187 µg/gm), Cr (0.027 µg/gm), Cd (0.003 µg/gm)
and Ni (0.004 µg/gm) (Table 49). This is why that this study goals at concentrating
attention on these species and their significance for human nutrition, as knowledge
and rediscovery of formulae in human and animal food could signify an economic
potential (Guarrera et al., 2006).

185
5. Rostraria cristata Linn. Belongs to Poaceae which occur naturally in this area
and used as food for cattle. This species have Moisture contents (4.5%), Ash (16%),
Fiber (18.5%), Fats (6%), Proteins (6.25%), Carbohydrates (48.75%) and Gross
energy is 356.45 Kcal/100g (Table 49). The macro and micro elemental status of this
plant was total nitrogen (1.00%), phosphorus (0.36 µg/gm), Potassium (9.892 %),
Calcium (4.900 µg/gm), Mg (1.295 µg/gm), Fe (9.917 µg/gm), Zn (0.825 µg/gm), Pb
(0.232 µg/gm), Cr (0.090 µg/gm), Cd (0.005 µg/gm) and Ni (0.080 µg/gm) (Table
49). Similar studied was conducted by Santayana et al., (2007) that wild plants have
been object of several studies as many have new and unfamiliar nutritional properties.
6. Farsetia jacquemontii (Hook. F. & Thoms) Jafri. Belongs to Brassicaceae
which occur naturally in this area and used as food for cattle. This species have
Moisture contents (6%), Ash (9%), Fiber (22.5%), Fats (9%), Proteins (6.25%),
Carbohydrates (47.25%) and Gross energy is 393.65 Kcal/100g (Table 49). The
macro and micro elemental status of this plant was total nitrogen (1.00%), phosphorus
(0.16 µg/gm), Potassium (7.166 %), Calcium (22.36 µg/gm), Mg (1.204 µg/gm), Fe
(3.049 µg/gm), Zn (0.349 µg/gm), Pb (0.331 µg/gm), Cr (0.029 µg/gm), Cd (0.027
µg/gm) and Ni (0.039 µg/gm) (Table 49). Ranfa et al., (2013) found that the quality
and quantity of the numerous components of the four-species under inspection could
make an brilliant role to balancing and rationalizing diet and stopping metabolic
pathologies. This study demonstrates how edible wild plants comprise many of the so-
called slight nutrients (because they are originate in small amounts).
7. Astragalus scorpiurus Bunge belongs to Papilionaceae which occur naturally
in this area and used as food for cattle. This species have Moisture contents (7.5%),
Ash (12.5%), Fiber (19.5%), Fats (8%), Proteins (8.06%), Carbohydrates (44.43%)
and Gross energy is 364.00 Kcal/100g (Table 49). The macro and micro elemental
status of this plant was total nitrogen (1.29%), phosphorus (0.20 µg/gm), Potassium
(9.078 %), Calcium (9.884 µg/gm), Mg (1.308 µg/gm), Fe (3.132 µg/gm), Zn (0.254
µg/gm), Pb (0.162 µg/gm), Cr (0.014 µg/gm), Cd (0.006 µg/gm) and Ni (0.005
µg/gm) (Table 49). Similarly, Kaur et al., (2015) was studied and identified presence
of an extensive range of phytoconstituents present in numerous old-style plants and
spices. Certain plants such as Lagenaria siceraria, Trigonella foenum graecum,
Curcuma longa, Vigna mungo etc. shows brilliant properties in remedial

186
hypertension, obesity, diabetes and hyper-cholestromia and also show the importance
of several nutraceuticals that we eat in our daily diet and their role.
8. Euphorbia dracunculoides Lam. Belongs to Euphorbiaceae which occur
naturally in this area and used as food for cattle’s and cows. This species have
Moisture contents (5.5%), Ash (15%), Fiber (14%), Fats (7%), Proteins (6.19%),
Carbohydrates (52.31%) and Gross energy is 358.90 Kcal/100g (Table 49). The
macro and micro elemental status of this plant was total nitrogen (0.29%), phosphorus
(0.18 µg/gm), Potassium (10.26 %), Calcium (9.689 µg/gm), Mg (1.198 µg/gm), Fe
(4.456 µg/gm), Zn (0.249 µg/gm), Pb (0.046 µg/gm), Cr (0.026 µg/gm), Cd (0.004
µg/gm) and Ni (0.026 µg/gm) (Table 49). Similar study was conducted by Sagar et
al., (2004) that substances with recognized nutritional functions, such as
carbohydrate, proteins, vitamins, minerals, amino acids, fatty acids and elemental
status emanate under this group. The most frequently known nutrients are
antioxidants, vitamins and essential minerals. Antioxidants are ingredients, which
check or prevent weakening, damage or annihilation caused by oxidation. Luckily, the
body has military of antioxidants for injury limitation.

187
Table 49. Nutritional values of selected plant species.
S.No Parameter Rostraria
cristata Linn.
Polypogon
mospeliensis
(L.) Desf.
Bromus
pectinatus
Thunb.
Dichanthium
annulantum
Forssk.
Aristida
adscensioni
s L.
Farsetia
jacquemontii
(Hook. F. &
Thoms) Jafri
Astragalus
scorpiurus
Bunge
Euphorbia
dracunculoid
es Lam.
1 Moisture % 4.5% 5.0% 5.5% 6.0% 5.5% 6.0% 7.5% 5.5%
2 Ash% 16% 12.5% 10% 11% 10% 9% 12.5% 15%
3 Fiber% 18.5% 4.5% 23.5% 34% 28% 22.5% 19.5% 14%
4 Fats% 6% 8% 5% 6% 8% 9% 8% 7%
5 Protein% 6.25% 4.88% 4.18% 4.44% 3.15% 6.25% 8.06% 6.19%
6 Carbohydrat
es%
48.75% 65.12% 51.81% 38.56% 45.37% 47.25% 44.43% 52.31%
7 Gross
Energy%
356.45
Kcal/100g
373.94
Kcal/100g
387.52
Kcal/100g
380.20
Kcal/100g
396.50
Kcal/100g
393.65
Kcal/100g
364.40
Kcal/100g
358.90
Kcal/100g
8 Total
Nitrogen%
1.00% 0.78% 0.67% 0.71% 0.50% 1.00% 1.29% 0.29%
9 Phosphorus 0.36µg/gm 0.24µg/gm 0.23µg/gm 0.11µg/gm 0.18µg/gm 0.16µg/gm 0.20µg/gm 0.18µg/gm
10 K 9.892% 6.982% 8.896% 6.802% 6.895% 7.166% 9.078% 10.26%
11 Ca 4.900µg/gm 4.029µg/gm 3.055µg/gm 2.337µg/gm 3.892µg/gm 22.36µg/gm 9.884µg/gm 9.689µg/gm
12 Mg 1.295µg/gm 1.338µg/gm 1.044µg/gm 1.183µg/gm 1.124µg/gm 1.204µg/gm 1.308µg/gm 1.198µg/gm
13 Fe 9.917µg/gm 10.30µg/gm 2.585µg/gm 2.510µg/gm 2.209µg/gm 3.049µg/gm 3.132µg/gm 4.456µg/gm
14 Zn 0.822µg/gm 0.540µg/gm 0.500µg/gm 0.570µg/gm 0.434µg/gm 0.349µg/gm 0.254µg/gm 0.249µg/gm
15 Pb 0.232µg/gm 0.206µg/gm 0.187µg/gm 0.281µg/gm 0.244µg/gm 0.331µg/gm 0.162µg/gm 0.046µg/gm
16 Cr 0.090µg/gm 0.057µg/gm 0.027µg/gm 0.024µg/gm 0.027µg/gm 0.029µg/gm 0.014µg/gm 0.026µg/gm
17 Cd 0.005µg/gm 0.004µg/gm 0.003µg/gm 0.002µg/gm 0.010µg/gm 0.027µg/gm 0.006µg/gm 0.004µg/gm
18 Ni 0.080µg/gm 0.100µg/gm 0.024µg/gm 0.025µg/gm 0.026µg/gm 0.039µg/gm 0.005µg/gm 0.026µg/gm

188
Achyranthes aspera L. Aerva javanica L.
Alhagi maurorum Medic. Alopecurus nepalensis Trin.Ex Steud.
Anagallis arvensis L. Amaranthus blitoides S. Watson

189
Amaranthus viridis L. Aristida adscensionis L.
Aristida cyanantha Nees ex Steud. Arnebia hispidissima (Lehm.) A.DC.
Asphadelus tunifolius Caven. Astragalus scorpiurus Bunge.

190
Atriplex stocksii Boiss. Avena fatua L.
Boerhavia procumbens Banks ex Roxb. Brassica tournefortii Gouan
Calendula officinalis L. Calotropis procera (Wild.) R. Br.

191
Carduus argentatus L. Carthamus persicus Willd.
Carthamus tinctorus L. Celosia argentea L.
Cenchrus ciliaris L. Centaurea iberica Spreng.

192
Centaurium pulchellum (Sw.) Druce Chenopodium murale L.
Chrozophora plicata (L.) Raf. Cirsium arvense (L.) Scop.
Cistanche tubulosa (Schrenk.) Hook.F. Convolvulus arvensis L.

193
Convolvulus spicatus L. Conyza bonariensis (L.) Cronduist
Corchorus depressus L. Croton bonplandianus Bat.
Cymbopogon distans Schutt. Cynodon dactylon (L.) Pers

194
Cyperus rotundus L. Datura alba Nees.
Dichanthium annulatum Forssk. Digera muricata (L.) Mart
Dinebra retroflexa (Vahl) Panzer Echinochloa crus-galli (L.) P. Beauv

195
Echinops echinatus L. Eleusine indica (L.) Gaertn.
Eragrostis pilosa (L.) P. Beauv. Eruca sativa Mill.
Euphorbia dracunculoides Lam. Euphorbia helioscopia L.

196
Euphorbia prostrate Ait. Fagonia indica L.
Farsetia jacquemontii (Hook. F &
thoms.) Jafri
Filago pyramidata L.
Fumaria indica Hausskn. Galium tricorne Stokes

197
Heliotropium crispum Wild Heliotropium europaeum (F. & M.) Kazmi
Heliotropium strigosum Wild Hypecoum pendulum L.
Hyoscyamus niger L. Ifloga spicata Forssk.

198
Melilotus indica (L.) All. Lactuca serriola L.
Lathyrus aphaca L. Launaea angustifolia (Desf.) Kuntze
Launaea procumbens Pravin Kawale Leptochloa panicea Retz.

199
Linum corymbulosum Reichenb. Malcolmia africana (L.) R. Br.
Malva neglecta Wallr Malvastrum coromendelianum (L.) Gracke
Neslia apiculate Fisch. Nicotiana plumbaginifolia Viv.

200
Nonea philistaea Boiss Nonea pulla (L.) DC.
`
Oligomeris linifolia (Vahl.) Macbride Bromus pectinatus Thunb.
Oxyria digyna (L.) Hill. Parthenium hysterophorus L.

201
Pegnum harmala L. Phalaris minor Retz.
Plantago lanceolate L. Plantago ovate Frossk.
Poa botryoides (Trin.ex Griseb.) Kom. Poa bulbosa L.

202
Polygonum biaristatum Aitch. & Hemsl. Polygonum plebejum R. Br.
Psammogeton biternatum Edgew. Ranunculus muricatus L.
Rumex dentatus (Meisn.) Rech.f. Saccharum arundinaceum Linn.

203
Setaria pumila (Poir.) Roem. Silene vulgaris (Moench) Garcke.
Sisymbrium irio L. Sonchus asper (L.) Hill.
Solanum surattense Burm. F. Sorghum halepense (L.) Pers

204
Spergula fallax (Lowe) E.H.L. Krause Taraxacum officinale F.H. Wiggers
Torilis nodosa (L.) Gaertn. Tribulus terrestris L.
Trichosanthes dioica Rxb. Trigonella crassipes Boiss

205
Verbena officinalis L. Vicia hirsute (L.) S.F. Gray, Nat.
Withania somnifera L. Withania coagulans Dunal
Xanthium strumarium L. Rostraria cristata (Linn.) Tzvelev

206
Conclusions
This study was conducted during 2013-2015 to explore the ethno floristic study,
vegetation structure and nutraceutical aspect of selected plant species of district
Bannu.
During this study, a total 193 plants species of 153 genera that belonged to 54
families were reported from the area.
Poaceae was dominant family with 37 species.
Dry habitat condition was dominant (45.07%) over the rest of habitat condition.
Spring season plants were dominant (41.37%) over other seasons.
It is evident from biological spectrum that therophytes plants were dominant in
the area.
The plant bearing nanophylous leaves were dominant over the other types.
Simple leaves were dominant with 76.16%.
58 plant species were used for medicinal purposes.
On the basis of soil variables and their micro and macro elements the area was
divided into three sites. At each sites, the soil was analyzed for micro and macro
elements.
At site I, 60 plant species of 29 families and six-plant communities were
established.
At site I, Shannon diversity index (3.814) and Species Richness (54) were noted.
At site II, 65 plant species of 26 families and six-plant communities were
established.
At site II, Shannon diversity index (3.742) and Species Richness (51) were
noted.
At site III, 85 plant species of 28 families and six-plant communities were
established.
At site III, Shannon diversity index (4.082) and Species Richness (72) were
noted.
Correlation of different soil variables with total values of Density, frequency,
cover and IV in 3-sites of study area was examined.
Correlation of different soil variables with herbs density, frequency, cover and
IV in four seasons of study area was also examined.

207
In this area, the palatable species were 80.83% while non-palatable were
19.17%.
Nutritional values of eight selected plants of the area show that the maximum
amount of protein contents in Astragalus scorpiurus were 8.06% while
minimum amount in Aristida adscensionis (3.15%). Similarly, the higher gross
energy in Aristida adscensionis was 396.50Kcal/100g while lowest in Rostraria
cristata (356.45Kcal/100g).
208
Recommendations and Suggestions
It has been concluded from these research that large numbers of area are
barren and dry due to water short fall.
Afforestation and proper water management system is needed to these areas in
future.
Control deforestation of the area from IDPs of North Waziristan agency.
Control over grazing to protect the soil from erosion.
Moderate grazing management is beneficial for future basis.
Seminars should be arranged in this area, to create awareness about the
benefits of afforestation and drastic effect of deforestation on the area.
Palynological studies should be carried of species and genera of the area.
Micromorphological and anatomical studies such as shape and size of
phytolith, rows of bundle sheath cells, stomatal complex, microhairs and
macrohairs should be employed.
Conserve the medicinally important plant species of the area.
To improve the overall sustainable biological productivity from the area, long
term policies are necessary which might contain rehabilitation of degraded
habitats by introducing fast growing fodder species, replacement of low
yielding livestock with upgraded breeds, rotational and mixing grazing. Such
long terms efforts might decrease pressure and permit the flora and fauna to
return to its original position.

209
REFERENCES:
Abbasi, A. M., M.A. Khan, M. Ahmad, M. Zafar, H. Khan, N. Muhammad and S.
Sultana. 2009. Medicinal plants used for the treatment of Jaundice and
Hepatitis based on Socio-Economics documentation. African Journal of
Biotechnology, 8(8): 1643-1650.
Abbasi, M. K., M. M. Tahir, A. H. Shah and F. T. Batool. 2009. Mineral nutrient
composition of different ecotypes of white clover and their nutrient credit to
soil at Rawalakot Azad Jammu and Kashmir. Pak. J. Bot., 41 (1): 41-51.
Acosta, J. A., M. Martinez, S. Faz and A. Arocena. 2012. Accumulation of major and
trace elements in particle size fractions of soils on eight different-parent
materials. Geoderma, 161: 30-42.
Adam, F. B and G. E. Crow. 2010. The Flora and vegetation of timber Island, Lake
Winnipesaukee, New Hampshire, U.S.A. Rhodora, 112 (950): 156-190.
Adhikari, B. S., H. C. Rikhari, Y. S. Rawat and S. P. Singh. 1991. High altitude forest
composition diversity and profile in a part of Kaumaun Himalaya. Tropical
Ecology, 32 (1): 86-97.
Agriculture University research farm at Koont and its surrounding areas. Pak. J. Bot.,
43(3): 1679-1684.
Agricultural research station Serai Naurang (Bannu), Khyber Pakhtunkhwa, Pakistan.
Ahmad, E., M. Arshad, M. M. Saeed and M. Ishaque. 2004. Ethno pharmacological
survey of some medicinally important plants of Galliyat areas of NWFP,
Pakistan. Asian J. Pl. Sciences, 3 (4): 410-415.
Ahmad, I., M. Hussain, M. Sajid, A. Ahmad and M. Hameed. 2008a. Spatio-temporal
effects on association of plant species in Soone valley of Pakistan. Pak. J.
Bot., 40 (5): 1865-1876.
Ahmad, K., M. Hussain, M. Ashraf, M. Luqman, M. Y. Ashraf and Z. I. Khan. 2007.
Indigenous vegetation of Soone Valley: at the risk of extinction. Pak. J. Bot.,
39 (3): 679-690.
Ahmad, K., Z. I. Khan, M. Ashraf, M. Hussain, M. Ibrahim and E. E. Valeem. 2008.
Status of plant diversity at Kufri (Soone Valley) Punjab, Pakistan and
prevailing threats therein. Pak. J. Bot., 40 (3): 993-997.

210
Ahmad, M., N. Khan, M. Wahab, S. Hamza, M. F. Siddiqui, K. Nazim and M. U.
Khan. 2009. Vegetation structure of Olea ferruginea Royle forests of lower
Dir District of Pakistan. Pak. J. Bot., 41 (6): 2683-695.
Ahmad, M., T. Husain, A. H. Sheikh, S. S. Hussain and M. F. Siddiqui. 2006.
Phytosociology and structure of Himalayan forests from different climatic
zones of Pakistan. Pak. J. Bot., 38 (2): 361-383.
Ahmad, S., M., Islam, G., Bano, S., Aslam and S., Koukab. 2009. Seasonal variation
in current season and dead biomass of Chrysopogon aucheri (Boiss) Stapf in
highland Baluchistan. Pak. J. Bot., 41 (2): 519-528.
Ajaib, M, Z. U Khan, N. Khan and M. Wahab. 2010. Ethnobotanical studies on useful
shrubs of District Kotli, Azad Jammu & Kashmir, Pakistan. Pak. J. Bot., 42
(3): 1407-1415.
Ajasa, A. M. O., Bello, M.O., Ibrahim, A. O., Ogunwande, I. A. and Olawore, N. O.
2004. Heavy trace metals and macronutrients status in herbal plants of
Nigeria. Food Chem., 85: 67–71.
Akhtar and Begum. 2009. Ethnopharmacological important plants of Jalala, District
Mardan, Pakistan. Pak. J. Pl. Sci., 15 (2): 95-100.
Akram, M., M. A. Kahlown and Z. A. Soomro. 2009. Desertification control for
sustainable land use in the Cholistan Desert, Pakistan. Earth & Envm. Science,
6: 483-492.
Akter, M. and T. Akagi. 2005. Effect of fine root contact on plant induced weathering
of basalt. Soil Sci Plant Nutr., 51: 861-871.
Ali, S. I. 2008. The significance of flora with special reference to Pakistan. Pak. J.
Bot., 40(30): 967-971.
Ali, S. M and R. N. Malik. 2010. Vegetation communities of urban open spaces:
Green belts and parks in Islamabad city. Pak. J. Bot., 42 (2): 1031-1039.
Amjad, M. S., M. Arshad and R. Qureshi .2015. Ethnobotanical inventory and folk
uses of indigenous plants from Pir Nasoora National Park, Azad Jammu and
Kashmir. Asian Pac J Trop Biomed. 5(3): 234-241.
Analysis of Ten Sudanese Medicinal Plants Using X-ray Fluorescence. Journal of
Applied and Industrial Sciences, 1 (1): 49-53.
Anely Nedelcheva. 2013. An ethno botanical study of wild edible plants in Bulgaria.
Eurasia J. Biosci., 7: 77-94.

211
Ankli, A., O. Sticher and M. Heinrich. 1999. Medical ethno botany of the Yucatec
Maya: Healer’s consensus as a quantitative criterion. Economic Botany, 53:
144-160.
Anonymous. 1978. Soil Physical and Chemical Analysis. Institute of Soil Science,
Chinese Academy of Sciences. Science and Technology Press, Shanghai,
China.
Antje, B. 2002. Determinants of inselberg floras in arid Nama Karoo land scapes. J.
Biogeography, 28 (10): 1211-1220.
Antje, B., J. K. Esler, P. Eugene and B. Phoebe. 2003. Species richness and floristic
relationships between mesas and their surroundings in southern African Nama
Karoo. Diversity & Distributions, 9 (1): 43-53.
AOAC .1999. Official Method of Analysis of AOAC Intl. 16th Edition, Association
of Official Analytical Chemists, Maryland.
AOAC. 1990. Official methods of analysis. 15thEdn. Association of official
Agriculture Chemists Washington, DC.
AOAC. 2000. Official Methods of Analysis. The 16th edition (1995) and the 15th
edition (1990). This last was published in Arlington, Virginia, USA, by
AOAC International.
AOCS Official Procedure Approved Procedure. 2005. Rapid determination of oil/fat
utilizing high temperature solvent extraction. American Oil Chemists Society.
Arenas and Scarpa. 2007. Edible wild plants of the Chorote Indians, Gran Chaco,
Argentina. Botanical J. Linn. Society, 153 (1): 73-85.
Arshad, M. 2003. Cholistan desert ecosystem monitoring for future management.
Annual technical report of a project sponsored by WWF-Pakistan.
(Unpublished).
Arshad, M. and G. Akbar. 2002. Benchmark of plant communities of Cholistan desert.
Pakistan J. Biological Sciences, 5: 1110-1113.
Arshad, M., A. U. Hussan, M. Y. Ashraf, S. Noureen and M. Moazzam. 2008.
Edaphic factors and distribution of vegetation in the Cholistan desert,
Pakistan. Pak. J. Bot., 40 (5): 1923-1931.
Aruoma, OI. 2003. Methodological considerations for characterizing potential
antioxidant actions of bioactive components in food plants. Mut. Res.523 –
524:9-20.

212
Aweto, AO. 1981. Secondary succession and soil fertility restoration in south-western
Nigeria: Soil and vegetation interrelationships. J Ecology, 69: 957-963.
BabaValley Malakand Agensy, Pakistan. Pakistan Journal of Plant Sciences, 12(2):
115-121.
Badshah, L., F. Hussain and N. Akhtar. 2010. Vegetation structure of subtropical
forest of Tabai, South Waziristan, Pakistan. Front. Agri. China, 4 (2): 232-
236.
Badshah, L., F. Hussain and N. Akhtar. 2010. Vegetation structure of subtropical
forest of Tabai, South Waziristan, Pakistan. Front. Agri. China, 4 (2): 232-236.
Badshah, L., F. Hussain and Z. Sher. 2013. Floristic inventory, ecological
characteristics and biological spectrum of rangeland, district tank, Pakistan.
Pak. J. Bot., 45(4): 1159-1168.
Bahadur, A., Chaudhry, Z., Jan, G., Danish, M., Rehman, A. Ahmad, R., Khan, A.,
Khalid, S., Irfan U., Shah, Z., Ali, F., Mushtaq, T. and Gul Jan, F. 2011.
Nutritional and elemental analyses of some selected fodder species used in
traditional medicine. Afri. J. Pharm. Pharmacol., 5: 1157-1161.
Bao, S.D. 1999. Agricultural Soil Analysis. (3rdEd.) China Agricultural Press,
Beijing.
Barkworth, M. E., K. M. Capels, A. Long, L. K. Anderton, M. B. Piep. 2007. Flora
of NorthAmerica. Oxford University Press: New York, 24: 1-910.
Barkworth, M. E., K. M. Capels, S. Long, and M. B. Piep. 2003. Flora of North
America. Oxford University Press: New York, 25, 1.575.
Bashan, Y., H. Vierheilig, BG. Salazar and LE. de-Bashan. 2006. Primary
colonization and breakdown of igneous rocks by endemic, succulent elephant
trees (Puchycormus discolor) of the deserts in Baja California, Mexico.
Naturwissenschaften, 93:344-347.
Bashan, Y., Li. CY. Lebsk, VK. Moreno, M. and LE.Bashan. 2002. Primary
colonization of volcanic rocks byplants in arid Baja California, Mexico. Plant
BioI., 4: 392-402.
Batalha and Martins. 2002. Life-form spectra of Brazilian Cerrado sites. Flora,
Morphology, Distribution, Functional Ecology of Plants, 197 (6): 452-460.
Bennett, B.C. and G.T. Prance. 2000. Introduced plants in the indigenous
pharmacopeias of northern South America. Economic Botany, 54: 90-102.

213
Bocuk, H., C. Ture and O. Ketenoglu. 2009. Plant diversity and conservation of the North
East Phrygia region under the impact of land degradation and desertification (Central
Anatolia, Turkey). Pak. J. Bot., 41 (5): 2305-2321.
Bouyoucos, G. J. 1936. Directions for making mechanical analysis of soils by the hydrometer
method. Soil Sci., 42: 225-228.
Brady and R.R. Weil, 1999. The Nature and Properties of Soils, 12th Edition. Upper Saddle
River, NJ: Prentice-Hall, Inc. 881p.
Brady and R.R. Weil, 2002. The Nature and Properties of soils. 13th Edition, Pearson
Education Pvt. Ltd., Delhi, India.
Brady, 1984. The Nature and Properties of Soils, 9 th Edition, USA, Macmillan Publishing
Co., 1984. P253-282.
Brady, N. C. 1990. The Nature and Properties of Soils. 10th ed. Macmillan Publishing Co.
New York, NY. Pp 621.
Bremner, J. M., and C. S. Mulvaney. 1982. Nitrogen - Total. In: Methods of Soil Analysis (A.
L. Page et al., Ed.). Agronomy Monograph 9, Part 2, 2nd ed. American Society of
Agronomy, Madison, WI. pp. 595-624.
Cain and Castro. 1956. Application of some phytosociological techniques to Brazilian rain
forest. Part II. Amer. J. Botany, 43: 915-928.
Campbell, 2006. Introduction to Remote Sensing Fourth Edition. Taylor & Francis, London,
467-469.
Canales, M., T. Hernandez, J. Caballero. 2005. “Informant consensus factor and antibacterial
activity of the medicinal plants used by the people of San Rafael Coxcatl´ an, Puebla,
Mexico”, Journal of Ethnopharmacology, 97, pp. 429–439.
Cannone, N., D. Wagner, H.W. Hubberten and M. Guglielmin. 2008. Biotic and abiotic
factors influencing soil properties across a latitudinal gradient in Victoria Land,
Antarctica. Geoderma, 144: 50–65.
Cheema, M. A., M. F. Saleem, N. Muhammad, M. A. Wahid and B. H. Baber. 2010. Impact
of rate and timing of nitrogen application on yield and quality of Canola (Brassica
napus L.) Pak. J. Bot., 42 (3): 1723-1731.
Chen, S. L., B. Sun, L. Liu, Z. Wu, S. Lu, D. Li, Z. Wang, Z. Zhu, N. Xia, L. Jia, G. Zhu, Z.
Guo, G. Yang, W. Chen, X. Chen, S. M. Phillips, C. Stapleton, R. J. Soreng, S. G.
Aiken, N.N. Tzvelev, P. M. Peterson, S. A. Renvoize, M.V. Olonova and K. H.
Ammann. 2006. In: Poaceae (Gramineae). (Eds.): Z.Y. Wu, P.H.
Raven, and D.Y. Hong. Flora of China, 22: 1-2.

214
Cherney and Cherney. 2005. Agronomic response of cool-Season grasses to low-
intensity harvest management and low potassium fertility. Agron J., 97: 1216-
1221.
Chiesa, A. P. R., G. V. Kozloski, L. M. B. Sanchez, L. D. Lima, L. Oliveira, C. J.
Harter, G. Fiorentini and R. L. Cadorin. 2008. Age of regrowth as a factor
affecting the nutritive value of hay of kikuyu grass (Pennisetum clandestinum)
offered to lambs. Grass & Forage Science, 63 (2): 193-201.
Choudhury and Garg. 2007. Variation in essential, trace and toxic elemental contents
in Murraya koenigii – A spice and medicinal herb from different Indian states.
Food Chem. 104: 1454-1463.
Claros, M. P. 2003. Changes in forest structure and species composition during
secondary forest succession in the Bolivian Amazon1. Biotropica, 35 (4): 450-
461.
Cobanoglu, U., Demir, H., Sayir, F., Duran, M. and Mergan, D. 2010. Some mineral,
trace element and heavy metal concentrations in lung cancer. Asian Pacific J.
Cancer Prev. 11 (3): 121-129.
Collinson, A.S. 1977. Introduction to world vegetation. The Lavenham Press Ltd.
Laveham Suffox, England.1383-1388.
Coskun Saglam. 2013. A phytosociological study of the forest, shrub, and steppe
vegetation of Kizildag and environs (Isparta, Turkey). Turk J Bot., 37: 316-
335
Coskun, B., N. Gulsen and H. D. Umucalilar. 2004. The nutritive value of Prangos
ferulacea. Grass & Forage Science, 59 (1): 15-19.
Costa. 2006. Descriptive morphology and phylogenetic relationships among species
of the Neotropical annual killifish
genera Nematolebias andSimpsonichthys (Cyprinodontiformes:
Aplocheiloidei: Rivulidae). Neotrop. ichthyol. (4):1
Cotton CM, (1996). Ethno botany Principles and applications. Chichester, New York
John Wiley and Sons Ltd.
Dasti, A. A., S. Saima, Z. Mahmood, M. Athar and S. Gohar. 2010. Vegetation
zonation along the geological and geomorphological gradient at Eastern slope
of Sulaiman range, Pakistan. African J. Biotechnology, 9 (37): 6105-6115.

215
Daud, M., S. M. Wazir, R. U. Khan, S. U. Khan, A. khan, I. Ullah and A. khattak.
2013. Ethnotaxonomical Study of Gymnosperms of Razmak North Waziristan
Agency (NWA). Canadian Journal of Applied Sciences. 3(3): 459-472.
Deepak and Anshu 2008. Indigenous Herbal Medicines: Tribal Formulations and
Traditional Herbal Practices, Aavishkar Publishers Distributor, Jaipur, india,
pp 440, 37: 101-111.
Devi V.K. and Rehman, F. 2002. Nutraceutical antioxidants-An overview, Indian
journal of pharmaceutical education, 36 (1):3-8.
Devineau, J. L. and A. Fournier. 2007. Integrating environmental and sociological
approaches to assess the ecology and diversity of herbaceous species in a
Sudantype savanna (Bondoukuy, Western Burkina Faso). Flora, Morphology,
Distribution, Functional Ecology of Plants, 202 (5): 350-370.
Dhar, U., R.S. Rawal and J. Upreti. 2000. Setting prorities for conservation of
medicinal plants-a case study in the Indian Himalaya. Biological conservation,
95: 57-65.
Durrani, M. J., A. Razaq, S. G. Muhammad and F. Hussain. 2010. Floristic diversity,
ecological, characteristics and ethnobotonical profile of plants of Aghberg
rangelands, Balochistan, Pakistan. Pak. J. Pl. Sci., 16 (1): 29-36.
Durrani, M. J., F. Hussain and S. U. Rehman. 2005. Ecological characteristics of
plants of Harboi rangeland, Kalat, Pakistan. J. Trop. & Sub Trop. Bot., 13 (2):
130-138.
Edward, M.R. Broadley, S.D. Young, C.R. Black, A.D.C. Chilmiba, E. L. Ander, T.
S. Barlow and MJ. Watts. 2015. Soil type’s influences crps mineral
composition in Malawi. Sciences of total Environments, 505: 587-595.
Eilu, G., L. N. H. David and J. M. Kasenene. 2004. Tree species distribution in forests
of the Albertine Rift, Western Uganda. African J. Ecology, 42 (2): 100-110.
Elekes, C. C., G. Busuioc and G. Ionita. 2010. The Bioaccumulation of Some Heavy
Metals in the Fruiting Body of Wild Growing Mushrooms. Not. Bot. Hort.
Agrobot. Cluj., 38 (2): 147-151
Enright, N. J., B. P. Miller and R. Akhter. 2005. Desert vegetation and vegetation
environment relationships in Kirthar National Park, Sindh, Pakistan. J. Arid
Environment, 61 (3): 397-418.
Enujiugha, V. N. 2003. Chemical and functional characteristics of Conophor Nut.
Pak. J. Nutrition, 2 (6): 335-338.

216
Eslami, A., Khaniki, J. Gh. R.., Nurani, M., Mehrasbi, M., Peyda, M., and Azimi, R.
2007.Heavy Metals in Edible Green Vegetables Grown Along the Sites of the
Zanjanrood River in Zanjan, Iran. Journal of Biological Sciences, 7 (6): 943-
948
Farooq, S., A. Z. Khan, M. Yousaf and H. Fazal. 2010. Phytosociological study of
Push Ziarat area (Shawal) in the South Waziristan, Pakistan. Pak. J. Weed Sci.
Res. 16(1): 47-55.
Fleischbgvhmann, K., P. J. Edwards, D. Ramseier and J. Kollmann. 2006. Stand
structure, species diversity and regeneration of an endemic palm forest on the
Seychelles. African J. Ecology, 43 (4): 291-301.
Frances and Shahroukh. 2006. Forbs diversity and community similarity of kopjes in
the Serengeti National Park, Tanzania. African J. Ecology, 44 (1): 3846.
Francisco, J. C., M. D. L. Estrella, C. Aedo and M. Velayos. 2009. Checklist of
Commelinaceae of Equatorial Guinea (Annobón, Bioko and Río Muni).
Botanical J. Linn. Society, 159 (1): 106-122.
Franz, C. 1993. Domestication of wild growing medicinal plants. Plant research and
Frasher. 2006. Phytosterols as functional food components and Nutraceuticals.
Phytochemistry. 212-214.
Friedman, J., Z. Yaniv, A. Dafni, D. Palewitch. 1986. “A preliminary classification of
the healing potential of medicinal plants, based on a rational analysis of an
ethnopharmacological field survey among Bedouins in the Negev Desert,
Israel”, Journal of Ethnopharmacology, 16: pp. 275–287.
Gillani, S. S., S. Q. Abbas, Z. K Shinwari, F. Hussain and K. Nargis. 2003.
Ethnobotanical studies of Kurram agency, Pakistan through rural community
participation. Pak. J. Biol. Sci., 6 (15): 1368-1375.
Gimenez, E., M. Melendo, F. Valle, F.G. Mercado and E. Cano. 2004. Endemic flora
biodiversity in the south of the Iberian Peninsula: altitudinal distribution, life
forms and dispersal modes. Biodiversity & Conservation, 13(14): 2641-2660.
Ginpreet K., S. Mukundan, V. Wani and M. S Kumar. 2015. Nutraceuticals in the
Management and Prevention of Metabolic Syndrome. Austin J Pharmacol
Ther, 3(1): 1-6.

217
Golluscio, R. A., M. Oesterheld and M. R. Aguiar. 2005. Relationship between
phenology and life form: a test with 25 Patagonian species. Ecography, 28 (3):
273-282.
Gould, W. A., G. Gonzalez and R G. Carrero. 2006. Structure and composition of
vegetation along an elevational gradient in Puerto Rico. J. Vegetation Science,
17: 563-574.
Grubb, P. J. 1987. Plant population and vegetation in relation to habitat disturbance
and competition: problems of generalization. In J. White (ed.), The population
structure of vegetation (Hand book of vegetation, part III). W. Junk,
Dordrecht.
Guarrera, P. M., Salerno, G. Caneva. 2006. Food, flavouring and feed plant traditions
in the Tyrrhenian sector of Basilicata, Italy. J. Ethnobiol Ethnomed 2 (37): 2-
37.
Gul, I., R. U. Khan, S. Mehmood, S. U. Khan Shahzeb, S. K. Sherwani, S. Mussarat
and M. U. Khan. 2014. Vegetation Structure, Classification and Distribution
Patterns of Latamber and its Outskirts, District Karak, Pakistan. International
Journal of Science, Engineering & Computer Technology, 4(1-2), 01-06
Guo, Q. S., X. F. Wang, G. Bar, Y. Kang, M. Hong, S. X. Pei and F. J. Zhang. 2009.
Life form spectra, leaf character, and hierarchical-synusia structure of vascular
plants in Thuja sutchuehensis community. Pub Med., 20 (9): 2057-2062.
Gutkowski, B., Krowiak, M., Niedzwiecka, J. and I. K. Oklejewicz. 2002. Floristic
notes from the Dynow foothills (Western Carpathians). Fragm. F. Geobot.
Polonica, 9: 43-47.
Hadi, F., P. Akhtar, S. M. Shah and F. Hussain. 2009. Graveyard of Palosi, District
Peshawar, as an example of conservation of local plants. PUTAJ Sci., 16: 21-
28.
Hardison, W.A., J.T. Reid, C. M. Martin and P.G. Woolflok. 1954. Degree of herbage
selection by grazing cattle. J. Dairy Sc. 37: 89-102.
Harshberger, 1896. The purpose of ethnobotany. Bot. Gaz., 21: 146-158.
Hazrat, A., J. Shah, S. Ahmad, M. Nisar, A. K. Jan and Sikandar. 2010. Medicinal
plants of Usherai valley, Dir, KPK, Pakistan. Pak. J. Bot., 42 (1): 31-34.
Heady, H. F. 1964. Palatability of herbage and animal preference. J. Range Mgmt. 17:
76-82.
218
Helmke, P.A., 2000. The chemical composition of soil. In: summer, M.E. (Ed.),
Handbook of soil sciences (RC press), Boca Raton, FL, pp. B3-B24.
Herrick, J. W. 1995. Iroquois Medical Botany. Syracuse, NY: Syracuse University
Press.
Hseu, Z. Y. 2004. Evaluating heavy metal contents in nine composts using four
digestion methods. Bio resource Technology, 95: 53-59.
Hurka, A. H. 2004. Species richness and composition during sylvigenesis in a tropical
dry forest in northwestern, Costa Rica. Tropical Ecology, 45 (1): 43-57.
Hussain, A., M. A. Farooq, M. Ahmad, M. Akbar and M. U. Zafar.2010.
Phytosociology and Structure of Central Karakoram National Park (CKNP) of
Northern Areas of Pakistan. World Applied Sciences Journal, 9 (12): 1443-
1449.
Hussain, A., S. N. Mirza, I. A. Khan and M. A. Naeem. 2009. Determination of
relative species composition and seasonal plant communities of Nurpur
reserved forest in scrub rangelands of district Chakwal Pak. J. Agri. Sci.,
46(1): 34-39.
Hussain, F. 1989. Field and Laboratory Manual of Plant Ecology. UGC. Islamabad.
Hussain, F. and L. Badshah. 1998. Vegetation structure of Pirghar Hills South
Waziristan, Pakistan. J. Tropical & Subtropical Bot., 6: 187-195.
Hussain, F. and M. J. Durrani. 2009. Seasonal availability, palatability and animal
preferences of forage plants in Harboi arid range land, Kalat, Pakistan. Pak. J.
Bot., 41 (2): 539-554.
Hussain, F., I. Iqbal and P. Akhtar. 2005. Floristic and vegetation studies of Ghalegay
Hills, district Swat, Pakistan. Inter. J. Biol. & Biotechnology (Pakistan), 2 (4):
847-852.
Hussain, F., L. Badshah, P. Sanaullah and M. J. Durrani. 2004. Ethnobotany of timber
wood species of South Waziristan, Pakistan. Pak. J. Pl. Sci., 10 (1): 9-16.
Hussain, T. and M.I. Chaudhary. 2009. A Floristic Description of Flora and
Ethnobotany of Samahni Valley (A.K.), Pakistan. Ethnobotanical Leaflets, 13:
873-99.
Ihsan, U., S. M. Wazir, A. Farooq, S. U. khan and Z. Hussain. 2011. Identification of
common Weeds and its distribution pattern in wheat field of FR Bannu,
Khyber Pakhtunkhwa, Pakistan. Pak. J. Weed Sci. Res., 17(4): 407-416.

219
Isaac, R. A. and S. C. Guimarães. 2008. Banco de sementes e flora emergente de
plantas daninhas. Planta Daninha, 26 (3): 521-530.
Isildak, O., I. Turkekul, M. Elmastas and M. Tuzen. 2004. Analysis of heavy metals
in some wild-grown edible mushrooms from the Middle Black Sea region,
Turkey. Food Chem., 86: 547-552.
Iwara, A. I., E.E. Ewa, F. O. Ogundele, J. A. Adeyemi and C.A. Out. 2011. Influence
of soil physico-chemical properties on the distribution of woody tree/shurb
species in South-Southern Nigeria. J. Agric. Sci., 2(2): 69-75.
Jabbar, A., M. A. Raza, Z. Iqbal and M. N. Khan. 2006. An inventory of the
ethnobotanicals used as anthelmintics in the southern Punjab (Pakistan). J.
Ethnopharmacol, 108 (1): 152-154.
Jackson, M. L. 1962. Soil chemical Analysis. Constable & Co., Ltd., 10 London p.
406 - 407.
Jamari, S., Z. Embong and I. Bakar. 2015. Elemental Composition Study of Heavy
Metal (Ni, Cu, Zn) in Riverbank Soil by Electrokinetic-Assisted
Phytoremediation using XRF and SEM/EDX. Advancing nuclear Research
and Energy development, 221-227.
Jankju, M., Mellai, F., Atashgahi, Z., 2011. Flora, life form and chorology of winter
and rural range plants in the Northern Khorasan Province, Iran. Journal of
Rangeland Science (4): 1-16.
John, R., J.W. Dalling, K.E. Harms, J.B. Yavitt, R.F. Stallard, M. Mirabello, S.P.
Hubbell, R. Valencia, H. Navarrete, M. Vallejo and R.B. Foster. 2007. Soil
nutrients influence spatial distributions of tropical tree species. PNAS., 104
(3): 864–869.
Johnstone-Wallace and Kennedy. 1944. Grazing management practices and their
relationship to the behavior and grazing habits of cattle. J. Agr. Sci. 34: 190-
197.
Joo, N., Kim, S., Jung, Y. and Kim, K. 2009. Hair iron and other minerals’ level in
breast cancer patients. Bio Trace Elem Res, 129: 28-35.
Jorge, R., M. C. Fandino and R. L. Chazdon. 2005. Vegetation structure, composition,
and species richness across a 56-year chronosequence of dry tropical forest on
Providencia Island, Colombia. Biotropica, 37 (4): 520-530.

220
Kalle and Soukand. 2012. Historical ethnobotanical review of wild edible plants of
Estonia (1770-1960). Acta Societatis Botanicorum Poloniae 81(4): 271-281.
Kalra. 2003. Nutraceutical - Definition and Introduction. AAPS Pharm Sci., 5 (3): 27-
28
Kamal, M., S. M. Wazir, M. Hassan, M. Subhan, S. U. Khan, A. Muhammad and S.
Taj. 2009. Ethnobotanically important plants of District Bannu, Pakistan. Pak.
J. Pl. Sci., 15 (2): 87-93.
Kappelle, M., G. Avertin, M. E. Juarez and N. Zamora. 2000. Useful plants within a
Campesino community in a Costa Rican montane cloud forest. Mountain
Research & Development, 20 (2): 162-171.
Karki, J. B., Y. V. Jhala and P. P. Khanna. 2000. Grazing lawns in terai grasslands,
royal bardia National Park, Nepal. Biotropica, 32 (3): 423-429.
Karsten, W., S. Miehe and G. Miehe. 2005. Plant communities of the Gobi Gurvan
Sayhan National Park (Aymak South Gobi, Mongolia). Candollea, 60 (1):
149-159.
Karthik, S, M. Subramanian and S. Ravikumar. 2015. Floristic Studies on Kilcheruvi
(Edaicheruvi) Sacred Grove at Cuddalore District, Tamil Nadu, South India.
Biosciences and Plant Biology, 2 (7): 192-205.
Kaur G, Mukundan S, Wani V and Kumar MS. 2015. Nutraceuticals in the
Management and Prevention of Metabolic Syndrome. Austin J Pharmacol
Ther. 3(1). 1-6.
Keddy, Paul A. (2007). Plants and Vegetation 2nd Edition, Cambridge University
Press. pp680.
Kennedy, A. D., H. Biggs and N. Zambatis. 2003. Relationship between grass species
richness and ecosystem stability in Kruger National Park, South Africa.
African J. Ecology, 41 (2): 131-140.
Khan, N.; A., Shabbir, D. George, G. Hassan, S. W. Adkins. 2014. Suppressive fodder
plants as part of an integrated management program for Parthenium
hysterophorus L. Field Crops Res., 156: 172-179
Khan, R. U., S. U. khan, S. Mehmood, I. Ullah, A. Khan .2013. Indigenous
Medicinal Plants of Village Khujaki, District Karak, KPK, Pakistan. Journal
of Medicinal Plants Studies, 1(4): 87-92.
221
Khan, S. U., R. U. Khan., S. Jamil., S. Mehmood., I. Ullah., M. Zahoor and M. Daud.
2013. Biodiversity in Medicinal Plants and its Distribution in Village
Shahbaz khel, Lakki Marwat, KP, Pakistan. Journal of Medicinal Plants
Studies. 1(3): 1-6.
Khan, S. U., S. M. Wazir, M. Subhan, M. Zahoor, M. Kamal and S. Taj. 2009. Some
of the ethnobotanically important plants of F.R. Bannu, NWFP, Pakistan. Pak.
J. Pl. Sci., 15 (1): 81-85.
Khan, S. W. and S. Khatoon. 2007. Ethnobotanical studies on useful trees and shrubs
of Haramosh and Bugrote Valleys in Gilgit northern areas of Pakistan. Pak. J.
Bot., 39 (3): 699-710.
Khan, S., Ullah, R. U.Khan, S. M. Wazir, I. Ullah and M. Ullah. 2013. Biodiversity of
Prominent Indigenous Medicinal Plants of Village Ahmad Abad, District
Karak, KP, Pakistan. Journal of Medicinal Plants Studies, 1(4): 121-127.
Khan, Z. I., M. Ashraf, E. E. Valeem, K. Ahmad and M. Danish. 2007. Pasture
concentration of minerals in relation to the nutrient requirements of farm
livestock. Pak. J. Bot., 39(6): 2183-2191
Kharkwal, G., P. Mehrotra and Y. P. S. Pangtey. 2005. Comparative studies on
species richness, diversity and composition of oak forest in Nainital District,
Uttaranchal. Curr. Sci., 89: 668-672.
Kiyani, S. A., A. Masood, A. K. Khan and S. Ambreen. 2007. Distribution of
secondary metabolites in plants of Quetta-Balochistan. Pak. J. Bot., 39 (4):
1173-1179.
Knoop and Smith. 2006. Foraging ecology of roan antelope: key resources during
critical periods. African J. Ecology, 44 (2): 228-236.
Kolasani, A., Xu, H. and Millikan, M. 2011. Evaluation of mineral content of Chinese
medicinal herbs used to improve kidney function with chemometrics. Food
Chem. 127: 1465-1471.
Koleva, V., A. Dragoeva., Z. Nanova., T. Koynova and G. Dashev. 2015. An
ethnobotanical Study on Current status of some Medicinal Plants Used in
Bulgaria. Int.J.Curr.Microbiol. App. Sci ., 4(4): 297-305
Kukkonen, I. 2001. Cyperaceae; Department of Botany, University of Karachi:
Karachi, 206: 1-190.

222
Kuva, M.A., R. A. Pitelli, PLCA Alves, T.P. Salgado and MCDM Pavani 2008.
Banco de sementes de plantas daninhas e sua correlaçao com a flora
estabelecida no agroecossistema cana-crua. Planta Daninha, 26 (4): 735-744.
Laidlaw, M., R. Kitching., K. Goodall., A. Small and N. Stork. 2007. Temporal and
spatial variation in an Australian tropical rainforest. Austral. Ecology, 32 (1):
1020.
Lee, W. G., M. Fenner, A. Loughnan and K. M. Lloyd. 2000. Long-term effects of
defoliation: incomplete recovery of a New Zealand alpine tussock grass,
Chionochloa pallens, after 20 years. J. Applied Ecology, 37: 348-355.
Leterme, P., Buldgen, A., Estrada, F. and Londono, A. M. 2006. Mineral content of
tropical fruits and unconventional foods of the Andes and the rain forest of
Colombia. Food Chem. 95: 644-652.
Luczaj, L., Dumanowski, J., Kohler, P and Mueller-Bieniek, A. 2012. Manna grass
(Glyceria) in Poland: the use and economic value of this wild cereal from the
middle Ages to the twentieth century. Human Ecology, 40: 721-733.
Luis, C., M. Eurico S. and D. M. Adelia. 2002. Vegetation structure and ecology of
the Cufada Lagoon (Guinea-Bissau). African J. Ecology, 40 (3): 252-259.
Macia, M. J. 2004. Multiplicity in palm uses by the Huaorani of Amazonian Eucador.
Botanical J. Linn. Society, 144 (2): 149-159.
Major, J., J. Lechmann, M. Rondon and C. Goodalc. 2005. Weed composition and
cover after three years of soil fertility management in the Central Brazilian
Amazon: compost, fertilizer, manure and charcoal applications. Weed Biol.
Manag, 5 (1): 69-76.
Malik and Husain. 2006. Classification and ordination of vegetation communities of
the Lohibehr reserve forest and its surrounding areas, Rawalpindi, Pakistan.
Pak. J. Bot., 38 (3): 543-558.
Malik, Z. H., N. Z., Malik, S., Bashir and M.S. Gorsi. 2001. Phytosociological studies
on the vegetation of Dao Khun Hills, J. Sci. Tech., 25: 35-41.
Malik, N.Z. and Z.H. Malik. 2004. Present status of subtropical chirpine vegetation of
Kotli Hills, Azad Jammu and Kashmir. Pak. J. Res. Sci., 15(1): 85-90.
Malik, R. N. and S. Z. Husain. 2008. Linking remote sensing and ecological
vegetation communities: a multivariate approach. Pak. J. Bot., 40 (1): 337-
349.

223
Manan, Z., Sirajuddin, A. Razzaq, M. Islam and Ikramullah. 2007. Diversity of
medicinal plants in Wari sub division District Upper Dir, Pakistan. Pak. J. Pl.
Sci., 13 (1): 21-28.
Manhas, R. K., L. Singh, H. B. Vasistha and M. Negi. 2010. Floristic diversity of
protected ecosystems of Kandi Region of Punjab, India. New York Science
Journal, 3 (4): 96-103.
Mark, A., F. J. M. D. Katharine, A. Jan, S. Rob and W. J. Carol. 2001. Vegetation
patterns, plant distribution and life forms across the alpine zone in southern
Tierra del Fuego, Argentina. Austral. Ecology, 26 (4): 423-440.
Martin G. J., (1995). Ethno botany: A method Manual. London, UK: Chapman and
Hall.
Martin, A.J.S., 1983. Medicinal plant in Central, Chile. Econ. Bot., 37(2): 216-217.
Martre, P., GB. North, EG. Bobich and PS. Nobel. 2002. Root deployment and shoot
growth for two desert species in response to soil rockiness. Am J Bot., 89:
1933-1939.
Mashayekhan, A., H. Jalilvand, M. R. Pourmajidian, M. R. Gholami and M. S.
Teimouri. 2015. Sustainable forest management through floristic study (Case
study: Darkesh forest, Northern Khorasan Province, Iran). Journal of the
Faculty of Forestry Istanbul University, 65(2): 80-87.
Maundu, PM. 1995. Methodology for collecting and sharing indigenous knowledge:
A case study. Indigenous knowledge and development Monitor. 3(2): 3-5.
McCauley, Clain Jones and Jeff Jacobsen. 2009. Nutrient Management Module No. 8,
Montana State University, USA.
Medinski, T. 2007. Soil Physical and Chemical Properties and their Influence on the
Plant Species Richness of Arid, South-Western Africa. Thesis Presented for
the Degree of Master of Science in Conservation Ecology, University of
Stellenbosch.
Menendez-Baceta, G., Aceituno-Mata, L., Molina, M., Reyes-García, V., Tardío, J
and Pardo-de-Santayana M .2014. Medicinal plants traditionally used in the
northwest of the Basque Country (Biscay and Alava), Iberian Peninsula. J.
Ethnopharmacol, 27; 152(1):113-134

224
Mengistu and Herbert. 2008. Wild edible fruit species cultural domain, informant
species competence and preference in three Districts of Amhara Region,
Ethiopia. Ethno botany Research and Applications, 6, 487-502.
Menhinick, E. F. 1964. A comparison of some species-individuals diversity indices
applied to samples of field insects. Ecology, 45 (4): 859-861.
Merrill, A.L. & Watt, B.K. 1973. Energy value of foods: basis and derivation.
Agriculture Handbook No. 74. Washington, DC, ARS United States
Department of Agriculture.
Milewski and Madden. 2006. Interactions between large African browsers and thorny
Acacia on a wildlife ranch in Kenya. African J. Ecology, 44 (4): 515-522.
Misra, S., RK. Maikhuri, CP. Kala, KS. Rao, and KG. Saxena. 2008. Wild Leafy
vegetables: a study of their substance dietetic support to the inhabitants of
Nanda Devi Biosphere Reserve, India. Journal of Ehnobotany and
Ethnomedicine, 4, 15.
Misson, L., D. Degueldre, C. Collin, R. Rodriguez, A. Rocheteau, J. M. Ourcival, and
S. Rambal. 2011. Phenological responses to extreme droughts in a
Mediterranean forest, Glob. Change Biol., 17, 1036–1048.
Mizaraite, D., S. Mizaras and L. Sadauskiene. 2007. Wood fuel supply, costs and
home consumption in Lithuania. Biomass & Bioenergy, 31 (10): 739-746.
Motyka, J., B. Dobrazanki and S. Zawadski. 1950. Preliminary studies on meadows in
the southeast of the province Lublin (English Summary). Ann. Univ. M.
Curie-Sklodowska, Sce. E.S. 13: 367-447.
Moura, E. G., A.C. Perdigao and M.M. Falagas. 2009. Incidência de ervas daninhas e
atributos do solo em um agrossistema da pré-amazônia, sob efeito da cobertura
morta de diferentes combinações de leguminosas em aléias. Sci. Agr., 10 (1):
7-10.
Mulyanto, B., G. Stoops and E. V. Ranst. 1999. Precipitation and dissolution of
gibbsite during weathering of previous andesitic boulders in humid tropical
West Java, Indonesia. Geoderma 89:287-305.
Muoghalu and Okeesan. 2005. Climber species composition, abundance and
relationship with trees in a Nigerian secondary forest. African J. Ecology, 43
(3): 258-266.

225
Musa, M.S., F.E. Abdelrasool, E.A. Alsheikh, L. Ahmad, A.L.E. Mahmoud, S.M.
Yagi. 2011. “Ethnobotanical study of medicinal plants in the blue Nile state,
South eastern Sudan”, Journal of medicinal plants research, 5: pp. 4287-4297.
Musila, W. M., J. I. Kinyamario and P. D. Jungerius. 2003. Vegetation dynamics of
coastal sand dunes near Malindi, Kenya. African J. Ecology, 39 (2): 170-177.
Mussarat, S., N. M. AbdElsalam, A. Tariq, S.M. Wazir, R. Ullah, M. Adnan. 2014.
“Use of ethnomedicinal plants by the people living around Indus River”,
Evidence Based, Complementary and Alternative medicine, Hindawi
Publishing Corporation. 1: 1-14.
Muthuramkumar, S., N. Ayyappan, N. Parthasarathy, M. Divya, S. T. R Raman, S. M.
Arthur and P. L. Arul. 2006. Plant community structure in tropical rain forest
fragments of the Western Ghats, India. Biotropica, 38 (2): 143-160.
Nagy, L., and J. Proctor 1997. Soil Mg and Ni as causal factors of plant occurrence
and distribution at the Meikle Kilrannoch ultramafic site in Scotland. New
Phytol, 135: 561-566.
Nasir, E. and S. I. Ali. 1971-2007. Flora of West Pakistan Department of Botany,
University of Karachi, Karachi, Pakistan.
Nasir, Z.A. and S. Sultan. 2002. Floristic, biological and leaf size spectra of weeds in
gram, lentil, mustard and wheat fields of district Chakwal, Pakistan. Pakistan
J. Biological Sciences, 5(7): 758-762.
Neal, J. E. and B. P. Miller. 2007. Livestock grazing impacts on desert vegetation,
Khirthar National Park, Pakistan. Rangeland Ecology & Management, 60 (6):
680 - 684.
Nobel, PS. and BR. Zutta. 2007. Rock associations, root, depth, and temperature
tolerances for the “rock live-forever” Dudleya saxosa, at three elevations in
the north-western Sonoran Desert. J Arid Environ, 69: 15-28.
Okello and Sesgawa. 2007. Medicinal plants used by communities of Ngai
Subcounty, Apac District, northern Uganda. African J. Ecology, 45 (1): 76-83.
Olsen, S. R. and L. E. Sommers. 1982. Phosphorus. In: Methods of Soil Analysis, Part
2 (2nd ed.), Madison, WI, USA, pp. 406-407.
Otto, S., T. S. Church and L. L. Craft. 2007. A modeling approach using seed bank
and soil properties to predict the relative weed density in organic fields of an
italian pre-alpine valley. Weed Res., 47: 311-326.

226
Pandey, N., R. P. Meena, S. K. Rai and S. P-Rai1. 2011. Medicinal Plants Derived
nutraceut icals : A Re-emerging Health Aid. International Journal of
Pharma and Bio Sciences. 2(4): 419-441.
Patrick, O., O. Joseph and A. B. Cunningham. 2004. Regeneration, density and size
class distribution of tree species used for drum making in central Uganda.
African J. Ecology, 42 (2): 129-136.
Peer, T., J. P. Gruber, A. Millinger and F. Hussain. 2007. Phytosociology, structure
and diversity of the steppe vegetation in the mountains of Northern Pakistan.
Phytocoenologia, 37 (1): 1- 65.
Perveen, A. and M. I. Hussain. 2007. Plant biodiversity and phytosociological
attributes of Gorakh hill (Khirthar Range). Pak. J. Bot., 39 (3): 691-698.
Perveen, A., G. R. Sarwar and I. Hussain. 2008. Plant biodiversity and
phytosociological attributes of Dureji (Khirthar Range). Pak. J. Bot., 40 (1):
17-24.
Peters, C., I.L. Gentry, R.O. Schneider, G. Platais, D. Rosenblatt and Mendelsohn,
1989. Valuation of an Amazonian rainforest. Nature, 29: 655.
Phillips O, Gentry AH, Reynel C, Wilki P, Gávez-Durand CB: 1994. Quantitative
ethnobotany and Amazonian conservation. Conservation Biology, 8: 225-248.
Phillips, W. A., P. J. Starks, S. Glasgow and S. W. Coleman. 2007. Different methods
of estimating crude protein concentration of Bermuda grass pastures for
stocker calf production. Professional Animal Scientist, 23: 696 -701.
Prakash, D., C. Gupta and G. Sharma. 2012. Importance of Phytochemicals in
Nutraceuticals. 1(3): 70-78.
Qader and Shetvy. 1986. Life form and leaf size spectra and phytosociology of some
Libyan plant communities. Pak. J. Bot., 18: 271–86.
Qasim, M., S. Gulzar, Z. K. Shinwari, I. Aziz and M. A. Khan. 2010. Traditional
ethnobotanical uses of halophytes from Hub, Baluchistan. Pak. J. Bot., 42 (3):
1543-1551.
Qureshi and Bhatti. 2008. Ethnobotany of plants used by the Thari people of Nara
Desert, Pakistan. Fitoterapia, 79 (6): 468-473.
Qureshi, R. A., S. A. Gilani and M.A. Ghufran. 2007. Ethnobotanical studies of plants
of Mianwali District Punjab, Pakistan. Pak. J. Bot., 39(7): 2285-2290.

227
Qureshi, R. and G.R. Bhatti. 2008. Taxonomy of Scrophulariaceae from Nara Desert,
Pakistan. Pak. J. Bot., 40(3): 973-978.
Qureshi, R., G.R. Bhatti and G. Shabbir. 2011. Floristic inventory of Pir Mehr Ali
Shah Arid
Rabotnov. 1970-1979. Phytocoenology. In: The Great Soviet Encyclopedia, 3rd Ed.
Raheb, A. and Heidari. 2012. Effects of clay mineralogy and physic-chemical
properties on potassium availability under soil aquatic condition. J. Soil Sci.
Plant Nutr. 12(4): 747-761.
Rahim, I. U., J. I. Sultan, Msu. Yaqoob, H. Nawaz, I. Javed and M. Hameed. 2008.
Mineral profile, palatability and digestibility of marginal land grasses of trans-
himalayan grasslands of Pakistan. Pak. J. Bot., 40 (1): 237-248.
Ram, J., A. Kumar and J. Bhatt. 2004. Plant diversity in six forest types of
Uttaranchal, Central Himalaya, India. Curr. Sci., 86: 975 - 978.
Ranfa, A., A. Maurizi, B. Romano & M. Bodesmo. 2013. The importance of
traditional uses and nutraceutical aspects of some edible wild plants in human
nutrition: the case of Umbria (central Italy). Taylor & Francis, 08(44): 1-10.
Ranfa, A., A. Maurizi, B. Romano & M. Bodesmo. 2013. The importance of
traditional uses and nutraceutical aspects of some edible wild plants in human
nutrition: the case of Umbria (central Italy). Taylor & Francis, 08(44): 1-10.
Rao, P. S., B. Sujatha, K. Lakshminarayana and S. V. Ratnam.2013. A study on
phytosociology, soil conservation and socio-economic aspects in red sand
dunes near Bhimili of Visakhapatnam. Archives of Applied Science Research,
5 (1):45-56.
Raunkiær, C. 1934. The life forms of plants and statistical plants geography being the
collected papers of C. Raunkiaer. Clarendon press, Oxford.
Raunkiær, C. 1936. The Life-form Spectrum of some Atlantic Islands. Botaniske
Studier, 4: 240-328.
Rawlins, B. G., S. P. MC Grsth, A. J. Scheib, N. Breward, M. Cane, T. R. Lister, M.
Inghan, C. Growing and S. Carter. 2012. The advanced Soil Geochemical
Atlas of England and Wales British geological Survey, Keyworth.
www.bgs.ac.uk.
Rayan, J. N., R. W. Harvey, D. W. Metge and J. E. Larson. 1997. Transport of
bacteriophage PRD1 and silica colloids in a sewage-contaminated aquifer.

228
Eos, Transactions of the American Geophysical Union 86, F231. Presented at
the Fall Meeting of the American Geophysical Union.
Rehman, S., S. M. Wazir, R. U. khan, S. U. khan, A.Farooq. 2013. Ethnobotanically
Important Plants of Humzoni, Nwa, Kpk, Pakistan. International Journal of
Herbal Medicine. 1 (2): 89-101.
Reyer, C., S. Leuzinger, A. Rammig, A. Wolf, R.P. Bartholomeus, A. Bonfante, F. de
Lorenzi, M. Dury, P. Gloning, R. Abou Jaoudé, T. Klein, T. M. Kuster, M.
Martins, G. Niedrist, M. Riccardi, G. Wohlfahrt, P. de Angelis, G. de Dato, L.
François, A. Menzel, and M .A. Pereira. 2012. A plant’s perspective of
extremes: terrestrial plant responses to changing climatic variability, Glob.
Change Biol., 19, 75–89.
Rhoades, J. D. 1982. Soluble salts. In: Methods of Soil Analysis, Part 2 (2nd. ed.),
Madison, WI, USA, pp. 169–173.
Rikhari, H. C., B. S. Adhikari and Y. S. Rawat. 1997. Woody species composition of
temperate forests along an elevational gradient in Indian central Himalaya. J.
Trop. For. Sci., 10 (2): 197-211.
Robert, K. P., M. T. Lee., M. D. Jennings & D. F. Langendoen. 2011. VegBank – a
permanent, open-access archive for vegetation-plot data. Biodiversity &
Ecology 4: 233–241.
S.S.Singh. 1995. Soil fertility and nutrient management, New Delhi, India, Kalyani
Publisher.
Saeed, M., H. khan, M. A. khan, F. khan, S. A. khan and N. Muhammad. 2010.
Quantification of Various Metals and Cytotoxic Profile of Aerial Parts of
Pollygonatum verticillatum. Pak. J. Bot., 42(6): 3995-4002.
Sagar, B.P.S., Zafar, R., Tyagi, K., Kumar, V., Kumar, S. and Panwar R. 2004.
‘Antioxidants’, The Indian Pharmacist, 3(4): 29-35.
Saima, S., A. Dasti, F. Hussain, S. M. wazir and S. A. Malik. 2009. Floristic
Compositions Along an 18 – km long Transect in Ayubia National Park
District Abbottabad, Pakistan. Pak. J. Bot., 41(5): 2115-2127.
Salvatori, V., F. Egunyu, A. K. Skidmore, J. D. Leeuw and H. A. M. van Gils. 2003.
The effects of fire and grazing pressure on vegetation cover and small
mammal populations in the Maasai Mara National Reserve. African J.
Ecology, 39 (2): 200-204.

229
Samant, S. S., S. Man, L. Manohar and P. Shreekar. 2007. Diversity, distribution and
prioritization of fodder species for conservation in Kullu District,
Northwestern Himalaya, India. J. Mountain Science, 4 (3): 259-274.
Santayana, P., M. Tardı, E. Blanco, A.M. Carvalho, E. Sanmiguel. 2007. Traditional
knowledge of wild edible plants used in the northwest of the Iberian Peninsula
(Spain and Portugal): A comparative study. J Ethnobiol Ethnomed, BioMed
Cent, 3: 1–11.
Sardar and Khan. 2009. Ethnomedicinal studies on plant resources of Tehsil
Shakargarh, District Narowal and Pakistan. Pak. J. Bot., 41 (1): 11-18.
Scheiter, S., L. Langan and S. I. Higgins. 2013. Next-generation dynamic global
vegetation models: learning from community ecology. New Phytologist, 198:
957–969.
Schultes, 1992. Ethnobotany and technology in the Northwest Amazon: A
partnership. In Sustainable harvest and marketing of rain forest products, Eds.
Plotkin and Famolare, Island Press, CA, pp: 45-76.
Segawa and Nkuutu. 2006 .Diversity of vascular plants on Ssese islands in Lake
Victoria, central Uganda. African J. Ecology, 44 (1): 22-29.
Shah and Hussain. 2008. Ecology of wetlands of Akbarpura, District Nowshera. Pak.
J. Pl. Sci., 14 (1): 47-57.
Shahzeb, S. Mehmood, R. U. khan, S. U. Khan. 2013. Use of Medicinal Plants of
District Bannu in Unani Medicines. International Journal of Herbal Medicine.
1(2): 81-88.
Sher, R., S. M. Wazir, R. U. Khan, S.U. Khan and A. Farooq. 2013. Ethnobotanically
Sher, Z. and Z.U. Khan. 2007. Floristic composition, life form and leaf spectra of the
vegetation of Chagharzai Valley, District Buner. Pak. J. Pl. Sci., 13(1): 57-66.
Sher, Z., F. Hussain, L. Badshah and M. Wahab. 2011. Floristic Composition,
Communities and ecological characteristics of weeds of wheat fields of Lahor,
district Swabi, Pakistan. Pak. J. Bot., 43(6): 2817-2820.
Shinwari, S., R. Qureshi, and E. Baydoun. 2011. Ethnobotanical Study of Kohat Pass
(Pakistan). Pak. J. Bot., 43: 135-139.
Shiratsuchi, L. S. J.R.A. Fontes and A.V. Resende. 2005. Correlaçao da distribuiçao
espacial do banco de sementes de plantas daninhas com a fertilidade dos solos.
Planta Daninha, 23 (3): 429-436.

230
Shoukat, S. S., M. A. Kheri and M. A. Khan. 1978. The relationships amongst
dominance, diversity and community maturity in desert vegetation. Pak. J.
Bot., 10 (2): 183-196.
Shuaib M., I. Khan, Sharifullah, R. Khan., Hashmatullah, S. Mubarik and R. Naz.
2014. Ethnobotanical Studies of Spring flora of District Dir (Lower), Khyber
Pakhtunkhwa, Pakistan, Pak. J. Weed Sci. Res., 20(1): 37-49.
Shukla and Mishra. 2006. Floristic composition, biological spectrum and plant
diversity of burnt and unburnt grazing lands of Dewghat forest, Koraon range
(u.p). National Academy Science Letters, 29 (9-10): 345-349.
Simpson, E. H. 1949. Measurement of diversity. Nature, 163: 688.
Smith, T., V. Mlambo, J. L. N. Sikosana, V. Maphosa, I. Mueller-Harvey and E.
Owen. 2005. Dichrostachys cinerea and Acacia nilotica fruits as dry season
feed supplements for goats in a semi-arid environment: Summary of a DFID
funded project in Zimbabwe. Animal Feed Science & Technology, 122 (1-2):
149-157.
Sorensen, T. 1948. A method of establishing groups of equal amplitudes in plant
sociology based on similarity of species content and its application to analyze
the vegetation of Darnish commons. Biol. Skr., 5: 1-34.
Soylak, M., S. Saracoglu, M. Tuzen and D. Mendil. 2005. Determination of trace
metals in mushroom sample from Kayseri, Turkey. Food Chem., 92: 649-652.
Starks, P. J., D. Zhao, W. A. Phillips and S. W. Coleman. 2006. Development of
canopy reflectance algorithms for real-Time prediction of Bermuda grass
pastures biomass and nutritive values. Crop Sci., 46: 927-934.
Starks, P. J., S. W. Coleman and W. A. Phillips. 2004. Determination of forage
chemical composition using remote sensing. J. Range Management, 57 (6):
635 - 640.
Stevens, PF. 2013. Angiosperm Phylogeny.
Sultan, J. I., I. U. Rahim, H. Nawaz and M. Yaqoob. 2007. Nutritive value of
marginal land grasses of northern grasslands of Pakistan. Pak. J. Bot., 39 (4):
1071-1082.
Surapaneni, A., A. S. Palmer, R. W. Tillman, J. H. Kirkman and P.E.H. Gregg. 2002.
The mineralogy and potassium supply power of some loessiel and relation
soils of New Zealand. Geoderma, 110: 191-204.
231
Svoboda, L., B. Havlickova and P. Kalac. 2006. Contents of cadmium, mercury and
lead in edible mushrooms growing in a historical silver-mining area. Food
Chem., 96: 580-585.
Tabanez, A. A. J. and V. M. Viana. 2000. Patch structure within Brazilian Atlantic
Forest fragments and implications for conservation. Biotropica, 32 (4): 925-
933.
Taiz and Zeiger. 2006. Plant physiology, 4th Edn. Sinauer, Sunderland.
Tardio, J., M. P. D. Santayana and R. Morales. 2006. Ethnobotanical review of wild
edible plants in Spain. Botanical J. Linn. Society, 152 (1): 27-71.
Tareen R. B., T. Bibi, M. A. Khan, M. Ahmad and M. D. Zafar. 2010. Indigenous
knowledge of folk medicine by the women of Kalat and Khuzdar regions of
Balochistan, Pakistan. Pak. J. Bot., 42 (3): 1465-1485.
Tareen, R.B. and S.A. Qadir. 1993. Life form and Leaf size spectra of the plant
communities of diverse areas ranging from Harnai, Sinjawi to Duki regions of
Pakistan. Pak. J. Bot., 25(1): 83-92.
Towett, E. K., K. D. Shepherd, J. E. Tondoh, L. A. Winowiecki, T. Lulseged, M.
Nyambura, A. Sila, T. G. Vagen and G. Cadisch. 2015. Total elemental
composition of soil in sub-Saharan Africa and relationship with soil forming
factor. Geoderma, 5: 157-168.
Tripathi and Shukla. 2007. Effect of clipping and grazing on various vegetational
parameters of grassland communities of Gorakhpur, U.P. Tropical Ecology, 48
(1): 61-70.
Tucker G. 2003. Nutritional enhancement of plants. Current Opinion in
Biotechnology, 14: 221-225.
Ture, C. and S. Tokur. 2000. The flora of the forest series of yirce- Bürmece-
Kömürsu and Muratdere (Bilecik-Bursa, Turkey). Tropical J. Bot., 24: 4-66.
Tuzen, M., 2003. Determination of heavy metals in fish samples of the middle Black
Sea (Turkey) by graphite furnace atomic absorption spectrometry. Fd. Chem.,
80: 119–123.
Tye, AM., SD. Young, NMJ. Cront, H. Zhang and S. Barbosa-Jefferson. 2003.
Predicting the activity of Cd2+ and Zn2+ in soil pore water from radio-labite
metal fraction. Geochim Cosmochim Acta, 67: 375-88.

232
Udoh, B. T. and S.B. Akpan. 2007. Influence of soil series and physicochemical
properties on weed flora distribution at moor plantation Ibadan, Southwestern
Nigeria. J. Agric. Social Sci., 3 (2): 55-58.
Ukpong, IE. 1994. Soil-vegetation interrelationships of mangrove swamps as revealed
by multivariate analyses. Geoderma, 64: 167-181.
Umerie, S. C., I. F. Okonkwo, N. A. Nwadialor and J. C. Okonkwo. 2010. Studies on
the Oil and Nutritive Value of Seeds of Crotoalariaretusa L. (Fabaceae),
Pakistan Journal of Nutrition, 9 (9): 912-914.
Valverde, T., S. Quijas, M. Lopez-Villavicencio and S. Castillo. 2004. Population
dynamics of Mammillaria magnitnamma Haworth (Cactaceae) in alava-field
in central Mexico. Plant Ecol., 170: 167-184.
Vanzani, P., R. M. De Marco, V. Shetti, L. E. Paoletti, and Rigo, A. 2011. Wild
Mediterranean plants as traditional food: A valuable source of antioxidants. J
Food Sci., 76(1): 46 –51.
Vartika, R., Poonam, K., Sayyada, K., Rawat, A. K. S. and Shanta, M. 2001. Heavy
metal accumulation in some herbal drugs. Pharm. Biol. 39: 384-387.
Volder, A., D. D. Briske, and M. G. Tjoelker. 2013. Climate warming and
precipitation redistribution modify tree-grass interactions and tree species
establishment in a warm-temperate savanna, Glob. Change Biol., 19, 843–857.
Volder, A., M. G. Tjoelker, and D. D. Briske. 2010. Contrasting physiological
responsiveness of establishing trees and a C (4) grass to rainfall events,
intensified summer drought, and warming in oak savanna, Glob. Change Biol.,
16, 3349–3362.
Voort man, R. T. 2011. Explorations into African land resource Ecology on the
Chemistry between soils, plants and fertilizers (PhD dissertation). Faculty of
Economics and Busness, Vrije University, p.264.
Wahab, M., M. Ahmad and N. Khan. 2008. Phytosociology and dynamics of some
pine forests of Afghanistan. Pak. J. Bot., 40 (3): 1071-1079.
Walpole, M. J., N. Moriaso and M. Charles. 2004. Status of the Mara woodlands in
Kenya. African J. Ecology, 42 (3): 180-188.
Wang, H.B., M.G. Ma, X.F. Wang, W.P. Yuan, Y. Song, J.L. Tan and G.H. Huang.
2013. Seasonal variation of vegetation productivity over an alpine meadow in
the Qinghai-Tibet Plateau in China: modeling the interactions of vegetation

233
productivity, phenology, and the soil freeze-thaw process. Ecol. Res., 28(2):
271-882.
Watson, L. H. and N. O. Smith. 2000. Diet composition and habitat selection of eland
in semi-arid shrub land. African J. Ecology, 38: 130-137.
Wazir, S. M., A. A. Dasti and J. Shah. 2004. Common medicinal plants of Chapursan
Valley, GojalIi, Gilgit Pakistan. J. Res. Sci., 15 (1): 41-43.
Wazir, S. M., A. A. Dasti, S. Saima, J. Shah and F. Hussain. 2008. Multivariate
analysis of vegetation of Chapursan Valley: an alpine meadow in Pakistan
Pak. J. Bot., 40 (2): 615-626.
Wazir, S. M., S. Saima, A. A. Dasti and M. Subhan. 2007. Ethnobotanical importance
of Salt Range species of District Karak Pakistan. Pak. J. Pl. Sci., 13 (1): 29-
31.
Willoughby, M. G. and M. J. Alexander. 2000. A Range Condition Dilemma.
Rangelands, 22 (1): 23-26.
Willoughby, M. G. and M. J. Alexander. 2005. Long-term trends in rangeland health
of the Rough fescue ecological site in the Montane subregion. Alberta
Sustainable Resource Development. Public Lands and Forest Division.
Edmonton, Alta. Pub. no. T/069. 26 pp.
Xu, J.C., R. E. Grumbine., and P. Beckschafer. 2014. Landscape transformation
through the use of ecological and socio economic indicators in
Xishuangbanna, Southwest China, Mekong Region. Ecological Indicators 36:
749-756.
Yadav and Gupta. 2007. Effect of micro-environment and human disturbance on the
diversity of herbaceous species in Sariska Tiger Project. Tropical Ecology, 48
(1): 125-128.
Yagi, S., A. E. A. Rahman., G. O. M. Elhassan and A. M. A. Mohammed.2013.
Elemental
Young, P.T. 1948. Appetite, palatability and feeding habit: A critical review. Psychol.
Bull. 45: 289-320.
Zabihullah, Q., A. Rashid and N. Akhtar. 2006. Ethnobotanical Survey in Kot
Manzary
Zare, S., M. Jafari,A. Tavili, H. Abbasi and M. Rostampour. 2011. Relationship
between environmental factors and plant distribution in arid and semi-arid area

234
(Case Study: Shahriyar Rangelands, Iran). American-Eurasian J Agric and
Environ Sci., 10(1): 97-105.
Zarnowski, R., and Y. Suzuki. 2004. Expedient Soxhlet extraction of resorcinolic
lipids from wheat grains. J. Food Compos. Anal., 17(5): 649-664.
Zeppel1, M. J. B., J. V. Wilks, and J. D. Lewis. 2014. Impacts of extreme
precipitation and seasonal changes in precipitation on plants. Biogeosciences,
11, 3083–3093.
Zhao, D., P. J. Starks, B. K. Kindiger and C. T. Mackown. 2008. Interspecies
variation of forage nitrogen and nonstructural carbohydrate concentrations in
perennial coolseason grasses. Agronomy J., 100 (3): 1-8.
Zhu, H., C. Yong., S. Zhou., H. Wang and L. Yan. 2015. Vegetation, floristic
composition and species diversity in a tropical mountain nature reserve in
southern Yunnan, SW China, with implications for conservation. Tropical
Conservation Science, 8 (2): 528-546.
1998 District Census report of Bannu. Census publication. 35. Islamabad: Population
Census Organization, Statistics Division, Government of Pakistan. 1999.

235
QUESRIONARRAIRE
1. Age of the respondent
a. 20-40 years
b. 41-60 years
c. 61-80 years
2. Education level of the respondent.
a. Illiterate
b. Primary
c. Middle
d. Matric
3. List of the local name of the ethno botanically important plants.
4. Local uses of the plants.
5. How you will use the plant, especially the recipe for medicinal plant.
6. Which plant is ranked by you as 1st, 2nd and 3rd in the following categories?
1. Fodder
1st……………………….2nd…………………………3rd……………………
2. Food and vegetable
1st……………………….2nd…………………………3rd……………………
3. Fuel
1st …………….………...2nd…………………………3rd………….…………
4. Furniture and agriculture
1st …..………………….2nd…………………………3rd…………..…………
5. Honey bee
1st ……………………...2nd……….…………………3rd……………………
6. Medicinal
1st ……………..……….2nd……………….…………3rd……………………
7. Veterinary Medicine
1st …………………….2nd……………………3rd……………………
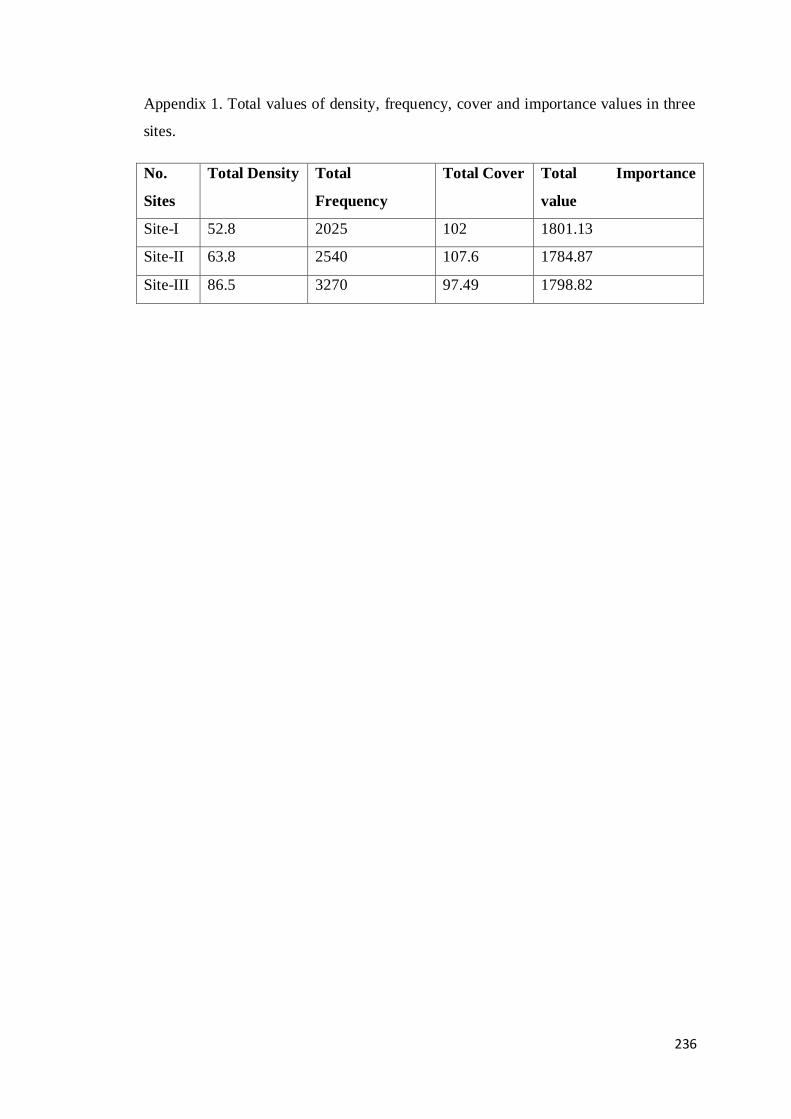
236
Appendix 1. Total values of density, frequency, cover and importance values in three
sites.
No.
Sites
Total Density Total
Frequency
Total Cover Total Importance
value
Site-I 52.8 2025 102 1801.13
Site-II 63.8 2540 107.6 1784.87
Site-III 86.5 3270 97.49 1798.82

237
Appendix 2. Phytosociological attributes of plant community at Site I
SNo Name of plant Family Density R/Density Frequency R/Frequency Cover R/Cover Importance value
During spring, trees
1 Acacia nilotica (L.) Wild.ex
Delile Mimosaceae 0.5
13.16 40 19.51 6.75 23.52 56.19
2 Cappris decidua (Frossk.)
Edgew. Cappridaceae 0.6
15.79 25 12.19 4.2 14.63 42.62
3 Prosopis cineraria L. Mimosaceae 1.1 28.94 55 26.83 6.25 21.78 77.55
4 Tamarix aphylla (L.) Karst Tamaricaceae 0.85 22.37 45 21.95 5.2 18.12 62.44
5 Ziziphus jujuba Mill Rhamnaceae 0.75 19.74 40 19.51 6.3 21.95 61.20
During spring, shrubs
6 Calligonum polygonoides L. Polygonaceae 1.5 26.79 60 23.08 4.95 37.53 87.4
7 Periploca aphylla Decne. Asclepiadaceae 0.75 13.39 50 19.23 2.56 19.41 52.03
8 Tamarix dioica Roxb. Ex
Roth. Tamaricaceae 1.1
19.64 35 13.46 1.55 11.75 44.85
9 Rhazya stricta Decne. Apocynaceae 0.7 12.5 40 15.38 2.15 1.30 44.18
10 Echinops echinatus L. Asteraceae 0.5 8.92 40 15.38 1.23 9.32 33.63
11 Cistanche tubulosa
(Shehenk.) Orobancheaceae 1.03
18.75 35 13.46 0.75 5.68 37.89

238
During spring, herbs
12 Arnebia hispidissima (Lehm.) A.
DC. Boraginaceae
1 4.21 35 4.66 1.25
4.25 13.12
13 Astragalus scorpiurus Bunge. Papilionaceae 1.35 5.68 45 6 1.44 4.90 16.58
14 Boerhavia procumbens Banks ex
Roxb Nyctaginaceae
0.7 2.94 40 5.33 1.75
5.96 14.23
15 Cenchrus ciliaris L. Poaceae 1.6 6.73 40 5.33 2.25 7.66 19.72
16 Chenopodium album L. Chenopodiaceae 1.05 4.42 35 4.66 1.85 6.30 15.38
17 Convolvulus arvensis L. Convolvulaceae 0.8 3.36 35 4.66 1.11 3.780 11.8
18 Cymbopogon distanse Schutt. Poaceae 2.25 9.47 60 8 4.55 15.49 32.96
19 Cynodon dactylon (L.) Pers. Poaceae 1.55 6.52 35 4.66 2.15 7.32 18.5
20 Euphobia dracunculoides Lam. Euphorbiaceae 1.2 5.05 25 3.33 0.88 2.99 11.37
21 Farsetia jacquemontii (Hook. F.
& thoms.) Jafri Brassicaceae
0.65 2.73 25 3.33 0.75
2.55 8.61
22 Heliotropium europaeum (F. &
M.) Kazmi Boraginaceae
0.55 2.31 25 3.33 0.95
3.23 8.87
23 Hypecoum pendulum L. Papaveraceae 0.8 3.36 30 4 0.56 1.90 9.26
24 Launaea procumbens Pravin
Kawale. Asteraceae
0.95 4 35 4.66 1.16
3.95 12.61
25 Melilotus indica (L.) All. Papilionaceae 0.9 3.78 30 4 0.56 1.90 9.68
26 Oligomeris linifolia (Vahl.) Resedaceae 0.5 2.10 20 2.66 0.45 1.53 6.29

239
Macbride
27 Plantago lanceolata L. Plantaginaceae 0.95 4 30 4 0.35 1.19 9.19
28 Plantago ovata Frossk. Plantaginaceae 0.7 2.94 25 3.33 0.55 1.87 7.98
29 Psammogeton biternatum Edgew. Apiaceae 0.9 3.78 25 3.33 0.65 2.21 9.32
30 Rostraria cristata Linn. Poaceae 1.65 6.94 45 6 0.35 1.19 14.13
31 Rumex dentatus (Meisn.) Rech.f. Polygonaceae 0.7 2.94 20 2.66 1.25 4.25 9.85
32 Silene vulgaris (Moench) Garcke. Caryophyllaceae 0.85 3.57 35 4.66 1.25 4.25 12.48
33 Sisymbrium irio L Brassicaceae 1 4.21 20 2.66 1.55 5.27 12.14
34 Trigonella crassipes Boiss. Papilionaceae 1.15 4.84 35 4.66 1.75 5.96 15.46
During summer, herbs
35 Alhagi maurorum Medic. Papilionaceae 0.65 5.88 45 10.84 1.15 8.21 24.94
36 Amaranthus viridis L. Amaranthaceae 0.9 8.14 35 8.43 0.75 5.35 21.92
37 Aristida cynantha L. Poaceae 0.95 8.59 40 9.63 1.45 10.35 28.57
38 Carthamus persicus Willd. Asteraceae 0.85 7.69 30 7.22 0.75 5.35 20.26
39 Chrozophora plicata (Vahl) A.
Juss. Ex Spreng Euphorbiaceae
0.75 6.78 25 6.02 0.8
5.71 18.51
40 Citrullus colocynthis (L.) Shred. Cucurbitaceae 0.5 4.52 25 6.02 0.99 7.07 17.61
41 Cynodon dactylon (L.) Pers. Poaceae 1.4 12.66 30 7.22 1.85 13.21 35.09
42 Cyperus rotundus L. Cyperaceae 0.75 6.78 25 6.02 0.85 6.07 18.87
43 Eragrostis pilosa (L.)P. Beauv. Poaceae 1.05 9.50 30 7.22 1.4 10 26.72
44 Eragrostis minor Host. Poaceae 0.85 7.69 30 7.22 0.85 6.07 20.98

240
45 Euphorbia prostrata Ait. Euphorbiaceae 0.6 5.42 25 6.02 0.95 6.78 18.22
46 Fagonia indica L. Zygophyllaceae 0.75 6.78 30 7.22 1.11 7.92 21.92
47 Plantago ovata Frossk. Plantaginaceae 0.55 4.97 25 6.02 0.45 3.21 14.2
48 Portulaca oleraceae Linn. Aizoaceae 0.5 4.52 20 4.81 0.65 4.64 13.97
During autumn, herbs
49 Cenchrus bifolrus Roxb. Poaceae 0.75 22.05 25 21.73 1.2 29.62 73.4
50 Chenopodium murale L. Chenopodiaceae 0.9 26.47 30 26.08 1.35 33.33 85.88
51 Cynodon dactylon (L.) Pers. Poaceae 1.05 30.88 35 30.43 0.95 23.45 84.77
52 Cyperus rotundus L. Cyperaceae 0.7 20.58 25 21.73 0.55 13.58 55.90
During winter, herbs
53 Asphadelus tunifolius Caven. Asphodelaceae 1.05 20.19 40 14.28 1.2 9.44 43.91
54 Aristida adscensionis L. Poaceae 0.8 20.19 25 8.92 1.35 9.05 38.16
55 Chenopodium album L. Chenopodiaceae 1.05 15.38 25 8.92 1.15 10.62 34.94
56 Cynodon dactylon (L.) Pers. Poaceae 0.55 7.28 20 14.28 1.1 29.52 51.49
57 Cyperus rotundus L. Cyperaceae 0.6 10.57 30 7.14 0.65 8.66 26.37
58 Dichanthium annulatum Frossk Poaceae 0.45 5.76 70 10.71 0.65 22.44 38.91
59 Launaea angustifolia (Desf.)
Kuntze Asteraceae
0.4 11.53 40 10.71 3.75
5.11 27.35
60 Malva neglecta Wallr. Malvaceae 0.3 8.65 30 25 2.85 5.11 38.76

241
Appendix 3. Phytosociological attributes of plant community at Site II
S.No Name of plants Family Density R/Density Frequency R/Frequency Cover R/Cover Importance value
During spring, trees
1 Acacia modesta Wall. Mimosaceae 0.7 10.68 45 14.28 4.25 12.89 37.87
2 Acacia nilotica (L.) Wild.ex
Delile Mimosaceae
0.55 8.39 50 15.87 5.75
17.45 41.72
3 Phoenix dactylifera L. Araceae 1.25 19.08 60 19.04 4.75 14.41 52.55
4 Prosopis cineraria L. Mimosaceae 1.35 20.61 60 19.05 5.8 17.60 57.26
5 Tamarix aphylla (L.) Karst Tamaricaceae 2 30.53 55 17.46 6.25 18.97 66.96
6 Ziziphus jujube Mill. Rhamnaceae 0.7 10.68 45 14.28 6.15 68.66 43.64
During spring, shrubs
7 Aerva javanica (Burm. F.) Juss. Amaranthaceae 0.95 11.18 55 16.67 0.65 4.21 32.05
8 Calotropis procera (Willd.) R.
Br. Asclepiadaceae
0.65 7.65 40 12.12 1.85
11.97 31.74
9 Cistanche tubulosa (Shehenk.) Orobanchaceae 1.15 13.53 30 9.09 0.95 6.15 28.77
10 Prosopis juliflora Swartz. Mimosaceae 1.45 17.05 60 18.18 5.25 33.98 69.22
11 Rhazya stricta Decne. Apocynaceae 0.85 10 35 10.60 2.2 14.24 34.84
12 Tamarix dioica Roxb. Ex Roth. Tamaricaceae 2 23.53 35 10.60 1.65 10.68 44.81
13 Vitex negundo L. Verbenaceae 0.6 7.06 30 9.09 1.25 8.09 24.24
14 Withania coagulans Dunal. Solanaceae 0.85 10 45 13.63 1.65 10.67 34.31
During spring, herbs

242
15 Anagallis arvensis L. Primulaceae 1.25 5.34 50 6.09 0.75 2.65 14.08
16 Avena fatua L. Poaceae 0.6 2.56 50 6.09 0.45 1.59 10.24
17 Calendula officinalis L. Asteraceae 0.65 2.77 40 4.87 0.85 3.00 10.64
18 Carthamus persicus Willd. Asteraceae 1 4.27 30 3.65 1.15 4.06 11.98
19 Cenchrus ciliaris L. Poaceae 2.25 9.61 40 4.87 1.75 6.18 20.66
20 Chenopodium album L. Chenopodiaceae 1.15 4.91 45 5.48 2.15 7.59 17.98
21 Convolvulus arvensis L. Convolvulaceae 0.75 3.20 30 3.65 0.95 3.35 10.22
22 Cymbopogon distanse Schutt. Poaceae 1.3 5.55 65 7.92 5.15 18.19 31.66
23 Cynodon dactylon (L.) Pers. Poaceae 1.85 7.90 60 7.31 2.65 9.36 24.57
24 Datura alba Nees. Solanaceae 0.95 4.059 40 4.87 1.25 4.41 13.33
25 Euphorbia helioscopia L. Euphorbiaceae 0.55 2.35 30 3.65 0.95 3.35 9.35
26 Heliotropium europaeum (F. &
M.) Kazmi Boraginaceae
0.65 2.77 30 3.65 1.25
4.41 10.83
27 Malcolmia Africana (L.) R.Br. Malvaceae 2.25 9.61 55 6.70 1.15 4.06 20.37
28 Oligomeris linifolia (vahl)
Macbride Resedaceae
0.6 2.56 35 4.26 0.65
2.29 9.12
29 Pegnum harmala L. Zygophyllaceae 1 4.27 45 5.48 1.85 6.53 16.26
30 Polygonum plebejum R.Br Polygonaceae 0.75 3.20 25 3.04 0.65 2.29 8.83
31 Rumex dentatus (Meisn.) Rech.f. Polygonaceae 1.05 4.48 35 4.26 1.25 4.41 13.15
32 Sisymbrium irio L Brassicaceae 1.45 6.19 30 3.65 1.3 4.59 14.43
33 Sonchus asper (L.) Hill. Asteraceae 1.45 6.19 35 4.26 0.65 2.29 12.74

243
34 Spergula fallax (Lowe) E.H.L.
Krause Caryophyllaceae
0.35 1.49 20 2.43 0.35
1.23 5.15
35 Taraxacum officinale F.H.
Wiggers Asteraceae
1.55 6.62 30 3.65 1.15
4.06 14.33
During summer, herbs
36 Alhagi maurorum Medic. Papilionaceae 0.95 7.6 50 9.90 1.45 7.83 25.33
37 Avena fatua L. Poaceae 0.6 4.8 35 6.93 0.45 2.43 14.16
38 Bromus pectinatus Thunb. Poaceae 0.95 9.6 30 10.89 0.95 8.91 29.4
39 Carthamus persicus Willd. Asteraceae 1.15 7.6 40 5.94 1.15 5.13 18.67
40 Cenchrus biflorus Roxb. Poaceae 1.55 9.2 45 7.92 1.25 6.21 23.33
41 Cynodon dactylon (L.) Pers. Poaceae 0.55 12.4 25 8.91 0.65 6.75 28.06
42 Cyperus rotundus L. Cyperaceae 1.2 4.4 55 4.95 1.65 3.51 12.86
43 Eleusine indica (L.) Gaertn. Poaceae 0.6 4.4 20 9.90 0.55 17.02 31.32
44 Fagonia cretica L. Zygophyllaceae 0.95 4.8 45 3.96 1.65 2.97 11.73
45 Pegnum harmala L. Zygophyllaceae 1.45 7.6 45 8.91 0.55 8.91 25.42
46 Poa annua L. Poaceae 0.95 11.6 35 8.91 1.2 2.97 23.48
47 Rumex dentatus (Meisn.) Rech.f. Polygonaceae 0.55 7.6 50 6.93 3.15 6.48 21.01
48 Taraxacum officinale F.H.
Wiggers Asteraceae
1.05 8.4 30 5.94 1.15
6.21 20.55

244
During autumn, herbs
49 Achyranthes aspera L. Amaranthaceae 0.85 12.68 45 14.51 0.75 7.28 34.47
50 Amaranthus viridis L. Amaranthaceae 0.7 10.44 35 11.29 0.65 6.31 28.04
51 Boerhavia procumbens Banks ex
Roxb Nyctaginaceae
0.75 11.19 25 8.06 0.95
9.22 28.47
52 Bromus pectinatus thumb. Poaceae 0.85 5.22 30 9.67 0.75 25.72 40.61
53 Chenopodium murale L. Chenopodiaceae 0.55 12.68 35 9.67 1.55 7.28 29.63
54 Citrullus colocynthis (L.) Shred. Cucurbitaceae 1.25 8.20 50 11.29 1.2 15.04 34.53
55 Cynodon dactylon (L.) Pers. Poaceae 0.85 18.65 35 16.12 0.65 11.65 46.42
56 Cyperus rotundus L. Cyperaceae 0.35 12.68 30 11.29 2.65 6.31 30.28
57 Solanum surattense Burm.f. Solanaceae 0.55 8.20 25 8.06 1.15 11.16 27.42
During winter, herbs
58 Aristida adscensionis L. Poaceae 0.55 8.94 35 13.46 0.55 11.45 33.85
59 Chenopodium album L. Chenopodiaceae 0.75 12.19 40 15.38 1.15 23.95 51.52
60 Convolvulus arvensis L. Convolvulaceae 0.55 8.94 25 9.61 0.75 15.62 34.17
61 Cynodon dactylon (L.) Pers. Poaceae 0.95 15.44 40 15.38 0.55 11.45 42.27
62 Dichanthium annulatum Forssk. Poaceae 0.65 10.56 30 11.53 0.5 10.41 32.5
63 Poa annua L. Poaceae 1.05 17.07 35 13.46 0.45 9.375 39.8
64 Polygonum plebejum R.Br Polygonaceae 0.6 9.75 20 7.69 0.4 8.33 25.77
65 Sonchus asper (L.) Hill. Asteraceae 1.05 17.07 35 13.46 0.45 9.37 39.9

245
Appendix 4. Phytosociological attributes of plant community at Site III
S.No Name of Plants Family Density R/Density Frequency R/Frequency Cover R/Cover
Importance
value
During spring, trees
1 Acacia modesta Wall. Mimosaceae 0.85 20.98 55 22 4.25 18.44 61.42
2 Acacia nilotica (L.) Wild.ex Delile Mimosaceae 1.05 25.92 60 24 6.15 26.68 76.60
3 Tamarix aphylla (L.) Karst Tamariaceae 1.4 34.57 65 26 4.75 20.60 81.17
4 Ziziphus jujuba Mill. Rhamnaceae 0.5 12.34 45 18 5.75 24.94 55.29
5 Prosopis cineraria L. Mimosaceae 0.25 6.17 25 10 2.15 9.33 25.50
During spring, shrubs
6 Aerva javanica (Burm. F.) Juss. Amaranthaceae 1.2 21.24 60 21.05 1.15 8.84 51.14
7 Calotropis procera (willd.) R. Br. Capparidaceae 0.75 13.27 55 19.29 2 15.38 47.96
8 Prosopis juliflora Swartz. Mimosaceae 1.75 30.97 70 26.56 6.25 48.08 103.61
9 Rhazya stricta Decne. Apocynaceae 0.8 14.16 40 14.03 1.75 13.46 41.65
10 Withania coagulans Dunal. Solanaceae 1.15 20.35 60 21.05 1.85 14.23 55.65
During spring, herbs
11 Alopecurus nepalensis Trin.Ex Steud. Poaceae 1.05 2.10 30 1.84 0.55 1.51 5.45
12 Anagallis arvensis L. Primulaceae 1.5 3.00 60 3.69 0.85 2.34 9.03
13 Atriplex stocksii Boiss Chenopodiaceae 0.85 1.70 40 2.46 0.85 2.34 6.5
14 Calendula officinalis L. Asteraceae 1.45 2.90 60 3.69 1.25 3.45 10.04
15 Carduus argentatus L. Asteraceae 0.75 1.50 30 1.84 0.75 2.07 5.41

246
16 Cirsium arvense (L.) Scop. Asteraceae 1.15 2.30 40 2.46 0.65 1.79 6.55
17 Convolvulus arvensis L. Convolvulaceae 1.75 3.51 50 3.07 1.15 3.17 9.75
18 Conyza bonariensis (L.) Cronquist Asteraceae 0.95 1.90 30 1.84 0.55 1.51 5.25
19 Cymbopogon distanse Schutt. Poaceae 0.65 1.30 45 2.76 1.45 4.00 8.06
20 Cynodon dactylon (L.) Pers. Poaceae 2.25 4.51 65 4 3.15 8.70 17.21
21 Datura alba Nees. Solanaceae 1.05 2.10 30 1.84 0.75 2.07 6.01
22 Dinebra retroflexa (Vahl) Panzer. Poaceae 0.45 0.90 30 1.84 0.25 0.69 3.43
23 Echinochloa crus-galli (L.) P. Beauv. Poaceae 0.7 1.40 35 2.15 0.3 0.82 4.37
24 Euphorbia helioscopia L. Euphorbiaceae 2.8 5.61 60 3.69 2.15 5.94 15.24
25 Euphorbia prostrata Ait. Euphorbiaceae 1.55 3.10 30 1.84 1.14 3.15 8.09
26 Fagonia indica L. Zygophyllaceae 1.35 2.70 35 2.15 1.15 3.17 8.02
27 Filago pyramidata L. Asteraceae 0.45 0.90 25 1.53 0.35 0.96 3.39
28 Fumeria indica Hausskn. Fumariaceae 1.45 2.90 40 2.46 1.35 3.73 9.09
29 Heliotropium crispum Desf. Boraginaceae 0.65 1.30 30 1.84 0.25 0.69 3.83
30 Lactuca serriola L. Asteraceae 0.95 1.90 35 2.15 0.45 1.24 5.29
31 Lathyrus aphaca L. Papilionaceae 0.7 1.40 25 1.53 0.2 0.55 3.89
32 Launaea procumbens Pravin Kawale Asteraceae 0.55 1.10 25 1.53 0.35 0.96 3.18
33 Leptochloa panacea Retz Poaceae 0.85 1.70 35 2.15 0.2 0.55 4.4
34 Malva neglecta Wallr. Malvaceae 0.75 1.50 25 1.53 0.3 0.82 3.85
35 Medicago polymorpha L. Papilionaceae 1.2 2.40 40 2.46 0.75 2.07 6.93
36 Melilotus alba Desr. Papilionaceae 0.65 1.30 25 1.53 0.25 0.69 3.52

247
37 Melilotus indica (L.) All. Papilionaceae 1.15 2.30 35 2.15 0.35 0.96 5.41
38 Neslia apiculata Fisch. Brassicaceae 0.55 1.10 20 1.23 0.4 1.10 3.43
39 Nicotiana plumbaginifolia Viv. Solanaceae 0.75 1.50 25 1.53 0.35 0.96 4.01
40 Oxalis corniculata L. Oxalidaceae 1.15 2.30 30 1.84 0.2 0.55 4.69
41 Phalaris minor Retz. Poaceae 0.9 1.80 30 1.84 0.35 0.96 4.6
42 Plantago lanceolata L. Plantaginaceae 1.5 3.00 45 2.76 0.55 1.51 7.27
43 Poa annua L. Poaceae 2.35 4.71 60 3.69 1.65 4.55 12.95
44 Poa botryoides (Trin. Ex Griseb.) Kom. Poaceae 1.05 2.10 30 1.84 0.45 1.24 5.18
45 Polygonum plebejum R.Br Polygonaceae 0.55 1.10 25 1.53 0.75 2.07 4.7
46 Ranunculus sceleratus L. Ranunculaceae 0.65 1.30 25 1.53 0.35 0.96 3.79
47 Rumex dentatus (Meisn.) Rech.f. Polygonaceae 0.55 1.10 20 1.23 0.65 1.79 4.12
48 Polypogon monspeliensis (L.) Desf. Poaceae 0.5 1.00 40 2.46 2.15 5.94 9.4
49 Sisymbrium irio L Brassicaceae 1.55 3.10 35 2.15 1.15 3.17 8.42
50 Sonchus asper (L.) Hill. Asteraceae 1.45 2.90 50 3.07 0.7 1.93 7.9
51 Solanum nigrum L. Solanaceae 0.5 1.00 30 1.84 0.35 0.96 3.8
52 Taraxacum officinale F.H. Wiggers Asteraceae 1.75 3.51 35 2.15 1.2 3.31 8.97
53 Torilis nodosa (L.) Gaertn. Apiaceae 1.15 2.30 25 1.53 0.75 2.07 5.9
54 Trigonella crassipes Boiss. Papilionaceae 1.55 3.10 35 2.15 0.75 2.07 7.32
55 Verbena officinalis L. Verbenaceae 0.85 1.70 30 1.84 0.55 1.51 5.05
56 Xanthium strumarium L. Asteraceae 0.95 1.90 25 1.53 1.15 3.17 6.6
During summer, herbs

248
57 Alhagi maurorum Medic. Papilionaceae 1.35 17.1 55 15.94 1.75 19.02 52.15
58 Aristida cyanantha Nees ex Steud. Poaceae 0.55 7.00 30 8.69 0.65 7.06 22.75
59 Cenchrus ciliaris L. Poaceae 0.85 10.82 45 13.04 0.55 5.97 29.83
60 Conyza bonariensis (L.)
Cronquist Asteraceae
0.75 9.55 35 10.14 0.6
6.52 26.21
61 Cynodon dactylon (L.) Pers. Poaceae 1.35 17.19 50 14.49 1.75 19.02 50.7
62 Cyperus rotundus L. Cyperaceae 0.95 12.10 35 10.14 0.75 8.15 30.39
63 Fagonia cretica L. Zygophyllaceae 0.95 12.10 30 8.69 0.65 7.06 27.85
64 Heliotropium strigosum Wild Boraginaceae 0.6 7.64 25 7.24 0.35 3.80 18.68
65 Polypogon monspeliensis (L.)
Desf. Poaceae
0.5 6.36 40 11.59 2.15
23.36 41.31
During autumn, herbs
66 Achyranthes aspera L. Amaranthaceae 1.15 13.60 50 12.65 1.1 11.82 38.07
67 Amaranthus viridis L. Amaranthaceae 1.2 14.20 50 12.65 1.15 12.36 39.21
68 Boerhavia procumbens Banks ex
Roxb Nyctaginaceae
0.65 7.69 30 7.59 0.55
5.91 21.19
69 Chenopodium murale L. Chenopodiaceae 1.25 14.79 55 13.92 1.35 14.51 43.22
70 Corchorus depressus (L.) Tiliaceae 0.5 5.91 25 6.32 0.45 4.83 17.06
71 Cynodon dactylon (L.) Pers. Poaceae 1.05 12.42 45 11.39 1.3 13.97 37.78
72 Cyperus rotundus L. Cyperaceae 0.8 9.46 35 8.86 0.45 4.83 23.15
73 Polypogon monspeliensis (L.) Poaceae 0.5 5.91 40 10.12 2.15 23.11 39.14

249
Desf.
74 Solanum surattense Burm.f. Solanaceae 0.7 8.28 30 7.59 0.45 4.83 20.7
75 Tribulus terrestris L. Zygophyllaceae 0.65 7.69 35 8.86 0.35 3.76 20.31
During winter, herbs
76 Avena fatua L. Poaceae 0.85 7.98 40 10.81 0.35 5.18 23.97
77 Convolvulus arvensis L. Convolvulaceae 1.25 11.73 35 9.45 0.55 8.14 29.32
78 Cynodon dactylon (L.) Pers. Poaceae 1.25 11.73 45 12.16 1.45 21.48 45.37
79 Dichanthium annulatum Forssk. Poaceae 1.05 9.85 40 10.81 1.25 18.51 39.17
80 Euphorbia helioscopia L. Euphorbiaceae 1.75 16.43 60 16.21 1.35 20 52.64
81 Leptochloa panacea Retz Poaceae 0.85 7.98 35 9.45 0.2 2.96 20.39
82 Melilotus alba Desr. Papilionaceae 0.65 6.10 25 6.75 0.25 3.70 16.55
83 Melilotus indica (L.) All. Papilionaceae 1.15 10.79 35 9.45 0.35 5.18 25.42
84 Poa botryoides (Trin. Ex Griseb.)
Kom. Poaceae
1.05 9.85 30 8.10 0.45
6.66 24.61
85 Setaria pumila (Poir.) Roem. Poaceae 0.8 7.51 25 6.75 0.55 8.14 22.4