CARBON AND NUTRIENT ACCUMULATION IN SECONDARY FORESTS REGENERATING ON PASTURES IN CENTRAL AMAZONIA

International Journal of Remote Sensing, 2013Vol. 34, No. 17, 6243–6262, http://dx.doi.org/10.1080/01431161.2013.793865
Do vegetation indices provide a reliable indication of vegetationdegradation? A case study in the Mongolian pastures
A. Karnielia*, Y. Bayarjargala† , M. Bayasgalanb, B. Mandakhc, Ch. Dugarjavc,J. Burgheimera, S. Khudulmurb, S.N. Bazhad, and P.D. Gunind
aThe Remote Sensing Laboratory, Jacob Blaustein Institutes for Desert Research, Ben GurionUniversity of the Negev, Negev, Israel; bNational Remote Sensing Centre, Ministry of Nature and
Environment, Ulaanbaatar, Mongolia; cInstitute of Botany, Mongolian Academy of Sciences,Ulaanbaatar, Mongolia; dA.N. Severtsov Institute of Ecology and Evolution, Russian
Academy of Sciences, Moscow, Russia
(Received 27 July 2011; accepted 24 November 2011)
Space and ground observations were applied to explore the ability of remote sens-ing techniques to assess the effect of grazing on vegetation degradation. The steppebiome of Mongolia was used as the study area, in which several pairs of siteswere investigated – each pair comprised an ungrazed (fenced-off) area and a heav-ily grazed area. For each pair, the enhanced vegetation index (EVI), computed fromLandsat-7 Enhanced Thematic Mapper Plus (ETM+) data, along with field-observedbiophysical variables (e.g. plant density, species composite, above-ground biomass(AGB), and percentage cover) and plant spectral reflectance data were collected.As expected, plant density, AGB, and percentage cover values were significantly higherin the ungrazed areas than in the adjacent grazed ones. However, unexpectedly, thegrazed areas had significantly higher EVI values than the ungrazed areas. It was foundthat unpalatable species had invaded into the grazed areas, substituting the nativegrasses. These invasive species, mostly characterized by denser leaf structure, inducedhigher spectral responses in the near infrared (NIR) region of the electromagnetic spec-trum. EVI is the preferred vegetation index to use for detecting this phenomenon, sinceit is more sensitive to variations in leaf cellular structural as expressed in the NIR(rather than the red) portion of the spectrum. The current study contradicts the generalassumption that the higher the vegetation index value, the better the grazing conditions.
1. Introduction
Grazing by domestic animals is among land-use practices with strong impacts on nativevegetation in rangelands throughout the world. According to the Food and AgricultureOrganization, FAO (FAOSTAT data 2006), permanent grasslands extend over 3.4 × 10⁹ haworldwide, representing approximately 26% of the Earth’s land surface. Therefore, rangemanagement and monitoring using traditional field surveys, especially over vast and remoteareas, might be problematic since these are expensive, manpower-demanding, and time-consuming processes. Satellite remote sensing, with its large surface cover and frequentroutine observation, has been intensively used for a large number of vegetation applicationsin rangelands. Examples for such applications include: assessing biomass (Schino et al.
*Corresponding author. Email: [email protected]†Present address: The Nature Conservancy, Ulaanbaatar, Mongolia.
© 2013 Taylor & Francis
Dow
nloa
ded
by [
Ben
Gur
ion
Uni
vers
ity o
f th
e N
egev
] at
04:
21 2
0 A
ugus
t 201
3

6244 A. Karnieli et al.
2003) and leaf area index (Friedl et al. 1994); monitoring vegetation temporal dynamicsand phenological changes (Reed et al. 1994; de Beurs and Henebry 2004); classifyingplant communities (Clark, Seyfried, and Harris 2001); calculating fractional vegetationcover (Dymond et al. 1992); estimating grass quality for herbivores (Girard et al. 1990;Griffith et al. 2002); monitoring primary production (Prince 1991) and CO2 (Vourlitis et al.2003; Wylie et al. 2003); distinguishing grassland from non-grassland (Fuller et al. 1989);evaluating grassland management status (Henebry 1993; Mino, Saito, and Ogawa 1998);quantifying grazing intensities (Kawamura et al. 2005); and many more. These applica-tions have mostly been implemented using various vegetation indices (e.g. Todd, Hoffer,and Milchunas 1998; Schino et al. 2003) and, among these, the normalized differencevegetation index (NDVI) (Tucker 1979) is by far the most commonly used:
NDVI = ρNIR − ρR
ρNIR + ρR, (1)
where ρ are reflectance values in the respective spectral bands. NDVI is based on the dif-ference between the maximum absorption of radiation in the red (R) spectral region (due tochlorophyll pigments) and the maximum reflection of radiation in the near infrared (NIR)region (due to leaf cellular structure), and the fact that soil spectra, lacking these mech-anisms, typically do not show such a dramatic spectral difference. Despite its wide rangeof applications, NDVI has several disadvantages that have led to the development of othervegetation indices – the soil adjusted vegetation index (SAVI), which is supposed to beless sensitive to soil background (Huete 1988), and the atmospheric resistant vegetationindex (ARVI), aimed at reducing the atmospheric effect (Kaufman and Tanré 1992). Morerecently, the enhanced vegetation index (EVI) was developed in order to optimize the vege-tation signal, with improved sensitivity in high-biomass regions while correcting for canopybackground signals, thereby reducing atmosphere influences (Liu and Huete 1995; Hueteet al. 1997). EVI is based on the NDVI, SAVI, and ARVI indices, and uses functionalitiesfrom each in order to overcome soil and atmospheric interferences. EVI is formulated as
EVI = G × ρNIR − ρred
ρNIR + C1 × ρred − C2 × ρBlue + L, (2)
where ρ are atmospherically corrected or partially corrected (Rayleigh and ozone absorp-tion) surface reflectances in the respective spectral bands, L is the canopy backgroundadjustment term, C1 and C2 are the coefficients of the aerosol resistance term that uses theblue band to correct for aerosol influences in the red band, and G is the gain factor. The coef-ficients adopted in the EVI algorithm are L = 1, C1 = 6, C2 = 7.5, and G = 2.5. It shouldbe noted that whereas NDVI is chlorophyll sensitive and responds mostly to ρred variations,EVI is more ρNIR sensitive and responsive to canopy structural variations, including LAI,canopy type, and architecture (Pettorelli et al. 2005).
Overgrazing is considered to be the key cause of rangeland degradation (Thomas andMiddleton 1994), which is in turn almost entirely manifested as vegetation degradation(Dregne and Chou 1992). The latter is directly related to reduction in biomass and/ordecrease in plant species diversity (Eswaran, Beinroth, and Virmani 2000). However, sinceit is usually easier to measure vegetation degradation qualitatively rather than quantita-tively, predicting a tendency towards rangeland degradation is not always straightforward.For instance, vegetation degradation may be manifested not by biomass loss, but by inva-sion by or increase in undesirable species that may actually increase biomass productionon degraded rangelands/ecosystems, or by loss of palatable pasture grasses and their
Dow
nloa
ded
by [
Ben
Gur
ion
Uni
vers
ity o
f th
e N
egev
] at
04:
21 2
0 A
ugus
t 201
3

International Journal of Remote Sensing 6245
replacement with unpalatable species (Dregne and Chou 1992; Brown and Archer 1999).From the remote sensing point of view, the above-mentioned vegetation applications, whichare related to quantitative variables, are widely implemented in rangelands. Bastin, Pickup,and Pearce (1995), who examined the potential of spaceborne systems for rangeland degra-dation mapping around Australian watering points, noted that it is impossible to distinguishbetween different plants or changes in species composition. However, more recently, tak-ing advantage of hyperspectral image spectroscopy technology, a few studies have beenaimed at mapping the distribution of certain biological invaders (Lass et al. 2002, 2005;Underwood, Ustin, and DiPietro 2003; Bradley and Mustard 2005, 2006; He et al. 2011)and evaluating changes in canopy chemistry and other canopy characteristics caused byinvasion (Asner and Vitousek 2005).
In Mongolia, from historic times, animal husbandry has been the main plank of theeconomy, with natural pastures comprising more than 78% of its territory. Native grasslandis distributed over an area of some 125.8 million ha and, from preliminary studies, it isestimated that there are about 2270 grass species and 600 of other fodder plants. Duringthe last 70 years, population density in the Mongolian drylands has increased more thanthreefold and total domestic livestock numbers have increased over 2.3-fold. In 2009, therewere about 44 million animals including 0.3 million camels, 2.1 million horses, 2.5 millioncattle, 17.9 million sheep, and 19.5 million goats. Due to market demands, the number ofgoats – which are a major source of cashmere and a major cause of pasture degradation –rose by about 400–500% more than the level recommended for ecological balance (Regdeland Dugarjav 2010).
Consequently, detrimental anthropogenic activities such as overgrazing have acceler-ated, causing vegetation degradation to become the main type of rangeland degradation(Adyasuren 1998; Batjargal 1999; Fujita et al. 2009). A few case studies, at plot-scalelevel, have drawn attention to a severe decrease in vegetation cover due to overgrazing nearsettlements and water sources. Yonghong and Jargalsaihan (1993) noted that plant commu-nity abundance (composition and richness) decreased as grazing pressure increased, andthe native vegetation was replaced by exotic species in the northeast pastureland of thecountry. They found that succession series along the grazing gradient were Stipa gran-dis and Leymus chinensis in the lightly grazed sites, Stipa krylovii, Artemisia frigida,and low grasses in the moderately grazed sites, and Carex duriuscula, Artemisia sco-paria, and annuals in the heavily grazed sites. Fernandez-Gimenez and Allen-Diaz (1999)found, based on ground observations over 2 years, that the vegetation pattern (in termsof species composition, biomass, etc.) changed along grazing gradients beginning at thewatering points, in response to increased grazing pressure in the Mountain Steppe andSteppe zones of Mongolia, while no consistent changes due to grazing were observed inthe desert steppe. Also, it was noted that vegetation changes over degraded and eroded areaswere significant, and unpalatable plants or weeds fully occupied these areas. However, noshrub encroachment was found to be associated with degradation in Mongolia’s grassland(Tserenbaljid 2002; Fernandez-Gimenez and Allen-Diaz 1999).
In the current study, advantage was taken of a unique phenomenon in Mongolia. TheTrans-Mongolian Railway, established in the 1950s, traverses the country from the north-ern border with Russia to the southern border with China, a distance of over 1000 km(Figure 1). The northern segment of this line, connecting Ulan-Ude, Soviet Union, withUlaanbaatar (the capital city of Mongolia), became operational in 1950 while the south-ern segment, linking the capital and the Chinese border, was completed in 1955. Sincethen, its entire length has been protected by fences to avoid animals crossing. Therefore, nograzing is allowed within the fences while intensive grazing characterizes the surrounding
Dow
nloa
ded
by [
Ben
Gur
ion
Uni
vers
ity o
f th
e N
egev
] at
04:
21 2
0 A
ugus
t 201
3

6246 A. Karnieli et al.
Ecosystems
Desert
Desert-steppe
Steppe
Mountain-steppe
Forest
High mountain
(a)
(b)
Test-site
Railway
50
° N
50
° N
100° E 110° E
100° E90° E 110° E 120° E
45
° N
45
° N
40
° N
40
° N
Landsat scene State border
Projection: UTMZone: 48 N
km0 200 400
Speriod/Datum: WGS84City/centre
River
Water bodies
Met. station
Figure 1. (a) Geo-botanical map of Mongolia and the railway that traverses the country from thenorthern border with Russia to the southern border with China. Locations of the Landsat images arepresented; (b) study sites along the route of the railway.
area. Vegetation degradation has been amplified in the vicinity of the railway, since thetrain is the major means of transporting herds and goods to the markets in Ulaanbaatar.Since the railway passes through grasslands with different grazing pressures within andoutside the enclosures, it enables the investigation of different plant communities andhence human-induced rangeland degradation. The old railway was constructed accordingto the topography and thus followed the contour lines, while the fences were stretchedalong shorter routes. Consequently, when the track curves the distance between flankingfences can be as wide as several kilometres, enabling remote sensing research using high-resolution imagery (Figure 2). The current article attempts at exploring the ability of theremote sensing technique to assess vegetation degradation in the Mongolian steppes. It ishypothesized that intensive grazing reduces plant density, above-ground net primary pro-duction, and fractional vegetation cover compared with the adjacent ungrazed sites, andthat this situation leads to significantly lower EVI values outside the fence than within.
Dow
nloa
ded
by [
Ben
Gur
ion
Uni
vers
ity o
f th
e N
egev
] at
04:
21 2
0 A
ugus
t 201
3

International Journal of Remote Sensing 6247
(a)
(b)
Figure 2. Example of a Landsat ETM+ image (RGB = 4,3,2) showing (a) study site M1 and (b)study site S1. The area between the fence and the railway is the ungrazed area, while intensive grazingcharacterizes the surrounding area. Note the reddish colour in the grazed area indicating relativelyhigh NIR reflectance.
2. Study area
Mongolia has a continental climate, characterized by cold, dry winters and warm, wet(rainy) summers. The current research is focused on the Mongolian steppe biome (exclud-ing the desert steppe) (Figure 1), which occupies approximately 4.5 × 10⁸ ha. Mean annualprecipitation ranges from less than 75 mm in the south to more than 350 mm in the north,and mean annual temperature gradually decreases from 7◦C in the south to –7◦C in thenorth. The aridity index (ratio of precipitation to potential evapotranspiration) ranges from0.2 to 0.5; Budyko (1974) classified the study area as a semi-arid environment. The north-ern part of the study area, called the Mountain Steppe, is characterized by a relative steeptopography with perennial bunchgrasses in the southern slopes of the mountains, while thenorthern slopes are covered by coniferous forests over the steppe and meadow types of veg-etation. The main plant species in this region are Festuca sibirica Hack. ex Boiss., Stipakrylovii Roshev., Stipa grandis P. Smirn., Stipa baicalensis Roshev., Agrostis mongholicaRoshev., Galium verum L., Poa attenuata Trin., Agropyron cristatum (L.) Beauv., Leymuschinensis (Trin.) Tzvel., Koeleria cristata (L.) Pers., Artemisia frigida Willd., A. dracun-culus L., Allium senescens L., and Allium ramosum L. The Steppe zone in the southernpart of the study area is characterized by flat plains and rolling hills covered in feather
Dow
nloa
ded
by [
Ben
Gur
ion
Uni
vers
ity o
f th
e N
egev
] at
04:
21 2
0 A
ugus
t 201
3

6248 A. Karnieli et al.
grass and shrubs. Here the main plant species are Stipa krylovii Roshev., Leymus chinensis(Trin.) Tzvel., Bupleurum scorzonerifolium Willd., Cleistogenes squarrosa (Trin.) Keng.,Carex duriuscula C.A. Mey., Agropyron cristatum (L.), Festuca lenensis Drob., Artemisiafrigida Willd., Artemisia adamsii Bess., Potentilla acaulis L., Allium senescens L., Ephedrasinica Stapf., Caragana microphylla Lam., and Caragana pygmaea (L.) DC. In morehumid ecotopes along valley bottoms and inter-mountain troughs, plant communities areformed by Agrostis mongholica Roshev., Leymus chinensis (Trin.) Tzvel., Carex duriusculaC.A. Mey., Thermopsis lanceolata R. Br., Artemisia laciniata Willd., Halerpestes salsug-inosa (Pall. Ex Georgi) Greene., Glaux maritima L., Iris bungei Maxim., and Potentillaanserina L.
3. Methodology
The research was conducted in six study sites selected along the route of the railway(Figure 1). Three are located within the Mountain Steppe zone (denoted hereafter as sitesM1, M2, and M3) and the other three are in the Steppe zone (S1, S2, and S3). Each siteconsists of pairs of study polygons – ungrazed (fenced-off area) and heavily grazed (outsidethe fences). All sites are large enough in terms of the spatial resolution of Landsat images(30 × 30 m) and are characterized by flat topography.
Four Landsat-7 Enhanced Thematic Mapper Plus (ETM+) images acquired in the early2000s were used (20 September 2000, 31 August 2001, 13 September 2000, and 26 July2002 for path 132 – row 26, 131–27, 131–26, and 130–27, respectively). In order to reducescene-to-scene variation related to sun angle, differences in atmospheric condition, andvegetation phenology, all images were selected during the vegetation growing season, whenthe ability to discriminate between vegetation and soil cover is optimal. In addition, cloudcover is minimal in all images. Digital number values were converted to radiance, andground-leaving reflectances were created from radiances using the 6S algorithm (Vermoteet al. 1997). Later, the four images were merged to create a continuous scene, and EVI(Equation (2)) was computed from reflectance values. This index was selected in order toreduce the uncertainty related to soil background and atmospheric effects throughout theentire study area. Approximately, the same number of pixels was sampled in the grazed andadjacent ungrazed polygons.
Ground-truth activities were conducted during two field campaigns in the summers of2002 and 2003, within the framework of the Joint Russian–Mongolian Complex BiologicalExpedition, a joint venture by the A.N. Severtsov Institute of Ecology and Evolution RAS,Russia, the Remote Sensing Laboratory (Blaustein Institutes for Desert Research, Ben-Gurion University of the Negev, Israel), the Institute of Botany (Mongolian Academy ofScience), and the National Remote Sensing Centre (Ministry for Nature and Environmentof Mongolia). In each of the six study sites a detailed geo-botanical survey of biophysicalvariables of dominant and co-dominant plant species was conducted using the methoddescribed by Shennikov (1964) to determine species composition, plant density, and canopycover. Relative abundance of species was evaluated by the Drude method (Shennikov 1964),nomenclature followed that of Gubanov (1996), and the above-ground biomass (AGB) ofplants was sampled by the method of Larin (1956). Samples were air dried and weighed inthe laboratory using an electronic balance of scale 0.1 g. The study polygons were preciselylocated by the global positioning system (GPS).
In conjunction with the above, spectral reflectance measurements were imple-mented during the ground surveys using the FieldSpec-HandHeld Spectroradiometer,manufactured by Analytical Spectral Devices (ASD 2000) at wavelength range
Dow
nloa
ded
by [
Ben
Gur
ion
Uni
vers
ity o
f th
e N
egev
] at
04:
21 2
0 A
ugus
t 201
3

International Journal of Remote Sensing 6249
325–1075 nm with a spectral resolution of 2 nm. A high intensity contact probe device witha fibre optic was attached to the spectroradiometer. This device has an independent lightsource (about twofold higher than solar intensity) that makes measurement feasible underall-weather conditions. The contact probe was attached to clipped plants and soil samples.Measurements of a white reference panel (Spectralon plate, Labsphere Inc., North Sutton,NH, USA) were taken immediately before each spectral reading. Reflectance measurementswere used to calculate NDVI (Equation (1)) and EVI (Equation (2)).
In order to further explore and compare the performance of these indices for assess-ing grazing conditions, relative sensitivity (Sr) analysis was carried out as suggested byGitelson (2004). The general expression for comparing the performance of two spectralindices (X and Y ) with respect to any variable is
Sr =(
dX
dY
) (�Y
�X
), (3)
where dX and dY are first derivatives of the compared indices under study, that is, the slopeof the regression line that holds the independent variable and the index as the dependentvariable; �Y and �X are the ranges of the indices; Sr > 1 means that index X is moresensitive (i.e. varies more with respect to the independent variable), Sr = 1 means thatsensitivities are equal, and Sr < 1 means that index Y is more sensitive to the independentvariable (Ji and Peters 2007). When Sr > 1, the larger the value (either positive or negative),the more sensitive is index X to the variable under study. When Sr < 1, the closer the valueto zero (either positive or negative), the more sensitive is index Y to the variable understudy.
4. Results and discussion
The vegetation communities in each of the six study sites, both within and outside thefencing, were observed during the field campaigns and are presented in Table 1. Table 2summarizes the results for biophysical variables, their descriptive statistics, and signif-icance. These variables include plant density (plants per unit area), AGB (g m−2), and
Table 1. Vegetation communities in the study sites.
Zone Site Polygon Community
Mountain steppe M1 Fenced Halerpestes salsuginosa + Agrostis mongholica + Irisbungei
Mountain steppe M1 Grazed Glaux maritima + Agrostis mongholicaMountain steppe M2 Fenced Agropyron cristatum + Stipa krylovii + Leymus chinensisMountain steppe M2 Grazed Leymus chinensisMountain steppe M3 Fenced Galium verum + Stipa krylovii + Poa attenuata + Leymus
chinensisMountain steppe M3 Grazed Gallium verum + Potentilla acaulis + Artemisia frigidaSteppe S1 Fenced Stipa krylovii + Bupleurum
scorzonerifolium + Cleistogenes squarrosa,Steppe S1 Grazed Carex duriuscula + Artemisia adamsiiSteppe S2 Fenced Agropyron cristatum + Festuca lenensis + Stipa kryloviiSteppe S2 Grazed Artemisia frigida + Potentilla acaulisSteppe S3 Fenced Allium senescens + A. ramosum + Stipa grandisSteppe S3 Grazed Carex duriuscula + Artemisia frigida
Dow
nloa
ded
by [
Ben
Gur
ion
Uni
vers
ity o
f th
e N
egev
] at
04:
21 2
0 A
ugus
t 201
3

6250 A. Karnieli et al.
Table 2. Biophysical variables in the grazed and ungrazed polygons at the study sites, descriptivestatistics, and significance.
Plant density(plants per unit
area)Above-ground
biomass (g m−2) Cover (%) EVI
Polygon Ungrazed Grazed Ungrazed Grazed Ungrazed Grazed Ungrazed Grazed
M1 23 12 216.7 32.2 99.9 59.0 0.21 0.28M2 29 25 126.4 81.2 58.5 52.0 0.26 0.30M3 34 25 188.6 43.7 62.6 48.5 0.20 0.28S1 30 12 53.6 19.2 73.0 50.0 0.25 0.27S2 20 14 66.1 61.4 55.0 56.0 0.21 0.27S3 25 20 122.8 114.6 48.0 45.5 0.22 0.27Average 26.83 18.00 129.03 58.72 66.17 51.83 0.22 0.28SD 5.12 6.16 64.70 35.00 18.50 4.97 0.02 0.01t-Test significance 0.004 0.036 0.037 0.001
percentage of vegetation cover. Values of the Landsat-derived EVI are also presented.Between 23 and 34 plants per square metre were counted within the fencing, while12–25 plants were found outside (Figure 3(a)). Thus, a higher plant density characterizesungrazed polygons in comparison with the adjacent grazed ones. Similarly, as shown inFigure 3(b), within the fencing the average AGB is double that outside. This ratio is higherin the Mountain Steppe polygons than in the Steppe ones. The same trend can also beobserved for plant cover, where higher plant cover was observed in the ungrazed poly-gons in comparison with the grazed ones (Figure 3(c)). However, a different trend wasrevealed by analysis of the image data (Figure 3(d)). EVI values derived from Landsat-ETM+ were significantly higher outside the enclosures than within. Additional statisticalanalyses (t-tests) were performed for plant density, AGB, percentage cover, and EVI values,confirming significant differences for each of these variables between grazed and ungrazedareas (Figure 3, Table 2).
This phenomenon (i.e. higher reflectance in grazed areas) was found consistently ineach of the study sites, as illustrated in Figure 4. This unexpected finding – negativerelations between biophysical variables and vegetation index – requires further discus-sion regarding plant composition, phenology, and the palatability characteristics of plants.Consequently, detailed examination of the entire species inventory, including individualspecies name, family, growth form, leaf structure, palatability, and nutrient value, is listedin Table 3. The list is ordered with respect to spectroradiometer-derived NIR reflectancevalues, which reveal that most of the unpalatable species have high NIR reflectance dueto their leaf/cell structure – either thick, hairy, or with high water content (e.g. succulentspecies).
4.1. Mountain Steppe zone
Different perennial grasses dominate the ungrazed areas, while mostly forbs with littlecontribution from grasses dominate the grazed areas. The perennial grasses have a goodpalatable value for animals during the summer, and some, such as Stipa krylovii andAgropyron cristatum, are especially highly nutritious and are very digestible plants for alllivestock throughout the year (Jigjidsuren and Johnson 2003). They bloom in early Augustand develop mature seeds in September. Also, communities such as Poa attenuata, Leymuschinensis, and Agrostis mongholica have very high palatability for all livestock, especially
Dow
nloa
ded
by [
Ben
Gur
ion
Uni
vers
ity o
f th
e N
egev
] at
04:
21 2
0 A
ugus
t 201
3

International Journal of Remote Sensing 6251
0
50
100
150
Ung
razed
Gra
zed
Ung
razed
Gra
zed
Ung
razed
Gra
zed
Ung
razed
Gra
zed
0
10
Plant density
Above ground biomass (g/m2) EVI
Cover (%)
20
30
40
(a)
(b)
(c)
(d)
300
250
200
150
100
50 0
0.3
5
0.2
5
0.1
5
0.0
5 0
0.1
0.2
0.3
M2
M1
M3
Stu
dy-s
ites
Stu
dy-s
ites
Stu
dy-s
ites
Stu
dy-s
ites S1
S2
S3
M1
M2
M3
S1
S2
S3
M1
M2
M3
S1
S2
S3
M1
M2
M3
S1
S2
S3
Figu
re3.
Res
ults
ofbi
ophy
sica
lvar
iabl
esan
dve
geta
tion
inde
xva
lues
inth
esi
xst
udy
site
s(M
ount
ain
Ste
ppe:
M1,
M2,
M3
and
Ste
ppe:
S1,
S2,
S3)
,in
graz
edan
dun
graz
ed(f
ence
d-of
f)ar
eas.
Var
iabl
esin
clud
e:(a
)pl
ant
dens
ity
(pla
nts
per
unit
area
);(b
)ab
ove-
grou
ndbi
omas
s(g
m−2
);(c
)pe
rcen
tage
ofve
geta
tion
cove
r;an
d(d
)L
ands
at-d
eriv
eden
hanc
edve
geta
tion
inde
x(E
VI)
valu
es.
Not
eth
atat
all
site
s,bi
ophy
sica
lva
riab
leva
lues
are
high
erin
the
ungr
azed
area
sth
anin
the
graz
ed,
whi
leE
VI
valu
essh
owth
eop
posi
tere
lati
ons.
Ver
tica
lba
rsde
note
±1st
anda
rdde
viat
ion
ofth
em
ean
and
show
asi
gnifi
cant
diff
eren
cebe
twee
ngr
azed
and
ungr
azed
area
s.D
etai
led
resu
lts
are
list
edin
Tabl
e2.
Dow
nloa
ded
by [
Ben
Gur
ion
Uni
vers
ity o
f th
e N
egev
] at
04:
21 2
0 A
ugus
t 201
3

6252 A. Karnieli et al.
0.1
0.2
0.3
0.4
0 85 171 256 342 427 513
EV
I
Distance (m)
Ungrazed Grazed
Fence
(a) M1
0.1
0.2
0.3
0.4
0 142 285 427 570 712 855
EV
I
Distance (m)
(b) M2
Ungrazed Grazed
Fence
0.1
0.2
0.3
0.4
0.5
0.6
0 114 228 342 456 570 684 798
EV
I
Distance (m)
(c) M3
Ungrazed Grazed
Fence
0.20
0.25
0.30
0 142 285 427 570 712 855
EV
I
Distance (m)
(d) S1
Ungrazed Grazed
Fence
0.15
0.20
0.25
0.30
0 142 285 427
EV
I
Distance (m)
(e) S2
Ungrazed Grazed
Fence
0.1
0.2
0.3
0.4
0 114 228 342 456 570 684
EV
I
Distance (m)
(f) S3
Ungrazed Grazed
Fence
Figure 4. Landsat-derived enhanced vegetation index (EVI) values across the study sites (MountainSteppe: M1, M2, M3 and Steppe: S1, S2, S3) perpendicular to the fence. Note that EVI values arelower in the ungrazed areas than in the grazed. Vertical bars denote ±1 standard deviation of themean and show a significant difference between grazed and ungrazed areas.
Dow
nloa
ded
by [
Ben
Gur
ion
Uni
vers
ity o
f th
e N
egev
] at
04:
21 2
0 A
ugus
t 201
3

International Journal of Remote Sensing 6253
Tabl
e3.
Lis
tof
indi
vidu
alsp
ecie
s,fa
mil
ies,
grow
thfo
rms,
leaf
stru
ctur
e,pa
lata
bili
ty,
and
nutr
ient
valu
e.T
heli
stis
orde
red
wit
hre
spec
tto
NIR
refl
ecta
nce
valu
es.
Not
eth
atm
ost
ofth
eun
pala
tabl
esp
ecie
sha
vehi
ghN
IRre
flec
tanc
edu
eto
thei
rle
afst
ruct
ure
–ei
ther
thic
k,ha
iry,
orw
ith
high
wat
erco
nten
t(su
ccul
ent)
(fro
mG
uban
ov19
96).
Sit
eP
lant
spec
ies
Fam
ilyG
row
thfo
rmL
eaf
stru
ctur
ePa
lata
bili
tyor
nutr
ient
valu
eN
IR
M1
Gla
uxm
arit
ima
L.
Pri
mul
acea
eV
ent.
Pere
nnia
l,fo
rbS
uccu
lent
Unp
alat
able
0.79
S3
The
rmop
sis
lanc
eola
taR
.B
r.L
egum
inos
aeJu
ss.
Pere
nnia
l,fo
rbT
hin
Unp
alat
able
0.73
S2
Eph
edra
sini
caS
tapf
.E
phed
race
aeD
um.
Dw
arf
shru
bS
cale
like
,thi
ckU
npal
atab
le,
ever
gree
n,po
ison
ous
plan
t
0.73
S1,
S2,
S3
Cle
isto
gene
ssq
uarr
osa
(Tri
n.)
Ken
g.Po
acea
eB
arnh
art
Pere
nnia
l,gr
ass
Thi
nH
ighl
ypa
lata
ble
0.73
S2
Fest
uca
lene
nsis
Dro
b.Po
acea
eB
arnh
art
Pere
nnia
l,gr
ass
Thi
ckH
ighl
ypa
lata
ble
0.72
M1
Pote
ntil
laan
seri
naL
.R
osac
eae
Juss
.Pe
renn
ial,
forb
Thi
n,w
ith
hair
yU
npal
atab
le0.
70M
3A
rtem
isia
laci
niat
aW
illd
.A
ster
acea
eD
umor
t.Pe
renn
ial,
sage
Thi
nU
npal
atab
le0.
70M
1H
aler
pest
essa
lsug
inos
a(P
all.e
xG
eorg
i)G
reen
eR
anun
cula
ceae
Juss
.Pe
renn
ial,
forb
Thi
nH
ighl
ypa
lata
ble
0.70
M3,
S2,
S3
Pote
ntil
laac
auli
sL
.R
osac
eae
Juss
.Pe
renn
ial,
forb
Thi
ck,w
ith
hair
yU
npal
atab
le0.
69M
1Ir
isbu
ngei
Max
im.
Irid
acea
eL
indl
.Pe
renn
ial,
forb
Suc
cule
ntU
npal
atab
le,n
otgr
azed
whe
ngr
een
0.67
S3
All
ium
ram
osum
L.
Lil
iace
aeJu
ss.
Pere
nnia
l,fo
rbS
uccu
lent
Hig
hly
pala
tabl
e0.
62M
2,M
3,S
1,S
2,S
3A
grop
yron
cris
tatu
m(L
.)B
eauv
.Po
acea
eB
arnh
art
Pere
nnia
l,gr
ass
Thi
ck,fl
at,h
airy
onup
per
surf
ace
Hig
hly
pala
tabl
e0.
59
S3
Koc
hia
pros
trat
a(L
.)S
chra
d.C
heno
podi
acea
eV
ent.
Sem
i-sh
rub
Suc
cule
ntH
ighl
ypa
lata
ble
0.59
M2,
M3
Art
emis
iadr
acun
culu
sL
.A
ster
acea
eD
umor
t.S
emi-
shru
bT
hin
Unp
alat
able
0.58
M1,
M3
All
ium
bide
ntat
umFi
sch.
exP
rokh
.L
ilia
ceae
Juss
.Pe
renn
ial,
forb
Suc
cule
ntH
ighl
ypa
lata
ble
0.56
S3
All
ium
sene
scen
sL
.L
ilia
ceae
Juss
.Pe
renn
ial,
forb
Suc
cule
ntH
ighl
ypa
lata
ble
0.55
(Con
tinu
ed)
Dow
nloa
ded
by [
Ben
Gur
ion
Uni
vers
ity o
f th
e N
egev
] at
04:
21 2
0 A
ugus
t 201
3

6254 A. Karnieli et al.
Tabl
e3.
(Con
tinu
ed).
Sit
eP
lant
spec
ies
Fam
ilyG
row
thfo
rmL
eaf
stru
ctur
ePa
lata
bili
tyor
nutr
ient
valu
eN
IR
S2,
S3,
M2,
M3
Art
emis
iafr
igid
aW
illd
.A
ster
acea
eD
umor
t.S
emi-
shru
bT
hick
,sil
very
wit
hsi
lky
hair
onbo
thsi
des
Hig
hly
pala
tabl
e0.
55
M1,
M2,
M3,
S1,
S2
Stip
akr
ylov
iiR
oshe
v.Po
acea
eB
arnh
art
Pere
nnia
l,gr
ass
Thi
ckH
ighl
ypa
lata
ble
0.55
M1,
M2,
M3,
S2
Ley
mus
chin
ensi
s(T
rin.
)T
zvel
.Po
acea
eB
arnh
art
Pere
nnia
l,gr
ass
Thi
ckH
ighl
ypa
lata
ble
0.53
S3
Stip
agr
andi
sP.
Sm
irn.
Poac
eae
Bar
nhar
tPe
renn
ial,
gras
sT
hick
Hig
hly
pala
tabl
e0.
52S
1,S
3,M
3C
arex
duri
uscu
laC
.A.
Mey
.C
yper
acea
eJu
ss.
Pere
nnia
lsed
geT
hick
Hig
hly
pala
tabl
e0.
52
S2
Fest
uca
sp.
Gra
min
eae
Juss
.Pe
renn
ialg
rass
Thi
ckH
ighl
ypa
lata
ble
0.52
M1
Bup
leur
umsc
orzo
neri
foli
umW
illd
.U
mbe
llife
rae
Juss
.Pe
renn
ialf
orb
Thi
nH
ighl
ypa
lata
ble
0.52
M3
Car
agan
apy
gmae
a(L
.)D
C.
Leg
umin
osae
Juss
.S
hrub
Thi
ckH
ighl
ypa
lata
ble
0.51
M2,
M3
Poa
atte
nuat
aT
rin.
Poac
eae
Bar
nhar
tPe
renn
ialg
rass
Thi
nH
ighl
ypa
lata
ble
0.51
M2
Pti
lotr
ichu
mte
nuifo
lium
(Ste
ph.)
C.A
.Mey
.B
rass
icac
eae
Bur
nett
.S
emi-
shru
bT
hick
Unp
alat
able
0.48
S3
Che
nopo
dium
sp.
Cne
nopo
diac
eae
Ven
t.A
nnua
lpla
ntT
hick
Unp
alat
able
0.47
M3
Gal
ium
veru
mL
.R
ubia
ceae
Juss
.Pe
renn
ialf
orb
Thi
ckH
ighl
ypa
lata
ble
0.47
S1
Het
erop
appu
shi
spid
us(T
hunb
.)L
ess.
Ast
erac
eae
Dum
ort.
Bie
nnia
lpla
ntT
hick
Unp
alat
able
0.44
S1
Art
emis
iaad
amsi
iBes
s.A
ster
acea
eD
umor
t.Pe
renn
ials
age
Thi
ck,w
ith
hair
yU
npal
atab
le0.
41M
1A
gros
tis
mon
ghol
ica
Ros
hev.
Poac
eae
Bar
nhar
tPe
renn
ialg
rass
Thi
nH
ighl
ypa
lata
ble
0.41
M2,
M3,
S2
Koe
leri
acr
ista
ta(L
.)Pe
rs.
Poac
eae
Bar
nhar
tPe
renn
ialg
rass
Thi
ckH
ighl
ypa
lata
ble
0.40
S3
Car
agan
am
icro
phyl
laL
am.
Leg
umin
osae
Juss
.S
hrub
Thi
nH
ighl
ypa
lata
ble
0.36
Dow
nloa
ded
by [
Ben
Gur
ion
Uni
vers
ity o
f th
e N
egev
] at
04:
21 2
0 A
ugus
t 201
3

International Journal of Remote Sensing 6255
small animals (i.e. sheep and goats) over the whole season, and constitute the main plantcontributors to Mongolia’s pastureland (Tserenbaljid 2002) in addition to the other nativePoaceae grasses. During the blooming period in August, the dominant perennial grasses,which reach a height of 30–70 cm, have bright grey and brown-grey flowers (1–1.5 cmwide) situated at the tip of their spikes. Since these needle grasses grow relatively uni-formly and cover about 20–30% of the fenced-off areas in each study site, the surfacelooks relatively brighter to the human eye (Figure 5(a)). In the false-colour composite ofthe Landsat image the ungrazed areas looks dark, and no indication for photosyntheticactivity is observed (Figure 2). In the grazed areas, perennial forbs, short grasses, andsemi-shrubs dominate (detailed in Table 1). Livestock, especially sheep, can barely grazeon these plants in summer, while goats moderately graze them in the autumn. Therefore,
Grazed
Grazed
Ungrazed
Ungrazed
(b)
(a)
Figure 5. General view of the research sites: (a) Mountain Steppe site (M1): the ungrazed area isdominated by Halerpestes salsuginosa and Agrostis mongolica, and the grazed area by Glaux mar-itime and A. mongholica. Note that the darker tones in the grazed area are due to the widespreadpresence of Iris bungei. (b) Steppe site (S1): dominating the ungrazed area are Stipa krylovii,Bupleurum scorzonerifolium, and Cleistogenes squarrosa, and the grazed area is dominated by Carexduriuscula and Artemisia adamsii. Note the brighter tones in the fenced-off area due to the presenceof S. krylovii.
Dow
nloa
ded
by [
Ben
Gur
ion
Uni
vers
ity o
f th
e N
egev
] at
04:
21 2
0 A
ugus
t 201
3

6256 A. Karnieli et al.
areas dominated by these plants are seen as relatively green (Figure 5(a)). Nevertheless,these dense bunch-forming semi-shrubs are very nutritious for livestock in early summerand late autumn when toxic values might be low. Gunin et al. (1999) noted that severalspecies such as Artemisia (A. scoparia, A. frigida, A. adamsii, Iris bungei) and Leymus chi-nensis, both abundant in the grazed areas of the present study, are indicators for rangelanddegradation and human-induced desertification processes.
4.2. Steppe zone
In the three study sites selected in the Steppe zone, communities of perennial grassesand forbs (see Table 1 for details) dominate the ungrazed areas. All these plants have avery high nutritional value, so they are invaluable forage plants (Jigjidsuren and Johnson2003). By contrast, perennial shrubs dominated in the grazed areas. As noted by Fernandez-Gimenez and Allen-Diaz (1999), these latter species have undergone different levels ofdegradation in the Steppe zone of Mongolia. Visually, ungrazed areas in the Steppe areseen as brighter than the grazed areas due to abundance of the perennial grass Stipa krylovii(Figure 5(b)).
Figure 6 illustrates the spectral reflectance curves of all species in all study sites,grouped into palatable and unpalatable species. Generally, it will be seen that the NIRrange of the spectrum (800–900 nm) for the dominant species in the fenced-off area, mostlyhighly palatable plants (e.g. Caragana microphylla, Koeleria cristata, Agrostis mongholica,and Galium verum) have lower reflectance levels, while many of the unpalatable speciesthat occupy the grazed areas (e.g. Glaux maritima, Thermopsis lanceolata, Ephedra sinica,Potentilla anserina, P. acaulis, Artemisia laciniata, Iris bungei, and more) have higherreflectance levels (see details in Table 3). General discriminant analysis (GDA) (Baudatand Anouar 2000) was applied in order to verify the significance of differences betweenthe two groups. It was found that in 81.3% of species, the NIR spectra of palatable can beclassified as palatable at a very high level of significance (p << 0.01), and in 81.8% ofspecies the NIR spectra of unpalatable species can be classified as unpalatable at a level
0.0
0.1
0.2
0.3
0.4
0.5
0.6
0.7
0.8
0.9
400 450 500 550 600 650 700 750 800 850 900
Reflecta
nce
Wavelength (nm)
Unpalatable
Palatable
Figure 6. Spectral reflectance curves of all species in all study sites grouped into palatable andunpalatable species. It will be seen that many of the dominant species in the fenced-off area, mostlyhighly palatable plants, have lower reflectance levels in the NIR part of the electromagnetic spectrum.In contrast, most of the unpalatable species that occupy the grazing areas have higher reflectancelevels in the NIR.
Dow
nloa
ded
by [
Ben
Gur
ion
Uni
vers
ity o
f th
e N
egev
] at
04:
21 2
0 A
ugus
t 201
3

International Journal of Remote Sensing 6257
(b)
(a)
Figure 7. Dominant species in the Mountain Steppe zone. (a) Iris bungei, representative of grazedareas, is a succulent plant characterized by a high refractive index that produces high NIR reflectancevalues; (b) Stipa krylovii, representative of protected areas, is a highly palatable grass. During mid-summer it turns yellow, its cells lose water, and its refractive index decreases, and hence its NIRreflectance decreases.
of significance of p = 0.01. Figure 7 demonstrates these differences using two represen-tatives from the Mountain Steppe site (M1) (see Figure 5(a)). Stipa krylovii is a highlypalatable grass that represents the protected area. In mid-summer this grass turns yellow,and so its cells lose water, the refractive index decreases, and hence reflectance in the NIRdecreases. Iris bungei represents the grazed area. This is a succulent plant and is thereforecharacterized by a high refractive index that produces high reflectance values in the NIRregion.
As indicated by Pettorelli et al. (2005), whereas NDVI is chlorophyll sensitive andresponds mostly to variation in the red band, EVI is more NIR sensitive and responsive tocanopy structural variations, including LAI, canopy type, and architecture. This theory wasfurther examined in the current project. Figure 8(a) confirms that there is higher correlation
Dow
nloa
ded
by [
Ben
Gur
ion
Uni
vers
ity o
f th
e N
egev
] at
04:
21 2
0 A
ugus
t 201
3

6258 A. Karnieli et al.
EVI = 1.11ρNIR – 0.11
R2 = 0.83
p << 0.01
EVI = –1.85ρR + 0.74
R2 = 0.24
p << 0.01
0.2
0.3
0.4
0.5
0.6
0.7
0.8
0.9
(a)
(b)
0.3 0.35 0.4 0.45 0.5 0.55 0.6 0.65 0.7 0.75 0.8
VI
Reflectance @ NIR
EVI NDVI
NDVI = –2.84ρR + 0.99
R2 = 0.78
p << 0.01
NDVI = 0.70ρNIR + 0.25
R2 = 0.46
p << 0.01
0
0.1
0.2
0.3
0.4
0.5
0.6
0.7
0.8
0.9
0.05 0.1 0.15 0.2 0.25
VI
Reflectance @ R
EVI NDVI
Figure 8. Enhanced vegetation index (EVI) values as a function of reflectance values in the NIR.Strong and significant correlation shows that the index is primarily dependent on leaf structure.
between NDVI and reflectance in the red band than EVI (r2 = 0.78 vs r2 = 0.24, respec-tively). However, since the grazed areas are primarily characterized by plants with higherreflectance levels in the NIR, due to their leaf cellular structure, higher correlation wasfound between EVI and reflectance levels in the NIR band than for NDVI (r2 = 0.83 vsr2 = 0.46, respectively), as illustrated in Figure 8(b). This conclusion can be also shownfrom the correlation matrix presented in Table 4, which summarizes the relationshipsbetween NDVI, EVI, and reflectance values in the red and NIR bands in terms of correla-tion coefficient (r). One will notice that the correlation coefficient between the red and NIRbands is only –0.27, though still significant. It should be noted that the present reflectancemeasurements are related to the leaf level rather that the canopy level. The relative sensi-tivity of the two indices to the red and NIR bands was examined by applying Equation (3).Results of this analysis confirm that NDVI is more sensitive to reflectance in the red bandthan EVI, while EVI is more sensitive than NDVI in the NIR. Relative sensitivity (Sr) valuesare presented in Table 5.
Dow
nloa
ded
by [
Ben
Gur
ion
Uni
vers
ity o
f th
e N
egev
] at
04:
21 2
0 A
ugus
t 201
3

International Journal of Remote Sensing 6259
Table 4. Relationships between NDVI, EVI, and reflectance values in the redand NIR bands in terms of Pearson’s correlation coefficient (r). Values in italicsindicate significant level >99%.
Red NIR NDVI
NIR −0.27NDVI −0.88 0.68EVI −0.49 0.91 0.81
Table 5. Relative sensitivity values. Sr > 1 means that index X is more sensi-tive, Sr = 1 means sensitivities are equal, and Sr < 1 means that index Y is moresensitive to the independent variable. NDVI is more sensitive to reflectance inthe red band than EVI, while EVI is more sensitive than NDVI in the NIR.
X = EVI
Y = NDVI 0.86 For redY = NDVI 2.09 For NIR
5. Conclusions
Ground observations along the route of the Mongolian Railway confirm previous rangecondition models of vegetation dynamics (e.g. Dyksterhuis 1949). These models predictthat as herbivore numbers increase, AGB and cover decline and species composition shiftsfrom dominance by perennial grasses and forbs (‘climax’ species) towards dominance byunpalatable forbs and weedy annuals. When grazing is decreased or stopped, AGB andcover are predicted to increase again and species composition is shifted back towardslate-successional stages. Plant invasion due to grazing in semi-arid and arid systems isa familiar phenomenon in several sites worldwide. For example, in the southwest USA themost conspicuous vegetation change is the growth of creosotebush shrubs, mesquite trees,cholla, and prickly pear cactus, which have transformed the grasslands into a mesquite–grass savanna (e.g. Grover and Musick, 1990; McClaran 2003). Similar to the results of thecurrent study, observations over the last 100 years have revealed a gradual increase in thecover and density of these plants. Although the standard remote sensing-based vegetationindex models assume higher index values as AGB and cover increase, the results of thecurrent study show the opposite. The reason is the difference in leaf cellular structure andphenological stage between palatable species within the fenced-off area and unpalatablespecies outside. Palatable species include mainly grasses that turn yellow in mid-summer,while invading species can be succulent plants characterized by high refractive index thatproduce high reflectance values. EVI is the correct vegetation index to select for detect-ing this phenomenon, since it is more sensitive to variations in leaf cell structure as this isexpressed in the NIR rather than in the red portion of the spectrum. Although no similarspectral measurements are known from other sites, it is assumed, with high confidence, thatsimilar results would be obtained.
AcknowledgementsThis project was partially supported by the EU-INCO programme (Grant No. ICA2 CT 200010022) and partially by the USAID-CDR (Grant No. TA-MOU-00-C20-010). The authors wouldlike to thank the anonymous referees for their helpful comments.
Dow
nloa
ded
by [
Ben
Gur
ion
Uni
vers
ity o
f th
e N
egev
] at
04:
21 2
0 A
ugus
t 201
3

6260 A. Karnieli et al.
ReferencesAdyasuren, Ts. 1998. “State of Drought and Desertification in Mongolia.” In Environment and
Development Issues in Mongolia, edited by B. Darin, 96 p. Ulaanbaatar: American Center forMongolian Studies.
ASD. 2000. Hand Held Spectrometer User’s Guide. FieldSpec UV/VNIR. Boulder, CO: AnalyticalSpectral Devices.
Asner, G. P., and P. M. Vitousek. 2005. “Remote Analysis of Biological Invasion and BiogeochemicalChange.” Proceedings of the National Academy of Sciences of the United States of America 102:4383–4386.
Bastin, G. N., G. Pickup, and G. Pearce. 1995. “Utility of AVHRR Data for Land DegradationAssessment – A Case-Study.” International Journal of Remote Sensing 16: 651–672.
Batjargal, Z. 1999. “Desertification in Mongolia.” In Icelandic Agricultural Research Service(RALA), 107–113. Report no. 200. Reykjavik, Iceland.
Baudat, G., and F. Anouar. 2000. “Generalized Discriminant Analysis Using a Kernel Approach.”Neural Computation 12: 2385–2404.
Bradley, B. A., and J. F. Mustard. 2005. “Identifying Land Cover Variability Distinct from Land CoverChange: Cheatgrass in the Great Basin.” Remote Sensing and Environment 94: 204–213.
Bradley, B. A., and J. F. Mustard. 2006. “Characterizing the Landscape Dynamics of an Invasive Plantand Risk of Invasion Using Remote Sensing.” Ecological Applications 16: 1132–1147.
Brown, J. R., and S. Archer. 1999. “Shrub Invasion of Grassland: Recruitment is Continuous and NotRegulated by Herbaceous Biomass or Density.” Ecology 80: 2385–2396.
Budyko, M. I. 1974. Climate and Life, 508 p. Orlando, FL: Academic Press.Clark, P. E., M. S. Seyfried, and B. Harris. 2001. “Intermountain Plant Community Classification
Using Landsat TM and SPOT HRV Data.” Journal of Range Management 54: 152–160.de Beurs, K. M., and G. M. Henebry. 2004. “Land Surface Phenology, Climatic Variation, and
Institutional Change: Analyzing Agricultural Land Cover Change in Kazakhstan.” RemoteSensing of Environment 89: 497–509.
Dregne, H. E., and N.-T. Chou. 1992. “Global Desertification Dimensions and Costs.” In Degradationand Restoration of Arid Lands, edited by H. E. Dregne, 249–281. Lubbock: Texas Tech.University.
Dyksterhuis, E. J. 1949. “Condition and Management of Range Land Based on Quantitative Ecology.”Journal of Range Management 2: 104–115.
Dymond, J. R., P. R. Stephens, P. F. Newsome, P. F. Newsome, and R. H. Wilde. 1992. “PercentageVegetation Cover of a Degrading Rangeland from SPOT.” International Journal of RemoteSensing 13: 1999–2007.
Eswaran, H., F. H. Beinroth, and S. M. Virmani. 2000. “Resource Management Domains:A Biophysical Unit for Assessing and Monitoring Land Quality.” Agriculture Ecosystems andEnvironment 81: 155–162.
FAOSTAT data. 2006. http://faostat.fao.org/.Fernandez-Gimenez, M. E., and B. Allen-Diaz. 1999. “Testing a Non-Equilibrium Model of
Rangeland Vegetation Dynamics in Mongolia.” Journal of Applied Ecology 36: 871–885.Friedl, M. A., J. Michaelsen, F. W. Davis, H. Walker, and D. S. Schimel. 1994. “Estimating Grassland
Biomass and Leaf-Area Index Using Ground and Satellite Data.” International Journal of RemoteSensing 15: 1401–1420.
Fujita, N., N. Amartuvshin, Y. Yamada, K. Matsui, S. Sakai, and N. Yamamura. 2009. “Positive andNegative Effects of Livestock Grazing on Plant Diversity of Mongolian Nomadic PasturelandsAlong a Slope with Soil Moisture Gradient.” Grassland Science 55: 126–134.
Fuller, R. M., R. J. Parsell, M. Oliver, and G. Wyatt. 1989. “Visual and Computer Classificationsof Remotely-Sensed Images – A Case-Study of Grasslands in Cambridgeshire International.”Journal of Remote Sensing 10: 193–210.
Girard, C. M., M. Benoit, E. Devaubernier, and P. J. Curran. 1990. “Spot HRV Data to DiscriminateGrassland Quality.” International Journal of Remote Sensing 11: 2253–2267.
Gitelson, A. A. 2004. “Wide Dynamic Range Vegetation Index for Remote Quantification ofBiophysical Characteristics of Vegetation.” Journal of Plant Physiology 161: 165–173.
Griffith, B., D. C. Douglas, N. E. Walsh, D. D. Young, T. R. McCabe, D. E. Russell, R. G. White, R. D.Cameron, and K. R. Written. 2002. “The Porcupine Caribou Herd.” In Arctic Refuge CoastalPlain Terrestrial Wildlife Research Summaries, edited by D. C. Douglas, P. E. Reynolds, and
Dow
nloa
ded
by [
Ben
Gur
ion
Uni
vers
ity o
f th
e N
egev
] at
04:
21 2
0 A
ugus
t 201
3

International Journal of Remote Sensing 6261
E. B. Rhode, 8–37. US Geological Survey, Biological Resources Division, Biological ScienceReport USGS/BRD/BSR-2002-0001.
Grover, H. D., and H. B. Musick. 1990. “Shrubland Encroachment in Southern New Mexico, U.S.A.:An Analysis of Desertification Processes in the American Southwest.” Climate Change 17:305–330.
Gubanov, I. A. 1996. Conspectus of the Flora of Outer Mongolia (Vascular Plants), 132 p. [InRussian.] Moscow: Valang Publishers.
Gunin, P., E. A. Vostokova, N. I. Dorofeyuk, P. E. Tarasov, and C. C. Black. 1999. “AssessingPresent Day Plant Cover Dynamics.” In Vegetation Dynamics of Mongolia, edited by P. Gunin,E. A. Vostokova, N. I. Dorofeyuk, P. E. Tarasov, and C. C. Black, C. C., 131–163. Dordrecht:Kluwer Academic Publishers.
He, K. S., D. Rocchini, M. Neteler, and H. Nagendra. 2011. “Benefits of Hyperspectral RemoteSensing for Tracking Plant Invasions.” Diversity and Distributions 17: 381–392.
Henebry, G. M. 1993. “Detecting Change in Grasslands Using Measures of Spatial Dependence withLandsat TM Data.” Remote Sensing of Environment 46: 223–234.
Huete, A. R. 1988. “A Soil-Adjusted Vegetation Index (SAVI).” Remote Sensing of Environment 25:295–309.
Huete, A. R., H. Q. Liu, K. Batchily, and W. van Leeuwen. 1997. “A Comparison of VegetationIndices Over a Global Set of TM Images for EOS-MODIS.” Remote Sensing of Environment 9:440–451.
Ji, L., and A. J. Peters. 2007. “Performance Evaluation of Spectral Vegetation Indices Using aStatistical Sensitivity Function.” Remote Sensing of Environment 106: 59–65.
Jigjidsuren, S., and D. A. Johnson. 2003. Forage Plants in Mongolia. Ullanbaatar: Admon Press.Kaufman, Y. J., and D. Tanré. 1992. “Atmospherically Resistant Vegetation Index (ARVI) for EOS-
MODIS.” IEEE Transactions on Geoscience and Remote Sensing 30: 261–270.Kawamura, K., T. Akiyama, H. Yokota, M. Tsutsumi, T. Yasuda, O. Watanabe, and S. P. Wang. 2005.
“Quantifying Grazing Intensities Using Geographic Information Systems and Satellite RemoteSensing in the Xilingol Steppe Region, Inner Mongolia, China.” Agriculture Ecosystems andEnvironment 107: 83–93.
Larin, I. V. 1956. Pasture Economy and Meadow Cultivation (Translated to English 1962 andpublished by Israel Program for Scientific Translation, Jerusalem), 544 p.
Lass, L. W., T. S. Prather, N. F. Glenn, K. T. Weber, J. T. Mundt, and J. Pettingill. 2005. “A Reviewof Remote Sensing of Invasive Weeds and Example of the Early Detection of Spotted Knapweed(Centaurea Maculosa) and Babysbreath (Gypsophila Paniculata) with a Hyperspectral Sensor.”Weed Science 53: 242–251.
Lass, L. W., D. C. Thill, B. Shafii, and T. S. Prather. 2002. “Detecting Spotted Knapweed (CentaureaMaculosa) with Hyperspectral Remote Sensing Technology.” Weed Technology 16: 426–432.
Liu, H. Q., and A. R. Huete. 1995. “A Feedback Based Modification of the NDVI to Minimize CanopyBackground and Atmospheric Noise.” IEEE Transactions on Geoscience and Remote Sensing 33:457–465.
McClaran, M. P. 2003. “A Century of Vegetation Change on the Santa Rita ExperimentalRange.” In Santa Rita Experimental Range: 100 years (1903 to 2003) of Accomplishmentsand Contributions, edited by M. P. McClaran, P. F. Ffolliott, and C. B. Edminster, 197 p.Conference proceedings; October 30–November 1; Tucson, AZ. Proc. RMRS-P-30. Ogden, UT:U.S. Department of Agriculture, Forest Service, Rocky Mountain Research Station.
Mino, N., G. Saito, and S. Ogawa. 1998. “Satellite Monitoring of Changes in Improved GrasslandManagement.” International Journal of Remote Sensing 19: 439–452.
Pettorelli, N., J. O. Vik, A. Mysterud, J. M. Gaillard, C. J. Tucker, and N. C. Stenseth. 2005. “Using theSatellite-Derived NDVI to Assess Ecological Responses to Environmental Change.” TRENDS inEcology and Evolution 20: 503–510.
Prince, S. D. 1991. “Satellite Remote-Sensing of Primary Production – Comparison of Results forSahelian Grasslands 1981–1988.” International Journal of Remote Sensing 12: 1301–1311.
Reed, B. C., J. F. Brown, D. Vanderzee, T. R. Loveland, J. W. Merchant, and D. O. Ohlen. 1994.“Measuring Phenological Variability from Satellite Imagery.” Journal of Vegetation Science 5:703–714.
Regdel, D., and Ch. Dugarjav. 2010. “Ecological Demands to the Social-economic Developmentof Mongolia.” In Proceedings of the International Conference on Ecological Consequences of
Dow
nloa
ded
by [
Ben
Gur
ion
Uni
vers
ity o
f th
e N
egev
] at
04:
21 2
0 A
ugus
t 201
3
6262 A. Karnieli et al.
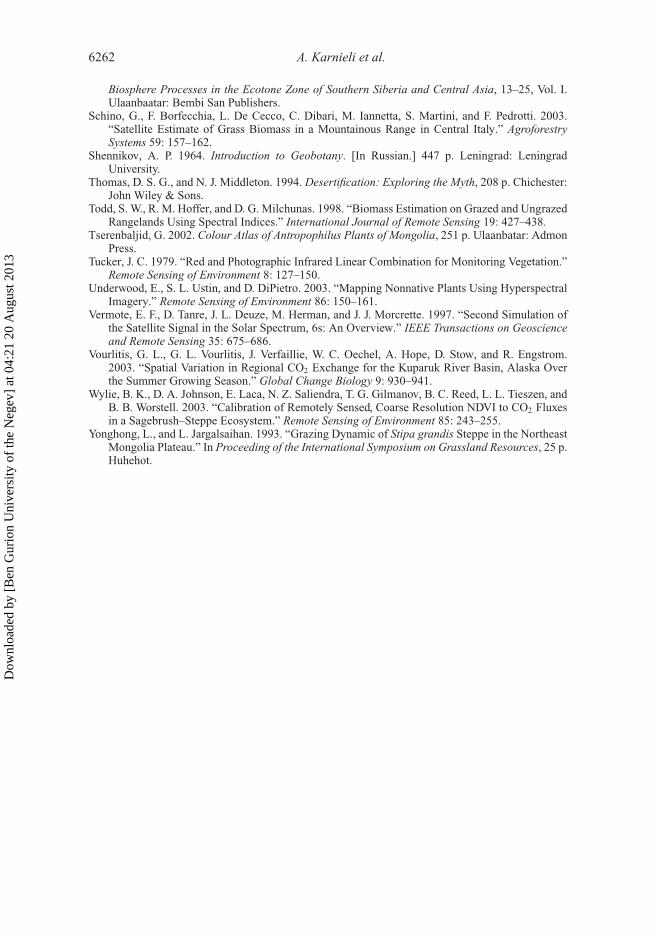
Biosphere Processes in the Ecotone Zone of Southern Siberia and Central Asia, 13–25, Vol. I.Ulaanbaatar: Bembi San Publishers.
Schino, G., F. Borfecchia, L. De Cecco, C. Dibari, M. Iannetta, S. Martini, and F. Pedrotti. 2003.“Satellite Estimate of Grass Biomass in a Mountainous Range in Central Italy.” AgroforestrySystems 59: 157–162.
Shennikov, A. P. 1964. Introduction to Geobotany. [In Russian.] 447 p. Leningrad: LeningradUniversity.
Thomas, D. S. G., and N. J. Middleton. 1994. Desertification: Exploring the Myth, 208 p. Chichester:John Wiley & Sons.
Todd, S. W., R. M. Hoffer, and D. G. Milchunas. 1998. “Biomass Estimation on Grazed and UngrazedRangelands Using Spectral Indices.” International Journal of Remote Sensing 19: 427–438.
Tserenbaljid, G. 2002. Colour Atlas of Antropophilus Plants of Mongolia, 251 p. Ulaanbatar: AdmonPress.
Tucker, J. C. 1979. “Red and Photographic Infrared Linear Combination for Monitoring Vegetation.”Remote Sensing of Environment 8: 127–150.
Underwood, E., S. L. Ustin, and D. DiPietro. 2003. “Mapping Nonnative Plants Using HyperspectralImagery.” Remote Sensing of Environment 86: 150–161.
Vermote, E. F., D. Tanre, J. L. Deuze, M. Herman, and J. J. Morcrette. 1997. “Second Simulation ofthe Satellite Signal in the Solar Spectrum, 6s: An Overview.” IEEE Transactions on Geoscienceand Remote Sensing 35: 675–686.
Vourlitis, G. L., G. L. Vourlitis, J. Verfaillie, W. C. Oechel, A. Hope, D. Stow, and R. Engstrom.2003. “Spatial Variation in Regional CO2 Exchange for the Kuparuk River Basin, Alaska Overthe Summer Growing Season.” Global Change Biology 9: 930–941.
Wylie, B. K., D. A. Johnson, E. Laca, N. Z. Saliendra, T. G. Gilmanov, B. C. Reed, L. L. Tieszen, andB. B. Worstell. 2003. “Calibration of Remotely Sensed, Coarse Resolution NDVI to CO2 Fluxesin a Sagebrush–Steppe Ecosystem.” Remote Sensing of Environment 85: 243–255.
Yonghong, L., and L. Jargalsaihan. 1993. “Grazing Dynamic of Stipa grandis Steppe in the NortheastMongolia Plateau.” In Proceeding of the International Symposium on Grassland Resources, 25 p.Huhehot.
Dow
nloa
ded
by [
Ben
Gur
ion
Uni
vers
ity o
f th
e N
egev
] at
04:
21 2
0 A
ugus
t 201
3
Copyright © 2022 FDOKUMEN