A Reliable Tool to Determine Cell Viability in Complex 3-D Culture: The Acid Phosphatase Assay
Upload
khangminh22Category
view
1download
0
Utah State UniversityDigitalCommons@USU
All Graduate Theses and Dissertations Graduate Studies
3-2013
The Phosphoramidase Compentency ofPrototypical Phosphatase Catalytic MotifsMark P. Haney
Follow this and additional works at: http://digitalcommons.usu.edu/etd
Part of the Biochemistry Commons
This Dissertation is brought to you for free and open access by theGraduate Studies at DigitalCommons@USU. It has been accepted forinclusion in All Graduate Theses and Dissertations by an authorizedadministrator of DigitalCommons@USU. For more information, pleasecontact [email protected].
Recommended CitationHaney, Mark P., "The Phosphoramidase Compentency of Prototypical Phosphatase Catalytic Motifs" (2013). All Graduate Theses andDissertations. Paper 1483.

THE PHOSPHORAMIDASE COMPETENCY
OF PROTOTYPICAL PHOSPHATASE CATALYTIC MOTIFS
by
Mark P. Haney
A dissertation submitted in partial fulfillment of the requirements for a degree
of
DOCTOR OF PHILOSOPHY
in
Chemistry
Approved: _________________________ _________________________ Alvan C. Hengge Lisa M. Berreau Major Professor Committee Member _________________________ _________________________ Cheng-Wei Tom Chang Bradley S. Davidson Committee Member Committee Member _________________________ _________________________ Daren P. Cornforth Mark R. McLellan Committee Member Vice President for Research and Dean of the School of Graduate Studies
UTAH STATE UNIVERSITY
Logan, Utah
2013

ii
Copyright © Mark P. Haney
All Rights Reserved

iii
ABSTRACT
The Phosphoramidase Competency of Prototypical Phosphatase Catalytic Motifs
by
Mark P. Haney, Doctor of Philosophy
Utah State University, 2013
Major Professor: Dr. Alvan C. Hengge Department: Chemistry and Biochemistry
The discovery that phosphorylation of proteins occurs on nitrogen by particular
kinases raises the question of whether a separate class of phosphoramidases also exists, or
if known phosphatases carry out the hydrolysis of phosphoramidates. The
phosphoramidase activity of a number of phosphatases with different catalytic motifs was
studied using the substrates N-phenylphosphoramidate (N-phPAM) and phosphoryl
imidazole (PIm). The phosphatases assayed were: the protein tyrosine phosphatase
YopH; alkaline phosphatase; the dual-specificity phosphatase VHR; prostatic acid
phosphatase, PAcP; PHPT1, the only known phosphohistidine phosphatase; and the
serine/threonine phosphatases λPP and PP1. The catalytic efficiencies, kcat/KM (s-1M-1),
were compared for the respective phosphoramidase and phosphatase activities for each
enzyme. Ratios of catalytic efficiencies (kcat/KM)/(kcat/KM) of pNPP over PIm are:
YopH – 27; AP – 4.1; VHR – 0.22; PAcP – 1.6; AP – 0.51; and PHPT1 – 0.00007. λPP
catalyzed hydrolysis of PIm, although kinetic constants could not be obtained. PP1
exhibited no phosphoramidase activity. The results show that most phosphatase catalytic
iv
motifs display catalytic promiscuity by cleaving both phosphoesters and
phosphoramidates, but with a pronounced preference for one substrate type versus the
other.
(199 pages)
v
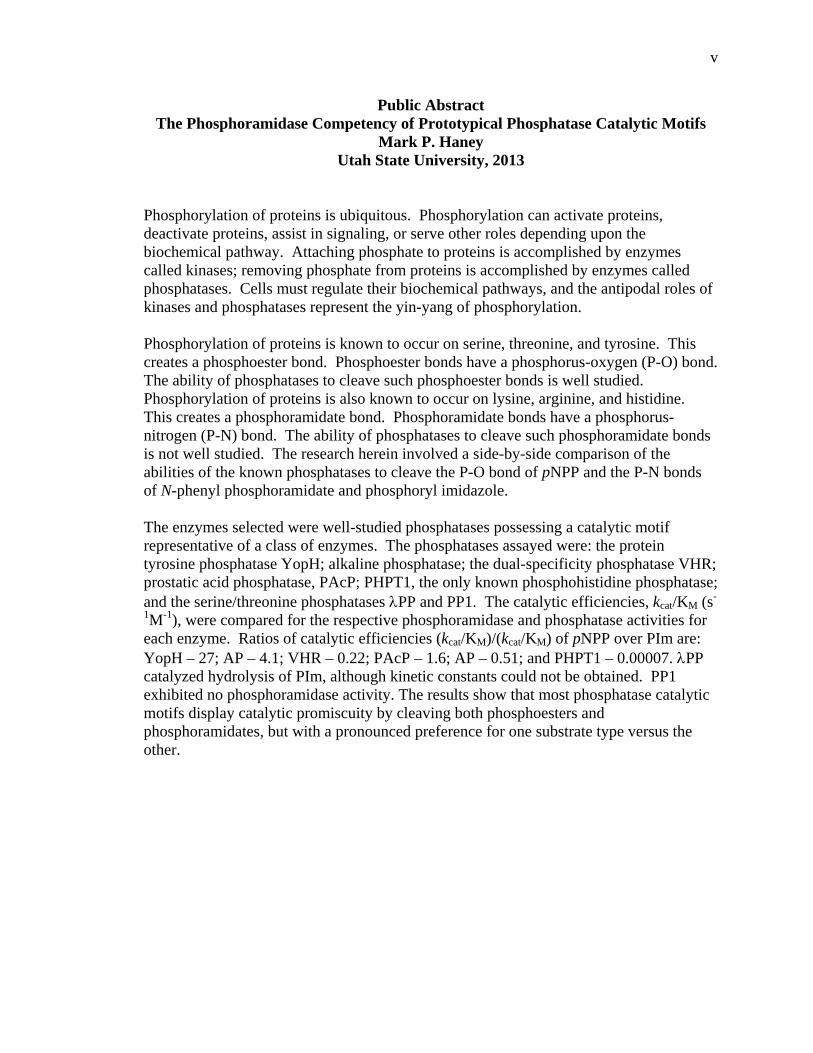
Public Abstract The Phosphoramidase Competency of Prototypical Phosphatase Catalytic Motifs
Mark P. Haney Utah State University, 2013
Phosphorylation of proteins is ubiquitous. Phosphorylation can activate proteins, deactivate proteins, assist in signaling, or serve other roles depending upon the biochemical pathway. Attaching phosphate to proteins is accomplished by enzymes called kinases; removing phosphate from proteins is accomplished by enzymes called phosphatases. Cells must regulate their biochemical pathways, and the antipodal roles of kinases and phosphatases represent the yin-yang of phosphorylation. Phosphorylation of proteins is known to occur on serine, threonine, and tyrosine. This creates a phosphoester bond. Phosphoester bonds have a phosphorus-oxygen (P-O) bond. The ability of phosphatases to cleave such phosphoester bonds is well studied. Phosphorylation of proteins is also known to occur on lysine, arginine, and histidine. This creates a phosphoramidate bond. Phosphoramidate bonds have a phosphorus-nitrogen (P-N) bond. The ability of phosphatases to cleave such phosphoramidate bonds is not well studied. The research herein involved a side-by-side comparison of the abilities of the known phosphatases to cleave the P-O bond of pNPP and the P-N bonds of N-phenyl phosphoramidate and phosphoryl imidazole. The enzymes selected were well-studied phosphatases possessing a catalytic motif representative of a class of enzymes. The phosphatases assayed were: the protein tyrosine phosphatase YopH; alkaline phosphatase; the dual-specificity phosphatase VHR; prostatic acid phosphatase, PAcP; PHPT1, the only known phosphohistidine phosphatase; and the serine/threonine phosphatases λPP and PP1. The catalytic efficiencies, kcat/KM (s-
1M-1), were compared for the respective phosphoramidase and phosphatase activities for each enzyme. Ratios of catalytic efficiencies (kcat/KM)/(kcat/KM) of pNPP over PIm are: YopH – 27; AP – 4.1; VHR – 0.22; PAcP – 1.6; AP – 0.51; and PHPT1 – 0.00007. λPP catalyzed hydrolysis of PIm, although kinetic constants could not be obtained. PP1 exhibited no phosphoramidase activity. The results show that most phosphatase catalytic motifs display catalytic promiscuity by cleaving both phosphoesters and phosphoramidates, but with a pronounced preference for one substrate type versus the other.

vi
DEDICATION To my wife Stefanie, who has supported me in this endeavor. And to my daughter, Mica,
and son, Thorin, who have taught me about life as I have taught them.

vii
ACKNOWLEDGMENTS
Money to run a lab and pay graduate students doesn’t fall from the sky like manna
from heaven. The professor has to chase it down. Hours thinking up projects, digging
through the literature, and getting preliminary results precede any grant application.
Once that’s done, there’s the stress of writing the application, submitting it, and God
willing, actually getting the funds. The agencies providing funds are filled with people
who expect results for the funds. So having the money doesn’t mean less stress. It’s just
a different kind of stress.
When I started graduate school my faculty advisor wasn’t the head of the
chemistry department. Sometime during my tenure as a student he became the
department head. This had to be more stress.
During the past five years I felt stress to get results. My first year’s project took
almost an entire year and resulted in nothing but experience. Nature decided my efforts
were to be rewarded with a null result. I moved to a different project that had some
literature background, but there were many unanswered questions. Two of the biggest
questions were: 1) how is the experiment actually to be conducted, and 2) is the
experiment even doable? It took me the better part of two years to figure out the answer
to question 1, all the while question 2 was nagging at my mind. So, for three years I was
having quite a bit of stress. I’m not deeply religious, but was praying a lot.
The stress I felt was mine. During this time I did not feel unduly pressured by
Prof. Hengge to get results. He found the money, he owned the lab, he needed results, he
was the department head, he had some stress.

viii
We both came to the chemistry building in the morning, he did his job, I did mine.
We both had stress. Like a good boss he insulated me from the stresses he was having
related to my research. I focused on the science. I focused on the results. I focused on
classes. I focused on TA duties. I was able to focus on what I was supposed to be
focusing on because my boss was a good boss. Thanks boss. I noticed the things you did
for me, even when I wasn’t around.
My committee is comprised of people who helped polish a rough-around-the-
edges Jarhead. With the exception of Prof. Cornforth, I’ve been a student in each
member’s class. During my cumulative exams, orals, and dissertation proofs I received
no quarter. But, I knew I wouldn’t and put my efforts into each event. It made me
smarter. I’ve received good feedback, and in the process have become more professional
in science. I am thankful for the help and advice of my committee.
My last acknowledgments must go to the staff in the chemistry building, Geri,
Margaret, and LuAnn, as well as the staff in the School of Graduate Studies. There’s a
bureaucracy that must be adhered to. If the bureaucracy runs smoothly the organization
runs smoothly. Flexibility in the bureaucracy is caused by people willing to work with
me. I’ve seen a lot of bureaucratic flexibility, and a lot of smooth administration, both of
which reflect good people doing their jobs well. Again, that’s helped me focus on my
job. Thanks.
Mark P. Haney

ix
CONTENTS
Page
ABSTRACT …………………………………………………………………….…….iii
PUBLIC ABSTRACT …………………………………………………………………… v
DEDICATION ………………………………………………………………..………vi
ACKNOWLEDGMENTS …………………………………………………………..…vii
LIST OF TABLES …………………………………………………………………....xii
LIST OF FIGURES …………………………………………………………………....xiv
LIST OF ABBREVIATIONS ……………………………………………………………..xix
CHAPTER
1. INTRODUCTION ……………………………………………………………….1
1.1 Background ………………………………………………………1 1.2 The Enzymes ……………………………………………………………3
1.2.1 PHPT1………………………………………………………….3 1.2.2 YopH …………………………………………………………5 1.2.3 VHR………………………………………………………….11 1.2.4 PAcP …………………………………………………………14 1.2.5 λPP & PP1 …………………………………………………18 1.2.6 AP ……………………………………………………………24 1.3 Comparisons between Phosphomonoesters and Phosphoramidates ….28 1.3.1 Relative Rates of Phosphomonoester versus Phosphoramidate Hydrolysis ……………………………...28 1.3.2 Hydrolysis Proceeds via Pre-equilibrium……………………32 1.3.3 LFER Values for Aryl Monoesters and Phosphoramidates Vary as a Function of Ionization ……………………………34 1.3.4 Metals ………………………………………………………37 1.3.5 Geometry ……………………………………………………40 1.3.6 Phosphorylated Amino Acids ………………………………41 1.3.7 Substrates used in Study …………………………………….42 1.3.8 Considerations for Benchtop Handling Phosphoramidates…44

x
2. MATERIALS AND METHODS …………………………………………….45
2.1 Initial Considerations …………………………………………………45 2.2 Synthetic Protocols ……………………………………………………46
2.2.1 General Procedures …………………………………………46 2.2.2 pNPP, disodium salt …………………………………………47 2.2.3 N-phenyl phosphoramidate …………………………………48 2.2.4 Tribenzyl phosphite …………………………………………48 2.2.5 Dibenzyl N-phenyl phosphoramidate ……………………….50 2.2.6 N-phPAM triethyl ammonium salt …………………………..51 2.2.7 N-phPAM sodium salt ………………………………………52 2.2.8 Phosphoimidazole …………………………………………..52 2.2.9 Diphosphoimidazole ………………………………………..53 2.2.10 Monophosphoimidazole …………………………………..54 2.3 Enzyme Preparation …………………………………………………..55 2.3.1 Human PHPT1 ………………………………………………55 2.3.2 YopH ………………………………………………………..58 2.3.3 Alkaline Phosphatase ……………………………………….59 2.3.4 λPP …………………………………………………………..61 2.4 Substrate-Dependent Experimental Techniques and Mathematical Analysis ………………………………………………………………63 2.4.1 pNPP ………………………………………………………..63 2.4.2 N-phPAM ……………………………………………………64 2.4.3 PIm ………………………………………………………….65 2.4.3.1 Specific Protocols for PIm Assays ………………..67 2.5 Enzymatic Assays …………………………………………………….68 2.5.1 PHPT1 ………………………………………………………68 2.5.2 YopH ……………………………………………………….69 2.5.3 VHR ………………………………………………………..70 2.5.4 PAcP ………………………………………………………..70 2.5.5 λPP …………………………………………………………..71 2.5.6 PP1γ …………………………………………………………73 2.5.7 AP …………………………………………………………..74 2.6 Titration of N-phPAM …………………………………………………74

xi
2.7 Computer Modeling of Substrates into Active Sites …………………..75 3. RESULTS ………………………………………………………………..……77
3.1 Overall Experimental Results ………………………………………….77 3.2 Results by Enzyme ……………………………………………………..79
3.2.1 PHPT1 ………………………………………………………79 3.2.2 YopH ……………………………………………………… 79 3.2.3 VHR ………………………………………………………..82 3.2.4 PAcP ………………………………………………………..85 3.2.5 λPP and PP1 ………………………………………………..89 3.2.6 AP …………………………………………………………..91 4. DISCUSSION ………………… ………………………………………………..103
4.1 Discussion of Overall Experimental Results …………………………103 4.2 Discussion of Results by Enzyme …………………………………….106
4.2.1 PHPT1 ………………………………………………………106 4.2.2 YopH ……………………………………………………….109 4.2.3 VHR ………………………………………………………..113 4.2.4 hPAcP ………………………………………………………117 4.2.5 λPP & PP1 …………………………………………………119 4.2.6 AP …………………………………………………………..121 5. CONCLUSIONS ………………………………………………………........124
5.1 Summary of Phosphoramidase vs. Phosphatase Activities ………….124 5.2 Computer Modeling ………………………………………………….125 5.3 Major Conclusions ……………………………………………………128 5.4 Future Study in the Field of Phosphoramidates and Phosphoramidases ……………………………………………….130 REFERENCES ………………………………………………………………………….131
APPENDIX ………………………………………………………………………………142
CURRICULUM VITAE …………………………………………………………...……176

xii
LIST OF TABLES
Table Page
1-1 A side by side comparison of the enzymes used in this study……………………..3
1-2 Phosphoramidate Brønsted values as a function of leaving group type and pKa….35
1-3 βnuc values for the hydrolysis of DNPP, bis-DNPP, pNPP, phosphopyridine, and phosphoacetate………………………………………………………………….. 36
1-4 Hydrolytic rates (s-1) for pNPP2-, phosphopicoline-, and PIm- in the presence of metals………………………………………………………………………….……38
2-1 Published inhibition values with Pi for enzymes used in this study………………46
3-1 The kcat, KM, and kcat/KM values measured for the hydrolysis of pNPP, N-phPAM, and PIm by the enzymes used in this study……………….………….77
3-2 Literature values for the catalytic pH optimum of the enzymes used in this study..78
3-3 Kinetic literature values for E. coli AP at pH 8.0………………………………..99
4-1 Ratio of second order rate constants (pNPP/PIm) by enzyme……………..….….103
4-2 Percent protonation of the substrate before catalysis versus percent protonation of the free leaving group in solvent………………………………………………..105
4-3 Kinetic results for PHPT1………………………………………………………..107
4-4 Comparison of distances between PHPT1 crystal structure with Pi and computer models with pNPP and PIm……………………………………………………..110 4-5 Kinetic results for YopH…………………………………………………………110
4-6 Comparison of distances between YopH crystal structure with vanadate and computer models with pNPP and PIm…………………………………………..114 4-7 Kinetic results for VHR. ……………………………………………………115
4-8 Comparison of distances between VHR crystal structure with sulfate and computer models with pNPP and PIm……………………………………………116
4-9 Kinetic results for PAcP………………………………………………………….118

xiii
4-10 Comparison of distances between PAcP crystal structure with phosphate and computer models with pNPP and PIm…………………………………….…119
4-11 Comparison of distances between λPP crystal structure with sulfate and computer models with pNPP and PIm……………………………………………..121
4-12 Kinetic results for AP…………………………………………………………….123
4-13 Comparison of distances between E. coli AP crystal structure with phosphate and computer models with pNPP and PIm……………………………………….123
A1 Excel spreadsheet for the data entry of the hydrolysis of PIm by PAcP. ………. 169

xiv
LIST OF FIGURES
Figure Page
1-1 The catalytic motif of PHPT1. …………………………………………………...4
1-2 Overall structure of PHPT1 (PDB 2OZW), A, with active site enlarged, B……...5
1-3 Active site of PHPT1 (PDB 2OZW) with bound phosphate as viewed from above phosphate………………………………………………………………………….6 1-4 Active site of PHPT1 (PDB 2OZW) with bound phosphate as viewed laterally toward phosphate………………………………………………………………….7 1-5 Overall structure of YopH (PDB 2I42)…………………………………………...8
1-6 The active site of YopH (PDB 2I42)………………………………………….......8
1-7 Active site of YopH (PDB 2I42) with bound vanadate as viewed from above vanadate…………………………………………………………………………...9 1-8 Active site of YopH (PDB 2I42) with bound vanadate as viewed laterally toward vanadate; vanadate cannot be seen because active site is buried……………….... 9 1-9 Catalytic motif of Protein Tyrosin Phosphatases as represented by YopH……... 10
1-10 Overall structure of VHR (PDB 1VHR) with sulfate bound at the active site….. 12
1-11 The active site of VHR (PDB 1VHR) with bound sulfate……………………..... 12
1-12 Active site of VHR (PDB 1VHR) with bound sulfate as viewed from above sulfate………………………………………………………………………….… 13 1-13 Active site of VHR (PDB 1VHR) with bound sulfate as viewed laterally toward sulfate……………………………………………………………………………. 13 1-14 Catalytic subunit of hPAcP (PDB 1ND6) with bound phosphate……………..... 15
1-15 Active site of hPAcP with bound phosphate……………………………………..16
1-16 The unreactive form of PAcP’s phosphoenzyme intermediate…………………..16
1-17 Catalytic motif of Histidine Acid Phosphatases as represented by PAcP………. 17

xv
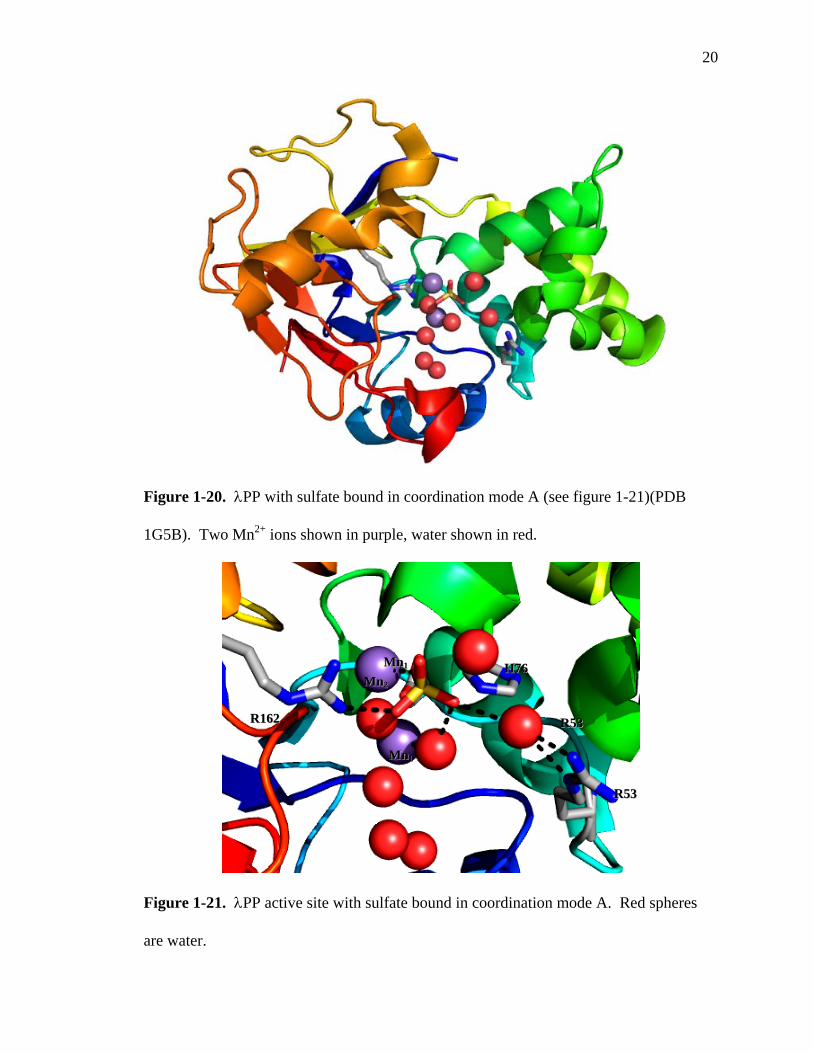
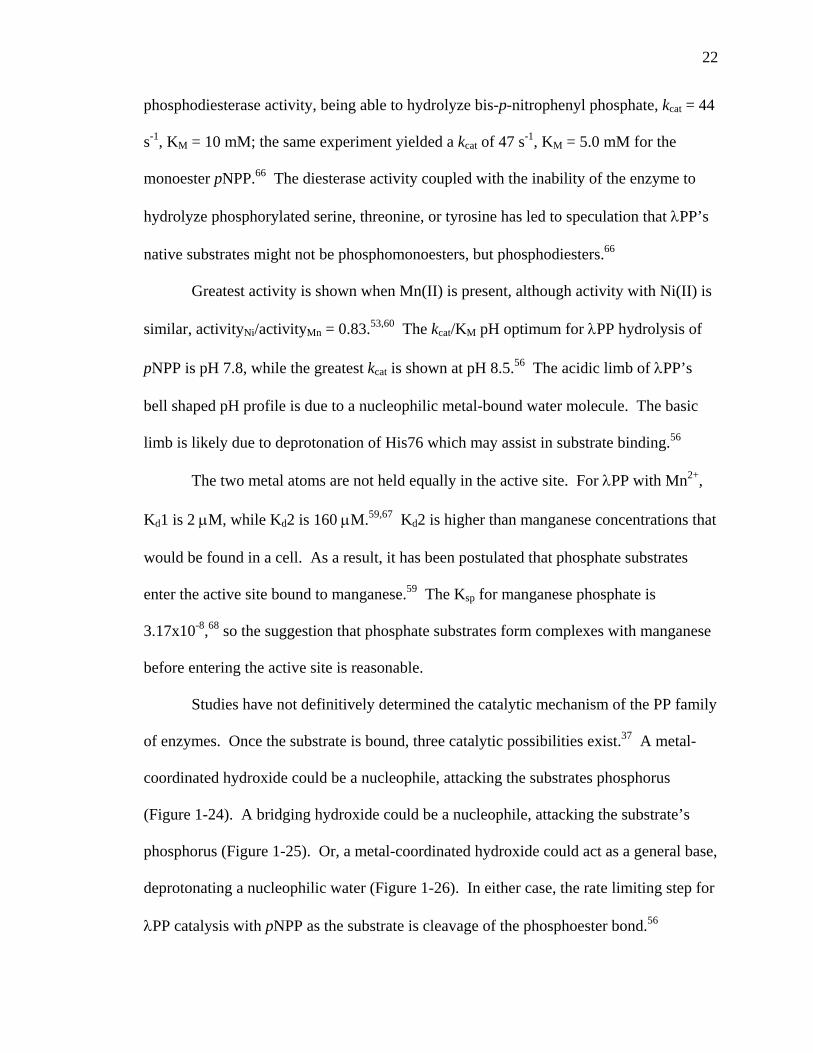
1-18 Active site of PAcP (PDB 1ND6) with bound phosphate as viewed from above phosphate………………………………………………………………………... 17 1-19 Active site of PAcP (PDB 1ND6) with bound phosphate as viewed laterally toward phosphate………………………………………………….…………….. 18 1-20 λPP with sulfate bound in coordination mode A (see figure 1-21)(PDB 1G5B).. 20
1-21 λPP active site with sulfate bound in coordination mode A…………………...... 20
1-22 λPP active site with sulfate bound in coordination mode B…………………….. 21
1-23 λPP active site with sulfate bound in coordination mode C…………………….. 21
1-24 Catalytic motif of λPP wherein a metal-coordinated hydroxide is the Nucleophile…………………………………………………………………….... 23
1-25 Catalytic motif of λPP wherein a bridging hydroxide is the nucleophile……….. 23
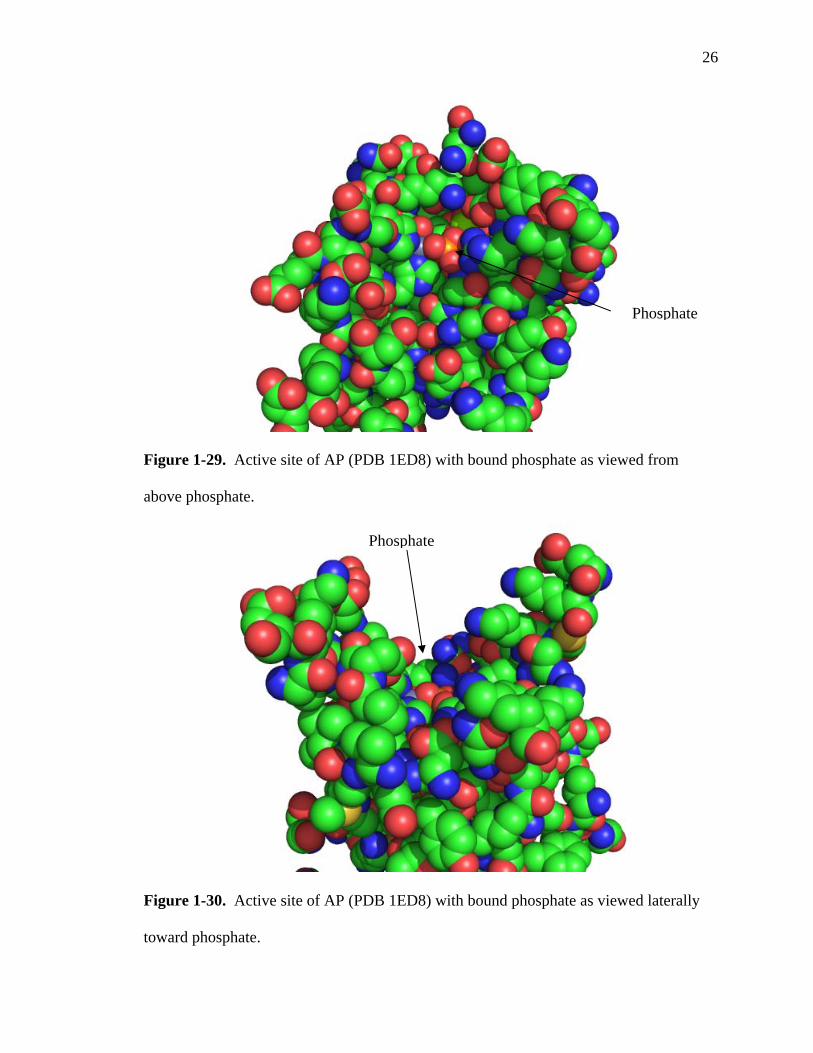
1-26 Catalytic motif of λPP wherein metal-coordinated hydroxide deprotonates a nucleophilic water……………………………………………………………….. 24 1-27 Structure of E. coli AP with phosphate bound (PDB 1ED8)……………………. 25
1-28 Active site of E. coli AP………………………………………………………… 25
1-29 Active site of AP (PDB 1ED8) with bound phosphate as viewed from above phosphate……………………………………………………………………….. 26 1-30 Active site of AP (PDB 1ED8) with bound phosphate as viewed laterally toward phosphate………………………………………………………………………... 26 1-31 Catalytic motif of alkaline phosphatase as represented by E. coli AP…….……. 28
1-32 Hydrolytic rates as a function of pH for phosphomonoesters………………….... 29
1-33 Hydrolytic rates as a function of pH for phosphoramidates……………………… 30
1-34 Species represented in Figures 1-32 and 1-33…………………………………... 30
1-35 Hydrolytic mechanism of alkyl phosphomonoester monoanions and dianions… 31
1-36 Hydrolytic mechanism of neutral alkyl phosphomonoesters…………………… 32
1-37 Pre-equilibrium protonation of the bridging atom………………………………. 32

xvi
1-38 Ionization states of phosphoramidates…………………………………………... 33
1-39 Transition state in the hydrolysis of phosphomonoester dianions………………. 36
1-40 Transition state in the hydrolysis of phosphopyridine monoanions……………. 37
1-41 Magnesium is catalytic under alkaline conditions……………………………… 38
1-42 Zinc catalyzes hydrolysis of PIm by bringing reactants in proximity…………... 39
1-43 3D structure of pNPP as the dianion, left, and monoanion, right……………….. 40
1-44 Bond and electron domain geometries of the bridging nitrogen for N-methyl phosphoramidate (A&B), N-phPAM (C), phosphopyridine (D), and PIm (E)..…41 1-45 Substrates and leaving groups with pKas………………………………………... 43
2-1 Synthesis of pNPP…………………………………………………………….… 48
2-2 General synthetic scheme for N-phenyl phosphoramidate……………………….. 49
2-3 Synthesis of tribenzyl phosphite…………………………………………………..50
2-4 Synthesis of Dibenzyl N-phenyl phosphoramidate………………………………..51
2-5 Synthesis of N-phPAM triethyl ammonium salt…………………………..……….52
2-6 General synthetic scheme for phosphoimidazole………………………………….53
2-7 Synthesis diphosphoimidazole…………………………………………………….54
2-8 Synthesis of monophosphoimidazole……………………………………………...55
2-9 SDS-PAGE of PHPT1…………………………………………………………….58
2-10 SDS-PAGE of YopH……………………………………………………………. 59
2-11 SDS-PAGE of AP……………………………………………………………...... 61
2-12 SDS-PAGE of λPP………………………………………………………….……63
2-13 UV/Vis profile for PIm versus Im, both at 1 mM………………………………...65
2-14 1H NMR Time course for the hydrolysis of PIm by PAcP ………………………..66
2-15 Titration curve showing 31P shift (ppm) of N-phPAM as a function of pH………75

xvii
3-1 Predominant protonation states of the substrates at the experimental pH………….. 78
3-2 Phosphate bound in the active site of PHPT1…………………………………..… 80
3-3 pNPP bound in the active site of PHPT1 as modeled in Acclerys………………… 80
3-4 PIm bound in the active site of PHPT1 as modeled in Acclerys………………….. 81
3-5 Vanadate bound in the active site of YopH……………………………………..... 82
3-6 pNPP bound in the active site of YopH as modeled in Acclerys……………….... 83
3-7 PIm bound in the active site of YopH as modeled in Acclerys…………………… 83
3-8 pNPP bound in the active site of YopH with the WPD llop removed as modeled in Acclerys……………………………………………………………………… 84
3-9 PIm bound in the active site of YopH with the WPD loop removed as modeled in Acclerys………………………………………………………………………. 84
3-10 Sulfate bound in the active site of VHR…………………………………………. 85
3-11 pNPP bound in the active site of VHR as modeled in Acclerys………………….. 86
3-12 PIm bound in the active site of VHR as modeled in Acclerys…………………… 86
3-13 Phosphate bound in the active site of PAcP……………………………………. 87
3-14 pNPP bound in the active site of PAcP as modeled in Acclerys………………... . 88
3-15 PIm bound in the active site of PAcP as modeled in Acclerys…………………... 88
3-16 Double reciprocal plot with λPP……………………………………….………. 90
3-17 λPP with bound sulfate in coordination mode B, boxes A and B (PDB 1G5B)…………………………………………………………….……... 92
3-18 λPP with pNPP as modeled in Acclerys, boxes A and B………………………. 93
3-19 λPP with PIm as modeled in Acclerys, boxes A and B…………………..…….. 94
3-20 Sulfate bound in active site………………………………………………..…….. 95
3-21 pNPP bound in active site of λPP as modeled in Acclerys…………….………… 96
3-22 PIm bound in active site of λPP as modeled in Acclerys……………….……… 97

xviii
3-23 PP1 active site with phosphate………………………………………………...... 97
3-24 PP1 active site with pNPP as modeled in Acclerys……………………………… 98
3-25 PP1 active site with PIm as modeled in Acclerys………………………..………. 98
3-26 Phosphate bound in active site of AP (PDB 1ED8)……………………………… 99
3-27 pNPP bound in active site of AP as modeled in Acclerys………………………… 100
3-28 PIm bound in active site of AP as modeled in Acclerys…………………..……… 100
3-29 Phosphate bound in active site of AP (PDB 1ED8)………………………..……. 101
3-30 pNPP bound in active site of AP as modeled in Acclerys………………………… 101
3-31 PIm bound in active site of AP as modeled in Acclerys………………………….. 102
5-1 Selective dephosphorylation of a protein……………………………….………..129
A1 Proton NMR spectrum of pNPP …………………………………………………143
A2 31P NMR spectrum of pNPP …………………………………………………… 144
A3 Proton NMR spectrum of tri-benzyl phosphite ……………………………….. 145
A4 31P NMR spectrum of tri-benzyl phosphite ……………………………………. 146
A5 31P NMR spectrum of tri-benzyl phosphite ……………………………………. 147
A6 Proton NMR spectrum of dibenzyl N-phPAM ………………………………… 148
A7 Proton NMR spectrum of dibenzyl N-phPAM ………………………………… 149
A8 31P NMR spectrum of dibenzyl N-phPAM …………………………………… 150
A9 Proton NMR spectrum of N-phPAM triethyl ammonium salt ………………… 151
A10 31P NMR spectrum of N-phPAM triethyl ammonium salt …………………..… 152
A11 Proton NMR spectrum of N-phPAM sodium salt …………………………….. 153
A12 31P NMR spectrum of N-phPAM sodium salt ……………………………….... 154
A13 Proton NMR spectrum of di-phospho imidazole ……………………………… 155
xix
A14 31P NMR spectrum of di-phospho imidazole …………………………………. 156
A15 Proton NMR spectrum showing the reaction of DPI to PIm ………………….. 157
A16 31P NMR spectrum showing the reaction of DPI to MPI ……………………… 158
A17 Proton NMR spectrum of imidazole …………………………………………... 159
A18 Proton NMR spectrum of pyrazine …………………………………………….. 160
A19 Proton NMR spectrum of PIm with pyrazine standard in the coaxial tube ……. 161
A20 Proton NMR spectrum of PIm with pyrazine standard in the coaxial tube ……. 162
A21 31P NMR spectrum of PIm ……………………………………………………. 163
A22 Plot of the data in Table A1. Curvature can be seen in the data. ……………... 170
A23 The hydrolysis of PIm by PHPT1 at pH 8.5 …………………………………… 171
A24 A dataset entered into Scientist. ……………………………………………….. 172
A25 A mathematical model inputted into Scientist. ………………………………… 172
A26 A Scientist parameter set. ……………………………………………………… 173
A27 The data spreadsheet will display calculated values ………………………….. 174
A28 A Micromath chart of the raw and fitted data. ………………………………… 174

xx
LIST OF ABBREVIATIONS Abbreviation Expanded Form or Meaning AMP Adenosine monophosphate AP Alkaline phosphatase
oC Degrees Celcius CDCl3 Deuterated chloroform DMSO Dimethyl sulfoxide DNA Deoxyribose nucleic acid DNPP Di-nitrophenylphosphate DTT Di-thiothreitol EDTA Ethylenediaminetetraacetic acid GMP Guanosine monophosphate HCl Hydrochloric acid HEPES 4-2-hydroxyethyl-1-piperazineethanesulfonic acid His tag Histidine tag HPLC High Performance Liquid Chromatography IPTG Isopropyl β-D-1 thiogalactopyranoside kcat Catalytic rate constant kDa kilo Dalton Ki Inhibition constant KIE Kinetic Isotope Effect KM The Michaelis constant λPP Lambda phosphatase

xxi
LFER Linear Free Energy Relationship MHz Mega Hertz mNBP meta-nitrobenzylphosphate NMR Nuclear magnetic resonance N-phPAM N-phenylphosphoramidate OD Optical density PAcP Prostatic acid phosphatase PCA pyridine-2-carbaldoxime PHPT1 Protein histidine phosphatase 1 Pi Inorganic phosphate PIm Phosphoryl Imidazole pNP para-nitrophenol pNPP para-nitrophenylphosphate PP1 Protein phosphatase 1 PTP Protein tyrosine phosphatase RCF Relative centrifugal force TCEP tris-c-carboxyethylphosphine TEV Tobacco etch virus Tris tris(hydroxymethyl)aminomethane UV/Vis Ultraviolet/Visible VHR Vaccinia H1 related protein. VH1 Vacinna H1 Vmax The maximum velocity of an enzymatic reaction

xxii
YopH Yersinia outer protein H WPD W – tryptophan, P – proline, D – aspartic acid.

CHAPTER 1
INTRODUCTION
1.1 Background
Protein phosphorylation occurs on histidine,1-6 lysine,5,7-9 and arginine,5,10-12 and
such phosphoramidates have been shown to account for as much as 76% of protein
phosphorylation as compared to 24% for phosphoesters.7 Therefore, phosphoramidases
should be prevalent in the proteome. Yet, only a single phosphoramidase is known.
While other phosphoramidases may remain undiscovered, another possibility is that
existing phosphoester phosphatases are catalytically promiscuous, cleaving
phosphoramidates in addition to their native phosphoester substrates.
Articles published in 1955 and 1957 reported enzymes with both
phosphomonoester phosphatase and phosphoramidase activities.13,14 The reports predate
amino acid sequencing and protein crystallography.15,16 Based on the biological source
and method of isolation, one of these enzymes was probably prostatic acid phosphatase,
PAcP, while the other may have been alkaline phosphatase, AP. If so, these reports
would be among the first to indicate that phosphoester phosphatases cleave
phosphoramidates.
There appears to be a single report of an enzyme that is completely specific for a
phosphoramidate.17 Purified rat brain extracts yielded a 30 kDa enzyme that was termed
6-phospholysine phosphatase. It catalyzed the hydrolysis of phospholysine and
ammonium phosphoramidate, but was unable to catalyze the hydrolysis of AMP, GMP,
pNPP, or phosphohistidine. The report did not include an amino acid sequence, even
though this technique was commonly available at the time of the report. Identification of

2
the enzyme was based mainly upon elution behavior of the enzyme during size exclusion
and ion exchange chromatography. The absence of a sequence prevents definitive
assignment of the enzyme to a class; that the enzyme was a previously, or subsequently,
reported enzyme cannot be ruled out. No additional reports of studies with this enzyme
have appeared in the literature.
The above literature reports show some enzymes catalyze hydrolysis of
phosphoesters and phosphoramidates, while in another case, an enzyme is completely
specific for a phosphoramidate. From a biological perspective, both results are
potentially beneficial to a cell.18 If a cell can accomplish multiple tasks with a single
protein it will reduce the energy expended in the synthesis of multiple proteins. On the
other hand, control of biochemical pathways is crucial, and high substrate specificity
allows a cell to maintain tight control of a pathway. If an enzyme is specific for either a
phosphomonoester or phosphoramidate substrate, it must be due to the active site and
catalytic mechanism, herein referred to as the motif.
The purpose of the research herein was to determine if known phosphatase motifs
cleave both P-O and P-N bonds, or if enzymes exist specifically with phosphoramidase
activity. Because enzymes within a class share the same catalytic motif, well-
characterized enzymes from the known phosphomonoester phosphatases are used to
represent the different classes. Each enzyme was assayed with phosphoramidates and a
phosphoester. Successful catalytic hydrolysis of both substrate types does not mean that
all enzymes within the class are promiscuous; it only indicates that the motif is able to act
on both bond types.

3
1.2 The Enzymes
This chapter provides a review of the motifs present in selected
phosphomonoesterases and a phosphoramidase. A synopsis of the enzymes is provided
in Table 1-1. Enzymes are selected for use in this study because they possess a catalytic
core representative of the enzyme class and are well-characterized. After reviewing the
enzymes, uncatalyzed phosphomonoester and phosphoramidate hydrolysis is reviewed.
Table 1-1. A side by side comparison of the enzymes used in this study.
Phosphatase class
Enzyme used
Substrate Specificity
Acid, base, and metal catalysis
Covalent intermediate
formed with:
Histidine Phosphatases
Phosphohistidinephosphatase 1 phosphohistidine General
base No covalent intermediate
Protein Tyrosine
Phosphatases
Yersenia outer protein H phosphotyrosine General
acid/base Cys403
Dual specificity Phosphatases
VH1 related protein
phosphotyrosine phosphoserine
phosphothreonine
General acid/base Cys124
Histidine acid phosphatases
Prostatic acid phosphatase non-specific General
acid/base His12
Serine/threonine specific
phosphatases
Lambda phosphatase
phosphoserine phosphothreonine
Two divalent Metals
No covalent intermediate
Alkaline Phosphatases E. coli AP non-specific
One Mg(II) and
two Zn(II) Ser102
1.2.1 hPHPT1 (human protein histidine phosphatase 1)
Relatively recently, the phosphoramidase, protein histidine phosphatase 1,
PHPT1, was isolated and characterized.19 PHPT1 is a mammalian protein found in liver
and brain cells. This relatively small 14 kDa enzyme possess 125 amino acids and is a
4
monomer. Presently, it is the sole representative of the phosphoramidase class. It has
displayed the ability to hydrolyze phosphorylated histidine residues in proteins and
peptides.2
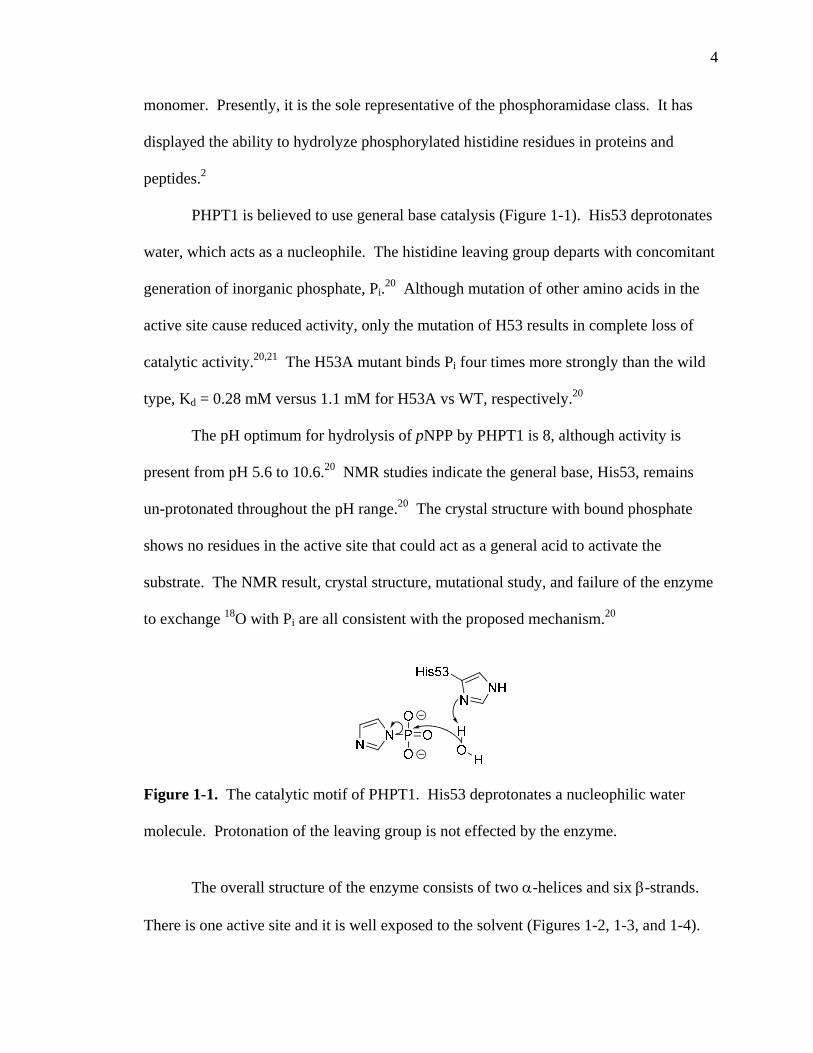
PHPT1 is believed to use general base catalysis (Figure 1-1). His53 deprotonates
water, which acts as a nucleophile. The histidine leaving group departs with concomitant
generation of inorganic phosphate, Pi.20 Although mutation of other amino acids in the
active site cause reduced activity, only the mutation of H53 results in complete loss of
catalytic activity.20,21 The H53A mutant binds Pi four times more strongly than the wild
type, Kd = 0.28 mM versus 1.1 mM for H53A vs WT, respectively.20
The pH optimum for hydrolysis of pNPP by PHPT1 is 8, although activity is
present from pH 5.6 to 10.6.20 NMR studies indicate the general base, His53, remains
un-protonated throughout the pH range.20 The crystal structure with bound phosphate
shows no residues in the active site that could act as a general acid to activate the
substrate. The NMR result, crystal structure, mutational study, and failure of the enzyme
to exchange 18O with Pi are all consistent with the proposed mechanism.20
Figure 1-1. The catalytic motif of PHPT1. His53 deprotonates a nucleophilic water
molecule. Protonation of the leaving group is not effected by the enzyme.
The overall structure of the enzyme consists of two α-helices and six β-strands.
There is one active site and it is well exposed to the solvent (Figures 1-2, 1-3, and 1-4).

5
Binding of the phosphate moiety is effected via hydrogen bond interactions with the
peptide backbone and electrostatic interaction with Lys21 (Figure 1-2B).
1.2.2 YopH (Yesinia outer protein H)
Protein Tyrosine Phosphatases, PTPs, have a conserved segment of 250 amino
acids that form the catalytic domain.22 The signature motif for PTPs is
(I/V)VHCXAGXGR(S/T)G.22 In this study, YopH is the selected representative of the
PTP, class of enzymes. It possesses the catalytic domain and motif of the PTP family.
Figure 1-2. A) overall structure of PHPT1 (PDB 2OZW) B) with active site enlarged.
Phosphate is bound to the enzyme through hydrogen bonding with His53, Ala54, Ser94,
Met95, Ala96 and electrostatic interaction with Lys21.
A96
SS9944
HH5533
KK2211
AA5544
MM9955
AA BB

6
Figure 1-3. Active site of PHPT1 (PDB 2OZW) with bound phosphate as viewed from
above phosphate. Active site is approximately 14 Å long, 9.2 Å wide, and 6.9 Å high.
Space filling models illustrate possible interactions of amino acid residues near the active
site with the substrate. The substrates used in this study are geometrically different, as
will be covered in 1.3.5, and the potential for interactions may be seen with these models.
Color scheme: green represents carbon, red represents oxygen, blue represents nitrogen,
yellow represents sulfur, orange represents phosphorus. This color scheme will be
maintained in further figures.
The 50.8 kDa wild type protein from Yersenia pestis has 468 amino acids and is a
monomer. YopH is secreted by Yersenia bacteria as a component of the pathogenic
process.
Phosphate
7
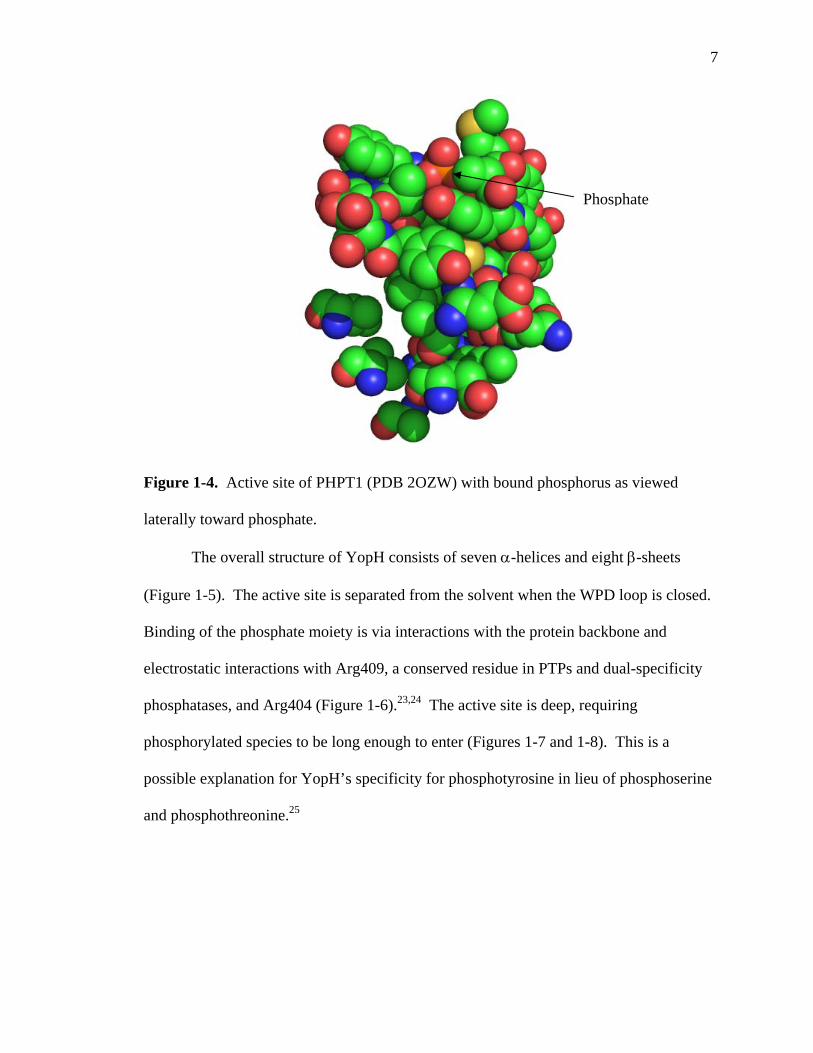
Figure 1-4. Active site of PHPT1 (PDB 2OZW) with bound phosphorus as viewed
laterally toward phosphate.
The overall structure of YopH consists of seven α-helices and eight β-sheets
(Figure 1-5). The active site is separated from the solvent when the WPD loop is closed.
Binding of the phosphate moiety is via interactions with the protein backbone and
electrostatic interactions with Arg409, a conserved residue in PTPs and dual-specificity
phosphatases, and Arg404 (Figure 1-6).23,24 The active site is deep, requiring
phosphorylated species to be long enough to enter (Figures 1-7 and 1-8). This is a
possible explanation for YopH’s specificity for phosphotyrosine in lieu of phosphoserine
and phosphothreonine.25
Phosphate

8
Figure 1-5. Overall structure of YopH (PDB 2I42). Bound vanadate is shown in purple
near the top of the image.
Figure 1-6. The active site of YopH (PDB 2I42). Vanadate is shown in purple/red.
DD335566 RR440044
QQ444466 CC440033
GG440066
GG440088
RR440099
VV440077
AA440055
EE229900

9
Figure 1-7. Active site of YopH (PDB 2I42) with bound vanadate as viewed from above
vanadate.
Figure 1-8. Active site of YopH (PDB 2I42) with bound vanadate as viewed laterally
toward vanadate; vanadate cannot be seen because active site is buried. With WPD loop
closed, the active site is separated from solvent.
vanadate
vanadate

10
PTPs effect catalysis via formation of a cysteine-phosphate intermediate (Figure
1-9).22-24,26-35 The cysteine involved has a pKa of approximately 4.7.36 YopH has a pH
optimum between 5.0 and 5.5.26 PTPs display a bell-shaped pH profile due to the pKa of
the cysteine nucleophile and an aspartic acid residue that acts as a general acid/base.37
The aspartic acid residue is part of a flexible WPD loop. It acts as a general acid,
providing a proton to stabilize charge on the leaving group.23 The same residue then acts
as a general base to deprotonate the nucleophilic water that breaks the phosphorus-sulfur
bond.
Figure 1-9. Catalytic motif of protein tyrosine phosphatases as represented by YopH.
In the catalytic mechanism, the substrate enters the active site as the dianion. In a
synchronous fashion, cysteine attacks phosphorus, cleaving the P-O bond and generating
the phosphoenzyme intermediate, while the general acid protonates the leaving group.
Water attacks phosphorus, being deprotonated by the general base. In assays with
phosphomonoesters, phosphoryl transfer is rate limiting.28,30,38-40 This motif is shared by
dual-specificity phosphatases, the difference being that the general acid/base is not on a
flexible WPD loop.
Timing of leaving group protonation is dependent upon the pKa of the leaving
group,31,41 which determines the extent of bond fission in the transition state; this mirrors

11
the behavior of substrates in uncatalyzed reactions.37 As will be seen in 1.3.2,
protonation of the leaving group is important in the cleavage of P-O bonds.
Mutant D356N’s kcat is ~ 104 fold lower than the wild type.22 That the mutant
retains some catalytic ability is an indication that YopH uses factors in addition to general
acid/base chemistry to effect catalysis.
1.2.3 VHR (Vaccinia H1-Related Dual-Specificity Phosphatase)
In this project VHR was used as a representative member of the dual-specificity
phosphatases, DSPs. It has been assigned two enzyme commission numbers, one
identifying it as a protein tyrosine phosphatase, 3.1.3.48, and another identifying it as a
dual-specificity phosphatase, DSP, 3.1.3.16. This enzyme is known to catalyze the
hydrolysis of phosphoserine, phosphothreonine, and phosphotyrosine substrates. It
shares the same conserved motif as the PTPs.42 VHR is a human protein, although VH1
is encoded from the virus which is used to inoculate against smallpox. VHR is a 20 kDa
enzyme with 184 amino acids and is monomer.
Like the PTPs its catalytic motif involves formation of a cysteine-phosphate
intermediate, which in VHR involves cysteine 124.38,42-45 The cysteine involved has a
pKa of approximately 5.5.46 VHR’s pH optimum is between 5.5 and 6.0.44 Unlike the
PTPs, in DSPs the general acid-base, Asp92 in VHR, is not positioned on a flexible loop.
Binding of the substrate’s phosphate moiety is through hydrogen bonding with the
protein backbone and electrostatic interactions with Arg130, directly analogous to
interactions seen with other enzymes in the PTP family (Figures 1-10 and 1-11). VHR
has a shallower active site cleft than YopH, an explanation for its dual-specificity
(Figures 1-12 and 1-13). With departure of the substrate’s leaving group, a

12
Figure 1-10. Overall structure of VHR (PDB 1VHR) with sulfate bound at the active
site.
Figure 1-11. The active site of VHR (PDB 1VHR) with bound sulfate. Potential
hydrogen bonds with a distance greater than 3.0 Å were not considered.
CC112244 RR112255
RR113300
YY112288
SS112299
DD9922
EE112266

13
Figure 1-12. Active site of VHR (PDB 1VHR) with bound sulfate as viewed from above
sulfate.
Figure 1-13. Active site of VHR (PDB 1VHR) with bound sulfate as viewed laterally
toward sulfate.
Sulfate
Sulfate
14
phosphoenzyme intermediate is formed. It is the breakdown of this phosphoenzyme
intermediate that is the rate limiting step in VHR catalyzed hydrolysis.42
In a side by side comparison between Protein Tyrosine Phosphatase 1, PTP1, and
VHR, using substituted aromatic phosphoesters, kcat values for PTP1 show dependence
upon the geometry of the substrate, while VHR’s values do not. The authors conclude
that “the active site structure of the VHR protein phosphatase appears to be more
accommodating than that of PTP1.”43 This observation may prove prescient when
considering geometrical differences between phosphomonoesters and phosphoramidates.
1.2.4 hPAcP (human prostatic acid phosphatase)
The acid phosphatases hydrolyze phosphate esters at low pH. These phosphatases
are found in many organisms, yeast, bacteria, mammals, and involve different
phosphoester substrates, e.g. glucose-1-phosphate, phytic acid, and phosphorylated amino
acids. The enzymes share a conserved sequence RH(G/N)XRX(P/A/S). Like the PTPs
and DSPs, the histidine acid phosphatases form a covalent phosphoenzyme intermediate;
in this case the phosphoenzyme intermediate is phosphohistidine in lieu of
phosphocysteine. Prostatic acid phosphatase, PAcP, possesses the conserved motif and
forms the phosphohistine intermediate.47-50 PAcP is the representative of the histidine
acid phosphatase class of enzymes for the research herein.
PAcP is expressed in mammalian prostates. Its up-regulation was used as a
marker for prostate cancer, although such application has ceased. Significant research
has been devoted to PAcP, reflecting its previous medical use.
This 41 kDa protein has 386 amino acids. In vivo it is a glycosylated
homodimer.48 Each monomer has an α/β domain with a seven-strand β-sheet with α-

15
helices on both sides, and an α-helix domain (Figure 1-14). Binding of the phosphate
moiety is accomplished through hydrogen bonding with active site residue His257, and
electrostatic interactions with conserved residues Arg11, Arg15, and Arg79 (Figure 1-
15).48,49
PAcP has a broad pH optimum from 3 to 5.5, with a limb showing reduced
activity in the basic pH region.47,48,51 The strong activity in the acidic range is a
reflection of the “enzymes specificity for the monoanionic form of the substrate.”47 The
basic limb is a result of deprotonation of the phosphoenzyme intermediate; the neutral
form of the intermediate is less reactive than the cationic form (Figure 1-16).47
Figure 1-14. Catalytic subunit of hPAcP (PDB 1ND6) with bound phosphate.

16
Figure 1-15. Active site of hPAcP with bound phosphate.
Figure 1-16. The basic limb of the pH rate profile is due to formation of the unreactive,
dianionic form of the phosphoenzyme intermediate (right).
A conserved aspartic acid acts as a general acid and base to donate a proton to the
leaving group and subsequently deprotonate a nucleophilic water (Figure 1-17). Attack
on the phosphorus by water cleaves the histidine-phosphorus bond, regenerating the
enzyme’s active site. The substrate is surrounded by amino acid residues (Figures 1-18
and 1-19). Breakdown of the phosphoenzyme intermediate is rate limiting.47,51,52
HH1122
RR1155
RR1111 RR7799
HH225577
DD225588

17
NH
N
His12
O
O Asp258
PO
OOO
NO2
NH
N
His12
O
O Asp258
PO OO
OHH
H
ROH
Figure 1-17. Catalytic motif of Histidine Acid Phosphatases as represented by PAcP.
Nucleophilic histidine attacks phosphorus, while a general acid protonates the leaving
group. In a subsequent step, water attacks phosphorus, being deprotonated by the general
base.
Figure 1-18. Active site of PAcP (PDB 1ND6) with bound phosphate as viewed from
above phosphate. The active site is constricted.
Phosphate

18
Figure 1-19. Active site of PAcP (PDB 1ND6) with bound phosphate as viewed laterally
toward phosphate.
Two mutants showed complete loss of activity, H12A and R11A. Aside from
facilitating binding, R11 may also play a role in the protonation of H12. D258A caused a
reduction of kcat/KM by two orders of magnitude. That catalysis was not completely
stopped indicates other general acid/base sources are available.50
1.2.5 λPP (lambda phosphatase) and PP1 (protein phosphatase)
Metalloenzymes used in this study included λPP, PP1, and AP. Both λPP and
PP1 are members of the serine/threonine specific phosphatases and possess the same
catalytic motif. Lambda phosphatase is encoded by the lambda virus, a bacteriophage.
λPP has the minimal catalytic core of the protein phosphatases, PP, and is the
representative of the protein phosphatase class of enzymes for this study.
Phosphate

19
The PP family of enzymes possesses the conserved motif
DXH(X)nGDXXD(X)mGN-HD/E. The active sites of the protein phosphatases use two
metal ions per active site.53 Different phosphatases within the family have different
divalent metal ion dependencies, with Mn, Fe, Co, Ni, Cu, and Zn being common.
Depending upon the phosphatase, the active site metals may be the same or may be
different metals. Identities of the native metal ions for most phosphatases within the PP
family have not been determined.
λPP is a 221 amino acid, 25 kDa monomeric protein.54 Each active site
possesses two of the same metal ions in vitro (Figures 1-20 through 1-23).54-65 The
overall structure consists of two β-sheets, one 4-stranded and one 6-stranded, and six α-
helices (Figure 1-20). X-ray crystal structures revealed sulfate bound in three modes,
hereinafter referred to as coordination modes A, B, and C.54 In modes A and B, a water
molecule is interposed between the tetrahedral sulfate and Arg53 (Figures 1-21 and 1-
22). One oxyanion is coordinated directly to Mn2, while another oxyanion has a water
molecule blocking coordination to Mn1. In coordination mode C, three of the sulfate
oxyanions are able to coordinate directly to Mn1 and Mn2, with one of the oxygens
forming a bridge between the metals (Figure 1-23). In this mode, no water is interposed
between the sulfate oxyanions and the metals. Whether or not each of the binding modes
represents a catalytically functional mode has not been determined. The crystal
structures show λPP demonstrates significant flexibility in its binding sulfate within the
active site, and a large part of this flexibility involves water.
20
Figure 1-20. λPP with sulfate bound in coordination mode A (see figure 1-21)(PDB
1G5B). Two Mn2+ ions shown in purple, water shown in red.
Figure 1-21. λPP active site with sulfate bound in coordination mode A. Red spheres
are water.
RR5533
MMnn11
RR116622
RR5533
MMnn22
MMnn11
HH7766

21
Figure 1-22. λPP active site with sulfate bound in coordination mode B.
Figure 1-23. λPP active site with sulfate bound in coordination mode C.
λPP dephosphorylates proteins and peptides phosphorylated on serine, threonine,
and tyrosine; it is unable to dephosphorylate the simple phosphorylated amino acids
phosphoserine, phosphothreonine, or phosphotyrosine.60 The enzyme has
RR5533
RR116622
RR5533
MMnn22
MMnn11
HH7766
RR116622
RR5533
MMnn22
MMnn11
HH7766
22
phosphodiesterase activity, being able to hydrolyze bis-p-nitrophenyl phosphate, kcat = 44
s-1, KM = 10 mM; the same experiment yielded a kcat of 47 s-1, KM = 5.0 mM for the
monoester pNPP.66 The diesterase activity coupled with the inability of the enzyme to
hydrolyze phosphorylated serine, threonine, or tyrosine has led to speculation that λPP’s
native substrates might not be phosphomonoesters, but phosphodiesters.66
Greatest activity is shown when Mn(II) is present, although activity with Ni(II) is
similar, activityNi/activityMn = 0.83.53,60 The kcat/KM pH optimum for λPP hydrolysis of
pNPP is pH 7.8, while the greatest kcat is shown at pH 8.5.56 The acidic limb of λPP’s
bell shaped pH profile is due to a nucleophilic metal-bound water molecule. The basic
limb is likely due to deprotonation of His76 which may assist in substrate binding.56
The two metal atoms are not held equally in the active site. For λPP with Mn2+,
Kd1 is 2 μM, while Kd2 is 160 μM.59,67 Kd2 is higher than manganese concentrations that
would be found in a cell. As a result, it has been postulated that phosphate substrates
enter the active site bound to manganese.59 The Ksp for manganese phosphate is
3.17x10-8,68 so the suggestion that phosphate substrates form complexes with manganese
before entering the active site is reasonable.
Studies have not definitively determined the catalytic mechanism of the PP family
of enzymes. Once the substrate is bound, three catalytic possibilities exist.37 A metal-
coordinated hydroxide could be a nucleophile, attacking the substrates phosphorus
(Figure 1-24). A bridging hydroxide could be a nucleophile, attacking the substrate’s
phosphorus (Figure 1-25). Or, a metal-coordinated hydroxide could act as a general base,
deprotonating a nucleophilic water (Figure 1-26). In either case, the rate limiting step for
λPP catalysis with pNPP as the substrate is cleavage of the phosphoester bond.56

23
Figure 1-24. Catalytic motif of λPP wherein a metal-coordinate hydroxide is the
nucleophile.
O
Asp49
CO
O
PO
OO
ROH
O
Asp49
CO
O
PO O
O
OH
NO2
Mn12+ Mn2
2+Mn1
2+ Mn22+
Figure 1-25. Catalytic motif of λPP wherein a bridging hydroxide is the nucleophile.
Mutation of a conserved histidine residue, H76 in λPP, results in lowered kcat with
little change in KM. The role of this histidine is not clear. It could function to bind the
substrate through a salt bridge, act as a general acid to protonate departing leaving
groups, or act as a general base to deprotonate the nucleophilic metal-coordinated

24
Mn12+
PO
OO
OH
Asp49
CO
O
NO2
HOH
ROH
PO
OO
OH
Asp49
CO
O
OH HO OHO
Mn22+ Mn1
2+ Mn22+
Figure 1-26. Catalytic motif of λPP wherein metal-coordinated hydroxide deprotonates
a nucleophilic water.
water.37 Arginines 53 and 162 are also important for activity. Crystal structures show
these residues playing a role in binding and possibly substrate orientation in modes A, B,
and C.
1.2.6 AP (Alkaline Phosphatase)
The other metalloenzyme used in this study was alkaline phosphatase. AP is
ubiquitous in organisms, being found in bacteria and higher organisms. It is found in
most organs in mammals. Because it has been extensively studied and has the catalytic
core representative of this class of enzymes, E. coli AP was chosen to represent this class
of enzymes.
E. coli AP is a 47 kDa, 449 amino acid homodimeric enzyme. The catalytic motif
involves three metals, two Zn2+ and one Mg2+ (Figures 1-27 and 1-28).69-79 The overall
structure of E. coli AP consists of a 10-stranded β-sheet surrounded by 15 α-helices, with
a second 3-stranded β-sheet and an α-helix outside the core structure.80 The active site is

25
well hydrated in crystal structures, which show the active site is also highly exposed to
solvent (Figures 1-27 and 1-28).
Figure 1-27. Structure of E. coli AP with phosphate bound (PDB 1ED8). Active site
metals form a catalytic triad.
Figure 1-28. Active site of E. coli AP.
SS110022
RR116666
ZZnn1122++
ZZnn2222++
MMnn22++
26
Figure 1-29. Active site of AP (PDB 1ED8) with bound phosphate as viewed from
above phosphate.
Figure 1-30. Active site of AP (PDB 1ED8) with bound phosphate as viewed laterally
toward phosphate.
Phosphate
Phosphate

27
The pH optimum is substrate dependent, but the optimal pH is always alkaline.
The acidic limb of AP’s bell-shaped pH profile is a reflection of the substrates pKa. The
basic limb is driven by factors within the enzyme that affect binding, possibly blocking of
the active site by a zinc-coordinated water molecule.73 E. coli AP has a pH optimum of
between 9.0 and 9.5 with pNPP.
The zinc ions bind the substrate, bring the nucleophilic serine close to the
electrophilic phosphorus, lower the pKa of serines hydroxyl moiety, and stabilize charge
buildup on the leaving group (Figure 1-31). The magnesium ion coordinates a general
base hydroxide that deprotonates the serine nucleophile; it may also assist in the
necessary geometry of the active site. Arg166 forms electrostatic interactions with the
substrates phosphate moiety, assisting in substrate binding. Breakdown of the
phosphoenzyme intermediate is the rate limiting step of catalysis below pH 7.5, while
release of Pi is rate limiting above pH 7.5.37,73,80-82
AP has been called a non-specific phosphatase as it is able to catalyze the
hydrolysis of a variety of substrates, including phosphomonoesters, phosphodiesters,
phosphotriesters, phosphonates, and phosphoramidates. Research has demonstrated its
ability to catalyze hydrolysis of phospholysine substrates.11,12 As will be reviewed,
phosphoramidates are relatively stable under alkaline conditions, the same conditions
where AP demonstrates its greatest catalytic efficiency.

28
Figure 1-31. Catalytic motif of alkaline phosphatase as represented by E. coli AP.
1.3 Comparisons between Phosphomonoesters and Phosphoramidates
1.3.1 Relative Rates of Phosphomonoester versus Phosphoramidate Hydrolysis Mechanisms for non-enzymatic cleavage of phosphoester bonds have been
intensely studied since the 1950’s. The non-enzymatic research laid the groundwork for
later enzymatic studies, as scientists realized enzymatic and non-enzymatic hydrolysis
must share some mechanistic similarities.83
The hydrolysis profiles as a function of pH for selected phosphomonoesters and
phosphoramidates are provided (Figures 1-32 and 1-33). The data is a collection from
the literature, and hydrolytic rates were collected at different temperatures.2,83-91 A direct

29
comparison of rates is not appropriate where different experimental temperatures were
used. However, the profiles are indicative of the mechanism of hydrolysis.
Figure 1-32. Hydrolytic rates as a function of pH for phosphomonoesters.
Methyl phosphate85 (1) at 100 oC , para-nitrophenyl phosphate88
(2), pNPP, at 37 oC, benzyl phosphate90 (3) at 76 oC. Plots from literature
were scanned, digitized with PlotDigitize, overlaid in Excel, and the resulting graphic
refined Photoshop.
Even when hydrolyzed at lower temperatures, hydrolytic rates are higher for
phosphoramidates (Figure 1-32) than phosphomonoesters (Figure 1-33). For the
phosphoesters and phosphoramidates shown in Figures 1-32 and 1-33, increases in proton
concentration tend to cause higher rates of hydrolysis, although there are troughs with
some species as pH decreases. The exceptions to the trend are N-methyl
Phosphomonoester Hydrolysisk
x 10
5 (s-1
)
pH

30
Figure 1-33. Hydrolytic rates as a function of pH for phosphoramidates.
PIm91 (4) and NMePIm91 (5), 40 oC; N-
phPAM86 (6), 20 oC; Ammonium PA87 (7), 36 oC; N-p-
chloroPAM86 (8), 20 oC; N-p-chloroPAM86 in 50% dioxane, 20 oC. Rate
constants for N-p-chloroPAM are x103. Plots from literature were scanned, digitized with
PlotDigitize, overlaid in Excel, and the resulting graphic refined in Photoshop.
O
P
N
OHO
NH
O
P
N
OHHO
N
Me
O
P
NH
OHHO
O
P
NH3
OHO
O
P
NH
OHHO
Cl
87654
O
P
O
Me
OHHO
O
P
O
OHHO
O
P
O
OHHO
NO2
1 2 3
Figure 1-34. Species represented in Figures 1-32 and 1-33. Protonation state will vary
as a function of pH.
pH
k x
105 (s
-1)
Phosphoramidate Hydrolysis

31
phosphoimidazole which hydrolyzes in a pH independent manner,91,92 and N-p-
chlorophosphoramidate in 50% dioxane.86 Phosphoramidate bonds are more labile under
acidic conditions than phosphoesters, while both species exhibit least hydrolysis under
mildly alkaline conditions.
The location of a proton(s) during phosphomonoester hydrolysis can be inferred
from pKas.93 The overall hydrolytic rate constant at a given pH is given by (1.1):94
ko = kN[N]+ kM[M]+ kD[D]
where [N], [M], and [D] are the mole fractions of the neutral, monoanion, and dianion of
a phosphomonoester species, as calculated from the Henderson-Hasselbalch equation,
respectively. The pH rate profiles are a reflection of equation 1.1. It is apparent that for
both phosphomonoesters and phosphoramidates kN > kM > kD.
Isotopic studies with 18O showed that the monoanions and dianions of alkyl
phosphomonoesters cleave at the bridging P-O bond, whereas the neutral and cationic
species cleave predominantly at the C-O bond (Figures 1-35 and 1-36).94 For the
enzymes studied, cleavage does not occur at the C-X (X = N or O) bond. Therefore,
comparisons of uncatalyzed versus enzyme-catalyzed reactions can be limited to
comparisons with monoanionic and dianionic hydrolysis.
Figure 1-35. Hydrolytic mechanism of alkyl phosphomonoester monoanions and
dianions. Cleavage is at the P-O bond.
(1.1)

32
Figure 1-36. Hydrolytic mechanism of neutral alkyl phosphomonoesters. Cleavage is
predominantly at the C-O bond.
1.3.2 Hydrolysis Proceeds via Pre-equilibrium Monoanions hydrolyze faster than dianions because they are able to undergo a
pre-equilibrium protonation of the bridging atom (Figure 1-37). Protonation of the
bridging atom places charge on the leaving group and makes the P-Obridge bond more
labile.
Figure 1-37. Pre-equilibrium protonation of the bridging atom. Monoanionic phosphoramidates may exist as either zwitterions, 12, 13, and 16, or
non-zwitterions, 11. 31P NMR experiments indicate 15 is not a predominant form in
aqueous media.91 Phosphopyridine cannot exist as a dianion; it must exist as a
monoanion, 13, or a neutral species, 14.

33
R – H, alkyl, or aryl. Figure 1-38. Ionization states of phosphoramidates. Rationalization for phosphoramidate hydrolysis being faster than
phosphomonoester hydrolysis can be provided by comparing the predominate
monoanionic form. Monoanionic phosphomonoesters exist predominantly with the non-
bridging atom protonated, as with 9. Monoanionic phosphoramidates can exist
predominantly with the bridging atom charged or sharing charge, as with 12, 13, 14, and
16, although some species can exist without the bridging nitrogen protonated, as with 11.
Pre-equilibrium is not necessary with 12, 13, 14, and 16, as the leaving group is already
activated by charge.
Confirmation that the bridging nitrogen is protonated in phosphoramidates as
expected by the pKa of the leaving group (Table A1) is provided by studies with heats of
ionization95 and 31P NMR.91 Phosphoramidate hydrolysis profiles (Figure 1-30) show
inflections close to the pKas of the leaving groups. N-methylphosphoryl imidazole is
charged under all conditions and shows no inflection, a further confirmation that charge
on the leaving group affects the profile.
Since the zwitterion is the reactive species, phosphoramidate substrates that enter
the enzyme active site as zwitterions may illuminate how the motif is handling the

34
substrate. The phosphoramidate substrate will not need to have the leaving group
activated, whereas phosphomonoesters with a pKa greater than 5.5 need the leaving group
to be activated during hydrolysis.
It will be seen that several enzymatic motifs use residues as a general acids to
effect protonation of the leaving group. This technique matches the non-enzymatic
hydrolysis in that protonation of the leaving group is important as demonstrated by the
faster hydrolysis of the monoanion form of monoesters.
1.3.3 LFER Values for Aryl Monoesters and Phosphoramidates Vary as a Function
of Ionization
As covered above, existence of a cationic bridging atom greatly enhances
hydrolysis. This phenomenon is reflected in LFER values with phosphomonoesters and
phosphoramidates.
βLG values for the hydrolysis of aryl phosphomonoester dianions demonstrate
sensitivity of the reaction to the leaving group, βLG = -1.23.96-98 Leaving groups able to
stabilize charge hydrolyze faster, whereas those that cannot stabilize charge hydrolyze
slower. Phosphomonoester monoanion hydrolysis has less sensitivity to the leaving
group, βLG = -0.27,99 as a proton exists that can participate in pre-equilibrium,
Phosphoramidate hydrolysis can display sensitivity or insensitivity to the leaving
group, depending upon the nature of the nitrogenous species. Those species with a
leaving group pKa below the pKa of the phosphate moiety display insensitivity to the
nature of the leaving group (Table 1-2). As with phosphomonoester monoanions, these
phosphoramidates will readily exchange the proton from the non-bridging oxygen to the
bridging atom, forming the reactive species. Substituted pyridines are charged and

35
sensitive to substituents that can stabilize the charge. Phosphoramidates wherein the
leaving group pKa is above the pKa of the phosphate moiety are also charged and
sensitive to substituents that can stabilize the charge. Available βnuc values are in
agreement with the βLG values, in that species displaying sensitivity to the leaving group
have little sensitivity to the nucleophile (Table 1-3).
PIm does not correspond with any of the Brønsted slopes in Table 1-2. Upon
protonation the imidazolium moiety can delocalize positive charge within the ring which
holds two nitrogens. This gives PIm much greater stability than analogous
phosphorylated pyridines.
Table 1-2. Phosphoramidate Brønsted values showing dependence on leaving group as a
function of leaving group type and leaving group pKa.100
Leaving Group
pKa βLG Leaving Group pKa βLG Leaving
Group pKa βLG
2.54 5.37 9.61
4.07 6.21 9.33
4.69 8.53 9.83
5.44 9.39
-1.11
10.77
5.7
0.2
9.38
-0.90
LFER data does not indicate whether or not the transition state involves complete
cleavage of the P-X bond, i.e. formation of metaphosphate. Stereochemical inversion
was found in the hydrolysis of the dianion of 2,4-dinitrophenyl phosphate and the
monoanion of phenyl phosphate; this demonstrated metaphosphate does not form as an
intermediate.103,104 Tempered with the lack of racemization, hydrolysis for

36
Table 1-3. βnuc values for the hydrolysis of DNPP, bis-DNPP,101 pNPP,99
phosphopyridine, and phosphoacetate.102
Hydrolyzing Species Cation Attacking Species βnuc None Substituted pyridines 0.18
0.33 M Mg2+ Substituted pyridines 0.17pNPP2- 0.33 M Ca2+ Substituted pyridines 0.21
None Oxygen nucleophiles 0.24Phosphopyridine- 0.33 M Mg2+ Oxygen nucleophiles 0.25Ammonium phosphoramidate- None Substituted pyridines 0.22
3-methoxypyridine- None Substituted pyridines 0.17Isoquinoline-N-phosphoramidate- None Substituted pyridines 0.2
4-morpholinopyridine None Substituted pyridines 0.22
Figure 1-39. Transition state in the hydrolysis of phosphomonoester dianions.
Hydrolysis proceeds via a concerted reaction with a loose transition state.
phosphomonoester dianions must proceed via a SN2 type mechanism with a loose
transition state (Figure 1-39).
Three lines of evidence demonstrate that phosphopyridine hydrolysis is also
concerted, with a SN2 type mechanism (Figure 1-40): 1 - phosphopyridine hydrolysis was
found to be second order; 2 – decreases in –βLG were concurrent with increasing strength
of the nucleophile; and 3 – a plot of rate versus pKnuc shows a positive slope.105 It is a
reasonable assumption that other phorphoramidates also undergo hydrolysis with a
concerted, loose transition state, but experimental data to support such an assumption is
not available.

37
Figure 1-40. Transition state in the hydrolysis of phosphopyridine monoanions.
Hydrolysis proceeds via a concerted reaction with a loose transition state. Charge on the
pyridine in the transition state will change from positive to neutral. δ- was drawn to
indicate charge is less positive than in ground state.
1.3.4 Metals
Divalent magnesium and calcium cause little change in βnuc or βLG values for
reactions of pNPP2- or phosphorylated pyridines. For phosphorylated pyridines βLGwater =
-1.05, while βLG in the presence of 0.33 M Mg2+ = -1.02,99 indicating Mg2+ causes no
change in the associative character of the transition state (Table 1-2). Yet, the presence
of such metals can have different effects upon hydrolytic rates that are compound specific
(Table 1-4). Reflecting their nature as Lewis acids, metals have catalytic interactions
with negatively charged leaving groups in the transition state.37,99 With phosphorylated
pyridines such interactions are not available. The metals still interact with the non-
bridging oxygens, and do so in an anti-catalytic manner.
Under more alkaline conditions, pH 9.1 versus 8.0, magnesium accelerates
hydrolysis of phosphoramidates. A metal-coordinated hydroxide is generated, which is a
stronger nucleophile than water. The oxygens of the phosphate moiety can coordinate to
magnesium, bringing the hydroxide in close proximity to the phosphorus (Figure 1-41).

38
The combined effects of generation of a strong nucleophile and intramolecularity serve to
facilitate catalysis.37,106
Table 1-4. Hydrolytic rates (s-1) for pNPP dianion, phosphopicoline monoanion,106 and
PIm monoanion107 in the presence of metals.
Rate (Rate enhancement) Species
Temp (oC) pH No metal Mg2+ Ca2+ Zn2+
pNPP2- 39.2 9.1 1.7x10⁻⁸ 1.4x10⁻⁸ a (0.8) 4.8x10⁻⁸ a (2.8) 25 8.0 1.6x10⁻³ 1.2x10⁻³ a (0.8) * Phospho-
Picoline- 25 9.1 1.6x10⁻³ 2.4x10⁻³ a (1.5) * PIm- 40.1 5.1 1.73x10⁻⁵ 1.18x10⁻⁵ a (0.7) 1.45x10⁻⁵ b (0.8) PIm- 81.6 4.5 2.00x10⁻⁵ 1.45x10⁻⁵ c (0.7)
*Rate constant could not be calculated from apparent rate constant because Ka for MPP
with Ca2+ was not determined. However, adjusted rate constant would be lower than
apparent rate constant, indicating Ca2+ is inhibitory. a – 0.33 M for metal, b – 0.117 M
for metal, c – 0.12 M for metal.
Figure 1-41. Magnesium is catalytic under alkaline conditions.
Zinc coordination lowers the pKa of water from 15.7 to 9.5. Depending upon the
number and types of ligands it can lower the pKa further to between 5 and 9.108,109
Variability of the resulting pKa of water results in flexibility of the resulting hydroxide.
Coordinated water with a low pKa can be readily deprotonated, making it a much better
nucleophile than water with a higher pKa.

39
If the coordinated water is to serve as a general base an enzyme’s coordination
sphere may be tailored to generate a metal coordinated hydroxide with a pKa to match the
compound that must be deprotonated by the hydroxide. This may give the enzyme
greater specificity for substrates. In general, hydroxyl species that can access zinc’s
coordination sphere will experience a lowered pKa, including serine. AP’s S102 has a
pKa of less than 5.5, a reflection of its coordination to zinc.
Zinc is able to form catalytic mononuclear and dinuclear complexes. A
mononuclear complex has been observed with Zn2+, pyridine-2-carbaldoxime, and PIm
(Figure 1-42). An entropy change from -5.2 eu for the uncatalyzed reaction to -28.3 eu
for the catalyzed reaction is observed. The Zn2+-PCA catalyzed reaction is 1x10³ times
faster for PIm.91 In addition, dinuclear Zn2+ complexes catalyze the cleavage of 2-
hydroxypropyl-4-NPP and RNA. In these reactions entropic advantages occur.37,91 It is
obvious that one of the roles of zinc is to bring the reactants together.
Figure 1-42. Zinc catalyzes hydrolysis of PIm by bringing reactants in close proximity.
40
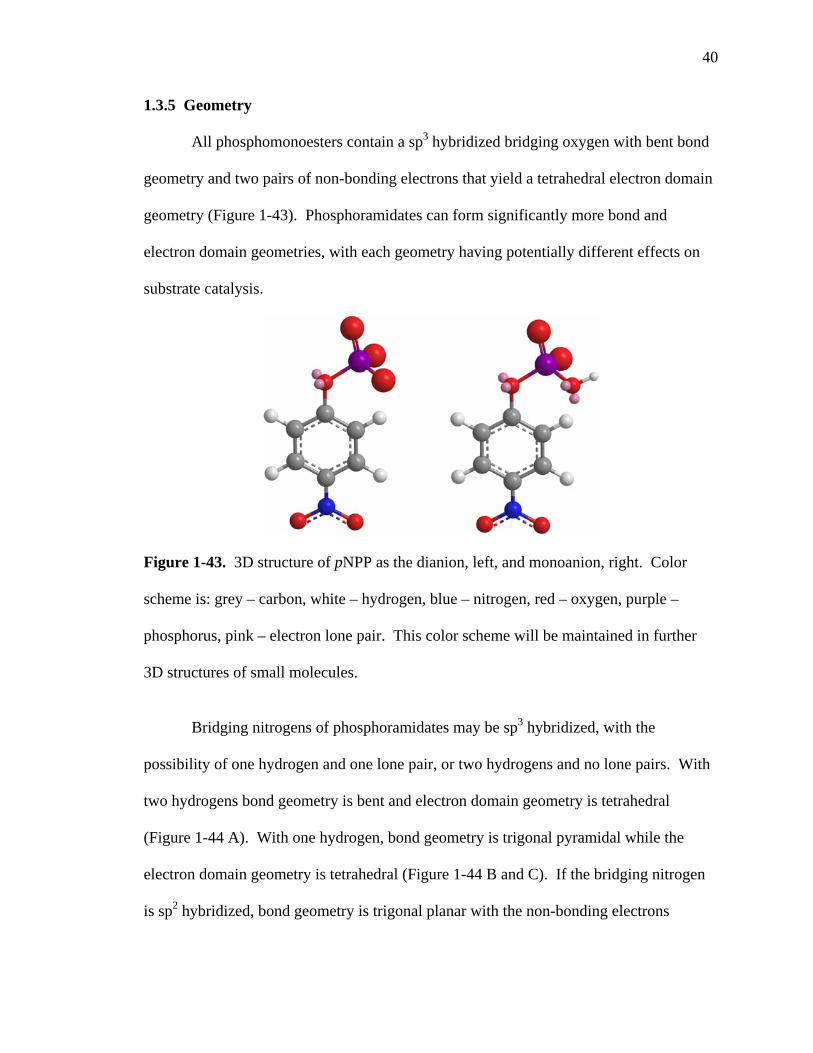
1.3.5 Geometry All phosphomonoesters contain a sp3 hybridized bridging oxygen with bent bond
geometry and two pairs of non-bonding electrons that yield a tetrahedral electron domain
geometry (Figure 1-43). Phosphoramidates can form significantly more bond and
electron domain geometries, with each geometry having potentially different effects on
substrate catalysis.
Figure 1-43. 3D structure of pNPP as the dianion, left, and monoanion, right. Color
scheme is: grey – carbon, white – hydrogen, blue – nitrogen, red – oxygen, purple –
phosphorus, pink – electron lone pair. This color scheme will be maintained in further
3D structures of small molecules.
Bridging nitrogens of phosphoramidates may be sp3 hybridized, with the
possibility of one hydrogen and one lone pair, or two hydrogens and no lone pairs. With
two hydrogens bond geometry is bent and electron domain geometry is tetrahedral
(Figure 1-44 A). With one hydrogen, bond geometry is trigonal pyramidal while the
electron domain geometry is tetrahedral (Figure 1-44 B and C). If the bridging nitrogen
is sp2 hybridized, bond geometry is trigonal planar with the non-bonding electrons

41
participating in aromaticity within the ring (Figure 1-44 D and E). For imidazole,
protonation of N3 will have no effect on bond or electron domain geometry.
Figure 1-44. Bond and electron domain geometries of the bridging nitrogen for N-
methyl phosphoramidate (A & B), N-phPAM (C), phosphopyridine (D), and PIm (E).
For PIm, as the pH decreases, protonation occurs on the imidazole moiety,91 most
likely on the non-bridging nitrogen. Protonation of the bridging nitrogen would result in
loss of aromaticity.
The information presented heretofore is not a complete review of what is known
about phosphomonoester and phosphoramidate hydrolysis. What has been presented
provides comparisons between phosphomonoesters and phosphoramidates. An
examination of physiological substrates has been readied with this information as
background.
1.3.6 Phosphorylated Amino Acids
Amino acids that can form phosphoesters are serine, threonine, and tyrosine,
while those that can form phosphoramidates are lysine, arginine, and histidine.
Phospholysine and phosphoarginine are the most labile of these phosphorylated species.
Much justification for instability can be attributed to pKa. At physiological pH,
A Bent,
tetrahedral
B Trigonal
pyramidal, tetrahedral
C Trigonal
pyramidal, tetrahedral
D Trigonal planar,
aromatic/trigonal planar
E Trigonal planar,
aromatic/trigonal planar
42
phospholysine and phosphoarginine will be protonated on the bridging nitrogen. Only
phosphohistidine will exhibit stability due to its pKa being slightly below physiological.
It will require a slightly acidic environment to activate the imidazole leaving group.
As mentioned previously, different enzyme classes have different catalytic motifs.
Some motifs protonate the bridging oxygen as part of catalysis. A case could arise
wherein a phosphoramidate with an already protonated and charged sp3 bridging nitrogen
binds at the active site. The nitrogen cannot accept another proton before breaking the P-
N bond; it may only be protonated during or after cleavage of the bond. What affect
timing has on protonation of the bridging atom and enzyme catalysis is uncertain. Also
covered were the effects of divalent metals on non-enzymatic catalysis of
phosphoramidates. What affect these same metals have on phosphoramidate catalysis
when enzyme-bound is uncertain. The geometries of phosphoesters and
phosphoramidates can be similar with sp3 nitrogens, or quite different, as with sp2
nitrogens. What affect these differences have on enzyme catalysis is uncertain. With the
differences between phosphomonoesters and phosphoramidates identified, it cannot then
be anticipated that all motifs will catalyze hydrolysis of phosphoesters and
phosphoramidates. Differences in the two types of substrates may be sufficient to
prevent catalytic promiscuity. On the other hand, there are similarities in the substrates
that may allow enzymes to hydrolyze both phosphomonoesters and phosphoramidates.
1.3.7 Substrates used in Study
Small molecule substrates used in this study are pNPP, N-phPAM, and PIm. The
ester bond of pNPP closely resembles that of phosphotyrosine, although the electron
withdrawing nitro group of pNPP helps stabilize charge on the bridging oxygen during

43
hydrolysis. N-phPAM is isoelectronic and isosteric with pNPP; it is isosteric with
phospholysine.
PIm is analogous to phosphohistidine, but differs in the lack of an alkyl
substituent at C4. In phosphorylation of histidine, preference is to nitrogen 3 simply
because it is less hindered. This point is not trivial, as kinases are selective for which
nitrogen is phosphorylated. PHPT1 demonstrated specificity in dephosphorylating
nitrogen 3 over nitrogen 1.2
The predominant protonation state of the substrates is determined by the assay pH
and pKa (Figure 1-45) N-phPAM was determined to have a pKa of 7.05110 with
protonation occurring on the phosphate oxygen.
Figure 1-45. Substrates and leaving groups with pKas.
Comparing the rate constants of the three substrates provides insight to the
relative ability of a particular motif to hydrolyze bonds similar those found in
phosphorylated proteins. The ability of a motif to catalyze hydrolysis of various
substrates is a demonstration of catalytic promiscuity. Catalytic promiscuity may exist
even if there are differences in the rate constants with the different substrates.
44
1.3.8 Considerations for Benchtop Handling of Phosphoramidates
As discussed above, phosphoramidates are several orders of magnitude more
labile than phosphate monoesters. Experience with N-phPAM demonstrates that even
under alkaline solutions significant hydrolysis occurs.
To minimize contact with water the compounds were isolated in the solid form.
Storing under inert gas and at cold temperatures was also done to slow degradation.
When preparing the compounds for use, they were dissolved in alkali media. The
minimum concentration of hydroxide was used to maintain high pH while not causing
high ionic strength of enzymatic reaction mixtures. With the general concepts of bench
top handling of the compounds in hand, synthetic routes, isolation, and storage can be
examined.

45
CHAPTER 2
MATERIALS AND METHODS
2.1 Initial Considerations
Kinetic constants were obtained by fitting kinetic data to the Michaelis-Menton
equation (2.1) to determine Vmax and KM.
Vobs is the observed velocity in units of Ms-1, [S] is the substrate concentration in units of
M, KM is the Michaelis constant in units of M, and Vmax is the velocity of the reaction
when all active sites of the enzyme are occupied by substrate. The value of kcat, units of
s-1, is given by
Vmax = kcat[E]
where [E] is the enzyme concentration. A second order rate constant is given from the
ratio of kcat/KM, units of M-1s-1. Comparing the enzymatic rate constant against the un-
catalyzed rate constant provides a measure of the enzymes catalytic efficiency.
The Michaelis-Menton equation is based upon consumption of a substrate as
represented by equation (2.3). In order to satisfy the assumptions of steady-state kinetics
typically less than 5% of the reaction is measured. The initial rate data obtained is used
to fit to equation 2.1.
Preconditions to this modus operandi are that the substrate can be synthesized and
isolated in reasonably pure form; that the substrate will not spontaneously and rapidly
(Vmax)[S]
KM + [S] Vobs
(2.2)
(2.1)
(2.3)

46
hydrolyze, masking enzymatic hydrolysis while also generating significant
concentrations of inhibitor; and that there is a way to monitor the reaction for a mere 5%
of the reaction. Phosphoramidates challenge all of these preconditions, likely explaining
why such experiments are scant in the literature.
With phosphatase assays a common contaminant that will cause difficulties is
inorganic phosphate, Pi. Phosphatases can have low inhibition constants, Ki, with Pi, so
elimination of Pi from the substrate preparation is critical (Table 2-1). For the three
substrates used in this study, different protocols were employed to isolate the products
and control concentrations of Pi.
Table 2-1. Published inhibition values, Ki, with Pi for enzymes used in this study.
Enzyme Phosphate Ki (mM)
Ref
AP 0.0143, 0.001 37,111 λPP 0.71 58
PAcP 0.8 112,113VHR 0.97 42 YopH 6.1, 5.5 26,27 PHPT1 1.1 20
2.2 Synthetic Protocols
2.2.1 General Procedures
Pyridine and methylene chloride were distilled after being refluxed over CaH2 and
used immediately. Methanol was sparged with nitrogen gas for an hour and used
immediately. Diethyl ether was distilled after being refluxed over sodium and used
immediately. Aniline was purchased from Fisher. It was purified by simple distillation,
followed by storage in the dark under nitrogen gas. Acetone and ethyl acetate were
purchased from Fisher and used as supplied. Phosphorus oxychloride, para-nitro phenol,

47
benzyl alcohol, trichloro phosphite, palladium on carbon, and imidazole were purchased
from Aldrich and used as supplied. Triethyl amine was purchased from Fisher. It was
kept over sodium hydroxide and distilled prior to use. 1H NMR spectra were obtained at
300 MHz (JEOL, Tokyo, Japan) with TMS as an internal standard in CDCl3; external
standard, when used, was pyrazine. 31P NMR spectra were obtained at 122 MHz (JEOL,
Tokyo, Japan). UV/Vis spectra requiring 1 or 0.1 cm path length cells were obtained on
a Cary 50 (Agilent Technologies, agilent.com/chem); assays suitable for 96 well plates
used Costar 96 well flat-bottomed 330 μL plates read in a Molecular Devices
VERSAMax microplate reader.
2.2.2 pNPP, disodium salt.
The disodium salt of pNPP was prepared following literature procedures (Figure
2-1).114 Phosphorus oxychloride (30 mL, 320 mmol, 1.5 eq) was dissolved in freshly
distilled anhydrous pyridine (205 mL) to make a 1.6 M solution. pNP, (27.8 g, 200
mmol, 1 eq) was dissolved in pyridine (100 mL) to make a 2 M solution and placed in an
addition funnel. The reaction was run under dry nitrogen at 0 oC. After slow addition of
pNP with stirring, the mixture stood for 30 minutes, upon which the mixture was slowly
poured into 400 mL of cold water. The resulting solution was titrated to pH 7~8 with 4 N
NaOH. The product was isolated by evaporation under reduced pressure and purified by
crystallization.115 After dissolving the crude product in 90% cold methanol (20 mL
MeOH per 1 g crude) and filtering, an equal volume of acetone was added to the filtrate.
The solution stood at 4 oC overnight, whereupon the resultant crystals were filtered and
washed with acetone. The crystals were air-dried on a Buchner funnel for thirty minutes.
The product was kept at 4 oC.
48
While it would seem counterintuitive to not dry the product as thoroughly as
possible, literature precedent indicated complete removal of water caused more
hydrolysis than leaving the product as a hydrate.115 The product was stored both as a
hydrate and after removing water via high vacuum with moderate heat. NMR confirms
that less hydrolysis was obtained with air drying. Further, storage at 4 oC was sufficient
to minimize hydrolysis in the solid state, and made handling easier when introducing the
product to the bench.
Figure 2-1. Synthesis of pNPP.
1H NMR (300 MHz, D2O): δ 7.2 (d, J=7.6 Hz, 2H), 8.1 (d, J=9.4 Hz, 2H); 31P NMR (122
MHz, D2O) δ 0.24 (Figures A1 and A2).
2.2.3 N-phenyl phosphoramidate
N-phenyl phosphoramidate was synthesized following the general scheme depicted in
Figure 2-2.
2.2.4 Tribenzyl phosphite, (Figure 2-3)116
Trichloro phosphite (2.56 mL, 29 mmol, 1 eq) and triethyl amine (12.5 mL, 89
mmol, 3.1 eq) were dissolved in freshly distilled anhydrous diethyl ether (150 mL) for a
0.2 M PCl3 solution in a round bottom flask with stir bar. Benzyl alcohol (8.9 mL, 86
mmol, 3 eq) was dissolved in 30 mL ether for a 2.9 M solution that was placed in an

49
PClCl
Cl+
OH
PO
OBnBnONH
PO
OBnBnONH H2, Pd/C,Et3N
PO
OHONH
CH2Cl2,
Et3N
Et2O,O
3P
O
3P
+ I2
Et3NH
NH2
MeOH
PO
OHONH
Et3NH
MeOH
NaOHPO
OHONH
Na
Figure 2-2. General synthetic scheme for N-phenyl phosphoramidate. Literature
protocols116,117 did not provide a direct route to the product.
addition funnel. The apparatus was purged with and reaction maintained under nitrogen.
The round bottom flask was cooled to -78 oC in a dry ice/acetone bath. The benzyl
alcohol was slowly added to completion. The mixture was brought to room temperature
over a 14 hour period and filtered. The filtrate was evaporated under reduced pressure.
The clear-colorless, oily product was used without purification. It was maintained under
nitrogen, in dark, at room temperature. The product rapidly degrades on normal phase
silica gel, even if triethylamine is added to the eluent, precluding purification in this
50
manner. NMR indicated the product was reasonably clean after high vacuum and was
used as is for the next step.
Figure 2-3. Synthesis of tribenzyl phosphite.
1H NMR (300 MHz, CDCl3): δ 4.9 (d, J =7.9 Hz, 6H), 7.3 (m, 15H); 31P NMR (122
MHz, CDCl3) δ 140.2 (Figures A3 through A5).
2.2.5 Dibenzyl N-phenyl phosphoramidate (Figure 2-4)117
Iodine (0.51 g, 1.95 mmol, <1 eq) was dissolved in 5 mL methylene chloride for a
0.4 M solution and placed in an addition funnel; it takes several hours for the iodine to
completely dissolve. Freshly distilled aniline (0.28 g, 3 mmol, 1.5 eq) was dissolved in 5
mL methylene chloride for a 0.6 M solution and placed in an addition funnel.
Tribenzyl phosphite (0.67 g, 2 mmol, 1 eq) was dissolved in 3 mL methylene chloride for
a 0.6 M solution. The addition funnels were placed over a round bottom flask holding the
tribenzyl phosphite, the system flushed with nitrogen, and cooled to 0 oC. The iodine
solution was slowly added with stirring to the tribenzyl phosphite. Less than 1 eq of
iodine was used, keeping the reaction clear and colorless. Excessive iodine causes the
reaction mixture to turn pink, lowers yield, and makes clean-up difficult. The mixture
was maintained at 0 oC for one hour, whereupon aniline was slowly added with stirring.
The reaction was maintained at 0 oC for twenty minutes, brought to room temperature,
kept for two hours, and evaporated under reduced pressure. The crude product was
partitioned between 25 mL of diethyl ether and 25 mL 2 N HCl. The organic layer was

51
washed twice with 25 mL of 2 N HCl, once with 25 mL of brine, dried over magnesium
sulfate, filtered, and evaporated under reduced pressure. Purification was completed
isocratically by normal phase silica chromatography (50/50 Hex/EtOAc). The product, a
white solid, was further purified by recrystallization (80/20 hexane/ethylene chloride).
Crystals were dried under vacuum and kept at -10 oC under nitrogen.
Figure 2-4. Synthesis of dibenzyl N-phenyl phosphoramidate.
1H NMR (300 MHz, CDCl3): δ 5.1 (m, 4H), 7.0 (t, J =7.6, 3H), 7.2 (m, 2H), 7.3 (m,
10H); 31P NMR (122 MHz, CDCl3) δ 3.1 (Figures A6 through A8).
2.2.6 N-phPAM triethyl ammonium salt (Figure 2-5)117
Dibenzyl N-phenyl phosphoramidate (2.2 g, 6.1 mmol, 1 eq), triethylamine (2.2
mL, 15 mmol, 2.5 eq), palladium on carbon (0.86 g of 5%), 40 mL of methanol, and a stir
bar were placed in a three neck flask fitted with a hydrogen filled balloon. The vessel
was evacuated three times followed by flushing with nitrogen. Hydrogen gas supplied by
balloon and vigorous stirring initiated. After thirty minutes, one benzyl group was
removed and the palladium had become poisoned. The reaction was quenched by
filtration of the palladium catalyst over celite. Repeating the above procedure using the
same quantities removed the second benzyl group. The solid white precipitate was
isolated by evaporation under reduced pressure. Recrystallization was effected using
85/10/5 hexane/dichloro ethane/ethyl acetate. The product is stored at -10 oC under N2.
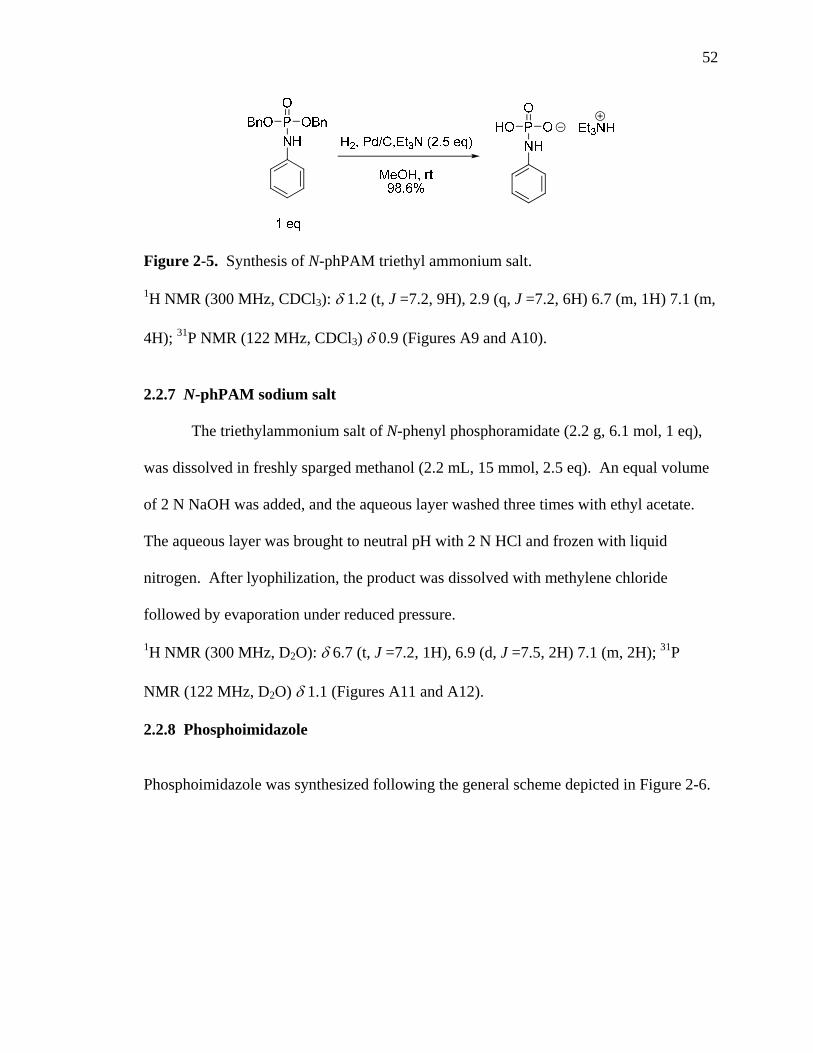
52
Figure 2-5. Synthesis of N-phPAM triethyl ammonium salt.
1H NMR (300 MHz, CDCl3): δ 1.2 (t, J =7.2, 9H), 2.9 (q, J =7.2, 6H) 6.7 (m, 1H) 7.1 (m,
4H); 31P NMR (122 MHz, CDCl3) δ 0.9 (Figures A9 and A10).
2.2.7 N-phPAM sodium salt
The triethylammonium salt of N-phenyl phosphoramidate (2.2 g, 6.1 mol, 1 eq),
was dissolved in freshly sparged methanol (2.2 mL, 15 mmol, 2.5 eq). An equal volume
of 2 N NaOH was added, and the aqueous layer washed three times with ethyl acetate.
The aqueous layer was brought to neutral pH with 2 N HCl and frozen with liquid
nitrogen. After lyophilization, the product was dissolved with methylene chloride
followed by evaporation under reduced pressure.
1H NMR (300 MHz, D2O): δ 6.7 (t, J =7.2, 1H), 6.9 (d, J =7.5, 2H) 7.1 (m, 2H); 31P
NMR (122 MHz, D2O) δ 1.1 (Figures A11 and A12).
2.2.8 Phosphoimidazole
Phosphoimidazole was synthesized following the general scheme depicted in Figure 2-6.
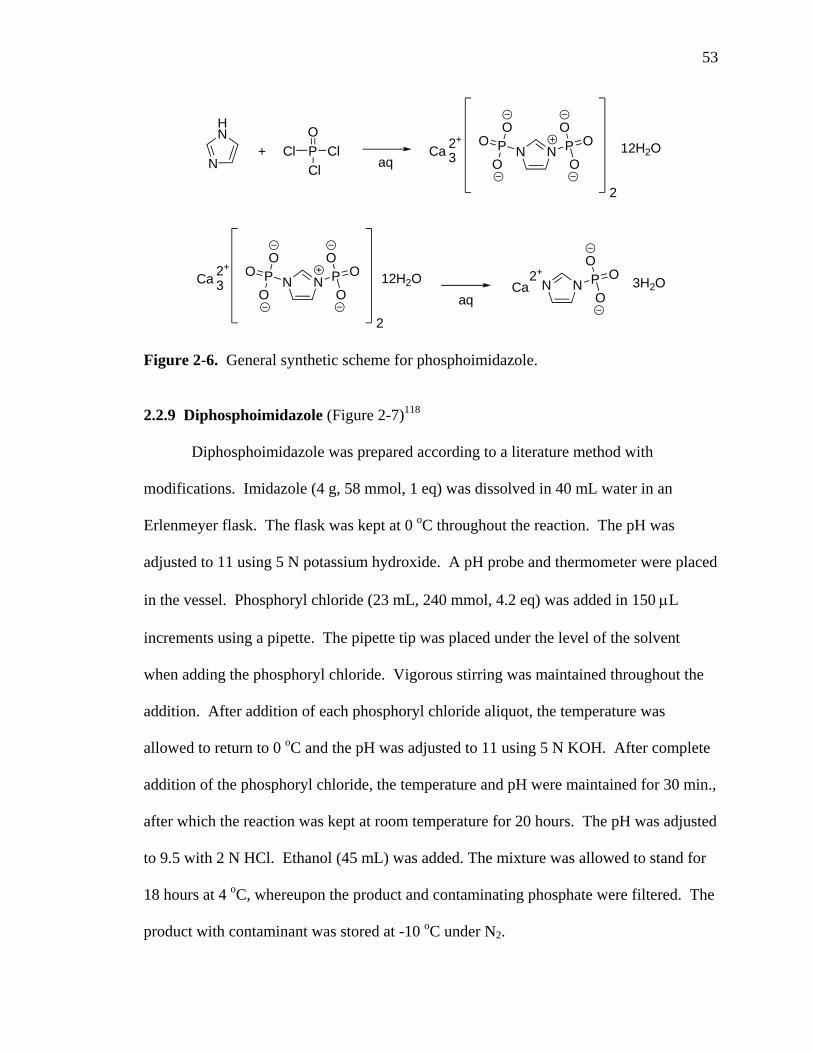
53
NN PPO OO
O
O
O
2
12H2O NN P OO
OCa 3H2O
N
HN O
PClCl
Cl NN PPO OO
O
O
OCa
2
312H2O+
aq
aq2+
Ca 32+
2+
Figure 2-6. General synthetic scheme for phosphoimidazole.
2.2.9 Diphosphoimidazole (Figure 2-7)118
Diphosphoimidazole was prepared according to a literature method with
modifications. Imidazole (4 g, 58 mmol, 1 eq) was dissolved in 40 mL water in an
Erlenmeyer flask. The flask was kept at 0 oC throughout the reaction. The pH was
adjusted to 11 using 5 N potassium hydroxide. A pH probe and thermometer were placed
in the vessel. Phosphoryl chloride (23 mL, 240 mmol, 4.2 eq) was added in 150 μL
increments using a pipette. The pipette tip was placed under the level of the solvent
when adding the phosphoryl chloride. Vigorous stirring was maintained throughout the
addition. After addition of each phosphoryl chloride aliquot, the temperature was
allowed to return to 0 oC and the pH was adjusted to 11 using 5 N KOH. After complete
addition of the phosphoryl chloride, the temperature and pH were maintained for 30 min.,
after which the reaction was kept at room temperature for 20 hours. The pH was adjusted
to 9.5 with 2 N HCl. Ethanol (45 mL) was added. The mixture was allowed to stand for
18 hours at 4 oC, whereupon the product and contaminating phosphate were filtered. The
product with contaminant was stored at -10 oC under N2.

54
Figure 2-7. Synthesis of diphosphoimidazole.
1H NMR (300 MHz, D2O): δ 7.3 (s, 2H), 8.3 (s, 1H); 31P NMR (122 MHz, D2O) δ -3.8
(Figures A13 and A14).
2.2.10 Monophosphoimidazole (Figure 2-8)119
Monophosphoimidazole was prepared according to a literature method with
modifications. Diphosphoimidazole (2.1 g, 0.0027 mol, 1 eq) was dissolved in 140 mL
water, the pH brought to 12.5, and the solution kept at 50 oC for 12 hours. Monitoring
the reaction via chromatography is problematic. The reaction was monitored by 1H
NMR. As the reaction progresses, starting material, product, and any contaminating Im
can be seen (Figures 2-21 and 2-22). When the reaction was complete the mixture was
cooled to 0 oC and filtered. The filtrate was adjusted to pH 8.5 with 5 M HCl. Calcium
chloride dihydrate (1.41 g, 0.0096 mol, 3.6 eq) was dissolved in the minimum quantity of
water and the pH was adjusted to pH 8.5. This was added to the filtrate, and the resulting
mixture filtered; the filtered precipitate was discarded. Three volumes of ethanol were
added to the filtrate, and the mixture was cooled to 4 oC for 4 hours. The resulting
monophosphoimidazole was filtered, washed with 75% ethanol, ethanol, and diethyl
ether. It was dried via high vacuum, placed in a 50 mL cylindrical vial, flushed with dry
nitrogen, and stored as the calcium salt. The calcium salt is insoluble in water and is
stable at room temperature. Prior to use, the calcium must be exchanged for sodium.

55
This is effected by incubating the calcium salt with Amberlite IRC 748 cation exchange
resin at a ratio of 20 g resin for 1 g phosphoimidazole at pH 8.5 for exactly 30 minutes.
The resulting PIm concentration was determined via NMR using a pyrazine standard of
known concentration.
Figure 2-8. Synthesis of monophosphoimidazole.
1H NMR (300 MHz, D2O): δ 6.9 (s, 1H), 7.1 (s, 1H), 7.7 (s, 1H); 31P NMR (122 MHz,
D2O) δ -4.0 (Figures A15 and A16).
2.3 Enzyme Preparation
2.3.1 Human PHPT1
The pNIC28-Bsa4 vector containing the human PHPT1 gene with His tag was a
gift from Martin Hammarstrom, M. Sc., Ph.D., Karolinska Institutet Structural Genomics
Consortium. Expression and purification were as described in the literature.20,120 DH-5α
cells (0.5 mL) were transformed with 2 μL of vector at 42 oC for 1 minute. The cells
were then placed on ice for 30 minutes. The cells were placed in 400 μL of growth
media (10 g/L tryptone, 5 g/L yeast extract, 5 g/L NaCl), and shaken at 37 oC for 1.5
hours. They were plated on growth media containing kanamycin (0.035 g/L) and grown
at 37 oC for 24 hours. A small scale growth was completed by selecting colonies and
inoculating two 50 mL tubes of growth media with kanamycin. DNA was removed via a

56
QIApre Spin Miniprep Kit (250). Concentration was determined by a Nanodrop ND-
1000 spectrophotometer from Thermo Fisher Scientific. An aliquot of DNA was sent to
USU’s Center for Integrated Biotechnology, CIB, for sequencing, which confirmed
vector contained the desired gene.
BL21 (DE3) cells were transformed with 2 μL of vector at 42 oC for 1 minute.
The cells were then placed on ice for 30 minutes. The cells were placed in 400 μL of
growth media (10 g/L tryptone, 5 g/L yeast extract, 5 g/L NaCl), and shaken at 37 oC for
1.5 hours. They were plated on growth media containing kanamycin (0.035 g/L) and
grown at 37 oC for 24 hours. A small scale growth was completed by selecting colonies
and inoculating two 50 mL tubes of growth media with kanamycin. After completing a
small scale growth, a large scale growth was completed using 3 L of growth media. After
inoculating the media, cells were grown at 37 oC until the OD600 was 1.8~2, whereupon
protein expression was induced by the addition of 0.5 mM isopropyl thiogalactaside,
IPTG. After overnight incubation, cells were harvested by centrifugation, RCF (g) 6816,
25 minutes at 4 oC. Cells were frozen at -80 oC.
Cells were placed in 40 mL lysis buffer (0.05 M sodium phosphate, 0.5 M NaCl,
0.01 M Im., 0.0005 M TCEP, 10% glycerol, 0.3 μM aprotinin, 4 μM leupeptin, 4 μM
pepstatin, titrated to pH 7.5) and thawed. Lysis was completed with ten iterations, seven
cycles per iteration, of sonication. The lysate was centrifuged, RCF (g) 52648, for 45
minutes at 4 oC.
The supernatant was added to nickel resin (10 mL) and mixed on a rotator-mixer
for an hour at 4 oC. The solution was centrifuged at 1,500 rpm for 10 minutes,
whereupon the supernatant was discarded. Bind/wash buffer (0.05 M sodium phosphate,

57
0.5 M NaCl, 0.01 M Im., 0.0005 M TCEP, 10% glycerol, pH 7.5) was added, mixed for
ten minutes, centrifuged, and the supernatant discarded; this step was repeated. Protein
was eluted isocratically from a 25 mL column at 4 oC (0.05 M sodium phosphate, 0.5 M
NaCl, 0.5 M Im., 0.0005 M TCEP, 10% glycerol, pH 7.5). Fractions were pooled and
dialyzed for 2 hours in dialysis buffer (0.05 M Tris, 0.5 mM EDTA, 10% glycerol, 10
mM DTT, pH 8.0).
Fresh dialysis buffer was added and TEV cleavage protease was added to the
dialysis bag. The solution was kept overnight at 4 oC, whereupon new dialysis buffer
was added (0.05 M sodium phosphate, 0.5 M NaCl, 10% glycerol, 10 mM Im., 0.5 mM
TCEP, pH 8.0); dialysis was run for 2 hours. The solution was equilibrated with the
nickel resin again. TEV protease, cleaved His tags, and un-cleaved protein stick to the
resin, leaving the protein in the supernatant. Protein was concentrated using an Amicon
10,000 MW membrane. Pressure for the concentrator was 20 psi.
The protein was purified by size exclusion chromatography using a SUPERDEX
column (0.02 M HEPES, 0.3 M NaCl, 10% glycerol, 0.5 mM DTT, pH 7.5).
Concentration was accomplished as indicated above (final concentration 300 μmol/L)
and checked using a Nanodrop ND-1000 spectrophotometer from Thermo Fisher
Scientific. Extinction coefficient was determined using protein sequence. Purity was
checked by SDS-PAGE (Figure 2-9). Protein was dialyzed (0.05 M HEPES, 0.3 M
NaCl, 10% glycerol, 0.5 mM DTT), concentrated, the concentration checked (ε 26088
cm-1M-1), and flash frozen in liquid nitrogen. The protein was stored at -80 oC.

58
Figure 2-9. SDS-PAGE of PHPT1. Lanes 1, 2 and 3 are final product. Lanes 4 and 5
are after cleavage with TEV protease.
2.3.2 YopH
BL21 cells with the YopH gene were obtained from lab cell stocks. Expression
and purification were as described in literature.22,35 Pin-head sized aliquots of frozen cell
stocks were used to inoculate small scale (40 mL) growth media (8 g bacto tryptone, 5 g
yeast extract, 5 g NaCl, pH 7.0, 100 μg/mL ampicillin). Cells were grown at 37 oC until
OD660 was ~1, whereupon protein expression was inducted with IPTG (400 μM). After
expression was continued overnight, cells were harvested by centrifugation, RCF (g)
6816, 25 minutes at 4 oC. Cells were frozen at -80 oC.
Cells were placed in 40 mL lysis buffer (100 mM sodium acetate, 100 mM NaCl,
1 mM EDTA, 10% glycerol, 0.3 μM aprotinin, 4 μM leupeptin, 4 μM pepstatin, titrated
to pH 5.7) and thawed. Lysis was completed with ten iterations, seven cycles per
iteration, of sonication. The lysate was centrifuged, RCF (g) 52648, for 45 minutes at 4
oC.
Lysate was bound to a Sephadex C-25 cation exchange column (100 mM sodium
acetate, 100 mM NaCl, 1 mM EDTA, pH 5.7) at 4 oC for 1 hour. Protein was removed
11
17 26 34
kDa L 2 1 5 4 3

59
using gradient elution with increasing concentration of NaCl (100 mM NaCl to 500 mM
NaCl, 100 mM sodium acetate, 1 mM EDTA, pH 5.7).
The protein was purified by size exclusion chromatography using a SUPERDEX
column (100 mM sodium acetate, 100 mM NaCl, 1 mM EDTA, pH 5.7) and concentrated
(final concentration 332 μmol/L) using an Amicon 10,000 MW membrane under 20 psi
of pressure. Purity was confirmed by SDS-PAGE (Figure 2-10). Concentration was
determined using a Nanodrop ND-1000 spectrophotometer from Thermo Fisher
Scientific using an extinction coefficient determined using the protein sequence. (ε
19348 cm-1M-1), and flash frozen in liquid nitrogen. Purified protein was stored at -80
oC.
Figure 2-10. SDS-PAGE of YopH. Lanes 1 and 2 are final product. Lanes 3 through 7
and 8 through 10 are before chromatography.
2.3.3 Alkaline Phosphatase
The pEK154 vector containing the E. coli AP gene was a gift from Prof. John
Peters, Montana State University. Expression and purification were as described in the
literature.111,121 Escherichia coli DH-5α cells (0.5 mL) were transformed by heating with
34
43 56 72
kDa L 1 10 7
17
2 3 8

60
2 μL of vector at 42 oC for 1 minute. The cells were then placed on ice for 30 minutes.
The cells were placed in 400 μL of growth media (8 g/L tryptone, 5 g/L yeast extract, 5
g/L NaCl, pH 7.5), and shaken at 37 oC for 1.5 hours. They were plated on growth media
with ampicillin (0.035 g/L) and grown at 37 oC for 24 hours. A small scale growth was
completed by selecting colonies and inoculating two 50 mL tubes of growth media with
ampicillin. DNA was isolated via a QIAprep Spin Miniprep Kit (250). Concentration
was determined by a Nanodrop ND-1000 spectrophotometer from Thermo Fisher
Scientific.
Escherichia coli BL21 (DE3) cells were transformed following the above
protocol. After completing a small scale growth, a large scale growth was completed
using 3 L of the same growth media. After inoculating the media, cells were grown at 37
oC until the OD600 was 0.5,71 whereupon protein expression was induced by the addition
of 0.5 mM IPTG. After overnight incubation, cells were harvested by centrifugation RCF
(g) 6816, 25 minutes at 4 oC. Cells were frozen at -80 oC.
Cells were thawed in 75 mL of wash buffer (10 mM Tris, 10 mM MgCl2, pH 7.6),
centrifuged RCF (g) 6816, 25 minutes at 4 oC. Washing was repeated once, whereupon
the cells were suspended in 30 mM Tris, pH 7.6. Using the cells in wash buffer, sucrose
was added to 20% weight/volume. EDTA was added to make the solution 5 mM. Cells
were gently stirred for 10 minutes at room temperature. The solution was centrifuged
RCF (g) 6816, 25 minutes at 4 oC. Cells were resuspended in ice water, shaken
vigorously for 10 minutes, and centrifuged, RCF (g) 6816, 25 minutes at 4 oC.
Stock solutions of Tris, MgCl2, ZnCl2 were added to make a final concentration of
10 mM, 100 mM, and 10 mM, respectively, with the final pH being 7.0. The mixture

61
was heated to 80 oC for 10 minutes, cooled in an ice bath, and centrifuged, RCF (g) 6816,
for 15 minutes at 4 oC. Ammonium sulfate was added to the supernatant to 85% of
saturation, followed by centrifugation RCF (g) 6816, 25 minutes at 4 oC. The pellet was
placed in 10 mL of dialysis buffer and dialyzed overnight with two changes of dialysis
buffer (10 mM Tris, 1 mM MgCl2, 0.1 mM NaH2PO4, 0.1 mM ZnSO4, pH 7.0).
Purity was checked by SDS-PAGE (Figure 2-11). The protein was concentrated
(final concentration 49 umol/L) using an Amicon 10,000 MW membrane. Pressure for
the concentrator was 20 psi. Concentration was determined with a Nanodrop ND-1000
spectrophotometer from Thermo Fisher Scientific using an extinction coefficient
determined from the protein sequence (ε 31390 cm-1M-1). Concentrated protein was flash
frozen in liquid nitrogen and stored at -80 oC.
Figure 2-11. SDS-PAGE of AP. Lanes 1 through 6 are final product. Lane 7 is before
purification and concentration.
2.3.4 λPP
The T7-7 vector containing the λPP gene with His tag was a gift from Amy
Rosenzweig and Nicholas Reiter, Northwestern University. Expression and purification
34
43 56 72
kDa L 1 7 6
62
were as described in literature.54,58-60 Escherichia coli DH-5α cells (0.5 mL) were
transformed by heating with 2 μL of vector at 42 oC for 1 minute. The cells were then
placed on ice for 30 minutes. The cells were placed in 400 μL of growth media (8 g/L
tryptone, 5 g/L yeast extract, 5 g/L NaCl, pH 7.5) and shaken at 37 oC for 1.5 hours.
They were plated on growth media containing ampicillin (0.4 mg/L) and grown at 37 oC
for 24 hours. A small scale growth was completed by selecting colonies and inoculating
two 50 mL tubes of growth media with ampicillin (0.4 mg/L). DNA was isolated via a
QIAprep Spin Miniprep Kit (250). Concentration was determined by a Nanodrop ND-
1000 spectrophotometer from Thermo Fisher Scientific. An aliquot of DNA was sent to
USU’s Center for Integrated Biotechnology, CIB, for sequencing, which confirmed the
isolated DNA contained the desired gene.
BL21 (DE3) cells were transformed following the above protocol. After
completing a small scale growth, a large scale growth was completed using 3 L of growth
media. After inoculating the media, cells were grown at 37 oC until the OD600 was 0.7~1,
whereupon protein expression was induced by the addition of 0.3 mM IPTG. After
overnight incubation, cells were harvested by centrifugation, RCF (g) 6816, 25 minutes at
4 oC. Cells were frozen at -80 oC.
Cells were placed in 40 mL lysis buffer (0.025 M Tris, 0.002 M EDTA, 20%
glycerol, 0.3 μM aprotinin, 4 μM leupeptin, 4 μM pepstatin, titrated to pH 7.8) and
thawed. Lysis was completed with ten iterations, seven cycles per iteration, of
sonication. The lysate was centrifuged, RCF (g) 52648, for 45 minutes at 4 oC.
The supernatant was loaded to 250 mL of DEAE Sephadex (25 mM Tris, pH 7.8,
2 mM EDTA) and eluted isocratically while maintaining 4 oC (25 mM Tris, pH 7.8, 100

63
mM NaCl, 2 mM EDTA). Fractions were pooled based upon phosphatase activity with
pNPP. The pooled active fractions were loaded to 100 mL of phenyl Sepharose fast flow
(25 mM Tris, pH 7.8, 500 mM NaCl) and eluted isocratically while maintaining 4 oC (25
mM Tris, pH 7.8, 50% glycerol). Fractions were pooled based upon phosphatase activity
and SDS-PAGE (Figure 2-12), and subsequently dialyzed (9 mM Tris, pH 7.8, 10%
glycerol, 1 mM DTT). The dialysalate was concentrated (final concentration 0.35
μmol/L) using an Amicon 10,000 MW membrane at a pressure of 20 psi. Concentration
was determined with a Nanodrop ND-1000 spectrophotometer from Thermo Fisher
Scientific (ε 40450 cm-1M-1), the concentrated protein was flash frozen in liquid nitrogen
and stored at -80 oC.
Figure 2-12. SDS-PAGE of λPP. Lanes 1 through 7 are final product. Lanes 8 through
10 are before chromatography
2.4 Substrate-Dependent Experimental Techniques and Mathematical Analysis
2.4.1 pNPP
Several techniques were employed to monitor pNPP hydrolysis. When the assay
was conducted under alkaline conditions, the hydrolysis product p-nitrophenolate was
L 9
11
17
26 34
kDa L 8 1 10 7

64
detected directly by UV/Vis (ε p-nitrophenolate 18,300 λmax = 405 nm).122,123 For
reactions at mildly acidic conditions hydroxide was added to quench the reaction and
produce fully ionized p-nitrophenolate.
Enzymatic rates were measured as a function of substrate concentration, followed
by a computerized least squares fit to the Michaelis-Menton equation, to yield Vmax and
KM. The value of kcat was then obtained from Vmax, and the second order rate constant
was had from kcat/KM.
2.4.2 N-phPAM
While a sufficient difference exists between the absorbance spectra of N-phPAM
and aniline to facilitate direct read assays, the difference is small. When using this
technique with N-phPAM, several runs must be made to reduce standard deviation to
acceptable levels. The change in absorbance is a reflection of the change in
concentration of product, or substrate (2.4).
The challenge in the technique is had by considering an example. At pH 7.5 the
difference in extinction coefficient is 415 M-1cm-1. If a 5 mM solution of N-phPAM is
enzymatically hydrolyzed to 5% in a 1 cm cell, the change in absorbance is 0.1 AU.
While this change is small, it is within the ability of the lab’s instrument to detect.
Each enzyme was treated with different concentrations of N-phPAM. Upon
mixing, the absorbance was read. Plots of concentration versus rate, were made, and
least-squares fitted to the Michaelis-Menton equation.
ΔAttl
Δt = l x
ΔCprod
Δtx (εprod - εSM) (2.4)

65
2.4.3 PIm
Enzymatic assays were conducted at, or near, the pH optimum for the enzyme
(see chapter 1). Because of this, assays were conducted at pH 5.5, 6.5, 7.8, and pH 8.0.
A method was needed to detect hydrolysis of PIm at these four pH conditions.
At pH 5.5 the absorbance spectra for PIm and Im are nearly identical making it
impractical to monitor the enzymatic reaction spectrophotometrically (Figure 2-13).
Although at pH 8.0 some absorbance difference existed between PIm and Im, buffers
absorb strongly in the region where the absorbance difference was greatest.
PIm versus ImpH 5.5
0
0.5
1
1.5
2
250 270 290 310 330 350
Wavelength
Abs
orba
nce
PIm Im
PIm versus ImpH 8.0
0
0.5
1
1.5
2
250 270 290 310 330 350
Wavelength
Abs
orba
nce
PIm Im
Figure 2-13. UV/Vis profile for PIm versus Im, both at 1 mM.
Molybdate assays of inorganic phosphate require acidic pH124-132 which result in
significant hydrolysis of PIm; this prohibited their use. Proton NMR was found to be
able to detect hydrolysis of PIm. NMR is not well suited to initial rate methods because
the sensitivity necessary to accurately quantify the first few percent of reaction is lacking.
For this reason, full time course kinetics were carried out.
During full time course experiments significant concentrations of inhibitor Pi are
produced. The Michaelis-Menton equation may be used if modified to account for the
inhibitor concentration (2.5).

66
I is the inhibitor, Ki is the inhibition constant.
Duplicate NMR experiments set at equal time intervals are run until an enzyme
consumes 90% of a substrate, or until the instrument cannot detect an integratable signal
(Figure 2-14). As substrate is converted to product and monitored over time, each NMR
spectrum yields three variables, [S], [I], and Vobs. Reactions are typically assayed at 5
minute intervals for 60 minutes. Least squares fitting of data is accomplished using the
Scientist program by Micromath. A similar technique has been reported.2
Figure 2-14. 1H NMR time course for the hydrolysis of PIm by PAcP at pH 5.5, Δtinterval
= 7 min. Full course not shown for clarity. At the start of the course, unhydrolyzed
substrate is indicated by a maximum signal at 8.6 ppm. As substrate is hydrolyzed, the
Vobs(Vmax)[S]
= KM(1 + [I]/Ki) + [S]
N
N
pyrazine standard
(2.5)
ppm
67
signal at 8.6 ppm disappears, and a new signal appears at 8.7 ppm indicating formation of
free imidazole. The net integration of the signals at 7.5 to 7.6 ppm will remain
unchanged as these signals are the same for the imidazole moiety of PIm and free
imidazole.
When least squares fitting full time course NMR data, the validity of allowing the
computer algorithm to determine the Ki is compared to the published Ki values (Table 2-
1). The same values for Vmax and KM are obtained whether Ki is fixed to the literature
value or allowed to float during the fit.
Substrate and protein concentrations that result in 90% completion within two
hours provide the best results. Consistent with literature precedent, substrate
concentrations greater than the obtained KM yielded the lowest standard deviation.133,134
2.4.3.1 Specific Protocols for PIm Assays
A 0.1 M pyrazine standard was made by dissolving 0.0404 g pyrazine in 5.0 mL
D2O. After incubating the calcium salt of PIm with Amberlite, see section 2.2.10, the
concentration of the PIm was determined by mixing 150 μL of pyrazine standard with
300 μL of PIm, final [pyrazine] = 0.033M, and integrating the proton signals, 1H NMR
(300 MHz, D2O): pyrazine, δ 8.5 (s, 4H); PIm δ 6.9 (s, 1H), 7.1 (s, 1H), 7.7 (s, 1H).
During the determination of PIm concentration a 31P experiment was run to determine if
any contaminating phosphate existed. In all cases, the substrate demonstrated no
contaminating phosphate. With the concentration of the sodium salt of PIm known, the
desired dilution for an enzymatic assay was made; specific concentrations are listed by
enzyme in section 2.5.

68
A 5 mM pyrazine standard was made by diluting 500 μL of 0.1 M pyrazine to 10
mL using D2O. 100 μL of this 5 mM standard was placed into a NMR coaxial tube.
Enzyme, buffer, and PIm were mixed and placed into the NMR tube, see section 2.5, the
coaxial tube placed into the NMR tube, and a series of duplicate NMR experiments run.
Concentrations of buffer varied by enzyme, but always greatly exceeded PIm and
pyrazine concentrations. To mitigate deleterious effects on the signals, offset was 8.1
ppm, and sweep was 3 ppm; pre-saturation of H2O was at 4.7 ppm and 35 db. Other
instrument settings were: scans – 32; prescans – 1; relaxation delay – 1.8 s; scans – 32; x
points – 4096. During the course of a reaction, loss of signal at 6.9 ppm was followed
(Figure 2-14) (Figures A17 through A20).
2.5 Enzymatic Assays
2.5.1 PHPT1
PHPT1 was tested with the substrates pNPP, N-phPAM, and PIm. pNPP assays
were conducted in a 96 well microplate, 330 μL total volume per well, 23 oC, [PHPT1] =
2.41 μM, μ 200 mM, in either 150 mM MES buffer at pH 5.5, or 150 mM EPPS buffer at
pH 8.0. Reactions at pH 5.5 were quenched after 10 minutes with 2N NaOH and read
at λ405. Reactions at pH 8.0 were monitored directly by UV/Vis (ε p-nitrophenolate at pH
8.0 = 16200, λmax = 405nm). pNPP concentrations at both pH conditions were 1, 2.5, 5,
8, 12, and 15 mM.
N-phPAM assays were conducted in quartz cuvettes via direct read, 23 oC,
[PHPT1] = 2 μM, μ 200 mM, 150 mM MES buffer at pH 5.5, λ295, 150 mM EPPS buffer
at pH 8.0, λ295. N-phPAM concentrations at both pH conditions were 1 mM, using a 1

69
cm quartz cell with a reaction volume of 1300 μL, and 4, 8, 12, and 14 mM using 0.1 cm
quartz cells with a reaction volume of 330 μL.
PIm assays were conducted by NMR using tube with coaxial insert holding the
external standard pyrazine, 23 oC, [PHPT1] = 2 μM, μ 100 mM, 150 mM MES buffer at
pH 5.5, or 150 mM EPPS buffer at pH 8.0. PIm concentration at both pH conditions was
6 mM with a total reaction volume of 550 μL. The 1H NMR signals δ = 8.4 ppm at pH
5.5 and δ = 7.9 ppm at pH 8.0 were followed during the time course. Integration was
against pyrazine at δ = 8.5.
2.5.2 YopH
YopH was tested with the substrates pNPP, N-phPAM, and PIm. pNPP assays
were conducted in a 96 well microplate, 330 μL total volume per well, 23 oC, [YopH] =
2.5 nM, μ 200 mM, 150 mM MES buffer at pH 5.5. Reactions were quenched after 1
minute with 2N NaOH and read at 405 nm. pNPP concentrations were 1, 2.5, 5, 7.5, 10,
and 15 mM.
N-phPAM assays were conducted in quartz cuvettes monitored at 295 nm, 23 oC,
[YopH] = 25 nM, μ 200 mM, 150 mM MES buffer at pH 5.5. N-phPAM concentrations
were 1 mM, using a 1 cm quartz cell with a reaction volume of 1300 μL, and 4, 8, 12, and
14 mM using 0.1 cm quartz cells with a reaction volume of 330 μL.
PIm assays were conducted by NMR using a coaxial insert holding the external
standard pyrazine, 23 oC, [YopH] = 120 nM, μ 100 mM, 150 mM MES buffer at pH 5.5.
PIm concentration was 5.5 mM with a total reaction volume of 550 μL. The 1H NMR

70
signal at δ = 8.4 ppm was followed during the time course and integrated relative to the
pyrazine standard at δ = 8.5 ppm.
2.5.3 VHR
VHR was tested with the substrates pNPP, N-phPAM, and PIm. pNPP assays
were conducted in a 96 well microplate, 330 μL total volume per well, 23 oC, [VHR] =
10 nM, μ 200 mM, 150 mM acetate buffer at pH 5.5. Reactions were quenched after 8
minutes with 2N NaOH and read at 405 nm. pNPP concentrations were 1, 2.5, 5, 7.5, 10,
and 15 mM.
N-phPAM assays were conducted in quartz cuvettes monitored at 295 nm, 23 oC,
[VHR] = 300 nM, μ 200 mM, 150 mM acetate buffer at pH 5.5. N-phPAM
concentrations were 1 mM, using a 1 cm quartz cell with a reaction volume of 1300 μL,
and 4, 8, 12, and 14 mM using 0.1 cm quartz cells with a reaction volume of 330 μL.
PIm assays were conducted by NMR using a coaxial insert holding the external
standard pyrazine, 23 oC, [VHR] = 300 nM, μ 200 mM, 150 mM acetate buffer at pH 5.5.
PIm concentration was 5.5 mM with a total reaction volume of 550 μL. The 1H NMR
signal at δ = 8.4 ppm was followed during the time course. Integration was against
pyrazine at δ = 8.5 ppm.
2.5.4 PAcP
PAcP was tested with the substrates pNPP, N-phPAM, and PIm. pNPP assays
were conducted in a 96 well microplate, 330 μL total volume per well, 23 oC, [PAcP] =
500 nM, μ 150 mM, 50 mM acetate buffer at pH 5.5. Reactions were quenched after 6
71
minutes with 2N NaOH and read at 405 nm. pNPP concentrations were 32, 200, 400,
600, and 800 μM.
N-phPAM assays were conducted in quartz cuvettes monitored at 295 nm, 23 oC,
[PAcP] = 81.6 nM, μ 150 mM, 50 mM acetate buffer at pH 5.5. N-phPAM
concentrations were 86, 200, 400, and 600 μM, using a 1 cm quartz cell with a reaction
volume of 1300 μL.
PIm assays were conducted by NMR using a coaxial insert holding the external
standard pyrazine, 23 oC, [PAcP] = 500 nM, μ 150 mM, 50 mM acetate buffer at pH 5.5.
PIm concentration was 3.0 mM with a total reaction volume of 550 μL. The 1H NMR
signal at δ = 8.4 ppm was followed during the time course and integrated relative to the
pyrazine standard at δ = 8.5 ppm.
2.5.5 λPP
λPP was tested with the substrates pNPP, N-phPAM, and PIm. λPP’s behavior
with pNPP followed normal Michaelis-Menton kinetics, but it did not for PIm. To
validate the results with PIm, both NMR and HPLC were used. Because kcat and KM
could not be obtained with PIm, percent hydrolysis after a single fixed time period was
obtained using HPLC. To make a side-by-side comparison of the enzyme’s behavior
with pNPP and PIm, percent pNPP hydrolysis after the same fixed time period was
obtained using HPLC.
Additionally, inhibition assays were conducted with PIm as inhibitor and pNPP as
substrate. Inhibition assays were conducted in a 96 well microplate, 330 μL total volume
per well, [λPP] = 1 nM, μ 200 mM, 150 mM Tris, pH 7.8, 1 mM MnCl2, 10 mM DTT,
72
10% glycerol, 30 oC. pNPP concentrations were 1, 2.5, 5, 10, 15, and 20 mM. PIm
concentrations were 3, 6, 12, 18, and 24 mM. Reactions were monitored at 405 nm.
Data were least squares fitted using the Visual Enzymics Program by SoftZymics.
pNPP activity assays were conducted in a 96 well microplate, 330 μL total
volume per well, [λPP] = 1 nM, μ 200 mM, 150 mM Tris, pH 7.8, 1 mM MnCl2, 10 mM
DTT, 10% glycerol, 30 oC. pNPP concentrations were 1, 2.5, 5, 10, 15, and 20 mM.
Reactions were monitored at 405 nm.
HPLC assays to detect percent pNPP hydrolysis after a single fixed time period
were conducted in 500 μL Eppendorf tubes, [λPP] = 100 nM, μ 150 mM, 1 mM MnCl2,
10% glycerol, 10 mM DTT, 100 mM Tris buffer, pH 7.8, 30 oC. Concentration of pNPP
was 1 mM. Reactions were injected directly into an Agilent Technologies Zorbax
Eclipse Plus C18 column and analyzed by an Agilent 1200 HPLC. The mobile phase
consisted of 42.5% 1 M NH4OH, pH 8.0, and 57.5% MeOH run isocratically at a flow
rate of 1 mL/min. UV/Vis detection was used at 410 nm. Retention time was 6.9 min.
The reference wavelength was 510 nm. Integration was against a calibration curve
developed using the same HPLC settings.
N-phPAM assays were conducted in quartz cuvettes monitored at 295 nm, [λPP]
= 100 nM, μ 200 mM, 1 mM MnCl2, 10% glycerol, 10 mM DTT, 150 mM Tris buffer,
pH 7.8, 30 oC. N-phPAM concentrations were 1 mM, using a 1 cm quartz cell with a
reaction volume of 1300 μL, and 4, 8, 12, and 14 mM using 0.1 cm quartz cells with a
reaction volume of 330 μL.
HPLC assays to detect percent PIm hydrolysis after a single fixed time period
were conducted in 500 μL Eppendorf tubes, [λPP] = 100 nM, μ 150 mM, 1 mM MnCl2,

73
10% glycerol, 10 mM DTT, 100 mM Tris buffer, pH 7.8, 30 oC. Concentration of PIm
was 1 mM. Reactions were injected directly into an Agilent Technologies Zorbax
Eclipse Plus C18 column and analyzed by an Agilent 1200 HPLC. Elution was run
stepwise at a flow rate of 1 mL/min. From 0 to 12 minutes the mobile phase consisted of
42.5% 1 M NH4OH, pH 8.0, and 57.5% MeOH. During the time period from 12 to 16
minutes, the composition of eluent was gradually changed to 100% MeOH. It was held
at 100% MeOH for an additional 2 minutes. UV/Vis detection was used at 209 nm.
Retention time was 15.2 min. The reference wavelength was 360 nm. Integration was
against a calibration curve developed using the same HPLC settings.
Percent hydrolysis for PIm was verified by NMR. Manganese was precipitated
prior to conducting the NMR experiment by EDTA.
2.5.6 PP1γ
Inhibition assays with PIm as inhibitor and pNPP as substrate were conducted in a
96 well microplate, 330 μL total volume per well, [PP1] = 400 nM, 50 mM Tris, 50 mM
Bis-Tris, 100 mM acetate, 0.05 mM MnCl2, pH 6.5, 23 oC. pNPP concentrations were 1,
2.5, 5, 7.5, 10, and 12.5 mM. PIm concentrations were 1, 5, and 10 mM. Reactions were
monitored at 405 nm.
N-phPAM assays were conducted in quartz cuvettes monitored at 293 nm, [PP1]
= 375 nM, 50 mM Tris, 50 mM Bis-Tris, 100 mM acetate, 0.05 mM MnCl2, pH 6.5, 23
oC. N-phPAM concentrations were 1 mM, using a 1 cm quartz cell with a reaction
volume of 1300 μL, and 4, 8, 12, and 14 mM using 0.1 cm quartz cells with a reaction
volume of 330 μL.

74
PIm assays were conducted in 500 μL Eppendorf tubes, [PP1] = 400 nM, 50 mM
Tris, 50 mM Bis-Tris, 100 mM acetate, 0.05 mM MnCl2, pH 6.5, 23 oC. Concentration
of PIm was 1 mM. Reaction progress was analyzed by NMR.
2.5.7 AP
pNPP assays were conducted in a 96 well microplate monitored at 405 nm, 330
μL total volume per well, [AP] = 5 nM, μ 100 mM, 75 mM MOPS at pH 8.0, 23 oC.
pNPP concentrations were 1, 10, 50, 100, 200, 300, 400, and 500 μM.
N-phPAM assays were conducted in quartz cuvettes monitored at 295 nm, [AP] =
1 μM, μ 200 mM, 150 mM MOPS, pH 8.0, 23 oC. N-phPAM concentrations were 0.75
and 1 mM, using a 1 cm quartz cell with a reaction volume of 1300 μL, and 2.5, 5, 7.5,
10, and 15 mM, using a 1 cm quartz cell with a reaction volume of 1300 μL.
PIm assays were conducted using a NMR tube with coaxial insert holding the
external standard pyrazine, [AP] = 500 nM, IS 200 mM, 150 mM MOPS, pH 8.0, 23 oC.
PIm concentration was 15 mM with a total reaction volume of 550 μL. 1H NMR δ 7.9
followed during time course. Integration was against pyrazine, δ 8.5.
2.6 Titration of N-phPAM
The pKa of N-phPAM was determined by 31P NMR titration.110 A coaxial tube
with methylphosphonic acid in D2O was used as an internal chemical shift standard.
N-phPAM was dissolved in buffer (50mM Tris, 50 mM Bis-Tris, 100 mM acetate) and
brought to pH 9.2. The pH of the buffered solution was lowered stepwise using 0.1 M
HCl. 31P NMR chemical shifts were obtained as a function of pH, and the data least
squares fitted against equation 2.6.
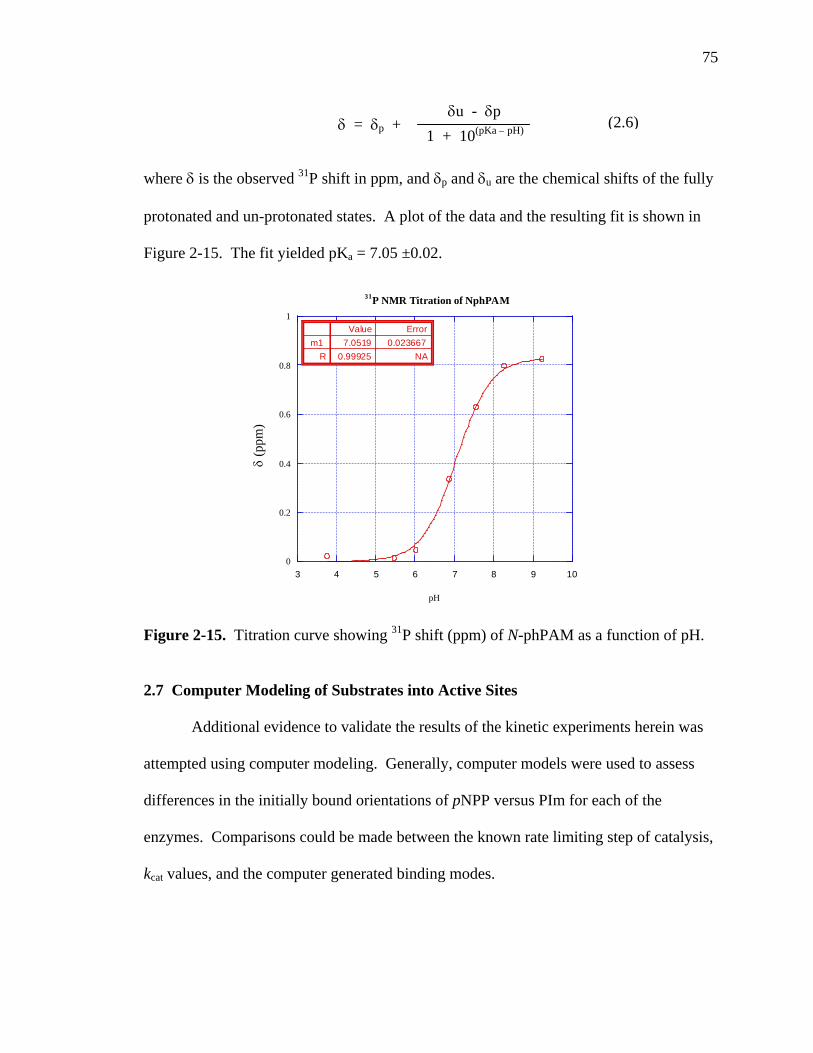
75
where δ is the observed 31P shift in ppm, and δp and δu are the chemical shifts of the fully
protonated and un-protonated states. A plot of the data and the resulting fit is shown in
Figure 2-15. The fit yielded pKa = 7.05 ±0.02.
0
0.2
0.4
0.6
0.8
1
3 4 5 6 7 8 9 10
31P NMR Titration of NphPAM
pH
ErrorValue0.0236677.0519m1
NA0.99925R
Figure 2-15. Titration curve showing 31P shift (ppm) of N-phPAM as a function of pH.
2.7 Computer Modeling of Substrates into Active Sites
Additional evidence to validate the results of the kinetic experiments herein was
attempted using computer modeling. Generally, computer models were used to assess
differences in the initially bound orientations of pNPP versus PIm for each of the
enzymes. Comparisons could be made between the known rate limiting step of catalysis,
kcat values, and the computer generated binding modes.
δ = δp + δu - δp
1 + 10(pKa – pH) (2.6)
δ (p
pm)

76
Kinetic experiments with λPP and PP1 showed significantly different results with
the substrates pNPP versus PIm. The geometric and charge differences between these
substrates are also significant, and computer modeling presented another possibility to
determine if these differences may be the cause for the kinetic results.
Protein Data Bank crystallographic files 2OZW (PHPT1 with phosphate bound),
2I42 (YopH with vanadate bound), 1VHR (VHR with sulfate bound in one structure and
4-(2-hydroxyethyl)-1-piperazine ethanesulfonic acid bound in another), 1ND6 (PAcP
with phosphate bound), 1ED8 (AP with phosphate bound), 1G5B (λPP with sulfate
bound), and 1IT6 (PP1γ with phosphocalyculin A bound) were used for computer
modeling. The files were loaded into Acclerys Design Studio Viewer Pro, version 5.0.
For each enzyme, PIm and pNPP were placed in the active site using the bound
tetrahedral compound shown in the crystal structure as the basis for substrate orientation.
Where multiple possibilities for the bridging atom were possible, all options were tried.
Once the substrates were emplaced, energy was minimized using the Dreiding model.135-
137 Such minimization was attempted in two manners: with just the active site and with
the entire enzyme. Minimization operations were conducted using 200 to 4000 iterations.

77
CHAPTER 3
RESULTS
3.1 Overall Experimental Results
Kinetic data were collected for hydrolysis of the substrates pNPP, N-phPAM, and
PIm for six of seven enzymes assayed (Table 3-1). For each enzyme, kinetic results will
be discussed along with the results of computer modeled fitting of the substrates.
Table 3-1. The kcat, KM, and kcat/KM values for enzymatic substrate hydrolysis.
pH 5.5 kcat KM kcat/KM x 10-3 * Enzyme Substrate (s-1) (mM) (M-1s-1)
pNPP 0.00407 ±0.00007 2.7 ±0.2 0.0015 N-phPAM 0.26 ±0.06 5 ±3 0.05 PHPT1 PIm 2.70 ±0.04 0.13 ±0.02 21 pNPP 610 ±30 3.1 ±0.4 200 N-phPAM 530 ±70 4 ±2 100 YopH PIm 34 ±2 4.9 ±0.5 7 pNPP 5.9 ±0.2 2.0 ±0.2 3.0 N-phPAM 5.8 ±0.6 0.8 ±0.2 7 VHR PIm 7.8 ±0.6 0.58 ±0.09 13 pNPP 2.13 ±0.02 0.23 ±0.04 9.3 N-phPAM 2.5 ±0.1 0.07 ±0.01 40 PAcP PIm 6.0 ±0.4 1.01 ±0.09 5.9
pH 8.0 pNPP 0.0106 ±0.0004 6.3 ±0.6 0.0017 N-phPAM 2.6 ±0.1 10 ±1 0.26 PHPT1 PIm 2.31 ±0.05 0.10 ±0.02 23 pNPP 27.3 ±0.8 0.0070 ±0.0008 3900 N-phPAM 1.30 ±0.09 0.0021 ±0.0002 620 AP PIm 18 ±2 0.0020 ±0.0003 9000
pH 7.8 pNPP138 390 ±10 11 ±1 35 N-phPAM Not detected λPP PIm Not determined
pH 6.5 N-phPAM Not detected PP1γ PIm Not detected
*Values in the column kcat/KM were multiplied by 10-3 for ease of display. Thus, the first
value of 0.0015 M-1s-1 for PHPT1 is actually 1.5 M-1s-1.
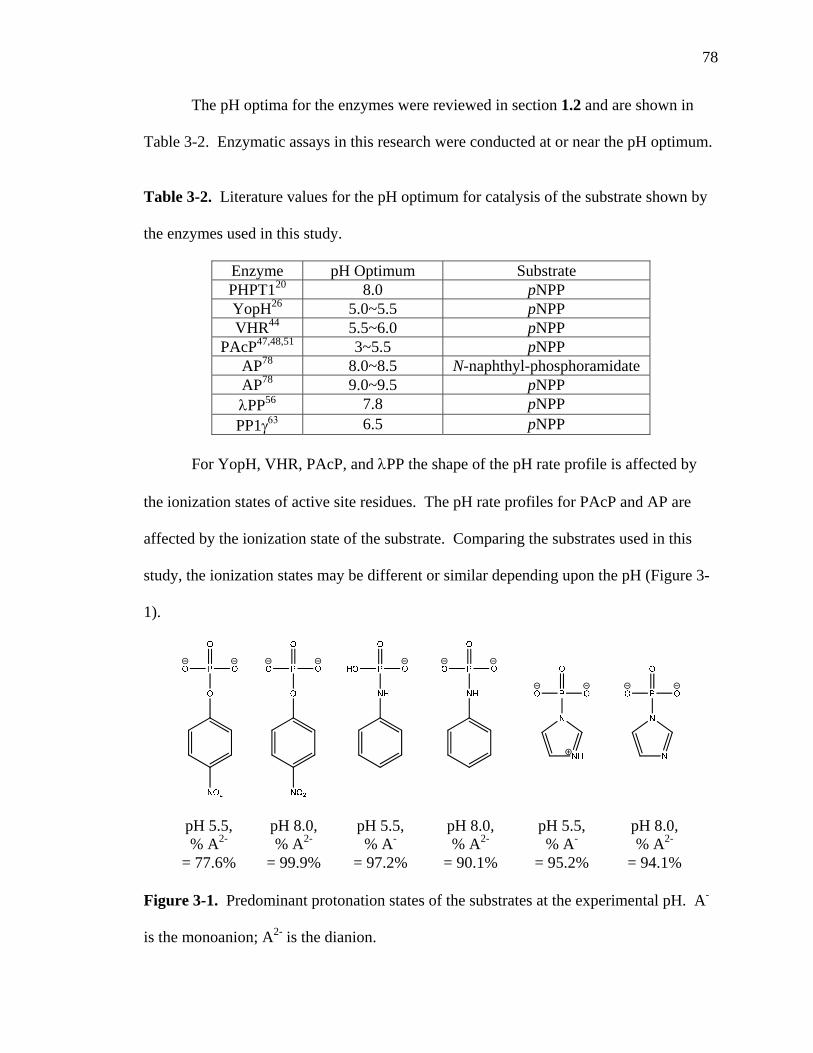
78
The pH optima for the enzymes were reviewed in section 1.2 and are shown in
Table 3-2. Enzymatic assays in this research were conducted at or near the pH optimum.
Table 3-2. Literature values for the pH optimum for catalysis of the substrate shown by
the enzymes used in this study.
Enzyme pH Optimum Substrate PHPT120 8.0 pNPP YopH26 5.0~5.5 pNPP VHR44 5.5~6.0 pNPP
PAcP47,48,51 3~5.5 pNPP AP78 8.0~8.5 N-naphthyl-phosphoramidate AP78 9.0~9.5 pNPP λPP56 7.8 pNPP PP1γ63 6.5 pNPP
For YopH, VHR, PAcP, and λPP the shape of the pH rate profile is affected by
the ionization states of active site residues. The pH rate profiles for PAcP and AP are
affected by the ionization state of the substrate. Comparing the substrates used in this
study, the ionization states may be different or similar depending upon the pH (Figure 3-
1).
Figure 3-1. Predominant protonation states of the substrates at the experimental pH. A-
is the monoanion; A2- is the dianion.
pH 5.5, % A2-
= 77.6%
pH 8.0, % A2-
= 99.9%
pH 5.5, % A-
= 97.2%
pH 8.0, % A2-
= 90.1%
pH 5.5, % A-
= 95.2%
pH 8.0, % A2-
= 94.1%

79
3.2 Results by Enzyme
3.2.1 PHTP1
The substrate PIm exhibited the greatest kcat, lowest KM, and greatest catalytic
efficiency (kcat/KM). The lowest kcat and highest KM with this enzyme were observed with
pNPP, while N-phPAM exhibited intermediate values. Kinetic values for PIm were
remarkably similar at both pH 8.0 and pH 5.5. The enzyme preparation for this project
had kcat and kcat/KM values with pNPP that were about an order of magnitude lower than
reported; literature values were kcat (0.35 s-1) and kcat/KM (47 M-1s-1).20 Two enzyme
preparations were made with the same result. No explanation is provided for this
discrepancy.
Computer modeling found Pi, PIm, and pNPP bind in the active site in the same
orientation, but with different hydrogen bonding and electrostatic interaction distances
(Figures 3-2 through 3-4). This result is consistent with the enzyme hydrolyzing both
PIm and pNPP; both substrates can bind, completing the first step in catalysis. PHPT1’s
binding motif was reviewed in section 1.2.1.
3.2.2 YopH
Catalysis of phosphomonoesters by YopH is one of the fastest displayed by
phosphatases.35 This project is the first to examine YopH’s ability to hydrolyze
phosphoramidates. In this study, YopH showed the highest kcat with pNPP and the lowest
kcat with PIm. It also showed a lower second order rate constant with PIm than with
pNPP.

80
Figure 3-2. Phosphate bound in the active site of PHPT1. Distances are in Å and are
taken directly from crystal structure without modification (PDB 2OZW).
Figure 3-3. pNPP bound in the active site of PHPT1 as modeled in Acclerys.
33..0033 33..0000 22..7766
44..2244 33..0055
22..8899 44..8877
22..9966
33..0033
44..2255
22..9977 33..0000
44..5599
33..1199
SS9944
AA9966 MM9955
HH5533
KK2211
AA5544
SS9944
AA9966
MM9955
HH5533
KK2211
AA5544

81
Figure 3-4. PIm bound in the active site of PHPT1 as modeled in Acclerys.
Differences in kcat between pNPP and PIm were not only large, but the values for
pNPP and N-phPAM were the highest displayed by any of the enzymes assayed in this
study. In contrast, values for KM were of equal order of magnitude. Thus, variation in
the second order rate constants was driven predominantly by differences in kcat. YopH’s
second order rate constants varied in the order pNPP>N-phPAM>PIm.
Computer modeling found Pi, PIm, and pNPP fit in the active site in the same
orientation, but with different hydrogen bonding distances (Figures 3-5 through 3-9).
This result is consistent with the observed ability of the enzyme to hydrolyze both PIm
and pNPP. YopH’s binding motif was reviewed in section 1.2.2.
The computer models indicate a 1.94 Å distance between PIm’s phosphorus and
the nucleophilic cystein’s sulfur (Figure 3-7). Since this distance is likely too short to
represent the position of the substrate and nucleophile prior to catalysis, amino acids
Asn353 through Ala359 were removed from the computer model and the distances
33..2200
33..0000
44..3355
33..0000
44..7755
33..0044
22..9999
SS9944
AA9966
MM9955
HH5533
KK2211
AA5544

82
recalculated for both PIm and pNPP (Figures 3-8 and 3-9). Removal of the sequences
eliminated the flexible WPD loop and any clashes between the loop and substrate. A
phosphorus-sulfur distance of 3.59 Å was found for PIm.
Figure 3-5. Vanadate bound in the active site of YopH. Distances are taken directly
from crystal structure without modification (PDB 2I42).
3.2.3 VHR.
VHR’s kcat values for the three substrates were of the same order of magnitude. In
comparison to the other PTP used in this study, YopH, VHR’s kcat values for pNPP and
N-phPAM were lower by two orders of magnitude, and for PIm was lower by one order
of magnitude. While KM for pNPP was similar between the enzymes, VHR’s KM values
with the phosphoramidates were an order of magnitude lower than for YopH. VHR’s
22..5588
22..6611
33..0099 22..8899
22..9911
22..6688
33..0033 33..1133
22..8822
44..1166
22..5522
CC440033
QQ444466
RR440099
RR440044
DD335566
GG440066VV440077
GG440088 AA440055
EE229900

83
Figure 3-6. pNPP bound in the active site of YopH as modeled in Acclerys.
Figure 3-7. PIm bound in the active site of YopH as modeled in Acclerys.
33..3333
33..0033
33..1111 33..0022
33..1111
33..3300
33..0088 33..3322 22..8811
33..1111 33..6666
22..3322
33..1122
33..0055 22..5555 22..8877
33..1188 22..4499 22..8866
33..4466
22..7700
11..9944
33..9911
CC440033
QQ444466
RR440099
RR440044
DD335566
GG440066VV440077
GG440088 AA440055
EE229900
CC440033
QQ444466
RR440099
RR440044
DD335566
GG440066VV440077
GG440088 AA440055
EE229900
33..8811

84
Figure 3-8. pNPP bound in the active site of YopH with the WPD loop removed as
modeled in Acclerys.
Figure 3-9. PIm bound in the active site of YopH with the WPD loop removed as
modeled in Acclerys.
second order rate constants had the order PIm>N-phPAM>pNPP; this relative efficiency
was driven both by differing kcat and KM values.
33..3300
33..0044 33..8800 33..1144
33..0044
33..5544 33..4488
33..3300
CC440033 QQ444466
RR440099
RR440044
GG440066VV440077
GG440088AA440055
EE229900
33..1144
33..1122
22..4411
22..5588
22..9944
44..4477 22..9933 33..7711
CC440033
QQ444466
RR440099
RR440044
GG440066VV440077
GG440088
AA440055
EE229900
22..8844
44..3399 22..9922
33..0099
33..5599 33..1155

85
Computer modeling found sulfate, PIm and pNPP fit in the active site in the same
orientation (Figures 3-10 through 3-12). The distance between the substrate’s oxyanion
and the amide hydrogen of E126 changes from 3.13 in sulfate to 2.46 with pNPP and
2.09 with PIm. This change is consistent with the lower KMs of the phosphoramidates in
comparison to pNPP. VHR’s binding motif was reviewed in section 1.2.3.
Figure 3-10. Sulfate bound in the active site of VHR. Distances are taken directly from
crystal structure without modification (PDB 1VHR).
3.2.4 PAcP.
The non-specific histidine acid phosphatase PAcP displayed the same order of
magnitude for kcat with the three substrates. The second order rate constants for pNPP
and PIm were of the same order of magnitude, while N-phPAM had the highest rate
33..1133
22..9944
33..2222 33..1122
22..9922
22..7788
33..0055 33..6644
33..5566 22..8899
DD9922
CC112244
RR112255
RR113300
EE112266
SS112299
YY112288

86
Figure 3-11. pNPP bound in the active site of VHR as modeled in Acclerys.
Figure 3-12. PIm bound in the active site of VHR as modeled in Acclerys.
22..8888
33..1155
22..9966
33..9955
22..9922
22..9911
33..5599
33..0088
33..0022
33..0088
22..9955
33..2299
33..2266 33..3388
33..0022
22..9911
33..7733
33..0055
33..2233
22..9999
DD9922 CC112244
RR112255
RR113300
EE112266
SS112299
YY112288
DD9922
CC112244
RR112255
RR113300
EE112266
SS112299
YY112288

87
constant of the three substrates. Differences in the rate constant were driven
predominantly by differences in KM. Relative KM values were PIm>pNPP>N-phPAM,
while kcat/KM values were N-phPAM>pNPP>PIm.
Computer modeling found Pi, PIm and pNPP fit in the active site in the same
orientation, but with different hydrogen bond distances (Figures 3-13 through 3-15). This
result is consistent with the enzyme hydrolyzing both PIm and pNPP; both substrates can
bind, completing the first step in catalysis. PAcP’s binding motif was reviewed in section
1.2.4.
Figure 3-13. Phosphate bound in the active site of PAcP. Distances are taken directly
from crystal structure without modification (PDB 1ND6).
22..7755
33..2277
33..0044
22..9988 22..7788
33..3388
22..8811
33..1199
HH225577
HH1122 RR7799
RR1111
RR1155
DD225588
22..9922

88
Figure 3-14. pNPP bound in the active site of PAcP as modeled in Acclerys.
Figure 3-15. PIm bound in the active site of PAcP as modeled in Acclerys.
22..7766
33..2299
22..9966
22..8833 22..7722
33..3333
22..9922
33..1199
22..7799
33..1155
33..0000
33..0033
22..7744
33..3322
22..7722
33..2222
22..9999
22..7799
HH225577
HH1122 RR7799
RR1111
RR1155
DD225588
HH225577
HH1122 RR7799
RR1111
RR1155
DD225588
22..8855
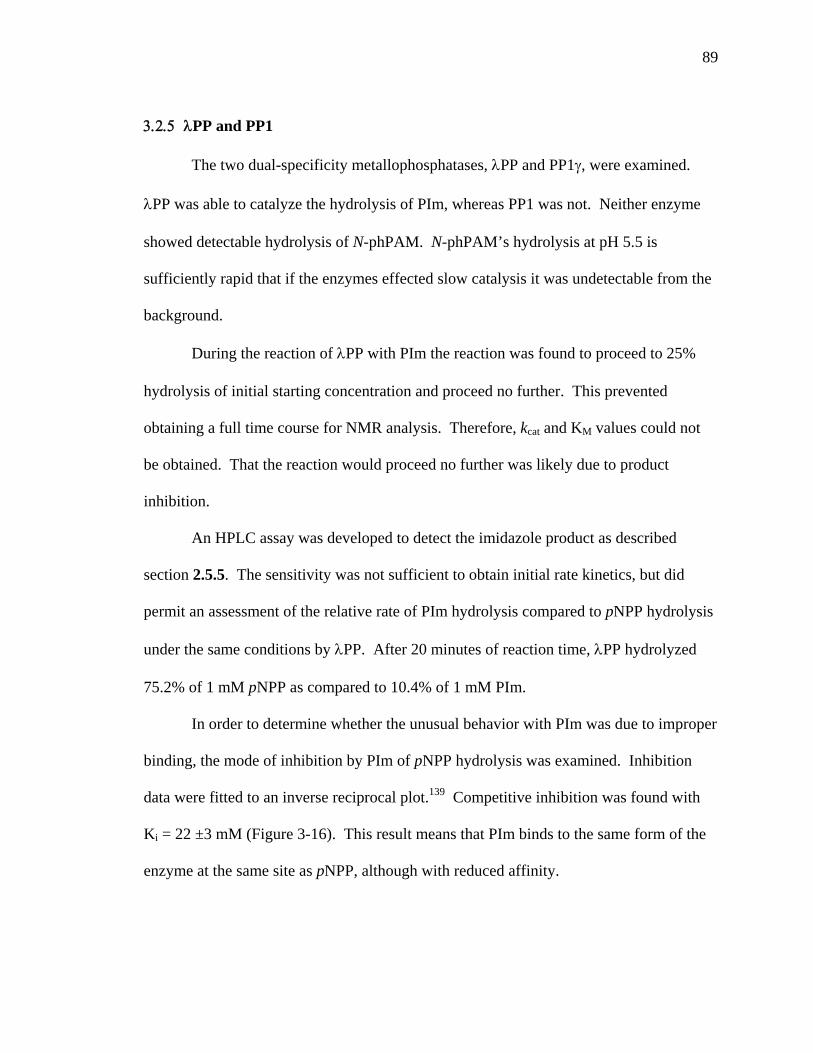
89
3.2.5 λPP and PP1
The two dual-specificity metallophosphatases, λPP and PP1γ, were examined.
λPP was able to catalyze the hydrolysis of PIm, whereas PP1 was not. Neither enzyme
showed detectable hydrolysis of N-phPAM. N-phPAM’s hydrolysis at pH 5.5 is
sufficiently rapid that if the enzymes effected slow catalysis it was undetectable from the
background.
During the reaction of λPP with PIm the reaction was found to proceed to 25%
hydrolysis of initial starting concentration and proceed no further. This prevented
obtaining a full time course for NMR analysis. Therefore, kcat and KM values could not
be obtained. That the reaction would proceed no further was likely due to product
inhibition.
An HPLC assay was developed to detect the imidazole product as described
section 2.5.5. The sensitivity was not sufficient to obtain initial rate kinetics, but did
permit an assessment of the relative rate of PIm hydrolysis compared to pNPP hydrolysis
under the same conditions by λPP. After 20 minutes of reaction time, λPP hydrolyzed
75.2% of 1 mM pNPP as compared to 10.4% of 1 mM PIm.
In order to determine whether the unusual behavior with PIm was due to improper
binding, the mode of inhibition by PIm of pNPP hydrolysis was examined. Inhibition
data were fitted to an inverse reciprocal plot.139 Competitive inhibition was found with
Ki = 22 ±3 mM (Figure 3-16). This result means that PIm binds to the same form of the
enzyme at the same site as pNPP, although with reduced affinity.

90
Ki for λPP with PIm as Inhibitor and pNPP as Substrate
0
10
20
30
40
50
60
70
80
0 200 400 600 800 1000 1200
1/[S] (1/M)
1/V
(1/(u
M/s
))
3 mM PIm6 mM PIm12 mM PIm18 mM PIm24 mM PImLinear (12 mM PIm)Linear (24 mM PIm)Linear (18 mM PIm)Linear (6 mM PIm)Linear (3 mM PIm)
Figure 3-16. Double reciprocal plot to determine the mode of inhibition and the Ki of
PIm with pNPP as substrate for λPP, 30 oC, pH 7.8.
Additional tests were completed to determine if the enzyme maintained activity
over the time course. Loss of activity was not detected up to four hours after frozen
enzyme was prepared for kinetic assays. Another test was conducted wherein enzyme
that had hydrolyzed PIm to 25%, [λPP] = 100 nM, was then used to hydrolyze pNPP,
[λPP] = 1 nM; the enzyme displayed full activity with pNPP. This verifies that the loss
of hydrolysis of PIm after 25% of hydrolysis was not due to loss of enzymatic activity.
λPP’s binding motif was reviewed in section 1.2.5. Computer modeling of the
substrates with λPP found sulfate, pNPP, and PIm bound in different orientations. This
difference was found regardless of the initial coordination mode of the sulfate in the
crystal structure, see section 1.2.5.

91
Using sulfate bound in coordination mode B as an example (Figures 3-17 through
3-22) illustrates the differences in binding between pNPP and PIm. In attaining the
lowest energy enzyme-substrate conformation, the computer placed water differently
between the modeled pNPP bound structure and the modeled PIm bound structure.
Further, the general orientation between pNPP and PIm was different (Figures 3-18 and
3-19).
Distances between active site residues, the metals, and the substrates are shown
(Figures 3-20 through 3-22). The active site metals are crucial for catalytic function, so
the metal to metal and phosphoryl group to metal distances were examined.
Metal to metal distance with pNPP in the active site was modeled at 4.13 Å in
pNPP as compared to 4.57 Å with PIm. A single oxyanion of pNPP coordinated to just one
of the metals, the distance being 3.05 Å. A water molecule was interposed between the other
metal and the same oxyanion. A single oxyanion of PIm coordinated to both metals, the
distances being 4.17 Å and 4.78 Å. It is apparent that the computer models show a
significantly closer distance between pNPP and the metals than PIm.
Computer modeling with PP1 provided similar results as with λPP. Placement of
water in the active site was different between the crystal structure with phosphate, the
model with pNPP, and the model with PIm (Figure 3-23 through 3-25). Further, pNPP
was closer to the metals than PIm.
3.2.6 AP.
AP hydrolyzes both PIm and N-phPAM. Literature reports of kinetic constants
for hydrolysis of pNPP by AP vary as a result of product inhibition by Pi (Table 3-6).
The most accurate values are obtained when substrate concentrations are kept low as this

92
Figure 3-17. λPP with bound sulfate in coordination mode B, boxes A and B (PDB
1G5B).
RR116622
RR5533
HH7766
RR116622 HH7766
RR5533
AA
BB

93
Figure 3-18. λPP with pNPP as modeled in Acclerys, boxes A and B.
RR116622 RR5533
HH7766
AA
BB
RR116622
HH7766
RR5533

94
Figure 3-19. λPP with PIm as modeled in Acclerys, boxes A and B.
RR116622
RR5533
HH7766
RR116622
RR5533 HH7766
AA
BB

95
Figure 3-20. Sulfate bound in active site. A is the same view as in figure 3-15; B is
rotated to view distances. Distances are taken directly from the crystal structure without
modification.
AA
BB
RR116622
RR5533
HH7766
RR116622
RR5533
HH7766
22..7766 22..3300
22..8877
33..1100
33..0033
22..3366
33..4466 22..8844
22..6622
22..2255 22..8844
22..3355
44..2222

96
Figure 3-21. pNPP bound in active site of λPP as modeled in Acclerys. A is the same
view as in figure 3-16; B is rotated to view distances.
AA
BB
RR116622
RR5533
HH7766
RR116622
RR5533
22..8800
22..9911
33..1111 22..9911
33..0055 33..2266
44..1133 22..8833
11..9933
44..3333

97
Figure 3-22. PIm bound in active site of λPP as modeled in Acclerys. A is the same
view as in figure 3-17; B is rotated to view distances.
Figure 3-23. PP1 active site with phosphate.
AA BB
RR116622
RR5533
HH7766
RR116622
RR5533
22..6622
22..8855 22..7766
33..3300
44..1177 22..6622
44..5577
44..7788
44..1177
44..3322
22..6622
33..5599
33..9999 55..1166
RR9966
HH112255
RR222211
HH224488

98
Figure 3-24. PP1 active site with pNPP as modeled in Acclerys.
Figure 3-25. PP1 active site with PIm as modeled in Acclerys.
keeps generated Pi low; under such conditions micromolar KM values have been reported.
In this study kcat and KM values for pNPP and PIm comparable to those reported in the
literature for pNPP at low substrate conditions. N-phPAM was a slower substrate than
33..0088 44..4488
55..0099 33..5588
RR9966
HH112255
RR222211
HH224488
RR9966
HH112255
RR222211
HH224488

99
either pNPP or PIm. Nonetheless, among all of the tested enzymes AP exhibited the
highest catalytic efficiencies with all three substrates.
Table 3-3. Kinetic literature values for E. coli AP at pH 8.0.
kcat KM kcat /KM (x106) (s-1) (μM) (M-1s-1) Reference79.8 21 3.8 70 167.5 32.7 5.1 75 175.5 34.9 5.0 140 74.7 21.8 3.4 141 44.4 9.4 4.7 142 13.6 7.4 1.8 111
1.3 78 3.3 73
Computer modeling found Pi, PIm and pNPP fit in the active site in the same
orientation, but with different hydrogen bonding distances (Figures 3-26 through 3-31).
This result is consistent with the enzyme’s ability to hydrolyze both PIm and pNPP.
AP’s binding motif was reviewed in section 1.2.6.
Figure 3-26. Phosphate bound in active site of AP (PDB 1ED8). Color scheme – green
is zinc, yellow is magnesium, red sphere is water.
RR116666
SS110022
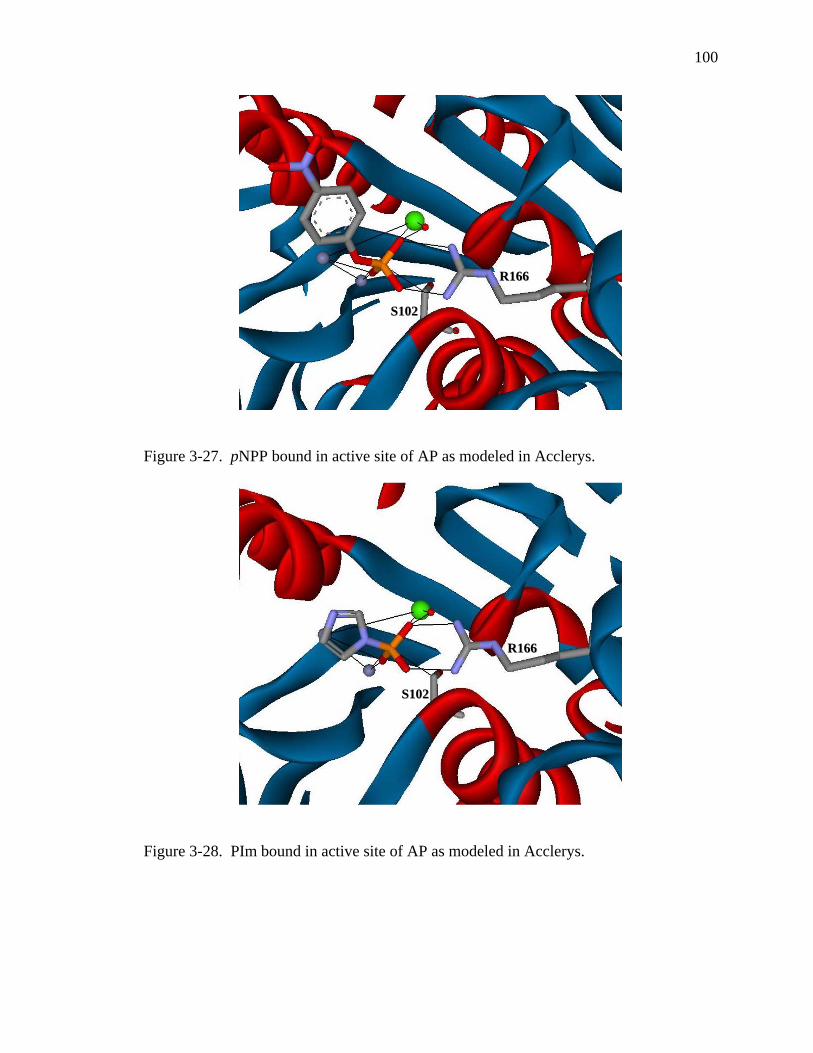
100
Figure 3-27. pNPP bound in active site of AP as modeled in Acclerys.
Figure 3-28. PIm bound in active site of AP as modeled in Acclerys.
RR116666
SS110022
RR116666
SS110022

101
Figure 3-29. Phosphate bound in active site of AP (PDB 1ED8).
Figure 3-30. pNPP bound in active site of AP as modeled in Acclerys.
33..9988 66..9999
44..7799 33..5500
11..8866
22..5599
22..2233
22..7700 22..9944
33..9999 77..0022
44..8800 33..5588
11..9933
22..5577
22..2233
22..5555 33..0000
22..8822
33..0022

102
Figure 3-31. PIm bound in active site of AP as modeled in Acclerys.
33..8888 66..7766
44..8800 33..4477
11..9922
22..5544
22..2233
22..5599 22..8866 33..3355

103
CHAPTER 4
DISCUSSION
4.1 Discussion of Overall Experimental Results
The purpose of this research is to determine if known phosphatase motifs cleave
both P-O and P-N bonds, or if enzymes must exist specifically with phosphoramidase
activity. With the exception of PP1γ, the enzymes in this study catalyze hydrolysis of
pNPP and PIm (Table 4-1). The known phosphomonoester phosphatases motifs were
found to be capable of catalyzing the hydrolysis of both phosphomonoesters and
phosphoramidates, albeit with different catalytic constants.
Table 4-1. Ratio of second order rate constants (pNPP/PIm) by enzyme.
(kcat/KM)/(kcat/KM) Catalyzes Hydrolysis of Enzyme (pNPP)/(PIm) pNPP N-phPAM PIm YopH 27 Yes Yes Yes VHR 0.22 Yes Yes Yes PAcP 1.6 Yes Yes Yes
PHPT1 at pH 5.5 7.1x10⁻⁵ Yes Yes Yes PHPT1 at pH 8.0 7.4x10⁻⁵ Yes Yes Yes
AP 0.51 Yes Yes Yes λPP Yes ND Yes PP1γ Yes ND No
In several cases catalytic values with an enzyme are similar with the different
substrates, a seeming validation that the substrates are being bound and catalyzed
similarly. Nevertheless, to justifiably state that all three substrates are hydrolytically
catalyzed in the same manner would require specific experiments and is not the purpose
of this study. Even so, there is an experimental result from this study that is consistent
with hydrolysis proceeding the same for both phosphomonoesters and phosphoramidates:

104
during NMR studies with PIm there was no indication of cleavage other than at the P-N
bond (see section 1.2). However, the NMR results do not mean that phosphoramidate
hydrolysis must follow the same mechanistic pathway as phosphomonoesters.
In addition to the kinetic assays a series of computer experiments was conducted
to examine whether there are structural properties of the enzymes that would shed insight
into how the substrates bind in the active site. Substrate binding can affect the activity of
an enzyme, and computer models have the ability to provide a snapshot of the enzyme-
substrate complex before hydrolysis. If the initial placement of phosphomonoesters was
different from phosphoramidates, catalysis proceeding via the same mechanism would be
in question. In making the models, the differences in charge and geometry were used to
assess the initial orientation of the substrate.
Charge may affect binding of the substrate. Inductive effects by the leaving group
have the potential to significantly affect charge localization on the non-bridging oxygens.
Charge localization might affect formation of the enzyme-substrate complex, and thus
KM. Charge repulsion between the bridging atom and active site residues may also affect
formation of the enzyme-substrate complex. Shown in several figures in chapters one
and three are active site arginines whose guanidinium groups are positively charged.
This positive charge is repulsive to positively charged leaving groups, as with the
imidazole moiety of PIm.
Geometric misalignments between the substrate and active site residues may also
affect catalysis. The bridging atoms of pNPP and PIm exhibit different hybridizations,
with pNPP’s sp3 bridging oxygen having free rotation around the C-O bond and PIm’s
sp2 bridging nitrogen being constrained around the C-N-C bonds. Also, PIm is a smaller

105
substrate than pNPP. The different hybridizations and sizes could result in different
relative orientations between the enzyme and substrates.
Two significant differences between the phosphate ester and phosphoramidate
substrates are the protonation of the phosphate moiety as well as protonation of the
leaving group. Location of a proton during hydrolysis is important as it affects electron
density on the phosphate moiety and P-X bond strength. Some accounting of proton
location may be made by considering the percent protonation of the substrate before
catalysis versus percent protonation of the free leaving group (Table 4-2).
Table 4-2. Percent protonation of the substrate before catalysis versus percent
protonation of the free leaving group in solvent. Refer to Figure 3-1 for location of
protonation.
pH 5.5 pH 8.0 Substrate Leaving group Substrate Leaving grouppNPP/pNP 22.4% 97.8% 0.1% 12.1% N-phPAM/aniline 97.2% 19% 9.9% 0.1% PIm/Im 95.2% 96.9% 5.9% 8.9%
As the purpose of this project is to determine if known phosphatase motifs can
cleave phosphoramidates, the remainder of this chapter will discuss the results obtained
from each enzyme with the different substrates. Where relevant, concepts from the
introduction regarding the enzyme’s motif as well as uncatalyzed hydrolysis will be
applied to the results.

106
4.2 Discussion of Results by Enzyme 4.2.1 PHPT1
The phosphohistidine phosphatase PHPT1 is believed to selectively cleave
phosphohistidine residues in proteins. No explanation has been given for the specificity,
but its mechanism employs general base catalysis. This is different from the other non-
metallic motifs, in that they employ general acid/base catalysis.
While the enzyme catalyzes hydrolysis of both phosphomonoesters and
phosphoramidates, there is a demonstrated preference for the phosphoramidates. The
enzyme is able to catalyze hydrolysis of PIm 14,000 times faster than pNPP at both acidic
and alkaline pH. Of the two phosphoramidate substrates, PHPT1 hydrolyzes PIm faster
than N-phPAM. The results of this experiment validate PHPT1’s assignment as a
histidine phosphatase.
At pH 5.5 PIm is predominantly a zwitterionic monoanion with two negative
charges on the phosphate moiety (Table 4-2 and Figure 3-1). The leaving group is
positively charged and therefore activated. In the zwitterion, the opposite charges are
proximal before the substrate enters the active site. After entering the active site the
opposite charges become separated due to the negative charge on the non-bridging
oxygens hydrogen bonding with the backbone. Intermolecular ionic attraction within the
substrate is weakened with the increased distance between the imidazole cation and
phosphoryl anions.
The enzyme’s crystal structure reveals no amino acids within the active site that
can act as a general acid. This was confirmed by mutational studies from the literature.20
At pH 5.5, the imidazole that was cleaved from the substrate must obtain a proton from

107
the solvent. At pH 8.0 PIm exists primarily as a dianion, again with two negative charges
on the phosphate moiety. Again, the imidazole that was cleaved from the substrate must
obtain a proton from the solvent.
The striking experimental result with PHPT1 is the similarities in kinetic
performance at acidic and alkaline conditions. Comparing catalysis of a substrate at pH
5.5 and pH 8.0 shows that changes in pH do not yield significantly different rates.
The rate limiting step for substrate catalysis by PHPT1 is not known. Values for
kcat vary significantly between the three substrates, as do the protonation states of the
substrates (Figure 3-1 and Table 4-3). The enzyme’s general base, His53, remains
unprotonated at pH 5.5 and pH 8.0, and the enzyme performs with similar catalytic
values at both conditions. If generation of the base or nucleophilic attack was rate
limiting, kcat values between the substrates would be expected to be similar; they are not.
Table 4-3. Kinetic results for PHPT1.
pH 5.5 kcat (s-1) KM (mM) kcat/KM (M-1s-1)
pNPP 0.00407 ±0.00007 2.7 ±0.2 1.5 N-phPAM 0.26 ±0.06 5 ±3 50
PIm 2.70 ±0.04 0.13 ±0.02 21000 pH 8.0
pNPP 0.0106 ±0.0004 6.3 ±0.6 1.7 N-phPAM 2.6 ±0.1 10 ±1 260
PIm 2.31 ±0.05 0.10 ±0.02 23000
The kinetic results are consistent with the rate limiting step is driven by
differences in the nature of the substrate’s P-X bond. They are also consistent with the
rate limiting step is driven by the protonation state of the substrate. A chemical step in
catalysis is rate limiting.

108
Noted in the introduction was that hydrolysis of phosphomonoesters and
phosphoramidates proceeded with pre-equilibrium protonation of the leaving group’s
bridging atom. In uncatalyzed hydrolysis phosphomonoesters rely on protons from the
non-bridging oxygens to protonate the bridging oxygen. This explains why
phosphomonoester monoanions hydrolyze rapidly. Phosphoramidates more readily hold
a proton on the bridging atom, explaining why they hydrolyze more rapidly than
phosphomonoesters.
Unlike the other non-metallo enzymes used in this study, PHPT1 does not
protonate the bridging atom. The phosphomonoesters should less susceptible to PHPT1’s
general base mechanism since the phosphomonoesters must rely on the solvent for
protonation of the bridging atom; phosphomonoesters bind as the dianion, so the proton
source for the bridging oxygen is likely not the phosphoryl oxygens. Conversely, the
phosphoramidates may be better able to gain a proton on the bridging nitrogen from the
solvent. It must also be noted that pNPP is a dianion at both pH 5.5 and 8.0 and will bind
as such. The phosphoramidates can bind as monoanions or dianions. More readily
obtaining a proton from the solvent, more readily holding a proton on the bridging
nitrogen, or entering the active site with the bridging nitrogen already protonated would
explain the greater kcat values of the phosphoramidates versus pNPP.
Whether or not protonation of the leaving group is responsible for the change in
rate could be determined by generating a pH rate profile of PHPT1 with PIm and N-
methyl PIm. N-methyl PIm’s hydrolysis is insensitive to hydrogen ion concentration. If
the pH rate profile of N-methyl PIm was also insensitive to pH and the rate profile with
PIm was sensitive to pH, then it could be discerned that protonation of the leaving group

109
is rate limiting. If the pH rate profile of N-methyl PIm was affected by hydrogen ion
concentration, then generation of the nucleophile is likely rate limiting.
The kinetic results herein are consistent with a similar mechanism for hydrolysis
of phosphoramidates and phosphomonoesters. The alternative possibility of cleavage of
the C-N bond has been ruled out by NMR experiments. Additional evidence that the
mechanism is similar was found by computer modeling of substrate binding.
Computer models with pNPP and PIm in the active site show the phosphate
moiety in the same general orientation (Figures 3-3 and 3-4). Hydrogen bonding
distances with the backbone and Ser94 were close between the two substrates (Table 4-
4). His53 to phosphorus distance varied by 2.4%, while Lys21 to the phosphoryl oxygen
distance varied by 3.5%. Both substrates were oriented in the active site essentially the
same and key distances exhibited little variation. This is consistent with the catalytic
mechanism being the same for the two substrates.
4.2.2 YopH YopH displays specificity for phosphotyrosine due to the depth of its active site.
Peptide substrates with shorter phosphorylated hydroxyl residues are not able to access
the active site. Aside from phosphotyrosine, YopH can dephosphorylate pNPP, naphthyl
phosphate, and nitro-benzyl phosphate, NBP.30 The ability to catalyze hydrolysis of NBP
shows that the ester bond need not involve an aryl ester. The small molecule substrates
in this experiment include both sp2 and sp3 bridging atoms and are able to access the
active site as they are not constrained by a peptide.
YopH catalyzes hydrolysis of pNPP with the highest rate constant, followed by N-
phPAM and PIm (Table 4-5). Although the bridging atom is different, pNPP and N-

110
Table 4-4. Comparison of distances between PHPT1 crystal structure with Pi and
computer models with pNPP and PIm.
Importance
of Amino Acid
Crystal Structure With Pi
(Å)
Computer Model
With pNPP (Å)
Computer Model
With PIm (Å)
His53 residue - phosphorus
Generates general base,
affects substrate binding
4.24 4.25 4.35
His53 amide backbone – phosphoryl group
Hydrogen bonding for
binding 2.89 3.00 2.99
Ala54 amide backbone – phosphoryl group
Hydrogen bonding for
binding 3.05 2.97 3.00
Lys21 – phosphoryl group
Hydrogen bonding for
binding, stabilize charge on
nucleophilic water
4.87 4.59 4.75
Ala96 amide backbone – phosphoryl group
Hydrogen bonding for
binding 3.03 3.19 3.20
Met95 amide backbone – phosphoryl group
Hydrogen bonding for
binding 3.00 2.96 3.04
Ser94 residue – phosphoryl group
Hydrogen bonding for
binding 2.76 3.03 3.00
Table 4-5. Kinetic results for YopH.
pH 5.5 kcat(s-1) KM (mM) kcat/KM x 10-3 (M-1s-1)
pNPP 610 ±30 3.1 ±0.4 200 N-phPAM 530 ±70 4 ±2 100
PIm 34 ±2 4.9 ±0.5 7
phPAM are isosteric. PIm differs from pNPP and N-phPAM in sterics and electronics,
and catalysis proceeds with an order of magnitude lower rate constant than either pNPP
or N-phPAM.

111
The KM’s for the substrates are very similar. Differences in the catalytic
efficiency are driven predominantly by differences in kcat, which must be due to the
nature of the leaving group. There is little effect on the rate constant by para substituted
monoester substrates,26 and the βLG value for YopH is -0.19.31
For all three substrates in this study, the same phosphocysteine intermediate is
expected. If hydrolysis of this intermediate is rate limiting with all three substrates, there
should be no difference in kcat. There is a significant difference in kcat between pNPP and
PIm, indicating that the rate limiting step is either different, or the first step is partially
rate limiting.
For catalysis, the WPD loop of the enzyme closes over the substrate, bringing the
general acid, Asp356, close to the bridging atom, facilitating protonation of the leaving
group. The leaving group of pNPP and N-phPAM can be effectively protonated by
Asp356 as they share sterics and electronics. Both enter the active site with a
predominantly uncharged leaving group. PIm likely enters the active site of YopH as a
monoanionic zwitterion (Figure 3-1 and Table 4-2). The leaving group is positively
charged and thus more labile; departure of imidazole need not involve protonation by the
general acid.
The kinetic results are consistent with pNPP and N-phPAM having the same rate-
limiting step in YopH catalysis. Cleavage of the C-N bond was not observed in NMR
experiments with PIm, which is consistent with the catalytic mechanism being similar for
pNPP and PIm. Additional insight to the pNPP and PIm mechanisms was found by
computer modeling.
112
The crystal structure used as the basis for computer modeling had the WPD loop
in the closed position. The advantage in starting with this structure is that it is a close
representation of the enzyme during catalysis. An advantage to using a structure with the
loop opened would be that such a structure would better represent binding. With the loop
open the bound substrate’s leaving group is not constrained by the shape or size of the
active site. With the loop closed there is constraint (Figures 1-7 and 1-8). The positive
charge on the imidazole moiety had the potential to interfere with loop closure, and
clashes between the imidazole moiety and WPD loop residues could occur with a loop
closed structure.
Computer models of pNPP and PIm in the active site show the phosphate moiety
in the same general orientation (Figures 3-6 and 3-7). Both substrate’s phosphate
oxyanions form hydrogen bonds with the same residues when bound. But, the computer
determines the distances by minimizing the energy for all distances between the enzyme
and substrate. In considering the Cys403 to phosphorus distance in the model with PIm,
the computer forced the distance to be 1.94 Å; this reflects the computer’s effort to
minimize the total energy between PIm and the residues (Table 4-6).
When the WPD loop is removed from the computer models, distances between
the enzyme and substrates trend toward lengthening; lengths were greater in all cases
with PIm, and the cysteine-phosphorus distance increased 1.65 Å (Table 4-6 and Figures
3-8 and 3-9). The computer modeling is consistent with loop closure creating an
unfavorable cysteine-phosphorus distance with PIm whereas no unfavorable distance
exists with pNPP. The two substrates are geometrically different. PIm’s imidazole

113
moiety cannot rotate away from the WPD loop, causing clash. Conversely, pNPP’s
phenol moiety can rotate away from the WPD loop.
The global conformation of the active site residues possesses differences in
distances between pNPP and PIm. While the general orientation of the substrates was
similar, differences in key enzyme-substrate distances indicate differences in the exact
orientation. Enzyme-PIm distances tend to be lower than enzyme-pNPP distances.
Aside from Cys403, two other important residues exhibit significant variation
between the substrates: Asp356, the general acid/base; and Gln446, responsible for
orienting the nucleophilic water. Asp356 is 0.37 Å further from PIm than pNPP, while
Gln446 is 0.51 Å further. These longer distances reflect the loop-closed conformation
having some differences between the substrates.
4.2.3 VHR VHR possesses a catalytic motif similar to YopH. Two important differences
between the enzymes’ active sites are the position of the general acid/base, and depth.
VHR’s general acid/base, Asp92, is not on a flexible loop. Additionally, VHR’s active
site is shallow, approximately 6.4 Å, as compared to YopH’s deep active site,
approximately 9.5 Å (these values were obtained using VHR crystal structure PDB
1VHR, and YopH crystal structure PDB 1YPT which is a loop open structure).
VHR catalysis of phosphomonoesters shows little dependence on the leaving
group, βLG = -0.074 ±0.023.42 Further, the enzyme displays burst kinetics.44 The low
dependence on the leaving group and burst kinetics are explained by breakdown of the
phosphoenzyme intermediate being rate limiting.

114
Table 4-6. Comparison of distances between YopH crystal structure with vanadate and computer models with pNPP and PIm.
Importance
of Amino Acid
Crystal Structure
With Vanadate
(Å)
Computer Model With pNPP (Å)
Computer Model
With PIm (Å)
Computer Model
With pNPP & WPD
Loop Removed
(Å)
Computer Model
With PIm & WPD
Loop Removed
(Å) Cys403 residue –
vanadate/ phosphorus
Nucleophile, forms covalent
bond 2.52 3.66 1.94 3.80 3.59
Arg404 amide backbone –
phosphoryl group
Hydrogen bonding for
binding 2.58 3.33 2.32 3.12 2.41
Ala405 amide backbone –
phosphoryl group
Hydrogen bonding for
binding 2.61 3.03 3.12 3.04 3.15
Gly406 amide backbone –
phosphoryl group
Hydrogen bonding for
binding 3.09 3.11 3.05 3.14 3.09
Val407 amide backbone –
phosphoryl group
Hydrogen bonding for
binding 2.89 3.02 2.55 3.04 2.58
Gly408 amide backbone –
phosphoryl group
Hydrogen bonding for
binding 2.91 3.11 2.87 3.14 2.94
Arg409 amide backbone –
phosphoryl group
Hydrogen bonding for
binding 2.68 3.11 2.70 3.12 2.84
Arg409 residue – phosphoryl
group
Hydrogen bonding for
binding, stabilize
charge on leaving group
3.03/3.13 3.08/3.32 2.86/3.46 3.48/3.54 2.93/3.71
Asp356 residue – bridging atom
General acid/base 2.82 2.81 3.18 N/A N/A
Gln446 residue – bridging atom
Orient nucleophilic
water 4.16 3.30
3.91 from GlnO
to bridge N 2.49 from
GlnO to non-
bridge N 3.81 from
GlnN to bridge N
3.30
4.39 from GlnO
to bridge N 2.92 from
GlnO to non-
bridge N 4.47 from
GlnN to bridge N
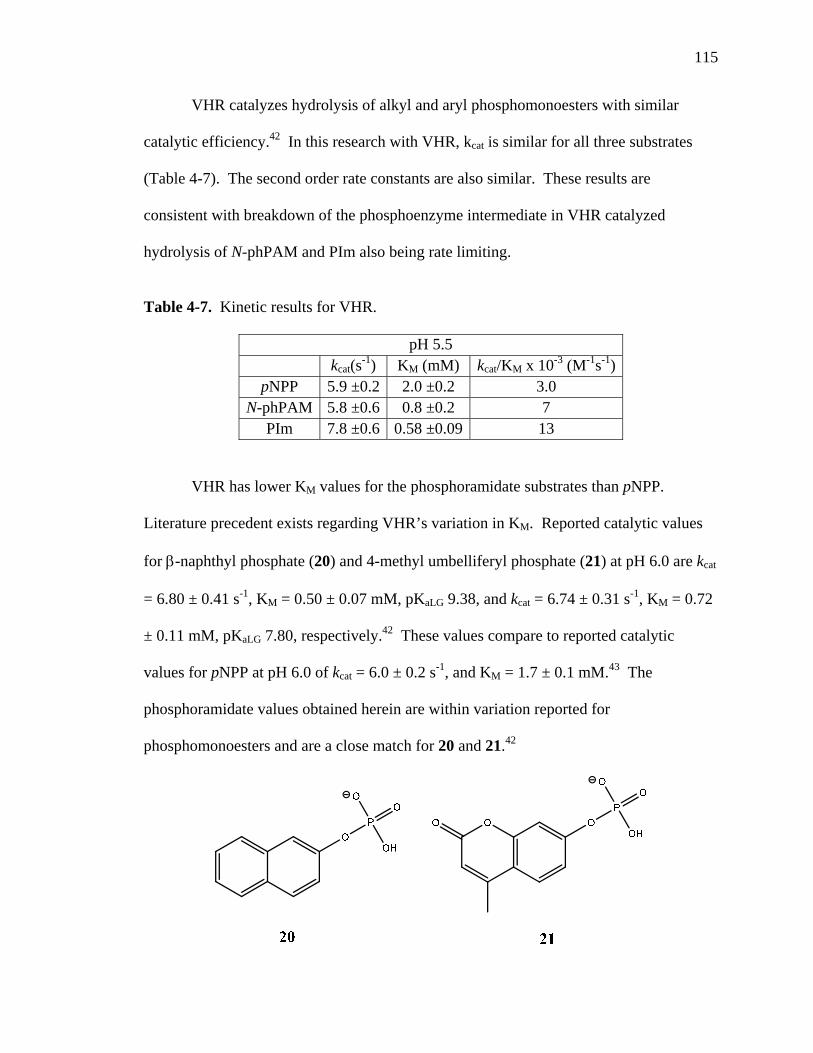
115
VHR catalyzes hydrolysis of alkyl and aryl phosphomonoesters with similar
catalytic efficiency.42 In this research with VHR, kcat is similar for all three substrates
(Table 4-7). The second order rate constants are also similar. These results are
consistent with breakdown of the phosphoenzyme intermediate in VHR catalyzed
hydrolysis of N-phPAM and PIm also being rate limiting.
Table 4-7. Kinetic results for VHR.
pH 5.5 kcat(s-1) KM (mM) kcat/KM x 10-3 (M-1s-1)
pNPP 5.9 ±0.2 2.0 ±0.2 3.0 N-phPAM 5.8 ±0.6 0.8 ±0.2 7
PIm 7.8 ±0.6 0.58 ±0.09 13
VHR has lower KM values for the phosphoramidate substrates than pNPP.
Literature precedent exists regarding VHR’s variation in KM. Reported catalytic values
for β-naphthyl phosphate (20) and 4-methyl umbelliferyl phosphate (21) at pH 6.0 are kcat
= 6.80 ± 0.41 s-1, KM = 0.50 ± 0.07 mM, pKaLG 9.38, and kcat = 6.74 ± 0.31 s-1, KM = 0.72
± 0.11 mM, pKaLG 7.80, respectively.42 These values compare to reported catalytic
values for pNPP at pH 6.0 of kcat = 6.0 ± 0.2 s-1, and KM = 1.7 ± 0.1 mM.43 The
phosphoramidate values obtained herein are within variation reported for
phosphomonoesters and are a close match for 20 and 21.42
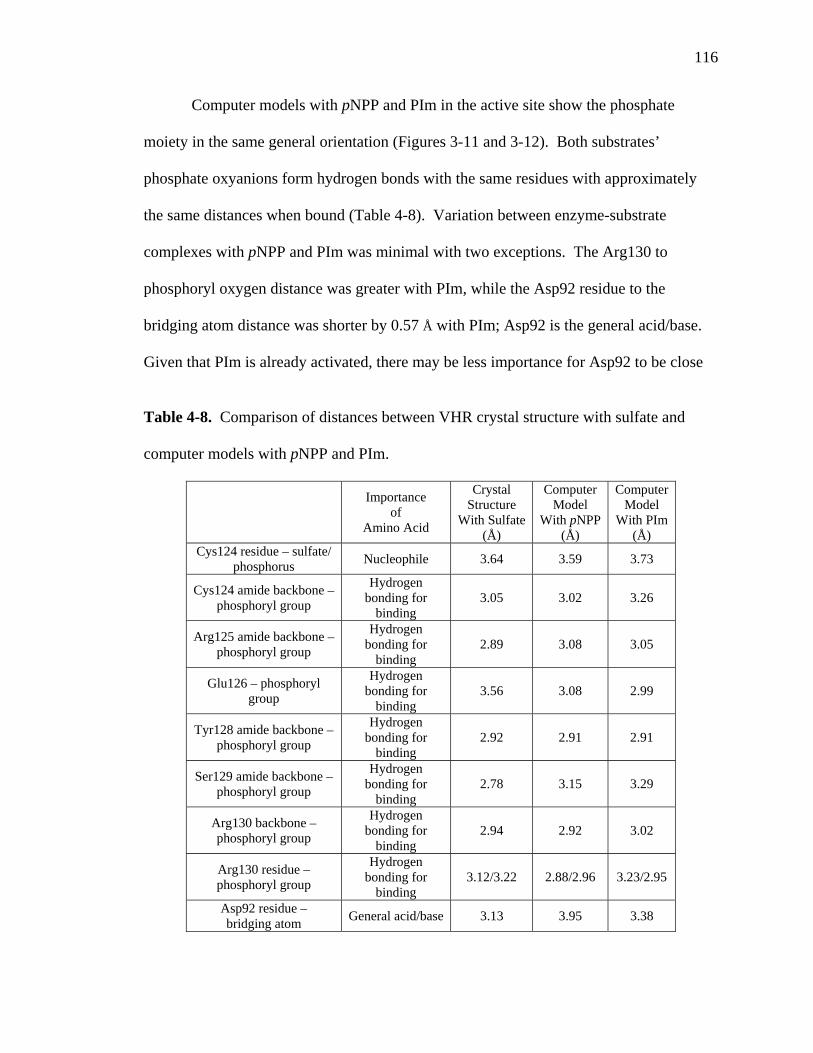
116
Computer models with pNPP and PIm in the active site show the phosphate
moiety in the same general orientation (Figures 3-11 and 3-12). Both substrates’
phosphate oxyanions form hydrogen bonds with the same residues with approximately
the same distances when bound (Table 4-8). Variation between enzyme-substrate
complexes with pNPP and PIm was minimal with two exceptions. The Arg130 to
phosphoryl oxygen distance was greater with PIm, while the Asp92 residue to the
bridging atom distance was shorter by 0.57 Å with PIm; Asp92 is the general acid/base.
Given that PIm is already activated, there may be less importance for Asp92 to be close
Table 4-8. Comparison of distances between VHR crystal structure with sulfate and
computer models with pNPP and PIm.
Importance
of Amino Acid
Crystal Structure
With Sulfate (Å)
Computer Model
With pNPP (Å)
Computer Model
With PIm (Å)
Cys124 residue – sulfate/ phosphorus Nucleophile 3.64 3.59 3.73
Cys124 amide backbone – phosphoryl group
Hydrogen bonding for
binding 3.05 3.02 3.26
Arg125 amide backbone – phosphoryl group
Hydrogen bonding for
binding 2.89 3.08 3.05
Glu126 – phosphoryl group
Hydrogen bonding for
binding 3.56 3.08 2.99
Tyr128 amide backbone – phosphoryl group
Hydrogen bonding for
binding 2.92 2.91 2.91
Ser129 amide backbone – phosphoryl group
Hydrogen bonding for
binding 2.78 3.15 3.29
Arg130 backbone – phosphoryl group
Hydrogen bonding for
binding 2.94 2.92 3.02
Arg130 residue – phosphoryl group
Hydrogen bonding for
binding 3.12/3.22 2.88/2.96 3.23/2.95
Asp92 residue – bridging atom General acid/base 3.13 3.95 3.38

117
to PIm as compared to pNPP.
The same mechanism of hydrolysis with pNPP and PIm is consistent with similar
kcat values, similar enzyme-substrate distances in computer models, and only P-N
cleavage in NMR experiments. One difference may be that the enzyme does not have to
protonate the leaving group to effect hydrolysis.
4.2.4 hPAcP The histidine acid phosphatases are able to catalyze a variety of substrates, to
include phosphotyrosine,143,144 glycerol phosphate,51,145,146 acetyl phosphate,145 adenosine
monophosphate,145 benzyl phosphate,51 naphthyl phosphate,144 phytate,147 and fructose
phosphate.147 Due to the many types of substrates PAcP is able to catalyze it is
considered a non-specific phosphatase.
With this enzyme, an interesting situation arises when phosphoimidazole enters
the active site. The P-N bond of the substrate is equivalent to the potential P-N bond of
the phosphoenzyme intermediate. That PAcP catalyzed hydrolysis of PIm shows that
active site must generate a preference for the enzyme’s histidine residue to attack the PIm
substrate and preferentially cleave one P-N bond over the other. This may be facilitated
by the imidazole moiety of the substrate being protonated during the transition state while
the imidazole moiety of His12 is not.
The βLG value with the enzyme and substituted phenyl phosphates was -0.08,
showing little dependence of the rate upon the leaving group.37,113 This is consistent with
breakdown of the phosphoenzyme intermediate being rate limiting. In the research here,
kcat values were similar for all three substrates, consistent with the same rate limiting step
being operative, i.e. breakdown of the phosphoenzyme intermediate (Table 4-9). KM

118
values varied significantly, a reflection of changes in formation of the enzyme-substrate
complex.
Table 4-9. Kinetic results for PAcP.
pH 5.5 kcat(s-1) KM (mM) kcat/KM x 10-3 (M-1s-1)
pNPP 2.13 ±0.02 0.23 ±0.04 9.3 N-phPAM 2.5 ±0.1 0.07 ±0.01 40
PIm 6.0 ±0.4 1.01 ±0.09 5.9
Unlike the other non-metallo enzymes, binding is not accomplished by hydrogen
bonds with the protein backbone. PAcP’s hydrogen bond network is with three arginines
and histidine. Whereas amide backbones have no charge, arginine and protonated
histidine have a positive charge. If the Arg11, Arg15, Arg79, and His 257 were
protonated, there would be four positive charges in the active site of PAcP (Figure 1-15).
This would be expected to be repulsive to the positive charge on the imidazole moiety of
PIm. Such repulsion may be the cause of the greater KM with PIm.
Computer modeling found PIm and pNPP bound in the same general orientation
(Figures 3-14 and 3-15). Both substrates’ phosphate oxyanions form hydrogen bonds
with the same residues with approximately the same distances when bound (Table 4-10).
There was a 0.2 Å shorter distance between the general acid/base Asp258 and the
bridging atom for PIm than for pNPP. Given that PIm is already activated, this distance
may be of minimal importance.
The same mechanism of hydrolysis with pNPP and PIm is consistent with similar
kcat values, similar enzyme-substrate distances in computer models, and only P-N
cleavage in NMR experiments.

119
Table 4-10. Comparison of distances between PAcP crystal structure with phosphate and computer models with pNPP and PIm.
Importance
of Amino Acid
Crystal Structure With Pi
(Å)
Computer Model
With pNPP (Å)
Computer Model
With PIm (Å)
His12 residue – phosphorus Nucleophile 3.19 3.19 3.22
Arg11 residue – phosphate oxyanion
Hydrogen bonding for
binding 3.38/3.27 3.33/3.29 3.32/3.15
Arg15 residue – phosphate oxyanion
Hydrogen bonding for
binding 2.78/2.98 2.72/2.83 2.74/3.03
Arg79 residue – phosphate oxyanion
Hydrogen bonding for
binding 3.04/2.75 2.96/2.76 3.00/2.79
His257 residue – phosphate oxyanion
Hydrogen bonding for
binding 2.92 2.85 2.99
Asp258 residue – bridging atom General acid/base 2.81 2.92 2.72 bridge N
2.79 non-bridge N
4.2.5 λPP & PP1. Both λPP and PP1γ are serine/threonine phosphatases. Despite this classification,
neither enzyme is able to hydrolyze monomeric serine or threonine phosphate.60,61,148
The amino acid sequence, as well as the length of the sequence, are crucial for catalytic
hydrolysis of phosphopeptide substrates.60
Both enzymes have the catalytic core of the serine/threonine phosphatases.
Between the two, λPP is the smaller enzyme, 221 amino acids versus 294 for the human
PP1γ protein. λPP is the smallest of the cataloged serine/threonine phosphatases.
Phosphohistidine peptides and proteins are substrates for λPP60 and PP1.62
Additionally, PP1 catalyzes hydrolysis of aryl methylphosphonates,63 while λPP
catalyzes hydrolysis of phosphodiesters.66 While the enzymes are classified as

120
serine/threonine phosphatases, their inability to catalyze hydrolysis of phosphoserine or
phosphothreonine, while at the same time catalyzing hydrolysis of phosphohistidine,
phosphonates, and phosphodiesters, throws into question what their native substrates are
and what classification they should be assigned. In the research herein, λPP effected
hydrolysis of PIm, while PP1 did not.
Under the same conditions and equal periods of time λPP catalyzes hydrolysis of
pNPP more than seven times more rapidly than PIm. But, catalysis goes to 25% with
PIm and stops. These results provide little insight as to why overall catalysis of pNPP
was greater than with PIm; kinetic constants cannot be obtained.
Computer models show pNPP and PIm bound in significantly different
orientations in the active site (Figures 3-18, 3-19, 3-21, and 3-22). Not only are the
substrates in different orientations, the location, number and placement of water
molecules is different. Since the number of water molecules in the active site varies
according to substrate, it is difficult to make comprehensive side by side distance
comparisons between computer modeled binding of pNPP and PIm. However, proximity
of the substrate to the metals must be crucial regardless of which of the three possible
mechanisms is operative. Arginines 162 and 53 may be important for binding and/or
proper orientation of the substrate.
Key distances between the substrates, metals, and arginines are shown (Table 4-
11). Most distances with the PIm model are significantly larger than with the pNPP
model. Coupled with a PIm Ki of 22 mM, it can be concluded that PIm does not bind
well to λPP.

121
Table 4-11. Comparison of distances between λPP crystal structure with sulfate and computer models with pNPP and PIm.
Crystal Structure
With Sulfate (Å)
Computer Model
With pNPP (Å)
Computer Model
With PIm (Å)
Mn2+ – Mn2+ 3.46 4.13 4.57 Mn1
2+ – oxyanion 2.30 3.05 4.17 Mn2
2+ – oxyanion 4.22 4.33 4.78 Arg162 –
phosphate oxyanion 2.76 2.78 3.69
Arg53 – phosphate oxyanion 5.57 5.35 4.58
Poor binding by PIm cannot be solely responsible for hydrolysis proceeding to
25% and stopping. The different binding orientations and distances may reflect a
different catalytic mechanism with PIm as compared to pNPP. Insight of the possible
mechanism cannot be gleaned from the results herein.
4.2.6 AP. AP is a non-specific enzyme. It is able to hydrolyze a wide variety of substrates,
including phosphopyridines,76 N-phenyl phosphoramidates,77,78 alkyl phosphoramidates,78
phenyl phosphate esters,81,149 alkyl phosphate esters,81,149 phosphodiesters,72
phosphorothioates,80,150 sulfates,69 and phosphonates.151
Diffusion controlled enzymatic reactions have a theoretical upper limit of ~109
M-1s-1.152 As a comparison, AP catalyzed reactions have rate constants up to 107 with
phosphomonoester substrates. Thus, not only does AP catalyze hydrolysis of many
different substrates, its motif is able to generate rate increases that approach diffusion
control.
122
At pH 8.0 release of Pi is rate limiting for phosphomonoester substrates as shown
by NMR, crystallography, mutagenesis, and βLG studies.82,153 AP displays burst kinetics,
which is also consistent with Pi release being rate limiting.154
A similar kcat between the three substrates would be consistent with the same rate
limiting step. PIm and pNPP have kcat values of the same order of magnitude, consistent
with the rate limiting step for the two substrates being the same. Yet, N-phPAM has a
lower kcat than PIm or pNPP. AP catalyzed hydrolysis of N-phPAM having a lower kcat
than pNPP is consistent with literature.77
It has been proposed that AP-catalyzed hydrolysis may be limited by substrate
binding or some other conformational change.155 It may be that N-phPAM has different
binding than the other substrates or otherwise changes the rate limiting step. The latter
suggestion has literature precedent that will now be reviewed.
AP catalyzed hydrolysis of phosphorylated pyridines has little dependence upon
the leaving group “because the chemical step is not rate limiting for these substrates.”73,76
The rate limiting step for phosphorylated pyridines has been attributed to limitations on
substrate binding or conformational changes to the enzyme.76 If N-phPAM had different
binding characteristics or required conformational changes to the enzyme, as with the
phosphorylated pyridines, it would be expected that kcat values of AP with N-phPAM
would be lower than with pNPP. The kapparentpNPP is 7.8 times the kapparent
1-picoline.76 The
results herein found kcatpNPP to be 21 times the kcat
N-phPAM (Table 4-12).
Computer models show pNPP and PIm bound in the active site in the same
orientation (Figures 3-27, 3-28, 3-30, and 3-31). Both models showed Ser102 with its
hydroxyl group facing away from the substrate’s phosphorus atom (Figures 3-25 and 3-

123
Table 4-12. Kinetic results for AP.
pH 8.0 kcat(s-1) KM (mM) kcat/KM x 10-3(M-1s-1)
pNPP 27.3 ±0.8 0.0070 ±0.0008 3900 N-phPAM 1.30 ±0.09 0.0021 ±0.0002 620
PIm 18 ±2 0.0020 ±0.0003 9000
26). For this reason, the methylene carbon of Ser102 is the basis for measurement of the
distance to the phosphorus atom (Table 4-13).
Table 4-13. Comparison of distances between E. coli AP crystal structure with
phosphate and computer models with pNPP and PIm.
Crystal Structure With Pi
(Å)
Computer Model
With pNPP (Å)
Computer Model
With PIm (Å)
Zn12+ – Zn2
2+ 3.98 3.99 3.88 Zn1
2+ – phosphate oxyanion 1.86 1.93 1.92
Zn22+ –
phosphate oxyanion 2.82 3.02 3.35
Zn12+ – Mg2+ 6.99 7.02 6.76
Zn12+ – Mg2+ 4.79 4.80 4.80
Arg166 residue – phosphate oxyanion 2.70/2.94 2.55/3.00 2.59/2.86
Ser102 – phosphorus 3.50 3.58 3.47 There is no apparent trend in key distances of the enzyme-substrate complexes;
some are closer for PIm than pNPP and vice versa. Distance of the nucleophile, Ser102,
is similar between Pi, pNPP, and PIm. None of the distances between the bound
substrates deviated by more than 5%. The same mechanism of hydrolysis with pNPP and
PIm is consistent with similar kcat values, similar enzyme-substrate distances in computer
models, and only P-N cleavage in NMR experiments.

124
CHAPTER 5
CONCLUSIONS
5.1 Summary of Phosphoramidase vs. Phosphatase Activities
The two phosphoramidates used in this study were analogs of phosphorylated
nitrogenous amino acids. N-phPAM possesses a sp3 hybridized bridging nitrogen as does
phospholysine. PIm possess a sp2 hybridized bridging nitrogen akin to phosphohistidine.
All of the motifs assayed in this study are capable of catalyzing hydrolysis of
phosphoramidates with sp2 bridging nitrogens. With the exception of the protein
phosphatase motif, the motifs can also catalyze phosphoramidates with sp3 bridging
nitrogens.
PHPT1 has been shown to selectively catalyze phosphohistidine proteins. The
results herein show the enzyme is also selective for phosphoimidazole, the
phosphohistidine analog. That the enzyme catalyzed PIm 14000 times faster than pNPP
in acidic and alkaline media shows that selectivity is based upon the P-X bond. That the
enzyme catalyzed PIm faster than N-phPAM shows hybridization of the nitrogen is
important.
Depending upon the PTP, phosphoramidase activity may be the same as
phosphatase activity, as with VHR, or it may be less, as with YopH. The hybridization of
the bridging atom can affect kinetic values, as demonstrated by YopH catalysis of
N-phPAM and PIm. Despite the enzymes showing different activities with the substrates,
PTPs are able to catalyze hydrolysis of all three substrates in this study with high activity.
While possessing very different motifs and having antipodal pH optima, PAcP
and AP are both non-specific phosphatases. Both enzymes were able to catalyze the
125
phosphoramidates with similar activity as the phosphomonoester. Thus, kinetic values
showed neither enzyme possessed clear specificity for any of the substrates.
Interpretation of the results from the serine/threonine phosphatases is difficult.
Clearly the motif can catalyze hydrolysis of PIm. But, the behavior of the two enzymes
with PIm was opposite: λPP catalyzed PIm while PP1 didn’t. While λPP catalyzed PIm,
it went to 25% and inexplicably stopped. To complicate experiments, small molecules
such as phosphorylated serine and threonine are not substrates. Phosphoramidase activity
was demonstrated in this study. Considering the inability of the enzymes to catalyze
phosphoserine or phosphothreonine as well as the behavior of the enzymes with the
phosphoramidate substrates in this study, specificity of the enzymes cannot be
determined with small molecule substrates.
5.2 Computer Modeling
The kinetic experiments address the question of whether or not phosphoramidase
activity exists in the known phosphatases. The positive results do not specify per se
whether or not catalysis proceeds with the same mechanism for phosphoramidates or
phosphomonoesters, although similar kcat values are consistent with the same rate limiting
step. NMR results showing cleavage of the P-N bond are also consistent with the same
mechanism. Isotope and LFER experiments would strengthen the proposition that
catalysis occurs with the same mechanism. Such experiments are costly in funds and
time. In this study, computer models were used to address the matter.
The transition state in enzymatic catalysis occurs in the time span of one
vibration. As such, a transition species is too short-lived to be detected. Crystal
structures cannot be obtained with an enzyme’s substrate as hydrolysis will occur before

126
crystallization. However, a computer can model a substrate in the active site of an
enzyme. Such a model provides an examination of the enzyme-substrate complex before
the transition state or catalysis.
Enzyme-substrates complexes with the same orientation of different substrates
and the same enzyme are consistent with the catalytic mechanism being the same.
However, there must be a justification for orienting the substrates. Inhibitors crystallized
with enzymes assume a specific orientation that can be a starting point for orienting a
substrate in a computer model.
There are two important considerations when placing a substrate into an active
site using an inhibitor as a starting point. One, the inhibitor lacks a leaving group, and
interactions between a substrate’s leaving group and residues are not seen in the crystal
structure. Two, the enzyme-inhibitor structure represents a product, or product analog,
bound with the enzyme in a specific conformation. This conformation may or may not be
a close transition-state analog.
Since the transition state occurs in the time span of one vibration, the enzyme
must assume its transition state conformation before catalysis. A model of this
conformation is desired. But, the starting point for the model is a crystal structure, and a
crystal structure represents a low-energy conformation of an enzyme. However,
transition state conformations represent higher-energy global enzyme conformations.
Attempts to artificially move residues in the low energy crystal structure to model an
enzyme-substrate complex at the high energy transition state would necessarily entail
significant assumptions.

127
A computer model with limited assumptions may be had realizing that the model
does not necessarily represent the transition state conformation. If a substrate is placed
into the active site in the same orientation as an inhibitor, a computer may modify
distances between residues and the substrate to lower the overall energy of the enzyme-
substrate complex. While a model so obtained would not necessarily represent the
transition state complex, it would show the bound orientation of a substrate before
catalysis. By mere orientation and proximity of the catalytic residues and the substrate,
the role of the residues could be inferred. This is what was done during this study.
The computer experiments completed in this study examine structure-activity
relationships. Significant geometric differences exist between the substrates, which may
alter the structure of the enzyme-substrate complex. With PHPT1, VHR, and λPP the
leaving group is surrounded predominantly by solvent when the substrate is bound. Little
difference is expected in binding distances or orientation between pNPP and PIm. This
was true for PHPT1 and VHR. λPP’s kinetic results indicated phenomena were causing
the enzymes to catalyze the substrates with significantly different values. The computer
modeling was consistent with the kinetic results in that binding of pNPP and PIm were
different.
Substrates bound to YopH, PAcP, and AP have leaving groups in greater contact
with the enzyme’s amino acids. Differences in binding distances and orientation are
possible, but not mandated, between pNPP and PIm because of the leaving group-amino
acid interactions. With the WPD loop closed, there is a difference between distances
with YopH. PAcP had little differences, neither did AP. This is an indication that the
128
different leaving groups are not a priori indicators that kinetic rates or binding orientation
are different.
While it is an equilibrium constant, the Michaelis constant is also a ratio of rates.
KM is not a reflection of binding strength, and there is no associating between binding
orientation or binding distances with KM. The computer modeled structures cannot be
directly associated with KM.
The rate limiting step of catalysis is given by kcat. Structure-activity relationships
do not indicate what step of catalysis is rate limiting, and computer modeled structures
cannot be directly associated with kcat.
With no direct link to kcat or KM, the computer models may seem of limited value.
However, there is no other technique to examine an enzyme-substrate complex before
catalysis. The strength of the method is that it provides a structure comparison between
enzyme-substrate complexes with different substrates. It is one more piece of evidence to
support a hypothesis that catalysis does, or does not, proceed by the same mechanism.
5.3 Major Conclusions
While phosphoramidases in addition to PHPT1 may be discovered, the existing
phosphomonoesterase motifs are capable of hydrolyzing phosphoramidates. The most
important result of this study is that there is no prerequisite for the future discovery of
additional phosphoramidases.
The results of this study are readily placed into a larger physiological perspective.
Proteins are often phosphorylated at multiple sites. With the exception of PHPT1’s
motif, none of the enzymes studied possess a motif that can selectively dephosphorylate a

129
protein (Figure 5-1). If an enzyme is to selectively dephosphorylate a protein, selection
must be accomplished by some property of the phosphatase other than its motif.
O
P
O
HO
O
O
P
OO
HO
O
P
O
HO O
HNN
PO
O
O
H2N
P
O
O
O
Phosphatase
O
P
O
HO
O
O
P
OO
HO
O
P
O
HO O
NNH
H2N
P
O
O
O
Figure 5-1. Selective dephosphorylation of a protein cannot be accomplished by an
enzyme’s motif. The exception being PHPT1, that can dephosphorylate
phosphohistidine. A generalized protein with multiple phosphorylation sites is shown in
green.
PHPT1 has an ability to selectively dephosphorylate phosphohistidine (Figure 5-
1). While the rate constant for catalysis of PIm does not appear to be high, the selectivity
for PIm over pNPP is high. This may be due to the general base catalysis employed by
the enzyme. The leaving group of phosphoesters is not especially labile, but can be made
so by protonation by a general acid. In comparison, phosphohistidine’s leaving group is
labile. The differences in leaving groups likely account for substrate susceptibility to
general base catalysis.

130
Proteins may be phosphorylated on lysine or arginine. While such residues would
possess labile P-N bonds, the results herein indicate the bonds could be catalytically
cleaved by motifs studied. Not only is there no prerequisite for phosphoramidases able to
cleave phosphohistidine, there is no prerequisite for phosphoramidases to cleave
phospholysine or phosphoarginine.
5.4 Future Study in the Field of Phosphoramidates and Phosphoramidases
In this study, PIm and N-phPAM were used as substrates. In vivo
phosphorylation of lysine and arginine are known. Analogs of such substrates could be
made, but the techniques to conduct kinetic assays with such substrates are nascent at
best.
The unique nature of phosphoramidates provides an interesting probe for
enzymatic action. Charged and uncharged sp3 nitrogens, as well as charged and
uncharged sp2 nitrogens provide different phosphoramidate substrates. The behavior of
enzymes with these substrates in vitro can provide insight as to how the enzymes may
work in vivo.
Presently the field seems to have attracted far less attention than studies with
phosphoesters, likely a reflection of the difficulties associated with the substrates.
Without more research in this area, an incomplete knowledge of biochemical pathways
will remain. This study is a start in understanding the catalyzed hydrolysis of
phosphoramidates.

131
REFERENCES
(1) Huang, J.; Wei, Y.; Kim, Y.; Osterberg, L.; Matthews, H. R. J. Biol.
Chem. 1991, 266, 9023-9031.
(2) Attwood, P. V.; Ludwig, K.; Bergander, K.; Besant, P. G.; Adina-Zada,
A.; Krieglstein, J.; Klumpp, S. Biochim. Biophys. Acta 2010, 1804, 199-205.
(3) Huang, J.; Nasr, M.; Kim, Y.; Matthews, H. R. J. Biol. Chem. 1992, 267,
15511-15515.
(4) Fujitaki, J. M.; Fung, G.; Oh, E. Y.; Smith, R. A. Biochemistry 1981, 20,
3658-3664.
(5) Chen, C. C.; Smith, D. L.; Bruegger, B. B.; Halpern, R. M.; Smith, R. A.
Biochemistry 1974, 13, 3785-3787.
(6) Boyer, P. D.; Deluca, M.; Ebner, K. E.; Hultquist, D. E.; Peter, J. B. J.
Biol. Chem. 1962, 237, PC3306-PC3308.
(7) Chen, C. C.; Bruegger, B. B.; Kern, C. W.; Lin, Y. C.; Halpern, R. M.;
Smith, R. A. Biochemistry 1977, 16, 4852-4855.
(8) Steiner, A. W.; Helander, E. R.; Fujitaki, J. M.; Smith, L. S.; Smith, R. A.
J. Chromatogr. 1980, 202, 263-269.
(9) Zetterqvist, O.; Engstrom, L. Biochim. Biophys. Acta 1967, 141, 523-532.
(10) Wakim, B. T.; Aswad, G. D. J. Biol. Chem. 1994, 269, 2722-2727.
(11) Nishino, M.; Tsujimura, S.; Kuba, M.; Kumon, A. Arch. Biochem.
Biophys. 1994, 312, 101-106.
(12) Kumon, A.; Kodama, H.; Kondo, M.; Yokoi, F. J. Biochem 1996, 119,
719-724.

132
(13) Moller, K. M. Biochim. Biophys. Acta 1955, 16, 162-165.
(14) Singer, M. F.; Fruton, J. S. J. Biol. Chem. 1957, 229, 111-119.
(15) Niall, H. D. Methods Enzymol. 1973, 27, 942-1010.
(16) Blake, C. C. F.; Koenig, D. F.; Mair, G. A.; North, A. C. T.; Phillips, D.
C.; Sarma, V. R. Nature 1965, 4986, 757-761.
(17) Ohmori, H.; Kuba, M.; Kumon, A. J. Biol. Chem. 1993, 268, 7625-7627.
(18) Khersonsky, O.; Tawfik, D. S. Annu. Rev. Biochem. 2010, 79, 471-505.
(19) Ek, P.; Pettersson, G.; B., E.; Gong, F.; Li, J.-P.; Zetterqvist, O. Eur. J.
Biochem. 2002, 269, 5016-5023.
(20) Gong, W.; Li, Y.; Cui, G.; Hu, J.; Fang, H.; Jin, C.; Xia, B. Biochem. J.
2009, 418, 337-344.
(21) Ma, R.; Kanders, E.; Sundh, U. B.; Geng, M.; Ek, P.; Zetterqvist, O.; Li,
J.-P. Biochem. Biophys. Res. Commun. 2005, 337, 887-891.
(22) Zhang, Z.-Y.; Wang, Y.; Dixon, J. E. Proc. Natl. Acad. Sci. U.S.A. 1994,
91, 1624-1627.
(23) Hoff, R. H.; Hengge, A. C.; Wu, L.; Keng, Y.-F.; Zhang, Z.-Y.
Biochemistry 2000, 39, 46-54.
(24) Stuckey, J. A.; Schubert, H. L.; Fauman, E. B.; Zhang, Z.-Y.; Dixon, J. E.;
Saper, M. A. Nature 1994, 370, 571-575.
(25) Hu, P.; Elliott, J.; McCready, P.; Skowronski, E.; Garnes, J.; Kobayashi,
A.; Brubaker, R. R.; Garcia, E. J. Bacteriol. 1998, 180, 5192-5202.
(26) Zhang, Z.-Y.; Malachowski, W. P.; Van Etten, R. L.; Dixon, J. E. J. Biol.
Chem. 1994, 269, 8140-8145.

133
(27) Zhang, Z.-Y.; Palfey, B. A.; Wu, L. Z., Y. Biochemistry 1995, 34, 16389-
16396.
(28) Hengge, A. C.; Sowa, G. A.; Wu, L.; Zhang, Z.-Y. Biochemistry 1995, 34,
13982-13987.
(29) Khajehpour, M.; Wu, L.; Liu, S.; Zhadin, N.; Zhang, Z.-Y.; Callender, R.
Biochemistry 2007, 46, 4370-4378.
(30) McCain, D. F.; Grzyska, P. K.; Wu, L.; Hengge, A. C.; Zhang, Z.-Y.
Biochemistry 2004, 43, 8256-8264.
(31) Zhao, Y.; Wu, L.; Noh, S. J.; Guan, K.-L.; Zhang, Z.-Y. J. Biol. Chem.
1998, 273, 5484-5492.
(32) Hu, X.; Stebbins, C. E. Biophys. J. 2006, 91, 948-956.
(33) Guan, K.; Dixon, J. E. J. Biol. Chem. 1991, 266, 17026-17030.
(34) Sun, J.-P.; Wu, L.; Fedorov, A. A.; Almo, S. C.; Zhang, Z.-Y. J. Biol.
Chem. 2003, 278, 33392-33399.
(35) Zhang, Z.-Y.; Clemens, J. C.; Schubert, H. L.; Stuckey, J. A.; Fischer, M.
W. F.; Hume, D. M.; Saper, M. A.; Dixon, J. E. J. Biol. Chem. 1992, 267, 23759-23766.
(36) Zhang, Z.-Y.; Dixon, J. E. Biochemistry 1993, 32, 9340-9345.
(37) Hengge, A. C. Adv. Phys. Org. Chem. 2005, 40, 49-108.
(38) Hengge, A. C.; Denu, J. M.; Dixon, J. E. Biochemistry 1996, 35, 7084-
7092.
(39) Rigas, J. D.; Hoff, R. H.; Rice, A. E.; Hengge, A. C.; Denu, J. M.
Biochemistry 2001, 40, 4398-4406.
(40) Zhao, Y.; Wu, L.; Zhang, Z.-Y. Biochemistry 1997, 36, 7928-7936.

134
(41) Zhao, Y.; Zhang, Z.-Y. Biochemistry 1996, 35, 11797-11804.
(42) Zhang, Z.-Y.; Wu, L.; Chen, L. Biochemistry 1995, 34, 16088-16096.
(43) Chen, L.; Montserat, J.; Lawrence, D. S.; Zhang, Z.-Y. Biochemistry 1996,
35, 9349-9354.
(44) Denu, J. M.; Dixon, J. E. Proc. Natl. Acad. Sci. U.S.A. 1995, 92, 5910-
5914.
(45) Zhou, G.; Denu, J. M.; Wu, L.; Dixon, J. E. J. Biol. Chem. 1994, 269,
28084-28090.
(46) Denu, J. M.; Zhou, G.; Yuping, G.; Dixon, J. E. Biochemistry 1995, 34,
3396-3404.
(47) Van Etten, R. L.; McTigue, J. J. Biochim. Biophys. Acta 1977, 484, 386-
397.
(48) Ortlund, E.; LaCount, M. W.; Lebioda, L. Biochemistry 2003, 42, 383-
389.
(49) Lindqvist, Y.; Schneider, G.; Vihko, P. Eur. J. Biochem. 1994, 221, 139-
142.
(50) Ostanin, K.; Saeed, A.; Van Etten, R. L. J. Biol. Chem. 1994, 269, 8971-
8978.
(51) Van Etten, R. L. Ann. N.Y. Acad. Sci. 1982, 390, 27-51.
(52) Lynn, K. R.; Clevette-Radford, N. A.; Chuaqui, C. A. Bioorg. Chem.
1981, 10, 90-96.
(53) Reiter, T. A.; Reiter, N. J.; Rusnak, F. Biochemistry 2002, 41, 15404-
15409.
135
(54) Voegtli, W. C.; White, D. J.; Reiter, N. J.; Rusnak, F.; Rosenzweig, A. C.
Biochemistry 2000, 39, 15365-15374.
(55) Barford, D.; Das, A. K.; Egloff, M.-P. Annu. Rev. Biophys. Biomol. Struct.
1998, 27, 133-164.
(56) Hoff, R. H.; Mertz, P.; Rusnak, F.; Hengge, A. C. J. Am. Chem. Soc. 1999,
121, 6382-6390.
(57) Mumby, M. C.; Walter, G. Physiol. Rev. 1993, 73, 673-699.
(58) Reiter, N. J.; White, D. J.; Rusnak, R. Biochemistry 2002, 41, 1051-1059.
(59) White, D. J.; Reiter, N. J.; Sikkink, R. A.; Yu, L.; Rusnak, F. Biochemistry
2001, 40, 8918-8929.
(60) Zhuo, S.; Clemens, J. C.; Hakes, D. J.; Barford, D.; Dixon, J. E. J. Biol.
Chem. 1993, 268, 17754-17761.
(61) Ansai, T.; Dupuy, L. C.; Barik, S. J. Biol. Chem. 1996, 271, 24401-24407.
(62) Kim, Y.; Huang, J.; Cohen, P.; Matthews, H. R. J. Biol. Chem. 1993, 268,
18513-18518.
(63) McWhirter, C.; Lund, E. A.; Tanifum, E. A.; Feng, G.; Sheikh, Q. I.;
Hengge, A. C.; Williams, N. H. J. Am. Chem. Soc. 2008, 130, 13673-13682.
(64) Xie, X.-J.; Huang, W.; Xue, C.-Z.; Wei, Q. Mol. Cell. Biochem. 2009,
327, 241-246.
(65) Zhang, L.; Lee, E. Y. C. Biochemistry 1997, 36, 8209-8214.
(66) Keppetipola, N.; Shuman, S. Nucleic Acids Res. 2007, 35, 7721-7732.
(67) Rusnak, R.; Yu, L.; Todorovic, S.; Mertz, P. Biochemistry 1999, 38, 6943-
6952.

136
(68) Mahapatra, P. P.; Dash, A. K.; Chickerur, N. S. Thermochim. Acta 1983,
70, 163-171.
(69) Catrina, I.; O'Brien, P. J.; Purcell, J.; Nikolic-Hughes, I.; Zalatan, J. G.;
Hengge, A. C.; Herschlag, D. J. Am. Chem. Soc. 2007, 129, 5760-5765.
(70) Wang, J.; Kantrowitz, E. R. Protein Sci. 2006, 15, 2395-2401.
(71) Nikolic-Hughes, I.; O'Brien, P. J.; Herschlag, D. J. Am. Chem. Soc. 2005,
127, 9314-9315.
(72) O'Brien, P. J.; Herschlag, D. Biochemistry 2001, 40, 5691-5699.
(73) O'Brien, P. J.; Herschlag, D. Biochemistry 2002, 41, 3207-3225.
(74) Stec, B.; Holtz, K. M.; Kantrowitz, E. R. J. Mol. Biol. 2000, 299, 1303-
1311.
(75) Wang, J.; Stieglitz, K. A.; Kantrowitz, E. R. Biochemistry 2005, 44, 8378-
8386.
(76) Labow, B. I.; Herschlag, D.; Jencks, W. P. Biochemistry 1993, 32, 8737-
8741.
(77) Snyder, S. L.; Wilson, I. B. Biochemistry 1972, 11, 3220-3223.
(78) Snyder, S. L.; Wilson, I. B. Biochemistry 1972, 11, 1616-1623.
(79) Stec, B.; Hehir, M. J.; Brennan, C.; Nolte, M.; Kantrowitz, E. R. J. Mol.
Biol. 1998, 277, 647-662.
(80) Coleman, J. E. Annu. Rev. Biophys. Biomol. Struct. 1992, 21, 441-483.
(81) Han, R.; Coleman, J. E. Biochemistry 1995, 34, 4238-4245.
(82) Holtz, K. M.; Kantrowitz, E. R. FEBS Lett. 1999, 462, 7-11.
(83) Cox, J. R. J.; Ramsay, O. B. Chem. Rev. 1964, 64, 317-352.

137
(84) Barnard, P. W. C.; Bunton, C. A.; Kellerman, D.; Mhala, M. M.; Silver,
B.; Vernon, C. A.; Welch, V. A. J. Chem. Soc. 1966, B, 227-235.
(85) Bunton, C. A. Acc. Chem. Res. 1970, 3, 257-265.
(86) Chanley, J. D.; Feageson, E. J. Am. Chem. Soc. 1958, 80, 2686-2691.
(87) Chanley, J. D.; Feageson, E. J. Am. Chem. Soc. 1963, 85, 1181-1190.
(88) Desjobert, A. Bull. Soc. Chim. Fr. 1964, 683-688.
(89) Kugel, L.; Halmann, M. J. Org. Chem. 1966, 32, 642-647.
(90) Kumamoto, J.; Westheimer, F. H. J. Am. Chem. Soc. 1955, 77, 2515-2518.
(91) Lloyd, G. J.; Cooperman, B. S. J. Am. Chem. Soc. 1971, 93, 4883-4889.
(92) Jencks, W. P.; Gilchrist, M. J. Am. Chem. Soc. 1965, 87, 3199-3209.
(93) Lide, D. R. CRC Handbook of Chemistry and Physics, 86th ed.; Taylor
and Francis Group: Boca Raton, London, New York, Singapore, 2005.
(94) Bunton, C. A.; Llewellyn, D. R.; Oldham, K. G.; Vernon, C. A. J. Chem.
Soc. 1958, 3574-3594.
(95) Levine, D.; Wilson, I. B. Inorg. Chem. 1968, 7, 818-820.
(96) Grzyska, P. K.; Czyryca, P. G.; Golightly, J.; Small, K.; Larsen, P.; Hoff,
R. H.; Hengge, A. C. J. Org. Chem. 2002, 67, 1214-1220.
(97) Kirby, A. J.; Jencks, W. P. J. Am. Chem. Soc. 1965, 87, 3209-3216.
(98) Kirby, A. J.; Varvoglis, A. G. J. Am. Chem. Soc. 1967, 89, 415-423.
(99) Herschlag, D.; Jencks, W. P. J. Am. Chem. Soc. 1987, 109, 4665-4674.
(100) Benkovic, S. J.; Sampson, E. J. J. Am. Chem. Soc. 1971, 93, 4009-4016.
(101) Kirby, A. J.; Varvoglis, A. G. J. Chem. Soc. 1968, B, 135-141.
(102) Herschlag, D.; Jencks, W. P. J. Am. Chem. Soc. 1989, 111, 7587-7596.

138
(103) Buchwald, S. L.; Friedman, J. M.; Knowles, J. R. J. Am. Chem. Soc. 1984,
106, 4911-4916.
(104) Lad, C.; Williams, N. H.; Wolfenden, R. Proc. Natl. Acad. Sci. U.S.A.
2003, 100, 5607-5610.
(105) Herschlag, D.; Jencks, W. P. J. Am. Chem. Soc. 1989, 111, 7579-7586.
(106) Herschlag, D.; Jencks, W. P. Biochemistry 1990, 29, 5172-5179.
(107) Lloyd, G. J.; Hsu, C.-M.; Cooperman, B. S. J. Am. Chem. Soc. 1971, 93,
4889-4892.
(108) Page, M. I.; Badarau, A. Bioinorg. Chem. Appl. 2008, 2008, 1-14.
(109) Ibrahim, M. M.; Shimomura, N.; Ichikawa, K.; Shiro, M. Inorg. Chim.
Acta 2001, 313, 125-136.
(110) Moody, E. M.; Brown, T. S.; Bevilacqua, P. C. J. Am. Chem. Soc. 2004,
126, 10200-10201.
(111) Chaidaroglou, A.; Brezinski, D. J.; Middleton, S. A.; Kantrowitz, E. R.
Biochemistry 1988, 27, 8338-8343.
(112) VanEtten, R. L.; Waymack, P. P.; Rehkop, D. M. J. Am. Chem. Soc. 1974,
96, 6782-6785.
(113) Ostanin, K.; Van Etten, R. L. J. Biol. Chem. 1993, 268, 20778-20784.
(114) Bessey, O. A.; Love, R. H. J. Biol. Chem. 1952, 196, 175-178.
(115) Aschaffenburg, R. Science 1953, 117, 611.
(116) Saady, M.; Lebeau, L.; Mioskowski, C. Helv. Chim. Acta 1995, 78, 670-
678.
(117) Burlingham, B. T.; Widlanski, T. S. J. Org. Chem. 2001, 66, 7561-7567.

139
(118) Rosenberg, T. Arch. Biochem. Biophys. 1964, 105, 315-318.
(119) van Dijk, A. A.; De Lange, L. C. M.; Bachovchin, W. W.; Robillard, G. T.
Biochemistry 1990, 29, 8164-8171.
(120) Busam, R. D.; Thorsell, A.-G. T.; Flores, A.; Hammarstrom, M.; Persson,
C.; Hallberg, B. M. J. Biol. Chem. 2006, 281, 33830-33834.
(121) Sadeghi, H. M. M.; Rabbani, M.; Fazeli, S. Res. Pharmaceut. Sci. 2008, 3,
35-39.
(122) Zhang, Z.-Y.; VanEtten, R. L. J. Biol. Chem. 1991, 266, 1516-1525.
(123) Kezdy, F.; Bender, M. L. Biochemistry 1962, 1, 1097-1106.
(124) Hess, H. H.; Derr, J. E. Anal. Biochem. 1975, 63, 607-613.
(125) Lowry, O. H.; Lopez, J. A. J. Biol. Chem. 1946, 162, 421-428.
(126) Sjosten, A.; Blomqvist, S. Water Res. 1997, 31, 1818-1823.
(127) Taussky, H. H.; Shorr, E. J. Biol. Chem. 1953, 202, 675-685.
(128) Wu, H. J. Biol. Chem. 1920, 43, 189-220.
(129) Lanzetta, P. A.; Alvarez, L. J.; Reinach, P. S.; Candia, O. A. Anal.
Biochem. 1979, 100, 95-97.
(130) Kallner, A. Clin. Chim. Acta 1975, 59, 35-39.
(131) Parvin, R.; Smith, R. A. Anal. Biochem. 1969, 27, 65-72.
(132) Saheki, S.; Takeda, A.; Shimazu, T. Anal. Biochem. 1985, 148, 277-281.
(133) Duggleby, R. G. Methods 2001, 24, 168-174.
(134) Duggleby, R. G.; Clarke, R. B. Biochim. Biophys. Acta 1991, 1080, 231-
236.
140
(135) Mayo, S. L.; Olafson, B. D.; Goddard, I., W. A. J. Phys. Chem. 1990, 94,
8897-8909.
(136) Eliel, E. L.; Wilen, S. H. Stereochemistry of Organic Compounds; John
Wiley & Sons: New York, 1994.
(137) Tollenaere, J. P.; Janssen, P. A. J. Med. Res. Rev. 1988, 8, 1-25.
(138) Mertz, P.; Yu, L.; Sikkink, R.; Rusnak, F. J. Biol. Chem. 1997, 272,
21296-21302.
(139) Copeland, R. A. Enzymes, A Practical Introduction to Structure,
Mechanism, and Data Analysis; John Wiley & Sons: New York, 2000.
(140) Wojciechowski, C. L.; Kantrowitz, E. R. J. Biol. Chem. 2002, 277, 50476-
50481.
(141) Boulanger, R. R.; Kantrowitz, E. R. J. Biol. Chem. 2003, 278, 23497-
23501.
(142) Hehir, M. J.; Murphy, J. E.; Kantrowitz, E. R. J. Mol. Biol. 2000, 304,
645-656.
(143) Lin, M.-F.; Clinton, G. M. Biochem. J. 1986, 235, 351-357.
(144) Luchter-Wasylewska, E. Biochim. Biophys. Acta 2001, 1548, 257-264.
(145) Kilsheimer, G. S.; Axelrod, B. J. Biol. Chem. 1957, 227, 879-890.
(146) Nigam, V. N.; Davidson, H. M.; Fishman, W. H. J. Biol. Chem. 1959, 234,
1550-1554.
(147) Oh, B.-C.; Choi, W.-C.; Park, S.; Kim, Y.-o.; Oh, T.-K. Appl. Microbiol.
Biotechnol. 2004, 63, 362-372.
(148) Barik, S. Proc. Natl. Acad. Sci. U.S.A. 1993, 90, 10633-10637.

141
(149) Hall, A. D.; Williams, A. Biochemistry 1986, 25, 4784-4790.
(150) Hollfelder, F.; Herschlag, D. Biochemistry 1995, 34, 12255-12264.
(151) Kelly, S. J.; Dardinger, D. E.; Butler, L. G. Biochemistry 1975, 14, 4983-
4988.
(152) Alberty, R. A.; Hammes, G. G. J. Phys. Chem. 1958, 62, 154-159.
(153) Runyu, H.; Coleman, J. E. Biochemistry 1995, 34, 4238-4245.
(154) Bloch, W.; Schlesinger, M. J. J. Biol. Chem. 1974, 6, 1760-1768.
(155) Hengge, A. C.; Edens, W. A.; Elsing, H. J. Am. Chem. Soc. 1994, 116,
5045-5049.

142
APPENDIX
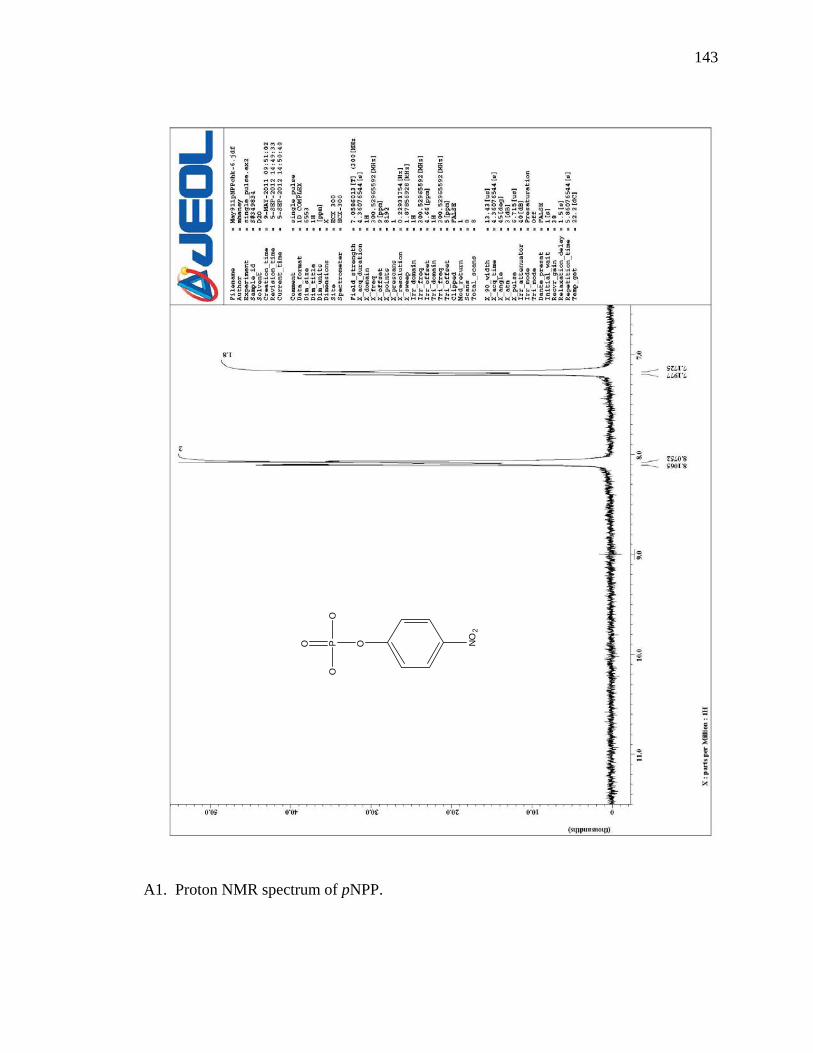
143
O P O
OO
NO
2
A1. Proton NMR spectrum of pNPP.
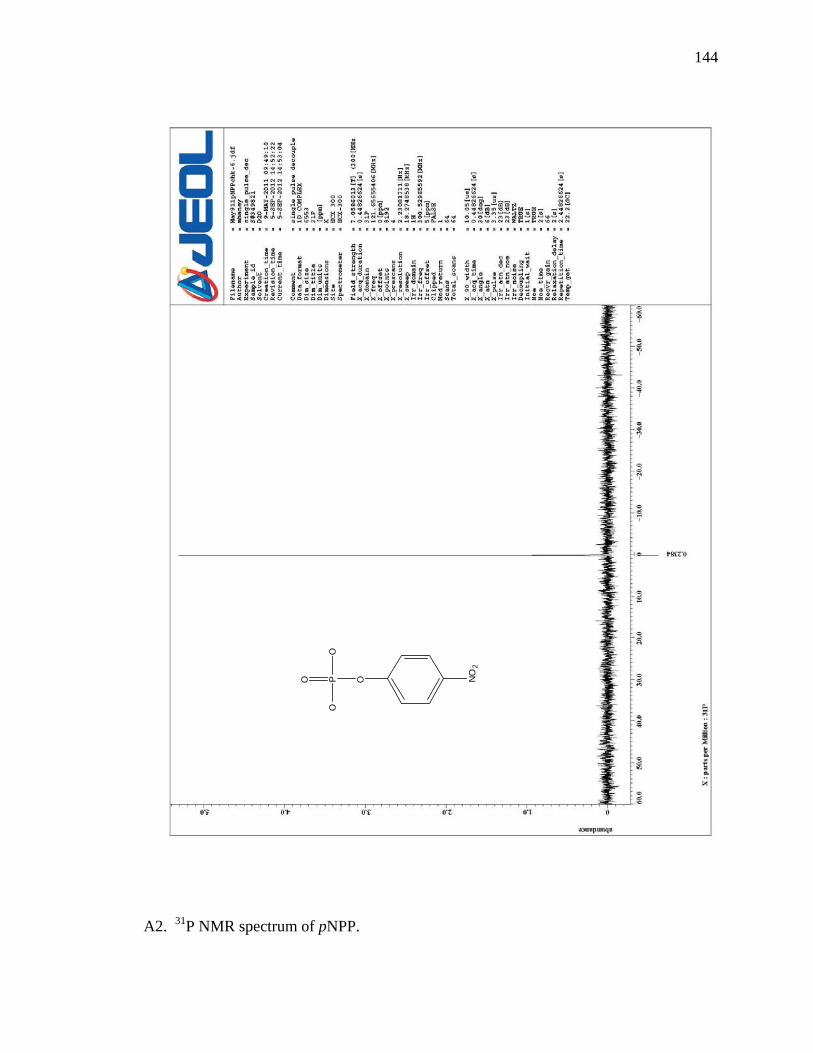
144
O P O
OO
NO
2
A2. 31P NMR spectrum of pNPP.

145
PO
O
O
A3. Proton NMR spectrum of tri-benzyl phosphite.

146
A4. 31P NMR spectrum of tri-benzyl phosphite.
PO
O
O

147
A5. 31P NMR spectrum of tribenzyl phosphite.
PO
O
O

148
PO
OO
NH
A6. Proton NMR spectrum of dibenzyl N-phPAM.

149
PO
OO
NH
A7. Proton NMR spectrum of dibenzyl N-phPAM

150
PO
OO
NH
A8. 31P NMR spectrum of dibenzyl N-phPAM.

151
O PH
OO
NH
NH
A9. Proton NMR spectrum of N-phPAM triethyl ammonium salt.

152
O PH
OO
NH
NH
A10. 31P NMR spectrum of N-phPAM triethyl ammonium salt.

153
O PH
OO
NH
Na
A11. Proton NMR spectrum of N-phPAM sodium salt.

154
O PH
OO
NH
Na
A12. 31P NMR spectrum of N-phPAM sodium salt.

155
NN
PO
O
O
PO
O
O
A13. Proton NMR spectrum of di-phospho imidazole.

156
NN
PO
O
O
PO
O
O
A14. 31P NMR spectrum of di-phospho imidazole.

157
NN
PO
O
O
PO
O
O
OH
-
NN
PO
O
O+
P i
A15. Proton NMR spectrum showing the reaction of DPI to PIm.

158
NN
PO
O
O
PO
O
O
OH
-
NN
PO
O
O+
P i
A16. 31P NMR spectrum showing the reaction of DPI to MPI.

159
N
H N
A17. Proton NMR spectrum of imidazole.

160
NN
A18. Proton NMR spectrum of pyrazine.

161
NN
PO
O
O
A19. Proton NMR spectrum of PIm with pyrazine standard in coaxial tube.

162
NN
PO
O
O
A20. Proton NMR spectrum of PIm with pyrazine standard in coaxial tube.

163
NN
PO
O
O
A21. 31P NMR spectrum of PIm.

164
Full Time-Course Kinetics
The inability to follow the hydrolysis of PIm by UV/Vis spectroscopy drove
development of a full time-course analytical technique using NMR spectrometry. The
disadvantage of following a full time-course is that it requires most, if not all of the initial
substrate to be consumed for reliable mathematical analysis. Disadvantages of using
NMR spectrometry to follow enzymatic reactions are the slow acquisition time and
minimal concentration of substrate detectable by the instrument.
Full time-course assays using NMR were conducted using the following steps: 1)
converting the calcium salt of PIm to the sodium salt; 2) determining the concentration of
the stock PIm solution using a 0.1M pyrazine standard and NMR, while in the process
adjusting instrument parameters for the subsequent enzymatic assay; 3) mixing a buffered
solution of PIm; mixing enzyme with the buffered solution of PIm, placing this mixture
in the NMR tube and placing a coaxial tube with pyrazine standard in the tube; 4) loading
the instrument queue with duplicate experiments; 5) processing each spectra; and 6)
inputting data from the processed spectra into a least-squares or simplex fitting program
to determine Vmax, KM, and Ki. Each step is covered below.
PIm is isolated as the insoluble calcium salt. It is made soluble by exchanging the
calcium for sodium with IRC 748 cation exchange resin (section 2.2.10). Minor changes
in incubation time with the resin or incubation temperature can affect the concentration of
sodium PIm in solution. For this reason, the concentration of the PIm should be checked
whenever a new stock solution is made (section 2.4.3.1). Mixing an aliquot of the
sodium PIm (Figures A19 and A20) with an aliquot of pyrazine of known concentration
yields the concentration of PIm by integrating the relative proton signals (section 2.4.3.1).

165
When integrating spectra, better accuracy is had by limiting the instrument’s
acquisition of proton signals to those of interest. Pyrazine, PIm, and imidazole have
signals in the aromatic region, whereas water and buffer have no signals in the aromatic
region. Water and buffer signals must be addressed before obtaining spectra.
The water signal will be much greater in intensity than the substrates. It should be
suppressed with pre-saturation. After the sample with mixed pyrazine and PIm is placed
in the instrument, an NMR experiment should be run with a sweep of from 9 to 0 ppm.
The resultant spectrum should be processed to determine the shift of the water signal; it
usually showed at 4.7 ppm but may vary based upon the instrument’s shims. The water
signal at the determined ppm was suppressed with pre-saturation at 35 decibels. While
35 decibels was used, the NMR manager should be consulted for the maximum
suppression power to minimize risk to the instrument.
With the water signal suppressed, the buffer will still be in much greater
concentration than the substrate and will obscure substrate signals. The instrument sweep
and offset should be adjusted to show only the aromatic region which will mitigate
interference of the buffer signals (section 2.4.3.1). The x-points should be reduced since
the sweep will be greatly reduced. Suppression of the water signal, adjustment of the
sweep, offset, and x-points will change a spectrum of a pyrazine/PIm mixture from that
shown in Figure A19 to that shown in Figure A20. At this point, the signals can be
integrated and the concentration of the stock solution determined. The instrument’s
settings are now adjusted to conduct the enzymatic assays. The purity of the stock PIm
solution may be ascertained at this point by obtaining a 31P spectrum (Figure A21).

166
The instrument should be prepared for an enzymatic assay. The spinner should be
turned off since the motion of the spinner may affect the enzyme. The time span between
data points is adjusted changing the number of scans. For example, if each scan takes 5
seconds and an experiment is set for 30 scans, the experiment will take 150 seconds.
With the spinner off and the time span adjusted, the instrument is ready for an enzymatic
assay.
Stock PIm and buffer can be mixed in a small microcentrifuge tube. Enzyme can
be added to the PIm/buffer mix, and the buffered solution placed into the NMR tube. A
coaxial tube containing pyrazine is inserted into the NMR tube, the NMR tube is inserted
into the instrument, and a series of duplicate NMR experiments are loaded into the queue
to be run automatically.
The intensity of the pyrazine signal should neither obscure the PIm signals by
being too great nor be obscured by the PIm signals by being too small (Figure A-19).
The purpose of the pyrazine standard during an enzymatic assay is to provide a standard
signal during the time-course. If the instrument’s shimming should vary, the intensities
of the signals will vary. Normalizing the PIm signals against the pyrazine signal
accounts for any variation in the shims. If the PIm concentration needs to be increased or
decreased, the pyrazine concentration in the coaxial tube may be increased or decreased.
Since the pyrazine in the coaxial tube’s purpose is to provide a normalized signal, it’s
concentration does not have to be known.
Spectra should be processed as NMR experiments from the queue are completed.
The phase and baseline should be adjusted on each spectra. The substrate (PIm) signals

167
and product (imidazole) signals should be integrated against the pyrazine standard
(section 2.4.3.1).
Since the initial concentration of PIm was known, each NMR experiment will
yield the concentration of PIm, or imidazole, at a specific time. Changes in concentration
of PIm, or imidazole, coupled with the time span between each NMR experiment will
give the observed velocity, Vobs. Upon addition of enzyme to the substrate hydrolysis
will begin immediately. The first data point will not be detected directly by the
instrument; the NMR tube holding the enzyme/substrate mixture will be in the
experimentalist’s hand. But, the substrate concentration at the first point will be known
since stock solution of known concentration was used to make the buffered solution.
For the substrates used in this study, a 1 to 1 ratio of substrate to Pi is maintained
during an assay. Specifically, for each mole of PIm hydrolyzed, a mole of Pi is formed.
This allows use of the below equation which accounts for generation of inhibitor
concentration during the time-course..
(Vmax)[S] (A1) Vobs =
KM(1 + [I]/Ki) + [S]
If the full time-course is followed using proton spectrometry concentrations of Pi
will not be directly detected. The instrument will provide the concentration of PIm, or
[S], at a given time point. Knowing the starting concentration of substrate, the
concentration of inhibitor, or Pi, is determined by [I] = [S]initial – [S]remaining. This assumes
Pi is not precipitating or otherwise being consumed.
Upon completion of a full time-course enzymatic assay monitored by NMR, Vobs,
[S], and [I] at a series of time points are known. These data are then fitted to equation A1

168
using the program Micomath by Scientist to determine Vmax and KM. Fits during this
study were completed using least squares. Simplex fitting was tried as well and gave the
same results as least squares.
Fitting the data involved converting the time of the experiment from hr:min:sec to
an elapsed ΔTime. This was done by assuming the first time period to be time t = 0. In
Table A1 it can be seen that the time of the first experiment was 3:12:08 a.m. This was
the first data point and was taken to be time t = 0. The initial concentration at time t = 0
was 3 mM PIm, 0 mM Pi, and the percent hydrolysis was 0. The data inputted into the
spreadsheet were the hours, minutes, seconds, initial concentration of PIm, and
concentration of PIm at the time point as determined by integration of the signal.
Concentration of Pi was determined as indicated above.
Inputting data into Excel before fitting the data in Scientist by Micromath is
necessary to convert the instrument’s output time to ΔTime and to determine the
concentration of PIm and Pi at each time point. Additionally, Excel will provide instant
confirmation that curvature is shown in the resulting plot and that hydrolysis has
proceeded to 90%.
A challenge in fitting the data to Equation A1 is having curvature to the plot.
During the initial phases of an enzymatic reaction it may visually appear that the rate
stays unchanged, even up to 50% or more of the reaction. Not only can the data (Vobs vs
time, [S] vs time, or [I] vs time) appear linear over the time-course to the eye, the data
can appear linear to the computer. If the algorithm does not have the expected curvature
to the data it cannot properly fit the data. Error in Vmax and/or KM will be larger than that
obtained values.

169
Table A1. Excel spreadsheet for the data entry of the hydrolysis of PIm by PAcP at pH
5.5.
PIm PIm by [PIm]Time Δ Time Δ Time Peak at Peak at %
hr min sec (h:m:s) (min) 7.3 7.9 [PIm] [Pi] Hydrolysis3 12 8 192.13 0.00 1 0.47 0.003 0 0%3 15 10 195.17 3.03 1 0.41 0.002617 0.000383 13%3 18 10 198.17 6.03 1 0.39 0.002489 0.000511 17%3 21 12 201.20 9.07 1 0.36 0.002298 0.000702 23%3 24 13 204.22 12.08 1 0.31 0.001979 0.001021 34%3 27 15 207.25 15.12 1 0.31 0.001979 0.001021 34%3 30 16 210.27 18.13 1 0.28 0.001787 0.001213 40%3 33 18 213.30 21.17 1 0.24 0.001532 0.001468 49%3 36 18 216.30 24.17 1 0.25 0.001596 0.001404 47%3 39 20 219.33 27.20 1 0.21 0.00134 0.00166 55%3 42 21 222.35 30.22 1 0.19 0.001213 0.001787 60%3 45 23 225.38 33.25 1 0.16 0.001021 0.001979 66%3 48 25 228.42 36.28 1 0.17 0.001085 0.001915 64%3 51 25 231.42 39.28 1 0.15 0.000957 0.002043 68%3 54 27 234.45 42.32 1 0.14 0.000894 0.002106 70%3 57 28 237.47 45.33 1 0.13 0.00083 0.00217 72%4 0 30 240.50 48.37 1 0.13 0.00083 0.00217 72%4 3 30 243.50 51.37 1 0.09845 0.000628 0.002372 79%4 6 32 246.53 54.40 1 0.1 0.000638 0.002362 79%4 9 33 249.55 57.42 1 0.1 0.000638 0.002362 79%4 12 35 252.58 60.45 1 0.09586 0.000612 0.002388 80%4 15 35 255.58 63.45 1 0.0706 0.000451 0.002549 85%4 18 37 258.62 66.48 1 0.07124 0.000455 0.002545 85%4 21 38 261.63 69.50 1 0.06547 0.000418 0.002582 86%4 24 40 264.67 72.53 1 0.04949 0.000316 0.002684 89%4 27 40 267.67 75.53 1 0.07169 0.000458 0.002542 85%4 30 42 270.70 78.57 1 0.05319 0.00034 0.00266 89%4 33 43 273.72 81.58 1 0.04319 0.000276 0.002724 91%4 36 44 276.73 84.60 1 0.03854 0.000246 0.002754 92%4 39 46 279.77 87.63 1 0.03266 0.000208 0.002792 93%

170
1 uM PAcP, pH 5.5, rt, 3 mM PIm
00.00050.001
0.00150.002
0.00250.003
0.0035
0 20 40 60 80 100
Time (min)
[PIm
](M)
Figure A22. Plot of the data in Table A1. Curvature can be seen in the data.
Literature reports that if a time-course proceeds to 90% or more reliable data can
be had.1,2 This matches attempts herein to least-squares fit time-courses. Shorter time-
courses may not display curvature. In nearly all cases attainment of 90% hydrolysis
yields visible curvature and good fit of the data to the Michaelis-Menton equation with
inhibition.
Experiments must be conducted with different concentrations of enzyme and
substrate that yield curvature to the hydrolysis plot (Figure A22). Too little substrate
concentration or too high an enzyme concentration and the reaction will be completed
before enough data points are collected. Further, the rates between data points will be too
great to represent instantaneous data points; no curvature will be seen (Figure A23).
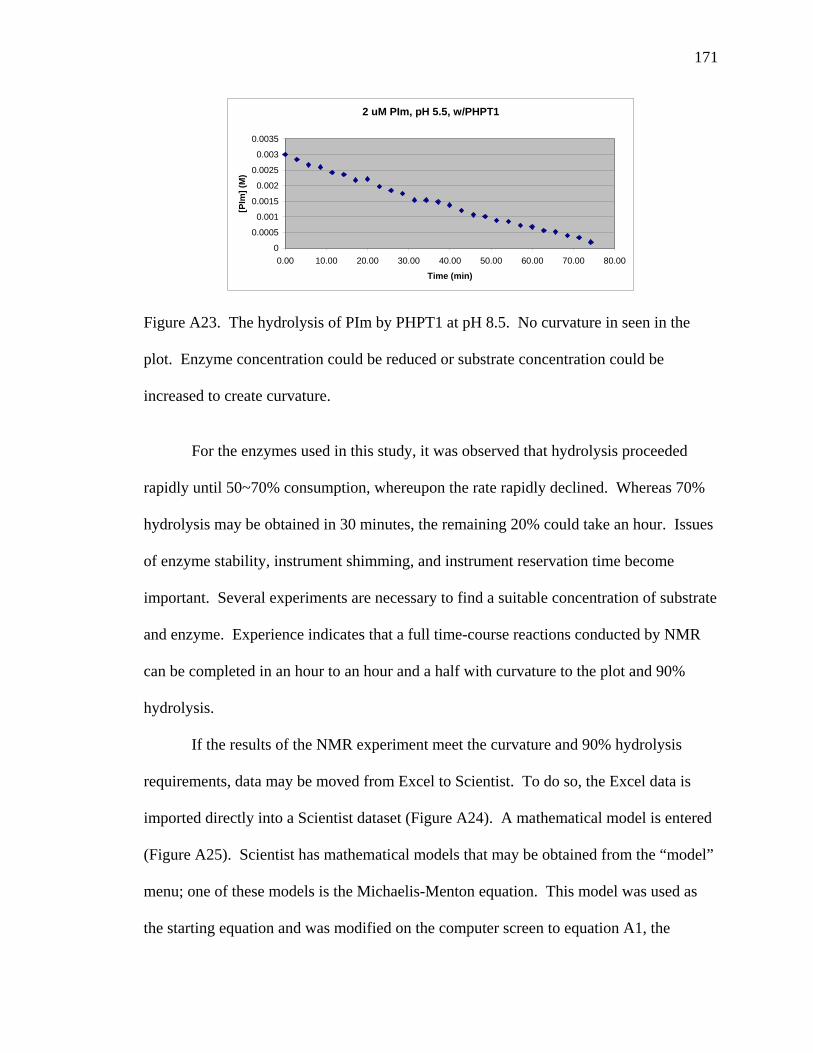
171
2 uM PIm, pH 5.5, w/PHPT1
0
0.0005
0.001
0.0015
0.002
0.0025
0.003
0.0035
0.00 10.00 20.00 30.00 40.00 50.00 60.00 70.00 80.00
Time (min)
[PIm
] (M
)
Figure A23. The hydrolysis of PIm by PHPT1 at pH 8.5. No curvature in seen in the
plot. Enzyme concentration could be reduced or substrate concentration could be
increased to create curvature.
For the enzymes used in this study, it was observed that hydrolysis proceeded
rapidly until 50~70% consumption, whereupon the rate rapidly declined. Whereas 70%
hydrolysis may be obtained in 30 minutes, the remaining 20% could take an hour. Issues
of enzyme stability, instrument shimming, and instrument reservation time become
important. Several experiments are necessary to find a suitable concentration of substrate
and enzyme. Experience indicates that a full time-course reactions conducted by NMR
can be completed in an hour to an hour and a half with curvature to the plot and 90%
hydrolysis.
If the results of the NMR experiment meet the curvature and 90% hydrolysis
requirements, data may be moved from Excel to Scientist. To do so, the Excel data is
imported directly into a Scientist dataset (Figure A24). A mathematical model is entered
(Figure A25). Scientist has mathematical models that may be obtained from the “model”
menu; one of these models is the Michaelis-Menton equation. This model was used as
the starting equation and was modified on the computer screen to equation A1, the

172
Figure A24. A dataset entered into Scientist. This data is that from Table A1.
Figure A25. A mathematical model inputted into Scientist.

173
Figure A26. A Scientist parameter set.
Michaelis-Menton equation with inhibition. A blank parameter set is generated using the
“New parameter set” command from the pull-down menu (Figure A26). Menus on the
parameter set link the parameter set to the data and the mathematical model. The
parameter set is “compiled” using the “compile” function from the pull-down menu,
followed by “least squares fitting” from the pull down menu. Micromath will then fit the
data from the menu and return values for the independent parameters, Vmax and KM.
Returning to Micromath’s data spreadsheet will reveal the program’s calculated values at
each data point based upon the fit (Figure A27). A chart may be generated in the
program to display the raw data and the fitted data (Figure A28).
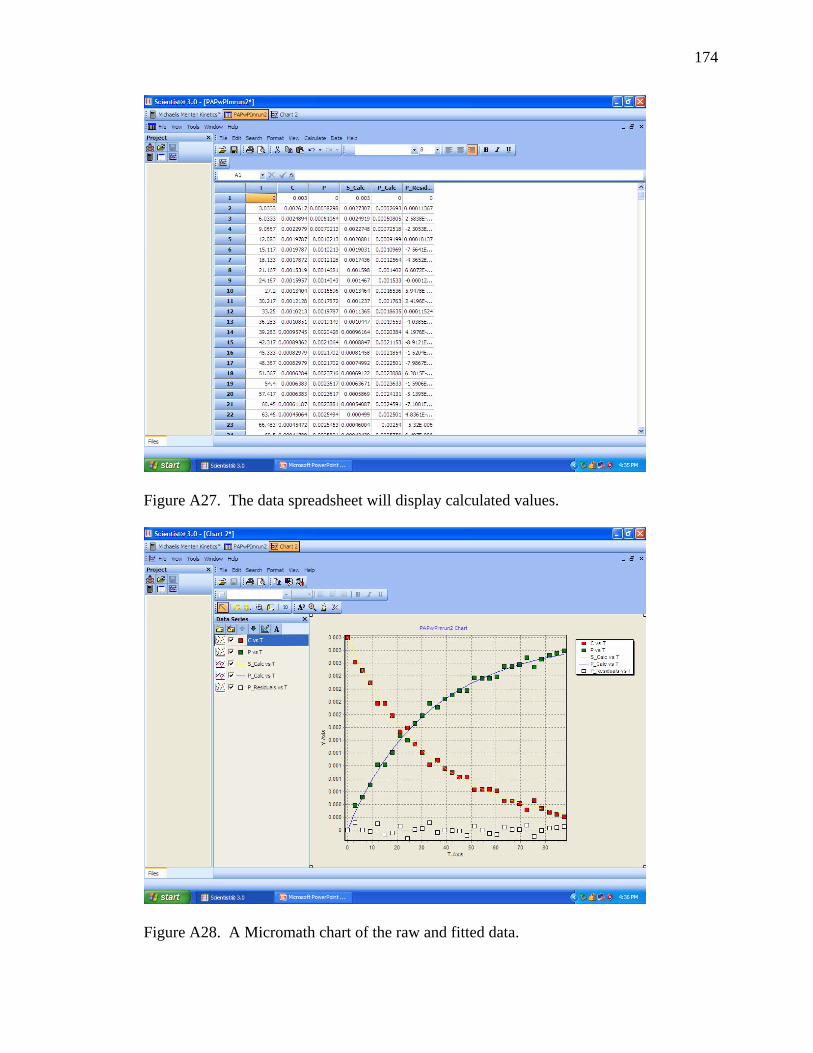
174
Figure A27. The data spreadsheet will display calculated values.
Figure A28. A Micromath chart of the raw and fitted data.

175
The Scientist program was purchased from Micromath using funds from the
Hengge Lab. Three licenses were purchased, two of which have been installed on
desktop computers in the Hengge Lab. One key is unused at the time of this writing.
Account information is: user name – Alvan Hengge; HWKEY – 1EC0-FB62; Key –
000015-W9JY7D-A2627V-93UZQD-RKETHQ-QT4UN1-ABA60M-0QUMXA-
U1ETYC-K4UZ35. A manual for the program is available using the “Help” menu within
the program.
References.
(1) Duggleby, R. G. Methods 2001, 24, 168-174.
(2) Duggleby, R. G.; Clarke, R. B. Biochimica et Biophysica Acta 1991, 1080,
231-236.

176
CURRICULUM VITAE
Mark P. Haney
2013 Curriculum Vitae. Employment history: USMC, 1983-2003 Education: Undergraduate school: B.A., geology, University of Colorado at Boulder, Boulder, CO, 1992. Graduate school: Ph.D in chemistry, Utah State University, Logan, UT, 2013. Dissertation: The Phosphoramidase Competency of Prototypical Catalytic Phosphatase Motifs. Teaching experience (2007-present): Teaching assistant for 19 general chemistry recitations, Chem 1210 & 1220, taught over 3 semesters. Teaching assistant for 3 general chemistry labs, Chem 1215, taught during 1 semester. Additionally, 3 labs are being taught in the current semester. Teaching assistant for 4 organic chemistry labs, Chem 2315, taught over 2 semesters. Taught organic chemistry lecture, Chem 2300, for two weeks while professor was away, Fall 2012. Currently developing broadcast course for Chem 1010, to be taught 3 Mar to 23 May. Research skills:
• Organic synthesis • Synthesis of organo-phosphorus compounds • Characterization using NMR, UV/Vis, IR, HPLC • Kinetic assays using NMR, UV/Vis, HPLC • Able to operate NMR, UV/Vis, IR, HPLC • Data analysis (least squares fitting using computer software) • 3D computer modeling using PYMOL and Acclerys viewer pro

177
• Bacterial cell transformation, growth, and protein expression • Protein preparation (cell lysis and purification using FPLC or protein
precipitation) • Able to choose appropriate column and operate FPLC
Laboratory skills:
• Inventory and manage storage of chemicals (MSDS, storage compatibility, etc.) • Order chemicals and supplies • Store and manage disposal of hazardous waste • Service laboratory stills, high-vacuum pumps, heating/cooling baths, rotovaps,
compressed gas tanks, etc. • Fill NMR instruments with helium and nitrogen • Maintain lab's safety program
Computer skills:
• Microsoft Word, Excel, Outlook • PyMol • Acclerys Design Studio • Micromath by Scientist • VisualEnzymics by SoftZymics • KaleidaGraph by Synergy • Agilent HPLC controller and processing software • JEOL controller and processing software
Presentations: Presented poster at American Society for Biochemistry and Molecular Biology, San Diego, 2012 Awards:
• USU Presidential Fellowship (2007-2008) • Poster Award, Hansen Life Sciences Retreat (2012) • Meritorious Service Medal, USMC (2003)
Professional Memberships: Member of the American Chemical Society
Copyright © 2022 FDOKUMEN