Potential role of PTEN phosphatase in ethanol-impaired survival signaling in the liver
12
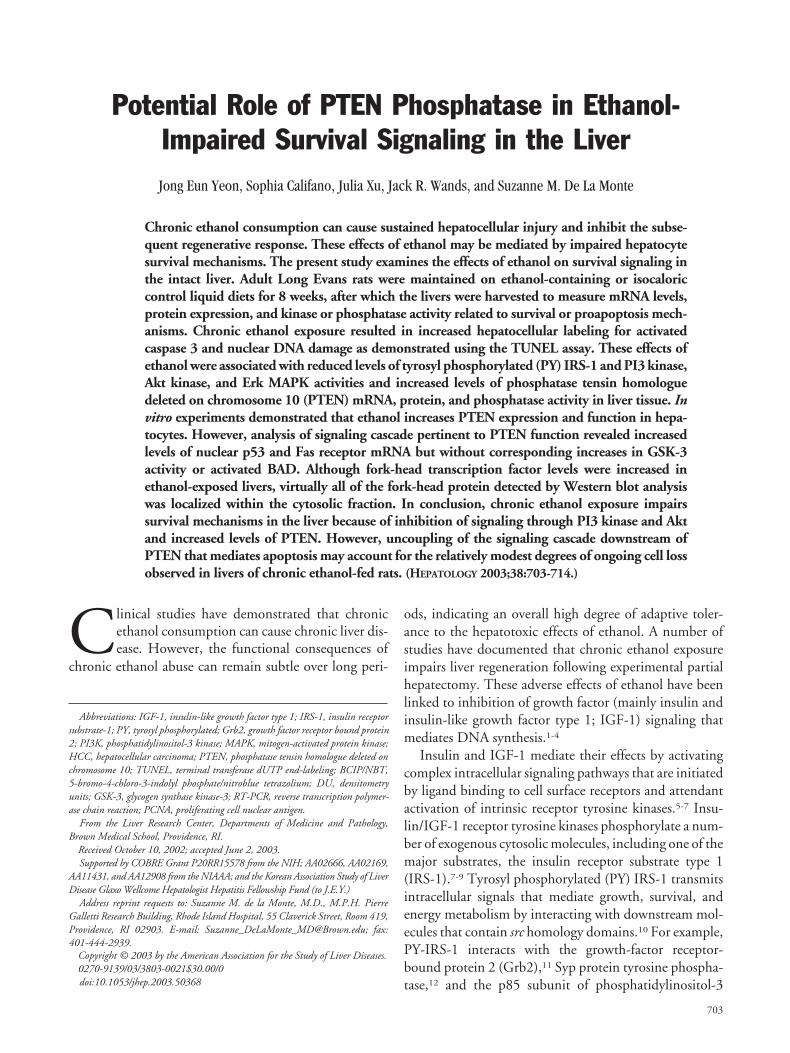
Potential Role of PTEN Phosphatase in Ethanol- Impaired Survival Signaling in the Liver Jong Eun Yeon, Sophia Califano, Julia Xu, Jack R. Wands, and Suzanne M. De La Monte Chronic ethanol consumption can cause sustained hepatocellular injury and inhibit the subse- quent regenerative response. These effects of ethanol may be mediated by impaired hepatocyte survival mechanisms. The present study examines the effects of ethanol on survival signaling in the intact liver. Adult Long Evans rats were maintained on ethanol-containing or isocaloric control liquid diets for 8 weeks, after which the livers were harvested to measure mRNA levels, protein expression, and kinase or phosphatase activity related to survival or proapoptosis mech- anisms. Chronic ethanol exposure resulted in increased hepatocellular labeling for activated caspase 3 and nuclear DNA damage as demonstrated using the TUNEL assay. These effects of ethanol were associated with reduced levels of tyrosyl phosphorylated (PY) IRS-1 and PI3 kinase, Akt kinase, and Erk MAPK activities and increased levels of phosphatase tensin homologue deleted on chromosome 10 (PTEN) mRNA, protein, and phosphatase activity in liver tissue. In vitro experiments demonstrated that ethanol increases PTEN expression and function in hepa- tocytes. However, analysis of signaling cascade pertinent to PTEN function revealed increased levels of nuclear p53 and Fas receptor mRNA but without corresponding increases in GSK-3 activity or activated BAD. Although fork-head transcription factor levels were increased in ethanol-exposed livers, virtually all of the fork-head protein detected by Western blot analysis was localized within the cytosolic fraction. In conclusion, chronic ethanol exposure impairs survival mechanisms in the liver because of inhibition of signaling through PI3 kinase and Akt and increased levels of PTEN. However, uncoupling of the signaling cascade downstream of PTEN that mediates apoptosis may account for the relatively modest degrees of ongoing cell loss observed in livers of chronic ethanol-fed rats. (HEPATOLOGY 2003;38:703-714.) C linical studies have demonstrated that chronic ethanol consumption can cause chronic liver dis- ease. However, the functional consequences of chronic ethanol abuse can remain subtle over long peri- ods, indicating an overall high degree of adaptive toler- ance to the hepatotoxic effects of ethanol. A number of studies have documented that chronic ethanol exposure impairs liver regeneration following experimental partial hepatectomy. These adverse effects of ethanol have been linked to inhibition of growth factor (mainly insulin and insulin-like growth factor type 1; IGF-1) signaling that mediates DNA synthesis. 1-4 Insulin and IGF-1 mediate their effects by activating complex intracellular signaling pathways that are initiated by ligand binding to cell surface receptors and attendant activation of intrinsic receptor tyrosine kinases. 5-7 Insu- lin/IGF-1 receptor tyrosine kinases phosphorylate a num- ber of exogenous cytosolic molecules, including one of the major substrates, the insulin receptor substrate type 1 (IRS-1). 7-9 Tyrosyl phosphorylated (PY) IRS-1 transmits intracellular signals that mediate growth, survival, and energy metabolism by interacting with downstream mol- ecules that contain src homology domains. 10 For example, PY-IRS-1 interacts with the growth-factor receptor- bound protein 2 (Grb2), 11 Syp protein tyrosine phospha- tase, 12 and the p85 subunit of phosphatidylinositol-3 Abbreviations: IGF-1, insulin-like growth factor type 1; IRS-1, insulin receptor substrate-1; PY, tyrosyl phosphorylated; Grb2, growth factor receptor bound protein 2; PI3K, phosphatidylinositol-3 kinase; MAPK, mitogen-activated protein kinase; HCC, hepatocellular carcinoma; PTEN, phosphatase tensin homologue deleted on chromosome 10; TUNEL, terminal transferase dUTP end-labeling; BCIP/NBT, 5-bromo-4-chloro-3-indolyl phosphate/nitroblue tetrazolium; DU, densitometry units; GSK-3, glycogen synthase kinase-3; RT-PCR, reverse transcription polymer- ase chain reaction; PCNA, proliferating cell nuclear antigen. From the Liver Research Center, Departments of Medicine and Pathology, Brown Medical School, Providence, RI. Received October 10, 2002; accepted June 2, 2003. Supported by COBRE Grant P20RR15578 from the NIH; AA02666, AA02169, AA11431, and AA12908 from the NIAAA; and the Korean Association Study of Liver Disease Glaxo Wellcome Hepatologist Hepatitis Fellowship Fund (to J.E.Y.) Address reprint requests to: Suzanne M. de la Monte, M.D., M.P.H. Pierre Galletti Research Building, Rhode Island Hospital, 55 Claverick Street, Room 419, Providence, RI 02903. E-mail: [email protected]; fax: 401-444-2939. Copyright © 2003 by the American Association for the Study of Liver Diseases. 0270-9139/03/3803-0021$30.00/0 doi:10.1053/jhep.2003.50368 703
-
Upload
independent -
Category
Documents
-
view
5 -
download
0
Transcript of Potential role of PTEN phosphatase in ethanol-impaired survival signaling in the liver
Potential Role of PTEN Phosphatase in Ethanol-Impaired Survival Signaling in the LiverJong Eun Yeon, Sophia Califano, Julia Xu, Jack R. Wands, and Suzanne M. De La Monte
Chronic ethanol consumption can cause sustained hepatocellular injury and inhibit the subse-quent regenerative response. These effects of ethanol may be mediated by impaired hepatocytesurvival mechanisms. The present study examines the effects of ethanol on survival signaling inthe intact liver. Adult Long Evans rats were maintained on ethanol-containing or isocaloriccontrol liquid diets for 8 weeks, after which the livers were harvested to measure mRNA levels,protein expression, and kinase or phosphatase activity related to survival or proapoptosis mech-anisms. Chronic ethanol exposure resulted in increased hepatocellular labeling for activatedcaspase 3 and nuclear DNA damage as demonstrated using the TUNEL assay. These effects ofethanol were associated with reduced levels of tyrosyl phosphorylated (PY) IRS-1 and PI3 kinase,Akt kinase, and Erk MAPK activities and increased levels of phosphatase tensin homologuedeleted on chromosome 10 (PTEN) mRNA, protein, and phosphatase activity in liver tissue. Invitro experiments demonstrated that ethanol increases PTEN expression and function in hepa-tocytes. However, analysis of signaling cascade pertinent to PTEN function revealed increasedlevels of nuclear p53 and Fas receptor mRNA but without corresponding increases in GSK-3activity or activated BAD. Although fork-head transcription factor levels were increased inethanol-exposed livers, virtually all of the fork-head protein detected by Western blot analysiswas localized within the cytosolic fraction. In conclusion, chronic ethanol exposure impairssurvival mechanisms in the liver because of inhibition of signaling through PI3 kinase and Aktand increased levels of PTEN. However, uncoupling of the signaling cascade downstream ofPTEN that mediates apoptosis may account for the relatively modest degrees of ongoing cell lossobserved in livers of chronic ethanol-fed rats. (HEPATOLOGY 2003;38:703-714.)
Clinical studies have demonstrated that chronicethanol consumption can cause chronic liver dis-ease. However, the functional consequences of
chronic ethanol abuse can remain subtle over long peri-
ods, indicating an overall high degree of adaptive toler-ance to the hepatotoxic effects of ethanol. A number ofstudies have documented that chronic ethanol exposureimpairs liver regeneration following experimental partialhepatectomy. These adverse effects of ethanol have beenlinked to inhibition of growth factor (mainly insulin andinsulin-like growth factor type 1; IGF-1) signaling thatmediates DNA synthesis.1-4
Insulin and IGF-1 mediate their effects by activatingcomplex intracellular signaling pathways that are initiatedby ligand binding to cell surface receptors and attendantactivation of intrinsic receptor tyrosine kinases.5-7 Insu-lin/IGF-1 receptor tyrosine kinases phosphorylate a num-ber of exogenous cytosolic molecules, including one of themajor substrates, the insulin receptor substrate type 1(IRS-1).7-9 Tyrosyl phosphorylated (PY) IRS-1 transmitsintracellular signals that mediate growth, survival, andenergy metabolism by interacting with downstream mol-ecules that contain src homology domains.10 For example,PY-IRS-1 interacts with the growth-factor receptor-bound protein 2 (Grb2),11 Syp protein tyrosine phospha-tase,12 and the p85 subunit of phosphatidylinositol-3
Abbreviations: IGF-1, insulin-like growth factor type 1; IRS-1, insulin receptorsubstrate-1; PY, tyrosyl phosphorylated; Grb2, growth factor receptor bound protein2; PI3K, phosphatidylinositol-3 kinase; MAPK, mitogen-activated protein kinase;HCC, hepatocellular carcinoma; PTEN, phosphatase tensin homologue deleted onchromosome 10; TUNEL, terminal transferase dUTP end-labeling; BCIP/NBT,5-bromo-4-chloro-3-indolyl phosphate/nitroblue tetrazolium; DU, densitometryunits; GSK-3, glycogen synthase kinase-3; RT-PCR, reverse transcription polymer-ase chain reaction; PCNA, proliferating cell nuclear antigen.
From the Liver Research Center, Departments of Medicine and Pathology,Brown Medical School, Providence, RI.
Received October 10, 2002; accepted June 2, 2003.Supported by COBRE Grant P20RR15578 from the NIH; AA02666, AA02169,
AA11431, and AA12908 from the NIAAA; and the Korean Association Study of LiverDisease Glaxo Wellcome Hepatologist Hepatitis Fellowship Fund (to J.E.Y.)
Address reprint requests to: Suzanne M. de la Monte, M.D., M.P.H. PierreGalletti Research Building, Rhode Island Hospital, 55 Claverick Street, Room 419,Providence, RI 02903. E-mail: [email protected]; fax:401-444-2939.
Copyright © 2003 by the American Association for the Study of Liver Diseases.0270-9139/03/3803-0021$30.00/0doi:10.1053/jhep.2003.50368
703
kinase (PI3K).10,13 The binding of PY-IRS-1 to Grb2 re-sults in sequential activation of p21ras, mitogen-activatedprotein kinase (MAPK) kinase, and Erk MAPK.14-16 ErkMAPK activation directly contributes to insulin/IGF-1-stimulated mitogenesis and gene expression. The bindingof PY-IRS-1 to p85 stimulates glucose uptake and inhibitsapoptosis by signaling through Akt/protein kinase B.17,18
Previous studies with hepatocellular carcinoma(HCC)19 or other cell lines and regenerating liver2 dem-onstrated ethanol inhibition of growth factor receptor ty-rosine kinases, Erk MAPK, and second messengercascades such as calcium phospholipid-dependent proteinkinase. These abnormalities were associated with reducedDNA synthesis and cell proliferation and impaired liverregeneration following partial hepatectomy.1,2 Therefore,the inhibitory effects of ethanol on hepatocellular growthmechanisms are well established. However, regeneratingliver differs from normal liver because of its vastly in-creased proliferative capacity. To understand better theadverse effects of ethanol, we explored ethanol-mediatedabnormalities in intracellular signaling that occur in nor-mal liver and in the absence of exogenous growth stimuli.Previous investigations from our laboratory demonstratedthat ethanol inhibition of insulin/IGF-1 signalingthrough IRS-1 impairs liver regeneration because of de-creased DNA synthesis and Erk MAPK activation.1 Fur-ther studies showed that with IRS-1 over expression ineither transgenic mice or HCC cell lines, ethanol promi-nently inhibits growth pathways.1,19 The present studydemonstrates that chronic ethanol exposure impairs sur-vival mechanisms in the previously normal liver by con-stitutively inhibiting PI3 kinase activity, an effect that ismediated by increased levels of phosphatase tensin homo-logue deleted on chromosome 10 (PTEN) phosphataseexpression and function.
Materials and Methods
Chronic Ethanol Feeding Model. Adult Long-Evansfemale rats were fed ethanol-containing (n � 9) or iso-caloric control (n � 8) liquid diets (BioServ, Frenchtown,NJ) for 8 weeks. Ethanol comprised 11.8%, 23.6%, and35.4% of the calorie content of the feedings during thefirst, second, and third weeks of adaptation, respectively,after which the ethanol-fed rats were maintained on the35.4% caloric (10% vol/vol) ethanol-containing diet.The preparation of the diets was such that the carbo-hydrate content was equal in the control and ethanol-containing formulas. This protocol resulted in serum eth-anol levels of �50 mmol/L, which is generally lower thanthe serum ethanol concentrations found in chronic alco-holics.20 Rats were monitored daily to ensure adequate
nutritional intake and maintenance of body weight. Atthe end of the feeding period, the rats were killed by i.p.injection of 120 mg/kg sodium pentothal, and liver tissuewas snap-frozen in a dry ice/methanol bath or fixed inHistochoice (Amresco, Solon, OH) for histologic studies.This protocol was approved by the subcommittee on An-imal Studies at the Rhode Island Hospital and conformsto guidelines established by the National Institutes ofHealth.
In Situ Assays for Apoptosis. The terminal trans-ferase dUTP end-labeling (TUNEL) assay was used todetect nicked or fragmented DNA in cryostat sections ofliver. TUNEL assays were performed using [FITC]dUTP(Gibco-BRL, Grand Island, NY) and terminal deoxynucle-otide transferase. The FITC-labeled DNA was detected withbiotinylated secondary antibody, alkaline phosphatase con-jugated Streptavidin, and 5-bromo-4-chloro-3-indolyl phos-phate/nitroblue tetrazolium (BCIP/NBT) substrate. Todetect nuclear pyknosis and fragmentation characteristicof apoptosis, adjacent sections were stained with HoechstH33258 (1 �g/mL in PBS) or propidium iodide (0.5�g/mL) for 2 minutes at room temperature. The slideswere rinsed thoroughly in PBS, cover-slipped withVectashield-mounting medium (Vector Laboratories,Burlingame, CA), and examined by fluorescence micros-copy. Adjacent sections were immunostained with poly-clonal antibodies to activated (cleaved) caspase-3 becausecaspase-3 is an important effector of apoptosis. The anti-bodies were generated with a synthetic peptide corre-sponding to amino-terminal residues adjacent to Asp 175(Cell Signaling, Beverly, MA). Sections were processedfor immunostaining according to the manufacturer’s proto-col, and immunoreactivity was detected with biotinylatedsecondary antibody, alkaline phosphatase-conjugatedStreptavidin, and the BCIP/NBT substrate.
Protein Studies. Protein expression was examined byWestern blot analysis or immunoprecipitation followedby immunoblotting. For direct Western blot analysis,liver tissue was homogenized in 5 volumes of radio-im-munoprecipitation assay buffer (50 mmol/L Tris-HCl,pH 7.5, 1% NP-40, 0.25% Na-deoxycholate, 150mmol/L NaCl, 1 mmol/L EDTA, 2 mmol/L EGTA) con-taining protease and phosphatase inhibitors (1 mmol/LPMSF, 0.1 mmol/L TPCK, 1 �g/mL aprotinin, 1 �g/mLpepstatin A, 0.5 �g/mL leupeptin, 1 mmol/L NaF, 1mmol/L Na4P2O7, 2 mmol/L Na3VO4). Protein concen-trations were determined using the bis-chloracetate assay(Pierce, Rockford, IL). For immunoblotting, samplescontaining 100 �g of protein were fractionated by so-dium dodecyl sulfate-polyacrylamide gel electrophoresisand transferred to PVDF membranes. Nonspecific bind-ing sites were blocked with SuperBlock-TBS (Pierce), and
704 YEON ET AL. HEPATOLOGY, September 2003
the membranes were incubated with primary antibody(0.5-1 �g/mL) overnight at 4°C with gentle agitation.Immunoreactivity was detected with horseradish peroxi-dase-conjugated secondary antibody and enhancedchemiluminescence reagents and then quantified usingthe Kodak Digital Science Imaging Station (NEN LifeSciences, Boston, MA). Levels of immunoreactivity arereported in arbitrary densitometry units (DU).
For immunoprecipitation studies, liver tissue was ho-mogenized in Triton lysis buffer (50 mmol/L Tris-HCl,pH 7.5, 10 mmol/L EDTA, 1% Triton X-100) contain-ing protease and phosphatase inhibitors as indicatedabove. Aliquots of 500 �g protein diluted to 1 mg/mL inTriton lysis buffer were precleared with Protein A sepha-rose (Amersham, Pharmacia) then incubated overnight at4°C with 1 �g/mL of primary antibody using constantrotation of the samples. Protein A sepharose was thenadded, and the samples were further incubated for 2 hoursat 4°C with constant rotation. The immune complexeswere washed 3 times in Triton lysis buffer using a stan-dard protocol.21 After the third wash, the immunopre-cipitants were either resuspended in sodium dodecylsulfate polyacrylamide gel electrophoresis sample bufferwith loading dye21 for Western blot analysis, or they wereprocessed further to assay kinase or phosphatase activity.
Assays of Kinase Activity. PI3K activity was mea-sured in IRS-1 and p85 immunoprecipitates containing0.1 mol/L Tris-HCl, pH 7.4, 5 mmol/L LiCl, and 0.1mmol/L sodium orthovanadate. After the third wash inTriton lysis buffer, the immune complexes were washed 3times in buffer containing 0.1 mol/L Tris-HCl, pH 7.4, 5mmol/L LiCl, and 0.1 mmol/L sodium orthovanadateand then twice with Tris-sodium chloride-EDTA buffer(TNE; 10 mmol/L Tris-HCl, pH 7.4, 150 mmol/LNaCl, 5 mmol/L EDTA, 0.1 mmol/L sodium orthovana-date). The immunoprecipitates were suspended in 25 �LTNE, and reactions were initiated by the addition of 10�L sonicated phosphatidylinositol (20 �g per reaction),10 �L of 100 mmol/L MgCl2, and 5 �L ATP reactionmixture (0.88 mmol/L ATP, 30 �Ci [�32-P]ATP [3,000Ci/mmol], 20 mmol/L MgCl2). Reactions were incu-bated for 10 minutes at 37°C and stopped by adding 20�L of 6 N HCl. Lipids were extracted with 1:1 CHCl3:MeOH, spotted on oxalate-treated silicon TLC plates(Merck, White House Station, NJ) and fractionated bychromatography. PI3K activity was detected by film au-toradiography and quantified using the Kodak DigitalScience Imaging Station.
Erk MAPK, Akt kinase, and glycogen synthase kinase 3(GSK-3) kinase activities were measured in correspond-ing immunoprecipitates obtained from 500 �g proteinsamples. The immunoprecipitates captured onto Protein
A sepharose were washed 3 times with Triton lysis bufferand twice with assay dilution buffer (ADB; 20 mmol/LMOPS, pH 7.2, 25 mmol/L �-glycerol phosphate, 5mmol/L EGTA, 1 mmol/L sodium orthovanadate, 1mmol/L dithiothreitol) and then resuspended in 10 �L ofADB. Reactions were initiated by adding 10 �L of kinasepeptide substrate followed by 10 �L ATP/mg cocktail([�32-P]ATP, 75 mmol/L MgCl2, 500 �mol/L coldATP). Myelin basic protein peptide (250 �mol/L) wasused to measure Erk MAPK activity; Crosstide (100�mol/L) was used to measure Akt kinase, and CREB (200�mol/L) was used to measure GSK-3 activity. Reactionswere incubated for 10 or 15 minutes at 30°C with agita-tion and stopped by adding 5 �L of 0.5 mol/L EDTA.The reaction products were blotted onto p81 phospho-cellulose, and unincorporated [�32P] ATP was removedby washing the filters with 0.85% phosphoric acid. [�32P]Incorporation was measured in a TopCount machine(Packard Instrument Co. Meriden, CT).
In Vivo PTEN Studies. Using rat liver tissue, PTENexpression was measured by Western blot analysis andreal-time quantitative reverse-transcription polymerasechain reaction (RT-PCR). For the RT-PCR studies, RNAwas isolated from liver tissue homogenates usingTRIZOL reagent (Invitrogen, Carlsbad, CA) accordingto the manufacturer’s protocol. Samples containing 1 �gRNA were reverse transcribed using the AMV FirstStrand cDNA synthesis kit (Roche, Basel, Switzerland)and random oligodeoxynucleotide primers. cDNA frag-ments isolated from HepG2 cells by RT-PCR werecloned into the PCRII vector (Invitrogen, Carlsbad, CA)and used to generate standard curves for determiningtranscript abundance. PCR amplifications were per-formed using 25 �L reactions containing RT productgenerated from 10 ng of template, 300 nmol/L each offorward and reverse primers (Table 1) and SYBR Green IPCR reagents (Applied Biosystems, Foster, CA). The am-
Table 1. Forward and Reverse Primer Sequences forReal-Time RT-PCR
Primer Sequence (5�B3�)PCR Product
(bp)
PTEN for GGA AAG GAC GGA CTG GTG TA 163PTEN rev TGC CAC TGG TCT GTA ATC CATPIP for TAT TCT GAT AG AAT TTT TCA TCT GC 95TPIP rev CCT CGG CAG TTA AAA ATA TTT CGFas R for GCA ATG CTT CTC TCT GTG ACC ACT G 374Fas R rev GCT GTT GTG CTC GAT CTC ATC GFas L for ATA GAG CTG TGG CTA CCG GTG 286Fas L rev CTC GAG AGA TCA AAG CAG TTC C18s for GGA CCA GAG CGA AAG CAT TTG CC 49518s rev TCA ATC TCG GGT GGC TGA ACG C
Abbreviations: for, forward; rev, reverse.
HEPATOLOGY, Vol. 38, No. 3, 2003 YEON ET AL. 705
plified signals were detected continuously with the Bio-Rad iCycler and iCycler iQ Multi-Color Real Time PCRDetection System (Hercules, CA). The following real-time PCR amplification protocol was used: (1) an initialdenaturation of 95°C for 10 minutes; (2) a 3-segmentamplification and quantification program consisting of40 cycles of 95°C � 60 seconds, 60°C � 45 seconds, and72°C for 30 seconds; and (3) a final extension at 72°C for10 minutes.
In Vitro PTEN Studies. To directly evaluate the ef-fects of ethanol on PTEN expression and functionalactivity in hepatocytes, primary cultures were gener-ated with hepatocytes isolated from chronic ethanol-fedand control animals using the collagenase perfusionmethod.22 The cultures were maintained in humidifiedchambers with 50 mmol/L or no ethanol included in thereservoir tray. The objective was to maintain the chronicethanol exposure state and simulate in vivo conditions.The studies did not include analysis of ethanol with-drawal or acute ethanol exposure because the objectivewas to determine whether the in vivo effects of chronicethanol exposure on PTEN expression and phosphataseactivity were due to responses occurring in hepatocytes.After 24 hours in culture, the cells were harvested forassays of PTEN expression, phosphorylation, and phos-phatase activity. Protein concentration was measured us-ing the bis-chloracetate assay. PTEN protein expression,phosphorylation, and phosphatase activity were measuredin 30 �g samples of total protein. PTEN phosphorylationwas detected by Western blot analysis of antiphospho-serine/phosphothreonine immunoprecipitates. PTENphosphatase activity was measured in PTEN immunopre-cipitates using the Biomol Green Reagent according tothe manufacturer’s protocol (Biomol, PA). The specificityof the Biomol Green assay is dependent on the use ofimmunoprecipitates rather than tissue or cellular homog-enates.
Source of Reagents. Antibodies to Akt, GSK-3, BAD,PTEN, Phospho-Akt, phospho-GSK-3� (Ser9), andphospho-BAD (Ser112) were purchased from Cell Signal-ing Technology (Beverly, MA). Antibodies to IRS-1, p85subunit of PI3K, and phosphotyrosine (PY20) were pur-chased from Transduction Laboratories (Lexington, KY).MAP kinase substrate peptide and Crosstide were pur-chased from Upstate Biotechnology (Lake Placid, NY).CREB was obtained from New England Biolabs (Beverly,MA). Phosphoserine and phosphothreonine antibodiesand phosphatidylinositol were purchased from Sigma-Al-drich, Inc. (St. Louis, MO).
Statistical Analysis. Data depicted in the graphs rep-resent mean � SEM. Intergroup comparisons were madewith Student’s t tests.
Results
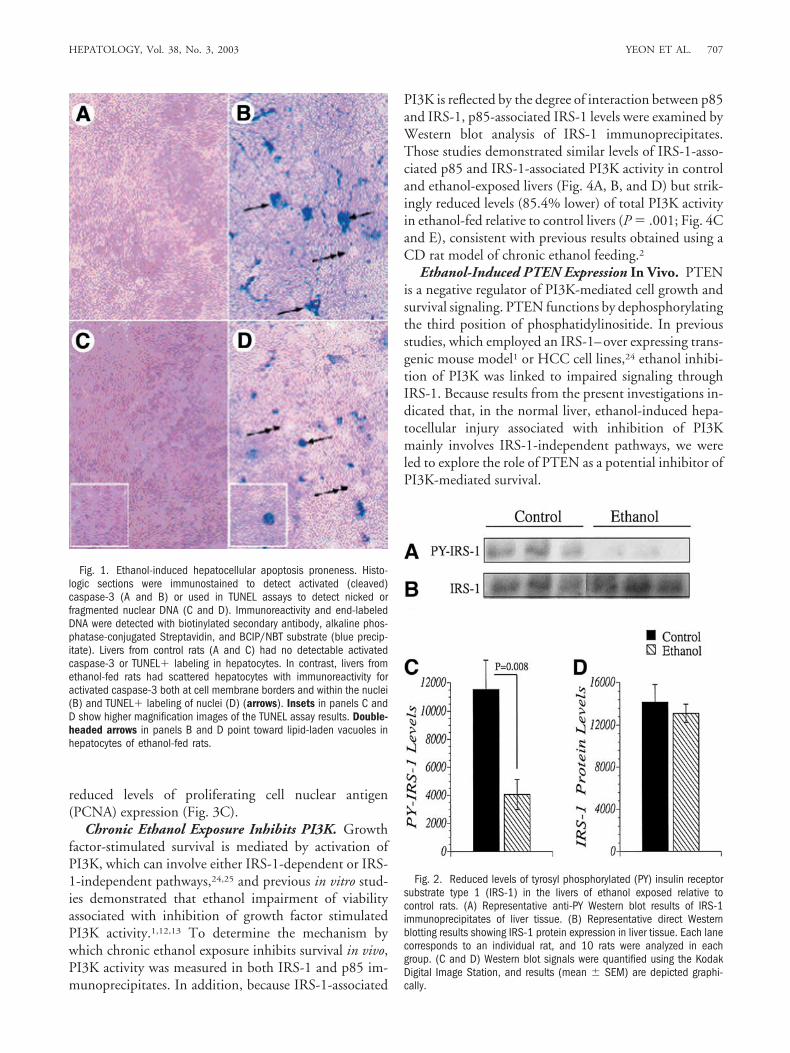
Increased Apoptosis Proneness in Livers From Eth-anol-Fed Rats. Histologic sections of liver demonstratedmicrovesicular lipid accumulation in hepatocytes of eth-anol-fed rats as previously described.1 Necrotic foci wererare and inconspicuous. Therefore, our studies were fo-cused on ethanol-induced apoptosis and proapoptosis/antisurvival mechanisms. Immunohistochemical stainingstudies demonstrated increased hepatocellular expressionof activated (cleaved) caspase-3, and TUNEL assay stain-ing revealed increased nuclear labeling in livers from eth-anol-exposed relative to control rats (Fig. 1). In theethanol-exposed livers, activated caspase-3 was mainly lo-calized in the nucleus, although peripheral membranouslabeling was also detected (Fig. 1B). Previous studiesshowed that nuclear translocation is required for caspaseinduction of apoptosis.23 Together with the finding ofincreased nuclear labeling by the TUNEL assay, whichreflects genomic DNA damage, these results demonstratethat chronic ethanol feeding promotes hepatocellular in-jury with apoptotic cell loss and remodeling in the liversof Long Evans rats.
Ethanol Inhibits Signaling Through IRS-1. Previ-ous in vitro studies showed that growth factor signalingthrough IRS-1 mediates growth and survival and thatethanol inhibits insulin and IGF-1 stimulated signaling invitro.1-4 To determine whether chronic ethanol feedingimpairs IRS-1 mediated signaling in vivo, the levels ofPY-IRS-1 and total IRS-1 protein were measured in livertissue by Western blot analysis of IRS-1-immunoprecipi-tates and direct immunoblotting. The studies revealed64.8% lower mean levels of PY-IRS-1 in livers from eth-anol-exposed relative to control rats (P � .008) but sim-ilar levels of total IRS-1 protein (�185 kd) in both groups(Fig. 2).
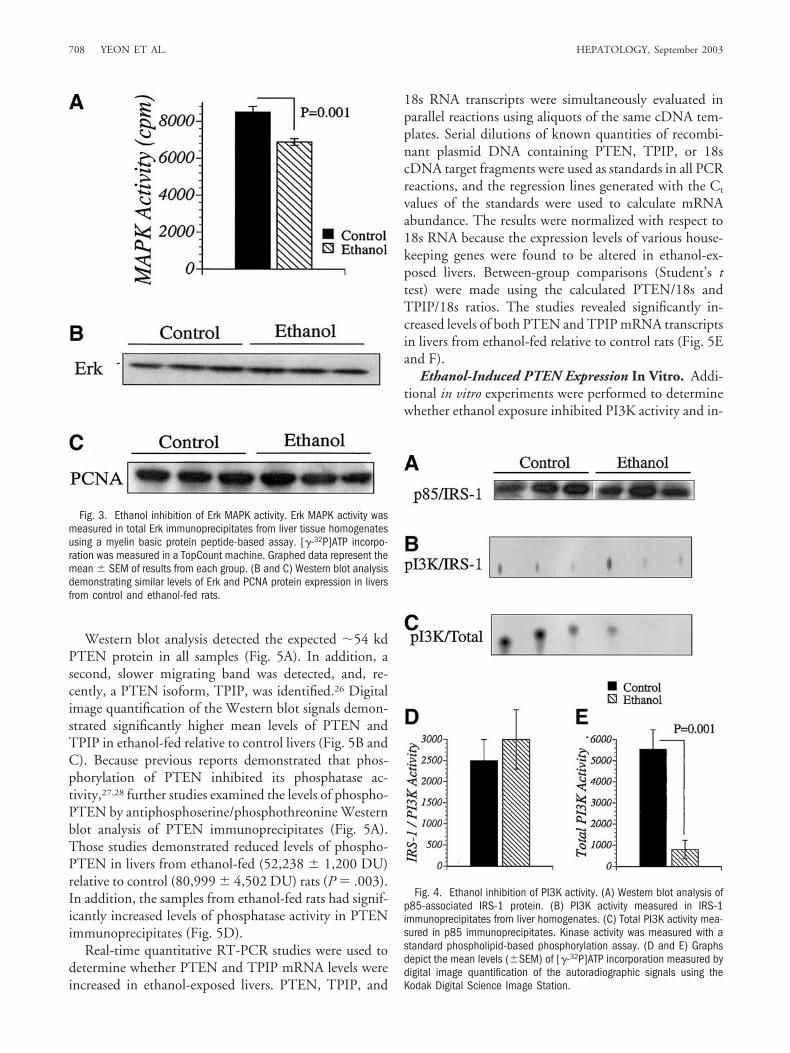
Chronic Ethanol Feeding Inhibits Progrowth Sig-naling in the Liver. Growth factor signaling throughIRS-1 mediates cell growth by activating the Ras-Raf-ErkMAPK pathway. Because previous studies correlated eth-anol-impaired liver regeneration with inhibition of IRS-1-transmitted signaling through Erk MAPK,10,12,13,15 itwas of interest to determine whether the reduced levels ofPY-IRS-1 in ethanol-exposed livers were associated withinhibition of Erk MAPK. Hepatic Erk MAPK activity wassignificantly reduced (�24% lower) in the ethanol-fedrelative to control samples (Fig. 3A; P � .001), whereasErk protein expression was similar in control and ethanol-exposed livers as demonstrated by Western blot analysiswith digital image quantification (Fig. 3B). However, eth-anol inhibition of Erk MAPK was not associated with
706 YEON ET AL. HEPATOLOGY, September 2003
reduced levels of proliferating cell nuclear antigen(PCNA) expression (Fig. 3C).
Chronic Ethanol Exposure Inhibits PI3K. Growthfactor-stimulated survival is mediated by activation ofPI3K, which can involve either IRS-1-dependent or IRS-1-independent pathways,24,25 and previous in vitro stud-ies demonstrated that ethanol impairment of viabilityassociated with inhibition of growth factor stimulatedPI3K activity.1,12,13 To determine the mechanism bywhich chronic ethanol exposure inhibits survival in vivo,PI3K activity was measured in both IRS-1 and p85 im-munoprecipitates. In addition, because IRS-1-associated
PI3K is reflected by the degree of interaction between p85and IRS-1, p85-associated IRS-1 levels were examined byWestern blot analysis of IRS-1 immunoprecipitates.Those studies demonstrated similar levels of IRS-1-asso-ciated p85 and IRS-1-associated PI3K activity in controland ethanol-exposed livers (Fig. 4A, B, and D) but strik-ingly reduced levels (85.4% lower) of total PI3K activityin ethanol-fed relative to control livers (P � .001; Fig. 4Cand E), consistent with previous results obtained using aCD rat model of chronic ethanol feeding.2
Ethanol-Induced PTEN Expression In Vivo. PTENis a negative regulator of PI3K-mediated cell growth andsurvival signaling. PTEN functions by dephosphorylatingthe third position of phosphatidylinositide. In previousstudies, which employed an IRS-1–over expressing trans-genic mouse model1 or HCC cell lines,24 ethanol inhibi-tion of PI3K was linked to impaired signaling throughIRS-1. Because results from the present investigations in-dicated that, in the normal liver, ethanol-induced hepa-tocellular injury associated with inhibition of PI3Kmainly involves IRS-1-independent pathways, we wereled to explore the role of PTEN as a potential inhibitor ofPI3K-mediated survival.
Fig. 2. Reduced levels of tyrosyl phosphorylated (PY) insulin receptorsubstrate type 1 (IRS-1) in the livers of ethanol exposed relative tocontrol rats. (A) Representative anti-PY Western blot results of IRS-1immunoprecipitates of liver tissue. (B) Representative direct Westernblotting results showing IRS-1 protein expression in liver tissue. Each lanecorresponds to an individual rat, and 10 rats were analyzed in eachgroup. (C and D) Western blot signals were quantified using the KodakDigital Image Station, and results (mean � SEM) are depicted graphi-cally.
Fig. 1. Ethanol-induced hepatocellular apoptosis proneness. Histo-logic sections were immunostained to detect activated (cleaved)caspase-3 (A and B) or used in TUNEL assays to detect nicked orfragmented nuclear DNA (C and D). Immunoreactivity and end-labeledDNA were detected with biotinylated secondary antibody, alkaline phos-phatase-conjugated Streptavidin, and BCIP/NBT substrate (blue precip-itate). Livers from control rats (A and C) had no detectable activatedcaspase-3 or TUNEL� labeling in hepatocytes. In contrast, livers fromethanol-fed rats had scattered hepatocytes with immunoreactivity foractivated caspase-3 both at cell membrane borders and within the nuclei(B) and TUNEL� labeling of nuclei (D) (arrows). Insets in panels C andD show higher magnification images of the TUNEL assay results. Double-headed arrows in panels B and D point toward lipid-laden vacuoles inhepatocytes of ethanol-fed rats.
HEPATOLOGY, Vol. 38, No. 3, 2003 YEON ET AL. 707
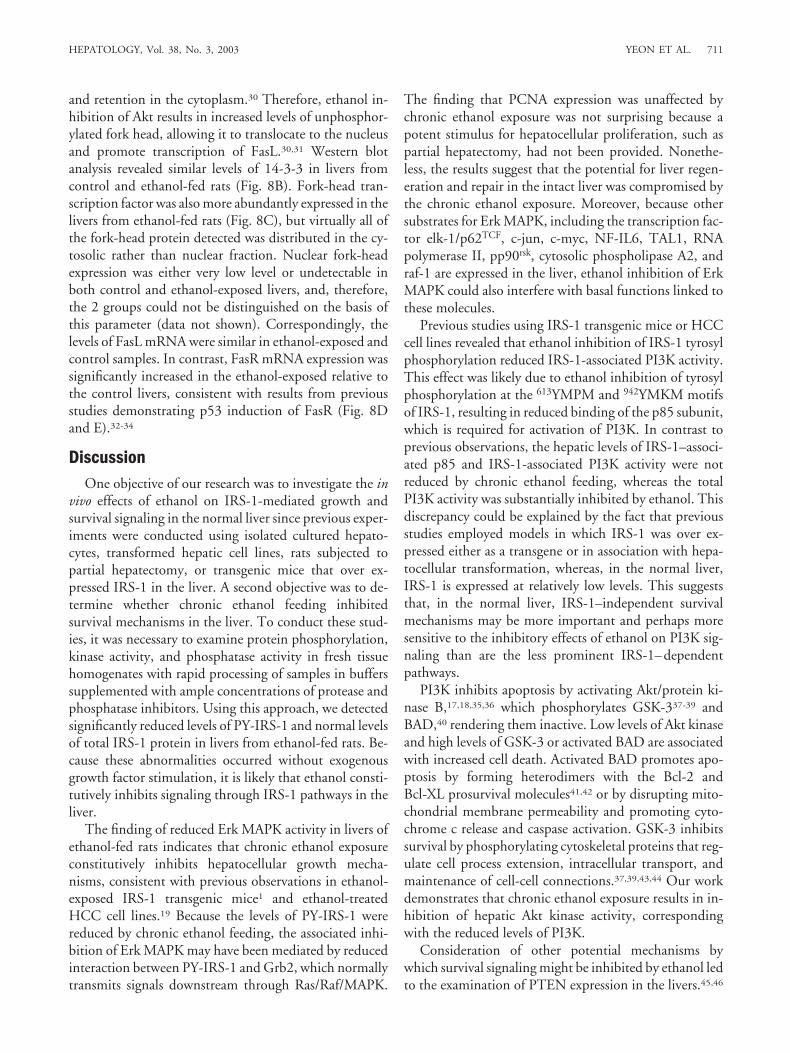
Western blot analysis detected the expected �54 kdPTEN protein in all samples (Fig. 5A). In addition, asecond, slower migrating band was detected, and, re-cently, a PTEN isoform, TPIP, was identified.26 Digitalimage quantification of the Western blot signals demon-strated significantly higher mean levels of PTEN andTPIP in ethanol-fed relative to control livers (Fig. 5B andC). Because previous reports demonstrated that phos-phorylation of PTEN inhibited its phosphatase ac-tivity,27,28 further studies examined the levels of phospho-PTEN by antiphosphoserine/phosphothreonine Westernblot analysis of PTEN immunoprecipitates (Fig. 5A).Those studies demonstrated reduced levels of phospho-PTEN in livers from ethanol-fed (52,238 � 1,200 DU)relative to control (80,999 � 4,502 DU) rats (P � .003).In addition, the samples from ethanol-fed rats had signif-icantly increased levels of phosphatase activity in PTENimmunoprecipitates (Fig. 5D).
Real-time quantitative RT-PCR studies were used todetermine whether PTEN and TPIP mRNA levels wereincreased in ethanol-exposed livers. PTEN, TPIP, and
18s RNA transcripts were simultaneously evaluated inparallel reactions using aliquots of the same cDNA tem-plates. Serial dilutions of known quantities of recombi-nant plasmid DNA containing PTEN, TPIP, or 18scDNA target fragments were used as standards in all PCRreactions, and the regression lines generated with the Ct
values of the standards were used to calculate mRNAabundance. The results were normalized with respect to18s RNA because the expression levels of various house-keeping genes were found to be altered in ethanol-ex-posed livers. Between-group comparisons (Student’s ttest) were made using the calculated PTEN/18s andTPIP/18s ratios. The studies revealed significantly in-creased levels of both PTEN and TPIP mRNA transcriptsin livers from ethanol-fed relative to control rats (Fig. 5Eand F).
Ethanol-Induced PTEN Expression In Vitro. Addi-tional in vitro experiments were performed to determinewhether ethanol exposure inhibited PI3K activity and in-
Fig. 4. Ethanol inhibition of PI3K activity. (A) Western blot analysis ofp85-associated IRS-1 protein. (B) PI3K activity measured in IRS-1immunoprecipitates from liver homogenates. (C) Total PI3K activity mea-sured in p85 immunoprecipitates. Kinase activity was measured with astandard phospholipid-based phosphorylation assay. (D and E) Graphsdepict the mean levels (�SEM) of [�-32P]ATP incorporation measured bydigital image quantification of the autoradiographic signals using theKodak Digital Science Image Station.
Fig. 3. Ethanol inhibition of Erk MAPK activity. Erk MAPK activity wasmeasured in total Erk immunoprecipitates from liver tissue homogenatesusing a myelin basic protein peptide-based assay. [�-32P]ATP incorpo-ration was measured in a TopCount machine. Graphed data represent themean � SEM of results from each group. (B and C) Western blot analysisdemonstrating similar levels of Erk and PCNA protein expression in liversfrom control and ethanol-fed rats.
708 YEON ET AL. HEPATOLOGY, September 2003
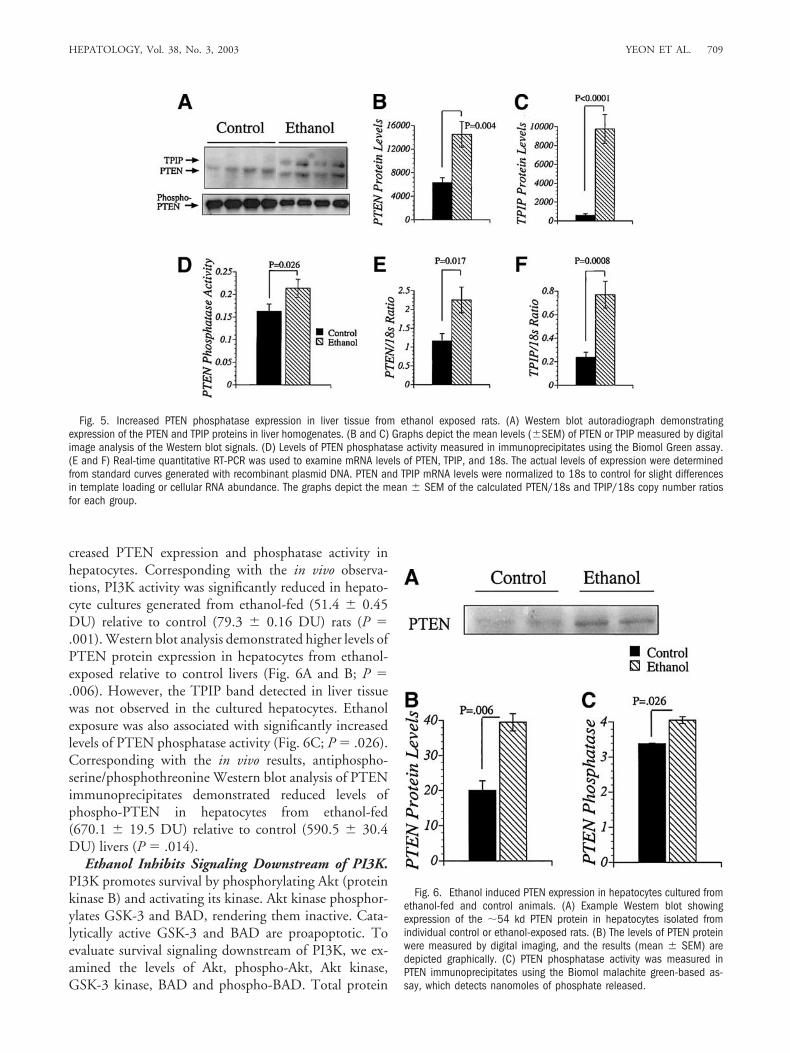
creased PTEN expression and phosphatase activity inhepatocytes. Corresponding with the in vivo observa-tions, PI3K activity was significantly reduced in hepato-cyte cultures generated from ethanol-fed (51.4 � 0.45DU) relative to control (79.3 � 0.16 DU) rats (P �.001). Western blot analysis demonstrated higher levels ofPTEN protein expression in hepatocytes from ethanol-exposed relative to control livers (Fig. 6A and B; P �.006). However, the TPIP band detected in liver tissuewas not observed in the cultured hepatocytes. Ethanolexposure was also associated with significantly increasedlevels of PTEN phosphatase activity (Fig. 6C; P � .026).Corresponding with the in vivo results, antiphospho-serine/phosphothreonine Western blot analysis of PTENimmunoprecipitates demonstrated reduced levels ofphospho-PTEN in hepatocytes from ethanol-fed(670.1 � 19.5 DU) relative to control (590.5 � 30.4DU) livers (P � .014).
Ethanol Inhibits Signaling Downstream of PI3K.PI3K promotes survival by phosphorylating Akt (proteinkinase B) and activating its kinase. Akt kinase phosphor-ylates GSK-3 and BAD, rendering them inactive. Cata-lytically active GSK-3 and BAD are proapoptotic. Toevaluate survival signaling downstream of PI3K, we ex-amined the levels of Akt, phospho-Akt, Akt kinase,GSK-3 kinase, BAD and phospho-BAD. Total protein
Fig. 5. Increased PTEN phosphatase expression in liver tissue from ethanol exposed rats. (A) Western blot autoradiograph demonstratingexpression of the PTEN and TPIP proteins in liver homogenates. (B and C) Graphs depict the mean levels (�SEM) of PTEN or TPIP measured by digitalimage analysis of the Western blot signals. (D) Levels of PTEN phosphatase activity measured in immunoprecipitates using the Biomol Green assay.(E and F) Real-time quantitative RT-PCR was used to examine mRNA levels of PTEN, TPIP, and 18s. The actual levels of expression were determinedfrom standard curves generated with recombinant plasmid DNA. PTEN and TPIP mRNA levels were normalized to 18s to control for slight differencesin template loading or cellular RNA abundance. The graphs depict the mean � SEM of the calculated PTEN/18s and TPIP/18s copy number ratiosfor each group.
Fig. 6. Ethanol induced PTEN expression in hepatocytes cultured fromethanol-fed and control animals. (A) Example Western blot showingexpression of the �54 kd PTEN protein in hepatocytes isolated fromindividual control or ethanol-exposed rats. (B) The levels of PTEN proteinwere measured by digital imaging, and the results (mean � SEM) aredepicted graphically. (C) PTEN phosphatase activity was measured inPTEN immunoprecipitates using the Biomol malachite green-based as-say, which detects nanomoles of phosphate released.
HEPATOLOGY, Vol. 38, No. 3, 2003 YEON ET AL. 709
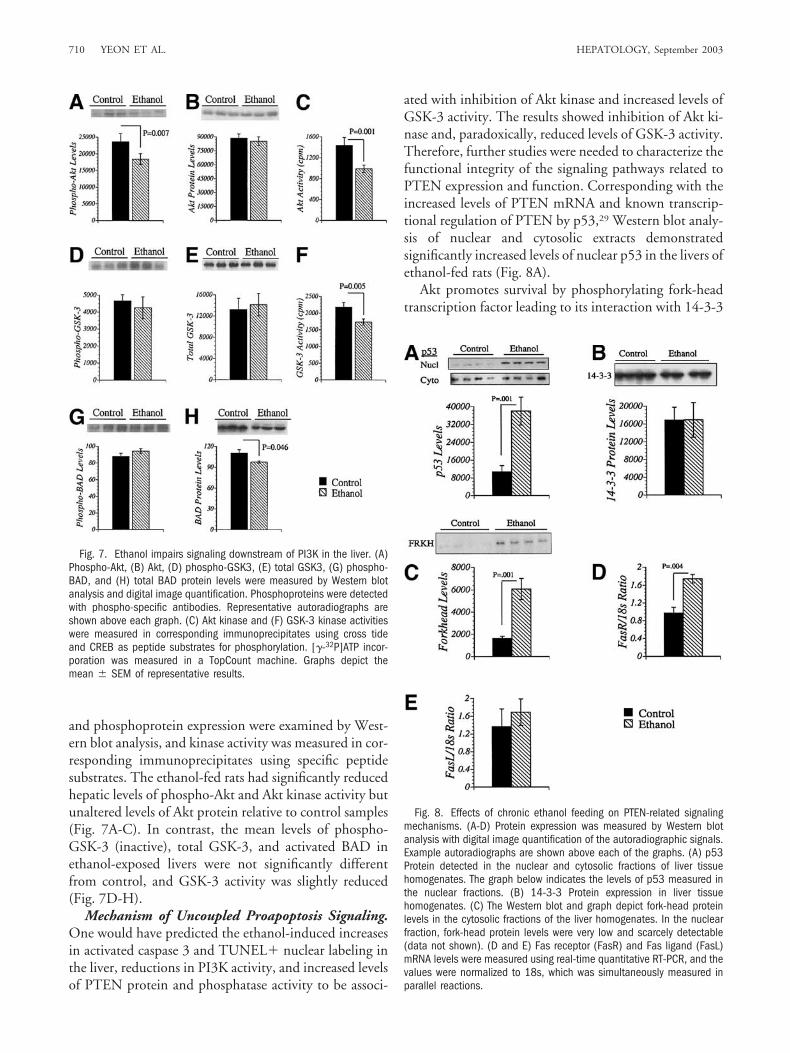
and phosphoprotein expression were examined by West-ern blot analysis, and kinase activity was measured in cor-responding immunoprecipitates using specific peptidesubstrates. The ethanol-fed rats had significantly reducedhepatic levels of phospho-Akt and Akt kinase activity butunaltered levels of Akt protein relative to control samples(Fig. 7A-C). In contrast, the mean levels of phospho-GSK-3 (inactive), total GSK-3, and activated BAD inethanol-exposed livers were not significantly differentfrom control, and GSK-3 activity was slightly reduced(Fig. 7D-H).
Mechanism of Uncoupled Proapoptosis Signaling.One would have predicted the ethanol-induced increasesin activated caspase 3 and TUNEL� nuclear labeling inthe liver, reductions in PI3K activity, and increased levelsof PTEN protein and phosphatase activity to be associ-
ated with inhibition of Akt kinase and increased levels ofGSK-3 activity. The results showed inhibition of Akt ki-nase and, paradoxically, reduced levels of GSK-3 activity.Therefore, further studies were needed to characterize thefunctional integrity of the signaling pathways related toPTEN expression and function. Corresponding with theincreased levels of PTEN mRNA and known transcrip-tional regulation of PTEN by p53,29 Western blot analy-sis of nuclear and cytosolic extracts demonstratedsignificantly increased levels of nuclear p53 in the livers ofethanol-fed rats (Fig. 8A).
Akt promotes survival by phosphorylating fork-headtranscription factor leading to its interaction with 14-3-3
Fig. 8. Effects of chronic ethanol feeding on PTEN-related signalingmechanisms. (A-D) Protein expression was measured by Western blotanalysis with digital image quantification of the autoradiographic signals.Example autoradiographs are shown above each of the graphs. (A) p53Protein detected in the nuclear and cytosolic fractions of liver tissuehomogenates. The graph below indicates the levels of p53 measured inthe nuclear fractions. (B) 14-3-3 Protein expression in liver tissuehomogenates. (C) The Western blot and graph depict fork-head proteinlevels in the cytosolic fractions of the liver homogenates. In the nuclearfraction, fork-head protein levels were very low and scarcely detectable(data not shown). (D and E) Fas receptor (FasR) and Fas ligand (FasL)mRNA levels were measured using real-time quantitative RT-PCR, and thevalues were normalized to 18s, which was simultaneously measured inparallel reactions.
Fig. 7. Ethanol impairs signaling downstream of PI3K in the liver. (A)Phospho-Akt, (B) Akt, (D) phospho-GSK3, (E) total GSK3, (G) phospho-BAD, and (H) total BAD protein levels were measured by Western blotanalysis and digital image quantification. Phosphoproteins were detectedwith phospho-specific antibodies. Representative autoradiographs areshown above each graph. (C) Akt kinase and (F) GSK-3 kinase activitieswere measured in corresponding immunoprecipitates using cross tideand CREB as peptide substrates for phosphorylation. [�-32P]ATP incor-poration was measured in a TopCount machine. Graphs depict themean � SEM of representative results.
710 YEON ET AL. HEPATOLOGY, September 2003
and retention in the cytoplasm.30 Therefore, ethanol in-hibition of Akt results in increased levels of unphosphor-ylated fork head, allowing it to translocate to the nucleusand promote transcription of FasL.30,31 Western blotanalysis revealed similar levels of 14-3-3 in livers fromcontrol and ethanol-fed rats (Fig. 8B). Fork-head tran-scription factor was also more abundantly expressed in thelivers from ethanol-fed rats (Fig. 8C), but virtually all ofthe fork-head protein detected was distributed in the cy-tosolic rather than nuclear fraction. Nuclear fork-headexpression was either very low level or undetectable inboth control and ethanol-exposed livers, and, therefore,the 2 groups could not be distinguished on the basis ofthis parameter (data not shown). Correspondingly, thelevels of FasL mRNA were similar in ethanol-exposed andcontrol samples. In contrast, FasR mRNA expression wassignificantly increased in the ethanol-exposed relative tothe control livers, consistent with results from previousstudies demonstrating p53 induction of FasR (Fig. 8Dand E).32-34
DiscussionOne objective of our research was to investigate the in
vivo effects of ethanol on IRS-1-mediated growth andsurvival signaling in the normal liver since previous exper-iments were conducted using isolated cultured hepato-cytes, transformed hepatic cell lines, rats subjected topartial hepatectomy, or transgenic mice that over ex-pressed IRS-1 in the liver. A second objective was to de-termine whether chronic ethanol feeding inhibitedsurvival mechanisms in the liver. To conduct these stud-ies, it was necessary to examine protein phosphorylation,kinase activity, and phosphatase activity in fresh tissuehomogenates with rapid processing of samples in bufferssupplemented with ample concentrations of protease andphosphatase inhibitors. Using this approach, we detectedsignificantly reduced levels of PY-IRS-1 and normal levelsof total IRS-1 protein in livers from ethanol-fed rats. Be-cause these abnormalities occurred without exogenousgrowth factor stimulation, it is likely that ethanol consti-tutively inhibits signaling through IRS-1 pathways in theliver.
The finding of reduced Erk MAPK activity in livers ofethanol-fed rats indicates that chronic ethanol exposureconstitutively inhibits hepatocellular growth mecha-nisms, consistent with previous observations in ethanol-exposed IRS-1 transgenic mice1 and ethanol-treatedHCC cell lines.19 Because the levels of PY-IRS-1 werereduced by chronic ethanol feeding, the associated inhi-bition of Erk MAPK may have been mediated by reducedinteraction between PY-IRS-1 and Grb2, which normallytransmits signals downstream through Ras/Raf/MAPK.
The finding that PCNA expression was unaffected bychronic ethanol exposure was not surprising because apotent stimulus for hepatocellular proliferation, such aspartial hepatectomy, had not been provided. Nonethe-less, the results suggest that the potential for liver regen-eration and repair in the intact liver was compromised bythe chronic ethanol exposure. Moreover, because othersubstrates for Erk MAPK, including the transcription fac-tor elk-1/p62TCF, c-jun, c-myc, NF-IL6, TAL1, RNApolymerase II, pp90rsk, cytosolic phospholipase A2, andraf-1 are expressed in the liver, ethanol inhibition of ErkMAPK could also interfere with basal functions linked tothese molecules.
Previous studies using IRS-1 transgenic mice or HCCcell lines revealed that ethanol inhibition of IRS-1 tyrosylphosphorylation reduced IRS-1-associated PI3K activity.This effect was likely due to ethanol inhibition of tyrosylphosphorylation at the 613YMPM and 942YMKM motifsof IRS-1, resulting in reduced binding of the p85 subunit,which is required for activation of PI3K. In contrast toprevious observations, the hepatic levels of IRS-1–associ-ated p85 and IRS-1-associated PI3K activity were notreduced by chronic ethanol feeding, whereas the totalPI3K activity was substantially inhibited by ethanol. Thisdiscrepancy could be explained by the fact that previousstudies employed models in which IRS-1 was over ex-pressed either as a transgene or in association with hepa-tocellular transformation, whereas, in the normal liver,IRS-1 is expressed at relatively low levels. This suggeststhat, in the normal liver, IRS-1–independent survivalmechanisms may be more important and perhaps moresensitive to the inhibitory effects of ethanol on PI3K sig-naling than are the less prominent IRS-1–dependentpathways.
PI3K inhibits apoptosis by activating Akt/protein ki-nase B,17,18,35,36 which phosphorylates GSK-337-39 andBAD,40 rendering them inactive. Low levels of Akt kinaseand high levels of GSK-3 or activated BAD are associatedwith increased cell death. Activated BAD promotes apo-ptosis by forming heterodimers with the Bcl-2 andBcl-XL prosurvival molecules41,42 or by disrupting mito-chondrial membrane permeability and promoting cyto-chrome c release and caspase activation. GSK-3 inhibitssurvival by phosphorylating cytoskeletal proteins that reg-ulate cell process extension, intracellular transport, andmaintenance of cell-cell connections.37,39,43,44 Our workdemonstrates that chronic ethanol exposure results in in-hibition of hepatic Akt kinase activity, correspondingwith the reduced levels of PI3K.
Consideration of other potential mechanisms bywhich survival signaling might be inhibited by ethanol ledto the examination of PTEN expression in the livers.45,46
HEPATOLOGY, Vol. 38, No. 3, 2003 YEON ET AL. 711
PTEN is a lipid phosphatase that dephosphorylates andreverses the activation of PI3K.46-50 Inactivation of PTENleads to membrane recruitment and increased phosphor-ylation of Akt, with attendant activation of Akt ki-nase.47,49 In contrast, high levels of PTEN are associatedwith reduced levels of Akt and increased levels of GSK-3activity,51 thereby inhibiting growth and survival mecha-nisms. Our in vivo studies demonstrated significantly in-creased levels of PTEN mRNA, protein expression, andphosphatase activity and reduced levels of phospho-PTEN in ethanol-exposed livers. Therefore, in additionto higher levels of gene expression, the increased levels ofPTEN phosphatase activity may have been partly medi-ated by ethanol inhibition of PTEN phosphorylation be-cause phosphorylation reduces the enzymatic activity ofPTEN.27,28 The in vivo effects of ethanol on PTEN ex-pression and function were confirmed by in vitro experi-ments.
The studies herein demonstrated dual mechanisms bywhich chronic ethanol feeding results in inhibition of Aktphosphorylation and kinase activity in the liver: Onepathway is linked to impaired growth factor signalingthrough PI3 kinase, and the other pertains to the regula-tion of PTEN expression and function. Akt kinase is animportant mediator of hepatocellular growth and sur-vival, and, correspondingly, ethanol inhibition of Akt wasassociated with increased apoptosis in the liver. Akt me-diates survival by phosphorylating and inhibiting GSK-3,39,51 BAD,40 and fork-head transcription factors.30,31,52
Therefore, we expected that ethanol activation of PTENand inhibition of Akt would be associated with increasedlevels of GSK-3 activity and activated BAD. However,paradoxically, the proapoptosis pathways downstream ofAkt were not activated in the ethanol-exposed livers as wasevidenced by the absence of ethanol-associated increasesin GSK-3 activity and activated BAD expression. More-over, although fork-head expression was increased, theprotein was largely retained in the cytosol rather thantranslocated to the nucleus where it could up-regulateproapoptosis molecules such as FasL.30 Correspondingly,we did not detect increased levels of FasL mRNA in theethanol-exposed livers. These findings suggest that theproapoptosis signaling cascades induced by chronic etha-nol feeding were partially blocked or uncoupled. Withregard to potential mechanisms, a recent study demon-strated that transcriptional up-regulation of FasR leads toinhibition of GSK-3 activity.53 In the present study, weobserved increased levels of FasR expression in livers fromchronic ethanol-fed rats.
Previous studies demonstrated ethanol-induced oxida-tive stress associated with increased p53 expression andDNA damage.54-57 Up-regulation of p53 induces FasR
expression and promotes apoptosis.32-34,58 Results fromthe present studies showed that chronic ethanol exposureleads to increased expression of p53, FasR, and PTEN andincreased PTEN phosphatase activity and inhibition ofsurvival signaling through PI3 kinase/Akt. Therefore, fol-lowing chronic ethanol exposure, several proapoptosis/antisurvival mechanisms become activated in theotherwise normal liver. In this context, one would antic-ipate chronic ethanol feeding to render the liver moresusceptible to any second insult that promotes cell losssuch as hepatitis B or hepatitis C virus infection. How-ever, we also obtained evidence that, with chronic ethanolfeeding, compensatory mechanisms become activatedthat effectively uncouple or inhibit downstream proapop-tosis/antisurvival signaling. In particular, the inhibition ofGSK-3, which could be attributed to increased levels ofFasR, may have helped to protect the ethanol-exposedlivers from more extensive programmed cell death andattendant loss of function. According to this analyticalscheme, we predict that, with chronic ethanol feeding,factors or agents that promote FasL expression or GSK-3activity would reverse or override endogenous compensa-tory prosurvival mechanisms and result in a greater sever-ity of hepatocellular injury than occurs in the absence ofchronic ethanol exposure.
References1. Mohr L, Tanaka S, Wands JR. Ethanol inhibits hepatocyte proliferation in
insulin receptor substrate 1 transgenic mice. Gastroenterology 1998;115:1558-1565.
2. Sasaki Y, Wands JR. Ethanol impairs insulin receptor substrate-1 mediatedsignal transduction during rat liver regeneration. Biochem Biophys ResCommun 1994;199:403-409.
3. Seiler AE, Ross BN, Rubin R. Inhibition of insulin-like growth factor-1receptor and IRS-2 signaling by ethanol in SH-SY5Y neuroblastoma cells.J Neurochem 2001;76:573-581.
4. Xu YY, Bhavani K, Wands JR, de la Monte SM. Ethanol inhibits insulinreceptor substrate-1 tyrosine phosphorylation and insulin-stimulated neu-ronal thread protein gene expression. Biochem J 1995;310:125-132.
5. Myers MG, Sun XJ, White MF. The IRS-1 signaling system. TrendsBiochem Sci 1994;19:289-293.
6. O’Hare T, Pilch PF. Intrinsic kinase activity of the insulin receptor. IntJ Biochem 1990;22:315-324.
7. Ullrich A, Bell JR, Chen EY, Herrera R, Petruzzelli LM, Dull TJ, Gray A,et al. Human insulin receptor and its relationship to the tyrosine kinasefamily of oncogenes. Nature 1985;313:756-761.
8. Sun XJ, Rothenberg P, Kahn CR, Backer JM, Araki E, Wilden PA, CahillDA, et al. Structure of the insulin receptor substrate IRS-1 defines a uniquesignal transduction protein. Nature 1991;352:73-77.
9. Sun XJ, Crimmins DL, Myers MJ, Miralpeix M, White MF. Pleiotropicinsulin signals are engaged by multisite phosphorylation of IRS-1. MolCell Biol 1993;13:7418-7428.
10. Myers MG, Backer JM, Sun XJ, Shoelson S, Hu P, Schlessinger J, YoakimM, et al. IRS-1 activates phosphatidylinositol 3�-kinase by associating withsrc homology 2 domains of p85. Proc Natl Acad Sci U S A 1992;89:10350-10354.
11. Bonini JA, Colca JR, Dailey C, White M, Hofmann C. Compensatoryalterations for insulin signal transduction and glucose transport in insulin-resistant diabetes. Am J Physiol 1995;269:E759-E765.
712 YEON ET AL. HEPATOLOGY, September 2003

12. Kuhne MR, Zhao Z, Rowles J, Lavan BE, Shen SH, Fischer EH, LienhardGE. Dephosphorylation of insulin receptor substrate 1 by the tyrosinephosphatase PTP2C. J Biol Chem 1994;269:15833-15837.
13. Backer JM, Myers MJ, Shoelson SE, Chin DJ, Sun XJ, Miralpeix M, Hu P,et al. Phosphatidylinositol 3�-kinase is activated by association with IRS-1during insulin stimulation. EMBO J 1992;11:3469-3479.
14. Auer KL, Contessa J, Brenz-Verca S, Pirola L, Rusconi S, Cooper G, AboA, et al. The Ras/Rac1/Cdc42/SEK/JNK/c-Jun cascade is a key pathway bywhich agonists stimulate DNA synthesis in primary cultures of rat hepa-tocytes. Mol Biol Cell 1986;9:561-573.
15. Baltensperger K, Kozma LM, Cherniack AD, Klarlund JK, Chawla A,Banerjee U, Czech MP. Binding of the Ras activator son of sevenless toinsulin receptor substrate-1 signaling complexes. Science 1993;260:1950-1952.
16. Skolnik EY, Batzer A, Li N, Lee CH, Lowenstein E, Mohammadi M,Margolis B, et al. The function of GRB2 in linking the insulin receptor toRas signaling pathways. Science 1993;260:1953-1955.
17. Burgering BM, Coffer PJ. Protein kinase B (c-Akt) in phosphatidylinosi-tol-3-OH kinase signal transduction. Nature 1995;376599-376602.
18. Coffer PJ, Jin J, Woodgett JR. Protein kinase B (c-Akt): a multifunctionalmediator of phosphatidylinositol 3-kinase activation. Biochem J 1998;335:1-13.
19. Banerjee K, Mohr L, Wands JR, de la Monte SM. Ethanol inhibition ofinsulin signaling in hepatocellular carcinoma cells. Alcohol Clin Exp Res1998;22:2093-2101.
20. Urso T, Gavaler JS, Van Thiel DH. Blood ethanol levels in sober alcoholusers seen in an emergency room. Life Sci 1981;28:1053-1056.
21. Ausubel FM, Brent R, Kingston RE, Moore DD, Seidman JG, Smith JA,Struhl K. Current Protocols in Molecular Biology. New York: John Wiley& Sons, 2002.
22. Seglen PO. Preparation of isolated rat liver cells. Methods Cell Biol 1976;13:29-83.
23. Mao PL, Jiang Y, Wee BY, Porter AG. Activation of caspase-1 in thenucleus requires nuclear translocation of pro-caspase-1 mediated by itsprodomain. J Biol Chem 1998;273:23621-23624.
24. Lingohr MK, Dickson LM, McCuaig JF, Hugl SR, Twardzik DR, RhodesCJ. Activation of IRS-2-mediated signal transduction by IGF-1, but notTGF-� or EGF, augments pancreatic �-cell proliferation. Diabetes 2002;51:966-976.
25. Xiao H, Yin T, Wang XY, Uchida T, Chung J, White MF, Yang YC.Specificity of interleukin-2 receptor gamma chain superfamily cytokines ismediated by insulin receptor substrate-dependent pathway. J Biol Chem2002;277:8091-8098.
26. Walker SM, Downes CP, Leslie NR. TPIP: a novel phosphoinositide3-phosphatase. Biochem J 2001;360:277-283.
27. Torres J, Pulido R. The tumor suppressor PTEN is phosphorylated by theprotein kinase CK2 at its C terminus. Implications for PTEN stability toproteasome-mediated degradation. J Biol Chem 2001;276:993-998.
28. Vazquez F, Ramaswamy S, Nakamura N, Sellers WR. Phosphorylation ofthe PTEN tail regulates protein stability and function. Mol Cell Biol2000;20:5010-5018.
29. Singh B, Reddy PG, Goberdhan A, Walsh C, Dao S, Ngai I, Chou TC, etal. p53 Regulates cell survival by inhibiting PIK3CA in squamous cellcarcinomas. Genes Dev 2003;16:984-993.
30. Brunet A, Bonni A, Zigmond MJ, Lin MZ, Juo P, Hu LS, Anderson MJ,et al. Akt promotes cell survival by phosphorylating and inhibiting a Fork-head transcription factor. Cell 1999;96:857-868.
31. Kawano T, Morioka M, Yano S, Hamada J, Ushio Y, Miyamoto E, Fuku-naga K. Decreased akt activity is associated with activation of forkheadtranscription factor after transient forebrain ischemia in gerbil hippocam-pus. J Cereb Blood Flow Metab 2002;22:926-934.
32. Muller M, Wilder S, Bannasch D, Israeli D, Lehlbach K, Li-Weber M,Friedman SL, et al. p53 Activates the CD95 (APO-1/Fas) gene inresponse to DNA damage by anticancer drugs. J Exp Med 1998;188:2033-2045.
33. Tamura T, Aoyama N, Saya H, Haga H, Futami S, Miyamoto M, Koh T,et al. Induction of Fas-mediated apoptosis in p53-transfected human coloncarcinoma cells. Oncogene 1995;11:1939-1946.
34. Owen-Schaub LB, Zhang W, Cusack JC, Angelo LS, Santee SM, FujiwaraT, Roth JA, et al. Wild-type human p53 and a temperature-sensitive mu-tant induce Fas/APO-1 expression. Mol Cell Biol 1995;15:3032-3040.
35. Hong F, Nguyen VA, Shen X, Kunos G, Gao B. Rapid activation ofprotein kinase B/Akt has a key role in antiapoptotic signaling during liverregeneration. Biochem Biophys Res Commun 2002;279:974-979.
36. Kulik G, Klippel A, Weber MJ. Antiapoptotic signalling by the insulin-likegrowth factor I receptor, phosphatidylinositol 3-kinase, and Akt. Mol CellBiol 1997;17:1595-1606.
37. Harwood AJ. Regulation of GSK-3: a cellular multiprocessor. Cell 2001;105:821-824.
38. Orena SJ, Torchia AJ, Garofalo RS. Inhibition of glycogen-synthase kinase3 stimulates glycogen synthase and glucose transport by distinct mecha-nisms in 3T3-L1 adipocytes. J Biol Chem 2000;275:15765-15772.
39. Pap M, Cooper GM. Role of glycogen synthase kinase-3 in the phospha-tidylinositol 3- Kinase/Akt cell survival pathway. J Biol Chem 1998;273:19929-19932.
40. Datta SR, Dudek H, Tao X, Masters S, Fu H, Gotoh Y, Greenberg ME.Akt phosphorylation of BAD couples survival signals to the cell- intrinsicdeath machinery. Cell 1997;91:231-241.
41. Condorelli F, Salomoni P, Cotteret S, Cesi V, Srinivasula SM, Alnemri ES,Calabretta B. Caspase cleavage enhances the apoptosis-inducing effects ofBAD. Mol Cell Biol 2001;21:3025-3036.
42. Kennedy SG, Kandel ES, Cross TK, Hay N. Akt/Protein kinase B inhibitscell death by preventing the release of cytochrome c from mitochondria.Mol Cell Biol 1999;19:5800-5810.
43. Dajani R, Fraser E, Roe SM, Young N, Good V, Dale TC, Pearl LH.Crystal structure of glycogen synthase kinase 3 �: structural basis for phos-phate-primed substrate specificity and autoinhibition. Cell 2001;105:721-732.
44. van Weeren PC, de Bruyn KM, de Vries-Smits AM, van Lint J, BurgeringBM. Essential role for protein kinase B (PKB) in insulin-induced glycogensynthase kinase 3 inactivation. Characterization of dominant-negative mu-tant of PKB. J Biol Chem 1998;273:13150-13156.
45. Di Cristofano A, Pesce B, Cordon-Cardo C, Pandolfi PP. Pten is essentialfor embryonic development and tumour suppression. Nat Genet 1998;19:348-355.
46. Di Cristofano A, Pandolfi PP. The multiple roles of PTEN in tumorsuppression. Cell 2000;100:387-390.
47. Dahia PL, Aguiar RC, Alberta J, Kum JB, Caron S, Sill H, Marsh DJ, et al.PTEN is inversely correlated with the cell survival factor Akt/PKB and isinactivated via multiple mechanismsin haematological malignancies. HumMol Genet 1999;8:185-193.
48. Lee JO, Yang H, Georgescu MM, Di Cristofano A, Maehama T, Shi Y,Dixon JE, et al. Crystal structure of the PTEN tumor suppressor: implica-tions for its phosphoinositide phosphatase activity and membrane associ-ation. Cell 1999;99:323-334.
49. Maehama T, Dixon JE. PTEN: a tumour suppressor that functions as aphospholipid phosphatase. Trends Cell Biol 1999;9:125-128.
50. Wu X, Senechal K, Neshat MS, Whang YE, Sawyers CL. The PTEN/MMAC1 tumor suppressor phosphatase functions as a negative regulatorof the phosphoinositide 3-kinase/Akt pathway. Proc Natl Acad Sci U S A1998;95:15587-15591.
51. Huang J, Kontos CD. Inhibition of vascular smooth muscle cell prolifer-ation, migration, and survival by the tumor suppressor protein PTEN.Arterioscler Thromb Vasc Biol 2002;22:745-751.
52. Kops GJ, Burgering BM. Forkhead transcription factors are targets ofsignalling by the proto- oncogene PKB (C-AKT). J Anat 2002;197:571-574.
53. Badorff C, Ruetten H, Mueller S, Stahmer M, Gehring D, Jung F, IhlingC, et al. Fas receptor signaling inhibits glycogen synthase kinase 3 beta andinduces cardiac hypertrophy following pressure overload. J Clin Invest2002;109:373-381.
HEPATOLOGY, Vol. 38, No. 3, 2003 YEON ET AL. 713

54. Zhu Q, Meisinger J, Emanuele NV, Emanuele MA, LaPaglia N, Van ThielDH. Ethanol exposure enhances apoptosis within the testes. Alcohol ClinExp Res 2002;24:1550-1556.
55. Mansouri A, Gaou I, De Kerguenec C, Amsellem S, Haouzi D, Berson A,Moreau A, et al. An alcoholic binge causes massive degradation of hepaticmitochondrial DNA in mice. Gastroenterology 1999;117:181-190.
56. de la Monte SM, Ganju N, Banerjee K, Brown NV, Luong T, Wands JR.Partial rescue of ethanol-induced neuronal apoptosis by growth factor
activation of phosphoinositol-3-kinase. Alcohol Clin Exp Res 2000;24:716-726.
57. Lumpkin CK Jr, Moore TL, Tarpley MD, Taylor JM, Badger TM, Mc-Clung JK. Acute ethanol and selected growth suppressor transcripts inregenerating rat liver. Alcohol 1995;12:357-362.
58. Kim JM, Yoon YD, Tsang BK. Involvement of the Fas/Fas ligand system inp53-mediated granulosa cell apoptosis during follicular development andatresia. Endocrinology 1999;140:2307-2317.
714 YEON ET AL. HEPATOLOGY, September 2003