PTEN inhibits BMI1 function independently of its phosphatase activity
Upload
khangminh22Category
view
2download
0
High levels of glucose-6-phosphatase gene and proteinexpression reflect an adaptive response in proliferating liver anddiabetes.
B A Haber, … , A Naji, R Taub
J Clin Invest. 1995;95(2):832-841. https://doi.org/10.1172/JCI117733.
The regenerating liver after partial hepatectomy is one of the few physiologic models of cellular proliferation in the adultanimal. During hepatic regeneration, the animal is able to maintain metabolic homeostasis despite the acute loss of twothirds of hepatic tissue. In examining the molecular mechanisms regulating hepatic regeneration, we isolated novelimmediate-early genes that are rapidly induced as the remnant liver undergoes the transition from its normal quiescentstate into the G1 phase of the cell cycle. One of the most rapidly and highly induced genes which we initially termed RL-1,encodes rat glucose-6-phosphatase (rG6Pase). G6Pase mRNA peaks at 30 min and 36-48 h after hepatectomycorrelating with the first and second rounds of cell division. This finding is compatible with studies that showed thatG6Pase enzyme activity increases during liver regeneration. However, the increase in G6Pase mRNA is much moredramatic, indicating that it is a more sensitive indicator of this regulation. G6Pase gene expression peaks in the perinataltime period in the liver and remains elevated during the first month of life. The expression of the G6Pase gene is alsodramatically elevated in BB diabetic rats, again higher than the enzyme elevation, and its relative induction after partialhepatectomy is blunted in these animals. Insulin treatment of partially hepatectomized diabetic animals downregulatesthe expression of G6Pase mRNA. […]
Research Article
Find the latest version:
https://jci.me/117733/pdf

High Levels of Glucose-6-Phosphatase Gene and Protein Expression Reflectan Adaptive Response in Proliferating Liver and DiabetesBarbara A. Haber,* Simon Chin,*§ Emil Chuang,* Wieneke Buikhuisen,* Ali Naji,11 and Rebecca Taub***Department of Genetics, *Howard Hughes Medical Institute, Division of Gastroenterology and Nutrition, §Department of Pediatrics,Children's Hospital of Philadelphia, 11 Department of Surgery, University of Pennsylvania School of Medicine, Philadelphia, Pennsylvania19104-6145
Abstract
The regenerating liver after partial hepatectomy is one ofthe few physiologic models of cellular proliferation in theadult animal. During hepatic regeneration, the animal isable to maintain metabolic homeostasis despite the acute lossof two thirds of hepatic tissue. In examining the molecularmechanisms regulating hepatic regeneration, we isolatednovel immediate-early genes that are rapidly induced asthe remnant liver undergoes the transition from its normalquiescent state into the G1 phase of the cell cycle. One ofthe most rapidly and highly induced genes which we initiallytermed RL-1, encodes rat glucose-6-phosphatase (rG6Pase).G6Pase mRNApeaks at 30 min and 36-48 h after hepatec-tomy correlating with the first and second rounds of celldivision. This finding is compatible with studies that showedthat G6Pase enzyme activity increases during liver regener-ation. However, the increase in G6Pase mRNAis much moredramatic, indicating that it is a more sensitive indicator ofthis regulation. G6Pase gene expression peaks in the perina-tal time period in the liver and remains elevated during thefirst month of life. The expression of the G6Pase gene is alsodramatically elevated in BB diabetic rats, again higher thanthe enzyme elevation, and its relative induction after partialhepatectomy is blunted in these animals. Insulin treatmentof partially hepatectomized diabetic animals downregulatesthe expression of G6Pase mRNA. Using specific antibodiesagainst G6Pase, we detect a 36-kD G6Pase protein, and itslevel is elevated in regenerating and diabetic livers. Thepattern of G6Pase mRNAexpression appears to reflect simi-lar changes in insulin and glucagon levels which accompanydiabetes and hepatic proliferation. The elevation of G6Paseexpression in these conditions is indicative of its importanceas a regulator of glucose homeostasis in normal and abnor-mal physiologic states. (J. Clin. Invest. 1995. 95:832-841.)Key words: metabolism * liver regeneration * hepatectomy* molecular sequence data * fetal development
Introduction
The regenerating liver after partial hepatectomy is one of thefew adult organs that demonstrates a physiologic growth re-
Address correspondence to Rebecca A. Taub, Howard Hughes MedicalInstitute, Department of Genetics, University of Pennsylvania, Schoolof Medicine, Philadelphia, PA 19104-6145. Phone: 215-898-9131; FAX:215-573-2195.
Receivedfor publication 7 June 1994 and in revisedform 6 October1994.
sponse (1-3). As such it provides an intact animal model inwhich cellular proliferation can be studied. Within minutes aftertwo thirds partial hepatectomy, the majority of cells in the rem-nant liver which are normally quiescent rapidly reenter the cellcycle accompanied by the induced expression of a large numberof growth response genes. The onset of DNAsynthesis occursat 12-16 h after hepatectomy in hepatocytes with peak level at24 h, and the mass of the liver is restored within 7-10 d whenproliferation ceases. A number of growth factors has been impli-cated as having a role in this process including HGF, TGFa,insulin, glucagon, and others, but the exact mechanisms regulat-ing this process are unknown. As the liver is a vital organ, itmust maintain metabolic and synthetic homeostasis throughoutthe regenerative period. Studies have shown that there is anacute fall in insulin and an increase in glucagon levels immedi-ately after hepatectomy both of which begin to renormalizewithin a few hours, thereby preventing the hypoglycemia whichmight accompany the loss of liver mass (4, 5). Previously, weand others (6-9) showed that phosphoenol pyruvate kinase(PEPCK)' and other genes involved in glucose homeostasis arerapidly up- or downregulated in the regenerating liver, thusallowing the remnant liver to maintain glucose balance.
To begin to define the molecular basis for liver regeneration,our laboratory first identified a large number of novel immedi-ate-early genes that are induced in the remnant liver withinminutes after partial hepatectomy (10). In total we have exam-ined the expression of more than 70 immediate-early genesexpressed in the regenerating liver. Of these, approximately onethird show liver-restricted induction and are not induced inmitogen-stimulated cells such as 3T3 fibroblasts (10, 11 ). Oneof these, RL-I ( 10, 12, 13), showed a very high peak of expres-sion within 30 min after hepatectomy and was expressed in atissue-restricted fashion with highest levels in liver and kidney.As we were particularly interested in defining the liver-specificaspects of cell growth, we focused on the characterization ofRL-J. After completing several studies, we found upon a repeatdata bank search that RL-l is the rat homologue of the recentlyidentified glucose-6-phosphatase (G6Pase) gene (14).
G6Pase is a key regulatory enzyme in glucose homeostasis,catalyzing the final step in gluconeogenesis and glycogenolysis(15). Decreased levels are found in two different diseases. Inglycogen storage disease type 1, a mutated form of G6Pase isfound ( 16). In tyrosinemia type 1, toxic by-products secondaryto a deficiency of fumaryl acetoactetate result in decreased ex-pression of G6Pase. The mouse model for this form of tyro-sinemia has demonstrated that the usual perinatal expression ofG6Pase is blunted ( 14, 17). Purification of G6Pase was difficultbecause of its tight association with the endoplasmic reticulum
1. Abbreviations used in this paper: G6Pase, glucose-6-phosphatase;IGFBP-1, insulin-like growth factor binding protein-l; PEPCK, phos-phoenol pyruvate kinase; RT, reverse transcriptase.
832 Haber et al.
J. Clin. Invest.0) The American Society for Clinical Investigation, Inc.0021-9738/95/02/0832/10 $2.00Volume 95, February 1995, 832-841

1 2 3 4 6 8 0 1e-- -- ;.-.- -....-.- --- -..-.---..-----.--.- ---. -----.----..--.-.--.----- -.- ....---.
_5
E ..... ..... .... ...= ... .. ... .__.*..A _ _§_....,.,.... _
h post-hepatectomy
RL-1
fig~~~~~~~~~~AU. -RL-1
Figure 1. Expression of the RL-I gene in regenerating liver and normal tissues. (A) Northern blot probed with a 32P-labeled RL-I cDNA. 10 ,ugof each liver RNAsample was loaded per lane as confirmed by control probes and ethidium-stained ribosomal RNAbands. Number of hours afterhepatectomy is indicated. 3Cx indicates pretreatment of the animal with cycloheximide followed by partial hepatectomy and collection of the RNA3 h later. Left panel, short time course; right panel, long time course. (B) RL-J's expression is restricted to liver and kidney. Samples are 3T3,Balbc/3T3 fibroblasts; SD, serum-deprived (48 h in 1% serum); or 3hCxSer, treated with 10% FBS for 3 h in the presence of cycloheximide; H35cells, treated as in Methods by serum deprivation for 72 h (SD) or serum deprivation for 72 h followed by insulin in the presence of cycloheximide(3hCxIns). Samples are from indicated adult rat tissue.
and nuclear membranes (18-21). Using enzymatic assays,G6Pase has commonly been used as a marker for hepatocytes.It is present in the periportal area in normal liver, but dispersedthroughout the liver at 4 h after hepatectomy (22). Its expres-
sion in diabetics and its regulation by insulin are complex.G6Pase activity has been reported to be high in diabetic animals(23-25), regardless of glycemia (26, 27), and its activity hasbeen shown to be decreased by insulin and increased by gluca-gon (28). Here we examine the expression of the G6Pase genein regeneration of the liver, fetal hepatic development, and dia-betic animals. Wefind that the G6Pase gene is highly expressedunder several experimental conditions which may reflect thebasis of its regulation in different hormonal milieus. Weshowthat G6Pase protein levels correlate with mRNAlevels underthese conditions, but that mRNAlevels change more dramati-cally. These expression patterns are indicative of the importanceof G6Pase as a regulatory enzyme in glucose metabolism inphysiologic and pathophysiologic conditions.
Methods
Animals and cell lines. H-35 cells were grown as described previously(29). After serum deprivation, cells were treated with various agents:insulin (10-8 M; Sigma Immunochemicals, St. Louis, MO), serum (20%FBS), and cycloheximide (10 gg/ml; Sigma Immunochemicals). Balb/3T3 cells were grown and induced with serum (20% FBS) with or
without cycloheximide ( 10 ug/ml) as described ( 10). For regeneratingliver, Fischer rats (160-200 g; Bantin and Kingman, Inc., Fremont,CA) were ether anesthetized and subjected to midventral laparotomywith 70% liver resection (left lateral and median lobes) (30). For
cycloheximide-treated samples, rats were treated with 50 mg/kg cyclo-
heximide (5% solution in PBS) intraperitoneally 15 min before surgery
(10). RNAwas prepared in 4 Mguanidine thiocyanate buffer and RNAprepared as described (31).
Diabetic BB rats (300-400 g), aged 3-5 mo, were maintained on
2 U of sc lente (long-acting) insulin daily. Insulin was withheld on theday of surgery when, after ether anesthesia, 70% liver resection was
performed as described above. Rats were subsequently killed at differenttime points, and total liver RNAwas prepared. Blood glucose (Accu-chek III; Boehringer Mannheim, Indianapolis, IN) and serum insulinlevels (RIA assay; Diabetes Center Core, University of PennsylvaniaMedical School) were measured preoperatively and at the time ofkilling.
For fetal liver samples, timed pregnant Fischer female rats were
purchased from Charles River Laboratories (Wilmington, MA), andembryos were harvested on the indicated days. Total RNAwas extractedfrom the fetal livers after homogenization in guanidine thiocyanate.Each RNAsample represents more than one fetal liver.
Northern blots. Northern blot analyses and labeling of recombinantRL-J/G6Pase plasmids have been described (10). Hybridization bufferconsisted of 10% dextran sulfate, 40% formamide, 0.6 MNaCl/0.06MNa Citrate, 7 mMTris (pH 7.6), 0.8 x Denhardt's solution, and0.002% heat-denatured, sonicated salmon sperm DNA. Northern blotswere hybridized at 42°C for 16 h and washed 2 x 30 min at 60°Cin 0.015 MNaCl/0.0015 MNa citrate/0.1% SDS before exposure tofilm (31).
Antibodies and immunoblots. Anti-polyclonal rG6Pase antibodieswere prepared by Cocalico Biologicals (Reamstown, PA) against bacte-rially expressed purified denatured rG6Pase peptide (amino acids 238-31 1 ). The peptide was expressed as we have described previously usinga PET expression vector system (32) after cloning a PCR-generatedfragment in front of the polyhistidine region. The sequence was con-
firmed. Immunoblots were performed as we have described using a
1:1,000 dilution of affinity-purified anti-G6Pase antisera followed by a
Expression of the Glucose-6-Phosphatase Gene 833
A
28S
18S-
qNXIII
"I IQ
-.N-Afj I.SI.

1:10,000 dilution of goat anti-rabbit sera and the chemiluminescencedetection system (Amersham Corp., Arlington Heights, IL) (33). Af-finity-purified a-G6Pase was prepared on an affigel column using immo-bilized G6Pase peptide and showed enhanced anti-G6Pase activity.
Cell extracts. Liver was extracted and fractionated as described (34).Nuclei preparation was verified by microscopy, as we have done pre-viously (34, 35), and was 99% pure. Cytoplasmic material was furtherfractionated by a high speed ( 100,000 g) spin, followed by resuspensionof the pellet in 0.5% Triton, and resuspension of the final Triton-insolu-ble pellet in loading buffer. Nuclear material was further fractionatedby treatment of intact nuclei in 0.5% Triton to remove the outer nuclearmembrane, lysis of nuclei by dounce homogenization, and recoveryof nuclear extract. The nuclear extract was subjected to high speedcentrifugation, the pellet resuspended in 0.5% Triton to recover theTriton-soluble fraction, the Triton-insoluble pellet, and the remaininginsoluble material resuspended in loading buffer.
cDNA cloning and DNA sequencing. The G6Pase(RL-J) cDNAwas isolated as we have described from a cDNA library prepared fromregenerating rat liver at 3 h after hepatectomy following pretreatmentwith cycloheximide (10). Several different cDNAs were isolated. Thenear full-length cDNA copy was verified by primer extension analysis.DNAsequencing was performed bidirectionally using the oligonucleo-tide primer extension modification of Sanger dideoxy methodology(36). Intelligenetics and GCGDNAsoftware and a BLAST search wereused in sequence analyses.
Reverse transcriptase PCR. RNApreviously extracted from liver atvarious time points after partial hepatectomy was used for the reversetranscriptase (RT) reaction. Each RT reaction was performed in a 20MI volume buffer (0.05 M Tris/HCl, pH 8.3, 0.075 M KCl, 3 mMMgCl2, 10 mMDTT), consisting of 2 pg of RNA, 8 pmol of 3' primer(CGAAAGATAGCGAGAGTAGA),0.01 mMDTT, 1 mMof eachdNTP and 200 U of Moloney murine leukemia virus RT (GIBCO BRL,Grand Island, NY). This was incubated for 90 min at 37°C followedby 5 min at 65°C. The primers used for the PCRreaction include the5' primer (ACTGGTTCAACCTCGTCTT),and the 3' primer was thesame as that used for the RT reactions. The 5' and 3' primers wereend-labeled with T4 polynucleotide kinase (New England Biolabs, Bev-erly, MA) and 0.01 mCi of [32P] ydATP at 37°C for 30 min. The PCRreactions were performed in 40-ttl volumes of Vent buffer (10 mMKC1, 20 mMTris/HCl, pH 8.8, 10 mM(NH4)2SO4, 2 mMMgSO4,and 0.1% Triton X-100) containing 2 p1 of DNAfrom the RT reaction,30 pmol of each primer, with 20%of each primer as end-labeled primer,2.5 mMof each dNTP, and 1 U Vent (New England Biolabs). Thealternate form of RL-J cDNA without the exon was used as a control.The PCRreaction gave a predicted fragment size of 209 and 99 bp forthe full length and exon 2 minus G6Pase mRNAforms, respectively.The products were electrophoresed on a 5% denaturing polyacrylamidegel relative to molecular size standards.
G6Pase enzymatic assays. Enzymatic activity of G6Pase in livertissue was detected by a modified technique of Teutsch et al. (37). 10-p.m frozen section slides were exposed to G6Pase substrate for 30 minat 37°C and subsequently washed briefly in 0.22% ammonium sulfidebefore fixation with acetone/methanol ( 1:1 ). Slides were then counter-stained lightly with hematoxylin.
G6Pase activity of subcellular fractions of liver tissue was assayedby incubating dilutions of the fractions in G6Pase substrate mixture at
37°C for 60 min ( 18). After stopping the reaction in 10% trichloroaceticacid, samples were centrifuged at 3,500 rpm at 4°C for 20 min and analiquot of the supernatant incubated with 10% ascorbic acid/0.42%ammonium molybdate (1:6) at 42°C for 20 min before reading at OD820 nm. Specific activity was calculated after standardization with ap-propriate dilutions of potassium phosphate and determination of theprotein concentrations of the fractions by the BCA (Pierce, Rockford,IL) protein assay method.
Immunohistochemistry. Immunohistochemistry was performed es-sentially as has been described (33, 38). 10-,um frozen tissue sectionswere fixed in ice cold methanol for 10 min. The Vectastain Elite ABC(Vector Labs, Inc., Burlingame, CA) avidin biotin horseradish peroxi-dase detection system was used according to the manufacturer's instruc-
1 GCCAGCTTCCTGAGGTACCAAGGAGGAAGGATGGAGGAAAGAMATAACGT51 GCTCCACGACTTTGGGATCCAGTCGACTCGCTACCTCCAAGTGAATTACG
101 AAGACTCCCAGGACTGGTTTGTCTTGGTGTCTGTGATCGCTGACCTCAGG151 AACGCCTTCTATGTCCTCTTTCCCATCTGGTTCCACATTCAAGAGACTGT201 GGGCATCAATCTCCTCTGGGTGGCAGTGGTTGGAGACTGGTTCAACCTCG251 TCTTTAAGGATTCTTTTTGGACAGCGCCCGTATTGGTGGGTCCTGGAC301 ACTGACTATTACAGCAACAGCTCCGTGCCTCTGATAAAACAGTTCCCCGT351 CACCTGTGAGACTGGACCAGAGTCCCTCGGGCCATGCCATGGGCACAG401 CAGGTGTATACTACGTTATGGTTACTTCTACTCTCGCTATCTTTCGTGGA451 AAGAAAAAGTCAACGTATGGATTCCGGTGCTTGAATGTCGTCTTGTGGTT501 GGGATACTGGGCTGTGCAGCTGAACGTCTGTCTGTCCCGGATCTACCTTG551 CGGCTCACTTTCCCCATCAGGTGGTGGCTGGAGTCTTGTCAGGCATTGCT601 GTGGCTGAAACTTTCAGCCACATCCGGGGCATCTACAATGCCAGCCTCCA651 GAGGTACTGTCTCATCACCTTCTTCCTGTTTGGTTTCGCACTTGGATTTT701 ACCTGCTGCTAAAGGGGCTAGGGGTGGACCTCCTGTGGACTTTGGAGAAG751 GCCAAGAGATGGTGTGAGCGCCCCGAGTGGGTCCACCTTGACACTACACC801 CTTTGCCAGCCTCTTCAAAAACCTGGGGACCCTCTTGGGGTTGGGGCTGG851 CCCTCAACTCCAGCATGTACCGCAAGAGCTGCAAAGGAGAACTGCGCAAG901 TCGCTCCCATTCCGTTTGGCCTGCATCGTGGCCTCCTTGGGCCTGCTGCA951 TCTCTTTGACTCGCTGAAGCCCCCGTCCCAGATTGAGTCGATCTTCTACA
1001 TCTTGTCTTTCTGCAAGAGTGCGACCGTCCCCTTTGCATCTGTCAGTCTT1051 ATCCCCTACTGCCTAGCCCGGCTCCTGGGACAGACACACAAGAAGTCTTT1101 GTAAAGCGTTAAGTCTCTGACACAAGTCAGCGGCCGTGCAAAGGACTAGG1151 AGCAACCCAAGCCTTGTGCAACCCAGTGTGGGGCCAGAGGTGTTCACAGC1201 CACCCTGGTAGCCCTGTCTTTCTTTGCCATCGTAACCAAAAAGGTGAATT1251 TTTAAAAGCTAACAGGGCTGTTTGAGGAAAGCGTGAATGCTGGAAGATGT1301 TTCCCTGATGAATCACTTCCGGTCTCCTGTCCGACACAGAAGAGAAAGCC1351 CAGACTAGAGATCCTGACAGAATGCTCTCACTGTGCAGAATCCTCCAGGC1401 CGAGGGTAAAAGAAAAGAGCGTTGTGCATTTGCTAGGAAGAGAAGGAAGG1451 ATCGGGAGGAGGGGGAGTGTTTGGTGGATTGAGCAAACCATATGCAAGCC1501 ATGTCTACCCGGCTTCAGTTATGCCTGGGTCTTTAGATATGTAGGACACT1551 CTCAATAATGATAGACCAGCCCGTGTAATGAGTAGCCAGTTAGAGGCGAT1601 CATTCTGCTCCCAGATTTTTCTCTACTGTACATGAAAGTCACACCGTGTG1651 CTTGTATTCCTGAATGGTAATGGTGACTGTCACTCAGGAACCACCACCTT1701 CTCTGTGACACCACAGCTTTGCCTCCTCGGCCCAGGTCTGCGTGCCATAG1751 GACTCATCACTGCTTCCCTGACCACGCTGCTGGACCCTGCATTGCTGAAC1801 CCCATGCTGCTGGACCCTGTGGTGTACGGTGGGCAATTGTTTGCTGGTGC1851 TTTTGTAGGGTTAAGTTAAACTCTGAGATCTTGGGCAAAACGGCAAGGGG1901 AGAGTCAGGATTCCTCTCTCCAAAGGTCACTCCGAAGTTACTTTTGATTC1951 CTGGAGCAGAAATGACTCCTTCCTCTAGCCCAAGCCAGCCAAGAACTCAT2001 TCTTAGAGGCAAAGCAGCCCAAGCCCGACTGTGCCTGTCCTCCAGCCTGG2051 GCTGGTTTTGCAGAGTGTGTCTTCAAGAAGAAAAAATGGTAAAGCTATTT2101 ATTCAAAATGCTTGTTTTTTGCTATGAATGATGCCTGTGTTTCCACCCAC2151 GCCAAGCACTTGTTCCTATTGTCTTGATAAGAAACTACATGTGTGCAGTA2201 TTTTATTAAAACGACATTTTATTTAAAAAAAAAAAAA
Figure 2. Sequence of rat G6Pase cDNA. Accession number L37333.The boxed area represents the region deleted from one cDNAclone andcorresponds to exon 2 of the mouse cDNA (14). The translation initia-tion site and poly A addition signal are underlined and an asteriskindicates the position of the stop codon.
tions with these modifications. After the blocking step in 3%goat serum
in PBS, pH 7.3, avidin and biotin blocking steps were performed usingthe avidin biotin blocking kit (Vector Labs, Inc.). Primary antibodywas diluted 1:500 in 3% goat serum in PBS, and tissue sections were
incubated for 40 min at room temperature in a humidified chamber. Afterthe secondary antibody incubation step, the sections were incubated with0.3% hydrogen peroxide in methanol for 30 min to quench endogenousperoxidase activity. The slides were then dehydrated in graded alcoholsand xylene and mounted with permount.
Results
RL-J is induced as a liver-restricted immediate-early gene inregenerating liver. RL-J represents an abundant induced gene
834 Haber et al.
I
I

_ rG6Pase (387aa)
~..__ .....rG6Pase -e2 (137aa)
S 0 1 2 4 16 24 30 36 48 60 72 168 C
-209 bp
.:
... ..
.I
-99 bp
Figure 3. Two spliced forms ofthe G6Pase mRNAin rat liver.RT-PCR of RNAfrom indicatedtime after hepatectomy. S, shamsurgery at 1 h; C, control using e2minus cDNA.
in the regenerating liver (Fig. 1), but unlike most immediate-early genes it shows some expression in normal liver cells.Nonetheless it is induced more than 25-fold by 30 min afterhepatectomy. Its identification as an immediate-early gene isconfirmed by its superinduction in the presence of cyclohexi-mide treatment (3 Cx). RL-J shows peak expression during thefirst GI phase of regeneration and a second peak that coincideswith the second GI phase in hepatocytes (Fig. 1 A) (39). Unlikemost immediate-early genes, RL-J is not induced in insulin-treated H35 cells or 3T3 cell fibroblasts (Fig. 1 B). H35 cellsare a minimal deviation hepatoma cell line that shows normalregulation of most immediate-early genes (6, 7, 40). Interest-
> BirthI -
S la_-
ingly, we had shown that two genes, insulin-like growth factorbinding protein-i (IGFBP-J) and PEPCK, are induced as im-mediate-early genes in regenerating liver and downregulated ininsulin-treated H35 cells (6, 7, 40). These genes are known tobe downregulated at the transcriptional level by insulin. How-ever, in serum-deprived H35 cells, as the level of RL-I mRNAisbarely detectable, insulin treatment has an imperceptible effect.Unlike almost all other immediate-early genes, RL-I is highlyinduced by sham surgery up to 50% of the level induced bypartial hepatectomy (10). Although RL-J mrRNA is presentprimarily in liver and kidney (Fig. I B), in previous studieswe found that RL-I mRNAis present in both hepatocytes and
gestational day postnatal18 19 20 21 22 | h 1d 4d 7d 14d 21d
-G6Pase Figure 4. G6Pase mRNAexpres-sion in the perinatal and newbornperiods. Northern blot probed asdescribed for Fig. 1. Gestationalday and days after birth are indi-cated.
Expression of the Glucose-6-Phosphatase Gene 835
e21 1 ObP
II
--I_-
rG6Pase-
rG6Pase
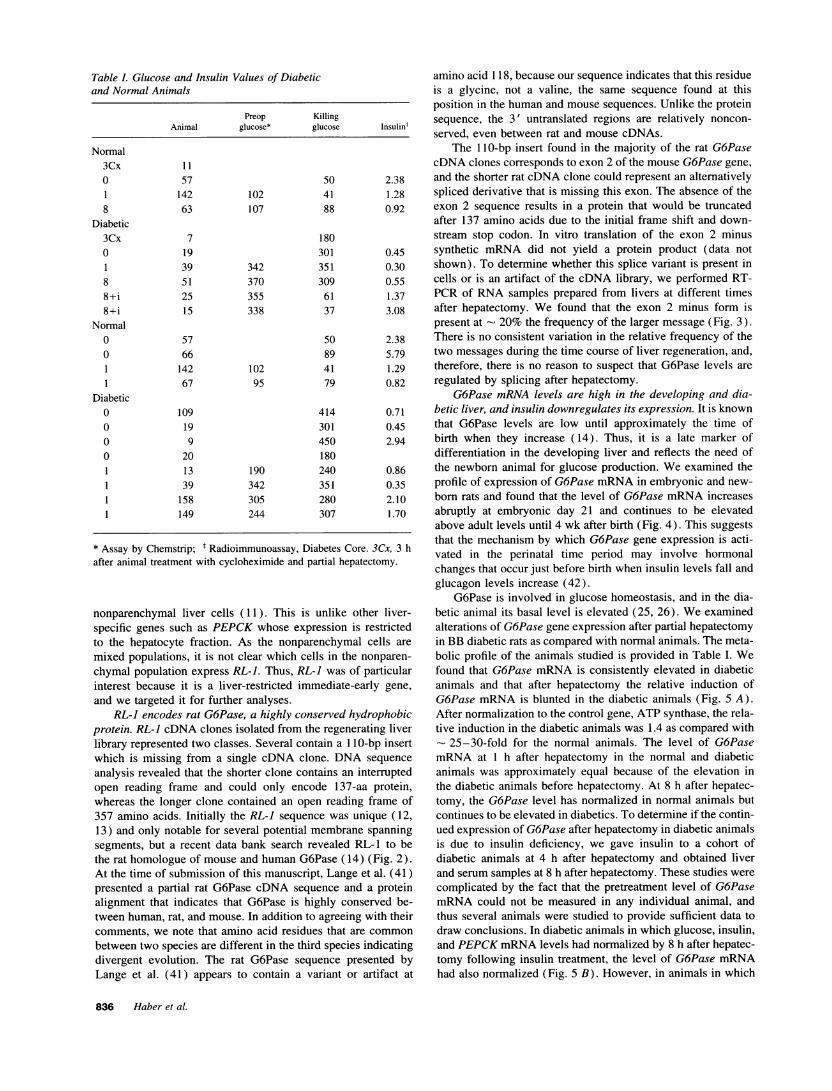
Table I. Glucose and Insulin Values of Diabeticand Normal Animals
Preop KillingAnimal glucose* glucose Insulint
Normal3Cx 110 57 50 2.381 142 102 41 1.288 63 107 88 0.92
Diabetic3Cx 7 1800 19 301 0.451 39 342 351 0.308 51 370 309 0.558+i 25 355 61 1.378+i 15 338 37 3.08
Normal0 57 50 2.380 66 89 5.791 142 102 41 1.291 67 95 79 0.82
Diabetic0 109 414 0.710 19 301 0.450 9 450 2.940 20 1801 13 190 240 0.861 39 342 351 0.351 158 305 280 2.101 149 244 307 1.70
* Assay by Chemstrip; Radioimmunoassay, Diabetes Core. 3Cx, 3 hafter animal treatment with cycloheximide and partial hepatectomy.
nonparenchymal liver cells (11). This is unlike other liver-specific genes such as PEPCKwhose expression is restrictedto the hepatocyte fraction. As the nonparenchymal cells aremixed populations, it is not clear which cells in the nonparen-chymal population express RL-J. Thus, RL-J was of particularinterest because it is a liver-restricted immediate-early gene,and we targeted it for further analyses.
RL-J encodes rat G6Pase, a highly conserved hydrophobicprotein. RL-J cDNAclones isolated from the regenerating liverlibrary represented two classes. Several contain a 1 10-bp insertwhich is missing from a single cDNA clone. DNAsequenceanalysis revealed that the shorter clone contains an interruptedopen reading frame and could only encode 137-aa protein,whereas the longer clone contained an open reading frame of357 amino acids. Initially the RL-1 sequence was unique (12,13) and only notable for several potential membrane spanningsegments, but a recent data bank search revealed RL-1 to bethe rat homologue of mouse and human G6Pase (14) (Fig. 2).At the time of submission of this manuscript, Lange et al. (41)presented a partial rat G6Pase cDNA sequence and a proteinalignment that indicates that G6Pase is highly conserved be-tween human, rat, and mouse. In addition to agreeing with theircomments, we note that amino acid residues that are commonbetween two species are different in the third species indicatingdivergent evolution. The rat G6Pase sequence presented byLange et al. (41) appears to contain a variant or artifact at
amino acid 118, because our sequence indicates that this residueis a glycine, not a valine, the same sequence found at thisposition in the human and mouse sequences. Unlike the proteinsequence, the 3' untranslated regions are relatively noncon-served, even between rat and mouse cDNAs.
The 1 10-bp insert found in the majority of the rat G6PasecDNAclones corresponds to exon 2 of the mouse G6Pase gene,and the shorter rat cDNAclone could represent an alternativelyspliced derivative that is missing this exon. The absence of theexon 2 sequence results in a protein that would be truncatedafter 137 amino acids due to the initial frame shift and down-stream stop codon. In vitro translation of the exon 2 minussynthetic mRNAdid not yield a protein product (data notshown). To determine whether this splice variant is present incells or is an artifact of the cDNA library, we performed RT-PCRof RNA samples prepared from livers at different timesafter hepatectomy. We found that the exon 2 minus form ispresent at 20% the frequency of the larger message (Fig. 3).There is no consistent variation in the relative frequency of thetwo messages during the time course of liver regeneration, and,therefore, there is no reason to suspect that G6Pase levels areregulated by splicing after hepatectomy.
G6Pase mRNAlevels are high in the developing and dia-betic liver, and insulin downregulates its expression. It is knownthat G6Pase levels are low until approximately the time ofbirth when they increase (14). Thus, it is a late marker ofdifferentiation in the developing liver and reflects the need ofthe newborn animal for glucose production. Weexamined theprofile of expression of G6Pase mRNAin embryonic and new-born rats and found that the level of G6Pase mRNAincreasesabruptly at embryonic day 21 and continues to be elevatedabove adult levels until 4 wk after birth (Fig. 4). This suggeststhat the mechanism by which G6Pase gene expression is acti-vated in the perinatal time period may involve hormonalchanges that occur just before birth when insulin levels fall andglucagon levels increase (42).
G6Pase is involved in glucose homeostasis, and in the dia-betic animal its basal level is elevated (25, 26). Weexaminedalterations of G6Pase gene expression after partial hepatectomyin BB diabetic rats as compared with normal animals. The meta-bolic profile of the animals studied is provided in Table I. Wefound that G6Pase mRNAis consistently elevated in diabeticanimals and that after hepatectomy the relative induction ofG6Pase mRNAis blunted in the diabetic animals (Fig. 5 A).After normalization to the control gene, ATP synthase, the rela-tive induction in the diabetic animals was 1.4 as compared with- 25-30-fold for the normal animals. The level of G6PasemRNAat 1 h after hepatectomy in the normal and diabeticanimals was approximately equal because of the elevation inthe diabetic animals before hepatectomy. At 8 h after hepatec-tomy, the G6Pase level has normalized in normal animals butcontinues to be elevated in diabetics. To determine if the contin-ued expression of G6Pase after hepatectomy in diabetic animalsis due to insulin deficiency, we gave insulin to a cohort ofdiabetic animals at 4 h after hepatectomy and obtained liverand serum samples at 8 h after hepatectomy. These studies werecomplicated by the fact that the pretreatment level of G6PasemRNAcould not be measured in any individual animal, andthus several animals were studied to provide sufficient data todraw conclusions. In diabetic animals in which glucose, insulin,and PEPCKmRNAlevels had normalized by 8 h after hepatec-tomy following insulin treatment, the level of G6Pase mRNAhad also normalized (Fig. 5 B). However, in animals in which
836 Haber et al.

Figure 5. G6Pase mRNAlevelsin diabetic animals, and the regu-lation of the gene after hepatec-tomy. (A) Expression of G6PasemRNAin two different normaland four different diabetic animallivers at 0 and 1 h after hepatec-tomy. (B) Expression of G6PasemRNAup to 8 h after hepatec-tomy in normal and diabetic ani-mals in the absence or presence ofinsulin treatment. 0.5 U regular in-sulin was given at 4 h after hepa-tectomy to the treated animals.
glucose, insulin, and the level of expression of PEPCK(Chin,S., unpublished data) were not corrected by insulin treatment,G6Pase mRNAalso remained uncorrected.
The highest specific activity of G6Pase protein and enzy-matic activity is found in the nuclear membrane, and the levelis elevated in diabetes and regenerating liver. Based on theG6Pase gene expression, we predicted that G6Pase protein andenzymatic activity should be high in regenerating and diabeticliver. It was important to document a correlation between pro-tein and mRNAlevels using antibody and enzymatic studies.Weraised specific antisera to a nonhydrophobic region of theprotein expressed in bacteria. As shown (Fig. 6 A), these anti-sera are specific for the peptide, and affinity purification demon-strates enhanced activity. In total cellular immunoblots, G6Paseprotein was not detected above the background levels, so subcel-lular fractionation was performed. G6Pase is a marker for cellu-lar microsomes, but when nuclear/cytoplasmic fractionation isperformed much of the activity is associated with nuclear mem-branes (21). This is not surprising since the endoplasmic reticu-lum forms a continuum with nuclear membranes. On immu-noblots, a single band with a molecular mass of 36 kD is de-
tected in the nuclear membrane fraction of the cell. The levelof this protein is fourfold higher in the sample prepared at 2 hafter hepatectomy than in normal liver (Fig. 6 B, right). Thisprotein band correlates with the known cellular localization ofG6Pase, its molecular mass, and its induction profile in theregenerating liver. To assess the correlation between proteinand enzymatic levels, enzymatic assays were performed on thesame fractions. The Triton-soluble nuclear fraction had the high-est specific activity. However, as nuclear membranes representonly 3% of total cellular protein, total enzyme activity washighest in the Triton-soluble cytoplasmic fraction. G6Pase wasnot detectable by immunoblot in this fraction because G6Paserepresents a smaller percentage of the cytosolic membrane pro-teins. The relative induction of G6Pase is most apparent in thenuclear membrane fraction (Fig. 6 C, fraction E) where it isinduced by more than fivefold, similar to the induction observedon immunoblot.
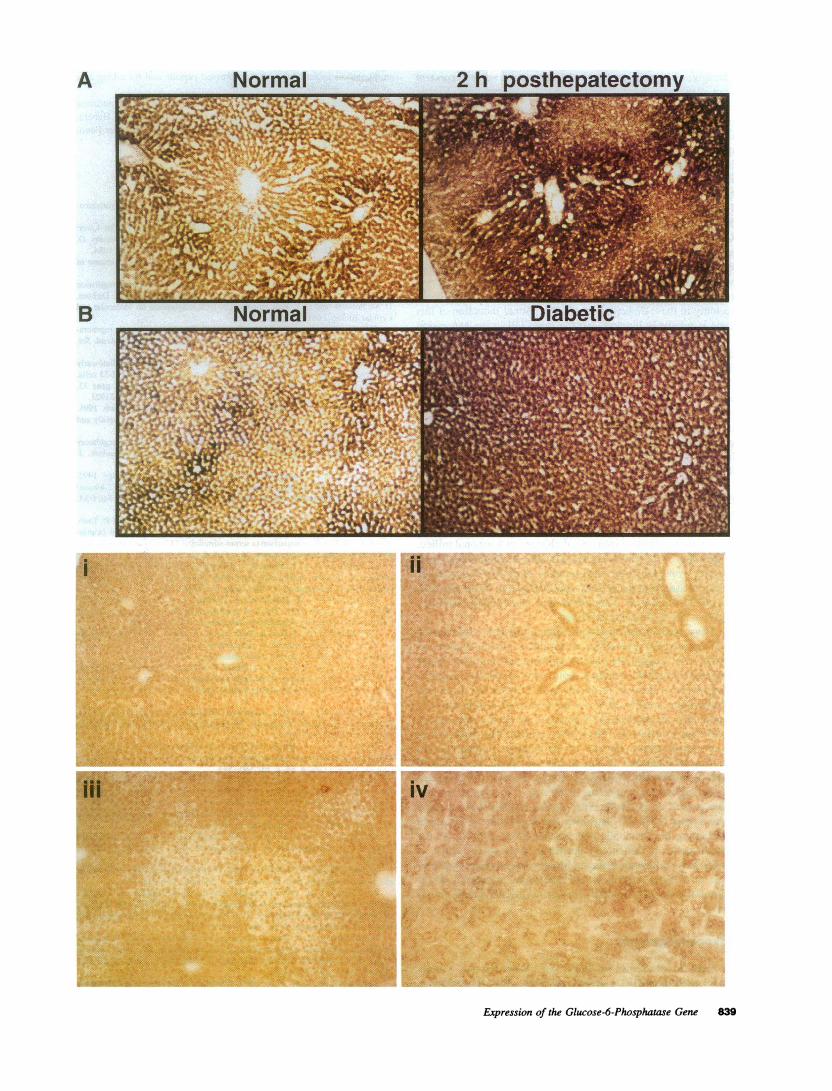
Wealso analyzed the tissue distribution of G6Pase by enzy-matic and immunohistochemistry on tissue sections obtainedfrom regenerating and diabetic livers (Fig. 7). In the normaland regenerating liver, enzymatic activity is periportal, with an
Expression of the Glucose-6-Phosphatase Gene 837

|B Cytoplasm ] NucleusA
I* h-G6Pasepeptide
1 2 3
C,25
._
Qa,Co
Fraction: A
Soluble Triton0 2 0 2
Outer Triton0 2 0
1 2 3 4 5 6
B C D E ct-G6Pase
2 h post PH I
i ,.TB
43
G6Pase
Figure 6. G6Pase protein and en-zyme levels in subcellular frac-dons of normal and regeneratingliver. (A) Immunoblot of bacteri-ally expressed G6Pase peptideblotted with: lane 1, preimmunesera; lane 2, anti-G6Pase antisera;lane 3, affinity-purified anti-G6Pase antisera. (B) Immunoblotof cytoplasmic and nuclear frac-tions from normal and 2-h post-hepatectomy liver. Fractions weremade as described in Methods in-cluding soluble cytoplasmic ex-tract, Triton-soluble cytoplasmicmaterial, outer nuclear membrane(0.5% Triton), and Triton-solublenuclear material. (C) Enzyme ac-tivity of fractions: A, soluble cyto-plasmic extract; B, cytoplasmicmembranes; C, external nuclearmembrane; D, soluble nuclear ex-tract; and E, nuclear membranes.
increase in the demarcation in the regenerating liver. The dia-betic liver has a diffuse and dramatic increase in the level ofG6Pase, and much of the periportal staining pattern is lost.Antibody studies show an increase in G6Pase in the periportalareas of the posthepatectomy liver and a diffuse distributionpattern of protein in the diabetic liver. Quantitation of G6Pasewas not possible on the tissue sections because glycogen deposi-tion in the diabetic livers affected the appearance of the stainingof these cells. At the cellular level, most of the staining appearsto be perinuclear. The normal rat liver shows a low level ofstaining, also with a diffuse distribution pattern.
Discussion
During liver regeneration, the remnant liver must maintain theability to regulate serum glucose levels. Immediately after hepa-tectomy, the portal vein insulin level rapidly falls as the gluca-gon level increases dramatically (4, 5). Changes in hormonelevels allow normal serum glucose to remain stable despite theabsence of two thirds of the liver. Wehave seen that severalliver-specific immediate-early genes are either known or postu-lated to be involved in metabolic control. Understanding the
basis for the regulation of these genes in liver regeneration mayindicate how the liver is able to maintain metabolic homeostasiswhile undergoing proliferation. Examples of upregulated imme-diate-early genes that encode proteins important for glucoseproduction include PEPCK, potentially IGFBP-1, and nowG6Pase (6- 10). Decreased expression of genes encoding L-pyruvate kinase, glucokinase, and 6-phosphofructo-2-kinase/fructose-2,6-biphosphatase, which oppose gluconeogenesis, oc-curs rapidly after hepatectomy (8). The change in expressionof these genes is important in controlling metabolism duringliver regeneration. Likewise, in the perinatal time period, thelevel of G6Pase must increase near the time of birth in rodentsto help insure that appropriate levels of glucose are produced.At the time of birth, insulin levels fall acutely and glucagonlevels are elevated (42). The G6Pase gene is induced near thetime of birth and its expression remains elevated during the firstmonth of life in the rodent, a time of rapid growth. The absenceof this induction is associated with mortality in the mouse tyro-sinemia model. Wehave also found that a similar set of genesincluding PEPCK, IGFBP-1, and G6Pase mRNAis induced tosome degree after sham surgery when most immediate-earlygenes are not (10). In sham surgery, the levels of insulin and
838 Haber et al.
Figure 7. G6Pase enzyme histochemistry and immunohistochemistry of regenerating and diabetic livers. Enzymatic activity of frozen sectionsassayed in parallel from (A) normal and 2-h posthepatectomy livers and (B) normal and diabetic livers. Identical exposure time and a magnificationof 10. Immunohistochemistry using affinity-purified antibody diluted 1:500 of (i) normal, (ii) diabetic, and (iii) 2-h posthepatectomy livers. Identicalexposure time and a magnification of 10. (iv) 2-h posthepatectomy liver depicted at a magnification of 40.
-.40M
2 h Dostheoatectomv
*
H1.
..iv
.
::
A .-..
Expression of the Glucose-6-Phosphatase Gene 839
A
B
I
i._,!z
..L
Normal
:o-- I.;-
t ; -,
glucagon change in the same direction but to a lesser extentthan after partial hepatectomy (4, 5). These hormonal changesmay contribute to this upregulation.
Likewise, an increased glucagon to insulin ratio is seen indiabetes (43). Increased hepatic glucose production is the majorcause of fasting hyperglycemia in all forms of diabetes. Diabetesincreases the level of G6Pase activity in the liver while decreas-ing glucokinase resulting in a net increase in glucose productionby the liver. Euglycemic clamp studies suggest that G6Paselevels are downregulated at least in part by the direct effect ofinsulin (26). Studies in FAO rat hepatoma cells suggest thatG6Pase mRNAis induced by dexamethasone, dominantly dow-nregulated by insulin, and modulated upwards in the presenceof cAMP(glucagon mediator) (41). Our studies are compatiblewith these findings. Hepatic G6Pase mRNAis grossly elevatedin all of the diabetic animals we have tested. After partial hepa-tectomy in these diabetic animals, the normal induction of thisgene is relatively blunted, and the rapid fall in the expressionof this gene by 8 h after hepatectomy is abolished. Insulintreatment can normalize the expression of the G6Pase gene inthe posthepatectomy time period. Euglycemic clamp studies indiabetic animals will help establish if G6Pase mRNAlevelscan be corrected after insulin treatment when no surgery hasbeen performed. PEPCKand IGFBP-J are known to be con-trolled at the level of transcription by insulin (downregulation),glucagon/cAMP (upregulation), and glucocorticoids (upregu-lation). The expression patterns of the G6Pase gene predictthat it may be similarly regulated (10, 33, 44).
Our studies provide initial evidence that the levels ofG6Pase protein and enzyme activity closely follow the mRNAlevels in the various physiologic and pathophysiologic condi-tions we have studied. G6Pase mRNAlevels appear to providea much more sensitive measure of changes in hormonal milieu,as they vary > 20-fold as compared with a fewfold in protein orenzyme levels. However, measurement of protein is a valuablemeans of assessing the activity and localization of the enzyme,and the feasibility of immunoblot and immunohistochemistryanalyses has now been established.
These studies also shed some light on insulin's role duringliver regeneration. The effects of insulin on the mitogenesis ofhepatic cells suggest that insulin can be a potent growth factormediated through the insulin receptor (45). In diabetic animals,regeneration is delayed or absent as determined by thymidineincorporation, and this effect can be restored by insulin adminis-tration (46). In addition to its proposed mitogenic role, insulinclearly has a metabolic role in liver growth. The acute fall ininsulin levels within minutes of the surgery is important forallowing maintenance of normal glucose levels. Since insulinlevels return toward a normal level after the first few hours (4,5) after hepatectomy, it seems likely that, if insulin has a mito-genic as well as metabolic effect during regeneration, it wouldoccur in mid to late GC. However, the importance of insulin inmaintaining the metabolic and nutritional homeostasis of theanimal makes it difficult to determine from these studies ifinsulin has a mitogenic effect in hepatic regeneration. Insulino-penic or diabetic animals would likely have metabolic abnor-malities that could secondarily prevent normal cellular prolifera-tion.
Acknowledgments
Wethank Drew Cressman for normal liver cellular fractions, VictoriaLee for preparation of RL-1 antisera, and Vashti Miles for performing
immunoblots against bacterially expressed peptide and for taking careof diabetic animals.
This work was supported in part by the Juvenile Diabetes Foundation(R. Taub), National Institutes of Health grant DK01905 (B. A. Haber),Juvenile Diabetes Foundation (A. Naji), and the American Liver Foun-dation (S. Chin).
References
1. Fausto, N., and J. E. Mead. 1989. Regulation of liver growth: protoonco-genes and transforming growth factors. Lab. Invest. 60:4-13.
2. Fausto, N., and E. M. Webber. 1994. Liver regeneration. In The Liver:Biology and Pathobiology. I. M. Arias, J. L. Boyer, N. Fausto, W. B. Jacoby, D.Schachter, -and D. A. Shafritz, editors. Raven Press, New York. 1059-1084.
3. Michalopoulos, G. K. 1990. Liver regeneration: molecular mechanisms ofgrowth control. FASEB (Fed. Am. Soc. Exp. Biol.) J. 4:176-187.
4. Bucher, N. L. R., J. A. McGowan, and U. Patel. 1978. Hormonal regulationof liver growth. In Cell Reproduction: In Honor of Daniel Mazia. E. R. Dirksen,D. M. Prescott, and C. F. Fox, editors. ICN-UCLA Symposia on Molecular andCellular Biology. 661-670.
5. Bucher, N. L. R., and M. N. Swaffield. 1975. Regulation of hepatic regenera-tion in rats by synergistic action of insulin and glucagon. Proc. Natl. Acad. Sci.USA. 72:1157-1160.
6. Mohn, K. L., T. M. Laz, A. E. Melby, and R. Taub. 1990. Immediate-earlygene expression differs between regeneration liver, insulin-stimulated H-35 cells,and mitogen-stimulated 3T3 cells: liver specific induction patterns of gene 33,PEPCK, and the jun, fos and egr families. J. Biol. Chem. 265:21914-21921.
7. Mohn, K. L., A. E. Melby, D. S. Tewari, T. M. Laz, and R. Taub. 1991.The gene encoding rat insulin like growth factor-binding protein 1 is rapidly andhighly induced in regenerating liver. Mol. Cell. Biol. 11:1393-1401.
8. Rosa, J. L., R. Bartrons, and A. Tauler. 1992. Gene expression of regulatoryenzymes of glycolysis/gluconeogenesis in regenerating rat liver. Biochem. J.287:113-116.
9. Rosa, J. L., A. Tauler, A. J. Lange, S. J. Pilkis, and R. Bartrons. 1992.Transcriptional and posttranscriptional regulation of 6-phosphofructo-2-kinase/fructose-2,6-bisphosphatase during liver regeneration. Proc. Natl. Acad. Sci. USA.89:3746-3750.
10. Mohn, K. L., T. M. Laz, J.-C. Hsu, A. E. Melby, R. Bravo, and R. Taub.1991. The immediate-early growth response in regenerating liver and insulin-stimulated H-35 cells: comparison to serum-stimulated 3T3 cells and identificationof 41 novel immediate-early genes. Mol. Cell. Biol. 11:381-390.
11. Haber, B. A., K. L. Mohn, R. H. Diamond, and R. Taub. 1993. Inductionpatterns of 70 genes during nine days after hepatectomy define the temporalcourse of liver regeneration. J. Clin. Invest. 91:1319-1326.
12. Haber, B. A., W. Buikhuisen, C. Hindman, J. Hsu, A. E. Melby, K. L.Mohn, and R. Taub. 1991. The liver specific induction of two genes that arehighly expressed during regeneration. Hepatology. 14:1 1Oa. (Abstr.)
13. Buikhuisen, W., J. Hsu, R. Taub, and B. A. Haber. 1992. The RL1 geneis rapidly and highly induced in regenerating liver and could have a role inregulating liver-specific growth. Gastroenterology. 102:A918. (Abstr.)
14. Shelly, L. L., K.-J. Lei, C.-J. Pan, S. F. Sakata, S. Ruppert, G. Shutz, andJ. Y. Chou. 1993. Isolation of the gene for murine glucose-6-phosphatase, theenzyme deficient in glycogen storage disease type 1A. J. Biol. Chem. 268:21482-21485.
15. Nordlie, R. C., and R. A. Jorgenson. 1976. Glucose-6-phosphatase. In TheEnzymes of Biological Membranes. A. Martonosi, editor. Plenum PublishingCorp., New York. 349-399.
16. Lei, K.-J., L. L. Shelly, C.-J. Pan, J. B. Sidbury, and J. Y. Chou. 1993.Mutations in the glucose-6-phosphatase gene that cause glycogen storage diseasetype la. Science (Wash. DC). 262:580-583.
17. Ruppert, S., G. Kelsey, A. Schedl, E. Schmid, E. Thies, and G. Schaltz.1992. Deficiency of an enzyme of tyrosine metabolism underlies altered geneexpression in newborn liver of lethal albino mice. Genes & Dev. 6:1430-1443.
18. Burchell, A., and B. Burchell. 1982. Identification and purification of aliver microsomal glucose 6-phosphatase. Biochem. J. 205:567-573.
19. Rymsa, B., and H. de Groot. 1988. Partial purification of rat liver micro-somal glucose-6-phosphatase on hydroxylapatite. Biol. Chem. Hoppe-Seyler.369:115-121.
20. Speth, M., and H.-U. Schulze. 1992. The purification of a detergent-solubleglucose-6-phosphatase from rat liver. Eur. J. Biochem. 208:643-650.
21. Zbarsky, I. B. 1975. Enzymatic activity of the nuclear envelope andnuclear-cytoplasmic interaction. In Biochemistry of the Cell Nucleus Mechanismand Regulation of Gene Expression. E. J. Hidvegi, J. Sutmegi, and P. Venetianer,editors. North-Holland/Elsevier, New York. 213-218.
22. Brinkmann, A., N. Katz, D. Sasse, and K. Jungermann. 1978. Increase ofthe gluconeogenic and decrease of the glycolytic capacity of rat liver with achange of the metabolic zonation after partical hepatectomy. Hoppe-Seyler's ZPhysiol. Chem. 359:1561-1571.
23. Chan, T. M., K. M. Young, N. J. Hutson, F. T. Brumley, and J. H. Exton.
840 Haber et al.

1975. Hepatic metabolism of genetically diabetic (db/db) mice. I. Carbohydratemetabolism. Am. J. Physiol. 229:1702-1712.
24. Gardner, L. B., Z. Liu, and E. J. Barrett. 1993. The role of glucose-6-phosphatase in the action of insulin on hepatic glucose production in the rat.Diabetes. 42:1614-1620.
25. Miethke, H., B. Wittig, A. Nath, S. Zierz, and K. Jungermann. 1985.Metabolic zonation in liver of diabetic rats. Biol. Chem. Hoppe-Seyler. 366:493-501.
26. Barzilai, N., and L. Rossetti. 1993. Role of glucokinase and glucose-6-phosphatase in the acute and chronic regulation of hepatic glucose fluxes byinsulin. J. Biol. Chem. 268:25019-25025.
27. Lavoie, L., D. Dimitrakoudis, A. Maretet, B. Annabi, A. Klip, M. Vranic,and G. van de Werve. 1993. Opposite effects of hyperglycemia and insulin defi-ciency on liver glycogen synthase phosphatase activity in the diabetic rat. Diabe-tes. 42:363-366.
28. Christ, B., I. Probst, and K. Jungermann. 1986. Antagonistic regulationof the glucose/glucose 6-phosphate cycle by insulin and glucagon in culturedhepatocytes. Biochem. J. 238:185-191.
29. Taub, R., A. Roy, R. Dieter, and J. Koontz. 1987. Insulin as a growthfactor in rat hepatoma cells: stimulation of protooncogene expression. J. BioLChem. 262:10893-10897.
30. Higgins, G. M., and R. M. Anderson. 1931. Experimental pathology ofthe liver. I. Restoration of the liver of the white rat following partial surgicalremoval. Arch. PathoL 12:186-202.
31. Sambrook, J., E. F. Fritsch, and T. Maniatis. 1989. Molecular Cloning:A Laboratory Manual. Cold Spring Harbor Laboratory, Cold Spring Harbor, NY.
32. Rosenberg, A. H., B. N. Lade, D. S. Chui, S. W. Lin, J. J. Dunn, andF. W. Studier. 1987. Vectors for selective expression of cloned DNAsby T7 RNApolymerase. Gene (Amst.). 56:125-135.
33. Lee, J., L. Greenbaum, B. A. Haber, D. Nagle, V. Lee, V. Miles, K. L.Mohn, M. Bucan, and R. Taub. 1994. Structure and localization of the IGFBP-Jgene and its expression during liver regeneration. Hepatology. 19:656-665.
34. Diamond, R. H., D. E. Cressman, T. M. Laz, C. S. Abrams, and R. Taub.
1994. PRL-1, a unique nuclear protein Tyr-phosphatase, affects cell growth. MoLCell. Biol. 14:3752-3762.
35. Kuret, J., H. Bell, and P. Cohen. 1986. Identification of high levels ofprotein phosphatase-l in rat liver nuclei. FEBS (Fed. Eur. Biochem. Soc.) Lett.203:197-202.
36. Sanger, F., S. Nicklen, and A. R. Coulson. 1977. DNAsequencing withchain terminating inhibitors. Proc. Natl. Acad. Sci. USA. 74:5463-5467.
37. Teutsch, H. F. 1978. Improved method for the histochemical demonstrationof glucose-6-phosphatase activity. Histochemistry. 57:107-117.
38. Harlow, E., and D. Lane. 1988. Antibodies: A Laboratory Manual. ColdSpring Harbor, Cold Spring Harbor, NY.
39. Grisham, J. W. 1962. A morphologic study of deoxyrobonucleic acidsynthesis and cell proliferation in regenerating rat liver: autoradiography withthymidine-H. Cancer Res. 22:842-849.
40. Diamond, R. H., K. Du, V. M. Lee, K. L. Mohn, B. A. Haber, D. S.Tewari, and R. Taub. 1993. Novel delayed-early and highly insulin-inducedgrowth response genes. J. Biol. Chem. 268:15185-15192.
41. Lange, A. J., D. Argaud, M. R. El-Maghrabi, P. Wansong, S. R. Maitra,and S. J. Pilkis. 1994. Isolation of a cDNA for the catalytic subunit of rat liverglucose-6-phosphatase: regulation of gene expression in FAOhepatoma cells byinsulin, dexamethasone, and cAMP. Biochen. Biophys. Res. Commun. 201:302-309.
42. Iritani, N., H. Fukuda, and Y. Matsumura. 1993. Lipogenic enzyme geneexpression in rat liver during development after birth. J. Biochem. 113:519-525.
43. Unger, R. H., and L. Orci. 1994. "Glucagon" in Joslin's Diabetes Mellitus.C. R. Kahn and G. C. Weir, editors. Lea & Febiger, Malvern, PA. 163-176.
44. O'Brien, R. M., and D. K. Granner. 1991. Regulation of gene expressionby insulin. Biochem J. 278:609-619.
45. Taub, R., K. L. Mohn, R. H. Diamond, K. Du, and B. A. Haber. 1994.Molecular aspects of insulin regulated hepatic growth. In Molecular Biology ofDiabetes, Part 2. B. Drazin and D. LeRoith editors. Humana Press, Totowa, NJ.
46. Barra, R., and J. C. Hall. 1977. Liver regeneration in normal and alloxan-induced diabetic rats. J. Exp. Zool. 201:93-100.
Expression of the Glucose-6-Phosphatase Gene 841
Copyright © 2022 FDOKUMEN