Exploring Sensory Processing among Hearing Impaired and ...
206
Exploring Sensory Processing among Hearing Impaired and Culturally Deaf Children By Kim Coulson-Thaker June 2020 Supervised by Dr K. Sullivan and Dr A. Ludlow University of Hertfordshire (OTFC, 2020) Submitted to the University of Hertfordshire as partial fulfilment of the requirements of the degree of Doctorate in Clinical Psychology Word Count: 28,916
-
Upload
khangminh22 -
Category
Documents
-
view
0 -
download
0
Transcript of Exploring Sensory Processing among Hearing Impaired and ...
Exploring Sensory Processing among Hearing
Impaired and Culturally Deaf Children
By Kim Coulson-Thaker
June 2020
Supervised by Dr K. Sullivan and Dr A. Ludlow
University of Hertfordshire
(OTFC, 2020)
Submitted to the University of Hertfordshire as partial fulfilment of the requirements of the
degree of Doctorate in Clinical Psychology
Word Count: 28,916

SENSORY PROCESSING AMONG d/DEAF CHILDREN. Page 1
THANKS AND ACKNOWLEDGEMENTS
“Get ‘em in, get ‘em in….Bring your people with you…Bring anyone who has ever loved you” (Angelou,
1992)
Contained within the pages of this thesis is a journey I have not walked alone. In
coming to express my thanks and acknowledge the contributions of everyone who made this
work possible I found myself travelling down an ever-stretching, bustling road. When I
turned to look back along that road to where I had come from, not even a step from where I
stood I found Keith and Amanda; supervisors who have supported and nurtured this project
and me alongside it, who navigated the twists, turns, and stumbling blocks we have faced
with ingenuity, warmth, pragmatism, and humour. Next to them, good-naturedly teasing each
other in their usual way stood my partner, Kishan, and my mum. Because of them I have
reached this point of my journey whole and balanced, powered by tea and biscuits. Turning
my head just slightly I could see an open, welcoming group of parents walking hand-in-hand
with their children. Weaving among them, a collection of teachers, TA’s, and charity workers
could be seen holding my recruitment posters high. A few steps further down the road I found
Jenna, who righted me when the wheels started to fall off. Standing alongside her were Helen
and Lizette; DClin’s research Marshallers helping land projects safely with smiles and
luminous wands. As I continued, I felt the presence of my friends from the course each
walking their own paths next to me and each a warm beacon of companionship reminding me
I was never really alone. On the side of my own path I saw Lisa and Mark, Laura A., Amy,
Vanessa, Francesca, and Laura D., the whole Coulson Clan and the entire Thaker Tribe
flickering and twinkling. Like images projected by an endlessly spinning lantern they flowed
with me, waving banners, and singing songs, at their brightest when things were darkest. All
along my road I met clients, mentors, teachers, supervisors, colleagues, and friends. People I
have known recently and people I reconnected with by retracing the steps along my road.
Pam, George, and Flo. Roy and Joan. Lesley. Lorena, Sandra, and Jeanette. Shirley, Joanna,
and Karen. Velia, Evelyn and Máiréad. Jude. Maria, Jorge, and Saskia. Wendy. Adrian and
Alex. The WWH assistants gang. Others whose names I cannot share but who I keep in
memory. A humbling host, most of who have never met but upon whose generosity, patience,
and faith the foundations of my research and clinical skills, and who I am as a person, rest.
Thank you all.

SENSORY PROCESSING AMONG d/DEAF CHILDREN. Page 2
GLOSSARY OF TERMS
The terms used within this thesis are defined within the text. However, for those with
limited knowledge of deafness and the Deaf some definitions are offered immediately in the
hopes these provide a foundation for engagement with and enjoyment of this thesis. To that
end, definitions are offered thematically rather than alphabetically.
deafness – When written with a lowercase “d” the term deafness refers to abilities
related to detecting sounds in the environment that fall beneath specified thresholds.
This conceptualisation is rooted in a medical view of deafness as a disability. A person
medically considered to have impaired levels of hearing is referred to as being deaf.
Usually deaf people subscribe to this view and consider themselves to be disabled.
People who are deaf tend to become so later in life, although not exclusively, and
typically use spoken or written languages to communicate. Often deaf people develop or
retain an identity related to dominant (hearing) groups in their society.
Hearing impaired - a synonym for deafness or being deaf.
Deafness - When written with an uppercase “D” the term Deafness refers to a specific
cultural identity. Deaf cultures include a set of social beliefs, behaviour, art, literary
traditions, history, and values which can differ from other cultural groups in a society.
An important aspect of Deaf culture is the use of a signed language as a primary means
of communication. As such Deaf people are considered a linguistic and cultural
minority group. Often Deaf people are born Deaf or deaf, or become deafened in early
childhood, often prelingually. They do not tend to consider themselves disabled. For
many Deaf people in the UK, English is a second language at best and not necessarily
one they obtain fluency in.
d/Deaf – a term used to refer to deaf and Deaf people simultaneously.
hearing – a term used in Deaf communities to describe people who are not d/Deaf.
Hearing – akin to the capitalisation of ‘White’ or ‘Male’ by theoreticians exploring
other areas of privilege (e.g. the ‘Hearing world’ or ‘Hearing way’)
deafblind - a person with a combination of sight and hearing loss.

SENSORY PROCESSING AMONG d/DEAF CHILDREN. Page 3
Signed Languages – visual languages based on hand movements and shapes, facial
expression, and body language rather than spoken words. It is estimated that there are
between 138 and 300 different signed languages in the world today.
British Sign Language (BSL) - the UK's official signed language. Records of signed
language in England date as far back as 1570, with scholars agreeing its use likely
significantly predated this. Despite this BSL was not officially recognised by the British
Government as a minority language until 2003. From 1880 until the 1940s sign
language was effectively banned in the western world and primarily survived by being
covertly passed on by Deaf people living in residential institutions. There are regional
dialects of BSL, similar to accents in spoken English, with some signs occurring only in
certain regions, towns, or cities. Like words in spoken English, signs come and go,
evolving over time (e.g. “toast” which has changed from hand shapes demonstrating
bread sliding under a grill to bread popping up from a toaster), with new signs created
as needed (e.g. “Internet” or “social media”). Family units also tend to create signs
which are unique to them. These are known as “home signs” and are often developed
and used by families to compensate for a lack of fluency in a signed language.
Sign Supported English (SSE) - a form of communication “borrowing” signs from BSL
but fitting them to the grammar and structure of spoken English. SSE is not a form of
BSL and can best be thought of as a language system which uses a form of manually
coded English.
Makaton – a language system using symbols, single signs, and speech to enable
communication.
Total Communication - an approach to educating d/Deaf children which makes use of
different modes of communication including signing, speaking, lip-reading, written
languages, and visual aids tailored to the needs and abilities of a child.
Cochlear Implants - an implanted medical device designed to produce useful hearing
sensations for a person with severe-to-profound nerve deafness by electrically
stimulating nerves inside the inner ear.
Audism - a term used to describe negative attitudes and prejudice toward d/Deaf people
that can lead to discrimination, marginalisation, disempowerment, and exclusion.

SENSORY PROCESSING AMONG d/DEAF CHILDREN. Page 4
ABSTRACT
It is estimated that 5-10% of the non-clinical paediatric population experience difficulties
with sensory processing (SP). In some clinical groups 90-95% of children are estimated to
experience difficulties in this area. SP needs correlate with higher rates of mental health
difficulties. Deaf and hearing-impaired children experience at least one sensory input
differently than the general population. They are also more vulnerable to mental health
difficulties than their hearing peers. SP needs among Deaf and hearing-impaired children
have never been explored.
Aim: This study explored SP and mental wellbeing among 5 to 10-year-old Deaf and
hearing-impaired children.
Method: A quantitative, within group design (N = 21) was used. Scores from two parent-
rated measures routinely used in clinical and research settings were analysed using
descriptive and inferential statistics. These measures were the Sensory Profile Caregiver
Questionnaire and the Strengths and Difficulties Questionnaire.
Results: In each area of SP 19 - 76% of the Deaf and hearing-impaired sample demonstrated
‘atypical’ responses. Mean SP scores for the Deaf and hearing-impaired children differed
significantly from norms for typically developing children and those with a diagnosis of ASD
and a diagnosis of ADHD. Children using hearing aids showed greater difficulties in two SP
areas compared to those using cochlear implants. Degree of hearing loss and sign language
use were not found to impact SP. SP scores explained a significant proportion of variance in
scores related to mental wellbeing.
Conclusion: Cautiously it is suggested that Deaf and hearing-impaired children may have a
unique SP profile, SP may be influenced by the use of hearing equipment, and there is a link
between SP needs and mental wellbeing among these children. More research across the
lifespan including research into assessment and interventions is needed.

SENSORY PROCESSING AMONG d/DEAF CHILDREN. Page 5
TABLE OF CONTEXT
THANKS AND ACKNOWLEDGEMENTS ......................................................................... 1
GLOSSARY OF TERMS ........................................................................................................ 2
ABSTRACT .............................................................................................................................. 4
TABLE OF CONTEXT ........................................................................................................... 5
INDEX OF TABLE.................................................................................................................. 9
TABLE OF FIGURES ........................................................................................................... 11
CHAPTER 1 - INTRODUCTION ........................................................................................ 12
Foreword ............................................................................................................................. 12
Ontology, Epistemology, and Me ...................................................................................... 12
A Critical Realist Approach. ........................................................................................... 12
Me, Myself & My Research. ........................................................................................... 13
Sensory Processing ............................................................................................................. 14
Introduction to Sensory Processing. .............................................................................. 14
Sensory Processing Disorder: A Critical Realist Perspective. ...................................... 16
Sensory Processing in Specific Paediatric Populations. ............................................... 17
Children with a diagnosis of ASD. ............................................................................... 18
Children with a diagnosis of ADHD. ........................................................................... 18
Other Groups of Children. ........................................................................................... 19
Intervention for Sensory Processing Needs. .................................................................. 20
Introduction to d/Deafness ................................................................................................ 21
Measuring deafness ........................................................................................................ 21
deaf or Deaf? ................................................................................................................... 23
The Deaf Community in the UK: Historical and Modern Contexts. ............................ 23
Mental Health. ................................................................................................................ 24
d/Deafness and Sensory Processing .................................................................................. 27
The Dangers of Paving with Good Intentions ................................................................. 29
Chapter Summary ............................................................................................................. 31
CHAPTER 2 - LITERATURE REVIEWS ......................................................................... 32
The Systematic Review: Sensory Processing Among d/Deaf People ............................. 32
Search Strategy. .............................................................................................................. 32
Findings. .......................................................................................................................... 35
Visual Processing......................................................................................................... 35
SENSORY PROCESSING AMONG d/DEAF CHILDREN. Page 6
Balance and Motor Skills. ............................................................................................ 36
Foreword: vestibular disorders. ............................................................................... 36
Balance. .................................................................................................................... 36
Motor........................................................................................................................ 38
Tactile Processing. ....................................................................................................... 38
Olfactory Processing. .................................................................................................. 40
Oral Sensitivity, Auditory Processing, and Mental Health.......................................... 41
Sensory Processing and d/Deaf Children. ................................................................... 41
Summary ......................................................................................................................... 42
The Scoping Review: Sensory Processing and Mental Wellbeing ................................. 43
Search Strategy. .............................................................................................................. 43
Findings. .......................................................................................................................... 48
Overall Summary ............................................................................................................... 49
Rationale and Research Aims ........................................................................................... 50
CHAPTER 3 - METHOD ..................................................................................................... 51
The Original Plan ............................................................................................................... 51
The Current Study ............................................................................................................. 52
Research Questions ......................................................................................................... 52
Research Design .............................................................................................................. 52
Ethics ............................................................................................................................... 53
Recruitment ..................................................................................................................... 53
…and then Covid-19 ....................................................................................................... 53
Participants ..................................................................................................................... 54
Inclusion/Exclusion Criteria .......................................................................................... 54
Instruments ..................................................................................................................... 54
Strengths and Difficulties Questionnaire. .................................................................... 55
The Sensory Profile Caregiver Questionnaire. ............................................................ 55
Procedure ........................................................................................................................ 56
Analytical Strategy .......................................................................................................... 58
CHAPTER 4 - RESULTS ..................................................................................................... 59
Demographic Information ................................................................................................. 59
Comparing the Sensory Processing Profiles of d/Deaf Children ................................... 61
Categorisations of Sensory Profiles. .............................................................................. 61
Item Scores. .................................................................................................................. 61

SENSORY PROCESSING AMONG d/DEAF CHILDREN. Page 7
Factor Scores. .............................................................................................................. 61
Quadrant Scores. ......................................................................................................... 61
Statistical Comparisons with Typically Developing and Atypical Populations. ........... 63
Item Scores. .................................................................................................................. 63
Typically Developing Children................................................................................ 63
Children with a Diagnosis of ASD. ......................................................................... 63
Children with a Diagnosis of ADHD. ...................................................................... 64
Factor Scores. .............................................................................................................. 66
Typically Developing Children................................................................................ 66
Children with a Diagnosis of ASD. ......................................................................... 66
Children with a Diagnosis of ADHD. ...................................................................... 66
Summary of Comparisons. ............................................................................................. 67
The Impact of Degree of Hearing Loss, Equipment Use, and BSL Use ........................ 69
The Impact of Sensory Processing on Psychological Distress ........................................ 70
Mental Wellbeing: SDQ Scores ...................................................................................... 70
Sensory Processing and Mental Wellbeing: Three Regression Analyses ..................... 70
Items Regression. ......................................................................................................... 70
Descriptive Statistics. ............................................................................................... 71
Regression Statistics. ............................................................................................... 75
Summary .................................................................................................................. 78
Factor Regression. ....................................................................................................... 79
Descriptive Statistics. ............................................................................................... 79
Regression Statistics. ............................................................................................... 81
Quadrant Regression. .................................................................................................. 83
Descriptive Statistics. ............................................................................................... 83
Regression Statistics ................................................................................................ 85
Summary of Regression Analyses. ............................................................................... 87
Overall Summary of Results ........................................................................................... 89
Comparison of Sensory Profiles. ................................................................................. 89
Degree of Hearing Loss, Equipment, and BSL Use. .................................................... 89
Sensory Processing and Mental Health. ...................................................................... 89
CHAPTER 5 - DISCUSSION ............................................................................................... 90
Discussion and Interpretation of Results ......................................................................... 90
Sensory Processing Profiles: Response to Sensory Stimuli among d/Deaf Children. . 90
Auditory Processing. .................................................................................................... 91
SENSORY PROCESSING AMONG d/DEAF CHILDREN. Page 8
Visual Processing......................................................................................................... 91
Vestibular Processing. ................................................................................................. 92
Tactile Processing. ....................................................................................................... 92
Oral Processing. .......................................................................................................... 93
Overview of Processing. .............................................................................................. 93
Modulation, and Behavioural and Emotional Responses ............................................ 93
Factors and Quadrant Responses. ............................................................................... 95
Sensory Processing Profiles: Comparison with Other Groups. .................................... 97
Degree of Hearing Loss, Equipment, and BSL Use. ..................................................... 97
Sensory Processing and Mental Health. ........................................................................ 98
Level if Difficulty.......................................................................................................... 98
Emotional Difficulties. ................................................................................................. 98
Hyperactivity. ............................................................................................................... 99
Prosocial Behaviour. ................................................................................................... 99
Conduct and Peer Relationships. ............................................................................... 100
Coulda, Woulda, Shoulda: Beneficial Changes and Future Commitments. .............. 100
Clinical Implications ........................................................................................................ 102
Conclusion ........................................................................................................................ 103
Overall Summary and Recommendations ..................................................................... 104
REFERENCES ..................................................................................................................... 106
TABLE OF APPENDICIES ............................................................................................... 117
SENSORY PROCESSING AMONG d/DEAF CHILDREN. Page 9
INDEX OF TABLE
Table 1. Dunn’s Sensory Processing Model Page 15
Table 2. Degrees of Hearing Loss (Based on Clark, 1981) Page 21
Table 3. Search Terms used for Systematic Review Page 33
Table 4. Systematic Review Inclusion and Exclusion Criteria Page 33
Table 5. Search Terms used for Scoping Review Page 44
Table 6. Scoping Review Inclusion and Exclusion Criteria Page 44
Table 7. Summary of Research Articles from Scoping Review Page 46
Table 8. SPCQ Items Descriptions Page 57
Table 9. SPCQ Factor Descriptions Page 57
Table 10 SPCQ Quadrants Descriptions Page 57
Table 11. Age and Sex Related Demographic Information Page 60
Table 12. Hearing Loss Related Demographic Information Page 60
Table 13. Use and Proficiency of Signed Languages in the Home Page 60
Table 14. Percentage of d/Deaf Children with ‘Typical’ and ‘Atypical’
Responses for each Item, Factor, and Quadrant
Page 62
Table 15. Percentage of d/Deaf Children outside of Typical Range in each area
(descending on typically developing norms)
Page 62
Table 16. Mean Scores from Different Comparison Groups (Items) Page 65
Table17. Mean Scores from Different Comparison Groups (Factor) Page 65
Table 18. SPCQ Items and Factors with Significant Mean Differences Between
d/Deaf Sample and Norms by Comparison Group
Page 68
Table 19. Effect of equipment on Endurance/Tone (Item Analysis) Page 69
Table 20. Effect of equipment use on Low Registration (Quadrant Analysis) Page 69
Table 21. SDQ Scores for d/Deaf children Page 70
Table 22. Kolmogorov-Smirnov Test (N = 21) for SPCQ Items Page 72
Table 23. Kolmogorov-Smirnov Test (N = 21) SDQ Items Page 73
Table 24. Descriptive Statistics for SPCQ Items Page 73
Table 25. Descriptive Statistics for SDQ Items Page 73
Table 26. SDQ Total Score - Item Regression Model Summary Page 76
Table 27. SDQ Total Score - Item ANOVA Page 76
SENSORY PROCESSING AMONG d/DEAF CHILDREN. Page 10
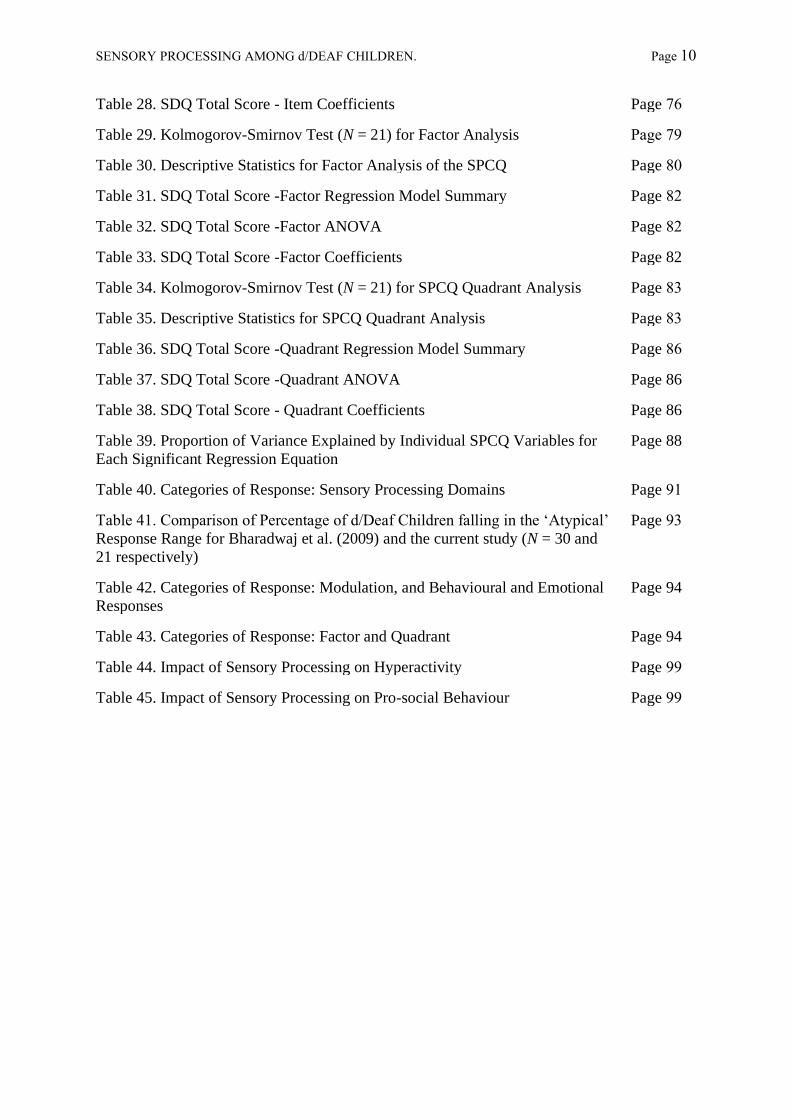
Table 28. SDQ Total Score - Item Coefficients Page 76
Table 29. Kolmogorov-Smirnov Test (N = 21) for Factor Analysis Page 79
Table 30. Descriptive Statistics for Factor Analysis of the SPCQ Page 80
Table 31. SDQ Total Score -Factor Regression Model Summary Page 82
Table 32. SDQ Total Score -Factor ANOVA Page 82
Table 33. SDQ Total Score -Factor Coefficients Page 82
Table 34. Kolmogorov-Smirnov Test (N = 21) for SPCQ Quadrant Analysis Page 83
Table 35. Descriptive Statistics for SPCQ Quadrant Analysis Page 83
Table 36. SDQ Total Score -Quadrant Regression Model Summary Page 86
Table 37. SDQ Total Score -Quadrant ANOVA Page 86
Table 38. SDQ Total Score - Quadrant Coefficients Page 86
Table 39. Proportion of Variance Explained by Individual SPCQ Variables for
Each Significant Regression Equation
Page 88
Table 40. Categories of Response: Sensory Processing Domains Page 91
Table 41. Comparison of Percentage of d/Deaf Children falling in the ‘Atypical’
Response Range for Bharadwaj et al. (2009) and the current study (N = 30 and
21 respectively)
Page 93
Table 42. Categories of Response: Modulation, and Behavioural and Emotional
Responses
Page 94
Table 43. Categories of Response: Factor and Quadrant Page 94
Table 44. Impact of Sensory Processing on Hyperactivity Page 99
Table 45. Impact of Sensory Processing on Pro-social Behaviour Page 99

SENSORY PROCESSING AMONG d/DEAF CHILDREN. Page 11
TABLE OF FIGURES
Figure 1. Examples of audiogram charts with speech banana Page 22
Figure 2. Flow of Sensory Processing Review Page 34
Figure 3. Flow of Scoping Review Page 45
Figure 4. Histogram of Auditory Processing Page 73
Figure 5. Boxplot of Visual Processing Page 73
Figure 6. Boxplot of Oral Processing Page 73
Figure 7. Boxplot of Sensory Processing Related to Endurance/Tone Page 73
Figure 8. Auditory Processing Residual Plot Page 74
Figure 9. Total SDQ Score Residual Plot Page 74
Figure 10. Factor 3: Low Endurance/Tone Boxplot Page 80
Figure 11. Factor 1: Sensory Seeking Residual Plot Page 80
Figure 12. Quadrant 1 Histogram Page 83
Figure 13. Quadrant Boxplot Page 84
Figure 14. Quadrant 1 Residual Plot Page 84
SENSORY PROCESSING AMONG d/DEAF CHILDREN. Page 12
CHAPTER 1 - INTRODUCTION
“We live on the leash of our senses” (Ackerman, 1991)
Foreword
This thesis has been completed as part of a doctoral programme in Clinical
Psychology at the University of Hertfordshire. It explores sensory processing needs and the
impact these have on psychological distress in a sample of d/Deaf 1 children aged between
five and 10. This work contains five chapters. In the first chapter the epistemological position
of the study and the context in which the lead author came to the work are outlined. An
introduction to the medical and cultural understandings of deafness and an overview of
sensory processing are also offered. The second chapter presents systematic and scoping
reviews summarising literature on the links between sensory processing and mental wellbeing
among people who are d/Deaf. Chapters three and four outline the method and results of the
current study. Chapter five contextualises these results and suggests ideas for future research.
Ontology, Epistemology, and Me
A Critical Realist Approach.
This work follows a critical realist philosophy. Realism research philosophies rely on
the idea that reality is independent of the human mind and can be objectively and
systematically studied. Broadly speaking, realism can be divided into two groups: direct and
critical. Direct realism, also known as naive realism, can be summarised as “what you see is
what you get” and postulates that “what is” is that which is observed. In contrast critical
realism argues that, while humans do experience the sensations and images of the ‘real’
world, these can be deceptive and are not usually all that accurate. Defining critical realism is
not an easy task as there is no unifying framework, set of beliefs, methodology, or dogma
which can be directly pointed to as critical realism (Archer et al., 2016). However, one key
tenant of this philosophy is the idea that ontology (the study of the nature of being) must be
understood as relatively autonomous from both epistemology (what can be known) and
interpretation. Joseph (2001) argues that critical realism in contrast to many philosophies of
science is actually an ontological rather than epistemological approach, stating that the very
practice of science indicates that the world is structured in a certain way, independent of our
1 d/Deaf – a term used to simultaneously refer to people who are hearing impaired and consider
deafness to be a medical condition, and those with a Deaf cultural identity

SENSORY PROCESSING AMONG d/DEAF CHILDREN. Page 13
knowledge of it. Critical realism contains an appreciation for the value of empirically driven
positivism, the hermeneutical movement of interpretivist methodologies, and the linguistic
sensitivity of postmodernism. In the social sciences hermeneutically-based methodologies are
usually the starting point for critical realist research; however, engagement with these is
defined in broad strokes and can be achieved through a literature review or by the use of
questionnaires and interviews, and does not preclude the use of quantitative measures and
statistical analysis (Price & Martin, 2018). Critical realism is defined not by particular
methods but by the idea that something of the world can be known independently of
interpretation provided a critical, cautious approach to causality and meaning is taken (Archer
et al., 2016). I selected critical realism as the ontology for this work as it allowed for an
acceptance of a real world which humans interact with via our senses as well as a contextual,
experiential, culturally-bound consideration of the meaning of sensory stimuli. This approach
allows for an acceptance of the idea that there are observable, measurable behavioural and
neurological responses to, and in anticipation of, real sensory stimuli (Borkowska, 2017), but
also that how stimuli and responses to these are experienced and interpreted may differ
according to dimensions such as personal tolerance, experience, and even cultural norms.
Me, Myself & My Research.
Just as it is important for researchers to outline their epistemological, or in this case,
ontological, standpoint it is also important to be transparent of the personal motivations and
intent informing their work. My oldest sister was born profoundly deaf. Following her
diagnosis at the age of two my mum enrolled in an evening class to learn British Sign
Language (BSL) and provide my sister with an accessible language. In the 1990s there was
no financial support for parents in my mum’s situation and so her friends rallied to help her
avoid the additional cost of a babysitter. When my twin and I were growing up there were no
classes available for us, so our mum taught us BSL herself. Today parents must still muddle
through learning to communicate with their d/Deaf children as best they can with little-to-no
financial support. A resource my mum made use of was our local Deaf club. Deaf clubs are
grassroots organisations which could, at one point, be found across the country. However,
many have been forced to close due to the years of austerity and budget cuts. In the process
of writing this thesis and in undertaking a specialist placement in a Deaf Child and
Adolescent Mental Health service I have been reflecting on the wider social and political
discourses around d/Deafness. The concept of audism “the notion one is superior based on
one’s ability to hear or behave in the manner of one who hears” (Bauman, 2004, p. 242) has

SENSORY PROCESSING AMONG d/DEAF CHILDREN. Page 14
been proposed as the root of the prejudice, discrimination, exclusion, and anti-Deaf rhetoric
and actions within our society. There are three levels of audism: individual, institutional, and
metaphysical. Individual audism refers to a hearing person without knowledge of signed
languages or Deaf people’s needs who maintains the status quo of a speaking society.
Institutional audism relates to the structural systems which are prejudicial towards Deaf
individuals such as: services refusing/limiting provision of interpreters; voice-based
appointment booking systems; loudspeaker announcements; a lack of support for families
with d/Deaf children; and harmful government policies. Finally, metaphysical audism refers
to “the [philosophical] orientation that links human identity and being with language defined
as speech” (Bauman, 2004, p. 242). This is where, in Western societies, the voice is viewed
as a source of truth, being, and presence. Metaphysical audism is thought to be the root of
some parents’ distress that their child will never hear them say “I love you”; a distress
suggesting that love expressed in sign is somehow love unexpressed (Bauman, 2008).
Individual, institutional, and metaphysical audism all contribute to the current and historical
trend of d/Deaf people being omitted from thinking around psychological distress and
research. In the UK it is estimated that there are 12 million d/Deaf people (Action on Hearing
Loss, n.d.). As researchers I invite you to reflect on the last time you read a paper with a
d/Deaf participant. Have you ever had a d/Deaf research participant? Are your adverts
accessible to Deaf people? Would you, and could you, include a d/Deaf person if they wanted
to take part in your study? In the on-going struggle to ensure d/Deaf people have equal access
to mental healthcare research focusing on the mental health of d/Deaf people is essential.
Efforts must be made to ensure d/Deaf people do not continue to be overlooked and excluded
from research because if they are then they will also continue to be excluded from the
evidence base which we rely on for the development of treatments and the creation of
services. In undertaking this research my motivations and intention are to highlight the
experiences of culturally Deaf and hearing-impaired children in an area of research which has
so far failed to include them.
Sensory Processing
Introduction to Sensory Processing.
The world is intrinsically multisensory. Our ability to interact with our world depends
on the capabilities of our cognitive system to coherently identify, use, and integrate a variety
of sensory inputs. Sensory processing in humans involves the reception of sensory stimuli

SENSORY PROCESSING AMONG d/DEAF CHILDREN. Page 15
from the environment and neurological processes that generate the conscious experience of
sensation (Miller et al., 2007). It also encompasses responses to stimuli including behavioural
responses (Tseng et al., 2011). Some people have difficulties regulating and organising their
behavioural responses to sensory input in line with environmental demand (Miller et al.,
2007). This has come to be known as ‘sensory processing dysfunction’ or ‘sensory processing
disorder’ (SPD) (Goldsmith et al., 2016; Miller et al., 2007). While some children labelled
with SPD may also meet the criteria for other psychiatric disorders it is also seen in children
without these additional diagnoses (Goldsmith et al., 2016). People with sensory processing
needs can demonstrate unusual responses to sensory stimuli such as over- or under-
responsivity in some or all sensory systems including tactile, auditory, visual, olfactory,
proprioceptive, and vestibular systems (Kandel et al., 2000; Reeves, 2001; Tseng et al.,
2011). This can in turn affect development and ‘functional abilities’ in cognitive,
behavioural, emotional, and motor domains (Kandel et al., 2000; Shepherd, 1994). According
to Dunn's (1997) sensory processing model there are four ‘dysfunctional’ sensory processing
patterns: low registration; sensation seeking; sensation avoiding; and sensory sensitivity.
These can be categorised into over- or under-responsiveness, and passive or active
behavioural strategies (see table 1). Sensory processing needs are surprisingly common with
conservative estimates suggesting 5% of the hearing, non-clinical paediatric population may
experience severe under- or over-responsiveness (Miller et al., 2007). Estimates for sensory
processing needs in typically-developing, hearing children in clinical settings range from 5%
to 10% (Ayres, 1989).
Table 1. Dunn’s Sensory Processing Model
Children with sensory processing dysfunction can show decreased social skills and less
participation in joint play, lower levels of self-confidence, self-esteem, and academic

SENSORY PROCESSING AMONG d/DEAF CHILDREN. Page 16
achievement, behavioural difficulties, diminished or delayed fine, gross, and sensorimotor
skill development, and higher rates of anxiety and depression (Ashburner et al., 2008;
Edgington et al., 2016; Parham & Mailloux, 2001). For children with sensory processing
needs school and home environments can contain physical and social stimuli that frequently
cause them significant levels of distress (Bundy, 2002; Burleigh et al., 2002). The fear,
anxiety, or discomfort that may accompany these everyday situations can significantly disrupt
daily routines (Bundy, 2002; Burleigh et al., 2002; Parham & Mailloux, 2001). Estimates of
SPD in the adult, hearing, non-clinical population may well be similar to that of children
(Engel-Yeger & Dunn, 2011). Adults who are over-responsive to environmental stimuli
appear to experience everyday life differently from other adults, describing their daily
experiences as irritating, overwhelming, disorganising, and distracting (Engel-Yeger & Dunn,
2011). They also report spending a great deal of time trying to cope with their responses to
environmental stimuli; a situation that leaves them feeling exhausted and frequently isolated
(Kinnealey et al., 1995; Oliver, 1990). This isolation can impact upon the individual’s ability
to fully participate and engage in the usual range of everyday occupations (Kinnealey et al.,
1995; Pfeiffer, 2002). SPD has also been linked to mental health issues such as anxiety,
depression, other social–emotional concerns, greater reactivity of the autonomic nervous
system, and the employment of behavioural coping strategies in hearing, adult populations
(see Engel-Yeger & Dunn, 2011 for a review). Sensory processing needs have also been
found to correlate with other known risk factors for mental ill health including poorer social
skills, social isolation, impaired self-care skills, and limitations in leisure activities and
occupational choice (Pfeiffer et al., 2005; Kinnealey et al., 2011). For some people sensory
processing needs can have a lifelong impact whereas for others these needs decline with age
(Pfeiffer; 2002).
Sensory Processing Disorder: A Critical Realist Perspective.
SPD is not currently recognised in the Diagnostic and Statistical Manual of Mental
Disorders Fifth Edition (DSM-5) or The World Health Organisation’s International Statistical
Classification of Diseases and Related Health Problems (10th Edition) (Borkowska, 2017).
Furthermore, symptoms associated with SPD have a large overlap with other psychiatric
diagnoses (Borkowska, 2017). Currently, it is a source of controversy as to whether SPD
represents a distinct set of symptoms or if it would best be thought of as part of the clinical
picture of other disorders (e.g. Autism Spectrum Disorder (ASD) or Attention Deficit
Hyperactivity Disorder (ADHD) (Borkowska, 2017)). This research was undertaken from the

SENSORY PROCESSING AMONG d/DEAF CHILDREN. Page 17
position of Critical Realism. This position advocates that something of the world can be
known, but takes a critical, cautious approach to interpretation of causality and meaning. Like
all psychiatric disorders SPD must be contextualised in the society in which it was developed.
Other epistemological positions such as Social Constructionism would likely undertake a
thorough deconstruction of the term “SPD”, for example asking: ‘What are the implications,
motivations, and meanings behind labelling a child as having ‘SPD’ when they are unable, or
unwilling, to endure an educational system designed in the Industrial Revolution to train
‘working-class’ children for a life of factory work?’ (Schrager, 2018). In the current study
terms such as ASD, ADHD, and SPD are held loosely, and a critical stance is kept regarding
the localisation and pathologisation of different ways of being. If it is accepted that at least 5-
10% of children (in the western world) have ‘severe’ responses to sensory stimuli ( Ayres,
1989; Miller et al., 2007) can we really consider these responses ‘abnormal’? Within the
current work it is accepted that human beings interact with the world through mediums such
as sound, taste, touch, and smell. It is also accepted that, at times, these interactions can
coincide with physical and psychological distress and the likelihood of difficult experiences
related to sensory processing appears higher for some groups of children compared to others.
Sensory Processing in Specific Paediatric Populations.
The causal mechanisms associated with sensory processing needs are unknown, with
genetic and familial factors, maternal stress during pregnancy, jaundice, and allergies all
suggested as risk factors (Ghanizadeh, 2011). Nonetheless, it is generally accepted that
certain paediatric populations have significantly higher levels of sensory processing needs
than the general population. These ideas are based on a growing evidence base consisting of
qualitative works, small quantitative cross-sectional studies, longitudinal research, and meta-
analyses. Amongst others, populations with higher levels of sensory processing needs include
children with diagnoses of ASD and ADHD (Dunn, 2006; Tomchek & Dunn, 2007).
However, it must also be acknowledged that patterns of behaviour associated with sensory
processing needs among children with neurodevelopmental diagnoses are reflected in the
general populations at large, and it is thought to be the frequency or intensity of certain
behaviours that differentiate groups rather than the presence or absence of them (Ermer &
Dunn, 1998). A full review of literature pertaining to sensory processing among children with
diagnoses of ASD and ADHD lies outside the scope of the current project; however, brief
summaries are offered to contextualise the current work.

SENSORY PROCESSING AMONG d/DEAF CHILDREN. Page 18
Children with a diagnosis of ASD.
Sensory processing needs among children with a diagnosis of ASD have been well
documented with estimates of sensory processing difficulties among this population as high
as 90–95% (see Tomchek & Dunn (2007) for a review). Evidence for differing patterns of
sensory processing among people with a diagnosis of ASD has been drawn from cross-
sectional studies using quantitative measures and parent-reports (Rogers et al., 2003), small
longitudinal studies (McCormick et al., 2016), qualitative work (Jones et al., 2003), and
meta-analyses (Ben-Sasson et al., 2009; Lim et al., 2017). Significant correlations between
anxiety and depression and sensory processing needs have also been identified among people
with a diagnosis of ASD (Pfeiffer et al., 2005; Jones, Quigney, & Huws, 2009 Edgington,
Hill, & Pellicano, 2016). Today the DSM-5 includes the presence of sensory processing
difficulties as part of the diagnostic criteria for ASD (American Psychiatric Association,
2013). As such children with this diagnosis are able to access interventions designed to
support and mitigate any emotional, psychological, behavioural, occupational, and
educational impacts of their sensory experiences (Arbesman & Lieberman, 2010; Ashburner
et al., 2008; Health Improvement Scotland, 2016; National Institute for Health and Care
Excellence, 2017). Sensory processing among children with a diagnosis of ASD has been so
highly studied that there are specific norms for this population available for clinical and
research activities (Dunn, 2006).
Children with a diagnosis of ADHD.
Sensory difficulties in children with a diagnosis of ADHD have been analysed using
behavioural and neurophysiology measures (Shimizu et al., 2014). While the majority of
studies have been limited by small sample sizes (N = 24 to 104) evidence suggests that
sensory processing needs among this group of children are significantly more common than
in the ‘typically’ developing population (Ghanizadeh, 2011). Greater sensory processing
needs among children with a diagnosis of ADHD have also been found to correlate with
increased anxiety and higher rates of diagnosis for “oppositional defiant disorder”
(Ghanizadeh, 2010). Dunn and Bennett (2002) suggested children with a diagnosis of ADHD
may not receive and process sensory information in the same way as their peers, leading to
difficulty producing appropriate responses including motor responses, activity levels, and
behavioural responses, and creating barriers to learning, organisation, and engagement in
leisure activities (Engel-Yeger & Ziv-On, 2011; Mulligan, 1996). Evidence also supports
quantitatively different sensory processing profiles for children with a diagnosis of ADHD
SENSORY PROCESSING AMONG d/DEAF CHILDREN. Page 19
compared to those with a diagnosis of ASD or pervasive developmental disorder (PDD) and
typically developing children (Cheung & Siu, 2009; Dunn, 2006). Similar to children with a
diagnosis of ASD sensory processing norms are also available for children with a diagnosis
of ADHD (Dunn, 2006).
Other Groups of Children.
Sensory processing needs have been investigated in several other groups of children.
This includes children born prematurely (e.g. Crozier et al., 2015), children with disrupted
attachment (Whitcomb et al., 2015), children with a diagnosis of Tourette’s Syndrome (e.g.
Ludlow & Wilkins, 2016), and children with a diagnosis of Specific Language Impairment
(SLI) (Van der Linde et al., 2013). In their study Whitcomb et al. (2015) assessed 68 children
(3–6 years) using the Short Sensory Profile (SSP), a shortened version of the ‘gold standard’
Sensory Profile Caregiver Questionnaire (SPCQ), and conducted behavioural observations in
the home to assess attachment quality. The results pointed to a modest correlation between
attachment and sensory processing suggesting children with an insecure attachment style may
also struggle with interpreting and responding to sensory stimulation from the environment.
Alternatively, it may also suggest that children who have atypical responses to sensory
information may have difficulty forming a healthy attachment to their primary caregivers.
Crozier et al. (2015) also used the SSP in their retrospective exploration of sensory
processing in a cohort of 160 four year old children born prior to 32 weeks gestation. Almost
half the cohort (46%) exhibited atypical sensory processing patterns. Van der Linde et al.
(2013) also found higher levels of atypical sensory processing among children with a
diagnosis of SLI, a communication disorder that interferes with the development of language
in children who have no hearing loss or intellectual disabilities. Van der Linde et al. (2013)
used the full SPCQ with a small sample (N = 21) of children and compared these results with
norms for typically developing children, and children with diagnoses of ASD or ADHD. The
results demonstrated differing sensory processing patterns among children with SIL
compared to other groups. Hulslander et al. (2004) have proposed a possible association
between speech and language disorders and sensory processing difficulties in general,
drawing on the view of speech and language as end products of sensory integration (Ayres,
1989). With children born prematurely also exhibiting atypical language development (Rand
& Lahav, 2014; Crozier et al., 2015) and language acquisition linked with attachment (van
IJzendoorn et al., 1995) we may begin to wonder at the impact of different experiences of
language on sensory integration and therefore sensory processing needs.

SENSORY PROCESSING AMONG d/DEAF CHILDREN. Page 20
Intervention for Sensory Processing Needs.
Understanding a child's experiences of sensory stimuli can help families and
professionals understand a child's emotional and psychological distress when they are faced
with experiences their peers seem to easily tolerate (Ermer & Dunn, 1998). As such,
developing a contextually relevant understanding of the impact of sensory experiences in
everyday environments is of paramount importance (Ermer & Dunn, 1998). For young
children the ‘gold standard’ in such assessment is the Sensory Profile Caregiver
Questionnaire (SPCQ) (Dunn, 2006; Ohl et al., 2012; Van der Linde et al., 2013) . The SPCQ
is a reliable and validated measure widely used in clinical assessment, as an outcome
measure, and as a research tool. It offers comparative norms for neurotypical and atypical
paediatric populations and has been translated and validated for use round the world
(Benjamin et al., 2014; Dunn, 2006; Ohl et al., 2012). The SPCQ offers therapists insight into
the sensory processing experiences of a young person allowing them to determine a child’s
sensory preferences and helping to guide therapeutic intervention (Dunn, 2006). This is of
crucial importance considering a growing body of research suggesting that once sensory
needs have been identified successful interventions can be offered. One such intervention is
Sensory Integration Therapy, tailored programmes of play-based activities such as using
therapy balls and swings and single sensory strategies (e.g. weighted vests) which aim to help
a child adapt their responses to sensory stimuli (Pollock, 2009). To date there is limited
evidence for the effectiveness of such interventions (Borkowska, 2017; Edgington et al.,
2016; Health Improvement Scotland, 2016; Lang et al., 2012; Vargas & Camilli, 2000).
Occupational Therapists can also employ other forms of interventions which focus on
working with the children, parents, and educators to adapt the environment a child is exposed
to (Pollock, 2009). This may include modifying clothing, changing room temperatures or
configurations, adjusting noise or light levels, or adjusting demands (Pollock, 2009). These
approaches are designed to enable children to function to the best of their ability as opposed
to trying to change their underlying neurological functioning (Pollock, 2009). There is also
limited evidence suggesting psychoeducational (Vargas & Camilli, 2000) and Cognitive
Behavioural Therapy interventions (Edgington et al., 2016) may also have some utility in
supporting some young people with sensory processing needs. To date, there have been no
studies exploring clinically based sensory processing assessments or interventions with
d/Deaf children. Moreover, there seems to be an active screening out of children with
comorbid deafness, with hearing loss listed as one of the exclusion criterion in a recent

SENSORY PROCESSING AMONG d/DEAF CHILDREN. Page 21
systematic review on the effectiveness of interventions for young people with sensory
processing needs (Arbesman & Lieberman, 2010)
Introduction to d/Deafness
Measuring deafness
Hearing loss can be separated into conductive and sensorineural hearing loss. Conductive
hearing loss occurs when a blockage or damage to the ear prevents sound from passing from
the outer to the inner ear (e.g. ear wax, glue ear, perforated eardrums). Sensorineural hearing
loss is caused by damage to hair cells inside the inner ear and/or damage to the hearing nerve.
This can be caused by genetic factors, infections such as meningitis, and physical trauma.
Presbycusis, (age-related hearing loss) and noise-induced hearing loss both fall into the
sensorineural hearing loss category. Sensorineural hearing loss can make it more difficult to
hear quiet sounds and/or reduces the quality of any sound that is heard. When diagnosing
deafness, audiologists measure hearing levels using two key indictors. These are audible
volume measured in decibels (dB) and audible pitch frequency measured in hertz (Hz).
Medically deafness is categorised into mild, moderate, severe, and profound deafness. A
useful way to understand how deafness impacts upon hearing is by considering an audiogram
chart with a ‘speech banana’ superimposed on to it. An audiogram chart show where
common noise occurs on the audiological spectrum while the speech banana, so called
because of its shape, shows the level and frequency of speech sounds in language (see table 2
and figure 1). Together these can indication an individual’s residual level of hearing.
Table 2. Degrees of Hearing Loss (based on Clark, 1981)

SENSORY PROCESSING AMONG d/DEAF CHILDREN. Page 22
Figure 1. Examples of audiogram chart with speech banana for typically hearing and
moderate to severely deaf person
Sound w
hic
h i
s hea
rd
Sound w
hic
h i
s hea
rd

SENSORY PROCESSING AMONG d/DEAF CHILDREN. Page 23
deaf or Deaf?
The word deaf with a lowercase ‘d’ is often used to describe a person who is medically
categorised as having impaired levels of hearing (Woodward, 1972). Usually deaf people
subscribe to this view and consider themselves to be hearing impaired or disabled. They may
have become deaf late in life, but not always, and typically use spoken or written language to
communicate. Often deaf people develop or retain an identity in line with the (hearing)
majority group into which they have been socialised (Woodward, 1972). In contrast to the
medical view of deafness, people with a Deaf cultural identity are often referred to as “Deaf”,
with a capital “D” (Woodward, 1972). Deaf people are usually born deaf or become so
prelingually (Glickman, 2007). When referring to both deaf and Deaf people at once it is
common to use the phrase d/Deaf (Woodward, 1972). Deaf cultures have their own social
norms, values, beliefs, and behaviour, their own art, literary traditions, and history
independent of the hearing majority. A key feature of Deaf cultures and identification with a
Deaf community is the use of a signed language as a first or preferred language (Glickman,
2007). This makes Deaf communities both a linguistic and cultural minority (Glickman,
2007). The signed language of the UK Deaf community is British Sign Language (BSL).
The Deaf Community in the UK: Historical and Modern Contexts.
The history of BSL and the UK Deaf community is deep and rich, but it is also
marked by substantial levels of prejudice, discrimination, and oppression by the hearing
majority. This is evident in historic terms such as “Deaf and Dumb”, ableist social attitudes
and norms, marginalisation, and exclusion of d/Deaf from the workplace and social life, and
governmental policies which delegitimise and repress BSL. There is solid evidence of signing
by d/Deaf people in Britain as early as in the 16th century, with most scholars agreeing that
signing predates these records (UCL, 2020). However, it wasn’t until 2003, after years of
activism by the Deaf community and an academic work ‘proving’ BSL to be a complete,
independent language (published in 1974) that the British Government recognised BSL as a
minority language (SeeHear, 2010; UCL, 2020). Further back, the 1880 Second International
Congress on Education of the Deaf held in Milan and commonly referred to as the Milan
Conference declared sign language inferior to Oralism, a method of teaching d/Deaf children
reliant on speech and lip-reading. This led to widespread bans on signed languages in Deaf
schools throughout the world including in the UK. The result of this saw Deaf teachers
unemployed and generations of d/Deaf children whose ‘education’ was years of attempts to
‘give them’ speech (SeeHear, 2012a, 2012b). It wasn’t until the 1970’s that d/Deaf education

SENSORY PROCESSING AMONG d/DEAF CHILDREN. Page 24
shifted away from the covenants laid down by the Milan conference and not until 2010 that
the 21st International Congress passed a resolution rejecting the motions passed in Milan
(UCL, 2020). Today like other minority groups Deaf communities and d/Deaf people
continue to experience prejudice, discrimination, and disempowerment (Glickman, 1996). In
the UK recent examples of this include caps to Access to Work (AtW) grants. AtW is a
government scheme designed to support ‘disabled’ people in the workplace. An estimated
90% of those affected by the AtW caps were Deaf people who relied on these funds to pay
for BSL interpreters without whom they could not continue to work (Clare, 2017). Another
example is the on-going refusal of the British Government to sanction a BSL GCSE. The
Government’s 2017 refusal statement, which was subsequently edited following significant
backlash for Deaf activists, stated “…the national curriculum...for languages contain a
number of requirements that could not be met through BSL; for example… the requirement to
describe [things]…in writing” (UK Government, 2017). This requirement privileges spoken
languages over visual ones as the written word is based on the spoken one (Chafe & Tannen,
1987). In the spring of 2020 Deaf campaigners began legal proceedings against the British
Government over the absence of a BSL interpreter at the Prime Minister’s daily Coronavirus
(Covid-19) briefings. This absence left Deaf people among who there are low levels of
literacy arising from inadequacies in the UK’s educational system (Glickman, 2007)
struggling to access public health information through English language subtitles (Rose,
2020).
Mental Health.
Around the world d/Deaf people achieve lower levels of education, experience lower
socio-economic status and levels of employment, suffer increased rates of sexual, domestic,
and substance abuse, and experience significant barriers in accessing health and social care
(Conama & Grehan, 2001; Conroy, 2006; Farrant & Mager, 2017; Guthmann & Graham III,
2005; Haualand & Allen, 2012; Landsberger & Diaz, 2010; SignHealth, 2014, 2016).
Globally there is a strong link between d/Deafness and mental health difficulties (Department
of Health, 2005) yet to date no major epidemiological work exploring incidence rates of
specific mental illnesses in d/Deaf populations has been undertaken (Fellinger, Holzinger, &
Pollard, 2012). Current literatures suggests d/Deaf people mostly experience common mental
health difficulties such as anxiety and depression; however, they do so at far greater rates
during childhood, as adults and older adults, and in forensic settings (Werngren-Elgström et
al., 2003; Department of Health, 2005; Landsberger & Diaz, 2010;Fellinger et al., 2012;

SENSORY PROCESSING AMONG d/DEAF CHILDREN. Page 25
McCulloch, 2012). There are also concerns that d/Deaf people in contact with services are
more vulnerable to being misdiagnosed, labelled mentally ill when no diagnosable disorder is
present, subjected to a restricted range of diagnoses, and deprived of treatment choice. There
are also additional concerns that residual categories such as “not otherwise specified” are
applied differently to d/Deaf patients and evidence that d/Deaf people being detained longer
within forensic settings (Steinberg et al., 1998; Young et al., 2001; Young, Howarth,
Ridgeway, & Monteiro, 2001; Black & Glickman, 2006; Landsberger & Diaz, 2010; Cole &
Magis, 2011; Fellinger et al., 2012). d/Deaf people are vulnerable to the same mental health
risk factors as their hearing peers (e.g. lower socioeconomic status, parental mental health
difficulties, substance misuse, bullying etc.), but they also face additional challenges (Moreno
& Glenn, 2018). Approximately 90% of d/Deaf children are born to hearing parents (Mitchell
& Karchmer, 2004). This can leave parents, even those with ample resources, unable to
provide their child with access to language. To illustrate this, let us consider the fictional case
of ‘Annie’. Annie ‘failed’ her new-born screening test. This meant her parents learnt she was
profoundly deaf within a week of her birth (not always the case with diagnosis for some
children as late as their teenage years). Annie’s parents felt no sense of loss or anxiety and
there were no disruptions in attachment due to her deafness. They acted immediately, signing
up for a 10-week Level 1 BSL evening course at a cost of £5002 per person. By the time
Annie was six months old both her parents could sign the alphabet and numbers, say “hello”,
and use single signs to describe the weather, name common animals, items of food and drink,
and rooms in the house. Their Level 2 course (£400 per person, 15 weeks2) taught Annie’s
parents to construct simple sentences in BSL and expanded their vocabulary to topics such as
work life, travel, and education. At Level 3 (£1,137 per person, 66 weeks3) the parents learnt
to create more complex sentences and acquired vocabulary on politics and health. They were
quick learners, always remembered to sign around Annie, never grew frustrated or tired, and
always had the time and resources for classes. Annie’s grandparents, aunts, and uncles also
signed up for these BSL classes. Annie’s is an idyllic, unrealistic example of a family’s
response to a child’s deafness but even in her case we see her parents were only able to start
exposing her to fluent language use at two years old. For late BSL learners, native-like
fluency is generally not achieved until they have completed Level 6. Most parents do not
2Costs, duration, and syllabus from Sign Language Course in London, an accredited BSL centre.
https://www.signlanguagecourses.co.uk/
3Costs, duration, and syllabus from Remark! in London, an accredited BSL centre https://remark.uk.com/bsl-
level-3/

SENSORY PROCESSING AMONG d/DEAF CHILDREN. Page 26
move beyond BSL Level 1, with Level 3-6 courses primarily aimed at organisations
supporting d/Deaf people and those seeking a career as a professional interpreter. The use of
spoken language by the majority of the population places d/Deaf children at a further
disadvantage as they cannot access the opportunities for incidental learning in the way their
hearing peers do. In illustration by anecdote, my Deaf sister and brother-in-law were often
left puzzled when my hearing niece came out with new words or phrases, unsure where she
had picked these up. As a family we were generally able to trace these back to overheard
conversations or on one memorable occasion a film that her father had not realised was
unmuted. d/Deaf children cannot access learning-by-osmosis the same way hearing children
do. This is one reason d/Deaf children sometimes present with significant gaps in language,
knowledge, and their understanding of social norms and expectations. Unless explicitly,
directly explained in a way they can absorb they simply miss out on some things other
children can just pick up on. As Annie’s case alludes to, delayed language acquisition is
common among d/Deaf children (Moreno & Glenn, 2018). This in turn results in early social
isolation which, with so much of development socially mediated, places d/Deaf children at a
higher risk of developing mental health problems (Moreno & Glenn, 2018). d/Deaf children,
particularly those with limited communication skills, may then exhibit ‘externalizing’
presentations that others interpret as disruptive, aggressive, or anti-social rather than as
indications of psychological or emotional distress (Moreno & Glenn, 2018). As such, they
may not be referred to mental health services until much later in life (Moreno & Glenn,
2018). Compounding this, d/Deaf children like d/Deaf adults experience significant
difficulties accessing mainstream services where staff lack the training, expertise, or
knowledge to meet their needs (NHS Commissioning Board, 2013; Szarkowski et al., 2014).
It was the recognition of these factors which led to the creation of small, highly in demand,
specialist mental health services for d/Deaf children and young people in the UK (NHS
Commissioning Board, 2013). The need for specialist services partly relates to d/Deaf
children’s unique communication needs. It also reflects the increased likelihood they will
experience other risk factors associated with mental health difficulties. More so than their
hearing peers, d/Deaf children present to services with additional physical, neurological, or
developmental needs, including increased rates of physical ill-health, attachment difficulties,
and higher rates of neurodevelopmental diagnosis such as ASD or ADHD (NHS
Commissioning Board, 2013; Szarkowski et al., 2014; Tomchek & Dunn, 2007). d/Deaf
people are also considerably more likely to experience trauma and abuse during childhood
(Landsberger & Diaz, 2010). d/Deaf children and young people are at a high risk of mental

SENSORY PROCESSING AMONG d/DEAF CHILDREN. Page 27
health difficulties which are often part of highly complex presentations, yet the evidence base
related to these children’s development and mental health remains particularly sparse
(Moreno & Glenn, 2018).
d/Deafness and Sensory Processing
Traditionally two opposing hypotheses relating to the impact of deprivation in one
sensory modality on the remaining senses have been proposed. These are the Perceptual
Deficit Hypothesis and the Sensory Compensation Hypothesis (Pavani & Bottari, 2012). The
Perceptual Deficit Hypothesis states that a ‘deficit’ in one sensory system will negatively
affect the development and organisation of other sensory systems (Pavani & Bottari, 2012).
This hypothesis would predict poorer performance in all sensory modalities among d/Deaf
people compared to age-matched hearing controls. In contrast, the Sensory Compensation
Hypothesis proposes deficits in one sensory system will lead to increased sensitivity in other
systems, compensating for the loss of one channel of input (Pavani & Bottari, 2012). This
hypothesis suggests areas of the brain traditionally associated with the impaired sense may
develop the ability to process perceptual inputs from other sensory systems (functional
reallocation) or that the other sensory systems will acquire enhanced functional and
processing capabilities (remaining senses hypertrophy) (Pavani & Bottari, 2012). If we
applied these hypotheses to d/Deaf people we might expect higher rates of under or over-
responsiveness to sensory stimuli depending on which hypothesis was proven. Despite 30
years of systematic research (largely focusing on visual abilities rather than sensory
processing in general) the debate over whether perceptual functioning in d/Deaf individuals is
under or overdeveloped remains unsettled (Pavani & Bottari, 2012). Research evidence is
mixed; split between suggestions of comparable performance between d/Deaf and hearing
people, and evidence of differential performance in the direction of deficits in abilities and
the direction of supranormal abilities in d/Deaf participants (for a full summary see Pavani &
Bottari (2012)). Since the 1980s a significant portion of sensory processing work with d/Deaf
people has focused on recording neural responses and comparing these with hearing people.
Today there is a growing acknowledgement that the absence of behavioural observations
related to sensory processing among d/Deaf people means even the most striking neurological
differences will not be able to unravel the debate round the Perceptual Deficit and Sensory
Compensation Hypotheses (Pavani & Bottari, 2012). The emphasis on the neurological has
also come at the expense of exploring meaningful differences related to sensory processing in
the lives of d/Deaf people, any difficulties that may arise from these, and the development of

SENSORY PROCESSING AMONG d/DEAF CHILDREN. Page 28
effective, relevant therapeutic interventions. d/Deaf people have different experiences from
hearing people in childhood, through adolescence, and as adults. As such, diagnostic
thresholds and interventions related to sensory processing relevant for any hearing
populations may not be relevant to d/Deaf children and young people. Furthermore, d/Deaf
children and young people are at an increased risk of life events and experiences which have
been linked with increased likelihood of sensory processing needs. For example, there are
increased rates of diagnosis for both ASD and ADHD among d/Deaf children although
clinically there are considerable challenges related to making these diagnoses for d/Deaf
children due to the similar nature of difficulties that can arise as consequences of deafness
and those associated with ASD and ADHD (Kelly et al., 1993; Szarkowski et al., 2014). As
such, missed and misdiagnosis of ASD and ADHD are commonplace (Szarkowski et al.,
2014). Missed diagnosis is thought to be linked to an exclusive focus on deafness limiting
understanding of difficulties as being solely linked to challenges related to being deaf. In the
case of missed diagnosis d/Deaf children and their families subsequently miss out on
beneficial support and early intervention which could significantly improve their quality of
life (Szarkowski et al., 2014). In contrast, misdiagnosis is thought to result from the
misinterpretations of social-communication difficulties and behaviour rooted in language
deprivation (Kelly et al., 1993; Szarkowski et al., 2014). As such, when considering sensory
processing among d/Deaf children it is important to hold in mind profiles found among
children with a diagnosis of ASD or ADHD as well as those associated with typically
developing children. There is also evidence of sensory processing needs among children born
prematurely. Like d/Deaf children, children born prematurely also exhibit atypical language
development. This is proposed as a potential consequence of limited access to language
during prolonged stays in Neonatal Intensive Care Units (Rand & Lahav, 2014; Crozier et al.,
2015). Considering this, and with a possible association between speech and language
disorders and sensory processing difficulties in general (Ayres, 1989; Hulslander et al.,
2004), we might also wonder about the impact of limited access to language on sensory
integration. Premature birth is also a risk factor associated with both deafness and disruptions
in attachment (Bielecki et al., 2011; Davis et al., 1983). Whitcomb et al. (2015) found a
significant proportion of the variance in sensory processing scores (measured by the SSP)
could be explained by the security of a child’s attachment suggesting a relationship between
attachment style and sensory processing needs. There is an acknowledged link between
disrupted attachment and a child’s deafness in hearing families that is not mirrored in Deaf
families (Meadow et al., 1983; Hughes, 2012). However, as 90% of d/Deaf children are born

SENSORY PROCESSING AMONG d/DEAF CHILDREN. Page 29
to hearing parents (Mitchell & Karchmer, 2004) the link between attachment and deafness,
and attachment and sensory processing needs is an important one to hold in mind. There is
also considerable academic research pointing to differences in sensory processing among
people who are d/Deaf, and links between auditory deprivation and functional plastic changes
in the central nervous system which plays a key role in sensory processing (Suarez et al.,
2007). d/Deaf people are also known to be at higher risk of developing mental health
difficulties. As such, the impact and meaning of any difficulties with sensory processing
needs may be of greater clinical significance for d/Deaf children and young people when
compared with their hearing peers. Despite known differences in sensory processing systems
among d/Deaf people, and links between sensory processing and attachment and language,
and neurodevelopmental diagnoses occurring at increased rates among d/Deaf children
sensory processing among this population have not yet been explored clinically. Meanwhile
research and interventions related to sensory processing, and its impact on psychological
distress and activities of daily living among other paediatric populations are well underway.
The Danger of Paving with Good Intention
There is growing evidence that sensory processing needs can have a lifelong,
significant, negative impact on wellbeing but that professional support and interventions can
help mitigate these. However, SPD is not currently recognised by the DSM-5 or ICD-10 and
there is a large overlap of symptomatology between this and other psychiatric diagnoses.
Sensory processing needs are not uncommon among the general paediatric population
however there is evidence that challenges related to attending to, receiving, using, and
responding to sensory stimuli are more likely in some cases than others (e.g. premature birth,
attachment difficulties, and specific clinical diagnoses). The concept of SPD has arisen in
particular time in Western society; a time when the medical-scientific model is the dominant,
where there are particular, significant demands and expectations for children and young
people, novel pressures in school, home, and community systems (particularly for d/Deaf
children), and greater levels and intensity of sensory stimulation than ever before in human
history. Within this work it has been accepted that people experience sensory stimuli, that
these experiences are linked to physical and psychological processes which are intrapersonal
and internal, and that these experiences have the potential to cause discomfort and distress.
However, we must also recognise that labelling responses to sensory stimuli as ‘typical’ or
‘atypical’ is a system of categorisation that is based on sociocultural constructs: similar to
categorisations in other aspects of the human experience such as intellectual functioning.

SENSORY PROCESSING AMONG d/DEAF CHILDREN. Page 30
Therefore, it is also important to take a critical view of ‘SPD’ and to hold an external and
interpersonal interpretation of behaviours associated with sensory processing in mind.
Behaviour associated with sensory processing needs do not necessarily suggest a deficit or
difficulty located within a child. Instead, these difficulties could be thought valid and
appropriate responses to demands and restrictions in maladaptive environments created for
children and young people by society. This shift in thinking necessitates a shift in clinical
efforts away from teaching a child to tolerate or adapt to an intolerable environment, and
towards the restructuring of society and the environments children are subjected to. This is
particularly true in the case of d/Deaf children who are often placed under significant levels
of demand to adapt to hearing environments. In the case of d/Deaf children, the same
behaviours associated with sensory processing needs are also linked with language
deprivation and sociocultural structures and attitudes which lead to experiences of prejudice,
discrimination, isolation, and marginalisation. While not inevitable, or uniform in any way,
the factors impact upon psychosocial development, family structure, attachment, access to
education and academic outcomes, and experiences of health and social care including
restricted access and limited choices, and differential rates and categories of diagnoses. By
definition d/Deaf children experience at least one sensory input differently than other children
and are also at a heightened risk of experiencing psychological distress due to the unique
challenges they face within society. They are also at an increased risk of missed and
misdiagnosis, resulting in less effective professional and social interventions and support. If
efforts are not made to include d/Deaf young people in research, this will continue. If efforts
are not made to understand more about the risk factors associated with psychological distress
among d/Deaf young people, develop effective interventions aiming to improve wellbeing
and quality of life for d/Deaf young people and to understand and meet the needs of d/Deaf
children, this will continue. As such, there is a strong ethical argument for undertaking
research related to mental wellbeing in d/Deaf young people, cautiously, carefully, and with
due consideration to the complexity of any clinical applications of the results and the wider
context and body of research in which any results are situated. Unfortunately, sensory
processing is just one area where, to date, d/Deaf people have been unconsciously missed or
deliberately excluded from thinking and research.

SENSORY PROCESSING AMONG d/DEAF CHILDREN. Page 31
Chapter Summary
• For some young people organising and regulating behavioural responses to sensory input
in line with environmental demand is challenging. Estimates suggest that between 5-10%
of the hearing paediatric and adult non-clinical populations demonstrate severe under or
over responses to sensory stimuli.
• Children with sensory processing needs show decreased social skills, experience lower
levels of self-confidence, self-esteem, and academic success, and experience difficulties in
activities of daily living. Sensory processing needs also correlate with higher rates of
mental health difficulties and can have a lifelong impact.
• Interventions for sensory processing needs and their impact on psychological wellbeing
and activities of daily living are available.
• Some groups of children are more likely to have sensory processing needs.
• d/Deaf people experience at least one sensory input (auditory stimuli) differently to the
general population, with research suggesting differences in multiple sensory domains.
• There are links between deafness and certain risk factors associated with increased levels
of sensory processing needs; however so far d/Deaf people have been excluded from
thinking and research in this area.
• Globally there is a strong link between d/Deafness and mental health difficulties across the
lifespan. d/Deaf children and young people are at a high risk of mental health difficulties
than their hearing peers but the evidence base related to their needs is limited.
• Estimates of sensory processing needs among d/Deaf children are unknown. Clinical
research relating to the impact of sensory processing on the daily lives and mental
wellbeing of d/Deaf children has not yet been conducted.
The next chapter of this thesis will summarise current knowledge relating to sensory
processing among d/Deaf people and explore links between sensory processing and mental
health people among people who are d/Deaf. The rationale and aims for the current project
are also outlined with later chapters outlining the method and results of the current study and
contextualising these findings within existing research.

SENSORY PROCESSING AMONG d/DEAF CHILDREN. Page 32
CHAPTER 2 - LITERATURE REVIEWS
“If I have seen a little further it is by standing on the shoulders of Giants” (Newton, 1676)
During the development of the current project a series of literature searches were
conducted to gain a sense of the available literature and refine search terms (see Appendix 1).
Initial search terms were created by the project team based on their knowledge of sensory
processing and mental health in d/Deaf people and supplemented by keywords and terms
generated by initial reviews of relevant work. Balancing a desire for comprehensiveness with
the requirements and constraints of this thesis led to two reviews being undertaken. The first
review was a scoping review; a type of review designed to outline gaps in a body of literature
and serving to enhance future research (Arksey & O’Malley, 2005). The process of
undertaking this review highlighted significant gaps in current knowledge relating to the
impact of sensory processing on mental health in d/Deaf children. However, due to the
scarcity of literature the review failed to adequately frame the need to understand sensory
processing in d/Deaf children. Therefore, broader search terms were used to undertake a
systematic review exploring literature on general differences in sensory processing among
d/Deaf people across the lifespan. A systematic review aims to evaluate the existing literature
related to a research question (Davis et al., 2009). In this chapter the broader systematic
review is presented first to offer context for the scoping review and current project.
The Systematic Review: Sensory Processing Among d/Deaf People
The systematic review aimed to address the question: are there differences in sensory
processing between d/Deaf and hearing people?
Search Strategy.
An electronic search of the Cochrane Database of Systematic Reviews, PubMed, and
Scopus databases was carried out. Searches were carried out in November 2019. Boolean
operators were used to combine the search terms, and search terms were truncated with the
asterisk operator where appropriate (see table 3). Literature from 2009-2019 was searched
using keyword, abstract, and title field searches. 596 papers were retrieved. During the initial
screening, duplicates were removed, and titles and abstracts were screened. 553 papers were
removed, and the remaining 43 texts were read in full and assessed using specific
inclusion/exclusion criteria (see table 4). To provide the most comprehensive review of the
literature the reference lists of articles were manually scanned for additional relevant papers.
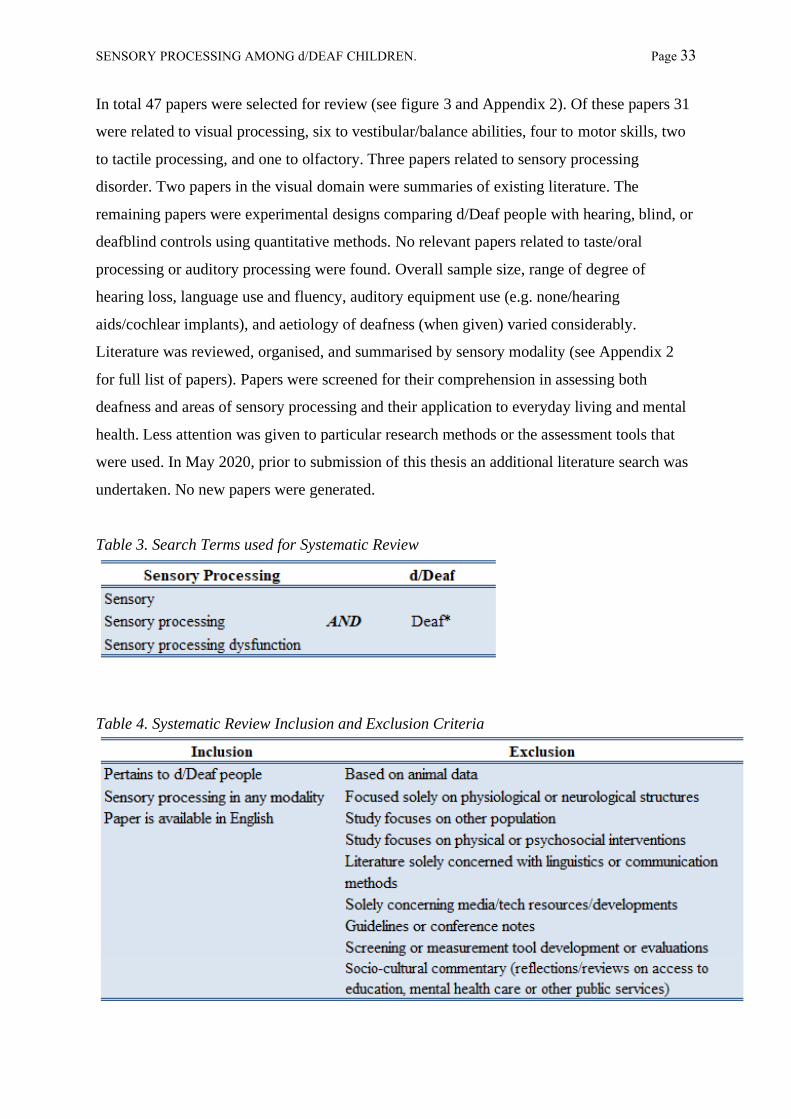
SENSORY PROCESSING AMONG d/DEAF CHILDREN. Page 33
In total 47 papers were selected for review (see figure 3 and Appendix 2). Of these papers 31
were related to visual processing, six to vestibular/balance abilities, four to motor skills, two
to tactile processing, and one to olfactory. Three papers related to sensory processing
disorder. Two papers in the visual domain were summaries of existing literature. The
remaining papers were experimental designs comparing d/Deaf people with hearing, blind, or
deafblind controls using quantitative methods. No relevant papers related to taste/oral
processing or auditory processing were found. Overall sample size, range of degree of
hearing loss, language use and fluency, auditory equipment use (e.g. none/hearing
aids/cochlear implants), and aetiology of deafness (when given) varied considerably.
Literature was reviewed, organised, and summarised by sensory modality (see Appendix 2
for full list of papers). Papers were screened for their comprehension in assessing both
deafness and areas of sensory processing and their application to everyday living and mental
health. Less attention was given to particular research methods or the assessment tools that
were used. In May 2020, prior to submission of this thesis an additional literature search was
undertaken. No new papers were generated.
Table 3. Search Terms used for Systematic Review
Table 4. Systematic Review Inclusion and Exclusion Criteria

SENSORY PROCESSING AMONG d/DEAF CHILDREN. Page 34
Figure 2. Flow of Sensory Processing Review

SENSORY PROCESSING AMONG d/DEAF CHILDREN. Page 35
Findings.
Visual Processing.
Literature available on d/Deaf people’s visual processing was considerable and over
half of the papers originally identified were related to the visual sensory domain (see
Appendix 2). Interest in this area dates back to the seventeenth century (Pavani & Bottari,
2012) but in the current review, restrained by time, resources, and the scope of the current
project, only a 10-year period from 2009-2019 could be covered. Given the number of papers
and the limited relevance an in-depth exploration of visual abilities in d/Deaf people would
offer to this project, a broader, higher level summary of this area will be provided instead of
an analysis critiquing individual papers. For those keen to explore this area, comprehensive
summaries of this body of research and detailed reviews of meta-analyses can be found in
Bavelier, Dye, & Hauser (2006) and more recently Alencar, Butler, & Lomber (2019). In
brief, visual skills in d/Deaf people do appear to be altered when compared with hearing
people but only in very specific ways and there is no evidence for general enhancement of
visual skills due to the absence of auditory input (Bavelier et al., 2006) nor lowered visual
abilities in adulthood (see Alencar et al. (2019) for more information). d/Deaf people do seem
to exhibit supranormal abilities compared to hearing control in some areas such as an ability
to detect motion in their peripheral vision, a lower threshold for detecting movement
(Bavelier et al., 2006; Shiell et al., 2014), and better performance in visuomotor
synchronisation tasks (Iversen et al., 2015). d/Deaf people also display differing lateralisation
biases in the detection of visual stimuli, performing better when stimuli is presented in the
right visual field whereas hearing controls demonstrate equivalence in performance for left
and right visual fields or even a bias toward the left (Brozinsky & Bavelier, 2004). However,
the right visual field advantage has also been seen among hearing sign language users and it
is therefore possible that lateralisation differences are the result of exposure to, and use of,
signed languages rather than hearing loss (Alencar et al., 2019). Of more direct relevance to
the current study are findings which suggest d/Deaf children achieve lower scores on
measures of visual perception compared to hearing controls until the age of approximately 10
years, similar to controls between 10 and 12 years, and better than controls from age 13 on
(Alencar et al., 2019). Five to 10 year old d/Deaf children have also been found to be worse
at detecting dim stimuli presented in the far periphery when compared to age-matched
hearing controls, reaching equivalent performance at 11-12 years (Codina et al., 2011). 10-12
year old d/Deaf children have demonstrated equivalent performance to hearing children in the

SENSORY PROCESSING AMONG d/DEAF CHILDREN. Page 36
central visual field on brightness discrimination (Bross & Sauerwein, 1980), and facial
recognition and orientation judgement (Parasnis et al., 1996). By age 13-15 years, d/Deaf
children show enhanced performance relative to hearing controls and adults on peripheral
visual tasks (Codina et al., 2011), visual object-matching tasks, and face-matching tasks with
d/Deaf adolescents showing significantly better rates of correct answers, fewer mistakes, and
greater overall accuracy (Megreya & Bindemann, 2017).
Balance and Motor Skills.
Foreword: vestibular disorders.
This review does not aim to summarise research into vestibular disorders among
d/Deaf children, however it is important to briefly highlight this area of study before
considering balance and motor processing. Vestibular disorders can lead to impairments of
motor development and balance (Rine, 2009). These are an overlooked problem in paediatric
populations in general (Rine, 2009) but d/Deaf children are at increased risk of these due to
malformation of vestibular receptors which can occur in some forms of inner-ear
deafness (Suarez et al., 2007). There are also suggestions of peripheral vestibular dysfunction
and delayed postural control in some types of congenital or early-acquired deafness
(e.g. inner-ear malformations, meningitis, viral labyrinthitis) and some forms of hereditary
deafness (Suarez et al., 2007). In fact it is estimated that 30–95% of children with hearing
loss experience some kind of vestibular dysfunction, with dysfunction increasing with degree
of hearing loss (De Kegel et al., 2010; del Pino et al., 2011; Selz et al., 1996). Vestibular
dysfunction can interfere with many areas of children's development, including static and
dynamic balance reactions, coordination, and the speed of performed movements (Chilosi et
al., 2010). As such, we would expect d/Deaf children to show increased difficulty with both
balance and motor skills. Despite some limitations research evidence in both of these areas
seems to support this expectation; however, it also suggests evidence of differing motor and
balance performance among d/Deaf children in the absence of any vestibular abnormalities
(e.g. Crowe & Horak, 1988).
Balance.
In a test of single-limb standing balance with 54 sets of matched-pairs An, Yi, Jeon, &
Park (2009) found that severe-profoundly d/Deaf children (hearing loss, ≥70 dB; see table 1)
SENSORY PROCESSING AMONG d/DEAF CHILDREN. Page 37
aged four to 14 years of age performed worse than hearing controls. However, lateralisation
of deafness was not specified, language use and use of hearing equipment was not controlled
for, and aetiology of hearing loss was not established. This is important information in the
interpretation of any results as it is unclear whether factors other than hearing loss may have
contributed to the results. For example, Selz et al. (1996) found significant differences in
balance performance between d/Deaf children aged 8-17 years with non-syndromic
hereditary deafness (n = 5) and acquired deafness (n = 5) due to meningitis, with children
with acquired deafness performing significantly worse than children with hereditary deafness
in some tests. However, in Selz et al.'s (1996) study all of the children exhibited normal
walking gaits and were active participants in ‘competitive sport events’ at their residential
school, although details of what is meant by this are lacking. This suggests any real-world
impact of difference in balance performance scores may be limited. In a more recent study
228 children (65 d/Deaf, 163 hearing) aged between eight and 17 years were assessed on
static balance with the children asked to stand still on one leg under differing conditions (e.g.
eyes open or closed, standing on different materials (Walicka-Cupryś et al., 2014)). In this
study d/Deaf children were found to have superior balance compared to their hearing peers.
However, there are severe limitations to this study. Of the d/Deaf children, 25 children were
born d/Deaf and 40 became so later in their lives. Aetiology and lateralisation of deafness is
not provided. The children are described as having a level of deafness ≤90 dB however the
lower limit is not given. As such, these children must be thought of as experiencing mild to
severe deafness, both unilaterally and bilaterally, which represents a considerable range of
experience. In addition, children with an intellectual disability and any comorbid illnesses
were excluded, including, presumably, any child with a known vestibular dysfunction,
limiting generalisability in a population with high levels of comorbid diagnoses. Language
use is once again not considered. In the most recent paper identified in the literature search
Ebrahimi, Movallali, Jamshidi, Rahgozar, & Haghgoo (2017) also support statistically
significantly lower levels of postural control in d/Deaf children between the ages of seven
and 12 compared with hearing controls (n = 30 and 49 respectively). The d/Deaf children in
this study were selected based on a diagnosis of profound sensorineural hearing loss (>90 dB)
and being at ‘high risk in balance’ although it is unclear if this high risk is solely related to
the level of the child’s deafness or if other factors were in play (e.g. parent/teacher evaluation
of play etc.). d/Deaf children with additional visual, physical, neurological, and cognitive
impairments were excluded from the study again limiting generalisability. Once again, the
children’s language use, lateralisation of deafness, and use of hearing equipment were not

SENSORY PROCESSING AMONG d/DEAF CHILDREN. Page 38
specified. Additionally, the authors specify ‘total communication’ was used to instruct the
d/Deaf children but this is a very broad language system encapsulating signs, lip-reading, and
spoken and written language which needs to be tailored to each individual child by
experienced professionals who know a young person well in order to ensure accurate
communication. In summary, there is a suggestion of difference in vestibular processing and
balance among d/Deaf children, but the impact of this, if any, on activities of daily living and
mental wellbeing remains unknown. Participants in the studies present with varying degrees
of deafness which are not accounted for in analyses and are selectively screened for inclusion
(e.g. Walicka-Cupryś et al.'s 2014 study). In addition, language use, and use of hearing
equipment has largely been neglected as a factor in these analyses despite evidence that
cochlear implants and sign language communication can contribute to difference in neural
responses and the response of the central nervous system in processing sensory stimuli
(Suarez et al., 2007).
Motor.
A thread of research suggests d/Deaf children perform, on average, significantly
worse than hearing children on tests of motor development (Dummer et al., 1996; Gheysen et
al., 2008) and there is some suggestion that a lack of early auditory input contributes to motor
delays in d/Deaf children (Savelsbergh et al., 1991). More specifically, d/Deaf children have
been reported to show lower scores on measures of general dynamic coordination, visual-
motor skills such as ball-catching (e.g. slower reaction times, speed of movement), complex
movement production, and movement sequencing disturbances (Conway et al., 2001;
Hartman et al., 2011; Savelsbergh et al., 1991; Schlumberger et al., 2004; Siegel et al., 1991;
Wiegersma & Van der Velde, 1983). Motor skills in d/Deaf adults have been less studied
however, some research has suggested visual-motor and complete motor learning skills in
d/Deaf adults are not significantly different from hearing controls (Hauser et al., 2007;
Lévesque et al., 2014). Again, while these findings are interesting and suggest differences in
motor-related experiences for d/Deaf children, the impact, if any, on activities of daily living
and mental wellbeing is unclear.
Tactile Processing.
A 1968 study by Chakravarty found greater sensitivity for detecting the location of
tactile stimulation in d/Deaf children compared to age and gender matched hearing controls,
suggesting an advantage in tactile processing for d/Deaf participants. However, level of

SENSORY PROCESSING AMONG d/DEAF CHILDREN. Page 39
hearing loss, equipment and language use, and communication methods used when carrying
out the study were not specified. Additionally, the introduction of the paper hints at a
‘fascination’ with d/Deaf and deafblind individuals such as Helen Keller, potentially
suggesting bias on the part of the researcher which is not reflected upon or explored. Another
study by Heming & Brown (2005) found temporal thresholds for tactile stimulation (i.e. the
time taken to detect touch) were significantly higher in d/Deaf participants than matched
hearing controls suggesting a disadvantage in tactile processing for d/Deaf participants.
Sample sizes in these studies were small (n = 12 and n = 20, respectively) and differences
were a matter of millimetres/seconds which, while statistically significant, have limited
implications for tactile sensory processing in daily life. Later a larger study of 300 children
found d/Deaf young people were more sensitive to vibrotactile stimulation than matched
hearing controls and increasing palmar sensitivity with age in the d/Deaf group. Again these
were clinically marginal differences and there were no differences in other areas of
processing such as tactile object identification, or pattern or texture discrimination (Schiff &
Dytell, 1972). The finding of greater sensitivity to vibrotactile stimulation is somewhat
supported by a 2001 study which suggested d/Deaf participants were statistically better at
detecting suprathreshold changes (changes above the conscious threshold) in tactical stimuli
compared to hearing controls (Levanen & Hamford, 2001). In the most recent study in this
review Papagno, Minniti, Mattavelli, Mantovan, & Cecchetto (2017) compared deafblind,
d/Deaf, blind, and hearing/sighted matched controls in their performance on tactile, short-
term memory tasks. Blind and d/Deaf participants outscored controls on measures of item
complexity and tactile span, and number of correct responses suggesting better memory for
tactile information. There was no significant difference in performance between blind and
d/Deaf participants who do not share blind people’s experience of a tactile language system
and as both groups outperformed the hearing controls this finding cannot be explained by any
practice effect related to experience with tactilely encoded information (Papagno et al.,
2017). Only one paper comparing Deaf people with hearing sign language users as well as
hearing non-signers was identified. This study found both Deaf people and hearing sign
language users outperformed the hearing non-signers in haptic matching tasks (matching
shapes to cut-outs as fast as possible) (van Dijk et al., 2013). This study neatly demonstrates
the importance of considering language use in addition to deafness as in this case controlling
for visual language use negated observed differences between Deaf and hearing subjects. In
summary, the research covers a broad range of areas within tactile processing among d/Deaf
people but is predominantly limited to comparison with blind and/or non-signing participants,

SENSORY PROCESSING AMONG d/DEAF CHILDREN. Page 40
largely neglecting the role of language. Additionally, while statistically significant
differences in temporal thresholds and sensitivity to the localisation of stimulation have been
identified between d/Deaf and hearing participants, these findings are derived from highly
artificial, lab-based research with little-to-no applications or impact and limited clinical
utility.
Olfactory Processing.
Studies exploring olfactory functioning among d/Deaf people have been
methodologically flawed, generating conflicting results which are of limited real-world
application. One study reported differences in brain activation in response to olfactory
stimulation between d/Deaf, blind, and hearing participants (Ozgoren et al., 2011). In this
study, additional areas of the brain located towards the auditory cortex were active in
response to olfactory stimulation in d/Deaf participants but not among hearing and blind
comparison groups (Ozgoren et al., 2011). A similar study in 2012 later found no significant
difference in neurological response to olfactory stimulation between blind, d/Deaf, and
hearing participants (Ozgoren et al., 2012). A third study, which required teenaged
participants to verbally identify smells found d/Deaf participants had less success
differentiating between smells and detected smells at a higher threshold compared to hearing
or blind participants (i.e. smells were stronger when first detected by d/Deaf participants
compared to other groups) (Guducu et al., 2016). This led the researchers to determine
hyposmia in 58% of participants in the d/Deaf group compared to 10% in the hearing group
and 36% in the blind group (Guducu et al., 2016). The results of this later study should be
interpreted cautiously. Three lab workers affiliated with the study learnt ‘basic’ sign language
specifically to undertake this piece of work and while it is reported a ‘teacher’ from their
school accompanied d/Deaf participants to the lab, no further information regarding their
signing skills or role in communicating instructions during the study are given. Furthermore,
during the odour discrimination test d/Deaf participants were asked to choose between smells
by pointing at words on a piece of paper which would be a slower than giving verbal
responses. In addition, assessment of the d/Deaf participants’ language skills (reading or
signed) is not reported. As such, is it unclear if the results obtained reflect genuine
differences in odour detection and discrimination among the d/Deaf participants or reflect
unclear instructions, differences in testing procedure, or a lack of smell related vocabulary
(signed and/or written) arising from restricted/delayed access to language. In their publication

SENSORY PROCESSING AMONG d/DEAF CHILDREN. Page 41
the authors do urge some caution in the interpretation of their results but frame concerns in
terms of ‘low collaboration’ from d/Deaf participants (Guducu et al., 2016).
Oral Sensitivity, Auditory Processing, and Mental Health.
No relevant papers relating to oral processing, auditory processing, or mental health
were identified. No papers on oral processing were identified at all while any papers related
to auditory processing were linked to medical interventions (e.g. cochlear implants),
neurological structures of the auditory cortex, or physical structures of the ear all of which lie
outside the scope of the current project. No papers exploring sensory processing and mental
health were found and none of the papers reviewed referenced mental wellbeing in relation to
the sensory processing experiences of d/Deaf people.
Sensory Processing and d/Deaf Children.
There are some indications that d/Deaf children may be more at risk of greater levels
of sensory processing needs than their hearing peers. A paper by Crowe & Horak (1988)
exploring sensory organisation in the motor domain among seven to 13 year old d/Deaf
children found diminished organisation in three of the 29 participants. This categorisation
was made based on the children displaying multiple motor deficits despite normal vestibular
functioning. Given the limitations of this study such as a small sample size, differing
aetiologies of deafness, unclear levels of hearing loss among the group as a whole (specified
only as above 30dB all children in the group with no upper limit given), unclear language use
by the children and in the running of the experiment (for instance, maybe these children did
not understand what was being asked of them in the tasks), and a focus on a single area of
sensory processing (motor) the conclusions that can be drawn from this study are very
limited. In another study which aimed to evaluate global language development in 40
children with hearing loss (hearing aid and cochlear implant users, 20-40 months old, hearing
loss 15-120dB) receiving an intensive auditory-verbal intervention (one to four years), 78%
of the children exhibited difficulties with sensory processing as assessed by occupational
therapy evaluations with nearly two-thirds identified as having moderate to severe sensory
processing needs (Rhoades & Chisolm, 2001). Unfortunately, this data was collected as
demographic data to help contextualise the impact of the auditory-verbal approach to
communication and no further details regarding sensory processing are given. Further
suggestions of increased sensory processing needs among d/Deaf children arise from a more
recent study in which scores of the parent-rated Sensory Profile Caregiver questionnaire for

SENSORY PROCESSING AMONG d/DEAF CHILDREN. Page 42
30 d/Deaf children (two-10 years old, congenital, severe-profound hearing loss) with cochlear
implants were combined with behavioural observations by Occupational Therapists
(Bharadwaj et al., 2009). Children suspected of, or diagnosed with ASD, developmental
delays, cognitive delays, blindness, or deafness acquired from cytomegalovirus or meningitis
were excluded. 70% of the children assessed were defined as ‘at-risk’ or as having ‘different’
behaviour in one or more sensory areas (auditory, visual, vestibular, tactile, and oral
processing). ‘Atypical’ behaviour was most prevalent in the auditory and vestibular
modalities (40% of the sample) followed by the oral and tactile (approximately 25% of the
sample), and least prevalent in the visual processing domain (10% of the sample). Both
sensory-seeking and sensory-avoiding behaviour was observed among the sample. There was
no correlation between duration of hearing loss and ‘atypical’ behaviour in any sensory
category. A significant, low negative correlation (r = - 0.3, p = < .001) was found between
duration of implant use and observed atypical behaviour for the vestibular category,
supporting parental reports of atypical behaviours linked to vestibular processing somewhat
diminishing with increasing length of implant use (Bharadwaj et al., 2009). While this study
has many strengths caution must still be used in generalising these results to the wider d/Deaf
paediatric population. Families who chose to take part in this study self-selected and as such
there is a high risk of sample bias. In addition, language use is once again not explored. The
evidence for increased sensory processing needs among d/Deaf children is limited in both
scope and quality. However, while conservative estimates for sensory processing needs in the
non-clinical, hearing paediatric population are 5%, unusual sensory processing was noted in
10% to 78% of d/Deaf children in the above studies (Bharadwaj et al., 2009; Crowe & Horak,
1988; Rhoades & Chisolm, 2001) putting d/Deaf children closer to estimates of need in other
clinical groups such as children with a diagnosis of ASD or ADHD (e.g. Dunn, 2006;
Tomchek & Dunn, 2007).
Summary
This review addressed the question: ‘Are there differences in sensory processing
between d/Deaf and hearing people?’. There was no literature available for oral or auditory
processing domains, however there was evidence of differences in visual, tactile, olfactory,
and motor domains between d/Deaf and hearing populations across the lifespan and
particularly in childhood. Whether these differences point to under-responsiveness or
supranormal capabilities remains unclear. In addition, the impact of sensory processing on the
daily lives and mental wellbeing of d/Deaf people remains unexplored.

SENSORY PROCESSING AMONG d/DEAF CHILDREN. Page 43
The Scoping Review: Sensory Processing and Mental Wellbeing in d/Deaf Children
The absence of literature relating to sensory processing and mental wellbeing among
d/Deaf people made a systematic review in this area impractical. As such a scoping review
aiming to outline gaps in the literature and provide a ‘first assessment’ of research in this area
was undertaken (Arksey & O’Malley, 2005). Here the term ‘sensory’ is used to refer to any
sensory modality (sight, sound, smell, touch, taste, balance, or movement).
Search Strategy.
An electronic search of the Cochrane Database of Systematic Reviews, PubMed, and
Scopus databases was carried out. Searches were carried out in November 2019. Boolean
operators were used to combine the search terms, and search terms were truncated with the
asterisk operator where appropriate (see table 5). Literature was searched from 2009,
covering a ten-year period, using keyword, abstract, and title field searches. The search
generated 2,074 papers. The first screening consisted of eliminating duplicates and reading
titles and abstracts. 2,067 papers were removed with six full-text articles assessed for
eligibility based on the full inclusion/exclusion criteria (see table 6). To provide the most
comprehensive overview of the literature reference lists for articles were manually scanned
for additional relevant papers. In total five papers were selected for inclusion in this review
(see figure 3). Requests for ‘grey literature’ were also made to relevant organisations. ‘Grey
literature’ refers to materials and research produced by organisations outside
traditional academic settings and can include annual reports, research conducted outside of
academic institutions, working papers, government documents such as white
papers, and service evaluations. Requests were made to a national NHS service and charity
supporting d/Deaf children, with neither able to contribute. Papers were screened for their
comprehension in assessing both deafness and areas of sensory processing and their
application to everyday living and mental health. Less attention was given to particular
research methods or the assessment tools that were used. In May 2020, prior to submission of
this thesis an additional literature search was undertaken. No new papers were generated.

SENSORY PROCESSING AMONG d/DEAF CHILDREN. Page 44
Table 5. Search Terms used for Scoping Review
Table 6. Scoping Review Inclusion and Exclusion Criteria

SENSORY PROCESSING AMONG d/DEAF CHILDREN. Page 45
Figure 3. Flow of Scoping Review
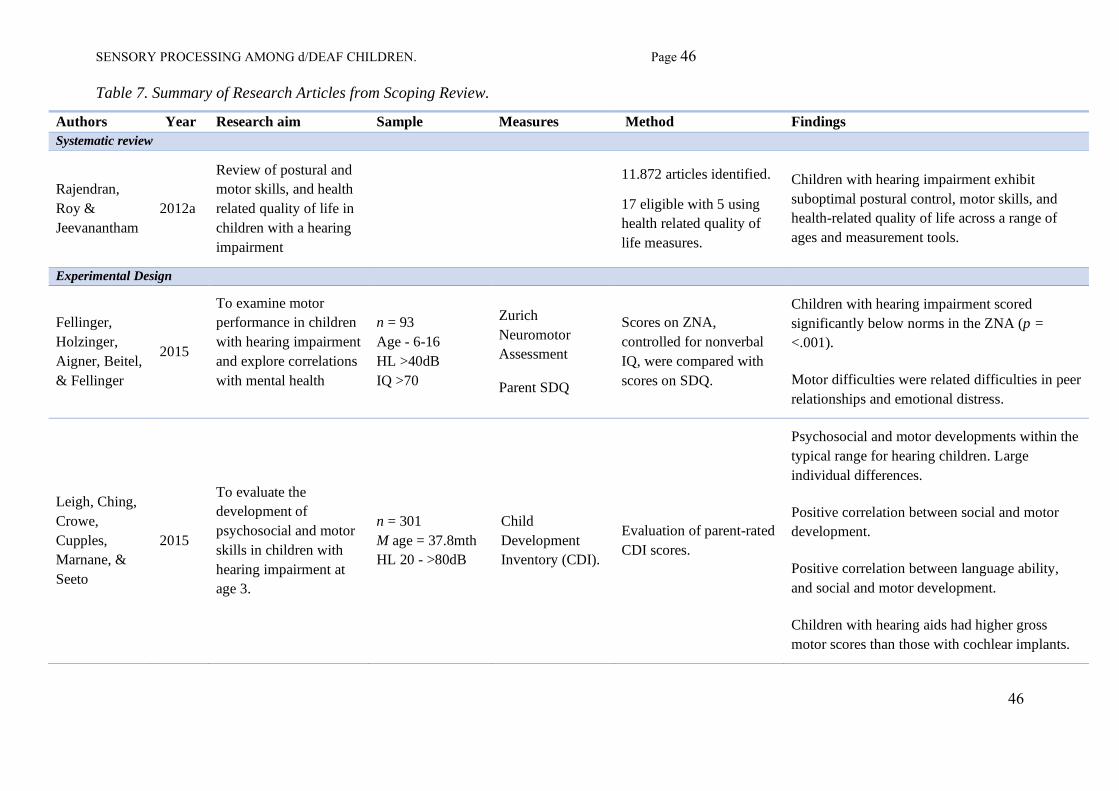
SENSORY PROCESSING AMONG d/DEAF CHILDREN. Page 46
46
Table 7. Summary of Research Articles from Scoping Review.
Authors Year Research aim Sample Measures Method Findings
Systematic review
Rajendran,
Roy &
Jeevanantham
2012a
Review of postural and
motor skills, and health
related quality of life in
children with a hearing
impairment
11.872 articles identified.
17 eligible with 5 using
health related quality of
life measures.
Children with hearing impairment exhibit
suboptimal postural control, motor skills, and
health-related quality of life across a range of
ages and measurement tools.
Experimental Design
Fellinger,
Holzinger,
Aigner, Beitel,
& Fellinger
2015
To examine motor
performance in children
with hearing impairment
and explore correlations
with mental health
n = 93
Age - 6-16
HL >40dB
IQ >70
Zurich
Neuromotor
Assessment
Parent SDQ
Scores on ZNA,
controlled for nonverbal
IQ, were compared with
scores on SDQ.
Children with hearing impairment scored
significantly below norms in the ZNA (p =
<.001).
Motor difficulties were related difficulties in peer
relationships and emotional distress.
Leigh, Ching,
Crowe,
Cupples,
Marnane, &
Seeto
2015
To evaluate the
development of
psychosocial and motor
skills in children with
hearing impairment at
age 3.
n = 301
M age = 37.8mth
HL 20 - >80dB
Child
Development
Inventory (CDI).
Evaluation of parent-rated
CDI scores.
Psychosocial and motor developments within the
typical range for hearing children. Large
individual differences.
Positive correlation between social and motor
development.
Positive correlation between language ability,
and social and motor development.
Children with hearing aids had higher gross
motor scores than those with cochlear implants.

SENSORY PROCESSING AMONG d/DEAF CHILDREN. Page 47
Authors Year Research aim Sample Measures Method Findings
Rajendran,
Roy &
Jeevanantham
2012b
To evaluate a vestibular-
specific neuromuscular
training programme’s
impact on children’s
motor and balance
skills, and health-related
quality of life
n = 23
Age 6 – 11
HL >90dB
PedsQL Generic
Core Scale (quality
of life).
Test of gross motor
development-2
(motor skills).
Paediatric reach
test, one leg
standing balance
test, and postural
sway meter
(postural control).
Random allocation to
control or experimental
group.
Experimental group
participated in
vestibular-specific
neuromuscular training
for six weeks.
Control group continued
regular activities at
school.
Intervention improved motor skills, postural
control, and health-related quality of life scores.
Vestibular-specific neuromuscular training may
improve motor skills, balance, and physical and
psychosocial health-related quality of life in
children with hearing impairments.
SENSORY PROCESSING AMONG d/DEAF CHILDREN. Page 48
Findings.
Research identified by this review is limited to the impact of motor and balance skills
on quality of life and it is acknowledged that this is a step away from a consideration of how
sensory processing experiences, in and of themselves, impact mental wellbeing. However this
body of work does suggest a link between lowered balance and motor performance and
decreased psychosocial wellbeing in d/Deaf children across a broad range of ages (Fellinger,
Holzinger, Aigner, Beitel, & Fellinger, 2015; Rajendran, Roy, & Jeevanantham, 2012a,
2012b). Rajendran et al's (2012a) review explored motor and balance skills and quality of life
as separate areas of interest with their 2012b study demonstrating that improvements in motor
and balance skills were linked with improved scores on the psychosocial components of a
health-related quality of life measure in a small sample (n = 23) of d/Deaf children (six to 11
years old). In this study participants were assigned to either a neuromuscular training
programme (three one-to-one sessions for 45 minutes per week, for six weeks) or a non-
active control. Baseline measures of motor skills and health-related quality of life were
compared with post-intervention measures using appropriate statistical testing procedures;
however, participants were not analysed as matched pairs. Pre-intervention group scores are
not reported and therefore it is not possible to tell whether a significant difference between
the two groups existed at baseline. The link between motor skills and mental wellbeing was
also emphasised in Fellinger et al.'s (2015) study with d/Deaf students scoring significantly
lower than the norms in an assessment of motor skill, and with poor motor performance
related to difficulties with peer relationships and increased rates of emotional difficulties. In
this study 93 d/Deaf children and young people (Age = 6 - 16,M = 11.3, SD = 2.9, range =
6.6-16) with hearing impairments of at least 40dB (M = 76.1dB, SD = 24.23, range = 40-
120dB) were assessed for motor performance on the Zurich Neuromotor Assessment (ZNA),
and mental health using the parent-rated Strengths and Difficulties Questionnaire (SDQ).On
average 74% of the d/Deaf children scored in the bottom 15% of the ZNA with 57% scoring
in the bottom 5%; however, these norms are based on hearing children and therefore must be
used with caution when applying them to d/Deaf children. Children with high ‘total
difficulties’ scores on the SDQ showed poorer performance in the motor subscale of the ZNA
with peer relationship problems negatively correlated with motor performance, and dynamic
balance subscales. Higher scores for emotional problems also correlated with lower
performance on the dynamic balance subscale. In contrast, Leigh et al. (2015) found
psychosocial and motor developments within typical ranges for hearing children in a group of
301 younger d/Deaf children (M = 37.8 months, SD = 1.7, range = 35-43, hearing loss = 20 -

SENSORY PROCESSING AMONG d/DEAF CHILDREN. Page 49
>80dB) using the Child Development Inventory. However, Leigh et al. (2015) did note large
individual differences between individual children and found those with hearing aids had
higher gross motor scores than those with cochlear implants. This may be related to the
aetiology of deafness in these children or degree of hearing loss, or reflect a greater number
of children with hearing aids in the study (72.3% vs. 27.2%). Leigh et al. (2015) also found
positive correlation between language ability and social development, language ability and
motor development, and social and motor development suggesting a far more complex
picture than hearing loss inevitably leading to any uniform impact on motor or psychosocial
development. Further complicating the results of this study are the varying language uses by
families participating in the study (Australian Sign Language (n = 2); mixed methods (n =
70); aural (n = 219)) and presence of additional disabilities (developmental delay (n = 39
(12.9%)); cerebral palsy (n = 23 (7.6%)); ASD; (n = 10 (3.3%))) which do not appear to have
been factored into the analysis.
Overall Summary
There is evidence from other paediatric populations that sensory processing needs can
negatively impact mental wellbeing, and that sensory processing needs can have a lifelong
impact. There is also evidence that some groups of children are more likely to experience
difficulties in processing sensory information than others and effective interventions are
available to mitigate any negative impact of processing sensory needs. Currently the extent of
any sensory processing needs among d/Deaf children, the sensory processing profiles of
d/Deaf children, and the impact of any sensory processing needs on mental wellbeing among
d/Deaf children is unknown. Almost paradoxically d/Deaf children seem to have been
omitted from research in this area despite:
• Definitional differences in processing auditory stimuli
• Consistent indications of processing differences across multiple sensory domains
compared with hearing controls
• Some suggestion of higher rates of sensory processing difficulties among d/Deaf children
• Increased levels of risk for developing mental health difficulties among d/Deaf children

SENSORY PROCESSING AMONG d/DEAF CHILDREN. Page 50
Rationale and Research Aims
Research suggests that 5-10% of typically developing hearing children may have
sensory processing needs. In some clinical populations estimates different sensory processing
needs are significantly higher (e.g. for children with diagnoses of ADHD or ASD). The
systematic and scoping reviews outline differences in sensory processing between d/Deaf and
hearing populations in multiple sensory domains across the lifespan, but particularly in
childhood. However, estimates of sensory processing needs among d/Deaf children remain
unknown and the influence of any of these on their daily lives and mental wellbeing is
unclear. Children with sensory processing dysfunction can show decreased social skills,
lower self-confidence, self-esteem, and daily life skills, and diminished fine, gross, and
sensorimotor skill development. For these children school and home environments can
contain stimuli that cause significant levels of distress, fear, anxiety, or discomfort which can
significantly disrupt their daily routines, academic performance, relationships, and
psychological wellbeing. It is likely that any established links between sensory processing
and mental health in hearing paediatric populations do not fully reflect the experiences of
d/Deaf children who are known to be at increased risk of common mental health difficulties
such as anxiety and depression in general and have increased rates of comorbid diagnoses,
and unique experiences related to auditory processing and language. It is therefore possible
that the impact of any sensory processing needs may lead to more significant difficulties for
d/Deaf children, who are already members of a socially disadvantaged and marginalised
group and also face increased barriers in accessing mental health support.
The current study aims to:
• Compare sensory processing profiles of d/Deaf children with typically developing children
and children with a diagnosis of ASD or ADHD
• Explore the impact of degree of hearing loss and BSL and equipment use on sensory
processing among d/Deaf children
• Explore the impact of sensory processing profiles on psychological distress among d/Deaf
children aged 5 to 10 years old.

SENSORY PROCESSING AMONG d/DEAF CHILDREN. Page 51
CHAPTER 3 - METHOD
“Thinking and planning is one side of life; doing is another” (Stewart, 1974)
The Original Plan
The original plan was to compare sensory processing and mental wellbeing between
d/Deaf and hearing populations across the lifespan. However, sensory processing measures
were not available in BSL and therefore a new measure would need to be developed, or an
existing one translated. Creating a new measure was highly impractical and therefore a
translation was considered. Ideally the processes by which other mental health measures have
been translated from written English into BSL would then have been followed. This would
have included gaining permission for the translation from, and collaborating with, the original
authors of the measure, independent translations of measures by multiple registered Deaf
interpreters and/or translators, validation meetings, numerous forward and back translations,
field-testing, piloting, follow-up interviews to check understanding of items and gather
feedback, reliability and validity testing, and the development of appropriate norms (e.g. as in
Rogers, Dodds, Campbell, & Young, 2018). However, this went far beyond what was a
possibility under the remit of the current project. In an attempt to continue with the original
lifespan project Mrs F, a member of the Deaf community known professionally and
personally to the lead author, was recruited to translate the Adolescent/Adult Sensory Profile
(AASP) into BSL. This would have allowed for the inclusion of teenage and adult
participants without the need for interpreters. Mrs F is a culturally Deaf woman with
extensive experience working with d/Deaf individuals in a mental health setting. Her role
specifically relates to the translation of medical, psychological, and legal materials, and she
holds multiple qualifications in translating across written English and BSL. Mrs S is a
qualified BSL interpreter known to both Mrs F and the lead author who also agreed to lend
support to the project. Mrs S is a skilled interpreter with extensive experience in a range of
settings, including academic and mental health domains. Mrs F agreed to offer consultation to
the project overall, and both she and Mrs S agreed to aid with the translation of the AASP.
Mrs F agreed to film herself signing the AASP questions so these could be uploaded to a
survey hosting site, allowing participants to choose to complete the questionnaire in written
English or BSL. Signed versions of the Strengths and Difficulties Questionnaires were
obtained from the University of Manchester, with permission to use these as measures of
psychological distress for adolescent and adult participants. Unfortunately, after several
meetings Mrs F was unable to continue to support the project due to ill health. Without Mrs

SENSORY PROCESSING AMONG d/DEAF CHILDREN. Page 52
F’s assistance it was no longer possible to translate the AASP, as Mrs S was not able to offer
the required hours needed to complete this work alone. The project team did not have the
necessary skills to translate the questionnaire and the cost to hire a professional interpreter is,
at minimum, £260 per day (National Union of British Sign Language Interpreters, 2020).
Given the specialist nature of the work it is likely this would have attracted a higher fee
(National Union of British Sign Language Interpreters, 2020). The budget for this project
was £200 in total. Realistically Mrs F and Mrs S’s generous offer to translate the AASP into
BSL represented the minimum standards of acceptability. Without their assistance it was no
longer feasible to translate the AASP without far more time and resources. The paediatric
population was therefore focused upon because 90% of d/Deaf children are born to hearing
parents who would be able to access the written English versions of the questionnaires
(Mitchell & Karchmer, 2004). Furthermore, evidence from literature pertaining to visual
abilities in d/Deaf children suggests greater levels of difference in d/Deaf children under the
age of 10 years (Alencar et al., 2019) and larger effect sizes are easier to detect with smaller
samples. Additionally, as estimates of sensory dysfunction in the adult, hearing, non-clinical
population has been cited as similar to that seen among children (Engel-Yeger & Dunn,
2011) understanding sensory processing needs among d/Deaf children may tentatively be
used to estimate possible needs among d/Deaf adults.
The Current Study
Research Questions
The current study aims to explore possible links between sensory processing profiles
and psychological distress in d/Deaf paediatric populations. It is hypothesised that d/Deaf
children with higher levels of sensory processing needs will present with more psychosocial
and emotional difficulties. The current study also aims to explore the sensory processing
profiles of d/Deaf children compared with typically developing children and those with
diagnoses of ASD or ADHD. It is hypothesised that there will be a difference between
sensory processing profiles of d/Deaf and typically developing children, and d/Deaf children
and those with developmental disorders.
Research Design
This study is a quantitative, within group design which uses descriptive, and
parametric and non- parametric inferential statistics.
SENSORY PROCESSING AMONG d/DEAF CHILDREN. Page 53
Ethics
Ethical approval for this project was granted by the University of Hertfordshire’s
Health, Science, Engineering and Technology Ethics Committee with Delegated Authority.
The protocol number is LMS/PGT/UH/03814 (see Appendix 3). This project did not require
NHS ethics as recruitment was conducted via the UK school system and third-sector
organisations. To comply with the Data Protection Act 2018 (DPA 2018) and General Data
Protection Regulation (GDPR), data was anonymised to protect patients’ identities and ensure
confidentiality. Participants were informed that they could withdraw their data up to the date
upon which analysis was due to commence (see Appendix 4). To facilitate this while
maintaining anonymity participants created unique identifier codes as part of the survey. The
purpose of the data collection was outlined, along with any potential uses for it. Qualtrics, a
secure, online survey hosting site, approved by the University’s ethics committee was used to
collect data. Raw data was stored securely on an encrypted hard drive only accessible by the
primary researcher.
Recruitment
Recruitment was undertaken through the UK school system, a national third-sector
organisation supporting d/Deaf children, social media, and word of mouth. Specialist d/Deaf
schools and mainstream schools with a hearing unit were contacted and provided with
recruitment information to share with their pupils’ parents. For these schools, recruitment
posters for the parents of hearing children were also provided to recruit for a control group
(see Appendix 5). Schools were identified via Google searches and from discussions with
members of the Deaf community. Posts on social media, including that of the national third-
sector organisation, and more general parenting forums were also undertaken (see Appendix
6 for a full list of recruitment avenues).
…and then Covid-19
In addition to the challenges this project faced during development, the global Covid-
19 pandemic unfolded during the recruitment, analysis, and write-up stages. As a response to
this emergency the UK Government took the advice of the World Health Organisation and
closed all the schools in the country. Together my supervisors and I considered the practical
and ethical implications of continuing to recruit in the face of significant levels of threat,
increasing national and global anxiety, and dramatic changes in routine and the fabric of daily
life. Ultimately, we felt we had no choice but to suspend our research activities. Fortunately,
SENSORY PROCESSING AMONG d/DEAF CHILDREN. Page 54
we had gathered completed data from the parents of d/Deaf children over the course of the
project, although not as many as we would have liked, and were able to produce a sample
which was in keeping with the size of samples in previous studies (e.g. children with
diagnoses of ASD or ADHD). Unfortunately, recruitment of hearing controls had fallen
behind that of the d/Deaf sample. The idea of pooling data from the parents of hearing
children from this study with data collected in a previous study by the external supervisor
was suggested. Were this permitted it would have been possible to develop a small number of
matched pairs to use in the analysis however this could not be approved by the ethics
committee. Ultimately this meant the original plan for a matched pairs analysis could not be
carried out.
Participants
Participants in the study were parents of d/Deaf children aged between five and 10
years old, who completed a parent-rated measure of sensory processing and parent-rated
measure of psychological distress, and the children on whom the data was based.
Inclusion/Exclusion Criteria
Data was excluded from the analysis if a child had a diagnosis such as ASD or ADHD
which are linked to sensory processing needs, or a diagnosis of SPD. There were no other
exclusion criteria.
Instruments
The parent/caregiver-rated Strengths and Difficulties Questionnaire (SDQ)
(Goodman, 1997) was used as a measure of psychological distress. The Sensory Profile
Caregiver Questionnaire (SPCQ) was also employed (Dunn, 2006). Demographic
information related to a child’s age, sex, language environment, and physical and
psychological health were also collected. As it is widely accepted that approximately 90% of
Deaf children are born to hearing parents (Mitchell & Karchmer, 2004), and given the
limitations of the doctoral thesis, both in terms of finances, scope and timeframe, these
measures were not translated to BSL or other spoken languages. As such d/Deaf children
with parents or caregivers who find it difficult to access written English would have found it
difficult to participate.

SENSORY PROCESSING AMONG d/DEAF CHILDREN. Page 55
Strengths and Difficulties Questionnaire.
The SDQ is a short assessment instrument that addresses positive and negative
behavioural attributes of children and adolescents and generates scores for clinically relevant
aspects. The SDQ contains 25 questions aiming to identify emotional, behavioural, and social
difficulties a child or young person may be experiencing and is often used clinically as an
initial screening measure and to suggest areas for further investigation. Raw data from the
SDQ can be used to generate a total score and scores for four subscales which identify
distress expressed emotionally, through conduct, hyperactivity, or through interaction with
peers. A fifth scale explores pro-social behaviour among respondents. The four ‘problem’
scales can be combined to give an overall score, and used to generate an ‘externalising’
behaviour scale (summing the conduct and hyperactivity scales) and an ‘internalising’ scale
(summing the emotional and peer relationship scales). Using these two amalgamated scales
may be preferable to using the four ‘problem’ scales in community samples, whereas using
the four scales may add more value in high-risk samples (Goodman & Goodman, 2009). The
SDQ is used in research and clinical settings worldwide, across multiple languages including
BSL (Roberts et al., 2015) and comes with a considerable body of published work
demonstrating its reliability and validity (e.g. Goodman & Goodman, 2011; Goodman, 1997;
Kersten et al., 2016; Van Roy, Veenstra, & Clench-Aas, 2008) (see Appendix 7 for an extract
of the measure). However this measure is not without criticism and concerns have been raised
about the factor structure for condition-specific populations in clinical settings, the invariance
between parent and teacher ratings, the predictive validity of the tool for specific disorders,
and validity of the tool as a longitudinal outcome measure in research trials (see Hall et al,
2019 for a review).
The Sensory Profile Caregiver Questionnaire.
The Sensory Profile Caregiver Questionnaire (SPCQ) is a reliable, valid, parent-rated
clinical tool used to assess sensory processing in young children (Dunn, 2006; Ohl et al,
2014). The SPCQ is a widely used as a diagnosis tool, outcome measure and research tool
around the world (Benjamin et al., 2014; Dunn, 2006; Ohl et al., 2012). However, there are
there are concerns regarding the use of both this and other measures of sensory processing
with calls for further validation of all measures and concerns about the reliance on parent-
rated measure in this area (Burns, Dixon,, Novack, & Granpeesheh, 2017). The SPCQ can
provide information about a child’s response to sensory stimuli and can be used to identify
which sensory systems are likely to be creating barriers in a child’s daily life (Dunn, 2006). It

SENSORY PROCESSING AMONG d/DEAF CHILDREN. Page 56
also offers comparative norms for neurotypical and atypical populations (Dunn, 2006). The
SPCQ is comprised of 125 questions covering three main areas: Sensory Processing;
Modulation; and Behavioural and Emotional Responses. The six Sensory Processing items
explore areas of sensory processing which are part of everyday life. The five Modulation
items reflect various combinations of sensory input which are part of daily life. The three
Behavioural and Emotional Responses items cover emotional and behavioural responses to
stimuli which might indicate a child’s sensory processing abilities (Pearson Education, 2008)
(see table 8). Respondents are asked to record the frequency at which their child displays
each described behaviour/response on a 5-point Likert scale. The SPCQ was developed based
on the performance of 1,037 children without disabilities (Dunn, 1999). Norms are also
available for children with diagnoses of ASD or ADHD (Kientz & Dunn, 1997; Dunn &
Bennett, 2002). The SPCQ can also analysed by totally raw scores in differing ways to
compute Factor and Quadrant scores (Dunn, 2006; Dunn & Brown, 1997). The nine Factor
scores can be used to gain an understanding of a child’s thresholds and responsiveness to
sensory events (see table 9) (Dunn, 2006; Dunn & Brown, 1997). The four Quadrant scores
can be used to quantify the degree to which a child may miss, obtain, detect, or be bothered
by sensory input (see table 10) (Dunn, 2006). In 2006 the Sensory Profile Supplement User’s
Manual was published to update the SPCQ assessment, ensuring that it reflects current
understandings of sensory processing (Dunn, 2006). The SPCQ has been shown to have
acceptable psychometric properties, with moderate-to-good test-retest reliability and
moderate-to-high internal consistency (Dunn, 2006; Ohl et al., 2012). The new quadrant level
of analysis was found to have better test-retest reliability and internal consistency than the
original Factor method of analysis and has therefore been recommended for analysing a
child’s sensory processing patterns (Ohl et al., 2012). However, as neither analysis has ever
been undertaken with a sample of d/Deaf children both will be undertaken in the current
study as they offer different insights into sensory processing. The SPCQ has also been
proposed as a possible intervention outcome measure (Ohl et al., 2012) (see Appendix 8 for
an extract from the measure and Appendix 9 for the Technical Report).
Procedure
After giving informed consent parents/caregivers were asked to provide demographic
information about their child including age, level of hearing impairment, language use,
equipment use, comorbid diagnosis and medical history. They were then asked to complete

SENSORY PROCESSING AMONG d/DEAF CHILDREN. Page 57
the SDQ and SPCQ. Questionnaires were completed online using Qualtrics, a secure survey
hosting site, approved for use by the ethics committee overseeing this project.
Table 8. SPCQ Items Descriptions
Table 9. SPCQ Factor Descriptions
Table 10. SPCQ Quadrant Descriptions

SENSORY PROCESSING AMONG d/DEAF CHILDREN. Page 58
Analytical Strategy
During analysis, a copy of the data was downloaded from Qualtrics and stored securely
on an encrypted hard drive which was only accessible by the primary researcher. Data was
analysed using quantitative methods. In the first instance a test of normality was applied. The
outcome of this determined if relevant parametric or non-parametric tests were conducted.
Specific analyses aimed to:
1. Compare the sensory profiles d/Deaf of children with norms for typically developing
children and children with a diagnosis of ASD or ADHD.
2. Consider the impact of degree of deafness, equipment and BSL use on sensory
processing
3. Consider the impact of sensory processing needs on psychological distress in d/Deaf
children.
IBM’s SPSS Statistics package, a commonly used statistical tool, could not be accessed when
analysing the current data. Compatibility issues prevented the software from being
downloaded from UH on the lead researcher’s personal devices and the UH campus was
closed due to the Covid-19 pandemic. As such data was analysed using
PSPP, a software application designed for the analysis of sampled data (GNU Operating
System, 2019). PSPP is an example of free and open-source software and is intended as a free
alternative for SPSS. PSPP offers comprehensive analytical capabilities including descriptive
statistics, T-tests, ANOVA, linear and logistic regression, factor, cluster, and principal
components analysis, and non-parametric testing. It can also produce a range of statistical
graphs including histograms and scree plots (GNU Operating System, 2019). As such, PSPP
offered most of the analytical functions required in the current project. Anything that was not
available (e.g. some graphical outputs including boxplots and Q-Q plots) were generated
using Microsoft Excel.

SENSORY PROCESSING AMONG d/DEAF CHILDREN. Page 59
CHAPTER 4 - RESULTS
“The goal is to turn data into information, and information into insight” (Fiorina, 1999)
Three regression analyses exploring the impact of sensory processing on
psychological distress rated by parents in a sample of d/Deaf children (N = 21) were
computed. Comparisons of sensory processing in the d/Deaf sample compared with norms for
typically developing children and those with diagnoses of ASD or ADHD were undertaken.
The impact of degree of hearing loss, and equipment and BSL use on sensory processing was
also explored.
Demographic Information
Data from 29 participants was collected between August 2019 and March 2020. Three
data sets were incomplete. Five were excluded due to additional diagnoses linked to sensory
processing needs (ADHD (n = 1), ASD (n = 1), SPD (n = 1), ADHD and SPD (n = 2)). There
were no other exclusion criteria. Data from 21 participants was accepted for analysis. The
majority of the respondents were mothers (n = 20). Children ranged from 5.4 -10.9 years
(Mean = 7.9, SD = 1.74; Median = 7.5) with roughly equal numbers of males and females (n
= 12 and n = 9) (see table 11). There were roughly equal numbers of cochlear implant and
hearing aid users (n = 10 and n = 11) (see table 12). The majority of children were diagnosed
with moderate to profound hearing loss (n = 20), with most in the profound range (n = 11)
(see table 12). All were from different families. For 10 children the cause of hearing loss was
unknown. For seven the cause was genetic in origin (see table 12). In five families two
parents signed. Two additional families listed only the mother as a signer. In one case a
grandparent who did not live in the family home was the signer. In five families the highest
level of qualification was BSL Level 14 or lower, in one family the highest was BSL Level
24, and in the remaining two it was BSL Level 34. The primary language used at home was
spoken English (n = 20), with one family using another spoken language. Five families
reported using BSL at home with three of these also reporting using Makaton5, Total
Communication6, and Sign Supported English7 (SSE). Two additional families reported use
of SSE at home (see table 13).
4 BSL Level 1 - basic e.g. alphabet and numbers, single signs for animals, food, drink, weather.
BSL Level 2 - simple sentence construction and vocabulary for education, work, and leisure
BSL Level 3 - more complex sentence construction and vocabulary for politics and heath 5 Makaton - a language system using symbols, signs and speech to enable people to communicate 6 Total Communication - using different forms of communication to match the needs and abilities of the child

SENSORY PROCESSING AMONG d/DEAF CHILDREN. Page 60
Table 11. Age and Sex Related Demographic Information
Table 12. Hearing Loss Related Demographic Information
Table 13. Use and Proficiency of Signed Language87in the Home
7 SSE - Manually-coded English. Signs from BSL fit to the grammar and structure of spoken English. 78 Makaton, Total Communication, and SSE are language systems not languages. They have been included in this
table as parents identified them as methods of communication in the home. They should not be considered full
and complete languages in their own right or as alternatives to BSL.
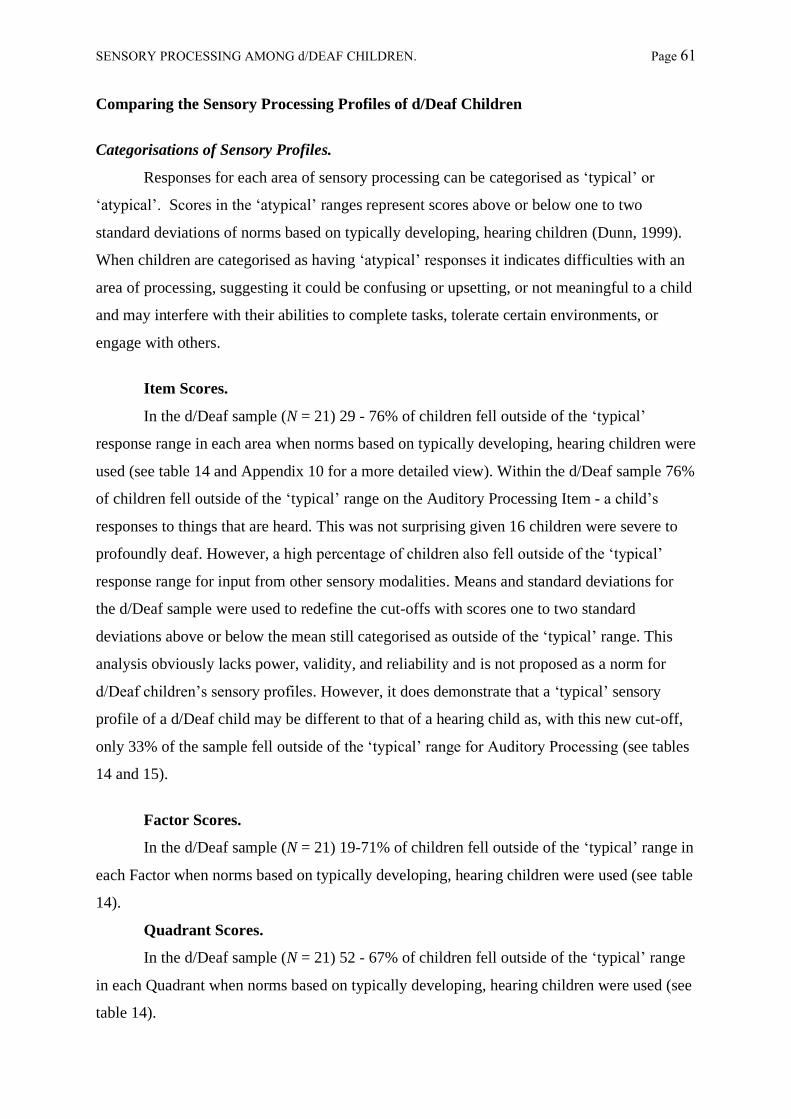
SENSORY PROCESSING AMONG d/DEAF CHILDREN. Page 61
Comparing the Sensory Processing Profiles of d/Deaf Children
Categorisations of Sensory Profiles.
Responses for each area of sensory processing can be categorised as ‘typical’ or
‘atypical’. Scores in the ‘atypical’ ranges represent scores above or below one to two
standard deviations of norms based on typically developing, hearing children (Dunn, 1999).
When children are categorised as having ‘atypical’ responses it indicates difficulties with an
area of processing, suggesting it could be confusing or upsetting, or not meaningful to a child
and may interfere with their abilities to complete tasks, tolerate certain environments, or
engage with others.
Item Scores.
In the d/Deaf sample (N = 21) 29 - 76% of children fell outside of the ‘typical’
response range in each area when norms based on typically developing, hearing children were
used (see table 14 and Appendix 10 for a more detailed view). Within the d/Deaf sample 76%
of children fell outside of the ‘typical’ range on the Auditory Processing Item - a child’s
responses to things that are heard. This was not surprising given 16 children were severe to
profoundly deaf. However, a high percentage of children also fell outside of the ‘typical’
response range for input from other sensory modalities. Means and standard deviations for
the d/Deaf sample were used to redefine the cut-offs with scores one to two standard
deviations above or below the mean still categorised as outside of the ‘typical’ range. This
analysis obviously lacks power, validity, and reliability and is not proposed as a norm for
d/Deaf children’s sensory profiles. However, it does demonstrate that a ‘typical’ sensory
profile of a d/Deaf child may be different to that of a hearing child as, with this new cut-off,
only 33% of the sample fell outside of the ‘typical’ range for Auditory Processing (see tables
14 and 15).
Factor Scores.
In the d/Deaf sample (N = 21) 19-71% of children fell outside of the ‘typical’ range in
each Factor when norms based on typically developing, hearing children were used (see table
14).
Quadrant Scores.
In the d/Deaf sample (N = 21) 52 - 67% of children fell outside of the ‘typical’ range
in each Quadrant when norms based on typically developing, hearing children were used (see
table 14).

SENSORY PROCESSING AMONG d/DEAF CHILDREN. Page 62
Table 14. Percentage of d/Deaf Children with ‘Typical’ and ‘Atypical’ Responses for each Item,
Factor and Quadrant
Table 15. Percentage of d/Deaf Children outside of Typical Range in each area (descending on
typically developing norms)

SENSORY PROCESSING AMONG d/DEAF CHILDREN. Page 63
Statistical Comparisons with Typically Developing and Atypical Populations.
Mean sensory profile scores for typically developing children (Dunn, 1999; Dunn &
Brown, 1997), and those with a diagnosis of ASD (Kientz & Dunn, 1997) and ADHD (Dunn
& Bennett, 2002) were collated and compared with mean scores for the d/Deaf sample. These
norms were available for the Item and Factor analysis of the SPCQ but not the Quadrant
analysis (Dunn, 2006). For typically developing children age-dependent norms are available.
Given the limitations in sample size it was not possible to compare age-dependent subsets of
the d/Deaf sample with the relevant norms. Instead, in line with Van der Linde’s (2003)
analysis of children diagnosed with specific language impairment the mean age of the sample
(7.9, SD = 1.74) was used to determine which norm to use. Norms for children with a
diagnosed of ASD and ADHD were not age dependent.
Item Scores.
Mean scores for d/Deaf children were lower than those of typically developing children for
each Item. Standard deviations for all sensory processing Items were higher in the d/Deaf
sample than for the typical developing norms. However, they were in line with standard
deviations for children with diagnoses of ASD or ADHD. This indicates there may be larger
variations in sensory processing scores for children in the d/Deaf sample when compared
with typical developing children. A series of One-Sample t-tests were used to explore if there
were statistically significant differences between mean scores of the sample of d/Deaf and
norms for children in the three comparison groups (see table 16 and Appendix 10).
Typically Developing Children.
There was a significant difference in the mean scores of the d/Deaf sample and the
norm for typically developing children on all Items of the SPCQ (p = <.001 on twelve items,
p = <.01 on two items, see table 16).
Children with a Diagnosis of ASD.
There was a significant difference in the mean scores of the d/Deaf sample and the
norm for children with a diagnosis of ASD (see table 16) for:
• Visual Processing – responses to things which are seen
• Touch Processing – responses to stimuli that touch the skin
• Multisensory Processing – responses to activities containing combined sensory experience
• Oral Sensory Processing – responses to touch and taste stimuli to the mouth

SENSORY PROCESSING AMONG d/DEAF CHILDREN. Page 64
• Sensory Processing Related to Endurance/Tone – ability to sustain physical performance
• Modulation Related to Body Position and Movement – ability to move effectively
• Modulation of Movement Affecting Activity Level – demonstration of activeness
• Modulation of Sensory Input Affecting Emotional Responses – ability to use body senses
to generate emotional responses
• Modulation of Visual Input Affecting Emotional Responses and Activity Level – ability to
use visual cues to establish contact with others
• Emotional/Social Responses – psychosocial coping strategies
• Behavioural Outcomes of Sensory Processing – ability to meet performance demands
• Thresholds for Response – ability to translate sensory information into behaviour
matching the nature and/or intensity of the input.
Children with a Diagnosis of ADHD.
There was a significant difference in the mean scores of the d/Deaf sample and the
norm for children with a diagnosis of ADHD (see table 16) for:
• Visual Processing – responses to things which are seen
• Vestibular Processing – responses to movement
• Touch Processing – responses to stimuli that touch the skin
• Multisensory Processing – responses to activities containing combined sensory experience
• Oral Sensory Processing – responses to touch and taste stimuli to the mouth
• Modulation Related to Body Position and Movement – ability to move effectively
• Modulation of Movement Affecting Activity Level – demonstration of activeness
• Modulation of Visual Input Affecting Emotional Responses and Activity Level – ability to
use visual cues to establish contact with others
• Emotional/Social Responses – psychosocial coping strategies
• Behavioural Outcomes of Sensory Processing – ability to meet performance demands
• Thresholds for Response – ability to translate sensory information into behaviour
matching the nature and/or intensity of the input.
For all significant results, the 95% Confidence Interval did not include zero (see Appendix
13).
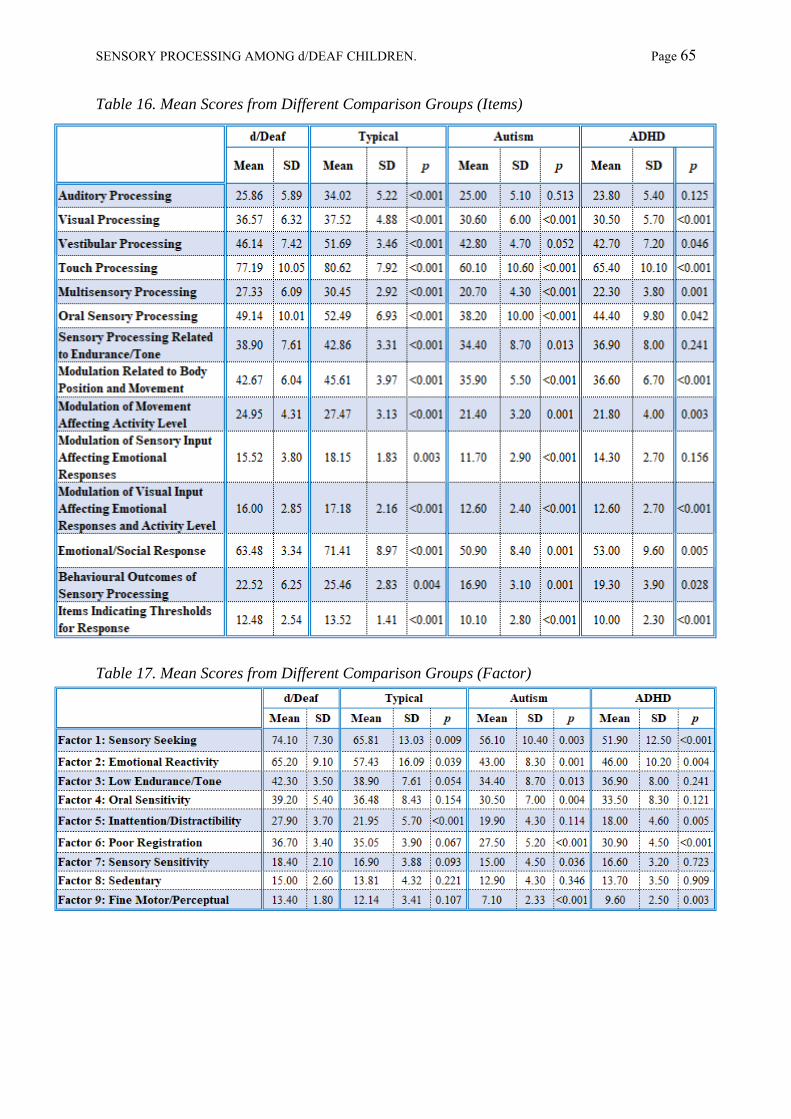
SENSORY PROCESSING AMONG d/DEAF CHILDREN. Page 65
Table 16. Mean Scores from Different Comparison Groups (Items)
Table 17. Mean Scores from Different Comparison Groups (Factor)

SENSORY PROCESSING AMONG d/DEAF CHILDREN. Page 66
Factor Scores.
Like children with a diagnosis of ASD or ADHD, mean scores for d/Deaf children
were lower than those of typically developing children in each Factor. Standard deviations for
all sensory processing Factors were higher in the d/Deaf sample than for the typical
developing norms. However, they were broadly in line with standard deviations for children
with diagnoses of ASD or ADHD. This indicates there may be larger variations in sensory
processing scores for children in the d/Deaf sample when compared with typically developing
children, but not when compared with children with diagnoses of ASD or ADHD. A series of
One-Sample t-tests were used to explore differences between mean scores for the d/Deaf
children and norms for the three comparison groups (see table 17 and Appendix 10).
Typically Developing Children.
There was a significant difference in the mean scores of the d/Deaf sample and the
norm for typically developing children for Factor scores related to sensory seeking behaviour,
emotional reactivity, and inattention/distractibility (see table 17).
Children with a Diagnosis of ASD.
There was a significant difference in the mean scores of the d/Deaf sample and the
norm for children with a diagnosis of ASD for sensory seeking behaviour, emotional
reactivity, low levels of physical endurance/muscle tone, sensitivity to oral sensory input,
poor registration of sensory, sensitivity to sensory input, and diminished fine motor skills (see
table 17).
Children with a Diagnosis of ADHD.
There was a significant difference in the mean scores for the d/Deaf sample and
norms for children with a diagnosis of ADHD for sensory seeking behaviour, emotional
reactivity, inattention/distractibility, lower registration of sensory input, and diminished fine
motor skills (see table 17).

SENSORY PROCESSING AMONG d/DEAF CHILDREN. Page 67
Summary of Comparisons.
Categorising d/Deaf Children’s Sensory Profiles
• 29 - 76% of the d/Deaf sample fell outside of the ‘typical’ range based on norms for
typically developing hearing children for each Item of sensory processing.
• 19-71% of the d/Deaf sample fell outside of the ‘typical’ range based on norms for
typically developing hearing children for each Factor.
Comparison with Typically Developing Children
• Mean scores were lower than norms for all Items and Factors of the SPCQ.
• These differences were significant for all Items of the SPCQ.
• There were significant differences in some Factor scores (see table 18).
Comparison with Children with a diagnosis of ASD
• Mean scores were higher than norms on all Items and Factors of the SPCQ.
• There were significant differences in some Item and Factor scores (see table 18).
Comparison with Children with a diagnosis of ADHD
• Mean scores were higher than norms on all Items and Factors of the SPCQ.
• There were significant differences in some Item and Factor score (see table 18)
It is acknowledged these analyses were undertaken with a small sample size, although
one that is similar in size to samples in previous sensory processing studies and as such
caution must be taken when interpreting the results. However, these results tentatively
support the hypothesis that neuro-atypical d/Deaf children may have differing sensory
profiles compared to typically developing children and children with diagnoses of ADHD or
ASD.

SENSORY PROCESSING AMONG d/DEAF CHILDREN. Page 68
Table 18. SPCQ Items and Factors with Significant Mean Differences Between d/Deaf Sample and Norms by Comparison Group

SENSORY PROCESSING AMONG d/DEAF CHILDREN. Page 69
The Impact of Degree of Hearing Loss, Equipment Use, and BSL Use
A series of one-way ANOVAs (and non-parametric equivalents where appropriate) were used
to explore the impact of degree of hearing loss (mild, moderate, severe, profound), equipment
use (cochlear implants, hearing aids) and BSL use on sensory processing scores.
No effect of degree of hearing loss or BSL use was found for Items, Factor, or Quadrant
analysis of the SPCQ. No effect of equipment use was found on the Factor analysis.
A large significant effect of equipment use was found on the Items analysis for a child’s
ability to sustain physical performance (Sensory Processing Related to Endurance/Tone - χ²
(1, N = 21) = 5.46, p = .02, φ = .5), with children with hearing aids showing decreased
performance compared to those with implants (Median = 14.25 and 8.05, respectively) (see
table 19).
A large, significant effect of equipment use was also found for low registration of sensory
input (Quadrant 1 – Low Registration - χ² (1, N = 21) = 5.75, p = .02, φ = .5), with children
with hearing aids showing lower registration compared to those with implants (Median = 45
and 37, respectively) (see table 20).
For both these analyses the Kruskal–Wallis One-Way Analysis of Variance, a rank-based,
nonparametric test used to determine statistically significant differences between groups, was
used as the Homogeneity of Variance and was statistically significant in both these cases.
Table 19. Effect of equipment on Endurance/Tone (Item Analysis)
Table 20. Effect of equipment use on Low Registration (Quadrant Analysis)
The impact of duration of cochlear implant use on sensory processing was not analysed due
to the limited number of children with implants (n = 10). The impact of aetiology of deafness
on sensory processing was not analysed due to limitations of the information available for
children in the sample (e.g. unknown aetiology, n = 10, and aetiology attributed to ‘genetics’
without further specification, n = 5, see table 12).
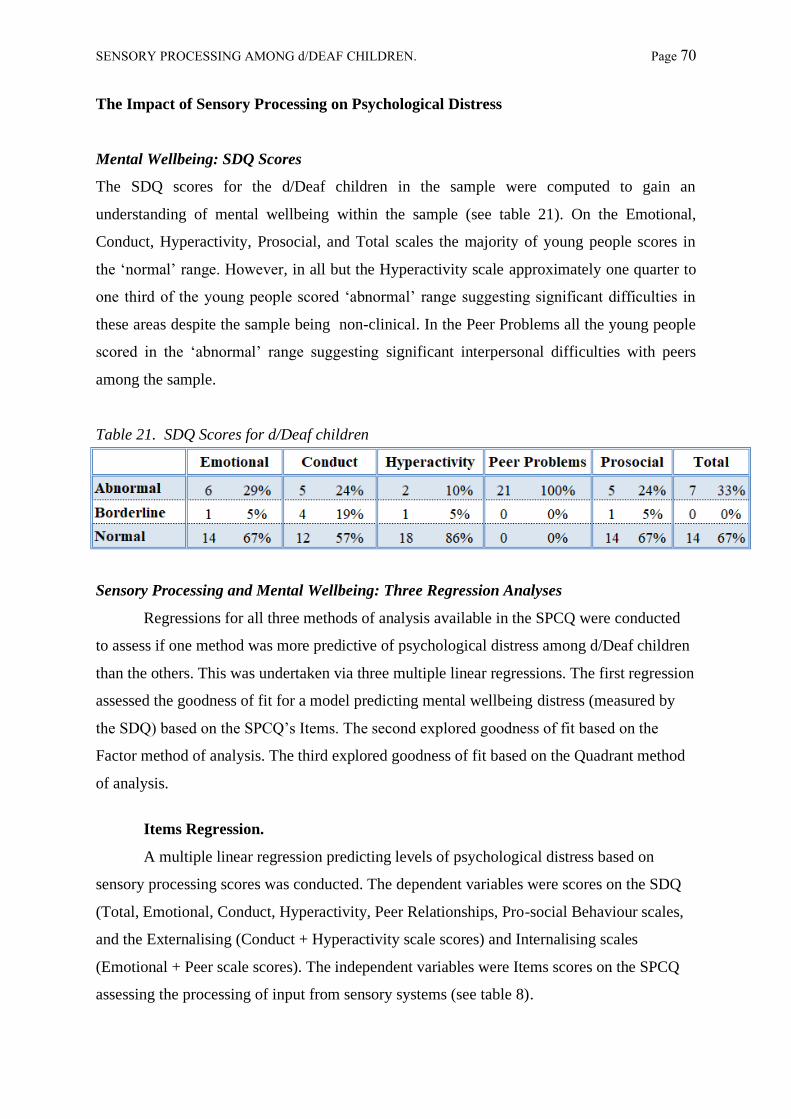
SENSORY PROCESSING AMONG d/DEAF CHILDREN. Page 70
The Impact of Sensory Processing on Psychological Distress
Mental Wellbeing: SDQ Scores
The SDQ scores for the d/Deaf children in the sample were computed to gain an
understanding of mental wellbeing within the sample (see table 21). On the Emotional,
Conduct, Hyperactivity, Prosocial, and Total scales the majority of young people scores in
the ‘normal’ range. However, in all but the Hyperactivity scale approximately one quarter to
one third of the young people scored ‘abnormal’ range suggesting significant difficulties in
these areas despite the sample being non-clinical. In the Peer Problems all the young people
scored in the ‘abnormal’ range suggesting significant interpersonal difficulties with peers
among the sample.
Table 21. SDQ Scores for d/Deaf children
Sensory Processing and Mental Wellbeing: Three Regression Analyses
Regressions for all three methods of analysis available in the SPCQ were conducted
to assess if one method was more predictive of psychological distress among d/Deaf children
than the others. This was undertaken via three multiple linear regressions. The first regression
assessed the goodness of fit for a model predicting mental wellbeing distress (measured by
the SDQ) based on the SPCQ’s Items. The second explored goodness of fit based on the
Factor method of analysis. The third explored goodness of fit based on the Quadrant method
of analysis.
Items Regression.
A multiple linear regression predicting levels of psychological distress based on
sensory processing scores was conducted. The dependent variables were scores on the SDQ
(Total, Emotional, Conduct, Hyperactivity, Peer Relationships, Pro-social Behaviour scales,
and the Externalising (Conduct + Hyperactivity scale scores) and Internalising scales
(Emotional + Peer scale scores). The independent variables were Items scores on the SPCQ
assessing the processing of input from sensory systems (see table 8).

SENSORY PROCESSING AMONG d/DEAF CHILDREN. Page 71
Descriptive Statistics.
The SDQ scales and Item variables were all normally distributed, producing non-
significant results on the Kolmogorov-Smirnov test of normality (see tables 22 and 23).
Given the small sample size there was a concern this test would not be sensitive enough to
adequately detect abnormalities in the distribution so skew and kurtosis were also computed
(see tables 24 and 245. In addition, visual inspections of histograms (see figure 4 for an
example and Appendix 11 for all other figures) and boxplots were undertaken. The Visual
and Oral Processing items showed a single outlier at the lower end of the spread (see figures
5-7 and Appendix 12 for all other figures). The Sensory Processing Related to
Endurance/Tone Item showed multiple outliers at the lower end (see figure 7). Outliers were
from different cases and data points did not fall into the extreme range. As such these were
retained to ensure milder sensory needs were not excluded for the analysis therefore biasing
the data. Assumptions of independent residuals, constant variance of residuals across scores
of the predictor, and normally distributed residuals were met (see figures 8 and 9 for
examples and Appendix 12 for all other figures).
Table 22. Kolmogorov-Smirnov Test (N = 21) for SPCQ Items
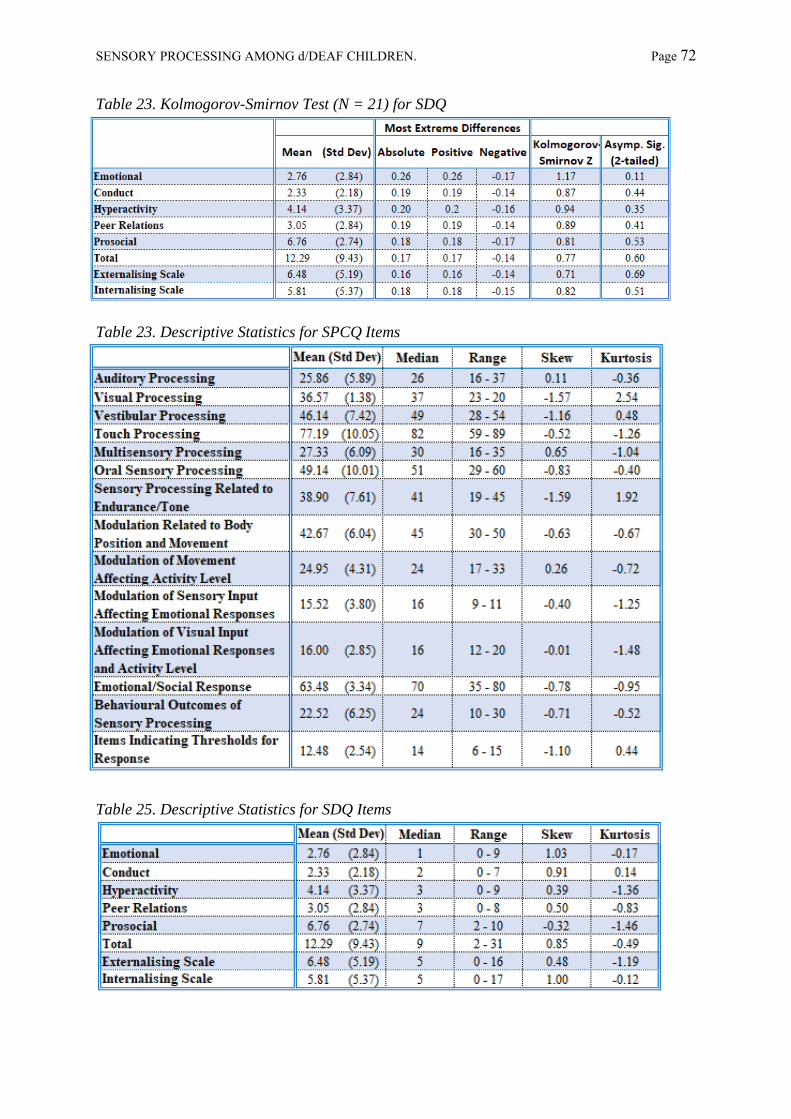
SENSORY PROCESSING AMONG d/DEAF CHILDREN. Page 72
Table 23. Kolmogorov-Smirnov Test (N = 21) for SDQ
Table 23. Descriptive Statistics for SPCQ Items
Table 25. Descriptive Statistics for SDQ Items
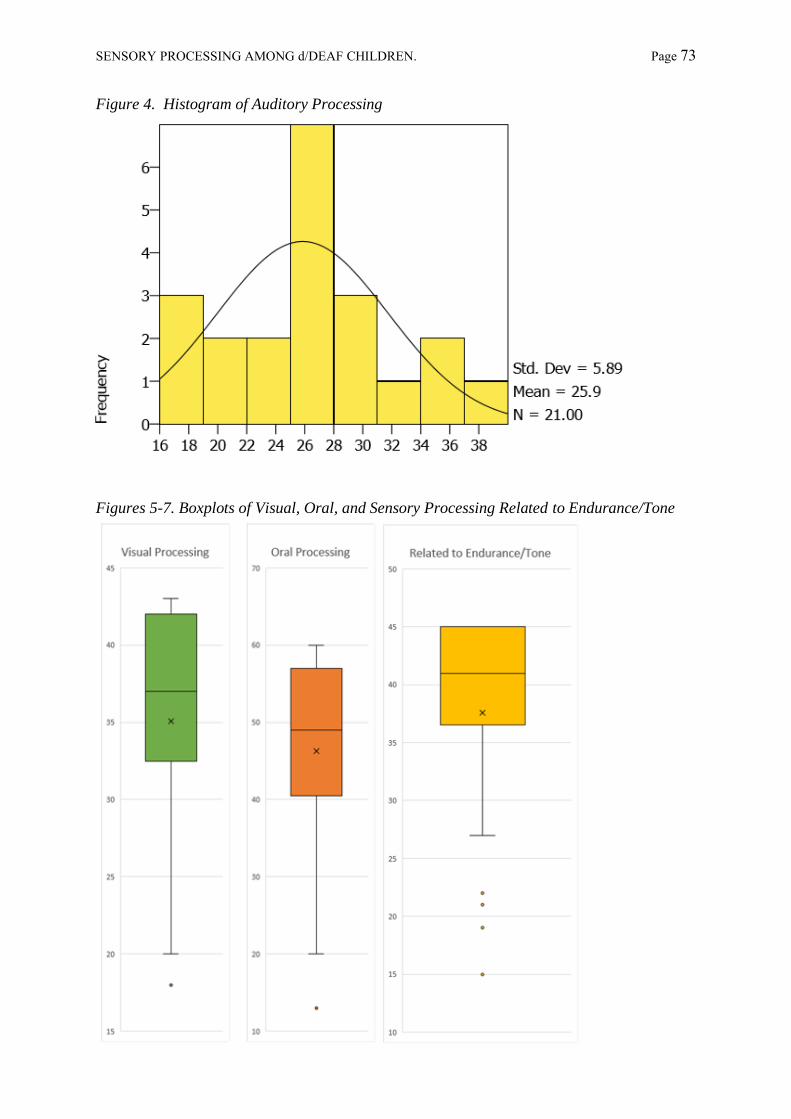
SENSORY PROCESSING AMONG d/DEAF CHILDREN. Page 73
Figure 4. Histogram of Auditory Processing
Figures 5-7. Boxplots of Visual, Oral, and Sensory Processing Related to Endurance/Tone

SENSORY PROCESSING AMONG d/DEAF CHILDREN. Page 74
Figure 8. Auditory Processing Residual Plot
Figure 9. Total SDQ Score Residual Plot
0
5
10
15
20
25
30
35
-2.5 -2 -1.5 -1 -0.5 0 0.5 1 1.5 2 2.5
Auditory Processing Q-Q Plot
-10
-5
0
5
10
15
20
25
30
35
-2 -1.5 -1 -0.5 0 0.5 1 1.5 2 2.5
SDQ Total Q-Q Plot

SENSORY PROCESSING AMONG d/DEAF CHILDREN. Page 75
Regression Statistics.
• Total SDQ - Sensory Processing scores explained a significant proportion of variance in
the Total scale (R2= 0.96, F (14, 6) = 9.28, p = < .01).
o Increased Modulation of Movement Affecting Activity Level (β = 0.65, p = .04,
95%CI 0.06 – 2.81) and Visual Input Affecting Emotional Responses and Activity
Level scores (β = 0.97, p = .02, 95%CI 0.84 – 5.58) significantly predicted an
increase in Total scores.
o Auditory, Visual, Touch and Multisensory Processing scores, and Emotional/Social
Response scores also significantly predicted Total scores, however these had a
95% confidence interval including zero.
o Behavioural Outcomes of Sensory Processing scores were borderline non-
significant (p = .06) in predicting Total scores hinting at the possibility this would
be significant in a larger sample.
Tables for this model were included in the main text as an exemplar (see tables 26-28).
Tables for other models are available in Appendix 14.
• Emotional Scale - A non-significant regression equation was found (R2 = 0.78. F (14,6) =
1.55, p = .31)
• Conduct Scale - A non-significant regression equation was found (R2 = 0.84, F (14, 6) =
2.18, p = .17).
• Hyperactivity Scale - Sensory Processing scores explained a significant proportion of
variance in the Hyperactivity scale (R2 = 0.92, F (14,6) = 5.08, p = .03)
o Increased Visual (β = -2.04, p = .02, 95%CI -1.94 – -0.24) and Touch Processing
(β = -2.11, p = .02, 95%CI -1.28 – -0.14),Modulation of Sensory Input Affecting
Emotional Response (β = -1.52, p = .04, 95%CI -2.59 – -0.09), and
Emotional/Social Response Responses (β = -1.08, p = .05, 95%CI -0.47 – -0.01)
scores predicted lower Hyperactivity scores.
o Increased Vestibular Processing scores (β =1.18, p = .02, 95%CI 0.14 – 0.92),
Sensory Processing Related to Endurance/Tone (β = 0.72, p = .03, 95%CI 0.04 –
0.60) and Modulation of Visual Input Affecting Emotional Responses and Activity
Level (β = 1.32, p = .02, 95%CI 0.43 – 2.68) predicted higher Hyperactivity
scores.

SENSORY PROCESSING AMONG d/DEAF CHILDREN. Page 76
Table 26. SDQ Total Score Item Regression Model Summary
Table 27. SDQ Total Score Item ANOVA
Table 28. SDQ Total Score Item Coefficients

SENSORY PROCESSING AMONG d/DEAF CHILDREN. Page 77
• Peer Relationships Scale – A borderline non-significant regression equation was found
(R2 = 0.90, F (14, 6) = 3.67, p = .06). A similar analysis with a larger sample may produce
a significant result in this area.
• Prosocial Behaviour Scale - Sensory Processing scores explained a significant proportion
of variance in scores on the Pro-social Behaviour scale (R2 = 0.92, F (14, 6) = 5.26, p =
.03).
o Increased Multisensory Processing (β = -2.35, p = < .01, 95%CI -1.71 – -0.40),
Modulation of Movement Affecting Activity Level (β = -1.39, p = < .01, 95%CI -
1.40 – -0.36), Modulation of Visual Input Affecting Emotional Responses (β = -
0.95, p = .05, 95%CI -1.81 – -0.01) and Behavioural Outcomes of Sensory
Processing scores (β = -1.92, p = .02, 95%CI -1.51– -0.17) significantly predicted
increased Pro-social Behaviour scores.
o Increased Auditory (β = 0.99, p = .03, 95%CI 0.06 – 0.86), Visual (β = 1.94, p =
.02, 95%CI 0.16 – 1.52), Touch processing scores (β = 1.98, p = .03, 95%CI 0.08 –
1.00), and Emotional/Social Response (β = 1.89, p = < .01, 95%CI 0.16 – 0.52)
significantly predicted increased Pro-social Behaviour scores.
• Externalising Scales –A borderline non-significant regression equation was found (R2 =
0.89, F (14, 6) = 3.45, p = .07). A similar analysis with a larger sample may produce a
significant result in this area.
• Internalising Scales - A non-significant regression equation was found (R2 = 0.86, F (14,
6) = 2.55 p = .13).

SENSORY PROCESSING AMONG d/DEAF CHILDREN. Page 78
Summary
o Sensory processing scores explained a significant proportion of variance in Total SDQ
scores with the following variables significantly predicting scores:
▪ Modulation Related to Body Position and Movement - ability to move
effectively
▪ Modulation of Visual Input Affecting Emotional Responses and Activity Level
- ability to use visual cues to establish contact with others.
o Sensory processing scores explained a significant proportion of variance in scores on
the Hyperactivity scale with the following variables significantly predicting scores:
▪ Modulation of Visual Input Affecting Emotional Responses and Activity
Level - ability to use visual cues to establish contact with others.
▪ Visual Processing - responses to things which are seen
▪ Vestibular Processing - responses to movement
▪ Touch Processing - responses to stimuli that touch the skin
▪ Sensory Processing Related to Endurance/Tone - ability to sustain physical
performance
▪ Modulation of Visual Input Affecting Emotional Responses and Activity
Level - ability to use visual cues to establish contact with others
▪ Emotional/Social Responses - psychosocial coping strategies.
o Sensory processing scores explained a significant proportion of variance in scores on
the Pro-social scale with the following variables significantly predicting scores:
▪ Auditory Processing - responses to things that are heard
▪ Visual Processing - responses to things which are seen
▪ Touch Processing - responses to stimuli that touch the skin
▪ Multisensory Processing - responses to activities containing combined sensory
experience
▪ Modulation of Movement Affecting Activity Level - level of activeness
▪ Modulation of Visual Input Affecting Emotional Responses and Activity
Level - ability to use visual cues to establish contact with others.

SENSORY PROCESSING AMONG d/DEAF CHILDREN. Page 79
Factor Regression.
For this regression, the dependent variables were the scales of the SDQ. The
independent variables were Factor scores on the SPCQ. These were Sensory Seeking
behaviour, Emotional Reactivity, Low Endurance/Tone, Oral Sensitivity,
Inattention/Distractibility, Poor Registration [of sensory stimuli], Sensory Sensitivity,
Sedentary [behaviour], and Fine Motor/Perceptual.
Descriptive Statistics.
One variable, Factor 7: Sensory Sensitivity, produced a borderline non-significant
result (p = .06) on the Kolmogorov-Smirnov test of normality (see table 29). Skew and
kurtosis were also once again computed (see table 30), revealing Sensory Sensitivity was not
normally distributed (Skew = -1.71, Kurtosis = 3.18). Low Endurance/Tone (Skew = -1.59,
Kurtosis = 1.92) and Poor Registration (Skew = -0.23, Kurtosis = -1.48) also appeared to be
non-normally distributed (see table 29). In addition, visual inspections of histograms and
boxplots for all variables were undertaken (see Appendices 11 and 12). Factor 3: Low
Endurance/Tone, Factor 4: Oral Sensitivity, and Factor 7: Sensory Sensitivity showed outliers
at the lower end of the spread (see figure 10 for an example, and Appendix 12 for all other
figures). For the Factor analysis regression, the assumption of normally distributed residuals
was not met (see figure 11 for an example and Appendix 13 for all other figures). As such,
while the Factor analysis regression is presented for completeness, it must be considered with
caution.
Table 29. Kolmogorov-Smirnov Test (N = 21) for SPCQ Factor Analysis

SENSORY PROCESSING AMONG d/DEAF CHILDREN. Page 80
Table 30. Descriptive Statistics for Factor Analysis of the SPCQ
Figure 10. Factor 3: Low Endurance/Tone Boxplot
Figure 11. Factor 1: Sensory Seeking Residual Plot
0
10
20
30
40
50
60
70
80
-2.5 -2 -1.5 -1 -0.5 0 0.5 1 1.5 2 2.5
Factor 1 - Sensory Seeking

SENSORY PROCESSING AMONG d/DEAF CHILDREN. Page 81
Regression Statistics.
• Total SDQ - Sensory Processing scores explained a significant proportion of variance in
scores on the Total scale (R2 = 0.83, F (9, 11) = 6.10, p = <.01). No individual factor
significantly predicted Total scores. Tables for this model were included in the main text
as an exemplar (see tables 31-33). Tables for other models are available in Appendix 15.
• Emotional Scale - A borderline non-significant regression equation was found (R2 =
0.72, F (9, 11) = 2.82, p = .06). A similar analysis with a larger sample may produce a
significant result in this area.
• Conduct Scale - A non-significant regression equation was found (R2 = 0.57, F (9, 11) =
1.49, p = .27).
• Hyperactivity Scale - Sensory Processing scores explained a significant proportion of
variance in scores on the Hyperactivity scale (R2 = 0.73, F (9, 11) = 2.95, p = .05). No
individual factor significantly predicted Hyperactivity scores.
• Peer Relationships Scale - Sensory Processing scores explained a significant proportion
of variance in scores on the Peer Relationship scale (R2 = 0.79, F (9, 11) = 4.13, p = .02).
No individual factor significantly predicted Peer Relationship scores.
• Prosocial Behaviour Scale - A non-significant regression equation was found (R2 =
0.48, F (9, 11) = 1.01, p = .49).
• Externalising Scale - A non-significant regression equation was found (R2 = 0.67, F (9,
11) = 2.30, p = .11).
• Internalising Scale - This scale is derived from the sum of the Emotional and Peer scale.
Sensory Processing scores explained a significant proportion of variance in scores on the
Internalising scale (R2 = 0.78, F (9, 11) = 4.05 p = .02). No individual factor
significantly predicted Internalising Scale scores.
• Summary - Sensory processing scores explained a significant proportion of variance in
Total scores and scores on the Hyperactivity, Peer Relationships, and Internalising
scales. For all three scales, no individual Factor significantly predicted scores

SENSORY PROCESSING AMONG d/DEAF CHILDREN. Page 82
Table 31. SDQ Total Score Factor Regression Model Summary
Table 32. SDQ Total Score Factor ANOVA
Table 33. SDQ Total Score Factor Coefficients

SENSORY PROCESSING AMONG d/DEAF CHILDREN. Page 83
Quadrant Regression.
A multiple linear regression was calculated to predict levels of mental distress based
on sensory processing needs. The dependent variables were the scales of the SDQ. The
independent variables were Quadrant scores on the SPCQ.
Descriptive Statistics.
Quadrant scores were normally distributed and produced non-significant results on the
Kolmogorov-Smirnov test of normality (see table 34) with minor levels of Kurtosis on
Sensation Seeking and Sensory Sensitivity (see table 35). A visual inspection of histograms
and boxplots supported a normal disruption and there were no outliers (see figures 12 and 13
and Appendices 11 and 12 for all other figures). The assumptions of independent residuals,
constant variance of residuals across scores of the predictor, and normally distributed
residuals were met (see figure 14 for an example and Appendix 13 for all other figures).
Table 34. Kolmogorov-Smirnov Test (N = 21) for SPCQ Quadrant Analysis
Table 35. Descriptive Statistics for Quadrant Analysis of the SPCQ
Figure 12. Quadrant 1 Histogram

SENSORY PROCESSING AMONG d/DEAF CHILDREN. Page 84
Figure 13. Quadrant Boxplot
Figure 14. Quadrant 1 Residual Plot
0
10
20
30
40
50
60
70
80
-2.5 -2 -1.5 -1 -0.5 0 0.5 1 1.5 2 2.5
Quadrant 1: Low Registration Q-Q Plot

SENSORY PROCESSING AMONG d/DEAF CHILDREN. Page 85
Regression Statistics
• Total SDQ Scores -Sensory Processing scores explained a significant proportion of
variance in scores on the Total scale (R2 = 0.72, F (4, 16) = 10.21, p = <.001). No
individual quadrant significantly predicted Total scores. Tables for this model were
included in the main text as an exemplar (see tables 36-38). Tables for other models are
available in Appendix 16.
• Emotional Scale - Sensory Processing scores explained a significant proportion of
variance in scores on the Emotional scale (R2 = 0.69, F (4, 16) = 8.78, p = .001).
Increased Sensory Sensitivity (β = -0.61, p = .04, 95%CI -0.28 – -0.01) predicted lower
Emotional scores.
• Conduct Scale - Sensory Processing scores explained a significant proportion of
variance in scores on the Conduct scale (R2 = 0.46, F (4, 16) = 3.44, p = .03). No
individual quadrant significantly predicted Conduct scores.
• Hyperactivity Scale - Sensory Processing scores explained a significant proportion of
variance in scores on the Hyperactivity scale (R2 = 0.65, F (4, 16) = 7.48, p = .001).
Increased Sensation Seeking (β = -0.74, p = .001, 95%CI -0.20 – -0.06) predicted lower
Hyperactivity scores.
• Peer Relationships Scale - Sensory Processing scores explained a significant proportion
of variance in scores on the Peer Relationship scale (R2 = 0.68, F (4, 16) = 8.66, p =
.001). No individual quadrant significantly predicted Peer Relationship scores.
• Prosocial Behaviour Scale - A non-significant regression equation was found (R2 =
0.32, F (4, 16) = 1.85, p = .17).
• Externalising Scale - This scale is derived from the sum of the Conduct and
Hyperactivity scale. Sensory Processing scores explained a significant proportion of
variance in scores on the Externalising scale (R2 = 0.57, F (4, 16) = 5.40, p = <.01).
Increased Sensation Seeking (β = -0.63, p = <.01, 95%CI -0.28 – -0.05) predicted lower
Externalising scores.

SENSORY PROCESSING AMONG d/DEAF CHILDREN. Page 86
• Internalising Scale - This scale is derived from the sum of the Emotional and Peer scale.
Sensory Processing scores explained a significant proportion of variance in scores on the
Internalising Scale scores of the SDQ (R2 = 0.74, F (4, 16) = 11.10, p = <.001). No
individual quadrant significantly predicted Internalising scale.
• Summary - Sensory processing scores explained a significant proportion of variance in
scores on Total scores and scores on the Emotional, Conduct, Hyperactivity, Peer,
Externalising and Internalising scales. For all scales, no individual quadrant significantly
predicted scores
Table 36. SDQ Total Score Quadrant Regression Model Summary
Table 37. SDQ Total Score Quadrant ANOVA
Table 38. SDQ Total Score Quadrant Coefficients

SENSORY PROCESSING AMONG d/DEAF CHILDREN. Page 87
Summary of Regression Analyses.
• In the Items regression sensory processing scores explained a significant proportion
of variance in Total, Hyperactivity and Pro-social scores (see table 39).
• In the Factor regression sensory processing scores explained a significant
proportion of variance in Total, Hyperactivity, Peer, and Internalising scores (see
table 39).
• In the Quadrant regression sensory processing scores explained a significant
proportion of variance in Total, Emotional, Conduct, Hyperactivity, Peer,
Externalising, and Internalising scales (see table 39).
In all three analyses sensory processing scores explained a significant proportion of variance
for Total SDQ scores. A significant proportion of variance in Hyperactivity and Peer
relationship scores were explained by the Factor analysis of SPCQ. Sensory processing
scores explained a significant proportion for most SDQ scales in the Quadrant analysis, only
proving non-significant in the Pro-social scale. It is acknowledged that these regressions
were undertaken with a small sample size, although one that is similar to previous sensory
processing studies. As such, caution must be taken when interpreting the results. However, it
is tentatively suggested that sensory processing needs may correlate with increased
psychological distress in d/Deaf children. This could be of considerable clinical significance
as d/Deaf children and young people are known to experience increased rates of
psychological distress due to societal context. In keeping with the findings of previous
research it is also further suggested that the Quadrant analysis may offer greater clinical
insight than the Factor analysis.

SENSORY PROCESSING AMONG d/DEAF CHILDREN. Page 88
Table 39. Proportion of Variance Explained by Individual SPCQ Variables for Each Significant Regression Equation
*Combined scores for conduct and hyperactivity scales
** Combined scores for emotional and peer scales
SENSORY PROCESSING AMONG d/DEAF CHILDREN. Page 89
Overall Summary of Results
Comparison of Sensory Profiles.
• 19 - 76% of scores for the d/Deaf sample fell outside of ‘typical’ ranges.
• Mean Item and Factors scores for the d/Deaf sample were lower than norms for typically
developing children and higher than norms for children diagnosed with ASD or ADHD.
• There were statistically significant differences between d/Deaf children and norms for
typically developing children on all Items, on 12 Items for children with a diagnosis of
ASD, and 11 Items for children with a diagnosis of ADHD.
• There were statistically significant differences between d/Deaf children and typically
developing children on three Factors, seven Factors for children with a diagnosis of ASD,
and five Factors for children with a diagnosis of ADHD.
Degree of Hearing Loss, Equipment, and BSL Use.
• Equipment use significantly impacted scores for ability to sustain physical performance
and low registration of sensory input with children using hearing aids showing greater
levels of difficulties. No effect for degree of hearing loss or BSL use was found.
Sensory Processing and Mental Health.
• Scores for Items related to sensory processing, modulation, and behaviour explained a
significant proportion of variance in Total, Hyperactivity and Pro-social scores.
• Factor scores explained a significant proportion of variance in Total, Hyperactivity, Peer,
and Internalising scores. No individual Factors were significant for these scales.
• Quadrant scores explained a significant proportion of variance in Total, Emotional,
Conduct, Hyperactivity, Peer, Externalising, and Internalising scores. Sensitivity to
sensory input explained a significant proportion of variance in Emotional scores while
seeking sensory input explained a significant proportion on Hyperactivity and
Externalising scales.
It is tentatively suggested that d/Deaf children may have differing sensory profiles to
both typically developing children and children with a diagnosis of ASD or ADHD and that
sensory processing may be influenced by hearing equipment use. It is also suggested that
sensory processing needs may correlate with increased psychological distress in d/Deaf
children. This could be of considerable clinical significance given increased rates of mental
health difficulties among d/Deaf children.

SENSORY PROCESSING AMONG d/DEAF CHILDREN Page 90
CHAPTER 5 - DISCUSSION
“Missing pieces do [not] complete the puzzle; they only fill an empty space” (Rice, 2020)
Discussion and Interpretation of Results
This study found a link between atypical sensory processing and increased scores
related to psychological distress in a sample of 21 d/Deaf children as rated by their parents.
While this sample size is not unusually small in context of studies exploring sensory
processing (e.g. Van Der Linde (2003), N = 24; Kientz & Dunn (1997), N = 32; Brown et al.,
(2008), N = 26) caution must still be taken in the interpretation of these findings as a result of
this limitation, particularly in light of the self-selecting nature of the sample. Furthermore,
this study is the first of its kind and therefore necessitates greater levels of caution.
Thoughtfulness must also be used in light of the complex picture that accompanies deafness
such as delayed language acquisition, increased rates of attachment difficulties, and
additional physical health and neurological diagnoses. The use of parent-rated measures of
sensory processing and psychological wellbeing also necessitates some caution as it is
acknowledged that parents sometimes perceive greater levels of difficulties than young
people themselves do (e.g. van der Meer et al., 2008). However, the use of the SPCQ
represents a clear strength in the current study as this measure is the gold standard in sensory
processing assessment and is used clinically to inform interventions.
Sensory Processing Profiles: Response to Sensory Stimuli among d/Deaf Children.
In all sensory processing areas a proportion of the d/Deaf sample fell outside the
‘typical’ range. When children fall into the ‘atypical’ response range it indicates difficulties
with processing sensory stimuli, suggesting a form of sensory stimuli could be confusing,
upsetting, or not meaningful to a child, and could interfere with their abilities to complete
tasks, tolerate certain environments, or engage with others. In all domains of sensory
processing a large proportion of the d/Deaf sample demonstrated ‘atypical’ responses (see
table 40). When reviewing figures in the d/Deaf sample it is important to remember that only
5-10% of the non-clinical hearing paediatric population are estimated to have ‘atypical’
responses to sensory stimuli.

SENSORY PROCESSING AMONG d/DEAF CHILDREN Page 91
Table 40. Categories of Response: Sensory Processing Domains
Area of Processing ‘Atypical’ Response ‘Typical’ Response
Auditory 76% 24%
Visual 38% 62%
Vestibular 43% 57%
Touch 38% 62%
Oral 43% 57%
Multisensory 48% 52%
Auditory Processing.
The cut offs used to define response ‘ranges’ are based on norms for hearing children
and it is very unlikely these will accurately reflect the experiences of d/Deaf children,
particularly in terms of auditory processing. In the current study 76% of the sample of d/Deaf
children fell in the ‘atypical’ response range (see table 40). This was not surprising given 16
of the 21 children in the sample were listed as severe to profoundly deaf and we might
therefore expect them to respond differently to auditory stimuli when compared with hearing
children. No papers relating to auditory processing were found in the systematic literature
review undertaken as part of the current project and as such only a limited consideration of
the results of this study in the context of other work can be made. In their study exploring
sensory processing in d/Deaf children with cochlear implants (N = 30) Bharadwaj et al.
(2009) reported ‘atypical’ responses in different domains of sensory processing. Their highest
reported level of ‘atypical’ responses was also in the auditory processing domain, although at
considerably lower levels (40%). In the current study mean scores for cochlear implant and
hearing aid users were on par (M = 27.9 and 24 respectively) and therefore this result cannot
be attributed to cochlear implant use specifically; however it is possible the result could
reflect deafness and use of hearing equipment in general. d/Deaf children are a varied and
heterogeneous group and there are substantial barriers to making general statements based on
the results of a single sample particularly when using hearing children as a reference group as
research findings can be influenced by aetiology of deafness, levels of hearing loss,
equipment use, language exposure, and numerous other factors.
Visual Processing.
Literature suggests no evidence for general enhancement of visual skills or lowered
visual abilities in adulthood (Alencar et al, 2019; Bavelier et al., 2006). However, a body of
research suggesting specific differences in visual processing between d/Deaf and hearing
adults was found. d/Deaf people are thought to exhibit supranormal abilities compared to

SENSORY PROCESSING AMONG d/DEAF CHILDREN Page 92
hearing controls in areas such as motion detection in peripheral vision, a lower threshold for
detecting movement in general, and better performance in visuomotor synchronisation tasks
(Bavelier et al., 2006; Iversen et al., 2015; Shiell et al., 2014). In contrast to adults d/Deaf
children have shown lower scores on measures of visual perception compared to hearing
controls until the age of approximately 10 years (Alencar et al., 2019). In the current study
the visual processing domain had the lowest levels of ‘atypical’ responses across the sensory
processing domains (39%) (see table 40). This is not an insubstantial figure, however changes
in visual processing skills have also been attributed to use of sign languages (Alencar et al.,
2019). Given the limited BSL skills among the parents of d/Deaf children in the sample it is
possible older d/Deaf young people may show fewer or greater levels of differences in this
area if they are exposed to more BSL as they grow.
Vestibular Processing.
Vestibular disorders are more prevalant among d/Deaf children however none of the
children in the sample has such diagnosis. In addition, increased rates of postural and balance
difficulties, and delayed motor skills have been found among d/Deaf children without
vestibular disorder diagnoses (An, Yi, Jeon, & Park, 2009; Walicka-Cupryś et al., 2014;
Ebrahimi, Movallali, Jamshidi, Rahgozar, & Haghgoo, 2017). In the current study roughly
half the sample fell within the ‘atypical’ range (see table 40). It is possible that these findings
are compatible as atypical sensitivity to bodily movements and where the body is in space
may make it harder to balance and use the body.
Tactile Processing.
In the current study a third of the children scored in the ‘atypical’ response range (see
table 40). The existing literature makes some suggestion of increased sensitivity to tactile
stimuli among d/Deaf young people (Chakravarty, 1968; Levanen & Hamford, 2001; Schiff
& Dytell, 1972) although this was not a uniform finding (Heming & Brown, 2005). There
was also a suggestion that d/Deaf people may be more skilled in using and remembering
information received through touch (Papagno et al., 2017). However, it must be
acknowledged that patterns of behaviour associated with ‘atypical’ sensory processing are
seen in the general population at large and it is thought to be the frequency or intensity of
certain behaviours which are suggestive of difficulties that may impact on daily living and
benefit from intervention (Ermer & Dunn, 1998). Further, the larger standard deviations in
sensory processing scores for the d/Deaf sample compared with norms for typically

SENSORY PROCESSING AMONG d/DEAF CHILDREN Page 93
developing children indicate there may be larger variations in sensory processing scores for
children in the d/Deaf sample.
Oral Processing.
In the current study 43% of the sample of d/Deaf children fell in the ‘atypical’
response range (see table 40). No papers relating to oral processing were found in the
systematic literature review undertaken as part of the current project. As such these results
cannot be contextualised with other studies.
Overview of Processing.
Overall, the results of this study suggest the d/Deaf children in the sample largely
respond to sensory stimuli in a ‘typical’ manner. However, in each area of sensory processing
a considerable proportion of the sample fell outside of this range to demonstrate greater levels
of ‘difficulties’ processing sensory stimuli (see table 41). This may be in line with previous
literature suggesting differences in sensory processing needs among d/Deaf children when
compared with hearing controls ( Bharadwaj et al., 2009; Rhoades & Chisolm, 2001). The
pattern of ‘atypical’ responses in the current study are also in keeping with Bharadwaj et al's
(2009) study of sensory processing in d/Deaf children with cochlear implants (N = 30)
although the current study indicated greater levels of ‘atypical’ responses in each domain (see
table 41).
Table 41. Comparison of Percentage of d/Deaf Children falling in the ‘Atypical’ Response
Range for Bharadwaj et al. (2009) and the current study (N = 30 and 21 respectively)
Area of Processing Atypical Response
Current Study Bharadwaj et al, 2009
Auditory 76% 40%
Visual 39% 10%
Vestibular 43% 40%
Touch 38% 25%
Oral 43% 25%
Modulation, and Behavioural and Emotional Responses
The Modulation items of the SPCQ reflect various combinations of sensory input
which are part of daily life. As with items relating to individual areas of sensory processing
scores outside of the ‘typical’ range indicates difficulties in a particular area. When a child
has a ‘typical’ response in modulating sensory experiences they can organise input and
generate appropriate responses while ‘atypical’ responses indicate difficulties. In the current

SENSORY PROCESSING AMONG d/DEAF CHILDREN Page 94
study approximately half the d/Deaf sample fell within the ‘atypical’ response range in each
area of modulation (see table 41). These results suggest a significant proportion of the d/Deaf
children in the sample may experience difficulties beyond those of their hearing peers in
relation to sitting still, remaining alert, and maintaining interaction with peers (Sensory
Processing Related to Endurance/Tone), anticipating how to move around safely,
incoordination, and clumsiness (Modulation Related to Body Position and Movement),
regulating their activity levels in line with environmental demands (Modulation of Movement
Affecting Activity Level), responding to social or environmental stimuli, becoming more
inflexible or upset in situations than others (Modulation of Sensory Input Affecting
Emotional Responses), and in understanding the usefulness of visual information resulting in
inappropriate responses (Modulation of Visual Input Affecting Emotional Responses and
Activity). This may be in line with previous literature suggesting difficulties pertaining to
sensory organisation among d/Deaf children (Crowe & Horak, 1998). The Behavioural and
Emotional Responses items of the SPCQ provide insight into emotional and behavioural
responses to stimuli. In the current study approximately half the d/Deaf sample fell within the
‘atypical’ response range for psychosocial coping strategies and ability to meet performance
demands. 20% of the sample fell within the ‘atypical’ response range for their ability to
translate sensory information into behaviour matching the nature/intensity of sensory input
(see table 42). These results suggest a significant proportion of the d/Deaf children in the
sample may become more frustrated or easily upset by sensory stimuli (Emotional/Social
Responses), struggle to complete tasks due to the impact of sensory input (Behavioural
Outcomes of Sensory Processing), and/or have difficulty identifying relevant stimuli
(Thresholds for Response). However, these behaviours may also be associated with other
experiences of d/Deaf children such as the consequences of language deprivation.
Furthermore, this data represents a pool of responses drawn for a sample of d/Deaf children.
As such, while these results may indicate difficulties with sensory processing among the
sample overall, it must be acknowledged that the patterns of behaviour associated with
‘atypical’ sensory processing are seen in the general populations at large and may not
necessarily translate to clinical levels of need. This would need to be assessed on an
individual basis as it is the frequency or intensity of behaviour which are significant in
assessing for difficulties and would guide any clinically relevant interventions (Ermer &
Dunn, 1998) (see Appendix 17).

SENSORY PROCESSING AMONG d/DEAF CHILDREN Page 95
Factors and Quadrant Responses.
The nine Factor scores can be used to gain an understanding of a child’s thresholds
and responsiveness to sensory events. In the current sample 71% of the children demonstrated
‘atypical’ responses in their abilities to concentrate and attend to input (Factor 5:
Inattention/Distractibility) with approximately half noted to have ‘atypical’ responses with
regards to their muscle tone and physical endurance (Factor 3: Low Endurance/Tone),
sensory seeking behaviour (Factor 1: Sensory Seeking), engagement in sedentary activities
(Factor 8: Sedentary) and emotional reactivity to sensory input (Factor 2: Emotional
Reactivity) (see table 43). The four Quadrant scores can be used to quantify the degree to
which a child may miss, obtain, detect, or be bothered by sensory input. Everyone engages in
behaviours associated with each quadrant; they are separate but related concepts (The
Psychological Corporation, 2003). For each Quadrant there is a separate continuum with
scores on one end suggesting an individual may be impoverished in the characteristic and at
the other end dominated by it. For example, the Sensory Sensitive and Low Registration
quadrants do not represent two extremes of the same continuum; instead, they represent
distinct sets of behaviour and necessitate differing intervention (The Psychological
Corporation, 2003). In the current study approximately half the sample appeared likely to
experience difficulties in each area (see table 43). Once again, the frequency or intensity of
behaviour demonstrated by individuals would need to be assessed in order to ascertain
whether these patterns represented clinically relevant difficulties and to determine
interventions which could be offered (Ermer & Dunn, 1998). It is also important to bear in
mind that factors such as language deprivation, difficulties with attachment, and the
consequences of deafness have also been shown to lead to some of the behaviours described
in the SPCQ (e.g. apparent inattention or distractibility could be related to a need for a greater
number of breaks which is linked to the higher levels of concentration d/Deaf people need to
exert in order to follow communication, or the repeating of information as a result of not
hearing an instruction).
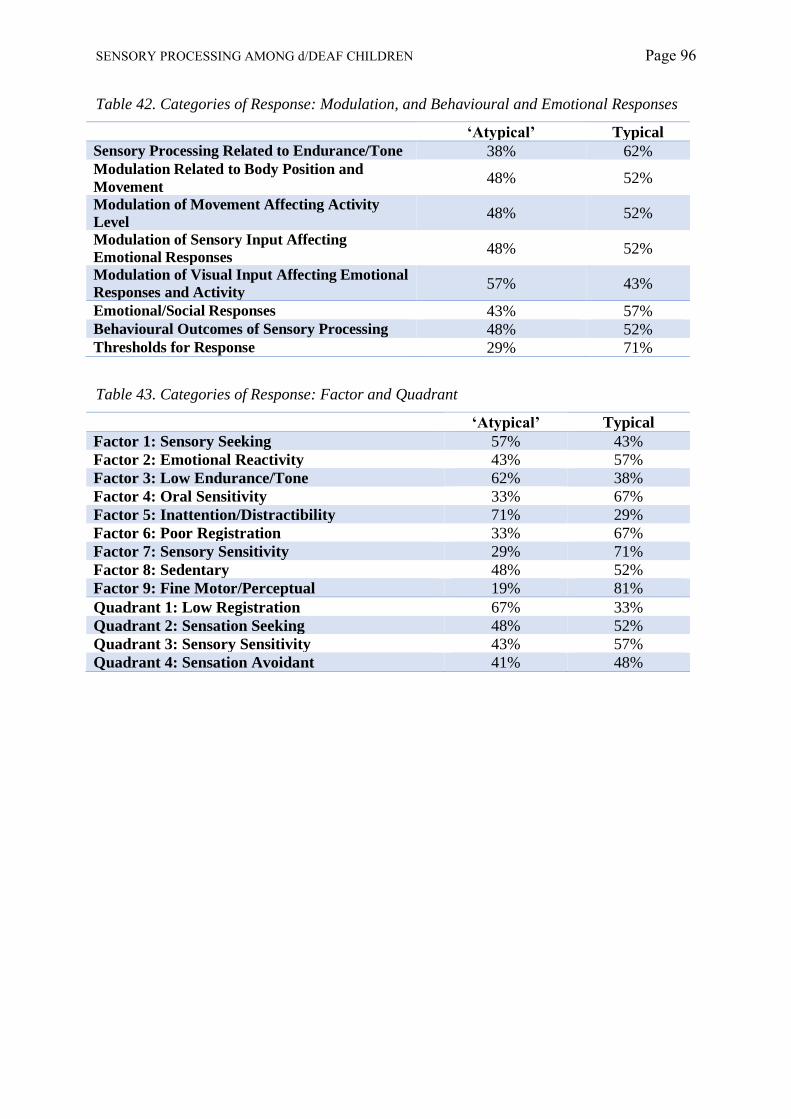
SENSORY PROCESSING AMONG d/DEAF CHILDREN Page 96
Table 42. Categories of Response: Modulation, and Behavioural and Emotional Responses
‘Atypical’ Typical
Sensory Processing Related to Endurance/Tone 38% 62% Modulation Related to Body Position and
Movement 48% 52%
Modulation of Movement Affecting Activity
Level 48% 52%
Modulation of Sensory Input Affecting
Emotional Responses 48% 52%
Modulation of Visual Input Affecting Emotional
Responses and Activity 57% 43%
Emotional/Social Responses 43% 57% Behavioural Outcomes of Sensory Processing 48% 52% Thresholds for Response 29% 71%
Table 43. Categories of Response: Factor and Quadrant
‘Atypical’ Typical
Factor 1: Sensory Seeking 57% 43%
Factor 2: Emotional Reactivity 43% 57%
Factor 3: Low Endurance/Tone 62% 38%
Factor 4: Oral Sensitivity 33% 67%
Factor 5: Inattention/Distractibility 71% 29%
Factor 6: Poor Registration 33% 67%
Factor 7: Sensory Sensitivity 29% 71%
Factor 8: Sedentary 48% 52%
Factor 9: Fine Motor/Perceptual 19% 81%
Quadrant 1: Low Registration 67% 33%
Quadrant 2: Sensation Seeking 48% 52%
Quadrant 3: Sensory Sensitivity 43% 57%
Quadrant 4: Sensation Avoidant 41% 48%

SENSORY PROCESSING AMONG d/DEAF CHILDREN Page 97
Sensory Processing Profiles: Comparison with Other Groups.
The current study excluded d/Deaf children with diagnoses of ASD and ADHD, two
diagnoses linked with additional sensory processing needs. This was necessary in order to
account for possible extraneous variables in the analysis. However, there are considerably
higher rates of these diagnoses with the d/Deaf population compared with their hearing peers.
In part this is related to the effects of language deprivation however both diagnoses also make
reference to sensory processing needs and/or behaviour associated with these. In the current
study mean scores for the d/Deaf sample were lower than norms for typically developing
children and higher than norms for children diagnosed with ASD or ADHD. There were
statistically significant differences between scores for d/Deaf children and norms for typically
developing children, and between scores for d/Deaf children with a diagnosis of ADHD. This
suggests differences in sensory processing profiles between d/Deaf children and typically
developing children, and between d/Deaf children a diagnosis of ASD or ADHD. These
results potentially suggest greater levels of sensory processing needs among typically
developing d/Deaf children when compared to hearing peers and that caution is required when
using sensory processing needs as indicators for diagnosing neurodevelopmental disorders
among d/Deaf children.
Degree of Hearing Loss, Equipment, and BSL Use.
No effect of degree of hearing loss or BSL use on sensory processing was found.
Equipment use was found to have a large impact on a child’s ability to sustain physical
performance and registration of sensory stimuli with children using hearing aids showing
greater levels of difficulties than those using cochlear implants. Given limitations in the
sample size of the current study and research regarding sensory processing among d/Deaf
children these results are difficult to interpret. The only previous study exploring sensory
processing among cochlear implant users did not report on the modulation items or quadrants
of the SPCQ (Bharadwaj et al., 2009). Hearing aids work by amplifying sound whereas
cochlear implants are used to bypass the damaged parts of the cochlea and directly stimulate
the auditory nerve. Using hearing aids does not restore ‘normal’ levels of hearing and
common problems with using them can include unwanted feedback noises and the
amplification of background noise as well as sounds a person may wish to focus on. That is
not to imply that using a cochlear implant leads to ‘normal’ hearing either 8
10. Furthermore,
10 To gain a sense of what it is like to hear using a cochlear implant, hearing people can listen to clips of vocoded speech on YouTube. Such clips are often used in research settings to simulate cochlear implant use for hearing research participants (e.g. Cardin et al, 2020).

SENSORY PROCESSING AMONG d/DEAF CHILDREN Page 98
cochlear implants are not suitable for all aetiologies of deafness. Nonetheless, improved
registration of sensory stimuli among cochlear implant users could be explained if it were
underpinned by higher scores on auditory processing items; however, this was not the case in
the current sample. The impact of aetiology of deafness or duration of implantation were not
analysed due to limitations related to sample size. More research will be needed to make
sense of these results.
Sensory Processing and Mental Health.
Overall Levels of Difficulties.
On the Emotional, Conduct, Hyperactivity, Prosocial, and Total scales of the SDQ the
majority of young people in the current sample scored in the ‘normal’ range; however,
approximately one quarter to one third of the young people also scored in the ‘abnormal’
range for the Emotional, Conduct, Prosocial, and Total scales. For the Peer Problems scales
all the young people scored in the ‘abnormal’ range. This could suggest significant
difficulties for a sizable portion of the d/Deaf children in this sample despite using a non-
clinical sample.
Emotional Difficulties.
Increased sensitivity to sensory stimuli was linked with greater emotional distress.
Theoretically, children with sensory sensitivity experience low thresholds for stimuli
experiencing discomfort associated with this and employing a passive behaviour strategy.
These children may be seen as precise or picky which may be interpreted as indications of
anxiety or low mood as measured by the SDQ (e.g. items associated with somatisation,
tearfulness, or nervousness/fearfulness). Literature available on sensory processing and
mental wellbeing in d/Deaf children was limited in scope and primarily focused on motor
development. However, within the literature there were some indications that lower levels of
balance and motor skills were linked with increased difficulties in peer relationship and
increased emotional difficulties among d/Deaf children and young people (6-16 years)
(Fellinger et al, 2015). The current results do not support this suggestion however, as noted,
this study had a smaller sample (N = 21) than Fellinger et al. (2015) (N = 93).

SENSORY PROCESSING AMONG d/DEAF CHILDREN Page 99
Hyperactivity.
Increased response to movement, and an increased ability to sustain physical
performance and establish contact with others using visual cues were linked with increased
hyperactivity, indicating greater levels of difficulty. Lower response to visual and tactile
stimuli, a lowered ability to use bodily senses to generate emotional responses, and fewer
psychosocial coping strategies were also linked with increased levels of hyperactivity. Lower
scores for sensory seeking behaviour were also linked to increased hyperactivity (see table
44). The SDQ is a screening measure which taps into multiple dimensions associated with
distress in children and young people. The hyperactivity scale covers attention, impulsivity,
and activity level however sensory seeking behaviour is associated with attention difficulties
and not necessarily impulsivity and increased activity levels. This may suggest attentional
difficulties which are being captured by this result (e.g. lower response to visual and tactile
stimuli because the child does not attend to them). This idea was supported by high rates of
‘atypical’ responses on the inattention/distractibility (71% of the sample) factor analysis but it
is possible that this is a reflection of the effects of language deprivation and/or the natural
consequences of deafness as well as, or instead of, any sensory processing needs.
Prosocial Behaviour.
Decreased responses to auditory, visual, and tactile stimuli, and decreased
psychosocial coping strategies were linked with lower pro-social behaviour scores, indicating
greater levels of difficulty. Lowered response to multiple sensory stimuli, lower activeness,
and decreased ability to establish contact with others using visual cues and meet performance
demands were also linked with decreased pro-social behaviour scores (see table 45).
Literature available on sensory processing and mental wellbeing in d/Deaf children did not
explore pro-social behaviour as a measure of wellbeing.
Table 44. Impact of Sensory Processing on Table 45. Impact of Sensory Processing on
Hyperactivity Pro-social Behaviour

SENSORY PROCESSING AMONG d/DEAF CHILDREN Page 100
Conduct and Peer Relationships.
There was a suggestion that sensory processing Quadrant scores were linked to scores
on the Conduct scale of the SDQ. However, no individual Quadrant demonstrated a
statistically significant link. There was also a suggestion that sensory processing Quadrant
scores and sensory processing Factors were both linked to scores on the Peer Relationships
scale of the SDQ. No individual Quadrant or Factor demonstrated a statistically significant
link however as this study had a smaller sample size 9
11 and was conducted with a non-clinical
sample it is possible this represents a false negative (see Appendix 18).
Coulda, Woulda, Shoulda: Beneficial Changes and Future Commitments.
If this project were repeated several changes could be made to mitigate some of limitations of
the current work. The first would be to ensure that early recruitment did not neglect the
parents of hearing children. While data from the parents of hearing children was collected the
planned analysis required hearing children to be age and gender matched with d/Deaf
children. This substantially limited the amount of data from the parents of hearing children
which could be used. This requirement alongside the decision to suspend recruitment due to
the Covid-19 pandemic meant an additional planned analysis could not be undertaken. Over a
nine-month period, 67 schools and organisations were contacted as part of the recruitment for
this study (see Appendix 3). The majority of these were local and national organisations
supporting d/Deaf children and their families, and schools with d/Deaf pupils. More schools
without d/Deaf students should have been contacted to facilitate recruitment of parents of
hearing children. Despite recruitment efforts focusing on the parents of d/Deaf children it
must be acknowledged that final d/Deaf sample size was small (although not usual for studies
exploring sensory processing) limiting the power of analyses, internal and external validity,
and generalisability of results. It is possible this low response rate reflects a limited
awareness of the impact of sensory processing needs among the parents and educators of
d/Deaf children (similar to the diagnostic overshadowing of deafness sometimes seen among
children with ‘missed’ diagnoses of ASD or ADHD wherein behaviour or challenges are
perceived as the consequences of d/Deafness). This in turn could be due to the limited
engagement of researchers in this area. On a practical level a lack of awareness could be
addressed by activities aiming to educate families and organisations about sensory processing
needs (e.g. offering training to teachers, speaking at third sector events). However, there are a
11 Power calculations suggests 59 - 91 participants are needed to detect large effect sizes with 934 – 1373 for small effect sizes dependent on which method of analysis is used for the SPCQ data (see Appendix 18).
SENSORY PROCESSING AMONG d/DEAF CHILDREN Page 101
number of ethical and methodological concerns that would need to be adequately addressed
prior to any such undertaking; especially if they were linked with research activities (e.g.
potentially priming parents or educators to view behaviour with a ‘sensory’ lens therefore
biasing results, or possible distress or harm this may cause to a young person or their family).
It is also possible the surveys used in the current project were not as accessible to the parents
of d/Deaf children as it was first thought they would be. There was a 53% attrition rate in the
current survey which may have introduced some bias into the results. For example, the SPCQ
is a long questionnaire (125 items) which may have resulted in disengagement by parents
who did not strongly feel that their child is distressed by sensory stimuli. Previous studies
have also suffered from low return rates when using the SPCQ (e.g. van der Linde et al.,
2013) and this may suggest that questionnaire is not generally accessible. The decision to use
written English questionnaires was made on the basis that 90% of d/Deaf children are born to
hearing parents who would therefore be able to access written English. However, one
Headteacher supporting recruitment disclosed that approximately two thirds of families with
children enrolled at the school did not use English as a first language at the home (personal
correspondence, 20th November 2019). This may be related to the school’s location but it is
an important piece of feedback for any future research: for example, this may suggest
researchers might be better off conducting in-person assessments rather than using internet-
based surveys with this population of parents. Conducting in-person assessments would have
the advantage of allowing for Deaf parents to take part in the study if funding for an
interpreter was available. If additional funding were available, it would also be valuable to
recruit an Occupational Therapist with experience in assessing sensory processing to the
research team. This would allow research activities to expand into areas such as behavioural
observations. The current work could also be expanded into a consideration of sensory
processing among d/Deaf people across the lifespan in light of suggestions that sensory
processing needs in adult populations may reflect those seen in childhood, and the lifelong
impacts of these needs. This may include a series of cross-sectional studies or even
longitudinal pieces of work. For adolescents and adults this would also mean that self-rated
data could be collected as the current study uses parent reported data and it is generally
accepted that parents report greater levels of difficulties than their young people. It would
also be interesting to undertake qualitative work, such as interviews with d/Deaf children,
young people, and adults with the aim of understanding their experiences of sensory
processing. Such studies could be based on similar studies undertaken with people with a
diagnosis of ASD. The current study was also limited to a non-clinical sample of d/Deaf
SENSORY PROCESSING AMONG d/DEAF CHILDREN Page 102
children. Future studies could explore sensory processing needs among d/Deaf children with
additional needs such as those with neurodevelopmental or mental health diagnoses. It could
also be used to account for the impact of other risk factors associated with sensory processing
needs such as premature birth and attachment styles. This could be undertaken in partnership
with Deaf mental health services such as SignHealth or Deaf4Deaf (third sector adult
services) and National Deaf CAMH services (NDCAMHS). This would also allow research
to address and explore professional viewpoints and perspectives (e.g. through clinician-rated
measures or interviews), while also allowing for analyses of individual case studies. The
current project team have made commitments to explore these ideas further and consider
applying for research grants to expand on the current work.
Clinical Implications
Behaviour associated with sensory processing needs can also arise from language
deprivation, attachment difficulties, adverse life experiences, and unjust sociocultural
structures. d/Deaf children are more at risk of delayed access to language, childhood trauma,
disrupted attachment, structural inequalities, and marginalisation and discrimination. Sensory
processing needs also form part of the clinical presentation of other psychiatric diagnoses
such as ASD and ADHD; both of which are diagnoses at higher rates in d/Deaf children and
young people. Clinicians working in specialist d/Deaf services therefore become skilled at
considering and thinking around different aspects of a young person’s experiences. A key
component of this is adopting a transdiagnostic and holistic perspective. In contrast to a
diagnostic classification system which implies each “disorder” requires its own specific form
of treatment, a transdiagnostic perspective holds common mechanisms underlie differing
manifestations of distress or difficulties, and suggests a more finely-grained etiologic and
phenomenological descriptions may better guide effective clinical practice compared with
treatment based on discrete diagnostic categories. As such, during assessments, formulation,
and intervention activities with d/Deaf young people consideration should be given to the
high probability of delayed language acquisition, family dynamics, social isolation, issues of
ablism such as parents having lower expectations for their child’s future because of their
deafness and issues of identity related to disability or cultural perspectives of d/Deafness,
possible disruptions of attachment, the impact of past physical illness (e.g. potential cognitive
impacts of meningitis, rubella, or measles which can be a cause of deafness) and current
comorbid physical health needs, and barriers to education and leisure activities all of which
impact of socioemotional development and psychological wellbeing. However, it is not only
SENSORY PROCESSING AMONG d/DEAF CHILDREN Page 103
clinicians within d/Deaf services that need to have knowledge around mental health and
d/Deafness. The d/Deaf population are geographically spread. This makes setting up
specialist services problematic, complicated further by structural barrier to accessing funding.
At present only secondary and tertiary services are recognised as “specialist” and therefore
eligible for ring-fenced funding. As such many d/Deaf people rely on accessing hearing
services. While this remains the case, improved awareness and training for mental health
practitioners is vital. However, an as-yet unpublished study by the lead author of this paper
which audited teaching on d/Deafness and mental health on UK clinician and forensic
psychology trainees suggested little-to-no training is provided (Coulson-Thaker & Coxell,
unpublished). As such it seems likely that clinicians meeting with a Deaf client for the first
time will be largely unaware of the complexities of working with Deaf clients, the barriers to
they may experience and how to minimise these, the roles of cultural and language in
assessment and treatment of these individuals, and the legal and ethical implications of
working with this group. Specific training and education around the complexities of working
with d/Deaf people across the lifespan within psychology courses is long overdue.
Conclusion
The current study suggests sensory processing among d/Deaf children may represent a
unique pattern that differs from typically developing children and children with
neurodevelopmental diagnoses. It also suggests d/Deaf children may experience more
difficulties in processing, using, and responding to sensory stimuli than their hearing peers,
and that there is a possible link between psychological distress and sensory processing needs
among d/Deaf children. The impact of degree of hearing loss, aetiology of deafness,
equipment or BSL use on sensory processing, if any, remains unclear due to limitations in the
analyses that could be undertaken based on the current sample size and demographics.
Considerable caution is needed when considering the findings of this study and their clinical
applications. The study has a small sample size and it is recognised that d/Deaf children are a
varied and heterogeneous group where the individual differences can be considerable. As
such generalizability is limited for this study. There are substantial, interwoven levels of
complexity which need to be adequately accounted for before any definite comment on
sensory processing among this group of children can be made. Given these complexities,
qualitative and case studies as well as more quantitative research exploring the impact of
sensory processing in both clinical and non-clinical populations of d/Deaf people across the
lifespan may be of considerable benefit.

SENSORY PROCESSING AMONG d/DEAF CHILDREN Page 104
Overall Summary and Recommendations
This study explored sensory processing in five to 10 year old d/Deaf children. d/Deaf people
experience at least one sensory input (auditory stimuli) differently to the general population,
with research suggesting differences in multiple of sensory processing domains. There are
also links between deafness and risk factors associated with increased levels of sensory
processing needs. Children with sensory processing needs can show decreased social skills,
experience lower levels of self-confidence, self-esteem, and academic success, and
experience difficulties in activities of daily living and higher rates of mental health
difficulties. d/Deaf children and young people are at a high risk of mental health difficulties
than their hearing peers due to multiple factors. To date d/Deaf children and young people
have been excluded from research into sensory processing and the effectiveness of
interventions for these. The current study was the first of its kinds and it is essential this work
is built on in order to develop a understanding of sensory processing among d/Deaf children,
how these affect children at home, school, and during leisure activities, and the impact they
have on mental wellbeing. Larger studies and more varied forms of research will be
necessary. Future studies in this area could include:
• Quantitative studies with larger samples, directly comparing d/Deaf children with other
groups of children, and accounting for other diagnoses and risk factors associated with
increased sensory processing needs;
• Qualitative studies exploring the impact of sensory processing from the perspectives of
both d/Deaf young people and their families;
• Mixed methods and multidisciplinary research (e.g. combining OT behavioural;
observations with parent-rated measures of sensory processing and interviews with d/Deaf
children and their families focusing on the impact of sensory processing on mental
wellbeing);
• Further exploration of factors which may impact sensory processing among d/Deaf
children (e.g. hearing equipment and signed language proficiency, and degree and
aetiology of deafness);
• Research which includes clinical populations such as children under the care of
NDCAMHS;
• Explorations of professional perspectives on working with d/Deaf children in the context
of sensory processing needs in educational and clinical settings;
• Detailed case studies about specific d/Deaf children with sensory processing needs

SENSORY PROCESSING AMONG d/DEAF CHILDREN Page 105
• Explorations of the impact of sensory processing needs among d/Deaf children in
educational settings;
• The development of assessments and interventions for d/Deaf children who experience
difficulties with sensory processing, and interventions for the impact these needs may have
on their mental wellbeing;
• Studies into sensory processing needs among d/Deaf people and their impact across the
lifespan.

SENSORY PROCESSING AMONG d/DEAF CHILDREN Page 106
REFERENCES
Ackerman, D. (1991). A Natural History of the Senses. Phoenix: Phoenix Publishing Group
Action on Hearing Loss (n.d.). Deaf Awareness. Retrevied from
https://actiononhearingloss.org.uk/information-and-support/deaf-awareness/
Alencar, C., Butler, B., & Lomber, S. (2019). What and How the Deaf Brain Sees. Journal of
Cognitive Neuroscience, 31(8), 1091–1109.
An, M., Yi, C., Jeon, H., & Park, S. (2009). Age-related changes of single-limb standing
balance in children with and without deafness. International Journal of Pediatric
Otorhinolaryngology, 73, 1539–1544.
Angelou, M. (1992). Commencement Address at Spelman College.
https://www.youtube.com/watch?v=70RH-h7QfP0. Accessed 12th February 2020
Arbesman, M., & Lieberman, D. (2010). Methodology for the Systematic Reviews of
Occupational Therapy for Children and Adolescents with Difficulty Processing and
Integrating Sensory Information. American Journal of Occupational Therapy, 64(3),
368–374.
Archer, M., Rutzou, T., Decoteau, C., Smith, C., Gorksi, P., Steinmetz, G., Little, D.,
Vandenberghe, F., & Porpora, D. (2016). What is Critical Realism? Perspectives.
Arksey, H., & O’Malley, L. (2005). Scoping studies: towards a methodological framework.
International Journal of Social Research Methodology, 8(1), 19–32.
Ashburner, J., Ziviani, J., & Rodger, S. (2008). Sensory processing and classroom emotional,
behavioral, and educational outcomes in children with Autism Spectrum Disorder.
American Journal of Occupational Therapy, 62(5), 564–573.
American Psychiatric Association. (2013). The Diagnostic and Statistical Manual of Mental
Disorders (5th ed.). American Psychiatric Publishing.
Ayres, A. J. (1989). Sensory Integration and Praxis Tests. Western Psychological Services.
Bauman, H. . (2004). Audism: Exploring the metaphysics of oppression. Journal of Deaf
Studies and Deaf Educatio, 9(2), 239–246.
Bauman, H. . (2008). Listening to Phonocentrism with Deaf Eyes: Derrida’s Mute Philosophy
of (Sign) Language. Essays in Philosophy, 9(1).
Bavelier, D., Dye, M. W., & Hauser, P. C. (2006). Do deaf individuals see better? Trends in
Cognitive Sciences, 10(11), 512–518.
Ben-Sasson, A., Hen, L., Fluss, R., Cermak, S. A., Engel-Yeger, B., & Gal, E. (2009). A
Meta-Analysis of Sensory Modulation Symptoms in Individuals with Autism Spectrum

SENSORY PROCESSING AMONG d/DEAF CHILDREN Page 107
Disorders. Journal of Autism and Developmental Disorders, 39(1), 1–11.
Benjamin, T., Crasta, J. E., Suresh, A. P., Alwinesh, M. J., Kanniappan, G., Padankatti, S.
M., Nair, M. K., & Russell, P. S. (2014). Sensory Profile Caregiver Questionnaire: a
measure for sensory impairment among children with developmental disabilities in
India. Indian Journal of Pediatrics, 81(2), 183–186.
Bharadwaj, S., Daniel, L. L., & Matzke, P. . (2009). Sensory-Processing Disorder in Children
with Cochlear Implants. American Journal of Occupational Therapy, 63, 208–213.
Bielecki, I., Horbulewicz, A., & Wolan, T. (2011). Risk factors associated with hearing loss
in infants: An analysis of 5282 referred neonates. International Journal of Pediatric
Otorhinolaryngology, 75(7), 925–930.
Black, P. A., & Glickman, N. S. (. (2006). Demographics, psychiatric diagnoses, and other
characteristics of North American deaf and hard-of-hearing inpatients. Journal of Deaf
Studies and Deaf Education, 11(3), 303–321.
Borkowska, A. (2017). Sensory processing disorders – diagnostic and therapeutic
controversies. Current Issues in Personality Psychology, 5(3), 196–205.
Bross, M., & Sauerwein, H. (1980). Signal detection of visual flicker in deaf and hearing
individuals. Perceptual and Motor Skills, 51, 839–843.
Brown, T., Leo, M., & Austin, D. W. (2008). Discriminant validity of the Sensory Profile in
Australian children with autism spectrum disorder. Physical & Occupational Therapy In
Pediatrics, 28(3), 253–266.
Brozinsky, C. J., & Bavelier, D. (2004). Motion velocity thresholds in deaf signers: Changes
in lateralization but not in overall sensitivity. Cognitive Brain Research, 21, 1–10.
Bundy, A. C. (2002). Using sensory integration theory in schools: Sensory integration and
consultation. In A. C. Bundy, S. J. Lane, & E. A. Murray (Eds.), Sensory integration:
Theory and practice (2nd ed., pp. 309–332).
Burleigh, J. M., McIntosh, K. W., & Thompson, M. W. (2002). Central auditory processing
disorders. In A. C. Bundy, S. J. Lane, & E. A. Murray (Eds.), Sensory integration:
Theory and practice (2nd ed., pp. 141–165).
Burns, C. O., Dixon, D. R., Novack, M., & Granpeesheh, D. (2017). A systematic review of
assessments for sensory processing abnormalities in autism spectrum disorder. Review
Journal of Autism and Developmental Disorders, 4(3), 209-224.
Cardin, V., Rosen, S., Konieczny, L., Coulson, K., Lametti, D., Edwards M., & Woll, B.
(2020). The effect of dopamine on the comprehension of spectrally-shifted noise-
vocoded speech: a pilot study. International Journal of Audiology, 1-8.
SENSORY PROCESSING AMONG d/DEAF CHILDREN Page 108
Chafe, W., & Tannen, D. (1987). The Relation Between Written and Spoken Language The
Relation Between Written and Spoken Language. Annual Review of Anthropology, 16,
383–407.
Chakravarty, A. (1968). Influence of tactile sensitivity on tactile localization, particularly of
deaf children. Journal of General Psychology, 78, 219–221.
Cheung, P., & Siu, A. (2009). A comparison of patterns of sensory processing in children
with and without developmental disabilities. Research in Developmental Disabilities,
30(6), 1468–1480.
Chilosi, A. M., Comparini, A., Scusa, M. F., Berrettini, S., Forli, F., Battini, R., Cipriani, P.,
& Cioni, G. (2010). Neurodevelopmental disorders in children with severe to profound
sensorineural hearing loss: a clinical study. Developmental Medicine & Child
Neurology.
Clare, S. (2017). Disabled “losing out on jobs” over Access to Work cap. BBC Derbyshire.
Clark, J. G. (1981). Uses and abuses of hearing loss. Asha: A Journal of the American
Speech-Language-Hearing Association, 23(7), 493–500.
Codina, C., Buckley, D., Port, M., & Pascalis, O. (2011). Deaf and hearing children: A
comparison of peripheral vision development. Developmental Science, 14, 725–737.
Conama, J. B., & Grehan, C. (2001). Is There Poverty in the Deaf Community?
Conroy, P. (2006). Signing In and Signing Out: The Education and Employment Experiences
of Deaf People in Ireland. A Study of Inequality and Deaf People in Ireland.
Conway, C. M., Pisoni, D. B., Anaya, E. M., Karpicke, J., & Henning, S. C. (2001). Implicit
sequence learning in deaf children with cochlear implants. Development Science, 41,
69–82.
Coulson-Thaker, K. & Coxell, unpublished Training of Deafness and Mental Health in UK
Clinical and Forensic Doctorate Courses
Crowe, T., & Horak, F. B. (1988). Motor Proficiency Associated with Vestibular Deficits in
Children with Hearing Impairments. Physical Therapy, 68(10), 1493–1499.
Crozier, S., Goodson, J., Mackay, M., Synnes, A., Grunau, R., Miller, S., & Zwicker, J.
(2015). Sensory Processing Patterns in Children Born Very Preterm. American Journal
of Occupational Therapy, 70.
Davis, J., Richards, M., & Roberton, N. (1983). Parent-Baby Attachment in Premature
Infants (Psychology Revivals). Routledge.
Davis, K., Drey, N., & Gould, D. (2009). What are scoping studies? A review of the nursing
literature. International Journal of Nursing Studies, 46(10), 1386–1400.

SENSORY PROCESSING AMONG d/DEAF CHILDREN Page 109
De Kegel, A., Dhooge, I., Peersman, W., Rijckaert, J., Baetens, T., Cambier, D., & Van
Waelvelde, H. (2010). Construct validity of the assessment of balance in children who
are developing typically and in children with hearing impairments. Physical Therapy,
90(12), 1783–1794.
del Pino, G. B., Femia, P., & Pérez-Fernández, N. (2011). Vestibular examination of children
with alterations in balance (II): results by pathologies. Acta Otorrinolaringologica
(English Edition), 62(5), 385–391.
Department of Health. (2005). Mental Health and Deafness: Towards Equity and Access.
http://webarchive.nationalarchives.gov.uk/20130124065527/http://www.dh.%0Agov.uk/
prod_consum_dh/groups/dh_digitalassets/@dh/@en/documents/digitalasset/dh_410400
5.pdf
Dummer, G. M., Haubenstricker, J. L., & Stewart, D. A. (1996). Motor skill performances of
children who are deaf. Adapt. Phys. Activ. Q., 13, 400–414.
Dunn, W. (1997). The impact of sensory processing abilities on the daily lives of young
children and their families: a conceptual model. Infants and Young Children, 9(4), 23–
35.
Dunn, W. (1999). Sensory Profile User’s Manual. Psychological Corporation.
Dunn, W. (2006). Sensory Profile Supplement User’s Manual. Psychological Corporation.
Dunn, W., & Bennett, D. (2002). Patterns of Sensory Processing with Children with
Attention Deficit Hyperactivity Disorder. Occupational Therapy Journal of Research,
22(1), 4–15.
Dunn, W., & Brown, C. (1997). Factor analysis on the Sensory Profile from a national
sample of children without disabilities. American Journal of Occupational Therapy,
51(7), 490–495.
Ebrahimi, A., Movallali, G., Jamshidi, A., Rahgozar, M., & Haghgoo, H. (2017). Postural
Control in Deaf Children. Acta Medica Iranica, 55(2), 115–122.
Edgington, L., Hill, V., & Pellicano, E. (2016). The design and implementation of a CBT-
based intervention for sensory processing difficulties in adolescents on the autism
spectrum. Research in Developmental Disabilities, 59, 221–233.
Engel-Yeger, B., & Ziv-On, D. (2011). The relationship between sensory processing
difficulties and leisure activity preference of children with different types of ADHD.
Research in Developmental Disabilities, 32(3), 1154–1162.
Engel-Yeger, B., & Dunn, W. (2011). The relationship between sensory processing
difficulties and anxiety level of healthy adults. British Journal of Occupational Therapy,

SENSORY PROCESSING AMONG d/DEAF CHILDREN Page 110
74(5), 210–216.
Ermer, J., & Dunn, W. (1998). The sensory profile: a discriminant analysis of children with
and without disabilities. American Journal of Occupational Therapy, 52(4), 283–290.
Farrant, R., & Mager, W. (2017). See Hear, Series 36, Episode 10. BBC 2.
Fellinger, J., Holzinger, D., & Pollard, R. (2012). Mental health of deaf people. The Lancet,
379(9820), 1037–1044.
Fellinger, M., Holzinger, D., Aigner, M., Beitel, C., & Fellinger, J. (2015). Motor
performance and correlates of mental health in children who are deaf or hard of hearing.
Developmental Medicine & Child Neurology, 57(10), 942–947.
Ghanizadeh, A. (2011). Sensory Processing Problems in Children with ADHD, a Systematic
Review. Psychiatry Investigation, 8(2), 89–94.
Gheysen, F., Loots, G., & Van Waelvelde, H. (2008). Motor development of deaf children
with and without cochlear implants. Journal of Deaf Studies and Deaf Education, 13,
215–224.
Glickman, N. S. (1996). What is culturally affirmative psychotherapy? In N. S. Glickman &
M. A. Harvey (Eds.), Culturally affirmative psychotherapy with Deaf persons (pp. 1–
55).
Glickman, N. S. (2007). Do you hear voices? Problems in assessment of mental status in deaf
persons with severe language deprivation. Journal of Deaf Studies and Deaf Education,
12(2), 127–147.
GNU Operating System. (2019). GNU PSPP. https://www.gnu.org/software/pspp/
Goldsmith, H. H., Van Hulle, C. A., Arneson, C. L., Schreiber, J. E., & Gernsbacher, M. A.
(2016). A population-based twin study of parentally reported tactile and auditory
defensiveness in young children. Journal of Abnormal Child Psychology, 34, 378–392.
Goodman, A., & Goodman, R. (2009). Strengths and difficulties questionnaire as a
dimensional measure of child mental health. Journal of the American Academy of Child
and Adolescent Psychiatry, 48(4), 400–403.
Goodman, A., & Goodman, R. (2011). Population mean scores predict child mental disorder
rates: validating SDQ prevalence estimators in Britain. Journal of Child Psychology and
Psychiatry2, 52(1), 100–108.
Goodman, R. (1997). The strengths and difficulties questionnaire: a research note. Journal of
Child Psychology and Psychiatry, 38, 581–586.
Guducu, G., Oniz, A., Ikiz, A. O., & Ozgoren, M. (2016). Chemosensory Function in
Congenitally Blind or Deaf Teenagers. Chemosensory Perception, 9(1), 8–13.

SENSORY PROCESSING AMONG d/DEAF CHILDREN Page 111
Guthmann, D., & Graham III, V. (2005). Substance abuse: A hidden problem within D/deaf
and hard of hearing communities. Journal of Teaching in the Addictions, 3(1), 49–64.
Hall. C.L., Guo, B., Valentine, A.Z., Groom, M.J., Daley, D., Sayal, K., & Hollis, C. (2019)
The validity of the Strengths and Difficulties Questionnaire (SDQ) for children with
ADHD symptoms. PLOS One, 14(6).
Hartman, E., Houwen, S., & Visscher, C. (2011). Motor skill performance and sports
participation in deaf elementary school children. Adapted Physical Activity Quarterly,
28, 132–145.
Haualand, H., & Allen, C. (2012). Deaf people and human rights world federation of the deaf
and Swedish National Association of the Deaf.
Hauser, P. C., Cohen, J., Dye, M. W., & Bavelier, D. (2007). Visual constructive and visual–
motor skills in deaf native signers. Journal of Deaf Studies and Deaf Education, 2, 148–
157.
Health Improvement Scotland. (2016). SIGN 145 Assessment, diagnosis and interventions for
autism spectrum disorders.
Heming, J. E., & Brown, L. N. (2005). Sensory temporal processing in adults with early
hearing loss. Brain and Cognition, 59, 173–182.
https://doi.org/10.1016/j.bandc.2005.05.012
Hughes, G. M. (2012). What impact, if any, does profound deafness have on the formation of
the attachment relationship between the profoundly deaf infant and hearing mother?
Auckland University of Technology.
Hulslander, J., Talcott, J., Witton, C., DeFries, J., Pennington, B., Wadsworth, S., Willcutt,
E., & Olson, R. (2004). Sensory processing, reading, IQ, and attention. Journal of
Experimental Child Psychology, 88(3), 274–295.
Iversen, J. R., Patel, A. ., Nicodemus, B., & Emmorey, K. (2015). Synchronization to
auditory and visual rhythms in hearing and deaf individuals. Cognition, 134, 232–244.
Jones, R. S. P., Quigney, C., & Huws, J. C. (2003). First-hand accounts of sensory perceptual
experiences in autism: a qualitative analysis. Journal of Intellectual & Developmental
Disability, 28(2), 112–121.
Joseph, J. (2001). Critical Realism: Essential Readings. Historical Materialism, 8(1), 507–
517.
Kandel, E. R., Schwartz, J. H., & Jessell, T. M. (2000). Principles of neural science (4th ed.).
McGraw-Hill.
Kelly, D., Forney, J., & Parker-Fisher, S. (1993). The Challenge of Attention Deficit Disorder

SENSORY PROCESSING AMONG d/DEAF CHILDREN Page 112
in Children Who Are Deaf or Hard of Hearing. American Annals of the Deaf, 138(4).
Kersten, P., Czuba, K., McPherson, K., Dudle, M., Elder, H., Tauroa, R., & Vandal, A.
(2016). A systematic review of evidence for the psychometric properties of the Strengths
and Difficulties Questionnaire. International Journal of Behavioral Development, 40(1),
64–75.
Kientz, M. A., & Dunn, W. (1997). A comparison of the performance of children with and
without autism on the Sensory Profile. American Journal of Occupational Therapy,
51(7), 530–537.
Kinnealey, M., Koenig, K. P., & Smith, S. (2011). Relationships between sensory modulation
and social supports and health-related quality of life. American Journal of Occupational
Therapy, 65(3), 320–327.
Kinnealey, M., Oliver, B., & Wilbarger, P. (1995). A phenomenological study of sensory
defensiveness in adults. The American Journal of Occupational Therapy, 49(5), 444–
451.
Landsberger, S. A., & Diaz, D. R. (2010). Inpatient psychiatric treatment of deaf adults:
demographic and diagnostic comparisons with hearing inpatients. Psychiatric Services,
61(2), 196–199.
Lang, R., O’Reilly, M., Healy, O., Rispoli, M., Lydon, H., Streusand, W., Davis, T., Kang,
S., Sigafoos, J., Lancioni, G., Didden, R., & Giesbers, S. (2012). Sensory integration
therapy for autism spectrum disorders: a systematic review.
Leigh, G., Ching, T. Y. C., Crowe, K., Cupples, L., Marnane, V., & Seeto, M. (2015). Factors
affecting psychosocial and motor development in 3-year-old children who are deaf or
hard of hearing. Journal of Deaf Studies and Deaf Education, 20(4), 331–342.
Levanen, S., & Hamford, D. (2001). Feeling vibrations: enhanced tactile sensitivity in
congenitally deaf humans. Neuroscience Letters, 301, 75–77.
Lévesque, J., Théoret, H., & Champoux, F. (2014). Reduced procedural motor learning in
deaf individuals. Frontiers in Human Neuroscience, 8(343), .
Lim, Y., Huey, K. P., Girdler, D., & Morris, S. L. (2017). Standing Postural Control in
Individuals with Autism Spectrum Disorder: Systematic Review and Meta-analysis.
Journal of Autism and Developmental Disorders, 47(7), 2238–2253.
McCormick, C., Hepburn, S., Young, G. S., & Rogers, S. J. (2016). Sensory symptoms in
children with autism spectrum disorder, other developmental disorders and typical
development: A longitudinal study. Autism, 20(5), 572–579.
Meadow, K., Greenberg, M., & Erthing, C. (1983). Attachment Behavior of Deaf Children

SENSORY PROCESSING AMONG d/DEAF CHILDREN Page 113
with Deaf Parents. Journal of the American Academy of Child Psychiatry, 22(1), 23–28.
Meer, van der, Dixon, A., & Rose, D. (2008). Parent and child agreement on reports of
problem behaviour obtained from a screening questionnaire, the SDQ. European Child
& Adolescent Psychiatry, 17, 491–497.
Megreya, A. M., & Bindemann, M. (2017). A visual processing advantage for young-
adolescent deaf observers: Evidence from face and object matching tasks. Scientific
Reports, 7(41133).
Miller, L., Ahn, R. R., Miller, L. J., Milberger, S., & Mcintosh, D. N. (2007). Prevalence of
Parents ’ Perceptions of Sensory Processing Disorders Among Kindergarten Children.
The American Journal of Occupational Therapy, 5(3), 287–293.
Mitchell, R. ., & Karchmer, M. A. (2004). Chasing the mythical ten percent: Parental hearing
status of deaf and hard of hearing students in the United States. Sign Language Studies.,
4(2), 138–163.
Moreno, C., & Glenn, S. (2018). Psychologists Working with Deaf Children and Young
People. Raising and Educating Deaf Children: Foundations for Policy, Practice and
Outcomes. http://www.raisingandeducatingdeafchildren.org/2018/07/18/psychologists-
working-with-deaf-children-and-young-people/ Accessed 18th March 2020.
Mulligan, S. (1996). An analysis of score patterns of children with attention disorders on the
sensory integration and praxis tests. Research in Developmental Disabilities, 50(8),
647–654.
National Institute for Health and Care Excellence. (2017). Autism spectrum disorder in under
19s: recognition, referral and diagnosis Clinical guideline [CG128].
National Union of British Sign Language Interpreters, T. (2020). Freelance fees for
interpreting engagements for BSL/English interpreters.
https://nubsli.com/guidance/interpreter-fees/
Newton, I. (1676). Correspondence with Robert Hooke.
NHS Commissioning Board. (2013). 2013/14 NHS Standard Contract for Mental Health
Service for Deaf Children and Adolescents. https://www.england.nhs.uk/wp-
content/uploads/2013/06/c04-mh-serv-deaf-c-ado.pdf
Ohl, A., Bulter, C., Carney, C., Jarmel, E., Palmieri, M., Pottheiser, D., & Smith, T. (2012).
Test–Retest Reliability of the Sensory Profile Caregiver Questionnaire. The American
Journal of Occupational T2herapy, 66, 483–487.
Oliver, B. F. (1990). The social and emotional issues of adults with sensory defensiveness.
Sensory Integration Special Interest Section Newsletter, 13(3), 1–3.

SENSORY PROCESSING AMONG d/DEAF CHILDREN Page 114
OTFC. (2020). What Is Sensory Integration Therapy?
https://occupationaltherapychildren.com.au/we-have-skills/what-is-sensory-integration-
therapy/ Accessed 18th March 2020.
Ozgoren, M., Guducu, C., Bezircioglu, T., Inanc, G., & Oniz, A. (2012). Multimodal sensory
evoked potentials in blind, deaf and healthy individuals. International Journal of
Psychophysiology, 3(85), 427.
Ozgoren, M., Guducu, C., & Oniz, A. (2011). The Chemosensory Responses in Blind, Deaf
and Healthy Humans. Frontiers in Neuroscience.
Papagno, C., Minniti, G., Mattavelli, G., Mantovan, L., & Cecchetto, C. (2017). Tactile short-
term memory in sensory-deprived individuals. Experimental Brain Research, 235(2),
471–480.
Parasnis, I., Samar, V., Bettger, J., & Sathe, K. (1996). Does deafness lead to enhancement of
visual spatial cognition in children? Negative evidence from deaf nonsigners. Journal of
Deaf Studies and Deaf Education, 1, 145–152.
Parham, L. D., & Mailloux, Z. (2001). Sensory integration. In J. Case-Smith (Ed.),
Occupational therapy for children (4th ed., pp. 329–381). Mosby.
Pavani, F., & Bottari, D. (2012). The Neural Bases of Multisensory Processes. (M. Murray &
M. Wallace (eds.)). CRC Press/Taylor & Francis.
Pfeiffer, B. (2002). The impact of dysfunction in sensory integration on occupations in
childhood through adulthood. Sensory Integration Special Interest Section Quarterly,
25(1), 1–2.
Pfeiffer, B., Kinnealey, M., Reed, C., & Herzberg, G. (2005). Sensory modulation and
affective disorders in children and adolescents with Asperger’s syndrome. American
Journal of Occupational Therapy, 59, 335–345.
Pollock, N. (2009). Sensory integration: A review of the current state of the evidence.
Occupational Therapy Now, 11(5), 6–10.
Price, L., & Martin, L. (2018). Introduction to the special issue: applied critical realism in the
social sciences. Journal of Critical Realism, 71(2), 89–96.
Rajendran, V., Roy, F. G., & Jeevanantham, D. (2012a). A preliminary randomized
controlled study on the effectiveness of vestibular-specific neuromuscular training in
children with hearing impairment. Clinical Rehabilitation, 27(5), 459–467.
Rajendran, V., Roy, F. G., & Jeevanantham, D. (2012b). Postural control, motor skills, and
health-related quality of life in children with hearing impairment: A systematic review.
European Archives of Oto-Rhino-Laryngology, 296(4), 1063–1071.

SENSORY PROCESSING AMONG d/DEAF CHILDREN Page 115
Rand, K., & Lahav, A. (2014). Impact of the NICU environment on language deprivation in
preterm infants. Acta Paediatrica, 103(3), 243–248.
Reeves, G. D. (2001). From neuron to behavior: Regulation, arousal, and attention as
important substrates for the process of sensory integration. In S. S. Roley, E. I. Blanche,
& R. C. Schaaf (Eds.), Understanding the nature of sensory integration with diverse
populations (pp. 89–108). Therapy Skill Builders.
Rhoades, E. A., & Chisolm, T. H. (2001). Global language progress with an auditory–verbal
approach for children who are deaf or hard of hearing. Volta Review, 102, 5–24.
Rice, L. (2020). Last Day (Thomas & Mercer (ed.)).
Rine, R. M. (2009). Growing evidence for balance and vestibular problems in children.
Audiological Med, 7(3), 138–142.
Roberts, S., Wright, B., Moore, K., Smith, J., Allgar, V., Tennant, A., Doherty, C., Hughes,
E., Moore, D. C., Ogden, R., Phillips, H., Besse, L., & Rogers, K. (2015). Translation
into British Sign Language and validation of the Strengths and Difficulties
Questionnaire. Health Services and Delivery Research, 3(2).
Rogers, S.J., Dodds, C., Campbell, M., & Young, A. (2018). The validation of the Short
Warwick-Edinburgh Mental Well-Being Scale (SWEMWBS) with Deaf British Sign
Language users in the UK. Health and Quality of Life Outcomes, 16(145), 1–12.
Rogers, S. J., Hepburn, S., & Wehner, E. (2003). Parent Reports of Sensory Symptoms in
Toddlers with Autism and Those with Other Developmental Disorders. Journal of
Autism and Developmental Disorders, 33, 631–642.
Rose, B. (2020). Coronavirus: Lack of sign language interpreters leads to legal case against
government. BBC News. https://www.bbc.co.uk/news/disability-52323854
Savelsbergh, G. J., Netelenbos, J. B., & Whiting, H. T. (1991). Auditory perception and the
control of spatially coordinated action of deaf and hearing children. Journal of Child
Psychology, 32, 489–500.
Schiff, W., & Dytell, R. S. (1972). Deaf and Hearing Children’s Performance on a Tactual
Perception Battery. Perceptual and Motor Skills, 35, 683–706.
Schlumberger, E., Narbona, J., & Manrique, M. (2004). Non-verbal development of children
with deafness with and without cochlear implants. Developmental Medicine & Child
Neurology, 46, 599–606.
Schrager, A. (2018). Factory Schools. Quartz. https://qz.com/1314814/universal-education-
was-first-promoted-by-industrialists-who-wanted-docile-factory-workers/
SeeHear. (2010). Archives for March 2010. Retrived from
SENSORY PROCESSING AMONG d/DEAF CHILDREN Page 116
https://www.bbc.co.uk/blogs/seehear/2010/03 Accessed 12th March 2020.
SeeHear. (2012a). History of Deaf Education Part 1. Retrived from
https://www.bslzone.co.uk/watch/history-deaf-education-1 Accessed 12th March 2020.
SeeHear. (2012b). History of Deaf Education Part 2. Retrived from
https://www.bslzone.co.uk/watch/history-deaf-education-1 Accessed 12th March 2020.
Selz, P. A., Girardi, M., Konrad, H. R., & Hughes, L. F. (1996). Vestibular deficits in deaf
children. Otolaryngology - Head Neck Surgery, 115(1), 70–77.
Shepherd, G. M. (1994). Neurobiology (3rd ed.). University Press.
Shiell, M. M., Champoux, F., & Zatorre, R. J. (2014). Enhancement of visual motion
detection thresholds in early deaf people. PLoS One, 9.
Shimizu, V. T., Bueno, O. F., & Miranda, M. C. (2014). Sensory processing abilities of
children with ADHD. Brazilian Journal of Physical Therapy, 18(4), 343–352.
Siegel, J. C., Marchetti, M., & Tecklin, J. S. (1991). Age-related balance changes in hearing-
impaired children. Physical Therapy, 71, 183–189.
SignHealth. (2014). Executive briefing on mental health services for deaf and hard of hearing
people. Retrived from https://signhealth.org.uk/wp-
content/uploads/2014/02/ExecutiveBriefing.pdf Accessed 10th May 2020.
SignHealth. (2016). Sick of it: how the health service is failing Deaf [Englsih version].
Retrived from https://signhealth.org.uk/wp-content/uploads/2016/09/Sick-Of-It-
Report.pdf Accessed 12th March 2020.
Stewart, M. (1974). The Crystal Cave. Hodder & Stoughton Ltd.
Suarez, H., Angeli, S., Suarez, A., Rosales, B., Carrera, X., & Alonso, B. (2007). Balance
sensory organization in children with profound hearing loss and cochlear implants.
International Journal of Pediatric Otorhinolaryngology, 71(4), 629–637.
Szarkowski, A., Mood, D., Shield, A., Wiley, S., & Yoshinaga-Itano, C. (2014). A Summary
of Current Understanding Regarding Children with Autism Spectrum Disorder Who Are
Deaf or Hard of Hearing. Seminars in Speech and Language, 35(4), 241–259.
The Psychological Corporation. (2003). Understanding Sensory Processing: An
Update/Updating Our Understanding of Sensory Processing.
Tomchek, S. D., & Dunn, W. (2007). ensory processing in children with and without autism a
comparative study using the short sensory profile. The American Journal of
Occupational Therapy, 61(2), 190–200.
Tseng, M. H., Fu, C. P., Cermak, S. A., Lu, L., & Shieh, J. Y. (2011). Emotional and
behavioral problems in preschool children with autism: Relationship with sensory
SENSORY PROCESSING AMONG d/DEAF CHILDREN Page 117
processing dysfunction. Research in Autism Spectrum Disorders, 5(4), 1441–1450.
UCL. (2020). History of British Sign Language. Retrived from https://www.ucl.ac.uk/british-
sign-language-history/bsl-timeline Accessed 12th March 2020.
UK Government. (2017). Response to Make British Sign Language Part of the National
Curriculum. Retrived from https://petition.parliament.uk/petitions/200000 accessed on
4th December 2017
Van der Linde, J., Franzsen, D., & Barnard-Ashton, P. (2013). The sensory profile:
Comparative analysis of children with Specific Language Impairment, ADHD and
Autism. South African Journal of Occupational Therapy, 43(3).
van Dijk, R., Kappers, A. M. L., & Postma, A. (2013). Haptic Spatial Configuration Learning
in Deaf and Hearing Individuals. PloS One, 8(4).
van IJzendoorn, M., Dijkstra, J., & Bus, A. (1995). Attachment, Intelligence, and Language:
A Meta‐analysis. Social Development, 4(2), 115–128.
Van Roy, B., Veenstra, M., & Clench-Aas, J. (2008). Construct validity of the five‐factor
Strengths and Difficulties Questionnaire (SDQ) in pre‐, early, and late adolescence.
Journal of Child Psychology and Psychiatry2, 49(12), 1304–1312.
Vargas, S., & Camilli, G. (2000). A meta-analysis of research on sensory integration
treatment. American Journal of Occupational Therapy, 53(2), 189-198.
Walicka-Cupryś, K., Przygoda, T., Czenczek, E., Truszczyńska, A., Drzał-Grabiec, J.,
Zbigniew, T., & Tarnowski, A. (2014). Balance assessment in hearing-impaired
children. Research in Developmental Disabilities, 35(11), 2728–2734.
Whitcomb, D., Carrasco, R., Neuman, A., & Kloos, H. (2015). Correlational Research to
Examine the Relation Between Attachment and Sensory Modulation in Young Children.
American Journal of Occupational Therapy, 69(4), 1-8.
Wickremasinghe, A. C., Rogers, E. E., Johnson, B. C., Shen, A., Barkovich, A. J., & Marco,
E. J. (2013). Children born prematurely have atypical sensory profiles. Journal of
Perinatology, 33(8), 631–635.
Wiegersma, P. H., & Van der Velde, A. (1983). Motor development of deaf children. Journal
of Child Psychology and Psychiatry, 24, 103–111.
Woodward, J. (1972). Implications for sociolinguistics research among the deaf. Sign
Language Studies, 1, 1–7.
TABLE OF APPENDICIES

SENSORY PROCESSING AMONG d/DEAF CHILDREN Page 118
Appendix 1 –Search Terms with Number of Papers Generated ..................................... 118
Appendix 2 - Papers Identified in the Sensory Processing Review by Sensory Area .... 121
Appendix 3 – Ethical Approval .......................................................................................... 126
Appendix 4 –Information Sheet and Consent Form ......................................................... 129
Appendix 5 – Recruitment Information ............................................................................ 133
Appendix 6 - Recruitment Sites .......................................................................................... 134
Appendix 7 - SDQ – Parent Report .................................................................................... 136
Appendix 8 - Extract From SPCQ ..................................................................................... 137
Appendix 9 – SPCQ Technical Report............................................................................... 138
Appendix 10 – One Sample T-Test Results ....................................................................... 142
Appendix 11 – Histograms .................................................................................................. 144
Appendix 12 – Boxplots ....................................................................................................... 157
Appendix 13 – Q-Q Plots ..................................................................................................... 162
Appendix 14 – Tables for Items Regression Model .......................................................... 175
Appendix 15 – Tables for Factor Regression Models ....................................................... 183
Appendix 16 – Tables for Quadrant Regression Models ................................................. 191
Appendix 17 – Example of a Clinical Interpre Appendices, tation of the SCPQ.......... 199
Appendix 18 – A Prior Power Plots.................................................................................... 203
Appendix 1 –Search Terms with Number of Papers Generated

SENSORY PROCESSING AMONG d/DEAF CHILDREN Page 119
Sensory Processing Deaf
Sensory Processing AND Deaf
Title, abstract, key word
search
All fields search
PubMed 0 PubMed 13
Scopus 401 Scopus 401
Cochrane 1 Cochrane 1
Total 402 Total 415
Sensory Processing Deaf
Sensory
AND
Sensory processing Deaf
Sensory processing dysfunction
Title, abstract, key word
search
All fields search
PubMed 14 PubMed 879
Scopus 569 Scopus 1,239
Cochrane 14 Cochrane 14
Total 596 Total 2,132
Sensory Processing Deaf Mental Health
Sensory
AND
Deaf
AND
Mental Health
Sensory processing hearing impair* Wellbeing
Sensory processing dysfunction hearing loss Well-being
Vestibular hard of hearing Quality of Life
Oral d/deaf Depress*
Auditory deaf* Anxi*
Title, abstract, key word
search
All fields search
PubMed 1 PubMed 10,634
Scopus 2,067 Scopus 3,485
Cochrane 6 Cochrane 6
Total 2,074 Total 14,125
Sensory Processing Deaf
Sensory AND
Deaf
Sensory processing hearing impair*

SENSORY PROCESSING AMONG d/DEAF CHILDREN Page 120
Sensory processing dysfunction hearing loss
hard of hearing
d/deaf
deaf*
Title, abstract, key word
search
All fields search
PubMed 1 PubMed 6,438
Scopus 9,450 Scopus 9,450
Cochrane 14 Cochrane 14
Total 9,465 Total 15,902
Sensory Processing Deaf
Sensory
AND
Deaf
Sensory processing hearing impair*
Sensory processing dysfunction hearing loss
Vestibular hard of hearing
Oral d/deaf
Auditory deaf*
Title, abstract, key word
search
All fields search
PubMed 265 PubMed 6,438
Scopus 65,874 Scopus 65,874
Cochrane 17 Cochrane 17
Total 66,156 Total 72,329

SENSORY PROCESSING AMONG d/DEAF CHILDREN. Page 121
Appendix 2 - Papers Identified in the Sensory Processing Review by Sensory Area
MOTOR
Author Title Year Found
Dummer, Haubenstricker, & Stewart Motor skill performances of children who are deaf 1995 An et al, 2009
Levesque, Theoret, & Champoux. Reduced procedural motor learning in deaf individuals 2014 PubMed
Rine, Cornwall, Gan, LoCascio, O’Hare, &
Robinson
Evidence of progressive delay of motor development in
children with sensorineural hearing loss and concurrent
vestibular dysfunction
2000 An et al, 2009
Suarez, Alonso, Arocena, Ferreira, Roman,
Suarez, & Lapilover
Sensorimotor interaction in deaf children. Relationship
between gait performance and hearing input during
childhood assessed in pre-lingual cochlear implant users
2017 PubMed
OLFACTORY
Author Title Year Found
Guducu, Oniz, Ikiz, & Ozgoren Chemosensory Function in Congenitally Blind or Deaf
Teenagers 2016 PubMed
TOUCH
Author Title Year Found
Heimler & Pavani Response speed advantage for vision does not extend to
touch in early deaf adults 2014 Cochrane
Papagno, Minniti, Mattavelli, Mantovan, &
Cecchetto Tactile short-term memory in sensory-deprived individuals 2017 PubMed

SENSORY PROCESSING AMONG d/DEAF CHILDREN Page 122
VESTIBULAR
Author Title Year Found
An, Jeon, & Park Age-related changes of single-limb standing balance in children
with and without deafness 2009 PubMed
de Sousa, de França Barros, & de Sousa Neto Postural control in children with typical development and
children with profound hearing loss 2012 PubMed
Ebrahimi, Movallali, Jamshidi, Rahgozar, &
Haghgoo Postural control in deaf children 2017 PubMed
Selz, Girardi, Konrad, & Hughes Vestibular deficits in deaf children 1996 An et al, 2009
Suarez, Angeli, Suarez, Rosales, Carrera, &
Alonso
Balance sensory organization in children with profound
hearing loss and cochlear implants 2004 An et al, 2009
Walicka-Cupryś, Przygoda, Czenczek,
Truszczyńska, Drzał-Grabiec, Zbigniew, &
Tarnowski
Balance assessment in hearing-impaired children 2014 PubMed
VISUAL
Author Title Year Found
Bottari D., Nava E., Ley P., Pavani F. Enhanced reactivity to visual stimuli in deaf individuals 2010 PubMed
Dye M.W.G., Bavelier D. Attentional enhancements and deficits in deaf populations: An
integrative review 2010 PubMed
Buckley D., Codina C., Bhardwaj P., Pascalis O. Action video game players and deaf observers have larger
Goldmann visual fields 2010 PubMed
Bottari D., Caclin A., Giard M.-H., Pavani F. Changes in early cortical visual processing predict enhanced
reactivity in deaf individuals 2011 PubMed
Bosworth R.G., Petrich J.A.F., Dobkins K.R. Effects of attention and laterality on motion and orientation
discrimination in deaf signers 2013 PubMed
Hauthal N., Sandmann P., Debener S., Thome
J.D. Visual movement perception in deaf and hearing individuals 2013 PubMed
Veena C.N., Nandan T.M., Vastrad B.C. Visual reaction time in congenitally deaf children 2015 PubMed

SENSORY PROCESSING AMONG d/DEAF CHILDREN Page 123
Author Title Year Found
Alencar, Butler, & Lomber What and how the deaf brain sees 2018 PubMed
Bavelier, Dye, & Hauser Do deaf individuals see better? 2006 Alencar et al, 2018
Bosworth, Petrich, & Dobkins Effects of attention and laterality on motion and orientation
discrimination in deaf signers 2013 PubMed
Bottari, Caclin, Giard, & Pavani Changes in early cortical visual processing predict enhanced
reactivity in deaf individuals 2011 PubMed
Bottari, Heimler, Caclin, Dalmolin, Giard, &
Pavani Visual change detection recruits auditory cortices in early deafness 2014 Cochrane
Bottari, Nava, Ley, & Pavani Enhanced reactivity to visual stimuli in deaf individuals 2010 PubMed
Bottarri, Valsecchi, & Pavani Prominent reflexive eye-movement orienting associated with
deafness 2012 PubMed
Bross & Sauerwein, Signal detection of visual flicker in deaf and hearing individuals 1980 Alencar et al, 2018
Brozinsky & Bavelier Motion velocity thresholds in deaf signers: Changes in
lateralization but not in overall sensitivity 2004 Alencar et al, 2018
Buckley, Codina, Bhardwaj, & Pascalis Action video game players and deaf observers have larger
Goldmann visual fields 2010 PubMed
Cattaneo, Cecchetto, & Papagno Deaf Individuals Show a Leftward Bias in Numerical Bisection 2016 PubMed
Cattaneo, Rinaldi, Geraci, Cecchetto, &
Papagno
Spatial biases in deaf, blind, and deafblind individuals as revealed
by a haptic line bisection task 2018 PubMed
Codina, Buckley, Port, & Pascalis, Deaf and hearing children: A comparison of peripheral vision
development 2011 Alencar et al, 2018
Codina, Pascalis, Mody, Toomey, Rose,
Gummer, & Buckley Visual advantage in deaf adults linked to retinal changes 2011 PubMed
Dye & Bavelier Attentional enhancements and deficits in deaf populations: An
integrative review 2010 PubMed
Gori, Chilosi, Forli, & Burr Audio-visual temporal perception in children with restored hearing 2017 PubMed
Güdücü, Ergönül, Öniz, İkiz, & Özgören Deaf adolescents have bigger responses for somatosensory and
visual stimulations 2019 PubMed
Hauthal, Sandmann, Debener, & Thome Visual movement perception in deaf and hearing individuals 2013 PubMed

SENSORY PROCESSING AMONG d/DEAF CHILDREN Page 124
Author Title Year Found
Hollingsworth, Ludlow, Wilkins, Calver, &
Allen
Visual performance and ocular abnormalities in deaf children and
young adults: A literature review 2014 Alencar et al, 2018
Iversen, Patel, Nicodemus, & Emmorey Synchronization to auditory and visual rhythms in hearing and
deaf individuals 2015 Alencar et al, 2018
Megreya & Bindemann A visual processing advantage for young-adolescent deaf
observers: Evidence from face and object matching tasks 2017 Alencar et al, 2018
Parasnis, Samar, Bettger, & Sathe Does deafness lead to enhancement of visual spatial cognition in
children? Negative evidence from deaf nonsigners 1996 Alencar et al, 2018
Samar & Berger Does a flatter general gradient of visual attention explain
peripheral advantages and central deficits in deaf adults? 2017 PubMed
Scott, Karns, Dow, Stevens, & Neville
Enhanced peripheral visual processing in congenitally deaf
humans is supported by multiple brain regions, including primary
auditory cortex
2014 PubMed
Seymour, Low, Maclin, Chiarelli, Mathewson,
Fabiani, Gratton, & Dye
Reorganization of neural systems mediating peripheral visual
selective attention in the deaf: An optical imaging study 2017 PubMed
Shiell & Zatorre White matter structure in the right planum temporale region
correlates with visual motion detection thresholds in deaf people 2017 PubMed
Shiell, Champoux, & Zatorre Enhancement of visual motion detection thresholds in early deaf
people 2014 Cochrane
Shiell, Champoux, & Zatorre
The Right Hemisphere Planum Temporale Supports Enhanced
Visual Motion Detection Ability in Deaf People: Evidence from
Cortical Thickness
2016 PubMed
Vachon, Voss, Lassonde, Leroux, Mensour,
Beaudoin, Bourgouin, & Lepore
Reorganization of the auditory, visual and multimodal areas in
early deaf individuals 2013 Cochrane
Veena, Nandan, & Vastrad Visual reaction time in congenitally deaf children 2015 PubMed
Yukhymenko Cortical Visual Evoked Potentials in Subjects with Auditory
Deprivation (Congenital Deafness) 2017 PubMed

SENSORY PROCESSING AMONG d/DEAF CHILDREN Page 125
SENSORY PROCESSING DYSFUNCTION
Author Title Year Found
Bharadwaj, S. Daniel, L.L. & Matzke, P.L Sensory-Processing Disorder in Children With Cochlear Implants 2009 PubMed
Crowe, T.K & Horak, F.B. Motor Proficiency Associated with Vestibular Deficits in Children
with Hearing Impairments 1988
Bharadwaj et al,
2009
Rhoades, E. A., & Chisolm, T. H. Global language progress with an auditory–verbal approach for
children who are deaf or hard of hearing 2001
Bharadwaj et al,
2009

SENSORY PROCESSING AMONG d/DEAF CHILDREN Page 126
Appendix 3 – Ethical Approval from University of Hertfordshire’s Health, Science,
Engineering and Technology Ethics Committee with Delegated Authority.
Ethical Approval for Study

SENSORY PROCESSING AMONG d/DEAF CHILDREN Page 127
Ethical Approval for Change of Study Name
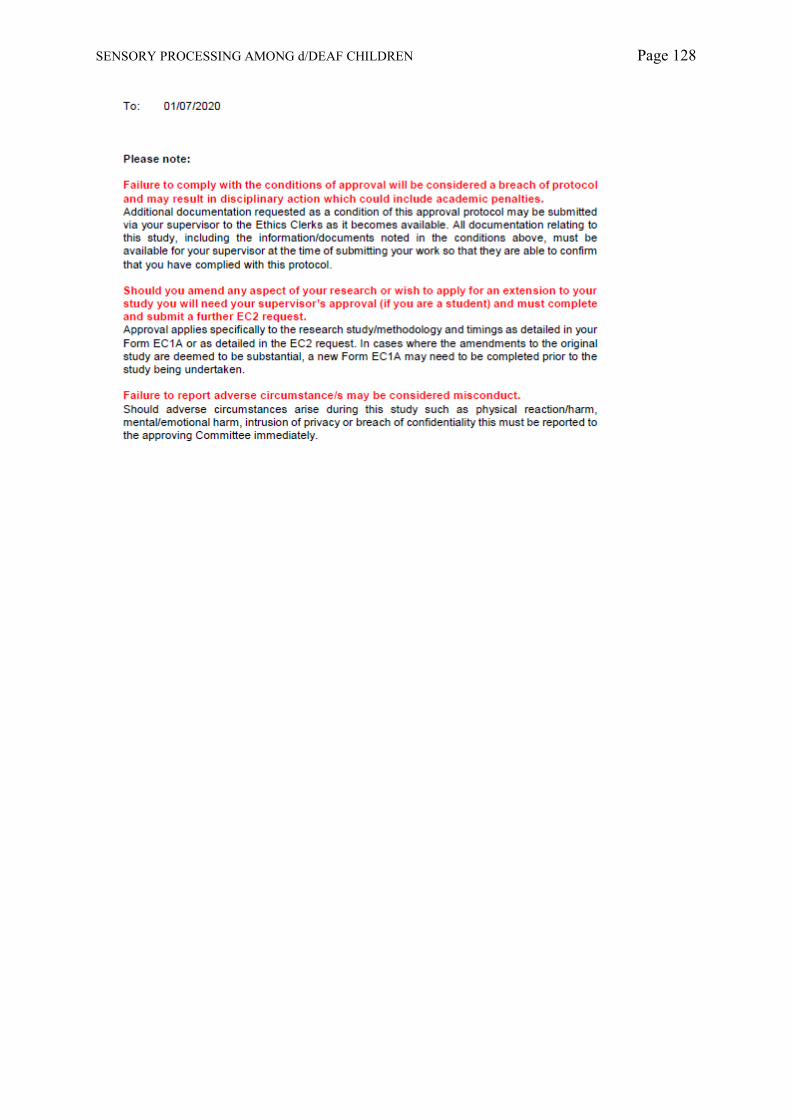
SENSORY PROCESSING AMONG d/DEAF CHILDREN Page 128
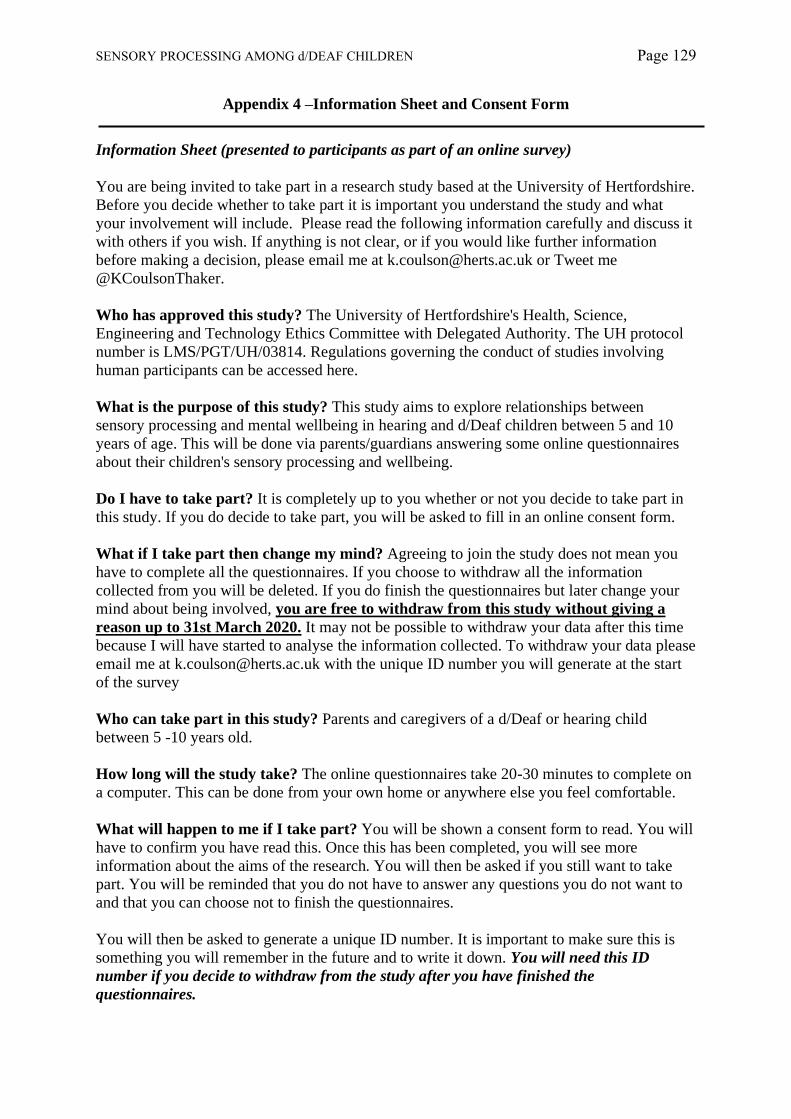
SENSORY PROCESSING AMONG d/DEAF CHILDREN Page 129
Appendix 4 –Information Sheet and Consent Form
Information Sheet (presented to participants as part of an online survey)
You are being invited to take part in a research study based at the University of Hertfordshire.
Before you decide whether to take part it is important you understand the study and what
your involvement will include. Please read the following information carefully and discuss it
with others if you wish. If anything is not clear, or if you would like further information
before making a decision, please email me at [email protected] or Tweet me
@KCoulsonThaker.
Who has approved this study? The University of Hertfordshire's Health, Science,
Engineering and Technology Ethics Committee with Delegated Authority. The UH protocol
number is LMS/PGT/UH/03814. Regulations governing the conduct of studies involving
human participants can be accessed here.
What is the purpose of this study? This study aims to explore relationships between
sensory processing and mental wellbeing in hearing and d/Deaf children between 5 and 10
years of age. This will be done via parents/guardians answering some online questionnaires
about their children's sensory processing and wellbeing.
Do I have to take part? It is completely up to you whether or not you decide to take part in
this study. If you do decide to take part, you will be asked to fill in an online consent form.
What if I take part then change my mind? Agreeing to join the study does not mean you
have to complete all the questionnaires. If you choose to withdraw all the information
collected from you will be deleted. If you do finish the questionnaires but later change your
mind about being involved, you are free to withdraw from this study without giving a
reason up to 31st March 2020. It may not be possible to withdraw your data after this time
because I will have started to analyse the information collected. To withdraw your data please
email me at [email protected] with the unique ID number you will generate at the start
of the survey
Who can take part in this study? Parents and caregivers of a d/Deaf or hearing child
between 5 -10 years old.
How long will the study take? The online questionnaires take 20-30 minutes to complete on
a computer. This can be done from your own home or anywhere else you feel comfortable.
What will happen to me if I take part? You will be shown a consent form to read. You will
have to confirm you have read this. Once this has been completed, you will see more
information about the aims of the research. You will then be asked if you still want to take
part. You will be reminded that you do not have to answer any questions you do not want to
and that you can choose not to finish the questionnaires.
You will then be asked to generate a unique ID number. It is important to make sure this is
something you will remember in the future and to write it down. You will need this ID
number if you decide to withdraw from the study after you have finished the
questionnaires.

SENSORY PROCESSING AMONG d/DEAF CHILDREN Page 130
You will be asked some questions about your child and their environment, (e.g. which
language you use at home, your child's age, and hearing levels), their sensory processing, and
their mental wellbeing. Once all the questions have been answered you will see a debrief
form and be thanked for your participation.
I am concerned about my mental health or my child's. Where can I access support? I
will only analyse the data from this study at a group level. This means I will not be looking at
any individual people’s answers to the questionnaires. This means I will not be able to give
any information about a child's mental wellbeing or their sensory processing.
If you are concerned about your mental wellbeing, or that of your child, please contact your
GP. Alternatively adults may self-refer to local their NHS psychological services. To find
your local adult service please click here.
If you or your child are d/Deaf the following national resources may also be useful:
SignHealth (for adults)
Deaf4Deaf (for adults)
NDCS (for children and young people)
What are the possible disadvantages, risks or side effects of taking part? There are no
known disadvantages, risks or side effects of participation in this study.
What are the possible benefits of taking part? This research aims to develop understanding
of sensory processing, and how it might link to mental wellbeing. It is hoped the information
gathered in this study can contribute towards understanding how to support people who
experience difficulties with sensory processing.
How will my data be kept confidential? All data collected will be anonymised. Data will
only be analysed and reported on at a group level. It will therefore not be possible to
comment on individual’s responses. Data will be securely stored on one secure, password-
protected external hard drive. Only the research team will have access to this information.
What will happen to the data from this study? Information gathered in the study will be
analysed. This will be used as part of the Principle Investigator’s Doctoral thesis. It will also
be written up for publication in scientific journals and may be presented at conferences. Your
personal details will not be included in any publications. Only the Principle Investigator and
their research team will have access to the data. Data will be kept for 5 years, as per the
British Psychological Guidelines, after which time it will be destroyed under secure
conditions.
Will the data be used in further studies? The data gathered in this study may be used for
future research by the research team. Data will not be allowed to be used by different
researchers. Data will remain in the possession of the principal investigator, accessible only
by them and their research team. Your personal details will not be included in any
publications.
Risk. If, during the study, any medical conditions or non-medical circumstances such as
unlawful activity become apparent that might, or have, put others at risk, the University may
refer the matter to the appropriate authorities.
SENSORY PROCESSING AMONG d/DEAF CHILDREN Page 131
Who can I contact if I have any questions? If you would like further information or would
like to discuss any details of this study, please get in touch with me by email
Although we hope it is not the case, if you have any complaints or concerns about
the way you have been approached or treated during this study, please write to the
University’s Secretary and Registrar at the following address:
Secretary and Registrar
University of Hertfordshire
College Lane
Hatfield
Herts
AL10 9AB
Thank you very much for reading this information and giving consideration to taking
part in this study.

SENSORY PROCESSING AMONG d/DEAF CHILDREN Page 132
Consent Form (presented to participants as part of an online survey)
I freely agree to take part in the study "Exploring Children's Sensory Processing: Implications
for Mental Wellbeing" (UH Protocol number: LMS/PGT/UH/03814)
I have been made aware of:
• The study's aims
• The methods and design of the study
• The names and contact details of key people
• The risks and potential benefits of taking part
• How the information collected will be stored and for how long
• Any plans for future studies that might involve further approaches to participants
• How my personal information will be stored and for how long
• What my involvement in the study will be
I have been assured I may withdraw my data from the study until 31st March 2020 without
having to give a reason.
I know I can do this by emailing the Principle Investigator at [email protected] with the
unique ID number I will create before I start the questionnaires.
I have been told:
• How information about me (data obtained in the course of the study, and data provided
by me) will be used
• How it will be kept safe
• Who will have access to it
• How it may be used.
I agree
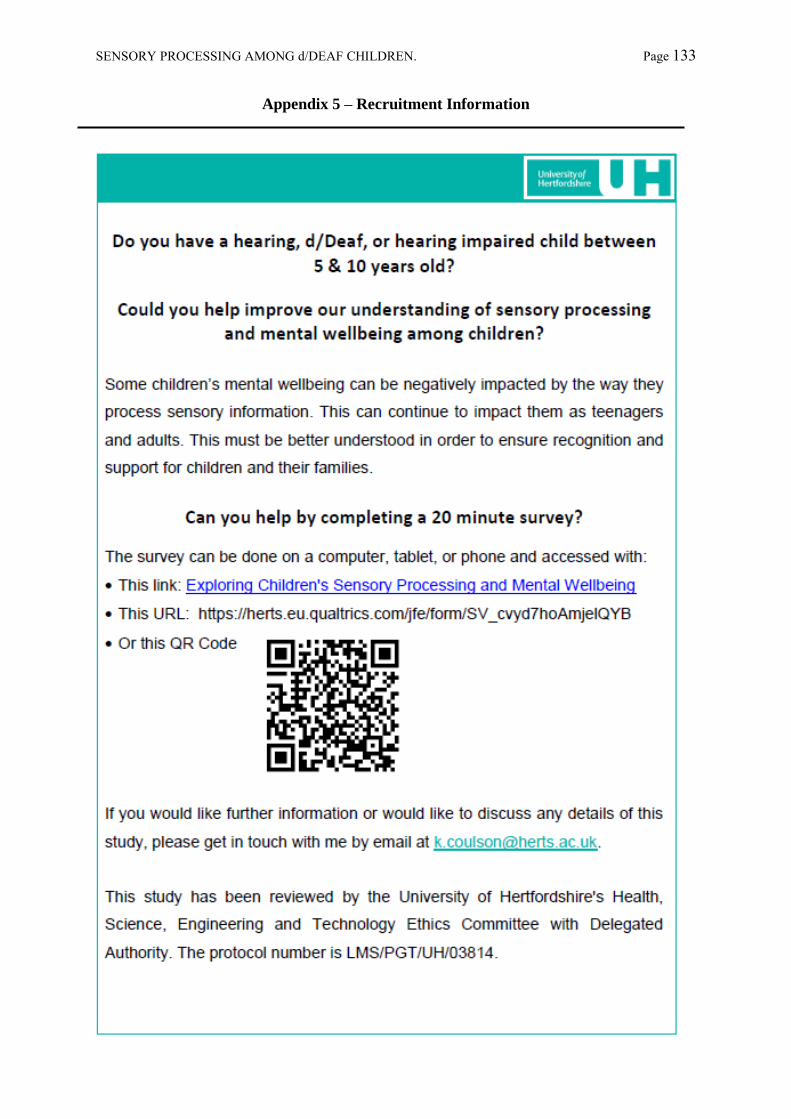
SENSORY PROCESSING AMONG d/DEAF CHILDREN. Page 133
Appendix 5 – Recruitment Information

SENSORY PROCESSING AMONG d/DEAF CHILDREN Page 134
Appendix 6 - Recruitment Sites
Organisation Location
School Bedfordshire
School Bedfordshire
School Bedfordshire
School Bedfordshire
School Bedfordshire
School Bedfordshire
School Bedfordshire
School Berkshire
School Cambridgeshire
School Cheshire
School Derbyshire
School Derbyshire
School Devon
School Essex
School Essex
School Essex
School Essex
School Hampshire
School Hampshire
School Hertfordshire
School Hertfordshire
School Hertfordshire
School Ireland
School Kent
School Kent
School Kent
School Lancashire
School London
School London
School London
School London
School London
School London
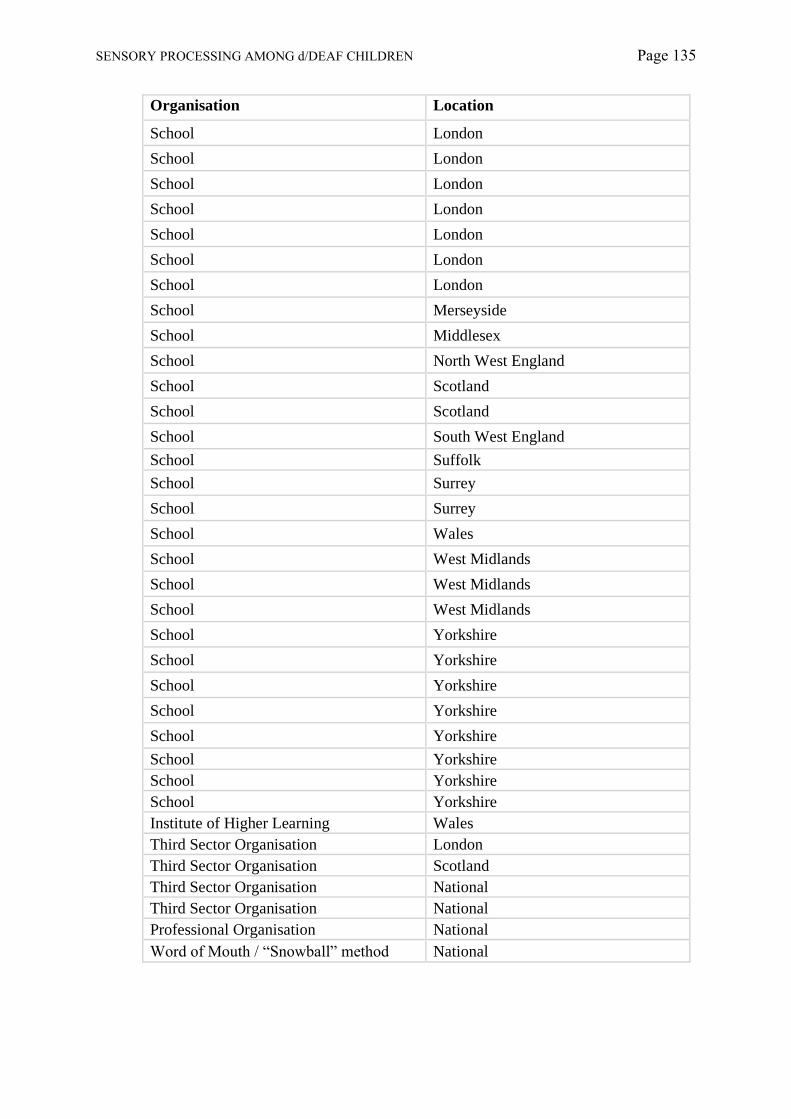
SENSORY PROCESSING AMONG d/DEAF CHILDREN Page 135
Organisation Location
School London
School London
School London
School London
School London
School London
School London
School Merseyside
School Middlesex
School North West England
School Scotland
School Scotland
School South West England
School Suffolk
School Surrey
School Surrey
School Wales
School West Midlands
School West Midlands
School West Midlands
School Yorkshire
School Yorkshire
School Yorkshire
School Yorkshire
School Yorkshire
School Yorkshire
School Yorkshire
School Yorkshire
Institute of Higher Learning Wales
Third Sector Organisation London
Third Sector Organisation Scotland
Third Sector Organisation National
Third Sector Organisation National
Professional Organisation National
Word of Mouth / “Snowball” method National
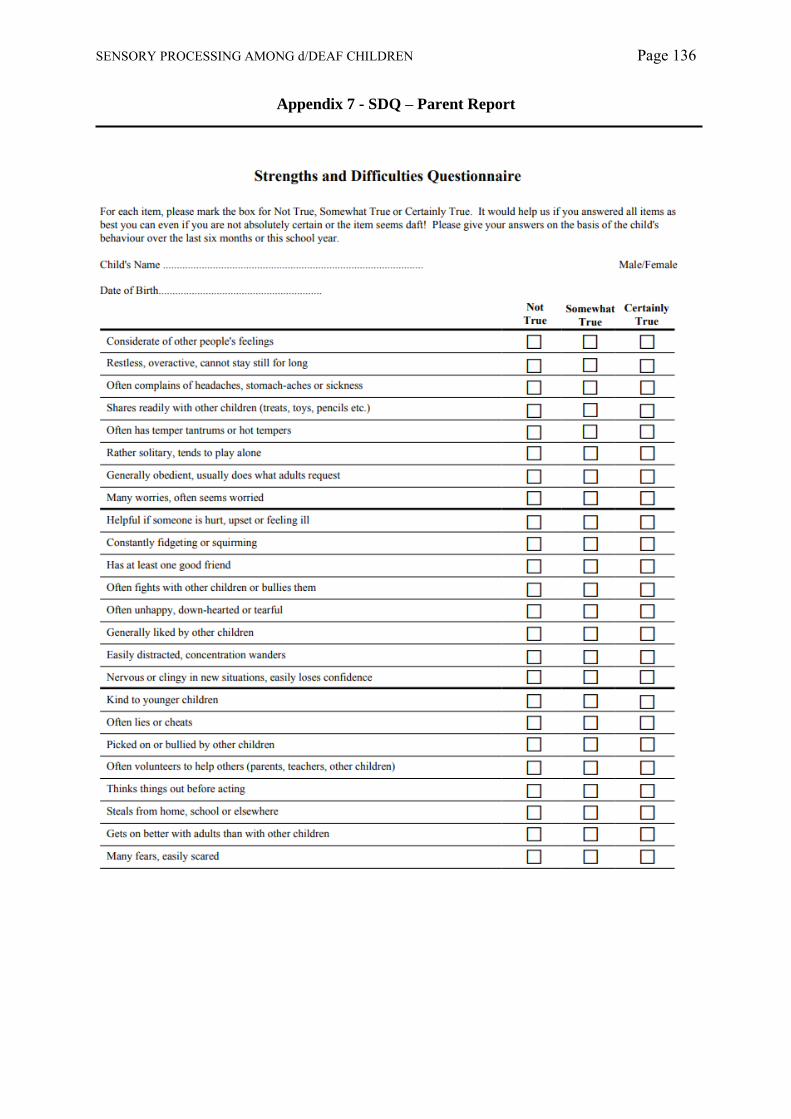
SENSORY PROCESSING AMONG d/DEAF CHILDREN Page 136
Appendix 7 - SDQ – Parent Report

SENSORY PROCESSING AMONG d/DEAF CHILDREN Page 137
Appendix 8 - Extract From SPCQ
SENSORY PROCESSING AMONG d/DEAF CHILDREN Page 138
Appendix 9 – SPCQ Technical Report

SENSORY PROCESSING AMONG d/DEAF CHILDREN Page 139

SENSORY PROCESSING AMONG d/DEAF CHILDREN Page 140

SENSORY PROCESSING AMONG d/DEAF CHILDREN Page 141

SENSORY PROCESSING AMONG d/DEAF CHILDREN Page 142
Appendix 10 – One Sample T-Test Results
Item Scores: One Sample T-tests for Differences in Mean Sensory Profile Scores for
d/Deaf and typically developing children, and children with a diagnosed with of ASD and
ADHD
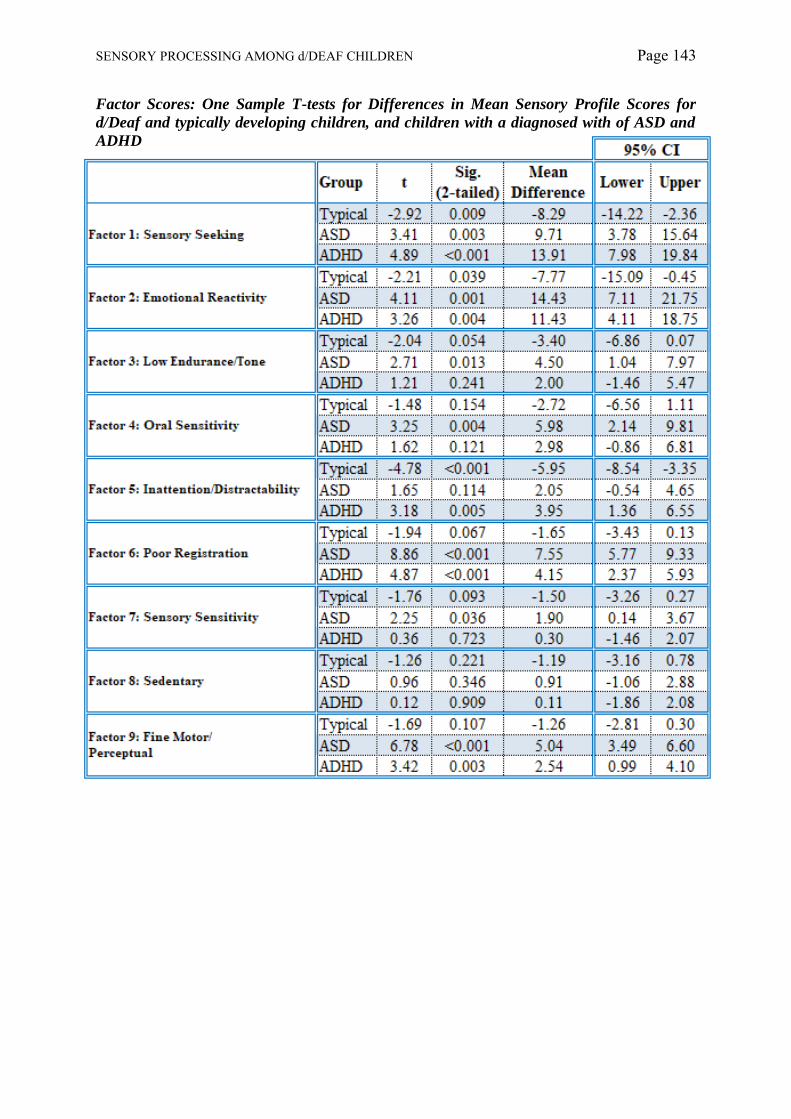
SENSORY PROCESSING AMONG d/DEAF CHILDREN Page 143
Factor Scores: One Sample T-tests for Differences in Mean Sensory Profile Scores for
d/Deaf and typically developing children, and children with a diagnosed with of ASD and
ADHD

SENSORY PROCESSING AMONG d/DEAF CHILDREN Page 144
Appendix 11 – Histograms
Items Analysis: Sensory Profile Caregiver Questionnaire
Auditory Processing
Visual Processing
N = 21, Mean = 36.57, Std. Dev. = 6.32
Visual Processing
Vestibular Processing

SENSORY PROCESSING AMONG d/DEAF CHILDREN Page 145
Touch Processing
Multisensory Processing
Oral Sensory Processing
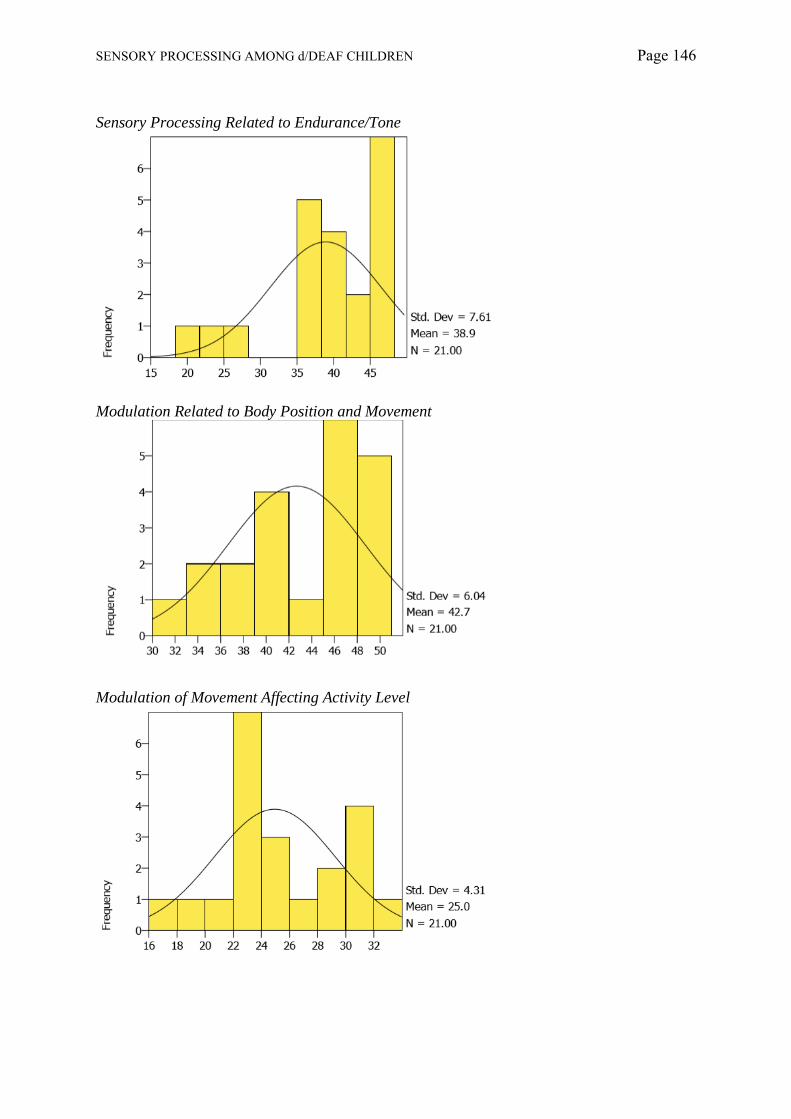
SENSORY PROCESSING AMONG d/DEAF CHILDREN Page 146
Sensory Processing Related to Endurance/Tone
Modulation Related to Body Position and Movement
Modulation of Movement Affecting Activity Level

SENSORY PROCESSING AMONG d/DEAF CHILDREN Page 147
Modulation of Sensory Input Affecting Emotional Responses
Modulation of Visual Input Affecting Emotional Responses and Activity Level
Emotional/Social Response

SENSORY PROCESSING AMONG d/DEAF CHILDREN Page 148
Behavioural Outcomes of Sensory Processing
Items Indicating Thresholds for Response

SENSORY PROCESSING AMONG d/DEAF CHILDREN Page 149
Factor Analysis: Sensory Profile Caregiver Questionnaire
Factor 1: Sensory Seeking
Factor 2: Emotional Reactivity
Factor 3: Low Endurance/Tone

SENSORY PROCESSING AMONG d/DEAF CHILDREN Page 150
Factor 4: Oral Sensitivity
Factor 5: Inattention/Distractibility
Factor 6: Poor Registration

SENSORY PROCESSING AMONG d/DEAF CHILDREN Page 151
Factor 7: Sensory Sensitivity
Factor 8: Sedentary
Factor 9: Fine Motor/Perceptual

SENSORY PROCESSING AMONG d/DEAF CHILDREN Page 152
Quadrant Analysis: Sensory Profile Caregiver Questionnaire
Quadrant 1: Low Registration
Quadrant 2: Sensation Seeking
Quadrant 3: Sensory Sensitivity

SENSORY PROCESSING AMONG d/DEAF CHILDREN Page 153
Quadrant 4: Sensation Avoidant

SENSORY PROCESSING AMONG d/DEAF CHILDREN Page 154
Strengths and Difficulties Questionnaire
Total
Emotional
Conduct

SENSORY PROCESSING AMONG d/DEAF CHILDREN Page 155
Hyperactivity
Peer Relations
Pro-social

SENSORY PROCESSING AMONG d/DEAF CHILDREN Page 156
Externalising Scale
Internalising Scale
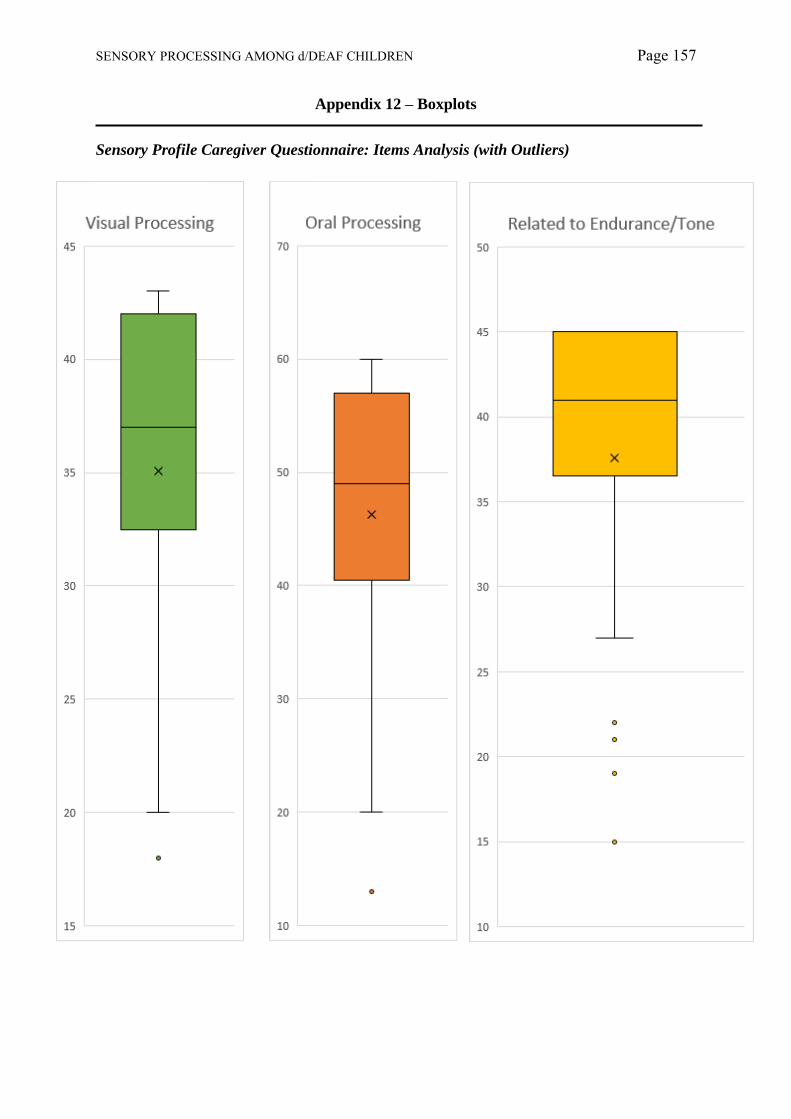
SENSORY PROCESSING AMONG d/DEAF CHILDREN Page 157
Appendix 12 – Boxplots
Sensory Profile Caregiver Questionnaire: Items Analysis (with Outliers)

SENSORY PROCESSING AMONG d/DEAF CHILDREN Page 158
Sensory Profile Caregiver Questionnaire: Items Analysis (without Outliers)
SENSORY PROFILE CAREGIVER QUESTIONNAIRE: QUADRANT ANALYSIS

SENSORY PROCESSING AMONG d/DEAF CHILDREN Page 159
Sensory Profile Caregiver Questionnaire: Factor Analysis (with Outliers)
Sensory Profile Caregiver Questionnaire: Factor Analysis (without Outliers)

SENSORY PROCESSING AMONG d/DEAF CHILDREN Page 160
Sensory Profile Caregiver Questionnaire: Quadrant Analysis

SENSORY PROCESSING AMONG d/DEAF CHILDREN Page 161
Strengths and Difficulties Questionnaire

SENSORY PROCESSING AMONG d/DEAF CHILDREN Page 162
0
5
10
15
20
25
30
35
-2.5 -2 -1.5 -1 -0.5 0 0.5 1 1.5 2 2.5
Auditory Processing Q-Q Plot
0
5
10
15
20
25
30
35
40
45
-2.5 -2 -1.5 -1 -0.5 0 0.5 1 1.5 2 2.5
Visual Processing Q-Q Plot
0
10
20
30
40
50
60
-2.5 -2 -1.5 -1 -0.5 0 0.5 1 1.5 2 2.5
Vestibular Processing Q-Q Plot
Appendix 13 – Q-Q Plots
Sensory Profile Caregiver Questionnaire: Items Analysis

SENSORY PROCESSING AMONG d/DEAF CHILDREN Page 163
0
10
20
30
40
50
60
70
80
90
100
-2.5 -2 -1.5 -1 -0.5 0 0.5 1 1.5 2 2.5
Touch Processing Q-Q Plot
0
5
10
15
20
25
30
35
40
-2.5 -2 -1.5 -1 -0.5 0 0.5 1 1.5 2 2.5
Multisensory Processing Q-Q Plot
0
10
20
30
40
50
60
70
-2.5 -2 -1.5 -1 -0.5 0 0.5 1 1.5 2 2.5
Oral Sensory Processing Q-Q Plot
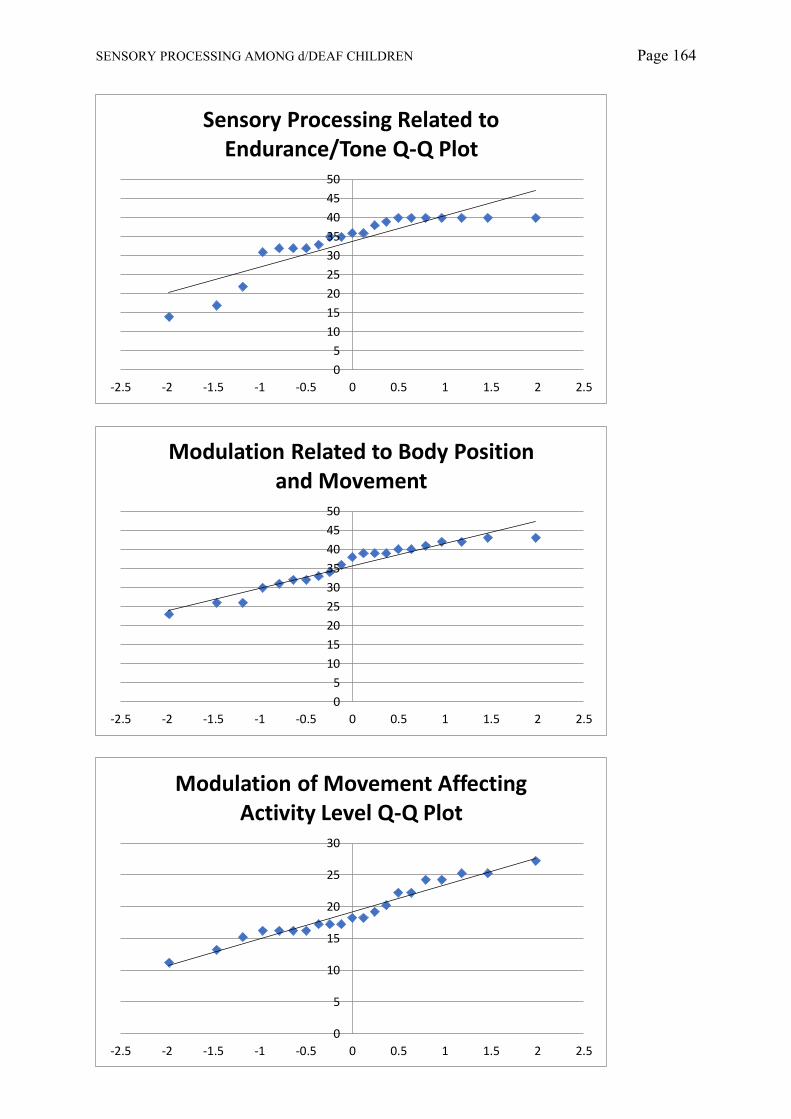
SENSORY PROCESSING AMONG d/DEAF CHILDREN Page 164
0
5
10
15
20
25
30
35
40
45
50
-2.5 -2 -1.5 -1 -0.5 0 0.5 1 1.5 2 2.5
Sensory Processing Related to Endurance/Tone Q-Q Plot
0
5
10
15
20
25
30
35
40
45
50
-2.5 -2 -1.5 -1 -0.5 0 0.5 1 1.5 2 2.5
Modulation Related to Body Position and Movement
0
5
10
15
20
25
30
-2.5 -2 -1.5 -1 -0.5 0 0.5 1 1.5 2 2.5
Modulation of Movement Affecting Activity Level Q-Q Plot

SENSORY PROCESSING AMONG d/DEAF CHILDREN Page 165
0
2
4
6
8
10
12
14
16
18
-2.5 -2 -1.5 -1 -0.5 0 0.5 1 1.5 2 2.5
Modulation of Visual Input Affecting Emotional Responses and Activity Level
Q-Q Plot
0
2
4
6
8
10
12
14
16
18
20
-2.5 -2 -1.5 -1 -0.5 0 0.5 1 1.5 2 2.5
Modulation of Sensory Input Affecting Emotional Responses Q-Q Plot
0
10
20
30
40
50
60
70
80
90
100
-2.5 -2 -1.5 -1 -0.5 0 0.5 1 1.5 2 2.5
Emotional/Social Response Q-Q Plot

SENSORY PROCESSING AMONG d/DEAF CHILDREN Page 166
0
2
4
6
8
10
12
-2.5 -2 -1.5 -1 -0.5 0 0.5 1 1.5 2 2.5
Items Indicating Thresholds for Response Q-Q Plot
0
5
10
15
20
25
30
-2.5 -2 -1.5 -1 -0.5 0 0.5 1 1.5 2 2.5
Behavioural Outcomes of Sensory Processing Q-Q Plot
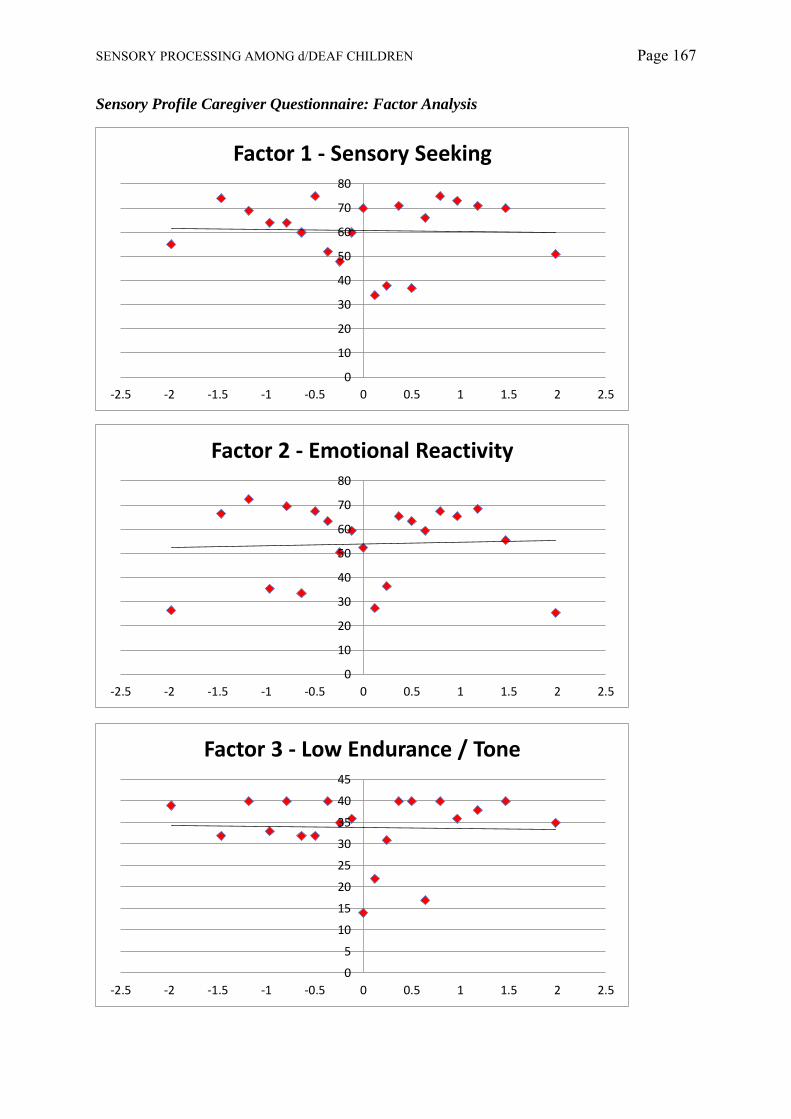
SENSORY PROCESSING AMONG d/DEAF CHILDREN Page 167
Sensory Profile Caregiver Questionnaire: Factor Analysis
0
10
20
30
40
50
60
70
80
-2.5 -2 -1.5 -1 -0.5 0 0.5 1 1.5 2 2.5
Factor 1 - Sensory Seeking
0
10
20
30
40
50
60
70
80
-2.5 -2 -1.5 -1 -0.5 0 0.5 1 1.5 2 2.5
Factor 2 - Emotional Reactivity
0
5
10
15
20
25
30
35
40
45
-2.5 -2 -1.5 -1 -0.5 0 0.5 1 1.5 2 2.5
Factor 3 - Low Endurance / Tone

SENSORY PROCESSING AMONG d/DEAF CHILDREN Page 168
0
5
10
15
20
25
30
35
40
45
-2.5 -2 -1.5 -1 -0.5 0 0.5 1 1.5 2 2.5
Factor 4 - Oral Sensitivity
0
5
10
15
20
25
30
-2.5 -2 -1.5 -1 -0.5 0 0.5 1 1.5 2 2.5
Factor 5 - Inattention/Distractability
0
5
10
15
20
25
30
35
-2.5 -2 -1.5 -1 -0.5 0 0.5 1 1.5 2 2.5
Factor 6 - Poor Registration

SENSORY PROCESSING AMONG d/DEAF CHILDREN Page 169
0
2
4
6
8
10
12
14
16
18
-2.5 -2 -1.5 -1 -0.5 0 0.5 1 1.5 2 2.5
Factor 7 - Sensory Sensitivity
0
2
4
6
8
10
12
14
16
18
-2.5 -2 -1.5 -1 -0.5 0 0.5 1 1.5 2 2.5
Factor 8 - Sedentary
0
2
4
6
8
10
12
14
-2.5 -2 -1.5 -1 -0.5 0 0.5 1 1.5 2 2.5
Factor 9 - Fine Motor/Perceptual

SENSORY PROCESSING AMONG d/DEAF CHILDREN Page 170
Sensory Profile Caregiver Questionnaire: Quadrant Analysis
0
10
20
30
40
50
60
70
80
-2.5 -2 -1.5 -1 -0.5 0 0.5 1 1.5 2 2.5
Quadrant 1: Low Registration Q-Q Plot
0
20
40
60
80
100
120
140
160
-2.5 -2 -1.5 -1 -0.5 0 0.5 1 1.5 2 2.5
Quadrant 2: Sensation Seeking Q-Q Plot
0
10
20
30
40
50
60
70
80
90
100
-2.5 -2 -1.5 -1 -0.5 0 0.5 1 1.5 2 2.5
Quadrant 3: Sensory Sensitivity Q-Q Plot

SENSORY PROCESSING AMONG d/DEAF CHILDREN Page 171
0
20
40
60
80
100
120
140
160
-2.5 -2 -1.5 -1 -0.5 0 0.5 1 1.5 2 2.5
Quadrant 4: Sensation Avoidant Q-Q Plot
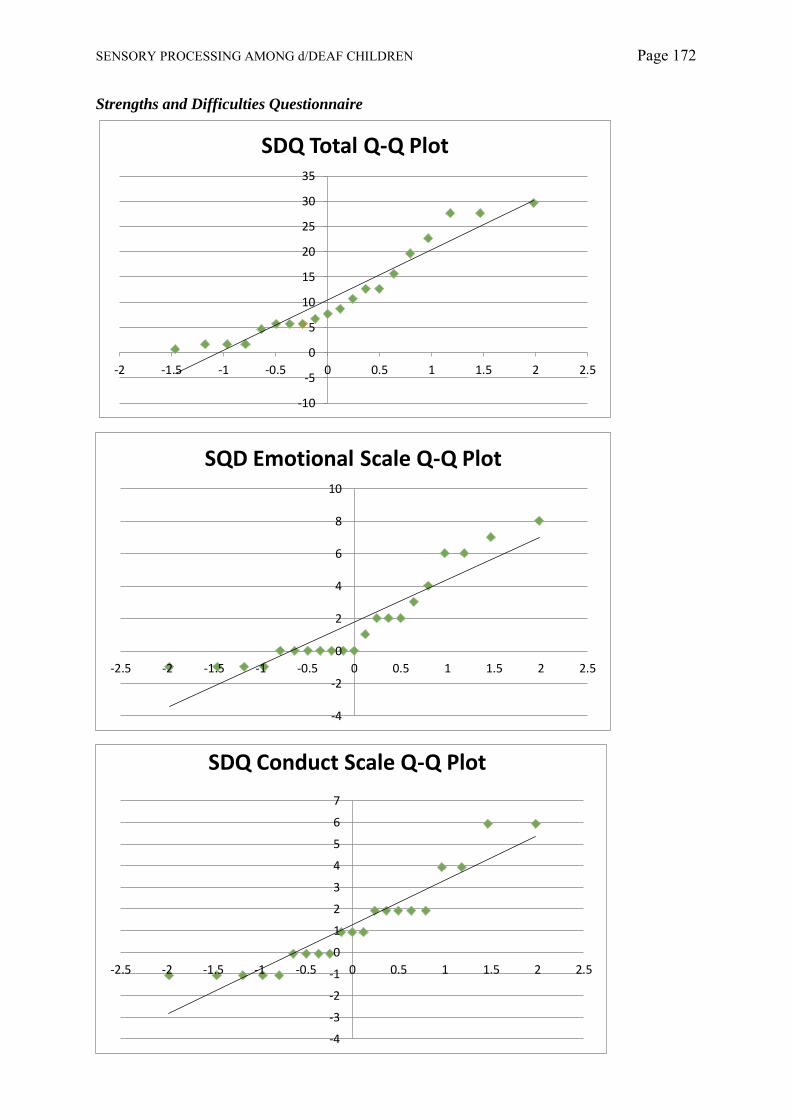
SENSORY PROCESSING AMONG d/DEAF CHILDREN Page 172
Strengths and Difficulties Questionnaire
-10
-5
0
5
10
15
20
25
30
35
-2 -1.5 -1 -0.5 0 0.5 1 1.5 2 2.5
SDQ Total Q-Q Plot
-4
-2
0
2
4
6
8
10
-2.5 -2 -1.5 -1 -0.5 0 0.5 1 1.5 2 2.5
SQD Emotional Scale Q-Q Plot
-4
-3
-2
-1
0
1
2
3
4
5
6
7
-2.5 -2 -1.5 -1 -0.5 0 0.5 1 1.5 2 2.5
SDQ Conduct Scale Q-Q Plot

SENSORY PROCESSING AMONG d/DEAF CHILDREN Page 173
-4
-2
0
2
4
6
8
-2.5 -2 -1.5 -1 -0.5 0 0.5 1 1.5 2 2.5
SDQ Peer Scale Q-Q Plot
-2
-1
0
1
2
3
4
5
6
7
8
9
-2.5 -2 -1.5 -1 -0.5 0 0.5 1 1.5 2 2.5
SDQ Hyperactivity Scale Q-Q Plot
-2
0
2
4
6
8
10
-2.5 -2 -1.5 -1 -0.5 0 0.5 1 1.5 2 2.5
SDQ Pro-social Scale Q-Q Plot

SENSORY PROCESSING AMONG d/DEAF CHILDREN Page 174
-10
-5
0
5
10
15
20
-2.5 -2 -1.5 -1 -0.5 0 0.5 1 1.5 2 2.5
SDQ Externalising Scale Q-Q Plot
-10
-5
0
5
10
15
20
-2.5 -2 -1.5 -1 -0.5 0 0.5 1 1.5 2 2.5
SDQ Internalising Scale Q-Q Plot

SENSORY PROCESSING AMONG d/DEAF CHILDREN Page 175
Appendix 14 – Tables for Items Regression Model
SDQ Total Score Item Regression Model Summary
SDQ Total Score Item ANOVA
SDQ Total Score Item Coefficients
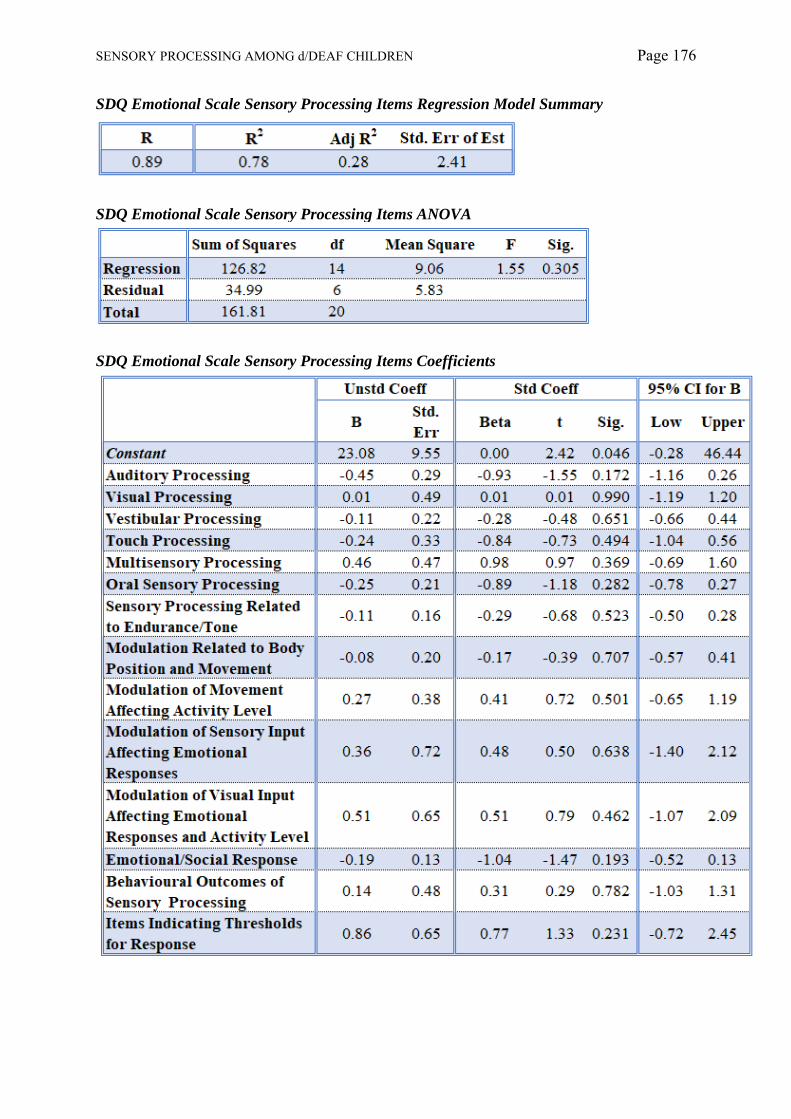
SENSORY PROCESSING AMONG d/DEAF CHILDREN Page 176
SDQ Emotional Scale Sensory Processing Items Regression Model Summary
SDQ Emotional Scale Sensory Processing Items ANOVA
SDQ Emotional Scale Sensory Processing Items Coefficients

SENSORY PROCESSING AMONG d/DEAF CHILDREN Page 177
SDQ Conduct Scale Sensory Processing Items Regression Model Summary
SDQ Conduct Scale Sensory Processing Items ANOVA
SDQ Conduct Scale Sensory Processing Items Coefficients

SENSORY PROCESSING AMONG d/DEAF CHILDREN Page 178
SDQ Hyperactivity Scale Sensory Processing Items Regression Model Summary
SDQ Hyperactivity Scale Sensory Processing Items ANOVA
SDQ Hyperactivity Scale Sensory Processing Items Coefficients
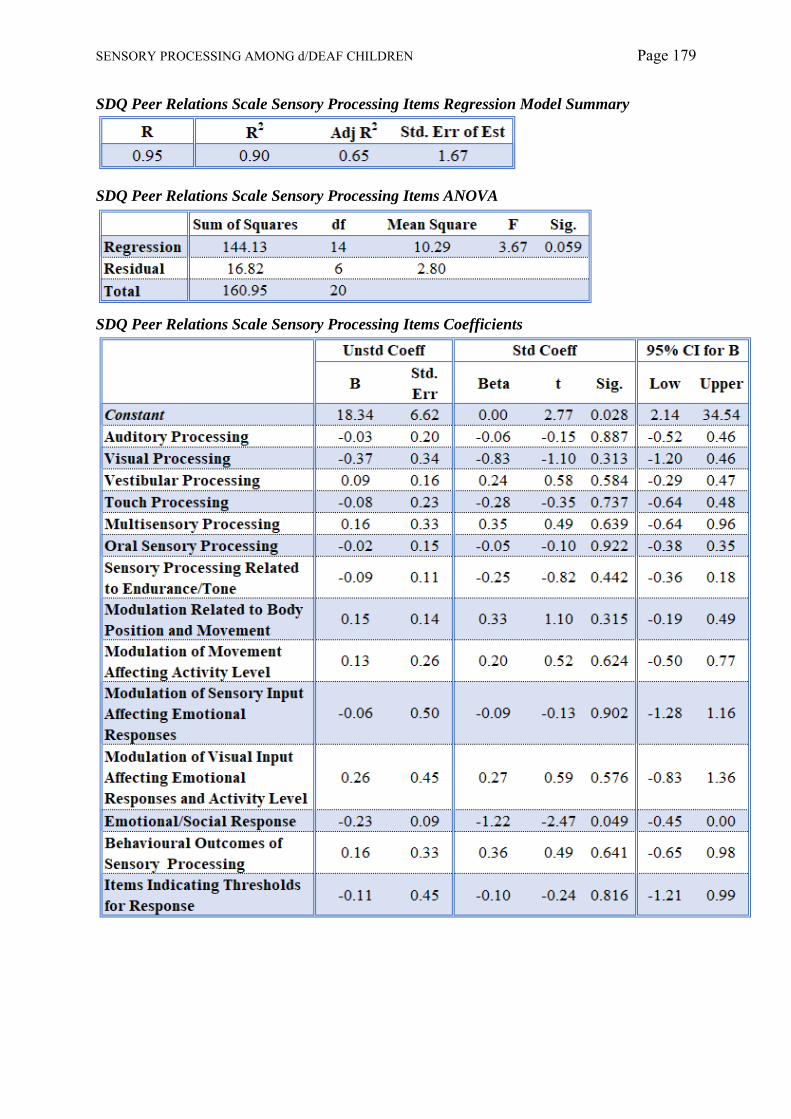
SENSORY PROCESSING AMONG d/DEAF CHILDREN Page 179
SDQ Peer Relations Scale Sensory Processing Items Regression Model Summary
SDQ Peer Relations Scale Sensory Processing Items ANOVA
SDQ Peer Relations Scale Sensory Processing Items Coefficients

SENSORY PROCESSING AMONG d/DEAF CHILDREN Page 180
SDQ Pro-social Scale Sensory Processing Items Regression Model Summary
SDQ Pro-social Scale ANOVA
SDQ Pro-social Scale Sensory Processing Items Coefficients
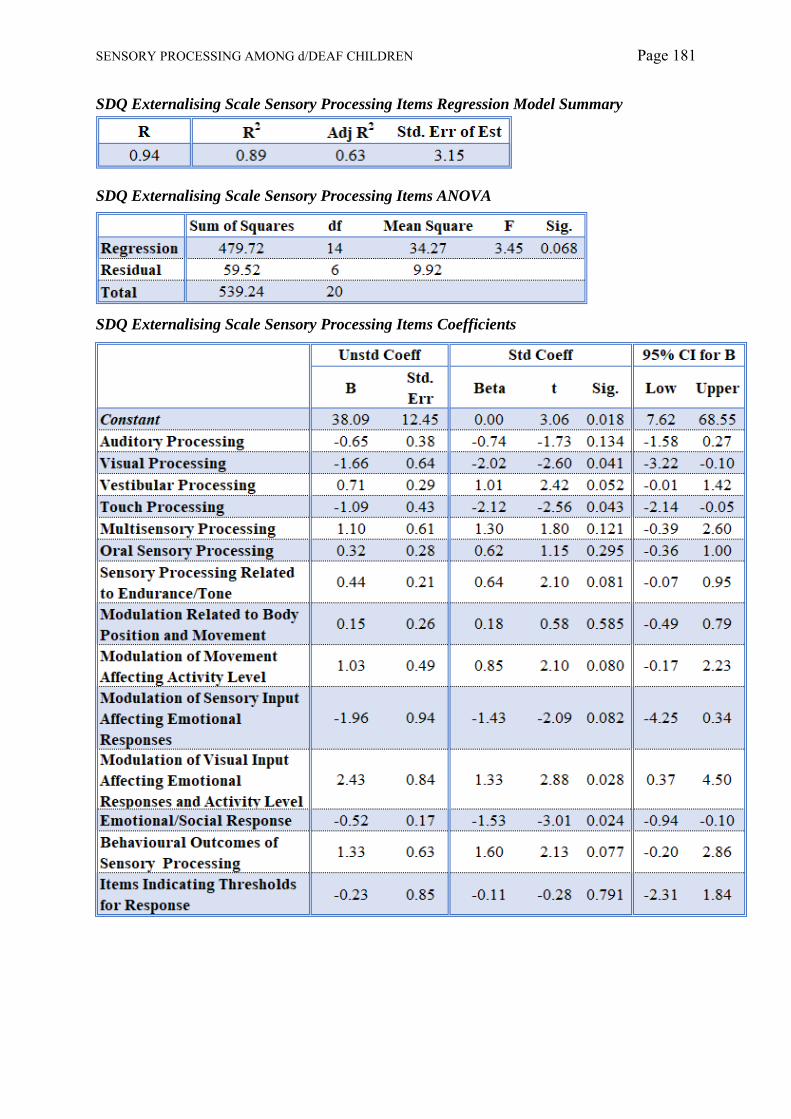
SENSORY PROCESSING AMONG d/DEAF CHILDREN Page 181
SDQ Externalising Scale Sensory Processing Items Regression Model Summary
SDQ Externalising Scale Sensory Processing Items ANOVA
SDQ Externalising Scale Sensory Processing Items Coefficients
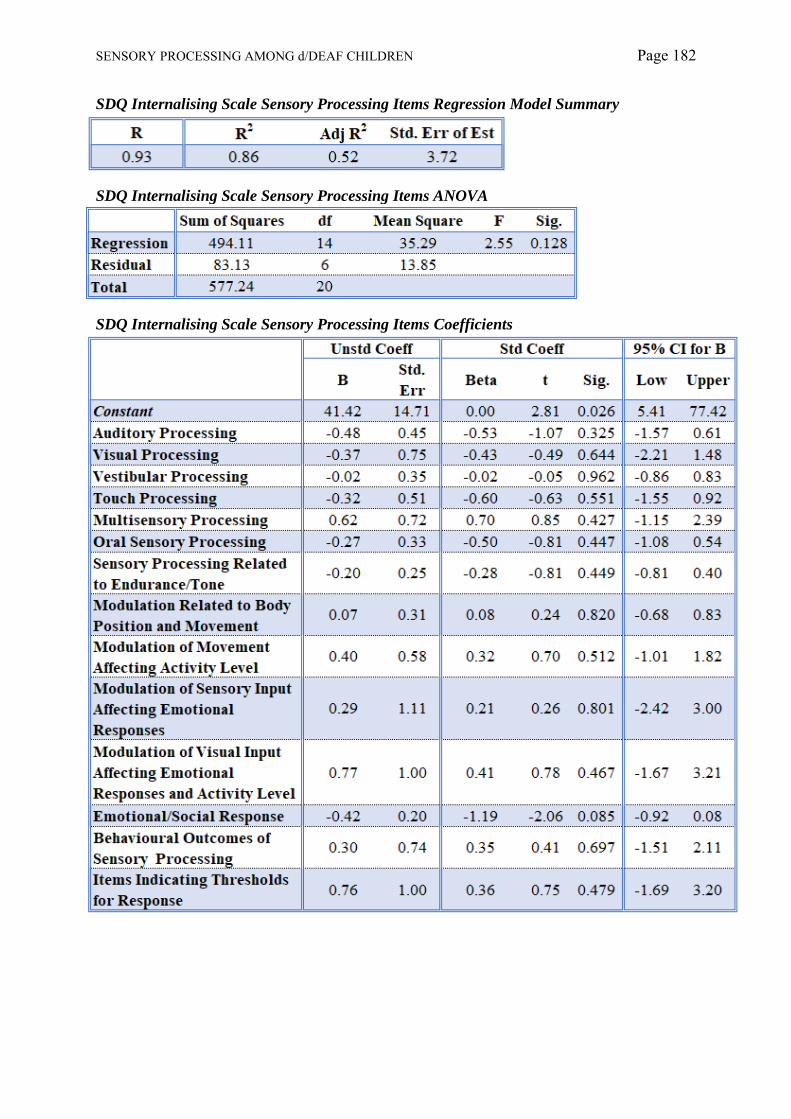
SENSORY PROCESSING AMONG d/DEAF CHILDREN Page 182
SDQ Internalising Scale Sensory Processing Items Regression Model Summary
SDQ Internalising Scale Sensory Processing Items ANOVA
SDQ Internalising Scale Sensory Processing Items Coefficients

SENSORY PROCESSING AMONG d/DEAF CHILDREN Page 183
Appendix 15 – Tables for Factor Regression Models
SDQ Total Scale Factor Regression Model Summary
SDQ Total Scale Factor ANOVA
SDQ Total Scale Factor Coefficients

SENSORY PROCESSING AMONG d/DEAF CHILDREN Page 184
SDQ Emotional Scale Factor Regression Model Summary
SDQ Emotional Scale Factor ANOVA
SDQ Emotional Scale Factor Coefficients

SENSORY PROCESSING AMONG d/DEAF CHILDREN Page 185
SDQ Conduct Scale Factor Regression Model Summary
SDQ Conduct Scale Factor ANOVA
SDQ Conduct Scale Factor Coefficients
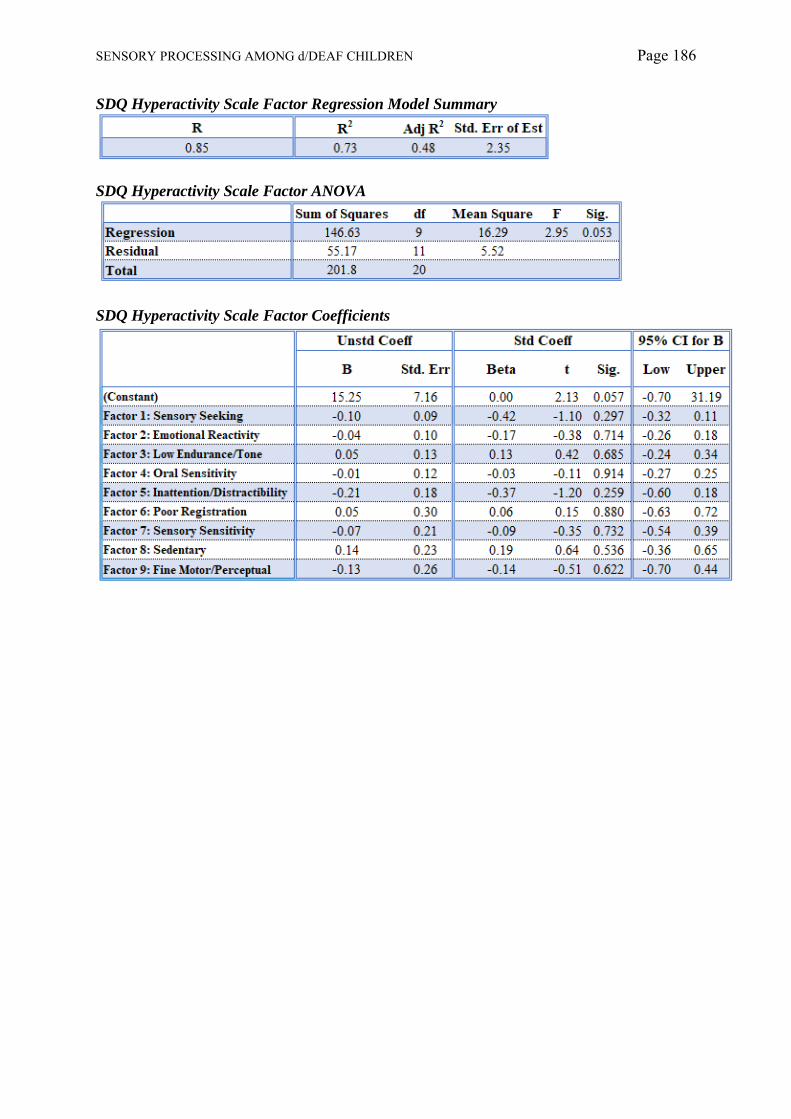
SENSORY PROCESSING AMONG d/DEAF CHILDREN Page 186
SDQ Hyperactivity Scale Factor Regression Model Summary
SDQ Hyperactivity Scale Factor ANOVA
SDQ Hyperactivity Scale Factor Coefficients

SENSORY PROCESSING AMONG d/DEAF CHILDREN Page 187
SDQ Peer Relations Scale Factor Regression Model Summary
SDQ Peer Relations Scale Factor ANOVA
SDQ Peer Relations Scale Factor Coefficients
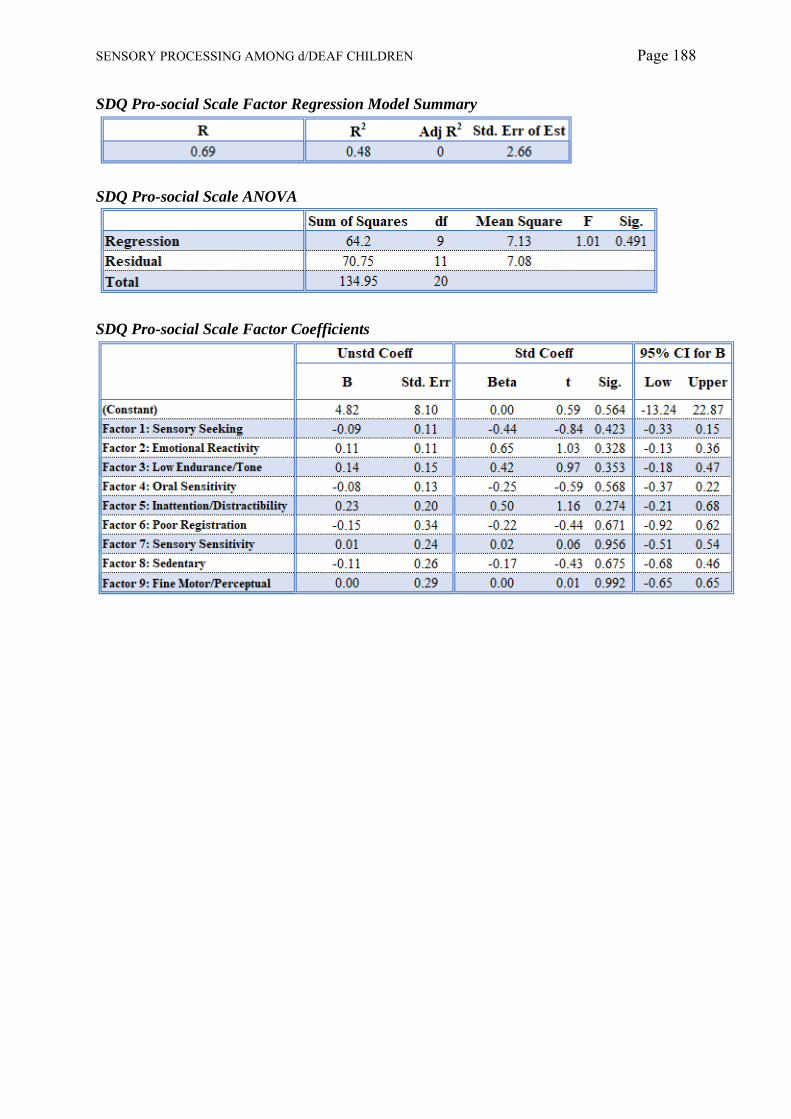
SENSORY PROCESSING AMONG d/DEAF CHILDREN Page 188
SDQ Pro-social Scale Factor Regression Model Summary
SDQ Pro-social Scale ANOVA
SDQ Pro-social Scale Factor Coefficients

SENSORY PROCESSING AMONG d/DEAF CHILDREN Page 189
SDQ Externalising Scale Factor Regression Model Summary
SDQ Externalising Scale Factor ANOVA
SDQ Externalising Scale Factor Coefficients
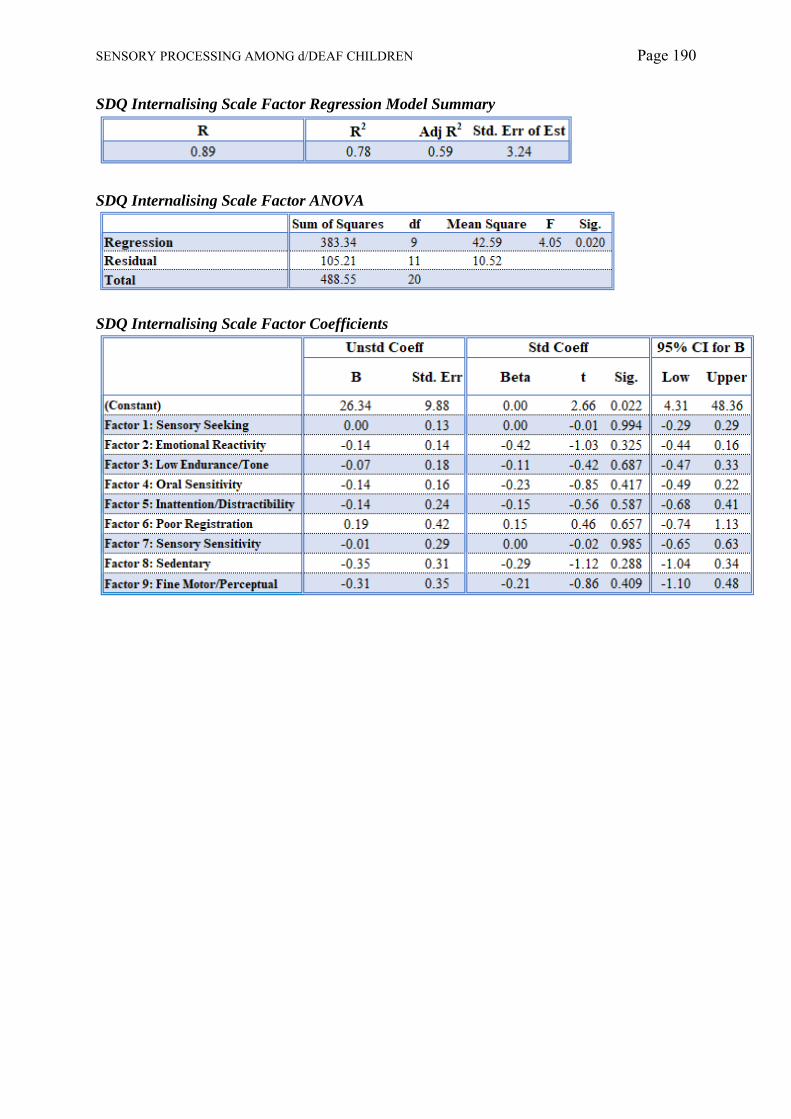
SENSORY PROCESSING AMONG d/DEAF CHILDREN Page 190
SDQ Internalising Scale Factor Regression Model Summary
SDQ Internalising Scale Factor ANOVA
SDQ Internalising Scale Factor Coefficients

SENSORY PROCESSING AMONG d/DEAF CHILDREN Page 191
Appendix 16 – Tables for Quadrant Regression Models
SDQ Total Score Quadrant Regression Model Summary
SDQ Total Score Quadrant ANOVA
SDQ Total Score Quadrant Coefficients

SENSORY PROCESSING AMONG d/DEAF CHILDREN Page 192
SDQ Emotional Scale Quadrant Regression Model Summary
SDQ Emotional Scale Quadrant ANOVA
SDQ Emotional Scale Quadrant ANOVA
SDQ Emotional Scale Quadrant Coefficients

SENSORY PROCESSING AMONG d/DEAF CHILDREN Page 193
SDQ Conduct Scale Quadrant Regression Model Summary
SDQ Conduct Scale Quadrant ANOVA
SDQ Conduct Scale Quadrant Coefficients

SENSORY PROCESSING AMONG d/DEAF CHILDREN Page 194
SDQ Hyperactivity Scale Quadrant Regression Model Summary
SDQ Hyperactivity Scale Quadrant ANOVA
SDQ Hyperactivity Scale Quadrant Coefficients

SENSORY PROCESSING AMONG d/DEAF CHILDREN Page 195
SDQ Peer Relationships Scale Quadrant Regression Model Summary
SDQ Peer Relationships Scale Quadrant ANOVA
SDQ Peer Relationships Scale Quadrant Coefficients
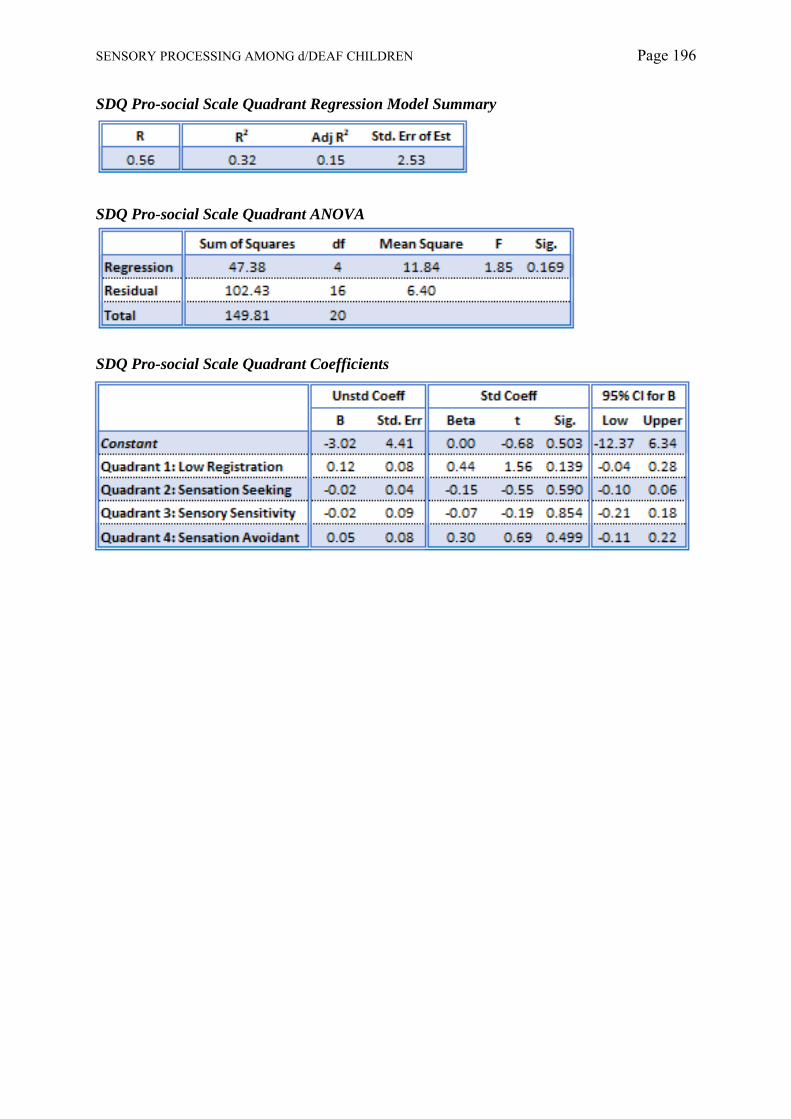
SENSORY PROCESSING AMONG d/DEAF CHILDREN Page 196
SDQ Pro-social Scale Quadrant Regression Model Summary
SDQ Pro-social Scale Quadrant ANOVA
SDQ Pro-social Scale Quadrant Coefficients
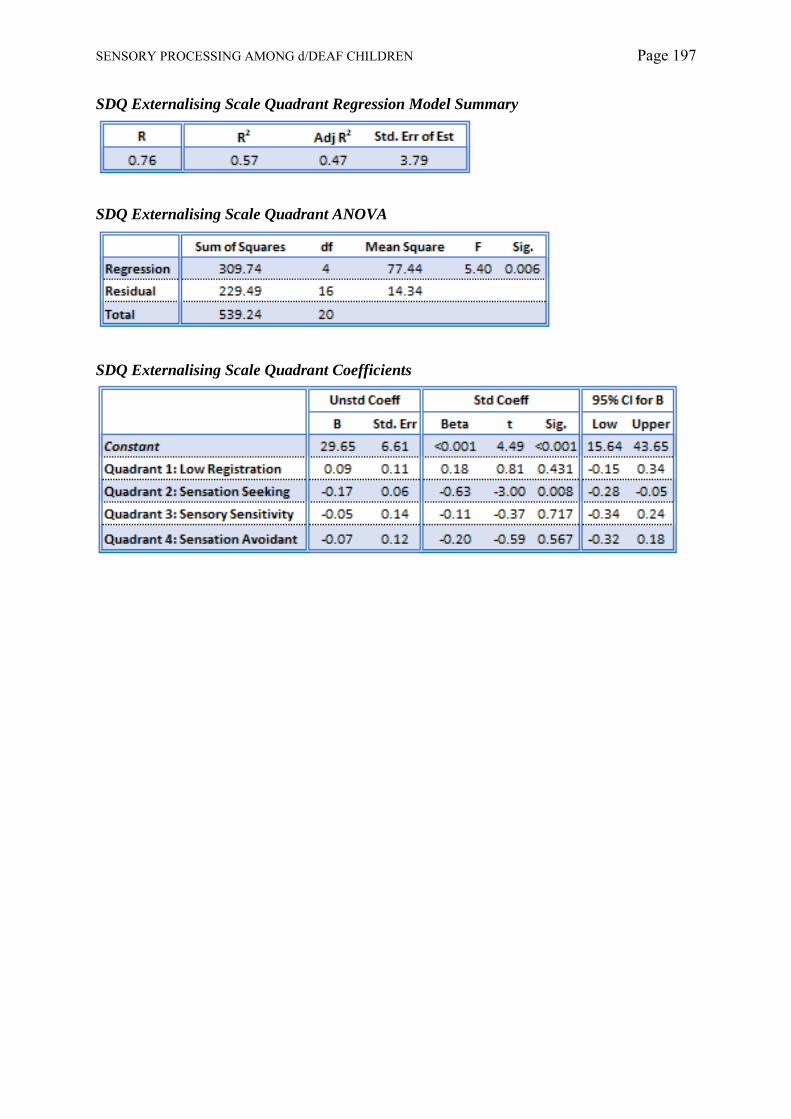
SENSORY PROCESSING AMONG d/DEAF CHILDREN Page 197
SDQ Externalising Scale Quadrant Regression Model Summary
SDQ Externalising Scale Quadrant ANOVA
SDQ Externalising Scale Quadrant Coefficients

SENSORY PROCESSING AMONG d/DEAF CHILDREN Page 198
SDQ Internalising Scale Quadrant Regression Model Summary
SDQ Internalising Scale Quadrant ANOVA
SDQ Internalising Scale Quadrant Coefficients

SENSORY PROCESSING AMONG d/DEAF CHILDREN Page 199
Appendix 17 – Example of a Clinical Interpretation of the SCPQ

SENSORY PROCESSING AMONG d/DEAF CHILDREN Page 200
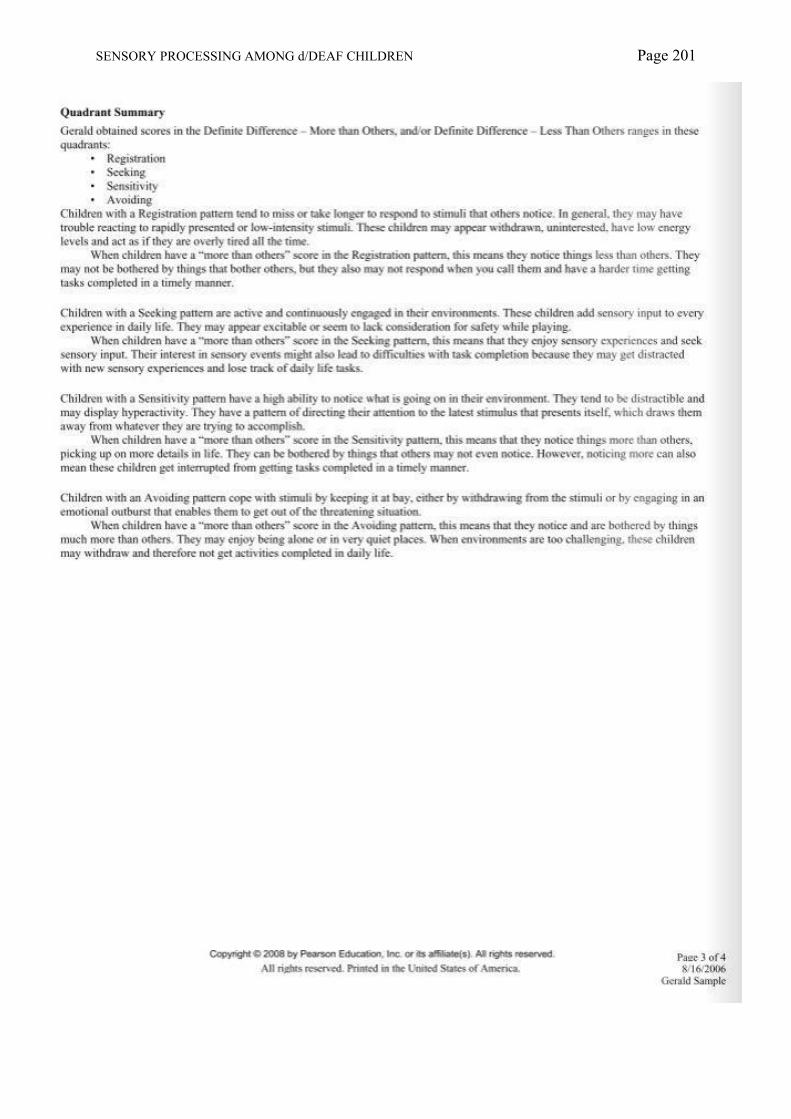
SENSORY PROCESSING AMONG d/DEAF CHILDREN Page 201

SENSORY PROCESSING AMONG d/DEAF CHILDREN Page 202

SENSORY PROCESSING AMONG d/DEAF CHILDREN Page 203
Appendix 18 – A Prior Power Plots
Item Analysis
G*Power Graph for Item Analysis f2 = 0.35 (large effect) – sample required n = 77
G*Power Graph for Factor Analysis f2 = 0.15 (medium effect) - sample required n = 166
G*Power Graph for Factor Analysis f2 = 0.02 (small effect) - sample required n = 1188

SENSORY PROCESSING AMONG d/DEAF CHILDREN Page 204
Factor Analysis
G*Power Graph for Factor Analysis f2 = 0.35 (large effect) – sample required n = 91
G*Power Graph for Factor Analysis f2 = 0.15 (medium effect) - sample required n = 194
G*Power Graph for Factor Analysis f2 = 0.02 (small effect) - sample required n = 1373

SENSORY PROCESSING AMONG d/DEAF CHILDREN Page 205
Quadrant Analysis
G*Power Graph for Quadrant Analysis f2 = 0.35 (large effect) – sample required n = 59
G*Power Graph for Quadrant Analysis f2 = 0.15 (medium effect) - sample required n = 129
G*Power Graph for Quadrant Analysis f2 = 0.02 (small effect) - sample required n = 934