Western Pond Turtle Population and Habitat Viability Assessment
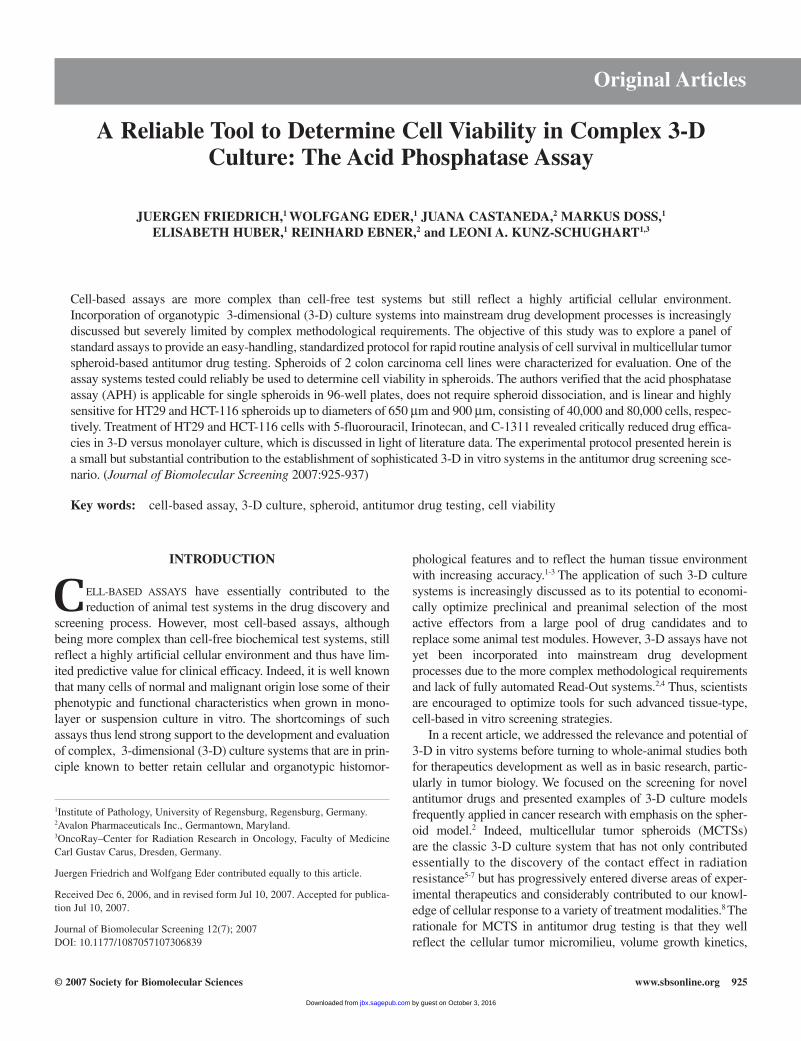
A Reliable Tool to Determine Cell Viability in Complex 3-DCulture: The Acid Phosphatase Assay
JUERGEN FRIEDRICH,1 WOLFGANG EDER,1 JUANA CASTANEDA,2 MARKUS DOSS,1
ELISABETH HUBER,1 REINHARD EBNER,2 and LEONI A. KUNZ-SCHUGHART1,3
Cell-based assays are more complex than cell-free test systems but still reflect a highly artificial cellular environment.Incorporation of organotypic 3-dimensional (3-D) culture systems into mainstream drug development processes is increasinglydiscussed but severely limited by complex methodological requirements. The objective of this study was to explore a panel ofstandard assays to provide an easy-handling, standardized protocol for rapid routine analysis of cell survival in multicellular tumorspheroid-based antitumor drug testing. Spheroids of 2 colon carcinoma cell lines were characterized for evaluation. One of theassay systems tested could reliably be used to determine cell viability in spheroids. The authors verified that the acid phosphataseassay (APH) is applicable for single spheroids in 96-well plates, does not require spheroid dissociation, and is linear and highlysensitive for HT29 and HCT-116 spheroids up to diameters of 650 µm and 900 µm, consisting of 40,000 and 80,000 cells, respec-tively. Treatment of HT29 and HCT-116 cells with 5-fluorouracil, Irinotecan, and C-1311 revealed critically reduced drug effica-cies in 3-D versus monolayer culture, which is discussed in light of literature data. The experimental protocol presented herein isa small but substantial contribution to the establishment of sophisticated 3-D in vitro systems in the antitumor drug screening sce-nario. (Journal of Biomolecular Screening 2007:925-937)
Key words: cell-based assay, 3-D culture, spheroid, antitumor drug testing, cell viability
© 2007 Society for Biomolecular Sciences www.sbsonline.org 925
INTRODUCTION
CELL-BASED ASSAYS have essentially contributed to thereduction of animal test systems in the drug discovery and
screening process. However, most cell-based assays, althoughbeing more complex than cell-free biochemical test systems, stillreflect a highly artificial cellular environment and thus have lim-ited predictive value for clinical efficacy. Indeed, it is well knownthat many cells of normal and malignant origin lose some of theirphenotypic and functional characteristics when grown in mono-layer or suspension culture in vitro. The shortcomings of suchassays thus lend strong support to the development and evaluationof complex, 3-dimensional (3-D) culture systems that are in prin-ciple known to better retain cellular and organotypic histomor-
phological features and to reflect the human tissue environmentwith increasing accuracy.1-3 The application of such 3-D culturesystems is increasingly discussed as to its potential to economi-cally optimize preclinical and preanimal selection of the mostactive effectors from a large pool of drug candidates and toreplace some animal test modules. However, 3-D assays have notyet been incorporated into mainstream drug developmentprocesses due to the more complex methodological requirementsand lack of fully automated Read-Out systems.2,4 Thus, scientistsare encouraged to optimize tools for such advanced tissue-type,cell-based in vitro screening strategies.
In a recent article, we addressed the relevance and potential of3-D in vitro systems before turning to whole-animal studies bothfor therapeutics development as well as in basic research, partic-ularly in tumor biology. We focused on the screening for novelantitumor drugs and presented examples of 3-D culture modelsfrequently applied in cancer research with emphasis on the spher-oid model.2 Indeed, multicellular tumor spheroids (MCTSs) are the classic 3-D culture system that has not only contributedessentially to the discovery of the contact effect in radiationresistance5-7 but has progressively entered diverse areas of exper-imental therapeutics and considerably contributed to our knowl-edge of cellular response to a variety of treatment modalities.8 Therationale for MCTS in antitumor drug testing is that they wellreflect the cellular tumor micromilieu, volume growth kinetics,
1Institute of Pathology, University of Regensburg, Regensburg, Germany.2Avalon Pharmaceuticals Inc., Germantown, Maryland.3OncoRay–Center for Radiation Research in Oncology, Faculty of MedicineCarl Gustav Carus, Dresden, Germany.
Juergen Friedrich and Wolfgang Eder contributed equally to this article.
Received Dec 6, 2006, and in revised form Jul 10, 2007. Accepted for publica-tion Jul 10, 2007.
Journal of Biomolecular Screening 12(7); 2007DOI: 10.1177/1087057107306839
Original Articles
by guest on October 3, 2016jbx.sagepub.comDownloaded from
and cytoarchitecture, with cell-to-cell and cell-to-matrix interac-tions very similar to those of avascular tumor nodules,micrometastases, or intervascular regions of large solid tumors.Due to these characteristics, MCTSs have become a powerful toolto study therapeutic problems associated with metabolic and pro-liferative gradients. Accordingly, they provide a promising sup-plement to the use of monolayer systems, serving as awell-controlled, 3-D experimental model with intermediate com-plexity that supposedly better estimate in vivo antitumor effectivedose ranges and treatment modalities.2,9,10
The particular aim of the present study was to provide an easy-handling, standardized protocol for rapid routine analysis with atechnique that complies with the following requirements: 1) lim-ited number of 3-D cultures per analysis, 2) appropriate for 3-Dcultures with cell numbers ranging between 5 × 10³ and 5 × 10⁵,and 3) high sensitivity and specificity to allow for the discrimina-tion of “normal” background in MCTSs with necrotic core. We explored the feasibility of various commercially availablecytotoxicity/viability assays, some of which are routinely appliedin high-throughput screening (HTS) with monolayer cultures, forapplication in 3-D MCTSs and found one of the assay systems tobe a reliable platform for determining cytotoxic effects in single-spheroid cultures. The experimental protocol and 1st applicationsof this assay are particularly highlighted in the present article as itpresents a small but substantial piece in the mosaic that contributesto the important establishment of advanced tissue-type in vitrosystems in the antitumor drug screening scenario. The failure ofother assay systems is briefly discussed.
MATERIALS AND METHODS
Cell line and spheroid culturing
Experiments were carried out with the human colon carcinomacell lines HT29 and HCT-116 (ATCC, Manassas, VA). Cells wereroutinely thawed from frozen stocks and were subcultured for <25 passages (cumulative population doublings [CPD] < 100).Dulbecco’s Modified Eagle’s Medium (DMEM) containing 1 g/Lglucose, 1% sodium pyruvate, 1% L-glutamine, and 3.7%NaHCO3, supplemented with 100 U/mL penicillin, 100 µg/mLstreptomycin, and 10% fetal calf serum (FCS), was used as “stan-dard medium” for routine culturing (medium and all ingredientsfrom PAN Biotech GmbH, Aidenbach, Germany). All cultureswere kept in a humidified atmosphere with 5% CO2 in air at 37 °C. Cell transfer and preparation of single-cell suspensionswere performed by mild enzymatic dissociation using a 0.05%trypsin and 0.02% EDTA solution in phosphate-buffered saline(PBS; PAN Biotech GmbH). Stock cultures were passaged every3 to 4 days by seeding 0.5 to 1 × 10⁶ cells into T75 culture flasks.Spheroids were initiated in liquid overlay11 by seeding 1.5 × 10³
HT29 cells/well and 0.75 × 10³ HCT-116 cells/well in a 200-µLmedium using agarose-coated 96-well plates (50 µL 1.5%agarose/well).11,12 After an initiation interval of 4 days, 50% of the
supernatant was replaced by fresh, standard medium and every 48h thereafter except for the 72-h drug treatment setup described inthe Drug Treatment section (see below).
Cell counting and flow cytometry
Viable cell counts and cell volumes were routinely recordedwith a Casy1 cell analyzer system (Schaerfe, Reutlingen,Germany) for culture quality assessment and to analyze cellgrowth kinetics as described earlier.13 For the determination ofviable cells in spheroids, 16 to 32 spheroids were collected anddissociated using a 0.1% trypsin and 0.04% EDTA solution inPBS, and the cell number was analyzed with the Casy1 cellanalyzer system. In addition, appropriate cell aliquots werestained with the DNA intercalating dye propidium iodide (PI:2 µg/mL per 106 cells), and the proportion of viable to membrane-damaged cells was analyzed on a FACSCalibur™ flow cytome-ter using the CellQuest/CellQuestPro software packages (BDBiosciences, San Jose, CA).
Microscopy and histology
Phase contrast imaging and morphological analyses ofspheroids in 96-well microplates were carried out manually ona Zeiss Axiovert 200 microscope equipped with an AxioCamMRc camera or automated using a Zeiss Axiovert 200Mequipped with an AxioCam MRm camera. Spheroid diametersand volumes were determined from images taken with a 10×objective using specific modules defined for the KS 300 andthe AxioVison software (Zeiss, Jena, Germany), respectively.Spheroid histology was documented in spheroids of differentsize ranges following routine paraffin-embedding procedures,sectioning (5-6 µm), and H&E (hematoxylin/eosin) staining.
Acid phosphatase assay
A modified acid phosphatase (APH) assay, which is based onquantification of cytosolic acid phosphatase activity, was vali-dated for determining cell viability in spheroids. Intracellular acidphosphatases in viable cells hydrolyze p-nitrophenyl phosphate top-nitrophenol. Its absorption at 405 nm is directly proportional tothe cell number in the range of 103 to 105 monolayer cells.14
MCTS cultures grown in liquid overlay with 200 µL medium perwell were transferred with supernatant into standard flat-bottom96-well microplates and centrifuged for 10 min at 1500 UpM on a Heraeus Sepatech Varifuge 3.2RS to spin down spheroids,clusters, and single cells. The spheroid/cell pellet was washed by carefully replacing 160 µL of the supernatant with PBS.Centrifugation was repeated, and the supernatant was discarded to a final volume of 100 µL. Then, 100 µL of the assay buffer (0.1 M sodium acetate, 0.1% Triton-X-100, supplemented withImmunoPure p-nitrophenyl phosphate; Pierce Biotech Inc.,Rockford, IL) was added per well and incubated for 90 min at
Friedrich et al.
926 www.sbsonline.org Journal of Biomolecular Screening 12(7); 2007
by guest on October 3, 2016jbx.sagepub.comDownloaded from
37 °C. Following incubation, 10 µL of 1 N NaOH was supple-mented to each well, and absorption at 405 nm was measuredwithin 10 min on a Fusion Universal Microplate Analyzer(Packard, Meriden, CT).
Drug treatment
Treatment was performed with the following drugs:5-fluorouracil (5-FU; Sigma-Aldrich, St. Louis, MO),Irinotecan (Toronto Research Chemicals, Ontario, Canada),and C-1311 (Symadex). The 5-(ω-aminoalkyl)-amino-8-hydroxyimidazoacridinone C-131115 was synthesized as describedearlier16,17 and generously provided by Marek Cholody (AvalonPharmaceuticals Inc., Germantown, MD). Drugs (100-mM stocksolutions in DMSO) were applied in the following final concen-trations: 200 µM, 100 µM, 50 µM, 25 µM, 10 µM, 1 µM, and 0.1µM in standard medium. Treatment with 10% Triton-X-100(Sigma-Aldrich) in standard medium for 2 h at 37 °C leads to a100% loss of cell membrane integrity in structurally intact spher-oids and served as ultimate (positive) control.
For drug treatment, HT29 and HCT-116 monolayer cultur-ing was carried out in 96-well plates (BD Biosciences/Falcon,Franklin Lakes, NJ) by plating 6 × 10² exponentially growingcells per well. Spheroids were grown in liquid overlay asdetailed earlier. Both monolayer and spheroid cultures weretreated 96 h after inoculation by replacing 50% (= 100 µL) ofthe culture supernatant with drug-supplemented fresh standardmedium. The spheroid diameter at the onset of treatment was380 to 400 µm. The routine treatment interval was 72 h.Untreated control cells and spheroids were always cultured inparallel as reference, using standard medium for refreshmentthat contained DMSO at the same concentration as present inthe 200-µM drug dilution. Appropriate compound vehicle (neg-ative) control experiments with 0.01% to 2% DMSO in stan-dard medium revealed that the concentration range required for drug dilution (0.01%-0.2%) does not significantly alter cellviability/growth and assay signal.
Analysis of drug efficacy
Drug effects were recorded after 72 h of treatment via spher-oid volume analysis and APH assay. All experiments were car-ried out at least in triplicate. APH data were corrected forbackground absorption at 405 nm as determined from wellscontaining medium alone. Drug effects were documented rela-tive to untreated controls, taking into account the mean APHsignal of n = 8 nontreated spheroids measured for each indi-vidual experiment. The absorption signals of medium back-ground and nontreated spheroid controls within 1 experimentalseries varied by only 5% to 10%. Dose-response curves andIC50 values were calculated for each individual experiment viasigmoidal dose-response analysis using the Hill fitting equation
in the Prism 4 software (GraphPad Software Inc., San Diego,CA). The individual dose-response curves and IC50 values foreach drug were averaged and are documented as mean ± stan-dard deviation (SD).
RESULTS
Characteristics of HT29 and HCT-116colon carcinoma spheroids
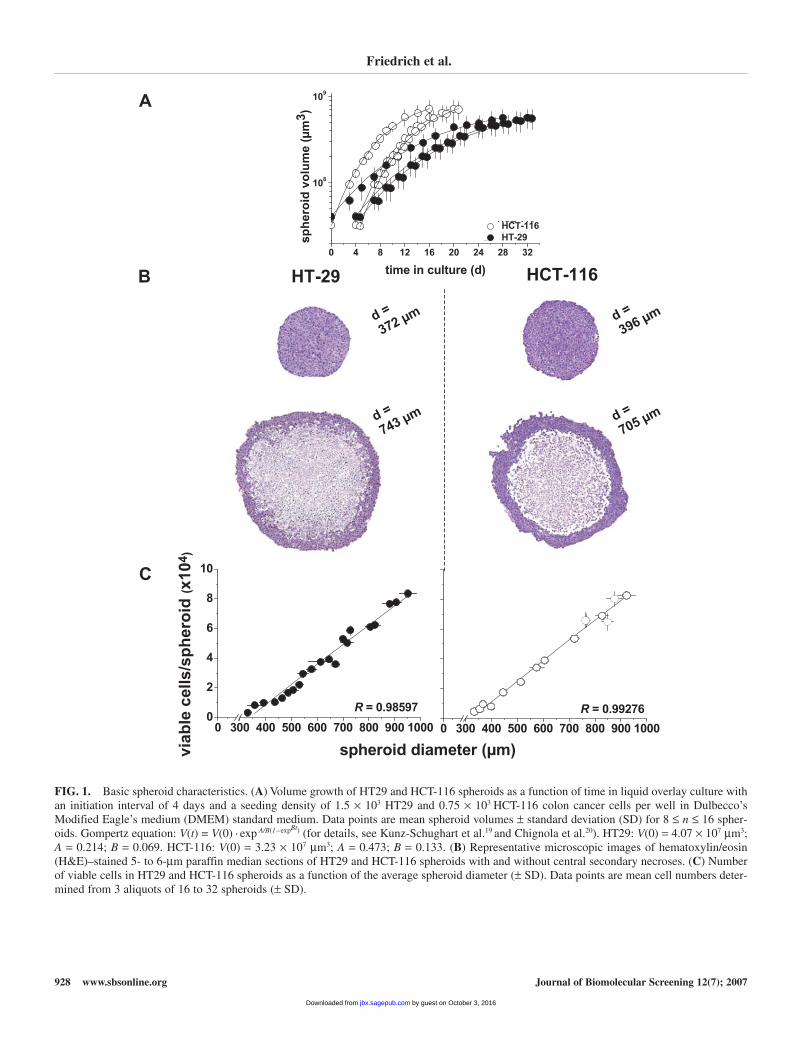
Robust, single MCTSs of about 400 µm in diameter wereobtained after an initiation interval of 96 h when 1.5 × 10³ HT29and 0.75 × 10³ HCT-116 cells, respectively, were seeded per well.The interwell variation in spheroid diameter for each experimentwas under 5%. The variation in the mean spheroid diameter at day4 in culture for independent experiments was below 10%.
With the standard medium (classic DMEM containing 10%FCS) being refreshed every 48 h, spheroid volume increased asa function of time in culture according to the Gompertz equa-tion, which mathematically describes tumor and also spheroidgrowth kinetics.18-20 Maximum spheroid sizes of about 1 mmwere reached after some 20 days for HCT-116 and 30 days forHT29 spheroids. The spheroid volume doubling was about 46h for HT29 and 14 h for HCT-116 spheroids (Fig. 1A).Representative histological images of HT29 and HCT-116 spher-oids of 2 size ranges are shown in Figure 1B. The 400-µm spher-oids did not yet exhibit central secondary necroses. Cell death inthe spheroid core developed at diameters of 520 to 580 µm in bothspheroid types (data not shown). Central secondary necrosis isclearly visible in the representative 700- to 750-µm HT29 andHCT-116 spheroids documented in Figure 1B.
Viable cell count/spheroid was analyzed as a prerequisite forthe evaluation of commercial cell viability/cytotoxicity assays.According to the spheroid volume, the number of viable cellsper spheroid was determined following spheroid dissociationvia automated counting amplified throughout spheroid cultur-ing. For HT29 and HCT-116 spheroids, a positive linear corre-lation between spheroid size and viable cells/spheroid wasdocumented (Fig. 1C). In parallel, the proportion of mem-brane-defective cells (PI positive) monitored via flow cytome-try increased throughout spheroid growth, reflecting the onsetand proceeding of cell death in the spheroid center at > 520 µm.However, spheroids with smaller sizes (e.g., 400 µm) containedonly 6% to 9% membrane-defective cells, which were hypoth-esized to not critically affect selectivity or sensitivity of anyviability assay. Sizes of 400 to 600 µm were chosen for a pre-liminary evaluation of various commercial cytotoxicity/viabilityassays. Among a series of assay systems that are discussed later(see Discussion section and Fig. 6), the quantification ofcytosolic acid phosphatase activity showed the most convinc-ing results and was thus further validated for reliable applica-tion in a spheroid drug screening assay.
Cell Viability Assessment in 3-D Cultures
Journal of Biomolecular Screening 12(7); 2007 www.sbsonline.org 927
by guest on October 3, 2016jbx.sagepub.comDownloaded from
Friedrich et al.
928 www.sbsonline.org Journal of Biomolecular Screening 12(7); 2007
A
0 300 400 500 600 700 800 900 10000
2
4
6
8
10
R = 0.98597
spheroid diameter (µm)via
ble
cells/s
ph
ero
id(x
10
4)
108
109
HCT-116
HT-29sp
hero
id v
olu
me (
µm
3)
0 4 8 12 16 20 24 28 32
s
time in culture (d)HT-29 HCT-116
d =
743 µm
d =
396 µm
d =
705 µm
d =
372 µm
0 300 400 500 600 700 800 900 1000
R = 0.99276
B
C
HCT-116
HT-29
FIG. 1. Basic spheroid characteristics. (A) Volume growth of HT29 and HCT-116 spheroids as a function of time in liquid overlay culture withan initiation interval of 4 days and a seeding density of 1.5 × 10³ HT29 and 0.75 × 10³ HCT-116 colon cancer cells per well in Dulbecco’sModified Eagle’s medium (DMEM) standard medium. Data points are mean spheroid volumes ± standard deviation (SD) for 8 ≤ n ≤ 16 spher-oids. Gompertz equation: V(t) = V(0) · exp A/B(1–expBt) (for details, see Kunz-Schughart et al.19 and Chignola et al.20). HT29: V(0) = 4.07 × 107 µm3;A = 0.214; B = 0.069. HCT-116: V(0) = 3.23 × 107 µm3; A = 0.473; B = 0.133. (B) Representative microscopic images of hematoxylin/eosin(H&E)–stained 5- to 6-µm paraffin median sections of HT29 and HCT-116 spheroids with and without central secondary necroses. (C) Numberof viable cells in HT29 and HCT-116 spheroids as a function of the average spheroid diameter (± SD). Data points are mean cell numbers deter-mined from 3 aliquots of 16 to 32 spheroids (± SD).
by guest on October 3, 2016jbx.sagepub.comDownloaded from
Applicability and linearity of the APH assayin spheroid cultures
Supernatants of adherent monolayer cells are in generalremoved prior to the addition of the APH assay buffer, and cellsmay even be washed once. However, with nonadherent spheroidcultures, this step is complicated and becomes even more prob-lematic after drug treatment if the spheroid structure is partiallydisrupted. Here, detached cells or cell clusters may not necessar-ily and entirely be destroyed and should not be sucked off.Generally, the way to deal with suspension-cultured cells to avoidsupernatant removal when using the APH assay is to add thereagents at higher concentrations. In a pilot study, we tried a non-removal procedure but found the FCS to interfere with the deter-mination of the acid phosphatase activity in our spheroidapproach. To circumvent this dilemma, we developed a modifiedassay protocol as detailed in the Materials and Methods section.
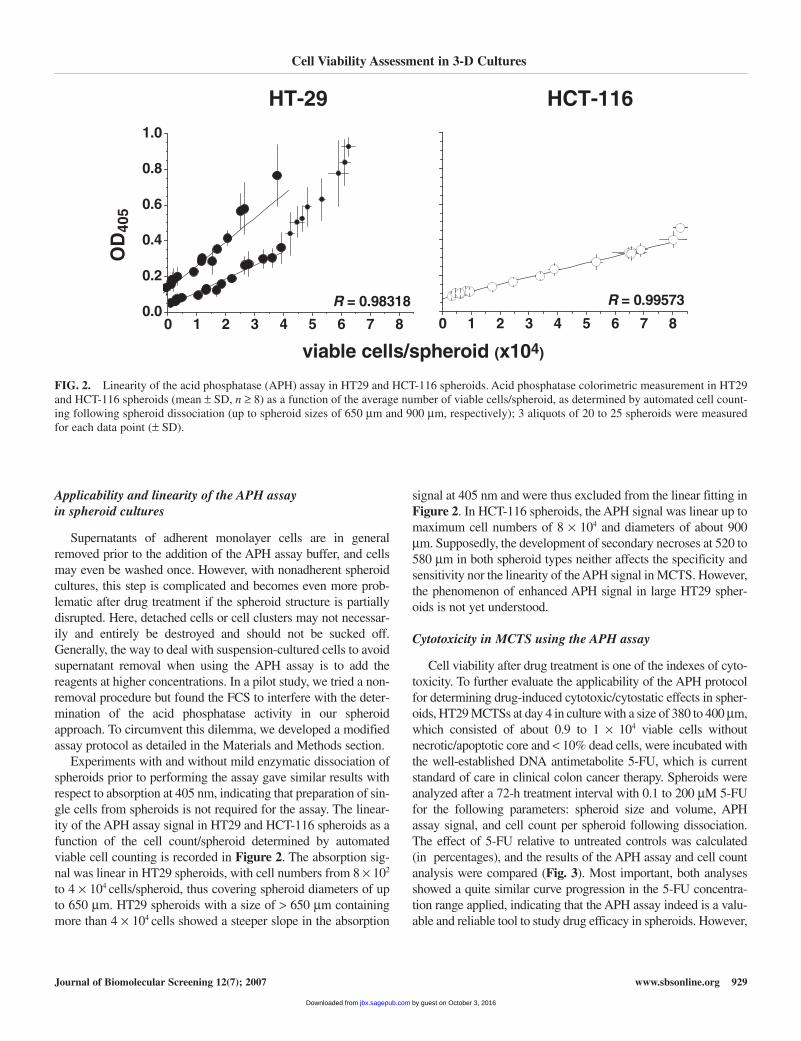
Experiments with and without mild enzymatic dissociation ofspheroids prior to performing the assay gave similar results withrespect to absorption at 405 nm, indicating that preparation of sin-gle cells from spheroids is not required for the assay. The linear-ity of the APH assay signal in HT29 and HCT-116 spheroids as afunction of the cell count/spheroid determined by automatedviable cell counting is recorded in Figure 2. The absorption sig-nal was linear in HT29 spheroids, with cell numbers from 8 × 10²
to 4 × 10⁴ cells/spheroid, thus covering spheroid diameters of upto 650 µm. HT29 spheroids with a size of > 650 µm containingmore than 4 × 10⁴ cells showed a steeper slope in the absorption
signal at 405 nm and were thus excluded from the linear fitting inFigure 2. In HCT-116 spheroids, the APH signal was linear up tomaximum cell numbers of 8 × 10⁴ and diameters of about 900µm. Supposedly, the development of secondary necroses at 520 to580 µm in both spheroid types neither affects the specificity andsensitivity nor the linearity of the APH signal in MCTS. However,the phenomenon of enhanced APH signal in large HT29 spher-oids is not yet understood.
Cytotoxicity in MCTS using the APH assay
Cell viability after drug treatment is one of the indexes of cyto-toxicity. To further evaluate the applicability of the APH protocolfor determining drug-induced cytotoxic/cytostatic effects in spher-oids, HT29 MCTSs at day 4 in culture with a size of 380 to 400 µm,which consisted of about 0.9 to 1 × 10⁴ viable cells withoutnecrotic/apoptotic core and < 10% dead cells, were incubated withthe well-established DNA antimetabolite 5-FU, which is currentstandard of care in clinical colon cancer therapy. Spheroids wereanalyzed after a 72-h treatment interval with 0.1 to 200 µM 5-FUfor the following parameters: spheroid size and volume, APHassay signal, and cell count per spheroid following dissociation.The effect of 5-FU relative to untreated controls was calculated (in percentages), and the results of the APH assay and cell countanalysis were compared (Fig. 3). Most important, both analysesshowed a quite similar curve progression in the 5-FU concentra-tion range applied, indicating that the APH assay indeed is a valu-able and reliable tool to study drug efficacy in spheroids. However,
Cell Viability Assessment in 3-D Cultures
Journal of Biomolecular Screening 12(7); 2007 www.sbsonline.org 929
0 1 2 3 4 5 6 7 80.0
0.2
0.4
0.6
0.8
1.0
R = 0.98318
OD
405
0 1 2 3 4 5 6 7 80
2
4
6
8
0
R = 0.99573
viable cells/spheroid (x104)
HT-29 HCT-116
FIG. 2. Linearity of the acid phosphatase (APH) assay in HT29 and HCT-116 spheroids. Acid phosphatase colorimetric measurement in HT29and HCT-116 spheroids (mean ± SD, n ≥ 8) as a function of the average number of viable cells/spheroid, as determined by automated cell count-ing following spheroid dissociation (up to spheroid sizes of 650 µm and 900 µm, respectively); 3 aliquots of 20 to 25 spheroids were measuredfor each data point (± SD).
by guest on October 3, 2016jbx.sagepub.comDownloaded from
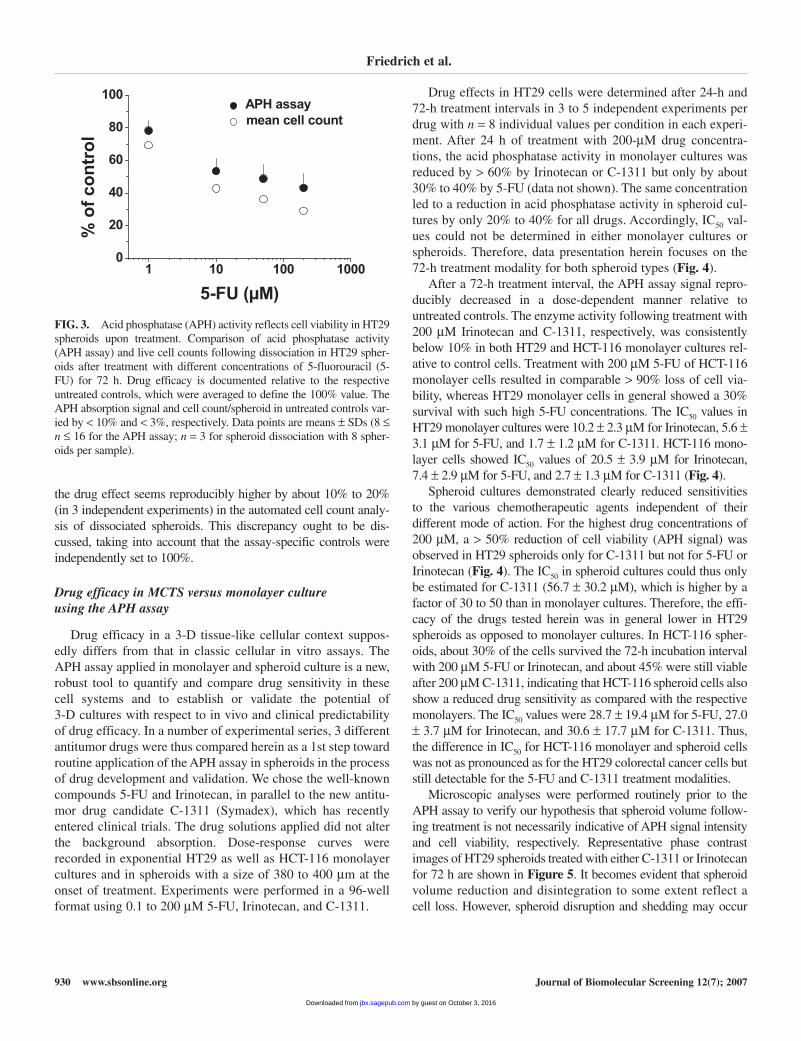
the drug effect seems reproducibly higher by about 10% to 20%(in 3 independent experiments) in the automated cell count analy-sis of dissociated spheroids. This discrepancy ought to be dis-cussed, taking into account that the assay-specific controls wereindependently set to 100%.
Drug efficacy in MCTS versus monolayer culture using the APH assay
Drug efficacy in a 3-D tissue-like cellular context suppos-edly differs from that in classic cellular in vitro assays. TheAPH assay applied in monolayer and spheroid culture is a new,robust tool to quantify and compare drug sensitivity in thesecell systems and to establish or validate the potential of 3-D cultures with respect to in vivo and clinical predictabilityof drug efficacy. In a number of experimental series, 3 differentantitumor drugs were thus compared herein as a 1st step towardroutine application of the APH assay in spheroids in the processof drug development and validation. We chose the well-knowncompounds 5-FU and Irinotecan, in parallel to the new antitu-mor drug candidate C-1311 (Symadex), which has recentlyentered clinical trials. The drug solutions applied did not alterthe background absorption. Dose-response curves wererecorded in exponential HT29 as well as HCT-116 monolayercultures and in spheroids with a size of 380 to 400 µm at theonset of treatment. Experiments were performed in a 96-wellformat using 0.1 to 200 µM 5-FU, Irinotecan, and C-1311.
Drug effects in HT29 cells were determined after 24-h and72-h treatment intervals in 3 to 5 independent experiments perdrug with n = 8 individual values per condition in each experi-ment. After 24 h of treatment with 200-µM drug concentra-tions, the acid phosphatase activity in monolayer cultures wasreduced by > 60% by Irinotecan or C-1311 but only by about30% to 40% by 5-FU (data not shown). The same concentrationled to a reduction in acid phosphatase activity in spheroid cul-tures by only 20% to 40% for all drugs. Accordingly, IC50 val-ues could not be determined in either monolayer cultures orspheroids. Therefore, data presentation herein focuses on the72-h treatment modality for both spheroid types (Fig. 4).
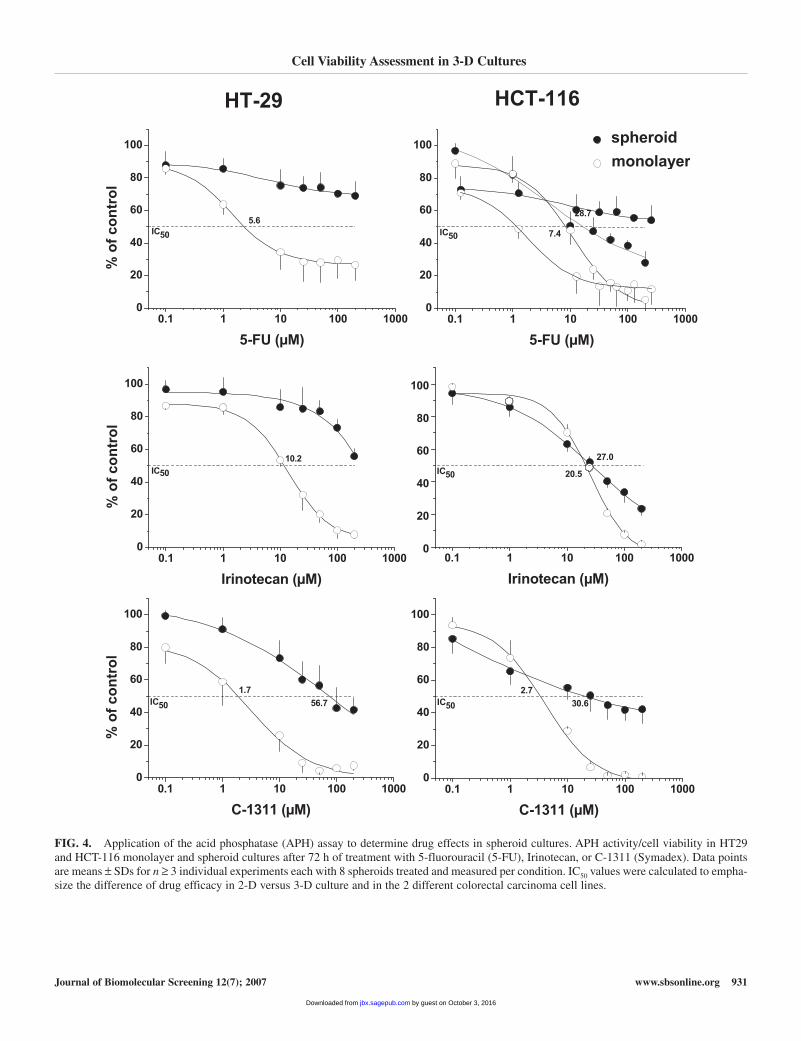
After a 72-h treatment interval, the APH assay signal repro-ducibly decreased in a dose-dependent manner relative tountreated controls. The enzyme activity following treatment with200 µM Irinotecan and C-1311, respectively, was consistentlybelow 10% in both HT29 and HCT-116 monolayer cultures rel-ative to control cells. Treatment with 200 µM 5-FU of HCT-116monolayer cells resulted in comparable > 90% loss of cell via-bility, whereas HT29 monolayer cells in general showed a 30%survival with such high 5-FU concentrations. The IC50 values inHT29 monolayer cultures were 10.2 ± 2.3 µM for Irinotecan, 5.6 ±3.1 µM for 5-FU, and 1.7 ± 1.2 µM for C-1311. HCT-116 mono-layer cells showed IC50 values of 20.5 ± 3.9 µM for Irinotecan,7.4 ± 2.9 µM for 5-FU, and 2.7 ± 1.3 µM for C-1311 (Fig. 4).
Spheroid cultures demonstrated clearly reduced sensitivities to the various chemotherapeutic agents independent of their different mode of action. For the highest drug concentrations of200 µM, a > 50% reduction of cell viability (APH signal) wasobserved in HT29 spheroids only for C-1311 but not for 5-FU orIrinotecan (Fig. 4). The IC50 in spheroid cultures could thus onlybe estimated for C-1311 (56.7 ± 30.2 µM), which is higher by afactor of 30 to 50 than in monolayer cultures. Therefore, the effi-cacy of the drugs tested herein was in general lower in HT29spheroids as opposed to monolayer cultures. In HCT-116 spher-oids, about 30% of the cells survived the 72-h incubation intervalwith 200 µM 5-FU or Irinotecan, and about 45% were still viableafter 200 µM C-1311, indicating that HCT-116 spheroid cells alsoshow a reduced drug sensitivity as compared with the respectivemonolayers. The IC50 values were 28.7 ± 19.4 µM for 5-FU, 27.0± 3.7 µM for Irinotecan, and 30.6 ± 17.7 µM for C-1311. Thus,the difference in IC50 for HCT-116 monolayer and spheroid cellswas not as pronounced as for the HT29 colorectal cancer cells butstill detectable for the 5-FU and C-1311 treatment modalities.
Microscopic analyses were performed routinely prior to theAPH assay to verify our hypothesis that spheroid volume follow-ing treatment is not necessarily indicative of APH signal intensityand cell viability, respectively. Representative phase contrastimages of HT29 spheroids treated with either C-1311 or Irinotecanfor 72 h are shown in Figure 5. It becomes evident that spheroidvolume reduction and disintegration to some extent reflect a cell loss. However, spheroid disruption and shedding may occur
Friedrich et al.
930 www.sbsonline.org Journal of Biomolecular Screening 12(7); 2007
1 10 100 10000
20
40
60
80
100APH assay
mean cell count
% o
f co
ntr
ol
5-FU (µM)
FIG. 3. Acid phosphatase (APH) activity reflects cell viability in HT29spheroids upon treatment. Comparison of acid phosphatase activity(APH assay) and live cell counts following dissociation in HT29 spher-oids after treatment with different concentrations of 5-fluorouracil (5-FU) for 72 h. Drug efficacy is documented relative to the respectiveuntreated controls, which were averaged to define the 100% value. TheAPH absorption signal and cell count/spheroid in untreated controls var-ied by < 10% and < 3%, respectively. Data points are means ± SDs (8 ≤n ≤ 16 for the APH assay; n = 3 for spheroid dissociation with 8 spher-oids per sample).
by guest on October 3, 2016jbx.sagepub.comDownloaded from
Cell Viability Assessment in 3-D Cultures
Journal of Biomolecular Screening 12(7); 2007 www.sbsonline.org 931
0.1 1 10 100 10000
20
40
60
80
100
10.2
% o
f co
ntr
ol
Irinotecan (µM)
IC50
0.1 1 10 100 10000
20
40
60
80
100
56.7
1.7
% o
f c
on
tro
l
C-1311 (µM)
IC50
0.1 1 10 100 10000
20
40
60
80
100
5.6
% o
f c
on
tro
l
5-FU (µM)
IC50
HT-29 HCT-116
0.1 1 10 100 10000
20
40
60
80
100
28.7
7.4
% o
f c
on
tro
l
5-FU (µM)
IC50
spheroid
monolayer
0.1 1 10 100 10000
20
40
60
80
100
27.0
20.5
% o
f co
ntr
ol
Irinotecan (µM)
IC50
0.1 1 10 100 10000
20
40
60
80
100
30.6
2.7
% o
f c
on
tro
l
C-1311 (µM)
IC50
FIG. 4. Application of the acid phosphatase (APH) assay to determine drug effects in spheroid cultures. APH activity/cell viability in HT29and HCT-116 monolayer and spheroid cultures after 72 h of treatment with 5-fluorouracil (5-FU), Irinotecan, or C-1311 (Symadex). Data pointsare means ± SDs for n ≥ 3 individual experiments each with 8 spheroids treated and measured per condition. IC50 values were calculated to empha-size the difference of drug efficacy in 2-D versus 3-D culture and in the 2 different colorectal carcinoma cell lines.
by guest on October 3, 2016jbx.sagepub.comDownloaded from

(e.g., in spheroids treated with ≥ 25 µM C-1311 or 200 µMIrinotecan, but viable cells were still detected by the APH assay)(Fig. 4). Vice versa, structurally intact spheroids may contain largenumbers of dead cells as, for example, found in the 10% Triton-X-100-treated control spheroids (data not shown).
DISCUSSION
Three-dimensional culture systems such as MCTS areknown to better mimic important aspects of the in vivo tumormicromilieu and environment but can, in contrast to in vivo
xenografts, easily be manipulated and exposed to specific treat-ment modalities. Here, we describe the essential evaluation ofa cytotoxicity/viability assay for MCTS and show the potentialof this application as a routine cell-based assay for HTS in 3-Dcultures.
Several routinely used cytotoxicity/viability assays formonolayer cultures based on absorption, luminescence, or flu-orescence were considered and tested in MCTS. Parametersdetermined included cellular uptake of membrane-impermeabledyes such as EtHD-1, release of substrates such as lactatedehydrogenase (LDH) or glucose-6-phosphate dehydrogenase(G6PD), activity of mitochondrial dehydrogenases or intracel-lular esterases, and cellular adenosine triphosphate (ATP) leveland the ratio of ATP/adenosine diphosphate (ADP). All of thesecommercially available systems have been successfully appliedin monolayer cultures in various tumor cell lines, includingHT29 or HCT-116 colon cancer cells.21-24 Unexpectedly, mostof the approaches tested could not be easily adapted for appli-cation in 3-D cultures.
One set of assays, such as the Live/Dead® Viability/CytotoxicityKit (Molecular Probes, Carlsbad, CA) and the ApoGlow™Adenylate Nucleotide Ratio Assay (Cambrex, East Rutherford,NJ), was checked for feasibility but was rapidly excluded from fur-ther validation due to handling difficulties as both assays requiredthe initial dissociation of the spheroids. This experimental setupwas too labor intensive, time consuming, and susceptible to arti-facts to be considered for routine drug testing in particular becausedissociation procedures and/or protocols would have to be opti-mized for each spheroid type.25 Some of the observations that led tothe exclusion of various other assays are documented in Figure 6and shall be discussed herein.
The determination of cell death via measurement of moleculesreleased from membrane-defective cells into the supernatant hasthe advantage of potentially continued cell culturing. Thus, asame well or MCTS could be analyzed over a long period of time.Such assays would be preferable, but none of those under investi-gation were indicative for cell death processes in spheroids. Oneproblem with this approach is the development of secondarynecroses in spheroids as a function of culture time and spheroidsize, respectively. This may or may not lead to an increase inbackground signal and may also critically depend on the spheroidfeeding interval. As a prerequisite for reliable quantitation of cyto-toxic effects with these technologies, the background signalshould either reflect the real proportion of dead cells, includingthe secondary necrotic cell population in the spheroid, or shouldbe negligible. We therefore compared the dead cell fraction cal-culated from the respective cytotoxicity assays with the propor-tion of membrane-defective, PI-stained cells in spheroids asdetermined by flow cytometric analysis following dissociation(Fig. 6A). The proportion of dead cells in HT29 spheroids with asize of 400 µm and 600 µm was about 6% to 10% and 18% to22%, respectively. As an example, the dead cell fraction in spher-oids calculated from the signals of a fluorescence-based assay to
Friedrich et al.
932 www.sbsonline.org Journal of Biomolecular Screening 12(7); 2007
FIG. 5. Spheroid integrity following treatment with Irinotecan or C-1311 (Symadex). Representative phase contrast images of HT29 multi-cellular tumor spheroids (MCTSs) at the onset of treatment and after a72-h treatment interval with 0 µM, 0.1 µM, 25 µM, and 200 µMIrinotecan or C-1311; magnification 10× objective.
by guest on October 3, 2016jbx.sagepub.comDownloaded from

Cell Viability Assessment in 3-D Cultures
Journal of Biomolecular Screening 12(7); 2007 www.sbsonline.org 933
0 30 60 90 120 1500
10
20
30
40
50
60
calc
ula
ted
dea
dce
ll fr
acti
on
per
sp
her
oid
(%)
0 300 400 500 600 700 800 900 10000
10
20
30
40
50
60
PI p
osi
tive
cel
ls (
%)
spheroid diameter (µm)
Onsetof
necrosis
w/ stop solution at t = 10 min
D
C
BA
400 µm 600 µm012345678
RL
U/1
000
cells
(x1
03)
0.00
0.02
0.04
0.06
0.08
0.10
OD
490/
1000
cel
ls
ATP-TCA CellTiter
0 30 60 90 120 1500
10
20
30
40
50
60
400 µm spheroids 600 µm spheroids
w/o stop solution
0
5
10
15
20
25
30
concentration of dye
calc
ula
ted
dea
d c
ell f
ract
ion
per
sp
her
oid
(%
)
400 µm spheroids 600 µm spheroids
1x 2x
Incubation time for dye
FIG. 6. Various routinely used cytotoxicity/viability assays for monolayer cultures fail in multicellular tunor spheroids (MCTSs). (A)Proportion of membrane-defective propidium iodide (PI)–positive cells in HT29 spheroids as a function of the average spheroid diameter (± SD)as determined by flow cytometry following dissociation of aliquots of 16 to 32 spheroids. (B) Estimated dead cell fraction in 400-µm and 600-µm HT29 spheroids as determined from the Vybrant® Cytotoxicity Assay (Molecular Probes) signal. Assay was performed with dye concentra-tion given in the standard protocol (1 × x) and with a 2× dye concentration. Data points are means ± SDs for n ≥ 5 spheroids. The data neithercorrespond with the real proportion of membrane-defective cells in 600-µm spheroids, nor can they be subtracted as a constant (negligible) back-ground. (C) Dead cell fraction in 400-µm and 600-µm HT29 spheroids estimated from the CytoTox-One™ Homogeneous Membrane IntegrityAssay signals (Promega, Madison, WI). Assay was performed with (left panel) and without (right panel) addition of stop solution according tothe manufacturer’s instructions. Data points are means ± SDs for n = 7 spheroids. The signal does not stabilize as a function of time after addi-tion of the dye. (D) Application of the ATP-TCA (DCS Innovative Diagnostic Systems, Hamburg, Germany) and the CellTiter 96® AQueous OneSolution Cell Proliferation (Promega) assays to determine cell viability in 400-µm and 600-µm HT29 spheroid cultures. Black bars show adeno-sine triphosphate (ATP) concentrations illustrated as relative light units (RLUs) per 1000 cells estimated via ATP-TCA assay; white bars showconversion of MTS to formazan, illustrated as absorption at 490 nm per 1000 cells estimated via CellTiter 96® AQueous. Data are means ± SDs forn = 7 spheroids. The signal intensity per cell and per 1000 cells, respectively, critically decreases with spheroid size.
by guest on October 3, 2016jbx.sagepub.comDownloaded from
detect G6PD significantly increased with size but was consis-tently and critically too low as compared with the PI control val-ues, even if the dye concentration (resazurin) was increased up toa factor of 2, as documented in Figure 6B (Vybrant® CytotoxicityAssay, Molecular Probes).
Another membrane integrity assay was applied to determineLDH release but did not result in reproducible and constant sig-nals. Here, various protocols ranging from measurement insupernatants of intact or dissociated spheroids were applied, anddifferent lyses solutions for recording maximum signal intensi-ties per well with all cells being membrane permeabilized weretested. The assay signals and the calculated dead cell fraction,respectively, changed as a function of incubation time with theresazurin dye, even if a solution that supposedly stops the con-tinued generation of fluorescent product was added according tothe manufacturer’s instructions (CytoTox-One™ HomogeneousMembrane Integrity Assay, Promega). We therefore concludedthat the red fluorescent end product resorufin does not reliablyand reproducibly reflect release of LDH from membrane-defective spheroid cells, and chemical, yet undefined, side reac-tions during the required incubation intervals dramatically affect the assay signal. Interestingly, the fluorescence signal for 400-µm spheroids stabilized after an incubation interval with theresazurin dye of about 15 to 30 min if the stop solution wasavoided. Here, the proportion of dead cells calculated from thesignal indeed correlated with the PI-positive cell fraction.However, the signal continuously increased for spheroids with adiameter of about 600 µm, even after incubation with the dye of120 min (Fig. 6C). The release of adenylate kinase was measuredas a 3rd parameter in supernatants, supposedly correlating withmembrane disintegration, but signal variations by a factor of 20 inspheroids with only 400 µm in diameter (ToxiLight® BioAssayKit, Cambrex) indicated that this parameter is also not useful tomeasure cytotoxic effects in spheroid cultures.
Other assays under investigation are exclusively used to deter-mine the number or proportion of viable cells relative to a control(e.g., untreated). Such cell viability assays include the APH assaydetailed herein but also the determination of metabolically activecells via tetrazolium salt (MTS)–based systems (CellTiter 96®
AQueous One Solution Cell Proliferation Assay, Promega) or thequantification of intracellular ATP (ATP-TCA assay, DCSInnovative Diagnostic Systems). If metabolic activity just reflectscell viability, assay signals should be independent of cell densityand cell cycle distribution. However, all of the assays tested so farshowed lower cellular signal intensities in confluent and spheroidcells as opposed to exponentially growing monolayer cells. Thisloss of sensitivity in spheroid cells is acceptable only if the signal/cell is constant throughout spheroid volume growth, a pre-requisite that was exclusively found for the APH assay. In con-trast, the fluorescence signals per cell resulting both from theNADH/NADPH-dependent production of formazan and from theintracellular ATP concentration were critically reduced in 600-µmas compared with 400-µm spheroids (Fig. 6D).
After this initial phase of assay testing, we focused on the mostpromising approach amenable to use in high-throughput settingsfor nondissociated spheroid cultures. Indeed, the APH assay fre-quently used for monolayer cultures14,26-29 showed convincing sen-sitivity using a standardized protocol for rapid routine analysis ofsingle spheroids. We verified that the APH assay is 1) applicablefor single HT29 spheroids in 96-well plates, 2) does not requirespheroid dissociation, 3) is linear and highly sensitive for HT29spheroids up to 40,000 cells/spheroid (up to a size of 650 µm),and 4) can also be applied to other spheroid types such as HCT-116, which show APH signal linearity up to 80,000 cells/spheroid(~900 µm).
The biologically interesting phenomenon of enhanced APHsignal in large HT29 spheroids is not yet understood. It remainsspeculation whether pathophysiological processes in this particu-lar spheroid type, such as perpetual hypoxia and/or intensifiedcell-cell interactions, are causally related with this alteration inenzymatic activity. The observation that the cell viability in HT29spheroids, determined by the acid phosphatase activity after treat-ment with different concentrations of 5-FU, slightly differs fromthe cell count analysis is an additional point of discussion. It washypothesized that the APH signal may be overestimated in com-parison to cell count analysis, an interpretation that seems to besupported by the observation of an offset of the APH signal as afunction of the cell count/spheroid if the linear regression isextended to the axis of abscissa (n = 0) (Fig. 2). Such offset at n = 0 has also been observed in monolayer cultures but remainsobscure.14,26,29 The recording of drug efficacy relative to therespective controls both for the cell count and APH signal analy-ses should, however, have guaranteed the elimination of this APHassay offset from the dose-response curves. As an alternative, thisdiscrepancy may also be attributed to some cell loss during spher-oid dissociation (i.e., 5-FU-treated spheroid cells might show ahigher sensitivity to trypsin/EDTA and/or other dissociationenzymes, resulting in artificial cell damage and reduced numbersof membrane-intact cells following spheroid dissociation). TheAPH assay may thus even more accurately reflect cellular integrityin MCTS. Despite these peculiarities, we found the APH assay inspheroids to be simple, rapid, and high-throughput compatible.
To establish a colon cancer–specific, spheroid-based screen,we evaluated the APH assay by treating HT29 and HCT-116spheroids with drugs that are commonly used in clinical adjuvantchemotherapy regimens after surgery. The efficacy of 5-FU andIrinotecan in monolayer and spheroid culture was compared. Aspreviously demonstrated via growth delay analyses and/or withother time-consuming or complex analytical tools (e.g., for MCF-7 breast cancer,4,30 DLD-1 colon cancer,30,31 and HT29 colon can-cer spheroids and multilayers, respectively32,33), we expected areduced sensitivity of spheroid cells to 5-FU or Irinotecan asopposed to monolayer cultures, which should be reflected notonly in the spheroid integrity and size34 but also in the APH sig-nals and the APH-dependent IC50 values. This was indeed foundto be the case. In our experimental series, monolayer controls
Friedrich et al.
934 www.sbsonline.org Journal of Biomolecular Screening 12(7); 2007
by guest on October 3, 2016jbx.sagepub.comDownloaded from
exhibited comparable dose-response curves and IC50 values asrecorded in the literature, both for 5-FU and Irinotecan.35-40 Drugeffects in HT29 MCTS were clearly visible via the acid phos-phatase activity assay, but the incubation interval necessary toreach the IC50 revealed that spheroids of the colorectal cancer cellline HT29 are less sensitive to 5-FU and Irinotecan than mono-layers. Reduced drug efficacy is also seen in HCT-116 cells in thespheroid as opposed to monolayer culture. However, differencesin the IC50 values are rather small (for 5-FU, factor of 4) or negli-gible (for Irinotecan). It also becomes evident that the near-diploid HCT-116 cells with the microsatellite-instable (MSI)phenotype are more sensitive to either 5-FU or Irinotecan in thespheroid culture than the aneuploid, chromosome-instable (CIN)HT29 spheroid cells. This cell line–dependent difference in drugsensitivity is not detected in monolayer culture.
The APH assay was then applied to also study the efficacyin spheroid versus monolayer cells of a new drug candidatethat recently entered a phase II clinical trial in patients withmetastatic breast and colorectal tumors (http://www.xanthus.com/products_symadex.htm). C-1311 (Symadex) belongs to the C-13xximidazoacridinone series of compounds that showed convincingantitumor activity in vitro and in vivo in various tumor models,including HT29 colon cancer cells.41-43 The in vitro studies, primar-ily performed with monolayer cultures, indicated multiple modesof action. Cell cycle perturbations and arrest in G2M have beenattributed to DNA intercalation and DNA topoismerase II inhibitoractivity.15,44-48 However, its potency as a selective FLT3 receptortyrosine kinase inhibitor has been identified only recently.49 TheIC50 value for HT29 and HCT-116 monolayer cells after 72 h oftreatment in our experiments was 1.7 µM and 2.7 µM, respectively,and corresponded to the literature data. However, in contrast to aprevious spheroid approach showing similar dose responses inspheroid and monolayer cultures, we found significantly reduceddrug efficacies in HT29 (IC50: 56.7 µM) and HCT-116 (IC50: 30.6µM) spheroids using the APH assay. This discrepancy can beexplained by the different cell types under investigation; that is,Skladanowski and coworkers45 examined Chinese hamster lungfibrosarcoma (DC-3F) but not human carcinoma cells. We con-clude that our colon cancer spheroid model more closely reflectsthe efficacy of new antitumor drugs in human epithelial tumors.With the APH assay, classic drug combinations such as 5-FU andIrinotecan, which already showed increased response rate, time to progression, and survival in patients,50 can now be more easilymonitored in spheroids and compared with monolayer data.38,51-53 Aparticular prospective is the potential application of the spheroid-APH assay platform for the testing of single and combined thera-peutic strategies with new, target, and/or pathway-specific treatmentmodalities. Further experiments to evaluate the feasibility of thisapproach are in progress.
In conclusion, validation of the APH assay for rapid and repro-ducible determination of cell viability in spheroid cultures is a pre-requisite for the automated application of the MCTS model system
for drug screening purposes and will essentially help to fill the gapbetween monolayer cultures and animal models in the process ofantitumor drug development and testing.
ACKNOWLEDGMENTS
The authors gratefully acknowledge the excellent technical assis-tance of Marit Wondrak and Frank van Rey. This work was sup-ported by a Small Grant Award from the Society for BiomolecularSciences (SBS) and by the Federal Ministry of Education andResearch through grant 0313143.
REFERENCES
1. Schmeichel KL, Bissel MJ: Modeling tissue-specific signaling and organfunction in three dimensions. J Cell Sci 2003;116:2378-2388.
2. Kunz-Schughart LA, Freyer JP, Hofstaedter F, Ebner R: The use of 3-Dcultures for high-throughput screening: the multicellular spheroid model.J Biomol Screen 2004;9:273-285.
3. Nelson CM, Bissel MJ: Modeling dynamic reciprocity: engineeringthree-dimensional culture models of breast architecture, function, andneoplastic transformation. Semin Cancer Biol 2005;15:342-352.
4. Zhang X, Wang W,Yu W, Xie Y, Zhang X, Zhang Y, et al: Development of anin vitro multicellular tumor spheroid model using microencapsulation and itsapplication in anticancer drug screening and testing. Biotechnol Prog 2005;21:1289-1296.
5. Freyer JP: Tumor spheroids in radiobiology research. In Bjerkvig R (ed):Spheroid Culture in Cancer Research. Boca Raton, FL: CRC Press,1992:217-275.
6. Olive PL, Durand RE: Drug and radiation resistance in spheroids: cellcontact and kinetics. Cancer Metastasis Rev 1994;13:121-138.
7. Dubessy C, Merlin JM, Marchal C, Guillemin F: Spheroids in radiobiologyand photodynamic therapy. Crit Rev Oncol Hematol 2000;36:179-192.
8. Mueller-Klieser W: Multicellular spheroids: a review on cellular aggre-gates in cancer research. J Cancer Res Clin Oncol 1987;113:101-122.
9. Kunz-Schughart LA: Multicellular tumor spheroids: intermediates betweenmonolayer culture and in vivo tumor. Cell Biol Int 1999;23:157-161.
10. Mueller-Klieser W: Tumor biology and experimental therapeutics. CritRev Oncol Hematol 2000;36:123-139.
11. Carlsson J, Yuhas JM: Liquid-overlay culture of cellular spheroids.Recent Results Cancer Res 1984;95:1-23.
12. Kunz-Schughart LA, Mueller-Klieser W: Three-dimensional culture. InMasters JRW (ed): Animal Cell Culture. Oxford, UK: Oxford UniversityPress, 2000.
13. Kunz LA, Groebe K, Mueller-Klieser W: Oncogene-associated growthbehavior and oxygenation of multicellular spheroids from rat embryofibroblasts. Adv Exp Med Biol 1994;345:359-366.
14. Yang TT, Sinai P, Kain SR: An acid phosphatase assay for quantifying thegrowth of adherent and nonadherent cells. Anal Biochem 1996;241:103-108.
15. Burger AM, Jenkins TC, Double JA, Bibby MC: Cellular uptake, cyto-toxicity and DNA-binding studies of the novel imidazoacridinone anti-neoplastic agent C1311. Br J Cancer 1999;81:367-375.
16. Cholody WM, Martelli S, Konopa J: 8-Substituted 5-[(aminoalkyl)amino]-6H-v-triazolo[4,5,1-de]acridin-6-ones as potential antineoplastic agents: syn-thesis and biological activity. J Med Chem 1990;33:2852-2856.
Cell Viability Assessment in 3-D Cultures
Journal of Biomolecular Screening 12(7); 2007 www.sbsonline.org 935
by guest on October 3, 2016jbx.sagepub.comDownloaded from
17. Cholody WM, Martelli S, Konopa J: Chromophore-modified antineoplasticimidazoacridinones: synthesis and activity against murine leukemias. J MedChem 1992;35:378-382.
18. Marusic M, Bajzer Z, Vuc-Pavlovic S, Freyer JP: Tumor growth in vivoand as multicellular spheroids compared by mathematical models. BullMath Biol 1994;56:617-631.
19. Kunz-Schughart LA, Groebe K, Mueller-Klieser: Three-dimensional cellculture induces novel proliferative and metabolic alterations associatedwith oncogenetic transformation. Int J Cancer 1996;66:578-586.
20. Chignola R, Schenetti A, Andrighetto G, Chiesa E, Foroni R, Sartoris S,et al: Forecasting the growth of multicell tumor spheroids: implicationsfor the dynamic growth of solid tumors. Cell Prolif 2000;33:219-229.
21. Hopfner M, Maaser K, Barthel B, von Lampe B, Hanski C, Riecken EO,et al: Growth inhibition and apoptosis induced by P2Y2 receptors in humancolorectal carcinoma cells: involvement of intracellular calcium and cyclicadenosine monophosphate. Int J Colorectal Dis 2006;16:154-166.
22. Netzer P, Domek M, Pai R, Halter F, Tarnawski A: Inhibition of humancolon cancer cell growth by antisense oligodeoxynucleotides targeted atbasic fibroblast growth factor. Aliment Pharmacol Ther 2001;15:1673-1679.
23. Chang YH, Chao Y, Hsieh SL, Lin WW: Mechanism of LIGHT/interferon-gamma-induced cell death in HT-29 cells. J Cell Biochem2004;93:1188-1202.
24. Cholody WM, Kosakowska-Cholody T, Hollingshead MG, HariprakashaHK, Michejda CJ: A new synthetic agent with potent but selective cyto-toxic activity against cancer. J Med Chem 2005;48:4474-4481.
25. Kunz-Schughart LA, Freyer JP: Adaptation of an automated selective dis-sociation procedure to two novel spheroid types. In Vitro Cell Dev BiolAnim 1997;33:73-76.
26. Connolly DT, Knight MB, Harakas NK, Wittwer AJ, Feder J:Determination of the number of endothelial cells in culture using an acidphosphatase assay. Anal Biochem 1986;152:136-140.
27. Martin A, Clynes M: Acid phosphatase: endpoint for in vitro toxicitytests. In Vitro Cell Dev Biol 1991;27A:183-184.
28. Martin A, Clynes M: Comparison of 5 microplate colorimetric assays forin vitro cytotoxicity testing and cell proliferation assays. Cytotechnology1993;11:49-58.
29. Si F, Shin SH, Biedermann A, Ross GM: Estimation of PC12 cellnumbers with acid phosphatase assay and mitochondrial dehydrogenaseassay: dopamine interferes with assay based on tetrazolium. Exp BrainRes 1999;124:145-150.
30. Nicholson KM, Bibby MC, Phillips RM: Influence of drug exposureparameters on the activity of paclitaxel in multicellular spheroids. Eur JCancer 1997;33:1291-1298.
31. Mellor HR, Ferguson DJ, Callaghan R: A model of quiescent tumourmicroregions for evaluating multicellular resistance to chemotherapeuticdrugs. Br J Cancer 2005;93:302-309.
32. Sutton JE, Roos IA, Hillcoat BL: Combined actions of 5-fluorouracil and1-(2-chloroethyl)-3-(4-methylcyclohexyl)-1-nitrosourea on human coloniccarcinoma cells in vitro. Cancer Res 1982;42:5172-5175.
33. Pizao PE, Winograd B, Peters GJ, Leyva A, Giaccone G, Pinedo HM: Invitro chemosensitivity testing of multilayered microcultures. AnticancerRes 2006;12:1319-1322.
34. Barone RM, Calabro-Jones P, Thomas TN, Sharp TR, Byfield JE: Surgicaladjuvant therapy in colon carcinoma: a human tumor spheroid model forevaluating radiation sensitizing agents. Cancer 1981;47:2349-2357.
35. Harstrick A, Gonzales A, Schleucher N, Vanhoefer U, Lu K, Formento JL,et al: Comparison between short or long exposure to 5-fluorouracil in human
gastric and colon cancer cell lines: biochemical mechanism of resistance.Anticancer Drugs 1998;9:625-634.
36. Ciccolini J, Peillard L, Evrard A, Cuq P,Aubert C, Pelegrin A, et al: Enhancedantitumor activity of 5-fluorouracil in combination with 2′-deoxyinosine inhuman colorectal cell lines and human colon tumor xenografts. Clin CancerRes 2000;6:1529-1535.
37. Lowthers EL, Richard CL, Blay J: Differential sensitivity to short-chainceramide analogues of human intestinal carcinoma cells grown in tumorspheroids versus monolayer culture. In Vitro Cell Dev Biol Anim 2003;39:340-342.
38. Hofmann C, Buttenschoen K, Straeter J, Henne-Bruns D, Kornmann M:Pre-clinical evaluation of the activity of irinotecan as a basis for regionalchemotherapy. Anticancer Res 2005;25:795-804.
39. Poindessous V, Koeppel F, Raymond E, Cvitkovic E, Waters SJ, LarsenAK: Enhanced antitumor activity of irofulven in combination with 5-fluorouracil and cisplatin in human colon and ovarian carcinoma cells. IntJ Oncol 2003;23:1347-1355.
40. Guichard S, Arnould S, Hennebelle I, Bugat R, Canal P: Combination ofoxaliplatin and irinotecan on human colon cancer cell lines: activity invitro and in vivo. Anticancer Drugs 2001;12:741-751.
41. Kusnierczyk H, Cholody WM, Paradziej-Lukowicz J, Radzikowski C,Konopa J: Experimental antitumor activity and toxicity of the selectedtriazolo- and imidazoacridinones. Arch Immunol Ther Exp 1994;42:415-423.
42. Burger AM, Double JA, Konopa J, Bibby MC: Preclinical evaluation ofnovel imidazoacridinone derivatives with potent activity against experi-mental colorectal cancer. Br J Cancer 1996;74:1369-1374.
43. Hyzy M, Bozko P, Konopa J, Skladanowski A: Antitumour imidazoacridoneC-1311 induces cell death by mitotic catastrophe in human colon carcinomacells. Biochem Pharmacol 2006,69:801-809.
44. Augustin E, Wheatley DN, Lamb J, Konopa J: Imidazoacridinones arrestcell-cycle progression in the G2 phase of L1210 cells. Cancer ChemotherPharmacol 1996;38:39-44.
45. Skladanowski A, Plisov SY, Konopa J, Larsen AK: Inhibition of DNAtopoisomerase II by imidazoacridinones, new antineoplastic agents withstrong activity against solid tumors. Mol Pharmacol 1996;49:772-780.
46. Mazerska Z, Dziegielewski J, Konopa J: Enzymatic activation of a new anti-tumour drug, 5-diethylaminoethylamino-8-hydroxyimidazoacridinone, C-1311, observed after its intercalation into DNA. Biochem Pharmacol 2001;61:685-694.
47. Zaffaroni N, De Marco C, Villa R, Riboldi S, Daidone MG, Double JA:Cell growth inhibition, G2M cell cycle arrest and apoptosis induced bythe imidazoacridinone C1311 in human tumour cell lines. Eur J Cancer2001;37:1953-1962.
48. Dziegielewski J, Slusarski B, Konitz A, Skladanowski A, Konopa J:Intercalation of imidazoacridinones to DNA and its relevance to cytotoxicand antitumor activity. Biochem Pharmacol 2002;63:1653-1662.
49. Chau M, Otake Y, Christensen JL, Fernandes DJ, Ajami AM: The imida-zoacridinone, C-1311(SymadexTM): the first of a potent new class ofFLT3 inhibitors [abstract B35]. Paper presented at the 2006 AmericanAssociation for Cancer Research (AACR) International Conference onMolecular Diagnostics in Cancer Therapeutic Development, Chicago,September 14, 2006.
50. Douillard JY, Cunningham D, Roth AD, Navarro M, James RD, Karasek P,et al: Irinotecan combined with fluorouracil compared with fluorouracilalone as first-line treatment for metastatic colorectal cancer: a multicentrerandomised trial. Lancet 2000;355:1041-1047.
Friedrich et al.
936 www.sbsonline.org Journal of Biomolecular Screening 12(7); 2007
by guest on October 3, 2016jbx.sagepub.comDownloaded from
51. Mans DR, Grivicich I, Peters GJ, Schwartsmann G: Sequence-dependentgrowth inhibition and DNA damage formation by the irinotecan-5-fluorouracil combination in human colon carcinoma cell lines. Eur JCancer 1999;35:1851-1861.
52. Grivicich I, Regner A, da Rocha AB, Grass LB, Alves PA, Kayser GB,et al: Irinotecan/5-fluorouracil combination induces alterations in mito-chondrial membrane potential and caspases on colon cancer cell lines.Oncol Res 2005;15:385-392.
53. Grivicich I, Regner A, da Rocha AB, Kayser GB, Schunemann DP, GrassLB, et al: The irinotecan/5-fluorouracil combination induces apoptosisand enhances manganese superoxide dismutase activity in HT-29 humancolon carcinoma cells. Chemotherapy 2005;513:93-102.
Address correspondence to:Leoni A. Kunz-Schughart
OncoRay–Center for Radiation Research in OncologyFaculty of Medicine Carl Gustav Carus
TU DresdenFetscherstraße 74, PF 8601307 Dresden, Germany
E-mail: [email protected]
Cell Viability Assessment in 3-D Cultures
Journal of Biomolecular Screening 12(7); 2007 www.sbsonline.org 937
by guest on October 3, 2016jbx.sagepub.comDownloaded from
Copyright © 2022 FDOKUMEN