Population viability analysis: using a modeling tool to assess the viability of tapir populations in...
17
© 2012 Wiley Publishing Asia Pty Ltd, ISZS and IOZ/CAS 356 1 2 3 4 5 6 7 8 9 10 11 12 13 14 15 16 17 18 19 20 21 22 23 24 25 26 27 28 29 30 31 32 33 34 35 36 37 38 39 40 41 42 43 44 45 46 47 48 49 50 51 1 2 3 4 5 6 7 8 9 10 11 12 13 14 15 16 17 18 19 20 21 22 23 24 25 26 27 28 29 30 31 32 33 34 35 36 37 38 39 40 41 42 43 44 45 46 47 48 49 50 51 Integrative Zoology 2012; 7: 356–372 doi: 10.1111/j.1749-4877.2012.00318.x ORIGINAL ARTICLE Population viability analysis: using a modeling tool to assess the viability of tapir populations in fragmented landscapes Emília Patrícia MEDICI 1,2,3 and Arnaud Leonard Jean DESBIEZ 3,4,5 1 Lowland Tapir Conservation Initiative, IPÊ–Institute for Ecological Research, Nazaré Paulista, São Paulo, Brazil, 2 IUCN/SSC Tapir Specialist Group (TSG), Gland, Switzerland, 3 Escola Superior de Conservação Ambiental e Sustentabilidade (ESCAS/IPÊ), Nazaré Paulista, São Paulo, Brazil, 4 IUCN/SSC Conservation Breeding Specialist Group (CBSG), Brazil Network, Campo Grande, MS, Brazil and 5 Royal Zoological Society of Scotland, Edinburgh, Scotland Abstract A population viability analysis (PVA) was conducted of the lowland tapir populations in the Atlantic Forest of the Pontal do Paranapanema region, Brazil, including Morro do Diabo State Park (MDSP) and surrounding forest fragments. Results from the model projected that the population of 126 tapirs in MDSP is likely to per- sist over the next 100 years; however, 200 tapirs would be required to maintain a viable population. Sensitiv- ity analysis showed that sub-adult mortality and adult mortality have the strongest influence on the dynamics of lowland tapir populations. High road-kill has a major impact on the MDSP tapir population and can lead to population extinction. Metapopulation modeling showed that dispersal of tapirs from MDSP to the surrounding fragments can be detrimental to the overall metapopulation, as fragments act as sinks. Nevertheless, the model showed that under certain conditions the maintenance of the metapopulation dynamics might be determinant for the persistence of tapirs in the region, particularly in the smaller fragments. The establishment of corridors con- necting MDSP to the forest fragments models resulted in an increase in the stochastic growth rate, making ta- pirs more resilient to threats and catastrophes, but only if rates of mortality were not increased when using cor- ridors. The PVA showed that the conservation of tapirs in the Pontal region depends on: the effective protection of MDSP; maintenance and, whenever possible, enhancement of the functional connectivity of the landscape, reducing mortality during dispersal and threats in the unprotected forest fragments; and neutralization of all threats affecting tapirs in the smaller forest fragments. Key words: Atlantic Forest, fragmentation, lowland tapir, minimum viable population, population viability analysis Correspondence: Emília Patrícia Medici, IPÊ Pantanal, Rua Licuala, 622, Damha 1, Campo Grande, Mato Grosso do Sul CEP: 79046-150, Brazil. Email: [email protected]; [email protected] INTRODUCTION Population viability analysis (PVA) provides a quan- titative means for predicting the probability of extinc- tion and the viability of a population (Gilpin & Soulé 1986). Tapirs are large-bodied mammals with low re- productive rates that occur at low population densities
Transcript of Population viability analysis: using a modeling tool to assess the viability of tapir populations in...

© 2012 Wiley Publishing Asia Pty Ltd, ISZS and IOZ/CAS356
123456789
101112131415161718192021222324252627282930313233343536373839404142434445464748495051
123456789101112131415161718192021222324252627282930313233343536373839404142434445464748495051
Integrative Zoology 2012; 7: 356–372 doi: 10.1111/j.1749-4877.2012.00318.x
ORIGINAL ARTICLE
Population viability analysis: using a modeling tool to assess the viability of tapir populations in fragmented landscapes
Emília Patrícia MEDICI1,2,3 and Arnaud Leonard Jean DESBIEZ3,4,5 1Lowland Tapir Conservation Initiative, IPÊ–Institute for Ecological Research, Nazaré Paulista, São Paulo, Brazil, 2IUCN/SSC Tapir Specialist Group (TSG), Gland, Switzerland, 3Escola Superior de Conservação Ambiental e Sustentabilidade (ESCAS/IPÊ), Nazaré Paulista, São Paulo, Brazil, 4IUCN/SSC Conservation Breeding Specialist Group (CBSG), Brazil Network, Campo Grande, MS, Brazil and 5Royal Zoological Society of Scotland, Edinburgh, Scotland
AbstractA population viability analysis (PVA) was conducted of the lowland tapir populations in the Atlantic Forest of the Pontal do Paranapanema region, Brazil, including Morro do Diabo State Park (MDSP) and surrounding forest fragments. Results from the model projected that the population of 126 tapirs in MDSP is likely to per-sist over the next 100 years; however, 200 tapirs would be required to maintain a viable population. Sensitiv-ity analysis showed that sub-adult mortality and adult mortality have the strongest influence on the dynamics of lowland tapir populations. High road-kill has a major impact on the MDSP tapir population and can lead to population extinction. Metapopulation modeling showed that dispersal of tapirs from MDSP to the surrounding fragments can be detrimental to the overall metapopulation, as fragments act as sinks. Nevertheless, the model showed that under certain conditions the maintenance of the metapopulation dynamics might be determinant for the persistence of tapirs in the region, particularly in the smaller fragments. The establishment of corridors con-necting MDSP to the forest fragments models resulted in an increase in the stochastic growth rate, making ta-pirs more resilient to threats and catastrophes, but only if rates of mortality were not increased when using cor-ridors. The PVA showed that the conservation of tapirs in the Pontal region depends on: the effective protection of MDSP; maintenance and, whenever possible, enhancement of the functional connectivity of the landscape, reducing mortality during dispersal and threats in the unprotected forest fragments; and neutralization of all threats affecting tapirs in the smaller forest fragments.
Key words: Atlantic Forest, fragmentation, lowland tapir, minimum viable population, population viability analysis
Correspondence: Emília Patrícia Medici, IPÊ Pantanal, Rua Licuala, 622, Damha 1, Campo Grande, Mato Grosso do Sul CEP: 79046-150, Brazil. Email: [email protected]; [email protected]
INTRODUCTIONPopulation viability analysis (PVA) provides a quan-
titative means for predicting the probability of extinc-tion and the viability of a population (Gilpin & Soulé 1986). Tapirs are large-bodied mammals with low re-productive rates that occur at low population densities

357
123456789101112131415161718192021222324252627282930313233343536373839404142434445464748495051
Lowland tapir viability analysis
© 2012 Wiley Publishing Asia Pty Ltd, ISZS and IOZ/CAS
(Medici 2011). Tapirs are extremely susceptible to an-thropogenic threats, which can cause severe population declines or local extinctions (Medici 2011). PVA is a valuable tool for evaluating the impact of threats and as-sessing potential management strategies for tapir popu-lations. The paper presents the use of PVA as a tool for the conservation of the lowland tapir [Tapirus terrestris (Linnaeus, 1758)].
Population viability analysis examines threats to per-sistence and evaluates the probability of a population of a specified size declining or becoming extinct over a specified length of time (Boyce 1992; Groom & Pascu-al 1998). The PVA process explores the consequences of different assumptions on population dynamics, especial-ly for small populations (Lindenmayer & Lacy 1995) and evaluates which of a suite of management or con-servation strategies is likely to maximize the probabili-ty of a population persisting over the long term (Linden-mayer & Possingham 1996). PVA works by using life-history or population growth-rate data to parameterize a population model that is then used to project population dynamics (Ludwig 1999). Wildlife populations fluctuate in size over time as a result of random (stochastic) vari-ation acting on a set of processes (most notably birth, offspring sex ratio, dispersal and death), which deter-mines the dynamics of population change. Numbers of individuals comprising a given population are deter-mined largely by specified rates of reproduction, surviv-al and dispersal in addition to the ecological limitations of habitat carrying capacity. Variation in these rates is influenced by processes both intrinsic (demographic sto-chasticity, genetic drift and/or inbreeding depression and deviations in age or social structure) and extrinsic (envi-ronmental variation and catastrophic events) to the pop-ulation (Soulé 1987).
Population viability analysis estimates the probabili-ty of extinction, mean time to extinction and other mea-sures of population performance, such as growth rate, stability or genetic diversity (Lacy 2000). The defini-tions and criteria for viability and extinction are set as arbitrary targets, such as a 95% probability of a popula-tion persisting for 100 years (Boyce 1992). A compari-son of such measures of population viability for a set of different scenarios then allows comparisons of which threats are most important. In addition, sensitivity analy-sis is used to determine the primary demographic deter-minants of population growth (Wisdom & Mills 1997) and management alternatives can be compared to deter-mine the most effective conservation strategies (Hamil-ton & Moller 1995).
A number of scientists have discussed the limitations of PVA (Coulson et al. 2001; Brook et al. 2002). How-ever, the problem with PVA does not seem to be the model itself but obtaining the data to drive it (Ruggie-ro et al. 1994). In a comprehensive study of the predic-tive capability of PVA modeling packages, Brook et al. (2000) demonstrate that, when adequately parameter-ized with reliable data on the species or population of concern, PVA methods can provide a consistent tech-nique for demographic population projection. Despite criticism, the use of PVA continues to grow and has be-come a valuable tool in the arsenal of conservation biol-ogists (Beissinger & McCullough 2002).
The lowland tapir populations in the Atlantic Forest of Morro do Diabo State Park (MDSP) and surrounding forest fragments in the Pontal do Paranapanema Region, São Paulo, Brazil provide a good case study for the ap-plication of PVA to tapir conservation in fragmented landscapes. In addition, these small, fragmented popu-lations have benefited from a long-term research study (Medici 2010). Using the VORTEX software pack-age, a detailed baseline model is presented, a sensitivity analysis is conducted and the minimum viable popula-tion (MVP) is estimated. The impact of selected anthro-pogenic threats is discussed and potential management strategies assessed. It is hoped that this case study will encourage the use of PVA to identify threats and to eval-uate potential management strategies for tapir species through their distribution.
MATERIALS AND METHODS
Study area
Over the past 500 years, the Atlantic Forest has suf-fered large-scale destruction and fragmentation. Today, this biome has been reduced to 8% of its original size (Ribeiro et al. 2009). Some of the most significant rem-nants of the Atlantic Forest are found in the plateau re-gion of Brazil (SOS Mata Atlântica & INPE 2008) and 84% of the remaining plateau forests are found in the Pontal do Paranapanema region, in the westernmost ex-tremity of São Paulo (Valladares-Padua et al. 2002). The remaining forests include: MDSP, which protects 370 km² of forest; Black-Lion-Tamarin Ecological Station, a federal protected area created in 2002 encompassing the 4 largest forest fragments located around MDSP and comprising an additional 67 km² of protected habitat; as well as a multitude of small forest fragments from 0.02

358
123456789
101112131415161718192021222324252627282930313233343536373839404142434445464748495051
E. P. Medici and A. L. J. Desbiez
© 2012 Wiley Publishing Asia Pty Ltd, ISZS and IOZ/CAS
to 20 km² scattered throughout the region, comprising a further 60 km² of forest (Ditt 2002). Lowland tapirs are found in MDSP and 7 of the surrounding forest frag-ments. In contrast to the eastern part of the biome, the process of deforestation in the Pontal is relatively re-cent (approximately 60 years). Therefore, although there has been an extensive loss of habitat, some of the forest remnants in the region still support an outstanding di-versity of flora and fauna, many of them endemic and/or threatened with extinction. More details of the study area are provided in Medici (2010).
VORTEX simulation model
VORTEX 9.94 software was used to model the vi-ability of lowland tapir populations in MDSP and sur-rounding forest fragments. VORTEX is a long-stand-ing, widely used PVA computer package that employs a Monte Carlo simulation of the impact of deterministic forces as well as demographic, environmental and ge-netic stochastic events on wildlife population dynam-ics (Lacy 2000). VORTEX models population dynam-ics as discrete, sequential events that occur according to probabilities that are random variables following user-specified distributions. It is an individual-based model, mostly appropriate for analyzing extinction dynamics in small populations (Lacy 2000). VORTEX provides a neutral platform upon which the user can examine the current status of a given species and determine which factors, if changed or manipulated, may have the great-est effect on causing or preventing extinction.
VORTEX input parameters: baseline model
A VORTEX baseline model was developed reflecting the biological potential of lowland tapirs in MDSP. The baseline model was based on 3 main sources of data: (i) data from a 12-year lowland tapir study in MDSP (Medici 2010); (ii) field and captivity data compiled during Population and Habitat Viability Assessment (PHVA) workshops held by the IUCN/SSC Tapir Spe-cialist Group and the IUCN/SSC Conservation Breed-ing Specialist Group for the 4 tapir species: Malayan ta-pir (Medici et al. 2003), mountain tapir (Lizcano et al. 2005), Baird’s tapir (Medici et al. 2006) and lowland ta-pir (Medici et al. 2007); and (iii) published literature and personal observations, including both wild and cap-tivity studies. Miller and Lacy (2005) provide further explanations about how each input parameter is defined and used by VORTEX.
Scenario settings
Duration of simulation
The tapir population in MDSP was modeled for 100 years, so that long-term population trends could be ob-served and evaluated. One hundred years is far enough into the future so as to decrease the chances of omitting a yet unknown event, but also not too short to fail to ob-serve a slowly developing event. The generation length of lowland tapirs is estimated to be 11 years (IUCN 2011); therefore, a 100-year simulation covers approxi-mately 9 generations. Number of iterations
To provide adequate precision, 1000 replicate simula-tions were run for each modeling scenario (Burgman et al. 1993).
Species description
Definition of extinction
Extinction was defined as the total removal of at least 1 sex (Ginzburg et al. 1982).Concordance of environmental variation between reproductive rates and survival rates
No evidence of such concordance exists in tapir spe-cies. It is generally assumed that large, long-lived ani-mals with long gestation periods show little correlation between breeding and survival. Inbreeding depression
VORTEX has the ability to model the detrimental ef-fects of inbreeding through reduced first-year survival of inbred individuals. Inbreeding is thought to have ma-jor effects on reproduction and survival, especially in small populations. As tapir populations continue to de-cline and become fragmented, genetic considerations are becoming very important. The impact of inbreeding was modeled as 3.14 lethal equivalents (LE). The me-dian value was estimated from an analysis of studbook data for 40 captive mammal populations (Ralls et al. 1988), with 50% of the effect of inbreeding ascribed to recessive lethal alleles.
Reproductive system and rates
Breeding system
Previous evidence from field studies on Baird’s tapirs in Costa Rica indicates that tapirs are probably faculta-tive polygamous (C. R. Foerster, pers. comm.). Previous VORTEX modeling for all 4 tapir species considered ta-

359
123456789101112131415161718192021222324252627282930313233343536373839404142434445464748495051
Lowland tapir viability analysis
© 2012 Wiley Publishing Asia Pty Ltd, ISZS and IOZ/CAS
pirs to be ‘short-term monogamous’ (Medici et al. 2003, 2006, 2007; Lizcano et al. 2005). In VORTEX, short-term monogamy means that each male can mate with at most 1 female at a time, but new pairs are formed each year. VORTEX is not spatially explicit and the selection of a polygamous system would suggest a panmictic sce-nario, which is less similar to what current data suggest than monogamy. The sex ratio between males and fe-males is equal and threats are generally not sex-specific; therefore, the choice between short-term monogamy or polygyny does not have an impact on tapir population dynamics. For this modeling, tapirs were categorized as ‘short-term monogamous’.Age of first reproduction
VORTEX defines reproduction as the time at which offspring are born and not the age of sexual maturity. The software uses the mean age rather than the earliest recorded age of offspring production. According to Bar-ongi (1993), captive lowland tapirs are sexually mature by 14–24 months and conceive at an average of 4 years of age. Results from the 2011 AZA Studbook for Low-land Tapirs show that females reach their sexual maturi-ty at 19 months of age and first reproduce at 32 months (D. Goff, pers. comm.). Natural situations impose a toll on achieving sexual maturity and, therefore, it was as-sumed that both sexes are capable of producing their first offspring at age 4.Maximum age of reproduction
VORTEX assumes that animals can reproduce (at the normal rate) throughout their adult life. According to Eisenberg (1997), a female lowland tapir can remain re-productively active into her tenth year of life and be-yond. Robinson and Redford (1986) report an average age of last reproduction for wild lowland tapirs of 23 years. Results from the 2011 AZA Studbook for Lowland Tapirs indicate a maximum age of reproduction of 15 years for females and 19 years for males (D. Goff, pers. comm.). In the present study, maximum age of repro-duction of 20 years was set for both male and female ta-pir. Maximum litter size
Female tapirs rarely give birth to more than 1 young per litter (Barongi 1993). The 2011 AZA Studbook for Lowland Tapirs recorded only 1 twinning event (D. Goff, pers. comm.). In 2011, a twinning event was re-ported at a zoo in Brazil (E. P. Medici, pers. comm.). However, these are very rare events. For this modeling, a maximum litter size of 1 progeny was considered.
Sex ratio at birth
The 2011 AZA Studbook for Lowland Tapirs reports a sex ratio at birth of 3 males to 1 female (D. Goff, pers. comm.). However, there is no evidence to suggest a skewed sex ratio at birth in the wild. Among 35 tapirs captured during a long-term study in MDSP, 20 were fe-males and 15 were males, resulting in a sex ratio of 1.33 females to 1 male (Medici 2010). The sample size of 35 individuals represented approximately 30% of the tapir population in MDSP and should, therefore, have yield-ed a fairly precise estimate of the population sex ra-tio. Souza-Mazurek et al. (2000) monitored subsistence hunting among the Waimiri Atroari Indians in Central Amazon in Brazil and recorded a sex ratio of kills of 1.03 females to 1 male. For this modeling, the sex ratio at birth was considered to be 50% female and 50% male. Female breeding success (percentage of adult females breeding)
The inter-birth interval for captive tapirs is close to 18 months (Barongi 1993). A pair of lowland tapirs kept together at the National Zoo, Washington, DC, USA gave birth to 9 calves, with an average inter-birth rate of 20 months (Baker 1920). Other zoo evidence and field observations for wild Baird’s tapirs in Costa Rica indi-cate that females may become pregnant while lactating, which can reduce the interval to as few as 16 months (C. R. Foerster, pers. comm.). In addition, some females may lose their offspring during lactation, or due to still-births or neonatal deaths and come into estrus sooner af-terward, therefore reducing the inter-birth interval. For this modeling, it was assumed that 60% of the females would be reproducing in a given year.Environmental variation in breeding
Annual environmental variation in female reproduc-tion is modeled in VORTEX by specifying an SD for the proportion of adult females that successfully pro-duce offspring in a given year. No data are available for this parameter. Given their body size and reproductive rate, tapirs are expected to show little variation. Assum-ing no variation in breeding might be less realistic than assuming a small variation; therefore, 10% of the initial rate, or 6% EV, was used in the simulation.Density dependent reproduction
Density dependent reproduction was not included in the baseline model.Mate monopolization
In many animal species, some adult males are social-ly restricted from breeding, despite being physiological-

360
123456789
101112131415161718192021222324252627282930313233343536373839404142434445464748495051
E. P. Medici and A. L. J. Desbiez
© 2012 Wiley Publishing Asia Pty Ltd, ISZS and IOZ/CAS
ly capable. Young males might be sexually mature but, because they are still dispersing or have not yet estab-lished their own home range, they might not be an ef-fective part of the breeding pool. This can be modeled in VORTEX by specifying a portion of the total pool of adult males that might be considered ‘available’ for breeding each year. Although there is a lack of field data for this parameter, it was considered that an average 90% of the adult males are capable of reproducing each year.
Mortality rates
There is virtually no data available on tapir mortali-ty rates in the wild. However, some of the data gathered during the long-term study in MDSP allows for calcu-lations of annual mortality of adult and sub-adult tapirs. A total of 25 tapirs (20 adults and 5 sub-adults) were radio-collared (Medici 2010). Of these, 5 died during the study (3 adults and 2 sub-adults). Among the adults, 2 died of natural causes and 1 was predated by jaguar. Among the sub-adults, 1 was predated by puma and the other by jaguar. By dividing the number of deaths (sep-arately for adults and sub-adults) by the total number of months of radio-tracking, annual mortality rates of adult and sub-adult tapirs were calculated. Monthly mortal-ity of adult tapirs was 3/315 = 0.0095, which means a monthly survival of 1 − 0.0095 = 0.9905 and an annu-al survival of 0.9905^12 = 0.892. The estimated annual mortality for adult tapirs in MDSP was 10.8% (1 − 0.892 = 0.108). Similar calculations yielded a mortality rate of 29% for sub-adult tapirs. When considering only adult tapirs radio-tracked in the long-term (8–36 months), monthly mortality of adult tapirs was 2/293 = 0.0068, which means a monthly survival of 1 − 0.0068 = 0.9932 and an annual survival of 0.9932^12 = 0.9214. The re-sulting annual mortality for adults was 8% (1 − 0.9214 = 0.0786) (Medici 2010).
For this modeling, the mortality rate of adult tapirs in MDSP was set at 8%. Field studies on Baird’s tapirs in Costa Rica demonstrated evidence of risk-prone behav-ior in sub-adults from ages 3–5 years, which suggests a high mortality rate for this age class (C. R. Foerster, pers. comm.). However, the sub-adult mortality rate ob-tained by Medici (2010), 29%, was considered to be ex-cessively high, probably due to the small sample size of sub-adults. Therefore, the mortality rates of sub-adults (ages 1–2, 2–3 and 3–4 years) were set at a more con-servative 15%.
According to Eisenberg (1997), mortality in low-land tapirs might be heavy during the first year of life
because predators (jaguar and puma) take younger ani-mals. In addition, data from captive tapirs shows a rel-atively high expected mortality of newborns. There-fore, the mortality rate for this age class was set at 10%. Mortality rates for all age classes were considered to be equivalent between males and females. Standard devia-tions were set to 20% of the mean values, which seemed to provide a sensible interval.
Population description
Number of populations
In the baseline model, only 1 population was consid-ered (MDSP). Dispersal among populations
In the baseline model only 1 population was consid-ered (MDSP), with no immigration or emigration of in-dividuals.Initial population size (N)
Two values of initial tapir population size were used, based on tapir densities estimated by Medici (2010) through 2 different methods: (i) radio telemetry (126 ta-pirs) and (ii) nocturnal line transect sampling (237 ta-pirs). Carrying capacity (K)
The carrying capacity was considered to be the same as the initial population size. In VORTEX, if the pop-ulation size N exceeds K at the end of a particular time cycle, additional mortality is imposed across all age and sex classes to reduce the population back to this upper limit (Miller & Lacy 2005).Catastrophe
Reed et al. (2003) report that the frequency of severe die-offs in vertebrate populations is strongly related to the generation length of the organism and that the prob-ability of a severe die-off for a particular population is approximately 14% per generation. The per year prob-ability was calculated simply from the per generation probability using the following formula: P(Y) = P(G)/T, where P(Y) is the probability of a catastrophe per year, P(G) is the probability of a catastrophe per generation (14%) and T is the generation length of the species (10 years for tapirs). P(Y) = 0.014. Catastrophes in MDSP could be fire or perhaps infectious disease. None of these catastrophes were thought to result in more than a 10% decrease in tapir survival or reproduction. For this modeling, catastrophes were included with a per year probability of 1.4% causing a 10% decrease in survival and reproduction.

361
123456789101112131415161718192021222324252627282930313233343536373839404142434445464748495051
Lowland tapir viability analysis
© 2012 Wiley Publishing Asia Pty Ltd, ISZS and IOZ/CAS
Harvest
The model included harvest by road-kill. There is a highway (SP-613, Rodovia Estadual Arlindo Bétio) that crosses MDSP, impacting the resident tapir population. Based on current data, 1 male and 1 female were con-sidered to be killed on the highway every 2 years.
A compilation of all parameters used in the baseline model is presented in Table 1.
Sensitivity analysis
It is important to recognize that uncertainty regard-ing the biological parameters of a given population oc-curs at several levels, especially for parameters that
have never been measured in the population. Therefore, sensitivity testing is required to determine the extent to which uncertainty in input parameters results in uncer-tainty regarding the future fate of the population. This tool is used to uncover particularly sensitive parameters that, if changed, could significantly alter the results and conclusions derived from the model. If alternative plau-sible parameter values result in divergent predictions for the population, then it is important to resolve the uncer-tainty with better data to produce more confident results. Sensitivity of population dynamics to certain parame-ters indicates that those parameters describe factors that could be critical determinants of population viability. In
Table 1 Summary of parameter input values used in the VORTEX baseline model for Morro do Diabo State Park (MDSP) lowland tapir population
Parameter Baseline valueNumber of populations 1Initial population size (N) 126 (radio telemetry)*
237 (line transect)*Carrying capacity (K) Same as NInbreeding depression 3.14 LE% of the effect of inbreeding due to recessive lethal alleles 50Breeding system MonogamyAge of first reproduction (♀/♂) 4 yearsMaximum age of reproduction 20 yearsAnnual % of adult females reproducing (SD) 60% (6%)Density dependent reproduction? NoMaximum litter size 1Overall offspring sex ratio 50:50Adult males in breeding pool (%) 90Mortality rates: % mortality from age 0–1 (SD) 10 (2) % mortality from age 1–2 (SD): sub-adult 15 (3) % mortality from age 2–3 (SD): sub-adult 15 (3) % mortality from age 3–4 (SD): sub-adult 15 (3) % mortality from age above 4 (SD): adult 8 (1.6)Catastrophe† YesHarvest† 1♀ + 1♂/2 yearsSupplementation None
*Population size estimates obtained from field data collected in MDSP, São Paulo, Brazil. †These values were used in the baseline model as well as for the estimate of minimum viable population. LE, lethal equivalent. (Medici 2010).

362
123456789
101112131415161718192021222324252627282930313233343536373839404142434445464748495051
E. P. Medici and A. L. J. Desbiez
© 2012 Wiley Publishing Asia Pty Ltd, ISZS and IOZ/CAS
addition, sensitivity analysis evaluates the robustness of the baseline model to variations in selected parame-ter values. The more robust the model is to variations in a particular parameter, the less sensitive the model’s re-sults are to the input values of that parameter.
A sensitivity analysis was performed to evaluate the effect of reproductive and mortality parameters on the stochastic growth rate (rstoc) of the tapir population in MDSP. In each analysis, only 1 parameter was varied at a time, using the highest and lowest estimated values (Table 2). Results of the sensitivity analysis were plotted against the (rstoc) value observed for the baseline model. Catastrophe and harvest were not considered.
Minimum viable population analysis
The minimum viable population (MVP) analysis is an estimate of the minimum number of organisms of a particular species that constitutes a viable population over the long term (Soulé 1987). The MVP is the small-est possible population size at which a biological pop-ulation can exist without facing extinction from natural disasters or demographic, environmental or genetic sto-chasticity (Gilpin & Soulé 1986).
Lowland tapirs have a wide geographic distribution, across different biomes, where they face various types and levels of threats (Medici 2011). Therefore, it is al-most impossible to establish a common definition of MVP for the species. In some areas, populations are small and fragmented, while in others, populations are large and contiguous (Medici 2011). Therefore, an anal-ysis of the MVP for tapirs depends on the objectives and measures used to characterize it. The analysis of the MVP for tapirs in MDSP was carried out using 2 mea-sures:
Average probability that the population will become extinct (P(E)100)
Extinction is defined as no animals of 1 or both sex-es remaining. P(E)100 is the proportion of the 1000 itera-tions within a given scenario that become extinct within 100 years. A goal was set of P(E)100 = 0. Genetic diversity of the extant populations (GD)
It is expressed as a percent of the initial genetic di-versity of the population that is maintained within 100 years. A goal was set of maintaining 95% GD after 100 years.
Modeling of scenarios
The baseline model was used to analyze different scenarios and conservation challenges facing tapirs in MDSP and surrounding forest fragments. These analy-ses evaluated which factors, if changed or manipulated, might have the greatest effect on causing or preventing tapir extinction. For some of these analyses, the base-line model excluded catastrophes and harvest as values for these threats were specifically tested. The scenarios modeled included: (i) the impact of road-kill; (ii) meta-population; and (iii) the effect of the establishment of corridors. The measures used to evaluate the results of different scenarios were: (i) the mean rate of stochastic population growth (rstoc); (ii) the probability of extinc-tion (P(E)100); (iii) the mean time to extinction (MeanTE, which is the mean for those simulations in which the population did become extinct); (iv) GD; and (v) the population size at the end of the simulations (N-extant).Impact of road-kill
One of the main threats to tapirs and many other spe-cies in MDSP is the highway that crosses the protected
Table 2 Highest and lowest reproductive and mortality lowland tapir parameter values and SD used for sensitivity analysis
Parameter Low Baseline Highest% juvenile mortality (age 0–1) 5 (1) 10 (2) 20 (4)% sub-adult mortality (age 1–4) 10 (2) 15 (3) 29† (5.8)% adult mortality (age above 4) 5 (1) 8† (2) 15 (3)Age of first reproduction (♀) 3 4 5Age of first reproduction (♂) 3 4 5Maximum age of reproduction 15 20 25Annual % of adult females reproducing 50 (6) 60 (6) 65 (6)
†Mortality rates obtained from field data collected in MDSP. (Medici 2010).

363
123456789101112131415161718192021222324252627282930313233343536373839404142434445464748495051
Lowland tapir viability analysis
© 2012 Wiley Publishing Asia Pty Ltd, ISZS and IOZ/CAS
area (Fig. 1). The Forestry Institute of São Paulo State and the Institute for Ecological Reseach (IPÊ) have monitored road-kill on the highway for a decade. From 1996 to 2006, an average of 6 tapirs were hit by cars and killed on the highway every year (Fig. 2) (Medici 2010). In 1998 alone, 8 tapirs were killed. It is very probable that more tapirs were killed but their deaths went un-detected. Most of the tapirs killed were adults capable of breeding. The Harvest mode of VORTEX was used, considering 3 adult males and 3 adult females killed ev-ery year.
Metapopulation scenario
There is a multitude of forest fragments of differ-ent sizes and levels of habitat disturbance throughout the Pontal do Paranapanema Region. Ditt (2002) sur-veyed all forest patches larger than 4 km² in the Pon-tal (13 fragments). Tapir presence was confirmed in 7 of them, wereas no tapir evidence was found in the oth-er 6. Medici (2010) identified 12 tapir dispersal routes between MDSP and surrounding fragments, as well as among the fragments themselves (Fig. 2). The average distance between fragments was 4150 m.
For the purpose of modeling a tapir metapopulation scenario for the Pontal region, 8 sub-populations were included: MDSP and 7 forest fragments where tapirs were known to be present. Two different rates of tapir dispersal among forest patches were tested: 1.0 or 0.5%. Dispersing tapirs were individuals of both sexes from 2–4 years of age (sub-adults). In addition, the impact of
Figure 1 (a) Highway crossing MDSP, São Paulo, Brazil and (b) tapir road-kill.
Figure 2 Potential routes of tapir dispersal between MDSP and 7 surrounding forest fragments (F1–F7) where tapir presence has been detected (Ditt 2002).

364
123456789
101112131415161718192021222324252627282930313233343536373839404142434445464748495051
E. P. Medici and A. L. J. Desbiez
© 2012 Wiley Publishing Asia Pty Ltd, ISZS and IOZ/CAS
rate of tapir mortality during dispersal was also tested: 10 or 0% mortality. Maximum and minimum population sizes were established using tapir densities provided by Medici (2010). In all models, the carrying capacity (K) was equal to the initial population size. Nevertheless, what would happen if the carrying capacity of each of the forest fragments was much higher was also tested (K = 100). Establishment of corridors
The establishment of corridors between MDSP and surrounding forest fragments was tested and the impact the increase in landscape connectivity would have on the viability of the tapir populations was analyzed. For the purpose of modeling this scenario, initial population size and carrying capacity were increased from 126 to 148 (telemetry density) and from 237 to 277 (line tran-sect density). Minimum values correspond to the tapir population size in MDSP; maximum values correspond to the sum of tapir population sizes in MDSP and the 7 smaller forest fragments where tapirs are known to be present (Ditt 2002; Medici 2010). We also tested what would happen if the 6 forest fragments where tapirs were absent were included in the analyses, increasing the initial population size and carrying capacity from 126 to 163 (telemetry density) or from 237 to 307 (line transect density).
RESULTS
VORTEX baseline model
Deterministic output
The demographic rates (reproduction and mortality) included in the baseline model were used to calculate deterministic characteristics of the model population. The baseline model resulted in a deterministic growth rate (rdet) of 0.047 (λ = 1.048). This represented a poten-tial annual growth rate of almost 5%, which enables the population to grow when below K. Generation time re-sulted in approximately 10 years for both sexes. The adult sex ratio was 1. Overall, these population charac-teristics were accepted as realistic for lowland tapirs and lend validity to the model as a reasonable representa-tion of the tapir population in MDSP and could be used to model other lowland tapir populations throughout the species distribution. Stochastic baseline results
The stochastic growth rate is the growth rate calcu-lated from the mean birth and death rates, under the pre-
sumption of no annual variation, no inbreeding and no limitation of mates among other factors, while rstoch is the mean growth rate observed in the simulation, im-pacted by a variety of sources of variation in the model. Results from the baseline model projected that a popu-lation of 126 tapirs, in complete absence of catastro-phes and threats, is likely to persist over the next 100 years. The rstoch of this population was 0.040, P(E) was zero and N-extant was 124 tapirs, with 92% of GD re-maining. When including catastrophe and harvest, the population still appears to be capable of persisting over the next 100 years. However, the stochastic growth rate (rstoch) was reduced to 0.029, N-extant was 122 tapirs, with 92% of GD remaining.
Sensitivity analysis
The parameters sub-adult mortality and adult mortal-ity have the strongest influence on the dynamics of low-land tapir populations (Fig. 3). The age of first reproduc-tion for females also appears to be a sensitive parameter.
Minimum viable population
The MVP was previously defined as a tapir popula-tion with P(E) = 0 and 95% of GD remaining after 100
Figure 3 Results from sensitivity analysis. The line represents the value of stochastic population growth from the baseline model (SubMort: Sub-adult mortality; AdMort: Adult mortali-ty; FA1R: Age of first reproduction for females; %FB: Annual percent of adult females breeding in the population; MaxAR: Maximum age of reproduction; JuMort: Juvenile mortality; MA1R: Age of first reproduction for males).
365
123456789101112131415161718192021222324252627282930313233343536373839404142434445464748495051
Lowland tapir viability analysis
© 2012 Wiley Publishing Asia Pty Ltd, ISZS and IOZ/CAS
years. According to the model, approximately 200 in-dividual tapirs would be necessary to maintain a viable population at MDSP for the next 100 years (Table 3).
Modeling of scenarios
Impact of road-kill
Removing 3 adult females and 3 adult males from the population every year due to road-kill had a major im-pact on the tapir population at MDSP. A population of 126 tapirs has a 100% probability of extinction in 100 years. Nevertheless, the higher the initial population size, the lower the probability of extinction (Table 4). Road-kill also reduced the genetic diversity of the popu-lation. Metapopulation scenario
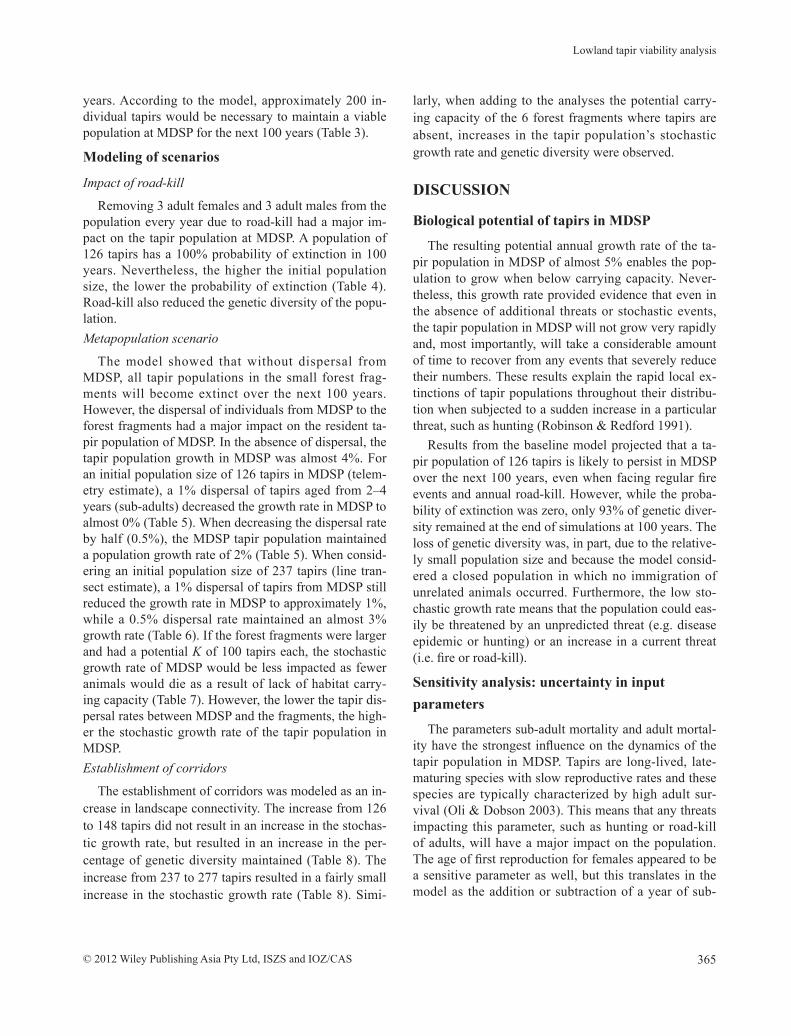
The model showed that without dispersal from MDSP, all tapir populations in the small forest frag-ments will become extinct over the next 100 years. However, the dispersal of individuals from MDSP to the forest fragments had a major impact on the resident ta-pir population of MDSP. In the absence of dispersal, the tapir population growth in MDSP was almost 4%. For an initial population size of 126 tapirs in MDSP (telem-etry estimate), a 1% dispersal of tapirs aged from 2–4 years (sub-adults) decreased the growth rate in MDSP to almost 0% (Table 5). When decreasing the dispersal rate by half (0.5%), the MDSP tapir population maintained a population growth rate of 2% (Table 5). When consid-ering an initial population size of 237 tapirs (line tran-sect estimate), a 1% dispersal of tapirs from MDSP still reduced the growth rate in MDSP to approximately 1%, while a 0.5% dispersal rate maintained an almost 3% growth rate (Table 6). If the forest fragments were larger and had a potential K of 100 tapirs each, the stochastic growth rate of MDSP would be less impacted as fewer animals would die as a result of lack of habitat carry-ing capacity (Table 7). However, the lower the tapir dis-persal rates between MDSP and the fragments, the high-er the stochastic growth rate of the tapir population in MDSP.Establishment of corridors
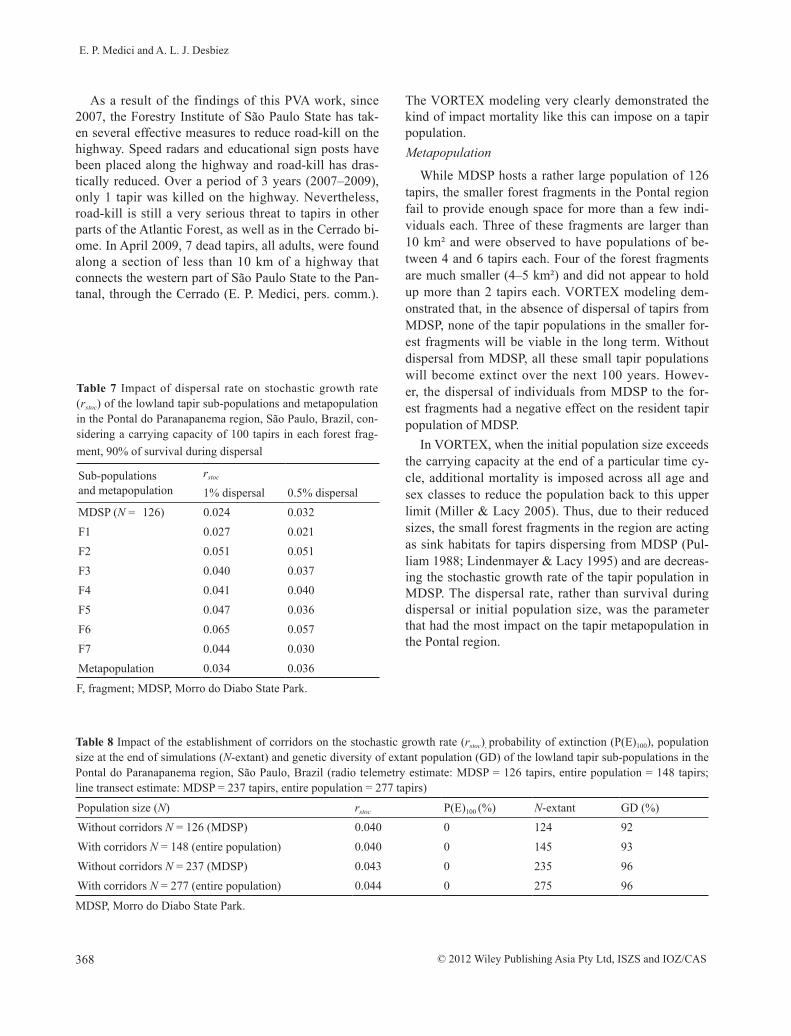
The establishment of corridors was modeled as an in-crease in landscape connectivity. The increase from 126 to 148 tapirs did not result in an increase in the stochas-tic growth rate, but resulted in an increase in the per-centage of genetic diversity maintained (Table 8). The increase from 237 to 277 tapirs resulted in a fairly small increase in the stochastic growth rate (Table 8). Simi-
larly, when adding to the analyses the potential carry-ing capacity of the 6 forest fragments where tapirs are absent, increases in the tapir population’s stochastic growth rate and genetic diversity were observed.
DISCUSSION
Biological potential of tapirs in MDSP
The resulting potential annual growth rate of the ta-pir population in MDSP of almost 5% enables the pop-ulation to grow when below carrying capacity. Never-theless, this growth rate provided evidence that even in the absence of additional threats or stochastic events, the tapir population in MDSP will not grow very rapidly and, most importantly, will take a considerable amount of time to recover from any events that severely reduce their numbers. These results explain the rapid local ex-tinctions of tapir populations throughout their distribu-tion when subjected to a sudden increase in a particular threat, such as hunting (Robinson & Redford 1991).
Results from the baseline model projected that a ta-pir population of 126 tapirs is likely to persist in MDSP over the next 100 years, even when facing regular fire events and annual road-kill. However, while the proba-bility of extinction was zero, only 93% of genetic diver-sity remained at the end of simulations at 100 years. The loss of genetic diversity was, in part, due to the relative-ly small population size and because the model consid-ered a closed population in which no immigration of unrelated animals occurred. Furthermore, the low sto-chastic growth rate means that the population could eas-ily be threatened by an unpredicted threat (e.g. disease epidemic or hunting) or an increase in a current threat (i.e. fire or road-kill).
Sensitivity analysis: uncertainty in input parameters
The parameters sub-adult mortality and adult mortal-ity have the strongest influence on the dynamics of the tapir population in MDSP. Tapirs are long-lived, late-maturing species with slow reproductive rates and these species are typically characterized by high adult sur-vival (Oli & Dobson 2003). This means that any threats impacting this parameter, such as hunting or road-kill of adults, will have a major impact on the population. The age of first reproduction for females appeared to be a sensitive parameter as well, but this translates in the model as the addition or subtraction of a year of sub-

366
123456789
101112131415161718192021222324252627282930313233343536373839404142434445464748495051
E. P. Medici and A. L. J. Desbiez
© 2012 Wiley Publishing Asia Pty Ltd, ISZS and IOZ/CAS
Table 3 Results of genetic diversity of extant population (GD), probability of extinction (P(E)100), mean rate of stochastic popula-tion growth (rstoc) and population size at the end of simulations (N-extant) obtained through the analysis of minimum viable popula-tion for lowland tapirs in MDSP
Population size (N) GD (%) P(E)100 (%) rstoc N-extant25 0 100 –0.063 050 77 67 –0.013 3075 86 6 0.014 61100 90 0 0.024 94125 92 0 0.028 121150 93 0 0.032 147175 94 0 0.034 172200 95 0 0.035 197225 95 0 0.037 223250 96 0 0.037 247275 96 0 0.038 273300 96 0 0.038 297
Table 4 Results of mean rate of stochastic population growth (rstoc), probability of extinction (P(E)100), mean time to extinction (MeanTE), genetic diversity of extant population (GD) and population size at the end of simulations (N-extant) obtained through the analysis of the impact of road-kill on lowland tapirs in MDSP
Population size (N) rstoc P(E)100 (%) MeanTE (years) GD (%) N-extant126 –0.082 100 38 0 0237 0.013 3 78 95 215
Table 5 Impact of probability of survival and dispersal rate on stochastic growth rate (rstoc) and probability of extinction (%) of the lowland tapir sub-populations and metapopulation in the Pontal do Paranapanema region, São Paulo, Brazil (N = 126; Medici 2010)
Sub-populationsandmetapopulation
1% dispersal 0.5% dispersal 90% survival 100% survival 90% survival 100% survivalrstoc P(E)100 rstoc P(E)100 rstoc P(E)100 rstoc P(E)100
MDSP (N = 126) 0.002 1 0.003 0 0.022 0 0.022 0F1 (N = 6) –0.010 98 –0.007 97 –0.008 100 –0.007 100F2 (N = 4) 0.166 22 0.182 20 0.110 27 0.120 24F3 (N = 4) 0.161 24 0.177 21 0.105 28 0.115 23F4 (N = 2) 0.167 99 0.172 98 0.158 100 0.161 100F5 (N = 2) 0.158 100 0.159 100 0.152 100 0.152 10F6 (N = 2) 0.545 61 0.582 64 0.389 62 0.411 62F7 (N = 2) 0.151 100 0.154 100 0.151 100 0.149 100Metapopulation (N = 148) 0.028 0 0.031 0 0.032 0 0.034 0
F, fragment; MDSP, Morro do Diabo State Park.

367
123456789101112131415161718192021222324252627282930313233343536373839404142434445464748495051
Lowland tapir viability analysis
© 2012 Wiley Publishing Asia Pty Ltd, ISZS and IOZ/CAS
adult mortality (the highest mortality rate of all age classes). Therefore, this parameter actually shows the impact of sub-adult mortality. These results show the importance of obtaining accurate values of tapir mortal-ity rates in the wild and reinforce the need for long-term studies on tapirs in the wild.
Minimum viable population
Although population size is the major determinant of persistence in populations (Berger 1990; Schoener & Spiller 1992), controversy remains as to how large these populations need to be to ensure long-term persistence (Reed et al. 2003). The analysis of tapir MVP in MDSP included 2 very strict parameters: zero probability of ex-tinction and maintenance of 95% of genetic diversity af-ter 100 years. According to the model, approximately 200 tapirs would be required to maintain a viable popu-lation in MDSP for the next 100 years, which is similar to the results obtained by Gatti et al. (2011). Thus, the estimated tapir population of 126 tapirs in MDSP is not large enough to be viable over the long term. Although it is likely to persist over the next 100 years, it is not large enough to maintain 95% genetic diversity. While the use of 95% GD as a viability criterion is stricter than what is often used in PVAs (90% GD is more common), a loss of over 5% of GD can indicate that a population is in genetic decay, losing some of the variation that might be critical for adaptability and resilience. Small populations might persist, but suffer such loss of genet-
ic diversity resulting in deleterious genes impacting the population over the long term. Therefore, conservation measures must be taken to promote the maintenance of genetic diversity in MDSP.
Scenarios: threats, metapopulation and conservation strategies
Impact of road-kill
Among the most widespread forms of modification of natural landscapes during the past century has been the construction and maintenance of roads (Diamond-back 1990). Roads affect ecosystems in many ways, one of these being the increased mortality of animals from collisions with vehicles. Road-kill can have a major im-pact on animal populations (Trombulak & Frissell 2000; Kerley et al. 2002).
The model showed that losing 6 adult tapirs to road-kill every year had a major impact on the tapir popula-tion in MDSP. This level of road-kill would lead the es-timated tapir population of 126 tapirs to extinction in approximately 38 years. As demonstrated in the sensi-tivity analysis, adult mortality is a very sensitive param-eter for tapirs and, therefore, road-kill greatly reduces the stochastic growth rate. An increase in the population size decreases the impact of road-kill, further emphasiz-ing the impact that fragmentation has on the long-term persistence of tapir populations.
Table 6 Impact of probability of survival and dispersal rate on stochastic growth rate (rstoc) and probability of extinction of the low-land tapir sub-populations and metapopulation in the Pontal do Paranapanema region, São Paulo, Brazil (N = 237; Medici 2010)
Sub-populationsandmetapopulation
1% dispersal 0.5% dispersal
90% survival 100% survival 90% survival 100% survival
rstoc P(E)100 rstoc P(E)100 rstoc P(E)100 rstoc P(E)100
MDSP (N = 237) 0.007 0 0.007 0 0.026 0 0.026 0F1 (N = 12) –0.009 89 –0.007 87 –0.008 94 –0.007 92F2 (N = 8) 0.178 2 0.195 1 0.105 2 0.116 3F3 (N = 8) 0.191 3 0.212 2 0.114 4 0.126 3F4 (N = 3) 0.056 95 0.059 92 0.042 98 0.048 98F5 (N = 3) 0.044 100 0.049 99 0.039 100 0.039 100F6 (N = 3) 0.701 35 0.756 34 0.460 35 0.492 35F7 (N = 3) 0.030 100 0.032 100 0.027 100 0.027 100Metapopulation (N = 277) 0.034 0 0.037 0 0.037 0 0.038 0
F, fragment; MDSP, Morro do Diabo State Park.
368
123456789
101112131415161718192021222324252627282930313233343536373839404142434445464748495051
E. P. Medici and A. L. J. Desbiez
© 2012 Wiley Publishing Asia Pty Ltd, ISZS and IOZ/CAS
As a result of the findings of this PVA work, since 2007, the Forestry Institute of São Paulo State has tak-en several effective measures to reduce road-kill on the highway. Speed radars and educational sign posts have been placed along the highway and road-kill has dras-tically reduced. Over a period of 3 years (2007–2009), only 1 tapir was killed on the highway. Nevertheless, road-kill is still a very serious threat to tapirs in other parts of the Atlantic Forest, as well as in the Cerrado bi-ome. In April 2009, 7 dead tapirs, all adults, were found along a section of less than 10 km of a highway that connects the western part of São Paulo State to the Pan-tanal, through the Cerrado (E. P. Medici, pers. comm.).
The VORTEX modeling very clearly demonstrated the kind of impact mortality like this can impose on a tapir population. Metapopulation
While MDSP hosts a rather large population of 126 tapirs, the smaller forest fragments in the Pontal region fail to provide enough space for more than a few indi-viduals each. Three of these fragments are larger than 10 km² and were observed to have populations of be-tween 4 and 6 tapirs each. Four of the forest fragments are much smaller (4–5 km²) and did not appear to hold up more than 2 tapirs each. VORTEX modeling dem-onstrated that, in the absence of dispersal of tapirs from MDSP, none of the tapir populations in the smaller for-est fragments will be viable in the long term. Without dispersal from MDSP, all these small tapir populations will become extinct over the next 100 years. Howev-er, the dispersal of individuals from MDSP to the for-est fragments had a negative effect on the resident tapir population of MDSP.
In VORTEX, when the initial population size exceeds the carrying capacity at the end of a particular time cy-cle, additional mortality is imposed across all age and sex classes to reduce the population back to this upper limit (Miller & Lacy 2005). Thus, due to their reduced sizes, the small forest fragments in the region are acting as sink habitats for tapirs dispersing from MDSP (Pul-liam 1988; Lindenmayer & Lacy 1995) and are decreas-ing the stochastic growth rate of the tapir population in MDSP. The dispersal rate, rather than survival during dispersal or initial population size, was the parameter that had the most impact on the tapir metapopulation in the Pontal region.
Table 7 Impact of dispersal rate on stochastic growth rate (rstoc) of the lowland tapir sub-populations and metapopulation in the Pontal do Paranapanema region, São Paulo, Brazil, con-sidering a carrying capacity of 100 tapirs in each forest frag-ment, 90% of survival during dispersal
Sub-populationsand metapopulation
rstoc 1% dispersal 0.5% dispersal
MDSP (N = 126) 0.024 0.032F1 0.027 0.021F2 0.051 0.051F3 0.040 0.037F4 0.041 0.040F5 0.047 0.036F6 0.065 0.057F7 0.044 0.030Metapopulation 0.034 0.036
F, fragment; MDSP, Morro do Diabo State Park.
Table 8 Impact of the establishment of corridors on the stochastic growth rate (rstoc), probability of extinction (P(E)100), population size at the end of simulations (N-extant) and genetic diversity of extant population (GD) of the lowland tapir sub-populations in the Pontal do Paranapanema region, São Paulo, Brazil (radio telemetry estimate: MDSP = 126 tapirs, entire population = 148 tapirs; line transect estimate: MDSP = 237 tapirs, entire population = 277 tapirs)
Population size (N) rstoc P(E)100 (%) N-extant GD (%)Without corridors N = 126 (MDSP) 0.040 0 124 92With corridors N = 148 (entire population) 0.040 0 145 93Without corridors N = 237 (MDSP) 0.043 0 235 96With corridors N = 277 (entire population) 0.044 0 275 96
MDSP, Morro do Diabo State Park.
369
123456789101112131415161718192021222324252627282930313233343536373839404142434445464748495051
Lowland tapir viability analysis
© 2012 Wiley Publishing Asia Pty Ltd, ISZS and IOZ/CAS
The metapopulation modeling showed that dispersal of tapirs from MDSP to the forest fragments in the sur-roundings can be detrimental to the overall metapopu-lation if the carrying capacity in the fragments is low. The fragments act as sinks as their initial population siz-es are very low, as is their carrying capacity. Higher ini-tial populations and higher carrying capacity of the frag-ments would benefit MDSP and tapir conservation in the region because tapirs from the fragments could also be a source of tapirs.
Overall, the results from the metapopulation model-ing demonstrate that there are opposing factors that can make the existence of fragments in the landscape either beneficial or detrimental to tapir conservation. This will depend on the carrying capacity of forest fragments as well as on the mortality rates during dispersal. Corridors: a potential conservation strategy for tapirs?
Conservation biologists generally agree that land-scape connectivity enhances population viability for many species (Noss 1987). Because habitat fragmenta-tion often breaks natural connections, many conserva-tionists have advocated the establishment of corridors to promote biological fluxes and landscape connectivity (Beier & Noss 1998; Damschen et al. 2006).
The modeling of the establishment of corridors con-necting MDSP to the surrounding forest fragments in the Pontal region reflected an increase in landscape con-nectivity for tapirs. This increase in landscape connec-tivity resulted in an increase in the stochastic growth rate, which made tapir populations more resilient to an-thropogenic threats and catastrophes. Furthermore, it re-sulted in an increase in the percentage of genetic diver-sity maintained over the long term, which particularly benefited smaller populations. Nevertheless, this model assumed that rates of tapir mortality were not increased when using corridors. If mortality does occur (e.g. dis-persing tapirs have to cross a road or become an easier target for hunters), the impact of corridors can be very different and can, in fact, cause the extinction of the metapopulation. If tapirs using the corridors do not ex-perience increased mortality rates, corridors can be im-portant tools for maintaining long-term genetically via-ble populations of tapirs in the smaller forest fragments as well as in MDSP.
Several authors argue that corridors can promote the spread of diseases, catastrophic disturbances such as fires, introduction of exotic species or the luring of ani-mals into areas where they might experience high mor-tality (Hobbs 1992; Simberloff et al. 1992; Hess 1994).
In addition, corridor skeptics have pointed out that the scientific evidence in support of corridors as a conser-vation tool is very weak and have objected to the finan-cial costs involved (Simberloff & Cox 1987). This case study of tapirs in the Pontal region highlights that many species-specific considerations need to be made when selecting corridors as a conservation strategy.
However, the corridor scenario in this study examines a case in which the total population size and carrying capacity were augmented by the connections between MDSP and surrounding forest fragments. This actual-ly represents other management actions that would have the same effect, such as the expansion of the habitat contiguous to MDSP through the establishment of for-ested buffer zones, without making tapirs as vulnerable to dispersal mortality.
Viability of lowland tapir populations in fragmented landscapes
MDSP hosts a rather large, healthy and apparent-ly stable tapir population of approximately 130 individ-uals. Although this population is likely to persist over the next 100 years, it is not large enough to maintain ge-netic diversity and is, therefore, not considered to be vi-able in the long term. An MVP of 200 tapirs would be necessary to ensure the long-term viability of tapirs in MDSP. Thus, there is an urgent need to design and im-plement conservation strategies for tapirs in MDSP, aiming at promoting an increase in carrying capaci-ty and the maintenance of 95% of genetic diversity. The analysis of the impact of road-kill in MDSP has clearly shown how susceptible tapirs are to this, and many other threats as well, such as hunting and infectious diseases. These threats potentially have even more drastic effects for much smaller tapir populations in forest fragments.
Although MDSP is the largest Atlantic Forest rem-nant in the Pontal do Paranapanema region, the smaller forest fragments are too small to provide enough space for more than just a few individuals each. The larg-est of the 7 fragments where the presence of tapirs has been previously confirmed (18 km²) is not large enough to host more than 6 tapirs, according to results on ta-pir spatial requirements obtained by Medici (2010). Al-together, the Atlantic Forest of the Pontal region should comprise approximately 150 tapirs in 8 patches of for-est. Unfortunately, these demographic estimates might be overestimated, especially if we considered that ta-pirs in the smaller forest fragments may not occur at the same density as observed in MDSP.

370
123456789
101112131415161718192021222324252627282930313233343536373839404142434445464748495051
E. P. Medici and A. L. J. Desbiez
© 2012 Wiley Publishing Asia Pty Ltd, ISZS and IOZ/CAS
Medici (2010) observes that tapirs move fairly easi-ly through areas of non-natural habitat, including fields of agricultural crops and pasture lands in the Pontal re-gion. This indicates that the landscape matrix in the re-gion provides a certain level of functional connectivity for these animals and provides evidence of the existence of a metapopulation scenario. The VORTEX models showed that the maintenance of metapopulation dynam-ics might be a determinant factor for the persistence of tapir populations in the region, particularly in the small-er fragments.
The functioning of the tapir metapopulation in the Pontal region is completely dependent on 3 main fac-tors. The first and most important is that MDSP must re-main intact and effectively protected. Second, the func-tional connectivity of the landscape matrix in the region must be maintained and, whereever possible, enhanced, while mortality during dispersal and threats in the un-protected forest fragments must be reduced. Third, any threats affecting tapirs in the smaller forest fragments must be neutralized. As evidenced by the VORTEX metapopulation model, the tapir population in MDSP is not large enough to maintain a disrupted ‘source-sink’ structure. It could destabilize the metapopulation and seriously compromise its persistence and viability over the long term.
REFERENCESBaker AB (1920). Breeding of the Brazilian tapir. Jour-
nal of Mammalogy 1, 143–4.Barongi RA (1993). Husbandry and conservation of ta-
pirs. International Zoo Yearbook 32, 7–15.Beier P, Noss RF (1998). Do habitat corridors real-
ly provide connectivity? Conservation Biology 12, 1241–52.
Beissinger SR, McCullough D (2002). Population Via-bility Analysis. University of Chicago Press, Chicago.
Berger J (1990). Persistence of different-sized popula-tions: an empirical assessment of rapid extinctions in bighorn sheep. Conservation Biology 4, 91–8.
Boyce MS (1992). Population viability analysis. Annual Review of Ecology and Systematics 23, 481–506.
Brook BW, O’Grady JJ, Chapman AP, Burgman MA, Akçakaya HR, Frankham F (2000). Predictive accu-racy of population viability analysis in conservation biology. Nature 404, 385–7.
Brook BW, Burgman MA, Akçakaya HR, O’Grady JJ, Frankham R (2002). Critiques of PVA ask the wrong
questions: throwing the heuristic baby out with the numerical bath water. Conservation Biology 16, 262–3.
Burgman MA, Ferson S, Akçakaya HR (1993). Risk As-sessment in Conservation Biology. Chapman and Hall, London, UK.
Coulson T, Mace GM, Hudson E, Possingham H (2001). The use and abuse of population viability analysis. Trends in Ecology & Evolution 16, 219–21.
Damschen EI, Haddad NM, Orrock JL, Tewksbury JJ, Levey DJ (2006). Corridors increase plant species richness at large scales. Science 313, 1284–6.
Diamondback A (1990). Ecological effects of roads. In: Davis J, ed. Killing Roads: A Citizens’ Primer on the Effects and Removal of Roads. Earth First! Biodiver-sity Project Special Publication, Tucson, USA, pp. 1–5.
Ditt EH (2002). Fragmentos florestais no Pontal do Pa-ranapanema. Annablume Editora, IPÊ, IIEB, São Paulo, Brazil.
Eisenberg JF (1997). Introduction. In: Brooks DM, Bod-mer RE, Matola S, eds. Tapirs: Status Survey and Conservation Action Plan. IUCN/SSC Tapir Special-ist Group, Gland, Switzerland, pp. 5–7.
Gatti A, Brito D, Mendes S (2011). How many lowland tapirs (Tapirus terrestris) are needed in Atlantic For-est fragments to ensure long-term persistence? Stud-ies on Neotropical Fauna and Environment 46, 77–84.
Gilpin ME, Soulé ME (1986). Minimum viable popula-tions: processes of species extinctions. In: Soulé ME, ed. Conservation Biology: The Science of Scarcity and Diversity. Sinauer Associates, Sunderland, MA, pp. 19–34.
Ginzburg LR, Slobodkin LB, Johnson K, Bindman AG (1982). Quasi-extinction probabilities as a measure of impact on population growth. Risk Analysis 2, 171–81.
Groom MJ, Pascual MA (1998). The analysis of popula-tion persistence: an outlook on the practice of viabili-ty analysis. In: Fiedler PL, Kareiva PM, eds. Conser-vation Biology. Chapman and Hall, NY, pp. 4–27.
Hamilton S, Moller H (1995). Can PVA models using computer packages offer useful conservation advice? Sooty shearwaters Puffinus griseus in New Zealand as a case study. Biological Conservation 73, 107–17.
Hess GR (1994). Conservation corridors and contagious disease: a cautionary note. Conservation Biology 8, 256–62.

371
123456789101112131415161718192021222324252627282930313233343536373839404142434445464748495051
Lowland tapir viability analysis
© 2012 Wiley Publishing Asia Pty Ltd, ISZS and IOZ/CAS
Hobbs RJ (1992). The role of corridors in conservation: solution or bandwagon? Trends in Ecology & Evolu-tion 7, 389–91.
IUCN (2011). The IUCN Red List of Threatened Spe-cies. [Cited 16 Oct 2012.] Available from URL: http://www.iucnredlist.org
Kerley LL, Goodrich JM, Miquelle DG, Smirnov EN, Quigley HB, Hornocker MG (2002). Effects of roads and human disturbance on Amur tigers. Conservation Biology 16, 97–108.
Lacy RC (2000). Structure of the VORTEX simulation model for PVA. Ecological Bulletins 48, 191–203.
Lindenmayer DB, Lacy RC (1995). A simulation study of the impacts of population subdivision on the mountain brushtail possum Trichosurus caninus Ogilby (Phalangeridae: Marsupialia) in south-eastern Australia. I. Demographic stability and population persistence. Biological Conservation 73, 119–29.
Lindenmayer DB, Possingham HP (1996). Ranking con-servation and timber management options for Lead-beater’s possum in southeastern Australia using pop-ulation viability analysis. Conservation Biology 10, 235–51.
Lizcano DJ, Medici EP, Montenegro OL, Carrillo L, Camacho A, Miller PS (2005). Mountain Tapir Pop-ulation and Habitat Viability Assessment. IUCN/SSC Tapir Specialist Group, IUCN/SSC Conservation Breeding Specialist Group, Apple Valley, MN, USA.
Ludwig D (1999). Is it meaningful to estimate a proba-bility of extinction? Ecology 80, 298–310.
Medici EP, Lynam A, Boonratana R et al. (2003). Ma-layan Tapir Population and Habitat Viability Assess-ment. IUCN/SSC Tapir Specialist Group, IUCN/SSC Conservation Breeding Specialist Group, Apple Val-ley, MN, USA.
Medici EP, Carrillo L, Montenegro OL et al. (2006). Baird´s Tapir Population and Habitat Viability As-sessment. IUCN/SSC Tapir Specialist Group, IUCN/SSC Conservation Breeding Specialist Group, Apple Valley, MN, USA.
Medici EP, Desbiez ALJ, Gonçalves da Silva A et al. (2007). Lowland Tapir Population and Habitat Via-bility Assessment. IUCN/SSC Tapir Specialist Group, IUCN/SSC Conservation Breeding Specialist Group, Sorocaba, Brazil.
Medici EP (2010). Assessing the viability of lowland ta-pir populations in a fragmented landscape (PhD dis-
sertation). Durrell Institute of Conservation and Ecol-ogy, University of Kent, Canterbury, UK.
Medici EP (2011). Family Tapiridae (tapirs). In: Wilson DE, Mittermeier RA, eds. Handbook of the Mammals of the World, Volume 2: Hoofed Mammals. Lynx Edi-tions, Spain.
Miller PS, Lacy RC (2005). VORTEX: a stochastic sim-ulation of the extinction process. Version 9.50 User’s Manual. IUCN/SSC Conservation Breeding Special-ist Group, Apple Valley, MN, USA.
Noss RF (1987). Protecting natural areas in fragmented landscapes. Natural Areas Journal 7, 2–13.
Oli MK, Dobson FS (2003). The relative importance of life-history variables to population growth rate in mammals: Cole’s prediction revisited. The American Naturalist 161, 422–40.
Pulliam HR (1988). Source, sinks and population regu-lation. The American Naturalist 132, 652–61.
Ralls K, Ballou JD, Templeton AR (1988). Estimates of lethal equivalents and the cost of inbreeding in mam-mals. Conservation Biology 2, 185–93.
Reed DH, O’Grady JJ, Brook BW, Ballou JD, Frankham R (2003). Estimates of minimum viable population sizes for vertebrates and factors influencing those es-timates. Biological Conservation 113, 23–34.
Ribeiro MC, Metzger JP, Martensen AC, Ponzoni FJ, Hirota MM (2009). The Brazilian Atlantic Forest: how much is left and how is the remaining forest dis-tributed? Implications for conservation. Biological Conservation 142, 1141–53.
Robinson JG, Redford KH (1986). Body size, diet and population density of Neotropical forest mammals. The American Naturalist 128, 665.
Robinson JG, Redford KH (1991). Sustainable harvest of Neotropical forest mammals. In: Robinson JG, Redford KH, eds. Neotropical Wildlife Use and Con-servation. University of Chicago Press, Chicago.
Ruggiero LF, Hayward GD, Squires JR (1994). Viability analysis in biological evaluations: concepts of PVA, biological population and ecological scale. Conserva-tion Biology 8, 364–72.
Schoener TW, Spiller A (1992). Is extinction rate related to temporal variability in population size? An empir-ical answer for orb spiders. The American Naturalist 139, 1176–207.
Simberloff D, Cox J (1987). Consequences and costs of conservation corridors. Conservation Biology 1, 63–71.

372
123456789
101112131415161718192021222324252627282930313233343536373839404142434445464748495051
E. P. Medici and A. L. J. Desbiez
© 2012 Wiley Publishing Asia Pty Ltd, ISZS and IOZ/CAS
Simberloff D, Farr JA, Cox J, Mehlman DW (1992). Movement corridors: conservation bargains or poor investments. Conservation Biology 6, 493–504.
SOS Mata Atlântica and INPE–Instituto Nacional de Pesquisas Espaciais (2008). Atlas dos Remanescen-tes Florestais da Mata Atlântica: Período 2000–2005. Relatório final. SOS Mata Atlântica & Instituto Na-cional de Pesquisas Espaciais, São José dos Campos, Brazil.
Soulé ME (1987). Viable Populations for Conservation. Cambridge University Press, NY, USA.
Souza-Mazurek RR, Pedrinho T, Feliciano X, Hilário W, Gerôncio S, Marcelo E (2000). Subsistence hunting
among the Waimiri Atroari Indians in Central Amazo-nia, Brazil. Biodiversity and Conservation 9, 579–96.
Trombulak S, Frissell CA (2000). Review of ecological effects of roads on terrestrial and aquatic communi-ties. Conservation Biology 14, 18–30.
Valladares-Padua CB, Padua SM, Cullen L (2002). Within and surrounding the Morro do Diabo State Park: biological value, conflicts, mitigation and sus-tainable development alternatives. Environmental Science & Policy 5, 69–78.
Wisdom MJ, Mills LS (1997). Sensitivity analysis to guide population recovery: prairie chickens as an ex-ample. Journal of Wildlife Management 61, 302–12.