Community Infrastructure Levy: Viability Study Final Report
148
Community Infrastructure Levy: Viability Study Final Report Warwick District Council June 2013
-
Upload
khangminh22 -
Category
Documents
-
view
0 -
download
0
Transcript of Community Infrastructure Levy: Viability Study Final Report

Community Infrastructure Levy:
Viability Study
Final Report
Warwick District Council
June 2013

ADL/130372 2
Contents 1 Executive Summary 3 2 Introduction 6 3 Methodology and appraisal inputs 12 4 Development appraisals 15 5 Appraisal outputs 28 6 Assessment of the results 32 7 Conclusions and recommendations 47
Appendices Appendix 1 - SHLAA sites Appendix 2 - Strategic sites details from SHLAA Appendix 3 - Residential appraisal results Appendix 4 - Strategic sites appraisal results Appendix 5 - Commercial appraisal results
Contact details: Anthony Lee MRTPI MRICS Senior Director – Development Consulting BNP Paribas Real Estate 5 Aldermanbury Square London EC2V 7BP Tel: 020 7338 4061 Fax: 020 7404 2028 Email: [email protected]

ADL/130372 3
1 Executive Summary 1.1 This report tests the ability of a range of development types (including a
sample of strategic sites) within Warwick District to yield contributions to infrastructure requirements through the Community Infrastructure Levy (‘CIL’). Levels of CIL have been tested in combination with the Council’s other planning requirements, including the provision of affordable housing.
Methodology
1.2 The study methodology compares the residual land values of a range of hypothetical developments and a sample of five strategic sites to a range of benchmark land values. If a development incorporating a given level of CIL generates a higher value than the benchmark land value, then it can be judged that the proposed level of CIL will be viable.
1.3 The study utilises the residual land value method of calculating the value of each development. This method is used by developers when determining how much to bid for land and involves calculating the value of the completed scheme and deducting development costs (construction, fees, finance and CIL) and developer’s profit. The residual amount is the sum left after these costs have been deducted from the value of the development, and guides a developer in determining an appropriate offer price for the site.
1.4 The housing and commercial property markets are inherently cyclical and the Council is testing its proposed rates of CIL at a time when values have fallen below their peak but have subsequently recovered to some degree. Despite this recovery, there is some uncertainty as to the likely short term trajectory of house prices. We have allowed for this by running a sensitivity analysis which decreases sales values by 5%, to enable the Council to take a view on the impact of any adverse movements in sales values in the short term. Our commercial appraisals incorporate sensitivity analyses on rent levels and yields.
Key findings
1.5 The key findings of the study are as follows:
■ The results of this study are reflective of current market conditions, which are likely to improve over the medium term. It is therefore important that the Council monitors the viability situation on a regular basis. Should substantial changes in market conditions occur, the Council may then consider it appropriate to undertake a review of its CIL rates1.
■ The ability of residential schemes to make CIL contributions varies
between different parts of the District. Having regard to the need to set rates that are not at the margins of viability, our appraisals indicate that the following levels of CIL should not adversely impact on viability of development and delivery of the plan as a whole:
■ Much of Leamington Spa and higher value rural areas: £180 per square metre (Zones B and D on the charging zones map);
■ Kenilworth: £120 per square metre (Zone C on the charging zones map);
1 The CIL regulations do not require charging authorities to publish specific dates or timescales for reviews of their charging schedules.

ADL/130372 4
■ Warwick, East Leamington Spa and lower value rural areas (Zone A on the charging zones map): £50 per square metre.
■ Our appraisals of strategic sites (i.e. larger sites that make up a significant
proportion of the Council’s housing supply and subsequently of strategic importance) reflect the likely scale of on-site infrastructure requirements. As a result of these requirements, strategic sites will not be able to absorb the same levels of CIL as other residential developments.
■ At current rent levels, Office development is unlikely to come forward in the short to medium term as the capital values generated are insufficient to cover development costs. We therefore recommend that the Council sets a nil rate for office development.
■ Our appraisals of developments of industrial and warehousing floorspace indicate that these uses are unlikely to generate positive residual land values. We therefore recommend a nil rate for industrial and warehousing floorspace.
■ Retail developments in Leamington Spa’s prime retail area generate sufficient surpluses to absorb a CIL of £65 per square metre , after allowing for a discount below the maximum rate.
■ Residual values generated by retail developments elsewhere are unlikely to be sufficiently high to absorb a CIL charge. In any case, is likely that a significant proportion of retail development will involve the re-use of existing retail space, so the differential in value between current and newly developed space is modest in areas where rents are low. We therefore recommend a nil rate on retail development outside the prime Leamington Spa area.
■ Superstores, supermarket and retail parks 2 are capable of generating greater surplus value and could absorb a CIL of £148 per square metre. After allowing for a discount below the maximum rate, we suggest a CIL of £105 per square metre.
■ D1 and D2 uses often do not generate sufficient income streams to cover their costs. Consequently, they require some form of subsidy to operate. This type of facility is very unlikely to be built by the private sector. We therefore suggest that a nil rate of CIL be set for D1 uses.
1.6 For residential schemes, the application of CIL of is unlikely to be an overriding factor in determining whether or not a scheme is viable. When considered in context of total scheme value, CIL will be a modest amount, typically accounting for less than 3% of value. Some schemes would be unviable even if a zero CIL were adopted. We therefore recommend that the Council pays limited regard to these schemes.
2 See definition in Table 1.6.1.

ADL/130372 5
Table 1.6.1: Suggested CIL rates for PDCS Type of development Zones B and D
Much of Leamington Spa and rural higher value
Zone C Kenilworth
Zone A Warwick, East Leamington Spa & rural lower value
Residential £170-£180 £120 £50
Strategic residential £90 - £110 £70 £30
Retail development – prime Leamington Spa £65 Nil Nil
Convenience based supermarkets3 and superstores and retail parks4
£105
Student housing £80
Hotels £100
Offices Nil
Industrial and warehousing Nil
D1 and D2 uses Nil
3 Superstores/supermarkets are shopping destinations in their own right where weekly food shopping needs are met and which can also include non-food floorspace as part of the overall mix of the unit. 4 Retail warehouses are large stores specialising in the sale of household goods (such as carpets, furniture and electrical goods), DIY items and other ranges of goods, catering for mainly car-borne customers.

ADL/130372 6
2 Introduction 2.1 This study has been commissioned to contribute towards an evidence base to
inform Warwick District Council’s (‘the Council’) CIL Charging Schedule (‘CS’), as required by Regulation 14 of the CIL Regulations April 2010 (as amended in 2011 and 2012). The aims of the study are summarised as follows:
■ to test the impact upon the economics of residential development of a range of levels of CIL;
■ for residential schemes, to test CIL alongside the Council’s requirements for 40% affordable housing on sites of 10 or more units within urban areas and on sites of 5 or more units in rural areas; as well as other planning obligations; and
■ to test the ability of commercial schemes to make a contribution towards infrastructure through CIL.
2.2 Our methodology, adopts a standard residual valuation approach to test the impact on viability of a range of levels of CIL. However, due to the extent and range of financial variables involved in residual valuations, they can only ever serve as a guide. Individual site characteristics (which are unique), mean that conclusions must always be tempered by a level of flexibility in application of policy requirements on a site by site basis. As CIL is fixed at the point of adoption, it is essential that levels of CIL are set so as to allow a sufficient margin to allow for these site specific variations.
Policy Context
2.3 The CIL regulations state that in setting a charge, local authorities must aim to strike “what appears to the Charging Authority to be an appropriate balance” between revenue maximisation on the one hand and the potentially adverse impact upon the viability of development on the other. The regulations also state that local authorities should take account of other sources of available funding for infrastructure when setting CIL rates. This report deals with viability only and does not consider other sources of funding.
2.4 The December 2012 Statutory Guidance places emphasis on setting rates of CIL that do not threaten “the ability to develop viably the sites and the scale of development identified in the Local Plan”. This guidance also suggests that charging authorities can treat major strategic sites as separate geographical zones “where it is supported by robust evidence on economic viability”.
2.5 Local authorities must consult relevant stakeholders on the nature and amount of any proposed CIL at two stages; after publication of the Preliminary Draft Charging Schedule (‘PDCS’) and the Draft Charging Schedule (‘DCS’). Following consultation, a charging schedule must be submitted for independent examination.
2.6 The regulations allow a number of reliefs and exemptions from CIL. Firstly, affordable housing and buildings with other charitable uses (if controlled by a charity) are subject to relief. Secondly, local authorities may, if they choose, elect to offer an exemption on proven viability grounds. The exemption would be available for 12 months, after which time viability of the scheme concerned would need to be reviewed. To be eligible for exemption, regulation 55 states that the Applicant must enter into a Section 106 agreement (and the costs of complying with the agreement must exceed the amount of CIL that would have been payable); and that the Authority must be satisfied that granting relief would not constitute state aid.

ADL/130372 7
2.7 The CIL regulations enable local authorities to set differential rates (including zero rates) for different zones within which development would take place and also for different types of development. However, there continues to be some debate as to whether the regulations permit charging authorities to levy different rates of CIL on different types of development within the same planning use class5. The December 2012 Statutory Guidance indicates that this is permissible.
2.8 The 2010 regulations set out clear timescales for payment of CIL, which varied according to the size of the payment, which by implication is linked to the size of the scheme. The 2011 amendments to the regulations allow local authorities to set their own timescales for the payment of CIL if they choose to do so. This is an important issue that the Council will need to consider, as the timing of payment of CIL can have an impact on an Applicant’s cashflow (the earlier the payment of CIL, the more interest the Applicant will bear before the development is completed and sold).
2.9 Several local authorities have undertaken viability assessments and have drafted CIL charging schedules, which they have submitted for independent examination. To date, a number of charging authorities (including inter-alia the Mayor of London, Portsmouth, Newark and Sherwood, Huntingdonshire, Wandsworth, Shropshire, Bristol, Poole, Brent, Barnet, Havant and Redbridge) have been through the examination process and have either adopted or are at various stages of implementation.
Economic and housing market context
2.10 The historic highs achieved in the UK housing market by mid 2007 followed a prolonged period of real house price growth. However, a period of ‘readjustment’ began in the second half of 2007, triggered initially by rising interest rates and the emergence of the US sub prime lending problems in the last quarter of 2007. The subsequent reduction in inter-bank lending led to a general “credit crunch” including a tightening of mortgage availability. The real crisis of confidence, however, followed the collapse of Lehman Brothers in September 2008, which forced the government and the Bank of England to intervene in the market to relieve a liquidity crisis.
2.11 The combination of successive shocks to consumer confidence and the difficulties in obtaining finance led to a sharp reduction in transactions and a significant correction in house prices in the UK, which fell to a level some 21% lower than at their peak in August 2007 according to the Halifax House Price Index. Consequently, residential land values fell by some 50% from peak levels. One element of government intervention involved successive interest rate cuts and as the cost of servicing many people’s mortgages is linked to the base rate, this financial burden has progressively eased for those still in employment. This, together with a return to economic growth early 2010 (see May 2012 Bank of England GDP fan chart below, showing the range of the Bank’s predictions for GDP growth to 2015) has meant that consumer confidence has started to improve to some extent.
5 At Borough of Poole’s CIL examination, Sainsbury’s argued that the CIL regulations do not permit authorities to charge different rates on different types of retail, even if viability differences have been demonstrated.

ADL/130372 8
Source: Bank of England
2.12 Throughout the first half of 2010 there were some tentative indications that improved consumer confidence was feeding through into more positive interest from potential house purchasers. Against the background of a much reduced supply of new housing, this would lead one to expect some recovery in prices. However it is evident that this brief resurgence has abated, with the Halifax House Price Indices showing a fall of 0.6% in the year to March 2012. The Halifax attributes at least some of the recent recovery in sales values to first time buyers seeking to purchase prior to the reintroduction of Stamp Duty from 1 April 2012.
2.13 The balance of opinion is that house prices will remain flat in the short term, with continuing high levels of unemployment likely to result in increased repossessions and increased supply of homes into the market. At the same time, demand is expected to remain subdued, due to the continuing difficulties consumers face in securing mortgages.
Figure 2.12.1: House prices in Warwickshire
Source: Land Registry

ADL/130372 9
Figure 2.12.2: Sales volumes in Warwickshire
Source: Land Registry
2.14 According to Land Registry data, residential sales values in Warwickshire have recovered since the lowest point in the cycle in April 2009. Prices increased by 9.6% between May 2009 and October 2010, but fell back by 3.9% in the period to March 2011. Between April 2011 and December 2012, sales values increased modestly by 1.6%. In December 2012, sales values remained 11.3% below their January 2008 peak value.
2.15 The future trajectory of house prices is currently uncertain, although Savills’ current prediction is that values are expected to increase over the next five years. Medium term predictions are that properties in mainstream West Midlands markets will grow over the period between 2013 to 20176. Savills predict that values in mainstream West Midlands markets (i.e. non-prime) will remain unchanged in 2013, increase by 0.5% in 2014, 1% in 2015, 3% in 2016 and 3% in 2017. This equates to cumulative growth of 7.5% between 2013-2017 inclusive, compared to a UK average of 11.5% cumulative growth over the same period.
Local Policy context – affordable housing
2.16 In addition to financing infrastructure, the Council expects residential developments to provide a mix of affordable housing tenures, sizes and types to help meet identified housing needs. The Council’s Local Plan – Preferred Options document Policy PO5 states its intention to secure 40% of new homes on schemes of 10 or more dwellings in urban areas and 5 or more dwellings in rural areas.
2.17 The Local Plan – Preferred Options document does not specify a tenure mix of the affordable housing. For modelling purposes, we have assumed a mix that reflects that adopted Local Plan requirement of 80% rented housing and 20% intermediate housing.
Development context
2.18 The District is a predominantly rural area, with three main settlements (Warwick and Royal Leamington Spa to the south and Kenilworth to the north. The District is adjacent to Coventry to the northern boundary. Developments in Warwick District range from small in-fill sites in rural areas to urban
6 Savills Research: Residential Property Focus, November 2012
ADL/130372 10
extensions attached mainly to the three main settlements and to Coventry across the District’s boundary.
2.19 The District is dissected to the south by the M40, which provides road access via junction 15 to Birmingham and London. The A46 provides access into Coventry.
2.20 The Council’s Strategic Housing Land Availability Assessment (‘SHLAA’) indicates that most new development will be located in urban extensions adjacent to the three main urban centres within the District, and adjacent to Coventry across the District boundary. The Local Plan – Preferred Options document indicates that the Council will allocate land for 8,300 new homes and circa 25 hectares of employment land. The Council’s preferred options are being changed in the Revised Development Strategy which is being issued for consultation in summer 2013. This suggests a total of 12,300 new homes between 2011 and 2029. The Council expects circa 7,000 of the houses to be on newly allocated sites (including proposals for circa 1,000 houses in villages), with the balance being from completions, commitments and windfalls. At present, there are no proposals for sites adjacent to Coventry.
2.21 The Local Plan – Preferred Options document does not stipulate a particular density of development. However, viability work undertaken for the Council7 in 2011 indicates that development will come forward at a density of 25 to 33 units per hectare in rural areas and between 30 to 40 units per hectare in suburban areas. In town centres, a higher density of 65 units per hectare is anticipated.
2.22 Residential sales values for new developments vary significantly between different parts of Warwick District. Our research indicates that there are higher values in some of the rural settlements (e.g. Barford, Norton Lindsey and Shrewley) than in the main settlements of Warwick, Leamington Spa and Kenilworth. Among the three main settlements, properties in Leamington Spa attract higher average sales values than Warwick and Kenilworth.
2.23 The District’s main employment centre is at Leamington Spa, with some companies located in Warwick. Employers in the District include financial and business services companies, such as Merrill Lynch, Millward Brown and IBM. The University of Warwick is also a major employer in the District.
2.24 The retail market in Leamington Spa is understood to be performing reasonably well, with higher levels of expenditure on comparison goods than average retail centres and lower vacancy rates than average levels. The retail offer includes House of Fraser and two Marks and Spencer stores.
Sites in the Strategic Housing Land Availability As sessment
2.25 The Council’s SHLAA identifies potential sites for development of new housing over the plan period. The sites are, in the main, urban extensions to the three main settlements and extensions adjacent to Coventry, which lies adjacent to the Council’s northern boundary.
2.26 The sites are predominantly greenfield, with very few readily identifiable opportunities for intensification of previously developed land. However, since the Preferred Options was published, the Council is developing a proactive approach to brownfield sites, which is shifting the emphasis slightly. The bulk of housing will, however, come from greenfield sites.
2.27 The SHLAA identifies some substantial urban extensions, including the
7 DTZ ‘Affordable Housing Viability Assessment’ November 2011

ADL/130372 11
following examples, which we appraise as part of this viability study:
■ L09 Land at Grove Farm (extension to Leamington Spa); ■ L48 Land at Blackdown (extension to Leamington Spa); ■ W26 Gallows Hill/ Europa Way (extension to Warwick); ■ K17 Southcrest Farm, Glasshouse Lane (extension to Kenilworth); ■ C13 Lodge Farm Westwood Heath (extension to Coventry).

ADL/130372 12
3 Methodology and appraisal inputs 3.1 Our methodology follows standard development appraisal conventions, using
assumptions that reflect local market and planning policy circumstances. The study is therefore specific to Warwick District and reflects the Council’s planning policy requirements.
Approach to testing development viability
3.2 Appraisal models can be summarised via the following diagram. The total scheme value is calculated, as represented by the left hand bar. This includes the sales receipts from the private housing and the payment from a Registered Social Landlord (‘RSL’) for the completed affordable housing units. The model then deducts the build costs, fees, interest, CIL (at varying levels) and developer’s profit. A ‘residual’ amount is left after all these costs are deducted – this is the land value that the Developer would pay to the landowner. The residual land value is represented by the brown portion of the right hand bar in the diagram.
£0
£10
£20
£30
£40
£50
£60
£70
£80
£90
£100
Scheme value Costs
Mill
ions
Land value
CIL
Interest
Fees
Profit
Build
3.3 The Residual Land Value is normally a key variable in determining whether a scheme will proceed. If a proposal generates sufficient positive land value (in excess of current use value), it will be implemented. If not, the proposal will not go ahead, unless there are alternative funding sources to bridge the ‘gap’.
3.4 Ultimately, the landowner will make a decision on implementing a project on the basis of return and the potential for market change, and whether alternative developments might yield a higher value. The landowner’s ‘bottom line’ will be achieving a residual land value that sufficiently exceeds ‘existing use value’ or another appropriate benchmark to make development worthwhile. The margin above current use value may be considerably different on individual sites, where there might be particular reasons why the premium to the landowner should be lower or higher than other sites.

ADL/130372 13
3.5 Clearly, however, landowners have expectations of the value of their land which often exceed the value of the current use. CIL will be a cost to the scheme and will impact on the residual land value. Ultimately, if landowners’ expectations are not met, they will not voluntarily sell their land and (unless a Local Authority is prepared to use its compulsory purchase powers) some may simply hold on to their sites, in the hope that policy may change at some future point with reduced requirements. It is within the scope of those expectations that developers have to formulate their offers for sites. The task of formulating an offer for a site is complicated further still during buoyant land markets, where developers have to compete with other developers to secure a site, often speculating on increases in value.
Viability benchmark
3.6 The CIL Regulations provide no specific guidance on how local authorities should test the viability of their proposed charges. However, there is a range of good practice generated by both the Homes and Communities Agency and appeal decisions that assist in guiding planning authorities on how they should approach viability testing for planning policy purposes.
3.7 In 2009, the Homes and Communities Agency published a good practice guidance manual ‘Investment and Planning Obligations: Responding to the Downturn’. This defines viability as follows: “a viable development will support a residual land value at level sufficiently above the site’s existing use value8 (EUV) or alternative use value (AUV) to support a land acquisition price acceptable to the landowner”.
3.8 A number of planning appeal decisions provide guidance on the extent to which the residual land value should exceed existing use value to be considered viable: Barnet & Chase Farm: APP/Q5300/A/07/2043798/NWF “the appropriate test is that the value generated by the scheme should exceed the value of the site in its current use. The logic is that, if the converse were the case, then sites would not come forward for development” Bath Road, Bristol: APP/P0119/A/08/2069226 “The difference between the RLV and the existing site value provides a basis for ascertaining the viability of contributing towards affordable housing.” Beckenham: APP/G5180/A/08/2084559 “without an affordable housing contribution, the scheme will only yield less than 12% above the existing use value, 8% below the generally accepted margin necessary to induce such development to proceed.” Oxford Street, Woodstock: APP/D3125/A/09/2104658 “The main parties’ valuations of the current existing value of the land are not dissimilar but the Appellant has sought to add a 10% premium. Though the site is owned by the Appellants it must be assumed, for valuation purposes, that the land is being acquired now. It is unreasonable to assume that an existing owner and user of the land would not require a premium over the actual value of the land to offset inconvenience and assist with relocation. The Appellants addition of the 10% premium is not unreasonable in these circumstances.”
8 This term should not be confused with the RICS Red Book definition. Existing Use Value in this context is taken to mean the value of the site in its current use, disregarding opportunities for redevelopment of the site for other uses.
ADL/130372 14
3.9 The guidance issued by the Local Housing Delivery Group9 (‘LHDG’) on 22 June 2012 advocates the use of current use value plus an appropriate premium as a benchmark for testing CIL and local plan policy requirements.
3.10 It is clear from the LHDG guidance, planning appeal decisions and HCA good practice publication that the most appropriate test of viability for planning policy purposes is to consider the residual value of schemes compared to the existing or current use value plus a premium. As discussed later in this report, our study adopts a range of benchmark land values, reflecting differing circumstances in which sites are brought forward.
3.11 The recent examination on the Mayor of London’s CIL charging schedule considered the issue of an appropriate land value benchmark. The Mayor had adopted existing use value, while certain objectors suggested that ‘Market Value’ was a more appropriate benchmark. The Examiner concluded that:
“The market value approach…. while offering certainty on the price paid for a development site, suffers from being based on prices agreed in an historic policy context.” (para 8) and that “I don’t believe that the EUV approach can be accurately described as fundamentally flawed or that this examination should be adjourned to allow work based on the market approach to be done” (para 9).
3.12 In his concluding remark, the Examiner points out that “the price paid for development land may be reduced [so that CIL may be accommodated]. As with profit levels there may be cries that this is unrealistic, but a reduction in development land value is an inherent part of the CIL concept. It may be argued that such a reduction may be all very well in the medium to long term but it is impossible in the short term because of the price already paid/agreed for development land. The difficulty with that argument is that if accepted the prospect of raising funds for infrastructure would be forever receding into the future. In any event in some instances it may be possible for contracts and options to be re-negotiated in the light of the changed circumstances arising from the imposition of CIL charges. (para 32 – emphasis added).
3.13 It is important to stress, however, that there is no single threshold land value at which land will come forward for development. The decision to bring land forward will depend on the type of owner and, in particular, whether the owner occupies the site or holds it as an asset; the strength of demand for the site’s current use in comparison to others; how offers received compare to the owner’s perception of the value of the site, which in turn is influenced by prices achieved by other sites. Given the lack of a single threshold land value, it is difficult for policy makers to determine the minimum land value that sites should achieve. This will ultimately be a matter of judgement for each individual Charging Authority.
3.14 The issue of an appropriate benchmark land value is more complex in regards to greenfield/agricultural sites, where the current use value is low (typically circa £21,000 per hectare) and the uplift arising from planning permission can be very high. An element of judgement is required as to the uplift required, but it will typically be a multiple of the current use value (e.g. ten times current use value).
9 This group was led by the Homes and Communities Agency and comprises representatives from the National Home Builders Federation, the Royal Town Planning Institute, local authorities and valuers (including BNP Paribas Real Estate).

ADL/130372 15
4 Development appraisals Residential development
4.1 We have appraised a series of hypothetical developments, reflecting both the range of sales values/capital values and also sizes/types of development and densities of development across the District. In addition, we have appraised five strategic sites contained with the Strategic Housing Land Availability Assessment The inputs to the appraisals are based on research on the local housing market and data from other identified sources.
Residential sales values
4.2 Residential values in the area reflect national trends in recent years but do of course vary between different sub-markets. We have considered comparable evidence of transacted properties in the area and also properties on the market to establish appropriate values for testing purposes. We have also had regard to the values identified in the Council’s 2011 Affordable Housing Viability Assessment, which broadly accords with the findings our own research. This exercise indicates that developments in the District will attract average sales values ranging from circa £214 per sq ft (£2,307 per square metre) to £295 per sq ft (£3,180 per square metre).
4.3 We have applied the following average sales values in our appraisals, reflecting the range above (see Table 4.4.3).
Table 4.4.3: Average sales values used in appraisal s
Area Average values £s per sq m
Average values £s per sq ft
Warwick and East Leamington Spa
£2,307 £214
Most of Leamington Spa £2,981 £277
Kenilworth £2,691 £250
Rural areas (higher value – Rowington, Leek Wootton, Ashow, Hunningham, Cubbington, Norton Lindsey, Shrewley, Bishop’s Tachbrook)
£3,180 £295
Rural areas (lower values)
£2,449 £228
4.4 As noted earlier in the report, Savills predict that sales values will increase over the medium term. However, as this growth cannot be relied upon, we recommend that the Council considers appropriate CIL rates based on current values only.
Affordable housing tenure and values
4.5 The Council’s policy position is set out in Core Strategy – Preferred Options document. Affordable housing is required on sites within built up areas of 10 or more units; and on sites in rural areas of 5 or more units. 40% of units should be provided as affordable housing. The tenure split of the affordable
ADL/130372 16
housing requires the provision of 80% social rented housing and 20% intermediate housing, with the exact split determined to reflect individual site circumstances and local need.
4.6 For modelling purposes, we have assumed that 40% of units on qualifying sizes of development are provided as affordable housing, with a tenure split of 80% rented housing and 20% intermediate.
4.7 The Council’s Joint Tenancy Strategy sets out the Council’s position with regards to rent levels. Registered Providers are expected to set rents for Affordable Rent properties so that they do not exceed 60% of market rents. For modelling purposes, we have adopted a worst case scenario and assumed that all the rented housing is provided at Target Rents.
4.8 The CLG/HCA ‘2011-2015 Affordable Homes Programme – Framework’ (February 2011) document clearly states that RSLs will not receive grant funding for any affordable housing provided through planning obligations. Consequently, all our appraisals assume nil grant. We recommend that the Council revisits this assumption when it next reviews its charging schedule, by which time a new funding programme may have been introduced by central government.
4.9 For shared ownership units, we have assumed that RSLs will sell 40% initial equity stakes and charge a rent of 2.75% on the retained equity, capitalised at 5%.
Residential development types, density and mix
4.10 We have run appraisals using the range of densities that are typically encountered in the District. We have had regard to the density of development indicated by the Council’s Local Plan – Preferred Options document. For modelling purposes, we have assumed densities ranging from (30 to 60 dwellings per hectare), although we note that the Council considers it unlikely that densities as high as 60 dwellings per hectare will be achieved.
4.11 Table 4.11.1 summarises the different development typologies selected for testing purposes. These are intended to reflect the range of developments across the District. Table 4.11.2 summaries the unit mix we have assumed for each of the development typologies.

ADL/130372 17
Table 4.11.1: Development typologies
Number of units
Housing type Location type
Development density units per ha
Site area (ha)10
1 4 100% houses Greenfield 35 0.17
2 8 100% houses Urban 35 0.23
3 25 90% houses 10% flats Greenfield 35 1.06
4 35 90% houses 10% flats Greenfield 30 1.74
5 50 50% houses 50% flats Urban 50 1.00
6 65 60% houses 40% flats Urban 40 1.63
7 75 100% houses Greenfield 20 5.60
8 75 100% houses Greenfield 35 3.20
9 100 100% flats Urban 60 1.67
Table 4.11.2: Unit mix
1B flat 2B flat 3B flat 2B house
3B house
4B house
1 - - - 30% 50% 20%
2 - - - 40% 45% 15%
3 5% 5% - 36% 42% 12%
4 7% 3% - 38% 42% 10%
5 20% 22% 7% 20% 23% 8%
6 16% 18% 6% 24% 27% 9%
7 - - - 20% 40% 40%
8 - - - 40% 40% 20%
9 40% 40% 20% - - -
Residential build costs
4.12 We have sourced build costs for the residential schemes from the RICS Building Cost Information Service (BCIS), which is based on tenders for actual schemes. However, adjustments to the base costs are necessary to reflect other factors which are not included in BCIS (external works and sustainability requirements). In addition to the build costs outlined below, our appraisals include a contingency of 5% of build costs. Our approach is set out in the following paragraphs.
4.13 Houses: we have used the mean average BCIS ‘Estate housing – generally’ cost, adjusted for Warwick, which is currently £831 per square metre. In addition to this base cost, we have included an allowance which equates to an
10 The Council’s SHLAA assumes that on sites of 10 or more hectares, 50% of the site will be developable for housing, with the remaining space used for supporting facilities (e.g. open space). For sites of less than 10 units, the SHLAA assumes that 67% of the site will be developable for residential. In urban areas, 100% of site is considered as developable area.
ADL/130372 18
additional 15% of the base cost for external works.
4.14 Although Code for Sustainable Homes level 4 is not presently mandatory across all tenures, we have incorporated a 6% allowance for this as the standard will become mandatory for affordable housing in 2013. The standard will be applied to private housing shortly afterwards.
4.15 Flats: we have used the mean average BCIS ‘Flats – generally’ cost, adjusted for Warwick, which is currently £953 per square metre. In addition to this base cost, we have included an allowance which equates to an additional 15% of the base cost for external works. Our appraisal assumes a gross to net ratio of 85% for flats.
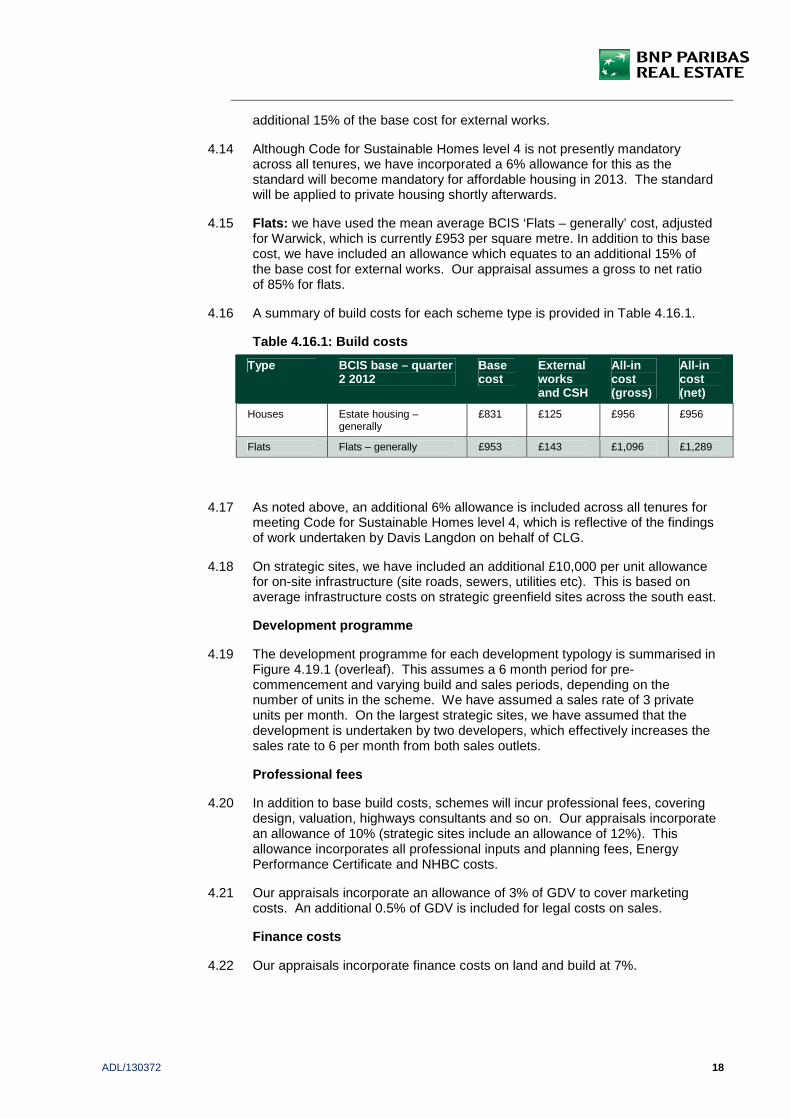
4.16 A summary of build costs for each scheme type is provided in Table 4.16.1.
Table 4.16.1: Build costs
4.17 As noted above, an additional 6% allowance is included across all tenures for meeting Code for Sustainable Homes level 4, which is reflective of the findings of work undertaken by Davis Langdon on behalf of CLG.
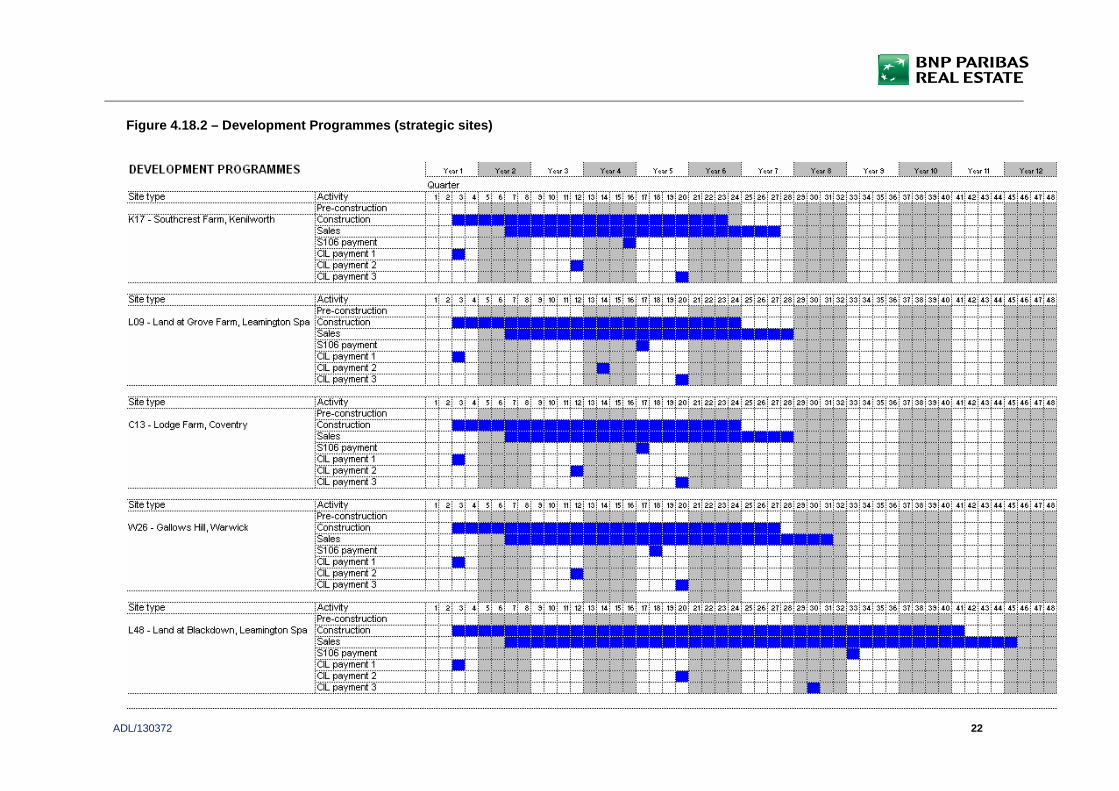
4.18 On strategic sites, we have included an additional £10,000 per unit allowance for on-site infrastructure (site roads, sewers, utilities etc). This is based on average infrastructure costs on strategic greenfield sites across the south east.
Development programme
4.19 The development programme for each development typology is summarised in Figure 4.19.1 (overleaf). This assumes a 6 month period for pre-commencement and varying build and sales periods, depending on the number of units in the scheme. We have assumed a sales rate of 3 private units per month. On the largest strategic sites, we have assumed that the development is undertaken by two developers, which effectively increases the sales rate to 6 per month from both sales outlets.
Professional fees
4.20 In addition to base build costs, schemes will incur professional fees, covering design, valuation, highways consultants and so on. Our appraisals incorporate an allowance of 10% (strategic sites include an allowance of 12%). This allowance incorporates all professional inputs and planning fees, Energy Performance Certificate and NHBC costs.
4.21 Our appraisals incorporate an allowance of 3% of GDV to cover marketing costs. An additional 0.5% of GDV is included for legal costs on sales.
Finance costs
4.22 Our appraisals incorporate finance costs on land and build at 7%.
Type BCIS base – quarter 2 2012
Base cost
External works and CSH
All-in cost (gross)
All-in cost (net)
Houses Estate housing – generally
£831 £125 £956 £956
Flats Flats – generally £953 £143 £1,096 £1,289

ADL/130372 19
Stamp duty and acquisition costs
4.23 We include stamp duty at 4% of land costs, agents fees of 1% and legal fees on acquisition of 0.8%.
Section 278 and residual Section 106 costs
4.24 Our appraisals incorporate an allowance of £1,500 per unit to address any Section 278 and residual Section 106 costs. This is an estimate only and actual sums sought will vary according to site specific circumstances.
4.25 On strategic sites, we have assumed a higher allowance of £10,000 per unit to reflect the costs of on-site infrastructure that will typically be sought by the Council. This is an estimate only and the actual amount sought on application schemes will be determined by specific needs and through negotiation between the Council and the Applicant.
Developer’s profit
4.26 Developer’s profit is closely correlated with the perceived risk of residential development. The greater the risk, the greater the required profit level, which helps to mitigate against the risk, but also to ensure that the potential rewards are sufficiently attractive for a bank and other equity providers to fund a scheme. In 2007, profit levels were at around 15% of GDV. However, following the impact of the credit crunch and the collapse in interbank lending and the various government bailouts of the banking sector, profit margins have increased. It is important to emphasise that the level of minimum profit is not necessarily determined by developers (although they will have their own view and the Boards of the major housebuilders will set targets for minimum profit).
4.27 The views of the banks which fund development are more important; if the banks decline an application by a developer to borrow to fund a development, it is very unlikely to proceed, as developers rarely carry sufficient cash to fund it themselves. Consequently, future movements in profit levels will largely be determined by the attitudes of the banks towards development proposals.
4.28 The near collapse of the global banking system in the final quarter of 2008 is resulting in a much tighter regulatory system, with UK banks having to take a much more cautious approach to all lending. In this context, and against the backdrop of the current sovereign debt crisis in the Eurozone, the banks may not allow profit levels to decrease much lower than their current level of 20%.
4.29 Our assumed return on the affordable housing GDV is 6%. A lower return on the affordable housing is appropriate as there is very limited sales risk on these units for the developer; there is often a pre-sale of the units to an RSL prior to commencement. Any risk associated with take up of intermediate housing is borne by the acquiring RSL, not by the developer. A reduced profit level on the affordable housing reflects the GLA ‘Development Control Toolkit’ guidance and Homes and Communities Agency’s guidelines in its Economic Appraisal Tool.

ADL/130372 20
Figure 4.18.1 – Development Programmes (smaller sch emes)
Note: GF = Greenfield, UB = Urban

ADL/130372 21
ADL/130372 22
Figure 4.18.2 – Development Programmes (strategic s ites)

ADL/130372 23
Benchmark land values for the residential analysis
4.30 Benchmark land values, based on the current use value or alternative use value of sites are key considerations in the assessment of development economics for testing planning policies and tariffs. Clearly, there is a point where the Residual Land Value (what the landowner receives from a developer) that results from a scheme may be less than the land’s current use value. Current use values can vary significantly, depending on the demand for the type of building relative to other areas. Similarly, subject to planning permission, the potential development site may be capable of being used in different ways – as a hotel rather than residential for example; or at least a different mix of uses. Current use value or alternative use value are effectively the ‘bottom line’ in a financial sense and therefore a key factor in this study.
4.31 We have arrived at a broad judgement on the likely range of benchmark land values. On previously developed sites, the calculations assume that the landowner has made a judgement that the current use does not yield an optimum use of the site; for example, it has fewer storeys than neighbouring buildings; or there is a general lack of demand for the type of space, resulting in low rentals, high yields and high vacancies (or in some cases no occupation at all over a lengthy period). We would not expect a building which makes optimum use of a site and that is attracting a reasonable rent to come forward for development, as residual value may not exceed current use value in these circumstances.
4.32 Redevelopment proposals that generate residual land values below current use values are unlikely to be delivered. While any such thresholds are only a guide in ‘normal’ development circumstances, it does not imply that individual landowners, in particular financial circumstances, will not bring sites forward at a lower return or indeed require a higher return. If proven current use value justifies a higher benchmark than those assumed, then appropriate adjustments may be necessary. As such, current use values should be regarded as benchmarks rather than definitive fixed variables on a site by site basis.
4.33 The benchmark land values used in this study have been selected to provide a broad indication of likely land values across the District, having regard to the predominant types of sites in the Strategic Housing Land Availability Assessment. It is important to recognise that other site uses and values may exist on the ground. There can never be a single threshold land value at which we can say definitively that land will come forward for development, especially in urban areas.
4.34 It is also necessary to recognise that a landowner will require an additional incentive to release the site for development11. The premium above current use value would be reflective of specific site circumstances (the primary factors being the occupancy level and strength of demand from alternative occupiers). For policy testing purposes it is not possible to reflect the circumstances of each individual site, so a blanket assumption of a 20% premium has been adopted to reflect the ‘average’ situation.
4.35 The majority of new housing supply will be on greenfield sites, which has a very low existing use value. However, it is recognised that landowners of
11 This approach is therefore consistent with the National Planning Policy Framework, which indicates that development should provide “competitive returns” to landowners. A 20% return above current use value is a competitive return when compared to other forms of investment.
ADL/130372 24
greenfield sites have expectations that exceed current values and adding a percentage premium is unlikely to provide a sufficient land value.
Benchmark land values
4.36 A majority of land identified for development in the District is greenfield, with some development in urban areas expected to come forward on former community buildings, car parks and former employment land. Our appraisals compare the value of each scheme to four benchmark land values. These benchmark land value are indicative of the ‘threshold values’ which will be required for land to be released for development.
4.37 Land values will inevitably vary, depending on their location and their existing use, as outlined in the preceding sections. Some sites will be in commercial use and will have a higher value than greenfield sites. This is recognised in the Council’s 2011 Affordable Housing Viability Assessment, which adopts a ‘threshold land value’ of £1.05 million per hectare, using an average of alternative uses. We have taken this as the highest benchmark. Other sites will have lower values, such as those owned by the Council or are in use as community facilities.
4.38 Values for greenfield sites are considerably lower if they are currently used as agricultural land; typically £20 - £22,000 per hectare. Landowners are unlikely, however, to trade their land for development at these values. The extent of ‘uplift’ required is often a matter of debate and has been considered by CLG research on land values. This research indicates a range of £247,000 to £371,000 per hectare12. The four benchmark land values used in our appraisals are as follows:
■ Commercial sites (AHVA benchmark): £1.05 million per hectare;
■ Former community sites: £0.5 million per hectare;
■ Greenfield (CLG high end of range): £0.37 million per hectare;
■ Greenfield (CLG lower end of range): £0.25 million per hectare.
4.39 Land values are not fixed and can (and should) flex to accommodate planning requirements. We would draw readers’ attention to the comments on land values in Examiner’s report on the Mayor of London’s CIL13, which indicates that owners will need to adjust their expectations to accommodate allowances for infrastructure.
Commercial development
4.40 We have appraised a series of hypothetical commercial developments, reflecting a range of use classes at average rent levels achieved on lettings of commercial space in actual developments. In each case, our assessment assumes an intensification of the existing use on the site, based on the same type of commercial development. In each case, the existing use value assumes that the existing building is no more than half the size of the new development, with a lower rent and higher yield reflecting the secondary
12 CLG ‘Cumulative impacts of regulations on house builders and landowners Research paper’ 2011 13 Para 32: “the price paid for development land may be reduced…. a reduction in development land value is an inherent part of the CIL concept…. in some instances it may be possible for contracts and options to be re-negotiated in the light of the changed circumstances arising from the imposition of CIL charges.”

ADL/130372 25
nature of the existing building.
Commercial rents and yields
4.41 Our research on lettings of commercial floorspace indicates a range of rents achieved, as summarised in table 4.40.1. This table also includes our assumptions on appropriate yields to arrive at a capital value of the commercial space. There does not appear to have been substantial development of new retail, offices and industrial/warehousing floorspace over the past few years and given the UK’s current macro-economic conditions, we would not anticipate substantial amounts of commercial development in the short term. The rents and yields adopted in our appraisals are summarised in Table 4.40.1.
4.42 Our appraisals of commercial floorspace test the viability of developments on existing commercial sites. For these developments, we have assumed that the site currently accommodates the same use class and the development involves intensification of that use. We have assumed lower rents and higher yields for existing space than the planned new floorspace. This reflects the lower quality and lower demand for second hand space, as well as the poorer covenant strength of the likely occupier of second hand space. A modest refurbishment cost of is allowed for to reflect costs that would be incurred to secure a letting of the existing space. A 20% landowner premium is added to the resulting existing use value as an incentive for the site to come forward for development. The actual premium would vary between sites, and be determined by site-specific circumstances, so the 20% premium has been adopted as a ‘top of range’ scenario for testing purposes.
Commercial build costs
4.43 We have sourced build costs for the commercial schemes from the RICS Building Cost Information Service (BCIS), which is based on tenders for actual schemes. These costs vary between different uses and exclude external works and fees (our appraisals include separate allowances for these costs). Costs for each type of development are shown in Table 4.40.1.
Profit
4.44 In common with residential schemes, commercial schemes need to show a risk adjusted profit to secure funding. Profit levels are typically around 20% of developments costs and we have incorporated this assumption into our appraisals.

ADL/130372 26
Table 4.40.1: Commercial appraisal assumptions for each use
Appraisal input Source/Commentary Hotels Offices (Prime
Warwick)
Industrial and warehouses
Retail –Prime Leamington
Retail - elsewhere
Retail – super-stores, retail parks
Student housing
Total floor area (sq ft) Hypothetical scheme 22,500 30,000 30,000 3,000 3,000 30,000 150,195
Rent (£s per sq ft) Based on average lettings sourced from EGI and Focus
Cap val £82k per
room £15 £5.50 £46 £25 £25
£120 pw 29 wk term
Rent free/void period (years)
BNPPRE assumption 2 2 2 1 1 1 n/a
Yield BNPPRE prime yield schedule 6%
Purchaser’s costs (% of GDV)
Stamp duty 4%, plus agent’s and legal fees 5.75% 5.75% 5.75% 5.75% 5.75% 5.75% 5.75%
Demolition costs (£s per sq ft of existing space)
Based on experience from individual schemes £5 £5 £5 £5 £5 £5 £5
Gross to net (net as % of gross)
Based on experience from individual schemes
75% 82£ 90% 82% 82% 82% 75%
Base construction costs (£s per sq ft)
BCIS costs. Offices – ‘generally’ for air conditioned offices with adjustment for quality. ‘Generally’ figure for industrial, supermarkets and retail.
£135 £160 £50 £150 £150 £97 £125
External works (% of build costs)
BNPPRE assumption 10% 10% 10% 10% 10% 20% 10%
Contingency (% of build costs)
BNPPRE assumption 5% 5% 5% 5% 5% 5% 5%
Letting agent’s fee (% of first year’s rent) 10% 10% 10% 10% 10% 10% 10%
Agent’s fees and legal fees
(% of capital value) 1% 1% 1% 1% 1% 1% 1%
Interest rate BNPPRE assumption 7% 7% 7% 7% 7% 7% 7%
Professional fees (% of build)
BNPPRE assumption, relates to complexity of scheme
10% 10% 10% 10% 10% 10% 10%
Profit (% of costs) BNPPRE assumption based on schemes submitted for planning
20% 20% 20% 20% 20% 20% 20%

ADL/130372 27
Table 4.40.1 (continued) Commercial appraisal assum ptions for each use – existing uses
Appraisal input Source/Commentary Hotels Offices (Prime
Warwick)
Industrial and warehouses
Retail –Prime Leamington
Retail - elsewhere
Retail – super-stores, retail parks
Student housing
Existing floorspace (sq ft)
Assumed to be between 25% to 50% of new space
11,250 9,000 15,000 1,500 1,500 15,000 45,000
Rent on existing floorspace
Reflects poor quality second hand space of same use, low optimisation of site etc and ripe for redevelopment
£19 - £21 £5 - £10 £3.50 - £5 £33 - £34 £12 - £22 £17 - £18 £7
Yield on existing floorspace
BNPPRE assumption, reflecting lower covenant strength of potential tenants, poor quality building etc
7% 8% - 8.5% 9% - 10% 6% 6.5% - 7% 7% 8.5%
Rent free on existing space
Years 2 3 3 1.5 1.5 1.5 3
Refurbishment costs (£s per sq ft)
General allowance for bringing existing space up to lettable standard £50 £30 £30 £50 £50 £50 £50
Fees on refurbishment (% of refurb cost)
BNPPRE assumption 7% 7% 7% 7% 7% 7% 7%
Landowner premium BNPPRE assumption – in reality the premium is likely to be lower, therefore this is a conservative assumption
20% 15 - 20% 15% 20% 20% 20% 20%

ADL/130372 28
5 Appraisal outputs Residential appraisals
5.1 The full outputs from our appraisals of residential development are attached as Appendix 3 (smaller sites) and Appendix 4 (strategic sites). We have modelled nine hypothetical site types, reflecting different densities and types of development, which are tested in the six broad housing market areas identified in Section 4 and against the typical land value benchmarks for the District. The development typologies are summarised in table 5.1.1 below.
Table 5.1.1: Development typologies
Number of units
Housing type Location type
Development density units per ha
Site area (ha)14
1 4 100% houses Greenfield 35 0.17
2 8 100% houses Urban 35 0.23
3 25 90% houses 10% flats Greenfield 35 1.06
4 35 90% houses 10% flats Greenfield 30 1.74
5 50 50% houses 50% flats Urban 50 1.00
6 65 60% houses 40% flats Urban 40 1.63
7 75 100% houses Greenfield 20 5.60
8 75 100% houses Greenfield 35 3.20
9 100 100% flats Urban 60 1.67
5.2 In addition, we have tested the viability of five strategic sites, summarised in Table 5.2.1.
Table 5.2.1: Strategic sites
SHLAA code
Location Major settlement
Gross site area (ha)
Estimated no of units @ 35 dph
L09 Land at Grove Farm
Extension to Leamington Spa
62.18 664
L48 Land at Blackdown Extension to Leamington Spa
66.74 1,165
W26 Gallows Hill/ Europa Way
Extension to Warwick
21.53 377
K17 Southcrest Farm, Glasshouse Lane
Extension to Kenilworth
16.79 319
C13 Lodge Farm, Westwood Heath
Extension to Coventry
30.48 324
14 The Council’s SHLAA assumes that on sites of 10 or more hectares, 50% of the site will be developable for housing, with the remaining space used for supporting facilities (e.g. open space). For sites of less than 10 units, the SHLAA assumes that 67% of the site will be developable for residential. In urban areas, 100% of site is considered as developable area.

ADL/130372 29
5.3 For schemes above the affordable housing threshold, we have tested with 40% affordable housing (the Council’s strategic target) with a tenure mix of 80% rented and 20% intermediate housing. We have run sensitivities analyses using 30%, 20% and 10% affordable housing.
5.4 The base position assumes a Developer’s profit of 20% of gross development value on private housing and 6% on affordable housing cost. We have also run two sensitivity analyses, using a higher profit level (22.5%) and a lower profit (17.5%). The former reflects a worsening of market conditions and/or tightening of bank funding criteria; while the latter reflects better market conditions and a reduction in risk associated with development.
5.5 We assume that all development types will meet Code for Sustainable Homes level 4. Level 4 is reflected through a 6% adjustment to our base build costs for all tenures. As noted previously, this is not currently a mandatory requirement for private housing, but will become mandatory for affordable housing during 2013.
5.6 The residual land values from each of the scenarios above in each housing market areas are then compared to the benchmark land value based on the assumptions set out in paragraphs 4.30 to 4.37. This comparison enables us to determine whether the imposition of CIL would have an impact on development viability. In some cases, the equation RLV less BLV results in a negative number, so the development would not proceed, whether CIL was imposed or not. We therefore focus on situations where the RLV is greater than BLV and where (all other things being equal) the development would proceed. In these situations, CIL has the potential to ‘tip the balance’ of viability into a negative position.
Commercial appraisals
5.7 Our research on rents achieved on commercial lettings indicates a range of rents within each main use class. Our commercial appraisals therefore model base position and test the range of rates (higher and lower than the base level) and changes to yields. This enables us to drawn conclusions on maximum potential rates of CIL. For each type of development tested, we have run appraisals of a quantum of floorspace, each with rent levels reflecting the range identified by our research.
Presentation of data
Residential appraisals results
5.8 The results for each site type are presented in tables showing the CIL rate and the corresponding RLV (which is then converted into a RLV per hectare). The RLV per hectare is then compared to the four benchmark land values, which are also expressed as a per hectare value. Where the RLV exceeds the benchmark, the amount of CIL entered into the appraisal is considered viable.
5.9 A sample of the format of the results is provided below. This sample relates to strategic site L09 (Land at Grove Farm).

ADL/130372 30
Community Infrastructure Levy Benchmark Land Values (per gross ha)Warwick District Council BLV1 BLV2 BLV3 BLV4
Greenfield 1 Greenfield 2 Greenfield 3 Greenfield 4£1,049,750 £500,000 £371,000 £247,000
Site type 2Houses Affordable % 30% Site area 37.94 ha
No of units 664 units % rented 80% Net to gross 50%Density: 35 dph % intermed 20%CSH level: 4 Growth
Sales 0% Build 0%
Rural areas (higher value) Private values £3180 psm
CIL amount per sq m
RLV RLV per ha RLV less BLV 1 RLV less BLV 2 RLV less BLV 3 RLV less BLV 4
0 24,328,725 641,194 -408,556 141,194 270,194 394,19420 23,732,308 625,475 -424,275 125,475 254,475 378,47540 23,135,890 609,756 -439,994 109,756 238,756 362,75660 22,539,473 594,037 -455,713 94,037 223,037 347,03780 21,943,055 578,318 -471,432 78,318 207,318 331,318
100 21,346,637 562,600 -487,150 62,600 191,600 315,600120 20,749,393 546,859 -502,891 46,859 175,859 299,859140 20,139,651 530,789 -518,961 30,789 159,789 283,789160 19,526,027 514,617 -535,133 14,617 143,617 267,617180 18,912,402 498,444 -551,306 -1,556 127,444 251,444200 18,290,350 482,050 -567,700 -17,950 111,050 235,050210 17,976,516 473,779 -575,971 -26,221 102,779 226,779220 17,659,899 465,434 -584,316 -34,566 94,434 218,434230 17,340,932 457,028 -592,722 -42,972 86,028 210,028240 17,021,965 448,621 -601,129 -51,379 77,621 201,621250 16,701,679 440,180 -609,570 -59,820 69,180 193,180
Commercial appraisal results
5.10 The appraisals include a ‘base’ rent level, with sensitivity analyses which model rents above and below the base level (an illustration is provided in Chart 5.9.1). The maximum CIL rates are then shown per square metre, against three different current use values (see Table 4.40.1). Chart 5.9.2 provides an illustration of the outputs in numerical format, while Chart 5.9.3 shows the data in graph format. In this example, the scheme could viably absorb a CIL of between £0 and £275 per square metre, depending on the current use value. The analysis demonstrates the significant impact of very small changes in yields (see appraisals 4 and 6, which vary the yield by 0.25% up or down) on the viable levels of CIL.
Chart 5.9.1: Illustration of sensitivity analyses
£s per sqft Yield Rent free
Appraisal 1 £21.00 6.50% 2.00 years
Appraisal 2 £22.00 6.50% 2.00 years
Appraisal 3 £23.00 6.50% 2.00 years
Appraisal 4 £24.00 6.75% 2.00 years Appraisal 5 (base) £24.00 6.50% 2.00 years
Appraisal 6 £24.00 6.25% 2.00 years
Appraisal 7 £25.00 6.50% 2.00 years
Appraisal 8 £26.00 6.50% 2.00 years
Appraisal 9 £27.00 6.50% 2.00 years
Appraisal 10 £28.00 6.50% 2.00 years

ADL/130372 31
Chart 5.9.2: Maximum CIL rates – numerical format
Change in rent
from base CUV 1 CUV 2 CUV 3
Appraisal 1 -14% £0 £0 £0
Appraisal 2 -9% £0 £0 £0
Appraisal 3 -4% £100 £23 £0
Appraisal 4 0% £99 £21 £0 Appraisal 5 (base) - £275 £197 £0
Appraisal 6 0% £465 £387 £38
Appraisal 7 4% £449 £371 £23
Appraisal 8 8% £624 £546 £197
Appraisal 9 11% £798 £720 £371
Appraisal 10 14% £972 £894 £546
Chart 5.9.3: Maximum CIL rates – graph format
Maximum CIL rates
£0
£200
£400
£600
£800
£1,000
£1,200
1 2 3 4 5(BASE)
6 7 8 9 10
Appraisal Number
CIL
per
squ
are
met
re
CUV 1 CUV 2 CUV 3
ADL/130372 32
6 Assessment of the results 6.1 This section should be read in conjunction with the full results attached at
Appendix 3 (residential appraisal results – urban areas), Appendix 4 (strategic sites results) and Appendix 5 (commercial appraisal results). In these results, the residual land values are calculated for scenarios with sales values and capital values reflective of market conditions across the District. These RLVs are then compared to appropriate benchmark land values.
6.2 The CIL regulations state that in setting a charge, local authorities must “aim to strike what appears to the charging authority to be an appropriate balance” between revenue maximisation on the one hand and the potentially adverse impact of CIL upon the viability of development across the whole area on the other. Our recommendations are that:
■ Firstly, the Council should take a strategic view of viability. There will always be variations in viability between individual sites, but viability testing should establish the most typical viability position; not the exceptional situations.
■ Secondly, the Council should take a balanced view of viability – residual valuations are just one factor influencing a developer’s decision making – the same applies to local authorities.
■ Thirdly, while a single charge is attractive, it may not be appropriate for all authorities, particularly in areas where sales values vary between areas.
■ Fourthly, markets are cyclical and subject to change over short periods of time. Sensitivity testing to sensitivity test levels of CIL to ensure they are robust in the event that market conditions improve over the life of a Charging Schedule is essential.
■ Fifthly, the Council should not set their rates of CIL at the limits of viability. A margin or contingency below the maximum rate should be allowed for to account for market change and site specific viability issues.
6.3 The early examinations have seen a debate on how viability evidence should translate into CIL rates. It has now been widely recognised that there is no requirement for a Charging Authority to slavishly follow the outputs of residual valuations. At Shropshire Council’s examination in public, Newark & Sherwood Council argued that rates of CIL should be set at the level dictated by viability evidence which would (if followed literally) have resulted in a Charging Schedule with around thirty different charging zones across the Shropshire area. Clearly this would have resulted in a level of complexity that CIL is intended to avoid. The conclusion of this debate was that CIL rates should not necessarily be determined solely by viability evidence, but should not be logically contrary to the evidence. Councils should not follow a mechanistic process when setting rates – appraisals are just a guide to viability and are widely understood to be a less than precise tool.
Assessment – residential development
6.4 As CIL is intended to operate as a fixed charge, the Council will need to consider the impact on two key factors. Firstly, the need to strike a balance between maximising revenue to invest in infrastructure on the one hand and the need to minimise the impact upon development viability on the other. Secondly, as CIL will effectively take a ‘top-slice’ of development value, there is a potential impact on the percentage or tenure mix of affordable housing that can be secured. This is a change from the current system of negotiated
ADL/130372 33
financial contributions, where the planning authority can weigh the need for contributions against the requirement that schemes need to contribute towards affordable housing provision.
6.5 In assessing the results, it is important to clearly distinguish between two scenarios; namely, schemes that are unviable regardless of the level of CIL (including a nil rate) and schemes that are viable prior to the imposition of CIL at certain levels. If a scheme is unviable before CIL is levied, it is unlikely to come forward and CIL would not be a factor that comes into play in the developer’s/landowner’s decision making. We have therefore disregarded the ‘unviable’ schemes in recommending an appropriate level of CIL. The unviable schemes will only become viable following a degree of real house price inflation, or in the event that the Council agrees to a lower level of affordable housing for particular sites in the short term15.
Determining maximum viable rates of CIL for residen tial development
6.6 As noted in paragraph 6.5, where a scheme is unviable the imposition of CIL at a zero level will not make the scheme viable. Other factors (i.e. sales values, build costs or benchmark land values) would need to change to make the scheme viable. For the purposes of establishing a maximum viable rate of CIL, we have had regard to the development scenarios that are currently viable and that might, therefore, be affected by a CIL requirement. All the results summarised below assume, firstly, that current affordable housing requirements are met in full. Sensitivity analyses which adopt reduced levels of affordable housing are also provided. This shows the relationship between CIL and affordable housing and the amounts that could be secured by changing the other requirement.
6.7 Tables 6.71 to 6.7.9 summarise the results of our residential appraisals of smaller sites (the full results are attached as Appendix 3). For each development typology, the tables show the highest CIL rate (within the testing range of £0 to £250 per square metre) that is viable against each of the four benchmark land values.
6.8 Site typologies 1, 3, 4, 7 and 8 are located on greenfield sites, while site typologies 2, 5, 6 and 9 are developments in urban areas. The relevant parts of the tables are shaded either green or brown to focus on the results that are most pertinent for each particular development typology. For example, for Site typology 1, BLV 3 and BLV 4 are shaded green, as these are the most relevant benchmarks for greenfield sites.
6.9 It is also important to note that Site typology 1 is a 4 unit scheme that falls below the Council’s affordable housing threshold of 5 units in a rural area. Similarly, Site typology 2 is an 8 unit scheme that falls below the 10 unit threshold for urban areas. Although the tables show the results for a range of affordable housing percentages (up to 40%), the current policy position does not require any contribution from these types of sites. The relevant results for site types 1 and 2 is therefore the ‘0%’ affordable housing column.
15 However, as shown by the sensitivity analyses (which reduce affordable housing to 30%, 20% and 10%) even a reduction in affordable housing does not always remedy viability issues. In these situations, it is not the presence or absence of planning obligations that is the primary viability driver – it is simply that the value generated by residential development is lower than some existing use values. In these situations, sites would remain in their existing use.

ADL/130372 34
Table 6.7.1: Site type 1 – 4 units, 100% houses, gr eenfield (35 dph)
BLV1 BLV2 BLV3 BLV4
40% 30% 20% 10% 0% 40% 30% 20% 10% 0% 40% 30% 20% 10% 0% 40% 30% 20% 10% 0%
Warwick nv nv nv nv 20 nv 20 120 220 250 nv 100 210 250 250 60 180 250 250 250
Leamington Spa 0 180 250 250 250 250 250 250 250 250 250 250 250 250 250 250 250 250 250 250
Kenilworth nv nv 100 210 250 180 250 250 250 250 250 250 250 250 250 250 250 250 250 250
Rural areas (higher value) 140 250 250 250 250 250 250 250 250 250 250 250 250 250 250 250 250 250 250 250
Rural areas (lower value) nv nv nv 20 120 nv 120 240 250 250 80 220 250 250 250 180 250 250 250 250
Table 6.7.2: Site type 2 – 8 units, 100% houses, ur ban area (35 dph)
BLV1 BLV2 BLV3 BLV4
40% 30% 20% 10% 0% 40% 30% 20% 10% 0% 40% 30% 20% 10% 0% 40% 30% 20% 10% 0%
Warwick nv nv nv 60 140 nv 80 180 250 250 20 140 250 250 250 100 210 250 250 250
Leamington Spa 200 250 250 250 250 250 250 250 250 250 250 250 250 250 250 250 250 250 250 250
Kenilworth nv 120 250 250 250 250 250 250 250 250 250 250 250 250 250 250 250 250 250 250
Rural areas (higher value) 250 250 250 250 250 250 250 250 250 250 250 250 250 250 250 250 250 250 250 250
Rural areas (lower value) nv nv 60 160 250 60 200 250 250 250 140 250 250 250 250 220 250 250 250 250
Table 6.7.3: Site type 3 – 25 units, 90% houses and 10% flats, greenfield (35 dph)
BLV1 BLV2 BLV3 BLV4
40% 30% 20% 10% 0% 40% 30% 20% 10% 0% 40% 30% 20% 10% 0% 40% 30% 20% 10% 0%
Warwick nv nv nv nv nv nv nv 40 120 210 nv 0 120 210 250 nv 100 200 250 250
Leamington Spa nv 20 180 250 250 250 250 250 250 250 250 250 250 250 250 250 250 250 250 250
Kenilworth nv nv nv 80 180 60 220 250 250 250 180 250 250 250 250 250 250 250 250 250
Rural areas (higher value) nv 180 250 250 250 250 250 250 250 250 250 250 250 250 250 250 250 250 250 250
Rural areas (lower value) nv nv nv nv 20 nv 20 140 240 250 nv 120 230 250 250 80 220 250 250 250
nv = not viable at zero CIL

ADL/130372 35
Table 6.7.4: Site type 4: 35 units, 90% houses and 10% flats, greenfield (30 dph)
BLV1 BLV2 BLV3 BLV4
40% 30% 20% 10% 0% 40% 30% 20% 10% 0% 40% 30% 20% 10% 0% 40% 30% 20% 10% 0%
Warwick nv nv nv nv nv nv nv nv 80 160 nv nv 80 160 240 nv 60 160 250 250
Leamington Spa nv nv 60 180 250 220 250 250 250 250 250 250 250 250 250 250 250 250 250 250
Kenilworth nv nv nv nv 80 nv 140 250 250 250 120 250 250 250 250 250 250 250 250 250
Rural areas (higher value) nv 20 210 250 250 250 250 250 250 250 250 250 250 250 250 250 250 250 250 250
Rural areas (lower value) nv nv nv nv nv nv nv 80 180 250 nv 60 180 250 250 40 180 250 250 250
Table 6.7.5: Site type 5: 50 units, 50% houses and 50% flats, urban area (50 dph)
BLV1 BLV2 BLV3 BLV4
40% 30% 20% 10% 0% 40% 30% 20% 10% 0% 40% 30% 20% 10% 0% 40% 30% 20% 10% 0%
Warwick nv nv nv nv 20 nv nv 20 100 180 nv nv 60 140 230 nv 0 100 180 250
Leamington Spa 0 180 250 250 250 250 250 250 250 250 250 250 250 250 250 250 250 250 250 250
Kenilworth nv nv 100 220 250 40 180 250 250 250 100 240 250 250 250 160 250 250 250 250
Rural areas (higher value) 160 250 250 250 250 250 250 250 250 250 250 250 250 250 250 250 250 250 250 250
Rural areas (lower value) nv nv nv 40 120 nv 0 120 220 250 nv 60 160 250 250 nv 100 210 250 250
Table 6.7.6: Site type 6: 65 units, 60% houses and 40% flats, urban area (40 dph)
BLV1 BLV2 BLV3 BLV4
40% 30% 20% 10% 0% 40% 30% 20% 10% 0% 40% 30% 20% 10% 0% 40% 30% 20% 10% 0%
Warwick nv nv nv nv 0 nv nv 20 100 180 nv nv 60 160 240 nv 20 120 210 250
Leamington Spa nv 140 250 250 250 250 250 250 250 250 250 250 250 250 250 250 250 250 250 250
Kenilworth nv nv 60 180 250 40 180 250 250 250 120 250 250 250 250 180 250 250 250 250
Rural areas (higher value) 120 250 250 250 250 250 250 250 250 250 250 250 250 250 250 250 250 250 250 250
Rural areas (lower value) nv nv nv 0 100 nv 0 120 220 250 nv 60 180 250 250 0 120 240 250 250
nv = not viable at zero CIL

ADL/130372 36
Table 6.7.7: Site type 7: 75 units, 100% houses, gr eenfield area (lower density – 20 dph)
BLV1 BLV2 BLV3 BLV4
40% 30% 20% 10% 0% 40% 30% 20% 10% 0% 40% 30% 20% 10% 0% 40% 30% 20% 10% 0%
Warwick nv nv nv nv nv nv nv nv nv 60 nv nv 0 80 160 nv 0 100 180 250
Leamington Spa nv nv nv nv 80 60 230 250 250 250 240 250 250 250 250 250 250 250 250 250
Kenilworth nv nv nv nv nv nv 0 140 240 250 0 160 250 250 250 160 250 250 250 250
Rural areas (higher value) nv nv nv 100 230 220 250 250 250 250 250 250 250 250 250 250 250 250 250 250
Rural areas (lower value) nv nv nv nv nv nv nv nv 60 140 nv nv 80 180 250 nv 100 210 250 250
Table 6.7.8: Site type 8: 75 units, 100% houses, gr eenfield area (standard density – 35 dph)
BLV1 BLV2 BLV3 BLV4
40% 30% 20% 10% 0% 40% 30% 20% 10% 0% 40% 30% 20% 10% 0% 40% 30% 20% 10% 0%
Warwick nv nv nv nv nv nv nv 20 100 180 nv 0 100 180 250 nv 80 180 250 250
Leamington Spa nv 20 160 250 250 250 250 250 250 250 250 250 250 250 250 250 250 250 250 250
Kenilworth nv nv nv 80 160 60 200 250 250 250 160 250 250 250 250 250 250 250 250 250
Rural areas (higher value) nv 160 250 250 250 250 250 250 250 250 250 250 250 250 250 250 250 250 250 250
Rural areas (lower value) nv nv nv nv 0 nv 20 120 210 250 nv 100 210 250 250 80 200 250 250 250
Table 6.7.9: Site type 9: 100 units, 100% flats, ur ban area (60 dph)
BLV1 BLV2 BLV3 BLV4
40% 30% 20% 10% 0% 40% 30% 20% 10% 0% 40% 30% 20% 10% 0% 40% 30% 20% 10% 0%
Warwick nv nv nv nv nv nv nv nv nv nv nv nv nv nv nv nv nv nv nv nv
Leamington Spa nv nv nv 80 180 nv 0 140 250 250 nv 40 200 250 250 nv 100 240 250 250
Kenilworth nv nv nv nv 0 nv nv nv 60 160 nv nv nv 100 200 nv nv 20 140 230
Rural areas (higher value) nv nv 80 220 250 nv 140 250 250 250 0 200 250 250 250 80 250 250 250 250
Rural areas (lower value) nv nv nv nv nv nv nv nv nv nv nv nv nv nv 20 nv nv nv nv 60
nv = not viable at zero CIL
ADL/130372 37
Strategic sites
6.10 Tables 6.10.1 to 6.10.5 summarise the results from our appraisals of five strategic sites in the District, located adjacent to the three main settlements and neighbouring Coventry. The results are displayed in the same format as the smaller sites, but with all five strategic sites being greenfield, benchmkark land values 3 and 4 are the most pertinent when considering a rate of CIL for these types of development.
6.11 As noted previously, the strategic sites carry higher costs than other developments, most notably on-site infrastructure (utilities, drainage, site roads etc) and on-site community infrastructure (schools, community facilities etc). For each unit, our appraisals assume a £10,000 allowance for on-site infrastructure (i.e. roads, utilities etc) and a further £10,000 to contribute towards on-site community infrastructure. Other relevant factors to consider are the long build out rate, which means that developers are carrying costs for a much longer period of time than is the case with small schemes. These factors combine to make these types of development more challenging, at least in principle.
6.12 Although each of the five strategic sites is clearly located adjacent to a particular settlement, we have also appraised them using sales values from each of the main value areas (i.e. Warwick, Leamington Spa, Kenilworth, higher value rural area and lower value rural area). As well as reflecting the viability conditions in their ‘actual’ area, the sites also provide an indication of the viability of a development of those characteristics in the other areas. This helps give more depth to the results.
6.13 Although strategic site W26 (Gallows Hill) is identified in the SHLAA as being located in Warwick, it actually lies to the south of Myton, which attracts significantly higher values than those in Warwick. There is a cluster of strategic sites in this area, as shown in Figure 6.13.1 below. These sites are more likely to benefit from the higher values in Myton and Heathcote
Figure 6.13.1: Location of strategic sites between Warwick and Leamington Spa

ADL/130372 38
6.14 Figure 6.14.1 shows average house prices in ‘heat map’ format. This shows the location of two sites we have tested in this study (W16 – Gallows Hill and L09 – Land at Grove Farm). This shows that both of these sites (and others adjacent to them) are likely to attract higher values than those found in the urban areas. In the results tables (6.10.1 to 6.10.5), the results for the Leamington Spa area are likely to apply to both sites.
Figure 6.14.1: Average values heat map
Source: Mouseprice
6.15 The results of our appraisals for Land at Blackdown, Leamington Spa, show lower residual land values than for the other strategic sites at Leamington. This is because this site is considerably large than the other sites, with a longer build out period. This longer build period means that costs are carried for a longer period of time before sales income is received, resulting in higher finance costs.
W26
L09

ADL/130372 39
Table 6.10.1: K17 Southcrest Farm, Kenilworth (35dp h)
BLV1 BLV2 BLV3 BLV4
40% 30% 20% 10% 0% 40% 30% 20% 10% 0% 40% 30% 20% 10% 0% 40% 30% 20% 10% 0%
Warwick nv nv nv nv nv nv nv nv nv nv nv nv nv nv 20 nv nv nv 20 100
Leamington Spa nv nv nv nv nv nv 20 180 250 250 nv 160 250 250 250 140 250 250 250 250
Kenilworth nv nv nv nv nv nv nv nv 80 180 nv nv 80 200 250 nv 80 210 250 250
Rural areas (higher value) nv nv nv nv 80 nv 180 250 250 250 140 250 250 250 250 250 250 250 250 250
Rural areas (lower value) nv nv nv nv nv nv nv nv nv 20 nv nv nv 20 120 nv nv 20 120 210
Table 6.10.2: L09 Land at Grove Farm, Leamington Sp a (35dph)
BLV1 BLV2 BLV3 BLV4
40% 30% 20% 10% 0% 40% 30% 20% 10% 0% 40% 30% 20% 10% 0% 40% 30% 20% 10% 0%
Warwick nv nv nv nv nv nv nv nv nv nv nv nv nv nv 20 nv nv nv 20 100
Leamington Spa nv nv nv nv nv nv 20 180 250 250 nv 160 250 250 250 140 250 250 250 250
Kenilworth nv nv nv nv nv nv nv nv 80 180 nv nv 80 200 250 nv 80 210 250 250
Rural areas (higher value) nv nv nv nv 60 nv 160 250 250 250 140 250 250 250 250 250 250 250 250 250
Rural areas (lower value) nv nv nv nv nv nv nv nv nv 20 nv nv nv 20 120 nv nv 20 120 210
Table 6.10.3: C13 Lodge Farm, Coventry border (35 d ph)
BLV1 BLV2 BLV3 BLV4
40% 30% 20% 10% 0% 40% 30% 20% 10% 0% 40% 30% 20% 10% 0% 40% 30% 20% 10% 0%
Warwick nv nv nv nv nv nv nv nv nv nv nv nv nv nv 20 nv nv nv 20 100
Leamington Spa nv nv nv nv nv nv 0 180 250 250 nv 160 250 250 250 140 250 250 250 250
Kenilworth nv nv nv nv nv nv nv nv 80 180 nv nv 80 200 250 nv 80 210 250 250
Rural areas (higher value) nv nv nv nv 60 nv 160 250 250 250 140 250 250 250 250 250 250 250 250 250
Rural areas (lower value) nv nv nv nv nv nv nv nv nv 0 nv nv nv 20 120 nv nv 20 120 210
nv = not viable at zero CIL

ADL/130372 40
Table 6.10.4: W26 Gallows Hill, Warwick
BLV1 BLV2 BLV3 BLV4
40% 30% 20% 10% 0% 40% 30% 20% 10% 0% 40% 30% 20% 10% 0% 40% 30% 20% 10% 0%
Warwick nv nv nv nv nv nv nv nv nv nv nv nv nv nv 0 nv nv nv 20 100
Leamington Spa nv nv nv nv nv nv nv 140 250 250 nv 140 250 250 250 120 250 250 250 250
Kenilworth nv nv nv nv nv nv nv nv 60 160 nv nv 60 180 250 nv 60 180 250 250
Rural areas (higher value) nv nv nv nv 20 nv 140 250 250 250 120 250 250 250 250 250 250 250 250 250
Rural areas (lower value) nv nv nv nv nv nv nv nv nv 0 nv nv nv 0 100 nv nv 20 120 200
Table 6.10.5: L48 Land at Blackdown, Leamington Spa
BLV1 BLV2 BLV3 BLV4
40% 30% 20% 10% 0% 40% 30% 20% 10% 0% 40% 30% 20% 10% 0% 40% 30% 20% 10% 0%
Warwick nv nv nv nv nv nv nv nv nv nv nv nv nv nv nv nv nv nv nv 60
Leamington Spa nv nv nv nv nv nv nv 0 140 250 nv 20 180 250 250 40 230 250 250 250
Kenilworth nv nv nv nv nv nv nv nv nv 40 nv nv nv 100 210 nv 0 140 250 250
Rural areas (higher value) nv nv nv nv nv nv nv 140 250 250 nv 180 250 250 250 220 250 250 250 250
Rural areas (lower value) nv nv nv nv nv nv nv nv nv nv nv nv nv nv 20 nv nv nv 80 160
nv = not viable at zero CIL

ADL/130372 41
CIL rate setting considerations
6.16 The results indicate that residential development should be able to absorb a CIL payment in all areas across the District, subject to allowing for a buffer or margin to address risks to delivery. There are four key risk factors:
■ the first is that individual sites might incur exceptional costs (decontamination, difficult ground conditions etc) and as a result the residual land value could fall. Developers will try and reflect such costs in their offer to the landowner, but the extent of any issues is not always fully apparent until the land value is fixed. Where sites have an existing use, an owner will not be prepared to accept a reduction below the value of the current building to accommodate exceptional costs upon redevelopment;
■ Secondly, current use values on individual sites will inevitably vary and will fall somewhere between the values used in our appraisals. As a result, the ability of schemes to absorb high rates of CIL could be adversely affected;
■ Thirdly, sales values could fall or normal build costs could rise over the life of the Charging Schedule, adversely affecting scheme viability. While the Council could change its rates to adapt to these changes, this cannot be done quickly due to the need to develop a refreshed evidence base and follow the statutory consultation and examination process; and
■ Fourthly, imposing a high rate of CIL (that vastly exceeds the current levels of Section 106 obligations) in the Council’s first Charging Schedule could ‘shock’ the land market with a consequential risk that land supply falls. This factor has led many charging authorities to seek to limit their CIL rates to no more than around 3-5% of development costs, or to set their CIL rates so that they are broadly comparable to existing Section 106 contributions16.
6.17 It is also important to consider that where a scheme is shown as unviable before the application of CIL, it will be other factors such as sales values, build costs and the percentage of affordable housing that will need to adjust for the scheme to become viable.
Suggested CIL rates – smaller (non-strategic) sites
6.18 Our appraisals indicate that smaller sites below the affordable housing threshold are viable with high levels of CIL against the relevant benchmark land values. In most situations, the maximum rate within the testing range (£250 per square metre) is achievable. The Council could potentially set a separate rate for these types of scheme, perhaps with a higher CIL rate than schemes which are required to provide on-site affordable housing.
6.19 Schemes located in Warwick and the surrounding areas are unlikely to be able to make substantial CIL contributions as well as making a meaningful affordable housing contribution. We therefore suggest that the Council considers a relatively modest CIL rate in this area. The maximum rate varies according to the affordable housing percentage secured, but is in the range of £100 to £180 per square metre when secured alongside 20% affordable housing. We therefore suggest a rate of £50 per square , which allows some headroom for the factors listed at section 6.13.
16 For example, Wandsworth Council has adopted this approach in the Vauxhall Nine Elms Opportunity Area, where the existing tariff has been converted into a per square metre CIL rate.

ADL/130372 42
6.20 Schemes in the Kenilworth area are more viable than those in Warwick, but the trade off between high levels of CIL and affordable housing at levels of around 40% is very clear in our appraisal results. To ensure an optimum balance between maximising affordable housing and infrastructure requirements, we consider that the maximum CIL level is in the region of £160 to £180 per square metre. At this level of CIL, most scheme types can provide 30% affordable housing. After allowing a discount for the factors outlined at section 6.13, this would result in a CIL of around £120 per square metre .
6.21 Scheme in Leamington Spa and the higher value rural area are the most viable in the District, with a maximum CIL in region of £200 - £240 per square metre achievable in most scenarios. After allowing for a discount for the factors outlined in section 6.13, we suggest a CIL of £170 to 180 per square metre .
Suggested CIL rates – strategic sites
6.22 The results of our strategic site appraisals indicate that major schemes adjacent to Warwick are likely to be challenging to bring forward in the short term if they are required to provide policy levels of affordable housing, on-site infrastructure and CIL. When tested against benchmark land value 3 and 4, all five strategic sites are unviable at policy levels of affordable housing. When affordable housing is provided at 10% of units, CIL starts to become viable. However, it should be noted that all the major sites identified by the Council to the south of Warwick and Leamington Spa are in areas of higher value in comparison to average Warwick values.
6.23 Requiring anything but a modest level of CIL (e.g. £20 per square metre) on these sites is likely to reduce opportunities for securing a reasonable affordable housing contribution from major sites adjacent to Warwick. However, given that no major sites are identified in or around the Warwick area, levying a slightly higher CIL would not adversely impact of delivery of the scale of development identified in the Plan.
6.24 A similar result emerges for strategic sites that might be located in the ‘rural’ lower value area. However, we understand that strategic sites adjacent to the main urban settlements are to be prioritised over large sites in rural areas. The Council may therefore decide to place limited weight on these results.
6.25 Strategic sites that might be located in the rural higher value area should be able to absorb relatively high levels of CIL as well as meeting the full 40% affordable housing target.
6.26 Strategic sites adjacent to Leamington Spa appear to be reasonably viable and able to accommodate CIL contributions as well as affordable housing percentages relatively close to the policy target. We would suggest, however, that the Council adopts a cautious approach, as the affordable housing percentage appears to be very sensitive to the level of CIL. The Council would therefore maximise the potential for securing 40% affordable housing if the rates of CIL are set at a modest level.
6.27 We would suggest the following approach for strategic sites that optimises opportunities for securing a meaningful affordable housing contribution alongside a contribution towards infrastructure through CIL:
■ Leamington Spa and Rural higher value area : ‘Maximum’ rate - £160 per square metre; suggested rate £90 to 110 per square metre;

ADL/130372 43
■ Kenilworth, Maximum rate - £110 per square metre; s uggested rate £70 per square metre
■ Warwick and rural ‘lower’ value area: ‘Maximum’ rate - £80 per square metre; suggested rate £30 per square metre;
Assessment – commercial development
6.28 Our appraisals indicate that the potential for commercial schemes to be viably delivered will be limited in current market conditions. Retail rents vary to some degree, but differences in yields are likely to be a more important factor in determining capital values of completed retail developments. For other types of development, such as offices, there is unlikely to be much, if any, net additional floorspace in the short term.
6.29 As noted in section 4, the level of rents that can be achieved for commercial space varies according to exact location; quality of building; and configuration of space. Consequently, our appraisals adopt a ‘base’ position based on average rents for each type of development and show the results of appraisals with lower and higher rents. This analysis will enable the Council to consider the robustness of potential CIL charges on commercial uses, including the impact that changes in rents might have on viability.
Office development
6.30 The results of our office appraisals indicate that new developments are unlikely to be viable, unless rents increase significantly over the life of the Charging Schedule (see Appendix 5). Short term demand for offices is likely to be relatively weak due to changing patterns of working and slower employment growth. It is therefore unlikely that any significant level of new office development will come forward in the District in the short term. In some parts of the District, there is a surplus second hand office buildings that owners may seek to redevelop for other uses
6.31 Office rents currently average £12 per sq ft and a considerable increase would be required to make development of new space economically viable. Whilst it is possible that new development might attract higher rents, there is currently insufficient evidence to demonstrate that this might be the case. If any significant schemes do come forward for development, the Council could seek to negotiate Section 106 obligations with developers, although clearly these would be restricted by Regulation 122.
6.32 A nil CIL rate is recommended for any office development that comes forward.
Industrial and warehouse development
6.33 Our appraisals of industrial development indicate that residual values are likely to be too low to absorb any level of CIL (see Appendix 4). A considerable increase in new build industrial rents would be required before any CIL could be absorbed. Rents would need to increase from their current level of around £7.50 per sq ft to over £15 per sq ft before developments would become sufficiently viable to absorb a CIL.
6.34 We note that the Council has received applications for logistics parks and other commercial development. It is possible that some or all of the warehouse floorspace will be sold to owner occupiers. In light of this, the Council may wish to consider adopting a modest rate on industrial and warehouse development. This rate would recognise that speculative development for rent is unlikely to come forward, but would capture schemes

ADL/130372 44
that are occupied by major national owner occupiers.
6.35 A nil CIL rate is recommended for any industrial and warehousing development that comes forward.
6.36 Alternatively, if any significant industrial and distribution schemes do come forward for development, the Council could seek to negotiate Section 106 obligations with developers, subject to the restrictions in CIL Regulation 12217.
Retail development – Prime Leamington (Central Para de and Royal Priors)
6.37 Our appraisals of development in the prime retail areas in Leamington (Central Parade and Royal Priors) indicate that they are sufficiently viable to absorb a CIL. The results vary depending on the current or existing use value selected. When viability is considered against the highest current use value, a CIL of up to £133 per square metre could be absorbed. We would suggest a CIL rate of around 50% of this maximum level (around £65 per square metre ).
Table 6.37.1: Prime retail development
Maximum CIL rates
£0
£100
£200
£300
£400
£500
£600
£700
£800
£900
£1,000
1 2 3 4 5(BASE)
6 7 8 9 10
Appraisal Number
CIL
per
squ
are
met
re
CUV 1 CUV 2 CUV 3
6.38 The existing retail market in the District is predominantly characterised by district centres arranged in traditional high street form. Consequently, a significant proportion of development activity involves recycling existing retail floorspace, rather than the creation of additional space. Consequently, it is unlikely that retail development would generate very substantial amounts of net additional floorspace that would be liable to pay CIL.
Retail elsewhere in Leamington Spa and other settle ments
6.39 Rents for retail floorspace in other parts of Leamington Spa and the rest of the District are lower than in the prime retail area. Consequently, development of new retail floorspace on existing sites is unlikely to generate significant surpluses that could fund CIL. This is because rents for new build floorspace
17 CIL Regulation 122 restricts the use of planning obligations. A planning obligation may only constitute a reason for granting planning permission if the obligation is (a) necessary to make the development acceptable in planning terms; (b) directly related to the development; and (c) fairly and reasonably related in scale and kind to the development.

ADL/130372 45
are only slightly higher than rents for existing floorspace. Our appraisals indicate that a CIL would not be viable until rents increased substantially from their current levels. We therefore recommend a nil rate on retail outside the Leamington Spa prime retail area.
Superstores, supermarkets and retail parks
6.40 Our appraisals of superstores, supermarkets and retail parks indicate a greater degree of viability than for other types of retail. This is associated largely with the lower yield attached to floorspace occupied by the large national retail chains, due to their perceived greater covenant strength in comparison to smaller operators. Chart 6.40.1 summarises the rates of CIL that large retail development could absorb. Based on the lowest of the three current use values, large retail development could absorb a CIL of up to £148 per square metre. To allow a sufficient buffer below the maximum rate, we suggest a CIL rate of £105 per square metre .
Chart 6. 40.1: Supermarket and retail park developm ent
Maximum CIL rates
£0
£200
£400
£600
£800
£1,000
£1,200
£1,400
£1,600
1 2 3 4 5(BASE)
6 7 8 9 10
Appraisal Number
CIL
per
squ
are
met
re
CUV 1 CUV 2 CUV 3
Hotel development
6.41 Capital values for hotels are comparable to other areas and generate a sufficient surplus after development costs to fund a CIL contribution. Our appraisals indicate that a CIL of up to a maximum of £204 per square metre could be levied on hotel developments. After allowing for a discount below the maximum rate, we would suggest a CIL rate of £100 per square metre .

ADL/130372 46
Chart 6.41.1: Hotel development
Maximum CIL rates
£0
£200
£400
£600
£800
£1,000
£1,200
£1,400
£1,600
£1,800
£2,000
1 2 3 4 5(BASE)
6 7 8 9 10
Appraisal Number
CIL
per
squ
are
met
re
CUV 1 CUV 2 CUV 3
Student housing
6.42 Our appraisals of student housing assume a halls of residence type development with ensuite bathrooms and communal kitchens and living space. Assuming rents charged by University of Warwick for its own accommodation, our appraisals indicate that student housing developments could viably absorb a CIL of up to £163 per square metre. After allowing for a discount below the maximum rate, we would suggest a CIL rate of £80 per square metre .
6.43 If the University continues to develop its own student accommodation, developments would be exempt from CIL under Regulation 43, providing the provision of student accommodation is consistent with the University’s charitable objectives.
D1 and D2 floorspace development
6.44 D1 and D2 floorspace typically includes uses that do not accommodate revenue generating operations, such as schools, health centres, museums and places of worship. Other uses that do generate an income stream (such as swimming pools) have operating costs that are far higher than the income and require public subsidy. Many D1 uses will be infrastructure themselves, which CIL will help to provide. It is therefore unlikely that D1 and D2 uses will be capable of generating any contribution towards CIL. D1 and D2 uses will sometimes include developments that are operated commercially (such as gyms) but with many new operations opening in existing floorspace, very little, if any CIL income could be secured.

ADL/130372 47
7 Conclusions and recommendations 7.1 The results of our analysis indicate a degree of variation in viability of
development in terms of different uses. In light of these variations, two options are available to the Council under the CIL regulations. Firstly, the Council could set a single CIL rate across the District, having regard to the least viable types of development and least viable locations. This option would suggest the adoption of the ‘lowest common denominator’, with sites that could have provided a greater contribution towards infrastructure requirements not doing so. In other words, the Council could be securing the benefit of simplicity at the expense of potential income foregone that could otherwise have funded infrastructure. Secondly, the Council has the option of setting different rates for different types of development. The results of our study point firmly towards the second option as our recommended route.
7.2 We have also referred to the results of development appraisals as being highly dependent upon the inputs, which will vary significantly between individual developments. In the main, the imposition of CIL is not the critical factor in determining whether a scheme is viable or not (with the relationship between scheme value, costs and land value benchmarks being far more important). This is evidenced by the very marginal differences between the ‘pre’ and ‘post’ CIL residential appraisals summarised in Section 6. This point is also illustrated in Chart 7.2.1 below, which compares the impact on the residual value of a scheme of a 10% increase and decrease in sales values and a 10% increase and decrease in build costs to a £100 per sq metre change in CIL.
Chart 7.2.1: Impact of changing levels of CIL in co ntext of other factors
Impact of changes in values, costs and CIL
-£0.80
-£0.60
-£0.40
-£0.20
£0.00
£0.20
£0.40
£0.60
£0.80
Sales values Build costs CIL
Mill
ions
Cha
nge
in r
esid
ual v
alue
+10%
-10%
7.3 Given CIL’s nature as a fixed tariff, it is important that the Council selects rates that are not on the limit of viability. This is particularly important for commercial floorspace, where the Council does not have the ability to ‘flex’ other planning obligations to absorb site-specific viability issues. In contrast, the Council could in principle set higher rates for residential schemes as the level of affordable housing could be adjusted in the case of marginally viable schemes. However, this approach runs the risk of frustrating one of the Council’s other key objectives of delivering affordable housing. Consequently, sensitive CIL rate setting for residential schemes is also vital.

ADL/130372 48
■ The results of this study are reflective of current market conditions, which are likely to improve over the medium term. It is therefore important that the Council continually monitors the market so that levels of CIL can be adjusted to reflect any future changes.
■ The ability of residential schemes to make CIL contributions varies
between different parts of the District. Having regard to the need to set rates that are not at the margins of viability, our appraisals indicate that the following levels of CIL should not adversely impact on viability of development and delivery of the plan as a whole:
■ Leamington Spa and higher value rural areas (Zones B and D on the charging zones map): £170-180 per square metre;
■ Kenilworth (Zone C on the charging zones map): £120 per square metre;
■ Warwick, East Leamington Spa and lower value rural areas (Zone A on the charging zones map): £50 per square metre.
■ At current rent levels, Office development is unlikely to come forward in
the short to medium term as the capital values generated are insufficient to cover development costs. We therefore recommend that the Council sets a nil rate for office development.
■ Our appraisals of developments of industrial and warehousing floorspace indicate that these uses are unlikely to generate positive residual land values. We therefore recommend a nil rate for industrial and warehousing floorspace.
■ Retail developments in Leamington Spa’s prime retail area generate sufficient surpluses to absorb a CIL of £65 per square metre , after allowing for a discount below the maximum rate.
■ Residual values generated by retail developments elsewhere are unlikely to be sufficiently high to absorb a CIL charge. In any case, is likely that a significant proportion of retail development will involve the re-use of existing retail space, so the differential in value between current and newly developed space is modest in areas where rents are low. We therefore recommend a nil rate on retail development outside the prime Leamington Spa area.
■ Superstores, supermarket and retail parks are capable of generating greater surplus value and could absorb a CIL of £148 per square metre. After allowing for a discount below the maximum rate, we suggest a CIL of £105 per square metre.
■ D1 and D2 uses often do not generate sufficient income streams to cover their costs. Consequently, they require some form of subsidy to operate. This type of facility is very unlikely to be built by the private sector. We therefore suggest that a nil rate of CIL be set for D1 uses.
7.4 For residential schemes, the application of CIL of is unlikely to be an overriding factor in determining whether or not a scheme is viable. When considered in context of total scheme value, CIL will be a modest amount, typically accounting for less than 3% of value. Some schemes would be unviable even if a zero CIL were adopted. We therefore recommend that the Council pays limited regard to these schemes.

ADL/130372 49
Table 7.4.1: Suggested rates for PDCS consultation
Type of development
Zones B and D Much of Leamington Spa and rural higher value zone
Zone C Kenilworth
Zone A Warwick, East Leamington Spa and and rural lower value zone
Residential £170 to £180 £120 £50
Strategic residential £90 to £110 £70 £30
Retail development – prime Leamington Spa
£65 Nil Nil
Convenience based Superstores and supermarkets18 and retail parks19
£105
Student housing £80
Hotels £100
Offices Nil
Industrial and warehousing Nil
D1 and D2 uses Nil
7.5 While there is no requirement for charging authorities to commit to a formal timescale for reviewing its CIL charging schedule, we recommend that the Council monitors the market on a regular basis. The proposed rates above allow a margin for movements in key variables, but if there are substantial movements in costs and values, a formal review of the CIL rates may be required. The Council may need to amend the rates in the future if significant changes occur.
7.6 The Council may also wish to consider developing an instalments policy which makes provision for distributing CIL payments over the development period of a scheme. This would help to minimise the cashflow impact of CIL in comparison to upfront payments.
18 Superstores/supermarkets are shopping destinations in their own right where weekly food shopping needs are met and which can also include non-food floorspace as part of the overall mix of the unit. 19 Retail warehouses are large stores specialising in the sale of household goods (such as carpets, furniture and electrical goods), DIY items and other ranges of goods, catering for mainly car-borne customers.
ADL/130372 50
Appendix 1 - SHLAA sites

ADL/130372 51
SITES WITHIN OR ON THE EDGE OF LEAMINGTON SPA AND W HITNASH
Site Ref Site Name Site Area L01 Lime Avenue 0.36 L02 R/O 22 Llewelyn Road 0.14 L03 R/O Bamburgh Grove 1.79 L04 Former Factory, Clarendon Street 0.10 L05 Trinity Storage Site, Queensway 1.50 L07 Land North of Milverton 83.30 L09 Land at Grove Farm 62.18 L10 Land South of Sydenham 7.56 L11 Golf Lane/ Fieldgate Lane 4.01 L12 Land at Golf Lane 0.26 L13 Soans Site & Land Adjacent 2.49 L14 Land at Woodside Farm 10.99 L15 Court Street/ Cumming Street 0.10 L16 77 Lillington Road 0.13 L17 Cubbington East 11.00 L18 Allotment Land, Rugby Road 2.23 L19 Land at North Cubbington 51.40 L20 Land at South Cubbington 16.00 L21 St Mary's Allotments, Radford Road 7.80 L22 Allotment Gardens, Coventry Road 1.50 L23 Land at Red House Farm, Campion Hills 11.53 L24 Confidential Site 0.27 L25 Confidential Site 0.24 L26 Confidential Site 0.67 L27 R/O Homebase 2.00 L28 Off Princes Drive 1.00 L30 Telephone Exchange 0.32 L31 Garage Site, Russell Street 0.37 L32 Jewsons & Quarry Street Dairy 1.60 L33 Court Street Opportunity Site 0.86 L34 Wise Street Opportunity Site 1.60 L35 Land at Station Approach 4.47 L36 Warwickshire College 5.78 L37 Riverside House 1.75 L38 Glebe Farm 53.20 L39 Land at Campion School/ S. Sydenham 51.49 L40 Leamington Cricket Club 3.19 L41 Castel Froma 1.14 L43 Waverley Equestrian Centre 1.72 L44 Confidential Site 0.40 L45 Leamington Fire Station 0.52 L46 Confidential Site 0.45 L47 Former Bath Place Community Venture 0.14 L48 Land at Blackdown 66.74

ADL/130372 52
SITES WITHIN OR ON THE EDGE OF WARWICK
Site Ref Site Name Site Area
W01 Tamlea Building, Nelson Lane 0.48 0.48 W02 2-22 Northgate Street & Offices to Rear 0.54 0.54 W03 Heathcote Sewage Works 13.10 13.10 W04 Former Car Park at IBM 4.35 4.35 W05 Hintons Nursery, Coventry Road 1.61 1.61 W06 Land at Stratford Road 4.44 4.44 W07 Lower Heathcote Farm 122.90 122.90 W08 Land West of Europa Way 38.86 38.86 W09 Ponderosa, Wedgenock Lane 0.72 0.72 W10 Land to the South of Gallows Hill 14.9 14.90 W11 Campbell House, Stratford Road 1.70 1.70 W12 Home Farm, Longbridge 18.42 18.42 W13 Darsons Yard, Miller Road 0.84 0.84 W14 Land at Corner of Cross Street and Priory Road 0.02 0.02 W15 Confidential Site 0.37 0.37 W16 Confidential Site 0.29 0.29 W17 Confidential Site 0.16 0.16 W18 Land at Montague Road 3.49 3.49 W19 Land at Gogbrook Farm 2.50 2.50 W20 Warwick Gates Employment Land 9.77 9.77 W21 County Land Europa Way 24.43 24.43 W23 R/O Cherry Street 0.33 0.33 W24 64 West Street 0.06 0.06 W25 Nelson Club Car Park 0.12 0.12 W26 Gallows Hill/ Europa way 21.53 21.53 W27 The Asps, Europa Way 94.46 94.46 W28 Loes Farm, Guy's Cliffe 28.54 28.54 W29 Heathcote Farmhouse 0.46 0.46 W30 Confidential Site 0.98 0.98 W31 Confidential Site 0.78 0.78 W32 Warwick Fire Station 0.16 0.16 W33 Confidential Site 22.26 22.26 W34 Confidential Site 0.53 0.53 W35 West of Warwick Racecourse

ADL/130372 53
SITES WITHIN OR ON THE EDGE OF KENILWORTH
Site Ref Site Name Site Area
K01 Land at Thickthorn 16.51 K02 Crackley Triangle and east of Kenilworth Road 14.26 K03 North of Highland Road 3.26 K04 East of Inchbrook Road 3.67 K05 Kenilworth RFC Land off Rocky Lane 11.30 K06 Kenilworth Rugby Club 1.76 K07 Kenilworth Golf Club, Dalehouse Lane 4.02 K08 Common Lane Industrial Estate 2.97 K09 Jersey Farm, Glasshouse Lane 15.47 K10 Land to the West of Clinton Lane 1.54 K11 Land at New Street 1.83 K12 Land at Clinton Road 16.54 K13 Land at Crackley Lane/ Coventry Road 9.01 K14 Playing Fields at Coventry Road/ Princes Drive 3.13 K15 Talisman Theatre Site 0.13 K17 Southcrest Farm, Glasshouse lane 16.79 K18 Glasshouse Lane/ Crewe Lane 37.28 K19 Woodside Training Centre 15.01 K20 Kenilworth Wardens Cricket Club 4.75 K21 Oaks Farm 102.26 K22 Former Magistrates Court 0.21 K23 Confidential Site 0.65 K24 Confidential Site 0.34 K25 East of Warwick Road 5.68

ADL/130372 54
SITES ON THE EDGE OF COVENTRY
Site Ref Site Name Site Area
C01 Russells Garden Centre Baginton 7.87 C02 Land SW of Westwood Heath Road Burton Green 2.44
C03 Westwood Heath Road/Bockendon Road Westwood Heath 14.40
C04 Land at Oak Lea, Howes Lane Coventry 1.77 C05 Land off Cromwell Lane Burton Green 3.21 C06 King's Hill Lane, Finham Coventry 269.24 C07 Land at Mill Hill Baginton 9.97 C08 Russells Garden Centre East Baginton 2.34 C09 Lodge Farmhouse Westwood Heath 0.13 C10 Land south of Baginton Baginton 62.26 C12 Seven Acre Egg Farm Coventry 3.91 C13 Lodge Farm Westwood Heath 30.48 C14 Land North of Baginton - Junction A45/A46 Baginton 13.59 C15 Land off Church Road Baginton 2.75 C18 Hurst Farm South Burton Green 99.19 C19 Land at Baginton Baginton 363.00

ADL/130372 55
SITES IN THE RURAL AREA
Site Ref Site Name Site Area
R01 The Valley, Radford Semele Radford Semele 0.14 R02 Hill Farm Bishops Tachbrook 18.54 R03 Tinkers Close Radford Semele 0.73 R04 Land adjacent to The Meadow House Lapworth 0.11 R06 Land South of Baddersley Clinton Baddesley Clinton 3.49 R07 Adjacent to Oak Gable Cottage Baddesley Clinton 0.38
R08 Land North of Oakley Cottage, Bedlam's End Chadwick End 0.78
R09 Barford House Barford 4.39 R10 South of Barford House Barford 0.83 R11 South of School Bishops Tachbrook 4.11 R12 Land north of Croft Close Bishops Tachbrook 1.84 R13 Shrewley Gate Nursery Shrewley 1.35 R14 Land east of Oakley Wood Road Bishops Tachbrook 2.54 R15 Land west of Wellesbourne Road Barford 0.17 R16 Sherbourne Nursery Barford 2.59 R17 Land at Brickyard Cottage Bishops Tachbrook 3.66 R18 Land NW of Rye Fields Bishops Tachbrook 0.61 R19 Land at Brickyard Farm Bishops Tachbrook 35.34 R20 Land at Brickyard Barn Bishops Tachbrook 0.28 R21 Land South of Radford Semele Radford Semele 2.62 R22 Land West of Bishop's Tachbrook Bishops Tachbrook 2.41 R23 Low Hill, Oakley Wood Road Bishops Tachbrook 0.37 R25 Ward's Hill & Snitterfield Lane Norton Lindsey 0.25 R26 Land West of Old Budbrooke Road Budbrooke 1.50 R27 Land Fronting Ward's Hill Norton Lindsey 0.90 R28 Land adj. Hall Farm Cottages Hunningham 0.20 R29 R/O 65 Lewis Road & Thornley Close Radford Semele 0.17 R30 Land south of Westham Lane Leamington Spa 1.25 R31 Land at Tachbrook Hill Farm Bishops Tachbrook 18.43 R33 South East of Convent Farm Baddesley Clinton 0.76 R34 Land West of Baddesley Clinton Baddesley Clinton 20.66 R35 Land at the Plough Eathorpe 0.20 R39 Land at Hatton Green Hatton 0.34 R40 Land at the Gatehouse Shrewley 0.42 R41 Land at Southam Road Radford Semele 7.78 R42 Land at Village Farm Offchurch 0.67 R43 Sydon's Piece Offchurch 3.84 R44 Canal Field, Offchurch Lane Radford Semele 2.58 R45 Canal Wharf, Offchurch Lane Radford Semele 1.14 R46 Land West of School Lane Radford Semele 14.06 R47 Land R/O Rectory Barford 0.28 R48 West of School Hill Offchurch 0.26 R49 Land off Green Lane, Little Shrewley Shrewley 0.32 R50 Land at Convent Farm Baddesley Clinton 0.28

ADL/130372 56
Site Ref Site Name Site Area
R51 Land SE of Shrewley Common Shrewley 0.27 R52 New House Farm Bishops Tachbrook 47.60 R53 R/O The Hamlet Leek Wootton 3.36 R54 Land N of Hill Wootton Road Leek Wootton 1.80 R55 West of Mill Lane Barford 0.54 R56 South West Radford Semele Radford Semele 5.94 R57 Land off Moat Close, Bubbenhall Bubbenhall 1.00 R58 Land at Red Lane Burton Green 0.43 R59 Land off Pit Hill/ Church Road Bubbenhall 3.02 R60 Land R/O Lower End Bubbenhall 3.82 R61 Land off Ryton Road Bubbenhall 1.73 R62 Land Off Warwick Road Leek Wootton 4.59 R63 Land NW of Leek Wootton Leek Wootton 25.50 R64 Land NE of Leek Wootton (1&2) Leek Wootton 46.90 R65 R/O Savages Close Bishops Tachbrook 2.44 R66 Land fronting Old Warwick Road Lapworth 0.19 R67 Land Fronting Southam Road Radford Semele 3.38 R68 Sunnyside, Valley Road Radford Semele 2.23 R69 South of Elmdene Close Hatton 1.25 R70 North of Hatton Station Hatton 2.06 R71 West of Station Road Hatton 1.20 R72 Cubbington Wood Yard Cubbington 1.04 R73 Land off Starmer Place Hatton 0.60 R74 Land South of Arras Boulevard Hampton Magna 6.45 R75 407 Birmingham Road & Land to West Hatton 1.15 R76 Confidential Site Kenilworth 19.63 R77 Former Storage Depot Hatton 1.16 R78 Village Field (North) Eathorpe 0.60 R79 Village Field (South) Eathorpe 0.38 R80 Penns Lane Eathorpe 0.72 R81 Confidential Site Pinley Green 0.81
Note: highlighted sites have been tested as the five strategic sites in this study.

ADL/130372 57
Appendix 2 - Strategic sites details from SHLAA

ADL/130372 58

ADL/130372 59

ADL/130372 60
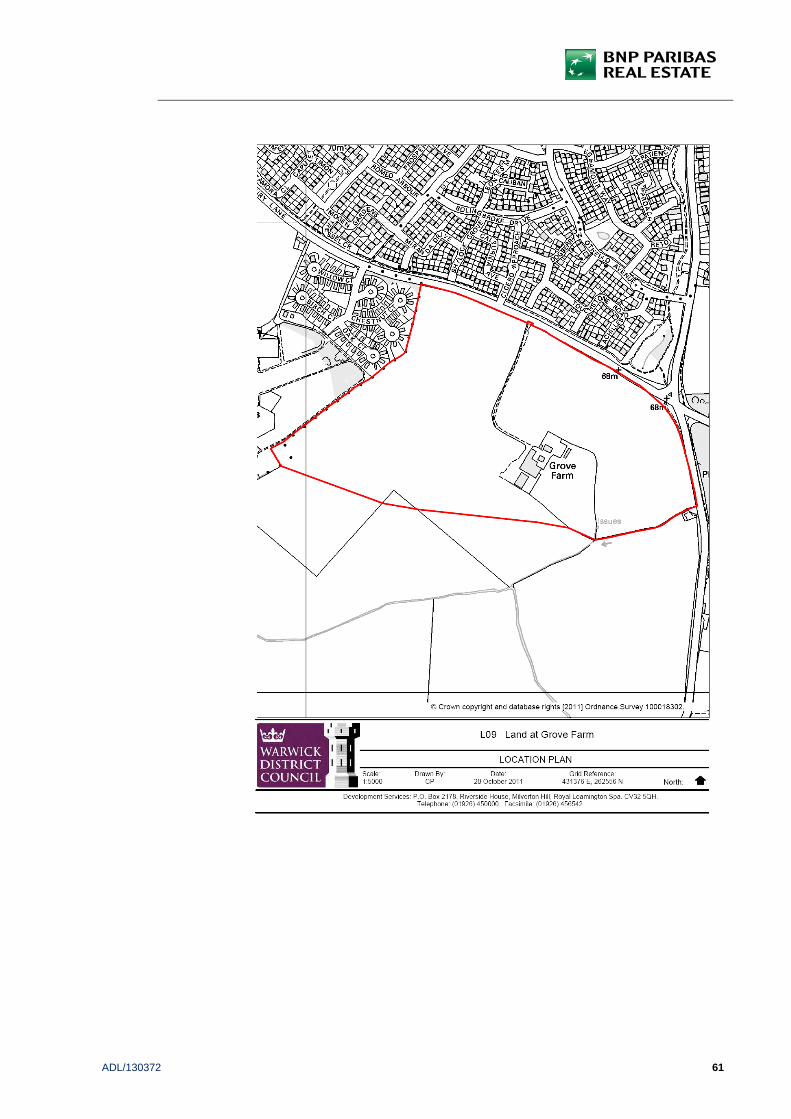
ADL/130372 61

ADL/130372 62

ADL/130372 63

ADL/130372 64

ADL/130372 65
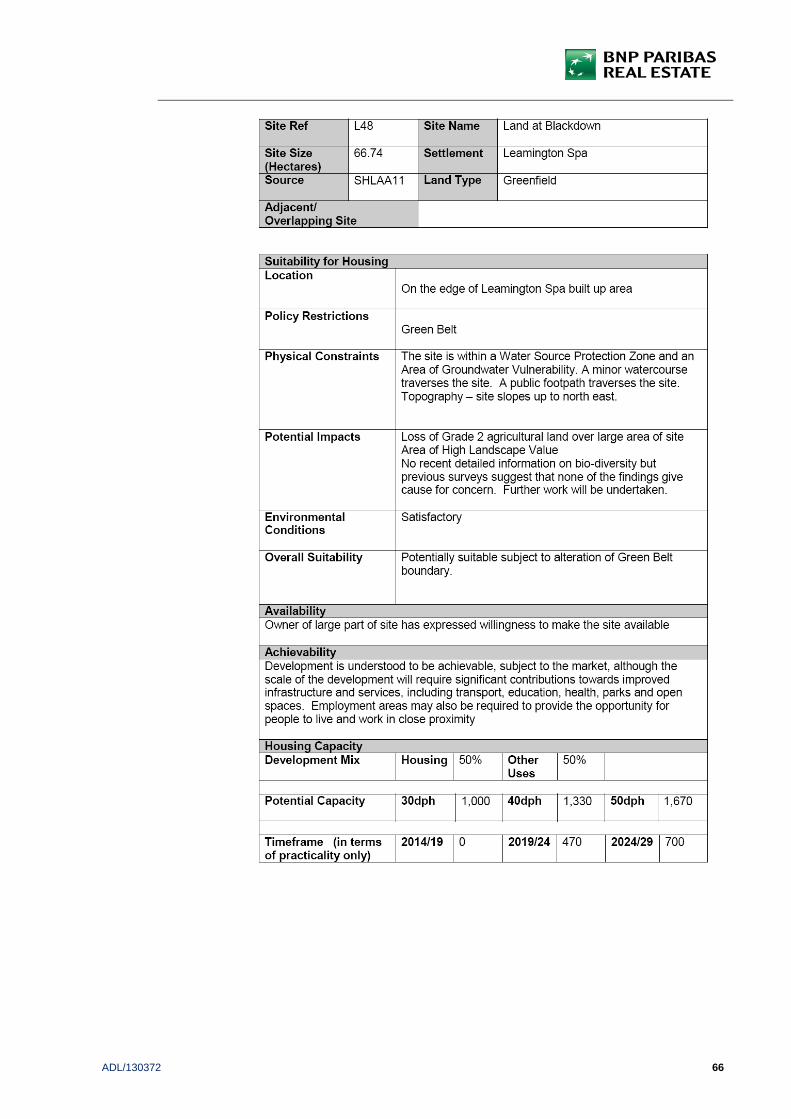
ADL/130372 66

ADL/130372 67

ADL/130372 68
Appendix 3 - Residential appraisal results

ADL/130372 69
Appendix 4 - Strategic sites appraisal results

ADL/130372 70
Appendix 5 - Commercial appraisal results

Community Infrastructure Levy Viability #N/A = Scheme RLV is lower
Warwick District Council than EUV with nil rate of CIL.
Results summary
Site type Type 1 - 4 units, houses, GF
BLV1 BLV2 BLV3 BLV4Warwick #N/A #N/A #N/A 60Leamington Spa 0 250 250 250Kenilworth #N/A 180 250 250Rural areas (higher value) 140 250 250 250Rural areas (lower value) #N/A #N/A 80 180
Site type Type 2 - 8 units, houses, UB
BLV1 BLV2 BLV3 BLV4Warwick #N/A #N/A 20 100Leamington Spa 200 250 250 250Kenilworth #N/A 250 250 250Rural areas (higher value) 250 250 250 250Rural areas (lower value) #N/A 60 140 220
Site type Type 3 - 25 units, houses & flats, GF
BLV1 BLV2 BLV3 BLV4Warwick #N/A #N/A #N/A #N/ALeamington Spa #N/A 250 250 250Kenilworth #N/A 60 180 250Rural areas (higher value) #N/A 250 250 250Rural areas (lower value) #N/A #N/A #N/A 80
Site type Type 4 - 35 units, houses & flats, GF
BLV1 BLV2 BLV3 BLV4Warwick #N/A #N/A #N/A #N/ALeamington Spa #N/A 220 250 250Kenilworth #N/A #N/A 120 250Rural areas (higher value) #N/A 250 250 250Rural areas (lower value) #N/A #N/A #N/A 40
Site type Type 5 - 50 units, houses & flats, UB
BLV1 BLV2 BLV3 BLV4Warwick #N/A #N/A #N/A #N/ALeamington Spa 0 250 250 250Kenilworth #N/A 40 100 160Rural areas (higher value) 160 250 250 250Rural areas (lower value) #N/A #N/A #N/A #N/A

Community Infrastructure Levy Viability #N/A = Scheme RLV is lower
Warwick District Council than EUV with nil rate of CIL.
Results summary
Site type Type 6 - 65 units, houses & flats, UB
BLV1 BLV2 BLV3 BLV4Warwick #N/A #N/A #N/A #N/ALeamington Spa #N/A 250 250 250Kenilworth #N/A 40 120 180Rural areas (higher value) 120 250 250 250Rural areas (lower value) #N/A #N/A #N/A 0
0 #N/A #N/A #N/A #N/A0 #N/A #N/A #N/A #N/A
Site type Type 7 - 75 units, houses, GF
BLV1 BLV2 BLV3 BLV4Warwick #N/A #N/A #N/A #N/ALeamington Spa #N/A 60 240 250Kenilworth #N/A #N/A 0 160Rural areas (higher value) #N/A 220 250 250Rural areas (lower value) #N/A #N/A #N/A #N/A
0 #N/A #N/A #N/A #N/A0 #N/A #N/A #N/A #N/A
Site type Type 8 - 75 units, houses, GF
BLV1 BLV2 BLV3 BLV4Warwick #N/A #N/A #N/A #N/ALeamington Spa #N/A 250 250 250Kenilworth #N/A 60 160 250Rural areas (higher value) #N/A 250 250 250Rural areas (lower value) #N/A #N/A #N/A 80
0 #N/A #N/A #N/A #N/A0 #N/A #N/A #N/A #N/A
Site type Type 9 - 100 units, flats, UB
BLV1 BLV2 BLV3 BLV4Warwick #N/A #N/A #N/A #N/ALeamington Spa #N/A #N/A #N/A #N/AKenilworth #N/A #N/A #N/A #N/ARural areas (higher value) #N/A #N/A 0 80Rural areas (lower value) #N/A #N/A #N/A #N/A
0 #N/A #N/A #N/A #N/A0 #N/A #N/A #N/A #N/A

Community Infrastructure Levy Benchmark Land Values (per gross ha)Warwick District Council BLV1 BLV2 BLV3 BLV4
Commercial 1 Commercial 2 Warehousing Community uses
£1,049,750 £500,000 £371,000 £247,000
Site type 1100% houses Affordable % 40% Site area 0.17 ha
No of units 4 units % rented 80% Net to gross 67%Density: 35 dph % intermed 20%CSH level: 4 Growth
Sales 0% Build 0%
Warwick Private values £2307 psmMaximum CIL rates (per square metre)
CIL amount per sq m
RLV RLV per ha RLV less BLV 1 RLV less BLV 2 RLV less BLV 3 RLV less BLV 4 BLV1 BLV2 BLV3 BLV4
0 58,782 344,609 -705,141 -155,391 -26,391 97,609 #N/A #N/A #N/A £6020 53,448 313,341 -736,409 -186,659 -57,659 66,34140 49,126 288,002 -761,748 -211,998 -82,998 41,00260 44,804 262,663 -787,087 -237,337 -108,337 15,66380 40,482 237,324 -812,426 -262,676 -133,676 -9,676
100 36,161 211,991 -837,759 -288,009 -159,009 -35,009 120 31,838 186,652 -863,098 -313,348 -184,348 -60,348 140 27,516 161,313 -888,437 -338,687 -209,687 -85,687 160 23,194 135,974 -913,776 -364,026 -235,026 -111,026 180 18,872 110,635 -939,115 -389,365 -260,365 -136,365 200 14,549 85,296 -964,454 -414,704 -285,704 -161,704 210 12,388 72,626 -977,124 -427,374 -298,374 -174,374 220 10,227 59,957 -989,793 -440,043 -311,043 -187,043 230 8,066 47,287 -1,002,463 -452,713 -323,713 -199,713 240 5,905 34,618 -1,015,132 -465,382 -336,382 -212,382 250 3,744 21,948 -1,027,802 -478,052 -349,052 -225,052
Leamington Spa Private values £2981 psmMaximum CIL rates (per square metre)
CIL amount per sq m
RLV RLV per ha RLV less BLV 1 RLV less BLV 2 RLV less BLV 3 RLV less BLV 4 BLV1 BLV2 BLV3 BLV4
0 £181,169 1,062,106 12,356 562,106 691,106 815,106 £0 £250 £250 £25020 173,731 1,018,500 -31,250 518,500 647,500 771,50040 169,409 993,161 -56,589 493,161 622,161 746,16160 165,087 967,822 -81,928 467,822 596,822 720,82280 160,766 942,489 -107,261 442,489 571,489 695,489
100 156,443 917,150 -132,600 417,150 546,150 670,150120 152,121 891,811 -157,939 391,811 520,811 644,811140 147,799 866,472 -183,278 366,472 495,472 619,472160 143,477 841,133 -208,617 341,133 470,133 594,133180 139,155 815,794 -233,956 315,794 444,794 568,794200 134,832 790,455 -259,295 290,455 419,455 543,455210 132,671 777,785 -271,965 277,785 406,785 530,785220 130,510 765,115 -284,635 265,115 394,115 518,115230 128,349 752,446 -297,304 252,446 381,446 505,446240 126,188 739,776 -309,974 239,776 368,776 492,776250 124,028 727,113 -322,637 227,113 356,113 480,113
Kenilworth Private values £2691 psmMaximum CIL rates (per square metre)
CIL amount per sq m
RLV RLV per ha RLV less BLV 1 RLV less BLV 2 RLV less BLV 3 RLV less BLV 4 BLV1 BLV2 BLV3 BLV4
0 128,510 753,387 -296,363 253,387 382,387 506,387 #N/A £180 £250 £25020 121,978 715,096 -334,654 215,096 344,096 468,09640 117,656 689,757 -359,993 189,757 318,757 442,75760 113,334 664,418 -385,332 164,418 293,418 417,41880 109,011 639,079 -410,671 139,079 268,079 392,079
100 104,689 613,740 -436,010 113,740 242,740 366,740120 100,367 588,401 -461,349 88,401 217,401 341,401140 96,045 563,062 -486,688 63,062 192,062 316,062160 91,723 537,729 -512,021 37,729 166,729 290,729180 87,401 512,390 -537,360 12,390 141,390 265,390200 83,079 487,051 -562,699 -12,949 116,051 240,051210 80,918 474,381 -575,369 -25,619 103,381 227,381220 78,757 461,711 -588,039 -38,289 90,711 214,711230 76,596 449,042 -600,708 -50,958 78,042 202,042240 74,435 436,372 -613,378 -63,628 65,372 189,372250 72,273 423,703 -626,047 -76,297 52,703 176,703
Rural areas (higher value) Private values £3180 psmMaximum CIL rates (per square metre)
CIL amount per sq m
RLV RLV per ha RLV less BLV 1 RLV less BLV 2 RLV less BLV 3 RLV less BLV 4 BLV1 BLV2 BLV3 BLV4
0 217,305 1,273,948 224,198 773,948 902,948 1,026,948 £140 £250 £250 £25020 209,246 1,226,704 176,954 726,704 855,704 979,70440 204,924 1,201,365 151,615 701,365 830,365 954,36560 200,601 1,176,026 126,276 676,026 805,026 929,02680 196,279 1,150,687 100,937 650,687 779,687 903,687
100 191,957 1,125,347 75,597 625,347 754,347 878,347120 187,635 1,100,008 50,258 600,008 729,008 853,008140 183,312 1,074,669 24,919 574,669 703,669 827,669160 178,990 1,049,330 -420 549,330 678,330 802,330180 174,668 1,023,991 -25,759 523,991 652,991 776,991200 170,347 998,658 -51,092 498,658 627,658 751,658210 168,186 985,988 -63,762 485,988 614,988 738,988220 166,025 973,319 -76,431 473,319 602,319 726,319230 163,863 960,649 -89,101 460,649 589,649 713,649240 161,702 947,980 -101,770 447,980 576,980 700,980250 159,541 935,310 -114,440 435,310 564,310 688,310

Site type 1
Rural areas (lower value) Private values £2449 psmMaximum CIL rates (per square metre)
CIL amount per sq m
RLV RLV per ha RLV less BLV 1 RLV less BLV 2 RLV less BLV 3 RLV less BLV 4 BLV1 BLV2 BLV3 BLV4
0 84,566 495,771 -553,979 -4,229 124,771 248,771 #N/A #N/A £80 £18020 78,790 461,908 -587,842 -38,092 90,908 214,90840 74,468 436,569 -613,181 -63,431 65,569 189,56960 70,146 411,230 -638,520 -88,770 40,230 164,23080 65,824 385,891 -663,859 -114,109 14,891 138,891
100 61,501 360,552 -689,198 -139,448 -10,448 113,552120 57,179 335,213 -714,537 -164,787 -35,787 88,213140 52,858 309,879 -739,871 -190,121 -61,121 62,879160 48,536 284,540 -765,210 -215,460 -86,460 37,540180 44,213 259,201 -790,549 -240,799 -111,799 12,201200 39,891 233,862 -815,888 -266,138 -137,138 -13,138 210 37,730 221,193 -828,557 -278,807 -149,807 -25,807 220 35,569 208,523 -841,227 -291,477 -162,477 -38,477 230 33,408 195,854 -853,896 -304,146 -175,146 -51,146 240 31,247 183,184 -866,566 -316,816 -187,816 -63,816 250 29,086 170,515 -879,235 -329,485 -200,485 -76,485
0 Private values £ psmMaximum CIL rates (per square metre)
CIL amount per sq m
RLV RLV per ha RLV less BLV 1 RLV less BLV 2 RLV less BLV 3 RLV less BLV 4 BLV1 BLV2 BLV3 BLV4
0 -366,024 -2,145,818 -3,195,568 -2,645,818 -2,516,818 -2,392,818 #N/A #N/A #N/A #N/A20 -364,122 -2,134,664 -3,184,414 -2,634,664 -2,505,664 -2,381,664 40 -368,514 -2,160,413 -3,210,163 -2,660,413 -2,531,413 -2,407,413 60 -372,907 -2,186,169 -3,235,919 -2,686,169 -2,557,169 -2,433,169 80 -377,300 -2,211,919 -3,261,669 -2,711,919 -2,582,919 -2,458,919
100 -381,693 -2,237,674 -3,287,424 -2,737,674 -2,608,674 -2,484,674 120 -386,085 -2,263,424 -3,313,174 -2,763,424 -2,634,424 -2,510,424 140 -390,478 -2,289,179 -3,338,929 -2,789,179 -2,660,179 -2,536,179 160 -394,871 -2,314,929 -3,364,679 -2,814,929 -2,685,929 -2,561,929 180 -399,264 -2,340,685 -3,390,435 -2,840,685 -2,711,685 -2,587,685 200 -403,656 -2,366,434 -3,416,184 -2,866,434 -2,737,434 -2,613,434 210 -405,853 -2,379,312 -3,429,062 -2,879,312 -2,750,312 -2,626,312 220 -408,049 -2,392,190 -3,441,940 -2,892,190 -2,763,190 -2,639,190 230 -410,246 -2,405,068 -3,454,818 -2,905,068 -2,776,068 -2,652,068 240 -412,442 -2,417,939 -3,467,689 -2,917,939 -2,788,939 -2,664,939 250 -414,638 -2,430,817 -3,480,567 -2,930,817 -2,801,817 -2,677,817

Community Infrastructure Levy Benchmark Land Values (per gross ha)Warwick District Council BLV1 BLV2 BLV3 BLV4
Commercial 1 Commercial 2 Warehousing Community uses
£1,049,750 £500,000 £371,000 £247,000
Site type 2100% houses Affordable % 40% Site area 0.23 ha
No of units 8 units % rented 80% Net to gross 100%Density: 35 dph % intermed 20%CSH level: 4 Growth
Sales 0% Build 0%
Warwick Private values £2307 psmMaximum CIL rates (per square metre)
CIL amount per sq m
RLV RLV per ha RLV less BLV 1 RLV less BLV 2 RLV less BLV 3 RLV less BLV 4 BLV1 BLV2 BLV3 BLV4
0 100,686 440,501 -609,249 -59,499 69,501 193,501 #N/A #N/A £20 £10020 90,780 397,161 -652,589 -102,839 26,161 150,16140 82,605 361,396 -688,354 -138,604 -9,604 114,39660 74,430 325,630 -724,120 -174,370 -45,370 78,63080 66,256 289,869 -759,881 -210,131 -81,131 42,869
100 58,081 254,103 -795,647 -245,897 -116,897 7,103120 49,906 218,338 -831,412 -281,662 -152,662 -28,662 140 41,732 182,577 -867,173 -317,423 -188,423 -64,423 160 33,557 146,811 -902,939 -353,189 -224,189 -100,189 180 25,382 111,045 -938,705 -388,955 -259,955 -135,955 200 17,208 75,284 -974,466 -424,716 -295,716 -171,716 210 13,120 57,399 -992,351 -442,601 -313,601 -189,601 220 9,033 39,519 -1,010,231 -460,481 -331,481 -207,481 230 4,946 21,638 -1,028,112 -478,362 -349,362 -225,362 240 858 3,753 -1,045,997 -496,247 -367,247 -243,247 250 -3,282 -14,360 -1,064,110 -514,360 -385,360 -261,360
Leamington Spa Private values £2981 psmMaximum CIL rates (per square metre)
CIL amount per sq m
RLV RLV per ha RLV less BLV 1 RLV less BLV 2 RLV less BLV 3 RLV less BLV 4 BLV1 BLV2 BLV3 BLV4
0 330,752 1,447,042 397,292 947,042 1,076,042 1,200,042 £200 £250 £250 £25020 317,021 1,386,968 337,218 886,968 1,015,968 1,139,96840 308,978 1,351,778 302,028 851,778 980,778 1,104,77860 300,934 1,316,588 266,838 816,588 945,588 1,069,58880 292,891 1,281,399 231,649 781,399 910,399 1,034,399
100 284,730 1,245,694 195,944 745,694 874,694 998,694120 276,555 1,209,928 160,178 709,928 838,928 962,928140 268,381 1,174,167 124,417 674,167 803,167 927,167160 260,206 1,138,401 88,651 638,401 767,401 891,401180 252,031 1,102,636 52,886 602,636 731,636 855,636200 243,856 1,066,870 17,120 566,870 695,870 819,870210 239,769 1,048,989 -761 548,989 677,989 801,989220 235,682 1,031,109 -18,641 531,109 660,109 784,109230 231,594 1,013,224 -36,526 513,224 642,224 766,224240 227,507 995,343 -54,407 495,343 624,343 748,343250 223,420 977,463 -72,287 477,463 606,463 730,463
Kenilworth Private values £2691 psmMaximum CIL rates (per square metre)
CIL amount per sq m
RLV RLV per ha RLV less BLV 1 RLV less BLV 2 RLV less BLV 3 RLV less BLV 4 BLV1 BLV2 BLV3 BLV4
0 232,075 1,015,328 -34,422 515,328 644,328 768,328 #N/A £250 £250 £25020 219,909 962,101 -87,649 462,101 591,101 715,10140 211,734 926,336 -123,414 426,336 555,336 679,33660 203,560 890,574 -159,176 390,574 519,574 643,57480 195,385 854,809 -194,941 354,809 483,809 607,809
100 187,210 819,043 -230,707 319,043 448,043 572,043120 179,036 783,282 -266,468 283,282 412,282 536,282140 170,861 747,516 -302,234 247,516 376,516 500,516160 162,686 711,751 -337,999 211,751 340,751 464,751180 154,512 675,990 -373,760 175,990 304,990 428,990200 146,337 640,224 -409,526 140,224 269,224 393,224210 142,250 622,344 -427,406 122,344 251,344 375,344220 138,162 604,459 -445,291 104,459 233,459 357,459230 134,075 586,578 -463,172 86,578 215,578 339,578240 129,988 568,697 -481,053 68,697 197,697 321,697250 125,900 550,812 -498,938 50,812 179,812 303,812
Rural areas (higher value) Private values £3180 psmMaximum CIL rates (per square metre)
CIL amount per sq m
RLV RLV per ha RLV less BLV 1 RLV less BLV 2 RLV less BLV 3 RLV less BLV 4 BLV1 BLV2 BLV3 BLV4
0 398,066 1,741,540 691,790 1,241,540 1,370,540 1,494,540 £250 £250 £250 £25020 383,176 1,676,395 626,645 1,176,395 1,305,395 1,429,39540 375,134 1,641,210 591,460 1,141,210 1,270,210 1,394,21060 367,090 1,606,020 556,270 1,106,020 1,235,020 1,359,02080 359,047 1,570,831 521,081 1,070,831 1,199,831 1,323,831
100 351,004 1,535,641 485,891 1,035,641 1,164,641 1,288,641120 342,961 1,500,456 450,706 1,000,456 1,129,456 1,253,456140 334,918 1,465,266 415,516 965,266 1,094,266 1,218,266160 326,875 1,430,076 380,326 930,076 1,059,076 1,183,076180 318,831 1,394,887 345,137 894,887 1,023,887 1,147,887200 310,775 1,359,640 309,890 859,640 988,640 1,112,640210 306,688 1,341,760 292,010 841,760 970,760 1,094,760220 302,601 1,323,879 274,129 823,879 952,879 1,076,879230 298,513 1,305,994 256,244 805,994 934,994 1,058,994240 294,426 1,288,113 238,363 788,113 917,113 1,041,113250 290,339 1,270,233 220,483 770,233 899,233 1,023,233
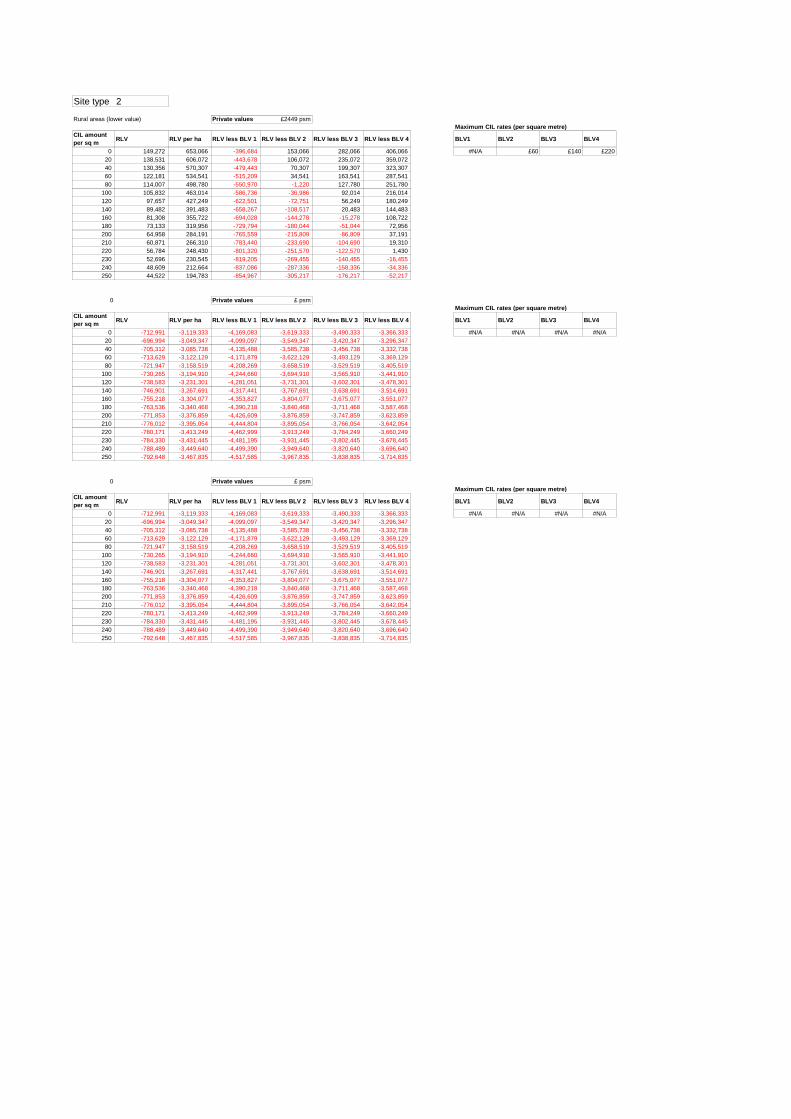
Site type 2
Rural areas (lower value) Private values £2449 psmMaximum CIL rates (per square metre)
CIL amount per sq m
RLV RLV per ha RLV less BLV 1 RLV less BLV 2 RLV less BLV 3 RLV less BLV 4 BLV1 BLV2 BLV3 BLV4
0 149,272 653,066 -396,684 153,066 282,066 406,066 #N/A £60 £140 £22020 138,531 606,072 -443,678 106,072 235,072 359,07240 130,356 570,307 -479,443 70,307 199,307 323,30760 122,181 534,541 -515,209 34,541 163,541 287,54180 114,007 498,780 -550,970 -1,220 127,780 251,780
100 105,832 463,014 -586,736 -36,986 92,014 216,014120 97,657 427,249 -622,501 -72,751 56,249 180,249140 89,482 391,483 -658,267 -108,517 20,483 144,483160 81,308 355,722 -694,028 -144,278 -15,278 108,722180 73,133 319,956 -729,794 -180,044 -51,044 72,956200 64,958 284,191 -765,559 -215,809 -86,809 37,191210 60,871 266,310 -783,440 -233,690 -104,690 19,310220 56,784 248,430 -801,320 -251,570 -122,570 1,430230 52,696 230,545 -819,205 -269,455 -140,455 -16,455 240 48,609 212,664 -837,086 -287,336 -158,336 -34,336 250 44,522 194,783 -854,967 -305,217 -176,217 -52,217
0 Private values £ psmMaximum CIL rates (per square metre)
CIL amount per sq m
RLV RLV per ha RLV less BLV 1 RLV less BLV 2 RLV less BLV 3 RLV less BLV 4 BLV1 BLV2 BLV3 BLV4
0 -712,991 -3,119,333 -4,169,083 -3,619,333 -3,490,333 -3,366,333 #N/A #N/A #N/A #N/A20 -696,994 -3,049,347 -4,099,097 -3,549,347 -3,420,347 -3,296,347 40 -705,312 -3,085,738 -4,135,488 -3,585,738 -3,456,738 -3,332,738 60 -713,629 -3,122,129 -4,171,879 -3,622,129 -3,493,129 -3,369,129 80 -721,947 -3,158,519 -4,208,269 -3,658,519 -3,529,519 -3,405,519
100 -730,265 -3,194,910 -4,244,660 -3,694,910 -3,565,910 -3,441,910 120 -738,583 -3,231,301 -4,281,051 -3,731,301 -3,602,301 -3,478,301 140 -746,901 -3,267,691 -4,317,441 -3,767,691 -3,638,691 -3,514,691 160 -755,218 -3,304,077 -4,353,827 -3,804,077 -3,675,077 -3,551,077 180 -763,536 -3,340,468 -4,390,218 -3,840,468 -3,711,468 -3,587,468 200 -771,853 -3,376,859 -4,426,609 -3,876,859 -3,747,859 -3,623,859 210 -776,012 -3,395,054 -4,444,804 -3,895,054 -3,766,054 -3,642,054 220 -780,171 -3,413,249 -4,462,999 -3,913,249 -3,784,249 -3,660,249 230 -784,330 -3,431,445 -4,481,195 -3,931,445 -3,802,445 -3,678,445 240 -788,489 -3,449,640 -4,499,390 -3,949,640 -3,820,640 -3,696,640 250 -792,648 -3,467,835 -4,517,585 -3,967,835 -3,838,835 -3,714,835
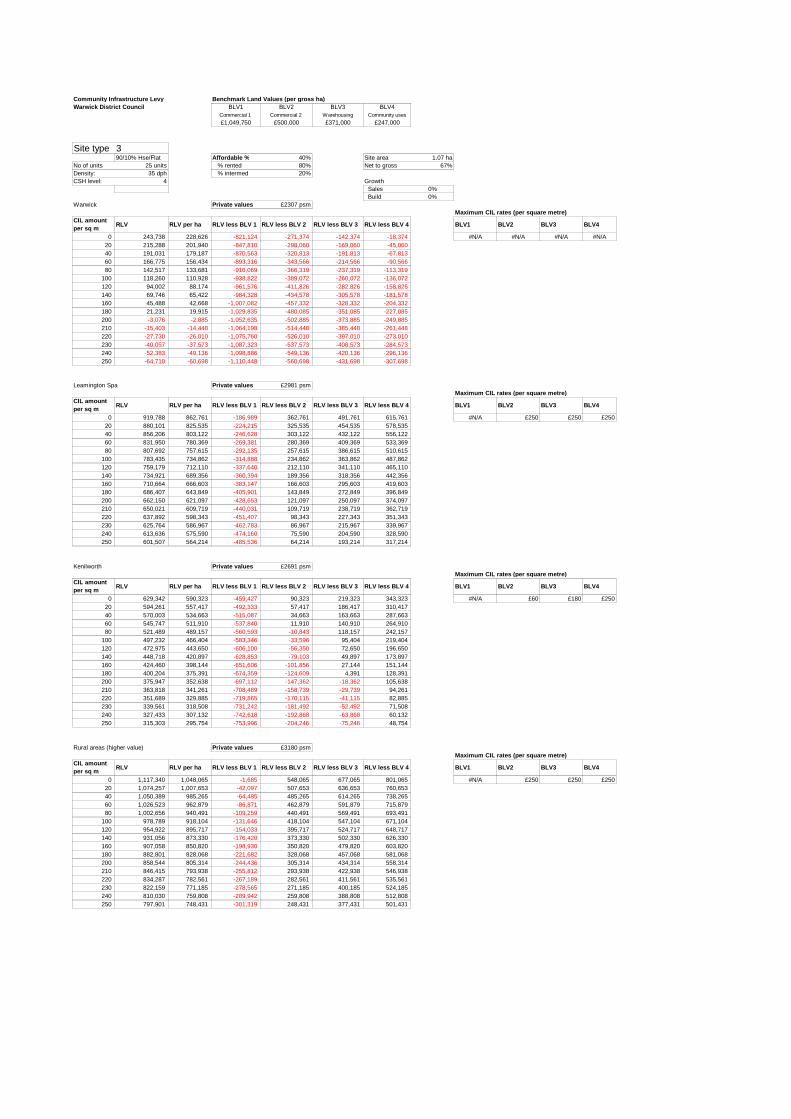
Community Infrastructure Levy Benchmark Land Values (per gross ha)Warwick District Council BLV1 BLV2 BLV3 BLV4
Commercial 1 Commercial 2 Warehousing Community uses
£1,049,750 £500,000 £371,000 £247,000
Site type 390/10% Hse/Flat Affordable % 40% Site area 1.07 ha
No of units 25 units % rented 80% Net to gross 67%Density: 35 dph % intermed 20%CSH level: 4 Growth
Sales 0% Build 0%
Warwick Private values £2307 psmMaximum CIL rates (per square metre)
CIL amount per sq m
RLV RLV per ha RLV less BLV 1 RLV less BLV 2 RLV less BLV 3 RLV less BLV 4 BLV1 BLV2 BLV3 BLV4
0 243,738 228,626 -821,124 -271,374 -142,374 -18,374 #N/A #N/A #N/A #N/A20 215,288 201,940 -847,810 -298,060 -169,060 -45,060 40 191,031 179,187 -870,563 -320,813 -191,813 -67,813 60 166,775 156,434 -893,316 -343,566 -214,566 -90,566 80 142,517 133,681 -916,069 -366,319 -237,319 -113,319
100 118,260 110,928 -938,822 -389,072 -260,072 -136,072 120 94,002 88,174 -961,576 -411,826 -282,826 -158,826 140 69,746 65,422 -984,328 -434,578 -305,578 -181,578 160 45,488 42,668 -1,007,082 -457,332 -328,332 -204,332 180 21,231 19,915 -1,029,835 -480,085 -351,085 -227,085 200 -3,076 -2,885 -1,052,635 -502,885 -373,885 -249,885 210 -15,403 -14,448 -1,064,198 -514,448 -385,448 -261,448 220 -27,730 -26,010 -1,075,760 -526,010 -397,010 -273,010 230 -40,057 -37,573 -1,087,323 -537,573 -408,573 -284,573 240 -52,383 -49,136 -1,098,886 -549,136 -420,136 -296,136 250 -64,710 -60,698 -1,110,448 -560,698 -431,698 -307,698
Leamington Spa Private values £2981 psmMaximum CIL rates (per square metre)
CIL amount per sq m
RLV RLV per ha RLV less BLV 1 RLV less BLV 2 RLV less BLV 3 RLV less BLV 4 BLV1 BLV2 BLV3 BLV4
0 919,788 862,761 -186,989 362,761 491,761 615,761 #N/A £250 £250 £25020 880,101 825,535 -224,215 325,535 454,535 578,53540 856,206 803,122 -246,628 303,122 432,122 556,12260 831,950 780,369 -269,381 280,369 409,369 533,36980 807,692 757,615 -292,135 257,615 386,615 510,615
100 783,435 734,862 -314,888 234,862 363,862 487,862120 759,179 712,110 -337,640 212,110 341,110 465,110140 734,921 689,356 -360,394 189,356 318,356 442,356160 710,664 666,603 -383,147 166,603 295,603 419,603180 686,407 643,849 -405,901 143,849 272,849 396,849200 662,150 621,097 -428,653 121,097 250,097 374,097210 650,021 609,719 -440,031 109,719 238,719 362,719220 637,892 598,343 -451,407 98,343 227,343 351,343230 625,764 586,967 -462,783 86,967 215,967 339,967240 613,636 575,590 -474,160 75,590 204,590 328,590250 601,507 564,214 -485,536 64,214 193,214 317,214
Kenilworth Private values £2691 psmMaximum CIL rates (per square metre)
CIL amount per sq m
RLV RLV per ha RLV less BLV 1 RLV less BLV 2 RLV less BLV 3 RLV less BLV 4 BLV1 BLV2 BLV3 BLV4
0 629,342 590,323 -459,427 90,323 219,323 343,323 #N/A £60 £180 £25020 594,261 557,417 -492,333 57,417 186,417 310,41740 570,003 534,663 -515,087 34,663 163,663 287,66360 545,747 511,910 -537,840 11,910 140,910 264,91080 521,489 489,157 -560,593 -10,843 118,157 242,157
100 497,232 466,404 -583,346 -33,596 95,404 219,404120 472,975 443,650 -606,100 -56,350 72,650 196,650140 448,718 420,897 -628,853 -79,103 49,897 173,897160 424,460 398,144 -651,606 -101,856 27,144 151,144180 400,204 375,391 -674,359 -124,609 4,391 128,391200 375,947 352,638 -697,112 -147,362 -18,362 105,638210 363,818 341,261 -708,489 -158,739 -29,739 94,261220 351,689 329,885 -719,865 -170,115 -41,115 82,885230 339,561 318,508 -731,242 -181,492 -52,492 71,508240 327,433 307,132 -742,618 -192,868 -63,868 60,132250 315,303 295,754 -753,996 -204,246 -75,246 48,754
Rural areas (higher value) Private values £3180 psmMaximum CIL rates (per square metre)
CIL amount per sq m
RLV RLV per ha RLV less BLV 1 RLV less BLV 2 RLV less BLV 3 RLV less BLV 4 BLV1 BLV2 BLV3 BLV4
0 1,117,340 1,048,065 -1,685 548,065 677,065 801,065 #N/A £250 £250 £25020 1,074,257 1,007,653 -42,097 507,653 636,653 760,65340 1,050,389 985,265 -64,485 485,265 614,265 738,26560 1,026,523 962,879 -86,871 462,879 591,879 715,87980 1,002,656 940,491 -109,259 440,491 569,491 693,491
100 978,789 918,104 -131,646 418,104 547,104 671,104120 954,922 895,717 -154,033 395,717 524,717 648,717140 931,056 873,330 -176,420 373,330 502,330 626,330160 907,058 850,820 -198,930 350,820 479,820 603,820180 882,801 828,068 -221,682 328,068 457,068 581,068200 858,544 805,314 -244,436 305,314 434,314 558,314210 846,415 793,938 -255,812 293,938 422,938 546,938220 834,287 782,561 -267,189 282,561 411,561 535,561230 822,159 771,185 -278,565 271,185 400,185 524,185240 810,030 759,808 -289,942 259,808 388,808 512,808250 797,901 748,431 -301,319 248,431 377,431 501,431

Site type 3
Rural areas (lower value) Private values £2449 psmMaximum CIL rates (per square metre)
CIL amount per sq m
RLV RLV per ha RLV less BLV 1 RLV less BLV 2 RLV less BLV 3 RLV less BLV 4 BLV1 BLV2 BLV3 BLV4
0 386,331 362,378 -687,372 -137,622 -8,622 115,378 #N/A #N/A #N/A £8020 355,429 333,393 -716,357 -166,607 -37,607 86,39340 331,172 310,639 -739,111 -189,361 -60,361 63,63960 306,915 287,886 -761,864 -212,114 -83,114 40,88680 282,657 265,133 -784,617 -234,867 -105,867 18,133
100 258,401 242,380 -807,370 -257,620 -128,620 -4,620 120 234,144 219,627 -830,123 -280,373 -151,373 -27,373 140 209,886 196,873 -852,877 -303,127 -174,127 -50,127 160 185,630 174,121 -875,629 -325,879 -196,879 -72,879 180 161,372 151,367 -898,383 -348,633 -219,633 -95,633 200 137,115 128,614 -921,136 -371,386 -242,386 -118,386 210 124,986 117,237 -932,513 -382,763 -253,763 -129,763 220 112,858 105,860 -943,890 -394,140 -265,140 -141,140 230 100,729 94,484 -955,266 -405,516 -276,516 -152,516 240 88,601 83,108 -966,642 -416,892 -287,892 -163,892 250 76,473 71,731 -978,019 -428,269 -299,269 -175,269
0 Private values £ psmMaximum CIL rates (per square metre)
CIL amount per sq m
RLV RLV per ha RLV less BLV 1 RLV less BLV 2 RLV less BLV 3 RLV less BLV 4 BLV1 BLV2 BLV3 BLV4
0 -2,106,804 -1,976,183 -3,025,933 -2,476,183 -2,347,183 -2,223,183 #N/A #N/A #N/A #N/A20 -2,095,223 -1,965,319 -3,015,069 -2,465,319 -2,336,319 -2,212,319 40 -2,119,877 -1,988,445 -3,038,195 -2,488,445 -2,359,445 -2,235,445 60 -2,144,531 -2,011,570 -3,061,320 -2,511,570 -2,382,570 -2,258,570 80 -2,169,185 -2,034,695 -3,084,445 -2,534,695 -2,405,695 -2,281,695
100 -2,193,839 -2,057,821 -3,107,571 -2,557,821 -2,428,821 -2,304,821 120 -2,218,492 -2,080,946 -3,130,696 -2,580,946 -2,451,946 -2,327,946 140 -2,243,146 -2,104,071 -3,153,821 -2,604,071 -2,475,071 -2,351,071 160 -2,267,800 -2,127,197 -3,176,947 -2,627,197 -2,498,197 -2,374,197 180 -2,292,454 -2,150,322 -3,200,072 -2,650,322 -2,521,322 -2,397,322 200 -2,317,108 -2,173,447 -3,223,197 -2,673,447 -2,544,447 -2,420,447 210 -2,329,435 -2,185,010 -3,234,760 -2,685,010 -2,556,010 -2,432,010 220 -2,341,762 -2,196,572 -3,246,322 -2,696,572 -2,567,572 -2,443,572 230 -2,354,089 -2,208,135 -3,257,885 -2,708,135 -2,579,135 -2,455,135 240 -2,366,415 -2,219,698 -3,269,448 -2,719,698 -2,590,698 -2,466,698 250 -2,378,742 -2,231,260 -3,281,010 -2,731,260 -2,602,260 -2,478,260

Community Infrastructure Levy Benchmark Land Values (per gross ha)Warwick District Council BLV1 BLV2 BLV3 BLV4
Commercial 1 Commercial 2 Warehousing Community uses
£1,049,750 £500,000 £371,000 £247,000
Site type 490/10% Hse/Flat Affordable % 40% Site area 1.74 ha
No of units 35 units % rented 80% Net to gross 67%Density: 30 dph % intermed 20%CSH level: 4 Growth
Sales 0% Build 0%
Warwick Private values £2307 psmMaximum CIL rates (per square metre)
CIL amount per sq m
RLV RLV per ha RLV less BLV 1 RLV less BLV 2 RLV less BLV 3 RLV less BLV 4 BLV1 BLV2 BLV3 BLV4
0 337,909 194,056 -855,694 -305,944 -176,944 -52,944 #N/A #N/A #N/A #N/A20 298,651 171,511 -878,239 -328,489 -199,489 -75,489 40 265,205 152,304 -897,446 -347,696 -218,696 -94,696 60 231,759 133,096 -916,654 -366,904 -237,904 -113,904 80 198,314 113,889 -935,861 -386,111 -257,111 -133,111
100 164,868 94,681 -955,069 -405,319 -276,319 -152,319 120 131,422 75,474 -974,276 -424,526 -295,526 -171,526 140 97,976 56,266 -993,484 -443,734 -314,734 -190,734 160 64,531 37,059 -1,012,691 -462,941 -333,941 -209,941 180 31,085 17,852 -1,031,898 -482,148 -353,148 -229,148 200 -2,399 -1,378 -1,051,128 -501,378 -372,378 -248,378 210 -19,396 -11,139 -1,060,889 -511,139 -382,139 -258,139 220 -36,392 -20,899 -1,070,649 -520,899 -391,899 -267,899 230 -53,389 -30,660 -1,080,410 -530,660 -401,660 -277,660 240 -70,384 -40,421 -1,090,171 -540,421 -411,421 -287,421 250 -87,381 -50,182 -1,099,932 -550,182 -421,182 -297,182
Leamington Spa Private values £2981 psmMaximum CIL rates (per square metre)
CIL amount per sq m
RLV RLV per ha RLV less BLV 1 RLV less BLV 2 RLV less BLV 3 RLV less BLV 4 BLV1 BLV2 BLV3 BLV4
0 1,270,015 729,352 -320,398 229,352 358,352 482,352 #N/A £220 £250 £25020 1,215,265 697,909 -351,841 197,909 326,909 450,90940 1,182,348 679,006 -370,744 179,006 308,006 432,00660 1,148,903 659,799 -389,951 159,799 288,799 412,79980 1,115,457 640,591 -409,159 140,591 269,591 393,591
100 1,082,011 621,384 -428,366 121,384 250,384 374,384120 1,048,566 602,177 -447,573 102,177 231,177 355,177140 1,015,120 582,969 -466,781 82,969 211,969 335,969160 981,674 563,761 -485,989 63,761 192,761 316,761180 948,228 544,554 -505,196 44,554 173,554 297,554200 914,783 525,347 -524,403 25,347 154,347 278,347210 898,060 515,743 -534,007 15,743 144,743 268,743220 881,337 506,139 -543,611 6,139 135,139 259,139230 864,615 496,536 -553,214 -3,464 125,536 249,536240 847,891 486,932 -562,818 -13,068 115,932 239,932250 831,169 477,328 -572,422 -22,672 106,328 230,328
Kenilworth Private values £2691 psmMaximum CIL rates (per square metre)
CIL amount per sq m
RLV RLV per ha RLV less BLV 1 RLV less BLV 2 RLV less BLV 3 RLV less BLV 4 BLV1 BLV2 BLV3 BLV4
0 869,579 499,387 -550,363 -613 128,387 252,387 #N/A #N/A £120 £25020 821,178 471,591 -578,159 -28,409 100,591 224,59140 787,732 452,383 -597,367 -47,617 81,383 205,38360 754,287 433,176 -616,574 -66,824 62,176 186,17680 720,841 413,968 -635,782 -86,032 42,968 166,968
100 687,395 394,761 -654,989 -105,239 23,761 147,761120 653,950 375,554 -674,196 -124,446 4,554 128,554140 620,504 356,346 -693,404 -143,654 -14,654 109,346160 587,057 337,139 -712,611 -162,861 -33,861 90,139180 553,611 317,931 -731,819 -182,069 -53,069 70,931200 520,166 298,724 -751,026 -201,276 -72,276 51,724210 503,443 289,120 -760,630 -210,880 -81,880 42,120220 486,720 279,517 -770,233 -220,483 -91,483 32,517230 469,998 269,913 -779,837 -230,087 -101,087 22,913240 453,274 260,309 -789,441 -239,691 -110,691 13,309250 436,552 250,706 -799,044 -249,294 -120,294 3,706
Rural areas (higher value) Private values £3180 psmMaximum CIL rates (per square metre)
CIL amount per sq m
RLV RLV per ha RLV less BLV 1 RLV less BLV 2 RLV less BLV 3 RLV less BLV 4 BLV1 BLV2 BLV3 BLV4
0 1,542,401 885,779 -163,971 385,779 514,779 638,779 #N/A £250 £250 £25020 1,482,965 851,646 -198,104 351,646 480,646 604,64640 1,450,057 832,747 -217,003 332,747 461,747 585,74760 1,417,150 813,849 -235,901 313,849 442,849 566,84980 1,384,243 794,951 -254,799 294,951 423,951 547,951
100 1,351,335 776,053 -273,697 276,053 405,053 529,053120 1,318,428 757,154 -292,596 257,154 386,154 510,154140 1,285,520 738,256 -311,494 238,256 367,256 491,256160 1,252,463 719,271 -330,479 219,271 348,271 472,271180 1,219,018 700,064 -349,686 200,064 329,064 453,064200 1,185,572 680,857 -368,893 180,857 309,857 433,857210 1,168,849 671,253 -378,497 171,253 300,253 424,253220 1,152,126 661,649 -388,101 161,649 290,649 414,649230 1,135,403 652,046 -397,704 152,046 281,046 405,046240 1,118,681 642,442 -407,308 142,442 271,442 395,442250 1,101,957 632,838 -416,912 132,838 261,838 385,838

Site type 4
Rural areas (lower value) Private values £2449 psmMaximum CIL rates (per square metre)
CIL amount per sq m
RLV RLV per ha RLV less BLV 1 RLV less BLV 2 RLV less BLV 3 RLV less BLV 4 BLV1 BLV2 BLV3 BLV4
0 534,516 306,965 -742,785 -193,035 -64,035 59,965 #N/A #N/A #N/A £4020 491,877 282,478 -767,272 -217,522 -88,522 35,47840 458,431 263,271 -786,479 -236,729 -107,729 16,27160 424,985 244,063 -805,687 -255,937 -126,937 -2,937 80 391,539 224,855 -824,895 -275,145 -146,145 -22,145
100 358,094 205,648 -844,102 -294,352 -165,352 -41,352 120 324,648 186,441 -863,309 -313,559 -184,559 -60,559 140 291,202 167,233 -882,517 -332,767 -203,767 -79,767 160 257,757 148,026 -901,724 -351,974 -222,974 -98,974 180 224,311 128,819 -920,931 -371,181 -242,181 -118,181 200 190,865 109,611 -940,139 -390,389 -261,389 -137,389 210 174,143 100,008 -949,742 -399,992 -270,992 -146,992 220 157,419 90,404 -959,346 -409,596 -280,596 -156,596 230 140,697 80,800 -968,950 -419,200 -290,200 -166,200 240 123,974 71,197 -978,553 -428,803 -299,803 -175,803 250 107,251 61,593 -988,157 -438,407 -309,407 -185,407
0 Private values £ psmMaximum CIL rates (per square metre)
CIL amount per sq m
RLV RLV per ha RLV less BLV 1 RLV less BLV 2 RLV less BLV 3 RLV less BLV 4 BLV1 BLV2 BLV3 BLV4
0 -2,902,987 -1,667,144 -2,716,894 -2,167,144 -2,038,144 -1,914,144 #N/A #N/A #N/A #N/A20 -2,887,051 -1,657,992 -2,707,742 -2,157,992 -2,028,992 -1,904,992 40 -2,921,044 -1,677,514 -2,727,264 -2,177,514 -2,048,514 -1,924,514 60 -2,955,036 -1,697,035 -2,746,785 -2,197,035 -2,068,035 -1,944,035 80 -2,989,029 -1,716,557 -2,766,307 -2,216,557 -2,087,557 -1,963,557
100 -3,023,022 -1,736,078 -2,785,828 -2,236,078 -2,107,078 -1,983,078 120 -3,057,015 -1,755,600 -2,805,350 -2,255,600 -2,126,600 -2,002,600 140 -3,091,007 -1,775,121 -2,824,871 -2,275,121 -2,146,121 -2,022,121 160 -3,125,000 -1,794,643 -2,844,393 -2,294,643 -2,165,643 -2,041,643 180 -3,158,993 -1,814,164 -2,863,914 -2,314,164 -2,185,164 -2,061,164 200 -3,192,985 -1,833,686 -2,883,436 -2,333,686 -2,204,686 -2,080,686 210 -3,209,982 -1,843,447 -2,893,197 -2,343,447 -2,214,447 -2,090,447 220 -3,226,978 -1,853,207 -2,902,957 -2,353,207 -2,224,207 -2,100,207 230 -3,243,975 -1,862,968 -2,912,718 -2,362,968 -2,233,968 -2,109,968 240 -3,260,971 -1,872,729 -2,922,479 -2,372,729 -2,243,729 -2,119,729 250 -3,277,968 -1,882,490 -2,932,240 -2,382,490 -2,253,490 -2,129,490

Community Infrastructure Levy Benchmark Land Values (per gross ha)Warwick District Council BLV1 BLV2 BLV3 BLV4
Commercial 1 Commercial 2 Warehousing Community uses
£1,049,750 £500,000 £371,000 £247,000
Site type 550/50% Hse/Flat Affordable % 40% Site area 1.00 ha
No of units 50 units % rented 80% Net to gross 100%Density: 50 dph % intermed 20%CSH level: 4 Growth
Sales 0% Build 0%
Warwick Private values £2307 psmMaximum CIL rates (per square metre)
CIL amount per sq m
RLV RLV per ha RLV less BLV 1 RLV less BLV 2 RLV less BLV 3 RLV less BLV 4 BLV1 BLV2 BLV3 BLV4
0 -58,068 -58,068 -1,107,818 -558,068 -429,068 -305,068 #N/A #N/A #N/A #N/A20 -99,582 -99,582 -1,149,332 -599,582 -470,582 -346,582 40 -142,095 -142,095 -1,191,845 -642,095 -513,095 -389,095 60 -184,607 -184,607 -1,234,357 -684,607 -555,607 -431,607 80 -227,121 -227,121 -1,276,871 -727,121 -598,121 -474,121
100 -269,633 -269,633 -1,319,383 -769,633 -640,633 -516,633 120 -312,147 -312,147 -1,361,897 -812,147 -683,147 -559,147 140 -354,660 -354,660 -1,404,410 -854,660 -725,660 -601,660 160 -397,173 -397,173 -1,446,923 -897,173 -768,173 -644,173 180 -439,686 -439,686 -1,489,436 -939,686 -810,686 -686,686 200 -482,199 -482,199 -1,531,949 -982,199 -853,199 -729,199 210 -503,456 -503,456 -1,553,206 -1,003,456 -874,456 -750,456 220 -524,712 -524,712 -1,574,462 -1,024,712 -895,712 -771,712 230 -545,968 -545,968 -1,595,718 -1,045,968 -916,968 -792,968 240 -567,225 -567,225 -1,616,975 -1,067,225 -938,225 -814,225 250 -588,482 -588,482 -1,638,232 -1,088,482 -959,482 -835,482
Leamington Spa Private values £2981 psmMaximum CIL rates (per square metre)
CIL amount per sq m
RLV RLV per ha RLV less BLV 1 RLV less BLV 2 RLV less BLV 3 RLV less BLV 4 BLV1 BLV2 BLV3 BLV4
0 1,101,668 1,101,668 51,918 601,668 730,668 854,668 £0 £250 £250 £25020 1,040,891 1,040,891 -8,859 540,891 669,891 793,89140 999,063 999,063 -50,687 499,063 628,063 752,06360 957,233 957,233 -92,517 457,233 586,233 710,23380 915,405 915,405 -134,345 415,405 544,405 668,405
100 873,576 873,576 -176,174 373,576 502,576 626,576120 831,746 831,746 -218,004 331,746 460,746 584,746140 789,918 789,918 -259,832 289,918 418,918 542,918160 748,088 748,088 -301,662 248,088 377,088 501,088180 706,260 706,260 -343,490 206,260 335,260 459,260200 664,431 664,431 -385,319 164,431 293,431 417,431210 643,516 643,516 -406,234 143,516 272,516 396,516220 622,602 622,602 -427,148 122,602 251,602 375,602230 601,687 601,687 -448,063 101,687 230,687 354,687240 580,773 580,773 -468,977 80,773 209,773 333,773250 559,859 559,859 -489,891 59,859 188,859 312,859
Kenilworth Private values £2691 psmMaximum CIL rates (per square metre)
CIL amount per sq m
RLV RLV per ha RLV less BLV 1 RLV less BLV 2 RLV less BLV 3 RLV less BLV 4 BLV1 BLV2 BLV3 BLV4
0 603,074 603,074 -446,676 103,074 232,074 356,074 #N/A £40 £100 £16020 550,873 550,873 -498,877 50,873 179,873 303,87340 509,044 509,044 -540,706 9,044 138,044 262,04460 467,215 467,215 -582,535 -32,785 96,215 220,21580 425,386 425,386 -624,364 -74,614 54,386 178,386
100 383,557 383,557 -666,193 -116,443 12,557 136,557120 341,728 341,728 -708,022 -158,272 -29,272 94,728140 299,899 299,899 -749,851 -200,101 -71,101 52,899160 258,070 258,070 -791,680 -241,930 -112,930 11,070180 216,242 216,242 -833,508 -283,758 -154,758 -30,758 200 174,412 174,412 -875,338 -325,588 -196,588 -72,588 210 153,498 153,498 -896,252 -346,502 -217,502 -93,502 220 132,584 132,584 -917,166 -367,416 -238,416 -114,416 230 111,669 111,669 -938,081 -388,331 -259,331 -135,331 240 90,755 90,755 -958,995 -409,245 -280,245 -156,245 250 69,840 69,840 -979,910 -430,160 -301,160 -177,160
Rural areas (higher value) Private values £3180 psmMaximum CIL rates (per square metre)
CIL amount per sq m
RLV RLV per ha RLV less BLV 1 RLV less BLV 2 RLV less BLV 3 RLV less BLV 4 BLV1 BLV2 BLV3 BLV4
0 1,439,710 1,439,710 389,960 939,710 1,068,710 1,192,710 £160 £250 £250 £25020 1,373,793 1,373,793 324,043 873,793 1,002,793 1,126,79340 1,332,637 1,332,637 282,887 832,637 961,637 1,085,63760 1,291,481 1,291,481 241,731 791,481 920,481 1,044,48180 1,250,325 1,250,325 200,575 750,325 879,325 1,003,325
100 1,209,170 1,209,170 159,420 709,170 838,170 962,170120 1,168,001 1,168,001 118,251 668,001 797,001 921,001140 1,126,171 1,126,171 76,421 626,171 755,171 879,171160 1,084,343 1,084,343 34,593 584,343 713,343 837,343180 1,042,514 1,042,514 -7,236 542,514 671,514 795,514200 1,000,685 1,000,685 -49,065 500,685 629,685 753,685210 979,770 979,770 -69,980 479,770 608,770 732,770220 958,856 958,856 -90,894 458,856 587,856 711,856230 937,942 937,942 -111,808 437,942 566,942 690,942240 917,027 917,027 -132,723 417,027 546,027 670,027250 896,112 896,112 -153,638 396,112 525,112 649,112

Site type 5
Rural areas (lower value) Private values £2449 psmMaximum CIL rates (per square metre)
CIL amount per sq m
RLV RLV per ha RLV less BLV 1 RLV less BLV 2 RLV less BLV 3 RLV less BLV 4 BLV1 BLV2 BLV3 BLV4
0 187,006 187,006 -862,744 -312,994 -183,994 -59,994 #N/A #N/A #N/A #N/A20 141,961 141,961 -907,789 -358,039 -229,039 -105,039 40 100,132 100,132 -949,618 -399,868 -270,868 -146,868 60 58,303 58,303 -991,447 -441,697 -312,697 -188,697 80 16,474 16,474 -1,033,276 -483,526 -354,526 -230,526
100 -25,769 -25,769 -1,075,519 -525,769 -396,769 -272,769 120 -68,283 -68,283 -1,118,033 -568,283 -439,283 -315,283 140 -110,795 -110,795 -1,160,545 -610,795 -481,795 -357,795 160 -153,309 -153,309 -1,203,059 -653,309 -524,309 -400,309 180 -195,822 -195,822 -1,245,572 -695,822 -566,822 -442,822 200 -238,334 -238,334 -1,288,084 -738,334 -609,334 -485,334 210 -259,592 -259,592 -1,309,342 -759,592 -630,592 -506,592 220 -280,848 -280,848 -1,330,598 -780,848 -651,848 -527,848 230 -302,104 -302,104 -1,351,854 -802,104 -673,104 -549,104 240 -323,360 -323,360 -1,373,110 -823,360 -694,360 -570,360 250 -344,618 -344,618 -1,394,368 -844,618 -715,618 -591,618
0 Private values £ psmMaximum CIL rates (per square metre)
CIL amount per sq m
RLV RLV per ha RLV less BLV 1 RLV less BLV 2 RLV less BLV 3 RLV less BLV 4 BLV1 BLV2 BLV3 BLV4
0 -4,089,338 -4,089,338 -5,139,088 -4,589,338 -4,460,338 -4,336,338 #N/A #N/A #N/A #N/A20 -4,061,518 -4,061,518 -5,111,268 -4,561,518 -4,432,518 -4,308,518 40 -4,104,031 -4,104,031 -5,153,781 -4,604,031 -4,475,031 -4,351,031 60 -4,146,544 -4,146,544 -5,196,294 -4,646,544 -4,517,544 -4,393,544 80 -4,189,057 -4,189,057 -5,238,807 -4,689,057 -4,560,057 -4,436,057
100 -4,231,570 -4,231,570 -5,281,320 -4,731,570 -4,602,570 -4,478,570 120 -4,274,083 -4,274,083 -5,323,833 -4,774,083 -4,645,083 -4,521,083 140 -4,316,596 -4,316,596 -5,366,346 -4,816,596 -4,687,596 -4,563,596 160 -4,359,109 -4,359,109 -5,408,859 -4,859,109 -4,730,109 -4,606,109 180 -4,401,622 -4,401,622 -5,451,372 -4,901,622 -4,772,622 -4,648,622 200 -4,444,136 -4,444,136 -5,493,886 -4,944,136 -4,815,136 -4,691,136 210 -4,465,392 -4,465,392 -5,515,142 -4,965,392 -4,836,392 -4,712,392 220 -4,486,648 -4,486,648 -5,536,398 -4,986,648 -4,857,648 -4,733,648 230 -4,507,905 -4,507,905 -5,557,655 -5,007,905 -4,878,905 -4,754,905 240 -4,529,161 -4,529,161 -5,578,911 -5,029,161 -4,900,161 -4,776,161 250 -4,550,418 -4,550,418 -5,600,168 -5,050,418 -4,921,418 -4,797,418

Community Infrastructure Levy Benchmark Land Values (per gross ha)Warwick District Council BLV1 BLV2 BLV3 BLV4
Commercial 1 Commercial 2 Warehousing Community uses
£1,049,750 £500,000 £371,000 £247,000
Site type 660/40% Hse/Flat Affordable % 40% Site area 1.63 ha
No of units 65 units % rented 80% Net to gross 100%Density: 40 dph % intermed 20%CSH level: 4 Growth
Sales 0% Build 0%
Warwick Private values £2307 psmMaximum CIL rates (per square metre)
CIL amount per sq m
RLV RLV per ha RLV less BLV 1 RLV less BLV 2 RLV less BLV 3 RLV less BLV 4 BLV1 BLV2 BLV3 BLV4
0 75,467 46,441 -1,003,309 -453,559 -324,559 -200,559 #N/A #N/A #N/A #N/A20 17,713 10,900 -1,038,850 -489,100 -360,100 -236,100 40 -39,377 -24,232 -1,073,982 -524,232 -395,232 -271,232 60 -96,756 -59,542 -1,109,292 -559,542 -430,542 -306,542 80 -154,135 -94,852 -1,144,602 -594,852 -465,852 -341,852
100 -211,514 -130,163 -1,179,913 -630,163 -501,163 -377,163 120 -268,893 -165,473 -1,215,223 -665,473 -536,473 -412,473 140 -326,273 -200,783 -1,250,533 -700,783 -571,783 -447,783 160 -383,652 -236,093 -1,285,843 -736,093 -607,093 -483,093 180 -441,031 -271,404 -1,321,154 -771,404 -642,404 -518,404 200 -498,410 -306,714 -1,356,464 -806,714 -677,714 -553,714 210 -527,100 -324,369 -1,374,119 -824,369 -695,369 -571,369 220 -555,789 -342,024 -1,391,774 -842,024 -713,024 -589,024 230 -584,479 -359,680 -1,409,430 -859,680 -730,680 -606,680 240 -613,168 -377,334 -1,427,084 -877,334 -748,334 -624,334 250 -641,859 -394,990 -1,444,740 -894,990 -765,990 -641,990
Leamington Spa Private values £2981 psmMaximum CIL rates (per square metre)
CIL amount per sq m
RLV RLV per ha RLV less BLV 1 RLV less BLV 2 RLV less BLV 3 RLV less BLV 4 BLV1 BLV2 BLV3 BLV4
0 1,637,300 1,007,569 -42,181 507,569 636,569 760,569 #N/A £250 £250 £25020 1,553,592 956,057 -93,693 456,057 585,057 709,05740 1,498,045 921,874 -127,876 421,874 550,874 674,87460 1,441,919 887,335 -162,415 387,335 516,335 640,33580 1,385,463 852,593 -197,157 352,593 481,593 605,593
100 1,329,007 817,851 -231,899 317,851 446,851 570,851120 1,272,552 783,109 -266,641 283,109 412,109 536,109140 1,216,096 748,367 -301,383 248,367 377,367 501,367160 1,159,640 713,625 -336,125 213,625 342,625 466,625180 1,103,184 678,883 -370,867 178,883 307,883 431,883200 1,046,728 644,141 -405,609 144,141 273,141 397,141210 1,018,500 626,770 -422,980 126,770 255,770 379,770220 990,273 609,398 -440,352 109,398 238,398 362,398230 962,045 592,027 -457,723 92,027 221,027 345,027240 933,817 574,656 -475,094 74,656 203,656 327,656250 905,589 557,285 -492,465 57,285 186,285 310,285
Kenilworth Private values £2691 psmMaximum CIL rates (per square metre)
CIL amount per sq m
RLV RLV per ha RLV less BLV 1 RLV less BLV 2 RLV less BLV 3 RLV less BLV 4 BLV1 BLV2 BLV3 BLV4
0 966,540 594,794 -454,956 94,794 223,794 347,794 #N/A £40 £120 £18020 893,461 549,822 -499,928 49,822 178,822 302,82240 837,005 515,080 -534,670 15,080 144,080 268,08060 780,549 480,338 -569,412 -19,662 109,338 233,33880 724,093 445,596 -604,154 -54,404 74,596 198,596
100 667,637 410,853 -638,897 -89,147 39,853 163,853120 611,181 376,111 -673,639 -123,889 5,111 129,111140 554,725 341,369 -708,381 -158,631 -29,631 94,369160 498,269 306,627 -743,123 -193,373 -64,373 59,627180 441,813 271,885 -777,865 -228,115 -99,115 24,885200 385,357 237,143 -812,607 -262,857 -133,857 -9,857 210 357,129 219,772 -829,978 -280,228 -151,228 -27,228 220 328,901 202,400 -847,350 -297,600 -168,600 -44,600 230 300,673 185,029 -864,721 -314,971 -185,971 -61,971 240 272,445 167,658 -882,092 -332,342 -203,342 -79,342 250 244,217 150,287 -899,463 -349,713 -220,713 -96,713
Rural areas (higher value) Private values £3180 psmMaximum CIL rates (per square metre)
CIL amount per sq m
RLV RLV per ha RLV less BLV 1 RLV less BLV 2 RLV less BLV 3 RLV less BLV 4 BLV1 BLV2 BLV3 BLV4
0 2,093,257 1,288,158 238,408 788,158 917,158 1,041,158 £120 £250 £250 £25020 2,001,708 1,231,820 182,070 731,820 860,820 984,82040 1,946,161 1,197,637 147,887 697,637 826,637 950,63760 1,890,613 1,163,454 113,704 663,454 792,454 916,45480 1,835,065 1,129,271 79,521 629,271 758,271 882,271
100 1,779,518 1,095,088 45,338 595,088 724,088 848,088120 1,723,970 1,060,905 11,155 560,905 689,905 813,905140 1,668,423 1,026,722 -23,028 526,722 655,722 779,722160 1,612,875 992,539 -57,211 492,539 621,539 745,539180 1,557,021 958,167 -91,583 458,167 587,167 711,167200 1,500,565 923,425 -126,325 423,425 552,425 676,425210 1,472,338 906,054 -143,696 406,054 535,054 659,054220 1,444,110 888,683 -161,067 388,683 517,683 641,683230 1,415,882 871,312 -178,438 371,312 500,312 624,312240 1,387,654 853,941 -195,809 353,941 482,941 606,941250 1,359,426 836,570 -213,180 336,570 465,570 589,570

Site type 6
Rural areas (lower value) Private values £2449 psmMaximum CIL rates (per square metre)
CIL amount per sq m
RLV RLV per ha RLV less BLV 1 RLV less BLV 2 RLV less BLV 3 RLV less BLV 4 BLV1 BLV2 BLV3 BLV4
0 404,978 249,218 -800,532 -250,782 -121,782 2,218 #N/A #N/A #N/A £020 341,557 210,189 -839,561 -289,811 -160,811 -36,811 40 285,101 175,447 -874,303 -324,553 -195,553 -71,553 60 228,645 140,705 -909,045 -359,295 -230,295 -106,295 80 172,189 105,963 -943,787 -394,037 -265,037 -141,037
100 115,733 71,221 -978,529 -428,779 -299,779 -175,779 120 59,277 36,478 -1,013,272 -463,522 -334,522 -210,522 140 2,821 1,736 -1,048,014 -498,264 -369,264 -245,264 160 -54,512 -33,546 -1,083,296 -533,546 -404,546 -280,546 180 -111,891 -68,856 -1,118,606 -568,856 -439,856 -315,856 200 -169,270 -104,166 -1,153,916 -604,166 -475,166 -351,166 210 -197,959 -121,821 -1,171,571 -621,821 -492,821 -368,821 220 -226,649 -139,476 -1,189,226 -639,476 -510,476 -386,476 230 -255,338 -157,131 -1,206,881 -657,131 -528,131 -404,131 240 -284,028 -174,787 -1,224,537 -674,787 -545,787 -421,787 250 -312,719 -192,442 -1,242,192 -692,442 -563,442 -439,442
0 Private values £ psmMaximum CIL rates (per square metre)
CIL amount per sq m
RLV RLV per ha RLV less BLV 1 RLV less BLV 2 RLV less BLV 3 RLV less BLV 4 BLV1 BLV2 BLV3 BLV4
0 -5,364,250 -3,301,077 -4,350,827 -3,801,077 -3,672,077 -3,548,077 #N/A #N/A #N/A #N/A20 -5,329,370 -3,279,612 -4,329,362 -3,779,612 -3,650,612 -3,526,612 40 -5,386,749 -3,314,923 -4,364,673 -3,814,923 -3,685,923 -3,561,923 60 -5,444,128 -3,350,233 -4,399,983 -3,850,233 -3,721,233 -3,597,233 80 -5,501,508 -3,385,543 -4,435,293 -3,885,543 -3,756,543 -3,632,543
100 -5,558,887 -3,420,853 -4,470,603 -3,920,853 -3,791,853 -3,667,853 120 -5,616,266 -3,456,164 -4,505,914 -3,956,164 -3,827,164 -3,703,164 140 -5,673,645 -3,491,474 -4,541,224 -3,991,474 -3,862,474 -3,738,474 160 -5,731,024 -3,526,784 -4,576,534 -4,026,784 -3,897,784 -3,773,784 180 -5,788,403 -3,562,094 -4,611,844 -4,062,094 -3,933,094 -3,809,094 200 -5,845,784 -3,597,405 -4,647,155 -4,097,405 -3,968,405 -3,844,405 210 -5,874,473 -3,615,060 -4,664,810 -4,115,060 -3,986,060 -3,862,060 220 -5,903,163 -3,632,716 -4,682,466 -4,132,716 -4,003,716 -3,879,716 230 -5,931,852 -3,650,370 -4,700,120 -4,150,370 -4,021,370 -3,897,370 240 -5,960,542 -3,668,026 -4,717,776 -4,168,026 -4,039,026 -3,915,026 250 -5,989,231 -3,685,681 -4,735,431 -4,185,681 -4,056,681 -3,932,681

Community Infrastructure Levy Benchmark Land Values (per gross ha)Warwick District Council BLV1 BLV2 BLV3 BLV4
Commercial 1 Commercial 2 Warehousing Community uses
£1,049,750 £500,000 £371,000 £247,000
Site type 7100% houses Affordable % 40% Site area 5.60 ha
No of units 75 units % rented 80% Net to gross 67%Density: 20 dph % intermed 20%CSH level: 4 Growth
Sales 0% Build 0%
Warwick Private values £2307 psmMaximum CIL rates (per square metre)
CIL amount per sq m
RLV RLV per ha RLV less BLV 1 RLV less BLV 2 RLV less BLV 3 RLV less BLV 4 BLV1 BLV2 BLV3 BLV4
0 865,183 154,579 -895,171 -345,421 -216,421 -92,421 #N/A #N/A #N/A #N/A20 764,793 136,643 -913,107 -363,357 -234,357 -110,357 40 679,284 121,365 -928,385 -378,635 -249,635 -125,635 60 593,775 106,088 -943,662 -393,912 -264,912 -140,912 80 508,265 90,810 -958,940 -409,190 -280,190 -156,190
100 422,755 75,532 -974,218 -424,468 -295,468 -171,468 120 337,246 60,255 -989,495 -439,745 -310,745 -186,745 140 251,736 44,977 -1,004,773 -455,023 -326,023 -202,023 160 166,227 29,699 -1,020,051 -470,301 -341,301 -217,301 180 80,718 14,422 -1,035,328 -485,578 -356,578 -232,578 200 -4,869 -870 -1,050,620 -500,870 -371,870 -247,870 210 -48,324 -8,634 -1,058,384 -508,634 -379,634 -255,634 220 -91,777 -16,398 -1,066,148 -516,398 -387,398 -263,398 230 -135,232 -24,161 -1,073,911 -524,161 -395,161 -271,161 240 -178,685 -31,925 -1,081,675 -531,925 -402,925 -278,925 250 -222,140 -39,689 -1,089,439 -539,689 -410,689 -286,689
Leamington Spa Private values £2981 psmMaximum CIL rates (per square metre)
CIL amount per sq m
RLV RLV per ha RLV less BLV 1 RLV less BLV 2 RLV less BLV 3 RLV less BLV 4 BLV1 BLV2 BLV3 BLV4
0 3,147,193 562,299 -487,451 62,299 191,299 315,299 #N/A £60 £240 £25020 3,008,932 537,596 -512,154 37,596 166,596 290,59640 2,924,798 522,564 -527,186 22,564 151,564 275,56460 2,840,665 507,532 -542,218 7,532 136,532 260,53280 2,756,531 492,500 -557,250 -7,500 121,500 245,500
100 2,672,397 477,468 -572,282 -22,532 106,468 230,468120 2,588,265 462,437 -587,313 -37,563 91,437 215,437140 2,504,131 447,405 -602,345 -52,595 76,405 200,405160 2,419,998 432,373 -617,377 -67,627 61,373 185,373180 2,335,864 417,341 -632,409 -82,659 46,341 170,341200 2,251,731 402,309 -647,441 -97,691 31,309 155,309210 2,209,664 394,793 -654,957 -105,207 23,793 147,793220 2,167,598 387,278 -662,472 -112,722 16,278 140,278230 2,124,988 379,665 -670,085 -120,335 8,665 132,665240 2,082,234 372,026 -677,724 -127,974 1,026 125,026250 2,039,479 364,387 -685,363 -135,613 -6,613 117,387
Kenilworth Private values £2691 psmMaximum CIL rates (per square metre)
CIL amount per sq m
RLV RLV per ha RLV less BLV 1 RLV less BLV 2 RLV less BLV 3 RLV less BLV 4 BLV1 BLV2 BLV3 BLV4
0 2,171,098 387,903 -661,847 -112,097 16,903 140,903 #N/A #N/A £0 £16020 2,049,624 366,199 -683,551 -133,801 -4,801 119,19940 1,965,492 351,168 -698,582 -148,832 -19,832 104,16860 1,880,257 335,939 -713,811 -164,061 -35,061 88,93980 1,794,746 320,661 -729,089 -179,339 -50,339 73,661
100 1,709,237 305,384 -744,366 -194,616 -65,616 58,384120 1,623,728 290,106 -759,644 -209,894 -80,894 43,106140 1,538,219 274,828 -774,922 -225,172 -96,172 27,828160 1,452,709 259,551 -790,199 -240,449 -111,449 12,551180 1,367,200 244,273 -805,477 -255,727 -126,727 -2,727 200 1,281,691 228,995 -820,755 -271,005 -142,005 -18,005 210 1,238,936 221,356 -828,394 -278,644 -149,644 -25,644 220 1,196,181 213,718 -836,032 -286,282 -157,282 -33,282 230 1,153,426 206,079 -843,671 -293,921 -164,921 -40,921 240 1,110,672 198,440 -851,310 -301,560 -172,560 -48,560 250 1,067,917 190,801 -858,949 -309,199 -180,199 -56,199
Rural areas (higher value) Private values £3180 psmMaximum CIL rates (per square metre)
CIL amount per sq m
RLV RLV per ha RLV less BLV 1 RLV less BLV 2 RLV less BLV 3 RLV less BLV 4 BLV1 BLV2 BLV3 BLV4
0 3,816,996 681,970 -367,780 181,970 310,970 434,970 #N/A £220 £250 £25020 3,667,214 655,209 -394,541 155,209 284,209 408,20940 3,583,081 640,177 -409,573 140,177 269,177 393,17760 3,498,948 625,145 -424,605 125,145 254,145 378,14580 3,414,814 610,113 -439,637 110,113 239,113 363,113
100 3,330,681 595,082 -454,668 95,082 224,082 348,082120 3,246,547 580,050 -469,700 80,050 209,050 333,050140 3,162,415 565,018 -484,732 65,018 194,018 318,018160 3,078,281 549,986 -499,764 49,986 178,986 302,986180 2,994,148 534,954 -514,796 34,954 163,954 287,954200 2,910,014 519,923 -529,827 19,923 148,923 272,923210 2,867,947 512,407 -537,343 12,407 141,407 265,407220 2,825,881 504,891 -544,859 4,891 133,891 257,891230 2,783,814 497,375 -552,375 -2,625 126,375 250,375240 2,741,748 489,859 -559,891 -10,141 118,859 242,859250 2,699,681 482,343 -567,407 -17,657 111,343 235,343

Site type 7
Rural areas (lower value) Private values £2449 psmMaximum CIL rates (per square metre)
CIL amount per sq m
RLV RLV per ha RLV less BLV 1 RLV less BLV 2 RLV less BLV 3 RLV less BLV 4 BLV1 BLV2 BLV3 BLV4
0 1,349,238 241,064 -808,686 -258,936 -129,936 -5,936 #N/A #N/A #N/A #N/A20 1,240,524 221,640 -828,110 -278,360 -149,360 -25,360 40 1,155,013 206,362 -843,388 -293,638 -164,638 -40,638 60 1,069,504 191,085 -858,665 -308,915 -179,915 -55,915 80 983,995 175,807 -873,943 -324,193 -195,193 -71,193
100 898,486 160,529 -889,221 -339,471 -210,471 -86,471 120 812,976 145,252 -904,498 -354,748 -225,748 -101,748 140 727,467 129,974 -919,776 -370,026 -241,026 -117,026 160 641,958 114,696 -935,054 -385,304 -256,304 -132,304 180 556,448 99,419 -950,331 -400,581 -271,581 -147,581 200 470,939 84,141 -965,609 -415,859 -286,859 -162,859 210 428,184 76,502 -973,248 -423,498 -294,498 -170,498 220 385,430 68,863 -980,887 -431,137 -302,137 -178,137 230 342,675 61,225 -988,525 -438,775 -309,775 -185,775 240 299,921 53,586 -996,164 -446,414 -317,414 -193,414 250 257,166 45,947 -1,003,803 -454,053 -325,053 -201,053
0 Private values £ psmMaximum CIL rates (per square metre)
CIL amount per sq m
RLV RLV per ha RLV less BLV 1 RLV less BLV 2 RLV less BLV 3 RLV less BLV 4 BLV1 BLV2 BLV3 BLV4
0 -7,246,125 -1,294,641 -2,344,391 -1,794,641 -1,665,641 -1,541,641 #N/A #N/A #N/A #N/A20 -7,210,028 -1,288,192 -2,337,942 -1,788,192 -1,659,192 -1,535,192 40 -7,298,556 -1,304,009 -2,353,759 -1,804,009 -1,675,009 -1,551,009 60 -7,387,084 -1,319,826 -2,369,576 -1,819,826 -1,690,826 -1,566,826 80 -7,475,612 -1,335,643 -2,385,393 -1,835,643 -1,706,643 -1,582,643
100 -7,564,140 -1,351,460 -2,401,210 -1,851,460 -1,722,460 -1,598,460 120 -7,652,669 -1,367,277 -2,417,027 -1,867,277 -1,738,277 -1,614,277 140 -7,741,197 -1,383,094 -2,432,844 -1,883,094 -1,754,094 -1,630,094 160 -7,829,726 -1,398,911 -2,448,661 -1,898,911 -1,769,911 -1,645,911 180 -7,918,254 -1,414,728 -2,464,478 -1,914,728 -1,785,728 -1,661,728 200 -8,006,782 -1,430,545 -2,480,295 -1,930,545 -1,801,545 -1,677,545 210 -8,051,047 -1,438,454 -2,488,204 -1,938,454 -1,809,454 -1,685,454 220 -8,095,311 -1,446,362 -2,496,112 -1,946,362 -1,817,362 -1,693,362 230 -8,139,575 -1,454,271 -2,504,021 -1,954,271 -1,825,271 -1,701,271 240 -8,183,839 -1,462,179 -2,511,929 -1,962,179 -1,833,179 -1,709,179 250 -8,228,103 -1,470,088 -2,519,838 -1,970,088 -1,841,088 -1,717,088

Community Infrastructure Levy Benchmark Land Values (per gross ha)Warwick District Council BLV1 BLV2 BLV3 BLV4
Commercial 1 Commercial 2 Warehousing Community uses
£1,049,750 £500,000 £371,000 £247,000
Site type 8100% houses Affordable % 40% Site area 3.20 ha
No of units 75 units % rented 80% Net to gross 67%Density: 35 dph % intermed 20%CSH level: 4 Growth
Sales 0% Build 0%
Warwick Private values £2307 psmMaximum CIL rates (per square metre)
CIL amount per sq m
RLV RLV per ha RLV less BLV 1 RLV less BLV 2 RLV less BLV 3 RLV less BLV 4 BLV1 BLV2 BLV3 BLV4
0 718,082 224,520 -825,230 -275,480 -146,480 -22,480 #N/A #N/A #N/A #N/A20 628,939 196,648 -853,102 -303,352 -174,352 -50,352 40 552,145 172,637 -877,113 -327,363 -198,363 -74,363 60 475,351 148,626 -901,124 -351,374 -222,374 -98,374 80 398,557 124,616 -925,134 -375,384 -246,384 -122,384
100 321,765 100,605 -949,145 -399,395 -270,395 -146,395 120 244,971 76,594 -973,156 -423,406 -294,406 -170,406 140 168,177 52,583 -997,167 -447,417 -318,417 -194,417 160 91,383 28,573 -1,021,177 -471,427 -342,427 -218,427 180 14,591 4,562 -1,045,188 -495,438 -366,438 -242,438 200 -63,220 -19,767 -1,069,517 -519,767 -390,767 -266,767 210 -102,246 -31,969 -1,081,719 -531,969 -402,969 -278,969 220 -141,270 -44,170 -1,093,920 -544,170 -415,170 -291,170 230 -180,295 -56,372 -1,106,122 -556,372 -427,372 -303,372 240 -219,319 -68,574 -1,118,324 -568,574 -439,574 -315,574 250 -258,344 -80,775 -1,130,525 -580,775 -451,775 -327,775
Leamington Spa Private values £2981 psmMaximum CIL rates (per square metre)
CIL amount per sq m
RLV RLV per ha RLV less BLV 1 RLV less BLV 2 RLV less BLV 3 RLV less BLV 4 BLV1 BLV2 BLV3 BLV4
0 2,747,324 858,997 -190,753 358,997 487,997 611,997 #N/A £250 £250 £25020 2,624,515 820,598 -229,152 320,598 449,598 573,59840 2,548,958 796,974 -252,776 296,974 425,974 549,97460 2,473,400 773,350 -276,400 273,350 402,350 526,35080 2,397,842 749,725 -300,025 249,725 378,725 502,725
100 2,322,284 726,101 -323,649 226,101 355,101 479,101120 2,246,727 702,477 -347,273 202,477 331,477 455,477140 2,171,169 678,852 -370,898 178,852 307,852 431,852160 2,095,611 655,228 -394,522 155,228 284,228 408,228180 2,020,053 631,603 -418,147 131,603 260,603 384,603200 1,944,496 607,979 -441,771 107,979 236,979 360,979210 1,906,717 596,167 -453,583 96,167 225,167 349,167220 1,868,938 584,354 -465,396 84,354 213,354 337,354230 1,831,159 572,542 -477,208 72,542 201,542 325,542240 1,793,381 560,730 -489,020 60,730 189,730 313,730250 1,755,602 548,918 -500,832 48,918 177,918 301,918
Kenilworth Private values £2691 psmMaximum CIL rates (per square metre)
CIL amount per sq m
RLV RLV per ha RLV less BLV 1 RLV less BLV 2 RLV less BLV 3 RLV less BLV 4 BLV1 BLV2 BLV3 BLV4
0 1,877,556 587,049 -462,701 87,049 216,049 340,049 #N/A £60 £160 £25020 1,769,706 553,328 -496,422 53,328 182,328 306,32840 1,694,148 529,704 -520,046 29,704 158,704 282,70460 1,618,591 506,080 -543,670 6,080 135,080 259,08080 1,543,033 482,455 -567,295 -17,545 111,455 235,455
100 1,467,475 458,831 -590,919 -41,169 87,831 211,831120 1,391,918 435,206 -614,544 -64,794 64,206 188,206140 1,315,360 411,269 -638,481 -88,731 40,269 164,269160 1,238,566 387,258 -662,492 -112,742 16,258 140,258180 1,161,772 363,247 -686,503 -136,753 -7,753 116,247200 1,084,979 339,237 -710,513 -160,763 -31,763 92,237210 1,046,583 327,231 -722,519 -172,769 -43,769 80,231220 1,008,186 315,226 -734,524 -184,774 -55,774 68,226230 969,789 303,221 -746,529 -196,779 -67,779 56,221240 931,392 291,215 -758,535 -208,785 -79,785 44,215250 892,995 279,210 -770,540 -220,790 -91,790 32,210
Rural areas (higher value) Private values £3180 psmMaximum CIL rates (per square metre)
CIL amount per sq m
RLV RLV per ha RLV less BLV 1 RLV less BLV 2 RLV less BLV 3 RLV less BLV 4 BLV1 BLV2 BLV3 BLV4
0 3,343,658 1,045,450 -4,300 545,450 674,450 798,450 #N/A £250 £250 £25020 3,211,091 1,004,001 -45,749 504,001 633,001 757,00140 3,135,533 980,377 -69,373 480,377 609,377 733,37760 3,059,976 956,752 -92,998 456,752 585,752 709,75280 2,984,418 933,128 -116,622 433,128 562,128 686,128
100 2,908,860 909,504 -140,246 409,504 538,504 662,504120 2,833,302 885,879 -163,871 385,879 514,879 638,879140 2,757,745 862,255 -187,495 362,255 491,255 615,255160 2,682,187 838,631 -211,119 338,631 467,631 591,631180 2,606,629 815,006 -234,744 315,006 444,006 568,006200 2,531,071 791,382 -258,368 291,382 420,382 544,382210 2,493,292 779,569 -270,181 279,569 408,569 532,569220 2,455,514 767,757 -281,993 267,757 396,757 520,757230 2,417,735 755,945 -293,805 255,945 384,945 508,945240 2,379,956 744,133 -305,617 244,133 373,133 497,133250 2,342,178 732,321 -317,429 232,321 361,321 485,321

Site type 8
Rural areas (lower value) Private values £2449 psmMaximum CIL rates (per square metre)
CIL amount per sq m
RLV RLV per ha RLV less BLV 1 RLV less BLV 2 RLV less BLV 3 RLV less BLV 4 BLV1 BLV2 BLV3 BLV4
0 1,149,724 359,480 -690,270 -140,520 -11,520 112,480 #N/A #N/A #N/A £8020 1,053,157 329,287 -720,463 -170,713 -41,713 82,28740 976,363 305,276 -744,474 -194,724 -65,724 58,27660 899,569 281,265 -768,485 -218,735 -89,735 34,26580 822,776 257,255 -792,495 -242,745 -113,745 10,255
100 745,983 233,244 -816,506 -266,756 -137,756 -13,756 120 669,189 209,233 -840,517 -290,767 -161,767 -37,767 140 592,396 185,223 -864,527 -314,777 -185,777 -61,777 160 515,602 161,212 -888,538 -338,788 -209,788 -85,788 180 438,809 137,201 -912,549 -362,799 -233,799 -109,799 200 362,015 113,190 -936,560 -386,810 -257,810 -133,810 210 323,618 101,185 -948,565 -398,815 -269,815 -145,815 220 285,222 89,179 -960,571 -410,821 -281,821 -157,821 230 246,825 77,174 -972,576 -422,826 -293,826 -169,826 240 208,429 65,169 -984,581 -434,831 -305,831 -181,831 250 170,032 53,163 -996,587 -446,837 -317,837 -193,837
0 Private values £ psmMaximum CIL rates (per square metre)
CIL amount per sq m
RLV RLV per ha RLV less BLV 1 RLV less BLV 2 RLV less BLV 3 RLV less BLV 4 BLV1 BLV2 BLV3 BLV4
0 -6,524,163 -2,039,888 -3,089,638 -2,539,888 -2,410,888 -2,286,888 #N/A #N/A #N/A #N/A20 -6,491,548 -2,029,691 -3,079,441 -2,529,691 -2,400,691 -2,276,691 40 -6,571,142 -2,054,577 -3,104,327 -2,554,577 -2,425,577 -2,301,577 60 -6,650,737 -2,079,464 -3,129,214 -2,579,464 -2,450,464 -2,326,464 80 -6,730,331 -2,104,350 -3,154,100 -2,604,350 -2,475,350 -2,351,350
100 -6,809,925 -2,129,237 -3,178,987 -2,629,237 -2,500,237 -2,376,237 120 -6,889,520 -2,154,123 -3,203,873 -2,654,123 -2,525,123 -2,401,123 140 -6,969,114 -2,179,010 -3,228,760 -2,679,010 -2,550,010 -2,426,010 160 -7,048,708 -2,203,896 -3,253,646 -2,703,896 -2,574,896 -2,450,896 180 -7,128,302 -2,228,782 -3,278,532 -2,728,782 -2,599,782 -2,475,782 200 -7,207,897 -2,253,669 -3,303,419 -2,753,669 -2,624,669 -2,500,669 210 -7,247,694 -2,266,112 -3,315,862 -2,766,112 -2,637,112 -2,513,112 220 -7,287,491 -2,278,556 -3,328,306 -2,778,556 -2,649,556 -2,525,556 230 -7,327,289 -2,290,999 -3,340,749 -2,790,999 -2,661,999 -2,537,999 240 -7,367,085 -2,303,442 -3,353,192 -2,803,442 -2,674,442 -2,550,442 250 -7,406,883 -2,315,885 -3,365,635 -2,815,885 -2,686,885 -2,562,885

Community Infrastructure Levy Benchmark Land Values (per gross ha)Warwick District Council BLV1 BLV2 BLV3 BLV4
Commercial 1 Commercial 2 Warehousing Community uses
£1,049,750 £500,000 £371,000 £247,000
Site type 9100% houses Affordable % 40% Site area 1.67 ha
No of units 100 units % rented 80% Net to gross 100%Density: 60 dph % intermed 20%CSH level: 4 Growth
Sales 0% Build 0%
Warwick Private values £2307 psmMaximum CIL rates (per square metre)
CIL amount per sq m
RLV RLV per ha RLV less BLV 1 RLV less BLV 2 RLV less BLV 3 RLV less BLV 4 BLV1 BLV2 BLV3 BLV4
0 -1,608,796 -965,278 -2,015,028 -1,465,278 -1,336,278 -1,212,278 #N/A #N/A #N/A #N/A20 -1,648,025 -988,815 -2,038,565 -1,488,815 -1,359,815 -1,235,815 40 -1,714,925 -1,028,955 -2,078,705 -1,528,955 -1,399,955 -1,275,955 60 -1,781,824 -1,069,095 -2,118,845 -1,569,095 -1,440,095 -1,316,095 80 -1,848,724 -1,109,234 -2,158,984 -1,609,234 -1,480,234 -1,356,234
100 -1,915,624 -1,149,374 -2,199,124 -1,649,374 -1,520,374 -1,396,374 120 -1,982,523 -1,189,514 -2,239,264 -1,689,514 -1,560,514 -1,436,514 140 -2,049,423 -1,229,654 -2,279,404 -1,729,654 -1,600,654 -1,476,654 160 -2,116,322 -1,269,793 -2,319,543 -1,769,793 -1,640,793 -1,516,793 180 -2,183,222 -1,309,933 -2,359,683 -1,809,933 -1,680,933 -1,556,933 200 -2,250,122 -1,350,073 -2,399,823 -1,850,073 -1,721,073 -1,597,073 210 -2,283,571 -1,370,143 -2,419,893 -1,870,143 -1,741,143 -1,617,143 220 -2,317,020 -1,390,212 -2,439,962 -1,890,212 -1,761,212 -1,637,212 230 -2,350,471 -1,410,282 -2,460,032 -1,910,282 -1,781,282 -1,657,282 240 -2,383,920 -1,430,352 -2,480,102 -1,930,352 -1,801,352 -1,677,352 250 -2,417,370 -1,450,422 -2,500,172 -1,950,422 -1,821,422 -1,697,422
Leamington Spa Private values £2981 psmMaximum CIL rates (per square metre)
CIL amount per sq m
RLV RLV per ha RLV less BLV 1 RLV less BLV 2 RLV less BLV 3 RLV less BLV 4 BLV1 BLV2 BLV3 BLV4
0 173,190 103,914 -945,836 -396,086 -267,086 -143,086 #N/A #N/A #N/A #N/A20 104,389 62,634 -987,116 -437,366 -308,366 -184,366 40 38,566 23,139 -1,026,611 -476,861 -347,861 -223,861 60 -27,703 -16,622 -1,066,372 -516,622 -387,622 -263,622 80 -94,602 -56,761 -1,106,511 -556,761 -427,761 -303,761
100 -161,502 -96,901 -1,146,651 -596,901 -467,901 -343,901 120 -228,401 -137,041 -1,186,791 -637,041 -508,041 -384,041 140 -295,301 -177,181 -1,226,931 -677,181 -548,181 -424,181 160 -362,200 -217,320 -1,267,070 -717,320 -588,320 -464,320 180 -429,100 -257,460 -1,307,210 -757,460 -628,460 -504,460 200 -496,000 -297,600 -1,347,350 -797,600 -668,600 -544,600 210 -529,449 -317,669 -1,367,419 -817,669 -688,669 -564,669 220 -562,899 -337,740 -1,387,490 -837,740 -708,740 -584,740 230 -596,349 -357,809 -1,407,559 -857,809 -728,809 -604,809 240 -629,799 -377,879 -1,427,629 -877,879 -748,879 -624,879 250 -663,248 -397,949 -1,447,699 -897,949 -768,949 -644,949
Kenilworth Private values £2691 psmMaximum CIL rates (per square metre)
CIL amount per sq m
RLV RLV per ha RLV less BLV 1 RLV less BLV 2 RLV less BLV 3 RLV less BLV 4 BLV1 BLV2 BLV3 BLV4
0 -591,925 -355,155 -1,404,905 -855,155 -726,155 -602,155 #N/A #N/A #N/A #N/A20 -648,644 -389,187 -1,438,937 -889,187 -760,187 -636,187 40 -715,544 -429,326 -1,479,076 -929,326 -800,326 -676,326 60 -782,444 -469,466 -1,519,216 -969,466 -840,466 -716,466 80 -849,343 -509,606 -1,559,356 -1,009,606 -880,606 -756,606
100 -916,243 -549,746 -1,599,496 -1,049,746 -920,746 -796,746 120 -983,142 -589,885 -1,639,635 -1,089,885 -960,885 -836,885 140 -1,050,042 -630,025 -1,679,775 -1,130,025 -1,001,025 -877,025 160 -1,116,942 -670,165 -1,719,915 -1,170,165 -1,041,165 -917,165 180 -1,183,841 -710,305 -1,760,055 -1,210,305 -1,081,305 -957,305 200 -1,250,741 -750,444 -1,800,194 -1,250,444 -1,121,444 -997,444 210 -1,284,190 -770,514 -1,820,264 -1,270,514 -1,141,514 -1,017,514 220 -1,317,639 -790,584 -1,840,334 -1,290,584 -1,161,584 -1,037,584 230 -1,351,090 -810,654 -1,860,404 -1,310,654 -1,181,654 -1,057,654 240 -1,384,539 -830,723 -1,880,473 -1,330,723 -1,201,723 -1,077,723 250 -1,417,989 -850,794 -1,900,544 -1,350,794 -1,221,794 -1,097,794
Rural areas (higher value) Private values £3180 psmMaximum CIL rates (per square metre)
CIL amount per sq m
RLV RLV per ha RLV less BLV 1 RLV less BLV 2 RLV less BLV 3 RLV less BLV 4 BLV1 BLV2 BLV3 BLV4
0 691,682 415,009 -634,741 -84,991 44,009 168,009 #N/A #N/A £0 £8020 613,964 368,378 -681,372 -131,622 -2,622 121,37840 548,140 328,884 -720,866 -171,116 -42,116 81,88460 482,317 289,390 -760,360 -210,610 -81,610 42,39080 416,494 249,897 -799,853 -250,103 -121,103 2,897
100 350,671 210,403 -839,347 -289,597 -160,597 -36,597 120 284,849 170,909 -878,841 -329,091 -200,091 -76,091 140 219,025 131,415 -918,335 -368,585 -239,585 -115,585 160 153,202 91,921 -957,829 -408,079 -279,079 -155,079 180 87,379 52,428 -997,322 -447,572 -318,572 -194,572 200 21,557 12,934 -1,036,816 -487,066 -358,066 -234,066 210 -11,540 -6,924 -1,056,674 -506,924 -377,924 -253,924 220 -44,991 -26,994 -1,076,744 -526,994 -397,994 -273,994 230 -78,440 -47,064 -1,096,814 -547,064 -418,064 -294,064 240 -111,890 -67,134 -1,116,884 -567,134 -438,134 -314,134 250 -145,340 -87,204 -1,136,954 -587,204 -458,204 -334,204

Site type 9
Rural areas (lower value) Private values £2449 psmMaximum CIL rates (per square metre)
CIL amount per sq m
RLV RLV per ha RLV less BLV 1 RLV less BLV 2 RLV less BLV 3 RLV less BLV 4 BLV1 BLV2 BLV3 BLV4
0 -1,232,765 -739,659 -1,789,409 -1,239,659 -1,110,659 -986,659 #N/A #N/A #N/A #N/A20 -1,278,463 -767,078 -1,816,828 -1,267,078 -1,138,078 -1,014,078 40 -1,345,363 -807,218 -1,856,968 -1,307,218 -1,178,218 -1,054,218 60 -1,412,261 -847,357 -1,897,107 -1,347,357 -1,218,357 -1,094,357 80 -1,479,161 -887,497 -1,937,247 -1,387,497 -1,258,497 -1,134,497
100 -1,546,061 -927,636 -1,977,386 -1,427,636 -1,298,636 -1,174,636 120 -1,612,960 -967,776 -2,017,526 -1,467,776 -1,338,776 -1,214,776 140 -1,679,860 -1,007,916 -2,057,666 -1,507,916 -1,378,916 -1,254,916 160 -1,746,759 -1,048,056 -2,097,806 -1,548,056 -1,419,056 -1,295,056 180 -1,813,659 -1,088,195 -2,137,945 -1,588,195 -1,459,195 -1,335,195 200 -1,880,559 -1,128,335 -2,178,085 -1,628,335 -1,499,335 -1,375,335 210 -1,914,008 -1,148,405 -2,198,155 -1,648,405 -1,519,405 -1,395,405 220 -1,947,458 -1,168,475 -2,218,225 -1,668,475 -1,539,475 -1,415,475 230 -1,980,907 -1,188,544 -2,238,294 -1,688,544 -1,559,544 -1,435,544 240 -2,014,358 -1,208,615 -2,258,365 -1,708,615 -1,579,615 -1,455,615 250 -2,047,807 -1,228,684 -2,278,434 -1,728,684 -1,599,684 -1,475,684
0 Private values £ psmMaximum CIL rates (per square metre)
CIL amount per sq m
RLV RLV per ha RLV less BLV 1 RLV less BLV 2 RLV less BLV 3 RLV less BLV 4 BLV1 BLV2 BLV3 BLV4
0 -7,717,960 -4,630,776 -5,680,526 -5,130,776 -5,001,776 -4,877,776 #N/A #N/A #N/A #N/A20 -7,652,118 -4,591,271 -5,641,021 -5,091,271 -4,962,271 -4,838,271 40 -7,719,018 -4,631,411 -5,681,161 -5,131,411 -5,002,411 -4,878,411 60 -7,785,917 -4,671,550 -5,721,300 -5,171,550 -5,042,550 -4,918,550 80 -7,852,817 -4,711,690 -5,761,440 -5,211,690 -5,082,690 -4,958,690
100 -7,919,717 -4,751,830 -5,801,580 -5,251,830 -5,122,830 -4,998,830 120 -7,986,616 -4,791,970 -5,841,720 -5,291,970 -5,162,970 -5,038,970 140 -8,053,516 -4,832,110 -5,881,860 -5,332,110 -5,203,110 -5,079,110 160 -8,120,415 -4,872,249 -5,921,999 -5,372,249 -5,243,249 -5,119,249 180 -8,187,315 -4,912,389 -5,962,139 -5,412,389 -5,283,389 -5,159,389 200 -8,254,215 -4,952,529 -6,002,279 -5,452,529 -5,323,529 -5,199,529 210 -8,287,664 -4,972,598 -6,022,348 -5,472,598 -5,343,598 -5,219,598 220 -8,321,114 -4,992,669 -6,042,419 -5,492,669 -5,363,669 -5,239,669 230 -8,354,564 -5,012,738 -6,062,488 -5,512,738 -5,383,738 -5,259,738 240 -8,388,014 -5,032,808 -6,082,558 -5,532,808 -5,403,808 -5,279,808 250 -8,421,463 -5,052,878 -6,102,628 -5,552,878 -5,423,878 -5,299,878

DEVELOPMENT PROGRAMMESQuarter
Site type Activity 1 2 3 4 5 6 7 8 9 10 11 12 13 14 15 16 17 18 19 20 21 22 23 24 25 26 27 28 29 30 31 32 33 34 35 36 37 38 39 40
Pre-construction Type 1 - 4 units, houses, GF Construction 0 1 1 1 1 0 0 0 0 0 0 0 0 0 0 0 0 0 0 0 0 0 0 0 0 0 0 0 0 0 0 0 0 0 0 0 0 0 0 0
Sales 0 0 0 0 0 1 0 0 0 0 0 0 0 0 0 0 0 0 0 0 0 0 0 0 0 0 0 0 0 0 0 0 0 0 0 0 0 0 0 0S106 payment 0 0 0 0 0 1 0 0 0 0 0 0 0 0 0 0 0 0 0 0 0 0 0 0 0 0 0 0 0 0 0 0 0 0 0 0 0 0 0 0CIL payment 1 1 0 0 0 0 0 0 0 0 0 0 0 0 0 0 0 0 0 0 0 0 0 0 0 0 0 0 0 0 0 0 0 0 0 0 0 0 0 0 0CIL payment 2 0 0 1 0 0 0 0 0 0 0 0 0 0 0 0 0 0 0 0 0 0 0 0 0 0 0 0 0 0 0 0 0 0 0 0 0 0 0 0 0CIL payment 3 0 0 0 0 1 0 0 0 0 0 0 0 0 0 0 0 0 0 0 0 0 0 0 0 0 0 0 0 0 0 0 0 0 0 0 0 0 0 0 0
Site type Activity 1 2 3 4 5 6 7 8 9 10 11 12 13 14 15 16 17 18 19 20 21 22 23 24 25 26 27 28 29 30 31 32 33 34 35 36 37 38 39 40
Pre-construction Type 2 - 8 units, houses, UBConstruction 0 1 1 1 1 0 0 0 0 0 0 0 0 0 0 0 0 0 0 0 0 0 0 0 0 0 0 0 0 0 0 0 0 0 0 0 0 0 0 0
Sales 0 0 0 0 0 1 1 1 0 0 0 0 0 0 0 0 0 0 0 0 0 0 0 0 0 0 0 0 0 0 0 0 0 0 0 0 0 0 0 0S106 payment 0 0 0 0 0 0 1 0 0 0 0 0 0 0 0 0 0 0 0 0 0 0 0 0 0 0 0 0 0 0 0 0 0 0 0 0 0 0 0 0CIL payment 1 1 0 0 0 0 0 0 0 0 0 0 0 0 0 0 0 0 0 0 0 0 0 0 0 0 0 0 0 0 0 0 0 0 0 0 0 0 0 0 0CIL payment 2 0 0 0 1 0 0 0 0 0 0 0 0 0 0 0 0 0 0 0 0 0 0 0 0 0 0 0 0 0 0 0 0 0 0 0 0 0 0 0 0CIL payment 3 0 0 0 0 0 1 0 0 0 0 0 0 0 0 0 0 0 0 0 0 0 0 0 0 0 0 0 0 0 0 0 0 0 0 0 0 0 0 0 0
Site type Activity 1 2 3 4 5 6 7 8 9 10 11 12 13 14 15 16 17 18 19 20 21 22 23 24 25 26 27 28 29 30 31 32 33 34 35 36 37 38 39 40
Pre-construction Type 3 - 25 units, houses & flats, GFConstruction 0 1 1 1 1 1 1 0 0 0 0 0 0 0 0 0 0 0 0 0 0 0 0 0 0 0 0 0 0 0 0 0 0 0 0 0 0 0 0 0
Sales 0 0 0 0 0 0 1 1 1 0 0 0 0 0 0 0 0 0 0 0 0 0 0 0 0 0 0 0 0 0 0 0 0 0 0 0 0 0 0 0S106 payment 0 0 0 0 0 0 0 1 0 0 0 0 0 0 0 0 0 0 0 0 0 0 0 0 0 0 0 0 0 0 0 0 0 0 0 0 0 0 0 0CIL payment 1 1 0 0 0 0 0 0 0 0 0 0 0 0 0 0 0 0 0 0 0 0 0 0 0 0 0 0 0 0 0 0 0 0 0 0 0 0 0 0 0CIL payment 2 0 0 0 1 0 0 0 0 0 0 0 0 0 0 0 0 0 0 0 0 0 0 0 0 0 0 0 0 0 0 0 0 0 0 0 0 0 0 0 0CIL payment 3 0 0 0 0 0 0 1 0 0 0 0 0 0 0 0 0 0 0 0 0 0 0 0 0 0 0 0 0 0 0 0 0 0 0 0 0 0 0 0 0
Site type Activity 1 2 3 4 5 6 7 8 9 10 11 12 13 14 15 16 17 18 19 20 21 22 23 24 25 26 27 28 29 30 31 32 33 34 35 36 37 38 39 40
Pre-construction Type 4 - 35 units, houses & flats, GFConstruction 0 1 1 1 1 1 1 0 0 0 0 0 0 0 0 0 0 0 0 0 0 0 0 0 0 0 0 0 0 0 0 0 0 0 0 0 0 0 0 0
Sales 0 0 0 0 0 0 1 1 1 0 0 0 0 0 0 0 0 0 0 0 0 0 0 0 0 0 0 0 0 0 0 0 0 0 0 0 0 0 0 0S106 payment 0 0 0 0 0 0 0 1 0 0 0 0 0 0 0 0 0 0 0 0 0 0 0 0 0 0 0 0 0 0 0 0 0 0 0 0 0 0 0 0CIL payment 1 1 0 0 0 0 0 0 0 0 0 0 0 0 0 0 0 0 0 0 0 0 0 0 0 0 0 0 0 0 0 0 0 0 0 0 0 0 0 0 0CIL payment 2 0 0 0 1 0 0 0 0 0 0 0 0 0 0 0 0 0 0 0 0 0 0 0 0 0 0 0 0 0 0 0 0 0 0 0 0 0 0 0 0CIL payment 3 0 0 0 0 0 0 1 0 0 0 0 0 0 0 0 0 0 0 0 0 0 0 0 0 0 0 0 0 0 0 0 0 0 0 0 0 0 0 0 0
Site type Activity 1 2 3 4 5 6 7 8 9 10 11 12 13 14 15 16 17 18 19 20 21 22 23 24 25 26 27 28 29 30 31 32 33 34 35 36 37 38 39 40
Pre-construction Type 5 - 50 units, houses & flats, UBConstruction 0 1 1 1 1 1 1 0 0 0 0 0 0 0 0 0 0 0 0 0 0 0 0 0 0 0 0 0 0 0 0 0 0 0 0 0 0 0 0 0
Sales 0 0 0 0 0 0 1 1 1 1 0 0 0 0 0 0 0 0 0 0 0 0 0 0 0 0 0 0 0 0 0 0 0 0 0 0 0 0 0 0S106 payment 0 0 0 0 0 0 0 1 0 0 0 0 0 0 0 0 0 0 0 0 0 0 0 0 0 0 0 0 0 0 0 0 0 0 0 0 0 0 0 0CIL payment 1 1 0 0 0 0 0 0 0 0 0 0 0 0 0 0 0 0 0 0 0 0 0 0 0 0 0 0 0 0 0 0 0 0 0 0 0 0 0 0 0CIL payment 2 0 0 0 1 0 0 0 0 0 0 0 0 0 0 0 0 0 0 0 0 0 0 0 0 0 0 0 0 0 0 0 0 0 0 0 0 0 0 0 0CIL payment 3 0 0 0 0 0 0 1 0 0 0 0 0 0 0 0 0 0 0 0 0 0 0 0 0 0 0 0 0 0 0 0 0 0 0 0 0 0 0 0 0
Site type Activity 1 2 3 4 5 6 7 8 9 10 11 12 13 14 15 16 17 18 19 20 21 22 23 24 25 26 27 28 29 30 31 32 33 34 35 36 37 38 39 40
Pre-construction Type 6 - 65 units, houses & flats, UBConstruction 0 1 1 1 1 1 1 0 0 0 0 0 0 0 0 0 0 0 0 0 0 0 0 0 0 0 0 0 0 0 0 0 0 0 0 0 0 0 0 0
Sales 0 0 0 0 0 0 1 1 1 1 0 0 0 0 0 0 0 0 0 0 0 0 0 0 0 0 0 0 0 0 0 0 0 0 0 0 0 0 0 0S106 payment 0 0 0 0 0 0 0 1 0 0 0 0 0 0 0 0 0 0 0 0 0 0 0 0 0 0 0 0 0 0 0 0 0 0 0 0 0 0 0 0CIL payment 1 1 0 0 0 0 0 0 0 0 0 0 0 0 0 0 0 0 0 0 0 0 0 0 0 0 0 0 0 0 0 0 0 0 0 0 0 0 0 0 0CIL payment 2 0 0 0 1 0 0 0 0 0 0 0 0 0 0 0 0 0 0 0 0 0 0 0 0 0 0 0 0 0 0 0 0 0 0 0 0 0 0 0 0CIL payment 3 0 0 0 0 0 0 1 0 0 0 0 0 0 0 0 0 0 0 0 0 0 0 0 0 0 0 0 0 0 0 0 0 0 0 0 0 0 0 0 0
Site type Activity 1 2 3 4 5 6 7 8 9 10 11 12 13 14 15 16 17 18 19 20 21 22 23 24 25 26 27 28 29 30 31 32 33 34 35 36 37 38 39 40
Pre-construction Type 7 - 75 units, houses, GFConstruction 0 1 1 1 1 1 1 1 1 0 0 0 0 0 0 0 0 0 0 0 0 0 0 0 0 0 0 0 0 0 0 0 0 0 0 0 0 0 0 0
Sales 0 0 0 0 0 0 0 0 1 1 1 1 0 0 0 0 0 0 0 0 0 0 0 0 0 0 0 0 0 0 0 0 0 0 0 0 0 0 0 0S106 payment 0 0 0 0 0 0 0 0 0 0 1 0 0 0 0 0 0 0 0 0 0 0 0 0 0 0 0 0 0 0 0 0 0 0 0 0 0 0 0 0CIL payment 1 1 0 0 0 0 0 0 0 0 0 0 0 0 0 0 0 0 0 0 0 0 0 0 0 0 0 0 0 0 0 0 0 0 0 0 0 0 0 0 0CIL payment 2 0 0 0 1 0 0 0 0 0 0 0 0 0 0 0 0 0 0 0 0 0 0 0 0 0 0 0 0 0 0 0 0 0 0 0 0 0 0 0 0CIL payment 3 0 0 0 0 0 0 1 0 0 0 0 0 0 0 0 0 0 0 0 0 0 0 0 0 0 0 0 0 0 0 0 0 0 0 0 0 0 0 0 0
Site type Activity 1 2 3 4 5 6 7 8 9 10 11 12 13 14 15 16 17 18 19 20 21 22 23 24 25 26 27 28 29 30 31 32 33 34 35 36 37 38 39 40
Pre-construction Type 8 - 75 units, houses, GFConstruction 0 1 1 1 1 1 1 1 1 0 0 0 0 0 0 0 0 0 0 0 0 0 0 0 0 0 0 0 0 0 0 0 0 0 0 0 0 0 0 0
Sales 0 0 0 0 0 0 0 0 1 1 1 1 1 0 0 0 0 0 0 0 0 0 0 0 0 0 0 0 0 0 0 0 0 0 0 0 0 0 0 0S106 payment 0 0 0 0 0 0 0 0 0 0 1 0 0 0 0 0 0 0 0 0 0 0 0 0 0 0 0 0 0 0 0 0 0 0 0 0 0 0 0 0CIL payment 1 1 0 0 0 0 0 0 0 0 0 0 0 0 0 0 0 0 0 0 0 0 0 0 0 0 0 0 0 0 0 0 0 0 0 0 0 0 0 0 0CIL payment 2 0 0 0 1 0 0 0 0 0 0 0 0 0 0 0 0 0 0 0 0 0 0 0 0 0 0 0 0 0 0 0 0 0 0 0 0 0 0 0 0CIL payment 3 0 0 0 0 0 0 1 0 0 0 0 0 0 0 0 0 0 0 0 0 0 0 0 0 0 0 0 0 0 0 0 0 0 0 0 0 0 0 0 0
Site type Activity 1 2 3 4 5 6 7 8 9 10 11 12 13 14 15 16 17 18 19 20 21 22 23 24 25 26 27 28 29 30 31 32 33 34 35 36 37 38 39 40
Pre-construction Type 9 - 100 units, flats, UBConstruction 0 1 1 1 1 1 1 1 1 0 0 0 0 0 0 0 0 0 0 0 0 0 0 0 0 0 0 0 0 0 0 0 0 0 0 0 0 0 0 0
Sales 0 0 0 0 0 0 0 0 1 1 1 1 1 0 0 0 0 0 0 0 0 0 0 0 0 0 0 0 0 0 0 0 0 0 0 0 0 0 0 0S106 payment 0 0 0 0 0 0 0 0 0 0 1 0 0 0 0 0 0 0 0 0 0 0 0 0 0 0 0 0 0 0 0 0 0 0 0 0 0 0 0 0CIL payment 1 1 0 0 0 0 0 0 0 0 0 0 0 0 0 0 0 0 0 0 0 0 0 0 0 0 0 0 0 0 0 0 0 0 0 0 0 0 0 0 0CIL payment 2 0 0 0 1 0 0 0 0 0 0 0 0 0 0 0 0 0 0 0 0 0 0 0 0 0 0 0 0 0 0 0 0 0 0 0 0 0 0 0 0CIL payment 3 0 0 0 0 0 0 1 0 0 0 0 0 0 0 0 0 0 0 0 0 0 0 0 0 0 0 0 0 0 0 0 0 0 0 0 0 0 0 0 0
Year 9 Year 10Year 5 Year 6 Year 7 Year 8Year 1 Year 2 Year 3 Year 4

LOCAL PLAN AND CIL VIABILITY MODEL This is input source box for reference info that appears on all sheets
Local Authority
Area(s)
Author
Date
Reference
Values:Sales values a 2,307 psm
Typology desriptionResidual Land
ValuesTotal units Total floor area
Private floor area
Ave unit size CIL as % of dev costs
Affordable housing percentage 40% Type 1 - 4 units, houses, GF £3,744 4 404 242 101 3.6% of which social rented 80% Type 2 - 8 units, houses, UB -£3,282 8 774 464 97 3.6% of which intermediate 20% Type 3 - 25 units, houses & flats, GF -£64,710 25 2,311 1,387 92 3.6%
Type 4 - 35 units, houses & flats, GF -£87,381 35 3,187 1,912 91 3.6%Code for Sustinable Homes Level Type 5 - 50 units, houses & flats, UB -£588,482 50 3,990 2,394 80 3.6%Cost allowance - all tenures (% of base costs) 6% 4 Type 6 - 65 units, houses & flats, UB -£641,859 65 5,385 3,231 83 3.6%
Type 7 - 75 units, houses, GF -£222,140 75 8,175 4,905 109 3.6%Type 8 - 75 units, houses, GF -£258,344 75 7,350 4,410 98 3.6%
Grant available Type 9 - 100 units, flats, UB -£2,417,370 100 6,300 3,780 63 3.6%
CIL rate 16 802 Benchmark Land Values
CIl rates Rate per sqm BLV no Description £s per ha
1 £0 BLV1 Commercial 1 £1,049,750
2 £20 BLV2 Commercial 2 £500,000
3 £40 BLV3 Greenfield 1 £371,000
4 £60 BLV4 Greenfield 2 £247,000
5 £806 £1007 £120 Growth
8 £140 Value growth 9 £160 Cost growth 10 £18011 £20012 £21013 £22014 £23015 £24016 £250
01 February 2013
130372
Warwick District Council
Warwick District (Warwick, Leamington Spa, Kenilworth and rural areas)
BNPPRE
check box
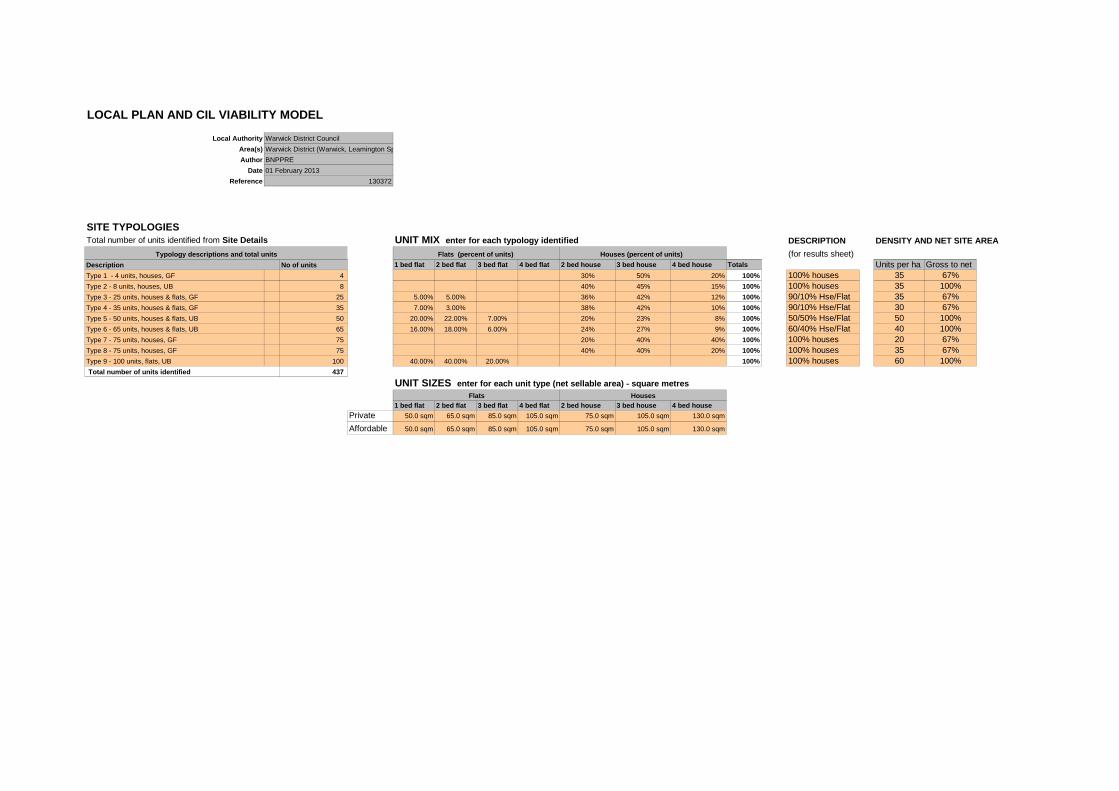
LOCAL PLAN AND CIL VIABILITY MODEL
Local Authority
Area(s)
Author
Date
Reference
SITE TYPOLOGIES Total number of units identified from Site Details UNIT MIX enter for each typology identified DESCRIPTION DENSITY AND NET SITE AREA
(for results sheet)No of units 1 bed flat 2 bed flat 3 bed flat 4 bed flat 2 bed ho use 3 bed house 4 bed house Totals Units per ha Gross to net
Type 1 - 4 units, houses, GF 4 30% 50% 20% 100% 100% houses 35 67%Type 2 - 8 units, houses, UB 8 40% 45% 15% 100% 100% houses 35 100%Type 3 - 25 units, houses & flats, GF 25 5.00% 5.00% 36% 42% 12% 100% 90/10% Hse/Flat 35 67%Type 4 - 35 units, houses & flats, GF 35 7.00% 3.00% 38% 42% 10% 100% 90/10% Hse/Flat 30 67%Type 5 - 50 units, houses & flats, UB 50 20.00% 22.00% 7.00% 20% 23% 8% 100% 50/50% Hse/Flat 50 100%Type 6 - 65 units, houses & flats, UB 65 16.00% 18.00% 6.00% 24% 27% 9% 100% 60/40% Hse/Flat 40 100%Type 7 - 75 units, houses, GF 75 20% 40% 40% 100% 100% houses 20 67%Type 8 - 75 units, houses, GF 75 40% 40% 20% 100% 100% houses 35 67%Type 9 - 100 units, flats, UB 100 40.00% 40.00% 20.00% 100% 100% houses 60 100%
437
UNIT SIZES enter for each unit type (net sellable area) - squa re metres
1 bed flat 2 bed flat 3 bed flat 4 bed flat 2 bed ho use 3 bed house 4 bed house
Private 50.0 sqm 65.0 sqm 85.0 sqm 105.0 sqm 75.0 sqm 105.0 sqm 130.0 sqm
Affordable 50.0 sqm 65.0 sqm 85.0 sqm 105.0 sqm 75.0 sqm 105.0 sqm 130.0 sqm
Total number of units identified
Houses (percent of units)
Flats Houses
Flats (percent of units)
Warwick District Council
Description
Typology descriptions and total units
Warwick District (Warwick, Leamington Spa, Kenilworth and rural areas)
BNPPRE
01 February 2013
130372

Sales and Affordable Housing Values 21/02/2013
LOCAL PLAN AND CIL VIABILITY MODEL
Local Authority
Area(s)
Author
Date
Reference
SALES AND AFFORDABLE HOUSING VALUES
VALUE BANDS for private sales GROUND RENTS from flat s (£s per annum) Investment value Sub Market £ per sq metre Private Affordable Private Affordable
A Warwick £2,307 One bed £100 £0 One bed £1,818 £0
B Leamington Spa £2,981 Two beds £150 £0 Two beds £2,727 £0
C Kenilworth £2,691 Three beds £200 £0 Three beds £3,636 £0
D Rural areas (higher value) £3,180 Four beds £250 £0 Four beds £4,545 £0
E Rural areas (lower value) £2,449 Capitalisation rate 5.50%
F
G
HI
Select affordable value option from drop down box
AFFORDABLE HOUSING CAPITAL VALUES (price paid to developer)Option 1 User defined capital values per unit
Capitalised rent per unit
Indicative HCA funding per unit
Value per unit Equity + rent
Indicative HCA funding per unit Value per unit
One bed flats £0 £0 £0
Two bed flats £0 £0 £0
Three bed flats £0 £0 £0
Four bed flats £0 £0 £0
Two bed house £0 £0 £0
Three bed house £0 £0 £0
Four bed house £0 £0 £0
Option 2 Capital values for affordable housing calc ulated from net rents & yield assumption
Net Target rent per annum Yield Capital value
Indicative unit funding Value per unit
Average market value
% of equity sold
Value of equity sold
Rent (% of retained equity)
Rent per annum Yield
Capital value of retained equity
One bed flats £2,757 6.50% £42,411 £0 £42,411 £115,350 40% £46,140 2.75% £1,903 5.00% £38,066
Two bed flats £3,181 6.50% £48,941 £0 £48,941 £149,955 40% £59,982 2.75% £2,474 5.00% £49,485
Three bed flats £3,702 6.50% £56,956 £0 £56,956 £196,095 40% £78,438 2.75% £3,236 5.00% £64,711
Four bed flats £4,223 6.50% £64,972 £0 £64,972 £242,235 40% £96,894 2.75% £3,997 5.00% £79,938
Two bed house £3,181 6.50% £48,941 £0 £48,941 £173,025 40% £69,210 2.75% £2,855 5.00% £57,098
Three bed house £3,606 6.50% £55,470 £0 £55,470 £242,235 40% £96,894 2.75% £3,997 5.00% £79,938
Four bed house £4,223 6.50% £64,972 £0 £64,972 £299,910 40% £119,964 2.75% £4,949 5.00% £98,970
130372
Social rent
Social rent NBHB
NBHB
Warwick District Council
Warwick District (Warwick, Leamington Spa, Kenilworth and rural areas)
BNPPRE
01 February 2013
Option 2: Capital values calculated from net rents & yields

Costs, s106, CIL, Timings, Other costs, Inflation 21/02/2013
LOCAL PLAN AND CIL VIABILITY MODEL
Local Authority
Area(s)
Author
Date
Reference
BUILD COSTS
Build start
Build period
Sales period
Sales period start S106 payments CIL Charges Fees
Typology
Build costs (flats) per gross sq m
Build costs (houses) per gross sq m
External works and other costs
Gross to net adjustment for flats Quarters Quarters Quarters
Quarters from start on site
£s per unit all tenures
Quarter paid
£s p sq m private sales only
Instal-ment 1 - Qtr paid
Instal-ment 2 - Qtr paid
Instal-ment 3 - Qtr paid
% of build cost
Type 1 - 4 units, houses, GF £953 £810 £149 85% 2 4 1 6 £1,500 6 £250 1 3 5 10%
Type 2 - 8 units, houses, UB £953 £810 £149 85% 2 4 3 6 £1,500 7 £250 1 4 6 10%
Type 3 - 25 units, houses & flats, GF £953 £810 £149 85% 2 6 3 7 £1,500 8 £250 1 4 7 10%
Type 4 - 35 units, houses & flats, GF £953 £810 £149 85% 2 6 3 7 £1,500 8 £250 1 4 7 10%
Type 5 - 50 units, houses & flats, UB £953 £810 £149 85% 2 6 4 7 £1,500 8 £250 1 4 7 10%
Type 6 - 65 units, houses & flats, UB £953 £810 £149 85% 2 6 4 7 £1,500 8 £250 1 4 7 10%
Type 7 - 75 units, houses, GF £953 £810 £149 85% 2 8 4 9 £1,500 11 £250 1 4 7 10%
Type 8 - 75 units, houses, GF £953 £810 £149 85% 2 8 5 9 £1,500 11 £250 1 4 7 10%
Type 9 - 100 units, flats, UB £953 £810 £149 85% 2 8 5 9 £1,500 11 £250 1 4 7 10%
OTHER COSTSSite prep 500 per unit
Private 20.00% Externals 14,445 per unit Affordable 6.00% 14,945
Code for Sustainable Homes All tenures 6% From test variables 149 Contingency 5%
Marketing costs % of sales values 3.00%
Legal Fees % of GDV 0.50%
Site acquisition costs % land value 5.80% monthsDevelopment Finance 7.00% PD units @ 3pcm years quarters
Type 1 4 2 1 0 0Type 2 8 5 1 0 0
INFLATION Type 3 25 15 5 0 2Type 4 35 21 7 1 2Type 5 50 30 5 0 2
Inflation Sales Build Type 6 65 39 7 1 2Year 1 0.0% 0.0% Type 7 75 45 8 1 3Year 2 0.0% 0.0% Type 8 75 45 8 1 3Year 3 0.0% 0.0% Type 9 100 60 10 1 3Year 4 0.0% 0.0%
Year 5 0.0% 0.0%
Year 6 0.0% 0.0%
Year 7 0.0% 0.0%
Year 8 0.0% 0.0%
Year 9 0.0% 0.0%
Year 10 0.0% 0.0%
Year 11 0.0% 0.0%
Year 12 0.0% 0.0%
Year 13 0.0% 0.0%
Year 14 0.0% 0.0%
Year 15 0.0% 0.0%
Year 16 0.0% 0.0%
Year 17 0.0% 0.0%
Year 18 0.0% 0.0%
Year 19 0.0% 0.0%
Year 20 0.0% 0.0%
Year 21 0.0% 0.0%
Year 22 0.0% 0.0%
Year 23 0.0% 0.0%
TIMINGS for cash flow PLANNING OBLIGATIONS / CIL
Developer return % GDV
Warwick District Council
Warwick District (Warwick, Leamington Spa, Kenilworth and rural areas)
BNPPRE
01 February 2013
130372

Cash Flow26 of 44
21/02/2013Warwick Smaller Sites - 40% AH
LOCAL PLAN AND CIL VIABILITY MODEL
Local Authority
Area(s)
Author
DateReference
DEVELOPMENT PERIOD CASHFLOW
dev hectarage dev acreage
Qtr 1 Qtr 2 Qtr 3 Qtr 4 Qtr 5 Qtr 6 Qtr 7 Qtr 8 Qtr 9 Qtr 10
Project Year 1 Year 1 Year 1 Year 1 Year 2 Year 2 Year 2 Year 2 Year 3 Year 3Revenue per Qtr Totals 1 2 3 4 1 2 3 4 1 2
RevenueType 1 - 4 units, houses, GF 559,217£ 559,217£ 4 559,217£ 0 0 0 0 0 559,217 0 0 0 0
Investment value of ground rents Type 1 - 4 units, houses, GF -£ -£ -£ 0 0 0 0 0 0 0 0 0 0
GDV before costs of sale Sub Total £559,217 0 0 0 0 0 559,217 0 0 0 0Costs of Sale
Marketing costs 3.00% 16,777£ 0 0 0 0 0 16,777 0 0 0 0Legal fees 0.50% 2,796£ 0 0 0 0 0 2,796 0 0 0 0
Sub Total -£19,573 0 0 0 0 0 19,573 0 0 0 0
Speculative NDV 539,644£ 0 0 0 0 0 539,644 0 0 0 0Affordable Housing Revenue
No fees on sale Revenue per Qtr -£ Type 1 - 4 units, houses, GF 134,871£ 33,718 4 134,871£ 0 33,718 33,718 33,718 33,718 0 0 0 0 0
-£
NDV Total 674,515£ 0 33,718 33,718 33,718 33,718 539,644 0 0 0 0
Standard CostsCost per Qtr
Type 1 - 4 units, houses, GF 407,070£ 101,768 4 407,070£ 0 101,768 101,768 101,768 101,768 0 0 0 0 0Contingency 20,354£ 0 5,088 5,088 5,088 5,088 0 0 0 0 0
Sub Total 427,424£ 0 106,856 106,856 106,856 106,856 0 0 0 0 0Other Costs
Professional fees 10.00% 42,742£ 0 10,686 10,686 10,686 10,686 0 0 0 0 0
Sub Total 42,742£ 0 10,686 10,686 10,686 10,686 0 0 0 0 0CIL
CIL Payment 1 20,200£ 20,200£ 20,200 0 0 0 0 0 0 0 0 0Payment 2 20,200£ 20,200£ 0 0 20,200 0 0 0 0 0 0 0
Payment 3 20,200£ 20,200£ 0 0 0 0 20,200 0 0 0 0 0
Sub Total 60,600£ 20,200 0 20,200 0 20,200 0 0 0 0 0
Section 106 Costs Type 1 - 4 units, houses, GF 6,000£ 6,000£ 0 0 0 0 0 6,000 0 0 0 0Sub Total 6,000£ 0 0 0 0 0 6,000 0 0 0 0
Total Abnormal Costs Sub Total 66,600£ 20,200 0 20,200 0 20,200 6,000 0 0 0 0
Total Costs 536,766£ 20,200 117,542 137,742 117,542 137,742 6,000 0 0 0 0
-£
Developer's profit on GDV % of GDV 20.00% 107,929£ 0 0 0 0 0 107,929 0 0 0 0% of GDV affordable 6% 8,092£ 0 2,023 2,023 2,023 2,023 0 0 0 0 0
Residual Sum before interest 21,727£ -20,200 -85,847 -106,047 -85,847 -106,047 425,715 0 0 0 0
Cumulative residual balance for interest calculatio n -20,200 -106,377 -214,164 -303,514 -414,525 4,411 0 0 0 0
Interest 7.00% 17,317-£ -330 -1,740 -3,503 -4,964 -6,780 0 0 0 0 0
Residual Sum for quarter after interest 4,411£ -20,530 -87,587 -109,550 -90,811 -112,827 425,715 0 0 0 0
3,975£ 6
Land Value per developable acre #DIV/0!per developable hectare #DIV/0!
Residual land value 3,975£
Site acquisition costs 5.80% 231£
MV (Residual Sum available to offer for Development Opportunity) 3,744£
130372
Warwick District Council
Warwick District (Warwick, Leamington Spa, Kenilworth and rural areas)
BNPPRE
01 February 2013

Cash Flow27 of 44
21/02/2013Warwick Smaller Sites - 40% AH
LOCAL PLAN AND CIL VIABILITY MODEL
Local Authority
Area(s)
Author
DateReference
DEVELOPMENT PERIOD CASHFLOW
dev hectarage 0.000 dev acreage 0.000
Qtr 1 Qtr 2 Qtr 3 Qtr 4 Qtr 5 Qtr 6 Qtr 7 Qtr 8 Qtr 9 Qtr 10
Project Year 1 Year 1 Year 1 Year 1 Year 2 Year 2 Year 2 Year 2 Year 3 Year 3Revenue per Qtr Totals 1 2 3 4 1 2 3 4 1 2
RevenueType 2 - 8 units, houses, UB 1,071,371£ 357,124£ 4 1,071,371£ 0 0 0 0 0 357,124 357,124 357,124 0 0
Investment value of ground rents Type 2 - 8 units, houses, UB -£ -£ -£ 0 0 0 0 0 0 0 0 0 0
GDV before costs of sale Sub Total £1,071,371 0 0 0 0 0 357,124 357,124 357,124 0 0Costs of Sale
Marketing costs 3.00% 32,141£ 0 0 0 0 0 10,714 10,714 10,714 0 0Legal fees 0.50% 5,357£ 0 0 0 0 0 1,786 1,786 1,786 0 0
Sub Total -£37,498 0 0 0 0 0 12,499 12,499 12,499 0 0
Speculative NDV 1,033,873£ 0 0 0 0 0 344,624 344,624 344,624 0 0Affordable Housing Revenue
No fees on sale Revenue per Qtr -£ Type 2 - 8 units, houses, UB 258,391£ 64,598 4 258,391£ 0 64,598 64,598 64,598 64,598 0 0 0 0 0
-£
NDV Total 1,292,263£ 0 64,598 64,598 64,598 64,598 344,624 344,624 344,624 0 0
Standard CostsCost per Qtr
Type 2 - 8 units, houses, UB 779,882£ 194,971 4 779,882£ 0 194,971 194,971 194,971 194,971 0 0 0 0 0Contingency 38,994£ 0 9,749 9,749 9,749 9,749 0 0 0 0 0
Sub Total 818,877£ 0 204,719 204,719 204,719 204,719 0 0 0 0 0Other Costs
Professional fees 10.00% 81,888£ 0 20,472 20,472 20,472 20,472 0 0 0 0 0
Sub Total 81,888£ 0 20,472 20,472 20,472 20,472 0 0 0 0 0
130372
Warwick District Council
Warwick District (Warwick, Leamington Spa, Kenilworth and rural areas)
BNPPRE
01 February 2013
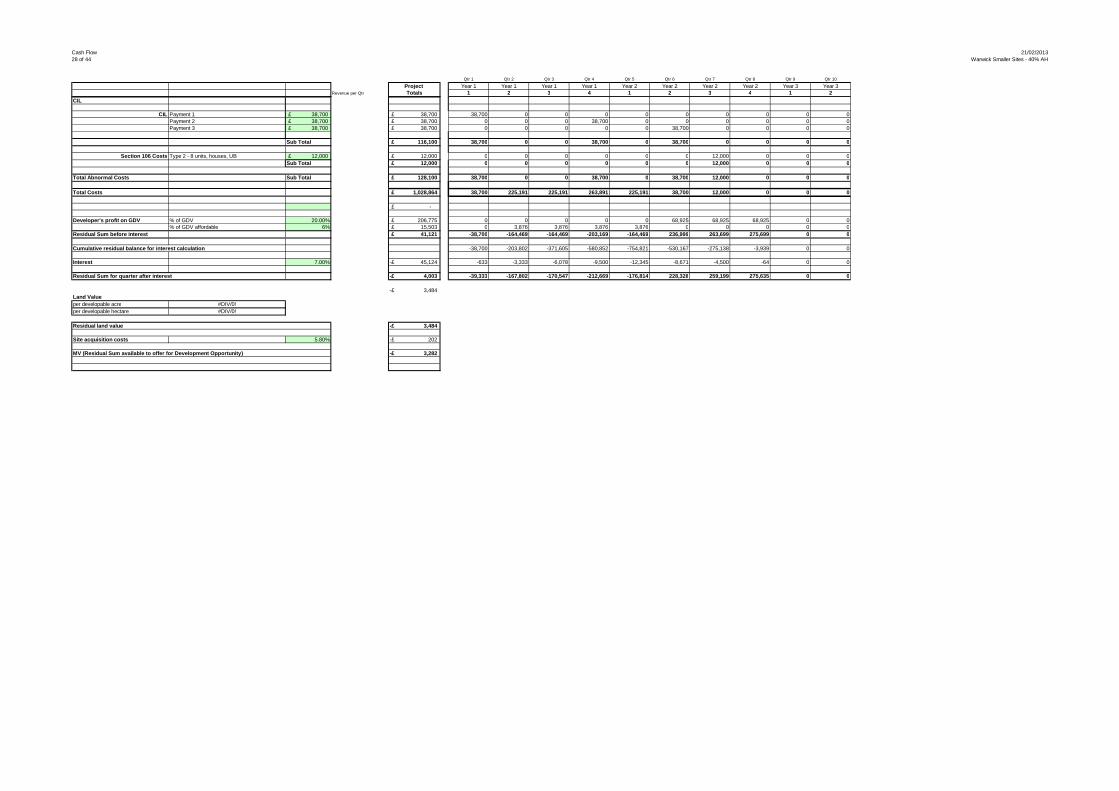
Cash Flow28 of 44
21/02/2013Warwick Smaller Sites - 40% AH
Qtr 1 Qtr 2 Qtr 3 Qtr 4 Qtr 5 Qtr 6 Qtr 7 Qtr 8 Qtr 9 Qtr 10
Project Year 1 Year 1 Year 1 Year 1 Year 2 Year 2 Year 2 Year 2 Year 3 Year 3Revenue per Qtr Totals 1 2 3 4 1 2 3 4 1 2
CIL
CIL Payment 1 38,700£ 38,700£ 38,700 0 0 0 0 0 0 0 0 0Payment 2 38,700£ 38,700£ 0 0 0 38,700 0 0 0 0 0 0
Payment 3 38,700£ 38,700£ 0 0 0 0 0 38,700 0 0 0 0
Sub Total 116,100£ 38,700 0 0 38,700 0 38,700 0 0 0 0
Section 106 Costs Type 2 - 8 units, houses, UB 12,000£ 12,000£ 0 0 0 0 0 0 12,000 0 0 0Sub Total 12,000£ 0 0 0 0 0 0 12,000 0 0 0
Total Abnormal Costs Sub Total 128,100£ 38,700 0 0 38,700 0 38,700 12,000 0 0 0
Total Costs 1,028,864£ 38,700 225,191 225,191 263,891 225,191 38,700 12,000 0 0 0
-£
Developer's profit on GDV % of GDV 20.00% 206,775£ 0 0 0 0 0 68,925 68,925 68,925 0 0% of GDV affordable 6% 15,503£ 0 3,876 3,876 3,876 3,876 0 0 0 0 0
Residual Sum before interest 41,121£ -38,700 -164,469 -164,469 -203,169 -164,469 236,999 263,699 275,699 0 0
Cumulative residual balance for interest calculatio n -38,700 -203,802 -371,605 -580,852 -754,821 -530,167 -275,138 -3,939 0 0
Interest 7.00% 45,124-£ -633 -3,333 -6,078 -9,500 -12,345 -8,671 -4,500 -64 0 0
Residual Sum for quarter after interest 4,003-£ -39,333 -167,802 -170,547 -212,669 -176,814 228,328 259,199 275,635 0 0
3,484-£ 8
Land Value per developable acre #DIV/0!per developable hectare #DIV/0!
Residual land value 3,484-£
Site acquisition costs 5.80% 202-£
MV (Residual Sum available to offer for Development Opportunity) 3,282-£

Cash Flow29 of 44
21/02/2013Warwick Smaller Sites - 40% AH
LOCAL PLAN AND CIL VIABILITY MODEL
Local Authority
Area(s)
Author
DateReference
DEVELOPMENT PERIOD CASHFLOW
dev hectarage 0.000 dev acreage 0.000
Qtr 1 Qtr 2 Qtr 3 Qtr 4 Qtr 5 Qtr 6 Qtr 7 Qtr 8 Qtr 9 Qtr 10 Qtr 11
Project Year 1 Year 1 Year 1 Year 1 Year 2 Year 2 Year 2 Year 2 Year 3 Year 3 Year 3Revenue per Qtr Totals 1 2 3 4 1 2 3 4 1 2 3
RevenueType 3 - 25 units, houses & flats, GF 3,199,232£ 1,066,411£ 6 3,199,232£ 0 0 0 0 0 0 1,066,411 1,066,411 1,066,411 0 0
Investment value of ground rents Type 3 - 25 units, houses & flats, GF 3,409£ 1,136£ 3,409£ 0 0 0 0 0 0 1,136 1,136 1,136 0 0
GDV before costs of sale Sub Total £3,202,641 0 0 0 0 0 0 1,067,547 1,067,547 1,067,547 0 0Costs of Sale
Marketing costs 3.00% 96,079£ 0 0 0 0 0 0 32,026 32,026 32,026 0 0Legal fees 0.50% 16,013£ 0 0 0 0 0 0 5,338 5,338 5,338 0 0
Sub Total -£112,092 0 0 0 0 0 0 37,364 37,364 37,364 0 0
Speculative NDV 3,090,549£ 0 0 0 0 0 0 1,030,183 1,030,183 1,030,183 0 0Affordable Housing Revenue
No fees on sale Revenue per Qtr -£ Type 3 - 25 units, houses & flats, GF 771,583£ 128,597 6 771,583£ 0 128,597 128,597 128,597 128,597 128,597 128,597 0 0 0 0
-£
NDV Total 3,862,132£ 0 128,597 128,597 128,597 128,597 128,597 1,158,780 1,030,183 1,030,183 0 0
Standard CostsCost per Qtr
Type 3 - 25 units, houses & flats, GF 2,380,011£ 396,668 6 2,380,011£ 0 396,668 396,668 396,668 396,668 396,668 396,668 0 0 0 0Contingency 119,001£ 0 19,833 19,833 19,833 19,833 19,833 19,833 0 0 0 0
Sub Total 2,499,011£ 0 416,502 416,502 416,502 416,502 416,502 416,502 0 0 0 0Other Costs
Professional fees 10.00% 249,901£ 0 41,650 41,650 41,650 41,650 41,650 41,650 0 0 0 0
Sub Total 249,901£ 0 41,650 41,650 41,650 41,650 41,650 41,650 0 0 0 0
130372
Warwick District Council
Warwick District (Warwick, Leamington Spa, Kenilworth and rural areas)
BNPPRE
01 February 2013

Cash Flow30 of 44
21/02/2013Warwick Smaller Sites - 40% AH
Qtr 1 Qtr 2 Qtr 3 Qtr 4 Qtr 5 Qtr 6 Qtr 7 Qtr 8 Qtr 9 Qtr 10 Qtr 11
Project Year 1 Year 1 Year 1 Year 1 Year 2 Year 2 Year 2 Year 2 Year 3 Year 3 Year 3Revenue per Qtr Totals 1 2 3 4 1 2 3 4 1 2 3
CIL
CIL Type 3 - 25 units, houses & flats, GF 115,563£ 115,563£ 115,563 0 0 0 0 0 0 0 0 0 0115,563£ 115,563£ 0 0 0 115,563 0 0 0 0 0 0 0
115,563£ 115,563£ 0 0 0 0 0 0 115,563 0 0 0 0
Sub Total 346,688£ 115,563 0 0 115,563 0 0 115,563 0 0 0 0
Section 106 Costs Type 3 - 25 units, houses & flats, GF 37,500£ 37,500£ 0 0 0 0 0 0 0 37,500 0 0 0Sub Total 37,500£ 0 0 0 0 0 0 0 37,500 0 0 0
Total Abnormal Costs Sub Total 384,188£ 115,563 0 0 115,563 0 0 115,563 37,500 0 0 0
Total Costs 3,133,100£ 115,563 458,152 458,152 573,715 458,152 458,152 573,715 37,500 0 0 0
-£
Developer's profit on GDV % of GDV 20.00% 618,110£ 0 0 0 0 0 0 206,037 206,037 206,037 0 0% of GDV affordable 6% 46,295£ 0 7,716 7,716 7,716 7,716 7,716 7,716 0 0 0 0
Residual Sum before interest 64,627£ -115,563 -337,271 -337,271 -452,833 -337,271 -337,271 371,313 786,646 824,146 0 0
Cumulative residual balance for interest calculatio n -115,563 -454,723 -799,431 -1,265,339 -1,623,305 -1,987,125 -1,648,311 -888,623 -79,011 0 0
Interest 7.00% 144,930-£ -1,890 -7,437 -13,075 -20,695 -26,549 -32,500 -26,958 -14,534 -1,292 0 0
Residual Sum for quarter after interest 80,303-£ -117,453 -344,708 -350,346 -473,528 -363,820 -369,770 344,355 772,113 822,854 0 0
68,694-£ 9
Land Value per developable acre #DIV/0!per developable hectare #DIV/0!
Residual land value 68,694-£
Site acquisition costs 5.80% 3,984-£
MV (Residual Sum available to offer for Development Opportunity) 64,710-£

Cash Flow31 of 44
21/02/2013Warwick Smaller Sites - 40% AH
LOCAL PLAN AND CIL VIABILITY MODEL
Local Authority
Area(s)
Author
DateReference
DEVELOPMENT PERIOD CASHFLOW
dev hectarage 0.000 dev acreage 0.000
Qtr 1 Qtr 2 Qtr 3 Qtr 4 Qtr 5 Qtr 6 Qtr 7 Qtr 8 Qtr 9 Qtr 10 Qtr 11 Qtr 12
Project Year 1 Year 1 Year 1 Year 1 Year 2 Year 2 Year 2 Year 2 Year 3 Year 3 Year 3 Year 3Revenue per Qtr Totals 1 2 3 4 1 2 3 4 1 2 3 4
RevenueType 4 - 35 units, houses & flats, GF 4,411,099£ 1,470,366£ 6 4,411,099£ 0 0 0 0 0 0 1,470,366 1,470,366 1,470,366 0 0 0
Investment value of ground rents Type 4 - 35 units, houses & flats, GF 4,391£ 1,464£ 4,391£ 0 0 0 0 0 0 1,464 1,464 1,464 0 0 0
GDV before costs of sale Sub Total £4,415,490 0 0 0 0 0 0 1,471,830 1,471,830 1,471,830 0 0 0Costs of Sale
Marketing costs 3.00% 132,465£ 0 0 0 0 0 0 44,155 44,155 44,155 0 0 0Legal fees 0.50% 22,077£ 0 0 0 0 0 0 7,359 7,359 7,359 0 0 0
Sub Total -£154,542 0 0 0 0 0 0 51,514 51,514 51,514 0 0 0
Speculative NDV 4,260,948£ 0 0 0 0 0 0 1,420,316 1,420,316 1,420,316 0 0 0Affordable Housing Revenue
No fees on sale Revenue per Qtr -£ Type 4 - 35 units, houses & flats, GF 1,063,858£ 177,310 6 1,063,858£ 0 177,310 177,310 177,310 177,310 177,310 177,310 0 0 0 0 0
-£
NDV Total 5,324,806£ 0 177,310 177,310 177,310 177,310 177,310 1,597,626 1,420,316 1,420,316 0 0 0
Standard CostsCost per Qtr
Type 4 - 35 units, houses & flats, GF 3,278,903£ 546,484 6 3,278,903£ 0 546,484 546,484 546,484 546,484 546,484 546,484 0 0 0 0 0Contingency 163,945£ 0 27,324 27,324 27,324 27,324 27,324 27,324 0 0 0 0 0
Sub Total 3,442,848£ 0 573,808 573,808 573,808 573,808 573,808 573,808 0 0 0 0 0Other Costs
Professional fees 10.00% 344,285£ 0 57,381 57,381 57,381 57,381 57,381 57,381 0 0 0 0 0
Sub Total 344,285£ 0 57,381 57,381 57,381 57,381 57,381 57,381 0 0 0 0 0
130372
Warwick District Council
Warwick District (Warwick, Leamington Spa, Kenilworth and rural areas)
BNPPRE
01 February 2013

Cash Flow32 of 44
21/02/2013Warwick Smaller Sites - 40% AH
Qtr 1 Qtr 2 Qtr 3 Qtr 4 Qtr 5 Qtr 6 Qtr 7 Qtr 8 Qtr 9 Qtr 10 Qtr 11 Qtr 12
Project Year 1 Year 1 Year 1 Year 1 Year 2 Year 2 Year 2 Year 2 Year 3 Year 3 Year 3 Year 3Revenue per Qtr Totals 1 2 3 4 1 2 3 4 1 2 3 4
CIL
CIL Type 4 - 35 units, houses & flats, GF 159,338£ 159,338£ 159,338 0 0 0 0 0 0 0 0 0 0 0159,338£ 159,338£ 0 0 0 159,338 0 0 0 0 0 0 0 0
159,338£ 159,338£ 0 0 0 0 0 0 159,338 0 0 0 0 0
Sub Total 478,013£ 159,338 0 0 159,338 0 0 159,338 0 0 0 0 0
Section 106 Costs Type 4 - 35 units, houses & flats, GF 52,500£ 52,500£ 0 0 0 0 0 0 0 52,500 0 0 0 0Sub Total 52,500£ 0 0 0 0 0 0 0 52,500 0 0 0 0
Total Abnormal Costs Sub Total 530,513£ 159,338 0 0 159,338 0 0 159,338 52,500 0 0 0 0
Total Costs 4,317,646£ 159,338 631,189 631,189 790,526 631,189 631,189 790,526 52,500 0 0 0 0
-£
Developer's profit on GDV % of GDV 20.00% 852,190£ 0 0 0 0 0 0 284,063 284,063 284,063 0 0 0% of GDV affordable 6% 63,831£ 0 10,639 10,639 10,639 10,639 10,639 10,639 0 0 0 0 0
Residual Sum before interest 91,139£ -159,338 -464,518 -464,518 -623,855 -464,518 -464,518 512,398 1,083,753 1,136,253 0 0 0
Cumulative residual balance for interest calculatio n -159,338 -626,461 -1,101,225 -1,743,091 -2,236,117 -2,737,207 -2,269,577 -1,222,943 -106,692 0 0 0
Interest 7.00% 199,576-£ -2,606 -10,246 -18,011 -28,508 -36,572 -44,767 -37,119 -20,001 -1,745 0 0 0
Residual Sum for quarter after interest 108,437-£ -161,943 -474,764 -482,528 -652,364 -501,090 -509,285 475,278 1,063,751 1,134,508 0 0 0
92,761-£ 9
Land Value per developable acre #DIV/0!per developable hectare #DIV/0!
Residual land value 92,761-£
Site acquisition costs 5.80% 5,380-£
MV (Residual Sum available to offer for Development Opportunity) 87,381-£

Cash Flow33 of 44
21/02/2013Warwick Smaller Sites - 40% AH
LOCAL PLAN AND CIL VIABILITY MODEL
Local Authority
Area(s)
Author
DateReference
DEVELOPMENT PERIOD CASHFLOW
dev hectarage 0.000 dev acreage 0.000
Project Revenue per Qtr Totals
RevenueType 4 - 35 units, houses & flats, GF 4,411,099£ 1,470,366£ 6 4,411,099£
Investment value of ground rents Type 4 - 35 units, houses & flats, GF 4,391£ 1,464£ 4,391£
GDV before costs of sale Sub Total £4,415,490Costs of Sale
Marketing costs 3.00% 132,465£ Legal fees 0.50% 22,077£
Sub Total -£154,542
Speculative NDV 4,260,948£ Affordable Housing Revenue
No fees on sale Revenue per Qtr -£ Type 4 - 35 units, houses & flats, GF 1,063,858£ 177,310 6 1,063,858£
-£
NDV Total 5,324,806£
Standard CostsCost per Qtr
Type 4 - 35 units, houses & flats, GF 3,278,903£ 546,484 6 3,278,903£ Contingency 163,945£
Sub Total 3,442,848£ Other Costs
Professional fees 10.00% 344,285£
Sub Total 344,285£
130372
Warwick District Council
Warwick District (Warwick, Leamington Spa, Kenilworth and rural areas)
BNPPRE
01 February 2013
Qtr 13 Qtr 14 Qtr 15 Qtr 16 Qtr 17 Qtr 18 Qtr 19 Qtr 20
Year 4 Year 4 Year 4 Year 4 Year 5 Year 5 Year 5 Year 51 2 3 4 1 2 3 4
0 0 0 0 0 0 0 0
0 0 0 0 0 0 0 0
0 0 0 0 0 0 0 0
0 0 0 0 0 0 0 00 0 0 0 0 0 0 0
0 0 0 0 0 0 0 0
0 0 0 0 0 0 0 0
0 0 0 0 0 0 0 0
0 0 0 0 0 0 0 0
0 0 0 0 0 0 0 00 0 0 0 0 0 0 0
0 0 0 0 0 0 0 0
0 0 0 0 0 0 0 0
0 0 0 0 0 0 0 0

Cash Flow34 of 44
21/02/2013Warwick Smaller Sites - 40% AH
Project Revenue per Qtr Totals
RevenueCIL
CIL Type 4 - 35 units, houses & flats, GF 159,338£ 159,338£ 159,338£ 159,338£
159,338£ 159,338£
Sub Total 478,013£
Section 106 Costs Type 4 - 35 units, houses & flats, GF 52,500£ 52,500£ Sub Total 52,500£
Total Abnormal Costs Sub Total 530,513£
Total Costs 4,317,646£
-£
Developer's profit on GDV % of GDV 20.00% 852,190£ % of GDV affordable 6% 63,831£
Residual Sum before interest 91,139£
Cumulative residual balance for interest calculatio n
Interest 7.00% 199,576-£
Residual Sum for quarter after interest 108,437-£
92,761-£ Land Value per developable acre #DIV/0!per developable hectare #DIV/0!
Residual land value 92,761-£
Site acquisition costs 5.80% 5,380-£
MV (Residual Sum available to offer for Development Opportunity) 87,381-£
Qtr 13 Qtr 14 Qtr 15 Qtr 16 Qtr 17 Qtr 18 Qtr 19 Qtr 20
Year 4 Year 4 Year 4 Year 4 Year 5 Year 5 Year 5 Year 51 2 3 4 1 2 3 4
0 0 0 0 0 0 0 00 0 0 0 0 0 0 00 0 0 0 0 0 0 0
0 0 0 0 0 0 0 0
0 0 0 0 0 0 0 00 0 0 0 0 0 0 0
0 0 0 0 0 0 0 0
0 0 0 0 0 0 0 0
0 0 0 0 0 0 0 00 0 0 0 0 0 0 00 0 0 0 0 0 0 0
0 0 0 0 0 0 0 0
0 0 0 0 0 0 0 0
0 0 0 0 0 0 0 0

Cash Flow35 of 44
21/02/2013Warwick Smaller Sites - 40% AH
LOCAL PLAN AND CIL VIABILITY MODEL
Local Authority
Area(s)
Author
DateReference
DEVELOPMENT PERIOD CASHFLOW
dev hectarage 0.000 dev acreage 0.000
Qtr 1 Qtr 2 Qtr 3 Qtr 4 Qtr 5 Qtr 6 Qtr 7 Qtr 8 Qtr 9 Qtr 10 Qtr 11 Qtr 12 Qtr 13 Qtr 14 Qtr 15
Project Year 1 Year 1 Year 1 Year 1 Year 2 Year 2 Year 2 Year 2 Year 3 Year 3 Year 3 Year 3 Year 4 Year 4 Year 4Revenue per Qtr Totals 1 2 3 4 1 2 3 4 1 2 3 4 1 2 3
RevenueType 5 - 50 units, houses & flats, UB 5,522,958£ 1,380,740£ 6 5,522,958£ 0 0 0 0 0 0 1,380,740 1,380,740 1,380,740 1,380,740 0 0 0 0 0
Investment value of ground rents Type 5 - 50 units, houses & flats, UB 34,000£ 8,500£ 34,000£ 0 0 0 0 0 0 8,500 8,500 8,500 8,500 0 0 0 0 0
GDV before costs of sale Sub Total £5,556,958 0 0 0 0 0 0 1,389,240 1,389,240 1,389,240 1,389,240 0 0 0 0 0Costs of Sale
Marketing costs 3.00% 166,709£ 0 0 0 0 0 0 41,677 41,677 41,677 41,677 0 0 0 0 0Legal fees 0.50% 27,785£ 0 0 0 0 0 0 6,946 6,946 6,946 6,946 0 0 0 0 0
Sub Total -£194,494 0 0 0 0 0 0 48,623 48,623 48,623 48,623 0 0 0 0 0
Speculative NDV 5,362,464£ 0 0 0 0 0 0 1,340,616 1,340,616 1,340,616 1,340,616 0 0 0 0 0Affordable Housing Revenue
No fees on sale Revenue per Qtr -£ Type 5 - 50 units, houses & flats, UB 1,332,013£ 222,002 6 1,332,013£ 0 222,002 222,002 222,002 222,002 222,002 222,002 0 0 0 0 0 0 0 0
-£
NDV Total 6,694,478£ 0 222,002 222,002 222,002 222,002 222,002 1,562,618 1,340,616 1,340,616 1,340,616 0 0 0 0 0
Standard CostsCost per Qtr
Type 5 - 50 units, houses & flats, UB 4,558,988£ 759,831 6 4,558,988£ 0 759,831 759,831 759,831 759,831 759,831 759,831 0 0 0 0 0 0 0 0Contingency 227,949£ 0 37,992 37,992 37,992 37,992 37,992 37,992 0 0 0 0 0 0 0 0
Sub Total 4,786,937£ 0 797,823 797,823 797,823 797,823 797,823 797,823 0 0 0 0 0 0 0 0Other Costs
Professional fees 10.00% 478,694£ 0 79,782 79,782 79,782 79,782 79,782 79,782 0 0 0 0 0 0 0 0
Sub Total 478,694£ 0 79,782 79,782 79,782 79,782 79,782 79,782 0 0 0 0 0 0 0 0
130372
Warwick District Council
Warwick District (Warwick, Leamington Spa, Kenilworth and rural areas)
BNPPRE
01 February 2013

Cash Flow36 of 44
21/02/2013Warwick Smaller Sites - 40% AH
Qtr 1 Qtr 2 Qtr 3 Qtr 4 Qtr 5 Qtr 6 Qtr 7 Qtr 8 Qtr 9 Qtr 10 Qtr 11 Qtr 12 Qtr 13 Qtr 14 Qtr 15
Project Year 1 Year 1 Year 1 Year 1 Year 2 Year 2 Year 2 Year 2 Year 3 Year 3 Year 3 Year 3 Year 4 Year 4 Year 4Revenue per Qtr Totals 1 2 3 4 1 2 3 4 1 2 3 4 1 2 3
CIL
CIL Type 5 - 50 units, houses & flats, UB 199,500£ 199,500£ 199,500 0 0 0 0 0 0 0 0 0 0 0 0 0 0199,500£ 199,500£ 0 0 0 199,500 0 0 0 0 0 0 0 0 0 0 0
199,500£ 199,500£ 0 0 0 0 0 0 199,500 0 0 0 0 0 0 0 0
Sub Total 598,500£ 199,500 0 0 199,500 0 0 199,500 0 0 0 0 0 0 0 0
Section 106 Costs Type 5 - 50 units, houses & flats, UB 75,000£ 75,000£ 0 0 0 0 0 0 0 75,000 0 0 0 0 0 0 0Sub Total 75,000£ 0 0 0 0 0 0 0 75,000 0 0 0 0 0 0 0
Total Abnormal Costs Sub Total 673,500£ 199,500 0 0 199,500 0 0 199,500 75,000 0 0 0 0 0 0 0
Total Costs 5,939,131£ 199,500 877,605 877,605 1,077,105 877,605 877,605 1,077,105 75,000 0 0 0 0 0 0 0
-£
Developer's profit on GDV % of GDV 20.00% 1,072,493£ 0 0 0 0 0 0 268,123 268,123 268,123 268,123 0 0 0 0 0% of GDV affordable 6% 79,921£ 0 13,320 13,320 13,320 13,320 13,320 13,320 0 0 0 0 0 0 0 0
Residual Sum before interest 397,066-£ -199,500 -668,923 -668,923 -868,423 -668,923 -668,923 204,070 997,493 1,072,493 1,072,493 0 0 0 0 0
Cumulative residual balance for interest calculatio n -199,500 -871,686 -1,554,865 -2,448,718 -3,157,691 -3,878,258 -3,737,618 -2,801,254 -1,774,576 -731,107 0 0 0 0 0
Interest 7.00% 345,997-£ -3,263 -14,257 -25,430 -40,049 -51,644 -63,429 -61,129 -45,815 -29,023 -11,957 0 0 0 0 0
Residual Sum for quarter after interest 743,064-£ -202,763 -683,180 -694,353 -908,472 -720,567 -732,352 142,941 951,678 1,043,469 1,060,536 0 0 0 0 0
624,715-£ 10
Land Value per developable acre #DIV/0!per developable hectare #DIV/0!
Residual land value 624,715-£
Site acquisition costs 5.80% 36,233-£
MV (Residual Sum available to offer for Development Opportunity) 588,482-£

Cash Flow37 of 44
21/02/2013Warwick Smaller Sites - 40% AH
LOCAL PLAN AND CIL VIABILITY MODEL
Local Authority
Area(s)
Author
DateReference
DEVELOPMENT PERIOD CASHFLOW
dev hectarage 0.000 dev acreage 0.000
Qtr 1 Qtr 2 Qtr 3 Qtr 4 Qtr 5 Qtr 6 Qtr 7 Qtr 8 Qtr 9 Qtr 10 Qtr 11 Qtr 12
Project Year 1 Year 1 Year 1 Year 1 Year 2 Year 2 Year 2 Year 2 Year 3 Year 3 Year 3 Year 3Revenue per Qtr Totals 1 2 3 4 1 2 3 4 1 2 3 4
RevenueType 6 - 65 units, houses & flats, UB 7,454,263£ 1,863,566£ 6 7,454,263£ 0 0 0 0 0 0 1,863,566 1,863,566 1,863,566 1,863,566 0 0
Investment value of ground rents Type 6 - 65 units, houses & flats, UB 36,164£ 9,041£ 36,164£ 0 0 0 0 0 0 9,041 9,041 9,041 9,041 0 0
GDV before costs of sale Sub Total £7,490,427 0 0 0 0 0 0 1,872,607 1,872,607 1,872,607 1,872,607 0 0Costs of Sale
Marketing costs 3.00% 224,713£ 0 0 0 0 0 0 56,178 56,178 56,178 56,178 0 0Legal fees 0.50% 37,452£ 0 0 0 0 0 0 9,363 9,363 9,363 9,363 0 0
Sub Total -£262,165 0 0 0 0 0 0 65,541 65,541 65,541 65,541 0 0
Speculative NDV 7,228,262£ 0 0 0 0 0 0 1,807,065 1,807,065 1,807,065 1,807,065 0 0Affordable Housing Revenue
No fees on sale Revenue per Qtr -£ Type 6 - 65 units, houses & flats, UB 1,797,801£ 299,633 6 1,797,801£ 0 299,633 299,633 299,633 299,633 299,633 299,633 0 0 0 0 0
-£
NDV Total 9,026,063£ 0 299,633 299,633 299,633 299,633 299,633 2,106,699 1,807,065 1,807,065 1,807,065 0 0
Standard CostsCost per Qtr
Type 6 - 65 units, houses & flats, UB 6,000,277£ 1,000,046 6 6,000,277£ 0 1,000,046 1,000,046 1,000,046 1,000,046 1,000,046 1,000,046 0 0 0 0 0Contingency 300,014£ 0 50,002 50,002 50,002 50,002 50,002 50,002 0 0 0 0 0
Sub Total 6,300,291£ 0 1,050,049 1,050,049 1,050,049 1,050,049 1,050,049 1,050,049 0 0 0 0 0Other Costs
Professional fees 10.00% 630,029£ 0 105,005 105,005 105,005 105,005 105,005 105,005 0 0 0 0 0
Sub Total 630,029£ 0 105,005 105,005 105,005 105,005 105,005 105,005 0 0 0 0 0
130372
Warwick District Council
Warwick District (Warwick, Leamington Spa, Kenilworth and rural areas)
BNPPRE
01 February 2013

Cash Flow38 of 44
21/02/2013Warwick Smaller Sites - 40% AH
Qtr 1 Qtr 2 Qtr 3 Qtr 4 Qtr 5 Qtr 6 Qtr 7 Qtr 8 Qtr 9 Qtr 10 Qtr 11 Qtr 12
Project Year 1 Year 1 Year 1 Year 1 Year 2 Year 2 Year 2 Year 2 Year 3 Year 3 Year 3 Year 3Revenue per Qtr Totals 1 2 3 4 1 2 3 4 1 2 3 4
CIL
CIL Type 6 - 65 units, houses & flats, UB 269,263£ 269,263£ 269,263 0 0 0 0 0 0 0 0 0 0 0269,263£ 269,263£ 0 0 0 269,263 0 0 0 0 0 0 0 0
269,263£ 269,263£ 0 0 0 0 0 0 269,263 0 0 0 0 0
Sub Total 807,788£ 269,263 0 0 269,263 0 0 269,263 0 0 0 0 0
Section 106 Costs Type 6 - 65 units, houses & flats, UB 97,500£ 97,500£ 0 0 0 0 0 0 0 97,500 0 0 0 0Sub Total 97,500£ 0 0 0 0 0 0 0 97,500 0 0 0 0
Total Abnormal Costs Sub Total 905,288£ 269,263 0 0 269,263 0 0 269,263 97,500 0 0 0 0
Total Costs 7,835,608£ 269,263 1,155,053 1,155,053 1,424,316 1,155,053 1,155,053 1,424,316 97,500 0 0 0 0
-£
Developer's profit on GDV % of GDV 20.00% 1,445,652£ 0 0 0 0 0 0 361,413 361,413 361,413 361,413 0 0% of GDV affordable 6% 107,868£ 0 17,978 17,978 17,978 17,978 17,978 17,978 0 0 0 0 0
Residual Sum before interest 363,066-£ -269,263 -873,398 -873,398 -1,142,660 -873,398 -873,398 302,992 1,348,152 1,445,652 1,445,652 0 0
Cumulative residual balance for interest calculatio n -269,263 -1,147,064 -2,039,223 -3,215,235 -4,141,218 -5,082,347 -4,862,477 -3,593,851 -2,206,977 -797,420 0 0
Interest 7.00% 447,396-£ -4,404 -18,760 -33,352 -52,586 -67,730 -83,122 -79,526 -58,778 -36,095 -13,042 0 0
Residual Sum for quarter after interest 810,462-£ -273,666 -892,158 -906,750 -1,195,246 -941,128 -956,520 223,465 1,289,374 1,409,557 1,432,610 0 0
681,379-£ 10
Land Value per developable acre #DIV/0!per developable hectare #DIV/0!
Residual land value 681,379-£
Site acquisition costs 5.80% 39,520-£
MV (Residual Sum available to offer for Development Opportunity) 641,859-£

Cash Flow39 of 44
21/02/2013Warwick Smaller Sites - 40% AH
LOCAL PLAN AND CIL VIABILITY MODEL
Local Authority
Area(s)
Author
DateReference
DEVELOPMENT PERIOD CASHFLOW
dev hectarage 0.000 dev acreage 0.000
Qtr 1 Qtr 2 Qtr 3 Qtr 4 Qtr 5 Qtr 6 Qtr 7 Qtr 8 Qtr 9 Qtr 10 Qtr 11 Qtr 12 Qtr 13 Qtr 14
Project Year 1 Year 1 Year 1 Year 1 Year 2 Year 2 Year 2 Year 2 Year 3 Year 3 Year 3 Year 3 Year 4 Year 4Revenue per Qtr Totals 1 2 3 4 1 2 3 4 1 2 3 4 1 2
RevenueType 7 - 75 units, houses, GF 11,315,835£ 2,828,959£ 8 11,315,835£ 0 0 0 0 0 0 0 0 2,828,959 2,828,959 2,828,959 2,828,959 0 0
Investment value of ground rents Type 7 - 75 units, houses, GF -£ -£ -£ 0 0 0 0 0 0 0 0 0 0 0 0 0 0
GDV before costs of sale Sub Total £11,315,835 0 0 0 0 0 0 0 0 2,828,959 2,828,959 2,828,959 2,828,959 0 0Costs of Sale
Marketing costs 3.00% 339,475£ 0 0 0 0 0 0 0 0 84,869 84,869 84,869 84,869 0 0Legal fees 0.50% 56,579£ 0 0 0 0 0 0 0 0 14,145 14,145 14,145 14,145 0 0
Sub Total -£396,054 0 0 0 0 0 0 0 0 99,014 99,014 99,014 99,014 0 0
Speculative NDV 10,919,781£ 0 0 0 0 0 0 0 0 2,729,945 2,729,945 2,729,945 2,729,945 0 0Affordable Housing Revenue
No fees on sale Revenue per Qtr -£ Type 7 - 75 units, houses, GF 2,729,125£ 341,141 8 2,729,125£ 0 341,141 341,141 341,141 341,141 341,141 341,141 341,141 341,141 0 0 0 0 0
-£
NDV Total 13,648,906£ 0 341,141 341,141 341,141 341,141 341,141 341,141 341,141 3,071,086 2,729,945 2,729,945 2,729,945 0 0
Standard CostsCost per Qtr
Type 7 - 75 units, houses, GF 8,237,130£ 1,029,641 8 8,237,130£ 0 1,029,641 1,029,641 1,029,641 1,029,641 1,029,641 1,029,641 1,029,641 1,029,641 0 0 0 0 0Contingency 411,857£ 0 51,482 51,482 51,482 51,482 51,482 51,482 51,482 51,482 0 0 0 0 0
Sub Total 8,648,987£ 0 1,081,123 1,081,123 1,081,123 1,081,123 1,081,123 1,081,123 1,081,123 1,081,123 0 0 0 0 0Other Costs
Professional fees 10.00% 864,899£ 0 108,112 108,112 108,112 108,112 108,112 108,112 108,112 108,112 0 0 0 0 0
Sub Total 864,899£ 0 108,112 108,112 108,112 108,112 108,112 108,112 108,112 108,112 0 0 0 0 0
130372
Warwick District Council
Warwick District (Warwick, Leamington Spa, Kenilworth and rural areas)
BNPPRE
01 February 2013

Cash Flow40 of 44
21/02/2013Warwick Smaller Sites - 40% AH
Qtr 1 Qtr 2 Qtr 3 Qtr 4 Qtr 5 Qtr 6 Qtr 7 Qtr 8 Qtr 9 Qtr 10 Qtr 11 Qtr 12 Qtr 13 Qtr 14
Project Year 1 Year 1 Year 1 Year 1 Year 2 Year 2 Year 2 Year 2 Year 3 Year 3 Year 3 Year 3 Year 4 Year 4Revenue per Qtr Totals 1 2 3 4 1 2 3 4 1 2 3 4 1 2
CIL
CIL Type 7 - 75 units, houses, GF 408,750£ 408,750£ 408,750 0 0 0 0 0 0 0 0 0 0 0 0 0408,750£ 408,750£ 0 0 0 408,750 0 0 0 0 0 0 0 0 0 0
408,750£ 408,750£ 0 0 0 0 0 0 408,750 0 0 0 0 0 0 0
Sub Total 1,226,250£ 408,750 0 0 408,750 0 0 408,750 0 0 0 0 0 0 0
Section 106 Costs Type 7 - 75 units, houses, GF 112,500£ 112,500£ 0 0 0 0 0 0 0 0 0 0 112,500 0 0 0Sub Total 112,500£ 0 0 0 0 0 0 0 0 0 0 112,500 0 0 0
Total Abnormal Costs Sub Total 1,338,750£ 408,750 0 0 408,750 0 0 408,750 0 0 0 112,500 0 0 0
Total Costs 10,852,635£ 408,750 1,189,236 1,189,236 1,597,986 1,189,236 1,189,236 1,597,986 1,189,236 1,189,236 0 112,500 0 0 0
-£
Developer's profit on GDV % of GDV 20.00% 2,183,956£ 0 0 0 0 0 0 0 0 545,989 545,989 545,989 545,989 0 0% of GDV affordable 6% 163,748£ 0 20,468 20,468 20,468 20,468 20,468 20,468 20,468 20,468 0 0 0 0 0
Residual Sum before interest 448,567£ -408,750 -868,563 -868,563 -1,277,313 -868,563 -868,563 -1,277,313 -868,563 1,315,393 2,183,956 2,071,456 2,183,956 0 0
Cumulative residual balance for interest calculatio n -408,750 -1,283,999 -2,173,562 -3,486,424 -4,412,009 -5,352,731 -6,717,589 -7,696,020 -6,506,497 -4,428,955 -2,429,935 -285,721 0 0
Interest 7.00% 738,961-£ -6,685 -21,000 -35,549 -57,021 -72,159 -87,545 -109,867 -125,869 -106,415 -72,436 -39,742 -4,673 0 0
Residual Sum for quarter after interest 290,394-£ -415,435 -889,563 -904,112 -1,334,334 -940,722 -956,108 -1,387,181 -994,433 1,208,978 2,111,520 2,031,714 2,179,283 0 0
235,817-£ 12
Land Value per developable acre #DIV/0!per developable hectare #DIV/0!
Residual land value 235,817-£
Site acquisition costs 5.80% 13,677-£
MV (Residual Sum available to offer for Development Opportunity) 222,140-£
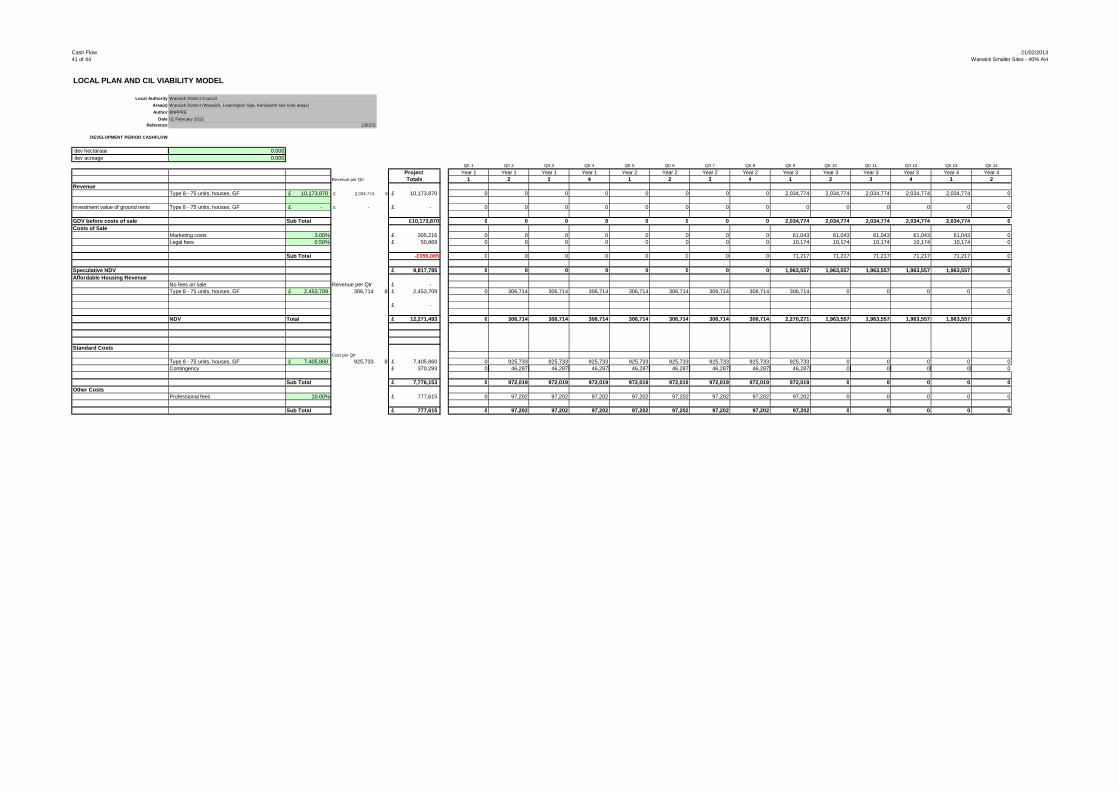
Cash Flow41 of 44
21/02/2013Warwick Smaller Sites - 40% AH
LOCAL PLAN AND CIL VIABILITY MODEL
Local Authority
Area(s)
Author
DateReference
DEVELOPMENT PERIOD CASHFLOW
dev hectarage 0.000 dev acreage 0.000
Qtr 1 Qtr 2 Qtr 3 Qtr 4 Qtr 5 Qtr 6 Qtr 7 Qtr 8 Qtr 9 Qtr 10 Qtr 11 Qtr 12 Qtr 13 Qtr 14
Project Year 1 Year 1 Year 1 Year 1 Year 2 Year 2 Year 2 Year 2 Year 3 Year 3 Year 3 Year 3 Year 4 Year 4Revenue per Qtr Totals 1 2 3 4 1 2 3 4 1 2 3 4 1 2
RevenueType 8 - 75 units, houses, GF 10,173,870£ 2,034,774£ 8 10,173,870£ 0 0 0 0 0 0 0 0 2,034,774 2,034,774 2,034,774 2,034,774 2,034,774 0
Investment value of ground rents Type 8 - 75 units, houses, GF -£ -£ -£ 0 0 0 0 0 0 0 0 0 0 0 0 0 0
GDV before costs of sale Sub Total £10,173,870 0 0 0 0 0 0 0 0 2,034,774 2,034,774 2,034,774 2,034,774 2,034,774 0Costs of Sale
Marketing costs 3.00% 305,216£ 0 0 0 0 0 0 0 0 61,043 61,043 61,043 61,043 61,043 0Legal fees 0.50% 50,869£ 0 0 0 0 0 0 0 0 10,174 10,174 10,174 10,174 10,174 0
Sub Total -£356,085 0 0 0 0 0 0 0 0 71,217 71,217 71,217 71,217 71,217 0
Speculative NDV 9,817,785£ 0 0 0 0 0 0 0 0 1,963,557 1,963,557 1,963,557 1,963,557 1,963,557 0Affordable Housing Revenue
No fees on sale Revenue per Qtr -£ Type 8 - 75 units, houses, GF 2,453,709£ 306,714 8 2,453,709£ 0 306,714 306,714 306,714 306,714 306,714 306,714 306,714 306,714 0 0 0 0 0
-£
NDV Total 12,271,493£ 0 306,714 306,714 306,714 306,714 306,714 306,714 306,714 2,270,271 1,963,557 1,963,557 1,963,557 1,963,557 0
Standard CostsCost per Qtr
Type 8 - 75 units, houses, GF 7,405,860£ 925,733 8 7,405,860£ 0 925,733 925,733 925,733 925,733 925,733 925,733 925,733 925,733 0 0 0 0 0Contingency 370,293£ 0 46,287 46,287 46,287 46,287 46,287 46,287 46,287 46,287 0 0 0 0 0
Sub Total 7,776,153£ 0 972,019 972,019 972,019 972,019 972,019 972,019 972,019 972,019 0 0 0 0 0Other Costs
Professional fees 10.00% 777,615£ 0 97,202 97,202 97,202 97,202 97,202 97,202 97,202 97,202 0 0 0 0 0
Sub Total 777,615£ 0 97,202 97,202 97,202 97,202 97,202 97,202 97,202 97,202 0 0 0 0 0
130372
Warwick District Council
Warwick District (Warwick, Leamington Spa, Kenilworth and rural areas)
BNPPRE
01 February 2013

Cash Flow42 of 44
21/02/2013Warwick Smaller Sites - 40% AH
Qtr 1 Qtr 2 Qtr 3 Qtr 4 Qtr 5 Qtr 6 Qtr 7 Qtr 8 Qtr 9 Qtr 10 Qtr 11 Qtr 12 Qtr 13 Qtr 14
Project Year 1 Year 1 Year 1 Year 1 Year 2 Year 2 Year 2 Year 2 Year 3 Year 3 Year 3 Year 3 Year 4 Year 4Revenue per Qtr Totals 1 2 3 4 1 2 3 4 1 2 3 4 1 2
CIL
CIL Type 8 - 75 units, houses, GF 367,500£ 367,500£ 367,500 0 0 0 0 0 0 0 0 0 0 0 0 0367,500£ 367,500£ 0 0 0 367,500 0 0 0 0 0 0 0 0 0 0
367,500£ 367,500£ 0 0 0 0 0 0 367,500 0 0 0 0 0 0 0
Sub Total 1,102,500£ 367,500 0 0 367,500 0 0 367,500 0 0 0 0 0 0 0
Section 106 Costs Type 8 - 75 units, houses, GF 112,500£ 112,500£ 0 0 0 0 0 0 0 0 0 0 112,500 0 0 0Sub Total 112,500£ 0 0 0 0 0 0 0 0 0 0 112,500 0 0 0
Total Abnormal Costs Sub Total 1,215,000£ 367,500 0 0 367,500 0 0 367,500 0 0 0 112,500 0 0 0
Total Costs 9,768,768£ 367,500 1,069,221 1,069,221 1,436,721 1,069,221 1,069,221 1,436,721 1,069,221 1,069,221 0 112,500 0 0 0
-£
Developer's profit on GDV % of GDV 20.00% 1,963,557£ 0 0 0 0 0 0 0 0 392,711 392,711 392,711 392,711 392,711 0% of GDV affordable 6% 147,223£ 0 18,403 18,403 18,403 18,403 18,403 18,403 18,403 18,403 0 0 0 0 0
Residual Sum before interest 391,946£ -367,500 -780,910 -780,910 -1,148,410 -780,910 -780,910 -1,148,410 -780,910 789,935 1,570,846 1,458,346 1,570,846 1,570,846 0
Cumulative residual balance for interest calculatio n -367,500 -1,154,421 -1,954,212 -3,134,583 -3,966,760 -4,812,547 -6,039,667 -6,919,357 -6,242,589 -4,773,842 -3,393,573 -1,878,230 -338,103 0
Interest 7.00% 735,579-£ -6,011 -18,881 -31,961 -51,267 -64,877 -78,710 -98,780 -113,167 -102,098 -78,077 -55,502 -30,719 -5,530 0
Residual Sum for quarter after interest 343,633-£ -373,511 -799,791 -812,872 -1,199,677 -845,787 -859,620 -1,247,190 -894,077 687,837 1,492,769 1,402,843 1,540,127 1,565,316 0
274,251-£ 13
Land Value per developable acre #DIV/0!per developable hectare #DIV/0!
Residual land value 274,251-£
Site acquisition costs 5.80% 15,907-£
MV (Residual Sum available to offer for Development Opportunity) 258,344-£
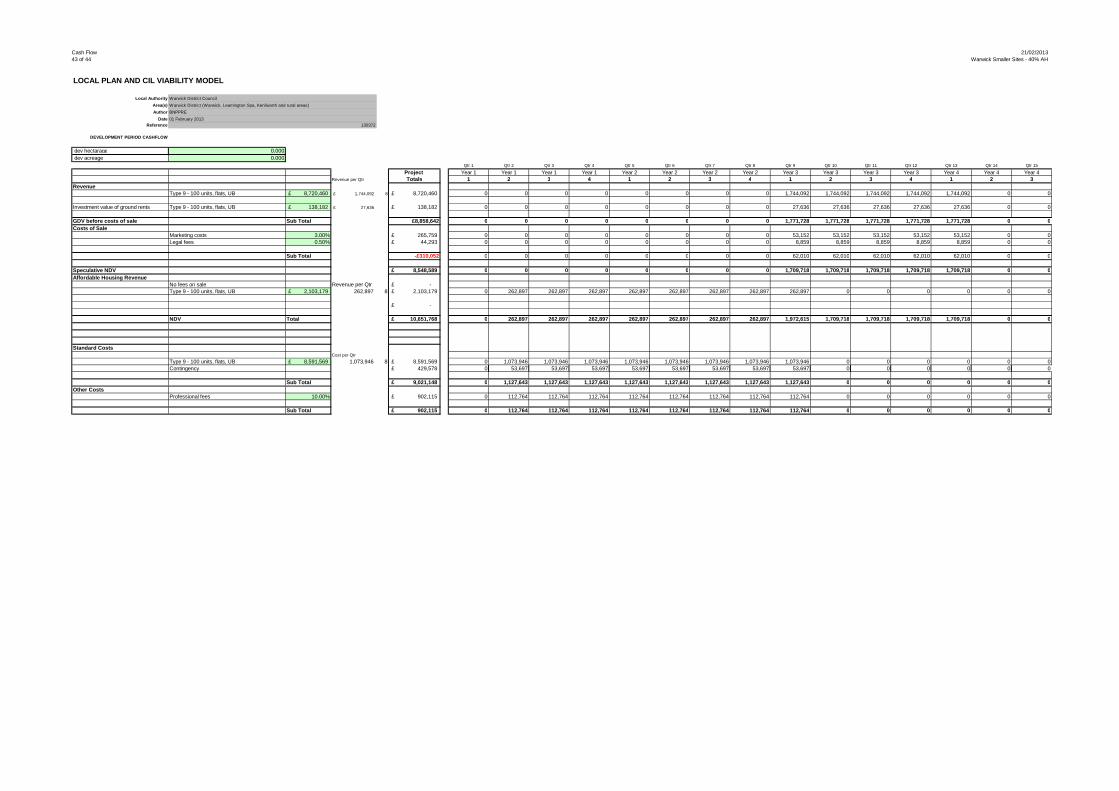
Cash Flow43 of 44
21/02/2013Warwick Smaller Sites - 40% AH
LOCAL PLAN AND CIL VIABILITY MODEL
Local Authority
Area(s)
Author
DateReference
DEVELOPMENT PERIOD CASHFLOW
dev hectarage 0.000 dev acreage 0.000
Qtr 1 Qtr 2 Qtr 3 Qtr 4 Qtr 5 Qtr 6 Qtr 7 Qtr 8 Qtr 9 Qtr 10 Qtr 11 Qtr 12 Qtr 13 Qtr 14 Qtr 15
Project Year 1 Year 1 Year 1 Year 1 Year 2 Year 2 Year 2 Year 2 Year 3 Year 3 Year 3 Year 3 Year 4 Year 4 Year 4Revenue per Qtr Totals 1 2 3 4 1 2 3 4 1 2 3 4 1 2 3
RevenueType 9 - 100 units, flats, UB 8,720,460£ 1,744,092£ 8 8,720,460£ 0 0 0 0 0 0 0 0 1,744,092 1,744,092 1,744,092 1,744,092 1,744,092 0 0
Investment value of ground rents Type 9 - 100 units, flats, UB 138,182£ 27,636£ 138,182£ 0 0 0 0 0 0 0 0 27,636 27,636 27,636 27,636 27,636 0 0
GDV before costs of sale Sub Total £8,858,642 0 0 0 0 0 0 0 0 1,771,728 1,771,728 1,771,728 1,771,728 1,771,728 0 0Costs of Sale
Marketing costs 3.00% 265,759£ 0 0 0 0 0 0 0 0 53,152 53,152 53,152 53,152 53,152 0 0Legal fees 0.50% 44,293£ 0 0 0 0 0 0 0 0 8,859 8,859 8,859 8,859 8,859 0 0
Sub Total -£310,052 0 0 0 0 0 0 0 0 62,010 62,010 62,010 62,010 62,010 0 0
Speculative NDV 8,548,589£ 0 0 0 0 0 0 0 0 1,709,718 1,709,718 1,709,718 1,709,718 1,709,718 0 0Affordable Housing Revenue
No fees on sale Revenue per Qtr -£ Type 9 - 100 units, flats, UB 2,103,179£ 262,897 8 2,103,179£ 0 262,897 262,897 262,897 262,897 262,897 262,897 262,897 262,897 0 0 0 0 0 0
-£
NDV Total 10,651,768£ 0 262,897 262,897 262,897 262,897 262,897 262,897 262,897 1,972,615 1,709,718 1,709,718 1,709,718 1,709,718 0 0
Standard CostsCost per Qtr
Type 9 - 100 units, flats, UB 8,591,569£ 1,073,946 8 8,591,569£ 0 1,073,946 1,073,946 1,073,946 1,073,946 1,073,946 1,073,946 1,073,946 1,073,946 0 0 0 0 0 0Contingency 429,578£ 0 53,697 53,697 53,697 53,697 53,697 53,697 53,697 53,697 0 0 0 0 0 0
Sub Total 9,021,148£ 0 1,127,643 1,127,643 1,127,643 1,127,643 1,127,643 1,127,643 1,127,643 1,127,643 0 0 0 0 0 0Other Costs
Professional fees 10.00% 902,115£ 0 112,764 112,764 112,764 112,764 112,764 112,764 112,764 112,764 0 0 0 0 0 0
Sub Total 902,115£ 0 112,764 112,764 112,764 112,764 112,764 112,764 112,764 112,764 0 0 0 0 0 0
130372
Warwick District Council
Warwick District (Warwick, Leamington Spa, Kenilworth and rural areas)
BNPPRE
01 February 2013

Cash Flow44 of 44
21/02/2013Warwick Smaller Sites - 40% AH
Qtr 1 Qtr 2 Qtr 3 Qtr 4 Qtr 5 Qtr 6 Qtr 7 Qtr 8 Qtr 9 Qtr 10 Qtr 11 Qtr 12 Qtr 13 Qtr 14 Qtr 15
Project Year 1 Year 1 Year 1 Year 1 Year 2 Year 2 Year 2 Year 2 Year 3 Year 3 Year 3 Year 3 Year 4 Year 4 Year 4Revenue per Qtr Totals 1 2 3 4 1 2 3 4 1 2 3 4 1 2 3
CIL
CIL Type 9 - 100 units, flats, UB 315,000£ 315,000£ 315,000 0 0 0 0 0 0 0 0 0 0 0 0 0 0315,000£ 315,000£ 0 0 0 315,000 0 0 0 0 0 0 0 0 0 0 0
315,000£ 315,000£ 0 0 0 0 0 0 315,000 0 0 0 0 0 0 0 0
Sub Total 945,000£ 315,000 0 0 315,000 0 0 315,000 0 0 0 0 0 0 0 0
Section 106 Costs Type 9 - 100 units, flats, UB 150,000£ 150,000£ 0 0 0 0 0 0 0 0 0 0 150,000 0 0 0 0Sub Total 150,000£ 0 0 0 0 0 0 0 0 0 0 150,000 0 0 0 0
Total Abnormal Costs Sub Total 1,095,000£ 315,000 0 0 315,000 0 0 315,000 0 0 0 150,000 0 0 0 0
Total Costs 11,018,263£ 315,000 1,240,408 1,240,408 1,555,408 1,240,408 1,240,408 1,555,408 1,240,408 1,240,408 0 150,000 0 0 0 0
-£
Developer's profit on GDV % of GDV 20.00% 1,709,718£ 0 0 0 0 0 0 0 0 341,944 341,944 341,944 341,944 341,944 0 0% of GDV affordable 6% 126,191£ 0 15,774 15,774 15,774 15,774 15,774 15,774 15,774 15,774 0 0 0 0 0 0
Residual Sum before interest 2,202,403-£ -315,000 -993,284 -993,284 -1,308,284 -993,284 -993,284 -1,308,284 -993,284 374,490 1,367,774 1,217,774 1,367,774 1,367,774 0 0
Cumulative residual balance for interest calculatio n -315,000 -1,313,436 -2,328,202 -3,674,564 -4,727,947 -5,798,557 -7,201,678 -8,312,746 -8,074,212 -6,838,493 -5,732,563 -4,458,546 -3,163,692 0 0
Interest 7.00% 1,013,031-£ -5,152 -21,481 -38,078 -60,098 -77,326 -94,836 -117,784 -135,956 -132,055 -111,845 -93,757 -72,920 -51,743 0 0
Residual Sum for quarter after interest 3,215,434-£ -320,152 -1,014,766 -1,031,362 -1,368,382 -1,070,611 -1,088,121 -1,426,069 -1,129,240 242,435 1,255,930 1,124,017 1,294,854 1,316,032 0 0
2,566,210-£ 13
Land Value per developable acre #DIV/0!per developable hectare #DIV/0!
Residual land value 2,566,210-£
Site acquisition costs 5.80% 148,840-£
MV (Residual Sum available to offer for Development Opportunity) 2,417,370-£

Community Infrastructure Levy Viability #N/A = Scheme RLV is lower
Warwick District Council than EUV with nil rate of CIL.
Results summary
Site type K17 - Southcrest Farm, Kenilworth
BLV1 BLV2 BLV3 BLV4Warwick #N/A #N/A #N/A #N/ALeamington Spa #N/A #N/A #N/A 140Kenilworth #N/A #N/A #N/A #N/ARural areas (higher value) #N/A #N/A 140 250Rural areas (lower value) #N/A #N/A #N/A #N/A
Site type L09 - Land at Grove Farm, Leamington Spa
BLV1 BLV2 BLV3 BLV4Warwick #N/A #N/A #N/A #N/ALeamington Spa #N/A #N/A #N/A 140Kenilworth #N/A #N/A #N/A #N/ARural areas (higher value) #N/A #N/A 140 250Rural areas (lower value) #N/A #N/A #N/A #N/A
Site type C13 - Lodge Farm, Coventry
BLV1 BLV2 BLV3 BLV4Warwick #N/A #N/A #N/A #N/ALeamington Spa #N/A #N/A #N/A 140Kenilworth #N/A #N/A #N/A #N/ARural areas (higher value) #N/A #N/A 140 250Rural areas (lower value) #N/A #N/A #N/A #N/A
Site type W26 - Gallows Hill, Warwick
BLV1 BLV2 BLV3 BLV4Warwick #N/A #N/A #N/A #N/ALeamington Spa #N/A #N/A #N/A 120Kenilworth #N/A #N/A #N/A #N/ARural areas (higher value) #N/A #N/A 120 250Rural areas (lower value) #N/A #N/A #N/A #N/A
Site type L48 - Land at Blackdown, Leamington Spa
BLV1 BLV2 BLV3 BLV4Warwick #N/A #N/A #N/A #N/ALeamington Spa #N/A #N/A #N/A 40Kenilworth #N/A #N/A #N/A #N/ARural areas (higher value) #N/A #N/A #N/A 220Rural areas (lower value) #N/A #N/A #N/A #N/A

Community Infrastructure Levy Benchmark Land Values (per gross ha)Warwick District Council BLV1 BLV2 BLV3 BLV4
Greenfield 1 Greenfield 2 Warehousing Community uses£1,049,750 £500,000 £371,000 £247,000
Site type 2Houses Affordable % 40% Site area 37.94 ha
No of units 664 units % rented 80% Net to gross 50%Density: 35 dph % intermed 20%CSH level: 4 Growth
Sales 0% Build 0%
Warwick Private values £2307 psmMaximum CIL rates (per square metre)
CIL amount per sq m
RLV RLV per ha RLV less BLV 1 RLV less BLV 2 RLV less BLV 3 RLV less BLV 4 BLV1 BLV2 BLV3 BLV4
0 -2,526,364 -66,583 -1,116,333 -566,583 -437,583 -313,583 #N/A #N/A #N/A #N/A20 -3,163,329 -83,371 -1,133,121 -583,371 -454,371 -330,371 40 -3,800,295 -100,158 -1,149,908 -600,158 -471,158 -347,158 60 -4,437,260 -116,946 -1,166,696 -616,946 -487,946 -363,946 80 -5,074,224 -133,733 -1,183,483 -633,733 -504,733 -380,733
100 -5,711,190 -150,521 -1,200,271 -650,521 -521,521 -397,521 120 -6,348,155 -167,308 -1,217,058 -667,308 -538,308 -414,308 140 -6,985,120 -184,096 -1,233,846 -684,096 -555,096 -431,096 160 -7,622,086 -200,883 -1,250,633 -700,883 -571,883 -447,883 180 -8,259,050 -217,671 -1,267,421 -717,671 -588,671 -464,671 200 -8,896,015 -234,458 -1,284,208 -734,458 -605,458 -481,458 210 -9,214,498 -242,852 -1,292,602 -742,852 -613,852 -489,852 220 -9,532,981 -251,246 -1,300,996 -751,246 -622,246 -498,246 230 -9,851,463 -259,639 -1,309,389 -759,639 -630,639 -506,639 240 -10,169,946 -268,033 -1,317,783 -768,033 -639,033 -515,033 250 -10,488,429 -276,427 -1,326,177 -776,427 -647,427 -523,427
Leamington Spa Private values £2981 psmMaximum CIL rates (per square metre)
CIL amount per sq m
RLV RLV per ha RLV less BLV 1 RLV less BLV 2 RLV less BLV 3 RLV less BLV 4 BLV1 BLV2 BLV3 BLV4
0 13,756,201 362,550 -687,200 -137,450 -8,450 115,550 #N/A #N/A #N/A £14020 13,209,840 348,151 -701,599 -151,849 -22,849 101,15140 12,656,772 333,575 -716,175 -166,425 -37,425 86,57560 12,092,766 318,710 -731,040 -181,290 -52,290 71,71080 11,519,866 303,611 -746,139 -196,389 -67,389 56,611
100 10,941,930 288,379 -761,371 -211,621 -82,621 41,379120 10,354,592 272,900 -776,850 -227,100 -98,100 25,900140 9,761,776 257,276 -792,474 -242,724 -113,724 10,276160 9,164,833 241,543 -808,207 -258,457 -129,457 -5,457 180 8,567,888 225,810 -823,940 -274,190 -145,190 -21,190 200 7,970,944 210,078 -839,672 -289,922 -160,922 -36,922 210 7,672,472 202,211 -847,539 -297,789 -168,789 -44,789 220 7,370,687 194,258 -855,492 -305,742 -176,742 -52,742 230 7,067,333 186,263 -863,487 -313,737 -184,737 -60,737 240 6,763,979 178,268 -871,482 -321,732 -192,732 -68,732 250 6,460,626 170,273 -879,477 -329,727 -200,727 -76,727
Kenilworth Private values £2691 psmMaximum CIL rates (per square metre)
CIL amount per sq m
RLV RLV per ha RLV less BLV 1 RLV less BLV 2 RLV less BLV 3 RLV less BLV 4 BLV1 BLV2 BLV3 BLV4
0 7,003,912 184,591 -865,159 -315,409 -186,409 -62,409 #N/A #N/A #N/A #N/A20 6,399,893 168,672 -881,078 -331,328 -202,328 -78,328 40 5,793,186 152,682 -897,068 -347,318 -218,318 -94,318 60 5,186,479 136,692 -913,058 -363,308 -234,308 -110,308 80 4,579,771 120,702 -929,048 -379,298 -250,298 -126,298
100 3,963,470 104,459 -945,291 -395,541 -266,541 -142,541 120 3,346,840 88,207 -961,543 -411,793 -282,793 -158,793 140 2,730,210 71,956 -977,794 -428,044 -299,044 -175,044 160 2,110,861 55,633 -994,117 -444,367 -315,367 -191,367 180 1,484,145 39,115 -1,010,635 -460,885 -331,885 -207,885 200 857,431 22,598 -1,027,152 -477,402 -348,402 -224,402 210 544,073 14,339 -1,035,411 -485,661 -356,661 -232,661 220 230,716 6,081 -1,043,669 -493,919 -364,919 -240,919 230 -83,993 -2,214 -1,051,964 -502,214 -373,214 -249,214 240 -402,476 -10,607 -1,060,357 -510,607 -381,607 -257,607 250 -720,959 -19,001 -1,068,751 -519,001 -390,001 -266,001
Rural areas (higher value) Private values £3180 psmMaximum CIL rates (per square metre)
CIL amount per sq m
RLV RLV per ha RLV less BLV 1 RLV less BLV 2 RLV less BLV 3 RLV less BLV 4 BLV1 BLV2 BLV3 BLV4
0 18,086,169 476,669 -573,081 -23,331 105,669 229,669 #N/A #N/A £140 £25020 17,567,545 463,000 -586,750 -37,000 92,000 216,00040 17,047,454 449,293 -600,457 -50,707 78,293 202,29360 16,526,021 435,550 -614,200 -64,450 64,550 188,55080 15,994,804 421,550 -628,200 -78,450 50,550 174,550
100 15,462,870 407,530 -642,220 -92,470 36,530 160,530120 14,928,132 393,437 -656,313 -106,563 22,437 146,437140 14,375,488 378,872 -670,878 -121,128 7,872 131,872160 13,821,629 364,275 -685,475 -135,725 -6,725 117,275180 13,256,079 349,370 -700,380 -150,630 -21,630 102,370200 12,685,008 334,319 -715,431 -165,681 -36,681 87,319210 12,396,064 326,703 -723,047 -173,297 -44,297 79,703220 12,107,121 319,088 -730,662 -180,912 -51,912 72,088230 11,818,178 311,473 -738,277 -188,527 -59,527 64,473240 11,524,676 303,738 -746,012 -196,262 -67,262 56,738250 11,231,006 295,998 -753,752 -204,002 -75,002 48,998
Rural areas (lower value) Private values £2449 psmMaximum CIL rates (per square metre)
CIL amount per sq m
RLV RLV per ha RLV less BLV 1 RLV less BLV 2 RLV less BLV 3 RLV less BLV 4 BLV1 BLV2 BLV3 BLV4
0 1,068,096 28,150 -1,021,600 -471,850 -342,850 -218,850 #N/A #N/A #N/A #N/A20 441,381 11,633 -1,038,117 -488,367 -359,367 -235,367 40 -188,366 -4,964 -1,054,714 -504,964 -375,964 -251,964 60 -825,330 -21,752 -1,071,502 -521,752 -392,752 -268,752 80 -1,462,296 -38,539 -1,088,289 -538,539 -409,539 -285,539
100 -2,099,261 -55,327 -1,105,077 -555,327 -426,327 -302,327 120 -2,736,226 -72,114 -1,121,864 -572,114 -443,114 -319,114 140 -3,373,191 -88,902 -1,138,652 -588,902 -459,902 -335,902 160 -4,010,156 -105,689 -1,155,439 -605,689 -476,689 -352,689 180 -4,647,121 -122,477 -1,172,227 -622,477 -493,477 -369,477 200 -5,284,087 -139,264 -1,189,014 -639,264 -510,264 -386,264 210 -5,602,570 -147,658 -1,197,408 -647,658 -518,658 -394,658 220 -5,921,052 -156,052 -1,205,802 -656,052 -527,052 -403,052 230 -6,239,534 -164,446 -1,214,196 -664,446 -535,446 -411,446 240 -6,558,017 -172,839 -1,222,589 -672,839 -543,839 -419,839 250 -6,876,499 -181,233 -1,230,983 -681,233 -552,233 -428,233

Community Infrastructure Levy Benchmark Land Values (per gross ha)Warwick District Council BLV1 BLV2 BLV3 BLV4
Greenfield 1 Greenfield 2 Warehousing Community uses£1,049,750 £500,000 £371,000 £247,000
Site type 3Houses Affordable % 40% Site area 18.51 ha
No of units 324 units % rented 80% Net to gross 50%Density: 35 dph % intermed 20%CSH level: 4 Growth
Sales 0% Build 0%
Warwick Private values £2307 psmMaximum CIL rates (per square metre)
CIL amount per sq m
RLV RLV per ha RLV less BLV 1 RLV less BLV 2 RLV less BLV 3 RLV less BLV 4 BLV1 BLV2 BLV3 BLV4
0 -1,232,744 -66,583 -1,116,333 -566,583 -437,583 -313,583 #N/A #N/A #N/A #N/A20 -1,546,855 -83,549 -1,133,299 -583,549 -454,549 -330,549 40 -1,860,968 -100,515 -1,150,265 -600,515 -471,515 -347,515 60 -2,175,080 -117,481 -1,167,231 -617,481 -488,481 -364,481 80 -2,489,192 -134,447 -1,184,197 -634,447 -505,447 -381,447
100 -2,803,303 -151,413 -1,201,163 -651,413 -522,413 -398,413 120 -3,117,415 -168,379 -1,218,129 -668,379 -539,379 -415,379 140 -3,431,527 -185,345 -1,235,095 -685,345 -556,345 -432,345 160 -3,745,639 -202,311 -1,252,061 -702,311 -573,311 -449,311 180 -4,059,751 -219,277 -1,269,027 -719,277 -590,277 -466,277 200 -4,373,862 -236,243 -1,285,993 -736,243 -607,243 -483,243 210 -4,530,918 -244,726 -1,294,476 -744,726 -615,726 -491,726 220 -4,687,974 -253,208 -1,302,958 -753,208 -624,208 -500,208 230 -4,845,030 -261,691 -1,311,441 -761,691 -632,691 -508,691 240 -5,002,087 -270,174 -1,319,924 -770,174 -641,174 -517,174 250 -5,159,143 -278,657 -1,328,407 -778,657 -649,657 -525,657
Leamington Spa Private values £2981 psmMaximum CIL rates (per square metre)
CIL amount per sq m
RLV RLV per ha RLV less BLV 1 RLV less BLV 2 RLV less BLV 3 RLV less BLV 4 BLV1 BLV2 BLV3 BLV4
0 6,712,363 362,550 -687,200 -137,450 -8,450 115,550 #N/A #N/A #N/A £14020 6,442,911 347,997 -701,753 -152,003 -23,003 100,99740 6,170,186 333,266 -716,484 -166,734 -37,734 86,26660 5,891,840 318,232 -731,518 -181,768 -52,768 71,23280 5,609,151 302,963 -746,787 -197,037 -68,037 55,963
100 5,323,903 287,557 -762,193 -212,443 -83,443 40,557120 5,034,265 271,912 -777,838 -228,088 -99,088 24,912140 4,741,604 256,105 -793,645 -243,895 -114,895 9,105160 4,447,228 240,205 -809,545 -259,795 -130,795 -6,795 180 4,152,852 224,305 -825,445 -275,695 -146,695 -22,695 200 3,858,476 208,405 -841,345 -291,595 -162,595 -38,595 210 3,711,289 200,455 -849,295 -299,545 -170,545 -46,545 220 3,561,926 192,388 -857,362 -307,612 -178,612 -54,612 230 3,412,331 184,308 -865,442 -315,692 -186,692 -62,692 240 3,262,736 176,228 -873,522 -323,772 -194,772 -70,772 250 3,113,140 168,148 -881,602 -331,852 -202,852 -78,852
Kenilworth Private values £2691 psmMaximum CIL rates (per square metre)
CIL amount per sq m
RLV RLV per ha RLV less BLV 1 RLV less BLV 2 RLV less BLV 3 RLV less BLV 4 BLV1 BLV2 BLV3 BLV4
0 3,417,571 184,591 -865,159 -315,409 -186,409 -62,409 #N/A #N/A #N/A #N/A20 3,119,693 168,502 -881,248 -331,498 -202,498 -78,498 40 2,820,502 152,342 -897,408 -347,658 -218,658 -94,658 60 2,521,312 136,182 -913,568 -363,818 -234,818 -110,818 80 2,222,075 120,020 -929,730 -379,980 -250,980 -126,980
100 1,917,992 103,595 -946,155 -396,405 -267,405 -143,405 120 1,613,908 87,171 -962,579 -412,829 -283,829 -159,829 140 1,309,824 70,747 -979,003 -429,253 -300,253 -176,253 160 1,003,995 54,228 -995,522 -445,772 -316,772 -192,772 180 694,938 37,535 -1,012,215 -462,465 -333,465 -209,465 200 385,881 20,842 -1,028,908 -479,158 -350,158 -226,158 210 231,352 12,496 -1,037,254 -487,504 -358,504 -234,504 220 76,823 4,149 -1,045,601 -495,851 -366,851 -242,851 230 -78,976 -4,266 -1,054,016 -504,266 -375,266 -251,266 240 -236,032 -12,749 -1,062,499 -512,749 -383,749 -259,749 250 -393,088 -21,232 -1,070,982 -521,232 -392,232 -268,232
Rural areas (higher value) Private values £3180 psmMaximum CIL rates (per square metre)
CIL amount per sq m
RLV RLV per ha RLV less BLV 1 RLV less BLV 2 RLV less BLV 3 RLV less BLV 4 BLV1 BLV2 BLV3 BLV4
0 8,825,179 476,669 -573,081 -23,331 105,669 229,669 #N/A #N/A £140 £25020 8,569,482 462,858 -586,892 -37,142 91,858 215,85840 8,313,071 449,008 -600,742 -50,992 78,008 202,00860 8,055,876 435,117 -614,633 -64,883 64,117 188,11780 7,793,817 420,962 -628,788 -79,038 49,962 173,962
100 7,531,540 406,796 -642,954 -93,204 35,796 159,796120 7,267,287 392,523 -657,227 -107,477 21,523 145,523140 6,994,562 377,793 -671,957 -122,207 6,793 130,793160 6,721,077 363,021 -686,729 -136,979 -7,979 116,021180 6,441,787 347,936 -701,814 -152,064 -23,064 100,936200 6,159,700 332,700 -717,050 -167,300 -38,300 85,700210 6,017,212 325,004 -724,746 -174,996 -45,996 78,004220 5,874,723 317,308 -732,442 -182,692 -53,692 70,308230 5,731,752 309,585 -740,165 -190,415 -61,415 62,585240 5,586,932 301,763 -747,987 -198,237 -69,237 54,763250 5,442,112 293,941 -755,809 -206,059 -77,059 46,941
Rural areas (lower value) Private values £2449 psmMaximum CIL rates (per square metre)
CIL amount per sq m
RLV RLV per ha RLV less BLV 1 RLV less BLV 2 RLV less BLV 3 RLV less BLV 4 BLV1 BLV2 BLV3 BLV4
0 521,179 28,150 -1,021,600 -471,850 -342,850 -218,850 #N/A #N/A #N/A #N/A20 212,122 11,457 -1,038,293 -488,543 -359,543 -235,543 40 -98,521 -5,321 -1,055,071 -505,321 -376,321 -252,321 60 -412,633 -22,287 -1,072,037 -522,287 -393,287 -269,287 80 -726,745 -39,253 -1,089,003 -539,253 -410,253 -286,253
100 -1,040,856 -56,219 -1,105,969 -556,219 -427,219 -303,219 120 -1,354,968 -73,185 -1,122,935 -573,185 -444,185 -320,185 140 -1,669,080 -90,151 -1,139,901 -590,151 -461,151 -337,151 160 -1,983,192 -107,117 -1,156,867 -607,117 -478,117 -354,117 180 -2,297,303 -124,083 -1,173,833 -624,083 -495,083 -371,083 200 -2,611,415 -141,049 -1,190,799 -641,049 -512,049 -388,049 210 -2,768,471 -149,532 -1,199,282 -649,532 -520,532 -396,532 220 -2,925,527 -158,015 -1,207,765 -658,015 -529,015 -405,015 230 -3,082,583 -166,498 -1,216,248 -666,498 -537,498 -413,498 240 -3,239,639 -174,981 -1,224,731 -674,981 -545,981 -421,981 250 -3,396,696 -183,463 -1,233,213 -683,463 -554,463 -430,463
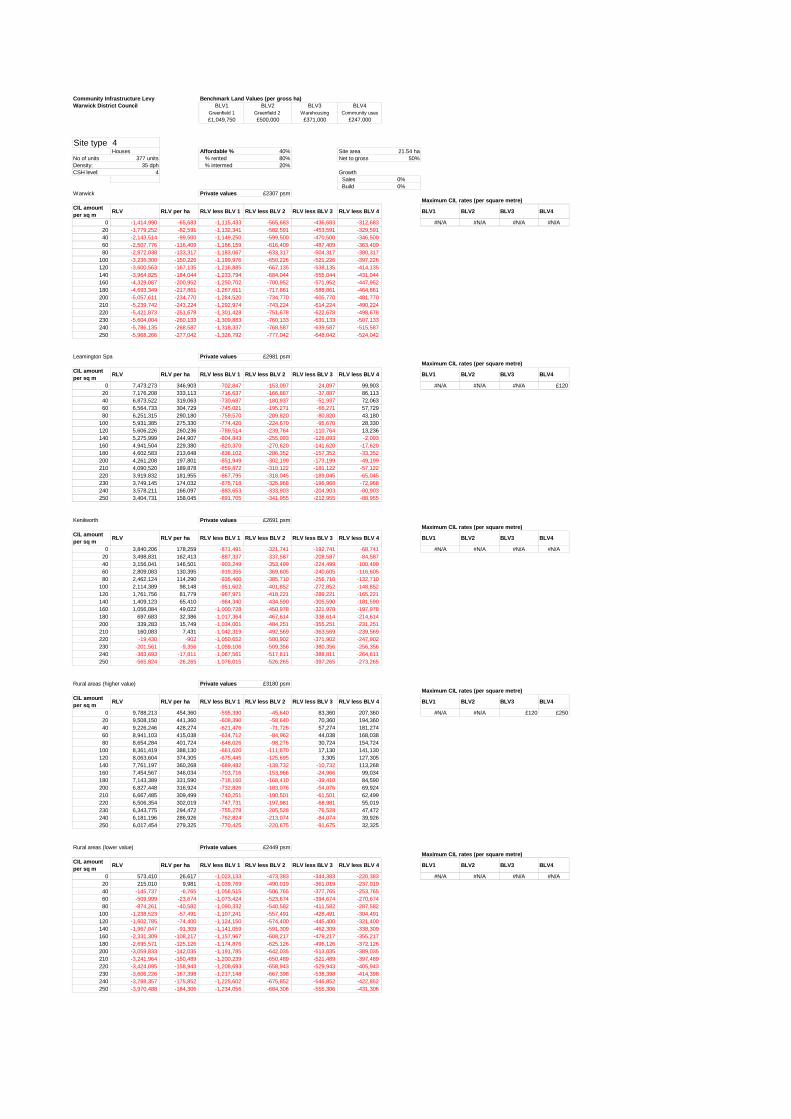
Community Infrastructure Levy Benchmark Land Values (per gross ha)Warwick District Council BLV1 BLV2 BLV3 BLV4
Greenfield 1 Greenfield 2 Warehousing Community uses£1,049,750 £500,000 £371,000 £247,000
Site type 4Houses Affordable % 40% Site area 21.54 ha
No of units 377 units % rented 80% Net to gross 50%Density: 35 dph % intermed 20%CSH level: 4 Growth
Sales 0% Build 0%
Warwick Private values £2307 psmMaximum CIL rates (per square metre)
CIL amount per sq m
RLV RLV per ha RLV less BLV 1 RLV less BLV 2 RLV less BLV 3 RLV less BLV 4 BLV1 BLV2 BLV3 BLV4
0 -1,414,990 -65,683 -1,115,433 -565,683 -436,683 -312,683 #N/A #N/A #N/A #N/A20 -1,779,252 -82,591 -1,132,341 -582,591 -453,591 -329,591 40 -2,143,514 -99,500 -1,149,250 -599,500 -470,500 -346,500 60 -2,507,776 -116,409 -1,166,159 -616,409 -487,409 -363,409 80 -2,872,038 -133,317 -1,183,067 -633,317 -504,317 -380,317
100 -3,236,300 -150,226 -1,199,976 -650,226 -521,226 -397,226 120 -3,600,563 -167,135 -1,216,885 -667,135 -538,135 -414,135 140 -3,964,825 -184,044 -1,233,794 -684,044 -555,044 -431,044 160 -4,329,087 -200,952 -1,250,702 -700,952 -571,952 -447,952 180 -4,693,349 -217,861 -1,267,611 -717,861 -588,861 -464,861 200 -5,057,611 -234,770 -1,284,520 -734,770 -605,770 -481,770 210 -5,239,742 -243,224 -1,292,974 -743,224 -614,224 -490,224 220 -5,421,873 -251,678 -1,301,428 -751,678 -622,678 -498,678 230 -5,604,004 -260,133 -1,309,883 -760,133 -631,133 -507,133 240 -5,786,135 -268,587 -1,318,337 -768,587 -639,587 -515,587 250 -5,968,266 -277,042 -1,326,792 -777,042 -648,042 -524,042
Leamington Spa Private values £2981 psmMaximum CIL rates (per square metre)
CIL amount per sq m
RLV RLV per ha RLV less BLV 1 RLV less BLV 2 RLV less BLV 3 RLV less BLV 4 BLV1 BLV2 BLV3 BLV4
0 7,473,273 346,903 -702,847 -153,097 -24,097 99,903 #N/A #N/A #N/A £12020 7,176,208 333,113 -716,637 -166,887 -37,887 86,11340 6,873,522 319,063 -730,687 -180,937 -51,937 72,06360 6,564,733 304,729 -745,021 -195,271 -66,271 57,72980 6,251,315 290,180 -759,570 -209,820 -80,820 43,180
100 5,931,385 275,330 -774,420 -224,670 -95,670 28,330120 5,606,226 260,236 -789,514 -239,764 -110,764 13,236140 5,275,999 244,907 -804,843 -255,093 -126,093 -2,093 160 4,941,504 229,380 -820,370 -270,620 -141,620 -17,620 180 4,602,583 213,648 -836,102 -286,352 -157,352 -33,352 200 4,261,208 197,801 -851,949 -302,199 -173,199 -49,199 210 4,090,520 189,878 -859,872 -310,122 -181,122 -57,122 220 3,919,832 181,955 -867,795 -318,045 -189,045 -65,045 230 3,749,145 174,032 -875,718 -325,968 -196,968 -72,968 240 3,578,211 166,097 -883,653 -333,903 -204,903 -80,903 250 3,404,731 158,045 -891,705 -341,955 -212,955 -88,955
Kenilworth Private values £2691 psmMaximum CIL rates (per square metre)
CIL amount per sq m
RLV RLV per ha RLV less BLV 1 RLV less BLV 2 RLV less BLV 3 RLV less BLV 4 BLV1 BLV2 BLV3 BLV4
0 3,840,206 178,259 -871,491 -321,741 -192,741 -68,741 #N/A #N/A #N/A #N/A20 3,498,831 162,413 -887,337 -337,587 -208,587 -84,587 40 3,156,041 146,501 -903,249 -353,499 -224,499 -100,499 60 2,809,083 130,395 -919,355 -369,605 -240,605 -116,605 80 2,462,124 114,290 -935,460 -385,710 -256,710 -132,710
100 2,114,389 98,148 -951,602 -401,852 -272,852 -148,852 120 1,761,756 81,779 -967,971 -418,221 -289,221 -165,221 140 1,409,123 65,410 -984,340 -434,590 -305,590 -181,590 160 1,056,084 49,022 -1,000,728 -450,978 -321,978 -197,978 180 697,683 32,386 -1,017,364 -467,614 -338,614 -214,614 200 339,283 15,749 -1,034,001 -484,251 -355,251 -231,251 210 160,083 7,431 -1,042,319 -492,569 -363,569 -239,569 220 -19,430 -902 -1,050,652 -500,902 -371,902 -247,902 230 -201,561 -9,356 -1,059,106 -509,356 -380,356 -256,356 240 -383,693 -17,811 -1,067,561 -517,811 -388,811 -264,811 250 -565,824 -26,265 -1,076,015 -526,265 -397,265 -273,265
Rural areas (higher value) Private values £3180 psmMaximum CIL rates (per square metre)
CIL amount per sq m
RLV RLV per ha RLV less BLV 1 RLV less BLV 2 RLV less BLV 3 RLV less BLV 4 BLV1 BLV2 BLV3 BLV4
0 9,788,213 454,360 -595,390 -45,640 83,360 207,360 #N/A #N/A £120 £25020 9,508,150 441,360 -608,390 -58,640 70,360 194,36040 9,226,246 428,274 -621,476 -71,726 57,274 181,27460 8,941,103 415,038 -634,712 -84,962 44,038 168,03880 8,654,284 401,724 -648,026 -98,276 30,724 154,724
100 8,361,419 388,130 -661,620 -111,870 17,130 141,130120 8,063,604 374,305 -675,445 -125,695 3,305 127,305140 7,761,197 360,268 -689,482 -139,732 -10,732 113,268160 7,454,567 346,034 -703,716 -153,966 -24,966 99,034180 7,143,389 331,590 -718,160 -168,410 -39,410 84,590200 6,827,448 316,924 -732,826 -183,076 -54,076 69,924210 6,667,485 309,499 -740,251 -190,501 -61,501 62,499220 6,506,354 302,019 -747,731 -197,981 -68,981 55,019230 6,343,775 294,472 -755,278 -205,528 -76,528 47,472240 6,181,196 286,926 -762,824 -213,074 -84,074 39,926250 6,017,454 279,325 -770,425 -220,675 -91,675 32,325
Rural areas (lower value) Private values £2449 psmMaximum CIL rates (per square metre)
CIL amount per sq m
RLV RLV per ha RLV less BLV 1 RLV less BLV 2 RLV less BLV 3 RLV less BLV 4 BLV1 BLV2 BLV3 BLV4
0 573,410 26,617 -1,023,133 -473,383 -344,383 -220,383 #N/A #N/A #N/A #N/A20 215,010 9,981 -1,039,769 -490,019 -361,019 -237,019 40 -145,737 -6,765 -1,056,515 -506,765 -377,765 -253,765 60 -509,999 -23,674 -1,073,424 -523,674 -394,674 -270,674 80 -874,261 -40,582 -1,090,332 -540,582 -411,582 -287,582
100 -1,238,523 -57,491 -1,107,241 -557,491 -428,491 -304,491 120 -1,602,785 -74,400 -1,124,150 -574,400 -445,400 -321,400 140 -1,967,047 -91,309 -1,141,059 -591,309 -462,309 -338,309 160 -2,331,309 -108,217 -1,157,967 -608,217 -479,217 -355,217 180 -2,695,571 -125,126 -1,174,876 -625,126 -496,126 -372,126 200 -3,059,833 -142,035 -1,191,785 -642,035 -513,035 -389,035 210 -3,241,964 -150,489 -1,200,239 -650,489 -521,489 -397,489 220 -3,424,095 -158,943 -1,208,693 -658,943 -529,943 -405,943 230 -3,606,226 -167,398 -1,217,148 -667,398 -538,398 -414,398 240 -3,788,357 -175,852 -1,225,602 -675,852 -546,852 -422,852 250 -3,970,488 -184,306 -1,234,056 -684,306 -555,306 -431,306

Community Infrastructure Levy Benchmark Land Values (per gross ha)Warwick District Council BLV1 BLV2 BLV3 BLV4
Greenfield 1 Greenfield 2 Warehousing Community uses£1,049,750 £500,000 £371,000 £247,000
Site type 5Houses Affordable % 40% Site area 66.57 ha
No of units 1165 units % rented 80% Net to gross 50%Density: 35 dph % intermed 20%CSH level: 4 Growth
Sales 0% Build 0%
Warwick Private values £2307 psmMaximum CIL rates (per square metre)
CIL amount per sq m
RLV RLV per ha RLV less BLV 1 RLV less BLV 2 RLV less BLV 3 RLV less BLV 4 BLV1 BLV2 BLV3 BLV4
0 -2,917,383 -43,823 -1,093,573 -543,823 -414,823 -290,823 #N/A #N/A #N/A #N/A20 -3,932,979 -59,079 -1,108,829 -559,079 -430,079 -306,079 40 -4,948,575 -74,335 -1,124,085 -574,335 -445,335 -321,335 60 -5,964,170 -89,591 -1,139,341 -589,591 -460,591 -336,591 80 -6,979,766 -104,846 -1,154,596 -604,846 -475,846 -351,846
100 -7,995,362 -120,102 -1,169,852 -620,102 -491,102 -367,102 120 -9,010,957 -135,358 -1,185,108 -635,358 -506,358 -382,358 140 -10,026,553 -150,613 -1,200,363 -650,613 -521,613 -397,613 160 -11,042,149 -165,869 -1,215,619 -665,869 -536,869 -412,869 180 -12,057,744 -181,125 -1,230,875 -681,125 -552,125 -428,125 200 -13,073,340 -196,381 -1,246,131 -696,381 -567,381 -443,381 210 -13,581,137 -204,008 -1,253,758 -704,008 -575,008 -451,008 220 -14,088,935 -211,636 -1,261,386 -711,636 -582,636 -458,636 230 -14,596,733 -219,264 -1,269,014 -719,264 -590,264 -466,264 240 -15,104,531 -226,892 -1,276,642 -726,892 -597,892 -473,892 250 -15,612,328 -234,520 -1,284,270 -734,520 -605,520 -481,520
Leamington Spa Private values £2981 psmMaximum CIL rates (per square metre)
CIL amount per sq m
RLV RLV per ha RLV less BLV 1 RLV less BLV 2 RLV less BLV 3 RLV less BLV 4 BLV1 BLV2 BLV3 BLV4
0 18,477,476 277,559 -772,191 -222,441 -93,441 30,559 #N/A #N/A #N/A £4020 17,798,736 267,363 -782,387 -232,637 -103,637 20,36340 17,118,556 257,146 -792,604 -242,854 -113,854 10,14660 16,437,259 246,912 -802,838 -253,088 -124,088 -88 80 15,752,833 236,631 -813,119 -263,369 -134,369 -10,369
100 15,068,407 226,349 -823,401 -273,651 -144,651 -20,651 120 14,380,057 216,009 -833,741 -283,991 -154,991 -30,991 140 13,689,343 205,634 -844,116 -294,366 -165,366 -41,366 160 12,990,130 195,131 -854,619 -304,869 -175,869 -51,869 180 12,279,069 184,450 -865,300 -315,550 -186,550 -62,550 200 11,546,875 173,451 -876,299 -326,549 -197,549 -73,549 210 11,173,879 167,848 -881,902 -332,152 -203,152 -79,152 220 10,790,580 162,090 -887,660 -337,910 -208,910 -84,910 230 10,404,902 156,297 -893,453 -343,703 -214,703 -90,703 240 10,012,365 150,400 -899,350 -349,600 -220,600 -96,600 250 9,613,134 144,403 -905,347 -355,597 -226,597 -102,597
Kenilworth Private values £2691 psmMaximum CIL rates (per square metre)
CIL amount per sq m
RLV RLV per ha RLV less BLV 1 RLV less BLV 2 RLV less BLV 3 RLV less BLV 4 BLV1 BLV2 BLV3 BLV4
0 10,343,405 155,373 -894,377 -344,627 -215,627 -91,627 #N/A #N/A #N/A #N/A20 9,630,420 144,663 -905,087 -355,337 -226,337 -102,337 40 8,885,543 133,474 -916,276 -366,526 -237,526 -113,526 60 8,107,981 121,794 -927,956 -378,206 -249,206 -125,206 80 7,295,144 109,584 -940,166 -390,416 -261,416 -137,416
100 6,443,374 96,789 -952,961 -403,211 -274,211 -150,211 120 5,562,235 83,553 -966,197 -416,447 -287,447 -163,447 140 4,637,854 69,667 -980,083 -430,333 -301,333 -177,333 160 3,672,900 55,172 -994,578 -444,828 -315,828 -191,828 180 2,694,842 40,480 -1,009,270 -459,520 -330,520 -206,520 200 1,711,669 25,712 -1,024,038 -474,288 -345,288 -221,288 210 1,212,558 18,214 -1,031,536 -481,786 -352,786 -228,786 220 712,933 10,709 -1,039,041 -489,291 -360,291 -236,291 230 213,307 3,204 -1,046,546 -496,796 -367,796 -243,796 240 -291,003 -4,371 -1,054,121 -504,371 -375,371 -251,371 250 -798,801 -11,999 -1,061,749 -511,999 -382,999 -258,999
Rural areas (higher value) Private values £3180 psmMaximum CIL rates (per square metre)
CIL amount per sq m
RLV RLV per ha RLV less BLV 1 RLV less BLV 2 RLV less BLV 3 RLV less BLV 4 BLV1 BLV2 BLV3 BLV4
0 23,981,423 360,236 -689,514 -139,764 -10,764 113,236 #N/A #N/A #N/A £22020 23,309,533 350,143 -699,607 -149,857 -20,857 103,14340 22,637,642 340,050 -709,700 -159,950 -30,950 93,05060 21,965,223 329,950 -719,800 -170,050 -41,050 82,95080 21,289,221 319,795 -729,955 -180,205 -51,205 72,795
100 20,613,219 309,641 -740,109 -190,359 -61,359 62,641120 19,936,578 299,476 -750,274 -200,524 -71,524 52,476140 19,256,398 289,259 -760,491 -210,741 -81,741 42,259160 18,576,218 279,042 -770,708 -220,958 -91,958 32,042180 17,895,080 268,810 -780,940 -231,190 -102,190 21,810200 17,210,654 258,529 -791,221 -241,471 -112,471 11,529210 16,868,441 253,389 -796,361 -246,611 -117,611 6,389220 16,526,228 248,248 -801,502 -251,752 -122,752 1,248230 16,182,429 243,084 -806,666 -256,916 -127,916 -3,916 240 15,834,824 237,862 -811,888 -262,138 -133,138 -9,138 250 15,486,540 232,630 -817,120 -267,370 -138,370 -14,370
Rural areas (lower value) Private values £2449 psmMaximum CIL rates (per square metre)
CIL amount per sq m
RLV RLV per ha RLV less BLV 1 RLV less BLV 2 RLV less BLV 3 RLV less BLV 4 BLV1 BLV2 BLV3 BLV4
0 2,503,162 37,601 -1,012,149 -462,399 -333,399 -209,399 #N/A #N/A #N/A #N/A20 1,520,079 22,834 -1,026,916 -477,166 -348,166 -224,166 40 520,826 7,824 -1,041,926 -492,176 -363,176 -239,176 60 -486,251 -7,304 -1,057,054 -507,304 -378,304 -254,304 80 -1,501,847 -22,560 -1,072,310 -522,560 -393,560 -269,560
100 -2,517,442 -37,816 -1,087,566 -537,816 -408,816 -284,816 120 -3,533,038 -53,071 -1,102,821 -553,071 -424,071 -300,071 140 -4,548,634 -68,327 -1,118,077 -568,327 -439,327 -315,327 160 -5,564,229 -83,583 -1,133,333 -583,583 -454,583 -330,583 180 -6,579,825 -98,839 -1,148,589 -598,839 -469,839 -345,839 200 -7,595,420 -114,094 -1,163,844 -614,094 -485,094 -361,094 210 -8,103,218 -121,722 -1,171,472 -621,722 -492,722 -368,722 220 -8,611,016 -129,350 -1,179,100 -629,350 -500,350 -376,350 230 -9,118,813 -136,978 -1,186,728 -636,978 -507,978 -383,978 240 -9,626,612 -144,606 -1,194,356 -644,606 -515,606 -391,606 250 -10,134,410 -152,234 -1,201,984 -652,234 -523,234 -399,234

DEVELOPMENT PROGRAMMESQuarter
Site type Activity 1 2 3 4 5 6 7 8 9 10 11 12 13 14 15 16 17 18 19 20 21 22 23 24 25 26 27 28 29 30 31 32 33 34 35 36 37 38 39 40 41 42 43 44 45 46 47 48
Pre-construction K17 - Southcrest Farm, Kenilworth Construction 0 0 1 1 1 1 1 1 1 1 1 1 1 1 1 1 1 1 1 1 1 1 1 0 0 0 0 0 0 0 0 0 0 0 0 0 0 0 0 0 0 0 0 0 0 0 0 0
Sales 0 0 0 0 0 0 1 1 1 1 1 1 1 1 1 1 1 1 1 1 1 1 1 1 1 1 1 0 0 0 0 0 0 0 0 0 0 0 0 0 0 0 0 0 0 0 0 0S106 payment 0 0 0 0 0 0 0 0 0 0 0 0 0 0 0 1 0 0 0 0 0 0 0 0 0 0 0 0 0 0 0 0 0 0 0 0 0 0 0 0 0 0 0 0 0 0 0 0CIL payment 1 0 0 1 0 0 0 0 0 0 0 0 0 0 0 0 0 0 0 0 0 0 0 0 0 0 0 0 0 0 0 0 0 0 0 0 0 0 0 0 0 0 0 0 0 0 0 0 0CIL payment 2 0 0 0 0 0 0 0 0 0 0 0 1 0 0 0 0 0 0 0 0 0 0 0 0 0 0 0 0 0 0 0 0 0 0 0 0 0 0 0 0 0 0 0 0 0 0 0 0CIL payment 3 0 0 0 0 0 0 0 0 0 0 0 0 0 0 0 0 0 0 0 1 0 0 0 0 0 0 0 0 0 0 0 0 0 0 0 0 0 0 0 0 0 0 0 0 0 0 0 0
Site type Activity 1 2 3 4 5 6 7 8 9 10 11 12 13 14 15 16 17 18 19 20 21 22 23 24 25 26 27 28 29 30 31 32 33 34 35 36 37 38 39 40 41 42 43 44 45 46 47 48
Pre-construction L09 - Land at Grove Farm, Leamington Spa Construction 0 0 1 1 1 1 1 1 1 1 1 1 1 1 1 1 1 1 1 1 1 1 1 1 0 0 0 0 0 0 0 0 0 0 0 0 0 0 0 0 0 0 0 0 0 0 0 0
Sales 0 0 0 0 0 0 1 1 1 1 1 1 1 1 1 1 1 1 1 1 1 1 1 1 1 1 1 1 0 0 0 0 0 0 0 0 0 0 0 0 0 0 0 0 0 0 0 0S106 payment 0 0 0 0 0 0 0 0 0 0 0 0 0 0 0 0 1 0 0 0 0 0 0 0 0 0 0 0 0 0 0 0 0 0 0 0 0 0 0 0 0 0 0 0 0 0 0 0CIL payment 1 0 0 1 0 0 0 0 0 0 0 0 0 0 0 0 0 0 0 0 0 0 0 0 0 0 0 0 0 0 0 0 0 0 0 0 0 0 0 0 0 0 0 0 0 0 0 0 0CIL payment 2 0 0 0 0 0 0 0 0 0 0 0 0 0 1 0 0 0 0 0 0 0 0 0 0 0 0 0 0 0 0 0 0 0 0 0 0 0 0 0 0 0 0 0 0 0 0 0 0CIL payment 3 0 0 0 0 0 0 0 0 0 0 0 0 0 0 0 0 0 0 0 1 0 0 0 0 0 0 0 0 0 0 0 0 0 0 0 0 0 0 0 0 0 0 0 0 0 0 0 0
Site type Activity 1 2 3 4 5 6 7 8 9 10 11 12 13 14 15 16 17 18 19 20 21 22 23 24 25 26 27 28 29 30 31 32 33 34 35 36 37 38 39 40 41 42 43 44 45 46 47 48
Pre-construction C13 - Lodge Farm, Coventry Construction 0 0 1 1 1 1 1 1 1 1 1 1 1 1 1 1 1 1 1 1 1 1 1 1 0 0 0 0 0 0 0 0 0 0 0 0 0 0 0 0 0 0 0 0 0 0 0 0
Sales 0 0 0 0 0 0 1 1 1 1 1 1 1 1 1 1 1 1 1 1 1 1 1 1 1 1 1 1 0 0 0 0 0 0 0 0 0 0 0 0 0 0 0 0 0 0 0 0S106 payment 0 0 0 0 0 0 0 0 0 0 0 0 0 0 0 0 1 0 0 0 0 0 0 0 0 0 0 0 0 0 0 0 0 0 0 0 0 0 0 0 0 0 0 0 0 0 0 0CIL payment 1 0 0 1 0 0 0 0 0 0 0 0 0 0 0 0 0 0 0 0 0 0 0 0 0 0 0 0 0 0 0 0 0 0 0 0 0 0 0 0 0 0 0 0 0 0 0 0 0CIL payment 2 0 0 0 0 0 0 0 0 0 0 0 1 0 0 0 0 0 0 0 0 0 0 0 0 0 0 0 0 0 0 0 0 0 0 0 0 0 0 0 0 0 0 0 0 0 0 0 0CIL payment 3 0 0 0 0 0 0 0 0 0 0 0 0 0 0 0 0 0 0 0 1 0 0 0 0 0 0 0 0 0 0 0 0 0 0 0 0 0 0 0 0 0 0 0 0 0 0 0 0
Site type Activity 1 2 3 4 5 6 7 8 9 10 11 12 13 14 15 16 17 18 19 20 21 22 23 24 25 26 27 28 29 30 31 32 33 34 35 36 37 38 39 40 41 42 43 44 45 46 47 48
Pre-construction W26 - Gallows Hill, Warwick Construction 0 0 1 1 1 1 1 1 1 1 1 1 1 1 1 1 1 1 1 1 1 1 1 1 1 1 1 0 0 0 0 0 0 0 0 0 0 0 0 0 0 0 0 0 0 0 0 0
Sales 0 0 0 0 0 0 1 1 1 1 1 1 1 1 1 1 1 1 1 1 1 1 1 1 1 1 1 1 1 1 1 0 0 0 0 0 0 0 0 0 0 0 0 0 0 0 0 0S106 payment 0 0 0 0 0 0 0 0 0 0 0 0 0 0 0 0 0 1 0 0 0 0 0 0 0 0 0 0 0 0 0 0 0 0 0 0 0 0 0 0 0 0 0 0 0 0 0 0CIL payment 1 0 0 1 0 0 0 0 0 0 0 0 0 0 0 0 0 0 0 0 0 0 0 0 0 0 0 0 0 0 0 0 0 0 0 0 0 0 0 0 0 0 0 0 0 0 0 0 0CIL payment 2 0 0 0 0 0 0 0 0 0 0 0 1 0 0 0 0 0 0 0 0 0 0 0 0 0 0 0 0 0 0 0 0 0 0 0 0 0 0 0 0 0 0 0 0 0 0 0 0CIL payment 3 0 0 0 0 0 0 0 0 0 0 0 0 0 0 0 0 0 0 0 1 0 0 0 0 0 0 0 0 0 0 0 0 0 0 0 0 0 0 0 0 0 0 0 0 0 0 0 0
Site type Activity 1 2 3 4 5 6 7 8 9 10 11 12 13 14 15 16 17 18 19 20 21 22 23 24 25 26 27 28 29 30 31 32 33 34 35 36 37 38 39 40 41 42 43 44 45 46 47 48
Pre-construction L48 - Land at Blackdown, Leamington SpaConstruction 0 0 1 1 1 1 1 1 1 1 1 1 1 1 1 1 1 1 1 1 1 1 1 1 1 1 1 1 1 1 1 1 1 1 1 1 1 1 1 1 1 0 0 0 0 0 0 0
Sales 0 0 0 0 0 0 1 1 1 1 1 1 1 1 1 1 1 1 1 1 1 1 1 1 1 1 1 1 1 1 1 1 1 1 1 1 1 1 1 1 1 1 1 1 1 0 0 0S106 payment 0 0 0 0 0 0 0 0 0 0 0 0 0 0 0 0 0 0 0 0 0 0 0 0 0 0 0 0 0 0 0 0 1 0 0 0 0 0 0 0 0 0 0 0 0 0 0 0CIL payment 1 0 0 1 0 0 0 0 0 0 0 0 0 0 0 0 0 0 0 0 0 0 0 0 0 0 0 0 0 0 0 0 0 0 0 0 0 0 0 0 0 0 0 0 0 0 0 0 0CIL payment 2 0 0 0 0 0 0 0 0 0 0 0 0 0 0 0 0 0 0 0 1 0 0 0 0 0 0 0 0 0 0 0 0 0 0 0 0 0 0 0 0 0 0 0 0 0 0 0 0CIL payment 3 0 0 0 0 0 0 0 0 0 0 0 0 0 0 0 0 0 0 0 0 0 0 0 0 0 0 0 0 0 1 0 0 0 0 0 0 0 0 0 0 0 0 0 0 0 0 0 0
Year 9 Year 10 Year 11 Year 12Year 5 Year 6 Year 7 Year 8Year 1 Year 2 Year 3 Year 4

LOCAL PLAN AND CIL VIABILITY MODEL This is input source box for reference info that appears on all sheets
Local Authority
Area(s)
Author
Date
Reference
Values:Sales values I - psm
Typology desriptionResidual Land
ValuesTotal units Total floor area
Private floor area
Ave unit size CIL as % of dev costs
Affordable housing percentage 40% K17 - Southcrest Farm, Kenilworth -£33,706,149 319 32,219 19,331 101 26.7% of which social rented 80% L09 - Land at Grove Farm, Leamington Spa -£69,481,740 664 67,064 40,238 101 26.7% of which intermediate 20% C13 - Lodge Farm, Coventry -£33,945,221 324 32,724 19,634 101 26.7%
W26 - Gallows Hill, Warwick -£38,598,556 377 38,077 22,846 101 26.7%Code for Sustinable Homes Level L48 - Land at Blackdown, Leamington Spa -£105,081,365 1165 117,665 70,599 101 26.7%Cost allowance - all tenures (% of base costs) 6% 4 0 £0 0 - - #DIV/0! #DIV/0!
0 £0 0 - - #DIV/0! #DIV/0!0 £0 0 - - #DIV/0! #DIV/0!
Grant available 0 £0 0 - - #DIV/0! #DIV/0!
CIL rate 16 802 Benchmark Land Values
CIl rates Rate per sqm BLV no Description £s per ha
1 £0 BLV1 Greenfield 1 £1,049,750
2 £20 BLV2 Greenfield 2 £500,000
3 £40 BLV3 Greenfield 3 £371,000
4 £60 BLV4 Greenfield 4 £247,000
5 £806 £1007 £120 Growth
8 £140 Value growth 9 £160 Cost growth 10 £18011 £20012 £21013 £22014 £23015 £24016 £250
01 February 2013
130372
Warwick District Council
Warwick District (Warwick, Leamington Spa, Kenilworth and rural areas)
BNPPRE
check box

LOCAL PLAN AND CIL VIABILITY MODEL
Local Authority
Area(s)
Author
Date
Reference
SITE TYPOLOGIES Total number of units identified from Site Details UNIT MIX enter for each typology identified DESCRIPTION DENSITY AND NET SITE AREA
(for results sheet)No of units 1 bed flat 2 bed flat 3 bed flat 4 bed flat 2 bed ho use 3 bed house 4 bed house Totals Units per ha Gross to net
K17 - Southcrest Farm, Kenilworth 319 30% 50% 20% 100% Houses 35 50%L09 - Land at Grove Farm, Leamington Spa 664 30% 50% 20% 100% Houses 35 50%C13 - Lodge Farm, Coventry 324 30% 50% 20% 100% Houses 35 50%W26 - Gallows Hill, Warwick 377 30% 50% 20% 100% Houses 35 50%L48 - Land at Blackdown, Leamington Spa 1,165 30% 50% 20% 100% Houses 35 50%
0%
0%
0%
0%
2,849
UNIT SIZES enter for each unit type (net sellable area) - squa re metres
1 bed flat 2 bed flat 3 bed flat 4 bed flat 2 bed ho use 3 bed house 4 bed house
Private 50.0 sqm 65.0 sqm 85.0 sqm 105.0 sqm 75.0 sqm 105.0 sqm 130.0 sqm
Affordable 50.0 sqm 65.0 sqm 85.0 sqm 105.0 sqm 75.0 sqm 105.0 sqm 130.0 sqm
Total number of units identified
Houses (percent of units)
Flats Houses
Flats (percent of units)
Warwick District Council
Description
Typology descriptions and total units
Warwick District (Warwick, Leamington Spa, Kenilworth and rural areas)
BNPPRE
01 February 2013
130372

Sales and Affordable Housing Values 21/02/2013
LOCAL PLAN AND CIL VIABILITY MODEL
Local Authority
Area(s)
Author
Date
Reference
SALES AND AFFORDABLE HOUSING VALUES
VALUE BANDS for private sales GROUND RENTS from flat s (£s per annum) Investment value Sub Market £ per sq metre Private Affordable Private Affordable
A Warwick £2,307 One bed £100 £0 One bed £1,818 £0
B Leamington Spa £2,981 Two beds £150 £0 Two beds £2,727 £0
C Kenilworth £2,691 Three beds £200 £0 Three beds £3,636 £0
D Rural areas (higher value) £3,180 Four beds £250 £0 Four beds £4,545 £0
E Rural areas (lower value) £2,449 Capitalisation rate 5.50%
F
G
HI
Select affordable value option from drop down box
AFFORDABLE HOUSING CAPITAL VALUES (price paid to developer)Option 1 User defined capital values per unit
Capitalised rent per unit
Indicative HCA funding per unit
Value per unit Equity + rent
Indicative HCA funding per unit Value per unit
One bed flats £0 £0 £0
Two bed flats £0 £0 £0
Three bed flats £0 £0 £0
Four bed flats £0 £0 £0
Two bed house £0 £0 £0
Three bed house £0 £0 £0
Four bed house £0 £0 £0
Option 2 Capital values for affordable housing calc ulated from net rents & yield assumption
Net Target rent per annum Yield Capital value
Indicative unit funding Value per unit
Average market value
% of equity sold
Value of equity sold
Rent (% of retained equity)
Rent per annum Yield
Capital value of retained equity
One bed flats £2,757 6.50% £42,411 £0 £42,411 £0 40% £0 2.75% £0 5.00% £0
Two bed flats £3,181 6.50% £48,941 £0 £48,941 £0 40% £0 2.75% £0 5.00% £0
Three bed flats £3,702 6.50% £56,956 £0 £56,956 £0 40% £0 2.75% £0 5.00% £0
Four bed flats £4,223 6.50% £64,972 £0 £64,972 £0 40% £0 2.75% £0 5.00% £0
Two bed house £3,181 6.50% £48,941 £0 £48,941 £0 40% £0 2.75% £0 5.00% £0
Three bed house £3,606 6.50% £55,470 £0 £55,470 £0 40% £0 2.75% £0 5.00% £0
Four bed house £4,223 6.50% £64,972 £0 £64,972 £0 40% £0 2.75% £0 5.00% £0
130372
Social rent
Social rent NBHB
NBHB
Warwick District Council
Warwick District (Warwick, Leamington Spa, Kenilworth and rural areas)
BNPPRE
01 February 2013
Option 2: Capital values calculated from net rents & yields

Costs, s106, CIL, Timings, Other costs, Inflation 21/02/2013
LOCAL PLAN AND CIL VIABILITY MODEL
Local Authority
Area(s)
Author
Date
Reference
BUILD COSTS
Build start
Build period
Sales period
Sales period start S106 payments CIL Charges Fees
Typology
Build costs (flats) per gross sq m
Build costs (houses) per gross sq m
External works and other costs
Gross to net adjustment for flats Quarters Quarters Quarters
Quarters from start on site
£s per unit all tenures
Quarter paid
£s p sq m private sales only
Instal-ment 1 - Qtr paid
Instal-ment 2 - Qtr paid
Instal-ment 3 - Qtr paid
% of build cost
K17 - Southcrest Farm, Kenilworth £953 £810 £222 85.0% 3 21 21 7 £10,000 16 £250 3 12 20 12%
L09 - Land at Grove Farm, Leamington Spa £953 £810 £222 85.0% 3 22 22 7 £10,000 17 £250 3 14 20 12%
C13 - Lodge Farm, Coventry £953 £810 £222 85.0% 3 22 22 7 £10,000 17 £250 3 12 20 12%
W26 - Gallows Hill, Warwick £953 £810 £222 85.0% 3 25 25 7 £10,000 18 £250 3 12 20 12%
L48 - Land at Blackdown, Leamington Spa £953 £810 £222 85.0% 3 39 39 7 £10,000 33 £250 3 20 30 12%
0 £953 £810 £222 85.0% 3 8 8 7 £10,000 6 £250 3 4 8 12%
0 £953 £810 £222 85.0% 3 9 9 7 £10,000 11 £250 3 4 8 12%
0 £953 £810 £222 85.0% 3 10 10 10 £10,000 11 £250 3 6 10 12%
0 £953 £810 £222 85.0% 3 12 15 12 £10,000 17 £250 3 7 10 12%
OTHER COSTSSite prep and infrastructure 10,000 per unit
Private 20.00% Externals 12150 per unit Affordable 6.00% 22,150
Code for Sustainable Homes All tenures 6% From test variables 221.50 Contingency 5%
Marketing costs % of sales values 3.00%
Legal Fees % of GDV 0.50%
Site acquisition costs % land value 5.80% monthsDevelopment Finance 7.00% PD units @ 3pcm years quarters
K17 319 191 64 5 21L09 664 398 66 6 22 Assume 2 developers
INFLATION C13 324 194 65 5 22W26 377 226 75 6 25L48 1165 699 117 10 39 Assume 2 developers
Inflation Sales Build
Year 1 0.0% 0.0%
Year 2 0.0% 0.0%
Year 3 0.0% 0.0%
Year 4 0.0% 0.0%
Year 5 0.0% 0.0%
Year 6 0.0% 0.0%
Year 7 0.0% 0.0%
Year 8 0.0% 0.0%
Year 9 0.0% 0.0%
Year 10 0.0% 0.0%
Year 11 0.0% 0.0%
Year 12 0.0% 0.0%
Year 13 0.0% 0.0%
Year 14 0.0% 0.0%
Year 15 0.0% 0.0%
Year 16 0.0% 0.0%
Year 17 0.0% 0.0%
Year 18 0.0% 0.0%
Year 19 0.0% 0.0%
Year 20 0.0% 0.0%
Year 21 0.0% 0.0%
Year 22 0.0% 0.0%
Year 23 0.0% 0.0%
TIMINGS for cash flow PLANNING OBLIGATIONS / CIL
Developer return % GDV
Warwick District Council
Warwick District (Warwick, Leamington Spa, Kenilworth and rural areas)
BNPPRE
01 February 2013
130372

Cash Flow1 of 2
21/02/2013Warwick Strategic Sites - 40% AH
LOCAL PLAN AND CIL VIABILITY MODEL
Local Authority
Area(s)
Author
DateReference
DEVELOPMENT PERIOD CASHFLOW
dev hectarage 0.000 dev acreage 0.000
Qtr 1 Qtr 2 Qtr 3 Qtr 4 Qtr 5 Qtr 6 Qtr 7 Qtr 8 Qtr 9 Qtr 10 Qtr 11 Qtr 12 Qtr 13 Qtr 14 Qtr 15
Project Year 1 Year 1 Year 1 Year 1 Year 2 Year 2 Year 2 Year 2 Year 3 Year 3 Year 3 Year 3 Year 4 Year 4 Year 4Revenue per Qtr Totals 1 2 3 4 1 2 3 4 1 2 3 4 1 2 3
RevenueL48 - Land at Blackdown, Leamington Spa -£ -£ 39 -£ 0 0 0 0 0 0 0 0 0 0 0 0 0 0 0
Investment value of ground rents L48 - Land at Blackdown, Leamington Spa -£ -£ -£ 0 0 0 0 0 0 0 0 0 0 0 0 0 0 0
GDV before costs of sale Sub Total £0 0 0 0 0 0 0 0 0 0 0 0 0 0 0 0Costs of Sale
Marketing costs 3.00% -£ 0 0 0 0 0 0 0 0 0 0 0 0 0 0 0Legal fees 0.50% -£ 0 0 0 0 0 0 0 0 0 0 0 0 0 0 0
Sub Total £0 0 0 0 0 0 0 0 0 0 0 0 0 0 0 0
Speculative NDV -£ 0 0 0 0 0 0 0 0 0 0 0 0 0 0 0Affordable Housing Revenue
No fees on sale Revenue per Qtr -£ L48 - Land at Blackdown, Leamington Spa 23,428,177£ 600,722 39 23,428,177£ 0 0 600,722 600,722 600,722 600,722 600,722 600,722 600,722 600,722 600,722 600,722 600,722 600,722 600,722
-£
NDV Total 23,428,177£ 0 0 600,722 600,722 600,722 600,722 600,722 600,722 600,722 600,722 600,722 600,722 600,722 600,722 600,722
Standard CostsCost per Qtr
L48 - Land at Blackdown, Leamington Spa 127,148,799£ 3,260,226 39 127,148,799£ 0 0 3,260,226 3,260,226 3,260,226 3,260,226 3,260,226 3,260,226 3,260,226 3,260,226 3,260,226 3,260,226 3,260,226 3,260,226 3,260,226Contingency 6,357,440£ 0 0 163,011 163,011 163,011 163,011 163,011 163,011 163,011 163,011 163,011 163,011 163,011 163,011 163,011
Sub Total 133,506,239£ 0 0 3,423,237 3,423,237 3,423,237 3,423,237 3,423,237 3,423,237 3,423,237 3,423,237 3,423,237 3,423,237 3,423,237 3,423,237 3,423,237Other Costs
Professional fees 12.00% 16,020,749£ 0 0 410,788 410,788 410,788 410,788 410,788 410,788 410,788 410,788 410,788 410,788 410,788 410,788 410,788
Sub Total 16,020,749£ 0 0 410,788 410,788 410,788 410,788 410,788 410,788 410,788 410,788 410,788 410,788 410,788 410,788 410,788
130372
Warwick District Council
Warwick District (Warwick, Leamington Spa, Kenilworth and rural areas)
BNPPRE
01 February 2013

Cash Flow2 of 2
21/02/2013Warwick Strategic Sites - 40% AH
Qtr 1 Qtr 2 Qtr 3 Qtr 4 Qtr 5 Qtr 6 Qtr 7 Qtr 8 Qtr 9 Qtr 10 Qtr 11 Qtr 12 Qtr 13 Qtr 14 Qtr 15
Project Year 1 Year 1 Year 1 Year 1 Year 2 Year 2 Year 2 Year 2 Year 3 Year 3 Year 3 Year 3 Year 4 Year 4 Year 4Revenue per Qtr Totals 1 2 3 4 1 2 3 4 1 2 3 4 1 2 3
CIL
CIL L48 - Land at Blackdown, Leamington Spa 5,883,250£ 5,883,250£ 0 0 5,883,250 0 0 0 0 0 0 0 0 0 0 0 05,883,250£ 5,883,250£ 0 0 0 0 0 0 0 0 0 0 0 0 0 0 0
5,883,250£ 5,883,250£ 0 0 0 0 0 0 0 0 0 0 0 0 0 0 0
Sub Total 17,649,750£ 0 0 5,883,250 0 0 0 0 0 0 0 0 0 0 0 0
Section 106 Costs L48 - Land at Blackdown, Leamington Spa 11,650,000£ 11,650,000£ 0 0 0 0 0 0 0 0 0 0 0 0 0 0 0Sub Total 11,650,000£ 0 0 0 0 0 0 0 0 0 0 0 0 0 0 0
Total Abnormal Costs Sub Total 29,299,750£ 0 0 5,883,250 0 0 0 0 0 0 0 0 0 0 0 0
Total Costs 178,826,738£ 0 0 9,717,275 3,834,025 3,834,025 3,834,025 3,834,025 3,834,025 3,834,025 3,834,025 3,834,025 3,834,025 3,834,025 3,834,025 3,834,025
-£
Developer's profit on GDV % of GDV 20.00% -£ 0 0 0 0 0 0 0 0 0 0 0 0 0 0 0% of GDV affordable 6% 1,405,691£ 0 0 36,043 36,043 36,043 36,043 36,043 36,043 36,043 36,043 36,043 36,043 36,043 36,043 36,043
Residual Sum before interest 156,804,251-£ 0 0 -9,152,596 -3,269,346 -3,269,346 -3,269,346 -3,269,346 -3,269,346 -3,269,346 -3,269,346 -3,269,346 -3,269,346 -3,269,346 -3,269,346 -3,269,346
Cumulative residual balance for interest calculatio n 0 0 -9,152,596 -12,571,634 -16,046,591 -19,578,382 -23,167,935 -26,816,196 -30,524,125 -34,292,698 -38,122,906 -42,015,757 -45,972,277 -49,993,506 -54,080,503
Interest 7.00% 62,636,409-£ 0 0 -149,692 -205,611 -262,444 -320,207 -378,915 -438,583 -499,226 -560,862 -623,505 -687,174 -751,883 -817,651 -884,494
Residual Sum for quarter after interest 219,440,660-£ 0 0 -9,302,288 -3,474,957 -3,531,790 -3,589,553 -3,648,261 -3,707,929 -3,768,573 -3,830,208 -3,892,852 -3,956,520 -4,021,229 -4,086,997 -4,153,840
111,551,343-£ 39
Land Value per developable acre #DIV/0!per developable hectare #DIV/0!
Residual land value 111,551,343-£
Site acquisition costs 5.80% 6,469,978-£
MV (Residual Sum available to offer for Development Opportunity) 105,081,365-£

COMMUNITY INFRASTRUCTURE LEVY Use class:
Commercial Development Location:
£s per sqft Yield Rent free Existing floorspace as % of new
Appraisal 1 £12.00 6.75% 2.00 years 30%Appraisal 2 £13.00 6.75% 2.00 yearsAppraisal 3 £14.00 6.75% 2.00 yearsAppraisal 4 £15.00 7.00% 2.00 yearsAppraisal 5 (base) £15.00 6.75% 2.00 yearsAppraisal 6 £15.00 6.50% 2.00 yearsAppraisal 7 £16.00 6.75% 2.00 yearsAppraisal 8 £17.00 6.75% 2.00 yearsAppraisal 9 £18.00 6.75% 2.00 yearsAppraisal 10 £19.00 6.75% 2.00 years
£s per sqft Yield Rent free PremiumCurrent use value 1 £5.00 8.50% 3.00 years 15.00%Current use value 2 £7.00 8.00% 3.00 years 20.00%Current use value 3 £10.00 8.00% 3.00 years 20.00%
Results - Maximum CIL rates per square metre
Change in rent from base CUV 1 CUV 2 CUV 3
Appraisal 1 -25% £0 £0 £0Appraisal 2 -15% £0 £0 £0Appraisal 3 -7% £0 £0 £0Appraisal 4 0% £0 £0 £0Appraisal 5 (base) - £0 £0 £0Appraisal 6 0% £0 £0 £0Appraisal 7 6% £0 £0 £0Appraisal 8 12% £0 £0 £0Appraisal 9 17% £0 £0 £0Appraisal 10 21% £0 £0 £0
OFFICE
Warwick - Prime - out of town tech parks
Maximum CIL rates
£0
£0
£0
£0
£0
£1
£1
£1
£1
£1
£1
1 2 3 4 5(BASE)
6 7 8 9 10
Appraisal NumberC
IL p
er s
quar
e m
etre
CUV 1 CUV 2 CUV 3

DEVELOPMENT APPRAISAL Use class:
Commercial Development Location:
DEVELOPMENT VALUE
Rental Income Floor area £ psf £ per annum £ psf £ per annum £ psf £ per annum £ psf £ per annum £ psf £ per annum £ psf £ per annum £ psf £ per annum £ psf £ per annum £ psf £ per annum £ psf £ per annumRent - area 1 10,000 £12.00 £120,000 £13 £130,000 £14.00 £140,000 £15.00 £150,000 £15.00 £150,000 £15.00 £150,000 £16.00 £160,000 £17.00 £170,000 £18.00 £180,000 £19.00 £190,000Rent - area 2 10,000 £12.00 £120,000 £13 £130,000 £14.00 £140,000 £15.00 £150,000 £15.00 £150,000 £15.00 £150,000 £16.00 £160,000 £17.00 £170,000 £18.00 £180,000 £19.00 £190,000Rent - area 3 10,000 £12.00 £120,000 £13 £130,000 £14.00 £140,000 £15.00 £150,000 £15.00 £150,000 £15.00 £150,000 £16.00 £160,000 £17.00 £170,000 £18.00 £180,000 £19.00 £190,000Total floor area / rent 30,000 £360,000 £390,000 £420,000 £450,000 £450,000 £450,000 £480,000 £510,000 £540,000 £570,000
Rent free/voids (years) 2.0 0.8775 2.0 0.8775 2.0 0.8775 2.0 0.8734 2.0 0.8775 2.0 0.8817 2.0 0.8775 2.0 0.8775 2.0 0.8775 2.0 0.8775Yield 6.75% 6.75% 6.75% 6.75% 7.00% 6.75% 6.50% 6.75% 6.75% 6.75% 6.75%Capitalised rent £4,680,184 £5,070,200 £5,460,215 £5,614,963 £5,850,230 £6,103,795 £6,240,246 £6,630,261 £7,020,277 £7,410,292
GROSS DEVELOPMENT VALUEPurchaser's costs 5.75% £269,111 £291,536 £313,962 £322,860 £336,388 £350,968 £358,814 £381,240 £403,666 £426,092
£4,411,074 £4,778,663 £5,146,253 £5,292,103 £5,513,842 £5,752,827 £5,881,432 £6,249,021 £6,616,611 £6,984,200
DEVELOPMENT COSTS
Development CostsExisting floor area 30% 9,000Demolition costs £5 psf £45,000 £45,000 £45,000 £45,000 £45,000 £45,000 £45,000 £45,000 £45,000 £45,000Building costs £160 psf £5,818,240 £5,818,240 £5,818,240 £5,818,240 £5,818,240 £5,818,240 £5,818,240 £5,818,240 £5,818,240 £5,818,240 Area 82% grs to net 36,364 External works 10.00% £581,824 £581,824 £581,824 £581,824 £581,824 £581,824 £581,824 £581,824 £581,824 £581,824Professional fees 10.00% £644,506 £644,506 £644,506 £644,506 £644,506 £644,506 £644,506 £644,506 £644,506 £644,506Contingency 5.00% £354,479 £354,479 £354,479 £354,479 £354,479 £354,479 £354,479 £354,479 £354,479 £354,479CIL 1 - 0 £0 £0 £0 £0 £0 £0 £0 £0S106 £60 psf 30,000 1,800,000 £1,800,000 £1,800,000 £1,800,000 £1,800,000 £1,800,000 £1,800,000 £1,800,000 £1,800,000 £1,800,000
Disposal Costs
Letting Agent's fee (% of rent ) 10.00% £36,000 £39,000 £42,000 £45,000 £45,000 £45,000 £48,000 £51,000 £54,000 £57,000Agent's fees (on capital value) 1.00% £46,802 £50,702 £54,602 £56,150 £58,502 £61,038 £62,402 £66,303 £70,203 £74,103Legal fees (% of capital value) 0.75% £35,101 £38,026 £40,952 £42,112 £43,877 £45,778 £46,802 £49,727 £52,652 £55,577
Finance on constructionLoan arrangement fee 1.00% £92,440 £92,440 £92,440 £92,440 £92,440 £92,440 £92,440 £92,440 £92,440 £92,440Interest rate 7.00%Interest on Construction Costs 18 months £485,313 £485,313 £485,313 £485,313 £485,313 £485,313 £485,313 £485,313 £485,313 £485,313
.ProfitDeveloper's profit on cost 20.00% £1,987,941 £1,989,906 £1,991,871 £1,993,013 £1,993,836 £1,994,724 £1,995,801 £1,997,766 £1,999,731 £2,001,696
TOTAL DEVELOPMENT COSTS £11,927,646 £11,939,437 £11,951,227 £11,958,077 £11,963,017 £11,968,342 £11,974,808 £11,986,598 £11,998,388 £12,010,179
LAND VALUE
Land surplus -£7,516,572 (7,160,773) -£6,804,974 -£6,665,974 -£6,449,175 -£6,215,515 -£6,093,376 -£5,737,577 -£5,381,778 -£5,025,978Stamp duty 4.00% £0 £0 £0 £0 £0 £0 £0 £0 £0 £0Agent's fees 1.25% £0 £0 £0 £0 £0 £0 £0 £0 £0 £0Legal fees 0.50% £0 £0 £0 £0 £0 £0 £0 £0 £0 £0Interest rate 6.50% £0 £0 £0 £0 £0 £0 £0 £0 £0 £0Finance period 18 months
RESIDUAL LAND VALUE -£7,516,572 -£7,160,773 -£6,804,974 -£6,665,974 -£6,449,175 -£6,215,515 -£6,093,376 -£5,737,577 -£5,381,778 -£5,025,978
Less CUV 1 (7,652,686) (7,296,887) (6,941,088) (6,802,088) (6,585,289) (6,351,629) (6,229,490) (5,873,691) (5,517,891) (5,162,092) Less CUV 2 (7,896,863) (7,541,064) (7,185,265) (7,046,264) (6,829,466) (6,595,806) (6,473,667) (6,117,867) (5,762,068) (5,406,269) Less CUV 3 (8,199,879) (7,844,080) (7,488,281) (7,349,280) (7,132,481) (6,898,822) (6,776,682) (6,420,883) (6,065,084) (5,709,285)
Net additional floorspace (sq ft) 21,000 21,000 21,000 21,000 21,000 21,000 21,000 21,000 21,000 21,000 21,000Net additional floorspace (sq m) 1,951 1,951 1,951 1,951 1,951 1,951 1,951 1,951 1,951 1,951 1,951
Maximum CIL per sqm Against CUV 1 - - - - - - - - - - Against CUV 2 - - - - - - - - - - Against CUV 3 - - - - - - - - - -
Appraisal 4 Appraisal 5
OFFICE
Common assumptions Appraisal 1 Appraisal 2 Appraisal 3
Warwick - Prime - out of town tech parks
Appraisal 10Appraisal 7Appraisal 6 Appraisal 8 Appraisal 9

CURRENT USE VALUE Use class: OFFICE
Commercial Development
Current use value Existing space as percentage of new 30% 9,000Rent per sq ft £5 psf £7 psf £10 psfRental income per annum £45,000 £63,000 £90,000
Rent free/voids (years) 3.0 0.7829 3.0 0.7938 3.0 0.7938Total revenue, capitalised (including all costs) 8.50% 8.00% 8.00%
Refurbishment costs £30 psf £270,000 £270,000 £270,000Fees 7% £18,900 £18,900 £18,900
Capitalised rent, net of refurb and fees £125,581 £336,243 £604,161Purchaser's costs 5.75% -£7,221 -£19,334 -£34,739
Current use value £118,360 £316,909 £569,422
CUV including Landowner premium 15% £136,114 20.00% £380,291 20.00% £683,306
Common assumptions CUV 1 CUV 2 CUV 3
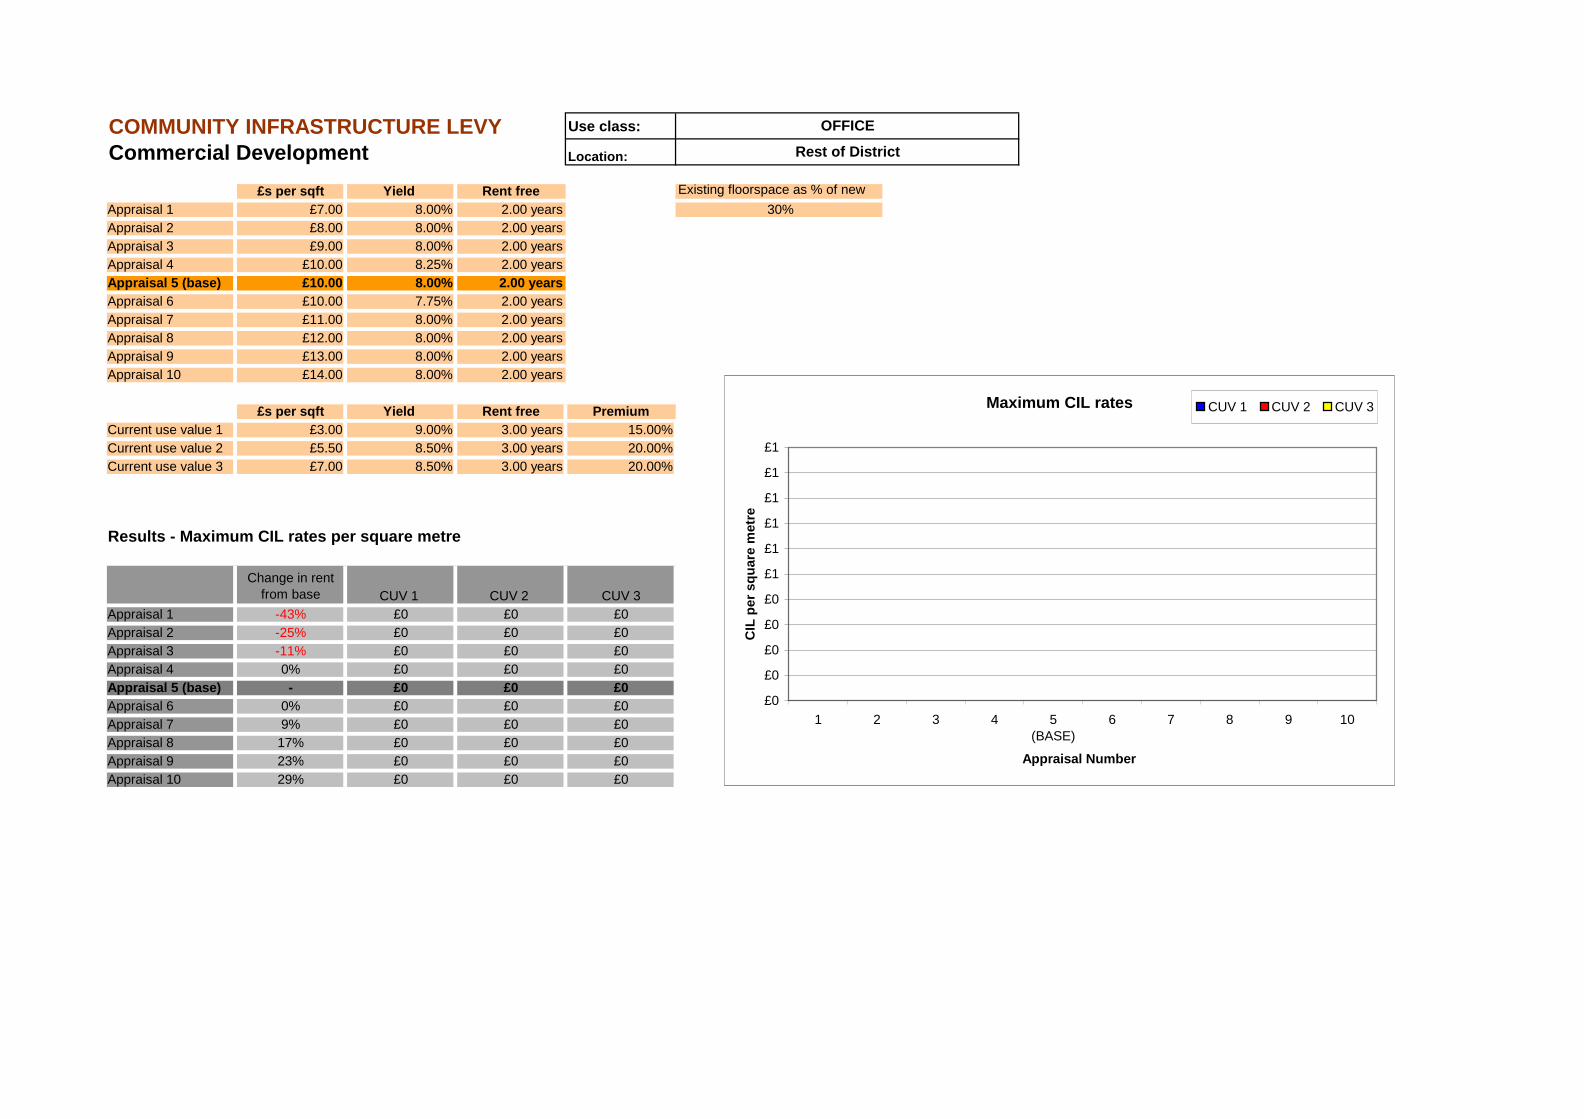
COMMUNITY INFRASTRUCTURE LEVY Use class:
Commercial Development Location:
£s per sqft Yield Rent free Existing floorspace as % of new
Appraisal 1 £7.00 8.00% 2.00 years 30%Appraisal 2 £8.00 8.00% 2.00 yearsAppraisal 3 £9.00 8.00% 2.00 yearsAppraisal 4 £10.00 8.25% 2.00 yearsAppraisal 5 (base) £10.00 8.00% 2.00 yearsAppraisal 6 £10.00 7.75% 2.00 yearsAppraisal 7 £11.00 8.00% 2.00 yearsAppraisal 8 £12.00 8.00% 2.00 yearsAppraisal 9 £13.00 8.00% 2.00 yearsAppraisal 10 £14.00 8.00% 2.00 years
£s per sqft Yield Rent free PremiumCurrent use value 1 £3.00 9.00% 3.00 years 15.00%Current use value 2 £5.50 8.50% 3.00 years 20.00%Current use value 3 £7.00 8.50% 3.00 years 20.00%
Results - Maximum CIL rates per square metre
Change in rent from base CUV 1 CUV 2 CUV 3
Appraisal 1 -43% £0 £0 £0Appraisal 2 -25% £0 £0 £0Appraisal 3 -11% £0 £0 £0Appraisal 4 0% £0 £0 £0Appraisal 5 (base) - £0 £0 £0Appraisal 6 0% £0 £0 £0Appraisal 7 9% £0 £0 £0Appraisal 8 17% £0 £0 £0Appraisal 9 23% £0 £0 £0Appraisal 10 29% £0 £0 £0
OFFICE
Rest of District
Maximum CIL rates
£0
£0
£0
£0
£0
£1
£1
£1
£1
£1
£1
1 2 3 4 5(BASE)
6 7 8 9 10
Appraisal NumberC
IL p
er s
quar
e m
etre
CUV 1 CUV 2 CUV 3
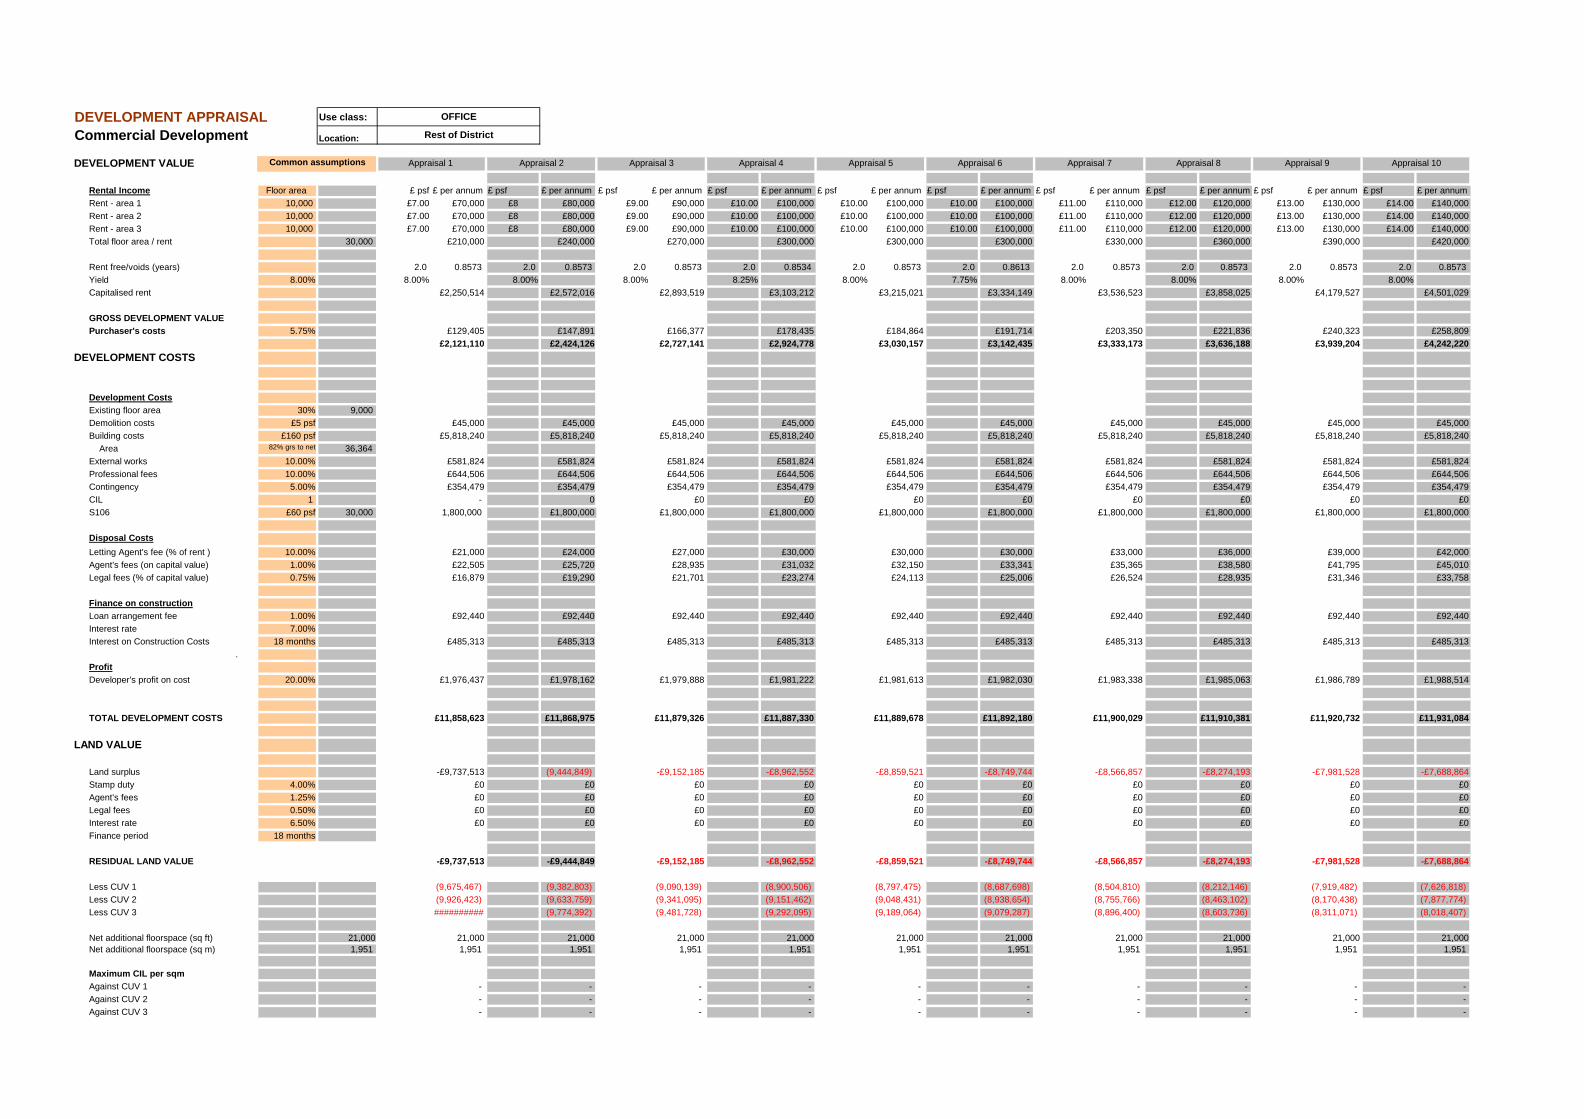
DEVELOPMENT APPRAISAL Use class:
Commercial Development Location:
DEVELOPMENT VALUE
Rental Income Floor area £ psf £ per annum £ psf £ per annum £ psf £ per annum £ psf £ per annum £ psf £ per annum £ psf £ per annum £ psf £ per annum £ psf £ per annum £ psf £ per annum £ psf £ per annumRent - area 1 10,000 £7.00 £70,000 £8 £80,000 £9.00 £90,000 £10.00 £100,000 £10.00 £100,000 £10.00 £100,000 £11.00 £110,000 £12.00 £120,000 £13.00 £130,000 £14.00 £140,000Rent - area 2 10,000 £7.00 £70,000 £8 £80,000 £9.00 £90,000 £10.00 £100,000 £10.00 £100,000 £10.00 £100,000 £11.00 £110,000 £12.00 £120,000 £13.00 £130,000 £14.00 £140,000Rent - area 3 10,000 £7.00 £70,000 £8 £80,000 £9.00 £90,000 £10.00 £100,000 £10.00 £100,000 £10.00 £100,000 £11.00 £110,000 £12.00 £120,000 £13.00 £130,000 £14.00 £140,000Total floor area / rent 30,000 £210,000 £240,000 £270,000 £300,000 £300,000 £300,000 £330,000 £360,000 £390,000 £420,000
Rent free/voids (years) 2.0 0.8573 2.0 0.8573 2.0 0.8573 2.0 0.8534 2.0 0.8573 2.0 0.8613 2.0 0.8573 2.0 0.8573 2.0 0.8573 2.0 0.8573Yield 8.00% 8.00% 8.00% 8.00% 8.25% 8.00% 7.75% 8.00% 8.00% 8.00% 8.00%Capitalised rent £2,250,514 £2,572,016 £2,893,519 £3,103,212 £3,215,021 £3,334,149 £3,536,523 £3,858,025 £4,179,527 £4,501,029
GROSS DEVELOPMENT VALUEPurchaser's costs 5.75% £129,405 £147,891 £166,377 £178,435 £184,864 £191,714 £203,350 £221,836 £240,323 £258,809
£2,121,110 £2,424,126 £2,727,141 £2,924,778 £3,030,157 £3,142,435 £3,333,173 £3,636,188 £3,939,204 £4,242,220
DEVELOPMENT COSTS
Development CostsExisting floor area 30% 9,000Demolition costs £5 psf £45,000 £45,000 £45,000 £45,000 £45,000 £45,000 £45,000 £45,000 £45,000 £45,000Building costs £160 psf £5,818,240 £5,818,240 £5,818,240 £5,818,240 £5,818,240 £5,818,240 £5,818,240 £5,818,240 £5,818,240 £5,818,240 Area 82% grs to net 36,364 External works 10.00% £581,824 £581,824 £581,824 £581,824 £581,824 £581,824 £581,824 £581,824 £581,824 £581,824Professional fees 10.00% £644,506 £644,506 £644,506 £644,506 £644,506 £644,506 £644,506 £644,506 £644,506 £644,506Contingency 5.00% £354,479 £354,479 £354,479 £354,479 £354,479 £354,479 £354,479 £354,479 £354,479 £354,479CIL 1 - 0 £0 £0 £0 £0 £0 £0 £0 £0S106 £60 psf 30,000 1,800,000 £1,800,000 £1,800,000 £1,800,000 £1,800,000 £1,800,000 £1,800,000 £1,800,000 £1,800,000 £1,800,000
Disposal Costs
Letting Agent's fee (% of rent ) 10.00% £21,000 £24,000 £27,000 £30,000 £30,000 £30,000 £33,000 £36,000 £39,000 £42,000Agent's fees (on capital value) 1.00% £22,505 £25,720 £28,935 £31,032 £32,150 £33,341 £35,365 £38,580 £41,795 £45,010Legal fees (% of capital value) 0.75% £16,879 £19,290 £21,701 £23,274 £24,113 £25,006 £26,524 £28,935 £31,346 £33,758
Finance on constructionLoan arrangement fee 1.00% £92,440 £92,440 £92,440 £92,440 £92,440 £92,440 £92,440 £92,440 £92,440 £92,440Interest rate 7.00%Interest on Construction Costs 18 months £485,313 £485,313 £485,313 £485,313 £485,313 £485,313 £485,313 £485,313 £485,313 £485,313
.ProfitDeveloper's profit on cost 20.00% £1,976,437 £1,978,162 £1,979,888 £1,981,222 £1,981,613 £1,982,030 £1,983,338 £1,985,063 £1,986,789 £1,988,514
TOTAL DEVELOPMENT COSTS £11,858,623 £11,868,975 £11,879,326 £11,887,330 £11,889,678 £11,892,180 £11,900,029 £11,910,381 £11,920,732 £11,931,084
LAND VALUE
Land surplus -£9,737,513 (9,444,849) -£9,152,185 -£8,962,552 -£8,859,521 -£8,749,744 -£8,566,857 -£8,274,193 -£7,981,528 -£7,688,864Stamp duty 4.00% £0 £0 £0 £0 £0 £0 £0 £0 £0 £0Agent's fees 1.25% £0 £0 £0 £0 £0 £0 £0 £0 £0 £0Legal fees 0.50% £0 £0 £0 £0 £0 £0 £0 £0 £0 £0Interest rate 6.50% £0 £0 £0 £0 £0 £0 £0 £0 £0 £0Finance period 18 months
RESIDUAL LAND VALUE -£9,737,513 -£9,444,849 -£9,152,185 -£8,962,552 -£8,859,521 -£8,749,744 -£8,566,857 -£8,274,193 -£7,981,528 -£7,688,864
Less CUV 1 (9,675,467) (9,382,803) (9,090,139) (8,900,506) (8,797,475) (8,687,698) (8,504,810) (8,212,146) (7,919,482) (7,626,818) Less CUV 2 (9,926,423) (9,633,759) (9,341,095) (9,151,462) (9,048,431) (8,938,654) (8,755,766) (8,463,102) (8,170,438) (7,877,774) Less CUV 3 ########## (9,774,392) (9,481,728) (9,292,095) (9,189,064) (9,079,287) (8,896,400) (8,603,736) (8,311,071) (8,018,407)
Net additional floorspace (sq ft) 21,000 21,000 21,000 21,000 21,000 21,000 21,000 21,000 21,000 21,000 21,000Net additional floorspace (sq m) 1,951 1,951 1,951 1,951 1,951 1,951 1,951 1,951 1,951 1,951 1,951
Maximum CIL per sqm Against CUV 1 - - - - - - - - - - Against CUV 2 - - - - - - - - - - Against CUV 3 - - - - - - - - - -
Appraisal 10Appraisal 7Appraisal 6 Appraisal 8 Appraisal 9Appraisal 4 Appraisal 5
OFFICE
Common assumptions Appraisal 1 Appraisal 2 Appraisal 3
Rest of District

CURRENT USE VALUE Use class: OFFICE
Commercial Development
Current use value Existing space as percentage of new 30% 9,000Rent per sq ft £3 psf £6 psf £7 psfRental income per annum £27,000 £49,500 £63,000
Rent free/voids (years) 3.0 0.7722 3.0 0.7829 3.0 0.7829Total revenue, capitalised (including all costs) 9.00% 8.50% 8.50%
Refurbishment costs £30 psf £270,000 £270,000 £270,000Fees 7% £18,900 £18,900 £18,900
Capitalised rent, net of refurb and fees -£57,245 £167,029 £291,373Purchaser's costs 5.75% £3,292 -£9,604 -£16,754
Current use value -£53,953 £157,425 £274,619
CUV including Landowner premium 15% -£62,046 20.00% £188,910 20.00% £329,543
Common assumptions CUV 1 CUV 2 CUV 3

COMMUNITY INFRASTRUCTURE LEVY Use class:
Commercial Development Location:
£s per sqft Yield Rent free Existing floorspace as % of new
Appraisal 1 £4.00 8.50% 2.00 years 50%Appraisal 2 £4.50 8.50% 2.00 yearsAppraisal 3 £5.00 8.50% 2.00 yearsAppraisal 4 £5.50 8.75% 2.00 yearsAppraisal 5 (base) £5.50 8.50% 2.00 yearsAppraisal 6 £5.50 8.25% 2.00 yearsAppraisal 7 £6.00 8.50% 2.00 yearsAppraisal 8 £6.50 8.50% 2.00 yearsAppraisal 9 £7.00 8.50% 2.00 yearsAppraisal 10 £7.50 8.50% 2.00 years
£s per sqft Yield Rent free PremiumCurrent use value 1 £3.50 10.00% 3.00 years 15.00%Current use value 2 £4.00 9.00% 3.00 years 15.00%Current use value 3 £5.00 9.00% 3.00 years 15.00%
Results - Maximum CIL rates per square metre
Change in rent from base CUV 1 CUV 2 CUV 3
Appraisal 1 -38% £0 £0 £0Appraisal 2 -22% £0 £0 £0Appraisal 3 -10% £0 £0 £0Appraisal 4 0% £0 £0 £0Appraisal 5 (base) - £0 £0 £0Appraisal 6 0% £0 £0 £0Appraisal 7 8% £0 £0 £0Appraisal 8 15% £0 £0 £0Appraisal 9 21% £0 £0 £0Appraisal 10 27% £0 £0 £0
INDUSTRIAL
Whole District
Maximum CIL rates
£0
£0
£0
£0
£0
£1
£1
£1
£1
£1
£1
1 2 3 4 5(BASE)
6 7 8 9 10
Appraisal NumberC
IL p
er s
quar
e m
etre
CUV 1 CUV 2 CUV 3

DEVELOPMENT APPRAISAL Use class:
Commercial Development Location:
DEVELOPMENT VALUE
Rental Income Floor area £ psf £ per annum £ psf £ per annum £ psf £ per annum £ psf £ per annum £ psf £ per annum £ psf £ per annum £ psf £ per annum £ psf £ per annum £ psf £ per annum £ psf £ per annumRent - area 1 10,000 £4.00 £40,000 £5 £45,000 £5.00 £50,000 £5.50 £55,000 £5.50 £55,000 £5.50 £55,000 £6.00 £60,000 £6.50 £65,000 £7.00 £70,000 £7.50 £75,000Rent - area 2 10,000 £4.00 £40,000 £5 £45,000 £5.00 £50,000 £5.50 £55,000 £5.50 £55,000 £5.50 £55,000 £6.00 £60,000 £6.50 £65,000 £7.00 £70,000 £7.50 £75,000Rent - area 3 10,000 £4.00 £40,000 £5 £45,000 £5.00 £50,000 £5.50 £55,000 £5.50 £55,000 £5.50 £55,000 £6.00 £60,000 £6.50 £65,000 £7.00 £70,000 £7.50 £75,000Total floor area / rent 30,000 £120,000 £135,000 £150,000 £165,000 £165,000 £165,000 £180,000 £195,000 £210,000 £225,000
Rent free/voids (years) 2.0 0.8495 2.0 0.8495 2.0 0.8495 2.0 0.8456 2.0 0.8495 2.0 0.8534 2.0 0.8495 2.0 0.8495 2.0 0.8495 2.0 0.8495Yield 8.50% 8.50% 8.50% 8.50% 8.75% 8.50% 8.25% 8.50% 8.50% 8.50% 8.50%Capitalised rent £1,199,231 £1,349,135 £1,499,039 £1,594,474 £1,648,943 £1,706,767 £1,798,846 £1,948,750 £2,098,654 £2,248,558
GROSS DEVELOPMENT VALUEPurchaser's costs 5.75% £68,956 £77,575 £86,195 £91,682 £94,814 £98,139 £103,434 £112,053 £120,673 £129,292
£1,130,275 £1,271,560 £1,412,844 £1,502,791 £1,554,128 £1,608,628 £1,695,413 £1,836,697 £1,977,982 £2,119,266
DEVELOPMENT COSTS
Development CostsExisting floor area 50% 15,000Demolition costs £5 psf £75,000 £75,000 £75,000 £75,000 £75,000 £75,000 £75,000 £75,000 £75,000 £75,000Building costs £50 psf £1,666,667 £1,666,667 £1,666,667 £1,666,667 £1,666,667 £1,666,667 £1,666,667 £1,666,667 £1,666,667 £1,666,667 Area 90% grs to net 33,333 External works 10.00% £166,667 £166,667 £166,667 £166,667 £166,667 £166,667 £166,667 £166,667 £166,667 £166,667Professional fees 10.00% £190,833 £190,833 £190,833 £190,833 £190,833 £190,833 £190,833 £190,833 £190,833 £190,833Contingency 5.00% £104,958 £104,958 £104,958 £104,958 £104,958 £104,958 £104,958 £104,958 £104,958 £104,958CIL 1 - 0 £0 £0 £0 £0 £0 £0 £0 £0S106 £60 psf 30,000 1,800,000 £1,800,000 £1,800,000 £1,800,000 £1,800,000 £1,800,000 £1,800,000 £1,800,000 £1,800,000 £1,800,000
Disposal Costs
Letting Agent's fee (% of rent ) 10.00% £12,000 £13,500 £15,000 £16,500 £16,500 £16,500 £18,000 £19,500 £21,000 £22,500Agent's fees (on capital value) 1.00% £11,992 £13,491 £14,990 £15,945 £16,489 £17,068 £17,988 £19,488 £20,987 £22,486Legal fees (% of capital value) 0.75% £8,994 £10,119 £11,243 £11,959 £12,367 £12,801 £13,491 £14,616 £15,740 £16,864
Finance on constructionLoan arrangement fee 1.00% £40,041 £40,041 £40,041 £40,041 £40,041 £40,041 £40,041 £40,041 £40,041 £40,041Interest rate 7.00%Interest on Construction Costs 18 months £210,217 £210,217 £210,217 £210,217 £210,217 £210,217 £210,217 £210,217 £210,217 £210,217
.ProfitDeveloper's profit on cost 20.00% £857,474 £858,299 £859,123 £859,757 £859,948 £860,150 £860,773 £861,597 £862,422 £863,247
TOTAL DEVELOPMENT COSTS £5,144,843 £5,149,791 £5,154,739 £5,158,543 £5,159,687 £5,160,901 £5,164,635 £5,169,583 £5,174,531 £5,179,479
LAND VALUE
Land surplus -£4,014,568 (3,878,232) -£3,741,895 -£3,655,752 -£3,605,559 -£3,552,274 -£3,469,222 -£3,332,886 -£3,196,549 -£3,060,213Stamp duty 4.00% £0 £0 £0 £0 £0 £0 £0 £0 £0 £0Agent's fees 1.25% £0 £0 £0 £0 £0 £0 £0 £0 £0 £0Legal fees 0.50% £0 £0 £0 £0 £0 £0 £0 £0 £0 £0Interest rate 6.50% £0 £0 £0 £0 £0 £0 £0 £0 £0 £0Finance period 18 months
RESIDUAL LAND VALUE -£4,014,568 -£3,878,232 -£3,741,895 -£3,655,752 -£3,605,559 -£3,552,274 -£3,469,222 -£3,332,886 -£3,196,549 -£3,060,213
Less CUV 1 (3,920,206) (3,783,870) (3,647,533) (3,561,390) (3,511,197) (3,457,912) (3,374,860) (3,238,524) (3,102,188) (2,965,851) Less CUV 2 (4,050,649) (3,914,313) (3,777,976) (3,691,833) (3,641,640) (3,588,355) (3,505,303) (3,368,967) (3,232,631) (3,096,294) Less CUV 3 (4,190,141) (4,053,804) (3,917,468) (3,831,325) (3,781,132) (3,727,847) (3,644,795) (3,508,459) (3,372,122) (3,235,786)
Net additional floorspace (sq ft) 15,000 15,000 15,000 15,000 15,000 15,000 15,000 15,000 15,000 15,000 15,000Net additional floorspace (sq m) 1,394 1,394 1,394 1,394 1,394 1,394 1,394 1,394 1,394 1,394 1,394
Maximum CIL per sqm Against CUV 1 - - - - - - - - - - Against CUV 2 - - - - - - - - - - Against CUV 3 - - - - - - - - - -
Appraisal 4 Appraisal 5
INDUSTRIAL
Common assumptions Appraisal 1 Appraisal 2 Appraisal 3
Whole District
Appraisal 10Appraisal 7Appraisal 6 Appraisal 8 Appraisal 9

CURRENT USE VALUE Use class: INDUSTRIAL
Commercial Development
Current use value Existing space as percentage of new 50% 15,000Rent per sq ft £4 psf £4 psf £5 psfRental income per annum £52,500 £60,000 £75,000
Rent free/voids (years) 3.0 0.7513 3.0 0.7722 3.0 0.7722Total revenue, capitalised (including all costs) 10.00% 9.00% 9.00%
Refurbishment costs £30 psf £450,000 £450,000 £450,000Fees 7% £31,500 £31,500 £31,500
Capitalised rent, net of refurb and fees -£87,060 £33,289 £161,986Purchaser's costs 5.75% £5,006 -£1,914 -£9,314
Current use value -£82,054 £31,375 £152,672
CUV including Landowner premium 15% -£94,362 15.00% £36,081 15.00% £175,573
Common assumptions CUV 1 CUV 2 CUV 3

COMMUNITY INFRASTRUCTURE LEVY Use class:
Commercial Development Location:
£s per sqft Yield Rent free Existing floorspace as % of new
Appraisal 1 £32.00 6.00% 2.00 years 50%Appraisal 2 £33.00 6.00% 2.00 yearsAppraisal 3 £34.00 6.00% 2.00 yearsAppraisal 4 £35.00 6.25% 2.00 yearsAppraisal 5 (base) £35.00 6.00% 2.00 years Typical capital values: £81,846 Based on The Waterways, Stratford, WarwickshireAppraisal 6 £35.00 5.75% 2.00 years Assume 225 sq ft net area per room 225Appraisal 7 £36.00 6.00% 2.00 years Value per room £364Appraisal 8 £37.00 6.00% 2.00 years £367Appraisal 9 £39.00 6.00% 2.00 yearsAppraisal 10 £40.00 6.00% 2.00 years
£s per sqft Yield Rent free PremiumCurrent use value 1 £19.00 7.00% 2.00 years 20.00%Current use value 2 £20.00 7.00% 2.00 years 20.00%Current use value 3 £21.00 7.00% 2.00 years 20.00%
Results - Maximum CIL rates per square metre
Change in rent from base CUV 1 CUV 2 CUV 3
Appraisal 1 -9% £0 £0 £0Appraisal 2 -6% £12 £0 £0Appraisal 3 -3% £260 £108 £0Appraisal 4 0% £118 £0 £0Appraisal 5 (base) - £508 £356 £204Appraisal 6 0% £932 £780 £628Appraisal 7 3% £756 £604 £452Appraisal 8 5% £1,004 £852 £700Appraisal 9 10% £1,500 £1,349 £1,197Appraisal 10 13% £1,749 £1,597 £1,445
HOTEL
Warwick District
Maximum CIL rates
£0
£200
£400
£600
£800
£1,000
£1,200
£1,400
£1,600
£1,800
£2,000
1 2 3 4 5(BASE)
6 7 8 9 10
Appraisal NumberC
IL p
er s
quar
e m
etre
CUV 1 CUV 2 CUV 3

DEVELOPMENT APPRAISAL Use class:
Commercial Development Location:
DEVELOPMENT VALUE
Rental Income Rooms £ psf £ per annum £ psf £ per annum £ psf £ per annum £ psf £ per annum £ psf £ per annum £ psf £ per annum £ psf £ per annum £ psf £ per annum £ psf £ per annum £ psf £ per annumRent - area 1 22,500 £32.00 £720,000 £33 £742,500 £34.00 £765,000 £35.00 £787,500 £35.00 £787,500 £35.00 £787,500 £36.00 £810,000 £37.00 £832,500 £39.00 £877,500 £40.00 £900,000Rent - area 2 £32.00 £0 £33 £0 £34.00 £0 £35.00 £0 £35.00 £0 £35.00 £0 £36.00 £0 £37.00 £0 £39.00 £0 £40.00 £0Rent - area 3 £32.00 £0 £33 £0 £34.00 £0 £35.00 £0 £35.00 £0 £35.00 £0 £36.00 £0 £37.00 £0 £39.00 £0 £40.00 £0Total floor area / rent 22,500 £720,000 £742,500 £765,000 £787,500 £787,500 £787,500 £810,000 £832,500 £877,500 £900,000
Rent free/voids (years) 2.0 0.8900 2.0 0.8900 2.0 0.8900 2.0 0.8858 2.0 0.8900 2.0 0.8942 2.0 0.8900 2.0 0.8900 2.0 0.8900 2.0 0.8900Yield 6.00% 6.00% 6.00% 6.00% 6.25% 6.00% 5.75% 6.00% 6.00% 6.00% 6.00%Capitalised rent £10,679,957 £11,013,706 £11,347,455 £11,161,246 £11,681,203 £12,246,781 £12,014,952 £12,348,701 £13,016,198 £13,349,947
GROSS DEVELOPMENT VALUEPurchaser's costs 5.75% £614,098 £633,288 £652,479 £641,772 £671,669 £704,190 £690,860 £710,050 £748,431 £767,622
£10,065,860 £10,380,418 £10,694,976 £10,519,474 £11,009,534 £11,542,591 £11,324,092 £11,638,650 £12,267,767 £12,582,325
DEVELOPMENT COSTS
Development CostsExisting floor area 50% 11,250Demolition costs £5 psf £56,250 £56,250 £56,250 £56,250 £56,250 £56,250 £56,250 £56,250 £56,250 £56,250Building costs £149 psf £4,455,000 £4,455,000 £4,455,000 £4,455,000 £4,455,000 £4,455,000 £4,455,000 £4,455,000 £4,455,000 £4,455,000 Area 75% grs to net 30,000 External works 10.00% £445,500 £445,500 £445,500 £445,500 £445,500 £445,500 £445,500 £445,500 £445,500 £445,500Professional fees 10.00% £495,675 £495,675 £495,675 £495,675 £495,675 £495,675 £495,675 £495,675 £495,675 £495,675Contingency 5.00% £272,621 £272,621 £272,621 £272,621 £272,621 £272,621 £272,621 £272,621 £272,621 £272,621CIL 1 - 0 £0 £0 £0 £0 £0 £0 £0 £0
Disposal Costs
Letting Agent's fee (% of rent ) 10.00% £72,000 £74,250 £76,500 £78,750 £78,750 £78,750 £81,000 £83,250 £87,750 £90,000Agent's fees (on capital value) 1.00% £106,800 £110,137 £113,475 £111,612 £116,812 £122,468 £120,150 £123,487 £130,162 £133,499Legal fees (% of capital value) 0.75% £80,100 £82,603 £85,106 £83,709 £87,609 £91,851 £90,112 £92,615 £97,621 £100,125
Finance on constructionLoan arrangement fee 1.00% £57,250 £57,250 £57,250 £57,250 £57,250 £57,250 £57,250 £57,250 £57,250 £57,250Interest rate 7.00%Interest on Construction Costs 18 months £300,565 £300,565 £300,565 £300,565 £300,565 £300,565 £300,565 £300,565 £300,565 £300,565
.ProfitDeveloper's profit on cost 20.00% £1,268,352 £1,269,970 £1,271,588 £1,271,387 £1,273,207 £1,275,186 £1,274,825 £1,276,443 £1,279,679 £1,281,297
TOTAL DEVELOPMENT COSTS £7,610,113 £7,619,822 £7,629,531 £7,628,320 £7,639,239 £7,651,116 £7,648,948 £7,658,657 £7,678,074 £7,687,783
LAND VALUE
Land surplus £2,455,747 2,760,596 £3,065,445 £2,891,154 £3,370,295 £3,891,475 £3,675,144 £3,979,994 £4,589,692 £4,894,542Stamp duty 4.00% -£98,230 -£110,424 -£122,618 -£115,646 -£134,812 -£155,659 -£147,006 -£159,200 -£183,588 -£195,782Agent's fees 1.25% -£30,697 -£34,507 -£38,318 -£36,139 -£42,129 -£48,643 -£45,939 -£49,750 -£57,371 -£61,182Legal fees 0.50% -£12,279 -£13,803 -£15,327 -£14,456 -£16,851 -£19,457 -£18,376 -£19,900 -£22,948 -£24,473Interest rate 6.50% -£225,668 -£253,682 -£281,695 -£265,679 -£309,709 -£357,602 -£337,723 -£365,737 -£421,764 -£449,778Finance period 18 months
RESIDUAL LAND VALUE £2,088,873 £2,348,180 £2,607,487 £2,459,234 £2,866,794 £3,310,113 £3,126,101 £3,385,407 £3,904,021 £4,163,328
Less CUV 1 (246,905) 12,402 271,709 123,456 531,016 974,335 790,323 1,049,629 1,568,243 1,827,550Less CUV 2 (405,668) (146,361) 112,946 (35,308) 372,253 815,572 631,560 890,866 1,409,480 1,668,787Less CUV 3 (564,431) (305,124) (45,817) (194,071) 213,490 656,809 472,796 732,103 1,250,717 1,510,024
Net additional floorspace (sq ft) 11,250 11,250 11,250 11,250 11,250 11,250 11,250 11,250 11,250 11,250 11,250Net additional floorspace (sq m) 1,045 1,045 1,045 1,045 1,045 1,045 1,045 1,045 1,045 1,045 1,045
Maximum CIL per sqm Against CUV 1 - 12 260 118 508 932 756 1,004 1,500 1,749Against CUV 2 - - 108 - 356 780 604 852 1,349 1,597Against CUV 3 - - - - 204 628 452 700 1,197 1,445
Appraisal 10Appraisal 7Appraisal 6 Appraisal 8 Appraisal 9Appraisal 4 Appraisal 5
HOTEL
Common assumptions Appraisal 1 Appraisal 2 Appraisal 3
Warwick District

CURRENT USE VALUE Use class: HOTEL
Commercial Development
Current use value Existing space as percentage of new 50% 11,250Rent per sq ft £19 psf £20 psf £21 psfRental income per annum £213,750 £225,000 £236,250
Rent free/voids (years) 2.0 0.8734 2.0 0.8734 2.0 0.8734Total revenue, capitalised (including all costs) 7.00% 7.00% 7.00%
Refurbishment costs £50 psf £562,500 £562,500 £562,500Fees 7% £39,375 £39,375 £39,375
Capitalised rent, net of refurb and fees £2,065,233 £2,205,607 £2,345,981Purchaser's costs 5.75% -£118,751 -£126,822 -£134,894
Current use value £1,946,482 £2,078,784 £2,211,087
CUV including Landowner premium 20% £2,335,778 20.00% £2,494,541 20.00% £2,653,304
Common assumptions CUV 1 CUV 2 CUV 3

DEVELOPMENT APPRAISALCommercial Development Use class: STUDENT HSG
DEVELOPMENT VALUE Term rent £120 per week
Vacation rent £210 per week
Rental IncomeAnnual rent per unit - term time (95% occupancy) 39 weeks 98% occupancy 61,975 2,417,033Annual rent per unit - summer (50% occupancy) 13 weeks 50% occupancy 55,335 719,355
Operating costs 527 units £1800 per unit (948,600) Net annual rents 2,187,788Total revenue, capitalised (including all costs) 6.25% 35,004,605
GROSS DEVELOPMENT VALUE 35,004,605
DEVELOPMENT COSTS
Development CostsDemolition costs £5 psf 45,059 sqt 225,293Building costs £125.40 psf 18,834,453 Area per unit (incl common areas) 285 sqft pu 150,195External works 10.00% 1,883,445Professional fees 10.00% 2,094,319
-
Disposal CostsLetting Agent's fee (% of rent ) 0.00% - Agent's fees (on capital value) 1.00% 350,046Legal fees (% of capital value) 0.75% 262,535
Interest on FinanceTotal development duration 24 monthsLoan arrangement fee 1.00% 230,375Interest on Construction Costs 24 months 6.50% 1,497,438
ProfitDeveloper's profit on total revenue 20.00% 7,000,921
TOTAL DEVELOPMENT COSTS 32,378,825
LAND VALUE
Land surplus 2,625,780Stamp duty 4.00% (105,031) Agent's fees 1.25% (32,822) Legal fees 0.50% (13,129) Interest on land finance 24 months 6.50% (321,724)
RESIDUAL LAND VALUE 2,153,074
Existing use value Existing space as % of new 30% 45,059Rent per sq ft £7.00 psfRental income per annum 315,410
Rent free/voids (years) 3.0 0.7829 Total revenue, capitalised (including all costs) 8.50% 2,905,137
Refurbishment costs £50 psf 2,252,925Fees 7% 157,705
Purchaser's costs 5.75% 28,434
Existing use value 466,073
EUV including Landowner premium 20% 559,288
Residual Land Value less EUV plus premium 1,593,786
Per sqm (net additional floorspace) 163

COMMUNITY INFRASTRUCTURE LEVY Use class:
Commercial Development Location:
£s per sqft Yield Rent free Existing floorspace as % of new
Appraisal 1 £44.50 5.75% 1.00 years 50%Appraisal 2 £45.00 5.75% 1.00 yearsAppraisal 3 £45.50 5.75% 1.00 yearsAppraisal 4 £46.00 5.85% 1.00 yearsAppraisal 5 (base) £46.00 5.75% 1.00 yearsAppraisal 6 £46.00 5.65% 1.00 yearsAppraisal 7 £46.50 5.75% 1.00 yearsAppraisal 8 £47.00 5.75% 1.00 yearsAppraisal 9 £47.50 5.75% 1.00 yearsAppraisal 10 £48.00 5.75% 1.00 years
£s per sqft Yield Rent free PremiumCurrent use value 1 £33.00 6.00% 1.50 years 20.00%Current use value 2 £33.50 6.00% 1.50 years 20.00%Current use value 3 £34.00 6.00% 1.50 years 20.00%
Results - Maximum CIL rates per square metre
Change in rent from base CUV 1 CUV 2 CUV 3
Appraisal 1 -3% £0 £0 £0Appraisal 2 -2% £43 £0 £0Appraisal 3 -1% £181 £88 £0Appraisal 4 0% £89 £0 £0Appraisal 5 (base) - £319 £226 £133Appraisal 6 0% £557 £464 £371Appraisal 7 1% £456 £363 £270Appraisal 8 2% £594 £501 £408Appraisal 9 3% £732 £639 £546Appraisal 10 4% £869 £776 £683
Retail
Lmtn Spa - Prime (Ctrl Parade & Royal Priors)
Maximum CIL rates
£0
£100
£200
£300
£400
£500
£600
£700
£800
£900
£1,000
1 2 3 4 5(BASE)
6 7 8 9 10
Appraisal NumberC
IL p
er s
quar
e m
etre
CUV 1 CUV 2 CUV 3

DEVELOPMENT APPRAISAL Use class:
Commercial Development Location:
DEVELOPMENT VALUE
Rental Income Floor area £ psf £ per annum £ psf £ per annum £ psf £ per annum £ psf £ per annum £ psf £ per annum £ psf £ per annum £ psf £ per annum £ psf £ per annum £ psf £ per annum £ psf £ per annumRent - area 1 1,000 £44.50 £44,500 £45 £45,000 £45.50 £45,500 £46.00 £46,000 £46.00 £46,000 £46.00 £46,000 £46.50 £46,500 £47.00 £47,000 £47.50 £47,500 £48.00 £48,000Rent - area 2 1,000 £44.50 £44,500 £45 £45,000 £45.50 £45,500 £46.00 £46,000 £46.00 £46,000 £46.00 £46,000 £46.50 £46,500 £47.00 £47,000 £47.50 £47,500 £48.00 £48,000Rent - area 3 1,000 £44.50 £44,500 £45 £45,000 £45.50 £45,500 £46.00 £46,000 £46.00 £46,000 £46.00 £46,000 £46.50 £46,500 £47.00 £47,000 £47.50 £47,500 £48.00 £48,000Total floor area / rent 3,000 £133,500 £135,000 £136,500 £138,000 £138,000 £138,000 £139,500 £141,000 £142,500 £144,000
Rent free/voids (years) 1.0 0.9456 1.0 0.9456 1.0 0.9456 1.0 0.9447 1.0 0.9456 1.0 0.9465 1.0 0.9456 1.0 0.9456 1.0 0.9456 1.0 0.9456Yield 5.75% 5.75% 5.75% 5.75% 5.85% 5.75% 5.65% 5.75% 5.75% 5.75% 5.75%Capitalised rent £2,195,498 £2,220,167 £2,244,835 £2,228,601 £2,269,504 £2,311,858 £2,294,172 £2,318,841 £2,343,509 £2,368,178
GROSS DEVELOPMENT VALUEPurchaser's costs 5.75% £126,241 £127,660 £129,078 £128,145 £130,496 £132,932 £131,915 £133,333 £134,752 £136,170
£2,069,257 £2,092,507 £2,115,757 £2,100,457 £2,139,007 £2,178,926 £2,162,257 £2,185,507 £2,208,757 £2,232,007
DEVELOPMENT COSTS
Development CostsExisting floor area 50% 1,500Demolition costs £5 psf £7,500 £7,500 £7,500 £7,500 £7,500 £7,500 £7,500 £7,500 £7,500 £7,500Building costs £150 psf £545,460 £545,460 £545,460 £545,460 £545,460 £545,460 £545,460 £545,460 £545,460 £545,460 Area 82% grs to net 3,636 External works 10.00% £54,546 £54,546 £54,546 £54,546 £54,546 £54,546 £54,546 £54,546 £54,546 £54,546Professional fees 10.00% £60,751 £60,751 £60,751 £60,751 £60,751 £60,751 £60,751 £60,751 £60,751 £60,751Contingency 5.00% £33,413 £33,413 £33,413 £33,413 £33,413 £33,413 £33,413 £33,413 £33,413 £33,413CIL 1 - 0 £0 £0 £0 £0 £0 £0 £0 £0S106 £60 psf 3,000 180,000 £180,000 £180,000 £180,000 £180,000 £180,000 £180,000 £180,000 £180,000 £180,000
Disposal Costs
Letting Agent's fee (% of rent ) 10.00% £13,350 £13,500 £13,650 £13,800 £13,800 £13,800 £13,950 £14,100 £14,250 £14,400Agent's fees (on capital value) 1.00% £21,955 £22,202 £22,448 £22,286 £22,695 £23,119 £22,942 £23,188 £23,435 £23,682Legal fees (% of capital value) 0.75% £16,466 £16,651 £16,836 £16,715 £17,021 £17,339 £17,206 £17,391 £17,576 £17,761
Finance on constructionLoan arrangement fee 1.00% £8,817 £8,817 £8,817 £8,817 £8,817 £8,817 £8,817 £8,817 £8,817 £8,817Interest rate 7.00%Interest on Construction Costs 18 months £46,288 £46,288 £46,288 £46,288 £46,288 £46,288 £46,288 £46,288 £46,288 £46,288
.ProfitDeveloper's profit on cost 20.00% £197,709 £197,825 £197,942 £197,915 £198,058 £198,206 £198,174 £198,291 £198,407 £198,523
TOTAL DEVELOPMENT COSTS £1,186,254 £1,186,952 £1,187,650 £1,187,489 £1,188,348 £1,189,238 £1,189,046 £1,189,744 £1,190,442 £1,191,140
LAND VALUE
Land surplus £883,003 905,555 £928,107 £912,967 £950,659 £989,689 £973,211 £995,763 £1,018,315 £1,040,867Stamp duty 4.00% -£35,320 -£36,222 -£37,124 -£36,519 -£38,026 -£39,588 -£38,928 -£39,831 -£40,733 -£41,635Agent's fees 1.25% -£11,038 -£11,319 -£11,601 -£11,412 -£11,883 -£12,371 -£12,165 -£12,447 -£12,729 -£13,011Legal fees 0.50% -£4,415 -£4,528 -£4,641 -£4,565 -£4,753 -£4,948 -£4,866 -£4,979 -£5,092 -£5,204Interest rate 6.50% -£81,142 -£83,215 -£85,287 -£83,896 -£87,360 -£90,946 -£89,432 -£91,504 -£93,577 -£95,649Finance period 18 months
RESIDUAL LAND VALUE £751,088 £770,271 £789,454 £776,576 £808,636 £841,835 £827,819 £847,002 £866,185 £885,368
Less CUV 1 (13,133) 6,050 25,233 12,355 44,416 77,614 63,599 82,781 101,964 121,147Less CUV 2 (26,087) (6,904) 12,278 (599) 31,461 64,660 50,644 69,827 89,010 108,193Less CUV 3 (39,042) (19,859) (676) (13,554) 18,507 51,706 37,690 56,873 76,056 95,239
Net additional floorspace (sq ft) 1,500 1,500 1,500 1,500 1,500 1,500 1,500 1,500 1,500 1,500 1,500Net additional floorspace (sq m) 139 139 139 139 139 139 139 139 139 139 139
Maximum CIL per sqm Against CUV 1 - 43 181 89 319 557 456 594 732 869Against CUV 2 - - 88 - 226 464 363 501 639 776Against CUV 3 - - - - 133 371 270 408 546 683
Appraisal 4 Appraisal 5
Retail
Common assumptions Appraisal 1 Appraisal 2 Appraisal 3
Lmtn Spa - Prime (Ctrl Parade & Royal Priors)
Appraisal 10Appraisal 7Appraisal 6 Appraisal 8 Appraisal 9

CURRENT USE VALUE Use class: Retail
Commercial Development
Current use value Existing space as percentage of new 50% 1,500Rent per sq ft £33 psf £34 psf £34 psfRental income per annum £49,500 £50,250 £51,000
Rent free/voids (years) 1.5 0.9163 1.5 0.9163 1.5 0.9163Total revenue, capitalised (including all costs) 6.00% 6.00% 6.00%
Refurbishment costs £50 psf £75,000 £75,000 £75,000Fees 7% £5,250 £5,250 £5,250
Capitalised rent, net of refurb and fees £675,704 £687,157 £698,611Purchaser's costs 5.75% -£38,853 -£39,512 -£40,170
Current use value £636,851 £647,646 £658,441
CUV including Landowner premium 20% £764,221 20.00% £777,175 20.00% £790,129
Common assumptions CUV 1 CUV 2 CUV 3

COMMUNITY INFRASTRUCTURE LEVY Use class:
Commercial Development Location:
£s per sqft Yield Rent free Existing floorspace as % of new
Appraisal 1 £22.00 6.50% 1.00 years 50%Appraisal 2 £23.00 6.50% 1.00 yearsAppraisal 3 £24.00 6.50% 1.00 yearsAppraisal 4 £25.00 6.25% 1.00 yearsAppraisal 5 (base) £25.00 6.50% 1.00 yearsAppraisal 6 £25.00 6.75% 1.00 yearsAppraisal 7 £26.00 6.50% 1.00 yearsAppraisal 8 £27.00 6.50% 1.00 yearsAppraisal 9 £28.00 6.50% 1.00 yearsAppraisal 10 £29.00 6.50% 1.00 years
£s per sqft Yield Rent free PremiumCurrent use value 1 £12.00 7.00% 1.50 years 20.00%Current use value 2 £15.00 7.00% 1.50 years 20.00%Current use value 3 £22.00 6.50% 1.50 years 20.00%
Results - Maximum CIL rates per square metre
Change in rent from base CUV 1 CUV 2 CUV 3
Appraisal 1 -14% £0 £0 £0Appraisal 2 -9% £0 £0 £0Appraisal 3 -4% £0 £0 £0Appraisal 4 0% £0 £0 £0Appraisal 5 (base) - £0 £0 £0Appraisal 6 0% £0 £0 £0Appraisal 7 4% £0 £0 £0Appraisal 8 7% £0 £0 £0Appraisal 9 11% £0 £0 £0Appraisal 10 14% £0 £0 £0
Retail
Rest of L'ton Spa, Warwick, Rest of District
Maximum CIL rates
£0
£0
£0
£0
£0
£1
£1
£1
£1
£1
£1
1 2 3 4 5(BASE)
6 7 8 9 10
Appraisal NumberC
IL p
er s
quar
e m
etre
CUV 1 CUV 2 CUV 3

DEVELOPMENT APPRAISAL Use class:
Commercial Development Location:
DEVELOPMENT VALUE
Rental Income Floor area £ psf £ per annum £ psf £ per annum £ psf £ per annum £ psf £ per annum £ psf £ per annum £ psf £ per annum £ psf £ per annum £ psf £ per annum £ psf £ per annum £ psf £ per annumRent - area 1 1,000 £22.00 £22,000 £23 £23,000 £24.00 £24,000 £25.00 £25,000 £25.00 £25,000 £25.00 £25,000 £26.00 £26,000 £27.00 £27,000 £28.00 £28,000 £29.00 £29,000Rent - area 2 1,000 £22.00 £22,000 £23 £23,000 £24.00 £24,000 £25.00 £25,000 £25.00 £25,000 £25.00 £25,000 £26.00 £26,000 £27.00 £27,000 £28.00 £28,000 £29.00 £29,000Rent - area 3 1,000 £22.00 £22,000 £23 £23,000 £24.00 £24,000 £25.00 £25,000 £25.00 £25,000 £25.00 £25,000 £26.00 £26,000 £27.00 £27,000 £28.00 £28,000 £29.00 £29,000Total floor area / rent 3,000 £66,000 £69,000 £72,000 £75,000 £75,000 £75,000 £78,000 £81,000 £84,000 £87,000
Rent free/voids (years) 1.0 0.9390 1.0 0.9390 1.0 0.9390 1.0 0.9412 1.0 0.9390 1.0 0.9368 1.0 0.9390 1.0 0.9390 1.0 0.9390 1.0 0.9390Yield 6.50% 6.50% 6.50% 6.50% 6.25% 6.50% 6.75% 6.50% 6.50% 6.50% 6.50%Capitalised rent £953,413 £996,750 £1,040,087 £1,129,412 £1,083,424 £1,040,853 £1,126,761 £1,170,098 £1,213,434 £1,256,771
GROSS DEVELOPMENT VALUEPurchaser's costs 5.75% £54,821 £57,313 £59,805 £64,941 £62,297 £59,849 £64,789 £67,281 £69,772 £72,264
£898,592 £939,437 £980,282 £1,064,471 £1,021,127 £981,004 £1,061,972 £1,102,817 £1,143,662 £1,184,507
DEVELOPMENT COSTS
Development CostsExisting floor area 50% 1,500Demolition costs £5 psf £7,500 £7,500 £7,500 £7,500 £7,500 £7,500 £7,500 £7,500 £7,500 £7,500Building costs £150 psf £545,460 £545,460 £545,460 £545,460 £545,460 £545,460 £545,460 £545,460 £545,460 £545,460 Area 82% grs to net 3,636 External works 10.00% £54,546 £54,546 £54,546 £54,546 £54,546 £54,546 £54,546 £54,546 £54,546 £54,546Professional fees 10.00% £60,751 £60,751 £60,751 £60,751 £60,751 £60,751 £60,751 £60,751 £60,751 £60,751Contingency 5.00% £33,413 £33,413 £33,413 £33,413 £33,413 £33,413 £33,413 £33,413 £33,413 £33,413CIL 1 - 0 £0 £0 £0 £0 £0 £0 £0 £0S106 £60 psf 3,000 180,000 £180,000 £180,000 £180,000 £180,000 £180,000 £180,000 £180,000 £180,000 £180,000
Disposal Costs
Letting Agent's fee (% of rent ) 10.00% £6,600 £6,900 £7,200 £7,500 £7,500 £7,500 £7,800 £8,100 £8,400 £8,700Agent's fees (on capital value) 1.00% £9,534 £9,967 £10,401 £11,294 £10,834 £10,409 £11,268 £11,701 £12,134 £12,568Legal fees (% of capital value) 0.75% £7,151 £7,476 £7,801 £8,471 £8,126 £7,806 £8,451 £8,776 £9,101 £9,426
Finance on constructionLoan arrangement fee 1.00% £8,817 £8,817 £8,817 £8,817 £8,817 £8,817 £8,817 £8,817 £8,817 £8,817Interest rate 7.00%Interest on Construction Costs 18 months £46,288 £46,288 £46,288 £46,288 £46,288 £46,288 £46,288 £46,288 £46,288 £46,288
.ProfitDeveloper's profit on cost 20.00% £192,012 £192,223 £192,435 £192,808 £192,647 £192,498 £192,858 £193,070 £193,282 £193,493
TOTAL DEVELOPMENT COSTS £1,152,070 £1,153,340 £1,154,610 £1,156,846 £1,155,880 £1,154,986 £1,157,150 £1,158,421 £1,159,691 £1,160,961
LAND VALUE
Land surplus -£253,479 (213,904) -£174,329 -£92,376 -£134,754 -£173,982 -£95,179 -£55,604 -£16,029 £23,546Stamp duty 4.00% £0 £0 £0 £0 £0 £0 £0 £0 £0 -£942Agent's fees 1.25% £0 £0 £0 £0 £0 £0 £0 £0 £0 -£294Legal fees 0.50% £0 £0 £0 £0 £0 £0 £0 £0 £0 -£118Interest rate 6.50% £0 £0 £0 £0 £0 £0 £0 £0 £0 -£2,164Finance period 18 months
RESIDUAL LAND VALUE -£253,479 -£213,904 -£174,329 -£92,376 -£134,754 -£173,982 -£95,179 -£55,604 -£16,029 £20,029
Less CUV 1 (425,477) (385,902) (346,327) (264,374) (306,752) (345,981) (267,177) (227,602) (188,027) (151,970) Less CUV 2 (491,168) (451,593) (412,018) (330,064) (372,443) (411,671) (332,868) (293,293) (253,718) (217,660) Less CUV 3 (685,159) (645,584) (606,009) (524,056) (566,434) (605,662) (526,859) (487,284) (447,709) (411,651)
Net additional floorspace (sq ft) 1,500 1,500 1,500 1,500 1,500 1,500 1,500 1,500 1,500 1,500Net additional floorspace (sq m) 1,500 139 139 139 139 139 139 139 139 139 139
139Maximum CIL per sqm Against CUV 1 - - - - - - - - - - Against CUV 2 - - - - - - - - - - Against CUV 3 - - - - - - - - - -
Appraisal 10Appraisal 7Appraisal 6 Appraisal 8 Appraisal 9Appraisal 4 Appraisal 5
Retail
Common assumptions Appraisal 1 Appraisal 2 Appraisal 3
Rest of L'ton Spa, Warwick, Rest of District

CURRENT USE VALUE Use class: Retail
Commercial Development
Current use value Existing space as percentage of new 50% 1,500Rent per sq ft £12 psf £15 psf £22 psfRental income per annum £18,000 £22,500 £33,000
Rent free/voids (years) 1.5 0.9035 1.5 0.9035 1.5 0.9099Total revenue, capitalised (including all costs) 7.00% 7.00% 6.50%
Refurbishment costs £50 psf £75,000 £75,000 £75,000Fees 7% £5,250 £5,250 £5,250
Capitalised rent, net of refurb and fees £152,077 £210,158 £381,680Purchaser's costs 5.75% -£8,744 -£12,084 -£21,947
Current use value £143,332 £198,074 £359,733
CUV including Landowner premium 20% £171,999 20.00% £237,689 20.00% £431,680
Common assumptions CUV 1 CUV 2 CUV 3

COMMUNITY INFRASTRUCTURE LEVY Use class:
Commercial Development Location:
£s per sqft Yield Rent free Existing floorspace as % of new
Appraisal 1 £22.00 5.25% 1.00 years 50%Appraisal 2 £23.00 5.25% 1.00 yearsAppraisal 3 £24.00 5.25% 1.00 yearsAppraisal 4 £25.00 5.35% 1.00 yearsAppraisal 5 (base) £25.00 5.25% 1.00 yearsAppraisal 6 £25.00 5.15% 1.00 yearsAppraisal 7 £26.00 5.25% 1.00 yearsAppraisal 8 £27.00 5.25% 1.00 yearsAppraisal 9 £28.00 5.25% 1.00 yearsAppraisal 10 £29.00 5.25% 1.00 years
£s per sqft Yield Rent free PremiumCurrent use value 1 £17.00 7.00% 1.50 years 20.00%Current use value 2 £17.50 7.00% 1.50 years 20.00%Current use value 3 £18.00 7.00% 1.50 years 20.00%
Results - Maximum CIL rates per square metre
Change in rent from base CUV 1 CUV 2 CUV 3
Appraisal 1 -14% £0 £0 £0Appraisal 2 -9% £0 £0 £0Appraisal 3 -4% £2 £0 £0Appraisal 4 0% £156 £77 £0Appraisal 5 (base) - £305 £227 £148Appraisal 6 0% £461 £382 £304Appraisal 7 4% £609 £530 £451Appraisal 8 7% £912 £833 £755Appraisal 9 11% £1,215 £1,136 £1,058Appraisal 10 14% £1,518 £1,440 £1,361
Retail
Supermarkets, Superstores, Retail Parks
Maximum CIL rates
£0
£200
£400
£600
£800
£1,000
£1,200
£1,400
£1,600
1 2 3 4 5(BASE)
6 7 8 9 10
Appraisal NumberC
IL p
er s
quar
e m
etre
CUV 1 CUV 2 CUV 3

DEVELOPMENT APPRAISAL Use class:
Commercial Development Location:
DEVELOPMENT VALUE
Rental Income Floor area £ psf £ per annum £ psf £ per annum £ psf £ per annum £ psf £ per annum £ psf £ per annum £ psf £ per annum £ psf £ per annum £ psf £ per annum £ psf £ per annum £ psf £ per annumRent - area 1 30,000 £22.00 £660,000 £23 £690,000 £24.00 £720,000 £25.00 £750,000 £25.00 £750,000 £25.00 £750,000 £26.00 £780,000 £27.00 £810,000 £28.00 £840,000 £29.00 £870,000Rent - area 2 £22.00 £0 £23 £0 £24.00 £0 £25.00 £0 £25.00 £0 £25.00 £0 £26.00 £0 £27.00 £0 £28.00 £0 £29.00 £0Rent - area 3 £22.00 £0 £23 £0 £24.00 £0 £25.00 £0 £25.00 £0 £25.00 £0 £26.00 £0 £27.00 £0 £28.00 £0 £29.00 £0Total floor area / rent 30,000 £660,000 £690,000 £720,000 £750,000 £750,000 £750,000 £780,000 £810,000 £840,000 £870,000
Rent free/voids (years) 1.0 0.9501 1.0 0.9501 1.0 0.9501 1.0 0.9492 1.0 0.9501 1.0 0.9510 1.0 0.9501 1.0 0.9501 1.0 0.9501 1.0 0.9501Yield 5.25% 5.25% 5.25% 5.25% 5.35% 5.25% 5.15% 5.25% 5.25% 5.25% 5.25%Capitalised rent £11,944,350 £12,487,275 £13,030,200 £13,306,779 £13,573,125 £13,849,840 £14,116,050 £14,658,975 £15,201,900 £15,744,825
GROSS DEVELOPMENT VALUEPurchaser's costs 5.75% £686,800 £718,018 £749,237 £765,140 £780,455 £796,366 £811,673 £842,891 £874,109 £905,327
£11,257,550 £11,769,257 £12,280,964 £12,541,639 £12,792,671 £13,053,474 £13,304,377 £13,816,084 £14,327,791 £14,839,498
DEVELOPMENT COSTS
Development CostsExisting floor area 50% 15,000Demolition costs £5 psf £75,000 £75,000 £75,000 £75,000 £75,000 £75,000 £75,000 £75,000 £75,000 £75,000Building costs £97 psf £3,510,052 £3,510,052 £3,510,052 £3,510,052 £3,510,052 £3,510,052 £3,510,052 £3,510,052 £3,510,052 £3,510,052 Area 82% grs to net 36,364 External works 20.00% £702,010 £702,010 £702,010 £702,010 £702,010 £702,010 £702,010 £702,010 £702,010 £702,010Professional fees 10.00% £428,706 £428,706 £428,706 £428,706 £428,706 £428,706 £428,706 £428,706 £428,706 £428,706Contingency 5.00% £235,788 £235,788 £235,788 £235,788 £235,788 £235,788 £235,788 £235,788 £235,788 £235,788CIL 1 - 0 £0 £0 £0 £0 £0 £0 £0 £0S106 £60 psf 30,000 1,800,000 £1,800,000 £1,800,000 £1,800,000 £1,800,000 £1,800,000 £1,800,000 £1,800,000 £1,800,000 £1,800,000
Disposal Costs
Letting Agent's fee (% of rent ) 10.00% £66,000 £69,000 £72,000 £75,000 £75,000 £75,000 £78,000 £81,000 £84,000 £87,000Agent's fees (on capital value) 1.00% £119,444 £124,873 £130,302 £133,068 £135,731 £138,498 £141,161 £146,590 £152,019 £157,448Legal fees (% of capital value) 0.75% £89,583 £93,655 £97,727 £99,801 £101,798 £103,874 £105,870 £109,942 £114,014 £118,086
Finance on constructionLoan arrangement fee 1.00% £67,516 £67,516 £67,516 £67,516 £67,516 £67,516 £67,516 £67,516 £67,516 £67,516Interest rate 7.00%Interest on Construction Costs 18 months £354,457 £354,457 £354,457 £354,457 £354,457 £354,457 £354,457 £354,457 £354,457 £354,457
.ProfitDeveloper's profit on cost 20.00% £1,489,711 £1,492,211 £1,494,711 £1,496,280 £1,497,212 £1,498,180 £1,499,712 £1,502,212 £1,504,712 £1,507,213
TOTAL DEVELOPMENT COSTS £8,938,266 £8,953,267 £8,968,269 £8,977,677 £8,983,270 £8,989,081 £8,998,272 £9,013,273 £9,028,275 £9,043,276
LAND VALUE
Land surplus £2,319,284 2,815,989 £3,312,695 £3,563,962 £3,809,400 £4,064,393 £4,306,106 £4,802,811 £5,299,516 £5,796,222Stamp duty 4.00% -£92,771 -£112,640 -£132,508 -£142,558 -£152,376 -£162,576 -£172,244 -£192,112 -£211,981 -£231,849Agent's fees 1.25% -£28,991 -£35,200 -£41,409 -£44,550 -£47,618 -£50,805 -£53,826 -£60,035 -£66,244 -£72,453Legal fees 0.50% -£11,596 -£14,080 -£16,563 -£17,820 -£19,047 -£20,322 -£21,531 -£24,014 -£26,498 -£28,981Interest rate 6.50% -£213,128 -£258,772 -£304,416 -£327,506 -£350,060 -£373,492 -£395,704 -£441,348 -£486,992 -£532,637Finance period 18 months
RESIDUAL LAND VALUE £1,972,798 £2,395,298 £2,817,799 £3,031,528 £3,240,300 £3,457,198 £3,662,800 £4,085,301 £4,507,802 £4,930,302
Less CUV 1 (842,027) (419,526) 2,975 216,704 425,475 642,374 847,976 1,270,477 1,692,978 2,115,478Less CUV 2 (951,511) (529,010) (106,509) 107,220 315,992 532,890 738,492 1,160,993 1,583,494 2,005,994Less CUV 3 (1,060,995) (638,494) (215,993) (2,264) 206,508 423,406 629,008 1,051,509 1,474,010 1,896,510
Net additional floorspace (sq ft) 15,000 15,000 15,000 15,000 15,000 15,000 15,000 15,000 15,000 15,000Net additional floorspace (sq m) 15,000 1,394 1,394 1,394 1,394 1,394 1,394 1,394 1,394 1,394 1,394
1,394Maximum CIL per sqm Against CUV 1 - - 2 156 305 461 609 912 1,215 1,518Against CUV 2 - - - 77 227 382 530 833 1,136 1,440Against CUV 3 - - - - 148 304 451 755 1,058 1,361
Appraisal 4 Appraisal 5
Retail
Common assumptions Appraisal 1 Appraisal 2 Appraisal 3
Supermarkets, Superstores, Retail Parks
Appraisal 10Appraisal 7Appraisal 6 Appraisal 8 Appraisal 9

CURRENT USE VALUE Use class: Retail
Commercial Development
Current use value Existing space as percentage of new 50% 15,000Rent per sq ft £17 psf £18 psf £18 psfRental income per annum £255,000 £262,500 £270,000
Rent free/voids (years) 1.5 0.9035 1.5 0.9035 1.5 0.9035Total revenue, capitalised (including all costs) 7.00% 7.00% 7.00%
Refurbishment costs £50 psf £750,000 £750,000 £750,000Fees 7% £52,500 £52,500 £52,500
Capitalised rent, net of refurb and fees £2,488,792 £2,585,595 £2,682,398Purchaser's costs 5.75% -£143,106 -£148,672 -£154,238
Current use value £2,345,687 £2,436,923 £2,528,160
CUV including Landowner premium 20% £2,814,824 20.00% £2,924,308 20.00% £3,033,792
Common assumptions CUV 1 CUV 2 CUV 3