List of projects used in HKIA/ARB Professional Assessment ...
Upload
khangminh22Category
view
1download
0
Part III:
Analysis and Conclusion


Section 6:
Summary and Discussion: Assessing Viability

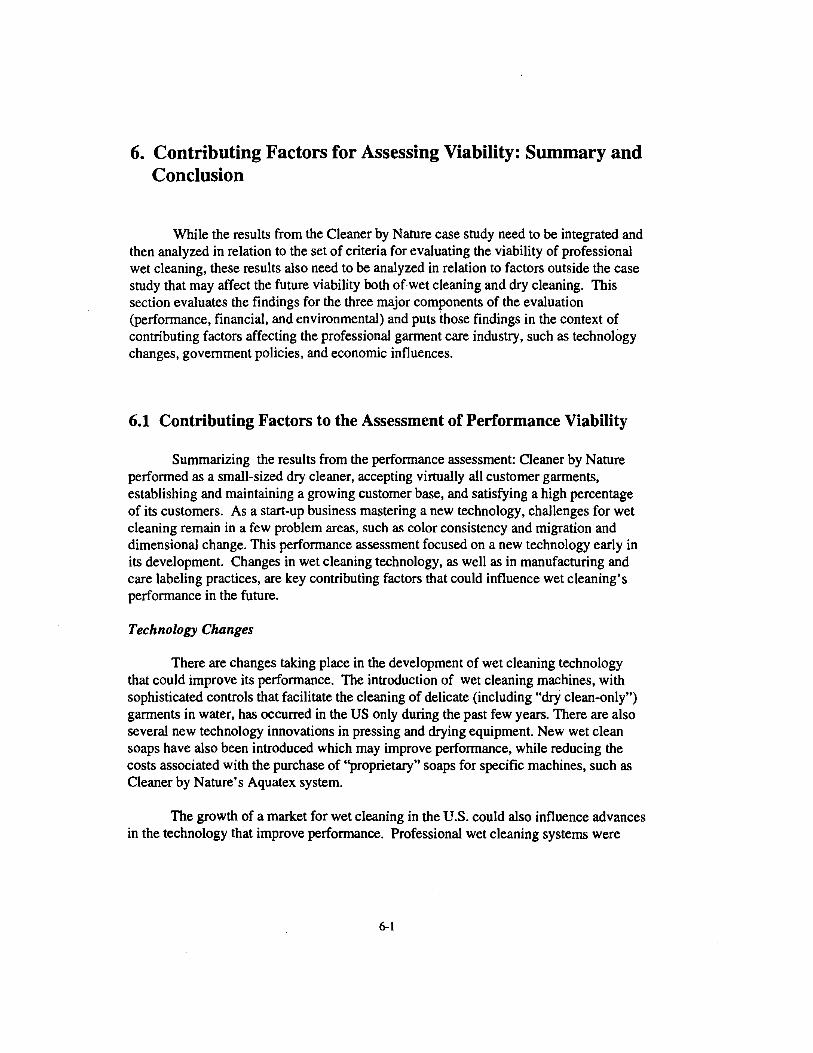
6. Contributing Factors for Assessing Viability: Summary and Conclusion
While the results from the Cleaner by Nature case study need to be integrated and then analyzed in relation to the set of criteria for evaluating the viability of professional wet cleaning, these results also need to be analyzed in relation to factors outside the case study that may affect the future viability both ofwet cleaning and dry cleaning. This section evaluates the findings for the three major components of the evaluation (performance, financial, and environmental) and puts those findings in the context of contributing factors affecting the professional garment care industry, such as technology changes, government policies, and economic influences.
6.1 Contributing Factors to the Assessment of Performance Viability
Summarizing the results from the performance assessment: Cleaner by Nature performed as a small-sized dry cleaner, accepting virtually all customer garments, establishing and maintaining a growing customer base, and satisfying a high percentage of its customers. As a start-up business mastering a new technology, challenges for wet cleaning remain in a few problem areas, such as color consistency and migration and dimensional change. This performance assessment focused on a new technology early in its development. Changes in wet cleaning technology, as well as in manufacturing and care labeling practices, are key contributing factors that could influence wet cleaning's performance in the future.
Technology Changes
There are changes taking place in the development of wet cleaning technology that could improve its performance. The introduction of wet cleaning machines, with sophisticated controls that facilitate the cleaning of delicate (including "dry clean-only") garments in water, has occurred in the US only during the past few years. There are also several new technology innovations in pressing and drying equipment. New wet clean soaps have also been introduced which may improve performance, while reducing the costs associated with the purchase of "proprietary" soaps for specific machines, such as Cleaner by Nature's Aquatex system.
The growth of a market for wet cleaning in the U.S. could also influence advances in the technology that improve performance. Professional wet cleaning systems were
6-1

initially developed in Europe.' However, the entry of UniMac, a major U.S. manufacturer and developer of commercial washing machines, into the wet clean machine market may facilitate the expansion of the U.S. market.
Garment Manufacturing Issues
Garment construction and related fabric and dye issues could influence the performance of professional wet cleaning as well as dry cleaning. Manufacturing strategies based on a stakeholder-linked sectoral approach (an approach to environmental decision-making associated with such recent US EPA programs as the Common Sense Initiative) could potentially improve the performance capabilities of the range of garment care technologies. Some of the challenges identified for professional wet cleaning, such as color migration issues, could be directly addressed through production-based changes (e.g., processes used for specific fabrics at dye houses).
In September 1996, a U.S. EPA-sponsored conference took place in Washington D.C. to address the relationship between apparel manufacturing and garment cleaning. The discussion focused on alternative cleaning technologies, the development of a professional wet cleaning care label, and changes in manufacturing that could facilitate increased wet cleaning. This conference, "Apparel Care and the Environment", established the type of dialogue between garment care professionals and manufacturers that is needed to address professional cleaning performance problems related to manufacturing choices and processes.
Care Labeling
Changes in care labeling policies could have a direct impact on professional wet cleaning's performance. In 1995, the Federal Trade Commission initiated a rulemaking proceeding to amend its garment care labeling policy.2 The Care Labeling Rule, first promulgated in December 1971 and amended in 1983,3 stipulates that manufacturers and importers of "textile wearing apparel" identify "what regular care is needed for the ordinary use of the product"; for example, whether a garment should be labeled "dry clean only". As part of the proceeding initiated in 1995, the FTC sought testimony on whether to introduce a professional wet clean label. By reorienting care labeling in that direction, both garment manufacturers and retailers (interested in both the marketing and manufacturing aspects of such a decision) could change certain manufacturing strategies (such as avoiding water soluble dyes) in order to produce garments that could be labeled "professional wet clean."
1 For example, the introduction of a "drying cabinet" by Aquatex designed to improve pressing performance and reduce problems of dimensional change was first introduced and evaluated in England. National Clothesline, April 1997,p.1 2 Federal Trade Commission, Trade Regulation Rule on Care Labeling ofTeXlile Wearing Apparel and Certain Piece Goods, 16 CFR Part 423, Federal Register, Vol. 60 No. 249, December 28, 1995, pp. 67102-67108 3 36 FR 23883 (December 16, 1971), amended May 20, 1983, 48 FR 22733.
6-2
In sum, improvements in technology and changes in care labeling and garment manufacturing could improve the performance of professional wet cleaning. Garment manufacturing changes could also improve the performance of dry cleaning.
6.2 Contributing Factors to the Assessment of Financial Viability
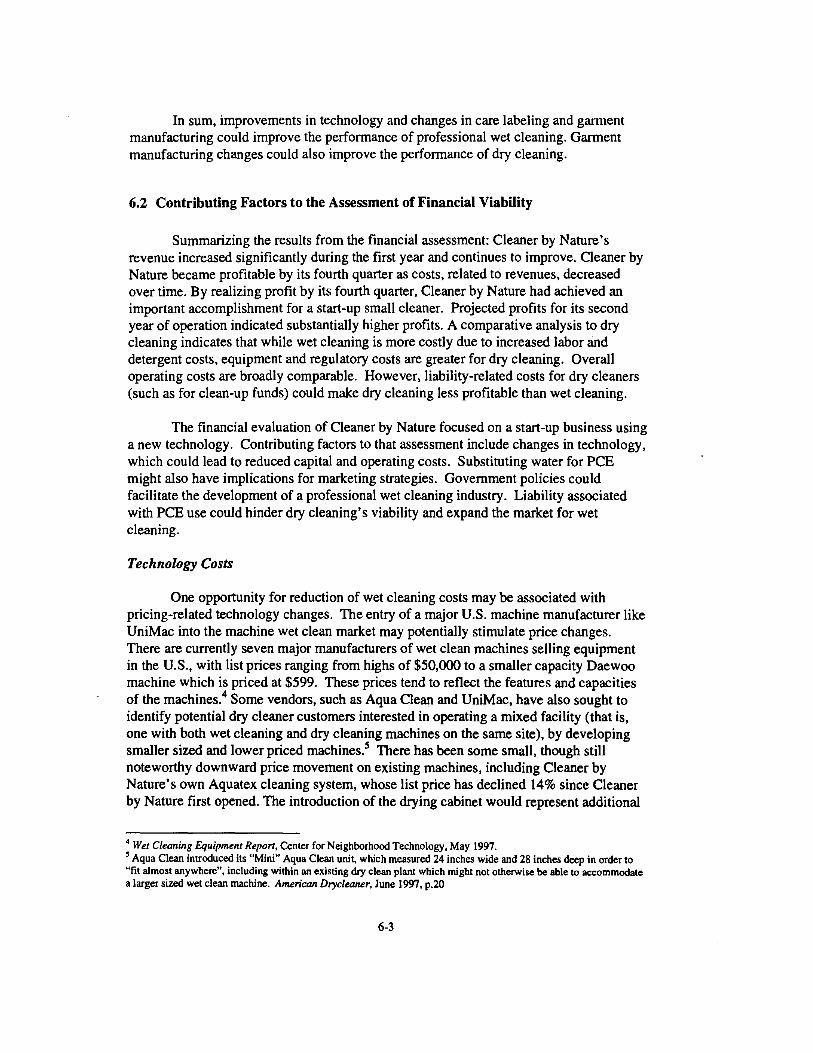
Summarizing the results from the financial assessment: Cleaner by Nature's revenue increased significantly during the first year and continues to improve. Cleaner by Nature became profitable by its fourth quarter as costs, related to revenues, decreased over time. By realizing profit by its fourth quarter, Cleaner by Nature had achieved an important accomplishment for a start-up small cleaner. Projected profits for its second year of operation indicated substantially higher profits. A comparative analysis to dry cleaning indicates that while wet cleaning is more costly due to increased labor and detergent costs, equipment and regulatory costs are greater for dry cleaning. Overall operating costs are broadly comparable. However, liability-related costs for dry cleaners (such as for clean-up funds) could make dry cleaning less profitable than wet cleaning.
The financial evaluation of Cleaner by Nature focused on a start-up business using a new technology. Contributing factors to that assessment include changes in technology, which could lead to reduced capital and operating costs. Substituting water for PCE might also have implications for marketing strategies. Government policies could facilitate the development of a professional wet cleaning industry. Liability associated with PCE use could hinder dry cleaning's viability and expand the market for wet cleaning.
Technology Costs
One opportunity for reduction of wet cleaning costs may be associated with pricing-related technology changes. The entry of a major U.S. machine manufacturer like UniMac into the machine wet clean market may potentially stimulate price changes. There are currently seven major manufacturers of wet clean machines selling equipment in the U.S., with list prices ranging from highs of $50,000 to a smaller capacity Daewoo machine which is priced at $599. These prices tend to reflect the features and capacities of the machines.4 Some vendors, such as Aqua Clean and UniMac, have also sought to identify potential dry cleaner customers interested in operating a mixed facility (that is, one with both wet cleaning and dry cleaning machines on the same site), by developing smaller sized and lower priced machines.5 There has been some small, though still noteworthy downward price movement on existing machines, including Cleaner by Nature's own Aquatex cleaning system, whose list price has declined 14% since Cleaner by Nature first opened. The introduction of the drying cabinet would represent additional
4 Wet Cleaning Equipment Repon, Center for Neighborhood Technology, May 1997. 'Aqua Clean introduced its "Mini" Aqua Clean unit, which measured 24 inches wide and 28 inches deep in order to "fit almost anywhere", including within an existing dry clean plant which might not otherwise be able to accommodate a larger sized wet clean machine. American Dryc/eaner, June 1997, p.20
6-3

equipment costs, but is designed to reduce pressing labor costs, potentially an important cost savings for wet cleaning.
A number of other new alternative cleaning technologies are currently on the market or in the research and development stage. These include a high flashpoint petroleum system and a liquid carbon-dioxide based cleaning system. The commercial development of these technologies could reduce wet cleaning's share of the market for non PCE-based professional cleaning systems (although the overall size of the non-PCE market could increase).
Marketing Issues
A major influence on financial performance concerns the marketability of a new garment care technology. For professional wet cleaning, three key marketing considerations are likely to be paramount: a) does marketing wet cleaning as a non-toxic alternative to dry cleaning provide opportunities for developing a customer base? b) are there marketing problems associated with cleaning clothes in water, especially for garments labeled "dry clean only" (until and unless the care labeling procedures are changed)? and c) are there demographic limits to an environmentally-oriented marketing approach?
Although wet cleaning is too new a business to fully analyze marketing factors as such, three possible marketing trends can be identified: a broad shift from dry cleaning to professional wet cleaning; a "mixed marketing" message that offers combined wet cleaning and dry cleaning service; and a "niche" market for wet cleaning based on its "green" customer base. (Each of these trends might in tum influence, as well as be influenced by, changes in garment manufacture or the pricing of garments for cleaning.)
The Cleaner by Nature case study indicated strong potential for an environmentally oriented marketing message for wet cleaning. Nearly 90 percent of customers surveyed were attracted to Cleaner by Nature because of environmental or health considerations. Two-thirds of the continuing customers surveyed have used Cleaner by Nature exclusively; that is, they did not use a dry cleaner simultaneously for a portion of their garments requiring professional care. Cleaner by Nature's high customer retention rate (77 .8%) also suggests that professional wet cleaning may be able to command a strong customer loyalty, providing marketing opportunities in locations where environmental and/or health considerations may be significant. There is insufficient information to evaluate whether environmental marketing for wet cleaning is demographically limited or could become part of a broad marketing message to diverse communities.
Similar to wet cleaning, marketing issues remain paramount to dry cleaners. Dry cleaning publications frequently note that "service" (that is, how the customers are serviced at the counter, getting the clothes to the customer at the designated time, the appearance of the clothes, etc.) represents a primary marketing focus for dry cleaning.
6-4

Price is another important marketing concern for dry cleaners. On the other hand, there have not been clear or consistent environmentally-based marketing messages for dry cleaners, given the high profile regulatory and liability-related environmental concerns of the industry. Environmental issues, however, may affect overall consumer acceptance and motivation for dry cleaning, dependent in part on the visibility of those issues, such as through media coverage.
Regulatory or Legislative Costs
Several laws and regulatory actions that target PCE use in dry cleaning could have important implications for dry cleaning and non-PCE based professional cleaning. The two key national laws most affecting dry cleaners are: The Clean Air Act Amendments of 1990, which involves retrofitting of equipment with control devices and requires that new machines be sold with such control technology; and the Comprehensive Environmental Response Compensation and Liability Act of 1980 (Superfund), which provides for the mitigation and/or clean up of contaminated sites and establishes joint and several liability provisions -- that is, liability which may attach to any parties past or present associated with such a site. Since clean up costs for PCE can be considerable, the provisions in Superfund have become a major area of uncertainty and financial risk for dry cleaners.6
Recent national legislation introduced on behalf of dry cleaning interests has sought to minimize those potential risks.
Faced with uncertainties and potentially catastrophic liabilities, dry cleaning organizations have promoted legislation to reduce liability exposure for dry cleaners and develop funding sources for clean up and remediation of sites. Dry cleaner-supported legislation has been enacted in eight states along these lines. To establish the funds to help pay the costs for reducing dry cleaner liability exposures, provisions in these legislative acts have included dry cleaner registration fees, a per gallon surcharge on PCE purchases, mandatory liability insurance, and/or a gross receipts tax.7 See Appendix 5-A and 5-B for a description of this legislation. The size of these fees, however, (notwithstanding reduced liability exposure) has also become a concern for some dry cleaners. 8
6 In this context, the International Fabricare Institute, in arguing for the need for legislation to mitigate Superfund impacts for dry cleaners, has noted that "dry cleaners are just beginning to comprehend the extent of potential liability for the industry." 7 In California, 1995 legislation called for a remediation fund to be financed in part by a $20/gallon fee on PCE paid for by PCB suppliers. (The Soil and Groundwater Reclamation and Protection Act of1996, Assembly Bill 1096). While the California legislation was withdrawn and there are no current plans for further reintroduction, similar legislation has now been enacted in Florida, Connecticut, Minnesota, Oregon, South Carolina, Kansas, and Tennessee, with legislation pending in 1997 in New Jersey, North Carolina, Illinois, and Pennsylvania. Although there is also clean-up and reduced liability legislation in Arizona, that state is not included in the appendix since it has no specific reference to dry cleaning, as does the legislation in the eight other states. 8 For example, 1997 New Jersey legislation supported by some dry cleaner organizations established a $1500 a year registration fee and a$ IO per gallon surcharge on PCE. These fees and surcharges were subsequently criticized by the state's organization for Korean dry cleaners as too large a sum, representing $5,000 to $5,500 in annual costs that are currently not assumed by dry cleaners in New Jersey. Dryeleaner News, May 1997, p.1
6-5
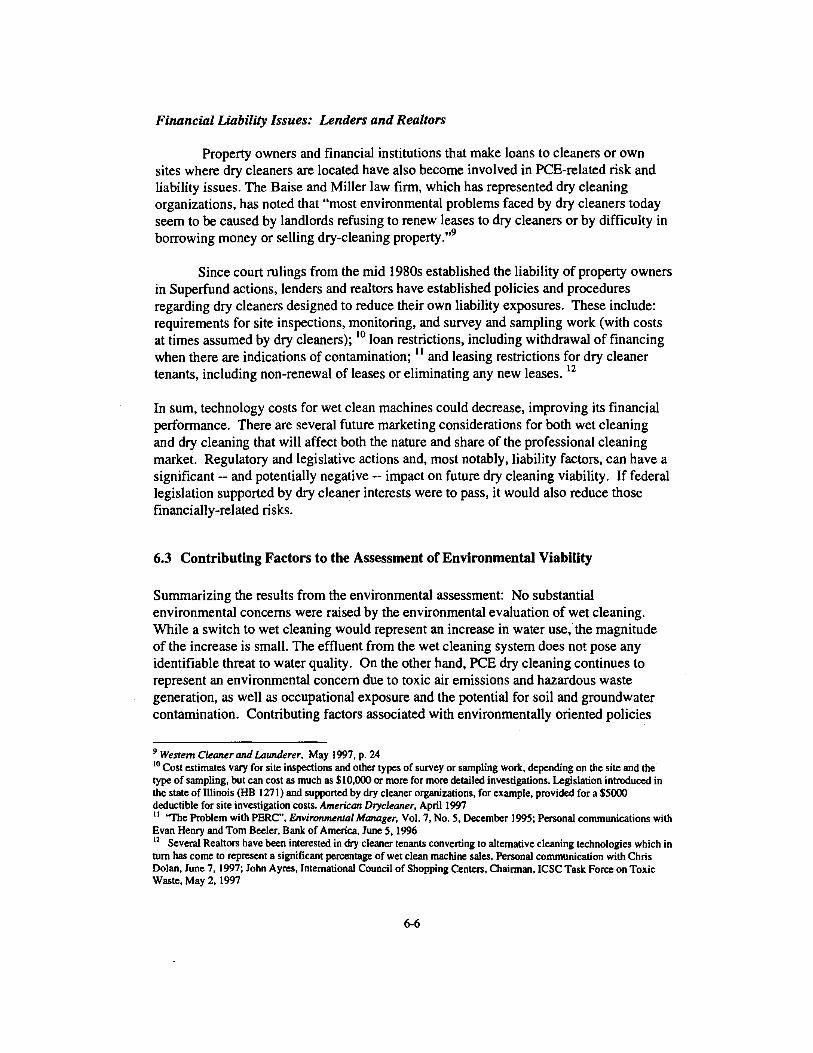
Financial Liability Issues: Lenders and Realtors
Property owners and financial institutions that make loans to cleaners or own sites where dry cleaners are located have also become involved in PCE-related risk and liability issues. The Baise and Miller law firm, which has represented dry cleaning organizations, has noted that "most environmental problems faced by dry cleaners today seem to be caused by landlords refusing to renew leases to dry cleaners or by difficulty in borrowing money or selling dry-cleaning property."9
Since court rulings from the mid 1980s established the liability of property owners in Superfund actions, lenders and realtors have established policies and procedures regarding dry cleaners designed to reduce their own liability exposures. These include: requirements for site inspections, monitoring, and survey and sampling work (with costs at times assumed by dry cleaners); 10 loan restrictions, including withdrawal of financing when there are indications of contamination; 11 and leasing restrictions for dry cleaner tenants, including non-renewal of leases or eliminating any new leases. 12
In sum, technology costs for wet clean machines could decrease, improving its financial performance. There are several future marketing considerations for both wet cleaning and dry cleaning that will affect both the nature and share of the professional cleaning market. Regulatory and legislative actions and, most notably, liability factors, can have a significant -- and potentially negative -- impact on future dry cleaning viability. If federal legislation supported by dry cleaner interests were to pass, it would also reduce those financially-related risks.
6.3 Contributing Factors to the Assessment of Environmental Viability
Summarizing the results from the environmental assessment: No substantial environmental concerns were raised by the environmental evaluation of wet cleaning. While a switch to wet cleaning would represent an increase in water use, the magnitude of the increase is small. The effluent from the wet cleaning system does not pose any identifiable threat to water quality. On the other hand, PCE dry cleaning continues to represent an environmental concern due to toxic air emissions and hazardous waste generation, as well as occupational exposure and the potential for soil and groundwater contamination. Contributing factors associated with environmentally oriented policies
9 Western Cleaner and Launderer, May 1997, p. 24 10 Cost estimates vary for site inspections and other types of survey or sampling work, depending on the site and the type of sampling, but can cost as much as $10,000 or more for more detailed investigations. Legislation introduced in the state of Illinois (HB 1271) and supported by dry cleaner organizations, for example, provided for a $5000 deductible for site investigation costs. American Drycleaner, April 1997 11 'The Problem with PERC", Environmental Manager, Vol. 7, No. 5, December 1995; Personal communications with Evan Henry and Tom Beeler, Bank of America, June 5, 1996 12 Several Realtors have been interested in dry cleaner tenants converting to alternative cleaning technologies which in tum has come to represent a significant percentage of wet clean machine sales. Personal communication with Chris Dolan, June 7, 1997; John Ayres, International Council of Shopping Centers, Chairman. ICSC Task Force on Toxic Waste, May 2, 1997
6-6

are subject to change, and could influence the future viability of both dry cleaning and wet cleaning.
Regulations and Legislation
Although wet cleaning itself is not likely to be the subject of environmentallyrelated regulatory or legislative interventions, given its limited environmental impacts, changes in the policy arena affecting PCE-based dry cleaning could influence the status of professional wet cleaning as a pollution prevention alternative to dry cleaning. For example, US EPA has established a technical review of alternative cleaning technologies, substitute solvents, and the range of issues associated with chemical exposure from dry cleaning (the Cleaner Technologies Substitute Assessment, or CTSA). This process, established through the EPA Design for the Environment (DfE) program, can potentially inform policy judgments (such as those associated with Clean Air Act implementation) through its review of various analyses that have been undertaken in such areas as technology and economics, exposure assessment, hazard assessment, and risk assessment. The Occupational Safety and Health Administration is also undertaking a review of the permissible exposure limits for perchloroethylene in the dry cleaning process. Possible outcomes from these and other review and regulatory processes may include greater or lesser restrictions or regulations governing PCE use as well as integrating wet cleaning into the rule making process.
In sum, the environmental regulatory process represents a significant arena for future policy-related changes that could influence future dry cleaning viability.
6.4 Conclusion: Assessing Viability
This evaluation sought to answer a series of questions about the viability of Cleaner by Nature, how professional wet cleaning, analyzed in relation to the Cleaner by Nature case study, could be compared to PCE~based dry cleaning, and whether professional wet cleaning represented a viable pollution prevention alternative. While case studies focus on one particular case (such as the analysis of Cleaner by Nature), systematically comparing, through a model plant analysis, an analysis that scales these results to the regional level, and a comparison of the results to other case studies of wet cleaning, it is possible to make an judgment about the overall viability of wet cleaning as a business. The results from this overall evaluation, including the analysis of contributing factors, thus provides the framework to identify the parameters of viability. The conclusions of this analysis of viability include:
6-7

Performance Criteria
• Can Cleaner by Nature function successfully as a 100% wet cleaner? -- Cleaner by Nature cleaned virtually all garments brought in by customers, including
those labeled "dry clean only".
• Can garments be professionally wet cleaned without significant problems? -- Cleaner by Nature is broadly comparable to dry cleaning in terms of the problem
areas identified through the cleaning performance evaluation. Significant problems were not indicated for either process. There was a similar proportion of customer garments returned for additional work for.both wet cleaning and dry cleaning. Although claims were higher for Cleaner by Nature compared to one area dry cleaner, there were limits to the claims data. Problem areas for wet cleaning, as identified through the Repeat Clean Test, were noted in terms of color change. In addition, there was a slightly greater amount of dimensional change in the wet clean garment, while some problems with pressing of garments was also indicated. There were slightly greater problems for dry cleaning for damage to fabrics and buttons. Volunteers who wore the test garments, however, did not detect differences in color change, but a few noticed some shrinkage for wet cleaning and in stretching for dry cleaning, and more identified problems with stain removal and damage among the dry cleaned garments.
• Can garments be professionally cleaned to the customer's satisfaction and maintain a steady and sufficient customer base?
Customers gave Cleaner by Nature a high (more than 90%) rating (excellent or good), which was slightly higher than how customers rated the dry cleaner they use regularly. There was significantly greater satisfaction for wet cleaning in terms color, feel, smell, and lack of damage to bottoms or decorations. There was a continuing growth of new customers and a high retention rate of those customers for wet cleaning (77.8%).
Financial Criteria
• Are capital costs in a reasonable range for a start up business, particularly for a small professional cleaner? -- Wet cleaning and dry cleaning start-up costs and the cash required for launching a
business are broadly comparable. Wet cleaning can be considered an attractive investment opportunity for a small business.
• Is the business potentially profitable? -- Cleaner by Nature recorded losses during its first year, partly due to higher
overhead and labor associated with its decision to operate in two locations, which in tum was tied to its future expansion plans. By its fourth quarter, however, Cleaner by Nature had made a profit. Projected profits in Cleaner by Nature's
6--8
second year are considerably higher, while a model plant analysis indicates wet cleaning's strong potential profitability.
• Would the financial risks associated with the cleaning process or other aspects of the business affect future costs or profit potential? -- Investing in a new technology like wet cleaning always involves possible financial
risks. While dry cleaning is a more mature technology, financial risks associated with PCE use in dry cleaning can be substantial.
Environmental Criteria
• Can all environmental regulations be met? -- Wet cleaning is capable of meeting all environmental regulations. Dry cleaning is
subject to a wide array of environmental regulations for which a number of controls and operating procedures have been required, and additional regulations are being discussed.
• Are the environmental impacts from the professional gannent care business acceptable to the community as well as for those who work on those businesses? -- Wet cleaning's environmental impacts are minimal and should be acceptable to
community residents and workers. There are uncertainties in how to evaluate and/or quantify risks from the environmental and health impacts associated with PCE use in dry cleaning, which may influence any future judgment of acceptability of environmental impacts.
Pollution prevention approaches are designed to identify technologies or processes which eliminate or reduce environmental impacts for communities and in workplaces. The case study evaluation of Cleaner by Nature and comparative analysis of professional wet cleaning and dry cleaning indicate that Cleaner by Nature, according to the PPERC assessment, is a viable business, and, based on the case study results in comparison to dry cleaning, that professional wet cleaning businesses which seek to clean the full range of garments that would otherwise be sent to a dry cleaner, can be considered a viable pollution prevention alternative. This pollution prevention alternative is one that should be explored by cleaners and facilitated by policymakers, consumers and other stakeholders.
6-9

Section 7:
Conclusion and Recommendations

7. Recommendations
This report has addressed the question of wet cleaning viability both through an evaluation at the plant level of the Cleaner by Nature wet cleaning business, and by evaluating professional wet cleaning as a potential pollution prevention alternative for PCE-based dry cleaning. This section presents a series of recommendations, based on these evaluations.
The PPERC case study evaluation of Cleaner by Nature and the analysis of professional wet cleaning viability provide important information for the development of new and appropriate policies and programs from a pollution prevention perspective for the garment care industry, for regulatory agencies, for stakeholder groups, and for consumers of professional garment cleaning services. The recommendations listed below are grouped by interested parties:
Garment Care Industry
Develop a Professional Wet Cleaning Network or Organizational Link. Wet cleaners need to share information about technologies, process changes, marketing, technical assistance programs, and information areas that can facilitate the development of professional wet cleaning. The development of such a network or organizational link should not be considered competitive with existing garment care trade organizations and can develop as a parallel or affiliated association.
Develop a Certification and Training Program for Professional Wet Cleaners (Train the Trainers) The development of professional wet cleaning, particularly in its early stages, requires a comprehensive and accessible certification and training program to insure quality control in the development of wet cleaning and to help create an infrastructure of knowledgeable wet cleaners, pressers, and other staff.
Maintain and Strengthen Existing Professional Wet Cleaning Partnership The Wet Clean Partnership was established to help facilitate the development of professional wet cleaning and maintain open lines of communication between dry cleaner representatives and wet cleaning advocates as well as research groups. This communication and dialogue is essential in discovering the common interests in promoting professional garment care options.
Facilitate Increased Communication and Technical Assistance for Different Segments of the Garment Care Industry, Including Korean Cleaners Different groups of cleaners may have special needs and/or maintain a strong identity as a group related to, but also independent from broader professional garment care associations. Korean cleaner organizations represent one important
7-1

group which would benefit from targeted programs (e.g., materials or training sessions translated in Korean and/or conducted by knowledgeable Korean wet cleaners).
Regulatory Agencies
Pursue Professional Wet Cleaning as Best Available Control Technology Federal, state, and regional agencies have established detailed regulations and compliance strategies for meeting specific legislative or regulatory mandates, such as those provided through the 1990 Clean Air Act Amendments. Professional wet cleaning, which appears to be a viable pollution prevention alternative, may represent important opportunities for regulators to develop pollution prevention as best available control technology for these mandates rather than the current exclusive focus on machines or equipment with advanced controls.
Facilitate Development ofTechnical Assistance Infrastructure for Professional Wet Cleaning Regulatory agencies have numerous training and technical assistance pollution control-oriented programs to achieve compliance. Such programs can be reoriented or expanded to include technical assistance for wet cleaning as a pollution prevention technology.
Establish Support Strategies, such as Small Business Loan Programs Small business loan and financial support programs can be initiated and/or expanded to facilitate the development of professional wet cleaning, including those addressing conversion of existing facilities and/or purchase of new wet cleaning equipment by dry cleaners.
Develop Economic Instruments to Encourage Professional Wet Cleaning as a Pollution Prevention Strategy (e.g., Tax Exemption for Purchase ofWet Cleaning Equipment and Machines) Pollution prevention economic instruments can be one of the most successful tools for achieving pollution prevention goals. For example, tax exemptions for purchase of wet cleaning machines and related equipment could provide an important incentive for wet cleaning development.
Provide for Professional Wet Cleaning Label for Care Labeling Procedure A change in the Federal Trade Commission's care label rule to allow for a professional wet cleaning label would significantly enhance customer acceptance, garment manufacturer interest, and cleaner interest in wet cleaning as an alternative garment care process.
Establish Procurement Programs to Enhance Opportunities for Professional Wet Cleaning
7-2

Federal, state, or local government procurement mandates (e.g., specifying professional wet cleaning for government-needed professional garment care and/or utilizing, when necessary, wet cleaning equipment, such as for cleaning of military uniforms) should be established to facilitate the development of professional wet cleaning.
Stakeholder groups
For Realtors and Lenders, Establish Support Mechanisms for Dry Cleaner Tenants to Access Increased Information and/or to Facilitate Conversion to Wet Cleaning Realtor and lender organizations, such as the International Council of Shopping Centers, need to expand information about professional wet cleaning for their members who have established or are about to establish restrictive policies for dry cleaner tenants. This information, including programs to facilitate the development of wet cleaning, can be made available to dry cleaner tenants to allow for continued leasing or financial arrangements.
Garment manufacturers and retailers need to develop testing procedures to allow for a "professionally wet clean" label on their garments In order to facilitate the development of a professionally wet clean label, garment manufacturers and retailers need to develop the capacity (e.g., testing facilities that have wet clean machines) to evaluate whether the garments they manufacture can and should include the "professionally wet clean" label.
Garment manufacturers and retailers need to establish a formal communication procedure on problem areas in garment care that could influence garment remanufacturing A dialogue needs to be established between professional cleaners and garment manufacturers in relation to "problem garments" for professional cleaning, and whether such problems can he addressed through remanufacturing strategies and/or changes in the cleaning process.
Consumer Groups
Consumer/community organizations need to be involved in information dissemination about wet cleaning as well as help facilitate the development of professional wet clean businesses.
Consumer and community-based groups can play a significant role in identifying opportunities for the development of professional wet cleaning businesses through workshops and other information dissemination strategies at the community scale. Agencies and cleaners need to partner with community groups to develop and make available information to the public about wet cleaning.
7-3


Appendices

Appendix 1-A
PARTNERSHIP AGREEMENT
between
UCLA's POLLUTION PREVENTION EDUCATION AND RESEARCH CENTER
and the
KOREAN YOUTH AND COMMUNITY CENTER
in order to
Create New Opportunities to Improve the Economic, Environmental, and Occupational Well-Being of Dry Cleaners
The UCLA Pollution Prevention Education and Research Center (PPERC) and the Korean Youth and Community Center (KYCC) are establishing, through this agreement, an information dissemination, policy analysis, and outreach partnership. The partnership will facilitate making information available, analyzing and recommending new policies, and creating new opportunities to improve the economic, environmental, and occupational well-being of dry cleaners.
BACKGROUND
In the southern California region, there are approximately 4000 dry cleaning establishmencs in operation. Of these facilities, an estimated 70% are owned by KoreanAmerican entrepreneurs. Dry cleanjng represents one of the most prominent and substantial sources of income for many Korean irranigrant families. Numerous dry cleaning facilities have been established from the life savings of these families, with family members working long hours at these businesses.
The dry cleaning business, however, faces serious problems associated with the use of the chemical solvent perchloroethylene (perc), the cleaning agent of choice used by more than 80% of the dry cleaning industry. Pere use and disposal :n the dry cleaning industry is highly regulated and there are significant regulatory, liability, and other financial costs also associated with its use. Regulatory interventions regarding perc"s role as a potential hazardous air and wacer contaminant as well as an occupacional hazard
is now compounded by fears expressed about consumer exposure. Several states are requiring dry cleaners to ac~uire pollution liability insurance while lenders mandate costly environmental assessments of possible contamination as a condition of a loan. Commercial realtors have also begun to place conditions on lease agreements for dry cleaners who use perc. Thus, the use of perc for dry cleaners is rapidly becoming an unanticipated burden that could, for some owners, threaten their very livelihood.
THE INFORMATION, POLICY INITIATIVE AND OUTREACH PARTNERSHIP
The UCLA/KYCC Partnership will consist of four sets of joint actions: Information dissemination, policy analysis and recommendati0n, development of denonstrati0n sites, and outreach.
Information Dissemination
The Partnership will work cooperatively to undertake the following information disseminating functions:
1. Evaluate Alternative Cleaning Technologies The Partnership shall disseminate information about
alternative non-perc based cleaning technologies for their performance, and their environmental and financial viability. The UCLA Cleaner by Nature Demonstration site evaluation offers one significant source of such information.
2 . -Assess Financial and Regulatory Costs from PereBased Dry Cleaning
The Partnership will seek to disseminate information from a wide variety of sources on the financial and regulatory costs associated with perc-based dry cleaning. This information will be crucial for Korean dry cleaners seeking to determine whether to switch to an alternative cleaning approach such as wet cleaning.
3 . Informational Items in English and Korean To make the information being disseminated by the
Partnership more accessible to the Korean dry cleaning community, materials, such as flyers, brochures, and reports will be made available in both English and Korean. This will help Korean dry cleaners to fully understand the issues surrounding perc and thus facilitate a more educated choice in
deciding whether or not to employ alternative cleaning methods.
4. Survey The Partnership will make available information regarding Korean dry cleaners' attitudes toward wet cleaning, including information gathered from an initial survey administered in April of this year.
Develop Demonstration Sites The Cleaner by Nature/UCLA Demonstration Site is
providing important information to the dry cleaning community and the general public. However, demonstration sites need to be developed that can help address the specific information needs of the Korean dry cleaning community.
5. Develop a Korean-Owned Demonstration Site The Partnership will seek to establish a
demonstration site in addition to Cleaner by Nature. The purpose is to create a more accessible, comfortable, and convenient atmosphere for Korean dry cleaners by using a Korean-owned dry cleaning shop as the demonstration site. The testimony of a fellow Korean dry cleaner successfully implementing wet cleaning into their business may add much credibility to alternative cleaning strategies. It will also provide a bilingual eLvironment that could foster a more specific technical discussion.
Policy Analysis and Recommendations
~he Partnership will analyze the policy options available to dry cleaners and develop a set of recommendations for policy makers to expand opportunities for dry cleaners.
6. Financial Assistance For those interested in using wet cleaning in their
businesses, the Partnership will explore financial assistance mechanisms. KYCC will work in collaboration with lending institutions and seek out loan programs in order to develop resources for dry cleaners wanting to use alternative methods.
7. Regulatory Actions If wet cleaning can be shown to dramatically
reduce environmental impacts, the Partnership will seek to encourage the South Coast Air Quality Management District and other regulatory agencies to develop rewards and incentives. One type of

incentive may include alternative compliance schedules and/or exemptions.
Outreach The following are specific mechanisms that will be used
to outreach to Korean dry cleaners:
8. Tours The Partnership will jointly organize tours of wet
cleaning facilities such as Cleaner by Nature and any additional sites. Translation of the tours as well as translation for questions and answers will be made available for Korean dry cleaners. In addition, bilingual material will also be given.
9. Entreprene~rial Traj;ing Based on availability of funds, the Partnership
will develop and provide entrepreneurial training material for a 13-week. sector specific program which will include technical training for wet cleaning. ·
1 O. Produce a Wet Cleaning Conversion Packet To assist those dry cleaners who may interested in
partially converting or converting to wet cleaning, the Partnership will seek to produce a conversion packet which will detail step-by-step all the necessary procedures and actions which must be taken. It will include sources for financial assistance, technical assistance, etc. This will help alleviate the anxiety·some dry cleaners may feel in altering their business.
11. Network with Lending Institutions, Building owners, and Other Business Contacts
The Partnership will seek to network with the portion of the business community that is directly connected to the dry cleaning industry. Lending institutions as well as building management companies that lease to dry cleaners have been concerned with liability issues regarding perc. Contacts will also be made with those businesses that use an extensive amount of dry cleaning in their operations.
12. Community Outreach/Collaboration with the Korean Health Education and Information Referral Center (KHEIR), Koryo Health Foundation, and the Korean Immigrant Workers Association (KIWA).
The Partnership will work in collaboration with other Korean-American organizations to disseminate
information and assist in education efforts about issues in the dry cleaning industry that are being addressed by the Partnership.
I
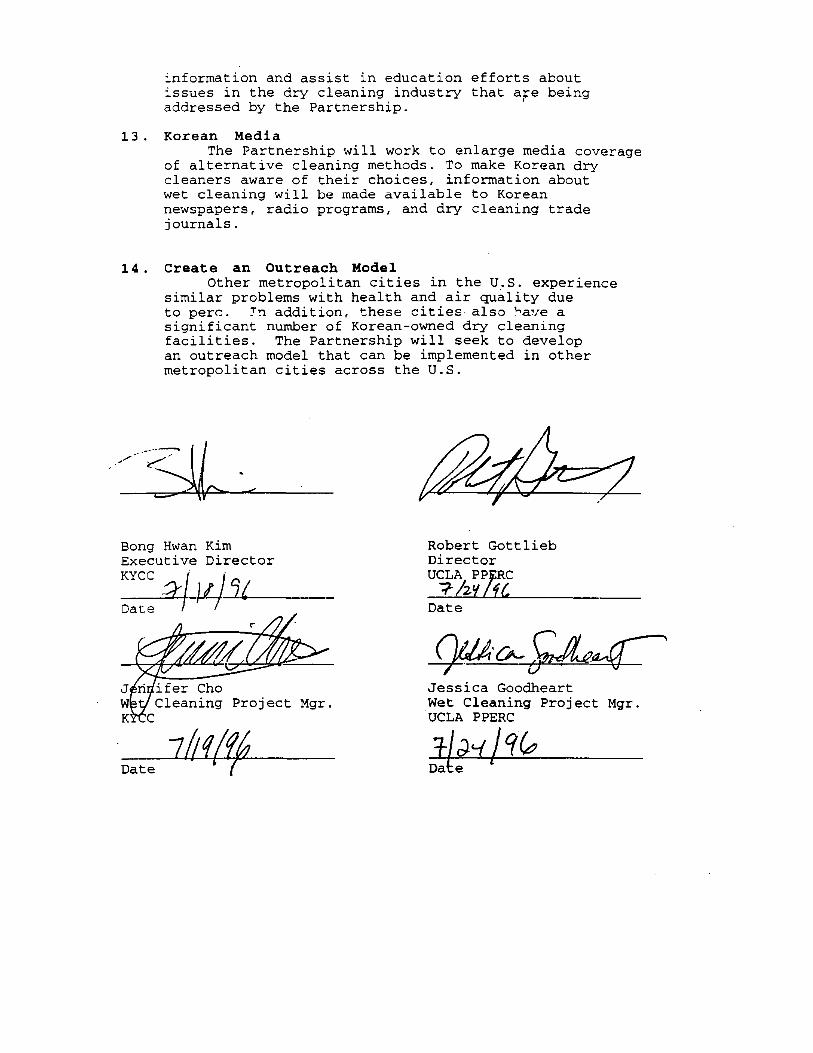
13. Korean Media The Partnership will work to enlarge media cove~age
of alternative cleaning methods. To make Korean dry cleaners aware of their choices, information about wet cleaning will be made available to Korean newspapers, radio programs, and dry cleaning trade journals.
14 . Create an Outreach Model Other metropolitan cities in the U.S. experience
similar problems with health and air quality due to perc. :rn addition, these cities also i,a,.re a significant number of Korean-owned dry cleaning facilities. The Partnership will seek to develop an outreach model that can be implemented in other metropolitan cities across the U.S.
Bong Hwan Kim Executive Director
KYCC -~' II I5t Dater r I
Project Mgr.
Date
Robert Gottlieb Director UCLA PP,:Rc ?-/z'flfl
Date
Jessica Goodheart Wet Cleaning Project Mgr. UCLA PPERC
Da riJ~/q~

Appendix 1-B
Advisory Committee Memben
Tim CarmichaeL policy director Coalition for Clean Air
Linda Delp, community programs coordinator UCLA Labor Occupational Safety and Health
Barry Gershenson, president California Fabricare Institute
Jennifer Holderness, senior environmental analyst, GAP Inc.
You-Lo Hsieh, professor UC Davis Textiles Division
Ung Sin Na, past president Korean Dry Cleaners & Laundry Association
Jo Patton, project director Alternative Clothes Cleaning Demonstration Project, Center for Neighborhood Technology
Donald Shoup, professor UCLA Department ofUrban Planning School ofPublic Policy and Social Research
John Suh, chairman Fashion Industry Alliance
Ex-Officio Committee Members
Brian Cahill, contract manager California Air Resources Board
Deborah Davis, owner Cleaner by Nature
Ranji George, program supervisor South Coast Air Quality Management District
Sharon Im, program manager Korean Youth and Community Center
Linda Wade, executive director Coalition for Clean Air
Mae Wong, environmental engineer US Environmental Protection Agency-Region IX
Appendix 1-C
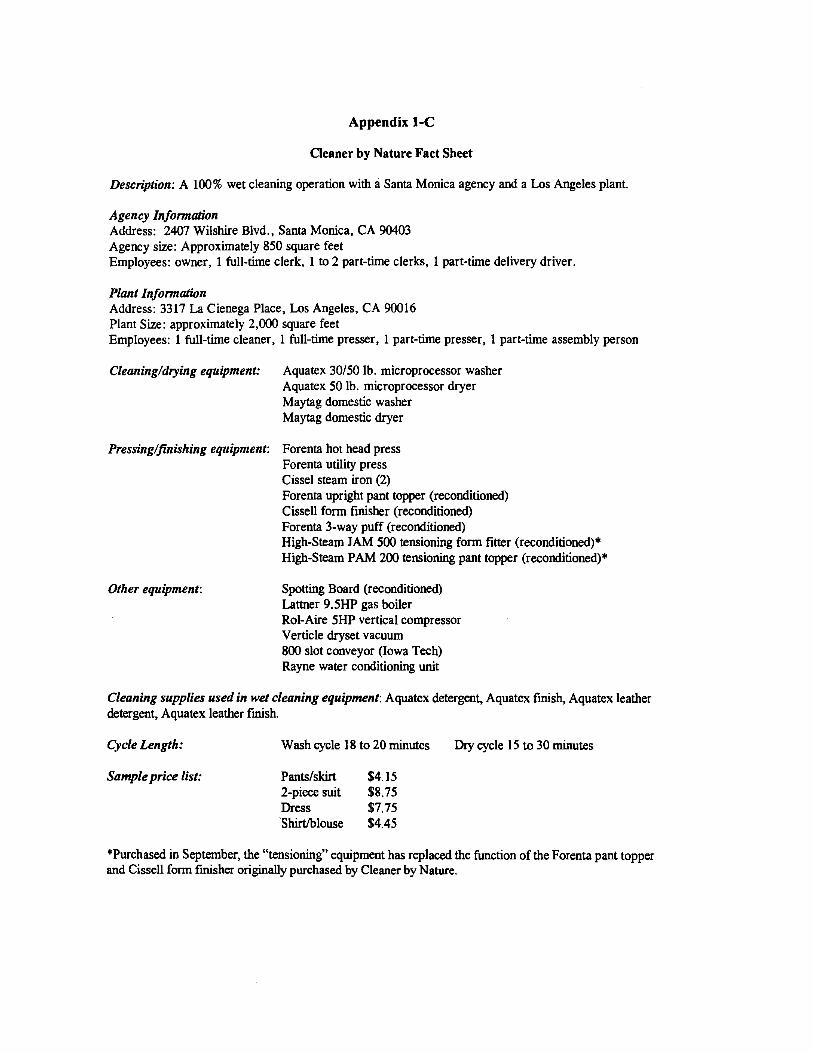
Cleaner by Nature Fact Sheet
Description: A 100% wet cleaning operation with a Santa Monica agency and a Los Angeles plant.
Agency Inf onnation Address: 2407 Wilshire Blvd., Santa Monica, CA 90403 Agency size: Approximately 850 square feet Employees: owner, 1 full-time clerk, 1 to 2 part-time clerks, 1 part-time delivery driver.
Plant Information Address: 3317 La Cienega Place, Los Angeles, CA 90016 Plant Size: approximately 2,000 square feet Employees: 1 full-time cleaner, 1 full-time presser, 1 part-time presser, 1 part-time assembly person
Cleaning/drying equipment: Aquatex 30/50 lb. microprocessor washer Aquatex 50 lb. microprocessor dryer Maytag domestic washer Maytag domestic dryer
Pressing/finishing equipment: Forenta hot head press Forenta utility press Cissel steam iron (2) Forenta upright pant topper (reconditioned) Cissell form finisher (reconditioned) Forenta 3-way puff (reconditioned) High-Steam JAM 500 tensioning form fitter (reconditioned)* High-Steam PAM 200 tensioning pant topper (reconditioned)*
Other equipment: Spotting Board (reconditioned) Lattner 9.5HP gas boiler Roi-Aire 5HP vertical compressor Verticle dryset vacuum 800 slot conveyor (Iowa Tech) Rayne water conditioning unit
Cleaning supplies used in wet cleaning equipment: Aquatex detergent, Aquatex finish, Aquatex leather detergent, Aquatex leather finish.
Cycle length: Wash cycle 18 to 20 minutes Dry cycle 15 to 30 minutes
Sample price list: Pants/skirt $4.15 2-piece suit $8.75 Dress $7.75 'Shirt/blouse $4.45
*Purchased in September, the "tensioning" equipment has replaced the function of the Forenta pant topper and Cissell form finisher originally purchased by Cleaner by Nature.
Appendix 3-A
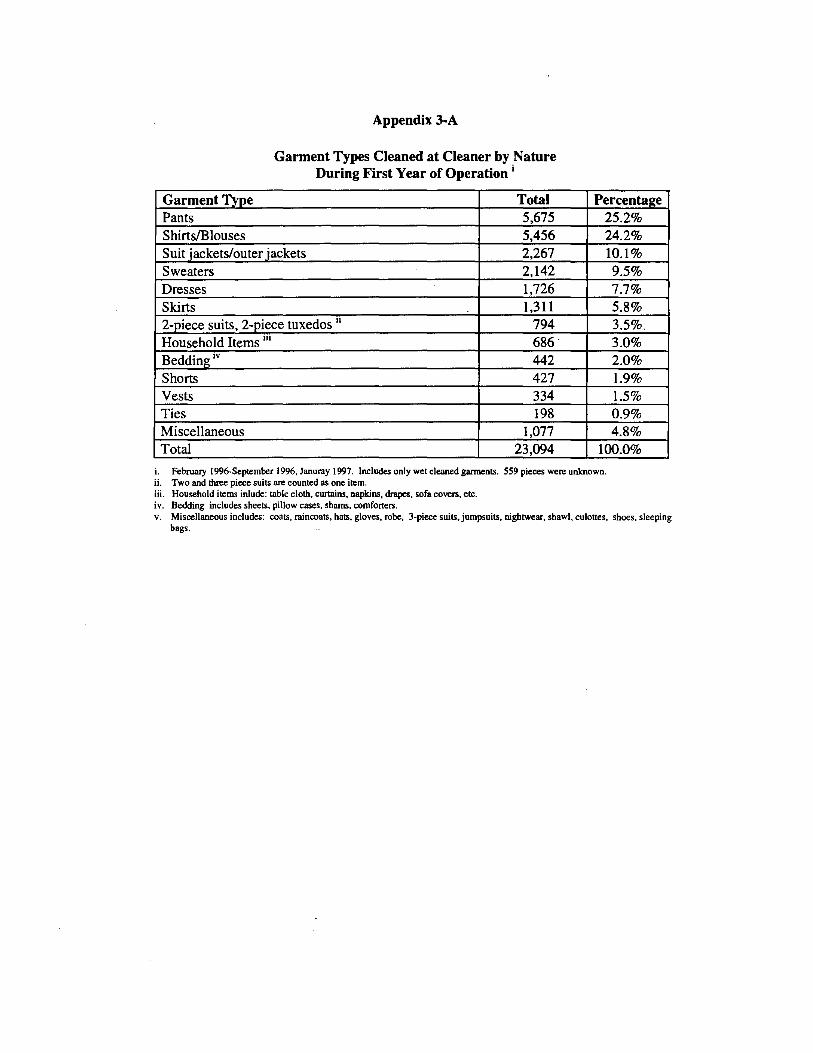
Garment Types Cleaned at Cleaner by Nature During First Year of Operation i
Garment Type Total Percenta2e Pants 5,675 25.2% Shirts/Blouses 5,456 24.2% Suit iackets/outer iackets 2,267 10.1% Sweaters 2,142 9.5% Dresses 1,726 7.7% Skirts 1,311 5.8% 2-piece suits, 2-piece tuxedos 11 794 3.5%. Household Items m 686· 3.0% Bedding'v 442 2.0% Shorts 427 1.9% Vests 334 1.5% Ties 198 0.9% Miscellaneous 1,077 4.8% Total 23,094 100.0%
i. February 1996-September 1996, Januray I 997. Includes only wet cleaned garments. S59 pieces were unknown. ii. Two and three piece suits are counted as one item. iii. Household items inlude: table cloth, curtains, napkins, drapes, sofa covers, etc. iv. Bedding includes sheets, pillow cases, shams, comforters. v. Miscellaneous includes: coats, raincoats, hats, gloves, robe, 3-piece suits.jumpsuits, nightwear, shawl, culottes, shoes, sleeping
bags.
Appendix 3-B
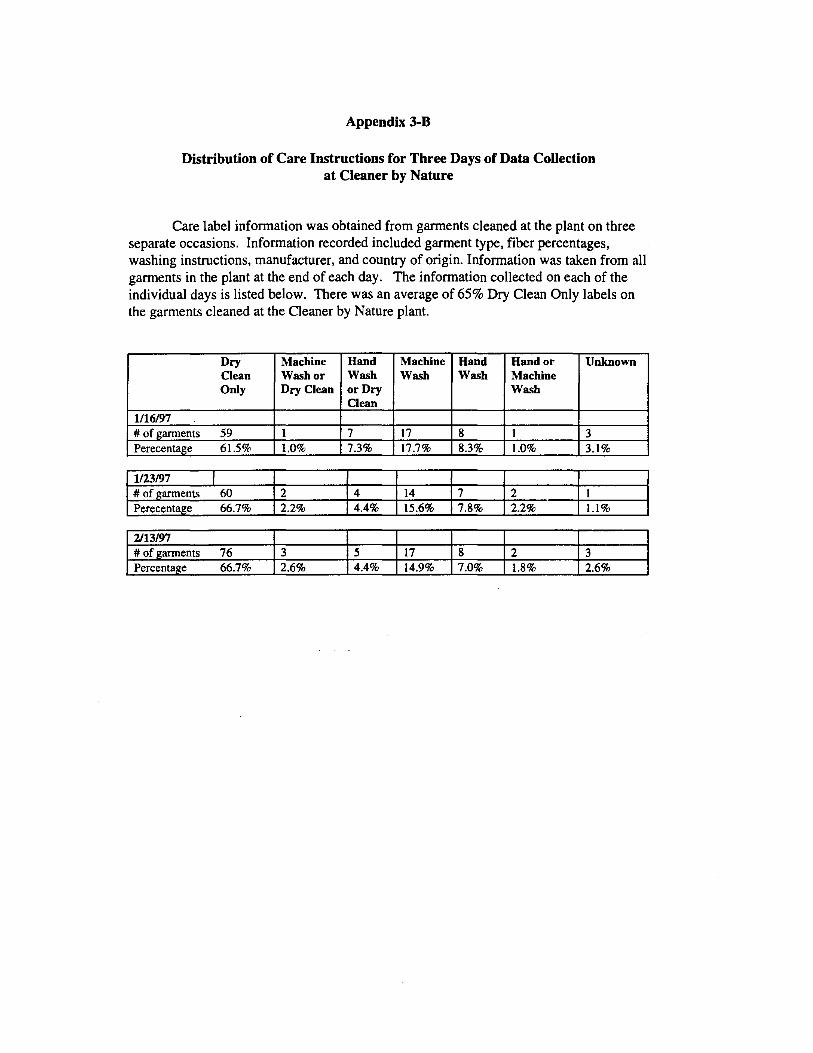
Distribution of Care Instructions for Three Days of Data Collection at Cleaner by Nature
Care label information was obtained from garments cleaned at the plant on three separate occasions. Information recorded included garment type, fiber percentages, washing instructions, manufacturer, and country of origin. Information was taken from all garments in the plant at the end of each day. The information collected on each of the individual days is listed below. There was an average of 65% Dry Clean Only labels on the garments cleaned at the Cleaner by Nature plant.
Dry Clean Only
Machine Washor Dry Clean
Hand Wash or Dry Clean
Machine Wash
Hand Wash
Hand or Machine Wash
Unknown
1/16/97 .
# of garments 59 1 7 17 8 1 3 Perecentage 61.5% 1.0% 7.3% 17.7% 8.3% 1.0% 3.1%
1/23/97 I # of garments 60 2 4 14 7 2 1 Perecentage 66.7% 2.2% 4.4% 15.6% 7.8% 2.2% 1.1%
2/13/97 # of garments 76 3 5 17 8 2 3 Percentage 66.7% 2.6% 4.4% 14.9% 7.0% 1.8% 2.6%
Appendix 3-C
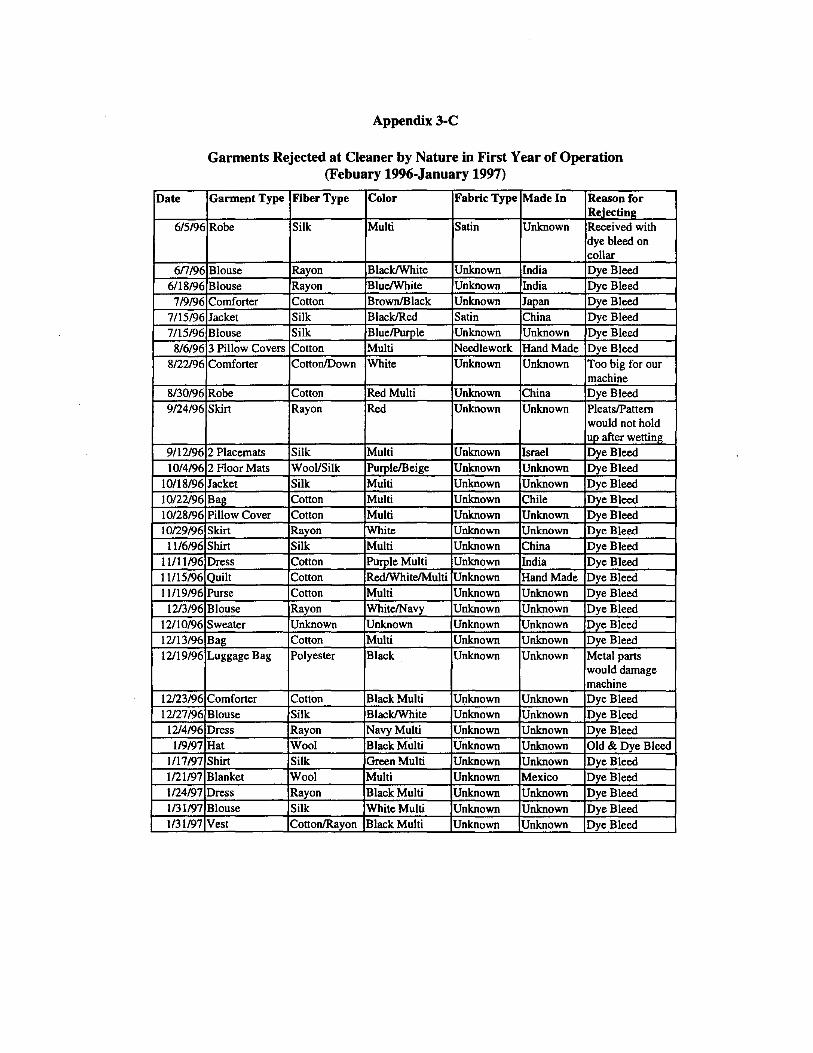
Garments Rejected at Cleaner by Nature in First Year of Operation (Febuary 1996-January 1997)
Date Garment Type Fiber Type Color Fabric Type Made In Reason for Re.iectine:
6/5196 Robe Silk Multi Satin Unknown Received with dye bleed on collar
6n/96 Blouse Rayon Black/White Unknown India Dye Bleed
6/18/96 Blouse Rayon Blue/White Unknown India Dye Bleed
7/9/96 Comforter Cotton Brown/Black Unknown Japan Dye Bleed
7/15/96 Jacket Silk Black/Red Satin China Dye Bleed
7/15/96 Blouse Silk Blue/Purple Unknown Unknown Dye Bleed
8/6/96 3 Pillow Covers Cotton Multi Needlework Hand Made Dye Bleed
8/22/96 Comforter Cotton/Down White Unknown Unknown Too big for our machine
8/30/96 Robe Cotton Red Multi Unknown China Dye Bleed 9/24/96 Skirt Rayon Red Unknown Unknown Pleats/Pattern
would not hold uo after wetting
9/12/96 2 Placemats Silk Multi Unknown Israel Dye Bleed
10/4/96 2 RoorMats Wool/Silk Purple/Beige Unknown Unknown Dye Bleed
10/18/96 Jacket Silk Multi Unknown Unknown Dye Bleed 10/22/96 Bag Cotton Multi Unknown Chile Dye Bleed 10/28/96 Pillow Cover Cotton Multi Unknown Unknown Dye Bleed 10/29/96 Skirt Rayon White Unknown Unknown Dye Bleed
11/6/96 Shirt Silk Multi Unknown China Dye Bleed 11/11/96 Dress Cotton Purple Multi Unknown India Dye Bleed 11/15/96 Quilt Cotton Red/White/Multi Unknown Hand Made Dye Bleed 11/19/96 Purse Cotton Multi Unknown Unknown Dye Bleed
12/3/96 Blouse Rayon White/Navy Unknown Unknown Dye Bleed
12/10/96 Sweater Unknown Unknown Unknown Unknown Dye Bleed 12/13/96 Bag Cotton Multi Unknown Unknown Dye Bleed 12/19/96 Luggage Bag Polyester Black Unknown Unknown Metal parts
would damage machine
12/23/96 Comforter Cotton Black Multi Unknown Unknown Dye Bleed 12/27/96 Blouse Silk Black/White Unknown Unknown Dye Bleed
12/4/96 Dress Rayon Navy Multi Unknown Unknown Dye Bleed 1/9/97 Hat Wool Black Multi Unknown Unknown Old & Dye Bleed
1/17/97 Shirt Silk Green Multi Unknown Unknown Dye Bleed 1/21/97 Blanket Wool Multi Unknown Mexico Dye Bleed 1/24/97 Dress Rayon Black Multi Unknown Unknown Dye Bleed 1/31/97 Blouse Silk White Multi Unknown Unknown Dye Bleed 1/31/97 Vest Cotton/Rayon Black Multi Unknown Unknown Dye Bleed

Appendix 3-D
Claims and Store Credit at Cleaner by Nature
A. Claims;
Date Garment Type
Fiber Tvne
Garment Maker
Color Problem Amount
2/12/96 Sweater Rayon Unknown White Holes $20.00 3/4/96 Pants Rayon Unknown Multi Shrinkage $56.00 3/4/96 Pants Rayon Unknown Multi Shrinkage $56.00 3/4/96 Dress Rayon Unknown Brown Shrinkage $75.00 4/8/96 Pants Silk Unknown Gray Stiff Texture $79.00
7/11/96 Matress Pad
Wool Unknown Natural Shrinkage $397.26
8/5/96 Sweater Silk Unknown Beige Sun Damage $92.00 8/12/96 Outer Coat Wool Unknown Brown Color Change $136.00
8/9/96 Dress Rayon Unknown Multi Shrinkage $62.33 8/9/96 Dress Rayon Unknown Multi Shrinkage $62.33 8/9/96 Dress Rayon Unknown Multi Shrinkage $62.33
12/12/96 Dress Rayon Unknown Navy& White
Dye Bleed $22.74
1/10/97 Sofa Cover Cotton Unknown Tan Shrinkage $338.26 1/16/97 Dress Acetate Unknown Brown Pulled Color While
Sootting $91.74
Total $1,550.99
i. Covers period from February 1996 - February 1997, March 11, 1997 - Apri 11, 1997. Number of garments cleaned during claim collection period is 44,860.
B. Store Credit ii
Date Garment Fiber Garment Color Problem Amount Type Type Maker
11/15/96 Blouse Silk Unknown Blue Pulled Color When $20.00+ Red Soottinl! Dve $17.50
12/11/96 Pants Linen Unknown Unknown Lost $50.00 12/26/96 Placemats Leather Unknown Multi Dye Bleed $200.00
'6) 12/29/96 Dress Acetate Unknown Red Pulled Color When $25.00
Spotting 1/17/97 Dress Cotton Unknwon Red Bruising of Velvet $25.00
1/3/97 Belt Silk Unknown Black Lost $25.00 2/28/97 Blouse Silk Unknown Maroon Tape Left $75.00
Permanent Stain 4/4/97 Blouse Rayon Unknown White Snag in blouse $15.00 Total $452.00 ..
11. Covers penod from November 1996 - February 1997, March 11, 1997 - Apnl 11, 1997. Number of garments cleaned during store credit collection period is 21,937.

Appendix 3-E
Claims and Store Credit at ''Dry Cleaner A"
A. Claims i
Date Resolved Garment Type
Fiber Type
Garment Maker
Color Problem Amount
8/19/96 shirt CQttOn Unknown Unknown Lost $64.00 6/17/96 iacket wool Unknown black Lost $75.00 9/18/95 blouse Unknown Darco white turned gray $82.27 4/30/96 jacket wool Unknown black Lost $214.34
5/8/96 blouse rayon Unknown Unknown Tape left mark $50.00
4/28/96 skirt wool Unknown Unknown Lost $49.00 2/24/96 pants & belt Unknown Unknown Unknown Lost $70.00
3/9/96 sweater Unknown. Unknown Unknown Lost cuffs & collars
$125.00
3/5/96 Unknown Unknown Unknown Unknown Lost $50.00 2/6/96 blouse silk Unknown Unknown Lost $150.00
1/12/96 blouse silk Unknown Unknown Lost $60.00 1/22/96 tie Unknown Unknown Unknown Lost $85.00
10/18/95 blouse silk Unknown Unknown Color loss $80.00 2/12/96 skirt Unknown Unknown Unknown Lost $50.00
$1,204.61
i. Covers period from September I, 1995 • August 31, 1996. Number of garments cleaned during this data collection period is 107,692
B. Store Credit ii
Date Resolved Garment Type
Fiber. Type
Garment Maker
Color Problem Amount
8/20/96 blouse Unknown Rampage blue Snag in top $22.08 2/12/96 skirt Unknown Unknown black Lost $50.00
Total $77.08
ii. Covers period from September!, 1995 • August 31, 1996. Number of garments cleaned during this data collection period is 107,692

Appendix 3-F
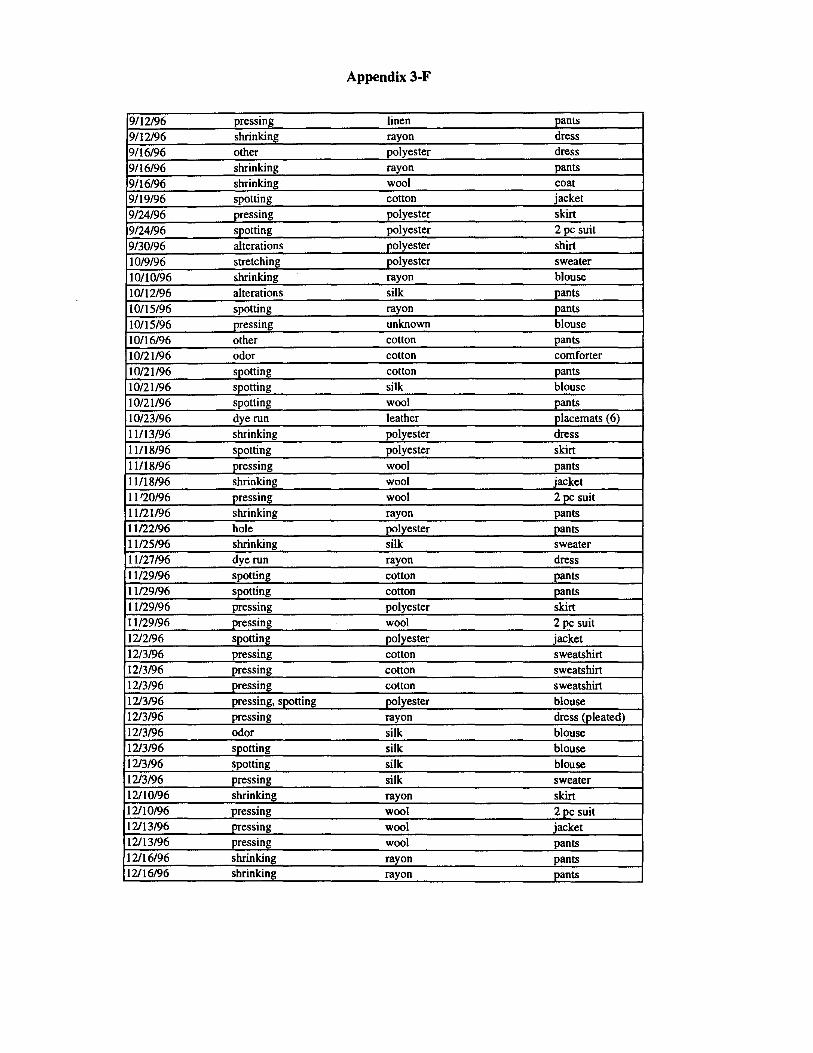
Garments Returned to Cleaner by Nature for Additional Work: February 1996-January 1997 (August data missing)
Date Problem Fiber Garment
2nt96 spotting polyester raincoat 2/8/96 spotting cotton outer coat 2/12/96 shrinking silk sweater 2/20/96 pressing wool jacket 2/21/96 pressing wool jacket 2/28/96 shrinking rayon pants 2/28/96 shrinking rayon pants 2/28/96 shrinking rayon pants 2/28/96 shrinking rayon pants
2/28/96 pressing wool shawl
3/1/96 shrinking wool sweater 3/5/96 shrinking cotton/rayon sweater 3/9/96 pressing wool 2 pc suit 3/16/96 shrinking acetate/rayon blouse 3/17/96 dye run silk sweater 3/17/96 spotting silk tie 3/23/96 shrinking silk sweater 3/23/96 spotting silk/cotton pants 3/23/96 spotting silk/cotton pants 4/1/96 dye run cotton dress 4/1/96 odor polyester/wool jacket 4/1/96 odor polyester/wool jackets 4/4/96 dye run silk sweater 4/6/96 spotting rayon jacket 4/9/96 spotting silk blouse 4/15/96 spotting cotton pants 4/19/96 spotting rayon shin 5/2/96 pressing linen pants 5/2/96 spotting linen shin 5/4/96 damage to fabric silk shin 5/11/96 spotting cotton raincoat 5/16/96 spotting wool vest 5/18/96 spotting cotton pillow sham 5/18/96 dye run unknown vest 5/18/96 spotting wool coat 5/20/96 spotting linen jacket 5/20/96 spotting linen pants 5/23/96 pressing cotton pants 5/28/96 pressing wool jacket 5/30/96 pressing wool jacket 5/31/96 spotting silk blouse 5/31/96 spotting silk tie 5/31/96 spotting silk tie 5/31/96 spotting silk tie 5/31/96 spotting silk tie

Appendix 3-F
5/31/96 spotting silk tie
5/31/96 shrinking wool sweater
5/31/96 shrinking wool sweater
6/3/96 shrinking wool sweater
6/6/96 spotting unknown duvet cover
6/9/96 spotting silk pants
6/10/96 shrinking rayon dress
6/10/96 shrinking rayon shirt
6/12/96 spotting linen vest
6/12/96 spotting silk blouse
6/12/96 spotting silk sweater
6/15/96 spotting cotton jacket
6/15/96 pressing linen jacket
6/15/96 stretching rayon dress
6/27/96 spotting linen skirt
6/28/96 spotting silk sweater
7/2/96 pressing wool jacket
7/8/96 spotting cotton pants 7/8/96 spotting cotton pants
7/8/96 spotting cotton pants
7/8/96 spotting cotton pants 7/9/96 spotting silk sweater
7/9/96 spotting silk sweater
7/10/96 pressing silk tie 7/12/96 shrinking rayon skirt 7/22/96 shrinking rayon dress 7/22/96 shrinking rayon dress 7/22/96 shrinking rayon dress 7/22/96 shrinking rayon skirt 7/24/96 pressing rayon dress 7/24/96 spotting silk shirt 7/26/96 pressing unknown dress 7/27/96 pressing linen pants 7/27/96 pressing linen pants 7/27/96 pressing linen pants 7/27/96 pressing linen pants 7/27/96 shrinking rayon skirt 7/27/96 spotting silk shirt 7/29/96 shrinking cotton hat 7/29/96 spouting linen shirt 7/29/96 pressing silk tie 9/4/96 spotting cotton jacket 9/4/96 spotting linen blouse 9/4/96 pressing wool jacket 9/6/96 dye run polyester blouse 9/9/96 other cotton shirt 9/9/96 spotting silk blouse 9/10/96 spotting cotton blouse 9/10/96 spotting silk blouse
Appendix 3-F
9/12/96 pressing linen pants
9/12/96 shrinking rayon dress
9/16/96 other polyester dress 9/16/96 shrinking rayon pants
9/16/96 shrinking wool coat
9/19/96 spotting cotton jacket
9/24/96 pressing polyester skirt 9/24/96 spotting polyester 2 pc suit
9/30/96 alterations polyester shirt
10/9/96 stretching polyester sweater 10/10/96
.shrinking rayon blouse
10/12/96 alterations silk pants
10/15/96 spotting rayon pants
10/15/96 pressing unknown blouse
10/16/96 other cotton pants
10/21/96 odor cotton comforter
10/21/96 spotting cotton pants
10/21/96 spotting silk blouse
10/21/96 spotting wool pants
10/23/96 dye run leather placemats (6)
11/13/96 shrinking polyester dress 11/18/96 spotting polyester skirt 11/18/96 pressing wool pants
11/18/96 shrinking wool jacket 11 120/96 pressing wool 2 pc suit 11/21/96 shrinking rayon pants 11/22/96 hole polyester pants 11/25/96 shrinking silk sweater 11/27/96 dye run rayon dress 11/29/96 spotting cotton pants 11/29/96 spotting cotton pants 11/29/96 pressing polyester skirt 11/29/96 pressing wool 2 pc suit 12/2/96 spotting polyester jacket 12/3/96 pressing cotton sweatshirt 12/3/96 pressing cotton sweatshirt 12/3/96 pressing cotton sweatshirt 12/3/96 pressing, sootting polyester blouse 12/3/96 pressing rayon dress (pleated) 12/3/96 odor silk blouse 12/3/96 spotting silk blouse 12/3/96 spotting silk blouse 12/3/96 pressing silk sweater 12/10/96 shrinking rayon skirt 12/10/96 pressing wool 2 pc suit 12/13/96 pressing wool jacket 12/13/96 pressing wool pants 12/16/96 shrinking rayon pants 12/16/96 shrinking rayon pants

Appendix 3-F
12/16/96 shrinking rayon pants
12/23/96 shrinking cotton couch cover
12/26/96 shrinking cotton pants
12/26/96 pressing silk blouse
1/2/97 spotting cotton sweater 1/2/97 pressing, spotting oolyester blouse 1/2/97 spotting oolyester sweater 1/2/97 spotting wool 2 pc suit 1/3/97 tape made mark silk blouse 1/6/97 dye run wool skirt 1/9/97 pressing cotton shirt 1/15/97 dye pulled during spotting acetate dress 1/16/97 spotting silk sweater 1/16/97 spotting wool coat 1/21/97 spotting silk blouse 1/27/97 shrinkinll: rayon sweater'
1/27/97 shrinking wool sweater 1/29/97 pressing cotton jacket 1/29/97 shrinking silk sweater 1/29/97 shrinking silk sweater

Appendix 3-G
Analysis of Garments Returned by Customers for Additional Work by Fiber Type1
30%
25%
20%
~ .... 15%s ..C
.. 10% ""
~
5%
0%
g C
t 35 0 :li " ~"
C 1 ....
0 =;je'
Flber 'fype
11 Observed••
■ Expected•••
i. This chart is based on redos of a known fiber type from Februm:y I, 1996-July3 l, I 996. Out of the 87 garments returned for additional wod<, 3 were unknown. The data for the month of August was unavalable to us. Observed: # of redos of a particular fiber type/total# of redos
•• Expected: # of garments of a particular fiber type/total # of garments cleaned

Appendix 3-H
Analysis of Garments Returned by Customers for Additional Work (February 1, 1996 - July 31, 1996)
A.
~ t..
50%
40%
■ Ol,served•
+----------------1 ■ Expected..
30%
20%
10%
0%
Cotton Rayon Wool LinenSilk
eiiB. Shrinka 50%
40%
30%
l 20%
10%
0%
Cotton Rayon Wool Silk
■ Observed•
■ Expected..
Linen
Pressin iii
40% -r---------------
300/4+----------------
l 20% +----
0%
Cotton Rayon Wool
■ Observed•
Silk Linen
i. A total of 39 garments were returned for additional worlc related to spotting. ii. A total of20 garments were returned for additional wm related o shrinkage. iii. This chart includes known fiber types only. Out of20 garments returned for additional pressing, only I was unknown.
Observed: # ofpressing redos of a particular fiber type/total pressing redos. •• Expected:# ofgarments cleaned ofa particular fiber type/total# ofgarments cleaned.
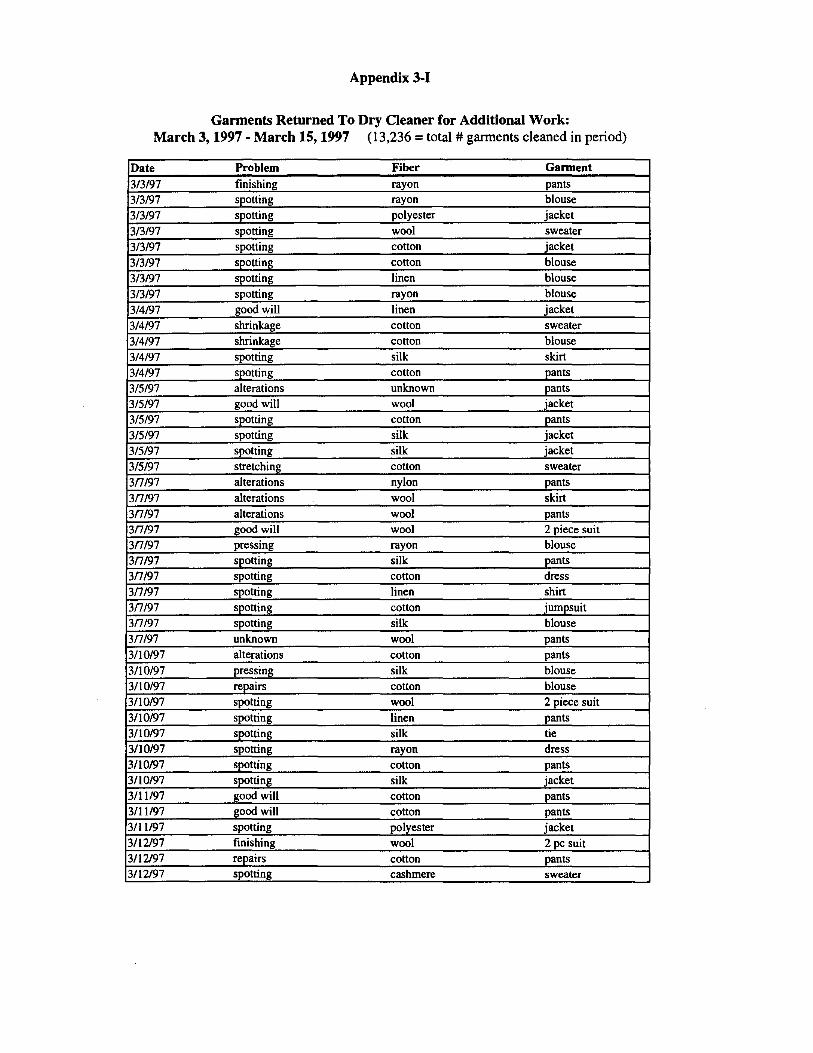
Appendix 3-1
Garments Returned To Dry Cleaner for Additional Work: March 3, 1997 - March 15, 1997 (13,236 =total# gannents cleaned in period)
Date Problem Fiber Garment
3/3/97 finishing rayon pants
3/3/97 spotting rayon blouse
3/3/97 spotting polyester jacket
3/3/97 spotting wool sweater
3/3/97 spotting cotton jacket
3/3/97 spotting cotton blouse
3/3/97 spotting linen blouse
3/3/97 spotting rayon blouse
3/4/97 good will linen jacket
3/4/97 shrinkage cotton sweater
3/4/97 shrinkage cotton blouse
3/4/97 spotting silk skirt
3/4/97 spotting cotton pants
3/5/97 alterations unknown pants
3/5/97 good will wool jacket
3/5/97 spotting cotton pants
3/5/97 spotting silk jacket
3/5/97 spotting silk jacket
3/5/97 stretching cotton sweater
3nt97 alterations nylon pants
3nt97 alterations wool skirt
3nt97 alterations wool pants 3nt97 good will wool 2 piece suit
3nt97 pressing rayon blouse
3n191 spotting silk pants
3nt97 spotting cotton dress
3nt97 spotting linen shirt
3nt97 spotting cotton jumpsuit
3nt97 spotting silk blouse
3nt97 unknown wool pants
3/10/97 alterations cotton pants
3/10/97 pressing silk blouse 3/10/97 repairs cotton blouse 3/10/97 spotting wool 2 piece suit 3/10/97 spotting linen pants 3/10/97 spotting silk tie 3/10/97 spotting rayon dress 3/10/97 spotting cotton pants 3/10/97 spotting silk jacket 3/11/97 good will cotton pants
3/11/97 good will cotton pants 3/11/97 spotting polyester jacket 3/12/97 finishing wool 2 pc suit 3/12/97 repairs cotton pants 3/12/97 spotting cashmere sweater

Appendix 3-1
3/13/97 alterations linen pants
3/13/97 spotting silk 2 pc suit
3/13/97 spotting wool pants
3/13/97 spotting silk pants
3/13/97 spotting wool pants 3/14/97 shrinkage cotton sweater
3/14/97 spotting cotton sweater
3/15/97 finishing silk shirt
3/15/97 repairs silk blouse
3/15/97 repairs rayon jacket
3/15/97 repairs angora sweater
3/15/97 spotting rayon jacket
3/15/97 spotting silk shirt
3/15/97 spotting silk tie
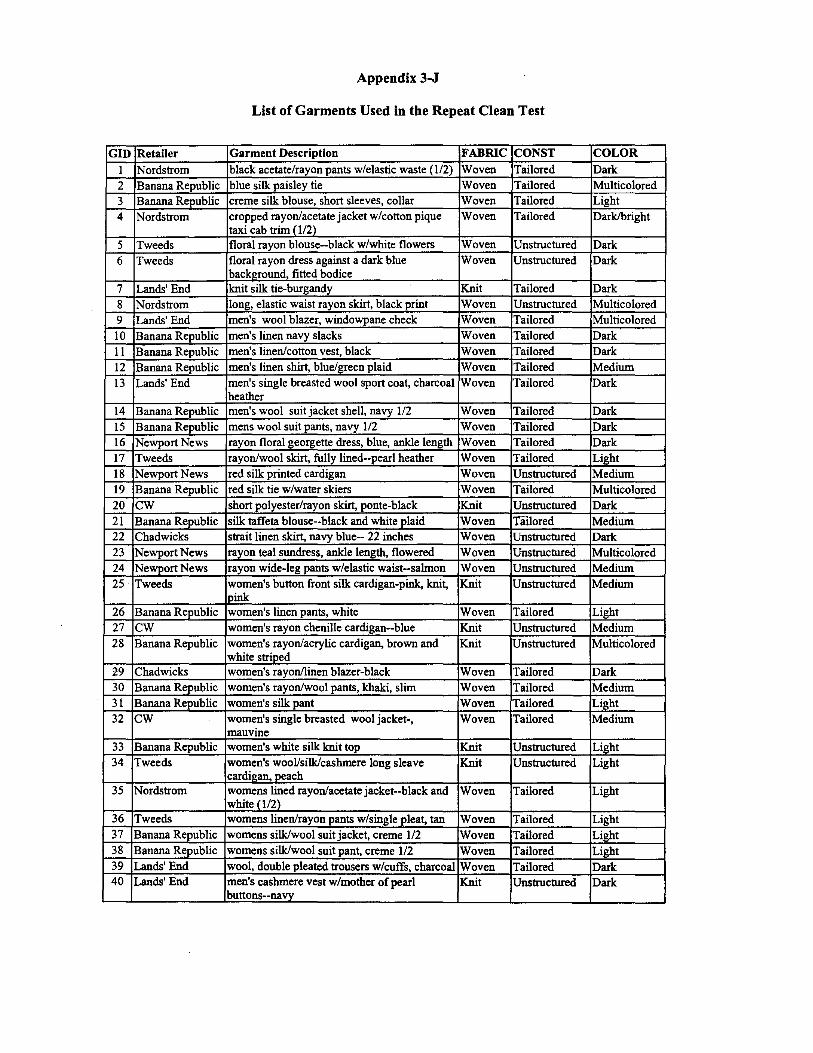
Appendix 3-J
List of Garments Used in the Repeat Clean Test
GID Retailer Garment Description FABRIC CONST COLOR
I Nordstrom black acetate/rayon pants w/elastic waste (I /2) Woven Tailored Dark 2 Banana Republic blue silk paisley tie Woven Tailored Multicolored 3 Banana Republic creme silk blouse, short sleeves, collar Woven Tailored Light 4 Nordstrom cropped rayon/acetate jacket w/cotton pique
taxi cab trim (1/2) Woven Tailored Dark/bright
5 Tweeds floral rayon blouse--black w/white flowers Woven Unstructured Dark 6 Tweeds floral rayon dress against a dark blue
background, fitted bodice Woven Unstructured Dark
7 Lands' End knit silk tie-burgandy Knit Tailored Dark 8 Nordstrom long, elastic waist rayon skirt, black print Woven Unstructured Multicolored 9 Lands' End men's wool blazer, windowpane check Woven Tailored Multicolored 10 Banana Republic men's linen navy slacks Woven Tailored Dark 11 Banana Republic men's linen/cotton vest, black Woven Tailored Dark 12 Banana Republic men's linen shirt, blue/green plaid Woven Tailored Medium 13 Lands' End men's single breasted wool sport coat, charcoal
heather Woven Tailored Dark
14 Banana Republic men's wool suit jacket shell, navy 1/2 Woven Tailored Dark 15 Banana Republic mens wool suit pants, navy 1/2 Woven Tailored Dark 16 Newport News rayon floral georgette dress, blue, ankle length Woven Tailored Dark 17 Tweeds rayon/wool skirt, fully lined--pearl heather Woven Tailored Light 18 Newport News red silk printed cardigan Woven Unstructured Medium 19 Banana Republic red silk tie w/water skiers Woven Tailored Multicolored 20 cw short polyester/rayon skirt, ponte-black Knit Unstructured Dark 21 Banana Republic silk taffeta blouse--black and white plaid Woven Tailored Medium 22 Chadwicks strait linen skirt, navy blue-- 22 inches Woven Unstructured Dark 23 Newport News rayon teal sundress, ankle length, flowered Woven Unstructured Multicolored 24 Newport News rayon wide-leg pants w/elastic waist--salmon Woven Unstructured Medium 25 Tweeds women's button front silk cardigan-pink, knit,
pink Knit Unstructured Medium
26 Banana Republic women's linen pants, white Woven Tailored Light 27 cw women's rayon chenille cardigan--blue Knit Unstructured Medium 28 Banana Republic women's rayon/acrylic cardigan, brown and
white striped Knit Unstructured Multicolored
29 Chadwicks women's rayon/linen blazer-black Woven Tailored Dark 30 Banana Republic women's rayon/wool pants, khaki, slim Woven Tailored Medium 31 Banana Republic women's silk pant Woven Tailored Light 32 cw women's single breasted wool jacket-,
mauvine Woven Tailored Medium
33 Banana Republic women's white silk knit top Knit Unstructured Light 34 Tweeds women's wooVsilk/cashrnere long sleave
cardi2an, neach Knit Unstructured Light
35 Nordstrom womens lined rayon/acetate jacket--black and white (1/2)
Woven Tailored Light
36 Tweeds womens linen/rayon pants w/single pleat, tan Woven Tailored Light 37 Banana Republic womens silk/wool suit jacket, creme 1/2 Woven Tailored Light 38 Banana Republic womens silk/wool suit pant, creme 1/2 Woven Tailored Light 39 Lands' End wool, double pleated trousers w/cuffs, charcoal Woven Tailored Dark 40 Lands' End men's cashmere vest w/mother of pearl
buttons--navv Knit Unstructured Dark


Appendix 3-K
UCLA Wet Cleaning Demonstration Project Repeat Clean Test
FINAL EVALUATION SHEET
Name of Evaluator: ________________________
Garment Type: ______Garment Identification Number:------
Odor Evaluation
Characteristic Evaluation
Does the gannent have e scent/odor?
If yes, describe the scent/odor.
Does this ; ■ rant have an acceptable odor?
General Appearance Evaluation
Characteristic Evaluation
Consistency of garrent color
Tears or ri"" or solit se..
Missing buttons, broken zippers
Ar:meerance of tri•
Appearance of shoulder pads
Other ar:mear■ nce factors
Overall Appearance
Resiliency Evaluation
Characteristic Evaluation
S-thness Replica Rating
Se• S-thnesa Replica Rating
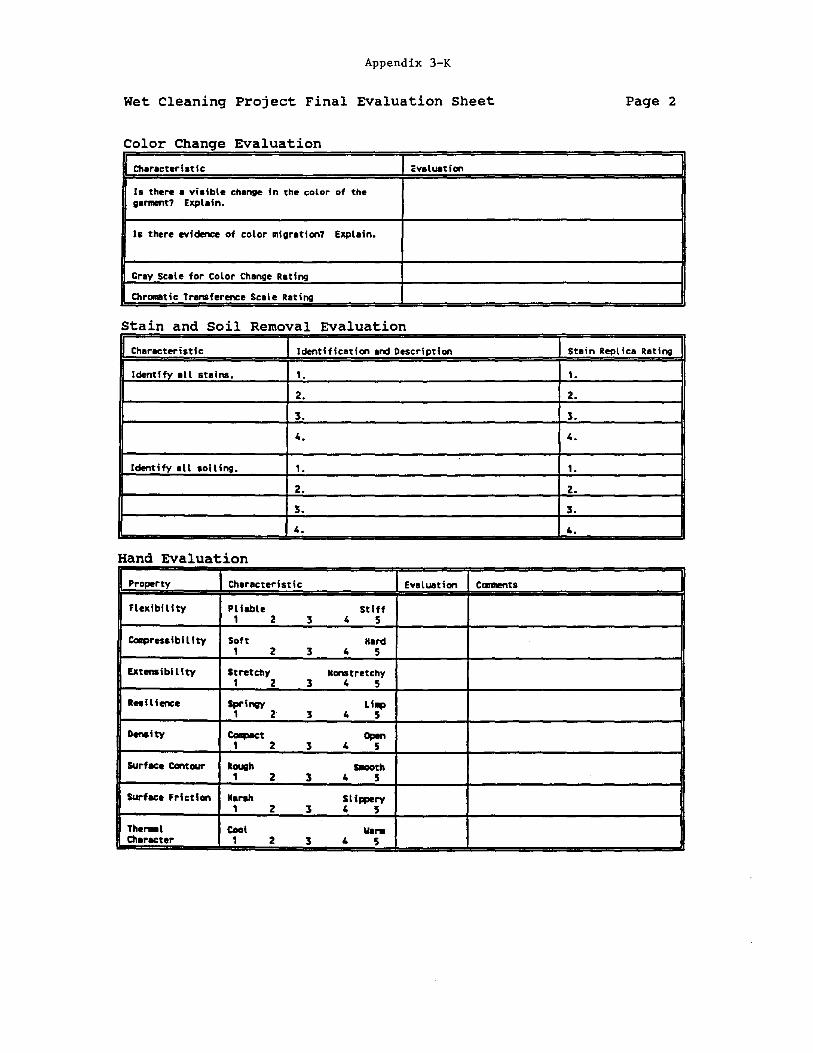
Appendix 3-K
Wet Cleaning Project Final Evaluation Sheet Page 2
Color Change Evaluation
Ol ■ r ■ cterlatlc evaluation
Is there• visible change in the color of the 11 ■nnent? Explain.
Is there evidence of color migration? Explain.
Grey Scale for Color Change Rating
Chromatic Transference Scale Rating
Stain and Soil Removal Evaluation
Characteristic Identification end Description Stein Replica Rating
Identify ell stains. ,. ,. 2. 2.
. 3. 3 •
4. 4.
Identify ■ II ■oiling. ,. ,. 2. 2.
3. 3.
4. 4.
Hand Evaluation
Property Characteristic Evaluation Cam,ents
Flexibll lty Pl leble, 2 3 Stiff
4 5
Coq,resslbll lty Soft, 2 3 Hard
4 5
Extenslbll lty Stretchy, 2 3 Nonstretchy
4 5
Resilience Springy, 2 3 LIIIIP
4 5
D-ity Colllp■ct, 2 3 Open
4 5
surface Contour R-h, 2 3 Saooth
4 5
Surface Friction Harah, 2 3 Slippery 4 5
The,_I Character
Cool, 2 3 Ila.-.
4 5
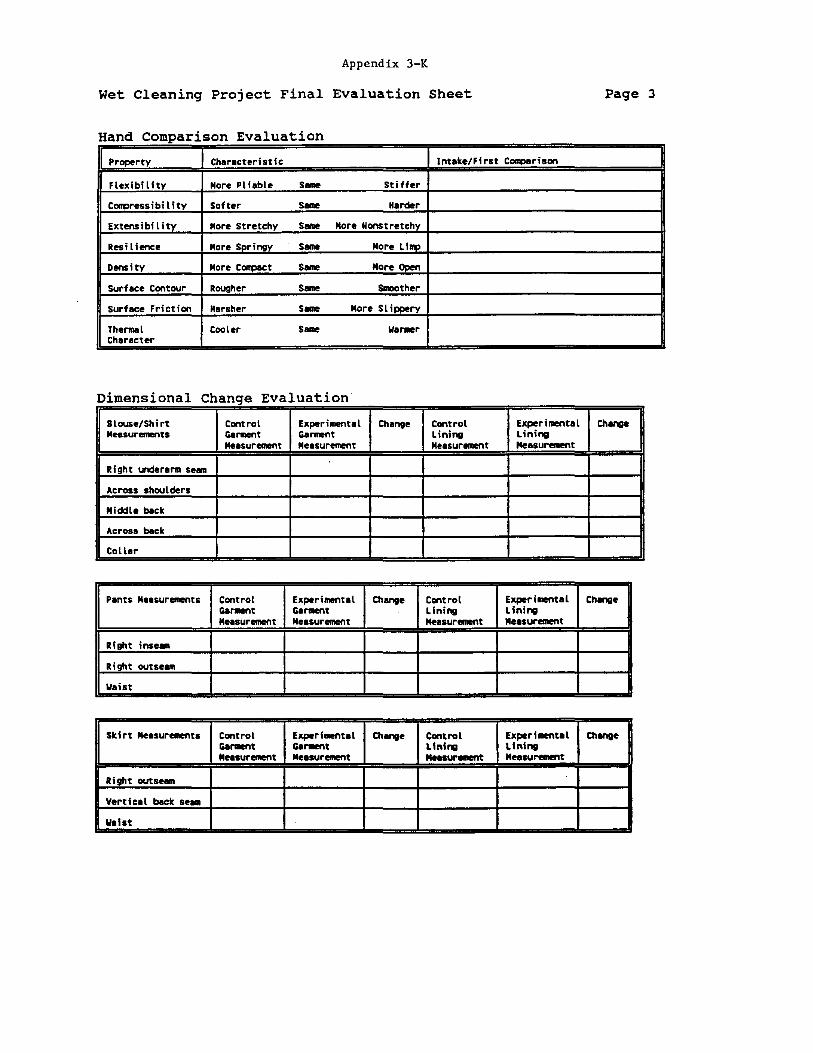
Appendix 3-K
Wet Cleaning Project Final Evaluation Sheet Page 3
Hand Comparison Evaluation
Property Characteristic Intake/First C-rison
Flexibi l lty More Pliable s- Stiffer
C00Dressibility Softer s- Harder
Extensibility More Stretchy s- More Nonstretchy
Resil fence More Springy s- More Lin>
Density More Con-pact s- More 0Den
Surface Contour Rougher s- Sllloother
surface Friction Harsher s- More SI ippery
Thermal Character
Cooler Same llanner
Dimensional Change Evaluation
Blouse/Shi rt Measurements
Control Gannent Measurement
Experimental Garment Measurement
Change Control Lining Measurement
Experi111ental Lining Measurement
Change
Right underarm semn
Across shoulders
Middle back
Across back
Collar
Pants Measurements Control Gannent Measurement
Experimental Gannent Measurement
Change Control Lining Measurement
ExperiNntal Lining Measurement
Ch-•
Right insemn
Right outsemn
llaist
Skirt Measurements Control Gannent Me■ sur1111ent
Experimental G■ nnent Measurement
Change Control Lining Me■ aureoent
ExperiNnt ■ l Lining Meaau,._,t
Change
Right outse■m
Vertical back se111
llalat
Appendix 3-K
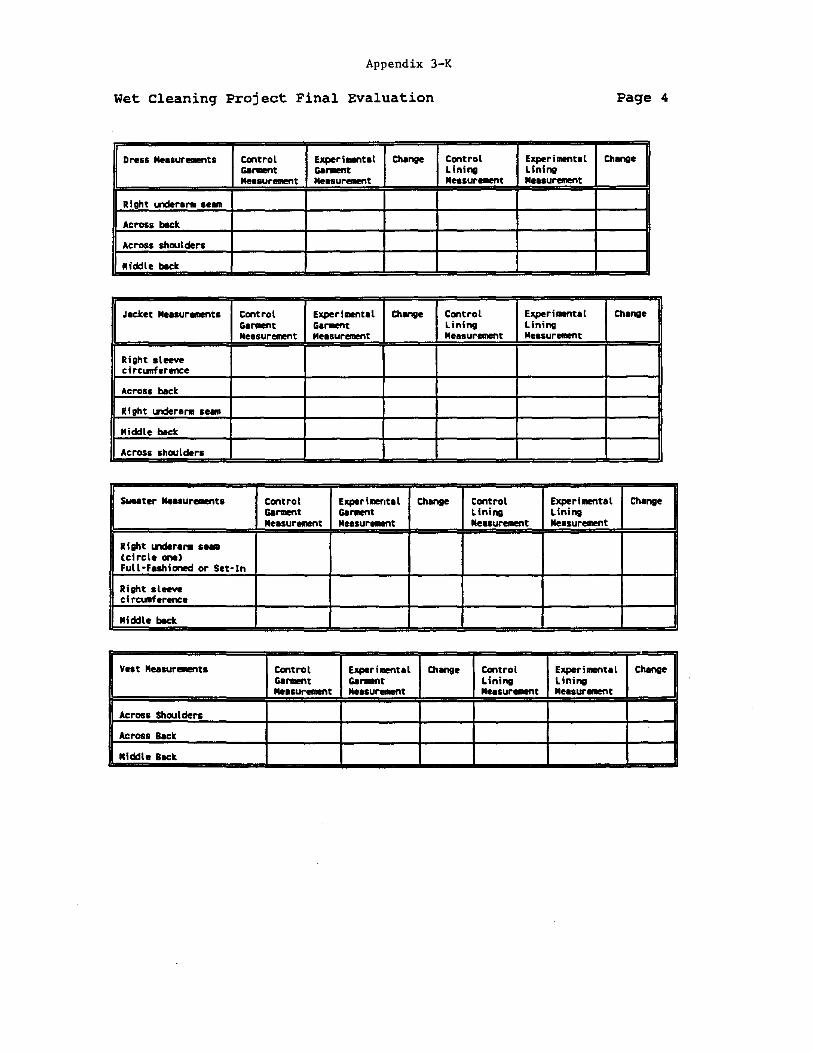
Wet Cleaning Project Final Evaluation Page 4
Dress Meaaurements Control Ga....t Measureaient
Experi..,tal Ga....t Measur-,t
Change Control Llning Measurement
Exper i menta I Lining Measur-t
Change
Right lllderann se•
Across beet
Across shoulders
Middle beet
Jacket Meuurments Control Garaent Measur-t
Experi..,tal Gannent Measurement
Change Control Lining Measurement
Exper i menta I Lining Measurement
Change
Right sleeve c;rcLlll'ference
Across beet
Right lllderar11 se•
Middle beet
Across shoulders
Sweater Meuu..-nta Control Ga.._,t Measur-t
Exper hner,ta I Gar..nt Measurement
Change Control Lining Measurement
Experi..ntal Lining Measur_,,t
Change
Right inleral'II •-(circle oiw> Full·Fashioned or Set•ln
Right •I-ci rcl.lllference
Middle back
Yest Meaaureaents Control Ga.._,t Measurement
Experi..,tal Garaent Measur.-nt
Change Control Lining Musur-,t
Experimental Lining Measurement
Change
Across Shoulders
Across Bac:k
Middle Back
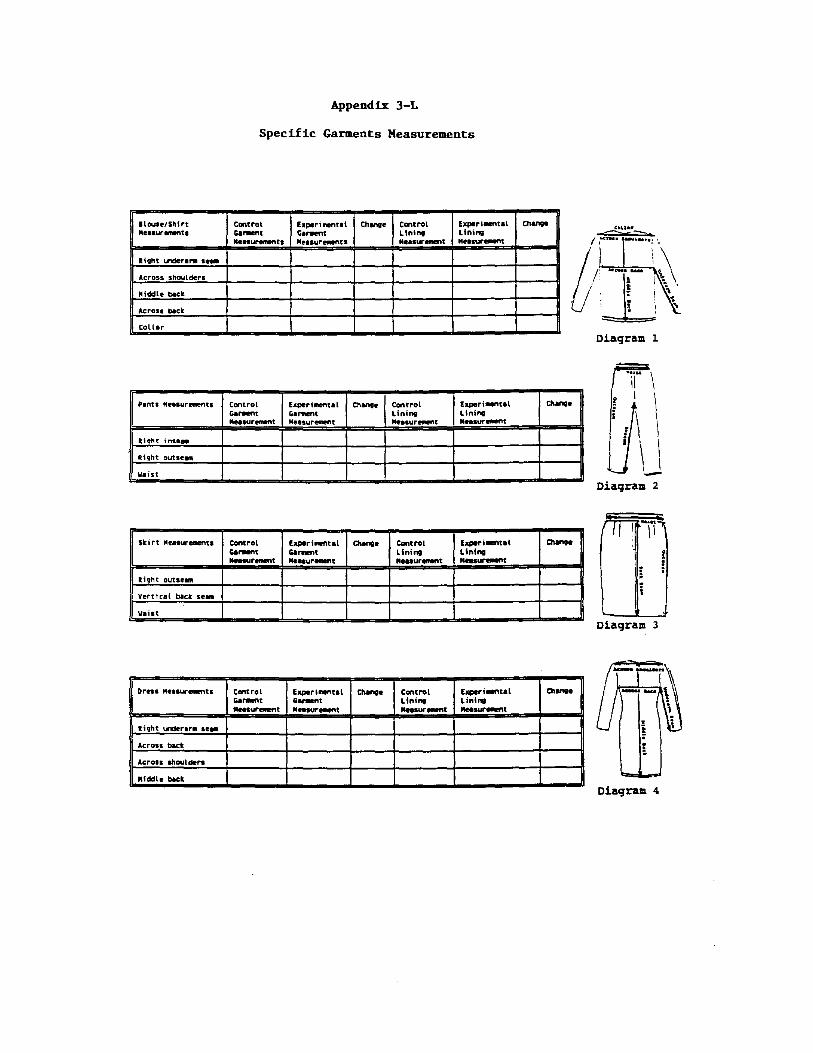
Appendix 3-L
Specific Garments Measurements
llouse/Shir't Ne■a1.1rernent1
Control Garmnt NHaur-ements
bperirenral Gar-,,t NHSUl"eMfttS
Change Control Ltning Neasur..ent
ExperiNnt ■ l Lining Me■ sureant
co.,..
light under ■ nn ae•
Acr-oss shoulders
Middle back
Across blc:lr.
Collar
Diagram l
Panu Me■ sure111enu Control Ga,_.,, Measurement
bperiinent ■ l
G ■ nient Measurement
Chante Cantrol Linint MeHurement
EXl'9riaent ■ l Lining Me■ sureaent
Chanoo
Right inse•
Right outse•
M ■ ist
Ii\ \
\ '
Diagram 2
Ski rt Measureaent1 Control Ga.-,.....,,.__,,
Experi..nt ■ l Ga,_,, Ne■1ure1Mnt
CIiano• Control Lining Meuur""""t
bperi.,,t ■ l Lining MeuureNnt
CIiano•
R; gh t outse-•
vertical baclr. se• .
Main
I ,~n,'TT I ' ! )i ;
' Diagram 3
Drns Me■ aur....,tl Cantrol Gal'Nnt MNSurewient
Experi.,11:al Garaent Musureaent
COanoe Cantrol Linil'II Neesur-et111nt
£aperiMntal Lining--·
Qionge
Right under■ rll H•
Across bact
Across thaulder-■
Nfddle blclr.
Diagram 4

J ■ c:ket Measurements Control Gament Measurement
Experiment ■ l Ga,_,t Mea■ urement
Change Control Lining MusurllNf'lt:
Exper; ment ■ l Lining Measurement
Change
Right sleeve circunference
Across back
R;ght underarm seam
Middle back
Across shoulders Diagram 5
Sweater "e ■ suremenu Control GlrNnt Measurement
Experinental G1nnent: Measurement
Change Control Lining Ne1suremen1:
Ea:perimen1: ■ l Lining Measurement
Change
Right underarm se• (circle one) Full•Fashioned or Set•ln
Right sleOYe circr.nference
Middle back
Diagram 6
Ven Measurements Control Gannent Measureftlel"lt:
Eaperiment:1l Glnnent Measurement
Change Control Lining Measurement
Experilllfflt: ■ l Lining Musureflll!l'lt
Change
Across Shoulders
Across Back
Middle Back Diagram 7
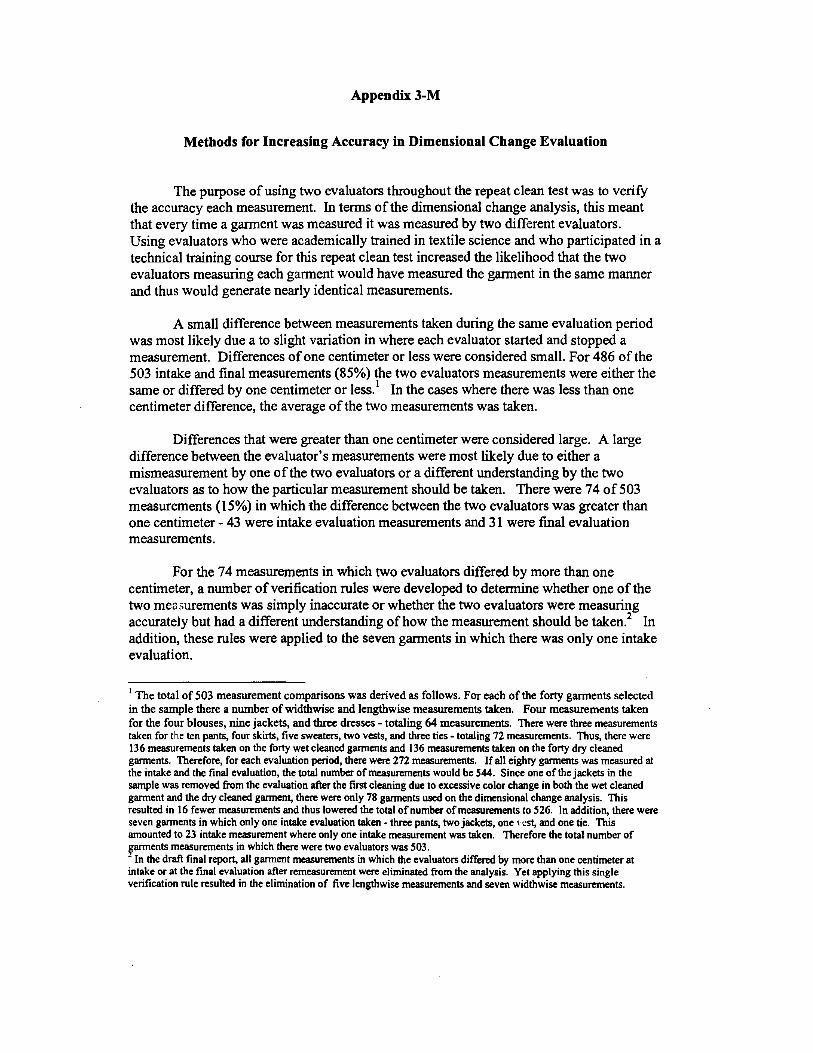
Appendix 3-M
Methods for Increasing Accuracy in Dimensional Change Evaluation
The purpose of using two evaluators throughout the repeat clean test was to verify the accuracy each measurement. In terms of the dimensional change analysis, this meant that every time a garment was measured it was measured by two different evaluators. Using evaluators who were academically trained in textile science and who participated in a technical training course for this repeat clean test increased the likelihood that the two evaluators measuring each garment would have measured the garment in the same manner and thus would generate nearly identical measurements.
A small difference between measurements taken during the same evaluation period was most likely due a to slight variation in where each evaluator started and stopped a measurement. Differences ofone centimeter or less were considered small. For 486 of the 503 intake and final measurements (85%) the two evaluators measurements were either the same or differed by one centimeter or less.1 In the cases where there was less than one centimeter difference, the average of the two measurements was taken.
Differences that were greater than one centimeter were considered large. A large difference between the evaluator's measurements were most likely due to either a mismeasurement by one of the two evaluators or a different understanding by the two evaluators as to how the particular measurement should be taken. There were 74 of 503 measurements ( 15%) in which -the difference between the two evaluators was greater than one centimeter - 43 were intake evaluation measurements and 31 were final evaluation measurements.
For the 74 measurements in which two evaluators differed by more than one centimeter, a number of verification rules were developed to determine whether one of the two meu~urements was simply inaccurate or whether the two evaluators were measuring accurately but had a different understanding ofhow the measurement should be taken.2 In addition, these rules were applied to the seven garments in which there was only one intake evaluation.
1 The total of 503 measurement comparisons was derived as follows. For each of the forty garments selected
in the sample there a number of widthwise and lengthwise measurements taken. Four measurements taken for the four blouses, nine jackets, and three dresses - totaling 64 measurements. There were three measurements taken for the ten pants, four skirts, five sweaters, two vests, and three ties - totaling 72 measurements. Thus, there were 136 measurements taken on the forty wet cleaned garments and 136 measurements taken on the forty dry cleaned garments. Therefore, for each evaluation period, there were 272 measurements. If all eighty garments was measured at the intake and the final evaluation, the total number of measurements would be 544. Since one of the jackets in the sample was removed from the evaluation after the first cleaning due to excessive color change in both the wet cleaned garment and the dry cleaned garment, there were only 78 garments used on the dimensional change analysis. This resulted in 16 fewer measurements and thus lowered the total ofnumber ofmeasurements to 526. In addition, there were seven garments in which only one intake evaluation taken - three pants, two jackets, one , est, and one tie. This amounted to 23 intake measurement where only one intake measurement was taken. Therefore the total number of farments measurements in which there were two evaluators was 503.
In the draft final report, all garment measurements in which the evaluators differed by more than one centimeter at intake or at the final evaluation after remeasurement were eliminated from the analysis. Yet applying this single verification rule resulted in the elimination of five lengthwise measurements and seven widthwise measurements.

Appendix 3-M
Two qualities of the data collected in the dimensional change evaluation aided in the development of these verification rules. First, because each garment was part of a set of three identical garments - two test garments and one control garment - it was possible to assess how consistently the garment was measured at intake. Second, because the coding sheets used in data collection identified the name of the evaluator, it was possible to assess how each evaluator measured a garment.
Rules Verifying Intake Evaluation Measurements
Two procedures were used to assess the accuracy of the 43 intake measurements where the measurements taken by the two evaluators differed by more than one centimeter.
1. When the difference between the evaluator measurements were greater than one centimeter at intake, these two measurements were compared to measurements from the other two garments in the set. For example, if the across the shoulder measurements of a particular jacket was measured by Evaluator A as 48 cm and by Evaluator B as 45 cm, these measurements were compared with the other across the shoulder measurements for the other two garments in the set. Ifall these other measurements were clustered within one centimeter ofone of the two disparate measurements, say all close to 45 cm measurements, then the other measurement, the 48 cm measurement in this case, was considered to be an inaccurate measurement and dropped from the analysis. For 9 of the 43 intake measurements where there as a greater than one centimeter difference between evaluators, the problem was resolved by this rule.
2. When the same evaluator measured each of the three garments in a set at intake, it was possible to assess how similarly they measured these garments. For example, if Evaluator A measured 48 cm for across the shoulder for the two test garments and the control and Evaluator B measured 45 cm for across the shoulder for the same three garments, then it would appear that Evaluator A and Evaluator B were measuring the across ofback measurement for this garment in a consistent manner yet were systematically measuring the garment from a different start or end point. Ifone of these two evaluators also measured the same garment in the final evaluation, it was assumed that they would measure that garment the same way in the final evaluation as they did in the initial evaluation. Thus, then there was a greater than one centimeter difference between evaluator measurements at intake, and when one of the two evaluators also measured all three garment in the set and measured them consistently, and if this evaluator also measured this garment in the final evaluation, then this evaluator's intake score was retained and the other evaluator's measurement was dropped. For 27 ofthe 43 intake measurements where there as a greater than one centimeter difference between evaluators, the problem was resolved by this rule.

Appendix 3-M
In sum, of the 43 intake measurements in which evaluator differences were greater than one centimeter, only 6 were dropped from the analysis because they could not be resolved by one of these two rules.
Rules Verifying Intake Evaluation Measurement Where Only One Evaluator Was Used
For seven of the eighty test garments (40 wet clean and 40 dry clean) there was only one intake evaluation taken. This amounted to a total of25 intake measurements measured by only one evaluator. Because there was only one measurement taken for these garments the accuracy of their measurement needed to evaluated. The same two rules used for verifying intake measures was used here. In 20 of these cases the one intake measurement was consistent with the other intake measurements for the other garments in the set (rule 1 ). In two cases, the same intake evaluator measured the other two garments in the set consistently at intake and also measured the same garment in the final evaluation (rule 2). In three cases the measure was eliminated because it did not conform to either one of these rules.
Rules Verifying Final Evaluation Measurements
Two verification rules were also developed to assess the accuracy of the 31 final evaluation measurements were evaluators measurements differed by more than one centimeter.
l. When the same evaluator measured both the final and the intake evaluation, and if the two intake evaluations did not differ by more than one centimeter this evaluator's final measurement was retailed and the other final measurements was dropped. For 26 of the 31 final measurements where there as a greater than one centimeter difference between evaluators, the problem was resolved by this rule.
2. All final evaluation measurements where the two evaluators differed by more than one centimeter were remeasured.3 If the same evaluator did not measure both the final and intake then the remeasured length was compared to the two final evaluation measurements that differed by more than one centimeter. If the remeasurement was within one centimeter ofone of these two measurements this measurement was retained and the other measurement was dropped. For 4 of the 31 final measurements where there as a greater than one centimeter difference between evaluators, the problem was resolved by this rule.
Thus, of the 31 final evaluation measurements that differed by more than one centimeter all but one was resolved by one of the two verification rules.
3 Professor Hazel Jackson remeasured each of the final garment measures where there was a greater than one centimeter difference between evaluators.

Appendix 3-M
This verification analysis resulted in the retention of the more accurate and reliable measurements when large differences between evaluators was observed or when only one intake evaluation was taken. Of the 72 intake and final measurements that were greater than one centimeter, only 7 needed to be dropped from the evaluation because they could not be resolved by one of the rules. In addition, oftlie 25 measurements in which where there was only one intake evaluation, only three were eliminated because the accuracy of the measurement could not be confirmed by one of the verification rules. Thus, there was a total of 10 measurements which were dropped from the analysis because the accuracy of the measurement could not be verified. Because there was often more than one widthwise or lengthwise measure for each garment, dropping these 10 measures resulted in the elimination of only one widthwise measure (i.e. for gid 39) and one lengthwise measure (i.e. for gid 7) or 2.5% of the eighty widthwise and lengthwise comparisons.4
4 By contrast, in the draft final report, eight measurements (7 widthwise and I lengthwise) were eliminated resulted in the loss of I0% (8/80) of the comparisons. This greater data loss was due to the fact that, in the draft final report, all measurements were eliminated when either the intake measurements among evaluators differed by more than one centimeter or the final measurement differed by more than one centimeter even after a remeasurement was taken. It is also important to note that the application of these verification rules allowed for the retention of six measurements that were eliminated in the final draft report, the addition of these six measures did not substantially change the analysis.
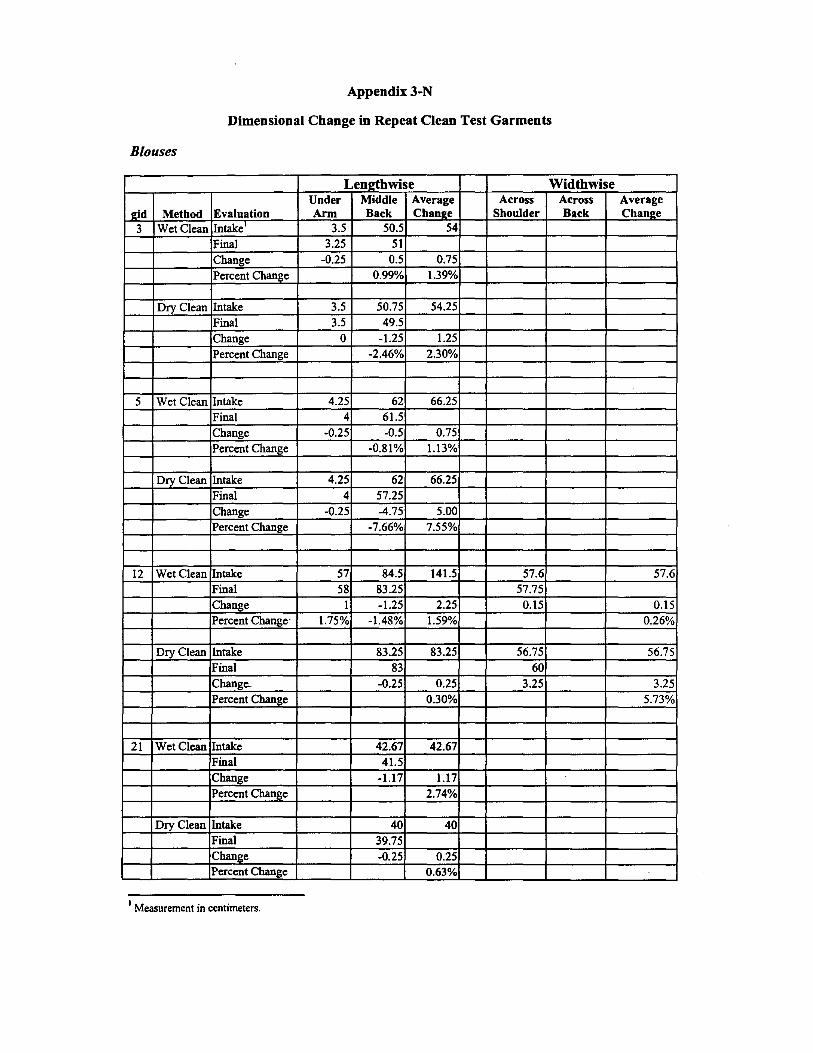
Appendix 3-N
Dimensional Change in Repeat Clean Test Garments
Blouses
Len2thwise Widthwise
eid Method Evaluation Under Arm
Middle Back
Average Chanee
Across Shoulder
Across Back
Average Cham!:e
3 Wet Clean Intake' 3.5 50.5 54 Final 3.25 51 Change -0.25 0.5 0.75
Percent Change 0.99% 1.39%
Dry Clean Intake 3.5 50.75 54.25 Final 3.5 49.5 Change 0 -1.25 1.25 Percent Change -2.46% 2.30%
~
5 Wet Clean Intake 4.25 62 66.25 Final 4 61.5 Change -0.25 -0.5 0.75 Percent Change -0.81% 1.13%
Dry Clean Intake 4.25 62 66.25 Final 4 57.25 Change -0.25 -4.75 5.00 Percent Change -7.66% 7.55%
12 Wet Clean Intake 57 84.5 141.5 57.6 57.6 Final 58 83.25 57.75 Change 1 -1.25 2.25 0.15 0.15 Percent Change· 1.75% -1.48% 1.59% 0.26%
Dry Clean Intake 83.25 83.25 56.75 56.75 Final 83 60 Change.- -0.25 0.25 3.25 3.25 Percent Change 0.30% 5.73%
21 Wet Clean Intake 42.67 42.67 Final 41.5 Change -1.17 1.17 Percent Change 2.74%
Dry Clean Intake 40 40 Final 39.75 Change -0.25 0.25 Percent Change 0.63%
1 Measurement in centimeters.
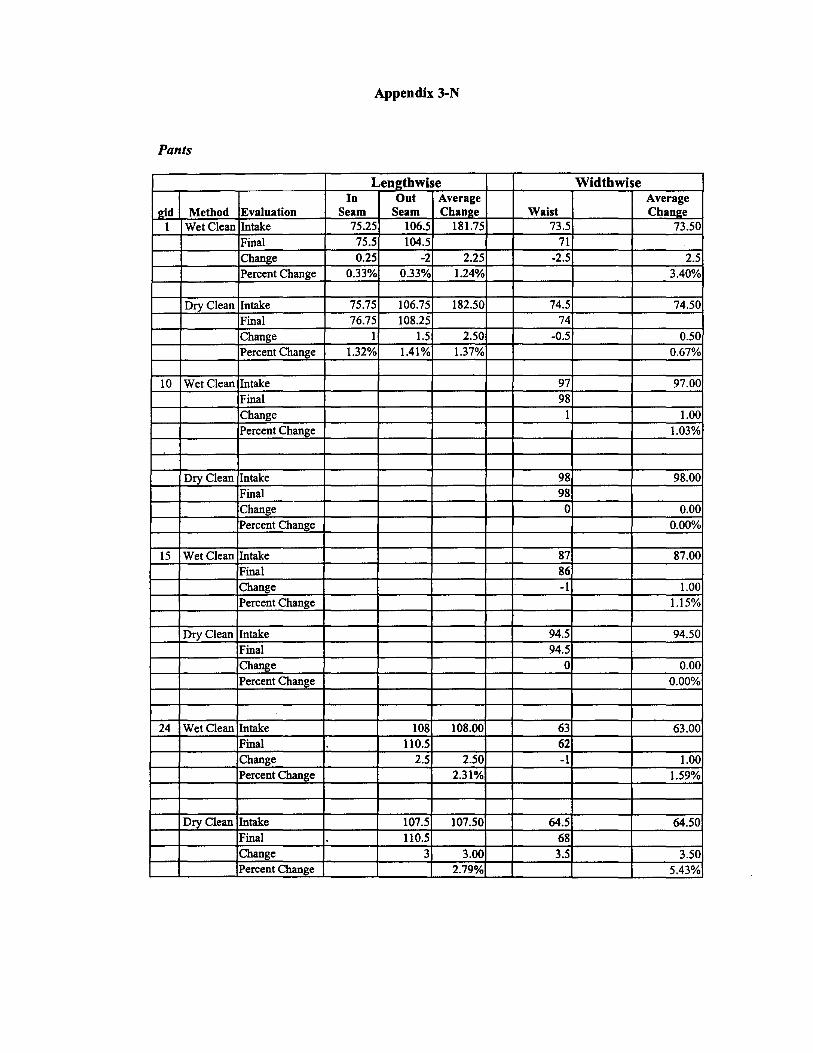
Appendix 3-N
Pants
Lenl!thwise Widthwise
e:id Method Evaluation Io
Seam Out
Seam Average Chane:e Waist
Average Chane:e
l Wet Clean Intake 75.25 106.5 181.75 73.5 73.50 Final 75.5 104.5 71 .
Change 0.25 -2 2.25 -2.5 2.5 Percent Change 0.33% 0.33% 1.24% 3.40%
Dry Clean Intake 75.75 106.75 182.50 74.5 74.50 Final 76.75 108.25 74 Change l 1.5 2.50 -0.5 0.50 Percent Change 1.32% 1.41% 1.37% 0.67%
10 Wet Clean Intake 97 97.00 Final 98 Change I 1.00 Percent Change 1.03%
Dry Clean Intake 98 98.00 Final 98 Change 0 0.00 Percent Change 0.00%
15 Wet Clean Intake 87 87.00 Final 86 Change . -1 1.00 Percent Change 1.15%
Dry Clean Intake 94.5 94.50 Final 94.5 Change 0 0.00 Percent Change 0.00%
24 Wet Clean Intake 108 108.00 63 63.00 Final ll0.5 62 Change 2.5 2.50 -1 1.00 Percent Change 2.31% 1.59%
Dry Clean Intake 107.5 107.50 64.5 64.50 Final ll0.5 68 Change 3 3.00 3.5 3.50 Percent Change 2.79% 5.43%
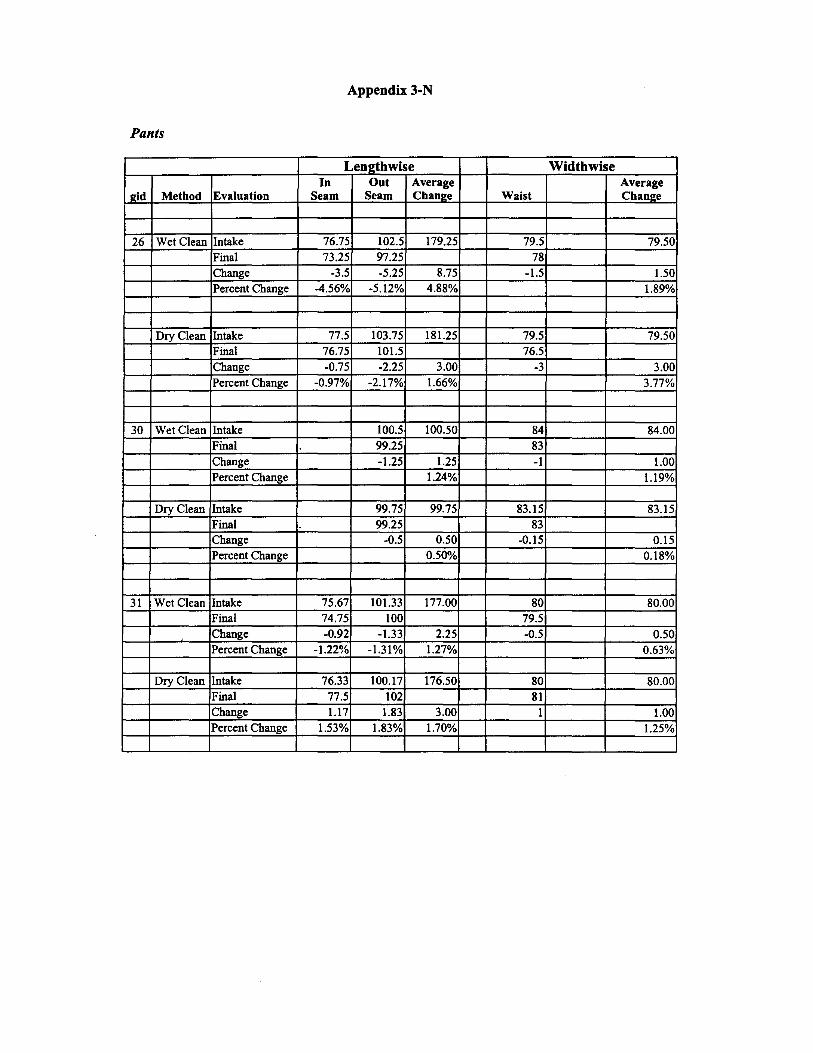
Appendix 3-N
Pants
Lemrthwise Widthwise
2id Method Evaluation In
Seam Out
Seam Average Cham1e Waist
Average Chan2e
26 Wet Clean Intake 76.75 102.5 179.25 79.5 79.50 Final 73.25 97.25 78 Change -3.5 -5.25 8.75 -1.5 1.50 Percent Change -4.56% -5.12% 4.88% 1.89%
Dry Clean Intake 77.5 103.75 181.25 79.5 79.50 Final 76.75 101.5 76.5 Change -0.75 -2.25 3.00 -3 3.00 Percent Change -0.97% -2.17% 1.66% 3.77%
30 Wet Clean Intake 100.5 100.50 84 84.00 Final 99.25 83 Change -1.25 1.25 -1 1.00 Percent Change 1.24% 1.19%
Dry Clean Intake 99.75 99.75 83.15 83.15 Final 99.25 83 Change -0.5 0.50 -0.15 0.15 Percent Change 0.50% 0.18%
31 Wet Clean Intake 75.67 101.33 177.00 80 80.00 Final 74.75 100 79.5 Change -0.92 -1.33 2.25 -0.5 0.50 Percent Change -1.22% -1.31% 1.27% 0.63%
Dry Clean Intake 76.33 100.17 176.50 80 80.00 Final 77.5 102 81 Change 1.17 1.83 3.00 1 1.00 Percent Change 1.53% 1.83% 1.70% 1.25%

Appendix 3-N
Pants
Lenl!thwise Widthwise AverageIn Out Average
Seam Seam Chan2e WaistMethod Evaluation Chan2e2id 78 104 182.00 80Wet Clean Intake 80.0036 77 101.5 80Final -1Change -2.5 3.50 0 0.00
-2.40% 1.92%Percent Change -1.28% 0.00%
78.5 103.5 182.00 81Dry Clean Intake 81.00 102.25Final 76.7 82.25
-1.8 -1.25Change 3.05 1.251.2~ Percent Change -2.29% -1.21% 1.68% 1.54%
Wet Clean Intake 78 105 183.00 8638 86.00 78 102.25Final 85.5
Change 0 -2.75 2.75 -0.5 0.50 Percent Change 0.00% -2.62% 1.50% 0.58%
Dry Clean Intake 77.5 105.25 182.75 86 86.00 Final 78 105.5 86
0.5Change 0.25 0.75 0 0.00 0.24% 0.41%Percent Change 0.65% 0.00%
8439 Wet Clean Intake 84.00 Final 84 Change 0 0.00 Percent Change 0.00%
Dry Clean Intake 84 84.00 Final 83.25 Change -0.75 0.75 Percent Change 0.89%
.
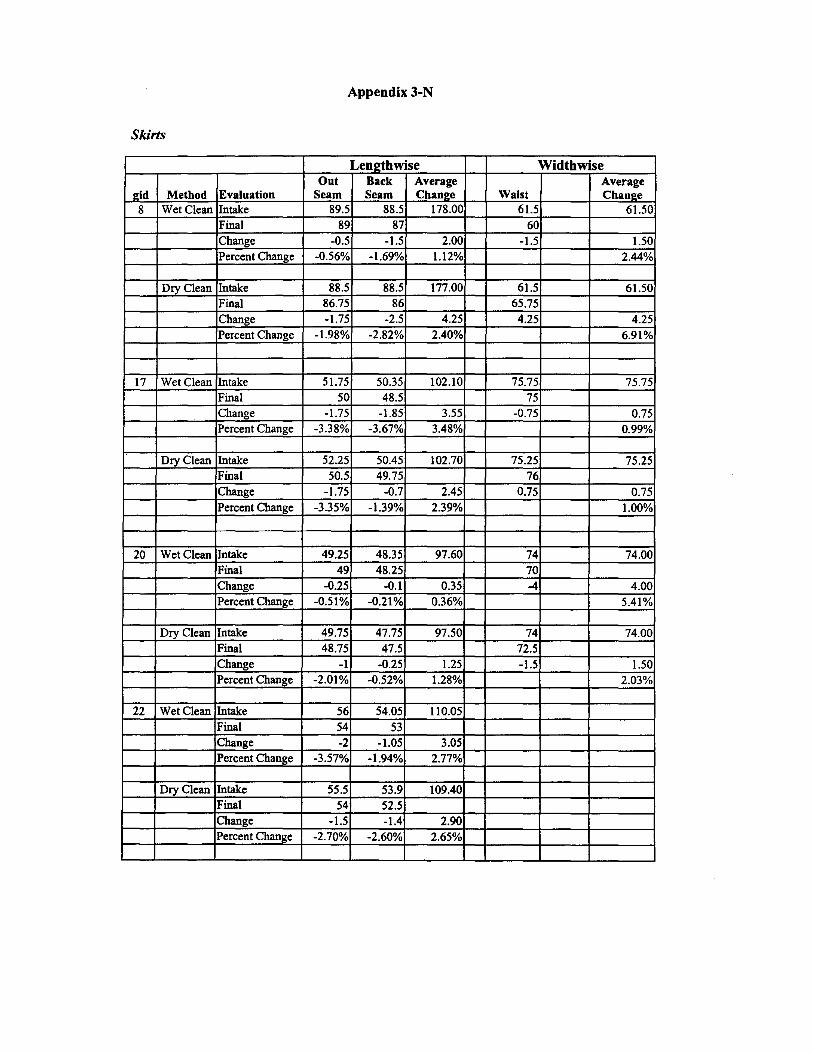
Appendix 3-N
Skirts
Lene:thwise Widthwise
2id Method Evaluation Out
Seam Back Seam
Average Chan2e Waist
Average Chan2e
8 Wet Clean Intake 89.5 88.5 178.00 61.5 61.50 Final 89 87 60 Change -0.5 -1.5 2.00 -1.5 1.50 Percent Change -0.56% -1.69% 1.12% 2.44%
Dry Clean Intake 88.5 88.5 177.00 61.5 61.50 Final 86.75 86 65.75 Change -1.75 -2.5 4.25 4.25 4.25 Percent Change -1.98% -2.82% 2.40% 6.91%
17 Wet Clean Intake 51.75 50.35 102.10 75.75 75.75 Final 50 48.5 75 Change -1.75 -1.85 3.55 -0.75 0.75 Percent Change -3.38% -3.67% 3.48% 0.99%
Dry Clean Intake 52.25 50.45 102.70 75.25 75.25 Final 50.5 49.75 76 Change -1.75 -0.7 2.45 0.75 0.75 Percent Change -3.35% -1.39% 2.39% 1.00%
20 Wet Clean Intake 49.25 48.35 97.60 74 74.00 Final 49 48.25 70 Change -0.25 -0.1 0.35 -4 4.00 Percent Change -0.51% -0.21% 0.36% 5.41%
Dry Clean Intake 49.75 47.75 97.50 74 74.00 Final 48.75 47.5 72.5 Change -1 -0.25 1.25 -1.5 1.50 Percent Change -2.01% -0.52% 1.28% 2.03%
22 Wet Clean Intake 56 54.05 110.05 Final 54 53 Change -2 -1.05 3.05 Percent Change -3.57% -1.94% 2.77%
Dry Clean Intake 55.5 53.9 109.40 Final 54 52.5 Change -1.5 -1.4 2.90 Percent Change -2.70% -2.60% 2.65%

Appendix 3-N
Dresses
1dd Method Evaluation 6 Wet Intake
Clean Final Change Percent Change
Dry Clean Intake Final Change Percent Change
16 Wet Intake Clean
Final Change Percent Change
Dry Clean Intake
F:11111 Change Percent Change
23 Wet Intake Clean
Final Change Percent Change
Dry Clean Intake Final
Change Percent Change
Lenlrthwise Under Middle Average Arm Back Chanl!e
1.15 86.5 87.65
I 83.25 -0.15 -3.25 4.40
-3.76% 5.02%
1.5 87.5 89.00 I 84.75
-0.5 -2.75 3.25 -2.75 3.65%
7.75 7.75
7.5 -0.25 0.25
3.23%
7 7.00 7.25 0.25 0.25
3.57%
116.83 116.83
116.5 -0.33 0.33
0.28%
117.83 I 17.83 116.5 -1.33 1.33
1.13%
Widthwise Across Across Average Back Shoulder Chane;e
45.25 45.25
47.5 2.25 2.25
4.97%
46 46.00 47
I 1.00 2.17%
45.5 45.50
47 1.5 1.50
3.30%
40 40.00 41
1 1.00 2.50%
45.83 45.83
44.25 -1.58 1.58
3.45%
46.33 46.33 48
1.67 1.67 3.60%
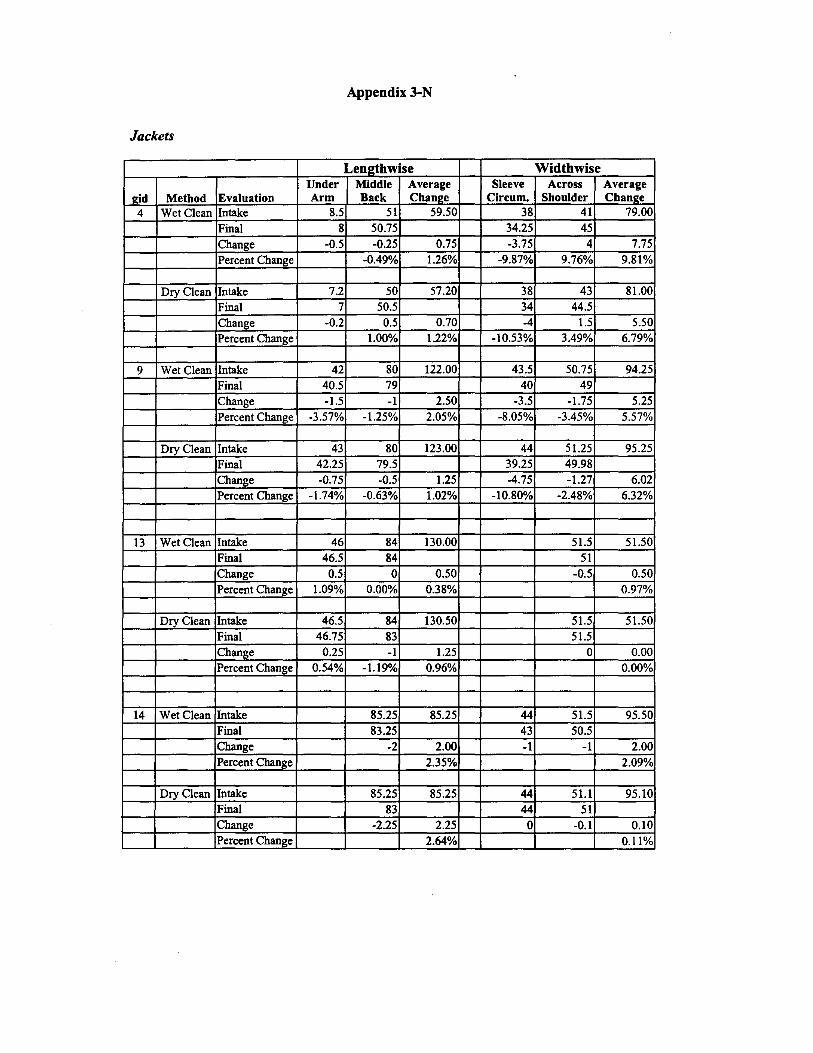
Appendix 3-N
Jackets
Len2thwise Widthwise
eid Method Evaluation Under Arm
Middle Back
Average Chan2e
Sleeve Circum.
Across Shoulder
Average Chan2e
4 Wet Clean Intake 8.5 51 59.50 38 41 79.00
Final 8 50.75 34.25 45
Change -0.5 -0.25 0.75 -3.75 4 7.75
Percent Change -0.49% 1.26% -9.87% 9.76% 9.81%
Dry Clean Intake 7.2 50 57.20 38 43 81.00
Final 7 50.5 34 44.5
Change -0.2 0.5 0.70 -4 1.5 5.50
Percent Change 1.00% 1.22% -10.53% 3.49% 6.79%
9 Wet Clean Intake 42 80 122.00 43.5 50.75 94.25
Final 40.5 79 40 49
Change -1.5 -1 2.50 -3.5 -1.75 5.25
Percent Change -3.57% -1.25% 2.05% -8.05% -3.45% 5.57%
Dry Clean Intake 43 80 123.00 44 51.25 95.25
Final 42.25 79.5 39.25 49.98
Change -0.75 -0.5 1.25 -4.75 -1.27 6.02 Percent Change -1.74% -0.63% 1.02% -10.80% -2.48% 6.32%
13 Wet Clean Intake 46 84 130.00 51.5 51.50 Final 46.5 84 51 Change 0.5 0 0.50 -0.5 0.50 Percent Change 1.09% 0.00% 0.38% 0.97%
Dry Clean Intake 46.5 84 130.50 51.5 51.50
Final 46.75 83 51.5 Change 0.25 -1 1.25 0 0.00 Percent Change 0.54% -1.19% 0.96% 0.00%
14 Wet Clean Intake 85.25 85.25 44 51.5 95.50 Final 83.25 43 50.5 Change -2 2.00 -1 -1 2.00 Percent Change 2.35% 2.09%
Dry Clean Intake 85.25 85.25 44 51.l 95.10 Final 83 44 51 Change -2.25 2.25 0 -0.l 0.10 Percent Change 2.64% 0.11%

Appendix 3-N
Jackets
Lemrtbwise Widthwise
11:id Method Evaluation Under Arm
Middle Back
Average Chane:e
Sleeve Circum.
Across Shoulder
Average Chane:e
18 Wet Clean Intake 41.5 75.25 116.75 44 .
44.00 Final 42 75 44 Change 0.5 -0.25 0.75 0 0.00 Percent Change 1.20% -0.33% 0.64% 0.00%
Dry Clean Intake 41.5 76.5 118.00 45 45.00 Final 42 76 45 Change 0.5 -0.5 1.00 0 0.00 Percent Change 1.20% -0.65% 0.85% 0.00%
29 Wet Clean Intake 43.85 73.88 117.73 43.5 43.50 Final 39.5 69.5 45 Change -4.35 -4.38 8.73 1.5 I.SO Percent Change -9.92% -5.93% 7.42% 3.45%
Dry Clean Intake 43.25 72.75 116.00 43.25 43.75 87.00 Final 41.5 71.5 42 45 Change -1.75 -1.25 .. 3.00 -1.25 1.25 2.50 Percent Change -4.05% -1.72% 2.59% -2.89% 2.86% 2.87%
32 Wet Clean Intake 64 64.00 36 43.5 79.50 Final 60 35.5 42.75 Change -4 4.00 -0.5 -0.75 1.25 Percent Change 6.25% -1.39% -1.72% 1.57%
Dry Clean Intake 64.75 64.75 36 43.5 79.50 Final 63 36 43 Change -1.75 1.75 0 -0.5 0.50 Percent Change 2.70% 0.00% -1.15% 0.63%
37 Wet Clean Intake 45 78.25 123.25 39.5 43.5 83.00 Final 44.33 77.25 40 42.5 Change -0.67 -1 1.67 0.5 -1 1.50 Percent Change -1.49% -1.28% 1.35% 1.27% -2.30% 1.81%
Dry Clean Intake 44.5 78 122.50 39.5 42.5 82.00 Final 43.75 76 40 42.75 Change -0.75 -2 2.75 0.5 0.25 0.75 Percent Change -1.69% -2.56% 2.24% 1.27% 0.59% 0.91%

Appendix 3-N
Sweaters
!!id Method Evaluation 25 Wet Clean Intake
Final Change Percent Change
Dry Clean Intake Final Change Percent Change
28 Wet Clean Intake Final Change Percent Change
Dry Clean Intake Final Change Percent Change
33 Wet Clean Intake Final Change Percent Change
Dry Clean Intake Final Change Percent Change
34 Wet Clean Intake Final Change Percent Change
Dry Clean Intake Final Change Percent Change
Lemrthwise Under Middle Average Arm Back Chanl!e
6 6.00 7 I 1.00
16.67%
6.5 6.50 6.5
0 0.00 0.00%
46.9 46.90 51.25
4.35 4.35 9.28%
46 46.00 49.5
3.5 3.50 7.61%
6.25 57.85 64.10 7 53
0.75 -4.85 5.60 8.74%
6.25 58.75 65.00 6 54
-0.25 -4.75 5.00 7.69%
.
Widthwise Sleeve Across Average
Circum. Shoulder Chanl!e 38 38.00
37.5 -0.5 0.50
1.32%
38 38.00 36.5 -1.5 1.50
3.95%
32.5 32.50 30
-2.5 2.50 7.69%
31.5 31.50 31.5
0 0.00 0.00%
30 30.00 33 3 3.00
10.00%
31.5 31.50 33.5
2 2.00 6.35%
36 36.00 32.5 -3.5 3.50
9.72%
37 37.00 32 -5 5.00
13.51%
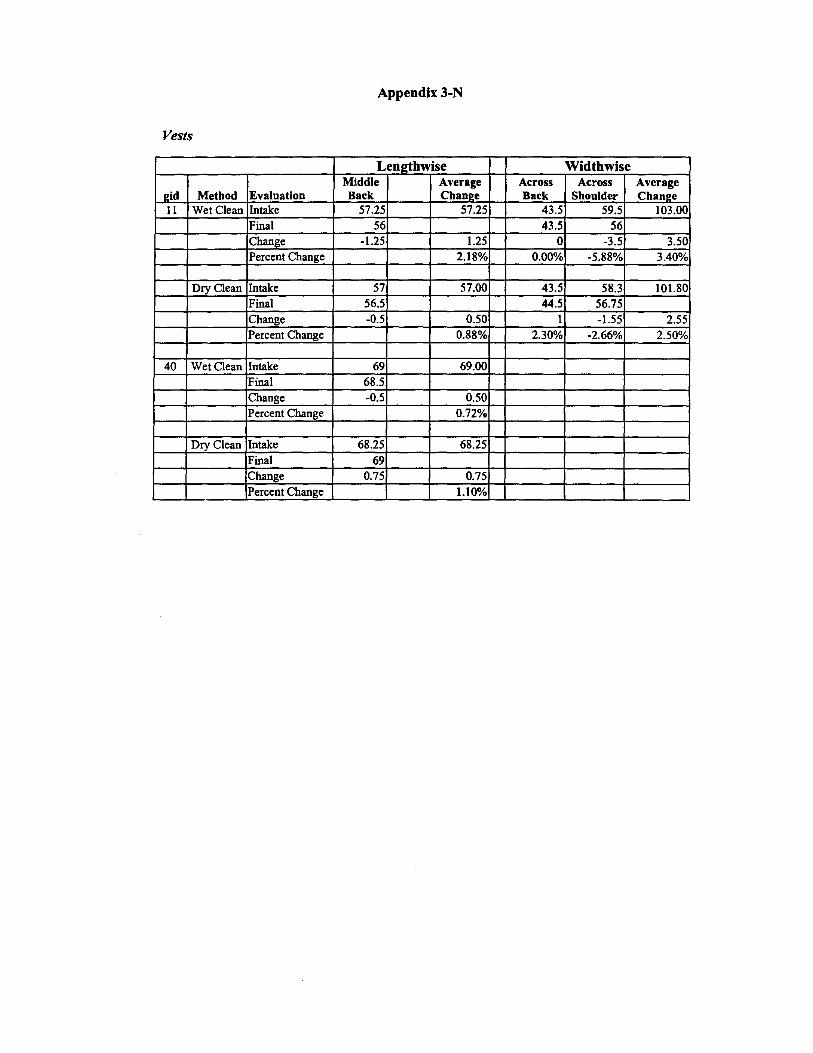
Appendix 3-N
Vests
Lenlrthwise Widthwise
eid Method Evaluation Middle Back
Average Chanl!e
Across Back
Across Shoulder
Average Chanee
11 Wet Clean Intake 57.25 57.25 43.5 59.5 l03.00 Final 56 43.5 56 Change -1.25 1.25 0 -3.5 3.50 Percent Change 2.18% 0.00% -5.88% 3.40%
Dry Clean Intake 57 57.00 43.5 58.3 101.80 Final 56.5 44.5 56.75 Change -0.5 0.50 l -1.55 2.55 Percent Change 0.88% 2.30% -2.66% 2.50%
40 Wet Clean Intake 69 69.00 Final 68.5 Change -0.5 0.50 Percent Change 0.72%
Dry Clean Intake 68.25 68.25 Final 69 Change 0.75 0.75 Percent Change 1.10%
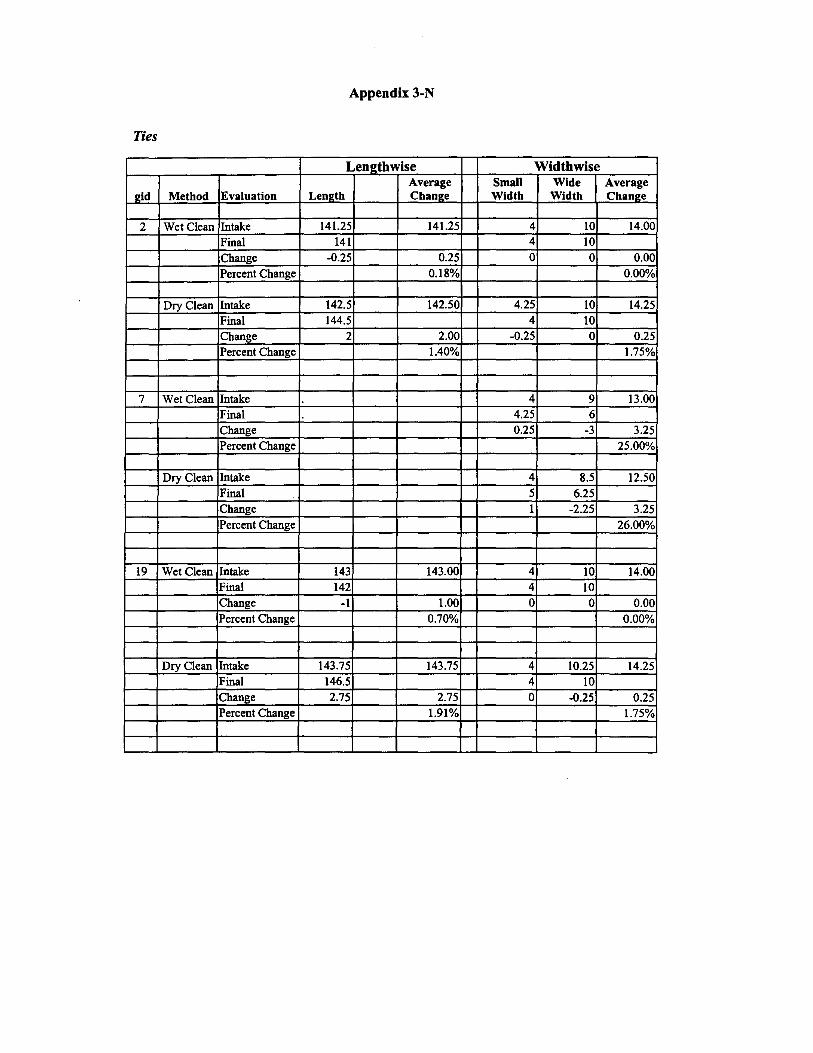
Appendix 3-N
Ties
2id Method Evaluation
2 Wet Clean Intake Final Change Percent Change
Dry Clean Intake Final Change Percent Change
7 Wet Clean Intake Final Change Percent Change
Dry Clean Intake
Final Change
Percent Change
19 Wet Clean Intake Final
Change Percent Change
Dry Clean Intake Final Change Percent Change
Lengthwise Average
Lem!th Cham!e
141.25 141.25 141
-0.25 0.25
0.18%
142.5 142.50 144.5
2 2.00 1.40%
143 143.00 142
-1 1.00
0.70%
143.75 143.75
146.5 2.75 2.75
1.91%
Widthwise Small Wide Average Width Width Chan2e
4 10 14.00 4 10 0 0 0.00
0.00%
4.25 10 14.25 4 10
-0.25 0 0.25
1.75%
4 9 13.00 4.25 6 0.25 -3 3.25
25.00%
4 8.5 12.50 5 6.25 1 -2.25 3.25
26.00%
4 10 14.00 4 10 0 0 0.00
0.00%
4 10.25 14.25 4 10 0 -0.25 0.25
1.75%
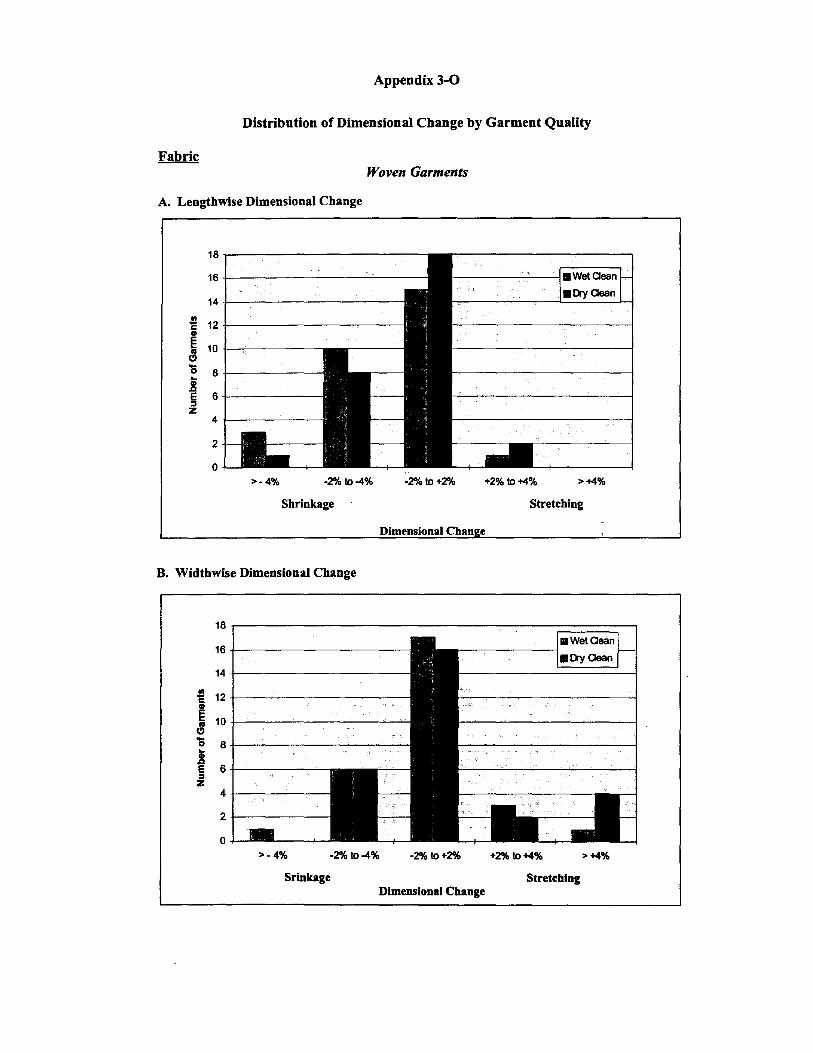
Appendix 3-0
Distribution of Dimensional Change by Garment Quality
Fabric Woven Garments
A. Lengthwise Dimensional Change
18
16 ------------1 ■ Wet Oean
14 ■ ClryOean
~ 12.. e 10.. Cl 'l5.. 8
1l e 6 ::, z
4
2
0 >-4% -2% to-4% -2% to +2% +2% to-+4% >-+4%
Shrinkage Stretching
Dimensional Chan e
B. Widthwise Dimensional Change
18
16
14 .. 12c.. e 10..
Cl 'l5 8.. 1l e 6 ::, z
4
2
0
11wetaean---------j
■ ClryOean
+2% to-+4%
Stretching
>-+4%>-4% -2% to-4% -2% to+2%
Srinkage Dimensional Change

Appendix 3-0
Fabric Knit Garments
A. Lengthwise Dimensional Change
mwetOean
■ ClryOean
3~------------
0 >-4% -2% to-4% -2% to+2% +2%to+4% >+4%
Srinkage Stretching Dimensional Change
B. Widthwise Dimensional Change
4
0
mwetOean
■ Clry0ean
>-4% -2%to-4% -2%to+2% +2%to+4% >+4%
Srinkage Stretching Dimensional Change

Appendix 3-0
A. Lengthwise Dimensional Change
25
20
!! C:.. E 15 ..... -t.:, ... =
10.i E :,
;z:
5
0 >~4% -2% to -4%
Shrinkage
B. Widthwise Dimensional Change
18
16
14
!! C: 12.. E... 10.. -t.:, = ... 8 .i E 6 :,
;z: 4
2
0
□ WetOean
_________,■ Dry Oean
-2%to +2% +2%to +4% >+4%
Stretching Dimensional Change
_________,□ Wet Oean
■ DryOean
>-4% -2%to -4% -2%to +2% +2%to +4% >+4%
Shrinkage Stretching Dimensional Change

Appendix 3-P
Repeat Clean Test Comparisons
METHODS
In order to compare the dimensional change results from the PPERC study with the results from the Center for Neighborhood Technology study, and the Environment Canada study it is first necessary to compare the methods used in each study and where differences occur to adjust how the data is analyzed and displayed so that the comparison reflects a difference in the outcome of the studies and not a difference in method.1
Sample ofTest Garments: A total of40 pairs of identical "dry clean only" labeled garments were used in the PPERC study, while 52 pairs were used in the CNT study and 13 pairs were evaluated in the Environment Canada study. While knits made up 20% of the PPERC sample and 25% of the CNT sample, only one garment in the Environment Canada sample was knit. PPERC was the only study to classify the construction of each garment as either tailored or unstructured, based on how the garment was designed to fit. Tailored garments accounted for 65% (26 of40) of the garments in the PPERC study. While it was not possible to precisely classify the construction of the garments used in the CNT study and Environment Canada studies without physically observing the garments, based on garment description alone, a higher proportion ofwoven garments appeared to be unstructured in the CNT sample compared to the PPERC sample.2 On the other hand, almost all of the Environment Canada garments appeared to be tailored.
Study Design: While each garment pair was repeatedly wet cleaned or dry cleaned in each of the three studies, the Environment Canada study did not have a volunteer wear each pair of garments before every cleaning. In the PPERC and CNT study, garments were marked so that the wearer and evaluator were unaware (blinded) as to which garment was the wet cleaned garment and which was dry cleaned. In addition, in the PPERC and CNT studies, the cleaner was not told which were the test garments. Because Environment Canada actually timed the pressing for each test garment, the cleaner was aware ofwhich were the test garments. PPERC and CNT used multiple evaluators to characterize each garment before and after repeated cleaning. Environment Canada used only one evaluator, who was part of the project team.
Analysis ofDimensional Change: All three studies measured each garment at intake and after repeated cleanings using at least one widthwise and one lengthwise measurement. The PPERC and Environment Canada study used almost identical methods for calculating dimensional change. However, when there were two lengthwise or widthwise
1 Center for Neighborhood Technology, Alternative Clothes Cleaning Demonstration Shop Final Report, (September 1996). Environment Canada, Final Report/or the Green Clean Project, (Samia, Ontario, October 1995). The 1992 EPA study of multi-process wet cleaning was the first study of wet cleaning to carry out a Repeat Clean Test. Since this evaluation was ofmulti-process wet cleaning, it was not used in this comparison. 2 The greater proportion of unstructured woven garments in the CNT sample was due to the fact that CNT purposefully chose garments that reflected the types of garments brought to a dry cleaner in Chicago, including coats and wool shirts. These types of garments were not represented in the PPERC sample.

Appendix 3-P
measurements, the PPERC study calculated a weighted average based in the initial length or width of the two measurements while Environment Canada used only one of the two measurements. For the purpose of this comparison, a weighted average of the Environment Canada data was used. In addition, while Environment Canada reported only their lengthwise results, both lengthwise and widthwise results are used in this comparison. 3 The PPERC and CNT studies differed in how evaluator discrepancies were dealt with and what measurement was used to represent the dimensional change ofa garment. In the PPERC study, differences between evaluators were resolved through the use of simple verification rules (See Appendix 4-M). In the CNT study, when there were differences between evaluators an attempt was made to develop a consensus among the evaluators measuring the garments. Yet in the data analysis stage, if large differences in measurement persisted, the measurement that produced the biggest difference between intake and final measurement was used. For the purpose of this comparison. when small differences between evaluators occurs (i.e. one centimeter or less) the two measurements are averaged. When there is a large difference between evaluators (i.e. greater than one centimeter) the measurement is eliminated.4 The PPERC study evaluated lengthwise and widthwise measurements separately, while the CNT study used the garment measurement in which there was the largest percentage change from intake to final as the dimensional change representing that garments. For the purpose of this comparison, lengthwise and widthwise measurements were analyzed separately. 5
Verification: While the repeat clean test is designed to quantify the changes in quality of identical garments that were wet cleaned and dry cleaned, the test cannot assess whether the change could be noticed by customers wearing the garments. Both PPERC and CNT conducted a survey of the volunteers who wore the garments in order to correlate the quantified changes in the repeat clean test and the subjective perception ofchange experienced by each volunteer wearing a pair oftest garments.
3 The Environment Canada report provided the actual raw data for each measurement for each time garments were cleaned. Environment Canada, Final Report for the Green Clean Project, (Samia, Ontario, October 1995): Appendix C -- Table D1-D5. 4
Because CNT did not identify the name of the evaluator measuring each garment it was not possible to assess intra-rater reliability (i.e. how the same rater measured garments at intake and the final evaluation). Thus, the conservative rule of dropping measurements in which there were large discrepancies between measurements was used. 5 Because CNT's final report only reported the maximum dimensional change for each garment and not the lengthwise and widthwise change, CNT provided the PPERC study the raw data for this analysis. See Appendix 3-T for a complete listing of this data.
Appendix 3-P
Results
Average Dimensional Change
Comparing the average dimensional change in the three studies makes it possible to assess the consistency of the relative magnitude of change for identical garments that were wet cleaned and dry cleaned.
For all three studies a very similar pattern of dimensional change among garments was observed (Figure A). Knit garments experienced greater dimensional change than woven garments in both length and width when repeatedly wet cleaned or dry cleaned.6
In the PPERC study, the average lengthwise change among knits was greater when the garment was wet cleaned, yet the average widthwise change for these same garments was greater when the garment was dry cleaned. In the CNT study, knits experienced more dimensional change in length and width when repeatedly wet cleaned than when dry cleaned, with the average difference twice as great in the widthwise direction as in the lengthwise direction.
For woven garments, both CNT and Environment Canada studies showed a one percent greater change in the lengthwise direction when the garment was wet cleaned, yet the widthwise change for these same garments was practically the same whether the garment was wet cleaned or dry cleaned. Woven garments in the PPERC study experienced almost identical amounts ofdimensional change in the lengthwise and widthwise directions when repeatedly wet cleaned or dry cleaned.
6 Since there was only one knit garment in the Environment Canada study no data point ofknit was created.

Appendix 3-P
Figure 4-P.1:
I. Lengthwise
Average Dimensional Change from PPERC, CNT, and Environment Canada Repeat Clean Tests
S% --Knit
-0-AII Garments .." 4% ~ ........-wovenC.,.c: 3%
] u
~ ...l'l 2% ~ ci
1%
0%
Wet Dry Wet Dry Wet Dry Oean Oean Oean Oean Oean aean
PPERC CNT Env. Canada i
i. Only one knit garment in the sample.
II. Widthwise
7%
..... --Knit....6% -0-AII Garments
........-woven.." S% C...c:
] u 4%
3% 0 0l'l ..-~ 2%Q • -00-• .... 1%
0%
Wet Dry Wet Dry Wet Dry Oean Oean Oean Oean aean aean
PPERC CNT Env. Canada i
i. Only one knit garment in the sample.

Appendix 3-P
Change Greater Than 4%
In all three studies, the proportion of garments that shrank or stretched greater than 4% after repeated wet cleaning or dry cleaning varied substantially by the gannent's fabric (See Figure B). Knit garments had the greatest chance of shrinking or stretching more than 4% in the lengthwise or widthwise direction for both wet cleaned and dry cleaned gannents.
The PPERC study found that a slightly greater proportion of knit gannents experience a dimensional change of over 4% in width when wet cleaned than when the identical gannents were dry cleaned. The CNT study found that a substantially greater proportion ofknit gannents experience a dimensional change ofover 4% in length and width when wet cleaned than when the identical garments were dry cleaned.
For woven garments, more lengthwise dimensional change of over 4% occurred among garments repeatedly wet cleaned. Yet, both the PPERC study and the CNT study reported more widthwise dimensional change greater than 4% among woven gannents that were dry cleaned than among those that were wet cleaned. In the Environment Canada study, only one wet cleaned woven gannent experienced a greater than 4% dimensional change in width while none of the dry cleaned garments experienced this amount of change.
In general, the PPERC study and the CNT study showed that there was a greater tendency for knit gannents to shrink or stretch more than 4% when wet cleaned. Yet, the proportion ofwoven gannents with greater than 4% dimensional change was relatively comparable.

Appendix 3-P
Figure 4-P.2: Dimensional Change Greater Than 4 Percent from PPERC, CNT, and Environment Canada Repeat Clean Tests
L Lengthwise
50% ~--------------------------~_-_-_-_-_-_-_-_-~-~
40%
30%
20%
10%
0%
□ Knit
1-------------□ All Garments
■ Woven
Wet Dry Wet Dry Wet Dry
Oean Oean Oean Oean Oean Oean
PPERC CNT Env. Canada i
i. No dry clean garments stretched or shrank roore than 4% in length.
II. Widthwise
60% n-,----:------------------------;:====:::::;-,
50%
40%
30%
□ Knit
1-----.-,--------.....---------------l □ All Garments
■ Wov"n
Wet Dry Wet Dry Wet Dry Oean Oean Oean Oean Oean Oean
PPERC CNT Env. Canada
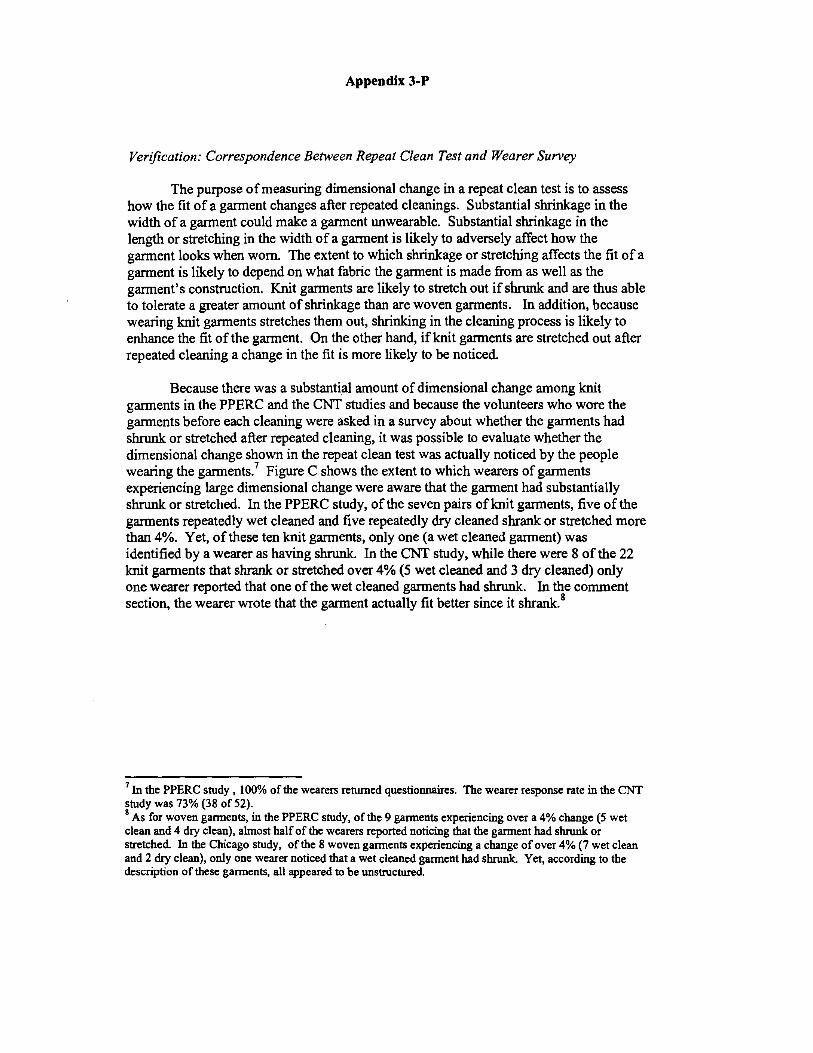
Appendix 3-P
Verification: Correspondence Between Repeat Clean Test and Wearer Survey
The purpose ofmeasuring dimensional change in a repeat clean test is to assess how the fit of a garment changes after repeated cleanings. Substantial shrinkage in the width of a garment could make a garment unwearable. Substantial shrinkage in the length or stretching in the width of a garment is likely to adversely affect how the garment looks when worn. The extent to which shrinkage or stretching affects the fit of a garment is likely to depend on what fabric the garment is made from as well as the garment's construction. Knit garments are likely to stretch out if shrunk and are thus able to tolerate a greater amount of shrinkage than are woven garments. In addition, because wearing knit garments stretches them out, shrinking in the cleaning process is likely to enhance the fit of the garment. On the other hand, if knit garments are stretched out after repeated cleaning a change in the fit is more likely to be noticed.
Because there was a substantial amount of dimensional change among knit garments in the PPERC and the CNT studies and because the volunteers who wore the garments before each cleaning were asked in a survey about whether the garments had shrunk or stretched after repeated cleaning, it was possible to evaluate whether the dimensional change shown in the repeat clean test was actually noticed by the people wearing the garments.7 Figure C shows the extent to which wearers of garments experiencing large dimensional change were aware that the garment had substantially shrunk or stretched. In the PPERC study, of the seven pairs ofknit garments, five of the garments repeatedly wet cleaned and five repeatedly dry cleaned shrank or stretched more than 4%. Yet, of these ten knit garments, only one (a wet cleaned garment) was identified by a wearer as having shrunk. In the CNT study, while there were 8 of the 22 knit garments that shrank or stretched over 4% (5 wet cleaned and 3 dry cleaned) only one wearer reported that one of the wet cleaned garments had shrunk. In the comment section, the wearer wrote that the garment actually fit better since it shrank. 8
7 In the PPERC study, 100% of the wearers returned questionnaires. The wearer response rate in the CNT study was 73% (38 of 52).8 As for woven garments, in the PPERC study, of the 9 garments experiencing over a 4% change (5 wet clean and 4 dry clean), almost half of the wearers reported noticing that the garment had shrunk or stretched. In the Chicago study, of the 8 woven garments experiencing a change of over 4% (7 wet clean and 2 dry clean), only one wearer noticed that a wet cleaned garment had shrunk. Yet, according to the description of these garments, all appeared to be unstructured
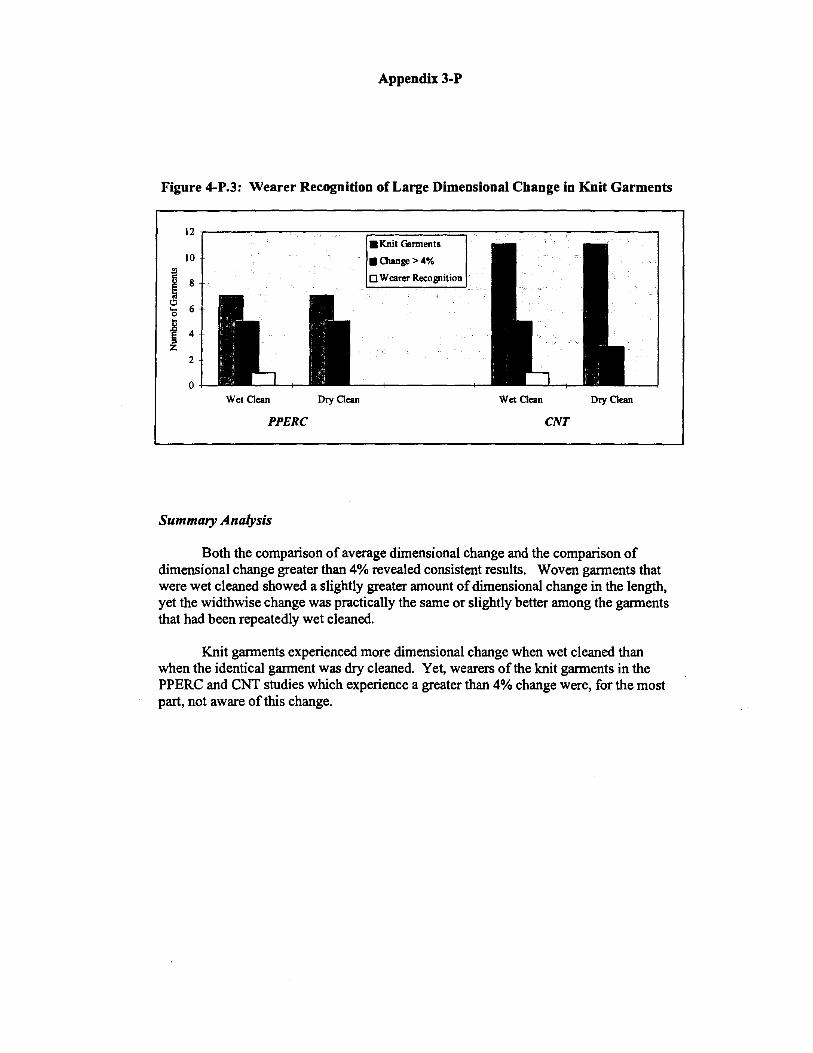
Appendix 3-P
Figure 4-P.3: Wearer Recognition of Large Dimensional Change in Knit Garments
JO
2
0
■ Knit Garments
■ 0iange>4%
□ Wearer Recognition
Wet Clean Dry Clean Wet Clean Dry Clean
PPERC CNT
Summary Analysis
Both the comparison of average dimensional change and the comparison of dimensional change greater than 4% revealed consistent results. Woven garments that were wet cleaned showed a slightly greater amount ofdimensional change in the length, yet the widthwise change was practically the same or slightly better among the garments that had been repeatedly wet cleaned.
Knit garments experienced more dimensional change when wet cleaned than when the identical garment was dry cleaned. Yet, wearers of the knit garments in the PPERC and CNT studies which experience a greater than 4% change were, for the most part, not aware of this change.
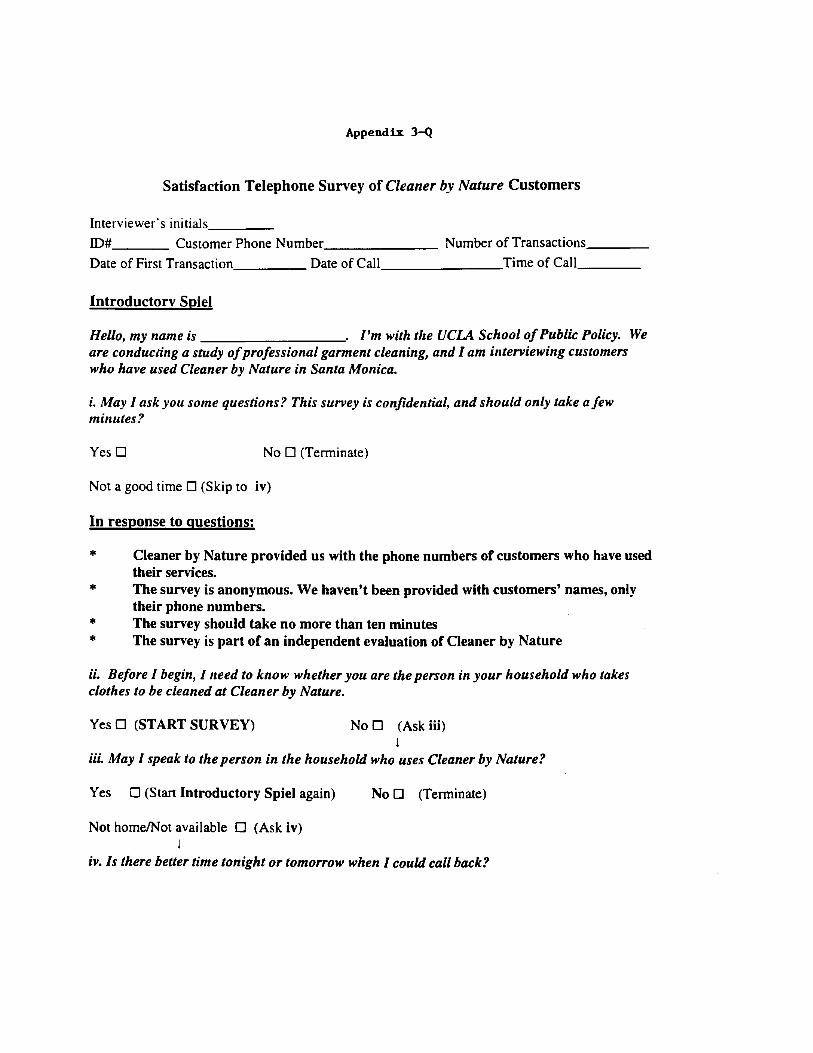
Appendix 3-Q
Satisfaction Telephone Survey of Cleaner by Nature Customers
Interviewer· s initials____ ID#____ Customer Phone Number _______ Number of Transactions____
Date of First Transaction _____ Date of Call Time of Call____
Introductorv Spiel
Hello, my name is _________.. I'm with the UCLA School ofPublic Policy. We are conducting a study ofprofessional garment cleaning, and I am interviewing customers who have used Cleaner by Nature in Santa Monica.
i. May I ask you some questions? This survey is confidential, and should only take a few minutes?
Yes □ No □ (Tenninate)
Not a good time □ (Skip to iv)
In response to questions:
Cleaner by Nature provided us with the phone numbers of customers who have used their services. The survey is anonymous. We haven't been provided with customers' names, only their phone numbers. The survey should take no more than ten minutes The survey is part of an independent evaluation of Cleaner by Nature
ii. Before I begin, I ,reed to know whether you are the person in your household who takes clothes to be cleaned at Cleaner by Nature.
Yes □ (START SURVEY) No □ (Ask iii) l
iii. May I speak to the person in the household who uses Cleaner by Nature?
Yes □ (Start Introductory Spiel again) No □ (Tenninate)
Not home/Not available □ (Ask iv) j
iv. Is there better time tonight or tomorrow when I could call back?
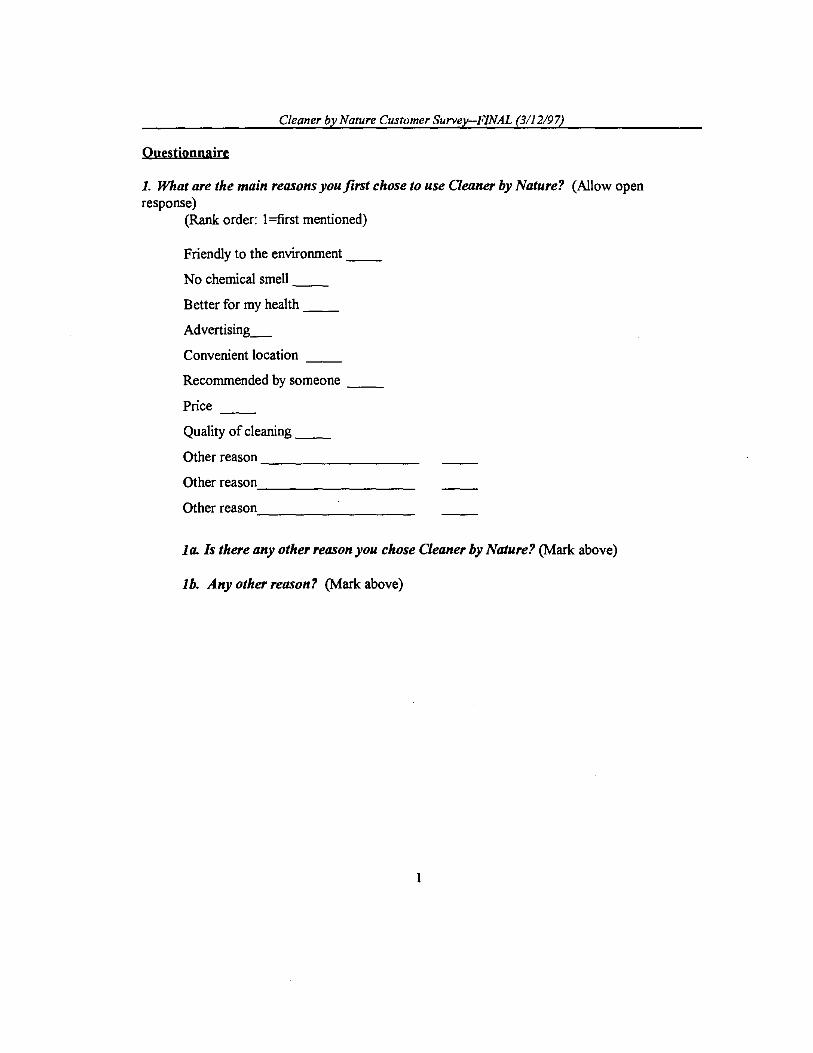
------------------------------
Cleaner by Nature Customer Survey-FINAL (3112197)
Questionnaire
1. What are the main reasons you first chose to use Cleaner by Nature? (Allow open response)
(Rank order: 1 =first mentioned)
Friendly to the environment __
No chemical smell
Better for my health __
Advertising_
Convenient location
Recommended by someone __
Price
Quality of cleaning __
Other reason
0ther reason
0ther reason
la. Is there any other reason you chose Qeaner by Nature? (Mark above)
lb. Any other reason? (Mark above)
1
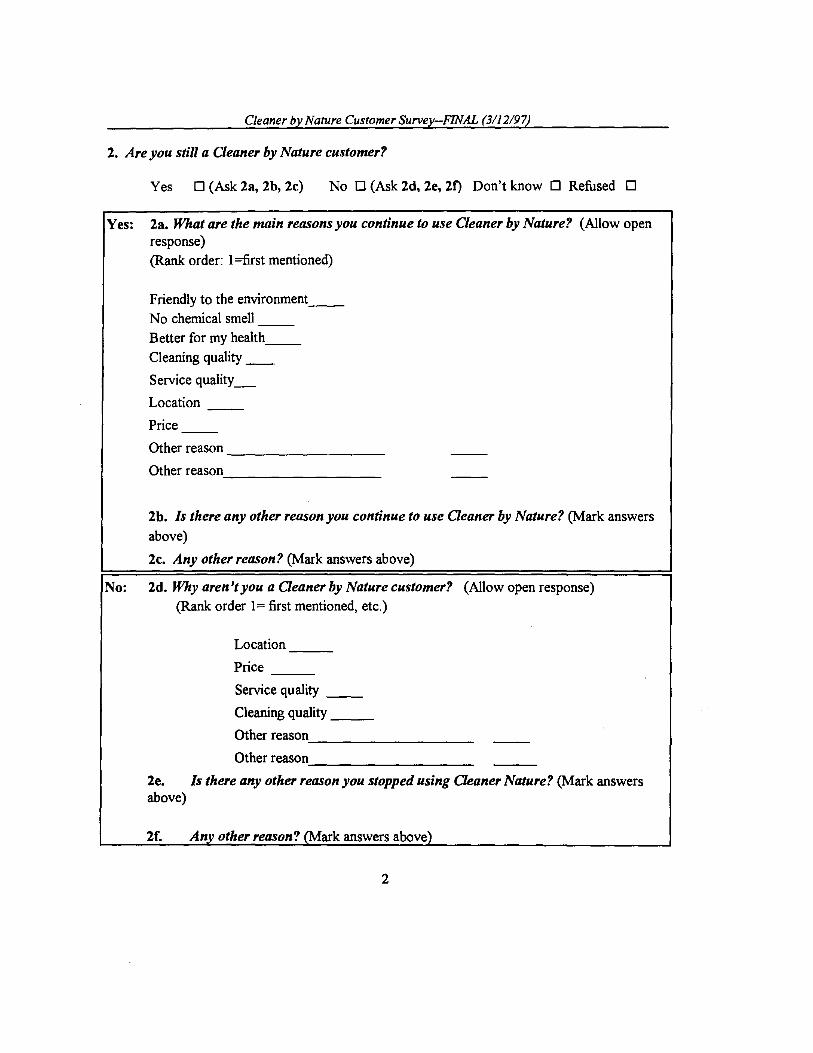
----------
---
--------------------
Cleaner by Nature Customer Survey-FINAL (3/12/97)
2. Are you still a Cleaner by Nature customer?
Yes □ (Ask 2a, 2b, 2c) No □ (Ask 2d, 2e, 21) Don't know □ Refused □
Yes: 2a. What are the main reasons you continue to use Oeaner by Nature? (Allow open response) (Rank order: 1 =first mentioned)
Friendly to the environment __
No chemical smell Better for my health __
Cleaning quality __
Service quality_
Location
Price
Other reason
0ther reason'-----------
2b. ls there any other reason you continue to use Qeaner by Nature? (Mark answers
above)
2c. Any other reason? (Mark answers above)
No: 2d. Why aren't you a Qeaner by Nature customer? (Allow open response) (Rank order 1= first mentioned, etc.)
Location ---Price
Service quality __
Cleaning quality ___
Other reason
0ther reason
2e. ls there any other reason you stopped using Qeaner Nature? (Mark answers above)
2f. Any other reason? <Mark answers above)
2

Cleaner by Nature Customer Survey-FINAL (3112197)
The following questions refer to garments that were professionally cleaned at Cleaner by Nature. We are not referring to cotton dress shirts, which Cleaner by Nature sends to a commercial laundry.
In response to questions: Like many dry cleanen, Cleaner by Nature sends cotton dress shirts to a commercial laundry.
3. Overall, how would you rate Cleaner by Nature as a professional cleaner? (Read bold choices)
Excellent □ Good □ Fair □ PoorO
Don't know □ Refused □
4. How often did you feel your garments were clean after they were taken to Oeaner by Nature?
Never □ Sometimes □ Frequently □ Always □
Don'tknow □ Refused □
5. How often have you been satisfied with how your garments were pressed and finished after taking them to Cleaner by Nature? (Read bold choices)
Never □ Sometimes □ Frequently □ Always □
Don't know □ Refused □
6. How often have you noticed any shrinkage after getting your clothes back from Cleaner by Nature? (Read bold choices)
NeverO Sometimes 0 Frequently 0 Always 0
Don't know □ Refused □
7. How often have you noticed any stretching after getting your clothes back from Qeaner by Nature? (Read bold choices)
Never □ Sometimes □ Frequently □ Always □
Don't know □ Refused □
3
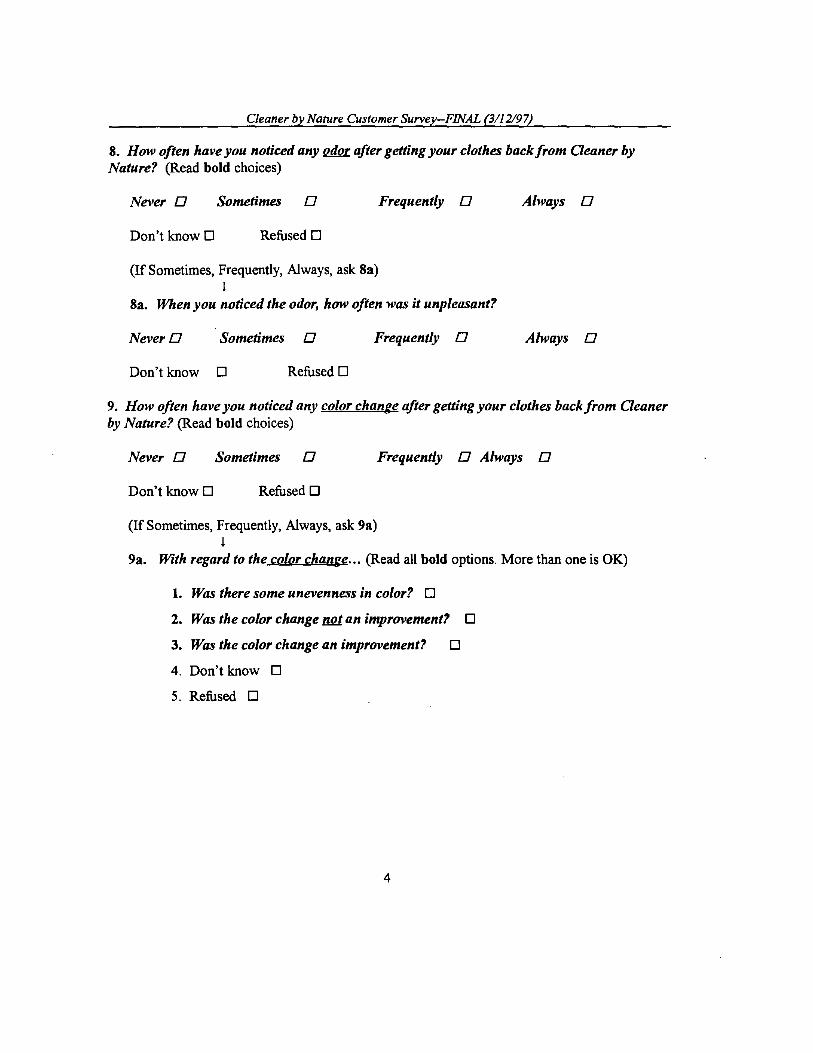
Cleaner by Nature Customer Survey-FINAL (3/12197)
8. How often have you noticed any odor after getting your clothes back from Cleaner by Nature? (Read bold choices)
Never 0 Sometimes 0 Frequently 0 Always 0
Don't know □ Refused □
(If Sometimes, Frequently, Always, ask 8a) I
Sa. When you noticed the odor, how often was it unpleasant?
NeverO Sometimes 0 Frequently 0 Always 0
Don'tknow □ Refused □
9. How often have you noticed any color change after getting your clothes back from CTeaner by Nature? (Read bold choices)
Never 0 Sometimes 0 Frequently O Always 0
Don't know □ Refused □
(If Sometimes, Frequently, Always, ask 9a) I
9a. With regard to the color chan,ge ... (Read all bold options. More than one is OK)
1. Was there some unevenness in color? □
2. Was the color change nfl1 an improvement? □
3. Was the color change an improvement? □
4. Don't know □
5. Refused □
4

Cleaner by Nature Customer Survey-FINAL (3/12197)
10. How often have you noticed a change in the/eel ofthe material after getting your clothes back from Cleaner by Nature? (Read all bold choices)
Never 0 Sometimes 0 Frequently O Always 0
Don't know □ Refused □
(If Sometimes, Frequently, Always, ask 10a) j
10a. With regard to the change in the feel ofthe material ... (Read bold options. More than one is OK)
1. Was the change !Y!1. an improvement? □
2. Was the change an improvement? □
3. Don't know □
4. Refused □
11. Did any ofthe clothes taken to Oeaner by Nature have any stains or spots you wanted removed?
Yes □ (Ask lla) No □ (Go to 12) Don't know □ (Go to 12)
Refused □ (Go to 12)
lla. How often were they satisfactorily removed? (Read bold choices.)
Never O Sometimes 0 FrequentlyO Always 0
Don't know □ Refused □
12. After getting your clothes back from Oeaner by Nature, how often have you noticed rips or tears that were not there when you took them in? (Read bold choices)
NeverO Sometimes 0 Frequent/yo Always 0
Don't know □ Refused □
5
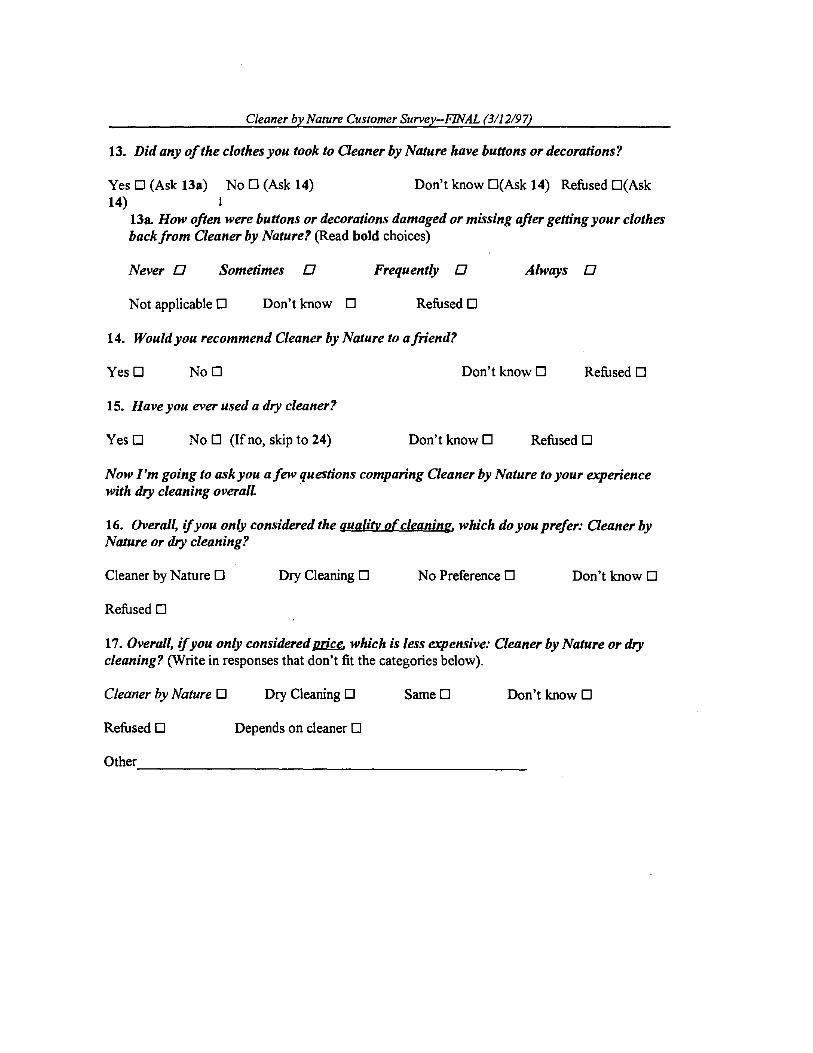
------------------------
Cleaner by Nature Customer Survey-FINAL (3/12197)
13. Did any ofthe clothes you took to CTeaner by Nature have buttons or decorations?
Yes □ (Ask 13a) No □ (Ask 14) Don't know □(Ask 14) Refused □(Ask 14) l
13a. How often were buttons or decorations damaged or missing after getting your clothes back from Cleaner by Nature? (Read bold choices)
Never 0 Sometimes 0 Frequently 0 Always 0
Not applicable □ Don't know □ Refused □
14. Would you recommend Cleaner by Nature to a friend?
Yes □ No □ Don't know □ Refused □
15. Have you ever used a dry cleaner?
Yes □ No □ (Ifno, skip to 24) Don't know □ Refused □
Now I'm going to ask you a few questions comparing Qeaner by Nature to your experience with dry cleaning overall ·
16. Overall, ifyou only considered the quality ofcleaning, which do you prefer: Qeaner by Nature or dry cleaning?
Cleaner by Nature □ Dry Cleaning □ No Preference □ Don't know □
Refused □
17. Overall, ifyou only considered price. which is less expensive: Cleaner by Nature or dry cleaning? (Write in responses that don't fit the categories below).
Cleaner by Nature □ Dry Cleaning □ Same □ Don't know □
Refused □ Depends on cleaner □
Other

--------------------
Cleaner by Nature Customer Survey-FINAL {3112197)
18. Overall, ifyou only take into account health or environmental considerations, which do you prefer: Cleaner by Nature or dry cleaning?
Cleaner by Nature □ Dry Cleaning □ No Preference □ Don't know □
Refused □
19. In terms of overall satisfaction. which do you prefer: CTeaner by Nature or Dry Cleaning?
Cleaner by Nature □ Dry Cleaning □
No Preference □ Don't know □ Refused □
20. Have you continued to use a dry cleaning service since you first went to CTeaner by Nature?
Yes □ (Ask 21) No □ (Skip to 22)
Don't know □ (Skip to 22) Refused □ (Skip to 22)
21. Why have you continued to use a dry cleaning service? (Allow open response) (Rank order 1= first mentioned, etc.)
Location/convenience__
Price__
Service
Cleaning quality __
Dry cleaning safer for certain garments __
Other
0ther
21a. ls there any other reason you continue to use a dry cleaning service?
21b. Any other reason?
7

------------------------------------------------------------------------------------------------------------
Cleaner by Nature Customer Survey--FINAL (3/12/97)
21c. Ofall the garments you take to be professionally cleaned, what percentage do you take to the dry cleaner?
100%0 (Go to 22) Write in____
Don't know □ Refused □
21d. Are there certain types of garments that you continue to take to the dry cleaner?
Yes □ (Ask 21e) No □ (Ask 22) Don't know □ (Ask 22) Refused □ (Ask 22) l
21e. What types of garments do you continue to take to the dry cleaner? (Allow open response. More than one response OK)
Tailored garments □
Suits □
Expensive garments □
Other
0ther
0ther
0ther
22. Overall, how would you rate your experience with dry cleaning? (Read bold choices)
Excellent □ Good □ Fair □ PoorO
Don'tknow □ Refused □
23. After getting your clothes back from Cleaner by Nature, did you examine them more closely than you would have if they had been dry cleaned?
Yes □ No □ Don't know □ Refused □
8
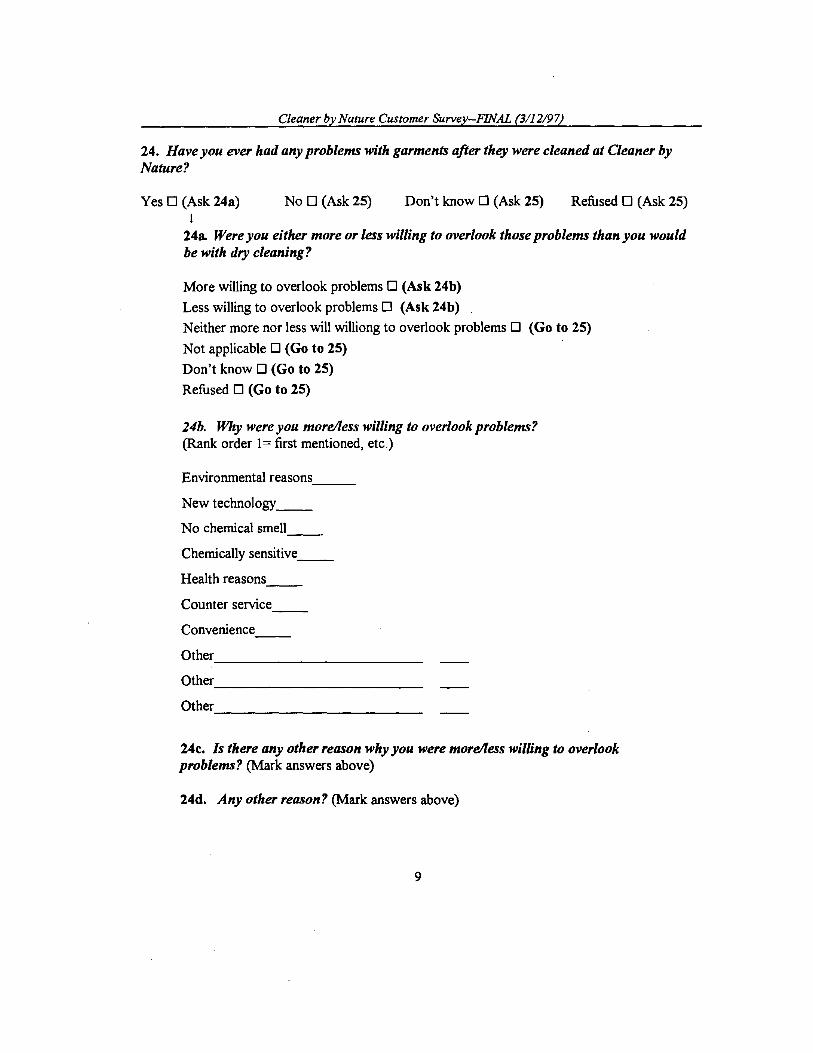
---------------------------------------
Cleaner by Nature Customer Survey--FINAL (3/12197)
24. Have you ever had any problems with garments after they were cleaned at Cleaner by Nature?
Yes □ (Ask 24a) No □ (Ask25) Don't know □ (Ask 25) Refused □ (Ask 25) I
24a. Were you either more or less willing to overlook those problems than you would be with dry cleaning?
More willing to overlook problems □ (Ask 24b)
Less willing to overlook problems □ (Ask 24b)
Neither more nor less will williong to overlook problems □ (Go to 25)
Not applicable □ (Go to 25)
Don't know □ (Go to 25)
Refused □ (Go to 25)
24b. Why were you more/less willing to overlook problems? (Rank order 1= first mentioned, etc.)
Environmental reasons---New technology__
No chemical smell __
Chemically sensitive __
Health reasons __
Counter service __
Convenience__
Other
0ther
0ther
24c. ls there any other reason why you were more/less willing to overlook problems? (Mark answers above)
24d. Any other reason? (Mark answers above)
9
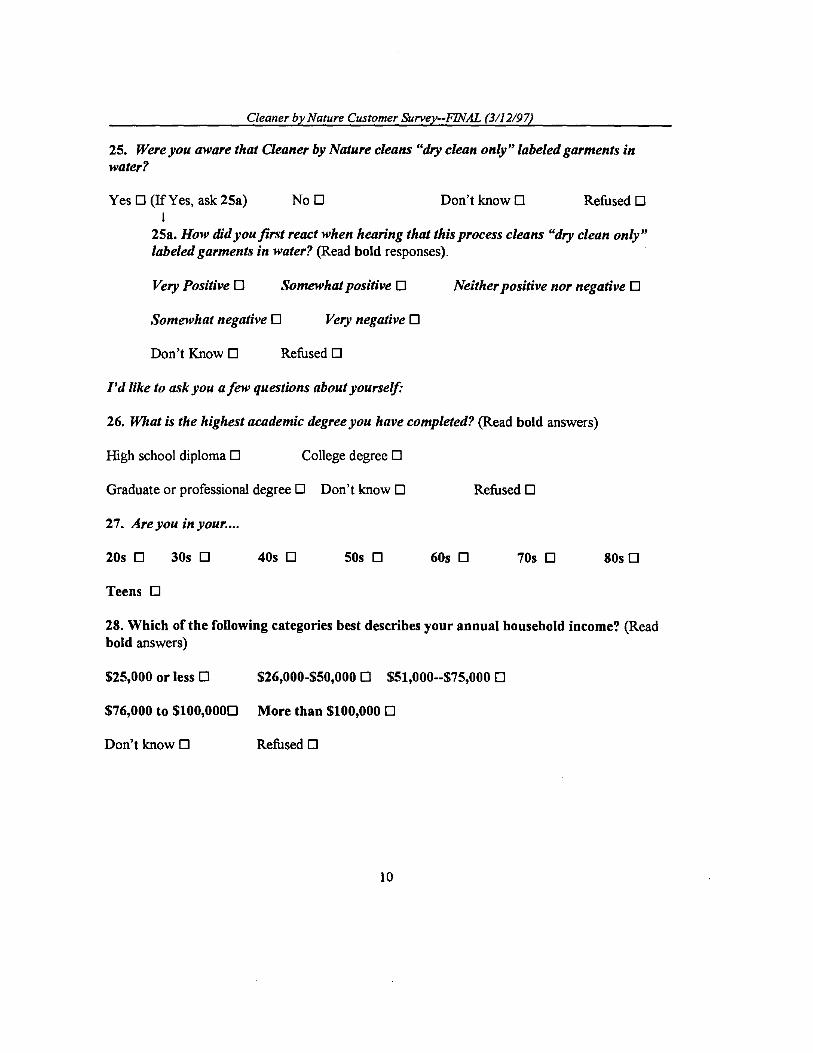
Cleaner by Nature Customer Surver-:FINAL (3/12197)
25. Were you aware that Cleaner by Nature cleans "dry clean only" labeled garments in water?
Yes D (IfYes, ask 25a) No □ Don't know □ Refused D l
25a. How did you first react when hearing that this process cleans "dry clean only" labeled garments in water? (Read bold responses).
Very Positive □ Somewhat positive □ Neither positive nor negative □
Somewhat negative □ Very negative □
Don't Know D Refused D
I'd like to ask you a few questions about yourself:
26. What is the highest academic degree you have completed? (Read bold answers)
High school diploma D College degree D
Graduate or professional degree D Don't know D Refused D
27. Areyou in your....
20s D 30s D 40s D 50s D 60s D 70s D 80s D
Teens D
28. Which of the following categories best describes your annual household income? (Read bold answers)
$25,000 or less D $26,000-$50,000 D $51,000--$75,000 D
$76,000 to $100,0000 More than $100,000 D
Don't know D Refused D
10
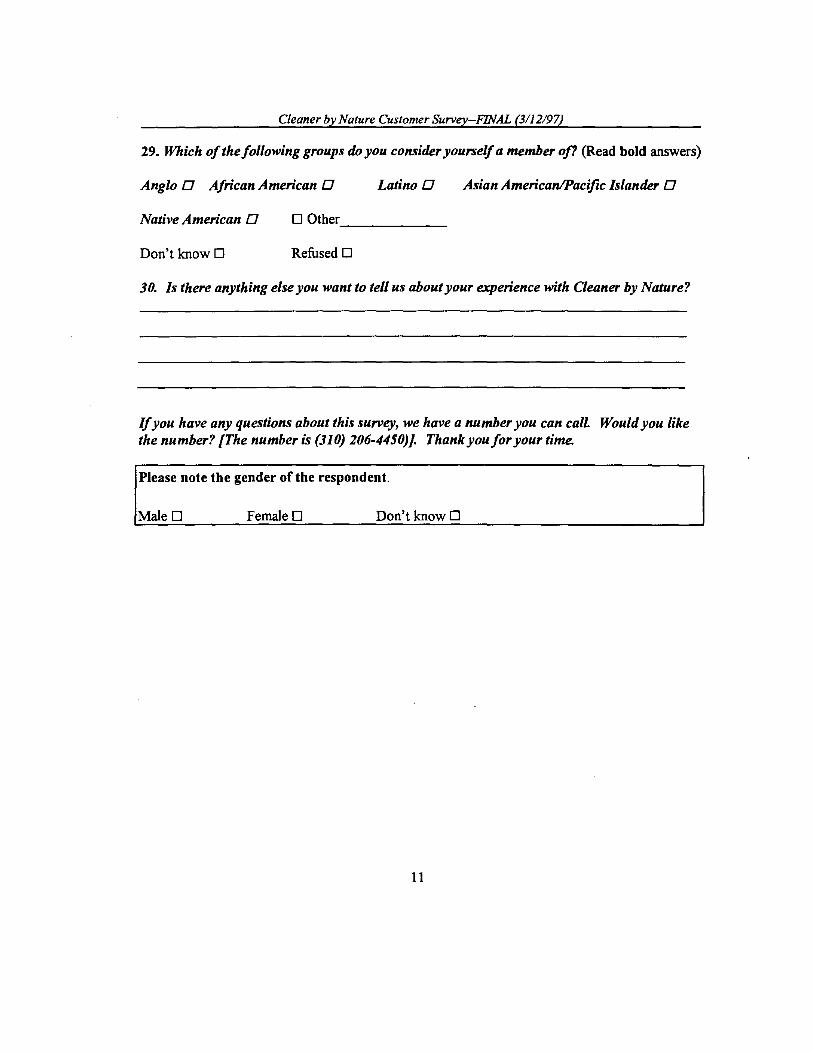
Cleaner by Nature Customer Survey-FINAL (3/12197)
29. Which of the following groups do you consider yourselfa member of? (Read bold answers)
Anglo O African American 0 Latino 0 Asian American/Pacific Islander 0
Native American 0 D Other-------Don't know D Refused D
30. Is there anything else you want to tell us about your experience with Cleaner by Nature?
Ifyou have any questions about this survey, we have a numberyou can call Would you like the number? /The number is (310) 206-4450)1. Thank you/oryour time.
Please note the gender of the respondent.
Male □ Female D Don't know D
11

Appendix 3-R
Analysis of Self-Selection in Cleaner by Nature Customer Satisfaction Survey
To evaluate whether self-selection influenced the overall findings of the Cleaner by Nature customer satisfaction survey, a comparison was make between the satisfaction rates ofcustomers who listed health or environmental reasons for first choosing or continuing to use Cleaner by Nature with those who did mension these reasons. Of the 180 customers interviewed in this survey, only 24 people did not mention environmental or health concerns as one of the reasons for first choosing or continuing to use Cleaner by Nature.
For eight of the ten performance problems, customers motivated by environmental and health concerns or "environmental/health customers" reported a s.imilar pattern of problems to the "remaining customers" (those who did not mention environmental or health concerns). For the remaining two performance problems, the pattern varied according to the population. In terms ofdamage to buttons and decorations, only 2% of environmental/health customers experienced damage while 16% of the remaining customers experienced damage to buttons or decorations (p=0.037). 1 Ifself-selection bias were occurring this is the pattern that one would expect. For the other performance problem (negative change in the feel ofthe garment), environmental/health customers were more likely to experience problems than the remaining population.
The fact that there was only one case in ten where this "self-bias" pattern occurred for the performance attributes and the fact that there was a case where the opposite pattern occurred suggests that, at least for the performance attributes, it is unlikely that self-selection explains the overall findings presented above.
The same pattern persists for the overall satisfaction rates. In fact, non-health or environmentally motivated customers were no more dissatisfied with Cleaner by Nature than their health and environmentally motivated counterparts. For example, 90% of the environmental/health customers rated Cleaner by Nature as "excellent" or "good" while 100% of the remaining customers gave the same rating. Significantly, fewer of those who were not motivated by health or environmental concerns were still Cleaner by Nature customers (p= 0.005). If selection bias were operating, we would expect that a greater proportion of those not motivated by health or environmental concerns would stop because of the quality ofcleaning. Yet only 10% (1 of 10) of this group mentioned quality ofcleaning as the primary reason for stopping, while 27% (8 of 29) of the environmental/health customers mentioned quality ofcleaning as the primary reason for stopping. Finally, one-third of the environmental/health customers continue to use dry cleaning while half of the remaining population continue to use both Cleaner by Nature and dry cleaning. Here again, if selection bias were operating, we would expect that a greater proportion of environmental/health customers to cite cleaning quality as a reason
1 1 The Chi Square Test was used to evaluate the signficance of differences between Cleaner by Nataure and dry clean customers. A p-value less than 0.05 is the standard usually used to signify a qualitative difference in response. (See Glantz, Stanton, Primer of Biostatistics McGraw-Hill, 1981, p.130).
Appendix 3-R
for continuing to use dry cleaning. Yet none of the people in this group mentioned cleaning quality- all stated that their primary reason for continuing to use dry cleaning had to do with either location, convenience or price.

Appendix 3-S
Satisfaction Telephone Survey of DRY CLEANING Customers
Interviewer"s initials ____ ID#____ Customer Phone Number _______ Date of Call ________Time of Call ____
lntroductorv Spiel
Hello, my name is . I'm with the UCLA School ofPublic Policy. We are conducting a study ofprofessional garment cleaning, and I am interviewing dry cleaning customers.
i. May I ask you some questions? This survey is confidential, and should only take a few minutes.
Yes □ No □ (Terminate)
Not a good time □ (Skip to v)
In response to questions:
The survey is anonymous. Your phone number was randomly selected. The survey should take no more than five minutes The survey is part of an independent UCLA evaluation of garment cleaning.
ii. Before I begin, I need to know whether you use dry cleaning services?
Yes □ (Ask iii)) No □ (Is there anyone in your household who uses dry cleani11g services?)
iii. Are you the person in the household who brings the clothes to the dry cleaner?
Yes □ (Start Survey) No □ (Ask iv)
iv. May I speak to the person in the household who brings the clothes to the dry cleaner?
Yes □ (Start Introductory Spiel again) No □ (Terminate)
Not home/Not available □ (Ask v) j
v. ls there better time tonight or tomo"ow when I could call back?
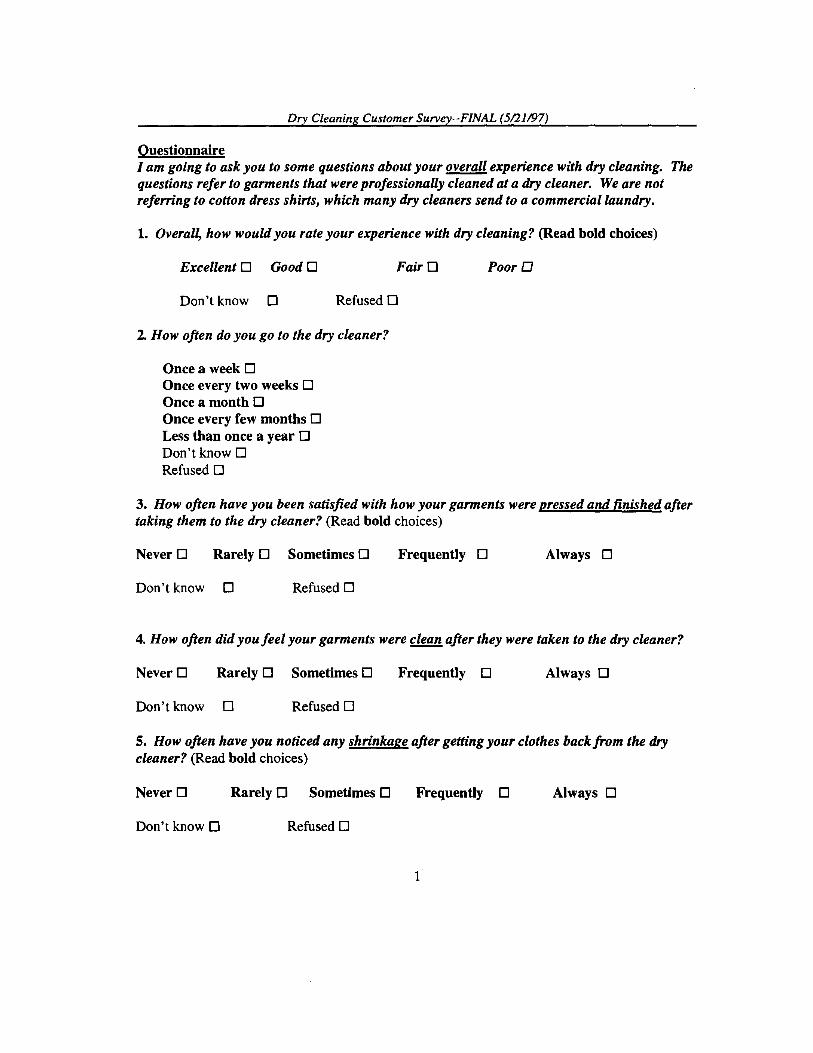
Dry Cleaning Customer Survey--FINAL (5121/97)
Questionnaire I am going to ask you to some questions about your overall experience with dry cleaning. The questions refer to garments that were professionally cleaned at a dry cleaner. We are not referring to cotton dress shirts, which many dry cleaners send to a commercial laundry.
1. Overall, how would you rate your experience with dry cleaning? (Read bold choices)
Excellent □ Good □ Fair □ Poor □
Don'tknow □ Refused □
2 How often do you go to the dry cleaner?
Once a week □
Once every two weeks □ Once a month □ Once every few months □ Less than once a year □ Don't know □
Refused □
3. How often have you been satisfied with how your garments were pressed and finished after taking them to the dry cleaner? (Read bold choices)
Never □ Rarely □ Sometimes □ Frequently □ Always □
Don'tknow □ Refused □
4. How often did you feel your garments were~ after they were taken to the dry cleaner?
Never □ Rarely □ Sometimes □ Frequently □ Always □
Don't know □ Refused □
5. How often have you noticed any shrinkage after getting your clothes back from the dry cleaner? (Read bold choices)
Never □ Rarely D Sometimes □ Frequently □ Always □
Don't know D Refused □
1
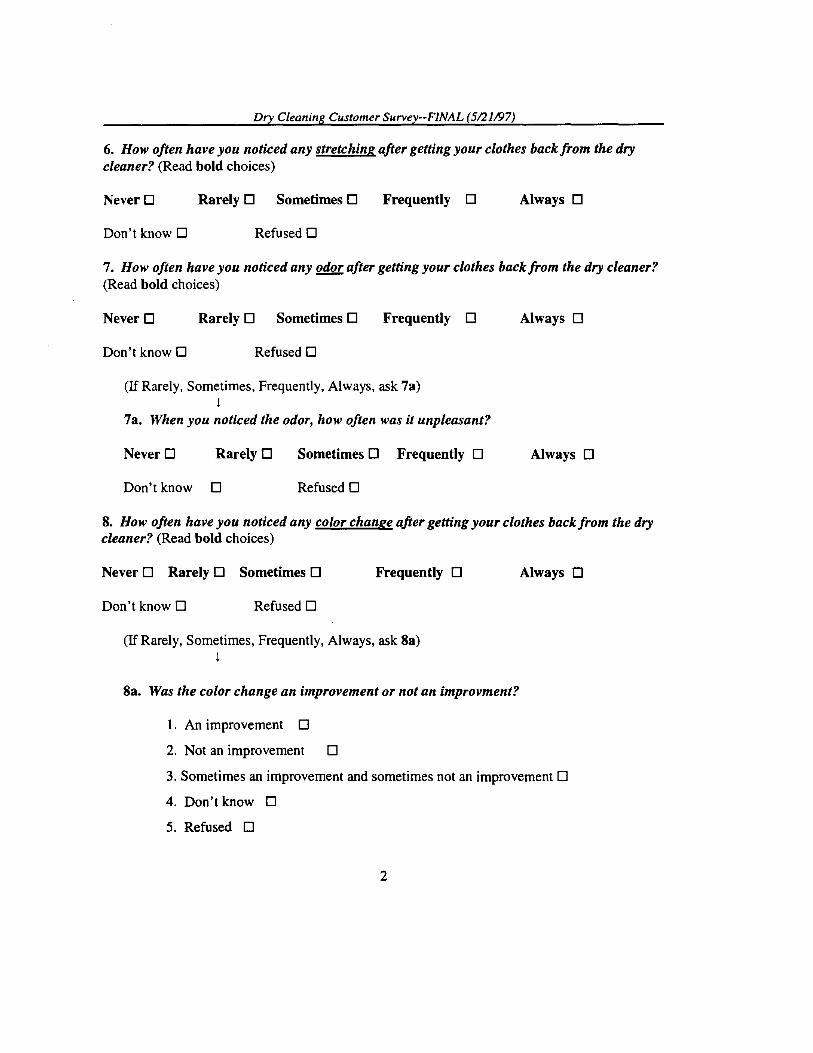
Dry Cleaning Customer Survey--FINAL (5121197)
6. How often have you noticed any stretching after getting your clothes back from the dry cleaner? (Read bold choices)
Never □ Rarely □ Sometimes □ Frequently □ Always □
Don't know □ Refused □
7. How often have you noticed any odor after getting your clothes back from the dry cleaner? (Read bold choices)
Never □ Rarely □ Sometimes □ Frequently □ Always □
Don't know □ Refused □
(If Rarely, Sometimes, Frequently, Always, ask 7a) J
7a. When you noticed the odor, how often was it unpleasant?
Never □ Rarely □ Sometimes □ Frequently □ Always □
Don'tknow □ Refused □
8. How often have you noticed any color change after getting your clothes back from the dry cleaner? (Read bold choices)
Never □ Rarely □ Sometimes □ Frequently □ Always □
Don't know □ Refused □
(If Rarely, Sometimes, Frequently, Always, ask Sa) J
Sa. Was the color change an improvement or not an improvment?
1. An improvement □
2. Not an improvement □
3. Sometimes an improvement and sometimes not an improvement □
4. Don't know □
5. Refused □
2
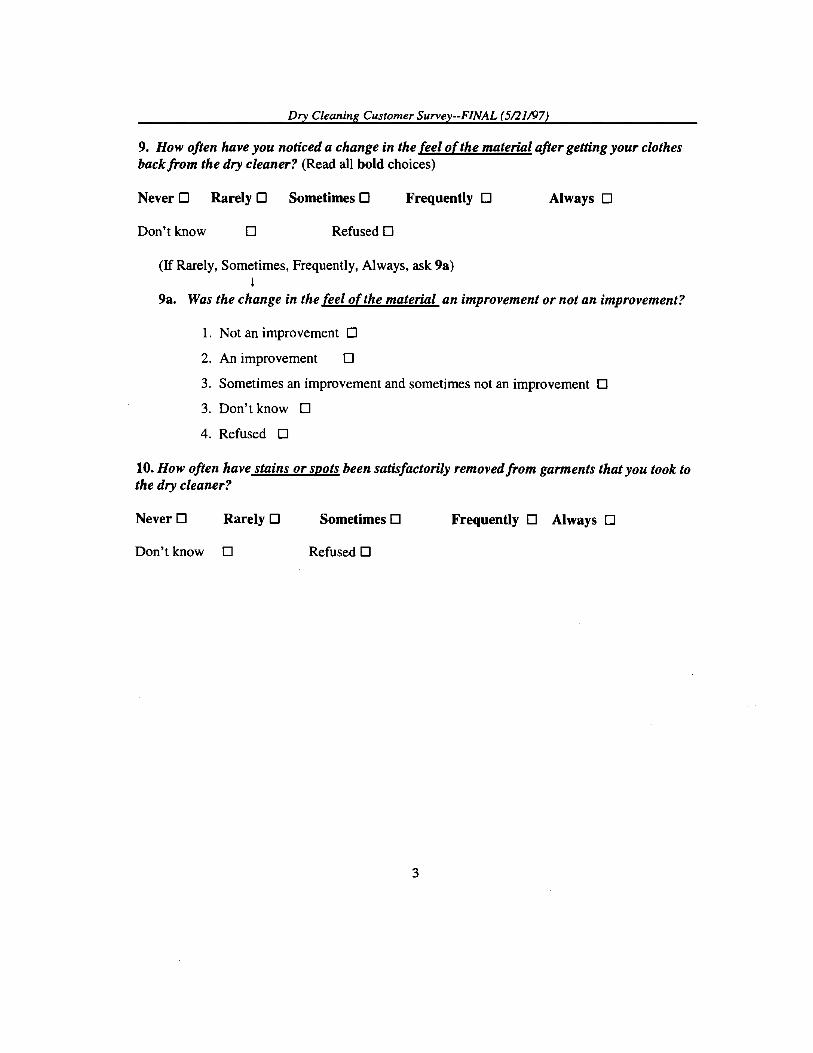
Dry Cleaning Customer Survey--FINAL (5121/97)
9. How often have you noticed a change in the feel ofthe material after getting your clothes back from the dry cleaner? (Read all bold choices)
Never D Rarely D Sometimes D Frequently D Always D
Don't know D Refused D
(If Rarely, Sometimes, Frequently, Always, ask 9a) I
9a. Was the change in the feel of the material an improvement or not an improvement?
1. Not an improvement D
2. An improvement D
3. Sometimes an improvement and sometimes not an improvement D
3. Don't know D
4. Refused D
10. How often have stains or spots been satisfactorily removed from garments that you took to the dry cleaner?
Never D Rarely D Sometimes D Frequently D Always D
Don'tknow D Refused D
3

Dry Cleaning Customer Survey--FINAL (5/21197)
11. After getting your clothes back from the dry cleaner, how often have you noticed rips or ~ that were not there when you took them in? (Read bold choices)
Never D Rarely D Sometimes D Frequently D Always D
Don't know D Refused D
12. How often have you noticed that buttons or decorations were damaged or missing after getting your clothes back from the dry cleaner?
Never D Rarely D Sometimes D Frequently D Always D
Don't know D Refused D
4
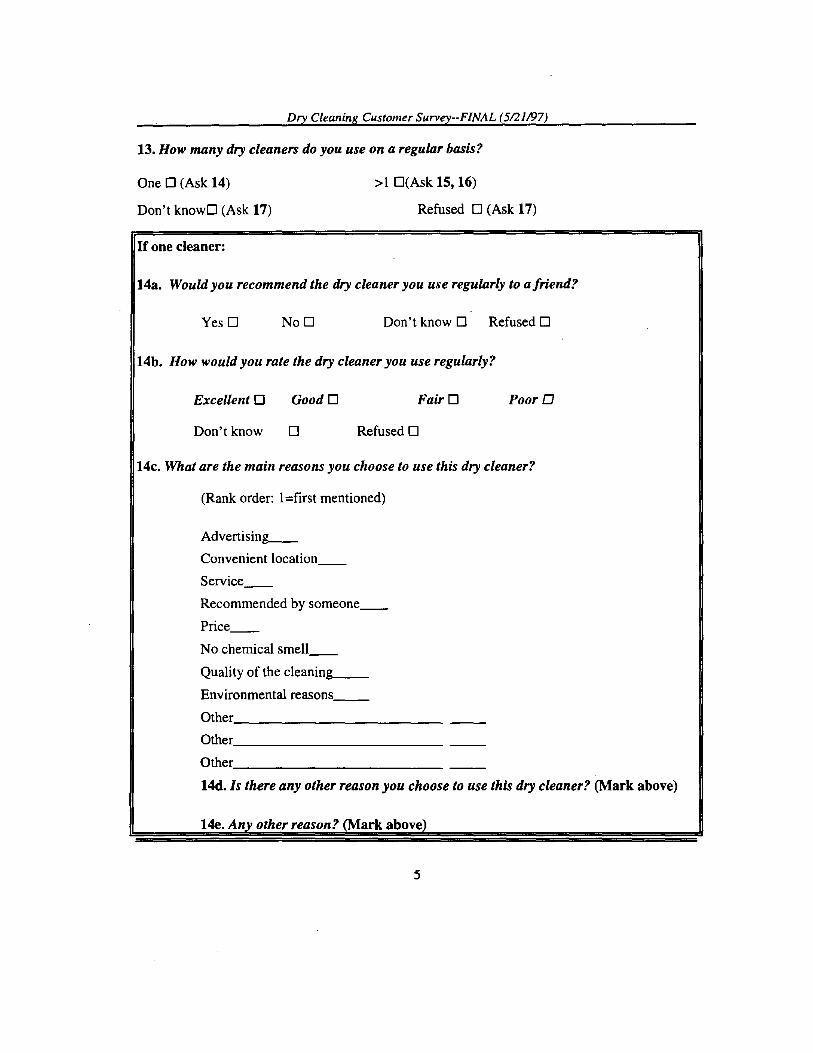
Dry Cleaning Customer Survey--FlNAL (5121/97)
13. How many dry cleaners do you use on a regular basis?
One D (Ask 14) > I □(Ask 15, 16)
Don't know□ (Ask 17) Refused D (Ask 17)
If one cleaner:
14a. Would you recommend the dry cleaner you use regularly to a friend?
Yes □ No □ Don't know D Refused D
14b. How would you rate the dry cleaner you use regularly?
Excellent □ Good □ Fair □ PoorO
Don't know D Refused D
14c. What are the main reasons you choose to use this dry cleaner?
(Rank order: !=first mentioned)
Advertising__
Convenient location __
Service__
Recommended by someone__
Price__
No chemical smell __
Quality of the cleanino-g__
Environmental reasons__
Other_____________
Other_____________
Other_____________
14d. ls there any other reason you choose to use this dry cleaner? (Mark above)
14e. An other reason? (Mark above
5

Dry Cleaning Customer Survey--FINAL (5121/97)
If more than one cleaner (>1):
15. Why do you use more than one dry cleaner?
(Circle those that apply for each cleaner mentioned)
CleanerD
Quality
Price
Convenient location
Coupons
Quick turnaround
Hours of operation
Service
Other
Cleaner A
Quality
Price
Convenient location
Coupons
Quick turnaround
Hours of operation
Service
Other_____
Cleaner B
Quality
Price
Convenient location
Coupons
Quick turnaround
Hours of operation
Service
Other
Cleaner C
Quality
Price
Convenient location
Coupons
Quick turnaround
Hours of operation
Service
Other
Other_____ Other Other Other
Other_____ Other Other Other
Don't Know □ Refused □
Comments._________________________________
15a. Is there any other reason you use more than one dry cleaner? (Mark above)
15b. Any other reason? (Mark above)
16. Would you recommend any of the dry cleaners you use regularly to a friend?
Yes □ (Ask 16a) No □ (Ask 17) Don't know □ (Ask 17) Refused □ (Ask17) I
16a. Which dry cleaners(s) would you recommend?
All cleaners □ Cleaner A □ Cleaner B □ Cleaner C □ Cleaner D □
Don'tknow □ Refused □ Other
6

Dry Cleaning Customer Survey--FINAL (5/2J/f)7)
17. What price category best describes the dry cleaner(s) you use regularly? (More than OK)
Bargain (usually less than $2.49 for a pair ofpants) 0 Moderately priced (usually $2.50 to $5.99 for a pair ofpants) 0 High priced (usually $6 or more fora pair ofpants) 0 _ Don't know D Refused D
18. Are there any dry cleaners that you have used in the past year that you are no longer using?
Yes D No □ Don't know D Refused D l
18a. Why did you stop using them?
(Rank order: l=first mentioned)
Location__
Price__
Service problem __
Cleaning quality __
Chemical smell __
Coupons__
Slow turnaround __
Limited hours of operation---.-=-
Other reason__________
Other reason__________
18b. Is there any other reason? (Mark above)
18c. Any other reason? (Mark above)
19. Did you know that dry cleaners use a chemical solvent to clean clothes?
Yes □ No □ Don't know □ Refused □
7

Dry Cleaning Customer Survey--FINAL (5121/97)
20. Have you ever used Cleaner by Nature, the professional cleaner in Santa Monica?
Yes □ No □ Don't know □ Refused □
I'd like to ask you a few questions about yourself:
21. How much education have you completed? (Read bold answers)
Less than a high school degree □ High school degree □
Some college □ College degree □ Graduate or professional degree □
Don't know □ Refused □
22. Are you in your ....
Teens □ 20s □ 30s □ 40s □ 50s □ 60s □
70s □ 80s □ Don't know □ Refused □
23. Which ofthe following categories best describes your annual household income? (Read bold answers)
$25,000 or less □ $26,000-$50,000 □ $51,000--$75,000 □
$76,000 to $100,000□ More than $100,000 □
Don't know □ Refused □
24. Which of the following groups do you consider yourself a member of? (Read bold answers)
White 0 African American 0 LatinoO
Asian American/Pacific Islander 0 Native American 0
□ Other_______ Don't know □ Refused □
8

Dry Cleaning Customer Survey--FINAL (5/21/97)
25. Is there anything else you want to tell us about your experience with dry cleaning?
Ifyou have any questions about this survey, we have a number you can call Would you like the number? [The number is (310) 206-4450)). Thank you/or your time.
Please note the gender of the respondent.
Male □ Female □ Don't know □
9
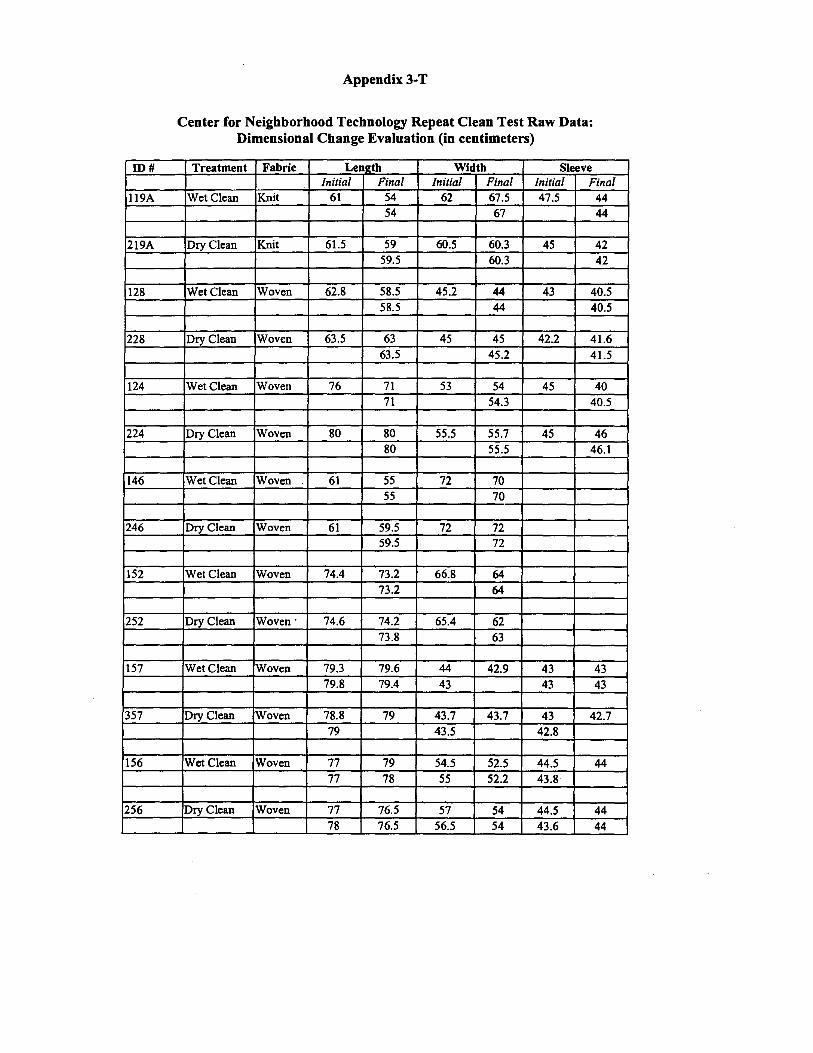
Appendix 3-T
Center for Neighborhood Technology Repeat Clean Test Raw Data: Dimensional Change Evaluation (in centimeters)
ID# Treatment Fabric Lenirth Width Sleeve Initial Final Initial Final Initial Final
119A Wet Clean Knit 61 54 62 67.5 47.5 44 54 67 44
219A Dry Clean Knit 61.5 59 60.5 60.3 45 42 59.5 60.3 42
128 Wet Clean Woven 62.8 58.5 45.2 44 43 40.5 58.5 44 40.5
228 Dry Clean Woven 63.5 63 45 45 42.2 41.6 63.5 45.2 41.5
124 Wet Clean Woven 76 71 53 54 45 40 71 54.3 40.5
224 Dry Clean Woven 80 80 55.5 55.7 45 46 80 55.5 46.l
.
146 Wet Clean Woven 61 55 72 70 55 70
246 Dry Clean Woven 61 59.5 72 72 59.5 72
152 Wet Clean Woven 74.4 73.2 66.8 64 73.2 64
252 Dry Clean Woven· 74.6 74.2 65.4 62 73.8 63
157 Wet Clean Woven 79.3 79.6 44 42.9 43 43 79.8 79.4 43 43 43
357 Dry Clean Woven 78.8 79 43.7 43.7 43 42.7 79 43.5 42.8
156 Wet Clean Woven 77 79 54.5 52.5 44.5 44 77 78 55 52.2 43.8
256 Dry Clean Woven 77 76.5 57 54 44.5 44 78 76.5 56.5 54 43.6 44

Appendix 3-T
ID# Treatment Fabric Lenatb Width Sleeve Initial Final Initial Final Initial Final
153A Wet Clean Woven 79.5 79.5 46.6 47 63.9 63
79.5 47.5 62.5
353A Dry Clean Woven 79.6 79.3 46.9 46 63.8 63
79.5 46.2 63
132A Wet Clean Woven 82.8 82.2 49.5 50 45.8 45.2
82.3 49.5 45.3
232A Dry Clean Woven 84.5 83.8 50 50 45.5 45.1
83.5 50 45.5
133A Wet Clean Woven 80.4 80.2 49.4 49.4 42.5 40.6
SO.I 49.5 40.2
233A Dry Clean Woven 80 80 50 49.4 42 41.2 80 49.4 40.9
134A Wet Clean Woven 79.9 79 50 49 42.5 42
79.1 49.6 42
234A Dry Clean Woven 79.8 80 50.1 49.5 42 42.1
80 50 42.2 42
154A Wet Clean Woven 79.2 78 50.2 49 65 63 79 50.5 63
254A Dry Clean Woven 79.2 78.5 49.7 49.5 63.8 63.5
77.9 50 63.5
119B Wet Clean Knit 73 65 70 71.7
65 71.4
72
219B Dry Clean Knit 73 73 72 70
73 70
530353A Wet Clean Woven 31 30 86 84
30 85
530353B Dry Clean Woven 30.5 30.3 83 84
30.4 84
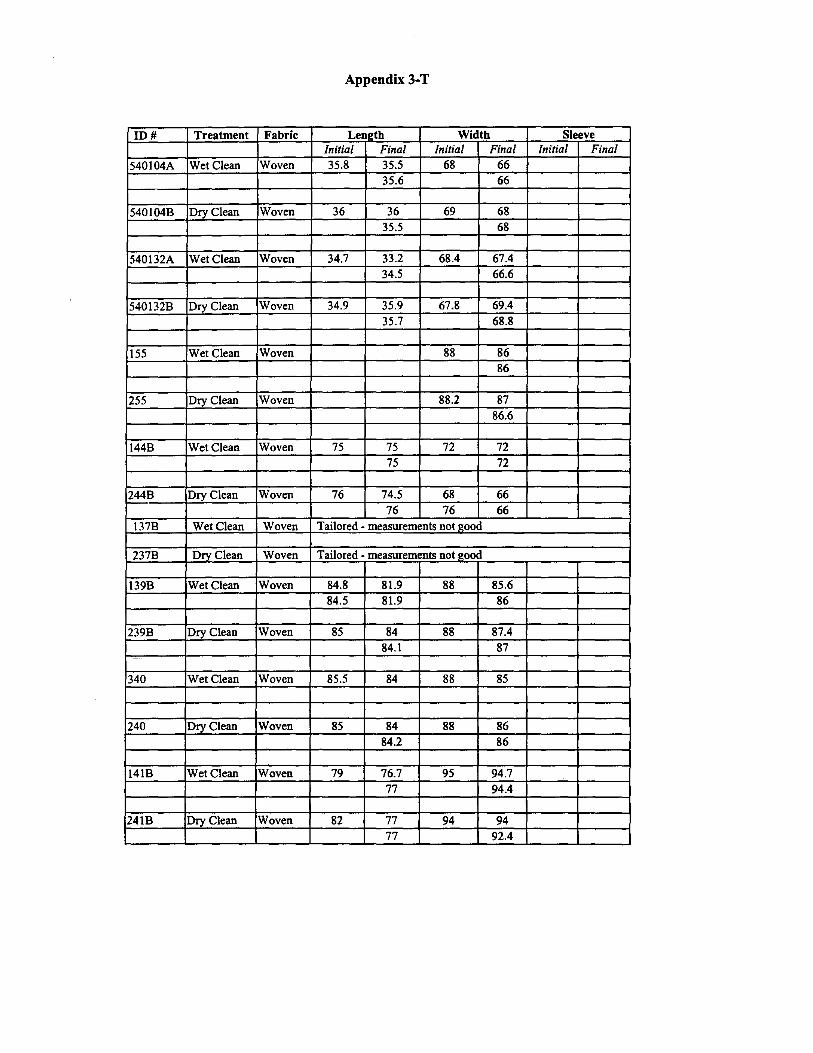
Appendix 3-T
ID#
540104A
Treatment
Wet Clean
Fabric
Woven
Leneth Initial Final 35.8 35.5
35.6
Width Initial Final
68 66 66
Sleeve Initial Final
540104B Dry Clean Woven 36 36 35.5
69 68 68
540132A Wet Clean Woven 34.7 33.2 34.5
68.4 67.4 66.6
540132B Dry Clean Woven 34.9 35.9 35.7
67.8 69.4 68.8
155 Wet Clean Woven 88 86 86
255 Dry Clean Woven 88.2 87 86.6
144B Wet Clean Woven 75 75 75
72 72 72
244B
137B
Dry Clean
Wet Clean
Woven
Woven
76 74.5 68 76 76
Tailored - measurements not 1>ood
66 66
237B
139B
DrvClean
Wet Clean
Woven
Woven 84.8 84.5
Tailored - measurements not eood
81.9 81.9
88 85.6 86
239B
340
Dry Clean
Wet Clean
Woven
Woven
85
85.5
84 84.1
84
88
88
87.4 87
85
240 Dry Clean Woven 85 84 84.2
88 86 86
141B
241B
Wet Clean
Dry Clean
Woven
Woven
79
82
76.7 77
77 77
95
94
94.7 94.4
94 92.4
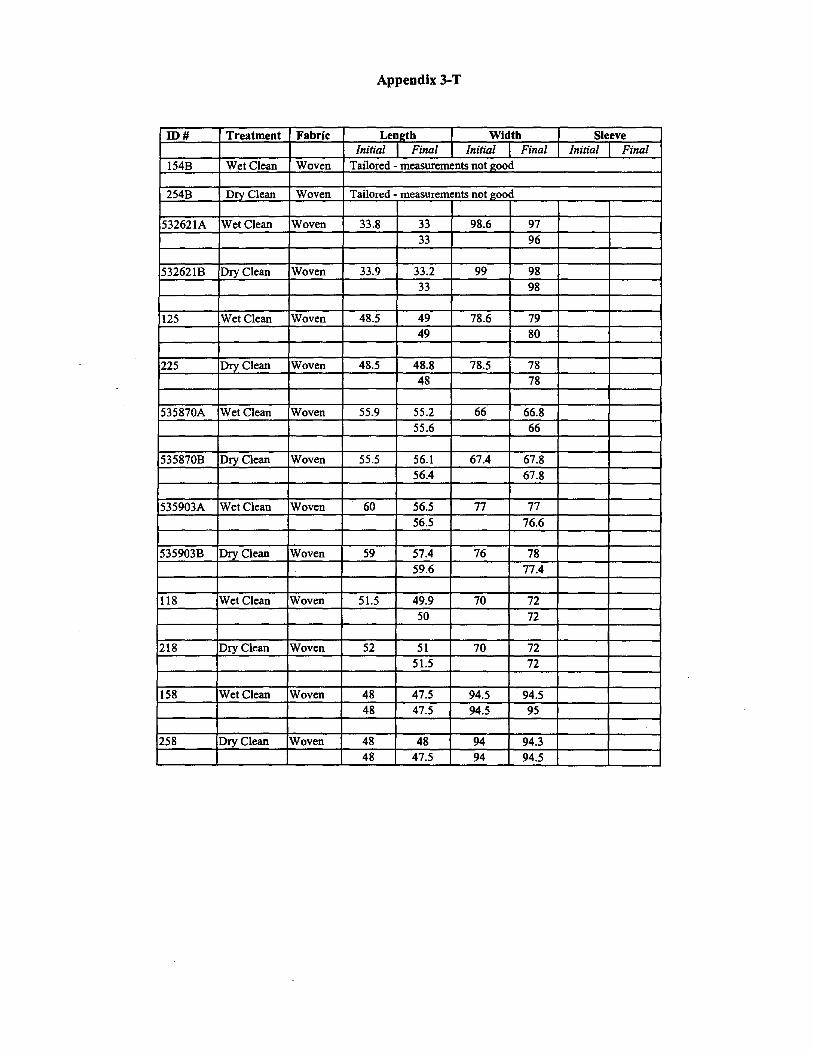
Appendix 3-T
ID# Treatment Fabric Leneth Width Sleeve Initial Final Initial Final Initial Final
154B Wet Clean Woven Tailored - measurements not 2:ood
254B Dry Clean Woven Tailored - measurements not e:ood
532621A Wet Clean Woven 33.8 33 98.6 97 33 96
5326218 Dry Clean Woven 33.9 33.2 99 98 33 98
125 Wet Clean Woven 48.5 49 78.6 79 49 80
225 Dry Clean Woven 48.5 48.8 78.5 78 48 78
535870A Wet Clean Woven 55.9 55.2 66 66.8 55.6 66
535870B Dry Clean Woven 55.5 56.1 67.4 67.8 56.4 67.8
535903A Wet Clean Woven 60 56.5 77 77 56.5 76.6
535903B Dry Clean Woven 59 57.4 76 78 59.6 77.4
118 Wet Clean Woven 51.5 49.9 70 72 50 72
218 Dry Clean Woven 52 51 70 72 51.5 72
158 Wet Clean Woven 48 47.5 94.5 94.5 48 47.5 94.5 95
258 Dry Clean Woven 48 48 94 94.3 48 47.5 94 94.5

Appendix 3-T
ID# Treatment Fabric Len2th Width Sleeve Initial Final Initial Final Initial Final
159 Wet Clean Woven 46 45.5 83 81.5 46 45.7 82.5 82
259 Dry Clean Woven 46 45.3 85 84.5 45.5 45.5 84.5 84
142 Wet Clean Knit 61.5 69 50 53 46 47.2 54 53.1 47 47.1
242 Dry Clean Knit 65.5 66 47 48 47.5 48.6 61 888 48 48
145 Wet Clean Knit 68.3 68 59.2 56 51.5 53 61.5 56.1 53
245 Dry Clean Knit 61 64 63 62 49 51.5 63.5 62.7 50.5
121 Wet Clean Knit 63.5 60 51 52 50.5 52 60 51.5 52.1
221 Dry Clean Knit 64 64 50.5 50.2 52 52 63.3 51 53.7
117 Wet Clean Knit 42 40.5 64.5 60.5 47.5 48 40 60.5 47.5
217 Dry Clean Knit -42 42 66 63.5 49 48.5 62.5 48 60.5
144A Wet Clean Knit 52 50.5 63 66 51.5 55.8 50.2 66 54
244A Dry Clean Knit 54 50.5 63 66 53 54 . 49.5 64.3 54
543861A Wet Clean Knit 61.9 62.5 45.8 49 11.5 11 62.5 49 11.3
543861B Dry Clean Knit 62.5 64 47 48 1l.8 11 63.9 48 10.9

Appendix 3-T
ID# Treatment Fabric
543865A Wet Clean Knit
543865B Dry Clean Knit
123 Wet Clean Knit
223 Dry Clean Knit
147 Wet Clean Knit
247 Dry Clean Knit
151 Wet Clean Knit
251 Dry Clean Knit
122 Wet Clean Knit
222 Dry Clean Knit
135 Wet Clean Woven
235 Dry Clean Woven
540278A Wet Clean Woven
540278B Dry Clean Woven
Leneth Initial Final
62.2 63.5 63.5
62.2 64 63.7
67 61.5 62
66.5 67.5 67.5
55.5 55 55
58 58.2 58.4
53.9 50 50
56 57.8 57.9
64 62.8 62.5
62 62 62
140.6 146 146
140.2 145
145
150.5 153.5 155.2
155.5 157.5
Width Initial Final
49.4 48.5 48.5
50.6 48.8 48.8
55 55 55
52 53.5 53.5
53 44 44
53 52 51.7
55.4 48 48
54.2 53 52.7
57.5 57.4 57
59.5 56.7 57
Sleeve Initial Final
II 10.5 10.5
11.2 10.5 II
57.5 53 53
57 58 58
41 39 39.1
44.5 44.5 44.5
60.7 57 57
61.9 63 63.4
53 53 53
53.5 51.5 52

Appendix 3-T
ID# Treatment Fabric Len2th Width Sleeve Initial Final Initial Final Initial Final
542004A Wet Clean Woven 141.7 147.6 147
542004B Dry Clean Woven 141.5 146 146.5
131 Wet Clean Woven 56 56.5 57 56.5 56.5 57
231 Dry Clean Woven 56.5 56.5 57.1 57 56.2 56.5
BOC Wet Clean Woven 67.6 66.7 54.5 54 66.5 54
230C Dry Clean Woven 67.7 66.5 54.5 54 67 54
126 Wet Clean Woven 121.5 ll9 66 65 50.5 50.1 ll9.5 65 50.2
226 Dry Clean Woven 122 ll9.5 66 64.5 51 51 ll9 65.1 51
127 Wet Clean Woven 126 124.5 60.5 62 46.5 46.5 124.5 61.5 47
227 Dry Clean Woven 126 124 61 61.5 48 47 124 61.5 47
129 Wet Clean Woven 84 83 51 51 51 51 83 50.5 50.2
229 Dry Clean Woven 84 82.5 52 51.5 51 50 51.8 50.1
148 Wet Clean Woven 85.5 82.5 56 54.5 44.5 42.5 82.5 55 43
248 Dry Clean Woven 85.5 85 58 56.5 45 44.3 85.2 56.7 44

Appendix 3-T
ID# Treatment Fabric Leneth Width Sleeve Initial Final Initial Final Initial Final
143 Wet Clean Woven 120 117 54.5 54.2 39.4 38.3 117.5 54.7 38.5
243 Dry Clean Woven 120 120 54.8 55 40.3 39 120 55.1 40 39.5
Length Width 150 Wet Clean Woven 161.5 141.5 36.5 30
142.2 30.5
250 Dry Clean Woven 164.2 164.4 40.5 39.5 163.2 39
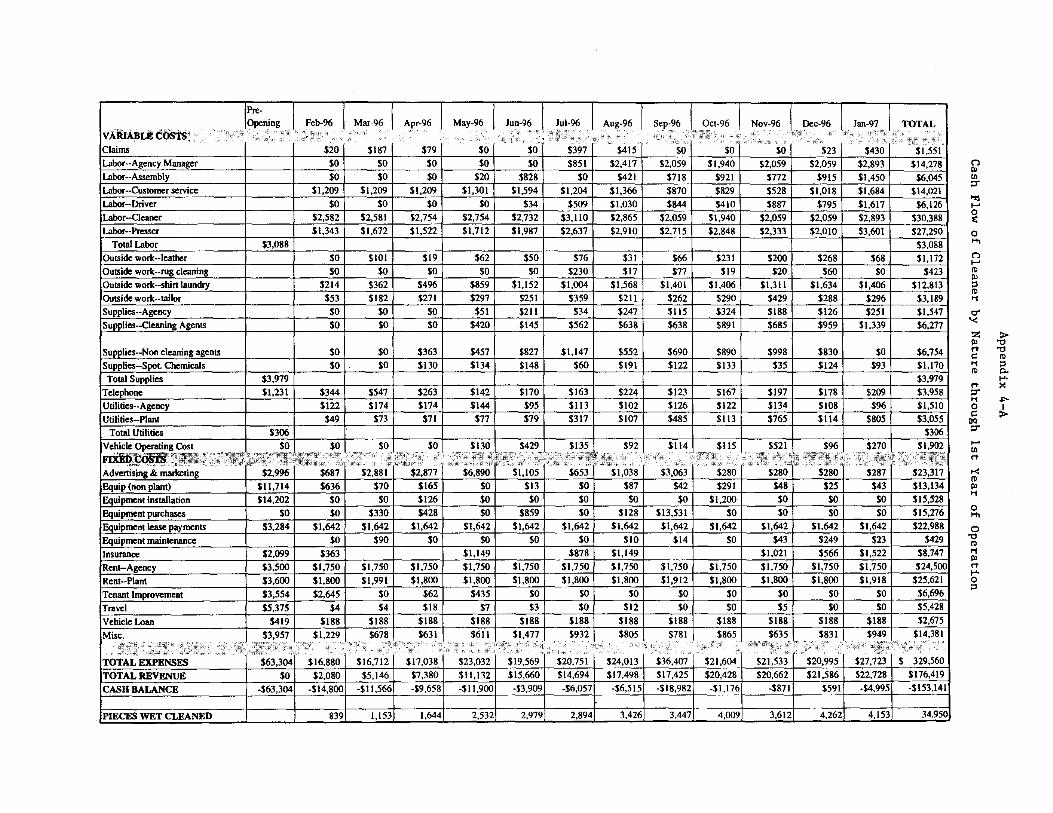
vARIABLE costs; !;n_ing ,.;~:~-96 I Mar-96 I Apr-96 I May-96 I Jun-96.\,, 41:t~. ~Aug-96 I Sep-9~.1'.?,•i?:i'.~:96 I Nov-96 Lpec-96 '•••f~-91) TOTA~-•
Claims $20 $187 $79 $0 $0 $397 $415 $0 $0 $0 $23 $430 $1,551 Labor--Agency Manager $0 $0 $0 $0 $0 $851 $2,417 $2,059 $1,940 $2,059 $2,059 $2,893 $14,278 Labor--Assembly $0 $0 $0 $20 $828 $0 $421 $718 $921 $772 $915 $1,450 $6,045 Labor--Customer service $1,209 $1,209 $1,209 $1,301 $1,594 $1,204 $1,366 $870 $829 $528 $1,018 $1,684 $14,021 Labor-Driver $0 $0 $0 $0 $34 $509 $1,030 $844 $410 $887 $795 $1,617 $6,126 Labor-Cleaner $2,582 $2,581 $2,754 $2,754 $2,732 $3,110 $2,865 $2,059 $1,940 $2,059 $2,059 $2,893 $30,388 Labor--Presser $1,343 $1,672 $1,522 $1,712 $1,987 $2,637 $2,910 $2,715 $2,848 $2,333 $2,010 $3,601 $27,290
Total Labor $3,088 $3,088 Outside work--leather $0 $IOI $19 $62 $50 $76 $31 $66 $231 $200 $268 $68 $1,172
Outside work--rug cleaning $0 $0 $0 $0 $0 $230 $17 $77 $19 $20 $60 $0 $423 Outside work--shirt laundry $214 $362 $496 $859 $1,152 $1,004 $1,568 $1,401 $1,406 $1,311 $1,634 $1,406 $12,813 Outside work--tailor $53 $182 $271 $297 $251 $359 $211 $262 $290 $429 $288 $296 $3,189 Supplies--Agency $0 $0 $0 $51 $211 $34 $247 $115 $324 $188 $126 $251 $1,547 Supplies--Oeaning Agents $0 $0 $0 $420 $145 $562 $638 $638 $891 $685 $959 $1,339 $6,277
Supplies--Non cleaning agents $0 $0 $363 $457 $827 $1,147 $552 $690 $890 $998 $830 $0 $6,754
Supplies--Spot. Chemicals $0 $0 $130 $134 $148 $60 $191 $122 $133 $35 $124 $93 $1,170
Total Supplies $3,979 $3,979
Telephone $1,231 $344 $541 $263 $142 $170 $163 $224 $123 $167 $197 $178 $209 $3,958
Utilities--Agency $122 $174 $174 $144 $95 $113 $102 $126 $122 $134 $108 $96 $1,510
Utilities-Plant $49 $73 $11 $77 $79 $317 $107 $485 $113 $765 $114 $805 $3,055
Total Utilities $306 $306
Vehicle Operating Cost $0 $0 $0 $0 $130 $429 $135 $92 $114 $115 $521 $96 $~~i rn;,,~:n;~g;F@>~~:&!~:i~~:~:;j.~!-~M~~~-~'.:.;:-~~1ffl~!J::·f:~f~-,:?:'~{~f~~ /7Y" ':>;: L":i1fft ,· ;,,,, if·,ol ,, t s :::i
.. '1::1] ,·. (?,, •d'->-. ',_ ,: !.:,y . .J' '!i '",U!:!i'!.c .. -:.: Advertising & marketing $2,996 $687 $2,881 $2,877 $6,890 $653 $1,038 $3,063 $280 $280 $280 $287 $23,317
Equip (non plant) $11,714 $636 $70 $165 $0 $13 $0 $87 $42 $291 $48 $25 $43 $13,134
Equipment installation $14,202 $0 $0 $126 $0 $0 $0 $0 $0 $1,200 $0 $0 $0 $15,528
Equipment purchases $0 $0 $330 $428 $0 $859 $0 $128 $13,531 $0 $0 $0 $0 $15,276
Equipment lease payments $3,284 $1,642 $1,642 $1,642 $1,642 $1,642 $1,642 $1,642 $1,642 $1,642 $1,642 $1,642 $1,642 $22,988
Equipment maintenance $0 $90 $0 $0 $0 $0 $10 $14 $0 $43 $249 $23 $429
Insurance $2,099 $363 $1,149 $878 $1,149 $1,021 $566 $1,522 $8,747
Rent-Agency $3,500 $1,750 $1,750 $1,750 $1,750 $1,750 $1,750 $1,750 $1,750 $1,750 $1,750 $1,750 $1,750 $24,500
Rent--Plant $3,600 $1,800 $1,991 $1,800 $1,800 $1,800 $1,800 $1,800 $1,912 $1,800 $1,800 $1,800 $1,918 $25,621
Tenant Improvement $3,554 $2,645 $0 $62 $435 $0 $0 $0 $0 $0 $0 $0 $0 $6,696
Travel $5,375 $4 $4 $18 $7 $3 $0 $12 $0 $0 $5 $0 $0 $5,428
Vehicle Loan $419 $188 $188 $188 $188 $188 $188 $188 $188 $188 $188 $188 $188 $2,675
Misc. $3,957 $1,229 $678 $631 $611 $1,477 $932 $805 $781 $865 $635 $831,1 $949 $14,381 ""' , ..
yj:, .;:;f'i'>' ·.•;; ·. ,,:•:,- 'i'.'/', " "-~:i. ' .,. . ' ';,R,'1}:~tifuI-\"; t .. . z;~•; ';['> • fJ'R. , ,.. ;fr•ji .. ,.- ' R!!f! '
TOTAL EXPENSES $63,304 $16,880 $16,712 $17,038 $23,032 $19,569 $20,751 $24,013 $36,407 $21,604 $21,533 $20,995 $27,723 $ 329,560
TOTAL REVENUE $0 $2,080 $5,146 $7,380 $11,132 $15,660 $14,694 $17,498 $17,425 $20,428 $20,662 $21,586 $22,728 $176,419
CASH BALANCE -$63,304 -$14,800 -$11,566 -$9,658 -$11,900 -$3,909 -$6,057 -$6,515 -$18,982 -$1,176 -$871 $591 -$4,995 -$153,141
PIECES WET CLEANED 839 1,153 1,644 2,532 2,979 2,894 3,426 3,447 4,009 3,612 4,262 4,153 34,950
C")
"' ::,-"" l,j I-' 0 (
0 H,
C")
I-' It)
;,"' It) ,;
o' '< !>:
"' c:: " ,; It)
::,-" ,; 0 c::
00 ::,-.... "' " o-< It)
,; "' 0 H,
0 '0 It) ,;
"' .... " 0 ;,
>'0 '0 It) ;, p. I-'• :< .i:-I >

Appendix 4-B
Accrued Revenue and Expense Key
The accrual basis of accounting is used to evaluate whether revenues generated exceed expenses accrued within a specific time period. The accrual basis of accounting first looks at the amount of service performed in a period of time and then matches the expenses and revenues associated with performing those services. The accrual method requires adjusting the cash-flow of a business (Appendix 4-1) to reflect when expenses were actually used and revenues were actually generated. Each line item in the CashFlow Table was evaluated to assess whether the revenues collected or the costs incurred reflected the work performed each month in wet cleaning garments at Cleaner by Nature. Each of the line items below reflects an adjustment that was necessary to match revenues and expenses to work performed each month of the first year of operation at Cleaner by Nature.
Gross Profit
Revenue Generated
Appendix 4A shows the monthly revenue collected at Cleaner by Nature. Cleaner by Nature also kept track of the number of garments cleaned each month and revenue generated from these pieces.
Data on revenue generated was compiled from the computer cash register, which matches each garment cleaned with the price paid. Two computer crashes in the months of October and December meant that, while the number of garments processed for these months was known, the revenue generated from those garments was missing. The average revenue per garment for September and January ($4.88/garment) was multiplied by the number of garments wet cleaned in October and December to estimated the revenue for these months. Data for November was not included because the price per garment ($5.44) was over 50 cents higher than any other month due to the fact that an unusually high volume of wedding dresses (for which a premium is charged) were processed this month.
Inventory
Cleaner by Nature's owner estimated that there was at least $500 worth of inventory purchased at the end of the first year of operation but not used until the second year. An inventory asset of $250 was added to months of December 1996 and January 1997.
Appendix 4-B
VARIABLE EXPENSES
Appendix 4A calculates the cost of labor based on the date that workers were paid. Cleaner by Nature pays work two weeks after the work is performed. Some pay checks cover both the month in which the pay check was issued and work carried out in the prior month. In order to calculate labor expenses generated within each month, when a pay period overlapped months, the fraction of the pay period attributed to work performed in the prior month was added to the labor cost from the prior month and subtracted from the pay period in which the checks were issued.
Supplies -- Agency and Plant
Appendix 4A lists the costs of supplies when they were purchased at pre-opening or within the first year of operation.1 To calculate the cost of supplies used each month, the total number of garments wet cleaned each month was multiplied by the average cost of supplies per garment. The average cost of supplies per garment cleaned was derived by dividing the total cost of supplies for the year for each supply category by the total number of garments cleaned. The total number of garments wet cleaned for the year was 34,950. The average cost per garment for each supply category were as follows:
Agency supplies: ($2,051/34,950) = $0.0587 /garment • Cleaning supplies: ($7, 141/34,950)= $0.2043/garment
Spotting chemicals: ($1,552/34,950) = $0.0444/garment • Clothes handling and other supplies: ($7,643/34,950) = $0.2187/garment
Supplies purchased at the end of the first year of operation and used to clean garments at the beginning of the second year were subtracted. The cost of cleaning agents for January was the only cost subtracted because it could be verified that this purchase was paid at the end of January to be used for February cleaning.
Utilities
Appendix 4A reports the utility costs paid each month. Because Cleaner by Nature began to pay the water bill at the plant every other month starting in July 1996, the average utility cost for two months was taken starting with June-July.
1 Pre-opening supply costs were not broken down by type of supply - agency supplies, cleaning supplies, spotting chemicals, and clothes handling. The proportion of all supplies taken up by each supply category in the first year of operation was used to estimate the cost of each category at pre-opening. These proportions were as follows: agency supplies= 13%, cleaning supplies= 55%, spotting chemicals= 10%, and handling= 22%. Thus, for all pre-opening supplies ($3,979), agency supply cost= $504, cleaning supply costs = $2,203, spotting chemicals = $382, and handling =$890.
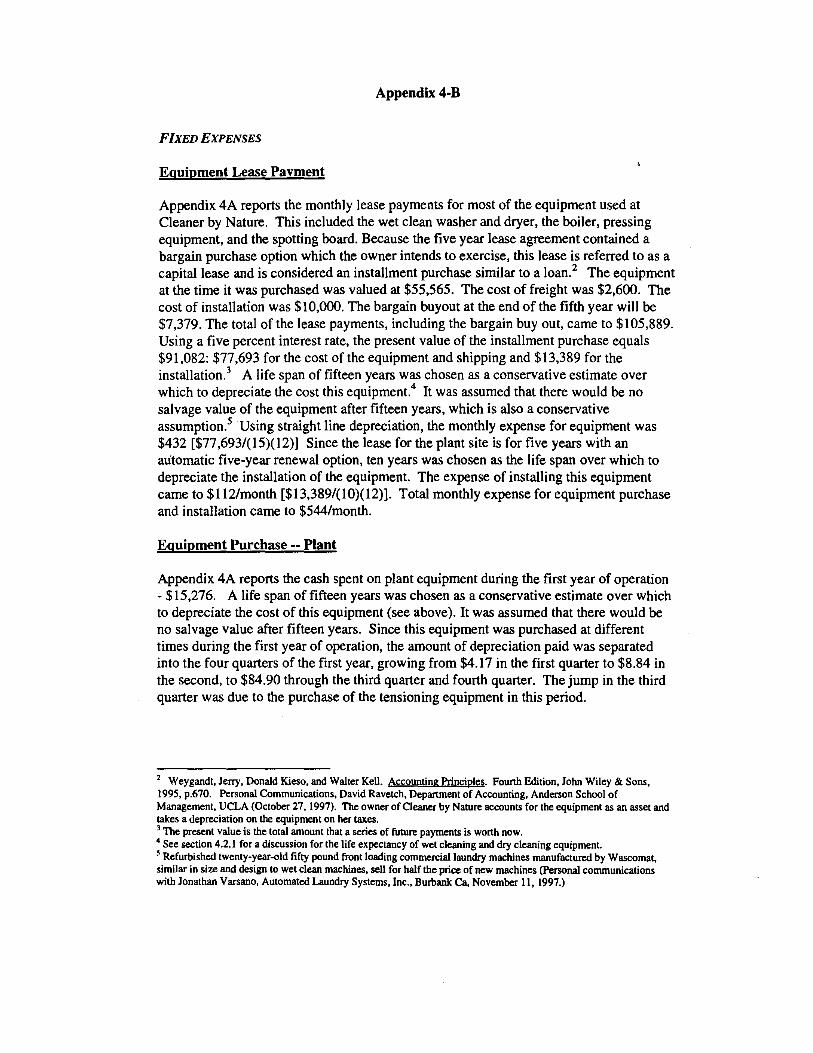
Appendix 4-B
FIXED EXPENSES
Equipment Lease Payment
Appendix 4A reports the monthly lease payments for most of the equipment used at Cleaner by Nature. This included the wet clean washer and dryer, the boiler, pressing equipment, and the spotting board. Because the five year lease agreement contained a bargain purchase option which the owner intends to exercise, this lease is referred to as a capital lease and is considered an installment purchase similar to a loan.2 The equipment at the time it was purchased was valued at $55,565. The cost of freight was $2,600. The cost of installation was $10,000. The bargain buyout at the end of the fifth year will be $7,379. The total of the lease payments, including the bargain buy out, came to $105,889. Using a five percent interest rate, the present value of the installment purchase equals $91,082: $77,693 for the cost of the equipment and shipping and $13,389 for the installation.3 A life span of fifteen years was chosen as a conservative estimate over which to depreciate the cost this equipment.4 It was assumed that there would be no salvage value of the equipment after fifteen years, which is also a conservative assumption.5 Using straight line depreciation, the monthly expense for equipment was $432 [$77,693/(15)(12)) Since the lease for the plant site is for five years with an automatic five-year renewal option, ten years was chosen as the life span over which to depreciate the installation of the equipment. The expense of installing this equipment came to $112/month [$13,389/(10)(12)). Total monthly expense for equipment purchase and installation came to $544/month.
Equipment Purchase -- Plant
Appendix 4A reports the cash spent on plant equipment during the first year of operation - $15,276. A life span of fifteen years was chosen as a conservative estimate over which to depreciate the cost of this equipment (see above). It was assumed that there would be no salvage value after fifteen years. Since this equipment was purchased at different times during the first year of operation, the amount of depreciation paid was separated into the four quarters of the first year, growing from $4.17 in the first quarter to $8.84 in the second, to $84.90 through the third quarter and fourth quarter. The jump in the third quarter was due to the purchase of the tensioning equipment in this period.
2 Weygandt, Jerry, Donald Kieso, and Walter Kell. Accounting Principles. Fourth Edition, John Wiley & Sons, 1995, p.670. Personal Communications, David Ravetch, Department of Accounting, Anderson School of Management, UCLA (October 27, 1997). The owner of Cleaner by Nature accounts for the equipment as an asset and takes a depreciation on the equipment on her taxes. 3 The present value is the total amount that a series of future payments is worth now. 4 See section 4.2.1 for a discussion for the life expectancy of wet cleaning and dry cleaning equipment. 5 Refurbished twenty-year-old fifty pound front loading commercial laundry machines manufactured by Wascomat, similar in size and design to wet clean machines, sell for half the price of new machines (Personal communications with Jonathan Varsano, Automated Laundry Systems, Inc., Burbank Ca, November 11, 1997.)

Appendix 4-B
Equipment Installation
Appendix 4A report the cost of plant installation apart from that covered under the capital lease. Ten years was chosen as the life span of the installation of the equipment (see above). The majority of plant equipment was installed in January of pre-opening, creating a monthly expense of $119 [$14,202/(10)(12)] . An additional large installation cost of $1,200 ( or $10/month) was incurred in September when the tensioning equipment was purchased.
Equipment Purchases -- Agency
Appendix 4A reports the cash spent on equipment at the agency during the start up period and during the first year of operation. Since most of this equipment cost was for a computer cash register and a credit card processing machine, which have relatively short life spans, the expense of using this was depreciated over a five-year period. It was assumed that there would be no salvage value after five years. Most of this equipment $11,714 of $13,134) was purchased in the pre-opening period for a monthly expense of $209 [$13,134/(5)(12)]. Additional expenses were added for purchases between August through October and November through January.
Insurance
Appendix 4A reports the cash spent of pre-paid insurance during the pre-opening period and first year of operation. To calculate the monthly expense of insuring workers, the business, and the vehicle, the total cost of prepaid insurance that covered the wet cleaner over the first year of operation was added as an expense for each month of coverage. Prepaid insurance paid during the first year but used in the second year was removed as a first year expense. Business insurance came to $1,253 for one year or $113 per month including the two months in the pre-opening period. Automobile insurance was $878 for six months or $146/month starting in the second month of operation. The total amount of workers' compensation paid through the first year of operation was $4,708. Since workers' compensation is proportional to payroll, to derive the monthly workers' compensation expense, the proportion of total payroll (minus the driver) paid each month was multiplied by the total amount of workers' compensation ($4,708).
Rent
Cleaner by Nature began paying rent in January 1996. While first and last month's rent was paid at both the plant and agency, only one month of rent payment was used.
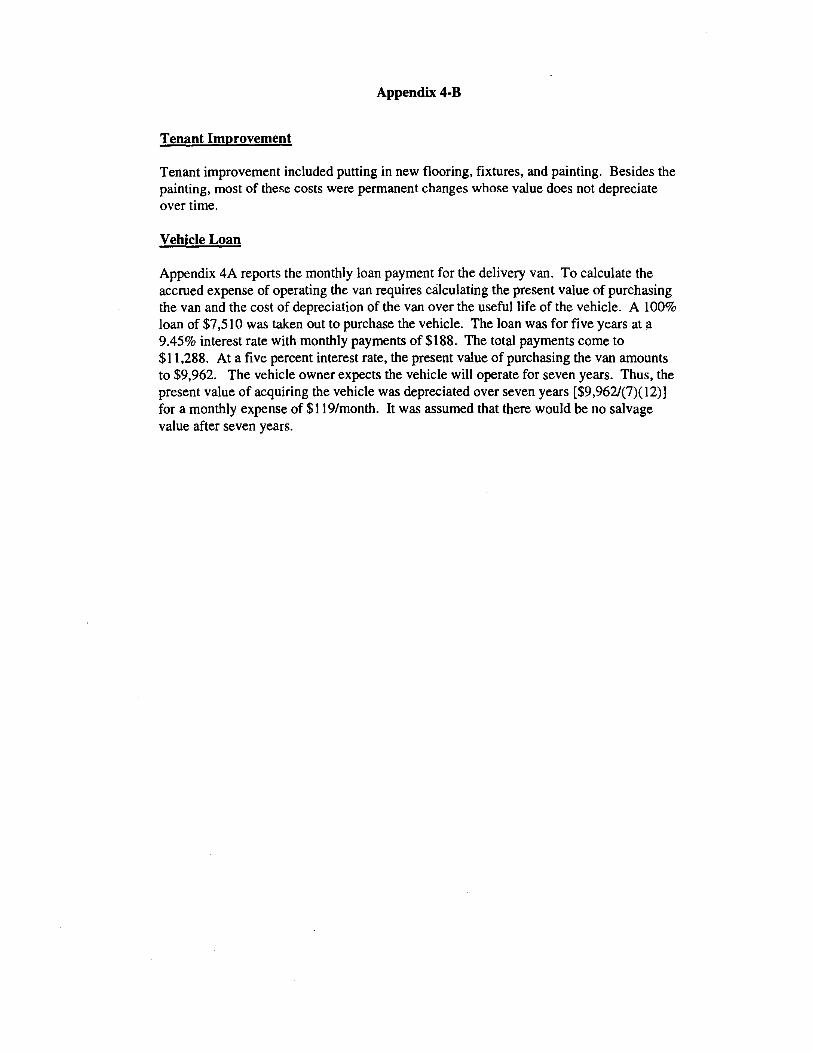
Appendix 4-B
Tenant Improvement
Tenant improvement included putting in new flooring, fixtures, and painting. Besides the painting, most of these costs were permanent changes whose value does not depreciate over time.
Vehicle Loan
Appendix 4A reports the monthly loan payment for the delivery van. To calculate the accrued expense of operating the van requires calculating the present value of purchasing the van and the cost of depreciation of the van over the useful life of the vehicle. A 100% loan of $7,510 was taken out to purchase the vehicle. The loan was for five years at a 9.45% interest rate with monthly payments of $188. The total payments come to $11,288. At a five percent interest rate, the present value of purchasing the van amounts to $9,962. The vehicle owner expects the vehicle will operate for seven years. Thus, the present value of acquiring the vehicle was depreciated over seven years [$9,962/(7)(12)] for a monthly expense of $119/month. It was assumed that there would be no salvage value after seven years.
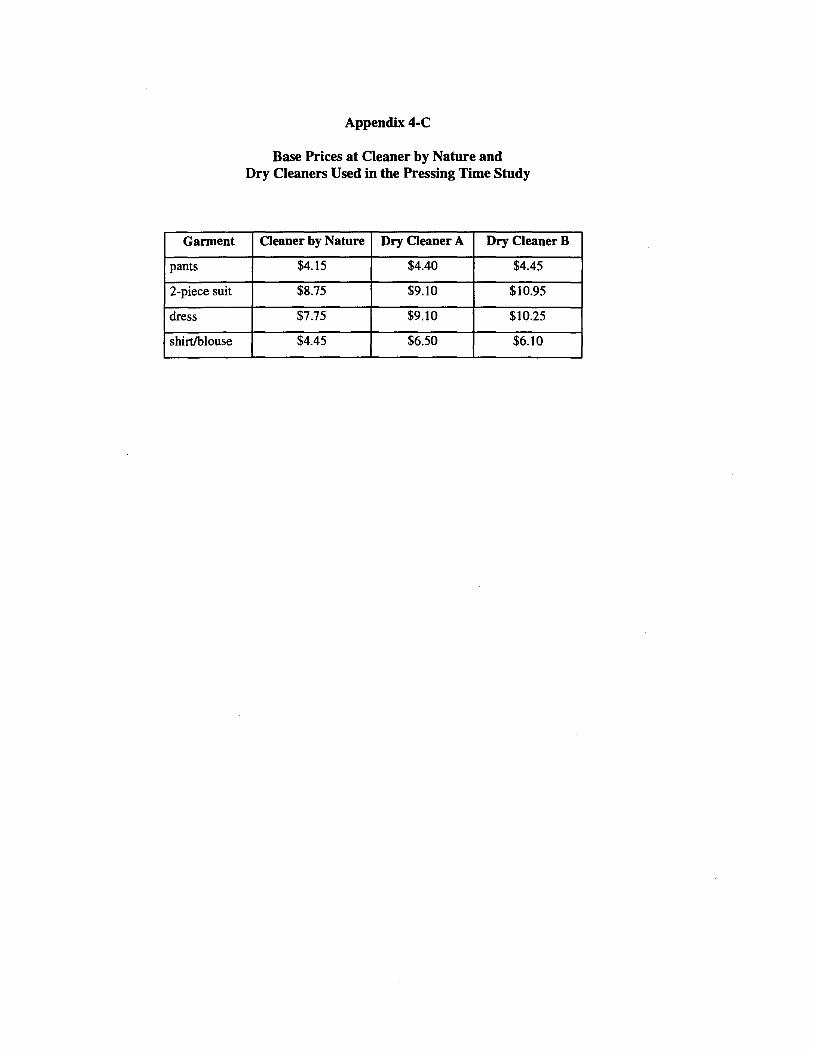
Appendix 4-C
Base Prices at Cleaner by Nature and Dry Cleaners Used in the Pressing Time Study
Garment Cleaner by Nature Dry Cleaner A Dry Cleaner B
pants $4.15 $4.40 $4.45
2-piece suit $8.75 $9.10 $10.95
dress $7.75 $9.10 $10.25
shirt/blouse $4.45 $6.50 $6.10

Appendix 4-D
Distribution of Fiber Types Pressed During Evaluation at Cleaner by Nature and Two Local Dry Cleaners
A. Percentage of Fiber Types in Plants
50%.., ] 40%
~ ., 30%
Ii 0 20%
< ~ 0 10% i=., ~ 0% ~
Wool
□ Cleaner by Nature
□ Dry Cleaner A
1---------------------i ■ Dry Cleaner B
Cotton Acetate Rayon Polyester Linen Silk
B. Percentage of Fiber types in Jackets
70% ..,
60%
£ 50% ~ C.,
40% ~
0 30%
< 20%'o i=., 10%
! 0%
□ Cleaner by Nature --------------------<
□ Dry Cleaner A
■ Dry Cleaner B
Wool Cotton Acetate Rayon Polyester Linen Silk
C. Percentage of Fiber Types in Shirts/Blouses
40% ..,
35%1JI
£ 30% ~
25%5 Ii 20% 0
~ 15%
'o 10% 5 5%~ ~
0%
□ Cleaner by Nature t-----------------c::::::r:::,---------l □ Dry Cleaner A
■ Dry Cleaner B
Wool Cotton Acetate Rayon Polyescer Linen Silk
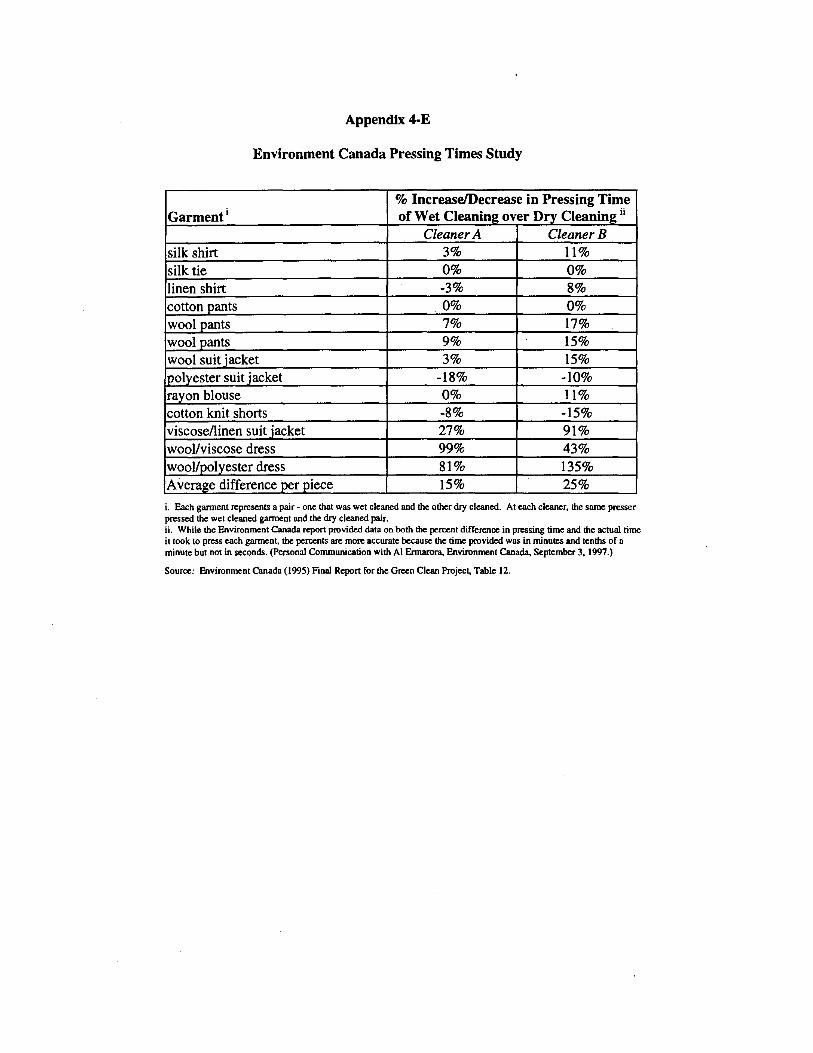
Appendix 4-E
Environment Canada Pressing Times Study
Garment; % Increase/Decrease in Pressing Time of Wet Cleaning over Dry Cleaning ii
Cleaner A Cleaner B silk shirt 3% 11%
silk tie 0% 0% linen shirt -3% 8% cotton pants 0% 0% wool pants 7% 17% wool pants 9% 15%
wool suit iacket 3% 15% oolvester suit iacket -18% -10% ravon blouse 0% 11% cotton knit shorts -8% -15% viscose/linen suit jacket 27% 91% wool/viscose dress 99% 43% wool/polyester dress 81% 135% Average difference per piece 15% 25%
i. Each gwment represents a pair - one that was wet cleaned and the other dry cleaned. At each cleaner, the same presser pressed the wet cleaned gwment and the dry cleaned pair. ii. While the Environment Canada report provided data on both the percent difference in pressing time and the actual time it took to press each gannent, the percents are more accurate because the time provided was in minutes and tenths or a minute but not in seconds. (Personal Communication with Al Ennarora, Environment Canada, September 3, 1997.)
Source: Environment Canada (1995) Final Report for the Green Clean Projec~ Table 12.
Appendix 4-F
Process-Dependent Operating Cost Key
All process-dependent operating costs have been calculated on a per piece basis and then multiplied by the number of garments cleaned. The per piece cost estimates were then used to calculate the difference in profitability between the two processes over a one-year period based on Cleaner by Nature's fourth quarter productivity, when the plant processed a total of 12,027 garments. Based on fourth quarter productivity the total number of garments cleaned in a year would equal 48,108 (12,027*4). Thus each per piece cost was multiplied by 48,108 to estimate the yearly cost for each process dependent cost. The model comparison assumes both facilities are small-sized cleaners such as Cleaner by Nature. In many cases, cost estimates are based on the assumption that Cleaner by Nature and the model cleaner are as productive as Cleaner by Nature was during the fourth quarter of the first year of operation (November 1, 1996 through January 31, 1997), when it was processing an average of 197 garments per day. Fourth quarter labor costs are also the most useful because Cleaner by Nature had purchased tensioning equipment and trained its pressers to use that equipment by that time. Different assumptions about volume would affect the calculation of cost per piece. For example, fixed costs per piece would be lower given a higher volume. Likewise, a higher volume dry cleaner might not enjoy certain exemptions from regulatory fees, such as the South Coast Air Quality Management District's emissions fee which only affects dry cleaners with net emissions of more than 4,000 pounds a year.
VARIABLE EXPENSES
Claims
Wet cleaning: The wet cleaning claims per piece was calculated using the total dollar amount of claims awarded to customers for lost or damaged garments during the last five months of the first year of operation. This post start-up period is more representative of the on-going claims costs of wet cleaning because it omits the periods in which any of the three Cleaner by Nature cleaners were learning the process. The total garments cleaned during that period was used to calculate the per garment claims rate for the model wet cleaner: $452.74 (claims)/19,483(garments) = $0.0232/garments. Based on a yearly volume of 48,108 garments, the yearly expense comes to $1,118.
Appendix 4-F
Dry Cleaning: The dry cleaning pressing labor costs assume that wet cleaning labor costs are from 20% to 70% higher than in dry cleaning (see Section 4.2.2). The percentages represent how much slower it takes to press wet cleaned garments than a dry cleaned garment. The 20% figures comes for the Environment Canada study and the 70% comes from the PPERC study. A labor cost that is 20% higher for wet cleaning is equivalent to being 16.7% lower in dry cleaning compared to wet cleaning -- [(120-100)/120]*100%. This means that dry clean pressing labor cost is 83.3% of wet clean labor cost. A labor cost that is 70% higher for wet cleaning is equivalent to being 41.2% lower in dry cleaning compared to wet cleaning [(170-100)/170]*100%. This means that dry clean pressing labor cost is 58.8% of wet clean labor cost.
Using Model Dry Cleaner A to represent the Environment Canada study, the cost of pressing a garment when dry cleaned came to $0.502/garment [$0.603/piece (CbN pressing cost/piece)(0.833)]. Using Model Dry Cleaner B to represent the PPERC study, the cost of pressing a garment when dry cleaned came to $0.355/garment garment [$0.603/piece (CbN pressing cost/piece)(0.588)]. Based on a yearly volume of 48,108 garments, the yearly expense for pressing labor in dry cleaning comes to $24,165 for Model Dry Cleaner A and $17,058 for Model Dry Cleaner B.
PPERC Pressing Time Study: The 1.7 ratio was derived from the PPERC pressing time study conducted at Cleaner by Nature and two local dry cleaners. The PPERC pressing time study provides ratios of Cleaner by Nature to dry cleaning pressing time for the three different garments types: pants, blouses, and jackets. The ratios are a weighted average of pressing times for pants, blouses and jackets, the three most commonly received garments at Cleaner by Nature. The ratios are weighted according to the distribution of garments cleaned at Cleaner by Nature. Because the time study was not able to control for one key factor (skill of the presser) and only partially controlled for the garment characteristics, and quality and productivity demands of the cleaner, the overall cost difference was verified by using other studies.
Environment Canada Study: The study best able to control for these confounding variables was Environment Canada's 1995 pressing time study that measured the differences in wet cleaning and dry cleaning pressing time for 13 identical garments at two local dry cleaners. This study found that the 13 wet cleaned garments took an average of 1.25 times longer to press than the dry cleaned garments. 2 (See Appendix 4-E).
Supplies -- Detergent, Sizing, Finishing
Wet Cleaning: The model wet cleaner's detergent cost was calculated based on a two-day load monitoring period at Cleaner by Nature. During that period the amount of detergent, finish, sizing, leather detergent and leather finish used was monitored through pump tests.
2 Environment Canada, Final Report for the Green Clean Project (Samia, Ontario, October 1995): 52-55.
Appendix 4-F
Dry Cleaning: The dry cleaning pressing labor costs assume that wet cleaning labor costs are from 20% to 70% higher than in dry cleaning (see Section 4.2.2). The percentages represent how much slower it takes to press wet cleaned garments than a dry cleaned garment. The 20% figures comes for the Environment Canada study and the 70% comes from the PPERC study. A labor cost that is 20% higher for wet cleaning is equivalent to being 16.7% lower in dry cleaning compared to wet cleaning -- [(120-100)/120]*100%. This means that dry clean pressing labor cost is 83.3% of wet clean labor cost. A labor cost that is 70% higher for wet cleaning is equivalent to being 41.2% lower in dry cleaning compared to wet cleaning [(170-100)/170]*100%. This means that dry clean pressing labor cost is 58.8% of wet clean labor cost.
Using Model Dry Cleaner A to represent the Environment Canada study, the cost of pressing a garment when dry cleaned came to $0.502/garment [$0.603/piece (CbN pressing cost/piece)(0.833)). Using Model Dry Cleaner B to represent the PPERC study, the cost of pressing a garment when dry cleaned came to $0.355/garment garment [$0.603/piece (CbN pressing cost/piece)(0.588)). Based on a yearly volume of 48,108 garments, the yearly expense for pressing labor in dry cleaning comes to $24,198 for Model Dry Cleaner A and $17,058 for Model Dry Cleaner B.
PPERC Pressing Time Study: The 1.7 ratio was derived from the PPERC pressing time study conducted at Cleaner by Nature and two local dry cleaners. The PPERC pressing time study provides ratios of Cleaner by Nature to dry cleaning pressing time for the three different garments types: pants, blouses, and jackets. The ratios are a weighted average of pressing times for pants, blouses and jackets, the three most commonly received garments at Cleaner by Nature. The ratios are weighted according to the distribution of garments cleaned at Cleaner by Nature. Because the time study was not able to control for one key factor (skill of the presser) and only partially controlled for the garment characteristics, and quality and productivity demands of the cleaner, the overall cost difference was verified by using other studies.
Environment Canada Study: The study best able to control for these confounding variables was Environment Canada's 1995 pressing time study that measured the differences in wet cleaning and dry cleaning pressing time for 13 identical garments at two local dry cleaners. This study found that the 13 wet cleaned garments took an average of 1.25 times longer to press than the dry cleaned garments.2 (See Appendix 4-E).
Supplies -- Detergent, Sizing, Finishing
Wet Cleaning: The model wet cleaner's detergent cost was calculated based on a two-day load monitoring period at Cleaner by Nature. During that period the amount of detergent, finish, sizing, leather detergent and leather finish used was monitored through pump tests.
2 Environment Canada, Final Report for the Green Clean Project (Samia, Ontario, October 1995): 52-55.
Appendix 4-F
The number of gannents cleaned per load was also tracked. This data was used to determine the average per piece price of cleaning agents at Cleaner by Nature ($0.0903/piece). Since the Aquatex cleaning agents are purchased out of state and Cleaner by Nature does not pay tax on cleaning agents, tax is not included. Shipping cost ( estimated by Iowa Techniques at an average of 8% of the sale price) is included in the cost: [$0.0903 (cost per garment)]* [l + 8% (shipping))= $0.098/garment. 3 Based on a yearly volume of 48,108, the yearly expense comes to $4,715.
Since the demonstration period ended, Cleaner by Nature has begun using less expensive detergent.
Dry Cleaning: Detergent cost estimates were based on a range of prices provided by two detergent distributors for the two types of dry cleaning detergents marketed to cleaners. Detergent used in a "charge" system is recycled with the solvent and is generally less expensive than detergent used an "injection" system, which is added to the solvent and disposed of after each wash cycle. The price listed is the mid-point between an estimate of "charge" system detergent (3.5 cents/pound) and the "injection" system cleaning agent (4.3 cents/pound). For the purposes of this analysis, one gannent is assumed to weigh one pound. While some dry cleaners also use sizing, a conservative assumption was made that the model dry cleaner did not use sizing. Sales tax at 8.25% is also included in the estimate: [$0.039 (detergent/piece)] * [1 +8.25% (sales tax)]= $0.042/gannent. Based on a yearly volume of 48,108 gannents, the yearly expense comes to $2,021.
Supplies---Spotting Chemicals
Wet Cleaning: The per piece cost of spotting chemicals was estimated based on the amount Cleaner by Nature spent on spotting chemicals in its first year and the number of gannents cleaned in that year: [$1,172 (spotting chemicals)/34,950 (pieces)]= $0.034/garment. Based on a yearly volume of 48,108, the yearly expense comes to $1,636.
Dry Cleaning: Because of the lack of cost comparison data on spotting chemical use, the costs are assumed to be the same in dry cleaning $1,172 (spotting chemicals)/34,950 (pieces). However, there is reason to believe that spotting chemical costs would be less in wet cleaning than in dry cleaning. The USEPA's multi-process wet cleaning report found spotting chemical costs to be slightly less for multi-process wet cleaning than for dry cleaning.4 In addition, researchers and cleaners report that water-based stains are
3 Personal Communication with Chris Dolan, Iowa Techniques, May 7, 1997. 4 US Environmental Protection Agency, Multiprocess Wet Cleaning: Cost and Performance Comparison of Conventional Dry Cleaning and An Alternative Process, EPA 7 44-R-93-004, (Washington, DC, September I 993): Exhibit 3.2.

Appendix 4-F
more prevalent on outer-wear than are oil-based stains.5 Since wet cleaning works better on the more common water-based stains fewer spotting chemicals may be needed in wet cleaning than in dry cleaning. Consequently, the spotting chemical cost per piece for dry cleaning represents a conservative estimate.
Perchloroethylene
Dry Cleaning: PCE use per garment was calculated using data from a 1992 California Air Resources Board survey of 2,000 California dry cleaners. The model dry cleaner is assumed to use the most up-to-date control technology, a factory PCE machine with a refrigerated condenser and carbons adsorber. PCE use per gallon was than multiplied by the average of the per gallon cost of PCE provided by two local suppliers: Ajax Supply Company in Los Angeles and United Fabricare Supply in Compton. Sales tax is also included in the estimate. PCE cost per garment amounts to $0.0136/garment [(0.00206 gallons PCE*$6.10/gallon PCE)*(l +8.25% )]. Based on a yearly volume of 48,108 garments, the yearly expense for PCE in dry cleaning comes to $654.
Supplies -- Filter Replacement
Dry Cleaning: As part of equipment maintenance, a dry cleaner would also have to pay for the purchase of cartridge filters for the PCE machine. The number of cartridge filters required per pound cleaned was gathered from waste disposal figures provided by the California Air Resources Board's 1992 survey of 2,000 dry cleaners.6 That survey provided data on the number of cartridge filters disposed of (and consequently purchased) per pound of garment cleaned for eight dry cleaners which used PCE machine with primary and secondary control devices. On average, these cleaners purchased .00054 filters for every garment cleaned. Each filter costs $19.74, according to United Fabricare Supply in Compton. The model dry cleaner's filter costs included a 8.25% sales tax and came to: [0.00054 (filters)*$19.74 (cost per filter)]*[! + 8.25% (sales tax)]: $0.012/garment. Based on a yearly volume of 48,108 garments, the yearly expense comes to $577.
Hazardous Waste Disposal
Hazardous waste disposal cost per pound was gathered from waste disposal figures provided by the California Air Resources Board's 1992 survey of 2,000 dry cleaners. That survey provided data on the number of cartridge filters and gallons of still bottoms
5 Kaspar D. Hasenclever, Report on Professional Wet Cleaning in Europe, Proceedings of Apparel Care and the Environment: Alternative Technologies and Labeling, EPA744-R-96-002, (September 1996): 101. 6 Figures for the eight dry cleaners were drawn &om a database provided by the California Air Resources Board to the UCLA PPERC Wet Cleaning Demonstration Project.

Appendix 4-F
disposed of per pound of garments cleaned for eight dry cleaners which used PCE machines with primary and secondary control devices. On average, these cleaners disposed of 0.00054 filters and 0.0009 gallons of still bottoms for every pound of garment cleaned. AAD Disposal in Vernon California provided cost information on hazardous waste disposal. The disposal cost per filter was calculated as the average between the cost of disposing the standard filter ($25.95 per filter) and the split filters ($35.00 per filter). The per gallon cost of disposing still bottoms is $5.25. Total hazardous waste cost per pound (or piece) comes to: [0.0009 (gallons of still bottoms)*$5.25 (disposal cost per gallon)+ 0.00054 (filters)*$30.48 (disposal cost per filter)]: $0.0212/garment. Based on a yearly volume of 48,108 garments, the yearly expense for hazardous waste disposal in dry cleaning comes to $1,010.
Utilities
All the assumptions about the quantity of water, sewer, and energy use come from the environmental analysis that is discussed in more detail in Section IV. The cost information was supplied by utility companies servicing Cleaner by Nature. The metering at Cleaner by Nature occurred over a period of 158 operating days at the plant. During that time, the plant was processing an average of 169 pieces a day, less than the fourth quarter volume of 197 pieces per day.
Utilities--Water and Sewer
Wet Cleaning: The water and sewer charges for the model wet cleaner were calculated using the water use figures derived from the environmental analysis (4.23 gallons per garment). Water and sewer rates were provided by the Los Angeles Department of Water and Power. Water and sewage costs together are $3.70 per cubic foot (748 gallons). The cost per garment amounts to $0.021/garment ($3.70n48 gallons)(4.23 gallons). Based on a yearly volume of 48,108 garments, the yearly expense for water and sewer in wet cleaning comes to $1,010.
Dry Cleaning: The water and sewer charges for the model dry cleaner were also calculated using the water use figures provided by the environmental analysis (2.38 gallons per garment) and DWP rates described above. The cost per garment amounts to $0.012/garment ($3.70n48 gallons)(2.38 gallons). Based on a yearly volume of 48,108 garments, the yearly expense for water and sewer use in dry cleaning comes to $577.
Appendix 4-F
Utilities--Electricity
Wet Cleaning: Electricity use for wet cleaning includes both the costs of electricity at the plant and at the agency. For this reason, electricity use may be slightly inflated for Cleaner by Nature, as well as for the model dry cleaner since the underlying assumption is that the model cleaners have a plant on the premises. Another approach might have been to only include the plant's electricity use. However, a facility with the plant on the premises would use significantly more electricity than a stand-alone plant like Cleaner by Nature's; the number of hours of operation at the Cleaner by Nature agency are longer and the cost of lighting is substantial. Plant electricity use was calculated using the per garment electricity usage figures provided by the environmental analysis (0.247 kWh/piece). According to a Los Angeles Department of Water and Power electricity bill for the period December 18, 1996 to January 21, 1997, the electricity cost per kWh is $0.12, putting Cleaner by Nature's per garment cost for the plant at $0.0296/piece (0.247 kWh*$0. l 2). The per piece cost at the agency was calculated using Southern California Edison bills for the period of June 19, 1996 through January 31, 1997 when 26,714 garments were processed. The bill was divided by the pieces wet cleaned during that period, amounting to $0.0307 /piece [$821.21 (electric bill)/26, 714 (pieces processed)]. The total cost of electric per piece amounted to $0.06/piece. Based on a yearly volume of 48,108 garments, the yearly expense for electricity used in wet cleaning comes to $2,886.
Dry Cleaning: The same method for calculating electricity costs at the model wet cleaning facility was used at the model dry cleaning facility. The environmental analysis estimated dry cleaning electricity use at 0.324 kWh/piece. Total electricity use for the model dry cleaner also include use at the Cleaner by Nature agency: [0.324 kWh (plant use)*$0.12 (plant cost)+ $821.2l(agency bill)/26,714 (pieces dry cleaned)]= $0.07/garment. Based on a yearly volume of 48,108 garments, the yearly expense for electricity used in dry cleaning comes to $3,368.
Utilities--Natural Gas
Wet Cleaning: Natural gas use for wet cleaning was also calculated using the per garment natural gas figures provided by the environmental analysis (398 Therms/month). The Southern California Gas Company uses a tiered rate structure that varies seasonally. See Table A. The per garment cost came to $0.081/garment. Based on a yearly volume of 48,108 garments, the yearly expense for natural gas in wet cleaning comes to $3,897.
Dry Cleaning: Natural gas use was calculated for the model dry cleaner from the environmental analysis (325 Therms/month). The per garment cost came to· $0.07/garment. Based on a yearly volume of 48,108 garments, the yearly expense for natural gas in dry cleaning comes to $3,368.

Appendix 4-F
Table 4-F.1: Southern California Gas Utility Rates (May 23, 1997)
Centsffhenn First Tier' 78.116 Second Tier 50.992 Low Income Surchar2e 0.884 Public Utilities Surchame 0.076
Other cbaroes Utility Users Tax 10% of bill
Flat Monthly Charge $15.00
1During the summer (4/1 -11/30), the first tier rate refers to the first 250 lbenns of use. During the winter (12/1 - 3/31), the first tier refers 10 the first 100 therms of use.
FIXED EXPENSES
Equipment Expense
The yearly expense of plant equipment is a function of both the purchase price of the equipment and the length of time the equipment is expected to last. The purchase price of wet clean equipment and comparable dry clean equipment is provided in Table 4.5. The method for estimating the life span of the wet clean system and the dry clean system as well as other plant equipment is discussed below.
Wet Cleaning: Fifteen years was given as the low end estimate for the useful life of wet clean machines by a distributor of Aquatex machines as well as by the chief mechanics at two professional cleaning firms that both distribute and repair dry cleaning and Aquatex machines. The head of distribution for AquaClean estimated that wet clean machines would be expected to last at least twenty years. All said that the simplicity of the design of wet clean machines meant that their useful life would be significantly longer than that of a dry clean machines.7 The useful life of all other plant equipment was assumed to be fifteen years as well.
The total cost of wet clean equipment, pressing equipment, and all other plant equipment came to $70,713. The yearly expense, depreciated over fifteen years, comes to $4,714. Total shipping and installation costs were estimated to be $27,000.8 The yearly expense, depreciated over fifteen years, totals $1,800. The total yearly expense of shipping, installing and using wet cleaning equipment depreciated over fifteen years equaled $6,514 (see Table 4.6).
7 While the purchase, shipping, and installation of plant equipment at Cleaner by Nature was arranged both through a capital lease as well as through outright purchase, to simplify the comparison with dry cleaning it was assumed that all of the plant equipment costs were paid outright. 8 Cleaner by Nature spent over $24,000 in installation costs and $2,600 in shipping costs.
Appendix 4-F
Dry Cleaning: Ten years appears to be a relatively stable estimate for the life of a dry clean machine. Of the three distributors contacted, one said the expected life of a dry clean machine is 10 years, one said 7-10 years for most machines, and one said 10-15 years. While two of the three repair people contacted said that a dry clean machine could last fifteen years, the operator usually would have to practice a significant amount of preventative maintenance which is costly. Both said that rather than carry out preventative maintenance most cleaners wait until a problem occurs, , which leads to more significant problems, more costly repairs, and greater overall deterioration of the machine. The third repair person said that dry clean machines are not designed to last longer than ten years. He said the maintenance cost of operating a dry clean machine is very low for the first five years, yet becomes very expensive for years five through ten and excessive afterwards. The dry cleaning consultant said that ten years is the figure he used for the expected life of a dry clean machine.
The total cost of dry clean equipment, pressing equipment, and all other plant equipment came to $77,980, including $40,813 for the dry clean machine system. (See Table 4.6). The yearly expense of the dry clean machine system, depreciated over ten years, comes to $4,081. The cost of all other plant equipment was $37,167, or $2,478 per year depreciated over fifteen years. Thus, total yearly equipment expense equals $6,559. The cost associated with shipping and installing the dry clean machine system in a new facility was estimated to be $3,500, or $350 per year depreciated over ten years.9 Installation cost for all other equipment comes to $23,500, or $1,567 per year depreciated over fifteen years. The total installation and shipping expense comes to $1,917. The total yearly expense of purchase, shipping, and installing dry clean equipment totals $8,326 (See Table 4.6).
Equipment Maintenance--Cleaning System
Wet Cleaning: No repairs of tpe wet cleaning system were required during the first year at Cleaner by Nature. Yet, over the life of the equipment, some repairs to the system are expected to occur. 10 Expec,ted repairs to the washer included replacing the door lock, the water drain valve, the water extractor bearings, and circulating pump bearings. Replacing the computer control unit (a $1,500 expense) was also included, although it was likely to last more than the fifteen year life. Expected repair cost to the dryer include replacing the lint screen, the bas valve, the thermostat, and the micro-processor. Total repair costs
9 The cost of installing a new dry clean machine in an existing facility was estimated to be no greater than $2,500, not including shipping. The cost of installing the electrical, water, air, and steam hook-ups to a dry clean machine in a new plant was estimated at $1,000. (Personal Communication with Steven Trainer, Iowa Techniques, December 5, I 997). '"(Personal Communication with Kim Bailey, Iowa Techniques, November 6, 1997); Eddy Centes (chief mechanic at Pacific Equipment), November 10, 1997.

Appendix 4-F
were estimated at $5,690. The estimate of the average yearly expense of maintaining the wet cleaning equipment came to $379 (See Table 4.6).
Dry Cleaning: The expected yearly expense (parts and labor) for maintaining the dry clean system (not including filter costs) came to $1,887 for a dry cleaner generating $185,000 in revenue (See Section 4.2.1 -- Yearly Equipment Expenses). Because this model comparison is based on Cleaner by Nature's fourth quarter volume, the yearly revenue generated at Cleaner by Nature based on revenue generated in the fourth quarter ($60,922) would be $243,688 [4*60,922]. Since the International Fabricare Institute survey shows that the proportion of revenue spent on maintenance declined from 3.07% to 2.28% for cleaners generating over $200,000 in revenue, the average of the IFI and NCA estimated is 1.765% [(2.28% + 1.25%)/2]. Maintenance of the dry clean machine was estimated to account for half of all maintenance cost at a dry cleaner. 11 Thus, the proportion of revenue spent on maintaining the dry clean machine comes to 0.8825%. The yearly expected maintenance expense for the dry clean machine amounts to $2,150.
Insurance-Workers' Compensation
Wet Cleaning: These figures were estimated using labor costs from Cleaner by Nature's fourth quarter and insurance rates charged by Henderson Insurance, Cleaner by Nature's insurer. Workers compensation insurance is a percentage of gross payroll: 4.23% for agency (counter) staff and 5.17% for plant staff. For the fourth quarter, workers' compensation came to:
$1,408 = [4.23%*$12,5 I7 (agency payroll)]+ [5.l 7%*$16,999 (plant payroll)].
For the year, this comes to $5,632.
Dry Cleaning: Cleaner by Nature and the model dry cleaner are assumed to have the same payroll, with the exception of pressing costs. The pressing labor cost for Model Dry Cleaner A was $4,811 less than for Cleaner by Nature. (See above: Labor - Pressing). This would have reduced the total Workers' Compensation by $249 (5.17%*$4,811) to equal $5,383. The pressing labor cost for Model Dry Cleaner B was $11,951 less for Cleaner by Nature. This would have reduced the total Workers' Compensation by $618 (5. l 7%*$11,951) to equal $5,014.
11 Ted Barry, with John Barry and Associates, a dry cleaning consulting firm, stated that dry cleaners should expect to pay between 3% and 5% of annual sales on maintenance and that half of this was associated with maintaining the dry cleaning machine. (Personal communication, November 5, 1997). Eddy Centes, chief mechanic at Pacific Equipment, Inc., stated that with preventive maintenance, a dry cleaner could get the repair cost of the dry clean machine down to 50% of the total repair cost of plant equipment. (Personal communications, November I 0, 1997). Steve Trainer, chief mechanic at Iowa Techniques suggested 50% was a good estimate of the proportion of repair expenses related to the dry cleaning machine if daily and periodic maintenance of the machine are not included. (Personal communications, November 11, 1997).

Appendix 4-F
lnsurance--Business
Wet Cleaning: Business insurance consists of the following coverage: building, property, business interruption, customer goods, and liability. Business insurance for the first year of operation at Cleaner by Nature came to $1,253.
Dry Cleaning: Dry cleaning business insurance costs would be expected to be slightly greater because of the greater capital costs involved in dry cleaning. Dry cleaning equipment is about $7,000 more costly than wet cleaning equipment (See Table 4.5). An addition $7,000 in equipment would boost the yearly insurance bill by about $14.00. Thus the business insurance for dry cleaning comes to $1,267
Regulatory Expenses and Compliance
All regulatory fees and compliance expenses are for dry cleaning only.
Regulatory Fees:
Los Angeles County Fire Department Fees: The Los Angeles County Fire Department requires dry cleaners to obtain a hazardous waste control license for $412 per fiscal year and a Hazardous Materials Control License for $110 per calendar year. The total yearly fees amount to $522.
SCAQMD Annual Operating Fee: The South Coast Air Quality Management District charges dry cleaners an annual operating fee of $168.
SCAQMD Emissions Fee: A dry cleaner the size of Cleaner by Nature would be exempt from the South Coast Air Quality Management District's emissions fee, which is $0.21 for every pound of PCE emitted. Businesses that emit less than 4,000 pounds a year are exempt.
Los Angeles County Public Health License Fee: A dry cleaner would also be required to obtain a public health license from the Los Angeles County Department of Health for $111 per year.
CARB Training: The California Air Resources Board requires dry cleaners to take a training course on regulatory compliance issues. The course is required once every three
Appendix 4-F
years, and the cost varies depending on who is offering it.12 The cost of $150 cited here was provided by the California Fabricare Institute. 13 Yearly cost would be $50.
Regulatory Compliance:
Beyond the regulatory fees and hazardous waste disposal costs, there is a cost in complying with government regulations. In a 1996 survey of 836 cleaners conducted by The Neighborhood Cleaners Association, a dry cleaning trade group, the total cost of all government regulation and compliance came to 2.25% of revenue for a cleaner charging $8.50 for the price of cleaning a two piece suit. 14 Based on yearly revenues of $243,688 the totally cost of government regulation and compliance amounts to $5,483 ($243,688*0.0225). This includes hazardous waste disposal changes, and all government fees. Thus, the cost of compliance, minus hazardous waste changes and government fees comes to $3,622 [$5,483 - $1,010 - (hazardous waste expense)- $851 (regulatory expense combined)].
12 Personal communication with Todd Wong, Senior Air Pollution Specialist, California Air Resources Board Stationary Source Division, April 21, 1997. 13 Personal communication with Cheryl Demetriff, Account Manager, California Fabricare Institute, April I, 1997. 14 See Neighborhood Cleaners Association, NCA Cost Comparison Chart-1996, (New York, New York).

Appendix 4-G
Process-Independent Operating Cost Key
Process independent costs are assumed to be the same for both the model wet cleaner and dry cleaner. Cleaner by Nature is accrued expenses serve as the basis for most of these costs. This cost key provides a line by line explanation of the methods for deriving the per garment cost.
VAR/ABLE EXPENSES
Labor--counter1 assembly, driver & management
Cleaner by Nature's fourth quarter labor expense was used to calculate the per garment cost of counter, assembly, driver, and management labor. The costs includes accrued payroll for the agency manager, other counter staff, the part-time assembly worker, and the driver, and totaled $15,380. These costs were divided by the number of garments cleaned during that period: ($15,380/12,027 garments)= $1.279/garment. Based on a yearly volume of 48,108 garments, the yearly expense comes to $61,482.
It should be noted that Cleaner by Nature's allocation of counter, assembly, and management labor is quite different than that of a cleaner with a plant on the premises where the cleaner is also the owner. Because of having two locations, there is a stricter division of labor at Cleaner by Nature than there might be at a typical comer dry cleaner. Another factor to take into consideration is that Cleaner by Nature's cleaner/spotter and one agency employee have management responsibilities and consequently may be paid at a higher rate than counter staff and cleaner/spotters at other facilities. Because of the atypical nature of Cleaner by Nature's management, counter, and assembly costs, payroll for assembly, counter, and management time was checked against a 1996 survey of 836 cleaners that was conducted by the Neighborhood Cleaners Association, a dry cleaning trade group. According to that survey, management, assembly, and counter payroll account for about 19.5% of the cost of a garment.1 According to Cleaner by Nature's fourth quarter payroll, payroll for these duties account for 22.8% of the cost of the garment. This is despite the fact that Cleaner by Nature's owner (who is not a cleaner) worked up to 12 hours per week in the fourth quarter without pay. Thus, Cleaner by Nature's payroll figure would appear to overestimate labor costs of a comer cleaner. Different assumptions about these costs would affect the level of profitability of either model facility as well as the percentage cost difference between the two processes.
1 The NCA survey actually shows costs as a percentage of revenue. The figures were chosen at the point where revenue equaled costs and adjusted to include the 12.8% payroll tax Cleaner by Nature pays. See Neighborhood Cleaners Association, NCA Cost Comparison Chart--1996, (New York, New York).
Appendix 4-G
Clothes Handling Supplies
Cleaner by Nature's yearly expense for clothes handling supplies, paid at start-up or during the first year of operation, was divided by total garments cleaned during the year: $6,958 (clothes handling supplies)/34,950 pieces -- $0.199/garrnent. Expenditures for the year (rather than for the fourth quarter) were used in this case because of the lag between the purchase of new supplies and their actual use. Based on a yearly volume of 48,108 garments, the yearly expense comes to $9,573.
Outside Work- leather and rug cleaning, shirt laundry, tailor
Cleaner by Nature's expenses for outside work for leather and rug cleaning and shirt laundry for the year came to $4,967, while revenue generated from this outside work was $5,742. Because the purpose of the cost comparison is to account for expenses associated with wet cleaning or dry cleaning, the expenses and revenues from this outside work should be subtracted from expenses and revenues. Since shirt laundry expenses and revenues were accounted for separately, they can be subtracted from both expenses and revenues. Tailoring and leather and rug cleaning revenues were included in a category of miscellaneous revenue and expenses and incorporated into the net revenue of the business. The yearly cost associated with tailoring ($3,088), and leather cleaning ($1,720) and rug cleaning ($423) must be accounted for. The total expense for the year associated with tailoring, leather, and was divided by the total number of garments wet cleaned: $4,783/34,950 (garments) equaling $0.137/garment. Based on a yearly volume of 48,108 garments, the yearly expense comes to $6,591.
Vehicle Use
Cleaner by Nature spent $887 in the fourth quarter associated with using the van. The per garment cost comes to $0.0738/garment ($887/12,027). Based on a yearly volume of 48,108 garments, the yearly expense comes to $3,560.
FIXED EXPENSES
Advertising & Marketing
This figure was calculated using Cleaner by Nature's advertising costs for the first year, excluding those advertising and marketing costs associated with start-up. Cleaner by Nature's owner identified $4,826 in yearly advertising costs unrelated to start-up. (See Section 4.1.1)

Appendix 4-G
Equipment Maintenance •· Other than the cleaning system
The repair expense of the cleaning machine is treated as a process dependent cost. All other maintenance expenses at a cleaner are expected to be process independent. The repair cost at Cleaner by Nature during the first year of operation included the repair of a leak in the spotting board, the tensioning equipment and a hand iron. No repairs of the wet cleaning system were required during the first year. Since most of the equipment was brand new (and under warranty) this is a low estimate of maintenance costs for wet cleaning. However, over time, it is expected that the cost of maintaining plant equipment will increase with increased wear and tear on the equipment. The yearly expense of maintaining all plant equipment other than the cleaning system at a wet cleaner and dry cleaner was estimated to be 0.8825% of revenue -- expected cost of equipment maintenance at a dry cleaner other than the cost of maintaining the PCE-machine itself. (See Equipment Maintenance -- Cleaning System in Process Dependent Cost above). The revenue basis for this comparison is $243,688. The expected yearly expense comes to $2,150.
Cleaner by Nature's rent for the first twelve months of operation came to $43,057.
Insurance - Auto
Cleaner by Nature paid $848 for six months of auto insurance to cover the van from July 1996 to January 1997. One year of insurance comes to $1,696.
Vehicle Loan
Cleaner by Nature's accrued vehicle expense for the van come to $118.6/month. (See Appendix 4-B) One year of vehicle loans comes to $1,423.
Appendix 4-G
Miscellaneous
Total miscellaneous expenses came to $11,883. The following categories were collapsed into the miscellaneous category.
Bank Charges: Cleaner by Nature's fourth quarter bank charges of $1,091. For a one year period this expense comes to $4,364.
Building Maintenance & Security: Cleaner by Nature's building and maintenance costs are for both the plant and premises came to $1,266.
Office Supplies: Cleaner by Nature's yearly office supply expense of $597 was divided by the number of pieces cleaned in the fourth quarter normalized for the year: $597/48,108 ($0.0124/garment). Based on a yearly volume of 48,108 garments, the yearly expense comes to $596.
Postage, Shipping & Fax: Cleaner by Nature's yearly expenses for postage, shipping & fax came to $317.
Refunds, Bounced Checks: This category includes refunds to unsatisfied customers, which are different from claims, as well as bounced checks. For the purposes of this analysis, they are assumed to be the same in both processes. Arguably, refunds vary according to the process. However, there was no comparative data available on this and the total is too small to make a difference. Refund and bounced checks were only included for the last quarter and divided by the number of garments processed in that quarter: $54/12,027 ($0.0045/garment). Based on a yearly volume of 48,108 garments, the yearly expense comes to $216.
Telephone: Cleaner by Nature's telephone expenses for the fourth quarter were $584. For the year this cost would be $2,336.
Other Miscellaneous: Cleaner by Nature's other miscellaneous expenses for the year were $2,788.
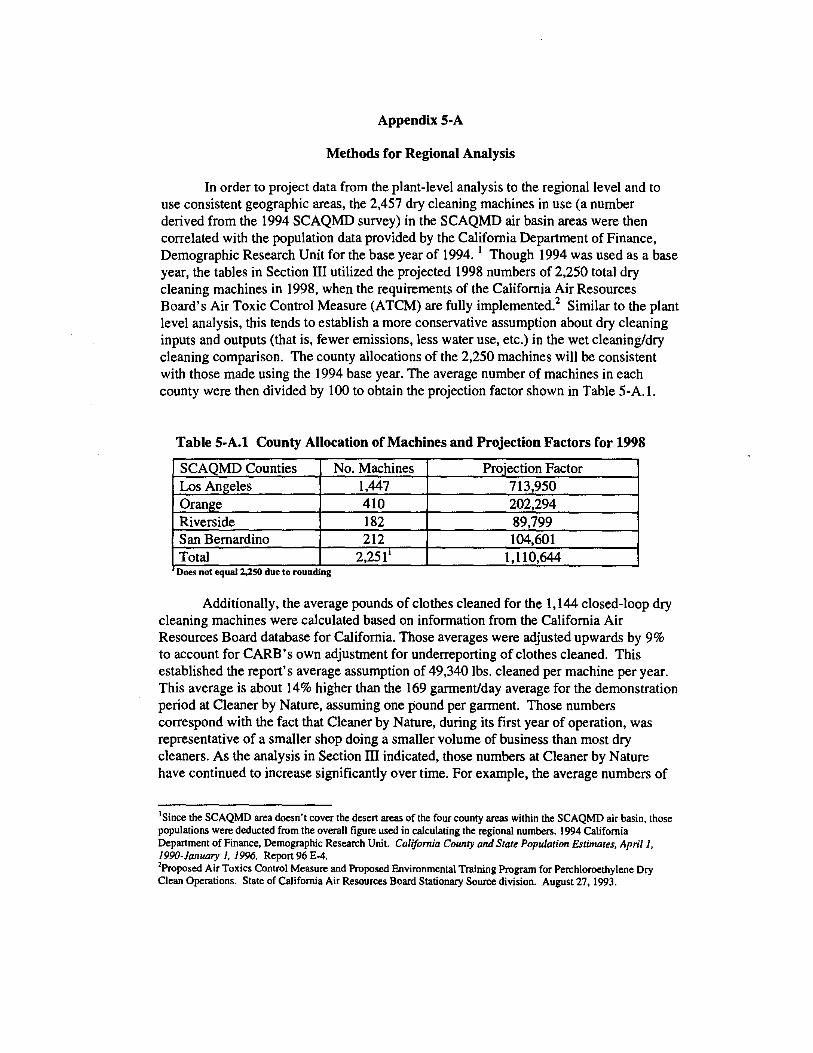
Appendix 5-A
Methods for Regional Analysis
In order to project data from the plant-level analysis to the regional level and to use consistent geographic areas, the 2,457 dry cleaning machines in use (a number derived from the 1994 SCAQMD survey) in the SCAQMD air basin areas were then correlated with the population data provided by the California Department of Finance, Demographic Research Unit for the base year of 1994. 1 Though 1994 was used as a base year, the tables in Section III utilized the projected 1998 numbers of 2,250 total dry cleaning machines in 1998, when the requirements of the California Air Resources Board's Air Toxic Control Measure (ATCM) are fully implemented.2 Similar to the plant level analysis, this tends to establish a more conservative assumption about dry cleaning inputs and outputs (that is, fewer emissions, less water use, etc.) in the wet cleaning/dry cleaning comparison. The county allocations of the 2,250 machines will be consistent with those made using the 1994 base year. The average number of machines in each county were then divided by 100 to obtain the projection factor shown in Table 5-A. l.
Table 5-A.1 County Allocation of Machines and Projection Factors for 1998
SCAQMD Counties No. Machines Proiection Factor Los Angeles 1,447 713,950 Orange 410 202,294 Riverside 182 89,799 San Bernardino 212 104,601 Total 2,251' 1,110,644 Does not equal 2,250 due to rounding
Additionally, the average pounds of clothes cleaned for the 1,144 closed-loop dry cleaning machines were calculated based on information from the California Air Resources Board database for California. Those averages were adjusted upwards by 9% to account for CARB 's own adjustment for underreporting of clothes cleaned. This established the report's average assumption of 49,340 lbs. cleaned per machine per year. This average is about 14% higher than the 169 garment/day average for the demonstration period at Cleaner by Nature, assuming one pound per garment. Those numbers correspond with the fact that Cleaner by Nature, during its first year of operation, was representative of a smaller shop doing a smaller volume of business than most dry cleaners. As the analysis in Section III indicated, those numbers at Cleaner by Nature have continued to increase significantly over time. For example, the average numbers of
1Since the SCAQMD area doesn't cover the desert areas of the four county areas within the SCAQMD air basin, those populations were deducted from the overall figure used in calculating the regional numbers. 1994 California Department of Finance, Demographic Research Unit. California County and State Population Estimates, April J, 1990-January 1, 1996. Report 96 E-4. 'Proposed Air Toxics Control Measure and Proposed Environmental Training Program for Perchloroethylene Dry Clean Operations. State of California Air Resources Board Stationary Source division. August 27, 1993.

Appendix 5-A
garments cleaned per day in May 1997 (five months after the conclusion of the demonstration period) was 279. While using a smaller shop for the basis of regional projections should not significantly affect the regional totals, since data are normalized by the number of garments, the 14% difference provides a conservative assumption favoring dry cleaning, given the likely resource use efficiency gains at large volume shops.

Appendix 5-B
Two-Day Study Period: Cleaner by Nature Water and Energy Use
For the two day intensive study period based on the per load analysis (as shown in Table 5-B.1), the Aquatex washer used 295 gallons of water for every 100 garments cleaned, about 9.7% Jess than the averages recorded during the one year demonstration period. The first day (a Monday, which tends to be the highest volume day at the plant) had higher total and per load water use than the second day (a Thursday). These figures thus also broadly correspond to the figures identified through the metering process and are shown in the table below.
Table 5-B.2 shows the water use for the Aquatex washer for the most commonly used load programs at Cleaner by Nature, including all loads completed on the test days. The quantity of water used per average load is presented in Table 5-B.1 and falls in the upper range of the load types shown. The half loads use more than half of the water used in full loads. Running a higher percentage of full loads at capacity would therefore result in water savings on a per garment basis. Program 19 is more typical of a laundry load and requires more water.
Table 5-B.1 Day-Level Water Use for Aquatex Washer Only
Units 9/30/96 10/03/96 2-DavTotal Gal/Dav 769 253 1,022
Gal/Avg. Load 59 42 54 Gal/100 gar. 309 261 295
Table 5-B.2 Load-Level Water Use for Aquatex Washer Only
Program No. Pro2ram. Description
Gallons Used
2 Delicates - Full Load 52 4 High Wool Content - Full Load 45 8 Delicates - ½ Load 35 9 High Wool Content - ½ Load 34
15 Leather/Suede - ½ Load 47 18 Rayon - Small Load Sizes 19 19 Dockers 72
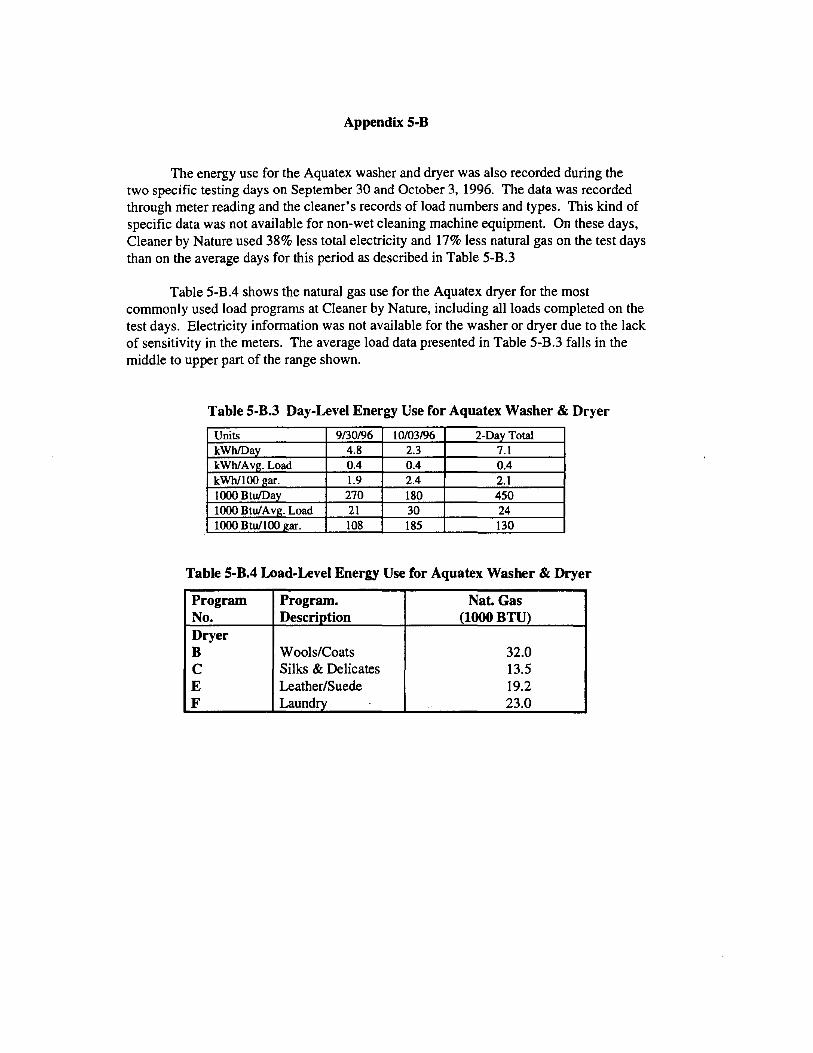
Appendix 5-B
The energy use for the Aquatex washer and dryer was also recorded during the two specific testing days on September 30 and October 3, 1996. The data was recorded through meter reading and the cleaner's records of load numbers and types. This kind of specific data was not available for non-wet cleaning machine equipment. On these days, Cleaner by Nature used 38% less total electricity and 17% less natural gas on the test days than on the average days for this period as described in Table 5-B.3
Table 5-B.4 shows the natural gas use for the Aquatex dryer for the most commonly used load programs at Cleaner by Nature, including all loads completed on the test days. Electricity information was not available for the washer or dryer due to the lack of sensitivity in the meters. The average load data presented in Table 5-B.3 falls in the middle to upper part of the range shown.
Table 5-B.3 Day-Level Energy Use for Aquatex Washer & Dryer
Units 9/30/96 10/03/96 2-Dav Total kWh/Dav 4.8 2.3 7.1 kWh/Av11:. Load 0.4 0.4 0.4 kWh/10011:ar. 1.9 2.4 2.1 1000 Btu/Dav 270 180 450 1000 Btu/Av11:. Load 21 30 24 1000 Btu/100 11:ar. 108 185 130
Table 5-B.4 Load-Level Energy Use for Aquatex Washer & Dryer
Program Program. Nat. Gas No. Descriotion (lOOOBTU) Dryer B Wools/Coats 32.0 C Silks & Delicates 13.5 E Leather/Suede 19.2 F Laundrv 23.0
Appendix 5-C
Water Use at Cleaner by Nature
Aquatex Equipment
It was not necessary to estimate average day consumption or make monthly allocations for the Aquatex equipment since superior continual monitoring data were available. The Sameco water meters mounted on the Aquatex water were read near the beginning of every month from 6/19/96 to 1/31/97. These meters were also read during the two-day test period and for frequently used load types.
Domestic Washers
METHODS
Water use for the Cleaner by Nature domestic washer was estimated during November 1996 on the basis of 20 days of operation where the cleaner tracked the number of loads and load sizes; (that is, small, medium, and large load sizes). For purposes of evaluation, the volume of effluent for a small washer load without garments was manually measured. Medium and large. load volumes were estimated through measurement of water levels in the washer basin.
RESULTS
During these twenty days of evaluation, a total of 17 loads of laundry were cleaned. Of those, four were smaller loads at 31 gallons each, six were medium loads at 46.5 gallons each, and seven were large loads at 62 gallons each. The average load volume came to 50 gallons, with an average of 0.85 loads per working day, or 43 gallons per working day. As opposed to the t\quatex machine, there were no greater efficiencies in use associated with the size of the load. 3
Boiler
METHODS
Cleaner by Nature 's boiler system is the Lattner system. The boiler manufacturer estimated the boiler's maximum water consumption, with those numbers then multiplied by the minutes per day of water consumption. An additional amount associated with boiler "blow down", which occurs at the end of each day, was also added. Water consumption from steam was estimated by multiplying the 39.3 galJhr. maximum boiler water use by each equipment's operating hours. These figures were derived from plant observations, manufacturer's specifications, and metered data.
Estimates or domestic washer use by CNT and Environment Canada were 4x and 3x greater respectively than the Cleaner by Nature results. due primarily to the smaller number or domestic washer loads per I 00 garment cleaned at the Cleaner by Nature plant.
Appendix 5-C
RESULTS
The boiler water consumption was 56 gallons per 100 garments. This included the amounts based on the manufacturer's water consumption equation (9.5 Horse Power x 0.069 = 0.655 gallons/minute); an additional 34 gallons of water from the boiler blow down; plus the water consumption from steam generation.4
·
Water Conditioner
METIIODS
The Rayne water conditioner softens water for all plant water uses at Cleaner by Nature. Consumption figures were derived from manufacturer estimates of the amount of water required for the grains of material (for example, minerals and other particles such as dust and fiber that inhibit the water's cleaning ability) that pass through the water conditioner. The actual grains of material passing through the Cleaner by Nature water conditioner was based on information provided by the Los Angeles Department of Water and Power.
The manufacturer estimated that Cleaner by Nature's unit would use 55 gallons of additional water for every 25,000 grains of material passing through the water conditioner.5 According to the L.A. DWP estimates, Cleaner by Nature's water input was calculated at about 7 grains per gallon.6 Thus, for approximately every 3,600 gallons used at Cleaner by Nature, an additional 55 gallons are consumed by the water conditioner.
Cleaner by Nature numbers for daily boiler water consumption were proximate to the numbers for boiler water consumption identified by the Chicago CNT and Canada study.
Personal communication, Kurt Chester, Rayne Company, March 28, 1997. Personal communication, Charles Lemke, Water Quality Inspector, Los Angeles Department of Water and
Power, March 28, 1997.
5
Appendix 5-D
Water Use in Dry Cleaning
The Dry Clean Machine
The water use data for the dry cleaning machine is based on manufacturer specifications combined with information that had been provided by a selected sample of three local dry cleaners.7 There is little reason to expect water use differences between the three configurations since they each use a refrigerated condenser and the secondary carbon adsorber doesn't require steam stripping. Therefore, all configurations were assigned equal values.8
It was assumed that dry cleaning uses 7.6 cleaning and 3.6 domestic washing loads per working day. This assumption is based on information provided by the three local dry cleaners, and then scaled to the demonstration period average of 169 garments cleaned per day at Cleaner by Nature.9 It was assumed that there would be one-half capacity (or 17.5 garments) dry cleaning loads for the Cleaner by Nature scenario, compared to an estimated 40% or less of capacity actually used at Cleaner by Nature. This assumption was supported by the levels reported by local dry cleaners (ranging from 50-65%), taking into account their larger business volumes and same-day service which would encourage larger load sizes than at Cleaner by Nature. 10 The estimate of 10% greater load sizes assumed for dry cleaners accounts for the greater sorting of loads that may be required by wet cleaners. The domestic washing loads were estimated at 10 garments per load based on the data supplied by local dry cleaners and the similar load sizes used at Cleaner by Nature.
The cooling tower has a water throughput of 45 gallons per minute (GPM), including evaporative losses of 25 gallons per hour (GPH), drift losses of 6.75 GPH, and bleed-off losses of 22.5 GPH. Based on 0.33 hours of still and refrigerated condenser operation per load and 7.6 loads per day under the dry cleaning scenario of 81 gallons per 100 garments.
The three cleaners surveyed for this information were the same cleaners that participated in the repeat Clean test described in Section IIL
While this may generally hold true, one equipment distributor points out that certain older machines don't have a valve regulator to stop water flow when the refrigerator condenser stops operating. These machines would send more water to their cooling tower, which would result in increased evaporative losses. Since there was no available sampling strategy to quantify the extent that this occurs in converted machines, an assumption was made that there would be equal water use for each configuration, based on what might be a more efficient rather than less efficient scenario. (Personal communication with Greg Leiram, April 22, 1997).
As described in Section I, those averages have continued to increase since the demonstration period.
Although Cleaner by Nature has provided same day service, it has not advertised it as such. As the business achieves a higher volume of use, however, the Cleaner by Nature scenario could achieve the higher levels reported by the local dry cleaners, which in tum would result in an overall decrease in water use per garment cleaned.
111

Appendix 5-D
Cooling Tower/Refrigerated Condenser
It was also assumed that all three dry cleaning configurations would have a cooling tower, based on information provided by equipment distributors and local dry cleaners. The cooling tower uses evaporation to cool hot water from the still and the refrigerated condenser for water reuse. Generally, the Los Angeles area is not hot and humid enough to merit a refrigerated chiller which performs a similar function to a cooling tower. The 15-ton unit recommended for a plant equivalent to the size of Cleaner by Nature experiences evaporative, drift, and bleed-off losses. 11 Since this water is really used by the dry cleaning machine, even though it is lost through the cooling tower, the cooling tower losses are identified as machine uses.
Non-Machine Uses
Boiler
Non-machine uses for dry cleaning vary with respect to wet cleaning uses, decreasing as a consequence of lesser pressing and water conditioning requirements, but increasing with greater domestic washing requirements. Conversations with boiler manufacturers and distributors indicated that Cleaner by Nature's 9.5 HP boiler would also be suitable for dry cleaning. 12 In terms of boiler sizing, the increased boiler requirements from the dry cleaning machine itself would be offset by fewer pressing requirements.
Domestic Washers
Information provided by a survey of the three local dry cleaners provided the information for estimated domestic washing uses, as well as the loads per day which were based on the estimates noted previously. Dry cleaning requires more domestic washing to clean garments like machine washables such as cottons which wet cleaning washes in normal wet cleaning loads (and therefore become "machine" water uses). For domestic washers, according to the survey of the three dry cleaners, dry cleaning uses about 3 \/2 times more water (or 180 gallons per day) in domestic washing than wet cleaning based on the same overall level of garment cleaning.
Pressing-related Water Use
Pressing water uses were adjusted for the dry cleaning scenario using results of the pressing time study conducted for the financial assessment described in Section IV. Overall pressing water uses at Cleaner by Nature were divided by I. 7 to estimate pressing water uses in the dry cleaning scenario. A£ discussed in Section III, this might represent a
II Personal communication with Von Kennedy, April 21,1997 ll Personal communication with Dan Hooper et al, April 1997.
Appendix 5-D
conservative estimate indicating greater water uses for wet cleaning than other pressing evaluations, such as the Environment Canada estimate of wet cleaning and dry cleaning pressing times. Conversations with the manufacturer of the tensioning presses indicated that per garment utility uses should not appreciably change with replacement of nontensioning equipment.13 The water conditioner also uses slightly less additional water in the dry cleaning scenario due to the lower overall water throughput.
Personal communication with Stewart Ilkowitz, April 23, 1997 13

Appendix 5-E
Wastewater Tables
Table 5-E.1 Sample and Analysis Overview Loads Sampled on 12117196: Aquatex Program 8 - Delicate½ Load Load I (wlo spotting) had 20 garments (mostly silks and rayons). Load 2 (with spotting) had 17 garment (mostly cottons, silks, and rayons).
Discharge/ Approx. EsL Discharge Load 1 (w/o spotting Load 2 (with Sample Start Time Volume (gal.) chems.) Analyses spotting chems.)
Analvses D1 7ml5s 11 voe VOC,oH D2 10ml5s 11 voe VOC,oH D3 16ml5s 11 voe VOC,oH D4 17m30s 2 voe VOC,oH Composite NIA NIA BOD, D, HM, OC,
O&G, SS, SVOC, pH D,SVOC,pH
·BOD Biochemical Oxygen Demand D Dioxin HM- Heavy Meials: Arsenic. Cadmium, Chromium, Copper, Lead, Molybdenum,
Nickel, Silver, Zinc. OC Other Contaminants: Chloride, Cyar jde, Iron, Mercury, Selenium O&G Oil and Grease SS - Suspended Solids SVOC Base/Neutral/Acid Extractables (see lab reports for list) VOC- Volatile Organic Compounds (see lab results for list)
Table 5-E.2 pH Results from Wastewater Analysis
H 6.6 7.4 7.2 6.8 6.8 7.0
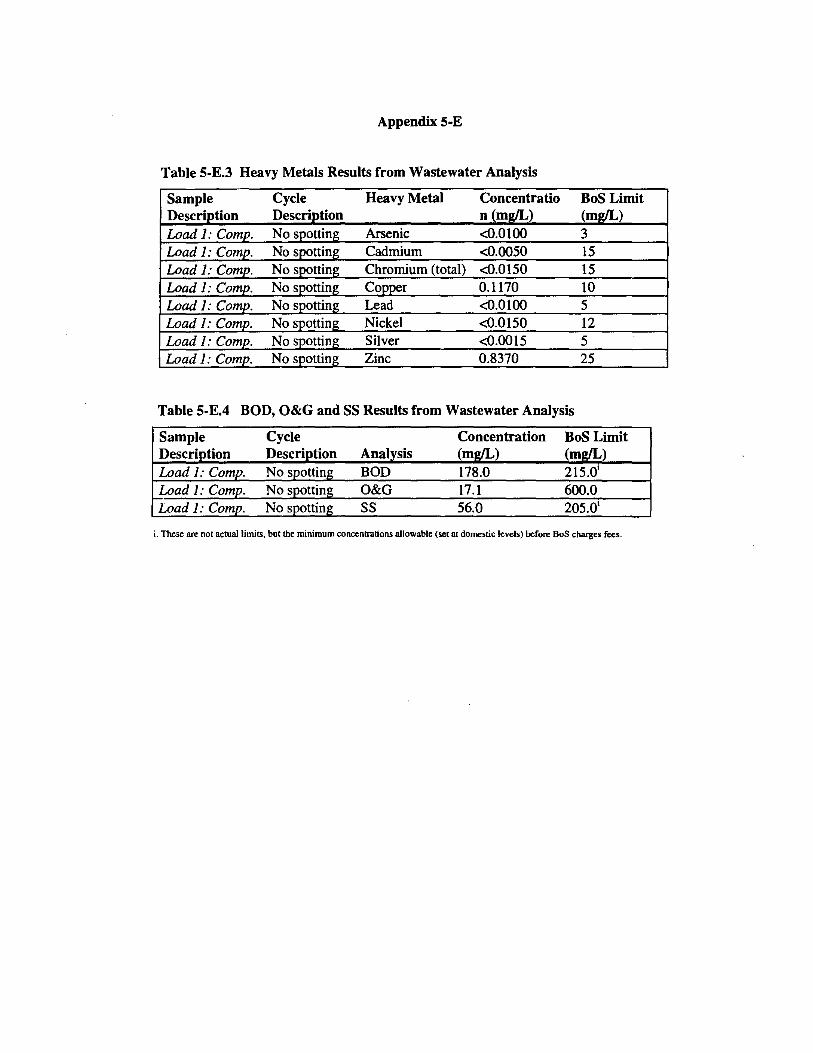
Appendix 5-E
Table 5-E.3 Heavy Metals Results from Wastewater Analysis
Sample Descri tion Load 1: Com.
Heavy Metal Concentratio BoS Limit n(m ) (m )
Arsenic <0.0100 3 Cadmium <0.0050 15
<0.0150 15 0.1170 10 <0.0100 5
Nickel <0.0150 12 Silver <0.0015 5 Zinc 0.8370 25
Table 5-E.4 BOD, O&G and SS Results from Wastewater Analysis
Sample Descri tion
ss
Concentration (m )
178.0 17.1 56.0
BoS Limit (m ) 215.0' 600.0 205.0'
i. These are not actuol limits, but the minimum concentrations allowable (sec ar. domestic levels) before BoS charges fees.
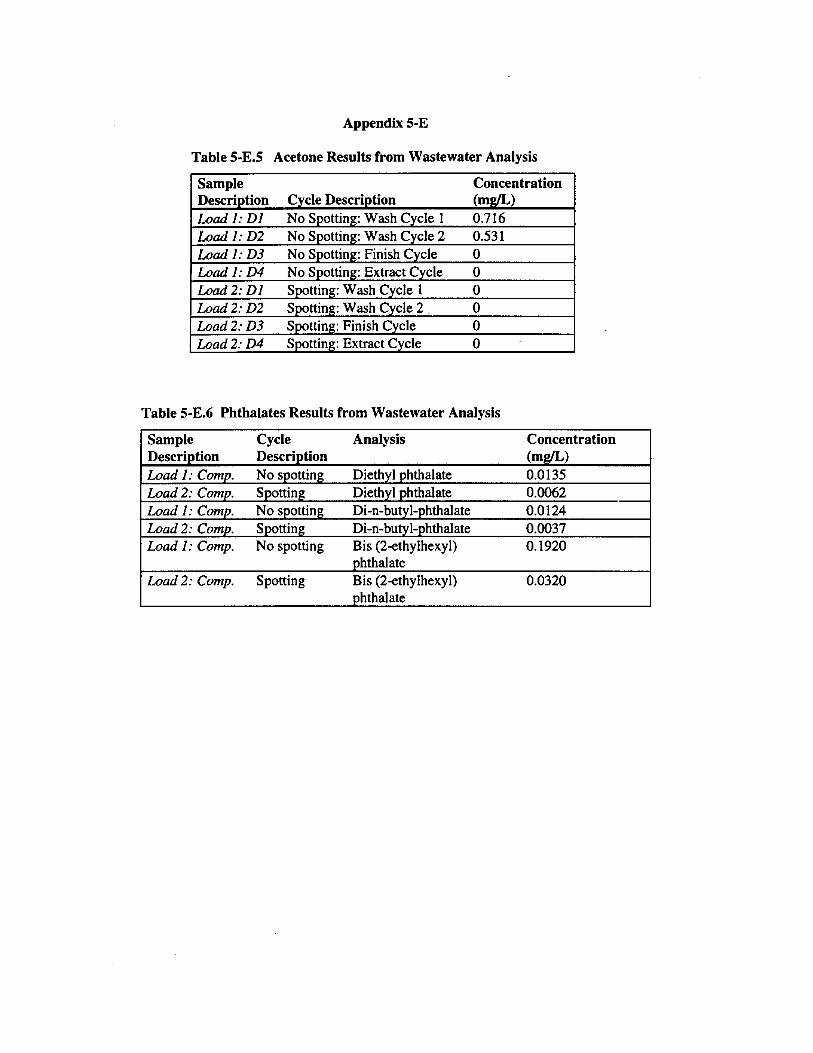
Appendix 5-E
Table 5-E.5 Acetone Results from Wastewater Analysis
Sample Concentration Descri tion (m )
Load J: DJ 0.716 Load J: D2 0.531 Load J: DJ 0 Load J: D4 0 Load 2: DJ 0 Load 2: D2 0 Load 2: DJ 0 Load 2: D4 0
e 1
Table 5-E.6 Phthalates Results from Wastewater Analysis
Sample Descri tion
Analysis Concentration (m )
Load J: Com. 0.0135 Load 2: Com. 0.0062
0.0124 0.0037
Load J: Comp. No spotting Bis (2-ethylhexyl) 0.1920 hthalate
Load 2: Comp. Spotting Bis (2-ethylhexyl) 0.0320 hthalate
Di-n-bu 1- hthalate

Appendix 5-F
Detailed Energy Use Methodologies
The Cleaner by Nature plant typically operates from 7am to 4:30pm from Monday to Thursday and stays open a couple of extra hours on Friday. Most equipment operate less than these times, with the exception of the water heater, water conditioner, fax machine, and phone which always stay on. Electricity (in kWh) calculations from specs typically involved: volts x average amps/ IOOO x hours. Sometimes electricity horsepower or wattage information were used: kWh= horsepower x 0.7456999 x hours, or kWh = W / 1000 x hours. Natural gas calculations (in 1000 BTU) typically involved: BTU x 1000 x hours. To create equivalent electricity and natural gas units, 1000 BTU units were converted to equivalent-kilowatt-hours (ekWh) by dividing by 3,412.14 BTU/kW
Aquatex Equipment
It was not necessary to estimate average day consumption or make monthly allocations for the Aquatex equipment since superior continual monitoring data were available. The ABB natural gas meter mounted on the Aquatex dryer were read near the beginning of every month from 6/19/96 to 1/31/97. These meters were also read during the two-day test period and for frequently used load types. Woods Electric installed the electric meters on both Aquatex washer and dryer on 9/13/96. The meters were removed on 10/18/96 due to their more costly nature. The electric meters were read several times including the two-day test period to develop ratios of consumption as compared to garments cleaned, water used, and natural gas used. The electricity data did require allocation from the metered period, 9/13 - 10/18, to the rest of the study months. For the Aquatex washer, a ratio of electricity to water use was calculated for the known period and then applied it to the unknown periods. For the Aquatex dryer, a ratio of electricity to natural gas use was calculated for the known period and then applied it to the unknown periods.
Boiler & Presses
The boiler and pressing equipment are inter-related and presented a challenge in terms of quantifying water and energy use. The boiler takes in water using an electrical pump and bums natural gas to convert the water into steam which is used intermittently by the presses. Some of the presses also use electricity for mechanical action. The estimates for electricity and natural gas were based on data from the main plant meters over periods when equivalent data was available for the Aquatex machine and most other equipment. The more certain sources from the plantwide meter data were subtracted to arrive at estimates for less certain sources like the boiler and related pressing equipment. 9/17 -I0/17 was chosen as the period for creating these average day values since actual garment counts and electricity data were available which could be matched against an electric bill for the plant. Based on an estimated 16 pressing and spotting hours per day from two pressers and lead cleaner, labor was allocated among the different pieces of equipment. Monthly allocation of resource use for the pressing and spotting equipment was

Appendix 5-F
complicated somewhat by the change in the form finisher and pant topper presses on September 29. The old Forenta pant topper was discontinued, while the Cissell form finisher was reduced to one-quarter of prior use levels. Starting in October, the tensioning presses and the Cissell press were allocated the same amount of use that the Forenta and Cissell presses had before: 4 hours/day combined. All press and spotting board uses were allocated based on the average number of garments per working day during each period. Monthly allocation for resource use from the boiler was based on both methods. The number of working days per period controlled the allocation of natural gas for startup/constant heating and electricity. The average number of garments per working day for each period determined the allocation of natural gas demanded for pressing and spotting across the periods.
Natural gas was estimated through manufacturer supplied BHP demand data for each press and spotting board combined with the press hours of operation. For the 9.5 horsepower and 398,00 BTU/hr Lattner boiler used at the plant, each BHP of demand bums 41,895 BTU/hr of natural gas. The boiler also consumes natural gas beyond that used directly for pressing. When the boiler warms up in the mo-ming, it heats at the maximum 398,000 BTU/hr for about half an hour. Once it has warmed up, it still must periodically bum natural gas to compensate for ambient heat loss. This amount was estimated through subtracting all other natural gas uses from the plant total for a given period. The result was comparable to that found by Environment Canada.
Electricity was estimated using manufacturers specifications for the boiler and presses combined with their hours of operation. The pant toppers and form finishers ( old and new) are the only pressing pieces which require electricity. The electricity consumption was calculated from the volts and amps data supplied by the manufacturers combined with the times of operation of each press. The boiler consumes electricity to pump water and in its monitoring circuitry. Electricity use was estimated by timing the amount of pump activity for a given period combined with the manufacturer specifications of volts and amps.
Domestic Washer and Dryer
Resource use by the domestic washer and dryer was estimated through a combination of on-site measurement and record keeping, and manufacturer specifications. A log of the number of loads and garments cleaned in the domestic equipment was kept for November. For water, the effluent volume for a small empty washer load was measured manually and then the medium and large load volumes were estimated through measurement of water levels in the washer basin. During the 20 working days of record keeping, there were 17 loads completed: 4 at 31 gallons each, 6 at 46.5 gallons each, and 7 at 62 gallons each for an average load volume of about 50 gallons with 0.85 loads per working day, or 43 gallons per working day. For electricity and natural gas, the manufacturer's ratings per hour were multiplied by the number of hours used per working day (estimated from the cleaner's log: 30 minutes/day for the washer and 34 minutes/day
Appendix 5-F
for the dryer) to arrive at energy use per day. Monthly allocation of resource use by the domestic washer and dryer was based on the number of working days per period. This method was used since a direct relationship of domestic equipment use with overall garment levels was not detected. One example of this was during the last two months, December and January, when Cleaner by Nature began providing "fluff & fold" service which relied on the domestic equipment. For these months, the normal allocation was simply doubled based on feedback from the cleaner.
Water Heater
The Reliance water heater bums natural gas to heat water for use in the domestic washer and kitchen and rest room sinks only. Water was accounted for at the end uses, i.e., domestic washer, rather than for the water heater. The water heater manufacturer indicated that if 68.3 gallons of hot water were consumed, then the heater would bum a maximum 75,100 BTU in reheating the replacement water. 14 The manufacturer also indicated that there should be very little continual heating requirements with the heater set on its lowest setting combined with the relatively high ambient temperatures in southern California. All the gallons of water consumed by the domestic washer were used as the basis for the water heater's natural gas consumption. The constant heating requirements were to be offset by the fact that not all domestic washer loads use hot water and the water heater operated at the lowest setting. Monthly allocation for water heater natural gas use relied on the monthly allocations for domestic washer use.
Water Conditioner
The Rayne water conditioner softens water for all plant water uses. The manufacturer estimated that Cleaner by Nature's unit would use 55 gallons of additional water for every 25,000 grains of material passing through the water conditioner. 15 Based on information provided by the L.A. Water and Power Department, Cleaner by Nature's water input was estimated to have about 7 grains/gallon.16 Thus, for approximately every 3,600 gallons used at Cleaner by Nature, an additional 55 gallons are consumed by the water conditioner. Electricity use from the water conditioner is continual, but minimal, at 115V and 0.5A .. Monthly allocation for the water conditioner's additional water use relied on the monthly allocations for all other water use. The electricity use was based on both working and non-working days for each period.
Air Compressor and Vacuum
The Roi-Air Systems air compressor provides pressure for the pressing and spotting equipment. It consumes electricity through a motor which periodically runs to maintain pressure. The amount of motor activity was timed for a given period and was then applied to the entire period that the compressor operated to arrive at a daily average hours of use. This figure was then multiplied by the manufacturer's electricity
14 Personal communication with Jim Bienias at Reliance Water Heater Co. (800-553-3452) 4/1/97. 15 Personal communication with Kurt Chester at Rayne in Santa Bamara (805-967-3424), 3/28197.16 Charles Lemke, Water Quality Inspector at LADWP, 3/28197.
Appendix 5-F
specifications provided for the motor. The Cissel vacuum provides suction for the hot head press, utility press, and spotting board. It continually consumes electricity during the periods in which it is turned on. Its hours of operation were multiplied by the manufacturer's electricity specifications. Monthly allocation for the air compressor and vacuum were based on number of working days per period.
Lighting
Both constant and intermittent lighting occur at the plant in fluorescent and incandescent bulbs. The cleaning and pressing main areas of the plant have constant lighting while the office, boiler room, mini-kitchen, and rest room have intermittent lighting. The wattages for each category were added and then multiplied by estimated average daily use. Monthly allocation for lighting was based on number of working days per period.
Miscellaneous Equipment
A mini-refrigerator and small water cooler are used in the kitchen area. The electrical specifications for the refrigerator were read and those for the water cooler were estimated and then grouped using estimated running times for the refrigerator. Other possible electricity uses at the plant include the ventilation equipment, fax, computer, phone, and radio. The cleaner indicated that the ventilation equipment is used on just a few of the hottest days of the year, none during the period in question. The rest of the items are used intermittently. All other uses from the total plant electricity use were subtracted to arrive at an estimated electricity consumption for these items as a group. The estimate appeared to be a reasonable percentage of total plant use (about one-half percent). Monthly allocation for the mini-refrigerator and small water cooler electricity use was based on both working and non-working days for each period and increased by 10% during the summer period. Monthly allocation for the office equipment was based on number of working days per period. "Other Equipment" was increased by 5% during the summer period (6/19 - 9/17) to account for ventilation use.
Appendix 5-G
Dry Cleaning Energy Use - Non-Cleaning Machine
Ventilation Requirements
The ventilation requirements were assumed to be the same, based on information provided by a Cal OSHA industrial hygienist, 17 who indicated that the general ventilation system found at the Cleaner by Nature plant was not intended for reducing ambient perc concentrations, but was only intended to maintain comfort levels. Thus, the ventilation system would seldom be needed at the temperate and airy Cleaner by Nature plant. However, for dry cleaners a local exhaust system was recommended to clear problem areas if the PCE concentrations could not be lowered below the 25 ppm Cal OSHA standard through equipment replacement/repair. Therefore, the assumption of equal ventilation requirements is conservative in that it doesn't account for possible local exhaust ventilation systems.
Pressing Requirements
Pressing energy uses were adjusted for the dry cleaning scenario using results of PPERC's pressing time study. Overall pressing water uses at Cleaner by Nature were divided by 1.7 to estimate pressing water uses in the dry cleaning scenario. Conversations with the maker of the tensioning presses indicated that per garment utility uses should not appreciably change with replacement of non-tensioning equipment. 18
Cooling Tower
The 15-ton cooling tower recommended for a plant like Cleaner by Nature uses a 0.5 HP fan motor and a 1.5 HP recirculation pump motor. 19 Based on 0.33 hours of operation per load and 7 .6 loads per day under the dry cleaning scenario, the electricity required should be about 2.22 kWh per 100 garments cleaned.
Evaporator
The electricity use from the evaporator was based on 110V/1.5a pump running 1 hour a day using a 169 garment/day average at Cleaner by Nature.20
.
17 Personal communication with Joe Chu, CalOSHA Industrial Hygienist, 4/23/97 Personal communication with Stewart Ilkowitz, Hi-Steam Corporation, 4/23/97 " 19 Personal communication with Gary Parker. RSD Cooling Towers, 4/24/97
20 Personal communication with Alan Phillips, Air Quality Laboratories, 4197.

Appendix 5-H
Detailed Water and Energy Use Results at Cleaner by Nature
A. Water
Category Jun (6/19-7/1)
Jul 1(7/2-7/31)
Aug (8/1-9/3)
Sep 1(9/4-30)
Oct (10/1-31)
Nov In i/1-12/3\
Dec (12/4-1/1)
Jan (1/2-1/3 I) Overall
Water (total 2al.) 0.80 0.77 0.94 1.04 0.97 1.07 1.19 1.08 0.99 - AQuatex washer 2,401 7,065 9 3S9 10,43S 15,331 17,146 11,858 12,688 86,282
Subtotal: Wetcleanin2 Machines 2,401 7,065 9,359 10,43S 15,331 17,146 11,858 12,688 86,282 - domestic washer 309 693 934 8S0 961 I 015 1,939 2,050 8,752 - Pantmat S03 Pant Tonner 0 0 0 0 207 219 209 221 8S6 - JAMSOO Form Fitter 0 0 0 0 ISS 164 1S7 166 642 - Forenta Pant To- 60 133 180 164 0 0 0 0 536 - Cissell Form Fitter 89 200 270 24S 69 73 70 74 1,091 - Forenta Hot Head 104 234 315 286 324 342 327 34S 2,277 - Forenta Puff Irons IS 33 4S 41 46 49 47 49 32S - Forenta Utilitv Press 104 234 31S 286 324 342 327 345 2,277
- Snottin• Board 74 167 22S 20S 231 244 233 247 1,626 - Lattner Boiler /blow down) 306 714 782 646 782 748 646 748 5,372 - Water Conditioner 90 253 333 360 516 573 423 453 2,999
Subtotal: Other 1,151 2,661 3,398 3,083 3,616 3,769 4,377 4,698 26,753 Total Water Use 3.552 9,726 12,758 13,518 18,947 20,914 16,235 17,386 113,035
B. Energy
E/ectricitv (total kWh! - Aauatcx washer 12 36 48 44 83 88 61 65 437 - Aauatex drver 19 46 57 40 64 60 53 59 396
Subtotal: Wetcleanin• Machines 31 82 105 83 147 148 113 124 833 - domestic washer 5 13 14 II 14 13 23 26 119 - domestic drver 4 9 9 8 9 9 16 18 82 - Pantmat 503 Pant Tonner 0 0 0 0 39 41 39 42 162 - JAM500 Form Filer 0 0 0 0 39 41 39 42 162 - Forenta Pant Ton,,..r 9 20 27 2S 0 0 0 0 82 - Cissell Form Fitter 12 27 36 33 9 10 9 10 146 - Lattner Boiler 32 74 81 67 81 77 67 77 554 - Water Conditioner I I 2 I I 2 I I 11 - Air Comoressor 42 98 107 88 107 102 88 102 736 - Cissell vacuum S7 133 146 120 146 139 120 139 1,001 - Constant li2htin2 (1000W) 90 210 230 190 230 220 190 220 1,580 - lntermittant li2htin2 (560W) 19 45 so 41 50 48 41 48 341 - Refri2erator 21 48 54 41 45 48 42 43 340 - vetillation eauio 26 62 68 55 64 62 53 62 451
Subtotal: Other 318 739 823 680 835 812 730 831 5,767 Total Electricity 349 821 928 764 982 960 843 954 6,600 Natural Gas (total 1000 BTU)
- Aauatex dryer 2,010 4,970 6,120 4,650 6,520 6,460 5,680 6,340 42,750 Subtotal: Wetcleanin2 Machines 2,010 4,970 6,120 4,650 6,520 6,460 5,680 6,340 42,750 Subtotal: ekWh 589 1,457 1,794 1,363 1,911 1,893 1,665 1,858 12,529
- domestic drver 113 263 288 238 288 276 477 552 2,495 - Pantmat 503 Pant T- 0 0 0 0 2,098 2,215 2,116 2,237 8,665 - JAM500 Form Fitter 0 0 0 0 1,573 1,661 1.587 1,678 6,499 - Forenta Pant Ton- 602 1,351 1.821 1.656 0 0 0 0 5,430 - Cissell Form Fitter 903 2,026 2.731 2.484 702 742 708 749 11,046 - Forenta Hot Head 1,054 2.364 3.186 2.898 3,278 3,461 3.306 3,495 23,042 - Forenta Puff Irons 151 338 455 414 468 494 472 499 3,292 - Forenta Utilitv Press 1,054 2.364 3.186 2,898 3,278 3.461 3.306 3,495 23.042 - Snottin2 Board 753 1,689 2.276 2,070 2 1.41 2.472 2.362 2,496 16,458 - Lattner Boiler fstart-un) 1.791 4,179 4,577 3,781 4.577 4,378 3,781 4,378 31,442 - Lattner Boiler fcontinous) 6,318 14,742 16,146 13.338 16,146 15.444 13,338 15,444 I 10,916 - Reliance Water Heater 340 762 1.027 934 1,057 1,116 2,132 2,254 9,623
Subtotal: Other 13,079 30,079 35.694 30,712 35 806 35,718 33,58S 37,277 251,951 Subtotal: Other (ekWh\ 3,833 8,815 10.461 9.001 10,494 10,468 9,843 10,92S 73,839 Total Natural Gas Use 15,089 35,049 41.814 35.362 42.326 42,178 39,265 43,617 294,701 Total Natural Gas Use (ekWhl 4,422 10.272 12.254 10,364 12,405 12.361 11.507 12,783 86,368 Total All EnentV Use (ekWh) 4.771 11.093 13,182 11,127 13.386 13,321 12,350 13,737 92,968 Machine En"""' Use (ekWhl 620 1.539 1.898 1,446 2.0S8 2,041 1,778 1,982 13,362 Non-machine Ene.-ov Use (ekWhl 4,151 9,554 11.284 9.681 11.328 11,280 10,572 11,755 79,606

Appendix 5-1
Spotting Agent Use at Cleaner by Nature
Spotting Chemical Harmful Characteristics Oz./100 gar
Ammonia can be highly irritating to throat and lungs at higher concentrations
0.05
Amyl Acetate vapors can be irritating and cause dizziness, headache, nausea, vomitin£, narcosis
0.08
AquatexA no harmful effects known to date 0.01
Aquatex B can irritate skin 0.01
AquatexC can irritate skin 0.01.
Aquatex Detergent no harmful effects known to date 0.40
Bisulfite inhalation can cause irritation to the mucous membranes of the unner resoiratorv tracts
0.01
Bleach 0.01
Devour inhalation can cause respiratory irritation 0.01
LPS (laund. pre spt) can dry out skin 0.42
Perborate (powder) caustic to nasal and Jung tissues O.Q3
Peroxide vapors and mists can severely irritate the nose and throat 0.04
Pyratex affects liver, kidneys, lungs, and red blood cells and contains si£nificant volumes of chemicals subiect to SARA rot£.
0.03
Rustgo high concentration of vapors can cause damage to lungs, resoiratory svstem, and pulmonarv edema
O.G7
Scram Blood contains isopropyl alcohol which is subject to SARA rptg. req. 0.09
Streetex can cause headaches 0.80
Laundry Wetspo contains a small amount (4%) of isopropyl alcohol which is suhiect to SARA rptg. rea.
0.54
Yellow-Go contains 25% sulfuric acid, inhalation can cause injury to lunl(s.
0.01
Total 2.62

Appendix 5-J
Cleaning Agent Use at Cleaner by Nature
Table 5-J.1 Cleaning Agent Use at Cleaner by Nature per Aquatex Load Type
Ounces of Cleaning Agent per 100 Garments
Program Detergent Finish Leath. Det. Leath. Fin.
Retex
2
4
8
9
15
18
19
Total
1.3
1.6
2.6
3.2
0.0
10.4
1.3
20.4
1.5
1.9
3.1
3.8
0.0
12.2
1.5
24.0
0.0
0.0
0.0
0.0
0.6
o.o 0.0
0.6
0.0
o.o 0.0
o.o 1.6
0.0
0.0
1.6
o.o 0.6
0.0
1.1
0.0
0.0
0.6
2.2

Appendix 6-A State Fees for Reduced Liability Exposures
Annual Fee" PCEtax Gross Receipt
Tax
Equivalent Cost Per Garment
Equivalent Cost Per 100
Garmenlc; Connecticut 1% $0.054 $5.40
Florida $100 $5.00/J!:allon 2% $0.124 $12.40 Kansas $3.75/1!:allond 2% $0.116 $11.58
Minnesota $1,000 $3.50/gallon $0.028 $2.80 North Carolina $2,500b $4.25/gallon $0.061 $6.07
Oregon $1,500' until 1996 -$12.00/gallon after 1996 - 103% of sale
South Carolina $1,500 $10.00/gallon $0.052 $5.18 Tennessee $1,000 $10.00/gallon $0.041 $4.14
• for facilities with approx. 9 employees (or no cost difference for size was indicated)
h Cost can he lowered to $500 ir financial rcsponsihility is demonstrated hy ohtaining pollution and remediation legal liability insurance with coverage or not less than one million dollars or deposit with the Commission securities or a third party bond for securing payment for pollution and liability in the amount or one million dollars.
'Fee is lowered to $1,000 ir annual sales arc less than $50.000
dThis tax will be raised by $0.25 each year until fee reaches $5.50/gallon

Appendix 6-B Provisions for Reduced Liability for State Legislation
Deductible* Max Paid/Year Site Investigation
Remediation and/or
Treatment
Monitoring
Connecticut $ I 0,000 if reported prior to 1990 $20,000 if after 1990
$50,000 X .
Florida up to 6/30/97 - $1,000 7/1/97 - 6/30/01 - $5,000
7/1/01 - 12/31/05 - $10,000 after 2005 - fund pays $0
X X X
Kansas $2,500 up to 7/1/95 - $100,000 after 7/1/95 - 10% of
fund's income for previous fiscal year
X X X
Minnesota $10,000 20% of account balance at beginning of fiscal
year
X
North Carolina $10,000 $200,000 $400,000 if substantial
threat to human health or the environment
X X X
Oregon $10,000 X South Carolina before:
10/1/97 - $1,000 10/1/98 - $5,000 I 0/1/99 - $10,000 10/1/00- $15,000 I0/ I /0 I - $20,000
after 2001 - $25,000
X X X
Tennessee 10% or max.of $10,000 $200,000 X X * for facilities with approx. 9 employees

ORDER FORM
To order a copy of this report, write to...
PPERC 1600 Campus Road Occidental College Los Angeles, CA 90041-3314
Please check the appropriate box ...
# of copies Executive Summarv $ 2.00 Full Report $20.00
*Please make checks payable to PPERC
For more information call (213) 259-2566, or fax (213) 259-2734


Copyright © 2022 FDOKUMEN