Dietary and Non-Dietary Phytochemicals and Cancer - Unglue.it
Upload
khangminh22Category
view
0download
0
i
TO DETERMINE THE IMPACT OF DIETARY CALCIUM
FROM DAIRY, AND/OR TOTAL DAIRY INTAKE, ON THE
BODY MASS INDEX OF GRADE 2 LEARNERS IN
PIETERMARITZBURG.
By
Joanne Louise Galliers
Bachelor of Science, Post Graduate Diploma in Dietetics (UKZN)
Dissertation submitted in fulfilment of the requirements for the degree
of
MASTER OF SCIENCE IN DIETETICS
Dietetics and Human Nutrition
School of Agricultural, Earth and Environmental Sciences
College of Agriculture, Engineering and Science
University of KwaZulu-Natal
Pietermaritzburg
March 2018

ii
ABSTRACT
Introduction: International and local figures show a steep rise in the incidence of overweight and
obesity in both adults and children, with more children suffering from overweight, obesity and
their associated diseases of lifestyle than ever before. The aetiology of overweight and obesity is
complex, with many interrelated factors involved. The South African government implemented
the Food Based Dietary Guidelines in an attempt to guide the public on making healthy food
choices. One of the guidelines encourages the public to “have milk, maas or yoghurt every day”
due to the beneficial health effects of these dairy products. South African studies investigating
the calcium intake of different age groups have shown children to consume inadequate amounts
of calcium. A recent national survey showed the age group of 7 to 8 years old in particular, to
have the lowest calcium intake of all age groups studied. Several international studies have shown
dairy products, and specifically milk, to have an inverse relationship with Body Mass Index (BMI)
in both adult and paediatric subjects. However, other international studies have provided
conflicting results. No such study has been conducted in South Africa, and so the need arose to
investigate a possible association between dairy products and childrens’ BMI.
Aim: To determine the impact of dietary calcium from dairy and/or total dairy intake, on the body
mass index of Grade 2 learners in Pietermaritzburg.
Objectives: To determine the following regarding Grade 2 learners: the prevalence of overweight
and obesity by interpreting their BMI; their calcium intake from dairy, and their total dairy intake;
the contribution of dairy products to meeting their calcium requirements; whether a relationship
exists between their dietary calcium (from dairy), and/or total dairy intake and their BMI; and
possible barriers to dairy intake.
Method: A cross sectional study was conducted on 91 Grade 2 learners from quintile 5 (fee-
paying) schools in Pietermaritzburg. A three-part questionnaire, comprised of an anthropometric
section, demographic questions, and a semi-quantitative food frequency questionnaire (FFQ)
were administered to the parents/guardians of the Grade 2 learners. The BMI of the learners was
compared to both the World Health Organization (WHO) and International Obesity Task Force
(IOTF) classifications for overweight and obesity. The calcium intake was obtained from the
FFQ, and compared to the Estimated Average Requirement (EAR) for calcium for 4 to 8 year
olds. The dairy intake was also determined, and compared to the recommended national
guidelines.

iii
Results: The study population comprised 57% female and 43% male learners, of whom 40.7%
were Black African, 27.5% were White, 17% were Indian and 13.2% were Coloured. Of these
learners, 28.6% (WHO) and 24.2% (IOTF) were overweight and 19.8% (WHO) and 15.4%
(IOTF) were obese. More female learners were overweight than male learners, but a greater
percentage of male learners were obese than female learners. Calcium intake from dairy was
significantly below the EAR of 800 mg per day for 75.8% (n=69) of learners, with the average
intake from the FFQ recorded as 615.2 mg. The mean number of dairy servings per day was 2.03,
also below the recommended number of 3 servings of dairy per day. No relationship between
BMI and calcium, or BMI and total dairy intake was established. Despite the low intake of dairy,
no significant barriers to the consumption of dairy were identified.
Conclusion: Grade 2 learners do not consume enough dairy products in their diet, and are
therefore unable to meet the calcium requirements for their age. Greater effort is required by
government, schools, health professionals and parents/guardians to promote, and encourage
children to consume more dairy products. Further research on this topic is recommended, where
the impact of lower fat and sugar containing dairy products on body fat (as opposed to BMI) can
be investigated.

iv
PREFACE
The work described in this dissertation was carried out in the School of Agricultural, Earth and
Environmental Sciences, University of KwaZulu-Natal, from July 2016 to December 2017, under
the supervision of Dr Nicola Wiles and Dr Nicola Tyler.
Signed: _________________________ Date: __________________
Joanne Louise Galliers
As supervisor of the candidate, I agree to the submission of this dissertation.
Signed: _________________________ Date: __________________
Dr Nicola Wiles (Supervisor)
Signed: _________________________ Date: __________________
Dr Nicola Tyler (Co-Supervisor)

v
DECLARATION OF ORIGINALITY
I, Joanne Louise Galliers, hereby declare that:
i) The research reported in this dissertation, except where otherwise indicated, is my
original research.
ii) This dissertation has not been submitted for any degree or examination at any other
University.
iii) This dissertation does not contain data, pictures, graphs or any other information
sourced from other people, unless specifically acknowledged as sourced from those
persons.
iv) The dissertation does not contain writing from other authors, unless specifically
acknowledged as being sourced from other authors. Where other written sources have
been quoted, then:
a. Their words have been re-written, but the general information attributed to them
has been referenced.
b. Where their exact words have been used, the quote has been placed inside
quotation marks, and referenced.
c. This dissertation does not contain copied text, graphics or tables, unless
specifically acknowledged, with the source referenced in text and in the Reference
section.
Signed: ________________________ Date: __________________
Joanne Louise Galliers (Candidate)

vi
ACKNOWLEDGEMENTS
Completing my Masters whilst working, and with a busy, young family has been challenging at
times, but not impossible. I would like to acknowledge the following people, whose constant
support has been invaluable to me completing my Masters:
My husband, Chris, and my children Bridget and Jed. Thank you for allowing me the time and
space to work, even though it took me away from our family time together. Thank you also for
the laughs and encouraging me to keep going during the tough times.
Maureen, Roger, Mom and Dad. Thank you for looking after the children on the weekends and
holidays when I needed to work, and for your constant interest and encouragement.
My supervisors Dr Nicola Wiles and Dr Nicola Tyler. Thank you for your guidance, honesty and
encouragement throughout the past few months. The financial assistance provided to help fund
my Masters study was greatly appreciated.
My colleagues Dr Kirthee Pillay, Dr Suna Kassier, Dr Chara Biggs, Dr Muthulisi Siwela, Mrs
Penny Jarvie and Mrs Elsie Correia. Thank you for answering my many questions, and for your
invaluable advice, and encouragement.
Dr Gill Hendry, thank you for the statistical analyses of my results, and your explanations that
helped me to understand statistics better. Your friendly emails and prompt responses helped me
get through Chapter 4!
My field workers, thank you for your enthusiasm and assistance in collecting the data, and making
the process more enjoyable.

vii
TABLE OF CONTENTS
CONTENTS PAGE
ABSTRACT .................................................................................................................................. ii
PREFACE .................................................................................................................................... iv
DECLARATION OF ORIGINALITY ......................................................................................... v
ACKNOWLEDGEMENTS ......................................................................................................... vi
TABLE OF CONTENTS ............................................................................................................ vii
LIST OF TABLES ....................................................................................................................... xi
LIST OF FIGURES .................................................................................................................... xii
APPENDICES ........................................................................................................................... xiii
CHAPTER 1: INTRODUCTION, THE PROBLEM AND STUDY SETTING ............... 1-10
1.1 Importance of the study .......................................................................................................... 1
1.2 Statement of the problem ........................................................................................................ 4
1.3 Research objectives ................................................................................................................. 4
1.4 Hypothesis .............................................................................................................................. 4
1.5 Inclusion and exclusion criteria .............................................................................................. 5
1.6 Definition of terms .................................................................................................................. 5
1.7 Abbreviations .......................................................................................................................... 8
1.8 Assumptions ............................................................................................................................ 9
1.9 Summary ................................................................................................................................. 9
1.10 Dissertation overview ......................................................................................................... 10
1.11 Referencing style ................................................................................................................ 10

viii
CHAPTER 2: LITERATURE REVIEW .............................................................................. 11-54
2.1 A background to the global problem of malnutrition ........................................................... 11
2.2 Overweight and obesity in South Africa ............................................................................... 13
2.3 Aetiology of overweight and obesity .................................................................................... 23
2.3.1 Dietary intake ..................................................................................................................... 24
2.3.2 Nutrition Transition ........................................................................................................... 24
2.3.3 Physical activity ................................................................................................................. 27
2.3.4 Socioeconomic status ......................................................................................................... 27
2.3.5 Culture ................................................................................................................................ 29
2.3.6 Gender ................................................................................................................................ 29
2.3.7 Stress .................................................................................................................................. 30
2.4 Encouraging a healthy diet in South Africa .......................................................................... 31
2.5 The benefits of milk and dairy products ............................................................................... 33
2.5.1 The cardiovascular system ................................................................................................. 35
2.5.2 The immune system ........................................................................................................... 35
2.5.3 The gastrointestinal system ................................................................................................ 36
2.5.4 The nervous system ............................................................................................................ 36
2.6 Barriers towards milk and dairy intake ................................................................................. 40
2.7 Dairy intake and obesity ....................................................................................................... 42
2.8 Summary ............................................................................................................................... 54
CHAPTER 3: METHODOLOGY ......................................................................................... 55-76
3.1 Type of study ........................................................................................................................ 55
3.2 Background information to the study area ............................................................................ 55
3.3 Design of study ..................................................................................................................... 55
3.3.1Cross sectional study ........................................................................................................... 55
3.4 Study population and sample selection ................................................................................. 56
3.5 Measurement of dietary intake .............................................................................................. 58
3.5.1Weighted food record .......................................................................................................... 58
3.5.2 24-hour recall ..................................................................................................................... 59
3.5.3 Food frequency questionnaire ............................................................................................ 60
3.5.4 Literature supporting the semi-quantitative FFQ ............................................................... 60
3.6 Study method and data collection ......................................................................................... 63
3.7 Measuring instruments used ................................................................................................. 64

ix
3.7.1 Anthropometric measurements .......................................................................................... 64
3.7.2 Semi-quantitative FFQ ....................................................................................................... 65
3.8 Fieldworker recruitment and training ................................................................................... 67
3.9 Pilot study ............................................................................................................................. 67
3.10 Data collection .................................................................................................................... 69
3.11 Data capturing and processing ............................................................................................ 69
3.12 Statistical analysis of data ................................................................................................... 71
3.13 Reliability and validity of data ............................................................................................ 74
3.14 Reduction of bias ................................................................................................................ 74
3.15 Ethical considerations ......................................................................................................... 75
3.16 Summary ............................................................................................................................. 76
CHAPTER 4: RESULTS .................................................................................................... 77-89
4.1 The demographic characteristics of the Grade 2 learners in Pietermaritzburg ..................... 77
4.2 The prevalence of overweight and obesity amongst Grade 2 learners in Pietermaritzburg, as
measured by their BMI ......................................................................................................... 78
4.3 The daily calcium and dairy intake of Grade 2 learners in Pietermaritzburg ....................... 81
4.4 The Grade 2 learners’ dietary calcium from dairy products, compared to the EAR for calcium
................................................................................................................................................ 83
4.5 The Grade 2 learners dairy intake compared to the recommended dairy intake .................. 83
4.6 The relationship between the Grade 2 learners’ calcium and total dairy intake, and their BMI
............................................................................................................................................ . 84
4.7 The dairy product most commonly consumed, and its effect on the Grade 2 learners’ BMI
................................................................................................................................................ .84
4.8 The dairy product that contributed the most calcium to the Grade 2 learners’ diet, and its
effect on the Grade 2 learners’ BMI ..................................................................................... 85
4.9 Barriers that prevented the Grade 2 learners from consuming an adequate dairy intake ..... 86
4.9.1 The relationship between dairy products and sugar sweetened beverages ........................ 88
4.10 Summary of results ............................................................................................................. 88

x
CHAPTER 5: DISCUSSION ............................................................................................. 90-103
5.1 The prevalence of overweight and obesity amongst Grade 2 learners in Pietermaritzburg,
as measured by their BMI ..................................................................................................... 90
5.2 The daily calcium and dairy intake of Grade 2 learners in Pietermaritzburg ....................... 93
5.3 Grade 2 learners dietary calcium intake from dairy products, compared to the EAR for
calcium .................................................................................................................................. 97
5.4 The Grade 2 learners dairy intake compared to the recommended dairy intake .................. 97
5.5 The relationship between the Grade 2 learners’ calcium and total dairy intake, and their BMI
................................................................................................................................................ 98
5.6 Barriers affecting dairy intake .............................................................................................. 99
5.7 Summary ............................................................................................................................. 102
CHAPTER 6: CONCLUSION AND RECOMMENDATIONS ..................................... 104-109
6.1 Conclusion of study findings .............................................................................................. 104
6.1.1 Objective 1: To determine the incidence of overweight and obesity amongst Grade 2
learners in Pietermaritzburg, as measured by their BMI ................................................. 104
6.1.2 Objective 2: To determine the calcium intake from dairy and the total dairy intake in
Grade 2 learners in Pietermaritzburg ............................................................................... 104
6.1.3 Objective 3: To determine the contribution that dairy products make towards meeting the
calcium requirements of Grade 2 learners ....................................................................... 105
6.1.4 Objective 4: To determine the relationship between the dietary calcium (from dairy)
and/or total dairy intake, and the BMI of Grade 2 learners in Pietermaritzburg ............. 105
6.1.5 Objective 5: To determine possible barriers to dairy intake in Grade 2 learners in
Pietermaritzburg ............................................................................................................... 105
6.2 Limitations .......................................................................................................................... 106
6.3 Recommendations ............................................................................................................... 107
6.3.1 Recommendations for dietetic practice ............................................................................ 107
6.3.2 Recommendations for the government ............................................................................ 108
6.3.3 Recommendations for future research ............................................................................. 108
REFERENCES ........................................................................................................................ 110

xi
LIST OF TABLES
Table 2.1: Summary of studies on the prevalence of overweight and obesity in children and
adolescents in South Africa ........................................................................................ 15
Table 2.2: Interpretation of WHO BMI-for-age growth charts .................................................. 21
Table 2.3: Calcium content of a single serving of milk and dairy products ............................... 33
Table 2.4: Approximate nutritional composition of fresh milk in South Africa (per 100 g) ...... 34
Table 2.5: Summary of studies on dairy intake and BMI in children ......................................... 44
Table 3.1: Serving sizes for milk and dairy products, calculated to provide 300 mg calcium ... 70
Table 3.2: Calcium content of dairy products per 100 g/ml ....................................................... 71
Table 3.3: Analysis of data ......................................................................................................... 73
Table 4.1: Gender and race differentiation amongst the learners ............................................... 77
Table 4.2: The interpretation of BMI according to the WHO classification .............................. 79
Table 4.3: The interpretation of BMI according to the IOTF classification ............................... 79
Table 4.4: Gender, race and BMI interpretations according to the WHO classification ............ 80
Table 4.5: Gender, race and BMI interpretations according to the IOTF classification ............. 80
Table 4.6: Summary of the calcium and dairy intake amongst the learners ............................... 81
Table 4.7: Analysis of dairy and calcium intake according to gender ........................................ 82
Table 4.8: Analysis of dairy and calcium intake according to race ............................................ 82
Table 4.9: Calcium intake compared to the EAR ....................................................................... 83
Table 4.10: The most regularly consumed dairy product in the learners’ diet ........................... 85
Table 4.11: The food item that contributed the most calcium in the learners’ diet .................... 86
Table 4.12: Existing barriers that prevent the learners from consuming an adequate dairy
(and calcium) intake…. ........................................................................................... 87

xii
LIST OF FIGURES
Figure 2.1: Principle determinants of paediatric obesity ............................................................ 23
Figure 2.2: Stages of the Nutrition Transition ............................................................................ 25
Figure 4.1: Normal distribution curve for BMI according to learners’ gender .......................... 78

xiii
LIST OF APPENDICES
Appendix A: International cut off points for BMI for overweight and obesity by gender
between 2 and 18 years, defined to pass through BMI of 25 and 30 kg/m² at 18
years of age ......................................................................................................... 133
Appendix B: International cut off points for BMI for grades 1, 2, and 3 thinness by gender
between 2 and 18 years, defined to pass through BMI of 16, 17 and 18.5 kg/m² at
18 years of age ..................................................................................................... 135
Appendix C: Informed consent form for Principal .................................................................. 137
Appendix D: Informed consent form for Grade 2 teacher ....................................................... 140
Appendix E: Food Frequency Questionnaire .......................................................................... 143
Appendix F: Permission to conduct research from the KZN DOE ......................................... 160
Appendix G: Informed consent form for parents/guardians .................................................... 161
Appendix H: Ethics approval from BREC .............................................................................. 164

1
CHAPTER 1: INTRODUCTION, THE PROBLEM AND ITS SETTING
1.1 Importance of the study
The global incidence of people who are overweight (Body Mass Index [BMI] ≥ 25-29.9 kg/m²)
and obese (BMI ≥30 kg/m²) is rising at an alarming rate. It was estimated in 2014 that 41
million children under the age of 5 years old were overweight or obese, with this number
almost doubling in African children from 5.4 million in 1990 to 10.3 million in 2014 (WHO
2016). Data from the comprehensive South African National Health and Nutrition Examination
Survey (SANHANES-1) published in 2013 depict a similarly concerning picture in South
Africa, with increasing levels of overweight and obesity noted in children, compared to data
from the 2005 National Food Consumption Survey-Fortification Baseline (NFCS-FB-1). It is
highly probable that an overweight or obese child will become an overweight or obese adult
(Kimani-Murage, Kahn, Pettifor, Tollman, Dunger, Gomez-Olive & Norris 2010; Reilly,
Methven, McDowell, Hacking, Alexander, Stewart & Kelnar 2003).
Overweight and obesity negate the rapid advances made in the medical field that contribute
towards enhanced longevity; combined, they ranked as the fifth greatest contributor to
mortality worldwide by the World Health Organization (WHO) in 2009. Childhood obesity has
been described as the primary health problem effecting children in developed countries (Olds
2011). Metabolic alterations that occur in overweight and obesity (van der Merwe & Pepper
2006) predispose the individual to elevated risks of non-communicable diseases (NCDs) such
as cardiovascular disease, in addition to type 1 and type 2 diabetes, and premature death. In
South Africa, poverty (which affects access to food and dietary diversity), low education levels,
crime and the raging HIV/AIDS epidemic further compound the rather complicated and
multifaceted presentation of overweight, obesity and NCDs that are observed. Increasing levels
of overweight and obesity will furthermore place a heavy burden on the country’s already
struggling health system and economy.
Despite the numerous studies that provide alarming statistics on the consequences of
overweight and obesity, and respected global and local organisations calling for interventions
to curb this worldwide crisis, it appears that little impact, if any at all, has been made to date.
The South African Food Based Dietary Guidelines (FBDG) were developed to assist South
Africans to eat in a healthy manner. They were first introduced in 2001, and updated more

2
recently in 2012. In the first set of guidelines, milk and dairy products were included in the
guideline that encouraged South Africans to eat animal products. However, a separate guideline
specifically encouraging the daily intake of milk, maas and yoghurt was created in the revised
2012 FBDG. This was driven by the proven beneficial effects of milk on health (for both over-
and undernutrition), and the recognised poor dietary intake of milk and dairy products amongst
the South African population (Vorster, Wenhold, Wright, Wentzel-Viljoen, Venter & Vermaak
2013). There is limited available data on the milk and dairy intake of South African children.
Of the few studies conducted, the calcium intake for children was shown to be far below the
recommended intake. Secondary data analysis from the National Food Consumption Survey
(NFCS) of 1999 showed that children in the 7 to 8 year age category had the lowest calcium
intake compared to the other age groups of 1 to 3 years and 4 to 6 years old (Steyn, Nel, Nantel,
Kennedy & Labadarios 2006), thus placing them at risk of poor skeletal accretion as they
approach the crucial stage of growth and development in puberty. Of concern is the preference
for carbonated beverages over milk, as seen in a study conducted on children as young as 12
to 24 months of age (Theron, Amissah, Kleynhans, Albertse & MacIntyre 2007).
Milk is the most nutritious liquid food source available, containing over ten essential nutrients
(Consumer Education Project of Milk SA 2013), and is the primary ingredient of all dairy
products. From the age of 1 year old, full cream milk can contribute a substantial amount of
essential macro- and micronutrients to a young child’s diet (Mahan, Escott-Stump & Raymond
2012, p380). It has been recommended by the American Heart Association (AHA), and
endorsed by the American Academy of Paediatrics (AAP) that full cream milk be switched to
skim or low fat milk from the age of 2 years, as a direct result of the overweight and obesity
crisis (Gidding, Dennison, Birch, Daniels, Gilman, Lichtenstein, Rattay, Steinberger, Stettler
& van Horn 2006). Thereafter, it is recommended that milk continue to contribute to the intake
of multiple nutrients throughout childhood, adolescence and adulthood (Vorster et al 2013).
Of great interest is the emerging evidence from international studies that suggest the intake of
milk and dairy products may help protect against overweight and obesity, conferring beneficial
effects on body weight, body fat and the metabolic syndrome. It has been proposed that calcium
is the major role player in these observations. Zemel, Shi, Greer, Dirienzo & Zemel (2000)
demonstrated how increased dietary calcium intake resulted in a decrease in adipocyte
intracellular Ca², and an increase in lipolysis.

3
In contrast, other international studies have shown no benefit at all of milk, dairy products or
calcium on weight or body fat of individuals. There is a paucity of data available on milk and
dairy intake amongst the South African population, with certainly no known local study
conducted on the impact they may have on BMI or body fat, especially amongst children. For
this reason it was deemed necessary for this study to be conducted in order to determine dairy
intake amongst children, and the impact it may have on their BMI.
The following questions therefore arise:
What is the prevalence of overweight and obesity amongst Grade 2 learners (7 to 8 years
old) in Pietermaritzburg, as measured by their BMI?
What is the dairy and calcium intake amongst Grade 2 learners (7 to 8 years old) in
Pietermaritzburg?
Is their dietary calcium intake from dairy products close to meeting the daily requirements
for calcium of 50% of a healthy population of 4 to 8 year olds, as stipulated by the Estimated
Average Requirements (EAR)?
Do these children meet their recommended dairy intake?
Does the calcium from their dairy intake, and/or their total dairy intake have any impact on
their BMI?
What barriers exist to prevent Grade 2 learners from consuming an adequate dairy intake?
It was considered important to conduct this study as it would provide baseline data in a field of
nutrition that has not previously been widely researched in this country. It was anticipated that
the milk and dairy intake of school children in Pietermaritzburg, KwaZulu-Natal (KZN) would
be established, to determine whether their intake is adequate in meeting their daily
requirements. Furthermore, any possible link between calcium and/or dairy intake and BMI
could be investigated, in light of the current overweight and obesity figures. By understanding
the current dietary intake of milk and dairy products in this subgroup of school children, it was
anticipated that this would help define any further nutritional intervention required by policy
makers and stakeholders in improving the health of children, both in terms of over- and
undernutrition.

4
1.2 Statement of the problem
The purpose of this study was to determine the incidence of overweight and obesity amongst
Grade 2 learners in Pietermaritzburg, and if dietary calcium from their dairy intake, and/or their
total dairy intake had any impact on their BMI. Furthermore, this study determined whether
Grade 2 learners in Pietermaritzburg were meeting their calcium and dairy requirements
(assuming they are receiving calcium from other, non-dairy sources), and if not, what barriers
to obtaining an adequate dairy intake exist.
1.3 Research Objectives
The objectives of this study were:
1.3.1 To determine the prevalence of overweight and obesity amongst Grade 2 learners in
Pietermaritzburg, as measured by their BMI.
1.3.2 To determine the calcium intake from dairy and the total dairy intake in Grade 2 learners
in Pietermaritzburg.
1.3.3 To determine the contribution that dairy products made towards meeting the calcium
requirements of Grade 2 learners.
1.3.4 To determine the relationship between the dietary calcium (from dairy) and/or total
dairy intake, and the BMI of Grade 2 learners in Pietermaritzburg.
1.3.5 To determine possible barriers to dairy intake in Grade 2 learners in Pietermaritzburg.
1.4 Hypothesis
1.4.1 The intake of dietary calcium, and/or total dairy intake was inversely related to the BMI
of Grade 2 learners in Pietermaritzburg.

5
1.5 Inclusion and exclusion criteria
1.5.1 Inclusion criteria
All quintile 5 schools in Pietermaritzburg that fell under the Msunduzi municipality were
included in this study.
Eligible quintile 5 schools were representative of all South African race groups (Black
African, White, Coloured and Indian)
Quintile 5 schools required at least one Grade 2 class.
Grade 2 learners were either seven (7) years old and turning eight (8) years old in 2016, or
already eight (8) years old.
Parents/caregivers of Grade 2 learners must have provided consent for participation.
1.5.2 Exclusion criteria
All quintile 1 to 4 schools in Pietermaritzburg that fell under the Msunduzi municipality.
Schools where all four of the main South African race groups were not represented at the
eligible school.
Grade 2 learners who were nine (9) years and older.
Parents/caregivers who did not provide consent.
1.6 Definition of terms
Body Mass Index (BMI): The weight (in kilograms) of an individual divided
by their height (in metres squared) (Cole, Bellizzi,
Flegal & Dietz 2000).
Cross-sectional study design: A type of study that investigates relationships at a
single point in time (Cade, Thompson, Burley &
Warm 2002).
Dairy: For the purpose of this study, dairy refers to milk,
flavoured milk, milk-based hot drinks, yoghurt,
drinking yoghurt, frozen yoghurt, cheese, maas, and
desserts/puddings composed mainly of milk.

6
Estimated Average Requirement: The average intake needs of the general population.
The distribution of dietary intakes should be
compared to the EAR to determine the proportion
below the EAR, which is an estimate of the
prevalence of inadequacy (Murphy, Guenther &
Kretsch 2006).
Food frequency questionnaire: A questionnaire commonly used to determine any
association between dietary intake and disease,
where the number of participants is large. A list of
food items, beverages and supplements is given, and
the respondent indicates their frequency of
consumption (Johansson 2006).
Grade 2 learner: Any child who is expected to be seven (7) years old
turning eight (8) in 2016, or already eight (8) years
old.
Metabolic Syndrome: The name given to a cluster of risk factors
(abdominal obesity, elevated triglycerides, low HDL
cholesterol, elevated blood pressure and elevated
fasting glucose) that increase an individual’s chance
of developing heart disease, diabetes, and stroke.
Three or more of these risk factors need to be present
for metabolic syndrome to be confirmed (Grundy,
Brewer, Cleeman, Smith & Lenfant 2004).
Non-Communicable Diseases: Diseases that increase the risk of mortality, but are
not infectious, such as cardiovascular disease,
diabetes, stroke and hypertension.
Obesity: International BMI cut-off value corresponding to a
BMI ≥ 30 kg/m² at age 18 for each gender (Cole et al
2000).

7
Observational study: A type of study whereby subjects are observed and
the particular variables of interest are measured,
without the subject’s receiving any treatment.
Overfat: Excess adiposity (Cameron & Getz 1997).
It is based on the sum of the triceps and subscapular
skinfold thicknesses ≥ 85th percentile (overfat)
(Frisancho 1990).
Overweight: International BMI cut-off value corresponding to a
BMI ≥ 25 kg/m² at age 18 for each gender (Cole et
al 2000). Excess weight, irrespective of the
composition of that weight (Cameron & Getz 1997).
Quintile: The categorisation of government schools into
quintiles 1 to 5, with quintile 1 being the poorest of
schools, and requiring the most financial assistance
from the government. These schools are non-fee
paying schools. Quintile 5 schools are on the
opposite end of the scale- they are the most well-
resourced government schools, and are fee-paying
(Department of Education, Pretoria 2004).
Rural: Living outside of a town or city.
Semi-quantitative food A unique type of food frequency questionnaire which
frequency questionnaire: includes the portion sizes of the food items of
interest. The frequency of which each food item is
consumed is multiplied by the nutrient content of the
average portion size specified, to determine the
amount of a particular nutrient consumed (Johansson
2006).
Urban: Living in a town or city.
8
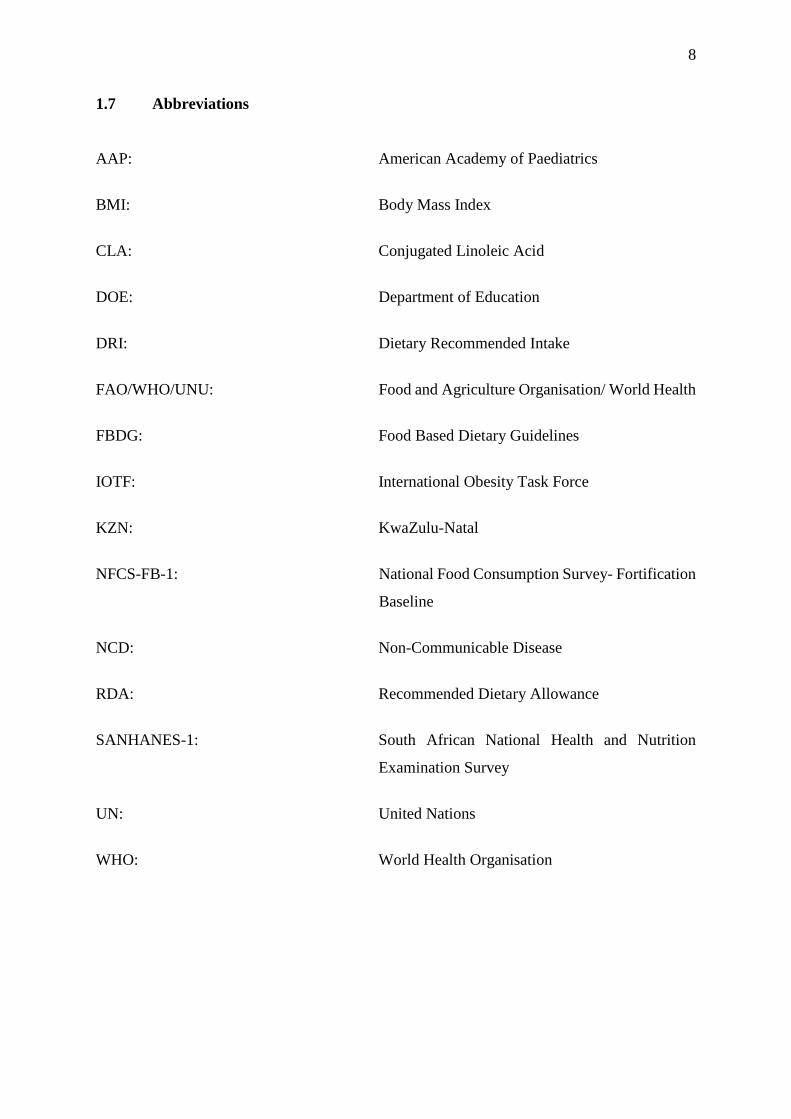
1.7 Abbreviations
AAP: American Academy of Paediatrics
BMI: Body Mass Index
CLA: Conjugated Linoleic Acid
DOE: Department of Education
DRI: Dietary Recommended Intake
FAO/WHO/UNU: Food and Agriculture Organisation/ World Health
FBDG: Food Based Dietary Guidelines
IOTF: International Obesity Task Force
KZN: KwaZulu-Natal
NFCS-FB-1: National Food Consumption Survey- Fortification
Baseline
NCD: Non-Communicable Disease
RDA: Recommended Dietary Allowance
SANHANES-1: South African National Health and Nutrition
Examination Survey
UN: United Nations
WHO: World Health Organisation

9
1.8 Assumptions
The following assumptions were made:
Each school sent out informed consent forms and questionnaires to all parents and guardians
of Grade 2 learners, and no eligible Grade 2 learners were omitted (either intentionally or
accidentally).
Parents/guardians of Grade 2 learners were aware of their learner’s dietary intake.
Parents/guardians of Grade 2 learners answered the questionnaire as truthfully and
accurately as possible.
Grade 2 teachers kept a record of learners’ allocated research codes, and returned the correct
completed questionnaire to the learner once the research team had arrived to take
anthropometric measurements.
Fieldworkers took consistent anthropometric measurements in the correct manner, as per
their training.
Results from the food frequency questionnaire closely resembled the learner’s true average
daily intakes.
1.9 Summary
The incidence of overweight and obesity, both globally and locally, is increasing in an
exponential manner. Within South Africa, the emerging predominant malnutrition problem is
one of overnutrition. Overweight and obesity contribute greatly to the risk of developing NCDs,
which can increase mortality rate and place an additional burden on struggling health facilities
already battling to cope with the HIV/AIDS epidemic and TB. Although the causes of
overweight and obesity are multifactorial, a change in dietary habits is urgently required to
assist the population in attaining a healthy BMI. Milk and dairy products contain many
beneficial dietary components, and a daily intake of these food products is recommended to
achieve optimal health. Conflicting results on the role of calcium and dairy products in weight
control have emerged from several international studies, but no similar studies have been
conducted in the Southern African region. Furthermore, there is a dearth of literature available
on the dairy and calcium intake of children in South Africa. It was anticipated that this study
would provide evidence of the dietary calcium and dairy intake amongst a subgroup of the
paediatric population in KZN, South Africa, and any relationship between calcium and/or dairy
intake on their weight be identified. Should an inverse relationship between calcium and/or

10
dairy intake and the BMI of children be shown, it would provide an exciting opportunity for
further research into this area, as part of a multi-pronged approach to tackling the overweight
and obesity crisis in South Africa.
1.10 Dissertation overview
This dissertation consists of six chapters. Chapter one provides an overview of the overweight
and obesity problem, briefly mentions the beneficial effects of milk and dairy products and
presents the objectives of the study. Chapter two is a literature review that includes the
aetiology of overweight and obesity, and the various mechanisms behind the favourable effects
of milk and dairy. International studies that have looked into the effect of calcium or dairy on
weight status in children are reviewed. Chapter three explains the methodology used in the
current study, whilst the fourth chapter presents the results following statistical analyses.
Chapter five discusses the results of the study and relates them back to the literature reviewed
in Chapter two. Chapter six concludes the dissertation and provides recommendations for
future research based on the results obtained.
1.11 Referencing style
This dissertation was written using the referencing style that is followed by the Discipline of
Dietetics and Human Nutrition, University of KwaZulu-Natal (UKZN).

11
CHAPTER 2: LITERATURE REVIEW
This literature review covers the extent and impact of overnutrition (overweight and obesity)
both globally, and locally in South Africa. Emphasis is placed on the many studies conducted
on the South African paediatric population. The aetiology of childhood obesity is explained,
and the corresponding changes in dietary patterns are analysed. Milk and dairy products are
reviewed, with particular focus placed on the beneficial role that they play in contributing
towards good health in children. Any barriers to ensuring an adequate dairy intake in children
are covered. International paediatric studies conducted on the effect of milk and dairy products
on weight and body fat are evaluated. This chapter is then concluded with a summary outlining
the importance of this study.
2.1 A background to the global problem of malnutrition
Overnutrition, a positive nutrient balance, can be a form of malnutrition (Stratton, Green &
Elia 2003) characterised by an “excess and imbalance of a wide range of nutrients”. The Global
Nutrition Report (2016) refers to malnutrition as resulting from “the interaction of poor-quality
diets and poor-quality health and care environments and behaviours, which are shaped in part
by a host of underlying factors, such as political instability, poor economic development,
conflict, inequality, and some dimensions of globalization” (International Food Policy
Research Institute 2016).
Momentum for good nutrition is gaining strength, with more and more organisations,
governments and stakeholders realising the importance of tackling the biggest risk factor to the
global burden of disease (International Food Policy Research Institute 2016). In the last few
years, targets were set by multiple global organisations to tackle the multifaceted issue of
malnutrition. The World Health Assembly announced its 2025 Global Targets for Maternal,
Infant and Young Child Nutrition in 2012, further adding targets to reduce NCDs the following
year. In 2015, the UN Sustainable Development Goals announced the intention of eradicating
malnutrition by the year 2030, and the UN recently declared 2016-2025 to be a Decade of
Action on Nutrition (International Food Policy Research Institute 2016).
The most recent statistics portray a dismal picture indicating that “one in three people are
malnourished in one form or another” (International Food Policy Research Institute 2015a).
Almost two billion adults are overweight or obese and 41 million children under five years of

12
age are overweight (Development Initiatives 2017; WHO 2016). In addition to the
psychological implications of depression and poor self-image (Rossouw, Grant & Viljoen
2012), the condition of overweight and obesity may lead to the development of NCDs such as
cardiovascular disease, diabetes, hypertension, stroke, respiratory disease and cancer, which
further compound the person’s health status and disability-adjusted-life-years (Mayosi, Flisher,
Lalloo, Sitas, Tollman & Bradshaw 2009).
Economists have demonstrated the detrimental impact of malnutrition on a country’s economy,
by showing malnutrition in all its forms to cause a 10% annual loss of Gross Domestic Product
(GDP) (International Food Policy Research Institute 2015). In the United States of America
(USA), obesity and its associated NCDs were shown to cause an additional annual healthcare
cost of 8% annual income in an average American household, as well as increased absenteeism
from work, decreased employment opportunities, less disposable income and poor quality of
life (Su, Huang, Chen, Iacobucci, Mocarski, Dall & Perreault 2015). In 2012, the subsequent
loss in productivity directly from diabetes cost the USA government $69 billion (American
Diabetes Association 2013). The prevalence of diabetes in China has dramatically increased in
the last 30 years where they now have the largest diabetic population in the world, and
healthcare and psychosocial implications of diabetes have directly resulted in an annual 16.3%
loss of income to the average household (Liu & Zhu 2014).
Children from developing countries have not been immune to the rapid dietary changes and
increasingly sedentary lifestyle observed in many countries, with levels of paediatric obesity
recorded as 41.8% in Mexico, 22.1% in Brazil, 22% in India and 19.3% in Argentina (Gupta,
Goel, Shah & Misra 2012).
The Global Nutrition Report (2017) states that most countries are not on track to meet their
targets for reducing overweight and obesity, and have urged countries to prioritise these targets
(Development Initiatives 2017). Not enough money spent on improving nutrition has been cited
as one of the contributing problems for not meeting the targets. In 2015, only one percent (1%)
of global donor’s overall contributions were allocated towards tackling obesity and NCDs
(Development Initiatives 2017), despite the fact that nutrition-related NCDs contributed to
more than half of all disabilities and deaths in low- and middle-income countries (LMIC)
(International Food Policy Research Institute 2016). Other areas requiring improvement are the
nutrition targets set by countries where only 30% of countries have targets to tackle obesity,
diabetes and the reduction of dietary salt intake, and of those targets only two thirds are

13
SMART (‘Specific’, ‘Measurable’, ‘Achievable’, ‘Relevant’, and ‘Time-bound’). Despite the
WHO’s recommendations for healthy diets, specifically reducing salt, reducing trans- and
saturated fats and regulating the marketing of foods and non-alcoholic beverages to children,
most countries have made no progress in executing these recommendations. Nutrition plays a
pivotal role in health, education, employment, poverty, inequality and female empowerment,
and should be incorporated into other governmental sectors, where a higher budget can be
allocated. Investment in nutrition must be seen as a way to improve economic growth, as
opposed to the current way of thinking where economic growth will lead to good nutrition
(International Food Policy Research Institute 2016). The incidence of overweight and obesity
in South Africa, will be discussed in the next section.
2.2 Overweight and obesity in South Africa
The prevalence of overweight, obesity, and their associated NCDs in South Africa is very
similar to the trends observed in other developing countries undergoing economic transition,
with increasing rates noted across all population groups, socioeconomic levels and ages
(Popkin 2003). The impact of the rapid socioeconomic progress that occurred in South Africa
in the latter half of the 1990’s is showing itself in the form of unprecedented levels of
overweight and obesity, closely pursued by the resultant NCDs. According to the WHO, the
burden from NCDs in South Africa is two to three fold greater than in developed countries,
with heart disease, diabetes and stroke contributing to the second most common cause of death
in South African adults (Mayosi et al 2009). Based on projections made by Abegunde, Mathers,
Adam, Ortegon & Strong (2007), the researchers estimate that in 2015 South Africa’s GDP
loss due to the impact of NCDs on the country’s economy will be US $21 million (Abegunde
et al 2007).
Aided by the improved roll-out of antiretroviral therapy, it is predicted that South Africans will
have an increased life expectancy, with the number of South African children aged 0 to 14
years old increasing by 10% in the next decade, and the number of people 60 years and older
expected to increase by 189% in the next decade (Mayosi et al 2009). With the population
living for longer, action needs to be taken to stem the rise in NCDs, due to the detrimental
impact they will have on the struggling health system and the economy. With adolescent
fertility being three times greater in LMIC’s compared to high income countries, there are the
additional risks arising from maternal overweight and obesity, which can lead to increased birth
complications, preterm delivery, and increased infant mortality (Black, Victora, Walker,

14
Bhutta, Christian, de Onis, Ezzati, Grantham-McGregor, Katz, Martorell, Uauy and the
Maternal and Child Nutrition Study Group 2013). This further compounds the burden that has
already been placed on health care facilities battling to cope with HIV/AIDS, TB,
undernutrition, NCDs, trauma and violence.
Numerous studies conducted on the South African population have shown an increasing
tendency towards overweight and obesity amongst both adults and children. Studies
specifically conducted on South African children have been reviewed, summarised and
presented in order of data collection in Table 2.1.
15
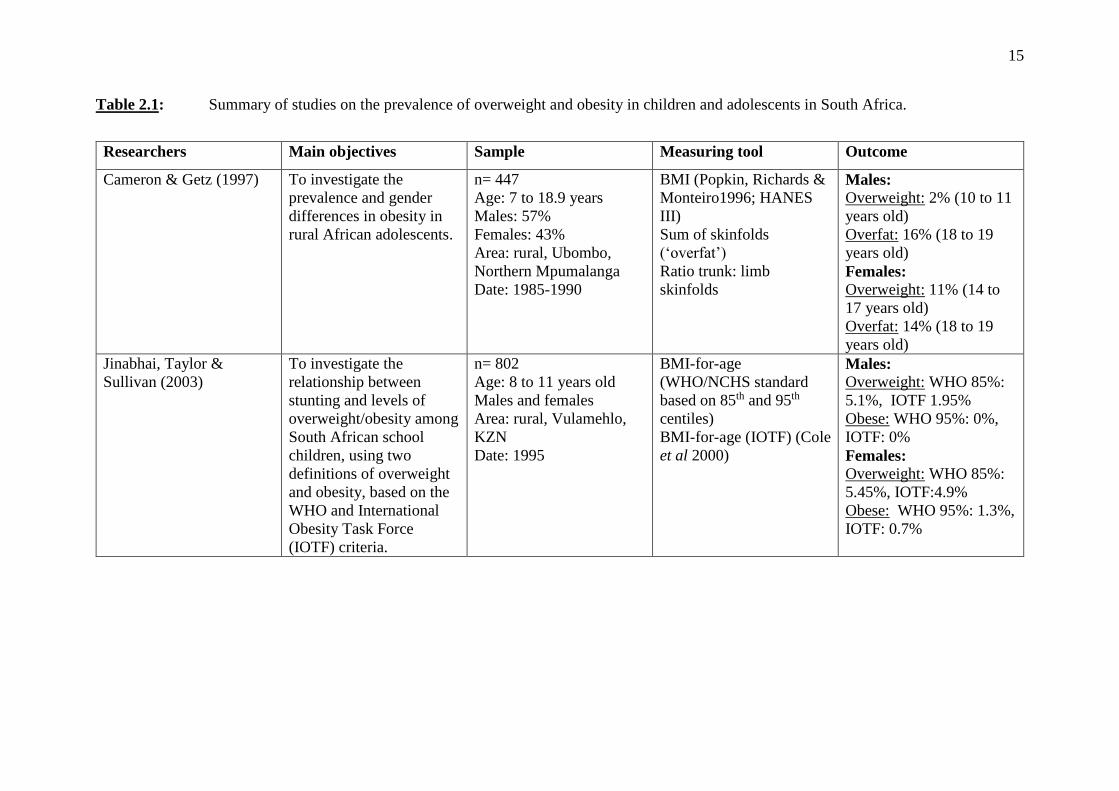
Table 2.1: Summary of studies on the prevalence of overweight and obesity in children and adolescents in South Africa.
Researchers Main objectives Sample Measuring tool Outcome
Cameron & Getz (1997) To investigate the
prevalence and gender
differences in obesity in
rural African adolescents.
n= 447
Age: 7 to 18.9 years
Males: 57%
Females: 43%
Area: rural, Ubombo,
Northern Mpumalanga
Date: 1985-1990
BMI (Popkin, Richards &
Monteiro1996; HANES
III)
Sum of skinfolds
(‘overfat’)
Ratio trunk: limb
skinfolds
Males: Overweight: 2% (10 to 11
years old)
Overfat: 16% (18 to 19
years old)
Females: Overweight: 11% (14 to
17 years old)
Overfat: 14% (18 to 19
years old)
Jinabhai, Taylor &
Sullivan (2003)
To investigate the
relationship between
stunting and levels of
overweight/obesity among
South African school
children, using two
definitions of overweight
and obesity, based on the
WHO and International
Obesity Task Force
(IOTF) criteria.
n= 802
Age: 8 to 11 years old
Males and females
Area: rural, Vulamehlo,
KZN
Date: 1995
BMI-for-age
(WHO/NCHS standard
based on 85th and 95th
centiles)
BMI-for-age (IOTF) (Cole
et al 2000)
Males: Overweight: WHO 85%:
5.1%, IOTF 1.95%
Obese: WHO 95%: 0%,
IOTF: 0%
Females: Overweight: WHO 85%:
5.45%, IOTF:4.9%
Obese: WHO 95%: 1.3%,
IOTF: 0.7%

16
Table 2.1: Continued
Researchers Main objectives Sample Measuring tool Outcome
Monyeki, van Lenthe &
Steyn (1999)
To determine the
development of total body
fatness in rural South
African children during the
preschool years and first
years of formal schooling.
n= 1336
Age: 3 to 10 years old
Males: 51%
Females: 49%
Area: Rural, Ellisras,
Limpopo Province
Date: 1996
BMI (>85th centile of
NHANES III)
Sum of skinfolds
Males: Total overweight
or obese: BMI 0.55%
Sum of skinfolds 4.15%
Females: Total overweight or
obese: BMI 1%
Sum of skinfolds 1.1%
Labadarios, Steyn,
Maunder, MacIntyre,
Gericke, Swart,
Huskisson, Dannhauser,
Vorster, Nesmvuni & Nel
(2005)
To determine the nutrient
intakes and anthropometric
status of children (1-9
years old), as well as
factors that influence their
nutrient intake.
n= 2894
Age: 1 to 9 years old
Area: National
Date: 1999
BMI-for-age (United
States National Centre for
Health Statistics) (NCHS)
Males and females
combined Overweight: Total: 12.1%
Rural 11.6%, Urban
12.5%
Obese: Total: 5%
Rural 3.7%, Urban 6.1%
Somers (2004) (Abstract) To determine the
prevalence of overweight
and obesity amongst
learners attending schools
in specific communities
within the City of Cape
Town, South Africa.
n= 338
Age: 10 to 16 years old
Male: 42.31%
Female: 57.69%
Race: Black and coloured
Area: Western Cape
Province
BMI (CDC) Overweight: Total: 8.31%
Males: 2.8%
Females: 12.3%
Obese: Total: 2.97%
Males: 2.8%
Females: 3.09%

17
Table 2.1: Continued
Researchers Main objectives Sample Measuring tool Outcome
Mukuddem-Petersen &
Kruger (2004)
(the THUSA BANA
study)
To investigate the
relationship between
stunting and
overweight among 10-
to 15 year old children
of the North West
province in South
Africa.
n = 1250
Age: 10 to 15 years old
Males: 48.3%
Females: 51.7%
Race: Black, White,
Coloured
Area: 35.8% rural,
46.4% urban, 17.8%
informal (NW Province)
BMI-for-age (IOTF)
(Cole et al 2000)
Sum of skinfolds
Prevalence of overweight and
obesity combined: Total 7.9%
Males: 5.6%, Females: 10.1%
White 14.2%, Black 7.1%,
Indian 6.4%, Mixed ancestry 2.9%
Armstrong, Lambert,
Sharwood & Lambert
(2006)
To determine the
prevalence of
overweight and
obesity in a sample of
South African children
aged 6 to 13 years.
n= 10195
Age: 6 to 13 years
Males: 55%
Females: 45%
Race: 47.6% Black,
32.46% White, 17.8%
Coloured
Area: 5 provinces,
children from different
socioeconomic status,
rural and urban.
Date: 2001-2004
BMI-for-age (IOTF)
(Cole et al 2000) Males: Overweight: All boys: 10.8%,
White boys: 15.4%, Black boys:
7.6%, Coloured boys: 8.7%,
Obese: All boys 3.2%, White boys:
4.3%, Black boys: 2.1%, Coloured
boys: 3%,
Females: Overweight: All girls: 13%, White
girls: 15.5%, Black girls: 12.3%,
Coloured girls: 10.7%
Obese: All girls: 4.9%, White girls:
7.8%, Black girls: 4.7%, Coloured
girls: 4.8%

18
Table 2.1: Continued
Researchers Main objectives Sample Measuring tool Outcome
Labadarios, Swart,
Maunder, Kruger, Gericke,
Kuzwayo, Ntsie, Styen,
Schloss, Dhansay, Jooste &
Dannhauser (2008)
The anthropometric and
selected micronutrient
status of children aged
1-9 years (amongst other
objectives).
Age: 1 to 9 years
old
Area: national
Date: 2005
BMI-for-age Total overweight: 10%
Total obese: 4%
Kruger, Venter, Vorster &
Margetts (2006) (the
THUSA study)
To investigate the
determinants of
overweight and obesity
among 10- to 15 year-
old school children in a
population in the
transitional phase in the
North West Province of
South Africa.
n= 1257
Age: 10 to 15 years
Males: 48%
Females: 52%
Race: Black 73.1%
White 15.2%,
Coloured 6.2%
Area: 35.8% rural,
46.4% urban,
17.8% informal
North West (NW)
province
BMI-for-age
(IOTF) (Cole et al
2000)
Sum of skinfolds
Overweight:
White 11.6%, Black 5.7%, Coloured:
2.9%, Indian 3.8%
Obese:
White 2.6%, Black 1.4%, Coloured: 0%,
Indian 2.6%
Kimani-Murage, Kahn,
Pettifor, Tollman, Dunger,
Gomez-Olive & Norris
(2010)
To investigate the
prevalence and patterns
of stunting and
overweight/obesity, and
hence risk for metabolic
disease, in a group of
children and adolescents
in rural South Africa
n= 3489
Age: 1 to 20 years
old
Males: 49.4%
Females: 50.6%
Race: Black
(Tsonga)
Area: Agincourt
sub-district,
Mpumalanga
Date: 2007
BMI-for-age
(IOTF) (Cole et al
2000)
Overweight: Total: 6%
1 to 4 years old: 7% ;
5 to 9 years old: 4%
10 to 14 years old: 6% ;
5 to 20 years old: 8%
Obese: Total: 2%
1 to 4 years old: 1% ;
5 to 9 years old: 1%
10 to 14 years old: 2% ;
15 to 20 years old: 4%

19
Table 2.1: Continued
Researchers Main objectives Sample Measuring tool Outcome
Truter, Pienaar & Du
Toit (2010)
To determine relationship
between overweight,
obesity and physical
fitness of 9 to 12 year old
South African children.
n= 280
Age: 9 to 13 years old
Males: 45.7%
Females: 54.3%
Area: 2 primary
schools in
Potchefstroom, NW
Province
BMI-for-age
(IOTF) (Cole et al
2000)
Overweight: Total: 15.5%
Males: 15.6%, Females: 15.1%
Obese: Total 6.5%
Males: 5.5%, Females: 7.2%
Puckree, Naidoo,
Pillay & Naidoo
(2011)
To determine whether
school children in the
eThekwini district in
KwaZulu-Natal, South
Africa, were underweight
or overweight.
n= 120
Age: 10 to 12 years old
Males: 40%
Females: 60%
Race: Indian 76%,
Black 24%
Area: urban, KZN
Date: 2006
BMI-for-age
(WHO)
Overweight: Total: 5.03%
Overweight for age:
Age 10 years: 1.7%
Age 11 years: 0.8%
Age 12 years: 2.5%
Obese: 1 of 120 children
Kemp, Pienaar &
Schutte (2011)
To determine the
prevalence of
hypertension in Grade 1
learners in the North
West province of South
Africa, and to investigate
the association between
blood pressure (BP) and
body composition of
these children.
n= 816
Age: mean 6.78 years
old
Males: 51.3%
Females: 48.7%
Race: Black 69%,
White 26.7%,
Coloured: 0.02%,
Indian 0.01%
Area: NW province
BMI-for-age
(IOTF) (Cole et al
2000)
Overweight: Total: 7.8%
Males: 6.4%, Females: 9.3%
Obese: Total: 3.8%
Males: 3.3%, Females: 2.8%

20
Table 2.1: Continued
Researchers Main objectives Sample Measuring tool Outcome
Shisana, Labadarios,
Rehle, Simbayi, Zuma,
Dhansay, Reddy, Parker,
Hoosain, Naidoo,
Hongoro, Mchiza, Steyn,
Dwane, Makoae,
Maluleke, Ramlagan,
Zungu, Evans, Jacobs,
Faber & SANHANES-1
Team (2013)
To determine (amongst
others):
1) the health status of
children under the age of
five years
2) the health status of
children aged 2 to 9 years
old with respect to physical
and /or mental disabilities.
n= 8634
Age: 0 to 14 years old
Race: Black, White,
Coloured, Indian
Area: national
Date: 2012
BMI-for-age (IOTF)
(Cole et al 2000)
Overweight: (6 to 9 years old)
Males: 4.5%, Females: 12.3%
Obese: (6 to 9 years old)
Males: 2.7%, Females: 4.1%
Tathiah, Moodley,
Mubaiwa, Denny &
Taylor (2013)
To describe the prevalence
of malnutrition among
female learners in the
Nongoma and Ceza
districts in Zululand,
KwaZulu-Natal (KZN).
n= 959
Age: 9 to 12 years old
Gender: Female
Race: Black African
Area: Nongoma (18
schools) and Ceza (13
schools), Zululand, KZN
BMI-for-age,
weight-for-age and
height-for-age Z
scores (WHO)
BMI-for-age (IOTF)
(Cole et al 2000)
Overweight: (WHO) 9%
(IOTF):
8 yrs: 5.3%, 9 yrs: 9.3%,
10 yrs: 10.3%, 11 yrs: 7.2%,
12 yrs: 5.6%
Obese: (WHO) 3.8%
(IOTF):
8 yrs: 0%, 9 yrs: 2.4%
10 yrs: 2.4%, 11 yrs: 1.3%
12 yrs: 2.75%
Wiles, Green & Veldman
(2013)
To determine the
anthropometric
characteristics of grade 4
learners in relation to their
tuck-shop purchasing
practices.
n= 311
Age: mean 9.9 years old
Males: 44%
Females: 56%
Race: Black, White,
Coloured, Indian
Area: Pietermaritzburg,
KZN
BMI-for-age (WHO) Overweight: Total: 26.7%
Males: 29%
Females: 24.9%
Obese: Total: 27.3%
Males: 24.6%
Females: 29.5%

21
Many of the South African studies reviewed in Table 2.1 did not consistently use the same
methods of interpreting nutritional status. Either the WHO (Table 2.2) or the IOTF
interpretation (Appendix A, p133) of BMI-for-age were used to classify children as overweight
or obese. In some studies, both methods of classification were used. The WHO childhood BMI
charts for 5 to 19 years of age were published in 2007, based on the United States National
Centre for Health Statistics (NCHS) 1977 reference curves (De Onis & Lobstein 2010). They
are based on Z-score growth curves ranging from -3 to +3 standard deviations (SD) from the
ideal BMI growth curve (0 SD), where greater than +1SD represents overweight, and greater
than +2SD represents obesity (De Onis, Onyango, Borghu, Siyam, Nishida & Siekmann 2007).
Table 2.2: Interpretation of WHO BMI-for-age growth charts (WHO 2007)
WHO Classification : Birth up to 5 years old 5 to 19 years old
Z Score HFA WFA WFH/Length BMI for age BMI for age
Above 3 Very tall-
usually no
problem.
Possible
Endocrine
disorder.
May be a
growth
problem.
Assess using
weight for
length/height
and BMI for
age.
Obese Obese Obese
Above 2 Normal Overweight Overweight Obese
Above 1 Normal Possible risk of overweight Overweight
0 (Median) Normal Normal Normal Normal Normal
Below -1 Normal Normal Normal Normal Normal
Below -2 Stunted Underweight Wasted Wasted Wasted
Below -3 Severely
stunted
Severely
underweight
Severely
wasted
Severely
wasted
Severely wasted
The IOTF definitions of overweight and obesity were derived by Cole et al (2000), who utilised
internationally recognised adult BMI cut off points for overweight and obesity. These cut off
points were extrapolated backwards from adulthood to 18 years of age, to predict risk of
overweight (BMI≥ 25-29.9 kg/m²) and obesity (BMI≥30 kg/m²) in children. In order to develop
these BMI cut off points for children, paediatric BMI data was taken from six countries in
large, nationally representative surveys, namely the Netherlands, Brazil, Singapore, Hong
Kong, the USA and the United Kingdom (UK). The IOTF overweight and obesity cut off points
are much higher than other, centile-based cut offs, which explains why the IOTF overweight
and obesity figures are lower than for other definitions (for example, the WHO classification),
22
and why IOTF based overweight and obesity cut off points are considered more serious
compared to other definitions (Cole & Lobstein 2012). The cut off points were not expressed
as centiles or Z-scores until much later on when unpublished data was used to define the cut-
offs as centiles corresponding to each BMI value. This enabled the international cut-offs to be
compared to other BMI references (Cole & Lobstein 2012). Although the IOTF BMI cut off
points are regularly used, the authors who developed them caution their application in children
of African descent, as the data used to develop these cut off points was not representative of
children from Africa (Cole et al 2000).
The WHO Z-score for BMI-for-age, and the IOTF BMI cut off points for thinness (Appendix
B, p135) can also be used to classify children according to the opposite spectrum, namely
“severely wasted”, “wasted” or “normal” BMI (WHO classification), or “thinness grades 1, 2
or 3” (IOTF classification).
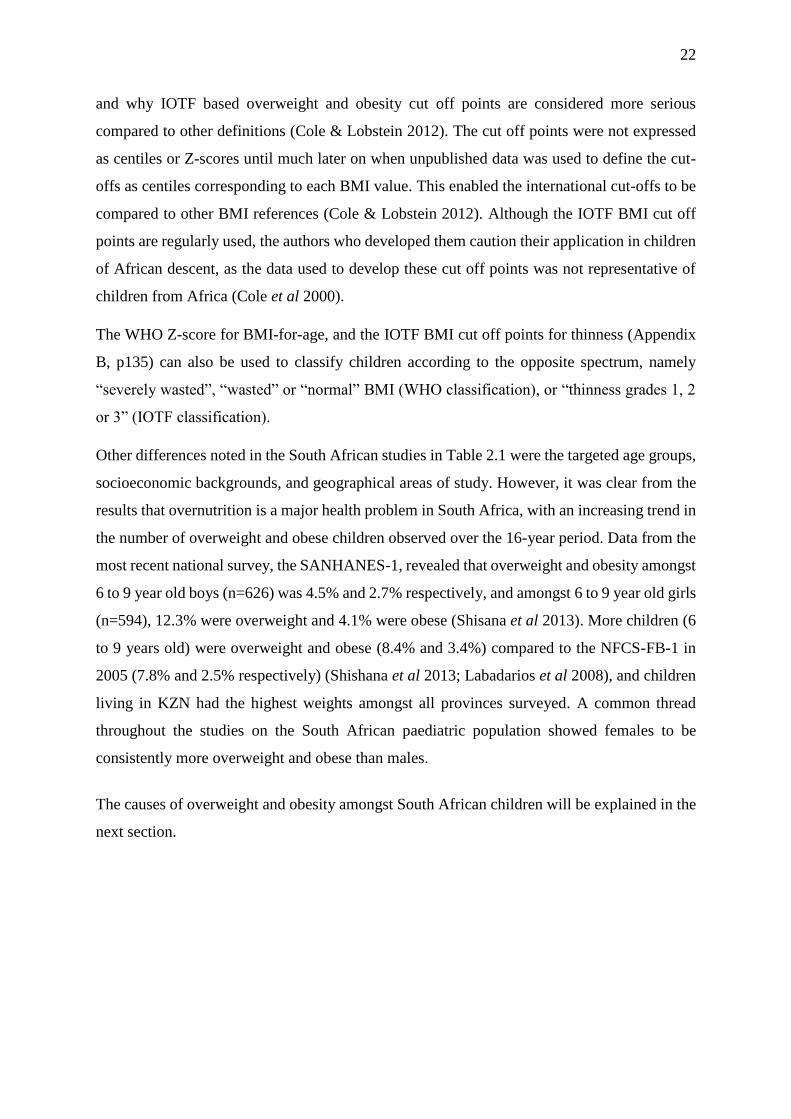
Other differences noted in the South African studies in Table 2.1 were the targeted age groups,
socioeconomic backgrounds, and geographical areas of study. However, it was clear from the
results that overnutrition is a major health problem in South Africa, with an increasing trend in
the number of overweight and obese children observed over the 16-year period. Data from the
most recent national survey, the SANHANES-1, revealed that overweight and obesity amongst
6 to 9 year old boys (n=626) was 4.5% and 2.7% respectively, and amongst 6 to 9 year old girls
(n=594), 12.3% were overweight and 4.1% were obese (Shisana et al 2013). More children (6
to 9 years old) were overweight and obese (8.4% and 3.4%) compared to the NFCS-FB-1 in
2005 (7.8% and 2.5% respectively) (Shishana et al 2013; Labadarios et al 2008), and children
living in KZN had the highest weights amongst all provinces surveyed. A common thread
throughout the studies on the South African paediatric population showed females to be
consistently more overweight and obese than males.
The causes of overweight and obesity amongst South African children will be explained in the
next section.
23
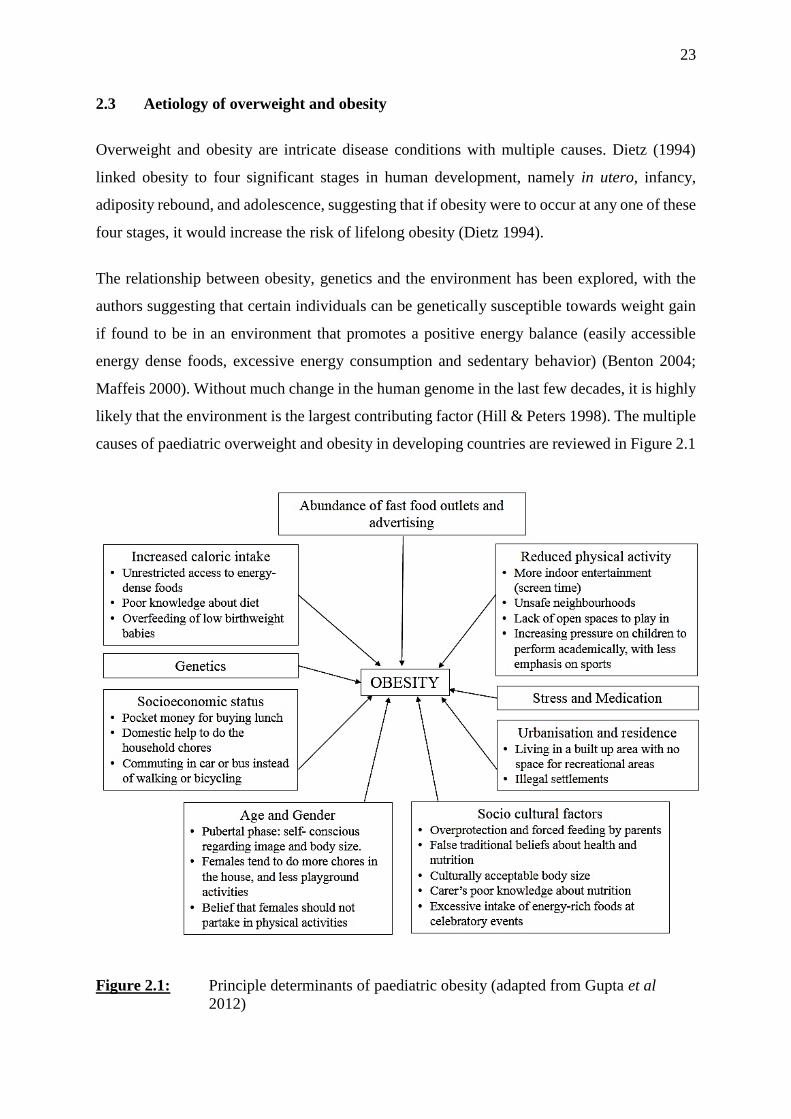
2.3 Aetiology of overweight and obesity
Overweight and obesity are intricate disease conditions with multiple causes. Dietz (1994)
linked obesity to four significant stages in human development, namely in utero, infancy,
adiposity rebound, and adolescence, suggesting that if obesity were to occur at any one of these
four stages, it would increase the risk of lifelong obesity (Dietz 1994).
The relationship between obesity, genetics and the environment has been explored, with the
authors suggesting that certain individuals can be genetically susceptible towards weight gain
if found to be in an environment that promotes a positive energy balance (easily accessible
energy dense foods, excessive energy consumption and sedentary behavior) (Benton 2004;
Maffeis 2000). Without much change in the human genome in the last few decades, it is highly
likely that the environment is the largest contributing factor (Hill & Peters 1998). The multiple
causes of paediatric overweight and obesity in developing countries are reviewed in Figure 2.1
Figure 2.1: Principle determinants of paediatric obesity (adapted from Gupta et al
2012)

24
2.3.1 Dietary intake
Diet is one of the first factors considered when determining the cause of obesity. A lack of
dietary knowledge on both the parents and child’s part may easily lead to the wrong food
choices being made both at home, and outside of the home. A key factor in predicting the
probability of a child becoming an obese adult is their parents’ weight status (Maffeis 2000).
From birth, adults are responsible for the type and amount of foods made available to infants,
toddlers and young children. In addition, they are also responsible for the food preferences
these children develop (Maffeis 2000). School cafeterias, tuck shops and vending machines
often stock large portions of energy-dense, nutrient-poor food options, and sweetened
beverages. Due to the fast-paced lifestyle of many parents, there is a heavy reliance on low
cost, processed, convenience foods for the main meal of the day. Ebbeling, Pawlak & Ludwig
(2002) described how television viewing can also encourage the passive consumption of
calorie-dense food items. Through watching television, children are also more likely to be
exposed to marketing of the Western lifestyle and diet. Those children living in urban areas
have unlimited access to fast food outlets and convenience stores on their doorstep, thus making
the Western diet more accessible (Gupta et al 2012).
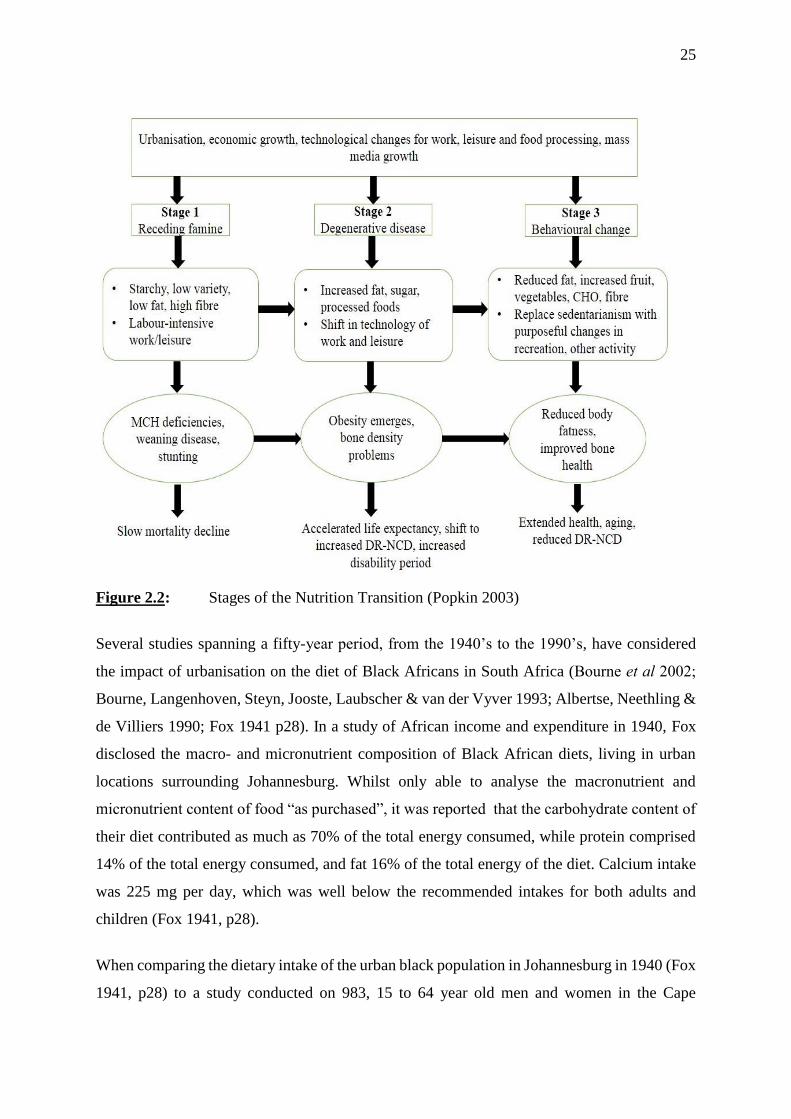
2.3.2 Nutrition Transition
A distinct phenomenon known as the Nutrition Transition (Figure 2.2) has been termed to
describe the shift in dietary patterns and physical activity experienced in many developing
countries due to urbanisation and enhanced technology. It is considered a major contributing
factor to the paradoxical “double burden” of malnutrition noted in developing countries such
as South Africa (Kimani-Murage et al 2010), and has been noted in other developing countries
such as Kuwait (Moussa, Shaltout, Nkansa-Dwamena, Mourad, AlSheikh, Agha & Galal
1998), China and Chile, where increasing income levels have been associated with obesity and
its related co-morbidities in children (Amuna & Zotor 2008). When members of society
previously consuming a more traditional diet derived from plant-based foods high in
carbohydrate and fibre, and low in fat, move to urban areas seeking employment, their diets
adapt to the more “Western” diet profile, typified by high intakes of animal protein, processed
foods high in saturated fats and sugar, and low in fibre (Popkin 2003). Black South Africans
are more affected by nutrition transition than any other race group within South Africa (Bourne,
Lambert & Steyn 2002).
25
Figure 2.2: Stages of the Nutrition Transition (Popkin 2003)
Several studies spanning a fifty-year period, from the 1940’s to the 1990’s, have considered
the impact of urbanisation on the diet of Black Africans in South Africa (Bourne et al 2002;
Bourne, Langenhoven, Steyn, Jooste, Laubscher & van der Vyver 1993; Albertse, Neethling &
de Villiers 1990; Fox 1941 p28). In a study of African income and expenditure in 1940, Fox
disclosed the macro- and micronutrient composition of Black African diets, living in urban
locations surrounding Johannesburg. Whilst only able to analyse the macronutrient and
micronutrient content of food “as purchased”, it was reported that the carbohydrate content of
their diet contributed as much as 70% of the total energy consumed, while protein comprised
14% of the total energy consumed, and fat 16% of the total energy of the diet. Calcium intake
was 225 mg per day, which was well below the recommended intakes for both adults and
children (Fox 1941, p28).
When comparing the dietary intake of the urban black population in Johannesburg in 1940 (Fox
1941, p28) to a study conducted on 983, 15 to 64 year old men and women in the Cape
26
Peninsula 50 years later (Bourne et al 1993), a clear shift in macronutrient intake was noted. A
significant decrease of 10.9% in carbohydrate intake, and a significant increase of 59.7% in
dietary fat intake (from a low intake of 16.4% total energy in 1940 to a fat intake of 26.2% total
energy in 1990) was observed (Bourne et al 1993). Furthermore, a significant decrease in the
intake of plant protein was recorded, with a simultaneous increase in the intake of animal
protein (high in saturated fat) (Bourne et al 1993). The population group followed a
nutritionally deplete diet, with most individuals failing to meet two thirds of the RDA of several
micronutrients.
A study by Walker, Walker & Walker (1992) further reinforced how the composition of the
Black African diet has changed over time. In 1989, the diets of elderly rural Black African
women were compared to the dietary intakes of a similar group in a nearby rural village twenty
years previously. The results showed an increase in their dietary fat intake (fat contributed 24%
of total energy in 1989, compared to 19% of total energy in 1969), and protein (comprising
14% of total energy in 1989, compared to 12% of total energy in 1969), with a respective
increase in the consumption of animal and dairy products of 75% and 20%. Fruit and vegetable
consumption increased considerably by 40%, but the dietary intake of sugar was triple that of
twenty years previously. Significant rises in BMI and cholesterol were noted (Walker et al
1992).
Data from SANHANES-1 (2013) showed a higher fat and sugar intake (23.1% of participants)
in urban formal areas compared to urban-informal, rural-formal and rural-informal areas, with
only 9.8-15.1% of participants in non-urban formal areas having a high fat intake, and 11.7-
18.2% of participants in non-urban formal areas having a high sugar intake. People living in
urban-formal areas were also able to maintain a higher intake of fruit and vegetables (34.5% of
participants) compared to people living in urban-informal, rural-formal and rural-informal
areas (22.2%, 24.5% and 20.9% respectively) (Shisana et al 2013).
South Africa is one of Coca Cola’s™ largest markets in the world (Chopra, Galbraith &
Darnton-Hill 2002), with South Africans consuming 260 servings (237ml) per person in 2012,
compared to the worldwide consumption of 94 servings per person (http://www.statista.com).
Carbonated beverages were found to be the third most frequently consumed food/beverage item
by very young urban children aged 12 to 24 months old, after maize meal and tea (Theron et al
2007). Small shops and street vendors are prolific in rural and township areas, where fruit, full
cream dairy products, high fat meats, fatty snacks such as potato chips and vetkoek, cakes,

27
biscuits and cool drinks are the main choices on offer (Steyn & Labadarios 2011; Mosupye &
von Holy 2000), with little salad and vegetables available. Whilst fruit is an acceptable snack,
the other foods listed are often fried, high in saturated fat, and low in fibre. With 19% of Black
Africans consuming such foods more than twice a week (Steyn & Labadarios 2011) there is a
probable deleterious effect on their weight and health status.
2.3.3 Physical activity
Sedentary lifestyles are on the rise with an increased amount of time spent viewing television,
playing games on computers and iPads, and the internet (Sigman 2012). The AAP (2001)
recommended that no more than 1 to 2 hours per day be dedicated to quality screen viewing
time (Bar-On, Broughton, Buttross, Corrigan, Gedissman, De Rivas, Rich, Shifrin, Brody,
Wilcox, Hogan, Holroyd, Reid, Sherry, Strasburger & Stone 2001). The South African Medical
Research Council reported that with many South African schools not offering physical
education, and more than three hours per day spent viewing television and playing
video/computer games (Reddy, James, Sewpaul, Koopman, Funani, Sifunda, Josie, Masuka,
Kambaran & Omardien 2010), some school children have become accustomed to an indoor
lifestyle. In households where parents work long hours, television has in turn replaced many
carers as the primary source of information to youngsters on eating habits, preferences and
behaviour (Renzaho 2004). Many other factors play a role in reduced physical activity in South
Africa such as the crime rate and lack of facilities available to exercise in (Reddy et al 2010).
As previously mentioned, many schools do not offer physical education as part of their
curriculum, whilst other schools may place more emphasis on academics as opposed to sports.
In urban built up areas there is also limited open space available for children to be physically
active.
2.3.4 Socioeconomic status
It has been shown that the higher the socioeconomic status, the greater the chance of obesity.
Factors related to this include domestic help to assist with household chores (which is a form
of physical activity), more pocket money to buy food at school, and greater reliance on
motorised transport to get to school and social activities, instead of walking or bicycling (Gupta
et al 2012).

28
The opposite is also true for people from a lower socioeconomic background. In Brazil, it has
been observed that women in the lowest income quartile are either underweight or overweight.
Their excess weight may be attributed to them joining the workforce to earn a living, and thus
forgoing the time available at home to cook a healthy meal (Caballero 2005). The result is
reliance on cheap, commercially available food for themselves and their family. In developing
countries, such as Brazil and South Africa, food costs can amount up to 50% of the family’s
income, forcing people to opt for cheaper, mass-produced, nutrient poor food (Caballero 2005).
In a study conducted on 3 to 17 year old children and adolescents in Germany, Kleiser, Rosario,
Mensink, Prinz-Langenohl & Kurth (2009) showed children and adolescents from a lower
socioeconomic status to have a higher incidence of obesity (26.6%, n=3655), compared to other
subjects from a middle socioeconomic status (20.3%, n=6121) and a high socioeconomic status
(14.5%, n=3326). A low socioeconomic status is also associated with obesity in South Africa,
as demonstrated by Steyn, Labadarios, Maunder, Nel & Lombard (2005) where an elevated
BMI in children aged 1 to 9 years old was associated with living in a traditional house and
having a flush toilet. Senekal, Steyn & Nel (2003) demonstrated a link between a low education
level and a higher BMI in a group of economically active South Africans representative of four
different ethnic groups. Poor education can manifest in a deficit of nutrition knowledge, which
may lead parents to offer and encourage unhealthy food options. Kruger et al (2006) discussed
a higher prevalence of overweight and obesity occurring in urban areas, smaller households,
and in children of parents with either low- or high-income occupations. Furthermore, Puoane,
Steyn, Bradshaw, Laubscher, Fourie, Lambert & Mbananga (2002) demonstrated a significant
relationship among adult women with no education, and those with more than 12 years
education, having higher BMI values, compared to those women who had between one to 12
years of education (Puoane et al 2002).
Poverty remains a problem in South Africa, with many people unable to consume an adequate
and diverse diet. In addition to poor nutrition, pregnant women living in poverty are more likely
to experience many other stressors such as unemployment, over-crowding and unhygienic
living conditions, which all have a profound effect on the unborn child. The risks of intrauterine
growth retardation and preterm labour are higher in such living conditions, and often result in
low birth weight babies (Larson 2007). A low birth weight can predispose an infant to future
central obesity through metabolic alterations that occur in utero (Oken & Gillman 2003),
especially if they experience accelerated catch up growth in their infancy and early childhood
(Lanigan & Singhal 2009).

29
2.3.5 Culture
Caprio, Daniels, Drewnowski, Kaufman, Palinkas, Rosenbloom & Schwimmer (2008) report
that “Culture provides meaning to a set of rules for behaviour that are normative (what
everyone should do) and pragmatic (how to do it). Culture, unlike instinct, is learned.” With
the migration of many different ethnic groups around the wold, a change in dietary patterns
have been observed as a result of acculturation. Unger, Reynolds, Shakib, Spruijt-Metz, Sun &
Johnson (2004) demonstrated how first-generation Asian and Latino adolescents previously
had higher fruit and vegetable consumption, and lower consumption of soda beverages than
White adolescents in North America. With each subsequent generation, the intake of these
items by Asians remained stable. However, the fruit and vegetable consumption by Latinos
decreased and their intake of soda increased to the extent that by the third generation their
nutritional intake was poorer than that of Whites (Unger et al 2004).
Cultural beliefs are a contributing element to the obesity epidemic in South Africa.
Overprotective parents may force their children to finish their meals, thus rendering their
hunger-satiety cues obsolete (Gupta et al 2012). Many South African social gatherings are
centred round large-scale food consumption. Foods high in sugar and fat are considered a
luxury in South Africa, and are associated with elevated status, power and wealth. These foods,
such as animal meats, fried foods, chocolate, biscuits, and soft drinks (Renzaho 2004) are
offered, and consumed in large quantities at family gatherings and important events.
2.3.6 Gender
As demonstrated in the reviewed South African studies, females show a greater propensity for
overweight and obesity, which could be attributed to hormones present during adolescence
(Kruger et al 2006). Cameron & Getz (1997) observed more ‘overweight’ females clustered
around the period before adolescence (8 to 9 years old) and the onset of menarche (after 14
years old) up to 18 years of age. Adiposity rebound (5 to 7 years of age) and puberty are both
developmental stages of life associated with a rapid growth spurt and corresponding release of
hormones, raising queries whether these hormones encourage the deposition of fat, and why
females are more susceptible to this phenomenon than males (Cameron & Getz 1997). Dietz
(1994) linked the presence of androgens released by the adrenal cortex with the deposition of
both adipose tissue and lean muscle mass during growth spurts (Dietz 1994). Cameron & Getz
(1997) further explained that following the onset of puberty, the increased levels of oestrogen

30
and progesterone in female subjects encouraged the deposition of fat both centrally and
peripherally, leading to gynoid (pear shaped) obesity and the incorrect supposition of ‘benign
obesity’. In male subjects, the presence of testosterone reduced excess fat deposition and
centralized the fat stores, resulting in android (apple shaped) obesity, and the associated
increase in morbidity.
It has been noted that amongst the Black African culture it is desirable for females to be
overweight, as it reflects on their husband’s ability to look after his family (Puoane et al 2002).
It also implies happiness and good health, and is an important external image with the raging
HIV/AIDS epidemic prevalent on the African continent (Mvo, Dick & Steyn 1999). However,
females exposed to Western media, where a thinner body image is promoted as the ideal are
more likely to aspire to a lower BMI (Tovée, Swami, Furnham & Mangalparsad 2006). In
areas where females from different ethnic backgrounds have a similar culture, as may be in the
case of urban Black African females accultured to the Western way of thinking, adaptive
behaviour is demonstrated whereby the ideal Western body image is strived for. This was
investigated by Tovée et al (2006), who discussed how females of African descent living in the
UK preferred a slimmer body image and lower BMI compared to Zulu females from the
Mshwathi-Mpolweni area in KZN. In addition, girls are also expected to help with domestic
chores, thus preventing them from engaging in more rigorous outdoor physical activities
(Gupta et al 2012).
2.3.7 Stress
Many theories exist on the link between obesity and stress. Frequent exposure to a stressful
environment can induce weight gain through the altered release of hormones, and
hyperactivation of the hypothalamic-pituitary-adrenal axis (HPA axis) (Drapeau, Therrien,
Richard & Tremblay 2001). The subsequent increase in cortisol levels precedes a cascade of
hormonal and enzymatic actions resulting in fat accumulation in adipocytes in the abdominal
region (Drapeau et al 2001). Post- traumatic stress is an important issue amongst South African
children (Kaminer, Grimsrud, Myer, Stein & Williams 2008), in addition to other stressors in
childhood such as abuse and neglect (Sher, Gershuny, Peterson & Raskin 1997; Lissau &
Sorensen 1994), parental divorce (Sandler, Tein & West 1994), poor self- esteem (Strauss
2000), anxiety and depression (Pine, Goldstein, Wolk & Weissman 2001).

31
As obesity in childhood often tracks into adulthood (WHO 2007) it is apparent that obesity
prevention initiatives should be focused on children to ensure the adoption of a healthy lifestyle
from an early age (Kruger et al 2006). With the most recent nationally representative study,
SANHANES-1 (2013) confirming 11.8% of 2 to 14 year old children are obese (Shishana et al
2013), intervention urgently needs to start at a young age, with the emphasis on identification
of dietary risk factors for overweight and obesity. As children approach the adolescent phase
they become more autonomous in their eating choices, and their bodies start to lay down the
nutrients required for the rapid growth and maturation they are about to undergo. It is essential
that focus is placed on a nutritious and balanced dietary intake in order for them to attain a
healthy weight, and increased physical activity for optimal growth and development. The next
section will discuss how the South African government has encouraged a healthy food intake.
2.4 Encouraging a healthy diet in South Africa
The first Food Based Dietary Guidelines (FBDG) developed for South Africa were published
in 2001, with the aim of promoting healthy eating amongst all South Africans. Milk and dairy
products were initially incorporated into the guideline on animal foods, due to concerns
regarding the cost of dairy, and lactose intolerance amongst the Black African population
(Vorster et al 2013). However, results from subsequent local studies (Theron et al 2007; Steyn
et al 2006; MacKeown, Cleaton-Jones & Norris 2003; MacIntyre, Kruger, Venter & Vorster
2002) revealed low dietary intakes of calcium and potassium, and high rates of NCDs such as
hypertension prevalent amongst the South African population. Due to the recognition that milk
and dairy products have attained in their role of reducing the risk of NCDs, the working group
assigned to revising the FBDGs a decade later, recommended that milk and dairy products have
their own specific guideline. The revised FBDGs were released in 2012, with the guideline
“Have milk, maas or yoghurt every day” encouraging the population to include dairy in their
daily diet. Cheese was not included in the guideline due to its high sodium content, and
emphasis was placed on low fat milk and dairy, in light of the obesity problem in South Africa
(Vorster et al 2013).
The 2012 South African Food Based Dietary Guidelines include:
1) Enjoy a variety of foods.
2) Make starchy food part of most meals.
3) Fish, chicken, lean meat or eggs could be eaten daily.
4) Have milk, maas or yoghurt every day.

32
5) Eat plenty of vegetables and fruit every day.
6) Eat dry beans, split peas, lentils and soya regularly.
7) Use salt and food high in salt sparingly.
8) Use fat sparingly; choose vegetable oils rather than hard fats.
9) Use sugar, and food and drinks high in sugar sparingly.
10) Drinks lots of clean, safe water.
11) Be active!
In South Africa, the recommended number of milk and dairy servings per day for 4 to 8 year
old children is 3 cups, or serving equivalents, which provides approximately 900 mg calcium
(Consumer Education Project of Milk SA 2013). South Africa follows the Metric System where
one cup of fluid is the equivalent to 250 ml. America still makes use of the Imperial system,
where one cup of fluid is the equivalent to 240 ml (Maryland Metrics 2017). Where studies
have investigated the effect of milk measured as ‘one cup’, the volume of milk is indicated in
addition.
If South African children aged 4 to 8 years old consumed the recommended three servings of
milk and/or dairy products per day (750 ml), it would be possible for them to meet the EAR
for calcium of 800mg per day, and up to 50% of their potassium requirements. The potassium
intake is a considerable contribution to the requirements of a population who also do not meet
their recommended fruit and vegetable intake (Vorster et al 2013). Table 2.3 shows the amount
of calcium derived from various single servings in commonly consumed milk and dairy
products.

33
Table 2.3: Calcium content of a single serving of milk and dairy products (Smit, Smith,
Schönfeldt & Heinze 1998)
Product Amount Calcium (mg) %EAR for 4-8
years old
Milk, full cream 250 ml 300 37.5%
Milk, low fat 250 ml 305 38%
Yoghurt,
sweetened, low
fat
200 ml 290 36%
Yoghurt, plain,
low fat
200 ml 298 37%
Drinking yoghurt 200 ml 284 35.5%
Maas 200 ml 324 40.5%
Cheese, cheddar 40 g 215 27%
Cheese, gouda 40 g 322 40%
2.5 The benefits of milk and dairy products
Cow’s milk is a highly nutritious food item that is encouraged from the age of one year old
(Mahan et al 2012, p380). It is the main ingredient of dairy products such as yoghurt, maas,
ice-cream, custard, milk-based desserts, and cheese. Plain cow’s milk is available in differing
fat content, and was re-marketed in 2016 to give consumers a fourth option, namely “medium
fat” milk. This was in order for South Africa to align itself with international legislation that
dictates low fat milk cannot exceed 1.5% fat (Burger 2016). The amount of fat found in the
various types of cow’s milk is presented in Table 2.4. Whilst American literature refers to
whole milk (3.5% fat), for the purpose of this literature review it is referred to as full cream
milk.

34
Table 2.4: Approximate nutritional composition of fresh milk in South Africa (per 100 g)
(Department of Agriculture, Forestry and Fisheries 2015, p7)
Class Energy
(kJ)
Protein
(g)
Carbohydrate
(g)
Fat (%)
(Previous
legislation
R2581)
Fat (%)
(New
legislation
R260)
Ca (mg)
Full cream
milk
260 3.25 4.63 3.3-4.5% >3.3-4.5% 120
Medium fat
milk
N/A N/A N/A N/A >1.5-3.3% N/A
Low fat milk 208 3.26 4.68 0.5-2.5% >0.5-1.5% 122
Fat-free milk 146 3.41 4.85 ≤0.5% ≤0.5% 123
The energy content of milk is mainly determined by the fat content. The addition of sucrose,
fruit pieces, fruit pulp, and chocolate pieces, as is in the case of flavoured yoghurt and flavoured
drinking yoghurts, further adds to the energy contribution of a particular dairy product. Milk
and dairy offer a valuable, energy dense product to different groups of people who have their
own unique needs; namely young children with small stomach capacity and high nutrient
requirements; growing older children and adolescents; physically active people participating
in sports; and the elderly suffering from poor appetites.
Cow’s milk offers a high biological value protein source that is easily digestible and contains
all nine of the essential amino acids that the body is unable to synthesise. The protein content
of cow’s milk is affected by the breed, year of birth, parity and lactation phase of the dairy cow,
and the season (Czajkowska, Sitkowska, Piwczynski, Wójcik & Mroczkowski 2015). On
average there is approximately 3.3% protein in cow’s milk; with casein being the predominant
protein component, contributing 80% of the total protein, and whey making up approximately
20% of the protein source (Kukovics & Németh 2013), with additional minor proteins present.
The different physical properties of casein and whey lead to different physiological effects on
the body. The casein fraction is digested slowly, resulting in delayed gastric emptying and
reduced post-prandial blood glucose and insulin response. The whey component is digested
more rapidly, resulting in a faster, but short-lived increase in plasma amino acids. Both casein
and whey are responsible for contributing to satiety, which may play an essential role in the
fight against overweight and obesity (Luhovyy, Akhavan & Anderson 2007).
Bioactive peptides present in milk are protein hydrolysates, which show potential to confer a
degree of protection upon the body once digested (Choi, Sabikhi, Hassan & Anand 2012). Such

35
is their health promoting impact on multiple systems within the body that it was recommended
dairy be considered a natural functional food that should be included as part of the daily diet
(Choi et al 2012). The bioactive peptides are inactive until cleaved from the protein by
enzymatic proteolysis during digestion, upon which they then exert their effects, either by
binding to receptors in the gastrointestinal tract, or entering the bloodstream and targeting
specific organs and tissues (Luhovyy et al 2007). The bacteria cultures added to fermented
dairy products further assist in the proteolysis and release of bioactive peptides (Meisel 2005).
The wide-ranging positive effects of bioactive peptides on organ systems will be presented in
the subsections that follow.
2.5.1 The cardiovascular system
Bioactive peptides exert an anti-hypertensive, anti-thrombotic, hypocholesterolaemic and
antioxidant effect (Kukovics & Németh 2013). They display their anti-hypertensive action in
the inhibition of angiotensin-1- converting enzyme (ACE), which is responsible for regulating
peripheral blood pressure. The result is an enhanced vasodilatory effect, and a decrease in both
systolic and diastolic blood pressure (Meisel 2005). Calder, Ahluwalia, Brouns, Buetler,
Clement, Cunningham, Esposito, Jönsson, Kolb, Lansink, Marcos, Margioris, Matusheski,
Nordmann, O’Brien, Pugliese, Rizkalla, Schalkwijk, Tuomilehto, Wärnberg, Watzl &
Winklhofer-Roob (2011) noted that the intake of dairy products exerted a positive effect on C-
reactive protein and adiponectin, both markers of low-grade inflammation associated with
overweight and obesity. These effects were related to the dairy-derived bioactive peptides.
2.5.2 The immune system
Bioactive peptides can exert anti-microbial, immune-modulatory and cyto-modulatory
activities (Korhonen & Pihlanto 2006). The peptide, lactoferricin, displays potent bactericidal
properties, with its small size enabling it to reach specific target sites on microorganisms
(Meisel 2005). Both casein and whey demonstrate immune stimulating properties, with whey
proteins enhancing immune cell proliferation and antibody synthesis (Meisel 2005), which is
of particular importance in the development of a newborn’s immune system. Cytomodulatory
activities, whereby milk protein-derived peptides have demonstrated the ability to reduce
proliferation of cancer cells, is an area of great interest (Meisel 2005).
36
2.5.3 The gastrointestinal system
Within the oral cavity, peptides have displayed an anti-cariogenic effect, preventing
demineralisation and assisting with the remineralisation of tooth enamel (Meisel 2005).
Peptides derived from casein can inhibit the growth of plaque-forming bacteria (Korhonen &
Pihlanto 2006). Some of these peptides are found in chewing gums and toothpastes (Aimutis
2004), as well as other personal hygiene products (Choi et al 2012). Phosphorylated peptides
regulate mineral absorption, such as calcium, iron and zinc, and are thought to be responsible
for the enhanced bioavailability of calcium (Meisel, 2005), reduced risk of oseteoporosis,
dental caries, hypertension and anaemia (Korhonen & Pihlanto 2006). Certain peptides found
in the small and large intestine display anti-diarrhoeal action via the net absorption of water
and electrolytes (Meisel, 2005). Peptides are also involved in the regulation of hyperglycaemia
(Luhovyy et al 2007) and contribute to satiety by assisting with the release of cholecystokinin,
a hormone involved in controlling food intake and digestion (Korhonen & Pihlanto 2006).
Bioactive peptides may independently, or synergistically together with calcium, also be
responsible for lipolysis (Zemel 2003).
2.5.4 The nervous system
Opioid receptors are found in the nervous, endocrine, immune and gastrointestinal systems
(Korhonen & Pihlanto 2006). Opioid peptides display both agonist and antagonist opioid
activities within the nervous system, such as controlling gastrointestinal smooth muscle
contractions, which affect the transit time of food (Korhonen & Pihlanto 2006).
Whilst the beneficial effects of milk-derived proteins and peptides have been acknowledged,
their impact is often as a result of a synergistic interaction with other components of milk, such
as calcium. The impact of peptides and calcium on reduced body fat and weight, for example,
is far greater than for calcium supplementation alone (Luhovyy et al 2007).
Carbohydrates account for approximately 31% of the total energy provided by full cream milk
(Vorster et al 2013). Lactose is the predominant carbohydrate found in milk, and enhances the
absorption of calcium and phosphorous from the intestine (Allman-Farinelli & Amanatidis
2002).

37
There is 12.5 g of lactose per 240 ml serving of milk (Savaiano, Boushey & McCabe 2006).
Lactose is a disaccharide that is hydrolysed to glucose and galactose by the lactase enzyme,
but this process is hindered in people who experience lactose intolerance. The undigested
lactose that subsequently ferments in the gut of some people from African, Asian, Middle
Eastern, Australian Aboriginal and Southern European origins causes uncomfortable
symptoms such as bloating, flatulence, diarrhoea and pain. Lactose intolerance can often result
in an inadequate dairy intake in order to avoid such unpleasant side effects. However, Savaiano
et al (2006) demonstrated that up to 1 cup (240 ml) of milk per day can be tolerated in lactose
intolerant individuals, with an improved experience gained when dairy is consumed as part of
a meal, and by consuming fermented dairy products such as yoghurt.
Milk fat is comprised of approximately 400 different fatty acids, with 60% of milk fat being
saturated fat, 33% monounsaturated fat, and less than 5% polyunsaturated fat (Allman-Farinelli
& Amanatidis 2002). It is an excellent source of energy, fat-soluble vitamins and essential fatty
acids. Although some concern exists over the effect of saturated fat on LDL-cholesterol, Griffin
(2011) noted that the link between dairy and cardiovascular disease has never been proven in
prospective cohort studies, and dairy actually exerts a protective effect on cardiovascular
disease, thought to be due to the actions of bioactive peptides and calcium. In addition to the
anti-hypertensive effects of bioactive peptides, calcium is thought to bind to, and sequestrate,
saturated fatty acids and bile salts in the gut, whereupon there is an increase in the faecal
excretion of saturated fat and bile salts (Griffin 2011). Simply limiting or completely removing
dairy from the diet in an attempt to reduce saturated fat intake is not likely to offer any benefit
overall (Givens 2010). Conjugated linoleic acid (CLA) is one of the fatty acids in milk
receiving much attention for its perceived health benefits. Although milk is a good source of
dietary CLA’s, the amount of CLA’s present is thought to be inadequate to enjoy any of its
claimed benefits, with a presence of only 0.2-3.7% CLA in milk (Gordon 2013). The body is
able to synthesise its own source of CLA’s, through the desaturation of vaccenic acid to CLA,
increasing the total CLA available to the body quite considerably over and above the dietary
intake alone (Gordon 2013). There have been conflicting findings regarding the role that CLA
plays in the human body, with reports of CLA decreasing plasma blood glucose levels, and
increasing insulin sensitivity. This is in contrast to the findings that it enhances insulin
resistance (Gordon 2013). Small studies displaying CLA’s anti-carcinogenic, anti-
artherosclerotic and anti-obesity properties have not produced convincing results, and further
research is required (Gordon 2013).

38
The beneficial impact of milk-derived proteins and peptides is often as a result of synergistic
interaction with other components of milk, such as calcium. Calcium is an essential nutrient
required for many biological processes within the human body, such as mitosis, nerve
conduction, muscle contraction, blood coagulation, support of the skeleton (Miller & Anderson
1999), and most importantly in growing children for the mineralization of bones (Mahan et al
2012 p380). The EAR for calcium for children aged 4 to 8 years old is 800 mg per day (the
amount expected to achieve the levels of calcium needed for bone accretion) (Ross, Taylor,
Yaktine & Del Valle 2011). Milk and dairy products are the main sources of calcium in young
children’s diets. Additional, non-dairy sources of dietary calcium include bony fish, leafy green
vegetables, cereals, legumes, fortified foods and beverages, and supplements, food items that
are often not popular options amongst toddlers and children. Furthermore, the calcium found
in milk and dairy products has a high bioavailability and is well absorbed, unlike the calcium
found in non-dairy food products. A much greater volume of non-dairy calcium needs to be
ingested in order to obtain the same calcium intake as that found in dairy products. The
presence of phytates in cereals, oxalates in spinach, and tannins in tea further decrease the
bioavailability of calcium (Miller, Jarvis & McBean 2001). Through its various physiological
roles, calcium is responsible for reducing the risk of certain chronic diseases such as
hypertension and osteoporosis. The DASH diet (Dietary Approaches to Stop Hypertension),
which recommends a low fat diet high in fruit and vegetables, and low fat dairy (two to four
servings per day), has shown promising results in reducing hypertension, especially amongst
the African-American population, who historically have a low calcium intake (Jarvis & Miller
2002). It is commonly thought that the calcium component within dairy products is responsible
for the success of the DASH diet in reducing hypertension (Vorster et al 2013).
If children do not consume an adequate amount of calcium in their daily diet, their body will
draw on reserves stored in their skeleton, predisposing them to an increased risk of low peak
bone mass, increased risk of bone fractures and osteoporosis later on in life (Cavadini, Siega-
Riz & Popkin 2000). International studies conducted on the impact of milk and dairy products
on obesity pinpoint the beneficial effects of dairy on body weight, body fat and the metabolic
syndrome to the role of calcium. Zemel et al (2000) demonstrated how increasing dietary
calcium intake suppressed the release of calcitriol, resulting in the decreased movement of
calcium into adipocytes and subsequent decrease in lipogenesis, with an increase in lipolysis
observed (Zemel et al 2000). This effect was noted when caloric intake was restricted (Zemel

39
2003). Supplementing with calcium and calcium-fortified products does not seem to produce
the same weight loss results (Zemel 2003).
The benefits of calcium are undisputed. The challenge is ensuring an ideal intake of this “super-
nutrient” (Miller et al 2001). Vorster, Oosthuizen, Jerling, Veldman & Burger (1997) reviewed
the nutritional status of the South African population based on literature from 1975-1996 for
the Health Systems Trust. Analysis of diets showed calcium intake to be low for all age groups
except children 0 to 1.9 year old, and White, Coloured and Indian children 2 to 5.9 years old.
The Birth-to-Ten Study (BTT) showed more than 70-90% of children surveyed between 1995
and 2000 were below the RDA for calcium (MacKeown et al 2003).
Steyn et al (2006) conducted a secondary analysis of data from the National Food Consumption
survey (NFCS) of 1999 to determine whether the dietary diversity score of South African
children’s diets was a good indicator of nutrient adequacy. Their findings on the dietary intake
of calcium amongst the 7 to 8 year age group was discouraging, with a nutrient adequacy ratio
(the intake of a nutrient divided by the recommended intake for that nutrient) of 46.1%. This
was the lowest intake amongst the three age groups studied (1 to 3 years old, 4 to 6 years old
and 7 to 8 years old).
Theron et al (2007) compared the dietary intake of urban stunted and non-stunted children aged
12 to 24 months, to rural stunted and non-stunted children and showed all four groups to have
very low calcium intakes well below the EAR of 500 mg per day for their age group. The urban
non-stunted group had a calcium intake of 242 mg and the urban stunted group had an intake
of 333 mg of calcium per day. The rural non-stunted group of children had a calcium intake
even lower of 194 mg, and the rural stunted group had an intake of 217 mg per day, excluding
the calcium found in breast milk. Fresh cow’s milk was the fourth most common food item
consumed in their diets, preceded by cooked maize meal, tea and carbonated cold drinks
(Theron et al 2007).
Diets lacking in calcium are often low in many other vital nutrients. One serving (250 ml) of
fresh, full cream milk ensures the following nutritional requirements for a 4 to 8 year old child
are met: 42.7% of RDA for protein, 27% Vitamin A, 67% riboflavin, 92% Vitamin B12, 30%
calcium, 20% zinc, 22% magnesium, and 17% potassium. However, little impact is made on
overall energy consumption (655 kJ versus requirements of 6785 to 7523 kJ per day for
moderately active 7 to 8 year old boys, and 6300 to 7000 kJ per day for moderately active 7 to

40
8 year old girls) (FAO/WHO/UNU 1985) and weight (Miller et al 1999). Increased dietary
intake of milk and dairy products is encouraged in preference to obtaining calcium from
fortified foods, beverages, and supplements due to the many other essential nutrients offered
when consuming dairy (Miller et al 1999). Various obstacles to ensuring an adequate dairy
intake exist, and these will be discussed in the next section.
2.6 Barriers towards milk and dairy intake
Several barriers to attaining an adequate milk, dairy and calcium intake have been identified.
These include replacing milk for sugar-sweetened beverages, the family environment (Racey,
Bransfield, Capello, Field, Kulak, Machmueller, Preyde & Newton 2017), eating away from
the home setting (Miller et al 2001), skipping meals (Racey et al 2017), food practices and
preferences based on culture, perceived lactose intolerance, milk allergy, animal rights beliefs
(Jarvis & Miller 2002), concern about the fat content (Racey et al 2017), and poor awareness
of the beneficial effects of dairy (Wham & Worsley 2003). In developing countries, the cost of
milk and dairy products may be an obstacle to their adequate consumption (Scholtz, Vorster,
Matshego & Vorster 2001).
Interestingly, a steady decline in the international consumption of milk with a subsequent
increase in the consumption and portion size of sweetened beverages such as juice and soda
drinks over the past few decades has been associated with an increased caloric intake and
incidence of overweight and obesity (Nielsen & Popkin 2004). Additional concern lies in the
fact that soft drinks offer empty calories, devoid of the essential nutrients needed for the
accelerated growth experienced by children.
Cavadini et al (2000) studied trends in USA adolescent food intake spanning from 1965 to
1996. There was a substantial decrease in milk consumption amongst both males and females,
with males consuming just under 1200 g per day in 1965, declining to approximately 750 g in
1996. Females consumed approximately 850 g per day in 1965, but this decreased to less than
500 g per day in 1996. The average US Food Guide Pyramid serving for milk was two and a
half servings per day (600 ml) in 1965, subsiding to two servings per day (480 ml) in 1996.
Calcium intake amongst the 11 to 18 year old subjects declined from 1100 mg in 1965 to 960
mg in the 1994-96 survey, with only one third of males meeting their calcium requirements,
and only 20% of females meeting their calcium requirements in 1996. Over the three decades
41
reviewed, low fat milk often replaced full cream milk. A subsequent increase in soft drinks,
diet soft drinks and fruit drinks was observed.
Drawing on a similar database, French, Lin & Guthrie (2003) observed trends in soft drink
consumption from the National Food Consumption Survey (NFCS) 1977/78 and the
Continuing Survey of Food Intakes by Individuals 1994/96 data, showing an 88% increase in
soft drink consumption amongst 6 to 10 year old males, and a 77% increase amongst 6 to 10
year old females. Furthermore, the overall contribution of soft drinks to the children’s energy
intake increased substantially over the 20-year period studied, with 6 to 10 year old males
experiencing a 68% increase in energy intake from soft drinks, and 6 to 10 year old females
experiencing a 59% increase in energy intake from soft drinks. Tam, Garnett, Cowell,
Campbell, Cabrera & Bauer (2006) showed soft drinks and cordials intake amongst 8 year old
Australian children to be associated with weight gain five years later. Whilst the home
environment was identified as the most common source of supply for soft drinks, restaurants
and fast food outlets were increasingly shown to be a site of soft drink consumption,
reaffirming the current trends for eating outside of the home (French et al 2003). To further
compound the problem of an inadequate dairy and calcium intake, restaurant and fast food
meals are known to have a much lower dietary calcium content compared to home-made meals
(Lin, Guthrie & Frazão 1999).
Wham & Worsley (2003) reaffirmed the decrease in milk consumption amongst the New
Zealand population, citing several reasons. These included the decrease in breakfast
consumption, “milk is expensive compared to fizzy drinks”, misperceptions that “fruit juice is
better for you than milk” due to the fat content of milk, the “discontinuation of the subsidized
school milk scheme in 1967, removal of the government milk subsidy in 1985, and the impact
of dairy export returns on milk prices”. Another component of decreased milk and dairy
product intake that needs to be considered, and has already been briefly mentioned, is the
misperception that milk and dairy products are “fattening”, and are thus often avoided,
especially amongst adolescent females striving for a thinner body shape (Miller et al 2001).
Racey et al (2017) highlighted the importance of taste as either a facilitator or barrier to dairy
intake amongst 10 to 12 year old school going boys and girls. In a study conducted by Palacios,
Badran, Spence, Drake, Reisner & Moskowitz (2010) the researchers measured the acceptance
of milk products amongst 8 to 16 year old children. The younger aged children seemed less
critical of the products tested, compared to the older children studied. It is because of these
42
early learned preferences in food taste that it is necessary to expose a child to, and encourage
an adequate, culturally appropriate dairy intake early on life to ensure a greater chance of dairy
product acceptability throughout the individual’s life. Racey et al (2017) reported that 10 to 12
year old females who did not meet their dairy requirements cited one of the reasons as parental
influence, with one of the subjects admitting her father wanted her to drink more dairy, but her
mother did not like it.
In South Africa, the consumption of milk and dairy products is dependent on the price of the
product, as can be demonstrated by the sale of fresh, pasteurised milk versus Ultra Heat Treated
(UHT) milk. A 14.4% increase in the sales of long life UHT milk in South Africa was recorded
in 2015, and was directly related to the reduced cost of the product. A simultaneous decrease
in the sale of fresh milk was noted, with price conscious consumers clearly driven by cost
effective purchasing practices. For the January to December 2015 period, sales of other dairy
products increased compared to the previous year, with flavoured milk sales increasing by
6.7%, yoghurt sales increasing by 6.5%, sales of maas increasing by 8.6%, pre-packaged
cheese increasing by 7.2%, butter sales increasing by 5% and cream by 9.8%. The prices of
fresh milk, UHT milk, maas and pre-packaged cheese were less in December 2015 than their
retail prices in December 2014 (Le Roux et al 2016). In South Africa, the cost of raw milk is
usually increased in the first half of each year (Le Roux et al 2016), with further factors
influencing the cost of dairy products, such as the severe drought recently experienced, which
pushed the cost of animal feeds up. The price of international dairy products and the exchange
rate may enhance foreign competition within the dairy industry, thus further contributing to the
affordability of milk and other dairy products in South Africa (Le Roux et al 2016).
With the observed global decrease in dairy intake, subsequent increase in sugar-sweetened
beverage intake and alarming rise in obesity, speculation has arisen that these factors are
inextricably linked. The next section will discuss the relationship between obesity and the
consumption of dairy products.
2.7 Dairy intake and obesity
Whilst physiological evidence exists for the beneficial effect of dietary calcium on body fat,
and weight management in adult subjects (Zemel, Thompson, Milstead, Morris & Campbell
2004; Zemel 2003; Pereira, Jacobs, Van Horn, Slattery, Kartashov & Ludwig 2002; Shi,
Dirienzo & Zemel 2001; Davies Heaney, Recker, Lappe, Barger-Lux, Rafferty & Hinders

43
2000; Lin, Lyle, McCabe, McCabe, Weaver & Teegarden 2000; Zemel et al 2000), the
mechanism has not yet been studied in children. Both children and adolescents differ to adults
in their metabolism, changes in body composition, hormone levels and growth patterns (Dror
2014). Several international studies conducted on children and adolescents to ascertain if any
relationship exists between their milk or dairy intake, and their body fat and/or BMI have been
published. The results of these studies are inconclusive; it appears that dairy may offer a
protective effect in adolescents, but not in children. One of the theories suggested to support
these findings is that dairy may influence weight and height patterns during periods of growth
that occur in defined life stages (Wiley 2010). During adolescence when a rapid growth spurt
occurs, in conjunction with enhanced hormonal levels, milk may exert its effect more
noticeably on body fat (Dror 2014). Studies on milk or dairy intake in children of a similar age
group to this intervention study have been summarized in the order of publication, in Table 2.5.
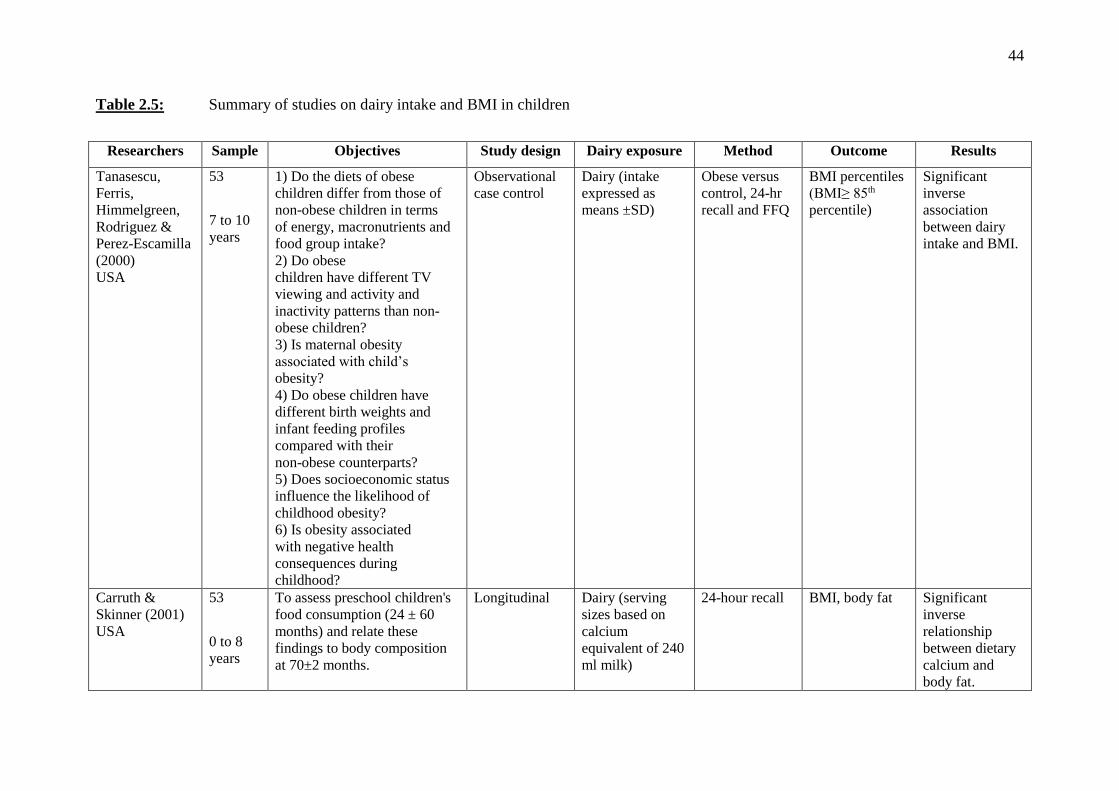
44
Table 2.5: Summary of studies on dairy intake and BMI in children
Researchers Sample Objectives Study design Dairy exposure Method Outcome Results
Tanasescu,
Ferris,
Himmelgreen,
Rodriguez &
Perez-Escamilla
(2000)
USA
53
7 to 10
years
1) Do the diets of obese
children differ from those of
non-obese children in terms
of energy, macronutrients and
food group intake?
2) Do obese
children have different TV
viewing and activity and
inactivity patterns than non-
obese children?
3) Is maternal obesity
associated with child’s
obesity?
4) Do obese children have
different birth weights and
infant feeding profiles
compared with their
non-obese counterparts?
5) Does socioeconomic status
influence the likelihood of
childhood obesity?
6) Is obesity associated
with negative health
consequences during
childhood?
Observational
case control
Dairy (intake
expressed as
means ±SD)
Obese versus
control, 24-hr
recall and FFQ
BMI percentiles
(BMI≥ 85th
percentile)
Significant
inverse
association
between dairy
intake and BMI.
Carruth &
Skinner (2001)
USA
53
0 to 8
years
To assess preschool children's
food consumption (24 ± 60
months) and relate these
findings to body composition
at 70±2 months.
Longitudinal Dairy (serving
sizes based on
calcium
equivalent of 240
ml milk)
24-hour recall BMI, body fat Significant
inverse
relationship
between dietary
calcium and
body fat.

45
Table 2.5: Continued
Researchers Sample Objectives Study design Dairy exposure Method Outcome Results
Forshee &
Storey (2003)
USA
3311
6 to 19
years
1) To examine total beverage
consumption among
children and adolescents.
2) To examine their
beverage choices.
3) To understand the
relationships between beverage
consumption and choice as
influenced by age, gender,
race/ethnicity, and BMI (i.e.
body size).
National
longitudinal
survey
Milk (grams) CSFII 1994-
1996, 1998
BMI Significant
inverse
association
between milk
intake and BMI
only in girls.
Phillips,
Bandini, Cyr,
Colclough-
Douglas,
Naumova &
Must (2003)
USA
196
girls
8 to 12
years
To examine the relation of
dairy food intake with relative
weight status and percentage
body fat (%BF).
Longitudinal
study
Dairy (serving
sizes ‘of natural
units or typical
serving sizes’)
FFQ,
Bioelectrical
impedance
analysis
% BF,
BMI Z score
No association
observed.
Barba, Troiano,
Russo, Venezia
& Siani (2005)
Italy
975
7.5 ±
2.1
years
To investigate the relationship
between frequency of
milk consumption and body
mass.
Observational Milk (classified
according to
frequency of
consumption)
FFQ BMI Z score Significant
inverse
association
between milk
and BMI.

46
Table 2.5: Continued
Researchers Sample Objectives Study design Dairy exposure Method Outcome Results
Dixon, Pellizon,
Jawad &
Tershakovec
(2005)
USA
342
4 to 10
years
To examine whether intake of
calcium and dairy foods was
associated with BMI and
skinfold measures in
hypercholesterolaemic and
normocholesterolaemic
children, ages 4 to 10 years, at
baseline and over the course of
1 year.
Longitudinal Dairy (standard
serving sizes for
4 to 10 year olds:
1 cup milk/ 240
ml = 1 serving)
3 x 24-hour
recalls
BMI Z-score,
sum of skinfold
thicknesses
Number of
servings per day
of dairy
inversely
associated with
BMI.
Berkey, Rocket,
Willett, Colditz
(2005)
USA
12829
9 to 14
years
To assess the associations
between milk, calcium from
foods and
beverages, dairy fat, and weight
change over time
Longitudinal
(Growing Up
Today Study)
Milk
(servings/day)
Self-
administered
FFQ
BMI (IOTF)
(Cole et al 2000)
Higher milk
intake (>3
servings/day)
associated with
larger weight
gain; children
that drank 1%
and skim milk
had larger
weight gain;
dietary calcium
positively
associated with
weight gain;
dairy fat not
associated with
weight gain.
Moreira, Padez,
Mourão &
Rosado (2005)
Portugal
3044
7 to 9
years
To assess nutritional intake in
school children and relate
calcium intake to BMI.
Cross
sectional
analysis
Dietary calcium
(mg)
24-hr recall BMI (IOTF)
(Cole et al 2000)
Inverse
relationship
between calcium and BMI only in
girls.

47
Table 2.5: Continued
Researchers Sample Objectives Study design Dairy exposure Method Outcome Results
Fiorito, Ventura,
Mitchell,
Smiciklas-Wright
& Birch (2006)
USA
166 girls
and their
parents
5 to 15
years
To assess whether beverage
intake at age 5 years predicted
energy intake, adiposity, and
weight status across childhood
and adolescence.
Longitudinal Milk
(servings per
day; 1 serving =
8 oz/ 240 ml)
3 day diet
recall, DXA %BF No association
between milk
intake and % BF
from 5 to 15
years.
Moore, Bradlee,
Gao & Singer
(2006)
USA
92
3 to 6,
to 13
years
To estimate the effect of dairy
intake in early childhood on the
acquisition of body fat
throughout childhood.
Longitudinal Dairy (serving
sizes: 1 cup (240
ml) milk/
yoghurt, 1.5 oz
natural cheese, 2
oz processed
cheese. Cream/
cottage cheese:
amount needed to
provide the same
calcium as 1 cup
milk)
15 day food
record Sum of
skinfold
thicknesses
Inverse
relationship
between dairy
intake and body
fat gain.
Tam et al (2006)
Australia
436
7.7± 0.6
years to
13 ± 0.2
years
To determine:
1) The relation between soft
drink/cordial and fruit
juice/drink consumption in
mid-childhood, and BMI status
in early adolescence.
2) Whether sweetened beverage
intake displaced milk intake.
Longitudinal Milk (ml/day) 3 day food
record
BMI Milk intake at
baseline not
associated with
BMI

48
Table 2.5: Continued
Researchers Sample Objectives Study
design
Dairy exposure Method Outcome Results
Johnson, Mander,
Jones, Emmett &
Jebb (2007)
UK
833
5, or 7 to
9 years
To assess whether high SSB
consumption at age 5 or 7
years was a risk factor for
increased fat mass at age 9
years.
Longitudinal Milk (g/day)
(1 serving = 180 g) 3 day food
record, DXA Fat mass Milk intake at 5
and 7 years
inversely
associated with
change in fat mass
at 9 years. LaRowe, Moeller
& Adams (2007)
USA
793
6 to 11
years
To determine whether specific
beverage patterns were
associated with overall diet
quality and whether beverage
patterns in preschool and
school-aged children were
related to BMI.
Longitudinal
cross-
sectional
survey
Milk (g/day) NHANES
2001-2002
24-hr recall
BMI Full cream milk
intake had a
significantly
inverse association
with BMI.
Murphy,
Douglass,
Johnson &
Spence (2008)
USA
2097
6 to 11
years
To compare nutrient intakes
and body measures among
children and adolescents
drinking flavoured milk (with
or without plain milk),
exclusively plain milk, and no
milk.
Longitudinal
cross-
sectional
survey
Milk
(abstract only)
NHANES
1999-2002
24-hr recall
BMI Z score No significant
association
between milk
intake (plain and
flavoured) and
BMI.
Moore, Singer,
Qureshi &
Bradlee (2008)
USA
6095
5 to 11
years
To explore the relation
between dairy intake and
body fat among children and
adolescents
Longitudinal
cross-
sectional
survey
Dairy (1 serving =
8 oz/ 240 ml
milk/yoghurt, 1.5
oz natural cheese,
2 oz processed
cheese)
NHANES
1998-1994,
1999-2002
24-hr recall
BMI Z score,
sum of skinfold
thicknesses
No significant
difference between
dairy intake and
BMI noted.

49
Table 2.5: Continued
Researchers Sample Objectives Study
design
Dairy exposure Method Outcome Results
Kelishadi, Zemel,
Hashemipour,
Hosseini,
Mohammadifard
& Pursafa (2009)
Iran
21 111
scholars
6 to 18
years
To determine the long-term
effect of a randomised
controlled trial of a dairy-rich
diet on generalised and
abdominal obesity, as well as
on the components of the
metabolic syndrome, among
obese and prepubescent
children.
Cross-
sectional
study
Dairy
(times/week) 6 months
dairy rich diet,
energy
restriction,
control group
BMI Z score,
waist
circumference
BMI and waist
circumference
significantly lower
in dairy-rich group
compared with
control group at 3
year follow up.
Eriksson &
Strandvik (2010)
Sweden
114
children
8 years
To analyse food intake and
the relationship to
anthropometry at the age of 8
years.
Cohort study Milk
(times/ week) FFQ and 24-hr
recall BMI (IOTF)
(Cole et al 2000) Significantly lower
BMI in those that
drank full cream
milk regularly
(versus those who
drank low fat or
skim milk),
compared to those
who seldom/never
drank full cream
milk.
Bradlee, Singer,
Qureshi & Moore
(2010)
USA
3761
5 to 11
years
To explore mean food group
intakes associated with
central obesity anthropometry
among children and
adolescents enrolled in the
NHANES.
Longitudinal Dairy (1 serving =
1 cup/ 240 ml
milk/yoghurt, 1,5
oz natural cheese, 2
oz processed
cheese).
NHANES
1988-1994,
1999-2002
Waist
circumference,
sum of skin fold
thicknesses
Dairy products
were inversely
associated with
central body fat
amongst
adolescents only.

50
Table 2.5: Continued
Researchers Sample Objectives Study design Dairy exposure Method Outcome Results
Wiley (2010)
USA
2526
5 to 10
years
To test the hypothesis that
milk or total dairy product
consumption is associated
with higher BMI percentiles.
Longitudinal Milk (in grams)
Dairy (in
kilojoules)
NHANES
1999-2004
BMI percentile No relationship
between dairy
intake and
BMI.
Abreu, Santos,
Moreira, Santos,
Vale, Soares-
Miranda, Mota,
Moreira (2012)
Portugal
1001
15 to 18
years
To examine the independent
association between dairy
product intake, body mass
index (BMI), and percentage
body fat (%BF) in
adolescents.
Cross
sectional
Milk (250 ml),
yoghurt (200 g),
cheese (40 g)
Self-
administered
FFQ
BMI
%BF
Milk negatively
associated with
BMI and %BF
only in girls.
No significant
association
between
yoghurt and
cheese, and
BMI or %BF
Danyliw,
Vatanparast,
Nikpartow &
Whiting (2012)
Canada
3613
6 to 11
years
To examine the relationship
between beverage intake
patterns and overweight and
obesity among Canadian
children.
Cross-
sectional study Milk (in grams) 24-hr diet
recall BMI percentile No significant
association
between milk
intake and
BMI.

51
Table 2.5: Continued
Researchers Sample Objectives Study design Dairy exposure Method Outcome Results
Lin, Tarrant, Hui,
Kwok, Lam,
Leung, Schooling
(2012)
Canada
5968
11 to 13
years
To examine the associations
of milk or other dairy product
consumption with adolescent
obesity.
Longitudina Milk/milk powder,
yoghurt, cheese
Self-
administered
FFQ
BMI (Z score)
Waist-to-hip
ratio
BMI (Z score)
Waist-to-hip
ratio
Fayet, Ridges,
Wright & Petocz,
(2013)
Australia
896
5 to 8
years
To compare the nutrient
intake, likelihood of meeting
calcium requirement, and
anthropometric measurements
among Australian children on
the basis of milk intake
patterns, with a focus on milk
drinking.
Cross-
sectional study Milk (in grams) 2 day diet
recall BMI, waist
circumference No significant
association
between milk
intake and BMI.
Gunther,
Branscum,
Kennel, Klein,
Monnat & Kaye
(2013)
USA
101
8 to 13
years
To assess the relationships of
dairy product and calcium
intake with BMI percentiles
in children.
Cross-
sectional
secondary
analysis of
baseline data
Dairy
(1 cup /240 ml
equivalents per
day) and calcium
(mg/day)
24-hour recall BMI
percentiles
Significant
inverse
association
between dairy
intake and BMI
in underweight
and normal
weight children.
No association
with overweight
and obese
children.

52
McCarron, Morris, Henry and Stanton (1984) discovered an inverse relationship between
dietary calcium and body weight indirectly, when studying the effect of nutrient intake on blood
pressure. Zemel (2000) then demonstrated the physiological changes that occurred in adult
human adipocytes when dietary calcium was consumed in large amounts, namely decreased
lipogenesis and increased lipolysis. The researchers showed that when dietary calcium intake
increased, the intracellular Ca²⁺ levels dropped via suppression of calcitrophic hormone
activity, stimulating lipolysis and weight loss. Conversely, when a diet low in calcium was
consumed, there was an increase in calcitriol levels, promoting the influx of Ca²⁺ into the cells.
Raised intracellular levels of calcium stimulated lipogenesis and triglyceride accumulation in
the cells, leading to weight gain and enhanced adiposity. Furthermore, Zemel et al (2000)
suggested that elevations in intracellular Ca² may also be responsible for insulin resistance and
hypertension, with the beneficial effects of calcium noted when caloric intake is restricted
(Zemel, 2003). However, supplemental sources of calcium were not found to have a similar
anti-obesity effect as the calcium from dairy sources, possibly due to the lack of other
ingredients such as bioactive compounds found in milk that may act on adipocyte metabolism
(Zemel 2002).
In light of Zemel’s (2000) laboratory findings, further studies were conducted reanalysing data
collected in previous studies to see if an association between milk, or dairy, and body weight,
or body fat, could be identified. The studies reviewed differed from one another in multiple
ways, and it was impossible to demonstrate a definitive outcome, with no clear consensus on
the relationship between dairy products and BMI reached.
Many inconsistencies were noted amongst the studies reviewed. There was a wide range in age
of subjects studied, as well as different ethnic groups from diverse, socioeconomic
backgrounds. Not all studies included subjects with a range of BMI values, with one study only
including participants of a normal weight (Forshee & Storey 2003). It has been suggested that
the impact of supplementing with dairy may only be noticeable in overweight or obese
individuals who have a regularly low calcium intake (less than 600 mg per day) (Zemel et al
2004). The study design varied from observational, longitudinal, or case control, and the
methodology for collecting dietary information was either in the form of a 24-hour recall, food
frequency questionnaire (either self-administered or interviewer-administered), food record, or
a combination of two of these methods. Either total milk intake, or total dairy intake was
measured, with the understanding of what constitutes total dairy differing amongst studies.

53
Some researchers chose to include high fat, high-energy dairy-based desserts, milkshakes and
sundaes in addition to yoghurt, cheese and mixed meals (Phillips et al 2003). These energy
dense food items may increase BMI and body fat stores, which is why it is necessary that
energy intake be adjusted for (Louie, Flood, Hector, Rangan & Gill 2011).
The measurement of total milk or total dairy intake also differed amongst the studies, with the
exposure variable expressed either in ‘millilitres’, ‘grams’ or ‘servings per day’. Discrepancies
were also noted between the researcher’s definition of a serving, with Carruth & Skinner (2001)
defining a single serving as ‘240 ml milk’ (Carruth & Skinner 2001), Dixon et al (2005) and
Moore et al (2006) using ‘1 cup of milk’, and Johnson et al (2007) using ‘180g’ as a single
serving (Louie et al 2011). This makes it difficult to compare results when the serving size of
dairy products differs.
The anthropometric measurement outcomes varied, with either BMI, body fat in grams, body
fat percentage, or waist circumference investigated. Statistical tests carried out differed, and
confounding factors such as energy intake, physical activity of subjects, screen time, and
parental BMI were not always considered. Forshee & Storey (2003), Moreira et al (2005) and
Abreu et al (2012) demonstrated an inverse relationship between dietary calcium and BMI only
in girls. Moreira et al (2005) noted that the male subjects were much more physically active
than the female subjects, and because males have a lower body fat percentage than females, it
was suggested that dietary calcium may have had little or no effect on the boys, as they had
much less body fat to show a change in body composition. The duration for follow up of the
studies also varied.
Some study limitations that were observed were the accuracy of dietary recall, with the
researchers discussing the risk of over- or under-reporting dietary intake (Johnson et al 2007;
Moreira et al 2005; Phillips et al 2003). Other limitations included the lack of regulation in
serving size of milk or dairy products consumed, the potential error in estimating dairy intake
from mixed dishes (Dixon et al 2005), the accuracy of the anthropometric measurements,
especially the skinfold measurements taken in children likely to be in the adiposity rebound
phase (Dixon et al 2005), and the fact that some of the studies did not commence with the
original objective of confirming whether a relationship between milk and/or dairy and BMI
existed or not, but were rather reanalyses of old data from larger national surveys. Dixon et al
(2005) suggested a potential threshold effect of calcium, with intakes ≥ 963 mg per day not
showing any benefit to older children, or obese children predisposed to developing Metabolic
54
Syndrome (Dixon et al 2005). The majority of studies indicated that full cream milk may be
more beneficial than low fat milk, and that milk alone was more likely to be associated with
changes in weight than total dairy products (Louie et al 2011).
2.8 Summary
The rapid increase in the extent of paediatric overweight and obesity requires urgent attention.
Calcium in milk has shown to regulate lipogenesis and lipolysis in adult human adipocytes;
however, several international paediatric studies have shown inconclusive evidence on the
association between milk and/or dairy on weight and body fat. Furthermore, most of these
studies were performed in the USA, and their results cannot be extrapolated to other developing
countries. Therefore, the need arose for a similar study to be conducted on South African
children. The following chapter will discuss and support the methodology chosen for the study
conducted on a subset of the paediatric population in KZN, South Africa.

55
CHAPTER 3: METHODOLOGY
In this chapter the following sections will be presented: the survey design and sample
population; the literature supporting the methodology; the study method; the training of the
fieldworkers; the pilot study, statistical analyses of the data, and ethical considerations.
3.1 Type of study
A cross-sectional observational survey was conducted to investigate the effect of dietary
calcium from dairy, and the total dairy intake, on the BMI of Grade 2 learners of all race groups,
from quintile 5 schools in Pietermaritzburg.
3.2 Background information to the study area
Pietermaritzburg is the capital city of KZN, and is home to several government and private
schools. The government schools are graded in five quintiles, according to the perceived
poverty of the school community (Department of Education 2004). Quintile 1 schools represent
the poorest of the province’s learners, and have limited resources. These schools rely
completely on government funding to operate. No school fees are charged, and these schools
are often located in the poorer communities (Department of Education 2004). With ascending
order of quintile, the amount of government funding and subsidy decreases, and the cost of
school fees increases, with quintile 5 schools being the most well-resourced and highest ‘fee-
paying’ out of all the quintiles (Department of Education 2004).
Quintile 5 schools were chosen for this study as they are fee-paying schools, and well-
resourced. Although the education level of the parents/guardians was not measured, it was
assumed that because their children were attending a school with high fees, they would be
literate, and able to afford a variety of dairy products for their children to consume.
3.3 Design of study
3.3.1 Cross sectional study
Cross sectional studies are observational in nature, whereby the researcher intends to study a
representative sample by drawing on a cross section of the population (Sedgwick 2014). In
contrast to a longitudinal study where subjects are observed multiple times, a cross sectional

56
study gathers data only once, and therefore no trends can be observed. Specific, measurable
variables are gathered, without any intervention taking place (Sedgwick 2014).
Cross sectional studies are ideal for studying the prevalence of a behaviour or disease, and
many different variables can be studied at a single time, with different population groups
observed together (Sedgwick 2014). They are generally quick and cost effective to conduct as
they usually involve a questionnaire, and a large number of participants can therefore also be
included. As subjects are seen only once, there are no concerns about losing a subject to follow-
up (Sedgwick 2014).
One of the disadvantages of a cross sectional study includes a non-response bias where the
subjects who consented to participate in the study are different to those who did not consent to
participate. The situation may then arise whereby the study is no longer representative of a
cross section of the population (Sedgwick 2014). Such a disadvantage was minimised in this
study by ensuring an objective study title, and encouraging all parents/guardians to participate.
Another disadvantage of this type of study is that as data are collected only once, no trends or
causal relationships can be concluded from the study. As this study did not aim to investigate
trends in the learners dietary intake, a cross sectional design was considered suitable.
3.4 Study population and sample selection
A resource-targeting list was obtained from the Department of Education (DOE), which
indicated that there were ten quintile 5 schools within the Msunduzi municipality. Each of these
ten schools were contacted telephonically to determine if they met the criteria for the study.
Eight quintile 5 primary schools met the study criteria to participate in this study. The study
criteria included:
i) Grade 2 learners who were seven (7) turning eight (8) years old, or were already eight (8)
years old at the time of data collection.
ii) Grade 2 learners that were representative of the four main racial groups in South Africa,
namely Black African, White, Indian and Coloured.
iii) Grade 2 learners that were enrolled at quintile 5 schools that fell under the Msunduzi
Municipality in Pietermaritzburg.
57
The reasons for selecting the age group 7 to 8 years old to study were as follows:
i) Data from the NFCS (1999) showed that the 7 to 8 year old age group had the lowest calcium
intake compared to the other age groups surveyed, namely 1 to 3 years and 4 to 6 years old.
ii) There is an EAR for calcium for the age group 4 to 8 years old, and therefore it was possible
to determine whether their calcium intake from their dairy consumption was close to
meeting the requirements for half the healthy population in their age group, considering
dairy is a major source of dietary calcium.
iii) Adiposity rebound commonly occurs between the ages of 3 to 7 years old, and is
characterised by a second rise in BMI (Cole 2004). During the first year of life, average
BMI levels increase rapidly (by approximately 5 kg/m²). Between the ages of 4 to 8 years
old BMI levels subsequently decrease, and reach the lowest point of approximately 15
kg/m². With subsequent increasing age, BMI levels begin to rise again, plateauing at roughly
20-25 kg/m² in adulthood (Freedman, Kettel Khan, Serdula, Srinivasan & Berenson 2001).
It was hypothesised that the earlier the adiposity rebound occurred, the greater the risk of
obesity later on in life. It was therefore proposed that by the age of 7 to 8 years old, the
adiposity rebound would have occurred, and it would be possible to flag the number of
children at increased risk for obesity in adulthood. This would allow the results to
recommend important dietary interventions to reduce the risk of adult obesity amongst
Grade 2 learners.
iv) Parents/guardians would be required to complete the questionnaire. Children younger than
ten (10) years old are unable to accurately recall their dietary intake (Magarey, Watson,
Golley, Burrows, Sutherland, McNaughton, Denney-Wilson, Campbell & Collins 2011;
Rockett Wolf & Colditz 1995). Because the children in this study were younger than ten, it
was postulated that having an adult complete this questionnaire, rather than a young child,
would increase the accuracy of the data collected. Therefore, learners in the Grade 2 age
group were an appropriate sample to study.
All eight quintile 5 schools that met the criteria were invited to participate in the study. Seven
of the eight schools that met the criteria responded positively to the researcher’s invitation,
following an appointment with the principal/head of department. The remaining school that
met the criteria did not respond to the researcher’s invitation to join the study. Following the
initial appointment with the principal/head of department, three schools that met the criteria for
study participation did not respond to the researcher’s repeated attempts to contact them.

58
Ultimately, the principals/heads of departments from four out of the seven schools that
responded gave informed consent for their school’s participation (Appendix C, p137).
Appointments were then set up with the relevant Grade 2 teachers to inform them of the study,
obtain their informed consent (Appendix D, p140) and discuss the role they would play in the
study.
According to the latest population census data from Stats SA (2011), there are 17281 (86.5%)
Black Africans, 1474 (7.4%) Indians, 709 (3.6%) Whites and 506 (2.5%) Coloureds in the age
category 7 to 8 years old residing in the Msunduzi municipality. This study was conducted in
schools where all four of the main racial groups in South Africa were represented. Most of the
participating schools had four Grade 2 classes, with a range of 12-33 learners in each class.
This amounted to approximately 377 eligible participants. Non-probability sampling, which
involved purposive sampling, was used in the study as specific subject criteria had to be met.
3.5 Measurement of dietary intake
Recording a child’s dietary intake has its challenges with many factors to consider, such as the
age of the child, their cognitive ability and literacy skills, and the respondent burden of the
chosen method (Magarey et al 2011). No single dietary assessment tool can adequately recall
an accurate dietary intake under all conditions (Magarey et al 2011; Huybrechts, De Bacquer,
Matthys, De Backer & De Henauw 2006). Therefore, the final chosen methodology is usually
a compromise between accurate data collection, respondent burden and available resources
(Magarey et al 2011). Measuring the diets of school-going children can be imprecise due to the
reliance on the child’s, or parents’ recall of dietary intake (McPherson, Hoelscher, Alexander,
Scanlon & Serdula 2000). Children and adults may overestimate portion sizes, or, in the case
of overweight individuals, the dietary intake may be underestimated (Magarey et al 2011).
The following methods are useful to determine dietary intake:
3.5.1 Weighted food record
The weighted food record is considered the most accurate method, whereby the participants
are required to record the amount or weight of all food items and beverages consumed
(Thompson, Subar, Loria, Reedy & Baranowski 2010). It does not rely on memory recall, and
training of the participants can be done in a group session, thus reducing the time required for

59
training (Magarey et al 2011). Furthermore, errors in portion sizes are reduced by measuring
food and beverage intake (Thompson et al 2010). However, the burden on the subjects is high
as it is time consuming (Bertoli, Petroni, Paglaito, Mora, Weber, Chiumello & Testolin 2005),
literacy and numeracy skills are required, and it is difficult to accurately report any food items
eaten outside of the home (Magarey et al 2011).
3.5.2 24-hour recall
The 24-hour recall is an estimate of all foods and beverages consumed in the previous 24 hours.
Interviewers need to be trained on using the tool in order to ensure the dietary recall is more
accurate, and several days need to be reported on in order to obtain the usual intake of an
individual (Magarey et al 2011). A detailed description of each item needs to be supplied,
including brand names, portion sizes, and methods of preparation. Due to the detail required,
an estimate of the total day’s nutrient intake can be calculated (McPherson et al 2000). The
advantages of the 24-hour recall method are that it is inexpensive, a large number of
participants can be included if there are sufficient resources available, and the respondent
burden on the subject is low (Johnson, Driscoll & Goran 1996). The participant does not require
literacy or numeracy skills to recall their intake (Magarey et al 2011).
One of the disadvantages of the 24-hour recall method is that if only one day is considered, it
may not be truly reflective of the regular intake, and multiple 24-hour recalls are necessary to
gauge a more accurate dietary intake (Magarey et al 2011). If the study has time limitations
and limited resources, it becomes difficult for both the interviewer and participant to arrange
suitable times for multiple interviews, especially if a large number of participants is anticipated.
Furthermore, a high variation may be reported between the different days recalled, and it also
does not reflect seasonal variation in the diet (Nöthlings, Hoffmann, Bergmann & Boeing
2007). The sources of error in 24-hour recalls are often similar to those found in food frequency
questionnaires (FFQ), such as reliance on memory, conceptualizing portion sizes from served
items, and overestimation of reported diet (Cade et al 2002). Moore et al (2007) suggested the
24-hour recall may underestimate calcium intake, as they noted the energy intakes reported in
the 24-hour recall were 10-35% less than the subject’s requirements, when they compared
calcium intake from a FFQ to calcium intake from a 24-hour recall.

60
3.5.3 Food frequency questionnaire
A FFQ asks subjects to indicate the frequency of consumption of particular food items, and in
the case of a semi-quantitative FFQ, the portion size consumed. Parrish, Marshall, Krebs,
Rewers & Norris (2003) reported that FFQs can be efficiently used in large epidemiological
studies to determine usual habitual dietary intake spanning a duration of one month to one year.
The usual dietary intake measured can then be used to rank an individual’s food consumption
according to usual intake (Magarey et al 2011), and is useful in predicting health outcomes
(McPherson et al 2000).
The literature supporting the FFQ as an acceptable dietary recall tool will be discussed in the
following section.
3.5.4 Literature supporting the semi-quantitative FFQ
There are many advantages to using a FFQ. As FFQ’s are usually self-administered, a highly
trained interviewer is not necessarily required, making them a cost effective tool (Thompson
et al 2010). Studies involving a large number of subjects from a widespread geographical area
have sent out FFQ via the post, with instruction on how to complete the FFQ (Lin et al 2012;
Berkey 2005; Philips 2003). Labonté, Cyr, Baril-Gravel & Lamarche (2012) studied the
validity of a web-FFQ, whereby the subjects were contacted electronically, and asked to
complete a web-based FFQ, which was validated against an interviewer-administered FFQ and
a 3 day record (Labonté et al 2012). The researchers concluded that the electronic tool showed
good reproducibility and reasonable validity for assessing dietary intake. For self-administered
questionnaires, it is recommended that questions be closed rather than open, to reduce coding
time and transcription errors, and limit the number of questionnaires that need to be rejected
due to inaccurate interpretation of the question (Cade et al 2002). If open questions are asked,
it is preferable to make use of highly trained fieldworkers who can ensure the questions are
answered effectively in one-on-one interviews (Cade et al 2002). As children experience
difficulty in accurately recalling previous food intake, parental assistance is preferred if the
recall is over a long period of time. Another advantage is that a minimal amount of time is
required to complete the FFQ (Parrish et al 2003) and a larger number of participants can be
included to increase the statistical significance. Anonymity of the subjects may enhance honest
reporting. There is a lower workload entering the data (Huybrechts et al 2006), fewer expenses

61
are incurred (Nöthlings et al 2007), and it gives an adequate estimate of the subject’s average
consumption over a set period of time.
The disadvantages of using a FFQ to collect data on dietary intake include inaccurate recall,
inability to probe further by asking the participant questions for clarification, literacy and
numeracy skills are required if it is self-completed (Magarey et al 2011), and overestimation
of portion size consumed (Parrish et al 2003). The risk of overestimating portion sizes is
enhanced if adult portions are used to estimate children’s intake (McPherson et al 2000). In a
study by Jenner, Neylon, Croft, Beilin & Vandogen (1989), a comparison of the dietary recall
efficiency between parents and their 11 to 12 year old children showed that children
overestimated their consumption far greater than their parents did. Another disadvantage is the
length of time taken by the researcher to develop and validate the FFQ, and then enter the data
for analysis (Magarey et al 2011).
Taylor and Goulding (1998) assessed the validity of a short FFQ in children aged 3 to 6 years
old. The calcium intake from a 4-day diet record was compared to the calcium intake recorded
on a 35-item FFQ. The results showed that the FFQ tended to overestimate calcium intake and
was not appropriate for determining individual calcium intakes. However, the predictive ability
of the FFQ to identify children with calcium intakes less than 800 mg per day was good (79%).
They concluded that the FFQ has merit in estimating calcium intake in relation to bone health
in young children.
In a study by Huybrechts et al (2006), a semi-quantitative FFQ tended to underestimate calcium
intakes in preschool children, but showed a reasonably good ability to classify the children into
extremes of calcium intake (Huybrechts et al 2006). Bertoli et al (2005) showed a good
correlation between a weighted 7-day food record and FFQ for 6 to 10 year old Italian children
and 16 to 20 year old Italian adolescents. They reported the calcium intake measured in the
FFQ to be 48% more than in the weighted food record, but suggested that respondents had
included high calcium foods in the FFQ, and failed to eat them on the day the weighted food
record was conducted. It was also noted that the long list of food items and food groups in the
questionnaire may have caused overestimation of nutrient intake. Bertoli et al (2005) concluded
that the correlation between the two dietary assessment methods was agreeable for calcium,
but there was a risk that the calcium intake on the questionnaire may be 144 mg per day lower
or 840 mg per day higher than the amount recorded in the food weighted record. Although the
FFQ could not accurately estimate calcium intake in children and adolescents, it was a very

62
useful tool for classifying them into low, medium and high calcium intake categories (Bertoli
et al 2005).
Moore, Braid, Falk & Klentrou (2007) compared the calcium intake obtained from a FFQ to
the calcium values obtained from a 24-hour recall in male children and adolescents. Their
results showed that the dietary calcium intake obtained from the FFQ was significantly higher
than the calcium from the 24-hour recall. Male children consumed 1576 mg (±1101 mg)
calcium according to the FFQ, and 1003 mg (± 543 mg) according to the 24-hour recall, whilst
male adolescents consumed 1873 mg (± 739 mg) calcium from the FFQ, versus 1159 mg (±
515 mg) calcium from the 24-hour recall. This is congruent with previous studies where FFQ
was found to overestimate calcium intake. The researchers also suggested one of the possible
reasons for FFQ overestimation is that the long list of food items presented to the subjects
compelled them to choose items, even though they may not regularly consume them (Moore et
al 2007). Zemel, Carey, Paulhamus, Stallings & Ittenbach (2010) conducted a study to
determine the validity and reliability of the 41-food item “Calcium Counts FFQ” amongst 139
healthy 7 to 10 year old American children. The subjects’ calcium intake from the FFQ (1192
mg per day, SD 537) was compared to a 7-day weighed food record (885 mg per day, SD 347).
The researchers found that although calcium intake from the FFQ was approximately 300 mg
higher (p<0.01) than the calcium intake from the 7-day weighed food records, the FFQ was
found to successfully identify children with low calcium intakes, and they concluded the FFQ
provided a valid and reliable estimation of calcium intake (Zemel et al 2010).
As it can be seen from the three methods that have been presented, all standard dietary
assessment tools are subject to bias and error (Kristal, Andrilla, Koepsell, Diehr & Cheadle
1998), and the final decision on which tool to use must be determined by the situation, and
study characteristics. The final chosen methodology is usually a compromise between accurate
data collection, respondent burden and available resources (Magarey et al 2011). From the
literature reviewed, the FFQ has proven to be a sound tool in estimating calcium intake. It can
successfully rank individuals into low, medium and high calcium intakes, and can identify
those children at risk of low calcium intakes. For the purpose of this study, a semi-quantitative
FFQ was selected as the most appropriate method for determining calcium and dairy intake,
due to low respondent burden, time constraints and cost limitations. The disadvantages of using
a FFQ were considered, and the FFQ used in this study was designed bearing in mind the
previously mentioned drawbacks. In the letter sent to them, the parents/guardians were

63
informed that the FFQ was anonymous. As the FFQ was to be self-administered, clear
instructions on how to complete it were given, and closed questions were asked in order to
reduce errors. The number of food items and related questions were limited to the absolute
minimum in order to prevent respondent fatigue and the possibility of overestimation as
discussed above.
In order to maintain the integrity of a larger sample size, it was decided not to make use of a
24-hour recall. An accurate and reliable 24-hour recall needs to be interviewer-administered,
and the time and financial resources required to hire additional qualified fieldworkers to
conduct multiple interviews on all the participants was not available. It was also a concern that
if the participant was not able to remain ‘anonymous’, as they would have if a FFQ was used
on its own, there was a risk that they may have adjusted their learners reported intake to meet
their perceived perceptions of the study’s requirements. This was particularly of concern in this
study because the focus was specifically on dairy intake.
3.6 Study method and data collection
The collection of data followed the procedure outlined below:
i) Necessary ethical considerations were obtained, to be discussed in section 3.15.
ii) The FFQ questionnaire (Appendix E, p143) was designed by the researcher, and the
structure and wording of the FFQ was validated by a statistician. The nutritionally related
content of the FFQ was validated by an international researcher (Abreu et al 2012).
iii) The pilot study (to be discussed in section 3.9) was carried out.
iv) Fieldworker training was conducted.
v) All quintile 5 schools that met the study criteria were contacted and invited to participate
in the main study.
vi) Once informed consent had been obtained from the principal/head of department
(Appendix C, p137) and Grade 2 teachers (Appendix D, p140), a letter was sent to all
parents/guardians of Grade 2 learners informing them of the details of the study, and
inviting them to participate (Appendix G, p161).
vii) The informed consent forms signed by the parent/guardians were accepted as proof that
the questionnaires were completed by the intended parent/guardian. By signing the
informed consent form, the parent/guardian acknowledged that participation in the study

64
was completely voluntary, and they could withdraw at any time without any penalties
incurred.
viii) The main study was conducted at the four schools that agreed to participate.
ix) The data from the FFQ were entered onto the SPSS Statistics Version 24 package. Once
the data had been entered twice, and errors corrected, the data were analysed.
3.7 Measuring instruments used
3.7.1 Anthropometric measurements
All participating learners were initially asked for their assent before their weight and height
was measured.
3.7.1.1 Procedure for measuring weight
A SECA digital scale was used to take the learner’s weight, using the following method:
The SECA digital scale was placed on a flat, even surface in a venue at the participating
school.
The scale was calibrated using a 5 kg weight.
The learners were asked to remove any heavy clothing, such as jerseys and blazers, in
addition to their school shoes and socks.
The fieldworker switched the scale on and waited for it to read 0.00kg.
The learner was asked to step on the scale and stand in the centre of it, with their weight
evenly distributed over both feet, and arms resting at their sides.
The learner was asked to remain still and the final reading, in kilograms to the nearest one
decimal place, was recorded on the learner’s questionnaire form (Gunther et al 2013;
Phillips et al 2003; Carruth & Skinner 2001).
The learner was asked to step off the scale, and the procedure was repeated a further two
times. The three weight readings were averaged to obtain a final reading.

65
3.7.1.2 Procedure for measuring height
A SECA stadiometer with a sliding headpiece was used to measure the learner’s height, using
the following method:
The SECA stadiometer was placed on a flat, even surface with the height stick in contact
with a wall.
The learner was asked to remove their school shoes and socks.
If their hair was tied up on their head, they were asked to untie it so as not to obstruct
measurements taken. If they were unable to untie their hair, a knitting needle was inserted
through their hair, and used to measure their true height.
The learner was asked to step onto the stadiometer, and turn around to face the fieldworker.
The learner was asked to stand up straight, with arms resting at their sides, heels together,
and head in the Frankfort horizontal plane.
The fieldworker checked that the back of the learners’ head, shoulders, bottom and heels
were in contact with the measuring stick.
The learner was asked to inhale deeply, and hold their breath whilst the measurement was
taken.
The headpiece was lowered so as to place firm pressure on the top of the learner’s head.
The height measure was read out aloud in centimetres to the nearest one decimal place
(Gunther et al 2013; Phillips et al 2003; Carruth & Skinner 2001), and recorded on the
learner’s questionnaire.
The learner was instructed to exhale, the headpiece was raised and the learner was asked to
step off the stadiometer.
The procedure was repeated a further two times, and the three height measurements were
averaged to obtain a final measurement.
3.7.2 Semi-quantitative FFQ
The FFQ (Appendix E, p143) was divided into three separate sections: the first section (on
page one of the questionnaire) recorded the learners’ code, and their anthropometric
measurements; namely weight, height and BMI. The second section enquired about the
learners’ age, gender, ethnic background, any medical conditions, level of physical activity and
time spent being physically active, and hours spent in sedentary behaviour. The third section
66
focussed on the consumption of milk and dairy products, namely hot milk drinks (Tea, Coffee,
Milo, Horlicks, Hot chocolate), flavoured milk drinks (Squillo’s, Nesquick, Super M, Steri
Stumpi), yoghurt, drinking yoghurt, maas, cheese, and dairy based desserts (icecream, custard,
frozen yoghurt and other dairy-based dessert). Closed questions were asked, as per the literature
recommendations, regarding the frequency of consumption of these products, and the amount
consumed in a single sitting. There were nine response options which the parents/guardians
could select: “less than once a week”, “once a week”, “twice a week”, “three times a week”,
“four times a week”, “five times a week”, “six times a week”, “everyday”, and “more than once
a day”.
Closed questions were asked, as recommended by the literature for self-administered FFQ
(Thompson et al 2010; Cade et al 2002). Portion sizes were stipulated so that absolute nutrient
intake could be calculated (Cade et al 2002). Respondents were able to select from a variety of
portion sizes, relevant to the packaging in which the dairy product was sold in. If none of the
options were applicable, space was given for the respondent to indicate another portion size.
The learners’ dairy intake was then converted into standard servings of milk, flavoured milk,
yoghurt, maas, cheese and dairy based desserts. This information was necessary to determine
the average number of dairy servings per day, and total calcium intake from dairy. From this,
it could be determined whether the learners were meeting their dairy and calcium requirements,
and their dairy and calcium intake could be statistically extrapolated to their relevant BMI.
In order to assist the parent/guardian with the self-administration process, detailed instructions
on how to complete the questionnaire as accurately and honestly as possible were provided on
the questionnaire, and the parents/guardians were asked to recall the milk and dairy intake of
their Grade 2 learner over the past 12 months. The researchers contact details were provided in
the informed consent form, should any of the parents/guardians have further queries.
The FFQ was emailed to several international researchers who had conducted similar studies
on school going children, to both validate the questionnaire and obtain any additional
comments regarding the structure and content of the FFQ. Only one researcher responded
(Abreu et al 2012) who, together with her research team, had conducted a study amongst
Portuguese adolescents, published in 2012. The comments received were incorporated into the
FFQ.

67
3.8 Fieldworker recruitment and training
Four field workers were recruited to assist with collecting anthropometric measurements. The
field workers were current third year BSc Dietetic students (2016), who had some previous
exposure and training in taking anthropometric measurements. The fieldworkers were
contacted and attended a training session in the Dietetics department at UKZN, prior to
collecting anthropometric data.
At the training session, the fieldworkers were informed of the purpose of the study. They were
given an anthropometric training booklet to refer to, which included the aims and objectives of
the anthropometric training session, and a step-by-step guide on taking correct weight and
height measurements. Potential measurement errors to be avoided were also discussed.
SECA digital scales and portable height sticks were made available for the practical training
session, where the researcher first demonstrated the correct technique for taking weights and
heights, and then the fieldworkers were given the opportunity to practice under supervision.
Once the researcher was satisfied that the fieldworkers had mastered the correct technique, they
were theoretically tested on the correct technique, and errors to avoid when taking and
recording anthropometric measurements.
3.9 Pilot study
A pilot study is a preliminary study conducted on a similar subject group to determine the
feasibility of the study, and address any adverse events prior to commencing data collection.
Prior to the pilot study commencing, permission was obtained from the DOE to perform the
study (Appendix F, p160). This letter of permission was distributed to all schools that met the
inclusion criteria when they were invited to participate in the study.
The pilot study was conducted in May/June 2016 at Athlone Primary School in Wembley,
Pietermaritzburg as a means of detecting flaws in the questionnaire or anthropometric
measurements. While Athlone Primary School met the criteria for inclusion in the study, it did
not fall within the Msunduzi Municipality. There were three Grade 2 classes at Athlone Primary
School, with approximately 28 learners in each class. Informed consent letters were sent to the
parent/guardian of every Grade 2 learner. Of the potential 84 learners, 26 parents/guardians
consented to participating in the pilot study, and were sent the FFQ with clear instructions on

68
how to complete it provided within the FFQ. The researcher’s contact details were also
provided in the informed consent letter to allow the parents/guardians to clarify any queries.
Once the completed FFQ forms were returned to school, the researcher made an appointment
with the school to visit with the fieldworkers and take the anthropometric measurements.
The following changes were made to the study method and design following the pilot study.
1) The duration of “physical activity (in minutes)” was expanded to include “per day”.
2) The category “less than once a week” was introduced when indicating the frequency of
product consumption. In the pilot study, the lowest frequency offered was “once a week”.
3) A question on the intake, amount and frequency of plain milk consumption was added.
During the pilot study, the researcher noted that the response rate was very poor in that only
26 out of a potential 84 questionnaires were completed. It was then decided that an incentive
should be offered to potentially increase participation in the main study. Galea & Tracy (2007)
discussed concerns regarding the declining participation rates in clinical studies, with the
researchers highlighting four main reasons for these declines: the emergence of an ‘over-
surveyed population’ due to the increase in tele-marketing surveys; general decline in
volunteerism of all kinds; a lack of willingness to participate in a study if the topic does not
directly affect or interest the participants; and the demands made by the study on the
participant’s time ie. response burden. In an attempt to improve study participation it was
observed that monetary incentives assist participation. Singer, Groves, Dillman, Eltinger &
Little (2002) indicated that monetary incentives may encourage participants from lower
household incomes and education levels, in addition to participants from higher income
households, as they feel their time has been compensated for. Galea & Tracy (2007) report that
creativity in study design may need to be employed to increase study participation. In a study
conducted by van der Horst, Oenema, van de Looij-Jansen & Brug (2008), school children
based in the Netherlands were offered a key holder as an incentive to participate in the
ENDORSE study, which looked at environmental determinants of obesity related behaviours.
Galea & Tracy (2007) further stated that extreme efforts at enrolling more participants may be
unethical and lead to coercion.
Based on these findings a R500 mall voucher was offered as a lucky draw to all completed
FFQ. The anonymous codes of the learners were put into a hat, and the winner of the voucher
was randomly selected. The voucher was not awarded based on the type of information
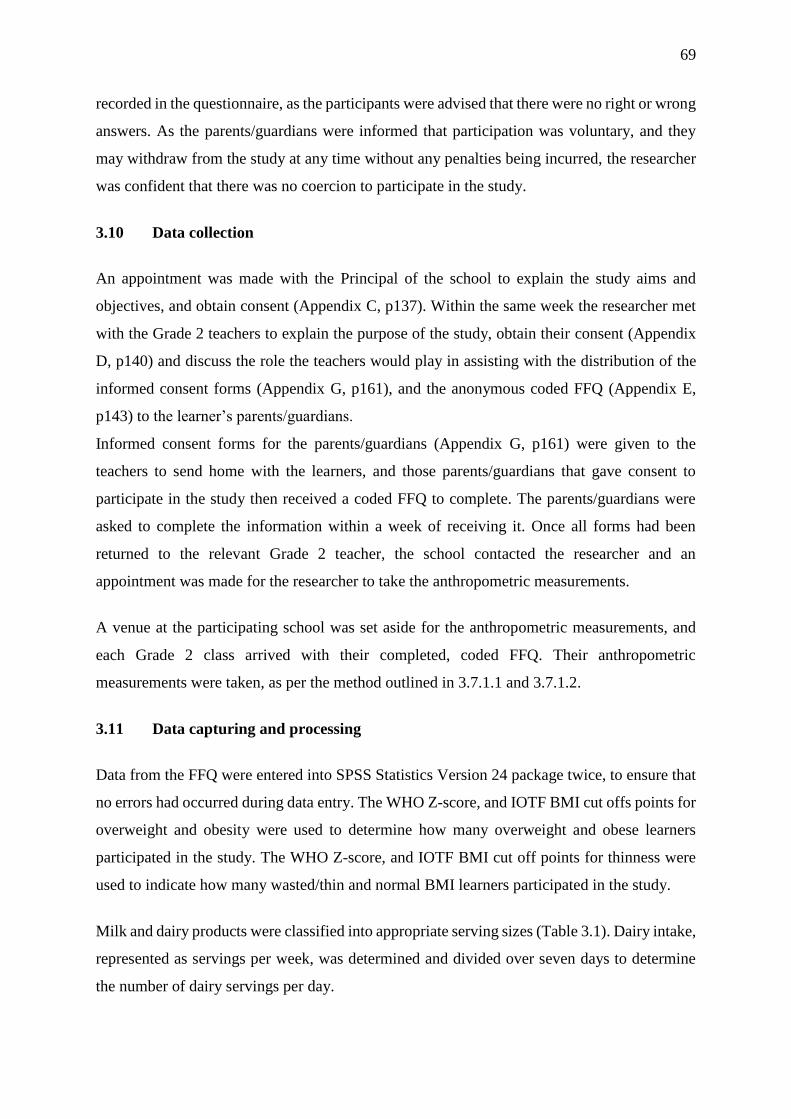
69
recorded in the questionnaire, as the participants were advised that there were no right or wrong
answers. As the parents/guardians were informed that participation was voluntary, and they
may withdraw from the study at any time without any penalties being incurred, the researcher
was confident that there was no coercion to participate in the study.
3.10 Data collection
An appointment was made with the Principal of the school to explain the study aims and
objectives, and obtain consent (Appendix C, p137). Within the same week the researcher met
with the Grade 2 teachers to explain the purpose of the study, obtain their consent (Appendix
D, p140) and discuss the role the teachers would play in assisting with the distribution of the
informed consent forms (Appendix G, p161), and the anonymous coded FFQ (Appendix E,
p143) to the learner’s parents/guardians.
Informed consent forms for the parents/guardians (Appendix G, p161) were given to the
teachers to send home with the learners, and those parents/guardians that gave consent to
participate in the study then received a coded FFQ to complete. The parents/guardians were
asked to complete the information within a week of receiving it. Once all forms had been
returned to the relevant Grade 2 teacher, the school contacted the researcher and an
appointment was made for the researcher to take the anthropometric measurements.
A venue at the participating school was set aside for the anthropometric measurements, and
each Grade 2 class arrived with their completed, coded FFQ. Their anthropometric
measurements were taken, as per the method outlined in 3.7.1.1 and 3.7.1.2.
3.11 Data capturing and processing
Data from the FFQ were entered into SPSS Statistics Version 24 package twice, to ensure that
no errors had occurred during data entry. The WHO Z-score, and IOTF BMI cut offs points for
overweight and obesity were used to determine how many overweight and obese learners
participated in the study. The WHO Z-score, and IOTF BMI cut off points for thinness were
used to indicate how many wasted/thin and normal BMI learners participated in the study.
Milk and dairy products were classified into appropriate serving sizes (Table 3.1). Dairy intake,
represented as servings per week, was determined and divided over seven days to determine
the number of dairy servings per day.

70
Table 3.1: Serving sizes for milk and dairy products, calculated to provide 300 mg calcium
(Milk SA 2016)
Dairy product Single serving size
Milk 250 ml
Flavoured milk 250 ml
Yoghurt 200 ml
Drinking yoghurt 200 ml
Maas 200 ml
Custard 275 ml
Ice-cream 235 ml
Cheese, grated ⅓ cup or 40g
Cheese, sliced 40 g
Processed cheese 2-3 portions or 40 g
Cottage cheese 275 g
Daily calcium intake was determined by multiplying the total amount of each dairy item
consumed per day, by its calcium content (per 100 g product) (Table 3.2).

71
Table 3.2: Calcium content of dairy products per 100 g/ml (Milk SA 2016;
Danone Southern Africa 2017)
Dairy product Calcium (mg)
Full cream milk, fresh 120 mg
Full cream UHT milk 117 mg
Full cream commercial milk, flavoured 112 mg
Low fat milk, fresh 122 mg
Low fat UHT milk 141 mg
Low fat commercial flavoured milk 115 mg
Skim milk, fresh 123 mg
Skim UHT milk 138 mg
Plain yoghurt, low fat 149 mg
Fruit yoghurt, low fat 145 mg
Fruit yoghurt, fat free 152 mg
Drinking yoghurt 142 mg
Maas 162 mg
Gouda cheese 806 mg
Cheddar cheese 788 mg
Mozarella cheese 505 mg
Feta cheese 386 mg
Full fat processed cheese 570 mg
Medium fat processed cheese 562 mg
Cream cheese 98 mg
Cottage cheese (full fat) 111 mg
Cottage cheese (fat free) 120 mg
Custard 102 mg
Ice-cream 124 mg
Ultramel Delight 105 mg
3.12 Statistical analysis of data
The following statistical tests were conducted:
A Chi-square test of independence was carried out to determine if a significant association
between gender and BMI, and race and BMI existed.
A Kruskal Wallis test was conducted to determine if a significant association between age
and BMI existed.
A Mann Whitney test was conducted to determine if dairy and calcium intake differed
amongst gender and race.
A one-sample t-test was conducted to determine if the FFQ calcium was significantly less
than the recommended EAR of 800 mg calcium per day.

72
A Pearson correlation was employed to determine if a linear relationship existed between
age and the corresponding calcium intake, and the EAR for calcium.
The Independent Samples Test was conducted to determine if there was any significant
difference between gender and calcium intake, when comparing dietary calcium intake to
the EAR for calcium.
ANOVA analysis was employed to determine if any particular race group had a greater
calcium intake, and were more likely to meet the EAR for calcium.
A one-sample t-test analysis was used to determine if the number of dairy servings of dairy
was significantly lower than the recommended three servings per day.
Regression analysis was utilized to compare the FFQ calcium intake with BMI.
Regression analysis was employed to determine if a significant difference existed between
the two genders’ BMI and FFQ calcium.
Regression analysis was also conducted to determine if there was a significant difference
between the different race groups FFQ calcium and their BMI.
Regression analysis was again used when total dairy intake and BMI was considered,
according to the different genders and race groups.
Pearson correlation was employed to determine if drinking either full cream milk, or low
fat milk, had any significant impact on the learners’ BMI.
A Pearson correlation analysis was conducted to determine if a relationship between dairy
intake and SSBs existed.
A Likert scale, and a one-sample t-test was applied to determine which options significantly
reduced the learners’ ability to consume adequate amounts of calcium and dairy on a daily
basis.
The objectives of the study, the variables required for analysis of the data, and the statistical
tests carried out are presented in Table 3.3. A p value <0.05 was considered statistically
significant.

73
Table 3.3: Analysis of data
Objectives Variables required for the
analysis
Statistical tests
To determine the BMI of
Grade 2 learners in
Pietermaritzburg
Weight (in kg)
Height (in m²)
Descriptive statistics
Cross tabulation
(gender and race)
Chi square test of
independence
(gender and race)
Kruskal Wallis test
(age)
To determine the intake of
dietary calcium from dairy,
along with the total
intake of dairy, in Grade 2
learners in Pietermaritzburg.
FFQ calcium
Total dairy intake
in grams or
millilitres per day
(obtained from the
FFQ).
Descriptive statistics
Mann Whitney
(gender and race)
Pearson correlation
(age)
Paired samples t-test
To determine if the Grade 2
learners are meeting their
dairy and calcium
requirements.
Calcium (mg per day)
Dairy intake
(servings per day)
EAR for calcium
Descriptive statistics
One sample t-test
ANOVA
Pearson correlation
Independent Samples
test
To determine whether there
is a relationship between the
dietary calcium (from dairy)
and/or total dairy intake, and
the BMI of Grade 2 learners
in Pietermaritzburg.
BMI
Calcium intake (mg
per day) (FFQ)
Dairy intake
(servings per day)
Regression analysis
ANOVA
Pearson correlation
To determine possible
barriers to dairy intake in
Grade 2 learners in
Pietermaritzburg.
Barriers to dairy
consumption in
questionnaire (Likert
scale)
One sample t-test to
test if the average
agreement is <3
(disagreement) or > 3
(agreement)
Pearson correlation

74
3.13 Reliability and validity of data
In order to ensure the study results were accurate, it was necessary to ensure that the process
of collecting data was reliable and valid. Reliability can be defined as the “degree to which an
assessment tool produces stable and repeatable results” (Golafshani 2003), or its ability to
replicate the same result on several occasions (Magarey et al 2011). The parents/guardians
were contacted by a standardised letter informing them of the study, thus ensuring that
everyone received the same information. As previously mentioned, the learners were attending
quintile 5 schools, and so it was assumed the parents/guardians were adequately literate to
understand the food frequency questions and record their learner’s intake. It was also assumed
that the parents/guardians signing the informed consent, completed the FFQ. The FFQ was
piloted to determine any errors in reliability. The appropriate changes were made prior to the
main study (pilot study, section 3.9). The scales were calibrated at each school visit, thus
ensuring accurate weight measurements.
Validity can be defined as “the degree to which the survey method can estimate the true dietary
intake” (Johansson 2006), or “the accuracy of a measure, or how close to the truth it is”
(Magarey et al 2011). To ensure the questionnaires were meeting the objectives of the
measurements, the content of the FFQ was validated by an international researcher who had
conducted a similar study (Abreu et al 2012), and the structure and wording of the FFQ was
validated by a statistician. Each time the structure or wording of the FFQ changed, it was
revalidated. The researcher trained the fieldworkers on the correct method for taking
anthropometric measurements, ensuring that valid weights and heights were obtained.
3.14 Reduction of bias
During the course of research, bias can occur at many different stages during the methodology,
data collection, analysis and reporting of results. Bias is introduced when the emotions,
personal beliefs, and behavioural orientations of the researcher, fieldworkers and subjects are
allowed to influence the course of research. In order to obtain accurate and objective results, it
is essential that bias in all forms be minimised (Dovidio, Gaertner, Stewart, Esses, ten Vergert
& Hodson 2004).
During the course of the study bias was introduced in that participation was voluntary, and
parents/guardians interested in health and diet may have been more inclined to respond, than

75
those who were not health conscious. In an attempt to recruit a wide variety of participants,
thus making the sample more representative, a mall voucher was offered as an incentive, in the
form of a lucky draw.
In order to reduce any further bias, the following steps were taken:
The FFQ was coded to ensure anonymity.
Clear instructions that were simply worded were given in the FFQ, so as not to mislead or
confuse the respondents.
Closed questions were asked in the FFQ, so as not to lead the respondent.
The researcher informed the parents/guardians in the Informed Consent letter (Appendix G,
p161), that there were no “right” or “wrong” answers to the questions posed to them,
therefore potentially minimizing bias and dishonesty.
The questions in the FFQ were worded in a neutral manner, with no positive or negative
wording employed (Schriesheim & Hill 1981).
The lucky draw prize of a mall voucher was randomly selected, and not based on the answers
given in the FFQ.
The researcher trained all fieldworkers together, and they were tested on their knowledge
and practical ability to correctly take anthropometric measurements prior to the study
commencing.
The fieldworkers were asked to remain objective throughout the anthropometric assessment,
and the researcher recorded all data accurately.
3.15 Ethical considerations
The DOE was contacted for permission to conduct the study within the Msunduzi municipality
of Pietermaritzburg, and permission was granted (Appendix F, p161). Ethics approval for the
study was applied for, and granted by the Biomedical Research Ethics Committee, Ref BE:
275/16 (Appendix H, p164). An informed consent form was drawn up for all role players
involved in the study- this included a separate informed consent form for the Principal of the
participating school (Appendix C, p137), the Grade 2 teachers whose classes were involved in
the study (Appendix D, p140), and the parents/guardians of the Grade 2 learners (Appendix G,
p161). In the informed consent form it was made clear that the study was anonymous, and
participation in the study was voluntary, with the participant able to withdraw at any time

76
without any negative consequences. The questionnaires were stored in a locked office, with
only the researcher having access to the information.
3.16 Summary
This chapter outlined the reasons supporting the chosen methodology, including evidence from
the literature. Background information to the sample population was given, and the process of
data collection was explained. Efforts to reduce bias and ensure valid and reliable results were
discussed. The following chapter will present the results of the statistical analyses of the data.

77
CHAPTER 4: RESULTS
This chapter will discuss the results of the study. A description of the study sample population
will be provided, along with statistical analyses of the results in accordance with the study’s
objectives.
4.1 The demographic characteristics of the Grade 2 learners in Pietermaritzburg
Three out of the four schools that participated in the study had four Grade 2 classes, and one
school had three Grade 2 classes. The number of learners in each class ranged from 12 to 33.
There were potentially 377 subjects for the main study, but only 109 parents/guardians gave
permission for their leaner to participate in the study. From this amount, 18 had to be excluded,
as they either did not complete all the information, or the learner was not between 7 to 8 years
of age. In total, data for 91 learners was captured. This represents 24.1% of the study
population.
More female learners (57.1%, n=52) participated in the study than males (42.9%, n= 39). Most
of the respondents were Black African (40.7%, n=37), followed by White (27.5%, n=25),
Indian (18.7%, n=17) and Coloured learners (13.2%, n=12). The gender and race of the learners
is presented in Table 4.1. The learners’ ages ranged from 7.67 to 8.83 years, with a mean of
8.3 years (SD 0.27539).
Table 4.1: Gender and race differentiation amongst the learners
Gender Total
Male Female
Race Black African 11 26 37
White 17 8 25
Indian 5 12 17
Coloured 6 6 12
Total 39 52 91

78
4.2 The prevalence of overweight and obesity amongst Grade 2 learners in
Pietermaritzburg, as measured by their BMI
The BMI measurements of the learners are presented as a distribution curve in Figure 4.1 with
the two blue lines indicating the recommended range for normal BMI, according to WHO
(2007) for that gender.
Figure 4.1: Normal distribution curve for BMI according to learners’ gender
Figure 4.1 shows that the BMI values for both the male and the female learners were not
distributed normally. The male learners had a mean BMI of 18.7 kg/m² (SD 3.83) (normal
BMI-for-age for 7 to 8 years olds is 15-15.5 kg/m²) (WHO 2007). The female learners had a
mean BMI of 18.1 kg/m² (SD 3.41) (normal BMI-for-age for 7 to 8 year olds is 14.9-15.4
kg/m²).

79
The classification of the learners’ BMI is presented in Tables 4.2 and 4.3. The BMI values were
compared to both the WHO and the IOTF classification for overweight and obesity. According
to the IOTF classification, 24.2% (n=22) of the learners were overweight and 15.4% (n=14)
were obese, compared to the WHO classification where 28.6% (n=26) of the learners were
overweight and 19.8% (n=18) were obese. The minimum BMI measured was 12.4 kg/m², the
maximum BMI measured was 29.1 kg/m², with a mean of 18.37 kg/m² (SD 3.59). The majority
of learners were of a normal BMI (WHO: 50.5%, n=46, IOTF: 51.6%, n=47).
Table 4.2: The representation of the learners’ BMI according to the WHO classification
Category WHO
n %
Wasted (< -2 to - 3 Z-score) 1 1.1
Normal (≤-1 to + 1 Z-score) 46 50.5
Overweight (> + 1 to + 2 Z score) 26 28.6
Obese (> + 2 Z score) 18 19.8
Table 4.3: The representation of the learners’ BMI according to the IOTF classification
Category IOTF
n %
Thinness (BMI <18.5 kg/m² at 18 years old) 8 8.8
Normal (BMI ≥18.5 kg/m² and ≤ 24.9 kg/m² at 18 years old) 47 51.6
Overweight (BMI ≥ 25 kg/m² at 18 years old) 22 24.2
Obese (BMI ≥ 30 kg/m² at 18 years old) 14 15.4
A chi-square test of independence was conducted to determine if a significant association
existed between the learners’ gender and BMI. However, no significant relationship was found
between the two variables. According to the WHO classification, more females were
overweight (30.8%) compared to their male counterparts (25.6%), but more males were obese
(23.1%) compared to females (17.3%) (Table 4.4). For the IOTF classification the same trend
was shown, with females twice as likely to be overweight than males (30.8% versus 15.4%),
but males were more likely to be obese than females (20.5% versus 11.5%) (Table 4.5).

80
A chi-square test of independence found no significant relationship between race and BMI
(Tables 4.4 and 4.5).
Table 4.4: Gender, race and BMI interpretations according to the WHO classification
Wasted
(< -2 to -3 Z
score)
Normal
(≤ -1 to +1 Z
score)
Overweight
(> +1 to +2 Z
score)
Obese
(> + 2 Z
score)
n % n % n % n %
Gender
Male 0 0 20 51.3 10 25.6 9 23.1
Female 1 1.9 26 50 16 30.8 9 17.3
Race
Black African 0 0.0 20 54.1 7 18.9 10 27.0
White 0 0.0 12 48.0 10 40.0 3 12.0
Indian 1 5.9 11 64.7 2 11.8 3 17.6
Coloured 0 0.0 3 25.0 7 58.3 2 16.7
Table 4.5: Gender, race and BMI interpretations according to the IOTF classification
Thinness
(BMI <18.5 kg/m²
at 18 years old)
Normal
(BMI ≥18.5 kg/m²
and ≤ 25 kg/m² at
18 years old)
Overweight
(BMI ≥ 25 kg/m²
at 18 years old)
Obese
(BMI ≥ 30
kg/m² at 18
years old)
n % n % n % n %
Gender
Male 2 5.1 23 59.0 6 15.4 8 20.5
Female 6 11.5 24 46.2 16 30.8 6 11.5
Race
Black African 2 5.4 18 48.6 10 27.0 7 18.9
White 1 4.0 14 56.0 7 28.0 3 12.0
Indian 5 29.4 8 47.1 2 11.8 2 11.8
Coloured 0 0.0 7 58.3 3 25.0 2 16.7
According to the Kruskal Wallis test, no significant differences between age and BMI were
found in learners of different gender and race.

81
4.3 The daily calcium and dairy intake of Grade 2 learners in Pietermaritzburg
The total dairy consumed per day was calculated using the dietary information obtained from
the FFQ. The number of dairy servings per day was then determined from the total dairy intake,
and a distinct range was observed. A minimum of 0.2 servings to a maximum of 7.6 servings
of dairy was consumed per day, with a mean of 2.03 (SD 1.34). Two values for total daily
calcium intake were obtained. Firstly, the FFQ gave the total amount of dairy consumed, and
the calcium content was then calculated from the amount of each dairy product ingested. The
total FFQ calcium consumed per day ranged from a minimum of 65 mg per day, to a maximum
of 2298 mg per day, with a mean of 615.22 mg per day (SD 405.59) (Table 4.6).
Table 4.6: Summary of the calcium and dairy intake amongst the learners
Recommended
amount
Mean SD Minimum Maximum
Calcium
FFQ calcium
(mg/day)
EAR: 800 mg/day 615.22 405.59 65 2298
Dairy
Number of dairy
servings per day
3 2.03 1.34 0.2 7.6
A Mann Whitney test showed no significant differences in calcium and dairy intake between
the two genders (Table 4.7). The males’ calcium intake from the FFQ was lower than that of
the females’ intake, which is in line with their lower dairy intake (mean 576.94 mg per day,
SD 326.29 versus mean 643.94 mg per day, SD 457.17). Males consumed less dairy products
per day, and therefore had fewer dairy servings per day than the females (mean 1.92 servings
per day, SD 1.08 versus mean 2.11 servings per day, SD 1.52).

82
Table 4.7: Analysis of calcium and dairy intake according to gender
Calcium n % Mean SD Minimum Maximum
FFQ calcium
(mg/day)
Male
Female
Combined
39
52
91
42.9
57.1
100
576.94
643.94
615.22
326.29
457.17
405.59
65
75
65
1706
2298
2298
Dairy
Dairy servings per
day
Male
Female
Combined
39
52
91
42.9
57.1
100
1.921
2.113
2.030
1.08
1.52
1.34
0.2
0.3
0.2
5.7
7.6
7.6
When race was introduced as the independent variable, a Kruskall Wallis test showed no
significant differences in calcium and dairy intake between the four different race groups
(Table 4.8)
Table 4.8: Analysis of calcium and dairy intake according to race
Calcium
n % Mean SD Minimum Maximum
FFQ calcium
(mg/day)
Black African
White
Indian
Coloured
Total
37
25
17
12
91
40.7
27.5
18.7
13.2
100
501.74
625.52
727.00
785.33
615.22
299.63
309.89
560.78
539.18
405.59
65
136
154
155
65
1213
1583
2095
2298
2298
Dairy
Dairy
servings per
day
Black African
White
Indian
Coloured
Total
37
25
17
12
91
40.7
27.5
18.7
13.2
100
1.66
2.10
2.37
2.55
2.03
0.99
1.04
1.84
1.81
1.34
0.2
0.5
0.5
0.5
0.2
4.0
5.2
6.9
7.6
7.6

83
4.4 The Grade 2 learners’ dietary calcium intake from dairy products, compared to the
EAR for calcium
The calcium from the FFQ was compared to the EAR of 800 mg per day (Table 4.9).
Table 4.9: Calcium intake compared to the EAR
FFQ calcium compared
to the EAR
n %
Below (< 800 mg/day) 69 75.8
Meets (800-899 mg/day) 4 4.4
Above (≥ 900 mg/day) 18 19.8
Table 4.9 reveals that most of the learners were not ingesting adequate amounts of dietary
calcium to meet the EAR recommendations for calcium. When analysing the calcium intake
from the FFQ, 75.8% of the learners consumed less than 800 mg calcium per day. Using a one-
sample t-test, the FFQ calcium was found to be significantly less than the recommended EAR
of 800 mg calcium per day, (t (90)=-4.346, p<0.05).
A Pearson correlation found no significant linear relationship between age and corresponding
calcium intake, or the EAR for calcium. Furthermore, no significant difference between gender
and calcium intake was noted by the Independent samples t-test, when comparing dietary
calcium intake to the EAR for calcium (p=0.06).
4.5 The Grade 2 learners’ dairy intake compared to the recommended dairy intake
A one-sample t-test analysis showed that the learners’ average number of dairy servings per
day (2.03) to be significantly lower than the recommended three servings per day
(t (90)=-6.889, p<0.05). No significant differences in meeting the recommended dairy intake
were noted by gender, race and categories of age.
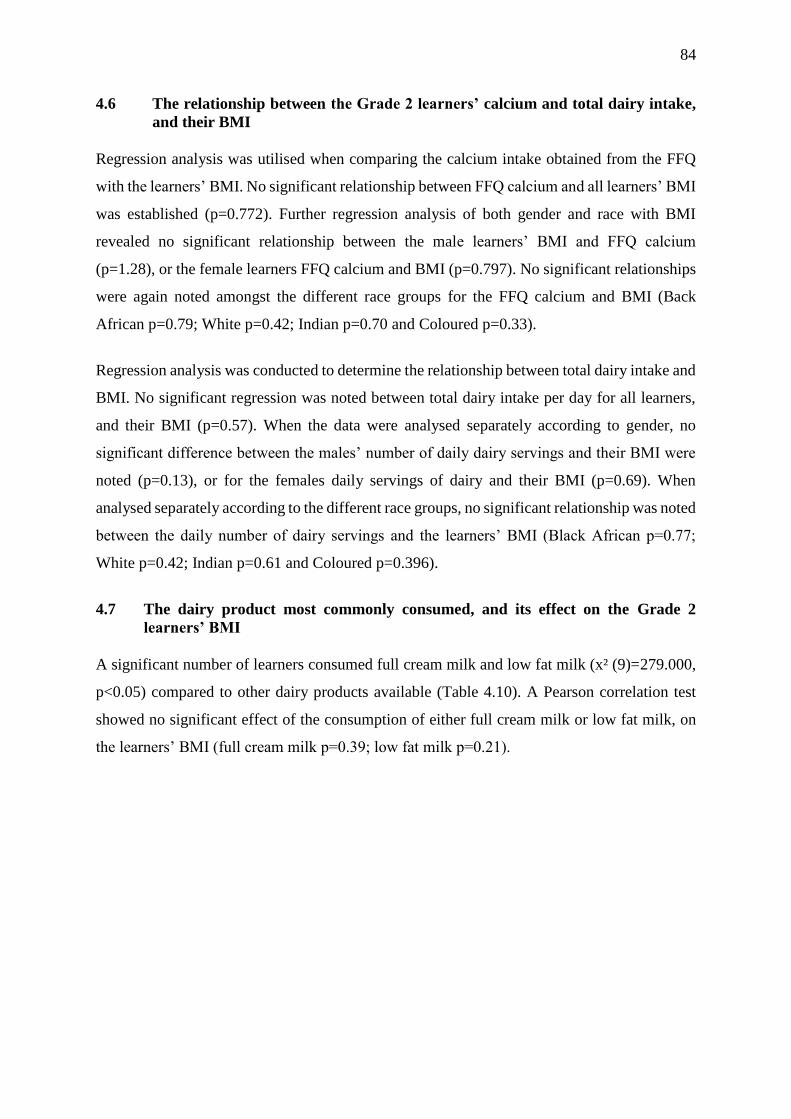
84
4.6 The relationship between the Grade 2 learners’ calcium and total dairy intake,
and their BMI
Regression analysis was utilised when comparing the calcium intake obtained from the FFQ
with the learners’ BMI. No significant relationship between FFQ calcium and all learners’ BMI
was established (p=0.772). Further regression analysis of both gender and race with BMI
revealed no significant relationship between the male learners’ BMI and FFQ calcium
(p=1.28), or the female learners FFQ calcium and BMI (p=0.797). No significant relationships
were again noted amongst the different race groups for the FFQ calcium and BMI (Back
African p=0.79; White p=0.42; Indian p=0.70 and Coloured p=0.33).
Regression analysis was conducted to determine the relationship between total dairy intake and
BMI. No significant regression was noted between total dairy intake per day for all learners,
and their BMI (p=0.57). When the data were analysed separately according to gender, no
significant difference between the males’ number of daily dairy servings and their BMI were
noted (p=0.13), or for the females daily servings of dairy and their BMI (p=0.69). When
analysed separately according to the different race groups, no significant relationship was noted
between the daily number of dairy servings and the learners’ BMI (Black African p=0.77;
White p=0.42; Indian p=0.61 and Coloured p=0.396).
4.7 The dairy product most commonly consumed, and its effect on the Grade 2
learners’ BMI
A significant number of learners consumed full cream milk and low fat milk (x² (9)=279.000,
p<0.05) compared to other dairy products available (Table 4.10). A Pearson correlation test
showed no significant effect of the consumption of either full cream milk or low fat milk, on
the learners’ BMI (full cream milk p=0.39; low fat milk p=0.21).

85
Table 4.10: The most regularly consumed dairy product in the learners’ diet
Product n %
Full cream milk 50 54.9
Low fat milk 29 31.9
Low fat yoghurt 4 4.4
Maas 2 2.2
Cheese 1 1.1
Skim milk 1 1.1
Drinking yoghurt 1 1.1
Dairy based dessert 1 1.1
Fortified supplement 1 1.1
Lactose free milk 1 1.1
Total 91 100
4.8 The dairy product that contributed the most calcium to the Grade 2 learners’ diet,
and its effect on the Grade 2 learners’ BMI
Full cream milk and low fat milk were the most significant sources of the learners’ calcium
intake, compared to the other dairy products consumed (x² (9)=236.363, p<0.05) (Table 4.11).
A Pearson correlation showed that the calcium obtained from full cream milk and low fat milk
did not have any relationship with the learners’ BMI.

86
Table 4.11: The food item that contributed the most calcium in the learners’ diet
Product n %
Full cream milk 49 53.8
Low fat milk 22 24.2
Cheese 8 8.8
Maas 4 4.4
Low fat yoghurt 3 3.3
Skim milk 1 1.1
Drinking yoghurt 1 1.1
Dairy based dessert 1 1.1
Fortified supplement 1 1.1
Lactose free milk 1 1.1
Total 91 100
4.9 Barriers that prevented the Grade 2 learners from consuming an adequate dairy
intake
Parents/guardians were presented with a Likert scale to rate possible barriers that may have
prevented the learners from consuming an adequate dairy intake (Table 4.12). From all the
possible options presented in the FFQ, the results of the t-test showed no significant barriers
that reduced the consumption of dairy. The most common barrier to dairy consumption was
cited as the ‘cost of dairy products’, with 28 parents/guardians (30.8%) reporting to ‘agree’ and
‘strongly agree’ with this statement, followed by 20 parents/guardians (22%) indicating that
the ‘learner dislikes dairy’ and 10 parents/guardians (11%) indicating ‘learner follows a special
diet’.
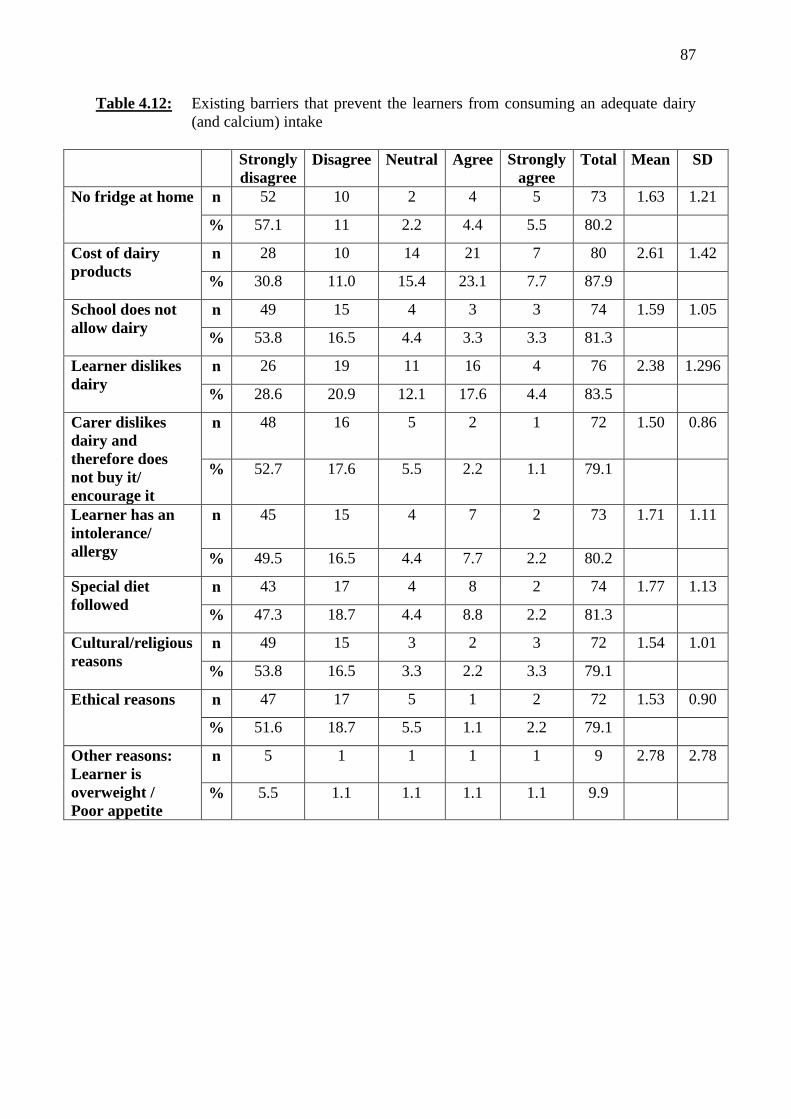
87
Table 4.12: Existing barriers that prevent the learners from consuming an adequate dairy
(and calcium) intake
Strongly
disagree
Disagree Neutral Agree Strongly
agree
Total Mean SD
No fridge at home n 52 10 2 4 5 73 1.63 1.21
% 57.1 11 2.2 4.4 5.5 80.2
Cost of dairy
products
n 28 10 14 21 7 80 2.61 1.42
% 30.8 11.0 15.4 23.1 7.7 87.9
School does not
allow dairy
n 49 15 4 3 3 74 1.59 1.05
% 53.8 16.5 4.4 3.3 3.3 81.3
Learner dislikes
dairy
n 26 19 11 16 4 76 2.38 1.296
% 28.6 20.9 12.1 17.6 4.4 83.5
Carer dislikes
dairy and
therefore does
not buy it/
encourage it
n 48 16 5 2 1 72 1.50 0.86
% 52.7 17.6 5.5 2.2 1.1 79.1
Learner has an
intolerance/
allergy
n 45 15 4 7 2 73 1.71 1.11
% 49.5 16.5 4.4 7.7 2.2 80.2
Special diet
followed
n 43 17 4 8 2 74 1.77 1.13
% 47.3 18.7 4.4 8.8 2.2 81.3
Cultural/religious
reasons
n 49 15 3 2 3 72 1.54 1.01
% 53.8 16.5 3.3 2.2 3.3 79.1
Ethical reasons n 47 17 5 1 2 72 1.53 0.90
% 51.6 18.7 5.5 1.1 2.2 79.1
Other reasons:
Learner is
overweight /
Poor appetite
n 5 1 1 1 1 9 2.78 2.78
% 5.5 1.1 1.1 1.1 1.1 9.9

88
4.9.1 The relationship between dairy products and sugar sweetened beverages
Although not measured in the Likert scale, a possible barrier to dairy consumption is sugar
sweetened beverages (SSBs). With the literature expressing concerns that reduced levels of
dairy intake are associated with a greater increase in the consumption of SSBs, a Pearson
correlation analysis was conducted to determine if such a relationship between dairy intake and
SSBs existed. However, no significant correlation was found between dairy consumption and
the following SSBs: fizzy soda drinks (p=0.49); diet soda drinks (p=0.62); 100% fruit juice
(p=0.77); less than 100% fruit juice (p=0.43); squashes (p=0.66); and cordials (p=0.19). When
all SSBs were analysed together, there was still no significant correlation between dairy intake
and SSBs (p=0.82), thus showing that those learners who drank less dairy were not necessarily
drinking more SSBs.
4.10 Summary of results
To summarise, data were collected from 91 out of a possible 377 Grade 2 learners, with a
response rate of 24.1%. Slightly more females than males participated in the study (57.1%,
n=52 females versus 42.9%, n=39 males), and the predominant racial group was Black African
(40.7%, n=37), followed by White (27.5%, n=25), Indian (18.7%, n=17) and Coloured learners
(13.2%, n=12). The mean age of the learners was 8.3 years old (SD 0.27539).
The first objective was to determine the BMI of the Grade 2 learners. The mean BMI for the
male learners was 18.7 kg/m² (SD 3.83), and the mean BMI for the female learners was 18.1
kg/m² (SD 3.41). Although the WHO classified 50.5% of learners as having a normal BMI,
and the IOTF classified 51.6% of learners as normal, almost half (48.6%) of the remaining
learners were classified as either overweight (28.6%) or obese (19.8%) according to the WHO.
Figures for the IOTF classification were slightly lower, with a total of 39.6% of learners
classified as either overweight (24.2%) or obese (15.4%). Whilst more females were found to
be overweight than males (WHO: 30.8% versus 25.6%; IOTF: 30.8% versus 15.4%), more
males were obese compared to females (WHO: 23.1% versus 17.3%; IOTF: 20.5% versus
11.5%). No significant differences between gender and BMI, race and BMI, and age and BMI
of the learners were observed.
The second objective was to determine the total calcium and dairy intake amongst the Grade 2
learners. The total amount of dairy consumed per day, as well as the number of dairy servings
per day was determined from the FFQ. Dairy servings per day ranged from 0.2 to 7.6, with a

89
mean of 2.03 servings per day (SD 1.34). Male learners consumed less dairy than females, with
the male learners recording a mean of 1.92 dairy servings per day, SD 1.08 versus the females’
daily mean of 2.11 dairy servings per day, SD 1.52. The learners’ average daily number of
dairy servings was significantly lower than the recommended amount of three servings per day,
but no significant differences were noted amongst gender, age or race in not meeting the
recommended three servings of dairy per day. Dietary calcium was obtained from the FFQ,
with a range of 65 mg per day to 2298 mg per day, mean 615.22 mg per day (SD 405.59) for
all leaners. According to the FFQ, males had a lower calcium intake than females, which is
consistent with their reported lower dairy intake (mean 576.94 mg per day, SD 326.29 versus
mean 643.94 mg per day, SD 457.17). No significant differences between gender or race, and
the dairy and calcium intake were observed.
The third objective was to investigate the contribution of dairy products to meeting the Grade
2 learners’ EAR requirements for calcium. The majority of learners significantly did not meet
the recommended daily intake for calcium, with 75.8% of learners consuming <800 mg calcium
per day from the FFQ. No significant differences between the learners’ ages or genders were
noted, when determining if their calcium intake met the EAR for calcium.
The fourth objective was to determine if any relationship existed between the Grade 2 learners
calcium and dairy intake, and their BMI. No significant association was noted between FFQ
calcium and all learners’ BMI, nor were any significant differences observed between the
calcium intake of different genders or races, and their corresponding BMI’s. When analysing
for total dairy intake and BMI, no significant association was noted between total dairy intake
per day for all learners, and their BMI. Once again, no significant differences were noted when
gender and race were considered.
With the majority of Grade 2 learners not meeting their calcium and dairy requirements,
parents/guardians were asked about possible barriers that prevented the learners from obtaining
sufficient calcium and dairy on a daily basis. Although there was significant disagreement that
the proposed barriers prevented an adequate calcium and dairy intake, the most common barrier
cited was the ‘cost of dairy products’, with ‘learner dislikes dairy’, and ‘special diet followed’
listed as the second and third most common barriers.
The next chapter will discuss the results from this study, in relation to similar studies conducted
locally and internationally.

90
CHAPTER 5: DISCUSSION
The purpose of this study was to determine if there was a relationship between the calcium
intake from dairy or total dairy intake, and the BMI of Grade 2 learners from quintile 5 schools
in Pietermaritzburg. This chapter will discuss the results of each study objective, drawing on
the findings from studies previously conducted, and comparing the results to the available
literature.
5.1 The prevalence of overweight and obesity amongst Grade 2 learners in
Pietermaritzburg, as measured by their BMI
According to the 2011 Census data (Stats SA 2016), Msunduzi is one of the most well
populated municipalities within KZN, with 618 536 residents. The population of 7 to 8 year
old children within the Msunduzi municipality consisted of 86.5% Black Africans, followed
by 7.4% Indians, 3.6% Whites and 2.5% Coloureds (Stats SA 2011). The final sample of
schools was not fully representative of the racial distribution of the learners in the Msunduzi
municipality, as quintile 5 schools were surveyed and more White, Coloured and Indian
learners responded, than were represented within the Msunduzi municipality population of 7
to 8 year olds (Stats SA 2016).
The BMI of the 91 learners was calculated and interpreted, according to both the WHO and the
IOTF classifications for ‘wasting’ (WHO) or ‘thinness’ (IOTF), ‘normal’ BMI, ‘overweight’
and ‘obese’. The results of this study showed lower levels of overweight and obesity when
consulting the IOTF classification, compared to the WHO classification. The BMI of the male
learners ranged from 13.9 kg/m² to 29.1 kg/m², with a mean BMI of 18.7 kg/m² (SD 3.83). The
ideal range of BMI-for-age for 7 to 8 year old boys is 15 to 15.5 kg/m². According to the WHO
classification, 51.3% of males had a normal BMI, 25.6% were overweight, and 23.1% were
obese. When combining the overweight and obese figures, almost half of all the male learners
studied (48.7%) were overweight or obese. According to the IOTF classification, 5.1% of males
were thin, 59.0% were of normal BMI, 15.4% were overweight, and 20.5% were obese. This
is a total of 35.9% of males who were overweight or obese, which is much lower than the WHO
classification.
For the female learners, a BMI-for-age range of 12.6 kg/m² to 27.6 kg/m² was recorded, with
a mean BMI-for-age of 18.1 kg/m² (SD 3.41). The normal BMI-for-age for 7 to 8 year old girls
is 14.9 to 15.4 kg/m². When the female learners’ BMI were compared to the WHO
91
classification, 1.9% were classified as wasted, 50.0% had a normal BMI-for-age, 30.8% were
overweight, and 17.3% were obese. When combined, a total of 48.1% female learners were
overweight or obese, slightly lower than for the male learners (48.7%). According to the IOTF
classification, 11.5% of female learners were thin, 46.2% were of a normal BMI-for-age, 30.8%
were overweight, and 11.5% were obese. This is a total of 42.3% overweight or obese females,
which is less than the WHO classification. The WHO classification showed almost equal
combined rates of overweight and obesity amongst the male and female learners, whereas the
IOTF classification showed far more female learners to be overweight and obese than male
learners.
As discussed in Chapter 3, the BMI interpretation according to the IOTF classification always
shows lower rates of overweight and obesity compared to the WHO classification. This is
because the cut-off values for overweight and obesity according to the IOTF criteria are higher
than the WHO’s criteria (for example, the SD equivalent for the IOTF overweight cut-off is
1.2-1.3, compared to the WHO’s 1 SD). This implies that the IOTF may classify the WHO’s
same ‘overweight’ and ‘obese’ children as ‘normal’ or ‘overweight’ respectively. As a result,
the IOTF results for overweight and obesity are considered more grave (Cole et al 2000).
Whilst the WHO cut-offs have received international recognition, and been widely cited in
many studies worldwide, the IOTF criteria, too, have been cited over 4250 times in many global
studies (Cole & Lobstein 2012). When comparing the IOTF cut-offs with the WHO, the two
standards follow a similar skewness in their curves, reflecting the fact they both include similar
US data (Cole & Lobstein 2012). Limitations to both references have been recognised, namely
the confusion that may arise at the age of five years old when the WHO cut off criteria for
overweight and obesity changes, and the fact that the IOTF cut-offs are restricted to 2 to 18
years of age.
Although most of the South African studies on paediatric overweight and obesity did not
specify the reason for their choice of either the WHO or IOTF for analysis of their results,
Kemp et al (2011) indicated the IOTF was chosen because it refers to age-specific BMI cut off
values, and the BMI of children changes constantly as they age. Armstrong et al (2006) stated
that the IOTF cut-off’s were consulted to ensure their results could be compared to other
international data. These authors also suggested the IOTF cut-offs were superior to “using
previous methods of arbitrarily defined percentile cut-offs”. Monasta, Lobstein, Cole,
Vignerovà & Cattaneo (2011) indicated the IOTF could be the method of choice in identifying

92
overweight and obese children at individual and population level as the cut-offs are “based on
a crude association with ill health later in life, namely the definition of overweight and obesity
at age 18 years”. Rolland-Cachera (2011) recommended that without international consensus
on which classification to use, both the IOTF and WHO definitions for overweight and obesity
should be used when assessing the prevalence of childhood overweight and obesity, and the
Cole et al (2007) and WHO classifications for thinness.
When compared to South African studies on the prevalence of childhood overweight and
obesity conducted from 1997 to 2013, the results of this study clearly depict an increasing trend
in the rate of paediatric overweight and obesity. The most recent national study, SANHANES-
1 (2013), showed paediatric overweight and obesity for 6 to 9 year olds (according to the IOTF
classification) to be 4.5% and 2.7% for male children, and 12.3% and 4.1% for female children,
with children from urban formal and urban informal areas having the highest BMI (Shisana et
al 2013). More children were overweight and obese (8.4% and 3.4%) compared to the NFCS-
FB study in 2005 (7.8% and 2.5% respectively). SANHANES-1 (2013) showed that South
African males aged 2 to 14 years old hailing from KZN had the highest mean BMI of 17.3
kg/m², whilst the male learners in this study had a much higher average BMI (18.7 kg/m² versus
17.3 kg/m²). The KZN females in the SANHANES-1 study (2 to 14 years old) also had the
highest mean BMI of 18.5 kg/m² out of all the other participating provinces (Shisana et al
2013), but the female learners in this study had a slightly lower mean BMI (18.1 kg/m² versus
18.5 kg/m²). The age range in the SANHANES-1 study was much larger than that of this study,
and therefore may have had an impact on the overall final mean BMI.
In the SANHANES-1 study, 6 to 9 year old females were significantly more overweight or
obese than the males. Although the IOTF classification figures in this study for overweight
were not statistically significant between the two genders, twice the number of females were
overweight compared to the males (30.8% versus 15.4%). Although also not statistically
significant, the male learners in this study were more likely to be obese than the female learners
(20.5% versus 11.5% respectively). This deviates from previous South African studies by
Shisana et al (2013); Kemp et al (2011); Truter et al (2010); Armstrong et al (2006);
Mukuddem-Petersen & Kruger (2004); Somers (2004); Jinabhai et al (2003); Monyeki et al
(1999) and Cameron & Getz (1997) where females were usually more obese than males, and
is a cause for possible concern.

93
Wiles et al (2013) conducted a study within Pietermaritzburg, regarding the tuck shop
purchasing practices of 311 Grade 4 learners in the same schools that the current study was
conducted in. The mean age of their learners was 9.85 (±0.5) years. Their results found that the
males had an average BMI of 19.8 (±4.9) kg/m², and the females had an average BMI of 20.3
(±4.6) kg/m². These figures are higher than the figures from the current study. In Wiles et al’s
(2013) study the incidence of overweight and obesity (according to the WHO classification)
for males was 29% and 24.6 % respectively (a total of 53.6%). The results for the females
showed 24.9% of females were overweight and 29.5% were obese (a total of 54.4%). It must
be noted that the male learners were more overweight than the females, but had not yet
surpassed them in rates of obesity.
While the current study shows a slight decrease in the overall incidence of overweight and
obesity in the past few years within Pietermaritzburg schools, these results should be
interpreted with caution considering the sample size of this study was much smaller than Wiles
et al’s (2013) study. More attention must be focussed on efforts to further reduce overweight
and obesity within these schools, especially in light of the number of obese male learners now
exceeding the number of obese female learners.
5.2 The daily calcium and dairy intake of Grade 2 learners in Pietermaritzburg
The average calcium intake of Grade 2 learners obtained from the FFQ was 615.22 mg calcium
per day. When considering gender and race, the female learners reported a higher calcium
intake from the FFQ than the male learners did (643.94 mg per day versus 576.94 mg per day).
Regarding the different races, the FFQ calcium intake was highest for the Coloured learners
(mean 785.33 mg per day), followed by the Indian learners (mean 727 mg per day), the White
learners (mean 625.52 mg per day), and the Black African learners (mean 501.74 mg per day).
These results are consistent with other studies, which have shown low calcium intakes amongst
the South African population, especially the Black Africans (Vorster et al 1997; Van Rensburg,
Benade, Rose & Du Plessis 1983).
The dairy intake of the Grade 2 learners was also obtained from the FFQ. Although the learners’
dairy intake varied widely, ranging from 0.2 to 7.6 servings per day, the average number of
dairy servings per day was 2.03 (±1.34). This amount was significantly lower than the
recommended three servings of dairy per day, which would provide 900 mg calcium per day

94
(Milk SA 2016). The most commonly consumed dairy product of the learners was full cream
milk (54.9%, n=50), followed by low fat milk (31.9%, n=29). As is consistent with the FFQ
calcium, the Coloured learners reported more dairy servings per day (mean 2.55 servings per
day) compared to the Indian learners (mean 2.37 servings per day), and the White learners
(mean 2.1 servings per day), with the Black African learners consuming the least amount of
dairy (mean 1.66 servings per day).
Whilst the importance of assessing children’s dietary intake is extremely relevant with today’s
current obesity epidemic, the many limitations and obstacles in obtaining an accurate dietary
report have been recognised (Magarey et al 2011). It is recommended in studies where children
are under the age of 10 years old that parents or caregivers report on their dietary intake, due
to the subjects’ limited memory recall and conceptualization of portion sizes and frequency of
eating (Magarey et al 2011). However, this is no guarantee that the recorded dietary intake will
be more accurate, as children are not always in the presence of their parents/guardians when
eating. The weight status of the reporting individual has also shown to influence reporting
accuracy, with increased body fatness associated with underreporting of food intake (Magarey
et al 2011).
A self-administered FFQ was chosen as the most practical means of gathering information on
the calcium and dairy intake of the Grade 2 learners, due to time and financial constraints. The
advantages and disadvantages of the FFQ were previously discussed in Chapter 3, where it was
shown to accurately rank individuals according to levels of intake of a particular nutrient;
however it could not always precisely determine the true intake of a particular nutrient. It must
be noted that because the FFQ was retrospectively done over a 12 month period, the results
should be interpreted with caution.
International studies have shown variance in the accuracy of measuring calcium intake when
using FFQ’s. In a study conducted on 162 Canadian male children and adolescents from 9 to
16 years of age, the calcium intake from a FFQ and 24-hour recall were compared, with the
results showing a significant, yet moderate, difference in the calcium intake between the two
methods. The authors concluded that the FFQ overestimated the dietary intake of calcium
(Moore et al 2007). Likewise, Zemel et al (2010) showed the calcium intake from a FFQ to
be higher than a 7-day weighted food record, but concluded that the FFQ was a valid tool in
identifying children with a low calcium intake. Conversely, Huybrechts et al (2006) found that
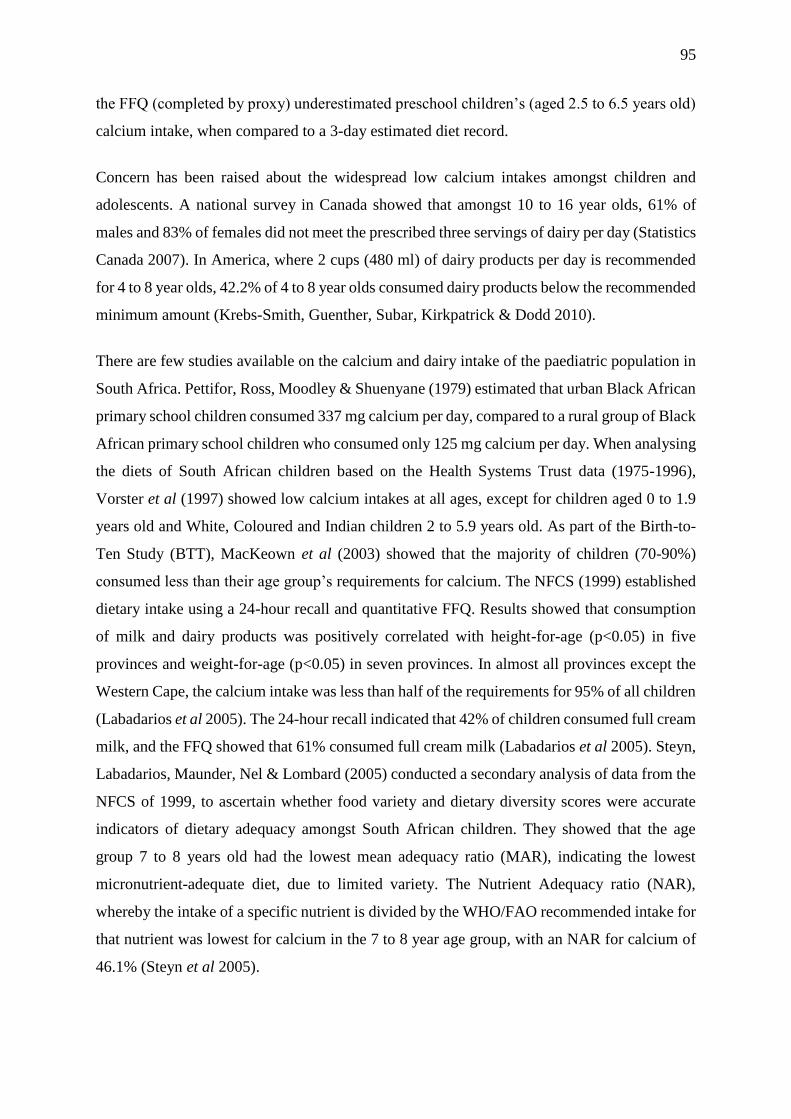
95
the FFQ (completed by proxy) underestimated preschool children’s (aged 2.5 to 6.5 years old)
calcium intake, when compared to a 3-day estimated diet record.
Concern has been raised about the widespread low calcium intakes amongst children and
adolescents. A national survey in Canada showed that amongst 10 to 16 year olds, 61% of
males and 83% of females did not meet the prescribed three servings of dairy per day (Statistics
Canada 2007). In America, where 2 cups (480 ml) of dairy products per day is recommended
for 4 to 8 year olds, 42.2% of 4 to 8 year olds consumed dairy products below the recommended
minimum amount (Krebs-Smith, Guenther, Subar, Kirkpatrick & Dodd 2010).
There are few studies available on the calcium and dairy intake of the paediatric population in
South Africa. Pettifor, Ross, Moodley & Shuenyane (1979) estimated that urban Black African
primary school children consumed 337 mg calcium per day, compared to a rural group of Black
African primary school children who consumed only 125 mg calcium per day. When analysing
the diets of South African children based on the Health Systems Trust data (1975-1996),
Vorster et al (1997) showed low calcium intakes at all ages, except for children aged 0 to 1.9
years old and White, Coloured and Indian children 2 to 5.9 years old. As part of the Birth-to-
Ten Study (BTT), MacKeown et al (2003) showed that the majority of children (70-90%)
consumed less than their age group’s requirements for calcium. The NFCS (1999) established
dietary intake using a 24-hour recall and quantitative FFQ. Results showed that consumption
of milk and dairy products was positively correlated with height-for-age (p<0.05) in five
provinces and weight-for-age (p<0.05) in seven provinces. In almost all provinces except the
Western Cape, the calcium intake was less than half of the requirements for 95% of all children
(Labadarios et al 2005). The 24-hour recall indicated that 42% of children consumed full cream
milk, and the FFQ showed that 61% consumed full cream milk (Labadarios et al 2005). Steyn,
Labadarios, Maunder, Nel & Lombard (2005) conducted a secondary analysis of data from the
NFCS of 1999, to ascertain whether food variety and dietary diversity scores were accurate
indicators of dietary adequacy amongst South African children. They showed that the age
group 7 to 8 years old had the lowest mean adequacy ratio (MAR), indicating the lowest
micronutrient-adequate diet, due to limited variety. The Nutrient Adequacy ratio (NAR),
whereby the intake of a specific nutrient is divided by the WHO/FAO recommended intake for
that nutrient was lowest for calcium in the 7 to 8 year age group, with an NAR for calcium of
46.1% (Steyn et al 2005).

96
The NFCS-FB (2005) and SANHANES-1 (2013) did not investigate the dairy and calcium
intake of the South African paediatric population as they were focused on the serum results of
micronutrients Vitamin A, iron (Shishana et al 2013; Labadarios et al 2005), iodine, zinc and
folate (Labadarios et al 2005) instead. Therefore no results regarding calcium intake of
children are available from either of these surveys to compare with the results of this study.
As part of the NutriGo study, Theron et al (2007) measured the calcium intake of 12 to 24
month old children from poor socioeconomic backgrounds in Gauteng and Limpopo. These
children consumed calcium well below the recommended intake for their age group of 500 mg
per day, with the urban group consuming an average of 286 mg per day (SD 245) and the rural
group consuming even less calcium: 205 mg per day (SD 207). The calcium intake increased
by approximately 100 mg per day in both groups when breastmilk was included in the analysis.
Whole, fresh milk (full cream milk) was the fourth most commonly consumed item in the urban
subjects’ diets, following maize meal, tea and carbonated drinks. The other dairy products
commonly consumed by these young children were mahewu (seventh), icecream (eleventh)
and skimmed milk (twenty eighth). In the rural subjects, whole fresh milk was the fifth most
commonly consumed item, following maize meal, tea, potato and mahewu. Skim fresh milk
was the nineteenth most commonly consumed item in their diet (Theron et al 2007).
In 2003, Smuts, Faber, Schoeman, Laubscher, Oelofse, Benadé & Dhansay (2008) looked at
the nutritional status of 0 to 71 month old children and their caregivers across two provinces,
KZN and the Eastern Cape. Most of the subjects came from a poor socioeconomic setting with
limited access to basic services. When looking at dietary intake, the variety of food consumed
was limited, with more people ‘seldom or never’ consuming products of animal origin, and 51-
64% of households interviewed claiming to ‘seldom or never’ drink milk (Smuts et al 2008).
The literature shows calcium and dairy intake amongst the paediatric population of South
Africa to be well below the requirements for their specific age group. Whilst the results from
this study are consistent with national results that show a low calcium intake in South African
children’ diets, the data from this study must be interpreted with caution. Written guidelines
on accurately and honestly completing the FFQ were given to the parents/guardians, but
because completion of the FFQ was not explained in person to the parents/guardians, an
element of bias and recall error may have resulted. It must also be noted that other nutrients in
the diet that interfere with the absorption of calcium, such as tannins in tea, phytates in cereals,

97
and oxalates in spinach were not measured, and therefore the bioavailability of the recorded
calcium intake cannot be confirmed.
Due to the current cost of dairy products and their need for refrigeration, it can be assumed that
learners from quintile 1-4 schools may have even less access to dairy products and therefore a
much lower dairy and calcium intake than the learners in this study. With the rapid skeletal
growth that occurs in the adolescent stage fast approaching, it is the last opportunity for learners
to lay down calcium stores for optimum bone accretion. It is therefore essential that primary
school children are encouraged to increase their dairy intake, and subsequent calcium intake,
to maximise on this window of opportunity.
5.3 Grade 2 learners’ dietary calcium intake from dairy products, compared to the
EAR
The majority of learners in this study did not consume adequate amounts of dietary calcium to
meet the EAR for calcium for 4 to 8 year olds. The FFQ showed calcium intakes to be
significantly less than the EAR, with 75.8% of learners consuming less than 800 mg calcium
per day. However, no significant differences were noted between age and dairy intake, or
gender and dairy intake. This implies that the prevalence of inadequate calcium intake amongst
the population group studied is high. However, as previously mentioned, these results need to
be interpreted cautiously, due to the researcher not having met the parents/guardians in person
to explain the dietary assessment tool. The intake of dietary supplements was not measured, as
the literature showed they have little anti-obesity effect (Zemel 2000), and were therefore not
considered necessary to the outcome of the study. However, some of the learners may have
taken dietary supplements containing calcium, and therefore have a higher calcium intake than
that measured.
Dairy is the richest source of dietary calcium, in addition to many other important nutrients
such as potassium, magnesium, the B vitamins, and bioactive peptides. One serving of dairy
provides approximately 300 mg calcium, and by consuming three servings of dairy per day,
approximately 900 mg calcium will be provided, thus ensuing the EAR for calcium is met.
5.4 The Grade 2 learners’ dairy intake compared to the recommended dairy intake
The average number of dairy servings per day amongst the learners was 2.03 (SD 1.34). This
was significantly lower than the recommended three servings of dairy per day, but this result

98
needs to be interpreted with caution. Dairy, specifically milk and yoghurt, can be used as a
good indicator of the quality of a diet, due to the nutritional density of these foods (Weaver
2014). In diets where dairy consumption was low, the nutritional profile of the diet was found
to be lacking in several vital nutrients; few people are able to meet all of their nutritional
requirements on a low dairy, or a dairy-free diet (Weaver 2014).
Considering the known benefits of calcium, and that there is often inadequate intake of calcium,
increasing the intake of dairy in the diet will contribute significantly towards improving the
growth potential and overall health of the South African paediatric population.
5.5 The relationship between the Grade 2 learners’ calcium and total dairy intake, and
their BMI
No significant associations were found between the calcium intake from the FFQ and BMI of
learners (p=0.772), irrespective of the learners’ gender or race. When analysing the effect of
dairy intake on the learners’ BMI, no significant relationship was detected for gender (males
p=0.13; females p=0.69), or race (Black African p=0.77; White p=0.42; Indian p=0.61 and
Coloured p=0.396). Therefore, the hypothesis that the intake of dietary calcium, and /or total
dairy intake is inversely related to the BMI of Grade 2 learners in Pietermaritzburg is rejected.
However, the rejection of this hypothesis must be done with caution due to the risk of recall
error in the self-administered FFQ.
Despite Zemel et al (2000) demonstrating an inverse relationship between dietary calcium and
adiposity in adult adipocytes, as yet, no such study has been conducted on children at cellular
level. As children express a different metabolic and physiological profile to adults, it has been
queried whether this same response would be noted in children (Dror 2014). Many international
studies have been conducted to determine the relationship between calcium or dairy products
on weight and body fat in children.
Some studies have shown a positive relationship between dietary calcium or dairy, and weight
loss (Eriksson & Strandvik 2010; Kelishadi et al 2009; LaRowe et al 2007; Johnson et al 2007;
Moore et al 2006; Barba et al 2005; Dixon et al 2005; Carruth & Skinner 2001; Tanasescu et
al 2000), whilst other studies have shown calcium or dairy to have no impact at all on weight
status (Fayet et al 2013; Lin et al 2012; Danyliw et al 2012; Bradlee et al 2010; Wiley 2010;
Moore et al 2008; Murphy et al 2008; Fiorito et al 2006; Tam et al 2006; Berkey et al 2005;
Phillips et al 2003). Gunther et al (2013) showed dairy to have a positive, inverse relationship

99
to weight in underweight and normal weight children only, with no effect on overweight or
obese children. Three studies showed calcium and milk products to have an inverse association
with BMI in girls only (Abreu et al 2012; Moreira et al 2005; Forshee & Storey 2003). Many
of the studies differed in terms of their subject demographics, study design, methodology, type
of dairy products and serving sizes thereof, follow up duration and anthropometric
measurement outcomes, and so it is impossible to compare them. With such mixed results, it
is difficult to draw an obvious conclusion on the matter.
The theory that a potential threshold effect of calcium exists at intakes equal or greater than
963 mg per day, with no benefit observed in obese children (Dixon et al 2005), cannot be
proven as the calcium intake was so low amongst the majority of learners studied. It can be
argued that the learners’ calcium and dairy intakes were too low to notice any association with
their BMI. Furthermore, the majority of studies indicated that full cream milk may be more
beneficial than low fat milk (Louie et al 2011), but most of the learners favoured full cream
milk (54.9%) compared to all other types of milk and dairy products, and no association was
observed with their weight.
5.6 Barriers affecting dairy intake
With the majority of learners’ not meeting the EAR for calcium, in addition to the
recommended three servings of dairy per day, it was important to determine what barriers
restricted them from consuming sufficient dairy, and therefore calcium. These questions were
posed in the form of a Likert scale in the FFQ, with 10 possible barriers presented to the
parents/guardians. However, the parents/guardians indicated that none of the potential barriers
listed significantly reduced the opportunity for their learners to consume dairy.
“Cost of dairy products” was the most commonly cited obstacle to the learners’ dairy intake,
with 23.1% agreeing and 7.7% strongly agreeing that cost played a large role in consuming an
adequate dairy intake. Cost is a major influence on purchasing practices in developing
countries, as observed by Le Roux et al (2016). The study population were specifically chosen
from quintile 5 schools, as it was expected that these families would be able to afford dairy
products. It may therefore be assumed that learners from quintile 1-4 schools are even less
likely to consume dairy products than the quintile 5 sample studied, and therefore have an even
lower dairy intake than the learners in this study.
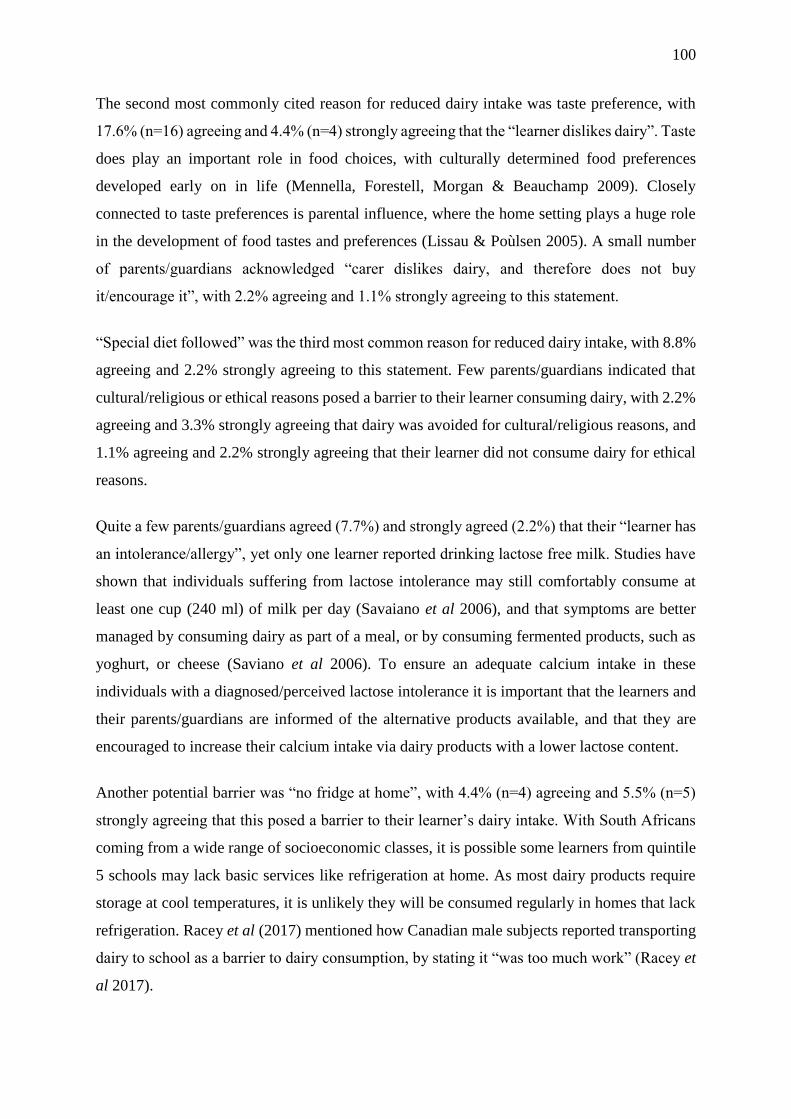
100
The second most commonly cited reason for reduced dairy intake was taste preference, with
17.6% (n=16) agreeing and 4.4% (n=4) strongly agreeing that the “learner dislikes dairy”. Taste
does play an important role in food choices, with culturally determined food preferences
developed early on in life (Mennella, Forestell, Morgan & Beauchamp 2009). Closely
connected to taste preferences is parental influence, where the home setting plays a huge role
in the development of food tastes and preferences (Lissau & Poùlsen 2005). A small number
of parents/guardians acknowledged “carer dislikes dairy, and therefore does not buy
it/encourage it”, with 2.2% agreeing and 1.1% strongly agreeing to this statement.
“Special diet followed” was the third most common reason for reduced dairy intake, with 8.8%
agreeing and 2.2% strongly agreeing to this statement. Few parents/guardians indicated that
cultural/religious or ethical reasons posed a barrier to their learner consuming dairy, with 2.2%
agreeing and 3.3% strongly agreeing that dairy was avoided for cultural/religious reasons, and
1.1% agreeing and 2.2% strongly agreeing that their learner did not consume dairy for ethical
reasons.
Quite a few parents/guardians agreed (7.7%) and strongly agreed (2.2%) that their “learner has
an intolerance/allergy”, yet only one learner reported drinking lactose free milk. Studies have
shown that individuals suffering from lactose intolerance may still comfortably consume at
least one cup (240 ml) of milk per day (Savaiano et al 2006), and that symptoms are better
managed by consuming dairy as part of a meal, or by consuming fermented products, such as
yoghurt, or cheese (Saviano et al 2006). To ensure an adequate calcium intake in these
individuals with a diagnosed/perceived lactose intolerance it is important that the learners and
their parents/guardians are informed of the alternative products available, and that they are
encouraged to increase their calcium intake via dairy products with a lower lactose content.
Another potential barrier was “no fridge at home”, with 4.4% (n=4) agreeing and 5.5% (n=5)
strongly agreeing that this posed a barrier to their learner’s dairy intake. With South Africans
coming from a wide range of socioeconomic classes, it is possible some learners from quintile
5 schools may lack basic services like refrigeration at home. As most dairy products require
storage at cool temperatures, it is unlikely they will be consumed regularly in homes that lack
refrigeration. Racey et al (2017) mentioned how Canadian male subjects reported transporting
dairy to school as a barrier to dairy consumption, by stating it “was too much work” (Racey et
al 2017).

101
An equal number of parents/guardians agreed (3.3%, n=3) and strongly agreed (3.3%, n=3)
that the “school does not allow dairy”, which inhibited their learners’ dairy intake. It is not
clear why only six out of 91 respondents felt the school did not allow dairy products, as the
numbers are not enough to imply this was a school rule. Perhaps this perception had been
verbally conveyed or implied in passing, due to a lack of sufficient refrigeration facilities at the
school. As children spend a large portion of their day at school, the school environment
becomes a major influence on the development of their attitudes and beliefs towards food
(Story 2009). It is therefore essential that the school environment encourages and promotes
healthy food options, in addition to making these food options available.
Wiles, Green & Veldman (2011) conducted a study on tuck shop practices in the same schools
as the current study. Their results showed that children bought from tuck shops on a regular
basis (at least three times a week). Only 18.2% (n=2) of tuck shops stocked flavoured milk (the
most nutritious beverage available for sale), and they were the least sold items of all the
beverages available (1.5 units per day) (Wiles et al 2011). The reasons given for such low sales
of flavoured milks were lack of visibility, and that they were unpopular amongst the school
children and as a result often expired. The school tuck shops were often supplied with fridges
by Amalgamated Beverage Industries Ltd, who supply Coca-Cola products (Wiles et al 2011).
As part of this arrangement, only Coca-Cola products were allowed to be displayed in these
fridges, with other, non Coca-Cola products such as flavoured milk, being stored in fridges at
the back of the tuck shop, possibly due to a shortage of space near the front of the tuck shop
(Wiles et al 2011).
Under ‘other reasons’, 1.1% (n=1) of the learners had a poor appetite, which hindered dairy
intake, and 1.1% (n=1) of the learners avoided dairy because the learner was overweight.
Negative misconceptions that dairy is fattening do exist (Henry, Whiting, Phillips, Finch, Zello
& Vatanparast 2015; James 2004), and this is regarded by many as a barrier to dairy
consumption. With the rich nutritional content of dairy products, it is essential that children
and adolescents be educated on the many health benefits of dairy, so as to avoid such
misconceptions and encourage a greater intake of dairy.
The literature has suggested a link between the observed decrease in the intake of milk and
dairy products, and the increased consumption of SSBs (Nielsen & Popkin 2004; French et al
2003; Cavadini et al 2000), and therefore it can be assumed that the consumption of SSBs may
be a barrier to ensuring an adequate dairy intake. The learners consumption of SSBs was

102
recorded as part of the FFQ, but no direct association between SSB consumption and dairy
intake was detected in this study (p=0.82). This implies that the learners who drank less dairy
were not drinking more SSBs, and so this barrier to dairy consumption may be ruled out.
5.7 Summary
The male learners in this study had a mean BMI of 18.7 kg/m², which was much greater than
the ideal range of 15-15.5 kg/m² for 7 to 8 year old boys. According to the WHO classification,
almost half of all the male learners studied (48.7%) were overweight or obese. However,
overweight and obesity figures were much lower when compared to the IOTF classification,
with a total of 35.9% of males overweight or obese. The female learners had a mean BMI-for-
age of 18.1 kg/m², which exceeded the ideal range for 7 to 8 year old girls of 14.9-15.4 kg/m².
The combined incidence of overweight and obesity was slightly lower when compared to the
male learners, with a total of 48.1% female learners overweight or obese according to the WHO
classification, and a total of 42.3% overweight or obese compared to the IOTF classification.
Although the females were more overweight than the males (WHO: 30.8% versus 25.6% and
IOTF: 30.8% versus 15.4%), the male learners were more obese than the females (WHO:
23.1% versus 17.3% and IOTF: 20.5% versus 11.5%).
These results for childhood overweight and obesity far exceed the measurements for 6 to 9 year
old males and females reported in the SANHANES-1 study (7.2% overweight and obese boys,
and 16.7% overweight and obese girls according to IOTF classification) (Shishana et al 2013).
Whilst previous national studies have shown a steady increase in the rates of paediatric
overweight and obesity (with females consistently heavier than males), this study demonstrates
the male obesity figures to have surpassed the rates of female obesity.
International studies have previously highlighted low calcium intakes amongst the paediatric
population (Krebs-Smith et al 2010; Statistics Canada 2007) with local studies showing similar
results. Although the SANHANES-1 (2013) and NFCS-FB (2005) did not specifically measure
calcium intake, other large studies in South Africa have shown calcium intakes to be well below
the recommended intake for the particular age group studied (Theron et al 2007; Labadarios et
al 2005; Steyn et al 2005; MacKeown et al 2003; Vorster et al 1997; Pettifor et al 1979). This
study showed a similar trend of low calcium intake, with the majority of learners not meeting
the EAR for calcium for 4 to 8 year olds. The FFQ showed an average calcium intake of 615.22
mg per day, with calcium intakes significantly less than the EAR (75.8% of learners consuming

103
less than 800 mg per day). The average number of dairy servings per day was 2.03 (±1.34),
which was significantly lower than the recommended three servings of dairy per day for this
age group (Milk SA 2016).
Many challenges have been identified in accurately obtaining a true reflection of dietary intake,
especially in the paediatric population. International studies have shown discrepancies using
different dietary recall methods to record the dietary calcium intake (Zemel et al 2010; Moore
et al 2007; Huybrechts et al 2006; McPherson et al 2000). Several factors need to be considered
when deciding which calcium value is a better indication of true calcium intake, for example
reporting bias of the parents/guardians, and poor memory recall. Due to the potential errors in
respondent bias that may have occurred in using the FFQ, the results obtained from this study
need to be carefully interpreted.
With Zemel et al (2000) demonstrating a link between calcium intake and adiposity in adults,
several international studies have been conducted on the association between milk and/or dairy
intake and BMI amongst children, with mixed results. Although no association was identified
in this study between calcium intake or dairy intake and the learners’ BMI, the learners’
calcium intakes were so low, with few meeting the EAR for calcium for their age group, that
this should be an incentive for encouraging increased calcium intake. Dairy is the most
abundant source of dietary calcium (in addition to many other important nutrients), and with
the presence of dairy (particularly milk and yoghurt) considered a good indicator of diet quality,
an increased intake across all population groups in South Africa must be encouraged by
government and various other stakeholders.
Parents/guardians were asked to identify barriers that existed to their learners’ dairy intake.
Although there was no significant agreement that all the barriers listed were obstructing dairy
intake, the cost of dairy products was identified as the most common barrier, supported by Le
Roux et al (2016). With Grade 2 learners from well-resourced quintile 5 schools not managing
to meet their calcium requirements, it is highly unlikely that children from poorer
socioeconomic backgrounds who lack basic services such as refrigeration, and knowledge of
healthy foods will be able to meet their calcium requirements. Other barriers to dairy intake
included taste preference, parental influence, special diet followed, cultural/religious or ethical
reasons, milk intolerance/ allergy, school does not allow dairy, misconceptions that dairy is
fattening, and poor appetite.

104
CHAPTER 6: CONCLUSION AND RECOMMENDATIONS
This chapter concludes the findings of the study in relation to the set objectives. Limitations of
the study are discussed, and appropriate recommendations for further research are made.
6.1 Conclusion of study findings
6.1.1 Objective 1: To determine the incidence of overweight and obesity amongst Grade
2 learners in Pietermaritzburg, as measured by their BMI
The number of people who are overweight and obese is increasing at a rapid rate, both globally
and at a national level. In several studies conducted over the last two decades on the South
African paediatric population, increasing levels of overweight and obesity have been observed,
with females often more overweight and obese than males. Compared to the most recent
national rates for a similar age group, the current study recorded even higher rates of
overweight and obesity amongst Grade 2 learners in Pietermaritzburg quintile 5 schools, with
the number of obese boys exceeding the number of obese girls. According to the IOTF
classification, 24.2% of the learners were overweight, and 15.4% were obese, with twice the
number of females overweight compared to the male learners (30.8% versus 15.4%). However,
more males were obese than females (20.5% versus 11.5% females). The WHO classification
showed higher rates of overweight and obesity, with 28.6% of learners overweight and 19.8%
of learners obese. More female learners were overweight compared to male learners (30.8%
versus 25.6%), however, 23.1% of male learners were obese, compared to 17.3% of female
learners.
6.1.2 Objective 2: To determine the calcium intake from dairy and the total dairy intake
in Grade 2 learners in Pietermaritzburg
The South African FBDG were implemented by the government in order to encourage a healthy
diet for all South Africans from different race groups and socioeconomic backgrounds. One of
these guidelines encourages the daily consumption of milk and dairy products, due to the
established low intake of dairy amongst the South African population, and the recognized
health benefits of this food group. The current study observed low calcium and dairy intakes
well below the recommended amount for the age group 4 to 8 years old, with Black African
learners having the lowest calcium intake of the four race groups studied. This is consistent
with previous studies that recorded low calcium and dairy intake amongst children from
different geographical areas across South Africa.

105
6.1.3 Objective 3: To determine the contribution that dairy products make towards
meeting the calcium requirements of Grade 2 learners
Dairy products have the potential to be the richest and most readily available source of calcium
in the diet. Therefore, it was expected that by meeting the dairy requirements of three servings
per day, the Grade 2 learners would undoubtedly meet their daily calcium requirements. The
current study showed the majority of learners were unable to meet the EAR for calcium for
their age group, as they were unable to meet the recommended number of three dairy servings
per day. The learners consumed two servings of dairy per day on average, with full cream milk
being the most commonly consumed dairy product.
6.1.4 Objective 4: To determine the relationship between the dietary calcium (from
dairy) and/or total dairy intake, and the BMI of Grade 2 learners in
Pietermaritzburg
Several international studies have shown an inverse relationship between calcium or milk
intake and the BMI of paediatric subjects, whilst other international studies have shown no
relationship at all between the two variables. In light of the obesity epidemic currently facing
South Africa, and that a study of this nature had not previously been conducted, the need arose
to investigate such an association.
No correlation between calcium or dairy intake, and the BMI of the Grade 2 learners could be
established in this study, leading to the conclusion that no relationship existed between calcium
and/or dairy intake, and the BMI of the Grade 2 learners.
6.1.5 Objective 5: To determine possible barriers to dairy intake in Grade 2 learners in
Pietermaritzburg
No significant barriers to ensuring the Grade 2 learners consumed adequate amounts of dairy
were identified. It can therefore be assumed that the learners’ low consumption of dairy
products may be as a result of poor knowledge regarding the recommended amount that should
be consumed for their age group.

106
6.2 Limitations
Time constraints restricted this study to only include Grade 2 learners (7 to 8 years old) from
quintile 5 schools in Pietermaritzburg thus limiting the sample size. Children from a wider area
should be included in further studies to increase the reliability of the results. In addition,
learners from quintile 1-4 schools were not included in the study, as it was assumed they would
not have adequate access to dairy products, due to financial constraints. However, further
research should include these learners to investigate this assumption. This will allow the results
to be more representative of all South African learners.
Time constraints prevented the researcher from being able to individually meet with each
participating family. Despite the scientifically endorsed methodology, the accuracy of the FFQ
has been queried due to the risk of recall error. Overestimation or underestimation of dairy
product intake may have occurred, with the parents/guardians unable to accurately recall their
learner’s dairy intake over the past 12 months, relying more on the learners’ most recent dairy
intake. As the study was conducted over the winter months the learners may have temporarily
reduced their dairy intake (by replacing breakfast cereals with porridge or toast, and avoiding
“cold” foods such as yoghurt), and this may have influenced what the parents/guardians
recorded in the FFQ.
The FFQ was chosen due to limited time and financial constraints, and the low respondent
burden it placed on the parents/guardians. The researcher made contact with the
parents/guardians via written correspondence, providing clear instructions on how to complete
the FFQ, and only physically met with the Grade 2 learners when the anthropometric
measurements were taken. Although no parents/guardians made use of the opportunity to
contact the researcher should they have had any queries, it cannot be assumed that they were
fully confident to complete the self-administered FFQ. It would be useful to include more
detailed dietary recall methods such as the weighted food method or 24-hour recall, in addition
to the FFQ, to provide more quantitative data. However, the weighted food method may be
tedious and result in fewer complete records from the respondents. The 24-hour recall was
originally included as an alternative dietary assessment tool, but due to limited time and
available financial resources, the parents/guardians were asked to complete it over two non-
consecutive days. As it was not interviewer-administered, concern was raised regarding the
reliability and validity of the data, and so it was decided not to include the data collected from
the 24-hour recall.
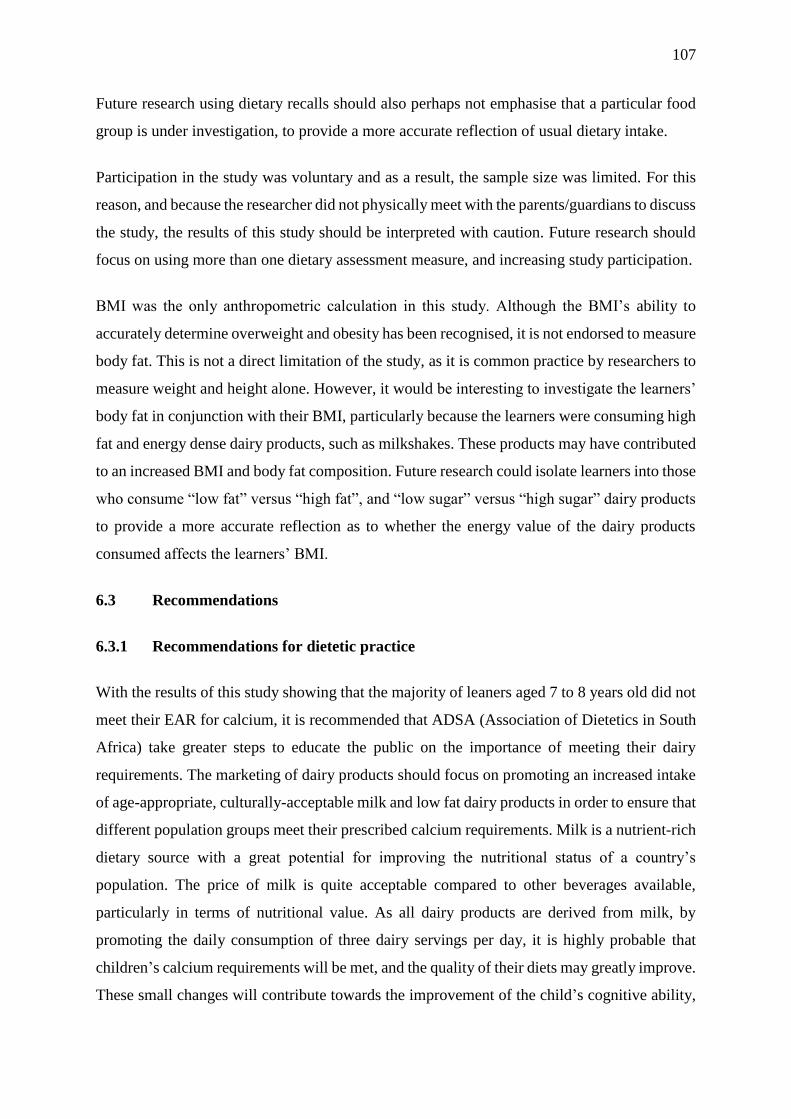
107
Future research using dietary recalls should also perhaps not emphasise that a particular food
group is under investigation, to provide a more accurate reflection of usual dietary intake.
Participation in the study was voluntary and as a result, the sample size was limited. For this
reason, and because the researcher did not physically meet with the parents/guardians to discuss
the study, the results of this study should be interpreted with caution. Future research should
focus on using more than one dietary assessment measure, and increasing study participation.
BMI was the only anthropometric calculation in this study. Although the BMI’s ability to
accurately determine overweight and obesity has been recognised, it is not endorsed to measure
body fat. This is not a direct limitation of the study, as it is common practice by researchers to
measure weight and height alone. However, it would be interesting to investigate the learners’
body fat in conjunction with their BMI, particularly because the learners were consuming high
fat and energy dense dairy products, such as milkshakes. These products may have contributed
to an increased BMI and body fat composition. Future research could isolate learners into those
who consume “low fat” versus “high fat”, and “low sugar” versus “high sugar” dairy products
to provide a more accurate reflection as to whether the energy value of the dairy products
consumed affects the learners’ BMI.
6.3 Recommendations
6.3.1 Recommendations for dietetic practice
With the results of this study showing that the majority of leaners aged 7 to 8 years old did not
meet their EAR for calcium, it is recommended that ADSA (Association of Dietetics in South
Africa) take greater steps to educate the public on the importance of meeting their dairy
requirements. The marketing of dairy products should focus on promoting an increased intake
of age-appropriate, culturally-acceptable milk and low fat dairy products in order to ensure that
different population groups meet their prescribed calcium requirements. Milk is a nutrient-rich
dietary source with a great potential for improving the nutritional status of a country’s
population. The price of milk is quite acceptable compared to other beverages available,
particularly in terms of nutritional value. As all dairy products are derived from milk, by
promoting the daily consumption of three dairy servings per day, it is highly probable that
children’s calcium requirements will be met, and the quality of their diets may greatly improve.
These small changes will contribute towards the improvement of the child’s cognitive ability,

108
sense of wellbeing and overall improved health that follows from the consumption of a
nutritious diet.
6.3.2 Recommendations for the government
The low consumption of dairy amongst the Grade 2 learners in Pietermaritzburg has
demonstrated that national nutritional messages and the South African FBDG are not
necessarily reaching an important segment of the population, and exerting a positive impact on
them. The school environment is considered one of the most influential areas of a child’s life,
therefore it is recommended that the DOE place greater emphasis on ensuring that a healthy
food environment is promoted at all schools.
Schools should be encouraged to monitor the type of foods and beverages offered on their
premises, whether it be food brought from home, or sold by the tuck shop. Whilst most learners
only consume one out of the main meals of the day at school, by ensuring that one serving of
dairy is consumed at school will aid in improving the learners overall dairy and subsequent
calcium intake. In addition, schools that offer meals to their learners, whether in the form of a
food programme or at a boarding school, should ensure that adequate milk/dairy products are
provided on the set menu. Registered dietitians should be invited to educate teachers, parents
and school going children on the fundamental basics of a healthy, balanced diet, with emphasis
on appropriate portion sizes provided. Dietitians should also be given the opportunity to clear
any misconceptions regarding dietary beliefs. The government could consider subsidizing
dairy farmers, or milk and dairy products to make them more affordable to the general public,
and improve marketing strategies so as to make dairy consumption more appealing.
6.3.3 Recommendations for future research
Future research on this topic should include a controlled intervention diet over an appropriate
length of time where causality between milk and/or dairy intake and BMI can be more
accurately assessed. A greater number of subjects would be useful for the results to be more
representative of the population, and children from other age groups where different rates of
growth are experienced should be included. Further studies could also focus on a narrower
spectrum of dairy products, such as milk, maas and yoghurt only, to reduce the length of the
FFQ and respondent fatigue. These products are also lower in energy, and thus less likely to
counteract any weight-loss promoting properties, compared to other, high-energy dairy

109
products. It would be preferable to interview each subject rather than use self-recall, in order
to obtain an accurate portrayal of the subjects’ dietary intake. It would also be advisable to
measure other anthropometric variables, such as subscapular skinfold thickness, to determine
if dairy products have any impact on body fat. Future research should be conducted during the
warmer months of the year, as cold dairy products such as fresh milk, maas and yoghurt may
be avoided in Winter.
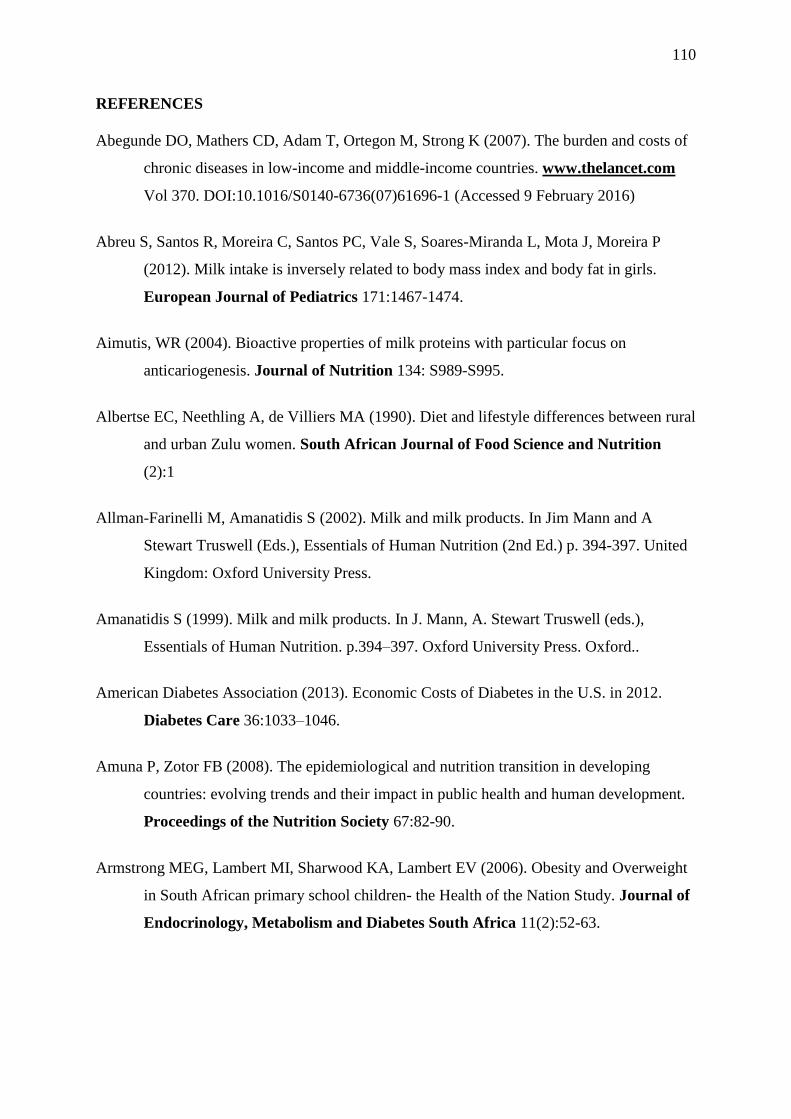
110
REFERENCES
Abegunde DO, Mathers CD, Adam T, Ortegon M, Strong K (2007). The burden and costs of
chronic diseases in low-income and middle-income countries. www.thelancet.com
Vol 370. DOI:10.1016/S0140-6736(07)61696-1 (Accessed 9 February 2016)
Abreu S, Santos R, Moreira C, Santos PC, Vale S, Soares-Miranda L, Mota J, Moreira P
(2012). Milk intake is inversely related to body mass index and body fat in girls.
European Journal of Pediatrics 171:1467-1474.
Aimutis, WR (2004). Bioactive properties of milk proteins with particular focus on
anticariogenesis. Journal of Nutrition 134: S989-S995.
Albertse EC, Neethling A, de Villiers MA (1990). Diet and lifestyle differences between rural
and urban Zulu women. South African Journal of Food Science and Nutrition
(2):1
Allman-Farinelli M, Amanatidis S (2002). Milk and milk products. In Jim Mann and A
Stewart Truswell (Eds.), Essentials of Human Nutrition (2nd Ed.) p. 394-397. United
Kingdom: Oxford University Press.
Amanatidis S (1999). Milk and milk products. In J. Mann, A. Stewart Truswell (eds.),
Essentials of Human Nutrition. p.394–397. Oxford University Press. Oxford..
American Diabetes Association (2013). Economic Costs of Diabetes in the U.S. in 2012.
Diabetes Care 36:1033–1046.
Amuna P, Zotor FB (2008). The epidemiological and nutrition transition in developing
countries: evolving trends and their impact in public health and human development.
Proceedings of the Nutrition Society 67:82-90.
Armstrong MEG, Lambert MI, Sharwood KA, Lambert EV (2006). Obesity and Overweight
in South African primary school children- the Health of the Nation Study. Journal of
Endocrinology, Metabolism and Diabetes South Africa 11(2):52-63.

111
Bar-On ME, Broughton DD, Buttross, S, Corrigan S, Gedissman A, De Rivas MRG, Rich M,
Shifrin DL, Brody M, Wilcox B, Hogan M, Holroyd HJ, Reid L, Sherry SN, Strasburger
V, Stone J (2001). Children, adolescents, and television. Pediatrics 107(2):423-426.
Barba G, Troiano E, Russo P, Venezia A, Siani A (2005). Inverse association between body
mass and frequency of milk consumption in children. British Journal of Nutrition
93:15-19.
Benton D (2004). Role of parents in the determination of the food preferences of children and
the development of obesity. International Journal of Obesity 28:858–869.
Berkey CS, Rockett HRH, Willett WC, Colditz GA (2005). Milk, Dairy Fat, Dietary
Calcium, and Weight Gain: A Longitudinal Study of Adolescents. Archives of
Pediatric and Adolescent Medicine.159 (6):543550.
Bertoli S, Petroni ML, Pagliato E, Mora S, Weber G, Chiumello G, Testolin G (2005).
Validation of Food Frequency Questionnaire for Assessing Dietary Macronutrients
and Calcium Intake in Italian Children and Adolescents. Journal of Pediatric
Gastroenterology and Nutrition 40:555-560.
Black RE, Victora CG, Walker SP, Bhutta ZA, Christian P, de Onis M, Ezzati M, Grantham-
McGregor S, Katz J, Martorell R, Uauy R and the Maternal and Child Nutrition Study
Group (2013). Maternal and Child Undernutrition and Overweight in Low-Income
and Middle-Income Countries. Lancet 382 (9890):427-451.
Bourne LT, Lambert EV, Steyn K (2002). Where does the black population of South Africa
stand on the nutrition transition? Public Health Nutrition 5(1A):157-162
Bourne LT, Langenhoven ML, Steyn K, Jooste PL, Laubscher JA, van der Vyver E (1993).
Nutrient intake in the urban African population of the Cape Peninsula, South Africa.
The BRISK study. The Central African Journal of Medicine 39 (12):238-247.
Bradlee ML, Singer MR, Qureshi MM, Moore LL (2010). Food group intake and central
obesity among children and adolescents in the Third National Health and Nutrition
Examination Survey (NHANES III). Public Health Nutrition 13:797-805.
112
Burger J (2016) (Dairy Standard Agency). New dairy regulation: fat content. The Consumer
Education Project of Milk SA. www.rediscoverdairy.co.za (Accessed 5 July 2017)
Caballero B (2005). A Nutrition Paradox- Underweight and Obesity in developing countries.
New England Journal of Medicine 352(15):1514-1516.
Cade J, Thompson R, Burley V, Warm D (2002). Development, validation and utilisation of
food-frequency questionnaires- a review. Public Health Nutrition 54(4): 567-587.
Calder PC, Ahluwalia N, Brouns F, Buetler T, Clement K, Cunningham K, Esposito K,
Jönsson LS, Kolb H, Lansink M, Marcos A, Margioris A, Matusheski N, Nordmann
H, O’Brien J, Pugliese G, Rizkalla S, Schalkwijk C, Tuomilehto J, Wärnberg J, Watzl
B, Winklhofer-Roob BM (2011). Dietary factors and low-grade inflammation in
relation to overweight and obesity. British Journal of Nutrition 106(S3):S1-S78.
Cameron N, Getz B (1997). Sex differences in the prevalence of obesity in rural African
adolescents. International Journal of Obesity 21:775-782.
Caprio S, Daniels SR, Drewnowski A, Kaufman FR, Palinkas LA, Rosenbloom AL,
Schwimmer JB (2004). Influence of Race, Ethnicity, and Culture on Childhood
Obesity: Implications for Prevention and Treatment. Diabetes Care 31(11): 2211-
2221.
Carruth BR, Skinner JD (2001). The role of dietary calcium and other nutrient in moderating
body fat in preschool children. International Journal of Obesity 25:559-566.
Cavadini C, Siega-Riz AM, Popkin BM (2000). US adolescent food intake trends from 1965
to 1996. Archives of Disease in Childhood 83:18–24.
Choi J, Sabikhi L, Hassan A, Anand S (2012). Bioactive peptides in dairy products.
International Journal of Dairy Technology 65(1):1-12.
Chopra M, Galbraith S, Darnton-Hill I (2002). A global response to a global problem: the
epidemic of overnutrition. Bulletin of the World Health Organization 80(12): 952-
958.
113
Cole TJ (2004). Children grow and horses race: is the adiposity rebound a critical period for
later obesity? BMC Pediatrics 4:6 http://www.biomedcentral.com/1471-2431/4/6
(Accessed 23 September 2016).
Cole TJ, Bellizzi MC, Flegal KM, Dietz WH (2000). Establishing A Standard Definition For
Child Overweight And Obesity Worldwide: International Survey. British Medical
Journal 320(7244):1240-1243.
Cole TJ, Flegal KM, Nicholls D, Jackson AA (2007). Body mass index cut offs to define
thinness in children and adolescents: international survey. British Medical
Journal 335:194. doi: https://doi.org/10.1136/bmj.39238.399444.55 (Accessed 16
March 2016)
Cole TJ, Lobstein T (2012). Extended international (IOTF) body mass index cut-offs for
thinness, overweight and obesity. Pediatric Obesity 7:284–294.
Consumer Education Project of Milk SA (2013). Dairy based Nutrition.
www.rediscoverdairy.co.za (Accessed 29 March 2016).
Czajkowska A, Sitkowska B, Piwczynski D, Wójcik P, Mroczkowski S (2015). Genetic and
environmental determinants of the urea level in cow’s milk. Archives Animal
Breeding 58:65–72.
Danone Southern Africa (2017). http://www.danone.co.za (Accessed 15 May 2017)
Danyliw AD, Vatanparast H, Nikpartow N, Whiting SJ (2012). Beverage patterns among
Canadian children and relationship to overweight and obesity. Applied Physiology,
Nutrition and Metabolism 37:900-906.
Davies KM, Heaney RP, Recker RR, Lappe JM, Barger-Lux MJ, Rafferty K, Hinders S
(2000). Calcium intake and body weight. Journal of Clinical Endocrinology and
Metabolism 85(12):4635-4638.

114
De Onis M, Onyango AW, Borghu E, Siyam A, Nishida C, Siekmann J (2007). Development
of a WHO growth reference for school-aged children and adolescents. Bulletin World
Health Organisation 85(9):660-667. https://dx.doi.org/10.1590/S0042-
96862007000900010 (Accessed 18 January 2017).
De Onis M, Lobstein T (2010). Defining obesity risk status in the general childhood
population: Which cut-offs should we use? International Journal of Pediatric
Obesity 5:458-460.
Department of Agriculture, Forestry and Fisheries (2015). Regulations relating to the
classification, packing and marking of dairy products and imitation dairy products
intended for sale in the Republic of South Africa. No. R. 260, p.7
Department of Education (2004). National Norms and Standards for School Funding:
Proposals for amendments. Pretoria.
Development Initiatives (2017). Global Nutrition Report 2017: Nourishing the SDGs. Bristol,
UK: Development Initiatives.
Dietz WH (1994). Critical periods in childhood for the development of obesity. American
Journal of Clinical Nutrition 59:955-959.
Dixon LB, Pellizon MA, Jawad AF, Tershakovec AM (2005). Calcium and dairy intake and
measures of obesity in hyper- and normocholesterolemic children. Obesity Research
13:1727-1738.
Dovidio JF, Gaertner SL, Stewart TL, Esses VM, ten Vergert M, Hodson G (2004). From
intervention to outcome: Processes in the reduction of bias. Education programs for
improving intergroup relations: Theory, research, and practice. p. 243-265. Teachers
College Press.
Drapeau V, Therrien F, Richard D, Tremblay A (2001). Is visceral obesity a physiological
adaptation to stress? Panminerva Medica 43:1-7.

115
Dror DK (2014). Dairy consumption and pre-school, school-age and adolescent obesity in
developed countries: a systematic review and meta-analysis. Obesity Reviews
15(6):516-527.
Ebbeling CB, Pawlak DB, Ludwig DS (2002). Childhood obesity: public-health crisis,
common sense cure. The Lancet 360:473-482.
Eriksson S, Strandvik B (2010). Food choice is reflected in serum markers and
anthropometric measures in healthy 8 year olds. European Journal of Clinical
Nutrition Metabolism 5:e117-e224. doi:10.1016/j.eclnm.2010.02.002.
FAO/WHO/UNU Expert Consultation (1985). Energy and protein requirements. WHO
Technical Report Series 724: 1–206. Geneva: World Health Organization.
Fayet F, Ridges LA, Wright JK, Petocz P (2013). Australian children who drink milk (plain or
flavoured) have higher milk and micronutrient intakes but similar body mass index to
those who do not drink milk. Nutrition Research 33:95-102.
Fiorito LM, Ventura AK, Mitchell DC, Smiciklas-Wright H, Birch LL (2006). Girls’ dairy
intake, energy intake, and weight status. Journal of the American Dietetic
Association 106 (11):1851-1855.
Forshee RA, Storey ML (2003). Total beverage consumption and beverage choices among
children and adolescents. International Journal of Food Science and Research
54:297-307.
Fox, FW (1941). Appendix I: Diet in the Urban Locations as Indicated by the Survey. In
Non-European Affairs Department and Miriam Janisch. A study of African Income
and Expenditure in 987 Families in Johannesburg: January-November 1940. p.28-37.
Radford, Adlington Ltd, Johannesburg.
Freedman DS, Kettel Khan L, Serdula MK, Srinivasan SR, Berenson GS (2001). BMI
rebound, childhood height and obesity among adults: the Bogalusa Heart Study.
International Journal of Obesity 25:543-549.

116
French SA, Lin B-H, Guthrie JF (2003). National trends in soft drink consumption among
children and adolescents age 6 to 17 years: Prevalence, amounts, and sources,
1977/1978 to 1994/1998. Journal of the American Dietetic Association
103(10):1326-1331.
Frisancho AR (1990). Anthropometric standards for the assessment of growth and nutritional
status. Ann Arbor, MI: The University of Michigan Press.
Galea S, Tracy M (2007). Participation Rates in Epidemiologic Studies. Annals of
Epidemiology 17:643-653.
Gidding SS, Dennison BA, Birch LL, Daniels SR, Gilman MW, Lichtenstein AH, Rattay KT,
Steinberger J, Stettler N, Van Horn L (2006). Dietary Recommendations for Children
and Adolescents: A Guide for Practitioners. Pediatrics 117(2):544-559
Givens DI (2010). Milk and meat in our diet: good or bad for health? Animal 4(12):1941-
1952. doi: 10.1017/S1751731110001503 (Accessed 15 February 2016) (Abstract)
Golafshani N (2003). Understanding Reliability and Validity in Qualitative Research. The
Qualitative Report 8(4):597-606.
Gordon MH (2013). Milk Lipids in Milk and Dairy Products in Human Nutrition p.65-75.
(Eds) Park YW, Haenlein GFW. Wiley-Blackwell (John Wiley & Sons Ltd).
DOI: 10.1002/9781118534168.ch4 (Accessed 28 March 2016)
Griffin B (2011). Dairy, dairy, quite contrary: further evidence to support a role for calcium
in counteracting the cholesterol-raising effect of SFA in dairy foods. British Journal
of Nutrition 105:1713-1714.
Grundy SM, Brewer Jr HB, Cleeman JI, Smith Jr SC, Lenfant C (2004). Definition of
Metabolic Syndrome. Report of the National Heart, Lung, and Blood
Institute/American Heart Association Conference on Scientific Issues Related to
Definition. Circulation January 27:433-438.
https://doi.org/10.1161/01.CIR.0000111245.75752.C6 (Accessed 5 May 2016).

117
Gunther CW, Branscum P, Kennel J, Klein EG, Monnat LE, Kaye G (2013). Examination of
the Relationship of Dairy Product Consumption and Dietary Calcium with Body Mass
Index Percentile in Children. International Journal of Child Health and Nutrition
2:1-8.
Gupta N, Goel K, Shah P, Misra A (2012). Childhood obesity in developing countries:
epidemiology, determinants, and prevention. Endocrine Reviews 33(1):48-70.
Henry C, Whiting SJ, Phillips T, Finch SL, Zello GA, Vatanparast H (2015). Impact of the
removal of chocolate milk from school milk programs for children in Saskatoon,
Canada. Applied Physiology, Nutrition and Metabolism 40:245–250.
Hill JO, Peters JC (1998). Environmental Contributions to the Obesity Epidemic. Science
280:1371-1374.
Huybrechts I, De Bacquer D, Matthys C, De Backer G, De Henauw S (2006). Validity and
reproducibility of a semi-quantitative food-frequency questionnaire for estimating
calcium intake in Belgain preschool children. British Journal of Nutrition 95:802-
816.
International Food Policy Research Institute (2016). Global Nutrition Report 2016: From
Promise to Impact: Ending Malnutrition by 2030 p.1. Washington DC.
International Food Policy Research Institute (2015). Global Nutrition Report 2015: Actions
and Accountability to Advance Nutrition and Sustainable Development (p.3)
Washington, DC.
James DC (2004). Factors influencing food choices, dietary intake, and nutrition-related
attitudes among African Americans: application of a culturally sensitive model. Ethic
Health 9:349-367.
Jarvis JK, Miller GD (2002). Overcoming the Barrier of Lactose Intolerance to reduce Health
Disparities. Journal of the National Medical Association 94(2):55-66.

118
Jehn M, Brewer A (2009). Paradoxical malnutrition in mother–child pairs: Untangling the
phenomenon of over- and under-nutrition in underdeveloped economies. Economics
and Human Biology 7:28–35.
Jenner DA, Neylon K, Croft S, Beilin LJ, Vandongen R (1989). A comparison of methods of
dietary assessment in Australian children aged 11-12 years. Europen Journal of
Clinical Nutrition 43:663-673.
Jinabhai CC, Taylor M, Sullivan KR (2003). Implications of the prevalence of stunting,
overweight and obesity amongst South African primary school children: a possible
nutritional transition? European Journal of Clinical Nutrition 57:358–365.
Johansson G (2006). Dietary assessments. Use, design concepts, biological markers, pitfalls
and validation (p.15). Institutionen för kostvetenskap, Umeå universitet.
Johnson RK, Driscoll P, Goran ML (1996). Comparison of multi-pass 24-hour recall
estimates of energy intake with total energy expenditure determined by the doubly
labelled water method in young children. Journal of the American Dietetic
Association 96(11):1140-1144.
Johnson L, Mander AP, Jones LR, Emmett PM, Jebb SA (2007). Is sugar-sweetened beverage
consumption associated with increased fatness in children? Nutrition 23:557-563.
Kaminer D, Grimsrud A, Myer L, Stein DJ, Williams DR (2008). Risk for post-traumatic
stress disorder associated with different forms of interpersonal violence in South
Africa. Social Science & Medicine 67(10):1589–1595 (Abstract)
Kelishadi R, Zemel MB, Hashemipour M, Hosseini M, Mohammadifard N, Pursafa P (2009).
Can a dairy-rich diet be effective in long term weight control of young children?
Journal of the American College of Nutrition 28:601-610.
Kemp C, Pienaar AE, Schutte AE (2011). The prevalence of hypertension and the
relationship with body composition in Grade 1 learners in the North West Province of
South Africa. South African Journal of Sports Medicine 23(4):117-122.

119
Kimani-Murage EW, Kahn K, Pettifor JM, Tollman SM, Dunger DB, Gomez-Olive XF,
Norris SA (2010). The prevalence of stunting, overweight and obesity, and metabolic
disease risk in rural South African children. BMC Public Health 10:158.
doi: 10.1186/1471-2458-10-158
Kleiser C, Rosario AS, Mensink GBM, Prinz-Langenohl R, Kurth B-M (2009). Potential
determinants of obesity among children and adolescents in Germany: results from the
cross-sectional KiGGS study. BMC Public Health 9:46.
Korhonen, HJ, Pihlanto, A (2006) Bioactive peptides: production and functionality.
International Dairy Journal 16:945–960.
Krebs-Smith SM, Guenther PM, Subar AF, Kirkpatrick SI, Dodd KW (2010). Americans do
not meet federal dietary recommendations. Journal of Nutrition 140:1832-1838.
Kristal AR, Andrilla CHA, Koepsell TD, Diehr PH, Cheadle A (1998). Dietary Assessment
Instruments are Susceptible to Intervention-associated Response Set Bias. Journal of
the Academy of Nutrition and Dietetics 98(1):40-43.
Kruger HS, Venter CS, Vorster HH, Margetts BM (2006). Physical Inactivity Is the Major
Determinant of Obesity in Black Women in the North West Province, South Africa:
The THUSA Study. Nutrition 18:422–427.
Kukovics S, Németh T (2013). Chapter 5: Milk Major and Minor Proteins, Polymorphisms
and Non-protein Nitrogen, in Milk and Dairy Products in Human Nutrition:
Production, Composition and Health p. 80-110 (Ed. Park YW and Haenlein GFW)
DOI: 10.1002/9781118534168.ch5 (Accessed 4 May 2016)
Labadarios D, Steyn NP, Maunder E, MacIntyre U, Gericke G, Swart R, Huskisson J,
Dannhauser A, Vorster HH, Nesmvuni AE, Nel JH (2005). The National Food
Consumption Survey (NFCS): South Africa, 1999. Public Health Nutrition
8(5):533-543.

120
Labadarios D, Swart R, Maunder EMW, Kruger HS, Gericke GJ, Kuzwayo PMN, Ntsie PR,
Styen NP, Schloss I, Dhansay MA, Jooste PL, Dannhauser A (2008). Executive
Summary of the National Food Consumption Survey Fortification Baseline (NFCS-
FB-I) South Africa, 2005. South African Journal of Clinical Nutrition 21(3) (Suppl
2):245-300.
Labonté M-E, Cyr A, Baril-Gravel L, Royer M-M, Lamarche B (2012). Validity and
reproducibility of a web-based, self-administered food frequency questionnaire.
European Journal of Clinical Nutrition (2012) 66, 166–173.
Lanigan J, Singhal A (2009). Early Nutrition and long term health: a practical approach.
Proceedings of the Nutrition Society 68(4):422-9.
LaRowe TL, Moeller SM, Adams AK (2007). Beverage patterns, diet quality, and body mass
index of US preschool and school aged children. Journal of the American Dietetic
Association 107:1124-1133.
Larson CP (2007). Poverty during pregnancy: Its effects on child health outcomes. Pediatrics
& Child Health 12(8):673-677.
Le Roux M, Jonker D, Kraamwinkel AP, SAMPRO (2016). Trends of the retail sales of nine
dairy and eight other generally used food products based on information up to
December 2015. A report prepared for Milk SA.
Lin B-H, Guthrie J, Frazão E (1999). Nutrient contribution of food away from home. In
Frazão E (ed): “America’s Eating Habits: Changes and Consequences”. Agriculture
Information Bulletin No. 750. p 213-242. Washington DC: US Department of
Agriculture, Economic Research Service, Food and Rural Economics Division.
Lin YC, Lyle RM, McCabe LD, McCabe GP, Weaver CM, Teegarden D (2000). Dairy
calcium is related to changes in body composition during a two-year exercise
intervention in young women. Journal of the American College of Nutrition 19(6):
754-760.

121
Lin SL, Tarrant M, Hui LL, Kwok MK, Lam TH, Leung GM, Schooling CM (2012) The
Role of Dairy Products and Milk in Adolescent Obesity: Evidence from Hong Kong’s
‘‘Children of 1997’’ Birth Cohort. PLoS ONE 7(12): e52575.
doi:10.1371/journal.pone.0052575 (Accessed 22/02/2018)
Lissau I, Poùlsen J (2005). Nutrition policy, food and drinks at school and after school care.
International Journal of Obesity 29:S58-S61.
Lissau I, Sorensen TIA (1994). Parental neglect during childhood and increased risk of
obesity in young adulthood. Lancet 343:324-327 (Abstract).
Liu X, Zhu C (2014).Will knowing diabetes affect labour income? Evidence from a natural
experiment. Economics Letters 124:74-78.
Louie JCY, Flood VM, Hector DJ, Rangan AM, Gill TP (2011). Dairy consumption and
overweight and obesity: a systematic review of prospective cohort studies. Obesity
Reviews 12(7):1-11.
Luhovyy BL, Akhavan T, Anderson GH (2007). Whey proteins in the regulation of food
intake and satiety. Journal of the American College of Nutrition 26(6):S704-S712.
MacIntyre UE, Kruger HS, Venter CS, Vorster HH (2002). Dietary intakes of an African
population in different stages in the North West Province, South Africa: the THUSA
study. Nutrition Research 22:239-256.
MacKeown JM, Cleaton-Jones PE, Norris SA (2003). Nutrient intake among a longitudinal
group of urban black South African children at four interceptions between 1995 and
2000 (Birth-to-Ten Study). Nutrition Research 23:185-197.
Maffeis C (2000). Aetiology of overweight and obesity in children and adolescents.
European Journal of Pediatrics 159:S35-S44.
Magarey A, Watson J, Golley RK, Burrows T, Sutherland R, McNaughton SA, Denney-
Wilson E, Campbell K, Collins C (2011). Assessing dietary intake in children and
adolescents: Considerations and recommendations for obesity research. International
Journal of Pediatric Obesity 6:2-11.

122
Mahan LK, Escott-Stump S, Raymond JL (2012). Krause’s Food and the Nutrition Care
Process 13th Edition p. 380. Elsevier Saunders, Missouri, USA.
Maryland Metrics (2017). Metric Kitchen Convertors and substitutions. http://mdmetric.com
(Accessed 13/10/2017).
Mayosi BM, Flisher AJ, Lalloo UG, Sitas F, Tollman SM, Bradshaw D (2009). The burden
of non-communicable diseases in South Africa. The Lancet 374(9693):934–47.
McCarron DA, Morris CD, Henry HJ, Stanton JL (1984). Blood pressure and nutrient intake
in the United States. Science 224:1392-1398.
McPherson RS, Hoelscher DM, Alexander M, Scanlon KS, Serdula MK (2000). Dietary
Assessment Methods among School-Aged Children: Validity and Reliability.
Preventive Medicine 31:S11-S33.
Meisel H (2005). Biochemical Properties of Peptides Encrypted in Bovine Milk Proteins.
Current Medicinal Chemistry 12:1623-1629.
Mennella JA, Forestell CA, Morgan LK, Beauchamp GK (2009). Early milk feeding
influences taste acceptance and liking during infancy. American Journal of Clinical
Nutrition 90:S780-S788.
Milk SA (2016). http://www.milksa.co.za (Accessed 13 May 2016).
Miller GD, Anderson JJB (1999). The Role of Calcium in Prevention of Chronic Diseases.
Journal of the American College of Nutrition 18(5):371S–372S.
Miller GD, Jarvis JK, McBean, LD (2001). The Importance of Meeting Calcium Needs with
Foods. Journal of the American College of Nutrition 20(2):S168-S185.
Monasta L, Lobstein T, Cole TJ, Vignerovà J, Cattaneo A (2011). Defining overweight and
obesity in pre-school children: IOTF reference or WHO standard? Obesity Reviews
12:295-300.

123
Monyeki KD, van Lenthe FJ, Steyn NP (1999). Obesity: Does it occur in African children in
a rural community in South Africa? International Journal of Epidemiology 28:287-
292.
Moore LL, Bradlee MM, Gao D, Singer MR (2006). Low dairy intake in early childhood
predicts excess body fat gain. Obesity 14:1010-1018.
Moore M, Braid S, Falk B, Klentrou P (2007). Daily calcium intake in male children and
adolescents obtained from the rapid assessment method and the 24-hour recall
method. Nutrition Journal 6(1):24.
Moore LL, Singer MR, Qureshi MM, Bradlee ML (2008). Dairy intake and anthropometric
measures of body fat among children and adolescents in NHANES. Journal of the
American College of Nutrition 27:702-710.
Moreira P, Padez C, Mourão I, Rosado V (2005). Dietary calcium and body mass index in
Portugese children. European Journal of Clinical Nutrition 59:861-867.
Mosupye FM, von Holy A (2000). Microbiological hazard identification and exposure
assessment of street food vending in Johannesburg, South Africa. International
Journal of Food Microbiology 61:137–145.
Moussa MAA, Shaltout AA, Nkansa-Dwamena D, Mourad M, AlSheikh N, Agha N, Galal
DO (1998). Factors associated with obesity in Kuwaiti Children. European Journal
of Epidemiology 15:41-49.
Mukkudem-Petersen J, Kruger HS (2004). Association between stunting and overweight
among 10–15 year old children in the North West Province of South Africa: the
THUSA BANA Study. International Journal of Obesity 28:842–851.
Murphy MM, Douglass JS, Johnson RK, Spence LA (2008). Drinking flavoured or plain milk
is positively associated with nutrient intake and is not associated with adverse effects
on weight status in US children and adolescents. Journal of the American Dietetic
Association 108:631-639 (Abstract).
124
Murphy SP, Guenther PM, Kretsch MJ (2006).Using the Dietary Reference Intakes to Assess
Intakes of Groups: Pitfalls to Avoid. Journal of the American Dietetic Association
106(10): 1550-1553.
Mvo Z, Dick J, Steyn K (1999). Perceptions of overweight African women about acceptable
body size of women and children. Curations 22(2):27-31.
Nielsen SJ, Popkin, BM (2004). Changes in Beverage Intake between 1977 and 2001.
American Journal of Preventive Medicine 27(3):205-210.
Nöthlings U, Hoffman K, Bergmann MM, Boeing H (2007). Fitting Portion Sizes in a Self-
Administered Food Frequency Questionnaire. The Journal of Nutrition 137(2):781–
786.
Oken E, Gillman MW (2003). Fetal Origins of Obesity. Obesity Reviews 11(4):493-506.
Olds T (2011). Evidence that the prevalence of childhood overweight is plateauing.
International Journal of Pediatric Obesity 6:342-369.
Palacios OM, Badran J, Spence L, Drake MA, Reisner M, Moskowitz HR (2010). Measuring
Acceptance of Milk and Milk Substitutes Among Younger and Older Children.
Journal of Food Science 75(9):S522-S526. (Abstract).
Parrish LA, Marshall JA, Krebs NF, Rewers M, Norris JM (2003). Validation of a Food
Frequency Questionnaire in Preschool Children. Epidemiology 14(2):213-217.
Pereira MA, Jacobs JD, Van Horn L, Slattery ML, Kartashov Al, Ludwig DS (2002). Dairy
consumption, obesity, and the insulin resistance syndrome in young adults: the
CARDIA Study. The Journal of the American Medical Association 287:2081-
2089.
Pettifor JM, Ross P, Moodley G, Shuenyane E (1979). Calcium deficiency in rural black
children in South Africa - a comparison between rural and urban communities.
American Journal of Clinical Nutrition 32:2477-2483.

125
Phillips SM, Bandini LG, Cyr H, Colclough-Douglas S, Naumova E, Must A (2003). Dairy
food consumption and body weight and fatness studied longitudinally over the
adolescent period. International Journal of Obesity Related Metabolic Disorders
27:1106-1113.
Pine DS, Goldstein RB, Wolk S, Weissman MM (2001). The association between childhood
depression and adult body mass index. Pediatrics 107:1049-1056.
Popkin BM (2003). The Nutrition Transition in the Developing World. Department Policy
Review 21(5-6):581
Popkin BM, Richards MK, Monteiro CA (1996). Stunting is associated with overweight in
children of four nations that are undergoing the nutrition transition. Journal of
Nutrition 126(12):3009-16 (Abstract)
Puckree T, Naidoo P, Pillay P, Naidoo T (2011). Underweight and overweight in primary
school children in eThekwini district in KwaZulu-Natal, South Africa. African
Journal of Primary Health Care and Family Medicine 3(1) Art. #203, 6 pages.
doi:10.4102/phcfm.v3i1.203 (Accessed 3 May 2016).
Puoane T, Steyn K, Bradshaw D, Laubscher R, Fourie J, Lambert V, Mbananga N (2002).
Obesity in South Africa: The South African Demographic and Health Survey.
Obesity Research 10(10): 1038-1048.
Racey M, Bransfield J, Capello K, Field D, Kulak V, Machmueller D, Preyde M, Newton G
(2017). Barriers and Facilitators to Intake of Dairy Products in Adolescent Males and
Females with different levels of Habitual Intake. Global Paediatric Health 4:1-12.
Reddy SP, James S, Sewpaul R, Koopman F, Funani NI, Sifunda S, Josie J, Masuka P,
Kambaran NS, Omardien RG (2010). Umthente uhlaba usamila-the 2nd South
African National Youth Risk Behaviour Survey 2008. Cape Town: South African
Medical Research Council p.45.
Reilly JJ, Methven E, McDowell ZC, Hacking B, Alexander D, Stewart L, Kelnar CJH
(2003). Health consequences of obesity. Archives of Disease in Childhood 88(9):
748-752.

126
Renzaho AMN (2004). Fat, rich and beautiful: changing socio-cultural paradigms associated
with obesity risk, nutritional status and refugee children from sub-Saharan Africa.
Health and Place 10(1):105-113.
Rockett HRH, Wolf AM, Colditz GA (1995). Development and reproducibility of a food
frequency questionnaire to assess diets of older children and adolescents. Journal of
the American Dietetic Association 95:336-340.
Rolland-Cachera MF, for the European Childhood Obesity Group (2011). Childhood obesity:
current definitions and recommendations for their use. International Journal of
Pediatric Obesity 6:325-331.
Ross AC, Taylor CL, Yaktine AL, Del Valle HB (Eds) (2011). Institute of Medicine (US)
Committee to Review Dietary Reference Intakes for Vitamin D and Calcium. p.S6.
Washington (DC): National Academies Press (US).
Rossouw HA, Grant CC, Viljoen M (2012). Overweight and obesity in children and
adolescents: The South African problem. South African Journal of Science 108:5-6.
Sandler IN, Tein J-Y, West SG (1994). Coping, Stress and the Psychological Symptoms of
Children of Divorce: A cross-sectional and longitudinal study. Child Development
65(6):1744-1763 (Abstract)
Savaiano DA, Boushey CJ, McCabe GP (2006). Lactose intolerance symptoms assessed by
meta-analysis: A grain of truth that leads to exaggeration. The Journal of Nutrition
13(4):1107-1113.
Scholtz SC, Vorster HH (Jnr), Matshego l, Vorster HH (2001). Foods from animals can be
eaten every day-not a conundrum! South African Journal of Clinical Nutrition
14(3):S39-S47 (Abstract).
Schriesheim CA, Hill KD (1981). Controlling Acquiescence Response Bias by Item
Reversals: The Effect on Questionnaire Validity. SAGE Journals 41(4):1101-1114.
Sedgwick P (2014). Cross sectional studies: advantages and disadvantages. British Medical
Journal 348: g2276. doi:10.1136/bmj.g2276 (Accessed 7 January 2017).

127
Senekal M, Steyn NP, Nel, JH (2003). Factors associated with overweight/obesity in
economically active South African populations. Ethnicity & Disease 13(1):109-116.
Sher KJ, Gershuny BS, Peterson L, Raskin G (1997). The roles of childhood stressors in the
intergenerational transmission of alcohol use disorders. Journal of Studies on
Alcohol 58(4):414-427 (Abstract).
Shi H, Dirienzo D & Zemel MB (2001). Effects of dietary calcium on adipocyte lipid
metabolism and body weight regulation in energy restricted aP2-agouti transgenic
mice. Federation of American Societies for Experimental Biology Journal 15:291-
293.
Shisana O, Labadarios D, Rehle T, Simbayi L, Zuma K, Dhansay A, Reddy P, Parker W,
Hoosain E, Naidoo P, Hongoro C, Mchiza Z, Steyn NP, Dwane N, Makoae M,
Maluleke T, Ramlagan S, Zungu N, Evans MG, Jacobs L, Faber M, & SANHANES-1
Team (2013). South African National Health and Nutrition Examination Survey
(SANHANES-1). Cape Town: HSRC Press
Sigman A (2012). Time for a view on screen time. Archives of Disease in
Childhood doi:10.1136/archdischild-2012-302196 (Accessed 25/10/2017)
Singer E, Groves RM, Dillman DA, Eltinger JL, Little RJA (2002). The use of incentives to
reduce nonresponse in household surveys. New York, NY: Wiley-Interscience;
2002:163–177
Smit LE, Smith N, Schönfeldt HC & Heinze PH (1998). The nutritional content of South
African Milk and Liquid Milk Products. Dairy Industry Centre, ARC-Animal
Nutrition and Animal Products Institute. Irene, South Africa.
Smuts CM, Faber M, Schoeman SE, Laubscher JA, Oelofse A, Benadé AJS, Dhansay MA
(2008). Socio-demographic profiles and anthropometric status of 0-to 71-month-old
children and their caregivers in rural districts of the Eastern Cape and KwaZulu-Natal
provinces of South Africa. South African Journal of Clinical Nutrition 21(3):117-
124.

128
Somers A (2004). The prevalence of obesity amongst learners attending the schools in
Belhar, Delft and Mfuleni in Cape Town, South Africa. Masters Dissertation
(Abstract)
Statistics Canada. Findings from the Canadian Community Health Survey (2007).
http://www.statcan.gc.ca/pub/82-620-m/2006002/4053669-eng.htm#milk
(Accessed 3 June 2017).
Statista. http://www.statista.com (Accessed 21 March 2016).
Stats SA. www.statssa.gov.za 2016 (Accessed 11 August 2017).
Steyn NP, Labadarios D (2011). Street foods and fast foods: How much do South Africans of
different ethnic groups consume? Ethnicity & Disease 21:462-466.
Steyn NP, Labadarios MB, Maunder E, Nel J, Lombard C (2005). Secondary anthropometric
data analysis of the national food consumption survey in South Africa: the double
burden. Nutrition 21:4-13.
Steyn NP, Nel JH, Nantel G, Kennedy G, Labadarios D (2006). Food variety and dietary
diversity scores in children: are they good indicators of dietary adequacy? Public
Health Nutrition 9(5):644-650.
Story M (2009). The third school nutrition dietary assessment study: Findings and policy
implications for improving the health of US children. Journal of the American
Dietetic Association 109(1):S7-S13.

129
Stratton RJ, Green CJ, Elia M (2003). Disease-Related Malnutrition. An Evidence based
Approach to Treatment p.2. CABI Publishing, Oxford, UK.
Strauss RS (2000). Childhood obesity and self- esteem. Pediatrics 105(1):e15-e15. DOI:
10.1542/peds.105.1.e15 (Accessed 5 April 2016)
Su W, Huang J, Chen F, Iacobucci W, Mocarski M, Dall TM, Perreault L (2015). Modelling
the clinical and economic implications of obesity using microsimulation. Journal of
Medical Economics 18(11):886-897.
Tam CS, Garnett SP, Cowell CT, Campbell K, Cabrera G, Bauer LA (2006). Soft drink
consumption and excess weight gain in Australian school students: results from the
Nepean study. International Journal of Obesity 30:1091-1093.
Tanasescu M, Ferris AM, Himmelgreen DA, Rodriguez N, Perez-Escamilla R (2000).
Biobehavioural factors are associated with obesity in Puerto Rican children. Journal
of Nutrition 130:1734-1742.
Tathiah N, Moodley I, Mubaiwa V, Denny L, Taylor M (2013). South Africa’s nutritional
transition: Overweight, obesity, underweight and stunting in female primary school
learners in rural KwaZulu-Natal, South Africa. South African Medical Journal
103(10):718-723.
Taylor RW, Goulding A (1998). Validation of a short food frequency questionnaire to assess
calcium intake in children aged 3 to 6 years. European Journal of Clinical
Nutrition 52:464-465.
Theron M, Amissah A, Kleynhans IC, Albertse E, MacIntyre UE (2007). Inadequate dietary
intake is not the cause of stunting amongst young children living in an informal
settlement in Gauteng and rural Limpopo Province in South Africa: the NutriGro
study. Public Health Nutrition 10(4):379–389.
Thompson FE, Subar AF, Loria CM, Reedy JL, Baranowski T (2010). Need for
Technological Innovation in Dietary Assessment. Journal of the Academy of
Nutrition and Dietetics 110(1):48-51.

130
Tovée MJ, Swami V, Furnham A, Mangalparsad R (2006). Changing perceptions of
attractiveness as observers are exposed to a different culture. Evolution and Human
Behavior 27: 443–456.
Truter L, Pienaar AE, Du Toit D (2010). Relationships between overweight, obesity and
physical fitness of nine to twelve year old South African children. South African
Family Practice 52(3):227-233.
Unger JB, Reynolds K, Shakib S, Spruijt-Metz D, Sun P, Johnson CA (2004). Acculturation,
physical activity, and fast-food consumption among Asian-American and Hispanic
adolescents. Journal of Community Health 29:467–481.
Van der Horst K, Oenema A, van de Looij-Jansen P, Brug J (2008). The ENDORSE study:
Research into environmental determinants of obesity related behaviors in Rotterdam
schoolchildren. BMC Public Health 8:142.
Van der Merwe MT, Pepper MS (2006). Obesity in South Africa. Obesity Reviews 7: 315-
322.
Van Rensburg SJ, Benade AS, Rose EF, Du Plessis JP (1983). Nutritional status of African
populations predisposed to esophageal cancer. Nutrition and Cancer 4:206-216.
Victoria CG, Adair L, Fall C, Hallal PC, Martorell R, Richter L, Sachdev HS (2008).
Maternal, Child Undernutrition Study G: Maternal and child undernutrition:
consequences for adult health and human capital. Lancet 371(9609):340-357.
Vorster HH, Oosthuizen W, Jerling JC, Veldman FJ, Burger HM (1997). The Nutritional
status of South Africans: a review of the literature from 1975-1996. p14. Health
Systems Trust, Durban.
Vorster HH, Wenhold FAM, Wright HH, Wentzel-Viljoen E, Venter CS, Vermaak M (2013).
“Have milk, maas or yoghurt every day”: a food-based dietary guideline for South
Africa. South African Journal of Clinical Nutrition 26(3): S57-S65.

131
Wabitsch M (2008). “Overweight and Obesity” in Pediatric Nutrition in Practice p. 151.
(Eds Koletzko B, Cooper P, Makrides M, Garza C, Uauy R, Wang W). Karger
Publishers https://doi.org/10.1159/000155488 (Accessed 29 March 2016).
Walker ARP, Walker BF, Walker AJ (1992). Comparison of Nutrient intakes of South
African elderly rural Black women in 1969 and 1989. Journal of Human Nutrition
and Dietetics 5:168-177.
Weaver C (2014). How sound is the science behind the dietary recommendations for dairy?
American Journal of Clinical Nutrition 99:S1217-S1222.
Wham CA, Worsley A (2003). New Zealanders’ attitudes to milk: implications for public
health. Public Health Nutrition 6(1):73-78.
Wiles NL, Green JM, Veldman FJ (2011). The variety, popularity and nutritional quality of
tuck shop items available for sale to primary school learners in Pietermaritzburg,
South Africa. South African Journal of Clinical Nutrition 24(3):129-135.
Wiles NL, Green JM, Veldman FJ (2013). Tuck-shop purchasing practices of Grade 4
learners in Pietermaritzburg and childhood overweight and obesity. South African
Journal of Clinical Nutrition 26(1):37-42.
Wiley AS (2010). Dairy and milk consumption and child growth: Is BMI involved? An
analysis of NHANES 1999-2004. American Journal of Biology 22:517-525.
World Health Organization (2007). The challenge of obesity in the WHO European Region
and the Strategies for Response, Summary. p.8. (Eds) Branca F, Nikogosian H,
Lobstein T. Denmark. ISBN 9789289013888.
World Health Organization (2007). Growth reference data for 5-19 years.
http://www.who.int/growthref/en. (Accessed 10 August 2016).
World Health Organization (2010). Nutrition Landscape Information System (NLIS).
Country Profile Indicators Interpretation Guide. Geneva, Switzerland.
http://www.who.int/nutrition/nlis_interpretation_guide.pdf (Accessed 6 May
2017)

132
World Health Organization (2011) Global status report on non-communicable diseases.
Geneva, Switzerland.
http://www.who.int/nmh/publications/ncd_report_full_en.pdf (Accessed 7 April
2016)
World Health Organization (2012). Top ten causes of mortality.
http://www.who.int/mediacentre/factsheets/fs310/en/index2.html (Accessed 30
March 2016)
World Health Organization (2016). Report of the Commission on Ending Childhood Obesity
http://apps.who.int/iris/bitstream/10665/204176/1/9789241510066_eng.pdf
(Accessed 3 April 2016)
Wright SM, Aronne LJ (2012). Causes of Obesity. Abdominal Imaging 37(5):730-2.
Zemel MB (2003). Role of Dietary Calcium and Dairy Products in Modulating Adiposity.
Lipids 38(2):139-146.
Zemel BS, Carey LB, Paulhamus DR, Stallings VA, Ittenbach, RF (2010). Quantifying
Calcium Intake in School Age Children: Development and Validation of the Calcium
Counts!© Food Frequency Questionnaire. American Journal of Human Biology
22(2):180–186.
Zemel MB, Shi H, Greer B, Dirienzo D, Zemel PC (2000). Regulation of adiposity by dietary
calcium. The Federation of American Societies for Experimental Biology Journal
14:1132-1138.
Zemel MB, Thompson W, Milstead A, Morris K, Campbell P (2004). Calcium and dairy
acceleration of weight and fat loss during energy restriction in obese adults. Obesity
Reviews 12:582-590.

133
APPENDIX A: International cut off points for BMI for overweight and obesity by gender
between 2 and 18 years, defined to pass through BMI of 25 and 30 kg/m² at
18 years of age (Cole et al 2000)
BMI 25 kg/m² (overweight) BMI 30 kg/m² (obese)
Age (in years) Male Female Male Female
2 18.4 18.0 20.1 20.1
2.5 18.1 17.8 19.8 19.5
3 17.9 17.6 19.6 19.4
3.5 17.7 17.4 19.4 19.2
4 17.6 17.3 19.3 19.1
4.5 17.5 17.2 19.3 19.1
5 17.4 17.1 19.3 19.2
5.5 17.5 17.2 19.5 19.3
6 17.6 17.3 19.8 19.7
6.5 17.7 17.5 20.2 20.1
7 17.9 17.8 20.6 20.5
7.5 18.2 18.0 21.1 21.0
8 18.4 18.3 21.6 21.6
8.5 18.8 18.7 22.2 22.2
9 19.1 19.1 22.8 22.8
9.5 19.5 19.5 23.4 23.5
10 19.8 19.9 24.0 24.1
10.5 20.2 20.3 24.6 24.8
11 20.6 20.7 25.1 25.4
11.5 20.9 21.2 25.6 26.1
12 21.2 21.7 26.0 26.7
12.5 21.6 22.1 26.4 27.2
13 21.9 22.6 26.8 27.8
13.5 22.3 23.0 27.2 28.2
14 22.6 23.3 27.6 28.6
14.5 23.0 23.7 28.0 28.9
15 23.3 23.9 28.3 29.1
15.5 23.6 24.2 28.6 29.3

134
16 23.9 24.4 28.9 29.4
16.5 24.2 24.5 29.1 29.6
17 24.5 24.7 29.4 29.7
17.5 24.7 24.8 29.7 29.8
18 25 25 30 30

135
APPENDIX B: International cut off points for BMI for grades 1, 2, and 3 thinness by gender
between 2 and 18 years, defined to pass through BMI of 16, 17 and 18.5 kg/m²
at 18 years of age (Cole, Flegal, Nicholls & Jackson 2007)
Boys Girls
Age
(years)
16 kg/m²
(thinness
grade 3)
17 kg/m²
(thinness
grade 2)
18.5 kg/m²
(thinness
grade 1)
16 kg/m²
(thinness
grade 3)
17 kg/m²
(thinness
grade 2)
18.5 kg/m²
(thinness
grade 1)
2.0 13.37 14.12 15.14 13.24 13.90 14.83
2.5 13.22 13.94 14.92 13.10 13.74 14.63
3.0 13.09 13.79 14.74 12.98 13.60 14.47
3.5 12.97 13.64 14.57 12.86 13.47 14.32
4.0 12.86 13.52 14.43 12.73 13.34 14.19
4.5 12.76 13.41 14.31 12.61 13.21 14.06
5.0 12.66 13.31 14.21 12.50 13.09 13.94
5.5 12.58 13.22 14.13 12.40 12.99 13.86
6.0 12.50 13.15 14.07 12.32 12.93 13.82
6.5 12.45 13.10 14.04 12.28 12.90 13.82
7.0 12.42 13.08 14.04 12.26 12.91 13.86
7.5 12.41 13.09 14.08 12.27 12.95 13.93
8.0 12.42 13.11 14.15 12.31 13.00 14.02
8.5 12.45 13.17 14.24 12.37 13.08 14.14
9.0 12.50 13.24 14.35 12.44 13.18 14.28
9.5 12.57 13.34 14.49 12.53 13.29 14.43
10.0 12.66 13.45 14.64 12.64 13.43 14.61
10.5 12.77 13.58 14.80 12.78 13.59 14.81
11.0 12.89 13.72 14.97 12.95 13.79 15.05
11.5 13.03 13.87 15.16 13.15 14.01 15.32
12.0 13.18 14.05 15.35 13.39 14.28 15.62
12.5 13.37 14.25 15.58 13.65 14.56 15.93
13.0 13.59 14.48 15.84 13.92 14.85 16.26
13.5 13.83 14.74 16.12 14.20 15.14 16.57
14.0 14.09 15.01 16.41 14.48 15.43 16.88
14.5 14.35 15.28 16.69 14.75 15.72 17.18
15.0 14.60 15.55 16.98 15.01 15.98 17.45

136
15.5 14.86 15.82 17.26 15.25 16.22 17.69
16.0 15.12 16.08 17.54 15.46 16.44 17.91
16.5 15.36 16.34 17.80 15.63 16.62 18.09
17.0 15.60 16.58 18.05 15.78 16.77 18.25
17.5 15.81 16.80 18.28 15.90 16.89 18.38
18.0 16.00 17.00 18.50 16.00 17.00 18.50

137
APPENDIX C: Informed consent form for Principal
11 April 2016
Dear Sir/Madam,
My name is Joanne Galliers and I am currently employed in the Discipline of Dietetics & Human
Nutrition at the University of KwaZulu-Natal.
Your school is invited to consider participating in my MSc Dietetics study which will look at the
impact of dietary calcium from dairy, and total dairy intake on the Body Mass Index (BMI) of grade 2
learners in Pietermaritzburg.
The aims and purpose of my research are:
To determine the Body Mass Index of Grade 2 learners in Pietermaritzburg.
To determine the intake of dietary calcium from dairy, along with the total intake of dairy, in
Grade 2 learners in Pietermaritzburg.
To determine the contribution of dairy product intake to meeting the calcium requirements of
Grade 2 learners.
To determine whether there is a relationship between the dietary calcium (from dairy), and/or
total dairy intake, and the Body Mass Index of Grade 2 learners in Pietermaritzburg.
To determine possible barriers to dairy intake in Grade 2 learners in Pietermaritzburg
The study is expected to enrol Grade 2 learners of all race groups from quintile 5 schools in
Pietermaritzburg.
The procedure for the study is as follows:
1) If you give consent for your Grade 2 teachers and learners to participate in the study, I will
visit your school to meet with yourself and the Grade 2 teachers to explain how the study
will proceed. As the study is anonymous, I will require the teachers to allocate each
consenting learner with a code against their name on the register.
2) The questionnaires will be delivered to your school, and the teachers will send one home
with each consenting learner. The questionnaire will consist of approximately 38 questions
related to the dairy intake of the Grade 2 learners’ diet. The parents/guardians will be asked
to answer each question as accurately and truthfully as possible. There are no right or wrong
answers.
I will request that the parents/ guardians complete the questionnaire as soon as possible,
and return it to your school.

138
3) Once the questionnaires have been completed and returned to your school, I will visit the
school to measure the weights and heights of the Grade 2 learners, so as to calculate their
Body Mass Index. These measurements will involve them standing on a portable scale and
height stick. These are not invasive procedures, and no pain or discomfort will be
experienced.
Please note this study will not provide any direct benefit or harm to the study participants. It is
hoped that the study will shed light on the actual consumption of dairy products in Grade 2 learners,
and whether there is a link between dairy intake and Body Mass Index.
The study will be anonymous and voluntary. Each Grade 2 learner will be allocated a code, and
his/her name will not be required on the questionnaire form. Your school may withdraw from the
study at any point, should you wish to do so, with no penalties incurred.
Data collected from the study will be stored, securely locked away. After a 5 year period the data will
be shredded and destroyed.
This study has been ethically reviewed and approved by the UKZN Biomedical Research Ethics
Committee (BE275/16).
In the event of any problems or concerns/questions you may contact the researcher at:
Mrs Joanne Galliers [email protected] (033) 2605820
Supervisors: Dr Nicky Wiles [email protected] (033) 260 5430
Dr Nicky Tyler [email protected] (033) 260 5475
OR
BIOMEDICAL RESEARCH ETHICS ADMINISTRATION
Research Office, Westville Campus Govan Mbeki Building University of KwaZulu-Natal Private Bag X 54001, Durban, 4000 KwaZulu-Natal, SOUTH AFRICA Tel: 27 31 2602486 - Fax: 27 31 2604609 Email: [email protected]
Reference number: BE275/16

139
CONSENT
I (Name) ____________________________________________________________________ have
been informed about the study entitled: “To determine the impact of dietary calcium from dairy,
and/or total dairy intake on the Body Mass Index (BMI) of Grade 2 learners in Pietermaritzburg” by
Joanne Galliers.
I understand the purpose and procedures of the study.
I declare that the staff, parents/carers and learner’s participation in this study is entirely voluntary
and that they may withdraw at any time.
If I have any further questions/concerns or queries related to the study I understand that I may
contact the researcher on email at [email protected] or telephonically at (033) 260 5820.
If I have any questions or concerns about my school’s rights as a study participant, or if I am
concerned about an aspect of the study or the researchers then I may contact:
BIOMEDICAL RESEARCH ETHICS ADMINISTRATION
Research Office, Westville Campus Govan Mbeki Building University of KwaZulu-Natal Private Bag X 54001, Durban, 4000 KwaZulu-Natal, SOUTH AFRICA Tel: 27 31 2602486 - Fax: 27 31 2604609 Email: [email protected]
Reference number: BE275/16
________________________________________ _______________
(Signature of Principal) Date

140
APPENDIX D: Informed consent form for Grade 2 teacher
18 July 2016
Dear Grade 2 teachers,
My name is Joanne Galliers and I am currently employed in the Discipline of Dietetics & Human
Nutrition at the University of KwaZulu-Natal.
Your school has been invited to consider participating in my MSc Dietetics study which will look at
the impact of dietary calcium from dairy and/or total dairy intake on the Body Mass Index (BMI) of
Grade 2 learners in Pietermaritzburg.
The aims and purpose of my research are:
To determine the Body Mass Index of Grade 2 learners in Pietermaritzburg.
To determine the intake of dietary calcium from dairy, along with the total intake of dairy, in
Grade 2 learners in Pietermaritzburg.
To determine the contribution of dairy product intake to meeting the calcium requirements of
Grade 2 learners.
To determine whether there is a relationship between the dietary calcium (from dairy), and/or
total dairy intake, and the Body Mass Index of Grade 2 learners in Pietermaritzburg.
To determine possible barriers to dairy intake in Grade 2 learners in Pietermaritzburg
The study is expected to enrol Grade 2 learners of all race groups from quintile 5 schools in
Pietermaritzburg.
The procedure for the study is as follows:
4) If you give consent for your participation in the study, I will visit your school to meet with the
principal and yourself to explain how the study will proceed. As the study is anonymous, I
will request you allocate each consenting learner with a code against their name on the
register.
5) The questionnaires will be delivered to your school, and I will request you send a
questionnaire home with each consenting learner. The questionnaire will consist of
approximately 43 questions related to the dairy intake of the Grade 2 learners’ diet, and a 24
hour dietary recall. The parents/guardians will be asked to answer each question as
accurately and truthfully as possible. There are no right or wrong answers.
I will request that the parents/ guardians complete the questionnaire as soon as possible,
and return it to your school.

141
6) Once the questionnaires have been completed and returned to you, please keep them safely
stored away until I visit the school to measure the weights and heights of the Grade 2
learners, so as to calculate their Body Mass Index. Prior to the learners having their
measurements taken, please can you hand their questionnaires back to them (using the
codes on the questionnaire against their names on the register). The weight and height
measurements to be taken will involve them standing on a portable scale and height stick.
These are not invasive procedures, and no pain or discomfort will be experienced. I will then
record their measurements on the front page of their questionnaire.
Please note this study will not provide any direct benefit or harm to the study participants. It is
hoped that the study will shed light on the actual consumption of dairy products in Grade 2 learners,
and whether there is a link between dairy intake and Body Mass Index.
All accurately completed questionnaires and 24 hour recalls will be entered into a lucky draw prize,
with a R500 Liberty Midlands Mall voucher offered to the winner. This will be delivered to the
school.
The study will be anonymous and voluntary. Each Grade 2 learner will be allocated a code, and
his/her name will not be required on the questionnaire form. Your school may withdraw from the
study at any point, should you wish to do so, with no penalties incurred.
Data collected from the study will be stored, securely locked away. After a 5 year period the data will
be shredded and destroyed.
This study has been ethically reviewed and approved by the UKZN Biomedical Research Ethics
Committee (BE275/16).
In the event of any problems or concerns/questions you may contact the researcher at:
Mrs Joanne Galliers [email protected] (033) 2605820
Supervisors: Dr Nicky Wiles [email protected] (033) 260 5430
Dr Nicky Tyler [email protected] (033) 260 5475
OR
BIOMEDICAL RESEARCH ETHICS ADMINISTRATION
Research Office, Westville Campus Govan Mbeki Building University of KwaZulu-Natal Private Bag X 54001, Durban, 4000 KwaZulu-Natal, SOUTH AFRICA Tel: 27 31 2602486 - Fax: 27 31 2604609 Email: [email protected]
Reference number: BE275/16

142
CONSENT
I (Name) ____________________________________________________________________ have
been informed about the study entitled: “To determine the impact of dietary calcium from dairy
and/or total dairy intake on the Body Mass Index (BMI) of Grade 2 learners in Pietermaritzburg” by
Joanne Galliers.
I understand the purpose and procedures of the study.
I declare that my participation in this study is entirely voluntary and that I may withdraw at any time.
If I have any further questions/concerns or queries related to the study I understand that I may
contact the researcher on email at [email protected] or telephonically at (033) 260 5820.
If I have any questions or concerns about my school’s rights as a study participant, or if I am
concerned about an aspect of the study or the researchers then I may contact:
BIOMEDICAL RESEARCH ETHICS ADMINISTRATION
Research Office, Westville Campus Govan Mbeki Building University of KwaZulu-Natal Private Bag X 54001, Durban, 4000 KwaZulu-Natal, SOUTH AFRICA Tel: 27 31 2602486 - Fax: 27 31 2604609 Email: [email protected]
Reference number: BE 275/16
________________________________________ _______________
(Signature of Grade 2 teacher) Date

143
APPENDIX E: Food Frequency Questionnaire
Questionnaire to determine the relationship of dietary calcium from dairy and/or total dairy
intake to the Body Mass Index (BMI) of Grade 2 learners in Pietermaritzburg.
Thank you for taking the time to complete this questionnaire. It should not take you more
than 20 minutes to complete. Please note the instructions below.
Instructions.
Please read all questions carefully, and mark your answer with an “X”.
Please answer each question as truthfully and accurately as possible. There are no right
or wrong answers.
Please do not leave any questions blank. Estimate if you are not sure.
If you decide to change your answer, please clearly cross out the incorrect answer, and
mark the correct answer with an “X”.
Please proceed to Section A: Information of Learner (overleaf)
TO BE COMPLETED BY RESEARCHER ONCE QUESTIONNAIRE IS RETURNED TO
SCHOOL
CODE:
Weight: _____________kg ___________________kg __________________kg
Average weight: _____________________kg
Height: _______________m __________________m __________________m
Average height: ____________________m
Body Mass Index: ___________________kg/m²

144
SECTION A: INFORMATION ABOUT YOUR GRADE 2 LEARNER
1. Date of birth: ________________________________
2. Gender:
3. Race:
4. Does your grade 2 learner have any of the following medical conditions?
YES NO
4.1 Lactose intolerance
4.2 Insulin dependent Diabetes
4.3 Non-insulin dependent Diabetes
4.4 Allergies - Please specify: ______________________
4.5 Other condition - Please specify: ______________________
5. Does your grade 2 learner partake in any physical activity?
Male
Female
Black
White
Indian
Coloured
Other: please specify _______________________________
YES NO

145
If you answered “no” to question 5, please proceed to Section B: Milk consumption
6. If you answered “yes” to question 5, please indicate the type of
physical activity, and it’s duration (Tick all that apply):
Activity Yes/ No Duration of activity/day
(in minutes)
6.1 Walking to school
6.2 Swimming
6.3 Tennis
6.4 Running
6.5 Cycling
6.6 Football
6.7 Cricket
6.8 Dancing
6.9 Other: please specify
7. For those activities selected in question 6, indicate how often, on
average, he/she partakes in the activity.
Activity O
nce a
we
ek
Tw
ice
a w
eek
Thre
e tim
es a
we
ek
Fou
r tim
es a
wee
k
Fiv
e t
ime
s a
wee
k
Six
tim
es a
wee
k
Eve
ry d
ay
Mo
re t
han o
nce a
da
y
Ple
ase
sp
ecify h
ow
ma
ny tim
es:
_____________
7.1 Walking to school
7.2 Swimming
7.3 Tennis
7.4 Running
7.5 Cycling

146
Activity O
nce a
we
ek
Tw
ice
a w
eek
Thre
e tim
es a
we
ek
Fou
r tim
es a
wee
k
Fiv
e t
ime
s a
wee
k
Six
tim
es a
wee
k
Eve
ry d
ay
Mo
re t
han o
nce a
da
y
Ple
ase
sp
ecify h
ow
ma
ny tim
es:
_____________
7.6 Football
7.7 Cricket
7.8 Dancing
7.9 Other: please specify
8. How many hours a day does your grade 2 learner spend watching television and/or
playing on a computer device? (eg. computer games, cell phone, iPad/tablet)
In the week (Monday –
Friday)
Over the weekend
In the holidays
8.1 Watching TV
8.2 Playing computer games
8.3 Using a cell phone
8.4 Using an iPad/tablet

147
SECTION B: MILK CONSUMPTION
9. Does your grade 2 learner drink plain milk?
If you answered “no” to question 9, please proceed to question 13
If you answered “yes” to question 9:
10. What type of milk does he/she consume most of the time?
(Select ONE option only)
Full cream 2% Low fat 1% Low fat Skim milk
11. Indicate approximately how much milk he/she drinks in one sitting.
(Select ONE option only)
¼cup
⅓cup
½cup
1 cup
Other: please specify ________________
YES NO

148
12. Over the past 12 months, how often did he/she drink plain milk?
(Select ONE option only)
Less than once a week
Once a week
Twice a week
Three times a week
Four times a week
Five days a week
Six days a week
Every day
More than once a day
How many times a day?
13. Does he/she consume milk in hot drinks eg. tea, coffee, hot chocolate, Milo, Horlicks?
If you answered “no” to question 13, please proceed to question 16
14. If you answered “yes” to question 13, indicate approximately how
much milk is added each time (Select ONE option only).
A few drops of milk
1 teaspoon
1 tablespoon
¼cup
⅓cup
½cup
Other: please specify ________________
YES NO

149
15. Over the past 12 months, how often did he/she drink hot drinks eg.
tea, coffee, hot chocolate, Milo, Horlicks?
Less than once a week
Once a week
Twice a week
Three times a week
Four times a week
Five times a week
Six times a week
Every day
More than once a day
How many times a day? _____________
16. Does your grade 2 learner consume milk in cereal or porridge?
If you answered “no” to question 16, please proceed to question 19.
17. If you answered “yes” to question 16, how much milk is added to
the cereal? (Select ONE option only)
¼cup
⅓cup
½cup
1 cup
Other: please specify ________________
YES NO

150
18. Over the past 12 months, how often did he/she eat cereal or porridge?
(Select ONE option only)
Less than once a week
Once a week
Twice a week
Three times a week
Four times a week
Five times a week
Six times a week
Every day
More than once a day
How many times a day? ___________
19. Does your grade 2 learner drink flavoured milk at home eg. Milo, Squillos or Nesquik?
If you answered “no” to question 19, please proceed to question 22
20. If you answered “yes” to question 19, indicate approximately how
much flavoured milk he/she drinks in one sitting. (Select ONE option
only)
¼cup
⅓cup
½cup
1 cup
Other: please specify ________________
YES NO

151
21. Over the past 12 months, how often did he/she drink flavoured milk at
home? (Select ONE option only)
Less than once a week
Once a week
Twice a week
Three times a week
Four times a week
Five times a week
Six times a week
Every day
More than once a day
How many times a day? ___________
22. Does your grade 2 learner consume flavoured milk purchased at a shop eg. Super M,
Steri Stumpi?
If you answered “no” to question 22, please proceed to Section C: Yoghurt
consumption
23. If you answered “yes” to question 22, indicate approximately how
much store- bought flavoured milk he/she drinks in one sitting.
(Select ONE option only)
100ml
200ml
250ml
300ml
350ml
Other: please specify _____________
YES NO

152
24. Over the past 12 months, how often did he/she consume store- bought
flavoured milk? (Select ONE option only)
Less than once a week
Once a week
Twice a week
Three times a week
Four times a week
Five times a week
Six times a week
Every day
More than once a day
How many times a day? ___________

153
SECTION C: YOGHURT CONSUMPTION
25. Does your grade 2 learner consume yoghurt in a tub?
If you answered “no” to question 25, please proceed to question 29
26. If you answered “yes” to question 25, what type of yoghurt does
he/she consume most of the time? (Select ONE option only)
Double cream Full cream Low fat Fat free
27. How much yoghurt does he/she eat in one sitting?
(Select ONE option only)
100g
175g
200g
250g
Other: please specify __________________
28. Over the past 12 months, how often did he/she eat yoghurt?
(Select ONE option only)
Less than once a week
Once a week
Twice a week
Three times a week
Four times a week
Five times a week
Six times a week
Every day
More than once a day
How many times a day? ___________
YES NO

154
29. Does your grade 2 learner drink drinking yoghurt?
If you answered “no” to question 29, please proceed to Section D: Maas
consumption
30. If you answered “yes” to question 29, how much drinking yoghurt is
consumed at one sitting? (Select ONE option only)
100ml
200ml
300ml
400ml
500ml
Other
How much? _____________
31. Over the past 12 months, how often did he/she consume drinking
yoghurt? (Select ONE option only)
Less than once a week
Once a week
Twice a week
Three times a week
Four times a week
Five times a week
Six times a week
Every day
More than once a day
How many times a day? ___________
YES NO

155
SECTION D: MAAS CONSUMPTION
32. Does your grade 2 learner consume plain maas or add it to food?
If you answered “no” to question 32, please proceed to Section E: Cheese
consumption
33. If you answered “yes” to question 32, how much maas does he/she
consume in one sitting? (Select ONE option only)
100ml
200ml
300ml
400ml
Other
How much? _____________
34. Over the past 12 months how often did he/she consume maas?
(Select ONE option only)
Less than once a week
Once a week
Twice a week
Three times a week
Four times a week
Five times a week
Six times a week
Every day
More than once a day
How many times a day? ___________
YES NO

156
SECTION E: CHEESE CONSUMPTION
35. Does your grade 2 learner eat cheese?
If you answered “no” to question 35, please proceed to Section F: Other dairy
consumption
36. If you answered “yes” to question 35, please indicate if cheese was
consumed in the following ways, what type of cheese was consumed,
and how much was consumed:
How cheese is consumed Yes/No
Type of cheese
eg. cheddar,
cream cheese
Amount consumed eg. 40g, 3
triangles, 2 slices pizza,
1 cup macaroni cheese
36.1 On a sandwich/ breadroll
36.2 Triangles/ wedges/blocks
36.3 On a pizza
36.4 As part of a dish eg. Macaroni Cheese
36.5 Other (please specify) _________
37. Over the past 12 months, how often did he/she consume cheese in
these dishes?
Dishes
Ne
ver
Less t
han o
nce a
wee
k
On
ce a
we
ek
Tw
ice
a w
eek
Thre
e tim
es a
wee
k
Fou
r tim
es a
wee
k
Fiv
e t
ime
s a
wee
k
Six
tim
es a
wee
k
Eve
ryd
ay
Mo
re t
han o
nce a
da
y.
Ple
ase
sp
ecify h
ow
ma
ny tim
es:
37.1 Sandwich/breadroll
37.2 Triangles/wedges
37.3 Pizza
37.4 Part of a dish
37.5 Other (please specify) ____________
YES NO

157
SECTION F: OTHER DAIRY CONSUMPTION
38. Does your grade 2 learner consume any of the other following dairy products?
Product Yes/ No Amount consumed in one sitting eg. 1 cup, 2
scoops
38.1 Custard
38.2 Icecream
38.3 Frozen yoghurt
38.4 Ultramel Delight
38.5 Other (please specify) ___________________________
39. Over the past 12 months, how often did he/she consume these products?
Ne
ver
Less t
han o
nce a
wee
k
On
ce a
we
ek
Tw
ice
a w
eek
Thre
e tim
es a
wee
k
Fou
r tim
es a
wee
k
Fiv
e t
ime
s a
wee
k
Six
tim
es a
wee
k
Eve
ry d
ay
Mo
re t
han o
nce a
da
y.
Ple
ase
sp
ecify h
ow
ma
ny tim
es
39.1 Custard
39.2 Icecream
39.3 Frozen yoghurt
39.4 Ultramel Delight
39.5 Other ______________

158
SECTION G: OTHER BEVERAGE CONSUMPTION
40. Does your grade 2 learner consume any of the beverages listed below?
Beverage Yes No
40.1 Fizzy soda drinks eg. Coke, Sprite, Fanta
40.2 Diet soda drinks eg. Coke Zero, Coke light, Tab, Sprite Zero, Fanta Zero
40.3 100% fruit juice eg. Ceres, Liqui Fruit
40.4 Less than 100% fruit juice eg. Fruit Nectar, Clover
40.5 Squashes eg. Oros, Lecol, Halls
40.6 Cordials eg. Roses
40.7 Other. Please specify __________________________
If you answered “no” to question 39, please proceed to Section H: Barriers to Dairy
Consumption
41. If you answered “yes” to question 40, how much does he/she
consume in one sitting?
100ml 200ml 300ml 400ml 500ml Other: Please
specify amount
41.1 Fizzy soda drinks
41.2 Diet soda drinks
41.3 100% fruit juice
41.4 Less than 100% fruit juice
41.5 Squashes
41.6 Cordials
41.7 Other. Please specify _____________

159
42. Over the past 12 months how often did he/she consume these
beverages?
Ne
ver
Less t
han o
nce a
we
ek
On
ce a
we
ek
Tw
ice
a w
eek
Thre
e tim
es a
wee
k
Fou
r tim
es a
wee
k
Fiv
e t
ime
s a
wee
k
Six
tim
es a
wee
k
Eve
ry d
ay
Mo
re t
han o
nce a
day.
Ple
ase
sp
ecify
how
ma
ny t
ime
s
________________
_____
42.1 Fizzy soda drinks
42.2 Diet soda drinks
42.3 100% fruit juice
42.4 Less than 100% fruit juice
42.5 Squashes
42.6 Cordials
42.7 Other. Please specify: ________________________
SECTION H: BARRIERS TO DAIRY CONSUMPTION
43. Indicate your agreement that the following factors limit your grade 2 learners’ intake of
dairy.
Factors limiting dairy intake Strongly disagree
Disagree Neutral Agree Strongly
agree
43.1 No refrigeration at home
43.2 Cost of dairy products
43.3 School does not allow dairy products
43.4 Learner does not like dairy products
43.5 Carer does not like dairy products and therefore does not buy them
43.6 Learner has an allergy/intolerance to dairy
43.7 Special diet followed
43.8 Cultural and religious reasons
43.9 Ethical reasons
43.10 Other: please specify _______________________
Thank you for taking the time to complete this questionnaire, it is much appreciated. Feedback
on the study will be sent to all participating schools.

160
APPENDIX F: Permission to conduct research from the KZN DOE

161
APPENDIX G: Informed consent form for parents/guardians
25 July 2016
Dear Parent/Guardian,
My name is Joanne Galliers and I am currently employed in the Discipline of Dietetics & Human Nutrition
at the University of KwaZulu-Natal.
If your daughter or son is already eight years old, or turning eight years old this year, you are invited to
consider participating in my MSc Dietetics study which will look at the impact of dietary calcium from
dairy, and dairy intake on the Body Mass Index (BMI) of Grade 2 learners in Pietermaritzburg.
The aims and purpose of my research are:
To determine the Body Mass Index of Grade 2 learners in Pietermaritzburg.
To determine the intake of dietary calcium from dairy, along with the total intake of dairy, in Grade 2
learners in Pietermaritzburg.
To determine the contribution of dairy product intake to meeting the calcium requirements of Grade
2 learners.
To determine whether there is a relationship between the dietary calcium (from dairy), and/or total
dairy intake, and the Body Mass Index of Grade 2 learners in Pietermaritzburg.
To determine possible barriers to dairy intake in Grade 2 learners in Pietermaritzburg.
The study is expected to enrol Grade 2 learners of all race groups from quintile 5 schools in
Pietermaritzburg.
The procedure for the study is as follows:
7) If you give your consent for participation in the study, a questionnaire will be sent home with your
Grade 2 learner. The questionnaire will consist of approximately 40 questions related to the dairy
intake of your Grade 2 learners’ diet, and a two day 24 hour recall. Please answer these questions as
accurately and truthfully as possible. There are no right or wrong answers.
Please can you complete the questionnaire and two day 24 hour recall as soon as possible, and
return them to your class teacher.
162
8) Once the questionnaire and 24 hour recalls have been completed and returned to school, I will visit
the school to measure the weights and heights of the Grade 2 learners, so as to calculate their Body
Mass Index. These measurements will involve them standing on a portable scale and height stick.
These are not invasive procedures, and no pain or discomfort will be experienced.
Please note this study will not provide any direct benefit or harm to the study participants.
All accurately completed questionnaires and 24 hour recalls will be entered into a lucky draw prize, with
a R500 Liberty Midlands Mall voucher offered to the winner. This will be delivered to the school.
The study will be anonymous and voluntary. Each Grade 2 learner will be allocated a code, and his/her
name will not be required on the questionnaire form. You may withdraw from the study at any point,
should you wish to do so, with no penalties incurred.
Data collected from the study will be stored, securely locked away. After a 5 year period the data will be
shredded and destroyed.
This study has been ethically reviewed and approved by the UKZN Biomedical Research Ethics
Committee (BE275/16).
In the event of any problems or concerns/questions you may contact the researcher at:
Mrs Joanne Galliers [email protected] (033) 2605820
Supervisors: Dr Nicky Wiles [email protected] (033) 260 5430
Dr Nicky Tyler [email protected] (033) 260 5475
OR
BIOMEDICAL RESEARCH ETHICS ADMINISTRATION
Research Office, Westville Campus Govan Mbeki Building University of KwaZulu-Natal Private Bag X 54001, Durban, 4000 KwaZulu-Natal, SOUTH AFRICA Tel: 27 31 2602486 - Fax: 27 31 2604609 Email: [email protected]
Reference number: BE275/16

163
CONSENT
I/We (Name) ____________________________________________________________________ have
been informed about the study entitled: “To determine the impact of dietary calcium from dairy and/or
total dairy intake on the Body Mass Index (BMI) of Grade 2 learners in Pietermaritzburg” by Joanne
Galliers, and would like to/ would not like to participate.
I understand the purpose and procedures of the study.
I declare that my participation in this study is entirely voluntary and that I may withdraw at any time.
If I have any further questions/concerns or queries related to the study I understand that I may contact
the researcher on email at [email protected] or telephonically at (033) 260 5820.
If I have any questions or concerns about my rights as a study participant, or if I am concerned about an
aspect of the study or the researchers then I may contact:
BIOMEDICAL RESEARCH ETHICS ADMINISTRATION Research Office, Westville Campus Govan Mbeki Building University of KwaZulu-Natal Private Bag X 54001, Durban, 4000 KwaZulu-Natal, SOUTH AFRICA Tel: 27 31 2602486 - Fax: 27 31 2604609 Email: [email protected]
Reference: BE 275/16
________________________________________ _______________
(Signature of parent/guardian) Date

164
APPENDIX H: Ethics approval from BREC
Copyright © 2022 FDOKUMEN