Which Factors Determine CO2 Emissions in China? Trade ...
18
Citation: Yang, Z.; Wang, M.-C.; Chang, T.; Wong, W.-K.; Li, F. Which Factors Determine CO 2 Emissions in China? Trade Openness, Financial Development, Coal Consumption, Economic Growth or Urbanization: Quantile Granger Causality Test. Energies 2022, 15, 2450. https:// doi.org/10.3390/en15072450 Academic Editor: David Borge-Diez Received: 9 February 2022 Accepted: 19 March 2022 Published: 26 March 2022 Publisher’s Note: MDPI stays neutral with regard to jurisdictional claims in published maps and institutional affil- iations. Copyright: © 2022 by the authors. Licensee MDPI, Basel, Switzerland. This article is an open access article distributed under the terms and conditions of the Creative Commons Attribution (CC BY) license (https:// creativecommons.org/licenses/by/ 4.0/). energies Article Which Factors Determine CO 2 Emissions in China? Trade Openness, Financial Development, Coal Consumption, Economic Growth or Urbanization: Quantile Granger Causality Test Zhenkai Yang 1 , Mei-Chih Wang 2 , Tsangyao Chang 3 , Wing-Keung Wong 4,5,6 and Fangjhy Li 7, * 1 Department of Finance, School of Economics and Management, Wuhan University, No. 299 Bayi Road, Wuchang District, Wuhan 430072, China; [email protected] 2 Department of Insurance and Finance, National Taichung University of Science and Technology, 129 Sec. 3, Sanmin Rd., Taichung 404336, Taiwan; [email protected] 3 Department of Finance, College of Finance, Feng Chia University, No. 100 Wenhwa Rd., Xitun District, Taichung 40724, Taiwan; [email protected] 4 Department of Finance, Fintech & Blockchain Research Center, and Big Data Research Center, Asia University, 500 Lioufeng Rd., Wufeng, Taichung 41354, Taiwan; [email protected] 5 Department of Medical Research, China Medical University Hospital, Taichung 40447, Taiwan 6 Department of Economics and Finance, Hang Seng University of Hong Kong, Hong Kong 999077, China 7 Department of Finance, School of Finance, Hubei University of Economics, No. 8 Yangqiaohu Road, Jiangxia District, Wuhan 430205, China * Correspondence: [email protected] Abstract: The current study employs a Granger causality test within a Quantile approach investigat- ing CO 2 emission determinants in China. Results show urbanization, financial development and openness to trade are leading determinants of CO 2 emissions in China. These results highlight climate change issues while taking advantage of a new methodology to fill a gap in the current literature. Our findings show key implications for PRC government policy related to pollutant reduction policy. Keywords: financial development; CO 2 emissions; economic growth; trade openness; quantile Granger causality test JEL Classification: G32; O44; Q43; Q53 1. Introduction As we all know, high CO 2 emissions pollute air, and this pollutant can endanger human health. Scientists agree CO 2 emissions from human industrial activities pose a risk to the earth’s climate stability. Evidence shows a relationship between greenhouse gasses and global climate change. Reducing CO 2 emissions directly affects a country’s eco- nomic structure, requiring a reduction in economic activity or a shift in energy-dependent processes, which can affect a country’s position and competitiveness on the international stage. Growth in CO 2 emissions of developing countries implies developed countries need to reduce emissions. Such reductions lead to a reduction in economic growth along with corresponding increases in unemployment. Such social implications could lead to dissatisfaction among citizens. However, social issues are also a potential problem when pollutants are high as human health is endangered and quality is life sacrificed. From a globalization perspective, the finance sector of China’s CO 2 emissions have become increasingly close to the international carbon finance market. The United Nations Framework Convention on Climate Cooperation, as specified in the Kyoto Protocol and the Paris Agreement, assume varying degrees of responsibility among nations for reducing emissions. In the international CO 2 emission rights trading market, the emission rights Energies 2022, 15, 2450. https://doi.org/10.3390/en15072450 https://www.mdpi.com/journal/energies
-
Upload
khangminh22 -
Category
Documents
-
view
2 -
download
0
Transcript of Which Factors Determine CO2 Emissions in China? Trade ...

�����������������
Citation: Yang, Z.; Wang, M.-C.;
Chang, T.; Wong, W.-K.; Li, F. Which
Factors Determine CO2 Emissions in
China? Trade Openness, Financial
Development, Coal Consumption,
Economic Growth or Urbanization:
Quantile Granger Causality Test.
Energies 2022, 15, 2450. https://
doi.org/10.3390/en15072450
Academic Editor: David Borge-Diez
Received: 9 February 2022
Accepted: 19 March 2022
Published: 26 March 2022
Publisher’s Note: MDPI stays neutral
with regard to jurisdictional claims in
published maps and institutional affil-
iations.
Copyright: © 2022 by the authors.
Licensee MDPI, Basel, Switzerland.
This article is an open access article
distributed under the terms and
conditions of the Creative Commons
Attribution (CC BY) license (https://
creativecommons.org/licenses/by/
4.0/).
energies
Article
Which Factors Determine CO2 Emissions in China? TradeOpenness, Financial Development, Coal Consumption,Economic Growth or Urbanization: Quantile GrangerCausality TestZhenkai Yang 1, Mei-Chih Wang 2 , Tsangyao Chang 3, Wing-Keung Wong 4,5,6 and Fangjhy Li 7,*
1 Department of Finance, School of Economics and Management, Wuhan University, No. 299 Bayi Road,Wuchang District, Wuhan 430072, China; [email protected]
2 Department of Insurance and Finance, National Taichung University of Science and Technology, 129 Sec. 3,Sanmin Rd., Taichung 404336, Taiwan; [email protected]
3 Department of Finance, College of Finance, Feng Chia University, No. 100 Wenhwa Rd., Xitun District,Taichung 40724, Taiwan; [email protected]
4 Department of Finance, Fintech & Blockchain Research Center, and Big Data Research Center, Asia University,500 Lioufeng Rd., Wufeng, Taichung 41354, Taiwan; [email protected]
5 Department of Medical Research, China Medical University Hospital, Taichung 40447, Taiwan6 Department of Economics and Finance, Hang Seng University of Hong Kong, Hong Kong 999077, China7 Department of Finance, School of Finance, Hubei University of Economics, No. 8 Yangqiaohu Road,
Jiangxia District, Wuhan 430205, China* Correspondence: [email protected]
Abstract: The current study employs a Granger causality test within a Quantile approach investigat-ing CO2 emission determinants in China. Results show urbanization, financial development andopenness to trade are leading determinants of CO2 emissions in China. These results highlight climatechange issues while taking advantage of a new methodology to fill a gap in the current literature.Our findings show key implications for PRC government policy related to pollutant reduction policy.
Keywords: financial development; CO2 emissions; economic growth; trade openness; quantileGranger causality test
JEL Classification: G32; O44; Q43; Q53
1. Introduction
As we all know, high CO2 emissions pollute air, and this pollutant can endangerhuman health. Scientists agree CO2 emissions from human industrial activities pose arisk to the earth’s climate stability. Evidence shows a relationship between greenhousegasses and global climate change. Reducing CO2 emissions directly affects a country’s eco-nomic structure, requiring a reduction in economic activity or a shift in energy-dependentprocesses, which can affect a country’s position and competitiveness on the internationalstage. Growth in CO2 emissions of developing countries implies developed countriesneed to reduce emissions. Such reductions lead to a reduction in economic growth alongwith corresponding increases in unemployment. Such social implications could lead todissatisfaction among citizens. However, social issues are also a potential problem whenpollutants are high as human health is endangered and quality is life sacrificed.
From a globalization perspective, the finance sector of China’s CO2 emissions havebecome increasingly close to the international carbon finance market. The United NationsFramework Convention on Climate Cooperation, as specified in the Kyoto Protocol andthe Paris Agreement, assume varying degrees of responsibility among nations for reducingemissions. In the international CO2 emission rights trading market, the emission rights
Energies 2022, 15, 2450. https://doi.org/10.3390/en15072450 https://www.mdpi.com/journal/energies

Energies 2022, 15, 2450 2 of 18
quotas held by various countries are limited. When conducting CO2 emission rightstrading, companies can purchase certified emission reductions or emission permit quotasin a targeted manner. In the case of price changes, companies can consider the price ofcertified emission reductions and emission allowances, choose the type of purchase, andadjust the purchase amount.
Energy activities are usually the main source of carbon emissions, generating morethan 90% of CO2 emissions, of which total greenhouse gas emissions account for 75%.Most energy activities rely on the burning of fossil fuels and the emission of green-house gases, while CO2 is mainly produced by burning fossil fuels. China is one ofthe countries that emit the most CO2 in the world, and its emissions are second onlyto the United States. As China hopes to continue to develop its industry rapidly, it isindeed facing great challenges in reducing greenhouse gas (GHG) emissions to a pre-determined target. In fact, there are some factors that can easily cause China’s GHGemissions to increase rather than decrease year by year. Petroleum, natural gas, coal, andother fossil fuels are currently the most important energy consumption products used inhuman activities and the leading contributors to greenhouse gas emissions. Accordingto BP’s World Energy Statistics Yearbook released by BP in July 2021, the global primaryenergy consumption in 2020 was 556.63 EJ (EJ = 1018 Joule), which was affected by theCOVID-19 epidemic and other factors. Since 2019, energy consumption has decreased,and the consumption has decreased by 4.28 percentage points compared with 2009. (BP,2021, https://www.bp.com/content/dam/bp/business-sites/en/global/corporate/pdfs/energy-economics/statistical-review/bp-stats-review-2021-full-report.pdf (accessed on12 December 2021)).
The largest emissions by country are from China, which is the leading energy consumer(Figure 1 shows the world’s top 10 CO2 emissions countries in order of emissions in 2020,BP, 2021). In 2020, China’s energy-related CO2 emissions reach 98.9351 million tons, ac-counting for 30.66% of the world’s total emissions (National Bureau of Statistics of China,2021, http://www.stats.gov.cn/english (accessed on 16 December 2021)). Energy consump-tion in China for 2020 totaled 49,800 million tons of standard coal, that is a 2.2% rise from2019. Coal decreased as a percentage of energy sources to 56.8%, a decrease of 0.9% from2019. Clean energy consumption, including hydropower, natural gas, nuclear power, andwind power totaled 24.3%, which was an increase of 1.0% from 2019. From 2016, the cleanenergy sector increased 5.2% from 19.1% of the total (National Bureau of Statistics of PRC,2021, http://www.stats.gov.cn/english (accessed on 16 December 2021)). As the economyand society shift to high-quality development, China’s energy consumption structure isgradually improving. Affected by the epidemic in 2020, the global primary energy con-sumption growth rate was −4.28%, but China’s primary energy consumption grew by2.41%. China’s share of global primary energy consumption rose from 20.64% in 2010 to26.13% in 2020, while still facing increasing regulatory pressure.
Energies 2022, 15, x FOR PEER REVIEW 3 of 19
Figure 1. The top 10 CO2 emissions countries in the world in 2020. Data sources: BP Statistical Re-
view of World Energy, 2021.
We organize the remainder of this study as follows. Previous literature is covered in
Section 2, followed by our theoretical model and discussion of the bootstrap Fourier
Granger causality in quantiles test proposed by Cheng et al. [1], in Section 3. Empirical
findings and their implications to policy are covered in Section 4. Finally, Section 5 in-
cludes conclusions.
2. Literature Review
Numerous factors affect CO2 emissions as found in previous research. These include
trade openness, power generation (especially coal consumption), financial development,
GDP (economic growth), and urbanization. Trade openness increases international trade,
which in turn leads to an expansion of manufacturing activity to meet demand. This leads
to an increase in CO2 emissions. Larch [2] believes that carbon tariffs can reduce CO2 emis-
sions worldwide and that carbon leakage can be reduced by changing the composition of
production within and between countries. This reduction comes at the cost of lowering
world trade flows and lowering welfare, especially for developing countries. Rasiah et al.
[3] pointed out trade openness, alongside energy usage and economic growth has signif-
icantly influenced CO2 emissions across selected ASEAN nations. Emission intensity of all
sectors in the PRC surpass Japan, as Long [4] found using a multiregional input-output
model from 2000 to 2014. Annual consumer-related emissions were surpassed by produc-
tion emissions. Environmental effects of foreign trade are negative—the “pollution para-
dise hypothesis”. This hypothesis holds that when the cost of compliance with domestic
environmental regulations is high, developed countries increase the importation of “pol-
luting products”. Thus, the polluting process is transferred to developing countries with
weaker environmental regulations, which bear the consequences of environmental pollu-
tion. Cai et al. [5] proposed a pollution paradise hypothesis verification model and con-
ducted a comprehensive analysis, calculating CO2 emissions in imports and exports. The
results showed that the PRC has become a pollution paradise for 22 developed countries.
To test influences on emissions from power production and economic expansion, Osobajo
et al. [6] employed Granger causality and panel cointegration tests to a pooled OLS re-
gression and fixed effects method. Such data provides needed input on the efforts to move
to a low-carbon economy. Jung et al. [7] established a dynamic computable general equi-
librium (CGE) model to study the relationship between population changes and CO2 emis-
sions in China, Japan, and South Korea. The results show that a country's labor participa-
tion rate affects the production function, which is converted into GDP, and that GDP is
positively correlated with CO2 emissions.
On the other hand, trade openness allows countries to easily acquire (from other
countries) and use new and clean technology, which is associated with low levels of CO2
0
2,000
4,000
6,000
8,000
10,000
12,000
CO2 emissions
Unit / Million Tons
Figure 1. The top 10 CO2 emissions countries in the world in 2020. Data sources: BP Statistical Reviewof World Energy, 2021.

Energies 2022, 15, 2450 3 of 18
Reduction of emissions is thus an important topic of research for academic researchersand government officials. The first step in reducing CO2 emissions is to understandthe main determinants and associated factors of CO2 emissions. Previous studies havefound numerous factors that impact CO2 emissions. Such factors include trade openness,energy consumption (especially coal consumption), GDP (economic growth), urbanization,and financial development. The current study examines the specific case in the People’sRepublic of China (PRC). Previous studies have mainly relied on the traditional method,Granger causality, which often ignores nonlinear and tail causal effects. A more detailedand flexible approach is the quantile causality perspective. To this end, we employ the Toda-Yamamoto Granger causality test by quantile regression (T-YGCQ, hereafter) proposed byCheng et al. [1] to investigate the major determinants of CO2 emissions in the PRC. Suchan approach can overcome the current gap in the research literature.
We organize the remainder of this study as follows. Previous literature is covered inSection 2, followed by our theoretical model and discussion of the bootstrap Fourier Grangercausality in quantiles test proposed by Cheng et al. [1], in Section 3. Empirical findings andtheir implications to policy are covered in Section 4. Finally, Section 5 includes conclusions.
2. Literature Review
Numerous factors affect CO2 emissions as found in previous research. These includetrade openness, power generation (especially coal consumption), financial development,GDP (economic growth), and urbanization. Trade openness increases international trade,which in turn leads to an expansion of manufacturing activity to meet demand. This leadsto an increase in CO2 emissions. Larch [2] believes that carbon tariffs can reduce CO2emissions worldwide and that carbon leakage can be reduced by changing the compositionof production within and between countries. This reduction comes at the cost of loweringworld trade flows and lowering welfare, especially for developing countries. Rasiah et al. [3]pointed out trade openness, alongside energy usage and economic growth has significantlyinfluenced CO2 emissions across selected ASEAN nations. Emission intensity of all sectorsin the PRC surpass Japan, as Long [4] found using a multiregional input-output model from2000 to 2014. Annual consumer-related emissions were surpassed by production emissions.Environmental effects of foreign trade are negative—the “pollution paradise hypothesis”.This hypothesis holds that when the cost of compliance with domestic environmental regu-lations is high, developed countries increase the importation of “polluting products”. Thus,the polluting process is transferred to developing countries with weaker environmentalregulations, which bear the consequences of environmental pollution. Cai et al. [5] pro-posed a pollution paradise hypothesis verification model and conducted a comprehensiveanalysis, calculating CO2 emissions in imports and exports. The results showed that thePRC has become a pollution paradise for 22 developed countries. To test influences onemissions from power production and economic expansion, Osobajo et al. [6] employedGranger causality and panel cointegration tests to a pooled OLS regression and fixed effectsmethod. Such data provides needed input on the efforts to move to a low-carbon economy.Jung et al. [7] established a dynamic computable general equilibrium (CGE) model tostudy the relationship between population changes and CO2 emissions in China, Japan,and South Korea. The results show that a country’s labor participation rate affects theproduction function, which is converted into GDP, and that GDP is positively correlatedwith CO2 emissions.
On the other hand, trade openness allows countries to easily acquire (from othercountries) and use new and clean technology, which is associated with low levels of CO2emissions. As Farhani et al. [8] pointed out; the technology, composition, and scale ofinternational trade are key inputs to emission levels. This perspective, the scale effectargument, asserts that increases in trade and economic growth lead to emission increases.Power consumption is the key ingredient as the theory of comparative advantage showsdemand for low-cost goods leads to increased production and pollution. Such trade thenleads to improvements in efficiency, through competitive pressures, that lower emissions.

Energies 2022, 15, 2450 4 of 18
Thus, it is clear that increases in international trade increase the demand for power con-sumption. Simultaneously, the same trade activity pressures industries to become morecompetitive through efficiency. Sebri and Ben-Salha [9] found that adopting renewableenergy sources (lowering CO2 emissions) among developing countries varies according tonational income levels. The magnitude and direction of trade’s relationship with emissionsis complex and not easily quantified. Zhang et al. [10] studied real GDP and total primaryenergy consumption to determine how trade liberalization affects CO2 emissions. Theyconcluded that trade liberalization has a negative and significant impact on emissions. Theempirical results of short-term causality show a one-way link between trade and energy.Real GDP and trade have Granger causality with CO2 emissions. Mutascu and Sokic [11]used samples and wavelet tools from the period 1960 to 2014 to explore the correlationbetween European Union (EU) trade openness and CO2 emissions. The results suggest thatcountries would choose trade over reducing CO2 emissions in the short- and long-term,strongly influenced by economic shocks, energy use, and economic growth. Li et al. [12]used a random-effects model and 1996-2018 data to study CO2 emissions from formersocialist countries in Central Europe and East Asia. They found that improvements inenergy efficiency and increased shares of agriculture, forestry and fisheries reduced CO2emissions per capita. An increase in the proportion of industry will increase CO2 emissionsper capita. Chen et al. [13] used the quantile regression method to investigate panel data of64 countries along with PRC “the Belt and Road Initiative” from 2001 to 2019 and studiedwhether increased trade openness would lead to more serious environmental problems.Published findings evidenced the indirect effect of increases in trade to emissions, whilesuch impact varies with the level of CO2 emissions. Table 1 shows the top 10 countries orregions in global trade, exports, and imports in 2020. Figure 2 shows the trade changesafter PRC character reform and opening up in 1978.
Table 1. The top 10 import and export countries or regions in global trade in 2020 (US$ billion).
Total Trade Value Exports Value Imports Value
Country/Region Amount Country/Region Amount Country/Region Amount
Global 35,395 Global 17,583 Global 17,8121 China 4647 China 2591 USA 24082 USA 3839 USA 1432 China 20563 Germany 2551 Germany 1380 Germany 11714 Japan 1276 Netherlands 674 UK 6355 Netherlands 1271 Japan 641 Japan 6356 China Hong Kong 1119 China Hong Kong 549 Netherlands 5977 France 1071 South Korea 512 France 5828 UK 1038 Italy 496 China Hong Kong 5709 South Korea 980 France 488 South Korea 46810 Italy 919 Belgium 419 Italy 423
Data sources: WTO Press/876 https://www.wto.org/english/res_e/statis_e/wts2021_e/wts21_toc_e.htm (ac-cessed on 16 December 2021).
Energies 2022, 15, x FOR PEER REVIEW 5 of 19
Figure 2. 1978–2020 Development Trends of China’s Import and Export Trade. Data sources: Na-
tional Bureau of Statistics of China, 2021.
Existing studies have shown environmental decline and economic expansion follow
an inverted U-shaped—also known as the Environmental Kuznets Curve (EKC). Re-
searchers such as Grossman and Krueger [14] and Selden and Song [15] have examined
this correlation, finding the early stages of economic expansion especially reflect this phe-
nomenon. Results, however, show large variances in the levels and significance of the
connections between economic growth and resulting emissions. Thus, the tension be-
tween increases in emissions from economic expansion and decreases in emissions from
increased living standards and improved production efficiencies is currently unresolved.
Li et al. [16] conducted a spatial analysis of dust, SO2, NOx, and CO2 emissions in China,
using local spatial correlation analysis, global spatial autocorrelation analysis, and a spa-
tial lag model. Empirical findings suggest that urbanization and economic growth are key
determinants of dust, NOx and CO2 emissions. Fang et al. [17] used energy-related CO2
emissions (ECE) data from 143 countries around the world from 1990 to 2014, and used
the coefficient of variation to analyze regional differences in ECE growth rates. Energy
intensity growth rate and GDP growth rate are the three key determinants of ECE growth
rates in most of the world. Growth rates in the non-OECD region were higher and trend-
ing upward, while ECE growth rates in the OECD region were lower and trending down-
ward. To and Lee [18] studied the relationship between Hong Kong's economic develop-
ment and energy consumption from 1970 to 2015, and their results showed that energy
consumption was the determinant of the resulting greenhouse gas (GHG) emissions.
Using data from 1990 to 2000, Jiang et al. [19] tested the degree of decoupling of trans-
portation and CO2 emissions in China and investigated the potential determinants of each
mode of transportation. Transport energy efficiency played the most important role in
accelerating the decoupling of transport-related CO2 emissions from turnover across all
modes of transport, while energy mixing effects hindered the evolution of decoupling for
most of the observation periods. Badulescu et al. [20] used a panel autoregressive distrib-
uted lag (ARDL) approach to investigate the role and impact of economic growth, envi-
ronmental pollution, and non-communicable diseases on health spending between 2000
and 2014. The results show that, in all 28 EU countries, economic growth is the most im-
portant factor influencing both short- and long-term health spending. The impact of CO2
emissions on healthcare spending varies, being negative in the short-term and positive in
the long-term. Tseng [21] used the Logarithmic Mean Divisia Index (LMDI) model to
measure the decoupling effect of economic growth and CO2 emissions, and explored the
influencing factors of the fluctuation of CO2 emissions in Inner Mongolia, China from 2005
to 2016. The results show that demographic factors, labor Productivity factors and labor
factors have a positive impact on CO2 emissions, and the decoupling between economic
growth and CO2 growth is weak. Carbonell Bojollo et al. [22] experimentally investigated
the relationship between soil and CO2 emissions. The results show that extreme rainfall
can cause large amounts of CO2 to be released into the atmosphere. Hu et al. [23] used the
0
1000
2000
3000
4000
5000
1978
1980
1982
1984
1986
1988
1990
1992
1994
1996
1998
2000
2002
2004
2006
2008
2010
2012
2014
2016
2018
2020
Total
Exports
Imports
(US$ billion)
Figure 2. 1978–2020 Development Trends of China’s Import and Export Trade. Data sources: NationalBureau of Statistics of China, 2021.

Energies 2022, 15, 2450 5 of 18
Existing studies have shown environmental decline and economic expansion follow aninverted U-shaped—also known as the Environmental Kuznets Curve (EKC). Researcherssuch as Grossman and Krueger [14] and Selden and Song [15] have examined this correla-tion, finding the early stages of economic expansion especially reflect this phenomenon.Results, however, show large variances in the levels and significance of the connectionsbetween economic growth and resulting emissions. Thus, the tension between increasesin emissions from economic expansion and decreases in emissions from increased livingstandards and improved production efficiencies is currently unresolved. Li et al. [16]conducted a spatial analysis of dust, SO2, NOx, and CO2 emissions in China, using localspatial correlation analysis, global spatial autocorrelation analysis, and a spatial lag model.Empirical findings suggest that urbanization and economic growth are key determinantsof dust, NOx and CO2 emissions. Fang et al. [17] used energy-related CO2 emissions (ECE)data from 143 countries around the world from 1990 to 2014, and used the coefficient ofvariation to analyze regional differences in ECE growth rates. Energy intensity growthrate and GDP growth rate are the three key determinants of ECE growth rates in mostof the world. Growth rates in the non-OECD region were higher and trending upward,while ECE growth rates in the OECD region were lower and trending downward. To andLee [18] studied the relationship between Hong Kong’s economic development and energyconsumption from 1970 to 2015, and their results showed that energy consumption was thedeterminant of the resulting greenhouse gas (GHG) emissions.
Using data from 1990 to 2000, Jiang et al. [19] tested the degree of decoupling oftransportation and CO2 emissions in China and investigated the potential determinants ofeach mode of transportation. Transport energy efficiency played the most important rolein accelerating the decoupling of transport-related CO2 emissions from turnover acrossall modes of transport, while energy mixing effects hindered the evolution of decouplingfor most of the observation periods. Badulescu et al. [20] used a panel autoregressivedistributed lag (ARDL) approach to investigate the role and impact of economic growth,environmental pollution, and non-communicable diseases on health spending between2000 and 2014. The results show that, in all 28 EU countries, economic growth is themost important factor influencing both short- and long-term health spending. The impactof CO2 emissions on healthcare spending varies, being negative in the short-term andpositive in the long-term. Tseng [21] used the Logarithmic Mean Divisia Index (LMDI)model to measure the decoupling effect of economic growth and CO2 emissions, andexplored the influencing factors of the fluctuation of CO2 emissions in Inner Mongolia,China from 2005 to 2016. The results show that demographic factors, labor Productivityfactors and labor factors have a positive impact on CO2 emissions, and the decouplingbetween economic growth and CO2 growth is weak. Carbonell Bojollo et al. [22] experi-mentally investigated the relationship between soil and CO2 emissions. The results showthat extreme rainfall can cause large amounts of CO2 to be released into the atmosphere.Hu et al. [23] used the Logarithmic Mean Divisia Index (LMDI) and the Kaya identitymethod to analyze the impact of CO2 emissions from PRC’s auto industry, and the resultsshowed that R&D intensity and energy intensity are the two main factors affecting emissionreductions the investment intensity effect is the biggest factor affecting CO2 emissions.
Zhou et al. [24] used data collected across 30 PRC provinces from 2007 to 2017,using spatial and nonlinear measurement methods and found increased power usageand financial developments are linked to economic expansion. They showed the needto support the transition to a low-carbon economy mainly through climate financing,which will help promote large-scale investment in clean energy, thereby significantly re-ducing CO2 emissions. Polzin and Sanders [25] studied the literature and quantitativedata on available financing sources for clean energy and pointed out that the fundingsources for the European low-carbon energy transition mainly include direct financingmodels such as private equity and green bonds, bank financing, and institutional investors.Patiño et al. [26] studied the relationship between CO2 emissions, energy consumption, andGDP in Colombia using the seemingly unrelated regression equations method and data
Energies 2022, 15, 2450 6 of 18
from the period 1971–2017. The results suggest that economic growth is associated withan increase in these environmental pressures. Energy consumption’s efficiency is raisedin a low-carbon economy with the goal of lowering greenhouse gas emissions while stillobtaining economic growth. This combination of social and economic growth along withincreased ecological and environmental protection is obtained through technological andinstitutional innovation and transformation, thus overcoming the contradictions betweenenvironmental issues and development. Another link that has been examined is that ofemissions and urbanization. In 1950, urbanization was 30% but has grown to 50% todayand is predicted to grow to 60% by 2030. The link of emissions to urbanization has beenexamined by researchers such as Poumanyvong and Kneko [27] who used a StochasticImpacts on Population, Affluence, and Technology (STIRPAT) model with data from abalanced panel of 199 countries, from 1975 to 2005. They attempted to quantify the link byconsidering a range of development stages and the unique profiles for different stages. Theyfound energy use is lower in low-income groups and increases in middle- and high-incomegroups, while especially pronounced in the middle-income group.
Martínez Zarzoso and Maruotti [28] analyzed the impact of urbanization on carbondioxide emissions in developing countries between 1975 and 2003. It takes into accountthe dynamics and existing heterogeneity of sample countries by examining the effectsof urbanization. The results show that the relationship between urbanization and CO2emission is inverted “U-shaped”. In fact, the emission urbanization elasticity is positivefor low urbanization levels, which is consistent with the higher environmental impactsobserved in less developed regions. Ponce de Leon Barido and Marshall [29] studied theimpact of urbanization and environmental policies on CO2 emissions at the national level.Zheng et al. [30] explored the CO2 emissions of 73 Chinese cities during the data periodfrom 2002 to 2012 using a linear mixed-effects regression method with quadratic termStochastic Impacts on Population, Affluence, and Technology (STIRPAT) model relatedfactors. The study found that there is heterogeneity in the cross-city distribution of percapita CO2 emissions and the relationship between carbon dioxide emissions and percapita GDP has a nonlinear structure. The empirical results show that population size,urbanization level, energy consumption structure, the proportion of secondary industryand economic level generally have a positive impact on PRC’s urban CO2 emissions.Xing et al. [31] used the Asia-Pacific Integrated Model (AIM/Enduse) to estimate themitigation potential of energy transitions and sustainable policies, and study the growthin energy use due to rising incomes and urbanization. The results show that both incomeand education level have significant effects on household energy choices in both ruraland urban areas. Sutthichaimethee and Kubaha [32] used the VARIMAX-ECM modelto predict Thailand’s CO2 emissions from 2018 to 2029 and found that short- and long-term urbanization rates, net exports, industrial structure, and GDP affect CO2 emissions.Wang et al. [33] also showed that the relationship between urbanization and CO2 emissionsvaried by income level and economic development. Further expanding on this thread,McGee and York [34] included emissions panel data along with percentages of individualsresiding in urban areas and a range of structural factors across less-developed countries(1960–2010). Those findings indicated lower urbanization leads to lower emissions to agreater degree compared to higher urbanization’s relationship to increased emissions. Theyassert deurbanization leads to disruptions in production and distribution of goods andservices with reduced access to power sources. Thus, patterns of migration flows from ruralto urban settings can impact emission levels, making deurbanization patterns important toany serious analysis.
Cointegration models along with Granger causality are often used to independentlytest short- and long-term connections among power consumption, emissions, and urbaniza-tion [35–37]. Evidence supports short-term causal connections from urbanization to energyconsumption and urbanization to CO2 emissions. Energy use and urbanization combine toraise emissions in the long-term [38]. Dynamic causal connections that include variablessuch as emissions, energy, trade openness, urbanization, consumption, and growth have

Energies 2022, 15, 2450 7 of 18
been examined by Khoshnevis Yazdi and Dariani [39] with the pooled mean group (P.M.G.)method for data from 1980 to 2014 in Asian nations. Urbanization was found to raise powerconsumption and emissions, while the quality of the environment was considered a normalgood over the long-term. Bidirectional causality between economic growth, urbanization,and emissions was shown using the Granger causality test. These results advance theliterature and draw attention to more nuanced analyses to better assist policymakers.
Chen et al. [40] also described an inverted “U-shaped” relationship from data collectedin western PRC (188 prefecture-level cities). In eastern regions of the sample, more naturalgas was used, compared to more coal in the west. The project of natural gas transmissionfrom west to east has been overlooked by researchers investigating this unusual finding.This shift in natural gas could lead to higher emissions in the west as coal displaces naturalgas moving east. Using time series data from Pakistan (1972–2014), Ali et al. [41] reportedon urbanization’s influence on emissions in Pakistan. In both the long- and short-term, emis-sions increased with urbanization, as quantified by an ARDL (auto-regressive distributedlag) bounds testing approach and the VECM model that were used for causal analysis.Policy implications from such an approach suggested reducing car emissions throughincreases in public transportation systems. Such government planning and execution canincrease green technology in urban settings.
Another examination of the PRC case was reported by Sarwar and Alsaggaf [42] intheir analysis of urbanization and income’s relation to carbon emissions in the case of China.Using panel data across 30 PRC provinces (1998–2016), urbanization exhibited a positivecoefficient, while urban income exhibited a negative coefficient in relation to emissions.Traditional methods as reviewed here fail to take into account tail or nonlinear causality.Yumashev et al. [43] used data from 2006 to 2017 to study the relationship between energyconsumption, Human Development Index (HDI) and carbon dioxide emissions. The resultsshow that the size and level of the HDI is influenced by urbanization, population growth,GDP, GNI and ‘clean’ energy consuming businesses. Wang et al. [44] studied 30 provincesin PRC from 2006 to 2019 and using exploratory spatial data analysis (ESDA) methods, theyanalyzed the spatiotemporal patterns and aggregation characteristics of CO2 emissions, aswell as the effects of industrial structure, energy consumption, urban development, foreigntrade, economic growth, and government management on CO2 emissions. The easterncoastal provinces exhibit spatial agglomeration and CO2 emission hotspots.
In the current study, we will revisit this issue to see what factors determine the CO2emissions in China using the Toda-Yamamoto Granger causality test by quantile regression(T-YGCQ, hereafter) proposed by Cheng et al. [1] to investigate the major determinants ofCO2 emissions in PRC. We hope our study can bridge the gap in current literature.
3. Data, Theoretical Model, and Methodology
Using yearly PRC data (1969–2019), we included the following variables in the currentstudy: CO2 emissions, coal consumption, financial development, urbanization, tradeopenness, and GDP. Data for financial development, urbanization, trade openness, and GDPwere sourced from the National Bureau of Statistics of China. Trade openness measured theratio of (export + import) over GDP, and financial development was measured as domesticcredit to the private sector (constant 2010). Coal consumption and emission data came fromthe BP Statistic Review of World Energy (June 2019).
Following the previous studies [45,46] we can write the theoretical function for CO2emissions as follows:
CO2 = f(FD, TO, GDP, Urban, Coalc) (1)
where CO2 is CO2 emissions, FD is financial development, TO is trade openness, GDPrepresents economic growth, Urban is urbanization, and Coalc is coal consumption. After takingpartial derivates, we can get the hypothesized sign for each variable as shown in the following:
∂CO2
∂FD> 0 or< 0,
∂CO2
∂TO>0 or < 0,
∂CO2
∂GDP> 0 or< 0,
∂CO2
∂Urban>0 or< 0, and
∂CO2
∂Coalc>0.

Energies 2022, 15, 2450 8 of 18
To test Granger causality running from each independent variable to CO2 emissions,we used the Toda-Yamamoto Granger causality test by quantile regression (T-YGCQ, here-after) proposed by Cheng et al. [1] to test the nexus between CO2 emissions and othervariables such as financial development, trade openness, urbanization, coal consump-tion, and GDP. Because the traditional Granger causality approach [47] lacks informationon causal variables in the tails and nonlinear causalities, we turned to quantile causal-ity in order to build a flexible and detailed description of causal relationships. We usedcausal relationship structural breaks, such as shown by Cai et al. [5], Goh et al. [48], andLin et al. [49] who included dummy variables in their models. Low-frequency componentsof a Fourier approximation have been shown to capture both gradual and sharp struc-tural breaks, such as the work by Gallant [50] and Gallant and Souza [51]. Therefore, inour study, we employed the Fourier function instead of using dummy variables in ourT-YGCQF (p + d) model. The b(t) was defined as follows:
b(t) = γ1 sin(
2πktT
)+ γ2con
(2πkt
T
). (2)
We can incorporate this Fourier expansion into a testing equation and obtain thefollowing Fourier Quantile equation:
CO2t(τ) = c(τ) + b(t) +p−1∑
i=1θ(τ)FDt−i +
p+d∑
i=1δ(τ)TOt−i +
p+d∑
i=1r(τ)GDPt−i +
p+d∑
i=1w(τ)Coalct−i
+p+d∑
i=1l(τ)Urbant−i + εt
(3)
where CO2 emissions are our dependent variable, FD is financial development, GDP iseconomic growth, Coalc is coal consumption, Urban is urbanization, and TO is trade open-ness. We can test the Granger causality test from financial development to CO2 emissionsat different quantiles under the null hypothesis of θ(τ1) = θ(τ2) = . . . = θ
(τp)= 0. The
optimal lags (p*) of our model were selected based on the Akaike Information Criterion(AIC). Regarding the k in our Fourier function, we first set k = 0.1, 0.2, . . . , 5, then weselected the optimal k* also based on AIC. The null hypothesis of no Granger causality isRβ(τ) = 0 and we can use the following Wald statistic:
Wald = (Rβ(τ))′[R(
Z′ Z)−1 ⊗ S
]R′)−1](Rβ(τ)) (4)
where R is an indicator matrix of the parameters, β(τ) is the column stack of D, S thevariance-covariance matrix of the unrestricted model, and ⊗ is the Kronecker product.Autoregressive conditional heteroskedasticity (ARCH) can result in non-normal data dis-tribution, making the Wald statistic reject an asymptotic result, as observed by Hatemi-Jand Uddin [52]. To overcome this issue, we employed a simulation bootstrapping with10,000 iterations and forming critical values at the 10%, 5%, and 1% levels. Additionally, aWald test was used to test the null hypothesis:
γ1 = γ1 = 0. (5)
4. Empirical Results and Policy Implications
To test the causal correlation between CO2 emissions, financial development, tradeopening, coal consumption, economic growth (GDP), and urbanization from 1969–to 2019in the PRC, we used the Fourier quantile Granger causality test.
First, we performed a traditional unit root test and next performed the Fourier quantileGranger causality in the quantile test. Summary results of the series can be seen in Table 2.Jarque–Bera statistics indicate that CO2 emissions, coal consumption, trade openness,financial development, urbanization, and GDP are all non-normally distributed. Figure 3shows the plots of time series for those six variables. We found that five variables (CO2

Energies 2022, 15, 2450 9 of 18
emissions, coal consumption, urbanization, financial development, and GDP) were all trendingupward although trade openness shows some fluctuations during the research period.
Table 2. Descriptive Statistics.
CO2 COALC FD GDP OP URBAN
Mean 4012.252 855.6958 2717.381 27,688.65 60.16725 33.31098Median 2925.528 653.1251 406.6474 5643.247 49.93000 28.50980
Maximum 9636.100 1964.372 14,652.30 142,165.0 115.2200 60.60000Minimum 582.7648 130.4050 56.94611 911.0500 18.17000 17.13181Std. Dev. 3050.341 642.1693 4358.050 41170.48 29.85965 14.16309Skewness 0.740837 0.694380 1.681978 1.563861 0.480481 0.503297Kurtosis 1.974960 1.894842 4.375087 4.030734 1.763160 1.887412
Jarque–Bera 6.897891 6.693817 28.06501 23.04576 5.213090 4.783554Probability 0.031779 ** 0.035193 ** 0.000001 *** 0.000010 *** 0.073789 * 0.091467 *
Note: *, **, and *** indicate significance at the 10%, 5%, and 1%, respectively.
Energies 2022, 15, x FOR PEER REVIEW 9 of 19
where R is an indicator matrix of the parameters, β(τ) is the column stack of D, S the
variance-covariance matrix of the unrestricted model, and ⨂ is the Kronecker product.
Autoregressive conditional heteroskedasticity (ARCH) can result in non-normal data dis-
tribution, making the Wald statistic reject an asymptotic result, as observed by Hatemi-J
and Uddin [52]. To overcome this issue, we employed a simulation bootstrapping with
10,000 iterations and forming critical values at the 10%, 5%, and 1% levels. Additionally,
a Wald test was used to test the null hypothesis:
γ1 = γ1 = 0. (5)
4. Empirical Results and Policy Implications
To test the causal correlation between CO2 emissions, financial development, trade
opening, coal consumption, economic growth (GDP), and urbanization from 1969–to 2019
in the PRC, we used the Fourier quantile Granger causality test.
First, we performed a traditional unit root test and next performed the Fourier quantile
Granger causality in the quantile test. Summary results of the series can be seen in Table 2.
Jarque–Bera statistics indicate that CO2 emissions, coal consumption, trade openness, fi-
nancial development, urbanization, and GDP are all non-normally distributed. Figure 3
shows the plots of time series for those six variables. We found that five variables (CO2
emissions, coal consumption, urbanization, financial development, and GDP) were all
trending upward although trade openness shows some fluctuations during the research
period.
Table 2. Descriptive Statistics.
CO2 COALC FD GDP OP URBAN
Mean 4012.252 855.6958 2717.381 27,688.65 60.16725 33.31098
Median 2925.528 653.1251 406.6474 5643.247 49.93000 28.50980
Maximum 9636.100 1964.372 14,652.30 142,165.0 115.2200 60.60000
Minimum 582.7648 130.4050 56.94611 911.0500 18.17000 17.13181
Std. Dev. 3050.341 642.1693 4358.050 41170.48 29.85965 14.16309
Skewness 0.740837 0.694380 1.681978 1.563861 0.480481 0.503297
Kurtosis 1.974960 1.894842 4.375087 4.030734 1.763160 1.887412
Jarque–Bera 6.897891 6.693817 28.06501 23.04576 5.213090 4.783554
Probability 0.031779 ** 0.035193 ** 0.000001 *** 0.000010 *** 0.073789 * 0.091467 *
Note: *, **, and *** indicate significance at the 10%, 5%, and 1%, respectively.
0
2,000
4,000
6,000
8,000
10,000
1970 1975 1980 1985 1990 1995 2000 2005 2010 2015
co2
0
400
800
1,200
1,600
2,000
1970 1975 1980 1985 1990 1995 2000 2005 2010 2015
coalCO2
Energies 2022, 15, x FOR PEER REVIEW 10 of 19
Figure 3. Plots of CO2 emissions, coal consumption, financial development, GDP, trade openness
and urbanization in PRC
4.1. Results from the Unit Root Test
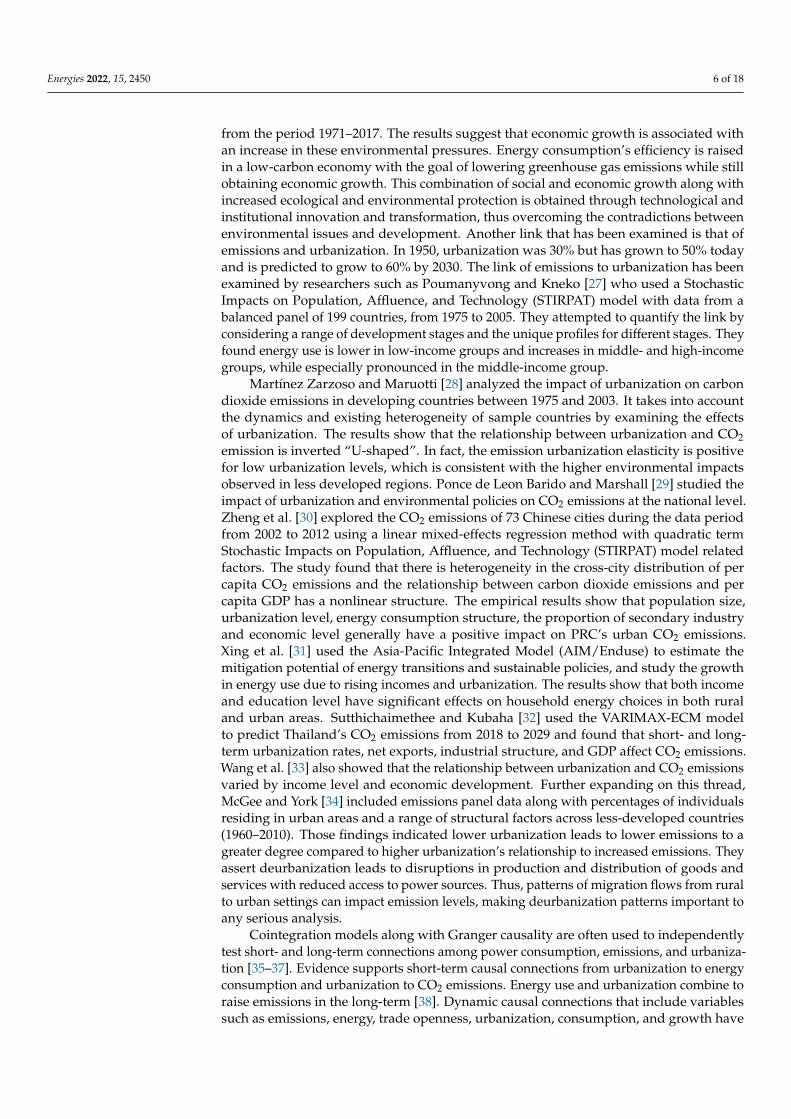
The unit root test results including ADF, PP and KPSS are shown in Table 3. The
results show that CO2 emissions, coal consumption, financial development, GDP, trade
openness and urbanization are all non-stationary I(0) and the results of the first differ-
ence are all stationary I(1). Figure 3 shows a line graph of the PRC’s variables (CO2 emis-
sions, Coal consumption, financial development, GDP, trade openness and urbanization)
across a range of years.
Table 3. Unit root test results
ADF PP KPSS ADF PP KPSS
Level First Difference
CO2 0.497 −1.911 0.948 *** −4.786 *** −4.784 *** 0.229
COALC −1.267 −1.845 0.942 *** −3.336 ** −4.724 *** 0.227
GDP 0.962 1.276 0.933 *** −5.665 *** −5.709 *** 0.354 *
FD 1.193 1.437 0.934 *** −4.985 *** −4.985 *** 0.409 *
TO −1.319 −1.271 0.274 −7.271 *** −7.271 *** 0.110
URBAN −0.702 0.794 0.943 *** −3.042 ** −3.496 ** 0.239
Notes: CO2 (CO2 emissions), COAL (coal consumption), GDP (gross domestic product), FD (finan-
cial development), TO (trade openness) and URBAN (urbanization). *, **, and *** indicate signifi-
cance at the 10%, 5%, and 1%, respectively.
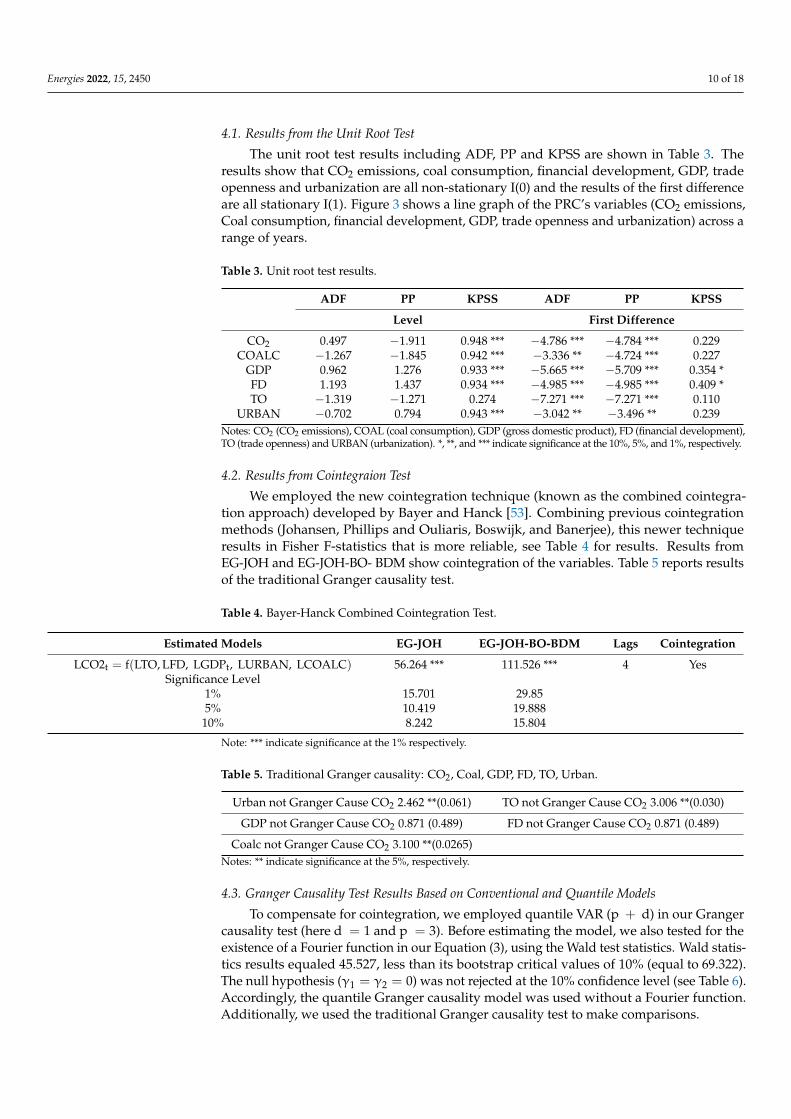
4.2. Results from Cointegraion Test
We employed the new cointegration technique (known as the combined cointegra-
tion approach) developed by Bayer and Hanck [53]. Combining previous cointegration
methods (Johansen, Phillips and Ouliaris, Boswijk, and Banerjee), this newer technique
results in Fisher F-statistics that is more reliable, see Table 4 for results. Results from EG-
0
2,000
4,000
6,000
8,000
10,000
12,000
14,000
16,000
1970 1975 1980 1985 1990 1995 2000 2005 2010 2015
FD
0
20,000
40,000
60,000
80,000
100,000
120,000
140,000
160,000
1970 1975 1980 1985 1990 1995 2000 2005 2010 2015
GDP
0
20
40
60
80
100
120
1970 1975 1980 1985 1990 1995 2000 2005 2010 2015
OP
10
20
30
40
50
60
70
1970 1975 1980 1985 1990 1995 2000 2005 2010 2015
Urbanization
Figure 3. Plots of CO2 emissions, coal consumption, financial development, GDP, trade opennessand urbanization in PRC.
Energies 2022, 15, 2450 10 of 18
4.1. Results from the Unit Root Test
The unit root test results including ADF, PP and KPSS are shown in Table 3. Theresults show that CO2 emissions, coal consumption, financial development, GDP, tradeopenness and urbanization are all non-stationary I(0) and the results of the first differenceare all stationary I(1). Figure 3 shows a line graph of the PRC’s variables (CO2 emissions,Coal consumption, financial development, GDP, trade openness and urbanization) across arange of years.
Table 3. Unit root test results.
ADF PP KPSS ADF PP KPSS
Level First Difference
CO2 0.497 −1.911 0.948 *** −4.786 *** −4.784 *** 0.229COALC −1.267 −1.845 0.942 *** −3.336 ** −4.724 *** 0.227
GDP 0.962 1.276 0.933 *** −5.665 *** −5.709 *** 0.354 *FD 1.193 1.437 0.934 *** −4.985 *** −4.985 *** 0.409 *TO −1.319 −1.271 0.274 −7.271 *** −7.271 *** 0.110
URBAN −0.702 0.794 0.943 *** −3.042 ** −3.496 ** 0.239Notes: CO2 (CO2 emissions), COAL (coal consumption), GDP (gross domestic product), FD (financial development),TO (trade openness) and URBAN (urbanization). *, **, and *** indicate significance at the 10%, 5%, and 1%, respectively.
4.2. Results from Cointegraion Test
We employed the new cointegration technique (known as the combined cointegra-tion approach) developed by Bayer and Hanck [53]. Combining previous cointegrationmethods (Johansen, Phillips and Ouliaris, Boswijk, and Banerjee), this newer techniqueresults in Fisher F-statistics that is more reliable, see Table 4 for results. Results fromEG-JOH and EG-JOH-BO- BDM show cointegration of the variables. Table 5 reports resultsof the traditional Granger causality test.
Table 4. Bayer-Hanck Combined Cointegration Test.
Estimated Models EG-JOH EG-JOH-BO-BDM Lags Cointegration
LCO2t = f(LTO, LFD, LGDPt, LURBAN, LCOALC) 56.264 *** 111.526 *** 4 YesSignificance Level
1% 15.701 29.855% 10.419 19.888
10% 8.242 15.804
Note: *** indicate significance at the 1% respectively.
Table 5. Traditional Granger causality: CO2, Coal, GDP, FD, TO, Urban.
Urban not Granger Cause CO2 2.462 **(0.061) TO not Granger Cause CO2 3.006 **(0.030)
GDP not Granger Cause CO2 0.871 (0.489) FD not Granger Cause CO2 0.871 (0.489)
Coalc not Granger Cause CO2 3.100 **(0.0265)Notes: ** indicate significance at the 5%, respectively.
4.3. Granger Causality Test Results Based on Conventional and Quantile Models
To compensate for cointegration, we employed quantile VAR (p + d) in our Grangercausality test (here d = 1 and p = 3). Before estimating the model, we also tested for theexistence of a Fourier function in our Equation (3), using the Wald test statistics. Wald statis-tics results equaled 45.527, less than its bootstrap critical values of 10% (equal to 69.322).The null hypothesis (γ1 = γ2 = 0) was not rejected at the 10% confidence level (see Table 6).Accordingly, the quantile Granger causality model was used without a Fourier function.Additionally, we used the traditional Granger causality test to make comparisons.

Energies 2022, 15, 2450 11 of 18
Table 6. Restrict test on Fourier function with H0 : γ1 = γ2 = 0.
Frequency Lags F Test CV 10% CV 5% CV 1%
0.500000 4 45.527 69.322 100.577 210.804Note: Lags selected based on AIC.
Empirical results indicated that urbanization, trade openness, and coal consumptionGranger cause CO2 emissions (see Table 6 and Figure 3). The Granger causality test [47]does not describe tail causal relations and also misses nonlinear causalities; while a quantilecausality approach does—providing better predictive power from more detailed descrip-tions. We therefore employed the Toda-Yamamoto Granger causality test, as specified byNazlioglu et al. [54], with quantile regression (QT-Y, hereafter). This approach was appliedin testing the correlation between emissions determinants such as financial development,coal consumption, trade openness, economic growth, and urbanization for the RPC. Toaccount for our sample size of 51, quantiles were set at 0.2, 0.4, 0.6, and 0.8, see Table 7 forresults. We found Granger causality running from financial development to CO2 emissionat all levels of quantiles (0.2, 0.4, 0.6, and 0.8), from trade openness to CO2 emission at twolevels of quantiles (0.4 and 0.6), and from urbanization to CO2 emission at all level of quantiles(0.2, 0.4, 0.6 and 0.8). Regarding GDP (economic growth) and coal consumption, our testmodel did not find any causal relationship. We can conclude that the main determinants ofPRC’s CO2 emissions are financial development, trade openness and urbanization.
Table 7. Quantile causality test without Fourier function: CO2, coal, GDP, FD, TO, and urbanization.
Quantile Wald Test CV 10% CV 5% CV 1%
0.2 FD -> CO2 72.897 ***(−) 28.957 41.052 79.8750.4 FD -> CO2 57.836 **(−) 22.555 31.403 58.3890.6 FD -> CO2 53.999 **(−) 22.881 32.908 62.5570.8 FD -> CO2 59.950 **(−) 29.351 42.620 78.6390.2 TO -> CO2 10.667(−) 36.446 53.615 115.9950.4 TO -> CO2 29.274 *(−) 28.660 42.317 84.2940.6 TO -> CO2 30.154 *(−) 28.985 41.314 83.7790.8 TO -> CO2 35.898(−) 36.678 53.364 109.7170.2 GDP -> CO2 3.541(+) 35.180 49.699 96.9550.4 GDP -> CO2 17.948(+) 26.645 36.553 75.6240.6 GDP -> CO2 17.432(+) 26.322 36.916 71.1790.8 GDP -> CO2 16.853(+) 32.495 46.185 92.8630.2 Coal -> CO2 8.708(+) 188.862 255.213 427.2120.4 Coal -> CO2 23.697(+) 138.523 187.771 324.5650.6 Coal -> CO2 65.834(+) 135.637 175.833 317.1410.8 Coal -> CO2 88.247(+) 168.657 229.957 411.5870.2 URB -> CO2 87.651 **(+) 32.272 50.293 94.6270.4 URB -> CO2 121.826 ***(+) 27.097 38.856 71.5210.6 URB -> CO2 124.798 ***(+) 26.429 37.397 76.3200.8 URB -> CO2 135.131 ***(+) 34.237 48.314 93.945
Notes: Data is annual. Confidence intervals are CV 10% = *; CV 5% = **; and CV 1% = ***. Direction of relationship− = negative and + = positive.
Results, based on the coefficients of the independent variables, show urbanizationcauses CO2 emissions to go up at all 4 quantiles (0.2, 0.4, 0.6, and 0.8), and financialdevelopment reduces CO2 emissions at all 4 quantiles. On the other hand, trade opennessreduces CO2 emissions at the middle quantiles (0.4 and 0.6). Though trade opennessis not significant at the extreme quantile (0.2 and 0.8), trade openness also negativelyimpact CO2 emissions. If we look at the signs of both GDP and coal consumption, wefind they both increase CO2 emissions though not significantly. Figure 4 details resultsof relationships among emissions and determinants (i.e., urbanization, trade openness,financial development, coal consumption, and CO2 emissions). This figure further confirmsour empirical findings.

Energies 2022, 15, 2450 12 of 18
Energies 2022, 15, x FOR PEER REVIEW 12 of 19
reduces CO2 emissions at the middle quantiles (0.4 and 0.6). Though trade openness is not
significant at the extreme quantile (0.2 and 0.8), trade openness also negatively impact
CO2 emissions. If we look at the signs of both GDP and coal consumption, we find they
both increase CO2 emissions though not significantly. Figure 4 details results of relation-
ships among emissions and determinants (i.e., urbanization, trade openness, financial de-
velopment, coal consumption, and CO2 emissions). This figure further confirms our em-
pirical findings.
Table 7. Quantile causality test without Fourier function: CO2, coal, GDP, FD, TO, and urbanization
Quantile Wald Test CV 10% CV 5% CV 1%
0.2 FD -> CO2 72.897 ***(−) 28.957 41.052 79.875
0.4 FD -> CO2 57.836 **(−) 22.555 31.403 58.389
0.6 FD -> CO2 53.999 **(−) 22.881 32.908 62.557
0.8 FD -> CO2 59.950 **(−) 29.351 42.620 78.639
0.2 TO -> CO2 10.667(−) 36.446 53.615 115.995
0.4 TO -> CO2 29.274 *(−) 28.660 42.317 84.294
0.6 TO-> CO2 30.154 *(−) 28.985 41.314 83.779
0.8 TO -> CO2 35.898(−) 36.678 53.364 109.717
0.2 GDP -> CO2 3.541(+) 35.180 49.699 96.955
0.4 GDP -> CO2 17.948(+) 26.645 36.553 75.624
0.6 GDP -> CO2 17.432(+) 26.322 36.916 71.179
0.8 GDP -> CO2 16.853(+) 32.495 46.185 92.863
0.2 Coal-> CO2 8.708(+) 188.862 255.213 427.212
0.4 Coal-> CO2 23.697(+) 138.523 187.771 324.565
0.6 Coal-> CO2 65.834(+) 135.637 175.833 317.141
0.8 Coal-> CO2 88.247(+) 168.657 229.957 411.587
0.2 URB-> CO2 87.651 **(+) 32.272 50.293 94.627
0.4 URB-> CO2 121.826 ***(+) 27.097 38.856 71.521
0.6 URB-> CO2 124.798 ***(+) 26.429 37.397 76.320
0.8 URB-> CO2 135.131 ***(+) 34.237 48.314 93.945
Notes: Data is annual. Confidence intervals are CV10% = *; CV 5% = **; and CV1% = ***. Direction
of relationship − = negative and + = positive.
Figure 4. Plot of link between CO2 and other determinants: urbanization, financial development.
Note: * refer to a 10% level of significance.
Apparently when urbanization increases, more construction will be built and more
energy will be consumed. Therefore, urbanization causes CO2 emissions to go up. The
PRC is experiencing increasing urbanization, which impacts emissions and in turn in-
creases public demand for renewable energy. This result is consistent with those of Pou-
manyvong and Kneko [27], Wu et al. [55], Ali et al. [41], and Khoshnevis Yazdi and Dariani
[39] who found that the impact of urbanization on CO2 emissions is positive. Since urban-
ization increases CO2 emission, the PRC government should adopt low-carbon policies
and encourage cities to remove air pollution pressure from the dependence of coal con-
sumption in the past and then use coal consumption in a more efficient way.
Figure 4. Plot of link between CO2 and other determinants: urbanization, financial development.Note: * refer to a 10% level of significance.
Apparently when urbanization increases, more construction will be built and moreenergy will be consumed. Therefore, urbanization causes CO2 emissions to go up. The PRCis experiencing increasing urbanization, which impacts emissions and in turn increasespublic demand for renewable energy. This result is consistent with those of Poumanyvongand Kneko [27], Wu et al. [55], Ali et al. [41], and Khoshnevis Yazdi and Dariani [39] whofound that the impact of urbanization on CO2 emissions is positive. Since urbanizationincreases CO2 emission, the PRC government should adopt low-carbon policies and en-courage cities to remove air pollution pressure from the dependence of coal consumptionin the past and then use coal consumption in a more efficient way.
Our findings suggest that financial development leads to a reduction in CO2 emissions.Previous research has shown mixed results in relation to this link. The theoretical argu-ments for the impact of financial development on CO2 emissions are compelling, althoughthey conflict with our findings. Therefore, the direction of influence is an unresolved con-troversial topic. Regarding trade openness, we find that it reduces CO2 emissions (negativesign and significant). This result is not consistent with that of Rasiah et al. [3] who foundthat trade openness alongside energy usage and economic growth fund increase CO2 emis-sions in selected ASEAN nations. On the other hand, trade openness allows countries toeasily acquire (from other countries) and use new and clean technology, which is associatedwith low levels of CO2 emissions. International trade’s influence on the environment ishighly influenced by the three factors of scale, composition, and technology as pointed outby Farhani et al. [8]. Higher emissions, the scale effect perspective argues, are linked toincreases in international trade activity, which require higher levels of power consumption.Competitive trade environments mean dirty goods gain an advantage in price competition,which is accompanied by increases in local emissions. As exports increase local economicsuccess, lowering emissions becomes a priority, as pointed out by Sebri and Ben-Salha [9].Thus, emissions have two distinct directions to move that depend on stages of develop-ment, trade economics, and local economic growth. The link between emissions and localeconomic expansion has been documented in a range of conflicting results in terms of signs,magnitudes and significance of the estimates of the emission-growth nexus.
Current research results show economic growth increases CO2 emissions in the PRC.However, the results shown in Table 6 demonstrate that though this relationship is positive,it is not significantly so. Finally, regarding the link between coal consumption and CO2emissions, we also found that coal consumption increases CO2 emissions but that this isnot significant in PRC. Apparently, our empirical results have shown that financial devel-opment, trade openness and urbanization are the major determinants of CO2 emissions inPRC. The results quantify issues directly related to climate change. Previous recommenda-tions focus on efforts to reduce CO2 emissions such as utilizing coal efficiency; exploitingnew energy including solar, nuclear, and wind energy; slowing urbanization; openingtrade; and promoting financial development. Results among these variables can be seenin Figure 4 (i.e., urbanization, coal consumption, and CO2 emissions), further confirmingempirical findings.
Results are consistent with Wang et al. [56] and Fan et al. [57] who reported urban-ization increases energy consumption and emissions in all 30 PRC provinces. However,

Energies 2022, 15, 2450 13 of 18
the specific province impact varies based on geographical location and economic structure.Urbanization increases both energy consumption and CO2 emissions in the PRC, whichis consistent with the findings of Jones [58], Shen et al. [59], Liu [60], Minx et al. [61],Jiang and Lin [62], Zhang and Lin [63], Khanna et al. [64] and Zhou et al. [65]. On the otherhand, our results are consistent with those of Fan et al. [66], Wei et al. [67], Zhu et al. [68]and Wang et al. [69] who found urbanization affected different economies in oppositedirections for nine Pacific Island countries and PRC, respectively.
4.4. Policy Implications
In terms of trade openness, PRC should: (1) actively attract foreign investment. Theinflow of foreign investment will bring about technology spillover effects, which will helpPRC’s manufacturers, improve their environmental protection technologies and reducethe production of CO2 and other pollutants in production and life. (2) Adjust the tradestructure. In terms of export trade structure, actively promote the export of high value-added low-carbon industry products. Increase the proportion of service trade, give theservice industry more capital investment and technical support, increase the added valueof the service industry, and enhance the country’s service trade competitiveness. In termsof trade imports, support the import of polluting products and prohibit the import offoreign garbage and toxic products in order to reduce domestic CO2 emissions. (3) Speedthe upgrading of the industrial structure and reduce the proportion of the secondaryindustry. On the one hand, the adjustment of PRC’s industrial structure is to improvethe level of production technology and change the production methods of high energyconsumption, low efficiency and low added value in traditional industries such as ironand steel, electricity, and petroleum. Traditional enterprises reduce production capacitythrough technological means. Another aspect is to increase efforts to establish high-endmanufacturing, restrict or ban high-emission industries, and promote the developmentof low-carbon and environmentally-friendly enterprises. When focusing on issues ofeconomic growth, focus on the “green effect” of economic growth. Emission reductioncan be achieved through environmental governance focused on emission reduction targetswhile encouraging steady economic growth. Such an approach can increase urbanization,while implementing clean energy supply systems, provide a “green road” approach thatspeeds up the construction of green cities. This can lead to clean energy and the gradualreduction of fossil fuel dependence while optimizing the power grid such that clean energycan be used safely and efficiently. Advanced technologies can be introduced to graduallyreplace coal-based energy dependence along with a range of clean energy sources, such assolar and wind.
In terms of carbon finance, PRC should continue to promote the development ofcooperation and linkage between the financial market and the carbon emission tradingmarket, promote the innovation of various off-exchange and on-exchange derivativesbased on CO2 emission rights. Promote financial institutions being active and secureparticipants in the carbon finance market. Build and enrich the participants in the carbonfinancial market. Develop carbon financial services such as the pledge of CO2 emissionrights, carbon repurchase, carbon funds, and carbon trusts; and enhance the vitality ofthe carbon financial market. Specific suggestions are: (1) Improve the national carbonmarket system. First, we must strengthen laws and regulations on the carbon market. The“Interim Regulations on the Management of Carbon Emissions Trading” will be issued assoon as possible to improve the legislative level of PRC’s carbon trading regulations andsystems and at the same time strengthen the carbon financial risk management and controlmechanism and system construction to effectively curb speculation and avoid excessivemarket risk concentration and market manipulation. (2) Speed the construction of a nationalvoluntary emissions reduction market for greenhouse gases. Complete the revision ofthe “Interim Measures for the Administration of Voluntary Greenhouse Gas EmissionReduction Transactions” as soon as possible and release them for implementation. At thesame time, restore the CCER methodology, projects, emission reductions, verification and

Energies 2022, 15, 2450 14 of 18
verification agencies, and transaction agencies to apply for filing and appropriately relaxthe verification and verification agencies for filing and conditions to alleviate the problemof insufficient supply of CCER. (3) Strengthen the cultivation of carbon intermediariesand investors. Encourage the development of “carbon investment banks”, “carbon auditinstitutions”, and various carbon intermediaries such as financing, investment, and services.Support large financial institutions to allow them to set up carbon finance functionaldepartments or franchise agencies. and develop various types of carbon financial services.Preferential fiscal and taxation policies encourage and guide various carbon intermediariesto participate in the national carbon market business and jointly promote the developmentand construction of the national carbon market. Encourage local governments, financialinstitutions, investment institutions, etc. to set up carbon funds, carry out secondary marketcarbon product investment transactions, increase market activity, increase investment inemission reduction projects, forestry carbon sink projects, etc., and expand financingchannels for owners. Accelerate the establishment of a national carbon market industryassociation, strengthen the self-discipline management of the intermediary industry, andintroduce self-discipline rules and business guidelines for the carbon market to promote thestandardized and healthy development of the national carbon market business. PRC carbonfinance market has a low status in the world’s carbon market. PRC has no pricing powerin global carbon market transactions. Once PRC national carbon trading market operatesnormally, it will become the world’s largest carbon market. Accelerate the pace of onlinetrading on the national carbon trading market, and increase the scale and influence of PRCcarbon trading market in the global carbon market. Under the premise of fair, commonbut differentiated responsibilities advocated by the Paris Agreement, PRC must cooperatewith the world. Together, all countries adhere to multilateralism, firmly safeguard theglobal carbon trading mechanism that has been developed, and actively learn from theadvanced experience of developed countries in the construction of carbon financial marketsto build a carbon financial development system that meets national standards and hasglobal influence.
In terms of urbanization: (1) Change the lifestyle of residents. In terms of consumptionawareness, reduce the use of disposable products, give priority to purchasing energy-saving, environmentally-friendly and low-carbon products, strengthen the awareness ofconservation, and eliminate waste and unreasonable consumption. In terms of travel,encourage public transportation + bicycle + walking, improve the public transportationsystem, open up the traffic microcirculation, realize intelligent travel information services,and gradually increase the proportion of electric and hybrid vehicles. In terms of homefurnishing, promote personalized and intelligent home furnishings, adopt energy-savingand environmentally friendly home appliances, and improve the electrification level ofend-use energy. In terms of housing, improve building energy efficiency standards, adoptadvanced building envelopes and materials, strengthen natural ventilation and light uti-lization, implement differentiated designs from north to south, and reduce the use of glasscurtain walls. (2) Improve urban energy supply methods. Promote the improvement of thecity’s distributed integrated energy system. Select energy resources on the spot and adoptscientific energy installation ratios to maximize energy utilization and allocation efficiency.Provide a coordinated promotion of urban environmental governance while emphasizingthat energy production is the new direction of urban renewal and urban energy develop-ment in PRC in the future. Through the integration of energy production, sewage treatment,garbage treatment and other municipal service facilities, implement energy supply projects.Prioritize urban pollution and waste by coordinating the use of local renewable energysources such as wind, solar and geothermal energy. With fossil energy such as naturalgas as the guarantee, coordinate the production and supply of terminal energy such ascold, heat, electricity, and gas to achieve multi-energy complementarity. (3) Optimize theurban development model. Accelerate urban renewal, optimize urban functions and layout,promote urban industrial upgrading, enhance cultural vitality and urban style, and buildnew smart cities. Develop job-housing balance, facilitate nearby work and travel, reduce

Energies 2022, 15, 2450 15 of 18
urban congestion and environmental pollution, and improve residential areas. Intensifyecological environment governance, promote the industrial utilization of urban wasteresources, promote the comprehensive utilization and recycling of various resources, andincorporate environmental governance and ecological protection into the urban planningand construction system. Construct ecological micro cycles to distribute, multimode, gridlike features. Build a green and low-carbon micro cycle, achieve carbon neutrality in asmall area, and reduce dependence on the city’s large-scale cycle.
5. Conclusions
This study employed the Granger causality test in the quantile method to investigatethe causal relationship between CO2 emissions and financial development, trade opening,coal consumption, economic growth (GDP), and urbanization during the period 1969–2019to understand which independent variables are the main determinants of PRC’s CO2emissions. Since the traditional Granger causality test cannot provide information abouttail causality or nonlinear causality of the relationship, the quantile causality method wasevaluated to obtain in a more detailed and flexible manner causal relationships. In ourresearch, we used the Fourier functions instead of dummy variables in our T-YGCQF(p + d) model. Moreover, to consider structural fractures in causality, we used a smallamount of low-frequency components of the Fourier approximation to capture an unknownnumber of progressive and sharp structural interruptions. In addition, we used a newcointegration method developed by Bayer and Hanck [53] to test the results of combiningthe previous cointegration methods (Johansen, Phillips and Ouliaris, Boswijk and Banerjee),and provide Fisher F statistics to obtain more conclusive and more reliable empirical results.
Our empirical results show that economic growth has a positive but not significantimpact on PRC CO2 emissions. Regarding the link between coal consumption and CO2emissions, we found that coal consumption has a positive but not significant impact onCO2 emissions. However, trade openness, coal consumption and economic growth fundshave a significantly positive impact on PRC CO2 emissions. On the other hand, we foundthat financial development has a negative and significant impact on CO2 emissions. Tradeopenness allows countries to easily acquire (from other countries) and use new cleantechnologies, which lower levels of CO2 emissions in the investor countries. Our findingsconclude that financial development, trade openness, and urbanization are the main de-terminants of PRC CO2 emissions. Our empirical results provide a new understandingof the issue of climate change. The previous recommendations were mainly to improvethe efficiency of coal consumption and develop new energy sources such as solar, nuclear,and wind energy. Another method is to slow the process of urbanization, increase tradeopenness, and promote financial development. It has become an important policy of thePRC government to reduce CO2 emissions. To bridge the gap in the literature, we used anew methodology to make up for the lack of literature. These results have important policyimplications for the PRC government to implement pollutant emission reduction policies.As part of future research, it will be interesting to expand our analysis of CO2 emissionsand the impact of carbon neutrality on PRC CO2 emissions reduction. The factors studiedfor their effects on CO2 emissions should expand beyond financial development, tradeopenness, coal consumption, economic growth (GDP) and urbanization. Recently, scholarshave studied the trees that also absorb CO2 and reduce greenhouse gas emissions fromhuman activities. As emissions increase, PRC might study the impact that afforestationmight have on reducing emissions.
Author Contributions: All authors designed the research and wrote the paper. Conceptualization,Z.Y. and M.-C.W.; data curation, T.C. and F.L. formal analysis, M.-C.W. and W.-K.W.; investigation,T.C. and M.-C.W.; methodology, T.C. and M.-C.W.; software, T.C. and W.-K.W.; supervision, W.-K.W.;validation, M.-C.W.; visualization, T.C. and F.L.; writing—original draft, Z.Y. and F.L.; writing—review and editing, Z.Y. and M.-C.W. All authors have read and agreed to the published version ofthe manuscript.

Energies 2022, 15, 2450 16 of 18
Funding: There is no funding for this manuscript.
Institutional Review Board Statement: Not applicable.
Informed Consent Statement: Not applicable.
Data Availability Statement: The data that support the findings of this study are available for sharingfrom the corresponding authors upon reasonable request.
Acknowledgments: The fourth author would like to thank Professors Robert B. Miller and HowardE. Thompson for their continuous guidance and encouragement. This research has been supportedby Wuhan University, National Taichung University of Science and Technology, Feng Chia University,Asia University, China Medical University Hospital, The Hang Seng University of Hong Kong, HubeiUniversity of Economics, Research Grants Council (RGC) of Hong Kong (project numbers 12502814and 12500915), and the Ministry of Science and Technology (MOST, Project Numbers 106-2410-H-468-002and 107-2410-H-468-002-MY3), Taiwan. However, any remaining errors are solely ours.
Conflicts of Interest: The authors declare no competing interest.
References1. Cheng, K.; Hsueh, H.P.; Ranjbar, O.; Wang, M.C.; Chang, T. Urbanization, coal consumption and CO2 emissions nexus in China
using bootstrap Fourier Granger causality test in quantiles. Lett. Spatial Resour. Sci. 2021, 14, 31–49. [CrossRef]2. Larch, M.; Wanner, J. Carbon tariffs: An analysis of the trade, welfare, and emission effects. J. Int. Econ. 2017, 109, 195–213.
[CrossRef]3. Rasiah, R.; Al-Amin, A.Q.; Chowdhurry, A.H.; Ahmed, F.; Zhang, C. Climate change mitigation projections for ASEAN. J. Asia
Pac. Econ. 2018, 23, 195–212. [CrossRef]4. Long, R.; Li, J.; Chen, H.; Zhang, L.; Li, Q. Embodied carbon dioxide flow in international trade: A comparative analysis based on
China and Japan. J. Environ. Manag. 2018, 209, 371–381. [CrossRef]5. Cai, Y.; Sam, C.Y.; Chang, T. Nexus between clean energy consumption, economic growth and CO2 emissions. J. Clean. Prod. 2018,
182, 1001–1011. [CrossRef]6. Osobajo, O.A.; Otitoju, A.; Otitoju, M.A.; Oke, A. The Impact of Energy Consumption and Economic Growth on Carbon Dioxide
Emissions. Sustainability 2020, 12, 7965. [CrossRef]7. Jung, T.Y.; Kim, Y.-G.; Moon, J. The Impact of Demographic Changes on CO2 Emission Profiles: Cases of East Asian Countries.
Sustainability 2021, 13, 677. [CrossRef]8. Farhani, S.; Chaibi, A.; Rault, C. CO2 emissions, output, energy consumption, and trade in Tunisia. Econ. Model. 2014, 38, 426–434.
[CrossRef]9. Sebri, M.; Ben-Salha, O. On the causal dynamics between economic growth, renewable energy consumption, CO2 emissions and
trade openness: Fresh evidence from BRICS countries. Renew. Sustain. Energy Rev. 2014, 39, 14–23. [CrossRef]10. Zhang, S.; Liu, X.; Bae, J. Does trade openness affect CO2 emissions: Evidence from ten newly industrialized countries? Environ.
Sci. Pollut. Res. 2017, 24, 17616–17625. [CrossRef]11. Mutascu, M.; Sokic, A. Trade Openness-CO2 Emissions Nexus: A Wavelet Evidence from EU. Environ. Modeling Assess. 2020, 25,
411–428. [CrossRef]12. Li, R.; Jiang, H.; Sotnyk, I.; Kubatko, O.; Ismail Almashaqbeh, Y.A. The CO2 Emissions Drivers of Post-Communist Economies in
Eastern Europe and Central Asia. Atmosphere 2020, 11, 1019. [CrossRef]13. Chen, F.; Jiang, G.; Kitila, G.M. Trade Openness and CO2 Emissions: The Heterogeneous and Mediating Effects for the Belt and
Road Countries. Sustainability 2021, 13, 1958. [CrossRef]14. Grossman, G.M.; Krueger, A.B. Economic Growth and the Environment. Q. J. Econ. 1995, 110, 353–377. Available online:
https://hdl.handle.net/10.2307/2118443 (accessed on 22 December 2021).15. Selden, T.M.; Song, D. Environmental Quality and Development: Is There a Kuznets Curve for Air Pollution Emissions? J. Environ.
Econ. Manag. 1994, 27, 147–162. [CrossRef]16. Li, L.; Hong, X.; Tang, D.; Na, M. GHG Emissions, Economic Growth and Urbanization: A Spatial Approach. Sustainability 2016, 8, 462.
[CrossRef]17. Fang, Y.; Wang, L.; Ren, Z.; Yang, Y.; Mou, C.; Qu, Q. Spatial Heterogeneity of Energy-Related CO2 Emission Growth Rates
around the World and Their Determinants during 1990–2014. Energies 2017, 10, 367. [CrossRef]18. To, W.-M.; Lee, P.K.C. Energy Consumption and Economic Development in Hong Kong, China. Energies 2017, 10, 1883. [CrossRef]19. Jiang, X.-T.; Su, M.; Li, R. Investigating the Factors Influencing the Decoupling of Transport-Related Carbon Emissions from
Turnover Volume in China. Sustainability 2018, 10, 3034. [CrossRef]20. Badulescu, D.; Simut, R.; Badulescu, A.; Badulescu, A.-V. The Relative Effects of Economic Growth, Environmental Pollution and
Non-Communicable Diseases on Health Expenditures in European Union Countries. J. Environ. Res. Public Health 2019, 16, 5115.[CrossRef]
21. Tseng, S.-W. Analysis of Energy-Related Carbon Emissions in Inner Mongolia, China. Sustainability 2019, 11, 7008. [CrossRef]

Energies 2022, 15, 2450 17 of 18
22. Carbonell-Bojollo, R.; Veroz-Gonzalez, O.; Ordoñez-Fernandez, R.; Moreno-Garcia, M.; Basch, G.; Kassam, A.; Repullo-Ruiberrizde Torres, M.A.; Gonzalez-Sanchez, E.J. The Effect of Conservation Agriculture and Environmental Factors on CO2 Emissions in aRainfed Crop Rotation. Sustainability 2019, 11, 3955. [CrossRef]
23. Hu, S.; Yang, J.; Jiang, Z.; Ma, M.; Cai, W. CO2 Emission and Energy Consumption from Automobile Industry in China:Decomposition and Analyses of Driving Forces. Processes 2021, 9, 810. [CrossRef]
24. Zhou, H.; Qu, S.; Yuan, Q.; Wang, S. Spatial Effects and Nonlinear Analysis of Energy Consumption, Financial Development, andEconomic Growth in China. Energies 2020, 13, 4982. [CrossRef]
25. Polzin, F.; Sanders, M. How to finance the transition to low-carbon energy in Europe? Energy Policy 2020, 147, 111863. [CrossRef]26. Patiño, L.I.; Padilla, E.; Alcántara, V.; Raymond, J.L. The Relationship of Energy and CO2 Emissions with GDP per Capita in
Colombia. Atmosphere 2020, 11, 778. [CrossRef]27. Poumanyvong, P.; Kaneko, S. Does urbanization lead to less energy use and lower CO2 emissions? A cross-country analysis. Ecol.
Econ. 2010, 70, 434–444. [CrossRef]28. Martínez-Zarzoso, I.; Maruotti, A. The impact of urbanization on CO2 emissions: Evidence from developing countries. Ecol. Econ.
2011, 70, 1344–1353. [CrossRef]29. Ponce de Leon Barido, D.; Marshall, J.D. Relationship between Urbanization and CO2 Emissions Depends on Income Level and
Policy. Environ. Sci. Technol. 2014, 48, 3632–3639. [CrossRef]30. Zheng, H.; Hu, J.; Guan, R.; Wang, S. Examining Determinants of CO2 Emissions in 73 Cities in China. Sustainability 2016, 8, 1296.
[CrossRef]31. Xing, R.; Hanaoka, T.; Kanamori, Y.; Masui, T. Greenhouse Gas and Air Pollutant Emissions of China’s Residential Sector: The
Importance of Considering Energy Transition. Sustainability 2017, 9, 614. [CrossRef]32. Sutthichaimethee, P.; Kubaha, K. A Relational Analysis Model of the Causal Factors Influencing CO2 in Thailand’s Industrial
Sector under a Sustainability Policy Adapting the VARIMAX-ECM Model. Energies 2018, 11, 1704. [CrossRef]33. Wang, S.; Zeng, J.; Huang, Y.; Shi, C.; Zhan, P. The effects of urbanization on CO2 emissions in the Pearl River Delta: A
comprehensive assessment and panel data analysis. Appl. Energy 2018, 228, 1693–1706. [CrossRef]34. McGee, J.A.; York, R. Asymmetric relationship of urbanization and CO2 emissions in less developed countries. PLoS ONE 2018,
13, e0208388. [CrossRef] [PubMed]35. Li, K.; Lin, B. Impacts of urbanization and industrialization on energy consumption CO2/ emissions: Does the level of develop-
ment matter? Renew. Sustain. Energy Rev. 2015, 52, 1107–1122. [CrossRef]36. Ouyang, X.; Lin, B. Carbon dioxide (CO2) emissions during urbanization: A comparative study between China and Japan. J.
Clean. Prod. 2017, 143, 356–368. [CrossRef]37. Wang, S.; Li, Q.; Fang, C.; Zhou, C. The relationship between economic growth, energy consumption, and CO2 emissions:
Empirical evidence from China. Sci. Total Environ. 2016, 542, 360–371. [CrossRef]38. Wang, Y.; Chen, L.; Kubota, J. The relationship between urbanization, energy use and carbon emissions: Evidence from a panel of
Association of Southeast Asian Nations (ASEAN) countries. J. Clean. Prod. 2016, 112, 1368–1374. [CrossRef]39. Khoshnevis Yazdi, S.; Dariani, A.G. CO2 emissions, urbanisation and economic growth: Evidence from Asian countries. Econ.
Res.-Ekon. Istraz. 2019, 32, 510–530. [CrossRef]40. Chen, S.; Jin, H.; Lu, Y. Impact of urbanization on CO2 emissions and energy consumption structure: A panel data analysis for
Chinese prefecture-level cities. Struct. Chang. Econ. Dyn. 2019, 49, 107–119. [CrossRef]41. Ali, R.; Bakhsh, K.; Yasin, M.A. Impact of urbanization on CO2 emissions in emerging economy: Evidence from Pakistan. Sustain.
Cities Soc. 2019, 48, 101533. [CrossRef]42. Sarwar, S.; Alsaggaf, M.I. Role of urbanization and urban income in carbon emissions: Regional analysis of China. Appl. Ecol.
Environ. Res. 2019, 17, 10303–10311. [CrossRef]43. Yumashev, A.; Slusarczyk, B.; Kondrashev, S.; Mikhaylov, A. Global Indicators of Sustainable Development: Evaluation of the
Influence of the Human Development Index on Consumption and Quality of Energy. Energies 2020, 13, 2768. [CrossRef]44. Wang, B.; Zheng, Q.; Sun, A.; Bao, J.; Wu, D. Spatio-Temporal Patterns of CO2 Emissions and Influencing Factors in China Using
ESDA and PLS-SEM. Mathematics 2021, 9, 2711. [CrossRef]45. Tamazian, A.; Chousa, J.P.; Vadlamannati, K.C. Does higher economic and financial development lead to environmental
degradation: Evidence from BRIC countries. Energy Policy 2009, 37, 246–253. [CrossRef]46. Tamazian, A.; Bhaskara Rao, B. Do economic, financial and institutional developments matter for environmental degradation?
Evidence from transitional economies. Energy Econ. 2010, 32, 137–145. [CrossRef]47. Granger, C.W.J. Investigating causal relations by econometric models and cross spectral methods. Econometrica 1969, 37, 424–438.
[CrossRef]48. Goh, S.K.; Sam, C.Y.; McNown, R. Re-examining foreign direct investment, exports, and economic growth in Asian economies
using a bootstrap ARDL test for cointegration. J. Asian Econ. 2017, 51, 12–22. [CrossRef]49. Lin, F.L.; Inglesi-Lotz, R.; Chang, T. Revisit coal consumption, CO2 emissions and economic growth nexus in China and India
using a newly developed bootstrap ARDL bound test. Energy Explor. Exploit. 2018, 36, 450–463. [CrossRef]50. Gallant, A.R. On the bias in flexible functional forms and an essentially unbiased form: The Fourier flexible form. J. Econom. 1981,
15, 211–245. [CrossRef]51. Gallant, A.R.; Souza, G. On the asymptotic normality of Fourier flexible form estimates. J. Econom. 1991, 50, 329–353. [CrossRef]
Energies 2022, 15, 2450 18 of 18
52. Hatemi-J, A.; Uddin, G.S. Is the causal nexus of energy utilization and economic growth asymmetric in the US? Econ. Syst. 2012,36, 461–469. [CrossRef]
53. Bayer, C.; Hanck, C.H. Combining non-cointegration tests. J. Time Ser. Anal. 2013, 34, 83–95. [CrossRef]54. Nazlioglu, S.; Gormus, N.A.; Soytas, U. Oil prices and real estate investment trusts (REITs): Gradual-shift causality and volatility
transmission analysis. Energy Econ. 2016, 60, 168–175. [CrossRef]55. Wu, Y.Z.; Shen, J.H.; Zhang, X.L.; Skitmore, M.; Lu, W.S. The impact of urbanization on carbon emissions in developing countries:
A Chinese study based on the U-Kaya method. J. Clean. Prod. 2016, 135, 589–603. [CrossRef]56. Wang, S.; Fang, C.; Guan, X.; Pang, B.; Ma, H. Urbanisation, energy consumption, and carbon dioxide emissions in China: A
panel data analysis of China’s provinces. Appl. Energy 2014, 136, 738–749. [CrossRef]57. Fan, J.-L.; Zhang, Y.-J.; Wang, B. The impact of urbanization on residential energy consumption in China: An aggregated and
disaggregated analysis. Renew. Sustain. Energy Rev. 2017, 75, 220–233. [CrossRef]58. Jones, D.W. Urbanization and energy use in economic development. Energy J. 1989, 10, 29–44. [CrossRef]59. Shen, L.; Cheng, S.; Gunson, A.J.; Wan, H. Urbanization, sustainability and the utilization of energy and mineral resources in
China. Cities 2005, 22, 287–302. [CrossRef]60. Liu, Y. Exploring the relationship between urbanization and energy consumption in China using ARDL (autoregressive distributed
lag) and FDM (factor decomposition model). Energy 2009, 34, 1846–1854. [CrossRef]61. Minx, J.C.; Baiocchi, G.; Peters, G.P.; Weber, C.L.; Guan, D.; Hubacek, K. A “carbonizing dragon”: China’s Fast growing CO2
emissions revisited. Environ. Sci. Technol. 2011, 45, 9144–9153. [CrossRef] [PubMed]62. Jiang, Z.; Lin, B. China’s energy demand and its characteristics in the industrialization and urbanization process. Energy Policy
2012, 49, 608–615. [CrossRef]63. Zhang, C.; Lin, Y. Panel estimation for urbanization, energy consumption and CO2 emissions: A regional analysis in China.
Energy Policy 2012, 49, 488–498. [CrossRef]64. Khanna, N.Z.; Zhou, N.; Fridley, D.; Fino-Chan, C. Evaluation of China’s local enforcement of energy efficiency standards and
labeling programs for appliances and equipment. Energy Policy 2013, 63, 646–655. [CrossRef]65. Zhou, X.; Fan, L.W.; Zhou, P. Marginal CO2 abatement costs: Findings from alternative shadow price estimates for Shanghai
industrial sectors. Energy Policy 2015, 77, 109–117. [CrossRef]66. Fan, Y.; Liu, L.-C.; Wu, G.; Wei, Y.-M. Analyzing impact factors of CO2 emissions using the STIRPAT model. Environ. Impact
Assess. Rev. 2006, 26, 377–395. [CrossRef]67. Wei, Y.; Liu, L.; Fang, Y.; Wu, G. The impact of lifestyle on energy use and CO2 emissions: An empirical analysis of China’s
residents. Energy Policy 2007, 35, 247–257. [CrossRef]68. Zhu, H.; You, W.; Zeng, Z. Urbanization and CO2 emission: A semi-parametric panel data analysis. Econ. Lett. 2012, 117, 848–850.
[CrossRef]69. Wang, Q. Effects of urbanization on energy consumption in China. Energy Policy 2014, 65, 332–339. [CrossRef]