Loyalty Programs and their Impact on Repeat-Purchase Loyalty Patterns: a replication and extension
Upload
khangminh22Category
view
0download
0
FACTORS THAT DETERMINE CUSTOMER LOYALTY TO CLOTH RETAILING STORES IN NAIROBI, KENYA.
BY:ALICE NTHENYA MUTUKU
SUPERVISOR: MS. CATHERINE NGAHU/
A Management Research Project Submitted In Partial Fulfillment For The Requirement Of The Award Of Masters In Business Administration (MBA),
School Of Business, University Of Nairobi.
NOVEMBER, 2010

DECLARATION
j declare that this is my original work and has not been resented for any award for a degree in any other university or college for examination or Academic purposes.
Signature: W ___________________ I 11 j S -O /O-----
Student: Mutuku Alice Nthenya DateD61/70215/2007
This research project has been submitted with my approval as the student university supervisor.
Ms. CatherineJ^gBhu University of Nairobi
K ilDate
ii
DEDICATION\
This work is affectionately dedicated first and foremost to the almighty God whose providence, grace, and care I cherish. Secondly, to my Dad, Philip Mutuku Kitungi and my mother, Justina Mbula Mwanza and my dear brothers and sisters who might have needed my presence in several occasions but could not avail myself. Thank you for your support and advice.
111

ACKNOWLEDGEMENTFirst and foremost, I thank God for the strength and yet another chance to go through college. I wish to acknowledge with the uttermost gratitude my supervisor, Ms Catherine Ngahu without whose guidance and patience this work would never been completed. I am grateful for the suggestions, corrections, and attention she afforded me. My heart felt gratitude goes to my family especially for the support and encouragement that they gave me during the entire period. You were more than my siblings and your immeasurable support kept me going. May God bless you eternally. My intense appreciation also goes to all my friends for their endless encouragement especially Velese, Timoth Mwamisi, Kelvin, Carol and Davis.
1 am greatly indebted to my two exceptional friends Fred and Evans for their role in this project. This project would not have been possible without the cooperation of the customers of cloth retailing stores in Nairobi, who spared time from their busy schedule to participate in the study. Thank you all.
I would also like to thank my classmates and colleagues whose contributions made this research a reality.
IV
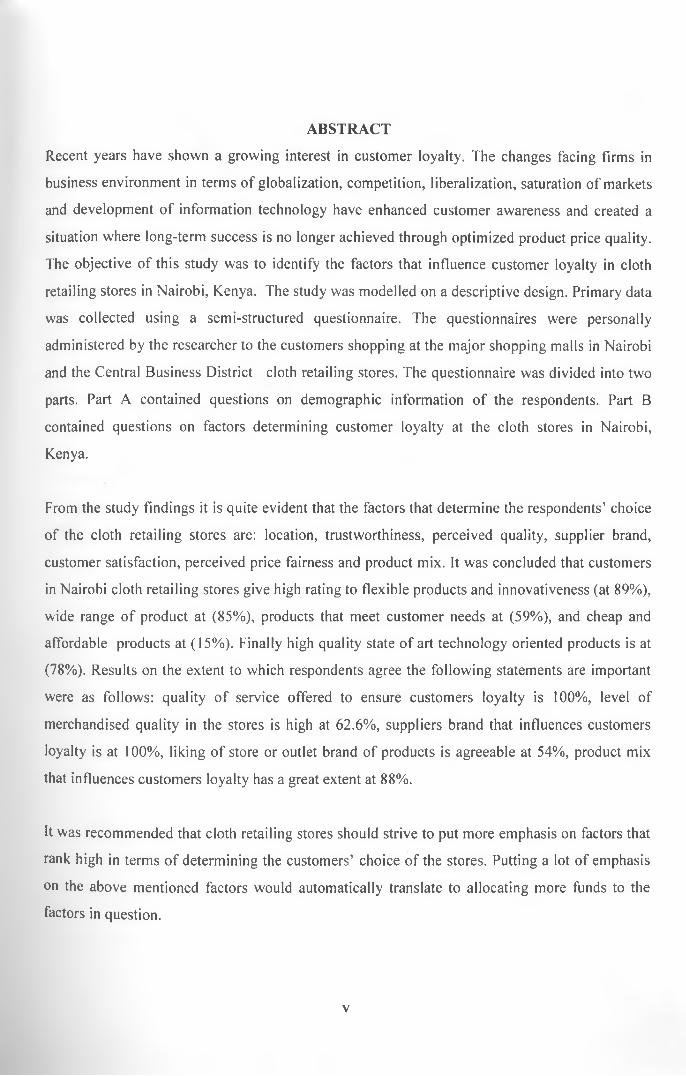
ABSTRACTRecent years have shown a growing interest in customer loyalty. The changes facing firms in business environment in terms of globalization, competition, liberalization, saturation of markets and development of information technology have enhanced customer awareness and created a situation where long-term success is no longer achieved through optimized product price quality. The objective of this study was to identify the factors that influence customer loyalty in cloth retailing stores in Nairobi, Kenya. The study was modelled on a descriptive design. Primary data was collected using a semi-structured questionnaire. The questionnaires were personally administered by the researcher to the customers shopping at the major shopping malls in Nairobi and the Central Business District cloth retailing stores. The questionnaire was divided into two parts. Part A contained questions on demographic information of the respondents. Part B contained questions on factors determining customer loyalty at the cloth stores in Nairobi, Kenya.
From the study findings it is quite evident that the factors that determine the respondents’ choice of the cloth retailing stores are: location, trustworthiness, perceived quality, supplier brand, customer satisfaction, perceived price fairness and product mix. It was concluded that customers in Nairobi cloth retailing stores give high rating to flexible products and innovativeness (at 89%), wide range of product at (85%), products that meet customer needs at (59%), and cheap and affordable products at (15%). Finally high quality state of art technology oriented products is at (78%). Results on the extent to which respondents agree the following statements are important were as follows: quality of service offered to ensure customers loyalty is 100%, level of merchandised quality in the stores is high at 62.6%, suppliers brand that influences customers loyalty is at 100%, liking of store or outlet brand of products is agreeable at 54%, product mix that influences customers loyalty has a great extent at 88%.
It was recommended that cloth retailing stores should strive to put more emphasis on factors that rank high in terms of determining the customers’ choice of the stores. Putting a lot of emphasis on the above mentioned factors would automatically translate to allocating more funds to the factors in question.
v
s LIST OF ABBREVIATIONSCBD- Central Business DistrictM&S- Marks and SpencerACSI- American Customer Satisfaction IndexECSI- European Customer Satisfaction IndexGPD- Gross Domestic ProductSPSS- Statistical package for Social Scientist
vi
d e d ic a t io n ..................................................................................................................................... iiiACKNOWLEDGEMENT.................................................................................................................. iiiLIST OF ABBREVIATION...............................................................................................................viABSTRACT.................................................................. ...................................................................... vTABLE OF CONTENTS.................................................................................................................... viLIST OF TABLES............................................................................................................................viiiLIST OF FIGURES.............................................................................................................................ixCHAPTER ONE: INTRODUCTION..............................................................................................11.1 Background of the Study.................................................................................................................11.1.1 Customer Loyalty........................................................................................................................21.1.2 Retailing Stores in Kenya...........................................................................................................41.1.3 Clothing stores.............................................................................................................................51.2 Statement of the Problem............................................................................................................... 71.3 Objectives of the Study:................................................................................................................ 81.4 Value of the Study..........................................................................................................................8CHAPTER TWO: LITERATURE REV IEW ...............................................................................92.1 Concept of customer loyalty..........................................................................................................92.2 Measuring Loyalty........................................................................................................................ 112.3 Proposed model of categories of loyal customers...................................................................... 122.4 Factors That Determine Customer Loyalty................................................................................ 132.4.1 Trustworthiness.......................................................................................................................... 132.4.2 Perceived Quality....................................................................................................................... 142.4.3 Customer Satisfaction................................................................................................................172.4.4 Supplier Brand........................................................................................................................... 192.4.5 Perceived Price Fairness...........................................................................................................212.4.6 Product M ix...............................................................................................................................222.5 Conceptual Framework.............................................................................................................. 23CHAPTER THREE: RESEARCH METHODOLOGY............................................................ 253.1 Introduction..................................................................................................................................25
t a b l e o f c o n t e n t sd e c l a r a t io n .................................................................................................................................. ii
vn

3.2 Research design............................................................................................................................253.3 Target Population..........................................................................................................................253.4 Sample Design..............................................................................................................................263.5 Data Collection Methods............................................................................................................. 273.5.1 Piloting......................................................................................................................................283.6 Data Analysis................................................................................................................................28CHAPTER FOUR: DATA ANALYSIS, RESULTS AND DISCUSSION .............................294.0 Introduction................................................................................................................................... 294.1 Gender........................................................................................................................................... 294.2 Where customers shop................................................................................................................. 304.3 Education level.............................................................................................................................314.4 Respondents’ Age.........................................................................................................................314.5 Quality of service offered........................................................................................................ ....324.6 Quality of Service.........................................................................................................................334.7 Supplier Brand Influence............................................................................................................. 334.8 Product M ix.................................................................................................................................. 354.9 Trustworthiness.............................................................................................................................404.10 Perceived quality................................................................................................. 424.11 Perceived price fairness............................................................................................................. 43CHAPTER FIVE: SUMMARY, CONCLUSIONS AND RECOMMENDATIONS............. 465.1 Introduction...................................................................................................................................465.2 Discussions................................................................................................................................... 465.3 Conclusions......................................................................................................................... 465.4 Recommendations...................................................... 465.5 Suggestions for further studies....................................................................................................47
REFERENCES................................................................................................................................. 47
APPENDICES................................................................................................................................... 58Appendix I: Introduction Letter.............................................................................. 58Appendix II: Research Questionnaire............................................................................................... 58Appendix III: List of cloth retail stores in Nairobi - Kenya............................................................64
vm
LIST OF TABLESTable 3.1 Target Population..................................................................................................26Table 3.2 Population Sample.................................................................................................27Table 4.1 Gender................................................................................................................... 29Table 4.2 where customers shop........................................................................................... 30Table 4.3 Respondents’ Age..................................................................................................31Table 4.4 Level of merchandise quality in the store purchase........................................... 32Table 4.5: The quality of service..........................................................................................33Table 4. 6: Clothing store/outlet brand of products.............................................................33Table 4.7: The brand relates well with your clothing needs................................................34Table 4.8: The brands are attractive as compared to those from other stores.....................34Table 4.9: The brand enhance your social identity..............................................................35Table 4.10: To what extent does product mix influence customer loyalty?......................35Table 4.11: The product match well to the ever changing customer market needs......... 36
Table 4.12: The products are able to meet most customers clothing needs......................37Table 4.13: The clothing store offers innovative and flexible products.............................37Table 4.14: The clothing store offers more customized products than its competitors..... 39Table 4.15: The clothing store offers high quality of art technology............ ....................39Table 4.16: I trust the clothing store brands because they are of high quality..................41Table 4.17: I trust the clothing store product due to its high quality trends over the years42Table 4.18: Perceived price fairness....................................................................................42Table 4.19 Am totally satisfied with the price offered by the stores..................................43Table 4.20: Price is an indicator of the quality of product..................................................43Table 4.21: A summary table................................................................................................ 45
ix
LIST OF FIGURESFigure 2.1: The relationship between the independent and dependent variables .............24Figure 4.1 Education Level............................................................................... 31Figure 4.2: Product range......................................................................................................36Figure 4.3: The clothing store offers cheap and affordable products.................................38Figure 4.4: I totally trust the store for my clothing needs...................................................40Figure 4.5: My trust for the clothing store is due to its performance & credibility...........41Figure 4.6: Cheap & affordable products as compared to other stores..............................44
x

CHAPTER ONE: INTRODUCTION
1.1 Background of the StudyCustomer loyalty is a composite of a number of qualities; it is driven by customer satisfaction, yet it also involves a commitment on the part of the customer to make a sustained investment in an ongoing relationship with a brand or company. Customer loyalty is reflected by a combination of attitudes (intention to buy again and/or buy additional products or services from the same company, willingness to recommend the company to others, commitment to the company demonstrated by a resistance to switching to a competitor) and behaviors (Prus & Randall 1995). The development of customer loyalty is a strategic objective for most companies. Marketers around the world agree that new customer retention alone will not ensure long-term success. Acquisition must be balanced with customer retention and customer development to optimize performance and shareholder value in the long run. In today’s highly competitive market place, retaining brand loyal customers is critical for survival (Evans, 1997).
Keeping customers is often a more efficient strategy than attracting new customers (Rosenberg, 1983). Customers have become more confident and more demanding. They want products and services that satisfy them and have no time for those which do not. More and more customers have a need to distinguish themselves from one another to express their individualism. For this reason, they demand quality that is sustained. Further, today’s customers are tougher, more informed and so sensitive to poor service that they often walk away and never come back. To make it worse, the average dissatisfied customers tells 9 to 10 other people.
Many marketing managers are concerned with a growing trend toward brand switching. Among the reasons given for the decline in brand loyalty is customer dissatisfaction with products/ services, the many new products appearing in the markets and consumers’ increased concern on the price at the expense of brand loyalty (Schiffman, 1994). Today’s customers are also becoming more and more knowledgeable, their tastes, preferences and quality expectations continue to change and this exerts pressure on
1
organizations which seek to meet these ever changing customer needs and build their success on a long-term customer relationships (Ndeti, 2007). Customers may demonstrate their loyalty in any one of a number of ways; they may choose to stay with a provider, whether this continuance is defined as a relationship or not, or they may increase the number of purchases or the frequency of their purchases or even both. They may also become advocates of the organisation concerned by playing a powerful role in the decision-making of others (Hallowed, 1996).
1.1.1 Customer LoyaltyCustomer loyalty is a major strategic objective and focus in marketing. It has been suggested that brand reputation is a major driver of customer loyalty, and hence companies seek to increase the equity of their brands. Quality affects not only customer satisfaction, but also the reputation of the brand. Thus, both brand reputation and customer satisfaction are important determinants of customer loyalty. Current definitions of customer loyalty include both behavioral and attitudinal aspects (Dick and Basu, 1994). Actions of customers such as word-of-mouth or the degree of repeat purchase of a product or a service are said to reflect behavioral loyalty (Dekimpe et al., 1997). The attitudinal aspect, in contrast, sees a loyal consumer as someone who has a positive attitude and a high degree of dispositional commitment in terms of some unique value that is associated with a brand (Jacoby and Chestnut, 1978); examples of measures of attitudinal loyalty include preference, or a commitment to repurchase.
Customer retention has been said to have become the “Holy Grail” of diverse industries (Coyles and Gokey, 2005). A number of studies have demonstrated the benefits of customer loyalty: Gronroos (1990) suggests that customer retention leads to lower sales and marketing costs compared to selling to new customers, and other authors argue that customer loyalty is a key determinant of the long-term financial performance of firms (Reichheld, 1993). As a result, an increasing amount of research has examined the drivers of customer loyalty. Despite the attractiveness of achieving “loyal” customers, research has indicated that 100 percent customer loyalty is relatively unusual: customers in cloth stores and other industries are increasingly sharing their purchases between multiple brands, thus demonstrating what has been called “polygamous loyalty” (Uncles et al.,
2
1994). Obtaining loyal customers is likely to be particularly challenging for cloth stores, since the industry is characterized by many customers having multiple simultaneous relationships with various service providers. For example, a significant number of customers have been shown to use more than one cloth store.
Previous research has shown that in modeling future customer loyalty, it is important to model a customer's usage of competing providers. However, few customer loyalty studies have allowed for the effect of use of competing products, and if they have done so, have typically modeled loyalty in the consumer packaged goods market, not the financial services market. Divided loyalty is not unique to the clothing industry: for example there is substantial evidence that most consumers of packaged goods purchase regularly from a portfolio of brands (Ehrenberg et al., 1990).
Previous research has shown that customers may stay with a provider, even if dissatisfied, because the costs of switching are perceived to be higher than the benefits of switching (Panther and Farquhar, 2004). Many clothing stores already have a strategic focus on customer retention due to keen competition, rising costs of customer acquisition and increasing customer switching behaviors (Ennew and Binks, 1996). While there has been previous research studying loyalty in business (Chan and Ma, 1990), there has been a relative lack of research into business customer loyalty, compared with research in the cloth retail market.
The decision-making process by business customers is also said to be becoming more complex, as customer choice increasingly depends on many different criteria simultaneously, including brand, quality, performance, price, features and distribution channel (McFadden, 1986). This problem is further confounded in purchasing clothes, where customers may consider other intangible features and characteristics of the market offerings such as service quality, perceived guanxi, and trust (Verma et al., 2008). This has resulted in a substantial body of research examining consumers' choice strategies.
In choosing between competing products, customers need to decide between the different bundles of attributes offered by competing products, a process which sometimes involves
3
difficult tradeoffs (Bettman et al., 1998). The design of effective marketing programs therefore requires an accurate forecast of the choice strategy used by consumers in the particular decision environment. For cloth retailing stores, understanding customers' choice strategies, and in particular, their tradeoffs between key attributes, can therefore help to develop appropriate product specifications and customer retention and crossselling programs, improving or emphasizing features which are important to significant groups of customers.
1.1.2 Retailing Stores in KenyaThe retailing stores started as self-service stores, covering small trading areas. However with time, they increased their volume and assortment of merchandise as well as trading space to become supermarkets, clothing stores and provisional stores (Kipkorir, 1995). In recent years (1980’s and early 1990’s), several retailing stores have been established in Nairobi and other major towns. Most of these retailing stores are owned by Asians of Kenyan origin and are run as family businesses (Karemu, 1993). Uchumi supermarkets, in which the government holds a 45% stake, went public in 1992 by offering 16 million shares to the public.
Factors that have led to the growth of retailing stores especially in Nairobi are the liberalization of trade, the increase among the city’s population (about 5million people), and the customers demand for effective and efficient retailing services (Kipkorir, 1995). Most of the leading retailing stores chains in Nairobi (Uchumi, Nakumatt’s, Little reds, Mannix, Sir Henry, Secrets Nairobi Sports House and Tuskys) offer a variety of imported and locally made household items. Recently, Kenya has witnessed a rapid increase in supermarkets and clothing stores brought about by strong forces of globalization and urbanization, The growth of retailing stores has been at the rate of 18%per annum and they have increased from a niche in the mid 1990s to 20% of the urban food market in 2003 (Naftali, 2006). These are Uchumi, Nakumatt, Tuskys and Ukwala.
The 2030 vision for wholesale and retail trade is to raise earnings by giving our large informal sector opportunities to transform itself into a part of the formal sector that is
4

efficient, multi-tiered, diversified in product range and innovative. This will be realized through: training and access to credit and markets; improving efficiency by reducing the number of players between the producer and the consumer; creating formal market outlets for small-scale operators who will then graduate from the informal sector; encouraging more investment in retail trade; developing an outreach programme to expand retail trade; and developing training programmes to improve retail skills and the simplification of business registration and licensing will continue to create a more enabling business environment for trading activity.
1.1.3 Clothing storesIt is not certain when people first started wearing clothes however, anthropologists give estimates that range between 100,000 to 500,000 years ago. The first clothes were made from natural elements: animal skin and furs, grasses and leaves, and bones and shells. Clothing was often draped or tied however; simple needles made out of animal bone provide evidence of sewn leather and fur garments from at least 30,000 years ago. When settled Neolithic cultures discovered the advantages of woven fibers over animal hides, the making of cloth, drawing on basketry techniques, emerged as one of humankind's fundamental technologies. The history of clothing goes hand in hand with the history of textiles (Furse, 1984). Humans had to invent weaving, spinning and other techniques and the machines needed in order to make the fabrics used for clothing. Before sewing machines, nearly all clothing was local and hand-sewn; there were tailors and seamstresses in most towns that could make individual items of clothing for customers. After the sewing machine was invented, the ready-made clothing industry took off. The earliest clothing store dates back to 1856; Thomas Burberry founded Burberry in 1856. Burberry manufactures clothing and fashion accessories; its plaid pattern is one of its most widely copied trademarks (Bennett, 2004). Stoke-on-Trent was founded by Harry Grosberg in 1924 while Belstaff was the first to sell women’s only clothes. Belstaff Clothing, women’s. In 1947, Christian Dior, introduced his line of women's clothing that revolutionized women's clothing and also fashion manufacturing. In clothing stores, a retailer buys clothes or products in large quantities from manufacturers or importers, either directly or through a wholesaler, and then sells individual items or small quantities
5
to the general public or end user customers, usually in a shop, also called apparel store. Retailers are at the end of the supply chain. Marketers see retailing as part of their overall distribution strategy. Clothing stores may be on residential streets, or in shopping streets with little or no houses, or in a shopping center or shopping mall. Shopping streets may or may not be for pedestrians only. Sometimes a shopping street has a partial or full roof to protect customers from precipitation.
Many clothing stores are part of a chain: a number of similar shops with the same name selling the same products in different locations. The stores may be owned by one company, or there may be a franchising company that has franchising agreements with the shop owners. The pricing technique used by most clothes retailers is cost-plus pricing. This involves adding a markup amount (or percentage) to the retailers cost. Another common technique is manufacturers suggested list pricing. This simply involves charging the amount suggested by the manufacturer and usually printed on the product by the manufacturer. In Western countries, retail prices are often so-called psychological prices or odd prices: a little less than a round number, e.g. $ 6.95. In Chinese societies, prices are generally either a round number or sometimes some lucky number. This creates price points. Often prices are fixed and displayed on signs or labels. Alternatively, there can be price discrimination for a variety of reasons. The retailer charges higher prices to some customers and lower prices to others. For example, a customer may have to pay more if the seller determines that he or she is willing to. The retailer may conclude this due to the customer's wealth, carelessness, lack of knowledge, or eagerness to buy.
Deacons is the umbrella company which owns and manages various internationally acclaimed fashion brands that meet the needs and preferences of varied market segments. Deacons promise lifestyle solutions to its customers through its Woolworths, Truworths, and Identity, 4U2, Mr. Price Apparel, Angelo and Life and Fitness brands. The company has realigned itself to its vision which is “To be the most trusted provider of desired lifestyle in Africa” by not only offering clothes on hangers but a lifestyle which encompasses the individual’s way of life. From selling the functional, Deacons is now mto the inspirational sphere. Deacons started its operations in 1958 and traded
4
6
successfully for 22 years using the Marks and Spencer (M&S) franchise for the East Africa region. In 1980 the Kenyan Government placed import restrictions on all imported goods to protect the local industry.
1.2 Statement of the ProblemThere has been much interest in the marketing literature in the concept of customer loyalty. Such loyalty might be to a brand, product, or service outlet. Loyalty is likely to lead to positive attitudes and behaviors, such as repeat patronage and purchases, and positive recommendations which may influence other actual or potential customers. A loyal customer base can be a valuable asset for any organization. It reduces the need to seek new customers, and is positive feedback that the organization’s products and services are meeting the needs of a particular group of people. There are substantial grounds for believing that there is a link between loyalty and profitability.
Customer loyalty is very important for every service provider the world over. Many service quality studies have been done in Kenya. Most have focused on relatively structured industries. Most have applied the Parasuraman, Zeithml, and Berry (1985) service-quality model on to the airline (Masinde, 1986), Mobile phone service (Mukiri, 2001) and many other services. These covered on one dimension of service, which has a link to customer satisfaction. However, it is important to note that loyalty has a lot to do with many other aspects. Service sector is also being fronted as a key area in helping boost economic growth with some of the major providers of employment being service oriented. The retail sector being an important part of the service economy is an important case to study. The managers of cloth stores should be able to understand the importance of loyal customers and the factors that influence it.
Locally, various Scholars have reviewed the concept of customer loyalty in different contexts. Muturi (2004) researched on factors that determine customer loyalty to a mobile phone service provider the case of mobile phone users in Nairobi and found out that the major factor is service quality, price indifference and perceived value, Tanui (2007) conducted a survey of customer loyalty programs applied by petrol stations in Nairobi and found that the main factors that contributed to customer loyalty to their products were
47

attractiveness of the brand personality and perceived quality while Kamau Edward Mungai (2008) studied the factors that determine customer loyalty the case of the port of Mombasa and found out that Customer Satisfaction, perceived quality and brand loyalty were the main determinant. To the best of the researcher’s knowledge, no such study has been done IVi Kenya in the textile industry. This study aims at understanding consumer perceptions towards cloth stores customer loyalty determinants by identifying what beliefs exist about various cloth stores, how these beliefs affect the imagery of various cloth stores, positioning of cloth stores in customers mind and how these perceptions affect consistency of making purchases and recommendation of a specific outlet to other customers. The Vision 2030 for wholesale and retail is to improve on earnings through helping large informal sectors transform themselves into part of the formal sector that is efficient and diversified in product range and innovation. The purpose of this study therefore is to investigate the determinants of customer loyalty to cloth retailing stores in Nairobi in order to provide high quality life to all its customers and contribute towards the growth of GDP as a whole in Kenya.
1.3 Objectives of the Study:i. To determine the extent to which perceived price fairness and trustworthiness
influences customer loyalty to a cloth retailing store provider.ii. To find out the extent to which quality of services influences customer loyalty to a
cloth retailing store.iii. To determine how supplier brand and product mix influences customer loyalty to
a cloth retailing store.1.4 Value of the StudyThe findings of this study will benefit the management of cloth retail stores through assistance to better understand their customers and anticipate their expectations in the clothing industry. The study will also empower the staff, especially those in marketing, research and development departments, in order to address the specific needs of the customers. The study will also be crucial to the academics as it contributes to literature on customer loyalty hence narrowing the knowledge gaps in the areas of customer services and loyalty. It also opens up avenues for further research in relevant topics.
4
8
CHAPTER TWO: LITERATURE REVIEW
2.1 Concept of customer loyalty
The concept of loyalty has not been uniquely defined. In marketing literature the term loyalty has often been used interchangeably with its operational (measurement) definition to refer to as repeat purchase; preference; commitment and retention and allegiance. Loyalty, as a concept, however, has its roots in the consumer behavior literature whose primary focus is private sector organizations and businesses. Organizations are concerned to secure as significant a loyal customer base as possible, and the literature abounds with professional practice case study articles which describe approaches to the retention of customers. The recent introduction of loyalty or reward cards, by retailers and shopping centers and areas, might be seen as a technologically-based tactic for cultivating loyalty (Hawkes, 1994).
The theoretical literature on customer loyalty conceptualizes loyalty as an interaction of attitude and behavior. In other words, loyalty (or the absence of it) is exhibited both through customer behavior and also through attitude. For example, loyal behavior might be manifested as repeat and relatively frequent patronage. Such behavior may or may not be associated with a loyal attitude, which leads a customer to value a cloth store. There are multiple approaches to customer loyalty. Theories of behavioral loyalty were dominating until 1970 considering loyalty as the function of the share of total purchases (Cunningham, 1956), function of buying frequency or buying pattern or function of buying probability. These approaches looked at brand loyalty in terms of outcomes (repeat purchase behavior) rather than reasons, until Day (1969) introduced the two- dimensional concept of brand loyalty, which stated that loyalty should be evaluated with both behavioral and attitudinal criteria. Contemporary researches consider and accent the psychological (mostly attitudinal and emotional) factor of loyalty (Jacoby et al, 1973).
These different approaches allow distinguishing customers as whether behaviorally or emotionally loyal. Behaviorally loyal customers act loyal but have no emotional bond with the brand or the supplier whereas emotionally loyal customers do. Jones and Sasser
49
call these two kinds of loyalty accordingly false or true long-term loyalty (Jones et al, 1995). Hofmeyr and Rice (2000) define customers as loyal (behavioral) or committed (emotional). Emotional loyalty is much stronger and longer lasting than behavioral loyalty. It’s an enduring desire to maintain a valued relationship. The relationship is so important for the customer that he or she makes maximum efforts to maintain it (Morgan et al, 1995). Highly bonded customers will buy repeatedly from a provider to which they are bonded, recommend those providers to others, and strongly defend these choices to others - insisting that they have chosen the “best” product or service (Butz et al, 1996). Behaviorally loyal customers could be divided to sub-segments by the reason of acting: forced to be loyal; loyal due to inertia; and/or functionally loyal.
Customers are forced to be loyal when they have to be clients even if they do not want to. Customers may be forced to consume certain products or services offered by certain vendors e.g. when the company acts as a monopoly or the poor financial status of the customer is limiting his selection of goods. Companies with low price strategy had a much higher loyalty than expected from their customer satisfaction. On the other hand, companies that had used a lot of energy on branding indeed had a high customer satisfaction but they did not have a correspondingly high loyalty (Gronholdt et al, 2000). Forced loyalty could be established through creating exit barriers as well. Loyal behavior may also result from inertia - customer does not move to another vendor due to comfort or relatively low importance of operation - if the choice has low importance, there is no point to spend time and effort on searching for alternatives. Thus, based on his faith in the suitability of the current product, the customer continues to use it without checking alternatives. It’s in accordance to Oliver’s approach of cognitive loyalty: the loyalty that is based on brand belief only. “Cognition can be based on prior or vicarious knowledge or on recent experience-based information.
If the transaction is routine, so that satisfaction is not processed (e.g. trash pickup, utility provision), the depth of loyalty is no deeper than mere performance (Oliver, 1999). Hofmeyr and Rice (2000) say that one of the reasons that customers don’t switch brands when they are dissatisfied is that they feel that the alternatives are just as bad as the brand they are using or even worse. Inertia may be caused also by lack of information about
410

attractive characteristics of the brands (Wernerfelt, 1991). Functionally loyal customers are loyal because they have an objective reason to be. Wernerfelt points out “cost-based brand loyalty” where brand utilities have a positive influence on brand choice. Functional loyalty can be created by functional values using price, quality, distribution, usage convenience of a product or through different loyalty programs (points, coupons, games, draws etc.) giving a concrete reason to prefer certain supplier. Unfortunately competitors can most easily copy functional values. Thus, creating functional value offers a fleeting competitive advantage: functional loyalty cannot be very long lasting (Barnes, 2003).
2.2 Measuring LoyaltyMost managers’ interest in loyalty derives from a desire to enhance the level of loyalty among their customers and clearly requires strategies for the management of loyalty. But loyalty will not be managed without measurement, which supports some evaluation of the progress achieved through any loyalty programme. In addition, attempts to measure loyalty provide another perspective on the nature of loyalty (Furse et al., 1984). Early measures of loyalty were based primarily on the extent to which customers performed repeat patronage but, as discussed, it is evident that loyalty may also have attitudinal elements. The consequences of loyalty are those components that can be measured or surveyed; these are: Search motivation - a number of studies suggest that, as experience learning satisfaction and repeat purchase increase, the search for information about alternative brands decreases (Furse et al., 1984). Word-of-mouth - post-purchase communication is supposed to be particularly likely if consumers experience notable emotional experiences, often arising from satisfaction or dissatisfaction. Resistance to counterpersuasion - individuals holding strong commitments, demonstrate enhanced resistance to counterpersuasion (Belch, 1981). Data on these characteristics are only likely to be collected by performing a specific market research or customer survey, or, possibly in some circumstances, by observation. Measures that are based on the extent of repeat patronage also continue to be useful. Libraries already collect such data through issue transactions, although they may have less easily available data in relation to the use of some of their other services, such as attendance at training courses on electronic databases. In general, however, there is the question of to what the repeat patronage
11
indicates loyalty. Loyalty may be to a brand, a product or a service provider or to a salesperson (Mackintosh and Lockshin, 1997).
2.3 Proposed model of categories of loyal customers
The proposed model seeks to further subdivide the category defined as loyals in Dick and Basu's categorization. There is agreement that loyals are important for the future of the business, and that this category is deserving of special attention. Organisations have the opportunity to develop life-long relationships with customers in this group, and may thereby benefit from the lifetime business associated with that customer. These customers are those who have a high relative attitude and a high relative behavior. In the diamond of loyalty (Knox, 1998), this category, described again as loyals, exhibits high customer involvement, and the brand is responsible for a high relative share of their purchasing. It is proposed that since this category is key in customer development and profitability, it is important to understand the loyalty condition for this category in more detail, and to use this understanding to develop further the relationship with customers in the loyal category.
According to Krosnick and Petty (1995), increasing attitude strength is seen to be more predictive of behavior in the sense that it describes the attitude's durability and impactfulness. Inertial loyalty on either dimension is associated with loyals who are neutral about their loyalty; they are consistent in behavior, but the fact that they do not switch does not signal any affinity for the business or brand. There are four categories of loyalty orientation: captive, contented, convenience-seekers, and committed. These all apply to customers who are loyal in both attitude and behavior to the brand, but the introduction of inertial and positive as ends of a scale in relation to both attitude and behavior, yield some categories which assist in thinking about the nature of loyalty (Greenaway, 1995). This is a speculative model at this stage of development, which is intended to provoke further thought about the nature of loyalty. By proposing a simple model that is amenable to further discussion and debate, we draw issues of convenience and customer choice into the debate. The discussion that follows explains how the categories in the model might be further conceptualized, and thereby seeks to illustrate
/12

how such a model might be useful to both practitioners and academics. The model proposes that loyals can be segmented into four categories. Any one individual is likely to exhibit the characteristics of each of these categories in relation to different products, services, outlets, and their associated brands. Below is a brief description of each of the categories (Rice, 2000).
2.4 Factors That Determine Customer Loyalty
2.4.1 Trustworthiness
Trust is logically and experientially a critical variable in relationships, as has been hypothesized and borne out in the marketing literature ( Morgan and Hunt, 1994). Those who are not willing to trust a vendor in a competitive marketplace are unlikely to be loyal. The importance of trust in explaining loyalty is also supported by authors as Lim et al. (1997), Chaudhuri and Holbrook (2001). Trust is sometimes conceived of having two components, performance or credibility trust and benevolence trust, as Ganesan (1994) pointed out in a business-to-business context. In this context, Ganesan found strong effects for credibility trust on relationship commitment but not for benevolence trust. He argued that this was because businesses base their purchase and selling decisions much more on performance issues. Clearly, performance or credibility trust is important in business-to-consumer relationships as well. Other authors have also suggested the existence of an effect for credibility trust on loyalty. Recently, Sirdeshmukh et al. (2002) have argued strongly for benevolence as a component of trust that may contribute to explaining loyalty.
Anderson and Narus (1990) emphasized that, in order to gain trust, one party has to believe that a third party will perform actions that result in positive outcomes for the first. Consequently, to trust a brand, a customer should perceive quality as positive. Doney and Cannon (1997) suggested th^t the construct of trust involves a calculative process based on the ability of a party to a transaction to continue to meet its obligations and on an estimation of the cost-benefits of staying in the relationship. Therefore, the customer should not only perceive positive outcomes but also believe that these positive outcomes W>11 continue in the future. Trust has been recognized as an important factor in
13
relationship commitment and hence in customer loyalty. It appears that, if one party trusts another, it is likely to develop some form of positive behavioral intention towards the other. Accordingly, when customers trust brands, they are also likely to form positive buying intentions towards them (Lau and Lee, 1999).
In this context, trust works at preserving relationship investments by cooperating with exchange partners, resists attractive short-term alternatives in favor of the expected longterm benefits of staying with existing partners, and views potentially high-risk actions as being prudent because of the belief that partners will not act opportunistically (Morgan and Hunt, 1994). Therefore, and consistent with other past research studies (Chaudhuri and Holbrook, 2002; Lau and Lee, 1999; Sirdeshmukh et al., 2002). There will be a positive relationship between trust in the firm and customer loyalty. On the other hand, an increase in perceived switching cost will influence the direct effect of trust on customer loyalty (Sharma, 2003; Patterson and Sharma, 2000). In other words, perceived switching cost has a moderator effect on the relationship between trust and customer loyalty. Therefore, that relationship may be expected to be weaker in segments where switching cost is high. In customers with high-perceived switching cost, there will be a weaker relationship between trust and customer loyalty than in customers with low-perceived switching cost.
2.4.2 Perceived QualityBloemer and Ruyter (1998) suggested that store loyalty resulted from a consumercommitted to the store through an explicit and extensive decision-making process.Customer loyalty is frequently operated as a conscious evaluation of the price/qualityratio or the willingness to pay a premium price, or alternatively price indifference.Supphellen and Nysveen (2001) suggested that corporate brand loyalty affected onlineshoppers' intentions to revisit the Web site. Perception affects behavior. People tend todevelop attitudes towards what they have perceived; this is normally based on what they*are familiar with. These attitudes are the perceptual outcomes and they influence the perceiver’s behavior and how he of she will perceive things at the present or in the future. Perceived quality is one of these attitudes developed. Consumers often judge the quality
14
of a service on the basis of a variety of information cues, which they associate with the service. Kibera and Waruingi (1998), define perceived quality as the customers’ perception of the overall quality or superiority of a product or service with respect to its intended purpose relative to alternatives available. Therefore perceived quality is the assessment of customers’ perception of an outlet/store on the basis of what they think constitutes a quality supermarket. Their perception is widely shaped comparatively by what they have seen from other supermarkets. It is for this reason that this study seek to compare service perception among cloth retailing stores in Nairobi-Kenya, it means that customers learn from one store what to expect from the other.
The customers in this case shoppers perceive some level of risk while shopping in these stores. The perceived risk also influences the consumers’ perceptions. Consumer behavior involves risk in the sense that any action of a consumer will produce consequences, which she cannot anticipate with anything approximating certainty. The degree of risk the consumers perceive and their own tolerance for risk-taking serves to influence their shopping strategies. Consumers perceive risk because they may have had little or no experience with the outlet or because the concept is new in the market. They may experience any of the following risks as outlined by Schiffman and Kanuk (1995): Functional risk - the risk that the product will not perform as is expected. According to my experience with supermarkets in Kenya, a customer may risk buying repackaged expired products. Physical risk is a risk to self and others that the product may pose for example it might cause harm in this case. Financial risk is the risk that the product will not be worth its cost, for example a product maybe substandard or overpriced. Social risk is a risk that a poor outlet choice will result in embarrassment before others for example an affluent consumer may not want to be associated with a down market supermarket called Ukwala or Jack & Jill which may not have the right connotation for an up-market target. Psychological risk on the other hand is the risk that a poor outlet choice will bruise the consumer’s ego (Knox, 1998^
Cronin and Taylor (1992) examined the causal relationships among service quality, customer satisfaction, and purchase intention. Each variable was measured by one item. There were 660 usable questionnaires randomly collected from customers of four types of
15

businesses in the southeastern United States: banking, pest control, dry cleaning, and fast food. The results* of correlation analysis have suggested that service quality was an antecedent of consumer satisfaction; service quality had less effect on purchase intentions than did consumer satisfaction and consumer satisfaction had a significant effect on purchase intentions. Dabholkar, et al (2000) also found that customer satisfaction strongly mediated the effect of service quality on behavioral intentions. The data used in their study were systematically randomly collected from 397 churches. A test of discriminant validity revealed that the construct of service quality was different from the construct of customer satisfaction. The result of regression analysis in structural equations modeling supported their proposition that customer satisfaction had a stronger effect on behavioral intentions than service quality did (Dabholkar et al., 2000).
Service quality literature indicated that perceptions of high service quality and high service satisfaction resulted in a very high level of purchase intentions (Zeithaml, 1993). Coner and Gungor (2002) claimed that customer loyalty was affected by product quality, service quality, and retailer image. They also suggested that quality [of product and service] is directly related to customer satisfaction, and lead to the loyalty of the customer (Coner and Gungor, 2002, p. 195). Customer satisfaction literature showed that the relationship between customer satisfaction and customer loyalty depended on the type of satisfaction. The positive impact of manifest satisfaction on customer loyalty was stronger than that of latent satisfaction on customer loyalty (Bloemer and Ruyter, 1998).
Based on empirical findings in service quality and satisfaction literature, service quality is one of the antecedents of satisfaction (Cronin and Taylor, 1994), and loyalty is one of the consequences of satisfaction (Coner and Gungor, 2002). Luarn and Lin (2004) tested their hypothesized customer loyalty model and found that customer satisfaction, perceived value, and customer loyalty were different constructs. Their findings indicated that not only customer satisfaction and perceived value directly affected customer loyalty, but also indirectly affected customer loyalty through commitment. Service recovery can be regarded as a passive strategy for the improvement of customer satisfaction. Service recovery refers to the actions taken by a firm in response to a service failure (Zeithaml
16
and Bitner, 2003). Service failure often occurs when the customer's perceived service quality falls beloW customer expectations. For example, delivery and Web site design problems are two major types of service failure in online retailing (Holloway and Beatty, 2003). Such failures may cause significant costs to the firm, such as lost customers and negative word of mouth.
Literature has addressed the importance of service recovery; according to Hart, Heskett, and Sasser (1990), firms learn from experiences of service recovery when they may not be able to prevent service failure. Berry and Parasuraman (1992) believed that firms should not regard service failure as a problem but as an opportunity to create satisfied customers. Hence, recovery strategies have a dramatic impact on a firm's revenue and profitability (Tax and Brown, 1998). Service recovery literature has shown that resolving customer problems has a strong impact on customer satisfaction and loyalty. Swanson and Kelley (2001) also found that customer behavioral intentions are more favorable when customers believe that firms consistently implement service recovery when failures occur. Furthermore, Robbins and Miller (2004) found that well-handled service recovery strongly affects customer loyalty.
2.4.3 Customer SatisfactionCustomer satisfaction is one of the key factors in modern marketing and customers’ behavior analysis. Generally speaking, if the customers are satisfied with the provided goods or services, the probability that they use the services again increases (East, 1997). Also, satisfied customers will most probably talk enthusiastically about their buying or the use of a particular service; this will lead to positive advertising. On the other hand, dissatisfied customers will most probably switch to a different brand; this will lead to negative advertising. The importance of satisfying and keeping a customer in establishing strategies for a market and customer oriented organization cannot be neglected. Customer satisfaction is often considered the most important factor in thriving in today’s highly competitive business world. Services have unique characteristics that distinguish them from the physical goods (Zeithaml and Bitner, 1996). Services are often characterized by •tangibility, inseparability, heterogeneity, and perish ability (Lovelock, 1996). The
17

importance of the above characterizations is that using them for evaluation before, while, and after using a particular service by the customers is often very hard because of the quality of being intangible, understanding how the customers would evaluate the quality of the organization’s services is often very hard (Zeithaml and Bitner, 1996).
In addition, the services are real- time, i.e. they are used by the customers as soon as offered. They cannot be stored and quality passed like physical goods. Therefore any bad service will most probably be experienced by a customer, which results in customer’s dissatisfaction while using the service (East, 1997). Researchers have studied customer satisfaction in different contexts; Chen and Ko (2007) proposed fuzzy linear programming models to determine the fulfillment levels of parts characteristics under the requirement to achieve the determined contribution levels of design requirements for customer satisfaction. Grigoroudis et al. (2008), considered the problem of measuring user satisfaction in order to analyze user perceptions and preferences to assess website quality. Hsu (2008) proposed an index for online customer satisfaction, which is adapted from an American Customer Satisfaction Index (ACS1). Bodet (2008) explored the satisfaction-loyalty relationships according to an empirical analysis in a sports-service context.
The impact of satisfaction on loyalty has been the most popular subject of studies. Several studies have revealed that there exists a direct connection between satisfaction and loyalty: satisfied customers become loyal and dissatisfied customers move to another vendor. The primary objective of creating ACSI (American Customer Satisfaction Index) in 1984 was to explain the development of customer loyalty. In ACSI model customer satisfaction has three antecedents:^ perceived quality, perceived value and customer expectations (Anderson et al. 2000). In the ECSI (European Customer Satisfaction Index) model perceived quality is divided into two elements: “hard ware”, which consists of the quality of the product or service attributes, and “human ware”, which represents the associated customer interactive elements in service, i.e. the personal behavior and atmosphere of the service environment (Gronholdt et al. 2000)
18
In both models increased satisfaction should increase customer loyalty. When the satisfaction is low customers have the option to exit (e.g. going to a competitor) or express their complaints. Researches have shown that 60-80% of customers who defect to a competitor said they were satisfied or very satisfied on the survey just prior to their defection (Reichheld et al. 2000). So it’s clear that there must be also other factors beside satisfaction that have a certain impact on customer loyalty. An early pioneer in the study of equity, George Homans stated that the essence of equity was contained in a "rule of justice" (Oliver, 1997). In fundamental terms, equity is an evaluation of fairness, rightness, or deservingness that customers make in reference to what others receives (Oliver, 1997). In the satisfaction literature, equity theory considers the ratio of the customer's perceived outcome/input to that of the service provider's outcome/input (Oliver, 1997). Bolton and Lemon (1999) extended this concept of outcome/input to the perspective of perceived value. They declared that equity referred to customers' evaluation of the perceived sacrifice (input) of the offering (outcome). Perceived sacrifices include purchase price and other possible costs such as time consumption.
A positive perception of value may bring customers back to make another transaction. When customers believe they are being treated fairly in an exchange, they will be satisfied with the transaction if their outcome-to-input ratio is in some sense adequate (Oliver, 1997). Ganesan (1994) pointed out that quality, price, and company or brand image were three factors that comprise the customer value package. In other words, customers will make an explicit comparison between what they give and what they get. The positive relationship between equity and satisfaction was supported in the literature (Oliver, 1997). However, customers expect prices to be lower in an online store than in a traditional sales channel. They may expect to get more value from an online store than from a physical store.
2.4.4 Supplier BrandImage of brand or supplier is one of the most complex factors. It affects loyalty at least in two ways. Firstly, customer may use his preferences to present his own image. That may occur both in conscious and subconscious level. According to the Belk’s theory of
19
extended self, people define themselves by the possessions they have, manage or create. Aaker (1999) has shown how consumers prefer brands with personality traits that are congruent with the personality traits that constitute their (malleable) self schemas (Aaker, 1999) Kim, Han and Park have researched the link between brand personality and loyalty. They did get positive support to hypothesis that the attractiveness of the brand personality indirectly affects brand loyalty.
Tidwell and Horgan (1993) have showed that people use products to enhance self-image. Secondly, according to social identity theory, people tend to classify themselves into different social categories. That leads to evaluation of objectives and values in various groups and organizations in comparison with the customer’s own values and objectives. They prefer partners who share similar objectives and values Fournier (1998) states that consumer-brand relationships are more a matter of perceived goal compatibility. Brands cohere into systems that consumers create not only to aid living but also to give meanings to their lives. Oliver (1997) argues that for fully bonded loyalty the consumable must be part of the consumer’s self-identity and his or her social-identity.
Much of the literature on customer loyalty has looked at brand loyalty, and there is a range of conceptualizations of loyalty from repeat purchase to a lifetime relationship as conveyed in recent banking advertisements (Ennew and Binks, 1996). In addition, customers typically have loyalty relationships with a range of brands; this may include several brands associated with the same category of goods. Polygamous loyalty is consistent with the notion of avoiding putting all one’s eggs in one basket. This phenomenon is common in retail financial services where consumers are often “multi- banked”. There is a consensus (Zeithaml, 1988) that loyalty to service companies is likely to be easier to maintain than with goods as consumers perceive there to be higher costs in switching services than goods.
These higher costs may be associated with the acculturalisation or learning that is embedded in the provision of services. Clearly the use of library resources involves learning about use of IT-based services, location of stock, and the parameters of loans
20
and reservations services and involves the management of customers’ expectations by the service provider. In addition, services that a customer uses regularly, such as a bank or a library, may have a large interpersonal element with service agents, becoming in some cases an integral part of a customer’s life. Often as a result of learning and familiarization, switching service providers carries a risk. Owing to the absence of tangibles, the risk associated with switching to a new service is perceived to be high, or, in other words, the customer cannot easily guess the quality of the service delivery of a new service provider, until they have sampled that service. The emotional costs already invested in relationships with a service provider contribute to make switching costs heavy.
2.4.5 Perceived Price FairnessFrom the consumer's perspective, the monetary cost of something is what is given up or sacrificed to obtain a product (Zeithaml, 1988). Thus, in studies on related topics, price has often been conceptualized and defined as a sacrifice (Anderson, Fornell and Lehmann, 1994). There are three components to the concept of price: objective price, perceived non-monetary price, and sacrifice (Zeithaml, 1988). The objective monetary price (simply put, the amount of money paid for product) is not equivalent to the perceived price (that is, the price as understood and recorded in the mind of consumer) since consumers do not always know or remember the actual price paid for a product. Instead, they encode the price in a way that it is meaningful to them (Zeithaml, 1988).
As to the relationship between price and satisfaction, research has shown that price is one of the determinants of customer satisfaction (Anderson, Fornell, and Lehmann, 1994; Zeithaml and Bitner, 2000). When customers were asked about the value of services rendered, they consistently considered the price charged for the service (Anderson, Fornell, and Lehmann, 1994). In those cases in which consumers did not consider price in forming their judgments about the quality of service, it was generally because they lacked a reference price (Zeithaml and Bitner 2000). Still, though, this group ranked price as an important factor when it came to their overall satisfaction.
21
The theoretical formation of price perception in services remains largely unexplored (Varki and Colgate, 2001). This study suggests that the perception of price fairness plays an important role in any exchange transaction. The feeling of fairness depends on the gain-loss ratio felt by both partners in the exchange. From the consumer's perspective, the gain is the product to be received, whereas the loss is the money to be paid. When a consumer pays a higher price than others do, or when a consumer receives a lesser product than anticipated (either in terms of quantity or quality), perceived negative price inequity occurs. On the other hand, perceived positive price inequity may result from either receiving a larger or better product than others, who paid the same price, or paying a lower price but receiving the same product. Price fairness should have an influence on customer satisfaction as well as on behavioral intentions (Varki and Colgate, 2001). This study, then, proposes that the perceived fairness of price should directly affect customer loyalty, and should also affect it indirectly via customer satisfaction.
2.4.6 Product MixFinancial product marketers need to manage their product portfolio in response to the changing environment and consumer needs, in addition to managing customer relationships effectively for achieving long-term profitability (Bell et al., 2002). The concept of a product can be understood in terms of the following four terms - actual product, expected product, augmented product, and potential product. For a financial product, the product strategy is greatly influenced by customers, competitors, technology, and government and legislation. Depending on these factors, the product mix strategy could be product mix expansion, product mix contraction, and product modification (Cannon and Cannon, 2005). Branding in financial services is done more at the corporate level than at the product level. Branding should start with a clear strategy for targeting and positioning. The brand image^should be consistent with the marketing strategy (Teach, Richard 1990). Advertising can be successful in building the brand only if the financial product caters to the requirements of the consumer and the entire service experience is consistent with the brand image that is communicated.
22
To implement one-to-one marketing, the marketer needs to identify the target customers, differentiate them into groups, interact with each customer group, and provide customized products and solutions in a cost-effective manner. This can be done using the technique of mass customization. The usage of Customer Relationship Management in India is expected to evolve from ensuring operational efficiency (in customer handling) to yielding strategic benefits -- through real-time customer segmentation, and co-creation of products with customers. Product recommendation sites give the power of decisionmaking back to the consumer; peers rely on them, marketers can learn about what products are faring well in the market-and which ones aren't, and the customer feels both connected and engaged with the company they are buying from. The critical elements of feedback and suggestions play a leading role in how e-retailers make website construction decisions. This is a simple way to increase sales, and it's become a key reason why shoppers continue to make their purchases from just one site, even when the products are offered from various retailers (Cannon and Cannon, 2005).
2.5 Conceptual FrameworkCustomer loyalty has lately been in the focus of academia as one of the main controlled factors of success (Johnson & Scholes, 2002). While the definition of loyalty itself has mainly been limited to existence of intentions of customers such as to stay with the company, to provide word of mouth recommendation, the current theories of relationship marketing acknowledge that it may not necessarily guarantee the actual favorable behavior. The table below clearly shows the dependent as well as the independent variables that constitutes the loyalty concept. For instance, quality customer service which is an independent variable may result to repeat buying by the customer (dependent variable). This study is therefore based on an understanding that a satisfied customer would repeat the purchase hence be loyal. The table below explains the relationship between the dependent and the independent variables.
23

Figure 2.1: The relationship between the independent and dependent variablesAn assessment of factors that determine customer loyalty Independent Variable Dependent variable
24
CHAPTER THREE: RESEARCH METHODOLOGY
3.1 IntroductionThis chapter discusses the research design, target population, research instruments,
piloting of the instruments, data collection and data analysis procedure.
3.2 Research designThe proposed study was modeled on a descriptive approach. According to Schinler and Coopers (2003) descriptive studies are more formalized and typically structured with clearly stated hypotheses or investigative questions. It serves a variety of research objective such as descriptions of phenomenon or characteristics associated with a subject population, estimates of proportions of a population that have these characteristics and discovery of associations among different variables. This study adopted a descriptive design since it has a variety of research objective or characteristics associated with a subject population.
3.3 Target PopulationThe study population was composed of customers at cloth retailing stores in Nairobi,- Kenya basically from the major shopping malls and the cloth outlets located in the Central Business District (CBD), Primary data was collected by the researcher from customers who were at the outlets at the time of the study. Nairobi has got over 300 cloth retailing stores highly represented in the main shopping malls.
25

Table 3.1 Target Population
Shopping Mall No. of outlets Population %Village Market 5 7Westlands 4 5Junction 5 7Prestige 2 3Ukay 8 11Sarit 9 12Westgate 12 16Capital 5 7Yaya 4 5Karen Crossroad 5 7Nakumatt 3 4CBD 11 15Total 73 100Source: General analysis output 20 0
3.4 Sample DesignA sample of 200 respondents was randomly selected from the eleven major shopping malls and the other outlets Central Business District in Nairobi- Kenya. This sample was hopefully adequately representing the population. Sudman (1983) and Perry (1994) have provided the guidance that the typical sample size for analyzing few segments is in the range of 100-200.The total number of customers that participated in the study was 90 as shown in the table below: *
26
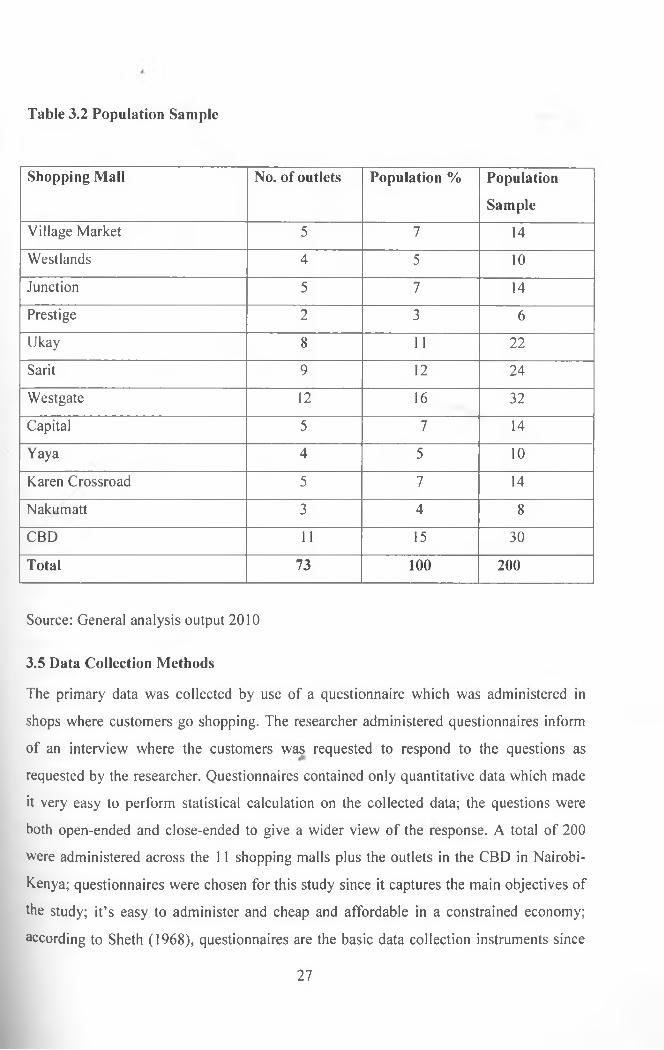
Table 3.2 Population Sample
Shopping Mall No. of outlets Population % PopulationSample
Village Market 5 7 14Westlands 4 5 10Junction 5 7 14Prestige 2 3 6Ukay 8 11 22Sarit 9 12 24Westgate 12 16 32Capital 5 7 14Yaya 4 5 10Karen Crossroad 5 7 14Nakumatt 3 4 8CBD 11 15 30Total 73 100 200
Source: General analysis output 2010
3.5 Data Collection MethodsThe primary data was collected by use of a questionnaire which was administered in shops where customers go shopping. The researcher administered questionnaires inform of an interview where the customers was requested to respond to the questions as requested by the researcher. Questionnaires contained only quantitative data which made it very easy to perform statistical calculation on the collected data; the questions were both open-ended and close-ended to give a wider view of the response. A total of 200 were administered across the 11 shopping malls plus the outlets in the CBD in Nairobi- Kenya; questionnaires were chosen for this study since it captures the main objectives of the study; it’s easy to administer and cheap and affordable in a constrained economy; according to Sheth (1968), questionnaires are the basic data collection instruments since
27

they capture the researcher’s interest. The focus for the study was due to the reason that many people shop in these outlets in these malls due to their strategic locations and variety of stock in the stores. From each shopping mall and CBD, respondents were issued with questionnaires to fill. To get the respective number of respondents from each of the malls, convenience sampling was used and every fifth adult leaving the cloth outlets in the mall was asked to complete the questionnaire. The selected sample was believed to be adequate for the statistical tools which were used in the data analysis.
3.5.1 PilotingPiloting was carried out to test the validity and reliability of the instruments. Validity indicates the degree to which the instrument measures the constructs under investigation (Mugenda and Mugenda, 1999). There are three types of validity test, content, criterion and related construct validity. This study used content validity because it measured the degree to which the sample of the items represents the content that the test is designed to measure. A pilot study was conducted by the researcher sending some few questionnaires to the stores. These were be filled by some customers at random. From this pilot study the researcher was able to detect questions that needed editing and those with ambiguities.
3.5.2 Data Collection Instrument And ProcedurePrimary data was used in the study. A Semi-structured questionnaire was used to collect data by the research assistants. The questionnaire was divided into two parts; part A comprised of general information about the respondent while part B solicited information about the factors that determine customer loyalty in the cloth retail stores in Nairobi- Kenya. The respondents filled the questionnaires as the research assistant waited to pick the questionnaire to reduce the non-response rate.
3.6 Data AnalysisCollected data was analyzed using SPSS as the main statistical package that helped to draw conclusions using inferential statistics and a measure of dispersion. To enhance better understanding of the analyzed data, the results were presented in charts and graphs with explanations thereafter to help in interpreting the results.
28
CHAPTER FOUR: DATA ANALYSIS, RESULTS AND DISCUSSION
4.0 IntroductionThe chapter contains summaries of data finding together with their possible interpretations. The chapter is divided into two sections. Section one is general information on the respondents section. Section two focuses on the factors that determine customer loyalty to cloth retail stores in Nairobi. Two hundred questionnaires were personally administered to the respondents and out of these, 198 questionnaires were returned. This was equivalent to 99% response rate which the researcher believes is adequate for generalization purposes. The non-response rate is 1% given that only 2 questionnaires were not adequately answered hence was considered as spoiled.
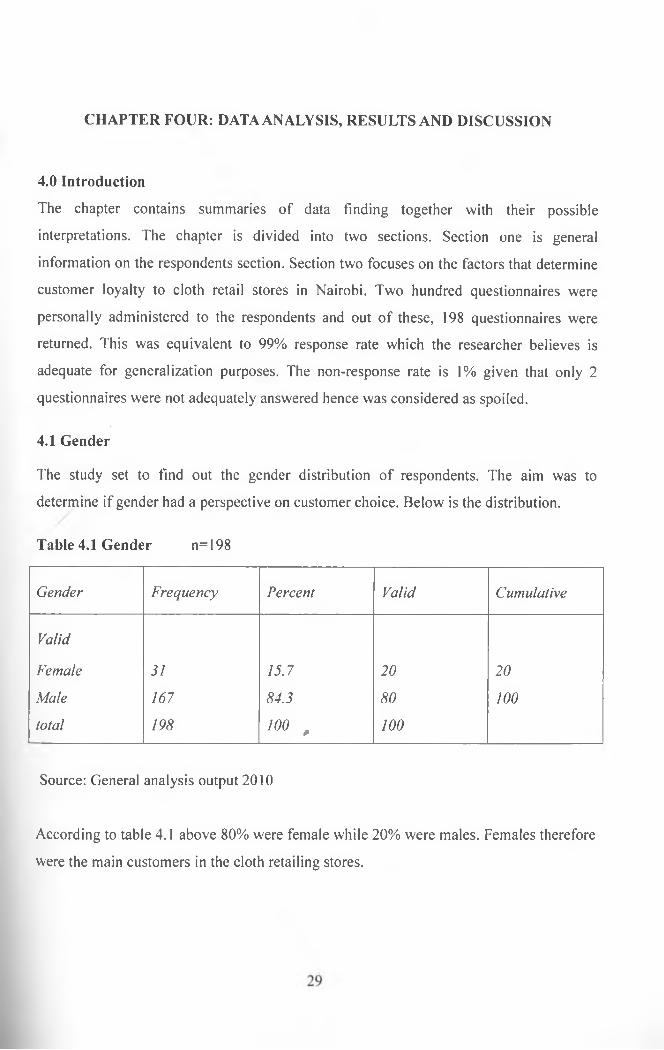
4.1 GenderThe study set to find out the gender distribution of respondents. The aim was to determine if gender had a perspective on customer choice. Below is the distribution.
Table 4.1 Gender n=198
Gender Frequency Percent Valid Cumulative
ValidFemale 31 15.7 20 20Male 167 84.3 80 100total 198 100 A 100
Source: General analysis output 2010
According to table 4.1 above 80% were female while 20% were males. Females therefore were the main customers in the cloth retailing stores.
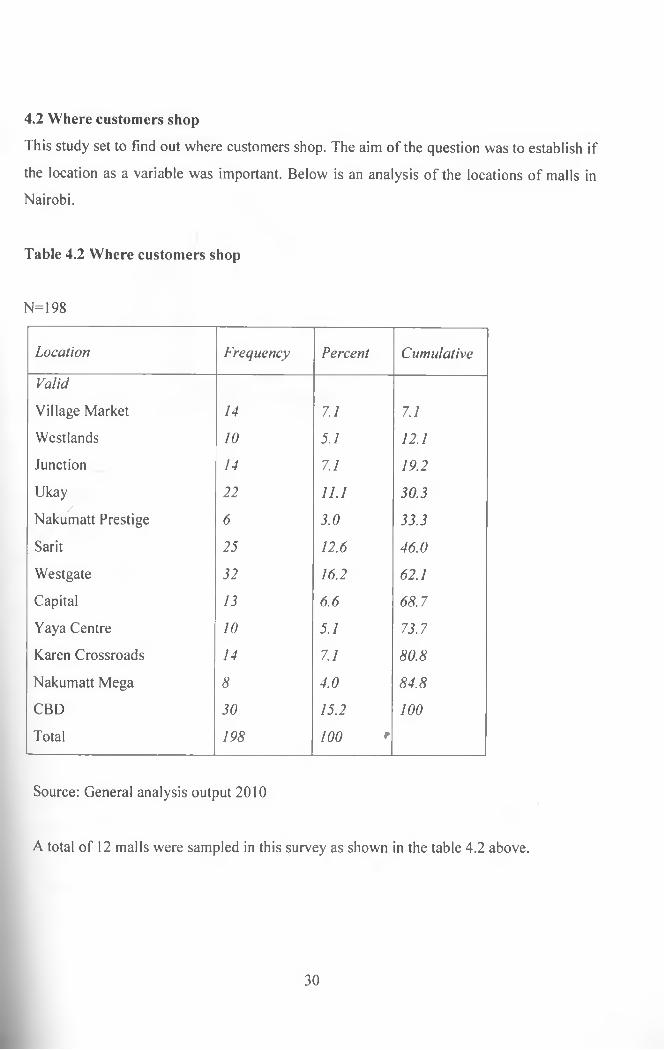
4.2 Where customers shopThis study set to find out where customers shop. The aim of the question was to establish if the location as a variable was important. Below is an analysis of the locations of malls in Nairobi.
Table 4.2 Where customers shop
N=198
Location Frequency Percent CumulativeValidVillage Market 14 7.1 7.1Westlands 10 5.1 12.1Junction 14 7.1 19.2Ukay 22 11.1 30.3/Nakumatt Prestige 6 3.0 33.3Sarit 25 12.6 46.0Westgate 32 16.2 62.1Capital 13 6.6 68.7Yaya Centre 10 5.1 73.7Karen Crossroads 14 7.1 80.8Nakumatt Mega 8 4.0 84.8CBD 30 15.2 100Total 198 100 *
Source: General analysis output 2010
A total of 12 malls were sampled in this survey as shown in the table 4.2 above.
30
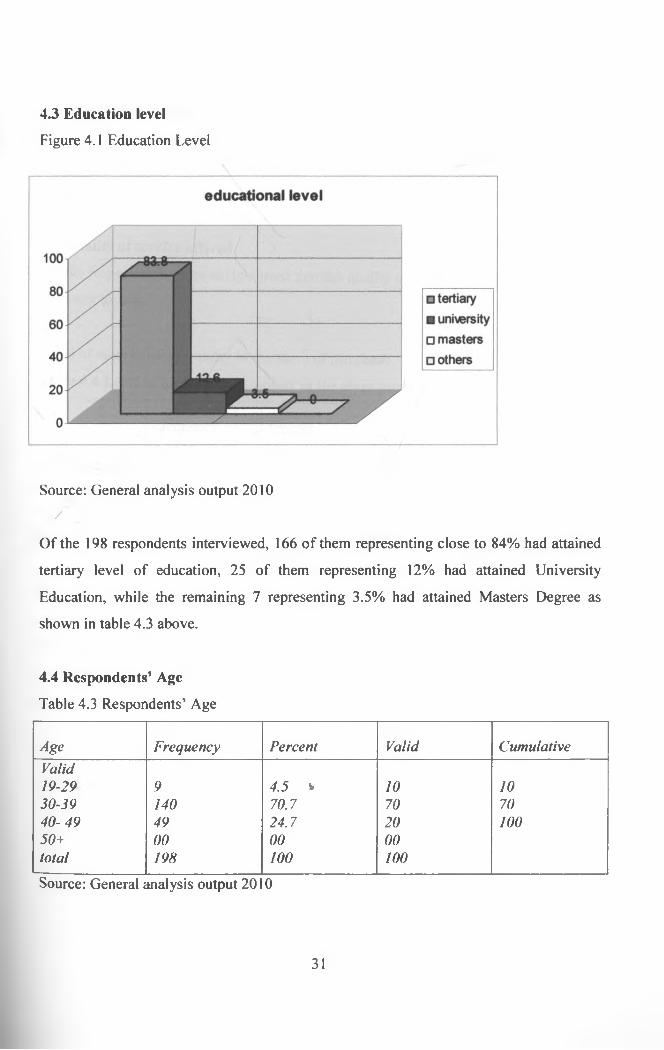
4.3 Education levelFigure 4.1 Education Level
Source: General analysis output 2010/
Of the 198 respondents interviewed, 166 of them representing close to 84% had attained tertiary level of education, 25 of them representing 12% had attained University Education, while the remaining 7 representing 3.5% had attained Masters Degree as shown in table 4.3 above.
4.4 Respondents’ AgeTable 4.3 Respondents’ Age
Age Frequency Percent Valid CumulativeValid19-29 9 4.5 v 10 1030-39 140 70.7 70 7040-49 49 24.7 20 10050+ 00 00 00total 198 100 100Source: General analysis output 20 0
31
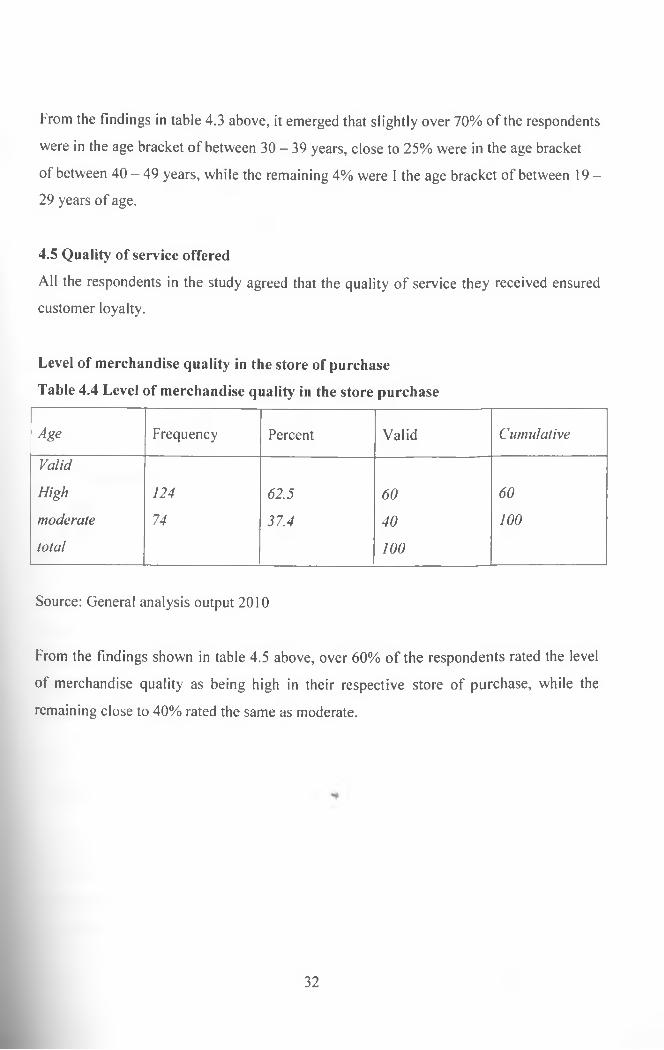
From the findings in table 4.3 above, it emerged that slightly over 70% of the respondents were in the age bracket of between 30 - 39 years, close to 25% were in the age bracket of between 40 - 49 years, while the remaining 4% were I the age bracket of between 19 - 29 years of age.
4.5 Quality of service offeredAll the respondents in the study agreed that the quality of service they received ensured customer loyalty.
Level of merchandise quality in the store of purchase Table 4.4 Level of merchandise quality in the store purchase
Age Frequency Percent Valid CumulativeValidHigh 124 62.5 60 60moderate 74 37.4 40 100total 100
Source: General analysis output 2010
From the findings shown in table 4.5 above, over 60% of the respondents rated the level of merchandise quality as being high in their respective store of purchase, while the remaining close to 40% rated the same as moderate.
32

From the findings in table 4.3 above, it emerged that slightly over 70% of the respondents were in the age bracket of between 30 - 39 years, close to 25% were in the age bracket of between 40 - 49 years, while the remaining 4% were I the age bracket of between 19 - 29 years of age.
4.5 Quality of service offeredAll the respondents in the study agreed that the quality of service they received ensured customer loyalty.
Level of merchandise quality in the store of purchase Table 4.4 Level of merchandise quality in the store purchase
Age Frequency Percent Valid CumulativeValidHigh 124 62.5 60 60moderate 74 37.4 40 100total 100
Source: General analysis output 2010
From the findings shown in table 4.5 above, over 60% of the respondents rated the level of merchandise quality as being high in their respective store of purchase, while the remaining close to 40% rated the same as moderate.
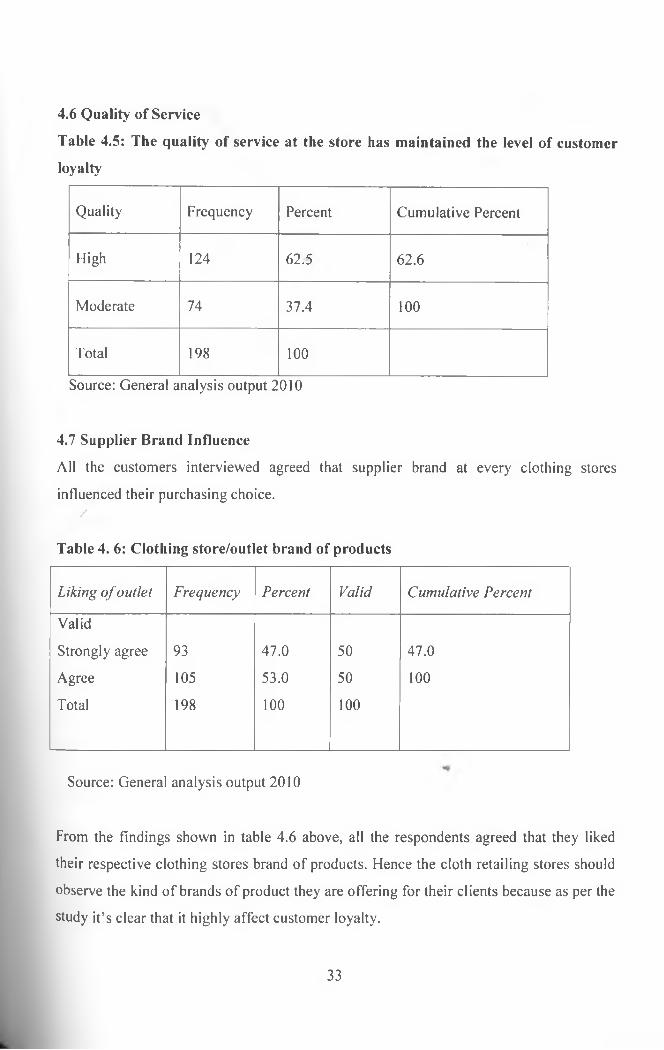
4.6 Quality of ServiceTable 4.5: The quality of service at the store has maintained the level of customer loyalty
Quality Frequency Percent Cumulative Percent
High 124 62.5 62.6
Moderate 74 37.4 100
Total 198 100Source: General analysis output 2010
4.7 Supplier Brand InfluenceAll the customers interviewed agreed that supplier brand at every clothing storesinfluenced their purchasing choice.
/Table 4. 6: Clothing store/outlet brand of products
Liking o f outlet Frequency Percent Valid Cumulative PercentValidStrongly agree 93 47.0 50 47.0Agree 105 53.0 50 100Total 198 100 100
Source: General analysis output 2010
From the findings shown in table 4.6 above, all the respondents agreed that they liked their respective clothing stores brand of products. Hence the cloth retailing stores should observe the kind of brands of product they are offering for their clients because as per the study it’s clear that it highly affect customer loyalty.
33

Table 4.7: The brand relates well with your clothing needs
Clothing needs Frequency Percent Valid CumulativeValidStrongly agree 75 37.9 40 37.9Agree 123 62.1 60 100Total 198 100
Source: General analysis output 2010
From the findings in table 4.7 above, virtually all the respondents agreed that the brands in the respective stores related well with their clothing needs. The study focused to find out to what extent customer satisfaction of their wants and needs affect their degree of customer loyalty to different cloth retailing stores. Basically 40% of the respondents strongly agreed and the 60% agreed.
Table 4.8: The brands are attractive as compared to those from other stores
Brandattractiveness
Frequency Percentage Valid Cumulative percentage
ValidStrongly agree 107 54.0 50 54.0Agree 82 41.1 40 95.5Neutral 9 4.5 10 100 *Total 198 100 100
Source: General analysis output 2010
From the findings in table 4.8 above, it emerged that 95% of the respondents agreed that the respective brands they used enabled them to achieve their goals, while the remaining 4.5% were neutral on the matter.
34

Table 4.9: The brand enhance your social identity
Social identify Frequency Percent Valid Cumulative percentValidStrongly agree 154 77.8 80 77.8Agree 26 13.1 10 90.9Neutral 18 9.1 10 100Total 198 100 100
Source: General analysis output 2010
From the findings in table 4.12 above, it emerged that over 90% of the respondents agreed that the respective brands they used, enhanced their social identity, while the remaining 9% were neutral on the same.
4.8 Product Mix/Table 4.10: To what extent does product mix influence your loyalty to the clothing store?
Extent Frequency Percent Valid Cumulative percentValidVery great extent 14 7.1 10 7.4Great extent 175 88.4 90 100Total 189 95.5 100Absconded 9 4.5 10Total 198 100
>Source: General analysis output 2010
From the findings in table 4.10 above, it emerged that 95% of the respondents agreed to a great extent that the product mix offered influenced their loyalty to the clothing store while the remaining 4.5% absconded. The study focused on the importance of products
35
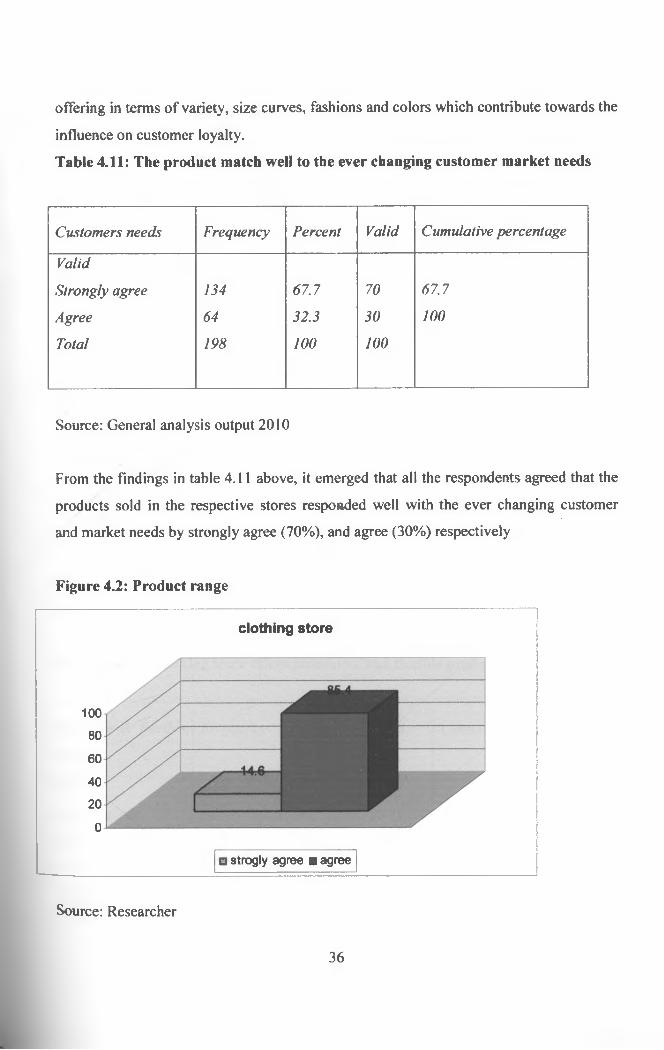
offering in terms of variety, size curves, fashions and colors which contribute towards the influence on customer loyalty.Table 4.11: The product match well to the ever changing customer market needs
Customers needs Frequency Percent Valid Cumulative percentageValidStrongly agree 134 67.7 70 67.7Agree 64 32.3 30 100Total 198 100 100
Source: General analysis output 2010
From the findings in table 4.11 above, it emerged that all the respondents agreed that the products sold in the respective stores responded well with the ever changing customer and market needs by strongly agree (70%), and agree (30%) respectively
Figure 4.2: Product range
clothing store
100 80 60 40 20
0□ strogly agree ■ agree
Source: Researcher
36

From the findings in table 4.15 above, it emerged that all the respondents agreed that the respective stores had a wide range of products that suited the needs of different cadre of people. As follows strongly agree (90%) and Agree (20%) thus the study shows that offering of a wide variety of product range influences customer loyalty to a great extent.
Table 4.12: The products are able to meet most customers clothing needs
Clothing needs Frequency Percent Valid Cumulative PercentValidStrongly agree 117 59.1 60 59.1Agree 81 40.9 40 100Total 198 100 100
Source: General analysis output 2010
From the findings in table 4.12 above, it emerged that all the respondents agreed that the products offered in the respective stores met most customers clothing needs. As strongly agree (60%) and agree (40%).
Table 4.13: The clothing store offers innovative and flexible products
Innovative & flexible products
Frequency Percent Valid Cumulative Percent
ValidStrongly agree 21 10.6 20 10.6Agree 117 89.4 80 100Total 198 100 100
Source: General analysis output 20 0
37

From the findings in table 4.13 above, it emerged that all the respondents agreed that the respective stores offered innovative and flexible products. Results from the table were as follows: strongly agree (20%) and agree (80%).the results imply that majority of the respondents strongly supported the need for innovativeness and product flexibility in cloth retailing stores on customer retention.
Figure 4.3: The clothing store offers cheap and affordable products
Whether cheap and affordable
1 I I--------------------
1□ affee ■ neutral □ disagree
Source: General analysis output 2010
From the findings above as shown in figure 4.3, it emerged that slightly over 50% of the respondents were neutral on the affordability of the products offered to them, 31% disagreed that the products were affordable, while only 15% agreed that the products offered in the respective stores were cheap and affordable.
38

Table 4.14: The clothing store offers more customized products than its competitors
Customizedproducts
Frequency Percent Valid Cumulative Percent
ValidStrongly agree 66 33.3 30 33.3Agree 118 59.6 60 92.9Disagree 24 7.1 10 100Total 198 100 100
Source: General analysis output 2010
From the findings in the above table 4.14, it emerged that strongly agree(30%) and agree (70%) of the respondents approved that the respective clothing stores offered moreKcustomized products than their competitors, while an identical 7.1% of the respondents disagreed and remained neutral respectively on the same matter.
Table 4.15: The clothing store offers high quality state of the art technology oriented products
Technology oriented products
Frequency Percent Valid Cumulative Percent
ValidStrongly agree 156 78.8 80 78.8Agree 42 21.2 20 100Total 198 100 100
Source: General analysis output 2010
39

From the findings as shown in table 4.15 above, all the respondents agreed that their respective stores offered high quality state of the art technology oriented products. The results imply that entrepreneurs need to be compliant with changes in technology in order to retain their customers.
4.9 TrustworthinessAll the respondents agreed that trustworthiness of the store affect the loyalty of their respective stores.Over 95% of the respondents agreed that trustworthiness of the store affected the customer loyalty to a great extent, while a paltry 3.5% stated that it affected it to a moderate extent.
Figure 4.4: I totally trust the store for my clothing needs
T rustworthnessK
□ strongly agree ■ agree □ neutral
Source: General analysis output 2010
From figure 4.4 above, over 95% of the respondents agreed that they had trust in their respective stores, while a partly 3.5% remained neutral on the same. The findings on the respondents regarding trust worthiness is strongly agree by (33.3%) and agree by (96.5%)
40
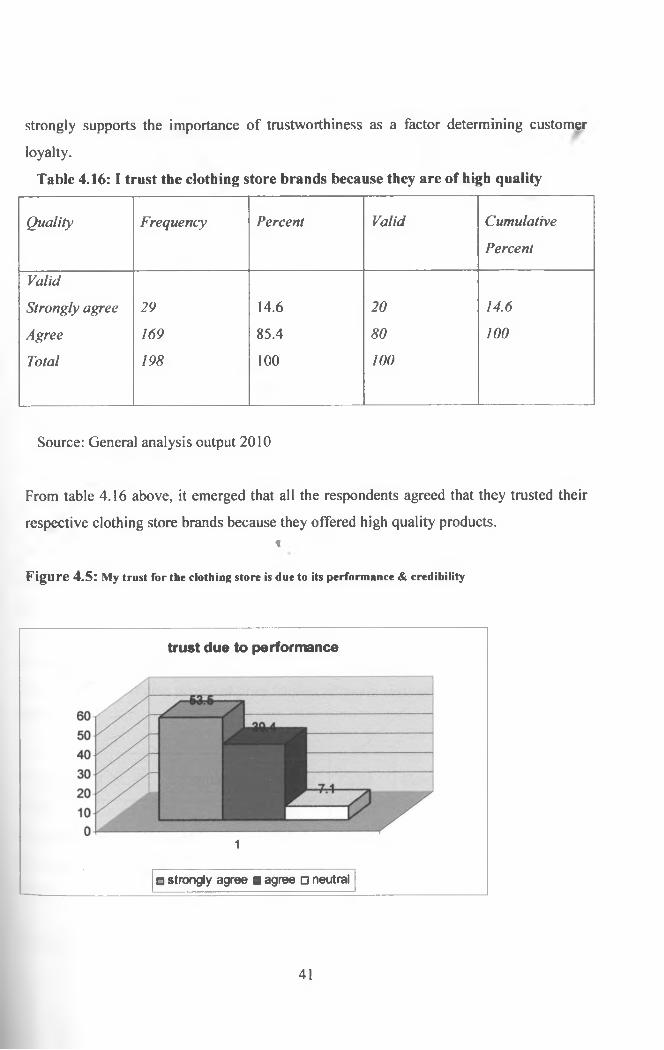
strongly supports the importance of trustworthiness as a factor determining customer loyalty.
Table 4.16: I trust the clothing store brands because they are of high quality
Quality Frequency Percent Valid CumulativePercent
ValidStrongly agree 29 14.6 20 14.6Agree 169 85.4 80 100Total 198 100 100
Source: General analysis output 2010
From table 4.16 above, it emerged that all the respondents agreed that they trusted their respective clothing store brands because they offered high quality products.
tFigure 4.5: My trust for the clothing store is due to its performance & credibility
trust due to performance
1
□ strongly agree ■ agree □ neutral
4 1

Table 4.17: I trust the clothing store product due to its high quality trends over the years
From figure 4.5 above, it was found that 94% of the respondents agreed that they hadtrust in their respective clothing store because of performance and credibility.
Quality trends Frequency Percent Valid CumulativePercent
ValidStrongly agree 92 46.5 50 46.5Agree 84 42.4 40 88.9Neutral 22 11.1 10 100Total 198 100
Source: General analysis output 2010%•
From table 4.17 above, it showed that close to 90% of the respondents agreed that they trusted their respective clothing store due to high quality trends over the years.
4.10 Perceived qualityTable 4.18: To what does perceived price fairness influence customer loyalty at the clothing store
Price fairness Frequency Percent Valid Cumulative PercentValidVery great extent 158 79.8 80 79.8Great extent 40 20.2 20 100Total 198 100 100
Source: General analysis output 2010
42

From the study it appears that in table 4.18 above; that all the respondents agreed that they perceived that price fairness influenced customer loyalty in their respective clothing stores.
4.11 Perceived price fairness
Table 4.19 Am totally satisfied with the price offered by the stores
Price offers Frequency Percent Valid Cumulative PercentvalidStrongly agree 35 17.7 20 17.7Agree 163 82.3 80 100Total 198 100 100
/Source: General analysis output 2010
From table 4.19 above, it emerged that all the respondents agreed that they were totally satisfied with price offered by their respective stores.
Table 4.20: Price is an indicator of the quality of product
Price indicator Frequency Percent Valid Cumulative PercentStrongly agree 53 26.8 30 26.8Agree 145 73.2 70 100Total 198 100 100
Source: General analysis output 20 0
43
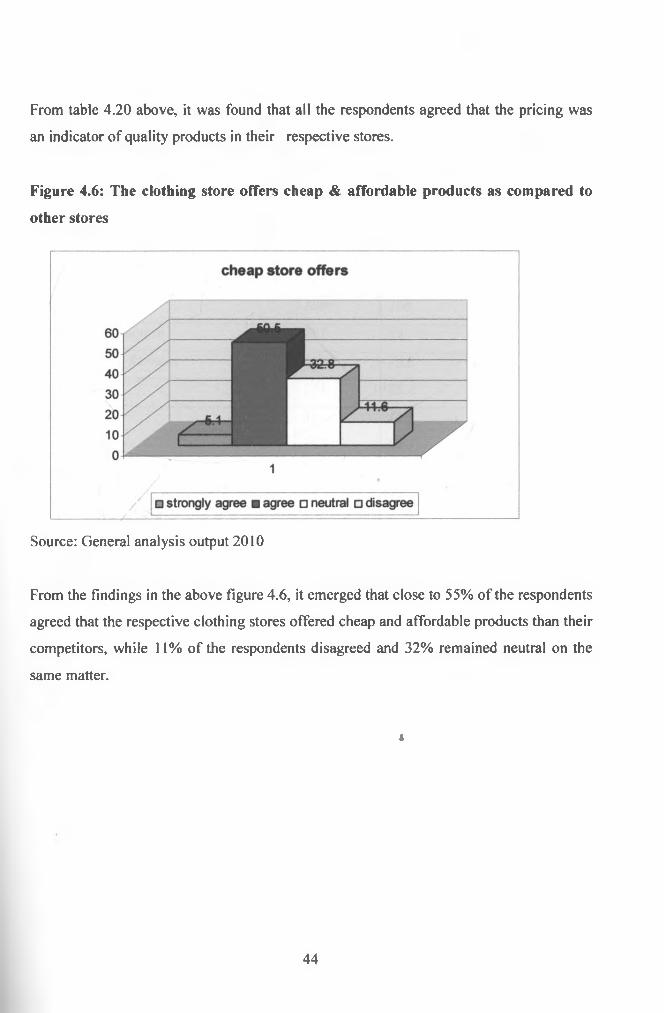
From table 4.20 above, it was found that all the respondents agreed that the pricing wasan indicator of quality products in their respective stores.
Figure 4.6: The clothing store offers cheap & affordable products as compared to other stores
Source: General analysis output 2010
From the findings in the above figure 4.6, it emerged that close to 55% of the respondents agreed that the respective clothing stores offered cheap and affordable products than their competitors, while 11% of the respondents disagreed and 32% remained neutral on the same matter.
4
44

From table 4.20 above, it was found that all the respondents agreed that the pricing wasan indicator of quality products in their respective stores.
Figure 4.6: The clothing store offers cheap & affordable products as compared to other stores
Source: General analysis output 2010
From the Findings in the above figure 4.6, it emerged that close to 55% of the respondents agreed that the respective clothing stores offered cheap and affordable products than their competitors, while 11% of the respondents disagreed and 32% remained neutral on the same matter.
i
44

Table 4.21: A summary tableThe above table shows a summary of all the factors that determine customer loyalty andtheir percentages for easy comparison.Factors determ ining custom er loyalty Frequency Percentage ValidTrustworthiness 176 88.9 88Perceived quality service 198 100 100level o f merchandised quality in stores 124 62 62Suppliers brand 198 100 100Customer satisfaction 107 54 54Perceived price fairness 158 79.8 80Product mix 175 88.4 88Gender: Male 31 15.7 16
Female 167 84.3 84
Where customers shop 32 16.2 16Education level (tertiary college) 166 84 84Respondents age (30-39) 140 70 70Products that meet a customer's needs 177 59.1 59Wide range o f products 169 85.4 85Offering innovativeness and flexible products
176 89 89
Cheap and affordable products 107 54 54High quality state o f the art technology oriented products
156
-------- 4-------
78 78
45

CHAPTER FIVE: SUMMARY, CONCLUSIONS AND RECOMMENDATIONS5.1 IntroductionThis chapter presents the discussion, summary of findings of the study as per the research objectives and conclusions. Also presented in this chapter are the limitations of the study, recommendations and suggestions for further studies.
5.2 DiscussionsResults on the extent to which respondents agree the following statements are important were as follows: quality of service offered to ensure customers loyalty is 100%, suppliers brand that influences customers loyalty is at 100%, product mix that influences customers loyalty has a great extent at 88%, level of merchandised quality in the stores is high at 62.6%, liking of store or outlet brand of products is agreeable at 54%.
From the findings of the study it is quite evident that the factors that determine the respondent loyalty at a clothing store rank as follows: offering innovativeness and flexible products is at 89%, wide range of products 85%, high quality state of the art technology oriented products is at 78%, products that meet a customer’ needs at 59%, cheap and affordable products 54%.\
5.3 ConclusionsThe study was aimed at establishing the factors that determine customer’s loyalty in clothing stores in Nairobi. The result of the data analysis shows that factors that determine customers loyalty in clothing stores are products in the stores, trustworthiness, quality of the products ,level of merchandised quality, product mix and the wide range of products in the clothing stores.
4
5.4 RecommendationsThe clothing stores management should strive to put more emphasis on factors that rank high in terms of determining the customers’ choice of clothing stores, For instance the cloth retailing stores should focus in offering prompt services to its customers. The managements should also put more emphasis on ensuring that they offer a wide variety of
46
merchandise on products so that the customers are not inconvenienced when they need the products of their choice. From the study it was found out that customers were more loyal to some of the stores than others due to their wide market share and the other factors for instance the Deacons Kenya Limited stores were mostly preferred. From the table 4.2 on where customers shop (16.2%) was the highest percentage that comprised of Deacons outlets.
5.5 Suggestions for further studiesThe study was conducted in just a few outlets in Nairobi. The findings can be utilized by conducting the same study in other major towns for further study. I suggest a study can be conducted with larger samples or which measure the factors in greater details.
4
47
REFERENCESAaker, J. L. (1999) The Malleable Self. The Role of Self-Expression in Persuasion. -
Journal of Marketing Research, 1999, Vol. 36, Issue 1, pp. 45-58.
Anderson, E.W. Fornell, C., Lehmann, D.R. (1994), Customer satisfaction, market share and profitability: findings from Sweden, Journal o f Marketing, Vol. 58 pp. 129- 41.
Andreson, E.W. & Fornell, C. (2000) Foundations of the American Customer Satisfaction Index. -Total Quality Management, 2000, Vol. 11, No. 7, pp. 869-882.
Anderson, E.W and Narus, D (1990), Leading with Meaning: Using CovenantalLeadership to Build a Better Organization, Palgrave Macmillan, New York, NY.
Bell ,T, Palmer, A., and Beggs, R. (2002), Loyalty programmes: congruence of marketstructure and success, Proceedings o f the Academy o f Marketing Conference, Manchester Metropolitan University, Manchester,.
Berry, M. and Parasuraman B, (1992), Leadership: Theory, Application, Skill Development, South-Western Publishing, Eagan, MN.
Bettman, J.R., Luce, M.F., & Payne, J.W. (1998), Constructive consumer choiceprocesses, Journal o f Consumer Research, December, Vol. 25 No.3, pp. 187-217
Bloemer, R.A. and Ruyter, J.A., (1998) , Focus Groups. A Practical Guide fo r Applied Research, 2nd ed., Sage, Thousand Oaks, CA .
4
Bodet G. (2008) Customer satisfaction and loyalty in service: Two concepts, fourconstructs, several relationships, Journal o f Retailing and Consumer Services, Volume 15, Issue 3, Pages 156-162, 2008.
48
Butz, H. E. Goodstein, L. D. (1996) Measuring customer value: gaining a strategic advantage. Organisational dynamics, Vol. 24, Issue 3 pp. 63-77.
Cannon, R.C., and Cannon, , J.H., ( 2005), An integration model of organizational trust, Academy o f Management Review, pp.709-29.
Chan, A.K.K., Ma, V.S.M. (1990), corporate banking behavior: a survey in Hong Kong, International Journal o f Bank Marketing, Vol. 8 No.2, pp.25-31.
Chaudhuri, A. & Holbrook, M. B. (2001). The chain of effects from brand trust and brand affect to brand performance: the role of brand loyalty. - Journal o f Marketing, 2001, Vol. 65, Issue 2, pp. 81-94.
Chen, D.J. and Ko , D.J. (2007), "In defense of external invalidity", American Psychologist, Vol. 38 No.4, pp.379-87.
/Coner, D.G. and Gungor, D.L. (2002), Focus Groups as Qualitative Research, Sage, Beverly Hills, CA.
Cooper, D.R & Schindler, P.S. (2003) Business Research Methods (8th Ed) McGraw- Hill: New York
Coyles, S. & Gokey, T.C. (2005), Customer retention is not enough, Journal o f Consumer Marketing, Vol. 22 No.2/3, pp. 101-5.
Cronin and Taylor (1992) Service Quality Management in Hospitality, Tourism and Leisure, Hardcover.
4
Cunningham & Ross, M. (1956) Brand Loyalty - what, where, how much? - Harvard Business Review, No. 34, pp. 116-128.
49
Dabholkar, R., Storbacka, K., Strandvik, T. (2000), Moments of greatness: entering the fundamental state of leadership, Harvard Business Review, Vol. 83 No.7, pp.74- 85.
Day GS (1969), A two dimensional concept of brand loyalty. Journal
Day, G. S. (2003) Creating a Superior Customer-Relating Capability. - MIT Sloan Management Preview, 2003, Vol. 44, Issue 3, pp. 77-83.
Dekimpe, M.G., Steenkampe, J.-B.E., Mellens, M., Abeele, P.V. (1997), Decline andvariability in brand loyalty, International Journal o f Research in Marketing, Vol. 14 No.5, pp.405-20
Dick, A.S., Basu, K. (1994), Customer loyalty: toward an integrated conceptualframework, Journal o f Academy o f Marketing Science, Vol. 22 No.2, pp.99-113.s/
Ehrenberg, A.S.C., Goodhardt, G.J. & Barwise, P.T. (1990), Double jeopardy revisited, Journal o f Marketing, Vol. 54 No.3, pp.82-91.
East, R., Hogg, A. (1997), The anatomy of conquest: Tesco versus Sainsbury, Journal o f Brand Management, Vol. 5 No.l, pp.53-60.
Ennew, C.T. & Binks, M.R. (1996), The impact of service quality and servicecharacteristics on customer retention: small businesses and their banks in the UK, British Journal o f Management, Vol. 7 No.3, pp.219-30.
Evans, N (1997), The corporate stake in $pcial cohesion, Corporate Governance, Vol.204 No.3, pp.5-19.
Fournier, S. (1998), Consumers and their brands: developing relationship theory in consumer research, Journal o f Consumer Research, Vol. 24 No.4, pp.343-73.
50

Ganesan (1994), Dimensions and level of trust: implication for the commitment to performance or credibility trust and benevolence trust.
GOK (2007) Kenya vision 2030. Nairobi. Government press
Greenaway, J. (1995), Having the bun and the halfpenny: can old public service ethics survive in the new Whitehall? Public Administration, Vol. 73 pp.357-74.
Grigoroudis,G.S. Primeaux, P., Karri, R., Caldwell, C. (2008), Cultural insights toorganizational justice - a preliminary perspective, Journal o f Business Ethics, Vol. 46 No.2, pp. 187-99.
Gronholdt, L., Martensen, A., & Kristensen, K.(2000) The relationship between customer satisfaction and loyalty: cross-industry differences. - Total Quality Management, Vol. 11, Nos. 4/5&6, pp. 509-514.
Gronroos, C. (1990), Service Management and Marketing, Lexington Books, Lexington, MA.
Gundlach, G.T., Achrol, R.S., & Mentzer, J.T. (1995), The structure of commitment in exchange, Journal o f Marketing, Vol. 59 No.January, pp.78-92.
Hallowell, R. (1996), The relationship of customer satisfaction, customer loyalty andprofitability: an empirical study, International Journal o f Service Industries Management, Vol. 7 No.4, pp.27-42
Furse, D.H., Punj, G.N. & Stewart, D.W. (1984), A typology of individual searchstrategies amongst purchasers of new automobiles’, Journal o f ConsumerResearch„ Vol. 10 pp.417-31.
51

Hart, C.W.L., Heskett, J.L., Sasser, W.E. (1990), "The profitable art of service recovery", Harvard Business Review, pp. 148-56.
Hawkes, P. (1994), Building brand loyalty and commitment, The Journal o f Brand Management, Vol. 1 pp.337-47.
Hofmeyr & Rice (2000), Religious Brand Loyalty and Political Loyalties. - Journalfor the Scientific Study o f Religion, 2000, Vol. 39, Issue 1, pp. 78-90.
Hofmeyr, J. & Rice, B., (2000): Commitment-Led Marketing. Chichester: John Wiley & Sons Ltd., 299p.
Holloway , F.F. and Beatty, W.J., (2003), Designing loyalty-building programs forpackaged goods brands", Journal o f Marketing Research (JMR), Vol. 39 No.2, pp.202-13.
Hsu , M.L., (2008), A new scale for the measurement of interpersonal trust, Journal o f Personality, Vol. 35 pp.651-65.
Jacoby, J. & Chestnut, R.W. (1978), Brand Loyalty Measurement and Management, John Wiley & Sons, New York, NY.
Jacoby, J., Kyner, D. B. (1973) Brand Loyalty vs. Repeat Purchasing Behavior. - Journal o f Marketing Research, Vol. 10, pp. 1-9.
Jenkins, D. (2003) The Cambridge History of Western Textiles, Cambridge, UK: Cambridge Universities.
Jones, T. O. & Sasser, W. E (1995). Why satisfied Costumers Defect. - Harvard Business Review, Vol. 73, Issue 6, pp. 88-99.
r
52
Johnson & Scholes, (2002), Loyalty saturation in retailing: exploring the end of retailloyalty cards?, International Journal o f Retail & Distribution Management, Vol. 10 pp.429-39.
Knox, S. (1998), Loyalty based segmentation and the customer development process, European Management Journal, Vol. 16 No.6, pp.729-37.
Kibera F.N and Waruingi B.C (1996) Fundamentals of Marketing: African Perspective Literature Bureau.
Kipkorir Lagat (1995), The State Of Marketing In Negligence Activities In Kenya Retailing Sector. Unpublished MBA project. University of Nairobi.
Krosnick, J.A. & Petty, R.E. (1995), Attitude strength: an overview, in Petty, R.E.,Krosnick, J.A. (Eds), Attitude Strength: Antecedents and Consequences, Lawrence Erlbaum Associates, Mahwah, NJ, pp. 1 -24
Lau, G. & Lee, S. (1999), Consumers’ trust in a brand and link to brand loyalty, Journal o f Market Focused Management, Vol. 4 pp.341 -70.
Lim, K. & Razzaque, A.M. (1997), Brand loyalty and situational effects: Aninteractionist perspective, Journal o f International Consumer Marketing, Vol. 9 No.4, pp.95-115.
Lovelock, C (Essentials of service marketing: Prentice hall. London Luarn R.T., and Lin, R.L. (2004), Should we delight the customer?", Journal o f the
Academy o f Marketing Science, Vol. 28 No. 1, pp.86-94.
Lynch J (1995), Customer Loyalty and Success, Macmillan, London Management, Vol. 11 No.7, pp. 1017-28. Marketing Tools Magazine, July-August 1995.
53
Mackintosh G and Lockshin. T (1997) A Conceptual Model o f Service Quality and Its Implications for Future Research, Journal o f Marketing, pp.44 in Marketing Management, Millennium Edition by P.
Masinde C. K. M., (1986) Perceived Quality o f Service: The Case o f Kenya Airways, Unpublished MBA Thesis University of Nairobi.
McFadden, D. (1986), The choice theory approach to market research, Marketing Science, Vol. 5 No.4, pp.275-97.
Morgan, R. M. & Hunt, S. D. The Commitment - Trust Theory of Relationship marketing. - Journal o f Marketing, 1995, Vol. 58, Issue 3, pp. 20-39.
Mugenda A G and Mugenda O M (1999), Research methods. Nairobi: ACTS press.
Mukiri P (2001), Perceived quality the case of Mobile services in Kenya, Unpublished MBA Thesis University of Nairobi.
Mungai, E (2008) Factors that determine customer loyalty: A case of the port of Mombasa: Unpublished MBA Thesis University of Nairobi
Muturi P.W. (2004), Factors that determine customer loyalty to a mobile phone serviceprovider. A case of mobile phone users in Nairobi. Unpublished MBA project. University of Nairobi.
Ndeti, M.N. (2007), Factors determining brand loyalty: The case of commercial banks is Westlands area of Nairobi. Unpublished MBA Project University of Nairobi.
Oliver, R.L. (1997), Whence consumer loyalty?, Journal o f Marketing, Vol. 63 pp.33-44.
54
Prus Amanda & Brandt Randall d., Understanding your customers.
Panther, T. & Farquhar, J.D. (2004), Consumer responses to dissatisfaction with financialservice providers: an exploration of why some stay while others switch, Journalo f F inancial Services M arketing, Vol. 8 No.4, pp.343-53.
Reichheld, F.F. (2003), The one number you need to grow, Harvard Business Review,Vol. 81 No. 12, pp.46-55.
Reichheld, F.F., Markey, R.G. & Hopton, C. (2000), The loyalty effect-the relationship between loyalty and profits, European Business Journal, Vol. 12 No.3, pp. 134-9.
Rice, E.H. (2000), Organizational Culture and Leadership, 3rd ed., Jossey-Bass, San Francisco, CA.
Robbins E.H. and Miller D.E. (2004), Subcultures of consumption: an ethnography of the new bikers, Journal o f Consumer Research, Vol. 22 No. 1, pp.43-61.
Rosenberg, L. & Czepiel, J.A. (1984) A Marketing Approach to Customer Retention. - Journal o f Consumer Marketing, Vol. 1, pp. 45-51.
Schiffman , J.W., and Kanuk , J.H. (1995), Loyalty programs and their impact on repeat- purchase loyalty patterns, International Journal o f Research in Marketing, Vol.14 No.5, pp.473-86.
Sharma, N. (2003), The role pure and quasi-moderators in services: an empiricalinvestigation of ongoing customer-service-provider relationships, Journal o f Retailing and Consumer Services, Vol. 10 No.4, pp.253-62.
55
Sirdeshmukh, D., Singh, J. & Sabol, B. (2002), Consumer trust, value, and loyalty in relational exchanges, Journal o f Marketing, Vol. 66 No. January, pp. 15-37.
Sudman,S. and Perry (1983) Asking questions. Sanfransisco: Jossey-Bass.
Supphellen , R.C., and Nysveen, B. (2001), Patterns of cognitive appraisal in emotion, Journal o f Personality and Social Psychology, Vol. 48 No.4, pp.813-38.
Swanson and Kelley (2001), Building Trust in Business, Politics, Relationships, and Life, Oxford University Press, Oxford.
Teach, B.A., Richard, R.F (1990), The influence of the transformational leader", Journal o f Leadership and Organizational Studies, Vol. 10 No.4, pp. 103-11.
Tanui.P.K. (2007). A survey of customer loyalty programs applied by petrol stations in✓Nairobi. Unpublished MBA journal. University of Nairobi.
Tax and Brown (1999) Principles of service Marketing and management. New York
Tidwell, T.R., and Horgan , M., (1993), International Journal o f Research in Marketing, Vol. 14 No.5, pp.399-404.
Uncles, M.D., Hammond, K.A., Ehrenberg, A.S.C., Davis, R.E. (1994), A replicationstudy of two brand-loyalty measures, European Journal o f Operational Research, Vol. 76 No.2, pp.375-84.
Varki & Colgate (2001) Theory, development and implementation of national customer satisfaction indices: the Swiss Index of Customer Satisfaction (SWICS), Total Quality Management, Vol. 11 No.7, pp. 1017-28.
56
Verma, R., Plaschka, G.R., Hanlon, B., Livingston, A., Kalcher, K. (2008), Predictingcustomer choice in services using discrete choice analysis, IBM Systems Journal, Vol.47 N o.l,pp. 179-82.
Zeithaml, M., and Bitner, G. (1996), Editorial: special issue on loyalty, International Journal o f Research in Marketing, Vol. 14 No.5, pp.399-404.
Zeithaml . F. and Bitner, N., (2003), Service quality, profitability, and the economicworth of customers: what we know and what we need to learn, Journal o f the Academy o f Marketing Science, Vol. 28 No. 1, pp.
Zeithaml. F. (1988) Theory, development and implementation of national customersatisfaction Indices: the Swiss index of customer satisfaction (SW1CS), Total
' Quality.
57

APPENDICESAppendix I: Introduction Letter September 2010
The Head of Human Resource Department
P.0 Box
Nairobi.
Dear Madam,
RE: REQUEST TO COLLECT DATA FOR MBA RESEARCH PROJECT
I am a student at the University of Nairobi pursuing a Masters of Business Administration program.
Pursuant to the pre-requisite course work, I would like to conduct a research project on factors that determine customer loyalty to cloth retailing stores in Nairobi -Kenya.The focus of my research will be the clothing stores and this will involve use of questionnaires administered to customers.
1 kindly seek your authority to conduct the research at clothing stores through questionnaires and use of relevant documents. I have enclosed an introductory letter from the University. Your assistance is highly valued. Thank you in advance.
Yours faithfully,
Alice Mutuku
* 58
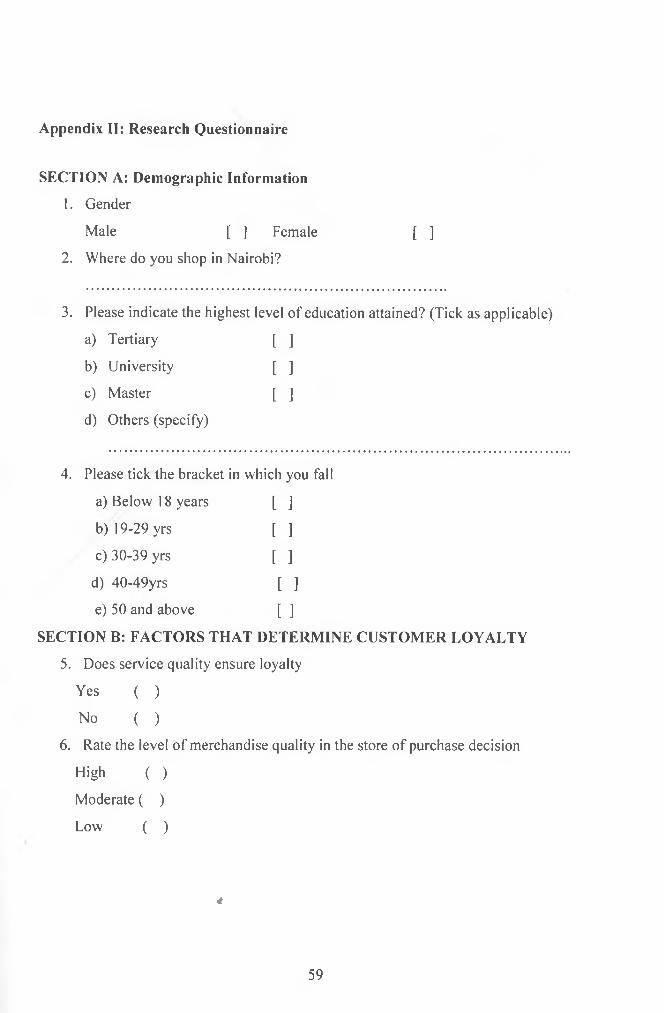
Appendix II: Research Questionnaire
SECTION A: Demographic Information1. Gender
Male [ ] Female [ ]2. Where do you shop in Nairobi?
3. Please indicate the highest level of education attained? (Tick as applicable)a) Tertiary [ ]b) University [ ]c) Master [ ]d) Others (specify)
4. Please tick the bracket in which you falla) Below 18 years [ ]b) 19-29 yrs t ]c) 30-39 yrs [ i
d) 40-49yrs t ie) 50 and above [ ]
SECTION B: FACTORS THAT DETERMINE CUSTOMER LOYALTY5. Does service quality ensure loyalty
Yes ( )No ( )
6. Rate the level of merchandise quality in the store of purchase decision High ( )Moderate ( )Low ( )
4
59

7. Do you agree with the following statement: The quality of service at the storehas maintained the level of customer loyaltyStrongly agree [ ]Moderately agree [ ]Neither agree nor disagree [ ]Moderately disagree [ ]Strongly disagree [ ]
8. Does supplier brand influence customer loyalty at your clothing store? Yes ( )
No ( )9. To what extent do you agree with the following statements on the influence of
supplier brand to customer loyalty?Statement Strongly
agreeagree neutral disagree Strongly
disagreeYou like this clothing store outlet/store brand of productsThe brands relate well with your clothing needsThe brands are attractive as compared to those from other storesThe brand you use enable you to achieve your goalThe brands enhance your social identity
10. To what extent does product mix influence your loyalty to the clothing store?Very great extent [ iGreat extent t ]Moderate extent t ]Little extent [ iNot at all [ i
60
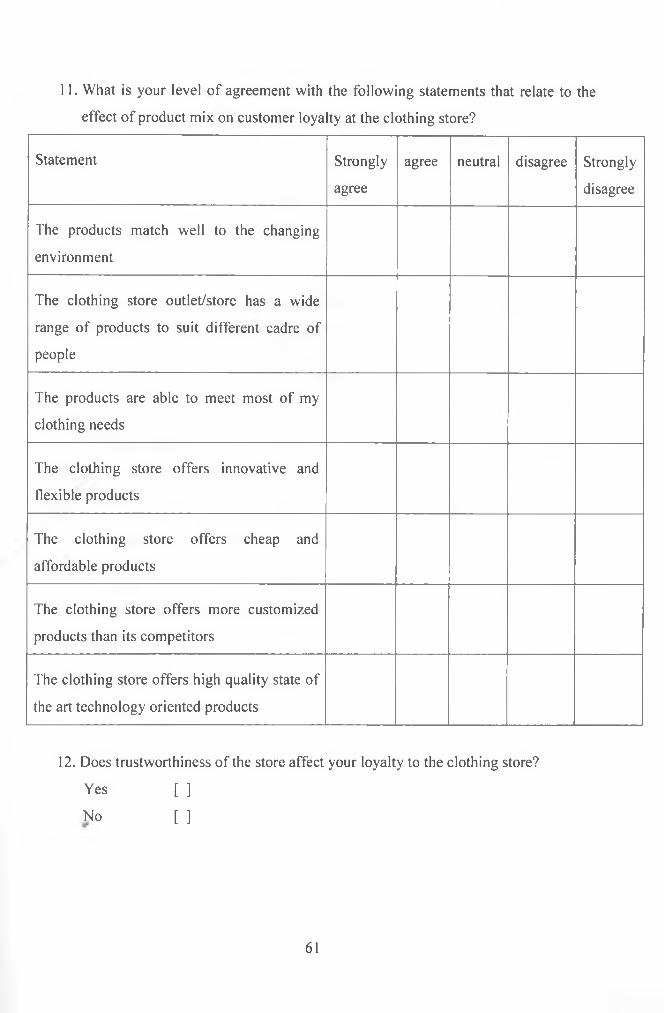
11. What is your level of agreement with the following statements that relate to theeffect of product mix on customer loyalty at the clothing store?
Statement Stronglyagree
agree neutral disagree Stronglydisagree
The products match well to the changing environment
The clothing store outlet/store has a wide range of products to suit different cadre of people
The products are able to meet most of my clothing needs
The clothing store offers innovative and flexible products
The clothing store offers cheap and affordable products
The clothing store offers more customized products than its competitors
The clothing store offers high quality state of the art technology oriented products
12. Does trustworthiness of the store affect your loyalty to the clothing store? Yes [ ]No t ]
61
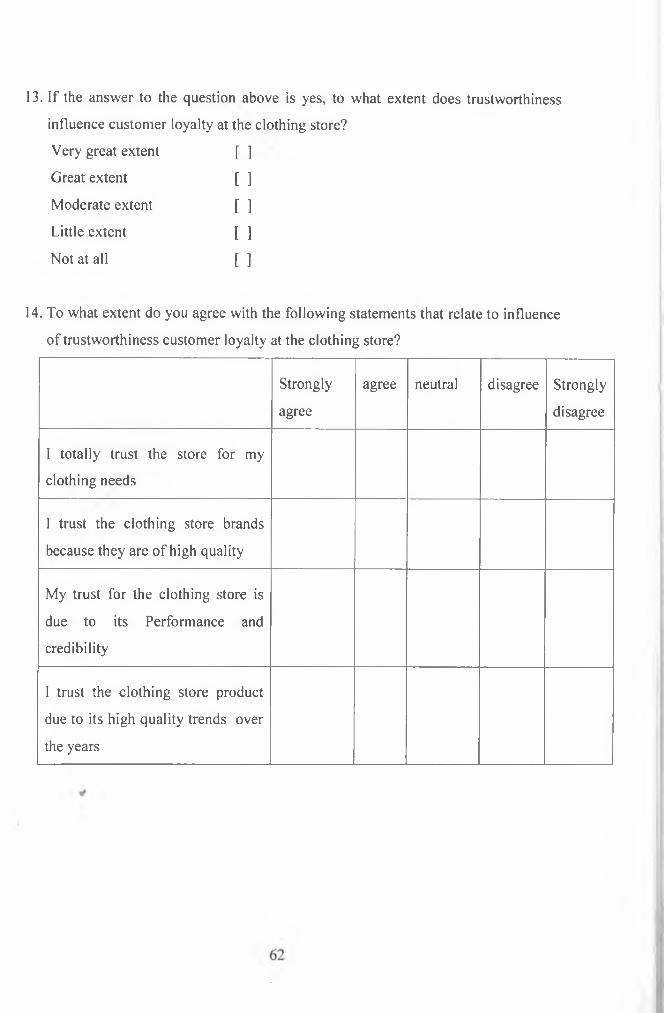
13. If the answer to the question above is yes, to what extent does trustworthinessinfluence customer loyalty at the clothing store?Very great extent [ iGreat extent [ jModerate extent t ]Little extent [ ]Not at all [ i
14. To what extent do you agree with the following statements that relate to influence of trustworthiness customer loyalty at the clothing store?
Stronglyagree
agree neutral disagree Stronglydisagree
I totally trust the store for my clothing needs
I trust the clothing store brands because they are of high quality
My trust for the clothing store is due to its Performance and credibility
1 trust the clothing store product due to its high quality trends over the years
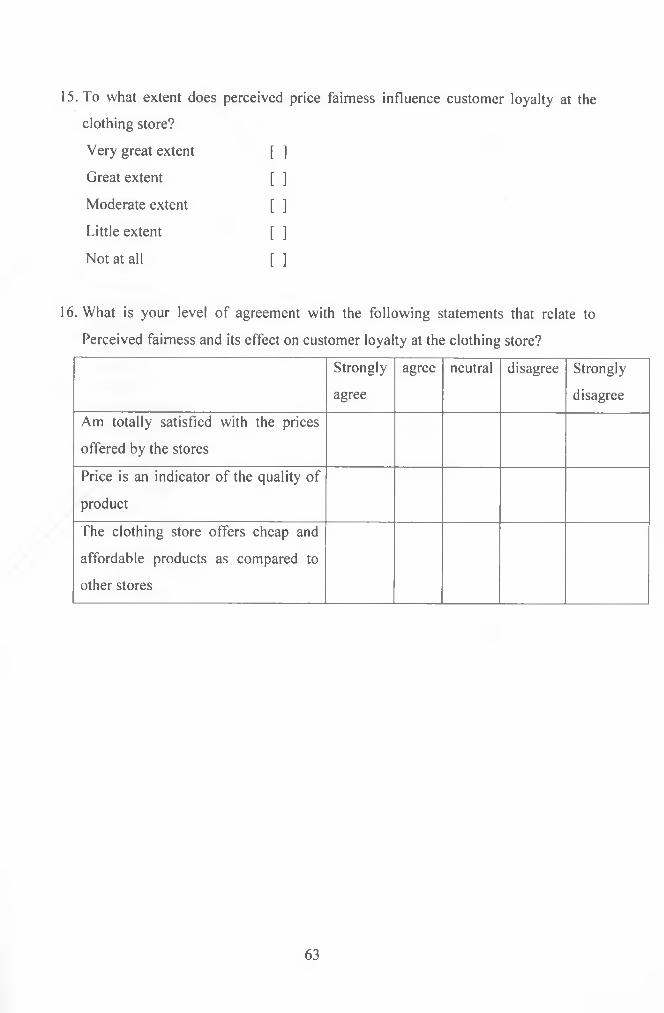
15. To what extent does perceived price fairness influence customer loyalty at theclothing store?Very great extent 11Great extent [ iModerate extent 11Little extent t ]Not at all [ ]
16. What is your level of agreement with the following statements that relate to Perceived fairness and its effect on customer loyalty at the clothing store?
Stronglyagree
agree neutral disagree Stronglydisagree
Am totally satisfied with the prices offered by the storesPrice is an indicator of the quality of productThe clothing store offers cheap and affordable products as compared to other stores
63
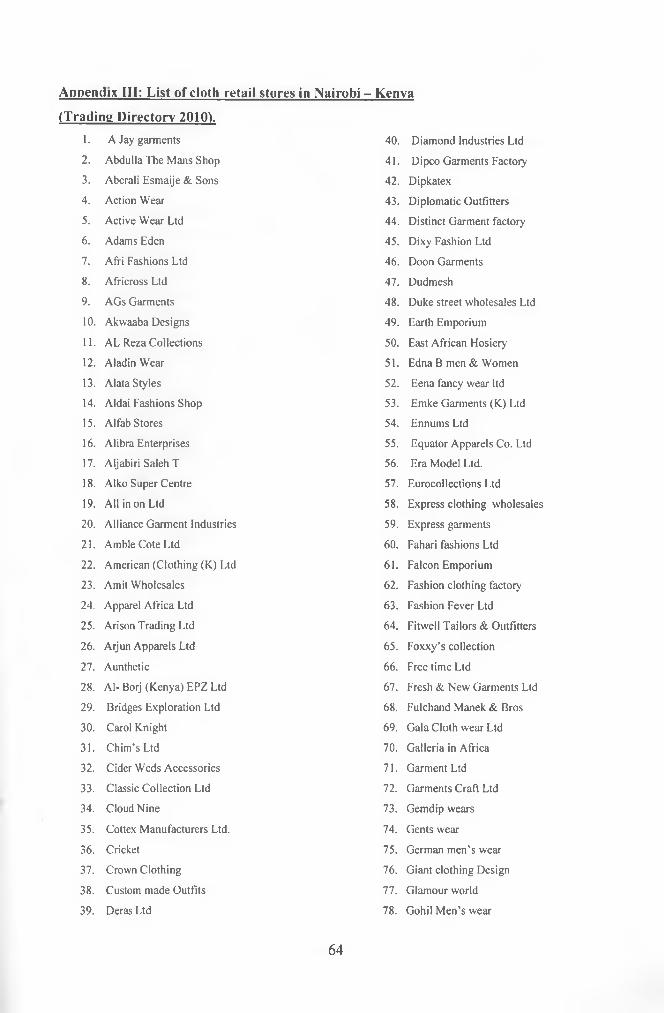
Appendix III: List of cloth retail stores in Nairobi - Kenya(Trading Directory 2010).
1. A Jay garments2. Abdulla The Mans Shop3. Aberali Esmaije & Sons4. Action Wear5. Active Wear Ltd6. Adams Eden7. Afri Fashions Ltd8. Africross Ltd9. AGs Garments10. Akwaaba Designs11. AL Reza Collections12. Aladin W'ear13. A lata Styles14. Aldai Fashions Shop15. Alfab Stores16. Alibra Enterprises17. Aljabiri Saleh T18. Alko Super Centre19. All in on Ltd20. Alliance Garment Industries21. Amble Cote Ltd22. American (Clothing (K) Ltd23. Amit Wholesales24. Apparel Africa Ltd25. Arison Trading Ltd26. Arjun Apparels Ltd27. Aunthetic28. Al- Borj (Kenya) EPZ Ltd29. Bridges Exploration Ltd30. Carol Knight31. Chim’sLtd32. Cider Weds Accessories33. Classic Collection Ltd34. Cloud Nine35. Cottex Manufacturers Ltd.36. Cricket37. Crown Clothing38. Custom made Outfits39. Deras Ltd
40. Diamond Industries Ltd41. Dipco Garments Factory42. Dipkatex43. Diplomatic Outfitters44. Distinct Garment factory45. Dixy Fashion Ltd46. Doon Garments47. Dudmesh48. Duke street wholesales Ltd49. Earth Emporium50. East African Hosiery51. Edna B men & Women52. Eena fancy wear ltd53. Emke Garments (K) Ltd54. Ennums Ltd55. Equator Apparels Co. Ltd56. Era Model Ltd.57. Eurocollections Ltd58. Express clothing wholesales59. Express garments60. Fahari fashions Ltd61. Falcon Emporium62. Fashion clothing factory63. Fashion Fever Ltd64. Fitwell Tailors & Outfitters65. Foxxy’s collection66. Free time Ltd67. Fresh & New Garments Ltd68. Fulchand Manek & Bros69. Gala Cloth wear Ltd70. Galleria in Africa71. Garment Ltd72. Garments Craft Ltd73. Gemdip wears74. Gents wear75. German men’s wear76. Giant clothing Design77. Glamour world78. Gohil Men’s wear
64
79. Golden Garments Ltd80. Gopitex knitwear mills Ltd81. Hillcrest Clothing Co. Ltd82. Hi-Q Collections83. Hirani Wears84. Hitex Wears85. Home Stores 1975 Ltd86. Homeland Wear & Designs87. Hopes Garments88. Ideal Collections89. Ideal Mens Wear90. Identity-Westgate91. Identity-Village92. Ilongo Fashions& Beauty Centre93. Imagitex Ltd94. Impressions lingerie95. In Vogue Wear96. Inca Kenya Ltd97. Instyle EX Centre98. Intra Ltd99. Iqrasha collections100. Irungu Fashions Centre101. Italian exclusive (K) ltd102. Italian Glamour103. J Crew, clothes stores104. Jabe investments105. Jack Rousse collection106. Jakari clothing Co.107. Jambo Boutique108. Jambo Manufactures Ltd109. Jamsons Industries Ltd110. Janeliete fashions111. JAR Kenya(EPZ) Ltd112. Jaroch Fashions113. Jasmac General Supplies114. Jaypee Fashions115. JD Sharma & sons116. Jejofa Fashion117. Jembe Enterprises Ltd118. Jesons The man’s shop119. Jethva Men’s wear120. Jita enterprises
121. JNG enterprises122. Jobet Designers123. Johari Designs124. Joshi Garments125. Jowelo Boutique126. Jozis Ltd127. Jp’s Italian Fashion Styles128. JR Patel & others129. JR Stephens & Co. Ltd130. Jude’s131. Julmoth fashions132. Jumose fashions133. Just looking Boutique134. Jynnyoike Designers135. Kache136. Kaderdina Hajee Essak Ltd.137. Kagwanja Emporium138. Kaks family Wear139. Kandani clothing store140. Kasuku Garments factory141. Keekorok Garments142. Kemco (clothing Factory)143. Kemp Garments144. Kenfranka Enterprises Ltd145. Kentex Apparels (EPZ) Ltd146. Kentex Manufactures Ltd147. Kerbrook Garment Manufactures Ltd148. Ketan Emporium.149. Khimji cloth wear150. Kiajabe Smart war209 Kibao fashions210 Kiboko Leisure wear Ltd211 Kikoy Co. ltd212 Kingly Fashion213 Kings Clothing Co. moi Avenue214 Kings collection215 Kings wear216 Kira General store Ltd151. KJ Shah & Co. ltd152. KMD fashions217 Kumi Kumi Garments218 Kuria Garments (K) Ltd
65

219 Kyu garment (1990) Ltd153. La Fric154. Latest fashion155. Lavi’s Int’l Ltd156. Laxmichand Keshauji &220 Le stud Ltd157. Leah Boutique221 Legend lives Ltd158. Leisure wear Ltd159. Leketyo Garments160. Lemon collections161. Lenoy’s maternity wear162. Leon’s shoppe163. Lexy’s collection164. Liasa king Designer165. Liberty manufactures Ltd166. Libs ltd167. Life clothing factory168. Lightway169. Liladhar Goar factory170. Linda Raja Ltd.171. Little Red Ltd172. Littlewood garments Ltd.173. Lollipop Ltd174. London Art Tailors175. Lord’s176. Lower kabete Textile Ltd177. Lucille Ltd178. Luck wear179. Lutex Ltd180. lwein’s181. Madafu Boutique & Madhura Garments182. Main Clothing Store183. Majestic clothes Ltd184. Makrom collection185. Maldetex186. Mali ya Abduka187. Mallino Fashion188. Man’s collections189. Mangils Lt190. Mango191. Manix clothing store
192. Mano styles Ltd193. Mansor store194. Manu excellent wear Co.Ltd.195. manufacturing C. Ltd196. Marina Fashions197. Market Fashion Emporium Ltd198. Matheri David Wahome199. Mathira Cloth wear200. Matonyo Supplies201. Mauyur’s Menwear202. Mawega family wear203. Maya Emporium Ltd204. Me Fashions205. Meenal Emporium206. Meera smart wear207. Mego baby shop208. Melablooms209. Men’s clothing Co.210. Men’s Emporium211. Men’s Secrets Ltd212. Miarmo Retail shop213. Midas Fabriques214. Midco Textiles (EA) Ltd215. Milano mens wear216. Milimani Drapers217. Mina Emporium218. Mini Pride219. Misans enterprises220. Miss Fashions221. Modella222. Moiz Kitabnalla223. Moksh Ltd224. Monsieur Ltd225. Montana Boutique226. Moonlight Fashions227. Moonlight Mini clothing228. Mr. Price Apparel229. MT Samani & sons230. No maneno Bazaar231. OfTex garments Co. Salon232. Shahip wholesales Ltd233. Shroff Enterprises
66
234. Sia235. Sidhi Vinayak collection236. Silverlite Ltd237. Simato Kenya Ltd238. Simba Distributors239. Simplex wears240. Sir Henry’s Ltd241. Skyways collection242. Sonalos colection sons (K) Ltd243. Sonso Emporium244. Sotik Stole245. sparsh creation246. Sport - in247. Starex Holidays Ltd248. Starx Kenya Ladhies249. Stay wears250. Stevels collection251. Stiches Den252. Stiches Den253. Straightline Enterprise Ltd (Oneway)254. Style Drapers & Outfitters255. Sunmatt Ltd256. Suntex family wear ltd257. Sunu’s258. Super selective store.259. Sushan Emporium260. Truworths261. V imal Jesel House262. Wawal untre shopping complex263. Wholesale stores Mawala264. Winka Fashions265. Woolworths266. World fashions Ltd.267. Yaya Fashions Ltd.
67
Copyright © 2022 FDOKUMEN