The impact of influencer marketing on brand loyalty towards ...
Upload
khangminh22Category
view
0download
0
DETERMINANTS OF BRAND LOYALTY IN LEADING
SUPERMARKET CHAINS IN KENYA
FRANCIS MUNGAI MUTURI
DOCTOR OF PHILOSOPHY
(Business Administration)
JOMO KENYATTA UNIVERSITY OF
AGRICULTURE AND TECHNOLOGY
2018

Determinants of brand loyalty in leading supermarket chains in
Kenya
Francis Mungai Muturi
A thesis submitted in partial fulfilment for the degree of Doctor of
Philosophy in Business Administration in the Jomo Kenyatta
University of Agriculture and Technology
2018

ii
DECLARATION
This thesis is my original work and has not been presented for a degree in any other
University
Signature: ……………………………… Date: .........................................
Francis Mungai Muturi
This thesis has been presented for examination with our approval as University
Supervisors.
Signature: ……………………………… Date: .........................................
Dr. Jane Omwenga
JKUAT, Kenya
Signature: ……………………………… Date: .........................................
Dr. Edward .O. Owino
KCA, Kenya

iii
DEDICATION
This thesis is dedicated to my mum and dad for bringing me up and taking me to
school. I also dedicate this thesis to my wife Lucy and my sons Joseph, Simon and
Steve. Many are the times they missed my attention as I spent many hours in the
study room preparing this thesis.

iv
ACKNOWLEDGEMENT
I am indebted to the many people who directly or indirectly contributed to the
success of this study. First, I thank Dr. Jane Omwenga and Dr. Edward Owino who
are my supervisors for their support and professional guidance. I am thankful for
their incredible commitment, patience, careful direction and motivation throughout
the thesis. You were more than supervisors but mentors always wanting me to be the
best and may God richly bless you. My sincere gratitude goes to Prof. Mike Iravo
and Dr. Kepha Ombui and Dr. Muathe SMA of Kenyatta University for their
contribution in the shaping of this thesis. I would also like to thank the staff and
fellow PhD students at JKUAT Westlands campus for their support and helping to
enrich my experience through sharing of knowledge.
I will forever be indebted to my father Mr. Joseph Muturi, my mother Mrs. Sarah
Mumbi, and my wife Dr. Lucy Mungai for inspiring me throughout my life. They
have always supported my dreams and aspirations.

v
TABLE OF CONTENTS
DECLARATION ........................................................................................................ ii
DEDICATION ........................................................................................................... iii
ACKNOWLEDGEMENT ........................................................................................ iv
TABLE OF CONTENTS ........................................................................................... v
LIST OF TABLES ..................................................................................................... x
LIST OF FIGURES ................................................................................................ xiii
LIST OF APPENDICES ........................................................................................ xiv
LIST OF ABBREVIATIONS AND ACRONYMS ............................................... xv
DEFINITION OF TERMS ..................................................................................... xvi
ABSTRACT ........................................................................................................... xviii
CHAPTER ONE ........................................................................................................ 1
INTRODUCTION ...................................................................................................... 1
1.1 Background of the Study .................................................................................. 1
1.2 Statement of the Problem ................................................................................. 6
1.3 Objectives of the Study .................................................................................... 8
1.3.1 General Objective..................................................................................... 8
1.3.2 Specific Objectives................................................................................... 8
1.4 Research Hypothesis ........................................................................................ 8
1.5 Justification ...................................................................................................... 9
1.6 Scope of the Study ......................................................................................... 10
1.7 Limitations of the Study ................................................................................. 10
vi
CHAPTER TWO ..................................................................................................... 12
LITERATURE REVIEW ........................................................................................ 12
2.1 Introduction ................................................................................................... 12
2.2 Theoretical Review ....................................................................................... 12
2.2.1 Service Quality (SERVQUAL) Model .................................................. 13
2.2.2 The Means–end theory: Zeithaml approach ........................................... 14
2.2.3 The Expectations-Disconfirmation Theory ............................................ 15
2.2.4 Adaptation Level Theory ....................................................................... 17
2.2.5 The Brand Consumer Relationship Theory............................................ 17
2.2.6 Social Class Theory................................................................................ 18
2.3 Conceptual framework .................................................................................. 18
2.4 Empirical Review .......................................................................................... 20
2.4.1 Service Quality ....................................................................................... 20
2.4.2 Customer Perceived Value ..................................................................... 22
2.4.3 Sales Promotion ..................................................................................... 24
2.4.4 Brand Image ........................................................................................... 27
2.4.5 Customer Satisfaction ............................................................................ 29
2.4.6 Brand Loyalty......................................................................................... 32
2.5 Critique of Existing Literature Relevant to the Study ................................... 34
2.6 Research Gaps ............................................................................................... 35
2.7 Summary of Literature Reviewed ................................................................. 35
CHAPTER THREE ................................................................................................. 38
RESEARCH METHODOLOGY ........................................................................... 38
3.1 Introduction ................................................................................................... 38

vii
3.2 Research Design ........................................................................................... 38
3.3 Target Population ......................................................................................... 38
3.4 Sampling Frame ........................................................................................... 39
3.5 Sample Size and Sampling Technique ......................................................... 39
3.5.1 Sample Size ............................................................................................ 39
3.5.2 Sampling Techniques ............................................................................. 41
3.6 Data Collection Instruments ......................................................................... 41
3.7 Data Collection Procedures .......................................................................... 42
3.8 Pilot Testing ................................................................................................. 42
3.8.1 Reliability of Research Instruments ....................................................... 42
3.8.2 Validity of Research Instruments ........................................................... 43
3.9 Data Analysis and Presentation .................................................................... 45
3.9.1 Data Analysis ......................................................................................... 45
3.9.2 Data Presentation ................................................................................... 48
3.10 Measurement of Variables ........................................................................... 49
CHAPTER FOUR .................................................................................................... 51
RESEARCH FINDINGS AND DISCUSSION ...................................................... 51
4.1 Introduction .................................................................................................. 51
4.2 Response Rate .............................................................................................. 51
4.3 Pilot Study results ........................................................................................ 52
4.4 Demographic Information ............................................................................ 53
4.4.1 Background Information ........................................................................ 54
4.4.2 ANOVA on Loyalty Cards .................................................................... 62
4.4.3 MANOVA results on shopping preferences .......................................... 64

viii
4.5 Descriptive Analysis of Study Variables ..................................................... 73
4.5.1 Descriptive Statistics of Customer Expectation ..................................... 73
4.5.2 Descriptive Statistics of Service Quality................................................ 75
4.5.3 Descriptive Statistics of sales promotions.............................................. 79
4.5.4 Descriptive Statistics of brand image ..................................................... 80
4.5.5 Descriptive Statistics of Customer Satisfaction ..................................... 82
4.5.6 Descriptive Statistics of brand loyalty ................................................... 84
4.6 Factors Influencing Brand Loyalty .............................................................. 85
4.6.1 Factor Analysis ...................................................................................... 86
4.6.2 Correlation Analysis............................................................................... 94
4.6.3 Validity ................................................................................................... 95
4.7 Diagnostic Tests for Regression Analysis ................................................... 98
4.7.1 Linearity ................................................................................................. 98
4.7.2 Heteroscedasticity .................................................................................. 99
4.7.3 Multicollinearity ................................................................................... 101
4.7.4 Normality ............................................................................................. 102
4.7.5 Autocorrelation .................................................................................... 106
4.8 Hypothesis Testing ..................................................................................... 107
4.8.1 Effects of Service Quality on Brand Loyalty ....................................... 110
4.8.2 Effects of Customer Perceived Value on Brand Loyalty ..................... 112
4.8.3 Effects of Sales Promotions on Brand Loyalty .................................... 112
4.8.4 Effects of Brand Image on Brand Loyalty ........................................... 114
4.9 Mediating Effect of Customer Satisfaction ................................................ 115
4.9.1 Relationship between Predictor Variables on Brand Loyalty .............. 115

ix
4.9.2 Relationship between Predictor Variables on Customer Satisfaction .. 117
4.9.3 Relationship between Customer Satisfaction and Brand Loyalty ........ 119
4.9.4 Relationship between Predictor Variables and Customer Satisfaction on
Brand Loyalty .......................................................................................... 121
4.9.5 Sobel test for mediation ....................................................................... 123
4.9.6 Mediating role of Customer Satisfaction ............................................. 125
4.10 Summary of Hypothesis Testing ................................................................ 126
4.10.1 The Overall Model ........................................................................... 128
CHAPTER FIVE .................................................................................................... 130
SUMMARY, CONCLUSION AND RECOMMENDATION ............................ 130
5.1 Introduction ................................................................................................ 130
5.2 Summary of Major Findings ...................................................................... 130
5.2.1 Service quality and brand loyalty ......................................................... 131
5.2.2 Customers’ value perception and brand loyalty ................................... 131
5.2.3 Sales promotions and brand loyalty ..................................................... 132
5.2.4 Brand image and brand loyalty ............................................................ 132
5.2.5 Mediation of customer satisfaction ...................................................... 132
5.3 Conclusion ................................................................................................. 133
5.4 Recommendations ...................................................................................... 134
5.5 Areas for Further Research ........................................................................ 135
REFERENCES ....................................................................................................... 137
APPENDICES ........................................................................................................ 159
x
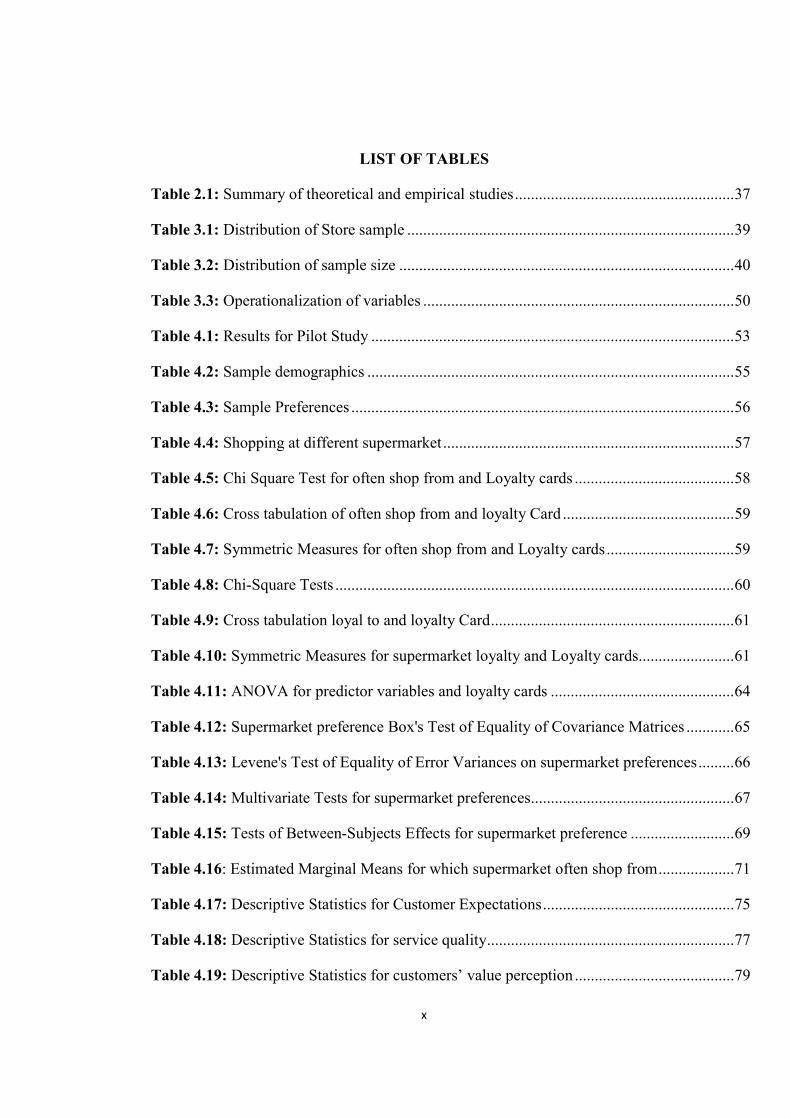
LIST OF TABLES
Table 2.1: Summary of theoretical and empirical studies ....................................................... 37
Table 3.1: Distribution of Store sample .................................................................................. 39
Table 3.2: Distribution of sample size .................................................................................... 40
Table 3.3: Operationalization of variables .............................................................................. 50
Table 4.1: Results for Pilot Study ........................................................................................... 53
Table 4.2: Sample demographics ............................................................................................ 55
Table 4.3: Sample Preferences ................................................................................................ 56
Table 4.4: Shopping at different supermarket ......................................................................... 57
Table 4.5: Chi Square Test for often shop from and Loyalty cards ........................................ 58
Table 4.6: Cross tabulation of often shop from and loyalty Card ........................................... 59
Table 4.7: Symmetric Measures for often shop from and Loyalty cards ................................ 59
Table 4.8: Chi-Square Tests .................................................................................................... 60
Table 4.9: Cross tabulation loyal to and loyalty Card ............................................................. 61
Table 4.10: Symmetric Measures for supermarket loyalty and Loyalty cards........................ 61
Table 4.11: ANOVA for predictor variables and loyalty cards .............................................. 64
Table 4.12: Supermarket preference Box's Test of Equality of Covariance Matrices ............ 65
Table 4.13: Levene's Test of Equality of Error Variances on supermarket preferences ......... 66
Table 4.14: Multivariate Tests for supermarket preferences ................................................... 67
Table 4.15: Tests of Between-Subjects Effects for supermarket preference .......................... 69
Table 4.16: Estimated Marginal Means for which supermarket often shop from ................... 71
Table 4.17: Descriptive Statistics for Customer Expectations ................................................ 75
Table 4.18: Descriptive Statistics for service quality .............................................................. 77
Table 4.19: Descriptive Statistics for customers’ value perception ........................................ 79
xi
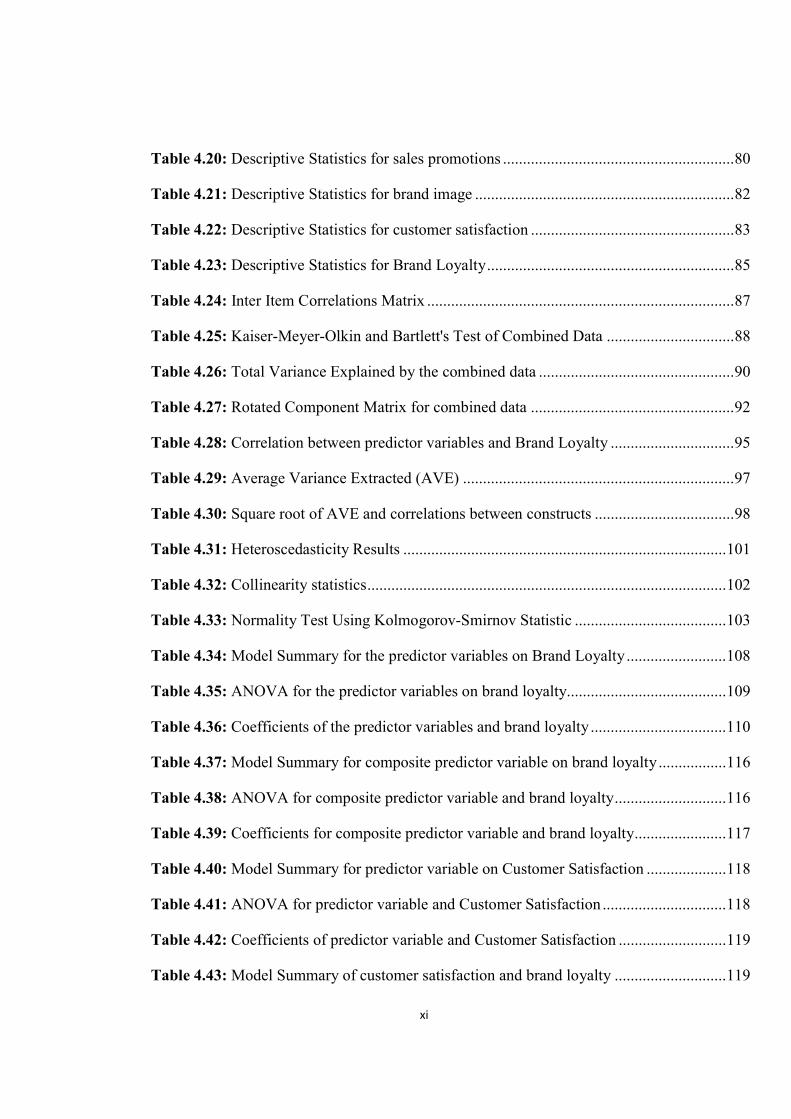
Table 4.20: Descriptive Statistics for sales promotions .......................................................... 80
Table 4.21: Descriptive Statistics for brand image ................................................................. 82
Table 4.22: Descriptive Statistics for customer satisfaction ................................................... 83
Table 4.23: Descriptive Statistics for Brand Loyalty .............................................................. 85
Table 4.24: Inter Item Correlations Matrix ............................................................................. 87
Table 4.25: Kaiser-Meyer-Olkin and Bartlett's Test of Combined Data ................................ 88
Table 4.26: Total Variance Explained by the combined data ................................................. 90
Table 4.27: Rotated Component Matrix for combined data ................................................... 92
Table 4.28: Correlation between predictor variables and Brand Loyalty ............................... 95
Table 4.29: Average Variance Extracted (AVE) .................................................................... 97
Table 4.30: Square root of AVE and correlations between constructs ................................... 98
Table 4.31: Heteroscedasticity Results ................................................................................. 101
Table 4.32: Collinearity statistics .......................................................................................... 102
Table 4.33: Normality Test Using Kolmogorov-Smirnov Statistic ...................................... 103
Table 4.34: Model Summary for the predictor variables on Brand Loyalty ......................... 108
Table 4.35: ANOVA for the predictor variables on brand loyalty........................................ 109
Table 4.36: Coefficients of the predictor variables and brand loyalty .................................. 110
Table 4.37: Model Summary for composite predictor variable on brand loyalty ................. 116
Table 4.38: ANOVA for composite predictor variable and brand loyalty ............................ 116
Table 4.39: Coefficients for composite predictor variable and brand loyalty ....................... 117
Table 4.40: Model Summary for predictor variable on Customer Satisfaction .................... 118
Table 4.41: ANOVA for predictor variable and Customer Satisfaction ............................... 118
Table 4.42: Coefficients of predictor variable and Customer Satisfaction ........................... 119
Table 4.43: Model Summary of customer satisfaction and brand loyalty ............................ 119

xii
Table 4.44: ANOVA for customer satisfaction and brand loyalty ........................................ 120
Table 4.45: Coefficients for Customer Satisfaction and Brand Loyalty ............................... 120
Table 4.46: Model Summary for predictor variable, Customer Satisfaction and
Brand Loyalty ...................................................................................................... 121
Table 4.47: ANOVA for predictor variable, Customer Satisfaction and Brand
Loyalty ................................................................................................................ 122
Table 4.48: Coefficients for predictor variable, Customer Satisfaction and Brand
Loyalty ................................................................................................................ 123
Table 4.49: Sobel test for mediation of customer satisfaction .............................................. 124
Table 4.50: Summary of Results of Hypotheses Testing ...................................................... 127

xiii
LIST OF FIGURES
Figure 2.1: The SERVQUAL model ..................................................................................... 14
Figure 2.2: Expectation Disconfirmation Model .................................................................... 16
Figure 2.3: Conceptual Framework. ....................................................................................... 19
Figure 4.1: Scree plot for combined data ................................................................................ 91
Figure 4.2: Normality Test for Service Quality .................................................................... 104
Figure 4.3: Normality Test for Customer Perceived Value .................................................. 104
Figure 4.4: Normality Test for Brand Image ........................................................................ 105
Figure 4.5: Normality Test for Sales Promotions ................................................................. 105
Figure 4.6: Revised Conceptual Framework......................................................................... 129
xiv
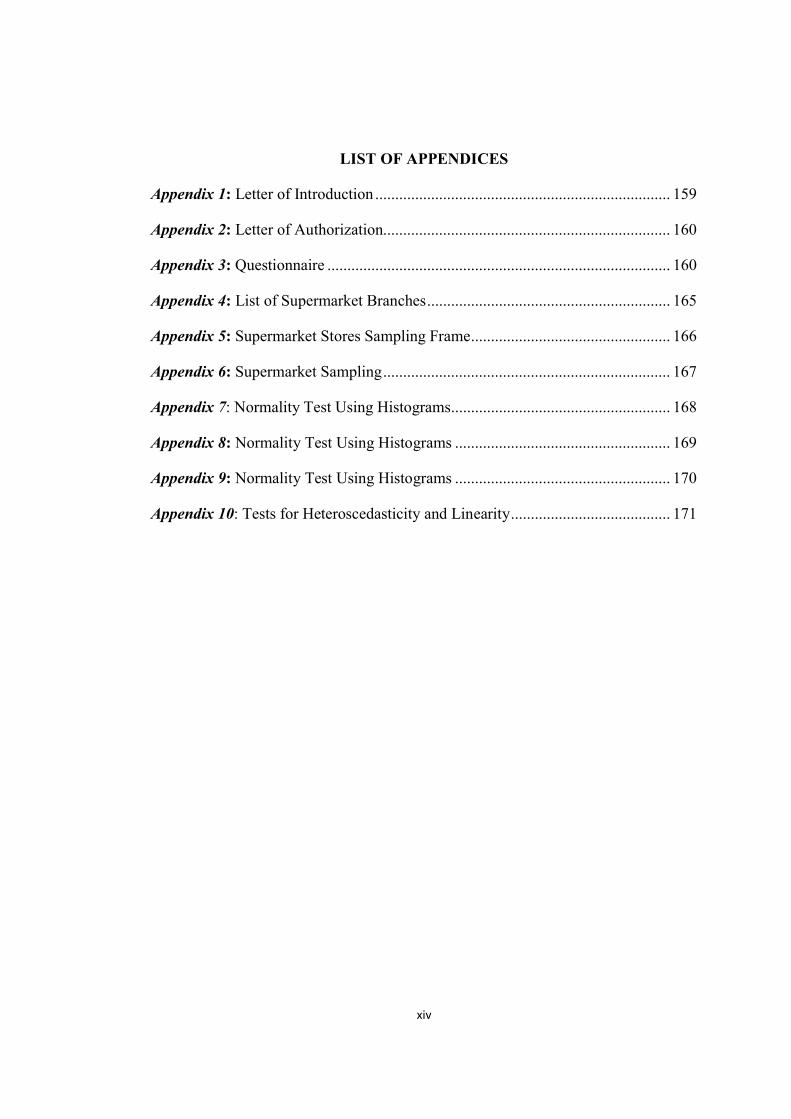
LIST OF APPENDICES
Appendix 1: Letter of Introduction .......................................................................... 159
Appendix 2: Letter of Authorization........................................................................ 160
Appendix 3: Questionnaire ...................................................................................... 160
Appendix 4: List of Supermarket Branches ............................................................. 165
Appendix 5: Supermarket Stores Sampling Frame .................................................. 166
Appendix 6: Supermarket Sampling ........................................................................ 167
Appendix 7: Normality Test Using Histograms....................................................... 168
Appendix 8: Normality Test Using Histograms ...................................................... 169
Appendix 9: Normality Test Using Histograms ...................................................... 170
Appendix 10: Tests for Heteroscedasticity and Linearity ........................................ 171

xv
LIST OF ABBREVIATIONS AND ACRONYMS
ANOVA Analysis of Variance
AVE Average Variance Extracted
BI Brand Image
CPV Customer Perceived Value
EDLP Every-Day-Low-Price
EDT Expectation Disconfirmation Theory
EFA Exploratory Factor Analysis
HiLO High Low Pricing
KMO Kaiser Meyer Oklin
MANOVA Multiple Analyses of Variance
OLS Ordinary Least Squares
PCA Principal Component Analysis
SD Standard Deviation
SERVQUAL Service Quality
SP Sales Promotions
SPSS Statistical Package for the Social Sciences
VIF Variance Inflation Factor

xvi
DEFINITION OF TERMS
Brand According to Kotler and Keller (2012) a brand is a
name, term, sign, symbol, or design or combination of
them which is intended to identify the goods and
services of one seller or group of sellers and to
differentiate them from those of competitors.
Brand Image A consumer‘s perceptions and feelings towards a brand
shaped by direct/indirect brand experiences, which
captures cognitive, sensory, and emotional aspects.
Brand image is the overall impression in consumers’
mind that is formed from all sources. Consumers
develop various associations with the brand. Based on
these associations, they form brand image (Roberts,
2006).
Brand loyalty is the customers’ behavioural intention to continuously
or increasingly conduct business with their present
supermarket store/brand, and their inclination to
recommend the store/brand to other persons (Hwang &
Kandampully, 2012).
Customer satisfaction is a collective outcome of perception, evaluation and
psychological reactions to the consumption experience
with a product/service. Customer Satisfaction is the
match between customer expectations and actual
performance of the product or service (Kotler & Keller,
2012).
Customer value is dependent on how customers perceive the benefits of
a product and the sacrifice related to its purchase.
Therefore, Customer value also referred to as customer
perceived value is the difference between the perceived

xvii
benefits and the perceived sacrifice/cost of getting
those benefits (Jobber, 2007).
Retail All the activities in selling goods or services directly to
final consumers for personal, non-business use (Kotler
& Keller, Marketing Management, 2012).
Sales Promotions A collection of incentive tools, mostly short term,
designed to stimulate quicker or greater purchases of
particular products or services by consumers or the
trade (Kotler & Keller, Marketing Management, 2012).
Service Quality Is how well a consumer’s needs are met and how well
the service delivered meets the customer’s expectations
(Lewis, 2004).
Supermarket A large, low cost, low margin, high volume, self-
service shop that carries a wide range of groceries and
household products (Kotler & Armstrong, 2008).

xviii
ABSTRACT
In the context of a retail supermarket, building customer and brand loyalty is a successful means of achieving market share and competitive advantage. Consumers, whose desires and expectations have been met or exceeded in the course of experiencing the service, are more satisfied and are likely to continue patronizing the organization. The Kenya retail industry has had its fair share of competition and rapid growth that has put smaller retailers out of business. Increased competition has led to an increase in more innovative services and stores. This study looked at the perspective of the user and will help the seller on how they can build brand loyalty, reduce price sensitivity and achieve more profitability. This study evaluated the determinants of brand loyalty in leading supermarkets in Kenya. The study specific objectives were to determine the influence of service quality on brand loyalty; establish the effect of customers’ value perception on brand loyalty; evaluate the effect of sales promotions on brand loyalty; determine the effect of brand image on brand loyalty; assess the extent to which customer satisfaction mediates the relationship with brand loyalty. The theoretical framework that guides this study is given by service quality theory, means-end theory, expectation disconfirmation theories, the brand consumer relationship theory, Social class theory and adaptation level theory. The study adopted a descriptive survey research design. The study covered the Nairobi and Nakuru county customers of the four main supermarkets (Nakumatt, Tusky’s, Naivas and Uchumi). Sampling was done using multi-stage sampling method to get an optimum sample of the supermarket stores and the customers. A supermarket store sample of 30 stores was picked using stratified random sampling. The study adopted a sample of 384 customer respondents. The research instrument used was a structured questionnaire. Exploratory Factor Analysis (EFA) was used to identify the main factors that define the independent variables. Regression analysis was used to evaluate the relationships between dependent and independent variables. The data was coded, sorted and analysed using the Statistical Package for Social Sciences (SPSS Version 23). The study found that brand loyalty in leading supermarkets in Kenya, was influenced positively by brand image, customer perceived value and service quality. The study also found that customer satisfaction significantly partially mediates on the combined effect of service quality, customer perceived value and brand image on brand loyalty. The study failed to reject the null hypothesis that there is no significant effect of sales promotions on brand loyalty in leading supermarket chains in Kenya. Sales promotions were found not to affect brand loyalty. Sales promotions are viewed as a short-term marketing activity to increase flow of customers and influence sales into the supermarket stores in the short run. The study concluded that service quality, customer perceived value and brand image are antecedents to brand loyalty. Brand Image, service quality and customer perceived value are variables that marketing practitioners in the supermarkets can focus on to increase high levels of customer satisfaction and hence brand loyalty. The measurement of these dimensions is a significant marketing tool for retail stores that wish to develop a competitive advantage and enhancing the customers repurchase intention and intention to recommend.

1
CHAPTER ONE
INTRODUCTION
1.1 Background of the Study
In the increasing competitive business world, organisations are paying more attention
to their customers than ever before. In retaining existing customers and gaining new
ones, a business should have a good understanding of customers, their needs and
wants, their expectations on price and quality of goods and services. Pleasing
customers is harder today, and most of the retailers try to achieve competitive
advantage by taking the responses of the customers beyond the level of ‘just
satisfied’ towards ‘exceeding their expectations’ (Kotler & Keller, 2012). Customers
are a more challenging component for any organisation and they expect the best
deals. Besides the above, the worst thing is ninety percent of dissatisfied customers
just switch to another supplier without complaining to former supplier (Kotler &
Keller, 2012).
According to Morgan (2009) in the last decade, the instability in the global economy
has pushed firms to re-evaluate their financial forecasts and their operating
assumptions. Today, the pressure on businesses is additionally increased due to a
market where customer acquisition rate is slowing down; the customer churn is on
the rise and lengthening sales cycles. Firms operating in such an environment, find
that losing a valuable customer to a competitor can have major impact on growth and
also on profitability. Consequently, firms have changed their spotlight from customer
acquisition to customer retention and loyalty. Brand loyalty is desired by firms
because retention of existing customers is less costly than obtaining new ones. Brand
loyal customers do contribute to a firm’s profitability as they spend more on
company services and products, by way of repeat purchases and by recommending
the organization to other consumers (Melnyk & Bijmolt, 2015).
Brand loyalty in marketing, consists of a consumer’s devotion, bond, and
commitment to repurchase and continue to use a brands product or service over time,
regardless of changes with competitors pricing or changes in the external

2
environment. Brand loyalty reflects a customer's commitment to remain in a
relationship for a long period of time with a brand (So, Andrew & Yap, 2013).
Loyalty is well thought-out to be a function of customer satisfaction and having
satisfied customers is not enough for a business to succeed, but there has to be
extremely satisfied customers (Youl & John, 2010). This is because customer
satisfaction must lead to loyalty. Customer satisfaction is not a guarantee of repeat
patronage. Satisfied customers jump ship every day, and the reasons are not always
due to customer dissatisfaction, some customers are lost due to indifference which
arises from pure neglect (Michael, Christopher, Tzu-Hui & Michelle, 2008).
A critical factor of building brand loyalty is developing a connection or relationship
between the consumer and the brand. An emotional relationship between the
consumer and the brand leads to a strong bond and a competitive advantage for that
particular brand (Melnyk & Bijmolt, 2015). According to Clarke (2001) the notion of
loyalty may appear at first sight to be outmoded in the era of the Internet, when
customers are able to explore and evaluate competing alternatives as well as
checking reports from others at the touch of a button. Indeed, the very fact that
customers can so readily assess the competing services and products on offer and
then so easily make the new purchase does in itself give added weight to the
importance of building strong ties of loyalty with customers (Clarke, 2001).
Khan (2009) discussed that a loyal and satisfied customer are not necessarily the
same thing. He found that customers may remain loyal for a number of reasons and
may not even be happy with the product or service. Khan (2009) study concluded
that true brand loyalty was not only an intention to buy it repeatedly over time but an
effective buying behaviour of a particular brand reinforced with a strong
commitment to that brand. Highly satisfied customers are more likely to become
loyal customers and potentially buy the new products introduced by the company,
speak well about the organization, and also pay less attention about competitors and
other brands (Ampoful, 2012). Above all, the costs for retaining existing customers
are far less than the costs of acquiring the new customers. In recent years, companies
have realized that a critical success factor is not a single transaction, but the creation

3
of a long-term relationship (Ampoful, 2012). Customer retention is thus critical,
since businesses lose about 30 per cent or more of their customers every year and
have large customer acquisition expenditures (Lee & Feick, 2001). Needless to say, it
is important for businesses to develop well-designed customer satisfaction programs
for increased customer retention. Customer retention is described as the marketing
goal of keeping your existing customers from going to a competitor (Ramakrishnan,
2006).
Brand loyalty is a valuable asset for every brand. Research has indicated that the cost
of recruiting new customers is very high due to advertising, personal selling,
establishing new accounts, and customer training (Hosseini & Zainal, 2014). Brand
loyalty is a critical goal for retailers because of an increasingly competitive retail
environment and low customer switching costs (Wallace, Giese & Johnson, 2004).
The rise of the retailer as a brand is one of the most important trends in retailing
(Grewal, Levy & Lehmann, 2004). Successful retail branding can be extremely
important in helping influence consumer perceptions and drive store choice and
loyalty (Ailawadi & Keller, 2004). Brand loyalty generates numerous benefits like
erecting barriers to competitors, generating greater sales and revenues, reducing
customer acquisition costs and inhibiting customers’ susceptibility to marketing
efforts of competitors (Rundle & Mackay, 2001). Thus, brand loyalty is a strategic
potent weapon to give a sustainable competitive advantage (Keller & Lehmann,
2006; Runyan & Droge, 2008).
There has been an immense global growth in the number of supermarkets in the last
few years. This increase has been exponential and is more prominent in the
developed countries. Many Supermarkets have grown rapidly in recent years by
adopting aggressive strategies to attract customers mainly due to emergence of new
supermarket formats and intense competition between supermarkets (Pacheco,
Cristina, Enrique, Rodriguez & Ricardo, 2012). The traditional grocery store has
transformed over the years to large supermarkets offering a wide variety of food and
household products, organized into aisles. It is larger and has a wider selection than a
traditional grocery store, but is smaller and more limited in the range of merchandise
4
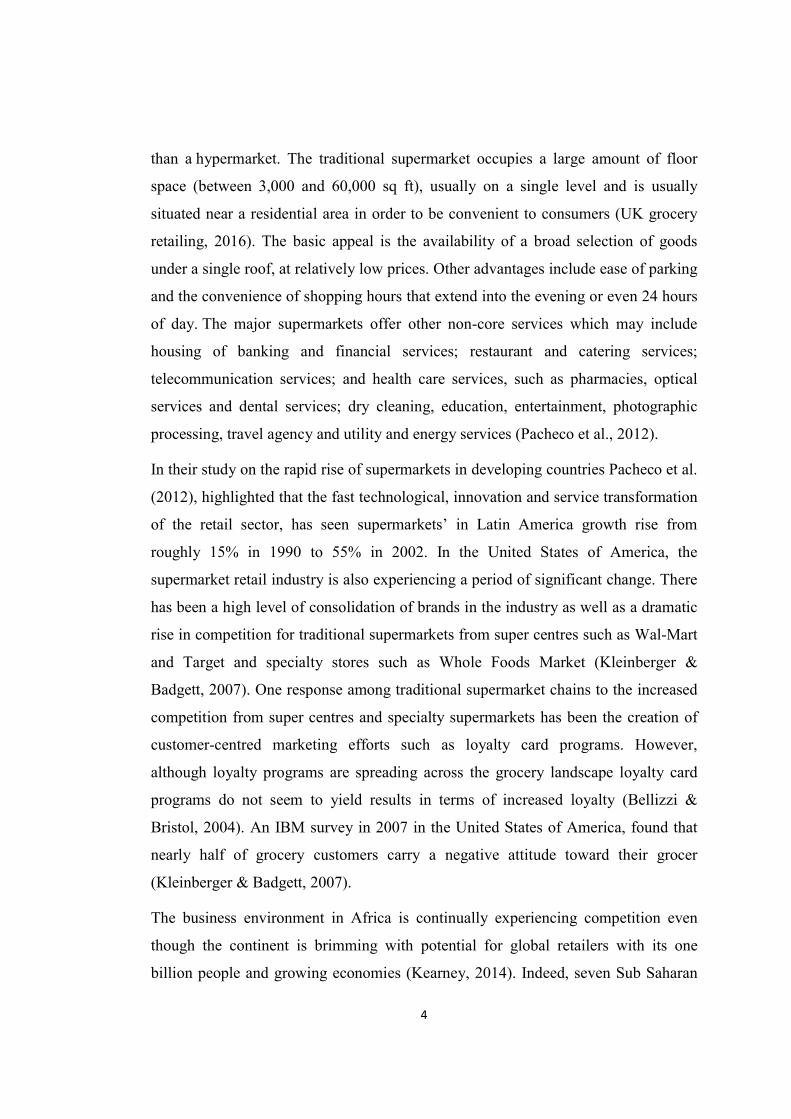
than a hypermarket. The traditional supermarket occupies a large amount of floor
space (between 3,000 and 60,000 sq ft), usually on a single level and is usually
situated near a residential area in order to be convenient to consumers (UK grocery
retailing, 2016). The basic appeal is the availability of a broad selection of goods
under a single roof, at relatively low prices. Other advantages include ease of parking
and the convenience of shopping hours that extend into the evening or even 24 hours
of day. The major supermarkets offer other non-core services which may include
housing of banking and financial services; restaurant and catering services;
telecommunication services; and health care services, such as pharmacies, optical
services and dental services; dry cleaning, education, entertainment, photographic
processing, travel agency and utility and energy services (Pacheco et al., 2012).
In their study on the rapid rise of supermarkets in developing countries Pacheco et al.
(2012), highlighted that the fast technological, innovation and service transformation
of the retail sector, has seen supermarkets’ in Latin America growth rise from
roughly 15% in 1990 to 55% in 2002. In the United States of America, the
supermarket retail industry is also experiencing a period of significant change. There
has been a high level of consolidation of brands in the industry as well as a dramatic
rise in competition for traditional supermarkets from super centres such as Wal-Mart
and Target and specialty stores such as Whole Foods Market (Kleinberger &
Badgett, 2007). One response among traditional supermarket chains to the increased
competition from super centres and specialty supermarkets has been the creation of
customer-centred marketing efforts such as loyalty card programs. However,
although loyalty programs are spreading across the grocery landscape loyalty card
programs do not seem to yield results in terms of increased loyalty (Bellizzi &
Bristol, 2004). An IBM survey in 2007 in the United States of America, found that
nearly half of grocery customers carry a negative attitude toward their grocer
(Kleinberger & Badgett, 2007).
The business environment in Africa is continually experiencing competition even
though the continent is brimming with potential for global retailers with its one
billion people and growing economies (Kearney, 2014). Indeed, seven Sub Saharan

5
Africa countries are now among the 10 fastest growing economies in the world. As
global retailers tiptoe into sub – Saharan Africa, figuring where to enter and how to
begin is a daunting task, it is even more difficult for the existing firms to maintain
market share and achieve growth (Kearney, 2014). Kenya’s retail industry has
experienced a phenomenal increase in supermarkets which has resulted in intense
competition forcing supermarkets to not only expand their range of products and
services but also pay special attention to quality of service and brand loyalty. In
addition, they have expanded their operations to the broader Eastern Africa
positioning themselves to all kinds of customer needs and income levels. According
to a study by Kestrel Capital (2014), the four major supermarkets in Kenya have
been on an aggressive expansion plan with Nakumatt, Tuskys, Uchumi and Naivas
increasing their stores regionally from 37, 37, 21 and 19 in March 2012 to 45, 46, 34
and 29 respectively in 2014. The four controlled 30% of the Kenya retail market as
per this study. There’s also been increased interest by South African Game,
Botswana Choppies and French Carrefour retailers who have entered the Kenyan
market. Other smaller but significant players include Maathais, Mulley’s, Tumaini,
Magunas, Ukwala, Ebrahims, Khetia, Chandarana, and Eastmatt (Kestrel Capital,
2014).
The main supermarkets in the market have ensured customers renewed shopping
experience by extremely offering classic after sale services to customer through
loyalty and bonus points approach, faster complaints handling customer care,
favourable shopping environment in terms of products displays and easy
communication to direct customers in the supermarkets (Karanja, 2012). All these
are intended to enhance faster, easier consumer purchase process and increase
competitive advantage. The competitive advantage of a best cost provider lowers
costs than rivals in incorporating upscale attributes, putting the company in a position
to under-price rivals whose products have similar upscale attributes (Thompson &
Gamble, 2007).
In today’s highly competitive markets a business that offers quality product and
better services will definitely have an advantage over the others due to the diversity

6
in the consumer markets and increasingly saturated supermarkets in the retail
industry (Cant & Machado, 2004). According to Khan, Jamwal and Sepehri (2010)
new technologies, deregulation, and competition open up industries, and make the
market more competitive. And in this strongly competitive and broadly liberalized
supermarket service industry, customer churn has turned into very serious issue.
Many customers frequent competing stores from one provider to another in search of
better rates, service or convenience (Lin & Chou, 2003). This study evaluated the
determinants of brand loyalty in the leading supermarkets in Kenya.
1.2 Statement of the Problem
The supermarket retail industry in Kenya has had many entrants in the last one
decade, which has increased competition in the industry. Global chains like Game,
Carrefour, Choppies and local groups have entered the Kenya retail industry. The
global business environment today and shifting economic activities between and
within regions are imposing new competitive pressures on companies, which in turn
create the necessity for competitiveness (Tharnurjan & Seneviratne, 2009). Each one
of these new entrants is fighting for a share of customers. Customers in the
supermarket retail industry, have options to choose among a number of service
providers and actively put into effect their rights to shop from one retailer to another.
This raises the issue of loyalty to the supermarket brand and a problem of retaining
customers. The main retailers have to deploy retention strategies to keep customers
loyal to their brand. With retention strategies in place, many companies start to
include churn reduction as one of their business goals (Ramakrishnan, 2006).
Slowing customer "churn" rate can add to a firm’s bottom line.
The intense competition has seen some leading retail chain superstores perform
poorly in terms of profitability culminating into eventual closure of business or
reduction in the number of branches. Thus, keeping customers satisfied and loyal is
key to the survival of these Supermarket chains. Keeping customers satisfied and
loyal is necessary because loyal customers tend to repeat and increase their purchase,
which in turn increases sales and revenue of the retail firm (Li & Green, 2011).
Customer satisfaction and brand loyalty is the output of a successful retail marketing
7
model in a competitive marketing environment, thus creating value for both
customers and retailers with many of these supermarkets laying special emphasis on
the development of customer satisfaction and brand loyalty, in order to tap long term
sales revenue (Heng, Yeong, Siong, Shi & Kuan, 2011). However, in their drive for
customer satisfaction and brand loyalty, many of these supermarkets continue to be
faced with impediments which include increasing competition and rising customer
expectations (Gomez, McLaughlin & Wittink, 2004).
It is generally believed that a satisfied customer is more likely to display loyalty
behaviour, which is expressed by repeat purchase and willingness to give positive
word of mouth (Schultz, 2005). Evidently, Reichheld and Markey (2000) noted that
those customers said to be satisfied or very satisfied on the survey, showed that
between 60 % and 80% will defect in most businesses. According to Schiffman &
Kanuk (2004) small reductions in customer defections produce significant increases
in profits because loyal customers buy more products; loyal customers are less price
sensitive and pay less attention to competitors advertising; servicing existing
customers who are familiar with the firms offering and processes is cheaper; and
loyal customers spread positive word of mouth and refer other customers (Schiffman
& Kanuk, 2004).
There are few studies that have focused on Supermarkets chains as a brand yet many
shoppers intending to purchase a particular product will first decide on which outlet
to get the product from. In general authors (Wan & Schell, 2013; Wang, Lo, Chi &
Yang, 2004; Tu, Li & Chih, 2011), agree that service quality, customer satisfaction,
sales promotions, brand image and customer perceived value are important
antecedents of brand loyalty. But none of them has studied all these constructs
together as interlinked. Little evidence exists in research that has simultaneously
compared the relative influence of these important constructs on service encounter
outcomes (Cronin, Brady & Hult, 2000). This gap generates a new call for a research
to establish simultaneously the relative influence of these constructs towards brand
loyalty in the supermarket retail sector. Also, most of the studies till now are done in
developed countries, so there is a need to validate these models in developing
8
countries, across different settings and cultures. It is in light of this background that
the proposed study is conceived, to establish the determinants of brand loyalty in
leading supermarkets in Kenya.
1.3 Objectives of the Study
The study was guided by the following objectives.
1.3.1 General Objective
The general objective of this study was to establish the determinants of brand loyalty
in leading supermarket chains in Kenya.
1.3.2 Specific Objectives
The specific objectives of this study were:
1. To determine the influence of service quality on brand loyalty in leading
supermarket chains in Kenya.
2. To establish the effect of customers’ value perception on brand loyalty in
leading supermarket chains in Kenya.
3. To evaluate the effect of sales promotions on brand loyalty in leading
supermarket chains in Kenya.
4. To determine the effect of brand image on brand loyalty in leading
supermarket chains in Kenya.
5. To assess the extent to which customer satisfaction mediates the relationship
between the independent variables and brand loyalty in leading supermarket
chains in Kenya.
1.4 Research Hypothesis
The study tested the following hypothesis:
H01 There is no significant effect of service quality on brand loyalty in
leading supermarket chains in Kenya.
H02 There is no significant effect of customers’ value perception on brand
loyalty in leading supermarket chains in Kenya.
9
H03 There is no significant effect of sales promotions on brand loyalty in
leading supermarket chains in Kenya.
H04 There is no significant effect of brand image on brand loyalty in leading
supermarket chains in Kenya.
H05 There is no significant mediation effect of customer satisfaction on the
relationship between the independent variables and brand loyalty in
leading supermarket chains in Kenya.
1.5 Justification
The proposed study is against a backdrop of changing landscape in the Supermarkets
sector in Kenya where the study supermarkets (Nakumatt, Tusky’s, Naivas, and
Uchumi) leads by occupying the top four positions respectively, in terms of having
the largest branch network in Kenya with a total of 146 branches and control a 30%
market share in 2014, and control an estimated 149 billion Kenya Shillings of annual
revenues (Kestrel Capital, 2014). These Supermarkets were still the market leaders in
2017 by which time the study was undertaken. A few years ago, the market was
dominated by Uchumi and Nakumatt. Tuskys and Naivas rose in the last few years to
challenge the duopoly. There has been a rapid increase in the number of outlets
controlled by the main supermarkets. These leading supermarkets should strategize
to stay ahead of the competition. Some of the supermarkets have not been able to
match to the fierce competition and have opted to merge in order to reap the
synergies associated with merging and/or acquisition (Kestrel Capital, 2014). This
study was crucial in exposing how Supermarkets can build brand loyalty so as to deal
with increased competition.
The study is of significance to various stakeholders’ in the Kenya Supermarkets
Sector. The stakeholders include supermarket managers who could use the study to
come up with marketing activities aimed at retaining their customers, building brand
loyalty and increasing profitability. The other stakeholder who would use the study
to formulate policies is the Government. These policies would create a more level
playing ground within the industry. Investors are the other stakeholders who would
10
use the study to make better decisions while making investments. The findings of the
study will also add to the existing body of knowledge on the subject of brand loyalty.
This study will thus be useful for future scholars in the subject.
1.6 Scope of the Study
This study was carried out in Nairobi and Nakuru counties in Kenya and targets the
loyalty card customers of the main supermarkets (Nakumatt, Uchumi, Naivas &
Tusky’s). The study data was collected in 2017 at which time the four supermarkets
were still leading in terms of the number of branch network. Nairobi County was
chosen as these 4 supermarkets have their headquarters and main branches in Nairobi
and the standards in Nairobi are replicated around the country. The four
supermarkets have the largest customer base in the Kenya. Nakuru was chosen as
three of these supermarkets (Nakumatt, Tusky’s and Naivas) originated from Nakuru
county before spreading all over the country. The Variables of the study focused on
the following main areas which are the bases of the study hypotheses: service
quality, customer perceived value, sales promotions and brand image as the
independent factors. These factors were found to influence brand loyalty.
1.7 Limitations of the Study
There is an apparent inadequacy of local literature on the subject of brand loyalty. As
such, most of the journals adopted in the study emanated from foreign countries with
different local conditions compared to Kenya. This inadequacy limited the
comparison between the research findings and other empirical studies conducted on
the subject locally. The study was limited to four major supermarkets in Kenya and a
replication can be undertaken with more supermarkets being studied. This study was
conducted in Kenya, and some of the findings might be more applicable to the
Kenyan context. The study was conducted in the supermarket retail sector and it
might not be appropriate for this study to make the claim that the findings are
applicable to all service industries. The supermarkets management was cautious in
providing customer information due to the sensitivity and suspicion normally
associated with any kind of a research study. To resolve their concerns, the
supermarket managers were assured of utmost confidentiality in the use of the

11
information. The variables on service quality, customer perceived value and brand
image are not the only antecedents to brand loyalty. There are other antecedents like
brand awareness, distribution intensity and brand trust.

12
CHAPTER TWO
LITERATURE REVIEW
2.1 Introduction
This chapter is devoted to reviewing literature relevant to the study on determinants
of brand loyalty. The theoretical framework that guides this study is given by gap
model of service quality theory, means-end theory, expectation disconfirmation
theory, adaptation level theory, brand consumer relationship theory and social class
theory. The chapter also displays the conceptual framework that outlines the
mediating effect of customer satisfaction on the relationship between service quality,
customer perceived value, sales promotion and brand image as the independent
variables with brand loyalty as the dependent variable. Further the chapter looks at
empirical studies and documented research findings by other researchers on the
subject and it ends by a summary section on key variables and identification of the
research gaps of the previous studies.
2.2 Theoretical Review
A theory consists of a coherent set of general propositions that explain some
phenomena by describing the way other things correspond to this phenomenon. A
theory is a formal, testable explanation of some events that includes explanations of
how things relate to one another. A theory can be built through a process of
reviewing previous findings of similar studies, simple logical deduction, and/or
knowledge of applicable theoretical areas (Zikmund, Babin, Carr, & Griffin, 2013).
In a scientific sense, a theory is a coherent narrative capable of describing the world
and perhaps even explaining the world and predicting the world’s next turn. In its
natural science aspirations, social theory would predict events before they happen, so
precise would be its cause–effect linkages. Theories are perspectives with which
people make sense of their world experiences (Stoner, Freeman & Gilbert, 2001).

13
2.2.1 Service Quality (SERVQUAL) Model
Parasuraman, Zeithaml, and Berry (1988) originated the model of service quality
measurement based on a disconfirmation paradigm. In the initial model ten factors
were mentioned for evaluating service quality. These ten factors included tangibility,
reliability, responsiveness, courtesy, credibility, security, accessibility,
communication and understanding the customer. These ten factors were simplified
and collapsed into five factors. In their conceptualization of SERVQUAL,
Parasuraman et al. (1988) suggested five dimensions of service quality. These
dimensions are reliability, assurance, tangibility, empathy and responsiveness also
acronym RATER by Buttle (1996).
The SERVQUAL model as shown in figure 2.1, proposes the use of the gap analysis
or difference between expected level of service and delivered level of service for
measuring service quality perception with five dimensions: reliability,
responsiveness, assurances, empathy, and tangibility. SERVQUAL is an analytical
tool, which can help in identifying the gaps between variables affecting the quality of
the offering services (Seth, Deshmukh & Vrat, 2005). This model has a wide
acceptance among marketing researchers and scientists, although it is an exploratory
study and does not offer a clear measurement method for measuring gaps at different
levels.

14
Figure 2.1: The SERVQUAL model (Parasuraman, Zeithaml, & Berry (1985)
According to Zeithaml, Bitner and Gremler (2009) reliability is the ability to perform
the promised service dependably and accurately; responsiveness is the willingness to
help customers and provide prompt service; assurance is the knowledge and courtesy
of employees and their ability to convey trust and confidence; empathy is the caring,
individualized attention; and tangibles covers the physical facilities, equipment and
appearance of personnel.
2.2.2 The Means–end theory: Zeithaml approach
The means–end theory (Gutman, 1982) has provided a theoretical and conceptual
structure that connects consumers’ values with their behaviour. This theory posits
that decision-making processes regarding consumption are influenced by: linkages
among product attributes; the perceived consequences of consumption; and the
personal values of consumers. The central thesis of the means–end theory is that
individuals are goal directed and that they use product or service attributes as a
means of inferring desired end states. An analysis of the relationships underlying this
Word of mouth
communications
Personal
Needs
Past
experiences
Determinants of
Service quality:
Reliability
Assurance
Tangibles
Empathy
Responsiveness
Expected
service
Perceived
service
Perceived
Service
Quality

15
behaviour can be depicted as a hierarchical value map. Zeithaml (1988) used means–
end theory to adapt a model first proposed by (Dodds, Monroe & Grewal, 1991)
whose conceptualization of value had been based mainly on the quality–price
relationship. Zeithaml (1988) described four different definitions of value: value as
low price; value as whatever the consumer wants in a product; value as the quality
obtained for the price paid; and value as what the consumer gets for what he or she
gives. The author ultimately defined perceived value as a bi-directional trade-off
between ‘giving’ and ‘getting’ that is, what is sacrificed versus what is received in an
exchange.
In so doing, Zeithaml (1988) proposed a means–end model in which a hierarchy of
variables is established according to their level of abstraction. This model provides
an overview of the relationships among the concepts of perceived price, perceived
quality, and perceived value. According to this conceptual model, people evaluate
products on the basis of their perceptions of price, quality, and value, rather than on
the basis of objective attributes such as actual prices or actual quality. Zeithaml
(1988) also indicated that, in the means–end chains, value (like quality) is proposed
to be a higher-level abstraction. However, it differs from quality in two ways: value
is more individualistic and personal than quality; and is therefore a higher-level
concept than quality. Thus, Zeithaml (1988) model reflects that both perceived price
and perceived sacrifice are perceptions of lower-level attributes; that perceived
quality is a higher-level attribute; and that the perceived value is a higher-level
construct that is inferred from perceived sacrifice and quality.
2.2.3 The Expectations-Disconfirmation Theory
Expectations-disconfirmation theory (EDT), posits that expectations, coupled with
perceived performance, lead to post-purchase satisfaction. This effect is mediated
through positive or negative disconfirmation between expectations and performance.
If a product outperforms expectations (positive disconfirmation) post-purchase
satisfaction will result. If a product falls short of expectations (negative
disconfirmation) the consumer is likely to be dissatisfied (Oliver, 1980; Spreng,
MacKenzie & Olshavsky, 1996). EDT, can measure customer’s satisfaction from

16
difference between customer’s expectation and experience in perceived products or
services. The four main constructs in the model as illustrated in figure 2.2, are:
expectations, performance, disconfirmation, and satisfaction. Expectations define
what customers anticipate about performance of products and services (Churchill &
Surprenant, 1982). Expectations reflect anticipated behavior (Churchill & Suprenant,
1982). They are predictive, indicating expected product attributes at some point in
the future (Spreng et al., 1996). Expectations serve as the comparison standard in
what consumers use to evaluate performance and form a disconfirmation judgment
(Haistead, 1994).
Figure 2.2: Expectation Disconfirmation Model. (Churchill & Surprenant, 1982)
Perceived performance indicates customer’s experience after using products or
services that can be better or worse than customer’s expectation (Spreng et al., 1996).
Disconfirmation is defined as the difference between customer’s initial expectation
and observed actual performance (Bhattacherjee & Premkumar, 2004).
Disconfirmation is hypothesized to affect satisfaction, with positive disconfirmation
leading to satisfaction and negative disconfirmation leading to dissatisfaction. EDT
has the ability to define multiple manners of customers in purchase process. First, the
customers have an initial expectation according to their previous experience with
using specific product or service. Second, the new customers that don’t have a first-
hand experience about performance of product or services and for the first time they
purchase from a specific business. The initial expectations of new customers consist
of feedbacks that they receive from other customers, advertising or mass media
Expectations
Perceived Performance
Disconfirmation Satisfaction Expectations
Perceived Performance

17
(Haistead & Hartman, 1994). Upon usage of the products or services, new and old
customers can realize actual quality of the company’s products or services.
2.2.4 Adaptation Level Theory
This theory proposes that consumers carry with them an adaptation level price or
‘internal reference price’ for a given product (Monroe, 1973). The internal reference
price represents the price a consumer expects to pay for a product and is formed on
the basis of past prices paid or observed either for the same product or similar
products. The internal reference price is a standard against which market prices are
compared and judged as high, low or medium. The existence of internal reference
prices has been confirmed in several studies (Gurumurthy & Winer, 1995).
Researchers have proposed that consumers respond to a price promotion based on the
comparison between the internal reference price and the promotional price. Frequent
price promotions can lead consumers to lower the reference price for the promoted
product. Consumers with lowered reference prices will be unwilling to pay the full
price of a product once the promotion is over (Lattin & Bucklin, 1989; Kalwani &
Yim, 1992).
2.2.5 The Brand Consumer Relationship Theory
Kotler and Keller (2012) states that a brand is a name, term, sign, symbol, or design
or combination of them which is intended to identify the goods and services of one
seller or group of sellers and to differentiate them from those of competitors. A study
by Dall’Olmo and De'Chernatony (2000) posits that a brand is the link between firms
marketing activities and consumers’ perceptions of functional and emotional
elements in their experience with the product and the way it is presented. They
suggest that this link can be viewed in terms of a relationship between consumers
and brands and that understanding consumer-brand bond in terms of relationship
marketing principles will assist marketers in enhancing brand value. Brand
relationships are critical in maintaining the relevance of the brand in an increasingly
competitive and fast-moving market place. Brand relationships have been recognised
as leading to increased market share and profits, providing a competitive edge,
improving marketing decisions such as product positioning and advertising, attitude

18
reinforcement, a higher volume of purchases and repeat business (Dall’Olmo &
De'Chernatony, 2000). A consumer-brand relationship also serves several functions
from the consumer viewpoint including reassuring consumers about the consistency
of the product quality, enabling consumers to express themselves emotionally, and
socially by making a statement to other people (Dall’Olmo & De'Chernatony, 2000).
2.2.6 Social Class Theory
Social class theory by Warner (1941) describes status hierarchy where groups and
individuals are described in terms of esteem and prestige (Meng & Fraedrich, 2010).
The theory helps to segment customers by lifestyle and predict their purchasing
patterns (Meng & Fraedrich, 2010). Social class is defined as the division of
members of a society into a hierarchy of distinct status classes (Schiffman, Kanuk &
Hansen, 2008). In order to update social class levels, Coleman (1983) suggested
dividing consuming public in four status groups: upper class, middle class, working
class, and lower class. Social class measures require relative rankings of its member
‘s status using factors such as amount of economic assets, influence over others or
degree of recognition received from others (Schiffman et al., 2008). Social class
membership forms the reference that customers base their attitudes and behaviour
(Schiffman et al., 2008). It means that customers try to behave according to specific
social class standards. Customers may purchase products which are favoured by their
own or higher social class members, and customers may avoid products which they
perceive as lower-class products (Schiffman et al., 2008). Customers have different
images of themselves or self-perceptions which are closely linked to personality
((Schiffman et al., 2008). In order to segment a market, a retailer should consider
customer self-images and position products and services as a symbol of particular
self-image (Schiffman et al., 2008). Store image can be enhanced when it matches
the target customer’s self-concept (He & Mukherjee, 2007).
2.3 Conceptual framework
Based on the literature reviewed, a conceptual framework showing how service
quality, customer perceived value, sales promotions, brand Image and customer
satisfaction interact with brand loyalty is displayed in Figure 2.3.

19
Independent Variables Mediating Variable Dependent
Variable
Figure 2.3: Conceptual Framework.
Brand Loyalty
Repurchase
Intentions
Positive word of mouth
Intention to
recommend
Commitment
to the brand
Service Quality Reliability Assurance Tangibility Empathy Responsiveness
Customer Perceived Value
Perceived benefits
Perceived quality
Perceived price
Sales Promotion
Discounts
Free gifts/Samples
Loyalty Programs
Brand Image Corporate appeal Consistency Reputation
Customer
Satisfaction
Positive
experience
Meeting expectations
Exceeding
expectations
Satisfied
needs

20
2.4 Empirical Review
Literature review surveys scholarly articles, books and other sources relevant to a
particular issue, area of research, or theory, and by so doing, providing a description,
summary and critical evaluation of these works. Literature reviews are designed to
provide an overview of sources while researching a particular topic and to
demonstrate to readers how the research fits into the larger field of study (Creswell,
2013).
2.4.1 Service Quality
Service quality is described as an overall judgment about the level of a service
provider's performance (Zeithaml, Bitner & Gremler, 2009). Service quality
measures how much the service delivered meets the customers’ expectations. Service
quality is a result of the comparison of perceptions about service delivery process
and actual outcome of service (Lovelock & Wirtz, 2011). The quality of service
highlights the ability of the firm to determine correctly the customer expectations and
to deliver the service at a level that will at least meet those expectations (Brink &
Brendt, 2008). The investigation by Lewis (2004) presents service quality as how
well a consumer’s needs are met and how well the service delivered meets the
customer’s expectations. Gronroos (2006) further argued that consumers’ perception
of a service’s value is highly dependent on the individual consumers’ expectations
and outcomes of the product evaluation. According to Owino (2013) the relationship
between service quality and customer satisfaction is significant and positive but can
be enhanced by building a strong corporate image. Omwenga, Ndung’u and
Manyinsa (2015) posits that, it is necessary for the service providers to meet the
consumers’ requirements and expectations in price and service quality.
Parasuraman, Zeithaml and Berry (1988) identified five dimensions of service
quality (Reliability, responsiveness, assurance, empathy, and Tangibles) that link
specific service characteristics to consumers’ expectations. Parasuraman, et al.
(1988) presents reliability as the ability of a firm to perform the promised service
dependably and accurately. In other words, it is conformance to specification, doing
what you said you would do when you said you would do it (Nicoulaud, Hooley,
21
Rudd & Piercy, 2017). Zeithaml et al. (2009) mentioned that this dimension is
critical as customers want to deal with a company that keep its promises and has
good communication with them.
Assurance stems from the knowledge and courtesy of employees and their ability to
convey trust and confidence in their technical abilities (Nicoulaud et al., 2017).
Assurance stems from professional competence. It is not enough, however, merely to
have a high level of competence. It must also be demonstrated to the customers,
often through the use of tangible cues. The Tangibles dimension is the physical
appearance of facilities, displays, equipment, staff, and written materials. It translates
to the store interior decorations, the appearance and condition of the store and shelf
space, the uniform of the staff, the appearance and design of the communication
materials, signage and advertisements (Zeithaml et al., 2009). Tangibles are used by
firms to convey image and signal quality. According to Bellini, Lunardi and
Henrique (2005) tangibles are the basic elements such as access to the facilities and
the safety and convenience for customers.
Empathy implies treating customers as individual clients and being concerned with
their longer-term interests (Nicoulaud et al., 2017). It is the quality good doctors
have of being able to convince patients that they really care about their welfare
beyond addressing the current ailment. The customer is treated as if he is unique and
special. There are several ways that empathy can be provided: knowing the
customer’s name, his preferences and his needs. Many small companies use this
ability to provide customized services as a competitive advantage over the larger
firms (Zeithaml et al., 2009). This dimension is also more suitable in industries
where building relationships with customers ensures the firm’s survival as opposed
to transaction marketing (Andaleeb & Conway, 2006).
Responsiveness is the willingness to help customers and provide prompt service
(Zeithaml et al., 2009). This dimension is concerned with dealing with the
customer’s requests, questions and complaints promptly and attentively. A firm is
known to be responsive when it communicates to its customers how long it would
take to get answers or have their problems dealt with. Responsiveness typically

22
requires flexibility. Customer requests can often be off-beat and unexpected. The
highly responsive organisation will need to predict customer needs where possible,
and also build an operations capacity to respond to the unpredictable (Nicoulaud et
al., 2017).
Besides SERVQUAL, Sureshchandar, Rajendran and Anantharaman (2003) have
identified five factors of service quality from the customers’ perspective. Those are;
core service or service product, human element of service delivery, systematization
of service delivery: non- human element, tangibles of service, and social
responsibility. After a close inspection it could be safely concluded that the newly
defined construct of service quality by Sureshchandar et al. (2003) has some
resemblance with the definition provided by Parasuraman et al. (1988). Owino,
Kibera, Munyoki and Wainaina (2014) identified four service quality dimensions that
have the greatest predictive power on customer satisfaction in universities in Kenya
and these are human elements reliability, human elements responsiveness, service
blue print and non-human elements. An increase in service quality results in an
increase in the levels of customer satisfaction. For this study the researcher employed
the five dimensions of service quality proposed by Parasuraman et al. (1988). Tu, Li
and Chih (2011) reported in their study that service quality is closely linked to
customers’ satisfaction, and thus, influences customers’ loyalty. Su (2004) argued
that retailers should give special consideration to service quality in order to enhance
customers’ relationship through customer satisfaction and loyalty in this modern day
of increased competitiveness in the retail market.
2.4.2 Customer Perceived Value
Value is a concept that is perceived by the customer and thus, it is the customer who
defines the service's/product value (Vargo & Lusch, 2004). Customer value takes
numerous meaning and Lee (2010) points out that perceived value are the benefits
customers receive relative to total costs. When it comes to marketing, Jobber (2007)
writes that customer perceived value is dependent on how customers perceive the
benefits of a product and the sacrifice related to its purchase. Therefore, [Customer
perceived value] = [perceived benefits – perceived sacrifice]. Here the perceived
23
benefits are the things which can be derived from the products or services. Monroe’s
(1990) gives a more concrete view of customer value, in that buyers’ perception of
value is a function of the quality or benefits they perceive in the product relative to
the sacrifice they perceive by paying the price. This shows customer perceived value
as a function of customer-perceived quality and customer-perceived price. Perceived
quality, in turn, has been conceptualized as buyers' judgment about a product's
overall excellence or superiority. Perceived customer value is often viewed as a
customer’s overall assessment of what is received and what is given (Zeithaml, 1988)
and as a trade-off between perceived quality and its affordability within a choice
setting. Zeithaml (1988) posits that all costs that are salient to customers, such as
monetary price and non-monetary price (time and effort) should be incorporated as
perceived costs, and that the benefit components of perceived value should include
perceived quality, and other intrinsic and extrinsic attributes. According to Muturi,
Wadawi and Owino (2014) perceived quality of service and perceived price
determines customer value perceptions and are vital factors that customers consider
when choosing a service provider.
Dodds, Monroe and Grewal (2007) indicates that perceived value, as conceptualized
is a cognitive trade-off between perceived quality and sacrifice, decrease when price
increases, suggesting that the perceived sacrifice component became stronger in
relation to perceived quality at higher prices. The conceptual argument suggests that,
as price increases from a low-priced model to a higher priced model, buyers'
perceptions of value will increase and then decrease. Consumers’ value perceptions
are enhanced with increasing levels of quality they perceive and lowered with
increasing levels of sacrifice they feel. When perceiving high levels of value from a
pending purchase, consumers tend to express high levels of willingness to eventually
buy and low levels of willingness to look for alternative purchases (Oh, 2000).
According to Liu (2006) it is the value that customers feel they receive, rather than
their level of satisfaction, that keeps them returning. Liu (2006) examines the
concept of customer value for a business service and its role in encouraging
customers purchasing business services to believe that the costs of switching to

24
another provider would be high. The author presents customer value, for a business
service, as an organizational buyer’s assessment of the economic, technical and
relational benefits received, in exchange for the price paid for a supplier’s offer
relative to competitive alternatives. Yang and Peterson (2004) findings indicate that
loyalty can be generated through improving customer satisfaction and offering high
product/service value. According to Wieringa and Verhoef (2007) service quality and
customer perceived value are critical antecedents to brand loyalty. Tams (2010)
indicate that service quality and perceived value are antecedents of customer
satisfaction and brand loyalty is a consequence of customer satisfaction. Providing
customers with value is regarded as a strategic tool to attracting and retaining
customers, and building customer loyalty, thereby contributing significantly to the
success of the service providers (Wang, Chi & Yang, 2004).
2.4.3 Sales Promotion
Consumer promotions are directed at the consumer and are designed to induce them
to purchase the marketer’s brand. Trade promotions are designed to motivate
distributors and retailers to carry a product and make an extra effort to push it to their
customers (Belch & Belch, 2008). Consumer promotions can be considered as pull
promotions in that they directly entice the consumer to purchase the product, thereby
pulling the brand through the channel. Trade promotions can be considered as push
promotions in that they provide incentives for the retailer to offer special deals and
push the product through the channel (Raghubir, Inman & Grande, 2004). Sales
promotion techniques are instruments that seek to increase sales of products and
brands, usually in a short time because they act in the consumer’s mind as a benefit
to him, thus creating consumer buying behaviour (Wierenga & Soethoudt, 2010).
According to Santini, Sampaio, Perin, Espartel and Ladeira (2015) sales promotions
incentives are of two classifications: price or monetary promotions (shelf price
discounts, coupons, rebates); non-monetary promotions or not geared to price (free
samples, distribution of promotional prizes, free gifts, contests and loyalty
programs), which are capable of effectively influencing consumer purchasing
behaviour. Monetary promotions tend to provide fairly immediate rewards to the

25
consumer and they are transactional in character while non-monetary promotions
tend to involve delayed rewards and are more relationship-based (Alvarez &
Casielles, 2005). Ashraf (2014) confirmed that consumers buying behaviour and
sales promotion can be motivated through promotion techniques such as free samples
and price discounts. Consumers respond to sales promotions because of the positive
benefits they provide (Luk & Yip, 2008).
Walters (1991) found that pricing activity for a specific brand in one store has
negative effects on sales in its competing stores or more specifically that price
promotions of a brand in one store has a negative effect on the brand or its substitutes
in a competing store. This is an indication, that consumers can theoretically be lured
into switching stores by offering them attractive promotions. The increasing level of
competition in the global business market has pushed marketers all over the world to
consider a variety of sales promotion incentives in order to stand out among their
competitors (Jean & Yazdanifard, 2015). Generally retail managers can decide
between two core pricing strategies, the every-day-low-price (EDLP) strategy or the
High Low (Hi-Lo) pricing (Tsiros & Hardesty, 2010). When implementing an every-
day-low-price strategy, the average price for every article is selected to be between a
regular market price and a promotional price. By offering below regular market
prices on all items, the EDLP-strategy aims at attracting price and time sensitive
customers, who want to combine an attractive offering while not visiting multiple
shops to hunt for the cheapest bargain (Seiders & Voss, 2004). This strategy is very
common according to Bolton and Shankar (2003) as approximately 45 % of US
retailers, among them industry leaders such as Wal Mart, Home Depot, Costco and
Aldi, have implemented this.
The HiLo pricing strategy is defined as offering higher non-promotional prices
mixed with temporary discounts on individual brands or categories to customers. In
contrast to the EDLP, the HiLo strategy attracts cherry-pickers, who are willing to
invest additional effort in finding and visiting the stores with the cheapest price for a
brand, even if this would require them to visit multiple stores (Bell & Lattin, 2009).
Bell and Lattin (2009) provide some evidence of a self-selection effect. They show

26
that consumers who purchase large total market baskets per visit tend to favour stores
that feature everyday low pricing (EDLP), whereas shoppers who purchase small
market baskets prefer stores that run good promotions. According to Luk and Yip
(2008) the buying behaviour of less-committed consumers is mainly promotion-
driven. This group is comprised of the so-called brand switchers: consumers who
process the brand’s promotions as information to discriminate among acceptable
brands and ultimately develop the habit of purchasing on promotion (Luk & Yip,
2008).
Kopalle et al. (2009) suggested two key retail pricing strategies; everyday low
pricing (EDLP) and promotional pricing (PROMO). EDLP is characterised by
constant low prices on all goods in the store and uses basket prices to provide good
value all the time in order to be able to attract consumers. In contrast to the EDLP
strategy, the PROMO price strategy uses price special offers with steep discount
prices, which implies low prices for a limited time period rather than a constant low
price. Kopalle et al. (2009) conclude that large retailers usually use the EDLP or
PROMO strategies to target consumers who demand low prices and deals, but who in
return have low loyalty to the store brand itself.
Park, Choi and Moon (2013) empirically verified the relationship between sales
promotions, customer satisfaction, customer perceived value and brand loyalty,
legitimizing the growth of sales promotions within the duty-free shop sector. Their
results indicate that there were significant relationships between cutting price,
customer satisfaction, customer value, image and behavioral intentions. Park et al.
(2013) posits that Duty-free retail shops should raise the level of customer
satisfaction, value perception and duty-free shop image formation by use of attractive
sales promotion strategies which also enhances customer repurchase intention and
recommendations to other customers.
Taylor and Neslin (2005) provide evidence for a positive effect of a special type of
promotion on store loyalty. Palazon and Delgado (2005) confirmed a positive
relationship between sales promotions and brand loyalty. The results showed that
nonmonetary promotions are more customer franchise building (brand loyalty) as far

27
as they enhance a greater number and more favourable associations than monetary
promotions. Based on the results obtained, sales promotions can be used to build
brand knowledge because the individuals exposed to promotion stimuli evoked a
greater number and more favourable associations (Palazon & Delgado, 2005).
However, Bridges, Briesch and Yin (2006) argued that promotion enhancement
reduces brand loyalty due to the increased sensitivity to marketing mix activities for
all brands in the category; therefore, reducing the likelihood of consumers to buy
previously purchased brands on promotions. Yoo, Donthu and Lee (2000) argued
that frequent use of price promotions causes consumers to infer lower product
quality. Hence, frequent use of price promotions, such as price deals, is related to
low brand equity. The reason for low brand equity is that price promotions lead
consumers to think primarily about the deals and not about the utility provided by the
brand. Oyeniyi (2011) posits that monetary sales promotions could have negative
impact on brand preference, trust and loyalty. Sirohi, McLaughlin, & Wittink (2008)
found that perceptions of a store’s promotions correlate positively with Customer
perceived value and store brand loyalty.
2.4.4 Brand Image
Brand image is presented as the consumer’s mental picture of the offering and it
includes symbolic meanings that consumers associate with the specific attributes of
the product or service (Salinas & Perez, 2009; Bibby, 2011). Brand image portrays
the overall image and impression of the brand in the memory of the customers
(Upamannyu & Mathur, 2013). Also, brand image displays the content of the brand
like reputation, function, brand name and overall values (Upamannyu & Mathur,
2013). Chen and Myagmarsuren (2011) argue that brand image is a subjective
perception, a mental representation of functional and non-functional information
regarding the product or service. In other words, brand image is seen as the
representation of a brand in the consumer’s mind that is linked to an offering or a set
of perceptions about a brand the consumer forms as reflected by brand associations
(Cretu & Brodie, 2007).

28
According to Kim, Jin-Sun and Kim (2008) the idea behind brand image is that the
consumer is not purchasing just the product/service but also the image associated
with that store, product or service. While conducting their research on hospital brand
image, Kim et al. (2008) explained that brand image is not absolute and is relative to
brand images of competing brand. They further stated that brand image is also
formed on the basis of direct experience with the brand. In business markets, brand
image can also be expected to play an important role, especially where it is difficult
to differentiate products or services based on tangible quality features (Shankar, Azar
& Fuller, 2008). Brand image plays a critical role in helping customers to decide
whether or not to buy the brand and thereby influencing their repurchase behaviour
(Bian & Moutinho, 2011). Brand image can also serve as a defensive marketing tool
to retain customers hence driving loyalty, particularly in the context of services
where the service brand/firm are deemed synonymous (Sweeney & Swait, 2008).
According to Hsieh, Pan and Setiono (2004) a successful brand image enables
consumers to identify the needs that the brand satisfies and to differentiate the brand
from its competitors, and consequently increases the likelihood that consumers will
purchase the brand. Marketers usually regard brand image as the basis of how
consumers assess the quality of the product or service, that is, the external clue of the
products (Cretu & Brodie, 2007). The understanding is that, consumers will utilize
brand image to infer their awareness of the product or service or maintain their
quality consciousness to the product or service (Bibby, 2011). Branding literature
points out that the products with stronger brand image can really reduce consumers’
cognitive risk and increase consumers appraise to the target product or service
(Kwon & Lennon, 2009). In this regard, consumers often make use of the sense of
brand image to infer the quality of the product or service and decide their behaviour
(Salinas & Perez, 2009). Thus, the quality of the brand image indirectly causes
consumers’ cognition of the product or service quality. The ideal brand image not
only assists enterprises to establish market positions, but also protect brands from
other competitors (Cretu & Brodie, 2007). For this reason, enterprises today work
hard to maintain their brand image and as such invest substantial resources to

29
develop brand names with a favourable image (Shankar, Azar & Fuller, 2008). A
company or its product / services which constantly holds a favourable image by the
public, would definitely gain a better position in the market, sustainable competitive
advantage, and increase market share or performance (Park, Jaworski & MacInnis,
2006).
According to Ray (2009) shopping is not only for functional need fulfilment but it
also makes customer to feel good. If a person has a positive emotional experience
then over time the customer creates a favourable attitude towards the particular
supermarket based on stores unique affective surroundings. Thus, supermarket store
loyalty is a store image function (Wan & Schell, 2013). If the customer likes the
supermarkets image, he/she is likely to develop loyalty to it. According to Wan and
Schell (2013) customers tend to visit those supermarkets whose image is similar to
the customers own image. Supermarkets image reflects the stereotypes in customer’s
minds, such as high status or low status supermarket, traditional or modern
supermarket. There are also functional supermarket images, which refers to tangible
characteristics exhibited by the respective supermarkets, such as clean or dirty
supermarket, quiet or noisy one (Wan & Schell, 2013). Koo (2003) further posits that
a favourable image of a brand store or retailer will lead to loyalty. According to
Hsieh and Li (2008) the effect of a firm's public relations practices on customer
loyalty is stronger when perceived brand image is favourable. Additionally, customer
satisfaction has the greatest influence on loyalty when considered along with
customer value and brand image (Lai, Griffin & Babin, 2009).
2.4.5 Customer Satisfaction
Kotler and Keller (2012) states that satisfaction is a person’s feelings of pleasure or
disappointment resulting from comparing a product’s perceived performance or
outcome in relation to his or her expectation. The theoretical basis for models of
satisfaction arises primarily from consumer psychology, and especially the theory of
expectancy disconfirmation, which posits that the difference between what a
customer expects and what the customer receives is a primary determinant of
satisfaction (Oliver, Rust & Varki, 2007). According to Cengiz (2010) customer

30
satisfaction is a post consumption experience which compares perceived quality with
expected quality, thus a comparative behaviour between inputs beforehand and after
consumption. Customer satisfaction is an abstract concept where the actual
satisfaction varies from individuals and products depending on a number of variables
which include service quality and the individual expectations (Cengiz, 2010).
Satisfaction is a feeling which results from a process of evaluating what has been
received against what was expected, including the purchase decision itself and the
needs and wants associated with the purchase (Kotler & Armstrong, 2008). In service
settings, customer satisfaction is described as a desired outcome of service
encounters that involves an evaluation of whether the service or product has met the
customer's needs and expectations (Orel & Kara, 2014). Customer Satisfaction is the
overall accumulation of customer expectation before the purchase and after purchase
of the product or service encounter (Serkan & Gokhan, 2005). Satisfaction is also
regarded as a consequence of the customer's post-purchase evaluations of both
tangible and intangible brand attributes and a key determinant of customer loyalty
(Krystallis & Chrysochou, 2014). The position taken by Krystallis and Chrysochou
(2014) has been adopted for this study.
Low quality service, which does not reach the customers’ expectations, leads to
consumer dissatisfaction (Bagram & Khan, 2012). Unsatisfied consumers are also
quick to switch from the brand which fails to fulfil basic requirements. Furthermore,
Morgan (2009) noted that a dis-satisfied customer may relate a bad experience to 5 to
15 other people, eroding potential patronage of the service provider. Customer
satisfaction in a business is fundamental. According to Hanif, Hafeez and Riaz
(2010) high level of satisfaction is established when the brand fulfils the needs of
customers far more than the competing brands. Satisfaction is an important precursor
in promoting customer repurchases behaviour as it can affect a buyer’s decision to
continue a relationship with the organisation (Ndubisi, Malhotra & Chan 2009).
According to Child and Kliger (2002) the view that customer satisfaction is the key
to securing customer loyalty is, far from a fully robust philosophy. Satisfaction does
not always result in loyalty and, it is equally apparent, dissatisfaction does not

31
necessarily result in defection (Child & Kliger, 2002). Santouridis and Trivellas
(2010) states that satisfied customers have a high possibility to stick with the existing
product or service while dissatisfied customers can easily switch to other alternative
brands. However, several studies have verified that consumer's satisfaction has
positively influenced loyalty (Da Silva & Syed, 2006). Maintaining the desired level
of customer satisfaction requires a proactive corporate responsiveness in accessing,
building and retaining satisfied customers for sustainable competitive advantages in
the market place (Rahman, Redwanuzzaman, Masud-Ul-Hassan & Rahman, 2014).
Satisfied customers have a high probability to continue using the existing company
product or brand as compared to dissatisfied customers, who are willing to search for
alternatives (Santouridis & Trivellas, 2010). Empirical studies on goods and service
markets support that customer satisfaction positively influences brand loyalty (Youl
& John, 2010). However, satisfaction is a necessary condition to customer loyalty,
but not a sufficient condition. Even if customers are satisfied with the brand,
sometimes they could switch to other brands (Youl & John, 2010).
Empirical evidence in retail/store image studies confirmed that satisfaction has
strongly influenced loyalty intention such as intention to recommend, intention to
repurchase and intention to revisit the store (Kandampully & Suhartanto, 2000). The
drivers of customer satisfaction include perceived supermarket image, customer
expectations, store offerings (merchandise, services, value for money), and shopper
behaviour (Sullivan & Dennis, 2002). Customer satisfaction and brand loyalty is the
output of a successful retail marketing model in a competitive marketing
environment, thus creating value for both customers and retailers (Nikhashemi, Paim,
Sidin and Khatibi, 2014). In their study of Malaysian hypermarkets Nikhashemi et al.
(2014) posits that the hypermarkets have experienced marked growth and
development in the recent years, with many of these hypermarkets laying special
emphasis on the development of customer satisfaction. However, in their drive for
customer satisfaction, many of these hypermarkets continue to be faced with a
number of impediments which includes increasing competition and rising customer
expectations (Nikhashemi et al., 2014).

32
Hu, Kandampully and Juwaheet (2009) indicated that customer perceived value
significantly affects customer satisfaction and the higher the perceived value the
higher the client overall satisfaction with the service provider. A number of
researches posit that customer satisfaction has a mediating influence on the
relationship between service quality affects and store brand loyalty (Bedi, 2010;
Kumar, Kee & Charles, 2010).
2.4.6 Brand Loyalty
The concept of brand loyalty is a two-dimensional construct containing attitudinal
and behavioural aspects (Hwang & Kandampully, 2012). According to the attitudinal
perspective, brand loyalty is presented as a deeply held commitment to re-buy or re-
patronize a preferred product/service consistently in the future, thereby causing
repetitive same-brand or same brand-set purchasing, despite situational influences
and marketing efforts having the potential to cause switching behaviour (Oliver,
2007). On the other hand, behavioural loyalty is usually understood as forms of
customer behaviour such as retention of the brand, repeat purchase, share of category
expenditure and portfolio size, which are directed toward a particular brand over time
(Lam, Ahearne, Hu & Schillewaert, 2010). Santouridis & Trivellas (2010) claim that
brand loyalty has both attitudinal and behavioural elements and it is determined by
the strength of the relationship between relative attitude and repeat patronage. For the
purpose of the current research, and in line with previous research (Hwang &
Kandampully, 2012), brand loyalty will be measured attitudinally by customers’
behavioural intention to continuously or increasingly conduct business with their
present supermarket store/brand, and their inclination to recommend the store/brand
to other persons.
Malik, Asif and Malik (2012) notes that loyalty cannot be taken for granted and
continue only as long as the customers feel they are receiving better value than they
would obtain from another supplier. While spurious loyalty is driven by situational
circumstances such as price and convenience true brand loyalty holds some indicator
of previous psychological and affective attachment to the brand (Iglesias, Singh &
Foguet, 2011; Lin, 2010). Yang and Peterson (2004) survey on online service users

33
indicated that companies that strive for customer loyalty should focus primarily on
satisfaction and perceived value. However Youl and John (2010) states that customer
satisfaction is an important factor for retention but not a sufficient one.
The concept of brand loyalty has been recognised as an important construct in
marketing literature, and most researchers agree that brand loyalty can create benefits
to a firm such as reduced marketing costs, positive word of mouth, business
profitability, increased market share and a competitive advantage (Sutikno, 2011;
Iglesias et al., 2011; Kabiraj & Shanmugan, 2011). Lopez, Redondo & Olivan (2006)
further highlights the need for firms to renew both acquisition and retention
strategies in order to take individual customer information into account. This should
help them to identify and retain the most valuable customers and to optimally
allocate marketing resources from switching-prone to non-switching-prone
customers. According to Malik, Asif and Malik (2012) purchase intentions can be
enhanced by brand awareness and brand Loyalty as a result of their strong positive
association, thus managers should strive to promote the brand awareness along with
brand loyalty as both of them contribute towards positive purchase intentions.
According to Schiffman & Kanuk (2004) small reductions in customer defections
produce significant increases in profits because loyal customers buy more products;
loyal customers are less price sensitive and pay less attention to competitors
advertising; servicing existing customers who are familiar with the firms offering and
processes is cheaper; and loyal customers spread positive word of mouth and refer
other customers (Schiffman & Kanuk, 2004).
Brand loyalty generates numerous benefits like erecting barriers to competitors,
generating greater sales and revenues, reducing customer acquisition costs and
inhibiting customers’ susceptibility to marketing efforts of competitors (Rundle &
Mackay, 2001). Thus, brand loyalty is a strategic potent weapon to give a sustainable
competitive advantage (Keller & Lehmann, 2006; Runyan & Droge, 2008). It is also
argued that a critical issue for the continued success of a firm is its capability to
retain its current customers and make them loyal to its brands (Bennett, Kennedy &
Coote, 2007). Numerous researchers have proposed different factors as antecedents

34
of brand loyalty. For instance, some scholars put forward psychological constructs
such as trust, satisfaction, commitment and customer perceived value to explain
consumer brand loyalty (Woodside & Walser, 2007; He & Harris, 2012).
2.5 Critique of Existing Literature Relevant to the Study
Although the SERVQUAL model is widely used in the literature, two criticisms have
been made against it: the validity of the model and the exact number of its
dimensions (Nam & Whyatt, 2011). After a comprehensive review of service quality
studies, Asubonteng, McCleary and Swan (1996) concluded that the number of
service quality dimensions varies in different industries. There is thus need to adapt
the service quality dimensions to the specific industry under study. Bridges, Briesch
and Yin (2006) argued that sales promotions enhancement reduces brand loyalty due
to the increased sensitivity to marketing mix activities for all brands in the category;
therefore, reducing the likelihood of consumers to buy previously purchased brands
on promotions. Yoo, Donthu and Lee (2000) argued that frequent use of price
promotions causes consumers to infer lower product quality. Hence, frequent use of
price promotions, such as price deals, is related to low brand equity. The reason for
low brand equity is that price promotions lead consumers to think primarily about the
deals and not about the utility provided by the brand.
Although the positive impact of brand image on customer satisfaction and loyalty has
been testified, there still exist minor disagreements between different researches.
Specifically, some studies prove that brand image not only influences loyalty
directly, but also impacts on it through other mediating factors. However, some
research results demonstrate that brand image exerts no direct influence on loyalty,
but it can impact on loyalty via customer satisfaction. According to Child and Kliger
(2002) the view that customer satisfaction is the key to securing loyalty is, far from a
fully robust philosophy. Satisfaction does not always result in loyalty and, it is
equally apparent, dissatisfaction does not necessarily result in defection (Child &
Kliger, 2002). According to Da Silva and Syed (2006), consumer's satisfaction
positively influences loyalty.

35
2.6 Research Gaps
The effect of promotions on store brand loyalty has not been studied as much. An
important measurement issue with regard to store loyalty is whether inherently non-
loyal shoppers are self-selected to shop at promotion-oriented stores, or whether
promotions in fact erode the loyalty of shoppers over time. There are few studies that
have focused on Supermarkets chains as a brand yet many shoppers intending to
purchase a particular product will first decide on which outlet to get the product
from. In general authors agree that service quality, customer satisfaction, sales
promotions, brand image and customer perceived value are important antecedents of
brand loyalty. But only a few of them study these constructs as interlinked (Wan &
Schell, 2013; He & Mukherjee, 2007; Bell & Lattin, 2009; Kopalle et al. 2009;
Taylor and Neslin, 2005; Sirohi, McLaughlin, & Wittink 2008). They are intangible,
complex and relatively vague, but also strategically important concepts. There is a
need for studying these factors interlinked in the same context in different service
industries.
No research has simultaneously compared the relative influence of these important
constructs on service encounter outcomes (Cronin, Brady & Hult, 2000). This gap
generates a new call for a research to establish simultaneously the relative influence
of these constructs towards brand loyalty in the service sector. Also, most of the
studies till now are done in developed countries, so there is a need to validate these
models in developing countries, across different settings and cultures.
2.7 Summary of Literature Reviewed
To sum up, this chapter addresses the theoretical models and frameworks and highlights
the service quality theory, means-end theory, expectation disconfirmation theory,
adaptation level theory, brand consumer relationship theory and social class theory.
Specifically, the chapter analyzes the determinants of brand loyalty and the mediating
effect of customer satisfaction on the relationship between brand loyalty as the
dependent variable with service quality, customer perceived value, sales promotions
and brand image as the independent variables. They were all linked together to form
the conceptual frame work which guided the study. Further the chapter looked at

36
empirical studies and documents research findings by other researchers on the
subject and it ends with an identification of the research gaps of the previous studies
and a summary section on key variables. A summary of the theoretical and empirical
studies is given on Table 2.1.
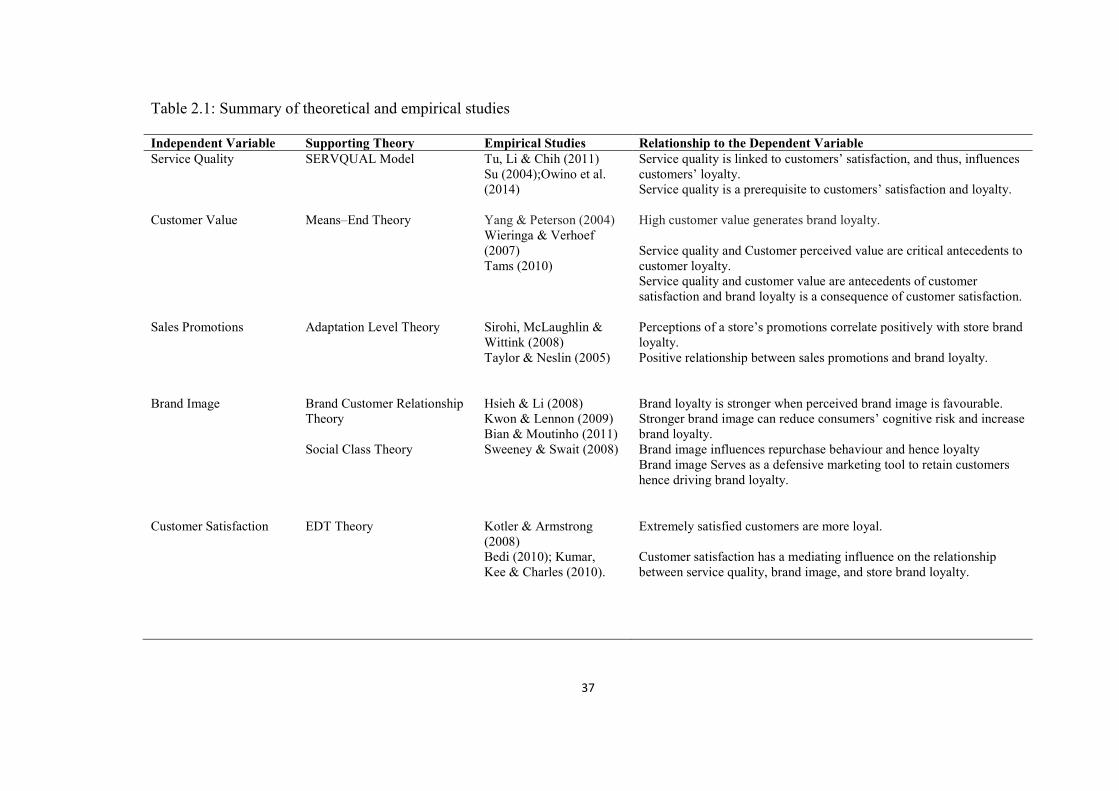
37
Table 2.1: Summary of theoretical and empirical studies
Independent Variable Supporting Theory Empirical Studies Relationship to the Dependent Variable Service Quality SERVQUAL Model Tu, Li & Chih (2011)
Su (2004);Owino et al. (2014)
Service quality is linked to customers’ satisfaction, and thus, influences customers’ loyalty. Service quality is a prerequisite to customers’ satisfaction and loyalty.
Customer Value Means–End Theory Yang & Peterson (2004) Wieringa & Verhoef (2007) Tams (2010)
High customer value generates brand loyalty. Service quality and Customer perceived value are critical antecedents to customer loyalty. Service quality and customer value are antecedents of customer satisfaction and brand loyalty is a consequence of customer satisfaction.
Sales Promotions Adaptation Level Theory Sirohi, McLaughlin & Wittink (2008) Taylor & Neslin (2005)
Perceptions of a store’s promotions correlate positively with store brand loyalty. Positive relationship between sales promotions and brand loyalty.
Brand Image Brand Customer Relationship Theory Social Class Theory
Hsieh & Li (2008) Kwon & Lennon (2009) Bian & Moutinho (2011) Sweeney & Swait (2008)
Brand loyalty is stronger when perceived brand image is favourable. Stronger brand image can reduce consumers’ cognitive risk and increase brand loyalty. Brand image influences repurchase behaviour and hence loyalty Brand image Serves as a defensive marketing tool to retain customers hence driving brand loyalty.
Customer Satisfaction EDT Theory Kotler & Armstrong (2008) Bedi (2010); Kumar, Kee & Charles (2010).
Extremely satisfied customers are more loyal. Customer satisfaction has a mediating influence on the relationship between service quality, brand image, and store brand loyalty.
38
CHAPTER THREE
RESEARCH METHODOLOGY
3.1 Introduction
This chapter discusses the overall methodology of the study. The chapter outlines the
research design, the population, the sampling design, data collection method, the
research procedure, and data analysis method used for purposes of this study.
3.2 Research Design
The study adopted a descriptive survey design. Descriptive research study is a study
concerned with finding out who, what, where, when, how much or how often in the
problem situation at hand (Cooper & Schindler 2013). The survey research strategy
is used in descriptive research and allows you to collect quantitative data, using
questionnaires which you can analyse quantitatively using descriptive and inferential
statistics (Saunders, Lewis, & Thornhill, 2015) According to Mangan and Lalwani
(2004) quantitative research is an empirical research in which the researcher explores
relationships between variables. The quantitative method is conventionally based on
the positivist research philosophy approach to explore scientific inquiry of the
phenomena. The descriptive survey design was adopted due to its usefulness in
examining the relationship between the variables in the population of study.
3.3 Target Population
According to Mugenda and Mugenda (2003) a target population is a complete set of
individuals, cases, or objects with some common observable characteristics. The
target population comprised of all the 146 branches of the four supermarkets as at the
time of the study. According to company sources, Kenya business directory (2016)
and the yellow pages, the four main supermarkets had a total of 146 stores out of
which 76 were in Nairobi and Nakuru counties, as shown in Appendix 4. Nairobi
was chosen because all these four main supermarkets have their head offices in
Nairobi and the standards set are replicated in the whole country. Nakuru was chosen
because Nakumatt, Tusky’s and Naivas originated from Nakuru County.
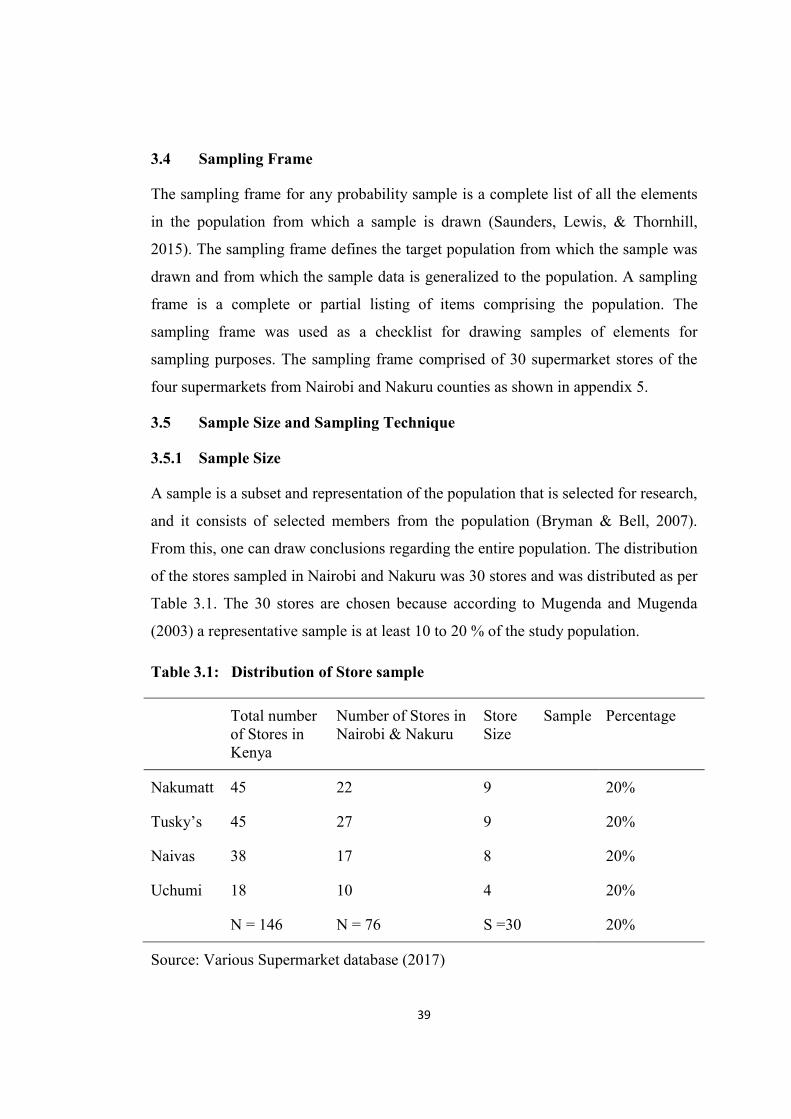
39
3.4 Sampling Frame
The sampling frame for any probability sample is a complete list of all the elements
in the population from which a sample is drawn (Saunders, Lewis, & Thornhill,
2015). The sampling frame defines the target population from which the sample was
drawn and from which the sample data is generalized to the population. A sampling
frame is a complete or partial listing of items comprising the population. The
sampling frame was used as a checklist for drawing samples of elements for
sampling purposes. The sampling frame comprised of 30 supermarket stores of the
four supermarkets from Nairobi and Nakuru counties as shown in appendix 5.
3.5 Sample Size and Sampling Technique
3.5.1 Sample Size
A sample is a subset and representation of the population that is selected for research,
and it consists of selected members from the population (Bryman & Bell, 2007).
From this, one can draw conclusions regarding the entire population. The distribution
of the stores sampled in Nairobi and Nakuru was 30 stores and was distributed as per
Table 3.1. The 30 stores are chosen because according to Mugenda and Mugenda
(2003) a representative sample is at least 10 to 20 % of the study population.
Table 3.1: Distribution of Store sample
Total number of Stores in Kenya
Number of Stores in Nairobi & Nakuru
Store Sample Size
Percentage
Nakumatt 45 22 9 20%
Tusky’s 45 27 9 20%
Naivas 38 17 8 20%
Uchumi 18 10 4 20%
N = 146 N = 76 S =30 20%
Source: Various Supermarket database (2017)

40
The study relied on the list of customers in the four supermarkets (Nakumatt, Tuskys,
Naivas and Uchumi), to come up with the number of customer respondents for the
study. The loyalty card customers were preferred because they are the supermarkets
immediate customers who were deemed to frequent these supermarkets more often
and were therefore best placed to answer questions on their perceived service
experience at the supermarkets.
According to Mugenda and Mugenda (2003) social science research applies the
following formula to determine the sample size:
n = =
Where n = the desired sample size (if the target population is greater than 10,000).
z = the standard normal deviate at the required confidence level.
p = the proportion in the target population estimated to have characteristics
being measured.
q = 1 – p
d = the level of significance set = 0.05 (5% level of significance)
Based on the formula a sample size of 384 respondents is derived. The respondents
were distributed as shown in Table 3.2.
Table 3.2: Distribution of sample size
Loyalty Card customers population
Sample Size Percentage
Naivas 440,694 102 0.023%
Uchumi 265,142 61 0.023%
Tusky’s 308,510 71 0.023%
Nakumatt 650,000 150 0.023%
N = 1,664,346 S = 384 0.023%
Source: Various Supermarket database (2017)

41
3.5.2 Sampling Techniques
Sampling was done using multi-stage sampling method to get an optimum sample of
the supermarket stores and the customers. At stage one, the supermarket stores in
Nairobi, and Nakuru counties was first categorized into large, medium and small
based on store size. At stage two, stratified random sampling was used to select the
supermarkets stores that participated in the study. A supermarket store sample of 30
stores from Nairobi and Nakuru counties was picked at random from the list of the
stores of the four main supermarkets (Nakumatt, Uchumi, Naivas & Tusky’s). The
stores sampled are distributed as per Table 3.1. At stage three, proportional stratified
sampling was used to consider the number of customers sampled from each stratum
of the supermarket while purposive sampling was used to pick the customers
respondents for each of the selected supermarket stores. A sample of 384 customer
respondents was given the study questionnaires. These respondents were distributed
as per Table 3.2. This sampling technique is adopted because, everyone in the target
population has an equal chance of being picked and contacted. As such, bias in the
sampling is minimized.
3.6 Data Collection Instruments
This study used primary and secondary data. Primary data was collected using
questionnaires. According to Mugenda and Mugenda (2003) this permitted greater
depth of response. Primary data was collected through self-administered
questionnaires, which contain structured and non-structured questions for customers.
The questionnaires were easy to read, that offer clear response. Communication was
through a cover letter that clearly stated the purpose of the study and assured
respondents of confidentiality. The data was collected over a period of three weeks.
Questionnaires were issued and filled face to face with the aim of having them as we
wait. The study utilized a questionnaire that has a 5-point Likert scale that ranges
from strongly agree to strongly disagree. The Likert-scale was used in this study
since it is more reliable and objective and can easily indicate the presence or absence
of attitude (Mugenda & Mugenda, 2003).

42
3.7 Data Collection Procedures
The study used data collected from both primary and secondary sources. The main
primary source was a questionnaire administered to the respondents. This was to
permit greater depth of response (Mugenda & Mugenda, 2003). A covering letter
was attached to each questionnaire to introduce the researcher to the respondents and
to explain the purpose of the research. Secondary data was obtained from internet,
journals, supermarkets newsletters and annual reports, publications, research articles
and books. Secondary data obtained from management helped to clarify the research
questions.
3.8 Pilot Testing
According to Saunders, Lewis, and Thornhill, (2015) the purpose of the pilot survey
is to refine the instruments so that the respondents do not have a problem in
answering the questions and provide for easy recording and analysis of data. This
also helped to assess the validity of the instruments and the reliability of the data that
was collected. A pilot test of 20 respondents comprising customers and managers
was picked through convenience sampling to ensure that the tool gives the required
response and that the respondents can understand the questions clearly. The sample
size for the pilot survey was in line with Mugenda and Mugenda (2003) who
suggested that 10 to 30 participants are sufficient for pilot study in survey research.
The pilot was done on respondents away from target scope to avoid a repeat bias on
the side of the targeted respondents in the target scope.
3.8.1 Reliability of Research Instruments
Reliability is concerned with the degree to which an instrument is free from error,
hence, yield consistent results (Collis & Hussey, 2003). The data collected was
subjected to a reliability test. Field (2013) interprets a Cronbach’s alpha (α), greater
than or equal to 0.7 as implying the instrument provides a relatively good
measurement tool hence reliable. George and Mallery (2003) provided the following
rule of thumb: α greater than 0.9 as excellent, α greater than 0.8 as good, α greater
than 0.7 as acceptable, α greater than 0.6 as questionable, α greater than 0.5 as poor,

43
and α less than 0.5 = unacceptable. Further, participant bias was minimized by
assuring participant anonymity through coded questionnaires.
3.8.2 Validity of Research Instruments
Validity is concerned with the integrity of the conclusions that are generated from a
piece of research (Bryman, 2015). It is the extent to which a measure actually
captures the meaning of the concept it is intended to measure (Abbott & McKinney,
2013). In this study face validity, content validity and construct validity were tested.
Face validity is whether an indicator appears to reflect the content of the concept in
question (Bryman, 2015). Face validity is an intuitive process and is established by
asking other people whether the measure seems to capture the concept that is the
focus of attention (Singh 2007). In this study the researcher met face validity criteria
by selecting those questions which seemed relevant to the study variables.
Content validity is defined as the extent to which a measuring instrument provides
adequate coverage of the investigative questions guiding the study (Cooper &
Schindler, 2013). If the researcher has concentrated only on some dimensions of a
construct or concept, then it is believed that other indicators were overlooked and
thus the study lacks content validity. Content validity is usually established by
content experts (Singh 2007). To ensure content validity in the study, the
questionnaire was subjected to a panel of 4 marketing experts to assess whether each
measurement question was essential, useful and in consonance with the known
literature (Singh, 2007). Their feedback was used to refine the questionnaire by
removing vague questions, and rewording some questions and to improve the
research instrument that was then adopted in the survey. In this study, content
validity was also assessed by referring to a comprehensive review of the literature
concerning the scale items that represented the study constructs (Fairoz, Hirobumi &
Tanaka, 2010). The draft questionnaire was carefully designed, scrutinized and
discussed with supervisors to ascertain the items suitability in obtaining information
according to the research objectives of the study. The questionnaire was then
administered to 20 respondents who included 10 supermarket managers who were
44
asked to review the questionnaire and make any comments on questions or terms
which were vague.
Construct validity concerns whether the measurement items actually measure the
construct they are supposed to measure (Saunders et al., 2015; Zikmund et al., 2013).
Construct validity can be further segmented into two sub-categories: convergent
validity and discriminate/divergent validity. Convergent validity refers to the extent
to which a measure converges with other measures of the same construct (Bryman,
2015). Discriminate validity assesses whether measures of dissimilar constructs
“diverge,” in that they show no obvious relationship.
Convergent validity in this study was examined in two different ways. The first
method was by using reliability results from factor analysis which is one of the
indicators of convergent validity (Hair et al., 2014; Ratray & Jones, 2007).
Exploratory factor analysis as shown in Table 4.27 was used to detect the constructs
that underlie the dataset based on the correlations between variables (Field, 2013;
Tabachnick & Fidell, 2013). High reliability above Cronbach’s alpha α = 0.7 shows
that internal consistency exists, indicating that measures can represent the same
latent construct. The factor analysis outputs in Table 4.27, shows that the
requirements of internal construct validity for each of the variables were met. The
second method was by evaluating for the constructs using the average variance
extracted (AVE) criteria recommended by Fornell and Larcker (1981). The result in
Table 4.29 showed that the Average Variance Extracted (AVE) values were above
0.50 which demonstrated convergent validity (Hair et al., 2014).
To satisfy the requirement of the discriminate validity, the square root of a
construct's average variance extracted must be greater than the correlations between
the construct and other constructs (Madhoushi, Sadati & Delavari, 2011; Henseler et
al., 2015). The results as illustrated in Table 4.30 showed that the square root of each
AVE was higher than the corresponding correlation coefficient thus supporting the
discriminate validity between the constructs.
45
3.9 Data Analysis and Presentation
3.9.1 Data Analysis
A check for consistency and completeness of the questionnaires was done using the
data preparation process detailed by Malhotra (2010). The preparation entails; data
checking, editing, coding, transcription and data cleaning. The data captured from the
complete questionnaires were entered into SPSS for analysis. The data was analysed
using descriptive analysis, factor analysis, multiple linear regressions, one-way
ANOVA, Multivariate ANOVA, correlation analysis and Chi square test of
independence or association.
Exploratory Factor Analysis (EFA) was used to identify the main factors that defined
the independent variables. The aim of EFA was to explain the matrix of correlations
with as few factors as possible (Cheruiyot, Jagongo & Owino, 2012). Factor analysis
was conducted to summarize data so that associations and patterns can be easily
understood and interpreted usually by regrouping variables into a controlled set of
clusters according to shared variance (Yong & Pearce, 2013; Kothari, 2009). Factor
analysis was undertaken in two stages namely Principal Component Analysis (PCA)
and Varimax with Kaiser Normalization method. This study used factor analysis to
create summated factor scores for service quality, customer perceived value, sales
promotions, brand image, customer satisfaction and brand loyalty. Kaiser-Meyer-
Olkin (KMO) measure of sampling adequacy and Bartlett’s Test of Sphericity were
adopted as pre-test condition to EFA.
Regression analysis was used to evaluate the relationships between dependent and
independent variables. Correlation analysis quantifies the association between two
variables. The value of correlation coefficient r is between -1 to +1 whereby positive
values of r show positive correlation between the two variables (Kothari, 2009). The
study tested for correlation between the service quality, customer perceived value,
sales promotions, brand image, customer satisfaction, and brand loyalty.
One-way ANOVA is a statistical test used to test whether three or more categories
are different. This variance is determined by comparing means within and between

46
groups of data and it is represented by the F ratio and the F statistic. A large F ratio
with a significance of less than 0.05 indicates a low chance of variance (Saunders et
al., 2015; Creswell, 2013). This study used ANOVA to test for the difference in
means between respondents with supermarket loyalty cards and those without on
their perceptions of the study variables. The study employed a MANOVA test in
testing the hypothesis that the mean of gender, age, education levels and shopping
preferences were different in their perception responses for each of the study
variables.
Chi square is used to test whether there is a significant difference between the
expected frequencies and the observed frequencies in one or more categories. It is
also used for testing goodness-of-fit of data, homogeneity and independence
(Saunders et al., 2015). The test assumes that the data for the study is randomly
obtained from a population and that the sample size is satisfactorily large (Bolboaca,
Jantschi, Sestras, Sestras, Pamfil, 2011). This study used the Chi Square test to
determine whether there was association between supermarkets where respondents
shopped from and where they were loyal to in relation to holding loyalty cards.
This study estimated multiple linear regression models using service quality,
customer perceived value, sales promotions and brand image as independent
variables and brand loyalty as dependent variable. The multiple linear regression
model can be expressed as shown in equation 3.1
BL = β0 + β1 SQ + β2 CPV+ β3 SP + β4 BI + ε0
Where,
β0 was the estimate of the intercept,
β1 was the beta value associated with service quality (SQ)
β2 was the beta value associated with customer perceived value (CPV)
β3 was the beta value associated with Sales Promotion (SP)
β4 was the beta value associated with Brand Image (BI)
ε0 was the associated regression error term.
BL stood for brand loyalty.
47
To estimate the effect of mediation variable, the study used mediational models that
comprised of univariate and multiple linear regression models. The test for mediation
proposed by Baron and Kenny (1986), Sobel (1982) and Greene (2012) was adopted. In
order to establish the effect of a mediator, four conditions must be met. Baron and
Kenny (1986) proposed a four-step approach in which several regression analyses are
conducted and significance of the coefficients is examined at each step. The study
first tested whether the independent variable (X) is significantly related to the
dependent variable (Y); second, the study tested if the independent variable (X) is
significantly related to the mediator (M); subsequently, the study tested whether the
mediator (M) is significantly related to the dependent variable (Y) and finally, the
study controlled for the influence of mediator (M) on dependent variable (Y) and
tested the effect of the independent variable (X) on the dependent variable (Y).
The purpose of Steps 1-3 is to establish that zero-order relationships among the
variables exist. If one or more of these relationships are non-significant, researchers
usually conclude that mediation is not possible or likely although this is not always
true (MacKinnon, Fairchild & Fritz, 2007). Assuming there are significant
relationships from Steps 1 through 3, one proceeds to Step 4. In the Step 4 model,
some form of mediation is supported if the effect of M remains significant after
controlling for X. If X is no longer significant when M is controlled, the finding
supports full mediation. If X is still significant (that is, both X and M both
significantly predict Y), the finding supports partial mediation. The models for
testing these conditions are detailed as follows:
Step 1 Conduct a simple regression analysis with X predicting Y
Y = B0 + B1 X1 + e
Step 2 Conduct a simple regression analysis with X predicting M
M = B0 + B1 X1 + e
Step 3 Conduct a simple regression analysis with M predicting Y
Y = B0 + B1 M + e

48
Step 4 Conduct a multiple regression analysis with X and M predicting Y
Y = B0 + B1X1 + B2M + e
Where: B1 denotes the coefficient for independent variables, X1 represents the
independent variable (service quality, customer perceived value, sales promotions,
brand image) and M represents the mediator (customer satisfaction) and e are the
error terms.
In order to further estimate the mediation effect, the Sobel test of mediation was used
(Sobel, 1982). The Sobel test uses the un standardised regression coefficients and
standard errors from the test of relationship between the composite predictor variable
and the mediating variable; the un standardised regression coefficients and standard
errors from the test of the relationship between the composite predictor variable and
brand loyalty after introduction of customer satisfaction in the regression model; and
the un standardised regression coefficients and standard errors from the test of the
composite predictor index relationship with brand loyalty. These coefficients and
standard errors are input into a Sobel test calculator. Sobel test reports the standard
errors and the p values thereby making it easy to interpret the results and test the
hypothesis. The study also ensured that assumptions of classical linear regression
model are not violated. This was done by testing for linearity, heteroscedasticity,
multicollinearity using Pearson correlation coefficients of the independent variables,
normality of the distribution of the error term and autocorrelation to ensure that the
error terms are not serially correlated (Greene, 2012).
3.9.2 Data Presentation
The data collected was tabulated and summarized using frequency tables. The most
appropriate presentations were chosen and tabulated. The general demographic
information and overall response rates is presented. Then the main body of the study
as per the stated specific objectives was presented. The presentation referred to
appropriate figures and tables. The results of the study are discussed and explained.
Then the trends observed, was discussed and finally relevant deductions were made.
Inference to appropriate similar or contrasting results from literature was also made
49
to support the discussion. Any unusual observations were noted and explanation
given for their cause.
3.10 Measurement of Variables
The constructs in this study were developed by using measurement scales adopted
from prior studies. Modifications were made to the scales to fit the purpose of the
study. All constructs were measured using five-point likert scales with anchors
strongly agree (= 5), agree (= 4), neutral (= 3), disagree (= 2), strongly disagree (= 1).
The respondents were to rate the statements on a scale of 1 to 5. This allowed for
standardisation of responses. All items were positively worded. The measurement of
variables is given in Table 3.3.

50
Table 3.3: Operationalization of variables
Variable Variable Name Indicator / Measurement Adapted from Independent Variable Service Quality Reliability
Assurance Tangibility Empathy Responsiveness
Cronin, Brady & Huit (2000); Parasuraman et al. (1988)
Independent Variable Customer Value Perceived benefits Perceived quality Perceived price
Levesque & McDougall (1996)
Independent Variable Sales Promotion Discounts; Free gifts/samples Loyalty programs
Chandon, Wansink & Laurent (2000); Grace & O’Cass (2005); Fullerton (2005)
Independent Variable Brand Image Corporate appeal Consistency; Reputation
Montaner & Pina (2008)
Mediating Variable Customer Satisfaction Positive experience Meeting expectations/ Exceeding expectations Needs met
Grace & O’Cass (2005); Fullerton (2005)
Dependent Variable Brand Loyalty Repurchase intentions Positive word of mouth Intention to recommend Commitment to the brand
Mols (1998); Fullerton (2005); Zeithaml et al. (2009)

51
CHAPTER FOUR
RESEARCH FINDINGS AND DISCUSSION
4.1 Introduction
The chapter gives an extensive analysis of the study finding. The study sought to
establish the determinants of brand loyalty in leading supermarket chains in Kenya.
Therefore, this chapter involves presentation and interpretation of the results
obtained from the study. Descriptive and inferential statistics has been used to
explain and expound the results obtained from the study. The data preparation
process detailed by Malhotra (2010) was adopted. The preparation entailed data
checking, editing, coding, transcription and data cleaning. To ensure effective and
efficient data analysis process, the data was coded, sorted and analysed using the
statistical package for social studies (SPSS Version 23), a computer-aided data
analysis tool. There were no outliers or errors in the data, and thus the data set was
considered clean for analysis.
The study undertook six statistical tests; descriptive statistical analysis, factor
analysis, one-way ANOVA test, Multivariate ANOVA, regression analysis and
Sobel test. Descriptive statistics was used to describe the study variables particularly
the sample profile. Factor analysis was used to decompose the large number of
variables into the main factors that defined the independent variables. The ANOVA
test was used to examine the existence of significant differences in the study
variables. Regression analysis was used to test the research hypotheses, and to
evaluate the relationships between dependent and independent variables. The test for
mediation proposed by Baron and Kenny (1986), Sobel (1982) and Greene (2012) was
adopted to test for the mediation effect of customer satisfaction.
4.2 Response Rate
The study sought to collect data from 384 respondents and managed to collect 336
responses. This represents an 87.5 % response rate. During the data editing process,
315 questionnaires were found useful for the study. In a related study by Omar &

52
Sawmong (2007) on customer satisfaction and loyalty to British supermarkets, 274
questionnaires were redeemed which represented a response rate was 61%. In another
study by Nikhashemi, Paim, Osman, & Sidin (2015) on brand loyalty in Malaysian
Hypermarkets, 300 questionnaires were collected which represented a response rate of
75%. Mugenda and Mugenda (2003) asserts that a response rate of 50% is adequate
for analysis and reporting; a response of 60% is good, while 70% and above is very
good. According to Kothari (2009), a response rate of 50% is acceptable to analyse
and publish, 60% is good, 70% is very good and more than 80% is an excellent
response rate. Therefore, 87.5% response rate achieved in this study was excellent
for subsequent data analysis.
4.3 Pilot Study results
The study conducted a pilot test to identify the suitability of the questionnaire, in
terms of the format, content, and ease of understanding of the terminology that might
be used. The questionnaire was pretested using convenience sampling in which 20
respondents were chosen. The 20 questionnaires were distributed among 10
supermarket managers and 10 customers who shop at least once a week at
supermarkets. The pilot study was used to measure the internal consistency which is
the degree to which the items that make up the scale are all measuring the same
underlying attribute. Internal consistency was measured using statistic Cronbach’s
coefficient alpha which provides an indication of the average correlation among all
of the items that makes up the scale.
Each of the constructs had Cronbach’s Alpha greater than or equal to 0.7 suggesting
that all the constructs were reliable. Further, the study found that the overall
questionnaire had a Cronbach Alpha of 0.942 that was greater than 0.7 implying that
the whole questionnaire was reliable and it could be used to collect data for the main
survey. George and Mallery (2003) provided the following rule of thumb: α greater
than 0.9 as excellent, α greater than 0.8 as good, α greater than 0.7 as acceptable, α
greater than 0.6 as questionable, α greater than 0.5 as poor, and α less than 0.5 =
unacceptable. These results show that the variables under study are internally
consistent. This information is presented in Table 4.1.

53
Table 4.1: Results for Pilot Study
Variables Cronbach’s Alpha Number of Items
Customer Expectations 0.847 11
Service Quality 0.738 9
Customer Perceived Value 0.766 5
Sales Promotions 0.737 5
Brand Image 0.851 7
Customer Satisfaction 0.752 5
Brand Loyalty 0.831 5
Overall Questionnaire 0.942 47
4.4 Demographic Information
The study sought background information from the study sample and used it to
describe sample characteristics. This background information included gender, age,
education level, supermarket preference, supermarket loyalty, years of shopping,
location of current supermarket, loyalty cards and whether respondents’ shop at other
supermarkets. This section covers the demographic characteristics of the entire
population and ensured there was no biasness in selecting respondents. Data
collected was analyzed and the findings of the study presented and interpreted.
From the demographic information, the study sought to establish an understanding of
the relationship between loyalty cards and where customers often shop from. To
achieve this, three statistical tests were done: correlation analysis, cross tabulation
and Chi-Square test for independence. Also, the study sought to establish an

54
understanding of the relationship between having supermarket loyalty cards and
which supermarkets customers were loyal to.
From the demographic information, the study conducted one-way ANOVA for
service quality, customer perceived value; sales promotions and brand image to
determine the difference in means of those customers who had customer loyalty card
and those who didn’t. The study also employed a MANOVA test in testing the
hypothesis that the mean of shopping preferences, gender and education levels are
different in their perception responses for each of the study variables.
4.4.1 Background Information
Both genders participated in study. Out of 315 respondents, 50.8% were female and
49.2% were male. Kothari (2009) asserts that a ratio of at least 1:2 in either gender
representation in the study is representative enough. These meant there were no
gender disparity and thus a good representation for gender. The results of this
information are presented in Table 4.2.
Majority of the respondents were aged between 18 and 27 having 52.9%. They were
followed by those with ages between 28 and 37 years who had 35%. This means that
majority of the respondents were of youthful age. Therefore, supermarket management
ought to focus more on developing marketing programs targeting the youth.
Respondents who were graduates had 40.9% and were closely followed by
undergraduate with 40.6%. This provided a good sample based on education level.
This implies that the sample respondents were literate, knowledgeable and capable of
making sound judgment on the subject matter. Since a majority of the respondents had
attained formal education training it would be easy to communicate with them. The
respondents with years of shopping experience between 3 and 5 years comprised of
47.6% of the respondents and those with years of shopping between 6 and 10 years
followed with 23% of the responses obtained. This meant that the sample has
adequate shopping experience and can articulate their preferences. The results of this
information are presented in Table 4.2.

55
Table 4.2: Sample demographics
Sample Characteristic Response Category Frequency Percentage
Gender of respondents
Female 160 50.8
Male 155 49.2
Total 315 100.0
Age of respondent Below 18 years 4 1.3
18-27 years 166 52.9
28-37 years 110 35
38- 57 years 33 10.5
Over58 years 2 0.3
Total 315 100
Educational level Under graduate 127 40.6
Graduate 128 40.9
Post graduate 58 18.5
Total 313 100
Years of Shopping Less than 2 years 59 18.8
3-5 years 149 47.6
6-10 years 72 23
10-15 years 24 7.7
Over 15 years 11 2.9
Total 313 100

56
From Table 4.3, Tuskys supermarket was the most preferred supermarket with a
preference of 34.9% followed by Naivas with 31.7%. Nakumatt had 17.5% while
Uchumi supermarket had the least with a preference of 1.6%. Whereas one would
have expected Nakumatt to have the highest preference, the results are indicative of
the stocking difficulties that Nakumatt was experiencing at the time of this study.
Naivas supermarket had the highest percentage 29.8% of respondents who expressed
loyalty. Tuskys followed with 28.9%, Nakumatt had 17.8%. This means that Naivas
and Tuskys have the largest number of loyal customers possibly because of the
stocking difficulties that Nakumatt was currently experiencing. As shown in Table
4.3, most of the respondents (41.5%), shop at supermarkets located near the
residential estate and 26.2% shop at supermarkets located near a bus stop. Only
24.3% shopped at supermarkets located in the shopping mall. This means that
shoppers’ shop where it’s most convenient. Majority of respondents held a
supermarket loyalty card with 59% of the responses which indicates a wide
acceptance of supermarket loyalty cards.
Table 4.3: Sample Preferences
Sample Characteristic Response Category Frequency Percentage Most preferred supermarket Nakumatt 55 17.5 Uchumi 5 1.6 Tuskys 110 34.9 Naivas 100 31.7 Others 45 14.3 Total 315 100 Supermarket loyal to Nakumatt 56 17.8 Uchumi 3 1 Tuskys 91 28.9 Naivas 94 29.8 Others 38 12.1 None 33 10.5 Total 315 100 Supermarket Location Shopping Mall 76 24.3 residential Estate 130 41.5 Near Bus Stop 82 26.2 others 25 8.0 Total 313 100 Loyalty card Yes 186 59.0
No 129 41.0 Total 315 100

57
This result as presented in Table 4.4 shows that a majority (90.2%), of the
respondents indicated that they also shopped at different supermarkets. This means
that customers are not bound to always shop from their preferred supermarkets or
from supermarkets that they have loyalty cards. The respondents did shop at different
supermarkets other than the supermarket brands they indicated they were loyal to.
Tusky’s had the highest number of these customers at 23.8%, Nakumatt 15.9% and
Naivas with 9.8%. Respondents also shopped at other smaller and less well-known
supermarkets which indicate the competitive nature of the retail sector in Kenya.
Table 4.4: Shopping at different supermarket
Sample Characteristic Response Category Frequency Percentage
Shopping at other Supermarkets
Yes 284 90.2
No 31 9.8 Total 315 100.0
Other supermarkets frequently shopped from
Nakumatt 50 15.9
Uchumi 21 6.7 Tuskys 75 23.8 Naivas 31 9.8 Tumaini 13 4.1 Cleanshelf 8 2.5 Magunas 6 1.9 Maathais 7 2.2 Mulleys 3 1.0 Stagemart 2 0.6 Powerstar 9 2.9 Quickmatt 10 3.2 Carrefour 6 1.9 Chandarana 5 1.6 Ukwala 10 3.2 Eastmatt 9 2.9 Game 1 0.3 None 20 6.3 Game 1 0.3 Total 315 100.0
The study sought to establish an understanding of the existence of a significant
relationship between loyalty cards and where customers often shop from. To achieve
this, three statistical tests were done: correlation analysis, cross tabulation and Chi-

58
Square test for independence. The Chi Square test of association between where
customers often shopped from and whether they have loyalty cards as shown in
Table 4.5, has a p value of 0.005 which is less than 0.05 implying that a significant
association exists between the expected frequencies and the observed frequencies in
the Supermarket from which the respondents often shop from and Supermarket
loyalty Cards. This means that customers often shop where they have loyalty cards.
According to Pallant (2011), the assumptions of chi-square concerning the ‘minimum
expected cell frequency’, should be 5 or greater (or at least 80 per cent of cells have
expected frequencies of 5 or more). The tests results indicate that the assumptions
were not violated as ‘2 cells (20%) have expected count less than 5’ as shown in
Table 4:5.
Table 4.5: Chi Square Test for often shop from and Loyalty cards
Value df
Asymptotic Significance (2-
sided)
Pearson Chi-Square 15.027a 4 .005
Likelihood Ratio 15.167 4 .004
Linear-by-Linear Association 11.142 1 .001
N of Valid Cases 315
a. 2 cells (20.0%) have expected count less than 5. The minimum expected count is 2.05.
A cross tabulation of where respondents often shopped from and whether they have
loyalty cards as shown in Table 4.6 indicates that customers who often shop from
Tuskys had the highest number of loyalty cards followed by Naivas. This is
consistent with the large number of customers that express they shop from these two
supermarket brands.

59
Table 4.6: Cross tabulation of often shop from and loyalty Card
Do you have a Supermarket Loyalty Card
Total Yes No Which Supermarket do you often shop from
Nakumatt Count 41 14 55 Expected Count
32.5 22.5 55.0
Uchumi Count 2 3 5 Expected Count
3.0 2.0 5.0
Tuskys Count 68 42 110 Expected Count
65.0 45.0 110.0
Naivas Count 58 42 100 Expected Count
59.0 41.0 100.0
Others Count 17 28 45 Expected Count
26.6 18.4 45.0
Total Count 186 129 315 Expected Count
186.0 129.0 315.0
The Phi coefficient is a correlation coefficient, and can range from 0 to 1, with higher
values indicating a stronger association between the two variables. In this test, the
Phi coefficient value was 0.218 and was considered of a small effect using Cohen’s
(1988), criteria of 0.10 for small effect, 0.30 for medium effect and 0.50 for large
effect. The Phi coefficient presented in Table 4.7 shows that having a loyalty card
has a small and weak effect on where customers shop from. This is in line with the
observation that customers with a particular supermarkets loyalty cards also do shop
from other supermarkets.
Table 4.7: Symmetric Measures for often shop from and Loyalty cards
Value Approximate Significance
Nominal by Nominal Phi .218 .005 Cramer's V .218 .005
N of Valid Cases 315
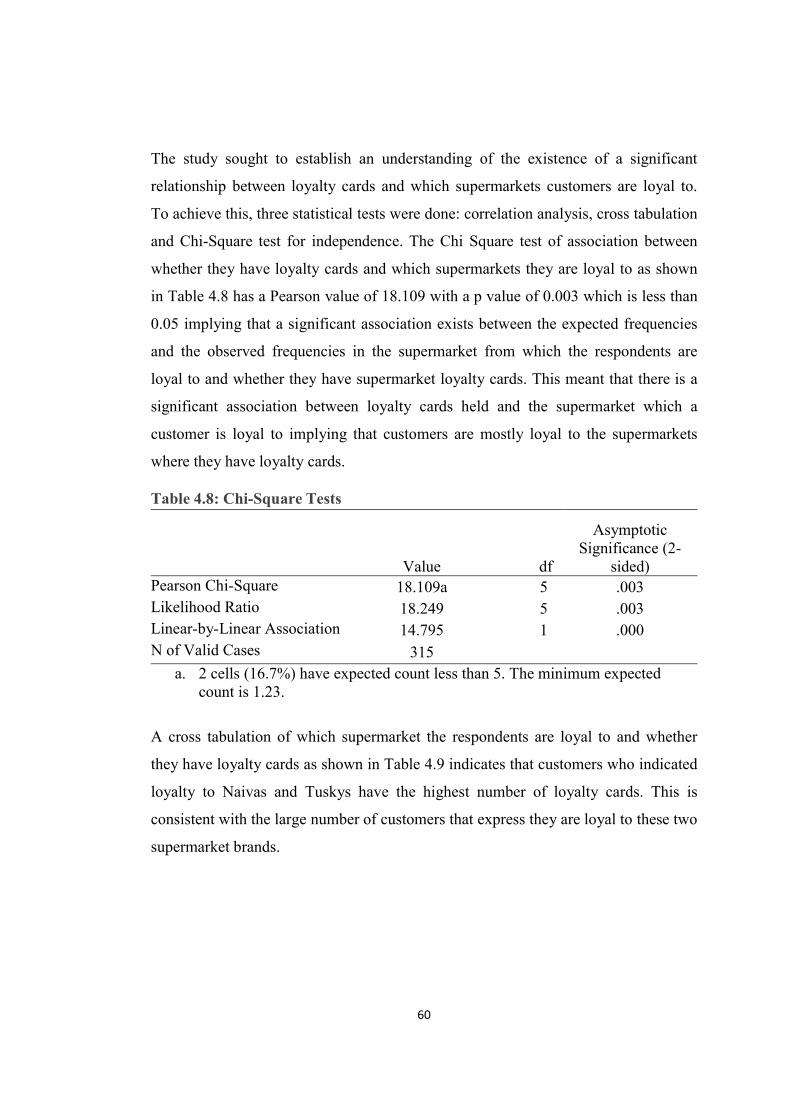
60
The study sought to establish an understanding of the existence of a significant
relationship between loyalty cards and which supermarkets customers are loyal to.
To achieve this, three statistical tests were done: correlation analysis, cross tabulation
and Chi-Square test for independence. The Chi Square test of association between
whether they have loyalty cards and which supermarkets they are loyal to as shown
in Table 4.8 has a Pearson value of 18.109 with a p value of 0.003 which is less than
0.05 implying that a significant association exists between the expected frequencies
and the observed frequencies in the supermarket from which the respondents are
loyal to and whether they have supermarket loyalty cards. This meant that there is a
significant association between loyalty cards held and the supermarket which a
customer is loyal to implying that customers are mostly loyal to the supermarkets
where they have loyalty cards.
Table 4.8: Chi-Square Tests
Value df
Asymptotic Significance (2-
sided) Pearson Chi-Square 18.109a 5 .003 Likelihood Ratio 18.249 5 .003 Linear-by-Linear Association 14.795 1 .000 N of Valid Cases 315
a. 2 cells (16.7%) have expected count less than 5. The minimum expected count is 1.23.
A cross tabulation of which supermarket the respondents are loyal to and whether
they have loyalty cards as shown in Table 4.9 indicates that customers who indicated
loyalty to Naivas and Tuskys have the highest number of loyalty cards. This is
consistent with the large number of customers that express they are loyal to these two
supermarket brands.

61
Table 4.9: Cross tabulation loyal to and loyalty Card
Do you have a Supermarket loyalty Card
Total Yes No Which Supermarket are you loyal to
Nakumatt Count 42 14 56 Expected Count
33.1 22.9 56.0
Uchumi Count 2 1 3 Expected Count
1.8 1.2 3.0
Tuskys Count 55 36 91 Expected Count
53.7 37.3 91.0
Naivas Count 59 35 94 Expected Count
55.5 38.5 94.0
Others Count 16 22 38 Expected Count
22.4 15.6 38.0
None Count 12 21 33 Expected Count
19.5 13.5 33.0
Total Count 186 129 315 Expected Count
186.0 129.0 315.0
The Phi coefficient is a correlation coefficient, and can range from 0 to 1, with higher
values indicating a stronger association between the two variables. The Phi
coefficient was 0.240, which shows that having a loyalty card has a small effect on
which supermarket customers are loyal to. Cohen’s (1988), criteria of 0.10 for small
effect, 0.30 for medium effect and 0.50 for large effect was used to assess the
strength of the association. This means that having a supermarket loyalty card does
not necessarily make a customer loyal. The results are presented in Table 4.10.
Table 4.10: Symmetric Measures for supermarket loyalty and Loyalty cards
Value Approximate Significance
Nominal by Nominal Phi .240 .003 Cramer's V .240 .003
N of Valid Cases 315

62
4.4.2 ANOVA on Loyalty Cards
The study conducted one-way ANOVA for service quality, customer perceived
value; sales promotions and brand image to determine the difference in means of
those customers who held customer loyalty card and those who don’t. One-way
ANOVA is used to test whether three or more categories are different by checking
their means. ANOVA tests the null hypothesis that all group means are equal (Field,
2013). A significant F test indicates that we can reject the null hypothesis, which
states that the population means are equal.
The one-way ANOVA for service quality had an F-statistic value F (1, 313) = 3.760
and the p-value of 0.053, which is more than the significance value = 0.05. The F test
was not significant thus we fail to reject the null hypothesis, which states that the
population means are equal. This meant that, there was no significant difference in
service quality perceptions between those with supermarket loyalty cards and those
without. The results are presented in Table 4.11. This result implied that those with
loyalty cards and those without loyalty cards perceive similar levels of service
quality. The one-way ANOVA for Customer Perceived Value to determine the
difference in means of those customers using customer loyalty card and those who do
not, had the F-statistic value was F (1, 313) = 0.102 and the p-value = 0.750, which is
greater than the significance value of 0.05. The F test was not significant thus we fail
to reject the null hypothesis, which states that the population means are equal.
Therefore, there was no significant difference in Customer Perceived Value between
those with supermarket loyalty cards and those without. This meant that customers
with loyalty cards and those without loyalty cards perceive customer value in the
same way.
The one-way ANOVA for Sales Promotions to determine the difference in means
using customer loyalty card had an F-statistic value F (1,313) = 1.053 and the p-
value = 0.306, which is greater than the significance value of 0.05. The F test was not
significant thus we fail to reject the null hypothesis, which states that the population
means are equal. Therefore, there was no significant difference in sales promotions
between the groups of those with and without loyalty cards. This meant that

63
customers with loyalty cards and those without loyalty cards perceive sales
promotions of the supermarkets in the same way. The one-way ANOVA for Brand
Image to determine the difference in means using customer loyalty card had the F-
statistic value was F (1,313) = 0.728 and the p-value = 0.394, which is greater than
the significance value of 0.05. The F test was not significant thus we fail to reject the
null hypothesis, which states that the population means are equal. Therefore, there
was no significant difference in brand image between those with supermarket loyalty
cards and those without. This meant that customers with loyalty cards and those
without loyalty cards perceive brand image of the supermarkets in the same way. The
one-way ANOVA for Customer Satisfaction to determine the difference in means
using customer loyalty card had an F-statistic value of F (1, 313) = 0.606 and the p-
value = 0.437, which is greater than the significance value of 0.05. The F test was not
significant thus we fail to reject the null hypothesis, which states that the population
means are equal. Therefore, there was no significant difference in customer
satisfaction between those with supermarket loyalty cards and those without. This
meant that customers with loyalty cards and those without loyalty cards perceive
customer satisfaction in the same way.

64
Table 4.11: ANOVA for predictor variables and loyalty cards
Sum of Squares Df Mean
Square F Sig. Service Quality Between
Groups 1.333 1 1.333
3.760 .053
Within Groups 110.954 313 .354
Total 112.287 314
Customer Perceived Value
Between Groups
.050 1 .050 .102 .750
Within Groups 153.656 313 .491
Total 153.706 314
Sales Promotions Between Groups
.511 1 .511 1.053 .306
Within Groups 151.905 313 .485
Total 152.416 314
Brand Image Between Groups
.334 1 .334 .728 .394
Within Groups 143.519 313 .459
Total 143.853 314
Customer Satisfaction Between Groups
.210 1 .210 .606 .437
Within Groups 108.514 313 .347
Total 108.725 314
4.4.3 MANOVA results on shopping preferences
Multivariate analysis of variance (MANOVA) is used when you want to compare
your groups on a number of different, but related, dependent variables. Multivariate
analysis of variance (MANOVA) is an extension of analysis of variance for use when
you have more than one dependent variable (Pallant, 2011). These dependent
variables should be related in some way, or there should be some conceptual reason
for considering them together. MANOVA compares the groups and tells you whether
the mean differences between the groups on the combination of dependent variables
are likely to have occurred by chance (Tabachnick & Fidell, 2013).
The study employed a MANOVA test in testing the hypothesis that the mean for
customer shopping preference (which supermarket customers often shop from) are
different in their perception responses for each of the study variables. The box test,

65
tests the null hypothesis that the observed covariance matrices of the dependent
variables are equal across groups. According to Pallant (2011) if the significant value
is larger than 0.001, the assumption is not violated. Tabachnick and Fidell (2013)
warn that Box’s M can tend to be too strict when you have a large sample size. The
Box’s Test of Equality of Covariance Matrices in Table 4.12 shows a significant
value of 0.008 which is larger than α value of 0.001 meaning that the data did not
violate the assumption of homogeneity of covariance.
Table 4.12: Supermarket preference Box's Test of Equality of Covariance
Matrices
Box's M 97.279 F 1.481 df1 63 df2 97816.188 Sig. .008 Tests of the null hypothesis that the observed covariance matrices of the dependent variables are equal across groups. a. Design: Intercept + Q4 (Where do you often shop from)
The next test was to check the Levene’s Test of Equality of Error Variances which
tests the null hypothesis that the error variances of the dependent variable are equal
across groups. Significant values that are less than 0.05 would indicate a violation of
the assumption of equality of variance for that variable (Pallant, 2011). Tabachnick
and Fidell (2013) suggest an alpha of 0.025 or 0.01 rather than the conventional 0.05
level. In Table 4.13, the significant values are all above α = 0.025 meaning that the
studies fail to reject the null hypothesis and conclude that none of the variables
recorded significant values therefore we can assume equal variances (Tabachnick &
Fidell, 2013).

66
Table 4.13: Levene's Test of Equality of Error Variances on supermarket preferences
F
df1 df2 Sig. Brand Loyalty 1.376 4 310 .242 Service Quality 1.829 4 310 .123 Customer Perceived Value .511 4 310 .728 Brand Image .906 4 310 .461 Customer Satisfaction .130 4 310 .972 Sales Promotions .932 4 310 .446 Tests of the null hypothesis that the error variance of the dependent variable is equal across groups. a. Design: Intercept + Q4 (which supermarket customers often shop from)
This set of multivariate tests of significance will indicate whether there are
statistically significant differences among the groups on a linear combination of the
dependent variables (Pallant, 2011). There are a number of statistics to choose from
(Wilks’ Lambda, Hotelling’s Trace, Pillai’s Trace). This study adopted the Wilks’
Lambda statistics. Tabachnick and Fidell (2013) recommend Wilks’ Lambda for
general use; however, if the data have problems (small sample size, unequal N
values, violation of assumptions), then Pillai’s Trace is more robust.
The test statistic is given in the second section of the Multivariate Tests on Table
4.14, in the row labelled Q4 (which supermarket customers often shop from). If the
significance level is less than .05, then there is a difference among the groups. The
study obtained a Wilks’ Lambda value of 0.760, with a significance value of 0.00.
This was less than α = 0.05; therefore, there was a statistically significant difference
between which supermarket customers often shop from in terms of the study
variables; brand loyalty, service quality, customer perceived value, brand image,
customer satisfaction and sales promotion.

67
Table 4.14: Multivariate Tests for supermarket preferences
Effect Value F Hypothesis
df Error df Sig. Partial Eta Squared
Intercept Pillai's Trace .954 1062.715b 6.000 305.000 .000 .954
Wilks' Lambda
.046 1062.715b 6.000 305.000 .000 .954
Hotelling's Trace
20.906 1062.715b 6.000 305.000 .000 .954
Roy's Largest Root 20.906 1062.715b 6.000 305.000 .000 .954
Q4 Pillai's Trace .257 3.531 24.000 1232.000 .000 .064
Wilks' Lambda
.760 3.628 24.000 1065.228 .000 .066
Hotelling's Trace
.293 3.701 24.000 1214.000 .000 .068
Roy's Largest Root .190 9.766c 6.000 308.000 .000 .160
a. Design: Intercept + Q4 b. Exact statistic c. The statistic is an upper bound on F that yields a lower bound on the significance level.
After obtaining a significant result on the multivariate test of significance, the study
proceeded to evaluate further the relationship of the preferred supermarket to each of
dependent variables (Tabachnick & Fidell, 2013). Does the preferred supermarket
differ on all of the dependent measures, or just some? Because the study was looking
at a number of separate analyses, the study set a higher alpha level to reduce the
chance of a Type 1 error (that is, finding a significant result when there isn’t really
one) (Tabachnick & Fidell, 2013). The most common way of doing this is to apply a
Bonferroni adjustment. In its simplest form, this involves dividing the original alpha

68
level of 0.05 by the number of analyses that you intend to do (Tabachnick & Fidell
2013). In this case, there were six dependent variables to evaluate; therefore, dividing
.05 by 6 resulted in a new alpha level of .008. The results were to be considered
significant only if the probability value (Sig.) was less than 0.008.
Looking at Table 4.15, in the third row (Q4 which supermarket customers often shop
from), in the Tests of Between-Subjects Effects box, the dependent variables brand
image, brand loyalty, service quality and customer perceived value recorded a
significance value less than our cut-off (with a Sig. Value of .008). Thus, in this
study, there was a significant difference between which supermarket customers often
shopped from and the study variables of brand image, brand loyalty, service quality
and customer perceived value. This meant that customers perceive these variables of
brand image, customer perceived value, brand loyalty and service quality differently
in each of the four supermarkets under study as important.
The variables sales promotion and customer satisfaction had p values of 0.348 and
0.024 respectively which were more than the significant value of 0.008. This meant
that there were no significant differences on which supermarket customers often
shopped from in these two study variables. These meant that customer perceptions on
sales promotions and customer satisfaction were not significantly different between
the four supermarkets under study.
The Partial Eta Squared represents the proportion of the variance in the study
variable that can be explained by the independent variable (Q4). The values in this
case were very small with the highest being 0.082 of variations in service quality
being explained by where customers often shopped from. Service quality had 8.2%
of its variations explained by which supermarket customers shopped from. The
supermarket the customers often shopped from explained 6.5% of the variations in
brand loyalty.

69
Table 4.15: Tests of Between-Subjects Effects for supermarket preference
Source
Type III Sum of Squares df
Mean Square F Sig.
Partial Eta
Squared Corrected Model Brand Loyalty 9.930a 4 2.483 5.403 .000 .065
Service Quality 9.169b 4 2.292 6.891 .000 .082
Customer Perceived Value 7.207c 4 1.802 3.812 .005 .047
Brand Image 9.154d 4 2.288 5.267 .000 .064 Customer Satisfaction 3.859e 4 .965 2.852 .024 .035
Sales Promotions 2.169f 4 .542 1.119 .348 .014
Intercept Brand Loyalty 1582.091 1 1582.091 3443.262 .000 .917 Service Quality 1432.128 1 1432.128 4305.347 .000 .933 Customer Perceived Value 1280.155 1 1280.155 2708.871 .000 .897 Brand Image 1462.297 1 1462.297 3365.359 .000 .916 Customer Satisfaction 1626.164 1 1626.164 4807.221 .000 .939 Sales Promotions 1239.663 1 1239.663 2557.764 .000 .892
Q4 Brand Loyalty 9.930 4 2.483 5.403 .000 .065 Service Quality 9.169 4 2.292 6.891 .000 .082 Customer Perceived Value 7.207 4 1.802 3.812 .005 .047 Brand Image 9.154 4 2.288 5.267 .000 .064 Customer Satisfaction 3.859 4 .965 2.852 .024 .035 Sales Promotions 2.169 4 .542 1.119 .348 .014
Error Brand Loyalty 142.437 310 .459 Service Quality 103.118 310 .333
Customer Perceived Value 146.499 310 .473
Brand Image 134.699 310 .435
Customer Satisfaction 104.865 310 .338
Sales Promotions 150.247 310 .485
Total Brand Loyalty 5290.440 315 Service Quality 4960.294 315
Customer Perceived Value 4474.200 315
Brand Image 4952.960 315
Customer Satisfaction 5421.930 315
Sales Promotions 4144.600 315
Corrected Total Brand Loyalty 152.367 314 Service Quality 112.287 314
Customer Perceived Value 153.706 314
Brand Image 143.853 314
Customer Satisfaction 108.725 314
Sales Promotions 152.416 314
a. R Squared = .065 (Adjusted R Squared = .053) d. R Squared = .064 (Adjusted R Squared = .052)
b. R Squared = .082 (Adjusted R Squared = .070) e. R Squared = .035 (Adjusted R Squared = .023)
c. R Squared = .047 (Adjusted R Squared = .035) f. R Squared = .014 (Adjusted R Squared = .002)
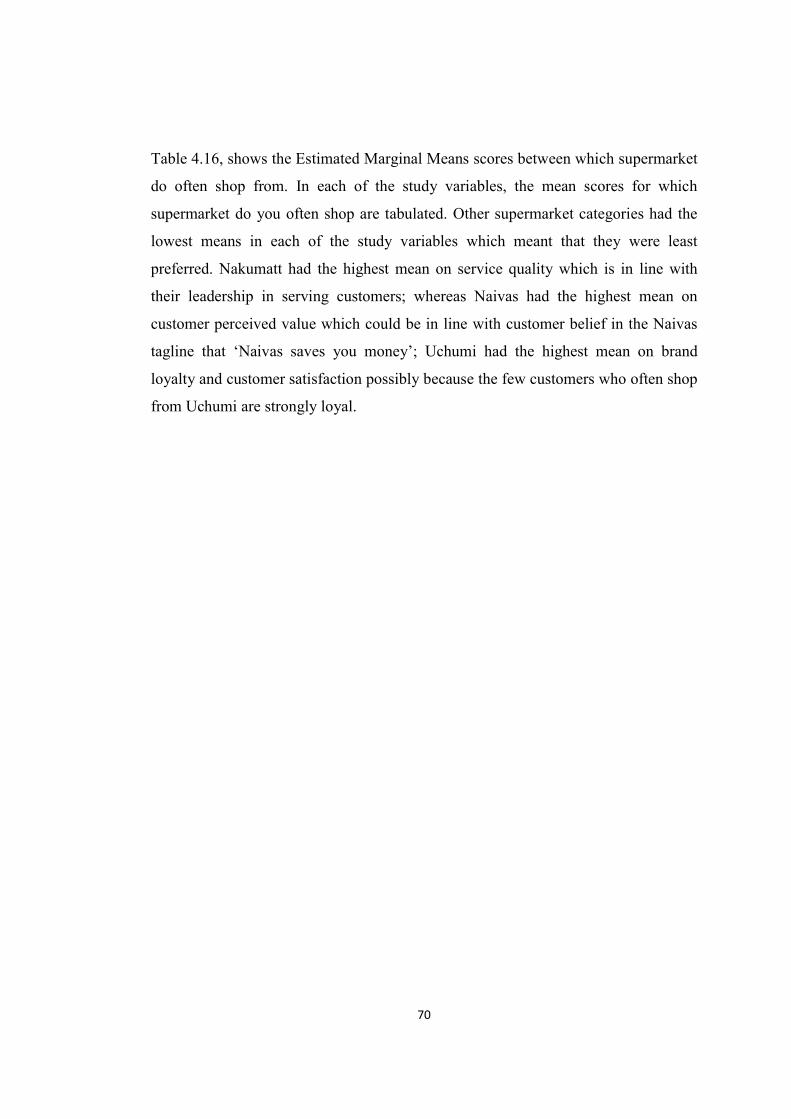
70
Table 4.16, shows the Estimated Marginal Means scores between which supermarket
do often shop from. In each of the study variables, the mean scores for which
supermarket do you often shop are tabulated. Other supermarket categories had the
lowest means in each of the study variables which meant that they were least
preferred. Nakumatt had the highest mean on service quality which is in line with
their leadership in serving customers; whereas Naivas had the highest mean on
customer perceived value which could be in line with customer belief in the Naivas
tagline that ‘Naivas saves you money’; Uchumi had the highest mean on brand
loyalty and customer satisfaction possibly because the few customers who often shop
from Uchumi are strongly loyal.
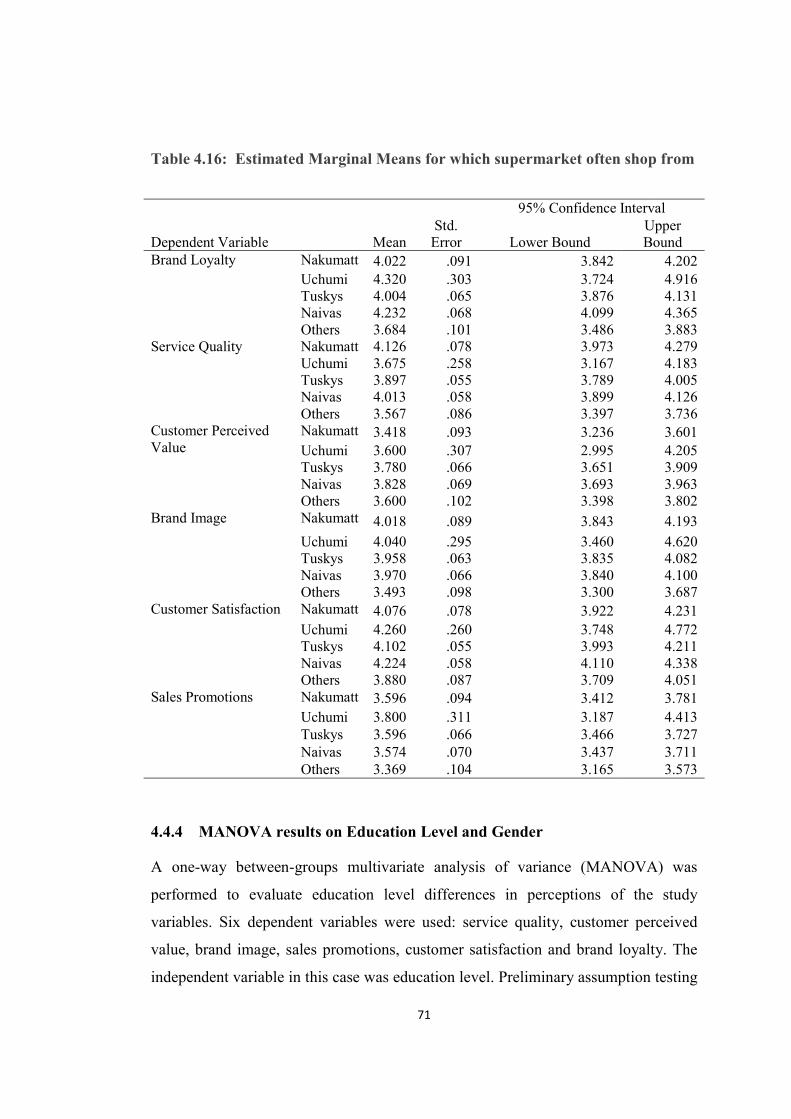
71
Table 4.16: Estimated Marginal Means for which supermarket often shop from
Dependent Variable Mean Std. Error
95% Confidence Interval
Lower Bound Upper Bound
Brand Loyalty Nakumatt 4.022 .091 3.842 4.202 Uchumi 4.320 .303 3.724 4.916 Tuskys 4.004 .065 3.876 4.131 Naivas 4.232 .068 4.099 4.365 Others 3.684 .101 3.486 3.883
Service Quality Nakumatt 4.126 .078 3.973 4.279 Uchumi 3.675 .258 3.167 4.183 Tuskys 3.897 .055 3.789 4.005 Naivas 4.013 .058 3.899 4.126 Others 3.567 .086 3.397 3.736
Customer Perceived Value
Nakumatt 3.418 .093 3.236 3.601 Uchumi 3.600 .307 2.995 4.205 Tuskys 3.780 .066 3.651 3.909 Naivas 3.828 .069 3.693 3.963 Others 3.600 .102 3.398 3.802
Brand Image Nakumatt 4.018 .089 3.843 4.193 Uchumi 4.040 .295 3.460 4.620 Tuskys 3.958 .063 3.835 4.082 Naivas 3.970 .066 3.840 4.100 Others 3.493 .098 3.300 3.687
Customer Satisfaction Nakumatt 4.076 .078 3.922 4.231 Uchumi 4.260 .260 3.748 4.772 Tuskys 4.102 .055 3.993 4.211 Naivas 4.224 .058 4.110 4.338 Others 3.880 .087 3.709 4.051
Sales Promotions Nakumatt 3.596 .094 3.412 3.781 Uchumi 3.800 .311 3.187 4.413 Tuskys 3.596 .066 3.466 3.727 Naivas 3.574 .070 3.437 3.711 Others 3.369 .104 3.165 3.573
4.4.4 MANOVA results on Education Level and Gender
A one-way between-groups multivariate analysis of variance (MANOVA) was
performed to evaluate education level differences in perceptions of the study
variables. Six dependent variables were used: service quality, customer perceived
value, brand image, sales promotions, customer satisfaction and brand loyalty. The
independent variable in this case was education level. Preliminary assumption testing

72
was conducted to check for normality, linearity, univariate and multivariate outliers,
homogeneity of variance covariance matrices, and multicollinearity, with no serious
violations noted. The p value was less than α = 0.05 therefore there was a statistically
significant difference between education level on the combined dependent variables,
F (12, 610) = 1.264, p = .0236; Wilks’ Lambda = 0.952; partial eta squared = .024.
When the results for the dependent variables were considered separately, none of the
education level group difference reached statistical significance, using an alpha level
of 0.05. This meant that different education level groups were similar in their
perceptions of the variables service quality, customer perceived value, sales
promotions, brand image, customer satisfaction and brand loyalty.
A one-way between-groups multivariate analysis of variance (MANOVA) was
performed to evaluate gender differences in perceptions of the study variables. Six
dependent variables were used: service quality, customer perceived value, brand
image, sales promotions, customer satisfaction and brand loyalty. The independent
variable in this case was gender. Preliminary assumption testing was conducted to
check for normality, linearity, univariate and multivariate outliers, homogeneity of
variance covariance matrices, and multicollinearity, with no serious violations noted.
There was no statistically significant difference between gender on the combined
dependent variables, F (6, 308) = 0.531, p = .0785; Wilks’ Lambda = 0.990; partial
eta squared = 0 .010. This is more than α = 0.05; therefore, there is no statistically
significant difference between males and females in terms of the overall study
variables. This implies that the shopping preferences in supermarkets of both male
and female are similar. This could be largely because both genders largely shop for
similar groceries and household items as found in supermarkets.
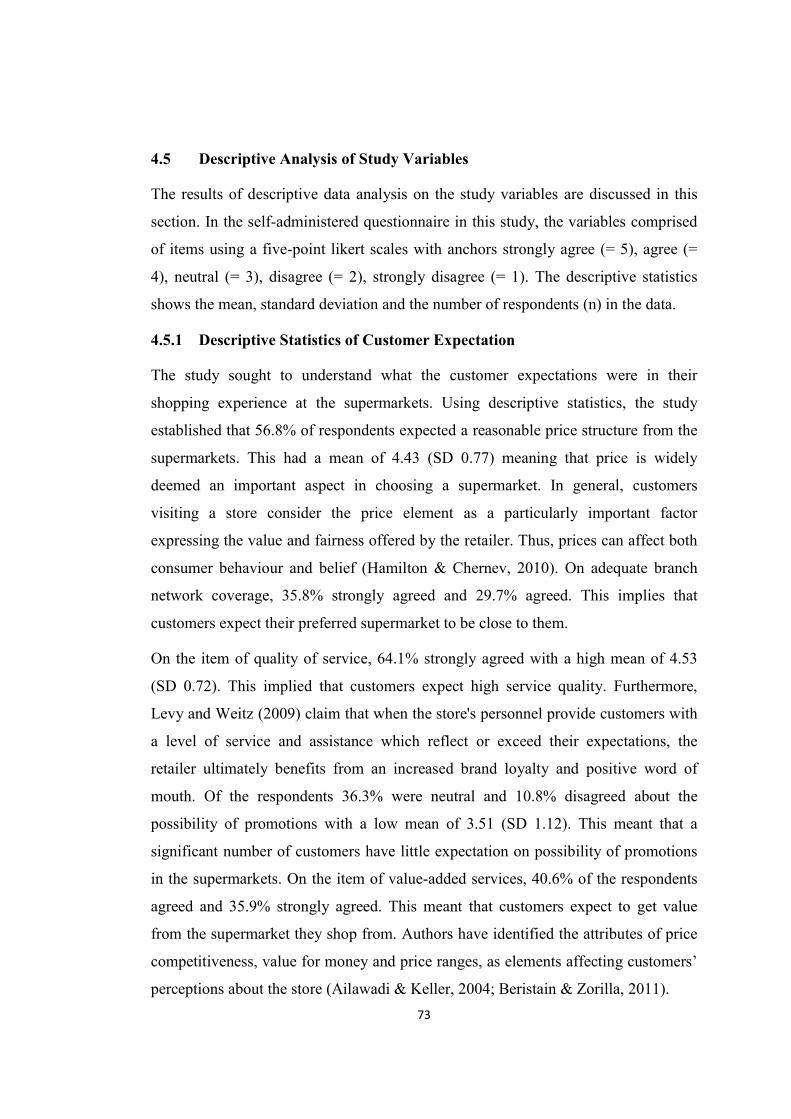
73
4.5 Descriptive Analysis of Study Variables
The results of descriptive data analysis on the study variables are discussed in this
section. In the self-administered questionnaire in this study, the variables comprised
of items using a five-point likert scales with anchors strongly agree (= 5), agree (=
4), neutral (= 3), disagree (= 2), strongly disagree (= 1). The descriptive statistics
shows the mean, standard deviation and the number of respondents (n) in the data.
4.5.1 Descriptive Statistics of Customer Expectation
The study sought to understand what the customer expectations were in their
shopping experience at the supermarkets. Using descriptive statistics, the study
established that 56.8% of respondents expected a reasonable price structure from the
supermarkets. This had a mean of 4.43 (SD 0.77) meaning that price is widely
deemed an important aspect in choosing a supermarket. In general, customers
visiting a store consider the price element as a particularly important factor
expressing the value and fairness offered by the retailer. Thus, prices can affect both
consumer behaviour and belief (Hamilton & Chernev, 2010). On adequate branch
network coverage, 35.8% strongly agreed and 29.7% agreed. This implies that
customers expect their preferred supermarket to be close to them.
On the item of quality of service, 64.1% strongly agreed with a high mean of 4.53
(SD 0.72). This implied that customers expect high service quality. Furthermore,
Levy and Weitz (2009) claim that when the store's personnel provide customers with
a level of service and assistance which reflect or exceed their expectations, the
retailer ultimately benefits from an increased brand loyalty and positive word of
mouth. Of the respondents 36.3% were neutral and 10.8% disagreed about the
possibility of promotions with a low mean of 3.51 (SD 1.12). This meant that a
significant number of customers have little expectation on possibility of promotions
in the supermarkets. On the item of value-added services, 40.6% of the respondents
agreed and 35.9% strongly agreed. This meant that customers expect to get value
from the supermarket they shop from. Authors have identified the attributes of price
competitiveness, value for money and price ranges, as elements affecting customers’
perceptions about the store (Ailawadi & Keller, 2004; Beristain & Zorilla, 2011).

74
Of the respondents 52.2% strongly agreed that stores should be well stocked. This
implies that customers expect to find what they need under one roof. Of the
respondents 50.5% strongly agreed that stores should be conveniently positioned.
This implies that customers expect to conveniently find a store as they go about their
daily business. Levy & Weitz (2009) and Zentes, Morschett & Schramm-Klein
(2011) posits that the location chosen by retailers for their stores is of paramount
importance.
On the item of convenience of procedures, 59.6% strongly agreed with a mean of
4.46 (SD 0.76). This indicates a strong desire by customers for convenience and ease
while shopping. Moreover, store environment is considered extremely influential for
the overall experience customers have in stores (Jain & Bagdare, 2009; Seock, 2009).
Consequently, in order to increase loyalty, retailers have to strive to understand what
determine customers’ store choices and create for them a pleasant store environment
(Seock, 2009). While considering customer support on complaint processing, (49.8%)
of the respondents strongly agreed. This meant that customers expect support when
they have complaints.
On the item of store image and appeal, 37.4% strongly agreed and 32.6% agreed.
This implies that customers are concerned about the appeal and the image of the
store they shop from. Burt, Johansson and Thelander (2007) posit that one of the
drivers that play a crucial role in a retailer's performance in the market is store image.
When consumers are satisfied with a store's image and when their needs are met,
higher levels of loyalty are achieved. Effective store image is connected to a favored
position in the market and offers a unique differentiator from competitors (Burt &
Mavromattis, 2006). Consequently, store image is a term that needs to attract
retailers' attention since consumers are selecting the store of their preference
depending on whether the store image is closely related to their perception of
themselves. Lastly, 52.4% of the respondents strongly agreed that customer support
(friendliness) is a key expectation while shopping. These findings on customer
expectation are summarized on Table 4.17.
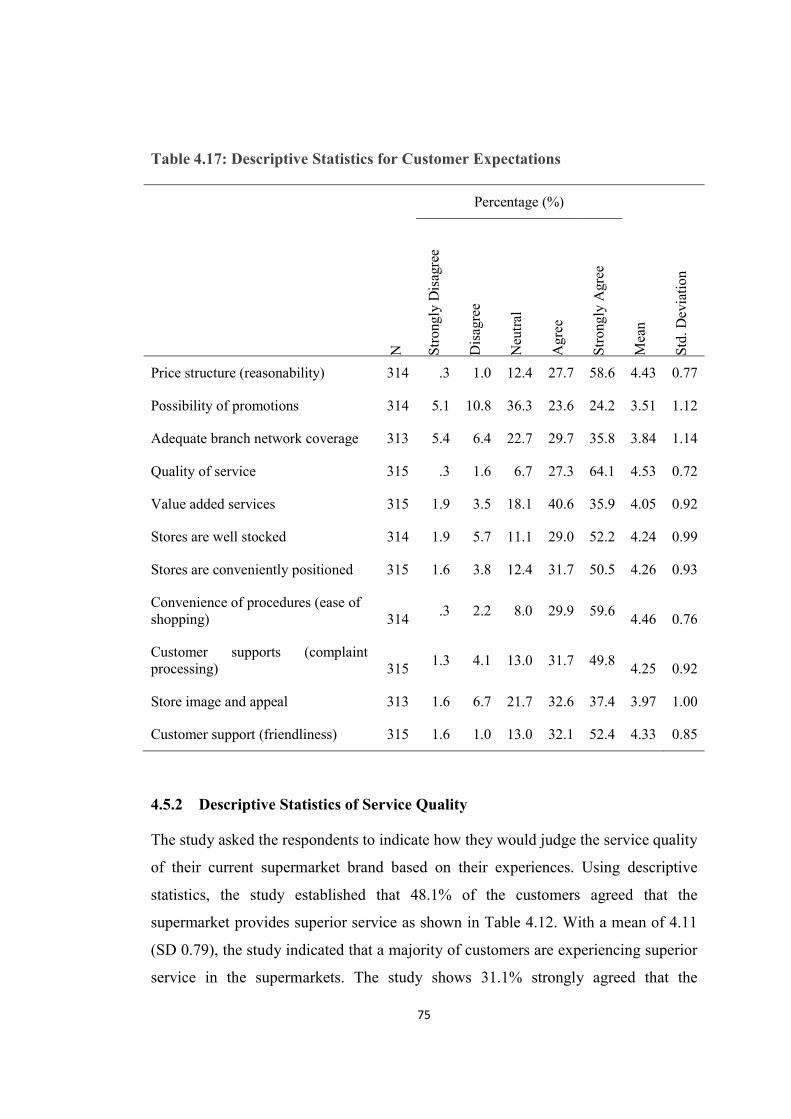
75
Table 4.17: Descriptive Statistics for Customer Expectations
Percentage (%)
N
Stro
ngly
Dis
agre
e
Dis
agre
e
Neu
tral
Agr
ee
Stro
ngly
Agr
ee
Mea
n
Std.
Dev
iati
on
Price structure (reasonability) 314 .3 1.0 12.4 27.7 58.6 4.43 0.77
Possibility of promotions 314 5.1 10.8 36.3 23.6 24.2 3.51 1.12
Adequate branch network coverage 313 5.4 6.4 22.7 29.7 35.8 3.84 1.14
Quality of service 315 .3 1.6 6.7 27.3 64.1 4.53 0.72
Value added services 315 1.9 3.5 18.1 40.6 35.9 4.05 0.92
Stores are well stocked 314 1.9 5.7 11.1 29.0 52.2 4.24 0.99
Stores are conveniently positioned 315 1.6 3.8 12.4 31.7 50.5 4.26 0.93
Convenience of procedures (ease of shopping) 314
.3 2.2 8.0 29.9 59.6 4.46 0.76
Customer supports (complaint processing) 315
1.3 4.1 13.0 31.7 49.8 4.25 0.92
Store image and appeal 313 1.6 6.7 21.7 32.6 37.4 3.97 1.00
Customer support (friendliness) 315 1.6 1.0 13.0 32.1 52.4 4.33 0.85
4.5.2 Descriptive Statistics of Service Quality
The study asked the respondents to indicate how they would judge the service quality
of their current supermarket brand based on their experiences. Using descriptive
statistics, the study established that 48.1% of the customers agreed that the
supermarket provides superior service as shown in Table 4.12. With a mean of 4.11
(SD 0.79), the study indicated that a majority of customers are experiencing superior
service in the supermarkets. The study shows 31.1% strongly agreed that the

76
supermarket provides sufficient parking. This indicated the significance of parking to
customers. The results show that 43.8% of the customers strongly agreed and 42.2%
agreed that supermarket layout made it easy for customers to trace items on the
shelves. Descriptive analysis of the scale data showed that the item with the highest
mean was "This Supermarket has a layout that makes it easy for customers to find
what they need" with a mean of 4.27 (SD= 0.79). The scale item with the lowest
mean was "The supermarket has clean, attractive and convenient public area
(Washrooms, fitting rooms)’’ with mean 3.59 (SD = 1.14). This is a possible area of
improvement for supermarket as cumulatively only 59.6 % agreed/strongly agreed
and cumulatively 18.8% disagreed that the supermarket has clean, attractive and
convenient public area (Washrooms, fitting rooms).
The item, this supermarket has error free transactions had 37.6% of the respondents
in agreement with cumulatively 13% disagreed. This indicates that there are cases of
errors in prices and billing. The item, this supermarket has merchandise available
when the customers want it had 45.1% of the respondents agreed. This meant that
customers shop where they can get what they need. The item, the employees of this
Supermarket have knowledge to answer customers questions had 42.5% of the
respondents agree and 30.2% strongly agreed. This indicates that the employees are
knowledgeable and able to answer customer questions. In the next item, 36.8%
agreed that the supermarket employees give customers individual attention. This
indicates the need to assist customers. Lastly, 45.1% agreed and 28.3% strongly
agreed that employees of this supermarket are consistently courteous with customers.
This meant that the employees were willing to assist customers. The summary results
are shown in Table 4.18.

77
Table 4.18: Descriptive Statistics for service quality
Percentage (%)
N
Str
ongl
y D
isag
ree
Dis
agre
e
Neu
tral
Agr
ee
Str
ongl
y A
gree
Mea
n
Std
. D
evia
tion
This supermarket brand provides superior service 314 0.3 2.9 15.3 48.1 33.4 4.11 0.79
There is sufficient parking at this Supermarket 315 4.4 8.9 25.7 31.1 29.8 3.73 1.11
The supermarket has clean, attractive and convenient public area (Washrooms, fitting rooms)
314 5.1 13.7 21.7 36 23.6 3.59 1.14
This Supermarket has a layout that makes it easy for customers to find what they need
315 0.6 1.9 11.4 42.2 43.8 4.27 0.79
This supermarket has error free transactions 314 4.1 8.9 26.8 37.6 22.6 3.65 1.06
This supermarket has merchandise available when the customers want it 315 1.6 5.7 19.4 45.1 28.3 3.96 0.92
The employees of this Supermarket have knowledge to answer customers questions
315 1 6.7 19.7 42.5 30.2 3.94 0.92
The Supermarket employees gives customers individual attention 315 1.9 6.7 25.4 36.8 29.2 3.85 0.98
Employees of this supermarket are consistently courteous with customers 315 1.6 5.7 19.4 45.1 28.3 3.93 0.92

78
4.5.2 Descriptive Statistics of customers’ value perception
The study asked the respondents to indicate how they would judge the perceptions of
value that they get from their current supermarket. Using descriptive statistics, the
study established that 47.6% agreed, 31.7% strongly agreed and only 0.6% strongly
disagreed that compared to alternative supermarkets brands, their current
supermarket offers attractive products/services of high quality. With a mean of 4.08
(SD 0.80), this implies that customers compare products and services and gravitate
where they feel they are getting good value.
Of the respondents, 43.8% agree that compared to alternative supermarket brands,
the current supermarket charges me fairly for similar products/ services. This implies
that the customers are charged fair prices. Of the respondents, 24.4% disagree while
34% were neutral that compared to alternative supermarket brands; the current
supermarket provides me with more free services. This implies that most
supermarkets do not offer free services but charge for services offered. On the item,
comparing what I pay to what I might get from other supermarkets, I think my
current supermarket provides me with good value, 42.9% of the respondents agreed.
This meant that the customers were getting value for money. Lastly, 31.4% of
respondents were neutral on the item, compared to other competitive supermarket
brands, I think my current supermarket, charges me low price. With a mean of 3.43
(SD 1.13), this implies that there is room for improvement of the issue of low prices.
The findings are summarized on Table 4.19.

79
Table 4.19: Descriptive Statistics for customers’ value perception
Percentage (%)
N
Stro
ngly
D
isag
ree
Dis
agre
e
Neu
tral
Agr
ee
Stro
ngly
A
gree
Mea
n
Std.
D
evia
tion
Comparatively the current supermarket offers attractive products/services of high quality 315 0.6 2.2 17.8 47.6 31.7 4.08 0.80
Comparatively the current supermarket charges me fairly for similar products/ services 315 1 7.9 20.6 43.8 26.7 3.87 0.93
Comparatively the current supermarket provides me with more free services. 315 4.1 24.4 34 24.4 13 3.18 1.07
Comparatively I think my current supermarket provides me with good value. 315 0 5.1 22.9 42.9 29.2 3.96 0.85
Comparatively I think my current supermarket, charges me low price. 315 5.4 14.9 31.4 27.9 20.3 3.43 1.13
4.5.3 Descriptive Statistics of sales promotions
The study asked the respondents to indicate how they would judge the sales
promotions that they get from their current Supermarket brand. Respondents who
agreed that their supermarket gives good discounts were 35.6% with 32.1% being
neutral and mean of 3.61 (SD 0.98). This indicates that there is room for
supermarkets to give good discounts. Further, 30.2% were neutral when asked to
indicate whether their supermarket gives often has free gifts/samples and 21.8%
disagreed with mean of 3.25 (SD 1.09). This indicates that customers are not getting
adequate promotions in terms of free gifts and samples. Respondents who agree that
the supermarket has a good loyalty program were 41.3% and 21.3% strongly agree.

80
This meant that the supermarkets had reasonably good loyalty programs. Of the
respondents 37.8% were neutral with mean 3.48 (SD 0.98), when asked if the
promotions make them feel like a smart shopper. This indicates some shortcomings
in the nature of the promotions being done at the supermarkets. Overall, 41.6%
agreed and 31.4% were neutral that they liked the advertising and promotions of their
respective supermarket. The results are shown in Table 4.20.
Table 4.20: Descriptive Statistics for sales promotions
Percentage (%)
N
Str
ongl
y D
isag
ree
Dis
agre
e
Neu
tral
Agr
ee
Str
ongl
y A
gree
Mea
n
Std
. Dev
iati
on
This Supermarket gives good discounts 315 1.6 11.1 32.1 35.6 19.7 3.61 0.98
This supermarket gives often has free gifts/samples 315 4.8 21.9 30.2 29.5 13.7 3.25 1.09
This supermarket has a good loyalty program 315 0.6 7 29.8 41.3 21.3 3.76 0.89
The promotions make me feel like I am a smart shopper 315 2.9 10.8 37.8 32.4 16.2 3.48 0.98
Overall, I like the advertising and promotions of this supermarket 315 0.6 7.6 31.4 41.6 18.7 3.70 0.88
4.5.4 Descriptive Statistics of brand image
The study asked the respondents to indicate how they would judge the image of their
current supermarket brand. Using descriptive statistics, the study established that

81
45.1% of the respondents agreed that the supermarket brand has unique
characteristics. With a mean of 3.79 (SD 0.90), this implies that customers are
satisfied with their supermarket brand unique characteristics. Respondents who
agreed that the brand has good corporate reputation were, 47.1% with a mean of 4.03
(SD 0.81). This implies the significance of good corporate reputation to customers.
Respondents who agreed that the brand personality distinguishes it from competitors
were 45.4%. This meant that supermarkets are trying to distinguish themselves from
competitors. A further 45.7% agreed while 25.1% strongly agreed that the brand
doesn’t disappoint. This indicates a satisfactory level with the brand. Respondents
who agreed that the brand was the best in the sector were 42.2% while 28.6%
strongly agreed. This indicates a fair number of customers like their supermarket
brand. Of the respondents 44.6% indicated that the supermarket brand is very
consistent in the market. This indicates the significance of brand consistency in the
market. Lastly 46.6% of respondents agree that the supermarket brand has visually
appealing physical facilities. This indicates the importance of appealing physical
facilities. The findings are summarized in Table 4.21.

82
Table 4.21: Descriptive Statistics for brand image
Percentage (%)
N
Str
ongl
y D
isag
ree
Dis
agre
e
Neu
tral
Agr
ee
Str
ongl
y A
gree
Mea
n
Std
. Dev
iati
on
The supermarket brand has unique characteristics 315 0.6 8.3 24.1 45.1 21.9 3.79 0.90
Brand has good corporate reputation 314 0 4.1 18.8 47.1 29.9 4.03 0.81
Brand personality distinguishes it from competitors 315 0.3 4.8 24.8 45.4 24.8 3.90 0.84
Brand doesn’t disappoint 315 1 4.4 23.8 45.7 25.1 3.90 0.86
Best brand in the sector 315 0.6 5.4 23.2 42.2 28.6 3.93 0.89
Brand is very consistent in the market 314 0.3 4.8 22.1 44.6 28.2 3.96 0.85
Brand has visually appealing physical facilities 315 0.6 6.4 18.5 46.6 27.8 3.95 0.88
4.5.5 Descriptive Statistics of Customer Satisfaction
The study asked the respondents to indicate how they would judge the satisfaction
with their current supermarket brand. More than half of the respondents 51% agreed
that they have had a positive experience with the supermarket. With a mean of 4.27
(SD 0.66), this implies majority of the respondents have a positive experience. Of the
respondents, 56.5% agreed that the supermarket does a good job in satisfying their
needs. This result points to satisfied customers. Forty seven percent of the
respondents agreed that their past experience with the supermarket is excellent
whereas 23.5% were neutral and a mean of 3.87 (SD 0.85). This meant that a fair

83
number of customers have had a bad experience with the supermarket. Of the
respondents, 52.7% agreed that they made the right decision in buying from that
supermarket. This meant that a majority of customers were proud of the decision to
shop in their current supermarket. Overall, 47.9% agreed that they were satisfied
shopping at their current supermarket. With a mean of 4.14 (SD 0.80), this meant
that customers are experiencing high satisfaction levels with their current
supermarket. The findings are summarized in Table 4.22.
Table 4.22: Descriptive Statistics for customer satisfaction
Percentage (%)
N
Str
ongl
y D
isag
ree
Dis
agre
e
Neu
tral
Agr
ee
Str
ongl
y A
gree
Mea
n
Std
. Dev
iati
on
Positive experience with the supermarket 314 0 0.6 9.9 51 38.5 4.27 0.66
Does a good job in satisfying my needs 315 0 2.5 12.4 56.5 28.6 4.11 0.71
My past experience is excellent 315 0.6 5.4 23.5 47 23.5 3.87 0.85
I made the right decision in buying from this supermarket 315 0.3 1 14.9 52.7 31.1 4.13 0.71
Overall, I am satisfied shopping with the supermarket 315 0.3 3.5 13 47.9 35.2 4.14 0.80

84
4.5.6 Descriptive Statistics of brand loyalty
The study asked the respondents to indicate how they would judge loyalty to their
current supermarket brand. Of the respondents 43.5% were neutral while 41.6 %
agreed that they will recommend this supermarket brand to other people. This meant
that a good number of customers are hesitant to recommend their current
supermarket brand. Of the respondents 47.9 % agreed that they say positive things
about this supermarket to other people. This meant that a good number of customers
will speak positive things if they are satisfied. The majority of respondents, 46.7 %
agreed and 32.4% strongly agreed that they will continue to be a loyal customer to
this supermarket brand. With a mean of 4.09 (SD 0.77), this indicates a good level of
brand loyalty. Of the respondents 42.5% agreed that they are very committed to this
supermarket brand while 25.7% were neutral. This meant that a fair number of
customers are not committed to their supermarket brand. Lastly 38.4% agreed that
the will continue to choose this supermarket brand before other brands while 27.9%
were neutral. With a mean of 3.91 (SD 0.91), this indicated the possibility of
switching to other brands. Table 4.23 summarizes this finding.

85
Table 4.23: Descriptive Statistics for Brand Loyalty
Percentage (%)
N
Str
ongl
y D
isag
ree
Dis
agre
e
Neu
tral
Agr
ee
Str
ongl
y A
gree
Mea
n
Std
. Dev
iati
on
I will recommend this supermarket brand to other people 315 0.6 14 43.5 41.6 0 4.26 0.72
I say positive things about this supermarket to other people 315 0.3 0.6 18.1 47.9 33 4.13 0.74
I will continue to be a loyal customer to this supermarket brand 315 0.3 1.6 19 46.7 32.4 4.09 0.77
I ‘am very committed to this supermarket brand 315 0.6 7.6 25.7 42.5 23.5 3.81 0.91
I will continue to choose this supermarket brand before other brands 315 1.6 2.9 27.9 38.4 29.2 3.91 0.91
4.6 Factors Influencing Brand Loyalty
The study sought to establish the critical factors that define brand loyalty using
Exploratory Factor Analysis (EFA). After establishing the critical factors that define
brand loyalty, the study investigated the relationship between the predictor variables
and brand loyalty using correlation analysis.

86
4.6.1 Factor Analysis
Factor analysis is a data reduction technique that reduces or summarizes a large set
of variables to a smaller set of factors or components (Pallant, 2011). Byrne (2013)
stated that factor analysis is a realistic approach to reduce a large number of variables
and summarize the important factor embedded in a construct. If researchers do not
get expected results then any ill-fitting item can be removed (Osman & Sentosa,
2013). In assessing the suitability of data for factor analysis, two main pre-tests are
considered. These pre-tests are to determine the sample size and to determine the
strength of the relationship among the various variables or items. Tabachnick and
Fidell (2013) advocates a sample size of at least 300 cases for factor analysis. For
this study the sample size of 315 was considered suitable for factor analysis.
To determine the strength of the relationship among the items, Tabachnick and Fidell
(2013) recommends inspection of the intercorrelation matrix for coefficients of more
than 0.3. If few above the level of 0.3 are found, then factor analysis may not be
appropriate. A correlation matrix was used to examine correlation coefficients between
the variables in the data set. The results in Table 4.24, shows that all the coefficients
were more than 0.3, meaning that the data was suitable for factor analysis.

87
Table 4.24: Inter Item Correlations Matrix
Service Quality
Customer Perceived
Value Brand Image
Customer Satisfaction
Sales Promotions
Service Quality
Pearson Correlation 1
Sig. (2-tailed) N 315
Customer Perceived Value
Pearson Correlation .414** 1
Sig. (2-tailed)
.000
N 315 315
Brand Image
Pearson Correlation .450** .477** 1
Sig. (2-tailed)
.000 .000
N 315 315 315
Customer Satisfaction
Pearson Correlation .502** .519** .643** 1
Sig. (2-tailed)
.000 .000 .000
N 315 315 315 315
Sales Promotions
Pearson Correlation .383** .540** .498** .470** 1
Sig. (2-tailed)
.000 .000 .000 .000
N 315 315 315 315 315 **. Correlation is significant at the 0.01 level (2-tailed).
A Kaiser-Meyer-Olkin Measure of Sampling Adequacy (KMO) and a Bartlett's Test
were employed as pre-tests to assess the factorability of the data. As shown in Table
4.25, the KMO had a value of 0.910. The KMO statistics vary between 0 and 1
(Field, 2013). A value of zero indicates that the sum of partial correlation is large
relative to the sum of correlations indicating diffusions in the patterns of correlations
hence factor analysis is likely to be inappropriate (Field, 2013). A value close to 1
indicates that the patterns of correlations are relatively compact and so factor
analysis should yield distinct and reliable factors. Factor analysis is considered

88
appropriate if the Kaiser-Meyer-Olkin Measure of Sampling Adequacy (KMO) value
was 0.6 or above and the Bartlett’s Test of Sphericity value is significant with a
value of 0.05 or smaller (Pallant, 2011). The result suggested that factor analysis
would be appropriate.
Bartlett's test was used to test the strength of the relationship among variables. The
study tested the null hypothesis that the variables were uncorrelated using the
Bartlett's Test of Sphericity. The p-value = 0.000 was significant and less than the
threshold of 0.05 and therefore the null hypothesis was rejected meaning the
variables in the population correlation matrix were correlated (Tabachnick & Fidell,
2013). The Bartlett's test of Sphericity was significant (p < 0.05), meaning that factor
analysis was considered appropriate. Refer to Table 4.25.
Table 4.25: Kaiser-Meyer-Olkin and Bartlett's Test of Combined Data
Kaiser-Meyer-Olkin Measure of Sampling Adequacy. .910
Bartlett's Test of Sphericity Approx. Chi-Square 4197.184
df 465
Sig. 0.000
The next step after the pre-tests to determine the suitability of the data set for factor
analysis was to select the most suitable factorial method. There are mainly two types
of factor analysis, Principal Components Analysis (PCA) and Common Factor
Analysis. The PCA was preferred because it allowed for data reduction to a more
manageable size while retaining as much of the original information (Netemeyer, et
al., 2004). The initial solution was determined using PCA method. This was a two-
stage method comprising un-rotated solution and a rotated solution.
The communalities results are evaluated. This gives information about how much of
the variance in each item is explained. Low values (less than 0.3) could indicate that

89
the item does not fit well with the other items in its component (Tabachnick & Fidell,
2013). Item ‘Error free transactions’ has the lowest communality value (0.396) and it
also shows a loading of (0.508) on component 2. The communalities for the
combined data were all above 0.3 suggesting that the variances in the original
variables can be explained by the extracted factors.
Using Kaiser’s criterion, the study sought variables with eigenvalues greater than or
equal to 1. Using this rule, only factors with an eigenvalue of 1.0 or more were
retained for further investigation. The eigenvalues of a factor represent the amount of
the total variance explained by that factor. Principal Component Analysis revealed
the presence of six components with eigenvalues greater than or equal to 1,
explaining 31.84 %, 6.9%, 6.7%, 5.3%, 4.0% and 3.7%, of the variance respectively.
The total variance results in Table 4.26, indicates that six components explained
58.639% of all items, leaving 41.361% unexplained. A scree plot test was
subsequently performed to confirm the results.
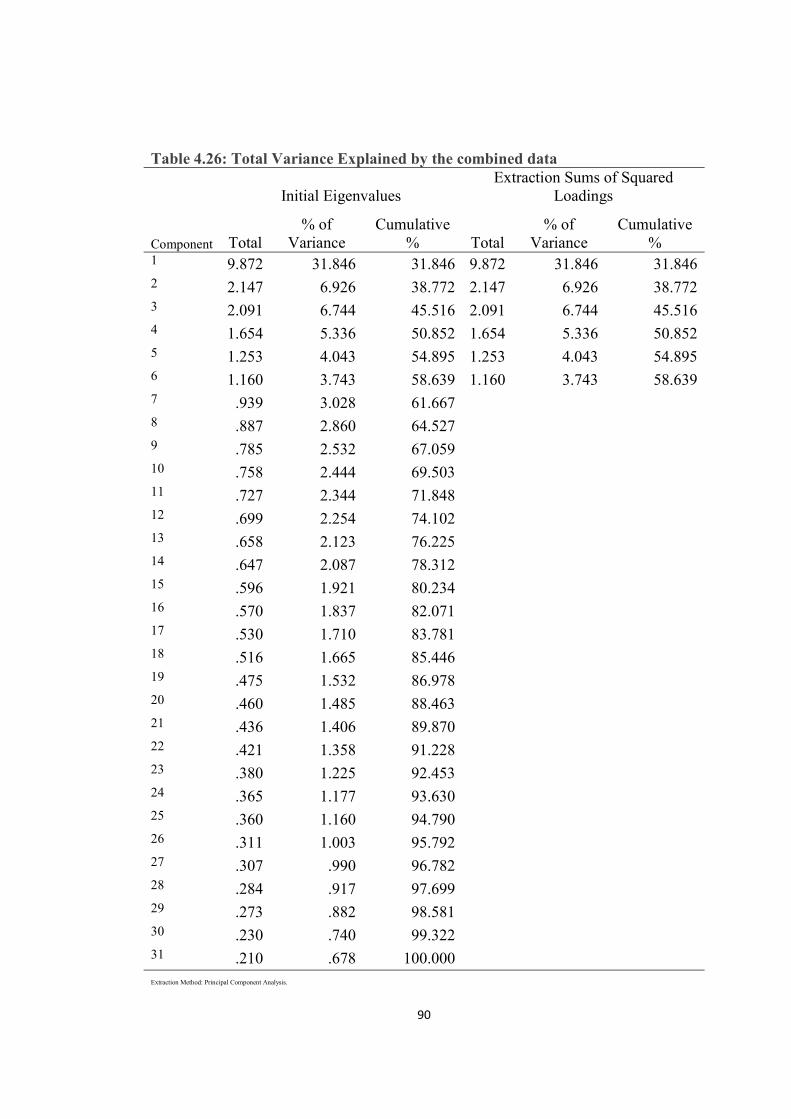
90
Table 4.26: Total Variance Explained by the combined data
Component
Initial Eigenvalues Extraction Sums of Squared
Loadings
Total % of
Variance Cumulative
% Total % of
Variance Cumulative
% 1 9.872 31.846 31.846 9.872 31.846 31.846 2 2.147 6.926 38.772 2.147 6.926 38.772 3 2.091 6.744 45.516 2.091 6.744 45.516 4 1.654 5.336 50.852 1.654 5.336 50.852 5 1.253 4.043 54.895 1.253 4.043 54.895 6 1.160 3.743 58.639 1.160 3.743 58.639 7 .939 3.028 61.667
8 .887 2.860 64.527
9 .785 2.532 67.059
10 .758 2.444 69.503
11 .727 2.344 71.848
12 .699 2.254 74.102
13 .658 2.123 76.225
14 .647 2.087 78.312
15 .596 1.921 80.234
16 .570 1.837 82.071
17 .530 1.710 83.781
18 .516 1.665 85.446
19 .475 1.532 86.978
20 .460 1.485 88.463
21 .436 1.406 89.870
22 .421 1.358 91.228
23 .380 1.225 92.453
24 .365 1.177 93.630
25 .360 1.160 94.790
26 .311 1.003 95.792
27 .307 .990 96.782
28 .284 .917 97.699
29 .273 .882 98.581
30 .230 .740 99.322
31 .210 .678 100.000 Extraction Method: Principal Component Analysis.

91
The Catell’s scree test involves plotting each of the eigenvalues of the factors and
inspecting the plot to find a point at which the shape of the curve changes direction
and becomes horizontal. Pallant (2011) recommends retaining all factors above the
elbow, or break in the plot, as these factors contribute the most to the explanation of
the variance in the data set. An inspection of the scree plot in Figure 4.1 revealed a
clear break after the sixth component confirming the findings of total variance
explained since six items had Eigen value greater than 1. It was decided to retain the
six items for further investigations.
Figure 4.1: Scree plot for combined data
The minimum factor loading is necessary to consider an item in its corresponding
variable. Hair et al. (2014) recommended that factor loading 0.40 can be considered
as an important loaded factor but greater than 0.50 can be considered as the most
significant loaded factor. However, for this research, the requirement for factor
loading greater than 0.50 is adopted and the items used to compute summated factor
scores for variables. The results of this study in Table 4.27, shows items are loaded
to six factor components.

92
Table 4.27: Rotated Component
Component 1 2 3 4 5 6 Factor
Supermarket provides superior service .589 Service Sufficient Parking facility
.779 Quality
Clean, attractive and convenient washrooms
.675 (Physical facilities) Error free transactions
.508
Well stocked merchandise
.607
Service Quality Employees have knowledge to answer customer questions
.739
(Human Element)
Employees gives customers individual attention
.694
Employees are consistently courteous
.711
comparatively I am charged fairly
.732
Customer comparatively I get more free services
.645
Value
comparatively I get good value for what i pay
.548
comparatively I am charged low prices
.767
Free gifts/samples
.585
Good loyalty programs
.654
Promotions make me feel I am a smart shopper
.763
Sales Promotions Overall, I like the advertising and the promotions
.602
The supermarket brand has unique characteristics .694
Brand has good corporate reputation .721
Brand personality distinguishes it from competitors .686
Brand doesn’t disappoint .557
Brand Image
Best brand in the sector .726
Brand is very consistent in the market .738
Brand has visually appealing physical facilities .639
Positive experience with the supermarket
.561
Does a good job in satisfying my needs
.701
My past experience is excellent
.538
I made the right decision in buying from this supermarket
.700
Customer Satisfaction Overall, I am satisfied shopping with the supermarket .751 Cronbach’s alpha value of factor 0.881 0.767 0.845 0.761 0.729 0.582 Overall α = 0.912 Principal Component Analysis. Rotation Method: Varimax with Kaiser Normalization. a. Rotation converged in 8 iterations.
93
Using Varimax with Kaiser normalization method, the study established in Table
4.27 that 28 items loaded on six factors. The first component had 7 items loaded on it
and was interpreted as the factor brand image. The overall Cronbach’s alpha of the
seven items was α = 0.881. The second component had 5 items loaded on it and was
interpreted as the factor human element. The overall Cronbach’s alpha of the five
items was α = 0.767. The third component had 5 items loaded on it and was
interpreted as the factor customer satisfaction. The overall Cronbach’s alpha of the
five items was α = 0.845. The fourth component had 4 items loaded on it and was
interpreted as the factor customer perceived value. The overall Cronbach’s alpha of
the four items was α = 0.761. The fifth component had 4 items loaded on it and was
interpreted as the factor sales promotions. The overall Cronbach’s alpha of the seven
items was α = 0.729. The first five components had good reliability and satisfied the
internal validity threshold requirement of overall Cronbach’s alpha of α >0.7. Field
(2013) interprets a Cronbach’s alpha (α), greater than or equal to 0.7 as implying the
instrument provides a relatively good measurement tool hence reliable. The sixth
component had 3 items loaded on it and was interpreted as the factor physical
facilities with a low reliability of Cronbach’s alpha of 0.582. The factor physical
facilities failed to meet the internal validity threshold requirement of overall
Cronbach’s alpha of α >0.7.
The close association between physical facilities and human element led the study to
seek an examination of the effect of combining the two data sets. Combining the two
emerged a new construct that was interpreted as the factor service quality. The 8
items loading on the construct service quality had an overall Cronbach’s alpha value
of 0.757, hence met the requirements of internal construct validity. The study
therefore established five critical factors that define brand loyalty as encompassing
brand image, service quality, customer satisfaction, customer perceived value and
sales promotions.

94
4.6.2 Correlation Analysis
The relationship between the predictor variables and brand loyalty was established
using Pearson product-moment correlation coefficient. Preliminary analyses were
performed to ensure no violation of the assumptions of normality, linearity and
homoscedasticity. Correlation analysis is used to describe the strength and direction
of the linear relationship between two variables. Pallant (2011) posits that the
Pearson correlation coefficients (r) can only take on values from –1 to +1. This value
will indicate the strength of the relationship between two variables. A correlation of
0 indicates no relationship at all, a correlation of 1.0 indicates a perfect positive
correlation, and a value of –1.0 indicates a perfect negative correlation. A correlation
was considered significant when the probability value was equal to or below 0.05 (p-
value less than or equal to 0.05). Field (2013) posit that because the correlation
coefficient is a standardized measure of an observed effect, it is a commonly used
measure of the size of an effect and that values of ± 0.1 represent a small effect, ± 0.3
is a medium effect and ± 0.5 is a large effect.
The correlation coefficient between service quality and brand loyalty was significant
(r = 0.412, p = 0.000) implying that there was significant relationship between
service quality and brand loyalty. The correlation between customer’s perceived
value and brand loyalty was significant (r = 0.479, p = 0.000) implying that
customer’s perceived value and brand loyalty are significantly associated. The
correlation analysis between sales promotion and brand loyalty was significant (r =
0.413, p = 0.000). This implies that sales promotion and brand loyalty are
significantly associated. The correlation analysis for brand image and brand loyalty
indicate that the relationship between brand image and brand loyalty was significant
(r = 0.614, p = 0.000). The correlation between customer satisfaction and brand
loyalty was significant (r = 0.698, p = 0.000). This means that the relationship
between customer satisfaction and brand loyalty was significant. The results are
shown in Table 4.28.
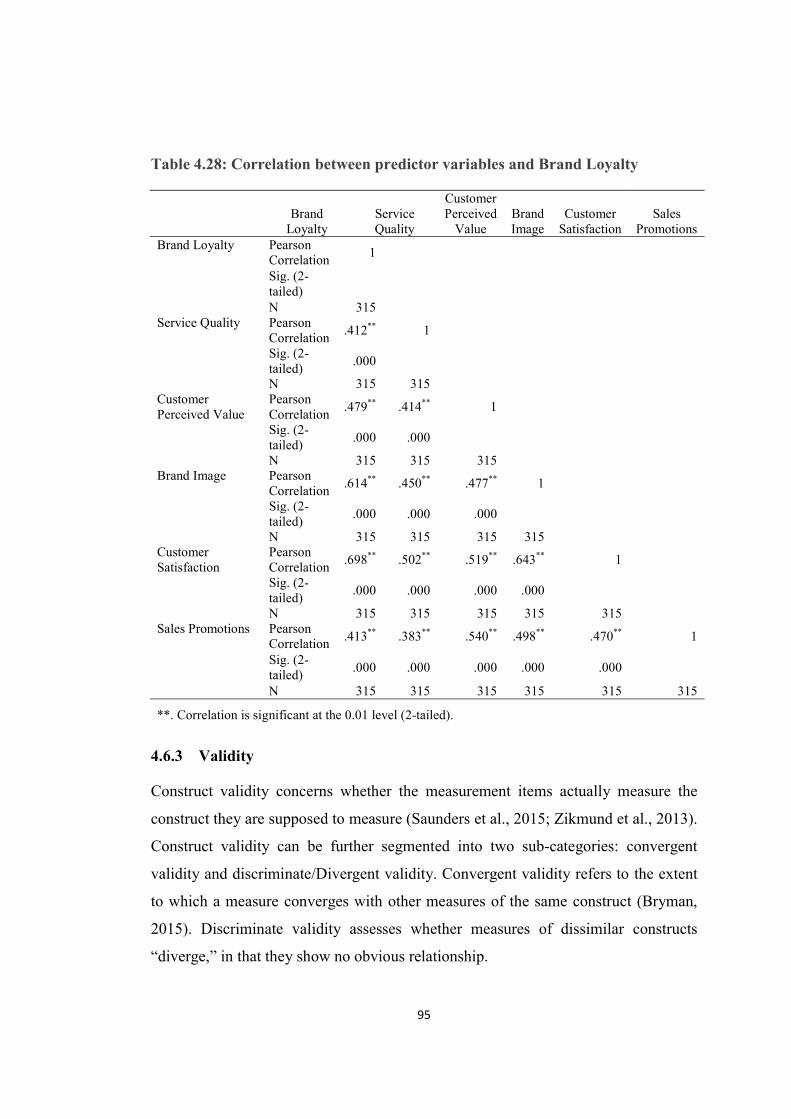
95
Table 4.28: Correlation between predictor variables and Brand Loyalty
Brand
Loyalty Service Quality
Customer Perceived
Value Brand Image
Customer Satisfaction
Sales Promotions
Brand Loyalty Pearson Correlation
1
Sig. (2-tailed) N 315
Service Quality Pearson
Correlation .412** 1
Sig. (2-tailed)
.000
N 315 315
Customer Perceived Value
Pearson Correlation
.479** .414** 1
Sig. (2-tailed)
.000 .000
N 315 315 315
Brand Image Pearson Correlation
.614** .450** .477** 1
Sig. (2-tailed)
.000 .000 .000
N 315 315 315 315
Customer Satisfaction
Pearson Correlation
.698** .502** .519** .643** 1
Sig. (2-tailed)
.000 .000 .000 .000
N 315 315 315 315 315
Sales Promotions Pearson Correlation
.413** .383** .540** .498** .470** 1
Sig. (2-tailed)
.000 .000 .000 .000 .000
N 315 315 315 315 315 315
**. Correlation is significant at the 0.01 level (2-tailed).
4.6.3 Validity
Construct validity concerns whether the measurement items actually measure the
construct they are supposed to measure (Saunders et al., 2015; Zikmund et al., 2013).
Construct validity can be further segmented into two sub-categories: convergent
validity and discriminate/Divergent validity. Convergent validity refers to the extent
to which a measure converges with other measures of the same construct (Bryman,
2015). Discriminate validity assesses whether measures of dissimilar constructs
“diverge,” in that they show no obvious relationship.
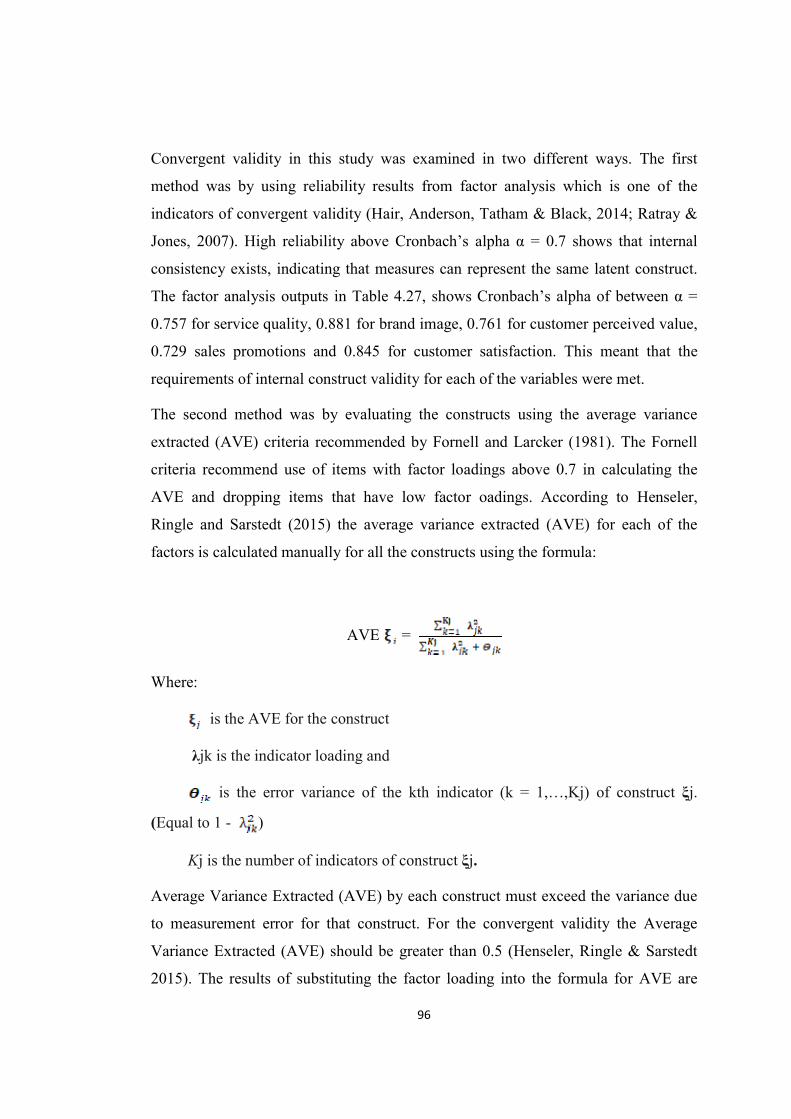
96
Convergent validity in this study was examined in two different ways. The first
method was by using reliability results from factor analysis which is one of the
indicators of convergent validity (Hair, Anderson, Tatham & Black, 2014; Ratray &
Jones, 2007). High reliability above Cronbach’s alpha α = 0.7 shows that internal
consistency exists, indicating that measures can represent the same latent construct.
The factor analysis outputs in Table 4.27, shows Cronbach’s alpha of between α =
0.757 for service quality, 0.881 for brand image, 0.761 for customer perceived value,
0.729 sales promotions and 0.845 for customer satisfaction. This meant that the
requirements of internal construct validity for each of the variables were met.
The second method was by evaluating the constructs using the average variance
extracted (AVE) criteria recommended by Fornell and Larcker (1981). The Fornell
criteria recommend use of items with factor loadings above 0.7 in calculating the
AVE and dropping items that have low factor oadings. According to Henseler,
Ringle and Sarstedt (2015) the average variance extracted (AVE) for each of the
factors is calculated manually for all the constructs using the formula:
AVE =
Where:
is the AVE for the construct
λjk is the indicator loading and
is the error variance of the kth indicator (k = 1,…,Kj) of construct ξj.
(Equal to 1 - )
Kj is the number of indicators of construct ξj.
Average Variance Extracted (AVE) by each construct must exceed the variance due
to measurement error for that construct. For the convergent validity the Average
Variance Extracted (AVE) should be greater than 0.5 (Henseler, Ringle & Sarstedt
2015). The results of substituting the factor loading into the formula for AVE are

97
presented in Table 4.29. The result shows that the Average Variance Extracted
(AVE) values were above 0.50 which demonstrated convergent validity (Hair et al.,
2014).
Table 4.29: Average Variance Extracted (AVE)
Average Variance Extracted (AVE) Square Root AVE
Service Quality 0.535 0.731
Customer Perceived Value 0.562 0.750
Brand Image 0.518 0.720
Customer Satisfaction 0.515 0.717
Sales Promotions 0.583 0.763
Discriminate validity focuses on the extent to which measures for constructs are
distinctively different from each other (Baker & Sinkula, 2009). To satisfy the
requirement of the discriminate validity, the square root of a construct's average
variance extracted must be greater than the correlations between the construct and
other constructs (Madhoushi, Sadati & Delavari, 2011; Henseler et al., 2015).
The diagonal items in the Table 4.30 represent the square root of AVE’s, which is a
measure of variance between construct and its indicators, and the off-diagonal items
represent correlation between constructs. The results as illustrated in Table 4.30
showed that the square root of each AVE was higher than the corresponding
correlation coefficient thus supporting the discriminant validity between the
constructs.

98
Table 4.30: Square root of AVE and correlations between constructs
Service Quality
Customer Perceived
Value Brand Image
Customer Satisfaction
Sales Promotions
Service Quality 0.731
Customer Perceived Value 0.414 0.750
Brand Image 0.450 0.477 0.720
Customer Satisfaction 0.502 0.519 0.643 0.717
Sales Promotions 0.383 0.540 0.498 0.470 0.763
4.7 Diagnostic Tests for Regression Analysis
The study used regression analysis to establish the determinants of brand loyalty in
supermarkets in Kenya. Preceding the regression analysis, the study conducted
various diagnostic tests to ensure that the assumptions of the Classical Linear
Regression Model (CLRM) were not violated. Before a complete regression analysis
can be performed, the assumptions concerning the original data must be made.
Ignoring the assumptions contribute to wrong validity estimates and inferences from
the analysis (Antonakis & Dietz, 2011). Meaningful data analysis carries significant
benefits to the study and relies on the testing of the assumptions and the
consequences of violations. In this section the test results on linearity,
multicollinearity, normality, heteroscedasticity and autocorrelation are presented.
4.7.1 Linearity
Linearity defines the dependent variable as a linear function of the predictor
(independent) variables (Pallant, 2011). If linearity is violated all the estimates of the
regression including regression coefficients, standard errors, and tests of statistical
significance may be biased (Keith, 2015). If the relationship between the dependent
and independent variables is not linear, the results of the regression analysis will

99
under- or over- estimate the true relationship and increase the risk of Type I and
Type II errors (Osborne & Waters, 2002).
According to Pallant (2011) the linearity assumption refers to the presence of a
straight-line relationship between each pair of your dependent variables. This can be
assessed in a number of ways; the most straightforward is to generate a matrix of
scatter plots between each pair of your variables, separately for our groups (Pallant,
2011). Tabachnick and Fidell (2013), urges that it is certainly not practical to check
scatter plots of all variables with all other variables. Tabachnick and Fidell (2013)
suggest a ‘spot check’ of some combination of variables. Linearity is displayed by
the data points being arranged in the shape of an oval. A spot check of various
combinations of x and y variables of the study data show evidence of linearity.
Residual plots showing the standardized residuals versus the predicted values are
very useful in detecting violations in linearity (Stevens, 2015). The residuals magnify
the departures from linearity (Keith, 2015). If there is no departure from linearity you
would expect to see a random scatter about the horizontal line. Any systematic
pattern or clustering of the residuals suggests violation (Stevens, 2015). A plot
of residuals versus predicted values, in Appendix 10 shows scatter plots of residuals
that indicate a linear relationship since the points are symmetrically distributed
around a horizontal line, with a roughly constant variance. In a plot of observed
versus predicted values, the points should be symmetrically distributed around a
diagonal line in the plot (Stevens, 2015). Appendix 10 shows the points are
symmetrically distributed around a diagonal line. The plots do show the evidence of
linearity; therefore, our assumption of linearity is satisfied.
4.7.2 Heteroscedasticity
The assumption of homoscedasticity refers to equal variance of the residual at each
level of the independent / predictor variables (Field, 2013). When this assumption is
violated by the variances being very unequal, the errors are heteroscedastic, a
condition known as heteroscedasticity. This means that researchers assume that
errors are spread out consistently between the variables (Keith, 2015). This is evident
when the variance around the regression line is the same for all values of the

100
predictor variable. According to Tabachnick and Fidell (2013) slight
heteroscedasticity has little effect on significance tests; however, when
heteroscedasticity is marked it can lead to serious distortion of findings and seriously
weaken the analysis thus increasing the possibility of a Type I error. This assumption
can be checked by visual examination of a scatter plot of the standardized residuals
(the errors) against the regression standardized predicted value (Tabachnick & Fidell,
2013; Keith, 2015). Heteroscedasticity is indicated when the scatter is not even; fan
and butterfly shapes are common patterns of violations.
According to Field (2013), the *ZRESID (the standardized residuals, or errors) and
*ZPRED (the standardized predicted values of the dependent variable based on the
model) should look like a random array of dots evenly dispersed around zero. If this
graph funnels out with evidence of residuals that grow larger either as a function of
time or as a function of the predicted value, then the chances are that there is
heteroscedasticity in the data. When the deviation is substantial more formal tests for
heteroscedasticity should be performed, such as collapsing the predictive variables
into equal categories and comparing the variance of the residuals (Keith, 2015). A
plot of the *ZRESID (the standardized residuals, or errors) against *ZPRED (the
standardized predicted values of the dependent variable based on the model) in
Appendix 10 shows a random array of dots evenly dispersed throughout the plot.
This pattern is indicative of a situation in which the assumptions of linearity and
homoscedasticity have been met. Hence the data did not violate the assumption of
homoscedasticity.
Residuals can be tested further for homoscedasticity using the Breusch Pagan /
Koenker test, which performs an auxiliary regression of the squared residuals on the
independent variables (Gujarati et al., 2013; Breusch & Pagan, 1979: Koenker,
1981). The study utilized Breusch Pagan and Koenker test macro available for SPSS.
The null hypothesis is stated as Ho: constant variance (Homoscedasticity), which
means the data, does not suffer from heteroscedasticity. If the significant value is less
than 0.05, reject the null hypothesis. The Breusch-Pagan / Koenker test results in
Table 4.31 had a p value of 0.1005. Thus, the null hypothesis of constant variance

101
was not rejected since the reported value was greater than critical p value of 0.05.
This implies that the data has constant variance and did not suffer from
heteroscedasticity.
Table 4.31: Heteroscedasticity Results
Breusch-Pagan / Koenker test for heteroscedasticity
Ho: Constant variance (Homoscedasticity)
CHI-SQUARE df=4 = 9.223
Prob > chi2 = 0.1005
4.7.3 Multicollinearity
Stevens (2015) proposes two methods for diagnosing multicollinearity: The first is to
examine the correlations among the predictors from the correlation matrix. These
should be observed, and are easy to understand, but they do not always indicate the
extent of multicollinearity. The second is to examine the variance inflation factors for
the predictors. The variance inflation factor for a predictor indicates whether there is
a strong linear association between it and all the remaining predictors Stevens
(2015). The study used a correlation matrix to test for multicollinearity. The results
indicate Pearson correlation coefficient of between 0.383 and 0.698, indicating that
none of the variables were highly correlated. According to Pallant (2011)
multicollinearity does not contribute to a good regression model and
multicollinearity exists when the independent variables are highly correlated (r = 0.9
and above). An inspection of the results of the correlation matrix in Table 4.28
indicates that the study data did not exhibit multicollinearity.
In this study, tolerance, the Variance Inflation Factor (VIF) and Pearson correlation
coefficient (r) were adopted as two collinearity diagnostic factors that could help
identify multicollinearity. Related to the VIF is the tolerance statistic, which is its
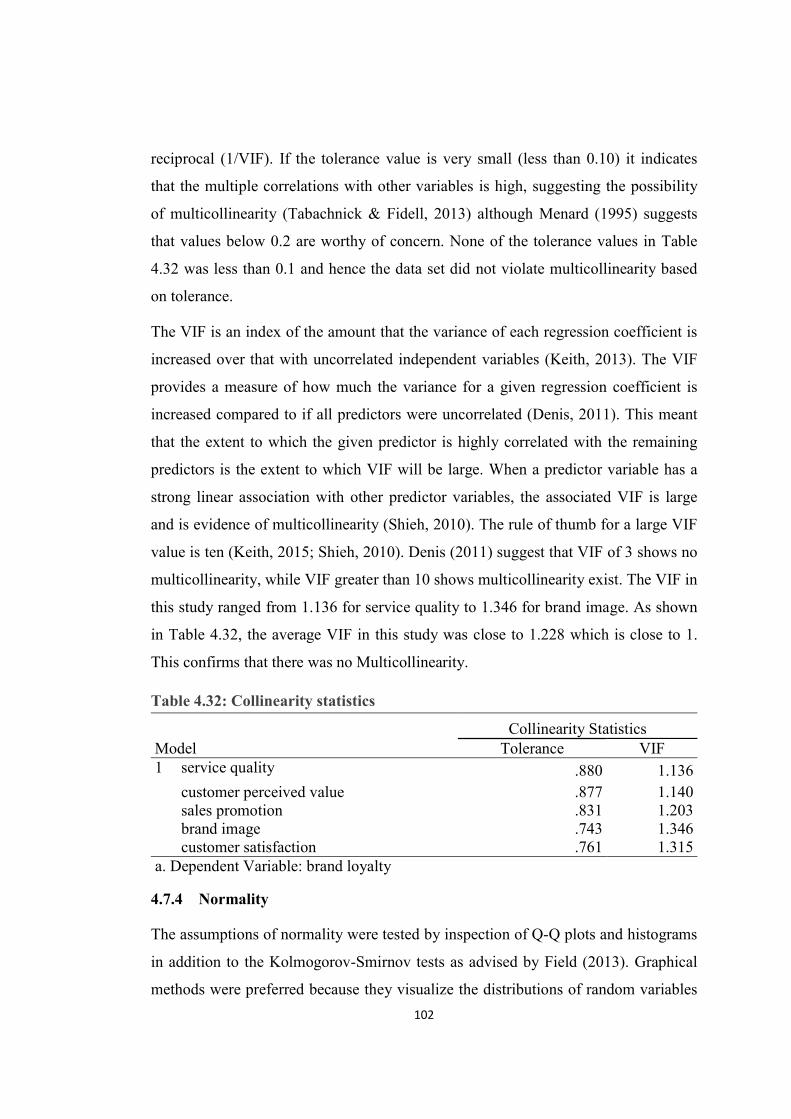
102
reciprocal (1/VIF). If the tolerance value is very small (less than 0.10) it indicates
that the multiple correlations with other variables is high, suggesting the possibility
of multicollinearity (Tabachnick & Fidell, 2013) although Menard (1995) suggests
that values below 0.2 are worthy of concern. None of the tolerance values in Table
4.32 was less than 0.1 and hence the data set did not violate multicollinearity based
on tolerance.
The VIF is an index of the amount that the variance of each regression coefficient is
increased over that with uncorrelated independent variables (Keith, 2013). The VIF
provides a measure of how much the variance for a given regression coefficient is
increased compared to if all predictors were uncorrelated (Denis, 2011). This meant
that the extent to which the given predictor is highly correlated with the remaining
predictors is the extent to which VIF will be large. When a predictor variable has a
strong linear association with other predictor variables, the associated VIF is large
and is evidence of multicollinearity (Shieh, 2010). The rule of thumb for a large VIF
value is ten (Keith, 2015; Shieh, 2010). Denis (2011) suggest that VIF of 3 shows no
multicollinearity, while VIF greater than 10 shows multicollinearity exist. The VIF in
this study ranged from 1.136 for service quality to 1.346 for brand image. As shown
in Table 4.32, the average VIF in this study was close to 1.228 which is close to 1.
This confirms that there was no Multicollinearity.
Table 4.32: Collinearity statistics
Model Collinearity Statistics
Tolerance VIF 1 service quality .880 1.136
customer perceived value .877 1.140 sales promotion .831 1.203 brand image .743 1.346 customer satisfaction .761 1.315
a. Dependent Variable: brand loyalty
4.7.4 Normality
The assumptions of normality were tested by inspection of Q-Q plots and histograms
in addition to the Kolmogorov-Smirnov tests as advised by Field (2013). Graphical
methods were preferred because they visualize the distributions of random variables

103
and are easy to interpret. The Kolmogorov–Smirnov tests compare the scores in the
sample to a normally distributed set of scores with the same mean and standard
deviation. If the test is non-significant (p > 0.05) it tells us that the distribution of the
sample is not significantly different from a normal distribution (Field, 2013). In
Table 4.33 the results of the Kolmogorov -Smirnov statistic have p values greater
than 0.05 suggesting the assumption of normality.
Table 4.33: Normality Test Using Kolmogorov-Smirnov Statistic
Kolmogorov-Smirnova
Statistic df Statistic Sig.
Service Quality 0.092 315 0.092 0.075
Customer Perceived Value
0.081 315 0.081 0.200
Brand Image 0.111 315 0.111 0.082
Customer Satisfaction 0.109 315 0.109 0.069
Sales Promotions 0.99 315 0.99 0.067
a. Lilliefors Significance Correction
In Q-Q plot, or the normal probability plot, the observed value for each score is
plotted against the expected value from the normal distribution, where, a sensibly
straight line suggests a normal distribution (Pallant, 2011). The graphical analysis
results showed the line representing the actual data distribution closely follow the
diagonal in the normal Q-Q plot as shown in Figures 4.2 to 4.5, suggesting normal
distribution (Hair et al., 2014).

104
Figure 4.2: Normality Test for Service Quality
Figure 4.3: Normality Test for Customer Perceived Value

105
Figure 4.4: Normality Test for Brand Image
Figure 4.5: Normality Test for Sales Promotions
A further inspection of the study dependent variables histograms in Appendix 7
shows largely symmetrical bell shapes confirming normal distribution. Given these

106
arguments and based on the results of the Normal Q-Q plots and the histograms, it
was assumed that the sample data came from a population with normal distribution,
thus assumption of normality was met.
According to Field (2013) the assumption of normality of errors is important in
research using regression (or general linear models). General linear models, assume
that errors in the model are normally distributed. To test the normality of residuals,
the histogram of the standardized residuals should be checked (Field, 2013; Stevens,
2015). The results of the normality test are shown in Appendix 9. The histogram has
a bell shape, and is symmetric with most of the frequency counts clustered in the
middle and with the counts deceasing in the tails. This shape confirms that the data is
normally distributed. Because the test did not reject normality, the study proceeded
to assume normality of residuals.
4.7.5 Autocorrelation
Autocorrelation is prevalent in times series data such that over time successive
observations are likely to exhibit intercorrelations, especially if the time interval
between successive observations is short (Gujarati, Porter, & Gunasekar, 2013).
Autocorrelation is a lag correlation of a given series with itself, lagged by a number
of time units. In statistics, the Durbin–Watson statistic is a test statistic used to detect
the presence of autocorrelation (a relationship between values separated from each other
by a given time lag) in the residuals (prediction errors) from a regression analysis
(Hateka, 2011).
The study used cross sectional data where the information about different individuals
was collected at the same time period. The data collected was on the basis of a random
sample of cross-sectional units, and thus there is no prior reason to believe that the
error term pertaining to one respondent is correlated with the error term of another
respondent. Without a time, component the residuals cannot be serially correlated.
So, a test for serial correlation in this case is not valid. The most common concerns
in cross-section data are heteroskedasticity and not autocorrelation. Thus, the study
concluded that there was no autocorrelation in the sample.

107
4.8 Hypothesis Testing
The study analyzed the relationship between service quality, Customer Perceived
Value, Sales Promotions, Brand Image and brand loyalty using multiple linear
regression. The predicted model relating the predictor variables and brand loyalty
was:
BL = β0 + β1 SQ + β2 CPV + β3 SP + β4 BI + ε0
Where,
β0 was the estimate of the intercept,
β1 was the beta value associated with service quality (SQ)
β2 was the beta value associated with customer perceived value (CPV)
β3 was the beta value associated with sales promotions (SP)
β4 was the beta value associated with brand image (BI)
ε0 was the associated regression error term.
BL stood for brand loyalty.
The study sought to establish the effect of the predictor variables on brand loyalty in
leading supermarket chains in Kenya. The study hypotheses were therefore tested:
H01 There is no significant effect of service quality on brand loyalty in leading
supermarket chains in Kenya.
H02 There is no significant effect of customers’ value perception on brand loyalty
in leading supermarket chains in Kenya.
H03 There is no significant effect of sales promotions on brand loyalty in leading
supermarket chains in Kenya.
H04 There is no significant effect of brand image on brand loyalty in leading
supermarket chains in Kenya.
Using ordinary least squares (OLS) method of estimation under linear regression
analysis, the study proceeded to determine the effect of service quality, Customer
108
Perceived Value, Sales Promotions, Brand Image on brand loyalty. The model
summary results of the regression analysis in Table 4.34, shows that R Square value
was 0.433. This meant that 43.3 % variations in brand loyalty were explained by
Service quality, customer perceived value, Sales Promotions and Brand Image. The
result leaves 56.7 % of the variations unexplained and was interpreted to mean that
the model provided a moderate fit.
Table 4.34: Model Summary for the predictor variables on Brand Loyalty
Model R
R
Square
Adjusted
R Square
Std.
Error of
the
Estimate
Change Statistics
R
Square
Change
F
Change df1 df2
Sig. F
Change
1 .658a .433 .425 .52804 .433 59.117 4 310 .000
a. Predictors: (Constant), Sales Promotions, Service Quality, Brand Image, Customer
Perceived Value
b. Dependent Variable: Brand Loyalty
The ANOVA tells us whether the model, overall, results in a significantly good
degree of prediction of the outcome variable (Field, 2013). The resulting ANOVA
Table 4.35, for service quality, customer perceived value, sales promotions, brand
image with brand loyalty had an F (4, 310) of 59.117 and had p value = 0.000. The
model was therefore significant at α = 0.05 level of significance in explaining the linear
relationship between service quality, customer perceived value, sales promotions,
brand image with brand Loyalty.

109
Table 4.35: ANOVA for the predictor variables on brand loyalty
Model Sum of Squares df
Mean Square F Sig.
1 Regression 65.933 4 16.483 59.117 .000b
Residual 86.435 310 .279
Total 152.367 314
a. Dependent Variable: Brand Loyalty
b. Predictors: (Constant), Sales Promotions, Service Quality, Brand Image, Customer Perceived Value
After establishing that the model was significant in explaining the relationship
between the predictor variables and brand loyalty, the study examined the
coefficients of predictor variables and brand loyalty as presented in Table 4.36. The
beta coefficients values were highest with brand image followed by customer
perceived value, service quality and sales promotions respectively. This meant that
brand image had the highest impact on brand loyalty. The Coefficients value for
effect of brand Image on brand loyalty was 0.462 and the p value of 0.000 which was
significant at α = 0.05 level. This implied that brand image significantly affects brand
loyalty. The study thus rejected the null hypothesis H04 that there is no significant
effect of brand image on brand loyalty in leading supermarket chains in Kenya.
The coefficients for customers’ perceived value were 0.194 with a significant p value
of 0.000 implying that customers’ perceived value significantly affects brand loyalty.
The study therefore rejected the null hypothesis H02 that there is no significant effect
of customers’ value perception and brand loyalty in leading supermarket chains in
Kenya.
The coefficient for service quality was 0.133 with a significant p-value of 0.023. The
finding implied that service quality significantly affects brand loyalty hence the study
rejected the null hypothesis H01 that there is no significant effect of service quality on
brand loyalty in leading supermarket chains in Kenya.

110
The coefficients for effects of Sales Promotion on Brand Loyalty were 0.041 with a p
value of 0.454 which is more than 0.05 and thus not significant. The study therefore
failed to reject the null hypothesis H03 that there is no significant effect of sales
promotions on brand loyalty in leading supermarket chains in Kenya. The result
implied that sales promotion does not significantly affect brand loyalty.
Table 4.36: Coefficients of the predictor variables and brand loyalty
Model
Un standardized Coefficients
Standardized Coefficients
t Sig.
95.0% Confidence
Interval for B
B Std.
Error Beta Lower Bound
Upper Bound
1 (Constant) .848 .228 3.720 .000 .400 1.297
Brand Image .462 .055 .449 8.402 .000 .018 .247
Customer Perceived Value
.194 .054 .195 3.614 .000 .089 .300
Service Quality .133 .058 .114 2.283 .023 .354 .570
Sales Promotions .041 .054 .041 .750 .454 -.066 .147
a. Dependent Variable: Brand Loyalty
4.8.1 Effects of Service Quality on Brand Loyalty
The first research objective was to assess the relationship between service quality on
brand loyalty in leading supermarket chains in Kenya. The null hypothesis was
stated as:
H01 There is no significant effect of service quality on brand loyalty in leading
supermarket chains in Kenya.
The study used multiple linear regression analysis, leading to the outputs in Tables 4.34
to Table 4.36, which established that service quality significantly affects brand loyalty.
The results of these findings led to the rejection of the null hypothesis H01 that there is
no significant effect of service quality on brand loyalty in leading supermarket chains
111
in Kenya. Table 4.27 identified the variables that define service quality to a great
extent as including: Supermarket provides superior service, sufficient parking
facility, clean, attractive and convenient washrooms, error free transactions, well
stocked merchandise, employees have knowledge to answer customer questions,
employee’s gives customers’ individual attention and employees are consistently
courteous. This result supports Tu, Li, and Chih (2011) who reported in their study that
service quality is closely linked to customers’ satisfaction, and thus, influences loyalty.
The findings also agree with Su (2004) who argued that retailers should give special
consideration to service quality in order to enhance customers’ relationship through
customer satisfaction and loyalty in this modern day of increased competitiveness in the
retail market.
Similarly, the results agree with Clottey and Collier (2008) who in their study of 972
retail customers of United States retail industry, found strong statistical evidence that
service quality has a great influence where it positively and significantly correlated
with brand loyalty. Clottey and Collier (2008) have posited that “perception of
service quality had a direct relationship with customer retention leading to brand
loyalty. Zetu and Miller (2016) further argue that service quality perception is a key
driver of customer repurchases and a crucial driver of brand loyalty. Retail service
quality is also highly associated with future buying decisions behaviour in terms of
the customers’ intention to visit, purchase and recommend the store to family and
friends (Nadiri & Tumer, 2009). According to Nadiri and Tumer (2009) it is apparent
that retail stores need to gain and maintain a competitive advantage if they are to
survive in this highly competitive sector. To do so, management must recognise that
retail service quality is a crucial marketing tool. Retailers should frequently assess
their customers’ perceptions of service quality and develop appropriate policies to
meet their customers’ expectations. Customers are unlikely to return or recommend a
service firm that falls short of their expectations of service quality.
112
4.8.2 Effects of Customer Perceived Value on Brand Loyalty
The second research objective was to assess the relationship between customers’ value
perception on brand loyalty in leading supermarket chains in Kenya. The null
hypothesis was stated as:
H02 There is no significant effect of customers’ value perception on brand loyalty
in leading supermarket chains in Kenya.
The study used multiple linear regression analysis, leading to the outputs in Tables
4.34 to Table 4.36, which established that customers’ value perception significantly
affects brand loyalty. The findings led to the rejection of the null hypothesis H02 that
there is no significant effect of customers’ value perception on brand loyalty in
leading supermarket chains in Kenya. Table 4.27 identified the variables that define
customers’ value perception to a great extent as including: comparatively I am
charged fairly, comparatively I get more free services, comparatively I get good
value for what I pay and comparatively I am charged low prices. This result supports
previous research by Chen and Hu (2010) who posit that perceived customer value
influences revisit intention and thereby leads to brand loyalty.
Wang, Lo, Chi and Yang (2004) argues that providing customers with value is a
strategic tool to attracting and retaining customers, building customer loyalty,
thereby contributing significantly to the success of the service providers. Hence, it is
expected that by offering greater customer value, service providers can promote trust
and commitment that eventually develops more loyal customers (Wang et al., 2004).
Moreover, research shows that customer value is an important antecedent to outcome
variables such as word-of-mouth and repeated behaviour, all that lead to brand
loyalty (Leroi-Werelds, Streukens, Brady, & Swinnen, 2014).
4.8.3 Effects of Sales Promotions on Brand Loyalty
The third research objective was to assess the relationship between sales promotions
on brand loyalty in leading supermarket chains in Kenya. The null hypothesis was
stated as:

113
H03 There is no significant effect of sales promotions on brand loyalty in leading
supermarket chains in Kenya.
The study used multiple linear regression analysis, leading to the outputs in Tables
4.34 to Table 4.36, which established that sales promotions do not significantly affect
brand loyalty. Thus, the study failed to reject the null hypothesis H03 that there is no
significant effect of sales promotions on brand loyalty in leading supermarket chains
in Kenya. Table 4.27 identified the variables that define sales promotions to a great
extent as including: free gifts/samples, good loyalty programs, promotions make me
feel, I am a smart shopper and overall, I like the advertising and the promotions.
The findings agree with Bridges, Briesch and Yin (2006) who argued that promotion
enhancement reduces brand loyalty due to the increased sensitivity to marketing mix
activities for all brands in the category; therefore, reducing the likelihood of
consumers to buy previously purchased brands on promotions. This result disagrees
with Sirohi, McLaughlin and Wittink (2008) who posits that perceptions of a store’s
promotions correlate positively with customer perceived value and store brand
loyalty.
According to Banerjee (2009), sales promotion is used as a short-term strategy to
drive demand and influence sales. It is important for supermarkets to organize
attractive sales promotion to help build patronage and store traffic (Ibrahim et al.,
2013). A sales promotion consists of techniques that are aimed at increasing sales in
the short run, meaning that they are mostly used for a short period of time. The
findings disagree with Zubairu, Idaomi, & Azubuike (2014) who posits that the
activities involved in sales promotions are controlled and integrated to influence
consumers to patronize and become loyal to an organization’s offering and
specifically designed to boost quick sales and ultimately create loyalty (Banabo &
Koroy, 2011). Whereas the intention is to ultimately build brand loyalty the finding
shows that sales promotions do not significantly affect brand loyalty.

114
4.8.4 Effects of Brand Image on Brand Loyalty
The fourth research objective was to assess the relationship between brand image on
brand loyalty in leading supermarket chains in Kenya. The null hypothesis was
stated as:
H04 There is no significant effect of brand image on brand loyalty in leading
supermarket chains in Kenya.
The study used multiple linear regression analysis, leading to the outputs in Tables
4.34 to Table 4.36, which established that brand image significantly, affects brand
loyalty. Thus, the study rejected the null hypothesis H04 that there is no significant
effect of brand image on brand loyalty in leading supermarket chains in Kenya.
Table 4.27 identified the variables that define brand image to a great extent as
including: the supermarket brand has unique characteristics, brand has good
corporate reputation, brand personality distinguishes it from competitors, brand
doesn’t disappoint, best brand in the sector, brand is very consistent in the market
and brand has visually appealing physical facilities. The findings support the
assertion that brand image plays a critical role in helping customers to decide
whether or not to buy the brand and thereby influencing their repurchase behaviour
(Bian & Moutinho, 2011). The findings further support Sweeney and Swait (2008)
who posits that brand image can also serve as a defensive marketing tool to retain
customers hence driving loyalty, particularly in the context of services where the
service brand/firm are deemed synonymous.
Similarly, the findings agree with Kuusik (2007) who concludes that brand image is
the most significant variable that increases the brand loyalty of the product or
service. Lazarevic (2011) states that brand image is an impressive measure in
enhancing the goal of brand loyalty. Therefore, a positive brand image leads firms to
deliver brand value to their customers hence reinforcing brand loyalty. Hyun & Kim
(2011) stated that a favourable brand image would have a positive influence on
consumer behavior towards the brand in terms of increasing loyalty, commanding a
price premium and generating positive word-of-mouth. Acquiring a similar position,
Beristain and Zorilla (2011) posits that the elements of store image include the

115
quality of products and services, the product assortment and portfolio, the product
pricing, the facilities of the store and the customers' service offered by the store's
clerk. In the marketing and retailing field of research, the term image is of paramount
importance (Burt, Johansson & Thelander, 2010; Kapferer, 2012) and global retail
companies usually adopts a standard way of presenting their brand and retail image
to consumers (Burt et al., 2010). Many firms acknowledge their brand image as their
main competitive advantage (Burt & Mavrommatis, 2006).
4.9 Mediating Effect of Customer Satisfaction
The study sought to determine the mediation effect of customer satisfaction. The
study Hypothesis tested was;
H05 There is no significant mediation effect of customer satisfaction on the
relationship between the independent variables and brand loyalty in leading
supermarket chains in Kenya.
A composite index for service quality, customer perceived value and Brand image
was computed. These three predictors were those found to significantly influence
brand loyalty. The procedure proposed by Baron and Kenny (1986) to test for
mediation was used. The mediating role was examined using a four-step process. The
first test was to determine if composite predictor index has a relationship with brand
loyalty by use of regression. The second step examined the existence of a significant
relationship between the composite predictor variable and the mediating variable
(Customer satisfaction). The third step examined the existence of a significant
relationship between the mediating variable (Customer satisfaction) and the
dependent variable (Brand loyalty). If it does, the last step would be to examine the
relationship between the composite predictor variable and brand loyalty and
determine whether the relationship still exist even after introduction of customer
satisfaction in the regression model.
4.9.1 Relationship between Predictor Variables on Brand Loyalty
The first test was to determine if composite predictor index has a relationship with
brand loyalty by use of regression. The composite construct of the independent
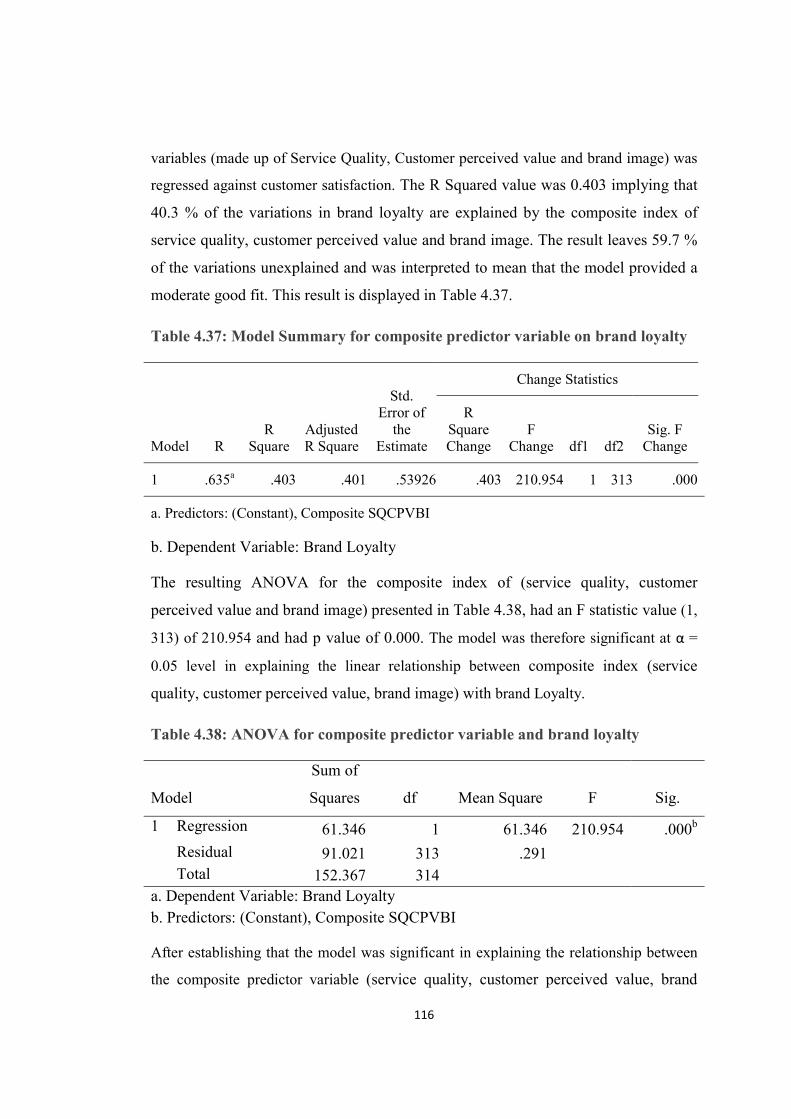
116
variables (made up of Service Quality, Customer perceived value and brand image) was
regressed against customer satisfaction. The R Squared value was 0.403 implying that
40.3 % of the variations in brand loyalty are explained by the composite index of
service quality, customer perceived value and brand image. The result leaves 59.7 %
of the variations unexplained and was interpreted to mean that the model provided a
moderate good fit. This result is displayed in Table 4.37.
Table 4.37: Model Summary for composite predictor variable on brand loyalty
Model R R
Square Adjusted R Square
Std. Error of
the Estimate
Change Statistics
R Square Change
F Change df1 df2
Sig. F Change
1 .635a .403 .401 .53926 .403 210.954 1 313 .000
a. Predictors: (Constant), Composite SQCPVBI
b. Dependent Variable: Brand Loyalty
The resulting ANOVA for the composite index of (service quality, customer
perceived value and brand image) presented in Table 4.38, had an F statistic value (1,
313) of 210.954 and had p value of 0.000. The model was therefore significant at α =
0.05 level in explaining the linear relationship between composite index (service
quality, customer perceived value, brand image) with brand Loyalty.
Table 4.38: ANOVA for composite predictor variable and brand loyalty
Model
Sum of
Squares df Mean Square F Sig.
1 Regression 61.346 1 61.346 210.954 .000b
Residual 91.021 313 .291
Total 152.367 314 a. Dependent Variable: Brand Loyalty b. Predictors: (Constant), Composite SQCPVBI
After establishing that the model was significant in explaining the relationship between
the composite predictor variable (service quality, customer perceived value, brand

117
image) in the relationship with brand loyalty, the coefficient of the model was examined
in Table 4.39. The p-value = 0.000 which meant that service quality, customer
perceived value and brand image was significant in predicting changes in brand loyalty.
This meant that at α = 0.05 level, there is a significant relationship between service
quality, customer perceived value and brand image with brand loyalty and the test for
the mediated relationship could be done.
Table 4.39: Coefficients for composite predictor variable and brand loyalty
Model
Un standardized Coefficients
Standardized Coefficients
t Sig.
95.0% Confidence
Interval for B
B Std.
Error Beta Lower Bound
Upper Bound
1 (Constant) .794 .225
3.520 .000 .350 1.237 Composite SQCPVBI
.844 .058 .635 14.524 .000 .730 .958
a. Dependent Variable: Brand Loyalty
4.9.2 Relationship between Predictor Variables on Customer Satisfaction
The second step in the test of mediation was to examine the existence of a significant
relationship between the composite predictor variable and the mediating variable
(Customer satisfaction) by use of regression. The model summary relating the
composite predictor variable and the mediating variable (Customer satisfaction) was
presented in Table 4.40 and it shows the model had R Squared of 0.489. This meant
48.9 % of the variations in customer satisfaction were explained by composite
predictor variable. The result leaves 51.17 % of the variations unexplained and was
interpreted to mean that the model provided a moderate good fit.

118
Table 4.40: Model Summary for predictor variable on Customer Satisfaction
Model R R
Square Adjusted R Square
Std. Error of
the Estimate
Change Statistics
R Square Change
F Change df1 df2
Sig. F Change
1 .699a .489 .487 .42135 .489 299.423 1 313 .000
a. Predictors: (Constant), Composite SQCPVBI
The results for ANOVA for composite index of (service quality, customer perceived
value, brand image) and customer satisfaction had an F statistic value (1, 313) of
299.423 and had p value of 0.000. The model was therefore significant at α = 0.05 level
of significance in explaining the linear relationship between composite index (service
quality, customer perceived value, brand image) with customer satisfaction. Table
4.41 summarizes this finding.
Table 4.41: ANOVA for predictor variable and Customer Satisfaction
Model Sum of Squares df
Mean Square F Sig.
1 Regression 53.157 1 53.157 299.423 .000b
Residual 55.567 313 .178
Total 108.725 314
a. Dependent Variable: Customer Satisfaction
b. Predictors: (Constant), Composite SQCPVBI
The coefficients of the composite variable (service quality, customer perceived value,
brand image) in the relationship with customer satisfaction were presented in Table
4.42. The p-value = 0.000 which meant that service quality, customer perceived value
and brand image was significant in predicting changes in customer satisfaction. This
meant that at α = 0.05 level there is a significant relationship between service quality,

119
customer perceived value and brand image with customer satisfaction and the test for
the mediated relationship could proceed to the next step.
Table 4.42: Coefficients of predictor variable and Customer Satisfaction
Model
Un standardized Coefficients
Standardized Coefficients
t Sig.
95.0% Confidence
Interval for B
B Std.
Error Beta Lower Bound
Upper Bound
1 (Constant) 1.086 .176
6.166 .000 .740 1.433
Composite SQCPVBI
.786 .045 .699 17.304 .000 .696 .875
a. Dependent Variable: Customer Satisfaction
4.9.3 Relationship between Customer Satisfaction and Brand Loyalty
The third test was to determine if the mediator customer satisfaction has a
relationship with brand loyalty by use of regression. Customer satisfaction was
regressed against brand loyalty. The R Squared value was 0.487 implying that 48.7 %
of the variations in brand loyalty are explained by customer satisfaction. The result
leaves 51.3 % of the variations unexplained and was interpreted to mean that the
model provided a moderate good fit. This result is displayed in Table 4.43.
Table 4.43: Model Summary of customer satisfaction and brand loyalty
Model R R
Square Adjusted R Square
Std. Error of the
Estimate
Change Statistics R
Square Change
F Change df1 df2
Sig. F Change
1 .698a .487 .485 .49997 .487 296.550 1 313 .000
a. Predictors: (Constant), Customer Satisfaction
The resulting ANOVA as presented in Table 4.44, had an F statistic value (1, 313) of
296.550 and had p value of 0.000. The model was therefore significant at α = 0.05 level
in explaining the linear relationship between customer satisfaction and brand Loyalty.

120
Table 4.44: ANOVA for customer satisfaction and brand loyalty
Model
Sum of
Squares df
Mean
Square F Sig.
1 Regression 74.128 1 74.128 296.550 .000b
Residual 78.240 313 .250
Total 152.367 314
a. Dependent Variable: Brand Loyalty
b. Predictors: (Constant), Customer Satisfaction
After establishing that the model was significant in explaining the relationship between
the customer satisfaction in the relationship with brand loyalty, the coefficient of the
model was examined in Table 4.45. The p-value = 0.000 which meant that customer
satisfaction was significant in predicting changes in brand loyalty. Therefore, the null
hypothesis H05 was rejected at α = 0.05 meaning that there was a significant relationship
between customer satisfaction with brand loyalty.
Table 4.45: Coefficients for Customer Satisfaction and Brand Loyalty
Model
Un standardized Coefficients
Standardized Coefficients
t Sig.
95.0% Confidence
Interval for B
B Std.
Error Beta Lower Bound
Upper Bound
1 (Constant) .648 .199 3.255 .001 .256 1.039
Customer Satisfaction
.826 .048 .698 17.221 .000 .731 .920
a. Dependent Variable: Brand Loyalty

121
4.9.4 Relationship between Predictor Variables and Customer Satisfaction on
Brand Loyalty
The last step in the mediation test examined if the relationship between the
composite predictor variable and brand loyalty would still exist even after
introduction of customer satisfaction in the regression model. The model summary
relating the composite predictor variable, the mediating variable (Customer
satisfaction) and brand loyalty was presented in Table 4.46 and it shows the model
had R Squared of 0.529. This meant 52.9 % of the variations in brand loyalty were
explained by composite predictor variable and customer satisfaction. The result
leaves 47.1 % of the variations unexplained and was interpreted to mean that the
model provided a moderate good fit.
Table 4.46: Model Summary for predictor variable, Customer Satisfaction and
Brand Loyalty
Model R R
Square Adjusted R Square
Std. Error of
the Estimate
Change Statistics
R Square Change
F Change df1 df2
Sig. F Change
1 .727a .529 .526 .47976 .529 174.985 2 312 .000
a. Predictors: (Constant), Customer Satisfaction, Composite SQCPVBI
The results for ANOVA for composite index of (service quality, customer perceived
value, brand image), customer satisfaction and brand loyalty had an F statistic value
(2, 312) of 174.985 and had p value of 0.000. The model was therefore significant at α
= 0.05 level in explaining the linear relationship between composite index (service
quality, customer perceived value, brand image), customer satisfaction and brand
loyalty. Table 4.47 summarizes this finding.
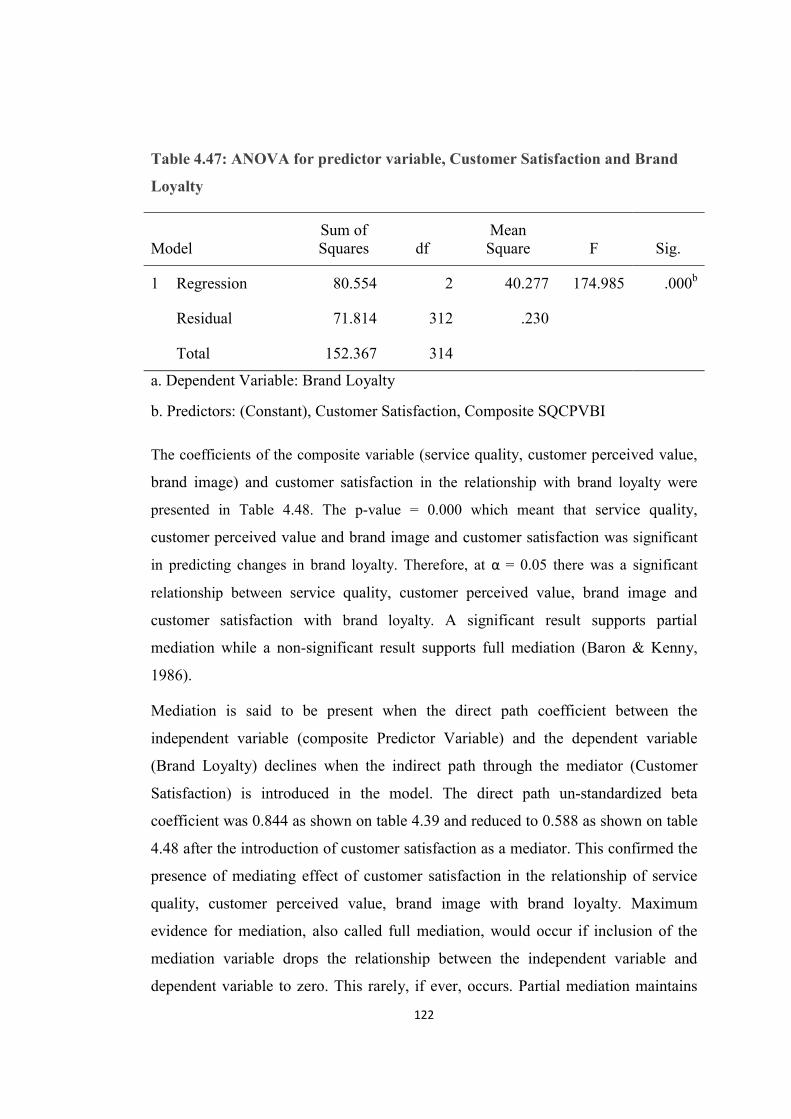
122
Table 4.47: ANOVA for predictor variable, Customer Satisfaction and Brand
Loyalty
Model Sum of Squares df
Mean Square F Sig.
1 Regression 80.554 2 40.277 174.985 .000b
Residual 71.814 312 .230
Total 152.367 314
a. Dependent Variable: Brand Loyalty
b. Predictors: (Constant), Customer Satisfaction, Composite SQCPVBI
The coefficients of the composite variable (service quality, customer perceived value,
brand image) and customer satisfaction in the relationship with brand loyalty were
presented in Table 4.48. The p-value = 0.000 which meant that service quality,
customer perceived value and brand image and customer satisfaction was significant
in predicting changes in brand loyalty. Therefore, at α = 0.05 there was a significant
relationship between service quality, customer perceived value, brand image and
customer satisfaction with brand loyalty. A significant result supports partial
mediation while a non-significant result supports full mediation (Baron & Kenny,
1986).
Mediation is said to be present when the direct path coefficient between the
independent variable (composite Predictor Variable) and the dependent variable
(Brand Loyalty) declines when the indirect path through the mediator (Customer
Satisfaction) is introduced in the model. The direct path un-standardized beta
coefficient was 0.844 as shown on table 4.39 and reduced to 0.588 as shown on table
4.48 after the introduction of customer satisfaction as a mediator. This confirmed the
presence of mediating effect of customer satisfaction in the relationship of service
quality, customer perceived value, brand image with brand loyalty. Maximum
evidence for mediation, also called full mediation, would occur if inclusion of the
mediation variable drops the relationship between the independent variable and
dependent variable to zero. This rarely, if ever, occurs. Partial mediation maintains

123
that the mediating variable accounts for some, but not all, of the relationship between
the independent variable and dependent variable (Hayes, 2009). Thus, the study
significant result meant that customer satisfaction has a partial mediation effect on
the relationship between service quality, customer perceived value, brand image with
brand loyalty.
Table 4.48: Coefficients for predictor variable, Customer Satisfaction and
Brand Loyalty
Model
Un standardized Coefficients
Standardized Coefficients
t Sig.
95.0% Confidence
Interval for B
B Std.
Error Beta Lower Bound
Upper Bound
1 (Constant) .155 .212
.730 .466 -.263 .573
Composite SQCPVBI
.382 .072 .287 5.284 .000 .240 .524
Customer Satisfaction
.588 .064 .497 9.135 .000 .461 .715
a. Dependent Variable: Brand Loyalty
4.9.5 Sobel test for mediation
In order for mediation to be established, the reduction in variance explained by the
independent variable must be significant as determined by one of several tests, such
as the Sobel test. The Sobel test is performed to establish if the relationship between
the independent variable and dependent variable has been significantly reduced after
inclusion of the mediator variable (Sobel, 1982). According to Hayes (2009), the
effect of an independent variable on the dependent variable can become non-
significant when the mediator is introduced simply because a trivial amount of
variance is explained (That is, not true mediation). Thus, it is imperative to show a
significant reduction in variance explained by the independent variable before
asserting either full or partial mediation. The test for mediation proposed by Sobel

124
(1982 and Greene (2012) further supports the stepwise mediation tests proposed by
Baron and Kenny (1986). The result is shown on Table 4.49.
Table 4.49: Sobel test for mediation of customer satisfaction
Coefficient Standard error Sobel test Standard error
p-value
A 0.786 0.045 8.1312 0.05683 0.000
B 0.588 0.064
C 0.844 .058
Where
A `is the coefficients and standard errors for Baron and Kenny step two of
examining the existence of a significant relationship between the composite
predictor variable and the mediating variable (Customer satisfaction).
B is the coefficients and standard errors for Baron and Kenny step three of
examining if the relationship between the composite predictor variable and
brand loyalty and determine whether the relationship still exist even after
introduction of customer satisfaction in the regression model.
C is the coefficients and standard errors for Baron and Kenny step one of
determining if composite predictor index has a relationship with brand loyalty
by use of regression.
These values are input into a Sobel test calculator to compute the Sobel test statistics.
The value of Sobel test for mediation of customer satisfaction on the effect of service
quality on brand loyalty was 8.1312 and the p value was significant at 0.000. This
finding confirms that customer satisfaction partially mediates on the combined effect
of service quality, customer perceived value and brand image on brand loyalty.
Partial mediation implies that there is not only a significant relationship between the
mediator and the dependent variable, but also some direct relationship between the
independent and dependent variable. The study therefore rejected the null hypothesis
H05 that there is no significant mediation effect of customer satisfaction on the

125
relationship between the independent variables with brand loyalty in leading
supermarket chains in Kenya.
4.9.6 Mediating role of Customer Satisfaction
The fifth research objective was to assess the mediation effect of customer
satisfaction on the relationship between the predictor variables and brand loyalty in
leading supermarket chains in Kenya. The null hypothesis was stated as:
H05 There is no significant mediation effect of customer satisfaction on the
relationship between the independent variables and brand loyalty in leading
supermarket chains in Kenya.
The study used multiple linear regression analysis in a four-step process proposed by
Baron and Kenny (1986) and Sobel (1982), leading to the outputs in Tables 4.37 to
Table 4.49, which established that customer satisfaction significantly affects brand
loyalty. The findings led to the rejection of the null hypothesis H05 that there is no
significant mediation effect of customer satisfaction on the relationship between the
predictor variables and brand loyalty in leading supermarket chains in Kenya. Table
4.27 identified the variables that define customer satisfaction to a great extent as
including: positive experience with the supermarket, supermarket does a good job in
satisfying my needs, my past experience is excellent, I made the right decision in
buying from this supermarket and overall, I am satisfied shopping with the
supermarket. The study results confirmed customer satisfaction partially mediates the
relationship between the predictor variables and brand loyalty in leading supermarket
chains in Kenya. This meant that improving customer satisfaction can result in
enhanced brand loyalty. These findings support a number of researchers who posits
that customer satisfaction has a mediating influence on the relationship between
service quality and store brand loyalty (Bedi, 2010; Kumar, Kee, & Charles, 2010).
Customer satisfaction is an important precursor to loyalty in the context of
supermarkets. Brand loyalty can be reasonably enhanced through the development of
customer satisfaction. The result of the study further agrees with Abdullah, Ismail,
Rahman, Suhaimin, and Safie (2012) who indicated that customer satisfaction plays a
mediation role with strong relationship with loyalty.

126
Looking at individual variables, these findings support Hu, Kandampully and
Juwaheet (2009) who indicated that customer perceived value significantly affects
customer satisfaction and the higher the perceived value the higher the client overall
satisfaction with the service provider. This result further supports Tams (2010) who
indicated that service quality and perceived value are antecedents of customer
satisfaction and brand loyalty is a consequence of customer satisfaction. Lai et al.
2009 posits that customer satisfaction has the greatest influence on loyalty when
considered along with customer value and brand image. The loyalty to the brand and
positive attitude is determined by the satisfied customers who repeatedly repurchase
of the brand or product (Youl & John, 2010). Further empirical studies on products
showed that satisfaction leads towards positive loyalty. Satisfaction is the
determining factor for brand loyalty, but in some condition, a satisfied customer
might turn towards other similar products (Youl & John, 2010). To ensure
repurchasing behaviour, a satisfied customer should also possess a positive attitude
towards the brand.
4.10 Summary of Hypothesis Testing
The summary of the hypothesis testing is given in Table 4:50. The summary of the
results of the hypotheses tested, presents the coefficient of determination associated
with each analytical model the p-values and the decision made. The results show that
four research hypotheses were rejected and hence there was a significant relationship
between the study variables. The study failed to reject one hypothesis; H04 There is
no significant effect of sales promotions on brand loyalty in leading supermarket
chains in Kenya. The result also shows that customer satisfaction had a partial
mediating influence between the predictor variables and brand loyalty.
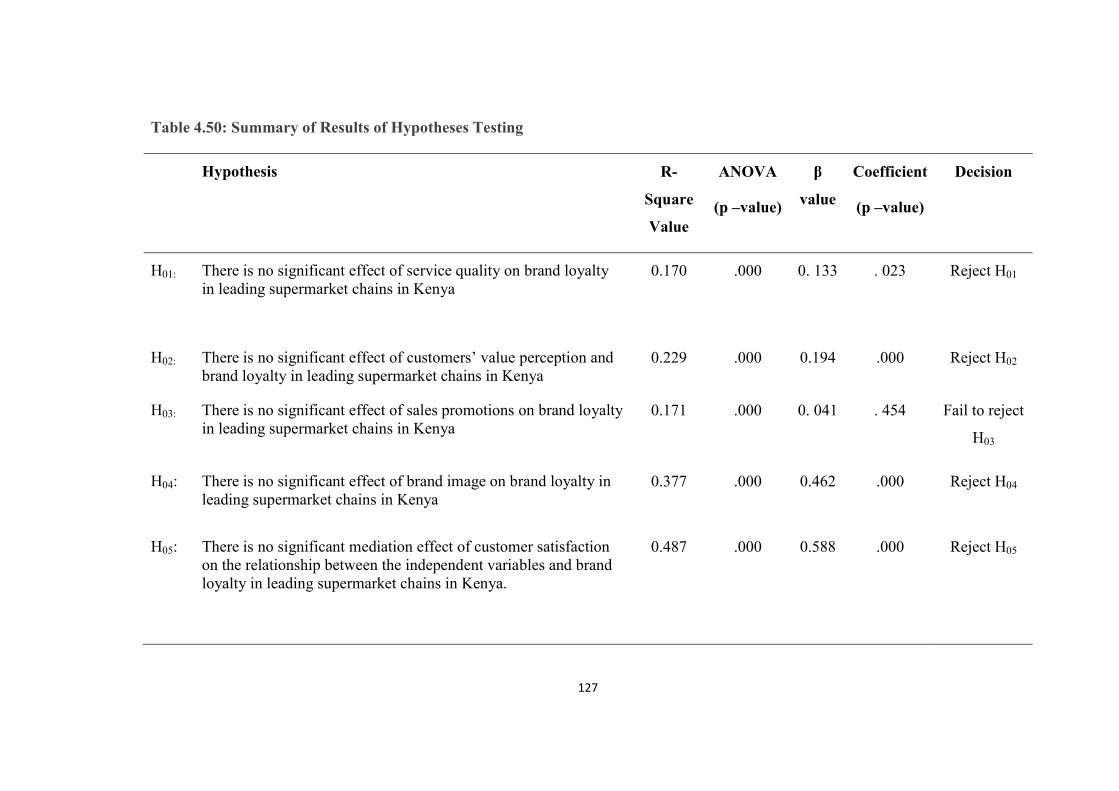
127
Table 4.50: Summary of Results of Hypotheses Testing
Hypothesis R-
Square
Value
ANOVA
(p –value)
β
value
Coefficient
(p –value)
Decision
H01: There is no significant effect of service quality on brand loyalty in leading supermarket chains in Kenya
0.170 .000 0. 133 . 023 Reject H01
H02: There is no significant effect of customers’ value perception and brand loyalty in leading supermarket chains in Kenya
0.229 .000 0.194 .000 Reject H02
H03: There is no significant effect of sales promotions on brand loyalty in leading supermarket chains in Kenya
0.171 .000 0. 041 . 454 Fail to reject
H03
H04: There is no significant effect of brand image on brand loyalty in leading supermarket chains in Kenya
0.377 .000 0.462 .000 Reject H04
H05: There is no significant mediation effect of customer satisfaction on the relationship between the independent variables and brand loyalty in leading supermarket chains in Kenya.
0.487 .000 0.588 .000 Reject H05
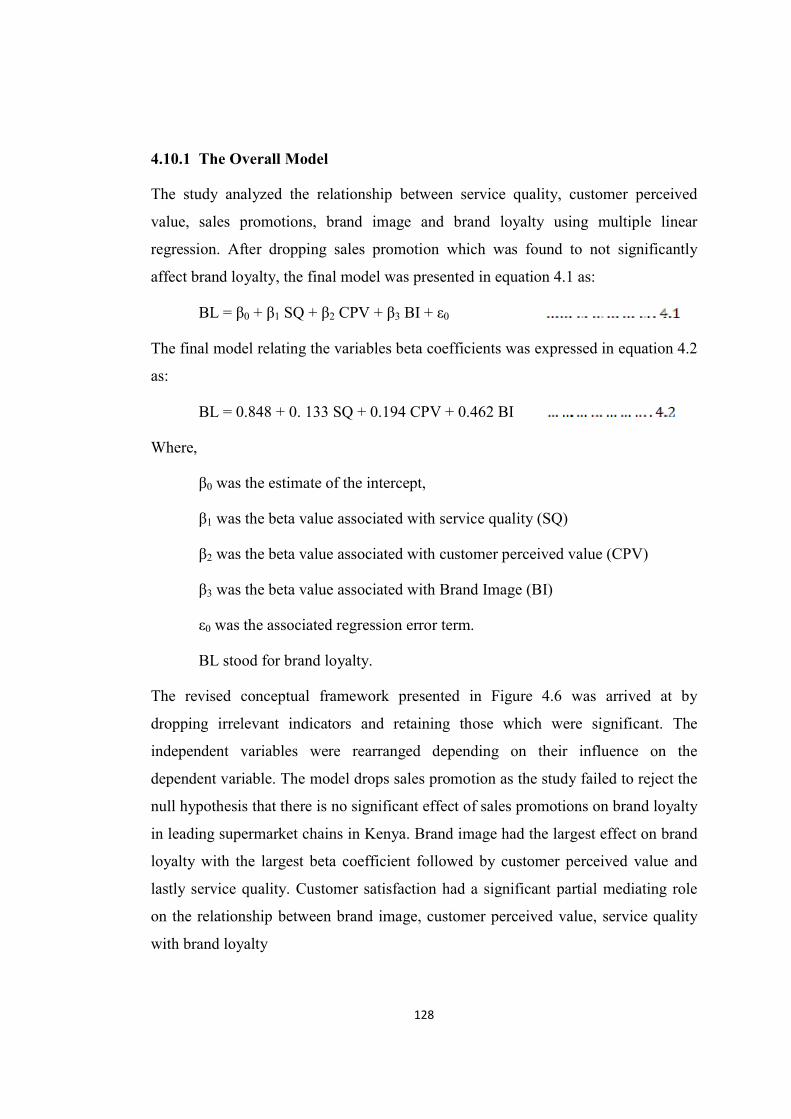
128
4.10.1 The Overall Model
The study analyzed the relationship between service quality, customer perceived
value, sales promotions, brand image and brand loyalty using multiple linear
regression. After dropping sales promotion which was found to not significantly
affect brand loyalty, the final model was presented in equation 4.1 as:
BL = β0 + β1 SQ + β2 CPV + β3 BI + ε0
The final model relating the variables beta coefficients was expressed in equation 4.2
as:
BL = 0.848 + 0. 133 SQ + 0.194 CPV + 0.462 BI
Where,
β0 was the estimate of the intercept,
β1 was the beta value associated with service quality (SQ)
β2 was the beta value associated with customer perceived value (CPV)
β3 was the beta value associated with Brand Image (BI)
ε0 was the associated regression error term.
BL stood for brand loyalty.
The revised conceptual framework presented in Figure 4.6 was arrived at by
dropping irrelevant indicators and retaining those which were significant. The
independent variables were rearranged depending on their influence on the
dependent variable. The model drops sales promotion as the study failed to reject the
null hypothesis that there is no significant effect of sales promotions on brand loyalty
in leading supermarket chains in Kenya. Brand image had the largest effect on brand
loyalty with the largest beta coefficient followed by customer perceived value and
lastly service quality. Customer satisfaction had a significant partial mediating role
on the relationship between brand image, customer perceived value, service quality
with brand loyalty

129
Independent Variables Mediating Variable Dependent
Variable
Figure 4.6: Revised Conceptual Framework
Brand Loyalty
Repurchase
Intentions
Positive word of mouth Intention to
recommend
Commitment to
the brand
Customer Perceived Value
Perceived benefits
Perceived quality
Perceived price
Brand Image Corporate appeal Consistency Reputation
Customer
Satisfaction
Positive
experience
Meeting expectations
Exceeding
expectations
Satisfied
needs
Service Quality Reliability Assurance Tangibility Empathy Responsiveness

130
CHAPTER FIVE
SUMMARY, CONCLUSION AND RECOMMENDATION
5.1 Introduction
This chapter presents a summary of findings, conclusions, recommendations and
areas of further research. For each of the research hypothesis a summary of the key
findings of the study are presented. The conclusions were guided by the research
objectives and informed by the analysis of findings, and discussions in the study.
Based on the conclusions made, the contribution of the study to knowledge was
examined. The recommendations are based on the conclusions and draw managerial
implications and identify policy recommendations based on the study findings. Areas
of further studies were identified.
5.2 Summary of Major Findings
The general objective of this study was to establish the determinants of brand loyalty
in leading supermarket chains in Kenya. The objectives were; to determine the
influence of service quality on brand loyalty in leading supermarket chains in Kenya,
to establish the effect of customer value perception on brand loyalty in leading
supermarket chains in Kenya, to evaluate the effect of sales promotions on brand
loyalty in leading supermarket chains in Kenya, to determine the effect of brand
image on brand loyalty in leading supermarket chains in Kenya and to assess the
extent to which customer satisfaction mediates the relationship between the
independent variables and brand loyalty in leading supermarket chains in Kenya.
From the demographic results presented in chapter four, it should be noted that
Tuskys supermarket was the most preferred supermarket with a preference of 34.9%
followed by Naivas with 31.7%. Nakumatt had 17.5% while Uchumi supermarket
had the least with a preference of 1.6%. Whereas one would have expected Nakumatt
to have the highest preference, the results are indicative of the stocking difficulties
that Nakumatt was experiencing at the time of this study. Naivas supermarket had the
highest percentage 29.8% of respondents who expressed loyalty. Tuskys followed
131
with 28.9%, Nakumatt had 17.8%. This meant that Tuskys was the market leader
followed closely by Naivas and both had the largest number of loyal customers. The
chi square test of association results showed that customers often shopped from
supermarkets where they have loyalty cards. It was however noted that 90.2% of
customers also occasionally shopped from other supermarkets apart from their
regular supermarket brand. This meant that having a supermarket loyalty card did not
necessarily make a customer loyal to that particular supermarket. Descriptive
statistics showed that the aspects of price, quality of service, store image, product
availability, store layout and corporate reputation were most important in
determining where the customer would shop. The MANOVA results showed that
Nakumatt had the highest mean on service quality which was in line with their
leadership in serving customers; whereas Naivas had the highest mean on customer
perceived value which was in line with customer belief in the Naivas tagline that
‘Naivas saves you money’; Uchumi had the highest mean on brand loyalty and
customer satisfaction possibly because the few customers who often shop from
Uchumi are strongly loyal. This section contains the summary of the findings which
was done per objective.
5.2.1 Service quality and brand loyalty
The first objective of the study was to determine the influence of service quality on
brand loyalty in leading supermarket chains in Kenya. The study hypothesised that
there is no significant effect of service quality on brand loyalty in leading
supermarket chains in Kenya. The study used multiple linear regression analysis, which
established that service quality significantly affects brand loyalty. The results of this
findings led to the rejecting the null hypothesis H01 that there is no significant effect of
service quality on brand loyalty in leading supermarket chains in Kenya. Service
quality had the third highest effect on brand loyalty with a beta coefficient of 0.133.
5.2.2 Customers’ value perception and brand loyalty
The second objective of the study was to establish the effect of customers’ value
perception on brand loyalty in leading supermarket chains in Kenya. The study
hypothesized that there is no significant effect of customers’ value perception on
132
brand loyalty in leading supermarket chains in Kenya. The study used multiple linear
regression analysis, which established that customers’ value perception significantly
affects brand loyalty. The findings led to the rejection of the null hypothesis H02 that
there is no significant effect of customers’ value perception on brand loyalty in
leading supermarket chains in Kenya. Customer value perception had the second
highest effect on brand loyalty with a beta coefficient of 0.194.
5.2.3 Sales promotions and brand loyalty
The third objective of the study was to evaluate the effect of sales promotions on
brand loyalty in leading supermarket chains in Kenya. The study hypothesised that
there is no significant effect of sales promotions on brand loyalty in leading
supermarket chains in Kenya. The study used multiple linear regression analysis,
which established that sales promotions do not significantly affect brand loyalty.
Thus, the study failed to reject the null hypothesis H03 that there is no significant
effect of sales promotions on brand loyalty in leading supermarket chains in Kenya.
5.2.4 Brand image and brand loyalty
The fourth objective of the study was to determine the effect of brand image on
brand loyalty in leading supermarket chains in Kenya. The study hypothesised that
there is no significant effect of brand image on brand loyalty in leading supermarket
chains in Kenya. The study used multiple linear regression analysis, which
established that brand image significantly, affects brand loyalty. Thus, the study
rejected the null hypothesis H04 that there is no significant effect of brand image on
brand loyalty in leading supermarket chains in Kenya. Brand image had the greatest
effect on brand loyalty with a beta coefficient of 0.462.
5.2.5 Mediation of customer satisfaction
The fifth objective of the study was to assess the extent to which customer
satisfaction mediates the relationship between the independent variables and brand
loyalty in leading supermarket chains in Kenya. The study hypothesised that there is
no significant mediation effect of customer satisfaction on the relationship between
the independent variables and brand loyalty in leading supermarket chains in Kenya.

133
The study used multiple linear regression analysis in a four-step process proposed by
Baron and Kenny (1986), which established that customer satisfaction significantly
affects brand loyalty. The findings thus rejected the null hypothesis H05 that there is
no significant mediation effect of customer satisfaction on the relationship between
the predictor variables and brand loyalty in leading supermarket chains in Kenya.
Customer satisfaction was shown to have a partial mediation effect on the
relationship between brand image, Customer perceived value, service quality with
brand loyalty. Partial mediation implies that there is not only a significant
relationship between the mediator and the dependent variable, but also some direct
relationship between the independent and dependent variable.
5.3 Conclusion
The study concluded that service quality, customer perceived value and brand image
are antecedents to brand loyalty. These three determinants were shown to have a
significant influence on brand loyalty in leading supermarket chains in Kenya. The
study also concluded that customer satisfaction has a significant partial mediating
effect on the relationship between brand image, customer perceived value, service
quality with brand loyalty.
Based on the findings, the study established that brand loyalty was influenced
positively to a greater extent by brand image followed by customer perceived value
and service quality. Thus, brand image had the greatest predictive power on brand
loyalty. Sales promotions were found not to significantly influence brand loyalty.
Sales promotions are viewed as a short-term marketing activity to increase flow of
customers and influence sales into the supermarket stores in the short run. The
aspects of price, quality of service, store image, product availability, store layout and
corporate reputation were most important in determining where the customer would
shop.
A large proportion of customers clearly have strong perceptions about the
supermarkets they patronize. In an industry with numerous supermarkets to choose
from, these perceptions can translate into shopping loyalty, higher levels of spending,
and intentions to recommend the supermarket brand to others. Customer expectations

134
can be exceeded through the enhancement of customer satisfaction leading to
improved brand loyalty.
5.4 Recommendations
Based on the findings of the study and the ensuing conclusions, the recommendations
are made. This study offered an insight into supermarkets brand loyalty from a
Kenyan customer perspective which has previously been scarcely evaluated. This
study has contributed to emerging body of research in consumer behaviour and brand
management in Kenya. The study also provided empirical evidence of how retail
service quality, customer perceived value, sales promotions, brand image and
customer satisfaction dimensions influence the behavioural intentions of brand
loyalty. Whereas sales promotions are an important tool to motivate shoppers to
patronise the stores, supermarket managers should focus more on brand image,
service quality and customer perceived value to increase brand loyalty with a view to
retain customers and gain a competitive edge. Therefore, the study seeks to inform
managers regarding what factors to prioritize to generate higher levels of loyalty.
Secondly, on brand image, the study recommends that supermarkets that seek to
retain loyal customers must invest heavily on brand image building. Brand image
distinguishes the supermarket from its competitors. Managers should cultivate a good
corporate reputation by carefully considering the supermarket marketing
communications. Supermarkets should also ensure they have visually appealing
physical facilities.
Thirdly, on customer perceived value, the study recommends that management of
supermarkets should create a perception that they offer comparatively higher value to
customers. Customers compare products and services and gravitate where they feel
they are getting good value. This can be achieved through competitive pricing, strong
positioning statements, value added services and well targeted promotion effects.
Fourthly, on service quality, the study recommends that supermarket management
should pay attention to the quality of service given to customers as this leads to
loyalty. The management of supermarkets must invest in training and motivating

135
their front office staff on effective customer service to win and retain more
customers. The supermarket employees should be consistently courteous and helpful
to customers. The supermarkets should ensure product availability and also consider
store layouts that make it easy for customers to find what they need.
Fifthly, on customer satisfaction, the study recommends that managers of
supermarkets should go out of their way to get customers from the level of just
satisfied to being highly satisfied. Managers should exceed customer expectations to
achieve highly satisfied customers who are also delighted customers. To aid this
quest for highly satisfied customers, the managers should constantly use customer
satisfaction and loyalty surveys as tools to measure customer perceptions. These
surveys should be used to improve on areas that affect brand loyalty. The feedback
from these surveys are a significant marketing tool for retail stores that wish to
develop a competitive advantage and enhance the customers repurchase intention and
intention to recommend. In today’s highly competitive markets, businesses are more
challenged to defend and increase their market share. The competitiveness of the
retail sector in Kenya calls for customer retention and market share defence
strategies. With globalization, continual technology innovations and entrants of new
retailers, consumers have greater access to more purchase alternatives, and have
opportunities to be less store and brand loyal. As a result, finding out the satisfaction
and loyalty levels of customers will assist managers in continually improving their
stores, being competitive in the marketplace, retaining their customers, exceeding
customer expectations and enhancing brand loyalty.
Lastly, on government policy, the study recommends that government should also
look into issues that affect product availability in supermarkets. It has been noted that
these issues revolve around how supermarkets treat their suppliers especially on
credit matters.
5.5 Areas for Further Research
The study concentrated on four variables namely service quality, customer perceived
value, sales promotions and brand image. Further research may be needed to study
other variable namely brand trust and brand Commitment to get more comprehensive

136
indicators of brand loyalty. Future studies should further discuss the
interrelationships and identify more comprehensive indicators for brand loyalty. The
study findings were based on evidence gathered from the main supermarket chains in
the retail industry. Future research may be extended to include smaller to medium
enterprise supermarkets. This study was a cross sectional survey. It is hoped that a
longitudinal survey would provide a basis for more informed interpretations in future
studies. A study can be carried out to establish whether these findings hold in other
service organizations like hospitality.

137
REFERENCES
Abbot, M. L., & McKinney, J. (2013). Understanding and Applying Reserch Design
(1st ed.). Somerset, NJ: John Wiley & Sons, Inc.
Abdullah, R. B., Ismail, N. B., Rahman, A. F., Suhaimin, M. B., & Safie, K. B.
(2012). The Relationship Beteween Store Brand and Customer Loyalty in
Retailing in Malaysia. Asian Social Science, 8(2), 117-185.
Ailawadi, K. L., & Keller, K. L. (2004). Understanding retail branding: conceptual
insights and research priorities. Journal of retailing, 80(4), 331-342.
Alvarez, B., & Casielles, R. (2005). Consumer evaluations of sales promotion: The
effect on brand choice. European Journal of Marketing, 39(1-2), 54-70.
Ampoful, A. (2012). The Effect of Customer Relationship Management (CRM) on
the Profitability of Financial Institutions-A Case Study of Barclays Bank
Limited, Takoradi Branches (Doctoral dissertation). Institute of Distance
Learning, KNUST.
Andaleeb, S. S., & Conway, C. (2006). Customer satisfaction in the restaurant
industry: An examination of the transaction-specific model. Journal of
Services Marketing, 20(1), 3-11.
Antonakis, J., & Dietz, J. (2011). Looking for validity or testing it? The perils of
stepwise regression, extreme-score analysis, heteroscedasticity, and
measurement error. Personality and Individual Differences. 50, 409-415.
Ashraf, M. G., Rizwan, M., & Khan, M. A. (2014). The promotional tools and
situational factors’ impact on consumer behaviour and sales promotion.
Journal of Public Administration and Governance, 4(2), 179-201.
Asubonteng, P., McCleary, K. J., & Swan, J. (1996). SERVQUAL revisited: a
critical review of service quality. Journal of Services Marketing, 10(6), 62-
81.

138
Bagram, M. M., & Khan, S. (2012). Attaining consumer loyalty. The role of
consumer attitude and consumer behaviour. International Review of
Management and Business Research, 1(1), 1-8.
Baker, W. E., & Sinkula, J. M. (2009). The complementary effects of market
orientation and entrepreneurial orientation on profitability in small
businesses. Journal of Small Business Management, 47(4), 443–464.
Banabo, E., & Koroy, B. H. (2011). Sales Promotion Strategies of Financial
Institutions in Bayelsa State. Asian Journal of Business Management, 3(3),
203-209.
Banerjee, S. (2009). Effect of product category on promotional choice: comparative
study of discounts and freebies. Management Research News, 32(2), 120-131.
Baron, R. M., & Kenny, D. A. (1986). The Moderator- Mediator Variable Distinction
in Social Psychological Research: Conceptual, Strategic and Statistical
Considerations. Journal of Personality and Social Psychology, 51, 1173-
1182.
Bedi, M. (2010). An integrated framework for service quality, customer satisfaction
and behavioural responses in Indian Banking industry, a comparison of public
and private sector banks. Journal of Services Research, 10(1), 157-172.
Belch, G. E., & Belch, M. A. (2008). Advertising and promotion: An integrated
marketing communications perspective (8th ed.). New York: McGraw-Hill.
Bell, D., & Lattin, J. (2009). Shopping behavior and consumer preference for store
price format: why “large basket” shoppers prefer EDLP. Marketing
Intelligence, 17(1), 66–68.
Bellini, C. G., Lunardi, G. L., & Henrique, J. L. (2005). Service quality in banks:
Insights from the Brazilian Experience. Journal of Internet Banking and
Commerce, 10(3), 40-45
Bellizzi, J. A., & Bristol, T. (2004). An assessment of supermarket loyalty cards in
one major US market . The Journal of Consumer Marketing, 21(2/3), 144.
139
Bennett, R., McColl-Kennedy, J. R., & Coote, L. (2007). Involvement, satisfaction,
and brand loyalty in a small business services setting. Journal of Business
Research, 60(12), 1253-1260.
Beristain, J. J., & Zorrilla, P. (2011). The relationship between store image and store
brand equity: A conceptual framework and evidence from hypermarkets.
Journal of Retailing and Consumer Services, 18(6), 562-574.
Bhattacherjee, A., & Premkumar, G. (2004). Understanding changes in belief and
attitude toward information technology usage: A theoretical model and
longitudinal test. MIS Quarterly Periodical, 28(2), 229-254.
Bian, X., & Moutinho, L. (2011). The role of brand image, product involvement, and
knowledge in explaining consumer purchase behaviour of counterfeits: direct
and indirect effects. European Journal of Marketing, 45(1), 191–216.
Bibby, D. N. (2011). Sponsorship portfolio as brand image creation strategies: a
commentary essay. Journal of Business Research, 64(6), 628-630.
Bolboaca, S. D., Jantschi, L., Sestras, A. F., Sestras, R. E., & Pamfil, D. C. (2011).
Pearson-Fisher chi-square statistic revisited. Information, 2(3), 528-545.
Bolton, R., & Shankar, V. (2003). An empirically driven taxonomy of retailer pricing
and promotion strategies. Journal of Retailing, 79(4), 213–224.
Breusch, T. S., & Pagan, A. R. (1979). Simple test for heteroscedasticity and random
coefficient variation. Econometrica , 47(5), 1287–1294.
Bridges, E., Briesch, R., & Yin, C. (2006). Effects of prior brand usage and
promotion on consumer promotional response. Journal of Retailing, 82(4),
295–307.
Brink, A., & Berndt, A. (2008). Relationship Marketing & Customer Relationship
Management. Lansdowne, South Africa: Juta and Co Ltd.
Bryman, A. (2015). Social Research Methods (5th ed.). Oxford: Oxford University
Press.

140
Bryman, A., & Bell, E. (2007). The nature of quantitive research. In: Business
Research Methods. New York: Oxford University Press.
Bryne, B. M. (2013). Structural equation modelling with LISREL, PRELIS and
SIMPLIS; Basic concepts, applications and programming. Psychology Press.
Burt, S., & Mavrommatis, A. (2006). The International Transfer of Store Brand
Image,. International Review of Retail Distribution and Consumer Research,
16(4), 395-413.
Burt, S., Johansson, U., & Thelander, A. (2007). Retail image as seen through
consumers’ eye: Studying international retail image through consumer
photographs of stores,. The International Review of Retail, Distribution and
Consumer Research, 5.
Buttle, F. (1996). SERVQUAL: Review, Critique and Research Agenda. European
Journal of Marketing, 30(1), 8-31.
Cant, M., & Machado, R. (2004). Marketing Success Stories (4th ed.). Cape Town:
Oxford University Press.
Cengiz, E. (2010). Measuring customer satisfaction: must or not . Journal of Naval
Science and Engineering, 6(2), 76-88.
Chandon, P., Wansink, B., & Laurent, G. (2000). A Benefit Congruency Framework
of Sales Promotion Effectiveness . Journal of Marketing, 64, 65-81.
Chen, C. F., & Myagmarsuren, O. (2011). Brand equity, relationship quality,
relationship value, and customer loyalty: Evidence from the
telecommunications services. Total Quality Management, 22(9), 957–974.
Chen, P. T., & Hu, H. H. (2010). The effect of relational benefits on perceived value
in relation to customer loyalty: An empirical study in the Australian coffee
outlets industry. International Journal of Hospitality Management, 29, 405-
412.
Cheruiyot, C. K., Jagongo, A., & Owino, E. (2012). Institutionalization of
Knowledge Management in Manufacturing Enterprises in Kenya: A Case of

141
Selected Enterprises. International Journal of Business and Social Science,
3(10), 127- 138.
Child, P. N., Heywood, S., & Kliger, M. (2002). Do retail brands travel? McKinsey
Quarterly, 1, 11-13.
Churchill, G. A., & Surprenant, C. (1982). An investigation into the determinants of
consumer satisfaction. Journal of Marketing Research, 19, 491–504.
Clarke, K. (2001). What Price on Loyalty When a Brand Switch is Just a Click
Away? Qualitative Market Research, 4, 160 - 168.
Clemes, M. D., Gan, C., Kao, T. H., & Choong, M. (2008). An empirical analysis of
customer satisfaction in international air travel. Innovative Marketing, 4(2),
50-62.
Clottey, T. A., & Collier, D. A. (2008). Drivers of customer loyalty in a retail store
environment. Journal of Service Science, 1(1), 35-47.
Cohen, J. W. (1988). Statistical power analysis for the behavioral sciences (2nd ed.).
Hillsdale, NJ: Lawrence Erlbaum Associates.
Coleman, R. P. (1983). The Continuing Significance of Social Class to Marketing .
Journal of Consumer Research, 10(3), 265-280.
Collis, J., & Hussey, R. (2003). Business Research: A Practical Guide
forUndergraduate and Postgraduate Students. Houndmills, Basingstoke,
Hampshire: Palgrave Macmillan.
Cooper, R. & Schindler, P. (2013). Business Research Methods (12th ed.). Irwin:
McGraw Hill.
Creswell, J. W. (2003). Research design: Qualitative, quantitative, and mixed
methods approaches (2nd ed.). California: Sage Publications Inc.
Cretu, A. E., & Brodie, R. J. (2007). The influence of brand image and company
reputation where manufacturers market to small firms: a customer value
perspective . Industrial Marketing Management, 36(2), 230-240.
142
Cronin, J. J., Brady, M. K., & Hult, G. T. (2000). Assessing the determinants of
consumer behavioral intentions in service environments: An investigation of
a comprehensive model of the effects of quality, value, and satisfaction.
Journal of Retailing, 76, 193-218.
Da Silva, R. V., & Syed, A. S. (2006). Cognitive, affective and conative behavioural
responses in retail corporate branding. Journal of Product and Brand
Management, 15(5), 293–305.
Dall’Olmo R, F., & De'Chernatony, L. (2000). The service brand as relationship
builder. British Journal of Management, 11, 137-150.
Denis, D. J. (2011). Multiple Linear Regression Using SPSS Part II. Montana:
University of Montana.
Dodds, W B, Monroe, K B,& Grewal, D. (1991). Effects of Price, Brand, and Store
Information on Buyers' Product Evaluations. Journal of Marketing Research,
28(3), 307-319.
Fairoz, F. M., Hirobumi, T., & Tanaka, Y. (2010). Entrepreneurial orientation and
performance of small and medium enterprises of Hambantoa District , Sri
Lanka. Asian Social Science, 6(3), 34- 47.
Field, A. P. (2013). Discovering Statistics Using SPSS (4th ed.). London: Sage.
Fornell, C., & Larcker, D. F. (1981). Evaluating structural equation models with
unobservable variables and measurement error. Journal of Market Research,
18(1), 39–50.
Fullerton, G. (2005). The Impact of Brand Commitment On Loyalty to Retail Service
Brands. Canadian Journal of Administration and Sciences, 22(2), 97-110.
George, D., & Mallery, P. (2003). SPSS for Windows Step by Step: A Simple Guide
and Reference (4th ed.). Boston: Alleyn and Bacon.
Gomez, M. I., McLaughlin, E. W., & Wittink, D. R. (2004). Customer satisfaction
and retail sales performance: an empirical investigation. Journal of Retailing,
80(4), 265-278.

143
Grace, D., & O'Cass, A. (2005). Examining the effects of service brand
communications on brand evaluation. The Journal of Product and Brand
Management, 14(2/3), 106.
Greene, W. H. (2012). Econometric Analysis (Vol. 7). Pearson.
Grewal, D., Levy, M., & Lehmann, D. (2004). Retail branding and loyalty: an
overview. Journal of Retailing, 80(4), ix-xii.
Gronroos, C. (2006). Adopting a service logic for marketing. Marketing theory. 6(3),
317-333.
Gujarati, D. N., Porter, D. C., & Gunasekar, S. (2013). Basic Econometrics. New
Delhi: Tata McGraw Hill.
Gurumurthy, K., & Winer, R. S. (1995). Empirical Generalizations from Reference
Price Research. Marketing Science, 14(3), 161-170.
Gutman, J. (1982). A means-end chain model based on consumer categorization
processes. Journal of Marketing, 46(2), 60-72.
Hair, J. F., Black, W. C., Babin, B. J., & Anderson, R. E. (2014). Multivariate Data
Analysis: A Global Perspective (7th ed.). Edinburg, England: Pearson.
Haistead, D., & Hartman, D. (1994). Multisource effects on the satisfaction
formation process. Journal of the Academy of Marketing Science, 22(2), 114-
129.
Hamilton, R., & Chernev, A. (2010). The impact of product line extensions and
consumer goals on the formation of price image. Journal of Marketing
Research (JMR), 47(1), 51-62.
Hanif, M., Hafeez, S., & Riaz, A. (2010). Factors affecting customer satisfaction .
International Research Journal of Finance and Economics, 60, 44-52.
Hateka, N. R. (2011). Principles of Econometrics: An Introduction (Using R). New
Delhi: SAGE Publications.
144
Hayes, A. F. (2009). "Beyond Baron and Kenny: Statistical mediation analysis in the
new millennium". Communication Monographs, 76(4), 408–420.
He, H., & Mukherje, A. (2007). I am, ergo I shop: does store image congruity
explain shopping behaviour of Chinese consumers? Journal of Marketing
Management, 17, 443-460.
He, H., Li, Y., & Harris, L. (2012). Social identity perspective on brand loyalty .
Journal of Business Research, 65(5), 648-657.
Heng, K. C., Yeong, K. S., Siong, L. C., Shi, T. Y., & Kuan, Y. M. (2011).
Customers' Perceptions of the Marketing Mix and the Effect on Malaysian
Hypermarkets' Brand Loyalty.
Henseler, J., Ringle, C. M., & Sarstedt, M. (2015). A new criterion for assessing
discriminant validity in variance-based structural equation modeling. Journal
of the Academy of Marketing Science, 43(1), 115-135.
Hosseini, R. S., & Zainal, A. (2014). The effects of indirect experience of hotel
customers on brand association and loyalty in iran. AAGBS International
Conference on Business Management. Tehran.
Hsieh, A. T., & Li, C. (2008). The moderating effect of brand image on public
relations perception and customer loyalty. Marketing Intelligence, 26(1), 26–
42.
Hsieh, M., Pan, S., & Setiono, R. (2004). Product, corporate, and country image
dimensions and purchase behavior: A multicountry analysis. Journal of the
Academy of Marketing Science, 32(3), 251–270.
Hu, H., Kandampully, J., & Juwaheet, T. (2009). Relationships and impacts of
service quality, perceived value, customer satisfaction and image: An
empirical study. Journal of Services Industry, 29(2), 111-125.
Hwang, J., & Kandampully, J. (2012). The role of emotional aspects in younger
consumer-brand relationships. Journal of Product and Brand Management,
21(2), 98-108.
145
Hyun, S., Kim, S., & Wansoo. (2011). Dimensions of brand equity in the chain
restaurant industry. Cornell Hospitality Quarterly, 52(4), 429-437.
Ibrahim, Z., Dana, L., Mahdi, A. F., Mohd, M. Z., Ramli, M. L., & Mohd, M. R.
(2013). Evaluation of Malaysian Retail Service Quality. Asian Social Science,
9(4), 14-26
Iglesias, O., Singh, J. J., & Foguet, B. J. (2011). The role of brand experience and
affective commitment in determining brand loyalty. Brand Management,
18(8), 570–582.
Jain, R., & Bagdare, S. (2009). Determinants of Customer Experience in New
Format Retail Stores. Journal of Marketing & Communication, 5(2), 34-44.
Jean, W. A., & Yazdanifard, R. (2015). The Review of How Sales Promotion
Change the Consumer’s Perception and Their Purchasing Behaviour of a
Product . Global Journal of Management and Business Research, 15(5), 32-
317.
Jobber, D. (2007). Foundations of marketing. Berkshire, UK: McGraw-Hill.
Kabiraj, S., & Shanmugan, J. (2011). Development of a conceptual framework for
brand loyalty: A Euro-Mediterranean perspective . Journal of Brand
Management, 18(4), 285-299.
Kalwani, M. U., & Yim, C. H. (1992). Consumer Price and Promotion Expectations.
Journal of Marketing Research, 29, 90-100.
Kandampully, J., & Suhartanto, D. (2000). Customer loyalty in the hotel industry:
The role of customer satisfaction and image . International Journal of
Contemporary Hospitality Management, 12(6), 346–351.
Kapferer, J. N. (2012). The new strategic brand management: Advanced insights and
strategic thinking (Fifth edition ed.). London , United Kingdom: Kogan page
publishers.

146
Karanja, P. (2012). Strategic responses to competition by medium and large
supermarkets in Nairobi, Kenya. Unpublished MBA research project,
University of Nairobi.
Kearney, A. T. (2014). The 2014 African Retail Development Index . Retrieved from
http://www.atkearney.com/consumer-products-retail/african-retail-
development-index
Keith, T. (2015). Multiple regression and beyond (2nd ed.). New York: Taylor &
Francis.
Keller, K. L., & Lehmann, D. R. (2006). Brands and branding: research findings and
future priorities. Marketing Science, 25(6), 740-759.
Kestrel Capital. (2014). Retrieved from http://www.kestrelcapital.com/wp-
content/uploads/2015/06/Uchumi-Supermarkets-Company-Update-March-
2014.pdf
Khan, A.A., Jamwal, S., & Sepehri, M.M. (2010). Applying Data Mining to
Customer Churn Prediction in an Internet Service Provider. International
Journal of Computer Applications, 9(7), 8-14.
Khan, B. M. (2009). Consumer and their Brands: Deciphering Dimensions of
Loyalty. International Journal of Business Insights and Transformation, 2(1),
84- 92.
Kim, W. G., Jin-Sun, B., & Kim, H. J. (2008). Multidimensional customer-based
brand equity and its consequences in midpriced hotels . Journal of Hospitality
& Tourism Research, 32, 235- 254.
Kleinberger, H., & Badgett, M. (2007). Why advocacy matters to grocers, 2007 IBM
Institute for Business Value, Customer-focused Grocer Study.
Koenker, R. (1981). A Note on Studentizing a Test for Heteroskedasticity. Journal of
Econometrics, 17, 107-112.

147
Koo, D. (2003). Inter-relationships among store images, store satisfaction, and store
loyalty among Korea discount retail patrons . Asia Pacific Journal of
Marketing and Logistics, 15(4), 42–71.
Kopalle, P., Biswas, D., Chintagunta, P. K., Fan, J., Pauwels, K., Ratchford, B. T., &
Sills, J. A. (2009). Retailing pricing and competitive effects. Journal of
Retailing, 85(1), 56-70.
Kothari, C. R. (2009). Research methodology: Methods and techniques (2nd ed.).
New Delhi: New Age International.
Kotler, P., & Armstrong, G. (2008). Principles of Marketing (12th ed.). New Jersey,
USA: Prentice Hall.
Kotler, P., & Keller, K. L. (2012). Marketing Management (14 ed.). Prentice Hall.
Krystallis, A., & Chrysochou, P. (2014). The effects of service brand dimensions on
brand loyalty. Journal of Retailing and Consumer Services, 21(2), 139–147.
Kumar, M., Kee, F. T., & Charles, V. (2010). Comparative evaluation of critical
factors in delivering service quality of banks: An application of dominance
analysis in modified SERVQUAL model. International Journal of Quality
and Reliability Management, 27(3), 351-377.
Kuusik, A. (2007). Affecting customer loyalty: Do different factors have various
influences in different loyalty levels? The University of Tartu Faculty of
Economics and Business Administration Working Paper, 58-2007.
Kwon, W. S., & Lennon, S. (2009). Reciprocal effects between multichannel
retailers’ offline and online brand images . Journal of Retailing, 85(3), 376-
390.
Lai, F., Griffin, M., & Babin, B. J. (2009). How quality, value, image, and
satisfaction create loyalty at a Chinese telecom . Journal of Business
Research, 62(10), 980-986.

148
Lam, S. K., Ahearne, M., Hu, Y., & Schillewaert, N. (2010). Resistance to Brand
Switching When a Radically New Brand Is Introduced: A Social Identity
Theory Perspective. Journal of Marketing, 74, 128– 146.
Lattin, M., & Bucklin, R. E. (1989). Reference Effects of Price and Promotion on
Brand Choice Behavior. Journal of Marketing research, 26, 299-310.
Lazarevic, V. (2012). Encouraging brand loyalty in fickle generation Y consumers.
Young Consumers, 13(1), 45-61.
Lee, H. S. (2010). Factors Influencing Customer Loyalty of Mobile Phone Service:
Empirical Evidence from Koreans Hyung. Journal of Internet Banking and
Commerce, 15(2), 1-14.
Lee, J., & Feick, L. (2001). The impact of switching costs on the customer
satisfaction-loyalty link: mobile phone service in France. Journal Of Services
Marketing, 15(1)., 35-48.
Leroi-Werelds, S., Streukens, S., Brady, M. K., & Swinnen, G. (2014). Assessing the
value of commonly used methods form ensuring customer value: a multi-
setting empirical study. Journal of the Acadamy of Marketing Science, 42(2),
430–451.
Levesque, T., & McDougall, G. H. (1996). Determinants of customer satisfaction in
retail banking . International Journal of Bank Marketing, 14, 12–20.
Levy, M., & Weitz, B. A. (2009). Retailing Management (7th ed.). New York:
McGraw-Hill/Irwin.
Lewis, M. (2004). The influence of loyalty programs and short-term promotions on
customer retention. Journal of Marketing Research, 281-292.
Li, M. L., & Green, R. D. (2011). A mediating influence on customer loyalty: The
role of perceived value. Journal of Management and Marketing Research, 7,
1-12.

149
Lin, A. & Chou, C. (2003). Antecedents and Consequences of Customer Switching
Costs for the Mobile Phone Market. Retrieved from www.jepa-
hq.com/ic/IC2004/abstract/44%20Chou-abst.pdf
Lin, L. (2010). The relationship of consumer personality trait, brand personality and
brand loyalty: an empirical study of toys and video games buyers. Journal of
Product and Brand Management, 19(1), 4-17.
Liu, A. H. (2006). Customer value and switching costs in business services:
developing exit barriers through strategic value management. Journal of
Business & Industrial Marketing, 21(1), 30-37.
Lopez, J.P.M., Redondo, Y.P., & Olivan, F.J.S. (2006). The impact of customer
relationship characteristics on customer switching behaviour: Differences
between switchers and stayers. Managing Service Quality, 16(6), 556-574.
Lovelock, C., & Wirtz, J. (2011). Services Marketing. New Jersey: Pearson.
Luk, S., & Yip, L. S. (2008). The moderator effect of monetary sales promotion on
the relationship between brand trust and purchase behavior. Brand
Management, 15(6), 452–464.
MacKinnon, D. P., Fairchild, A. J., & Fritz, M. S. (2007). Mediation analysis.
Annual Review of Psycholog. 58, 593-614.
Madhoushi, M., Sadati, A., & Delavari, H. (2011). Entrepreneurial orientation and
innovation performance : The mediating role of knowledge management.
Asian Journal of Business Management, 3(4), 310 – 316.
Malhotra, N. K. (2010). Marketing Research: An Applied Orientation (6th ed.).
Upper Saddle River, NJ: Prentice Hall, Inc.
Malik, F., Asif, U., & Malik, O. (2012). Determinants of Brand Loyalty in Health
Sector of Pakistan . Information Management and Business Review, 477-486.
Mangan, J., & Lalwani, C. (2004). Combining Quantitative and Qualitative
Methodology in Research. International Journal of Physical and Logistics
Management, 34(7), 565 - 578.
150
Melnyk, V., & Bijmolt, T. (2015). The effects of introducing and terminating loyalty
programs . European Journal of Marketing, 49(3), 398–419.
Menard, S. (1995). Applied logistic regression analysis. Sage university paper series
on quantitative applications in the social sciences, 07–106 .
Meng, J. G., & Fraedrich, J. P. (2010). 21st Century Social Class Theory as it
Applies to Marketing. Marketing Management Journal, 6, 194-200.
Mols, N. P. (1998). The behavioral consequences of PC banking . International
Journal of Bank Marketing, 16, 195–201.
Monroe, K. (1990). Pricing: Making profitable decisions (1st ed.). New York:
McGraw-Hill.
Monroe, K. B. (1973). Buyers’ Subjective Perceptions of Price. Journal of Marketing
Research, 10(1), 70-80.
Montaner, T., & Pina, J. (2008). The Effect Of Promotion Type And Benefit
Congruency On Brand Image . The Journal of Applied Business Research,
24(3), 15-28.
Morgan, R. L. (2009). Calming upset customers: Stay in control in any situation (4th
ed.). San Jose: Axzo Press.
Mugenda, O. M., & Mugenda, A. G. (2003). Research methods: Quantitative and
qualitative approaches. Nairobi: African Centre for Technology Studies.
Muturi, F., Wadawi, J. K., & Owino, E. O. (2014). Antecedents of Customer
Perceived Value: Evidence of Mobile Phone Customers in Kenya.
International Journal of Business and Social Science, 5(4). 318-326
Nadiri, H., & Tumer, M. (2009). Retail Service Quality and Behavioural Intentions:
An Empirical application of the Retail Service. E + M EKONOMIE A
MANAGEMENT.
Nam, J., Ekinci, Y., & Whyatt, G. (2011). Brand equity, brand loyalty and consumer
satisfaction. Annals of Tourism Research, 38(3), 1009-1030.
151
Ndubisi, N. O., Malhotra, N. K., & Chan, K. W. (2009). Relationship marketing,
customer satisfaction and loyalty: a theoretical and empirical analysis from an
Asian perspective. Journal of International Consumer Marketing, 21(1), 5.
Netemeyer, R. G., Krishnan, B., Pullig, C., Wang, G., Yagci, M., Deane, D., . . .
Wirth, F. (2004). Developing and validating measures of facets of customer-
based brand equity. Journal of Business Research, 57(2), 209-224.
Nicoulaud, B., Hooley, G. J., Rudd, J., & Piercy, N. F. (2017). Marketing Strategy
and Competitive Positioning (6th ed.). Edinburgh Gate, England: Pearson
Education Limited.
Nikhashemi, S. R., Paim, L. H., Sidin, S. M., & Khatibi, A. (2014). Driving Forces
of Hypermarket’s Customer Loyalty: An Empirical Study in Malaysia.
Australian Journal of Basic and Applied Sciences, 8(3), 377-386.
Nikhashemi, S., Paim, L., Osman, S., & Sidin, S. (2015). The significant role of
Customer Brand Identification Towards Brand Loyalty Development; An
Empirical Study among Malaysian Hypermarkets Customer. Procedia -
Social and Behavioural Sciences(207), 182-188.
Oh, H. (2000). The Effect of Brand Class, Brand Awareness, and Price on Customer
Value and Behavioral Intentions. Journal of Hospitality & Tourism Research,
136.
Oliver, R. L. (1980). A Cognitive Model of the Antecedents and Consequences of
Satisfaction Decisions. Journal of Marketing Research, XVII.
Oliver, R. L. (2007). Whence consumer loyalty? Journal of Marketing, 63(4), 33–44.
Oliver, R. L., Rust, R. T., & Varki, S. (2007). Customer Delight: Foundations,
Findings, and Managerial Insight. Journal of Retailing, 73, 311-336.
Olum, Y. (2004). Modern management theories and practices. Makerere University,
Uganda.
Omar, O., & Sawmong, S. (2007). Customer Satisfaction and Loyalty to British
Supermarkrts. Journal of Food Products Marketing, 13(2), 19-32.

152
Omwenga, J., Ndung’u, M., & Manyinsa, G. G. (2015). Determinants for choice of
mobile telephony service provider in Kenya: A case study of Kirinyaga
County. Prime Journal of Social Science, 4(11), 1186-1194.
Orel, F. D., & Kara, A. (2014). Supermarket self check out service quality, customer
satisfaction, and loyalty: Empirical evidence from an emerging market.
Journal of Retailing and ConsummerServices, 21(2), 118–129.
Osborne, J., & Waters, E. (2002). Four assumptions of multiple regression that
researchers should always test. Practical Assessment, Research & Evaluation,
8(2).1-9
Osman, Z., & Sentosa, I. (2013). Service quality and customer loyalty in Malaysian
Rural Tourism: A Mediating Effect of Trust. International Journal of
Marketing Practices, 1(1), 31-42.
Owino, E. O. (2013). The influence of service quality and corporate image on
customer satisfaction among university students in kenya. Unpublished
doctorate thesis.
Owino, E., Kibera, F., Munyoki, J., & Wainaina, G. (2014). Service Quality in
Kenyan Universities: Dimensionality and Contextual Analysis. European
Journal of Business and Management, 6(11), 180.
Oyeniyi, O. (2011). Sales Promotion and Consumer Loyalty: A Study of Nigerian
Telecommunication Industry . Journal of Business Perspective, 13(4), 35-48.
Pacheco, R. O., Cristina, M., Enrique, C. V., Rodríguez, P., & Ricardo, H. (2012).
Organizational Competences and Competitiveness.The effect of Business
Strategies. 20(4), 16-31.
Palazon, V., & Delgado, D. (2005). Sales promotions effects on consumer-based
brand equity. International Journal of Market Research, 47(2), 179–204.
Pallant, J. (2011). SPSS SURVIVAL MANUAL- A step by step guide to data analysis
using SPSS (4th ed.). Australia: Allen & Unwin.

153
Parasuraman, A., Zeithaml, V. A., & Berry, L. L. (1988). SERVQUAL: a multiple-
item scale for measuring consumer perceptions of service quality. Journal of
Retailing, 64, 12-40.
Park, C. W., Jaworski, B. J., & Maclnnis, D. J. (2006). Strategic brand concept -
image management. Journal of Marketing, 50(4), 135–145.
Park, J. W., Choi, Y. J., & Moon, W. C. (2013). Investigating the effects of sales
promotions on customer behavioral intentions at duty-free shops: An Incheon
International Airport case study. Journal of Airline and Airport Management,
3(1), 18-30.
Raghubir, P., Inman, J., & Grande, H. (2004). The three faces of consumer
promotions. California Management Review, 46(4), 23–42.
Rahman, M. H., Redwanuzzaman, M., Masud-Ul-Hasan, M., & Rahman, M. A.
(2014). Factors Affecting Customer Satisfaction on Grameenphone Users in
Bangladesh . Global Journal of Management and Business Research, 14(3),
57-66.
Ramakrishnan, K. (2006). Customer retention: the key to business performance
(online) . Retrieved from http://www.estrategicmarketing.com/smNov-
Dec2/art11.html
Rattray, J. C., & Jones, M. C. (2007). Essential elements of questionnaire design and
development. Journal of Clinical Nursing, 16, 234-243.
Ray, M. (2009). The loyalty effect: The relationship between loyalty and profits.
European Business Journal, 12(3), 134.
Reichheld, F., & Markey, J. R. (2000). The loyalty effect – The relationship between
loyalty and profits . European Business Journal, 12(3), 134.
Roberts, K. (2006). The lovemarks effect: Winning in the consumer revolution. New
York: Powerhouse Books.
Rundle-Thiele, S., & Mackay, M. M. (2001). Assessing the performance of brand
loyalty measures. Journal of Service Marketing, 15(7), 529–46.

154
Runyan, R. C., & Droge, C. (2008). Small store research streams: what does it
portend for the future? . Journal of Retailing, 84(1), 77-94.
Salinas, E. M., & Perez, J. M. (2009). Modeling the brand extensions’ influence on
brand image. Journal of Business Research, 62(1), 50-60.
Santini, F. O., Sampaio, C. H., Perin, M. G., Espartel, L. B., & Ladeira, W. J. (2015).
Moderating Effects of Sales Promotion Types. Brazilian Administration
Review, 12(2), 169-189.
Santouridis, I., & Trivellas. (2010). Investigating the impact of service quality and
customer satisfaction on customer loyalty in mobile telephony in Greece.
TQM Journal, 22(3), 330-343
Saunders, M., Lewis, P., & Thornhill, A. (2015). Research Methods for Business
Students (7th ed.). London: Prentice Hall.
Schiffman, L. G., & Kanuk, L. L. (2004). Consumer Behaviour (8th ed.). New York:
Prentice Hall.
Schiffman, L. G., Kanuk, L., & Hansen, H. (2008). Consumer Behaviour - An
European Outlook, The Consumer as an Individual, Self and Self-Image.
Pearson Education.
Schultz, D. E. (2005). The loyalty paradox. Marketing Management, 14(5), 10–11.
Seiders, K., & Voss, G. (2004). From price to purchase. Journal of Marketing
Management, 13(6), 26–43.
Seock, Y. K. (2009). Influence of retail store environmental cues on consumer
patronage behavior across different retail store formats: An empirical analysis
of US Hispanic consumers. Journal of Retailing and Consumer Services,
16(5), 329-339.
Serkan, A., & Gokhan, O. (2005). Customer loyalty and the effect of switching costs
as a moderator variable: A case in the Turkish mobile phone market
Marketing. Journal of Intelligence & Planning , 23(1), 89-103.

155
Seth, N., Deshmukh, S. G., & Vrat, P. (2005). Service quality models: a review.
International Journal of Quality & Reliability Management, 22(9), 913-949.
Shankar, V., Azar, P., & Fuller, M. (2008). Brand Equity: a multicategory brand
equity model and its application at allstate . Marketing Science, 27(4), 567-
584.
Shieh, G. (2010). On the misconception of multicollinearity in detection of
moderating effects: Multicollinearity is not always detrimental. Multivariate
Behavioral Research, 45, 483- 507.
Singh, K. (2007). Quantitative Social Research Methods. New Delhi : Sage
Publications.
Sirohi, N., McLaughlin, E. W., & Wittink, D. (2008). A Model of Consumer
Perceptions and Store Loyalty Intentions for a Supermarket Retailer. Journal
of Retailing, 74(2), 223 – 245.
So, J. T., Andrew, G. P., & Yap, S. (2013). Corporate branding, emotional
attachment and brand loyalty: The case of luxury fashion branding" . Journal
of Fashion Marketing and Management, 17(4), 403–423.
Sobel, M. E. (1982). Asymptotic confidence intervals for indirect effects in structural
equation models. Sociological methodology, 13, 290-312.
Spreng, R. A., MacKenzie, S. B., & Olshavsky, R. W. (1996). A reexamination of
the determinants of consumer satisfaction. Journal of Marketing, 60(3), 15.
Stevens, J. P. (2015). Applied multivariate statistics for the social sciences (6th ed.).
New York, NY: Routledge.
Stoner, J. A., Freeman, E., & Gilbert, D. R. (2001). Management. New Delhi:
Prentice Hall.
Su, A. Y. (2004). Customer satisfaction measurement practice in Taiwan hotels.
International journal of hospitality management, 23(4), 397-408.

156
Sullivan, M., & Dennis, A. (2002). Retail Marketing . Cornwall, UK: TJ
International.
Sureshchanndra, G. S., Rajendran, C., & Anantharaman, R. N. (2003). The
relationship between service quality and customer satisfaction - a factor
specific approach. Journal of Service Marketing, 16(4), 363-379.
Sutikno, B. (2011). Does Consumers’ Brand Identification Matter: The Mediating
Roles of Brand Loyalty. The International Journal of Interdisciplinary Social
Sciences, 6(3), 1833-1882.
Sweeney, J., & Swait, J. (2008). The effects of brand credibility on customer loyalty.
Journal of Retail and Consumer Service, 15(3), 179–193.
Tabachnick, B. G., & Fidell, L. S. (2013). Using Multivariate Statistics (6th ed ed.).
Boston: Pearson.
Tams, J. L. (2010). The effects of service quality, perceived value and customer
satisfaction on behavioral intentions. Journal of Hospitality and Leisure
Marketing, 6(4), 31-44.
Taylor, G. A., Neslin, & A, S. (2005). The Current and Future Sales Impact of a
Retail Frequency Reward Program. Journal of Retailing, 81(4), 293–305.
Tharnujan, R., & Seneviratne, L. P. (2009). The Role of Knowledge Management in
Postdisaster Housing Reconstruction . Disaster Prevention and Management ,
18(1), 66-77.
Tsiros, M., & Hardesty, D. M. (2010). Ending a price promotion: retracting it in one
step or phasing it out gradually. Journal of Marketing, 74(1), 49-64.
Tu, Y. T., Li, M. L., & Chih, H. (2011). The Effect of Service Quality, Customer
Perceived Value and Satisfaction on Loyalty. Journal of Economics and
Behavioral Studies, 3(3), 198-212.
UK grocery retailing. (2016). Retrieved from
http://www.igd.com/Research/Retail/UK-grocery-retailing/

157
Upamannyu, N. K., & Mathur, G. (2013). Effect of brand trust, brand affect and
brand image on customer brand loyalty and consumer brand extension
attitude in FMCG sector. PRIMA, 3(2), 1-14.
Vargo, S. L., & Lusch, R. F. (2004). Evolving to a new dominant logic for
marketing. Journal of Marketing, 68(1), 1-17.
Wallace, D., Giese, J., & Johnson, J. (2004). Customer retailer loyalty in the context
of multiple channel strategies. Journal of Retailing, 80, 249 – 263.
Walters, R. G. (1991). Assessing the impact of retail price promotions on product
substitution, complementary purchase, and inter store sales displacement.
Journal of Marketing, 55(2), 17–28.
Wan, H. H., & Schell, R. (2013). Reassessing Corporate Image – An Examination of
How Image Bridges Symbolic Relationships with Behavioural Relationships.
Journal of Public Relations Research, 19(1), 25- 45.
Wang, Y., Lo, H. P., Chi, R., & Yang, Y. (2004). An integrated framework for
customer value and customer‐relationship‐management performance: a
customer‐based perspective from China. Managing Service Quality
International Journal, 14(2/3), 169–182.
Warner, W. L. (1941). The social life of a modern community . New Haven: Yale
University Press.
Wierenga, B., & Soethoudt, H. (2010). Sales promotions and channel coordination .
Original Empirical Research, 38(3), 383-397.
Wieringa, J. E., & Verhoef, P. C. (2007). Understanding Customer Switching
Behavior In A Liberalizing Service Market. Journal of Service Research,
10(2), 174–86.
Woodside, A. G., & Walser, M. G. (2007). Building strong brands in retailing.
Journal of Business Research, 60(1), 1-10.

158
Yang, Z., & Peterson, R.T. (2004). Customer Perceived Value, Satisfaction, and
loyalty: The Role of Switching Costs. Journal of Psychology & Marketing,
21(10), 799-822.
Yong, A. G., & Pearce, S. (2013). A beginner’s guide to factor analysis: Focusing on
exploratory factor analysis. Tutorials in quantitative methods for psychology,
9(2), 79-94.
Yoo, B., Donthu, N., & Lee, S. (2000). An examination of selected marketing mix
elements and brand equity . Journal of the Academy of Marketing Science,
28(2), 195–211.
Youl, H., & John, J. (2010). Role of customer orientation in an integrative model of
brand loyalty in services. The Service Industries Journal, 30(7), 1025–1046.
Zeithaml, V. A., Bitner, M. J., & Gremler, J. T. (2009). ServicesMarketing:
integrating customer focus across the firm (5th ed.). New York: McGraw
Hill.
Zeithaml, V.A. (1988, July). Customer perceptions of price, quality, and value: a
means-end model and synthesis of evidence. Journal of Marketing, 52, 2-22.
Zentes, J., Morschett, D., & Schramm-Klein, H. (2011). Strategic Retail
Management, Text and International Cases (2nd ed.). Auflage: Wiesbaden:
Gabler Verlag.
Zetu, D., & Miller, L. (2016). Managing customer loyalty in the auto industry using
six sigma and the ‘Toyota Way’methodology,. MEST , 4(1), 99-110.
Zikmund, W. G., Babin, B. J., Carr, J. C., & Griffin, M. (2013). Business research
methods (9th ed.). Ohio, USA: Cengage Learning.
Zubairu, I. T., Idaomi, T. O., & Azubuike, A. S. (2014). Impact of Sales Promotion
Strategies on Product Patronage: A Case Study of Chuppet Supermarket,
Ilorin. Journal of Business and Organizational Development, 6(1), 1-14.

159
APPENDICES
Appendix 1: Letter of Introduction
15th February, 2017 Jomo Kenyatta University of Agriculture and Technology Nairobi. Dear Respondent, RE: A STUDY ON DETERMINANTS OF BRAND LOYALTY IN LEADING SUPERMARKET CHAINS IN KENYA. This questionnaire is designed to study the determinants of brand loyalty in the leading supermarkets in Kenya. This study has the following objectives:
1. To determine the influence of service quality on brand loyalty in leading supermarket chains in Kenya.
2. To establish the effect of customers’ value perception on brand loyalty in leading supermarket chains in Kenya.
3. To evaluate the effect of sales promotions on brand loyalty in leading supermarket chains in Kenya.
4. To determine the effect of brand image on brand loyalty in leading supermarket chains in Kenya.
5. To assess the extent to which customer satisfaction mediates the relationship between the independent variables and brand loyalty in leading supermarket chains in Kenya.
It is to this end that we believe your input to this research is crucial. The study is conducted as academic research and the information you provide will be treated in the strictest confidence. Strict ethical principles will be observed to ensure confidentiality. The questionnaire has an identification number for mailing and follow-up purposes only. The study outcomes and report will not include reference to any individuals. To facilitate the completion of the study, could you kindly please take a few minutes to complete the attached questionnaire and return it to the administrator. In case of any questions, please do not hesitate to contact the undersigned on Tel: 0722 527957 Email: [email protected] Thank you very much for your invaluable contribution and we appreciate the time you have spared to answer the questions. Sincerely, Francis Mungai

160
Appendix 2: Letter of Authorization

161
Appendix 3: Questionnaire
This study is a requirement for the partial fulfillment of the Doctor of Philosophy in Business Administration at JKUAT. This is an academic research and all information collected from respondents will be treated with strict confidentiality. PART A: GENERAL INFORMATION Kindly respond to all the questions either by ticking in the boxes or writing in the spaces provided. 1. Your gender: Female Male 2. Age: Below 18 years 18-27 years 28-37 years
38 -57 years over 58 years 3. What is your highest level of education?
Undergraduate Graduate Postgraduate 4. Which Supermarket do you most often shop from?
Nakumatt Uchumi Tuskys Naivas Others 5. Which Supermarket are you loyal to?
Nakumatt Uchumi Tuskys Naivas Others None
6. How long have you been shopping at the current Supermarket? Less than 2 years 3-5 years 6-10 years 10-15 years over 15 years
7. Where is your current Supermarket located? Shopping mall Near the Estate Near the bus stop Others
8. Do you have a supermarket loyalty card? Yes No
9. Do you shop in another Supermarket? Yes No
10. Which other supermarket do you frequently shop from? ……………………………………………………………………………………………………..……………………………………………………………………
PART B: CUSTOMER EXPECTATIONS Please tick the numeric value that most corresponds to your personal opinion towards the questions asked.
What would you consider most important when choosing a Supermarket to shop in?
Str
ongl
y
agre
e
Agr
ee
Neu
tral
disa
gree
Str
ongl
y D
isag
ree
11 Reasonability of price 5 4 3 2 1
12 Possibility of promotions 5 4 3 2 1
13 Adequate branch network coverage. 5 4 3 2 1
14 Quality of service. 5 4 3 2 1
15 Value-Added services 5 4 3 2 1

162
16 Stores are well stocked 5 4 3 2 1
17 Stores are conveniently positioned. 5 4 3 2 1
18 Convenience (Ease of shopping) 5 4 3 2 1
19 Customer support (Speed of complaint processing) 5 4 3 2 1
20 Store image and appeal 5 4 3 2 1
21 Customer support (Friendliness) 5 4 3 2 1
PART C: SERVICE QUALITY
Based on your current experience, how would you judge the service quality of your current Supermarket brand?
Str
ongl
y ag
ree
Agr
ee
Neu
tral
disa
gree
Str
ongl
y D
isag
ree
22 This supermarket brand provides superior service 5 4 3 2 1
23 There is sufficient parking at this Supermarket 5 4 3 2 1
24 The supermarket has clean, attractive and convenient public area (Washrooms, fitting rooms)
5 4 3 2 1
25 This Supermarket has a layout that makes it easy for customers to find what they need
5 4 3 2 1
26 This supermarket has error free transactions 5 4 3 2 1
27 This supermarket has merchandise available when the customers want it
5 4 3 2 1
28 The employees of this Supermarket have knowledge to answer customers questions
5 4 3 2 1
29 The Supermarket employees gives customers individual attention
5 4 3 2 1
30 Employees of this supermarket are consistently courteous with customers
5 4 3 2 1
PART D: CUSTOMER PERCEIVED VALUE
How would you judge the perceptions of value that you get from your current Supermarket brand?
Str
ongl
y a
gree
Agr
ee
Neu
tral
disa
gree
Str
ongl
y D
isag
ree
31 Compared to alternative supermarkets brands, the current supermarket offers attractive products/services of high quality.
5 4 3 2 1
32 Compared to alternative supermarket brands, the current supermarket charges me fairly for similar products/ services.
5 4 3 2 1
33 Compared to alternative supermarket brands, the current supermarket provides me with more free services.
5 4 3 2 1
34 Comparing what I pay to what I might get from other supermarkets, I think my current supermarket provides me with good value.
5 4 3 2 1
35 Compared to other competitive supermarket brands, I think my 5 4 3 2 1

163
current supermarket, charges me low price.
PART E: SALES PROMOTIONS
How would you judge the sales promotions that you get from your current Supermarket brand?
Str
ongl
y
agre
e
Agr
ee
Neu
tral
disa
gree
Str
ongl
y di
sagr
ee
36 This Supermarket gives good discounts 5 4 3 2 1
37 This supermarket often has free gifts/samples 5 4 3 2 1
38 This supermarket has a good loyalty program 5 4 3 2 1
39 The promotions make me feel like I am a smart shopper 5 4 3 2 1
40 Overall, i like the advertising and promotions of this supermarket
5 4 3 2 1
PART F: BRAND IMAGE
Based on your current experience, how would you judge the image of your current supermarket brand?
Str
ongl
y ag
ree
Agr
ee
Neu
tral
disa
gree
Str
ongl
y D
isag
ree
41 The supermarket has good characteristics that other brands don't 5 4 3 2 1
42 The supermarket has a good corporate reputation 5 4 3 2 1
43 The brand has a personality that distinguish itself from competitor’s brands
5 4 3 2 1
44 It’s a brand that doesn’t disappoint its customers 5 4 3 2 1
45 It’s one of the best brands in the sector 5 4 3 2 1
46 The supermarket brand is very consistent in the market 5 4 3 2 1
47 This Supermarket brand has physical facilities that are visually appealing
5 4 3 2 1
PART G: CUSTOMER SATISFACTION
Based on your current experience, how would you judge satisfaction with your current supermarket brand?
Str
ongl
y ag
ree
Agr
ee
Neu
tral
disa
gree
Str
ongl
y D
isag
ree
48 I have a positive experience with the supermarket 5 4 3 2 1
49 This supermarket does a good job of satisfying my needs. 5 4 3 2 1
50 My experience with the supermarket staff is excellent 5 4 3 2 1
51 I made the right decision when I decided to buy from this supermarket
5 4 3 2 1
52 Overall, I am satisfied shopping at the supermarket 5 4 3 2 1

164
PART H: BRAND LOYALTY
Based on your current experience, how would you judge loyalty to your current Supermarket brand?
Str
ongl
y a
gree
Agr
ee
Neu
tral
disa
gree
Str
ongl
y D
isag
ree
53 I will recommend this supermarket brand to other people 5 4 3 2 1
54 I say positive things about this supermarket brand 5 4 3 2 1
55 I will continue to be a loyal customer for this supermarket brand
5 4 3 2 1
56 I am very committed to this Supermarket brand 5 4 3 2 1
57 I will continue to choose this supermarket brand before other brands.
5 4 3 2 1
THANK YOU FOR TAKING TIME TO COMPLETE THE QUESTIONNAIRE

165
Appendix 4: List of Supermarket Branches
NAKUMAT UCHUMIS NAIVAS TUSKYS1 Nakumatt Thika 1 Uchumi Buruburu 1 Naivas Makongeni 1 Tuskys Kakamega2 Nakumatt Wendani 2 Uchumi Juja 2 Naivas Thika 2 Tuskys United Kisumu3 Nakumatt TRM 3 Uchumi Stadium 3 Naivas Githurai 3 Tuskys Kericho4 Nakumatt Garden City 4 Uchumi Agahakan walk 4 Naivas Kasarani 4 Tuskys Kitale 5 Nakumatt Kiambu 5 Uchumi City Squre 5 Naivas Ronald Ngala 1 5 Tuskys Kisii6 Nakumatt Ronald Ngala 6 Uchumi Kisumu 6 Naivas Ronald Ngala 2 6 Tuskys Juja7 Nakumatt Lifestyle 7 Uchumi Kericho 7 Naivas Eastgate 7 Tuskys K Mall8 Nakumatt Cityhall 8 Uchumi Mombasa 8 Naivas Buruburu 8 Tuskys Stadium9 Nakumatt Moi Avenue 9 Uchumi Meru 9 Nivas Umoja 9 Tuskys Road A
10 Nakumatt Haile Sallasie 10 Uchumi Karatina 10 Naivas Komarocks 10 Tuskys Lunga Lunga11 Nakumatt Shujaa 11 Uchumi Eldorate 11 Naivas Kisumu 11 Tuskys Embakasi12 Nakumatt Mega 12 Uchumi Rongai 12 Naivas Bungoma 12 Tuskys Jirani13 Nakumatt Junction 13 Uchumi Langata 13 Naivas Kisii 13 Tuskys Chania14 Nakumatt Karen 14 Uchumi Ngong Hyper 14 Naivas Nyali 14 Tuskys Chapchap15 Nakumatt Prestige 15 Uchumi Adams 15 Naivas Ukunda 15 Tuskys Ananas Mall16 Nakumatt Westgate 16 Uchumi Sarit 16 Naivas Bamburi 16 Tuskys Pioneer17 Nakumaa Ukay 17 Uchumi Westlands 17 Naivas Embu 17 Tuskys Beba18 Nakumatt Village Market 18 Uchumi Captal Center 18 Naivas Nyeri 18 Tuskys Hakati19 Nakumatt South C 19 Naivas Mid town 19 Tuskys OTC20 Nakumatt Galleria 20 Naivas Super Center 20 Tuskys Imara21 Nakumatt Nextgen 21 Naivas Ndogo 21 Tuskys Magic22 Nakumatt Mega Kisumu 22 Naivas Kubwa 22 Tuskys Kilifi23 Nakumatt Nyanza Kisumu 23 Naivas Sokoni 23 Tuskys Digo24 Nakumatt Ktale 24 Naivas Referral 24 Tuskys Bandari25 Nakumatt Bungoma 25 Naivas Ngong 25 Tuskys mtwapa26 Nakumatt Kakamega 26 Naivas Home ground 26 Tuskys Mall27 Nakumatt Midtown Kakamega 27 Naivas Karen 27 Tuskys Magic28 Nakumatt Kisii 28 Naivas Green House 28 Tuskys Hyrax29 Nakumat Nyali 29 Naivas Westlands 29 Tuskys Midtown30 Nakumatt Bamburi 30 Naivas Limuru 30 Tuskys Wareng31 Nakumatt Cinemax 31 Naivas Kawangware 31 Tuskys Zion Mall32 Nakumatt Diani 32 Naivas Hazina 32 Tuskys Rongai33 Nakumatt Malindi 33 Naivas Supercenter Machakos 33 Tuskys Ruaka34 Nakumatt Likoni 34 Naivas old Machakos 34 Tuskys Adams35 Nakumatt Meru 35 Naivas Kitengela 35 Tuskys Athi river36 Nakumattt Nyanyuki 36 Naivas Kitale 36 Tuskys Milele37 Nakumatt Nakuru 37 Naivas Narok 37 Tuskys Matasia38 Nakumatt House Hold 38 Naivas Thika town branch 38 Tuskys Chapchap39 Nakumaa Eldo Center 39 Tuskys Uthiru41 Nakumatt Mobil 40 Tuskys Greenspan42 Nakumatt Kericho 41 Tuskys T-mall43 Nakumatt kitsuru 42 Tuskys Buruburu44 Nakumatt Embakasi 43 Tuskys Mountain view45 Nakumatt Emali 44 Tuskys Buffalo Mall
45 Tuskys shell CBD

166
Appendix 5: Supermarket Stores Sampling Frame
Supermarket Name Town Supermarket Name Town
1 Nakumatt Wendani Nairobi 16 Tuskys Magic Nakuru
2 Nakumatt Prestige Ngong Road Nairobi 17 Tuskys Midtown Nakuru
3 Nakumatt Ridgeways Nairobi 18 Tuskys Hydrax Nakuru
4 Nakumatt City Hall Nairobi 19 Naivas Kasarani Nairobi
5 Nakumatt Moi Avenue Nairobi 20 Naivas Mountain Mall
Nairobi
6 Nakumatt Ukay Nairobi 21 Naivas Ronald Ngara Nairobi
7 Nakumatt Mega Nairobi 22 Naivas Komarock Nairobi
8 Nakumatt Galleria Nairobi 23 Naivas Buruburu Nairobi
9 Nakumatt Nakuru Nakuru 24 Naivas Supercentre Nakuru
10 Tuskys Greenspan Nairobi 25 Naivas Kubwa Nakuru
11 Tuskys T-Mall Mbagathi Nairobi 26 Naivas Ndogo Nakuru
12 Tuskys Stadium Nairobi 27 Uchumi Capital Centre
Nairobi
13 Tuskys Embakasi Nairobi 28 Uchumi Sarit Westlands
Nairobi
14 Tuskys Beba Beba Nairobi 29 Uchumi Ngong Hyper
Nairobi
15 Tuskys Adams Nairobi 30 Uchumi Jipange Nairobi
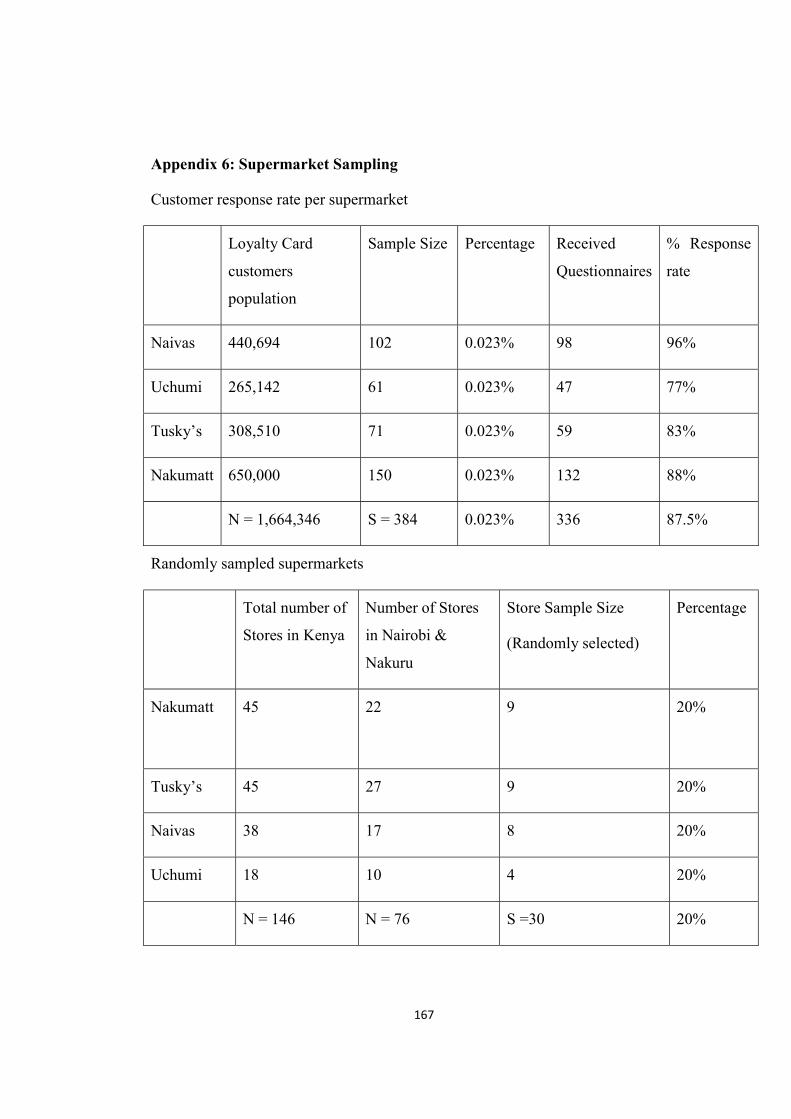
167
Appendix 6: Supermarket Sampling
Customer response rate per supermarket
Loyalty Card
customers
population
Sample Size Percentage Received
Questionnaires
% Response
rate
Naivas 440,694 102 0.023% 98 96%
Uchumi 265,142 61 0.023% 47 77%
Tusky’s 308,510 71 0.023% 59 83%
Nakumatt 650,000 150 0.023% 132 88%
N = 1,664,346 S = 384 0.023% 336 87.5%
Randomly sampled supermarkets
Total number of
Stores in Kenya
Number of Stores
in Nairobi &
Nakuru
Store Sample Size
(Randomly selected)
Percentage
Nakumatt 45 22 9
20%
Tusky’s 45 27 9 20%
Naivas 38 17 8 20%
Uchumi 18 10 4 20%
N = 146 N = 76 S =30 20%

168
Appendix 7: Normality Test Using Histograms

169
Appendix 8: Normality Test Using Histograms

170
Appendix 9: Normality Test Using Histograms
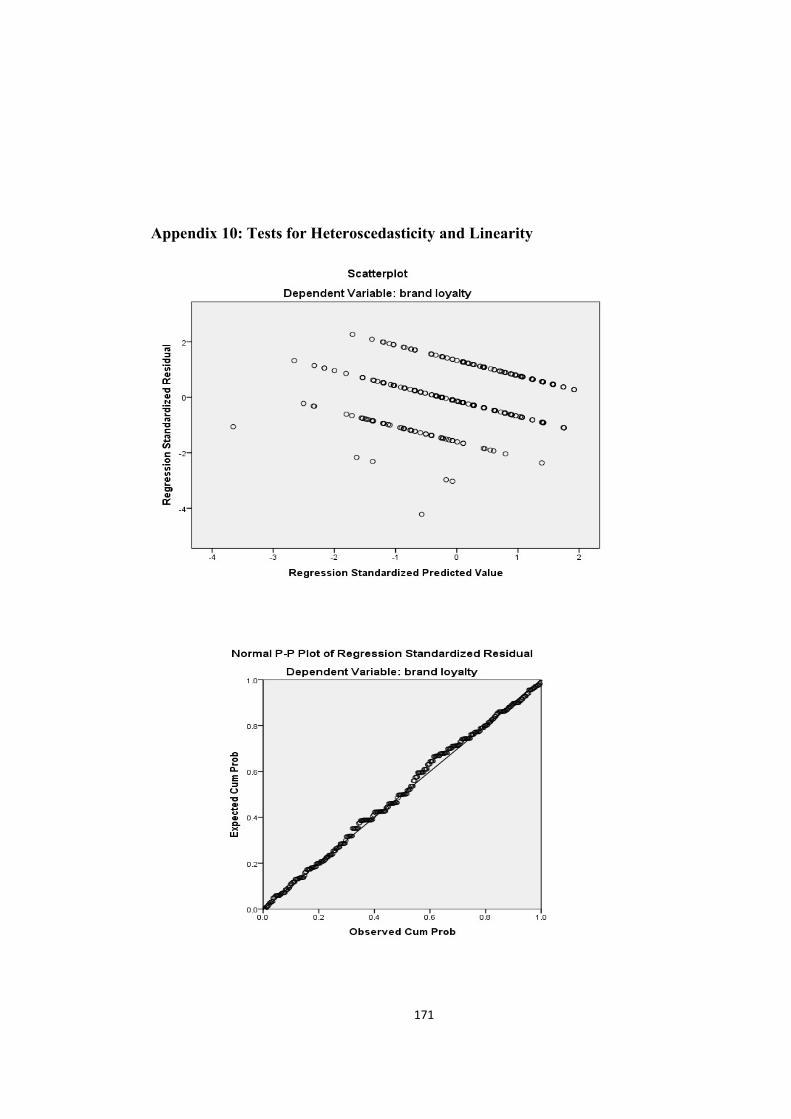
171
Appendix 10: Tests for Heteroscedasticity and Linearity
Copyright © 2022 FDOKUMEN