
Sports Spectators' Suspense: Affect and Uncertainty in Sports Entertainment
Upload
khangminh22Category
view
2download
0
BRAND LOYALTY IN THE SPO TS DRINKS MARKET
Neo Phiri
short dissertation submitted as partial fulfillment of the requirements
for the degree
Magister Commercii in Business Management
in the Faculty of Management at the
University of Johannesburg
Johannesburg Supervisor: H B Klopper 2007

ABSTRACT
This study focuses on the South African sports sector. This sector, despite being
relatively small, continues to grow due to growing consumer health
consciousness. Health and energy are the biggest trends which drives this
sector. It is a competitive market where companies use aggressive advertising to
gain market share, and growth is driven partially by the augmented health
consciousness of South African consumers including consumption by athletes
during exercise. World Soccer Cup to be held in South Africa in 2010 may be
prompting many South African food and beverage companies to be watching the
sports world trends. In 2006, the South African sports drinks market estimated at
R853.8 million grew by 7.7% to a volume of approximately 78.7 million liters.
This sector offers a cost saving benefit in terms of Rand per liter compared to
ready-to-drink products. Sports drinks will continue to increase, due to
consumption by many athletes during exercise.
The following study concerns the extent of brand loyalty amongst university
students attending campus gyms in the Gauteng province, specifically at the
University of Johannesburg, Kingsway campus (APC), University of Pretoria and
Monash University. More specifically, it focuses on aspects that play a significant
role in consumers decision making process, and factors that are considered
when sports drinks are being purchased.
A total of 196 interviews have been conducted, 18 were not fit for analysis therefore 178
were fit for response rate 178/196=90.8%. These questionnaires were designed to
specifically measure the extent of brand loyalty amongst university students. A
number of factors were identified as the main influencers and deterrents of sports
drink purchase. Nutritional information on the packaging label and functional
benefits were perceived to be of the utmost importance in the purchasing
decision.

Due to the fact that this study was implemented within the three stated
universities in the Gauteng province, it is important to note that the findings of
this study cannot be generalised, thus providing an opportunity for future
comparative research.

Acknowledgement
I would like to thank the following people whose continuous guidance,
support and love have made completing this research a reality:
The Almighty, my Lord and Saviour, who has made all this possible.
My parents, Batho and Sonono Phiri, for instilling the culture of
learning in our family. My siblings, Comfort, Karabo, Piletso and
Omphile for tolerating and loving me.
Tshepo, for loving me, encouraging and continuously challenging me.
My friends, for listening to me and supporting me.
My mentor and friend, Dr Melanie Louw for always believing in me.
Mr HB Klopper, thank you for all your help in supervising and advising
me through this study and for your experience, insight, guidance and
patience.
vvnacnaa
TABLE OF CONTENTS
ABSTRACT
ACKNOWLEDGEMENTS
LIST OF FIGURES
LIST OF TABLES
CHAPTER 1
RIENTATION
1
1.1. INTRODUCTION
1
1.2. PROBLEM STATEMENT
3
1.3. THE PURPOSE OF THE STUDY
7
1.4. RESEARCH OBJECTIVES
7
1.4.1. Primary research objective
7
1.4.2. Secondary research objectives
7
1.5. RESEARCH METHODOLOGY
8
1.5.1. Sampling
8
1.6. NATURE AND FORM OF RESULTS
8
1.7. THE IMPORTANCE OF THE STUDY
9
1.8. VALUE OF THE STUDY
9
1.9. DEMARCATION AND SCOPE OF THE STUDY
10
CHAPTER 2
AN OVERVIEW OF BRAND LOYALTY
12
2.1. INTRODUCTION
12
2.2. CONCEPT OF BRANDING AND BRAND LOYALTY 12
iii
601.8 1111 ,011111.0
2.2.1. Product versus Brand
2.2.2. Brand loyalty defined
2.2.3. Strategic value of brand loyalty
2.2.4. Measuring brand loyalty
2.2.5. The Stages of brand loyalty
2.2.6. Maintaining and enhancing brand loyalty
2.3. CONCEPT OF CONSUMER BUYING BEHAVIOUR
14
16
21
31
33
35
37
2.3.1. Consumer Behaviour Theory 37
2.3.2. The Consumer Decision making process 39
2.3.3. Factors influencing the consumers decision
making process 42
2.3.4. Brand loyalty and repeat buying behaviour 44
2.3.5. Generation Y 46
2.4. CONCLUSION 55
CHAPTER 3
OVERVIEW OF THE SPORTS DRINKS MARKET 56
3.1. INTRODUCTION 56
3.1.1 Manufacturers 59
3.1.2 Packaging Trends 62
3.1.2.1 Industry Packaging Trends and Characteristics 63
3.1.2.2 Global Trends 73
3.1.2.3 Primary Packaging 74
3.1.2.4 Plastic 74
3.1.3 Outlet Distribution 75
3.1.4 New Products and Promotions 77
3.1.5 Consumption per capita 77
3.1.6 Historical Average Retail Selling Price 78
3.1.7 Growth Prospects 80
iv
%ALM ICH lb"
3.2. INDUSTRY TRENDS DEFINED BY THE MARKETING MIX
CONCEPT 81
3.2.1. Product 81
3.2.2. Price 83
3.2.3. Promotions 84
3.2.4. Place 84
3.2.5. Physical Evidence 86
3.2.6. Processes 86
3.2.7. People 6
3.3. CONCLUSION 87
CHAPTER 4
RESEARCH METHODOLOGY AND PROCEDURE 89
4.1. INTRODUCTION 89
4.2. RESEARCH DESIGN 90
4.3. PRIMARY DATA ANALYSIS 90
4.4. DATA ANALYSIS 92
4.5. METHODS OF COLLECTING QUANTITATIVE DATA 92
4.5.1. Fieldworkers 93
4.6 SAMPLING SIZE DETERMINATION AND THE SELECTION F
THE SAMPLING METHOD 93
4.6.1. Sample size 94
4.6.2. Determining the sample size 94
4.6.3. Defining the target population 95
4.7. QUESTOINNAI RE DESIGN 95
4.7.1. Validity 97
4.7.2. Reliability 99
4.7.3. Choice of scale 99
4.7.4. Questionnaire format and content 100
4.8 ANALYSIS 101
%rtIFIllefil5
4.9 DATA CODING AND EDITING
101
4.9.1 Coding 101
4.9.2 Editing 102
4.10 STATISTICAL PROCEDURES
102
4.10.1 Descriptive statistics 102
4.10.2 Statistical techniques and procedures implemented in
this research 102
4.10.3 Graphic representation of data 103
4.11 CONCLUSION 104
CHAPTER 5
RESEARCH FINDINGS AND INTERPRETATIONS 105
5.1. INTRODUCTION 105
5.2. FINDINGS 105
5.2.1. Section A: Demographic Information 105
5.2.2. Section B: Consumption Frequency 108
5.3. RESULTS OF STATISTICAL TESTING 114
5.4. CONCLUSION 115
CHAPTER 6
CONCLUSIONS, IMPLICATIONS AND RECOMMENDATIONS FOR
FUTURE RESEARCH
116
6.1. INTRODUCTION 116
6.2. ACHIEVEMENT OF OBJECTIVES 116
6.2.1. Primary objective 116
6.2.2. Secondary objectives 117
6.3. LIMITATIONS 118
6.3.1. Limitations in the literature review 118
6.3.2. Limitations in the empirical research 118
6.4. RECOMMENDATIONS FOR FUTURE RESEARCH 119
vi
%.%/1111C1111Z,
6.5. CONCLUSION
119
CHAPTER 7
REFERENCES
120
CHAPTER 8
APPENDICES
132
8.1. APPENDIX A: QUESTIONNAIRE
8.2. APPENDIX B: FREQUENCIES
8.3. APPENDIX C: CROSS TABULATIONS
vii

..onienis
I
LIST OF FIGURES
I Page:
Figure 1.2: Alternative Growth Strategies Matrix
4
Figure 2.1: The Stages Of Brand Loyalty 33
Figure 2.2: Consumer decision making process 41
Figure 2.3: Factors influencing consumer behaviour 43
Figure 2.4: Repeat Purchase Behaviour and Brand Loyalty 44
Figure 2.5: Level of Involvement and Brand Loyalty 45
Figure 3.1: Volume of Sports Drinks by Subcategory
57
Figure 3.2: Global Sports Beverage Launches over Past Decade 5
Figure 3.3: South Africa Sports Beverage Launches in Past 59
Decade
Figure 3.4: Key Success Factors 62
Figure 3.5: Latest Top Global Trends 63
Figure 3.6: Packaging Trends - Pack Size 64
Figure 3.7: Top 10 Global Flavours - Past 5 Years 65
Figure 3.8: Top 10 Global "Food"/Nutrition Claims-Past 5 Years 67
Figure 3.9: The Four Ps of The Marketing Mix 81
Figure 5.1: Respondent Age 105
viii

,60%.111161 310
LIST OF TABLES
Page:
Table 2.1: The Definition And Benefits of Brands 15
Table 2.2: The Loyalty Matrix - Priorities 24
Table 2.3: Response To Out-Of-Stock Action 41
Table 2.4: Population Estimates By Gender And Age In Gauteng 51
Table 2.5: Demographic Characteristics Of Generati*n 52
Table 3.1: Sports Drink Manufacturers 60
Table 3.2: Comparison Of Sports Drinks Beverages In SA 61
Table 3.3: The Main Food Labelling Requirements And Examples e
Information Than Can Be Provided By Food 71
Manufacturers
Table 3.4: Channel Definitions 75
Table 3.5: Outlet Distribution Of Sports Drinks 75
Table 3.6: Historical SA Per Capita Consumption per year selling 76
Price Per Litre Of Sports Drinks
Table 3.7: Incidence Of Usage By LSM Group Forecast 78
Table 3.8: Selling Price Per Litre of Sports Drinks 79
Table 3.9: Sports Drink Growth Forecast 80
Table 3.10: Packaging Solutions 83
Table 3.11: General Elements of The Physical Environment 85
Table 4.1: Linkages Between Questions In The Questionnaire, 97
Research Objectives And Research Hypotheses
Table 5.1: Demographic Profile 106
Table 5.2: Sports Drinks being sold at gym 106
Table 5.3: Sports Drinks being sold at gym — by University 107
Table 5.4: Branded refrigerator at gym where sports drink is being 108
ix

‘of.71111.G1 1110
Table 5.5:
Table 5.6:
Table 5.7:
Table 5.8:
Table 5.9:
Table 5.10:
Table 5.11:
Table 5.12:
Table 5.13:
Table 5.14:
sold from
Attendance of gym per week
Number of years going to Gym
Activities Done At Gym
Last purchase of Sports Drink
Frequency of Sports Drinks Consumption
Components of the Package
Ranking of characteristics of Sports Drinks
Characteristics of Sports Drinks
Important factors when purchasing a Sports Drink
Favourite Sports Drinks
108
109
109
110
110
111
112
112
113
114
x

Chapter 1
CHAPTER 1
ORIENTATION
"Marketing should focus on market creation, not market sharing."
- Regis McKenna
1.1 INTRODUCTION
Sports drinks are essentially beverages containing nutrients and electrolytes
to replace those lost by the body during physical exertion, or to improve and
sustain performance (BMI Foodpack, 2007:7). Sports drinks claim to
re-hydrate / replenish as well as restore minerals, sugar, and other nutrients
usually lost during sports practise and exercise, and beverages which claim to
improve sports performance and increase endurance" (Robertson, 2007:2).
According to BMI Foodpack (2007:7), the major ingredients comprise water
(to which carbohydrates in the form of fructose, sucrose or glucose have been
added), electrolytes (i.e. sodium, potassium, magnesium, calcium, and
phosphorus) and vitamins and minerals. The functions of these added
ingredients include activating enzymes, strengthening bones, supporting
metabolism and transporting energy.
The South African sports drinks market grew by 7.7% during 2006, to a
volume of approximately 78.7 million litres. The market is worth an estimated
R 853.8 million (BMI Foodpack 2007:7).
The primary driver of this growth is the ready to drink sector of the market by
volume. According to Hehir (2007:9), this growth could be attributed to, the
upward trend to be more health conscious by adopting a healthier diet as well
as attending a gym or health club, consumers consequently incorporate
sports drinks to give energy and replace fluids and electrolytes lost during
training, good weather, increased consumer spending, new launches, sports
drinks have less calories than other non-alcoholic beverages and therefore
provide a healthier alternative for the health conscious consumer. Sports
drinks are expected to grow by 1.0% over the medium to longer tern.
Page 1

Chapter 1
The South African sports drinks market is divided into two segments — ready
to drink segment constituting 72.0% and the concentrates and powder
segment constituting 28.0% of total market volume after reconstitution (BMI
Foodpack, 2007:4).
The South African sports drink market consists of seven major competing
sports drinks, all vying for a greater market share. They are not only
competing with one another, but also with no-name brands distributed through
chain stores, as well as less known brands sold through smaller independent
stores (BMI Foodpack, 2007:2).
There has been an increase in the number of sports drink launches in 2006,
and this is likely to continue for the next few years until the 2010 Soccer World
Cup (Robertson, 2007:16).
According to Robertson (2007:16), as with overseas, vitamins and mineral
supplementation was the dominant trend in South Africa. Likewise, "low in"
claims are a trend - after all, consumers are consuming these because they
are doing exercise generally to control their body weight. Hehir (2007:9)
further states that sports drinks with added proteins are conspicuous by their
absence, and also predicted that future trends in SA would be, as
internationally: increased supplementation with electrolytes, amino acids and
protein hydrolosates; more "low in" claims; local experimentation with
innovative ingredients; more sports drinks for children; and more products
with "natural credentials".
The principle of brand loyalty is very specific in this market, as will be shown
further in this study. With a current increase in demand for sports drinks in
the beverage market, it makes for both an interesting and relevant topic of
discussion (BMI Foodpack, 2007:2). In reviewing the different types of
consumers that make purchases, Generation Y consumers are often
described as those that are free spending but hard to reach, ranging from age
18 to 25 years old (Horovitz as in Martin and Turley, 2004:464).
Page 2
Chapter 1
1.2 PROBLEM STATEMENT
The sports drinks market is a difficult one within which to compete. Barriers of
entry are high, with a great deal of competition. Many manufacturers and
retailers are finding business increasingly difficult in the present socio-
economic-political environment (BMI Foodpack, 2007:2).
Brand loyalty was once highly significant, now consumers are in the habit of
shopping around and of changing brands with greater frequency. Consumers
are already way less tolerant of mediocrity and less resistant to or afraid of
brand and service provider change that they were just a few years ago
(Simpkins, 2005:1).
Higgs (2002:15) indicates that a not strong relationship with the brand has the
following implications on consumers;
Buy what is available - or what is easiest to find
Be more open to special offers or competitor discounts
Tend to not worry about its availability (Higgs, 2002:15).
While, brand loyalty reduces marketing costs, creates barriers to competitors,
provides trade leverage, affects the brand image, and provides time to
respond to competitive threats (Aaker, 1995:213).
According to BMI Foodpack (2007:3), the sports-drink category is reaching
maturity and that it is currently under a degree of threat, especially from
increased activity in the bottled-water and flavoured-water categories, with
which it competes indirectly. Powerade and Energade control the category in
volume and value.
1.2.1 Growth strategies
According to Aaker (2001:229), the road to improved performance must
involve a renewed emphasis on growth. Growth provides both the potential
for enhanced productivity, as well as greater vitality in the organisation by
providing new challenges and rewards. The next product-market matrix
Page 3

Present New
I. Growth in existing product markets
Increase market share Increase product usage
0 Increase the frequency used Increase the quantity used Find new applications for
current users
II. Product Development 0 Add product features, product
refinement Expand the product line Develop a new generation
product Develop new products for
same market
Present
III. Market Development .
0 Expand geographically 0 Target new segments
V. Diversification involving new products and new markets Related Unrelated
New
IV. Vertical Integration Strategies 0 Forward integration
0 Backward integration Vertical
Chapter 1
(Ansoff matrix) shows a way to structure alternative growth strategies. The
first set of growth strategies involves existing product markets. The next two
concern product development and market development. The fourth concerns
vertical integration strategies, and the fifth, diversification strategies (Aaker,
2001:213). Figure 1.2 illustrates:
FIGURE 1.2: ALTERNATIVE GROWTH STRATEGIES MATRIX
Source: Adapted from Aaker (2001:213)
According to Aaker (2001:229), the most fruitful growth area is often to
increase product usage within existing product market, where assets and
competences are in place and only need to be leveraged. Growth can be
achieved in existing product markets through:
o Increase market share:
- Advertising and promotions
- Offering good value (quality)
o Increase product usage:
- Reminders
- Make use easier
Page 4

Chapter 1
- Remove undesirable consequences
- Revitalize the brand (Aaker, 2001:213).
The literature review to follow takes an extensive look at brand loyalty,
consumer decision making process, the sports drinks market as well as the
characteristics of university students or inhabitants of "Generation Y" as
potentially lucrative consumers.
It is apparent from the literature that there is considerable evidence identifying
the reasons why people buy products and services throughout the world as
well as the factors that may affect these purchases. However there has been
no conclusive evidence as to the motivation of students in selected Gauteng
universities and more specifically, no South African studies have currently
been identified in which the concept of brand loyalty and the rationale of
university students has been successfully scrutinised and evaluated for
decision making processes. The following problems have prompted the study
of the extent of brand loyalty in the sports drinks market:
(a) Lack of brand differentiation
According to Aaker (2001:168), differentiation can be based on a host of
dimensions including design, ingredients or components, product line breadth,
or service. According to Keller (2003:556), if two brands cannot be easily
distinguished, then it may be confusing for consumers to make choices
between them.
There is no clear differentiation between the sports drinks brands, and
therefore volume share often comes down to pricing. Consumers cannot tell
the difference between sports drinks brand's advertising or sponsorships,
reducing return on investment (Anon, 2006:62). There is an opportunity to
differentiate through product and communication innovation to establish
unique selling propositions for the brands (Anon, 2006:62).
Competitive brands within the sports drink category are making claims around
being the only "real" sports drink in South Africa. The delicate credibility of
Page 5

Chapter 1
sports brands is being brought into question. There is an opportunity to use
advertising and public relations to improve consumer education around
product intrinsics (Anon, 2006:62).
Low consumption frequency
Consumers use sports drinks infrequently, and sports drinks are bought
mainly on impulse (Anon, 2006:62). There is an opportunity to drive volume
through improving availability by increasing availability at the point of
purchase. There is also an opportunity to increase volume through increasing
frequency by using advertising and public relations to improve consumer
education (Anon, 2006:62). According to Keller (2003:101), brand awareness
plays an important role in consumer decision making process for three main
reasons — learning advantages, consideration advantages and choice
advantages. Keller (2003:430), states that brands can gain a lot of attention
from public relations through well placed newspaper and magazine stories.
Lack of consumer education
Consumers will switch flavours before they switch brands, making flavour
availability key to maintaining volume for a brand (Anon, 2006:62). There is
an opportunity to increase consumer purchase through ensuring an educated
choice, by maximising in-store presence through increased flavour range
penetration and merchandising, ensuring that consumers understand the
flavour range. According to Vorster (2004:1), though demand for functional
properties is increasing, taste and flavour is still the prime consideration for
consumers. The addition of flavour and colour to a sport drink are very
important components in the success of the beverage. The use of various
flavours gives the customers the variety they are looking for in the product
they drink. The flavour gives the customer the refreshment and the first
quenching characteristics they may be looking for (Vorster, 2004:1). Aside
from the global trend towards health and wellness. There is an opportunity to
drive volume through advocating a healthy lifestyle, of which sport is a key
part (Anon, 2006:62).
Page 6

Chapter 1
Therefore the problem statement is: There tends to be a lack of brand loyalty
in the South African sports drinks market.
1.3 PURPOSE OF THE STUDY
The purpose of the study is to explore the underlying theory of the brand
loyalty concept. It is the specific objective of this research to clarify the extent
of brand loyalty in the sports drinks market. The literature study will be
expanded by extensive descriptive research to determine the influence of
brand loyalty in the sports drink market amongst consumers. With the ever
increasing number of competitors in this category, the findings of this study
will be valuable to manufacturers of sports drinks.
1.4 RESEARCH OBJECTIVES
The research objective is the purpose of the research, expressed in
measurable terms; the definition of what the research should accomplish.
Research objectives specify information needs (Zikmund, 2005:45). The
research objectives in this study are both primary and secondary, and
discussed below:
1.4.1 Primary research objective
The primary objective of this study is to establish the influence of brand loyalty
in the sports drinks market under students.
1.4.2 Secondary research objectives
The secondary objectives of this study are:
To investigate the purchasing behaviour of students, the needs that
sports drinks satisfy, students motivations for buying sports drinks,
characteristics of students, and lastly, students attitudes to different
brands within the sports drinks market.
To identify the perceptions of attributes and package designs of
different brands considered in the choice of the student, and to
establish the attributes that students look for.
Page 7
Chapter 1
(c) To investigate the buying motive of sports drinks relating to
ingredients and packaging.
1.5 RESEARCH METHODOLOGY
This is a descriptive study aimed at determining the extent of brand loyalty in
the sports drink market. The research study is limited to students in three
Gauteng universities. The questionnaire was distributed, filled in and
analysed by Statkon. The response rate was 178/196=90.8%. The focus will
be on the student market, targeted at students who drink sports drinks.
A sample was drawn according to the guidelines of sampling and sample size
determination, resulting in a response rate of 178/196=90.8%. This will be
explained in Chapter 4. The study covers the theory on brand the loyalty
concept as revealed in the literature review.
1.5.1 Sampling
The sample for this study was be based on convenience, thus non-probability,
sampling. The target population can be defined as the sports drink students in
selected Gauteng universities that drink sports drink as a qualification
question to screen respondents will enable non drinkers of sports drinks to be
eliminated. The sampling frame will constitute both females and males, of all
races and are 18 years and older. A total of 196 interviews have been
conducted, 18 were not fit for analysis therefore 178 were fit for response rate
178/196=90.8%, the intercept interviews were conducted, on students in
selected Gauteng universities who drink sports drinks.
1.6 NATURE AND FORM OF RESULTS
The results of the study will be provided in a report format including tables,
and figures. Results will include recommendations and action plans for the
sports drinks category.
Page 8
Chapter 1
1.7 THE IMPORTANCE OF THE STUDY
Discovering the extent of brand loyalty amongst students in selected Gauteng
universities is necessary because this targeted group should be viewed as the
exceptionally valuable consumers of tomorrow. Many companies have
identified university students in their early twenties as the most profitable
group of consumers to target. This study further investigates consumer
decision making process bearing in mind that consumer behaviour, needs to
be fully understood in order to capitalise on its potential. This research will
therefore provide necessary information to facilitate understanding the
rationale of this potentially profitable consumer group.
1.8 VALUE OF STUDY
Considering the ever increasing number of competitors in the sports drinks
market, the researcher finds it very relevant to conduct a study on brand
loyalty in the sports drinks market. Despite South Africa's many struggles
regarding health issues and poverty, it remains an extremely profitable
country in terms of trade and industry.
By identifying the needs, wants and motivations of Generation Y (suggested
to be some of the most lucrative consumers), organisations will be better
prepared to address these beneficial consumers with products and services
developed to specifically satisfy their needs.
The literature study revealed that empirical studies predominantly focused on
research conducted in developed countries such as the United States and
selected areas in Europe and as such, data were only moderately applicable
to South Africa. Therefore, this research will provide value, not only in terms
of understanding the behaviour of students in selected Gauteng universities,
but also because it will reveal the acceptance of these "new-age" consumers
toward brand loyalty.
Page 9

Chapter 1
1.9 DEMARCATION AND SCOPE OF THE STUDY
This is a descriptive study intended to investigate the extent of brand loyalty in
the sports drink segment. The following aspects should be noted:
o The study covers the theory on brand loyalty as well as the characteristics
and behaviour of consumers ranging from the ages of 18-25 (Generation
Y) as divulged in the literature review.
o Focus is placed on consumer behaviour and the consumer decision
making process.
This study will centre around students in selected Gauteng universities whom
attend on campus gyms, at the University of Johannesburg, Kingsway
campus., University of Pretoria, Pretoria campus, Monash University,
Roodeport campus. Although respondents targeted will be of differing
ethnicities and varying degrees of affluence, the data captured will ultimately
lack generalisability because Gauteng students are extremely different to
those students living in other areas of the country, particularly in the more
rural districts.
Chapter 2: Overview of Brand Loyalty
This chapter will provide a theoretical discussion regarding the concept of
branding with emphasis on brand loyalty and the consumer decision making
process. The chapter will include literature on the different areas, criticisms
and gaps.
Chapter 3: Overview of Sports Drinks Market
This chapter will provide a discussion regarding the sports drinks market is
global and local trends as well as growth prospects, a general discussion
regarding major players, distribution and pack trends as applicable to South
Africa.
Page 10

Chapter 1
Chapter 4: Research Methodology
The research methodology will be discussed with special reference to the
population, sample, measuring instrument, and qualification of the variables
and the proposed statistical analysis.
Chapter 5: Research Findings and Interpretation
This chapter will present the response rates, descriptive statistics, more
advanced statistics that will be reported on a question-by question basis.
Chapter 6: Summary, conclusions and recommendations for future
research
The final chapter will present all the major findings of this study. The chapter
will be concluded by a discussion on the limitations of the study and will be
enhanced by recommendations for future research.
Page 11
Chapter 2
CHAPTER 2
AN OVERVIEW OF BRAND LOYALTY
2.1 INTRODUCTION
The purpose of this section is to introduce the topics of brand loyalty,
consumer decision making process, and Generation Y. A good knowledge of
customer behaviour provides marketers with a sound basis from which to
make decisions regarding forthcoming marketing strategies (Cant, Brink and
Brijball, 2006:236).
Consumers engage in decision-making because they have unlimited wants
and limited resources to satisfy these wants. To make sure that their most
important needs are fulfilled first and that they derive maximum utility from
their purchases, consumers undergo the process of decision-making.
Sometimes a consumer can go through the entire decision-making process
without even realising it, while at other times consumer decision-making may
be complex, deliberate and time-consuming. The level of decision-making
that the consumer engages in depends on the extent of their involvement in a
particular purchase (Cant et al., 2006:207).
2.2 CONCEPT OF BRANDING AND BRAND LOYALTY
Branding is seen as a form of security that adds value and profitability to the
overall marketing effort. There is a relationship between consumers' attitude
toward the brand and their buying behaviour. The repeat buying of a brand
does not imply loyalty towards it. Instead, for brand loyalty to exist, there
must be psychological commitment to the brand. Brand loyalty is the opposite
of variety-seeking behaviour. Consumers engage in variety seeking when
they buy different brands because of heir urge to try different things, curiosity,
novelty or the desire to overcome boredom with original choice (Cant et al.,
2006:236).
Page 12

Chapter 2
Branding serves to distinguish products from other similar ones so that they
can be marketed separately. Kotler and Armstrong (2001:172), define a
brand as a name, term, sign, symbol or design, or a combination of these
characteristics, intended to identify the goods or services of one seller or
groups of sellers and to differentiate tem from those of competitors (Cant et
al., 2006:237).
Branding has been around for centuries as a means to distinguish the goods
of one producer form those of another (Keller, 2003:3), and whenever a
marketer creates a new name, logo, or symbol for a new product, he or she
has created a brand. According to O'Malley (1991:107), a brand is a name,
symbol, design, or some combination which identifies the product of a
particular organization as having a substantial, differentiated advantage".
Branding can be an effective and powerful tool for all types of business
organisations. If brand owners use their product correctly, the payoffs can be
substantial. However, if brands are mismanaged, the results can be
damaging. There are many ways to ensure success with branding. Choosing
the right name, using the right advertising, applying the best strategy, and
using the most relevant application techniques are some ingredients needed
to make a branding effort successful (Rooney, 1995:48).
Brand loyalty refers to one's tendency to repurchase the same brand time
after time, and also to have a psychological commitment or attitudinal bias
toward the brand. Thus, the brand loyal customer not only buys the brand, but
refuses to switch even when a better offer comes along (Schoenbachler,
Gordon and Aurand, 2004:488). According to Koekemoer (2004:94), brand
loyalty involves faithful use and purchase of a product.
Once customers have made a decision about a brand and its associations,
they are often loyal to that brand, continue to buy it in the future, recommend
it to friends, and choose the product over others, even those with better
features or lower prices (Assael, 1991:52).
Page 13
Chapter 2
2.2.1 Product versus Brand
Keller (2003:3) refers to a product as anything that can be offered to a market
for attention, acquisition, use or consumption that might satisfy a need or
want. Thus a product may be a physical good, retail store, person,
organisation or idea. Keller (2003:4) continues to mention that, a brand is
therefore a product, but one that adds other dimensions- (a name, term, sign,
symbol, or design) that differentiate it in some way from other products
designed to satisfy the same need.
There are many characteristics shared by the strongest brands today, the
most critical of which are: clarity, consistency and leadership (Clifton and
Maughan, 2000:2). According to Kapferer (1995:17), the spirit of a brand can
only be inferred through its products and its advertising.
David Ogilvy defined brand as "the intangible sum of a product's attributes: its
name, packaging and price, its history, its reputation and the way it's
advertised. A brand may also denote the product's relatively straightforward
acquisition, financing, ease of use, after sales support, warranty, and lasting
value. Brands also carry emotional impact; they can connect with a
customer's identity and deep aspirations (Barrera 2005:27).
A brand is the product or service of a particular supplier, which is
differentiated by its name and presentation, brands introduce stability into
businesses, help guard against competitive imitation, and allow consumers to
shop with confidence in an increasingly complex world (Aaker, 1991:27).
Once customers have made a decision about a brand and its associations,
they are often loyal to that brand, continue to buy it in the future, recommend
it to friends, and choose the product over others, even those with better
features or lower prices (Assael, 1991:54). Brands are natural barriers to new
competitors because branding reduces consumer risks associated with the
purchase of products or services.
Page 14
Chapter 2
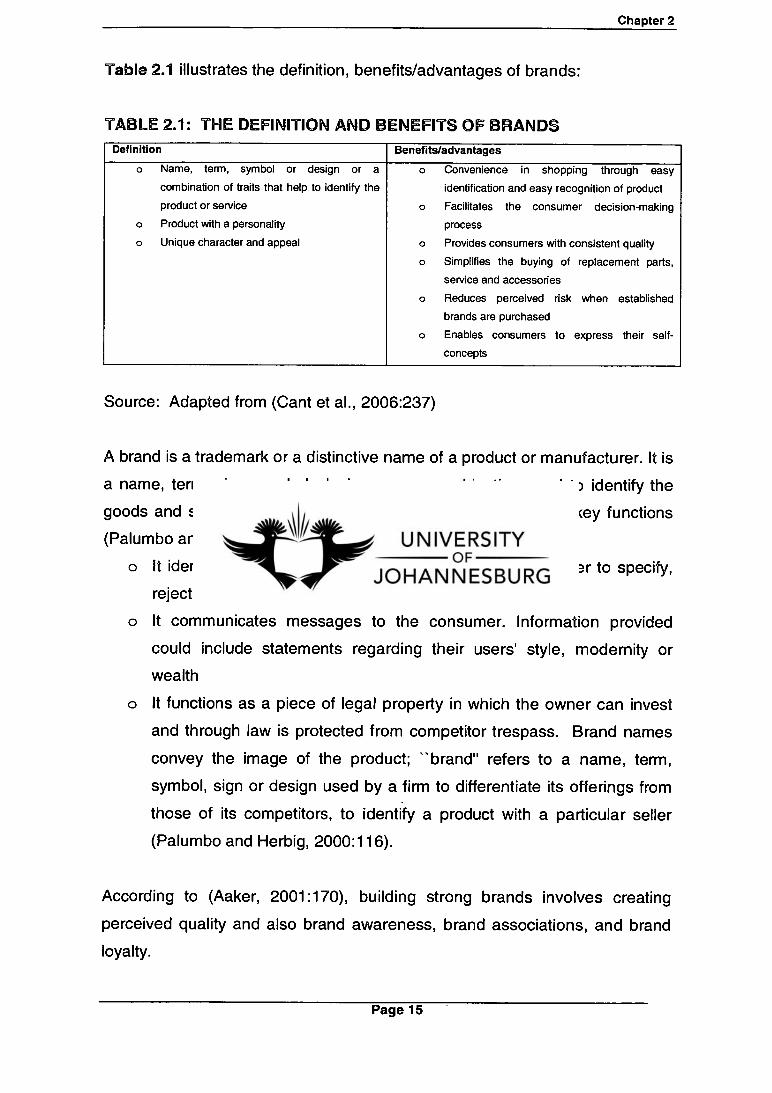
Table 2.1 illustrates the definition, benefits/advantages of brands:
TABLE 2.1: THE DEFINITION AND BENEFITS OF BRANDS Definition Benefits/advantages
o Name, term, symbol or design or a
combination of traits that help to identify the
o Convenience in shopping through easy
identification and easy recognition of product
product or service o Facilitates the consumer decision-making
o Product with a personality process
o Unique character and appeal o
o
o
o
Provides consumers with consistent quality
Simplifies the buying of replacement parts,
service and accessories
Reduces perceived risk when established
brands are purchased
Enables consumers to express their self-
concepts
Source: Adapted from (Cant et al., 2006:237)
A brand is a trademark or a distinctive name of a product or manufacturer. It is
a name, term, sign, symbol, design or any combination used to identify the
goods and services of a seller. A brand name performs many key functions
(Palumbo and Herbig, 2000:116):
It identifies the product or service and allows the customer to specify,
reject or recommend.
It communicates messages to the consumer. Information provided
could include statements regarding their users' style, modernity or
wealth
It functions as a piece of legal property in which the owner can invest
and through law is protected from competitor trespass. Brand names
convey the image of the product; "brand" refers to a name, term,
symbol, sign or design used by a firm to differentiate its offerings from
those of its competitors, to identify a product with a particular seller
(Palumbo and Herbig, 2000:116).
According to (Aaker, 2001:170), building strong brands involves creating
perceived quality and also brand awareness, brand associations, and brand
loyalty.
Page 15
Chapter 2
Brands offer consumers convenience in shopping. They make it easier for the
consumer to identify particular items from a multitude of goods and assure
them that it will always be the same product (Cant et al., 2006:237). Brands
provide consumers with consistent quality. Once they have established a
preference for a specific brand, they can be assured of the same quality every
time they buy it. Consumers can also express their self-concepts through
branding. Moreover, as a result of sophisticated buyers and marketers,
brands have acquired an emotional dimension that reflects buyers' moods,
personalities and the messages they wish to convey to others. Individuals
may buy brands that maintain or enhance their self-concepts in a non-verbal
manner (Cant et al., 2006:237).
2.2.2 Brand loyalty defined
Brand loyalty is a measure of a consumers attachment to a specific brand
and is a function of several factors such as the perceived quality of the brand,
its perceived value, its image, the trust placed in the brand, and the
commitment the consumer feels towards it (De Chernatony and McDonald,
2003:439). According to Wozniak and Hanna (2001:293), brand loyalty is an
attachment to brand that have proven satisfactory in the past.
Brand loyalty occurs when consumers make a conscious evaluation that a
brand or service satisfies their needs to a greater extent than others do and
buy the same brand repeatedly for that reason. Brand loyalty therefore
results from very positive reinforcement of a performance related choice
tactic. The level of commitment to the brand distinguishes brand loyalty from
habit. The stronger this evaluation becomes over time, the higher the degree
of brand loyalty (Maclnnis and Hoyer, 2001:4). Research conducted on brand
loyalty has found that losing brand loyalty also means losing a share of the
total market (Giddens and Hofman, 2002:1).
Aaker (1991:31) identifies brand loyalty as a key determinant of brand choice
and brand equity. He notes that the brand loyalty of the customer base is
often the core of a brand's equity. If customers are indifferent to the brand and
will buy with respect to features, price, etc., there is likely little equity.
Page 16

Chapter 2
According to Aaker (1992:10), brand loyalty develops when the brand fits the
personality or self-image of the consumer or when the brand offers gratifying
and unique benefits that the consumer seeks. In both instances, personal
attachment develops towards the brand.
Brand loyalty is the consumer's conscious or unconscious decision,
expressed through intention or behaviour, to repurchase a brand continually.
It occurs because the consumer perceives that the brand offers the right
product features, image, or level of quality at the right price. In today's highly
competitive environments, improving consumers' loyalty to brands permits
marketers to maintain a comfortable and lasting position in the marketplace
(Essortment, n.d.). According to Hofmeyer and Rice (2000:87), loyalty is the
behavioural propensity to buy a brand repeatedly — differs from commitment —
the strength of the consumers psychological attachment to the brand.
Committed loyalty is the ideal structure. But it is possible for a brand to be
bought loyally without commitment. This happens in two ways:
By force of circumstance — when consumers cannot buy the brand that
they want, and so loyally buy a second or third best brand
By choice — when consumers don't care what they buy, and so loyally
buy the market-leading brand by default (Hofmeyer and Rice, 2000:87)
Many consumers in many markets are both uncommitted and disloyal. But
the fact that loyalty can exist without commitment means that there are other
options (Hofmeyer and Rice 2000:107):
Uncommitted, disloyal consumers can be managed either by making
them enthusiastic about the brand or by mobilizing market forces in
favour of the brand
Consumers who are committed and loyal should be managed by
maintaining both their beliefs about the brand and the importance of
those beliefs.
Consumers whose loyalty is based on market factors need to be
managed by maintaining a strong brand presence because they are
market driven (Hofmeyer and Rice, 2000:107)
Page 17

Chapter 2
According to Hofmeyer and Rice (2000:87), loyalty refers to consumers who
buy one brand repeatedly. A committed person is one who is strongly
attached to a brand. It is possible to be committed to a brand and yet seldom
buy it. It is also possible to buy a brand again and again, but not be
committed. When the two are combined, we get committed loyalty. If there is
no commitment, then what we have is (merely) loyalty. Having committed
loyalists is the marketing ideal.
Loyalty without commitment occurs when there is a systematic external
reason why consumers cannot get the brand they want. Hofmeyer and Rice
(2000:94), brands with a strong market presence herd uninvolved consumers
into being unconsciously loyal, and when a consumer has no strong
preference for any brand, then they will tend to buy the brand with the
greatest presence in the local market.
According to Aaker (1991:27), brand equity is a set of assets (and liabilities)
linked to a brand's name and symbol that adds to (or subtracts from) the value
provided by a product or service to a organisation and/or that firm's
customers.
The major asset categories are:
Brand name awareness
Brand loyalty
Perceived quality
Brand associations (Aaker, 1991:27)
Aaker (1991:27) identifies brand loyalty as a key determinant of brand choice
and brand equity. He notes that the brand loyalty of the customer base is
often the core of a brand's equity. If customers are indifferent to the brand and
will buy with respect to features, price, etc., there is likely little equity.
Page 18
Chapter 2
Brand loyalty is a consumer's preference to buy a particular brand in a
product category. It occurs because consumers perceive that the brand offers
the right product features, images, or level of quality at the right price. This
perception becomes the foundation of a new buying habit. Basically,
consumers will make a trial purchase of the brand and, after satisfaction, tend
to form habits and continue purchasing the same brand because the product
is safe and familiar (Giddens and Hofman, 2002:1).
Brand loyalty can be defined as being the degree of attachment that a
customer has to a brand. It reflects how likely a customer will be to switch to
another brand, especially when that brand makes a change, either in price or
in product features. As brand loyalty increases the vulnerability of the
customer base to competitive action is reduced (Aaker, 1996:39). Consumer
using two brands in a short period of time should not be considered 'disloyal'
Instead this is more an expression of active discernment, choosing brand to
meet specific need-states (De Chernatony et al., 2003:439).
Brand loyalty is a measure of the commitment or obligation felt by consumers
to purchase or use a particular brand. Brand loyalty was once highly
significant, now consumers are in the habit of shopping around and of
changing brands with greater frequency (Crainer, 1995:34).
Brand loyalty in fast moving consumer goods categories is a topical issue,
with several brands resorting to price cuts across categories. More
importantly, price cuts or sales promotion by themselves do not seem to have
done much for brands in terms of sustaining brand loyalty. They may attract
consumers in the short run: consumers may stock the brands and consumers
new to the brand may try it. But over a period of time, a brand's value may get
diluted in consumers' psyche, and will eventually lose a strong base of
consumers (Kumar, 2005:1).
A brand without a loyal customer base usually is vulnerable or has value only
in its potential to create loyal customers. Further, the impact of brand loyalty
on marketing costs is often substantial; it is simply much less costly to retain
Page 19

Chapter 2
customers than to attract new ones. A common and expensive mistake is to
seek growth by enticing new customers to the brand while neglecting existing
ones. The loyalty of existing customers also represents a substantial entry
barrier to competitors in part because the cost of enticing customers to
change loyalties is often prohibitively expensive (Aaker, 2002:21).
According to Hofmeyer and Rice (2000:87), loyalty is always going to be
behavioural; 'attitudinal loyalty' is always going to be 'commitment'.
'Brand loyalty' refers to a situation where a consumer strongly prefers one
brand to others. Consumers become brand loyal in different ways. Some
individuals try different brands and may even buy a different brand every time
they go shopping. Becoming brand loyal is essentially a learning process,
which takes place over a period of time (Cant et al., 2006:237).
According to Schoenbachler, Gordon and Aurand (2004:488), brand loyalty
refers not only to one's tendency to repurchase the same brand time after
time, but also to have a psychological commitment or attitudinal bias toward
the brand. Thus, the brand loyal customer not only buys the brand, but
refuses to switch even when a better offer comes along.
There are three factors that appear to be vital in its development (Cant et al.,
2006:237):
Exposure to information concerning the brand
Favourable experience in buying and using the brand
The extent of its use by peers and social reference groups
There are a number of factors that can influence the degree of brand loyalty
that develops within a target market. Brand loyalty is lower when (Cant et al.,
2006:237):
more brands are available for consumers to choose from
more products of greater value are bought
prices are relatively active among competing brands
Page 20
Chapter 2
consumers use a number of brands at the same time (Cant et al.,
2006:237).
According to (Bandyopadhyay, Gupta and Dube, 2005:414), small brands in a
product category face twin disadvantages against the big brands: fewer
buyers and lower purchase frequencies among these buyers given the
relatively limited resources of small brands, careful market segmentation may
be the key in circumventing jeopardy among loyal and switching consumer
bases. With regard to the possible jeopardy of small brands among switching
consumers, results are particularly encouraging in that at a given level,
transaction specific antecedents (e.g. exposure to advertisements, price
discount, etc.) are as powerful in influencing choice for small brands as they
are for big brands.
2.2.3 Strategic value of brand loyalty
According to Aaker (2001:168), an existing base of loyal customers provides
enormous sustainable competitive advantages. First, it reduces the marketing
costs of dong business, since existing customers usually are relatively easy to
hold — the familiar is comfortable and reassuring. Keeping existing customers
happy and reducing their motivation to change is usually considerably less
costly than trying to reach new customers and persuading them to try another
brand. Of course, the higher the loyalty, the easier it is to keep customers
happy (Aaker, 2001:168).
Secondly, the loyalty of existing customers represents a substantial entry
barrier to competitors. Significant resources are required when entering a
market in which existing customers must be enticed away from an established
brand that they are loyal to or even merely satisfied with. The profit potential
for the entrant is thus reduced. For the barrier to be effective, however,
potential competitors must know about it; they cannot be allowed to entertain
the delusion that customers are vulnerable. Therefore, signals of strong
customer loyalty, such as advertisements about documented customer loyalty
or product quality, can be useful (Aaker, 2001:168).
Page 21

Chapter 2
Third, relatively large, satisfied customer base provides an image of a brand
as an accepted, successful, enduring product that will include service backup
and product improvements (Aaker, 2001:168).
Finally, brand loyalty provides the time to respond to competitive moves — it
gives a firm some breathing room. If a competitor develops a superior
product, a loyal following will allow the organization the time needed to
respond by matching and neutralizing (Aaker, 2001:168).
According to Maclnnis et al. (2001:259), brand loyal consumers form a solid
base from which brand profitability can be built. The extent to which a
consumer is brand loyal depends on the product category. According to De
Chernatony et al. (2003:439), committed consumers guarantee future income
streams as well as facilitating brand extensions by transferring any positive
associations to new brands. According to Heimerl (1994:98), there is an
existing relationship between brand loyalty and market share.
According to (Higgs, 2002:15) the following aspects result from relationships
with brands:
Strong relationship with a brand;
Pay more for their brand
Overcome market obstacles to buy that brand
-shop where it's available
-complain if it's out of stock
Ignore competition marketing
Buy again without persuasion (Higgs, 2002:15)
Not strong relationship with brand;
Buy what is available - or what is easiest to find
Be more open to special offers or competitor discounts
Tend to not worry about its availability (Higgs, 2002:15).
Brand loyalty reduces marketing costs, creates barriers to competitors,
provides trade leverage, affects the brand image, and provides time to
respond to competitive threats (Aaker, 1995:213).
Page 22

Chapter 2
According to Giddens and Hofman (2002:2), an existing base of loyal
customers provides enormous sustainable competitive advantages.
Firstly, it reduces the marketing costs of doing business, since existing
customers usually are relatively easy to hold — the familiar is comfortable and
reassuring. Keeping existing customers happy and reducing their motivation
to change is usually considerably less costly than trying to reach new
customers and persuading them to try another brand. Of course, the higher
the loyalty, the easier it is to keep customers happy (Giddens and Hofman,
2002:2).
Secondly, the loyalty of existing customers represents a substantial entry
barrier to competitors. Excessive resources are required when entering a
market in which existing customers must be enticed away from an established
brand that they are loyal to or even just satisfied with. The profit potential for
the entrant is thus reduced. For the barrier to be effective, however, potential
competitors must know about it, they cannot be allowed to entertain the
delusion that customers are vulnerable. Therefore signals of strong customer
loyalty, such as advertisements about documented customer loyalty or
product quality can be useful (Giddens and Hofman, 2002:2).
Thirdly, brand loyalty provides trade leverage. Strong loyalty toward brands
will ensure preferred shelf space because stores know that customers include
such brands on their shopping lists (Giddens and Hofman, 2002:2).
Fourthly, a relatively large, satisfied customer base provides an image of a
brand as an accepted, successful, enduring product that will include service
backup and service improvements. Finally, brand loyalty provides the time to
respond to competitive moves-it gives an organization some breathing room.
If a competitor develops a superior product, a loyal following will allow the
organization the time needed to respond by match or neutralising (Giddens
and Hofman, 2002:2).
Page 23

Chapter 2
Reducing customer loss can dramatically improve business growth and brand
loyalty, which leads to consistent and even greater sales since the same
brand is purchased repeatedly (Giddens and Hofman, 2002:2).
Giddens and Hofman (2002:2), further contend that as brand loyalty
increases, consumers are less sensitive to price changes. Generally, they are
willing to pay more for their preferred brand because they perceive some
unique value in the brand that other alternatives do not provide. Brand
loyalists are willing to search for their favourite brand and are less sensitive to
competitor promotions. The results are lower costs for advertising, marketing
and distribution. Specifically it costs four to six times as much to attract a new
customer as it does to retain an old one.
According to (Aaker, 2001:45), brand loyalty, an important consideration in
allocating resources, can be structured using a loyalty matrix as shown in
Table 2.2. Each cell represents a very different strategic priority and can
justify a very different program. Generally it is too easy to take the loyal
customer for granted. A study by Bain shows that a 5 percent increase in
loyalty can nearly double the lifetime profits generated by customers. The key
is often to reward the loyal customer by living up to expectations consistently,
providing an ongoing relationship, and offering extras hat surprise and delight.
TABLE 2.2: THE LOYALTY MATRIX - PRIORITIES Switchers Fence-sitters Loyal
Customer Medium High Highest
Noncustomer Low to Medium High Low
Source: Adapted from Aaker (2001:46).
The loyalty matrix suggests that the brand fence-sitters, including those of
competitors, should also have high priority. Using the matrix involves
estimating the size of each of the six cells, identifying the customers in each
Page 24

Chapter 2
group, and designing programs that will influence their brand choice and
loyalty levels (Aaker 2001:46).
According to Aaker (2001:46), the loyalty matrix suggests that the brand fence
sitters, including those of competitors
2.2.3.1 Importance of brand loyalty
According to Reichheld (1996:23), the advantages of brand loyalty as follows:
Continues profit. The advantages of customer loyalty are long-term and
cumulative. The longer a customer remains loyal, the more profit a
business can get from that single customer.
Reduces marketing cost. Businesses have to invest money to attract
new customers, such as advertising. For loyal customers, these costs
are eliminated or minimised.
Increases per-customer revenue growth. Customer spending tends to
increase over time. For example, a customer who repeatedly stays at
the same hotel becomes more familiar with the hotel's full product line,
such as gift shops and banquet rooms. And that customer will be likely
to sample other product lines of the company, thus helping the
company achieve a larger share of customers.
Decreases operating cost. For a loyal customer, the front desk clerk
does not need to spend time entering data into the computer — instead
she/he retrieves the loyal customer's existent data. Loyal customers'
familiarity with the company's products makes them less dependent on
its employees for information and service, thus decreasing servicing
cost.
Increases referrals. Satisfied customers recommend the business to
friends and others. Referrals are a vital source of new customers, and
customers who show up on the strength of a personal recommendation
tend to stay longer.
Increases price premiums. Brand loyal customers pay more for a brand
because they perceive some unique value in the brand that no other
alternative can provide, and they are less likely to be lured away by a
Page 25

Chapter 2
discount of a few dollars. Many people will pay more to stay in a hotel
they know than to take a chance on a less expensive competitor.
Provides competitive advantage. As consumers become loyal to a
brand, they become less sensitive to a price increase. The company
can maintain a price differentiation over the competition because of the
product's ability to satisfy their needs (Reichheld, 1996:23).
The management of brand loyalty is a key to achieving strategic success.
According to Aaker (2001:169), organizations that manage brand loyalty well
are likely to:
Place a value on the future purchases expected from a customer so
that existing customers receive appropriate resources
Measure the loyalty of existing customers. Measurement should
include not only sensitive indicators of customer satisfaction but also
measures of the relationship between the customer and the brand
Conduct exit interviews with those who leave the brand to locate points
of vulnerability
Reward loyal customers with frequent-buyer programs or special
unexpected benefits or premiums
Make customers feel that they are part of the organization, perhaps
through customer clubs
Have continuing communication with customers, using direct mail, the
Web, toll-free numbers, and a solid customer backup organization
(Aaker, 2001:169).
2.2.3.2 Factors contributing to brand loyalty
Brand loyalty in fast moving consumer goods categories is a topical issue,
with several brands resorting to price cuts across categories. More
importantly, price cuts or sales promotion by themselves do not seem to have
done much for brands in terms of sustaining brand loyalty. They may attract
consumers in the short run: consumers may stock the brands and consumers
new to the brand may try it. But over a period of time, a brand's value may get
diluted in consumers' psyche, and will eventually lose a strong base of
consumers (Kumar, 2005:1).
Page 26

Chapter 2
According to Bowen and Shoemaker (1998:12), loyal customers generally
show these common behaviors: making repeat purchases, trying other
product lines of the company, showing resistance to the pull of the
competition, giving referrals, providing publicity, and serving on advisory
boards. The following paragraphs summarize the factors that create brand
loyalty:
Factor 1 - Awareness
The first step toward loyalty begins with the customer's becoming aware of
the product (Aaker, 1991:27). At the awareness stage, a potential customer
knows that the brand exists, but the bond between a customer and the
product is low. At this point, a brand-name may provide the awareness of the
product because brand names offer value to the consumers by helping them
interpret, process, store, and retrieve large quantities of information about
products (Aaker, 1991:27). According to Kumar (2005:1), a high brand
involvement would mean a greater search intention, and satisfaction of the
customer could lead to repeat purchase and then loyalty. Low involvement
could lead to brand habit.
Branding activities can differentiate between brands on name, symbol, images
and associations. Branding activity in this context refers to creating strong
associations which will influence the consumers not only with regard to
functional attributes but also with symbolism (Kumar, 2005:1)
Awareness can be enhanced in a variety of ways such as advertising, direct
mail, trade press, word-of-mouth communication, and promotion activities
(Grover and Srinivasan, 1992:76). The more the customer is aware of the
product, the greater the possibility that she/he will purchase the product. The
more places the customer can buy the product, the more often that customer
will become a new customer of the same product in another marketplace
(Lewis, Chambers and Chacko, 1995:655).
Page 27
Chapter 2
Factor 2 - Reputation
If the products are differentiated in their characteristics and this difference is
perceivable, there are chances of brand loyalty being formed based on
satisfaction with greater performance or fit of product with needs. In this case,
loyalty is driven by functional or symbolic benefits (Kumar, 2005:1). If the
products are differentiated in their characteristics and this difference is
perceivable, there are chances of brand loyalty being formed based on
satisfaction with greater performance or fit of product with needs. In this case,
loyalty is driven by functional or symbolic benefits. Functional benefits would
be specific tangible features of the product whereas symbolic benefits would
be intangibles such as brand personality and 'hedonistic' value of purchase
(Kumar, 2005:1)
Selling high-quality products and commanding premium prices increases the
reputation of a firm; thus, developing brand loyalty. In order to build and
maintain a reputation, the promised quality of goods or services must be
delivered. For a firm expanding its product line, a well-known brand can
facilitate user acceptance of the new product (Aaker, 1991:27).
Factor 3 - Image
One of the first steps in maintaining customer brand loyalty is to build and
sustain a positive brand image. A strong brand image is important to brand
owners because the brand name distinguishes a product from the
competitors' products. The image includes colors, symbols, words, and
slogans that convey a clear, consistent message and not simply the name
(Berry, Lefkowith and Claek, 1988:28). The brand image plays an important
role in product choice because consumers attempt to reinforce their self-
image by buying products that are congruent with their self-image. The
consumer may perceive that one brand is more desirable than its competitor's
solely because of the difference in image (Schiffman and Kanuk, 1991:22).
According to Kumar (2005:1), if the price differentiation in the market is
perceivable, price-led loyalty might exist in the market. Price-led loyalty is
practised by supermarkets, airline companies and FMCG brands, which come
Page 28

Chapter 2
out with frequent sales promotions based on freebies. Alternatively, price
might be taken as an indicator of brand quality, and the customer might go in
for higher priced options. Price-led loyalty has to be carefully considered with
other marketing mix elements and the consumer should never perceive
dilution, especially in low-priced bands. Hence, lower prices should create a
sense of value through the product offerings as well as through
communication.
Factor 4 - Promotion
According to Kumar (2005:1), the more the number of price-discount led sales
promotions, the lesser the likelihood of brand loyalty in the category/segment
which is the focus of such efforts. This is because the consumers are inducted
into the price war mind set. A premium brand which gets into frequent sales
promotion has the risk of losing its premiumness
While promotion is the biggest reason consumers initially try a product
(Grover and Srinivasan, 1992:76), if tied to something positive, such as a new
or better facility or a new product, it facilitates brand loyalty. Promotions can
be used to develop cost leadership or differentiation, and can be used to
create loyalty through switching costs (Grover and Srinivasan, 1992:76).
Factor 5 - Perceived quality
A brand should represent a credible guarantee of quality to the consumers
(Aaker, 1991:22). Once the consumers are persuaded that the brand offers
what they expect, they stay with the brand. Brand names provide a symbolic
meaning which assists the user in the recognition and decision-making
process. A consumer will choose a familiar name because brand names carry
higher perceived quality. Customers may also see this price difference as a
quality indication.
According to loyalty is driven by functional or symbolic benefits. Functional
benefits would be specific tangible features of the product whereas symbolic
benefits would be intangibles such as brand personality and 'hedonistic' value
of purchase.
Page 29

Chapter 2
Factor 6 - Innovation
Innovation allows the brand to remain up-to-date and demonstrates an
unceasing attentiveness to the changes in customer taste. To keep pace with
changes in the marketplace companies should meet and exceed customer
needs and wants (Aaker and Keller, 1990). A pioneering brand in a category
which offers a good product and addresses the perceived risks associated
with the product is likely to get a loyal base of consumers (Kumar, 2005:1).
According to Uncles, Dowling and Hammond (2003:294), where the focus is
on individual customers, loyalty programs can be seen as vehicles to increase
single-brand loyalty, decrease price sensitivity, induce greater consumer
resistance to counter offers or counter arguments (from advertising or sales-
people), dampen the desire to consider alternative brands, encourage word-
of-mouth support and endorsement, attract a larger pool of customers, and/or
increase the amount of product bought.
Factor 7 - Brand extension
Carrying the brand into new categories that fit well with its concept and image
will help companies increase customer brand loyalty (Aaker, 1991:22). When
the brand's associations and perceived quality can provide a point of
differentiation and advantage for brand extension, the extension will be
successful. However, there is a risk that an extension may damage the core
brand by weakening its associations or its perceived quality. If customers
want to buy a new product, they will prefer a familiar brand. They already
know the brand and have the same performance expectations with the new
product. If they do not get what they expect, they may switch to the new brand
(Aaker, 1991:22).
Loyalty-program members are encouraged to buy products they would not
normally have bought from that provider. In essence, the loyalty program is
seen as a brand extension aid (Uncles et al., 2003:294).
Page 30

Chapter 2
Factor 8 - Satisfaction
The relationship between satisfaction and brand loyalty has been observed in
several studies. Highly satisfied customers are much more loyal than satisfied
customers — any drop in total satisfaction results in a major drop in loyalty
(Jones, 1990:145).
Factor 9 - Customer background
Customer background characteristics may also contribute to brand loyalty
(Morgan and Dev, 1994:267). Higher income customers may stick to one
premium brand because they perceive it as a contribution to their social
status. Some brands carry images or symbolic meanings that may provide
social value for them. The higher household income, the less switching is
expected because customers can exercise their preferences independently
from monetary considerations.
According to Kumar (2005:1), in the FMCG sector, brand habit is high
whereas attitudinal loyalty is low. As creating attitudinal loyalty based on
functional differentiation is difficult, symbolic differentiation is the key. Building
strong brand personalities and associated symbolic benefits is important for
crafting customer loyalty. The factors discussed cannot be treated in
isolation: they are to provide a synergy to result in brand loyalty. The
combination of these factors and the timing of the combination is the topical
challenge which marketers face in an environment where loyalty is slowly
eroding (Kumar, 2005:1)
2.2.4 Measuring brand loyalty
According to Jensen and Hansen (2006:444), repeat purchasing is measured
by a single item - how many times of the last five purchases they bought the
same brand. Although this is recognized as a measure of past behaviour,
such a measure is a reasonable indicator for future repeat purchasing. An
alternative way to measure behavioural loyalty could be the perceived
probability of purchasing the same brand in the future. Considering the weak
relationship between attitude and behaviour often found in studies of low
involvement situations, such an indicator would neither be a very reliable
Page 31

Chapter 2
measure of future repeat purchasing, particularly not with regard to frequently
purchased goods markets.
In order to cope with the forces of disloyalty among consumers an accurate
method to measure and predict brand loyalty is needed (Lyong Ha, 1998:51).
There are numerous measures of loyalty, for example measuring actual
purchasing behaviour over time which reflects the degree of satisfaction
existing customers have with the brand (De Chernatony et al., 2003:439).
According to Maclnnis et al. (2001:259), consumers who exhibit a particular
sequence of purchases (three to four purchases of the same brand in a row)
or proportion of purchases (seven or eight out of ten purchases of the same
brand) are considered brand loyal.
It is important to understand the difference between regular users and brand
loyal consumers and to understand the factors that make up brand loyalty in
order to examine and measure this phenomenon. According to Aaker
(1996:43), it is useful to consider approaches to brand loyalty measurement.
A consideration of several measurement tacks will provide additional insights
into its scope and nuances as well as provide a practical tool in using the
construct and linking it to profitability. One approach is to consider actual
behaviour. Other approaches are based upon the loyalty constructs of
switching costs, satisfaction, liking, and commitment.
A market can usually be divided into the following groups: non customers
(those who buy competitor brands or are not product class users), price
switchers (those who are price sensitive), the passively loyal (those who buy
out of habit rather that reason), fence sitters (those who are indifferent
between two or more brands), and the committed (Aaker, 1996:21). The
challenge is to improve the brands loyalty profile: to increase the number of
customers who are not price switchers, to strengthen the fence sitters and
committed's ties to the brand, and to increase the number who would pay
more (or endure some inconvenience) to use the brand or service. Two
segments in which firms often under invest are the passively loyals and the
committed customers (Aaker, 1996:21).
Page 32
Brand awareness
Brand trial
Brand image
Brand awareness
Brand habit
Brand loyalty
Chapter 2
One approach to enhancing the loyalty of fence sitters and the committed is to
develop or strengthen their relationship with the brand. Brand awareness,
perceived quality, and an effective, clear brand identity can contribute to this
goal. Increasingly, however, programs that can build loyalty more directly are
becoming important and even critical in many product classes. Included
among these are frequent buyer programs and customer clubs (Aaker,
1996:21).
According to (Aaker, 2001:170), brand loyalty reduces marketing costs,
creates barriers to competition, improves the brand image, and provides time
to reposition in response to competitive threats
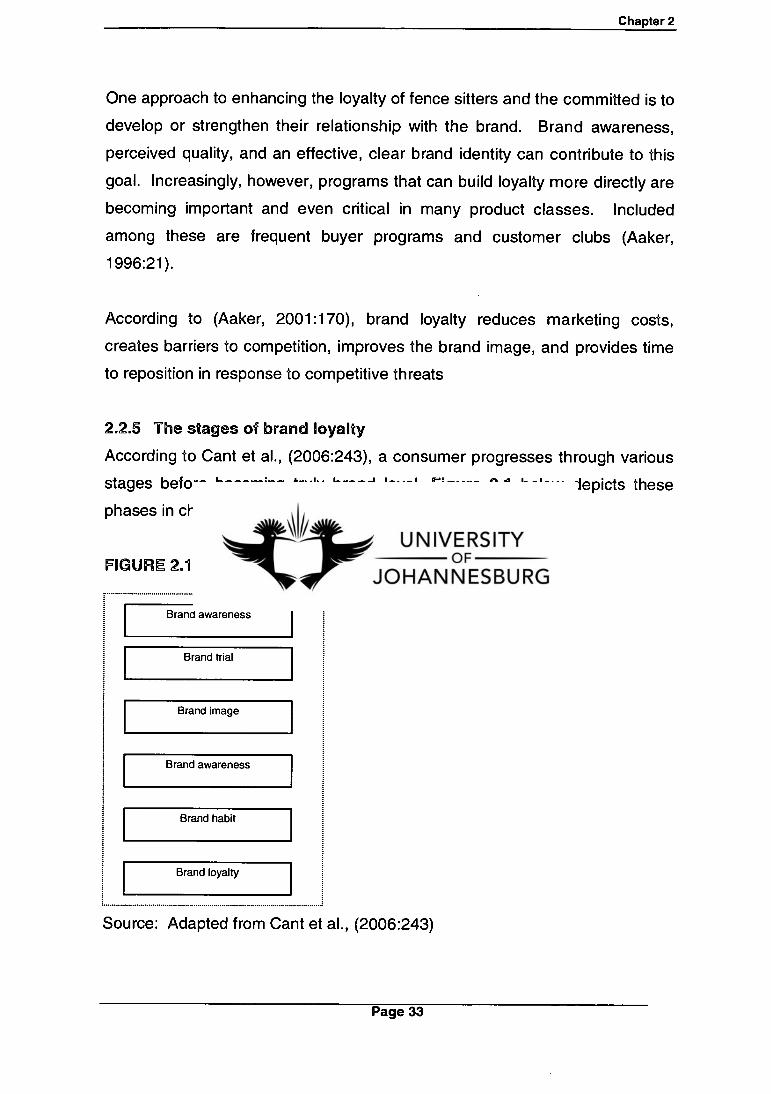
2.2.5 The stages of brand loyalty
According to Cant et al., (2006:243), a consumer progresses through various
stages before becoming truly brand loyal, Figure 2.1 below depicts these
phases in chronological order;
FIGURE 2.1: THE STAGES OF BRAND LOYALTY
Source: Adapted from Cant et al., (2006:243)
Page 33
Chapter 2
Stage 1 - Brand awareness
According to Cant et al., (2006:242), consumers cannot buy a brand unless
they are aware of its existence. By creating brand awareness, marketers
hope that whenever the need for the product arises, the consumer will
remember the brand and include it among the choice alternatives during
decision-making. A high level of brand awareness is vital to influence brand
choice.
Brand awareness provides a sustainable competitive difference. It serves to
differentiate the brands along a recall/familiarity dimension (Aaker, 2001:165).
According to Keller (2003:730), brand awareness is related to the strength of
the brand node or trace in memory as reflected by consumers ability to recall
or recognize the brand under different conditions.
Awareness refers to the strength of a brand's presence in the consumers
mind (Aaker, 2002:10). Brand awareness consists of brand recognition and
brand recall performance. Brand recognition relates to consumers' ability to
confirm prior exposure to the brand when given the brand as a cue. Brand
recall relates to consumers' ability to retrieve the brand from memory when
given the product category, the needs fulfilled by the category, or a purchase
or usage situation as a cue (Keller, 2003:67). The percentage of consumers
or potential consumers who have knowledge of or can identify a particular
brand (Crainer, 1995:33).
Stage 2 - Brand trial
According to Cant et al., (2006:242), consumers will know a brand only if they
try it. Marketers encourage this by providing free samples, or coupons or
attractive reductions on prices as compared to competitors' prices.
Stage 3 - Brand image
According to Cant et al., (2006:242), brand image is the consumers
impression of the brand created by brand messages and experiences, and
assimilated or evaluated into a perception through the processing of
information. According to Kotler (2003:70), a positive brand image is created
Page 34

Chapter 2
by marketing programs that link strong, favourable, and unique associations
to the brand in memory. According to Keller (2003:206), the consumer
develops a set of brand beliefs about where each brand stands on each
attribute. The set of beliefs about a brand name make up the brand image.
Stage 4 - Brand preference
According to Cant et al., (2006:243), this is a tendency to select a brand or
product from among a set of known available brands. When confronted with a
choice of brands, the consumer will have a more positive feeling about one
brand than about competitor brands.
Stage 5 - Brand habit
According to Cant et al., (2006:243), a consumer who prefers a particular
brand of product will habitually buy it without thinking about or evaluating it.
Stage 6 - Brand loyalty
According to Cant et al., (2006:243), brand loyalty indicates that a person has
a psychological commitment or attachment to a brand. They will visit another
store if their preferred brand is unavailable or out of stock, and may even do
without it until they are able to get the brand from another store. Loyalty is a
true measure of brand preference.
2.2.6 Maintaining and enhancing brand loyalty
According to Schoenbachler et al., (2004:488), building brand loyalty has
taken numerous forms over time. Initially, mass awareness advertising
campaigns were used almost exclusively to build a brand's image, with hopes
that a strong brand image would be enough to establish brand loyal
customers. Firms have used promotional tools such as coupons, rebates,
discounts, bonus packs and gift premiums in an effort to build loyalty.
Establishing brand loyalty may require developing a relationship with
customers that is more than product-based. In a marketplace where products
and services are difficult to differentiate, customers may need an additional
point of contact with a company to develop the commitment needed for brand
loyalty.
Page 35

Chapter 2
To build loyalty, a manufacturer must concentrate on customer needs, the
consumer has changed, consumer have become better informed and more
discerning. He recognises and expects excellence (Linton, 1993:15).
According to Aaker (1991:49), treat the customer right, stay close to the
customer, measure/manage customer satisfaction, create switching costs,
proved extras. Consumers are loyal to the perceived attributes of the brand
(Melamdowitz, 1993:79).
A brand loyal consumer is less likely to be influenced by a coupon or price
deal for another brand. Price deals have gradually eroded consumer loyalty
towards many brands, and more and more consumers are buying on the
basis of price. Therefore, marketers are now striving to develop consumer
loyalty through product quality or sales promotions (Maclnnis et al.,
2001:260).
One critical way to develop brand loyalty is to provide that consumer with a
high-quality product that leads to satisfaction. Recent evidence suggests that
consumers will become brand loyal to high quality brands if these products
are offered at a fair price. Brand loyalty can also be cultivated through sales
promotions (Maclnnis et al., 2001:260).
Favourable brand attitudes are the determinants of brand loyalty — consumers
must like the product in order to develop loyalty to it. In order to convert
occasional purchasers into brand loyalists, habits must be reinforced
(Giddens and Hofman, 2002:1).
According to Van den Brink, Odekerken and Pauwels (2006:15), in the past,
brand loyalty has been conceptualised both in a behavioural and in an
attitudinal way. The former captures more the patronage behaviour and
focuses on repeated purchasing of a certain brand by a consumer over time.
An advantage of the behavioural approach is that it measures observable
behaviours, instead of (self-reported) intentions and declarations. Observable
behaviour is also easier and less costly to measure.
Page 36
Chapter 2
To encourage repeat purchase, advertisements before and after the sale is
critical. In addition to creating awareness and creating initial purchases,
advertising shapes and reinforces consumer attitudes so these attitudes
mature into beliefs, which need to be reinforced until they develop into loyalty.
According to Giddens and Hofman (2002:1), a few more points to keep in
mind regarding maintaining brand loyalty:
Develop an unbeatable product
Give customers an incentive to repeat-purchase
Stand behind your product
Know your trophy customers and treat them best of all
Make it easier to buy your brand than competing brands
Go to your customers
Become a customer service champion (Giddens and Hofman, 2002:1).
The less loyal the consumers, the more marketers must deal. A purchase
made on deal will always deliver less profit to the marketer than a purchase
made at full priced (Hallberg, 1995:50).
According to Koekemoer (2005:276), consumers generally have become
much less brand loyal than they once were. Belch and Belch (2004:120) state
that for many products fewer than 50 per cent of consumers are loyal to one
brand. This is partly due to the fact that many products have become
increasingly similar, due to technology. Consumers find it easy to switch
among brands, especially cheaper substitutes, since they all offer similar
features and benefits. There is another reason for reduced brand loyalty and
that has been created by marketers themselves. Marketers in most
developed countries have effectively 'trained' consumers to expect that at
least one brand in a particular product category will be 'on deal' with a
coupon, cents-off offer or refund. The extensive use of sales promotion has
reduced brand loyalty and increased brand switching, therefore requiring even
more 'dealing' to feed the 'monster' (Koekemoer, 2005:276).
Page 37

Chapter 2
2.3 THE CONCEPT OF CONSUMER BUYING BEHAVIOUR
The purpose of this section is to discuss themes of consumer behaviour,
consumer decision making process and Generation Y.
2.3.1 Consumer Behaviour Theory
Consumer behaviour reflects the totality of consumer's decisions with respect
to the acquisition, consumption, and disposition of goods, services, time and
ideas by (human) decision making units (over time) (MacInnis et al., 2001:4).
Malholtra et al., (2003:51) contends that consumer behaviour focuses on the
consumption-related active entities of individuals. Consumer behaviour
investigates the way individuals choose, purchase, use, and dispose of goods
and services in order to satisfy personal or household needs. Some of the
influences that shape consumer choices and tendencies are internal
processes, such as our own thinking, feeling and desiring. Other influences
spring from environmental factors, such as social forces, economic,
situational, retail, and promotional considerations. These forces combine and
dynamically interact to produce shopping behaviour (Wozniak et al., 2001:2).
According to Schiffman and Kanuk (1997:6), consumer behaviour is how
individuals make decisions to spend their available resources (time, money,
effort) on consumption-related items. It includes what they buy, why they buy
it, where they buy it, how often they buy it, and how often they use it.
Schiffman and Kanuk (1997:6), state that it is important to recognize why and
how individuals make their consumption decisions, so that better strategic
marketing decisions can be made.
According to Schiffman and Kanuk (1991:592), consumer behaviour is not just
making a purchase decision or the act of purchasing: it also includes the full
range of experiences associated with using or consuming products and
services. It also includes the sense of pleasure and satisfaction derived from
possessing or collecting "things". The outputs of consumption are changes in
feelings, moods, or attitudes; reinforcement or lifestyles; an enhanced sense
Page 38
Chapte•2
of self: satisfaction of a consumer-related need: belonging to groups;
expressing and entertaining oneself.
The field of consumer behaviour can be defined as "the study of individuals,
groups, or organizations and the processes they use to select, secure, use,
and dispose of products, services, experiences, or ideas to satisfy needs and
the impacts that these processes have on the consumer and society"
(Hawkins, Best and Coney, 2004:7). From the above definition, it is
abundantly clear that identifying consumer motivation is an activity that is
firmly situated within this marketing discipline.
Consumer behavior is habitual because habits are safe and familiar. In order
to create brand loyalty, advertisers must break consumer habits, help them
acquire new habits, and reinforce those habits by reminding consumers of the
value of their purchase and encourage them to continue purchasing those
products in the future (Essortment 2002:1)
Customer behaviour concerns all the activities and influences that occur
before, during and after the purchase itself. According to Olson and Peter
(2005:5), consumer behaviour involves the thoughts and feelings people
experience and the actions they perform in consumption processes.
Consumer behaviour is dynamic because the thinking, feelings, and actions of
individual consumers, targeted consumer groups, and society at large are
constantly changing. Consumer behaviour involves interactions among
people's thinking, feelings, and actions, and the environment. Consumer
behaviour involves exchanges between human beings. In other words,
people give up something of value to others and receive something in return
(Olson and Peter, 2005:8).
2.3.2 The Consumer Decision Making Process
Consumer decision process can be characterized as a form of problem
solving. When consumers perceive a discrepancy between an actual state of
affairs and a desired or ideal state of affairs, problem recognition arises.
Individuals then become involved in a problem solving process. This process
Page 39
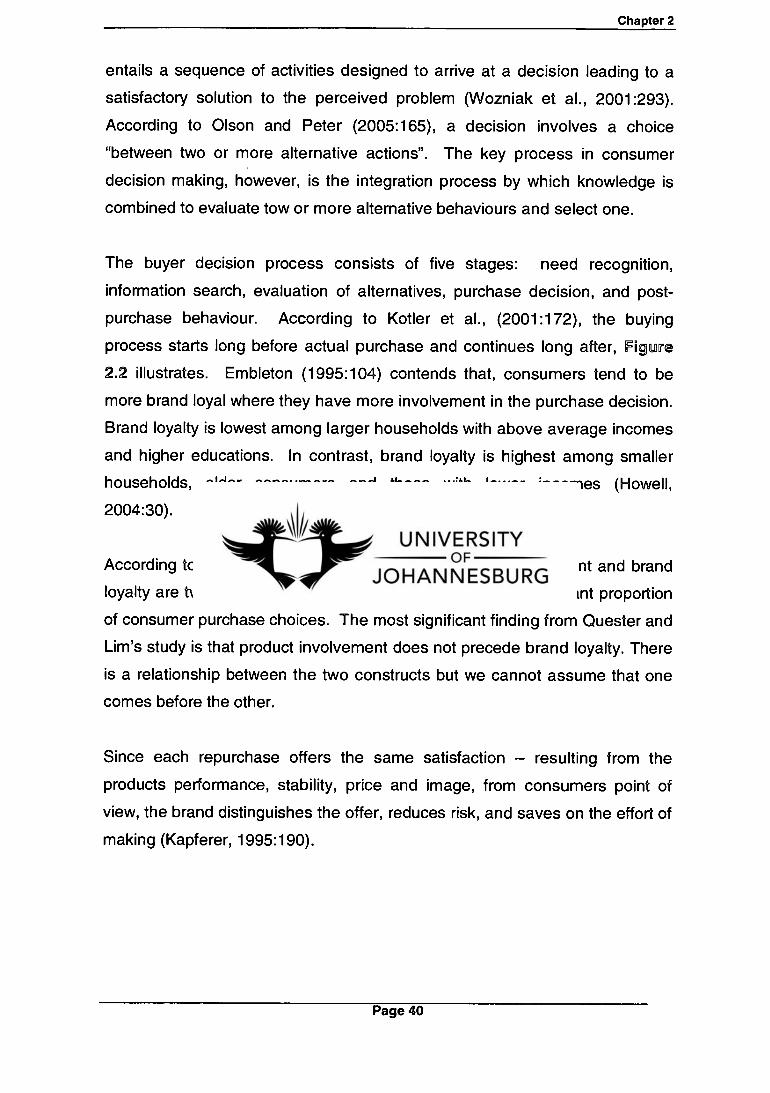
Chapter 2
entails a sequence of activities designed to arrive at a decision leading to a
satisfactory solution to the perceived problem (Wozniak et al., 2001:293).
According to Olson and Peter (2005:165), a decision involves a choice
"between two or more alternative actions". The key process in consumer
decision making, however, is the integration process by which knowledge is
combined to evaluate tow or more alternative behaviours and select one.
The buyer decision process consists of five stages: need recognition,
information search, evaluation of alternatives, purchase decision, and post-
purchase behaviour. According to Kotler et al., (2001:172), the buying
process starts long before actual purchase and continues long after, Figure
2.2 illustrates. Embleton (1995:104) contends that, consumers tend to be
more brand loyal where they have more involvement in the purchase decision.
Brand loyalty is lowest among larger households with above average incomes
and higher educations. In contrast, brand loyalty is highest among smaller
households, older consumers and those with lower incomes (Howell,
2004:30).
According to Quester and Lin Lim (2003:22), product involvement and brand
loyalty are two important concepts believed to explain a significant proportion
of consumer purchase choices. The most significant finding from Quester and
Lim's study is that product involvement does not precede brand loyalty. There
is a relationship between the two constructs but we cannot assume that one
comes before the other.
Since each repurchase offers the same satisfaction — resulting from the
products performance, stability, price and image, from consumers point of
view, the brand distinguishes the offer, reduces risk, and saves on the effort of
making (Kapferer, 1995:190).
Page 40
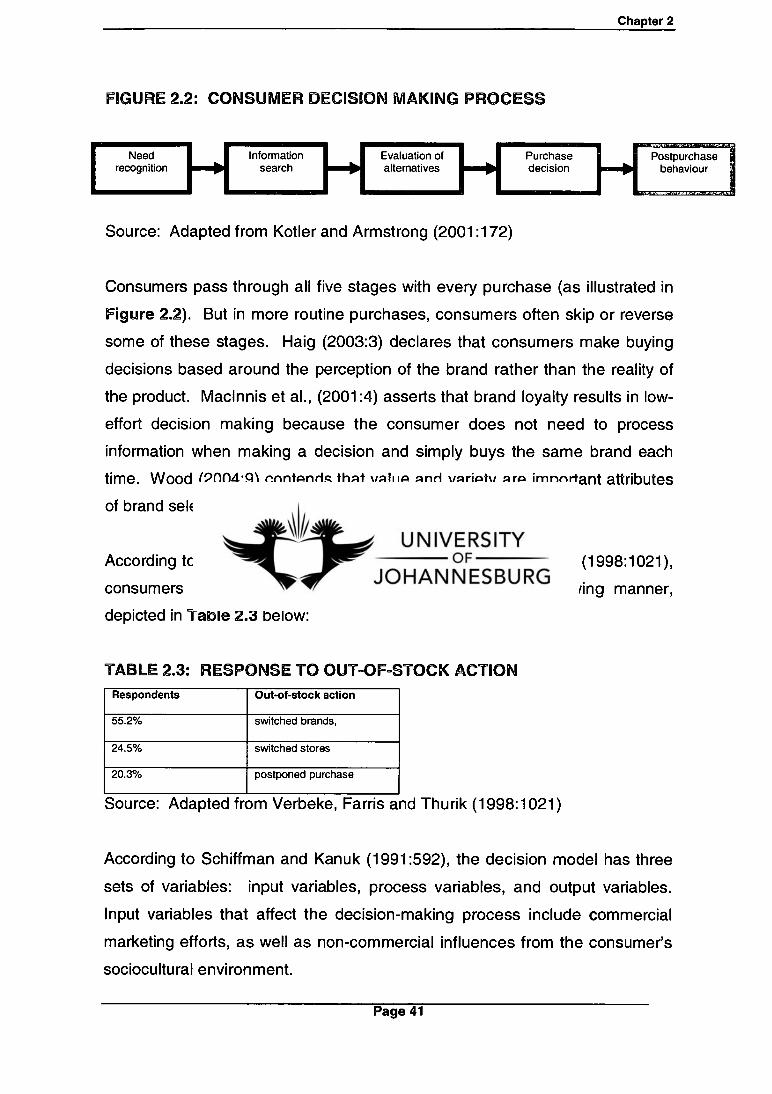
Chapter 2
FIGURE 2.2: CONSUMER DECISION MAKING PROCESS
Need recognition
Information search
Evaluation of alternatives
Purchase decision
Postpurchase behaviour
Source: Adapted from Kotler and Armstrong (2001:172)
Consumers pass through all five stages with every purchase (as illustrated in
Figure 2.2). But in more routine purchases, consumers often skip or reverse
some of these stages. Haig (2003:3) declares that consumers make buying
decisions based around the perception of the brand rather than the reality of
the product. MacInnis et al., (2001:4) asserts that brand loyalty results in low-
effort decision making because the consumer does not need to process
information when making a decision and simply buys the same brand each
time. Wood (2004:9) contends that value and variety are important attributes
of brand selection.
According to a survey conducted by Verbeke, Farris and Thurik (1998:1021),
consumers respond to an out-of-stock situation in the following manner,
depicted in Table 2.3 below:
TABLE 2.3: RESPONSE TO OUT-OF-STOCK ACTION Respondents Out-of-stock action
55.2% switched brands,
24.5% switched stores
20.3% postponed purchase
Source: Adapted from Verbeke, Farris and Thurik (1998:1021)
According to Schiffman and Kanuk (1991:592), the decision model has three
sets of variables: input variables, process variables, and output variables.
Input variables that affect the decision-making process include commercial
marketing efforts, as well as non-commercial influences from the consumer's
sociocultural environment.
Page 41
Chapter 2
The decision process variables are influenced by the consumer's
psychological field, including evoked set (i.e., the brands in a particular
product category considered in making a purchase choice). Taken as a
whole, the psychological field influences the consumer's recognition of a
need, prepurchase search for information, and evaluation of alternatives. The
output phase of the model includes the actual purchase (either trial or repeat
purchase) and postpurchase evaluation. Both prepurchase and postpurchase
evaluation feed back in the form of experience into the consumer's
psychological field, and serve to influence future decision processing
(Schiffman and Kanuk, 1991:592).
According to Cant et al., (2006:193), consumers are continuously making
decisions about what products and services to consume. There are two
fundamental reasons why individuals must make decisions:
o They have to satisfy their needs and desires
o Frequently, more than one choice or alternative will satisfy their needs
Cant et al., (2006:193).
According to Cant et al., (2006:193), consumer behaviour is triggered by
needs. Consumer decision-making directs needs by assessing and selecting
the actions that will fulfill them. However, the process of consumer decision-
making, unlike consumer actions, cannot be observed. Consumer decision-
making is a cognitive process that consists of those mental activities that
determine what activities are undertaken to remove a tension state caused by
a need (Cant et al., 2006:193).
Page 42

Chapter 2
2.3.3 Factors influencing consumers decision making process
Consumer purchases are influenced strongly by cultural, social, personal, and
psychological factors. Cultural factors exert the broadest and deepest
influence on consumer behaviour. The marketer needs to understand the role
played by the buyers culture, subculture, and social class. A consumer's
behaviour also is influenced by social factors, such as the consumer's small
groups, family, social roles and status. A buyer's decisions are also
influenced by personal characteristics such as the buyer's age and life-cycle
stage, occupation, economic situation, lifestyle, and personality and self-
concept (Kotler et al., 2001:172).
A person's buying choices are further influenced by four major psychological
factors: motivation, perception, learning, and beliefs and attitudes. Many
forces act on consumer behaviour. Embleton (1995:104) contends that, the
lower income groups tend to be more brand loyal than their higher income
counterparts.
The consumer's choice results from the complex interplay of cultural, social,
personal, and psychological factors (Kotler et al., 2001:172). Figure 2.3
below illustrates:
FIGURE 2.3: FACTORS INFLUENCING CONSUMER BEHAVIOUR
Cultural Social Personal Psychological Buyer Age and life-
[
Culture Reference groups
cycle stage Motivation
Subculture Occupation Perception Family
Social class Economic Learning Roles and status situation Beliefs and
attitudes Lifestyle
Personality and self-concept
Source: Adapted from Kotler and Armstrong (2001:172)
Page 43
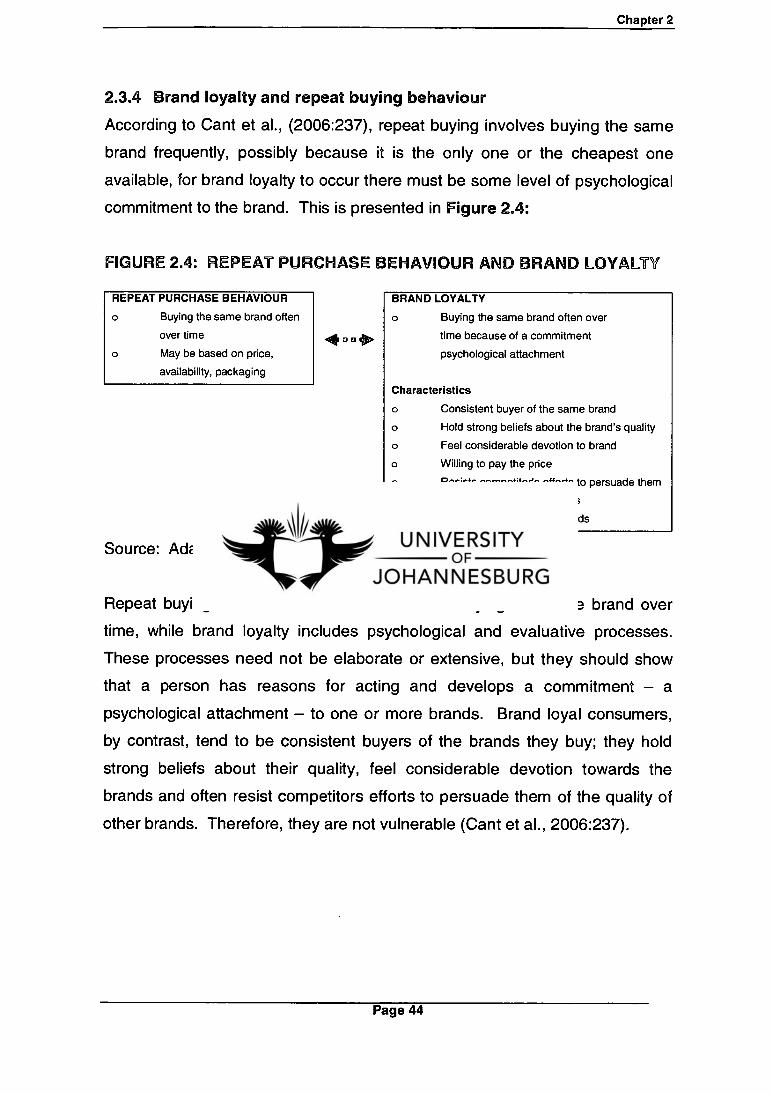
Chapter 2
2.3.4 Brand loyalty and repeat buying behaviour
According to Cant et al., (2006:237), repeat buying involves buying the same
brand frequently, possibly because it is the only one or the cheapest one
available, for brand loyalty to occur there must be some level of psychological
commitment to the brand. This is presented in Figure 2.4:
FIGURE 2.4: REPEAT PURCHASE BEHAVIOUR AND BRAND LOYALTY
REPEAT PURCHASE BEHAVIOUR
Buying the same brand often
over time
May be based on price,
availability, packaging
BRAND LOYALTY
Buying the same brand often over
time because of a commitment
psychological attachment
Characteristics
Consistent buyer of the same brand
Hold strong beliefs about the brand's quality
Feel considerable devotion to brand
Willing to pay the price
Resists competitor's efforts to persuade them
of the quality of other brands
Not vulnerable to other brands
Source: Adapted from Cant et al., (2006:237)
Repeat buying behaviour refers to consumers buying the same brand over
time, while brand loyalty includes psychological and evaluative processes.
These processes need not be elaborate or extensive, but they should show
that a person has reasons for acting and develops a commitment — a
psychological attachment — to one or more brands. Brand loyal consumers,
by contrast, tend to be consistent buyers of the brands they buy; they hold
strong beliefs about their quality, feel considerable devotion towards the
brands and often resist competitors efforts to persuade them of the quality of
other brands. Therefore, they are not vulnerable (Cant et al., 2006:237).
Page 44

I Low involvement
Exposure and brand awareness
Buying behaviou
Attitude change
Brand habit
Cannot be brand loyal as there is no low commitment
I High involvement
V
Extensive search for information
Attitude change
Buying behaviour
Brand loyalty (result of brand attitude and commitment)
Chapter 2
Complex decision-making and brand loyalty
Brand loyalty is often measured by how involved consumers are in the
decisions to buy particular products, as shown in Figure 2.5:
FIGURE 2.5: LEVEL OF INVOLVEMENT AND BRAND LOYALTY
Source: Adopted from Cant et al., (2006:237).
As depicted in Figure 2.5, high involvement leads to extensive search for
information, attitude change, buying behaviour and then brand loyalty, while
low involvement creates exposure and brand awareness, buying behaviour,
perhaps attitude change and then brand habit. Since brand loyalty is defined
as a commitment, the low involvement consumer cannot be considered to be
brand loyal. Brand commitment is the result of consumer attitude. The
greater the brand commitment, the more rooted the brand is in the
consumer's mind as the only choice within the product class. If the shop does
not have the brand in stock, this will be a serious problem for the consumer,
who will then look for the brand in another shop. Hence, brand commitment
implies brand loyalty, but brand loyalty does not imply brand commitment.
Consumers who are not brand loyal may be persuaded to buy a competitors
brand (Cant et al., 2006:237).
Page 45
Chapter 2
2.3.5 GENERATION Y: UNDERSTANDING THE NEW CONSUMER
According to Kotler (2003:291), many researchers are turning to generation
segmentation. Each generation is profoundly influenced by the times in which
it grows up-the music, movies, politics, and defining events of that period.
Demographers call these groups cohorts. Members of a cohort share the
same major experiences. They have similar outlooks and values (Kotler,
2003:291).
Individuals in Generation Y are the children of the "baby boomers" generation
or "Generation X" (Bakewell and Mitchell, 2003:96). There is no exact
consensus as to the years that these consumers were born, however, the
range usually lies between the early 1980's and the early 1990's.
According to NAS Insights (2006:1), there are three major characteristics of
the Millennial group: 1) They are racially and ethnically diverse, 2) They are
extremely independent because of divorce, day care, single parents, latchkey
parenting, and the technological revolution that they are growing up
alongside, and 3) They feel empowered; thanks to overindulgent parents, they
have a sense of security and are optimistic about the future.
The researcher, as a result of the sample in this study, will look specifically at
The Generation Y Cohort. The Generation Y Cohort is shaped by economic
prosperity and the Internet; aged 23 and under in 2000. The following are
traits often ascribed to Generation Y (Kotler, 2003:291):
Optimism and big expectations for the future
An obsession with achievement
Technologically savvy
Greater acceptance of racial and ethnic differences
Media savvy
Busy schedules
Higher levels of stress
A heightened ability to multitask
A strong sense of community and teamwork
A wish to make money, but a need to give back
Page 46

Chapter 2
Emphasis on immediate gratification
Suspicious of advertising (Kotler, 2003:291).
Groups of people born within the same 20-year time frame are known as
generational clusters. These clusters encounter the same life experiences and
as such share common attitudes and traits (Kruse, 2002:212). Generation Y's
are often described as a free spending but hard to reach generation of 18 —
25 year olds with the wealthiest of its members being the 19 — 25 year old
margin that represent a significant opportunity for today's retailers (Martin and
Turley, 2004:464).
Kruse (2002:212) identified that Generation Y consumers have three
significant expectations: real-time access in the form of instant digital
gratification; personalisation in that these individuals are fully accustomed to
shaping their own digital worlds; and community in that this generation is
proficient at managing larger and more diverse social networks than their
predecessors.
2.3.5.1 Focus of Today - Youth: 16-24 Years
This group is more open to innovation and change than any other group (SA
Consumer Trends, 2006:1);
They are at the cutting edge of new trends which are often absorbed
into the mainstream later on
They are a market that is fast changing, so there is a continual need to
keep abreast of their shifting attitudes and behaviour (SA Consumer
Trends, 2006:1).
2.3.5.2 The importance of youth
SA Youth Market is unique; they follow some overseas trends, reject others,
modify what they see and incorporate all of this into a locally relevant package
(SA Consumer Trends, 2006:1);
The youth market is, on its own, an economically significant sector
Page 47
Chapter 2
Current youth are learning about buying behaviour which they will carry
with them for much of their lives
While youth have certain values, life styles and buying behaviour of
their own, they are a reference point for many younger and older
consumers
Youth create brands at most, or at very least, gate keep existing
brands, in a manner which is acceptable for themselves (SA Consumer
Trends, 2006:1).
2.3.5.3 Marketing to youth
Youth marketing challenges the very way we think of marketing at a
fundamental level, and this is reflected in how we should be (SA Consumer
Trends, 2006:1);
developing and managing brands
styling and choosing techniques of communication
engage with them in a sensitive and insightful way;
draw on the understanding and experience of people close to the
market (SA Consumer Trends, 2006:1).
2.3.5.4 Meaning makers not meaning takers
Brands playing in this environment need to always remember that they are
targeting consumers who, in many cases are re-shaping brand meaning to
negotiate their own identities (SA Consumer Trends, 2006:1);
Brands that contribute to image need to allow consumers to co-create
meaning
These Brands need to be seen as a 'co-operative project' and
marketers need to create space for consumers to add their own
meaning and experiment
This process adds and deepens brand meaning (SA Consumer
Trends, 2006:1).
Page 48

Chapter 2
2.3.5.5 Technology
Growing up in the age of technology, educational availability and parents who
want to give it all to their children has made the members of Generation Y a
product of their environment. Generation Y is the workforce of the future. A
few things to keep in mind (Kruse, 2002:212):
These kids are connected: technologically savvy, they are used to
using cellular telephones and the Internet as primary means of
communication.
They are career-minded: the work they do should mean something and
have importance to them personally and to their company.
They are confident: products of encouraged self-esteem and
educational opportunities, they believe they can do it all. Generation Y
will bring new ideas and values into the workplace. They are highly
educated, willing to learn, technologically savvy and motivated.
Understanding and being sensitive to the needs of these workers will
be the key factor in recruiting and retaining them. If you want them to
care about your company, show them that you care about them (SA
Consumer Trends, 2006:1).
Growing up in the age of technology has put a computer in the hands of
almost every child. They have understanding and knowledge of technology
and keep up quite well with its advances. Unlike past generations, the
technological advances in the past decade have put a multitude of choices at
the fingertips of Generation Y. The wealth of information available in seconds
from the Internet, hundreds of television stations to choose from and a
different shopping center every ten miles has given Gen Y members the
notion that if they do not get what they want from one source, they can
immediately go to another (NAS Insights, 2006:1).
Page 49

Chapter 2
The uptake of cellphones is another form of accessing the internet — will these
become the true "personal" computers of the future? (SA Consumer Trends,
2006:1);
There is substantial growth in cellphone usage among the youth
In South Africa, the SMS component of cellphone use is showing rapid
growth to match global trends
The current school leavers were the first generation to grow up
e-mersed in technology. As Kids and Teens at home, they were
already the experts on the operation of all electronic and technological
devices
Being the authority on something so important has had a significant
impact on their self esteem and their position in the home
Computers govern their lives in an unprecedented way
Advantaged young South Africans have levels of technological
proficiency similar to their counterparts in developed countries
Rapid progress is taking place among the emerging black elite/middle
class (SA Consumer Trends, 2006:1).
Generation Y members have used computers since a young age and are e-
learners (Jorgensen, 2003:82). They live to be trained, enjoy the challenge of
new opportunities, seek work-life balance and like to be involved in decision
making (Jorgensen, 2003:82). Indeed, work-life balance is one of the top
priorities of graduating university students (Jorgensen, 2003:82).
Generation Y has "control" of the marketers, and will be able to obtain any
product desired. (Dias, 2003:43). Generation Y's have been acculturated into
a materialistic culture more so than other generations as a result of
technological innovations. It remains to be seen what Generation Y will grow
up to become. They are determined, motivated workers, and do not mind
fitting into the norm, unlike Generation Xers. Generation Ys have been
brought up in an era where shopping is not regarded as a simple act of
purchasing.
Page 50
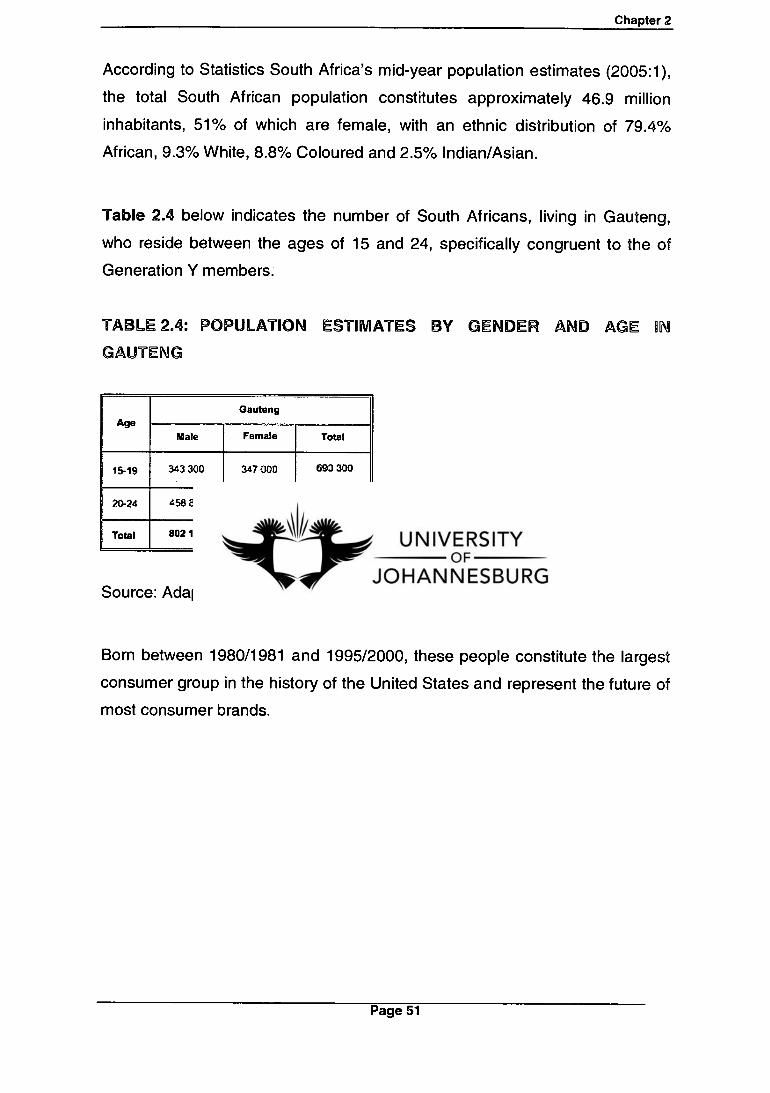
Chapter 2
According to Statistics South Africa's mid-year population estimates (2005:1),
the total South African population constitutes approximately 46.9 million
inhabitants, 51% of which are female, with an ethnic distribution of 79.4%
African, 9.3% White, 8.8% Coloured and 2.5% Indian/Asian.
Table 2.4 below indicates the number of South Africans, living in Gauteng,
who reside between the ages of 15 and 24, specifically congruent to the of
Generation Y members.
TABLE 2.4: POPULATION ESTIMATES BY GENDER AND AGE ON
GAUTENG
Age
Gauteng
Male Female Total
15-19 343 300 347 000 693 300
20-24 458 800 422 400 881 200
Total 802 100 769 400 1 571 500
Source: Adapted from Statistics South Africa (2005:20)
Born between 1980/1981 and 1995/2000, these people constitute the largest
consumer group in the history of the United States and represent the future of
most consumer brands.
Page 51
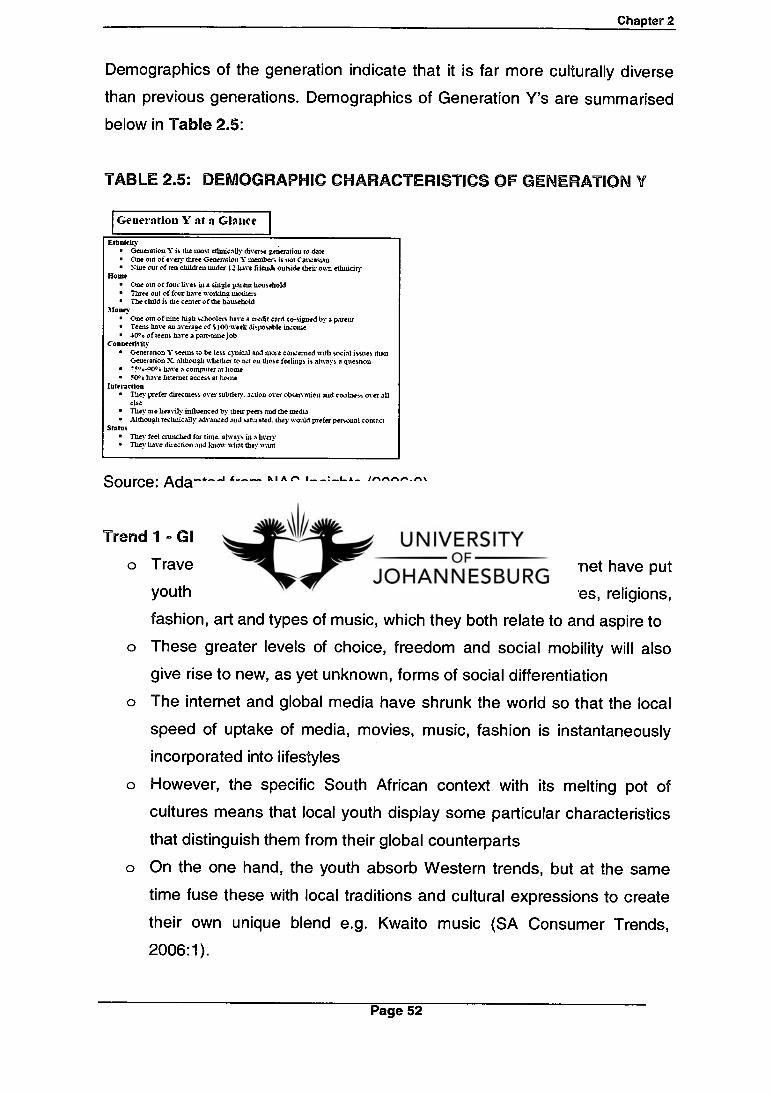
Chapter 2
Demographics of the generation indicate that it is far more culturally diverse
than previous generations. Demographics of Generation Y's are summarised
below in Table 2.5:
TABLE 2.5: DEMOGRAPHIC CHARACTERISTICS OF GENERATION Y
Generation Y at a Glance
Ethnicity Generation Y is the most ethnically diverse generation to date One out of every three Generation Y members is not Caucasian sine out of ten children under 12 have friends outside their own ethnicity
Home One out of four lives in a single parent household Three out of four have working mothers The child is the center of the household
Money One out of nine high schoolers have a credit card co-signed by a parent Teens have an average of S100,'week disposable income airo of teens have a part-tune job
Connectisity Generation Y seems to be less cynical and more concerned with social issues than Generation X. although whether to act on those feelings is always a question '5..-90°6 have a computer at home 504 o have Internet access at home
Interaction They prefer directness over subtlety. action over observation and coolness over all else They are heavily influenced by their peers and the media Although technically advanced and saturated. they would prefer personal contact
Status They feel crunched for time. always in a hurry They have direction and brow 'ohm they want
Source: Adapted from NAS Insights (2006:3)
Trend 1 - Global Village
Travel, communication, the media and especially the internet have put
youth in touch with a whole world of different ideas, cultures, religions,
fashion, art and types of music, which they both relate to and aspire to
These greater levels of choice, freedom and social mobility will also
give rise to new, as yet unknown, forms of social differentiation
The internet and global media have shrunk the world so that the local
speed of uptake of media, movies, music, fashion is instantaneously
incorporated into lifestyles
However, the specific South African context with its melting pot of
cultures means that local youth display some particular characteristics
that distinguish them from their global counterparts
On the one hand, the youth absorb Western trends, but at the same
time fuse these with local traditions and cultural expressions to create
their own unique blend e.g. Kwaito music (SA Consumer Trends,
2006:1).
Page 52

Chapter 2
Trend 2 — E Mancipation: Interactivity & Customisation
The Generation Y cohort is information and media savvy; has a strong
work ethic, entrepreneurial spirit and sense of responsibility; is
comfortable with change; is paving the way to a more open and
tolerant society; is self-reliant and independent; blends collaboration,
networking and interdependence to achieve goals; has self confidence
and optimism about the future; values skill development and thrives on
mentoring/coaching; and is well educated (Dias, 2003:43).
The new generation of global youth signals the death of the couch
potato and the increasing influence of interactivity.
Interactivity has prepared this generation for a future of customisation -
soon they will be designing their own clothing, their own furniture, their
own cars etc.
The youth will be using their technological skills to transform the
workplace, the home and the world of the future (SA Consumer
Trends, 2006).
Trend 3 - The New SA Fusion
The Berlin walls which divided different cultural and racial groups in the past
are beginning to crumble and this is most apparent amongst young South
Africans (SA Consumer Trends, 2006:1);
This new generation is adopting a set of more common, altered and
negotiated values and attitudes - particularly evidenced in sport and
music.
High levels of social mixing are taking place in schools, campuses and
the work place (SA Consumer Trends, 2006:1).
Generation Y, being career and goal driven, prefer advertising to simply
explain the product features, with high quality, fast moving graphics, similar to
the lives they lead. They like advertisements showing people getting along or
fitting in (Dias, 2003:43). The most successful brands will adequately
represent the generational need to be individual, but also represent the time,
and the events of society. However, once any generation reaches a certain
Page 53

Chapter 2
age, needs are very similar, resulting in different advertising for each
generation, but similar products (Dias, 2003:43).
A company that can understand these differences will be able to create better
products that speak to generations and learn how to better advertise and
market to these generations. This generation is one of the most watched by
the media in recent memory (Howe and Strauss, 2000). They score high on
maturity and while their attitude is edgy, they are very optimistic, unlike
Generation X (Dias, 2003:43).
Trend 4 - Politicised, Not Political
Global & Local
Politics is in deep trouble all around the world — the young in the developed
world are basically ignoring it en-masse (SA Consumer Trends, 2006:1);
o In South Africa, with the struggle ultimately over, the youth see little
role for conventional politics other than a government that lives up to its
promises
o Deep disillusionment is setting in (SA Consumer Trends, 2006:1).
Trend 5 - Show Me the Money
As Generation Y members become upper-level students, their accrued
wisdom about money and its value often increases, indicating that they are
likely to be protective of their money and focused on the tangible benefits of
products (Martin and Turley, 2004:470). The significant objective consumption
motivation displayed by Generation Y's might also explain their lack of overly
positive attitudes towards the physical environment characteristics (SA
Consumer Trends, 2006:1).
Page 54

Chapter 2
2.4 CONCLUSION
Having reviewed the literature, it is evident that brand loyalty is very dynamic,
and therefore has important implications for developing marketing strategies.
Consumer behaviour enables marketers to understand and predict consumer
behaviour in the marketplace; it also promotes understanding of the role that
consumption plays in the lives of individuals (Schiffman and Kanuk, 1997:18).
Analysis of the various stages of the consumer decision-making process
showed that the buying of consumer goods and major durable products are
much alike. Irrespective of the situation, consumer buying behaviour is the
outcome of rational considerations in selecting goods and services that fulfil
consumption goals (Cant et al., 2006:206).
Generation Y's represent a significant portion of the South African population
and as such, are being viewed as an extremely lucrative subset of the
country's total inhabitants. Their savvy and comfort in utilising various
technologies make these consumers more likely to exhibit online purchasing
behaviour than any previous generation. Generation Y, is a constantly
moving target; we have to immerse ourselves in it often and regularly to keep
up with it, so that we can ensure success in this critical and influential
segment (SA Consumer Trends, 2006:1).
One can therefore not take a generalized view, when one looks at specific
products, markets, individuals or groups of consumers. The next chapter will
focus on the sports drinks market.
Page 55
Chapter 3
CHAPTER 3
OVERVIEW OF THE SPORTS DRINKS MARKET - READY TO DRINK MARKET
3.1 INTRODUCTION
Beverages have always been a source of refreshment, but developments with
energy drinks and sport beverages are pushing the boundaries to include
fortification as well as physical and mental pick-me-ups. Almost two thirds of
consumers enjoy sport drinks in connection with sports activity, almost as
many regard to the products as "anytime" drinks. There is a definite increase
in impulse buying of sport drinks have crossed from the benefit-orientated
category into the refreshment area, where carbonated beverages can be
found (Vorster, 2006:1).
Another area to consider for the future of the category is the female market.
With weight loss issues becoming a hot topic again, the stage may be set for
an increase in woman's consumption of sport drinks, particularly those opting
to lose weight through exercise (Vorster, 2006:1).
According to (www.sportsdietitians.com ):
Sports drinks are very well researched and can definitely improve
sports performance when used properly.
Sports drinks provide carbohydrates and electrolytes.
The carbohydrates supply the muscles with fuel during sport.
The main electrolyte is sodium, which improves the flavour and
water absorption.
Sports drinks are best suited to endurance sports and high intensity
sports.
The best sports drink depends on personal taste preferences and
individual tolerance. Sports drinks are intended to cater for the
majority of exercise needs most of the time but will not meet every
individual's needs. When undertaking unusual sports or extreme
Page 56

100.0% --
90.0% -
80.0% -
70.0% -
60.0% -
50.0% -
40.0% -
30.0% -
20.0% -
10.0% -
0.0% 1 11 11111 77.9% 22.1% 92.0% 012mm Jul06 7.8% 45.7% 42.0% 79.2% 42.7% 41.6% CI 12mm Jul07 20.7% 93.8% 6.1%
80.4% la 6mm Jul07 41.6% 41.7% 6.1% 93.8% 19.6%
81.6% 18.4% 0 May07 42.0% 39.7% 6.0% 93.9%
77.0% 0 Jun07 93.6% 41.4% 39.0% 6.3% 23.0%
73.0% CiJul07 91.7% 27.0% 39.9% 40.0% 8.3%
ENEROADE POWERADE
CONCENTRATE
(CLIFTON
POWDER
ENEROADE POVVERADE
RTD
GAME
Chapter 3
exercise, it is best to discuss drink choice with a sports dietician
(www.sportsdietitians.com ).
According to Infocy (2007:3), both the ready to drink and concentrate
subcategory are dominated by Powerade and Energade's market share.
Figure 3.1 illustrates:
FIGURE 3.1: VOLUME OF SPORTS DRINKS BY SUBCATEGORY
DEF. RETAILERS Brand Volume% (UC) Of Total Sports Drinks By Subcategory
DEF. RETAILERS SH6PP.ITE. HE( NERS. _HE4. KERS HYPERS. NIPS. PDPF. PDPH. Pf4P1,1
Source: Adapted from Infocy (July 2006:3)
According to Hehir (2007:8), the USA has the highest number of new products
by country in the sports drinks category, while South Africa has the third
lowest. Figure 3.2 illustrates:
Page 57
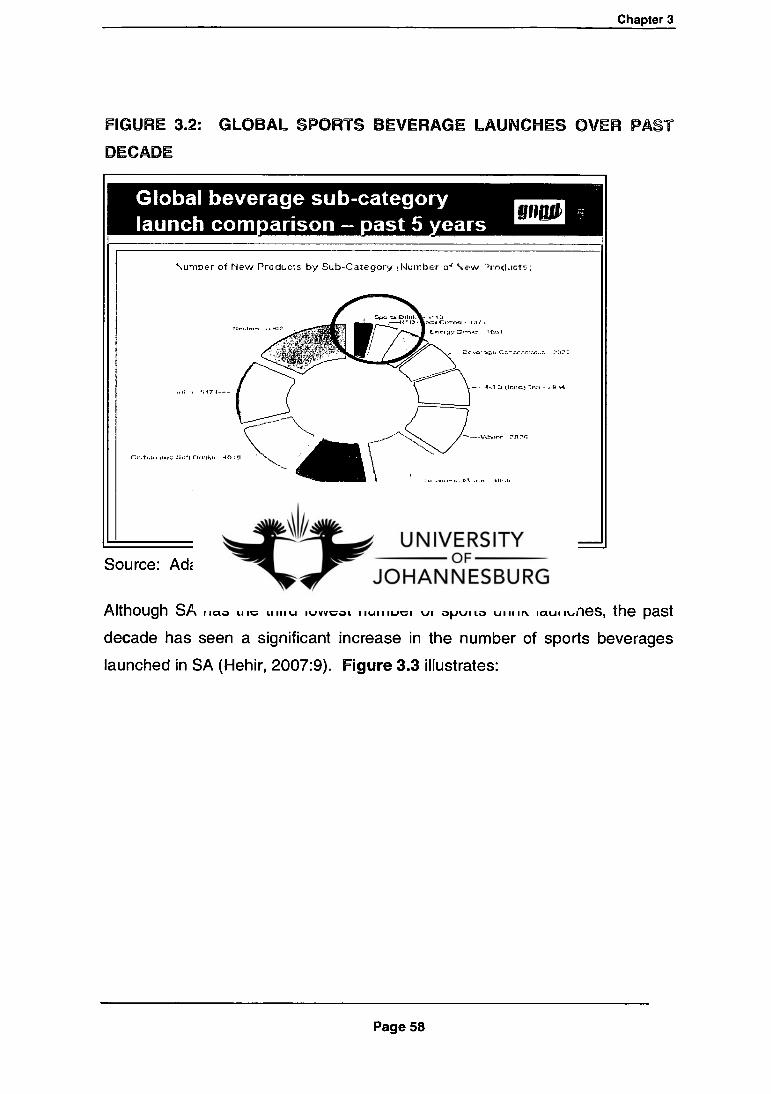
Chapter 3
FIGURE 3.2: GLOBAL SPORTS BEVERAGE LAUNCHES OVER PAST
DECADE
.„, Global beverage sub-category
ORO launch corn • arison — • ast 5 ears
\ umber of New Products by Sub-Category
C.,,, -h;:n iron nrs.1 Corvika 40 HI
1,1,41'11M -.+ tt vrolf roil t It 01-,
t Number c \ew 75roclacte:
. '''''..-14Ti`g'. ,;:;:il.,-,-,-,, - ■ :.; .
Mc -....4,a,, C.- cc r,,, - :,:):,
— 4-.1 71 1,1r.m; Tr. - .17 4C.
-- -Vat,:cr 7_ri7c
Source: Adapted from Hehir (2007:8)
Although SA has the third lowest number of sports drink launches, the past
decade has seen a significant increase in the number of sports beverages
launched in SA (Hehir, 2007:9). Figure 3.3 illustrates:
Page 58

South Africa — sports beverage launches in past decade goo
Number or Ncv., P,7odLct'3 by Dalt Published
Chapter 3
FIGURE 3.3: SOUTH AFRICA SPORTS BEVERAGE LAUNCHES IN PAST
DECADE
Source: Adapted from Hehir (2007:9)
3.1.1 MANUFACTURERS
The sports drink market is traditionally a difficult one within which to compete.
Barriers to entry are high, with a great deal of competition. Powerade and
Energade are currently the biggest two players in the South African market,
with other brands occupying smaller market share. USN is a new entrant with
a market share that is continuously growing.
Page 59
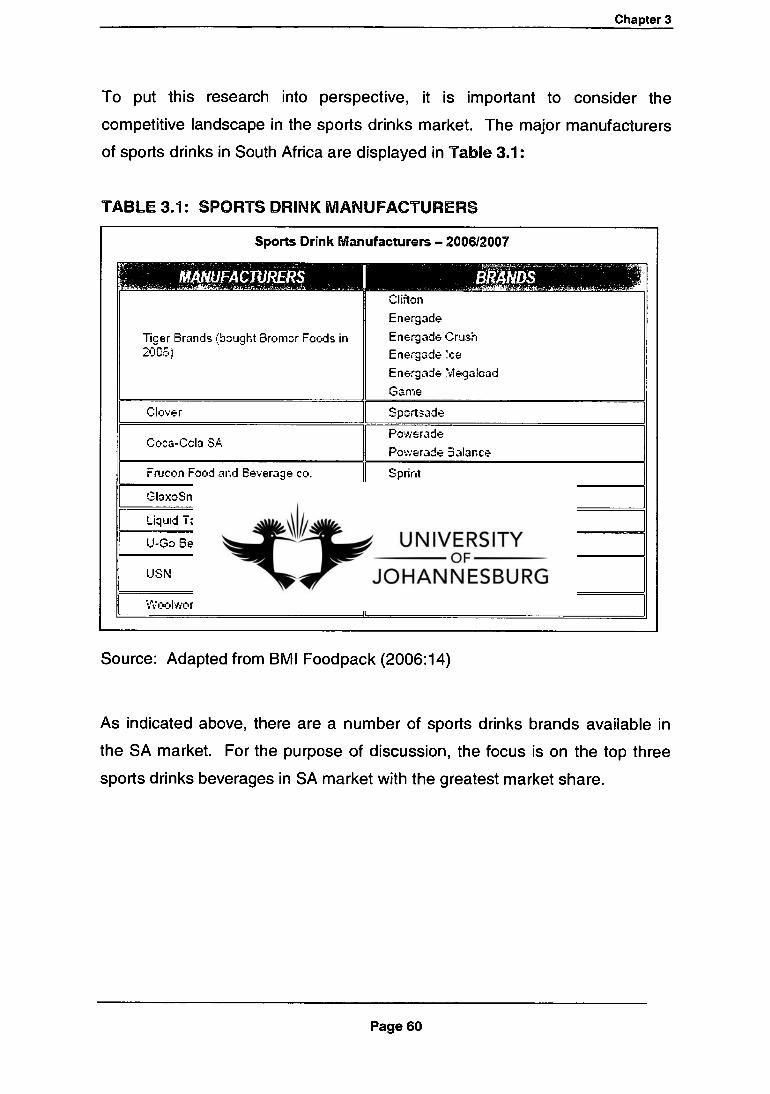
Chapter 3
To put this research into perspective, it is important to consider the
competitive landscape in the sports drinks market. The major manufacturers
of sports drinks in South Africa are displayed in Table 3.1:
TABLE 3.1: SPORTS DRINK MANUFACTURERS
Sports Drink Manufacturers
MANUFACTURERS
Tiger Brands (bought Bromor Foods in 200E.)
I
— 2006/2007
pirpl Clifton
Energade
Energade Crush
Energade !ce
Energade Megaload
Game
Clover Sportsade
Coca-Cola SA Powerade
Powerade Balance
Frucon Food and Beverage co. Sprint
GlaxoSmithKline Lucozade
Liquid Taste Adventures I Edge Sports Drink
U-Go Beverages l Top-Go Sports Quencher
USN Dynamic Ener•
Lean R
?..!oc.lworths Isoactive
Source: Adapted from BMI Foodpack (2006:14)
As indicated above, there are a number of sports drinks brands available in
the SA market. For the purpose of discussion, the focus is on the top three
sports drinks beverages in SA market with the greatest market share.
Page 60
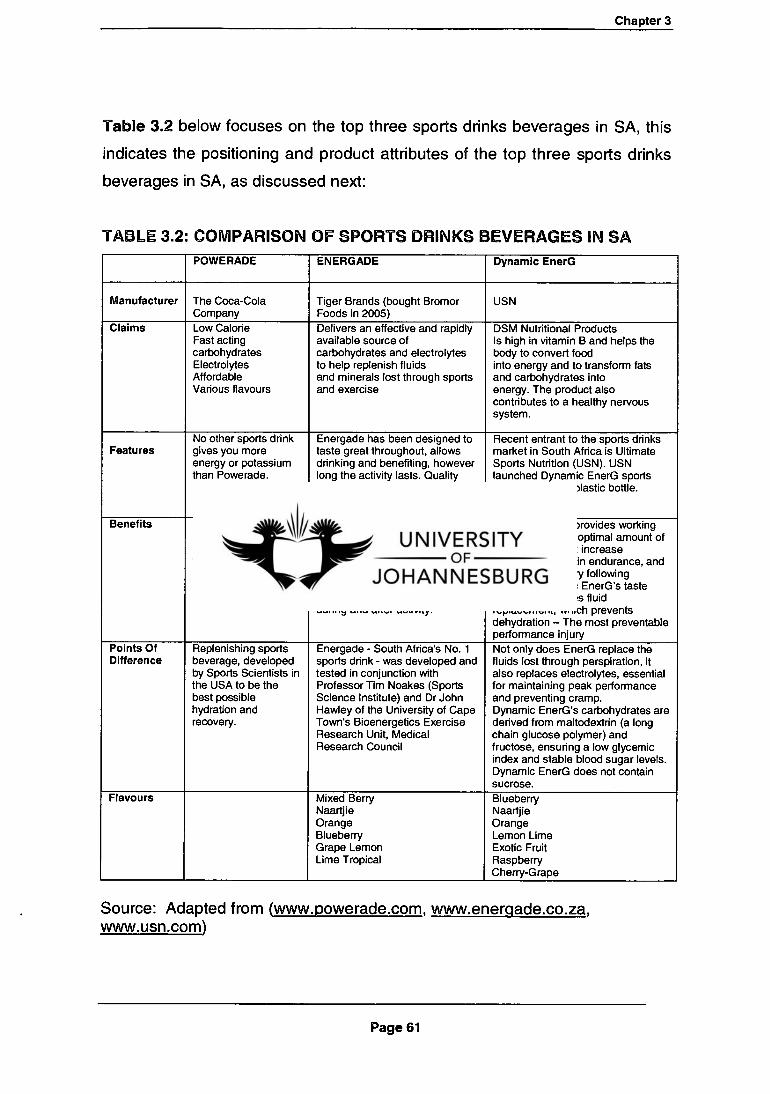
Chapter 3
Table 3.2 below focuses on the top three sports drinks beverages in SA, this
indicates the positioning and product attributes of the top three sports drinks
beverages in SA, as discussed next:
TABLE 3.2 COMPARISON OF SPORTS DRINKS BEVERAGES IN SA POWERADE ENERGADE Dynamic EnerG
Manufacturer The Coca-Cola Company
Tiger Brands (bought Bromor Foods in 2005)
USN
Claims Low Calorie Fast acting carbohydrates Electrolytes Affordable Various flavours
Delivers an effective and rapidly available source of carbohydrates and electrolytes to help replenish fluids and minerals lost through sports and exercise
DSM Nutritional Products Is high in vitamin B and helps the body to convert food into energy and to transform fats and carbohydrates into energy. The product also contributes to a healthy nervous system.
Features No other sports drink gives you more energy or potassium than Powerade. Quality push/pull nozzle.
Energade has been designed to taste great throughout, allows drinking and benefiting, however long the activity lasts. Quality push/pull nozzle.
Recent entrant to the sports drinks market in South Africa is Ultimate Sports Nutrition (USN). USN launched Dynamic EnerG sports drink in a 600m1 plastic bottle.
Benefits Potassium is an electrolyte which helps replace lost fluids.
The Energade Sports Performance range was therefore developed to deliver a rapidly available and effective source of carbohydrates and electrolytes to replenish these lost fluids and minerals - before, during and after activity.
Dynamic EnerG provides working muscles with the optimal amount of carbohydrates to: increase absorption, sustain endurance, and speed up recovery following training. Dynamic EnerG's taste profile encourages fluid replacement, which prevents dehydration — The most preventable performance injury
Points Of Difference
Replenishing sports beverage, developed by Sports Scientists in the USA to be the best possible hydration and recovery.
Energade - South Africa's No. 1 sports drink - was developed and tested in conjunction with Professor Tim Noakes (Sports Science Institute) and Dr John Hawley of the University of Cape Town's Bioenergetics Exercise Research Unit, Medical Research Council
Not only does EnerG replace the fluids lost through perspiration, it also replaces electrolytes, essential for maintaining peak performance and preventing cramp. Dynamic EnerG's carbohydrates are derived from maltodextrin (a long chain glucose polymer) and fructose, ensuring a low glycemic index and stable blood sugar levels. Dynamic EnerG does not contain sucrose.
Flavours Mixed Berry Naartjie Orange Blueberry Grape Lemon Lime Tropical
Blueberry Naartjie Orange Lemon Lime Exotic Fruit Raspberry Cherry-Grape
Source: Adapted from (www.powerade.com , www.energade.co.za , www.usn.com)
Page 61
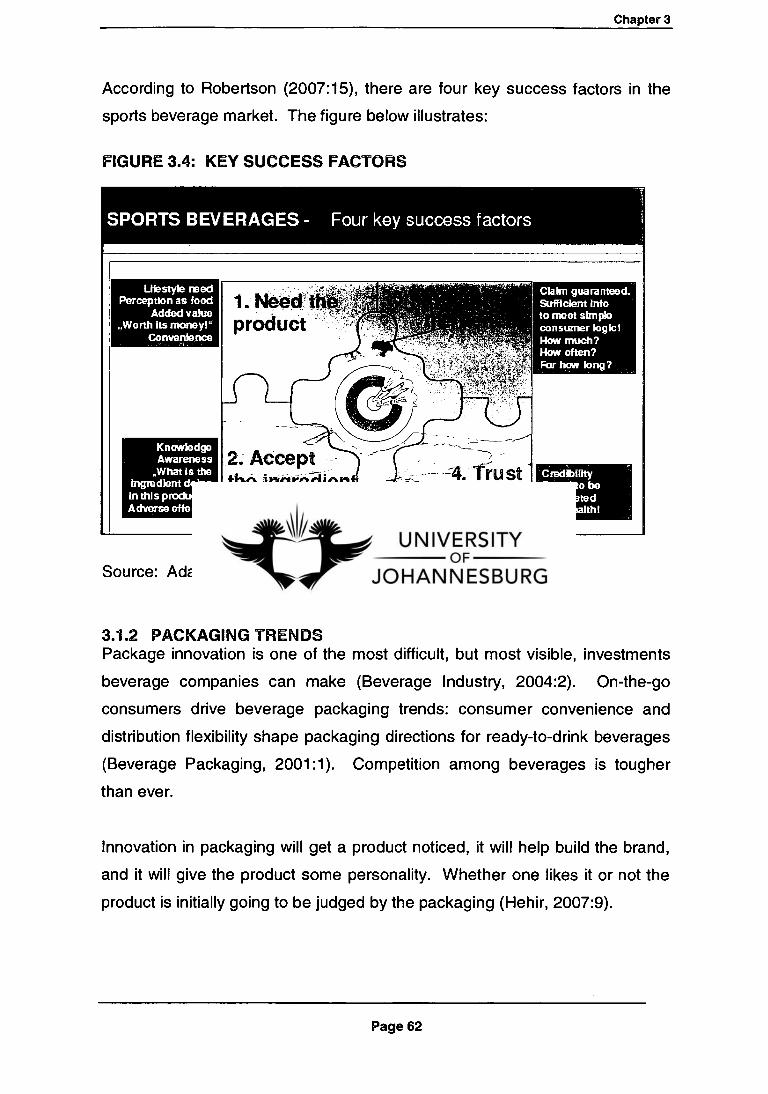
Chapter 3
According to Robertson (2007:15), there are four key success factors in the
sports beverage market. The figure below illustrates:
FIGURE 3.4: KEY SUCCESS FACTORS
SPORTS BEVERAGES - Four key success factors
Lit style reed Perception as food
Added value ..Worth its money!"
Convenience
Claim guaranteed. Sufficient Info to meet simple consumer logic! How much? How often? For how long?
Cmdlbility Brand to be associated with health!
Knowledge Awareness
„What Is the ingredient doing In this product?" Adverse effects?
Source: Adapted from Robertson (2007:15)
3.1.2 PACKAGING TRENDS Package innovation is one of the most difficult, but most visible, investments
beverage companies can make (Beverage Industry, 2004:2). On-the-go
consumers drive beverage packaging trends: consumer convenience and
distribution flexibility shape packaging directions for ready-to-drink beverages
(Beverage Packaging, 2001:1). Competition among beverages is tougher
than ever.
Innovation in packaging will get a product noticed, it will help build the brand,
and it will give the product some personality. Whether one likes it or not the
product is initially going to be judged by the packaging (Hehir, 2007:9).
Page 62

Chapter 3
3.1.2.1 Industry packaging Trends and Characteristics
According to Hehir (2007:3), the latest top global trends include:
Vitamin/Mineral Fortified, Flavours, Protein, Packaging, consideration of
young athletes and low in positioning. Figure 3.5 illustrates:
FIGURE 3.5: LATEST TOP GLOBAL TRENDS
Source: Adapted from Hehir (2007:8)
Trend 1 — Packaging According to Hehir (2007:4), the bottle package type has the highest number
of new products in the sports drinks category, followed by cans. Many
sportspeople freeze drinks before their training/competition, allowing it to thaw
over that time. Bottles often burst/crack in the freezer. Hehir (2007:5)
continues to state that plastic package material type has the highest number
of new products in the sports drinks category, followed by metal.
According to Hehir (2007:6), the 500m1 pack size has the highest number of
new products in the sports drinks category, followed by 600m1. Figure 3.6
illustrates:
Page 63
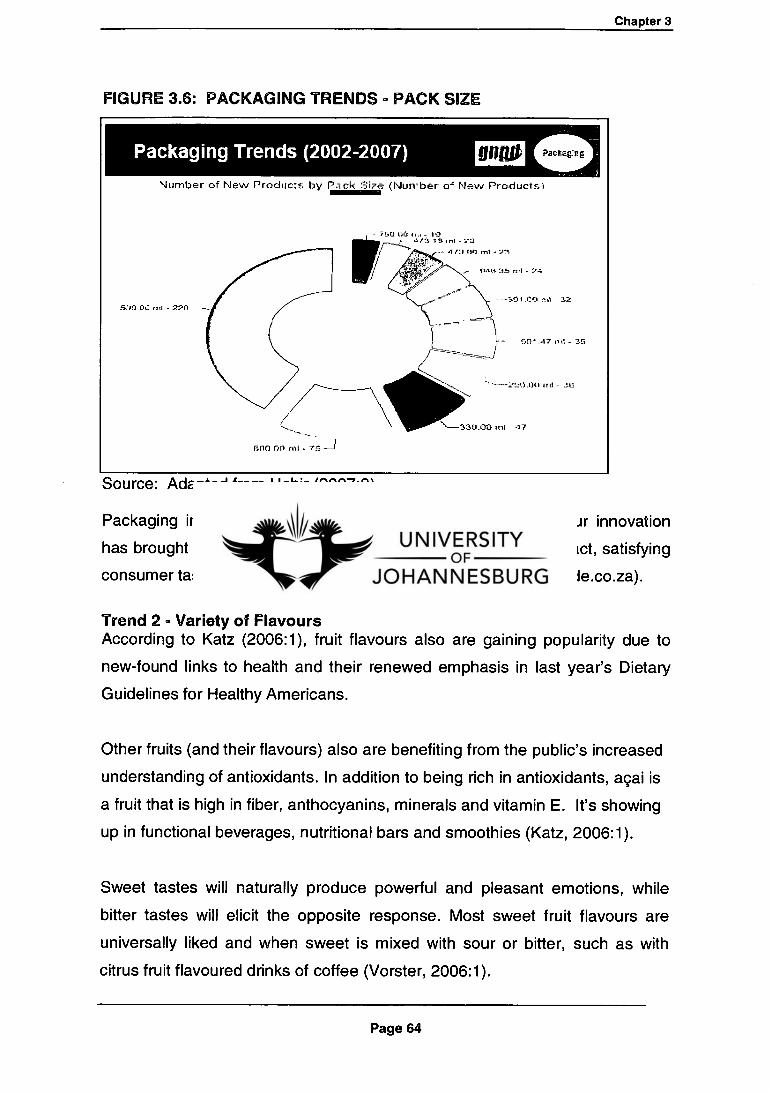
5.:PO 5, rrd - 2Pn
4,4e. 31, 2-;
- - 1 .00 AA 32
05 4 .47 - 35
rra - 3E
—330.01} ml -17
rino on - 75 -1
'Dumber of New Products by Pack Si7e (Nun - ber o' New Productsi
SO 00 1•.a 1:1 , 4 Ifs. 1.'9. -
4 r:i rrs1 - 1171.
Chapter 3
FIGURE 3.6: PACKAGING TRENDS - PACK SIZE
Source: Adapted from Hehir (2007:8)
Packaging innovation has improved the functionality and flavour innovation
has brought new flavours into the range, improving on shelf impact, satisfying
consumer taste patterns and ultimately encouraging trial (energade.co.za ).
Trend 2 - Variety of Flavours According to Katz (2006:1), fruit flavours also are gaining popularity due to
new-found links to health and their renewed emphasis in last year's Dietary
Guidelines for Healthy Americans.
Other fruits (and their flavours) also are benefiting from the public's increased
understanding of antioxidants. In addition to being rich in antioxidants, acai is
a fruit that is high in fiber, anthocyanins, minerals and vitamin E. It's showing
up in functional beverages, nutritional bars and smoothies (Katz, 2006:1).
Sweet tastes will naturally produce powerful and pleasant emotions, while
bitter tastes will elicit the opposite response. Most sweet fruit flavours are
universally liked and when sweet is mixed with sour or bitter, such as with
citrus fruit flavoured drinks of coffee (Vorster, 2006:1).
Page 64

lit- WA -emu to-r10.1:::" - -C4crut. •as
co _ - aa —Aputr, 40
- ifl
--Pruit
— 14tu E;itt,staiutt - 57
Fruit flavours continue to dominate
Ji.xiber Product's by Flavo -Jr Any IN -Jr-ibe , of New Products)
Chapter 3
Sours has been extremely successful as flavouring agent in the last decade,
but that quality is found more in some regions or ethnicities than others
(Vorster, 2006:1).
According to Hehir (2007:7), fruit flavours continue to dominate the number of
new products by flavour. Figure 3.7 illustrates:
FIGURE 3.7: TOP 10 GLOBAL FLAVOURS - PAST 5 YEARS
Source: Adapted from Hehir (2007:8)
Hehir (2007:11), further states that:
Citrus dominates in the RTD sports beverages.
Citrus masks unpleasant taste of some ingredients.
Protein powders and meal replacers and shakes are still dominated by
variants of vanilla, chocolate, strawberry, toffee, caramel etc. (Hehir
2007:11).
Sports drinks with added protein are conspicuously absent. Fruity flavours
remain the top flavours (Robertson, 2007:15). According to
(www.sportsdietitians.com ), flavour is an important feature of sports drinks.
The more you enjoy the flavour of a drink, the more you drink.
Page 65
Chapter 3
According to Jones-Dille (2007:1), fruit flavours are the most favoured for
functional beverages. In these drinks, a "true to fruit" profile is essential.
Consumers expect healthy products to taste natural and fresh, and the
flavours should truly complement the functional ingredients used in the
product.
According to De Swardt (2005:1), with Powerade you have it. The various
flavours ensure that you will find your ideal taste and allow the required
variation.
Citrus flavours and astringent berry flavours work especially well with
antioxidant fortifications. These flavours blend nicely with the acidity that is
inherent in vitamin C and other antioxidant ingredients. Another alternative is
to pair a citrus flavour with a less acidic, milder fruit to create a tropical-type
flavour blend (Jones-Dille, 2007:1).
Trend 3 - Nutrition Increasing consumer interest in health and nutrition places particular
emphasis on the nutritional properties of products as determinants of
consumer demand (Baltas 2000:709). In this respect, nutrition labelling
provides a channel to demonstrate the nutritional properties of products and
an incentive to improve the nutrient content of those that fail to meet
consumer requirements in target markets. Differential advantages can be
achieved by providing overall superior nutritional quality or exhibiting a unique
nutritional profile.
The information provided in the label can also support communication
programmes based on health or, more generally, diet-related claims targeted
to certain consumer segments. For example, high values in ingredients such
as fibre and folic acid have helped cereal brands to become instantly
recognized and differentiated from the competition. Additional benefits may
stem from interactions of nutritional profile with other perceived attributes such
as taste and quality (Baltas 2000:709). Interest in sport has increased greatly
over the last decades. The science of nutrition in relation to sports
Page 66

Top 10 global "food"/nutrition claims —past 5 years
gam 11
Nur- De , o' New r'od.,L,! ..s oy - 700d Dr"c. (.slumbe!. of Now P•ocluc:sj
0--L44,MA
— -
- tatatms
t ?re ...sc-11 • :03
un,l•wr 1 ror:,t 4,1 c.
- '11.:1111 rer-1 c;lnnn • ".
Chapter 3
performance has progressed and we now have a better understanding of the
relationship between diet and physical performance (Hassapidou, 2001:31).
According to Hehir (2007:11), vitamins/mineral fortified have the most number
of new products under food and drink, followed by low calorie. Figure 3.8
illustrates:
FIGURE 3.8: TOP 10 GLOBAL "FOOD"/NUTRITION CLAIMS-PAST 5
YEARS
Source: Adapted from Hehir (2007:11)
Nutrition labelling is intended to enable informed consumer choice, raise the
demand for healthier food products, encourage competition on nutritional
quality, and stimulate development and production of goods with improved
nutritional properties (Pirouznia, 2001:62).
Trend 4 - Labelling
The benefits of consumer information in general and labelling in particular are
clear. For the consumer, it provides the means for the operator to pass on
essential information about products (use-by dates, safety warnings, etc.) as
well as information which, whilst perhaps not essential, is considered useful
Page 67

Chapter 3
(nutrition labelling, recycling details, etc.). As such, the label has the role of
allowing the consumer to make an informed choice at the point of sale about
whether to purchase a product and, if they do so, to consider how best it
should be used (European Communities, 2006).
Should nutrition labelling be mandatory? Some consider this to be
essential in order to increase consumer use of such labels, although
some consider that the latest research shows that this labelling is very
little used. If it is felt that mandatory labelling is useful, its introduction
could adversely affect some businesses, especially smaller ones, who
would find it hard to bear the costs. However, ways of minimising
these, such as longer implementation dates, derogations for short
production runs or low turnover businesses, providing tools or guidance
to help implementation, could be considered (European Communities,
2006).
Where should the nutrition label be put? Evidence suggests that
simplified front of pack labelling ('signposting') may offer significant
advantages in terms of increasing consumer use (European
Communities, 2006).
How important is presentation of the information? Consumers
often complain that nutrition labels are poorly presented, making them
difficult to use. In particular concern is expressed that the labels
contain too much information and the type size is too small (European
Communities, 2006).
Determinants of label utilisation
Several studies report that consumers want on-pack nutrition information and
make unfavourable inferences about the nutritional properties of products
lacking such information. However, an important issue is the extent to which
consumers actually gather on-pack nutrition information; in other words, use
the label (Baltas 2000:708).
Page 68
Chapter 3
Nutrition-related advertisements may have a positive effect on awareness of
diet-health relationships and purchase behaviour (Baltas 2000:709). Keller et
al. (1997) find that consumers rely more on nutrition information than on
claims when both are available. Nutrition information is seen as more credible
and people may use it to check the veracity of claims.
Baltas (2000:709) finds that consumers' beliefs about food products differ
when consumers are exposed to health claims on labels that include nutrition
information versus when consumers are exposed to claims on labels that do
not include nutrition information. The use of claims may also be related
positively to the use of nutrition labels because some consumers tend to use
all information readily available to them (Baltas 2000:709). One may
conclude that use of claims and use of nutrition labelling are correlated over
people in the sense that information-seekers usually look at both (Baltas
2000:709).
Although consumers increasingly look at labels, their understanding of
nutrition information is a major issue (Baltas 2000:709). It appears that while
consumers claim extensive label usage and general understanding of dietary
matters, they are often confused by technical terms miscalculate nutrient
intake (Baltas 2000:709).
Nutritional labelling and purchase behaviour
In the UK, more than 80 percent of surveyed individuals claim that they look at
labels and that label information affects their purchase decision (Abbott,
1997). Most consumers also use information on nutrition labels the first time
they purchase a product and this then becomes a source of new knowledge
they can draw on in subsequent purchases (Baltas 2000:709).
According to Brown, Mcllveen and Strugnell (2000:230), many young
consumers whilst being aware of nutritional information and potential
implementation, may indeed be very hesitant in actually putting the theory into
practice. This must not be underestimated in the continued pursuit of a better
diet and/or lifestyle for tomorrow's adult consumers. There remains a
Page 69

Chapter 3
significant "gap" between young consumers' nutritional knowledge and their
ability to implement such knowledge into the reality of their daily food
behaviour. Unfortunately, such food preference behaviour presents
challenges for future nutritional awareness campaigns (Brown et al., 2000).
Nutrition labelling standards
Where on-pack nutrition information is provided, it should include energy,
protein, carbohydrate and fat or all the former plus sugars, saturates, fibre and
sodium. In addition, nutrition labelling may include data on starch, polyols,
mono-unsaturates, polyunsaturates, cholesterol and listed minerals and
vitamins (Baltas 2000:709).
By disclosing nutrition composition, mandatory labelling intensifies
competition on nutritional quality. Even if only a segment of the population
uses nutrition labelling, this may be sufficient to induce product changes by
manufacturers who wish to increase market share by selling to information-
seeking consumers (Baltas 2000:709). Truthful producer claims may increase
consumer awareness and interfirm competition on nutritional quality, leading
to improved consumption and production patterns (Baltas 2000:709).
Consumer views of labelling practices
According to Humphries (1998:193), common labelling practices were found
to be misleading consumers:
the small print;
the half truth;
the hidden truth;
the bluff;
rose-tinted spectacles;
weasel words;
the illusion (Humphries, 1998:193)
According to EU Labelling Regulations (EuroFIR, 2006:1), the current
legislation requires that information is easily visible, clearly legible and
indelible. Pre-packed foods are also required to make a number of mandatory
Page 70

Chapter 3
declarations (see Table 3.3). Additional information, also listed in Table 3.3,
can be provided voluntarily, so long as the information is accurate and not
misleading. Provision of nutrition information is voluntary unless a claim is
made on pack, in which case full nutrient labelling (the big 8, namely energy,
protein, total carbohydrate, sugars, total fat, saturates, fibre and sodium)
becomes mandatory.
TABLE 3.3: THE MAIN FOOD LABELLING REQUIREMENTS AND
EXAMPLES OF INFORMATION THAN CAN BE PROVIDED BY FOOD
MANUFACTURERS Mandatory food labelling requirements Voluntary* information sometimes provided
Name Nutrition information (if no claims made)
List of ingredients Nutrition signposting
Quantity of certain ingredients (QUID) e.g. pork (10%) Guideline Daily Amounts
Net quantity (weights & measures) Claims such as 'no artificial additives'
Date of minimum durability ('best before' or 'use by') Graphical and pictorial information
The name and address of manufacturer/ packer/ seller Vegetarian/ vegan labelling
Place of origin (if failure to do so might mislead) May contain (e.g. nuts) labelling
Instructions for use (if failure to do so might mislead) Assurance schemes
Allergen information (in the ingredient list) Method of slaughter (e.g. Halal)
Alcoholic strength by volume (drinks over 1.2% only) Free range e.g. eggs
Sweeteners labelling Environmental impact e.g. dolphin friendly
Polyol warning ('excessive consumption may produce a laxative effect) Country of origin (where not required)
Packaging gases ('packaged in a protective atmosphere') Quality type claims e/g/ '100% chicken breast'
Raw milk labelling Special offer competitions
GMO labelling Production methods (e.g. organic)
Nutritional Panel (where a nutritional claim is made, e.g. low in fat) Brand information
* Based on information provided voluntarily in the UK
Source: Adapted from EuroFIR (2006:1)
Labelling policy must be dynamic if it is to keep up with modern technology
and meet the increasing needs and demands of consumers (Humphries,
1998:193).
Page 71

Chapter 3
How to Read a Sports Drink Label
Each ingredient in a sports drink (carbohydrate, water, sodium and
potassium) performs an important function. The Nutrition Facts label is a tool
to help consumers choose food products based on their nutrition composition.
The label is designed to provide the nutrient content of select nutrients per
serving. The nutrients listed on the label include: total fat grams, saturated fat
grams, trans fat grams, protein grams, total carbohydrate grams, fiber grams,
sugar grams, sodium milligrams, percent of the Daily Value of calcium,
vitamin A, vitamin C and iron (Walters, County and Kochert, 2007:36).
Besides the nutrition label there is also an ingredient list on food labels. By
law food companies have to list the ingredients in descending order by weight.
The most abundant ingredient is listed first, then the second and so on
(Walters, County and Kochert, 2007:36).
Trend 5 - Vitamin/Mineral Fortified Some beverages marketed as sports drinks have other added ingredients eg
vitamins, minerals, protein and herbs. Currently, there is little evidence to
support the addition of substances other than carbohydrate and electrolytes.
The extra ingredients tend to increase the price and often have adverse
effects on flavour (www.sportsdietitians.com ).
Sports drinks include the electrolytes sodium and potassium. Some also
include magnesium, although there is no evidence that this improves sports
performance. Sodium stimulates the absorption of both carbohydrate and
water from the small intestine. It stimulates thirst receptors, so you are
encouraged to drink more and hence replace fluids faster
(www.sportsdietitians.com ). Sports drinks use glucose, glucose polymers,
sucrose and fructose as a carbohydrate source (www.sportsdietitians.com ).
According to Hehir (2007:11), people often mix sports drinks with additions
e.g enzymes, amino acids, creatine etc. Hehir (2007:11) also states that
packaging solutions will address this, because many of these ingredients
Page 72
Chapter 3
added are not stable in liquids for very long. There is a need for continuous
consumer awareness of benefit of adequate vitamins/minerals in the diet.
Also, lack of vitamins/minerals and salts can hinder performance.
Trend 6 - Low in positioning
According to Hehir (2007:11),"low positioning" statements have become
convincing to consumers the following are often used by sports drinks
manufacturers to communicate value for their products:
Low Sodium, due to links of high intakes of sodium with blood pressure
and other cardiovascular conditions
Low Calorie, Low Sugar, Low fat, Low Carbohydrates, consumers want
to replace lost micronutrients, electrolytes and fluids, not the energy.
Trend 7 - Protein
According to Hehir (2007:11), athletes and bodybuilders have increased
protein requirements to build and maintain muscle. There is a highlight on
protein in the diet, and by having a protein enriched drink, consumers can
track more accurately their protein intake.
3.1.2.2 Global Trends - Forecast/Predictions
Hehir (2007:11), has identified the following predictions for the future of sports
drinks:
Sports Drinks are likely to offer more supplementation with electrolytes,
amino acids, minerals and vitamins.
Products low in sodium, sugar, calories, and fat are likely to increase
for diet-conscious consumers.
Companies are likely to experiment with innovative ingredients, such
as easy-to-digest protein, specific carbohydrate to protein ratios for
different kinds of exercise, with potential to supplement for specific
forms of exercise, relative to the ratio of stamina and strength needed,
ensuring customised optimal nutrition.
Page 73

Chapter 3
Products could become more natural or have 'more natural credentials'
communicated more clearly on pack.
Sports Drinks for children seem a likely alternative to more fatty and
sweet offerings such as milk mix drinks, carbonated soft drinks, or juice
drinks.
Packaging is likely to focus on portability; children's products could be
packaged so they fit easier into lunch boxes (Hehir, 2007:11).
3.1.2.3 Primary Packaging The South African sports drink market currently comprises three different
sectors:
Liquid concentrated format: available in 1 Litre plastic bottle
Ready to drink format: available in plastic bottles, carton and
glass
Powder concentrate format: available in sachets and metal cans
Demand for 500m1 - 600m1 Litre packs in 2006 accounted for 64.6% and is
estimated to show some positive growth in the future
The 500m1/600m1 pack range grew well to constitute 64.6% of total volumes
sold during 2006. This pack size category is well suited to the on-the-go
convenient demands of this market. The pack size also proves popular for
promotional campaigns at sporting and other events (BMI Foodpack,
2007:27).
3.1.2.4 Plastic Plastic constituted 91.6% of total sports drinks market volume in 2006. It is the
most dominant form of packaging within the South African sports drinks
market. (BMI Foodpack, 2007:28).
Page 74

Chapter 3
In 2006, the 500 ml/600 ml pack size is convenient for on-the-go consumption
and at sports events. Overall plastic packaging is anticipated to grow by 4.1%
in 2007(BMI Foodpack, 2007:31).
According to Stewart (1996:169), plastic "PET" is lightweight, with strength,
clarity and is easily molded. Compared to glass, there is a loss of carbon
dioxide through bottle walls which must be allowed for.
3.1.3 OUTLET DISTRIBUTION Sports drinks are products that are designed to re-hydrate and replenish the
minerals lost by athletes during sporting activity. The very nature of sports
drinks dictates that they should be available where people are taking part in
sporting events (BMI Foodpack, 2007:15).
According to Neves, Zuurbier and Campomar (2001:58), distribution builds
stable competitive advantages, since marketing channels have a long-run
character and to build them it is necessary to have a consistent structure; and
due also to the fact that they are focused on people and relationships.
Retail remained dominant across all channels with top-end representing
31.1% of the 48.8% of overall volume sold through the retail channel during
2006. Wholesale saw a share decline in 2006 to constitute 9.9% from 10.6%
in 2005, while garage forecourts demand saw an increase from 2005 to
represent 16.8% during 2006. On-consumption demand declined by 0.6% in
2006 to represent 24.5% of total volumes sold during 2006 (BMI Foodpack,
2007:2).
Page 75
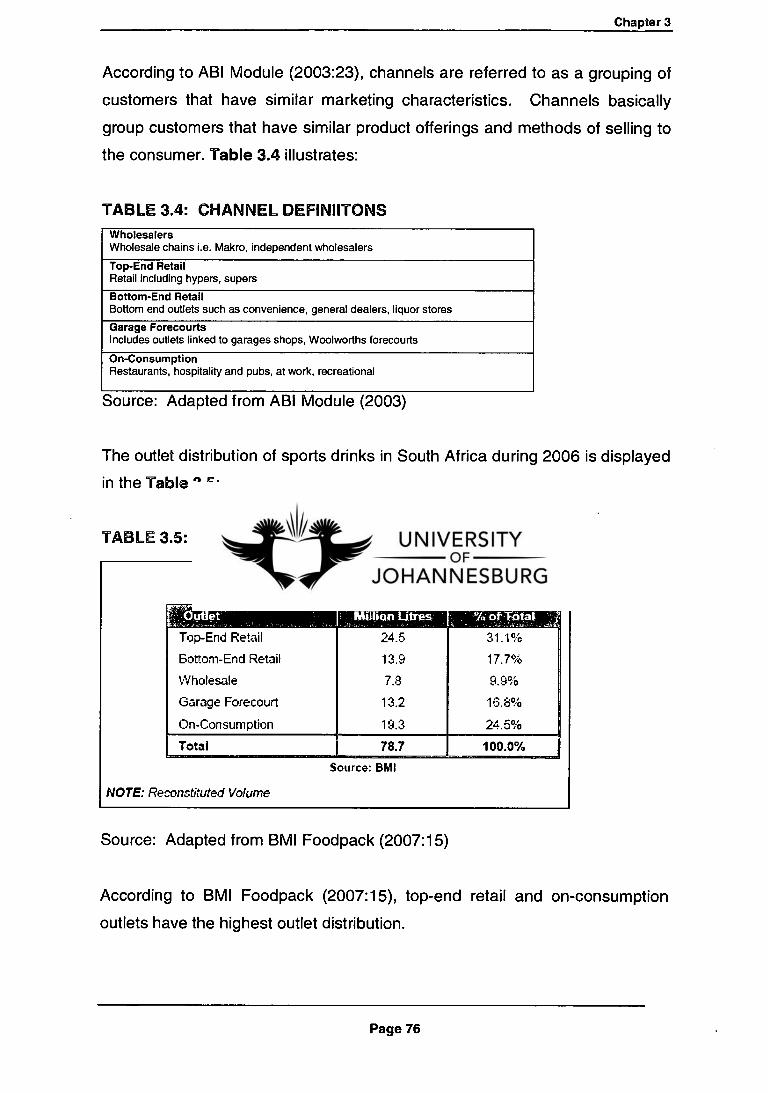
Outlet Distribution of Sports Drinks — 2006
r.Outlet___ • &Ilion Litres % of Total
Top-End Retail 24.5 31.1%
Bottom-End Retail 13.9 17.7%
Wholesale 7.8 9.9%
Garage Forecourt 13.2 16.8%
On-Consumption 19.3 24.5%
Total 78.7 100.0%
Source: BMI
NOTE: Reconstituted Volume
Chapter 3
According to ABI Module (2003:23), channels are referred to as a grouping of
customers that have similar marketing characteristics. Channels basically
group customers that have similar product offerings and methods of selling to
the consumer. Table 3.4 illustrates:
TABLE 3.4: CHANNEL DEFINIITONS Wholesalers Wholesale chains i.e. Makro, independent wholesalers
Top-End Retail Retail including hypers, supers
Bottom-End Retail Bottom end outlets such as convenience, general dealers, liquor stores
Garage Forecourts Includes outlets linked to garages shops, Woolworths forecourts
On-Consumption Restaurants, hospitality and pubs, at work, recreational
Source: Adapted from ABI Module (2003)
The outlet distribution of sports drinks in South Africa during 2006 is displayed
in the Table 3.5:
TABLE 3.5: OUTLET DISTRIBUTION OF SPORTS DRINKS
Source: Adapted from BMI Foodpack (2007:15)
According to BMI Foodpack (2007:15), top-end retail and on-consumption
outlets have the highest outlet distribution.
Page 76

Chapter 3
3.1.4 NEW PRODUCTS AND PROMOTIONS Bromor Foods, manufacturers of Energade sports drink, extended their range
by introducing a low calorie sports drink. Bromor Foods has since being
bought by Tiger Brands Limited during 2005. Various sports activities are
sponsored by players in the sports drinks market create awareness and drive
consumption of their products and also because consumers involved in
sporting activities are their primary target market.
USN — Ultimate Sports Nutrition - has introduced a new sports drink, Lean R.
Lean R is packaged in a unique 600m1 PET bottle and is said to aid weight
loss when used in conjunction with an eating plan. It also claims to aid weight
loss during exercise. In addition, USN has launched a range of sports waters,
giving maximum energy while assisting with weight management (BMI
Foodpack, 2007:20).
3.1.5 CONSUMPTION PER CAPITA The table below and overleaf indicates the per capita consumption per year of
sports drinks by the South African market; the per capita consumption is
expected to grow significantly (BMI Foodpack, 2007:21). Table 3.6 illustrates:
TABLE 3.6: HISTORICAL SA PER CAPITA CONSUMPTION PER YEA
Historical SA Per Capita Consumption per year
Year
2002
COMUmptice (MIlilion Litres)
63.9
pit .1$ rl (Whom)
45.8
titres per Capita
1.4
Per Colman
2303 65.3 46.2 1.4 2.9%
2304 69.5 46.6 1.5 3.9%
2305 73.0 46.8 1.6 4.6%
2006 78.7 47.1 1.7 7.1%
Source: BP.Ii
NOTE: Reconstituted Volume
Source: Adapted from BMI Foodpack (2007:21)
Page 77

% incidence of
Wagq LSM 1 4.9%
LSM 2 13.0%
LSM 3 15.4%
LSM 4 20.3%
LSM 24.0%
LSF.1 28.9%
LSM 7 28.8%
LSM 8 22.5%
LSF.1 9 25.3%
LSM 10 28.4%
Incidence of Usage of Sports/Energy Drinks by LSM Group-2006
Source: SAARF AMPS:D
Chapter 3
Table 3.7 highlights the incidence of usage of sports and energy drinks by
LSM group in the South African market, the higher the LSM, the higher the %
incidence of usage (BMI Foodpack, 2007:21):
TABLE 3.7: INCIDENCE OF USAGE BY LSM GROUP
Source: Adapted from BMI Foodpack (2007:22)
3.1.6 Historical Average Retail Selling Price The average historical retail selling price of sports drinks are indicated in the
table below. The average price is expected to increase significantly. The
previous LSM data indicated that the higher the LSM, the higher the % of
incidence of usage. Price plays an important role in affordability by LSM (BMI
Foodpack, 2007:25). Table 3.8 illustrates:
Page 78

Chapter 3
TABLE 3.8: SELLING PRICE PER LITRE OF SPORTS DRINKS
Average Historical Retail
Year
2001
Selling Price
RSP
R 7:9.
per Litre of Sports
I Chari*p__ . .a. _.,.._ ........a. ,...umore
Drinks
2002 R 8.• 11.4%
2003 R 9.3 .5.2?i,
2004 R 9.8 5.4%
2005 R 10.3 5.5?i.
2006 R 10.9 4.8%
Source: BM
Historical Annual-Retail Selling iPrice of Stiotis.Drinks
-7; 2 z: 5 OD 2 &.
:5
g II: OD
6.131 10.30
:035 .---
- 14 0%
1: tr;
6.C%
T.%
E.80 -.-
E
i : t —
'
2:C1 2:C2 --C's :C.:4 2CC5 :008 Year
BM - =I RSP •=0='% Change p.a.
Source: Adapted from BMI Foodpack (2007:25)
Page 79

Chapter 3
3.1.7 GROWTH PROSPECTS The forecast growth for the South African sports drink market is displayed in
the table and graph below. The category is expected to grow, with growth
being led by RTD (BMI Foodpack, 2007:26). Table 3.9 illustrates:
TABLE 3.9: SPORTS DRINK GROWTH FORECAST
Sports Drink Growth Forecast (Million Litres)
rz ,: .. „zilop._, „,„,..„,„ ,„..9.,..,.„., ,a0mi ---m, , Ready :c, :rir k f 3.!
Cor ae-cra:e, and Powders 22.1
c•. 5°.b 1A V: f3.7
-2 2 ,4 4 .0% 2:2
TOTAL 78.7 4./..% 81.9 2.14:: 69.0
Source: MI
NOTE: Reconstituted Volume
Forecast Production of Sports Drinks in South Africa
'Avera^e. Gro'.vih par ArIP urn
ICC :-,
2C C
tO C ..,.
he
C :
120._ 1
85 89.0 872 63.6 .4 78.7 61 9
,.
:::!. :2•27;40 2::E%f) 2032;f: I: : C4f) 23111f1
Year tii Mi
NOTE: Reconstituted Volume
Source: Adapted from BMI Foodpack (2007:26)
Page 80

Pis t“) Cliannels. Cowasp ksc.attrnmts Locadois troverM4 Tr3rsporfinon Lzfisbc:a
Product PrIc.2 Yericy I 1 Fie..cci
1 CLtat ::: 1315,ximIE Dumign A"cf,vaicEs FeicrAL.In Payre.r. peritcl F4i-pznr; -vim CrEel. lemes oackRoria 8arrvel3S
Ta10:11 c,mtccnert;
CItencot
Prtimation Araverttsing Pr canal 5e1 hg .9r_Itzt prarnatian PLE)14 rewicTs
Chapter 3
3.2 INDUSTRY TRENDS DEFINED BY THE MARKETING MIX
CONCEPT
The marketing mix is the set of controllable, tactical marketing tools that the
organisation blends to produce the response it wants in the target market.
The marketing mix consists of everything the organisation can do to influence
the demand for its product. These can be collected into four groups, as
displayed in Figure 3.10 of variables known as the "four Ps": product, price,
place, and promotion (Kotler and Armstrong, 2001:67).
FIGURE 3.9: THE FOUR PS OF THE MARKETING MIX
Source: Adapted from Kotler and Armstrong (2001:67)
3.2.1 PRODUCT
Product means the goods-and services combination the company offers to the
target market (Kotler et al., 2001:67). Aspects of product are illustrated in
Figure 3.8. Members within the industry claim that the basic sports drink is a
commodity. A commodity is a product presumably so basic that it cannot be
physically differentiated in the minds of consumers (Keller, 2003:13). In the
sports drink market, the difference appears to lie in the "packaging" created by
the different brand manufacturers.
Page 81
Chapter 3
Consumer's view and respond to the shape of the package, the recognition of
the brand, the colour and the words, and the graphic style and format and
instinctively conjures up an image of the product (Meyers and Lubliner,
1998:1). Packaging involves designing and producing the container or
wrapper for a product, and, innovative packaging can give a company an
advantage over competitors (Kotler and Armstrong, 2001:67).
According to (Melamdowitz, 1993:80) without the labelling and packaging,
many products look the same. Easy grip handle feature on plastic bottles
provides better leverage. The 500m1 pack size sports drink constitutes 64.6%
of total market volume in South Africa. Convenience offered by the push-pull
lids and reusability of these bottles has added to the popularity of this pack
size and secured its place as a favourite with consumers in this category (BMI
Foodpack, 2007:3).
If brand distinctiveness is known to the customers, social visibility of certain
brands is meaningful, increasing product prestige (Melamdowitz, 1993:80).
Aaker and Joachimsthaler (1999:9) contend that, whenever a clear and strong
brand identity is lacking, a brand is like a ship without a rudder.
Winning in the marketplace means being able to deliver beverages where,
when and how consumers want them. Packaging is playing a key role in
expanding both the audience and distribution of spirits, wine, soft drinks, beer,
milk, water, tea and juice drinks (BMI Foodpack, 2007:19).
Today, packaging helps beverage marketers meet three crucial needs:
Deliver consumer convenience.
Gain distribution.
Assure production efficiences (Neves et al., 2001:518)
Page 82

Chapter 3
Product - Packaging Innovation
Beverage sales begin and end with a satisfied customer. Nothing pleases
busy consumers as much as timesaving, convenient packaging. Recent
packaging solutions include:
TABLE 3.10: PACKAGING SOLUTIONS Proliferation of single-serve sizes
This changes the point of consumption, making grab-and-go portion packaging essential to meet consumer needs. The amount of product in a single-serve package varies depending on the target customer and the venue.
Switch to plastic Plastic bottles continue to find new applications. Reclosable The switch to plastic containers also triggers the change from metal caps to
plastic closures, which may cause a product quality and freshness issue. As one closure manufacturer explains, "There's not a plastic closure available today that can compete in oxygen barrier with metal closures." Barrier closure liners or composite metal/plastic closures are two possible solutions.
Multipack options The increase in single-serve containers has also spurred growth in multipacks. Consumers like the convenience of multipacks for their single-serve beverages. They can buy economically in bulk yet still grab one bottle and run.
Shapes Unique or unusual container shapes catch the customer's eye. Package differentiation helps connect with consumers on an emotional level.
Handles/grips on larger
sizes
For carrying convenience and better control for pouring, larger beverage bottles creatively incorporate grip indents and/or handles.
Hygienic concerns The number of health and wellness drinks has exploded within the last year. In this, and other categories, consumers continue to choose clear, °clean° containers.
Source: Adapted from Hehir (2007:8)
3.2.2 PRICE
Price is the amount of money customers have to pay to obtain the product
(Kotler and Armstrong, 2001:67). Aspects of pricing are illustrated in Figure
3.8. The nature of sports drinks makes them an impulse product to which
consumers are not too often price sensitive. Sports drinks are normally
consumed by people who are thirsty and wanting to replenish themselves
after sporting activity. However, some of the smaller brands within the market
try and broaden their appeal to consumers by offering their product at a lower
price (BMI Foodpack, 2006:8).
The price premium may be the best single measure of brand equity available,
because it directly captures the loyalty of customers in a most relevant way. If
they are loyal, they should logically be willing to pay a price premium; if they
are not willing to pay more, the loyalty level is shallow (Aaker, 1996:51).
Page 83

Chapter 3
3.2.3 PROMOTIONS
Promotions mean activities that communicate the merits of the product and
persuade target customers to buy it (Kotler and Armstrong, 2001:67).
Marketing and promotion has been heavily targeted at the sports sector. As
competition for share of throat and consumer attention increases, promotional
activity increases (BMI Foodpack, 2007:8).
Once a brand has been built, it must be maintained through advertising and
other forms of communication. Brand building no longer means putting a
commercial in the media and expecting that people will buy your product.
People want to know what the product can do for them (Kuzwayo, 2000:87).
Advertising can induce resistance to switching. By occasionally reminding the
consumer of a reason for buying the brand and keeping the brand name "top
of mind," marketers may be able to keep consumers from switching (Maclnnis
and Hoyer, 2001:257).
3.2.4 PLACE
Place includes company activities that make the product available to target
consumers (Kotler and Armstrong, 2001:67). Sports drinks are products that
are designed to re-hydrate and replenish the minerals lost by athletes during
sporting activity. The very nature of sports drinks dictates that they should be
available where people are taking part in sporting events. The manufacturers
of these products would typically sell their products to wholesalers, who in
turn would then resell the products to outlets such as sporting/running clubs
that fall into the on-consumption sector. Convenience sectors, like forecourt
shops, are also popular channels of distribution (BMI Foodpack, 2007:9).
Distribution is also important to prevent habitual consumers from switching to
another brand. One major factor that might force a consumer to break a habit
is an out-of-stock condition. Without a strong preference, the consumer is
more likely to break the habit and buy another brand than to go to another
store. Widespread distribution can ensure that the consumer is not forced to
buy something else (Maclnnis et al., 2001:257).
Page 84

Chapter 3
3.2.5 PHYSICAL EVIDENCE
According to Zeithaml, Bitner and Gremler (2006:27), physical evidence is the
environment in which the service is delivered and where the organization and
customers interact, as well as any tangible components that facilitate
performance or communication of the service. The physical environment can
influence customers' choices, expectations, behaviour and satisfaction with
the service. General elements of physical evidence as shown in Table 3.11
includes all aspects of the organization's physical facilities, also known as the
services cape as well as forms of tangible communication.
TABLE 3.11: GENERAL ELEMENTS OF THE PHYSICAL ENVIRONMENT
SERVICESCAPE
Facility exterior
Exterior design Signage Parking Landscape Surrounding
Other tangibles
Business cards Stationery Bulling statements Reports Employee appearance
Facility interior
Interior design Equipment Signage Layout
Other tangibles
Uniforms Brochures Website
Source: Adapted from Hehir (2007:8)
Physical evidence is rooted in the five senses of sight (colour and aesthetics)
sound, scent, touch and taste. Because services are characterised by
inseparability, customers are present in the production premises; therefore,
the physical setting of the delivery processes is vital for success. Physical
setting is sometimes seen as the reason of existence of the service.
Physical evidence is used to make the service more tangible. It is used to
communicate a message of quality, positioning and differentiation. It also
plays a role in setting and meeting customer's expectations. Physical
evidence can also be used to facilitate the service delivery process through
layout and signage, which communicate the customer's role in the service
delivery process. By creating a certain ambience with physical evidence,
service providers can influence the customers' mood states.
Page 85
Chapter 3
3.2.6 PROCESSES
According to Zeithaml et al., (2006:27) processes refer to the actual
procedures, mechanisms and flows of activity by which a service is delivered.
As such, it includes the service delivery and operating systems required to
deliver a service promise to customers.
Customers do not like chaotic, slow, inconsistent, disorganized or
inconvenient service but demand service that is orderly, fast, uniform,
organized and convenient to them. It is vital that an organization's service
processes must be designed to achieve the ideal set out above. Therefore,
service delivery processes must be designed to meet customers'
requirements.
While service processes must be designed with customer needs and
requirements in mind, operational constraints and efficiency requirements
must also be considered. Service marketers and operations managers must
therefore join forces when designing service processes.
3.2.7 PEOPLE
According to Zeithaml et al., (2006:27), people's role in the service
environment is vital for the success of the entire service experience. People in
the service environment encompasses of customers, other customers and
employees.
People as elements in the service industry include all the human actors - the
organization's employees, the customer and other customers (who play a part
in service delivery and accordingly influence the customer's perception in the
service environment). Service employees interact with customers during
service delivery processes and provide cues to customers concerning the
services.
Hence, it can be said that service employees' competence, attitudes and
appearance, influence customers' perception of services. Customers often
experience service employees as synonymous with the service and no matter
Page 86
Chapter 3
how small or large part they play in the actual delivery of the service; they are
still the focal point of the service for customers. It is crucial that service
organizations stipulate very specifically to their employees what is expected of
them during interactions with customers.
Employees and customers must be viewed as valuable assets, and
management must attempt to manage them in such a way that they can
achieve their full potential. Specifically, managers have a responsibility to
contribute toward a supportive organizational climate.
3.3. CONCLUSION
In summary, commercial sports drinks supply water, sugar and electrolytes,
including sodium. They promote fluid retention and tend to increase voluntary
drinking because of their taste. They are highly recommended during athletic
and intense physical activity that last over one hour. For casual activities of
less than one hour water is a good choice for hydration purposes. On the
other hand, beverages high in sugar, including fruit juices (fructose) that can
cause nausea or gastrointestinal distress and caffeine or alcohol that increase
urine output and reduce fluid retention (Hehir, 2007:13).
Vitamin and mineral fortification is the dominant trend in this category. Apart
from fortification with vitamins and minerals, low-in positioning dominates the
category, with some Sports Drinks claiming to be low in sodium, calories, and
sugar. As Sports Drinks are usually consumed during or right after exercise
to compensate the fluid and nutrients lost due to sweating, consumers avoid
beverages that are high in calories, sugar, and fat, especially when they
exercise to maintain or lose weight. Sports drinks with added protein are
conspicuously absent. Fruity flavours remain the top flavours. As many
electrolytes have a salty taste, fruity flavours can mask this making the
beverage more appealing (Hehir, 2007:13).
Having reviewed the literature, it is evident that the sports-drink category is
reaching maturity and that it is currently under a degree of threat, especially
from increased activity in the bottled-water and flavoured-water categories,
Page 87

Chapter 3
with which it competes indirectly. Powerade and Energade control the
category in volume and value. The next chapter will focus on the research
approach, where quantitative aspects of the study will be discussed, to
answer the research questions.
The chapter to follow (Chapter Four) will provide a discussion of the research
methodology, total population and sample size determination, questionnaire
design and various aspects of data collection employed in this research.
Page 88

Chapter 4
CHAPTER 4
RESEARCH METHODOLOGY
4.1 INTRODUCTION This chapter describes the research methodology employed in this research
study. A well-designed research plan forms the basis of the entire research
process. Research can be described as a practical activity whose purpose is
to find out things in a systematic way. It is a process of designing, gathering,
analyzing and reporting information to uncover opportunities and reduce the
risks of decision-making (Caldwell and Herbst, 2003:10). According to Shao
(2002:7), research is a systematic and objective investigation of a subject or a
problem to discover relevant information or principles
It is therefore necessary for the researcher to conduct an extensive literature
search on the concept of brand loyalty in order to derive the views of the
majority of researchers. These views will make an important contribution to
the foundation of the proposed study. With the use of research design
methods, primary data will be collected analysed, and reported. Personal
contact of the researcher within the industry helped in gaining access to
relevant information as well as a keen business interest in the outcome of the
results.
This chapter will describe in detail the methodology, namely the research
design, the choice of population, questionnaire design, data collection and the
analysis of the data that was followed by this study. It is not the purpose of
this chapter to provide a detailed description of the relevant theory but rather
to describe and motivate the methodology followed.
Page 89
Chapter 4
4.2 RESEARCH DESIGN
A research design is a framework or blueprint for conducting a marketing
research project. It entails the procedures necessary for obtaining the
information needed to structure or solve marketing research problems
(Malholtra et al., 2003:51).
According to Shao (2002:41), research design is the framework that directs
marketing research efforts. An effective research design does two things (1)
provides answers to questions as objectively; accurately, an economically as
possible; and (2) controls possible sources of errors, such as collecting data
from respondents who are not representative of the population of interest.
According to the objectives of the study as described in Chapter one form an
integral part of the research design. They ensure that appropriate information
is collected, help to determine the sources of the information, determine the
technique for data gathering, specify the sampling methodology and influence
the schedule and cost of the research project (Zikmund, 2003:58).
According to Malholtra et al. (2003:51), descriptive research is conclusive
research that has as its major objective the description of something, usually
market characteristics or functions. For the purpose of this study, the
researcher will make use of descriptive research to describe the extent of
brand loyalty in the sports drink market.
4.3 PRIMARY DATA ANALYSIS
According to Dillon, Madden and Firtle (1993:78), secondary data involves
already published data collected for purposes other than specific research
needed at hand. Malholtra et al. (2003:87) contends that, the examination of
available secondary data is a prerequisite to the collection of primary data.
The researcher has started with secondary data, and only proceeded to
primary data only when the secondary data sources where exhausted or yield
marginal returns. An extensive literature search on brand loyalty has been
conducted by consulting a wide range of relevant scientific journals and
research publications.
Page 90
Chapter 4
The data requirements described above indicate the most appropriate
methodology to be used, namely a combination of both the descriptive and
analytical survey techniques. Survey research is a "procedure for
systematically collecting information about the attitudes, beliefs, background,
experiences, and behaviour of a sample of people by using interviews and
questionnaires".
Survey research has a number of characteristics (Kerlinger 1973):
It is carried out in a short space of time as possible
Surveys are generally said to be structured. There is a fixed set of
questions, and responses are systematically classified
Survey research has a social nature. That it is concerned with
relationships such as opinions and beliefs (Kerlinger 1973).
The biggest advantage of survey research is that it facilitates accumulating a
great deal of information. Another advantage is that it is accurate as long as it
is efficiently administered. Disadvantages include the fact that in-depth
analysis is not facilitated, it is time consuming and costly, and it is dependent
on the respondents perception and honesty.
This method of research is suitable for the purposes of this study. It provides
a means of measuring peoples attitudes and perceptions. It is capable of
generating results that can be generalised to a much larger population, and
allows for a wide range of methods of obtaining information. Face-to-face
interviews will be used for this research.
In today's marketing research environment, secondary data research tasks
are applied more often to specific marketing problems because of the relative
speed and cost-effectiveness of gathering this data (Hair et al., 2003:97).
Page 91

Chapter 4
4.4 DATA ANALYSIS
Data analysis begins after the data has been collected. During the analysis
stage several interrelated procedures are performed to summarise and
rearrange the data. The raw data must be transformed into meaningful
information, where the transformation of raw data into a form that will make it
easy to understand and interpret is defined as descriptive analysis.
4.5 METHODS OF COLLECTING QUANTITATIVE DATA
According to Dillon et al. (1993:134), quantitative research involves relatively
large numbers of respondents, which are designed to generate information
that can be projected to the whole population. Dillon et al. (1993:158-172),
further state that, versatility, quantity of data, sample control, quality of data,
response rate, speed, cost and uses, influenced the choice of a survey
method. After considering all the advantages and disadvantages of the
various methods (mall intercept, personal interview, mail, telephone and e-
mail), a decision was taken to make use of gym intercept interviews.
According to Dillon et al. (1993:158), a gym intercept is a survey method
using a central location test facility at a sports gym centre; respondents are
intercepted while they are coming into gym. This method fits well with the
study to be conducted, as it is flexible, will cover a broader sample, and is
both cost and time effective.
The choice of data collection method is of great importance, and the
advantages and disadvantages of the method should be taken into
consideration before a choice is made. Because of the attainable
environments, a fieldworker-administered survey was considered the most
appropriate data collection method.
The advantages of this type of survey where:
the availability of a fieldworker to answer questions
the right respondents were interviewed and
it spurred interest among the respondents to answer the questions
(Hair et al., 2003:266).
Page 92

Chapter 4
4.5.1 Fieldworkers
Fieldworkers are individuals responsible for the gathering of data (Zikmund,
2003:475). According to Dillon et al., (1993:336) field workers should be
carefully prepared for the fieldwork by way of a formal briefing session. During
the briefing session, fieldworkers are given the necessary material and
instructions. They must be informed about who qualifies as respondents, the
period within which the survey must be conducted and the controls that must
be in place. The content of the questionnaire must be explained as well as the
way that respondent's enquiries should be handled. For the purpose of this
study, three field workers will be employed for a period of one week.
4.6 SAMPLING SIZE DETERMINATION AND THE SELECTION OF THE
SAMPLING METHOD
A sample is a subset of the population of interest. If the sample is
representative, then the survey results can be extrapolated to the entire
population (Dillon et al., 1993:214). Non-probability sampling will be used,
there is however no statistical formulas for determining the appropriate
sample size in this method. However cost limitations and industry standards
will be considered in the sample size selection.
Sampling involves any procedure using a small number of items or parts of
the whole population to make conclusions regarding the whole population. A
sample is therefore a subset, or part of a larger population. There are several
alternative ways of taking a sample. The major alternative sampling plans
can be grouped into probability and non-probability techniques (Zikmund,
2003:369).
The purpose of sampling is to enable researchers to estimate some unknown
characteristics. The process of sampling involves any procedure using a
small number of items or parts of the whole population. A sample is a subset,
or some part, of a larger population. There are several alternative ways of
taking a sample. The major alternative sampling plans may be grouped into
two categories according to Malhotra and Birks (2003:362):
Page 93

Chapter 4
Probability samples where each element of the population has a fixed
probabilistic chance of being selected for the sample
Non-probability samples do no use chance selection procedure, but
rather rely on the personal judgment of the researcher
In probability sampling every element in the population has a known nonzero
probability of selection, where the simple random sample is the best known
probability sample, in which each member of the population has an equal
probability of being selected. In non-probability sampling on the other hand
the probability of any particular member of the population being chosen is
unknown (Zikmund, 2003:369).
According to Dillon et al. (1993:229) non probability sampling designs share a
common characteristic:
There is no way of determining the probability of selecting any
particular element for inclusion in the sample
4.6.1 Sample size
A non-probability sampling design has been used in this research to draw a
representative sample of consumers. This design does not guarantee the
chance of selecting any particular element or sampling unit into the sample.
The sample units will be selected using convenience sampling and
respondents will be randomly selected. Convenience sampling attempts to
obtain a sample of convenient elements. Selection of sampling is left to the
interviewer (Malhotra et al., 2003:363). Non probability sampling will be used
as discussed earlier in the chapter. Consumers will be chosen subjectively
based on availability and convenience.
4.6.2 Determining the sample size
The sample size has been determined according to industry standards and
sampling used in similar studies (Eiselen, n.d.). The researcher will use
industry standard sample size for the purpose of this study. Previous studies
conducted by (Melamdowitz, 1992: Brand loyalty in the denim jean market)
used a sample of 90 respondents, and by (Stephanou, 1983: Brand loyalty in
Page 94
Chapter 4
the sunglasses market) used sample of 150 respondents. For the purpose of
this study the researcher uses a sample of 178 quantitative interviews. A
cross section of university gyms will be used to gain access to different
students.
4.6.3 Defining the target population
The sample represents students who drink sports drinks. The target
population can be defined as university students that drink sports drink as a
qualification question to screen respondents will enable non drinkers of sports
drinks to be eliminated. The sampling frame constitutes both females and
males, of all races within the age group of 18 years and older. A total of 196
interviews have been conducted, 18 were not fit for analysis therefore 178
were fit for response rate 178/196=90.8%, on students who drink sports
drinks. Respondents include White, Black, Coloured and Indian individuals.
Respondents have been targeted, as mentioned in the demarcation and
scope of study, at students in selected Gauteng universities.
4.7 QUESTOINNAIRE DESIGN
A questionnaire is a set of questions designed to generate the data necessary
for accomplishing the objectives of the research project (McDaniel and Gates,
2001:289). According to Cant et al. (2003:118), a questionnaire is a set of
questions formalised to obtain information from respondents. The
questionnaire will be arranged in a valid, logical fashion that will produce
meaningful results. Questionnaire design can be viewed in terms of four
interrelated activities: (1) preliminary considerations, (2) asking questions, (3)
constructing the questionnaire, and (4) pretesting the questionnaire (Dillon et
al., 1993:300).
A detailed questionnaire will be developed from the literature derived and the
principles associated with questionnaire design applied. The questionnaire
will comprise of both open-ended and closed questions. According to
Creswell (1998:127), phenomenology emphasis that if the research is to be
conducted on people, they should be permitted to speak. Their words should
be used to constitute data for the drawing of ethical and emancipatory findings
Page 95

Chapter 4
about them. In order to put this principle in practice, a loose structure will be
used to allow sports drink consumers to go into great detail in describing their
view point at every stage of this survey (Denzin and Lincoln, 1998:144).
The purpose of a questionnaire is to collect and record primary research data.
A questionnaire needs to be well designed because it is very seldom possible
to repeat the survey if the researcher finds out afterwards that the
questionnaire was not complete, or that some important topic was omitted.
Once a survey has been completed, the data cannot be changed (Boyce,
2002:318). According to Miller and Read (1998:86) good questionnaires are
those that meet research objectives, obtain valid and reliable data from
respondents, facilitate data processing, achieve, and maintain the
involvement of respondents. The questionnaire to be used in this study to
collect primary data (as viewed in Appendix A) has been designed in
accordance with the research problem, hypotheses and primary and
secondary research objectives.
Dillon et al. (1993:304) specify seven basic principles of questionnaire design
and layout upon which much consideration was given in developing the data
collection instrument. These principles include:
Principle 1: Be clear and precise
Principle 2: Response choices should not overlap and should be exhaustive
Principle 3: Use natural and familiar language
Principle 4: Do not use words or phrases that show bias
Principle 5: Avoid double-barrelled questions
Principle 6: State explicit alternatives
Principle 7: Questions should meet criteria of validity and reliability.
The questionnaire utilised in this study was divided into two distinct sections:
Section A: Demographic Information
NOTE: question one, in this section of the questionnaire were filtering
questions that assisted the researcher in excluding "unwanted" respondents
who did not fit the criteria.
Section B: Frequency
Page 96

Chapter 4
The formulation of this study's data collection tool was in accordance with the
research problem, primary and secondary research objectives, and the
research hypotheses as specified in chapter one. Table 4.1 below indicates
the relationships between questions in the questionnaire and the research
objectives and hypotheses of this study.
TABLE 4.1: LINKAGES BETWEEN QUESTIONS IN THE
QUESTIONNAIRE AND RESEARCH OBJECTIVES Questions linked to the research objectives
Primary Objective Questions
To establish the influence of brand loyalty in the sports drinks market. 7, 8, 9, 10,11
Secondary Objectives Questions
To investigate the purchasing behaviour of students, the needs that sports drinks satisfy, students
motivations for buying sports drinks, characteristics of students, and lastly, students attitudes to
different brands within the sports drinks market. 1, 2, 3, 4, 5, 6, 8, 9
To identify the perceptions of attributes and package designs of different brands considered in the
choice of the student, and to establish the attributes that students look for. 7, 8, 9, 10, 11
To investigate the buying motive of sports drinks relating to ingredients and packaging. 7, 10
The most predominant question format used in this questionnaire was that of
closed-ended or itemised questions. This type of question requires
respondents to select from preset numbers or descriptions, the one that best
expresses their feelings (Dillon et al., 1993:310). The principal advantages of
such itemised questions include their ease of use in the field, their ability to
diminish interviewer bias, their capacity to decrease bias based differences
pertaining to the articulation of respondents, and their relatively
straightforward coding and tabulation requirements.
4.7.1 Validity
Validity, according to Malhotra et al. (2003:140), is the extent to which a
measurement represents characteristics that in the phenomenon under
investigation. (Dillon et al., 1993:293), also state that to be valid, a scale must
fully capture all the aspects of the characteristic or trait to be measured.
A question is valid if it measures what the questionnaire intends it to measure,
therefore validity can only be measured if the purpose or intentions of the
Page 97

Chapter 4
question is known. A valid question will always be reliable but a reliable
measure does not guarantee the validity of the question (Webb, 2002:108).
A researcher can utilise various types of validity to prove whether there has
been no measurement error. Thus validity can be examined from a number of
different perspectives using content validity, criterion-related validity, and
construct validity (Webb, 2002:108).
According to Malhotra et al. (2003:314) content validity consists of a
subjective but systematic evaluation of the representativeness of the content
of a scale for measuring the risk at hand. Criterion validity examines whether
the measurement scale performs as expected in relation to other selected
variables such as meaningful criteria. Construct validity addresses the
question of what construct or characteristic the scale is, in fact, measuring
(Malhotra et al., 2003:315).
There are six ways to make an estimation as to the validity of measurements:
Face validity is the ability of the test scale items to measure the topic of
interest as judged subjectively by experts on the topic.
Predictive validity is the ability to predict a future occurrence or
phenomenon.
Concurrent validity is the validation of how well the results from one
scale correspond with those of another, when examining the same
phenomenon at the same point in time.
Construct validity is the ability of the scale to measure an observable
phenomenon that an underlying theory correlates with the construct on
interest.
Convergent validity is the ability of a scale to correlate with other scales
to measure the same concept.
Discriminant validity is the scale's lack of correlation with another scale
that measures different concepts (Struwig and Stead, 2003:139 —
143).
Page 98

Chapter 4
4.7.2 Reliability
Reliability is a necessary but not sufficient condition for validity (Dillon et al.,
1993:294). Reliability refers to the extent to which a measurement
reproduces consistent results if the process of measurement were to be
repeated (Malholtra et al., 2003:140). A reliability coefficient can be
determined, this coefficient varies from 0 to 1, and a value of 0.6 or less
generally indicates unsatisfactory internal consistency and reliability
(Malholtra et al., 2003:314). The coefficient alpha or Cronbach's alpha for the
measurement of internal consistency in the proposed study will test the
construct reliability.
According to (Dillon et al., 1993:283), if a measurement scale is reliable, then
repeated measurements of the same characteristic will yield similar scores
over time and across situations. Reliability implies consistent and stable
measurement from one use of the scale to the next.
4.7.3 Choice of scale
Measuring is a fundamental activity in each research project. The task of
measurement is to assign numbers to the characteristics of the population
being measured (Dillon et al., 1993:272). This study allows the respondents to
rate how strongly they agree or disagree with their experience and
expectations of the carefully constructed statements in the questionnaire,
(Appendix A).
A Likert scale was employed as a measurement scale of choice. The Likert
scale is one of the most widely used attitude-scaling techniques and it allows
respondents to express the intensity of their feelings. In developing the Likert
scale for this research report, statements were generated corresponding to
the important issues that were identified in the literature study. Each
statement had to be judged as favourable or non-favourable. Respondents
are asked to judge their expectations and experience on a five-point scale
ranging between degrees of strongly agree and strongly disagree with a
neutral point in the middle. The success of a five-point scale is determined by
the quality of scale items used. Scale items should possess three qualities
Page 99

Chapter 4
namely, the ability to capture all the relevant aspects of the attitude object, to
be unambiguous and to be sensitive enough to discriminate among
respondents with respect to the attitude object under investigation (Dillon, et
al., 1993:292).
According to McDaniel and Gates (2005:311), the Liken scale is a
measurement scale in which the respondent specifies a level of agreement or
disagreement with statements expressing either a favourable or an
unfavourable attitude toward the concept under study. Some of the questions
used, also made use of rank order scales. Rank order scales require
respondents to be simultaneously presented with several objects that they
order in rank (Dillon et al., 1993:283).
4.7.4 Questionnaire format and content
Questionnaires for this study included a covering letter to emphasise the
importance of this study for the beverage industry.
The questionnaire consisted of two sections and 11 questions. The sections
were divided a follows:
Section A: Demographic Information
Section B: Frequency
In Section A, the respondents were asked to indicate their gender, age, and
information based on gym frequency. Section B consists of 11 statements and
required that each respondent indicate their perception and expectation of
each of the statements. The statements were structured as simply as
possible, in wording and language that was perceived as intelligible by all the
elements included in the population.
Page 100

Chapter 4
4.8 ANALYSIS
After data collection, the emphasis of the research process focuses on the
analysis of the data collected. The analysis of the data collected by this
research report was conducted by STATKON, the statistical consultancy
service of University of Johannesburg.
Analysis is essentially about making sense of the data that has been collected
and using the results of this process to answer the research question
(Sarantakos, 1998:313). In light of this, the responses of the interviews
conducted from the selected consumers of sports drinks around students in
selected Gauteng universities will be coded. The following aspects will be
addressed:
4.9 DATA CODING AND EDITING
All questionnaires were numbered in order to facilitate possible future
reference.
4.9.1 Coding
Data coding relates to the assemblage and assigning of value to responses to
the questions contained in the survey instrument (Hair et al., 2003:499). More
specifically, data coding in this study involved the assigning of numerical
values to each individual response for each question within the questionnaire,
bearing in mind that the questionnaire made use of only closed-ended
questions. The purpose of coding is to convert a respondent's answers to
survey questions into relevant codes/symbols in order to facilitate the ease of
entering and reading by a statistical analysis software package (Cant et al.,
2003:153). According to Dillon et al. (1993:37), coding involves assigning
numerical values to represent specific responses to specific questions. Data
codes have been assigned and the data captured on Microsoft Access to
ensure that no data capturing mistakes were made. After capturing, the data
is exported to SPSS and/or Microsoft Excel and/or Statistica Computer
Software for processing purposes.
Page 101
Chapter 4
4.9.2 Editing
Editing is the process whereby the raw data are checked to ensure that all
mistakes are found, those made by either the interviewer or respondent (Hair
et al., 2003:493). During the editing process of this study, all the usable
questionnaires had been examined for maximum precision.
4.10 STATISTICAL PROCEDURES
According to Shao (2002:380), statistical procedure is the process of
gathering, organizing, summarizing, presenting, and analyzing data, and
inferring (making decisions) based on the analysis.
4.10.1 Descriptive statistics
"Descriptive statistics are all about describing, graphically displaying and
summarising data" (Cant et al., 2003:170). More simply put, descriptive
statistics are used in this study to describe the basic characteristics of the
data collected. A frequency distribution is a table that displays the amount of
times in the data set that each response occurs (e.g. 42 respondents out of
178 indicated that they consume sports drinks once per week). These tables
will also display the percentage (e.g. 42/178 x 100 = 21.3% of respondents
say they consume sports drinks once per week, which is considered to be a
more meaningful way to express relative frequencies (Anon 1 , 2000).
Furthermore, the researcher can make use of certain measures of central
tendency and variability to routinely report when tabulating a study (Dillon et
al., 1993:372).
4.10.2 Statistical techniques and procedures implemented in this
research
In order for the collected data to aid in determining if research hypotheses are
true or false, cross tabulation was required. Cross tabulation refers to the
process of simultaneously treating two or more variables in the study (Hair et
al., 2003:669). According to Malhotra et al. (2003:759), a cross tabulation is a
statistical technique that describes two or more variables simultaneously and
result in tables that reflect the joint distribution of two or more variables that
Page 102

Chapter 4
have a limited number of categories or distinct values. A frequency
distribution objective is to obtain a count of the number of responses
associated with different values of one variable and to express these counts in
percentage terms. Critical aspects of the questionnaire will be cross tabulated
with classification or demographic questions in the questionnaire.
Fisher's Exact Test is a statistical significance test used to analyse categorical
data where the sample size is small. This test is used to examine the
significance of the association between two variables in a 2 x 2 contingency
table. It is extremely accurate and as such can be used regardless of the
sample characteristics (Wikipedia, 2005). This process becomes difficult to
use with large samples or well-balanced tables, these being the exact
conditions that make the Chi-Square test particularly appropriate.
According to Shao (2002:460), a chi-square distribution is a frequency
distribution used to test how well a set of observed sample frequencies
corresponds to or "fits" a set of expected or theoretical frequencies.
The Chi-Square test is used to examine the significance between the two (or
more) frequency distributions, and was significant at the 0.05 level. If the
p-value was lower than 0.05, the hypothesis was reject. Conversely, if the
p-value was higher than 0.05, the hypothesis was not rejected.
4.10.3 Graphic representation of data
According to Dillon et al. (1993:381), graphs are a valuable means of
summarizing and displaying data. Data will be presented by the use of
graphs and pie charts. Some of the data will be presented in table format.
Page 103

Chapter 4
4.11 CONCLUSION
This chapter described the research methodology that was used by this study
to achieve results. A description of the conclusive research was presented as
well as justification for the choice of population. The measuring scale used in
this study was the Likert scale, and an interviewer-administered questionnaire
was the choice of survey for data collection. The results of the fieldworkers'
data collection were given. The method of data analysis of the data was
identified and discussed. In the next chapter the results from the statistical
analysis will be summarised and presented.
The chapter to follow (Chapter Five) will provide a discussion of the research
findings, the interpretation of these findings, including the outcomes of the
various hypotheses as proposed in chapter one.
Page 104

Chapter 5
CHAPTER 5
RESEARCH FINDINGS AND INTERPRETATIONS
5.1 INTRODUCTION
This chapter presents the results of the empirical study conducted. Findings
will subsequently be presented in a similar order to that within the
measurement instrument. The frequency distributions of the data will be
reported on, with a summary of all the results available in APPENDIX
Statistical procedures that were performed on the data (Pearson's Chi-
Square) will also be conveyed. Data depicting cross tabulations and statistical
processes can be viewed in APPENDIX C.
5.2 FINDINGS
The original sample was drawn from students in selected Gauteng
universities, with the findings based on the 178 completed questionnaires as
explained in Chapter Four.
5.2.1 Section A: Demographic Information
With this empirical research focused on students in selected Gauteng
universities, it is not surprising that the majority of respondents are between
the ages of (and including) 18 to 24 years old as depicted in Figure 5.1
(Source: Section A: Question 1). The respondents were comparatively
distributed between the different universities in Gauteng i.e. University of
Johannesburg (25%), University of Pretoria (51.3%) and Monash University
(23%), as evidenced by the data depicted in Table 5.1.
Figure 5.1: Respondents Age
Source: Section A: Question 1
Page 105
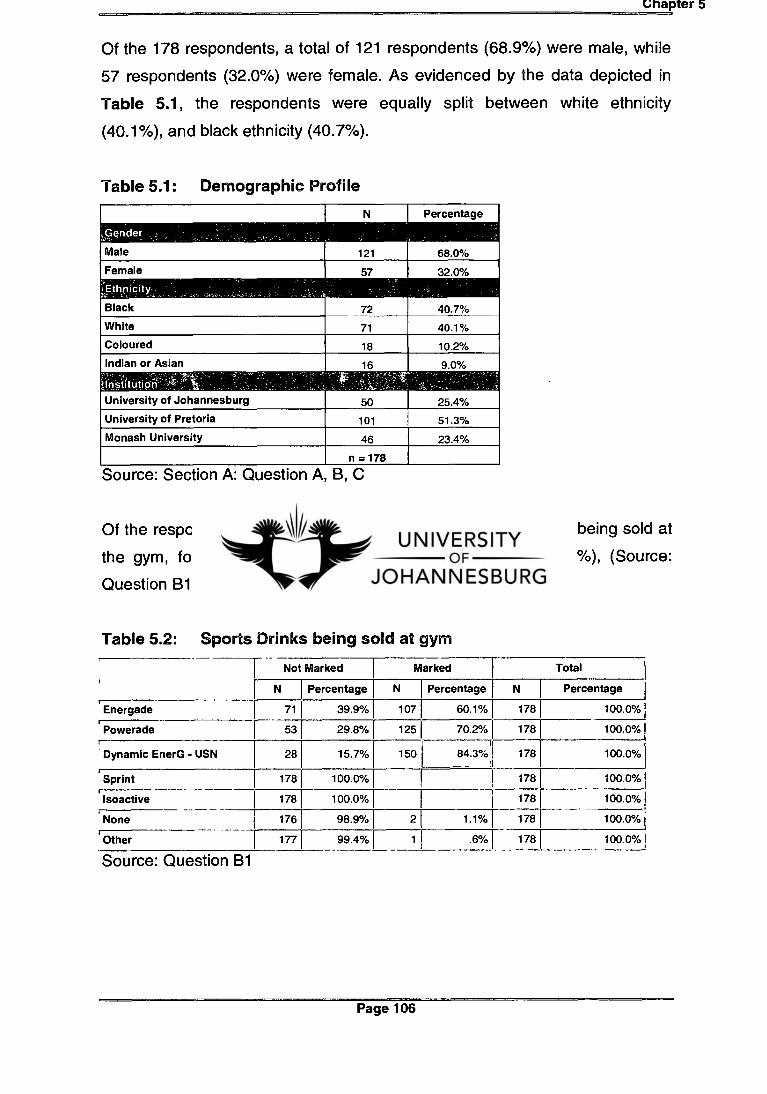
N Percentage
,Gender.
Male 121 68.0%
Female 57
32.0%
Ethnicity
Black
White
Coloured 18 10.2%
Indian or Asian 16
9.0%
n = 178
Institution
University of Johannesburg 50 25.4%
University of Pretoria 101 51.3%
Monash University 46 23.4%
Chapter 5
Of the 178 respondents, a total of 121 respondents (68.9%) were male, while
57 respondents (32.0%) were female. As evidenced by the data depicted in
Table 5.1, the respondents were equally split between white ethnicity
(40.1%), and black ethnicity (40.7%).
Table 5.1: Demographic Profile
Source: Section A: Question A, B, C
Of the respondents, (84.3%) indicated that Dynamic EnerG was being sold at
the gym, followed by Powerade (70.3%) and Energade (60.1%), (Source:
Question B1). As evident by the data depicted in Table 5.2.
Table 5.2: Sports Drinks being sold at gym
I Not Marked Marked Total
N Percentage N I Percentage N Percentage
Energade 71 39.9% 107 60.1% 178 100.0%
Powerade 53 29.8% 125 70.2% 178 100.0%
Dynamic EnerG - USN 28 15.7% 150 84.3% 178 100.0%
Sprint 178 100.0% 178 100.0%
lsoactive 178 100.0% 178 100.0% I
None 176 98.9% 2 1.1% 178 100.0%
Other 177 99.4% 1 1 .6% 178 100.0%1
Source: Question B1
Page 106
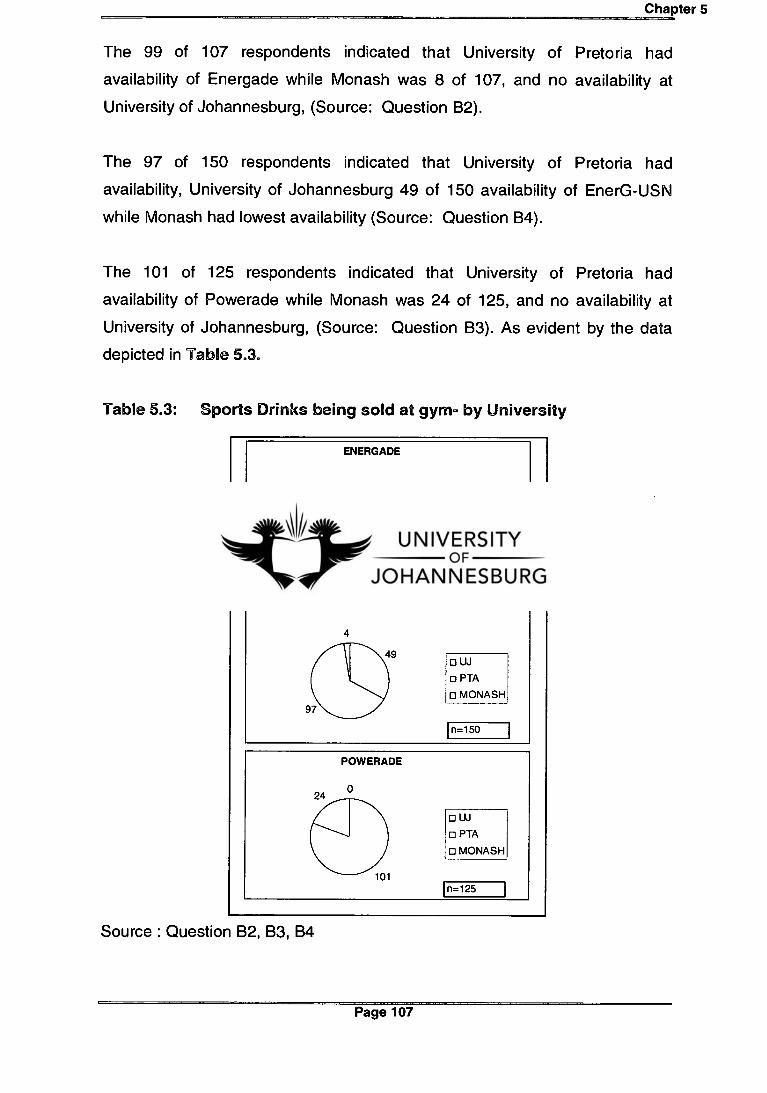
Chapter 5
The 99 of 107 respondents indicated that University of Pretoria had
availability of Energade while Monash was 8 of 107, and no availability at
University of Johannesburg, (Source: Question B2).
The 97 of 150 respondents indicated that University of Pretoria had
availability, University of Johannesburg 49 of 150 availability of EnerG-USN
while Monash had lowest availability (Source: Question B4).
The 101 of 125 respondents indicated that University of Pretoria had
availability of Powerade while Monash was 24 of 125, and no availability at
University of Johannesburg, (Source: Question B3). As evident by the data
depicted in Table 5.3.
Table 5.3: Sports Drinks being sold at gym by University
Source : Question B2, B3, B4
Page 107
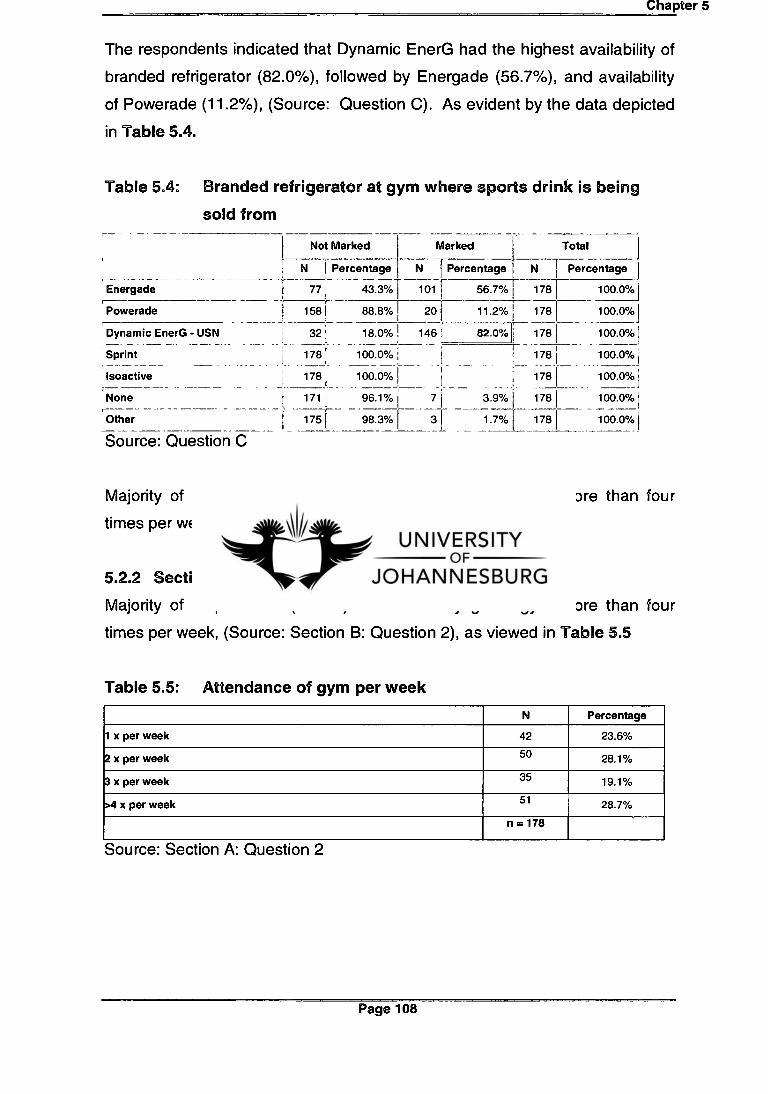
Chapter 5
The respondents indicated that Dynamic EnerG had the highest availability of
branded refrigerator (82.0%), followed by Energade (56.7%), and availability
of Powerade (11.2%), (Source: Question C). As evident by the data depicted
in Table 5.4.
Table 5.4: Branded refrigerator at gym where sports drink is being
sold from
Not Marked Marked Total
N Percentage N Percentage N I Percentage
Energade 77 43.3% 101 56.7% 178 100.0%
Powerade 158 88.8% 20 11.2% 178 ! 100.0%]
Dynamic EnerG - USN 32 18.0%1 146 82.0% 1781 100.0%
Sprint 178 100.0% 178 I 100.0%
Isoactive 178 100.0% 1781 100.0%
None 171 96.1% 7 3.9% 1781 100.0%1
Other 175 98.3% 3 1.7% 178 I 100.0% I
Source: Question C
Majority of respondents (28.7%) indicated they go to gym more than four
times per week, (Source: Section B: Question 2).
5.2.2 Section B: Consumption Frequency
Majority of respondents (28.7%) indicated they go to gym more than four
times per week, (Source: Section B: Question 2), as viewed in Table 5.5
Table 5.5: Attendance of gym per week
N Percentage
1 x per week 42 23.6%
2 x per week 50 28.1%
3 x per week 35 19.1%
>4 x per week 51 28.7%
n = 178
Source: Section A: Question 2
Page 108
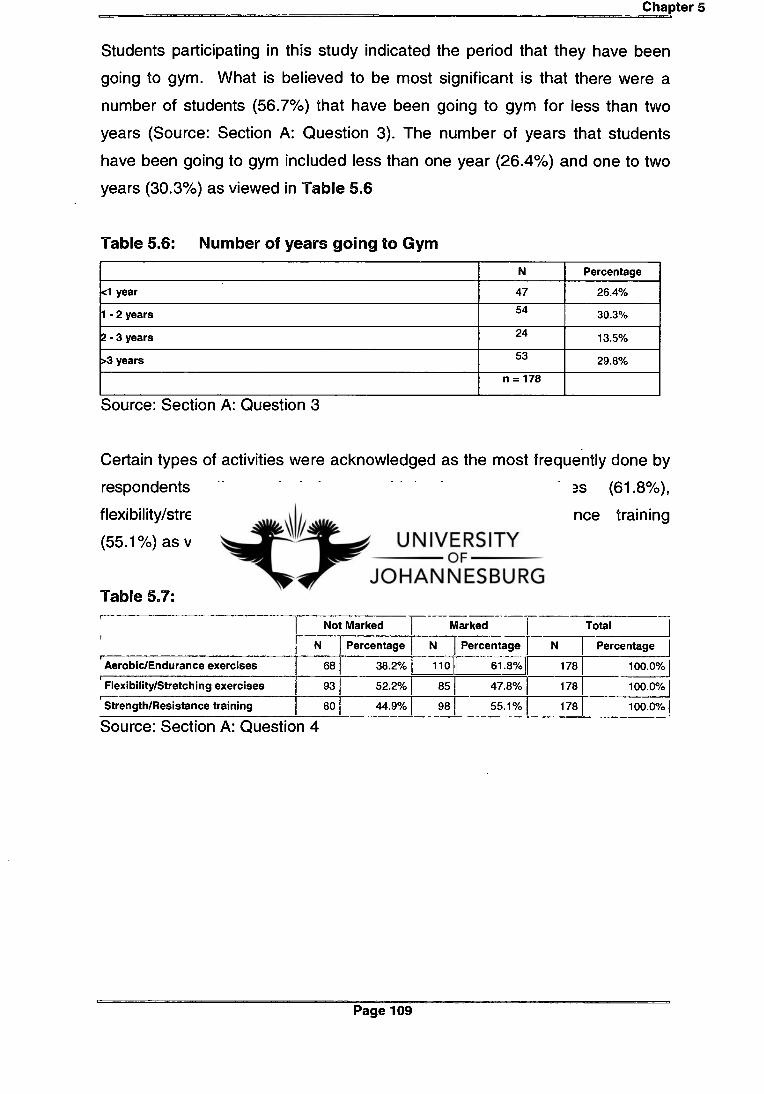
93 52.2% 85 47.8%
r-
Aerobic/Endurance exercises
Flexibility/Stretching exercises
Not Marked T- Marked
N Percentage N I Percentage
68 38.2% 110I[ 61.8%
1 Total
N
178
178
Percentage I
100.0% I
100.0%
Strength/Resistance training 80 44.9% I 98 I 55.1%
Source: Section A: Question 4 178 100.0% I
Chapter 5
Students participating in this study indicated the period that they have been
going to gym. What is believed to be most significant is that there were a
number of students (56.7%) that have been going to gym for less than two
years (Source: Section A: Question 3). The number of years that students
have been going to gym included less than one year (26.4%) and one to two
years (30.3%) as viewed in Table 5.6
Table 5.6: Number of years going to Gym
N Percentage
<1 year 47 26.4%
1 - 2 years 54 30.3%
2 - 3 years 24 13.5%
>3 years 53 29.8%
n = 178
Source: Section A: Question 3
Certain types of activities were acknowledged as the most frequently done by
respondents, these include, aerobic/endurance exercises (61.8%),
flexibility/stretching exercises (47.8%) and strength/resistance training
(55.1%) as viewed in Table 5.7.
Table 5.7: Activities Done At Gym
Page 109
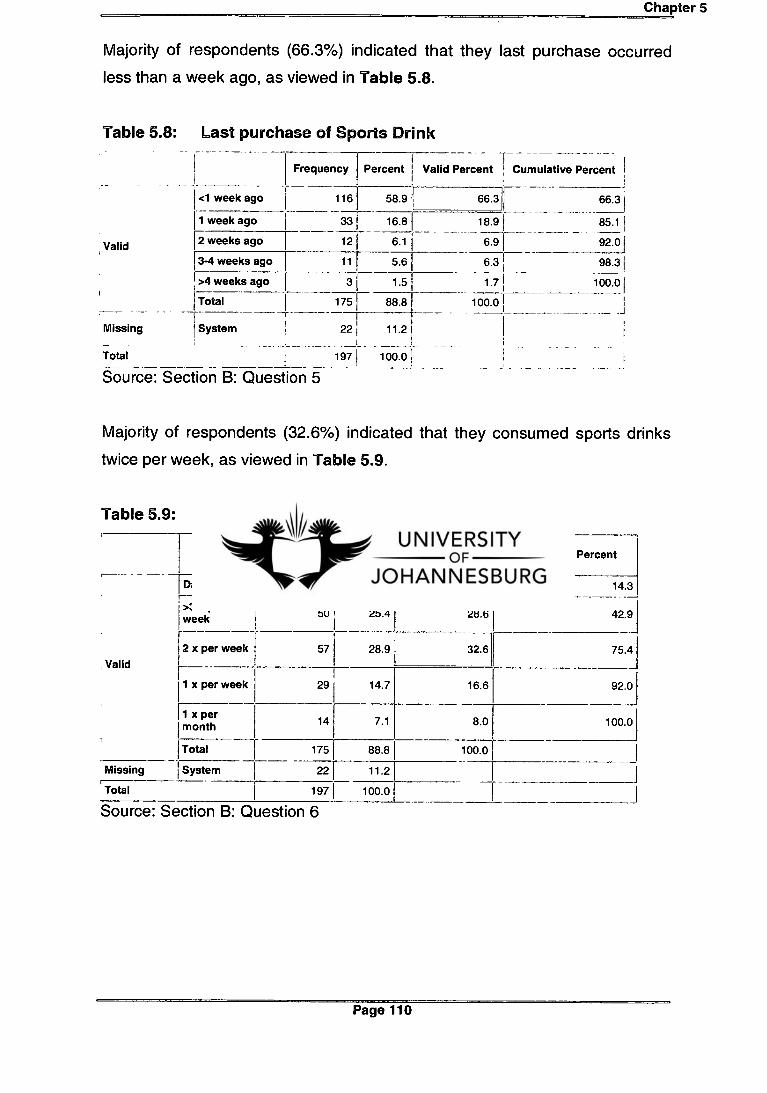
14 7.1 8.0 100.0i
175 88.8 100.0
22 11.2
197 100.0
1 x per month
Total
1 Missing System
Total
Chapter 5
Majority of respondents (66.3%) indicated that they last purchase occurred
less than a week ago, as viewed in Table 5.8.
Table 5.8: Last purchase of Sports Drink
Frequency Percent I Valid Percent 1 Cumulative Percent
<1 week ago 116 .1
58.91 66.3 i 66.3
1 week ago 33 16.8 18.9 85.1 1
Valid 2 weeks ago 12 6.1 6.9 I 92.01
3-4 weeks ago 11 5.6 6.31 98.31
>4 weeks ago 3 1.5 1.71 100.01
Total 175 88.8 100.01 j
Missing System 22 11.2 1 I
Total 197 100.0
Source: Section B: Question 5
Majority of respondents (32.6%) indicated that they consumed sports drinks
twice per week, as viewed in Table 5.9.
Table 5.9: Frequency of Sports Drinks Consumption
Frequency Percent Valid Percent Cumulative Percent
Daily 25 12.7 14.3 14.3
>3 x per week 50 25.4 28.6 42.9
2 x per week 57 28.9 32.6 75.4
1 x per week 29 14.7 16.6 92.0
Valid
Source: Section B: Question 6
Page 110
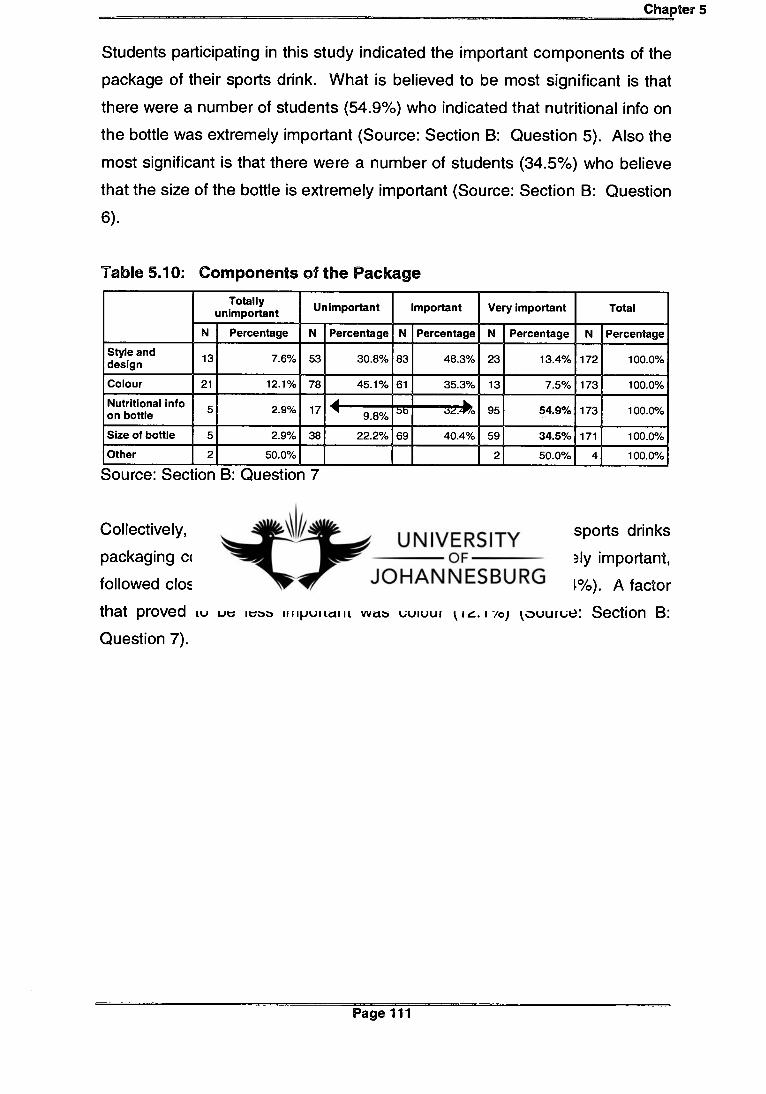
Chapter 5
Students participating in this study indicated the important components of the
package of their sports drink. What is believed to be most significant is that
there were a number of students (54.9%) who indicated that nutritional info on
the bottle was extremely important (Source: Section B: Question 5). Also the
most significant is that there were a number of students (34.5%) who believe
that the size of the bottle is extremely important (Source: Section B: Question
6).
Table 5.10: Components of the Package
Totally unimportant Unimportant Important Very important Total
N Percentage N Percentage N Percentage N Percentage N Percentage
Style and design 13 7.6% 53 30.8% 83 48.3% 23 13.4% 172 100.0%
Colour 21 12.1% 78 45.1% 61 35.3% 13 7.5% 173 100.0%
Nutritional info on bottle
5 2.9% 17 :.1Z.Z*0 95 54.9% 173 100.0% 1 9.8%
bb
Size of bottle 5 2.9% 38 22.2% 69 40.4% 59 34.5% 171 100.0%
Other 2 50.0% 2 50.0% 4 100.0%
Source: Section B: Question 7
Collectively, 54.9% of respondents indicate that the fact that sports drinks
packaging components have nutritional info on bottle is extremely important,
followed closely by size of bottle (34.5%), style and design (13.4%). A factor
that proved to be less important was colour (12.1%) (Source: Section B:
Question 7).
Page 111
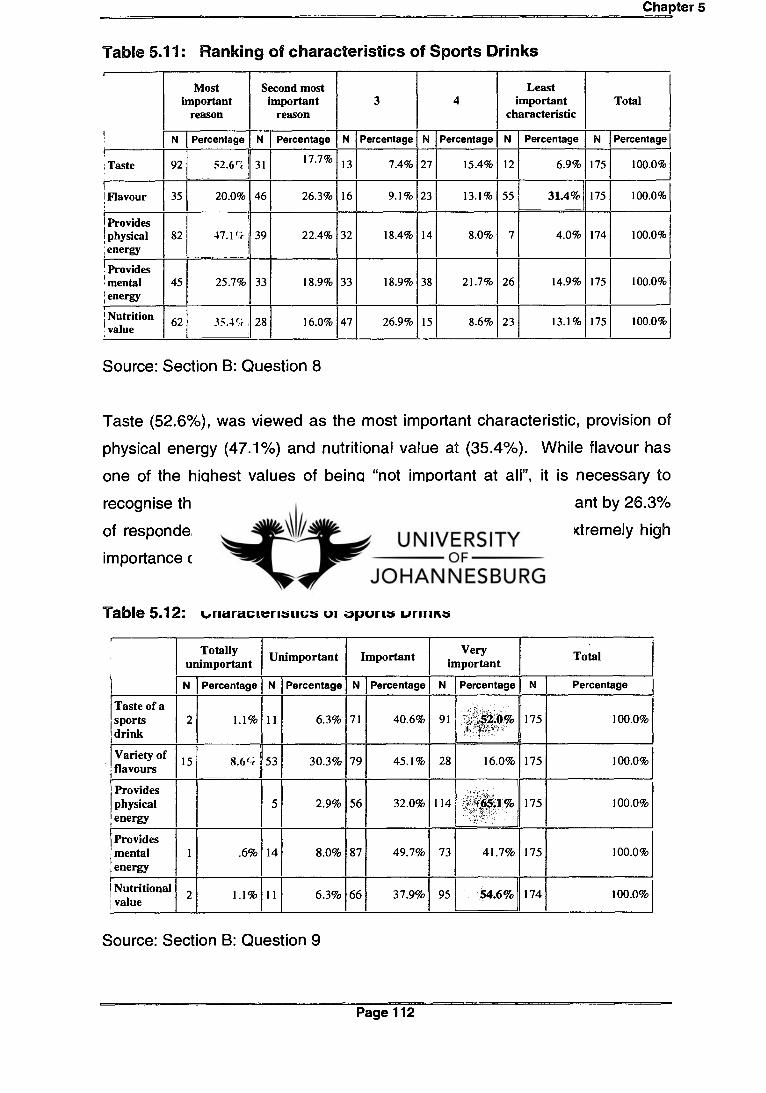
Most important
reason
Second most important
reason
Least important
characteristic 3 4 Total
Percentage N Percentage N Percentage N Percentage N Percentage Percentage
Chapter 5
Table 5.11: Ranking of characteristics of Sports Drinks
Taste 92 52.6 31 17.7% 13 7.4% 27 15.4% 12 6.9% 175 100.0%
Flavour 35 20.0% 46 26.3% 16 9.1% 23 13.1% 55 31.4% 175 100.0%
(Provides physical
l;energy 82 47.1 I 1 r'c I
I
39 22.4% 32 18.4% 14 8.0% 7 4.0% 174 100.0%
Provides mental energy
45
25.7% 33
18.9% 33
18.9% 38
21.7% 26 14.9% 175
100.0%
' Nutrition I value
62 35.45 28 16.0% 47 26.9% 15 8.6% 23 13.1% 175 100.0%
Source: Section B: Question 8
Taste (52.6%), was viewed as the most important characteristic, provision of
physical energy (47.1%) and nutritional value at (35.4%). While flavour has
one of the highest values of being "not important at all", it is necessary to
recognise that this factor was perceived to be moderately important by 26.3%
of respondents, with a further 20.0% of respondents placing extremely high
importance on this aspect (Source: Section B: Question 8).
Table 5.12: Characteristics of Sports Drinks
r
ly uni
Totam
lportant Unimportant Important Very
important Total
N Percentage N Percentage N Percentage N Percentage N Percentage
Taste of a sports drink
2 1.1% 11 6.3% 71 40.6% 91 .0% i -
175 100.0%
Variety flavoursof
15 8.6`i 53 30.3% 79 45.1% 28 16.0% 175 100.0%
Provides physical energy
5 2.9% 56 32.0% 114 •5.1% 175 100.0%
Provides mental energy
1 .6% 14 8.0% 87 49.7% 73 41.7% 175 100.0%
Nutritional value
2 1.1% 11 6.3% 66 37.9% 95 54.6% 174 100.0%
Source: Section B: Question 9
Page 112

Chapter 5
Collectively, 65.1% of respondents indicate that the fact that sports drinks
provide physical energy is extremely important, followed closely by nutritional
value (54.6%) and taste (52.0%). Factors that proved to be of less
importance were variety of flavours (8.6%) (Source: Section B: Question 9).
Table 5.13: Important factors when purchasing a Sports Drink
Totally unimportant
Unimportant Important Very important Total
N Percentage N Percentage N Percentage N Percentage N Percentage]
100.0% ] The brand 11 6.3% 49 27.8% 76 43.2% 40 22.7% 176
'Variety of flavours 11 6.3% 52 29.5% 93 52.8% 20 11.4% 176 100.0%
Ingredients on the bottle
4.6% 26 14.9% 75 42.9% 66 37.7% 175 100.0%
Technical features 24 13.6e7r 66 37.5% 72 40.9% 14 8.0% 176 100.0%
' Price 23 13.0 % 40 22.6% 53 29.9% 61 34.5% 177 100.0%
Association with top sports performers
56 35.9 % 46 29.5% 33 21.2% 21 13.5% 156 100.0%
Other
50.0% 1
50:0%
2 100.0%
Source: Section B: Question 10
As observed in the comprehensive literature review (Chapter Two), there are
a number of factors that university students in Gauteng take into account
when purchasing a sports drinks, and these factors influence the purchase
decision process (see Table 5.13).
Collectively, 37.7% of respondents agree that ingredients on the bottle are
extremely important on a sports drink bottle, followed closely by price and the
brand (22.7%). Factors that proved to be of less importance were association
with top sports performers (35.9%), the price (22.6%) and technical features
(37.5%), (Source: Section B: Question 10).
Page 113

N N Percentage N N Percentage N Percentage Percentage N Percentage Percentage
100.0%
Percentage N
2 176 Energade
Powerade
69 25.6% 45 34.1% 60 39.2%
50.6% 3 1.7% 176 100.0% 66 37.5% 18 10.2% 89
Most important
reason
Second most important
reason
Least important
reason 3 4 5 Total
Chapter 5
Table 5.14: Favourite Sports Drinks
Dynamic EnerG - USN
32 18.7% 54 31.6% 64 37.4% 9 5.3% 4 2.3% 8 4.7% 171 100.0%
Sprint 1 1.1% 17 19.3% 14 15.9% 28 31.8% 17 19.3% 11 12.5% 88 100.0%
Isoactive 4 4.3% 15 16.3% 9 9.8% 23 25.0% 26 28.3% 15 16.3% 92 100.0%
I prefer drinking somethin g else
2 33.3% 1 16.7% 2 33.3% 1 16.7% 6 100.0%
Source: Section B: Question 11
Powerade has one of the highest values of being "most favourite" at 50.6%, it
is necessary to recognise that Energade was also perceived to be moderately
important by 39.2% of respondents (Source: Section B: Question 11).
5.3 RESULTS OF STATISTICAL TESTING
To facilitate the use of statistical procedures, it was necessary to recode
certain data groups within the entire set of collected data, thereby improving
the accuracy of the statistical analyses conducted. The relationship between
frequency of consumption with age, gender and race was tested. There was
no statistical relationship between frequency of consumption with age, gender
and race. Since the respective p-values were more than 0.05. The recoded
data can be viewed in APPENDIX D.
Page 114

Chapter 5
5.4 CONCLUSION
This chapter portrayed the results of the empirical section of this study.
Responses were arranged by demographic information, purchase behaviour
of sports drinks, purchaser motivation and brand loyalty. Frequency
distributions were analysed, interpreted and where appropriate, graphically
represented. The results of statistical tests (i.e. significance) were also
reported.
The chapter to follow (Chapter Six) will provide a discussion pertaining to
certain conclusions of this study and the implications thereof, as well as
recommendations for future research.
Page 115
Chapter 6
CHAPTER 6
CONCLUSIONS, IMPLICATIONS AND RECOMMENDATIONS FOR FUTURE
RESEARCH
6.1 INTRODUCTION
While the previous chapter discussed the empirical results, this chapter will focus
on the main conclusions, limitations and recommendations of this descriptive study.
Final conclusions will be drawn regarding the aspects that have the greatest
influence on undergraduate students' offline and online shopping behaviour as well
as general recommendations for future research.
6.2 ACHIEVEMENT OF OBJECTIVES
6.2.1 Primary objective
The primary objective was to discover and evaluate the influence of brand loyalty in
the sports drink market amongst students in selected universities in Gauteng.
In Chapter 1 the study is introduced, with a framework of how the study is
structured.
Brand loyalty (Chapter 2)
The theory brand loyalty presented shows the importance of this topic. Brand
attributes are seen as important to the students. The decision making process is
discussed, without labeling and packaging of sports drinks, they look the same.
Generation Y is discussed as a constantly moving target; we have to immerse
ourselves in it often and regularly to keep up with it, so that we can ensure success
in this critical and influential youth segment.
Overview of The Sports drinks market (Chapter 3)
Although sports drinks are consumed primarily when engaging in formal/informal
exercise (rehydration, energy, refreshment) they are also consumed whilst
"generally keeping active". The sports drinks market is extremely competitive, with
very little differentiation. Consumers must understand the ingredients on the label,
therefore, communication on packaging needs to describe benefits.
Page 116

Chapter 6
Research Methodology (Chapter 4)
The study has been conducted amongst 178 students in selected Gauteng
Province universities. Statistical analysis has been conducted through Frequency
distributions and cross tabulation.
Research Findings (Chapter 5)
Respondents indicate that, brand loyalty and product attributes have an influence in
the purchasing decision of sports drinks. Students have specific motivations for
purchasing brands based on brand intrinsic and extrinsic benefits.
Conclusion, Implications and Recommendations (Chapter 6)
The key lessons learnt from this study, is no different to what the literature states,
the sports drinks market is a highly competitive market and not well differentiated.
Whilst the target is students in selected Gauteng universities, the students exhibit
similar attribute preferences. Attributes have indicated to have a major influence in
the decision making process. The findings on the sports drinks market have
managerial implications, and are important issues in the development and
implementation of marketing strategies, aimed at building and maintaining market
share.
6.2.2 Secondary objectives
To investigate the purchasing behaviour of students, the needs that sports drinks
satisfy, students motivations for buying sports drinks, characteristics of students,
and lastly, students attitudes to different brands within the sports drinks market.
o Purchasing behaviour of students:
Majority of respondents indicated that their last purchase
occurred less than a week ago (Section B: Question 5).
Majority of respondents also indicated that they consumed sports
drinks twice per week (Section B: Question 6).
o The needs that sports drinks satisfy:
Respondents indicated that the fact that sports drinks provide
physical energy is extremely important, followed closely by nutritional
value and taste (Section B: Question 9).
Page 117

Chapter 6
To identify the perceptions of attributes and package designs of different brands
considered in the choice of the student, and to establish the attributes that students
look for.
o Perceptions of attributes and packaging:
Majority of respondents agree that ingredients on the bottle are
extremely important on a sports drink bottle, followed closely by price
and the brand name. Factors that proved to be of less importance
were association with top sports performers (Section B: Question 10).
To investigate the buying motive of sports drinks relating to ingredients and
packaging.
o Buying motive related to ingredients and packaging:
Majority of respondents indicate that the fact that sports drinks
packaging components have nutritional info on bottle is extremely
important, followed closely by size of bottle, style and design
(Section B: Question 7).
6.3 LIMITATIONS
Limitations were identified with regards to the information obtained for the literature
review as well as during the actual data collection process.
6.3.1 Limitations in the literature review
Much of the literature acquired for Chapter Two regarding both Brand loyalty well as
the characteristics of Generation Y consumers was obtained from American and
European studies and is therefore only moderately applicable to South Africa as it is
still considered to be a developing country.
6.3.2 Limitations in the empirical research
The research was carried out at Gauteng universities and relevance is assumed for
the rest of South Africa universities.
Page 118

Chapter 6
6.4 RECOMMENDATIONS FOR FUTURE RESEARCH
The research topic can be further investigated and extended in the future in the
following areas:
The influence of brand awareness on the purchasing decision of sports drinks
The influence of brand loyalty on the purchasing decision of sports drinks
If differentiation of product attributes complicates the consumer decision
making process
If communication of nutritional value and ingredients on the pack influence
product credibility
Comparisons of brand loyalty across a range of industries
6.5 CONCLUSION
This study was conducted to investigate brand loyalty in the sports drink market
amongst students in selected Gauteng universities. The primary and secondary
objectives of this study have been realised and it can therefore be deduced that the
results add value to the body of knowledge pertaining to marketing theory in
general as well as to consumers' purchasing behaviour in particular.
Page 119
Chapter 7
CHAPTER 7
REFERENCES
Aaker DA. 1991. Managing brand equity: capitalizing on the value of a brand
name. New York: Free Press.
Aaker DA. 1995. Strategic market management. 4 th ed. London: John Wiley
and Sons.
Aaker DA. 1996. Building strong brands. 1 st ed. New York: Free Press.
Aaker DA & Joachimsthaler E. 1999. Building brands without mass media.
Havard Business Review on Brand Management, 5(1):1-22.
Aaker DA. 2002. Building strong brands. 2nd ed. New York: Free Press.
Aaker DA & Keller KL. 1990. "Consumer evaluations of brand extensions",
Journal of Marketing, Vol. 54 pp.27-41.
ABI Channel Specifics. 2003. Account Manager Material Channel Specifics.
Anonymous. 2006. Sports Drinks: sizing the opportunity. Johannesburg,
South Africa: 62.
Assael H. 1991. Consumer Behavior and Marketing Action, PWS-KENT, Boston, MA.
Bakewell C & Mitchell VW. 2003. Generation Y Female Consumer Decision-
Making Styles. International Journal of Retail & Distribution Management,
31(2):95-106. Available from: Emerald: http://www.emeraldinsight.com/
[Downloaded: 2007-08-09].
Page 112
Chapter 7
Baltas G. 2000. Nutrition labelling: issues and policies. European Journal of
Marketing 35, 5/6. Athens University of Economics and Business, Athens,
Greece.
Bandyopadhyay S, Gupta K & Dube L. Does brand loyalty influence double
jeopardy? A theoretical and empirical study. Journal of Product & Brand
Management. Volume 14 Number 7 2005 pp. 414-423. Available from:
Emerald: http://www.emeraldinsight.com/ [Downloaded: 2007-11-27].
Barrera R. 2005. Over promise and over deliver: The secrets of unshakable
customer loyalty. Penguin Books Ltd.
Belch GE & Belch MA. 2004. Advertising and Promotion: An Integrated
Marketing Communications Perspective. 6 th ed. McGraw-Hill/Irwin: Burr
Ridge, Illinois.
Berry L, Lefkowith E & Claek T. 1988. Harvard Business Review, Vol. 66
pp.28-32.
BMI Foodpack. July 2004. Packaging of sports drinks and energy drinks.
BMI Foodpack cc: Bedfordview.
Bowen JT & Shoemaker S. 1998. "Loyalty: a strategic commitment", The
Cornell Hotel and Restaurant Administration Quarterly, pp.12-25.
Boyce J. 2002. Market research in Practice. Australia: McGraw-Hill.
Bradley J. 2003. Baby Boomers, Generation X and Generation Y? Policy
implications for defence forces in the modern era. Volume 5 Number 4 pp.
41-49. Available from: Emerald: http://www.emeraldinsight.com/
[Downloaded: 2007-08-09].
Page 113

Chapter 7
Brown K, Mcllveen H & Strugnell C. 2000. Nutritional awareness and food
preferences of young consumers. Nutrition & Food Science. Volume 30
Number 5 pp. 230-235. Available from: Emerald:
http://www.emeraldinsight.com/ [Downloaded: 2007-10-14].
Cant M, Gerber-Nel C, Nel D & Kotze T. 2003. Marketing Research.
Claremont: New Africa Books.
Cant M, Brink A & Brijball S. 2006. Consumer Behaviour. Juta & Co.
Coldwell D & Herbst F. 2004. Business research. South Africa: Juta.
Clifton R & Maughan E. 2000. The future of brands: twenty-five visions.
London: McMillian.
Crainer S. 1995. The real power of brands: making brand work for
competitive advantage. London: Pitman.
Creswell JW. 1998. Research design, qualitative and quantitative and mixed
approaches. California: Sage.
De Chernatorny L & McDonald HB. 2003. Creating powerful brands in
consumer, service and industrial markets. Boston: Elsevier/Butterworth-
Heinemann.
Denzin NK & Lincoln YS. 1998. Collecting and interpreting qualitative
material. London: Sage.
De Swardt A. 2005. Team Cyanosis. Powerade Sports Drink. Available from:
Teamcyanosis: http:// www.teamcyanosis.co.za / [Downloaded: 2007-10-14].
Page 114
Chapter 7
Dias L. 2003. Generational buying motivations for fashion. Journal of
Fashion Marketing and Management. Volume 7 Number 1 2003 pp. 78-86.
Available from: Emerald: http://www.emeraldinsight.com/ [Downloaded: 2007-
08-09].
Dillon WR, Madden TJ & Firtle NH. 1993. Essentials of Marketing Research.
Boston: Irwin.
Eiselen R. n.d. 2005. Sampling. Statkon: University of Johannesburg.
Johannesburg.
Embleton P. 1995. Factors influencing brand loyalty of Fast Moving
Consumer Goods. Unpublished MBA dissertation. Johannesburg: University
of the Witwatersrand.
Energade. History of Energade. Brands - Domestic Food - Beverages -
Energade - Content. http://www.energade.co.za . [Downloaded: 2007-10-14].
Essortment. n.d. 2002. Brand loyalty's influence on consumer behaviour.
Available from: Essortment: http://iLessortment.com/brandloyalty_pqk.htm/
[Downloaded: 2005-08-18].
EuroFIR. 2006. EU Labelling Regulations. Public Site. Home
/ Users / Consumers / EU Labelling Regulations
European Communities. 2006. Labelling: competitiveness, consumer
information and better regulation for the EU. A DG SANCO Consultative
Document. Directorate E - Safety of the food chain. Available from: Europa:
http://ec.europa.eu/dgs/health_consumer/index_en.htm [Downloaded: 2007-
10-14].
Gatorade Sports Science Institute. How to Read a Sports Drink Label
www.gatorade.com [Downloaded: 2007-10-14].
Page 115
Chapter 7
Gilbert A & Churchill Jnr. 2001. Basic marketing research. 4th edition. USA;
The Dryden Press.
Giddens N & Hofman A. 2002. Brand loyalty. Paper presented at the
University Of Missouri Value-Added Development Center, September: 1-2.
Grover R. & Srinivasan, V. (1992), "Evaluating the multiple effects of retail
promotions on brand loyal and brand switching segments", Journal of
Marketing Research, Vol. 29 pp.76-89.
Haig M. 2003. Brand failures: the truth about 100 biggest branding mistakes
of all time. London: Kogan.
Hair Jnr JF, Bush RP & Ortinau DJ. 2003. Marketing research within a
changing information environment 2nd edition. New York: McGraw-Hill.
Hallberg G. 1995. All consumers are not created equal: the differential
marketing strategy for brand loyalty and profits. New York: Wiley.
Hassapidou M. 2001. Dietary assessment of five male sports teams in
Greece. Nutrition & Food Science. Volume 31 Number 1 2001 pp. 31-35.
Available from Emerald: http://emerald.com/ [Downloaded: 2007-10-14].
Hawkins DI, Best RJ & Coney KA. 2004. Consumer Behaviour: Building
Marketing Strategy. New York: McGwaw-Hill Irwin.
Hehir A. 2007. Sports Beverages global trends. DSM Nutritional Products.
Available from: SAAFOST:
www.saafost.prg.za/presentations/SportsBeveragesGlobalTrends/
[Downloaded: 2007-08-09].
Heimerl J. 1993. A comparative study of Brand Loyalty between Urban
Blacks and Urban Whites. Unpublished MBA dissertation. Johannesburg:
University of the Witwatersrand.
Page 116
Chapter 7
Higgs N. 2003. Workshop material for Introduction to Conversion Model:
Background and Theory-The Segments. Johannesburg: Research Surveys
academy, Research Surveys.
Higginson C, Rayner M, Draper S & Kirk T. 2002. The nutrition label — which
information is looked at? Nutrition & Food Science. Volume 32, Number 3,
92-99
Hofmeyer J & Rice B. 2000. Commitment-led marketing : the key to brand
profits is in the customer's mind . Chichester ; New York : Wiley.
Howell D. 2004. Today's consumers more open to try new brands. DSN
Retailing Today, 43(20):29-32. Available from: Proquest: ABI/Inform Global:
http://proquest.umi.com/ [Downloaded: 2005-02-21].
Humphries C. 1998. A code of practice for food labeling. Nutrition & Food
Science. Volume 98 Number 4 pp. 193-197. Available from Emerald:
http://emerald.com/ [Downloaded: 2007-10-14].
Irvine M. 2001. Labels Don't Fit Us, Gen Y Insists. Denver Post.
Jensen JM & Hansen T. 2006. An empirical examination of brand loyalty
Journal of Product & Brand Management 15/7. pp442-449. Emerald Group
Publishing Limited. Available from Emerald: http://emerald.com/
[Downloaded: 2007-10-14].
Jones-Dille J. 2007. Flavour Trends in Functional Food & Beverages. Wild
Flavour, Inc, Erlanger. Nutraceticals World. Available from:
Nutrainlngredients: http:// www.nutraingredients.com/ [Downloaded: 2007-10-
14].
Page 117
Chapter 7
Jones JP. 1990. "The double jeopardy of sales promotions", Harvard
Business Review, Vol. 68 No.5, pp.145-52.
Jorgensen B. 2003. Baby Boomers, Generation X and Generation Y? Policy
implications for defence forces in the modern era. Volume 5 Number 4 2003
pp. 41-49. Available from Emerald: http://emerald.com/ [Downloaded: 2007-
06-08].
Kapferer J. 1995. Strategic Brand Management: new approaches to
creating and evaluating brand equity. London: Kogan Page.
Katz F. 2006. Flavor trends forecast. Available from Food Processing: http://
foodprocessing.com emerald.com/ [Downloaded: 2007-10-14].
Keller KL. 2003. Building, measuring, and managing brand equity. New
Jersey: Prentice Hall.
Koekemoer L. 2004. Marketing Communication. Juta: Cape Town
Kotler P & Armstrong G. 2001. Principles of Marketing. New Jersey:
Prentice-Hall International.
Kotler P. 2003. Marketing Management. New Jersey: Prentice Hall.
Kruse K. 2002. Buckle Up: Generation Y is Here. Available from: Clomedia:
http://www.clomedia.com/content/anmviewer/ [Downloaded: 2005-10-03].
Kumar SR. 2005. Brand loyalty and marketing strategy. Financial Daily from
The Hindu group of publications. Thursday, Feb 17, 2005. Available from:
http://www.thehindubusinessline.com/praxis/index.htm/ [Downloaded: 2007-
10-10].
Kuzwayo M. 2000. Marketing through mud and dust. Cape Town: Inc Creda
Communications.
Page 118

Chapter 7
Lawrence M. 1999. Trends:X-ed Out: Gen Y takes over. Boston Herald
Lewis RC, Chambers RE, & Chacko, H.E. 1995. Marketing Leadership in
Hospitality: Foundations and Practices, Van Nostrand Reinhold, New York,
NY.,
Linton I. 1993. Building customer loyalty. London: Pitman.
Lyong Ha C. 1998. The theory of reasoned action applied to brand loyalty.
Journal of Product & Brand Management. 7(1):51-61. Available from:
Emerald: http://www.emeraldinsight.com/ [Downloaded: 2005-05-13].
Maclnnis DJ & Hoyer WD. 2001. Consumer Behavior. Boston: Houghton
Miffilin.
Malholtra NK & Birks DF. 2003. Marketing research: an applied approach.
Harlow: Prentice Hall.
Martin CA & Turley LW. 2004. Malls and Consumption Motivation: An
Exploratory Examination of Older Generation Y Consumers. International
Journal of Retail & Distribution Management, 32(10):464-475. Available from:
Emerald: http://www.emeraldinsight.com/ [Downloaded: 2005-08-09].
McDaniel C & Gates R. 2001. Marketing research essentials. 3 rd ed. Ohio:
South Western College.
McDaniel C & Gates R. 2005. Marketing Research. 6 th ed. John Wiley &
Sons.
Melamdowitz C. 1992. Brand loyalty in the denim jean market. MBA
dissertation. Johannesburg: University of the Witwatersrand.
Page 119

Chapter 7
Meyers HM & Lubliner MJ. 1998. The marketer's guide to successful
package design. Chicago: NTC Business Books.
Morgan MS, Dev CS. 1994. "An empirical study of brand switching for a retail
service", Journal of Retailing, Vol. 70 No.3, pp.267-82.
NAS Insights. 2006. Generation Y: The Millennia's Ready Or Not, Here They
Come. A Demand Chain Proprietary Tool.
Neves F, Zuurbier P & Campomar M. 2001. A model for the distribution
channels planning process. Journal of Business & Industrial Marketing.
Volume 16 Number 7 2001 pp. 518-539. Emerald:
http://www.emeraldinsight.com/ [Downloaded: 2007-10-14].
O'Malley D. 1991. Brand means business, Accountancy, Vol. 107, pp. 107-8.
Palumbo F & Herbig P. 2000. The multicultural context of brand loyalty.
European Journal of Innovation Management Volume 3. Number 3. 2000. pp.
116±124. MCB University Press
Pierce LM. 2001. On-the-go Consumers drive beverage packaging trends.
Food & Drug Packaging. Available from: Find Articles.
http://findarticles.com/p/articles/ [Downloaded: 2005-08-18].
Peter JP & Olson JC. 2005. Consumer Behavior and Marketing Strategy. 7th
ed. McGraw Hill Irwin.
Pirouznia M. 2001. The influence of nutrition knowledge on eating behavior —
the role of grade level. Nutrition & Food Science; Volume: 31; Issue:2; 2001;
62-67
Page 120

Chapter 7
Quester P & Lin Lim A. 2003. Product involvement/brand loyalty: is there a
link? 2003. Journal of Product & Brand Management. Volume 12 Number 1
pp. 22-38. Emerald: http://www.emeraldinsight.com/ [Downloaded: 2007-10-
121.
Reichheld FF. 1996. The Loyalty Effect, Harvard Business School Press,
Boston, MA.
Robertson H. 2007. Sports Beverages Available On The SA Market— A
Survey. DSM Nutritional Products. South African Association for Food
Science & Technology. 21 February 2007. www.saafost.org.za/presentations.
Rogerson WP. 1983. "Reputation and product quality", The Bell Journal of
Economics, Vol. 14 pp.500-10.
Rooney J. 1995. Branding: a trend for today and tomorrow. Journal of
Product & Brand Management; Volume: 4; Issue: 4; 48-55.
Sarantakos S. 1998. Social research. 2nd ed. Australia: MacMillian.
Schiffman L & Kanuk L. 1991. Consumer Behavior, Prentice-Hall, Englewood
Cliffs, NJ.
Schiffman L & Kanuk L. 1997. Consumer Behavior. 6th ed. Prentice-Hall,
Englewood Cliffs, NJ.
Schoenbachler D, Gordon G & Aurand T. 2004. Building brand loyalty
through individual stock ownership. Journal of Product & Brand Management;
Volume: 13; Issue: 7; 2004; pg 488-497.
Shao AT. 2002. Marketing research: An aid to decision making 2nd edition.
Southwestern: Thompson.
Page 121

Chapter 7
Simpkins C. 2005. Loyalty is dead. [Online] Available from: Marketing Web:
http://www.marketingweb.co.za/ [Downloaded: 2005-05-19].
SA Consumer Trends. 2006. Unpublished. Coca-Cola South Africa Internal
Document.
Sports Dieticians. Sports Drinks. www.sportsdietitians.com . Fact Sheet:
Fuelling fitness for the future. 19. Australia.
Statistics South Africa. 2005. Mid-year Population estimates, South Africa
2005.
[Online]Availablefrom:http://www.statssa.gov.za/publications/P0302/P030220
05.pdf [Downloaded: 2005-10-09].
Stephanou AM. 1983. Brand loyalty in the sunglasses market. Unpublished
MBA dissertation. Johannesburg: University of the Witwatersrand.
Stewart B. 1996. Packaging as and Effective marketing tool. Kogan page.
Pira International.
Theodore S. 2004. Packaging trends of the future. Beverage Industry.
Available from: Find Articles: http://findarticles.com/p/articles/ [Downloaded:
2007-08-09].
UCT Libraries. n.d. The Literature Review Survival guide. Available from:
http://www.lib.uct.ac.za/ [Downloaded: 2005-02-04].
Uncles MD, Dowling RD & Hammond K. 2003. Customer loyalty and
customer loyalty programs. Journal of Consumer Marketing. Volume 20
Number 4. pp. 294-316. Emerald: http://www.emeraldinsight.com/
[Downloaded: 2007-10-12].
Page 122

Chapter 7
Van den Brink D, Odekerken G & Pauwels P. 2006. The effect of strategic
and tactical cause-related marketing on consumers' brand loyalty. Journal of
Consumer Marketing 23/. pp15-25. Emerald Group Publishing Limited.
Emerald: http://www.emeraldinsight.com/ [Downloaded: 2007-10-12].
Verbeke W, Farris P & Thurik R. 1998. Consumer response to the preferred
brand out of stock situation. European Journal of Marketing, 32(11/12):1008-
1028.
Vorster C. 2006. Flavours with "mixed emotions". Energy- And Sports Drink
Trends. Creative Flavors International Pty (Ltd). Creative Flavors
International.
Walters C, County 0 & Kochert J. 2007. Sports Drinks Teaching guide.
Department of Family Youth and Community Sciences, IFAS, University of
Florida.
Webb JR. 2002. Understanding and designing marketing research 2nd
edition. UK: Thompsons Learning.
Wood LM. 2004. Dimensions of brand purchasing behaviour: Consumers in
the 18-24 age group. Journal of Consumer Behaviour, 4 (1):9-25. Available
from: Proquest: ABI/Inform Global: http://proquest.umi.com/ [Downloaded:
2005-02-19].
Wozniak R & Hanna N. 2001. Consumer Behavior: An applied approach.
New Jersey: Prentice Hall.
Zeithaml VA, Bitner MJ & Gremler DD. 2006. Services Marketing: Integrating
customer focus across the firm. 4 th ed. New York, NY: McGraw-Hill.
Zikmund WG. 2003. Business research methods. 7 th ed. Ohio:
Thompson/South western.
Page 123
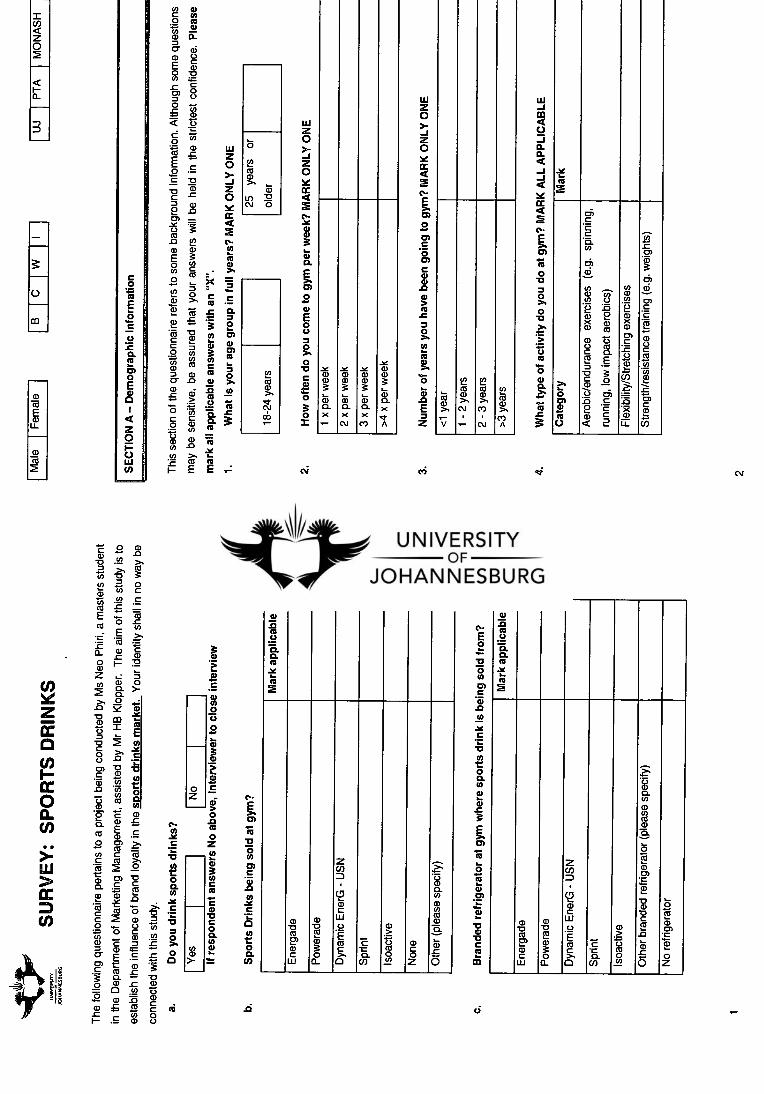
C) 0
Ae r
obic
/end
ura
nce
ex
erc
ises
(e.
g. s
pin
nin
g,
runn
ing,
low
im
p act
aer
ob
ics)
Str
eng
th/r
esis
tance
tra
inin
g (e
.g. w
eig
hts )
Fle
xib
ility
/Str
etc h
ing
exe
rcis
es
a)
X
—V
0. >C
CO
CO co >,
A
8
>,
111 CV 0
Nu
mbe
r of
yea
rs y
ou h
ave
been
goi
ng to
gym
? M
AR
K O
NLY
ON
E
SE
CTI
ON
A—
De m
ogra
phi
c In
form
atio
n
mar
k a l
l app
licab
le a
nsw
ers
with
an
"X".
Wha
t is
y ou
r ag
e g
roup
in fu
ll ye
ars
? M
AR
K O
NLY
ON
E
=I=
0
How
ofte
n do
you
com
e to
gy m
per
wee
k? M
AR
K O
NL
Y O
NE
csi
5 o a) -0 '0 >,
CD ti)
2 o c o 7) .c as E Ts .c as u) c
*.E - a_
V CD
a)
2
z ...: a '3 co a) o >-
a_ _o >. o ...;
4) -o -w a)
i co al
t E -o = co c
:t
•
>
o
• o
c c v
•
• 6
• a
e —
ca
T t ..c a)
CL ca E •c
a) 0) CD 4.'
cA c as c as >, cp— m 0
E .co) vc C. ..., 2 2 0 .o '5 I "6 c c 2 a)
"5 c :0 o u) a) m a) "5 = c. -..= CT E .—
11)11) : 111 75 .. 0 . .. .§ a)
E .u)
.c CD CD 0
as .0 CL
Cr)
0) t a)
i— .c a)
Mar
k ap
plic
able
Ene
rga
de
Pow
era d
e
Dy n
amic
Ener
G -
US
N
5 -0 o.
(.0 Isoa
ctiv
e
Z
a) c o
Oth
er (
ple
ase
spec
i fy)
Mar
k ap
plic
able
Ene
rga
de
Po
wer
a de
Dy n
amic
En
erG
- U
SN
5 -c 0_ u) Is
oact
ive
Ot h
er b
rand
ed r
efri
gera
tor
(ple
ase
spec
ify)
No
refr
iger
ato
r
Do
you
dri
nk
spor
ts d
rin
ks?
conn
ecte
d w
ith t
his
stu
dy.
ci
.ci
SU
RV
EY
: S
PO
RT
S D
RIN
KS
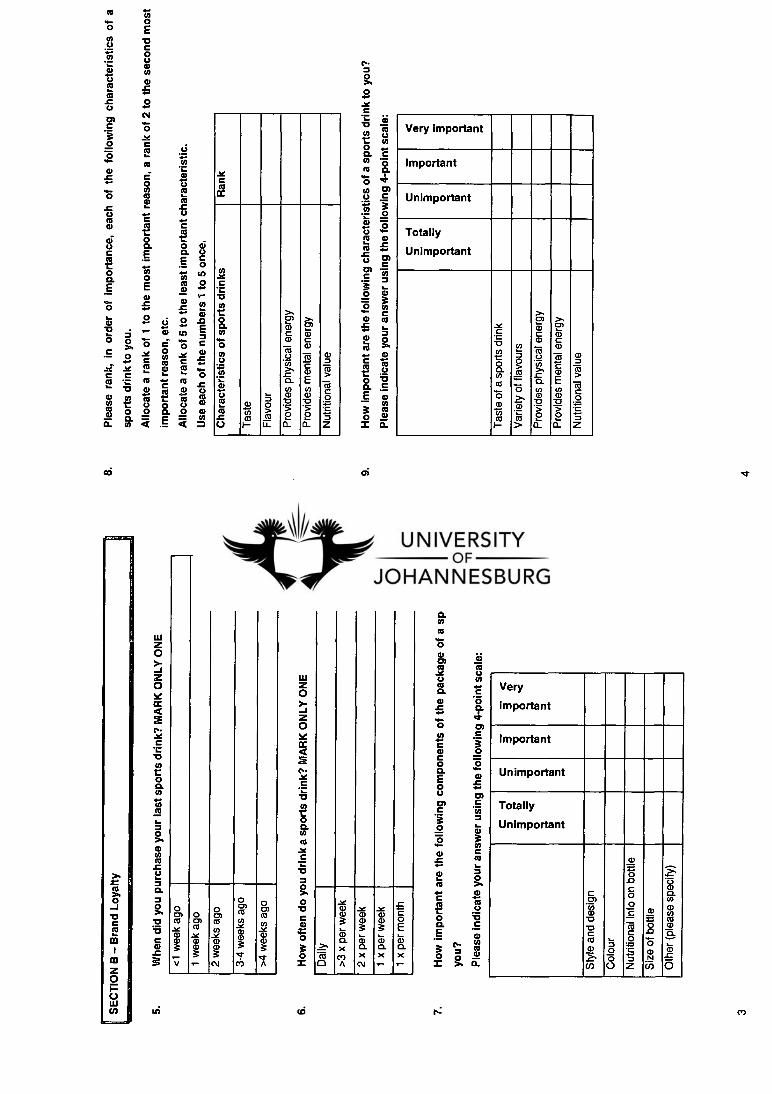
spor
ts d
rin
k to
you
.
Ple
ase
ran
k,
in o
rder
of
imp
ort
ance
, eac
h o
f th
e fo
llow
ing
cha
ract
eris
tics
of
a
Allo
cate
a r
ank
of 1
to
the
mo
st
imp
ort
ant
re
aso
n, a
ran
k o
f 2
to t
he s
econ
d m
ost
eZISIGSZI
SE
CT
ION
B —
Bra
nd
Lo
yalty
Very important
Important
Unimportant
Totally
Unimportant
How
imp
ort
ant
are
the
fo
llow
ing
cha
ract
eri
stic
s o
f a s
po
rts
dri
nk
to y
ou
?
imp
ort
ant
rea
son
, etc
.
Allo
cate
a r
ank
of 5
to
the
leas
t im
po
rtan
t cha
ract
eris
tic.
Use
eac
h o
f the
nu
mbe
rs 1
to
5 o
nce.
2
O 0.
a) C
0
0
5 (3) C in
C C co
O
to
'EsC C)
co o.
ai
Very
important
Important
Unimportant
Totally
Unimportant
2 C C
0 0.
0 O
Of
0. .c 0 0
C C 0 0. E 0 (.) cr) C
O 0
co .c
C co 0 0. E 3 c; O 0 =
Wh
en d
id y
ou p
urc
hase
yo
ur
las
t sp
ort
s d
rin
k? M
AR
K O
NL
Y O
NE
Ho
w o
ften
do
you
dri
nk
a sp
ort
s d
rin
k ? M
AR
K O
NLY
ON
E
hi To
C *(7) 0.
17) C
0
0
rn C
CC u,
0
C C) co F.
U .; ci

Wh
ich
flavo
urs
do
you
pre
fer?
List
an
y 3:
c■i
Than
ks v
ery
mu
ch
for
your
tim
e. Y
our
par
tici
pat
ion
in t
his
stu
dy is
gre
atly
app
rec
iate
d.
e
•
Tau a. td C_ co '5 c
4 a.
'S. rn .0
C
.c o z
11
• 6
as co a) c
o
4) 0
lC
rc,
:42 0
10
m
0
-V c co cc
ur f
avou
rite
bra
nd
of s
por
ts d
rin
k
erga
de
wer
ade
nam
ic E
ner G
- U
SN
C .c act iv
e
II pre
fer
drin
king
so
met
hing
els
e (p
leas
e sp
ecify
)
0- CO
O E
-13 C O
C
-o .
▪
c
O t o a. CNI U)
"6. "6 C
▪
•
m to
▪
a
e
o cou)
6 .2
>. 0.0
.E_
zo a
•
E .
•
c "6 ,15 O c •
JE ea
eu N
06° ° a: 7i imp
orta
nt r
easo
n, e
tc.
Allo
cate
a r
ank
of 6
to t
he le
ast
imp
orta
nt r
easo
n.
Use
eac
h of
the
num
bers
1 to
6 o
nce.
CO
Very important
Important
Unimportant
Totally
Unimportant
The
bran
d
Va r
iety
of f
lavo
urs
Ing
redi
ents
on
the
bottl
e
Tec h
nica
l fea
ture
s (e
. g. n
ozzl
e )
Pr ic
e
Ass
ocia
tion
with
top
spor
ts p
erfo
r mer
s
Oth
er (p
leas
e sp
ecify
)
Lt)

Frequencies
Statistics
Cumulative Percent
68.01
100.01
1
gender irace
N I Valid I 178 177
location al
178 197 1901
19 0 71
Missing I 19 1 20
A.1
gender
Frequency Percent Valid Percent
Valid
1 Male 121 61.4 68.0
2 Female 57 28.9 32.0
Total 178 90.4 100.0
Missing System 19 9.6
19-7-{ 100.0 Total
race
, Frequency Percent Valid Percent Cumulative Percent
Valid
1 Black 72 36.5 40.7 40.7
2 Coloured 18 9.1 10.2 50.8
3 White 71 36.0 40.1 91.0
4 Indian 16 8.1 9.0 100.0
Total 177 89.8 100.0
Missing System 20 10.2
Total 197 100.0
A.1
Frequency Percent Valid Percent Cumulative Percent
Valid
1 18-24 years 143 72.6 80.3 80.31
2 25 years or older 35 17.8 19.7 100.01
Total 178 90.4 100.0 I
Missing System 19 9.6 I
Total 197 100.0 1
location
Frequency Percent Valid Percent Cumulative Percent
alid
1 UJ 50 25.4 25.4 25.41
2 PTA 101 51.3 51.3 76.61
3 MONASH 46 23.4 23.4 100.01
Total 197 100.0 100.0 j
al
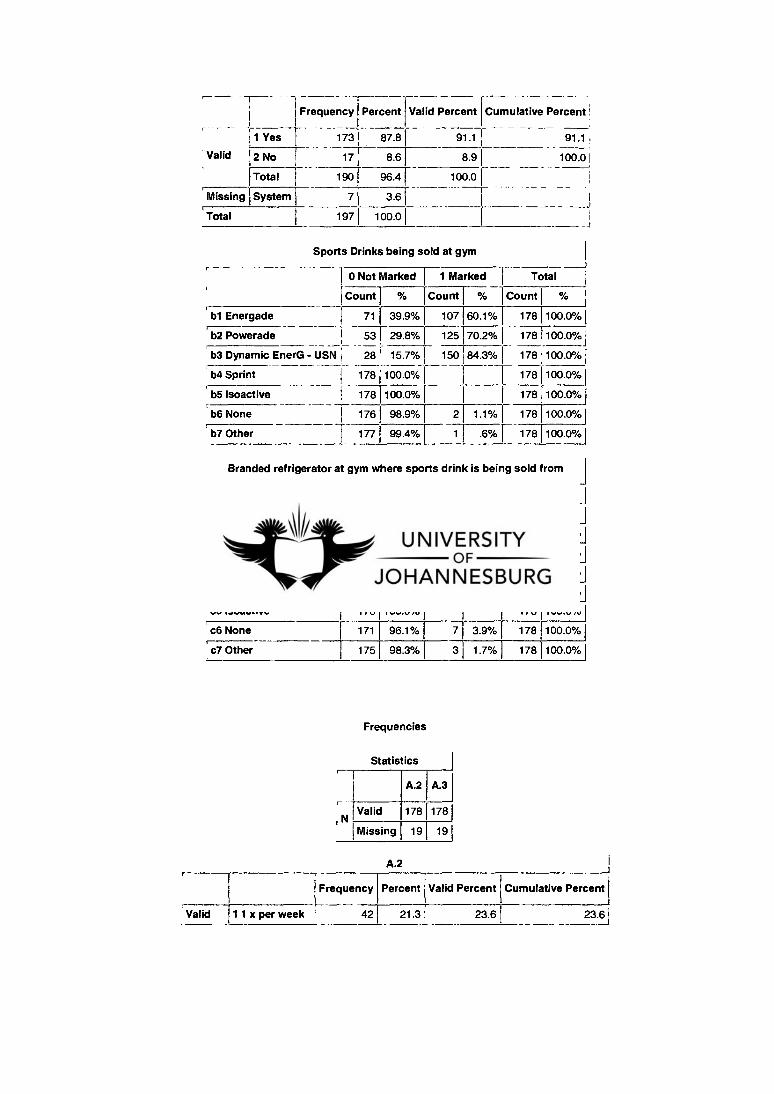
Valid Percent 1 Cumulative Percent
Frequency Percent
A.2 A.3 1
Valid 178 1781
Missing 19 191
A.2
r
,N
b6 None
b7 Other
b3 Dynamic EnerG - USN 1
b4 Sprint 1
, b5 Isoactive
1 Frequency Percent Valid Percent Cumulative Percent'
11 Yes 1 173 87.8 91.1 91.1
Valid 1 2 No 17 8.6 8.9 100.0 I
Total 190 96.4 100.0
Missing System 7 3.6 1
Total 197 100.0
Sports Drinks being sold at gym
1 0 Not Marked
1 Marked
Total
b1 Energade
1
b2 Powerade
I
Branded refrigerator at gym where sports drink is being sold from
0 Not Marked 1 Marked Total 1
Count % Count % Count % 1
rc1 Energade 77 43.3% 101 56.7% 178 100.0%1
c2 Powerade 158 88.8% 20 11.2% 178 100.0%1
100.0%1
100.0%
c3 Dynamic EnerG - USN 32 18.0% 146 82.0% 178
c4 Sprint 178 100.0% 178
c5 Isoactive 178 100.0% 178 100.0%1
c6 None 171 96.1% 7 3.9% 178 100.0%1
100.0%1 c7 Other 175 98.3% 3 1.7% 178
Frequencies
Statistics
Count % Count % Count %
71 39.9% 107 60.1% 178 100.0%
53 29.8% 125 70.2% 178 1100.0%]
28 15.7%1 150 84.3% 178 100.0%1
178 1100.0% 178 100.0%
178 100.0% 178 [100.0%1
176 98.9% 2 1.1% 178 100.0%1
177 99.4% 1 .6% 178 100.0%1
Valid 1 1 x per week T 42 21.3 23.6 23.61

A.3 1
Frequency Percent Valid Percent jCumulative Percent
47 23.9 26.4 26.41
54 27.4 30.3 56.7
24 12.2 13.5 70.11
53 26.9 29.8 100.01
I
1
178 90.4 100.0
19 9.6
197 100.0
1 <1 year
2 1-2 years
Valid
3 2-3 years
174 >3 years
Total
Missing System
Total
66.3
18.9
66.3
85.1 I 92.01
98.31
100.01
6.9
6.3
1.7
100.0
Valid Percent Cumulative Percent
2 2 x per week 50 25.4
3 3 x per week 35 17.8
4 >4 x per week 51 25.9
Total 178 90.4
Missing System 19 9.6
Total 197 100.0
28.1 1 51.71
19.7 1 71.3
28.7 1 100.01
100.01
I 1 I II
Type of activity
0 Not Marked 1 Marked Total
Count Count % Count %
A.4.1 Aerobic/Endurance exercises 68 38.2% 110 61.8% 178 1 00 .0% 1
1 00 .0%1
100.0%1
A.4.2 Flexibility/Stretching exercises 93 52.2% 85 47.8% 178
A.4.3 Strength/Resistance training 80 44.9% 98 55.1% 178
Frequencies
Statistics
8.5 B.6 I
,N Valid 175 1751
Missing 22 221
B.5
Frequency Percent
, Valid
1 <1 week ago 116 58.9
2 1 week ago 33 16.8
3 2 weeks ago 12 6.1
4 3-4 weeks ago 11 5.6
5 >4 weeks ago 3 1.5
Total 175 88.8
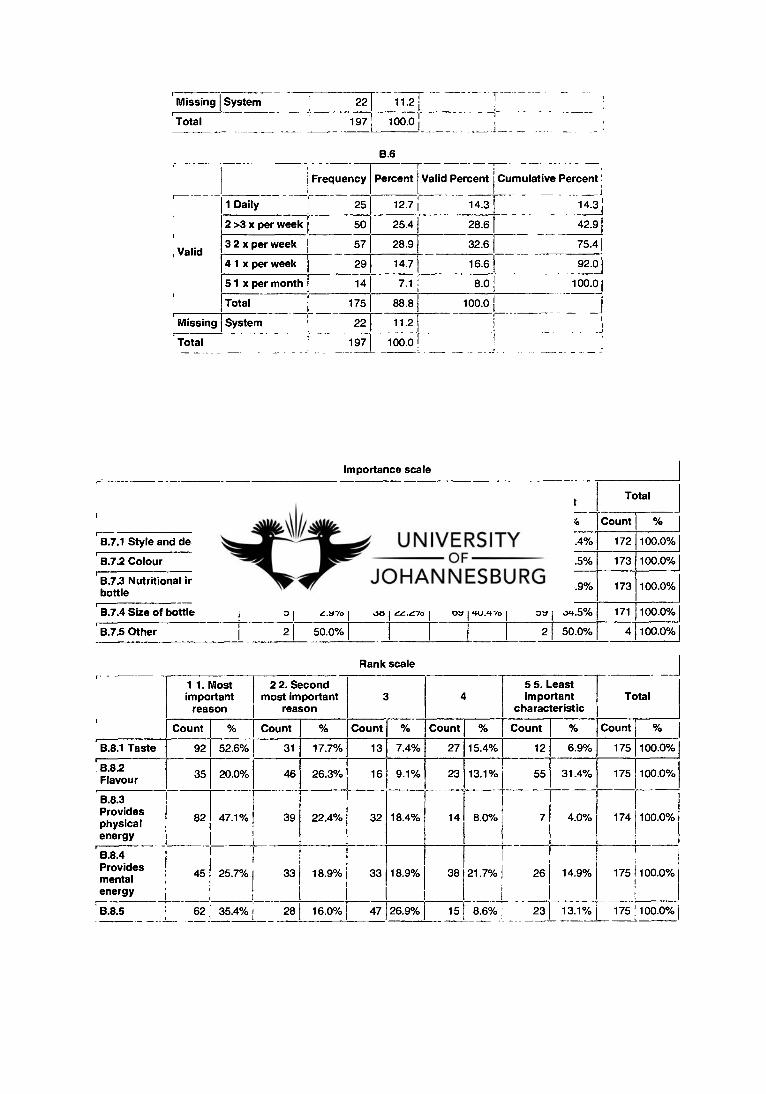
Valid Percent Cumulative Percent
14.3 14.31
28.6 42.91
32.6 75.41
16.6 92.01
8.0 100.01
100.0
Missing I System 22 11.2
Total 1971 100.01
B.6
, Valid
Frequency Percent
1 Daily 25 12.7
2 >3 x per week 50 25.4
3 2 x per week 57 28.9
41 x per week 29 14.7
51 x per month 14 7.1
Total i 175 88.8
Missing System 22
197
11 .2
Total 100.0
Importance scale r---
1 Totally unimportant
2 Unimportant
3 Important 4 Very
important Total
Count % Count % Count % Count % Count %
B.7.1 Style and design 13 7.6% 53 30.8% 83 48.3% 23 13.4% 172 100.0%
B.7.2 Colour 21 12.1% 78 45.1% 61 35.3% 13 7.5% 173 100.0%
6.7.3 Nutritional info on bottle 5 2.9% 17 9.8% 56 32.4% 95 54.9% 173 100.0%
B.7.4 Size of bottle 5 2.9% 38 22.2% 69 40.4% 59 34.5% 171 100.0%
B.7.5 Other 2 50.0% 2 50.0% 4 100.0%
Rank scale
Count
13
16
32
33
1 1. Most important
reason
2 2. Second most important
reason
Count Count
B.8.1 Taste 92 52.6% 31 17.7%
13.82 Flavour 35 20.0% 46 26.3%
B.8.3 Provides physical energy
82 47.1% 39 22.4%
B.8.4 Provides mental energy
45 25.7% 33 18.9%
B.8.5 T 62 35.4% 28 16.0%
3 4 5 5. Least important
characteristic Total
Count Count Count
7.4% 27 15.4% 12 6.9% 175 100.0%
9.1% 23 13.1% 55 31.4% 175 100.0%
18.4% 14 8.0% 7 4.0% 174 100.0%
18.9%
26.9%
38
151
21.7% 26
8.6% 23
14.9% 175 100.0%
13.1% 175 100.0% 1-47

Nutrition value
2 Unimportant
3 Important 4 Very
important
% Count I- % Count ! % ICountf
11 i 6.3% 71 40.6% 91 52.0%
53 30.3% 79 45.1% 28 16.0%
5 2.9% 56 32.0% 114 65.1%
14 8.0% 87 49.7% 73 41.7%
11 6.3% 66 37.9% 95 54.6%
Total
Counil.
-I- 1 Totally unimportant
Count T %
B.9.4 Provides mental energy
1 .6%
2 1.1% B.9.5 Nutritional value
B.9.1 Taste of a sports drink
B.9.2 Variety of flavours 15
B.9.3 Provides physical energy
2
Importance scale 2 i
175 100.0%
175 100.0% I
175 100.0%
175 100.0%
174 100.0%
Importance scale 3 r-
1 Totally unimportant
2 Unimportant
3 Important 4 Very
important Total
Count % Count % Count % Count % Count % i
' B.10.1 The brand 11 6.3% 49 27.8% 76 43.2% 40 22.7% 176 100.0%
' B.10.2 Variety of flavours 11 6.3% 52 29.5% 93 52.8% 20 11.4% 176 100.0%
B.10.3 Ingredients on the bottle 8 4.6% 26 14.9% 75 42.9% 66 37.7% 175 100.0%
B.10.4 Technical features 24 13.6% 66 37.5% 72 40.9% 14 8.0% 176 100.0%
B.10.5 Price 23 13.0% 40 22.6% 53 29.9% 61 34.5% 177 100.0%
8.10.6 Association with top sports performers
56 35.9% 46 29.5% 33 212% 21 13.5% 156 100.0%
B.10.7 Other 1 50.0% 1 50.0% 2 100.0%
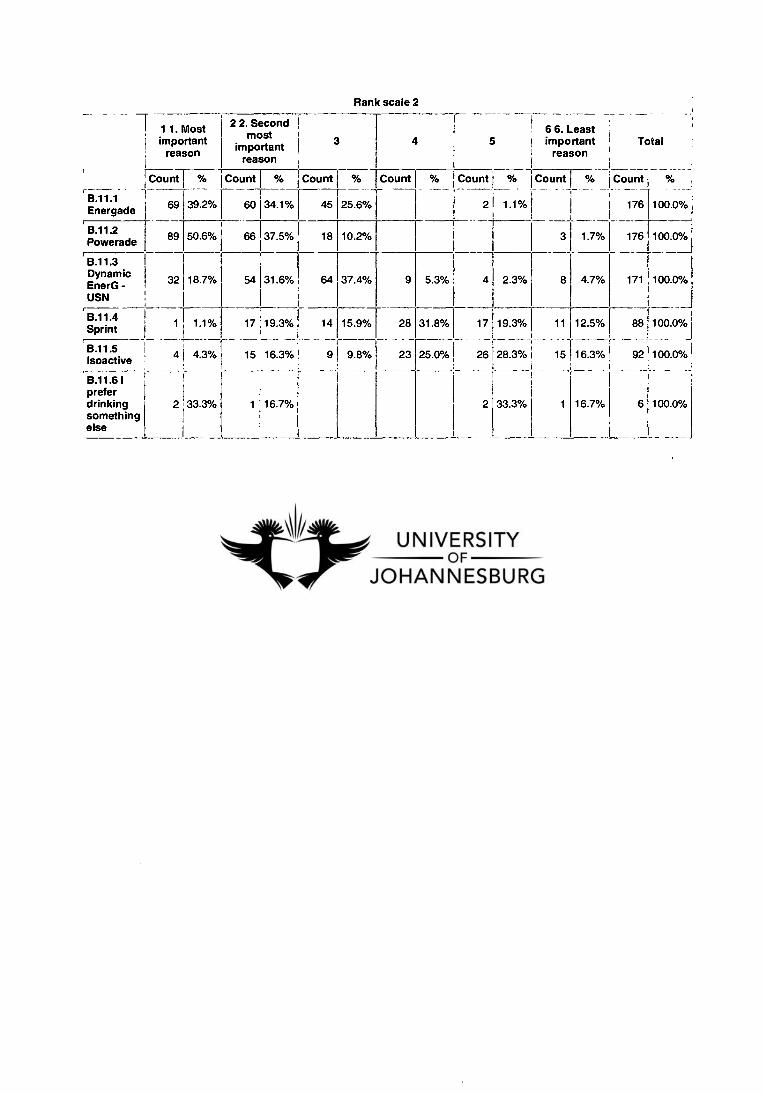
Rank scale 2
6 6. Least important Total
reason
% Count [ % Count %
1.1% 176 100.0%
3 1.7% 176 100.0%
2.3% 8 4.7% 171 100.0%
19.3% 11 12.5% 88 100.0%
28.3% 15 16.3% 92 100.0%
33.3% 1 16.7% 6 100.0%
18.7% 54 31.6% 64 37.4% 9 5.3% 4
Count % Count % Count % Count
B.11.1 69 39.2% 60 34.1% 45 25.6%
Energade
4 5
% Count
r 21
B.11.2 Powerade 10.2%
B.11.4 Sprint
8.11.5 4 4.3% Isoactive
B.11.6 I prefer drinking something else
17 19.3% 14 15.9%
15 16.3% 9 9.8%
-7-
1 16.7%
•
1 1.1%
2
1 1. Most important
reason
2 2. Second most
important reason
3
B.11.3 Dynamic EnerG -USN
2 33.3%
28 31.8% 17
23 25.0% 26
89 50.6% 66 37.5% 18
32
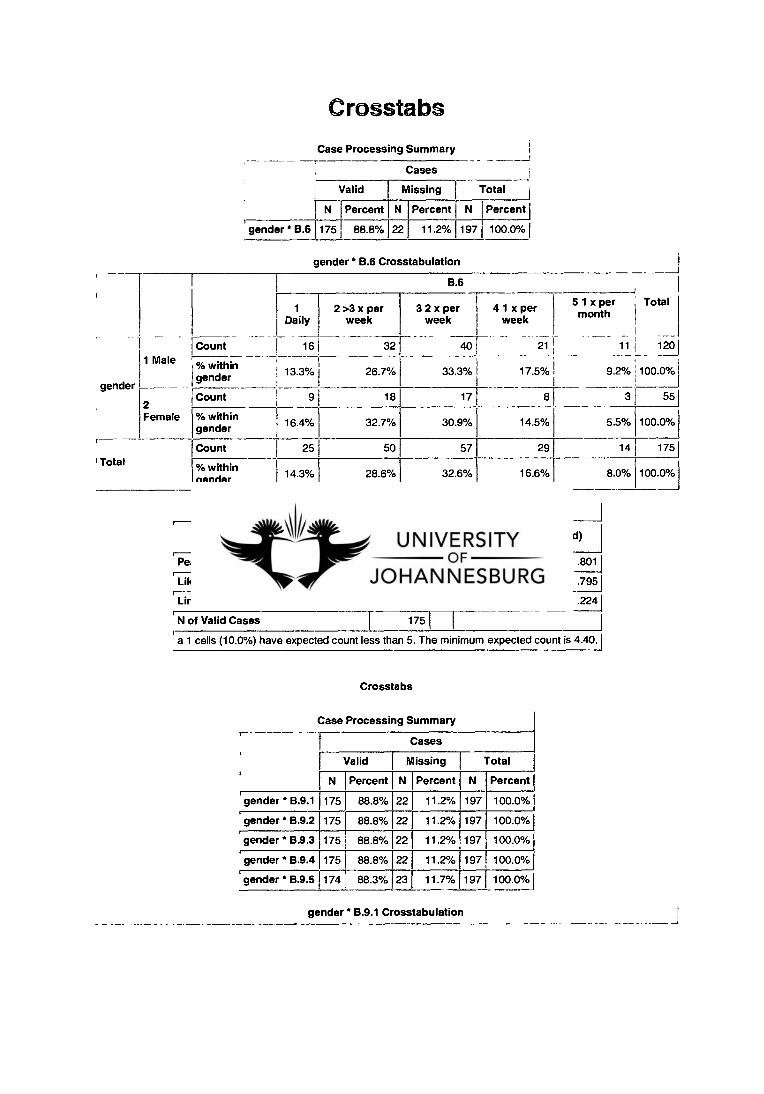
18 17 9
gender B.6
Val id
N Percent
175 88.8%
Missing Total
N Percent N Percent 1
22 11.2% 197 100.0%
3 2 x per week
2 >3 x per week
1 Daily
r 16
13.3%
4 1 x per week
21 32 40 1 Male
17.5% 9.2% 100.0% 33.3% 26.7% gender
8
Count
% within gender
Count
% within gender
3 551
5.5% 100.0%
14 1751
8.0% 100.0%
2 Female 14.5% 32.7% 30.9% 16.4%
Count
% within gender
29 25 50 57 Total
28.6% 16.6% 32.6% 14.3%
gender * B.6 Crosstabulation r
B.6 J
5 1 x per Total month
11 120
Crosstabs
Case Processing Summary
Cases
Chi-Square Tests
Value df Asymp. Sig. (2-sided)
Pearson Chi-Square 1.644(a) 4 .8011
Likelihood Ratio 1.679 4 .795
Linear-by-Linear Association 1.480 1 .224
N of Valid Cases 175
a 1 cells (10.0%) have expected count less than 5. The minimum expected count is 4.40.1
Crosstabs
Case Processing Summary
Cases
Valid Missing Total
N Percent N Percent N Percent
gender * B.9.1 175 88.8% 22 11.2% 197 100.0%
gender * B.9.2 175 88.8% 22 11.2% 197 100.0%
gender • B.9.3 175 88.8% 22 11.2% 197 100.0%
gender * B.9.4 175 88.8% 22 11.2% 197 100.0%
gender ' B.9.5 174 88.3% 23 11.7% 197 100.0%
gender • B.9.1 Crosstabulation
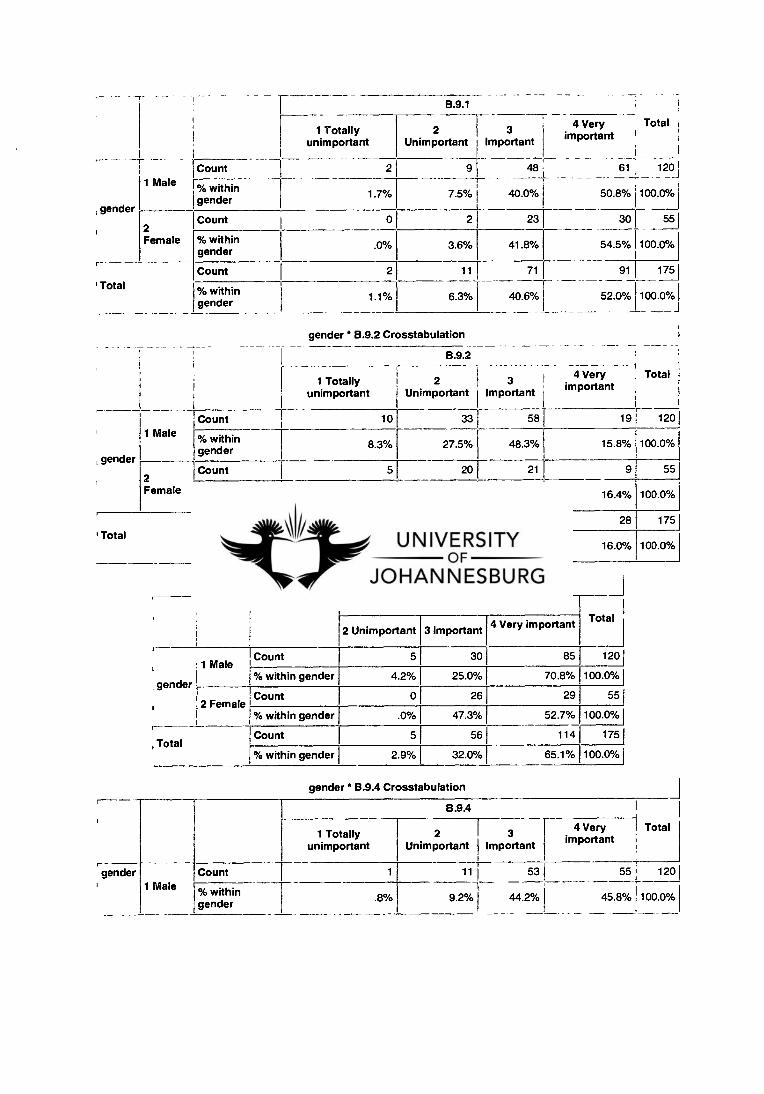
-r
--r
gender
1 Male
B.9.1
Total 1 Totally
unimportant 2
Unimportant
-7
3 Important
4 Very important
61
50.8%
Count 2 9 48
40.0%
120 1
100.0% % within gender
1.7% 7.5%
2 Female
Count 0 2 23 30 551
% within gender
.0% 3.6% 41.8% 54.5% 100.0%
1 Total Count 2 11 71 91 1751
% within gender
1.1% 6.3% 40.6% 52.0% 100.0%
gender B.9.2 Crosstabulation
B.9.2
r__
1 Totally unimportant
2 Unimportant
3 Important
4 Very
1 important Total
, gender
1 Male Count 10 33 58 19 1201
100.0%1
551
% within gender
8.3% 27.5% 48.3% 15.8%
2 Female
Count 5 20 21 9
cYc. within gender
9.1% 36.4% 38.2% 16.4% 100.0%
1 Total Count 15 53 79 28 175 !
% within gender
8.6% 30.3% 45.1% 16.0% 100.0%
gender B.9.3 Crosstabulation
B.9.3 Total
2 Unimportant 3 Important 4 Very important rt
gender
1 Male Count 5 30 85 120 !
%within gender 4.2% 25.0% 70.8% 100.0%1
55 2 Female
Count 0 26 29
% within gender .0% 47.3% 52.7% 100.0%1
175 !
.----
Total Count 5 56 114
cr. within gender 2.9% 32.0% 65.1% 100.0% I
gender * 8.9.4 Crosstabulation
B.9.4
1 Totally unimportant
2 Unimportant
3 Important
4 Very 1 Total important
53 Count gender
.8%
55 120
45.8%1-100.0% 1 Male % within
gender
1
9.2% 44.2%
11

B.9.5
3 Important
2 Unimportant
1 Totally unimportant
4 Very I Total important
68 119 1 57.1% 100.0%
27 55 1 49.1% 100.0%
95 174
54.6% 100.0%]
10 40
8.4% 33.6% 1 Male % within
gender
Count
gender
2 Count
Female % within gender
Count Total % within
gender
1 26
1.8% 47.3%
11 66
6.3% 37.9%
Total
2 Female
'Count
% within gender
Count
% within gender
3I 341 181 551
5.5% I
61.8% 1 32.7% 100.0% I 1
.0%
1
14I
87 1 73 1751
"7-
.6%
8.0%1 49.7% j 41.7% 100.0%
gender • B.9.5 Crosstabulation
Crosstabs
Case Processing Summary
Cases
Valid Missing Total
N Percent N Percent N Percent I
gender * B.10.1 176 89.3% 21 10.7% 197 100.0% j
gender * B.10.2 176 89.3% 21 10.7% 197 100.0% I
gender • B.10.3 175 88.8% 22 11.2% 197 100.0%
gender • B.10.4 176 89.3% 21 10.7% 197 100.0%
gender * B.10.5 177 89.8% 20 10.2% 197 100.0%
gender * B.10.6 156 79.2% 41 20.8% 197 100.0%
gender • B.10.7 2 1.0% 195 99.0% 197 100.0%
gender B.10.1 Crosstabulation
gender
B.10.1
Total 1 Totally
unimportant 2
Unimportant 3
Important
4 Very important
1 Male Count 7 34 49 31 121
% within gender 5.8% 28.1% 40.5% 25.6% 100.0%
2 Female
Count 4 15 27 9 55 - -
% within gender
7.3% 27.3% 49.1% 16.4% 100.0% I
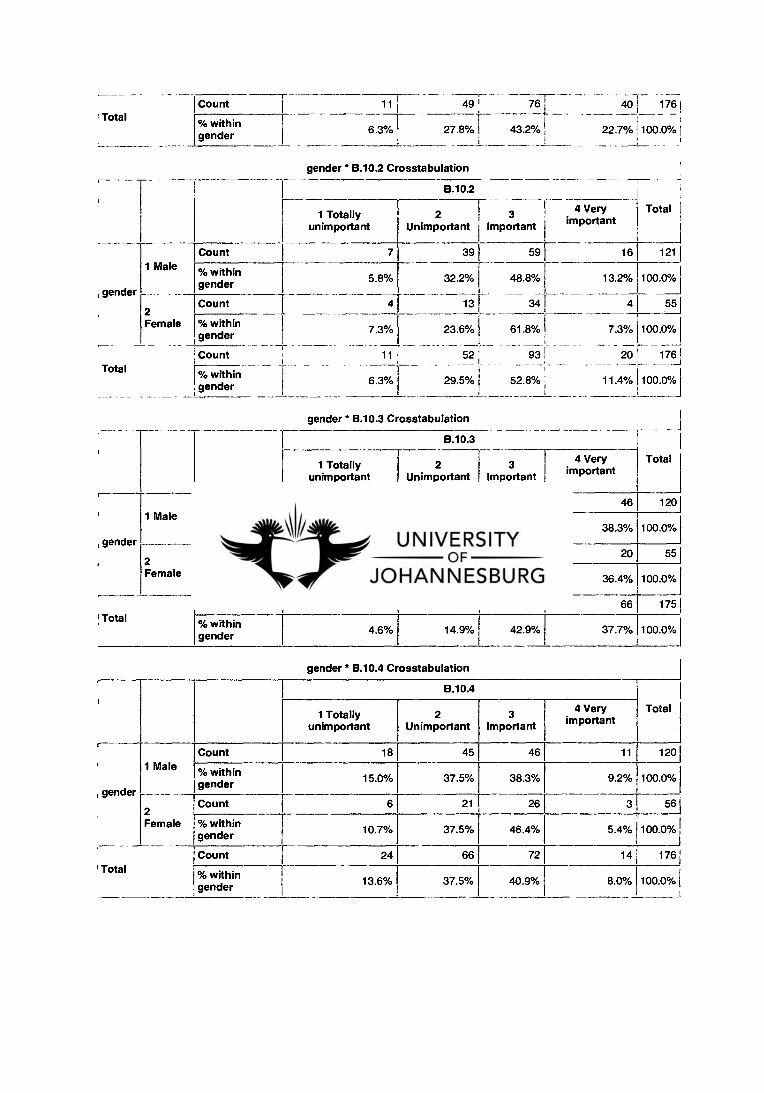
2 Female
1 Male
1 Totally unimportant
5.8%
7
41- 13 34
2 3 Unimportant Important
B.10.2
32.2%
39 59
48.8%
Count
% within gender
Count
% within gender
Count
% within gender
Count
% within gender
40 1 1761
22.7%1100.0%1
4 Very important
16
13.2%
4 551
Total 111 49I 761
1
6.3% 27.8% 43.2% 1
gender * B.10.2 Crosstabulation
, gender
Total
100.0%
Total
1
1211
7.3% 23.6% 61.8% 7.3% 100.0%
11 52 931 20 1761 _J
6.3% 29.5% 52.8% , 11.4% 100.0%
gender • B.10.3 Crosstabulation
B.10.3
4 Very important
Total 1 Totally
unimportant 2
Unimportant 3
Important
21 7 46 120 46 Count 1 Male
, gender
2 Female
% within gender 5.8% 17.5% 38.3% 38.3% 100.0%
Count 1 5 29 20 55
% within gender
1.8% 9.1% 52.7% 36.4% 100.0%
Total Count
% within gender
26
4.6% 14.9%
75
42.9%
66
37.7%
175
100.0%
8
gender * B.10.4 Crosstabulation
1 B.10.4
Total 1 Totally
unimportant 2
Unimportant 3
Important
4 Very important
'
, gender
1 Male Count 18 45 46 11 120
% within gender 15.0% 37.5% 38.3% 9.2% 100.0%
2 Female
Count 6
10.7%
21
37.5%
26
46.4%
3
5.4%
561
100.0% % within gender
Total Count 24 66 72 14 1761
% within gender 13.6% 37.5% 40.9% 8.0% 100.0%1

gender * B.10.5 Crosstabulation
-
, gender
1 Totally unimportant
1 Male Count 11
% within gender
9.1%
2 Female
Count 12
% within gender
21.4%
' Total Count 23
% within gender 13.0%
8.10.5
2 1 3 4 Very j Total
Unimportant I Important important
23 37 1
50 , 1211
19.0% 30.6% 41.3%1100.0%1
17 16 11 1 561
30.4% 28.6% 19.6% 100.0%
40 53 611 1771
22.6% 29.9% 34.5% r1;0.0%
gender • B.10.6 Crosstabulation
B.10.6 1-
1 Totally unimportant
2 Unimportant
4 Very 3 important
Important
Total
Count 31 34 27 18 110
% within gender
282% 30.9% 24.5% 16.4% 100.0%
a
Count 25 12 6 3 __1
% within gender
54.3% 26.1% 13.0% 6.5% 100.0%
Count 56 46 33 21 1561
100.0% % within gender 35.9% 29.5% 21.2% 13.5%
gender " B.10.7 Crosstabulation
B.10.7 Total
2 Unimportant 3 Important
, gender
1 Male Count 0 1 1
% within gender .0% 100.0% 100.0%
2 Female Count 1 0 1
% within gender 100.0% .0% 100.0%
Total Count 1 1 2
% within gender 50.0% 50.0% 100.0%
Crosstabs
Case Processing Summary
Cases
Valid Missing Total
N I Percent 1 N !Percent N 1 Percent(
1 Mal
, gender
2 Femal
:Total

Count
100.0% 28.7% 8.0% 32.2% 16.7%
5j
% within 31.3% race
Count 25
% within 14.4% race
4 Indian 5
25.0% 31.3% _ _
50 56
21 0 161
12.5%1 .0% 100.0°k]
29 14 1741 ' Total
race* B.6 1174 1 88.3%1231 11.7%11971 100.0%
race * B.6 Crosstabulation
B.6
1 I Daily
2 >3 x per 1 week
3 2 x per week
4 1 x per week
' 5 1 x per 1 month
1 Black Count I 71 24 21 12 7
1( % within race 9.9% 33.8% 29.6% 16.9% 9.9%
2 Coloured
Count 0
.0%1-
7 9 -- -
50.0%
2 _ _ _
11.1%
0 __ _ _.
.0%
-
1( % within race
38.9%
3 White Count 13 15 21 13 7
% within race
18.8% 21.7% 30.4% 18.8% 10.1% 1(
Chi-Square Tests r
Value df Asymp. Sig. (2-sided)
Pearson Chi-Square 16.355(a) 12 .1761
Likelihood Ratio 20.674 12 .0551
Linear-by-Linear Association 1.340 1 .247
' N of Valid Cases 174
a 7 cells (35.0%) have expected count less than 5. The minimum expected count is 1.29]
Symmetric Measures
Value Approx. Sig.
, Nominal by Nominal Phi 307 .1 .176
Cramer's V .177 .1761
N of Valid Cases 174
a Not assuming the null hypothesis.
b Using the asymptotic standard error assuming the null hypothesis.]
Crosstabs
Case Processing Summary
Cases
r Valid 1 Missing Total
, race
otal
71
181
0.0%
69j
0.0%1

, Total
4 Indian % within race
Count
% within race
Count
.0%
2
1.1%
0
0 6
.0% 37.5%
11 70
6.3% 40.2%
10
62.5%
91
52.3%
100.0%
174
100.0%
16
171 Totally unimportant
B.9.1
2 Unimportant Total
3 Important 4 Very important
2
2.8%
0 0 10 8 181
.0% .0%-{ 55.6% 44.4% , 100.0% ,
0 5 27 37 69
% within race .0% 72% 39.1% 53.6% 100.0%
r-
race
Count 1 Black
% within race
Count 2 Coloured
% within race
Count 3 White
6 27
8.5% 38.0%
36 71J
50.7% 100.0%
race * B.9.2 Crosstabulation
B.9.3
2 Unimportant 3 Important 14 Very important Total
1 Black Count
% within race
2 Coloured Count
2
2.8% 35.2%
0
44 711
62.0% 100.0%
16 18j
race 25 1
2 I
N 1 Percent N Percent 1 N I Percent j
race ' B.9.1 174 88.3% 23 11.7%1197 100.0%
race * B.9.2 174 I 88.3% 23 11.7%1197 100.0% i
race ' B.9.3 174 88.3% 23 11.7% 1197 100.0% I
i race' B.9.4 174 88.3% 23 11.7%1197 100.0% 1
race * B.9.5 173 87.8% 24 12.2%1197 100.0%
race * B.9.1 Crosstabulation
B.9.2 Total
1 Totally unimportant 2 Unimportant 3 Important 4 Very import important
T 1 Black
Count 6 18 33
46.5%
14
19.7%
71j
100.0% % within race 8.5% 25.4%
2 Coloured Count 3 6 8 1 18
% within race 16.7% 33.3% 44.4% 5.6% 100.0%
3 White Count 3 26 31 9 69
% within race 4.3% 37.7% 44.9% 13.0% 100.0%
4 Indian Count 3 3 7 3 16
% within race 18.8% 18.8% 43.8% 18.8% 100.0%
I Count 15 53 79 27 174
% within race 8.6% 30.5% 45.4% 15.5% 100.0°/.11
race B.9.3 Crosstabulation
, race
Tota
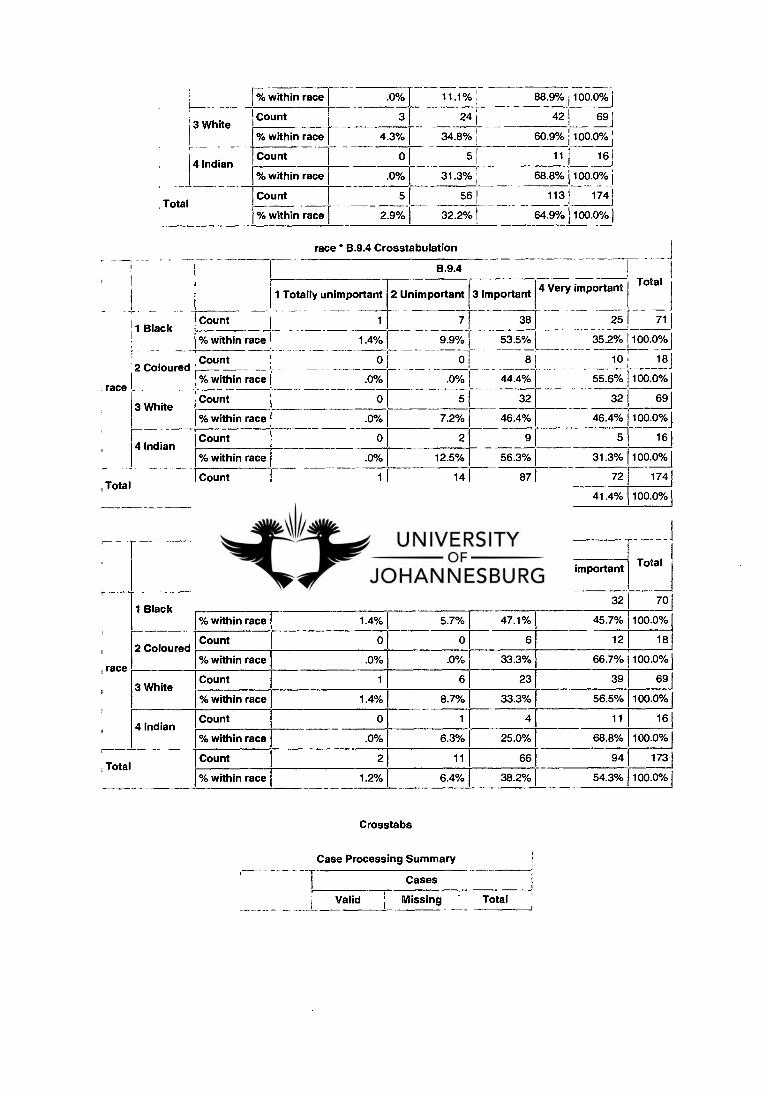
i 3 White
4 Indian
, Total
Pie within race I .0% 11.1% 88.9%1100.0%1
Count 1 3 24 1 42 69
% within race I 4.3% 34.8%1 60 9% 1 100 0%
Count I 0 51 111 161
% within race 1 .0% 31.3% I ' 68.8%1100.0%1
Count I 5 56 1 113 1 1741
% within racel 2.9% 32.2%1 64.9%1100.0%1
1 Black
race
Total
Count
% within race
2 Coloured Count °A within race
Count 3 White
% within race
Count 4 Indian
% within race
Count
% within race
j
B.9.4 I
1 Totally unimportant 2 Unimportant 3 Important 4 Very important Total
1 7 38 25 71I
1.4% 9.9%f 53.5% 35.2%1100.0e/0j
10
0 0 8 18j
.0% .0% 44.4% 55.6% 100.0%
0 5 32 32 69
.0% 7.2% 46.4% 46.4%1100.0%
5
31.3%
72
41.4%
race B.9.4 Crosstabulation
.0%
.6%
0
2 9
12.5% 56.3%
14 87
8.0% 50.0%
16
100.0%
174
100.0%
race ° B.9.5 Crosstabulation
B.9.5 Total
1 Totally unimportant 2 Unimportant 3 Important 4 Ve Very important
1 Black Count 1 4 33 32 70
% within race 1.4% 5.7% 47.1% 45.7% 100.0%
2 Coloured Count 0 0 6 12 18
% within race .0% .0% 33.3% 66.7% 100.0%
3 White Count 1 6 23 39 69
% within race 1.4% 8.7% 33.3% 56.5% 100.0%
4 Indian Count 0 1 4 11 16
% within race .0% 6.3% 25.0% 68.8% 100.0%
Count 2 11 66 94 173
% within race 1.2% 6.4% 38.2% 54.3% 100.0%
Crosstabs
Case Processing Summary
Cases
1 Valid Missing Total ! _J
, race
t---
Total
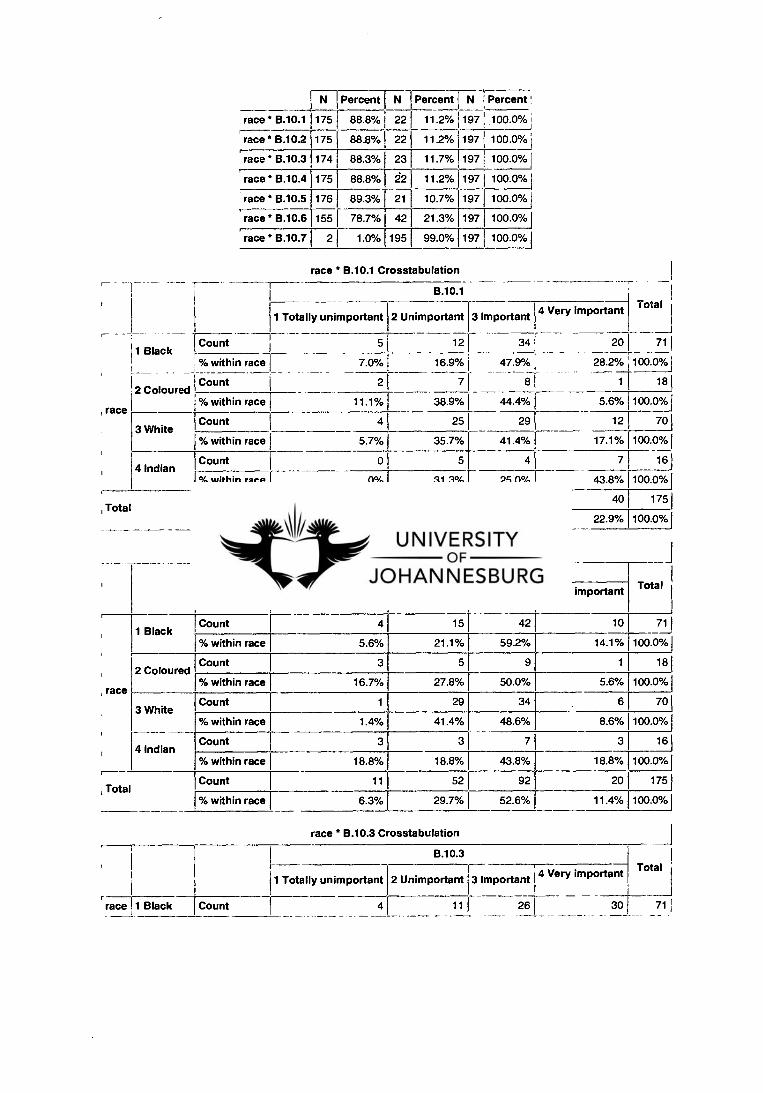
B.10.1
T -{--- 2 Unimportant 3 Important 4 Very important
Total
38.9% 1 44.4%
25 29
41.4%
4
25.0%
75
42.9%
711
100.0%1
181
5.6% 100.0%1
12 701
17.1% 100.0%1
7 161
43.8% 100.0%
40 1751
22.9% 100.0%1
121 34 20
16.9%1 47.9% 28.2%
7I 8I 1
35.7%
5
31.3%
49
28.0%
1 1 rt 1 Totally unimportant 2 Unimportant 3 Important
B.10.3
4 Very important Total
N Percent N Percent N Percent I
race* 8.10.1 175 88.8% 22 11.2% 197 100.0% I
race * B.10.2 175 88.8% 22 112% 197 I 100.0%1
100.0% 1 I race* B.10.3 174 88.3% 23 11.7% 197
race • B.10.4 175 88.8% 22 11.2% 197 100.0%
race' B.10.5 176 89.3% 21 10.7% 197 100.0%1
race* B.10.6 155 78.7% 42 21.3% 197 100.0%1
100.0%1 race* B.10.7 2 1.0% 195 99.0% 197
race • B.10.1 Crosstabulation
1 Totally unimportant
Count 5 1 Black
% within race 7.0%
Count 2 2 Coloured
% within race 11.1% , race
Count 4 3 White
% within race 5.7%
Count 0 4 Indian
within race .0%
Count 11 Total
% within race 6.3%
race • B.10.2 Crosstabulation
B.10.2 Total
1 Totally unimportant 2 Unimportant 3 Important 4 Very important
, race
,
1 Black Count 4 15 42 10 71
% within race 5.6% 21.1% 59.2% 14.1% 100.0%
2 Coloured Count 3 5 9 1 18
% within race 16.7% 27.8% 50.0% 5.6% 100.0%
3 White Count 1 29 34 6 70
% within race 1.4% 41.4% 48.6% 8.6% 100.0%
4 Indian Count 3 3 7 3 16
% within race 18.8% 18.8% 43.8% 18.8% 100.0%
, Total Count 11 52 92 20 175
% within race 6.3% 29.7% 52.6% 11.4% 100.0%
race • B.10.3 Crosstabulation
race 1 Black Count
4 11I 26
301 711
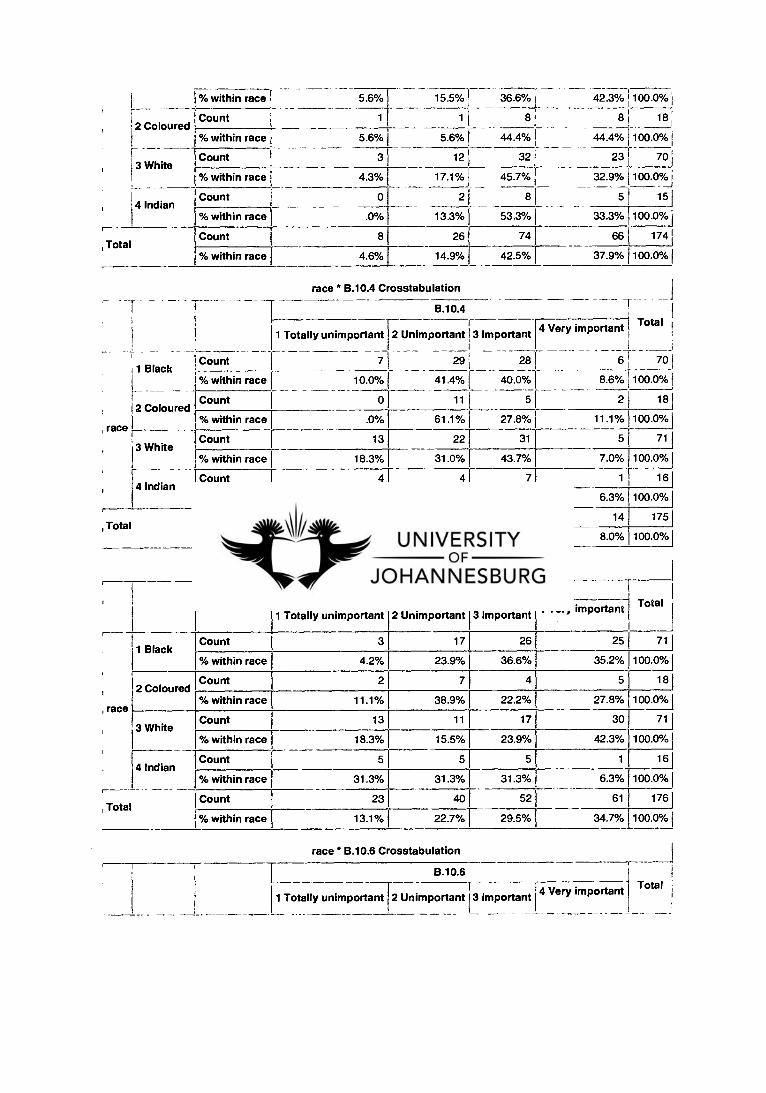
74
66 1741
42.5%
37.9% 100.0%1
i, within race 5.6% 15.5%
2 Coloured Count 1 1
% within race 5.6% 5.6%
3 White Count 3 12
% within race 4.3% 17.1%1
Count 0 2 4 Indian
% within race .0% 13.3%
Count 8 26 , Total
% within race 4.6% 14.9%
36.6% 42.3% 100.0%
8T 8 18
44.4% 44.4% 100.0%1
32 23 701
45.7% 32.9% 100.0% I
8 5 15]
53.3% 33.3% 100.0%
B.10.6 Total
1 4 Very important
1 Totally unimportant 2 Unimportant 13 Important
race * B.10A Crosstabulation
B.10.4
1 Totally unimportant 2 Unimportant 13 Important
Count 7 29 1 28 1 1 Black I
% within race 10.0% 41.4% 1 40.0%
2 Coloured Count 0 11 1 5
, race 31
43.7%
7
% within race 25.0% 25.0% 43.8% 6.3% 100.0%
Count 24 66 71 14 175
% within race
13.7%
37.7% 40.6%
8.0% 100.0%
race • B.10.5 Crosstabulation r-
B.10.5 Total
1 Totally unimportant 2 Unimportant 3 Important 4 Very import
important
r-
, race
1 Black Count 3 17 26 25 71 1
% within race 4.2% 23.9% 36.6% 35.2% 100.0%1
18 2 Coloured
Count 2 7 4 5
% within race 11.1% 38.9% 22.2% 27.8% 100.0%1
71)
100.0%1
161
100.0%1
3 White Count 13 11 17 30
% within race 18.3% 15.5% 23.9% 42.3%
4 Indian Count 5 5 5 1
% within race 31.3% 31.3% 31.3% 6.3%
, Total Count 23 40 52 61 1761
100.0%1 % within race 13.1% 22.7% 29.5% 34.7%
race • 8.10.6 Crosstabulation
4 Very important Total I
6 70
8.6% 1-100.0%1
3 White
4 Indian
% within race .0% 61.1%
Count 13 22
% within race 18.3% 31.0%
Count 4 4
1 27.8%
2 181
11.1% 100.0%1
5 711
7.0% 100.0%1
1 161
, Total
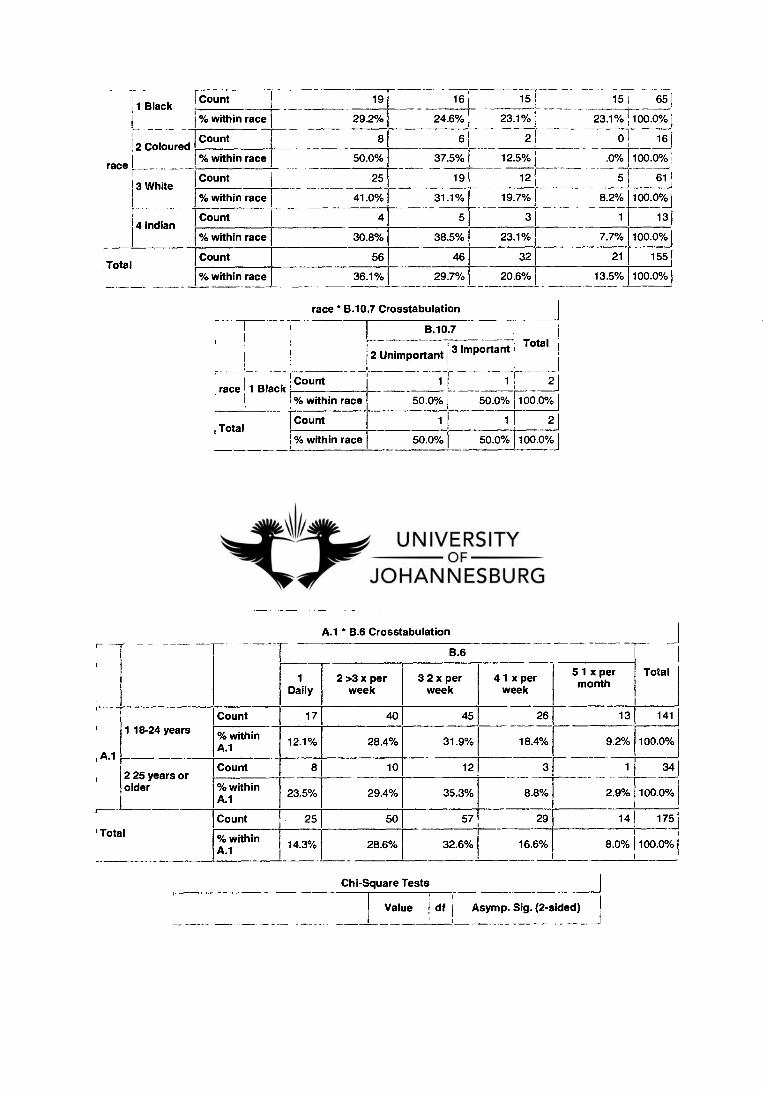
Count 19 16
within race 29.2% 24.6%
Count 8 6
% within race 50.0% 37.5%
Count 25 19
% within race 41.0% 31.1%
Count 4 5
within race 30.8% 38.5%
Count 56 46
% within race 36.1% 29.7%
1 Black
2 Coloured
race 1_
1 3 White
4 Indian
Total
15 1 15, 651
23.1% I
23.1% 100.0%
21
0 161
12.5%1 .0% 100.0%1
121
5 61 1
1
19.7%
8.2% 100.0%1
3
1 131
23.1%
7.7% 100.0%1
32
21
1551
20.6%
13.5% 100.0%
race * B.10.7 Crosstabulation
; race
B.10.7 Total 1
2__I
2 Unimportant I c 3 Important
1 1 1 Black Count 1
% within race 50.0%1 50.0% 100.0%
, Total Count 1 1 1 2
% within race 50.0%1 50.0% 100.00/d
Crosstabs
Case Processing Summary
Cases r Valid Missing Total
N Percent N Percent N Percent I
A.1 * B.6 175 88.8% 22 11.2% 197 100.0%
A.1 * B.6 Crosstabulation ,
1 1- B.6
Total 1 Daily
2 >3 x per week
3 2 x per week
41 x per week
51 x per month
4 A.1
1 18-24 years Count 17 40 45 26 13 1411
100.0!,1
341
% within A.l
12.1% 28.4% 31.9% 18.4% 9.2%
2 25 years or older
Count 8 10 12 3 1
% within A.1
23.5% 29.4% 35.3% 8.8% 2.9% 100.0%
' Total Count 25 50 57 29 14 175_1
100.0% % within A.1
14.3% 28.6% 32.6% 16.6% 1 8.0%
Chi-Square Tests !
Value I df ' Asymp. Sig. (2-sided) 1
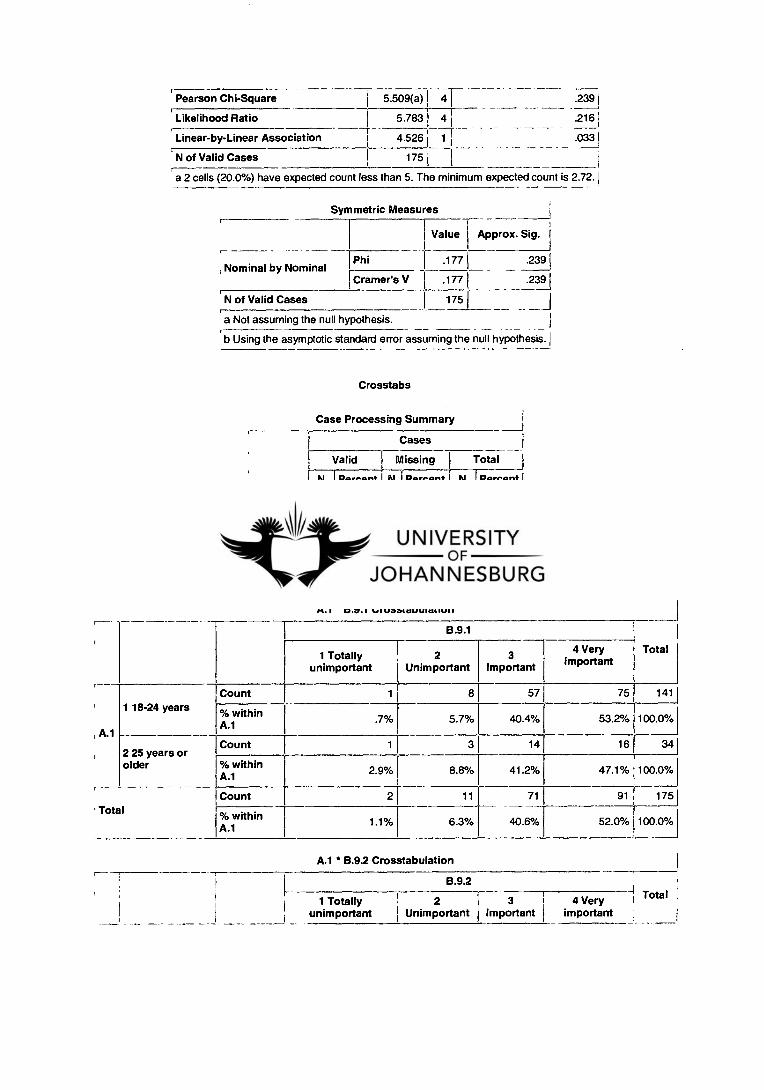
Pearson Chi-Square 5.509(a)1 4f .239
Likelihood Ratio 5.783 41 .2161
Linear-by-Linear Association 4.526 1 1 .033 1
' N of Valid Cases 175 I 1
a 2 cells (20.0%) have expected count less than 5. The minimum expected count is 2.72.
Symmetric Measures
Value Approx. Sig.
Nominal by Nominal Phi .177 1 .2391
Cramer's V .177 1 .2391
175 1 J
I
N of Valid Cases
a Not assuming the null hypothesis.
b Using the asymptotic standard error assuming the null hypothesis.
Crosstabs
Case Processing Summary
Cases I Valid Missing Total j
N Percent N Percent N Percent I
A.1 ' B.9.1 175 88.8% 22 11.2% 197 100.0%_1
100.0%1
100.0%1
100.0% I
A.1 ' B.9.2 175 88.8% 22 11.2% 197
1 A.1 * B.9.3 175 88.8% 22 11 .2% 197
A.1 * B.9.4 175 88.8% 22 11 2% 197
A.1 * B.9.5 174 88.3% 23 11.7% 197 100.0% I
A.1 * B.9.1 Crosstabulation
B.9.1
Total 1 Totally
unimportant 2
Unimportant 3
Important
4 Very important
, A.1
Total
1 18-24 years Count 1 8 57 75 141
% within . A 1
.7% 5.7% 40.4% 53.2% 100.0%
2 25 years or older
Count 1 3 14 16 34 1
% within A.1
2.9% 8.8% 41.2% 47.1% 100.0%
Count 2 11 71 91 1751
% within A.1
1.1% 6.3% 40.6% 52.0% 100.0%]
A.1 B.9.2 Crosstabulation
B.9.2
3 4 Very
tal ry Important I important
1 Totally 2 unimportant 1 Unimportant

1 18-24 years
, A.1
, 2 25 years or older
r--
1 Count
1 °Akrithin
Count
% within A.1
Count
% within A.1
1 1 1
11 ; 431 62 i 251 141 r
7.8%1
1
30.5%1 44.0% 1 17.7% 100.0%1
. ---t-1
10 - -
4 I
17 3 ,
34i
11.8%1 29.4%1 50.0%1 8.no, 100.0%
; 8.8%
i 1
151 531 791 281 1751
8.6%1 30.3% 45.1%1 16.0%1100.0%1
1 18-24 years
A.1
2 25 years or older
' Total
1 18-24 years
A 1 1 , 12 25 years or older
, Total
A.1 ° B.9.3 Crosstabulation
,
B.9.3 Total
2 Unimportant 3 Important I
46 1
4 Very important
Count 41 91 141 1
% within A.1 2.8% 32.6% 64.5% 100.0%1
341 Count 1 10 23
% within A.1 2.9% 29.4% 67.6% 100.0%1
1751 Count 5 56 114
% within A.1 2.9% 32.0% 65.1% 100.0%1
A.1 B.9.4 Crosstabulation ,
.
, A.1
,
B.9.4
Total 1 Totally
unimportant 2 3
Unimportant Important
4 Very important
1 18-24 years Count 1 12 74 54 1411
% within A.1
.7% 8.5% 52.5% 38.3% 100.0%1
341 2 25 years or older
Count 0 2 13 19
% within A.1
.0% 5.9% 38.2% 55.9% 100.0%
r---
Total Count 1 14 87 73 175
% within A.1
. 6% 8.0% 49.7% 41.7% 100.0%
A.1 * B.9.5 Crosstabulation
B.9.5
4 Very I Total
1401
100.0%1
25 341
73.5% 100.0%
2 Unimportant
3 Important
1 Totally unimportant
2
1.4%
Count
% within A.1
important
10 58 70
7.1% 41.4% 50.0%
1 8
2.9% I 23.5%
0
% within A.1
.0%
Count

- Count
--r 2 11 66 95
• Total % within
A.1 1.1% 1 6.3% 37.9% 54.6%
174 , _ 100.0%;
B.10.1
1 Totally unimportant
2 Unimportant
3 Important
4 Very important
, A.1
1 18-24 years Count 9 37 64 32
% within A.1 6.3% I 26.1% 45.1% 22.5%
2 25 years or older
Count 2 12 12 8
% within A.1
5 .9% 35.3% 35.3% 23.5%
' Total Count 11 49 76 40
% within A.1
6.3% 27.8% 43.2% 22.7%
Total
142
100.0%
341
100.0%
1761
100.0%_d
Crosstabs
Case Processing Summary
Cases
Valid Missing f Total 1
N Percent N Percent 1 N Percent'
A.1 * B.10.1 176 89.3% 21 10.7%1197 100.0%1
A.1 * 8.102 176 89.3% 21 10.7% 197 100.0%
A.1 • B.10.3 175 88.8% 22 11.2% 197
197
197
100.0%1
100.0%1 A.1 ' 8.10.4 176 89.3% 21 10.7%
I 10.2% A.1 * 8.10.5 177 89.8% 20 100.0%1
eA.1 • B.10.6 156 79.2% 41 20.8% 197 100.0% 1
A.1 * B.10.7 2 1.0% 195 99.0% 197 100.0%
A.1 * B.10.1 Crosstabulation
A.1 B.10.2 Crosstabulation
8.10.2
Total 1 Totally
unimportant 2
Unimportant 3
Important
4 Very important
A.1
1 18-24 years Count 9 40 77 16 1421
100.0%1
341
% within A.1 6.3% 28.2% 54.2% 11.3%
2 25 years or older
Count 2 12 16 4
% within A.1 5.9% 35.3% 47.1% 11.8% 100.0%
Total Count 11 52 93 20 176J
100.0% % within A.1
6.3% 29.5% 52.8% 11.4% 1
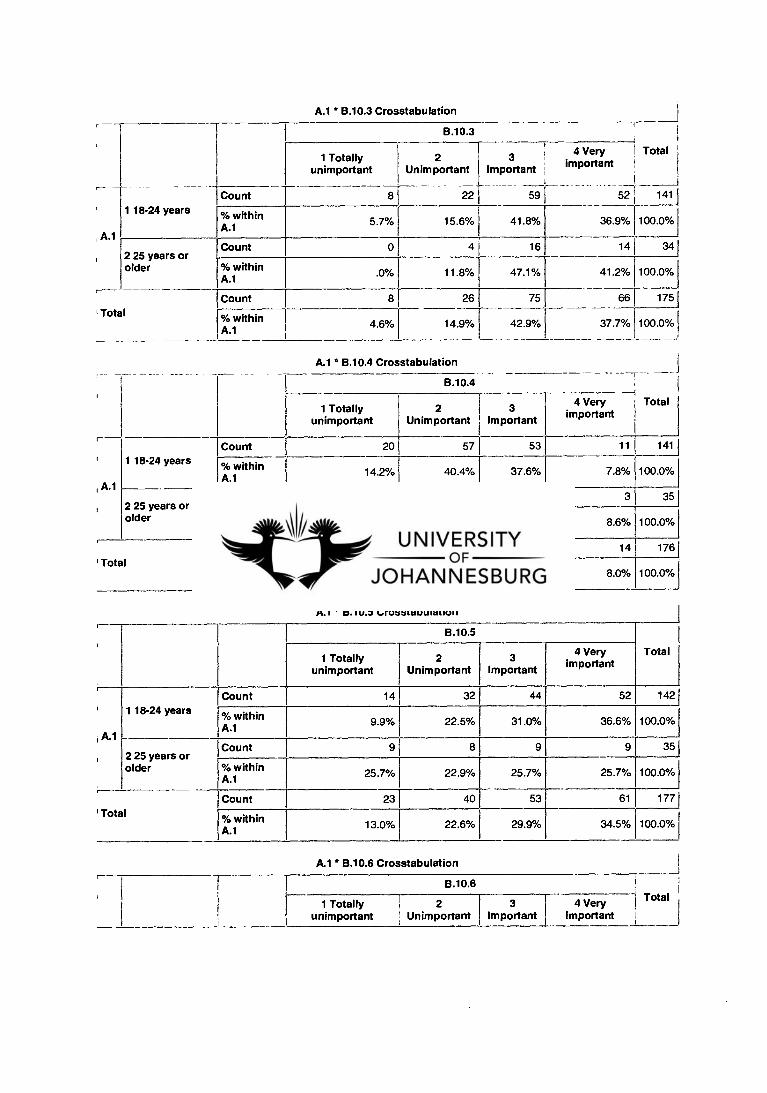
A.1 * B.103 Crosstabulation
, A 1
I Total
B.10.3
Total 1 Totally
unimportant 2
Unimportant 3
Important
4 Very I important
1 18-24 years Count 8 59 52 1411
% within A.1
5 .7% 15.6% 41.8% 36.9% 100.0%1
341
100.0%
2 25 years or older
Count 0 4 16 14
% within A.1
.0% 11.8% 47.1% 41.2%
Count 8 26 75 66 175]
100.0% % within A.1
4.6% 14.9% 42.9% 37.7%
A.1 * B.10.4 Crosstabulation
■
r---
, A 1
,
B.10.4
Total 1 Totally
unimportant 2
Unimportant 3
Important
4 Very important
1 18-24 years Count 20 57 53 11 141
% within Al.
14.2% 40.4% 37.6% 7.8% 100.0%
2 25 years or older
Count 4 9 19 3 35
% within A.1
11.4% 25.7% 54.3% 8.6% 100.0%
' Total Count 24 66 72 14 176
% within A.1
13.6% 37.5% 40.9% 8.0% 100.0%
A.1 * B.10.5 Crosstabulation
B.10.5
Total 1 Totally
unimportant 2
Unimportant 3
Important
4 Very important
'
A.1
1 18-24 years Count 14 32 44 52 142
% within A.1
9.9% 22.5% 31.0% 36.6% 100.0%
225 years or older
Count 9 8 9 9 351
% within A.1
25.7% 22.9% 25.7% 25.7% 100.0%
' Total Count 23 40 53 61 1771
100.0% % within A.1 13.0% 22.6% 29.9% 34.5%
A.1 * B.10.6 Crosstabulation
B.10.6
1 Totally 2 unimportant Unimportant
3 Important
4 Very important
1 Total
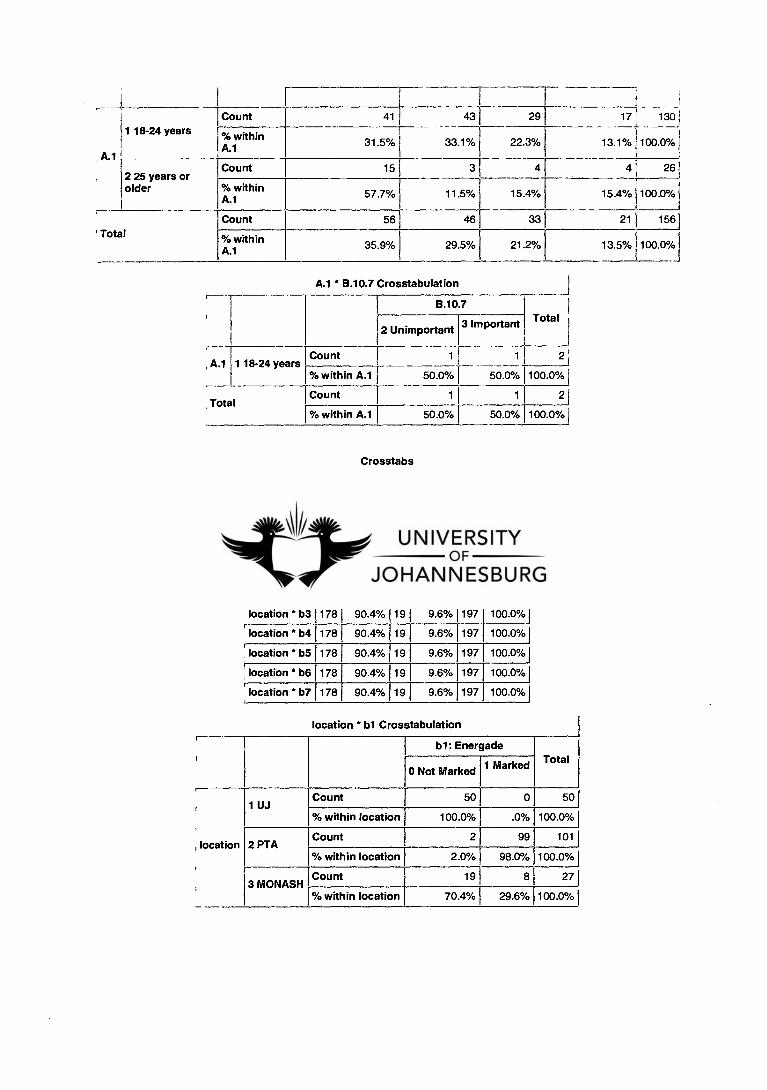
,
A.1
,
1 18-24 years Count 41 43 29 17 1301
% within A.1 31.5% 33.1% 22.3% 13.1% 100.0%
2 25 years or older
Count 15 3 4 4 261
% within A.1 57.7% 11.5% 15.4% 15.4% 100.0%
Total Count 56 46 33 21 1561
100.0%] % within A.1 35.9% 29.5% 21.2% 13.5%
A.1 * B.10.7 Crosstabulation
B.10.7 Total
2 Unimportant 3 Important
, A.1 1 18-24 years Count 1 1 2
I % within A.1 50.0% 50.0% 100.0%
Total Count 1 1 2
% within A.1 50.0% 50.0% 100.0%1
Crosstabs
Case Processing Summary
i
Cases
Valid Missing Total
N Percent N Percent N Percent
' location * b1 178 90.4% 19 9.6% 197 100.0%
. location • b2 178 90.4% 19 9.6% 197 100.0%
t location * b3 178 90.4% 19 9.6% 197 100.0%
location * b4 178 90.4% 19 9.6% 197 100.0%
location * b5 178 90.4% 19 9.6% 197 100.0%
' location * b6 178 90.4% 19 9.6% 197 100.0%
location * b7 178 90.4% 19 9.6% 197 100.0%
location • b1 Crosstabulation
r
b1: Energade Total
0 Not Marked 1 Marked
, location
■
1 UJ Count 50 0 50
% within location 100.0% .0% 100.0%
2 PTA Count 2 99 101
% within location 2.0% 98.0% 100.0%
3 MONASH Count 19 8 27
% within location 70.4% 29.6% 100.0%

b2 Powerade
0 Not Marked 1 Marked
Count 50 0
cYo within location 100.0% .0%
Count 0 101
% within location .0% 100.0%
Count 3 24
% within location 11.1% 88.9%
Count 53 125
% within location 29.8% 70.2%
1 UJ
location 2 PTA
3 MONASH
Total
Total
501
100.0% I
101)
100.0%1
271
100.0cYd
1781
100.0%
b3 Dynamic EngerG
1 Marked Total J
0 Not Marked
Count 1 49
% within location 2.0% 98.0%
Count 4 97
% within location 4.0% 96.0% 100.0%
Count 23 4 27
50 1 UJ
100.0%
101 2 PTA
3 MONASH
, location
% within location
Count
% within location
14.8% 100.0%
150 178
15.7% 84.3% 100.0%
85.2%
28 Total
Total Count 71 1 107 178
% within location 39.9%1 60.1% 100.0%
location * b2 Crosstabulation
location * b3 Crosstabulation
location • b4 Crosstabulation
b4 Sprint I
Total 0 Not Marked
location
,---
1 UJ Count 50 50
% within location 100.0% 100.0%
2 PTA Count 101 101
% within location 100.0% 100.0%
3 MONASH Count 27 27
% within location 100.0% 100.0%
Total Count 178 178
% within location 100.0% 100.0% I
location b5 Crosstabulation
1 b5 lsoactive Total I

I I
1 UJ
r0 Not Marked
I I Count I 50 501
% within location I 100.0% 100.0%1
location 2 PTA Count 1 01 101
% within location 100.0% 100.0%1
Count 27 271
% within location 100.0% 100.0%
Count 178 1781
% within location 100.0% 100.0% , Total
3 MONASH
location * b6 Crosstabulation
b6 None
0 I Not Marked 1 Marked !
Total i
1 UJ Count 50 01 501
% within location I 100.0% .0%1100.0%1
location 2 PTA Count 101 0 101 1
% within location 100.0% .0% 100.0%1
3 MONASH Count 25 2 271
% within location 92.6% 7.4% 100.0%1
Count 176 2 1781 Total ,
% within location 98.9% 1.1% 100.0%I
location b7 Crosstabulation C
b7 Other Total
0 Not Marked 1 Marked
■
, location
■
1 UJ Count 50 0 50
cY. within location 100.0% .0% 100.0%
2 PTA Count 100 1 101
% within location 99.0% 1.0% 100.0%
3 MONASH Count 27 0 27
% within location 100.0% .0% 100.0%
Total Count 177 1 178
% within location 99.4% .6% 100.0%

2099 -02- 2 6
2011 -03- 3 0
X099 -05- 11 9
UNOVERSITY OF JOH NNESIBURG UNOVERSFEOT VAN JOH NNESBURG
AUCKLAND PARK KINGSWAY CAMPUS / KAMPUS POSBUS 524 BOX 524
AUCKLAND PARK 2006
Tel: 011 559-2165
This item must be returned on or before the last date stamped. A renewal for a further period may be granted provided the book is not in demand. Fines are charged on overdue items.
Copyright © 2022 FDOKUMEN