
Inferring the photometric and size evolution of galaxies from ...

This article appeared in a journal published by Elsevier. The attachedcopy is furnished to the author for internal non-commercial researchand education use, including for instruction at the authors institution
and sharing with colleagues.
Other uses, including reproduction and distribution, or selling orlicensing copies, or posting to personal, institutional or third party
websites are prohibited.
In most cases authors are permitted to post their version of thearticle (e.g. in Word or Tex form) to their personal website orinstitutional repository. Authors requiring further information
regarding Elsevier’s archiving and manuscript policies areencouraged to visit:
http://www.elsevier.com/copyright

Author's personal copy
a n a l y t i c a c h i m i c a a c t a 6 1 5 ( 2 0 0 8 ) 165–173
avai lab le at www.sc iencedi rec t .com
journa l homepage: www.e lsev ier .com/ locate /aca
The fundamental properties of the direct injection methodin the analysis of gaseous reduced sulfur by gaschromatography with a pulsed flame photometric detector
Sudhir Kumar Pandey, Ki-Hyun Kim ∗
Department of Earth & Environmental Sciences, Atmospheric Environment Laboratory, Sejong University,Seoul 143-747, Republic of Korea
a r t i c l e i n f o
Article history:
Received 5 December 2007
Received in revised form
27 March 2008
Accepted 28 March 2008
Published on line 4 April 2008
Keywords:
Reduced sulfur compounds
Calibration
Pulsed flame photometric detection
Direct injection
a b s t r a c t
In this study, the fundamental aspects of gas chromatography with a pulsed flame pho-
tometric detector were investigated through the calibration of gaseous reduced sulfur
compounds based on the direct injection method. Gaseous standards of five reduced sul-
fur compounds (hydrogen sulfide, methane thiol, dimethyl sulfide, carbon disulfide, and
dimethyl disulfide) were calibrated as a function of injection volume and concentration
level. The results were evaluated by means of two contrasting calibration approaches: fixed
standard concentration method (variable volumetric injection of standard gases prepared
at a given concentration) and fixed standard volume method (injection of multiple stan-
dards with varying concentrations at a given volume). The optimum detection limit values
of reduced sulfur compounds, when estimated at 100 �L of injection volume, ranged from
2.37 pg (carbon disulfide) to 4.89 pg (dimethyl sulfide). Although these detection limit values
improved gradually with decreasing injection volume, the minimum detectable concentra-
tion (e.g., in nmol mol−1 scale) remained constant due to a balance by the sample volume
reduction. The linearity property of pulsed flame photometric detector also appeared to
vary dynamically with changes in its sensitivity. According to this study, the performance of
pulsed flame photometric detector, when tested by direct injection method, is highly reliable
to precisely describe the behavior of reduced sulfur compounds above ∼20 nmol mol−1.
© 2008 Elsevier B.V. All rights reserved.
1. Introduction
The environmental significance of sulfur compounds is well-recognized because of their potent role in acid deposition,rapid acidification of lakes, the loss of forests, the corrosionof metal structures and historical monuments, and the pro-duction of oxidized pollutants (e.g., sulfuric acid) [1]. Thesocio-environmental concerns related to unpleasant odorshave led to the quantification of many odorous sulfur com-pounds which include: hydrogen sulfide (H2S), methane thiol
∗ Corresponding author. Tel.: +82 2 499 9151; fax: +82 2 499 2354.E-mail address: [email protected] (K.-H. Kim).
(MT: CH3SH), dimethylsulfide (DMS: (CH3)2S), and dimethyld-isulfide (DMDS: (CH3)2S2) [2]. These malodors have been calledvolatile sulfur compounds (VSC) or reduced sulfur compounds(RSCs) [3]. In contrast to the oxidized form of sulfur species(e.g., SO2), RSCs predominantly originate from natural sources(e.g., marine, terrestrial biogenic, volcanic, biomass burning,etc.) [4].
In light of RSC’s potential for malodor [5,6], accurateacquisition of their concentration levels is often consideredas a basic means of odor control [7]. The determination of
0003-2670/$ – see front matter © 2008 Elsevier B.V. All rights reserved.doi:10.1016/j.aca.2008.03.055
Author's personal copy
166 a n a l y t i c a c h i m i c a a c t a 6 1 5 ( 2 0 0 8 ) 165–173
RSCs contained in environmental samples has been achievedmost commonly by gas chromatography (GC) interfaced withseveral detection systems, e.g., flame photometric detection(FPD), pulse flame photometric detection (PFPD), sulfur chemi-luminescence detection (SCD), and atomic emission detection(AED) [8]. Although most of these detectors have proven to bevaluable in sulfur analysis, the PFPD provides certain advan-tages such as price (e.g., relative to SCD and AED), sensitivityand selectivity (e.g., relative to FPD), and reproducibility [9].
Our research group has been investigating the GC-PFPDdetection techniques for diverse RSCs in both clean and pol-luted air samples. In an earlier study, the performance ofGC-PFPD was tested with the loop-based injecting methodagainst four RSCs (H2S, MT, DMS, and DMDS) over a wide con-centration range (0.1–10 �mol mol−1) [10]. The properties ofcalibration error in the determination of RSCs were assessedby employing two contrasting calibration approaches (i.e.,fixed standard concentration (FSC) and fixed standard volume(FSV)) based on the identical loop-based injection method [11].In a good analogue to our previous efforts, Catalan et al. alsoexamined the loop-based injection method to estimate thedetection properties of GC-PFPD for the sulfur compounds invarious respects [8].
The loop-based injection technique is useful for moder-ately increasing the volume capacity of a directly injectablequantity, as the system allows for the transfer of analytesfilled in a given loop size [11]. In contrast, such expansion islimited when using direct injection, due to the low flexibili-ties of control on the injectable volume of the sample (e.g.,the build-up of back pressure within the injector line). Thedirect GC-injection method is however preferred because ofits simplicity, reliability, convenience, and throughput for theanalysis of various compounds [12–14]. However, since theapplication cannot be expanded beyond a certain injectionvolume, there is a lack of information pertaining to its basicproperties. Hence, the present study is intended to describethe general aspects of the direct injection method in GC-PFPDapplication.
In this study, a number of direct injection-based calibra-tions were conducted for five RSCs (H2S, MT, DMS, carbondisulfide (CS2), and DMDS) by varying the aforementionedvariables in different combinations (i.e., using standards of dif-ferent concentration levels and of different injection volumeswithin a relatively wide range). The results of all calibrationdata were then pooled together to evaluate the similaritiesand differences in terms of the two contrasting calibrationapproaches. In addition, the absolute and relative detectionproperties of the PFPD, obtained through direct injection tech-niques, were evaluated.
2. Materials and methods
2.1. Experimental scheme
The fundamental properties of GC-PFPD were investigated tospecifically describe its response characteristics against fiveRSCs (H2S, MT, DMS, CS2, and DMDS). A series of calibrationexperiments were designed and conducted to assess the rela-tionship between injection volume and concentration range
of gaseous RSCs standards. The primary standard gas wasmixed with ultrapure nitrogen to prepare working standards(WS) at five different calibration points with different con-centration levels. As the maximum available concentrationof the primary standard was 10 �mol mol−1, these WS gaseswere prepared at five individual concentration levels (0.5, 1,2, 5, and 10 �mol mol−1). Hence, our calibration experimentswere designed and conducted to cover five concentration lev-els (0.5–10 �mol mol−1) at five injection volumes (100, 200, 300,400, and 500 �L) (Table 1). The calibration curves for eachinjection volume can be drawn by pooling the gaseous stan-dards of all five concentration levels (Table 1); this approachis hence named the fixed standard (injection) volume (FSV)method [11]. All the calibration data examined on the basis ofFSV approach can be re-organized as a function of the stan-dard concentration level. Hence, the calibration data for eachconcentration level can also be combined together to derivecalibration curves across varying injection volumes. The pro-cedure used for the latter concept was named as the fixedstandard concentration (FSC) approach [11].
For the acquisition of comparative calibration data setsbetween FSV and FSC, the first round of experiments startedwith injection at the lowest volume (100 �L) for workingstandards of all five concentration levels and proceeded con-secutively for other injection volumes in the same manner.All the gaseous samples (of 100–500 �L) were introduced intothe system by injecting them with a single gas-tight syringeof 500 �L capacity. The second and third rounds of the exper-iment then proceeded to obtain the replicate calibration datasets. However, during the second round, the calibration startedfrom the highest injection volume (500 �L) and ended with thelowest (400, 300, 200, and 100 �L). After completing the secondround, the third round was initiated again in the same manneras the first round (i.e., starting from low to high injection vol-ume). The initiating conditions of calibration were controlledby reversing the order of injection volume or concentration;this was necessary to reduce the possible bias that can stemfrom the abrupt changes in concentration levels or in vol-ume range of the calibration. The system was checked forblank after each analysis, and a blank run was repeated severaltimes after injecting a large quantity of analytes (e.g., 500 �L) toeliminate the possible memory effect of the system. Althougha single round of experiment basically required a minimumof 72 h to complete all three individual rounds of calibration(with an individual run time of 20 min), the mean values werederived and used for the data interpretation after combiningall matching replicate data sets obtained from three separaterounds of calibration experiments.
2.2. Preparation of working standards
Primary standards of RSCs contained in a cylinder were pur-chased at equimolar concentrations (10 �mol mol−1 with ±5%accuracy) for five target sulfur gases (Ri Gas, Corp. Dae Jeon,Korea). The working standards of RSCs were prepared at fiveconcentration ranges (0.5, 1, 2, 5, and 10 �mol mol−1) by mix-ing the primary standards with ultrapure nitrogen in a 1-LTedlar bags (refer to Table 1). This mixing stage was com-pleted by a single-step dilution of the primary standard gas(i.e., 10 �mol mol−1) to the desired concentration with the aid
Author's personal copya
na
ly
tic
ac
him
ica
ac
ta
61
5(2
00
8)
165–173167
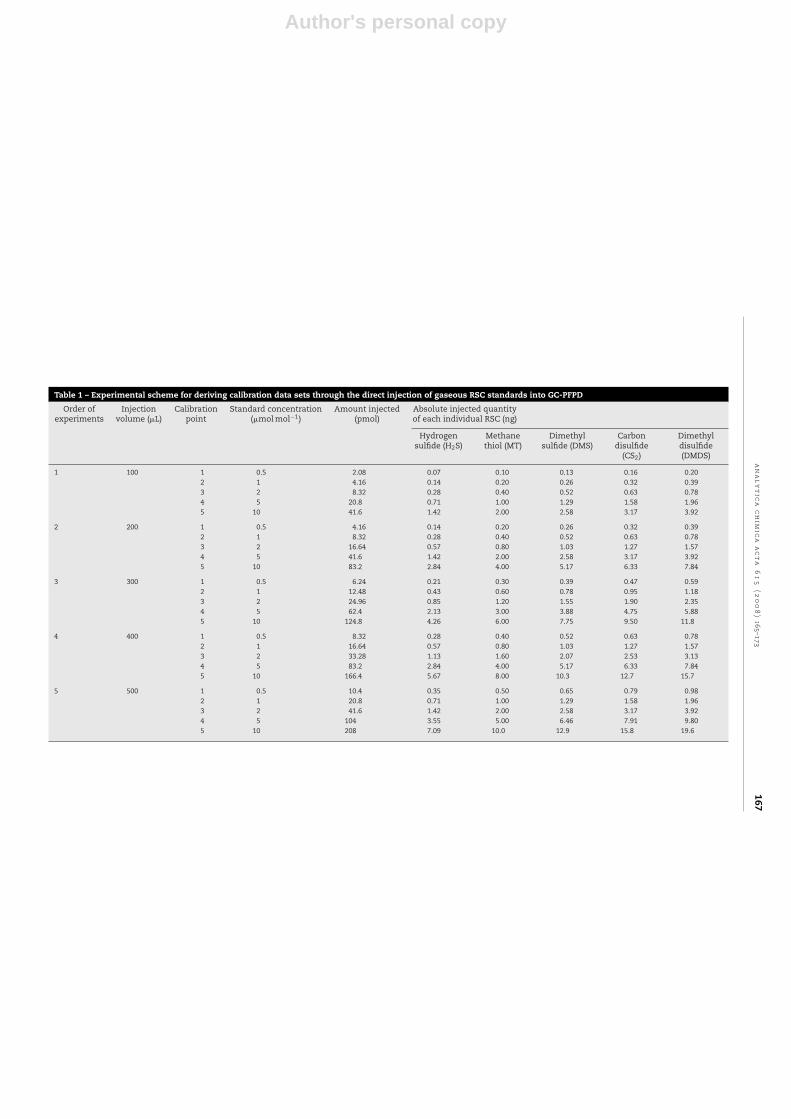
Table 1 – Experimental scheme for deriving calibration data sets through the direct injection of gaseous RSC standards into GC-PFPD
Order ofexperiments
Injectionvolume (�L)
Calibrationpoint
Standard concentration(�mol mol−1)
Amount injected(pmol)
Absolute injected quantityof each individual RSC (ng)
Hydrogensulfide (H2S)
Methanethiol (MT)
Dimethylsulfide (DMS)
Carbondisulfide
(CS2)
Dimethyldisulfide(DMDS)
1 100 1 0.5 2.08 0.07 0.10 0.13 0.16 0.202 1 4.16 0.14 0.20 0.26 0.32 0.393 2 8.32 0.28 0.40 0.52 0.63 0.784 5 20.8 0.71 1.00 1.29 1.58 1.965 10 41.6 1.42 2.00 2.58 3.17 3.92
2 200 1 0.5 4.16 0.14 0.20 0.26 0.32 0.392 1 8.32 0.28 0.40 0.52 0.63 0.783 2 16.64 0.57 0.80 1.03 1.27 1.574 5 41.6 1.42 2.00 2.58 3.17 3.925 10 83.2 2.84 4.00 5.17 6.33 7.84
3 300 1 0.5 6.24 0.21 0.30 0.39 0.47 0.592 1 12.48 0.43 0.60 0.78 0.95 1.183 2 24.96 0.85 1.20 1.55 1.90 2.354 5 62.4 2.13 3.00 3.88 4.75 5.885 10 124.8 4.26 6.00 7.75 9.50 11.8
4 400 1 0.5 8.32 0.28 0.40 0.52 0.63 0.782 1 16.64 0.57 0.80 1.03 1.27 1.573 2 33.28 1.13 1.60 2.07 2.53 3.134 5 83.2 2.84 4.00 5.17 6.33 7.845 10 166.4 5.67 8.00 10.3 12.7 15.7
5 500 1 0.5 10.4 0.35 0.50 0.65 0.79 0.982 1 20.8 0.71 1.00 1.29 1.58 1.963 2 41.6 1.42 2.00 2.58 3.17 3.924 5 104 3.55 5.00 6.46 7.91 9.805 10 208 7.09 10.0 12.9 15.8 19.6
Author's personal copy
168 a n a l y t i c a c h i m i c a a c t a 6 1 5 ( 2 0 0 8 ) 165–173
of a gas-tight syringe. For instance, for the preparation of a1 �mol mol−1 concentration standard, 100 mL of primary stan-dard gas was drawn by a gas-tight syringe and mixed withultrapure nitrogen in the Tedlar bag to make the final vol-ume of 1 L. Once prepared, these working standards wereimmediately utilized for calibration analysis, according to theexperimental scheme described in Table 1.
2.3. Schematic of the analytical setup
The GC system used in this study was a Varian CP 3800 model(Walnut Creek, CA, USA) interfaced with a PFPD. For the anal-ysis of RSCs, our GC system was operated at the followingtemperature settings T (initial): 80 ◦C for 3 min, T (ramping):10 ◦C min−1 rate, and T (final): 200 ◦C. Chromatographic sepa-ration was done by BP-1 column (60 m × 0.32 mm i.d. and 5 �mfilm thickness (SGE Ltd. (Melbourne, Australia)) at a columnflow rate of 2 mL min−1 (ultrapure N2 carrier gas). Each runningcycle was programmed to end at 20 min intervals. To providepulsed flames into the combustor (15 mm length and 2 mmi.d.), gases were provided: ultrapure H2 = 14, ultrapure air (1)(wall gas) = 17 and ultrapure air (2) (combustor) = 10 mL min−1.Other detector settings were: detector temperature: 250 ◦C,photo multiplier (PMT) voltage: 530 V, gate delay: 6 ms, gatewidth: 20 ms, gain factor: 20, and trigger level: 200 mV.
The air-hydrogen needle valve controlling the ratio of wallflow to combustor flow in the PFPD system was optimized toensure the operation of detector close to tick–tock mode. (Thetick–tock sound occurs, when the combustible mixture ignitesin the ignitor chamber.) However, it does not propagate intothe combustor chamber, if the combustor is not filled with acombustible gas mixture. The optimum performance of PFPDis normally achieved, when the detector is operating near, butnot in, the tick–tock mode [15]. In addition, to allow a simplecomparison of the PFPD’s responses among different S com-pounds, the peak areas of all RSCs were integrated in the linearmode with the square root (SR) function [10].
3. Results and discussions
3.1. The effect of injection volume change on PFPDsensitivity
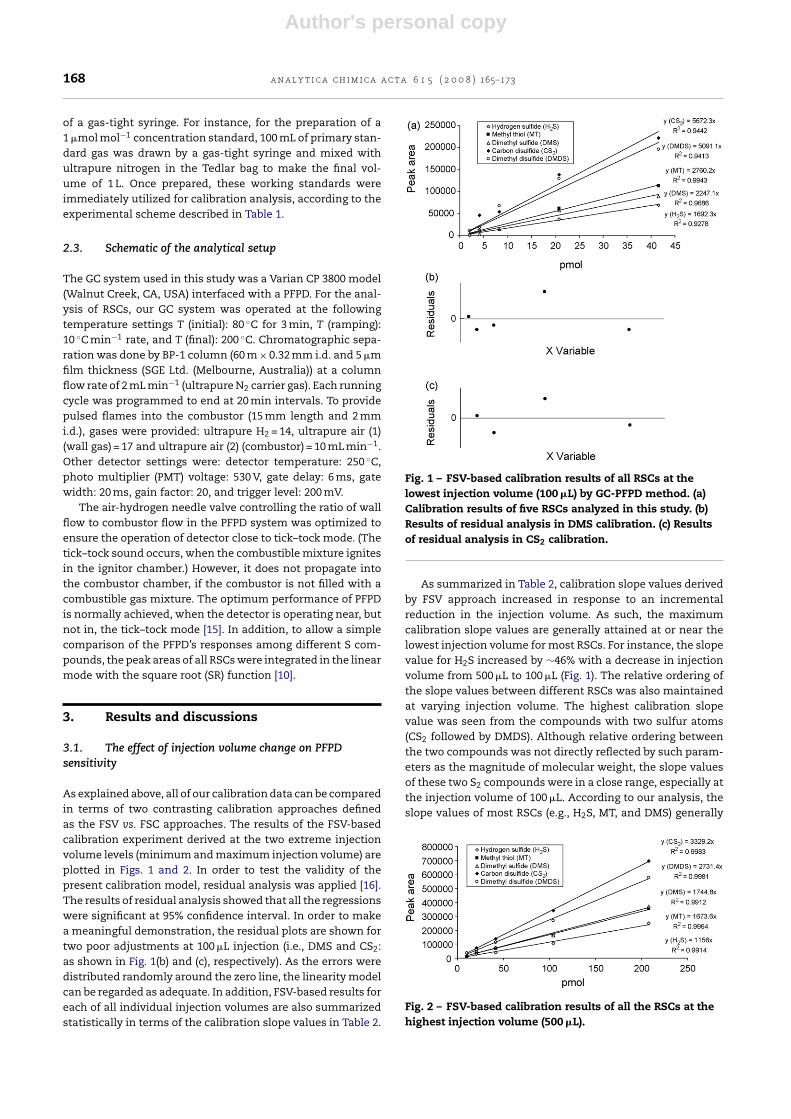
As explained above, all of our calibration data can be comparedin terms of two contrasting calibration approaches definedas the FSV vs. FSC approaches. The results of the FSV-basedcalibration experiment derived at the two extreme injectionvolume levels (minimum and maximum injection volume) areplotted in Figs. 1 and 2. In order to test the validity of thepresent calibration model, residual analysis was applied [16].The results of residual analysis showed that all the regressionswere significant at 95% confidence interval. In order to makea meaningful demonstration, the residual plots are shown fortwo poor adjustments at 100 �L injection (i.e., DMS and CS2:as shown in Fig. 1(b) and (c), respectively). As the errors weredistributed randomly around the zero line, the linearity modelcan be regarded as adequate. In addition, FSV-based results foreach of all individual injection volumes are also summarizedstatistically in terms of the calibration slope values in Table 2.
Fig. 1 – FSV-based calibration results of all RSCs at thelowest injection volume (100 �L) by GC-PFPD method. (a)Calibration results of five RSCs analyzed in this study. (b)Results of residual analysis in DMS calibration. (c) Resultsof residual analysis in CS2 calibration.
As summarized in Table 2, calibration slope values derivedby FSV approach increased in response to an incrementalreduction in the injection volume. As such, the maximumcalibration slope values are generally attained at or near thelowest injection volume for most RSCs. For instance, the slopevalue for H2S increased by ∼46% with a decrease in injectionvolume from 500 �L to 100 �L (Fig. 1). The relative ordering ofthe slope values between different RSCs was also maintainedat varying injection volume. The highest calibration slopevalue was seen from the compounds with two sulfur atoms(CS2 followed by DMDS). Although relative ordering betweenthe two compounds was not directly reflected by such param-eters as the magnitude of molecular weight, the slope valuesof these two S2 compounds were in a close range, especially atthe injection volume of 100 �L. According to our analysis, theslope values of most RSCs (e.g., H2S, MT, and DMS) generally
Fig. 2 – FSV-based calibration results of all the RSCs at thehighest injection volume (500 �L).
Author's personal copy
a n a l y t i c a c h i m i c a a c t a 6 1 5 ( 2 0 0 8 ) 165–173 169
Table 2 – A comparison of calibration results at each injection volume (FSV approach)
Injection volume (�L) RSCs
Hydrogensulfide (H2S)
Methanethiol (MT)
Dimethylsulfide (DMS)
Carbondisulfide (CS2)
Dimethyldisulfide DMDS
100Slope 1692 2760 2247 5672 5091r2 0.928 0.994 0.969 0.944 0.941
200Slope 1888 2788 3007 5520 4742r2 0.999 0.987 0.995 0.988 0.998
300Slope 1514 2197 2461 4645 4050r2 0.966 0.893 0.969 0.929 0.876
400Slope 1422 2213 2207 4186 3582r2 0.998 0.988 0.985 0.997 0.988
500Slope 1156 1673 1745 3329 2731r2 0.991 0.996 0.991 0.998 0.998
Mean (slope) 1534 2326 2333 4670 4039RSE (slope) 8.06 8.90 8.78 9.28 10.4
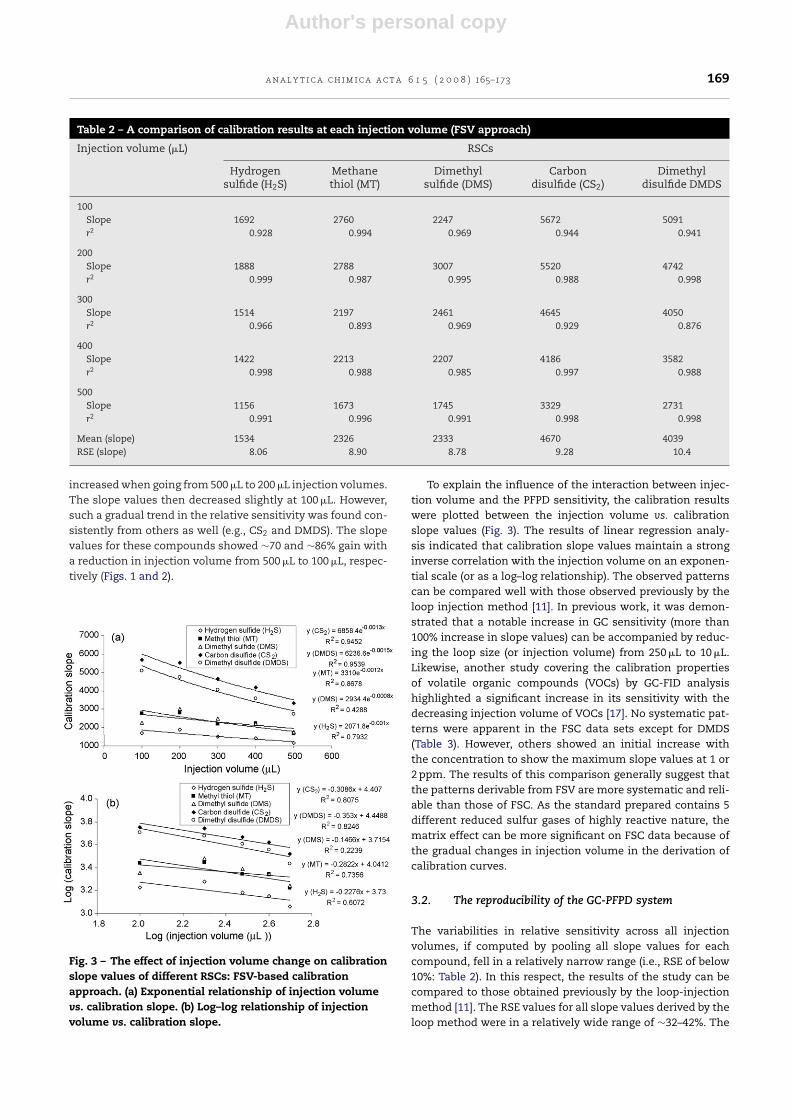
increased when going from 500 �L to 200 �L injection volumes.The slope values then decreased slightly at 100 �L. However,such a gradual trend in the relative sensitivity was found con-sistently from others as well (e.g., CS2 and DMDS). The slopevalues for these compounds showed ∼70 and ∼86% gain witha reduction in injection volume from 500 �L to 100 �L, respec-tively (Figs. 1 and 2).
Fig. 3 – The effect of injection volume change on calibrationslope values of different RSCs: FSV-based calibrationapproach. (a) Exponential relationship of injection volumevs. calibration slope. (b) Log–log relationship of injectionvolume vs. calibration slope.
To explain the influence of the interaction between injec-tion volume and the PFPD sensitivity, the calibration resultswere plotted between the injection volume vs. calibrationslope values (Fig. 3). The results of linear regression analy-sis indicated that calibration slope values maintain a stronginverse correlation with the injection volume on an exponen-tial scale (or as a log–log relationship). The observed patternscan be compared well with those observed previously by theloop injection method [11]. In previous work, it was demon-strated that a notable increase in GC sensitivity (more than100% increase in slope values) can be accompanied by reduc-ing the loop size (or injection volume) from 250 �L to 10 �L.Likewise, another study covering the calibration propertiesof volatile organic compounds (VOCs) by GC-FID analysishighlighted a significant increase in its sensitivity with thedecreasing injection volume of VOCs [17]. No systematic pat-terns were apparent in the FSC data sets except for DMDS(Table 3). However, others showed an initial increase withthe concentration to show the maximum slope values at 1 or2 ppm. The results of this comparison generally suggest thatthe patterns derivable from FSV are more systematic and reli-able than those of FSC. As the standard prepared contains 5different reduced sulfur gases of highly reactive nature, thematrix effect can be more significant on FSC data because ofthe gradual changes in injection volume in the derivation ofcalibration curves.
3.2. The reproducibility of the GC-PFPD system
The variabilities in relative sensitivity across all injectionvolumes, if computed by pooling all slope values for eachcompound, fell in a relatively narrow range (i.e., RSE of below10%: Table 2). In this respect, the results of the study can becompared to those obtained previously by the loop-injectionmethod [11]. The RSE values for all slope values derived by theloop method were in a relatively wide range of ∼32–42%. The
Author's personal copy
170 a n a l y t i c a c h i m i c a a c t a 6 1 5 ( 2 0 0 8 ) 165–173
Table 3 – A comparison of calibration results in terms of slope values obtained at each standard concentration level (FSCapproach): results are shown after excluding the outlying data by applying Q-testa
Concentration(�mol mol−1)
RSCs
Hydrogensulfide (H2S)
Methanethiol (MT)
Dimethylsulfide (DMS)
Carbondisulfide CS2
Dimethyldisulfide DMDS
0.5Slope 1071 1215 2730 2933 8056r2 0.92 (0.71)b 0.79 (0.38) 0.97 (0.56) 0.75 (0.43) 0.87 (0.29)
1Slope 1382 3857 2852 9204 7468r2 0.96 (−0.68) 0.84 (0.53) 0.83 (0.76) 0.97 (−1.19) 0.85 (0.24)
2Slope 1532 3936 3716 7649 7022r2 0.87 (0.50) 0.98 (−2.21) 0.88 (0.48) 0.95 (0.06) 0.83 (−0.29)
5Slope 1732 2701 3067 5862 3685r2 0.91 (0.51) 0.94 (0.41) 0.98 (0.43) 0.93 (0.47) 0.78 (0.25)
10Slope 1852 2700 2793 5403 1443r2 0.98 (0.83) 1.00 (0.79) 0.93 (0.78) 0.99 (0.75) 0.76 (0.70)
Mean (slope) 1514 2882 3032 6210 5368RSE (slope) 9.06 17.2 5.95 17.1 26.3
a Efstatheou [27].b Denotes the regression coefficients obtained with all data.
range of injection volume in the previous study was moder-ately low (250–10 �L) relative to the current one (500–100 �L).The observation of enhanced compatibility by direct GC-injection in this study (e.g., relative to those of the loopmethod) suggests that this application can yield highly con-sistent patterns.
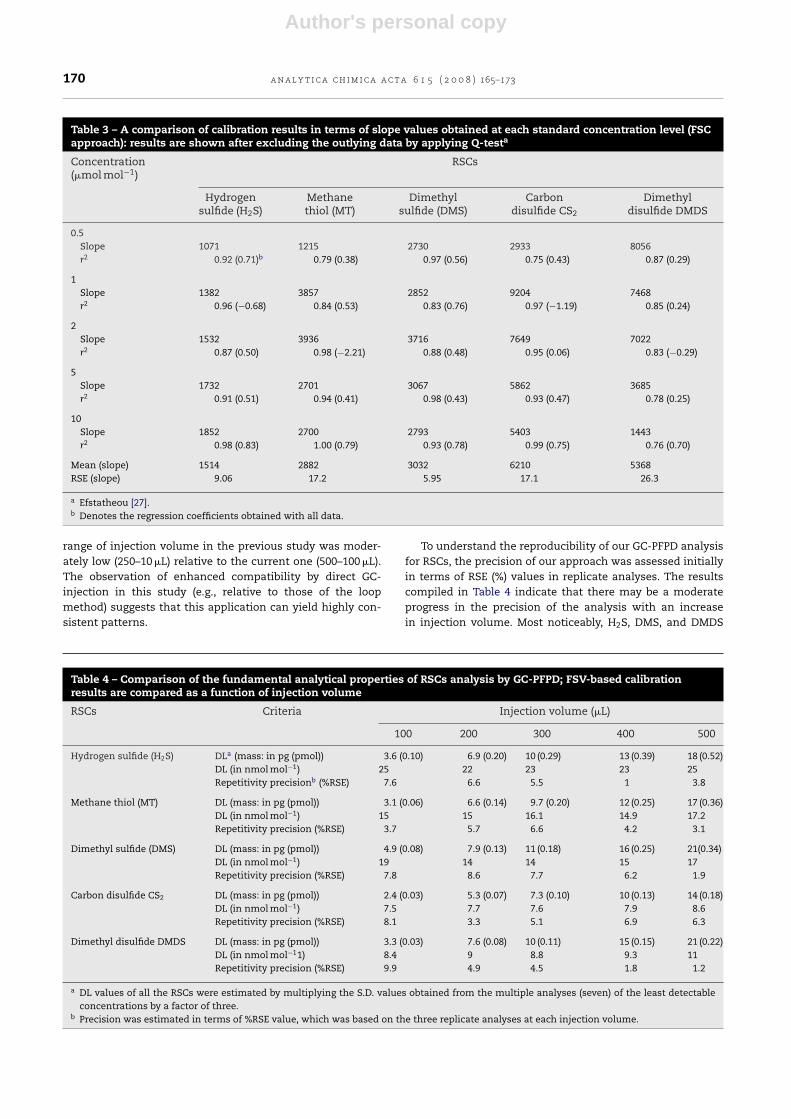
To understand the reproducibility of our GC-PFPD analysisfor RSCs, the precision of our approach was assessed initiallyin terms of RSE (%) values in replicate analyses. The resultscompiled in Table 4 indicate that there may be a moderateprogress in the precision of the analysis with an increasein injection volume. Most noticeably, H2S, DMS, and DMDS
Table 4 – Comparison of the fundamental analytical properties of RSCs analysis by GC-PFPD; FSV-based calibrationresults are compared as a function of injection volume
RSCs Criteria Injection volume (�L)
100 200 300 400 500
Hydrogen sulfide (H2S) DLa (mass: in pg (pmol)) 3.6 (0.10) 6.9 (0.20) 10 (0.29) 13 (0.39) 18 (0.52)DL (in nmol mol−1) 25 22 23 23 25Repetitivity precisionb (%RSE) 7.6 6.6 5.5 1 3.8
Methane thiol (MT) DL (mass: in pg (pmol)) 3.1 (0.06) 6.6 (0.14) 9.7 (0.20) 12 (0.25) 17 (0.36)DL (in nmol mol−1) 15 15 16.1 14.9 17.2Repetitivity precision (%RSE) 3.7 5.7 6.6 4.2 3.1
Dimethyl sulfide (DMS) DL (mass: in pg (pmol)) 4.9 (0.08) 7.9 (0.13) 11 (0.18) 16 (0.25) 21(0.34)DL (in nmol mol−1) 19 14 14 15 17Repetitivity precision (%RSE) 7.8 8.6 7.7 6.2 1.9
Carbon disulfide CS2 DL (mass: in pg (pmol)) 2.4 (0.03) 5.3 (0.07) 7.3 (0.10) 10 (0.13) 14 (0.18)DL (in nmol mol−1) 7.5 7.7 7.6 7.9 8.6Repetitivity precision (%RSE) 8.1 3.3 5.1 6.9 6.3
Dimethyl disulfide DMDS DL (mass: in pg (pmol)) 3.3 (0.03) 7.6 (0.08) 10 (0.11) 15 (0.15) 21 (0.22)DL (in nmol mol−11) 8.4 9 8.8 9.3 11Repetitivity precision (%RSE) 9.9 4.9 4.5 1.8 1.2
a DL values of all the RSCs were estimated by multiplying the S.D. values obtained from the multiple analyses (seven) of the least detectableconcentrations by a factor of three.
b Precision was estimated in terms of %RSE value, which was based on the three replicate analyses at each injection volume.
Author's personal copya
na
ly
tic
ac
him
ica
ac
ta
61
5(2
00
8)
165–173171
Table 5 – The basic analytical properties of gas chromatographic approaches for RSCs: comparison is made between different detection techniques/conditions
Basicanalytical
criteria
Order GC detectiontechnique
Sampleintroduction
method
Injectionvolume (�L)
RSCs Reference
Hydrogensulfide (H2S)
Methanethiol (MT)
Dimethylsulfide (DMS)
Carbondisulfide
(CS2)
Dimethyldisulfide(DMDS)
[A] DL in absolutequantity (pg)
1 PFPD Direct GC-injection
100 3.6 3.1 4.9 2.4 3.3 This study
2 PFPD Loop-basedinjection
500 1.7 1.8 2.6 –a 0.9 Kim [10]
3 PFPD Loop-basedinjection
250 2.4 3.3 4.2 – 1.9 Catalan etal. [8]
4 FPD Loop-basedinjection
10,000 709 998 1289 1248 1959 EPA [19]
5 SCD Loop-basedinjection
1,000 43 60 77 75 117 SCAQMD[20]
[B] Repetitivityprecision (inRSE/RSD (%))
1 PFPD Direct GC-injectionb
100 7.6 3.7 7.8 8.1 9.9 This study
2 PFPD SPME(PDMS)c
Not applicable 15 7.8 9.2 – 4.5 Lestremauet al. [18]
3 PFPD Loop-basedinjection
500 2.2 2.5 1 – 0.8 Kim [10]
4 FPD Loop-basedinjection
10,000 ∼5 ∼5 ∼5 ∼5 ∼5 EPA [19]
a Data not available.b Precision is expressed in terms of relative standard error (RSE) of repetitivity analysis.c Precision is expressed in terms of relative standard deviation (RSD) of repetitivity analysis.
Author's personal copy
172 a n a l y t i c a c h i m i c a a c t a 6 1 5 ( 2 0 0 8 ) 165–173
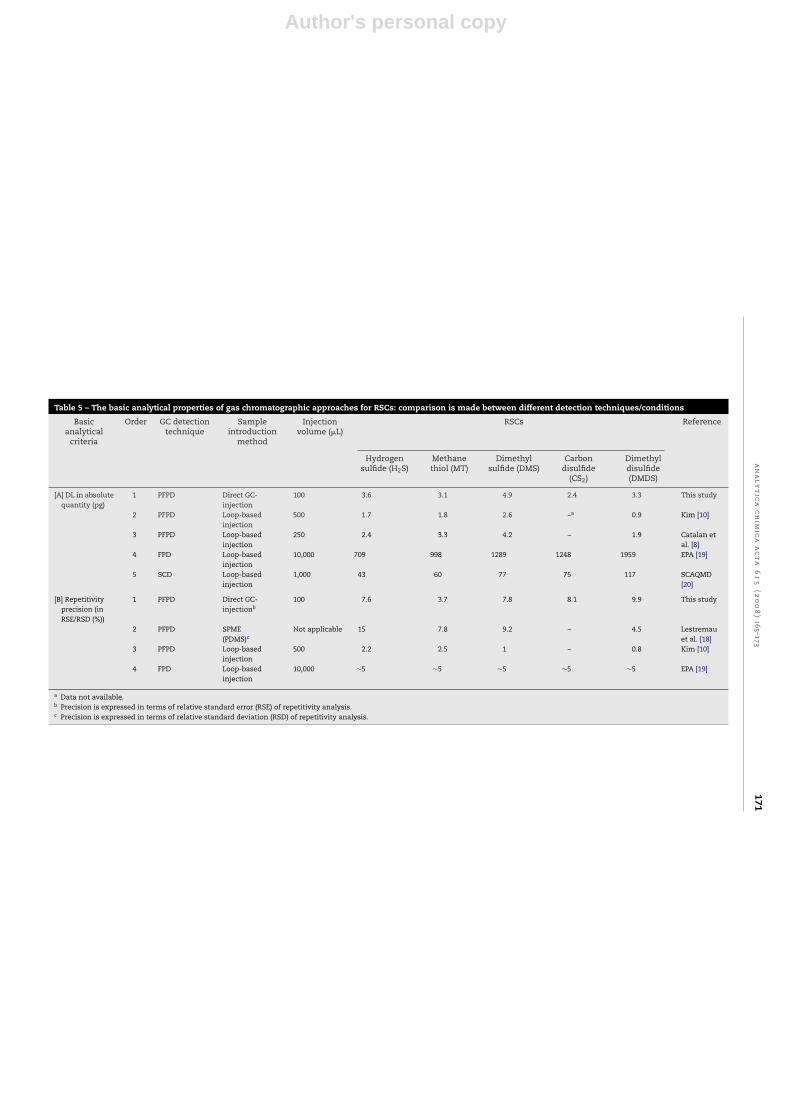
showed improvement in precision level to a degree. The RSEvalues of these compounds decreased with increasing injec-tion volume. On the other hand, MT and CS2 did not revealnotable changes in RSE values across the injection volume.In order to assess the overall analytical performance of directGC-injection method, a comprehensive comparison was madebetween the basic analytical criteria (such as precision, detec-tion limit (DL), and linearity) reported from many of previousstudies (Table 5). According to this comparison, the overallprecision levels (∼1–6%) obtained by the direct GC injectionwere not significantly different from or even superior to thatmeasured by the loop injection or by the solid phase micro-extraction (SPME) methods, due to the differences in the basicexperimental set ups [10,11,18].
3.3. Detectability of PFPD
In light of the dynamic enhancement of the PFPD sensitiv-ity in the application of the FSV approach, it is important tounderstand how the practical aspects of PFPD detectability areaffected in the handling of actual samples. This is becausethe enhancement of sensitivity is accompanied by the reduc-tion in analyte quantity (i.e., the decreasing injection volume).Hence, the importance of this was evaluated based on thequantification of the DL values for two different criteria. Assummarized in Table 4, all DL values were initially assessedin terms of absolute mass (pg). Although moderately variablebetween different sulfur compounds, the DL values (in termsof absolute mass) decreased (or improved) systematically witha decrease in the injection volume for almost all cases (Table 4).For instance, the DL for H2S decreased by ∼5 times with thedecrease in injection volume from 500 �L (17.6 pg) to 100 �L(3.57 pg).
The optimum DL values observed in this study (i.e., at100 �L of injection volume) ranged from 2.37 pg for CS2 to4.89 pg for DMS. The DL values obtained previously at a com-parable injection volume (i.e., sampling loop size of 500 �L)were noticeably low with a magnitude of 0.9 to 2.6 pg relativeto the present GC injection (17.2–21.3 pg). The differences inthese MDL values arose due to the differences in the analyti-cal system (and settings) such as: PFPD model, temperatureprogramming, carrier gas flow rate, air and hydrogen flowrates to the detector, detector settings, column type and size,etc. [8]. However, our DL values based on the direct injectionmethod are superior to those of the FPD [19] or the SCD meth-ods [20]. As mentioned in the method 16 of the US EPA, theFPD detectability of the four RSCs (i.e., H2S, MT, DMS, andDMDS) ranged between ∼0.7 ng (for H2S) and 2 ng (for DMDS)in terms of mass quantity, at a loop capacity of 10 mL [10]. Onthe other hand, the detection limit of a SCD ranged between42.5 pg (H2S) and 117 pg (DMDS) with a loop capacity of 1 mL(Table 5).
As shown above, a decrease in injection volume helpsto increase GC sensitivity. However, it inevitably reducesthe quantity of analytes introduced into the GC system. Toassess the effect of such volume changes, we also evaluatedthe DL values in terms of actual concentration (nmol mol−1)by simultaneously considering the quantity of analytes andthe volume of sample introduced in to the system. Theresults indicate that the relative enhancement in sensitivity
(accompanied by the reduction in injection volume) is sys-tematically balanced by the loss of analyte quantity (Table 4).For instance, in the case of H2S, the minimum detectableconcentration changes from 22.6 nmol mol−1 (200 �L injec-tion volume) to 25.1 nmol mol−1 (100 �L injection volume).Hence, the quantifiable concentrations of RSC do not actu-ally change much between different injection volumes undermost circumstances. In fact, such patterns need to be seenquite consistently for most RSCs. The direct GC-injectionsystem employed in this study thus demonstrates that thereduced sulfur compounds can be detected directly at or above∼20 nmol mol−1 level; this may be useful for the rapid analysisof real samples collected from the highly polluted areas.
3.4. Linearity of PFPD
The calibration pattern of RSCs derived from this studyshowed that the direct GC-injection method yielded some-what similar linearity patterns for all RSCs. The heavier RSCstend to experience an early deflection of linearity (i.e., beyond150 pmol) with the application of a thermal-desorber (TD) unit[21]; a line of evidence indicates that the response propertyof RSCs can vary significantly by the use of such modifiedinstrumental setup. Because of the modification of detec-tion properties at the thermal desorbing stage, the dynamiclinearity range of PFPD can be assessed without system modi-fication. As such, the maximum linearity of PFPD was confinedby the sample volume we injected (a 500 �L injection) and bythe concentration levels of the primary standard we prepared(i.e., 10 �mol mol−1). We were able to confirm the linearity ofour PFPD system up to the maximum quantity (208 pmol) ofthe calibration range; the linear response of the PFPD systemcan be easily extendible beyond 102 range (refer to Table 1). Theobserved range of linearity exceeds what we observed previ-ously from the loop-based analysis [10] but is comparable tothe previous reports of FPD and micro-FPD [22,23]. This is how-ever narrower than those of SCD (105) [24], AED (104) [25], andamperometric sulfur detector (ASD) (105) [26].
4. Conclusions
In an effort to investigate the analytical performance of theGC-PFPD technique in relation to change in sample volumeand concentration, a comparative analysis was conducted forreduced sulfur compounds based on the direct GC-injection.For this purpose, a series of calibration experiments were car-ried out to account for the fundamental aspects of GC-PFPDapplication. The results derived from the two different cali-bration approaches (i.e., fixed standard volume (FSV) and fixedstandard concentration (FSC)) were analyzed in various ways.The results confirmed the superiority of the FSV approach interms of sensitivity and reproducibility. Moreover, the cali-bration patterns of FSV were also systematic and consistentenough to allow for the direct evaluation of GC-PFPD perfor-mance. The calibration sensitivity increased systematicallywith decreasing injection volume in most cases so that a gainof 46% (H2S) to 86% (DMDS) in slope values was observed witha decrease in injection volume (from 500 �L to 100 �L).

Author's personal copy
a n a l y t i c a c h i m i c a a c t a 6 1 5 ( 2 0 0 8 ) 165–173 173
Knowing that the sensitivity enhancement of the GC-PFPDis accompanied by a reduction in the injection volume, theDL values were evaluated both in terms of absolute quantity(pg) and by considering the changes in the injection volume(nmol mol−1). The results indicated that DL values improvedsignificantly in terms of absolute mass (pg) with a reductionin injection volume. However, the DL values quantified in vol-ume/volume ratio (e.g., nmol mol−1) remained constant withinjection volume changes (i.e., due to the reduction in analytequantities). The linearity performance of all the RSCs, whentested by the calibration data sets of different injection vol-umes, generally exhibited improvement at higher injectionvolume. This was possibly due to relatively reduced sensitiv-ity with increasing injection volume. Although the linearityof PFPD detection appeared to vary in relation to injection vol-ume, we were able to find that the linearity was maintained upto around 102 range under the conditions of the present study.The overall results of this study indicated that the PFPD cansensitively detect the changes in fundamental variables (i.e.,injection volume and concentration levels of standards) withrespect to direct GC-injection approach. Hence, the direct GC-injection method can be utilized for the rapid analysis of thefield samples of RSCs above a ∼20 nmol mol−1 in a fairly reli-able manner, once a suitable calibration condition is assured.
Acknowledgements
This work was supported by a grant from the Korea ResearchFoundation (KRF-2005-201-C00045) funded by the Korean gov-ernment (MOEHRD). We greatly acknowledge the constructivecriticism provided by the four anonymous reviewers and theeditor to improve the final version of this manuscript.
r e f e r e n c e s
[1] S.-K. Song, Z.-H. Shon, K.-H. Kim, S.-C. Kim, Y.-K. Kim, J.-K.Kim, Atmos. Environ. 41 (2007) 974.
[2] K.-H. Kim, E.-C. Jeon, Y.-S. Koo, M.-S. Im, Y.-H. Youn, Atmos.Environ. 41 (2007) 3829.
[3] W. Wardencki, J. Chromatogr. A. 793 (1998) 1.[4] T.S. Bates, B.K. Lamb, A. Guenther, J. Dignon, R.E. Stoiber, J.
Atmos. Chem. 14 (1992) 315.[5] K.-H. Kim, Y.J. Choi, E.C. Jeon, Y. Sunwoo, Atmos. Environ. 39
(2005) 1103.[6] K.-H. Kim, E.-C. Jeon, Y.-J. Choi, Y.-S. Koo, Atmos. Environ. 40
(2006) 4478.[7] J.T. Novak, G. Adams, Y.C. Chen, Z. Real, R. Forbes, D.H.
Linemen Jr., J.R. Hargreaves, L. Hentz, M.J. Higgins, S.N.Murthy, J. Witherspoon, Water Environ. Res. 78 (2006)821.
[8] L.J.J. Catalan, V. Liang, Q.J. Charles, J. Chromatogr. A. 1136(2006) 89.
[9] H. Jing, A. Amirav, J. Chromatogr. A. 805 (1998) 177.[10] K.-H. Kim, Atmos. Environ. 39 (2005) 2235.[11] K.-H. Kim, Anal. Chim. Acta 566 (2006) 75.[12] C. Witschi, E. Doelker, Eur J. Pharm. Biopharm. 43 (1997) 215.[13] M. Abdel-Rehim, K.A. Svensson, Y. Askemark, K.-J.
Pettersson, J. Chromatogr. B. 755 (2001) 253.[14] C. Camarasu, C. Madichie, R. Williams, Trends Anal. Chem.
25 (2006) 768.[15] A. Amirav, H. Jing, Anal. Chem. 67 (1995) 3305.[16] K. Danzer, L.A. Currie, Pure Appl. Chem. 70 (1998) 993.[17] K.-H. Kim, T.N. Hang, J. Sep. Sci. 30 (2007) 367.[18] F. Lestremau, V. Desauziers, J.C. Roux, J.L. Fanlo, J.
Chromatogr. A. 999 (2003) 71.[19] USEP A: 2000, Method 16 of Sulfur (Semicontinuous
Determination), available athttp://www.epa.gov/ttn/emc/promgate/m-16.pdf.
[20] SCAQMD, Determination of sulfur in a gaseous matrix,Method 307-91, 1994, available athttp://aqmd.gov/tao/methods/lab/307-91.pdf.
[21] K.-H. Kim, Environ. Sci. Technol. 39 (2005) 6765.[22] L. Kalontarov, H. Jing, A. Amirav, S. Cheskis, J. Chromatogr. A.
696 (1995) 245.[23] K.B. Thurbide, C.D. Anderson, The Analyst 128 (2003) 616.[24] D.L. MacTaggart, S.O. Farwell, J.R. Burdge, Z.-T. Cai, T.J.
Haakenson, W.L. Bamesberger, Atmos. Environ. 33 (1999)625.
[25] R.L. Firor, B.D. Quimby, Application Note provided by AgilentTechnologies, Inc., 5988-2426EN, 16 August 2001.
[26] Perkin Elmer’s Product note, Sulfur-analyzer systems usingthe Amperometric Sulfur Detector (ASD), 2005, available atwww.perkinelmer.com.
[27] C.E. Efstatheou, Talanta 69 (2006) 1068.
Copyright © 2022 FDOKUMEN