Synthesis and Characterisation of a New Class of Alkene ...
299
Synthesis and Characterisation of a New Class of Alkene Polymers Bearing Nucleotide Functionality by Michael Wilson Thesis Submitted to Flinders University for the degree of Doctor of Philosophy Science and Engineering December 2020
-
Upload
khangminh22 -
Category
Documents
-
view
1 -
download
0
Transcript of Synthesis and Characterisation of a New Class of Alkene ...

Synthesis and Characterisation of a New Class of Alkene
Polymers Bearing Nucleotide Functionality
by
Michael Wilson
Thesis Submitted to Flinders University
for the degree of
Doctor of Philosophy Science and Engineering
December 2020
ii
Table of Contents
Table of Contents ..................................................................................................................... ii
Table of Figures ..................................................................................................................... xiii
List of Tables ........................................................................................................................ xxv
Abstract ............................................................................................................................... xxvi
Declaration .......................................................................................................................... xxix
Acknowledgements .............................................................................................................. xxx
1 Chapter 1: Introduction and Literature Review ................................................................ 1
1.1 Synopsis ..................................................................................................................... 1
1.2 Nucleotides ................................................................................................................ 2
1.2.1 Nucleobases ........................................................................................................ 3
1.2.2 Sugar ................................................................................................................... 4
1.2.3 Phosphate ............................................................................................................ 5
1.2.4 Specific Binding Between Nucleobases ............................................................. 6
1.2.4.1 Watson-Crick Binding between Nucleobases ............................................. 7
1.2.5 Non-canonical Binding Between Nucleobases. ................................................. 8
1.2.5.1 G-quartets .................................................................................................. 10
1.2.6 Nucleic Acids ................................................................................................... 11
1.3 Secondary Structures of DNA ................................................................................. 12
1.3.1 The DNA Double Helix ................................................................................... 12
1.3.1.1 π-π stacking of nucleobases within dsDNA .............................................. 13
iii
1.3.2 Forms of the DNA Double Helix ..................................................................... 14
1.3.3 G-quadruplexes ................................................................................................ 18
1.3.4 Nucleic Acid Wires .......................................................................................... 20
1.3.5 Xeno Nucleic Acids .......................................................................................... 22
1.4 Synthesis of DNA .................................................................................................... 24
1.4.1 Enzymatic Synthesis of DNA ........................................................................... 24
1.4.1.1 The Polymerase Chain Reaction ............................................................... 24
1.4.2 Chemical Synthesis of DNA ............................................................................ 26
1.4.2.1 H-Phosphonate Method for the Chemical Synthesis of DNA .................. 27
1.4.2.2 Phosphoester Approaches for the Chemical Synthesis of DNA ............... 27
1.4.3 Phosphoramidite Method for the Chemical Synthesis of Nucleic Acids ......... 28
1.4.3.1 Activators .................................................................................................. 30
1.4.3.2 Non-nucleotide Additions ......................................................................... 32
1.4.3.3 Oxidation ................................................................................................... 33
1.4.3.4 Deprotection .............................................................................................. 33
1.4.4 Modified Nucleic Acids ................................................................................... 34
1.4.5 Visualisation of Nucleic Acids Using Fluorescent Dyes ................................. 35
1.5 Synthetic Polymers .................................................................................................. 38
1.5.1 Types of Polymers ............................................................................................ 38
1.5.2 Describing Synthetic Polymerisations .............................................................. 39
1.5.3 Free Radical Polymerisations ........................................................................... 41
iv
1.5.4 Controlling Polydispersity of Living Radical Polymers .................................. 42
1.6 Reversible Addition-Fragmentation Chain Transfer Polymerisations (RAFT) ....... 43
1.6.1.1 Monomers ................................................................................................. 44
1.6.1.2 Chain Transfer Agents (CTAs) ................................................................. 45
1.6.1.3 Kinetics of RAFT Polymerisation ............................................................. 48
1.7 Synthetic Polymer DNA Analogues ........................................................................ 49
1.8 Conclusions .............................................................................................................. 55
1.9 References ................................................................................................................ 57
2 Chapter 2: Methods and Materials ................................................................................. 82
2.1 Synopsis ................................................................................................................... 82
2.2 Abbreviations for Nucleotide Derivatives. .............................................................. 83
2.2 Materials .................................................................................................................. 86
2.2.1 Table of Chemicals and Reagents ................................................................... 86
2.2.2 Table of DNA Sequences ................................................................................. 88
2.3 Preparations ............................................................................................................. 88
2.3.1 Recrystallisation of AIBN ............................................................................... 88
2.3.2 Generation of Molecular Sieves ...................................................................... 89
2.3.3 Preparation of HPMA and DCI solutions. ...................................................... 89
2.4 Synthetic Procedures ............................................................................................... 90
2.4.1 Chapter 3 Methods ........................................................................................... 90
v
2.4.1.1 Synthesis of 5′-dimethoxytrityl-N-benzoyl-2′-deoxycytosine,3′-[(2-
cyanoethyl)-(oxyethyl methacrylate)]-phosphate monomer..................................... 90
2.4.1.2 Polymerisation of 5′-dimethoxytrityl-N-benzoyl-2′-deoxycytosine,3′-[(2-
cyanoethyl)-(oxyethyl methacrylate)]-phosphate monomer..................................... 90
2.4.2 Chapter 4 Methods ........................................................................................... 91
2.4.2.1 Coupling: Synthesis of 5′-dimethoxytrityl-N-isobutyryl-2′-
deoxyguanosine,3′-[(2-cyanoethyl)-(oxypropyl methacrylate)]-phosphate monomer
................................................................................................................... 91
2.4.2.2 Polymerisation of 5′-dimethoxytrityl-N-isobutyryl-2′-deoxyguanosine,3′-
[(2-cyanoethyl)-(oxypropyl methacrylate)]-phosphate monomer. ........................... 91
2.4.2.3 Deprotection of poly(2-(5′-dimethoxytrityl-N-isobutyryl-2′-
deoxyguanosine-monophosphate)oxypropyl methacrylate). .................................... 92
2.4.2.4 Detritylation of poly(2-(5′-dimethoxytrityl-2′-deoxyguanosine-
monophosphate)oxypropyl methacrylate). ................................................................ 92
2.4.3 Chapter 6 Methods ........................................................................................... 92
2.4.3.1 Synthesis of poly(dT-P-PMA) ................................................................. 92
2.5 Characterisation ....................................................................................................... 93
2.5.1 Chapter 3 Characterisation .............................................................................. 93
2.5.1.1 Nuclear magnetic resonance (NMR) spectroscopy of DMT-dC-CE-P-PMA
phosphate ................................................................................................................... 93
2.5.1.2 Quantitative Solvent-Gel Analysis ............................................................ 94
2.5.1.3 Attenuated Total Reflectance-Fourier Transform Infrared (ATR-FTIR)
Spectroscopy .............................................................................................................. 94
vi
2.5.2 Chapter 4 Characterisation ............................................................................... 94
2.5.2.1 Electrospray Ionisation- Mass Spectrometry (ESI-MS) ........................... 94
2.5.2.2 Size-exclusion chromatography (SEC) .................................................... 95
2.5.2.3 Kinetics Measurements ............................................................................ 95
2.5.2.4 Solubility of poly(dG-P-PMA) ................................................................ 97
2.5.3 Chapter 5 Characterisation .............................................................................. 98
2.5.3.1 SEM .......................................................................................................... 98
2.5.3.2 UV-visible (UV-vis) single sample.......................................................... 98
2.5.3.3 UV-vis Measurement of TMB Oxidation Using Well Plate Reader....... 98
2.5.3.4 Dynamic Light Scattering (DLS) ............................................................. 99
2.5.3.5 Circular Dichroism (CD) .......................................................................... 99
2.5.3.6 Melting Measurements Using Fluorescence of ATTO 550 Dye ........... 100
2.5.3.7 Fluorescence Measurements .................................................................. 100
2.5.4 Chapter 6 ........................................................................................................ 101
2.5.4.1 UV-vis Spectroscopy of Poly(dT-P-PMA) Interactions with dA ssDNA ..
................................................................................................................. 101
2.5.4.2 Effect of Annealing on Fluorescence of Poly(dT-P-PMA) Dye Interactions
................................................................................................................. 101
2.5.4.3 Effect of Sodium Concentration on the Interaction of the SYBR Dye ... 101
2.5.4.4 Complementary Dye Interactions .......................................................... 102
2.6 References .............................................................................................................. 102
vii
3 Chapter 3: Synthesis of Poly(2-(5′-dimethoxytrityl-N-benzoyl-2′-deoxycytosine-
monophosphate)oxyethyl methacrylate): a Cytosine Rich Methacrylate Polymer .............. 103
3.1 Synopsis ................................................................................................................. 103
3.1 Introduction ............................................................................................................ 104
3.1.1 Choice of Phosphoramidite Coupling Method ............................................... 106
3.1.2 Selection of Compatible Vinyl Moiety........................................................... 108
3.1.3 Activation of the Nucleotide Phosphoramidite .............................................. 111
3.1.3.1 Quenching the Activator ......................................................................... 112
3.1.3.2 Oxidation ................................................................................................. 112
3.2 Synthesis of HEMA-Nucleotide Bioconjugate ...................................................... 114
3.2.1.1 Proton Nuclear Magnetic Resonance (1H NMR) Spectroscopy ............. 115
3.2.1.2 Phosphorous Nuclear Magnetic Resonance (31P NMR) Spectroscopy ... 119
3.3 Polymerisation of the DMT-dC-CE-EMA Phosphate Monomer .......................... 121
3.3.1.1 Selection of RAFT Agent ....................................................................... 123
3.3.2 Polymerisation of DMT-dC-CE-EMA Phosphate Monomer ......................... 124
3.3.3 Investigating Solvent Effect on Poly(DMT-dC-CE-P-EMA) ........................ 127
3.3.3.1 Quantitative Solvent-Gel Analysis .......................................................... 128
3.3.3.2 ATR-FTIR Spectroscopy ........................................................................ 131
3.3.4 Determining the Structure of the Poly(DMT-dC-CE-P-EMA) Gel ............... 133
3.4 Conclusion ............................................................................................................. 134
3.5 References .............................................................................................................. 135
viii
4 Chapter 4: Synthesis of The Poly(2-(2′-deoxyguanosine-monophosphate)oxypropyl
methacrylate)): a Guanine Rich Methacrylate Polymer ....................................................... 142
4.1 Synopsis ................................................................................................................. 142
4.2 Introduction ............................................................................................................ 143
4.2.1 Maintaining the Use of the Phosphoramidite Coupling Method .................... 144
4.2.2 Determining the Phosphoramidite Isomer to be Used .................................... 145
4.2.3 Preventing the Formation of a Gel ................................................................. 146
4.2.4 Changing the Nucleobase ............................................................................... 147
4.2.5 Changing the Vinyl Moiety ............................................................................ 147
4.3 Analysis of DMT-dG-CE-P-PMA Phosphite and Phosphate ................................ 149
4.3.1 Electrospray Ionisation Mass Spectrometry (ESI-MS) .................................. 149
4.3.2 Nuclear Magnetic Resonance (NMR) Spectroscopy ...................................... 152
4.3.2.1 Proton Nuclear Magnetic Resonance (1H NMR) Spectroscopy ............. 152
4.3.2.2 Phosphorous Nuclear Magnetic Resonance (31P-NMR) Spectroscopy ... 155
4.4 Polymerisation of DMT-dG-CE-PMA phosphate monomer ................................. 157
4.4.1 Preliminary Testing for RAFT Polymerisation of DMT-dG-CE-PMA Phosphate
Monomer ...................................................................................................................... 158
4.4.2 Confirmation of polymerisation of DMT-dG-CE-P-PMA Phosphate by 1H
NMR ........................................................................................................................ 161
4.4.3 Solvent Effect on Polymerisation of DMT-dG-CE-PMA Phosphate Monomer ..
........................................................................................................................ 163
4.5 Kinetics for the Polymerisation of DMT-dG-CE-PMA Phosphate Monomer ...... 166
ix
4.5.1 In-situ 1H Nuclear Magnetic Resonance (NMR) Spectroscopy Kinetic
Measurements ............................................................................................................... 167
4.5.2 Ex-situ Kinetics Determined by Size Exclusion Chromatography. ................ 172
4.6 Activation of the Guanine Nucleobase in Poly(DMT-dG-CE-P-PMA) ................ 175
4.6.1 Deprotection ................................................................................................... 176
4.6.2 Detritylation .................................................................................................... 177
4.6.2.1 Neutralisation Agents .............................................................................. 178
4.6.3 Isolation .......................................................................................................... 178
4.6.4 Confirmation of Nucleobase Activation ......................................................... 179
4.7 Conclusion. ............................................................................................................ 181
4.8 References .............................................................................................................. 182
5 Chapter 5: Formation of G-quartets Utilising Nucleotide Functionalised Synthetic
Polymers ............................................................................................................................... 184
5.1 Synopsis ................................................................................................................. 184
5.2 Introduction ............................................................................................................ 185
5.2.1 Size Exclusion Chromatography (SEC) of Poly(dG-P-PMA) ....................... 186
5.3 Formation of Poly(dG-P-PMA) Particles .............................................................. 187
5.3.1 Scanning Electron Microscopy (SEM) of Poly(dG-P-PMA) Particles .......... 190
5.3.2 Particle Sizing of Poly(dG-P-PMA) Particles by Dynamic Light Scattering
(DLS) ........................................................................................................................ 194
5.4 Determining the Presence of G-quartets and the G-quadruplex Structure. ........... 195
5.5 Testing for DNAzyme Properties with TMB Oxidation ....................................... 198
x
5.5.1 Bulk testing of DNAzyme Activity ................................................................ 200
5.5.2 Analysis of DNAzyme activity using UV-Vis spectroscopy ......................... 202
5.6 Properties of Poly(dG-P-PMA) Particles ............................................................... 205
5.6.1 Particle Sizing by Dynamic Light Scattering (DLS) ...................................... 205
5.6.2 Melting Behaviour of poly(dG-P-PMA) Particles. ........................................ 206
5.7 ATTO 550 Fluorescence Measurements ............................................................... 208
5.7.1 Melting Behaviour of Poly(dG-P-PMA) as measured with ATTO 550 ........ 209
5.7.2 Optical Imaging of Poly(dG-P-PMA) with ATTO 550 ................................. 211
5.8 Conclusion ............................................................................................................. 214
5.9 References .............................................................................................................. 214
6 Chapter 6: Interactions of Nucleotide Functionalised Synthetic Polymers with DNA
Using Poly(2-(2'-deoxythymine-monophosphate)oxypropyl methacrylate) as a Model System.
...................................................................................................................................... 218
6.1 Synopsis ................................................................................................................. 218
6.2 Introduction ............................................................................................................ 219
6.2.1 Choice of Nucleobases ................................................................................... 219
6.3 Synthesis of Target T6 ........................................................................................... 221
6.3.1 Synthesis of T3 Monomer .............................................................................. 221
6.3.2 Synthesis of Polymer ...................................................................................... 223
6.4 Computer Modelling of T6 .................................................................................... 225
6.4.1 Modelling of Selective Binding Interactions Between T6 and dA ssDNA .... 226
xi
6.4.2 Modelling of Long-strand T6 ......................................................................... 228
6.5 Analysis by UV-Vis spectroscopy of DNA ........................................................... 229
6.6 Determination of Duplex Formation Using Fluorescent Dyes .............................. 231
6.6.1 Binding and Properties of SYBR Safe® DNA stain ...................................... 232
6.6.2 Optimisation of T6 Concentration for Investigation of Dye Binding ............ 233
6.6.3 Optimisation of the SYBR Safe Concentration. ............................................. 235
6.6.4 Effect of Sodium Chloride on SYBR Interaction ........................................... 237
6.6.5 Effect of Pre-annealing on Fluorescence ........................................................ 239
6.7 Comparison of Binding Interactions of dA ssDNA with Complementary Polymers ..
............................................................................................................................... 240
6.7.1 Interactions with SYBR Safe Dye .................................................................. 240
6.7.2 Interactions with dsGreen ............................................................................... 242
6.7.3 Interactions with Yo-Pro-1 Dye ..................................................................... 244
6.7.4 Interactions with SYBR Green II ................................................................... 246
6.8 Structural Hypothesis ............................................................................................. 248
6.9 Conclusion ............................................................................................................. 248
6.10 References .......................................................................................................... 249
7 Chapter 7: Conclusion .................................................................................................. 253
7.1 Synopsis ................................................................................................................. 253
7.2 Concluding Remarks and Future Work. ................................................................ 254
7.3 Future Work ........................................................................................................... 257

xii
7.4 References .............................................................................................................. 258
Appendix 1: C3 1H NMR Peak Attributions .................................................................... 259
Apendix 2: G3 1H NMR Peak assignments ...................................................................... 260
Appendix 3: Example DRI chromatograms for the polymerisation kinetics of C3. ........ 261
Apendix 4: T3 1H NMR Peak Attributions ...................................................................... 268
xiii
Table of Figures
Figure
Number
Caption Page
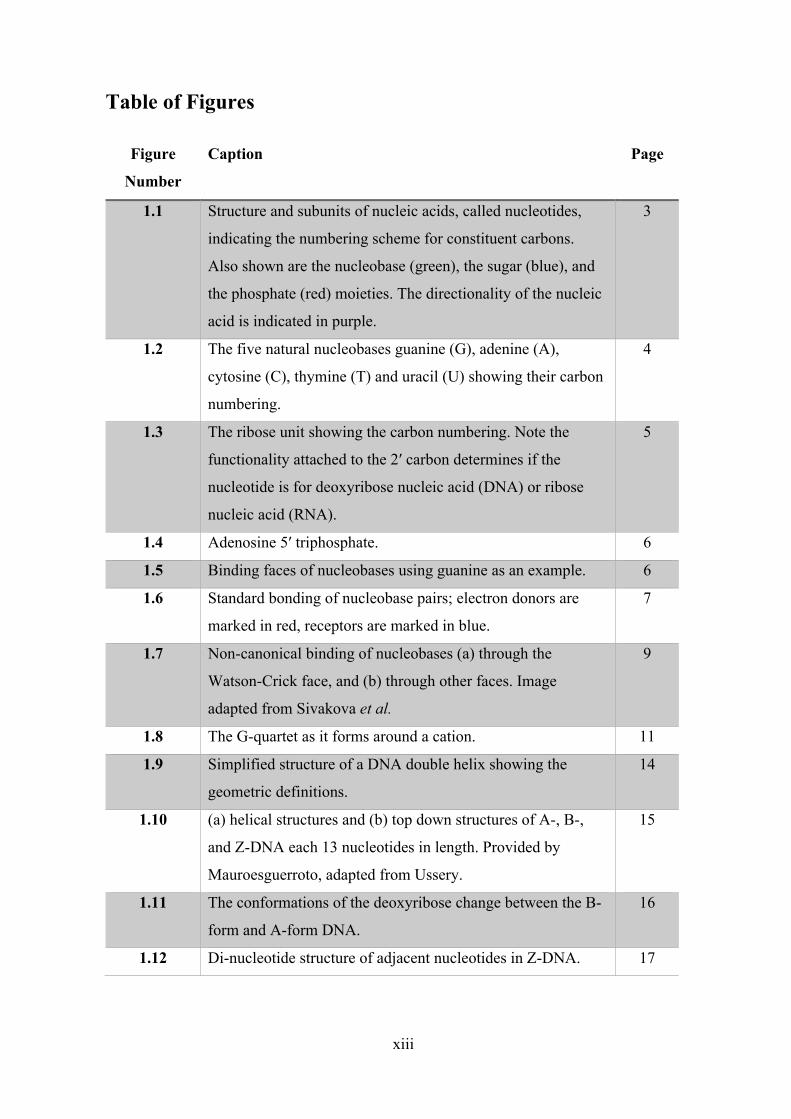
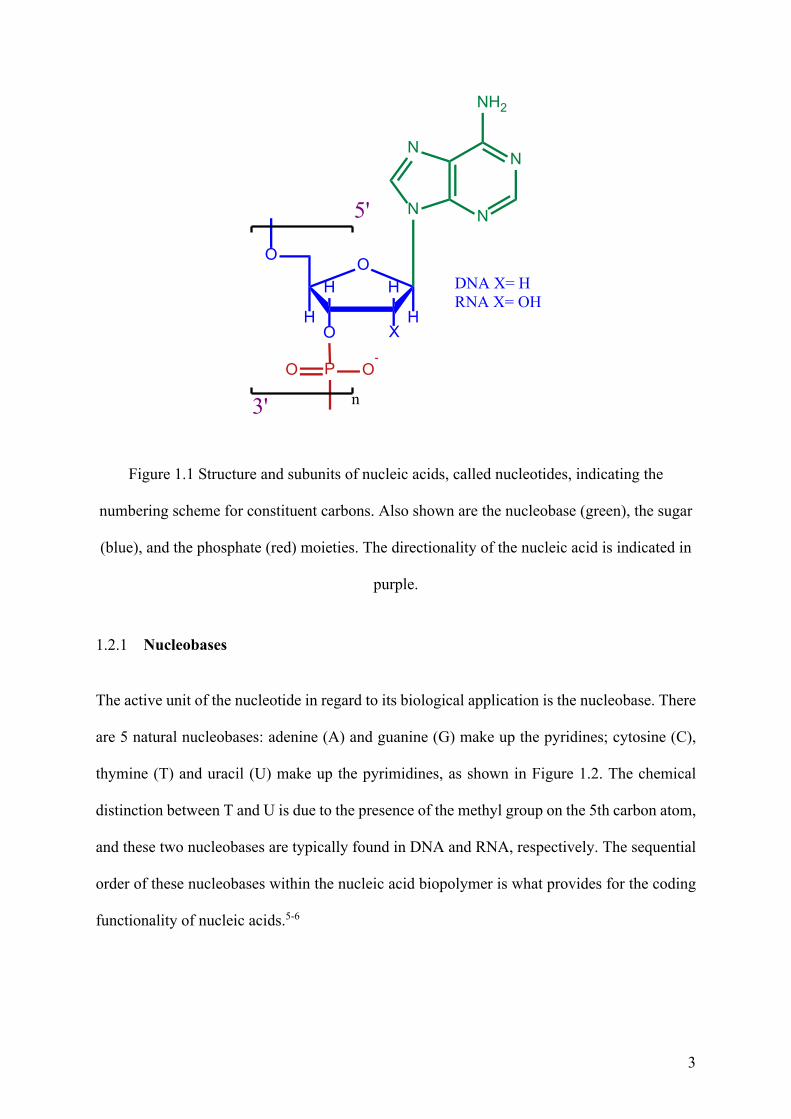
1.1 Structure and subunits of nucleic acids, called nucleotides,
indicating the numbering scheme for constituent carbons.
Also shown are the nucleobase (green), the sugar (blue), and
the phosphate (red) moieties. The directionality of the nucleic
acid is indicated in purple.
3
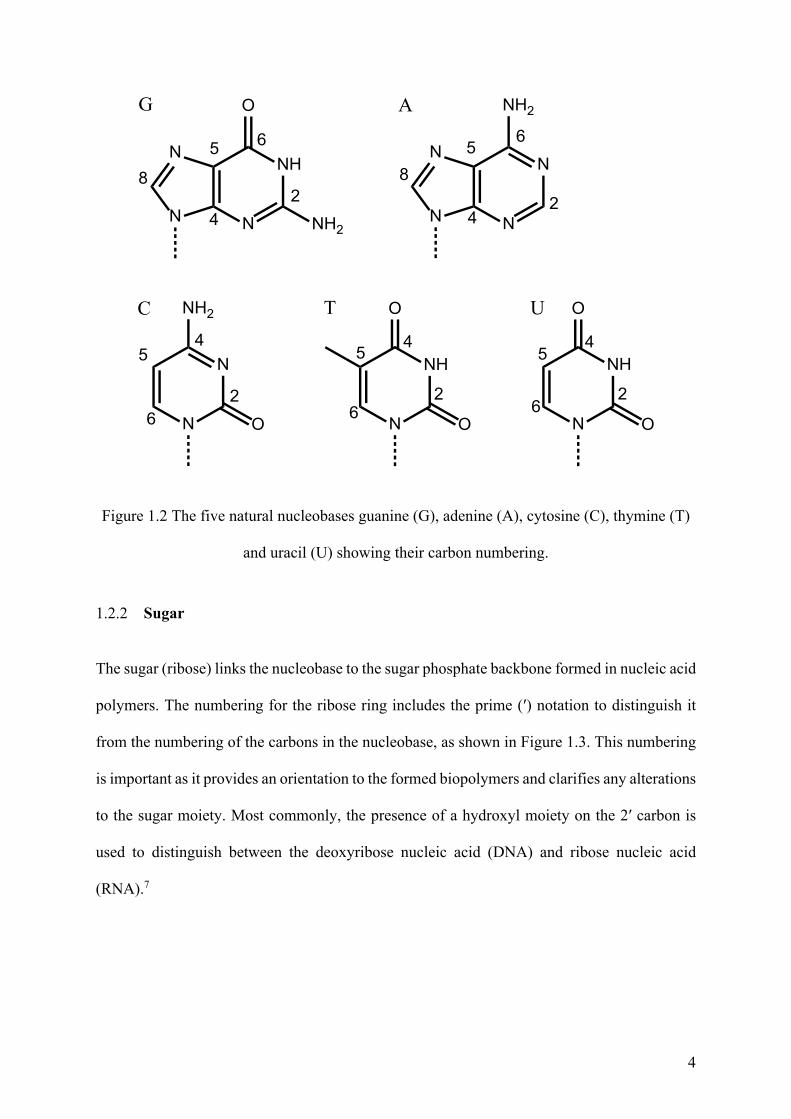
1.2 The five natural nucleobases guanine (G), adenine (A),
cytosine (C), thymine (T) and uracil (U) showing their carbon
numbering.
4
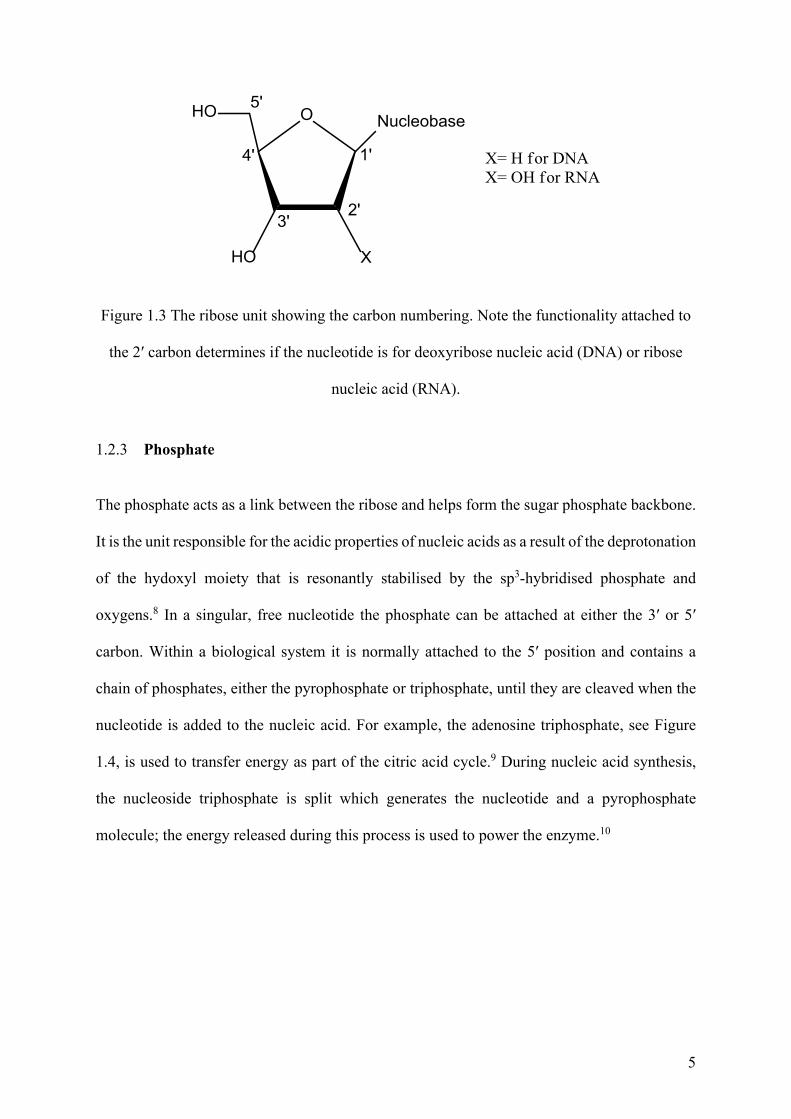
1.3 The ribose unit showing the carbon numbering. Note the
functionality attached to the 2′ carbon determines if the
nucleotide is for deoxyribose nucleic acid (DNA) or ribose
nucleic acid (RNA).
5
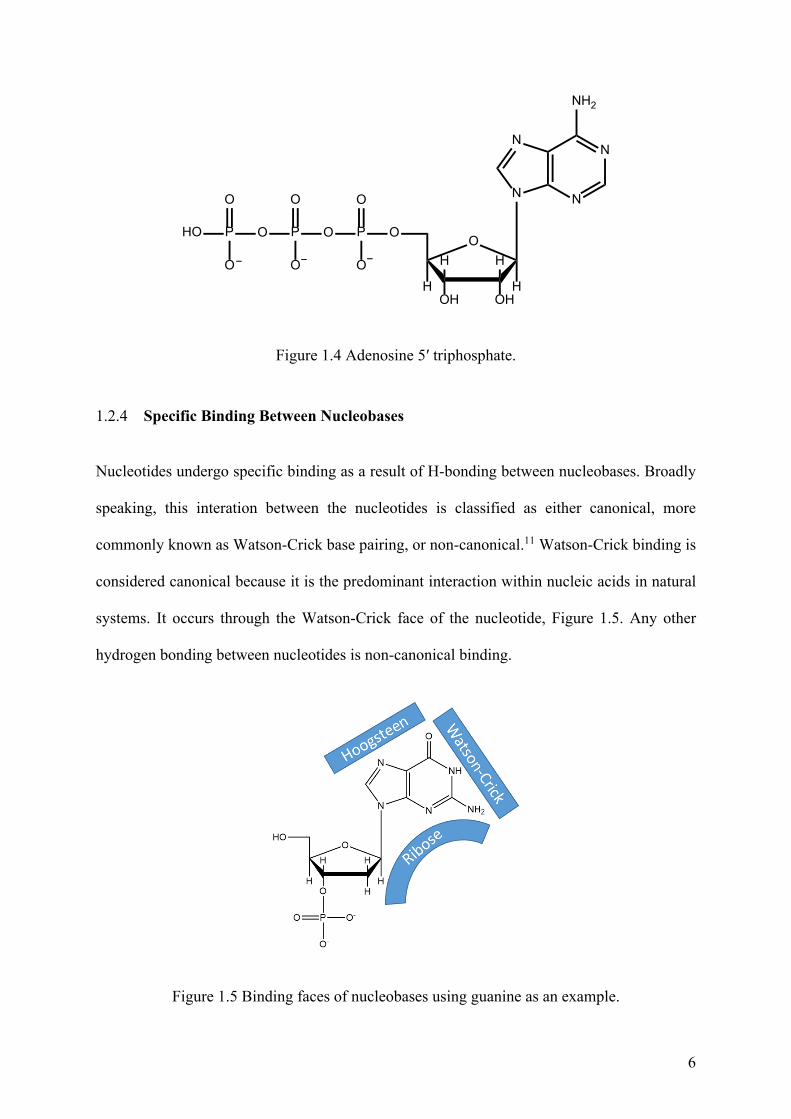
1.4 Adenosine 5′ triphosphate. 6
1.5 Binding faces of nucleobases using guanine as an example. 6
1.6 Standard bonding of nucleobase pairs; electron donors are
marked in red, receptors are marked in blue.
7
1.7 Non-canonical binding of nucleobases (a) through the
Watson-Crick face, and (b) through other faces. Image
adapted from Sivakova et al.
9
1.8 The G-quartet as it forms around a cation. 11
1.9 Simplified structure of a DNA double helix showing the
geometric definitions.
14
1.10 (a) helical structures and (b) top down structures of A-, B-,
and Z-DNA each 13 nucleotides in length. Provided by
Mauroesguerroto, adapted from Ussery.
15
1.11 The conformations of the deoxyribose change between the B-
form and A-form DNA.
16
1.12 Di-nucleotide structure of adjacent nucleotides in Z-DNA. 17
xiv
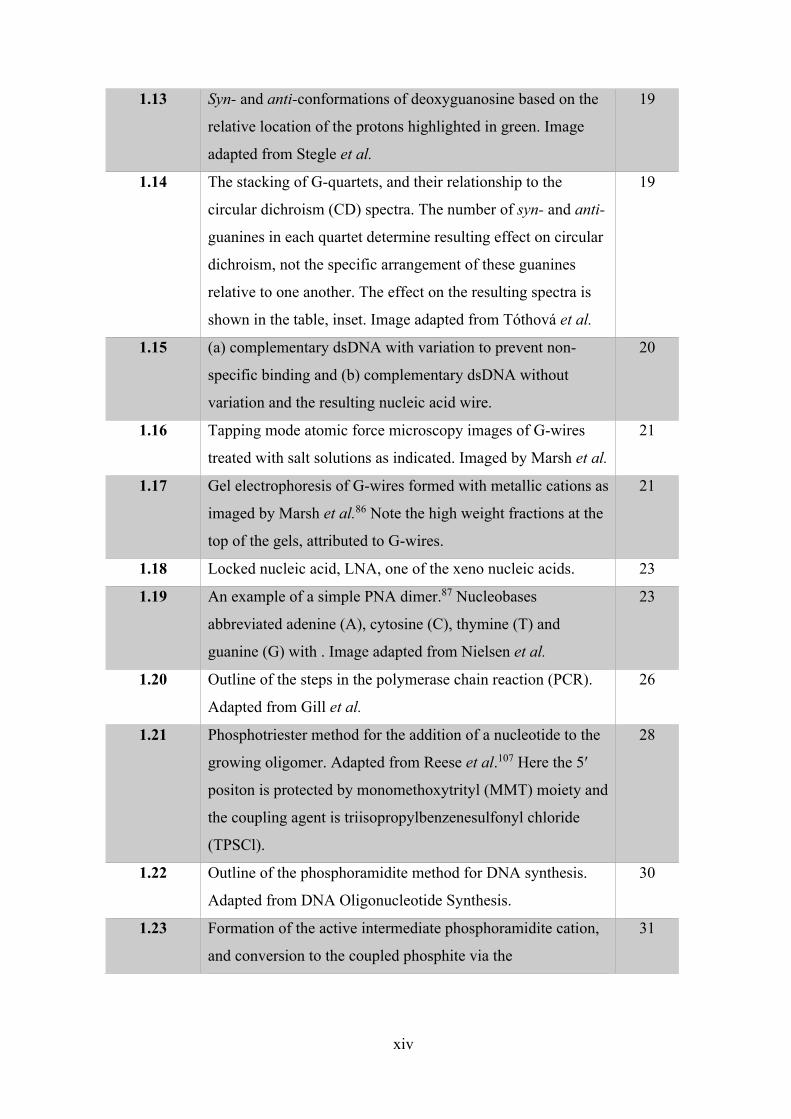
1.13 Syn- and anti-conformations of deoxyguanosine based on the
relative location of the protons highlighted in green. Image
adapted from Stegle et al.
19
1.14 The stacking of G-quartets, and their relationship to the
circular dichroism (CD) spectra. The number of syn- and anti-
guanines in each quartet determine resulting effect on circular
dichroism, not the specific arrangement of these guanines
relative to one another. The effect on the resulting spectra is
shown in the table, inset. Image adapted from Tóthová et al.
19
1.15 (a) complementary dsDNA with variation to prevent non-
specific binding and (b) complementary dsDNA without
variation and the resulting nucleic acid wire.
20
1.16 Tapping mode atomic force microscopy images of G-wires
treated with salt solutions as indicated. Imaged by Marsh et al.
21
1.17 Gel electrophoresis of G-wires formed with metallic cations as
imaged by Marsh et al.86 Note the high weight fractions at the
top of the gels, attributed to G-wires.
21
1.18 Locked nucleic acid, LNA, one of the xeno nucleic acids. 23
1.19 An example of a simple PNA dimer.87 Nucleobases
abbreviated adenine (A), cytosine (C), thymine (T) and
guanine (G) with . Image adapted from Nielsen et al.
23
1.20 Outline of the steps in the polymerase chain reaction (PCR).
Adapted from Gill et al.
26
1.21 Phosphotriester method for the addition of a nucleotide to the
growing oligomer. Adapted from Reese et al.107 Here the 5′
positon is protected by monomethoxytrityl (MMT) moiety and
the coupling agent is triisopropylbenzenesulfonyl chloride
(TPSCl).
28
1.22 Outline of the phosphoramidite method for DNA synthesis.
Adapted from DNA Oligonucleotide Synthesis.
30
1.23 Formation of the active intermediate phosphoramidite cation,
and conversion to the coupled phosphite via the
31
xv
phosphoramidite method. The R-group is the propagating
chain or surface to be grafted from.
1.24 Diagram demonstrating the structural similarities of (a) 1H-
tetrazole, (b) 4,5-dicyanoimidazole and (c) 5-(ethylthio)-1H-
tetrazole. Modified groups are shown in red.
32
1.25 Oxidative mechanism of the phosphoramidite method for
DNA synthesis using pyridine/I2 .
33
1.26 Sites of binding of fluorescent dyes in the DNA double helix. 35
1.27 Radical Polymerisation, mechanisms and processes. The
initiator (I) creates radicals that react with monomer units (M)
to propagate the polymer. Adapted from Living Radical
Polymerization by the RAFT Process – A Second Update.
41
1.28 RAFT mediation mechanism, adapted from Moad et al.173
Verticle arrows indicate the polymer exiting the RAFT
mediation as dead polymers through termination (combination
or disproportionaltion).
44
1.29 Some examples of monomers for reversible-addition
fragmentation chain transfer polymerisations, shown on a
scale from least to most activated from left to right.
45
1.30 RAFT agent structures. Note: the dithioester groups, marked
in green, are consistent between all of the RAFT agents.
46
1.31 Switchable polymerisation of styrene and vinyl acetate using
sodium carbonate as a ‘switch’. Modified from Thang et al.
49
1.32 Poly(p-phenylenebutadiynylene) polymer and it’s interaction
with polyadenine DNA. Taken from Lo et al.
50
1.33 Overview of the Sonogashira polymerisation method for the
templated synthesis of Poly(p-phenylenebutadiynylene).
Taken from Lo et al.
51
1.34 Mechanism for ring opening metathesis polymerisation.
Adapted from Bielawski et al.
52
1.35 Formation of the adenine methacrylate (AMA) and thymine
methacrylate (TMA) monomers by nucleophilic substitution
using alkylhalides. Taken from O'Reilly et al.
53
xvi
1.36 Formation of the non-conjugated polymer dots. Taken from
O’Rielly et al.
55
2.1 Overview of polymer synthesis from protected nucleotide
phosphoramidite to the final deprotected polymer
bioconjugate.
83
2.2 ChemSpeed Swing XL showing (a) syringe pump, (b)
syringes, and racks for (c) reagents, (d) reactions, and (e)
collected samples.
96
3.1 Overview for the conversion of C1 starting material through
the activation with tetrazole to form (i) the activated C1
intermediate. This in turn was coupled to HEMA to form C2
and subsequently oxidised to form C3. The tetrazole required
for the activation (step 1) was regenerated during the coupling
step (step 2) allowing it to act as a catalyst.
105
3.2 (i) 2'deoxyadenosine 5′ monophosphate and (ii)
2'deoxyadenosine 3′ monophosphate. Green arrows indicate
sites that could be used for conjugation of the vinyl moiety
using the phosphoramidite coupling method.
107
3.3 Coupling of the protected C1, (i) the activated
phosphoramidite intermediate to (ii) HEMA resulting in the
C3 monomer.
110
3.4 Mechanism for the activation of (i) a phosphoramidite,
substituting the diisopropylamine (blue) with tetrazole (pink)
resulting in (iii) an activated phosphoramidite.7 The tetrazole
is subsiquently regenerated when it is substiruted with the
monomer, completing the coupling.
111
3.5 (i) Oxidation of phosphite to phosphate using I2/pyridine/H2O2
(ii) the halide addition to an alkene, and (iii) oxidation of
phosphite by ozone present in air.
113
3.6 1H NMR spectra of (i) C1 and (ii) C3 monomer, showing the
appearance of peaks (a-e) associated with HEMA and the
disappearance of peak (f) associated with the diisopropyl
amine (inset (i, red)) Spectra acquired in deuterated
116
xvii
acetonitrile at 600 MHz. Full peak attributions can be found in
Appendix 1.
3.7 1H NMR spectra of the C1 (red), and C3 monomer (blue),
showing the region from 1 ppm to 1.25 ppm. Spectra acquired
in deuterated acetonitrile at 600 MHz.
117
3.8 1H NMR spectra of the 5.5 ppm to 6.5 ppm region of C1 (red)
and C3 monomer (blue), showing the appearance of peaks (a
and b) associated with the cis and trans protons of the alkene
(inset). In addition the peak associated with the 1′ proton on
the ribose is also visible in this region. Spectra acquired in
deuterated acetonitrile at 600 MHz.
118
3.9 31P NMR spectra of the -10 ppm to 160 ppm region of C1
(red, P(III)) and C3 monomer (blue, P(V)) Spectra acquired
pulse decoupled in deuterated acetonitrile at 600 MHz.
120
3.10 Thermal decomposition of AIBN into N2 and the
isobutyronitrile radical.
122
3.11 General scheme for the polymerisation of (i) C3 monomer to
(ii) C4 using the RAFT agent 4-cyano-4-
(phenylcarbonothioylthio)pentanoic acid N-succinimidyl ester
and AIBN (ii) showing the active vinyl group (red) converted
to the alkyl backbone (blue).
125
3.12 C4 gel swollen with (a) water or (b) DMSO and, (b) dried at
60 °C.
126
3.13 Structure of the C4, indicating hydrophobic moieties in red. 128
3.14 Normalised ATR-FTIR spectrum of the C4 gel. 131
3.15 ATR-FTIR spectra of C4 gel in the fingerprint region 500-
2000 cm-1.
132
3.16 Proposed by-product reaction caused by the solvation of
vinyl-nucleotide bioconjugate for extended periods, resulting
in the diene impurity that would act as the cross linking agent
and subsequently leading to the gel formation.
134
4.1 Overview for the conversion of G1 starting material through
the activation with DCI to form the activated G1 intermediate.
144
xviii
This in turn was coupled to HPMA to form a G2 monomer
and then oxidised to form the G3 monomer. The DCI required
for the activation (step 1) is regenerated during the coupling
step (step 2) allowing it to act as a catalyst.
4.2 (i) 3′-deoxy guanosine monophosphate and (ii) 5′-deoxy
guanosine monophosphate isomers.
146
4.3 Formation of the diene impurity from G3 monomer in
solution, followed by polymerisation creating the first
addition, and leading to cross-linkeding with the second
addition. For clarity active vinyl groups are shown in red.
Polymerised vinyl groups shown in blue.
148
4.4 ESI-MS spectrum of the final product showing the following
peaks: (a) G2 (molecule shown inset), (b) G2 sodium adduct,
(c) G3 monomer sodium adduct, and (d) G3 monomer
disodium + acetonitrile adduct.
151
4.5 1H NMR spectra of (i) G1 starting material and (ii) the
bioconjugate G3 monomer. Spectra acquired in deuterated
acetonitrile at 400 MHz, with triethylamine residue (TEA).
Full peak attributions can be found in Appendix 2.
153
4.6 1H NMR spectra region from 3 ppm to 2 ppm showing the G1
(black) and the G3 monomer (blue). Spectra acquired in
deuterated acetonitrile at 400 MHz.
154
4.7 1H NMR of the 6.3 ppm to 5.3 ppm region for G1 (black) G3
(blue). Spectra acquired in deuterated acetonitrile at 400 MHz.
155
4.8 31P NMR spectra of (i) G1 starting material and (ii) G3
monomer with (inset) the 6 ppm to 1 ppm region. Spectra
acquired in deuterated acetonitrile at 400 MHz.
156
4.9 Polymerisation of G3 monomer showing the starting vinyl
group (red) converted to the alkyl group (green) and the
incorporation of the NHS-RAFT agent (purple).
157
4.10 (i) Photo showing the phase separation of G4 upon cooling of
the polymerisation mixture, and (ii) DRI chromatogram and
results of the 24 h polymerisation of G4, showing the
159
xix
formation of a polymer, 6750 Da. at 27.5 min attributed to the
G4. Additional peaks at 31 min is attributed to the monomer
and 32.5 min to DMT residue in solution.
4.11 Structure of the G4 heptamer. Note that following
polymerisation it has not been treated in a way that would
remove the NHS protecting group.
161
4.12 1H NMR spectra of G4 in deuterated acetonitrile with
majority noted peak allocation indicating (a) polymerisation,
(b) nucleobase retention and, (c) the ribose connection
between them. Spectra acquired in deuterated acetonitrile at
400 MHz
162
4.13 Difference in solution hue of the G5 reaction mixture with (i)
DMF and, (ii) acetonitrile as solvent after 2 h.
164
4.14 DRI chromatograms of G4 polymerised for 2 h using either (i)
acetonitrile, or (ii) dimethylformamide as the solvent.
Numbers shown indicate the Mw at maximum.
165
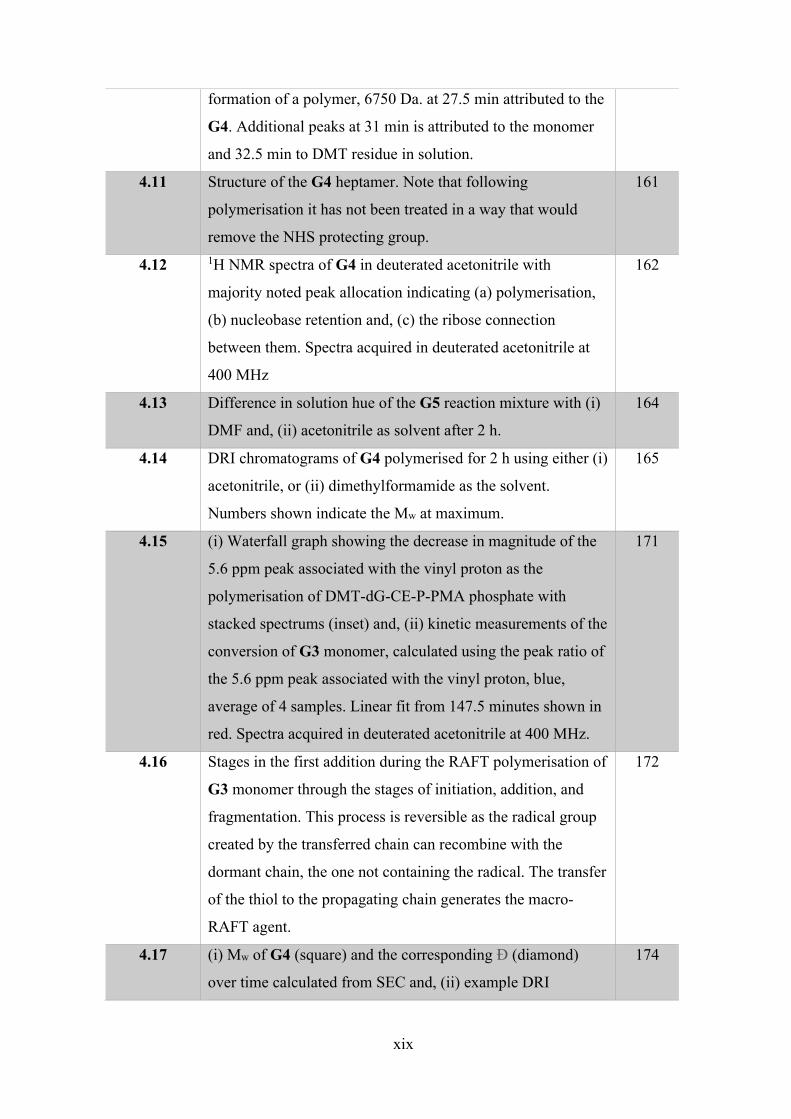
4.15 (i) Waterfall graph showing the decrease in magnitude of the
5.6 ppm peak associated with the vinyl proton as the
polymerisation of DMT-dG-CE-P-PMA phosphate with
stacked spectrums (inset) and, (ii) kinetic measurements of the
conversion of G3 monomer, calculated using the peak ratio of
the 5.6 ppm peak associated with the vinyl proton, blue,
average of 4 samples. Linear fit from 147.5 minutes shown in
red. Spectra acquired in deuterated acetonitrile at 400 MHz.
171
4.16 Stages in the first addition during the RAFT polymerisation of
G3 monomer through the stages of initiation, addition, and
fragmentation. This process is reversible as the radical group
created by the transferred chain can recombine with the
dormant chain, the one not containing the radical. The transfer
of the thiol to the propagating chain generates the macro-
RAFT agent.
172
4.17 (i) Mw of G4 (square) and the corresponding Đ (diamond)
over time calculated from SEC and, (ii) example DRI
174

xx
chromatogram for the 240 min sample of G4. Further example
DRI chromatograms can be found in Appendix 3.
4.18 Process for the conversion of G4 into G6 through (i)
deprotection removing the CE protecting groups shown in red
and, (ii) detritylation removing the groups shown in orange.
176
4.19 (i) Mechanism for the removal of the cyanoethyl protecting
group by ammonia resulting in acrylonitrile and G5 and (ii)
mechanism for the removal of isobutyryl protection from
guanine using ammonia (iii) the white colloidal suspension of
G5 generated.
177
4.20 The orange colour produced as a result of the acetic acid
addition to the G5 from (i) immediately after addition to (ii) 5
min after addition with (iii) the mechanism for this
conversion.
178
4.21 1H NMR spectra of (i) G4 in deuterated acetonitrile and (ii)
G6 in deuterated DMSO. Spectra acquired in deuterated
acetonitrile at 400 MHz.
180
5.1 DRI chromatogram of G4 hexamer prior to deprotection, with
specific results inset. Note, the large peaks at 30.5 min and 32
min were attributed to cleaved DMT and residual monomer,
respectively, based on their elution time and the
corresponding Mw.
186
5.2 Sample of G6 following deprotection and detritylation as
isolated using NaOAc in propan-2-ol:water (a) 5:1 and (b)
1:15 (v/v).
189
5.3 Structure of G6 showing the hydrophilic nucleotide based
region known to be water soluble in isolation (green) and the
comparatively hydrophobic region known to be water
insoluble in issolation (red).
190
5.4 SEM images of the G6 isolated in propan-2-ol:water 5:1 (v/v)
at various magnification.
191
5.5 Non-grafted polymer monoliths of poly(2-(2-
methoxyethoxy)ethyl methacrylate (MEO2MA)-co-
192
xxi
oligo(ethylene glycol) methacrylate at differing magnification.
Taken from Li et al.
5.6 SEM images of the G6 isolated in propan-2-ol:water 1:15
(v/v) at various magnifications.
193
5.7 Proposed general structure of G6 in propan-2-ol:water 1:15
(v/v) (a) sheet ‘unit’ and (b) sheet cross section of
polymersome wall.
193
5.8 DLS measurements showing the particle size of G6 in 15:1
(v/v) water:propan-2-ol as isolated with NaOAc.
195
5.9 The stacking of G-quartets to form a G-quadruplex. Image
adapted from Tóthová et al.
196
5.10 Circular dichroism measurements of G6 in 10:1 (v/v)
water:propan-2-ol as isolated with LiOAc (red) and with
added NaOAc (green) and KOAc (blue) normalised to the 325
nm peak.
197
5.11 Structure of ferric chloride heme (Hemin) 199
5.12 Oxidation of TMB caused by the G-quadruplex/Hemin
DNAzyme with absorption wavelengths shown. Adapted from
Stefan et al.
199
5.13 UV-Vis measurements at 450 nm for acceleration in the
oxidation of TMB by hemin/G-quadruplex complex. Positive
controls of TMB/Hemin/GQ DNA (blue) and negative control
of TMB/Hemin (black) with non-linear behaviour (red
arrows). Samples measured in triplicate.
203
5.14 UV-Vis measurements at 450 nm for TMB oxidation of the
positive GQ DNA control (blue), poly(HPMA) (orange),
negative control (grey) and G6 (yellow).
204
5.15 DLS measurements of Z-average particle diameter of G6
(blue), and its protected form G4 (orange).
205
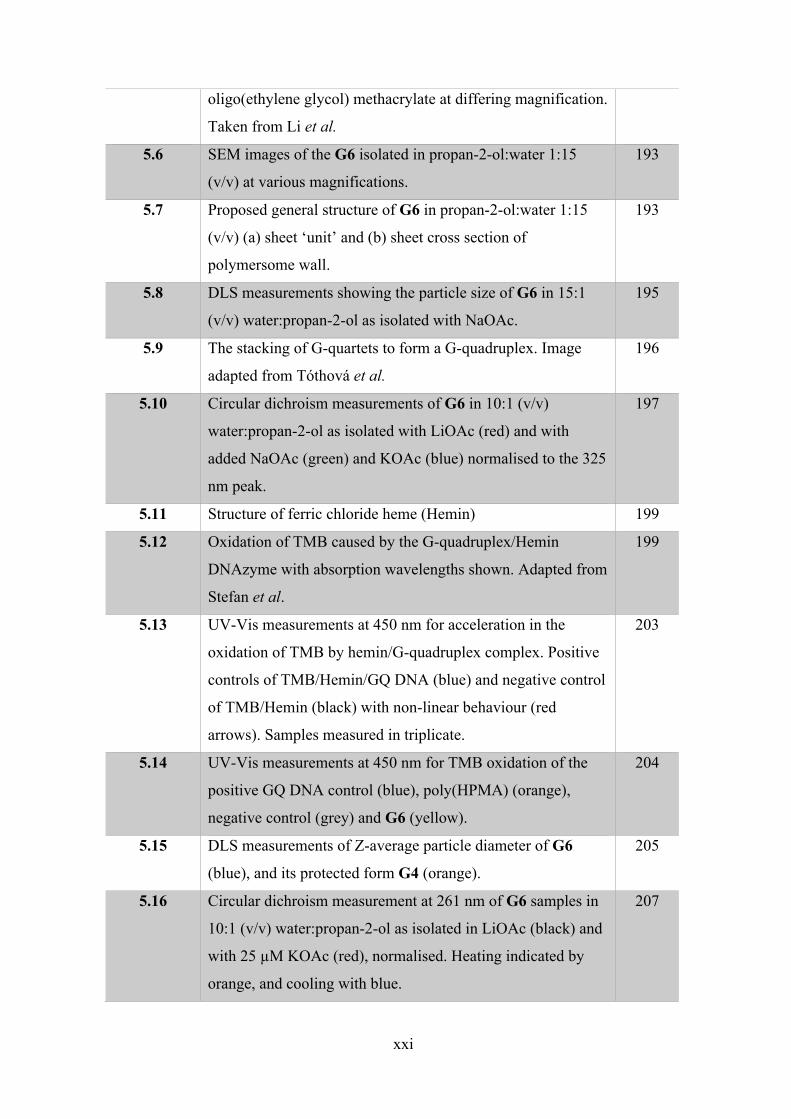
5.16 Circular dichroism measurement at 261 nm of G6 samples in
10:1 (v/v) water:propan-2-ol as isolated in LiOAc (black) and
with 25 µM KOAc (red), normalised. Heating indicated by
orange, and cooling with blue.
207
xxii
5.17 Change in fluorescence intensity of ATTO 550 treated G6
measured with heating, average of 4 samples. Particles
isolated with LiOAc (solid blue) and treated with 25 µM K+
ions (solid orange), normalised to the 95 ℃ untreated
maximum fluorescence and the derivative of the melting
curves (dashed).
210
5.18 Optical and CLSM images of ATTO 550 stained (a and b)
poly(HPMA), (c and d) G6 as isolated with LiOAc, and (e and
f), as isolated with LiOAc and added Na+ ions and (g and h)
and as isolated with LiOAc and added K+ ions (25 mM),
respectively. Note the excitation laser output for poly(HPMA)
had been amplified 10x. Scale bars indicate 20 μm.
212
5.19 Proposed pathway for the formation of G6 particles and their
interactions with K+ ions. Starting with the polymer, forming
sheets, becoming micelles with G-quartets on the surface, and
forming inter-particle G-quartets.
213
6.1 Proposed binding of T6 23-mer (blue) interacting with dA
ssDNA 23-mer (red).
220
6.2 ESI -MS spectrum of T2 monomer showing the following
peaks: (i) T2 monomer (molecule shown inset), (ii) T3
monomer, (iii) T2 monomer sodium adduct, (iv) T3 monomer
water adduct, and (v) DMT-dT-CE-PMA sodium adduct.
221
6.3 1H NMR of the 6.5 ppm to 5.5 ppm region for T3 (inset).
Spectra acquired in deuterated acetonitrile at 600 MHz.
223
6.4 DRI chromatogram of T6 following 4 h polymerisation,
showing the formation of a polymer, 9364 Da.
224
6.5 Optimised structural model of T6 and dA ssDNA pentamers
following 100,000 iterations. Directionality of the dA ssDNA
shown. Angles provided are (i) groove, (ii) T6 front, (iii) top,
and (iv) dA ssDNA front.
227
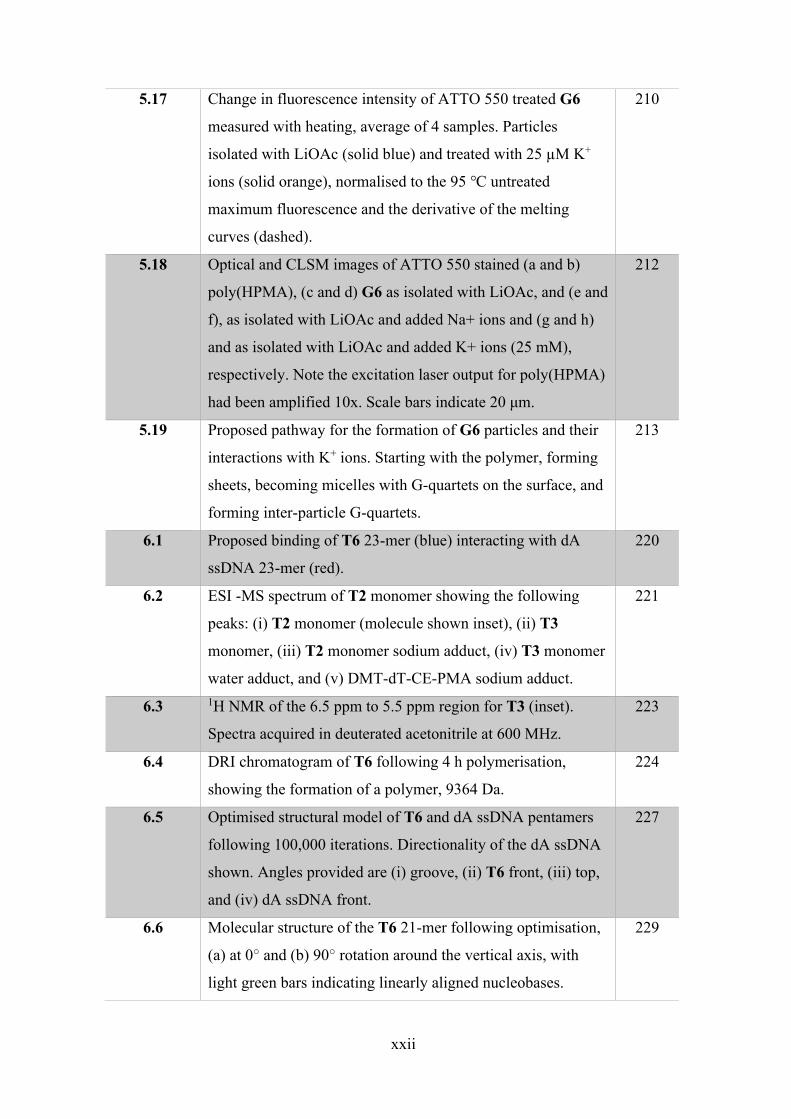
6.6 Molecular structure of the T6 21-mer following optimisation,
(a) at 0° and (b) 90° rotation around the vertical axis, with
light green bars indicating linearly aligned nucleobases.
229
xxiii
6.7 The absorbance with increasing ratio of T6 to dA ssDNA at
260 nm, average of 4 samples.
230
6.8 Structure of SYBR Safe dye. 233
6.9 Normalised fluorescence of 5X SYBR Safe (blue) and with
T6 at 1 mM (orange), 100 µM (grey), 10 µM (yellow) and 1
µM (green). Samples run in quadruplicate at gain 10.
234
6.10 Normalised fluorescence of SYBR Safe with 10 µM T6 (blue)
and without (orange) at (a) 25 ℃ and (b) 99 ℃. Samples run in
quadruplicate at gain 10, error bars are displayed in both plots
though fit within the marker for some data points.
236
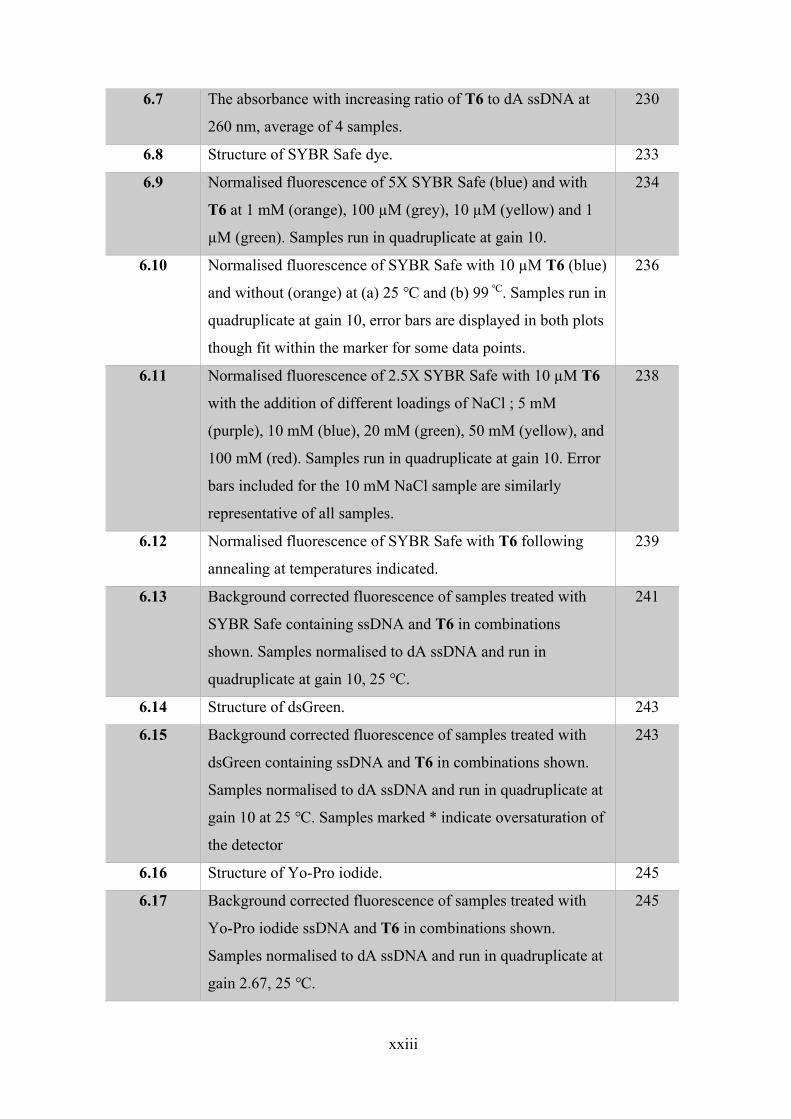
6.11 Normalised fluorescence of 2.5X SYBR Safe with 10 µM T6
with the addition of different loadings of NaCl ; 5 mM
(purple), 10 mM (blue), 20 mM (green), 50 mM (yellow), and
100 mM (red). Samples run in quadruplicate at gain 10. Error
bars included for the 10 mM NaCl sample are similarly
representative of all samples.
238
6.12 Normalised fluorescence of SYBR Safe with T6 following
annealing at temperatures indicated.
239
6.13 Background corrected fluorescence of samples treated with
SYBR Safe containing ssDNA and T6 in combinations
shown. Samples normalised to dA ssDNA and run in
quadruplicate at gain 10, 25 ℃.
241
6.14 Structure of dsGreen. 243
6.15 Background corrected fluorescence of samples treated with
dsGreen containing ssDNA and T6 in combinations shown.
Samples normalised to dA ssDNA and run in quadruplicate at
gain 10 at 25 ℃. Samples marked * indicate oversaturation of
the detector
243
6.16 Structure of Yo-Pro iodide. 245
6.17 Background corrected fluorescence of samples treated with
Yo-Pro iodide ssDNA and T6 in combinations shown.
Samples normalised to dA ssDNA and run in quadruplicate at
gain 2.67, 25 ℃.
245
xxiv
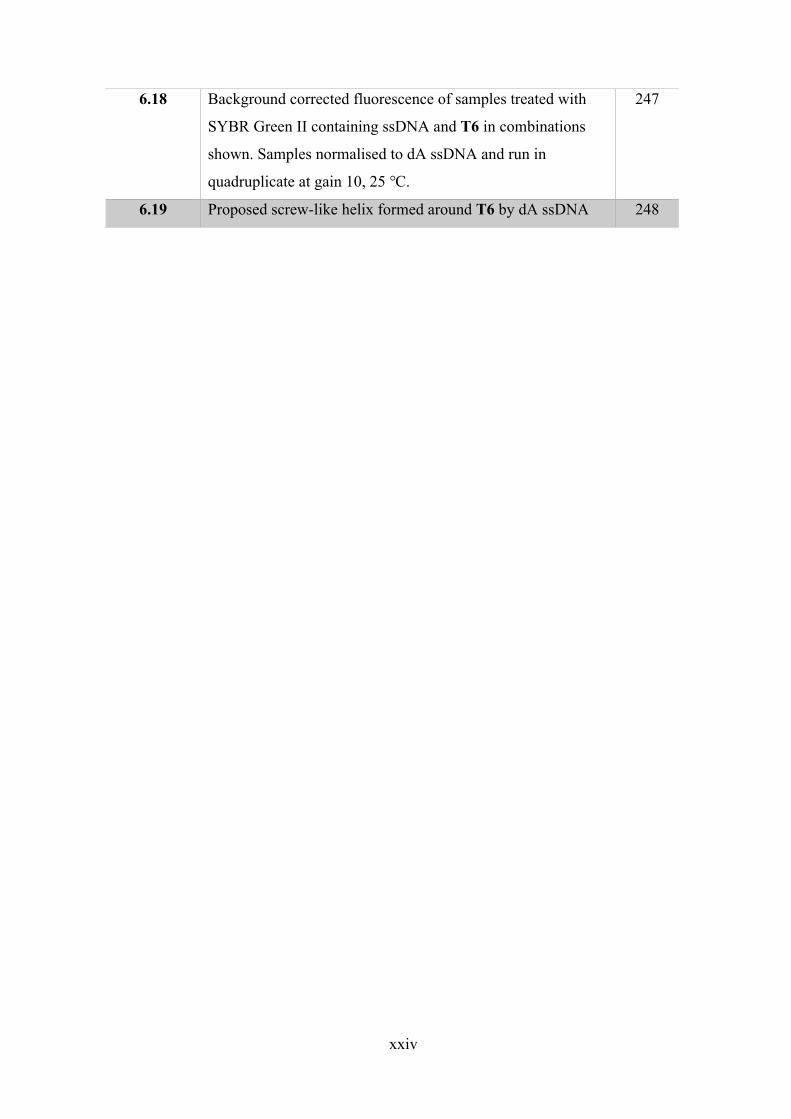
6.18 Background corrected fluorescence of samples treated with
SYBR Green II containing ssDNA and T6 in combinations
shown. Samples normalised to dA ssDNA and run in
quadruplicate at gain 10, 25 ℃.
247
6.19 Proposed screw-like helix formed around T6 by dA ssDNA 248
xxv
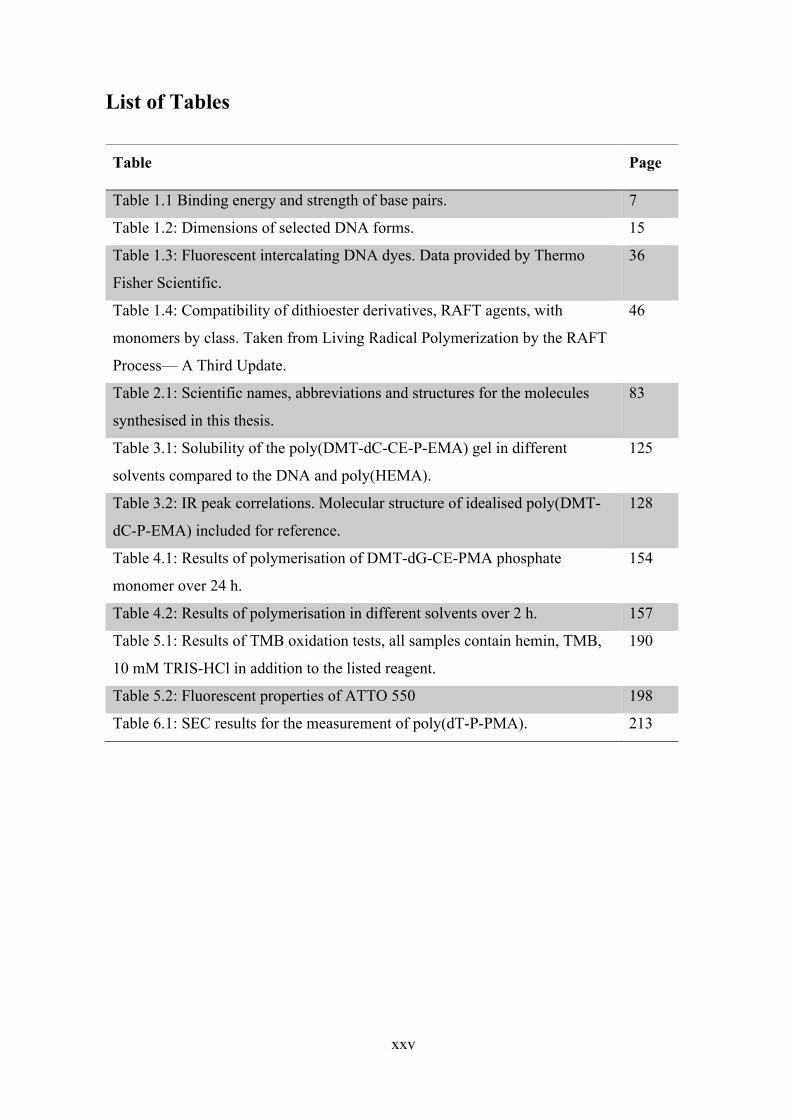
List of Tables
Table Page
Table 1.1 Binding energy and strength of base pairs. 7
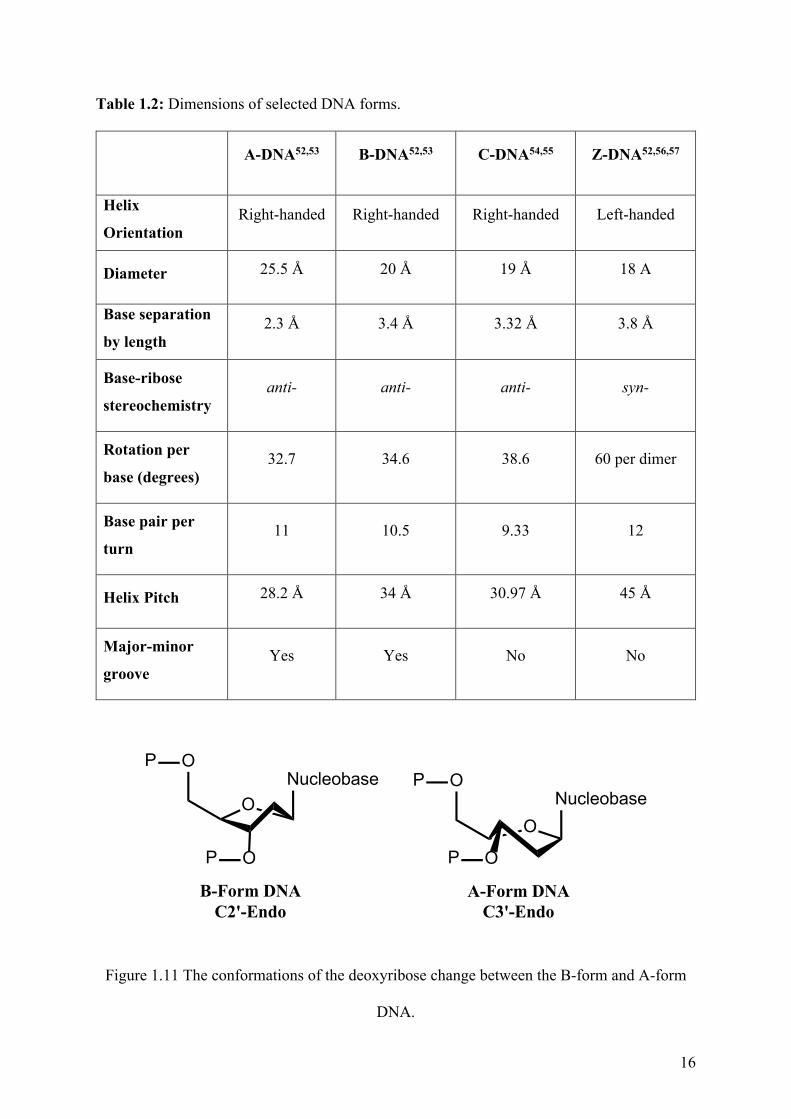
Table 1.2: Dimensions of selected DNA forms. 15
Table 1.3: Fluorescent intercalating DNA dyes. Data provided by Thermo
Fisher Scientific.
36
Table 1.4: Compatibility of dithioester derivatives, RAFT agents, with
monomers by class. Taken from Living Radical Polymerization by the RAFT
Process— A Third Update.
46
Table 2.1: Scientific names, abbreviations and structures for the molecules
synthesised in this thesis.
83
Table 3.1: Solubility of the poly(DMT-dC-CE-P-EMA) gel in different
solvents compared to the DNA and poly(HEMA).
125
Table 3.2: IR peak correlations. Molecular structure of idealised poly(DMT-
dC-P-EMA) included for reference.
128
Table 4.1: Results of polymerisation of DMT-dG-CE-PMA phosphate
monomer over 24 h.
154
Table 4.2: Results of polymerisation in different solvents over 2 h. 157
Table 5.1: Results of TMB oxidation tests, all samples contain hemin, TMB,
10 mM TRIS-HCl in addition to the listed reagent.
190
Table 5.2: Fluorescent properties of ATTO 550 198
Table 6.1: SEC results for the measurement of poly(dT-P-PMA). 213
xxvi
Abstract
DNA is a fundamental compound in biology and, from a polymer science perspective, exceeds
most synthetic polymers in terms of size and composition. This thesis outlines a synthetic
method for an alkene polymer bearing nucleotide functionality and its subsequent properties.
Alkene polymers are built on the radical polymerisation of alkenes leading to long chain alkyl
backbones and are known to be stable for long periods. Combining the selectivity and control
of DNA with the rapid synthesis and stability of living radical techniques will allow
applications of DNA nanotechnologies in environments where DNA is currently unsuitable.
The background and information relevant to a thorough understanding of this thesis is
presented in Chapter 1. This includes discussion of the nature of DNA and variants of its
structure, methods for its synthesis, and analysis of the subsequent products. Further,
information essential to understanding the polymerisation methods utilised in this work such
as the radical polymerisation and the reversible addition-fragmentation chain-transfer method
are also discussed. Existing literature discussing the convergence of these two fields is also
covered, with the specific methods and materials as they relate to this work presented in the
following Chapter 2.
Chapter 3 outlines the initial method developed for the synthesis of a nucleotide functionalised
polymer using the phosphoramidite method. This method has been reported previously for the
synthesis of DNA and other nucleic acids (broadly poly(ribose-phosphates)). The
phosphoramidite method was altered to generate a nucleotide-alkene monomer using a
protected cytosine phosphoramidite. This was possible through careful selection of the alkene
moiety (hydroxyethyl methacrylate (HEMA)) and the optimisation of experimental
parameters. This method was found to successfully generate the polymer as confirmed with
proton and 31phosphorus nuclear magnetic resonance (NMR) spectroscopy.
xxvii
The synthesised HEMA-cytosine monophosphate bioconjugate monomer was polymerised
using reversible addition-fragmentation chain-transfer (RAFT) polymerisation. The resulting
polymers were limited in their applications as interconversion of the monomer appeared to
form a diene that caused the polymer to be cross-linked, resulting in the formation of an
insoluble gel. This gel was found to retain the nucleobase functionality and demonstrated the
interaction of the nucleotide-alkene with solvents consistent with a hybrid polymer system.
Chapter 4 builds upon Chapter 3, presenting an improved method for the synthesis of a
nucleotide-alkene bioconjugate by changing the alkene source from HEMA to 2-
hydroxypropyl methacrylate (HPMA) and the nucleotide source to guanosine monophosphate.
The HPMA was chosen as the presence of an additional methyl group explicitly prevented the
formation of the diene impurity in the monomer. This improved method was shown to result
in the HPMA-protected guanosine monophosphate through proton and 31phosphorus NMR
spectroscopy along with electrospray ionisation mass spectrometry.
The compatibility of the synthesised HPMA-guanosine monophosphate with RAFT
polymerisation was then demonstrated through both in-situ and ex-situ techniques. Samples
measured in-situ utilised NMR spectroscopy, with ex-situ measurements using size exclusion
chromatography. The poly(HPMA-guanosine monophosphate) formed colloidal suspensions
during isolation which lead to further analysis in the following chapter.
Chapter 5 investigated the formation of particles from the poly(HPMA-guanosine
monophosphate). It was shown that the polymer was able to replicate the formation of G-
quartets normally formed in guanine-rich DNA systems. Through the use of fluorescent dye
binding, circular dichroism and fluorescence microscopy, the general structure of these
particles was determined to be similar to vesicles or micelles with surfaces covered in active
xxviii
guanine moieties. The aggregation of the particles could be adjusted by the addition of
potassium chloride to stabilise the formation of G-quartets between particles.
Finally, Chapter 6 demonstrated the successful synthesis of poly(HPMA-thymine
monophosphate) by utilising the synthetic method developed in Chapter 4, thereby
demonstrating the flexibility of the synthesis for creating a library of nucleotide-alkene
bioconjugate compatible with RAFT polymerisation.
Following this successful synthesis of poly(HPMA-thymine monophosphate), its interactions
with single stranded DNA were investigated with the aid of computer modelling and the use
of nucleic acid binding dyes. This led to the determination that the poly(HPMA-thymine
monophosphate) does bind to a complementary single stranded DNA sequence, but that the
structure formed was conformationally distinct to classical double stranded DNA.

xxix
Declaration
I certify that this thesis does not incorporate without acknowledgment any material previously
submitted for a degree or diploma in any university; and that to the best of my knowledge and
belief it does not contain any material previously published or written by another person except
where due reference is made in the text.
Michael James Wilson
xxx
Acknowledgements
To begin I thank my supervisors Professor Amanda Ellis and Professor Joe Shapter for their
support and encouragement throughout the project, and Dr Elizabeth Williams of CSIRO for
their collaboration and funding support especially in the early stages of the project. Further
funding support was provided by ARC Future Fellowship FT130100211.
Further thanks are well deserved for Dr Renzo Fenati for his support and lending expertise to
the DNA and biological components of the thesis. Sharing a lab and office with someone as
proficient and skilled as Dr Fenati significantly helped me to improve my own work.
The most supportive group of friends anyone could ask for. Wingar, Fay St Clair-Burke, and
Catherine Alekseenko for being my rocks, without them I would have given up a long time
ago. Nobody could ask for better people in their life than those I’ve been fortunate enough to
find.
Finally, I wish to thank the people who have contributed the most to this effort over the longest
time, my family; parents Jim and Colleen, brother Ryan and sister Jamie. From an early age
they fostered my inquisitive nature and always pushed me to question the world around me.
Further their sacrifices to support my various academic endeavours throughout the years have
pushed me to all of my greatest achievements and helped me recover when I have fallen. I can
never fully express how lucky and fortunate I am to have such supportive parents.
1
1 Chapter 1: Introduction and Literature Review
1.1 Synopsis
This chapter will focus on the two classes of polymers used in the project: nucleic acid biopolymers and synthetic vinyl-based polymers. It will discuss the composition and structures of nucleic acids as well as used methods of analysis; this includes the selective bonding of complementary nucleotides and the resulting secondary structures and some of the relevant biological processes they undergo. The discussion of vinyl-based polymers will focus on the formation using reversible addition-fragmentation chain transfer (RAFT) polymerisations as this was the selected method of polymerisation used in this project. A brief overview of other polymerisation techniques is given as a means to justify the selection of this polymerisation method.
2
1.2 Nucleotides
Nucleotides are the individual repeating units that form larger molecules called nucleic acids.
These acids are found in many biological systems where they direct the synthesis of proteins1,2
and regulate cell processes3 by the means of using enzymes which translate the sequences of
nucleotide units into amino acids and, in turn, proteins.4
Each nucleotide comprises 3 subunits: nucleobase, ribose, and phosphate; as shown in Figure
1.1. The nucleobase is the active unit and is used to give the nucleotide its name, while the
sugar (ribose) and the phosphate form the ‘backbone’ of the molecule when multiple
nucleotides are joined together. When several nucleotides connect, they form nucleic acid
polymers which are covered in Section 1.2.6. Understanding of the structure and function of
these molecules forms the foundation of the work performed for the purpose of and covered in
this thesis. The incorporation of nucleotides into synthetic polymers is only useful if the binding
function of the nucleobase is maintained, and the full nucleotides were used to provide for the
best chance at enzymatic compatibility in the future work.
3
N
NN
N
NH2
O
XO
HH
HH
O
P O-
O
n
DNA X= HRNA X= OH
5'
3'
Figure 1.1 Structure and subunits of nucleic acids, called nucleotides, indicating the
numbering scheme for constituent carbons. Also shown are the nucleobase (green), the sugar
(blue), and the phosphate (red) moieties. The directionality of the nucleic acid is indicated in
purple.
1.2.1 Nucleobases
The active unit of the nucleotide in regard to its biological application is the nucleobase. There
are 5 natural nucleobases: adenine (A) and guanine (G) make up the pyridines; cytosine (C),
thymine (T) and uracil (U) make up the pyrimidines, as shown in Figure 1.2. The chemical
distinction between T and U is due to the presence of the methyl group on the 5th carbon atom,
and these two nucleobases are typically found in DNA and RNA, respectively. The sequential
order of these nucleobases within the nucleic acid biopolymer is what provides for the coding
functionality of nucleic acids.5-6
4
N
NN
N
NH2
NH
N
O
O
NH
NN
N
O
NH2
N
N
NH2
O
A
T
G
C
NH
N
O
O
U
24
5 6
82
4
56
8
26
54
26
5 4
26
54
Figure 1.2 The five natural nucleobases guanine (G), adenine (A), cytosine (C), thymine (T)
and uracil (U) showing their carbon numbering.
1.2.2 Sugar
The sugar (ribose) links the nucleobase to the sugar phosphate backbone formed in nucleic acid
polymers. The numbering for the ribose ring includes the prime (′) notation to distinguish it
from the numbering of the carbons in the nucleobase, as shown in Figure 1.3. This numbering
is important as it provides an orientation to the formed biopolymers and clarifies any alterations
to the sugar moiety. Most commonly, the presence of a hydroxyl moiety on the 2′ carbon is
used to distinguish between the deoxyribose nucleic acid (DNA) and ribose nucleic acid
(RNA).7
5
X= H for DNAX= OH for RNA
OHO
HO
Nucleobase
X
3'2'
1'4'
5'
Figure 1.3 The ribose unit showing the carbon numbering. Note the functionality attached to
the 2′ carbon determines if the nucleotide is for deoxyribose nucleic acid (DNA) or ribose
nucleic acid (RNA).
1.2.3 Phosphate
The phosphate acts as a link between the ribose and helps form the sugar phosphate backbone.
It is the unit responsible for the acidic properties of nucleic acids as a result of the deprotonation
of the hydoxyl moiety that is resonantly stabilised by the sp3-hybridised phosphate and
oxygens.8 In a singular, free nucleotide the phosphate can be attached at either the 3′ or 5′
carbon. Within a biological system it is normally attached to the 5′ position and contains a
chain of phosphates, either the pyrophosphate or triphosphate, until they are cleaved when the
nucleotide is added to the nucleic acid. For example, the adenosine triphosphate, see Figure
1.4, is used to transfer energy as part of the citric acid cycle.9 During nucleic acid synthesis,
the nucleoside triphosphate is split which generates the nucleotide and a pyrophosphate
molecule; the energy released during this process is used to power the enzyme.10
6
N
NN
N
NH2
O
OHOH
HH
HH
OPO
O
O
POPHO
O O
OO
Figure 1.4 Adenosine 5′ triphosphate.
1.2.4 Specific Binding Between Nucleobases
Nucleotides undergo specific binding as a result of H-bonding between nucleobases. Broadly
speaking, this interation between the nucleotides is classified as either canonical, more
commonly known as Watson-Crick base pairing, or non-canonical.11 Watson-Crick binding is
considered canonical because it is the predominant interaction within nucleic acids in natural
systems. It occurs through the Watson-Crick face of the nucleotide, Figure 1.5. Any other
hydrogen bonding between nucleotides is non-canonical binding.
Figure 1.5 Binding faces of nucleobases using guanine as an example.
7
For the purpose of this project, the main binding of interest is Watson-Crick base pairing and
the formation of the non-canonical G-quartet, covered in Sections 1.2.4.1 and 1.2.5.1
respectively. Select other non-canonical bindings are covered briefly in the following chapters
as part of experimental design considerations.
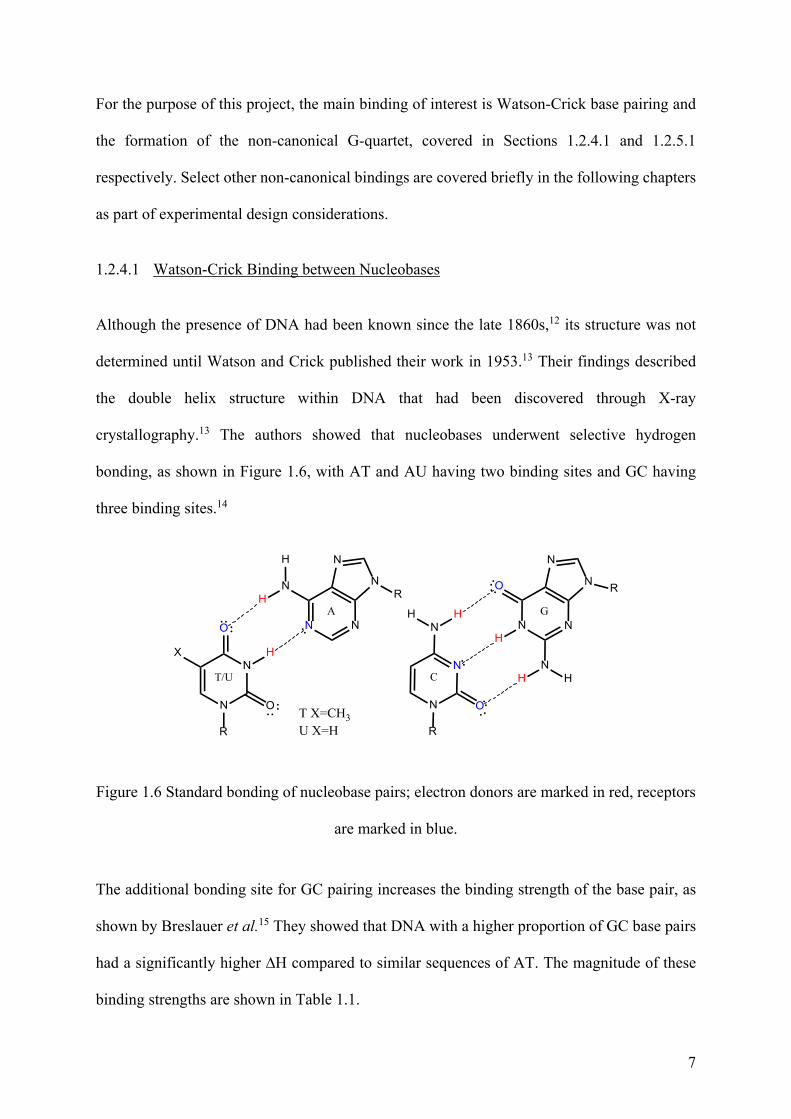
1.2.4.1 Watson-Crick Binding between Nucleobases
Although the presence of DNA had been known since the late 1860s,12 its structure was not
determined until Watson and Crick published their work in 1953.13 Their findings described
the double helix structure within DNA that had been discovered through X-ray
crystallography.13 The authors showed that nucleobases underwent selective hydrogen
bonding, as shown in Figure 1.6, with AT and AU having two binding sites and GC having
three binding sites.14
N N
N
N
N
N N
N
N
O
NN
N
N
O
N
N
O
O
X
T/U
A
C
G
T X=CH3U X=HR
R R
R
HH
HH
H H
H
H
Figure 1.6 Standard bonding of nucleobase pairs; electron donors are marked in red, receptors
are marked in blue.
The additional bonding site for GC pairing increases the binding strength of the base pair, as
shown by Breslauer et al.15 They showed that DNA with a higher proportion of GC base pairs
had a significantly higher ∆H compared to similar sequences of AT. The magnitude of these
binding strengths are shown in Table 1.1.
8
Table 1.1: Binding energy and strength of base pairs.
Base Pair Calculated ΔGassoc(aq) contributions at 300
K (kcal/mol) 16
Total force required to
separate bound pair (pN)17
H-Bonding Base Stacking
A-T 0.18 -1.86 14.0 ± 0.3
G-C -0.91 -2.22 20.0 ± 0.2
1.2.5 Non-canonical Binding Between Nucleobases.
The hydrogen bonding between the bases, while considered selective to AT and GC, has some
variance referred to as non-canonical binding. These binding structures can occur through the
same Watson-Crick face as canonical binding, but may be differently orientated or form
between other combinations of bases that are not AT and GC.
Aside from Watson-Crick base pairs, there are other combinations of nucleobases that can form
similar electron pair donor-acceptor relationships. In total there are a further 26 stable
combinations that may possibly form between the four natural nucleobases found in
deoxyribose nucleotides, as reported by Sivakova et al.18 Their works demonstrated that
exposure of the amine and ketone groups from non-canonical bonding can also support the
formation of tertiary structures.
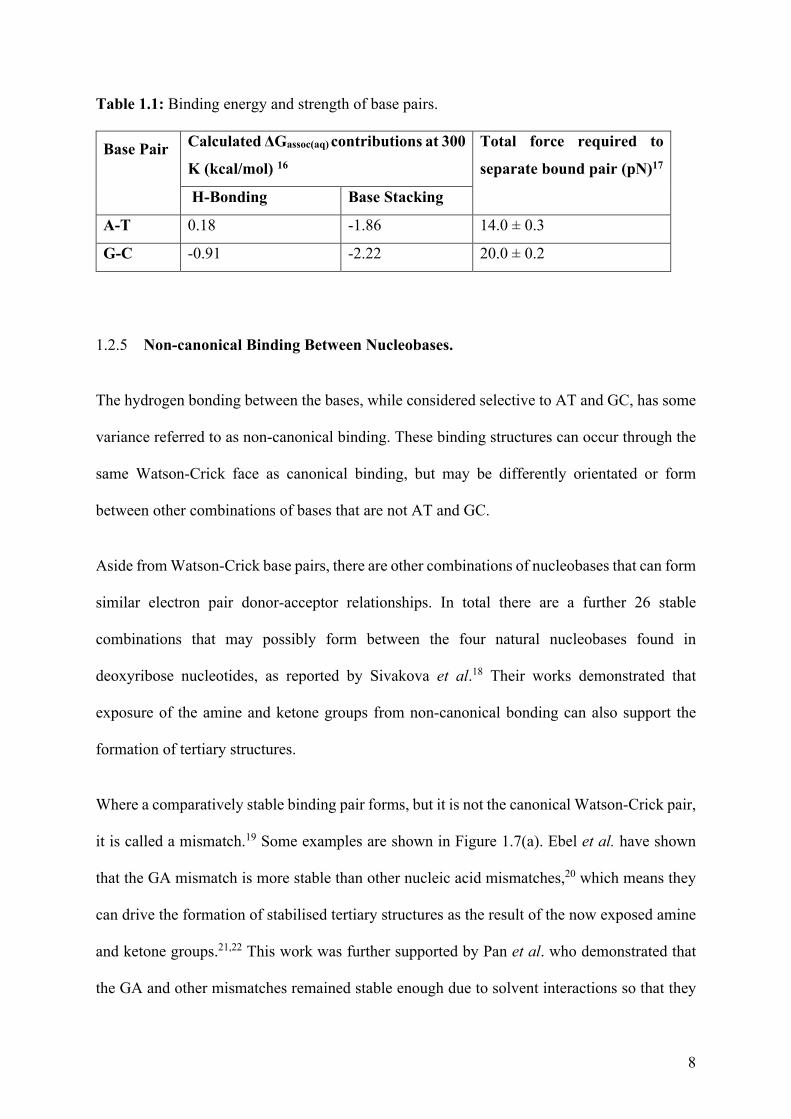
Where a comparatively stable binding pair forms, but it is not the canonical Watson-Crick pair,
it is called a mismatch.19 Some examples are shown in Figure 1.7(a). Ebel et al. have shown
that the GA mismatch is more stable than other nucleic acid mismatches,20 which means they
can drive the formation of stabilised tertiary structures as the result of the now exposed amine
and ketone groups.21,22 This work was further supported by Pan et al. who demonstrated that
the GA and other mismatches remained stable enough due to solvent interactions so that they
9
could be analysed using electrospray without separating.23 Further, they demonstrated that
certain mismatches, GG, AC, TC and CC specifically, are destabilised in solution.23
Reverse Watson-Crick binding is the binding of a canonical nucleobase pair through the
Watson-Crick face in a non-canonical orientation.24 When formed in some RNAs, they are
referred to as a Levitt base pairs; an example of this is shown in Figure 1.7(a). Though not
preferred over canonical binding, Sharma et al.25 showed through simulation that the formation
of this type of pair can allow for distant regions of a nucleic acid to interact with one another.
This was further supported by Shawla et al.26 who concluded that these regions participate in
binding with non-nucleic acids such as metabolites.
N
NN
N
NN
N O
O
R
R
H H
H N N
O
O
RH
T
T
A
TAT base-triplet
N
NN
N
O
N
R
H
H
H
N
N N
O
R
H
H
N N
N
O
R
H
H
H
C+
G
C
CGC+ base-triplet
N
NN
N
N
R
H HN
N O
O
R
H
T
A
Hoogsteen face base-pair
N
N
N
N O
N
N
N
O
O RR
H
H
H
H
N
N
N
N O
N
R
H
H
H
G
G
N
N
N
N
N
R
H
H
A
T
GT Mismatched
GA Mismatched
N
N
O
O
R
HN
NN
N
N
R
H H
A
T
AT Reverse Watson-Crick
(a) (b)
Figure 1.7 Non-canonical binding of nucleobases (a) through the Watson-Crick face, and (b)
through other faces. Image adapted from Sivakova et al.18

10
The formation of non-canonical structures in DNA does not inherently require non-canonical
binding or synthetic DNA sequences. For example, G-quadruplex and i-motif are present in
natural DNA systems and can form together from DNA in a high potassium concentration
environment.27 The formation of DNA triplexes, shown in Figure 1.7 (b), have also been shown
to act as a regulator for gene expresion.28
For this project it is important to consider these non-canonical binding structures as they affect
experimental decisions and what combinations of polymer and DNA should be used for binding
studies and polymerisation. This gives insight into the interactions between polymers and any
resulting structures formed; for example, combining non-complementary base pairs such as G
and T may result in the formation of secondary structures, which might not be desirable for the
purpose of the experiment.
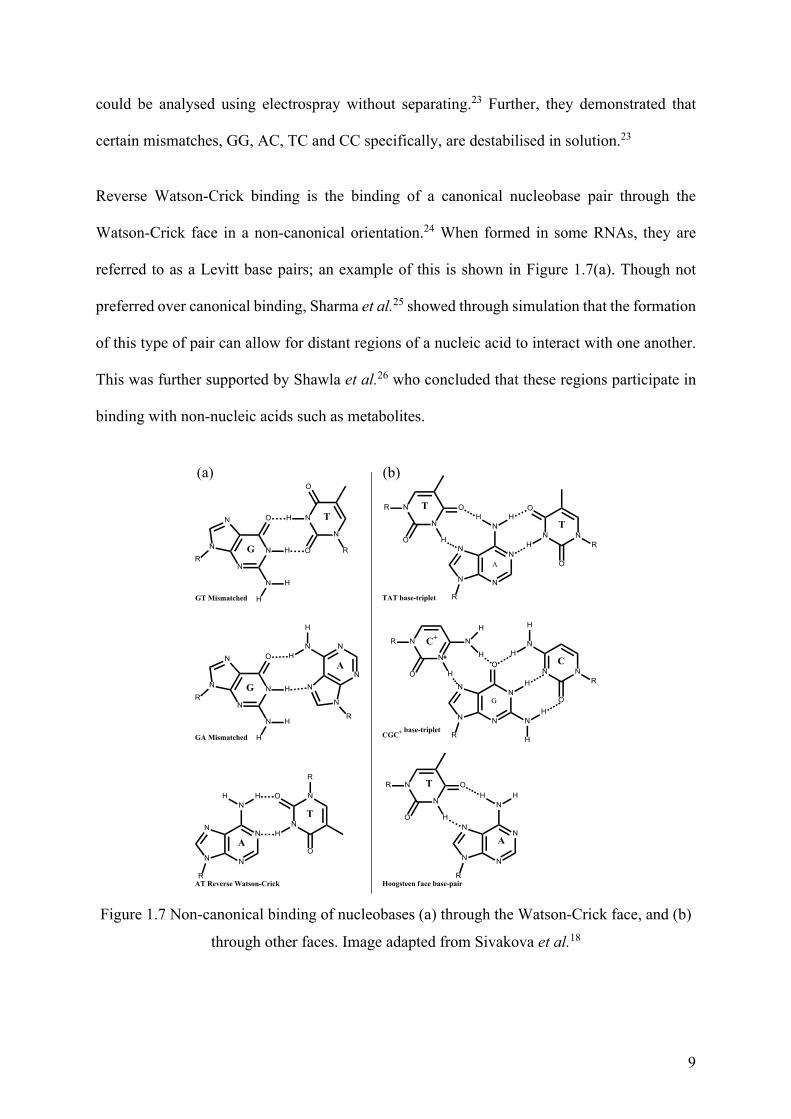
1.2.5.1 G-quartets
G-quartets are tetramers of guanine, as shown in Figure 1.8. They form as a result of binding
of the Hoogsteen face to the Watson-Crick face and are normally stabilised around a cation.29
Ivar Bang in 1910 was able to show through observations of how guanylic acid solutions
formed gels that G-quartets may form from single nucleotides without the need for additional
quartets to be present.30 This work went relativity unknown until publication by Davies et al.
in 1962 where they demonstrated using x-ray crystallography that the guanylic acid was made
up of fibres formed from the stacking of these G-quartets.31
11
Figure 1.8 The G-quartet as it forms around a cation.32
Later work by Becker et al.33 demonstrated for the first time that the presence of metallic
cations stabilised the formation of the G-quartet. The degree to which they were stabilised by
the cation was dependent on its diameter and charge. It has also been shown that there was a
preference for monovalent cations and in most work the alkali metals have been used.
Williamson reported on the binding preferences of guanylic acid for these Group I cations as
K+ > Na+ > Cs+ > Li+.34 When multiple quartets are coordinated together they form the more
stable G-quadruplex, explored further in Section 1.3.3.
1.2.6 Nucleic Acids
Nucleic acids are the biopolymers formed by chains of nucleotides. They derive their name
from their acidic properties and their presence in the nucleus of the cell. The two naturally
occurring nucleic acid biopolymers, deoxyribose nucleic acid (DNA) and ribose nucleic acid
(RNA) are the most commonly used.35 These linear polymers form from the connection of the
phosphate to the ribose building a linear polymer, as shown earlier in Figure 1.1, with the
nucleobases coming off as pendant groups.
12
It is the sequence of the nucleobase groups that gives the nucleic acid its coding functionality.
For consistency, the sequences of nucleobases are listed in terms of direction along the nucleic
acid chain. This directionality is provided in relation to the ribose subunit of the nucleotide in
terms of 3′ and 5′ based on the carbons as shown in Figure 1.3. This is important since synthetic
DNA is typically synthesised in the 3′ to 5′ direction, while enzymatically it is generated in the
5′ to 3′ direction.36 This nomenclature is consistent for eukaryotic cells, such as those in
mammals.37 In prokaryotic cells the DNA is a continuous loop and as a result does not have a
terminus.2 In these cases, the 3′ and 5′ are a reference to directionality within each ssDNA.
These nucleic acids are multiply charged anions due to the negatively charged phosphate and
the positive charge on the nucleobase amines, however their actual charge is pH dependent.38
Under neutral and basic conditions the DNA molecule takes on a negative charge due to the
higher pH of the phosphate relative to the nucleobase. It then only takes on a positive charge
at low pH, as reported by Guo et al.39 These charges can be used for the isolation of DNA
through pH based precipitation, solvent extraction or electrophoresis.40
1.3 Secondary Structures of DNA
DNA can form a number of secondary structures; most recognised is the DNA double helix
reported by Watson and Crick,13 however, there are many other variations and alternatives.
This thesis focuses on the formation and stability of the DNA double helix and the G-
quadruplex as covered in the following sections.
1.3.1 The DNA Double Helix
Natural DNA is stored as a duplex or dimer structure called a double helix. These consist of
two strands of ssDNA running in opposite directions and designated as double stranded DNA,
dsDNA. Each of the two ssDNAs that form the duplex are read in opposite directions, leading
13
to the 3′ and 5′ notation based on the ribose component of the backbone. Where ssDNA is
amorphous dsDNA forms a defined helix shape with a major and minor groove, as shown in
Figure 1.9. This behaviour is not as common in RNA which typically exists only in its single
stranded form, although double stranded RNA has been found in some viruses.41
1.3.1.1 π-π stacking of nucleobases within dsDNA
The presence of multiple nucleotides in a nucleic acid contributes to additional stability of the
overall duplex. This is a result of the nucleobases containing conjugated ring structures with
overlapping π-orbitals between the adjacent nucleobases.42 This means that the presence of
adjacent nucleotides has a strong stabilising effect on the nucleic acid as a whole and in turn is
a major contributor to the overall stability of the DNA double helix.43 These π-orbitals stack
between nucleobases allowing the formation of other nucleobase secondary structures such as
i-motifs and G-quartets that are covered in Section 1.1.3.5. The strength of this effect is
considered to be dependent on the adjacent nucleobases within the strand and the corresponding
amount of overlap; this is called ‘the nearest neighbour principle’.44,45
The effect of the π-π stacking is primarily observed in the macrostructure of the dsDNA. The
formation of the double helix is stabilised and coordinated by the stacking with the hydrogen
bonding between the base pairs binding it together, i.e., the bases hold the dsDNA together but
the π-π orbitals orientate them to each other along the strand, limiting their inter-chain effect.46
This stacking has been shown to be the determining factor for the thermodynamic stability of
the dsDNA compared to base pairing. Hydrogen bonding provides for less than half the
stability, while the A-T interaction performs as a destabilising force when considered in
isolation.42
14
1.3.2 Forms of the DNA Double Helix
When two strands of DNA containing complementary sequences of nucleotides bind together
they form a DNA duplex, dsDNA. This binding is asymmetric around the long axis leading to
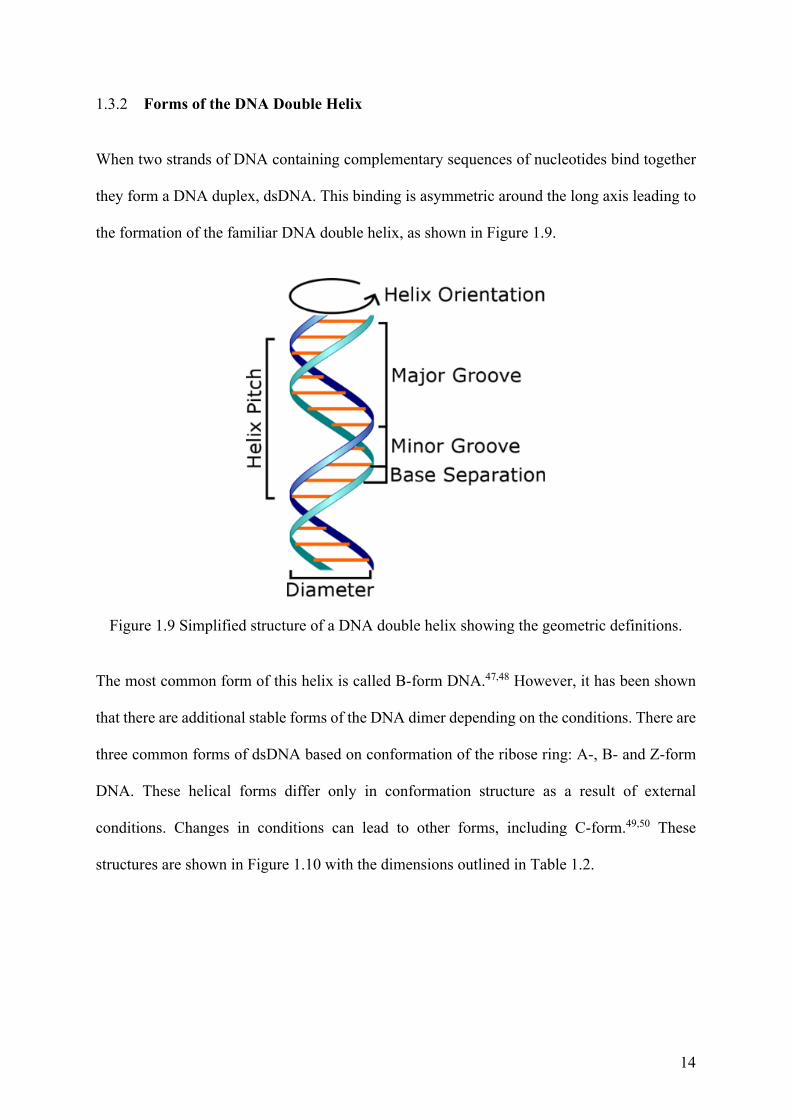
the formation of the familiar DNA double helix, as shown in Figure 1.9.
Figure 1.9 Simplified structure of a DNA double helix showing the geometric definitions.
The most common form of this helix is called B-form DNA.47,48 However, it has been shown
that there are additional stable forms of the DNA dimer depending on the conditions. There are
three common forms of dsDNA based on conformation of the ribose ring: A-, B- and Z-form
DNA. These helical forms differ only in conformation structure as a result of external
conditions. Changes in conditions can lead to other forms, including C-form.49,50 These
structures are shown in Figure 1.10 with the dimensions outlined in Table 1.2.
15
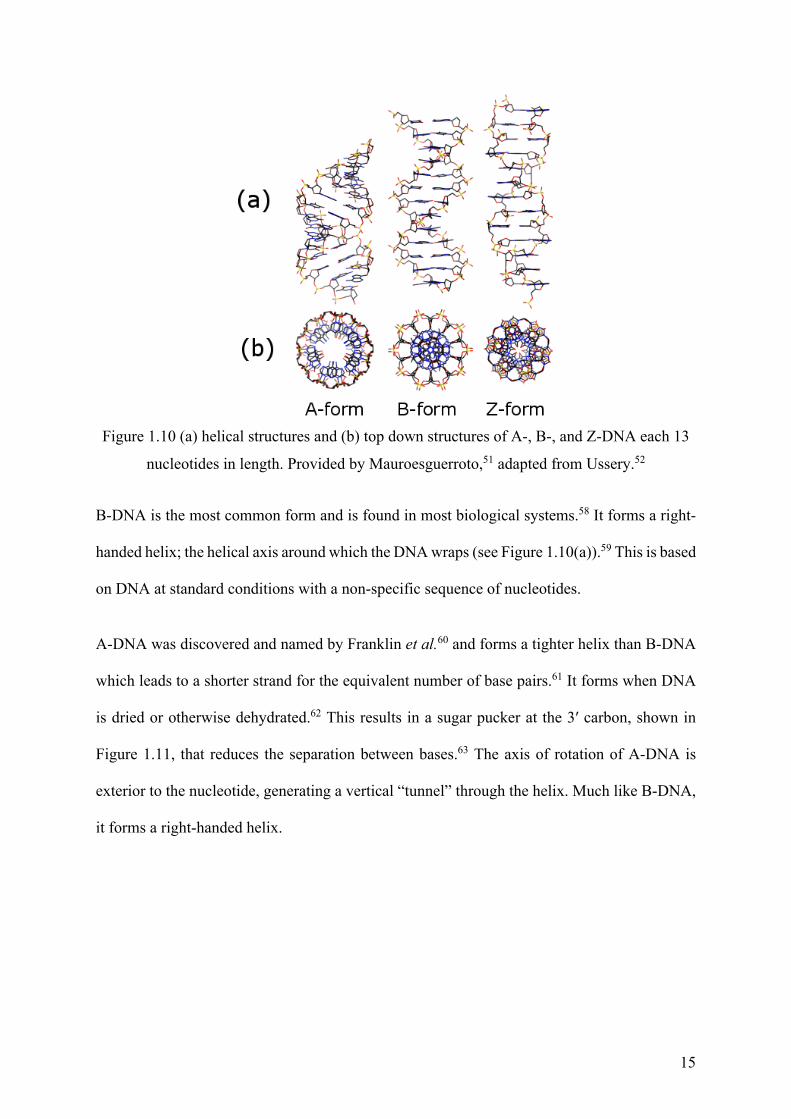
Figure 1.10 (a) helical structures and (b) top down structures of A-, B-, and Z-DNA each 13
nucleotides in length. Provided by Mauroesguerroto,51 adapted from Ussery.52
B-DNA is the most common form and is found in most biological systems.58 It forms a right-
handed helix; the helical axis around which the DNA wraps (see Figure 1.10(a)).59 This is based
on DNA at standard conditions with a non-specific sequence of nucleotides.
A-DNA was discovered and named by Franklin et al.60 and forms a tighter helix than B-DNA
which leads to a shorter strand for the equivalent number of base pairs.61 It forms when DNA
is dried or otherwise dehydrated.62 This results in a sugar pucker at the 3′ carbon, shown in
Figure 1.11, that reduces the separation between bases.63 The axis of rotation of A-DNA is
exterior to the nucleotide, generating a vertical “tunnel” through the helix. Much like B-DNA,
it forms a right-handed helix.
16
Table 1.2: Dimensions of selected DNA forms.
A-DNA52,53 B-DNA52,53 C-DNA54,55 Z-DNA52,56,57
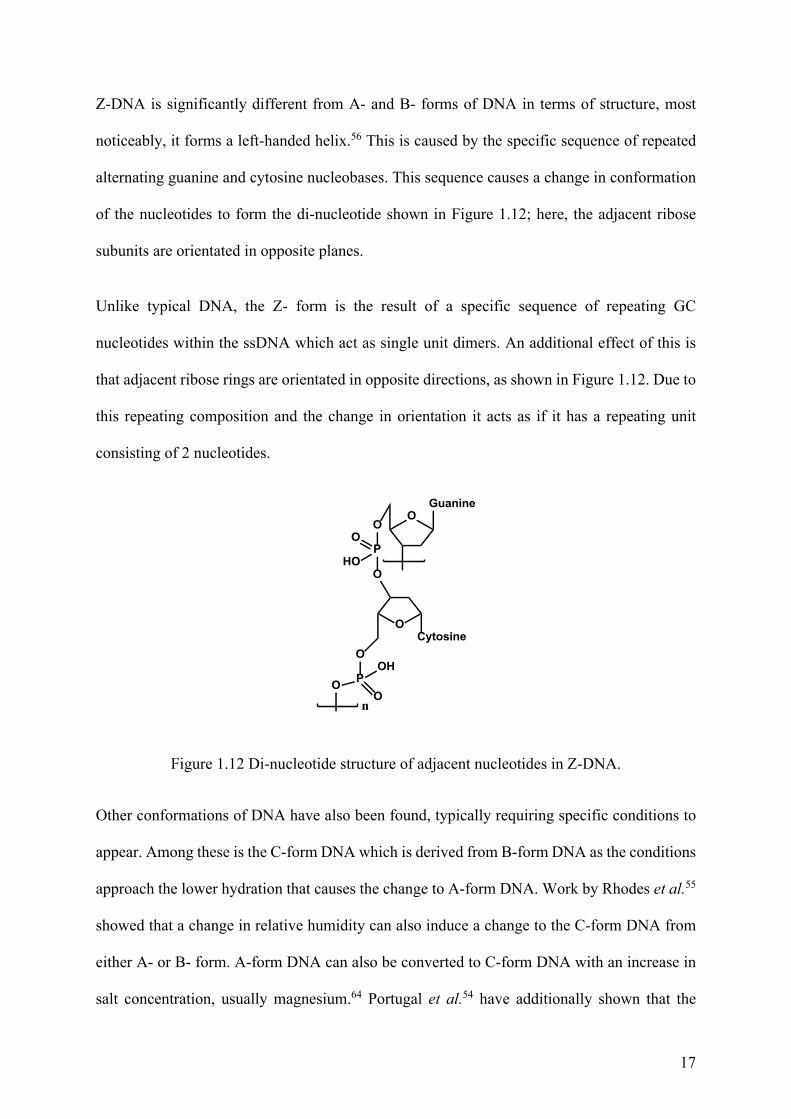
Helix
Orientation Right-handed Right-handed Right-handed Left-handed
Diameter 25.5 Å 20 Å 19 Å 18 A
Base separation
by length 2.3 Å 3.4 Å 3.32 Å 3.8 Å
Base-ribose
stereochemistry anti- anti- anti- syn-
Rotation per
base (degrees) 32.7 34.6 38.6 60 per dimer
Base pair per
turn 11 10.5 9.33 12
Helix Pitch 28.2 Å 34 Å 30.97 Å 45 Å
Major-minor
groove Yes Yes No No
ONucleobase
OP
OP
ONucleobase
OP
OP
B-Form DNAC2'-Endo
A-Form DNAC3'-Endo
Figure 1.11 The conformations of the deoxyribose change between the B-form and A-form
DNA.
17
Z-DNA is significantly different from A- and B- forms of DNA in terms of structure, most
noticeably, it forms a left-handed helix.56 This is caused by the specific sequence of repeated
alternating guanine and cytosine nucleobases. This sequence causes a change in conformation
of the nucleotides to form the di-nucleotide shown in Figure 1.12; here, the adjacent ribose
subunits are orientated in opposite planes.
Unlike typical DNA, the Z- form is the result of a specific sequence of repeating GC
nucleotides within the ssDNA which act as single unit dimers. An additional effect of this is
that adjacent ribose rings are orientated in opposite directions, as shown in Figure 1.12. Due to
this repeating composition and the change in orientation it acts as if it has a repeating unit
consisting of 2 nucleotides.
OO
P
OHO
O
OCytosine
Guanine
O
POO
OH
n
Figure 1.12 Di-nucleotide structure of adjacent nucleotides in Z-DNA.
Other conformations of DNA have also been found, typically requiring specific conditions to
appear. Among these is the C-form DNA which is derived from B-form DNA as the conditions
approach the lower hydration that causes the change to A-form DNA. Work by Rhodes et al.55
showed that a change in relative humidity can also induce a change to the C-form DNA from
either A- or B- form. A-form DNA can also be converted to C-form DNA with an increase in
salt concentration, usually magnesium.64 Portugal et al.54 have additionally shown that the
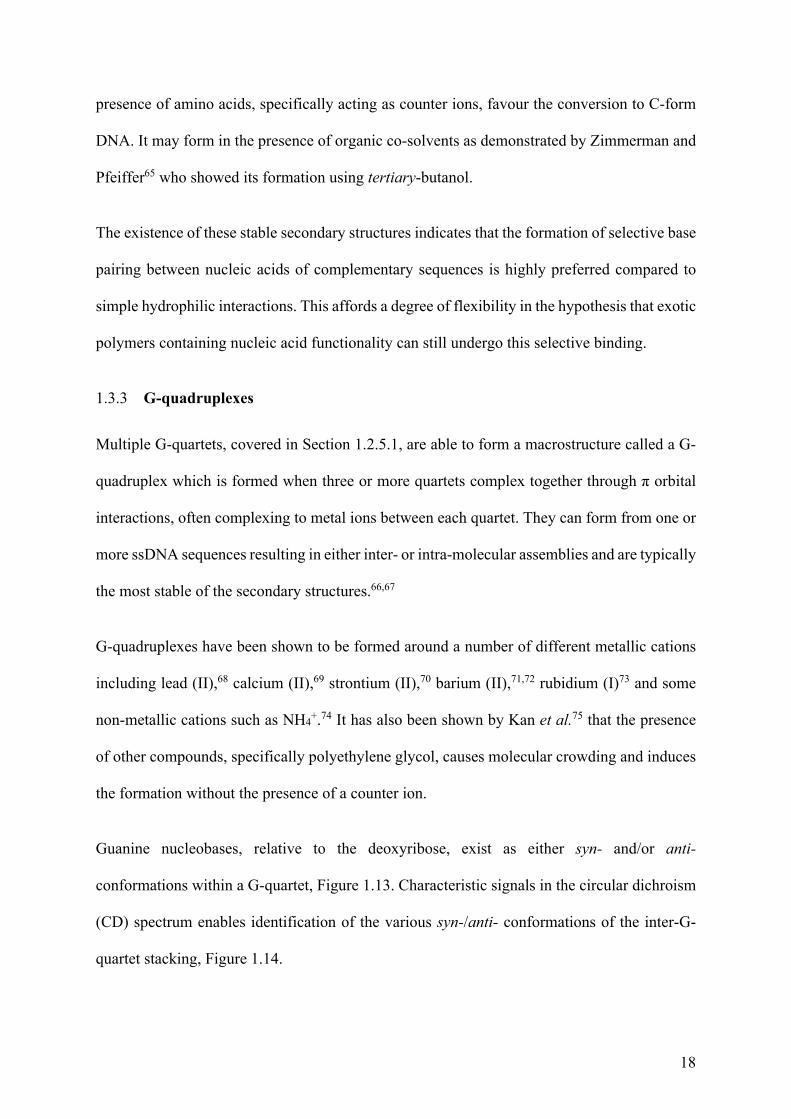
18
presence of amino acids, specifically acting as counter ions, favour the conversion to C-form
DNA. It may form in the presence of organic co-solvents as demonstrated by Zimmerman and
Pfeiffer65 who showed its formation using tertiary-butanol.
The existence of these stable secondary structures indicates that the formation of selective base
pairing between nucleic acids of complementary sequences is highly preferred compared to
simple hydrophilic interactions. This affords a degree of flexibility in the hypothesis that exotic
polymers containing nucleic acid functionality can still undergo this selective binding.
1.3.3 G-quadruplexes
Multiple G-quartets, covered in Section 1.2.5.1, are able to form a macrostructure called a G-
quadruplex which is formed when three or more quartets complex together through π orbital
interactions, often complexing to metal ions between each quartet. They can form from one or
more ssDNA sequences resulting in either inter- or intra-molecular assemblies and are typically
the most stable of the secondary structures.66,67
G-quadruplexes have been shown to be formed around a number of different metallic cations
including lead (II),68 calcium (II),69 strontium (II),70 barium (II),71,72 rubidium (I)73 and some
non-metallic cations such as NH4+.74 It has also been shown by Kan et al.75 that the presence
of other compounds, specifically polyethylene glycol, causes molecular crowding and induces
the formation without the presence of a counter ion.
Guanine nucleobases, relative to the deoxyribose, exist as either syn- and/or anti-
conformations within a G-quartet, Figure 1.13. Characteristic signals in the circular dichroism
(CD) spectrum enables identification of the various syn-/anti- conformations of the inter-G-
quartet stacking, Figure 1.14.
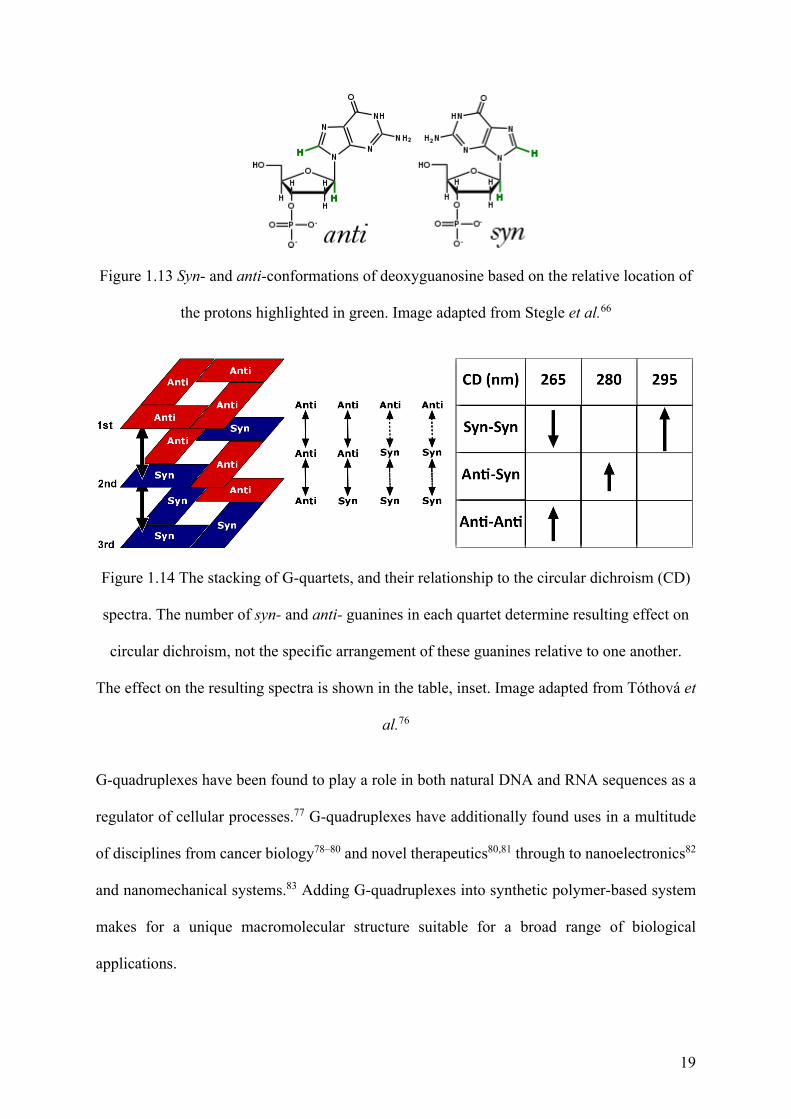
19
Figure 1.13 Syn- and anti-conformations of deoxyguanosine based on the relative location of
the protons highlighted in green. Image adapted from Stegle et al.66
Figure 1.14 The stacking of G-quartets, and their relationship to the circular dichroism (CD)
spectra. The number of syn- and anti- guanines in each quartet determine resulting effect on
circular dichroism, not the specific arrangement of these guanines relative to one another.
The effect on the resulting spectra is shown in the table, inset. Image adapted from Tóthová et
al.76
G-quadruplexes have been found to play a role in both natural DNA and RNA sequences as a
regulator of cellular processes.77 G-quadruplexes have additionally found uses in a multitude
of disciplines from cancer biology78–80 and novel therapeutics80,81 through to nanoelectronics82
and nanomechanical systems.83 Adding G-quadruplexes into synthetic polymer-based system
makes for a unique macromolecular structure suitable for a broad range of biological
applications.
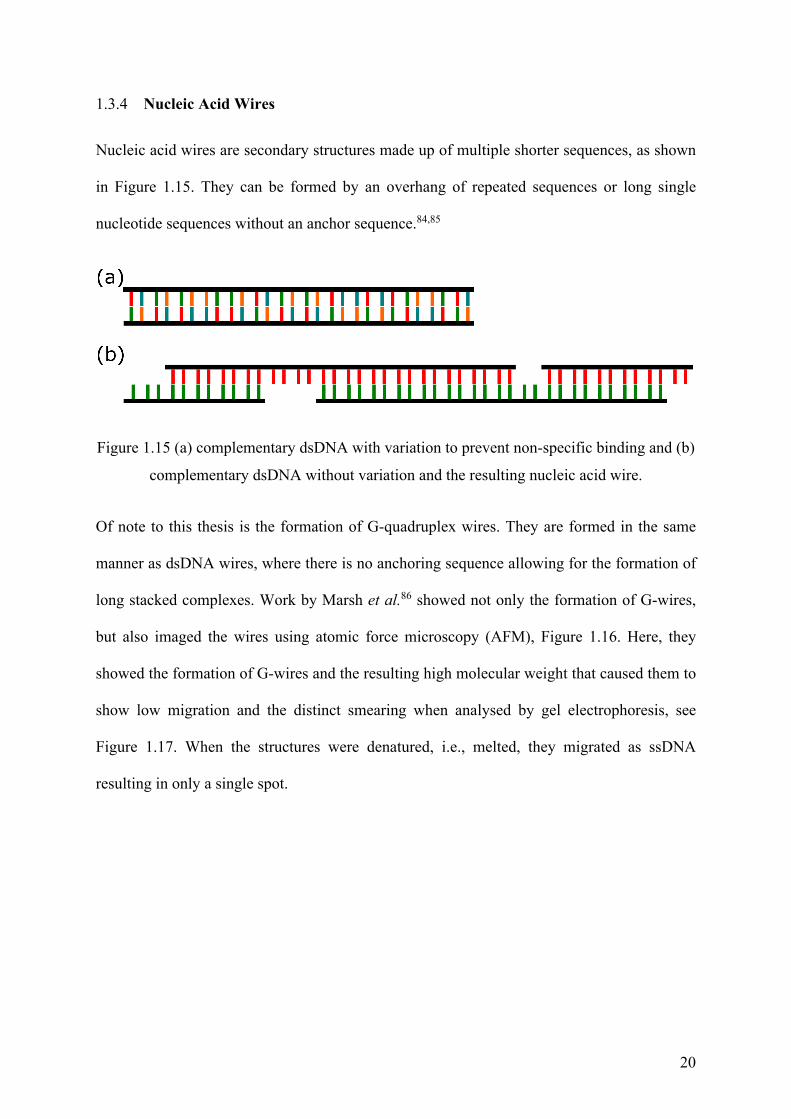
20
1.3.4 Nucleic Acid Wires
Nucleic acid wires are secondary structures made up of multiple shorter sequences, as shown
in Figure 1.15. They can be formed by an overhang of repeated sequences or long single
nucleotide sequences without an anchor sequence.84,85
Figure 1.15 (a) complementary dsDNA with variation to prevent non-specific binding and (b)
complementary dsDNA without variation and the resulting nucleic acid wire.
Of note to this thesis is the formation of G-quadruplex wires. They are formed in the same
manner as dsDNA wires, where there is no anchoring sequence allowing for the formation of
long stacked complexes. Work by Marsh et al.86 showed not only the formation of G-wires,
but also imaged the wires using atomic force microscopy (AFM), Figure 1.16. Here, they
showed the formation of G-wires and the resulting high molecular weight that caused them to
show low migration and the distinct smearing when analysed by gel electrophoresis, see
Figure 1.17. When the structures were denatured, i.e., melted, they migrated as ssDNA
resulting in only a single spot.
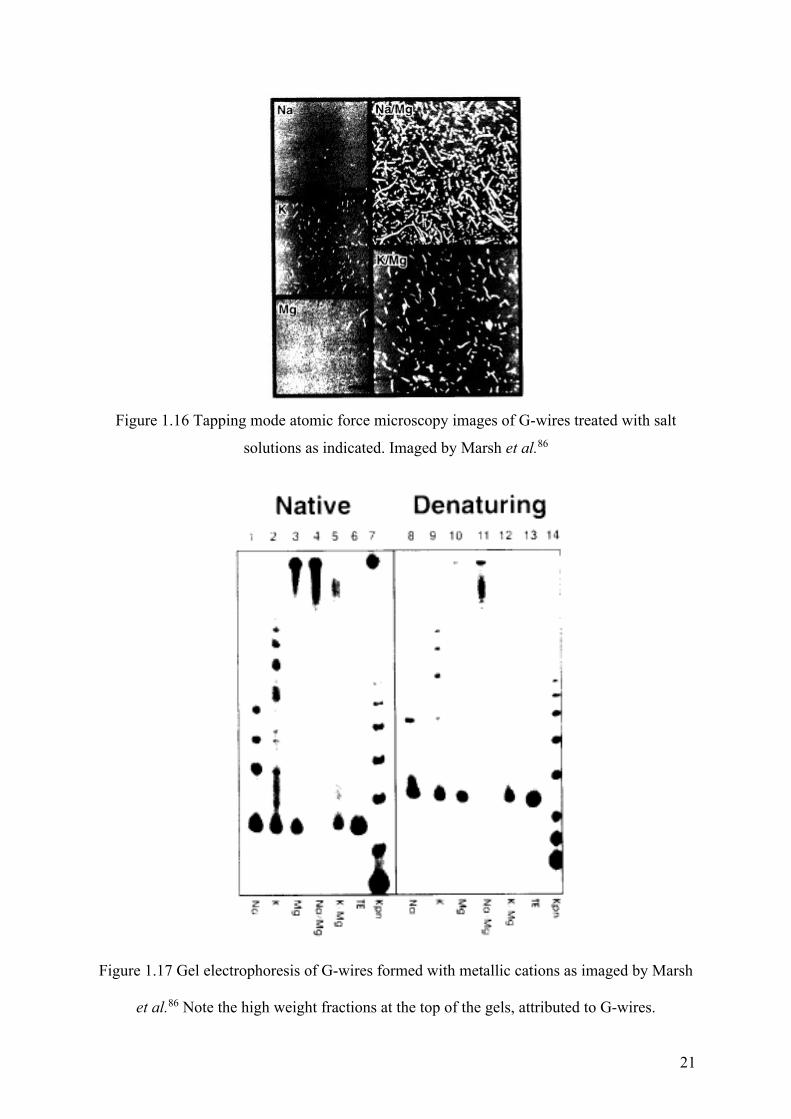
21
Figure 1.16 Tapping mode atomic force microscopy images of G-wires treated with salt
solutions as indicated. Imaged by Marsh et al.86
Figure 1.17 Gel electrophoresis of G-wires formed with metallic cations as imaged by Marsh
et al.86 Note the high weight fractions at the top of the gels, attributed to G-wires.
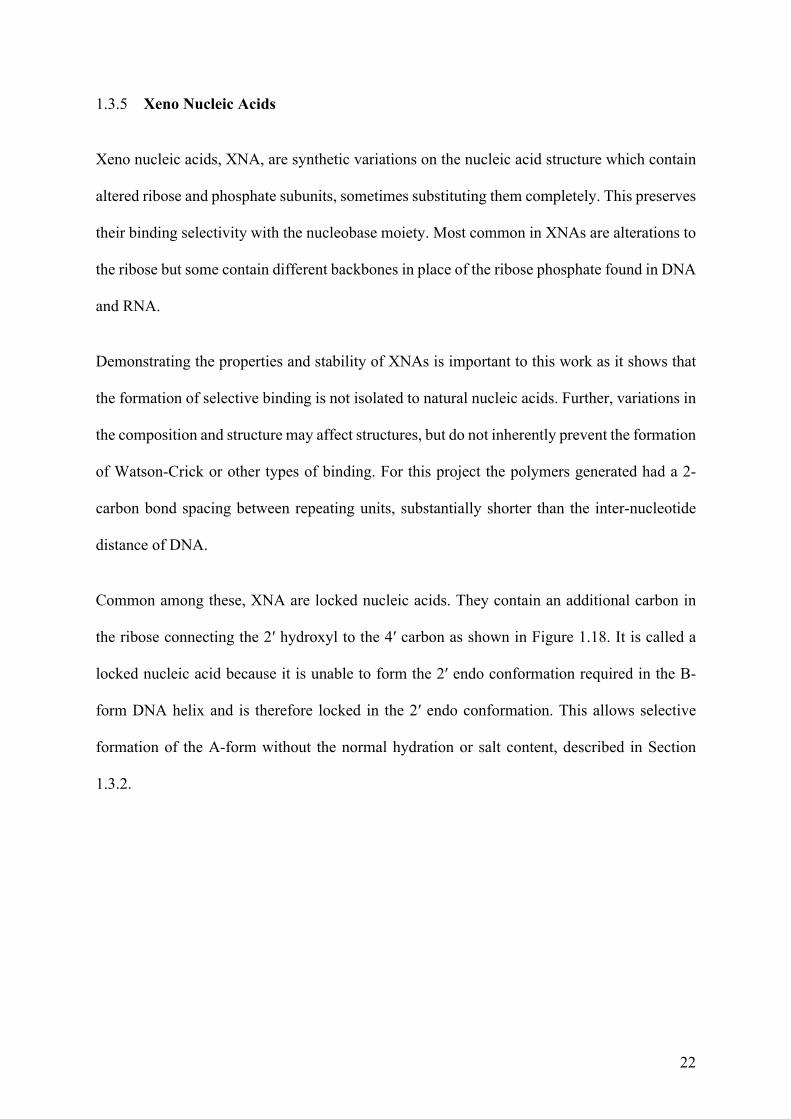
22
1.3.5 Xeno Nucleic Acids
Xeno nucleic acids, XNA, are synthetic variations on the nucleic acid structure which contain
altered ribose and phosphate subunits, sometimes substituting them completely. This preserves
their binding selectivity with the nucleobase moiety. Most common in XNAs are alterations to
the ribose but some contain different backbones in place of the ribose phosphate found in DNA
and RNA.
Demonstrating the properties and stability of XNAs is important to this work as it shows that
the formation of selective binding is not isolated to natural nucleic acids. Further, variations in
the composition and structure may affect structures, but do not inherently prevent the formation
of Watson-Crick or other types of binding. For this project the polymers generated had a 2-
carbon bond spacing between repeating units, substantially shorter than the inter-nucleotide
distance of DNA.
Common among these, XNA are locked nucleic acids. They contain an additional carbon in
the ribose connecting the 2′ hydroxyl to the 4′ carbon as shown in Figure 1.18. It is called a
locked nucleic acid because it is unable to form the 2′ endo conformation required in the B-
form DNA helix and is therefore locked in the 2′ endo conformation. This allows selective
formation of the A-form without the normal hydration or salt content, described in Section
1.3.2.
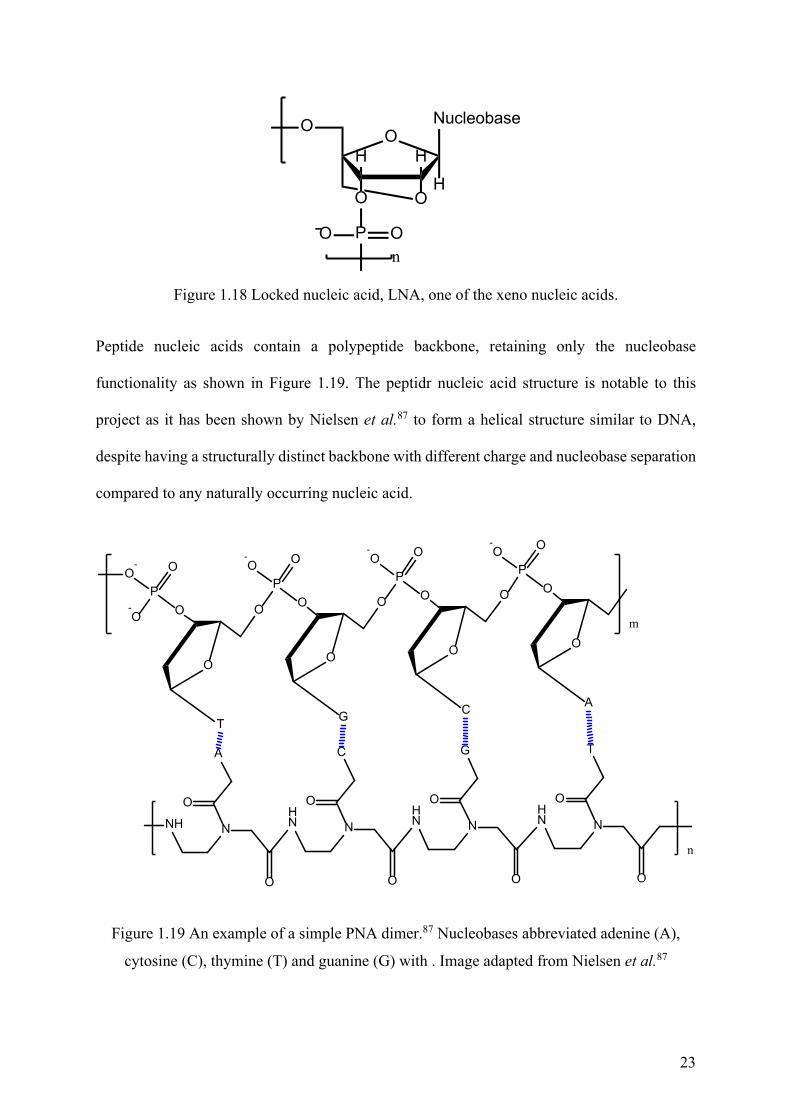
23
NucleobaseO
O
HHH
O
O
P OOn
Figure 1.18 Locked nucleic acid, LNA, one of the xeno nucleic acids.
Peptide nucleic acids contain a polypeptide backbone, retaining only the nucleobase
functionality as shown in Figure 1.19. The peptidr nucleic acid structure is notable to this
project as it has been shown by Nielsen et al.87 to form a helical structure similar to DNA,
despite having a structurally distinct backbone with different charge and nucleobase separation
compared to any naturally occurring nucleic acid.
T
O
OP
OO-
O-O
G
O
OP
O-O
O
C
O
OP
O-O
O
A
O
OP
O-O
m
NH N
A
O
O
HN N
C
O
O
HN N
G
O
O
HN N
T
O
O
n
Figure 1.19 An example of a simple PNA dimer.87 Nucleobases abbreviated adenine (A),
cytosine (C), thymine (T) and guanine (G) with . Image adapted from Nielsen et al.87
24
1.4 Synthesis of DNA
1.4.1 Enzymatic Synthesis of DNA
DNA sequences can be copied onto a template strand through the use of enzymes called
polymerases, both in-vitro and in-situ. Polymerases are a class of enzymes that transcribe DNA
from a template sequence onto a new sequence doubling the volume of DNA in the solution
where the subsequent templated DNA polymer is complementary to the initial template. These
enzymes vary across species and cell types but can be extracted for use in-vitro. The most
common example is Taq polymerase derived from the bacteria Thermus aquaticus.88 In-situ
DNA replication is carried out on dsDNA which interacts with enzymes and separates only in
target regions.89 In synthetic methods such as the polymerase chain reaction (PCR), covered in
the following section, the dsDNA is heated until melting, where the nucleobase dehybridises,
forming ssDNA.
The transcription process performed by these enzymes is unidirectional, typically occurring in
the 5′ to 3′ direction as shown in Figure 1.1.90 This results in the ssDNA containing phosphate
functionality at the 5′ terminus, and hydroxyl functionality at the 3′ terminus.
1.4.1.1 The Polymerase Chain Reaction
The most common method for in-vitro DNA synthesis is PCR. This is an amplification method
whereby a sequence of DNA is repeatedly transcribed into a new sequence. It is often called
an amplification process because it requires an initial template, and all DNA produced during
the process is either complementary or equivalent to that original sequence. It is typically used
for sequences in the range of 25 up to 2,000 bases.91 The enzymatic process is preferred for
many applications as the DNA is copied reliably and with virtually no error.92 Under
specialised conditions, reported by Cheng et al.,93 an excess of 50,000 bases (approximately
25
16,350 kDa) has been recorded. The exact range for PCR is determined by the enzymes used,
but the process is consistent with that shown in Figure 1.20.
To perform this synthesis, the dsDNA to be amplified is placed in a solution with free
nucleotides and primers; the latter are short chain complementary DNA which defines where
the transcription will begin. In a typical experiment, a dsDNA template is heated to
approximately 95 °C in order to melt and separate the dsDNA into ssDNA. It is then cooled to
68 °C in order to anneal the complementary primers to the ssDNA which then allows for the
binding of Taq polymerase. This enzyme is then activated by heating to 72 °C for the
transcription. Here, the enzyme moves along the template strand drawing nucleotides from
solution and extending the daughter strand.
Each cycle of this process effectively doubles the number of DNA strands in a sample. This
process maintains all the properties of the original DNA and copies created this way are
indistinguishable from it once the process is complete. The choice of primers determines the
region of the DNA to be replicated and can be used to target specific genetic sequences,94,95 or
to add functionality to the 5′ terminus of the ssDNA.96 The major drawback of PCR is its limited
scale, typically with output in the order of micrograms, as reported by Wang et al.97
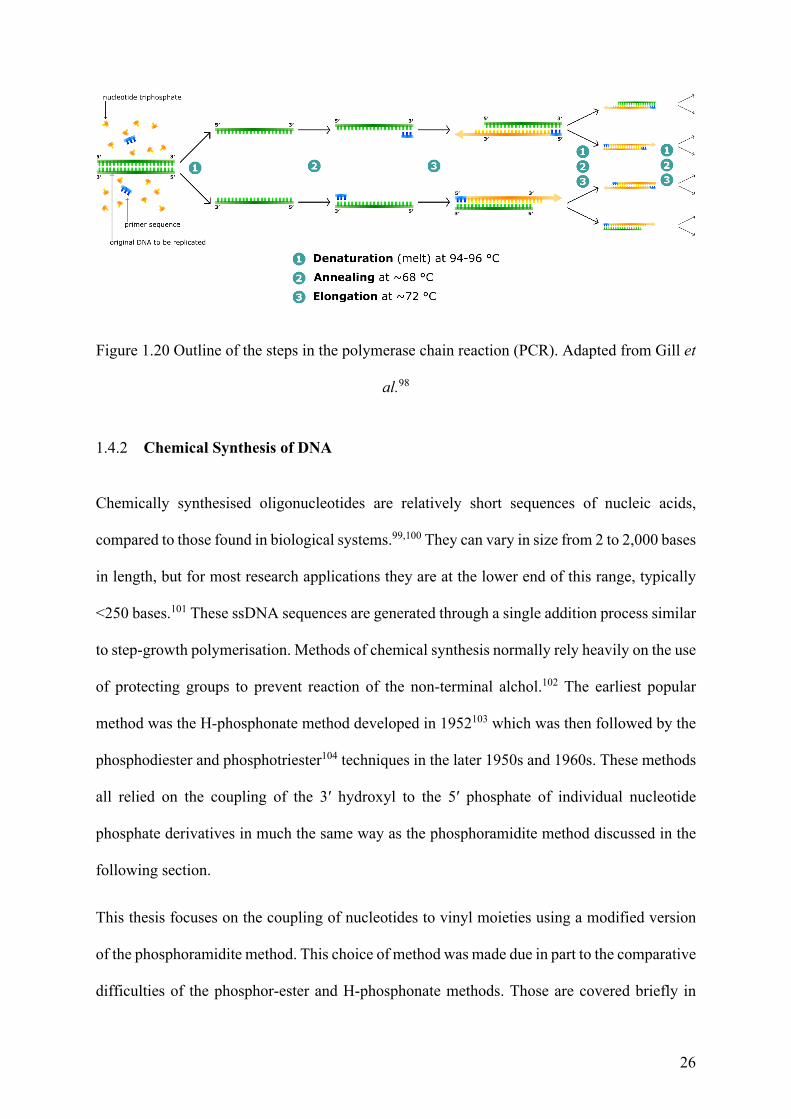
26
Figure 1.20 Outline of the steps in the polymerase chain reaction (PCR). Adapted from Gill et
al.98
1.4.2 Chemical Synthesis of DNA
Chemically synthesised oligonucleotides are relatively short sequences of nucleic acids,
compared to those found in biological systems.99,100 They can vary in size from 2 to 2,000 bases
in length, but for most research applications they are at the lower end of this range, typically
<250 bases.101 These ssDNA sequences are generated through a single addition process similar
to step-growth polymerisation. Methods of chemical synthesis normally rely heavily on the use
of protecting groups to prevent reaction of the non-terminal alchol.102 The earliest popular
method was the H-phosphonate method developed in 1952103 which was then followed by the
phosphodiester and phosphotriester104 techniques in the later 1950s and 1960s. These methods
all relied on the coupling of the 3′ hydroxyl to the 5′ phosphate of individual nucleotide
phosphate derivatives in much the same way as the phosphoramidite method discussed in the
following section.
This thesis focuses on the coupling of nucleotides to vinyl moieties using a modified version
of the phosphoramidite method. This choice of method was made due in part to the comparative
difficulties of the phosphor-ester and H-phosphonate methods. Those are covered briefly in
27
this work as they were considered a possible alternative should the phosphoramidite method
have proven unsuccessful, or for future work where their differing substrates may prove more
useful.
1.4.2.1 H-Phosphonate Method for the Chemical Synthesis of DNA
The H-phosphonate method uses a 3′ phosphonate nucleotide and couples it to the 5′ hydroxyl
of the growing chain using a condensing agent such as pivaloyl chloride.105 One of the major
benefits to this method is that the nucleobases do not require protection, as shown by Kung et
al.106 In general it is no longer used commercially due to its lower yield, but has found
application where additional functionality is needed, as the coupled phosphonate is in
equilibrium between the PO3H and PO2OH.102 Due to this lower yield and the reactive PO3H
intermediate it was ruled out for this project.
1.4.2.2 Phosphoester Approaches for the Chemical Synthesis of DNA
The phosphodiester and phosphotriester methods are condensation reactions for the chemical
synthesis of DNA.107 These were developed in the 1970-80s during the time between the H-
phosphonate and phosphoramidite methods, but have now fallen mostly out of use due to their
relatively low yields.108,109 More recently they have found some new application benefiting
from their comparatively simple substrates.110 The reaction for the phosphotriester method is
shown in Figure 1.21.
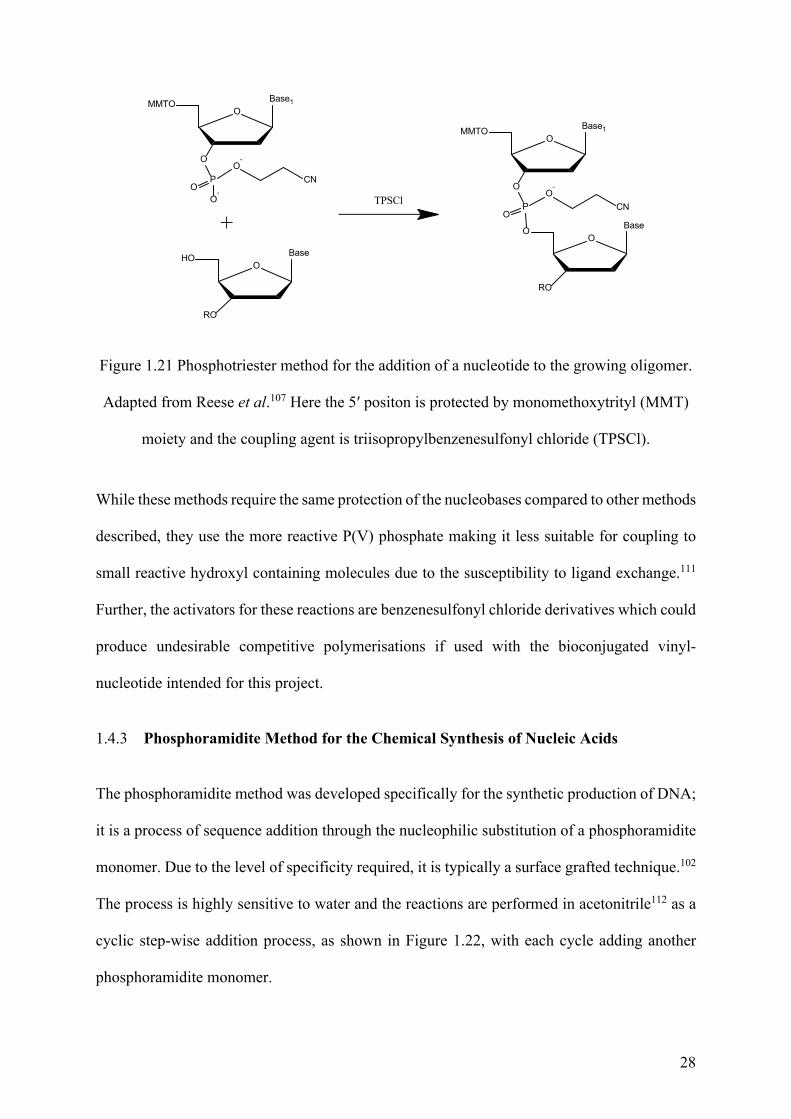
28
Base1O
O
PO
O-
MMTO
O-
CN
+
OHO
RO
Base
Base1O
O
PO
MMTO
O-
CN
OO
RO
Base
TPSCl
Figure 1.21 Phosphotriester method for the addition of a nucleotide to the growing oligomer.
Adapted from Reese et al.107 Here the 5′ positon is protected by monomethoxytrityl (MMT)
moiety and the coupling agent is triisopropylbenzenesulfonyl chloride (TPSCl).
While these methods require the same protection of the nucleobases compared to other methods
described, they use the more reactive P(V) phosphate making it less suitable for coupling to
small reactive hydroxyl containing molecules due to the susceptibility to ligand exchange.111
Further, the activators for these reactions are benzenesulfonyl chloride derivatives which could
produce undesirable competitive polymerisations if used with the bioconjugated vinyl-
nucleotide intended for this project.
1.4.3 Phosphoramidite Method for the Chemical Synthesis of Nucleic Acids
The phosphoramidite method was developed specifically for the synthetic production of DNA;
it is a process of sequence addition through the nucleophilic substitution of a phosphoramidite
monomer. Due to the level of specificity required, it is typically a surface grafted technique.102
The process is highly sensitive to water and the reactions are performed in acetonitrile112 as a
cyclic step-wise addition process, as shown in Figure 1.22, with each cycle adding another
phosphoramidite monomer.
29
The typical phosphoramidite method for DNA synthesis utilises a 3′ surface grafted nucleotide
as the first nucleotide. The process begins with the removal of the 5′ dimethoxytrityl protecting
group using a mild acid, typically chloroacetic acid.113 The next phosphoramidite to be added
in the sequence is then activated with 1H-tetrazole or a derivative114 and added to the growing
oligonucleotide. Tetrazole acts as a regenerated catalyst and substitutes with the
diisopropylamine, in turn substituting with the deprotected 5′ hydroxyl group of the growing
oligonucleotide. The surface is then washed to remove residual activated phosphoramidite and
the process is repeated for each nucleotide addition. For simplicity the oxidation and final
deprotection is normally conducted at the end following the complete oligonucleotide
synthesis.

30
NNuucclleeoobbaassee
OO
HHOO
HHHHHHHH
PP
OODDMMTT
NN OOCCNN
NNuucclleeoobbaassee
OO
HHOO
HHHHHHHH
RR
OODDMMTT
SSuurrffaaccee
NNuucclleeoobbaasseeOO
HHOO
HHHHHHHH
RR
HHOO
SSuurrffaaccee
NNuucclleeoobbaassee
OO
HHOO
HHHHHHHH
RR
OO
SSuurrffaaccee
NNuucclleeoobbaassee
OO
HHOO
HHHHHHHH
PP
OODDMMTT
OO
NNCC
11.. DDeettrriittyyllaattiioonn
22.. CCoouupplliinngg
33.. NNeexxtt AAddddiittiioonn
44.. OOxxiiddaattiioonn
NNuucclleeoobbaassee
OO
HHOO
HHHHHHHH
RR
OO
SSuurrffaaccee
NNuucclleeoobbaassee
OO
HHOO
HHHHHHHH
PP
OODDMMTT
OOOO
nn
Figure 1.22 Outline of the phosphoramidite method for DNA synthesis. Adapted from DNA
Oligonucleotide Synthesis.115
1.4.3.1 Activators
Activators are the reagents in the coupling step, shown in Figure 1.22, that create the
intermediate phosphoramidite to undergo the SN2 reaction. The most common activator is 1H-
tetrazole. The mechanism of the coupling is debated with the activator being both an acid
catalyst, and also shown to act as a nucleophile to generate a P-tetrazolyl intermediate, as
outlined in Figure 1.23. Following coupling, however, the activator is regenerated so once an
excess is present the reaction is typically quantitative. A variety of possible activators may be
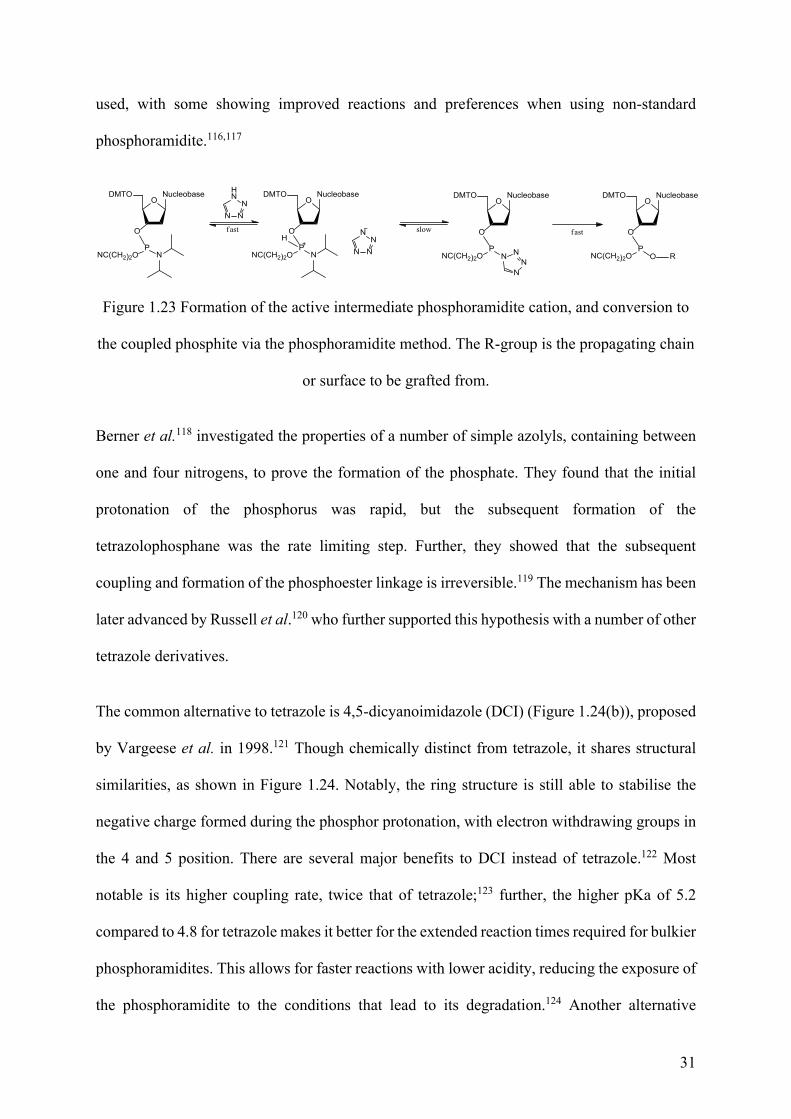
31
used, with some showing improved reactions and preferences when using non-standard
phosphoramidite.116,117
ODMTO Nucleobase
PNC(CH2)2O N
N NN
HN O
DMTO Nucleobase
PNC(CH2)2O N
H
N NN
N
ODMTO Nucleobase
PNC(CH2)2O
NN
NN
slowfast fast
ODMTO Nucleobase
PNC(CH2)2O RO
O O O O
Figure 1.23 Formation of the active intermediate phosphoramidite cation, and conversion to
the coupled phosphite via the phosphoramidite method. The R-group is the propagating chain
or surface to be grafted from.
Berner et al.118 investigated the properties of a number of simple azolyls, containing between
one and four nitrogens, to prove the formation of the phosphate. They found that the initial
protonation of the phosphorus was rapid, but the subsequent formation of the
tetrazolophosphane was the rate limiting step. Further, they showed that the subsequent
coupling and formation of the phosphoester linkage is irreversible.119 The mechanism has been
later advanced by Russell et al.120 who further supported this hypothesis with a number of other
tetrazole derivatives.
The common alternative to tetrazole is 4,5-dicyanoimidazole (DCI) (Figure 1.24(b)), proposed
by Vargeese et al. in 1998.121 Though chemically distinct from tetrazole, it shares structural
similarities, as shown in Figure 1.24. Notably, the ring structure is still able to stabilise the
negative charge formed during the phosphor protonation, with electron withdrawing groups in
the 4 and 5 position. There are several major benefits to DCI instead of tetrazole.122 Most
notable is its higher coupling rate, twice that of tetrazole;123 further, the higher pKa of 5.2
compared to 4.8 for tetrazole makes it better for the extended reaction times required for bulkier
phosphoramidites. This allows for faster reactions with lower acidity, reducing the exposure of
the phosphoramidite to the conditions that lead to its degradation.124 Another alternative
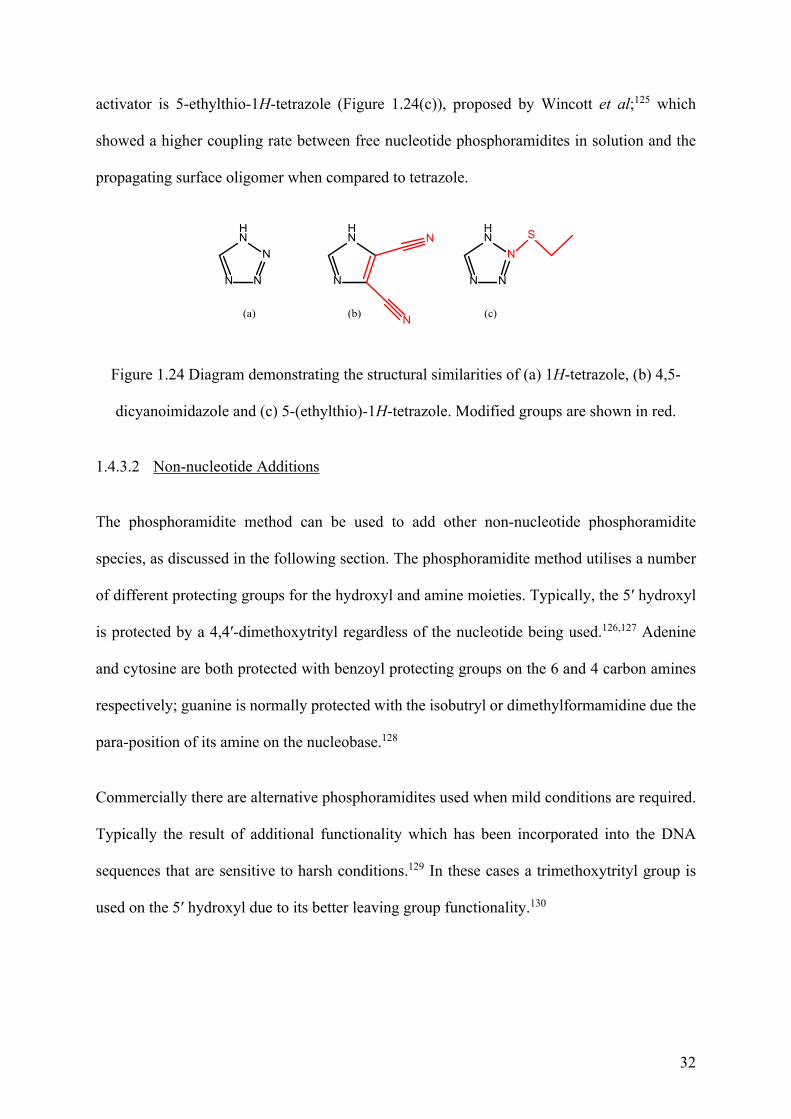
32
activator is 5-ethylthio-1H-tetrazole (Figure 1.24(c)), proposed by Wincott et al;125 which
showed a higher coupling rate between free nucleotide phosphoramidites in solution and the
propagating surface oligomer when compared to tetrazole.
N
HN
N N
N
HN N
N(a) (b)
N N
N
HN S
(c)
Figure 1.24 Diagram demonstrating the structural similarities of (a) 1H-tetrazole, (b) 4,5-
dicyanoimidazole and (c) 5-(ethylthio)-1H-tetrazole. Modified groups are shown in red.
1.4.3.2 Non-nucleotide Additions
The phosphoramidite method can be used to add other non-nucleotide phosphoramidite
species, as discussed in the following section. The phosphoramidite method utilises a number
of different protecting groups for the hydroxyl and amine moieties. Typically, the 5′ hydroxyl
is protected by a 4,4′-dimethoxytrityl regardless of the nucleotide being used.126,127 Adenine
and cytosine are both protected with benzoyl protecting groups on the 6 and 4 carbon amines
respectively; guanine is normally protected with the isobutryl or dimethylformamidine due the
para-position of its amine on the nucleobase.128
Commercially there are alternative phosphoramidites used when mild conditions are required.
Typically the result of additional functionality which has been incorporated into the DNA
sequences that are sensitive to harsh conditions.129 In these cases a trimethoxytrityl group is
used on the 5′ hydroxyl due to its better leaving group functionality.130
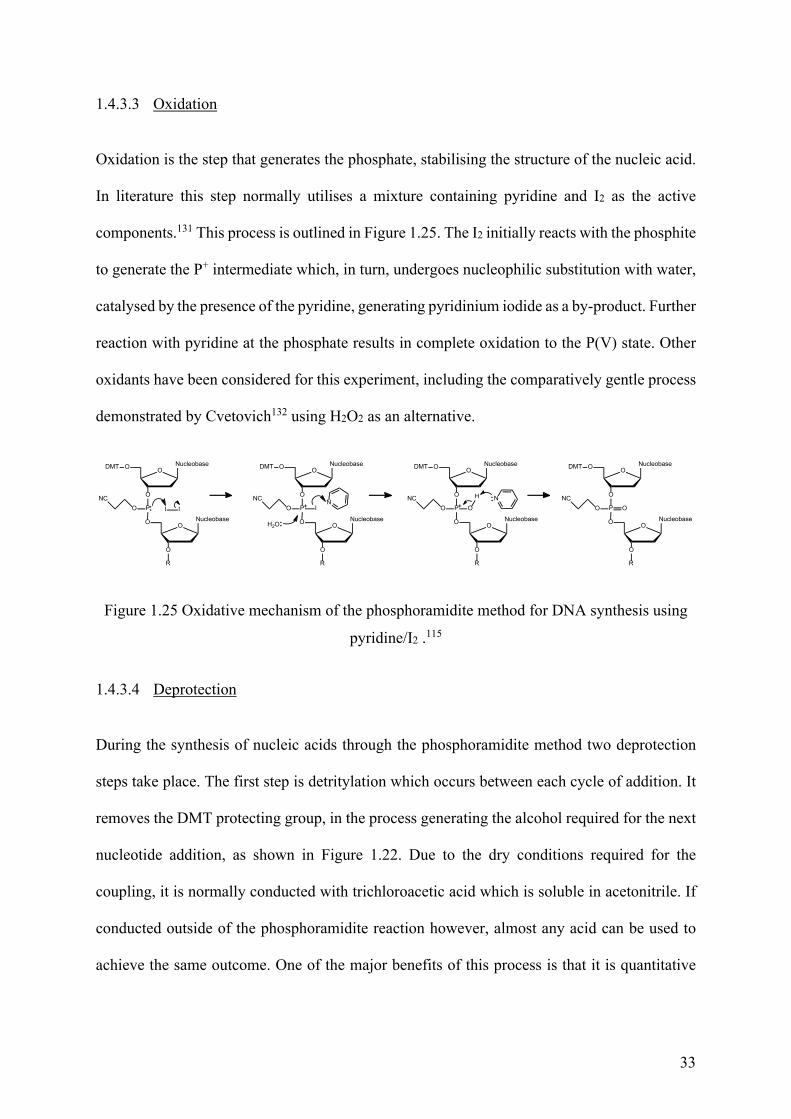
33
1.4.3.3 Oxidation
Oxidation is the step that generates the phosphate, stabilising the structure of the nucleic acid.
In literature this step normally utilises a mixture containing pyridine and I2 as the active
components.131 This process is outlined in Figure 1.25. The I2 initially reacts with the phosphite
to generate the P+ intermediate which, in turn, undergoes nucleophilic substitution with water,
catalysed by the presence of the pyridine, generating pyridinium iodide as a by-product. Further
reaction with pyridine at the phosphate results in complete oxidation to the P(V) state. Other
oxidants have been considered for this experiment, including the comparatively gentle process
demonstrated by Cvetovich132 using H2O2 as an alternative.
Figure 1.25 Oxidative mechanism of the phosphoramidite method for DNA synthesis using
pyridine/I2 .115
1.4.3.4 Deprotection
During the synthesis of nucleic acids through the phosphoramidite method two deprotection
steps take place. The first step is detritylation which occurs between each cycle of addition. It
removes the DMT protecting group, in the process generating the alcohol required for the next
nucleotide addition, as shown in Figure 1.22. Due to the dry conditions required for the
coupling, it is normally conducted with trichloroacetic acid which is soluble in acetonitrile. If
conducted outside of the phosphoramidite reaction however, almost any acid can be used to
achieve the same outcome. One of the major benefits of this process is that it is quantitative
NucleobaseO
O
PO
ODMT
NucleobaseO
O
R
O
NCI I
NucleobaseO
O
PO
ODMT
NucleobaseO
O
R
O
NCI
H2O
N
NucleobaseO
O
PO
ODMT
NucleobaseO
O
R
O
NC NO
H
NucleobaseO
O
PO
ODMT
NucleobaseO
O
R
O
NCO
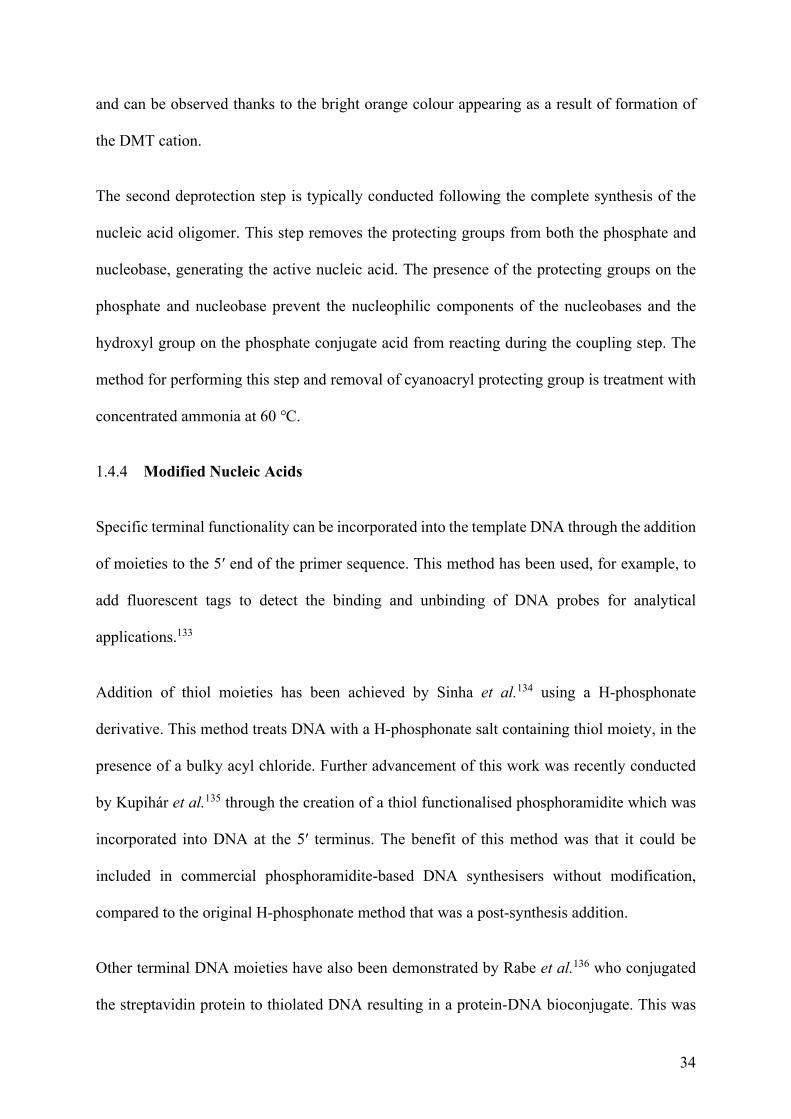
34
and can be observed thanks to the bright orange colour appearing as a result of formation of
the DMT cation.
The second deprotection step is typically conducted following the complete synthesis of the
nucleic acid oligomer. This step removes the protecting groups from both the phosphate and
nucleobase, generating the active nucleic acid. The presence of the protecting groups on the
phosphate and nucleobase prevent the nucleophilic components of the nucleobases and the
hydroxyl group on the phosphate conjugate acid from reacting during the coupling step. The
method for performing this step and removal of cyanoacryl protecting group is treatment with
concentrated ammonia at 60 ℃.
1.4.4 Modified Nucleic Acids
Specific terminal functionality can be incorporated into the template DNA through the addition
of moieties to the 5′ end of the primer sequence. This method has been used, for example, to
add fluorescent tags to detect the binding and unbinding of DNA probes for analytical
applications.133
Addition of thiol moieties has been achieved by Sinha et al.134 using a H-phosphonate
derivative. This method treats DNA with a H-phosphonate salt containing thiol moiety, in the
presence of a bulky acyl chloride. Further advancement of this work was recently conducted
by Kupihár et al.135 through the creation of a thiol functionalised phosphoramidite which was
incorporated into DNA at the 5′ terminus. The benefit of this method was that it could be
included in commercial phosphoramidite-based DNA synthesisers without modification,
compared to the original H-phosphonate method that was a post-synthesis addition.
Other terminal DNA moieties have also been demonstrated by Rabe et al.136 who conjugated
the streptavidin protein to thiolated DNA resulting in a protein-DNA bioconjugate. This was
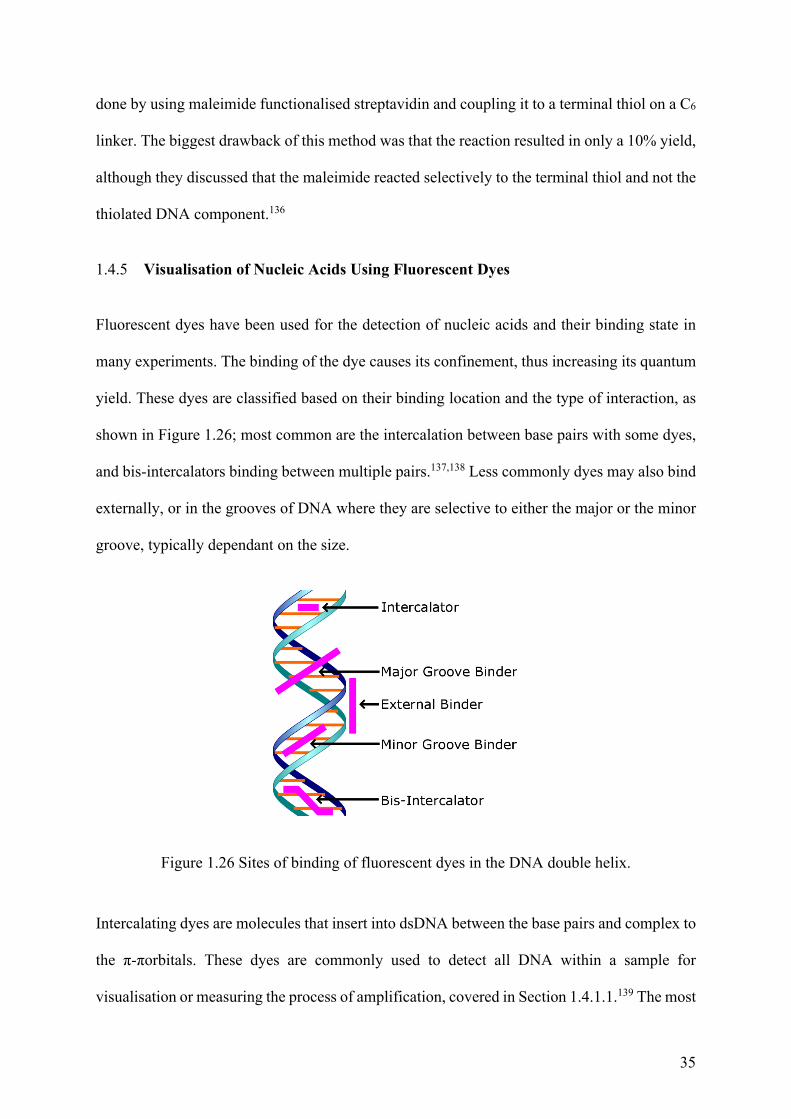
35
done by using maleimide functionalised streptavidin and coupling it to a terminal thiol on a C6
linker. The biggest drawback of this method was that the reaction resulted in only a 10% yield,
although they discussed that the maleimide reacted selectively to the terminal thiol and not the
thiolated DNA component.136
1.4.5 Visualisation of Nucleic Acids Using Fluorescent Dyes
Fluorescent dyes have been used for the detection of nucleic acids and their binding state in
many experiments. The binding of the dye causes its confinement, thus increasing its quantum
yield. These dyes are classified based on their binding location and the type of interaction, as
shown in Figure 1.26; most common are the intercalation between base pairs with some dyes,
and bis-intercalators binding between multiple pairs.137,138 Less commonly dyes may also bind
externally, or in the grooves of DNA where they are selective to either the major or the minor
groove, typically dependant on the size.
Figure 1.26 Sites of binding of fluorescent dyes in the DNA double helix.
Intercalating dyes are molecules that insert into dsDNA between the base pairs and complex to
the π-πorbitals. These dyes are commonly used to detect all DNA within a sample for
visualisation or measuring the process of amplification, covered in Section 1.4.1.1.139 The most

36
commonly used intercalator dye has been ethidium bromide.140 However, due in part to its
toxicity, there is now a wide range of alternative stains available, most notably the SYBR series
of dyes. These dyes intercalate within the helix and are complexed to the π-orbitals141 which
prevents the heterocyclic dye systems from changing orientation, and that is what creates their
fluorescent appearance.141,142 Yo-ProTM stains also fit into this category with its intercalation
being the major source of their fluorescence.143
Groove binding dyes fill the vacant regions in the base pair plane and fill whichever groove
they can fit in. Some of these dyes have also been shown to act as intercalating dyes.144,145
Hoechst stains as a class are exclusively groove binding dyes.146 Cyanine dyes, such as SYBR
and dsGreen, have been shown by Vitzthum et al.147 to bind as both intercalating dyes and
groove binding dyes, with the majority of the fluorescent yield coming from the groove binding
position.
External binders are a unique class of dyes as they attach through electrostatic interactions
rather than selective binding to DNA148 which makes them more suitable for visualisation
applications. However, this type of dyes lacks specificity towards nucleic acids which makes
them least suitable for the polymer-nucleic acid systems investigated in this project.149
For this project the dyes used were SYBR™ Green II, dsGREEN, Yo-Pro-1 Iodide and SYBR™
SAFE. The SYBR name is a trademark of ThermoFisher Scientific and refers to a class of mostly
cyanine dyes. These dyes were chosen based on their performance extensively described in
literature and their selectivity for different binding conditions, as listed in Table 1.3.
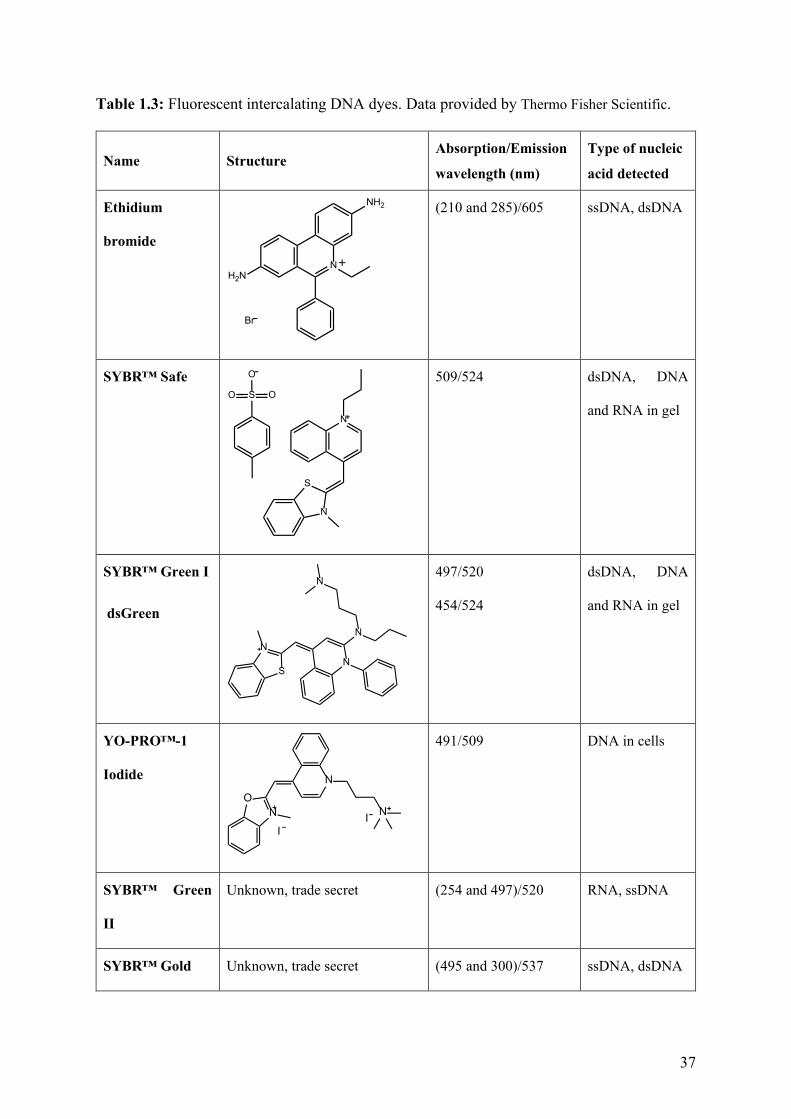
37
Table 1.3: Fluorescent intercalating DNA dyes. Data provided by Thermo Fisher Scientific.
Name Structure Absorption/Emission
wavelength (nm)
Type of nucleic
acid detected
Ethidium
bromide N
H2N
NH2
Br
(210 and 285)/605 ssDNA, dsDNA
SYBR™ Safe
N
S
N
S OO
O
509/524 dsDNA, DNA
and RNA in gel
SYBR™ Green I
dsGreen
NS
NN
N
497/520
454/524
dsDNA, DNA
and RNA in gel
YO-PRO™-1
Iodide
NO
N
N
II
491/509 DNA in cells
SYBR™ Green
II
Unknown, trade secret (254 and 497)/520 RNA, ssDNA
SYBR™ Gold Unknown, trade secret (495 and 300)/537 ssDNA, dsDNA
38
1.5 Synthetic Polymers
This thesis covers the generation of synthetic polymers that replicate properties characteristic
to nucleic acids. The replication is achieved through the incorporation of nucleotides into
monomers and then subsequently polymerising them. Out of a broad range of polymerisation
techniques that could be used, several are covered in this section, and then narrowed down to
the method chosen: mediated living radical polymerisation.
1.5.1 Types of Polymers
The polymers synthesised in this project were homopolymers: polymers generated from only
a single monomer, as this allowed the polymers to be interrogated while limiting their
secondary effects. Existing literature that studies the synthesis and interactions of synthetic
DNA analogues has frequently used heteropolymers,150 polymers containing a mixture of
monomers, as such an explanation of them is given here for clarity.
Block co-polymers contain discrete regions generated from each monomer. For example,
ABA-type co-polymers would be made up of one block of monomer A followed by a block of
polymer B and then ending in another block of polymer A. These can be made by the addition
of a second monomer of significantly higher reactivity partway through the polymerisation or
through pausing, cleaning, and restarting the polymerisation.151 This has been demonstrated by
a number of groups, though notably Manguian et al.152 demonstrated the use of a novel first
block that allowed for the synthesis of a second block that was otherwise incompatible in their
solvent system.
One of the additional benefits to block co-polymers is that they can be used to combine
polymerisation techniques. For example, Klaerner et al.153 combined the formation of a radical
polymerisation with a condensation polymerisation for the formation of block co-polymers. In

39
their work they specifically showed the concurrent formation of the two blocks, possibly
because the monomers were orthogonal to the opposing techniques. The result of this work
could allow for the increased speed of synthesis of mixed functionality polymers.
Typically, as no two monomers have the same reactivity, the radical will begin to propagate
with the more active monomer first, effectively starting as a homopolymer. As the more
reactive monomer is consumed the balance shifts and the now higher concentration of the
second monomer causes it to be preferred.157,158
1.5.2 Describing Synthetic Polymerisations
The effectiveness of these polymerisation methods and the characteristics of the resulting
polymers are measured by a number of metrics: conversion, size, composition, and dispersity
index (Đ).
Conversion is a simple mass transfer metric and is the equivalent to extent of reaction, ξ, shown
in Equation 1.1,159 where ξ is a percentage value that represents the mass of monomer that has
been converted to the polymer, Δni is the amount of each reagent, and vi is the stoichiometric
amount initially. For addition polymerisations this formula can be simplified to Equation 1.2,
as there is no ejected small molecule and the stoichiometry is 1:1; here mf is the mass of
monomer remaining and mi is the initial amount of monomer. High values are considered a
better result as this indicates efficient use of the monomer reducing the amount of isolation
required and unused monomer wasted.
ξ = 𝛥𝛥𝛥𝛥𝑖𝑖𝑣𝑣𝑖𝑖
Equation 1.1
ξ = 𝑚𝑚𝑓𝑓
𝑚𝑚𝑖𝑖 Equation 1.2
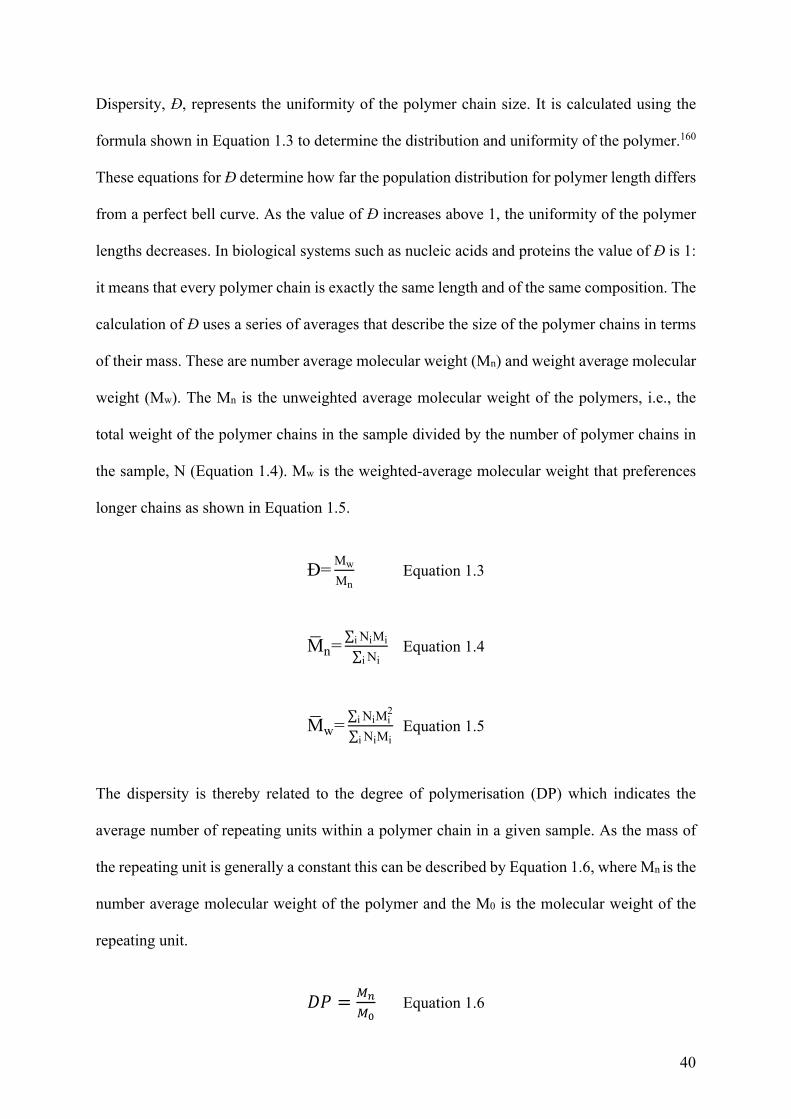
40
Dispersity, Đ, represents the uniformity of the polymer chain size. It is calculated using the
formula shown in Equation 1.3 to determine the distribution and uniformity of the polymer.160
These equations for Đ determine how far the population distribution for polymer length differs
from a perfect bell curve. As the value of Đ increases above 1, the uniformity of the polymer
lengths decreases. In biological systems such as nucleic acids and proteins the value of Đ is 1:
it means that every polymer chain is exactly the same length and of the same composition. The
calculation of Đ uses a series of averages that describe the size of the polymer chains in terms
of their mass. These are number average molecular weight (Mn) and weight average molecular
weight (Mw). The Mn is the unweighted average molecular weight of the polymers, i.e., the
total weight of the polymer chains in the sample divided by the number of polymer chains in
the sample, N (Equation 1.4). Mw is the weighted-average molecular weight that preferences
longer chains as shown in Equation 1.5.
Đ= Mw
Mn Equation 1.3
M� n= ∑ NiMii∑ Nii
Equation 1.4
M� w= ∑ NiMi2
i∑ NiMii
Equation 1.5
The dispersity is thereby related to the degree of polymerisation (DP) which indicates the
average number of repeating units within a polymer chain in a given sample. As the mass of
the repeating unit is generally a constant this can be described by Equation 1.6, where Mn is the
number average molecular weight of the polymer and the M0 is the molecular weight of the
repeating unit.
𝐷𝐷𝐷𝐷 = 𝑀𝑀𝑛𝑛𝑀𝑀0
Equation 1.6
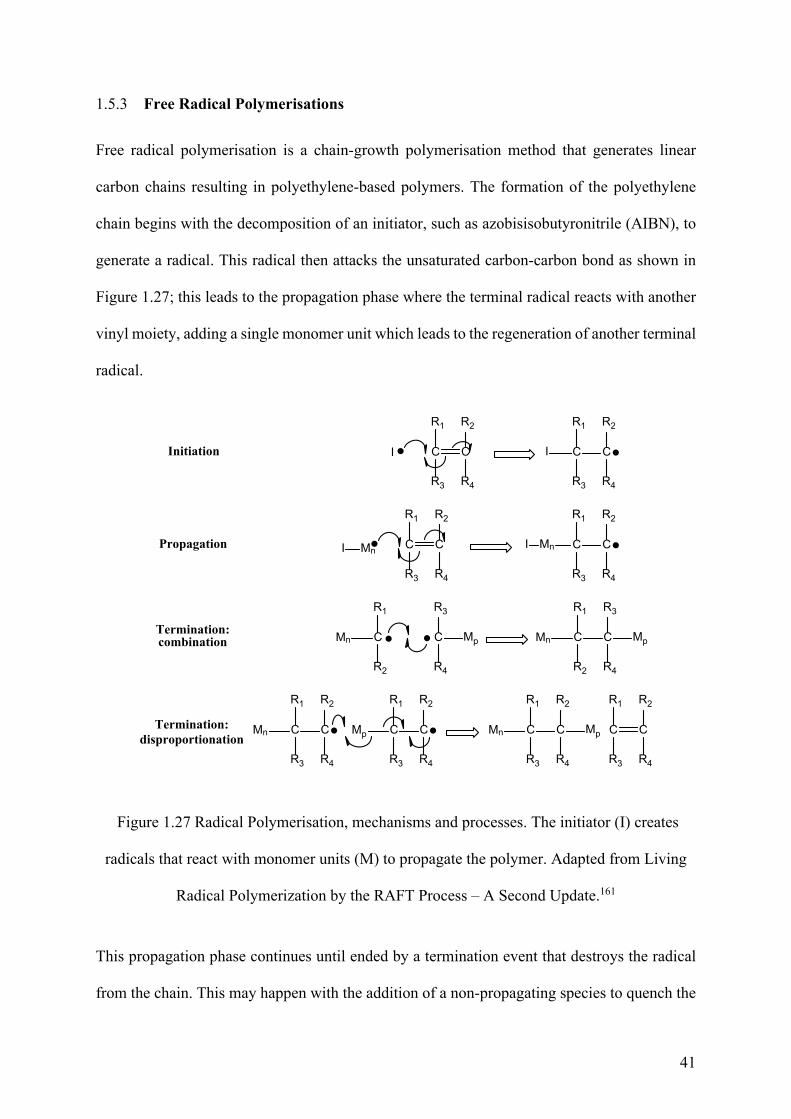
41
1.5.3 Free Radical Polymerisations
Free radical polymerisation is a chain-growth polymerisation method that generates linear
carbon chains resulting in polyethylene-based polymers. The formation of the polyethylene
chain begins with the decomposition of an initiator, such as azobisisobutyronitrile (AIBN), to
generate a radical. This radical then attacks the unsaturated carbon-carbon bond as shown in
Figure 1.27; this leads to the propagation phase where the terminal radical reacts with another
vinyl moiety, adding a single monomer unit which leads to the regeneration of another terminal
radical.
Mn C C
R1
R3
R2
R4
Mn C C
R1
R3
R2
R4
I C C
R1
R3
R2
R4
I C C
R1
R3
R2
R4
I I
Initiation
Propagation
Termination: combination
Termination:disproportionation
Mn C
R1
R2
MpC
R4
R3
Mn C
R1
R2
MpC
R4
R3
Mn C C
R1
R3
R2
R4
Mp C C
R1
R3
R2
R4
Mn C C
R1
R3
R2
R4
Mp C C
R1
R3
R2
R4
Figure 1.27 Radical Polymerisation, mechanisms and processes. The initiator (I) creates
radicals that react with monomer units (M) to propagate the polymer. Adapted from Living
Radical Polymerization by the RAFT Process – A Second Update.161
This propagation phase continues until ended by a termination event that destroys the radical
from the chain. This may happen with the addition of a non-propagating species to quench the
42
reaction, an additive, or through two propagating chains interacting. Of the latter there are two
types: firstly, termination though combination where two propagating radicals react to form a
single chain; secondly, disproportionation where a propagating radical reacts with another
chain causing a fragmentation which can result in a small molecule being formed which may
be a different monomer.161
1.5.4 Controlling Dispersity of Living Radical Polymers
There are a number of methods used to lower the Đ of a polymer towards the ideal Đ = 1, all
of which broadly fall into one of two categories: isolation or mediation.
Isolation means the reaction is controlled by limiting the monomers access to their initiator.162
A typical example presented for this type of control is the utilisation of step-growth
condensation polymerisations where the repeating unit is comprised of two monomers, such as
a dialcohol and a diisocynate, that do not polymerise individually but will react together.163 As
this reaction typically proceeds to completion, stoichiometric additions of each monomer
ensure single monomer addition to the terminal groups.163 For radical polymerisations this is
demonstrated with emulsion polymerisation;164 here the monomer is encapsulated within a
two-phase mixture. The bulk phase is the non-solvent within which the solvent forms an
emulsion: 'capsules' of solvent contain, ideally, a single initiator and a uniform amount of
monomer in each one.152 These then propagate within the capsule until all of the monomer is
exhausted. As all the capsules contain the same amount of monomer the resulting polymers
should be of the same molecular weights and Đ. In practice, however, it is rarely the case that
there is a perfect 1:1 ratio of initiator to particle, or that the monomer is evenly distributed.165,166
Mediation methods imply an introduction of an additional component to the reaction that
controls the rate of polymerisation, typically slowing it down so that no individual polymer
chain propagates significantly ahead of the others.167,168
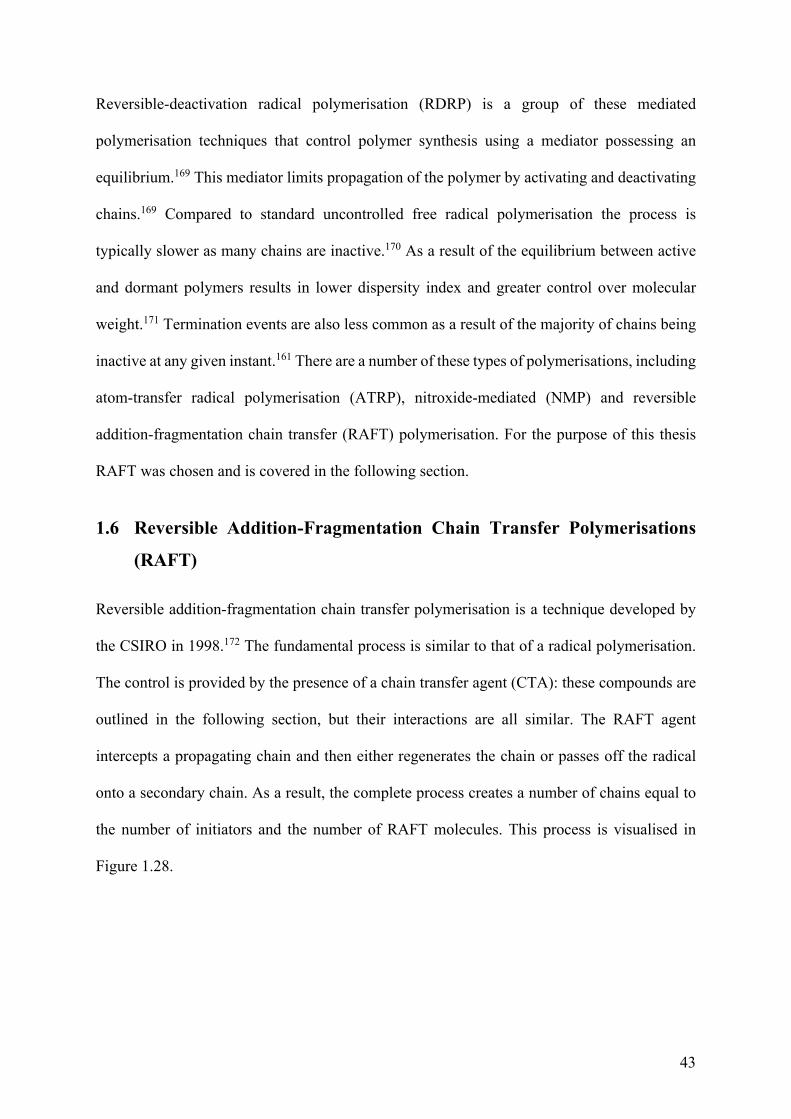
43
Reversible-deactivation radical polymerisation (RDRP) is a group of these mediated
polymerisation techniques that control polymer synthesis using a mediator possessing an
equilibrium.169 This mediator limits propagation of the polymer by activating and deactivating
chains.169 Compared to standard uncontrolled free radical polymerisation the process is
typically slower as many chains are inactive.170 As a result of the equilibrium between active
and dormant polymers results in lower dispersity index and greater control over molecular
weight.171 Termination events are also less common as a result of the majority of chains being
inactive at any given instant.161 There are a number of these types of polymerisations, including
atom-transfer radical polymerisation (ATRP), nitroxide-mediated (NMP) and reversible
addition-fragmentation chain transfer (RAFT) polymerisation. For the purpose of this thesis
RAFT was chosen and is covered in the following section.
1.6 Reversible Addition-Fragmentation Chain Transfer Polymerisations
(RAFT)
Reversible addition-fragmentation chain transfer polymerisation is a technique developed by
the CSIRO in 1998.172 The fundamental process is similar to that of a radical polymerisation.
The control is provided by the presence of a chain transfer agent (CTA): these compounds are
outlined in the following section, but their interactions are all similar. The RAFT agent
intercepts a propagating chain and then either regenerates the chain or passes off the radical
onto a secondary chain. As a result, the complete process creates a number of chains equal to
the number of initiators and the number of RAFT molecules. This process is visualised in
Figure 1.28.

44
Z
SS Pm
Z
S SPn
Z
S SPn PmPn Pm
MM
Active Polymer
Dead Polymer
Dormant Polymer
Dormant Polymer
Active Polymer
Dead Polymer
RAFT Intermediate
Figure 1.28 RAFT mediation mechanism, adapted from Moad et al.173 Verticle arrows
indicate the polymer exiting the RAFT mediation as dead polymers through termination
(combination or disproportionaltion).
1.6.1.1 Monomers
RAFT polymerisation in principle works with all monomers compatible with radical
polymerisation, for example, molecules containing an ethene functionality. In general, these
monomers are divided into 2 classes: more-activated monomers (MAMs) and less-activated
monomers (LAMs). This class combined with the reaction conditions required, temperature,
solvent, and initiator, are the criteria used to determine a suitable RAFT agent. The following
is a brief description, with more detailed explanation of their kinetics in relation to RAFT
polymerisation covered in Section 1.6.1.3.
MAMs are monomers that contain an electron deficient vinyl group with radical stabilising
substituents: they include those adjacent to aromatic, carbonyl or nitrile groups. Conversely,
LAMs are monomers that contain an electron rich vinyl group with radical destabilising
substituents: they include those adjacent to methyl, nitrogen or oxygen lone pair, or a
heteroatom of a heteroaromatic ring.174 Some examples are shown in Figure 1.29.
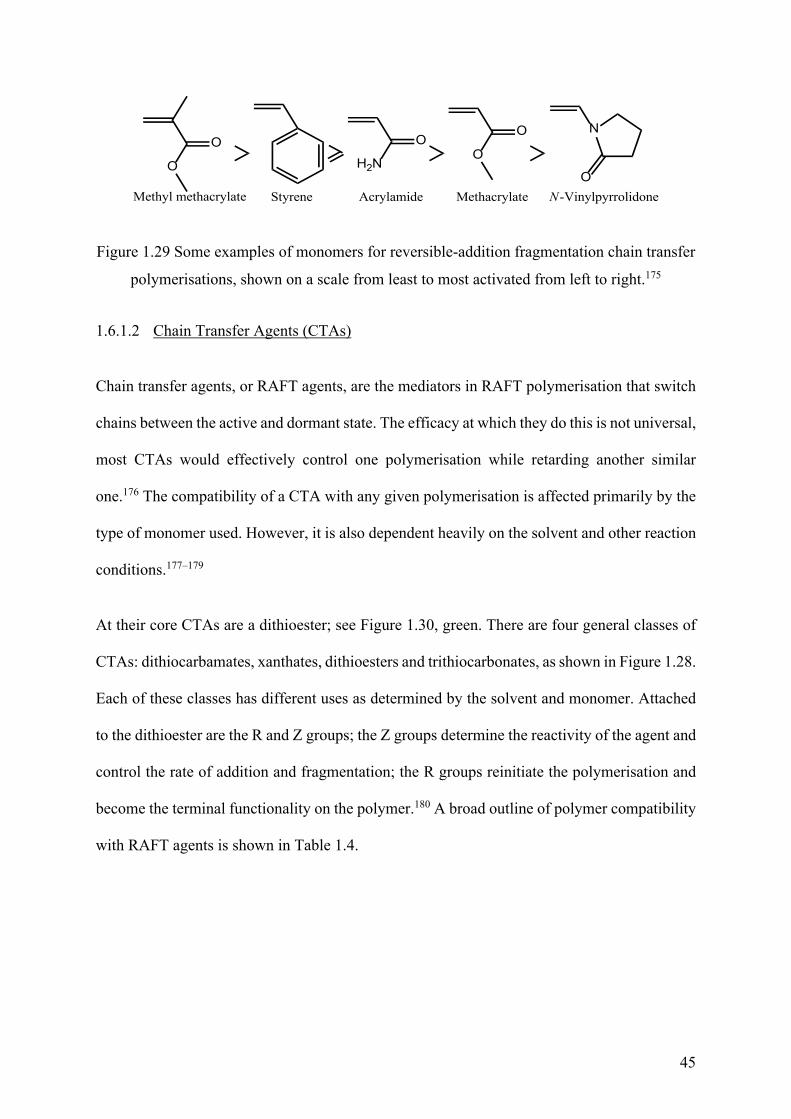
45
O
O
Methyl methacrylate
O
O N
ON-VinylpyrrolidoneMethacrylateStyrene Acrylamide
H2N
O
Figure 1.29 Some examples of monomers for reversible-addition fragmentation chain transfer
polymerisations, shown on a scale from least to most activated from left to right.175
1.6.1.2 Chain Transfer Agents (CTAs)
Chain transfer agents, or RAFT agents, are the mediators in RAFT polymerisation that switch
chains between the active and dormant state. The efficacy at which they do this is not universal,
most CTAs would effectively control one polymerisation while retarding another similar
one.176 The compatibility of a CTA with any given polymerisation is affected primarily by the
type of monomer used. However, it is also dependent heavily on the solvent and other reaction
conditions.177–179
At their core CTAs are a dithioester; see Figure 1.30, green. There are four general classes of
CTAs: dithiocarbamates, xanthates, dithioesters and trithiocarbonates, as shown in Figure 1.28.
Each of these classes has different uses as determined by the solvent and monomer. Attached
to the dithioester are the R and Z groups; the Z groups determine the reactivity of the agent and
control the rate of addition and fragmentation; the R groups reinitiate the polymerisation and
become the terminal functionality on the polymer.180 A broad outline of polymer compatibility
with RAFT agents is shown in Table 1.4.
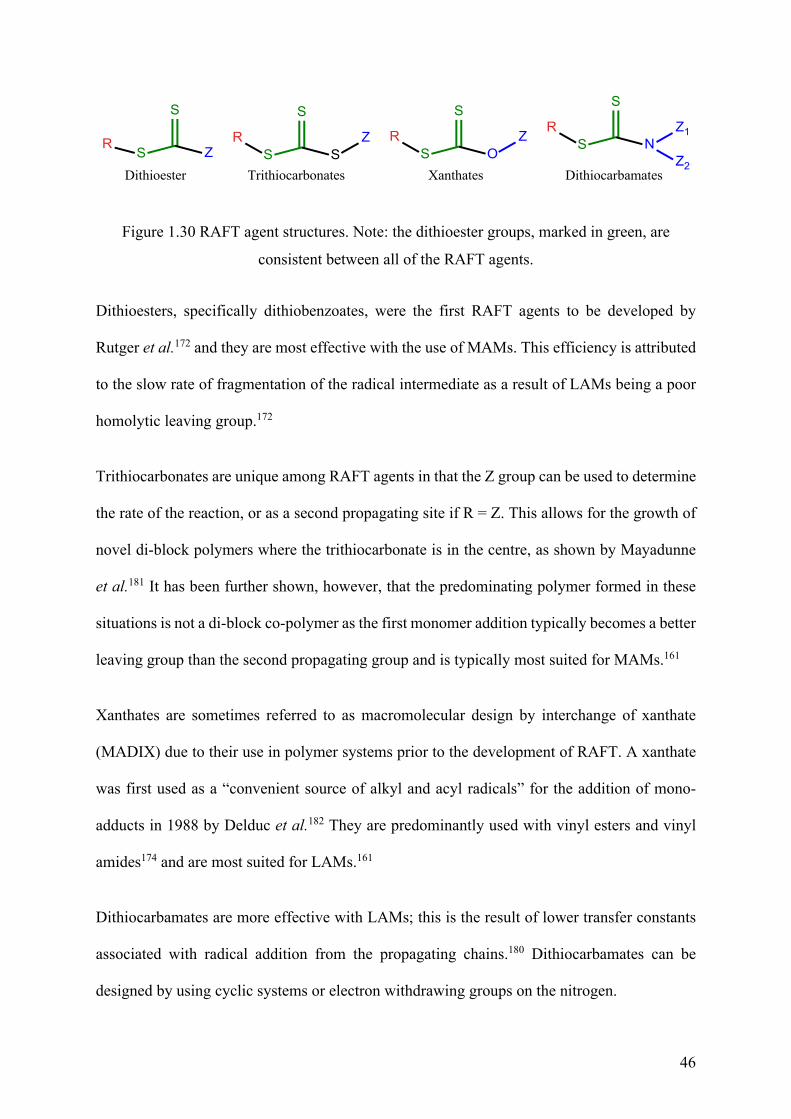
46
S
S
R Z S
S
RN
S
S
ROS
S
RS
Z1
Z2
Z Z
Dithioester DithiocarbamatesTrithiocarbonates Xanthates
Figure 1.30 RAFT agent structures. Note: the dithioester groups, marked in green, are
consistent between all of the RAFT agents.
Dithioesters, specifically dithiobenzoates, were the first RAFT agents to be developed by
Rutger et al.172 and they are most effective with the use of MAMs. This efficiency is attributed
to the slow rate of fragmentation of the radical intermediate as a result of LAMs being a poor
homolytic leaving group.172
Trithiocarbonates are unique among RAFT agents in that the Z group can be used to determine
the rate of the reaction, or as a second propagating site if R = Z. This allows for the growth of
novel di-block polymers where the trithiocarbonate is in the centre, as shown by Mayadunne
et al.181 It has been further shown, however, that the predominating polymer formed in these
situations is not a di-block co-polymer as the first monomer addition typically becomes a better
leaving group than the second propagating group and is typically most suited for MAMs.161
Xanthates are sometimes referred to as macromolecular design by interchange of xanthate
(MADIX) due to their use in polymer systems prior to the development of RAFT. A xanthate
was first used as a “convenient source of alkyl and acyl radicals” for the addition of mono-
adducts in 1988 by Delduc et al.182 They are predominantly used with vinyl esters and vinyl
amides174 and are most suited for LAMs.161
Dithiocarbamates are more effective with LAMs; this is the result of lower transfer constants
associated with radical addition from the propagating chains.180 Dithiocarbamates can be
designed by using cyclic systems or electron withdrawing groups on the nitrogen.
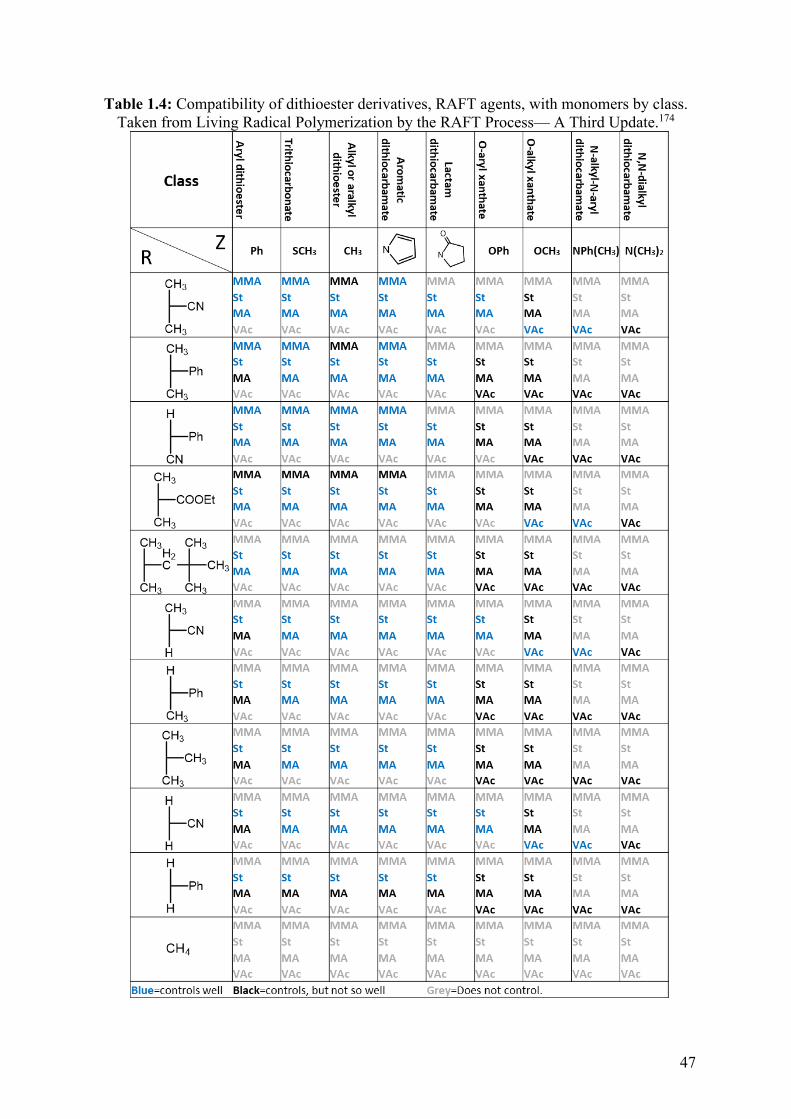
47
Table 1.4: Compatibility of dithioester derivatives, RAFT agents, with monomers by class. Taken from Living Radical Polymerization by the RAFT Process— A Third Update.174
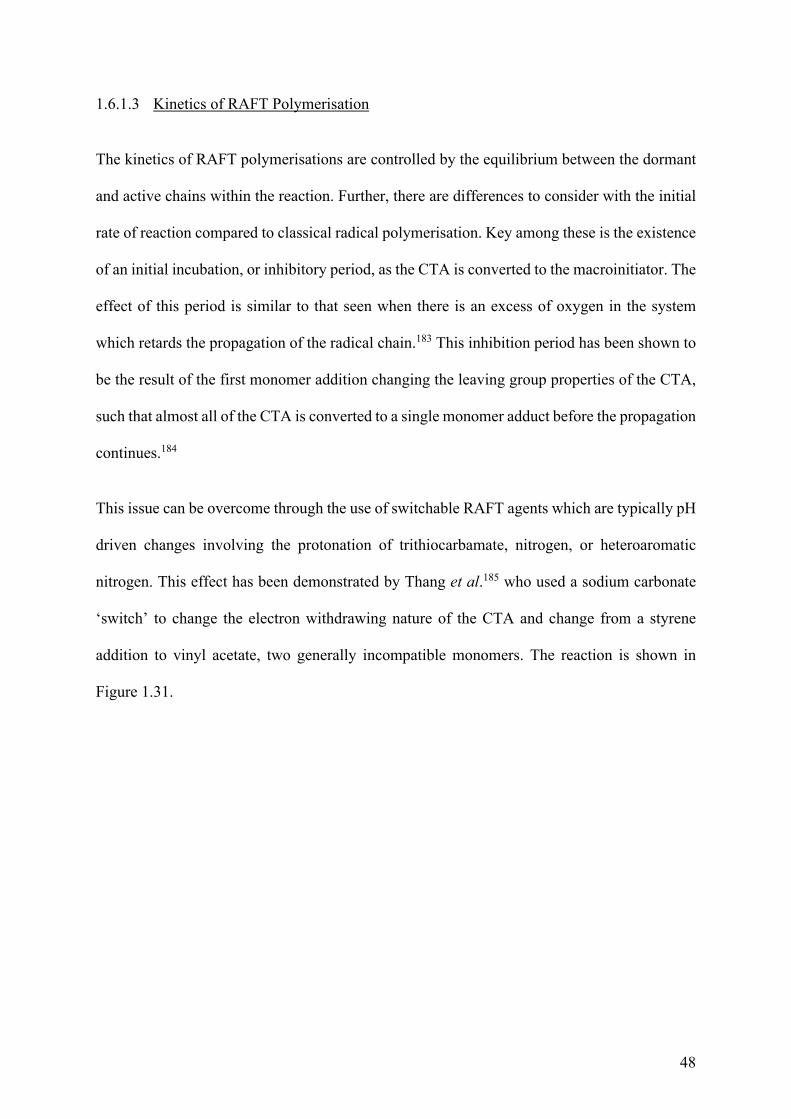
48
1.6.1.3 Kinetics of RAFT Polymerisation
The kinetics of RAFT polymerisations are controlled by the equilibrium between the dormant
and active chains within the reaction. Further, there are differences to consider with the initial
rate of reaction compared to classical radical polymerisation. Key among these is the existence
of an initial incubation, or inhibitory period, as the CTA is converted to the macroinitiator. The
effect of this period is similar to that seen when there is an excess of oxygen in the system
which retards the propagation of the radical chain.183 This inhibition period has been shown to
be the result of the first monomer addition changing the leaving group properties of the CTA,
such that almost all of the CTA is converted to a single monomer adduct before the propagation
continues.184
This issue can be overcome through the use of switchable RAFT agents which are typically pH
driven changes involving the protonation of trithiocarbamate, nitrogen, or heteroaromatic
nitrogen. This effect has been demonstrated by Thang et al.185 who used a sodium carbonate
‘switch’ to change the electron withdrawing nature of the CTA and change from a styrene
addition to vinyl acetate, two generally incompatible monomers. The reaction is shown in
Figure 1.31.
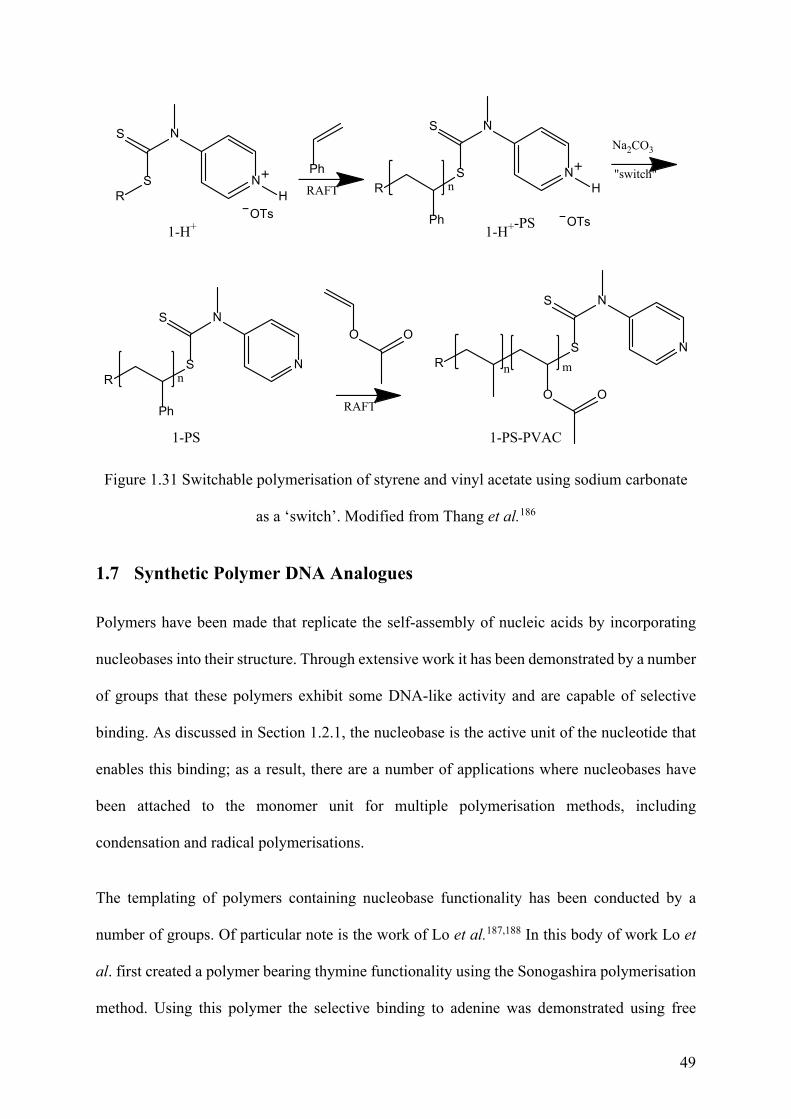
49
SR
S N
NH RAFT
Ph
OTs
S
S N
NH
"switch"
OTs
R
Ph
n
Na2CO3
S
S N
NR
Ph
n
S
S N
N
O
n
O
R
O O
RAFT
m
1-H+ 1-H+-PS
1-PS 1-PS-PVAC
Figure 1.31 Switchable polymerisation of styrene and vinyl acetate using sodium carbonate
as a ‘switch’. Modified from Thang et al.186
1.7 Synthetic Polymer DNA Analogues
Polymers have been made that replicate the self-assembly of nucleic acids by incorporating
nucleobases into their structure. Through extensive work it has been demonstrated by a number
of groups that these polymers exhibit some DNA-like activity and are capable of selective
binding. As discussed in Section 1.2.1, the nucleobase is the active unit of the nucleotide that
enables this binding; as a result, there are a number of applications where nucleobases have
been attached to the monomer unit for multiple polymerisation methods, including
condensation and radical polymerisations.
The templating of polymers containing nucleobase functionality has been conducted by a
number of groups. Of particular note is the work of Lo et al.187,188 In this body of work Lo et
al. first created a polymer bearing thymine functionality using the Sonogashira polymerisation
method. Using this polymer the selective binding to adenine was demonstrated using free
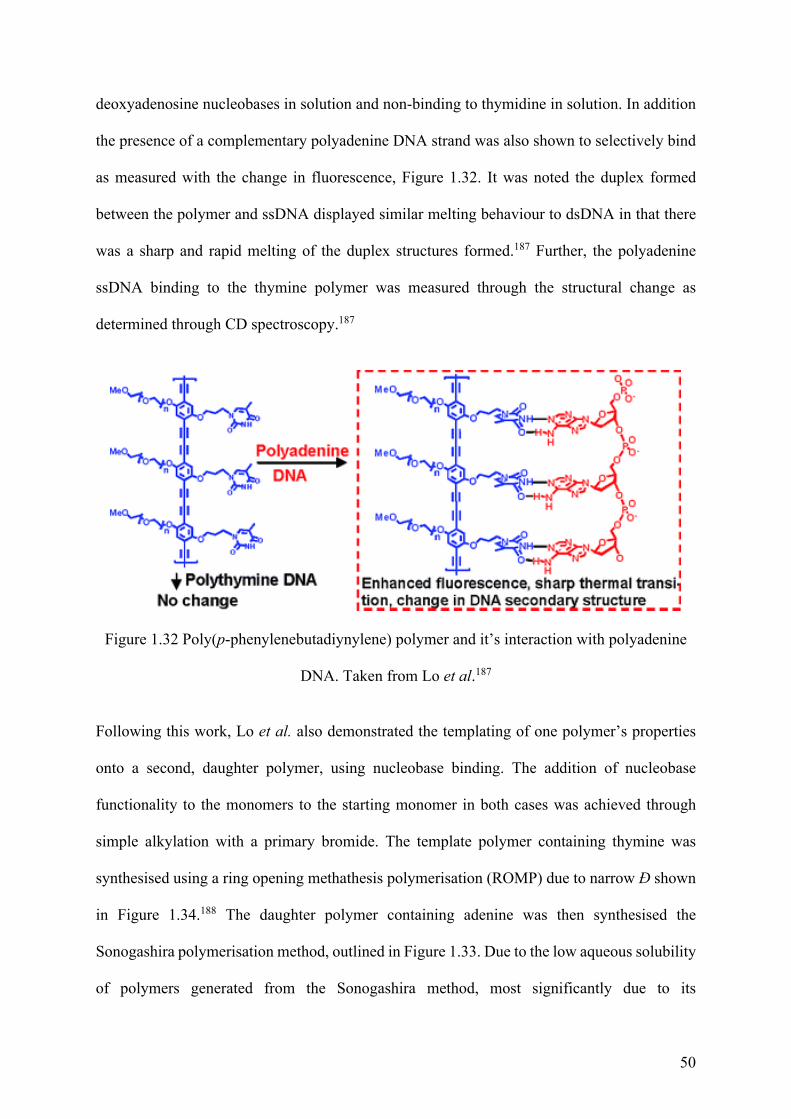
50
deoxyadenosine nucleobases in solution and non-binding to thymidine in solution. In addition
the presence of a complementary polyadenine DNA strand was also shown to selectively bind
as measured with the change in fluorescence, Figure 1.32. It was noted the duplex formed
between the polymer and ssDNA displayed similar melting behaviour to dsDNA in that there
was a sharp and rapid melting of the duplex structures formed.187 Further, the polyadenine
ssDNA binding to the thymine polymer was measured through the structural change as
determined through CD spectroscopy.187
Figure 1.32 Poly(p-phenylenebutadiynylene) polymer and it’s interaction with polyadenine
DNA. Taken from Lo et al.187
Following this work, Lo et al. also demonstrated the templating of one polymer’s properties
onto a second, daughter polymer, using nucleobase binding. The addition of nucleobase
functionality to the monomers to the starting monomer in both cases was achieved through
simple alkylation with a primary bromide. The template polymer containing thymine was
synthesised using a ring opening methathesis polymerisation (ROMP) due to narrow Đ shown
in Figure 1.34.188 The daughter polymer containing adenine was then synthesised the
Sonogashira polymerisation method, outlined in Figure 1.33. Due to the low aqueous solubility
of polymers generated from the Sonogashira method, most significantly due to its
51
phenylacetylene backbone, a PEG-3 pendant group was also incorporated to improve solubility
and give space to the adenine; the resulting polymer is shown in Figure 1.33.
Figure 1.33 Overview of the Sonogashira polymerisation method for the templated synthesis
of Poly(p-phenylenebutadiynylene). Taken from Lo et al. 188
This experiment is of note as it demonstrated two achievements: firstly, the combination of a
nucleobase containing polymer with an additional polymerisation technique; more importantly,
however, this was the first work demonstrating enzymatic-like activity in copying the
molecular properties of one polymer onto another using the addition of nucleobase
functionality.188
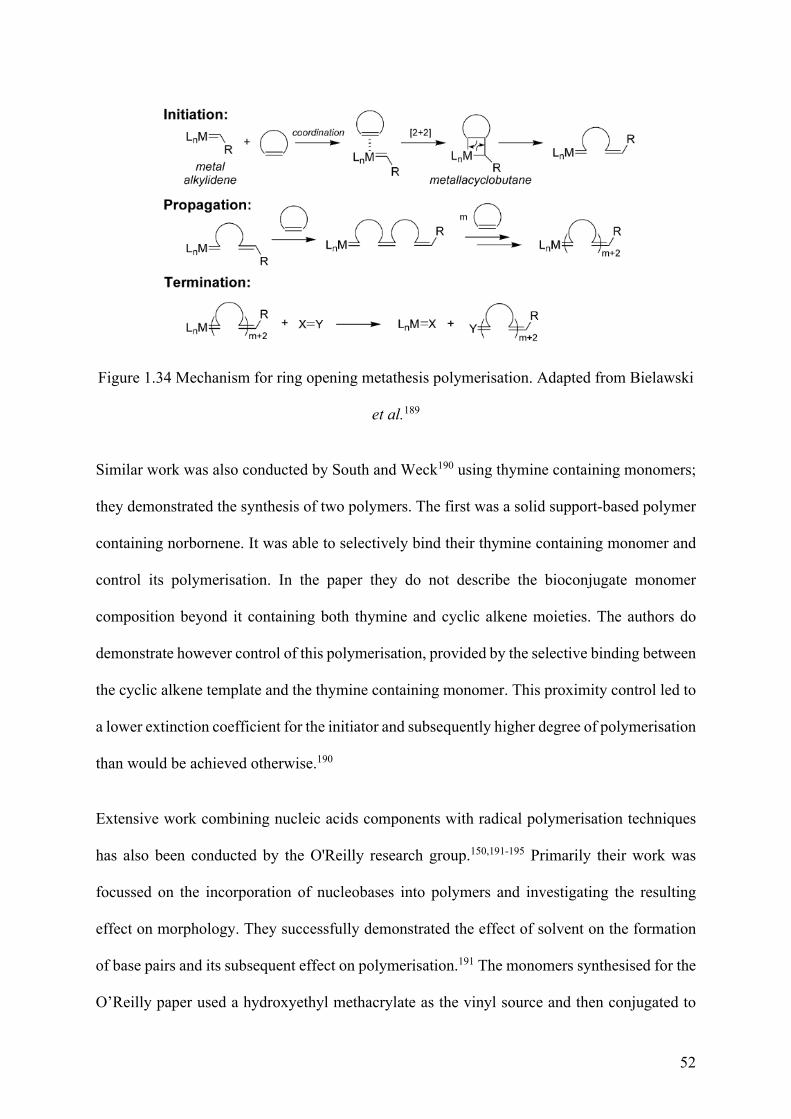
52
Figure 1.34 Mechanism for ring opening metathesis polymerisation. Adapted from Bielawski
et al.189
Similar work was also conducted by South and Weck190 using thymine containing monomers;
they demonstrated the synthesis of two polymers. The first was a solid support-based polymer
containing norbornene. It was able to selectively bind their thymine containing monomer and
control its polymerisation. In the paper they do not describe the bioconjugate monomer
composition beyond it containing both thymine and cyclic alkene moieties. The authors do
demonstrate however control of this polymerisation, provided by the selective binding between
the cyclic alkene template and the thymine containing monomer. This proximity control led to
a lower extinction coefficient for the initiator and subsequently higher degree of polymerisation
than would be achieved otherwise.190
Extensive work combining nucleic acids components with radical polymerisation techniques
has also been conducted by the O'Reilly research group.150,191-195 Primarily their work was
focussed on the incorporation of nucleobases into polymers and investigating the resulting
effect on morphology. They successfully demonstrated the effect of solvent on the formation
of base pairs and its subsequent effect on polymerisation.191 The monomers synthesised for the
O’Reilly paper used a hydroxyethyl methacrylate as the vinyl source and then conjugated to
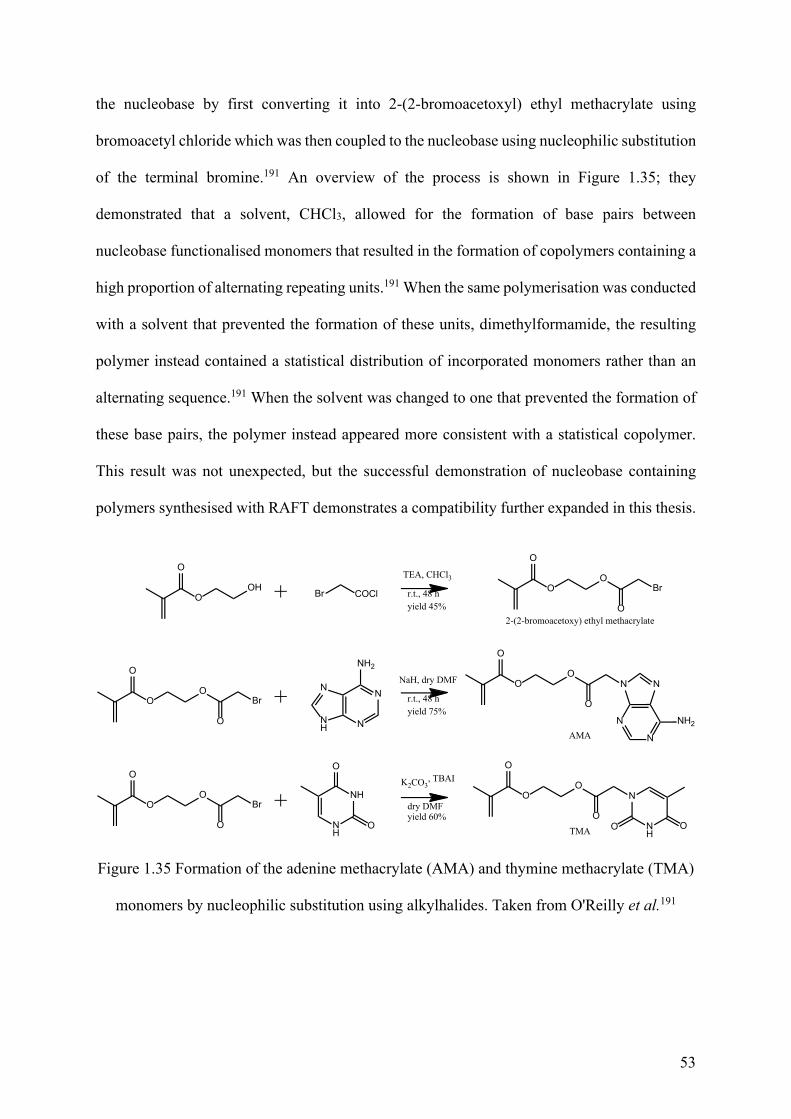
53
the nucleobase by first converting it into 2-(2-bromoacetoxyl) ethyl methacrylate using
bromoacetyl chloride which was then coupled to the nucleobase using nucleophilic substitution
of the terminal bromine.191 An overview of the process is shown in Figure 1.35; they
demonstrated that a solvent, CHCl3, allowed for the formation of base pairs between
nucleobase functionalised monomers that resulted in the formation of copolymers containing a
high proportion of alternating repeating units.191 When the same polymerisation was conducted
with a solvent that prevented the formation of these units, dimethylformamide, the resulting
polymer instead contained a statistical distribution of incorporated monomers rather than an
alternating sequence.191 When the solvent was changed to one that prevented the formation of
these base pairs, the polymer instead appeared more consistent with a statistical copolymer.
This result was not unexpected, but the successful demonstration of nucleobase containing
polymers synthesised with RAFT demonstrates a compatibility further expanded in this thesis.
O
OOH
O
OO
O
OO
O
Br
O
Br COCl
N
NNH
N
NH2
NH
NH
O
O
O
OO
O
OO
O
OO
O
O
N
N
N N
NH2
NH
N
OO
O
Br
Br
TEA, CHCl3
NaH, dry DMF
K2CO3, TBAI
r.t., 48 hyield 45%
dry DMFyield 60%
r.t., 48 hyield 75%
2-(2-bromoacetoxy) ethyl methacrylate
AMA
TMA
Figure 1.35 Formation of the adenine methacrylate (AMA) and thymine methacrylate (TMA)
monomers by nucleophilic substitution using alkylhalides. Taken from O'Reilly et al.191
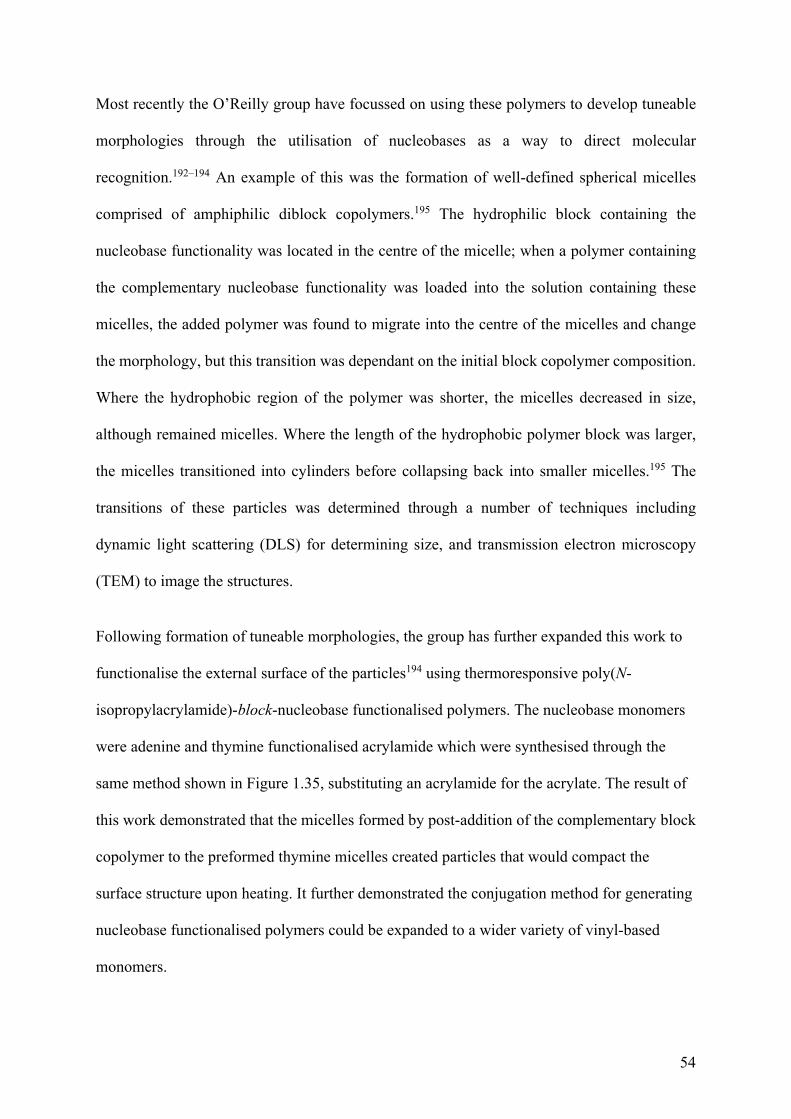
54
Most recently the O’Reilly group have focussed on using these polymers to develop tuneable
morphologies through the utilisation of nucleobases as a way to direct molecular
recognition.192–194 An example of this was the formation of well-defined spherical micelles
comprised of amphiphilic diblock copolymers.195 The hydrophilic block containing the
nucleobase functionality was located in the centre of the micelle; when a polymer containing
the complementary nucleobase functionality was loaded into the solution containing these
micelles, the added polymer was found to migrate into the centre of the micelles and change
the morphology, but this transition was dependant on the initial block copolymer composition.
Where the hydrophobic region of the polymer was shorter, the micelles decreased in size,
although remained micelles. Where the length of the hydrophobic polymer block was larger,
the micelles transitioned into cylinders before collapsing back into smaller micelles.195 The
transitions of these particles was determined through a number of techniques including
dynamic light scattering (DLS) for determining size, and transmission electron microscopy
(TEM) to image the structures.
Following formation of tuneable morphologies, the group has further expanded this work to
functionalise the external surface of the particles194 using thermoresponsive poly(N-
isopropylacrylamide)-block-nucleobase functionalised polymers. The nucleobase monomers
were adenine and thymine functionalised acrylamide which were synthesised through the
same method shown in Figure 1.35, substituting an acrylamide for the acrylate. The result of
this work demonstrated that the micelles formed by post-addition of the complementary block
copolymer to the preformed thymine micelles created particles that would compact the
surface structure upon heating. It further demonstrated the conjugation method for generating
nucleobase functionalised polymers could be expanded to a wider variety of vinyl-based
monomers.
55
This has to date culminated in the synthesis of several polymeric nanoparticles with both
morphology and fluorescence controlled through the incorporation of nucleobase
functionality.192 One such example was using 4-acryloylmorpholine-bloc-vinyl nucleobase
polymers containing either adenine or thymine functionality. These polymers were then
combined to form the micelle-like particles, and the thymine components cross-linked. This
resulted in fluorescent particles called non-conjugated polymer dots, similar to quantum or
carbon dots in function. The group demonstrated that confinement of the nucleobases,
particularly the adenine, results in π-π stacking which creates the emission-decay pathway
necessary for fluorescence. Further, it was shown that this fluorescence was generated in the
core of the particles primarily from adenine that had become entrapped during the cross-
linkeding process, see Figure 1.36.
Figure 1.36 Formation of the non-conjugated polymer dots. Taken from O’Rielly et al.192
1.8 Conclusions
Notably, to date all work with radical based polymer systems has been conducted using
nucleobases, rather than any larger subunit. The reasoning for this is likely the difficulty in
synthesising these compounds: the additional moieties increase the chance for cleavage or
56
competing polymerisation systems. The major limitation, however, is that these methods will
only ever be limited to synthetic systems and binding to natural DNA. The aim of this project
is to develop a nucleotide functionalised synthetic polymer that not only exhibits similar
binding properties but may in the future extend them to enzymatic compatibility.
There are 6 chapters that comprise the remainder of this thesis as follows:
Chapter 2: Experimental Methods, describes the methods and materials used to synthesise
and characterise the nucleotide bioconjugates developed in this thesis.
Chapter 3: Synthesis of poly(2-(5′-dimethoxytrityl-N-benzoyl-2′-deoxycytosine-
monophosphate)oxyethyl methacrylate): a cytosine rich methacrylate polymer, describes
the synthesis and characterisation of a nucleotide functionalised monomer bearing cytosine
functionality, and their subsequent polymerisation. It also includes the experimental
development process and justification for the reagents used in the synthesis.
Chapter 4: Synthesis of poly(2-(2′-deoxyguanosine-monophosphate)oxypropyl
methacrylate): a guanine rich methacrylate polymer, describes the polymerisation and
isolation of the bioconjugated polymers bearing guanine functionality. This chapter improves
and refines the methods presented in chapter 3. This includes detailing the deprotection and
detritylation of the polymer synthesised to generate an active guanine moiety. Also covered are
the competitive polymerisations and the kinetics of the polymerisation of the poly(2-(2′-
deoxyguanosine-monophosphate)oxypropyl methacrylate).
Chapter 5: Formation of G-quartets utilising nucleotide functionalised synthetic
polymers, describes the self-assembling and subsequent characterisation of G-quartets from
poly(2-(2′-deoxyguanosine-monophosphate)oxypropyl methacrylate). It also covers the effect
of monovalent cations, K+ and Na+, on the formation of the G-quartets and G-quadruplex.

57
Chapter 6: Interactions of nucleotide functionalised synthetic polymers with DNA using
Poly(2-(2′-deoxythymine-monophosphate)oxypropyl methacrylate) as a model system,
describes the interactions of the nucleotide functionalised synthetic polymer poly(2-(2′-
deoxythymine-monophosphate)oxypropyl methacrylate) with single stranded DNA.
Chapter 7 concludes the thesis, summarises its findings, and outlines potential future research
based on the work presented.
1.9 References
(1) Owen, B.; McMurray, C. Rapid Method for Measuring DNA Binding to Protein Using
Fluorescence Anisotropy. Protoc. Exch. 2009.
(2) Seligmann, H. Codon Expansion and Systematic Transcriptional Deletions Produce
Tetra-, Pentacoded Mitochondrial Peptides. J. Theor. Biol. 2015, 387, 154–165.
(3) Kanzaki, H.; Shinohara, F.; Kanako, I.; Yamaguchi, Y.; Fukaya, S.; Miyamoto, Y.;
Wada, S.; Nakamura, Y. Molecular Regulatory Mechanisms of Osteoclastogenesis
through Cytoprotective Enzymes. Redox Biol. 2016, 8, 186–191.
(4) Nirenberg, M.; Leder, P. RNA Codewords and Protein Synthesis: The Effect of
Trinucleotides upon the Binding of SRNA to Ribosomes. Science (80-. ). 1964, 145
(3639), 1399–1407.
(5) Wang, J.; Liu, G.; Munge, B.; Lin, L.; Zhu, Q. DNA-Based Amplified Bioelectronic
Detection and Coding of Proteins. Angew. Chemie Int. Ed. 2004, 43 (16), 2158–2161.
(6) Deleault, N. R.; Lucassen, R. W.; Supattapone, S. RNA Molecules Stimulate Prion
Protein Conversion. Nature 2003, 425 (6959), 717–720.
58
(7) Saenger, W. Why Study Nucleotide and Nucleic Acid Structure? In Principles of
Nucleic Acid Structure; Springer-Verlag, 1984; pp 1–8.
(8) Thaplyal, P.; Bevilacqua, P. C. Experimental Approaches for Measuring PKa’s in RNA
and DNA. In Methods in Enzymology; NIH Public Access, 2014; Vol. 549, pp 189–219.
(9) Thauer, R. K. Citric-Acid Cycle, 50 Years on. Modifications and an Alternative Pathway
in Anaerobic Bacteria. Eur. J. Biochem. 1988, 176 (3), 497–508.
(10) Kottur, J.; Nair, D. T. Pyrophosphate Hydrolysis Is an Intrinsic and Critical Step of the
DNA Synthesis Reaction. Nucleic Acids Res. 2018, 46 (12), 5875–5885.
(11) Westhof, E.; Yusupov, M.; Yusupova, G. Recognition of Watson-Crick Base Pairs:
Constraints and Limits Due to Geometric Selection and Tautomerism. F1000Prime
Reports. Faculty of 1000 Ltd 2014, p 19.
(12) Dahm, R. Friedrich Miescher and the Discovery of DNA. Dev. Biol. 2005, 278 (2), 274–
288.
(13) Watson, J. D.; Crick, F. H. Molecular Structure of Nucleic Acids. A Structure for
Deoxyribose Nucleic Acid. Nature 1953, 55 (2), 108–109.
(14) Pederson, T. Molecular Biology of the Gene: By James D. Watson: W. A. Benjamin
(1965): New York, New York. FASEB J. 2015, 29 (11), 4399–4401.
(15) Breslauer, K. J.; Frank, R.; Blocker, H.; Marky, L. A. Predicting DNA Duplex Stability
from the Base Sequence. Proc. Natl. Acad. Sci. 1986, 83 (11), 3746–3750.
(16) Cieplak, P.; Kollman, P. A. Calculation of the Free Energy of Association of Nucleic
Acid Bases in Vacuo and Water Solution. J. Am. Chem. Soc. 1988, 110 (12), 3734–3739.
59
(17) Zhang, T. B.; Zhang, C. L.; Dong, Z. L.; Guan, Y. F. Determination of Base Binding
Strength and Base Stacking Interaction of DNA Duplex Using Atomic Force
Microscope. Sci. Rep. 2015, 5, 9143.
(18) Sivakova, S.; Rowan, S. J. Nucleobases as Supramolecular Motifs. Chem. Soc. Rev.
2005, 34 (1), 9.
(19) Rossetti, G.; Dans, P. D.; Gomez-Pinto, I.; Ivani, I.; Gonzalez, C.; Orozco, M. The
Structural Impact of DNA Mismatches. Nucleic Acids Res. 2015, 43 (8), 4309–4321.
(20) Ebel, S.; Lane, A. N.; Brown, T. Very Stable Mismatch Duplexes: Structural and
Thermodynamic Studies on Tandem G.Cntdot.A Mismatches in DNA. Biochemistry
1992, 31 (48), 12083–12086.
(21) Lewis, J. P.; Sankey, O. F. Geometry and Energetics of DNA Basepairs and Triplets
from First Principles Quantum Molecular Relaxations. Biophys. J. 1995, 69 (3), 1068–
1076.
(22) Rurack, K.; Resch-Genger, U. Rigidization, Preorientation and Electronic Decoupling -
The “magic Triangle” for the Design of Highly Efficient Fluorescent Sensors and
Switches. Chem. Soc. Rev. 2002, 31 (2), 116–127.
(23) Pan, S.; Sun, X.; Lee, J. K. Stability of Complementary and Mismatched DNA
Duplexes: Comparison and Contrast in Gas versus Solution Phases. Int. J. Mass
Spectrom. 2006, 253 (3), 238–248.
(24) Sykes, M. T.; Levitt, M. Simulations of RNA Base Pairs in a Nanodroplet Reveal
Solvation-Dependent Stability. Proc. Natl. Acad. Sci. U. S. A. 2007, 104 (30), 12336–
12340.
60
(25) Sharma, P.; Mitra, A.; Sharma, S.; Singh, H.; Bhattacharyya, D. Quantum Chemical
Studies of Structures and Binding in Noncanonical RNA Base Pairs: The trans Watson-
Crick:Watson-Crick Family. J. Biomol. Struct. Dyn. 2008, 25 (6), 709–732.
(26) Chawla, M.; Abdel-Azeim, S.; Oliva, R.; Cavallo, L. Higher Order Structural Effects
Stabilizing the Reverse Watson-Crick Guanine-Cytosine Base Pair in Functional RNAs.
2014, 42 (2).
(27) Zemánek, M.; Kypr, J.; Vorlíčková, M. Conformational Properties of DNA Containing
(CCA)n and (TGG)n Trinucleotide Repeats. Int. J. Biol. Macromol. 2005, 36 (1–2), 23–
32.
(28) Peters, M.; Rozas, I.; Alkorta, I.; Elguero, J. DNA Triplexes: A Study of Their Hydrogen
Bonds. J. Phys. Chem. B 2002, 107 (1), 323–330.
(29) Lane, A. N.; Chaires, J. B.; Gray, R. D.; Trent, J. O. Stability and Kinetics of G-
Quadruplex Structures. Nucleic Acids Res. 2008, 36 (17), 5482–5515.
(30) Bang, I. Untersuchungen Über Die Guanylsäure. Biochem. Z. 1910, 26, 293–311.
(31) Gellert, M.; Lipsett, M. N.; Davies, D. R.; Lim, K. W.; Mechulam, Y.; Phan, A. T. Helix
Formation By Guanylic Acid. Proc. Natl. Acad. Sci. 1962, 48 (12), 2013–2018.
(32) Bhattacharyya, D.; Arachchilage, G. M.; Basu, S. Metal Cations in G-Quadruplex
Folding and Stability. Frontiers in Chemistry. Frontiers Media SA 2016, p 38.
(33) Pinnavaia, T. J.; Marshall, C. L.; Mettler, C. M.; Fisk, C. L.; Miles, H. T.; Becker, E. D.
Alkali Metal Ion Specificity in the Solution Ordering of a Nucleotide, 5’-Guanosine
Monophosphate. J. Am. Chem. Soc. 1978, 100 (11), 3625–3627.
61
(34) Williamson, J. R. G-Quartet Structures in Telomeric DNA. Annu. Rev. Biophys. Biomol.
Struct. 1994, 23 (1), 703–730.
(35) Breaker, R. R. Natural and Engineered Nucleic Acids as Tools to Explore Biology.
Nature 2004, 432 (7019), 838–845.
(36) Ellington, A.; Pollard, J. D. Synthesis and Purification of Oligonucleotides. In Current
Protocols in Molecular Biology; Wiley-Blackwell, 2001; Vol. 42, pp 2.11.1-2.11.25.
(37) Hance, N.; Ekstrand, M. I.; Trifunovic, A. Mitochondrial DNA Polymerase Gamma Is
Essential for Mammalian Embryogenesis. Hum. Mol. Genet. 2005, 14 (13), 1775–1783.
(38) Allemand, J. F.; Bensimon, D.; Jullien, L.; Bensimon, A.; Croquette, V. PH-Dependent
Specific Binding and Combing of DNA. Biophys. J. 1997, 73 (4), 2064–2070.
(39) Guo, Z.; Wang, Y.; Yang, A.; Yang, G. The Effect of PH on Charge Inversion and
Condensation of DNA. Soft Matter 2016, 12 (31), 6669–6674.
(40) Miller, S. A.; Dykes, D. D.; Polesky, H. F. A Simple Salting out Procedure for Extracting
DNA from Human Nucleated Cells. Nucleic Acids Res. 1988, 16 (3), 1215.
(41) Libonati, M.; Carsana, A.; Furia, A. Double-Stranded RNA. Mol. Cell. Biochem. 1980,
31 (1), 147–164.
(42) Yakovchuk, P.; Protozanova, E.; Frank-Kamenetskii, M. D. Base-Stacking and Base-
Pairing Contributions into Thermal Stability of the DNA Double Helix. Nucleic Acids
Res. 2006, 34 (2), 564–574.
(43) Mignon, P.; Loverix, S.; Steyaert, J.; Geerlings, P. Influence of the - Interaction on the
Hydrogen Bonding Capacity of Stacked DNA/RNA Bases. Nucleic Acids Res. 2005, 33
62
(6), 1779–1789.
(44) SantaLucia, J.; Allawi, H. T.; Seneviratne, P. A. Improved Nearest-Neighbor Parameters
for Predicting DNA Duplex Stability. Biochemistry 1996, 35 (11), 3555–3562.
(45) Huguet, J. M.; Ribezzi-Crivellari, M.; Bizarro, C. V.; Ritort, F. Derivation of Nearest-
Neighbor DNA Parameters in Magnesium from Single Molecule Experiments. Nucleic
Acids Res. 2017, 45 (22), 12921–12931.
(46) Matta, C. F.; Castillo, N.; Boyd, R. J. Extended Weak Bonding Interactions in DNA: π-
Stacking (Base−Base), Base−Backbone, and Backbone−Backbone Interactions. J. Phys.
Chem. B 2006, 110 (1), 563–578.
(47) Sharma, S. Non-B DNA Secondary Structures and Their Resolution by RecQ Helicases.
Journal of Nucleic Acids. Hindawi October 2, 2011, p 724215.
(48) Guiblet, W. M. F.; Cremona, M. A.; Cechova, M.; Harris, R. S.; Kejnovska, I.;
Kejnovsky, E.; Eckert, K.; Chiaromonte, F.; Makova, K. D. Non-B DNA Affects
Polymerization Speed and Error Rate in Sequencers and Living Cells, July 16, 2017.
(49) Wahl, M. C.; Sundaralingam, M. B-Form to A-Form Conversion by a 3’-Terminal
Ribose: Crystal Structure of the Chimera d(CCACTAGTG)r(G). Nucleic Acids Res.
2000, 28 (21), 4356–4363.
(50) Vongsutilers, V.; Phillips, D. J.; Train, B. C.; McKelvey, G. R.; Thomsen, N. M.;
Shaughnessy, K. H.; Lewis, J. P.; Gannett, P. M. The Conformational Effect of Para-
Substituted C8-Arylguanine Adducts on the B/Z-DNA Equilibrium. Biophys. Chem.
2011, 154 (1), 41–48.
63
(51) Mauroesguerroto. File:Dnaconformations.png - Wikimedia Commons
https://commons.wikimedia.org/wiki/File:Dnaconformations.png (accessed Jun 18,
2018).
(52) Ussery, D. W. DNA Structure: A-, B- and Z-DNA Helix Families. In Encyclopedia of
Life Sciences; John Wiley & Sons, Ltd: Chichester, UK, 2002.
(53) Vargason, J. M.; Henderson, K.; Ho, P. S. A Crystallographic Map of the Transition
from B-DNA to A-DNA. Proc. Natl. Acad. Sci. U. S. A. 2001, 98 (13), 7265–7270.
(54) Portugal, J.; Subirana, J. A. Counterions Which Favour the C Form of DNA. EMBO J.
1985, 4 (9), 2403–2408.
(55) Rhodes, N. J.; Mahendrasingam, A.; Pigram, W. J.; Fuller, W.; Brahms, J.; Vergne, J.;
Warren, R. A. J. The C Conformation Is a Low Salt Form of Sodium DNA. Nature 1982,
296 (5854), 267–269.
(56) Rich, A.; Nordheim, A.; Wang, A. H. J. The Chemistry and Biology of Left-Handed Z-
DNA. Annu. Rev. Biochem. 1984, 53 (1), 791–846.
(57) Ho, P. S. The Non-B-DNA Structure of d(CA/TG)n Does Not Differ from That of Z-
DNA. Proc. Natl. Acad. Sci. U. S. A. 1994, 91 (20), 9549–9553.
(58) Srinivasan, J.; Cheatham, T. E.; Cieplak, P.; Kollman, P. A.; Case, D. A. Continuum
Solvent Studies of the Stability of DNA, RNA, and Phosphoramidate-DNA Helices. J.
Am. Chem. Soc. 1998, 120 (37), 9401–9409.
(59) Dickerson, R. E.; Klug, A. Base Sequence and Helix Structure Variation in B and A
DNA. J. Mol. Biol. 1983, 166 (3), 419–441.
64
(60) Franklin, R. E.; Gosling, R. G. The Structure of Sodium Thymonucleate Fibres. I. The
Influence of Water Content. Acta Crystallogr. 1953, 6 (8), 673–677.
(61) Lu, X. J.; Shakked, Z.; Olson, W. K. A-Form Conformational Motifs in Ligand-Bound
DNA Structures. J. Mol. Biol. 2000, 300 (4), 819–840.
(62) Kulkarni, M.; Mukherjee, A. Understanding B-DNA to A-DNA Transition in the Right-
Handed DNA Helix: Perspective from a Local to Global Transition. Prog. Biophys. Mol.
Biol. 2017, 128, 63–73.
(63) Dickerson, R. E.; Drew, H. R.; Conner, B. N.; Wing, R. M.; Fratini, A. V; Kopka, M. L.
The Anatomy of A-, B-, and Z-DNA. Science (80-. ). 1982, 216 (4545), 475–485.
(64) Van Dam, L.; Levitt, M. H. BII Nucleotides in the B and C Forms of Natural-Sequence
Polymeric DNA: A New Model for the C Form of DNA. J. Mol. Biol. 2000, 304 (4),
541–561.
(65) Zimmerman, S. B.; Pheiffer, B. H. Does DNA Adopt the C Form in Concentrated Salt
Solutions or in Organic Solvent/Water Mixtures? An X-Ray Diffraction Study of DNA
Fibers Immersed in Various Media. J. Mol. Biol. 1980, 142 (3), 315–330.
(66) Stegle, O.; Payet, L.; Mergny, J. L.; MacKay, D. J. C.; Huppert, J. L. Predicting and
Understanding the Stability of G-Quadruplexes. Bioinformatics 2009, 25 (12), 374–382.
(67) Phan, A. T.; Kuryavyi, V.; Luu, K. N.; Patel, D. J. Structure of Two Intramolecular G-
Quadruplexes Formed by Natural Human Telomere Sequences in K+ Solution. Nucleic
Acids Res. 2007, 35 (19), 6517–6525.
(68) Kotch, F. W.; Fettinger, J. C.; Davis, J. T. A Lead-Filled G-Quadruplex: Insight into the
65
G-Quartet’s Selectivity for Pb2+ over K+. Org. Lett. 2000, 2 (21), 3277–3280.
(69) Lee, M. P. H.; Parkinson, G. N.; Hazel, P.; Neidle, S. Observation of the Coexistence of
Sodium and Calcium Ions in a DNA G-Quadruplex Ion Channel. J. Am. Chem. Soc.
2007, 129 (33), 10106–10107.
(70) Kankia, B. I.; Marky, L. A. Folding of the Thrombin Aptamer into a G-Quadruplex with
Sr2+: Stability, Heat, and Hydration. J. Am. Chem. Soc. 2001, 123 (44), 10799–10804.
(71) Shi, X.; Fettinger, J. C.; Davis, J. T. Homochiral G-Quadruplexes with Ba2+ but Not
with K+: The Cation Programs Enantiomeric Self-Recognition. J. Am. Chem. Soc. 2001,
123 (27), 6738–6739.
(72) Zhang, D.; Huang, T.; Lukeman, P. S.; Paukstelis, P. J. Crystal Structure of a DNA/Ba2+
G-Quadruplex Containing a Water-Mediated C-Tetrad. Nucleic Acids Res. 2014, 42
(21), 13422–13429.
(73) Ida, R.; Wu, G. Solid-State 87Rb NMR Signatures for Rubidium Cations Bound to a G-
Quadruplex. Chem. Commun. 2005, No. 34, 4294–4296.
(74) Nagesh, N.; Chatterji, D. Ammonium Ion at Low Concentration Stabilizes the G-
Quadruplex Formation by Telomeric Sequence. J. Biochem. Biophys. Methods 1995, 30
(1), 1–8.
(75) Kan, Z.; Yao, Y.; Wang, P.; Li, X.; Hao, Y.; Tan, Z. Molecular Crowding Induces
Telomere G-Quadruplex Formation under Salt-Deficient Conditions and Enhances Its
Competition with Duplex Formation. Angew. Chemie Int. Ed. 2006, 45 (10), 1629–1632.
(76) Tóthová, P.; Krafčíková, P.; Víglaský, V. Formation of Highly Ordered Multimers in G-

66
Quadruplexes. Biochemistry 2014, 53 (45), 7013–7027.
(77) Rhodes, D.; Lipps, H. J. Survey and Summary G-Quadruplexes and Their Regulatory
Roles in Biology. Nucleic Acids Research. Oxford University Press October 15, 2015,
pp 8627–8637.
(78) Kaiser, C. E.; Gokhale, V.; Yang, D.; Hurley, L. H. Gaining Insights into the Small
Molecule Targeting of the G-Quadruplex in the c-MYC Promoter Using NMR and an
Allele-Specific Transcriptional Assay. In Topics in current chemistry; 2012; Vol. 330,
pp 1–21.
(79) Han, H.; Hurley, L. H. G-Quadruplex DNA: A Potential Target for Anti-Cancer Drug
Design. Trends Pharmacol. Sci. 2000, 21 (4), 136–142.
(80) Balasubramanian, S.; Neidle, S. G-Quadruplex Nucleic Acids as Therapeutic Targets.
Curr. Opin. Chem. Biol. 2009, 13 (3), 345–353.
(81) Bidzinska, J.; Cimino-Reale, G.; Zaffaroni, N.; Folini, M. G-Quadruplex Structures in
the Human Genome as Novel Therapeutic Targets. Molecules 2013, 18 (10), 12368–
12395.
(82) Livshits, G. I.; Stern, A.; Rotem, D.; Borovok, N.; Eidelshtein, G.; Migliore, A.; Penzo,
E.; Wind, S. J.; Di Felice, R.; Skourtis, S. S.; et al. Long-Range Charge Transport in
Single G-Quadruplex DNA Molecules. Nat. Nanotechnol. 2014, 9 (12), 1040–1046.
(83) Alberti, P.; Mergny, J.-L. DNA Duplex-Quadruplex Exchange as the Basis for a
Nanomolecular Machine. Proc. Natl. Acad. Sci. U. S. A. 2003, 100 (4), 1569–1573.
(84) Berlin, Y. A.; Burin, A. L.; Ratner, M. A. DNA as a Molecular Wire. Superlattices
67
Microstruct. 2000, 28 (4), 241–252.
(85) Catherall, T.; Huskisson, D.; McAdams, S.; Vijayaraghavan, A. Self-Assembly of One
Dimensional DNA-Templated Structures. J. Mater. Chem. C 2014, 2 (34), 6895–6920.
(86) Marsh, T. C.; Vesenka, J.; Henderson, E. A New DNA Nanostructure, the G-Wire,
Imaged by Scanning Probe Microscopy. Nucleic Acids Res. 1995, 23 (4), 696–700.
(87) Nielsen, P. E. Peptide Nucleic Acid. A Molecule with Two Identities. Acc. Chem. Res.
1999, 32 (7), 624–630.
(88) Chien, A.; Edgar, D. B.; Trela, J. M. Deoxyribonucleic Acid Polymerase from the
Extreme Thermophile Thermus Aquaticus. J. Bacteriol. 1976, 127 (3), 1550.
(89) Berg, J. M.; Tymoczko, J. L.; Stryer, L. Biochemistry; W.H. Freeman, 2002.
(90) Teplitz, R. R. An Introduction to Genetic Analysis. JAMA J. Am. Med. Assoc. 2011, 257
(16), 2223.
(91) PCR Selection Chart | NEB https://www.neb.com/tools-and-resources/selection-
charts/pcr-selection-chart (accessed May 23, 2018).
(92) Ppyun, H.; Kim, S. H.; Youn, M. H.; Cho, S. S.; Kwon, K. M.; Kweon, D. H.; Kwon, S.
T. Improved PCR Performance and Fidelity of Double Mutant Neq A523R/N540R DNA
Polymerase. Enzyme Microb. Technol. 2016, 82, 197–204.
(93) Cheng, S.; Fockler, C.; Barnes, W. M.; Higuchi, R. Effective Amplification of Long
Targets from Cloned Inserts and Human Genomic DNA. Proc. Natl. Acad. Sci. U. S. A.
1994, 91 (12), 5695–5699.
68
(94) Shuber, A. P. Universal Primer Sequence for Multiplex DNA Amplification.
WO1996041012A1, June 7, 1995.
(95) Truett, G. E.; Heeger, P.; Mynatt, R. L.; Truett, A. A.; Walker, J. A.; Warman, M. L.
Annealing Control Primer System for Improving Specificity of PCR Amplification.
Biotechniques. Biotechniques 2004, 35 (6), 1180–1184.
(96) Brownstein, M. J.; Carpten, J. D.; Smith, J. R. Modulation of Non-Templated Nucleotide
Addition by Taq DNA Polymerase: Primer Modifications That Facilitate Genotyping.
Biotechniques 1996, 20 (6), 1004–1010.
(97) Wang, Y.; Barbacioru, C.; Hyland, F.; Xiao, W.; Hunkapiller, K. L.; Blake, J.; Chan, F.;
Gonzalez, C.; Zhang, L.; Samaha, R. R. Large Scale Real-Time PCR Validation on Gene
Expression Measurements from Two Commercial Long-Oligonucleotide Microarrays.
BMC Genomics 2006, 7 (1), 59.
(98) Gill, P.; Ghaemi, A. Nucleic Acid Isothermal Amplification Technologies - A Review.
Nucleosides, Nucleotides and Nucleic Acids 2008, 27 (3), 224–243.
(99) LeProust, E. M.; Peck, B. J.; Spirin, K.; McCuen, H. B.; Moore, B.; Namsaraev, E.;
Caruthers, M. H. Synthesis of High-Quality Libraries of Long (150mer)
Oligonucleotides by a Novel Depurination Controlled Process. Nucleic Acids Res. 2010,
38 (8), 2522–2540.
(100) Kodumal, S. J.; Patel, K. G.; Reid, R.; Menzella, H. G.; Welch, M.; Santi, D. V. Total
Synthesis of Long DNA Sequences: Synthesis of a Contiguous 32-Kb Polyketide
Synthase Gene Cluster. Proc. Natl. Acad. Sci. U. S. A. 2004, 101 (44), 15573–15578.
(101) Hughes, R. A.; Ellington, A. D. Synthetic DNA Synthesis and Assembly: Putting the
69
Synthetic in Synthetic Biology. Cold Spring Harb. Perspect. Biol. 2017, 9 (1), a023812.
(102) Roy, S.; Caruthers, M. Synthesis of DNA/RNA and Their Analogs via Phosphoramidite
and H-Phosphonate Chemistries. Molecules 2013, 18 (11), 14268–14284.
(103) Corby, N. S.; Kenner, G. W.; Todd, A. R. Nucleotides. Part XVI. Ribonucleoside-5′
Phosphites. A New Method for the Preparation of Mixed Secondary Phosphites. Journal
of the Chemical Society (Resumed). The Royal Society of Chemistry January 1, 1952,
pp 3648–3649.
(104) Gilham, P. T.; Khorana, H. G. Studies on Polynucleotides. I. A New and General
Method for the Chemical Synthesis of the C5′-C3′ Internucleotidic Linkage. Syntheses
of Deoxyribo-Dinucleotides. J. Am. Chem. Soc. 1958, 80 (23), 6212–6222.
(105) Stawinski, J.; Kraszewski, A. Some Aspects of Oligoribonucleotides Synthesis via the
H-Phosphonate Approach. Acta Biochim. Pol. 1998, 45 (4), 907–915.
(106) Kung, P.-P.; Jones, R. A. H-Phosphonate DNA Synthesis without Amino Protection.
Tetrahedron Lett. 1992, 33 (40), 5869–5872.
(107) Reese, C. B. The Chemical Synthesis of Oligo- and Poly-Nucleotides by the
Phosphotriester Approach. Tetrahedron 1978, 34 (21), 3143–3179.
(108) Cashion, P.; Porter, K.; Cadger, T.; Sathe, G.; Tranquilla, T.; Notman, H.; Jay, E.
Simplification of DNA Synthesis by the Phosphotriester Method. Tetrahedron Lett.
1976, 17 (42), 3769–3772.
(109) Beaucage, S. L.; Iyer, R. P. Advances in the Synthesis of Oligonucleotides by the
Phosphoramidite Approach. Tetrahedron 1992, 48 (12), 2223–2311.

70
(110) Efimov, V. A.; Molchanova, N. S.; Chakhmakhcheva, O. G. Approach to the Synthesis
of Natural and Modified Oligonucleotides by the Phosphotriester Method Using O-
Nucleophilic Intramolecular Catalysis. Nucleosides, Nucleotides and Nucleic Acids
2007, 26 (8–9), 1087–1093.
(111) Grøndahl, L.; Suzuki, S.; Wentrup-Byrne, E. Influence of a Diene Impurity on the
Molecular Structure of Phosphate-Containing Polymers with Medical Applications.
Chem. Commun. (Camb). 2008, No. 28, 3314–3316.
(112) Gaytán, P. Chemical Synthesis of Oligonucleotides Using Acetone as a Washing
Solvent. Biotechniques 2009, 47 (2), 701–702.
(113) Guzaev, A.; Manoharan, M. Conjugation of Oligonucleotides via an Electrophilic
Tether: N- Chloroacetamidohexyl Phosphoramidite Reagent. Bioorganic Med. Chem.
Lett. 1998, 8 (24), 3671–3676.
(114) Vargeese, C.; Carter, J.; Yegge, J.; Krivjansky, S.; Settle, A.; Kropp, E.; Peterson, K.;
Pieken, W. Efficient Activation of Nucleoside Phosphoramidites with 4,5-
Dicyanoimidazole during Oligonucleotide Synthesis. Nucleic Acids Res. 1998, 26 (4),
1046–1050.
(115) DNA Oligonucleotide Synthesis. Sigma-Aldrich Technical Documents. 2017, pp 5–9.
(116) Welz, R.; Müller, S. 5-(Benzylmercapto)-1H-Tetrazole as Activator for 2′-O-TBDMS
Phosphoramidite Building Blocks in RNA Synthesis. Tetrahedron Lett. 2002, 43 (5),
795–797.
(117) Froehler, B. C.; Matteucci, M. D. Substituted 5-Phenyltetrazoles: Improved Activators
of Deoxynucleoside Phosphoramidites in Deoxyoligonucleotide Synthesis. Tetrahedron
71
Lett. 1983, 24 (31), 3171–3174.
(118) Berner, S.; Mü-hlegger, K.; Seliger, H. The Reaction of Tetrazole with
Phosphoramidites as a Model for the Nucleotide Coupling Step. Nucleosides and
Nucleotides 1988, 7 (5–6), 763–767.
(119) Berner, S.; Mühlegger, K.; Seliger, H. Studies on the Role of Tetrazole in the Activation
of Phosphoramidites. Nucleic Acids Res. 1989, 17 (3), 853–864.
(120) Russell, M. A.; Laws, A. P.; Atherton, J. H.; Page, M. I. The Mechanism of the
Phosphoramidite Synthesis of Polynucleotides. Org. Biomol. Chem. 2008, 6 (18), 3270.
(121) Vargeese, C.; Carter, J.; Yegge, J.; Krivjansky, S.; Settle, A.; Kropp, E.; Peterson, K.;
Pieken, W. Efficient Activation of Nucleoside Phosphoramidites with 4,5-
Dicyanoimidazole during Oligonucleotide Synthesis. Nucleic Acids Res. 1998, 26 (4),
1046–1050.
(122) Sanghvi, Y. S.; Guo, Z.; Pfundheller, H. M.; Converso, A. Improved Process for the
Preparation of Nucleosidic Phosphoramidites Using a Safer and Cheaper Activator. Org.
Process Res. Dev. 2000, 4 (3), 175–181.
(123) Beaucage, S. L.; Caruthers, M. H. Synthetic Strategies and Parameters Involved in the
Synthesis of Oligodeoxyribonucleotides According to the Phosphoramidite Method.
Curr. Protoc. Nucleic Acid Chem. 2000, 00 (1), 3.3.1-3.3.20.
(124) DCI-A Logical Alternative Activator; 1997.
(125) Wincott, F.; Direnzo, A.; Shaffer, C.; Grimm, S.; Tracz, D.; Workman, C.; Sweedler,
D.; Gonzalez, C.; Scaringe, S.; Usman, N. Synthesis, Deprotection, Analysis and
72
Purification of RNA and Ribosomes. Nucleic Acids Res. 1995, 23 (14), 2677–2684.
(126) Iwai, S.; Shimizu, M.; Kamiya, H.; Ohtsuka, E. Synthesis of a Phosphoramidite
Coupling Unit of the Pyrimidine (6-4) Pyrimidone Photoproduct and Its Incorporation
into Oligodeoxynucleotides. J. Am. Chem. Soc. 1996, 118 (32), 7642–7643.
(127) Nikiforov, T. T.; Connolly, B. A. Straightforward Preparation and Use in
Oligodeoxynucleotide Synthesis of 5′-O-(4,4′-Dimethoxytrityl)-4-[S-(2-Cyanoethyl)]-
Thiothymidine. Tetrahedron Lett. 1992, 33 (17), 2379–2382.
(128) Vu, H.; McCollum, C.; Jacobson, K.; Theisen, P.; Vinayak, R.; Spiess, E.; Andrus, A.
Fast Oligonucleotide Deprotection Phosphoramidite Chemistry for DNA Synthesis.
Tetrahedron Lett. 1990, 31 (50), 7269–7272.
(129) Guzaev, A. P.; Vvedenskiy, V. V.; Khirud Gogoi. Solid Supports and Phosphoramidite
Building Blocks for Oligonucleotide Conjugates. US20180016232A1, July 14, 2017.
(130) Srivastava, S. C.; Thatikonda, S. K.; Shukla, P.; Srivastav, S. K. Synthesis of High Purity
Dmt-C3-Disulfide Phosphoramidite. WO2013126034A1, February 22, 2012.
(131) Maier, M. A.; Choi, Y.; Gaus, H.; Barchi, J. J.; Marquez, V. E.; Manoharan, M.
Synthesis and Characterization of Oligonucleotides Containing Conformationally
Constrained Bicyclo[3.1.0]Hexane Pseudosugar Analogs. Nucleic Acids Res. 2004, 32
(12), 3642–3650.
(132) Cvetovich, R. J. Hydrogen Peroxide Oxidation of Phosphite Triesters in Oligonucleotide
Syntheses. Org. Process Res. Dev. 2010, 14 (1), 295–297.
(133) Proudnikov, D.; Mirzabekov, A. Chemical Methods of DNA and RNA Fluorescent
73
Labeling. Nucleic Acids Res. 1996, 24 (22), 4535–4542.
(134) Sinha, N. D.; Cook, R. M. The Preparation and Application of Functionalised Synthetic
Oligonucleotides: III. Use of H-Phosphonate Derivatives of Protected Amino-Hexanol
and Mercapto-Propanol or-Hexanol. Nucleic Acids Res. 1988, 16 (6), 2659–2670.
(135) Kupihár, Z.; Schmél, Z.; Kele, Z.; Penke, B.; Kovács, L. Synthesis and Application of a
Novel, Crystalline Phosphoramidite Monomer with Thiol Terminus, Suitable for the
Synthesis of DNA Conjugates. Bioorganic Med. Chem. 2001, 9 (5), 1241–1247.
(136) Rabe, K. S.; Niemeyer, C. M. Selective Covalent Conjugation of Phosphorothioate DNA
Oligonucleotides with Streptavidin. Molecules 2011, 16 (8), 6916–6926.
(137) Jacobsen, J. P.; Pedersen, J. B.; Hansen, L. F.; Wemmer, D. E. Site Selective Bis-
Intercalation of a Homodimeric Thiazole Orange Dye in DNA Oligonucleotides.
Nucleic Acids Res 1995, 23 (5), 753–760.
(138) Rye, H. S.; Yue, S.; Wemmer, D. E.; Quesada, M. A.; Haugland, R. P.; Mathies, R. A.;
Glazer, A. N. Stable Fluorescent Complexes of Double-Stranded DNA with Bis-
Intercalating Asymmetric Cyanine Dyes: Properties and Applications. Nucleic Acids
Res. 1992, 20 (11), 2803–2812.
(139) Gudnason, H.; Dufva, M.; Bang, D. D.; Wolff, A. Comparison of Multiple DNA Dyes
for Real-Time PCR: Effects of Dye Concentration and Sequence Composition on DNA
Amplification and Melting Temperature. Nucleic Acids Res. 2007, 35 (19), e127.
(140) Singer, V. L.; Lawlor, T. E.; Yue, S. Comparison of SYBR® Green I Nucleic Acid Gel
Stain Mutagenicity and Ethidium Bromide Mutagenicity in the Salmonella/Mammalian
Microsome Reverse Mutation Assay (Ames Test). Mutat. Res. Toxicol. Environ.
74
Mutagen. 1999, 439 (1), 37–47.
(141) Olmsted, J.; Kearns, D. R. Mechanism of Ethidium Bromide Fluorescence Enhancement
on Binding to Nucleic Acids. Biochemistry 1977, 16 (16), 3647–3654.
(142) Millar, D. P.; Robbins, R. J.; Zewail, A. H. Torsion and Bending of Nucleic Acids
Studied by Ubnanosecond Time-Resolved Fluorescence Depolarization of Intercalated
Dyes. J. Chem. Phys. 1982, 76 (4), 2080–2094.
(143) Biebricher, A. S.; Heller, I.; Roijmans, R. F. H.; Hoekstra, T. P.; Peterman, E. J. G.;
Wuite, G. J. L. The Impact of DNA Intercalators on DNA and DNA-Processing
Enzymes Elucidated through Force-Dependent Binding Kinetics. Nat. Commun. 2015,
6 (1), 7304.
(144) Armitage, B. A. Cyanine Dye-DNA Interactions: Intercalation, Groove Binding, and
Aggregation. Top. Curr. Chem. 2005, 253, 55–76.
(145) Bengtsson, M.; Karlsson, H. J.; Westman, G.; Kubista, M. A New Minor Groove
Binding Asymmetric Cyanine Reporter Dye for Real-Time PCR. Nucleic Acids Res.
2003, 31 (8), 45e – 45.
(146) Latt, S. A.; Stetten, G.; Juergens, L. A.; Willard, H. F.; Scher, C. D. Recent
Developments in the Detection of Deoxyribonucleic Acid Synthesis by 33258 Hoechst
Fluorescence. J. Histochem. Cytochem. 1975, 23 (7), 493–505.
(147) Zipper, H.; Brunner, H.; Bernhagen, J.; Vitzthum, F. Investigations on DNA
Intercalation and Surface Binding by SYBR Green I, Its Structure Determination and
Methodological Implications. Nucleic Acids Res. 2004, 32 (12), e103–e103.
75
(148) Blake, A.; Peacocke, A. R. The Interaction of Aminoacridines with Nucleic Acids.
Biopolymers 1968, 6 (9), 1225–1253.
(149) Armstrong, R. W.; Kurucsev, T.; Strauss, U. P. Interaction between Acridine Dyes and
Deoxyribonucleic Acid. J. Am. Chem. Soc. 1970, 92 (10), 3174–3181.
(150) McHale, R.; OReilly, R. K. Nucleobase Containing Synthetic Polymers: Advancing
Biomimicry via Controlled Synthesis and Self-Assembly. Macromolecules 2012, 45
(19), 7665–7675.
(151) Tasdelen, M. A.; Yagci, Y.; Levent Demirel, A.; Biedron, T.; Kubisa, P. Synthesis and
Characterization of Block-Graft Copolymers [Poly(Epichlorohydrin-b-Styrene)-
Gpoly(Methyl Methacrylate)] by Combination of Activated Monomer Polymerization,
NMP and ATRP. Polym. Bull. 2007, 58 (4), 653–663.
(152) Manguian, M.; Save, M.; Charleux, B. Batch Emulsion Polymerization of Styrene
Stabilized by a Hydrophilic Macro-RAFT Agenta. Macromol. Rapid Commun. 2006, 27
(6), 399–404.
(153) Klaerner, G.; Trollsås, M.; Heise, A.; Husemann, M.; Atthoff, B.; Hawker, C. J.;
Hedrick, J. L.; Miller, R. D. Concurrent Chain and Stepwise Polymerizations for the
Preparation of Block Copolymers in One Step. Macromolecules 1999, 32 (24), 8227–
8229.
(154) Wang, F.; Hickner, M.; Kim, Y. S.; Zawodzinski, T. A.; McGrath, J. E. Direct
Polymerization of Sulfonated Poly(Arylene Ether Sulfone) Random (Statistical)
Copolymers: Candidates for New Proton Exchange Membranes. J. Memb. Sci. 2002,
197 (1–2), 231–242.
76
(155) Wang, F.; Hickner, M.; Ji, Q.; Harrison, W.; Mecham, J.; Zawodzinski, T. A.; McGrath,
J. E. Synthesis of Highly Sulfonated Poly(Arylene Ether Sulfone) Random(Statistical)
Copolymers via Direct Polymerization. Macromol. Symp. 2001, 175 (1), 387–396.
(156) Bhanu, V. .; Rangarajan, P.; Wiles, K.; Bortner, M.; Sankarpandian, M.; Godshall, D.;
Glass, T. .; Banthia, A. .; Yang, J.; Wilkes, G.; et al. Synthesis and Characterization of
Acrylonitrile Methyl Acrylate Statistical Copolymers as Melt Processable Carbon Fiber
Precursors. Polymer (Guildf). 2002, 43 (18), 4841–4850.
(157) Harwood, H. J. Structures and Compositions of Copolymers. Makromol. Chemie.
Macromol. Symp. 1987, 10–11 (1), 331–354.
(158) Fineman, M.; Ross, S. D. Linear Method for Determining Monomer Reactivity Ratios
in Copolymerization. J. Polym. Sci. 1950, 5 (2), 259–262.
(159) Green Book, 2nd Ed.: IUPAC Quantities, Units and Symbols in Physical Chemistry.
Second Edition, Blackwell Scientific Publications, Oxford, 1993.; 2007.
(160) Stepto, R. F. T. Dispersity in Polymer Science (IUPAC Recommendations 2009). Pure
Appl. Chem. 2009, 81 (2), 351–353.
(161) Moad, G.; Rizzardo, E.; Thang, S. H. Living Radical Polymerization by the RAFT
Process A Second Update. Aust. J. Chem. 2009, 62 (11), 1402–1472.
(162) Boyer, C.; Soeriyadi, A. H.; Zetterlund, P. B.; Whittaker, M. R. Synthesis of Complex
Multiblock Copolymers via a Simple Iterative Cu(0)-Mediated Radical Polymerization
Approach. Macromolecules 2011, 44 (20), 8028–8033.
(163) Huh, K. M.; Bae, Y. H. Synthesis and Characterization of Poly(Ethylene Glycol)/Poly(l-

77
Lactic Acid) Alternating Multiblock Copolymers. Polymer (Guildf). 1999, 40 (22),
6147–6155.
(164) Thickett, S. C.; Gilbert, R. G. Emulsion Polymerization: State of the Art in Kinetics and
Mechanisms. Polymer (Guildf). 2007, 48 (24), 6965–6991.
(165) Murray, M. J.; Snowden, M. J. The Preparation, Characterisation and Applications of
Colloidal Microgels. Adv. Colloid Interface Sci. 1995, 54 (C), 73–91.
(166) Li, B.; Brooks, B. W. Semi‐batch Processes for Emulsion Polymerisation. Polym. Int.
1992, 29 (1), 41–46.
(167) Prescott, S. W. Chain-Length Dependence in Living/Controlled Free-Radical
Polymerizations: Physical Manifestation and Monte Carlo Simulation of Reversible
Transfer Agents. Macromolecules 2003, 36 (25), 9608–9621.
(168) Izgorodina, E. I.; Coote, M. L. Is the Addition-Fragmentation Step of the RAFT
Polymerisation Process Chain Length Dependent? Macromol. Theory Simulations 2006,
15 (5), 394–403.
(169) Jenkins, A. D.; Jones, R. G.; Moad, G. Terminology for Reversible-Deactivation Radical
Polymerization Previously Called “Controlled” Radical or “Living” Radical
Polymerization (IUPAC Recommendations 2010). Pure Appl. Chem. 2009, 82 (2), 483–
491.
(170) Shipp, D. A. Reversible-Deactivation Radical Polymerizations. Polymer Reviews.
Taylor & Francis Group April 22, 2011, pp 99–103.
(171) Konkolewicz, D.; Wang, Y.; Zhong, M.; Krys, P.; Isse, A. A.; Gennaro, A.;
78
Matyjaszewski, K. Reversible-Deactivation Radical Polymerization in the Presence of
Metallic Copper. A Critical Assessment of the SARA ATRP and SET-LRP
Mechanisms. Macromolecules. American Chemical Society November 26, 2013, pp
8749–8772.
(172) Chiefari, J.; Chong, Y. K. B.; Ercole, F.; Krstina, J.; Jeffery, J.; Le, T. P. T.; Mayadunne,
R. T. A.; Meijs, G. F.; Moad, C. L.; Moad, G.; et al. Living Free-Radical Polymerization
by Reversible Addition - Fragmentation Chain Transfer : The RAFT Process We Wish
to Report a New Living Free-Radical Polymer- Ization of Exceptional Effectiveness and
Versatility . 1 The Living Character Is Conferred By. Macromolecules 1998, 31 (16),
5559–5562.
(173) Moad, G.; Rizzardo, E.; Thang, S. H. RAFT Polymerization and Some of Its
Applications. Chem. - An Asian J. 2013, 8 (8), 1634–1644.
(174) Moad, G.; Rizzardo, E.; Thang, S. H. Living Radical Polymerization by the RAFT
Process a Third Update. In Australian Journal of Chemistry; CSIRO PUBLISHING,
2012; Vol. 65, pp 985–1076.
(175) Chong, B. Y. K.; Krstina, J.; Le, T. P. T.; Moad, G.; Postma, A.; Rizzardo, E.; Thang,
S. H. Thiocarbonylthio Compounds [S=C(Ph)S-R) in Free Radical Polymerization with
Reversible Addition-Fragmentation Chain Transfer (RAFT Polymerization). Role of the
Free-Radical Leaving Group (R). Macromolecules 2003, 36 (7), 2256–2272.
(176) Chong, B. Y. K.; Le, T. P. T.; Moad, G.; Rizzardo, E.; Thang, S. H. More Versatile
Route to Block Copolymers and Other Polymers of Complex Architecture by Living
Radical Polymerization: The RAFT Process. Macromolecules 1999, 32 (6), 2071–2074.
79
(177) Perrier, S.; Davis, T. P.; Carmichael, A. J.; Haddleton, D. M. First Report of Reversible
Addition–Fragmentation Chain Transfer (RAFT) Polymerisation in Room Temperature
Ionic Liquids. Chem. Commun. 2002, 2 (19), 2226–2227.
(178) Barner-Kowollik, C.; Buback, M.; Charleux, B.; Coote, M. L.; Drache, M.; Fukuda, T.;
Goto, A.; Klumperman, B.; Lowe, A. B.; Mcleary, J. B.; et al. Mechanism and Kinetics
of Dithiobenzoate-Mediated RAFT Polymerization. I. The Current Situation. J. Polym.
Sci. Part A Polym. Chem. 2006, 44 (20), 5809–5831.
(179) Baussard, J.-F.; Habib-Jiwan, J.-L.; Laschewsky, A.; Mertoglu, M.; Storsberg, J. New
Chain Transfer Agents for Reversible Addition-Fragmentation Chain Transfer (RAFT)
Polymerisation in Aqueous Solution. Polymer (Guildf). 2004, 45 (11), 3615–3626.
(180) Moad, G.; Rizzardo, E.; Thang, S. H. Living Radical Polymerization by the RAFT
Process. Aust. J. Chem. 2005, 58 (6), 379–410.
(181) Mayadunne, R. T. A.; Rizzardo, E.; Chiefari, J.; Krstina, J.; Moad, G.; Postma, A.;
Thang, S. H. Living Polymers by the Use of Trithiocarbonates as Reversible Addition-
Fragmentation Chain Transfer (RAFT) Agents: ABA Triblock Copolymers by Radical
Polymerization in Two Steps. Macromolecules 2000, 33 (2), 243–245.
(182) Delduc, P.; Tailhan, C.; Zard, S. Z. A Convenient Source of Alkyl and Acyl Radicals. J.
Chem. Soc. Chem. Commun. 1988, 0 (4), 308–310.
(183) McLeary, J. B.; McKenzie, J. M.; Tonge, M. P.; Sanderson, R. D.; Klumperman, B.
Initialisation in RAFT-Mediated Polymerisation of Methyl Acrylate. Chem. Commun.
2004, 10 (17), 1950–1951.
(184) McLeary, J. B.; Calitz, F. M.; McKenzie, J. M.; Tonge, M. P.; Sanderson, R. D.;
80
Klumperman, B. Beyond Inhibition: A 1H NMR Investigation of the Early Kinetics of
RAFT-Mediated Polymerization with the Same Initiating and Leaving Groups.
Macromolecules 2004, 37 (7), 2383–2394.
(185) Benaglia, M.; Chen, M.; Chong, Y. K.; Moad, G.; Rizzardo, E.; Thang, S. H.
Polystyrene- Block -Poly(Vinyl Acetate) through the Use of a Switchable RAFT Agent.
Macromolecules 2009, 42 (24), 9384–9386.
(186) Chiefari, J.; Chong, Y. K. B.; Ercole, F.; Krstina, J.; Jeffery, J.; Le, T. P. T.; Mayadunne,
R. T. A.; Meijs, G. F.; Moad, C. L.; Moad, G.; et al. Living Free-Radical Polymerization
by Reversible Addition - Fragmentation Chain Transfer : The RAFT Process.
Macromolecules 1998, 31 (16), 5559–5562.
(187) Lo, P. K.; Sleiman, H. F. Synthesis and Molecular Recognition of Conjugated Polymer
with DNA-Mimetic Properties. Macromolecules 2008, 41 (15), 5590–5603.
(188) Lo, P. K.; Sleiman, H. F. Nucleobase-Templated Polymerization: Copying the Chain
Length and Polydispersity of Living Polymers into Conjugated Polymers. J. Am. Chem.
Soc. 2009, 131 (12), 4182–4183.
(189) Bielawski, C. W.; Grubbs, R. H. Living Ring-Opening Metathesis Polymerization.
Progress in Polymer Science (Oxford). Pergamon January 1, 2007, pp 1–29.
(190) South, C. R.; Weck, M. Template-Enhanced Ring-Opening Metathesis Polymerization.
Macromolecules 2007, 40 (5), 1386–1394.
(191) Kang, Y.; Lu, A.; Ellington, A.; Jewett, M. C.; O’Reilly, R. K. Effect of Complementary
Nucleobase Interactions on the Copolymer Composition of RAFT Copolymerizations.
ACS Macro Lett. 2013, 2 (7), 581–586.
81
(192) Hua, Z.; Wilks, T. R.; Keogh, R.; Herwig, G.; Stavros, V. G.; O’Reilly, R. K.
Entrapment and Rigidification of Adenine by a Photo-Cross-Linked Thymine Network
Leads to Fluorescent Polymer Nanoparticles. Chem. Mater. 2018, 30 (4), 1408–1416.
(193) Fong, D.; Hua, Z.; Wilks, T. R.; O’Reilly, R. K.; Adronov, A. Dispersion of Single-
Walled Carbon Nanotubes Using Nucleobase-Containing Poly(Acrylamide) Polymers.
J. Polym. Sci. Part A Polym. Chem. 2017, 55 (16), 2611–2617.
(194) Hua, Z.; Keogh, R.; Li, Z.; Wilks, T. R.; Chen, G.; O’Reilly, R. K.; O’Reilly, R. K.
Reversibly Manipulating the Surface Chemistry of Polymeric Nanostructures via a
“Grafting To” Approach Mediated by Nucleobase Interactions. Macromolecules 2017,
50 (9), 3662–3670.
(195) Hua, Z.; Pitto-Barry, A.; Kang, Y.; Kirby, N.; Wilks, T. R.; O’Reilly, R. K. Micellar
Nanoparticles with Tuneable Morphologies through Interactions between Nucleobase-
Containing Synthetic Polymers in Aqueous Solution. Polym. Chem. 2016, 7 (25), 4254–
4262.
82
2 Chapter 2: Methods and Materials
2.1 Synopsis
This chapter pertains to the materials, reagents, experimental procedures, and characterisation techniques used in this thesis.
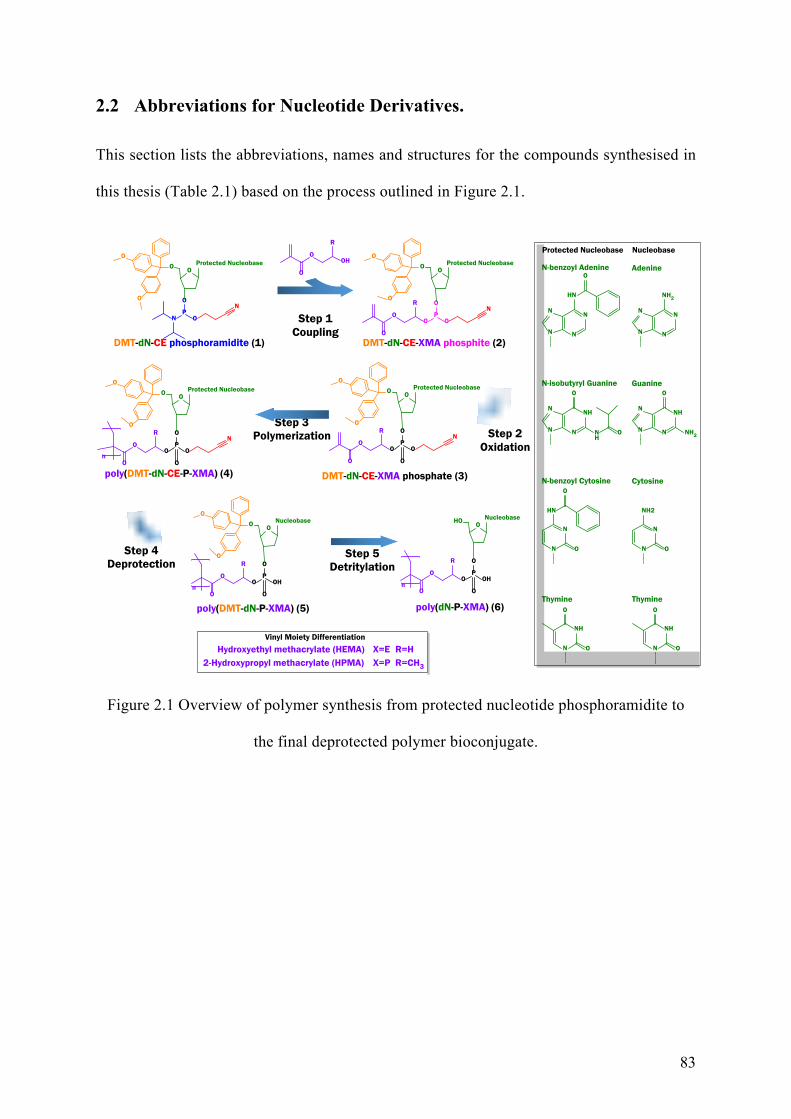
83
2.2 Abbreviations for Nucleotide Derivatives.
This section lists the abbreviations, names and structures for the compounds synthesised in
this thesis (Table 2.1) based on the process outlined in Figure 2.1.
Figure 2.1 Overview of polymer synthesis from protected nucleotide phosphoramidite to
the final deprotected polymer bioconjugate.
OOO
O
O
N
O
O
R
OO
O
P
N
O
O
R
OO
O
PN
O
O
PN
OOO
O
OOO
O
O
N
O
O
R
OO
O
P
OOO
O
O
OH
O
R
OO
O
P
OOO
O
O
OH
O
R
OO
O
P
OHO
O
R
OOH
Step 1Coupling
Step 2Oxidation
Step 3Polymerization
n
n n
Step 4Deprotection
Step 5Detritylation
DMT-dN-CE phosphoramidite (1) DMT-dN-CE-XMA phosphite (2)
DMT-dN-CE-XMA phosphate (3)poly(DMT-dN-CE-P-XMA) (4)
poly(DMT-dN-P-XMA) (5) poly(dN-P-XMA) (6)
Protected NucleobaseProtected Nucleobase
Protected Nucleobase
Nucleobase Nucleobase
Protected Nucleobase
N
NN
N
HN
NH
NN
N
O
NH
N
N
HN
O
NH
N
O
O
O
O
O
N
NN
N
NH2
NH
NN
N
O
NH2
N
N
NH2
O
NH
N
O
O
Protected Nucleobase Nucleobase
N-benzoyl Adenine
N-isobutyryl Guanine
Adenine
Guanine
N-benzoyl Cytosine
Thymine Thymine
Cytosine
R=HHydroxyethyl methacrylate (HEMA) X=ER=CH3X=P2-Hydroxypropyl methacrylate (HPMA)
Vinyl Moiety Differentiation
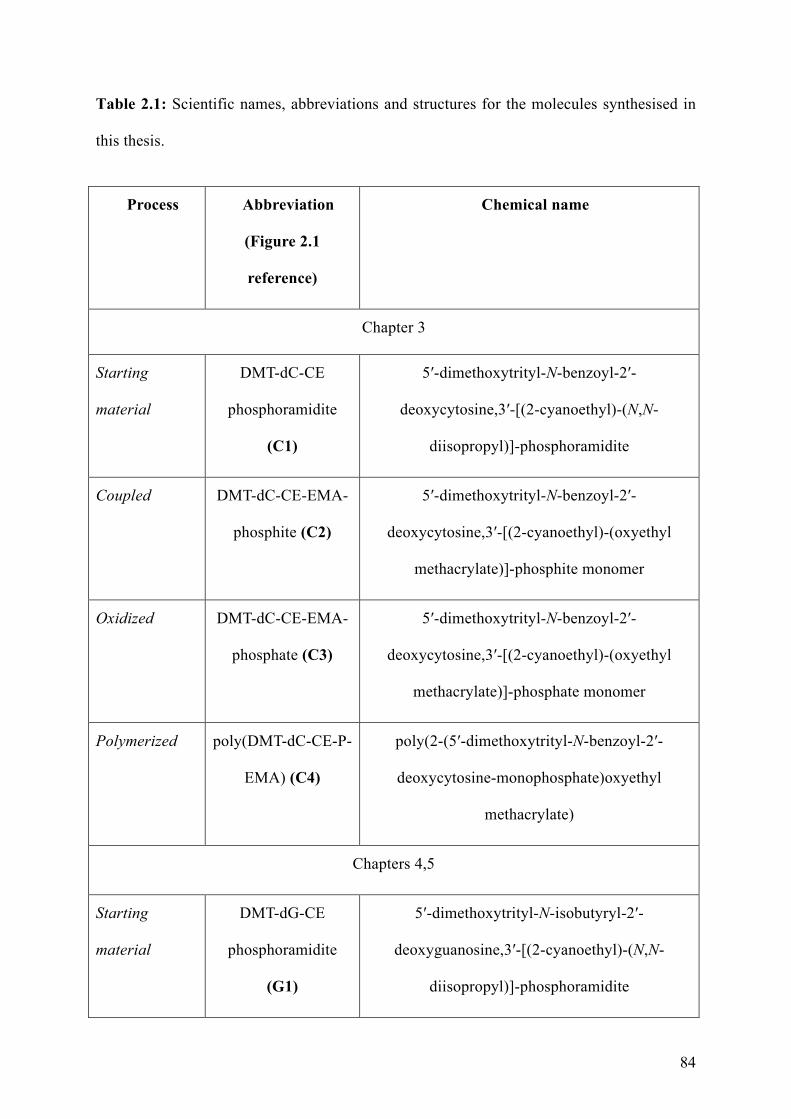
84
Table 2.1: Scientific names, abbreviations and structures for the molecules synthesised in
this thesis.
Process Abbreviation
(Figure 2.1
reference)
Chemical name
Chapter 3
Starting
material
DMT-dC-CE
phosphoramidite
(C1)
5′-dimethoxytrityl-N-benzoyl-2′-
deoxycytosine,3′-[(2-cyanoethyl)-(N,N-
diisopropyl)]-phosphoramidite
Coupled DMT-dC-CE-EMA-
phosphite (C2)
5′-dimethoxytrityl-N-benzoyl-2′-
deoxycytosine,3′-[(2-cyanoethyl)-(oxyethyl
methacrylate)]-phosphite monomer
Oxidized DMT-dC-CE-EMA-
phosphate (C3)
5′-dimethoxytrityl-N-benzoyl-2′-
deoxycytosine,3′-[(2-cyanoethyl)-(oxyethyl
methacrylate)]-phosphate monomer
Polymerized poly(DMT-dC-CE-P-
EMA) (C4)
poly(2-(5′-dimethoxytrityl-N-benzoyl-2′-
deoxycytosine-monophosphate)oxyethyl
methacrylate)
Chapters 4,5
Starting
material
DMT-dG-CE
phosphoramidite
(G1)
5′-dimethoxytrityl-N-isobutyryl-2′-
deoxyguanosine,3′-[(2-cyanoethyl)-(N,N-
diisopropyl)]-phosphoramidite
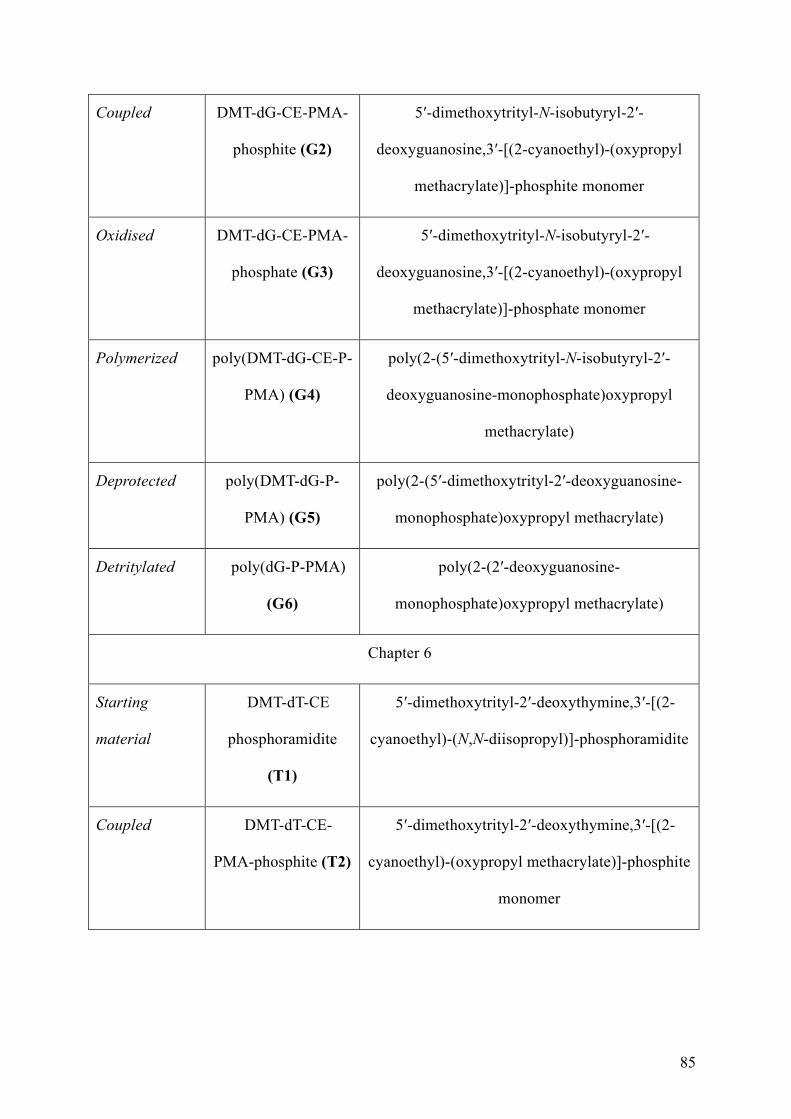
85
Coupled DMT-dG-CE-PMA-
phosphite (G2)
5′-dimethoxytrityl-N-isobutyryl-2′-
deoxyguanosine,3′-[(2-cyanoethyl)-(oxypropyl
methacrylate)]-phosphite monomer
Oxidised DMT-dG-CE-PMA-
phosphate (G3)
5′-dimethoxytrityl-N-isobutyryl-2′-
deoxyguanosine,3′-[(2-cyanoethyl)-(oxypropyl
methacrylate)]-phosphate monomer
Polymerized poly(DMT-dG-CE-P-
PMA) (G4)
poly(2-(5′-dimethoxytrityl-N-isobutyryl-2′-
deoxyguanosine-monophosphate)oxypropyl
methacrylate)
Deprotected poly(DMT-dG-P-
PMA) (G5)
poly(2-(5′-dimethoxytrityl-2′-deoxyguanosine-
monophosphate)oxypropyl methacrylate)
Detritylated poly(dG-P-PMA)
(G6)
poly(2-(2′-deoxyguanosine-
monophosphate)oxypropyl methacrylate)
Chapter 6
Starting
material
DMT-dT-CE
phosphoramidite
(T1)
5′-dimethoxytrityl-2′-deoxythymine,3′-[(2-
cyanoethyl)-(N,N-diisopropyl)]-phosphoramidite
Coupled DMT-dT-CE-
PMA-phosphite (T2)
5′-dimethoxytrityl-2′-deoxythymine,3′-[(2-
cyanoethyl)-(oxypropyl methacrylate)]-phosphite
monomer
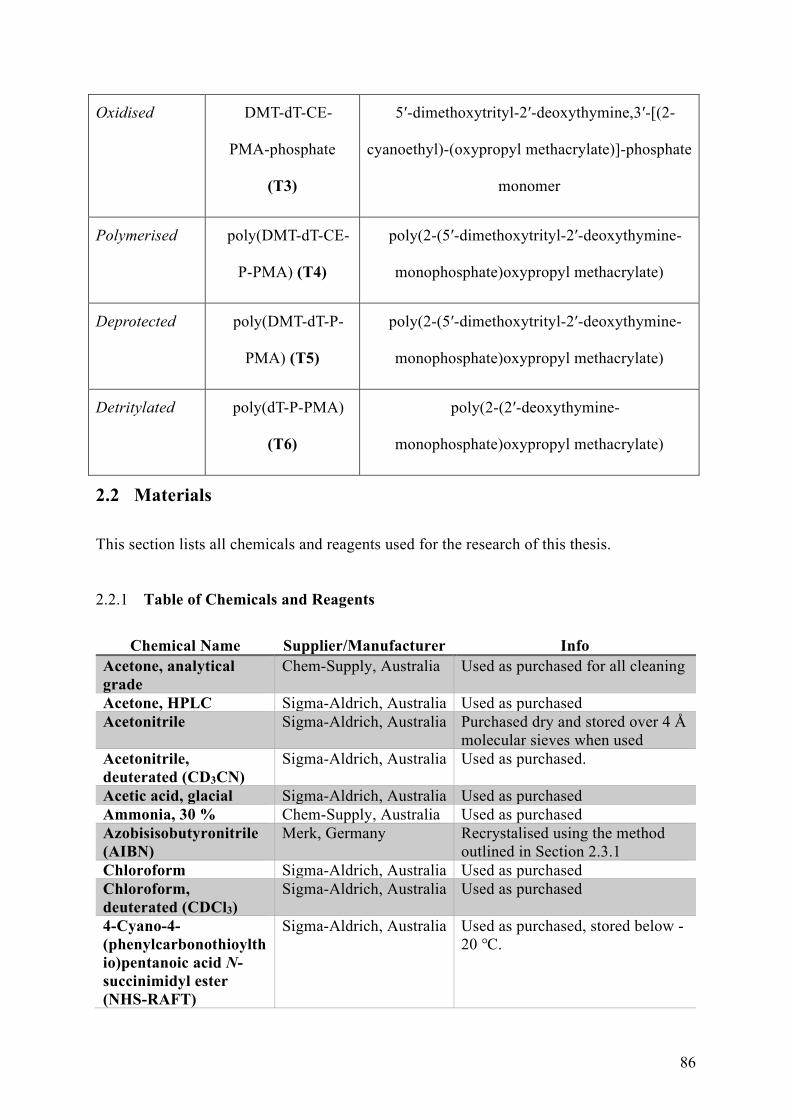
86
Oxidised DMT-dT-CE-
PMA-phosphate
(T3)
5′-dimethoxytrityl-2′-deoxythymine,3′-[(2-
cyanoethyl)-(oxypropyl methacrylate)]-phosphate
monomer
Polymerised poly(DMT-dT-CE-
P-PMA) (T4)
poly(2-(5′-dimethoxytrityl-2′-deoxythymine-
monophosphate)oxypropyl methacrylate)
Deprotected poly(DMT-dT-P-
PMA) (T5)
poly(2-(5′-dimethoxytrityl-2′-deoxythymine-
monophosphate)oxypropyl methacrylate)
Detritylated poly(dT-P-PMA)
(T6)
poly(2-(2′-deoxythymine-
monophosphate)oxypropyl methacrylate)
2.2 Materials
This section lists all chemicals and reagents used for the research of this thesis.
2.2.1 Table of Chemicals and Reagents
Chemical Name Supplier/Manufacturer Info Acetone, analytical grade
Chem-Supply, Australia Used as purchased for all cleaning
Acetone, HPLC Sigma-Aldrich, Australia Used as purchased Acetonitrile Sigma-Aldrich, Australia Purchased dry and stored over 4 Å
molecular sieves when used Acetonitrile, deuterated (CD3CN)
Sigma-Aldrich, Australia Used as purchased.
Acetic acid, glacial Sigma-Aldrich, Australia Used as purchased Ammonia, 30 % Chem-Supply, Australia Used as purchased Azobisisobutyronitrile (AIBN)
Merk, Germany Recrystalised using the method outlined in Section 2.3.1
Chloroform Sigma-Aldrich, Australia Used as purchased Chloroform, deuterated (CDCl3)
Sigma-Aldrich, Australia Used as purchased
4-Cyano-4-(phenylcarbonothioylthio)pentanoic acid N-succinimidyl ester (NHS-RAFT)
Sigma-Aldrich, Australia Used as purchased, stored below -20 ℃.
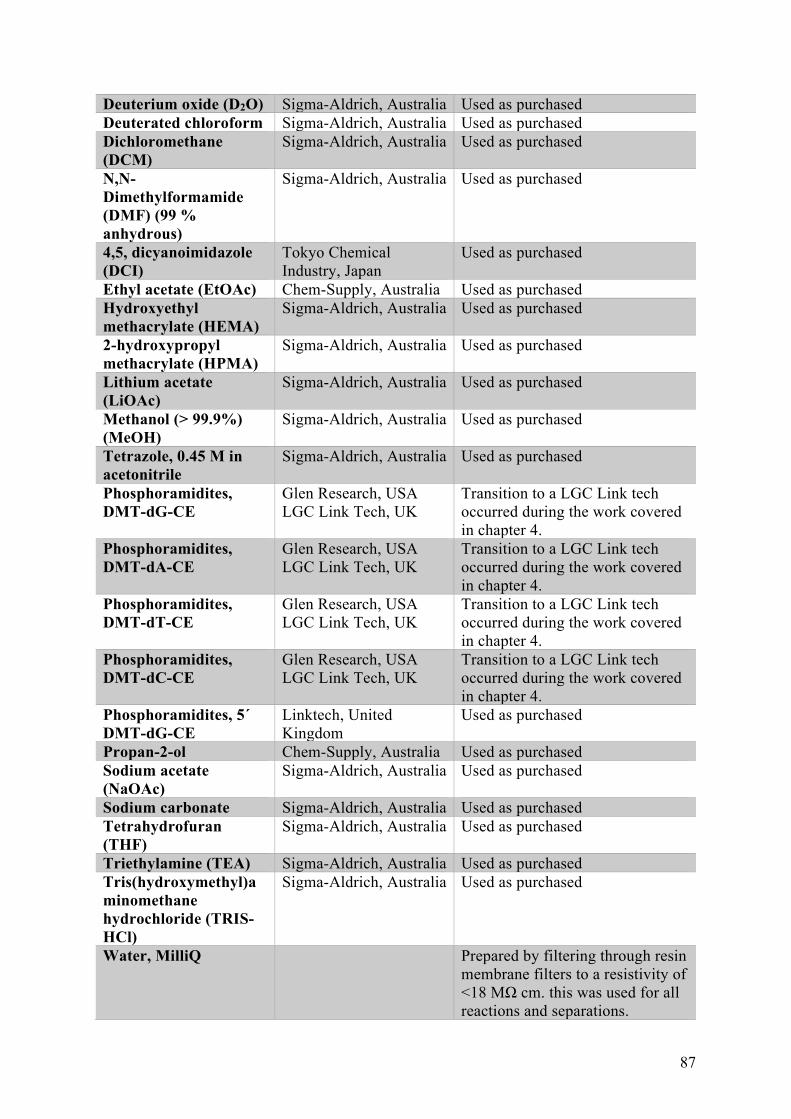
87
Deuterium oxide (D2O) Sigma-Aldrich, Australia Used as purchased Deuterated chloroform Sigma-Aldrich, Australia Used as purchased Dichloromethane (DCM)
Sigma-Aldrich, Australia Used as purchased
N,N-Dimethylformamide (DMF) (99 % anhydrous)
Sigma-Aldrich, Australia Used as purchased
4,5, dicyanoimidazole (DCI)
Tokyo Chemical Industry, Japan
Used as purchased
Ethyl acetate (EtOAc) Chem-Supply, Australia Used as purchased Hydroxyethyl methacrylate (HEMA)
Sigma-Aldrich, Australia Used as purchased
2-hydroxypropyl methacrylate (HPMA)
Sigma-Aldrich, Australia Used as purchased
Lithium acetate (LiOAc)
Sigma-Aldrich, Australia Used as purchased
Methanol (> 99.9%) (MeOH)
Sigma-Aldrich, Australia Used as purchased
Tetrazole, 0.45 M in acetonitrile
Sigma-Aldrich, Australia Used as purchased
Phosphoramidites, DMT-dG-CE
Glen Research, USA LGC Link Tech, UK
Transition to a LGC Link tech occurred during the work covered in chapter 4.
Phosphoramidites, DMT-dA-CE
Glen Research, USA LGC Link Tech, UK
Transition to a LGC Link tech occurred during the work covered in chapter 4.
Phosphoramidites, DMT-dT-CE
Glen Research, USA LGC Link Tech, UK
Transition to a LGC Link tech occurred during the work covered in chapter 4.
Phosphoramidites, DMT-dC-CE
Glen Research, USA LGC Link Tech, UK
Transition to a LGC Link tech occurred during the work covered in chapter 4.
Phosphoramidites, 5´ DMT-dG-CE
Linktech, United Kingdom
Used as purchased
Propan-2-ol Chem-Supply, Australia Used as purchased Sodium acetate (NaOAc)
Sigma-Aldrich, Australia Used as purchased
Sodium carbonate Sigma-Aldrich, Australia Used as purchased Tetrahydrofuran (THF)
Sigma-Aldrich, Australia Used as purchased
Triethylamine (TEA) Sigma-Aldrich, Australia Used as purchased Tris(hydroxymethyl)aminomethane hydrochloride (TRIS-HCl)
Sigma-Aldrich, Australia Used as purchased
Water, MilliQ Prepared by filtering through resin membrane filters to a resistivity of <18 MΩ cm. this was used for all reactions and separations.
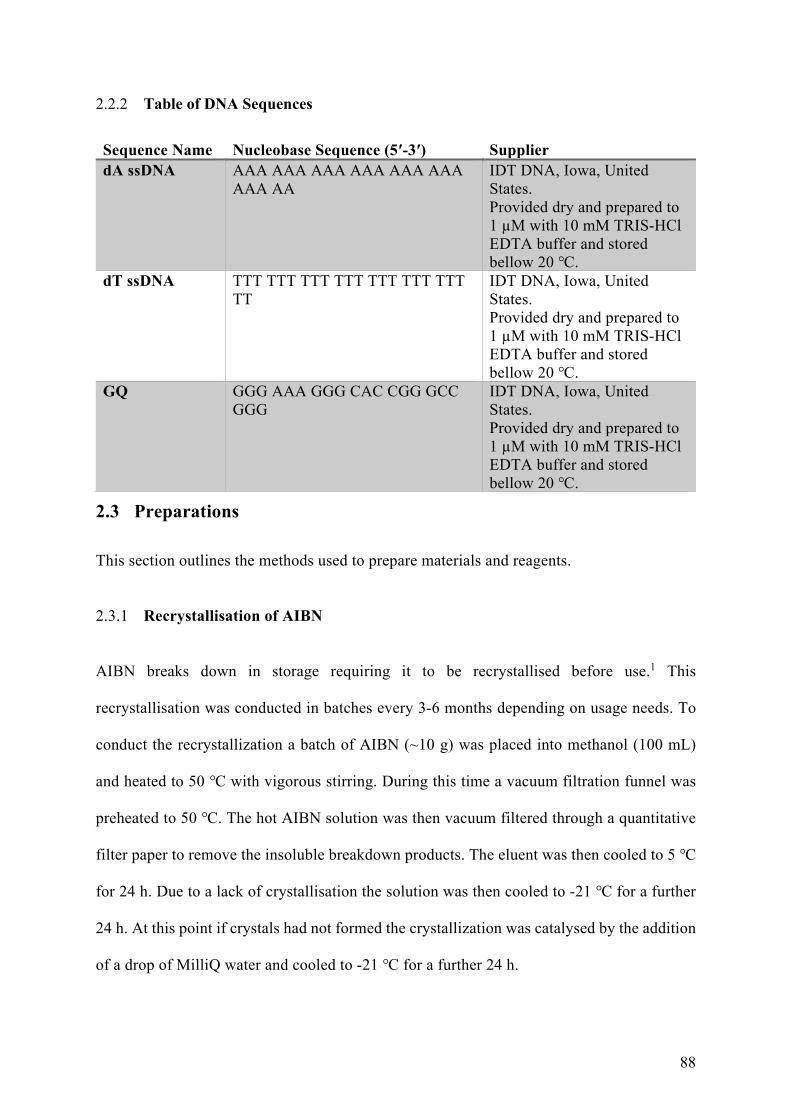
88
2.2.2 Table of DNA Sequences
Sequence Name Nucleobase Sequence (5′-3′) Supplier dA ssDNA AAA AAA AAA AAA AAA AAA
AAA AA IDT DNA, Iowa, United States. Provided dry and prepared to 1 µM with 10 mM TRIS-HCl EDTA buffer and stored bellow 20 ℃.
dT ssDNA TTT TTT TTT TTT TTT TTT TTT TT
IDT DNA, Iowa, United States. Provided dry and prepared to 1 µM with 10 mM TRIS-HCl EDTA buffer and stored bellow 20 ℃.
GQ GGG AAA GGG CAC CGG GCC GGG
IDT DNA, Iowa, United States. Provided dry and prepared to 1 µM with 10 mM TRIS-HCl EDTA buffer and stored bellow 20 ℃.
2.3 Preparations
This section outlines the methods used to prepare materials and reagents.
2.3.1 Recrystallisation of AIBN
AIBN breaks down in storage requiring it to be recrystallised before use.1 This
recrystallisation was conducted in batches every 3-6 months depending on usage needs. To
conduct the recrystallization a batch of AIBN (~10 g) was placed into methanol (100 mL)
and heated to 50 ℃ with vigorous stirring. During this time a vacuum filtration funnel was
preheated to 50 ℃. The hot AIBN solution was then vacuum filtered through a quantitative
filter paper to remove the insoluble breakdown products. The eluent was then cooled to 5 ℃
for 24 h. Due to a lack of crystallisation the solution was then cooled to -21 ℃ for a further
24 h. At this point if crystals had not formed the crystallization was catalysed by the addition
of a drop of MilliQ water and cooled to -21 ℃ for a further 24 h.
89
This resulted in the formation of fine crystals ~2 mm in length which were isolated by
filtration. These AIBN crystals were then placed under vacuum in a desiccator until dried.
Once dry the AIBN was transferred to a screw top vial and sealed with paraffin film, then
stored below -10 ℃ until required.
2.3.2 Generation of Molecular Sieves
To generate the 4 Å molecular sieves, they were placed in a dry glass watch glass, and heated
to 250 ℃ for 12 h prior to use. When not used immediately, the sieves were stored at 110 ℃.
Before use the 4 Å molecular sieves were placed in the desired vessel, sealed with a rubber
septum, and allowed to cool to room temperature before the addition of solvents.
2.3.3 Preparation of HPMA and DCI solutions.
The glassware required for these solutions was first dried in an oven at 95 ℃ for a minimum
of 24 h prior to use to ensure any surface moisture was thoroughly removed.
A solution of DCI (0.8 M, 250 mL) was prepared by adding DCI (23.62 g, 0.2 mol) to a
volumetric flask and filled to the 250 mL marker with dry acetonitrile and sonicated until
dissolved. The solution was then decanted into a dried bottle containing 100 g of 4 Å
molecular sieves and sealed with a rubber septum. The bottle was then backfilled and
degassed with dry N2, and stored at 5 ℃ until used.
A solution of HPMA (0.2 M, 250 mL) was prepared by adding HPMA (7.28 g, 0.05 mol) to
a volumetric flask and filled to the 250 mL marker with dry acetonitrile. The solution was
then sealed with a rubber septum, backfilled and degassed with dry N2, and stored at 5 ℃
until used.
90
2.4 Synthetic Procedures
This section outlines the specific synthesis procedures for compounds used in this thesis.
2.4.1 Chapter 3 Methods
2.4.1.1 Synthesis of 5′-dimethoxytrityl-N-benzoyl-2′-deoxycytosine,3′-[(2-cyanoethyl)-
(oxyethyl methacrylate)]-phosphate monomer.
To carry out the conjugation C1 (0.17 g, 0.2 mmol) was placed into a dried 15 mL vial, sealed
with a rubber septa, and backfilled with N2. Tetrazole in dry acetonitrile (0.45 M, 6 mL) was
combined with HEMA (0.31 g, 2.3 mmol) and added to the C1 using a syringe while
maintaining N2 atmosphere. The sample was then cooled to 4 °C for 4 h and quenched with
2 mL of 45:45:10 v/v/v, ethyl acetate (EtOAc), dichloromethane (DCM), and triethylamine
(TEA) (EtOAc:DCM:TEA) solution. The resulting mixture was solvent extracted with DCM
(~30 mL) to isolate the organic phase containing the C3 monomer. This was then dried under
a flow of compressed air to oxidise the P(III) phosphite to the P(V) phosphate, thereby
generating the C3 monomer. The yield was recorded as 0.14 g (76%).
2.4.1.2 Polymerisation of 5′-dimethoxytrityl-N-benzoyl-2′-deoxycytosine,3′-[(2-
cyanoethyl)-(oxyethyl methacrylate)]-phosphate monomer.
For the polymerisation, C3 monomer (1 g, 1.1 mmol) was dissolved in dry acetonitrile (10
mL). To this azobisisobutyronitrile (AIBN) (0.2 mg, 1.2 µmol) was added as an initiator and
4-cyano-4-(phenylcarbonothioylthio)pentanoic acid N-succinimidyl ester (NHS-RAFT) (0.6
mg, 15 µmol) as a mediator. This resulted in a ratio of 3C:RAFT-NHS:AIBN of 100:1.5:0.1
The resulting solution was degassed using N2 for 45 min before being heated to 70 °C to
activate the polymerisation and maintained at that temperature for 3.5 h resulting in C4 which
formed a gel. The exact yield could not be obtained due to the hydration of the gel but was
greater than 50%.
91
2.4.2 Chapter 4 Methods
2.4.2.1 Coupling: Synthesis of 5′-dimethoxytrityl-N-isobutyryl-2′-deoxyguanosine,3′-[(2-
cyanoethyl)-(oxypropyl methacrylate)]-phosphate monomer (G3)
HPMA (0.2 M, 6 mL) and DCI (0.8 M, 6 mL) solutions were added to G1 (1 g, 1.1 mmol) in
the sealed vial as supplied and sonicated for 1 min before being cooled to 4 ℃ for 4 h. The
reaction was then quenched with a 45:45:10 solution of EtOAc:DCM:TEA (v/v/v, 4 mL) and
left for 12 h at 0 ℃. Though not vital, it was found that the addition of the HPMA solution
to the reaction before adding the DCI allowed for easier solvation of the phosphoramidite.
The resulting mixture containing G2 monomer was then phase extracted by pouring the
mixture into an aqueous NaHCO3 solution (0.1 M, 20 mL) and isolating the organic (DCM)
phase. This phase was then washed with an equal volume of milliQ water. The organic
(DCM) phase containing the G2 monomer was then isolated.
The DCM solvent was removed under a high flow of compressed air (>5 L/min) (typically
12 h) in order to avoid the formation of any diene by-product during the isolation of the final
G3 monomer product. This also serves the secondary purpose of oxidising the phosphite into
a phosphate (from the P(III) to P(V) oxidation state). The yield was recorded as 0.82 g (76%).
Resulting in the formation of the G3 monomer.
2.4.2.2 Polymerisation of 5′-dimethoxytrityl-N-isobutyryl-2′-deoxyguanosine,3′-[(2-
cyanoethyl)-(oxypropyl methacrylate)]-phosphate monomer (G3).
The following is an example polymerisation method based on the molar ratio of 100:4:1 gives
an effective ratio of 20:1 monomer to initiators and was designed to yield short polymers for
easier characterisation and solubility studies. The exact amounts varied for some experiments
to match the ratios presented. The G3 monomer (1.54 g, 1.7 mmol) was combined with the
92
NHS-RAFT agent (27 mg, 7.1 µmol) and AIBN (3 mg, 1.8 µmol) at a molar ratio of 100:4:1
in dry acetonitrile (15 ml). The reaction mixture was put into a scintillation vial with a rubber
septum seal and degassed using dry N2 for 45 min, typically resulting in a decrease in solvent
volume of between 5-15 v/v, and then heated to 70 ℃ in a mineral oil bath with stirring for
24 h under a sealed N2 atmosphere. At the end of this time the reaction vessel was quenched
by rapidly cooling the reaction vessel with an ice water bath and exposing it to atmosphere.
This cooling caused the polymer to precipitate from solution. Samples were then freeze dried
until a pressure of 0.019 mbar was attained. The yield was recorded as 0.96 g (62%).
2.4.2.3 Deprotection of poly(2-(5′-dimethoxytrityl-N-isobutyryl-2′-deoxyguanosine-
monophosphate)oxypropyl methacrylate).
The crude G4 (0.8 g, 0.9 mmol) was placed in a round bottom flask with 30% ammonia in
water (50 mL). The solution was heated to 50 ℃ for up to 24 h until the sample dissolved
and the solution turned clear. The solution was then vacuum filtered through a quantitative
filter paper and the eluent dried under N2.
2.4.2.4 Detritylation of poly(2-(5′-dimethoxytrityl-2′-deoxyguanosine-
monophosphate)oxypropyl methacrylate).
G5 (0.4 g, 0.5 mmol) was placed into 80% acetic acid in water (10 mL) for 20 min producing
a bright orange colour. Lithium acetate (1.5 M, 1 mL, 1.5 mmol) was then added until the
orange colour was removed. The solution was cooled to 0 ℃ for 30 min, then the solution
centrifuged to isolate the final polymeric product G6. The yield was recorded as 0.16 g
(38%).
2.4.3 Chapter 6 Methods
2.4.3.1 Synthesis of poly(dT-P-PMA)
93
Synthesis of the starting material, T3 monomer was conducted using the same methodology
presented in Section 2.4.2.1 for the synthesis of G3 monomer. To generate the thymine
version of the bioconjugate G1 was substituted for T1.
The polymerisation of the T3 monomer was conducted using the same procedure as discussed
in Section 2.4.2.2 for the polymerisation of G3 monomer.
To adapt the method for T3 monomer and achieve the increased Mw for the resulting polymer
the ratio of monomer:NHS-RAFT:AIBN was altered to 100:4:1, an effective
monomer:initiators . Therefore, T3 (0.78 g, 0.86 mmol) was combined with NHS-RAFT
(14.4 mg) and AIBN (1.95 mg) in dry acetonitrile (6 mL). The yield was recorded as 0.34 g
(78%).
2.5 Characterisation
This section outlines the general methods for characterisation used in the following chapters.
2.5.1 Chapter 3 Characterisation
2.5.1.1 Nuclear magnetic resonance (NMR) spectroscopy of DMT-dC-CE-P-PMA phosphate
Samples (5 mg) were placed into a single use NMR tube with deuterated acetonitrile solvent
(1 mL). The sample was then sonicated until the C3 fully dissolved.
2.5.1.1.1 1H NMR Spectroscopy
Samples were measured using either a Bruker 400 MHz or 600 MHz spectrometer, as
indicated in the data captions, using a 5 mm inverse multinuclear probe measuring 1H.
Spectra were acquired using compilation of 32 scans.

94
2.5.1.1.2 31P NMR Spectroscopy
Bruker 400 MHz spectrometer using a 5 mm inverse multinuclear probe measuring 31P.
Spectra were acquired using 128 scans.
2.5.1.2 Quantitative Solvent-Gel Analysis
Five fragments of the C4 polymer gel between 0.5 mg and 2.5 mg were placed separately
into 25 mL scintillation vials and dried at 50 ℃ for 6 h. To each vial 10 mL one of the
solvents DMSO, H2O, MeOH, THF, or acetonitrile was added. These samples were the
placed in a dark cupboard for 12 h to absorb any solvent they could. Fragments were then
removed and patted dry on Kimtech® Science™ Kimwipes™ to remove surface moisture
before being weighed to determine their swelling ratio.
2.5.1.3 Attenuated Total Reflectance-Fourier Transform Infrared (ATR-FTIR) Spectroscopy
Fragments of the poly(DMT-dG-CE-P-EMA) gel approximately 1 mg in weight were dried
and placed onto the Nicolet Nexus 870 step-scan FTIR using the ATR accessory with a
diamond crystal. The spectrum was acquired over the range of 525 nm to 5000 nm in
transmission mode.
2.5.2 Chapter 4 Characterisation
2.5.2.1 Electrospray Ionisation- Mass Spectrometry (ESI-MS)
ESI-MS contains two stages; the electrospray to ionise the analyte and the mass spectrometer
to measure the resulting mass to charge ratio of the analyte. In this case the analyte was the
G2 monomer solution. To start with liquid containing the analyte is positively charged
through the removal of electrons by a cathode as the sample moves towards the ESI nozzle.
The analyte is then exposed to both a high electric potential and vacuum. This causes the
formation of a charged aerosol, electrospray, which is accelerated across the potential
95
towards a mass spectrometer inlet. Through a process of Coulomb fission these aerosol
particles break up until only one molecule of analyte remains in each particle.
Simultaneously, due to the vacuum present the solvent is removed. This spray is then
analysed by the mass spectrometer.
The ESI-MS spectrum presented in this thesis were recorded on a Waters Synapt HDMS
(Waters, Manchester, UK) in electrospray positive ion mode, using an infusion of 0.05 mM
sodium formate solution for calibration.
2.5.2.2 Size-exclusion chromatography (SEC)
The average molecular weight (Mn) and Đ of G4 synthesised via the large-scale process was
determined using SEC on a Waters 2690 Separation Module using a Waters 410 differential
refractometer. Two Agilent PLgel 5 µm MiniMIX-C columns were used in series with an
Agilent guard column for protection. The eluent was HPLC grade tetrahydrofuran at 5
mL/min with 5 µL sample injection volumes. Calibration was conducted using polystyrene
standards.
2.5.2.3 Kinetics Measurements
2.5.2.3.1 In-situ NMR Spectroscopy Kinetic Measurements
In-situ NMR spectroscopy polymerisation measurements to determine kinetics were
conducted on a Bruker 400 MHz spectrometer using a 5 mm inverse multinuclear probe
measuring 1H nucleus.
To acquire measurements the NMR instrument was preheated to 70 ℃ prior to inserting the
NMR tube. A degassed solution of G3 (1 mL, 75 mg/mL) with RAFT agent and AIBN at a
molar ratio of 20:4:1 in d3-acetonitrile was sealed in a glass NMR tube under an N2
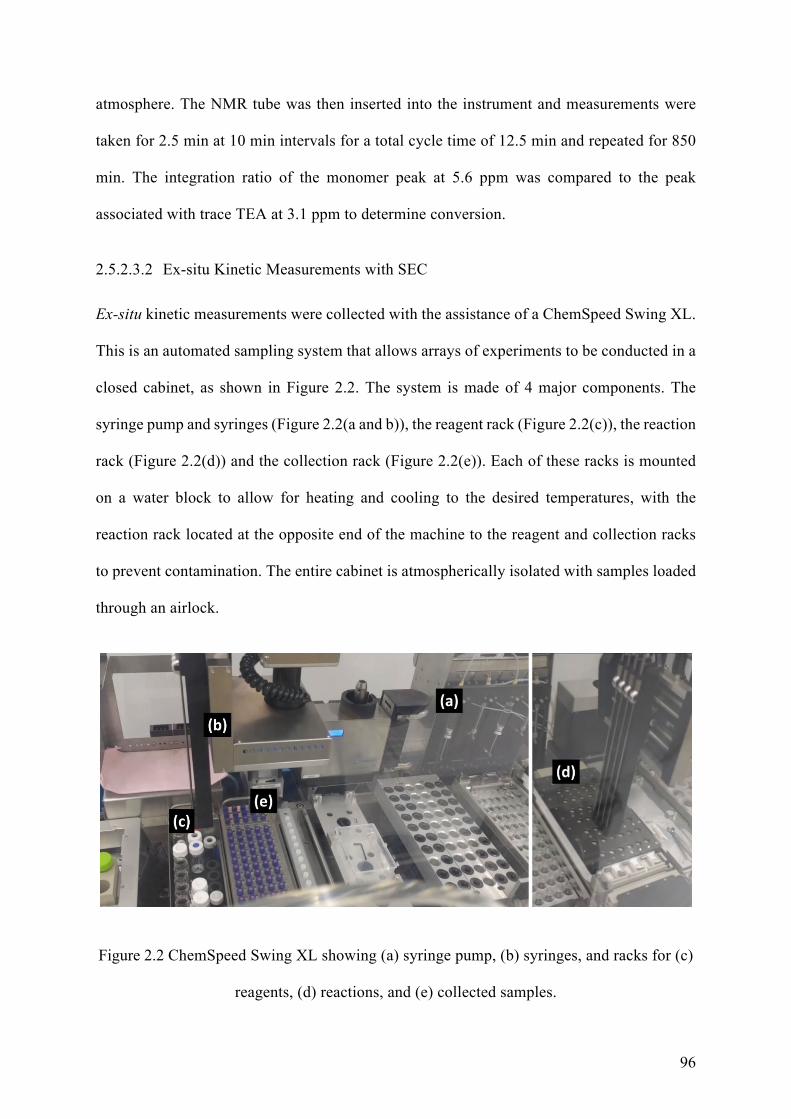
96
atmosphere. The NMR tube was then inserted into the instrument and measurements were
taken for 2.5 min at 10 min intervals for a total cycle time of 12.5 min and repeated for 850
min. The integration ratio of the monomer peak at 5.6 ppm was compared to the peak
associated with trace TEA at 3.1 ppm to determine conversion.
2.5.2.3.2 Ex-situ Kinetic Measurements with SEC
Ex-situ kinetic measurements were collected with the assistance of a ChemSpeed Swing XL.
This is an automated sampling system that allows arrays of experiments to be conducted in a
closed cabinet, as shown in Figure 2.2. The system is made of 4 major components. The
syringe pump and syringes (Figure 2.2(a and b)), the reagent rack (Figure 2.2(c)), the reaction
rack (Figure 2.2(d)) and the collection rack (Figure 2.2(e)). Each of these racks is mounted
on a water block to allow for heating and cooling to the desired temperatures, with the
reaction rack located at the opposite end of the machine to the reagent and collection racks
to prevent contamination. The entire cabinet is atmospherically isolated with samples loaded
through an airlock.
Figure 2.2 ChemSpeed Swing XL showing (a) syringe pump, (b) syringes, and racks for (c)
reagents, (d) reactions, and (e) collected samples.
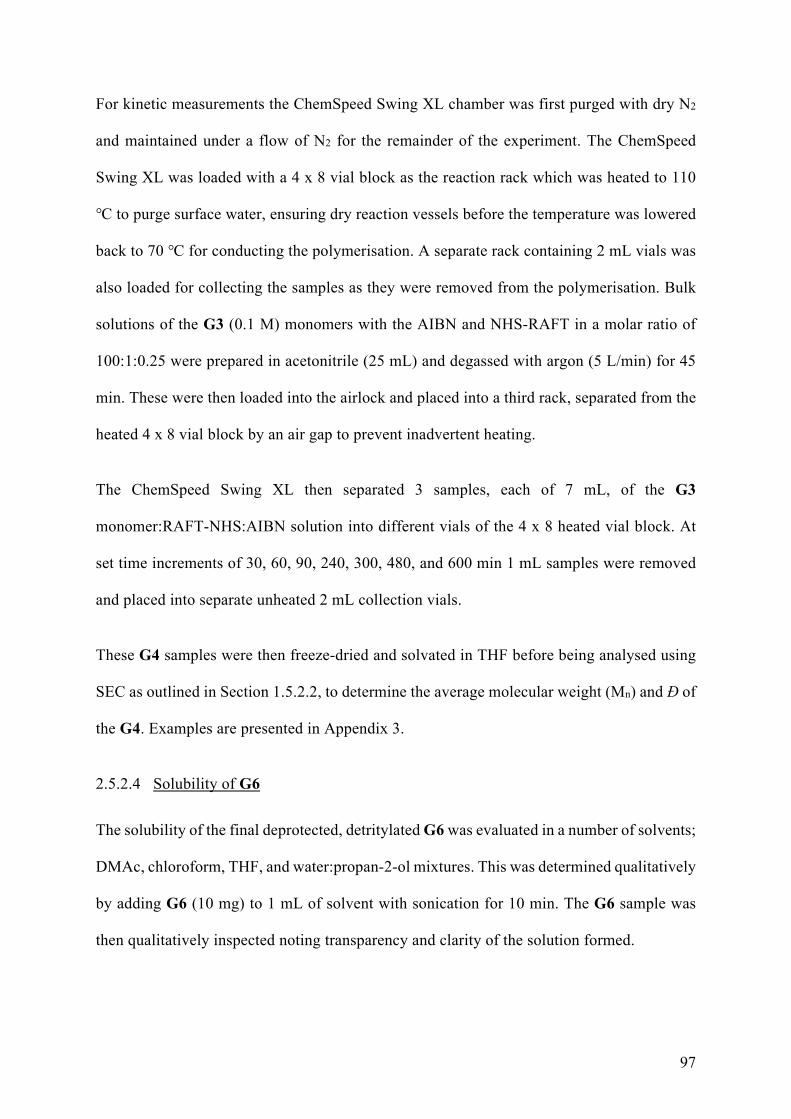
97
For kinetic measurements the ChemSpeed Swing XL chamber was first purged with dry N2
and maintained under a flow of N2 for the remainder of the experiment. The ChemSpeed
Swing XL was loaded with a 4 x 8 vial block as the reaction rack which was heated to 110
℃ to purge surface water, ensuring dry reaction vessels before the temperature was lowered
back to 70 ℃ for conducting the polymerisation. A separate rack containing 2 mL vials was
also loaded for collecting the samples as they were removed from the polymerisation. Bulk
solutions of the G3 (0.1 M) monomers with the AIBN and NHS-RAFT in a molar ratio of
100:1:0.25 were prepared in acetonitrile (25 mL) and degassed with argon (5 L/min) for 45
min. These were then loaded into the airlock and placed into a third rack, separated from the
heated 4 x 8 vial block by an air gap to prevent inadvertent heating.
The ChemSpeed Swing XL then separated 3 samples, each of 7 mL, of the G3
monomer:RAFT-NHS:AIBN solution into different vials of the 4 x 8 heated vial block. At
set time increments of 30, 60, 90, 240, 300, 480, and 600 min 1 mL samples were removed
and placed into separate unheated 2 mL collection vials.
These G4 samples were then freeze-dried and solvated in THF before being analysed using
SEC as outlined in Section 1.5.2.2, to determine the average molecular weight (Mn) and Đ of
the G4. Examples are presented in Appendix 3.
2.5.2.4 Solubility of G6
The solubility of the final deprotected, detritylated G6 was evaluated in a number of solvents;
DMAc, chloroform, THF, and water:propan-2-ol mixtures. This was determined qualitatively
by adding G6 (10 mg) to 1 mL of solvent with sonication for 10 min. The G6 sample was
then qualitatively inspected noting transparency and clarity of the solution formed.
98
2.5.3 Chapter 5 Characterisation
2.5.3.1 SEM
Silicon wafer was diced into ~5 mm squares and washed successively in MilliQ water,
acetone, water, and HPLC grade ethanol. The wafers were then air dried in a covered
container to prevent dust settling. Samples of the G6 were then dropcast onto the wafer and
placed into liquid nitrogen 5 min until vigorous bubbling had stopped and the samples were
frozen solid. The wafers were then freeze-dried to 0.019 mbar, approximately 4 h, until dry.
The dried samples were coated with 3 nm platinum using an Emitech Quorum Sputter Coater
K575X and imaged on a FEI Phenom Scanning Electron Microscope under ambient
atmosphere.
2.5.3.2 UV-visible (UV-vis) single sample
The UV-vis spectrum of G6 was obtained on the NanoDrop 1000 microvolume
spectrophotometer. 1.5 µL sample volumes were measured with 0.2 mm path length and 3
nm resolution.
To determine the nature of the binding within the G6 particles, they were isolated using the
method described previously, Section 1.4.2.4, using LiOAc and prepared in 10:1 (v/v)
water:propan-2-ol at 10 µg/mL loading of the G6. Two additional samples were prepared
from this batch prepared with added NaOAc and KOAc salts. This was done as larger
monovalent cations have been shown to increase the formation and stability of G-quartets.2,3
The samples were then analysed using a full spectrum scan at 4 s nm-1 dwell-time between
180 nm and 340 nm.
2.5.3.3 UV-vis Measurement of TMB Oxidation Using Well Plate Reader.
99
Stock solutions (1 mL each) were prepared containing analyte (0.5 µL. 0.1 M), KCl reaction
buffer (18.5 µL, 25 mM) and TMB solution (985 µL, 400 µM). From these bulk solutions 4
x 100 µL samples were taken for each analyte and placed into a 96-well microplate. Hemin
solution (1 µL, 500X) was then added to each well to catalyse the oxidation. The well plate
was then immediately placed into a well plate reader measuring absorbance at 595 nm over
15 min, taking samples every 30 s for 125 min.
2.5.3.4 Dynamic Light Scattering (DLS)
G6 (1 µM, 1 mL) was prepared in a cuvette and recorded on a Malvern high performance
particle size analyser. Hemin solution (2 µL, 500X) was added in increments and inverted
for successive samples. For comparison, a solution of the protected G4 (1 µM, 1 mL) was
used as a control.
2.5.3.5 Circular Dichroism (CD)
CD spectra were recorded on an Aviv Biomedical Model 410 (Aviv, Rhode Island, USA)
equipped with Peltier-controlled thermostat housing unit using a SQ-grade cuvette, with a
path length of 1 mm. Spectra were obtained at 25 ℃ using a scanning rate of 15 nm min-1,
bandwidth of 1 nm, 1 nm interval data sampling, and a single accumulation.
Samples were prepared by re-suspending the final product G6 (0.1 M) in water:propan-2-ol
(10:1 (v/v), 1 mL) with mild sonication. Multiple solutions were prepared for each instrument
analysis. For experiments where G6 was doped with KOAc or NaOAc this was performed
by taking 300 µL of the G6 solution and adding in 3 µL of aqueous KOAc or NaOAc (2.5
M). This resulted in a doping of 25 mM of KOAc or NaOAc.
100
Melting data was obtained using the same sample preparation. Measurements were taken at
the 261 nm wavelength with a 1 nm slit. Samples were then heated by 1 ℃ at a rate of 5
℃/min and equilibrated for 30 s before recording measurements for 1 min.
2.5.3.6 Melting Measurements Using Fluorescence of ATTO 550 Dye
For the G4 analysis as isolated with lithium acetate, ATTO 550 fluorescent dye (1 µL, 500X)
was added to 100 µL of G6 in water:propan-2-ol 10:1 (v/v) a solution. Then 25 µL was
transferred into each of 4 separate plastic vials for analysis. For the G6 doped with KOAc
(25 mM), ATTO 550 dye (1 µL, 500X) was added to 100 µL of the KOAc doped solution.
Then 25 µL was transferred into 4 separate plastic vials for analysis.
2.5.3.7 Fluorescence Measurements
Fluorescence versus temperature measurements were then conducted on each 25 µL sample
simultaneously in a Rotor-Gene real-time polymerase chain reaction (PCR) thermocycler
using a yellow channel (530 ± 5 nm excitation, 557 ± 5 detection) for detection. The samples
were heated at 1 ℃/min from 30 ℃ to 95 ℃. The fluorescence of each of the 4 solutions of
each sample were averaged.
For the G6 samples were analysed as isolated with LiOAc. 1x ATTO 550 fluorescent dye (1
µL) was added to 100 µL of G6 in water:propan-2-ol 10:1 (v/v) a solution. For the G6 doped
with KOAc (25 mM), 1x ATTO 550 dye (1 µL) was added to 100 µL of the KOAc doped
solution. Confocal fluorescence microscope images were taken on a Nikon A1R with a 150
µm glass cover slide using a 488 nm excitation at 200x magnification and red band detection.
Each sample was drop cast onto the glass cover slide and the sample imaged near the glass-
solvent interface.
101
2.5.4 Chapter 6
2.5.4.1 UV-vis Spectroscopy of Poly(dT-P-PMA) Interactions with dA ssDNA
UV-Vis spectroscopy was used to determine if the combinations of dA ssDNA 23-mer and
poly(dT-P-PMA) 21-mer when mixed caused the formation of a duplex. To do this, separate
solutions of the 23-mer dA ssDNA and 21-mer poly(dT-P-PMA) were prepared at 1 ng/µL
each in TRIS-HCl EDTA buffer. The solutions were then combined at ratios from 100% dA
ssDNA through to 100% poly(dT-P-PMA). Absorption was measured using the 260 nm peak
associated with free nucleotides.4
2.5.4.2 Effect of Annealing on Fluorescence of Poly(dT-P-PMA) Dye Interactions
For measuring dye interactions with mixtures where binding was being determined, samples
were tested in quadruplicate. Samples of poly(dT-P-PMA) (100 µL, 10 µM) were prepared in
TRIS-HCl buffer (0.01 mM) then heated to either 45 ℃ or 95 ℃ from room temperature, held
at that temperature for 15 min, before being cooled. SYBR Safe 2.5X was then added. These
temperatures were chosen as 45 ℃ was above the 35 ℃ seen in Chapter 6 Section 6.6.2, where
the fluorescence rapidly drops. The 95 ℃ point was chosen as a maximum temperature control.
This heating process was conducted using a generic PCR heating block before measuring the
samples on the Qiagen® Rotor-Gene Q real time PCR instrument.
2.5.4.3 Effect of Sodium Concentration on the Interaction of the SYBR Dye
Samples of poly(dT-P-PMA) (1 µL, 1 mM) were prepared in TRIS-HCl buffer (0.01 mM) with
SYBR safe dye (5 µL, 50X). To this 0.5, 1, 2, 5 or 10 µL of sodium chloride solution (2.5 M)
was added and the solution made up to a total of 100 µL. The 100 µL solution was then divided
into four 25 µL aliquots and measured on the Qiagen® Rotor-Gene Q real time PCR instrument
using the default detection settings for the relevant dye.
102
2.5.4.4 Complementary Dye Interactions
Samples were prepared in TRIS-HCl buffer (0.01 mM). To prepare each sample the relevant
dye (5 µL) was added to a vial with samples of the analyte; poly(dT-P-PMA) (10 µL, 10 µM),
dA ssDNA (10 µL, 10 µM), dT ssDNA (10 µL, 10 µM), poly(acrylic acid) (10 µL, 10 µM).
The solution was then made to 100 µL. From the 100 µL solution four 20 µL aliquots and
measured on the Qiagen® Rotor-Gene Q real time PCR instrument using the default detection
settings for the relevant dye.
2.6 References
(1) Bossoutrot, J.-M. Method for the Recrystallisation and/or Purification of Azo-Type
Compounds. WO2006072699A1, 2005.
(2) Nagesh, N.; Chatterji, D. Ammonium Ion at Low Concentration Stabilizes the G-
Quadruplex Formation by Telomeric Sequence. J. Biochem. Biophys. Methods 1995, 30
(1), 1–8.
(3) Kaiser, C. E.; Gokhale, V.; Yang, D.; Hurley, L. H. Gaining Insights into the Small
Molecule Targeting of the G-Quadruplex in the c-MYC Promoter Using NMR and an
Allele-Specific Transcriptional Assay. In Topics in current chemistry; 2012; Vol. 330,
pp 1–21.
(4) Desjardins, P.; Conklin, D. NanoDrop Microvolume Quantitation of Nucleic Acids. J.
Vis. Exp. 2010, No. 45.

103
3 Chapter 3: Synthesis of Poly(2-(5′-dimethoxytrityl-N-
benzoyl-2′-deoxycytosine-monophosphate)oxyethyl
methacrylate): a Cytosine Rich Methacrylate Polymer
3.1 Synopsis
This chapter describes the design, synthesis and characterisation of 5′-dimethoxytrityl-N-benzoyl-2′-deoxycytosine,3′-[(2-cyanoethyl)-(oxyethyl methacrylate)]-phosphate monomer, henceforth referred to as the DMT-dC-CE-EMA phosphate monomer. Synthesis of the DMT-dC-CE-EMA phosphate monomer was achieved through the coupling of hydroxyethyl methacrylate (HEMA) with a protected 5′ cytosine (C) monophosphate. Following the synthesis of the DMT-dC-CE-EMA phosphate monomer it was polymerised using reversible addition-fragmentation chain transfer (RAFT) polymerisation and subsequently found to form a cross-linked gel.
104
3.1 Introduction
This chapter outlines a method for the synthesis of 5′-dimethoxytrityl-N-isobutyryl-2′-
deoxycytosine, 3′-[(2-cyanoethyl)-(2-oxyethyl methacrylate)]-phosphate (C3 monomer) using
a phosphoramidite coupling approach. In this method hydroxyethyl methacrylate (HEMA) was
coupled to a protected cytosine phosphoramidite 5′-dimethoxytrityl-N-benzoyl-2′-
deoxycytosine,3′-[(2-cyanoethyl)-(N,N-diisopropyl)]-phosphoramidite (C1). The coupling
was achieved through the substitution of the diisopropylamine (DIPA) moiety with an oxyethyl
methacrylate (EMA) moiety chosen for this experiment as it contained the alkene group
required for radical polymerisation. The reasoning for the choice of the phosphoramidite
coupling as the polymerisation method will be discussed in Section 3.2.1., followed by the
discussion of choice of specific variables as they pertain to the synthesis of a nucleotide-vinyl
bioconjugate. An overview of the phosphoramidite coupling method used in this chapter is
shown in Figure 3.1. This synthesis route results in a C3 monomer.
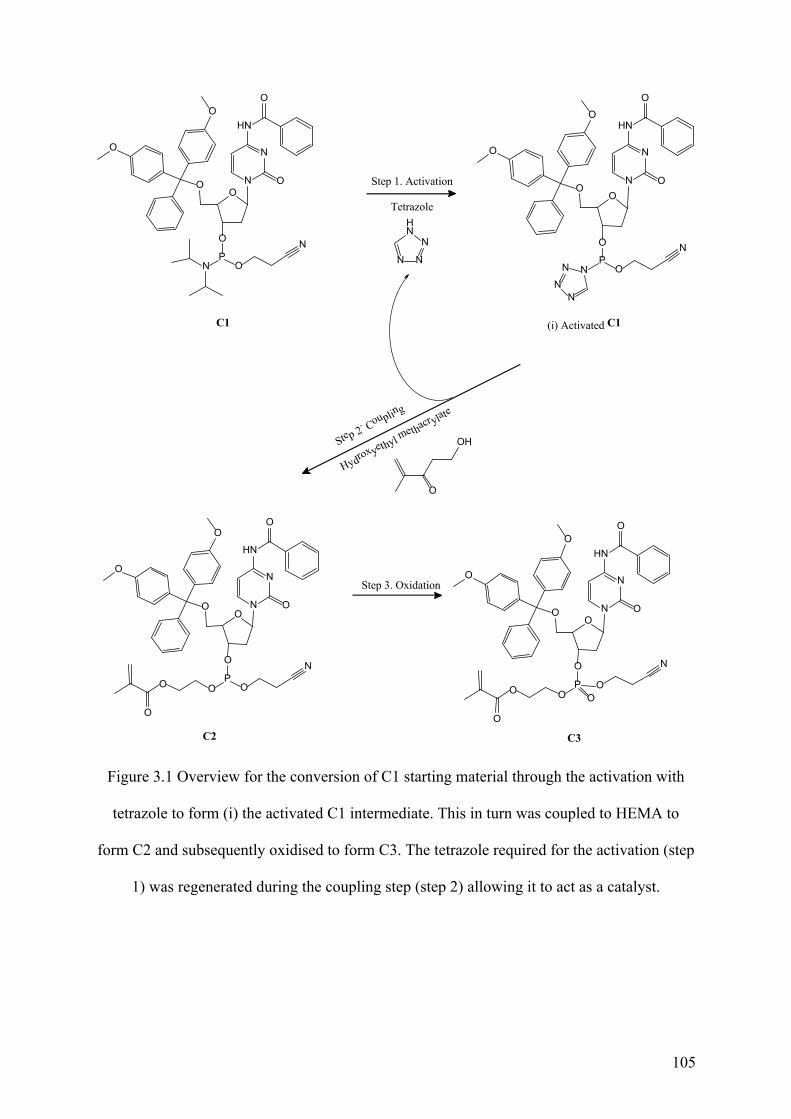
105
P
O
OO
N
O
O
O
O
NN
N N
Step 1. Activation
Tetrazole
Step 2
. Coupling
Step 3. Oxidation
O
O
P
O
OO
N
OO
O
O
O
O
O
P
O
OO
N
O
O
O
P
O
OO
N
O
O
O
N N N
N
HN
O
OH
(i) Activated C1
Hydroxyethyl
methacrylate
N
N
HN
O
O
N
N
HN
O
O
N
N
HN
O
O
N
N
HN
O
O
C1
C3C2
Figure 3.1 Overview for the conversion of C1 starting material through the activation with
tetrazole to form (i) the activated C1 intermediate. This in turn was coupled to HEMA to
form C2 and subsequently oxidised to form C3. The tetrazole required for the activation (step
1) was regenerated during the coupling step (step 2) allowing it to act as a catalyst.
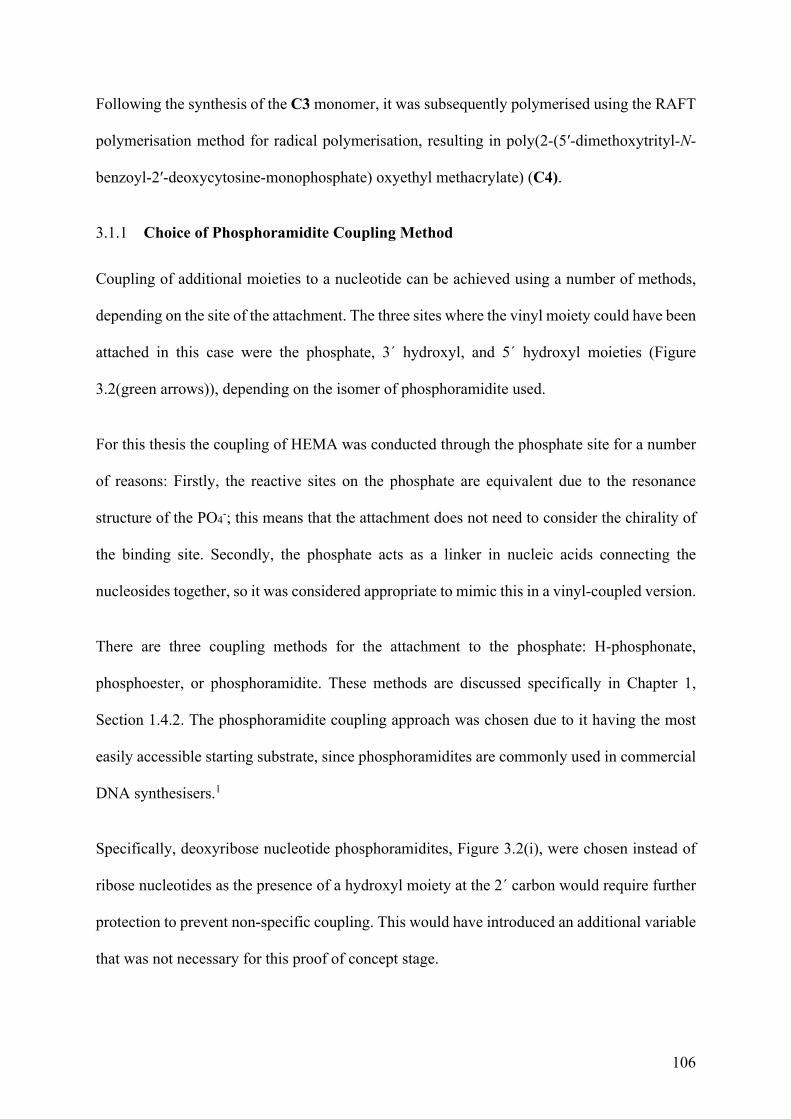
106
Following the synthesis of the C3 monomer, it was subsequently polymerised using the RAFT
polymerisation method for radical polymerisation, resulting in poly(2-(5′-dimethoxytrityl-N-
benzoyl-2′-deoxycytosine-monophosphate) oxyethyl methacrylate) (C4).
3.1.1 Choice of Phosphoramidite Coupling Method
Coupling of additional moieties to a nucleotide can be achieved using a number of methods,
depending on the site of the attachment. The three sites where the vinyl moiety could have been
attached in this case were the phosphate, 3´ hydroxyl, and 5´ hydroxyl moieties (Figure
3.2(green arrows)), depending on the isomer of phosphoramidite used.
For this thesis the coupling of HEMA was conducted through the phosphate site for a number
of reasons: Firstly, the reactive sites on the phosphate are equivalent due to the resonance
structure of the PO4-; this means that the attachment does not need to consider the chirality of
the binding site. Secondly, the phosphate acts as a linker in nucleic acids connecting the
nucleosides together, so it was considered appropriate to mimic this in a vinyl-coupled version.
There are three coupling methods for the attachment to the phosphate: H-phosphonate,
phosphoester, or phosphoramidite. These methods are discussed specifically in Chapter 1,
Section 1.4.2. The phosphoramidite coupling approach was chosen due to it having the most
easily accessible starting substrate, since phosphoramidites are commonly used in commercial
DNA synthesisers.1
Specifically, deoxyribose nucleotide phosphoramidites, Figure 3.2(i), were chosen instead of
ribose nucleotides as the presence of a hydroxyl moiety at the 2´ carbon would require further
protection to prevent non-specific coupling. This would have introduced an additional variable
that was not necessary for this proof of concept stage.
107
With these criteria in mind, the choice was narrowed to two isomers of the nucleotide
phosphoramidite dependent on whether the phosphorous was attached to the 3´ or 5´ hydroxyl
moiety on the nucleoside subunit, see Figure 3.2. The largest effect this difference could have
had on the coupling was the possibility of the phosphorous being cleaved from the nucleoside
resulting in a vinyl phosphate monomer and free nucleoside. As a result, the 3´ isomer was
chosen as the secondary hydroxyl is less susceptible to hydrolysis, reducing the possibility of
the cleavage occuring.
NN
NNNN
NN
NNHH22
OO
HHOOHH
HHHHHHHH
OOPP--OO
OO--
OO
NN
NNNN
NN
NNHH22
OO
HHOO
HHHHHHHH
PPOO
OO--
HHOO
OO--
((ii)) ((iiii))
55'' 33''
Figure 3.2 (i) 2'deoxyadenosine 5′ monophosphate and (ii) 2'deoxyadenosine 3′
monophosphate. Green arrows indicate sites that could be used for conjugation of the vinyl
moiety using the phosphoramidite coupling method.
The phosphoramidite coupling method requires a polar aprotic solvent. For this thesis
acetonitrile was used. Work conducted by Gaytán et al.2 has shown that acetone could be used
as an alternative. It would be preferable as acetone is easier to remove due to its higher vapour
pressure. However, the conditions of the coupling require the reaction to be immaculately dry,
and this requirement was easier to meet with acetonitrile through the use of molecular sieves.
Burfield et al.3 showed that the same method was not suitable when using acetone due to the
108
catalytic effect of the molecular sieves that caused the production of water in-situ through an
aldol reaction. As a result, for this preliminary work acetonitrile was used to avoid this effect.
3.1.2 Selection of Compatible Vinyl Moiety
Selection of the vinyl moiety required a few specific criteria to be met: a vinyl moiety, a
hydroxyl group, and some form of linker between the two.
Firstly, for the living radical technique of RAFT polymerisation, the monomer would require
the vinyl moiety during the polymerisation process because it propagates the radical, as
discussed in Chapter 1, Section 1.6.1.1. Further, the choice was made to use a methacrylate as
the vinyl source to increase the stability of the propagating radical as methacrylates are more
activated monomers due to the presence of the methyl and ester moieties attached to the vinyl.
These properties allow the propagating radical to be stabilised, increasing its lifetime which
may also assist with polymerisation as the extended lifetime of the radical can compensate for
the steric hindrance of the conjugated nucleotide.
When using the phosphoramidite coupling method, a hydroxyl moiety is required for the
conjugation to the nucleotide. The two options for achieving this were a hydroxyl or a
carboxylic acid. For later work, following the polymerisation of the vinyl-nucleotide
bioconjugate monomer, it would have been more preferable to use the carboxylic acid as it was
more soluble than the hydroxyl in water. However, the carboxylic acid would have lowered the
pH significantly more than the hydroxyl, and the lower pH would cause the removal of the
protecting groups from the nucleobase and the 5´ hydroxyl as they were susceptible to acid
catalysed hydrolysis.4 For this reason a hydroxyl moiety was chosen.
The vinyl moiety was the most important component of this project as an incompatible group
connecting the vinyl to the nucleotide could prevent polymerisation altogether. The first
109
requirement was the presence of a hydroxyl group for the phosphoramidite coupling to the
nucleotide. Additionally, it was important to consider the solvent compatibility with the
phosphoramidite for the coupling reactions, and the water for DNA interaction studies with the
final bioconjugate. These factors ruled out many of the common monomers for RAFT
polymerisation such as styrene or vinyl acetate. The two most appropriate classes of monomer
were therefore methacrylates and methacrylamides as these have multiple derivatives that are
soluble in both acetonitrile and water.
There are two main issues with these compounds to consider; cleavage of the linker, and off
site reactions. Both the ester and the amide would be susceptible to acid catalysed hydrolysis,
though there is no explicit use of acids strong enough to achieve this in the workup through the
phosphoramidite method. There is a risk of dehydration, converting the amide to a nitrile,
caused by the use of trifluroacetic anhydride for the removal of the DMT protecting group as
the method is presented in literature.5 This reaction occuring would leade to removal of
nucleotides from the final polymer and even partial removal would result in uneven spacing,
in turn effecting the binding behavior.
The methacrylamide has the potential to undergo an off target coupling reaction by creating a
second nucleophilic site on the monomer for the coupling of the phosphoramidite which was
undesirable for this experiment. Though it is not nucleophilic enough to proceed under the
initial conditions outlined as this procedure was unknown, having it present may have limited
options when adjusting the reaction conditions. The dehydration and off target reactions lead
to the selection of the ester, and thereby methacrylate, as the monomer of choice.
To give the vinyl moiety some spacing from the alkyl backbone during the polymerisation
process, the vinyl source chosen for the work outlined in this chapter was hydroxyethyl
methacrylate (HEMA) shown in Figure 3.3(iii). When HEMA was coupled to the C1 (Figure
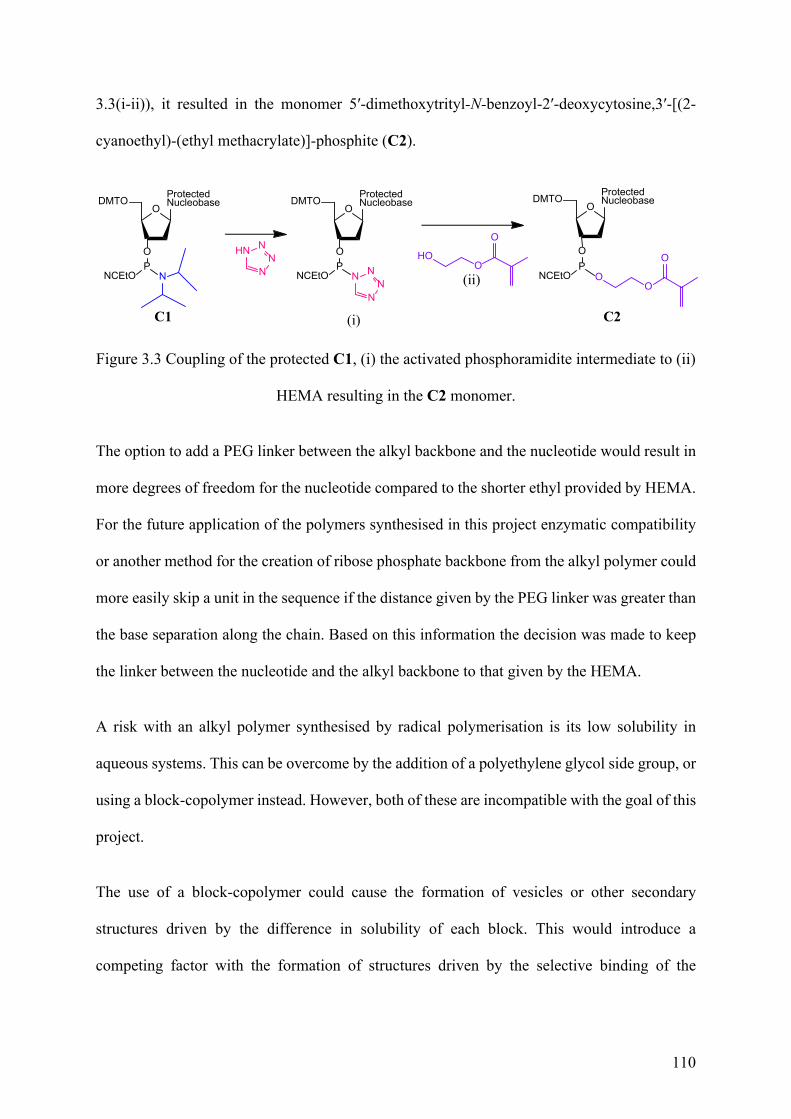
110
3.3(i-ii)), it resulted in the monomer 5′-dimethoxytrityl-N-benzoyl-2′-deoxycytosine,3′-[(2-
cyanoethyl)-(ethyl methacrylate)]-phosphite (C2).
ODMTO
PNCEtO
NN
NN
Protected Nucleobase
O HOO
O
ODMTO
PNCEtO
Protected Nucleobase
O
OO
O
(i)
(ii)
C2
ODMTO
PNCEtO N
Protected Nucleobase
O
C1
NN
NHN
Figure 3.3 Coupling of the protected C1, (i) the activated phosphoramidite intermediate to (ii)
HEMA resulting in the C2 monomer.
The option to add a PEG linker between the alkyl backbone and the nucleotide would result in
more degrees of freedom for the nucleotide compared to the shorter ethyl provided by HEMA.
For the future application of the polymers synthesised in this project enzymatic compatibility
or another method for the creation of ribose phosphate backbone from the alkyl polymer could
more easily skip a unit in the sequence if the distance given by the PEG linker was greater than
the base separation along the chain. Based on this information the decision was made to keep
the linker between the nucleotide and the alkyl backbone to that given by the HEMA.
A risk with an alkyl polymer synthesised by radical polymerisation is its low solubility in
aqueous systems. This can be overcome by the addition of a polyethylene glycol side group, or
using a block-copolymer instead. However, both of these are incompatible with the goal of this
project.
The use of a block-copolymer could cause the formation of vesicles or other secondary
structures driven by the difference in solubility of each block. This would introduce a
competing factor with the formation of structures driven by the selective binding of the

111
nucleobases, and is used as a method for controlling Mw and Đ in other polymerisation
techniques.
3.1.3 Activation of the Nucleotide Phosphoramidite
The first step of the phosphoramidite coupling method is activation, which converts the
phosphoramidite into a reactive intermediate. The most common activator for single nucleotide
phosphoramidite coupling is tetrazole, as discussed in Chapter 1, Section 1.4.3. In literature
tetrazole has been shown to be most effective with primary hydroxyls such as that found in
HEMA.6
Tetrazole was used in this study and underwent substitution with the diisopropyl amine, Figure
3.4 (blue), on the phosphoramidite to form the semi-stable intermediate as shown in Figure 3.4
(ii). The initial activation of the phosphoramidite was a rapid reaction that protonates the
phosphoramidite.7 The tetrazole was then, in turn, substituted with the hydroxyl moiety,
resulting in the C3 monomer.
ODMTO
Protected Nucleobase
PNC(CH2)2O N
N NN
HN
ODMTO
PNC(CH2)2O N
H
N NN
Nfast
Protected Nucleobase
ODMTO
PNC(CH2)2O
NN
NNslow
Protected Nucleobase
O O O
HN
(i) (ii)
Figure 3.4 Mechanism for the activation of (i) a phosphoramidite, substituting the
diisopropylamine (blue) with tetrazole (pink) resulting in (iii) an activated phosphoramidite.7
The tetrazole is subsiquently regenerated when it is substiruted with the monomer,
completing the coupling.
112
3.1.3.1 Quenching the Activator
Following the coupling of the bioconjugate, the reaction needed to be quenched to prevent
further addition of water to the C3 by the activator during the following phase extraction as
otherwise it would lead to the coupled vinyl moiety being replaced with water.8 To quench the
coupling reaction a solution containing triethylamine (TEA), ethyl acetate (EtOAc), and
dichloromethane (DCM) at a ratio of 45:45:10 v/v EtOAc:DCM:TEA is added to the coupling
solution. This combination of solvents has been shown by Dahl et al.8 to quench the
phosphoramidite coupling reaction while maintaining the successfully coupled phosphite
product in solution.
3.1.3.2 Oxidation
Oxidation of phosphite to phosphate was required to convert the protected phosphoramidite
into the nucleotide monophosphate. This step was necessary as the PO4- anion formed in the
process was more soluble in water, which was required to determine if the vinyl-nucleotide
bioconjugate was compatible with DNA systems.
When oxidising phosphite to phosphate, the ideal oxidant was something that would provide a
rapid and selective reaction. In literature, I2 has been used with a mixture of pyridine, THF and
water using the method outlined in Figure 3.5.9 This was not an option for the synthesis used
in this project because the I2 would add across the alkene bond which would remove the active
group for the living radical polymerisation. Therefore, an alternative method had to be found.
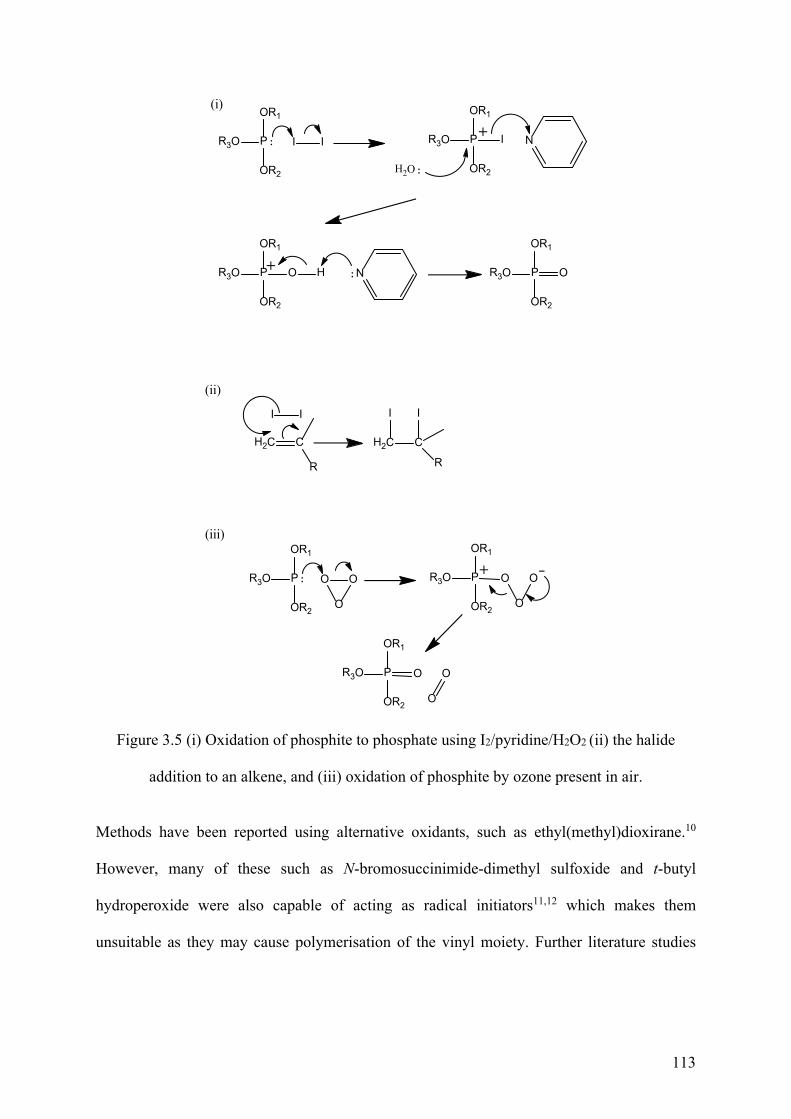
113
P I
OR1
R3O
OR2
I P I N
H2O
N
OR1
OR2
R3O
P O
OR1
OR2
R3O H P O
OR1
OR2
R3O
I I
(i)
(ii)
H2C C
R
H2C C
II
R
(iii)
P O
OR1
R3O
OR2
O
O
P O
OR1
R3O
OR2
O
O
P O
OR1
R3O
OR2
O
O
Figure 3.5 (i) Oxidation of phosphite to phosphate using I2/pyridine/H2O2 (ii) the halide
addition to an alkene, and (iii) oxidation of phosphite by ozone present in air.
Methods have been reported using alternative oxidants, such as ethyl(methyl)dioxirane.10
However, many of these such as N-bromosuccinimide-dimethyl sulfoxide and t-butyl
hydroperoxide were also capable of acting as radical initiators11,12 which makes them
unsuitable as they may cause polymerisation of the vinyl moiety. Further literature studies
114
found no other suitable oxidative compounds reported for the oxidation of phosphite to
phosphate for phosphoramidite coupling method.
Based on work by Dennison et al.13,14 with phosphorous compounds, compressed air was
trialled as it had several obviously favourable properties: notably, it uses oxygen gas which
acts as a mild oxidant, meaning that during the short exposure required the oxygen degradation
of the nucleic acid components of the C3 would not take place. There was limited evidence
directly showing the use of compressed air as a method for oxidation of phosphorous, e.g.,
Bolduc and Goe15 demonstrated the oxidation of phosphite with O2 under UV light using a dye
sensitiser. More recently, Martin et al.16 have shown that the oxidation of phosphite can occur
rapidly in the presence of atmospheric gases, specifically ozone, oxygen, nitroxides and/or
hydroxyl radicals.
More common than the deliberate oxidation of phosphite to phosphate using atmospheric
gasses, was the use of alkyl phosphates as antioxidants. These are compounds that undergo
sacrificial oxidation to protect another compound. Notably to this work is the previous use of
alkyl phosphites to protect synthetic polymers.17,18
Further, due to the phase extraction method employed to isolate the C3 the solution needed to
be dried. The use of compressed air also increased the rate of evaporation of the solvent
effectively increasing the rate of isolation and reducing the amount of remaining solvent to be
removed during freeze drying.
3.2 Synthesis of HEMA-Nucleotide Bioconjugate
The following sections outline the analytical methods used to confirm the synthesis of the
DMT-dC-CE-EMA phosphoramidite monomer, as described in Chapter 2, Section 2.4.1.1. The
methods employed for this analysis were NMR spectroscopy using 1H and 31P methods.
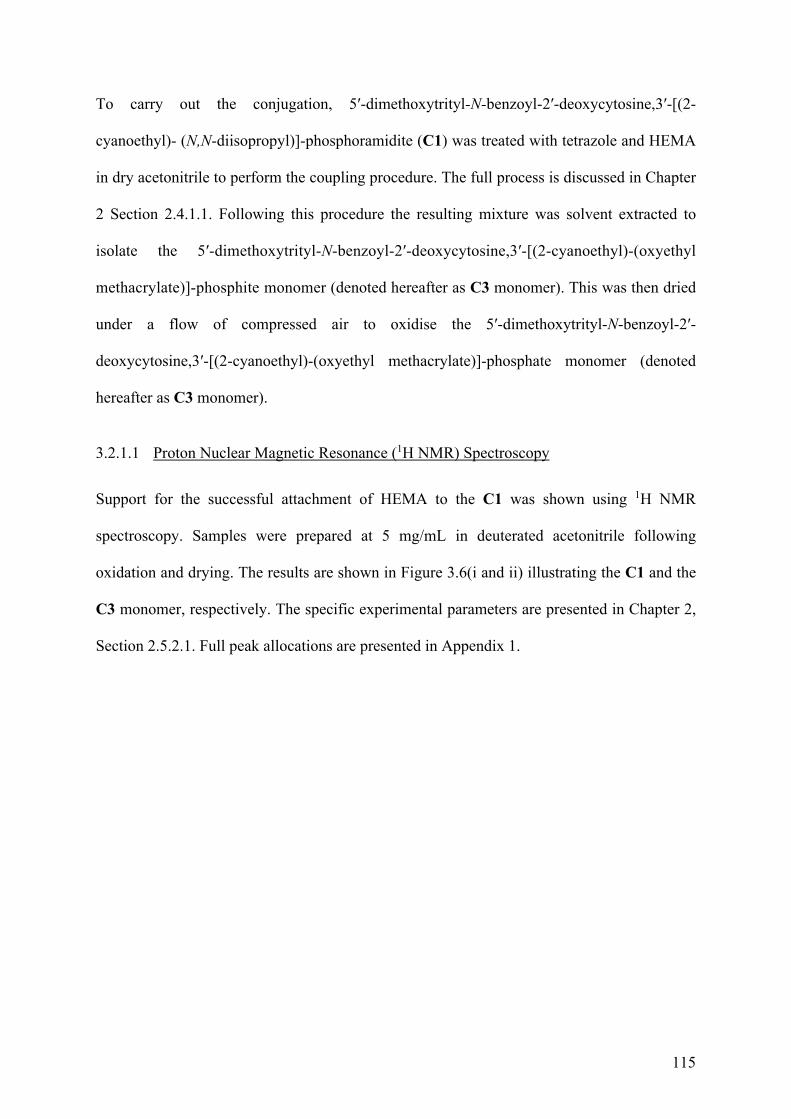
115
To carry out the conjugation, 5′-dimethoxytrityl-N-benzoyl-2′-deoxycytosine,3′-[(2-
cyanoethyl)- (N,N-diisopropyl)]-phosphoramidite (C1) was treated with tetrazole and HEMA
in dry acetonitrile to perform the coupling procedure. The full process is discussed in Chapter
2 Section 2.4.1.1. Following this procedure the resulting mixture was solvent extracted to
isolate the 5′-dimethoxytrityl-N-benzoyl-2′-deoxycytosine,3′-[(2-cyanoethyl)-(oxyethyl
methacrylate)]-phosphite monomer (denoted hereafter as C3 monomer). This was then dried
under a flow of compressed air to oxidise the 5′-dimethoxytrityl-N-benzoyl-2′-
deoxycytosine,3′-[(2-cyanoethyl)-(oxyethyl methacrylate)]-phosphate monomer (denoted
hereafter as C3 monomer).
3.2.1.1 Proton Nuclear Magnetic Resonance (1H NMR) Spectroscopy
Support for the successful attachment of HEMA to the C1 was shown using 1H NMR
spectroscopy. Samples were prepared at 5 mg/mL in deuterated acetonitrile following
oxidation and drying. The results are shown in Figure 3.6(i and ii) illustrating the C1 and the
C3 monomer, respectively. The specific experimental parameters are presented in Chapter 2,
Section 2.5.2.1. Full peak allocations are presented in Appendix 1.
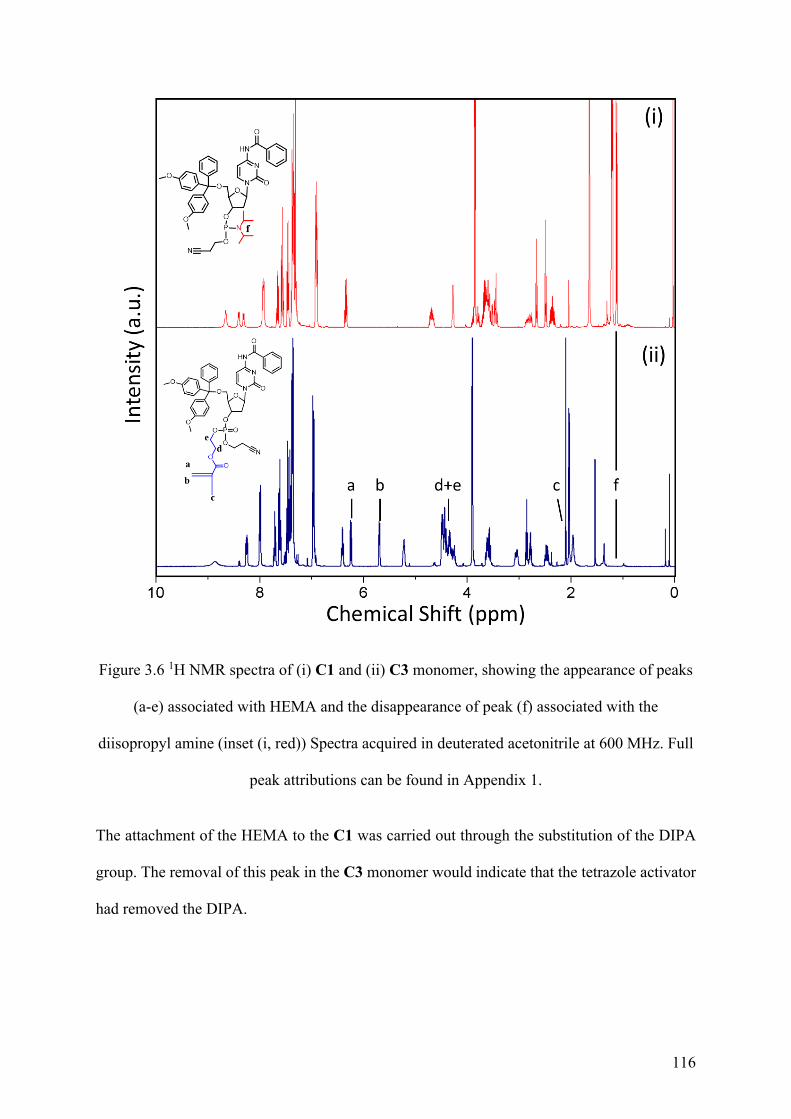
116
Figure 3.6 1H NMR spectra of (i) C1 and (ii) C3 monomer, showing the appearance of peaks
(a-e) associated with HEMA and the disappearance of peak (f) associated with the
diisopropyl amine (inset (i, red)) Spectra acquired in deuterated acetonitrile at 600 MHz. Full
peak attributions can be found in Appendix 1.
The attachment of the HEMA to the C1 was carried out through the substitution of the DIPA
group. The removal of this peak in the C3 monomer would indicate that the tetrazole activator
had removed the DIPA.
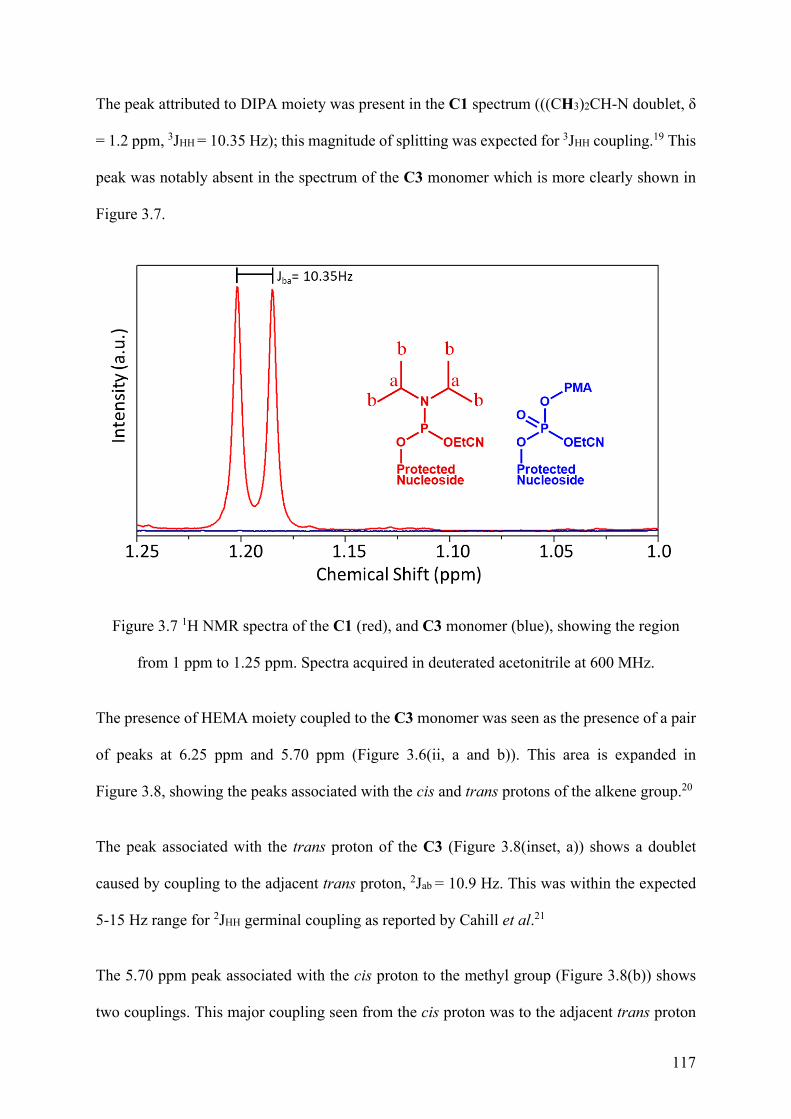
117
The peak attributed to DIPA moiety was present in the C1 spectrum (((CH3)2CH-N doublet, δ
= 1.2 ppm, 3JHH = 10.35 Hz); this magnitude of splitting was expected for 3JHH coupling.19 This
peak was notably absent in the spectrum of the C3 monomer which is more clearly shown in
Figure 3.7.
Figure 3.7 1H NMR spectra of the C1 (red), and C3 monomer (blue), showing the region
from 1 ppm to 1.25 ppm. Spectra acquired in deuterated acetonitrile at 600 MHz.
The presence of HEMA moiety coupled to the C3 monomer was seen as the presence of a pair
of peaks at 6.25 ppm and 5.70 ppm (Figure 3.6(ii, a and b)). This area is expanded in
Figure 3.8, showing the peaks associated with the cis and trans protons of the alkene group.20
The peak associated with the trans proton of the C3 (Figure 3.8(inset, a)) shows a doublet
caused by coupling to the adjacent trans proton, 2Jab = 10.9 Hz. This was within the expected
5-15 Hz range for 2JHH germinal coupling as reported by Cahill et al.21
The 5.70 ppm peak associated with the cis proton to the methyl group (Figure 3.8(b)) shows
two couplings. This major coupling seen from the cis proton was to the adjacent trans proton
118
(2JHH = 8.9 Hz). Due to the fixed rotation of the alkene group an additional minor coupling was
seen between the cis proton and the spatially adjacent methyl protons (4JHH = 1.77 Hz). The
signal attributed to this methyl group appeared as a sharp peak at 2.10 ppm (
Figure 3.6ii (c)).
Figure 3.8 1H NMR spectra of the 5.5 ppm to 6.5 ppm region of C1 (red) and C3 monomer
(blue), showing the appearance of peaks (a and b) associated with the cis and trans protons of
the alkene (inset). In addition the peak associated with the 1′ proton on the ribose is also
visible in this region. Spectra acquired in deuterated acetonitrile at 600 MHz.
The coupling is further supported by the integration ratio between the peak at HEMA moiety
trans proton (6.2 ppm) and the 1′ proton (6.4 ppm) integrating to 1 and 0.9 respectively. This
indicates that at the very least there is no excess of HEMA in the solution that could undergo a
competing polymerisation during the following stages.

119
3.2.1.2 Phosphorous Nuclear Magnetic Resonance (31P NMR) Spectroscopy
To confirm the oxidation of the C1 from the P(III) oxidation state to the C3 monomer P(V)
oxidation state 31P NMR spectroscopy was used. The specific parameters are presented in
Chapter 2, Section 2.5.2.1
For this work the important difference was caused by the oxidation following the
phosphoramidite coupling. Prior to coupling the C1 was significantly deshielded the
phosphorous in the P(III) oxidation state. Following successful oxidation to the P(V) oxidation
state of the C3 monomer there was a significant upfield shift that can be seen in Figure 3.9 as
the difference in peak location between the red to blue spectra.
Figure 3.9 31P NMR spectra of the -10 ppm to 160 ppm region of C1 (red, P(III)) and C3
monomer (blue, P(V)) Spectra acquired pulse decoupled in deuterated acetonitrile at 600 MHz.
120
The result of the NMR for the C1 (Figure 3.9, red) showed a pair of peaks at 148.7 ppm and
147.8 ppm. This would lead to a coupling constant of J = 540 Hz. This value would be beyond
possible 1J coupling values and suggests the computer pulse decoupling has not worked
successfully. Due to the infrequent use of 31P spectroscopy is likely the CPD had not been
calibrated, resulting in the peak splitting seen. The potential for the sample to be contaminated
with another phosphite is unlikely as the supplier reported purity >98% by HPLC and the
sample was used directly as supplied. The similar shift and symmetry suggests that this may
be due to deuterium induced peak splitting22 or another effect as similar peak splitting has been
previously reported in 31P spectra for cysteine deoxynucleotide phosphites.23,24
The spectra for C3 monomer (Figure 3.9, blue) shows a triplet peak (-2.71 ppm, t, J = 58.43
Hz). This was attributed to the P(V) oxidation state of the C3 monomer following oxidation.
The splitting of the peak was attributed to the chiral isomers at the phosphate position. The
asymmetry seen in this peak was therefore assigned to JPH coupling between the phosphorous
and the protons on the deoxyribose ring in one of these isomers.
3.3 Polymerisation of the C3 Monomer
Following the synthesis of the C3 monomer, it was polymerised using the RAFT method for
radical polymerisation. This method introduces a mediator in the form of a RAFT agent that
mediates the polymerisation to reduce the Đ of the resulting polymers. The Đ is discussed in
more detail in Chapter 1, Section 1.5.2.
Radical polymerisation is a method that generates polymers through the conversion of the
alkene moiety of the monomer into a long chain alkane through addition of a radical; this
process is discussed in Chapter 1, Section 1.5.3. As previously mentioned, uncontrolled radical
polymerisation results in polymers of varying lengths, which in turn causes the properties of
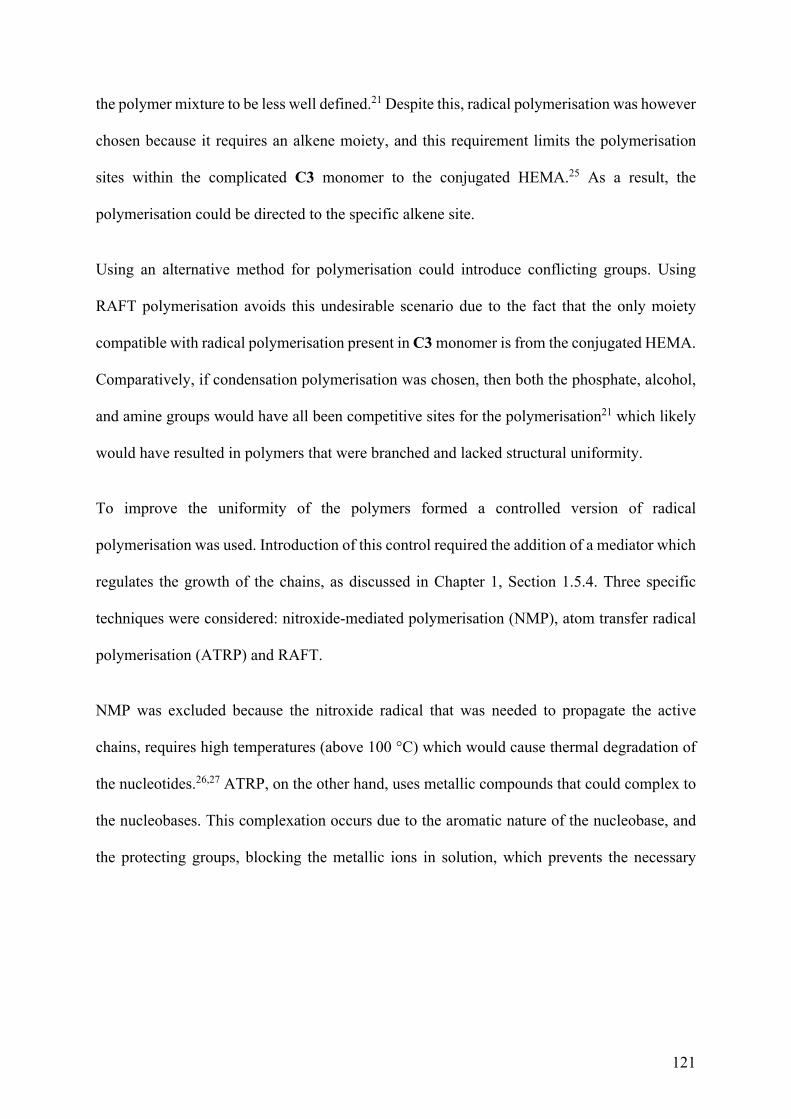
121
the polymer mixture to be less well defined.21 Despite this, radical polymerisation was however
chosen because it requires an alkene moiety, and this requirement limits the polymerisation
sites within the complicated C3 monomer to the conjugated HEMA.25 As a result, the
polymerisation could be directed to the specific alkene site.
Using an alternative method for polymerisation could introduce conflicting groups. Using
RAFT polymerisation avoids this undesirable scenario due to the fact that the only moiety
compatible with radical polymerisation present in C3 monomer is from the conjugated HEMA.
Comparatively, if condensation polymerisation was chosen, then both the phosphate, alcohol,
and amine groups would have all been competitive sites for the polymerisation21 which likely
would have resulted in polymers that were branched and lacked structural uniformity.
To improve the uniformity of the polymers formed a controlled version of radical
polymerisation was used. Introduction of this control required the addition of a mediator which
regulates the growth of the chains, as discussed in Chapter 1, Section 1.5.4. Three specific
techniques were considered: nitroxide-mediated polymerisation (NMP), atom transfer radical
polymerisation (ATRP) and RAFT.
NMP was excluded because the nitroxide radical that was needed to propagate the active
chains, requires high temperatures (above 100 °C) which would cause thermal degradation of
the nucleotides.26,27 ATRP, on the other hand, uses metallic compounds that could complex to
the nucleobases. This complexation occurs due to the aromatic nature of the nucleobase, and
the protecting groups, blocking the metallic ions in solution, which prevents the necessary
122
change in oxidation state of the metallic ion used to mediate the polymerisation which would
cause retardation.28
The thiol chemistry that provides the mediation of RAFT polymerisation is less sensitive to
complexation, and due to the solubility and reactivity being primarily determined by the
secondary functional groups it could be applied over a wide range of conditions.29 This made
RAFT the most viable option for the polymerisation of nucleotide-vinyl polymers.
The RAFT agent was able to act as a mediator during the polymerisation but still required a
radical source, the initiator. For this purpose, AIBN was chosen, the radical generation
mechanism is shown in Figure 3.10. The main reason for this choice was that AIBN activates
above room temperature, with a 10 h half-life at 65 °C, while still allowing the temperature to
remain low enough, below 90 °C, to not cause rapid thermal degradation of the nucleotide.30
NN
N
NN
N
N
2
Figure 3.10 Thermal decomposition of AIBN into N2 and the isobutyronitrile radical.31
3.3.1.1 Selection of RAFT Agent
The RAFT agent mediates the polymerisation to control the Đ and molecular weight of the
polymers formed. It was used to ensure that the polymers formed from the C3 monomer would
be of similar molecular weight and therefore share similar properties. If the Đ varied greatly
between chains it could lead to inconsistent properties, such as broad melting peaks or
solubilities. This would make the analysis of the polymer and its interactions with DNA
difficult to perform, as different chains would act differently.
123
Not all RAFT agents were able to mediate all monomers, each showing different
compatibilities with monomers, as discussed in Chapter 1, Section 1.6.1.2. For the
polymerisation of the C3 monomer, the 4-cyano-4-(phenylcarbonothioylthio) pentanoic acid
N-succinimidyl ester (NHS-RAFT) agent was chosen based on compatibility with methacrylate
monomers as well as shared solubility with the monomer.
The HEMA coupled to the C1 was a methacrylate, which had been shown to work well with
dithiobenzoates so this was the first class of RAFT agents tested.
To conduct the polymerisation in solution, the RAFT agent was required to share similar
solvent compatibility as the C3 monomer. By this point it was known that C3 monomer was
soluble in several organic polar solvents including acetonitrile, DMSO, DCM, DMF and THF.
To accomplish similar solubility, 2-cyanopentanoic acid was chosen as the R group on the
RAFT agent. The pentatonic acid provided similar solubility to the nucleotide as it was organic
with an ionisable carboxylic acid group allowing it to be solvated in aqueous solutions. To act
as a RAFT agent, it also required for cyanoethyl to be an electron withdrawing group and assist
in the stabilisation of the radical intermediate of the dithiobenzoate, as discussed in Chapter 1,
Section 1.6.1.2.
To prevent the removal of the DMT protecting group from the C3 monomer during the
polymerisation the carboxylic acid group needed to be protected. This was achieved through
the use of the NHS protected version of the RAFT agent. In the absence of the NHS group the
DMT moiety would be cleaved by the pentanoic acid Z-group present. This would generate a
primary alcohol at the 5′ position which would in turn be susceptible to condensation reactions
with the pentanoic acid Z-group of the RAFT agent, or the phosphate on the C3 monomer.
3.3.2 Polymerisation of C3 Monomer
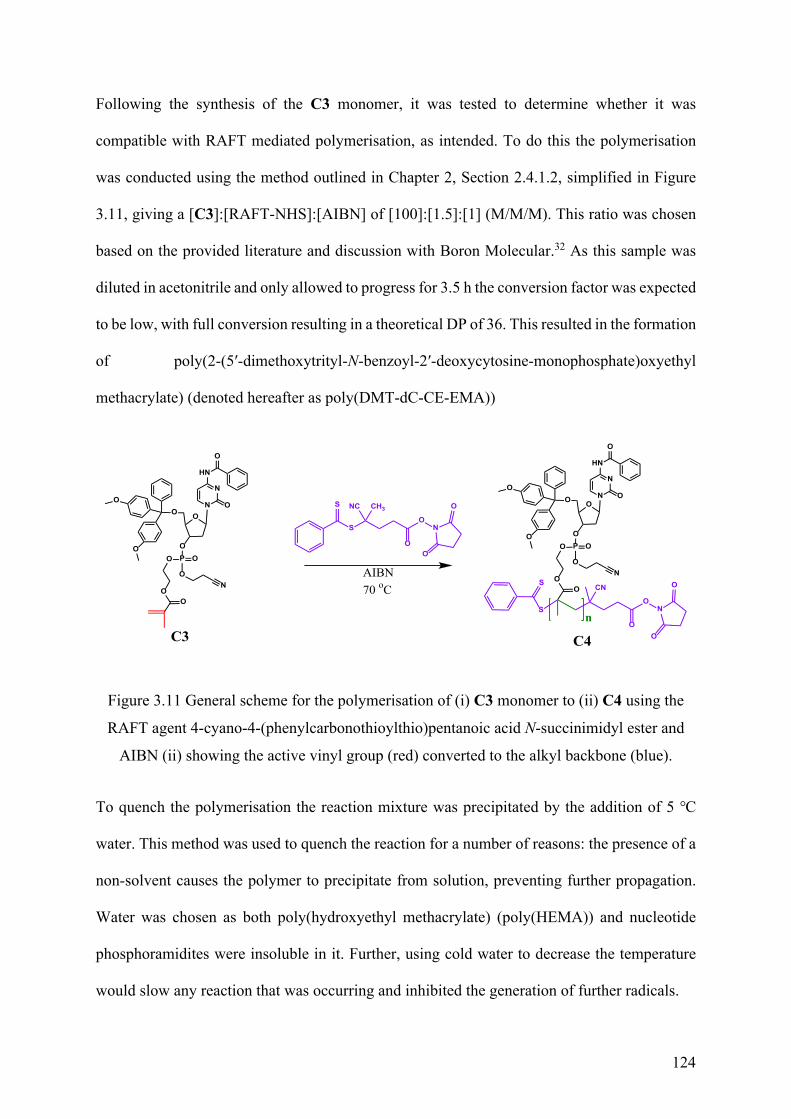
124
Following the synthesis of the C3 monomer, it was tested to determine whether it was
compatible with RAFT mediated polymerisation, as intended. To do this the polymerisation
was conducted using the method outlined in Chapter 2, Section 2.4.1.2, simplified in Figure
3.11, giving a [C3]:[RAFT-NHS]:[AIBN] of [100]:[1.5]:[1] (M/M/M). This ratio was chosen
based on the provided literature and discussion with Boron Molecular.32 As this sample was
diluted in acetonitrile and only allowed to progress for 3.5 h the conversion factor was expected
to be low, with full conversion resulting in a theoretical DP of 36. This resulted in the formation
of poly(2-(5′-dimethoxytrityl-N-benzoyl-2′-deoxycytosine-monophosphate)oxyethyl
methacrylate) (denoted hereafter as poly(DMT-dC-CE-EMA))
PO
OO
O
OO
O
Sn
O
O
O
NS CN
O
ON
O
O
O
O
NO
O
NC CH3S
S
PO
OO
O
OO
O
O
O
O
NAIBN70 oC
C3 C4
N
N
HN
O
O
N
N
HN
O
O
Figure 3.11 General scheme for the polymerisation of (i) C3 monomer to (ii) C4 using the
RAFT agent 4-cyano-4-(phenylcarbonothioylthio)pentanoic acid N-succinimidyl ester and
AIBN (ii) showing the active vinyl group (red) converted to the alkyl backbone (blue).
To quench the polymerisation the reaction mixture was precipitated by the addition of 5 ℃
water. This method was used to quench the reaction for a number of reasons: the presence of a
non-solvent causes the polymer to precipitate from solution, preventing further propagation.
Water was chosen as both poly(hydroxyethyl methacrylate) (poly(HEMA)) and nucleotide
phosphoramidites were insoluble in it. Further, using cold water to decrease the temperature
would slow any reaction that was occurring and inhibited the generation of further radicals.
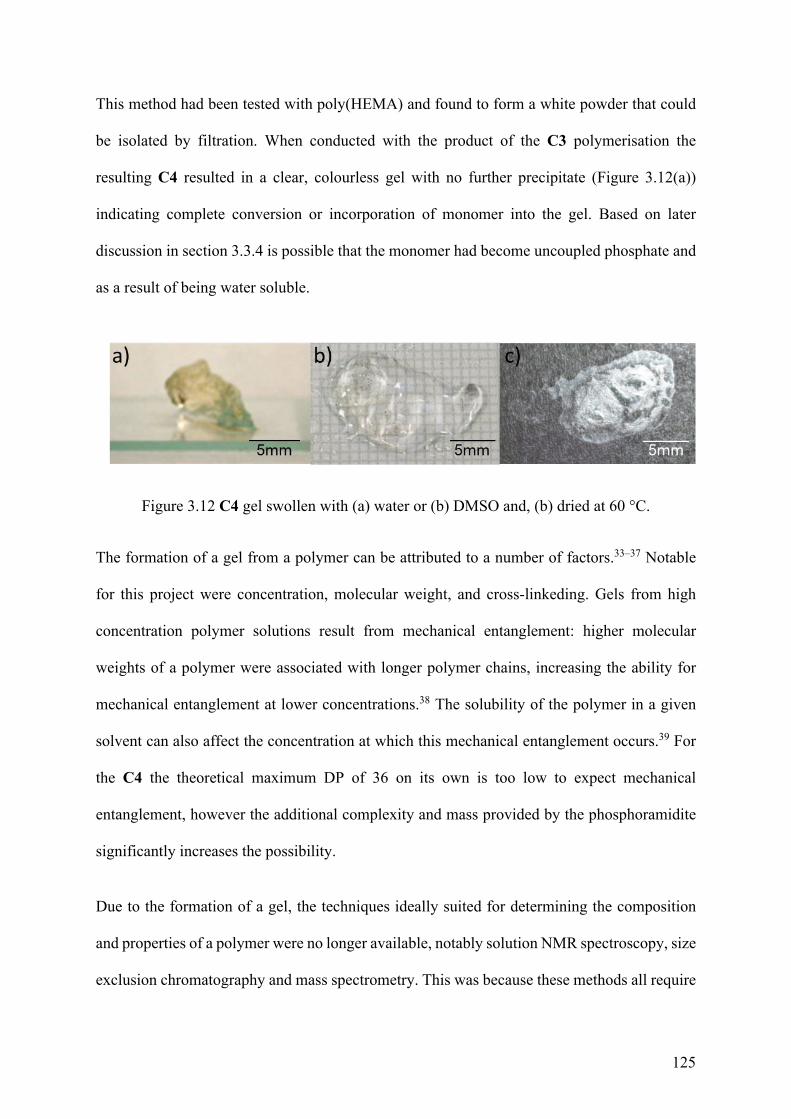
125
This method had been tested with poly(HEMA) and found to form a white powder that could
be isolated by filtration. When conducted with the product of the C3 polymerisation the
resulting C4 resulted in a clear, colourless gel with no further precipitate (Figure 3.12(a))
indicating complete conversion or incorporation of monomer into the gel. Based on later
discussion in section 3.3.4 is possible that the monomer had become uncoupled phosphate and
as a result of being water soluble.
Figure 3.12 C4 gel swollen with (a) water or (b) DMSO and, (b) dried at 60 °C.
The formation of a gel from a polymer can be attributed to a number of factors.33–37 Notable
for this project were concentration, molecular weight, and cross-linkeding. Gels from high
concentration polymer solutions result from mechanical entanglement: higher molecular
weights of a polymer were associated with longer polymer chains, increasing the ability for
mechanical entanglement at lower concentrations.38 The solubility of the polymer in a given
solvent can also affect the concentration at which this mechanical entanglement occurs.39 For
the C4 the theoretical maximum DP of 36 on its own is too low to expect mechanical
entanglement, however the additional complexity and mass provided by the phosphoramidite
significantly increases the possibility.
Due to the formation of a gel, the techniques ideally suited for determining the composition
and properties of a polymer were no longer available, notably solution NMR spectroscopy, size
exclusion chromatography and mass spectrometry. This was because these methods all require
126
the solvation of the polymer analyte to measure its properties. As a gel it was insoluble,
displaying swelling behaviour in some solvents, and as such other techniques were found. For
this thesis they were qualitative and quantitative solution studies to determine the binding
between chains that caused the formation of the gel, and FTIR spectroscopy to determine if the
nucleotide unit had been retained in the gel.
3.3.3 Investigating Solvent Effect on C4
Following polymerisation of the C3 monomer, the C4 gel that formed was tested in a number
of other solvents. This was done to determine the cause of the gel formation, whether by
mechanical, electrostatic, or covalent forces. In the case of a cytosine rich system there is a
broader scope for the electrostatic interaction in the form of i-motifs, these are stacked cytosine-
cytosine non-canonical pairs. These are able to form only in aqueous systems, so the same
alternating solvent that would prevent electrostatic interactions would also reduce the
formation of the i-motifs.
If the C4 gel was able to be dispersed in any solvent it would have ruled out covalent bonding
as covalent gels will only swell. If the gel swells in a solvent and then disperses it would
indicate a mechanical entanglement that is overcome by reducing the concentration. If the gel
is formed by electrostatic forces, then a solvent that destabilises these forces should disperse
the gel at low concentrations.
The C4 was first dried and then swollen in water to ensure no acetonitrile from the
polymerisation remained. The C4 sample was placed into a gross excess of DMSO. This
resulted in the C4 gel shrinking as it ejected the absorbed water, before again expanding in the
127
DMSO. The resulting DMSO swollen C4 gel was less rigid and had poorly defined edges,
Figure 3.12(b), compared to the water swollen C4 gel.
The active rejection of the water from the polymer indicates a mechanical change a structural
change within the gel that made it hydrophobic in the presence of DMSO as solvent
displacement alone would not cause the gel to shrink and re swell. Due to the different
solubilities of the backbone this was hypothesised to be the result of the hydration of the
nucleotide moiety in water combined with the contraction of the hydrophobic regions shown
in Figure 3.13(red). This in turn restricted the movement of the polymer, leading to a more
rigid structure in water.
When the C4 was then exposed to DMSO the whole structure became hydrated thereby
allowing the hydrophobic regions to relax. This allowed more flexibility in the repeating units,
leading to the decreased rigidity seen in Figure 3.12 (b).
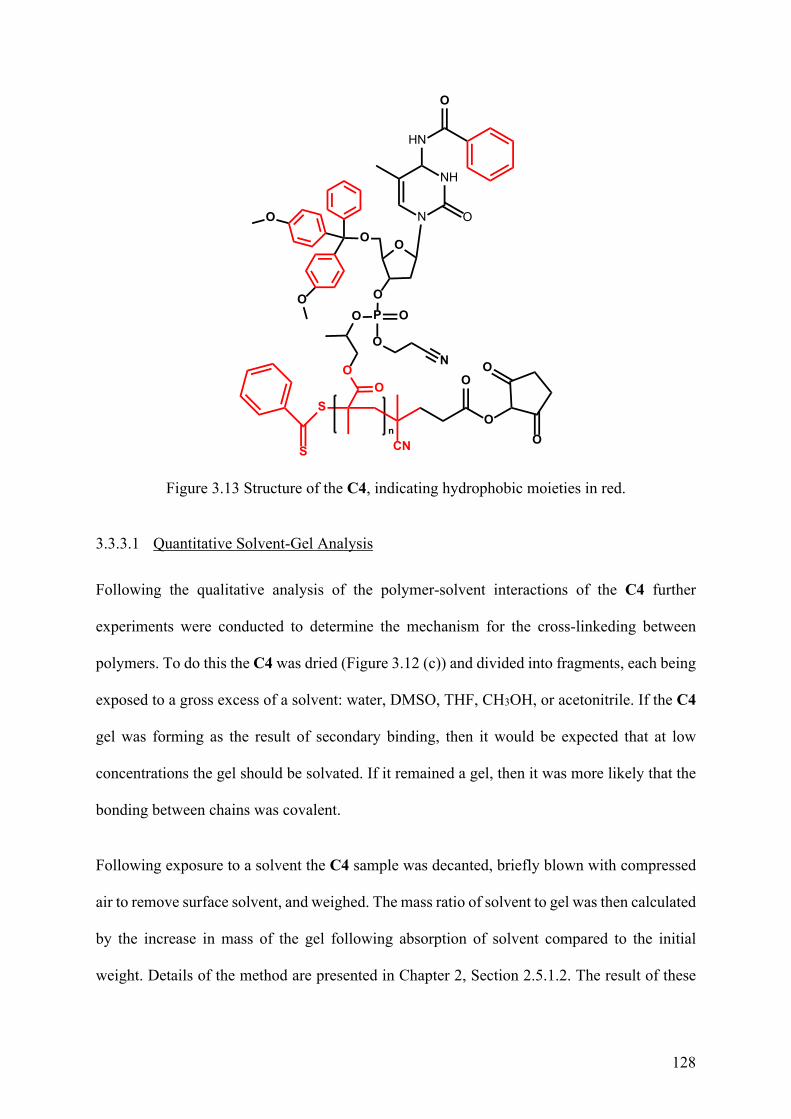
128
PO
OO
O
OO
S
O
O
O
N
NH
N
HN
O
O
n
O
S CN
O
O
O
O
Figure 3.13 Structure of the C4, indicating hydrophobic moieties in red.
3.3.3.1 Quantitative Solvent-Gel Analysis
Following the qualitative analysis of the polymer-solvent interactions of the C4 further
experiments were conducted to determine the mechanism for the cross-linkeding between
polymers. To do this the C4 was dried (Figure 3.12 (c)) and divided into fragments, each being
exposed to a gross excess of a solvent: water, DMSO, THF, CH3OH, or acetonitrile. If the C4
gel was forming as the result of secondary binding, then it would be expected that at low
concentrations the gel should be solvated. If it remained a gel, then it was more likely that the
bonding between chains was covalent.
Following exposure to a solvent the C4 sample was decanted, briefly blown with compressed
air to remove surface solvent, and weighed. The mass ratio of solvent to gel was then calculated
by the increase in mass of the gel following absorption of solvent compared to the initial
weight. Details of the method are presented in Chapter 2, Section 2.5.1.2. The result of these
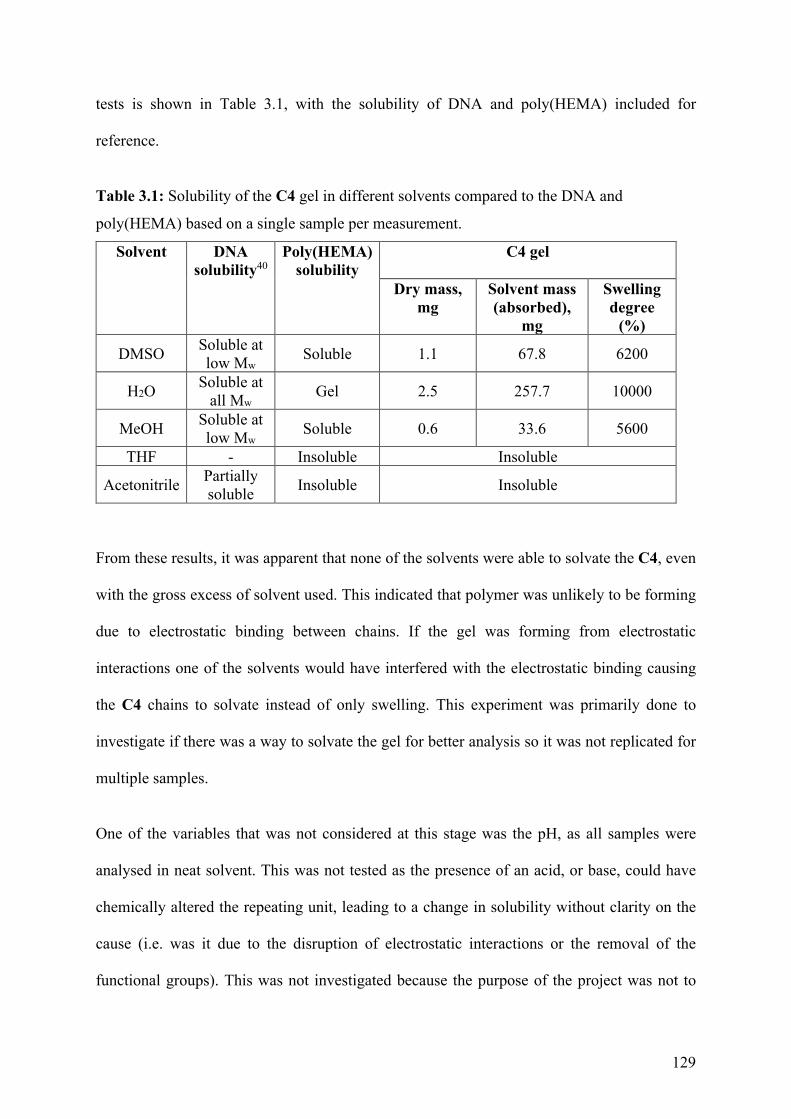
129
tests is shown in Table 3.1, with the solubility of DNA and poly(HEMA) included for
reference.
Table 3.1: Solubility of the C4 gel in different solvents compared to the DNA and
poly(HEMA) based on a single sample per measurement.
Solvent DNA solubility40
Poly(HEMA) solubility
C4 gel
Dry mass, mg
Solvent mass (absorbed),
mg
Swelling degree
(%)
DMSO Soluble at low Mw Soluble 1.1 67.8 6200
H2O Soluble at all Mw Gel 2.5 257.7 10000
MeOH Soluble at low Mw Soluble 0.6 33.6 5600
THF - Insoluble Insoluble
Acetonitrile Partially soluble Insoluble Insoluble
From these results, it was apparent that none of the solvents were able to solvate the C4, even
with the gross excess of solvent used. This indicated that polymer was unlikely to be forming
due to electrostatic binding between chains. If the gel was forming from electrostatic
interactions one of the solvents would have interfered with the electrostatic binding causing
the C4 chains to solvate instead of only swelling. This experiment was primarily done to
investigate if there was a way to solvate the gel for better analysis so it was not replicated for
multiple samples.
One of the variables that was not considered at this stage was the pH, as all samples were
analysed in neat solvent. This was not tested as the presence of an acid, or base, could have
chemically altered the repeating unit, leading to a change in solubility without clarity on the
cause (i.e. was it due to the disruption of electrostatic interactions or the removal of the
functional groups). This was not investigated because the purpose of the project was not to
130
investigate the properties of this homopolymer gel, and as such it falls beyond the scope of the
project.
If the C4 was mechanically entangled due to the molecular length then the low concentration
of gel used would be expected to dissolve the gels. As all the C4 gels remained solid through
the process, this indicates that mechanical entanglement was not the source of the gel
formation. This left the covalent binding between the C4 chains as the most likely cause of the
gel formation.
The magnitude of the degree of swelling found for the solvents DMSO, H2O and CH3OH was
significantly higher than that found for other gels in literature.33,41 For example the
poly(ethylene glycol)/poly(L-lactic acid) alternating copolymer synthesised by Huh et al,41
chosen for its similarly high complexity, was found to have a maximum swelling degree of
250%.
These high results were attributed to the small masses used and the balances available. As a
result, the swelling magnitude could not be determined with a high degree of accuracy.
However, the correlation between the swelling degree and the solubility of DNA indicates that
the HEMA moiety determined if the gel was able to form, as the non-solvents for poly(HEMA)
were also non-solvents for the C4. After that the nucleotide moiety affects the mass of solvent
absorbed, with better nucleotide compatibility indicated by better solvation of DNA, leading
to a higher swelling degree.
3.3.3.2 ATR-FTIR Spectroscopy
The gel-solvent analysis of the C4 had shown that the gel acted as if the nucleotides had been
incorporated. Further analysis using ATR-FTIR spectroscopy was conducted to confirm that
the cytosine nucleotide had been retained. ATR-FTIR spectroscopy was chosen as it did not
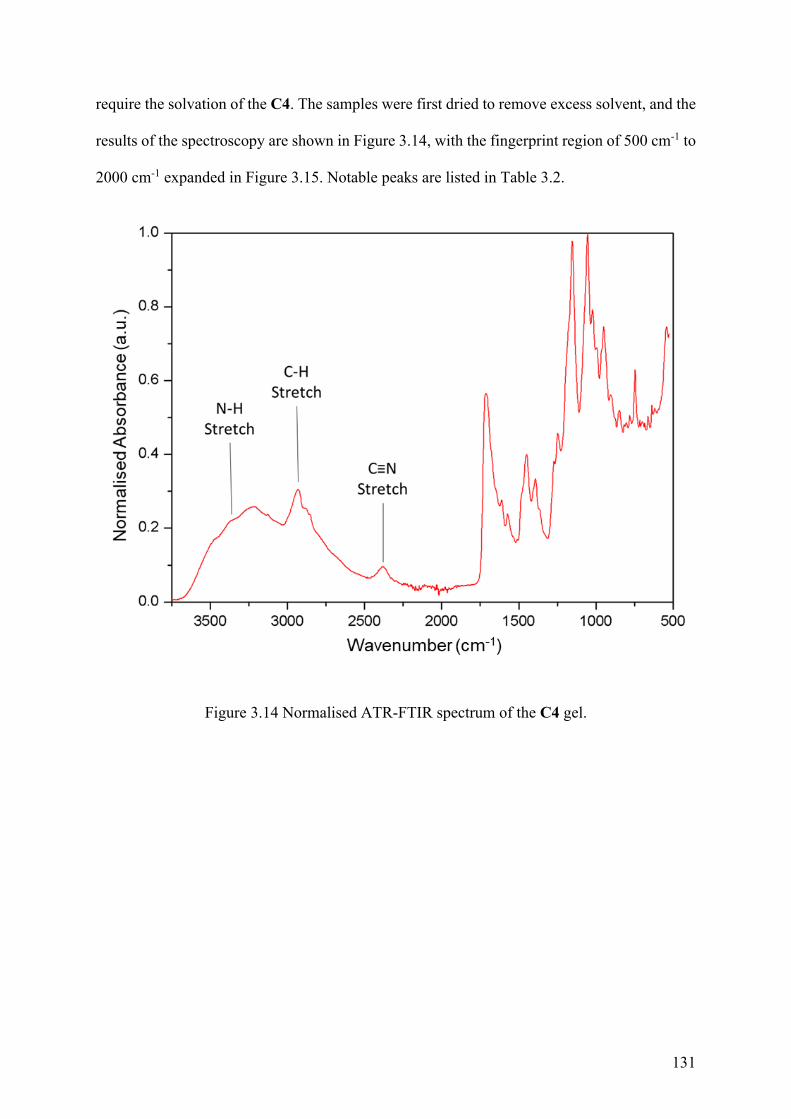
131
require the solvation of the C4. The samples were first dried to remove excess solvent, and the
results of the spectroscopy are shown in Figure 3.14, with the fingerprint region of 500 cm-1 to
2000 cm-1 expanded in Figure 3.15. Notable peaks are listed in Table 3.2.
Figure 3.14 Normalised ATR-FTIR spectrum of the C4 gel.
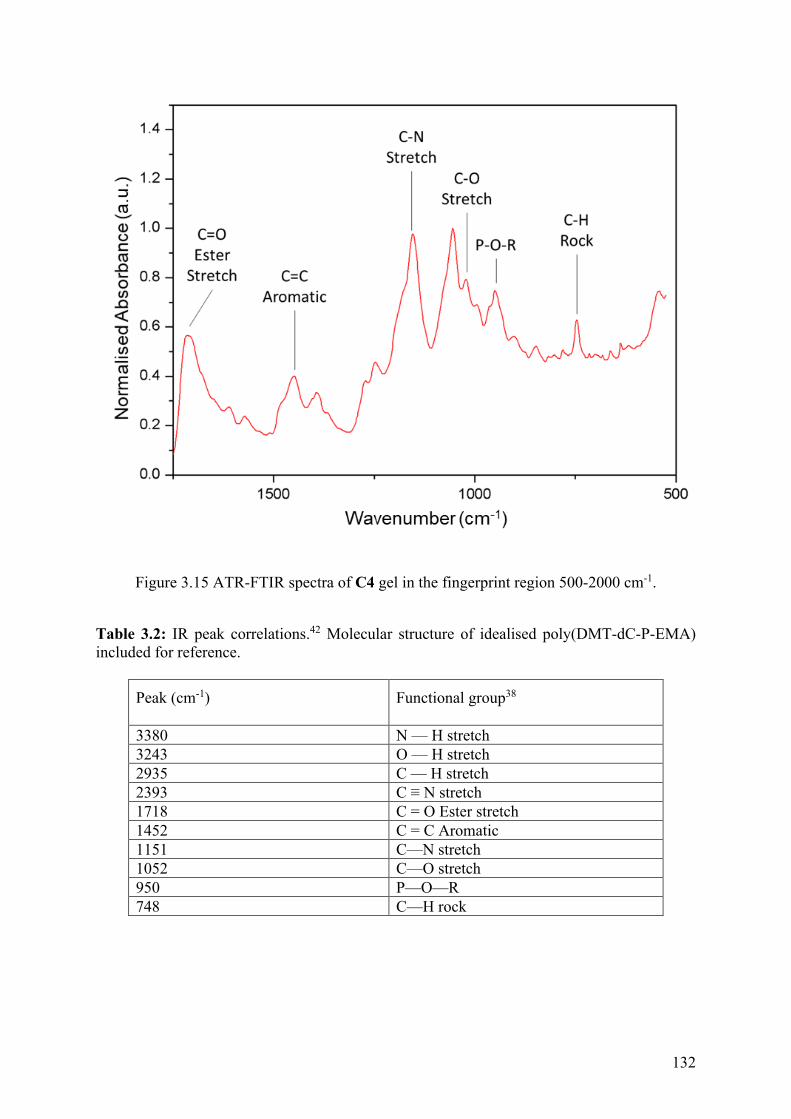
132
Figure 3.15 ATR-FTIR spectra of C4 gel in the fingerprint region 500-2000 cm-1.
Table 3.2: IR peak correlations.42 Molecular structure of idealised poly(DMT-dC-P-EMA) included for reference.
Peak (cm-1) Functional group38
3380 N — H stretch 3243 O — H stretch 2935 C — H stretch 2393 C ≡ N stretch 1718 C = O Ester stretch 1452 C = C Aromatic 1151 C—N stretch 1052 C—O stretch 950 P—O—R 748 C—H rock
133
The peaks present at 3380 cm-1 and 1151 cm-1 were associated with nucleobase amines. This
indicated that the cytosine moiety of the C4 had been incorporated into the gel and was not
cleaved during its formation.39 Further evidence that the full nucleotide had been incorporated
into the C4 gel was seen from the presence of the 950 cm-1 peak associated with the phosphate
moiety.43
The presence of the peak at 2393 cm-1 associated with a C≡N stretch indicated that the
cyanoethyl protecting group was still present on the phosphates that make up the C4 gel. This
showed that the gel was unlikely to have formed from hydrolysis as the conditions required
would result in the removal of the cyanoethyl protecting group.
The presence of the broad peak centred at 3250 cm-1 indicated the O-H stretch, associated with
adsorbed water.40 This indicated that the C4 gel was hygroscopic and absorbed water from the
air.
3.3.4 Determining the Structure of the C4 Gel
At this point in the experiment the solvent analysis and ATR-FTIR spectroscopy showed that
the C4 gel formed during the polymerisation was associated with strong binding between the
polymer chains, and that the nucleotide unit was retained within the gel.
The broad insolubility of the C4 gel in multiple solvents suggested covalent cross-linkeding of
the polymer chains. Of the moieties that were present, the phosphate was the more reactive and
susceptible to hydrolysis and other reactions due to the expanded octet of the P(V) oxidation
state, confirmed in Section 3.2.1.2.
As the phosphate was still protected within the gel, the possibility of hydrolysis, or similar
reaction, to create the cross-linkeding unit was not possible. As a result, it was hypothesised
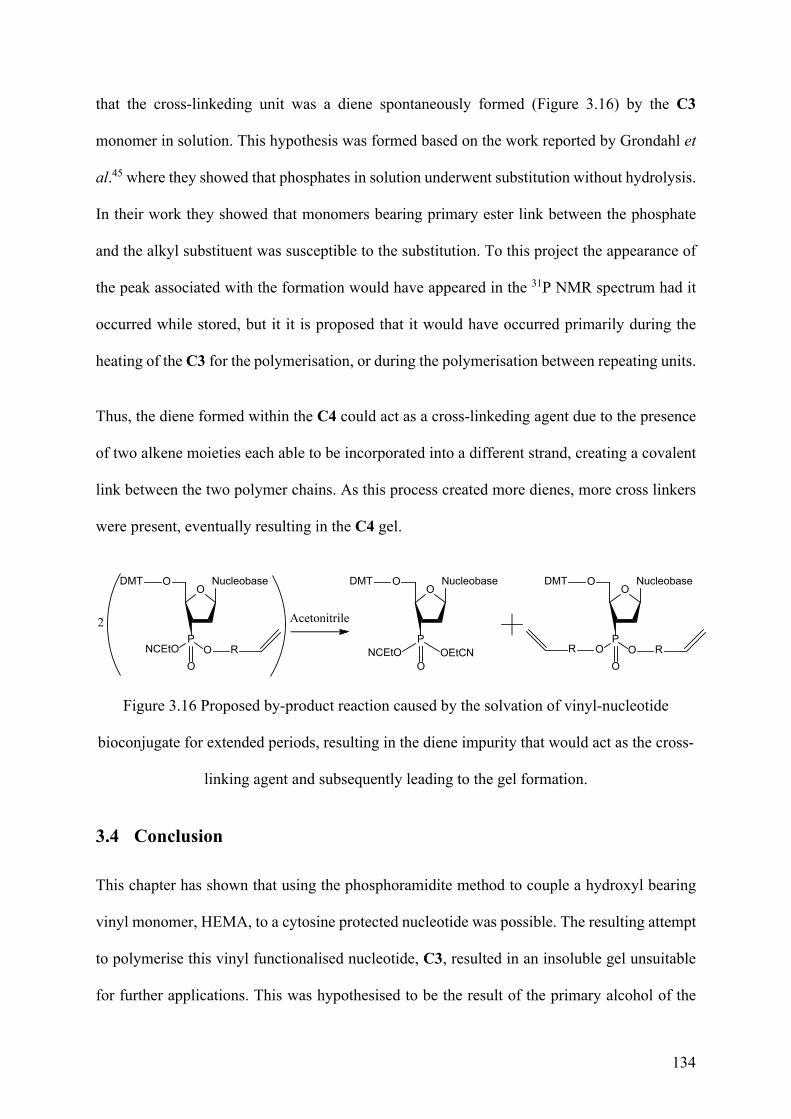
134
that the cross-linkeding unit was a diene spontaneously formed (Figure 3.16) by the C3
monomer in solution. This hypothesis was formed based on the work reported by Grondahl et
al.45 where they showed that phosphates in solution underwent substitution without hydrolysis.
In their work they showed that monomers bearing primary ester link between the phosphate
and the alkyl substituent was susceptible to the substitution. To this project the appearance of
the peak associated with the formation would have appeared in the 31P NMR spectrum had it
occurred while stored, but it it is proposed that it would have occurred primarily during the
heating of the C3 for the polymerisation, or during the polymerisation between repeating units.
Thus, the diene formed within the C4 could act as a cross-linkeding agent due to the presence
of two alkene moieties each able to be incorporated into a different strand, creating a covalent
link between the two polymer chains. As this process created more dienes, more cross linkers
were present, eventually resulting in the C4 gel.
OO Nucleobase
PNCEtO O
DMT
2 Acetonitrile
OR
OO Nucleobase
PNCEtO
DMT
O
OO Nucleobase
PO O
DMT
OROEtCN R
Figure 3.16 Proposed by-product reaction caused by the solvation of vinyl-nucleotide
bioconjugate for extended periods, resulting in the diene impurity that would act as the cross-
linking agent and subsequently leading to the gel formation.
3.4 Conclusion
This chapter has shown that using the phosphoramidite method to couple a hydroxyl bearing
vinyl monomer, HEMA, to a cytosine protected nucleotide was possible. The resulting attempt
to polymerise this vinyl functionalised nucleotide, C3, resulted in an insoluble gel unsuitable
for further applications. This was hypothesised to be the result of the primary alcohol of the
135
HEMA being able to undergo substitution while solvated. This hypothesis was tested by
utilising a sterically hindered secondary alcohol, namely 2-hydroxypropyl methacrylate, to
prevent the substitution as presented in the following chapter.
3.5 References
(1) Venkatesan, N.; Kim, S. J.; Kim, B. H. Novel Phosphoramidite Building Blocks in
Synthesis and Applications toward Modified Oligonucleotides. Curr. Med. Chem. 2003,
10 (19), 1973–1991.
(2) Gaytán, P. Chemical Synthesis of Oligonucleotides Using Acetone as a Washing
Solvent. Biotechniques 2009, 47 (2), 701–702.
(3) Burfield, D. R.; Smithers, R. H. Desiccant Efficiency in Solvent Drying. 3. Dipolar
Aprotic Solvents. J. Org. Chem. 1978, 43 (20), 3966–3968.
(4) Bolton, P. D. Hydrolysis of Amides. Ii. Substituent Effects in Dilute Acid and Alkali.
Aust. J. Chem. 1966, 19 (6), 1013–1021.
(5) Brown, R. S.; Bennet, A. J.; Slebocka-Tilk, H. Recent Perspectives Concerning the
Mechanism of H3O+- and Hydroxide-Promoted Amide Hydrolysis. Acc. Chem. Res.
1992, 25 (11), 481–488.
(6) Berner, S.; Mühlegger, K.; Seliger, H. Studies on the Role of Tetrazole in the Activation
of Phosphoramidites. Nucleic Acids Res. 1989, 17 (3), 853–864.
(7) Nurminen, E. J.; Mattinen, J. K.; Lönnberg, H. Kinetics and Mechanism of Tetrazole-
Catalyzed Phosphoramidite Alcoholysis. J. Chem. Soc. Perkin Trans. 2 1998, 0 (7),
1621–1628.
136
(8) Dahl, B. H.; Nielsen, J.; Dahl, O. Mechanistic Studies on the Phosphoramidite Coupling
Reaction in Oligonucleotide Synthesis. I. Evidence for Nucleophilic Catalysis by
Tetrazole and Rate Variations with the Phosphorus Substituents. Nucleic Acids Res.
1987, 15 (4), 1729–1743.
(9) Maier, M. A.; Choi, Y.; Gaus, H.; Barchi, J. J.; Marquez, V. E.; Manoharan, M.
Synthesis and Characterization of Oligonucleotides Containing Conformationally
Constrained Bicyclo[3.1.0]Hexane Pseudosugar Analogs. Nucleic Acids Res. 2004, 32
(12), 3642–3650.
(10) Masanori, K.; Akira, H.; Shinya, O.; Mamoru, H.; Mitsue, A.; Rie, K.; Hayakawa, Y.
Ethyl(Methyl)Dioxirane as an Efficient Reagent for the Oxidation of Nucleoside
Phosphites into Phosphates under Nonbasic Anhydrous Conditions. Org. Lett. 2001, 3
(6), 815–818.
(11) Uzagare, M. C.; Padiya, K. J.; Salunkhe, M. M.; Sanghvi, Y. S. NBS-DMSO as a
Nonaqueous Nonbasic Oxidation Reagent for the Synthesis of Oligonucleotides. Bioorg.
Med. Chem. Lett. 2003, 13 (20), 3537–3540.
(12) Pérez-Rentero, S.; Garibotti, A. V; Eritja, R. Molecules Solid-Phase Synthesis of
Oligodeoxynucleotides Containing N4-[2-(t-Butyldisulfanyl)Ethyl]-5-Methylcytosine
Moieties. Molecules 2010, 15, 5692–5707.
(13) Dennison, G. H.; Johnston, M. R. Mechanistic Insights into the Luminescent Sensing of
Organophosphorus Chemical Warfare Agents and Simulants Using Trivalent
Lanthanide Complexes. Chemistry - A European Journal. John Wiley & Sons, Ltd April
20, 2015, pp 6328–6338.
137
(14) Dennison, G. H.; Sambrook, M. R.; Johnston, M. R. Interactions of the G-Series
Organophosphorus Chemical Warfare Agent Sarin and Various Simulants with
Luminescent Lanthanide Complexes. RSC Adv. 2014, 4 (98), 55524–55528.
(15) Bolduc, P. R.; Goe, G. L. Singlet Oxygen Oxidation of Phosphites to Phosphates. J. Org.
Chem. 1974, 39 (21), 3178–3179.
(16) Martin, P.; Tuazon, E. C.; Atkinson, R.; David Maughan, A. Atmospheric Gas-Phase
Reactions of Selected Phosphorus-Containing Compounds. J. Phys. Chem. A 2002, 106
(8), 1542–1550.
(17) Schwetlick, K.; Pionteck, J.; Winkler, A.; Hähner, U.; Kroschwitz, H.; Habicher, W. D.
Organophosphorus Antioxidants: Part X—Mechanism of Antioxidant Action of Aryl
Phosphites and Phosphonites at Higher Temperatures. Polym. Degrad. Stab. 1991, 31
(2), 219–228.
(18) Schwetlick, K. Mechanisms of Antioxidant Action of Phosphite and Phosphonite Esters.
In Mechanisms of Polymer Degradation and Stabilisation; Springer Netherlands:
Dordrecht, 1990; pp 23–60.
(19) Pregosin P.S.;Rüegger, H; 2.1 - Nuclear Magnetic Resonance Spectroscopy,
Comprehensive Coordination Chemistry II, 2003, 2, 1-35
(20) Robinson, K. L.; Khan, M. A.; De Paz Báñez, M. V.; Wang, X. S.; Armes, S. P.
Controlled Polymerization of 2-Hydroxyethyl Methacrylate by ATRP at Ambient
Temperature. Macromolecules 2001, 34 (10), 3155–3158.
(21) Cahill, R.; Cookson, R. C.; Crabb, T. A. Geminal Coupling Constants in Methylene
Groups-II. J in CH2 Groups α to Heteroatoms. Tetrahedron 1969, 25 (19), 4681–4709.
138
(22) Kupriyanov, V.V.; Steinschneider, A.Ya.; Ruuge, E.K.; Smirnov, V.N.; Saks, V.A.;
31P-NMR spectrum of phosphocreatine: Deuterium-induced splitting of the signal,
Biochemical and Biophysical Research Communications. 1983, 114 (3), 1117-1125
(23) Weinrich, T.; Jaumann, E. A.; Scheffer, U. M.; Prisner, T.F., Gobel, M.
W.;Phosphoramidite building blocks with protected nitroxides for the synthesis of spin-
labeled DNA and RNA. Beilstein J. Org. Chem. 2018, 14, 1563–1569
(24) Meher, G.; Efthymiou, T.; Stoop, M.; Krishnamurthy, R; Microwave-Assisted
Preparation of Nucleoside-Phosphoramidites, Chemical Communications, 2014, 50,
7463-7465
(25) Mayadunne, R. T. A.; Rizzardo, E.; Chiefari, J.; Krstina, J.; Moad, G.; Postma, A.;
Thang, S. H. Living Polymers by the Use of Trithiocarbonates as Reversible Addition-
Fragmentation Chain Transfer (RAFT) Agents: ABA Triblock Copolymers by Radical
Polymerization in Two Steps. Macromolecules 2000, 33 (2), 243–245.
(26) Schuerch, C.; Some Steric Factors in Vinyl Polymerization. Annu. Rev. Phys. Chem.
1962, 13, 195–220.
(27) Puts, R. D.; Sogah, D. Y. Control of Living Free-Radical Polymerization by a New
Chiral Nitroxide and Implications for the Polymerization Mechanism. Macromolecules
1996, 29 (9), 3323–3325.
(28) Ma, J. W.; Smith, J. A.; McAuley, K. B.; Cunningham, M. F.; Keoshkerian, B.; Georges,
M. K. Nitroxide-Mediated Radical Polymerization of Styrene in Miniemulsion: Model
Studies of Alkoxyamine-Initiated Systems. Chem. Eng. Sci. 2003, 58 (7), 1163–1176.
(29) Clark, A. J.; Battle, G. M.; Heming, A. M.; Haddleton, D. M.; Bridge, A. Ligand
139
Electronic Effects on Rates of Copper Mediated Atom Transfer Radical Cyclisation and
Polymerisation. Tetrahedron Lett. 2001, 42 (10), 2003–2005.
(30) Moad, G.; Rizzardo, E.; Thang, S. H. Radical Addition-Fragmentation Chemistry in
Polymer Synthesis. Polymer. Elsevier March 3, 2008, pp 1079–1131.
(30) Van Hook, J. P.; Tobolsky, A. V. The Thermal Decomposition of 2,2′-Azo-Bis-
Isobutyronitrile. J. Am. Chem. Soc. 1958, 80 (4), 779–782.
(31) Charton, N.; Feldermann, A.; Theis, A.; Stenzel, M. H.; Davis, T. P.; Barner-Kowollik,
C. Initiator Efficiency of 2,2’-Azobis(Isobutyronitrile) in Bulk Dodecyl Acrylate Free-
Radical Polymerizations over a Wide Conversion and Molecular Weight Range. J.
Polym. Sci. Part A Polym. Chem. 2004, 42 (20), 5170–5179.
(32) RAFT General Proceedures, Boron Molecular, accessed 20 February 2016,
<http://www.boronmolecular.com/index.php?route=information/information&informat
ion_id=52>
(33) Sasaki, S.; Suzuki, A. Factors Influencing the Swelling and Elution Properties of
Poly(Vinyl Alcohol) Cast Gels. Polym. Adv. Technol. 2016, 27 (3), 318–324.
(34) Madkour, A. E.; Grolman, J. M.; Tew, G. N. Synthesis of Hydrogels via Ring-Opening
Metathesis Polymerization: Factors Affecting Gelation. Polym. Chem. 2011, 2 (1), 114–
119.
(35) Lvov, Y.; Ariga, K.; Ichinose, I.; Kunitake, T. Formation of Ultrathin Multilayer and
Hydrated Gel from Montmorillonite and Linear Polycations. Langmuir 1996, 12 (12),
3038–3044.
140
(36) Kim, Y.; Faqih, M. .; Wang, S. . Factors Affecting Gel Formation of Inulin. Carbohydr.
Polym. 2001, 46 (2), 135–145.
(37) Abend, S.; Lagaly, G. Sol–Gel Transitions of Sodium Montmorillonite Dispersions.
Appl. Clay Sci. 2000, 16 (3–4), 201–227.
(38) Porter, R. S.; Johnson, J. F. The Entanglement Concept in Polymer Systems. Chem. Rev.
1966, 66 (1), 1–27.
(39) Charlesby, A. Gel Formation and Molecular Weight Distribution in Long-Chain
Polymers. Proc. R. Soc. London. Ser. A. Math. Phys. Sci. 1954, 222 (1151), 542–557.
(40) Nakano, S.-I.; Sugimoto, N. The Structural Stability and Catalytic Activity of DNA and
RNA Oligonucleotides in the Presence of Organic Solvents. Biophys. Rev. 2016, 8 (1),
11–23.
(41) Huh, K. M.; Bae, Y. H. Synthesis and Characterization of Poly(Ethylene Glycol)/Poly(l-
Lactic Acid) Alternating Multiblock Copolymers. Polymer (Guildf). 1999, 40 (22),
6147–6155.
(42) Stuart, B. H. Infrared Spectroscopy: Fundamentals and Applications; Analytical
Techniques in the Sciences; Chichester, UK, 2004.
(43) Kyogoku, Y.; Lord, R. C.; Rich, A. An Infrared Study of Hydrogen Bonding between
Adenine and Uracil Derivative in Chloroform Solution. J. Am. Chem. Soc. 1967, 89 (2),
496–504.
(44) Pereira, R.; Tojeira, A.; Vaz, D. C.; Mendes, A.; Bártolo, P. Preparation and
Characterization of Films Based on Alginate and Aloe Vera. Int. J. Polym. Anal.

141
Charact. 2011, 16 (7), 449–464.
(45) Grøndahl, L.; Suzuki, S.; Wentrup-Byrne, E. Influence of a Diene Impurity on the
Molecular Structure of Phosphate-Containing Polymers with Medical Applications.
Chem. Commun. (Camb). 2008, No. 28, 3314–3316.
142
4 Chapter 4: Synthesis of The Poly(2-(2′-deoxyguanosine-
monophosphate)oxypropyl methacrylate)): a Guanine
Rich Methacrylate Polymer
4.1 Synopsis
This chapter describes the design, synthesis and characterisation of the 5'-dimethoxytrityl-N-isobutyryl-2'-deoxyguanosine,3'-[(2-cyanoethyl)-(oxypropyl methacrylate)]-phosphate monomer, henceforth referred to as DMT-dG-CE-PMA phosphate monomer, building on the methods and conclusions presented in Chapter 3. Synthesis of DMT-dG-CE-PMA phosphate monomer was achieved through the coupling of 2-hydroxypropyl methacrylate (HPMA) with a protected 5′ guanosine (G) monophosphate. Following the synthesis of the DMT-dG-CE-PMA phosphate monomer, it was polymerised using reversible addition-fragmentation chain transfer (RAFT) polymerisation and subsequently deprotected to form poly(2-(2′-deoxyguanosine-monophosphate)oxypropyl methacrylate), referred to as poly(dG-P-PMA).
143
4.2 Introduction
This chapter builds on Chapter 3 which showed the synthesis of 5'-dimethoxytrityl-N-benzoyl-
2'-deoxycytosine,3'-[(2-cyanoethyl)-(oxyethyl methacrylate)]-phosphate monomer (C3
monomer) using a phosphoramidite coupling approach. This approach was chosen for a number
of reasons, discussed in more depth in Chapter 3.
The phosphoramidite coupling method used in Chapter 3 was further developed for this
chapter, resulting in the procedure shown in Figure 4.1. The phosphoramidite coupling
approach started with a protected nucleotide phosphoramidite, Figure 4.1(i); the nucleotide
phosphoramidite was then activated with the imidazole derivative 4,5-dicyanoimidazole (DCI),
the activator. The activator reacts with the phosphoramidite moiety to form the activated
intermediate phosphoramidite, Figure 4.1(ii). This chapter utilised 4,5-dicyanoimidazole
instead of the tetrazole used in Chapter 3 for the reasons discussed in Section 4.2.5. The
activated phosphoramidite intermediate targets virtually any hydroxyl moiety, coupling it to
the nucleotide and forming a nucleotide phosphite, Figure 4.1(iii), and the coupling also
regenerates the activator allowing the latter to act as a catalyst. The final step in the coupling
is the conversion of the phosphite into a phosphate. This step was conducted in order to control
the oxidation of the phosphite, rather than allowing it to react uncontrollably during the
following polymerisation process.
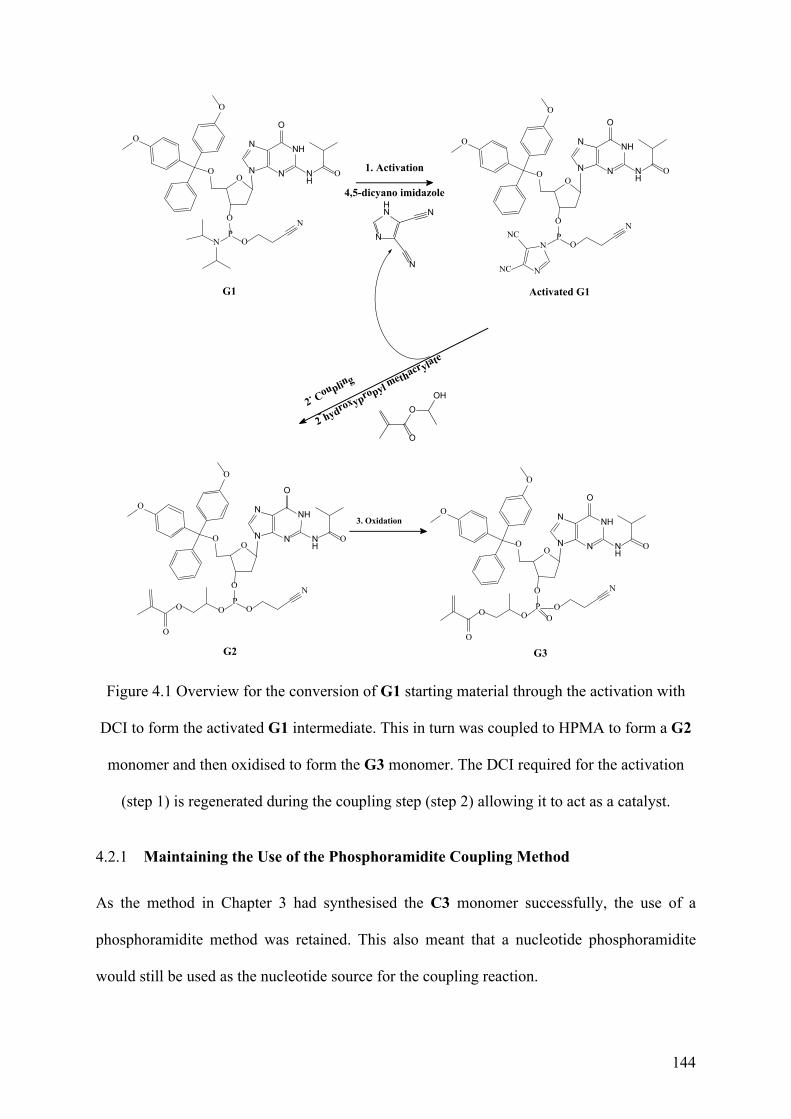
144
P
O
OO
N
O
O
O
O
N
NNC
NC
1. Activation
4,5-dicyano imidazole
2. Coupling
3. Oxidation
O
O
P
O
OO
N
OO
O
O
O
O
O
P
O
OO
N
O
O
O
P
O
OO
N
O
O
O
N
NH
NN
N
O
NH
O
NH
NN
N
O
NH
O
NH
NN
N
O
NH
O
NH
NN
N
O
NH
O
N
HN N
N
O
OOH
G1 Activated G1
G2 G3
2- hydroxypropyl
methacrylate
Figure 4.1 Overview for the conversion of G1 starting material through the activation with
DCI to form the activated G1 intermediate. This in turn was coupled to HPMA to form a G2
monomer and then oxidised to form the G3 monomer. The DCI required for the activation
(step 1) is regenerated during the coupling step (step 2) allowing it to act as a catalyst.
4.2.1 Maintaining the Use of the Phosphoramidite Coupling Method
As the method in Chapter 3 had synthesised the C3 monomer successfully, the use of a
phosphoramidite method was retained. This also meant that a nucleotide phosphoramidite
would still be used as the nucleotide source for the coupling reaction.
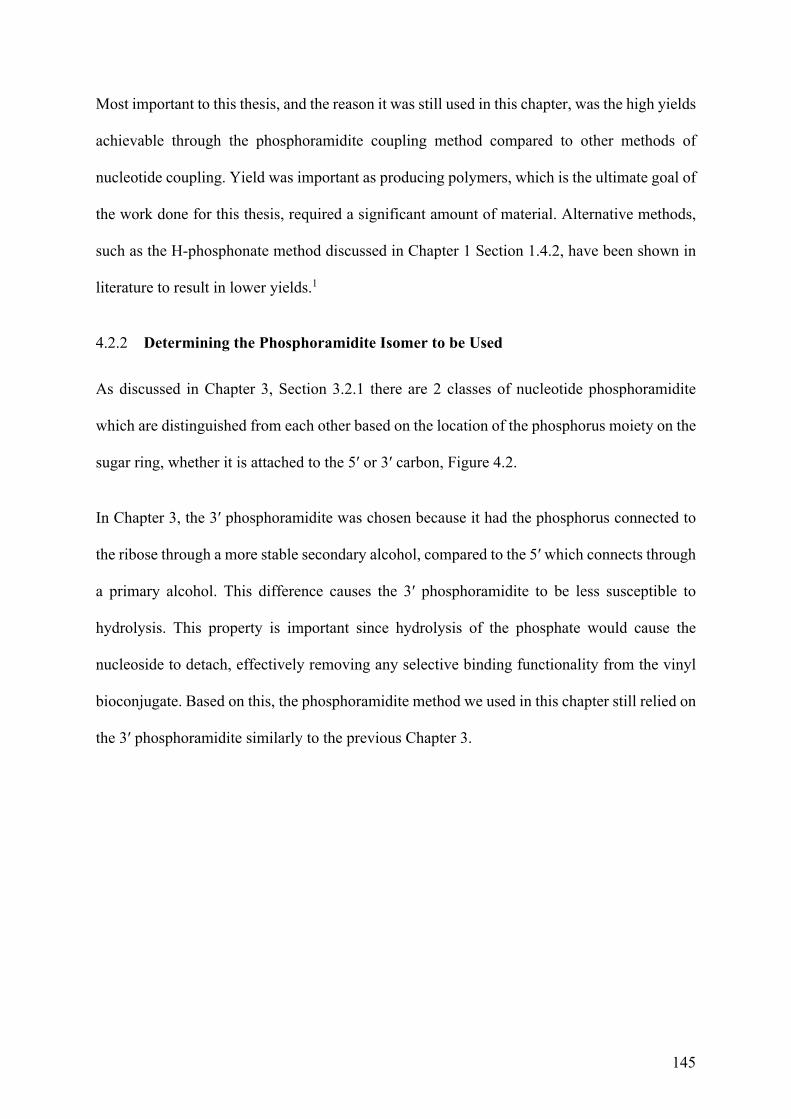
145
Most important to this thesis, and the reason it was still used in this chapter, was the high yields
achievable through the phosphoramidite coupling method compared to other methods of
nucleotide coupling. Yield was important as producing polymers, which is the ultimate goal of
the work done for this thesis, required a significant amount of material. Alternative methods,
such as the H-phosphonate method discussed in Chapter 1 Section 1.4.2, have been shown in
literature to result in lower yields.1
4.2.2 Determining the Phosphoramidite Isomer to be Used
As discussed in Chapter 3, Section 3.2.1 there are 2 classes of nucleotide phosphoramidite
which are distinguished from each other based on the location of the phosphorus moiety on the
sugar ring, whether it is attached to the 5′ or 3′ carbon, Figure 4.2.
In Chapter 3, the 3′ phosphoramidite was chosen because it had the phosphorus connected to
the ribose through a more stable secondary alcohol, compared to the 5′ which connects through
a primary alcohol. This difference causes the 3′ phosphoramidite to be less susceptible to
hydrolysis. This property is important since hydrolysis of the phosphate would cause the
nucleoside to detach, effectively removing any selective binding functionality from the vinyl
bioconjugate. Based on this, the phosphoramidite method we used in this chapter still relied on
the 3′ phosphoramidite similarly to the previous Chapter 3.
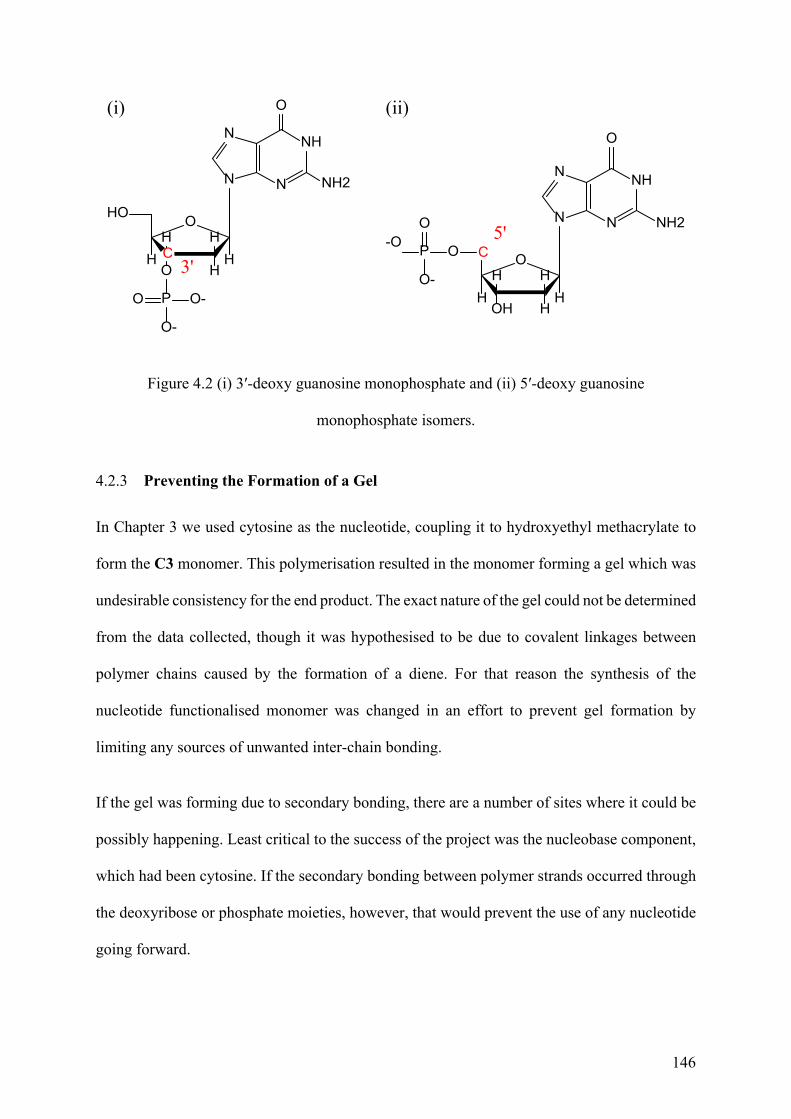
146
NH
N
N
O
NH2N
O
H
HHH
C
HOH
OP-OO
O-
NH
N
N
O
NH2N
C
O
H
HHHH
O
PO
O-
HO
O-
3'
5'
(i) (ii)
Figure 4.2 (i) 3′-deoxy guanosine monophosphate and (ii) 5′-deoxy guanosine
monophosphate isomers.
4.2.3 Preventing the Formation of a Gel
In Chapter 3 we used cytosine as the nucleotide, coupling it to hydroxyethyl methacrylate to
form the C3 monomer. This polymerisation resulted in the monomer forming a gel which was
undesirable consistency for the end product. The exact nature of the gel could not be determined
from the data collected, though it was hypothesised to be due to covalent linkages between
polymer chains caused by the formation of a diene. For that reason the synthesis of the
nucleotide functionalised monomer was changed in an effort to prevent gel formation by
limiting any sources of unwanted inter-chain bonding.
If the gel was forming due to secondary bonding, there are a number of sites where it could be
possibly happening. Least critical to the success of the project was the nucleobase component,
which had been cytosine. If the secondary bonding between polymer strands occurred through
the deoxyribose or phosphate moieties, however, that would prevent the use of any nucleotide
going forward.
147
4.2.4 Changing the Nucleobase
As discussed in Chapter 3 Section 3.4.4 the formation of a gel from the C4 may have been the
result of intermolecular secondary bonding from the formation of i-motifs 3.3.3. To rule this
out as a possibility, the nucleobase used as a model for the generation for a nucleotide
functionalised polymer was changed from cytosine to guanine.
Thymine phosphoramidites were excluded as a model because they do not bear any protecting
group on the nucleobase moiety, meaning that they may act differently to the protected
nucleobases. Specifically of note, the conditions for the removal of the protection group with
ammonium hydroxide could not be tested as there is no protecting group present, and the
potential difference in solubility this may cause.
Adenine was not chosen as it contained the benzoyl protecting group which had also been
present in cytosine that was used previously; if this aromatic group had been involved in the
intermolecular binding it was more likely to occur when using adenine. Guanine sits in between
thymine and adenine in this regard, bearing the non-aromatic isobutyryl protecting group.
Guanine can also form secondary structures known as G-quartets, as discussed in Chapter 1,
Section 1.2.5.1. Similar to cytosine, G-quartets form through non-canonical bonding; on the
other hand, literature shows that G-quartets, unlike cytosine, form around large cations, such
as K+ or Mg2+. As none of the compounds being used contained such ions, this was not
considered an issue in this experiment.
4.2.5 Changing the Vinyl Moiety
The possible covalent route for the cross-linkeding was the formation of a diene impurity, as
described in Chapter 3 Section 3.4.4, and previously presented by Grøndahl et al.2 The reaction
as it pertains to this project is shown in Figure 4.3. In their work Grøndahl et al. showed the
148
dienes could form due to the exchange of the vinyl moieties on phosphates while solvated.2
This exchange could occur with the C3 monomer when solvated during the polymerisation in
which case the resulting DMT-dG-PMA-PMA phosphate diene would contain two vinyl
groups, each of which could be incorporated into a separate chain, thereby acting as a cross-
linkeding agent.
PO
OO
O
OO
O
NH
NN
NO
NH
O
O
O
N
O
PO
OO
O
OO
O
NH
NN
NO
NH
O
O
O
O
OO
PO
OO
O O
NH
NN
NO
NH
O
O
O
N
O
N
G3DMT-dG-PMA-PMA Phosphate Di-eneDMT-dG-CE-CE Phosphate
PO
OO
O
OO
O
NH
NN
NO
NH
O
O
O
O
O
O
R1 R2n
PO
OO
O
OO
O
NH
NN
NO
NH
O
O
O
O
O
O
R1 R2n
R3
R4n2
Free-radical Polymerisarion
Substitution
DMT-dG-PMA-PMA Phosphate Di-eneFirst addition
DMT-dG-PMA-PMA Phosphate Di-eneSecond addition
Figure 4.3 Formation of the diene impurity from G3 monomer in solution, followed by
polymerisation creating the first addition, and leading to cross-linkeding with the second
addition. For clarity active vinyl groups are shown in red. Polymerised vinyl groups shown in
blue.
149
To mitigate the formation of the diene, the vinyl containing moiety was changed from HEMA
to 2-hydroxypropyl methacrylate (HPMA). The HPMA structure was similar to that of HEMA,
with the addition of a methyl group converting it from a primary to a secondary alcohol. This
change was hypothesised to minimise the formation of the diene through the decreased
reactivity and steric hindrance provided by the adjacent methyl group.
As a result of the change to HPMA, however, the activator also needed to be changed.
Tetrazole, the activator used in Chapter 3, has been shown in literature to undergo the coupling
more efficiently with primary alcohols; as a result the activator was changed to 4,5-
dicyanoimidazole (DCI). DCI was chosen as in literature it had been shown to produce higher
coupling yields with sterically hindered phosphoramidite compared to tetrazole.3 This
improvement in yield is explained by the increased nucleophilicity of DCI.3 This allows it to
be regenerated more easily during the coupling step (Figure 4.1).
The oxidation process that follows the coupling phase of the experiment was done in the same
way as described in Chapter 3 since using of HPMA as the vinyl source still prohibited the use
of I2 or pyridine as an oxidant due to the risk of halide addition, as discussed in Chapter 3
Section 3.2.3.2.
4.3 Analysis of DMT-dG-CE-P-PMA Phosphite and Phosphate
The following sections outline the analytical methods used to confirm the synthesis of G2 and
G3 monomers, as described in Chapter 2 Section 2.5.2.1. The methods employed were ESI-
MS and NMR Spectroscopy using both 1H and 31P variations of the method.
4.3.1 Electrospray Ionisation Mass Spectrometry (ESI-MS)
ESI-MS was used as the primary method for determining the successful synthesis of G2
monomer. This technique was chosen because it can provide an accurate mass measurement
150
for all the components within the mixture, which can be compared to the theoretical mass of
the products in our calculations.4 As a result, it also gives a reasonable idea of not only how
pure a sample is (based on what m/z are present) but what impurities might be present.5 ESI-
MS is less sensitive to impurities compared to other techniques, such as NMR spectroscopy,6
since ESI-MS gives each molecule a dedicated signal despite impurities. For contrast, 1D NMR
spectroscopy maps all chemical environments for a given sample, which then need to be
interrogated to determine the source of each signal.6
Due to the ionisation method used, the G2 and phosphate monomers form adducts with the
cations present, notably H+ and Na+, and with solvent molecules attached through electrostatic
interactions. This is evident as a series of peaks following the molecular ion represent these
adducts on the resulting spectrogram.
To perform the ESI-MS analysis, samples of the G2 monomer were freeze-dried from the DCM
phase prior to evaporation and oxidation. This resulted in the formation of a white powder
which was prepared for ESI-MS at 1 mg/mL in acetonitrile. Measurements were then taken
under positive ion mode; the result is shown in Figure 4.4. The theoretical mass value for G2
monomer was calculated as 882.3 m/z. Following oxidation the DMT-dG-CE-P-PMA
phosphate monomer was calculated theoretically to be 899.3 m/z.
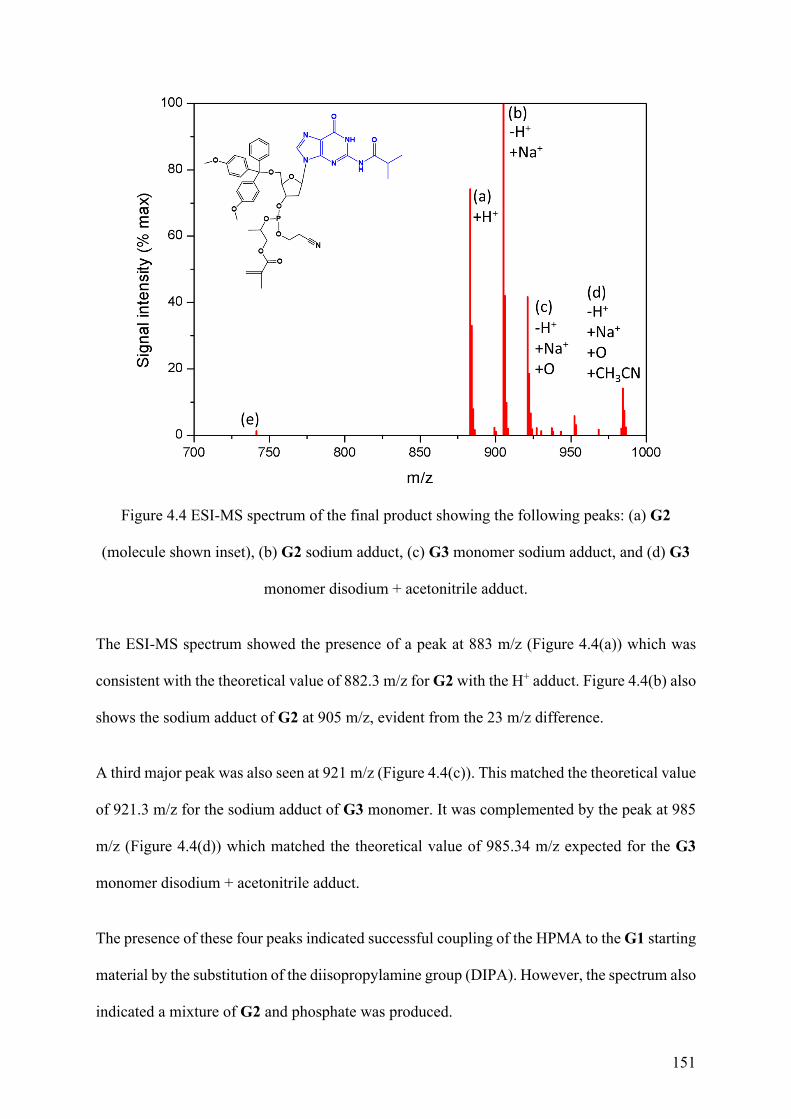
151
Figure 4.4 ESI-MS spectrum of the final product showing the following peaks: (a) G2
(molecule shown inset), (b) G2 sodium adduct, (c) G3 monomer sodium adduct, and (d) G3
monomer disodium + acetonitrile adduct.
The ESI-MS spectrum showed the presence of a peak at 883 m/z (Figure 4.4(a)) which was
consistent with the theoretical value of 882.3 m/z for G2 with the H+ adduct. Figure 4.4(b) also
shows the sodium adduct of G2 at 905 m/z, evident from the 23 m/z difference.
A third major peak was also seen at 921 m/z (Figure 4.4(c)). This matched the theoretical value
of 921.3 m/z for the sodium adduct of G3 monomer. It was complemented by the peak at 985
m/z (Figure 4.4(d)) which matched the theoretical value of 985.34 m/z expected for the G3
monomer disodium + acetonitrile adduct.
The presence of these four peaks indicated successful coupling of the HPMA to the G1 starting
material by the substitution of the diisopropylamine group (DIPA). However, the spectrum also
indicated a mixture of G2 and phosphate was produced.
152
The G1 starting material, with a theoretical m/z of 839.38, appears as a trace peak in the G2
spectrum (Figure 4.4(e)). This indicated virtually complete conversion during the
phosphoramidite coupling.
In addition to these major peaks, each is shadowed by a series of diminishing peaks of
increasing m/z due to the presence of different isotopes within the molecule.7 For all of the
elements present in the G2 and phosphate monomers, the major isotope for each element is
also the lightest which means that the statistically most common m/z is also the lightest.
4.3.2 Nuclear Magnetic Resonance (NMR) Spectroscopy
NMR spectroscopy analysis was chosen as the secondary analysis method to confirm the
synthesis of the G3 monomer. Firstly, 1H NMR (proton) spectroscopy was used to confirm the
substitution of the diisopropylamine group with HPMA on the phosphorus. Following this 31P
NMR was used to determine the successful conversion of the phosphorus from the P(III)
oxidation state of the G1 starting material to the P(V) oxidation state of DMT-dG-CE
phosphate monomer.
4.3.2.1 Proton Nuclear Magnetic Resonance (1H NMR) Spectroscopy
Support for successful conjugation of HPMA to the DMT-dG-CE-phosphoramidite was shown
using 1H NMR spectroscopy. Samples were prepared at 5 mg/mL in deuterated acetonitrile
following oxidation and drying. Figure 4.5(i and ii) shows the obtained 1H NMR spectra of the
G1 starting material, and the G3 monomer, respectively.
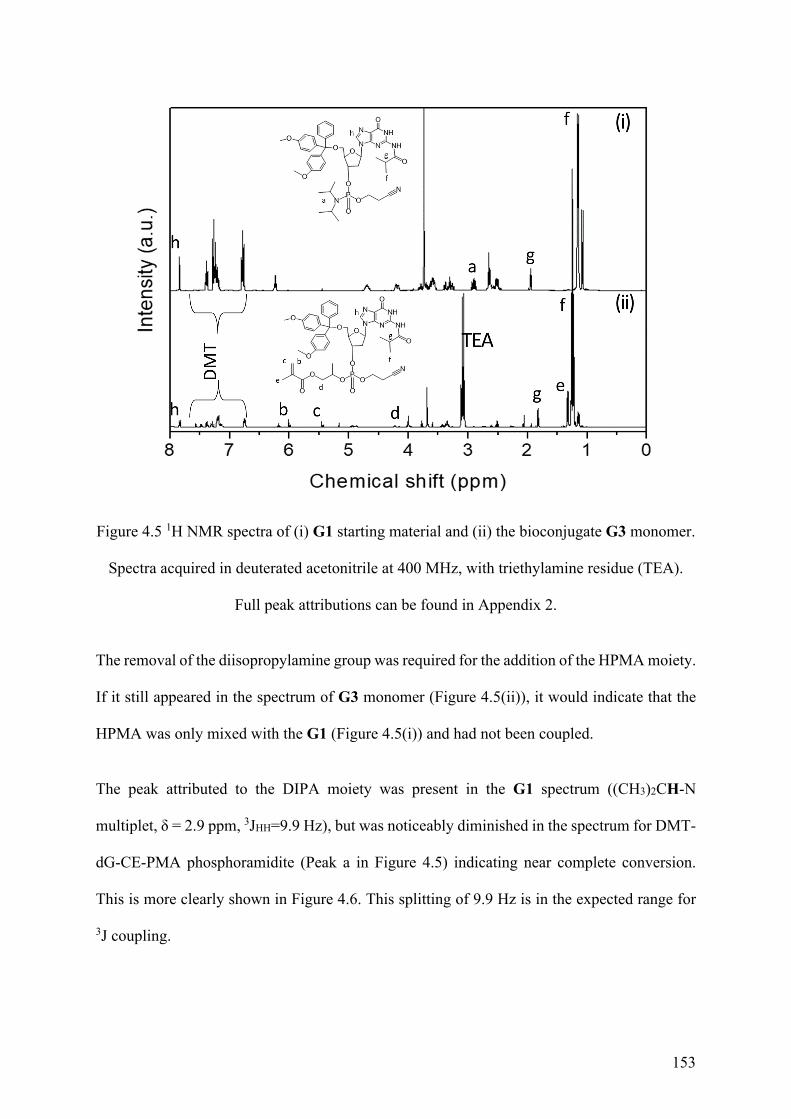
153
Figure 4.5 1H NMR spectra of (i) G1 starting material and (ii) the bioconjugate G3 monomer.
Spectra acquired in deuterated acetonitrile at 400 MHz, with triethylamine residue (TEA).
Full peak attributions can be found in Appendix 2.
The removal of the diisopropylamine group was required for the addition of the HPMA moiety.
If it still appeared in the spectrum of G3 monomer (Figure 4.5(ii)), it would indicate that the
HPMA was only mixed with the G1 (Figure 4.5(i)) and had not been coupled.
The peak attributed to the DIPA moiety was present in the G1 spectrum ((CH3)2CH-N
multiplet, δ = 2.9 ppm, 3JHH=9.9 Hz), but was noticeably diminished in the spectrum for DMT-
dG-CE-PMA phosphoramidite (Peak a in Figure 4.5) indicating near complete conversion.
This is more clearly shown in Figure 4.6. This splitting of 9.9 Hz is in the expected range for
3J coupling.
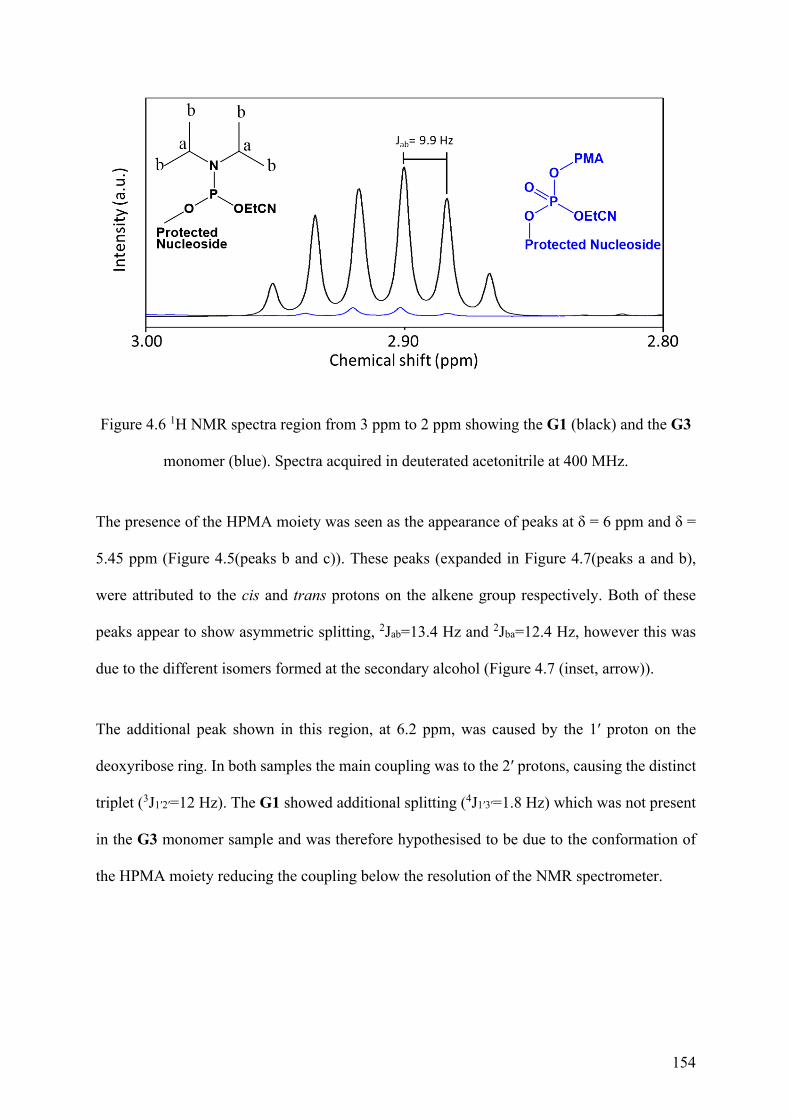
154
Figure 4.6 1H NMR spectra region from 3 ppm to 2 ppm showing the G1 (black) and the G3
monomer (blue). Spectra acquired in deuterated acetonitrile at 400 MHz.
The presence of the HPMA moiety was seen as the appearance of peaks at δ = 6 ppm and δ =
5.45 ppm (Figure 4.5(peaks b and c)). These peaks (expanded in Figure 4.7(peaks a and b),
were attributed to the cis and trans protons on the alkene group respectively. Both of these
peaks appear to show asymmetric splitting, 2Jab=13.4 Hz and 2Jba=12.4 Hz, however this was
due to the different isomers formed at the secondary alcohol (Figure 4.7 (inset, arrow)).
The additional peak shown in this region, at 6.2 ppm, was caused by the 1′ proton on the
deoxyribose ring. In both samples the main coupling was to the 2′ protons, causing the distinct
triplet (3J1′2′=12 Hz). The G1 showed additional splitting (4J1′3′=1.8 Hz) which was not present
in the G3 monomer sample and was therefore hypothesised to be due to the conformation of
the HPMA moiety reducing the coupling below the resolution of the NMR spectrometer.
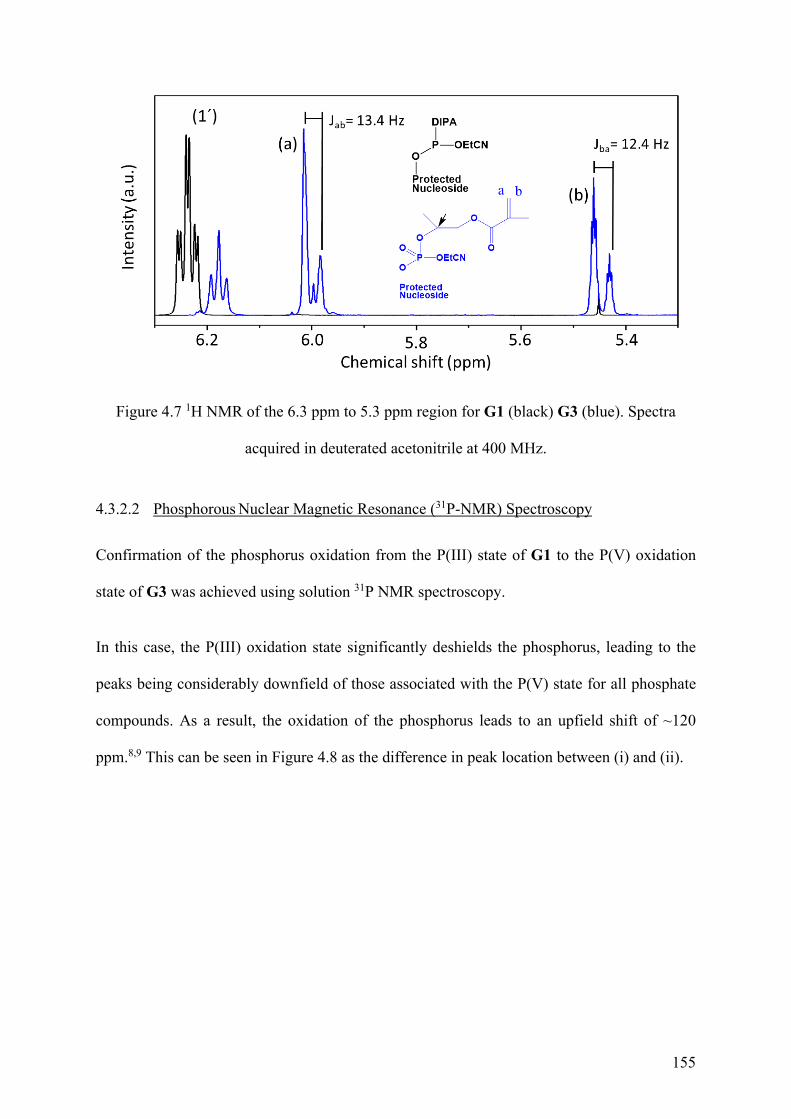
155
Figure 4.7 1H NMR of the 6.3 ppm to 5.3 ppm region for G1 (black) G3 (blue). Spectra
acquired in deuterated acetonitrile at 400 MHz.
4.3.2.2 Phosphorous Nuclear Magnetic Resonance (31P-NMR) Spectroscopy
Confirmation of the phosphorus oxidation from the P(III) state of G1 to the P(V) oxidation
state of G3 was achieved using solution 31P NMR spectroscopy.
In this case, the P(III) oxidation state significantly deshields the phosphorus, leading to the
peaks being considerably downfield of those associated with the P(V) state for all phosphate
compounds. As a result, the oxidation of the phosphorus leads to an upfield shift of ~120
ppm.8,9 This can be seen in Figure 4.8 as the difference in peak location between (i) and (ii).
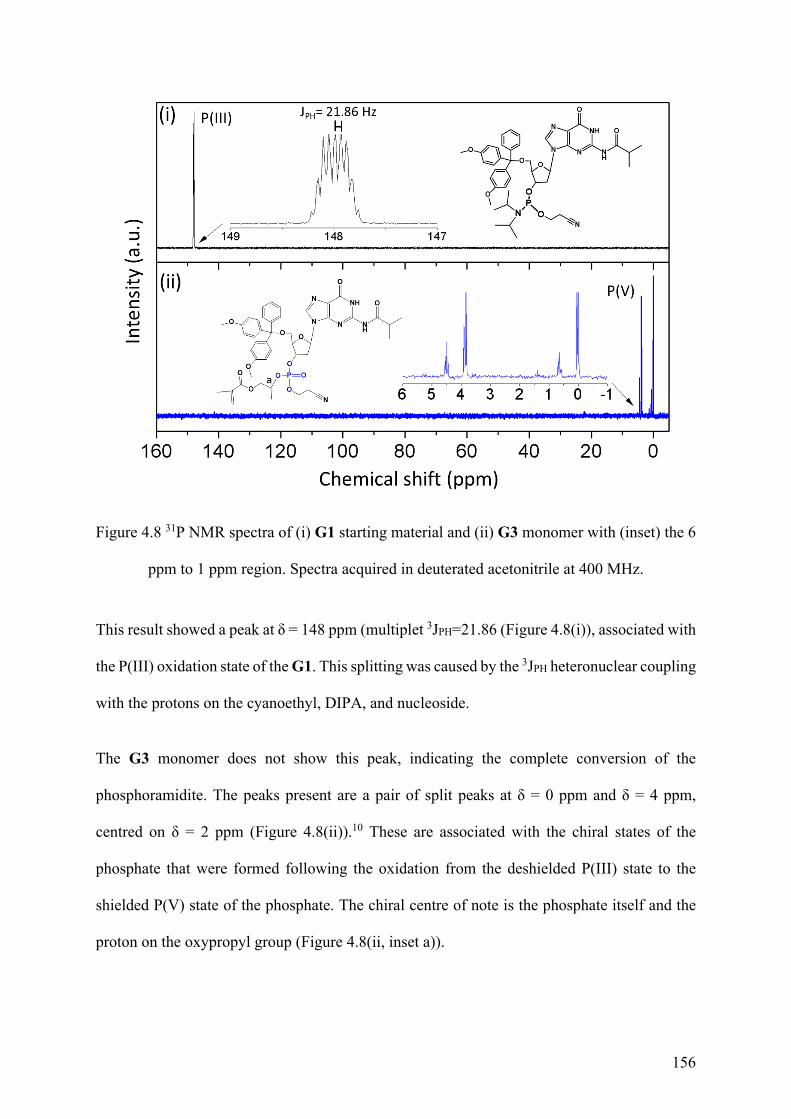
156
Figure 4.8 31P NMR spectra of (i) G1 starting material and (ii) G3 monomer with (inset) the 6
ppm to 1 ppm region. Spectra acquired in deuterated acetonitrile at 400 MHz.
This result showed a peak at δ = 148 ppm (multiplet 3JPH=21.86 (Figure 4.8(i)), associated with
the P(III) oxidation state of the G1. This splitting was caused by the 3JPH heteronuclear coupling
with the protons on the cyanoethyl, DIPA, and nucleoside.
The G3 monomer does not show this peak, indicating the complete conversion of the
phosphoramidite. The peaks present are a pair of split peaks at δ = 0 ppm and δ = 4 ppm,
centred on δ = 2 ppm (Figure 4.8(ii)).10 These are associated with the chiral states of the
phosphate that were formed following the oxidation from the deshielded P(III) state to the
shielded P(V) state of the phosphate. The chiral centre of note is the phosphate itself and the
proton on the oxypropyl group (Figure 4.8(ii, inset a)).
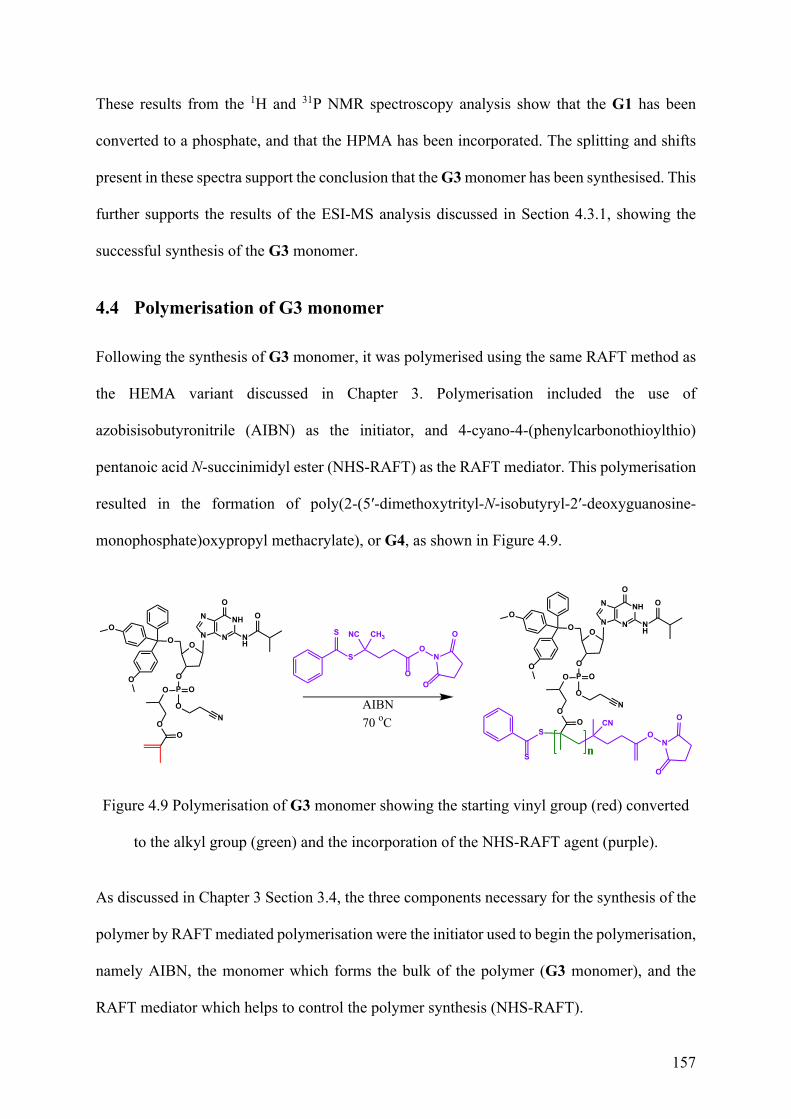
157
These results from the 1H and 31P NMR spectroscopy analysis show that the G1 has been
converted to a phosphate, and that the HPMA has been incorporated. The splitting and shifts
present in these spectra support the conclusion that the G3 monomer has been synthesised. This
further supports the results of the ESI-MS analysis discussed in Section 4.3.1, showing the
successful synthesis of the G3 monomer.
4.4 Polymerisation of G3 monomer
Following the synthesis of G3 monomer, it was polymerised using the same RAFT method as
the HEMA variant discussed in Chapter 3. Polymerisation included the use of
azobisisobutyronitrile (AIBN) as the initiator, and 4-cyano-4-(phenylcarbonothioylthio)
pentanoic acid N-succinimidyl ester (NHS-RAFT) as the RAFT mediator. This polymerisation
resulted in the formation of poly(2-(5′-dimethoxytrityl-N-isobutyryl-2′-deoxyguanosine-
monophosphate)oxypropyl methacrylate), or G4, as shown in Figure 4.9.
PO
OO
O
OO
O
S
n
NH
NN
NO
NH
O
O
O
N
O
S
CNO
N
O
O
O
O
NO
O
NC CH3S
S
PO
OO
O
OO
O
NH
NN
NO
NH
O
O
O
N
O
AIBN70 oC
Figure 4.9 Polymerisation of G3 monomer showing the starting vinyl group (red) converted
to the alkyl group (green) and the incorporation of the NHS-RAFT agent (purple).
As discussed in Chapter 3 Section 3.4, the three components necessary for the synthesis of the
polymer by RAFT mediated polymerisation were the initiator used to begin the polymerisation,
namely AIBN, the monomer which forms the bulk of the polymer (G3 monomer), and the
RAFT mediator which helps to control the polymer synthesis (NHS-RAFT).
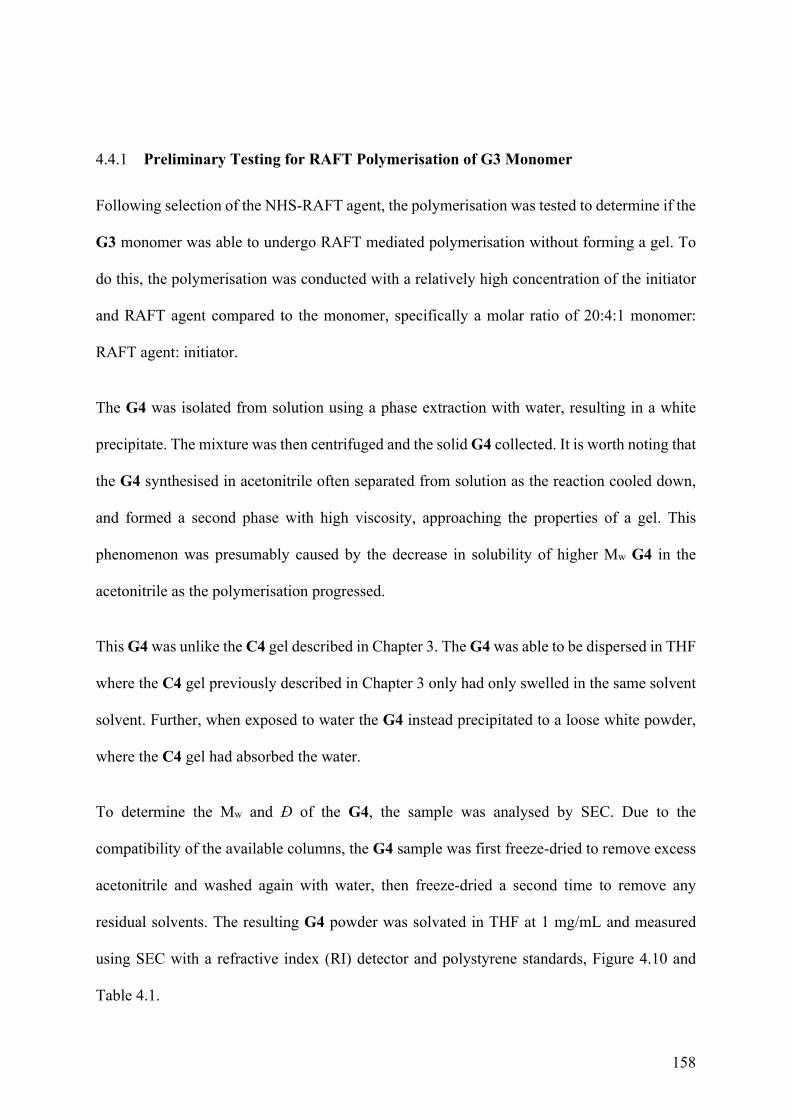
158
4.4.1 Preliminary Testing for RAFT Polymerisation of G3 Monomer
Following selection of the NHS-RAFT agent, the polymerisation was tested to determine if the
G3 monomer was able to undergo RAFT mediated polymerisation without forming a gel. To
do this, the polymerisation was conducted with a relatively high concentration of the initiator
and RAFT agent compared to the monomer, specifically a molar ratio of 20:4:1 monomer:
RAFT agent: initiator.
The G4 was isolated from solution using a phase extraction with water, resulting in a white
precipitate. The mixture was then centrifuged and the solid G4 collected. It is worth noting that
the G4 synthesised in acetonitrile often separated from solution as the reaction cooled down,
and formed a second phase with high viscosity, approaching the properties of a gel. This
phenomenon was presumably caused by the decrease in solubility of higher Mw G4 in the
acetonitrile as the polymerisation progressed.
This G4 was unlike the C4 gel described in Chapter 3. The G4 was able to be dispersed in THF
where the C4 gel previously described in Chapter 3 only had only swelled in the same solvent
solvent. Further, when exposed to water the G4 instead precipitated to a loose white powder,
where the C4 gel had absorbed the water.
To determine the Mw and Đ of the G4, the sample was analysed by SEC. Due to the
compatibility of the available columns, the G4 sample was first freeze-dried to remove excess
acetonitrile and washed again with water, then freeze-dried a second time to remove any
residual solvents. The resulting G4 powder was solvated in THF at 1 mg/mL and measured
using SEC with a refractive index (RI) detector and polystyrene standards, Figure 4.10 and
Table 4.1.
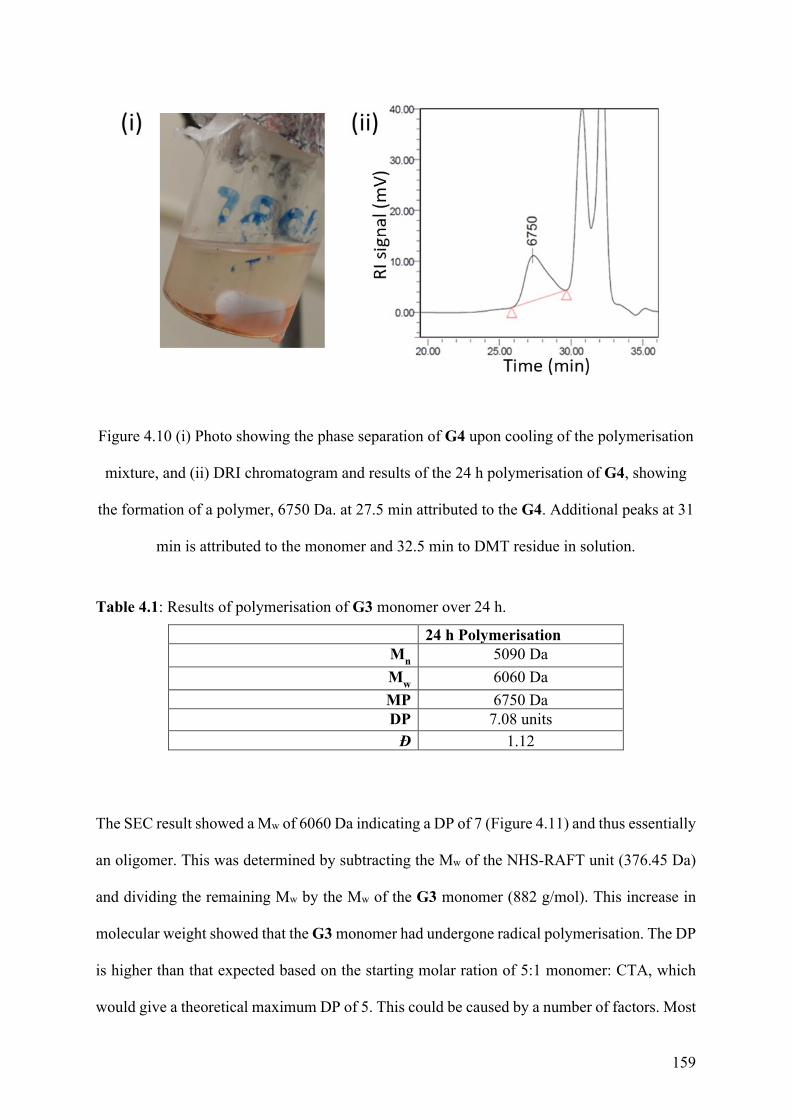
159
Figure 4.10 (i) Photo showing the phase separation of G4 upon cooling of the polymerisation
mixture, and (ii) DRI chromatogram and results of the 24 h polymerisation of G4, showing
the formation of a polymer, 6750 Da. at 27.5 min attributed to the G4. Additional peaks at 31
min is attributed to the monomer and 32.5 min to DMT residue in solution.
Table 4.1: Results of polymerisation of G3 monomer over 24 h.
24 h Polymerisation Mn 5090 Da Mw 6060 Da MP 6750 Da DP 7.08 units Đ 1.12
The SEC result showed a Mw of 6060 Da indicating a DP of 7 (Figure 4.11) and thus essentially
an oligomer. This was determined by subtracting the Mw of the NHS-RAFT unit (376.45 Da)
and dividing the remaining Mw by the Mw of the G3 monomer (882 g/mol). This increase in
molecular weight showed that the G3 monomer had undergone radical polymerisation. The DP
is higher than that expected based on the starting molar ration of 5:1 monomer: CTA, which
would give a theoretical maximum DP of 5. This could be caused by a number of factors. Most
160
apparent is that the PMMA standards used for SEC are not a perfect analogue to the G4 as
there may be a difference in solubility or the formation of aggregates that causes them to
migrate faster through the column. Based on this alone the DP and Mw can not be accurately
determined.
For the G4 the Đ of 1.1 found showed that the polymers were relatively uniform in length
compared to a non-mediated polymerisation. There is sufficient data to suggest that the
polymerisation has proceeded under RAFT mediation as the reported low Đ is consistent with
the standard bounds of Đ<1.2.11 This was calculated within the processing software based on
the formulas shown in Chapter 1, Section 1.5.2.
The peaks at 31 minutes (880 Da) and 32.5 minutes (303 Da) were determined to be residual
monomer monomer and DMT respectively. This indicates the incomplete conversion of the
monomer which is not ideal, a more complete analysis of the maximum attainable Mw for the
monomer is presented in Section 4.5.2. Importantly there is a large peak attributed to the
presence of free DMT in solution indication the partial degradation of the monomer or polymer.
As this is the removal of a protecting group, just earlier than anticipated in the procedure, it
was not considered an impedance in the continuation of the project.
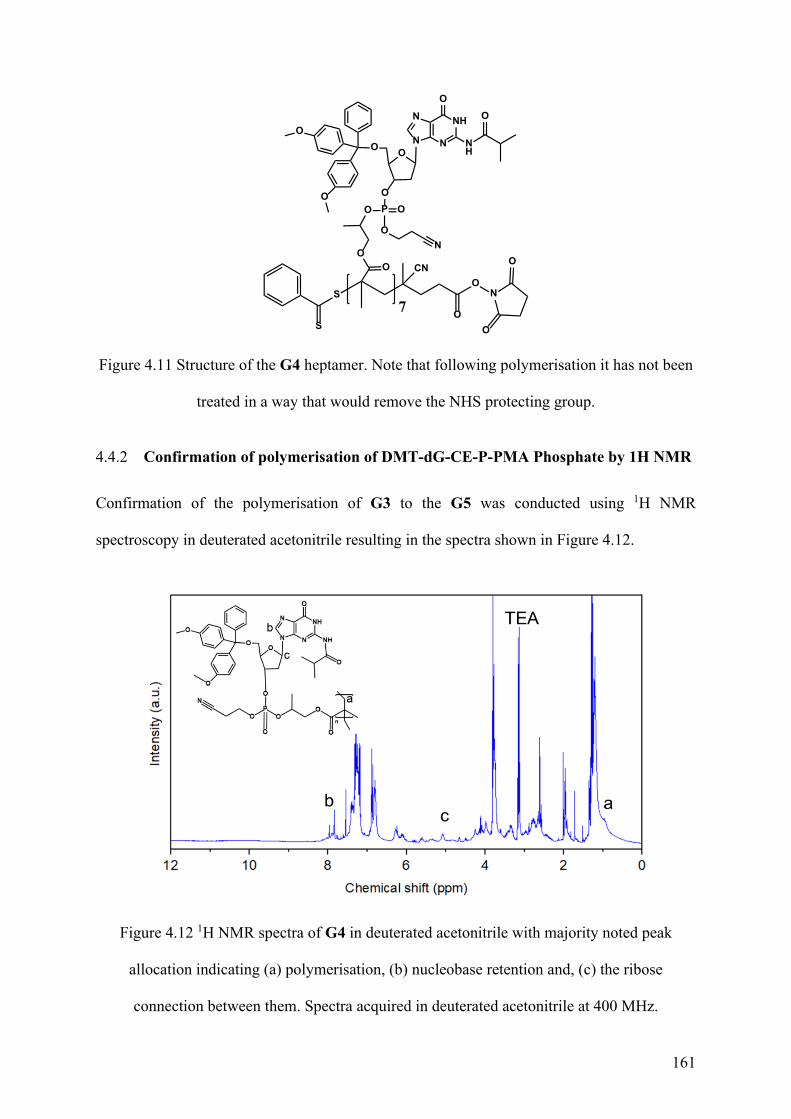
161
PO
OO
O
OO
O
S7
NH
NN
NO
NH
O
O
O
N
O
S
CN
O
ON
O
O
Figure 4.11 Structure of the G4 heptamer. Note that following polymerisation it has not been
treated in a way that would remove the NHS protecting group.
4.4.2 Confirmation of polymerisation of DMT-dG-CE-P-PMA Phosphate by 1H NMR
Confirmation of the polymerisation of G3 to the G5 was conducted using 1H NMR
spectroscopy in deuterated acetonitrile resulting in the spectra shown in Figure 4.12.
Figure 4.12 1H NMR spectra of G4 in deuterated acetonitrile with majority noted peak
allocation indicating (a) polymerisation, (b) nucleobase retention and, (c) the ribose
connection between them. Spectra acquired in deuterated acetonitrile at 400 MHz.
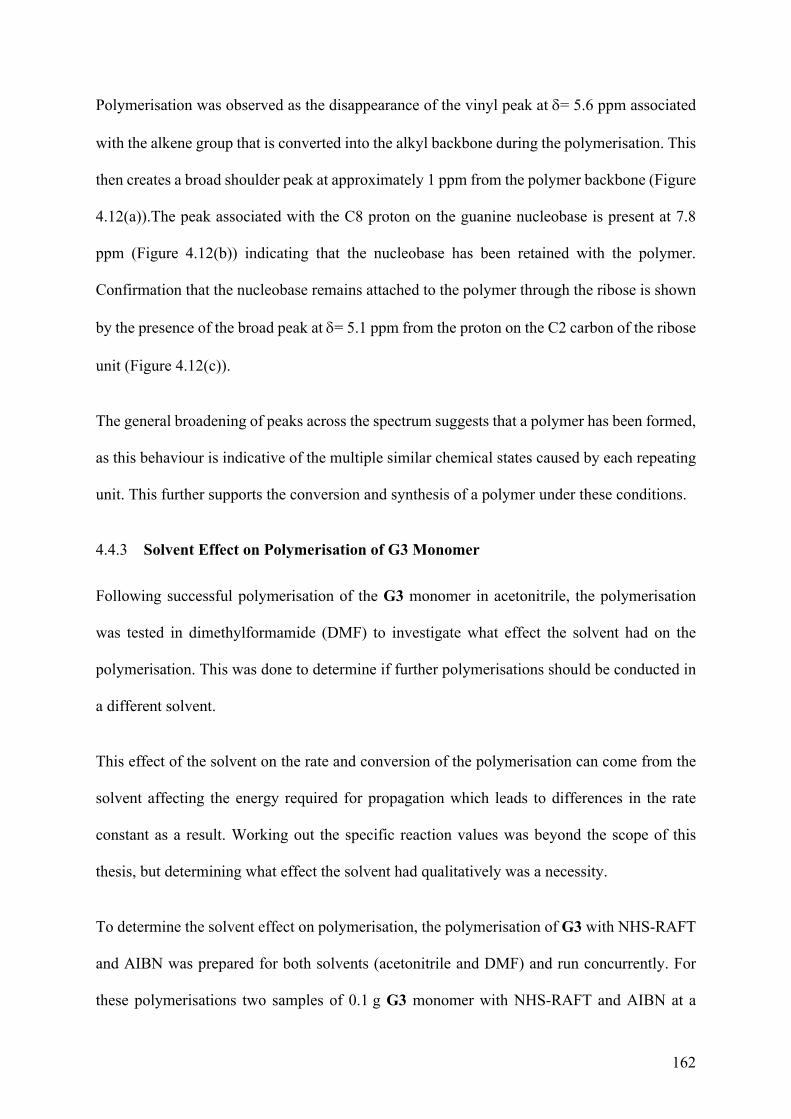
162
Polymerisation was observed as the disappearance of the vinyl peak at δ= 5.6 ppm associated
with the alkene group that is converted into the alkyl backbone during the polymerisation. This
then creates a broad shoulder peak at approximately 1 ppm from the polymer backbone (Figure
4.12(a)).The peak associated with the C8 proton on the guanine nucleobase is present at 7.8
ppm (Figure 4.12(b)) indicating that the nucleobase has been retained with the polymer.
Confirmation that the nucleobase remains attached to the polymer through the ribose is shown
by the presence of the broad peak at δ= 5.1 ppm from the proton on the C2 carbon of the ribose
unit (Figure 4.12(c)).
The general broadening of peaks across the spectrum suggests that a polymer has been formed,
as this behaviour is indicative of the multiple similar chemical states caused by each repeating
unit. This further supports the conversion and synthesis of a polymer under these conditions.
4.4.3 Solvent Effect on Polymerisation of G3 Monomer
Following successful polymerisation of the G3 monomer in acetonitrile, the polymerisation
was tested in dimethylformamide (DMF) to investigate what effect the solvent had on the
polymerisation. This was done to determine if further polymerisations should be conducted in
a different solvent.
This effect of the solvent on the rate and conversion of the polymerisation can come from the
solvent affecting the energy required for propagation which leads to differences in the rate
constant as a result. Working out the specific reaction values was beyond the scope of this
thesis, but determining what effect the solvent had qualitatively was a necessity.
To determine the solvent effect on polymerisation, the polymerisation of G3 with NHS-RAFT
and AIBN was prepared for both solvents (acetonitrile and DMF) and run concurrently. For
these polymerisations two samples of 0.1 g G3 monomer with NHS-RAFT and AIBN at a
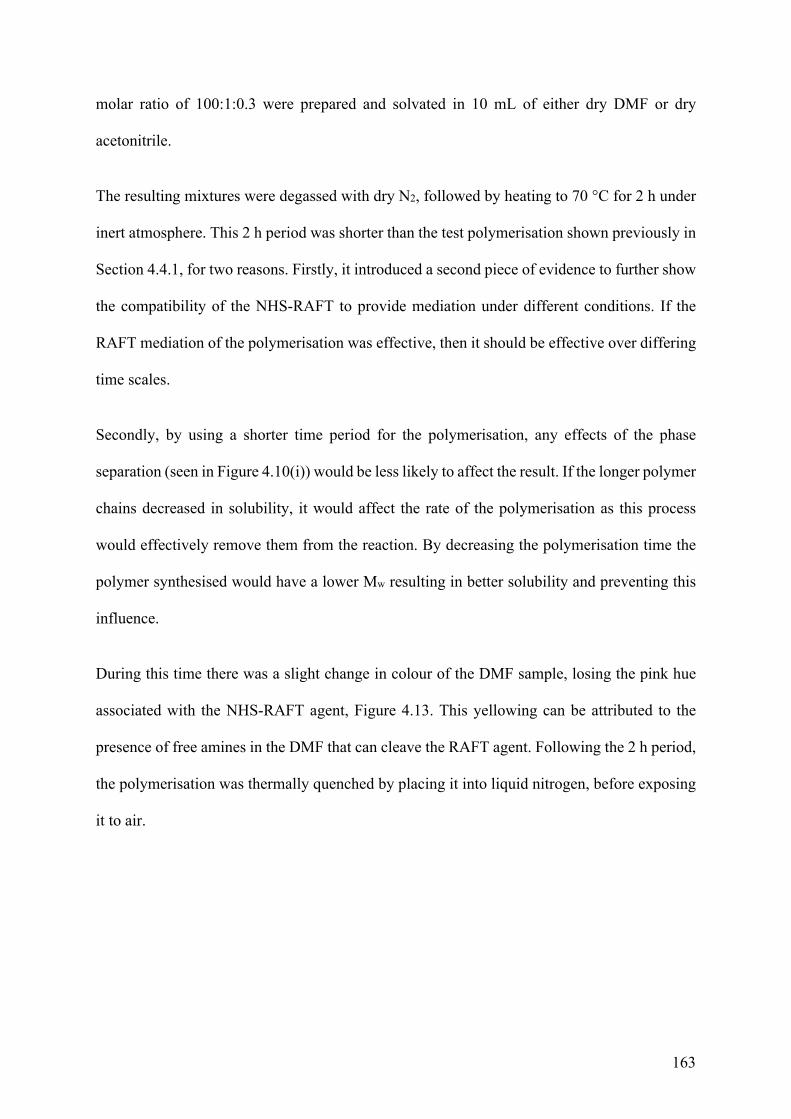
163
molar ratio of 100:1:0.3 were prepared and solvated in 10 mL of either dry DMF or dry
acetonitrile.
The resulting mixtures were degassed with dry N2, followed by heating to 70 °C for 2 h under
inert atmosphere. This 2 h period was shorter than the test polymerisation shown previously in
Section 4.4.1, for two reasons. Firstly, it introduced a second piece of evidence to further show
the compatibility of the NHS-RAFT to provide mediation under different conditions. If the
RAFT mediation of the polymerisation was effective, then it should be effective over differing
time scales.
Secondly, by using a shorter time period for the polymerisation, any effects of the phase
separation (seen in Figure 4.10(i)) would be less likely to affect the result. If the longer polymer
chains decreased in solubility, it would affect the rate of the polymerisation as this process
would effectively remove them from the reaction. By decreasing the polymerisation time the
polymer synthesised would have a lower Mw resulting in better solubility and preventing this
influence.
During this time there was a slight change in colour of the DMF sample, losing the pink hue
associated with the NHS-RAFT agent, Figure 4.13. This yellowing can be attributed to the
presence of free amines in the DMF that can cleave the RAFT agent. Following the 2 h period,
the polymerisation was thermally quenched by placing it into liquid nitrogen, before exposing
it to air.
164
Figure 4.13 Difference in solution hue of the G5 reaction mixture with (i) DMF and, (ii)
acetonitrile as solvent after 2 h.
To analyse the polymerisation, the samples were dried by evaporation at ambient temperature
with compressed air to remove residual solvent. The samples were then solvated in THF at 1
mg/mL for analysis by SEC, Figure 4.14. Freeze-drying was not an option as the sample
synthesised in DMF was incompatible with the equipment available. The results are shown in
Table 4.2.

165
Figure 4.12 DRI chromatograms of G4 polymerised for 2 h using either (i) acetonitrile, or (ii)
dimethylformamide as the solvent. Numbers shown indicate the Mw at maximum.
Table 4.2: Results of polymerisation in different solvents over 2 h.
Acetonitrile Dimethylformamide Mw (Da) 4054 5003
DP (units) 4.6 5.7 Đ 1.12 1.14
The DRI chromatogram showed that the 2 h polymerisation in DMF resulted in a higher
measured molecular weight (5033 Da) compared to that achieved with acetonitrile (4054 Da)
over the same 2 h period. As with the previous sample the Mw reported can not be considered
166
accurate but does still allow for conclusions to be drawn on the relative rate of reaction. The
higher Mw represents that roughly one additional G3 monomer unit had been incorporated per
chain. As the polymerisation was conducted over the same period, this suggested that the DMF
increased the rate of polymerisation.
Comparing the two polymerisations, there was also a change in the Đ. DMF showed a slightly
higher Đ = 1.14 compared to the Đ = 1.12 for acetonitrile. The difference in Đ between the two
solvents was small. In practice, it showed that the NHS-RAFT was roughly as effective at
mediating the polymerisation when solvated in DMF as compared to acetonitrile. The
experiment was conducted once, so there is no reported error, and the method for measuring
the Đ is subjective, so this result did not provide a distinction between the two solvents. Due
to the DMT-dG-CE-P-PMA phosphate monomer being prepared in acetonitrile, the decision
was made to use acetonitrile as the solvent for further polymerisations as it was at this point a
known value in the reaction procedure and the impact of a single addition was considered minor
at the cost of possible degradation.
4.5 Kinetics for the Polymerisation of G3 Monomer
The two methods for measuring the rate of polymerisation considered for this project were in-
situ and ex-situ measurements.
In-situ measurements have the benefit of being able to measure the direct conversion of
monomer to polymer by the change in NMR spectrum peak intensity of specific groups. In this
project it was the conversion of the monomer’s alkene group to the polymer’s alkane as the
polymerisation progresses. This allows direct measurement of the conversion rate and degree
of polymerisation but does not give insight to the mass properties on an individual strand basis,
i.e., the method describes how much monomer was converted but not the Đ or the Mw of the
167
product. These values were collected following completion of the polymerisation using SEC,
following the same method as used in Section 4.4.2.
Ex-situ measurements require removal of a fraction of the mixture as a sample to study at
specific time increments during the reaction. Due to the removal of solution the number of
samples that can be measured was limited by the volume of solution. Further, under normal
laboratory conditions, there was a high risk of contamination by air due to repeated interactions
with the solution, however, such risk can be minimised with the use of a glove box or similar
isolation equipment. For this thesis ex-situ samples were collected using the automated
Chemspeed SWING robotic synthesis platform based at CSIRO Clayton, Victoria, Australia.
The Chemspeed SWING robotic synthesis platform is an automated system that operates under
a dry nitrogen atmosphere and can collect samples automatically using a syringe pump. The
machine is shown, and procedure described, in Chapter 2, Section 1.5.2.3.2.
4.5.1 In-situ 1H Nuclear Magnetic Resonance (NMR) Spectroscopy Kinetic
Measurements
The kinetics of the polymerisation were measured in-situ using an NMR spectrometer by pinch
sealing the reaction solution in glass NMR tubes, which had been previously backfilled with
nitrogen. The benefit of this method was that the number of data points was only limited by the
time it took for each individual measurement to be made (2.5 min), as the total volume of
solvent (1 mL) was maintained throughout the reaction. In principle, this method allowed for
more consistent analysis because once the reaction was sealed it could not be contaminated.
This seal prevented oxygen or water entering the system and quenching the reaction, as is a
risk with ex-situ measurements.
The disadvantage to using NMR spectroscopy as a method for measuring the kinetics of
polymerisation was the need of a deuterated solvent, which meant that any significant scale of

168
polymerisation became prohibitively expensive. Further, deuterated solvents can influence the
kinetics of a reaction of this type through the difference in the stabilisation of the radical
intermediate created during the propagation phase of the polymerisation, changing the chiral
preference of subsequent monomer additions.12
Samples for the NMR in-situ spectra kinetics measurements were first prepared by dissolving
the G3 monomer (1 g) into deuterated acetonitrile (6 mL) with NHS-RAFT (60 mg) and AIBN
(8.5 mg) for a molar ratio of 20:4:1, replicating the ratio used in Section 4.1. This volume was
then degassed with dry N2 and divided into 5 sealed NMR tubes under inert atmosphere. In
order to do this, 2 syringes were sealed into the end of the NMR tube by melting the glass and
pinching it closed. The syringe-modified NMR tube was then purged with N2 for 10 min to
ensure there was no oxygen remaining. The polymerisation mixture (1 mL) was then added to
the tube and the other end of the tube was sealed by melting and pinching it shut with pliers,
fusing the glass.
The sample compartment within the NMR instrument was then heated to 70 °C while
containing a ceramic spinner and one of the five samples of the polymerisation mixture,
denoted as the "locking sample". This locking sample was used to maintain the NMR phase
lock as the instrument was heated. This was needed as the heating of the solvent affects the
shift, which can result in the instrument failing to achieve a successful lock. If this lock was
not obtained the samples would not be comparable.
The heating was completed in 10 °C increments, with a 15 min hold time to equilibrate at each
temperature increment. This procedure was required to ensure the non-magnetic alloys used in
the NMR probe were not damaged by sudden temperature change. Locking and shimming was
also conducted at each of the equilibration points to ensure that the instrument auto-lock and
shim could account for the effects of higher temperature on the chemical shift.
169
When the temperature had equilibrated at 70 °C, the locking sample was removed and replaced
with the sample of G3 monomer polymerisation mixture to be analysed. A series of 1H NMR
spectra were acquired using 16 scans. This process required 2.5 min per time increment, with
a 10 min delay between each set of the scans, resulting in the time separation of 12.5 min
between each data point. This process was then repeated a total of 4 times, the fifth sample
having been used as the locking sample.
When taking in-situ measurements the conversion would normally be measured by
comparing the decrease in the integration of the alkene peak associated with the G3 monomer
at 5.4 ppm (Figure 4.7(b)) with the appearance of the peak associated with the polymer at 1.2
ppm. However, in the case of the G4 an additional peak at 1.8 ppm associated with the
formation of the alkyl backbone overlaps with the signals from the nucleotide moiety.
The increased temperature appeared to affect the lock and shim enough that it caused a
downfield shift of the 5.4 ppm peak associated with the alkene to 5.6 ppm. As a result, a method
was developed to measure the decrease in the integration of the vinyl peak at 5.6 ppm (shown
in Figure 4.7(b)).13
To measure the conversion the integration of the 5.6 ppm peak was measured over time (Figure
4.13(i)). To do this the ratio of this peak had to be normalised to the 3.1 ppm peak associated
with the triethylamine residue from the isolation of the G3 monomer. The integration ratio of
the 5.6 ppm vinyl peak was then plotted against time to determine the kinetics of the
polymerisation Figure 4.15.
Over the first 3 time points (37.5 min) there was a steep upward trend. Based on prior literature
this represented the rapid decomposition of the AIBN initiator and its first addition to the G3
monomer.14
170
Following the first addition there was a plateau until 100 min. This was attributed to the first
addition of the G3 monomer reacting preferentially with the NHS-RAFT, rather than
propagating with other monomers in solution. This created the macro-RAFT agent, as shown
in Figure 4.16(inset). This phenomenon has been previously discussed in Chapter 1, Section
1.5.4.
Following this, from 147.5 min there was a linear trend during the propagation phase of the
reaction. Here, the macro-RAFT agent reacts with the G3 in solution, incorporating it into the
propagating chains through addition to the alkene group. This causes the decrease in the alkene
concentration as it was converted to the alkyl backbone of the polymer. The mechanism for
this process is shown in Chapter 1, Section 1.6.
Over the 4 runs the results showed a low level of variance (indicated by the consistent error
bars) and linear growth over the remainder of the 850 min period, indicating that the
polymerisation was progressing under RAFT mediation.
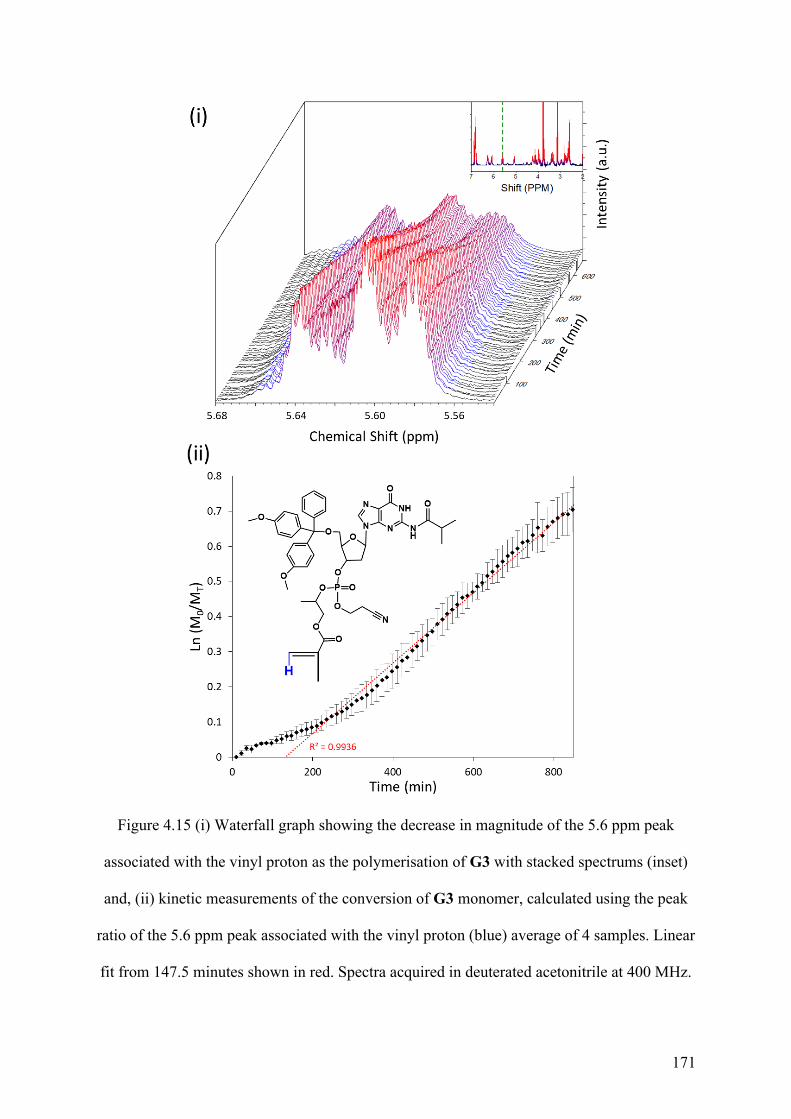
171
Figure 4.15 (i) Waterfall graph showing the decrease in magnitude of the 5.6 ppm peak
associated with the vinyl proton as the polymerisation of G3 with stacked spectrums (inset)
and, (ii) kinetic measurements of the conversion of G3 monomer, calculated using the peak
ratio of the 5.6 ppm peak associated with the vinyl proton (blue) average of 4 samples. Linear
fit from 147.5 minutes shown in red. Spectra acquired in deuterated acetonitrile at 400 MHz.
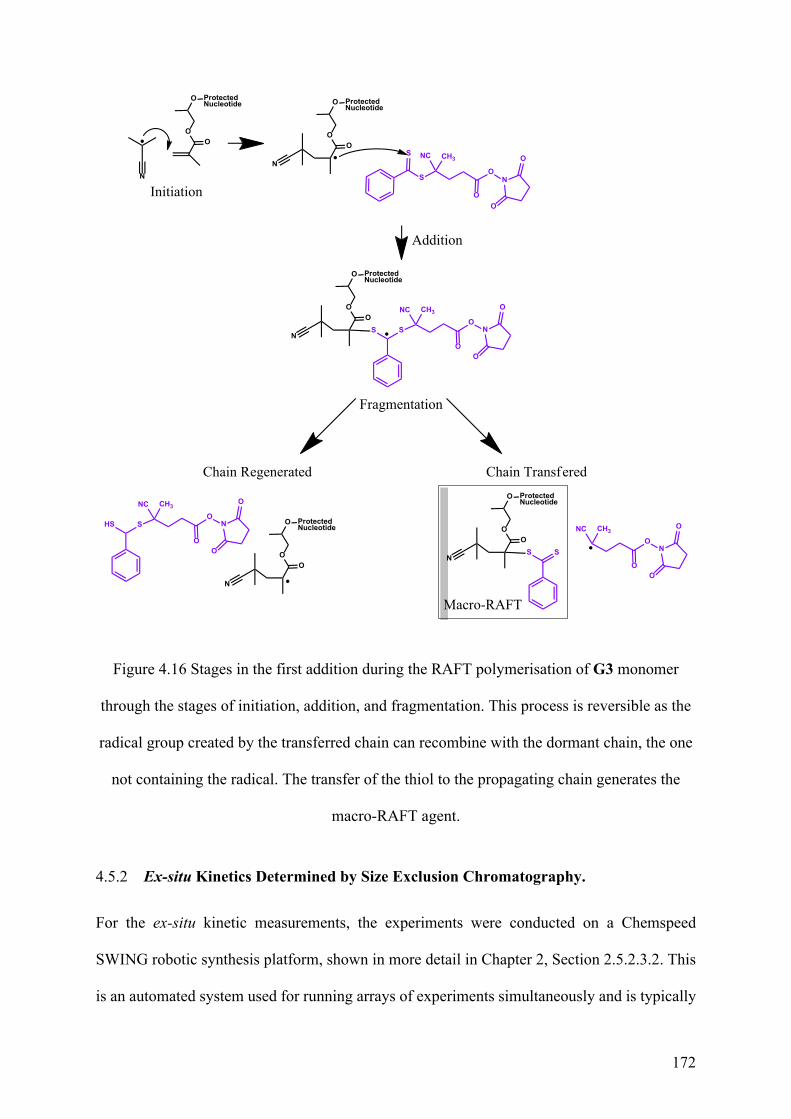
172
N
Protected Nucleotide
O
OO
Protected Nucleotide
O
OO
N
O
O
NO
O
NC CH3S
S
Protected Nucleotide
O
OO
N
O
O
NO
O
NC CH3
S S
Protected Nucleotide
O
OO
N
O
O
NO
O
NC CH3
S S
Protected Nucleotide
O
OO
N
O
O
NO
O
NC CH3
HS S
Initiation
Chain TransferedChain Regenerated
Addition
Fragmentation
Macro-RAFT
Figure 4.16 Stages in the first addition during the RAFT polymerisation of G3 monomer
through the stages of initiation, addition, and fragmentation. This process is reversible as the
radical group created by the transferred chain can recombine with the dormant chain, the one
not containing the radical. The transfer of the thiol to the propagating chain generates the
macro-RAFT agent.
4.5.2 Ex-situ Kinetics Determined by Size Exclusion Chromatography.
For the ex-situ kinetic measurements, the experiments were conducted on a Chemspeed
SWING robotic synthesis platform, shown in more detail in Chapter 2, Section 2.5.2.3.2. This
is an automated system used for running arrays of experiments simultaneously and is typically

173
used for formulation variations. For measuring the polymerisation of G3 monomer it allowed
for the reaction to be run both in triplicate and simultaneously.
The Chemspeed system was required for ex-situ measurements as the inert atmosphere could
not be maintained using the conventional lab setup. When the polymerisation was conducted
using manual syringing with positive N2 pressure only the first sample could be consistently
acquired. Following this the reaction solution would turn dark brown to black as if burning.
Potentially this could be overcome using an alternative methodology, but as the Chemspeed
was available and able to perform more consistently it was chosen instead.
To measure the polymerisation, G3 monomer was prepared with the NHS-RAFT and AIBN in
a molar ratio of 100:1:0.25 in acetonitrile. This ratio was substantially higher in monomer than
that used for the in-situ kinetics, discussed in Section 4.5.1. The choice to use this ratio was
made so that the automated system could determine if there was maximum molecular weight
achievable with acetonitrile as the solvent. By testing with acetonitrile this would indicate if
the solvent limited not only the rate, as discussed in Section 4.4.1, but the Mw achievable.
Based on the molar ratio 100:1:0.25 of G3 monomer: NHS-RAFT: AIBN, the calculated
maximum Mw for the resulting polymers was 78 kDa. This is provided by Equation 4.1 and
based on full conversion of the monomer into polymer, complete reaction with the RAFT agent,
and complete decomposition of the initiator.
Equation 4.1
The G3 monomer samples were polymerised in triplicate at 70 °C with 1 mL samples collected
at each time point. Following the collection of all time points, the 1 mL G4 samples were
freeze-dried for 24 h until the pressure equilibrated at 0.019 mbar. The G4 samples were then

174
solvated in 1.5 mL DMF each and analysed using SEC against PMMA standards. The results
of these measurements were then collected and plotted, as shown in Figure 4.17.
Figure 4.17 (i) Mw of G4 (square) and the corresponding Đ (diamond) over time calculated
from SEC and, (ii) example DRI chromatogram for the 240 min sample of G4. Further
example DRI chromatograms can be found in Appendix 3.
These results showed that initially there was a noticeable increase in Mw between 0 and 240
min as the polymerisation progressed. Following the initial increase achieving a maximum Mw
of 40 kDa, equivalent to a DP of 43, there was an 18% decrease in Mw over the subsequent 360
minutes. This indicates that the polymerisation had stopped and that the product may have been
undergoing thermal degradation, likely partial deprotection of some repeating units based on
the results presented in section 4.4.1.
Over the first hour of polymerisation the Đ appears to remain below the threshold for RAFT
polymerisation to be controlled (Đ < 1.2) and the MW has increased above that seen in Section
4.4.1. Following this time however the Đ begins climes to over 1.5. The change in Đ over time
indicates that there is a loss of control for the polymerisation, potentially caused by the change
in solubility of the polymer inhibiting the ability for the chain addition step based on other
results. Further, the increased variance in the Đ at 300 minutes and 480 minutes matched the
175
increased variance in the Mw at these time points, further supporting the partial decomposition
of the polymer. As the SEC indicated the conversion of Mw and not Mn
These observations suggested that the maximum Mw achievable by this method was a DP of
43. Combined with the results of the bulk polymerisation, being able to reach higher molecular
weights will likely require further optimisation of the solvent system, either adjusting
concentration or changing the solvent entirely, which could in turn need the RAFT agent and
possibly initiator to be altered.
4.6 Activation of the Guanine Nucleobase in G4
Following the successful synthesis of G4, the activation of the nucleobase functionality was
required to investigate the binding properties of the nucleobase. This was done through the two
step process: deprotection and detritylation.
The proper, deprotection, removes the cyanoethyl group from the phosphate and the isobutyryl
from the guanine. The latter, detritylation, removes the dimethoxytrityl protection from the 5′
hydroxyl on the ribose. Completion of these steps results in poly(2- (2′-deoxyguanosine
monophosphate)- methacrylate), or G6; the process is summarised in Figure 4.18.
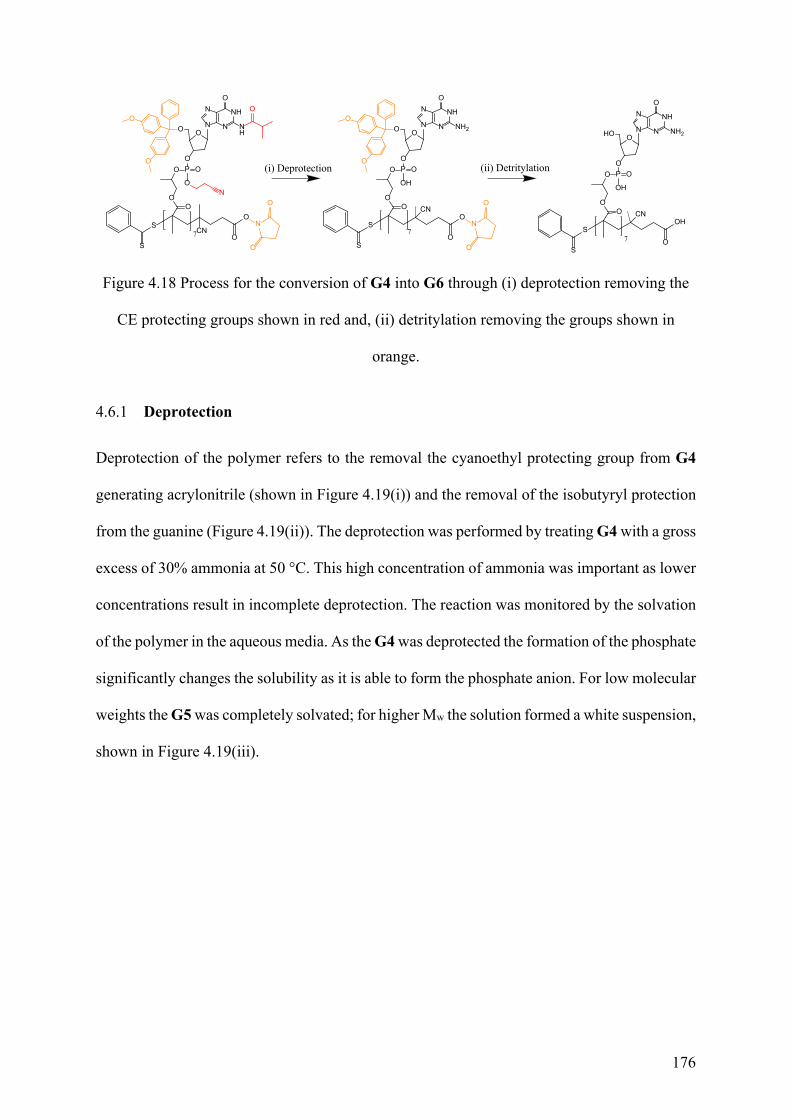
176
PO
OO
O
OO
O
S7
NH
NN
NO
NH
O
O
O
N
O
S
CNO
ON
O
O
PO
OO
O
OO
O
S7
NH
NN
NO
NH2
OH
O
O
S
CN
O
ON
O
O
PO
OHO
O
OO
O
S7
NH
NN
NO
NH2
OH
S
CN
O
OH
(i) Deprotection (ii) Detritylation
Figure 4.18 Process for the conversion of G4 into G6 through (i) deprotection removing the
CE protecting groups shown in red and, (ii) detritylation removing the groups shown in
orange.
4.6.1 Deprotection
Deprotection of the polymer refers to the removal the cyanoethyl protecting group from G4
generating acrylonitrile (shown in Figure 4.19(i)) and the removal of the isobutyryl protection
from the guanine (Figure 4.19(ii)). The deprotection was performed by treating G4 with a gross
excess of 30% ammonia at 50 °C. This high concentration of ammonia was important as lower
concentrations result in incomplete deprotection. The reaction was monitored by the solvation
of the polymer in the aqueous media. As the G4 was deprotected the formation of the phosphate
significantly changes the solubility as it is able to form the phosphate anion. For low molecular
weights the G5 was completely solvated; for higher Mw the solution formed a white suspension,
shown in Figure 4.19(iii).
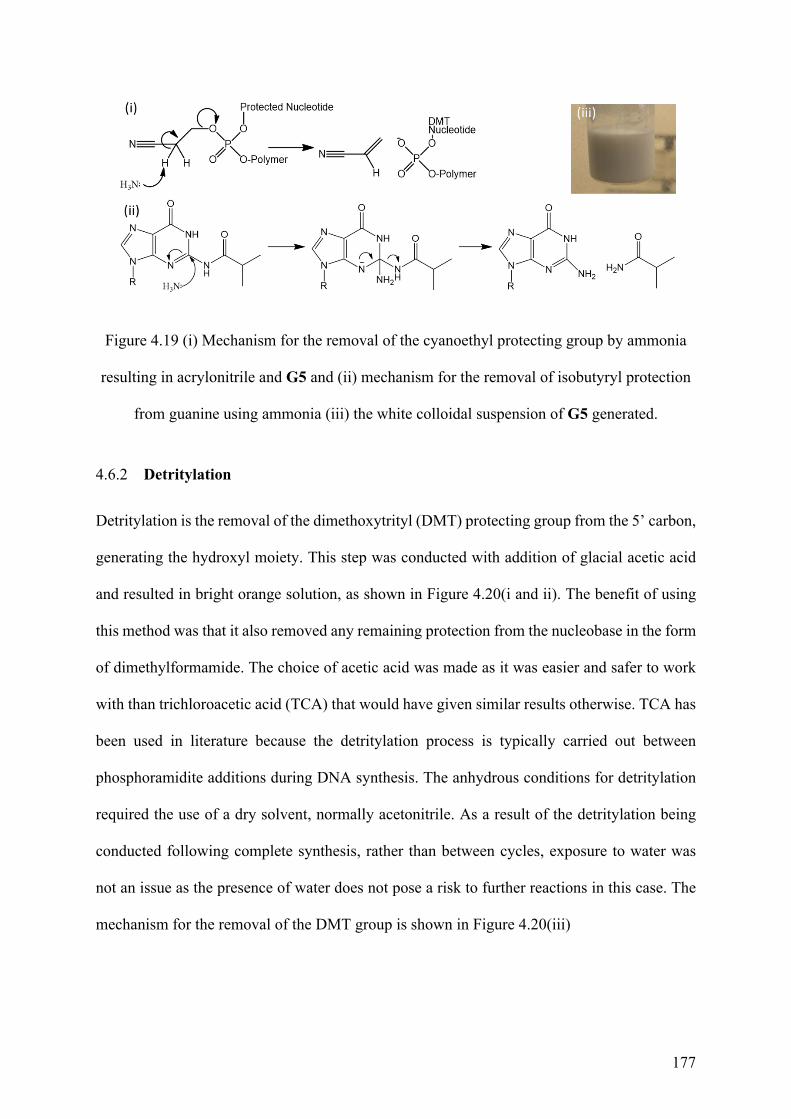
177
Figure 4.19 (i) Mechanism for the removal of the cyanoethyl protecting group by ammonia
resulting in acrylonitrile and G5 and (ii) mechanism for the removal of isobutyryl protection
from guanine using ammonia (iii) the white colloidal suspension of G5 generated.
4.6.2 Detritylation
Detritylation is the removal of the dimethoxytrityl (DMT) protecting group from the 5’ carbon,
generating the hydroxyl moiety. This step was conducted with addition of glacial acetic acid
and resulted in bright orange solution, as shown in Figure 4.20(i and ii). The benefit of using
this method was that it also removed any remaining protection from the nucleobase in the form
of dimethylformamide. The choice of acetic acid was made as it was easier and safer to work
with than trichloroacetic acid (TCA) that would have given similar results otherwise. TCA has
been used in literature because the detritylation process is typically carried out between
phosphoramidite additions during DNA synthesis. The anhydrous conditions for detritylation
required the use of a dry solvent, normally acetonitrile. As a result of the detritylation being
conducted following complete synthesis, rather than between cycles, exposure to water was
not an issue as the presence of water does not pose a risk to further reactions in this case. The
mechanism for the removal of the DMT group is shown in Figure 4.20(iii)

178
Figure 4.20 The orange colour produced as a result of the acetic acid addition to the G5 from
(i) immediately after addition to (ii) 5 min after addition with (iii) the mechanism for this
conversion.
Exposure to acetic acid during the detritylation step also results in the removal of the NHS
protecting group from the NHS-RAFT unit of the polymer and converting it into the pentatonic
acid.
4.6.2.1 Neutralisation Agents
At this stage of the experiment the G6 was solvated at pH <3 as a result of the acetic acid used
during the detritylation. The solution therefore needed to be neutralised to ensure that the
guanine was not cleaved.
To perform the neutralisation the G6 solution was treated with an acetate counter ion which
was provided in the form of either sodium or lithium acetate. The addition of the acetate caused
a loss of colour as the orange DMT cation was converted to dimethoxytrityl acetate, a
colourless compound.
4.6.3 Isolation
Isolation of G6 was performed to remove residual monomer and salts during the deprotection
and detritylation phases. To achieve this, the G6 mixture following detritylation was
precipitated into propan-2-ol and chilled to -20 °C for 14 h. This method for desalting was
chosen based on the literature for isolation of DNA synthesised using similar approaches.
179
Under these conditions DNA has been shown to precipitate at most Mw and even lower
concentrations where ethanol is ineffective. In this work however, early instances where
sodium acetate had been used in the detritylation step no precipitate formed. Instead the
solution turned slightly opaque. Further investigation of this solution and its subsequent
characterisation is presented and discussed in more depth in Chapter 5. The result was that the
colloid was attributed to the formation of G-quartets, discussed in Chapter 1, Section 1.2.5.1,
with the sodium cation.
To overcome this lithium acetate was used resulting in the polymerisation and isolation of G6
from any residual monomer by centrifugation. The G6 was then repeatedly washed with pure
water to complete the desalting (removal of acetate and excess lithium). Final isolation of the
polymer was achieved by drying the precipitate, which resulted in a solid white compound.
At this point it was found that the G6 was limited in that it was insoluble in water, requiring
the addition of propan-2-ol as a cosolvent. Polymers at all Mw tested appeared to be soluble in
10:1 water: propan-2-ol v/v, with the solutions appearing cloudy at other ratios tested. A test
with acetic acid showed that it could allow for the solvation of the polymer without a secondary
solvent, but the concentration of acetic required acid and the subsequent pH may damage the
polymer so no further work was conducted to improve its solubility.
4.6.4 Confirmation of Nucleobase Activation
Confirmation of the conversion of G4 (Figure 4.21(i)) to the G6 (Figure 4.21(ii)) was
conducted using 1H NMR spectroscopy in deuterated dimethyl sulfoxide. Due to the low
solubility of the polymer, the spectrum showed low signal-to-noise. However, it can be noted
that the spectrum was simpler following deprotection compared to the G4 suggesting that the
polymer has now had bulky moieties removed resulting in fewer proton signals.
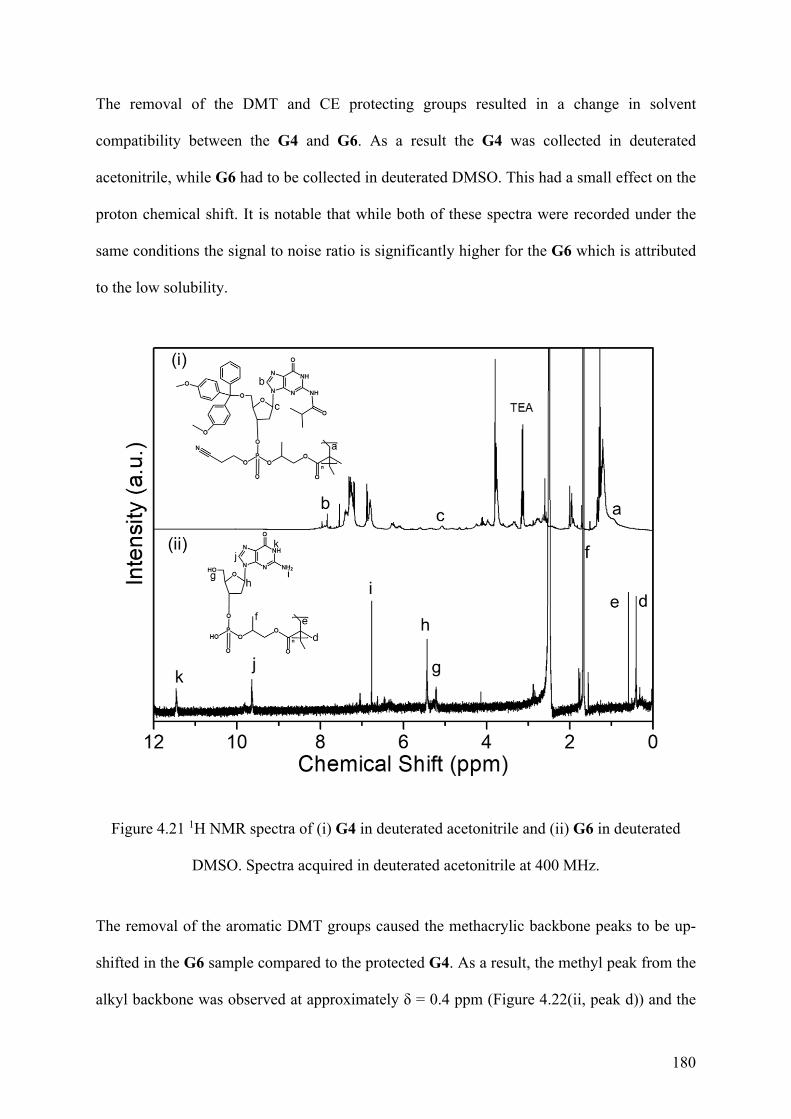
180
The removal of the DMT and CE protecting groups resulted in a change in solvent
compatibility between the G4 and G6. As a result the G4 was collected in deuterated
acetonitrile, while G6 had to be collected in deuterated DMSO. This had a small effect on the
proton chemical shift. It is notable that while both of these spectra were recorded under the
same conditions the signal to noise ratio is significantly higher for the G6 which is attributed
to the low solubility.
Figure 4.21 1H NMR spectra of (i) G4 in deuterated acetonitrile and (ii) G6 in deuterated
DMSO. Spectra acquired in deuterated acetonitrile at 400 MHz.
The removal of the aromatic DMT groups caused the methacrylic backbone peaks to be up-
shifted in the G6 sample compared to the protected G4. As a result, the methyl peak from the
alkyl backbone was observed at approximately δ = 0.4 ppm (Figure 4.22(ii, peak d)) and the
181
two ethylene protons were now observed at approximately δ = 0.6 ppm (Figure 4.22(ii, peak
e)). The propyl linkage between the phosphate and the methacrylic backbone was seen as a
series of peaks around δ = 1.7 ppm (Figure 4.20(ii, peak f)).
The activated guanosine units were observed as the appearance of peaks from the ribose and
guanine. For the ribose, peaks were observed at δ = 5.2 ppm (C5′–OH) and δ = 5.4 ppm (H-2′)
(Figure 4.22(ii, peaks g and h respectively)). Finally, for guanine, peaks were observed at δ =
6.7 ppm (NH2), δ = 9.6 ppm (H-8) and δ = 11.5 ppm (NH) (Figure 4.22(ii, peaks i, j and k
respectively)). These results confirmed the presence of the guanosine monophosphate
nucleotides on the propyl methacrylate backbone.
4.7 Conclusion.
This chapter showed the successful use of HPMA as a vinyl source in the generation of the
vinyl functionalised nucleotide, G3 monomer, using the phosphoramidite coupling method
previously described in Chapter 3.
The polymerisation of the G3 monomer using the RAFT polymerisation method resulted in
polymers of low dispersity (Đ<1.2) indicating that the RAFT method was successful. This was
further reinforced through the use of different conditions and reagent ratios of monomer: RAFT
agent: initiator where the dispersity remained below the 1.2 threshold. This indicated the NHS-
RAFT agent was able to mediate the polymerisation in acetonitrile. This resulted in a protected
G4 polymer.
Activation of the guanine moiety was achieved using similar deprotection procedures to
synthetic DNA and resulted in the activated G6 polymer. However this polymer formed a
colloid which is investigated further in the following Chapter 5.
182
4.8 References
(1) Roy, S.; Caruthers, M. Synthesis of DNA/RNA and Their Analogs via Phosphoramidite
and H-Phosphonate Chemistries. Molecules 2013, 18 (11), 14268–14284.
(2) Grøndahl, L.; Suzuki, S.; Wentrup-Byrne, E. Influence of a Diene Impurity on the
Molecular Structure of Phosphate-Containing Polymers with Medical Applications.
Chem. Commun. (Camb). 2008, No. 28, 3314–3316.
(3) Vargeese, C.; Carter, J.; Yegge, J.; Krivjansky, S.; Settle, A.; Kropp, E.; Peterson, K.;
Pieken, W. Efficient Activation of Nucleoside Phosphoramidites with 4,5-
Dicyanoimidazole during Oligonucleotide Synthesis. Nucleic Acids Res. 1998, 26 (4),
1046–1050.
(4) Smith, P. B.; Snyder, A. P. Electrospray Ionization Tandem Mass Spectrometry of
Mixtures: Deconvolution by Parent-Ion Scans. Rapid Commun. Mass Spectrom. 1992,
6 (6), 373–375.
(5) Qian, K.; Edwards, K. E.; Diehl, J. H.; Green, L. A. Fundamentals and Applications of
Electrospray Ionization Mass Spectrometry for Petroleum Characterization. Energy and
Fuels 2004, 18 (6), 1784–1791.
(6) Emwas, A. H. M. The Strengths and Weaknesses of NMR Spectroscopy and Mass
Spectrometry with Particular Focus on Metabolomics Research. Methods Mol. Biol.
2015, 1277, 161–193.
(7) de Hoffmann, E. Mass Spectrometry. In Kirk-Othmer Encyclopedia of Chemical
Technology; John Wiley & Sons, Inc.: Hoboken, NJ, USA, 2005.
(8) Ugi, I.; Jacob, P.; Landgraf, B.; Rupp, C.; Lemmen, P.; Verfürth, U. Phosphite Oxidation
183
and the Preparation of Five-Membered Cyclic Phosphorylating Reagents via the
Phosphites. Nucleosides and Nucleotides 1988, 7 (5–6), 605–608.
(9) Masanori, K.; Akira, H.; Shinya, O.; Mamoru, H.; Mitsue, A.; Rie, K.; Hayakawa, Y.
Ethyl(Methyl)Dioxirane as an Efficient Reagent for the Oxidation of Nucleoside
Phosphites into Phosphates under Nonbasic Anhydrous Conditions. Org. Lett. 2001, 3
(6), 815–818.
(10) Li, Y.; Raushel, F. M. Differentiation of Chiral Phosphorus Enantiomers by 31P and 1H
NMR Spectroscopy Using Amino Acid Derivatives as Chemical Solvating Agents.
Tetrahedron Asymmetry 2007, 18 (12), 1391–1397.
(11) Moad, G.; Rizzardo, E.; Thang, S. H. Radical Addition-Fragmentation Chemistry in
Polymer Synthesis. Polymer. Elsevier March 3, 2008, pp 1079–1131.
(12) Green, M. M.; Peterson, N. C.; Sato, T.; Teramoto, A.; Cook, R.; Lifson, S. A Helical
Polymer with a Cooperative Response to Chiral Information. Science (80-. ). 1995, 268
(5219), 1860–1866.
(13) Scales, C. W.; Vasilieva, Y. A.; Convertine, A. J.; Lowe, A. B.; McCormick, C. L.
Direct, Controlled Synthesis of the Nonimmunogenic Hydrophilic Polymer, Poly(N-(2-
Hydroxypropyl)Methacrylamide) via RAFT in Aqueous Media. Biomacromolecules
2005, 6 (4), 1846–1850.
(14) Foster, J. C.; Radzinski, S. C.; Matson, J. B. Graft Polymer Synthesis by RAFT Transfer-
To. Journal of Polymer Science, Part A: Polymer Chemistry. John Wiley & Sons, Ltd
September 15, 2017, pp 2865–2876.
184
5 Chapter 5: Formation of G-quartets Utilising
Nucleotide Functionalised Synthetic Polymers
5.1 Synopsis
This chapter outlines the characterisation of poly(2-(2′-deoxyguanosine-monophosphate)oxypropyl methacrylate), referred to as poly(dG-P-PMA), colloidal solutions following their synthesis as presented in Chapter 4.
The poly(dG-P-PMA) colloid was found to form as a result of sodium acetate being present, indicating the formation of G-quartet based secondary structures, as determined by circular dichroism and melting studies.
185
5.2 Introduction
This chapter builds on some of the results described in Chapter 4. Specifically the formation
of a colloidal solution from poly(2-(2′-deoxyguanosine-monophosphate)oxypropyl
methacrylate) (G6) following isolation. This G6 colloid formed during the desalting procedure
discussed in Chapter 4 Section 4.6.3, and was attributed to the presence of sodium acetate
(NaOAc) during the isolation.
The investigation of the G6 colloid and its properties forms the basis for this chapter. First the
specific characterisation of the G6 samples that formed the colloid will be presented, followed
by an investigation of causes for the colloid forming. This will include the effect of different
salts, lithium acetate (LiOAc), NaOAc and potassium acetate (KOAc), as they relate to the
secondary structures of G6.
The nature of the G6 suspension was determined using scanning electron microscopy (SEM)
and dynamic light scattering (DLS). This determined that the colloid led to the formation of
spherical particles in solution, and that the formation of these particles was solvent dependant.
This led to the hypothesis that G-quartets were influencing the formation of the particles. The
formation of secondary structures within nucleic acids was not a new phenomenon. The DNA
double helix was most notable of these but others, such as the i-motif and G-quadruplex
discussed in Chapter 1 Section 1.2.5, have been shown to form in both natural and synthetic
systems.1–3 Based on this hypothesis, experiments were conducted using circular dichroism
(CD) spectroscopy, fluorescence microscopy and melting behaviour of the G6 to determine if
G-quartets were the cause of particle formation.
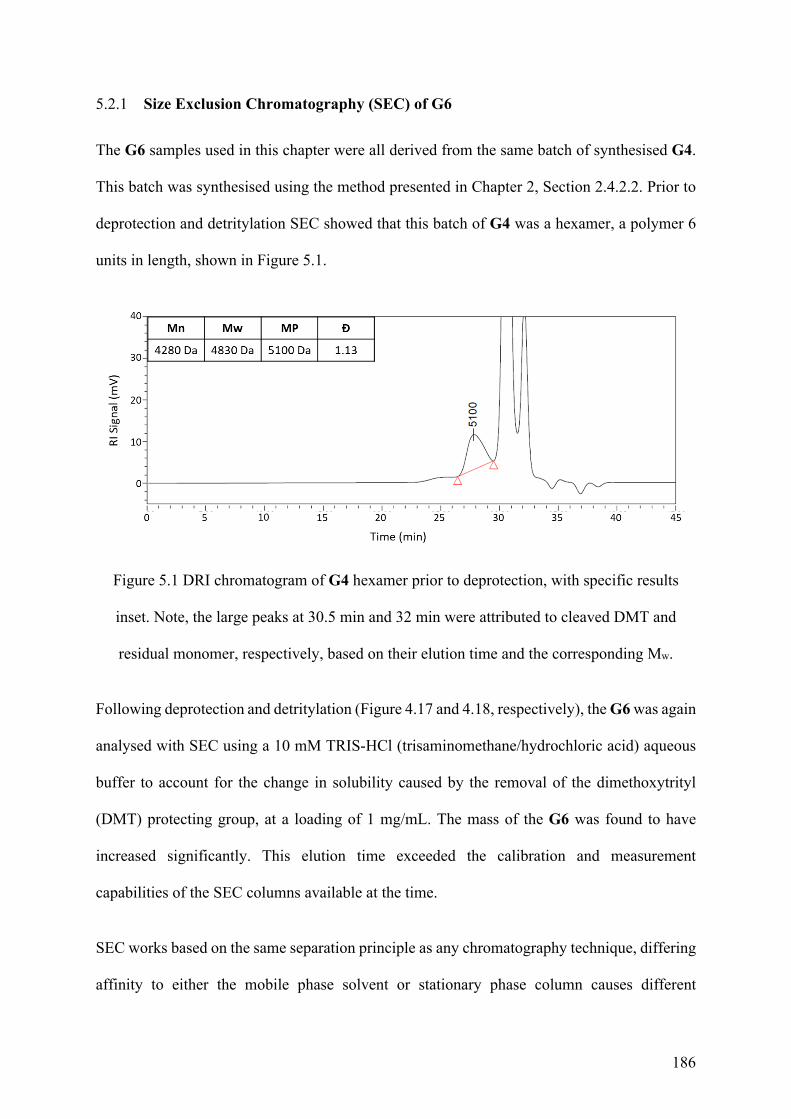
186
5.2.1 Size Exclusion Chromatography (SEC) of G6
The G6 samples used in this chapter were all derived from the same batch of synthesised G4.
This batch was synthesised using the method presented in Chapter 2, Section 2.4.2.2. Prior to
deprotection and detritylation SEC showed that this batch of G4 was a hexamer, a polymer 6
units in length, shown in Figure 5.1.
Figure 5.1 DRI chromatogram of G4 hexamer prior to deprotection, with specific results
inset. Note, the large peaks at 30.5 min and 32 min were attributed to cleaved DMT and
residual monomer, respectively, based on their elution time and the corresponding Mw.
Following deprotection and detritylation (Figure 4.17 and 4.18, respectively), the G6 was again
analysed with SEC using a 10 mM TRIS-HCl (trisaminomethane/hydrochloric acid) aqueous
buffer to account for the change in solubility caused by the removal of the dimethoxytrityl
(DMT) protecting group, at a loading of 1 mg/mL. The mass of the G6 was found to have
increased significantly. This elution time exceeded the calibration and measurement
capabilities of the SEC columns available at the time.
SEC works based on the same separation principle as any chromatography technique, differing
affinity to either the mobile phase solvent or stationary phase column causes different
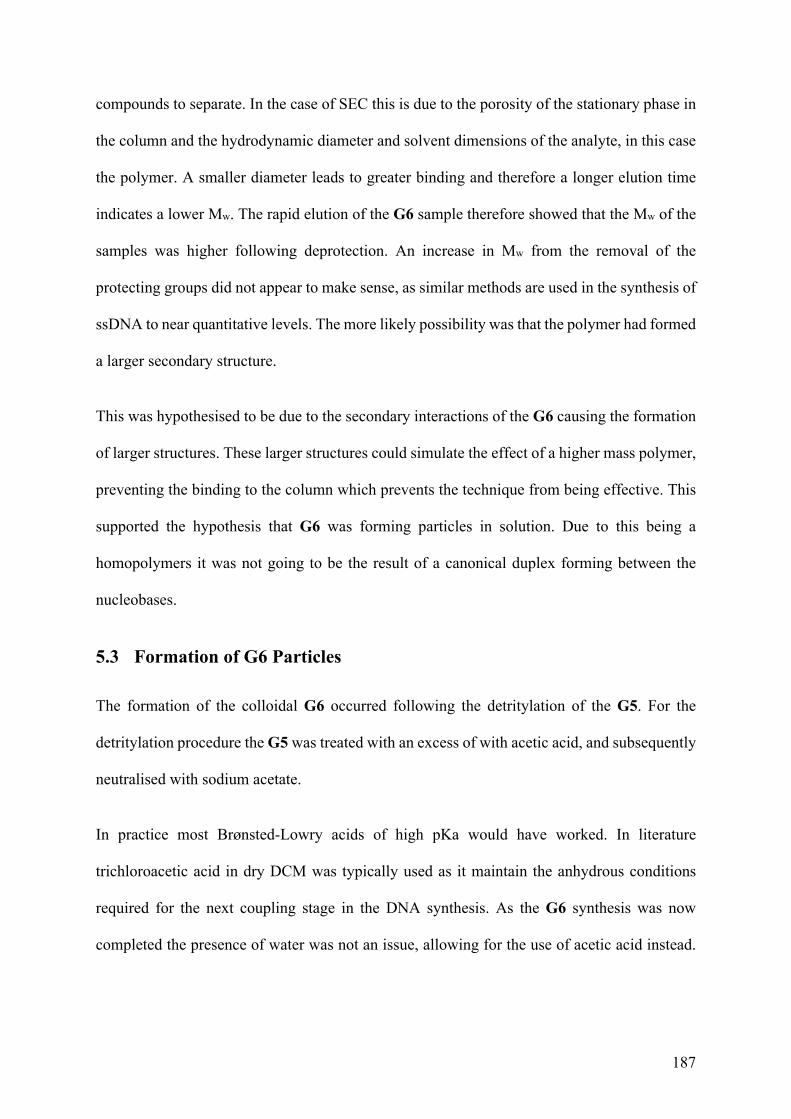
187
compounds to separate. In the case of SEC this is due to the porosity of the stationary phase in
the column and the hydrodynamic diameter and solvent dimensions of the analyte, in this case
the polymer. A smaller diameter leads to greater binding and therefore a longer elution time
indicates a lower Mw. The rapid elution of the G6 sample therefore showed that the Mw of the
samples was higher following deprotection. An increase in Mw from the removal of the
protecting groups did not appear to make sense, as similar methods are used in the synthesis of
ssDNA to near quantitative levels. The more likely possibility was that the polymer had formed
a larger secondary structure.
This was hypothesised to be due to the secondary interactions of the G6 causing the formation
of larger structures. These larger structures could simulate the effect of a higher mass polymer,
preventing the binding to the column which prevents the technique from being effective. This
supported the hypothesis that G6 was forming particles in solution. Due to this being a
homopolymers it was not going to be the result of a canonical duplex forming between the
nucleobases.
5.3 Formation of G6 Particles
The formation of the colloidal G6 occurred following the detritylation of the G5. For the
detritylation procedure the G5 was treated with an excess of with acetic acid, and subsequently
neutralised with sodium acetate.
In practice most Brønsted-Lowry acids of high pKa would have worked. In literature
trichloroacetic acid in dry DCM was typically used as it maintain the anhydrous conditions
required for the next coupling stage in the DNA synthesis. As the G6 synthesis was now
completed the presence of water was not an issue, allowing for the use of acetic acid instead.
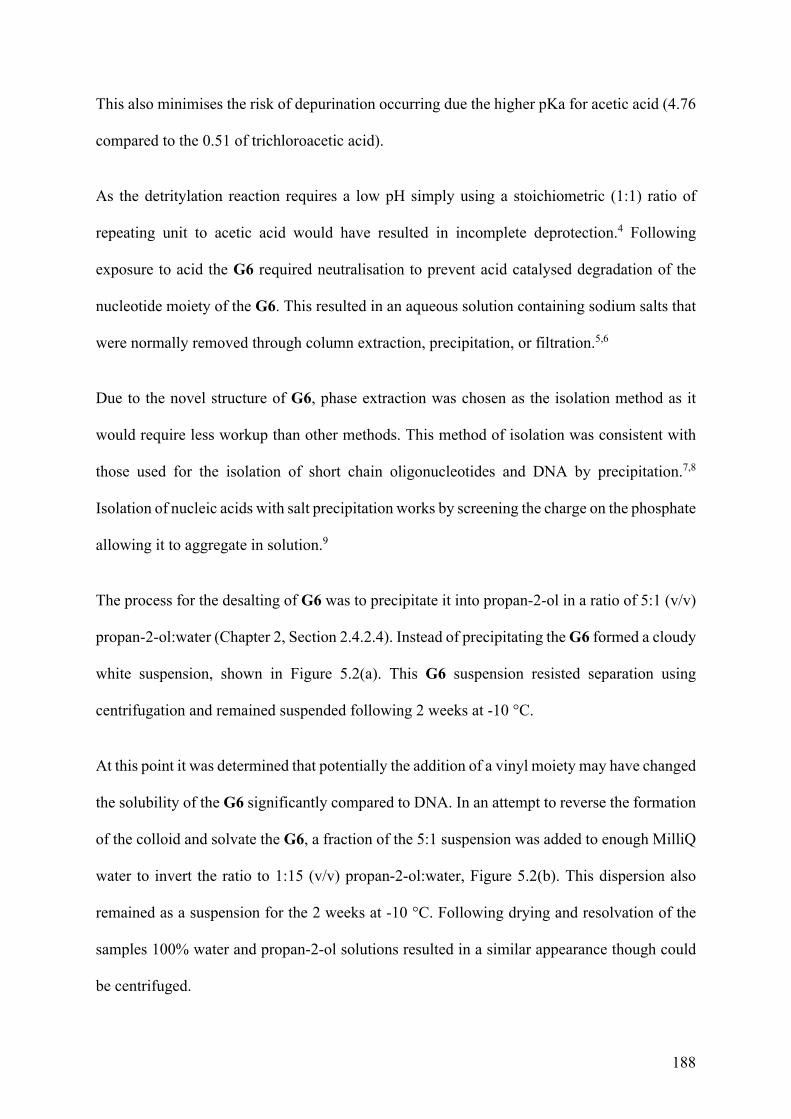
188
This also minimises the risk of depurination occurring due the higher pKa for acetic acid (4.76
compared to the 0.51 of trichloroacetic acid).
As the detritylation reaction requires a low pH simply using a stoichiometric (1:1) ratio of
repeating unit to acetic acid would have resulted in incomplete deprotection.4 Following
exposure to acid the G6 required neutralisation to prevent acid catalysed degradation of the
nucleotide moiety of the G6. This resulted in an aqueous solution containing sodium salts that
were normally removed through column extraction, precipitation, or filtration.5,6
Due to the novel structure of G6, phase extraction was chosen as the isolation method as it
would require less workup than other methods. This method of isolation was consistent with
those used for the isolation of short chain oligonucleotides and DNA by precipitation.7,8
Isolation of nucleic acids with salt precipitation works by screening the charge on the phosphate
allowing it to aggregate in solution.9
The process for the desalting of G6 was to precipitate it into propan-2-ol in a ratio of 5:1 (v/v)
propan-2-ol:water (Chapter 2, Section 2.4.2.4). Instead of precipitating the G6 formed a cloudy
white suspension, shown in Figure 5.2(a). This G6 suspension resisted separation using
centrifugation and remained suspended following 2 weeks at -10 °C.
At this point it was determined that potentially the addition of a vinyl moiety may have changed
the solubility of the G6 significantly compared to DNA. In an attempt to reverse the formation
of the colloid and solvate the G6, a fraction of the 5:1 suspension was added to enough MilliQ
water to invert the ratio to 1:15 (v/v) propan-2-ol:water, Figure 5.2(b). This dispersion also
remained as a suspension for the 2 weeks at -10 °C. Following drying and resolvation of the
samples 100% water and propan-2-ol solutions resulted in a similar appearance though could
be centrifuged.

189
Figure 5.2 Sample of G6 following deprotection and detritylation as isolated using NaOAc in
propan-2-ol:water (a) 5:1 and (b) 1:15 (v/v).
From the stability of the G6 samples in solution it was hypothesised that surface charged
particles had formed, and that this surface charge prevented the aggregation required for
precipitation. The oxypropyl methacrylate moiety (Figure 5.(red)) was known to be insoluble
in water and propan-2-ol, and to aggregate to itself.10 The cause of the particle formation was
unclear at this time as both solutions appeared visually similar, but the generation of the
phosphate moiety (Figure 5.3(green)) may have had some impact, generating a negative surface
charge.
Alternatively, the nucleobases were mildly basic, and within the G6 structure were the most
exposed groups (Figure 5.3(green)). This, combined with their hydrophilicity, may have
resulted in them being pushed away from the hydrophobic alkyl backbone, creating a positive
surface charge.
190
Figure 5.3 Structure of G6 showing the hydrophilic nucleotide based region known to be
water soluble in isolation (green) and the comparatively hydrophobic region known to be
water insoluble in issolation (red).
5.3.1 Scanning Electron Microscopy (SEM) of G6 Particles
Following the formation of the white suspension, SEM was used to investigate the nature of
the suspention. At this point it had been determined that it was acting as a colloid in terms of
its solubility, and SEM was thought to give some insight into the particle size. It would not
show what the interactions were directly, but the shape of the particles could indicate if they
were forming uniformly or if they were disorganised agglomerates.
The limitation of using SEM for solution particle analysis was that it is not a solution-based
technique. As a result, the G6 samples were prepared in such a way as to preserve any structures
that had formed while removing the solvent matrix. This procedure involved freeze drying the
samples onto a silicon wafer using the method described in Chapter 2, Section 2.5.3.1. Images
of the G6 particles isolated from 5:1 (v/v) propan-2-ol:water deposited onto silicon are shown
in Figure 5.4.
PO
OHO
O
OO
O
6
NH
NN
NO
NH2
OH
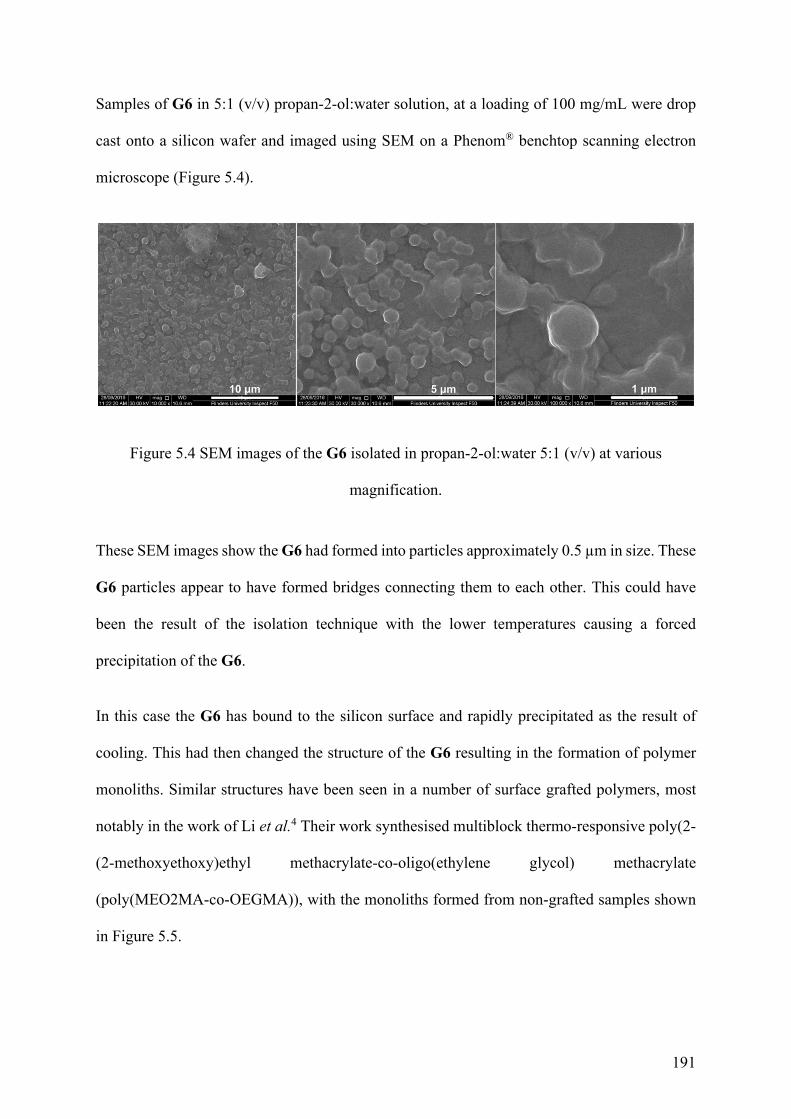
191
Samples of G6 in 5:1 (v/v) propan-2-ol:water solution, at a loading of 100 mg/mL were drop
cast onto a silicon wafer and imaged using SEM on a Phenom® benchtop scanning electron
microscope (Figure 5.4).
Figure 5.4 SEM images of the G6 isolated in propan-2-ol:water 5:1 (v/v) at various
magnification.
These SEM images show the G6 had formed into particles approximately 0.5 µm in size. These
G6 particles appear to have formed bridges connecting them to each other. This could have
been the result of the isolation technique with the lower temperatures causing a forced
precipitation of the G6.
In this case the G6 has bound to the silicon surface and rapidly precipitated as the result of
cooling. This had then changed the structure of the G6 resulting in the formation of polymer
monoliths. Similar structures have been seen in a number of surface grafted polymers, most
notably in the work of Li et al.4 Their work synthesised multiblock thermo-responsive poly(2-
(2-methoxyethoxy)ethyl methacrylate-co-oligo(ethylene glycol) methacrylate
(poly(MEO2MA-co-OEGMA)), with the monoliths formed from non-grafted samples shown
in Figure 5.5.
192
Figure 5.5 Non-grafted polymer monoliths of poly(2-(2-methoxyethoxy)ethyl methacrylate
(MEO2MA)-co-oligo(ethylene glycol) methacrylate at differing magnification. Taken from
Li et al10
Following these measurements the same batch of the G6 was used to prepare samples with the
solvent ratio of 1:15 (v/v) propan-2-ol:water using the same method (Figure 5.6). This ratio
was not chosen deliberately but was an attempt to force the precipitation of the G6 by changing
the major solvent from propan-2-ol to water.
These SEM images showed the G6 formed particles of more irregular size, where some larger
particles have collapsed or deformed in such a way as to suggest they were hollow. This was
consistent with the formation of polymersomes.10 These are vesicle macrostructures similar to
liposomes caused by a difference in solubility or amphiphilic nature within the polymer.10
Typically these are seen with block copolymers and surfactants.10
Image Removed Due to Copyright Restrictions.
See Reference: 10.1021/am403510g
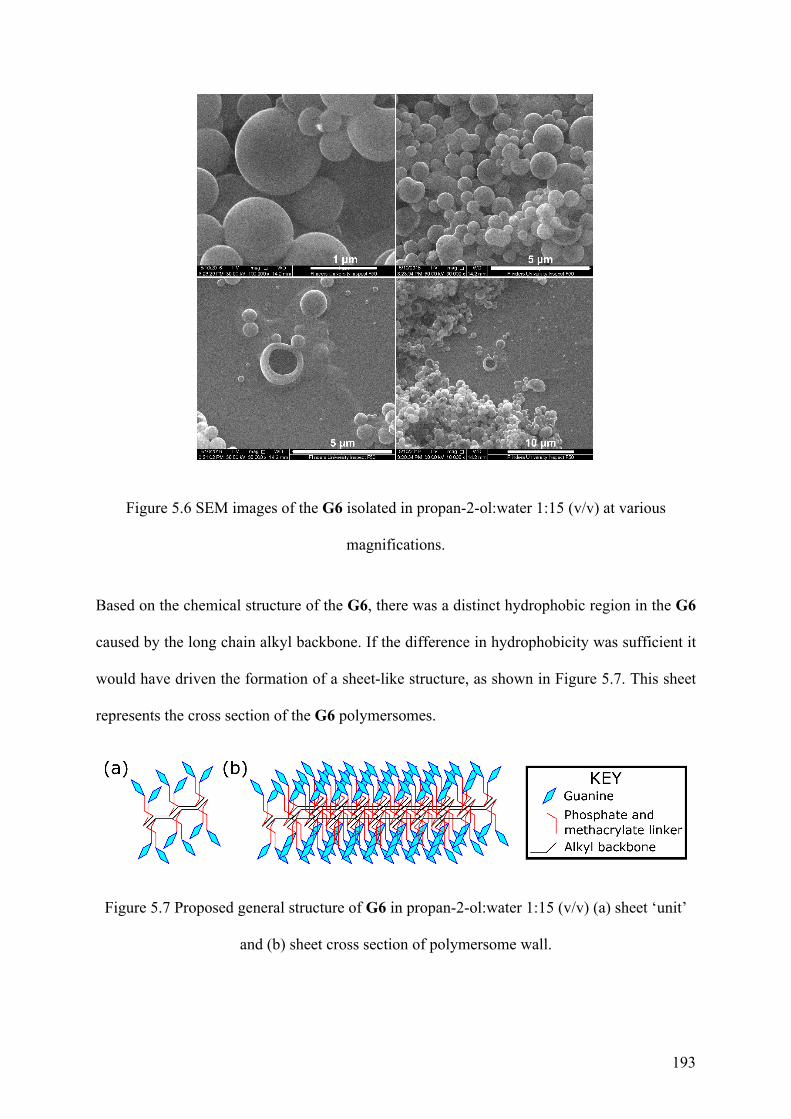
193
Figure 5.6 SEM images of the G6 isolated in propan-2-ol:water 1:15 (v/v) at various
magnifications.
Based on the chemical structure of the G6, there was a distinct hydrophobic region in the G6
caused by the long chain alkyl backbone. If the difference in hydrophobicity was sufficient it
would have driven the formation of a sheet-like structure, as shown in Figure 5.7. This sheet
represents the cross section of the G6 polymersomes.
Figure 5.7 Proposed general structure of G6 in propan-2-ol:water 1:15 (v/v) (a) sheet ‘unit’
and (b) sheet cross section of polymersome wall.
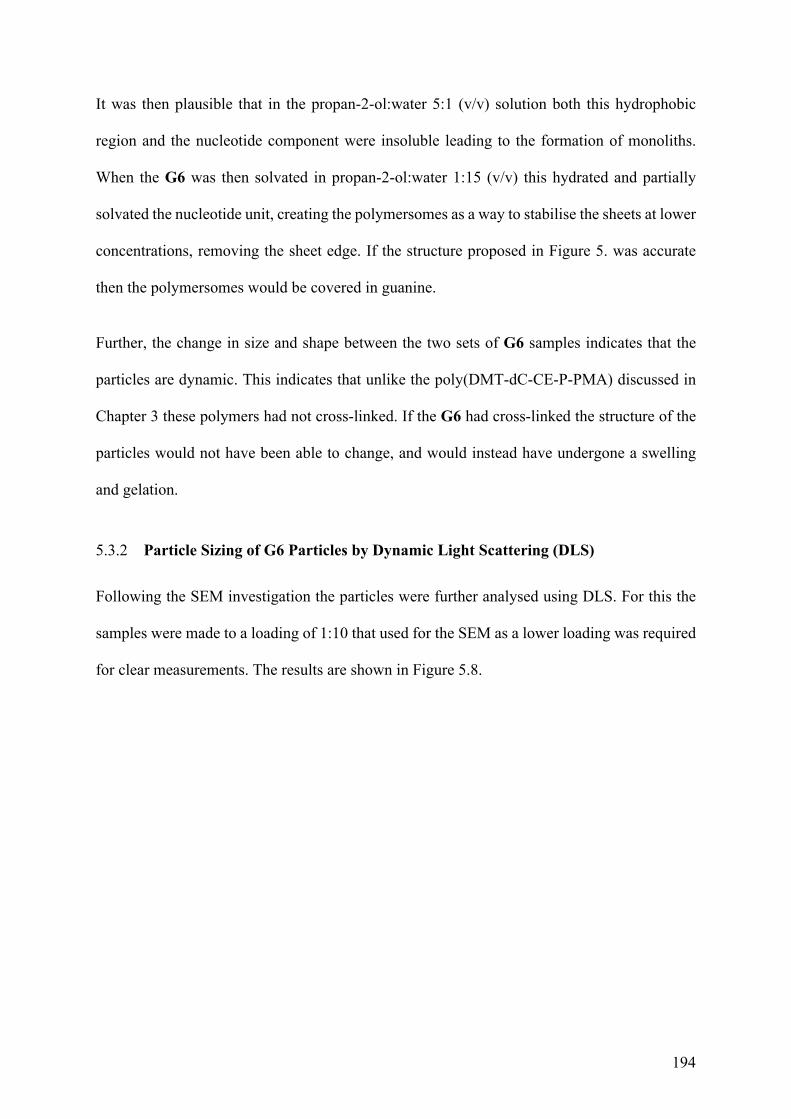
194
It was then plausible that in the propan-2-ol:water 5:1 (v/v) solution both this hydrophobic
region and the nucleotide component were insoluble leading to the formation of monoliths.
When the G6 was then solvated in propan-2-ol:water 1:15 (v/v) this hydrated and partially
solvated the nucleotide unit, creating the polymersomes as a way to stabilise the sheets at lower
concentrations, removing the sheet edge. If the structure proposed in Figure 5. was accurate
then the polymersomes would be covered in guanine.
Further, the change in size and shape between the two sets of G6 samples indicates that the
particles are dynamic. This indicates that unlike the poly(DMT-dC-CE-P-PMA) discussed in
Chapter 3 these polymers had not cross-linked. If the G6 had cross-linked the structure of the
particles would not have been able to change, and would instead have undergone a swelling
and gelation.
5.3.2 Particle Sizing of G6 Particles by Dynamic Light Scattering (DLS)
Following the SEM investigation the particles were further analysed using DLS. For this the
samples were made to a loading of 1:10 that used for the SEM as a lower loading was required
for clear measurements. The results are shown in Figure 5.8.
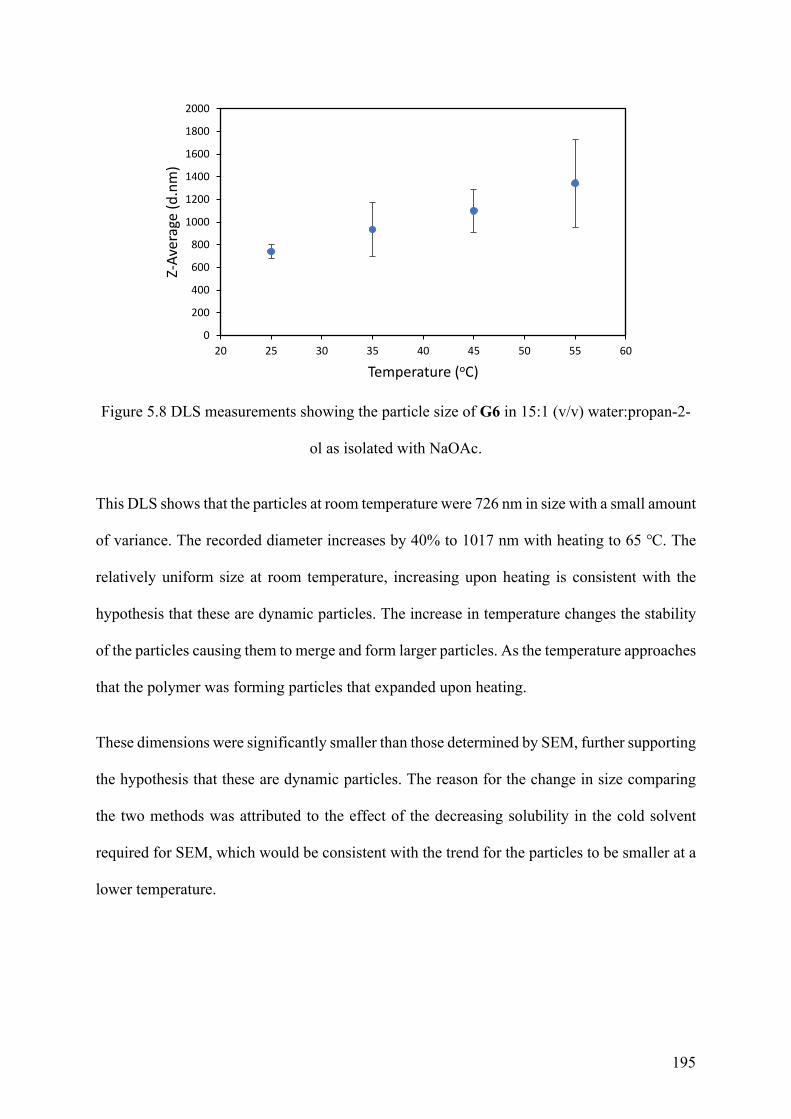
195
Figure 5.8 DLS measurements showing the particle size of G6 in 15:1 (v/v) water:propan-2-
ol as isolated with NaOAc.
This DLS shows that the particles at room temperature were 726 nm in size with a small amount
of variance. The recorded diameter increases by 40% to 1017 nm with heating to 65 ℃. The
relatively uniform size at room temperature, increasing upon heating is consistent with the
hypothesis that these are dynamic particles. The increase in temperature changes the stability
of the particles causing them to merge and form larger particles. As the temperature approaches
that the polymer was forming particles that expanded upon heating.
These dimensions were significantly smaller than those determined by SEM, further supporting
the hypothesis that these are dynamic particles. The reason for the change in size comparing
the two methods was attributed to the effect of the decreasing solubility in the cold solvent
required for SEM, which would be consistent with the trend for the particles to be smaller at a
lower temperature.
0
200
400
600
800
1000
1200
1400
1600
1800
2000
20 25 30 35 40 45 50 55 60
Z-Av
erag
e (d
.nm
)
Temperature (oC)
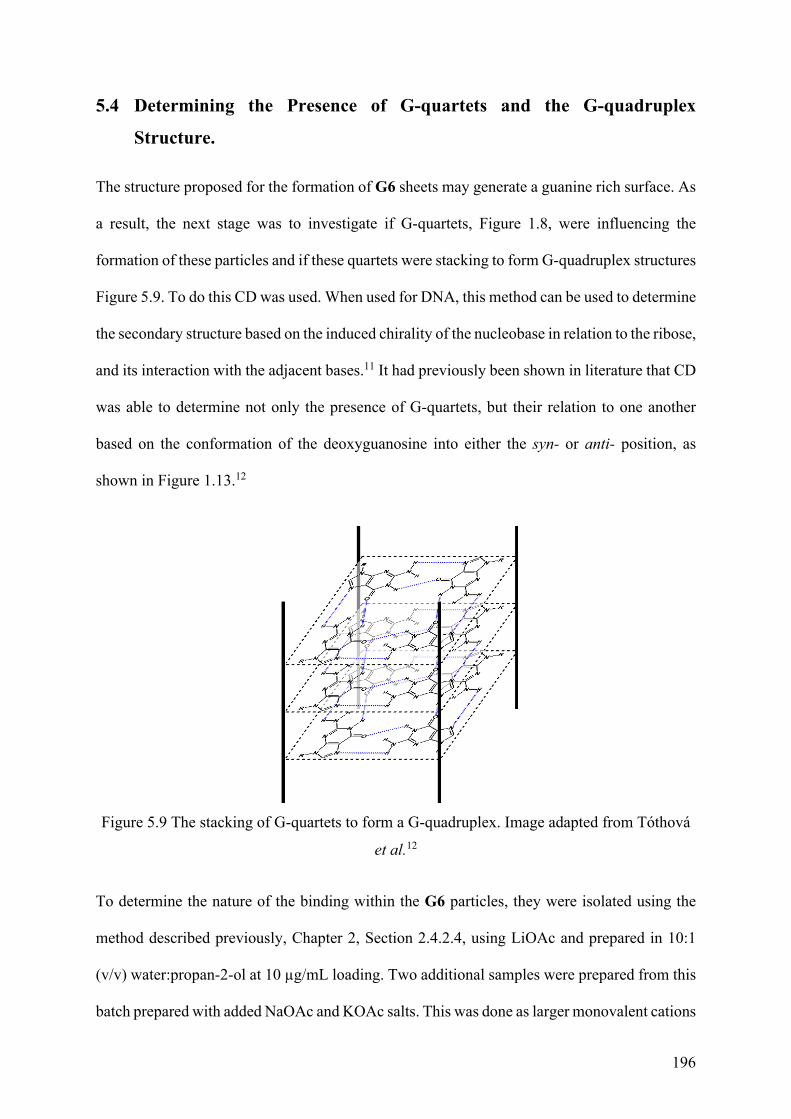
196
5.4 Determining the Presence of G-quartets and the G-quadruplex
Structure.
The structure proposed for the formation of G6 sheets may generate a guanine rich surface. As
a result, the next stage was to investigate if G-quartets, Figure 1.8, were influencing the
formation of these particles and if these quartets were stacking to form G-quadruplex structures
Figure 5.9. To do this CD was used. When used for DNA, this method can be used to determine
the secondary structure based on the induced chirality of the nucleobase in relation to the ribose,
and its interaction with the adjacent bases.11 It had previously been shown in literature that CD
was able to determine not only the presence of G-quartets, but their relation to one another
based on the conformation of the deoxyguanosine into either the syn- or anti- position, as
shown in Figure 1.13.12
Figure 5.9 The stacking of G-quartets to form a G-quadruplex. Image adapted from Tóthová
et al.12
To determine the nature of the binding within the G6 particles, they were isolated using the
method described previously, Chapter 2, Section 2.4.2.4, using LiOAc and prepared in 10:1
(v/v) water:propan-2-ol at 10 µg/mL loading. Two additional samples were prepared from this
batch prepared with added NaOAc and KOAc salts. This was done as larger monovalent cations
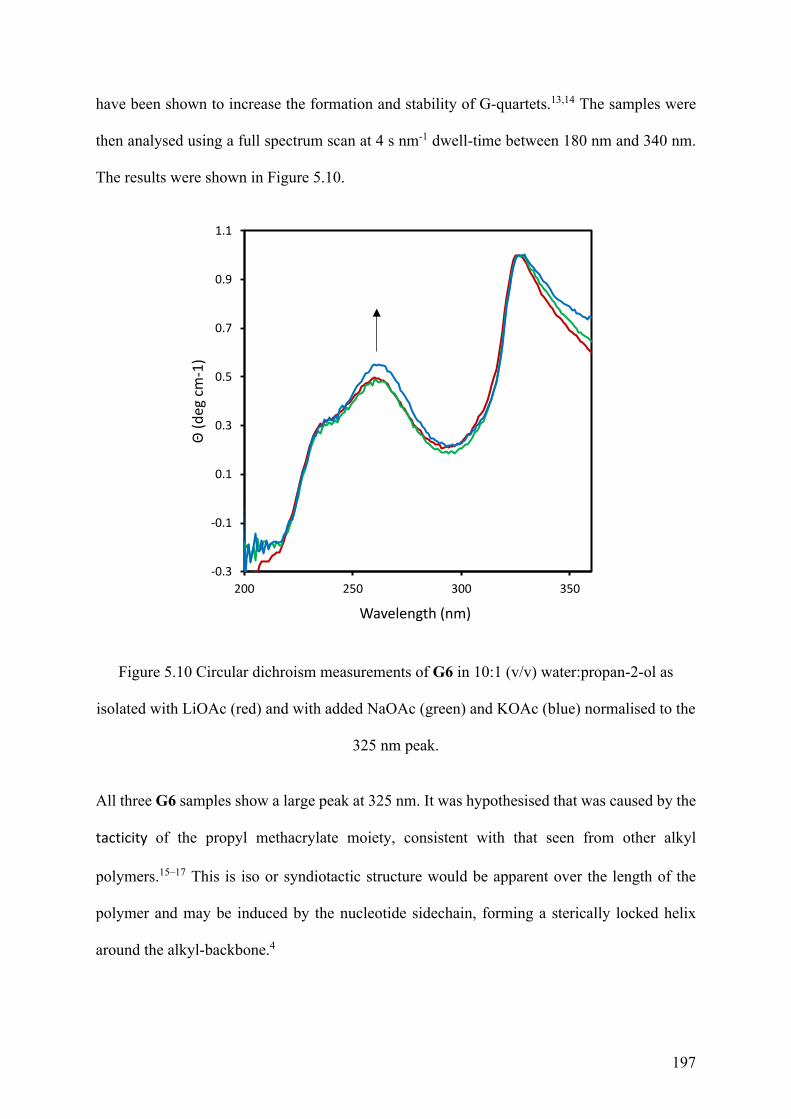
197
have been shown to increase the formation and stability of G-quartets.13,14 The samples were
then analysed using a full spectrum scan at 4 s nm-1 dwell-time between 180 nm and 340 nm.
The results were shown in Figure 5.10.
Figure 5.10 Circular dichroism measurements of G6 in 10:1 (v/v) water:propan-2-ol as
isolated with LiOAc (red) and with added NaOAc (green) and KOAc (blue) normalised to the
325 nm peak.
All three G6 samples show a large peak at 325 nm. It was hypothesised that was caused by the
tacticity of the propyl methacrylate moiety, consistent with that seen from other alkyl
polymers.15–17 This is iso or syndiotactic structure would be apparent over the length of the
polymer and may be induced by the nucleotide sidechain, forming a sterically locked helix
around the alkyl-backbone.4
-0.3
-0.1
0.1
0.3
0.5
0.7
0.9
1.1
200 250 300 350
Θ(d
eg c
m-1
)
Wavelength (nm)
198
The two peaks relevant to the formation of G-quadruplexes were 261 nm, and the shoulder at
240 nm.18 These peaks were caused by the guanine moiety which as a pair is associated in
literature with the formation of a G-quadruplex containing stacked anti-G-quartets.12,19 The
increase in the peak 261 nm peak (Figure 5.10 (arrow) with the addition of KOAc shows greater
formation of G-quartets as would be expected for their increased stability.20 This was attributed
to the larger valence shell of the K+ cation being better able to stabilise the charge distribution
across the G-quartet.20 This increased stabilisation allowed some quartets to form that were to
far separated to be stabilised by the smaller sodium cation.
This data showed that the G6 polymersomes found in section 5.3 are able to form G-
quadruplexes. Further, similar to those found in DNA the G6 G-quartets are increasingly
stabilised by the presence of potassium cations.
5.5 Testing for DNAzyme Properties with TMB Oxidation
In addition to circular dichroism the oxidation of 3,3',5,5'-tetramethylbenzidine (TMB) was
typically used as a method to determine the presence of G-quartets within DNA systems.21 This
was possible as ferric chloride heme (hemin) (figure 5.11) forms a complex with G-
quadruplexes with is then able to demonstrate a peroxidase mimicking activity, a so-called a
DNAzyme as presented in Chapter 1, Section 1.3.3. This in turn accelerates the oxidation of
TMB which causes a change in colour, from colourless to blue, that can be measured with UV-
vis spectroscopy, specifically by measuring the peak at 450 nm.22 The mechanism for this
process is shown in Figure 5.12. However as the peroxidase mimicking activity is not required
for the oxidation to occur the rate of oxidation needs to be compared to the background rate.
Seeing a similar rate acceleration in the presence of G6 would therefore suggest the presence
of G-quadruplexes and the ability for the G6 to act as a DNA analogue in this reaction.
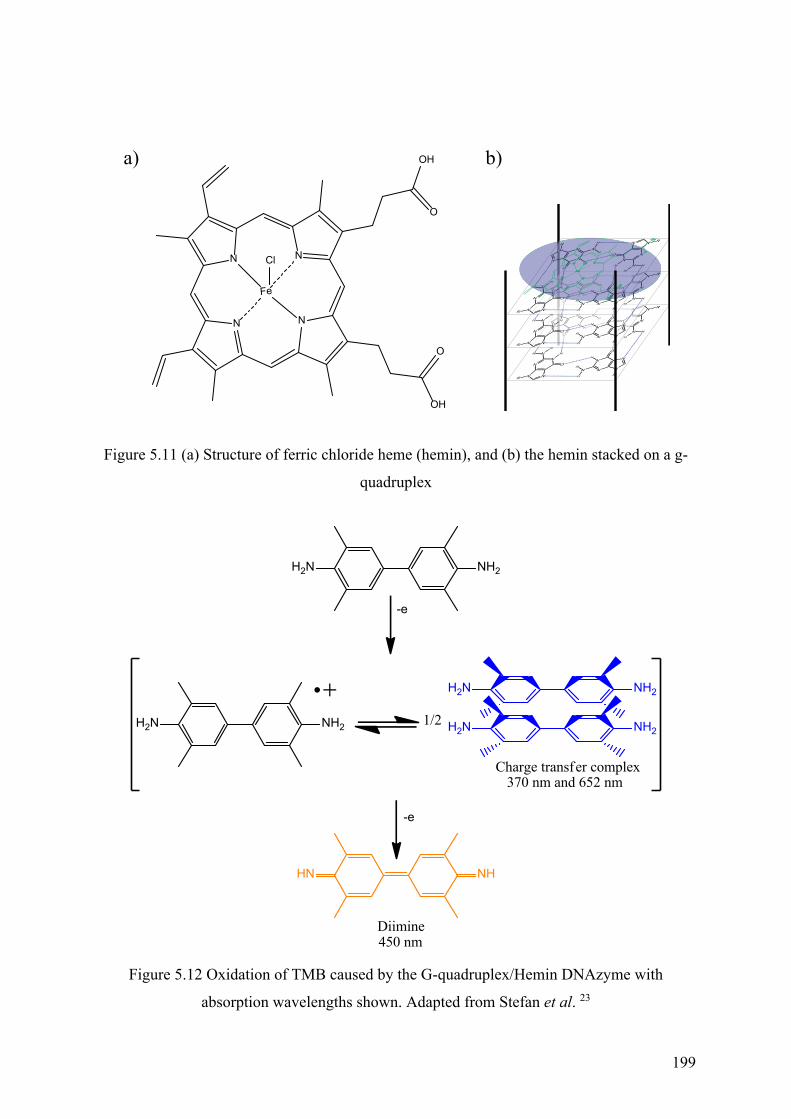
199
N
NN
N
Fe
Cl
O
OH
O
OHa) b)
Figure 5.11 (a) Structure of ferric chloride heme (hemin), and (b) the hemin stacked on a g-
quadruplex
H2N NH2
H2N NH2
H2N NH2
H2N NH2
NHHN
-e
-e
Charge transfer complex370 nm and 652 nm
Diimine450 nm
1/2
Figure 5.12 Oxidation of TMB caused by the G-quadruplex/Hemin DNAzyme with
absorption wavelengths shown. Adapted from Stefan et al. 23
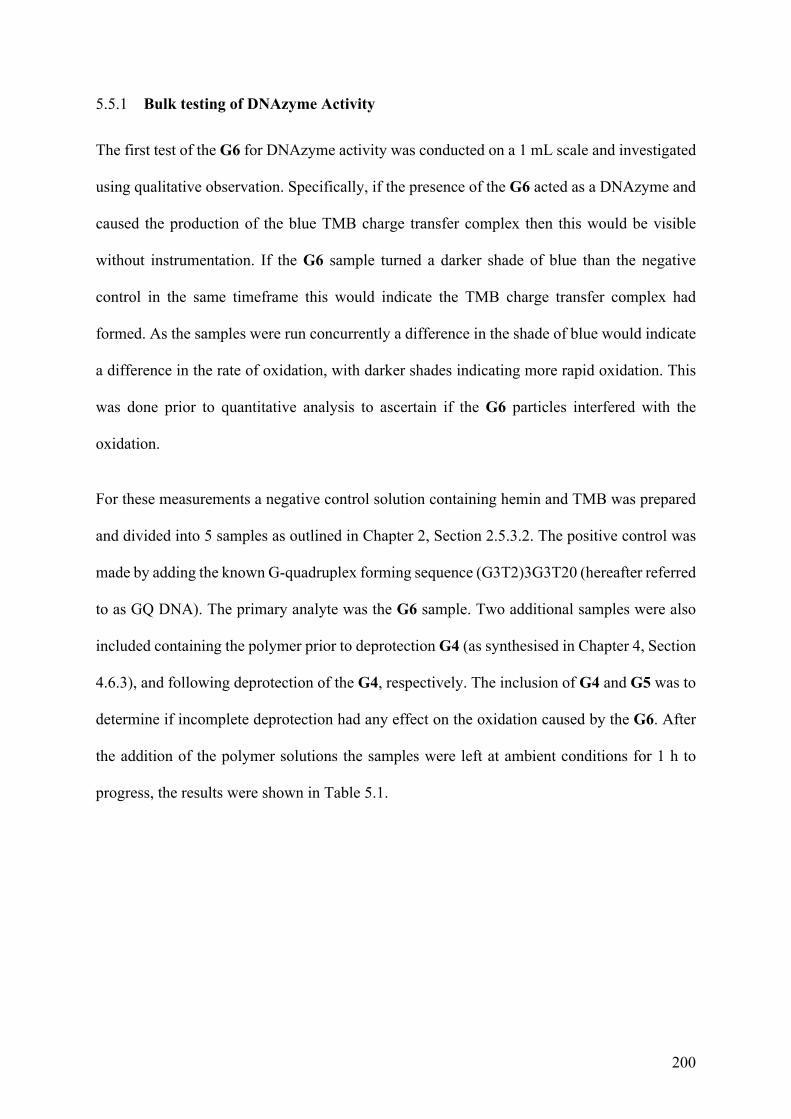
200
5.5.1 Bulk testing of DNAzyme Activity
The first test of the G6 for DNAzyme activity was conducted on a 1 mL scale and investigated
using qualitative observation. Specifically, if the presence of the G6 acted as a DNAzyme and
caused the production of the blue TMB charge transfer complex then this would be visible
without instrumentation. If the G6 sample turned a darker shade of blue than the negative
control in the same timeframe this would indicate the TMB charge transfer complex had
formed. As the samples were run concurrently a difference in the shade of blue would indicate
a difference in the rate of oxidation, with darker shades indicating more rapid oxidation. This
was done prior to quantitative analysis to ascertain if the G6 particles interfered with the
oxidation.
For these measurements a negative control solution containing hemin and TMB was prepared
and divided into 5 samples as outlined in Chapter 2, Section 2.5.3.2. The positive control was
made by adding the known G-quadruplex forming sequence (G3T2)3G3T20 (hereafter referred
to as GQ DNA). The primary analyte was the G6 sample. Two additional samples were also
included containing the polymer prior to deprotection G4 (as synthesised in Chapter 4, Section
4.6.3), and following deprotection of the G4, respectively. The inclusion of G4 and G5 was to
determine if incomplete deprotection had any effect on the oxidation caused by the G6. After
the addition of the polymer solutions the samples were left at ambient conditions for 1 h to
progress, the results were shown in Table 5.1.

201
Table 5.1: Results of TMB oxidation tests, all samples contain hemin, TMB, 10 mM TRIS-
HCl in addition to the listed reagent.
The results of this test gave several key insights. Firstly, the evolution of the blue colour in
both the positive and negative control samples indicated that the oxidation of TMB occurs
without the presence of the GQ DNA to act as a DNAzyme.
Secondly, samples containing G6 and G5 show significantly less colour. The reduction in the
rate of oxidation compared to the negative control rate suggests that some component of the
reaction is being removed, either the TMB or the hemin.
Both of these samples contain an active guanine moiety, compared to the G4 which still has
the protecting group present. This suggested that the presence of the activated guanine moiety
on these vinyl based polymers decreased the rate of oxidation below the negative control. This
indicated that either the TMB or the hemin had been removed from the reaction. As it was
Reagent Result No further addition (negative control)
GQ DNA (positive control)
G6
G5
G4
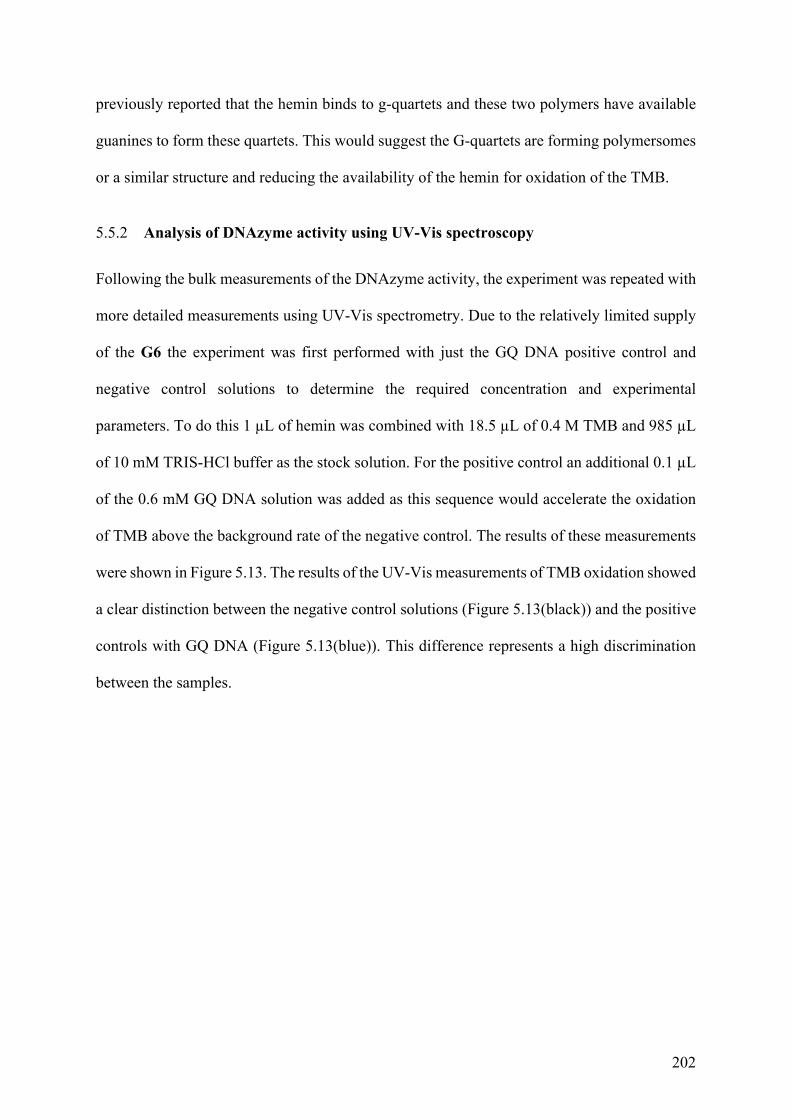
202
previously reported that the hemin binds to g-quartets and these two polymers have available
guanines to form these quartets. This would suggest the G-quartets are forming polymersomes
or a similar structure and reducing the availability of the hemin for oxidation of the TMB.
5.5.2 Analysis of DNAzyme activity using UV-Vis spectroscopy
Following the bulk measurements of the DNAzyme activity, the experiment was repeated with
more detailed measurements using UV-Vis spectrometry. Due to the relatively limited supply
of the G6 the experiment was first performed with just the GQ DNA positive control and
negative control solutions to determine the required concentration and experimental
parameters. To do this 1 µL of hemin was combined with 18.5 µL of 0.4 M TMB and 985 µL
of 10 mM TRIS-HCl buffer as the stock solution. For the positive control an additional 0.1 µL
of the 0.6 mM GQ DNA solution was added as this sequence would accelerate the oxidation
of TMB above the background rate of the negative control. The results of these measurements
were shown in Figure 5.13. The results of the UV-Vis measurements of TMB oxidation showed
a clear distinction between the negative control solutions (Figure 5.13(black)) and the positive
controls with GQ DNA (Figure 5.13(blue)). This difference represents a high discrimination
between the samples.
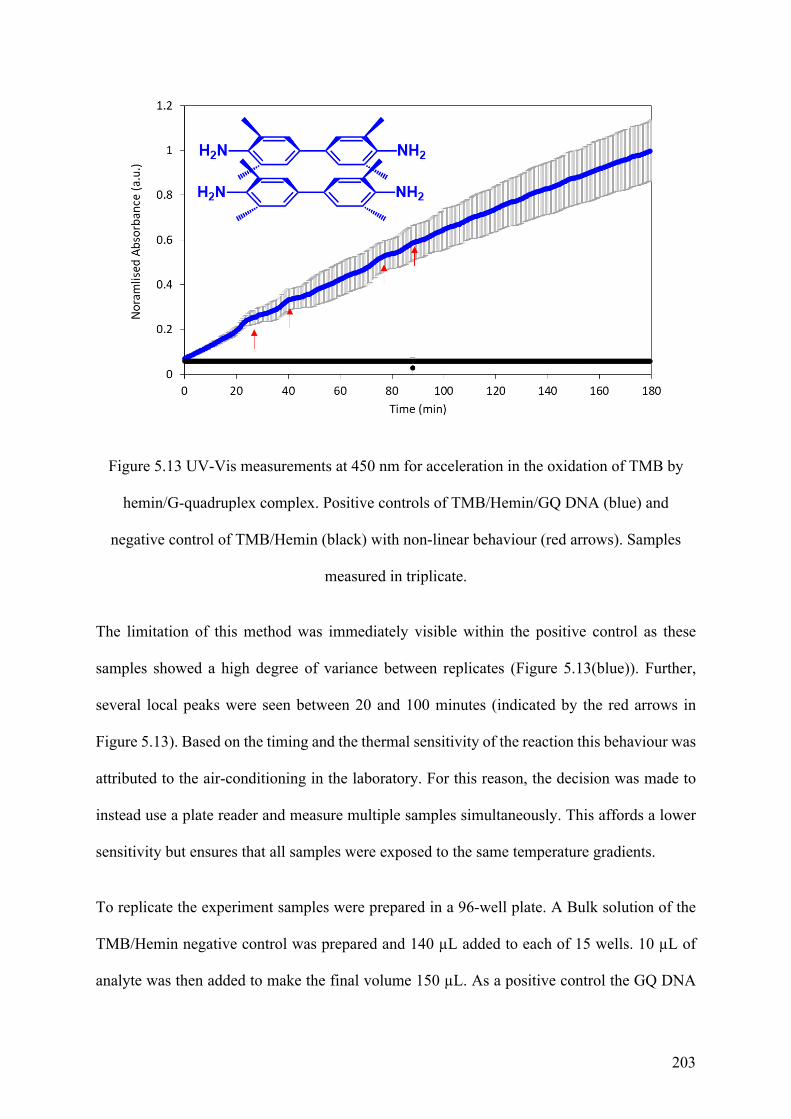
203
Figure 5.13 UV-Vis measurements at 450 nm for acceleration in the oxidation of TMB by
hemin/G-quadruplex complex. Positive controls of TMB/Hemin/GQ DNA (blue) and
negative control of TMB/Hemin (black) with non-linear behaviour (red arrows). Samples
measured in triplicate.
The limitation of this method was immediately visible within the positive control as these
samples showed a high degree of variance between replicates (Figure 5.13(blue)). Further,
several local peaks were seen between 20 and 100 minutes (indicated by the red arrows in
Figure 5.13). Based on the timing and the thermal sensitivity of the reaction this behaviour was
attributed to the air-conditioning in the laboratory. For this reason, the decision was made to
instead use a plate reader and measure multiple samples simultaneously. This affords a lower
sensitivity but ensures that all samples were exposed to the same temperature gradients.
To replicate the experiment samples were prepared in a 96-well plate. A Bulk solution of the
TMB/Hemin negative control was prepared and 140 µL added to each of 15 wells. 10 µL of
analyte was then added to make the final volume 150 µL. As a positive control the GQ DNA
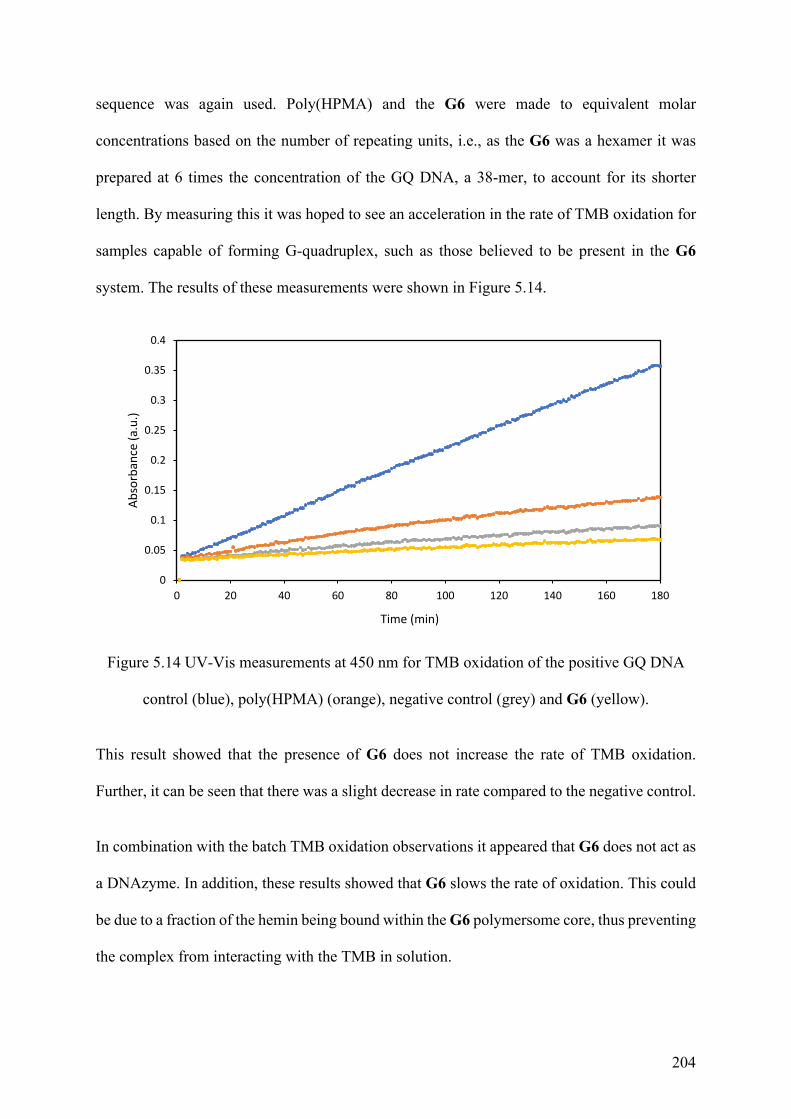
204
sequence was again used. Poly(HPMA) and the G6 were made to equivalent molar
concentrations based on the number of repeating units, i.e., as the G6 was a hexamer it was
prepared at 6 times the concentration of the GQ DNA, a 38-mer, to account for its shorter
length. By measuring this it was hoped to see an acceleration in the rate of TMB oxidation for
samples capable of forming G-quadruplex, such as those believed to be present in the G6
system. The results of these measurements were shown in Figure 5.14.
Figure 5.14 UV-Vis measurements at 450 nm for TMB oxidation of the positive GQ DNA
control (blue), poly(HPMA) (orange), negative control (grey) and G6 (yellow).
This result showed that the presence of G6 does not increase the rate of TMB oxidation.
Further, it can be seen that there was a slight decrease in rate compared to the negative control.
In combination with the batch TMB oxidation observations it appeared that G6 does not act as
a DNAzyme. In addition, these results showed that G6 slows the rate of oxidation. This could
be due to a fraction of the hemin being bound within the G6 polymersome core, thus preventing
the complex from interacting with the TMB in solution.
0
0.05
0.1
0.15
0.2
0.25
0.3
0.35
0.4
0 20 40 60 80 100 120 140 160 180
Abso
rban
ce (a
.u.)
Time (min)
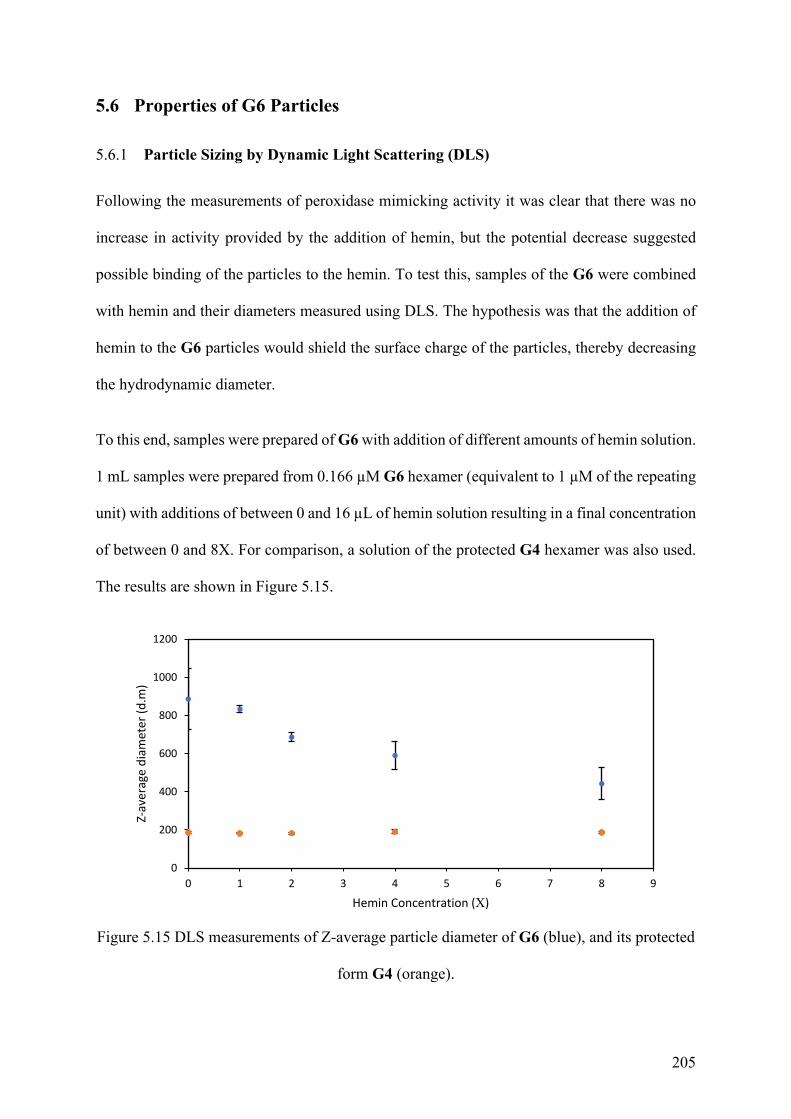
205
5.6 Properties of G6 Particles
5.6.1 Particle Sizing by Dynamic Light Scattering (DLS)
Following the measurements of peroxidase mimicking activity it was clear that there was no
increase in activity provided by the addition of hemin, but the potential decrease suggested
possible binding of the particles to the hemin. To test this, samples of the G6 were combined
with hemin and their diameters measured using DLS. The hypothesis was that the addition of
hemin to the G6 particles would shield the surface charge of the particles, thereby decreasing
the hydrodynamic diameter.
To this end, samples were prepared of G6 with addition of different amounts of hemin solution.
1 mL samples were prepared from 0.166 µM G6 hexamer (equivalent to 1 µM of the repeating
unit) with additions of between 0 and 16 µL of hemin solution resulting in a final concentration
of between 0 and 8X. For comparison, a solution of the protected G4 hexamer was also used.
The results are shown in Figure 5.15.
Figure 5.15 DLS measurements of Z-average particle diameter of G6 (blue), and its protected
form G4 (orange).
0
200
400
600
800
1000
1200
0 1 2 3 4 5 6 7 8 9
Z-av
erag
e di
amet
er (d
.m)
Hemin Concentration (X)

206
From this data it can be seen that the protected G4 had a smaller hydrodynamic diameter than
the G6 following deprotection. This was consistent with the G4 having a lower solubility, and
the DMT groups being hydrophobic. This causes the surface of the particles to be ‘hard’ and
separated from the solution, compared to the deprotected version which is better able to
hydrate.
Further, the G6 particle’s hydrodynamic diameter decreased with increasing additions of the
hemin solution. It was hypothesised that as the hemin was added to the G6 particles it
coordinated to the surface, similarly to its complexation with G-quartets. The result is the
screening of the guanine with the less soluble porphyrin, thereby decreasing the hydrodynamic
diameter. Full investigation would have required zeta potential analysis which was unavailable
at the time.
Zeta potential measurements may have indicated if the presence of the larger Fe(3+) present in
the hemin was able to effectively screen the particles to prevent aggregation, compared to the
K+ or Na+ present in a g-quadruplex.
5.6.2 Melting Behaviour of G6 Particles.
Melting measurements were conducted to determine the stability of the G-quadruplexes created
within G6 and the effect of addition of K+ ions. This was done as the increased stability of G-
quartets provided by K+ ions should increase the melting point of the G-quadruplex. To
measure the melting behaviour CD was used as the melting of the G-quadruplexes could be
measured by the decrease in optical rotation of the 261 nm peak associated with the stacked
anti-G-quartets.

207
For these measurements 1 µg/mL G6 was prepared with both untreated and treated with 25
mM KOAc. Measurements were taken as described in Chapter, 2 Section 2.5.3.5. These
measurements were obtained at 261 nm with samples heated from 25 ℃ to 85 ℃ and then
cooled to obtain a heating cycle and determine if the particles reformed. The results of this
method are shown in Figure 5.16.
Figure 5.16 Circular dichroism measurement at 261 nm of G6 samples in 10:1 (v/v)
water:propan-2-ol as isolated in LiOAc (black) and with 25 µM KOAc (red), normalised.
Heating indicated by orange, and cooling with blue.
These measurements showed an initial decrease in rotation as the samples were heated and that
this did not recover upon cooling. This suggested that 85 ℃ was above the upper critical
solution temperature (UCST), causing the G6 to precipitate into a hydrophobic structure as a
whole, preventing the reformation of the G-quadruplexes upon cooling.
This was most evident for the G6 sample as isolated with LiOAc. For this sample the increase
in temperature caused a decrease in the optical rotation to 0º. This indicated a generally
disordered structure with no preference for the induced chirality of the guanine in a G-
208
quadruplex. When the G6 with LiOAc was cooled the angle of optical rotation remained at 0º,
indicating that there were no G-quadruplexes present. The lack of recovery to a higher angle
of rotation suggested that the process was non-reversible, and that the G-quadruplexes were
not reformed. This was likely due to the polymer passing its UCST and undergoing a major
structural change which prevented the reformation of the G-quadruplex.
The G6 treated with KOAc showed a distinctly different result. Firstly, the optical rotation
decreased in rotation more rapidly, reaching a minimum at ~60 ℃ compared to the ~70 ℃ for
the G6 sample, as isolated (i.e., no KOAc). Further, the optical rotation decreased beyond the
0º and began to show negative rotation, i.e., anti-clockwise. This could indicate that the
presence of the K+ ions stabilises a different conformation of the nucleotide as the G-quartet
melts.
As with the G6 sample without KOAc, the optical rotation measured returns to 0° rotation,
indicating that this was a non-reversible process. Further, as the optical rotation returned to 0º
this indicated that the high temperature structure was only stable at the increased temperature,
and was the result of the KOAc. This indicated that the negative rotation seen at high
temperatures could be the result of surface attachment between particles that precipitated above
the UCST. This would in turn mean that as the temperature decreased the particles partially
solvated causing the G-quadruplexes to separate.
5.7 ATTO 550 Fluorescence Measurements
To determine the chemical properties of the G6, fluorescence measurements were chosen. This
was because the confinement of fluorescent dyes within nanodomains had been shown as a
method for investigating the melting behaviour and structure of polymer particles.24,25
209
For the measurements of the G6 polymersomes ATTO 550 was chosen as it was slightly
hydrophobic. This was chosen so that localised binding of the dye within the G6 polymersomes
would indicate that they contain a hydrophobic core. This in turn would mean that the alkyl
backbone was preferentially orientated inward within the particles. The specific properties of
the ATTO dye were listed in Table 5.1.
Table 5.1: Fluorescent properties of ATTO 550 Absorption wavelength, λabs
Molar attenuation, εmax
Emission wavelength, λfl
Quantum yield, ηfl
Fluorescence-lifetime, τfl
554 nm 120000 M-1cm-1 576 nm 80% 3.2 ns
5.7.1 Melting Behaviour of G6 as measured with ATTO 550
The melting behaviour of the particles treated with ATTO 550 fluorescent dye was analysed
using the fluorescence detector on a Q-gen® real time PCR machine, as discussed in Chapter
2 Section 2.5.3.6. To do this 100 µL samples of the 1 µg/mL G6, which had been isolated in
LiOAc, were prepared in 10:1 (v/v) water:propan-2-ol with the addition of 2 µL of the ATTO
550 dye. This was then divided into 4 x 25 µL tubes so that an average could be taken. This
process was then repeated for samples made with an addition of KOAc to make a concentration
of 24 µM. The samples were then heated from 30 ℃ to 95 ℃, and the change in fluorescence
measured. The results of are shown in Figure 5.17.
Figure 5.17 shows an increase in fluorescence with heating, and that both G6 samples showed
similar magnitude increases. As the samples were loaded with the same concentration of ATTO
550 this indicated that the particles were releasing the dye in roughly the same quantity. This
suggests that the dye, initially bound within the G6 particles, was quenching the fluorescence.
When the particles were heated they undergo a change causing the release of the dye, allowing
it to fluoresce in solution.
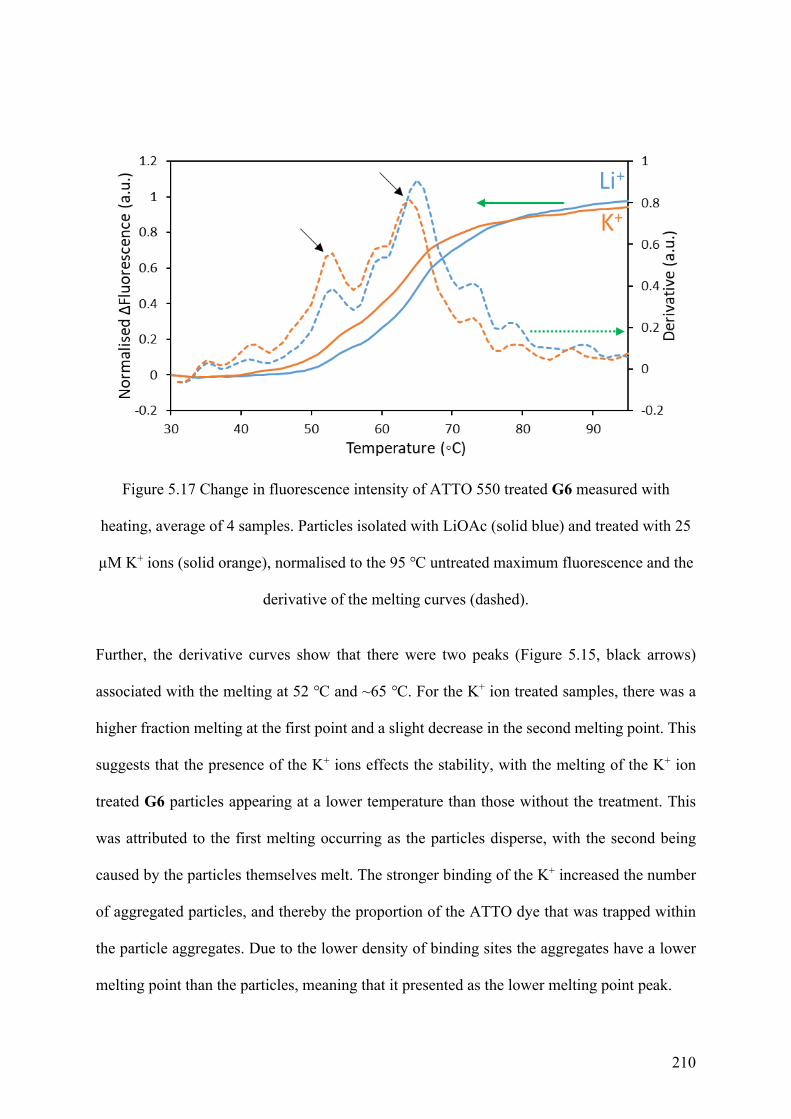
210
Figure 5.17 Change in fluorescence intensity of ATTO 550 treated G6 measured with
heating, average of 4 samples. Particles isolated with LiOAc (solid blue) and treated with 25
µM K+ ions (solid orange), normalised to the 95 ℃ untreated maximum fluorescence and the
derivative of the melting curves (dashed).
Further, the derivative curves show that there were two peaks (Figure 5.15, black arrows)
associated with the melting at 52 ℃ and ~65 ℃. For the K+ ion treated samples, there was a
higher fraction melting at the first point and a slight decrease in the second melting point. This
suggests that the presence of the K+ ions effects the stability, with the melting of the K+ ion
treated G6 particles appearing at a lower temperature than those without the treatment. This
was attributed to the first melting occurring as the particles disperse, with the second being
caused by the particles themselves melt. The stronger binding of the K+ increased the number
of aggregated particles, and thereby the proportion of the ATTO dye that was trapped within
the particle aggregates. Due to the lower density of binding sites the aggregates have a lower
melting point than the particles, meaning that it presented as the lower melting point peak.
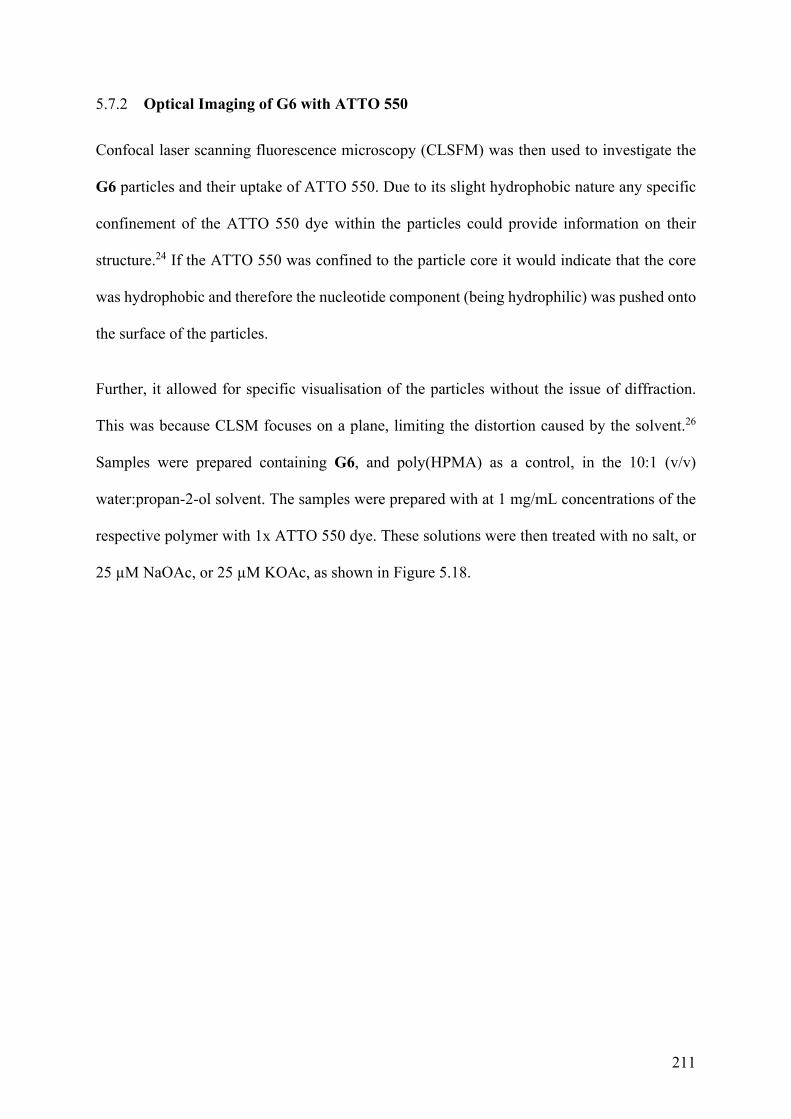
211
5.7.2 Optical Imaging of G6 with ATTO 550
Confocal laser scanning fluorescence microscopy (CLSFM) was then used to investigate the
G6 particles and their uptake of ATTO 550. Due to its slight hydrophobic nature any specific
confinement of the ATTO 550 dye within the particles could provide information on their
structure.24 If the ATTO 550 was confined to the particle core it would indicate that the core
was hydrophobic and therefore the nucleotide component (being hydrophilic) was pushed onto
the surface of the particles.
Further, it allowed for specific visualisation of the particles without the issue of diffraction.
This was because CLSM focuses on a plane, limiting the distortion caused by the solvent.26
Samples were prepared containing G6, and poly(HPMA) as a control, in the 10:1 (v/v)
water:propan-2-ol solvent. The samples were prepared with at 1 mg/mL concentrations of the
respective polymer with 1x ATTO 550 dye. These solutions were then treated with no salt, or
25 µM NaOAc, or 25 µM KOAc, as shown in Figure 5.18.
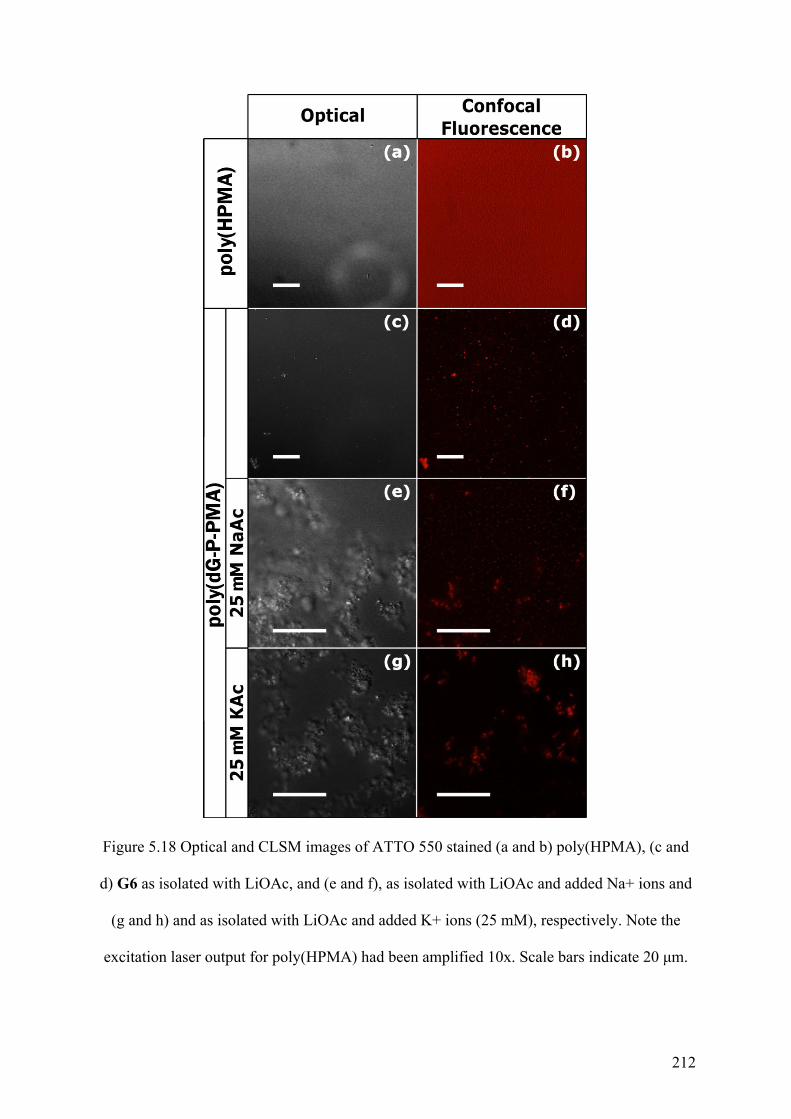
212
Figure 5.18 Optical and CLSM images of ATTO 550 stained (a and b) poly(HPMA), (c and
d) G6 as isolated with LiOAc, and (e and f), as isolated with LiOAc and added Na+ ions and
(g and h) and as isolated with LiOAc and added K+ ions (25 mM), respectively. Note the
excitation laser output for poly(HPMA) had been amplified 10x. Scale bars indicate 20 μm.
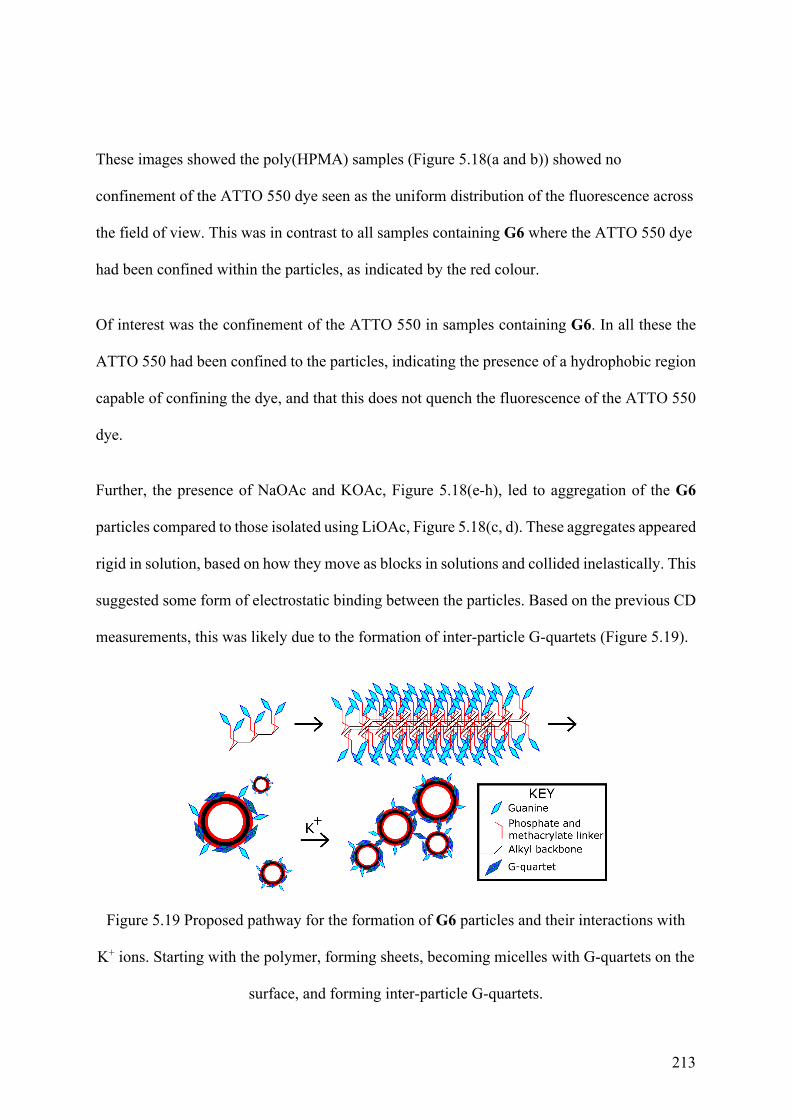
213
These images showed the poly(HPMA) samples (Figure 5.18(a and b)) showed no
confinement of the ATTO 550 dye seen as the uniform distribution of the fluorescence across
the field of view. This was in contrast to all samples containing G6 where the ATTO 550 dye
had been confined within the particles, as indicated by the red colour.
Of interest was the confinement of the ATTO 550 in samples containing G6. In all these the
ATTO 550 had been confined to the particles, indicating the presence of a hydrophobic region
capable of confining the dye, and that this does not quench the fluorescence of the ATTO 550
dye.
Further, the presence of NaOAc and KOAc, Figure 5.18(e-h), led to aggregation of the G6
particles compared to those isolated using LiOAc, Figure 5.18(c, d). These aggregates appeared
rigid in solution, based on how they move as blocks in solutions and collided inelastically. This
suggested some form of electrostatic binding between the particles. Based on the previous CD
measurements, this was likely due to the formation of inter-particle G-quartets (Figure 5.19).
Figure 5.19 Proposed pathway for the formation of G6 particles and their interactions with
K+ ions. Starting with the polymer, forming sheets, becoming micelles with G-quartets on the
surface, and forming inter-particle G-quartets.

214
5.8 Conclusion
This chapter has shown that the samples of G6 found in Chapter 4 formed polymersomes.
These macrostructures were the result of the hydrophobic alkyl backbone of the polymer and
the hydrophilic nucleotide groups interacting with the solvent to create a bilayer.
This lead to the hypothesis that the polymersomes would have a guanine rich surface.
Investigation with circular dichroism showed that G-quartets were formed and subsequently
stacked to form G-quadruplexes. This lead to an investigation of the effect of stabilising cations
which showed that the addition of Na+ and K+ ions stabilised the formation of inter-
polymersome binding. From this it could be determined that further study on alkyl polymer-
DNA interactions, such as that covered in Chapter 6, should avoid the use of guanine containing
polymers to avoid the competitive formation of G-quartets.
5.9 References
(1) Li, W.; Wu, P.; Ohmichi, T.; Sugimoto, N. Characterization and Thermodynamic
Properties of Quadruplex/Duplex Competition. FEBS Lett. 2002, 526 (1–3), 77–81.
(2) Simonsson, T. G-Quadruplex DNA Structures Variations on a Theme. Biol. Chem.
2001, 382 (4), 621–628.
(3) Zhu, J.; Kim, Y.; Lin, H.; Wang, S.; Mirkin, C. A. PH-Responsive Nanoparticle
Superlattices with Tunable DNA Bonds. J. Am. Chem. Soc. 2018, 140 (15), 5061–5064.
(4) Cahill, R.; Cookson, R. C.; Crabb, T. A. Geminal Coupling Constants in Methylene
Groups-II. J in CH2 Groups α to Heteroatoms. Tetrahedron 1969, 25 (19), 4681–4709.
(5) Berner, S.; Mühlegger, K.; Seliger, H. Studies on the Role of Tetrazole in the Activation
215
of Phosphoramidites. Nucleic Acids Res. 1989, 17 (3), 853–864.
(6) Caruthers, M. H. Gene Synthesis Machines: DNA Chemistry and Its Uses. Science 1985,
230 (4723), 281–285.
(7) Klassen, R.; Fricke, J.; Pfeiffer, A.; Meinhardt, F. A Modified DNA Isolation Protocol
for Obtaining Pure RT-PCR Grade RNA. Biotechnol. Lett. 2008, 30 (6), 1041–1044.
(8) Tamkovich, S. N.; Laktionov, P. P.; Rykova, E. Y.; Vlassov, V. V. Simple and Rapid
Procedure Suitable for Quantitative Isolation of Low and High Molecular Weight
Extracellular Nucleic Acids. In Nucleosides, Nucleotides and Nucleic Acids; Taylor &
Francis Group, 2004; Vol. 23, pp 873–877.
(9) Feig, M.; Pettitt, B. M. Sodium and Chlorine Ions as Part of the DNA Solvation Shell.
Biophys. J. 1999, 77 (4), 1769–1781.
(10) Li, M.; Qi, L.; Shen, Y.; Li, Y.; Chen, Y. Thermoresponsive oligo(ethylene glycol)-
based polymer brushes on polymer monoliths for all-aqueous chromatography. ACS
Appl Mater Interfaces. 2013, 5 (23), 12441-12448.
(11) Protozanova, E.; Macgregor, R. B. Circular Dichroism of DNA Frayed Wires. Biophys.
J. 1998, 75 (2), 982–989.
(12) Tóthová, P.; Krafčíková, P.; Víglaský, V. Formation of Highly Ordered Multimers in G-
Quadruplexes. Biochemistry 2014, 53 (45), 7013–7027.
(13) Nagesh, N.; Chatterji, D. Ammonium Ion at Low Concentration Stabilizes the G-
Quadruplex Formation by Telomeric Sequence. J. Biochem. Biophys. Methods 1995, 30
(1), 1–8.
216
(14) Kaiser, C. E.; Gokhale, V.; Yang, D.; Hurley, L. H. Gaining Insights into the Small
Molecule Targeting of the G-Quadruplex in the c-MYC Promoter Using NMR and an
Allele-Specific Transcriptional Assay. Topics in current chemistry; 2012; Vol. 330, pp
1–21.
(15) Pini, D.; Iuliano, A.; Salvadori, P.; Zuliano, A.; Salvadori, P. Synthesis and CD Spectra
of Isocyanide Polymers: Some New Aspects about Their Stereochemistry.
Macromolecules 25, 6059–6062.
(16) Jin, Y. J.; Seo, K. U.; Choi, Y. G.; Teraguchi, M.; Aoki, T.; Kwak, G. Annealing-
Induced Circular Dichroism Enhancement in Luminescent Conjugated Polymers with
an Intramolecular Stack Structure. Macromolecules 2017, 50 (17), 6433–6438.
(17) Chen, L.-C.; Mao, Y.-C.; Lin, S.-C.; Li, M.-C.; Ho, R.-M.; Tsai, J.-C. Induced Circular
Dichroism of Stereoregular Vinyl Polymers. Chem. Commun. 2012, 48 (30), 3668.
(18) Ilc, T.; Šket, P.; Plavec, J.; Webba da Silva, M.; Drevenšek-Olenik, I.; Spindler, L.
Formation of G-Wires: The Role of G:C-Base Pairing and G-Quartet Stacking. J. Phys.
Chem. C 2013, 117 (44), 23208–23215.
(19) Haider, S. M.; Neidle, S.; Parkinson, G. N. A Structural Analysis of G-
Quadruplex/Ligand Interactions. Biochimie 2011, 93 (8), 1239–1251.
(20) Kan, Z.; Yao, Y.; Wang, P.; Li, X.; Hao, Y.; Tan, Z. Molecular Crowding Induces
Telomere G-Quadruplex Formation under Salt-Deficient Conditions and Enhances Its
Competition with Duplex Formation. Angew. Chemie Int. Ed. 2006, 45 (10), 1629–1632.
(21) Stefan, L.; Denat, F.; Monchaud, D. Insights into How Nucleotide Supplements Enhance
the Peroxidase-Mimicking DNAzyme Activity of the G-Quadruplex/Hemin System.
217
Nucleic Acids Res. 2012, 40 (17), 8759–8772.
(22) Li, W.; Li, Y.; Liu, Z.; Lin, B.; Yi, H.; Xu, F.; Nie, Z.; Yao, S. Insight into G-
Quadruplex-Hemin DNAzyme/RNAzyme: Adjacent Adenine as the Intramolecular
Species for Remarkable Enhancement of Enzymatic Activity. Nucleic Acids Res. 2016,
44 (15), 7373–7384.
(23) Golub, E.; Freeman, R.; Willner, I. A Hemin/G-Quadruplex Acts as an NADH Oxidase
and NADH Peroxidase Mimicking DNAzyme. Angew. Chemie 2011, 123 (49), 11914–
11918.
(24) ATTO Gmbh. Fluorescent Labels and Dyes. Fluoresc. Labels Dye. Cat. 2013, 49, 1–45.
(25) Jana, B.; Bhattacharyya, S.; Patra, A. Perspective of Dye-Encapsulated Conjugated
Polymer Nanoparticles for Potential Applications. Bull. Mater. Sci. 2018, 41 (5), 122.
(26) Jang, J.; Lim, B. Facile Fabrication of Inorganic-Polymer Core-Shell Nanostructures by
a One-Step Vapor Deposition Polymerization. Angew. Chemie - Int. Ed. 2003, 42 (45),
5600–5603.
218
6 Chapter 6: Interactions of Nucleotide Functionalised
Synthetic Polymers with DNA Using Poly(2-(2'-
deoxythymine-monophosphate)oxypropyl
methacrylate) as a Model System.
6.1 Synopsis
This chapter outlines the principles for the binding of a thymine functionalised homopolymer, poly(dT-P-PMA) (T6) with dA ssDNA. This interaction will be considered initially from a computational model with further insight provided from UV and fluorescence spectroscopy measurements. This chapter describes the synthesis characterisation of 5′-dimethoxytrityl-N-isobutyryl-2′-deoxythymine,3′-[(2-cyanoethyl)-(2-oxypropyl methacrylate)]-phosphate, hence forth referred to as the T3 monomer (T3), using the methodology developed in the previous Chapter 4. Following the synthesis of the T3 monomer, it was polymerised using reversible addition-fragmentation chain-transfer (RAFT) method resulting in poly(dT-P-PMA). This poly(dT-P-PMA)(T6) was then tested with a complementary sequence of monoadenine deoxyribose nucleic acid (dA ssDNA) to investigate the binding properties of the two complementary polymers.
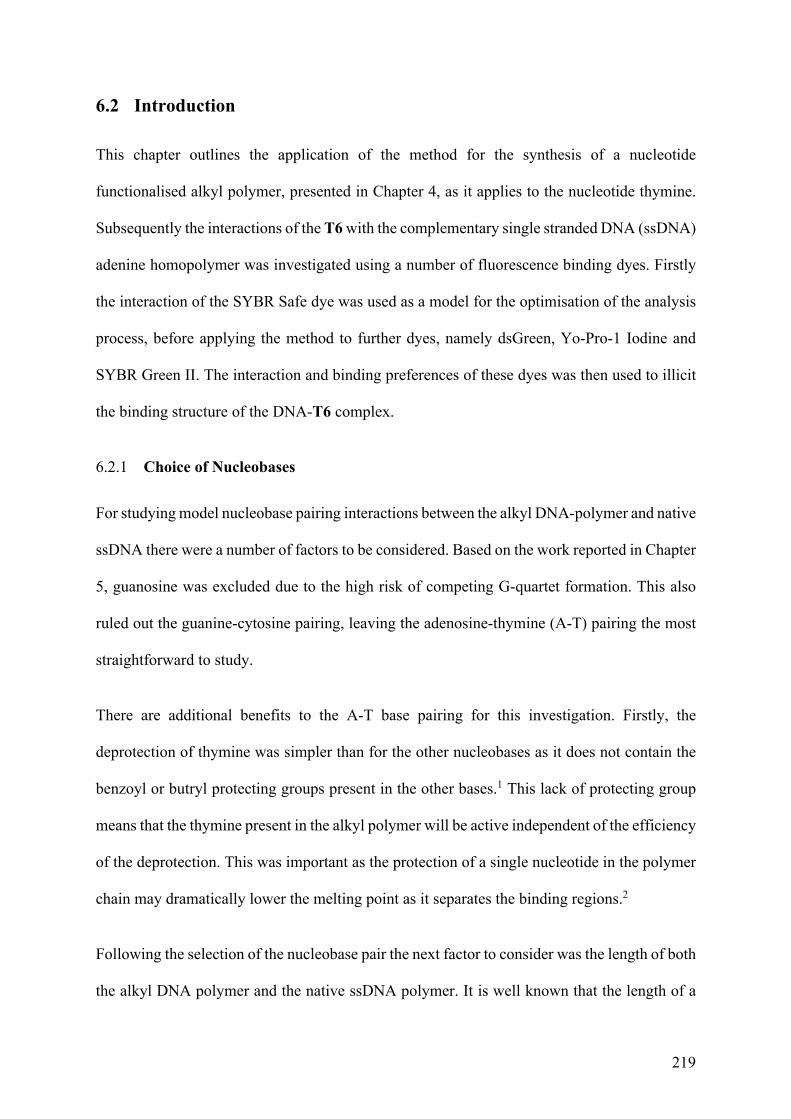
219
6.2 Introduction
This chapter outlines the application of the method for the synthesis of a nucleotide
functionalised alkyl polymer, presented in Chapter 4, as it applies to the nucleotide thymine.
Subsequently the interactions of the T6 with the complementary single stranded DNA (ssDNA)
adenine homopolymer was investigated using a number of fluorescence binding dyes. Firstly
the interaction of the SYBR Safe dye was used as a model for the optimisation of the analysis
process, before applying the method to further dyes, namely dsGreen, Yo-Pro-1 Iodine and
SYBR Green II. The interaction and binding preferences of these dyes was then used to illicit
the binding structure of the DNA-T6 complex.
6.2.1 Choice of Nucleobases
For studying model nucleobase pairing interactions between the alkyl DNA-polymer and native
ssDNA there were a number of factors to be considered. Based on the work reported in Chapter
5, guanosine was excluded due to the high risk of competing G-quartet formation. This also
ruled out the guanine-cytosine pairing, leaving the adenosine-thymine (A-T) pairing the most
straightforward to study.
There are additional benefits to the A-T base pairing for this investigation. Firstly, the
deprotection of thymine was simpler than for the other nucleobases as it does not contain the
benzoyl or butryl protecting groups present in the other bases.1 This lack of protecting group
means that the thymine present in the alkyl polymer will be active independent of the efficiency
of the deprotection. This was important as the protection of a single nucleotide in the polymer
chain may dramatically lower the melting point as it separates the binding regions.2
Following the selection of the nucleobase pair the next factor to consider was the length of both
the alkyl DNA polymer and the native ssDNA polymer. It is well known that the length of a
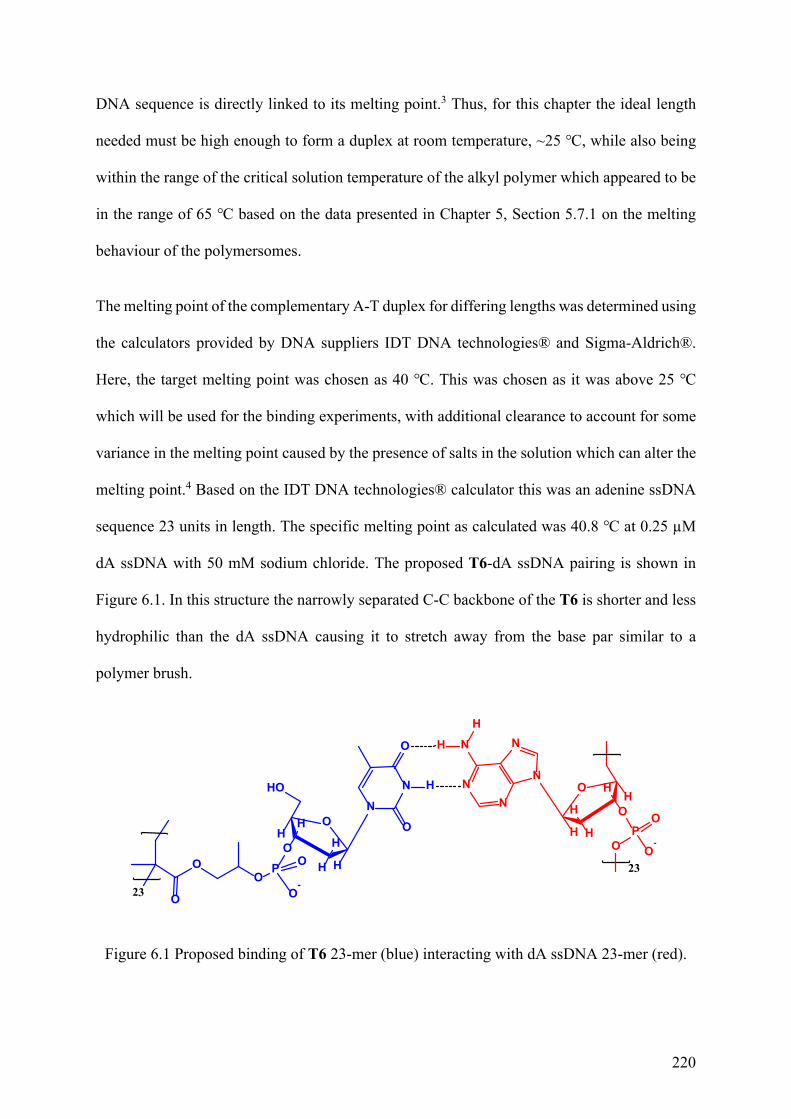
220
DNA sequence is directly linked to its melting point.3 Thus, for this chapter the ideal length
needed must be high enough to form a duplex at room temperature, ~25 ℃, while also being
within the range of the critical solution temperature of the alkyl polymer which appeared to be
in the range of 65 ℃ based on the data presented in Chapter 5, Section 5.7.1 on the melting
behaviour of the polymersomes.
The melting point of the complementary A-T duplex for differing lengths was determined using
the calculators provided by DNA suppliers IDT DNA technologies® and Sigma-Aldrich®.
Here, the target melting point was chosen as 40 ℃. This was chosen as it was above 25 ℃
which will be used for the binding experiments, with additional clearance to account for some
variance in the melting point caused by the presence of salts in the solution which can alter the
melting point.4 Based on the IDT DNA technologies® calculator this was an adenine ssDNA
sequence 23 units in length. The specific melting point as calculated was 40.8 ℃ at 0.25 µM
dA ssDNA with 50 mM sodium chloride. The proposed T6-dA ssDNA pairing is shown in
Figure 6.1. In this structure the narrowly separated C-C backbone of the T6 is shorter and less
hydrophilic than the dA ssDNA causing it to stretch away from the base par similar to a
polymer brush.
NN
N
NN
O
H
OH
H
H
H
PO
O-
N
O
ON
O
HO H
H
H
H
P O
O-
HO
HH
H
O
O
O
O
23
23
Figure 6.1 Proposed binding of T6 23-mer (blue) interacting with dA ssDNA 23-mer (red).
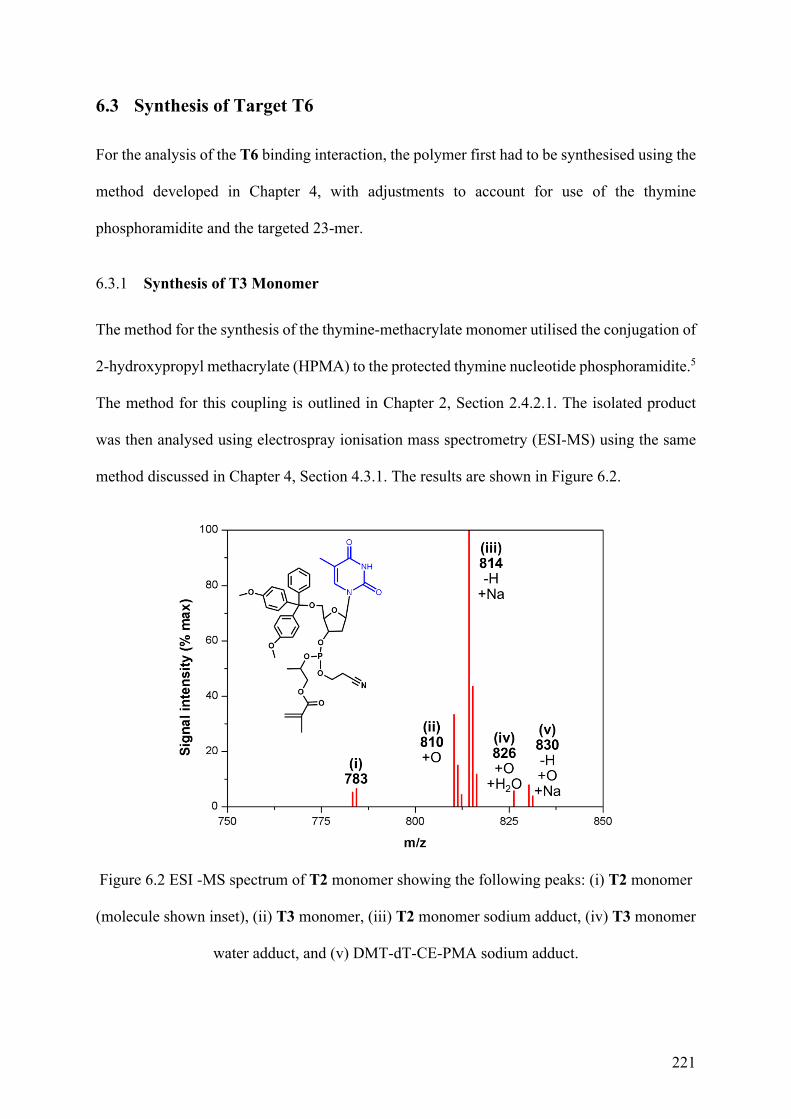
221
6.3 Synthesis of Target T6
For the analysis of the T6 binding interaction, the polymer first had to be synthesised using the
method developed in Chapter 4, with adjustments to account for use of the thymine
phosphoramidite and the targeted 23-mer.
6.3.1 Synthesis of T3 Monomer
The method for the synthesis of the thymine-methacrylate monomer utilised the conjugation of
2-hydroxypropyl methacrylate (HPMA) to the protected thymine nucleotide phosphoramidite.5
The method for this coupling is outlined in Chapter 2, Section 2.4.2.1. The isolated product
was then analysed using electrospray ionisation mass spectrometry (ESI-MS) using the same
method discussed in Chapter 4, Section 4.3.1. The results are shown in Figure 6.2.
Figure 6.2 ESI -MS spectrum of T2 monomer showing the following peaks: (i) T2 monomer
(molecule shown inset), (ii) T3 monomer, (iii) T2 monomer sodium adduct, (iv) T3 monomer
water adduct, and (v) DMT-dT-CE-PMA sodium adduct.
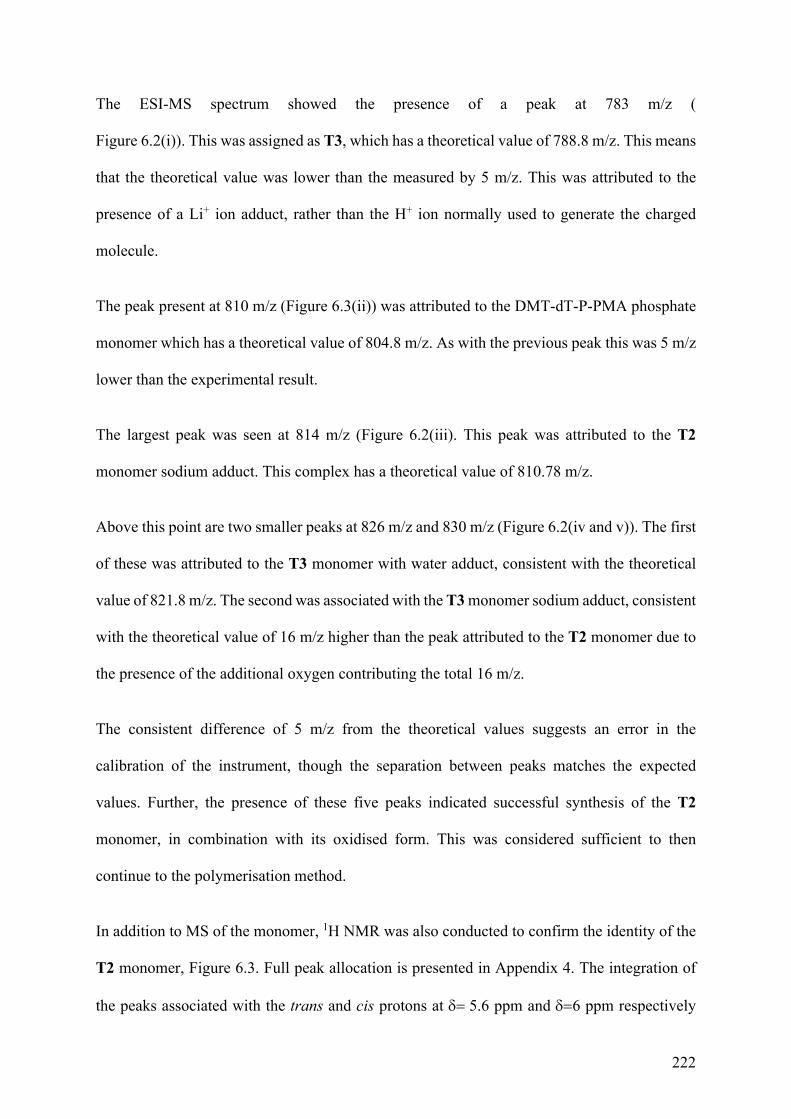
222
The ESI-MS spectrum showed the presence of a peak at 783 m/z (
Figure 6.2(i)). This was assigned as T3, which has a theoretical value of 788.8 m/z. This means
that the theoretical value was lower than the measured by 5 m/z. This was attributed to the
presence of a Li+ ion adduct, rather than the H+ ion normally used to generate the charged
molecule.
The peak present at 810 m/z (Figure 6.3(ii)) was attributed to the DMT-dT-P-PMA phosphate
monomer which has a theoretical value of 804.8 m/z. As with the previous peak this was 5 m/z
lower than the experimental result.
The largest peak was seen at 814 m/z (Figure 6.2(iii). This peak was attributed to the T2
monomer sodium adduct. This complex has a theoretical value of 810.78 m/z.
Above this point are two smaller peaks at 826 m/z and 830 m/z (Figure 6.2(iv and v)). The first
of these was attributed to the T3 monomer with water adduct, consistent with the theoretical
value of 821.8 m/z. The second was associated with the T3 monomer sodium adduct, consistent
with the theoretical value of 16 m/z higher than the peak attributed to the T2 monomer due to
the presence of the additional oxygen contributing the total 16 m/z.
The consistent difference of 5 m/z from the theoretical values suggests an error in the
calibration of the instrument, though the separation between peaks matches the expected
values. Further, the presence of these five peaks indicated successful synthesis of the T2
monomer, in combination with its oxidised form. This was considered sufficient to then
continue to the polymerisation method.
In addition to MS of the monomer, 1H NMR was also conducted to confirm the identity of the
T2 monomer, Figure 6.3. Full peak allocation is presented in Appendix 4. The integration of
the peaks associated with the trans and cis protons at δ= 5.6 ppm and δ=6 ppm respectively

223
(Figure 6.3(a and b)) can be seen and integrate to the peak at δ= 6.2 associated with the 1'
proton on the deoxyribose ring. The additional splitting is due to the combination of the T2
P(III) and some T3 in the (PV) state caused by oxidation during preparation.
Figure 6.3 1H NMR of the 6.5 ppm to 5.5 ppm region for T2 (inset) with T3 present. Spectra
acquired in deuterated acetonitrile at 600 MHz.
6.3.2 Synthesis of Polymer
The synthesis of the T6 used the same method developed in Chapter 4, with the concentration
of T3 monomer increased to four times the concentration of guanine bioconjugate which
resulted in the hexamer discussed in Chapter 5. Assuming similar conversion this would have
resulted in a 24-mer of the T6. This increased length compared to the 23-mer desired was
chosen as the target to account for the decreased rate of polymerisation caused by the longer
polymer chain becoming less soluble. This behaviour was previously discussed in Chapter 4,
Section 4.4.1.
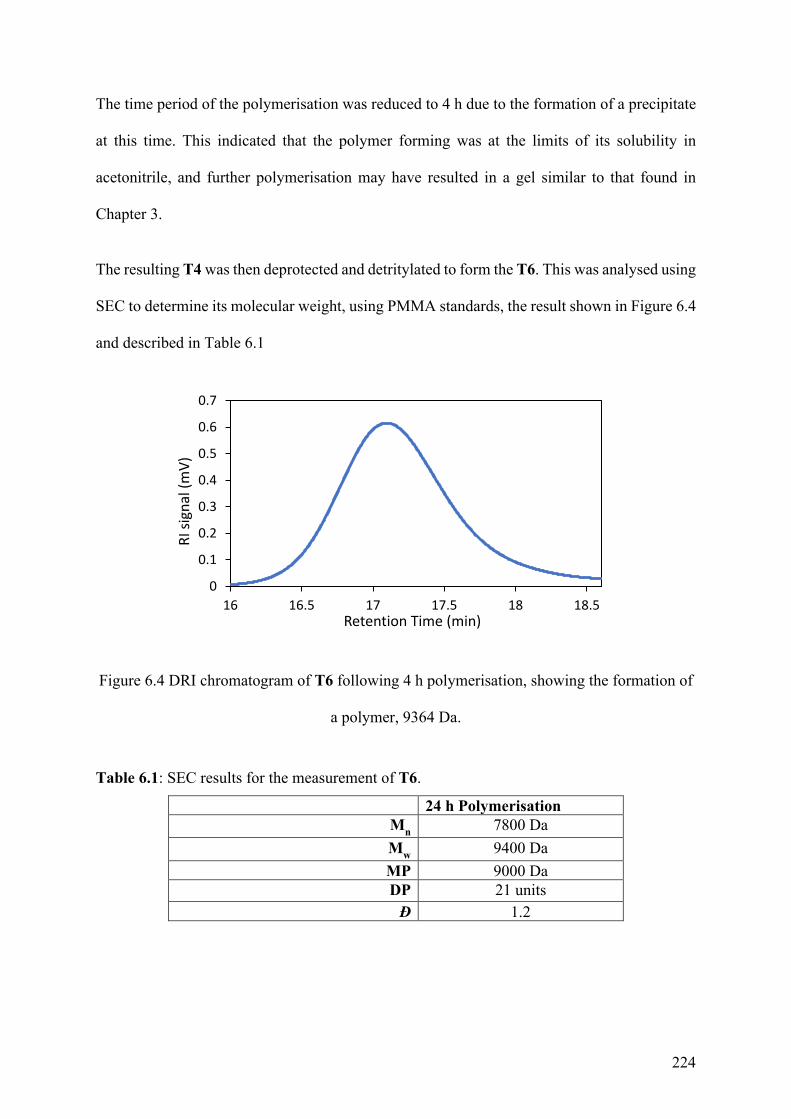
224
The time period of the polymerisation was reduced to 4 h due to the formation of a precipitate
at this time. This indicated that the polymer forming was at the limits of its solubility in
acetonitrile, and further polymerisation may have resulted in a gel similar to that found in
Chapter 3.
The resulting T4 was then deprotected and detritylated to form the T6. This was analysed using
SEC to determine its molecular weight, using PMMA standards, the result shown in Figure 6.4
and described in Table 6.1
Figure 6.4 DRI chromatogram of T6 following 4 h polymerisation, showing the formation of
a polymer, 9364 Da.
Table 6.1: SEC results for the measurement of T6.
24 h Polymerisation Mn 7800 Da Mw 9400 Da MP 9000 Da DP 21 units Đ 1.2
0
0.1
0.2
0.3
0.4
0.5
0.6
0.7
16 16.5 17 17.5 18 18.5
RI si
gnal
(mV)
Retention Time (min)
225
The SEC result showed the T6 had a Mw of 9364 Da. This showed that the T6 chains formed
were approximately 21 units in length. This was determined by dividing the Mw of the T6 (9364
Da) by the Mw of the dT-P-PMA repeating unit (447.3 Da).
The Mw found was below the targeted Mw of 10281 Da for the T6 23-mer. Based on the
formation of the precipitate this was close to, if not, the maximum Mw attainable using this
polymerisation method. For this reason, it was decided to progress using the T6 21-mer and
measure its interaction with the dA ssDNA 23-mer.
For a length of 21 base pairs the expected melting point of the duplex was 38.2 ℃ based on
the IDT DNA technologies calculator. This temperature still fits within the intended
temperature range, discussed in Section 6.2.1.
6.4 Computer Modelling of T6
To validate the proposed binding of T6 to dA ssDNA computer modelling was conducted using
Ascalaph designer running on the FIREFLY computational chemistry algorithms. This
program was chosen as Ascalaph was open access software based on the same fundamental
protocols, definitions, and code parameters as other programs such as PC GAMES (UK) and
PC GAMES (US). Further, its open file standards make it more accessible for integrating
structures from other programs, notably for this project ChemDraw Ultra 12.0.1076.
Modelling was conducted on a consumer level workstation running a 4.02 GHz Intel 4790k
quad-core 8 thread CPU and nVidia 970 TI GPU. This combination was chosen as Ascalaph
was CPU bottlenecked with limited multithread optimisation and the 4790k was the highest
speed CPU based on single core performance available at the time.6
226
6.4.1 Modelling of Selective Binding Interactions Between T6 and dA ssDNA
Pentamers of T6 and dA ssDNA were generated in Chemdraw ultra 14, converted to the .mol2
format and imported into Ascalaph designer. This method was chosen as Chemdraw allows for
rapid generation of complex structures, where Ascalaph designer was optimised for generation
of DNA and protein structures. Further, using the 2 dimensional visualisation of the structure
makes proofreading easier. From here the molecules were converted to 3 dimensional
structures using the quick optimisation tool and checked for correct stereocenters at the 2’, 3’
and 5’ positions. The program was then optimised a further 2 times to relieve stress on the
structure generated by this conversion.
The binding state simulation was run initially at 1 K to reduce energy generated from the
optimisation, followed by 2 optimisations at 50 K. This was essential as running the simulation
immediately at 50 K resulted in the molecules breaking apart and crashing the simulation. Once
a stable state for the model had been found as a starting point the simulation was run for
100,000 iterations using the hybrid Lui Storey and conjugate descent method (LS&CD) for
optimising the structure.6–8 The resulting optimised dimer structure is shown in Figure 6.5.
This showed that there was a level of binding and orientation seen between some of the
nucleobases, specifically 5´ terminal group of the dA ssDNA, located in the lower right of
Figure 6.5(i) as indicated. The T6 strand on the left appears to be fanning out more, a result of
the shorter base separation caused by the alkyl backbone as hypothesised. As a result of this
measurement it was determined that binding between the complementary bases was possible,
but that the duplex structure formed would need to somehow account for this difference in base
separation.
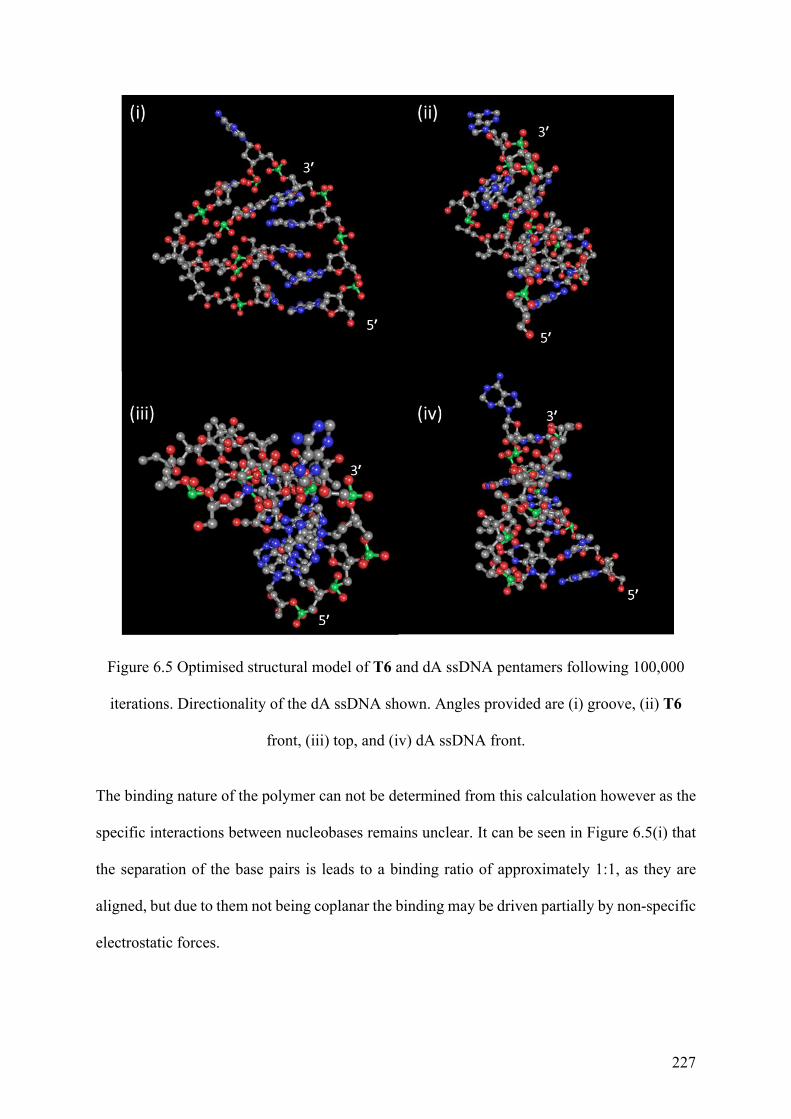
227
Figure 6.5 Optimised structural model of T6 and dA ssDNA pentamers following 100,000
iterations. Directionality of the dA ssDNA shown. Angles provided are (i) groove, (ii) T6
front, (iii) top, and (iv) dA ssDNA front.
The binding nature of the polymer can not be determined from this calculation however as the
specific interactions between nucleobases remains unclear. It can be seen in Figure 6.5(i) that
the separation of the base pairs is leads to a binding ratio of approximately 1:1, as they are
aligned, but due to them not being coplanar the binding may be driven partially by non-specific
electrostatic forces.
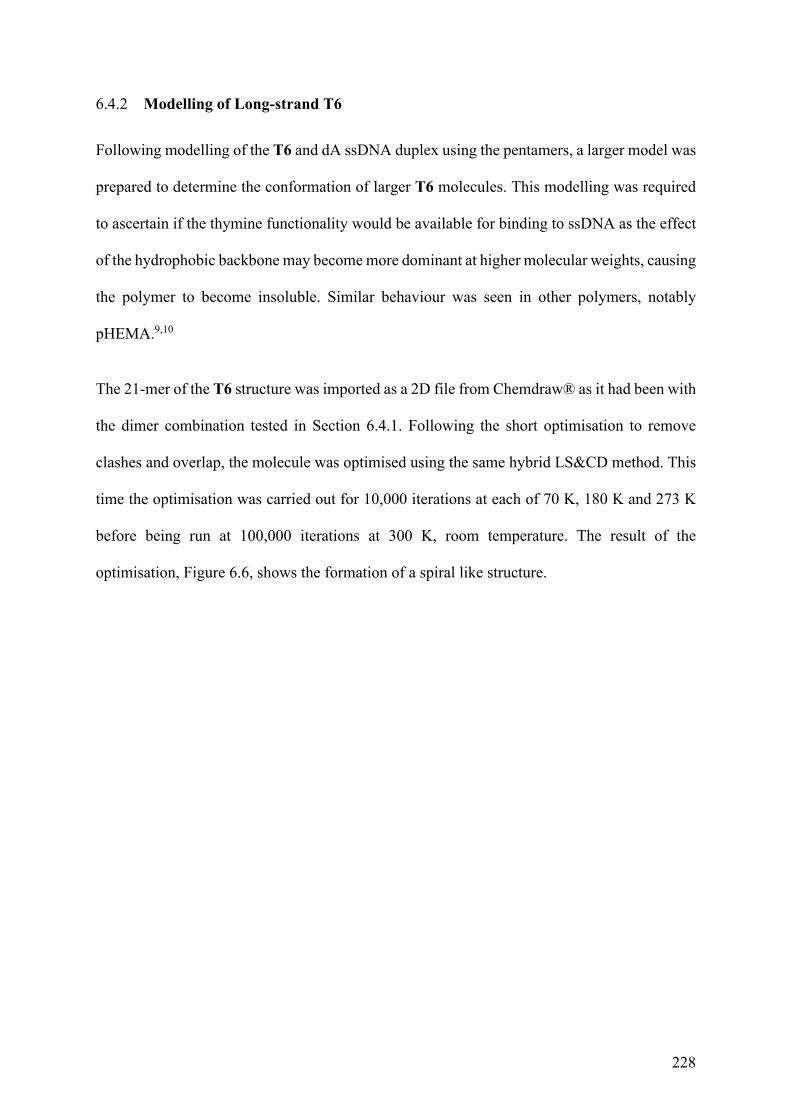
228
6.4.2 Modelling of Long-strand T6
Following modelling of the T6 and dA ssDNA duplex using the pentamers, a larger model was
prepared to determine the conformation of larger T6 molecules. This modelling was required
to ascertain if the thymine functionality would be available for binding to ssDNA as the effect
of the hydrophobic backbone may become more dominant at higher molecular weights, causing
the polymer to become insoluble. Similar behaviour was seen in other polymers, notably
pHEMA.9,10
The 21-mer of the T6 structure was imported as a 2D file from Chemdraw® as it had been with
the dimer combination tested in Section 6.4.1. Following the short optimisation to remove
clashes and overlap, the molecule was optimised using the same hybrid LS&CD method. This
time the optimisation was carried out for 10,000 iterations at each of 70 K, 180 K and 273 K
before being run at 100,000 iterations at 300 K, room temperature. The result of the
optimisation, Figure 6.6, shows the formation of a spiral like structure.
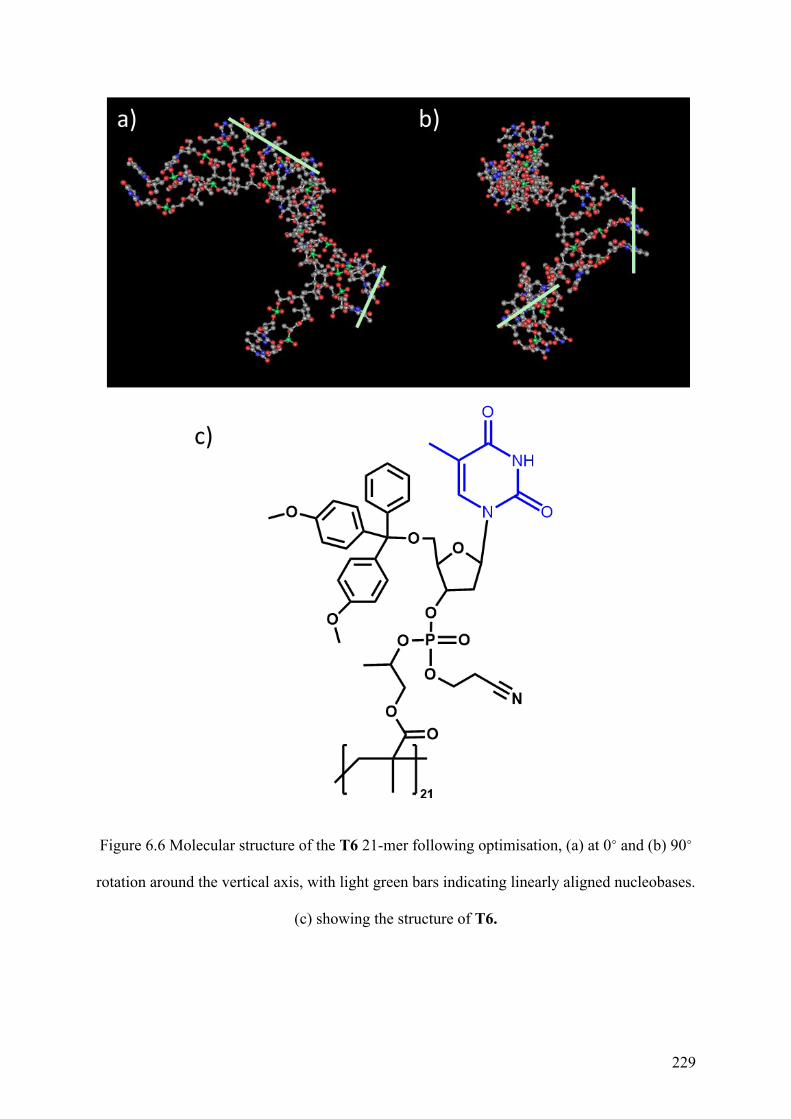
229
Figure 6.6 Molecular structure of the T6 21-mer following optimisation, (a) at 0° and (b) 90°
rotation around the vertical axis, with light green bars indicating linearly aligned nucleobases.
(c) showing the structure of T6.
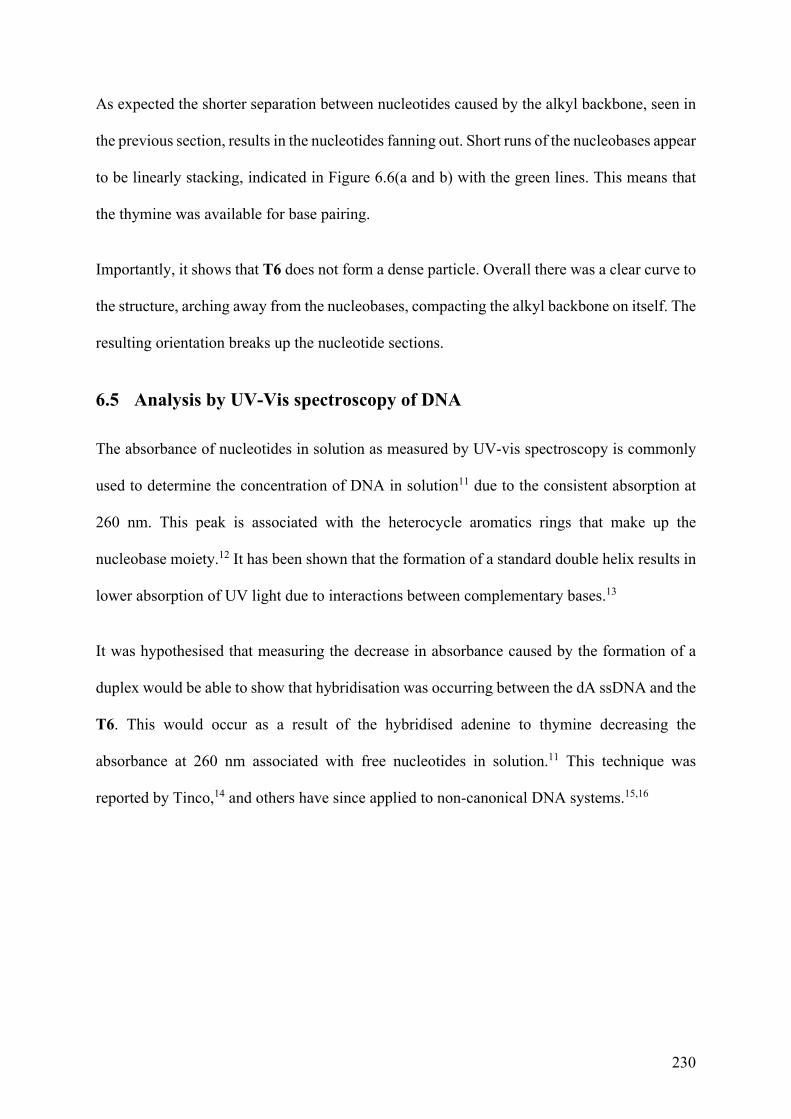
230
As expected the shorter separation between nucleotides caused by the alkyl backbone, seen in
the previous section, results in the nucleotides fanning out. Short runs of the nucleobases appear
to be linearly stacking, indicated in Figure 6.6(a and b) with the green lines. This means that
the thymine was available for base pairing.
Importantly, it shows that T6 does not form a dense particle. Overall there was a clear curve to
the structure, arching away from the nucleobases, compacting the alkyl backbone on itself. The
resulting orientation breaks up the nucleotide sections.
6.5 Analysis by UV-Vis spectroscopy of DNA
The absorbance of nucleotides in solution as measured by UV-vis spectroscopy is commonly
used to determine the concentration of DNA in solution11 due to the consistent absorption at
260 nm. This peak is associated with the heterocycle aromatics rings that make up the
nucleobase moiety.12 It has been shown that the formation of a standard double helix results in
lower absorption of UV light due to interactions between complementary bases.13
It was hypothesised that measuring the decrease in absorbance caused by the formation of a
duplex would be able to show that hybridisation was occurring between the dA ssDNA and the
T6. This would occur as a result of the hybridised adenine to thymine decreasing the
absorbance at 260 nm associated with free nucleotides in solution.11 This technique was
reported by Tinco,14 and others have since applied to non-canonical DNA systems.15,16
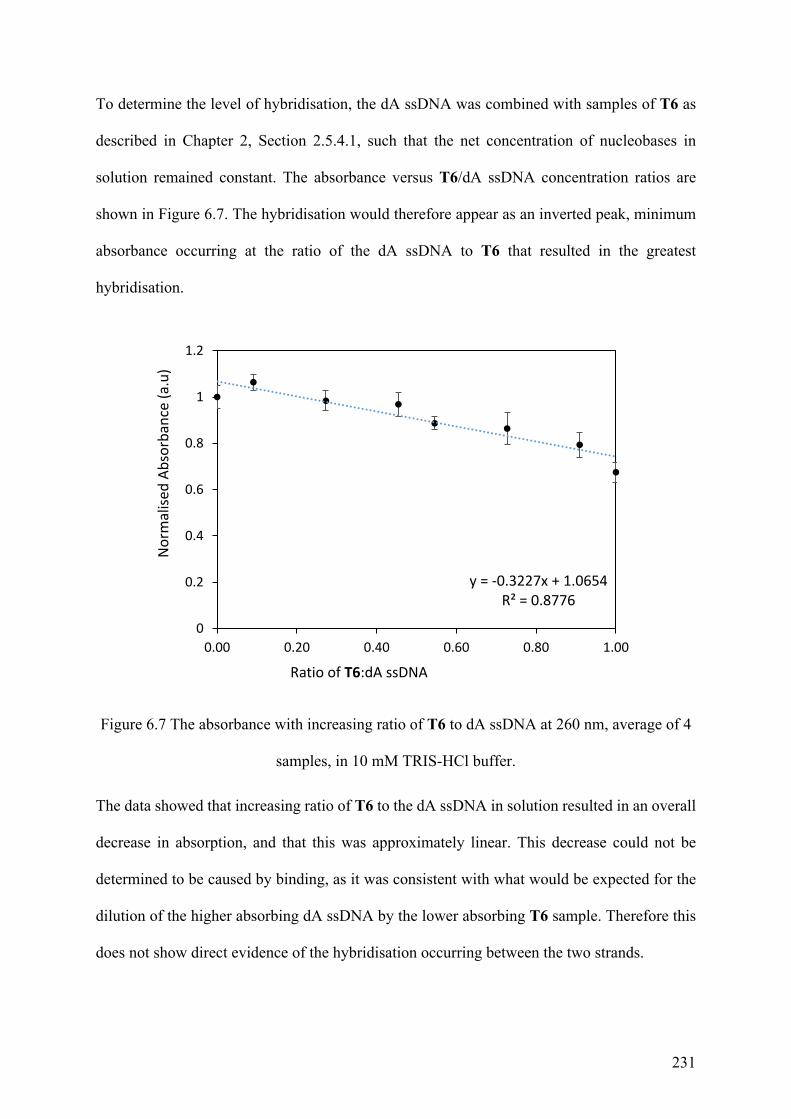
231
To determine the level of hybridisation, the dA ssDNA was combined with samples of T6 as
described in Chapter 2, Section 2.5.4.1, such that the net concentration of nucleobases in
solution remained constant. The absorbance versus T6/dA ssDNA concentration ratios are
shown in Figure 6.7. The hybridisation would therefore appear as an inverted peak, minimum
absorbance occurring at the ratio of the dA ssDNA to T6 that resulted in the greatest
hybridisation.
Figure 6.7 The absorbance with increasing ratio of T6 to dA ssDNA at 260 nm, average of 4
samples, in 10 mM TRIS-HCl buffer.
The data showed that increasing ratio of T6 to the dA ssDNA in solution resulted in an overall
decrease in absorption, and that this was approximately linear. This decrease could not be
determined to be caused by binding, as it was consistent with what would be expected for the
dilution of the higher absorbing dA ssDNA by the lower absorbing T6 sample. Therefore this
does not show direct evidence of the hybridisation occurring between the two strands.
y = -0.3227x + 1.0654R² = 0.8776
0
0.2
0.4
0.6
0.8
1
1.2
0.00 0.20 0.40 0.60 0.80 1.00
Nor
mal
ised
Abso
rban
ce (a
.u)
Ratio of T6:dA ssDNA
232
This experiment did show that the equivalent concentration of T6 resulted in a decrease in
absorption of 32.5% compared to the dA ssDNA. This gives two important pieces of
information. Firstly, that the T6 still shows absorption in the 260 nm region associated with
DNA, indicating nucleobase functionality was still present. Secondly, if there was any binding
to form a duplex it was not significantly effecting the absorption of either compound. This does
not explicitly rule out the formation of base pairs, but it does show that they may not form a
traditional double helix.
6.6 Determination of Duplex Formation Using Fluorescent Dyes
The determination of DNA hybridisation is frequently measured by the addition of intercalator
dyes.17,18 These dyes bind to DNA as described in Chapter 1, Section 1.4.5. As a result, they
were used to interrogate some of the binding properties of the dA ssDNA-T6 duplex that would
be formed. If the dyes show the same fluorescence response when exposed to the dA ssDNA-
T6 duplex that is seen with the dAdT dsDNA this would show that the binding is almost
identical. Conversely, no change in fluorescence response to the dA ssDNA-T6 duplex would
indicate no binding is present. An intermediate result would indicate an alternative binding site
has formed.
There are a number of possible dyes that can be used to illicit binding properties of DNA that
will be considered in this chapter including the SYBR(R) range of dyes and Yo-Pro-1 Iodine.
Four stains were tested, namely SYBR Safe, dsGreen (equivalent to SYBR Green I), Yo-Pro-
1 and SYBR Green II.
Throughout this section the concentration of the fluorescent dyes will be referred to in terms
of “X” for concentration. Due to the proprietary nature of the dyes, unfortunately, there was no
direct conversion for this measure into standardised units, such as mM or g L-1. Through this
233
chapter the provided concentrations of dye before dilution was 10,000X dye in dimethyl
sulfoxide (DMSO). Based on the result presented in Chapter 3, Section 3.4.3.1, DMSO may
affect the solubility of the nucleotide functionalised alkyl polymer. However, as the dye was
diluted below 1/100 of the original concentration, the interaction of the DMSO was deemed
insignificant.
For measuring the fluorescence, a Qiagen® Rotor-Gene Q real time PCR instrument was used.
This instrument was chosen because it was a high throughput system able to measure 72
samples at low volumes (20 µL) meaning that replicates can be conducted in a single run to
minimise variation between measurements. Further, it was designed for use with the dyes used
in this section, specifically the SYBR binding dyes.
One limitation of this method was that the fluorescence detector can be over saturated for some
samples, requiring the automatic adjustment of the signal gain. As a result, the gain was
recorded with the data, and samples that saturated the detector are noted. These samples exceed
the detection limit the Rotor-Gene Q. This automatic adjustment of gain was limited to 10,
raising it further could have introduced artefacts and reduce reproducibility between runs by
amplifying secondary effects, for example additional fluorescence from the plastic of the PCR
tubes.
6.6.1 Binding and Properties of SYBR Safe® DNA stain
The most common series of dyes used in DNA staining was the SYBR series produced by
Thermos Fisher Scientific. For the initial round of testing SYBR Safe® was chosen for its
relative versatility as it could be used in a wide range of tests including being free in solution,
added into precast gels or added into gels post-electrophoresis. The structure of SYBR Safe is
shown in Figure 6.8. SYBR Safe was primarily used as a dsDNA dye for measuring the
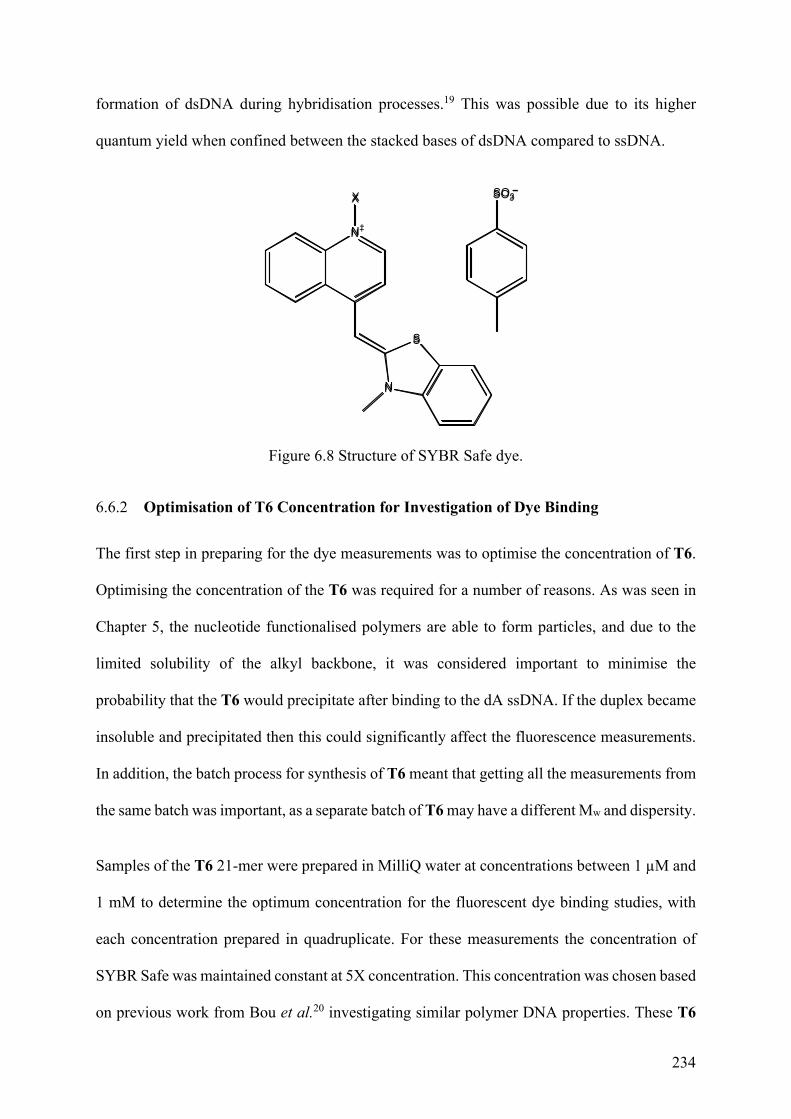
234
formation of dsDNA during hybridisation processes.19 This was possible due to its higher
quantum yield when confined between the stacked bases of dsDNA compared to ssDNA.
NN++
SS
NN
XX SSOO33
Figure 6.8 Structure of SYBR Safe dye.
6.6.2 Optimisation of T6 Concentration for Investigation of Dye Binding
The first step in preparing for the dye measurements was to optimise the concentration of T6.
Optimising the concentration of the T6 was required for a number of reasons. As was seen in
Chapter 5, the nucleotide functionalised polymers are able to form particles, and due to the
limited solubility of the alkyl backbone, it was considered important to minimise the
probability that the T6 would precipitate after binding to the dA ssDNA. If the duplex became
insoluble and precipitated then this could significantly affect the fluorescence measurements.
In addition, the batch process for synthesis of T6 meant that getting all the measurements from
the same batch was important, as a separate batch of T6 may have a different Mw and dispersity.
Samples of the T6 21-mer were prepared in MilliQ water at concentrations between 1 µM and
1 mM to determine the optimum concentration for the fluorescent dye binding studies, with
each concentration prepared in quadruplicate. For these measurements the concentration of
SYBR Safe was maintained constant at 5X concentration. This concentration was chosen based
on previous work from Bou et al.20 investigating similar polymer DNA properties. These T6
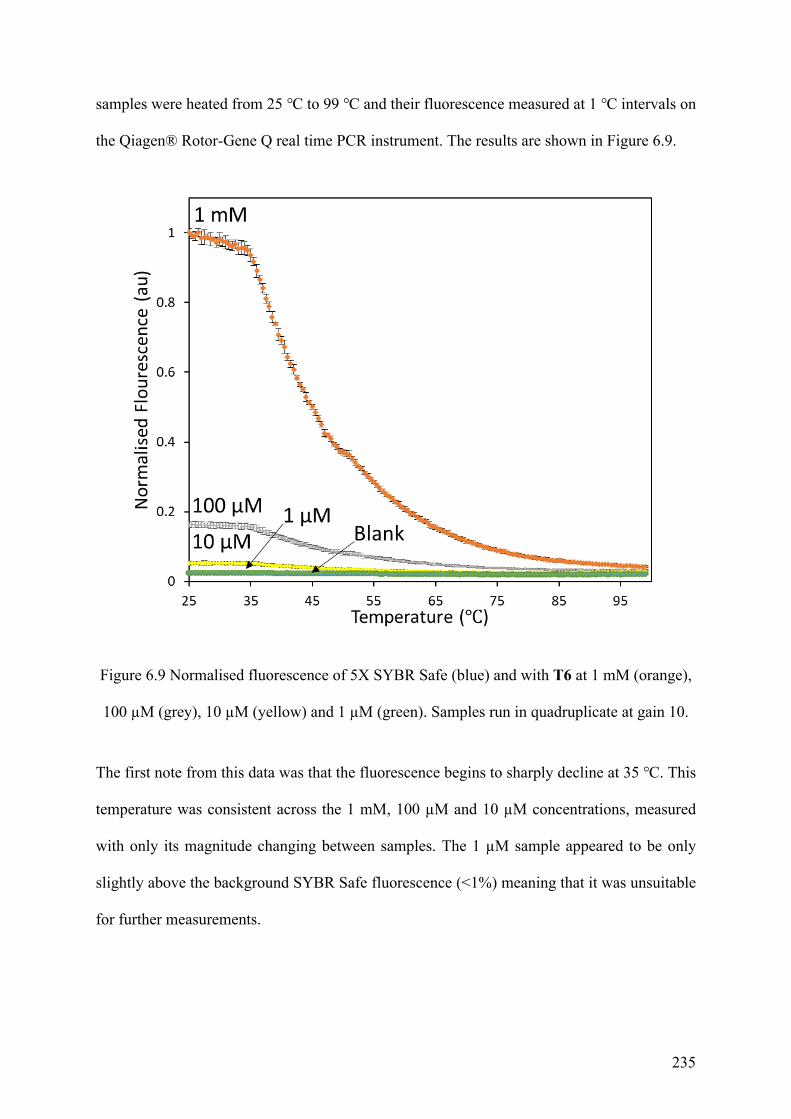
235
samples were heated from 25 ℃ to 99 ℃ and their fluorescence measured at 1 ℃ intervals on
the Qiagen® Rotor-Gene Q real time PCR instrument. The results are shown in Figure 6.9.
Figure 6.9 Normalised fluorescence of 5X SYBR Safe (blue) and with T6 at 1 mM (orange),
100 µM (grey), 10 µM (yellow) and 1 µM (green). Samples run in quadruplicate at gain 10.
The first note from this data was that the fluorescence begins to sharply decline at 35 ℃. This
temperature was consistent across the 1 mM, 100 µM and 10 µM concentrations, measured
with only its magnitude changing between samples. The 1 µM sample appeared to be only
slightly above the background SYBR Safe fluorescence (<1%) meaning that it was unsuitable
for further measurements.
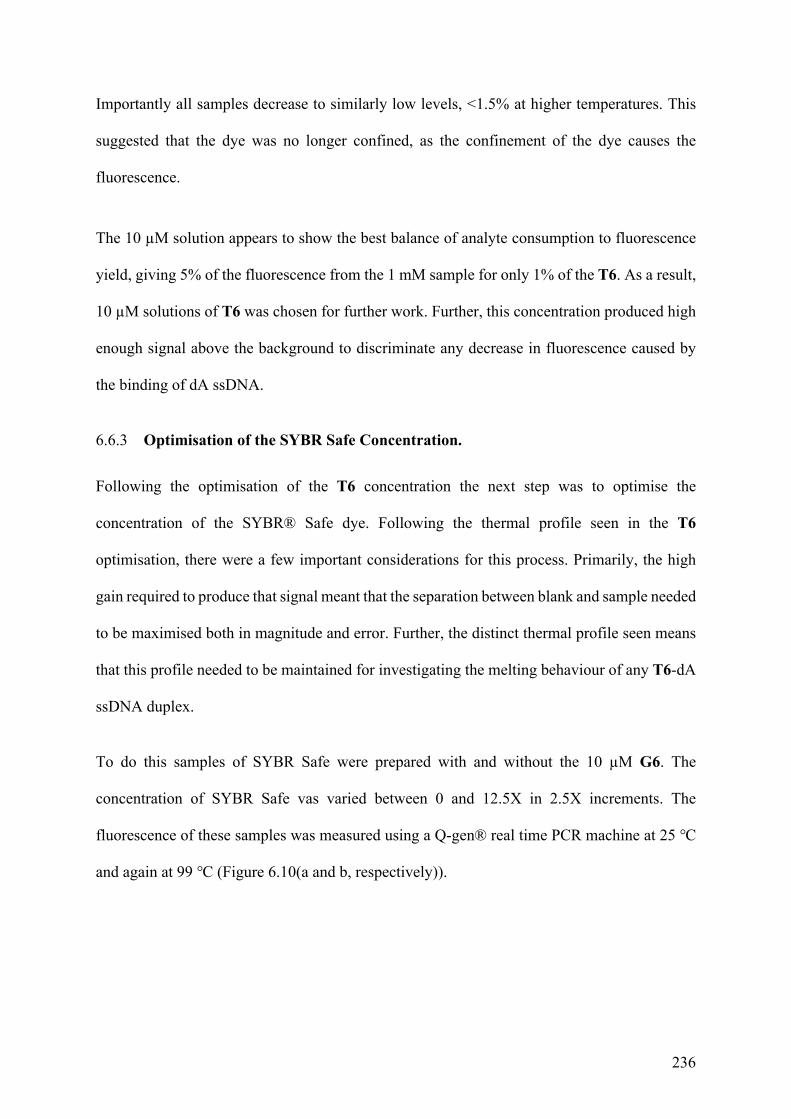
236
Importantly all samples decrease to similarly low levels, <1.5% at higher temperatures. This
suggested that the dye was no longer confined, as the confinement of the dye causes the
fluorescence.
The 10 µM solution appears to show the best balance of analyte consumption to fluorescence
yield, giving 5% of the fluorescence from the 1 mM sample for only 1% of the T6. As a result,
10 µM solutions of T6 was chosen for further work. Further, this concentration produced high
enough signal above the background to discriminate any decrease in fluorescence caused by
the binding of dA ssDNA.
6.6.3 Optimisation of the SYBR Safe Concentration.
Following the optimisation of the T6 concentration the next step was to optimise the
concentration of the SYBR® Safe dye. Following the thermal profile seen in the T6
optimisation, there were a few important considerations for this process. Primarily, the high
gain required to produce that signal meant that the separation between blank and sample needed
to be maximised both in magnitude and error. Further, the distinct thermal profile seen means
that this profile needed to be maintained for investigating the melting behaviour of any T6-dA
ssDNA duplex.
To do this samples of SYBR Safe were prepared with and without the 10 µM G6. The
concentration of SYBR Safe vas varied between 0 and 12.5X in 2.5X increments. The
fluorescence of these samples was measured using a Q-gen® real time PCR machine at 25 ℃
and again at 99 ℃ (Figure 6.10(a and b, respectively)).
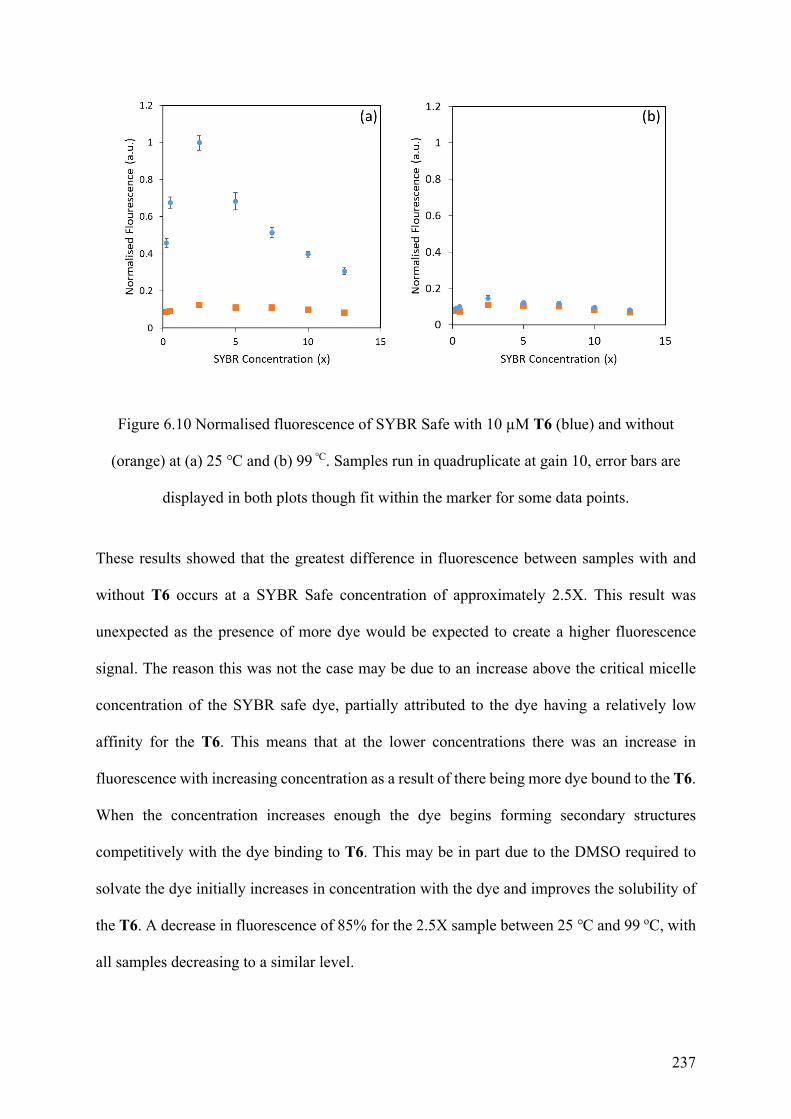
237
Figure 6.10 Normalised fluorescence of SYBR Safe with 10 µM T6 (blue) and without
(orange) at (a) 25 ℃ and (b) 99 ℃. Samples run in quadruplicate at gain 10, error bars are
displayed in both plots though fit within the marker for some data points.
These results showed that the greatest difference in fluorescence between samples with and
without T6 occurs at a SYBR Safe concentration of approximately 2.5X. This result was
unexpected as the presence of more dye would be expected to create a higher fluorescence
signal. The reason this was not the case may be due to an increase above the critical micelle
concentration of the SYBR safe dye, partially attributed to the dye having a relatively low
affinity for the T6. This means that at the lower concentrations there was an increase in
fluorescence with increasing concentration as a result of there being more dye bound to the T6.
When the concentration increases enough the dye begins forming secondary structures
competitively with the dye binding to T6. This may be in part due to the DMSO required to
solvate the dye initially increases in concentration with the dye and improves the solubility of
the T6. A decrease in fluorescence of 85% for the 2.5X sample between 25 ℃ and 99 oC, with
all samples decreasing to a similar level.
238
As with the measurements in Section 6.6.2 this was attributed to the non-confinement of the
dye at higher temperatures. This was supported by the same decrease observed in the samples
not containing T6.
From these results it was observed that the best concentration for discrimination between the
blank and the T6 sample was at 2.5X and as a result it was this concentration that was used for
further SYBR dye measurements.
6.6.4 Effect of Sodium Chloride on SYBR Interaction
Sodium chloride (NaCl) can play a significant role in the conformation of DNA, being a major
contributor to the conversion between A-, B-, and C- forms of the double helix (see Chapter 1,
Section 1.3.2 for further details). Similarly, the presence of NaCl can affect the solubility of
DNA and methacrylate polymers.
To ensure this was not an issue, samples of 10 µM T6 and 2.5X SYBR safe were prepared with
NaCl concentrations between 5 mM and 1 M (see Chapter 2, Section 2.5.4.3 for experimental
details), in quadruplicate. These samples were then heated from 25 ℃ to 99 ℃ and their
fluorescence measured at 1 ℃ intervals. If the presence of the NaCl was impeding the binding
of the SYBR safe dye there would be a significant change in the melting curve, as the dye
would not be released because it had not bound to the duplex formed. The results are shown in
Figure 6.11.
239
Figure 6.11 Normalised fluorescence of 2.5X SYBR Safe with 10 µM T6 with the addition of
different loadings of NaCl ; 5 mM (purple), 10 mM (blue), 20 mM (green), 50 mM (yellow),
and 100 mM (red). Samples run in quadruplicate at gain 10. Error bars included for the 10
mM NaCl sample are similarly representative of all samples.
Most importantly these measurements showed a low reproducibility between samples as
indicated by the large error bars. This demonstrated that the addition of sodium chloride
interfered with the binding and stabilisation between the T6 and SYBR safe dye. This could be
due to the destabilisation of the SYBR Safe ion pair, or the change in solubility of T6. For this
reason, no NaCl was added to further experiments.
0.4
0.6
0.8
1
1.2
1.4
1.6
1.8
2
20 40 60 80 100
Nor
mal
ised
Fluo
resc
ence
(a.u
.)
Temperature (℃)
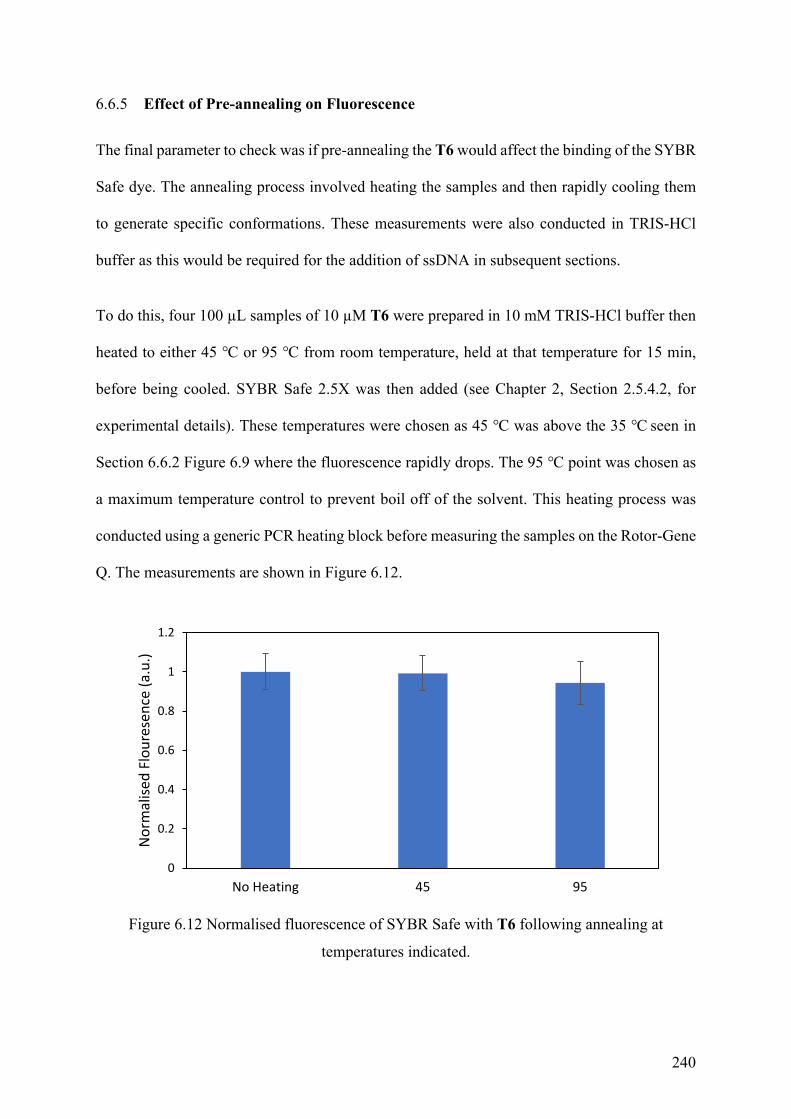
240
6.6.5 Effect of Pre-annealing on Fluorescence
The final parameter to check was if pre-annealing the T6 would affect the binding of the SYBR
Safe dye. The annealing process involved heating the samples and then rapidly cooling them
to generate specific conformations. These measurements were also conducted in TRIS-HCl
buffer as this would be required for the addition of ssDNA in subsequent sections.
To do this, four 100 µL samples of 10 µM T6 were prepared in 10 mM TRIS-HCl buffer then
heated to either 45 ℃ or 95 ℃ from room temperature, held at that temperature for 15 min,
before being cooled. SYBR Safe 2.5X was then added (see Chapter 2, Section 2.5.4.2, for
experimental details). These temperatures were chosen as 45 ℃ was above the 35 ℃ seen in
Section 6.6.2 Figure 6.9 where the fluorescence rapidly drops. The 95 ℃ point was chosen as
a maximum temperature control to prevent boil off of the solvent. This heating process was
conducted using a generic PCR heating block before measuring the samples on the Rotor-Gene
Q. The measurements are shown in Figure 6.12.
Figure 6.12 Normalised fluorescence of SYBR Safe with T6 following annealing at
temperatures indicated.
0
0.2
0.4
0.6
0.8
1
1.2
No Heating 45 95
Nor
mal
ised
Flou
rese
nce
(a.u
.)
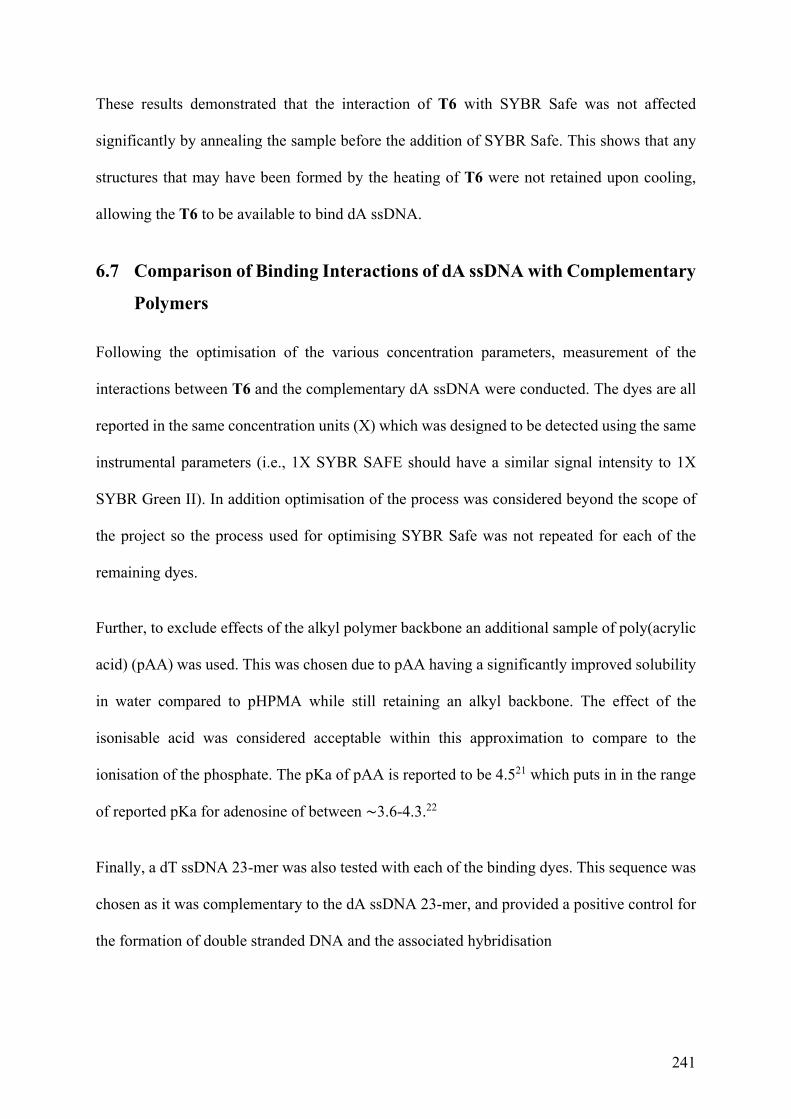
241
These results demonstrated that the interaction of T6 with SYBR Safe was not affected
significantly by annealing the sample before the addition of SYBR Safe. This shows that any
structures that may have been formed by the heating of T6 were not retained upon cooling,
allowing the T6 to be available to bind dA ssDNA.
6.7 Comparison of Binding Interactions of dA ssDNA with Complementary
Polymers
Following the optimisation of the various concentration parameters, measurement of the
interactions between T6 and the complementary dA ssDNA were conducted. The dyes are all
reported in the same concentration units (X) which was designed to be detected using the same
instrumental parameters (i.e., 1X SYBR SAFE should have a similar signal intensity to 1X
SYBR Green II). In addition optimisation of the process was considered beyond the scope of
the project so the process used for optimising SYBR Safe was not repeated for each of the
remaining dyes.
Further, to exclude effects of the alkyl polymer backbone an additional sample of poly(acrylic
acid) (pAA) was used. This was chosen due to pAA having a significantly improved solubility
in water compared to pHPMA while still retaining an alkyl backbone. The effect of the
isonisable acid was considered acceptable within this approximation to compare to the
ionisation of the phosphate. The pKa of pAA is reported to be 4.521 which puts in in the range
of reported pKa for adenosine of between ∼3.6-4.3.22
Finally, a dT ssDNA 23-mer was also tested with each of the binding dyes. This sequence was
chosen as it was complementary to the dA ssDNA 23-mer, and provided a positive control for
the formation of double stranded DNA and the associated hybridisation
242
6.7.1 Interactions with SYBR Safe Dye
The first dye tested was SYBR Safe. This dye binds to dsDNA, leading to its confinement and
an increase in fluorescence. For this experiment the signal increase for the combination of T6
with dA ssDNA would indicate the formation of a double helix with base pair stacking similar
to that seen in traditional double stranded DNA systems. For that reason the combination of dT
ssDNA and dA ssDNA was also measured, as this would hybridise to form dsDNA.
Samples were prepared at 10 µM with 2.5X SYBR Safe in 10 mM TRIS-HCl buffer, full
experimental details are presented in Chapter 2, Section 2.5.4.4. The samples to undergo
hybridisation have a loading of 10 µM of the duplex to account for hybridisation, i.e. 10 µM
dA ssDNA and 10 µM dT ssDNA results in 10 µM dAdT dsDNA. Fluorescence was measured
at 25 ℃ with the results shown in Figure 6.13.
As expected, Figure 6.13 shows that the combination of dA ssDNA and dT ssDNA resulted
in far greater fluorescence than any other sample, exceeding the detection limit of the
instrument at the maximum permitted gain settings. This showed that the SYBR Safe has an
increased quantum yield in the presence of dsDNA.
Interestingly the fluorescence of the SYBR Safe in the presence of T6 is 290% that seen in the
dA ssDNA and 241% greater than that seen in dT ssDNA alone. This suggests that the T6 only
sample confines the SYBR Safe dye, but the insertion does not lead to a dramatically higher
fluorescence state.
243
Figure 6.13 Background corrected fluorescence of samples treated with SYBR Safe
containing ssDNA and T6 in combinations shown. Samples normalised to dA ssDNA and run
in quadruplicate at gain 10, 25 ℃.
The measured fluorescence of the dA ssDNA + T6 sample was significantly lower than the
fluorescence measured for dsDNA. This indicated that any hybridisation was not in the same
conformation as dsDNA. This result was therefore consistent with the findings of Section 6.4.2.
The lack of fluorescence signal for the pAA shows that the confinement provided by the T6
does not come solely from the hydrophobic alkyl backbone of the polymer.
6.7.2 Interactions with dsGreen
Following testing with SYBR Safe the experiment was repeated with dsGreen, Figure 6.14.
dsGreen was more sensitive to dsDNA than SYBR Safe being both an intercalator and a minor
groove binder with both binding sites causing fluorescence (see Chapter 1, Section 1.4.5 for
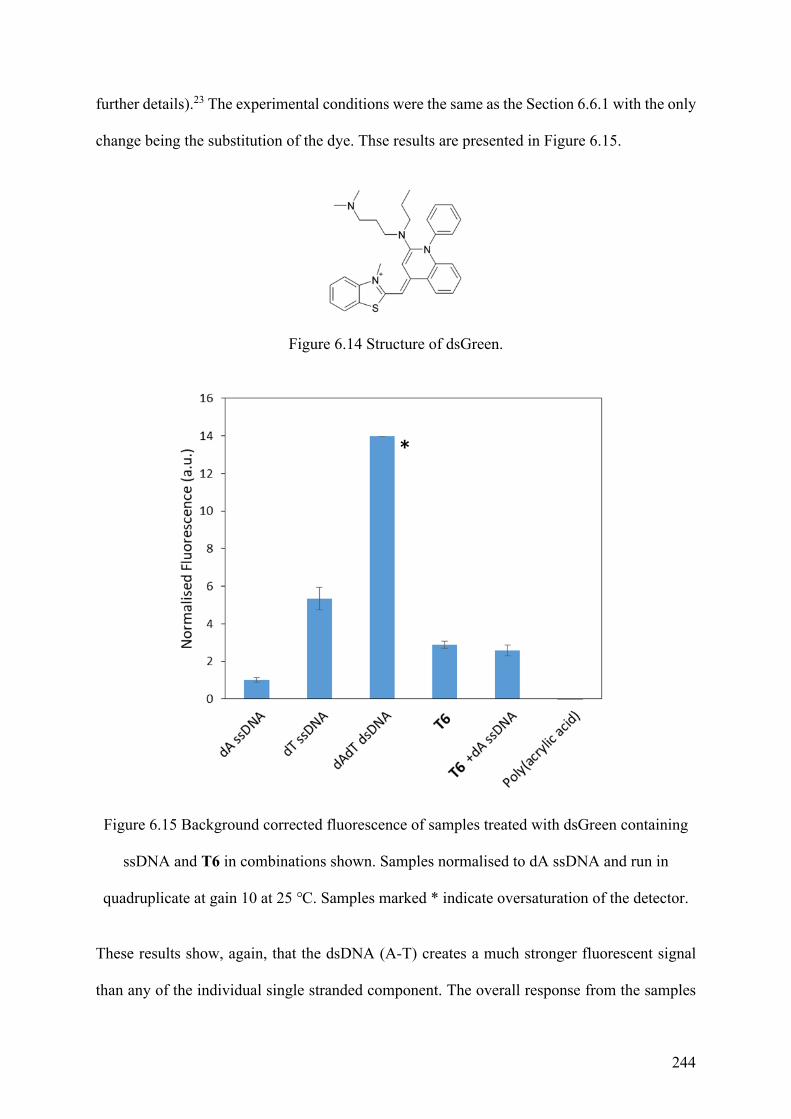
244
further details).23 The experimental conditions were the same as the Section 6.6.1 with the only
change being the substitution of the dye. Thse results are presented in Figure 6.15.
Figure 6.14 Structure of dsGreen.
Figure 6.15 Background corrected fluorescence of samples treated with dsGreen containing
ssDNA and T6 in combinations shown. Samples normalised to dA ssDNA and run in
quadruplicate at gain 10 at 25 ℃. Samples marked * indicate oversaturation of the detector.
These results show, again, that the dsDNA (A-T) creates a much stronger fluorescent signal
than any of the individual single stranded component. The overall response from the samples
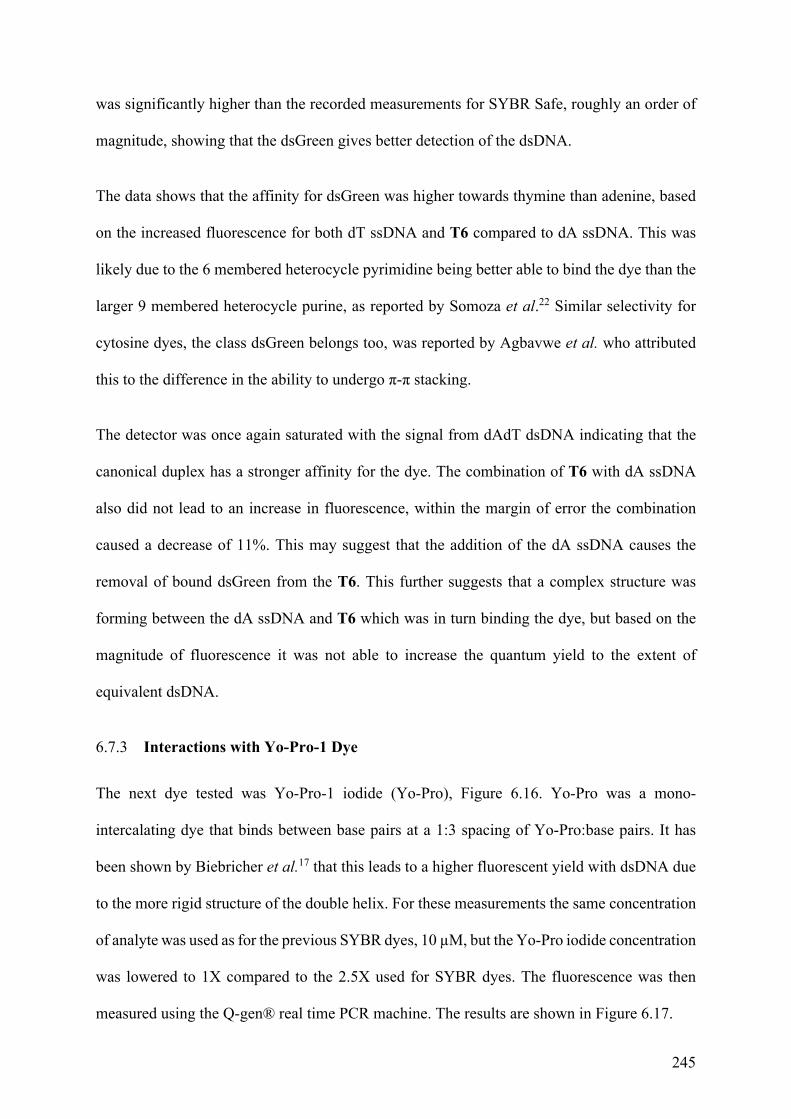
245
was significantly higher than the recorded measurements for SYBR Safe, roughly an order of
magnitude, showing that the dsGreen gives better detection of the dsDNA.
The data shows that the affinity for dsGreen was higher towards thymine than adenine, based
on the increased fluorescence for both dT ssDNA and T6 compared to dA ssDNA. This was
likely due to the 6 membered heterocycle pyrimidine being better able to bind the dye than the
larger 9 membered heterocycle purine, as reported by Somoza et al.22 Similar selectivity for
cytosine dyes, the class dsGreen belongs too, was reported by Agbavwe et al. who attributed
this to the difference in the ability to undergo π-π stacking.
The detector was once again saturated with the signal from dAdT dsDNA indicating that the
canonical duplex has a stronger affinity for the dye. The combination of T6 with dA ssDNA
also did not lead to an increase in fluorescence, within the margin of error the combination
caused a decrease of 11%. This may suggest that the addition of the dA ssDNA causes the
removal of bound dsGreen from the T6. This further suggests that a complex structure was
forming between the dA ssDNA and T6 which was in turn binding the dye, but based on the
magnitude of fluorescence it was not able to increase the quantum yield to the extent of
equivalent dsDNA.
6.7.3 Interactions with Yo-Pro-1 Dye
The next dye tested was Yo-Pro-1 iodide (Yo-Pro), Figure 6.16. Yo-Pro was a mono-
intercalating dye that binds between base pairs at a 1:3 spacing of Yo-Pro:base pairs. It has
been shown by Biebricher et al.17 that this leads to a higher fluorescent yield with dsDNA due
to the more rigid structure of the double helix. For these measurements the same concentration
of analyte was used as for the previous SYBR dyes, 10 µM, but the Yo-Pro iodide concentration
was lowered to 1X compared to the 2.5X used for SYBR dyes. The fluorescence was then
measured using the Q-gen® real time PCR machine. The results are shown in Figure 6.17.
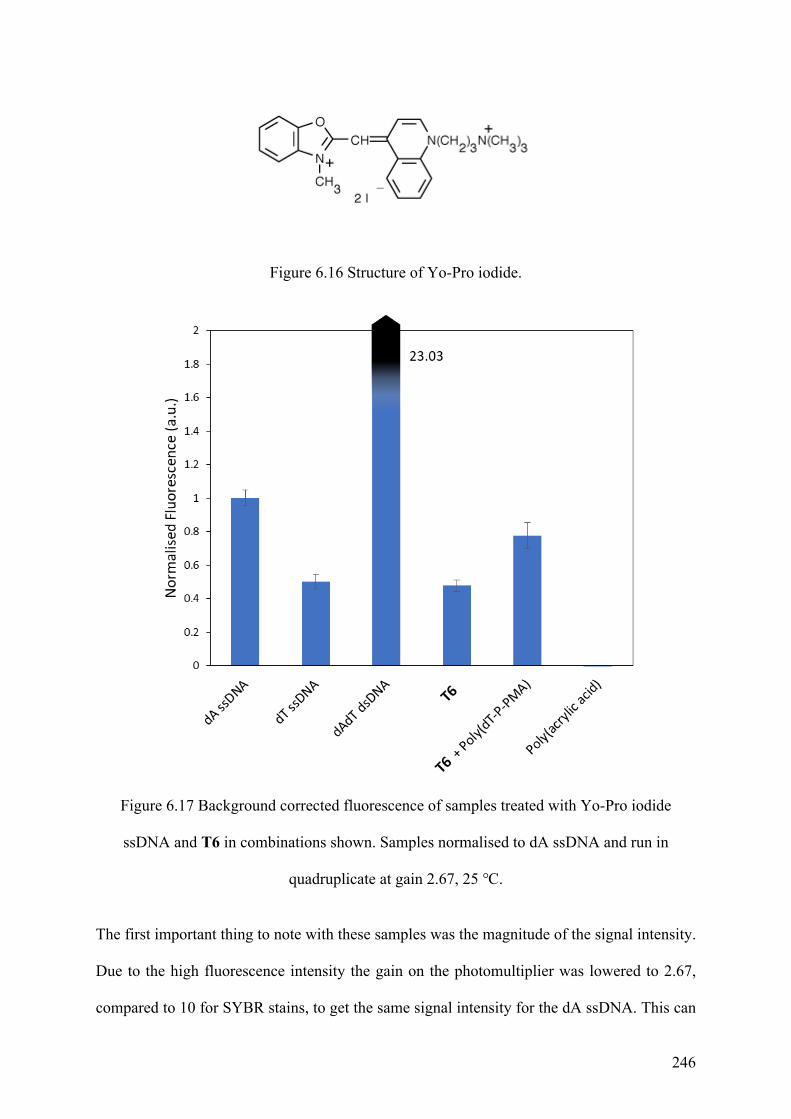
246
Figure 6.16 Structure of Yo-Pro iodide.
Figure 6.17 Background corrected fluorescence of samples treated with Yo-Pro iodide
ssDNA and T6 in combinations shown. Samples normalised to dA ssDNA and run in
quadruplicate at gain 2.67, 25 ℃.
The first important thing to note with these samples was the magnitude of the signal intensity.
Due to the high fluorescence intensity the gain on the photomultiplier was lowered to 2.67,
compared to 10 for SYBR stains, to get the same signal intensity for the dA ssDNA. This can
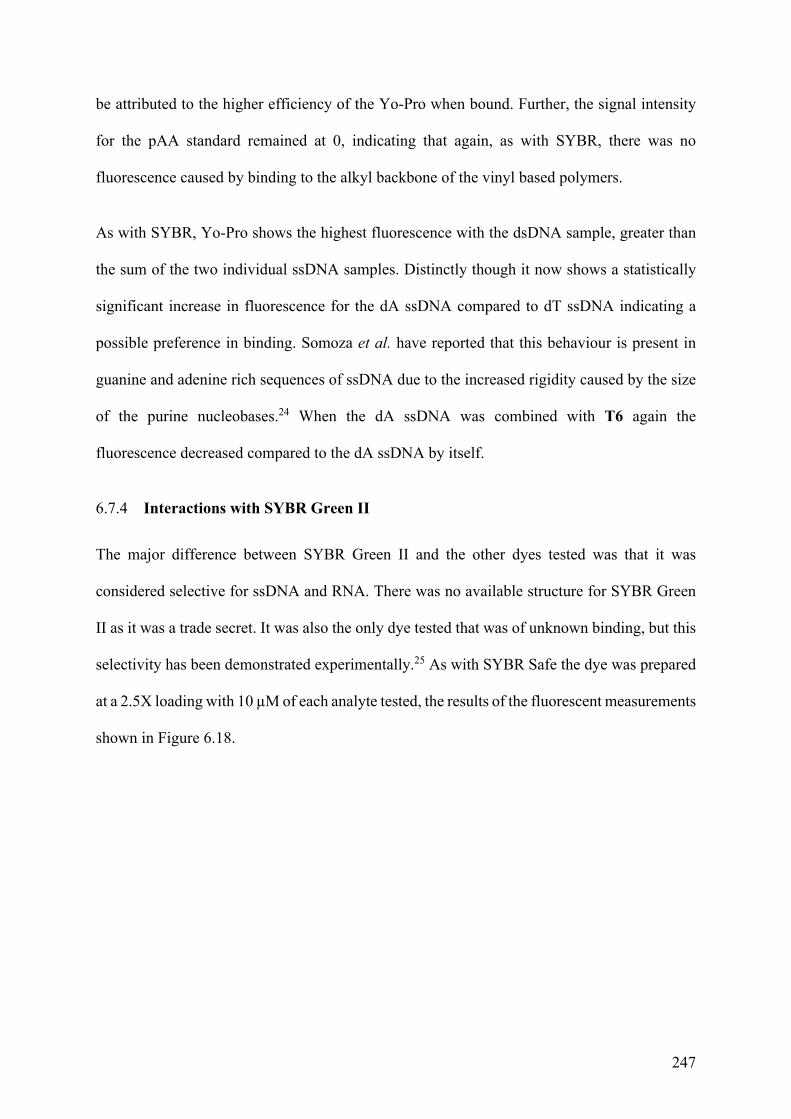
247
be attributed to the higher efficiency of the Yo-Pro when bound. Further, the signal intensity
for the pAA standard remained at 0, indicating that again, as with SYBR, there was no
fluorescence caused by binding to the alkyl backbone of the vinyl based polymers.
As with SYBR, Yo-Pro shows the highest fluorescence with the dsDNA sample, greater than
the sum of the two individual ssDNA samples. Distinctly though it now shows a statistically
significant increase in fluorescence for the dA ssDNA compared to dT ssDNA indicating a
possible preference in binding. Somoza et al. have reported that this behaviour is present in
guanine and adenine rich sequences of ssDNA due to the increased rigidity caused by the size
of the purine nucleobases.24 When the dA ssDNA was combined with T6 again the
fluorescence decreased compared to the dA ssDNA by itself.
6.7.4 Interactions with SYBR Green II
The major difference between SYBR Green II and the other dyes tested was that it was
considered selective for ssDNA and RNA. There was no available structure for SYBR Green
II as it was a trade secret. It was also the only dye tested that was of unknown binding, but this
selectivity has been demonstrated experimentally.25 As with SYBR Safe the dye was prepared
at a 2.5X loading with 10 µM of each analyte tested, the results of the fluorescent measurements
shown in Figure 6.18.
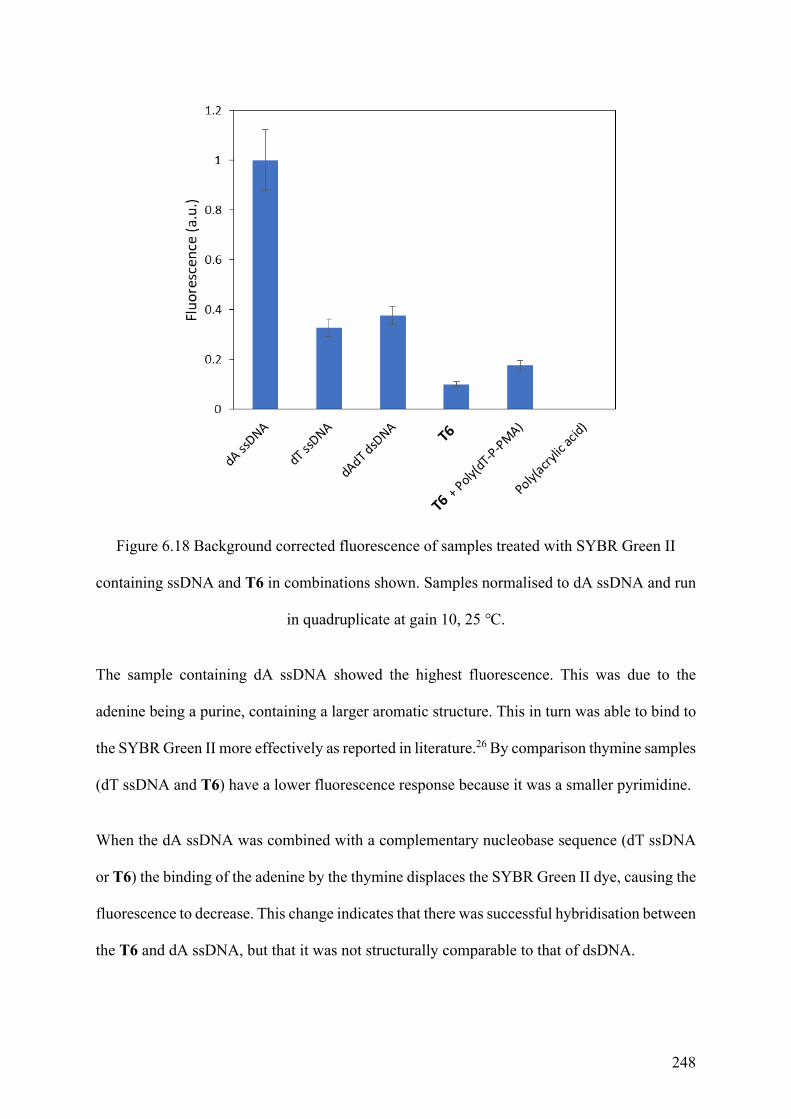
248
Figure 6.18 Background corrected fluorescence of samples treated with SYBR Green II
containing ssDNA and T6 in combinations shown. Samples normalised to dA ssDNA and run
in quadruplicate at gain 10, 25 ℃.
The sample containing dA ssDNA showed the highest fluorescence. This was due to the
adenine being a purine, containing a larger aromatic structure. This in turn was able to bind to
the SYBR Green II more effectively as reported in literature.26 By comparison thymine samples
(dT ssDNA and T6) have a lower fluorescence response because it was a smaller pyrimidine.
When the dA ssDNA was combined with a complementary nucleobase sequence (dT ssDNA
or T6) the binding of the adenine by the thymine displaces the SYBR Green II dye, causing the
fluorescence to decrease. This change indicates that there was successful hybridisation between
the T6 and dA ssDNA, but that it was not structurally comparable to that of dsDNA.
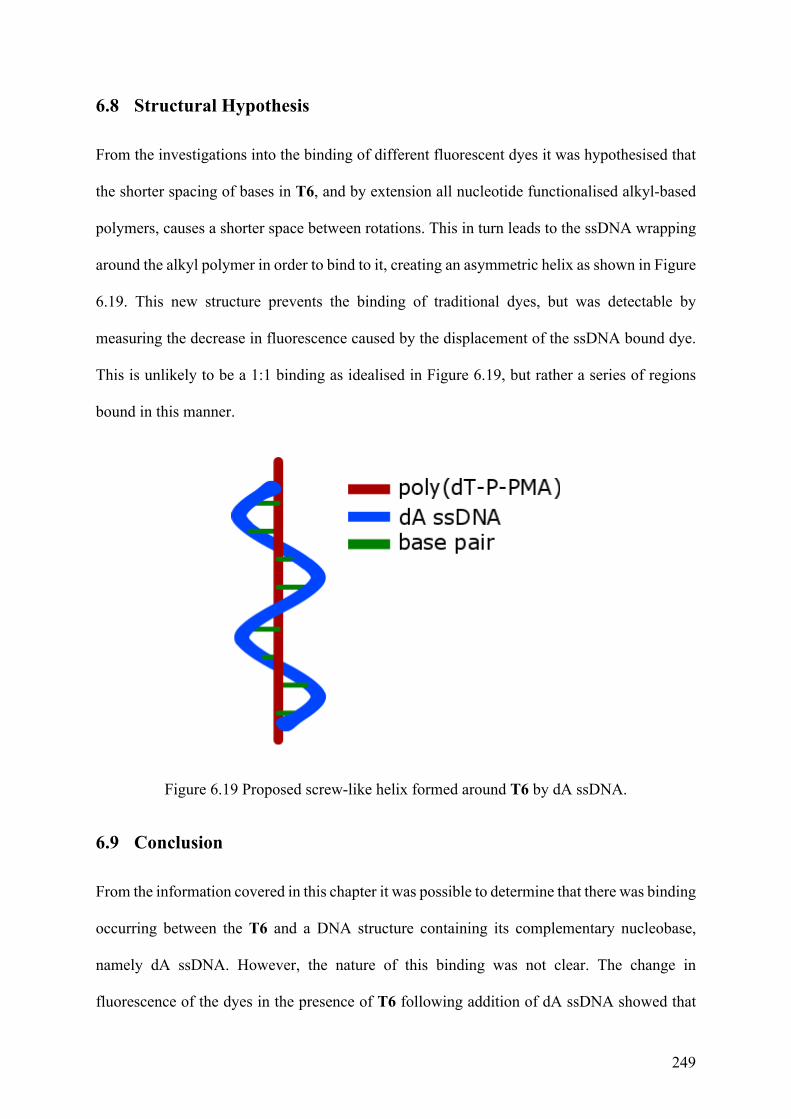
249
6.8 Structural Hypothesis
From the investigations into the binding of different fluorescent dyes it was hypothesised that
the shorter spacing of bases in T6, and by extension all nucleotide functionalised alkyl-based
polymers, causes a shorter space between rotations. This in turn leads to the ssDNA wrapping
around the alkyl polymer in order to bind to it, creating an asymmetric helix as shown in Figure
6.19. This new structure prevents the binding of traditional dyes, but was detectable by
measuring the decrease in fluorescence caused by the displacement of the ssDNA bound dye.
This is unlikely to be a 1:1 binding as idealised in Figure 6.19, but rather a series of regions
bound in this manner.
Figure 6.19 Proposed screw-like helix formed around T6 by dA ssDNA.
6.9 Conclusion
From the information covered in this chapter it was possible to determine that there was binding
occurring between the T6 and a DNA structure containing its complementary nucleobase,
namely dA ssDNA. However, the nature of this binding was not clear. The change in
fluorescence of the dyes in the presence of T6 following addition of dA ssDNA showed that
250
there was binding occurring between them. The magnitude of the change in fluorescence seen
following the addition showed that the spacing of nucleotides does not offer the same
confinement of the dye as it did for the similar complementary dsDNA under the same
conditions. It was hypothesised that this was the result of the shorter spacing between bases in
the T6 caused by the shorter distance between repeating units in the polymer chain, compared
to dT ssDNA equivalent, impairing the binding of the subsequent confinement of the dye which
would have led to a higher fluorescence signal.
6.10 References
(1) Caruthers, M. H. Gene Synthesis Machines: DNA Chemistry and Its Uses. Science 1985,
230 (4723), 281–285.
(2) Cahill, R.; Cookson, R. C.; Crabb, T. A. Geminal Coupling Constants in Methylene
Groups-II. J in CH2 Groups α to Heteroatoms. Tetrahedron 1969, 25 (19), 4681–4709.
(3) Breslauer, K. J.; Frank, R.; Blocker, H.; Marky, L. A. Predicting DNA Duplex Stability
from the Base Sequence. Proc. Natl. Acad. Sci. 1986, 83 (11), 3746–3750.
(4) Huguet, J. M.; Ribezzi-Crivellari, M.; Bizarro, C. V.; Ritort, F. Derivation of Nearest-
Neighbor DNA Parameters in Magnesium from Single Molecule Experiments. Nucleic
Acids Res. 2017, 45 (22), 12921–12931.
(5) Russell, M. A.; Laws, A. P.; Atherton, J. H.; Page, M. I. The Mechanism of the
Phosphoramidite Synthesis of Polynucleotides. Org. Biomol. Chem. 2008, 6 (18), 3270.
(6) Zhang, L.; Zhou, W. Two Descent Hybrid Conjugate Gradient Methods for
Optimization. J. Comput. Appl. Math. 2008, 216 (1), 251–264.
251
(7) Livieris, I. E.; Tampakas, V.; Pintelas, P. A Descent Hybrid Conjugate Gradient Method
Based on the Memoryless BFGS Update. Numer. Algorithms 2018, 79 (4), 1169–1185.
(8) Yang, X.; Luo, Z.; Dai, X. A Global Convergence of LS-CD Hybrid Conjugate Gradient
Method. Adv. Numer. Anal. 2013, 2013, 1–5.
(9) Beers, K. L.; Boo, S.; Gaynor, S. G.; Matyjaszewski, K. Atom Transfer Radical
Polymerization of 2-Hydroxyethyl Methacrylate. Macromolecules 1999, 32 (18), 5772–
5776.
(10) Robinson, K. L.; Khan, M. A.; De Paz Báñez, M. V.; Wang, X. S.; Armes, S. P.
Controlled Polymerization of 2-Hydroxyethyl Methacrylate by ATRP at Ambient
Temperature. Macromolecules 2001, 34 (10), 3155–3158.
(11) Desjardins, P.; Conklin, D. NanoDrop Microvolume Quantitation of Nucleic Acids. J.
Vis. Exp. 2010, No. 45.
(12) Bhushan, B. Handbook of Nanomaterials Properties; 2006; Vol. 44.
(13) Gray, B. Basic Biochemical Methods. Biochem. Educ. 1985, 13 (4), 186.
(14) Xodo, L. E. Characterization of the DNA Triplex Formed by
d(TGGGTGGGTGGTTGGGTGGG) and a Critical R · Y Sequence Located in the
Promoter of the Murine Ki-Ras Proto-Oncogene. FEBS Lett. 1995, 370 (1–2), 153–157.
(15) Rosu, F.; Gabelica, V.; De Pauw, E.; Antoine, R.; Broyer, M.; Dugourd, P. UV
Spectroscopy of DNA Duplex and Quadruplex Structures in the Gas Phase. J. Phys.
Chem. A 2012, 116 (22), 5383–5391.
(16) Rhodes, W. The Symmetry and Spectral Properties of Helical Polynucleotides. Radiat.
252
Res. 1963, 20 (1), 120.
(17) Biebricher, A. S.; Heller, I.; Roijmans, R. F. H.; Hoekstra, T. P.; Peterman, E. J. G.;
Wuite, G. J. L. The Impact of DNA Intercalators on DNA and DNA-Processing
Enzymes Elucidated through Force-Dependent Binding Kinetics. Nat. Commun. 2015,
6 (1), 7304.
(18) Armitage, B. A. Cyanine Dye-DNA Interactions: Intercalation, Groove Binding, and
Aggregation. Top. Curr. Chem. 2005, 253, 55–76.
(19) Gudnason, H.; Dufva, M.; Bang, D. D.; Wolff, A. Comparison of Multiple DNA Dyes
for Real-Time PCR: Effects of Dye Concentration and Sequence Composition on DNA
Amplification and Melting Temperature. Nucleic Acids Res. 2007, 35 (19), e127.
(20) Bou, S. J. M. C.; Connolly, A. R.; Ellis, A. V. High-Throughput Physicochemical
Analysis of Thermoresponsive Polymers. Polym. Chem. 2018, 9 (15), 1934–1937.
(21) Michaels, A.S.; Morelos, O.; Polyelectrolyte adsorption by kaolinite. Ind Eng Chem.
1955, 47,1801–1809
(22) Thaplyal, P.; Bevilacqua, P.C.; Experimental Approaches for Measuring pKa's in RNA
and DNA, Methods Enzymol. 2014; 549: 189–219.
(23) Zipper, H.; Brunner, H.; Bernhagen, J.; Vitzthum, F. Investigations on DNA
Intercalation and Surface Binding by SYBR Green I, Its Structure Determination and
Methodological Implications. Nucleic Acids Res. 2004, 32 (12), e103–e103.
(24) Agbavwe, C.; Somoza, M. M. Sequence-Dependent Fluorescence of Cyanine Dyes on
Microarrays. PLoS One 2011, 6 (7), e22177.
253
(25) Law, J. C.; Facher, E. A.; Deka, A. Nonradioactive Single-Strand Conformation
Polymorphism Analysis with Application for Mutation Detection in a Mixed Population
of Cells. Anal. Biochem. 1996, 236 (2), 373–375.
(26) Section 8.1-Nucleic Acid Stains, The Molecular Probes Handbook, Thermofisher
Technical Reference Library. Accessed online 2018-06-20.
254
7 Chapter 7: Conclusion
7.1 Synopsis
This aim of this thesis was to develop a method for the synthesis of alkyl based polymers bearing nucleotide functionality with a view to creating a DNA analogue. Chapter 3 demonstrated the fundamental basis for the process through the phosphoramidite coupling method to generate the required class of monomer. Chapter 4 built on this to show that a polymer could be synthesised that contained guanine functionality. This polymer and its secondary interactions were further investigated in Chapter 5 with the determination that they formed complexes analogous to those found in DNA. Chapter 6 applied the techniques and information gathered to determine that the thymine nucleotide polymer bioconjugate underwent binding to complementary DNA.
255
7.2 Concluding Remarks and Future Work.
Chapter 1 presented the prior work on the convergence of biological nucleic acid and synthetic
polymerisation techniques, demonstrating that nature has already achieved what artificial
methods are still attempting to replicate (Section 1.5.2). The body of literature presented shows
that achieving this through a hybrid method of combined biological and synthetic techniques
has formed a foundation on which to build. The incorporation of nucleic acid fragments has
already built a foundation for this work (Section 1.7). Building upon that, this thesis has
developed a monomer possessing both nucleic acid and radical polymerisation compatible
moieties. What has made this work unique is that it is the first to combine the full nucleic acid
repeating unit, a nucleotide.
The work presented in Chapter 3 demonstrated the coupling method for attaching a vinyl
moiety from a methacrylate, to a nucleotide in the form of 5′-dimethoxytrityl-N-benzoyl-2′-
deoxycytosine,3′-[(2-cyanoethyl)-(N,N-diisopropyl)]-phosphoramidite (Section 3.3). This was
achieved through the use of a modified phosphoramidite coupling method, created for this
project. This resulted in the formation of the C3 monomer. Confirmation of this coupling was
achieved through the use of proton and 31phosphorous nuclear magnetic resonance (NMR)
spectroscopy. This was through the substitution of the diisopropyl amine peak at 1.2 ppm with
a pair of peaks associated with the HPMA conjugation at 6.25 ppm and 5.7 ppm.
Subsequently the bioconjugate monomer was found to undergo radical polymerisation
successfully, but testing resulted in the formation of a polymer-gel (Section 3.4). The remainder
of the chapter investigated the formation of this gel, determining its characteristics and
properties to prevent it happening in subsequent iterations of the procedure. Fourier transform
infrared spectroscopy demonstrated that the nucleic acid functionality had been retained within
the gel, ruling out hydrolysis of the nucleotide connection to the methacrylate. Testing with a
256
variety of solvents revealed that the most likely cause of the C4 forming a gel was the diene
caused by substitution of the methacrylate moieties while in solution.
Chapter 4 demonstrated how the limitations of the initial method could be overcome for the
synthesis of a monomer capable of forming a stable polymer by adjusting the vinyl source to
clock the substitution that caused the diene to form (Section 4.2). This was achieved using a 2-
hydroxypropyl methacrylate, and conjugating it to the 5'-dimethoxytrityl-N-isobutyryl-2'-
deoxyguanosine,3'-[(2-cyanoethyl)-(diisopropyl)]-phosphoramidite, resulting in 5'-
dimethoxytrityl-N-isobutyryl-2'-deoxyguanosine,3'-[(2-cyanoethyl)-(oxypropyl ethacrylate)]-
phosphate monomer. This conjugation was again confirmed through the use of proton and
31phosphorous NMR spectroscopy (Section 4.3). The appearance of peaks 3.6 ppm and 5.3
ppm in the proton NMR spectrum combined with the removal of the 2.9 ppm peak associated
with the substituted diisopropyl amine confirmed the conjugation. The 31phosphorous NMR
showed a shift from 148 ppm to the 2 ppm range indicating that the phosphorous had oxidised
to the desired P(V) state of the phosphate.
The successful conjugation was further confirmed through the use of electrospray ionisation
mass spectrometry where the peak at 883 m/z and the associated adducts further confirmed the
conjugation.
Chapter 4 further demonstrated the compatibility of the G3 monomer with radical
polymerisation and the controlled growth that could be achieved (Section 4.4). Though
preliminary experiments showed the formation of a stable suspension, further investigated in
Chapter 5, the successful polymerisation was confirmed through size exclusion
chromatography.

257
Additional investigation of the polymerisation of G3 utilised both in-situ an ex-situ
measurements to determine that the polymerisation was proceeding under RAFT mediated
conditions (Section 4.5). The in-situ NMR spectroscopy methods demonstrated that the
polymerisation of G3 monomer initially begins under the expected RAFT control based on the
distinct growth period, followed by a decrease as monomer availability in solution decreases.
The addition of SEC as a technique showed that there is a distinct plateau in the rate of
polymerisation at ~22 repeating units incorporated, indicating the maximum Mw attainable
using this methodology.
Chapter 5 investigated the formation of particles from the G6 in solution. It was found that
these particles were forming as the result of g-quartets forming between the guanine units of
the G6 chains, resulting in the formation of g-quadruplexes (Section 5.3).1 These g-
quadruplexes were found to form more strongly in the presence of the monovalent potassium,
consistent with the g-quadruplexes found in other DNA systems. The measurement of the
structures formed using the ATTO 550 fluorescent dye with microscopy and melting analysis
indicated the formation of a vesicle like structure with a hydrophobic shell and hydrophilic
core (Section 5.5).
Finally, Chapter 6 investigated the formation of duplexes between the thymine functionalised
homopolymer, T6 and a complementary sequence dA ssDNA. Computer modelling using the
Firefly computational modelling system demonstrated that the binding was possible, and
introduced strain to the system forming a non-typical structure (Section 6.4). This was further
supported through the investigation of the binding with florescence dyes, comparing their
relative affinity to the canonical DNA duplex to that seen for the polymer-ssDNA duplex
(Section 6.7).
258
7.3 Future Work
The synthesis of nucleotide functionalised polymers as presented in this thesis demonstrate a
distinct method to those presented previously. The resulting polymers bare a structural
similarity closer, to that seen in natural systems, and therefore should be further investigated
in systems where this similarity may provide a benefit.
Most notably among these is enzymatic compatibility. The polymers presented here show that
when a vinyl back bone is generated through a radical addition there remains a binding affinity
for DNA, as presented in Chapter 6. The extension of this then would be to generate a ribose
phosphate backbone using a polymerase enzyme and determine if this allows the radical
polymerisation to be conducted afterwards. If possible, this presents a route for the synthesis
of sequence-controlled polymers beyond what has been achieved to date.2 Along this line then
is the expansion of the monomer library, utilising different vinyl sources such as the amides
considered in Chapter 3 Section 3.2.2, and non-natural nucleotides.
Utilising the current polymers though there is scope to investigate their binding and use as a
scaffold in the synthesis of nanostructures. Previous literature has shown that DNA can be used
to form structures through origami like folding,2,3 but the potential to create these structures
from more resilient alkyl polymers increases the range of potential applications.
The potential resilience of the alkyl based polymers able to bind DNA selectively could also
increase the availability of DNA sensors. Currently the conditions required for the preservation
of DNA restrict their possible application. The polymers presented here may assist in
overcoming this as the alkyl based polymer would be incompatible with biological breakdown
mechanisms, such as bacteria, and more thermally stable due to the carbon-carbon back bone.
259
To determine if this is the case further work is required to investigate the biocompatibility of
the polymers presented.
Overall, the work presented in this thesis is a significant step towards the use of biological
processes for the synthesis of tailored artificial polymers over a broad range of applications.
7.4 References
1. Wilson, M. J., Fenati, R. A., Williams, E. G. L., Ellis, A. V. New J. Chem., 2018, 42,
8815–8822.
2. Yang, D., Campolongo, M. J., Nhi Tran, T. N., Ruiz, R. C. H., Kahn, J. S., Luo, D.
Wiley Interdiscip. Rev. Nanomedicine Nanobiotechnology, 2010, 2, 648–669.
3. Kuzuya, A., Komiyama, M. Nanoscale, 2010, 2, 310–322.
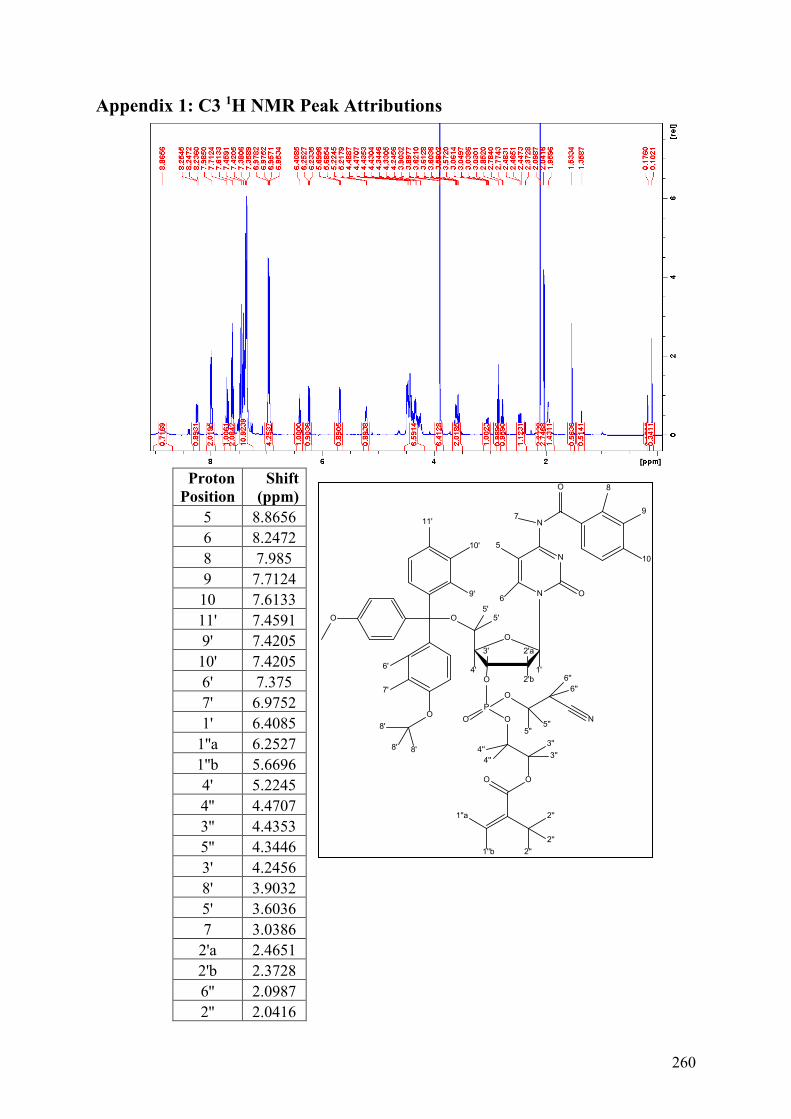
260
Appendix 1: C3 1H NMR Peak Attributions
Proton Position
Shift (ppm)
5 8.8656 6 8.2472 8 7.985 9 7.7124 10 7.6133 11' 7.4591 9' 7.4205 10' 7.4205 6' 7.375 7' 6.9752 1' 6.4085
1''a 6.2527 1''b 5.6696 4' 5.2245 4'' 4.4707 3'' 4.4353 5'' 4.3446 3' 4.2456 8' 3.9032 5' 3.6036 7 3.0386
2'a 2.4651 2'b 2.3728 6'' 2.0987 2'' 2.0416
O O
OP
O
O
O
N
O
2'b
2'a3'
1'4'
O
N
N
N
O
O
O
O
11'
10'
9'
6'
7'
1''a
1''b
2''
2''2''
3''3''
4''4''
6''6''
5''5''
5'5'
6
5
7
8
9
10
8' 8'
8'
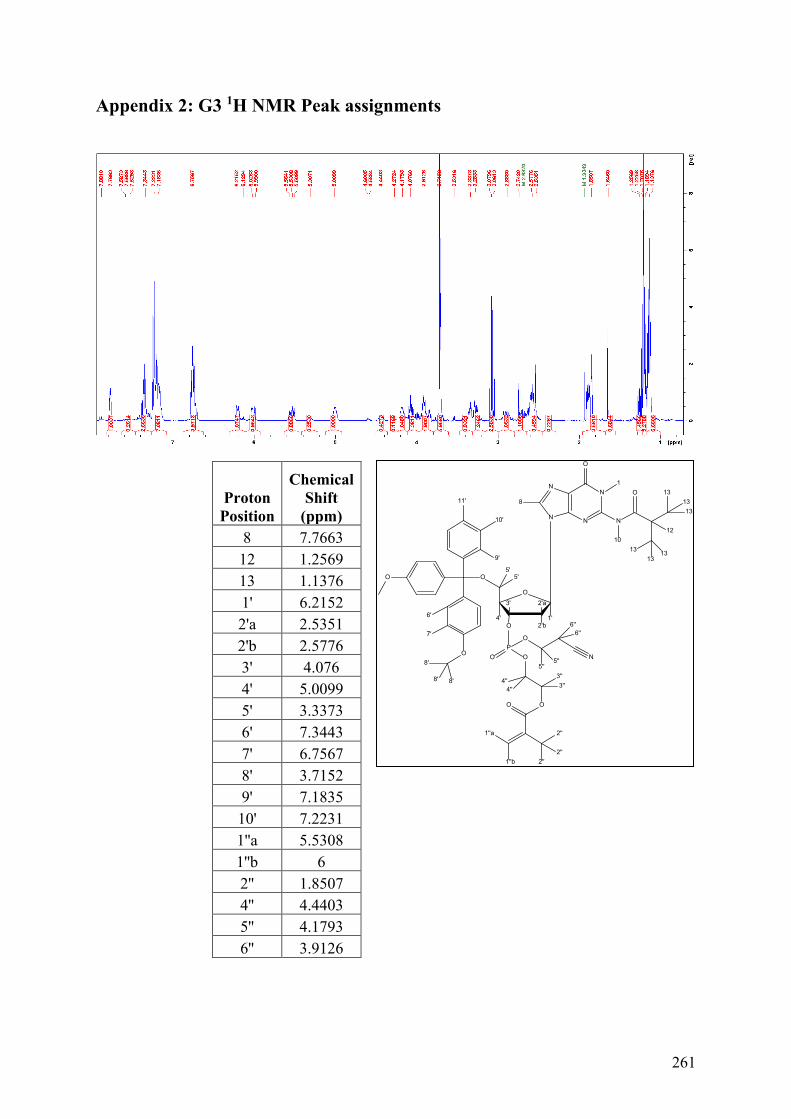
261
Appendix 2: G3 1H NMR Peak assignments
Proton Position
Chemical Shift
(ppm) 8 7.7663 12 1.2569 13 1.1376 1' 6.2152 2'a 2.5351 2'b 2.5776 3' 4.076 4' 5.0099 5' 3.3373 6' 7.3443 7' 6.7567 8' 3.7152 9' 7.1835 10' 7.2231 1''a 5.5308 1''b 6 2'' 1.8507 4'' 4.4403 5'' 4.1793 6'' 3.9126
O O
OP
O
O
O
N
O
2'b
2'a3'
1'4'
OO
O
11'
10'
9'
6'
7'
1''a
1''b
2''
2''2''
3''3''
4''4''
6''6''
5''5''
5'5'
8' 8'
8'
N
NN
N
O
N
8
1
10
O 131313
1313
13
12
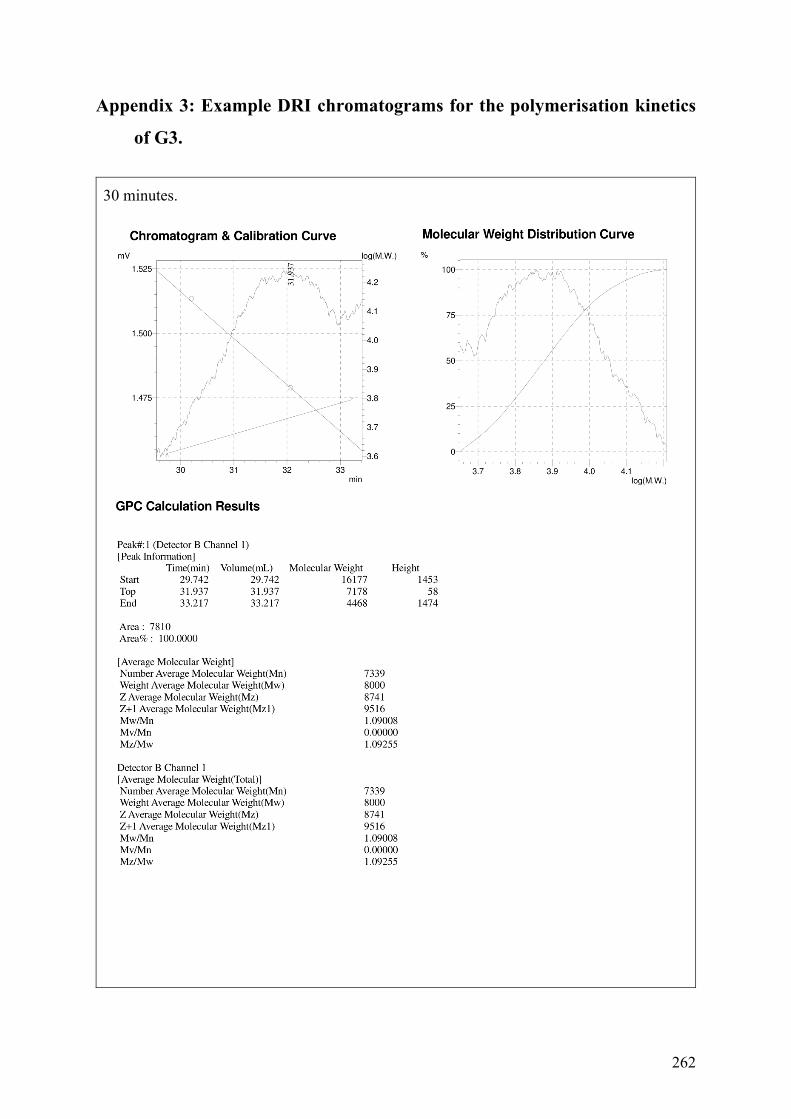
262
Appendix 3: Example DRI chromatograms for the polymerisation kinetics
of G3.
30 minutes.
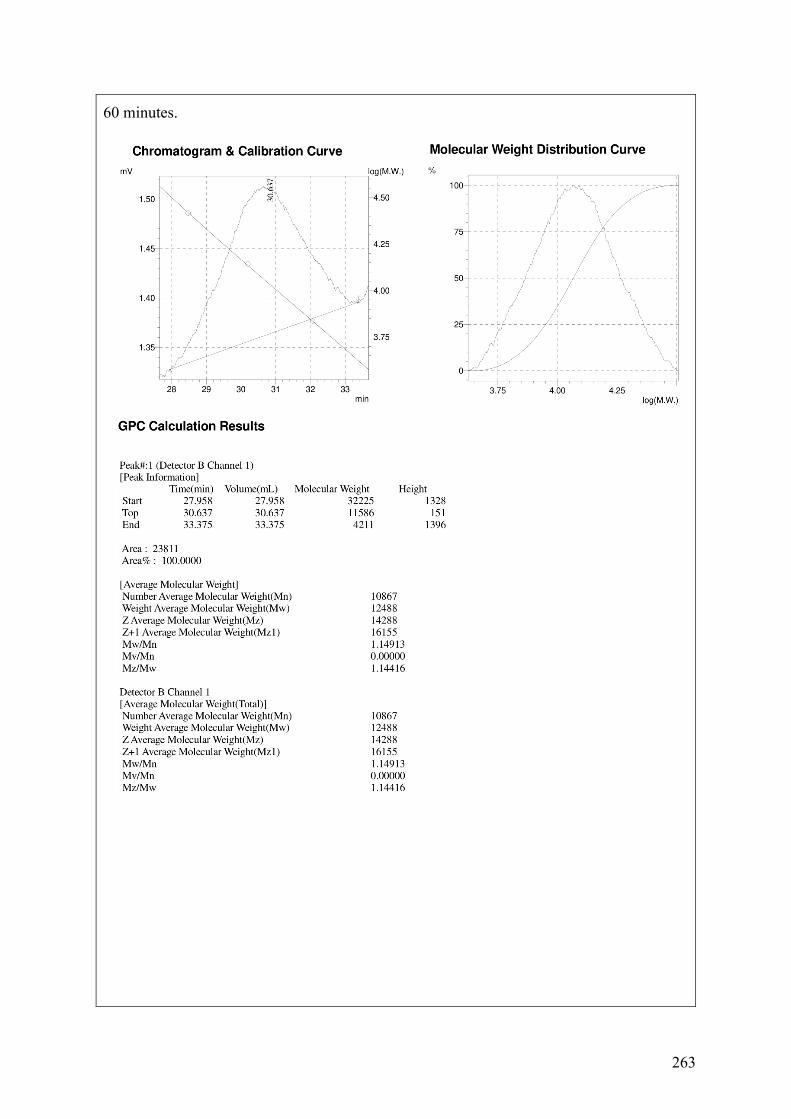
263
60 minutes.
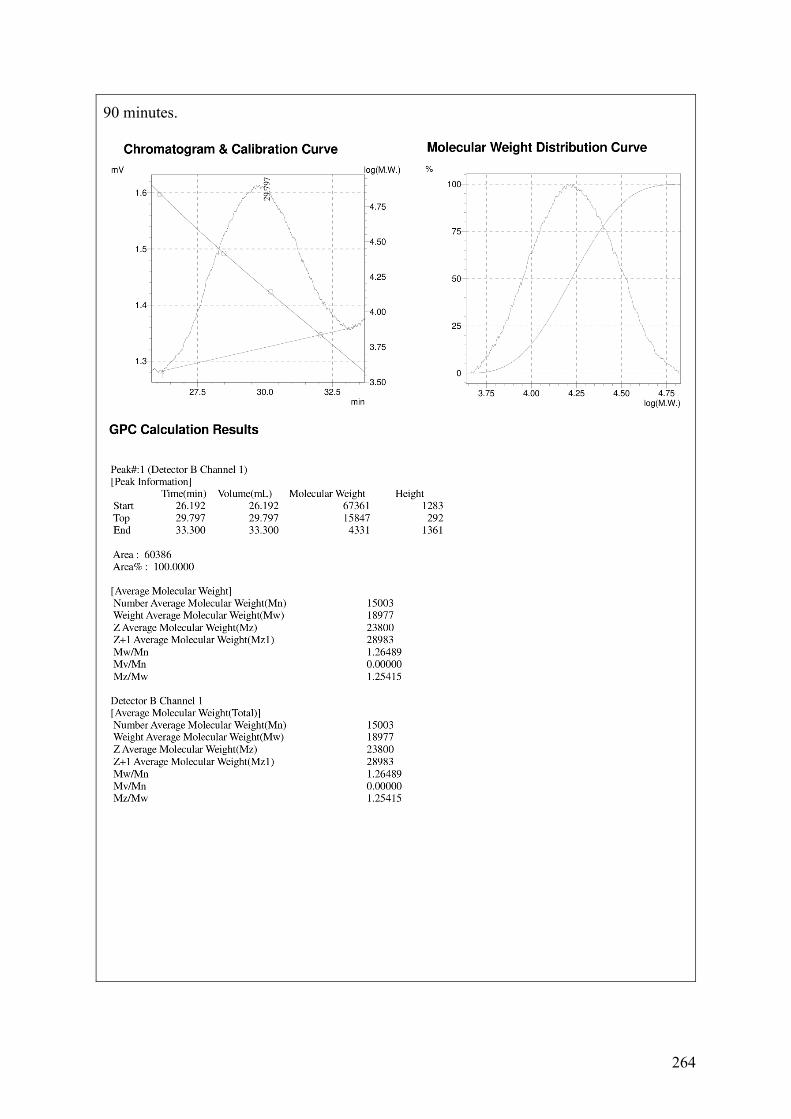
264
90 minutes.
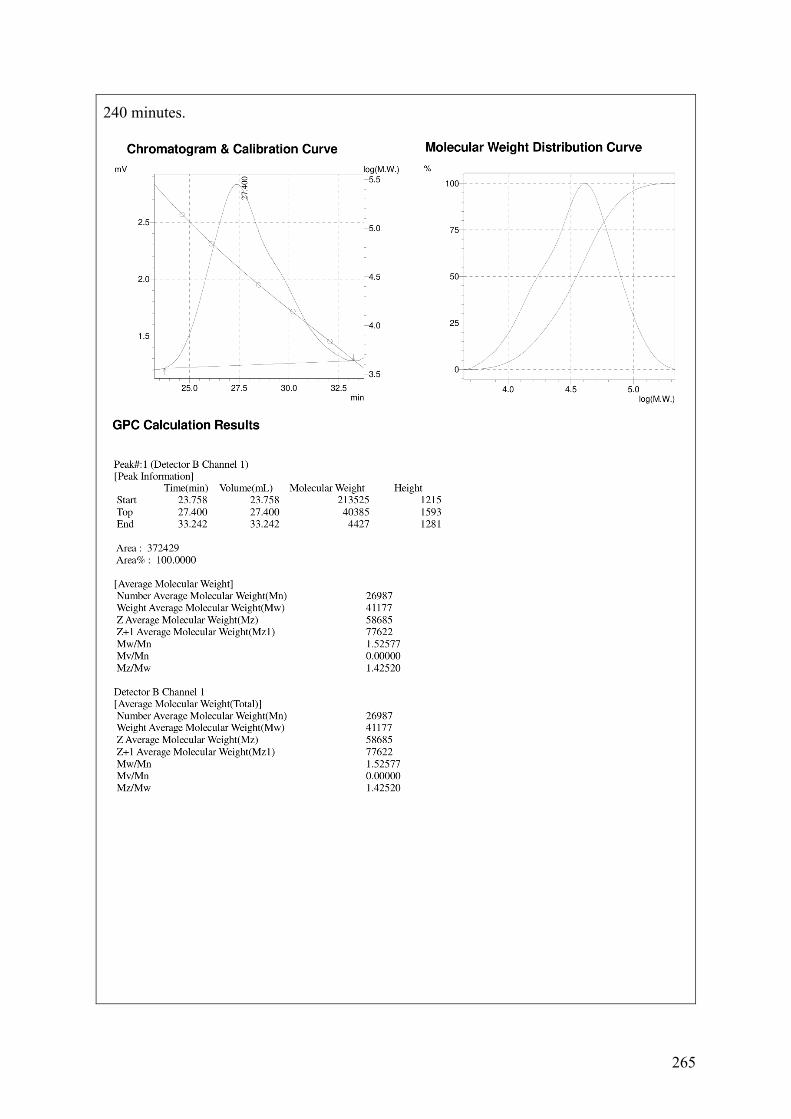
265
240 minutes.
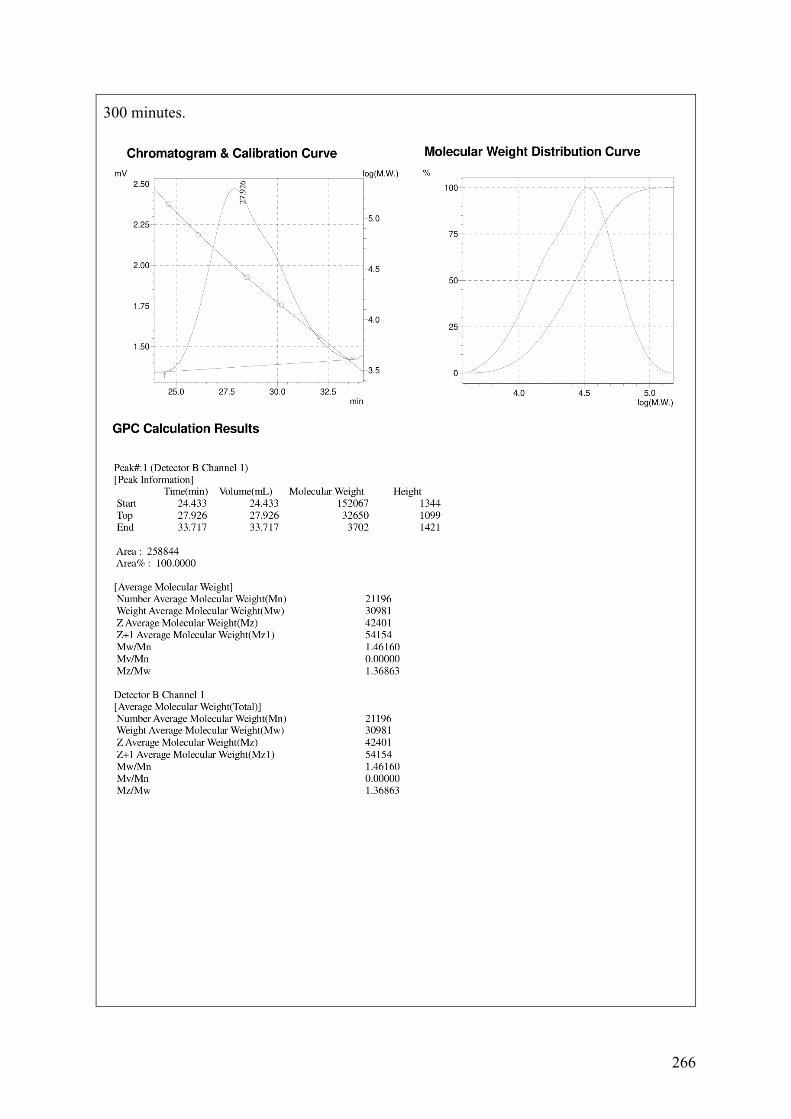
266
300 minutes.
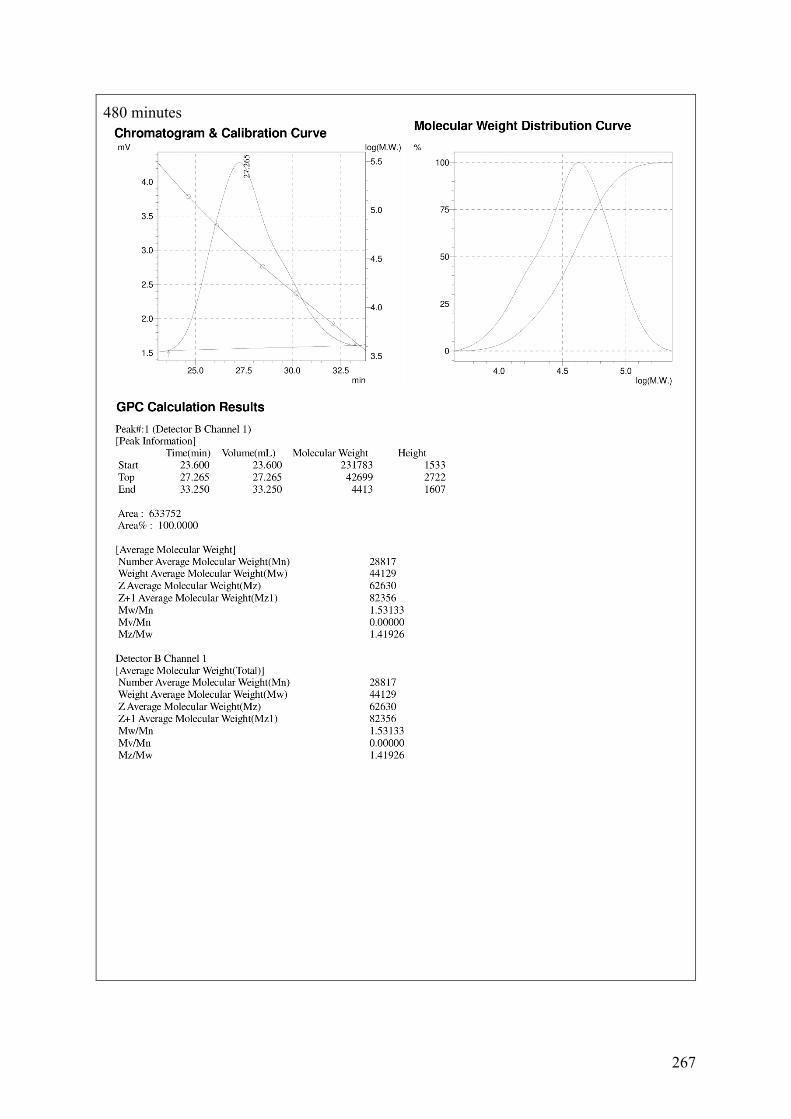
267
480 minutes
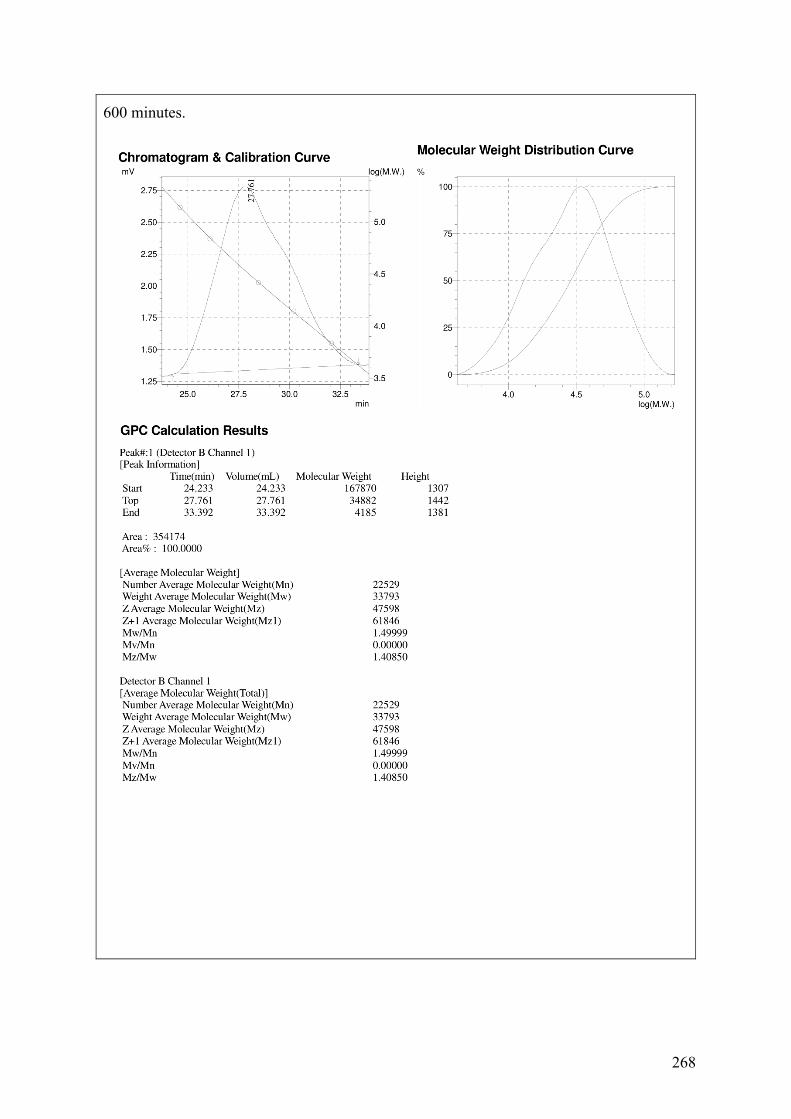
268
600 minutes.
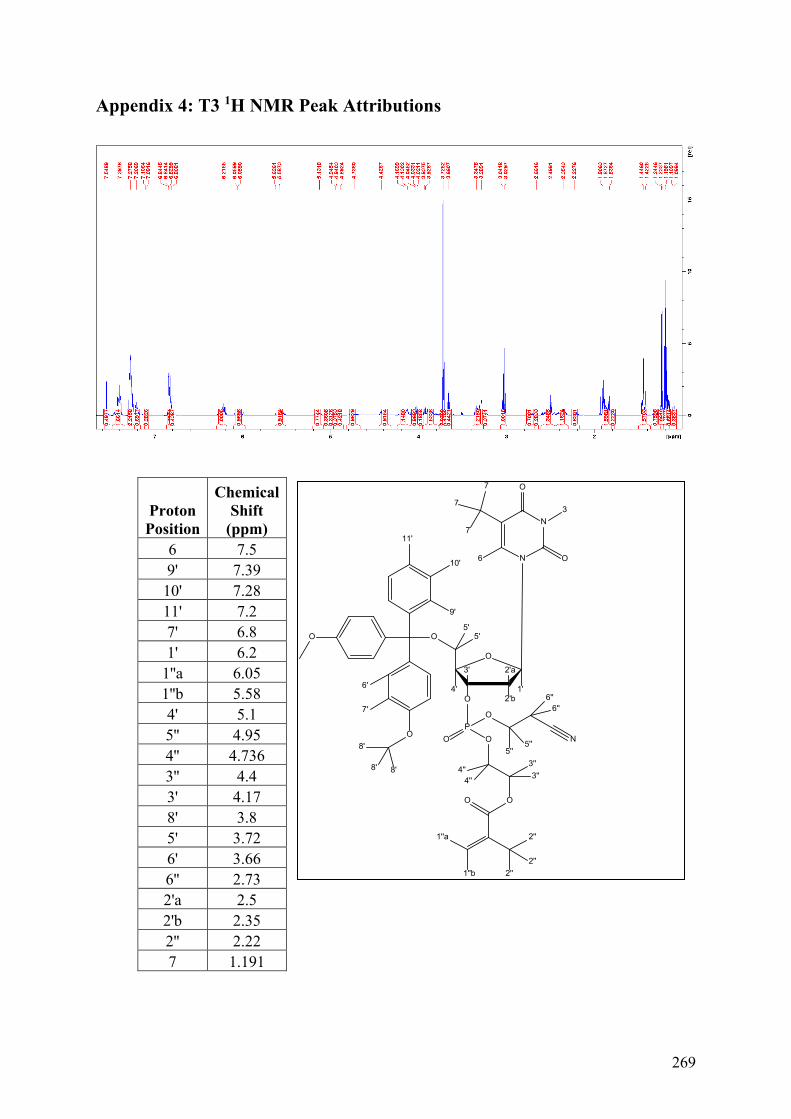
269
Appendix 4: T3 1H NMR Peak Attributions
Proton Position
Chemical Shift
(ppm) 6 7.5 9' 7.39 10' 7.28 11' 7.2 7' 6.8 1' 6.2
1''a 6.05 1''b 5.58 4' 5.1 5'' 4.95 4'' 4.736 3'' 4.4 3' 4.17 8' 3.8 5' 3.72 6' 3.66 6'' 2.73 2'a 2.5 2'b 2.35 2'' 2.22 7 1.191
O O
OP
O
O
O
N
O
2'b
2'a3'
1'4'
OO
O
11'
10'
9'
6'
7'
1''a
1''b
2''
2''2''
3''3''
4''4''
6''6''
5''5''
5'5'
8' 8'
8'
N
N
O
O6
3
7
7
7