Isolation and Characterisation of Novel Glycosaminoglycan ...
180
i Isolation and Characterisation of Novel Glycosaminoglycan-like Polysaccharides Derived from Marine Molluscs with Antiproliferative activity Abdullah Faisal K Aldairi Submitted in Partial Fulfilment of the requirements for the Degree of Doctor of Philosophy School of Environment and Life Sciences University of Salford, Manchester, UK 2019
-
Upload
khangminh22 -
Category
Documents
-
view
3 -
download
0
Transcript of Isolation and Characterisation of Novel Glycosaminoglycan ...

i
Isolation and Characterisation of Novel
Glycosaminoglycan-like Polysaccharides
Derived from Marine Molluscs with
Antiproliferative activity
Abdullah Faisal K Aldairi
Submitted in Partial Fulfilment of the requirements
for the Degree of Doctor of Philosophy
School of Environment and Life Sciences
University of Salford, Manchester, UK
2019

ii
Contents
List of figures ............................................................................................................ v
Acknowledgement .................................................................................................. xix
DECLARATION ..................................................................................................... xx
Abstract .................................................................................................................. xxi
1. General introduction ......................................................................................... 1
1.1. The chemical constituents of the body .............................................. 2
1.1.1. Carbohydrates ............................................................................ 3
1.2. Glycosaminoglycans ......................................................................... 7
1.2.1. Glycosaminoglycan biosynthesis ................................................ 9
1.3. Core protein glycosylation .............................................................. 10
1.3.1. N-linked glycan ........................................................................ 12
1.3.2. O-linked glycan ........................................................................ 18
1.4. Glycosaminoglycan classification ................................................... 18
1.4.1. HS ............................................................................................ 18
1.4.1.1. HS biosynthesis ..................................................................... 19
1.4.2. Heparin..................................................................................... 22
1.4.3. CS ............................................................................................ 24
1.4.4. DS ............................................................................................ 26
1.4.5. KS ............................................................................................ 30
1.4.6. Hyaluronan ............................................................................... 31
1.5. Proteoglycans (PG) ......................................................................... 33
1.5.1. Secreted PG .............................................................................. 34
1.5.2. Basement membrane PGs ......................................................... 34
1.5.3. Membrane-bound PGs .............................................................. 34
1.5.4. Extracellular PGs ...................................................................... 35
1.6. Glycosaminoglycan roles in normal cell physiological status .......... 37
1.6.1. GAG’s role in cellular development .......................................... 37
1.6.2. GAGs’ role in cellular adhesion ................................................ 39
1.6.3. GAGs’ role in wound healing and tissue repair ......................... 40
1.6.4. GAGs’ roles in coagulation....................................................... 41
1.7. Normal cellular growth ................................................................... 42

iii
1.7.1. Cell injury ................................................................................ 43
1.8. Cancer progression ......................................................................... 44
1.9. Cancer epidemiology and incidence ................................................ 45
1.10. Glycosaminoglycans’ role in cancer progression ......................... 46
1.10.1. Cancer treatment related to GAGs’ pathological roles ............. 48
1.11. Blood cancer ............................................................................... 50
1.12. Malignant mesothelioma ............................................................. 53
1.13. Cancer treatment ......................................................................... 53
1.14. Polysaccharides from natural products as pharmaceutical agents . 56
1.14.1. Head of shrimp—Litopenaeus vannamei................................. 58
1.14.2. Bivalve mollusc—Nodipecten nodosus ................................... 59
1.14.3. Bivalve mollusc—Corbicula fluminea .................................... 60
1.14.4. Sea cucumber—Ludwigothurea grisea ................................... 61
1.14.5. Squid cartilage—Ommastrephes sloani pacificus .................... 62
1.14.6. King Crab Cartilage—Tachypleus tridentatus ......................... 64
1.14.7. African snail—Achatina fulica ................................................ 65
1.14.8. Sea squirt—Ascidian .............................................................. 66
1.14.9. Cuttlefish ink—Sepiella maindroni ......................................... 67
1.14.10. Bivalve mollusc—Ruditapes philippinarum .......................... 68
2. Aims and objectives ....................................................................................... 69
3. Materials and methods.................................................................................... 70
3.1. Outline of experimental work ......................................................... 70
3.2. Materials ........................................................................................ 70
3.3. Methods.......................................................................................... 71
3.3.1. Extraction of sulphated polysaccharides from common cockle .. 71
3.3.2. Anion-exchange chromatography ............................................. 73
3.3.3. Enzymatic digestion ................................................................. 73
3.3.4. Maintenance of cell lines .......................................................... 75
3.3.5. Cell proliferation assay ............................................................. 76
3.3.6. Annexin-V Apoptosis Assay ..................................................... 77
3.3.7. Monosaccharide composition analysis ...................................... 78
3.3.8. Disaccharides analysis .............................................................. 79
3.3.9. FT-IR ....................................................................................... 80

iv
3.3.10. NMR ...................................................................................... 80
4. Results—Cockle CE polysaccharide biological and structural analysis ........... 82
4.1. Biological activities of cockle CE polysaccharides .......................... 82
4.1.1. Cockle CE polysaccharides—cell proliferation assay ................ 82
4.1.2. Apoptosis detection assay—Annexin V .................................... 90
4.2. Structural analysis of cockle CE polysaccharides ............................ 92
4.2.1. Disaccharide analysis of cockle CE polysaccharides ................. 92
4.2.2. Monosaccharide compositional analysis ................................... 94
4.2.3. FT-IR ....................................................................................... 95
4.2.4. NMR spectroscopy ................................................................... 97
5. Results—Cockle GAGs purification and polysaccharides fractions
analysis 98
5.1. Anion-exchange chromatography ................................................... 99
5.2. Biological activities of cockle polysaccharide purified fractions ..... 99
5.2.1. Cell proliferation assay—Cockle purified fractions ................... 99
5.2.2. Effects of enzymatic degradation on cockle polysaccharide
Fraction 5 antiproliferative activities ...............................................................102
5.2.3. Apoptosis detection assay Annexin-V—Cockle polysaccharide
purified fraction 5 ............................................................................................104
5.3. Structural analysis of cockle polysaccharides purified fractions .....106
5.3.1. Disaccharide analysis—anion-exchange purified fractions .......106
5.3.2. Monosaccharide composition analysis—anion-exchange purified
fractions 109
5.3.3. NMR—anion-exchange purified fractions ...............................109
6. Discussion .................................................................................................... 112
7. Conclusion and future study ......................................................................... 118
8. Limitations ................................................................................................... 119
9. Appendices .................................................................................................. 120
9.1. Appendix I: Extraction of polysaccharides from common cockle ...120
9.2. Appendix II: Cockle polysaccharides purification using size-exclusion
chromatography. .................................................................................................120
9.3. Appendix III: Anion-exchange optimisation. .................................122
9.4. Appendix IV: Cell proliferation assay using MTS on K-562 cell line.
124
9.5. Appendix V: Monosaccharides cell proliferation assay. .................125

v
9.6. Appendix VI: Enzymes activity checks using spectrophotometer. ..125
9.7. Appendix VII: α-L-fucosidase activity. ..........................................126
9.8. Appendix VIII: Cell proliferation assay using cockle disaccharides
residues from the 10 kDa spin filter.....................................................................126
9.9. Appendix IX: Cell proliferation assay using cockle CE
polysaccharides treated with different enzymes on Molt-4 cell line. ....................128
9.10. Appendix X: Cell proliferation assay using cockle CE
polysaccharides treated with different enzymes. ..................................................129
9.11. Appendix XI: Cell proliferation assay of purified cockle
polysaccharide samples using 10 mL fractions. ...................................................130
9.12. Appendix XII: HS disaccharide mass spectrum profile. ..............131
9.13. Appendix XIII: CS/DS disaccharide mass spectrum profile. .......136
9.14. Appendix XIV: Monosaccharide composition analysis using
HPAEC-PAD. 141
9.15. Appendix XV: NMR figures ......................................................145
10. References ................................................................................................... 148
List of figures
Figure 1. Schematic diagram shows the cell strcuture. ............................................... 1
Figure 2. The distribution of biomolecules in multicellular organisms. Water
contributes about 70% of the living organism biomolecule, followed by proteins
(16.8%), fats (16.5%), minerals (4.5%), carbohydrates (0.7%) and nucleic acids
(0.4%) (Pocock et al., 2013)............................................................................... 3
Figure 3. Monosaccharides structural differences as aldehydes (glucose) or ketones
(fructose) are assigned in blue colour, in addition to the difference in D- and L-
configuration in glucose as an example in red colour (Nelson, Lehninger and
Cox, 2008). ........................................................................................................ 4
Figure 4. Lactose chemical structure as an example of disaccharide. It is composed of
galactopytanose attached to glucopyranose via β-glyosidic linkage (Nelson,
Lehninger and Cox, 2008). ................................................................................ 5
Figure 5. Demonstrate the main features that can be found in polysaccharide chain ... 6
Figure 6. Schematic diagram showing polysaccharides classification according to
monosaccharide building blocks, as homo-polysaccharide chain (A) that consists
of repeating units of only one type monosaccharide or hetero-polysaccharide
chain (B), which consist of more than one monosaccharide along the chain. Both
(A) and (B) can have different chain lengths, glyosidic linkages, branching or
unbranching features (Nelson, Lehninger and Cox, 2008). ................................. 6

vi
Figure 7. Schematic diagram showing GAGs attached to different core proteins at
different locations. ............................................................................................. 8
Figure 8. Schematic diagram demonstrates an example of the biosynthesis pathway of
glucosamine or glucuronic acid from glucose................................................... 10
Figure 9. Schematic diagram shows the antiporter mechanism of monosaccharides
and the phosphate donor 3′-phosphoadenosine 5′-phosphosulphate (PAPS)
precursors in Golgi apparatus membrane. As the transporters are functionally
like antiporters, except for PAPS, the antiporter is unknown (Hirschberg,
Robbins and Abeijon, 1998). ........................................................................... 11
Figure 10. Schematic diagram of protein glycosylation process: (A) Represents the
core protein formation in the endoplasmic reticulum. (B) The initial addition of
saccharides to the polypeptide residues of the core protein that can be added
from the rER or Golgi apparatus, following by chain elongation (C) and chain
modification (D). Finally, according to the cell-type, the fully synthesised
glycosylated core protein can be secreted to its location (Silbert, 1966). .......... 12
Figure 11. Schematic diagram showing N-linked glycan biosynthesis following
Dolichol-phosphate pathway (Stanley, Schachter and Taniguchi, 2009). .......... 13
Figure 12: Dolichol-phosphate chemical structure that is composed of multiple
isoprene monomers that can reach 19 units in mammalian cells (Stanley,
Schachter and Taniguchi, 2009). ...................................................................... 14
Figure 13: Schematic diagram showing synthesis of [Dolichol-P-P-GlcNAc(2)-Man(5)]
after flipping to the rER lumen, followed by chain elongation by addition of 4
Man residues as well as 3 Glc units after several chain modifications as a result
of [Dolichol-P-P-GalNAc(2)-Man(9)-Glc(3)] (Stanley, Schachter and Taniguchi,
2009). .............................................................................................................. 15
Figure 14. Schematic diagram shows three possible modified glycan structures,
namely oligomannose, complex and hybrid (Stanley, Schachter and Taniguchi,
2009). .............................................................................................................. 16
Figure 15. HS common disaccharide structure. During the modification phase, GlcA
can acquire sulphate group at C-2, while GlcNH2 can acquire sulphate group at
C-3 and/or C-6 and the amino group (C-2) can be sulphated or acetylated,
depending of cell function (Höök et al., 1984). ................................................ 19
Figure 16. HS biosynthesis pathway in Golgi apparatus that follow HS three phases,
namely chain initiation, chain polymerization and chain modification. HS chain
starts by addition of tetrasaccharide linker, which is Xyl-Gal-Gal-GlcA, to Ser or
Thr residues. Following chain polymerization, where addition of GlcA and
GlcNH2 to extend the HS chain. Finally, chain modification, where several
possible modifications can take place to give HS its unique structure according to
cell type, for instance, epimerisation, deacetylation, sulphation for both the
GlcA/IdoA and the GlcNH2 (Lin, 2004). .......................................................... 21
Figure 17. Heparin common disaccharide building blocks structure. During
modification phase, IdoA can acquire a sulphate group at C-2, while GlcNH2 can
acquire sulphate group at C-3 and/or C-6, however, the amine group is more

vii
likely sulphated or to a lesser extend acetylated, depending on cell function
(Höök et al., 1984). .......................................................................................... 22
Figure 18. Heparinase reaction pathway. This figure shows the heparinase enzyme
that catalase the elimination of polysaccharides containing heparin/HS α(1→4),
resulting in unsaturated oligo- and disaccharides. ............................................. 24
Figure 19. CS common disaccharide building block structure. During the modification
phase, GlcA can acquire sulphate group at C-2, and GalNH2 can acquire sulphate
group at C-4 and/or C-6 and the amino group either can be sulphated or
acetylated, depending on cell function (Höök et al., 1984). .............................. 25
Figure 20. DS common disaccharide building blocks structure. During the
modification phase, IdoA can acquire a sulphate group at C-2, and GalNH2 can
acquire a sulphate group at C-4 and/or at C-6 and the amino group (C-2) can be
either acetylated or sulphated, depending on cell function (Höök et al., 1984). . 27
Figure 21. Chondroitinase-ABC reaction pathway. chondroitinase-ABC enzyme
catalase the elimination of polysaccharides containing CS/DS chain β(1→4),
resulting in unsaturated oligo- and disaccharides. ............................................. 28
Figure 22. Schematic figure shows CS/DS biosynthesis pathway. Chain starts by
addition of O-linked tetrasaccharides to Ser residues on the core protein.
According to the cell type, specific enzymes catalyse the synthesis of either CS
or DS. .............................................................................................................. 29
Figure 23. KS common disaccharide building blocks structure. During the
modification phase, Gal can acquire sulphate group at C-6 and/or sialic acid at C-
3, and GlcNH2 can be capped with sialic acid at C-4, fucose at C-3 and/or
sulphate group at C-4, C-6 and/or C-3 and the amino group (C-2) can be either
acetylated or sulphated, depending on cell function. (Meyer et al., 1953;
Funderburgh, 2000; Meininger et al., 2016). .................................................... 30
Figure 24. Hyaluronan saccharides structure, which is consist of long unbranched and
unmodified GlcA-GlcNAc. .............................................................................. 32
Figure 25. Schematic diagram of hyaluronan biosynthesis pathway by HAS enzyme
family, where HAS is responsible for catalysing the addition of monosaccharides
from their UDP-precursors. Then, hyaluronan is synthesized and maturated in the
ECM (Hascall and Esko, 2015). ....................................................................... 33
Figure 26. Schematic diagram showing membrane bound glypican PG via its GPI
anchor.............................................................................................................. 35
Figure 27. Schematic diagram of the coagulation cascade (Hoffbrand and Moss,
2015). .............................................................................................................. 41
Figure 28. Heparin minimal pentasaccharide structure with unique anticoagulation
properties. ........................................................................................................ 42
Figure 29. Schematic diagram of cancer progression resulting from inactive tumour
suppressor gene p53 leading to uncontrolled proliferating cells (Kumar, Abbas
and Aster, 2017). ............................................................................................. 45
Figure 30. Schematic diagram represents blood cell lines from the bone marrow.
Starting from haematopoietic stem cell that is arise from the bone marrow. The
common myeloid progenitor cells (left side) that produce red blood cells,

viii
platelets, monocytes, neutrophils, eosinophils and basophils. The lymphoid stem
cell (right side) can produce B-lymphocytes, T-lymphocytes and natural killer
cells. ................................................................................................................ 51
Figure 31. Structural presentation of novel hybrid heparin-HS structure, which
isolated from head of shrimp (Litopenaeus vannamei) (Pomin, 2015). ............. 59
Figure 32. Structural presentation of novel HS-like structure isolated from bivalve
mollusc (Nodipecten nodosus). ........................................................................ 60
Figure 33. (A) Shows CS-like disaccharides from Ludwigothurea grisea as GlcA can
acquire 3-O-sulphate group. (B) Shows CS-like disaccharide structure from
marine Ludwigothurea grisea with fucp attached α(1→3) to GlcA making this
novel fucosylated-CS, where fucopyranose are attached via (1→2) glycosidic
linkages. .......................................................................................................... 62
Figure 34. Structural presentation of squid cartilage (Ommastrephes sloani pacificus)
purified fraction-II-2—[GlcA β(1→3) Glc β(1→6) GalNAc(4S)]. ................... 63
Figure 35. Structural presentation of squid cartilage (Ommastrephes sloani pacificus)
purified fraction-II-6—[GlcA β(1→3) Glc β(1→6) GalNAc(4S) β(1→4) GlcA
β(1→3) GalNAc(4S,6S)]. ................................................................................ 64
Figure 36. Structural representation of the AS, isolated from African snail (Achatina
fulica). IdoA can acquire sulphate group at C-2, whereas, the glucosamine
residues are acetylated (Pomin, 2015). ............................................................. 66
Figure 37. Structural representation of the DS-like extracted from two different
ascidian species (Pomin, 2015). ....................................................................... 67
Figure 38. Structural representation of Sepiella maindroni ink hexasaccharide
repeating structure that is composed of [→4) L-Fucp β(1→4) L-Fucp β(1→4) D-
GalNAc α(1→6) D-Man α(1→4) GalNAc α(1→], where the GlcA is attached to
the Man in α(1→3) linkages. ........................................................................... 68
Figure 39. MTT assay 96-well U-shaped wells for suspension cell lines or Flat-shaped
wells for adherent cell line. Maximum drug concentration was added in the last
row (H), then, drug was diluted until row (B). Row (A) was used for untreated
control cells. Every drug concentration was tested in triplicates including control
cells. ................................................................................................................ 77
Figure 40. The antiproliferative activity of cockle CE polysaccharides on three cancer
cell lines. Cancer cell lines K-562 (A), Molt-4 (B) and Mero-25 (C) were treated
with increasing doses of cockle CE polysaccharides (0, 0.78, 1.56, 3.12, 6.25,
12.5, 25, 50 µg/mL) and cell viability was determined using MTT assay, as
detailed in section 3.3.4. The inserts show the effects of cisplatin treatment on
the number of viable cells. Cell viability is expressed as a percentage relative to
the untreated control cells. All experiments were conducted in triplicate and the
results are shown as the mean ± the SD. Cells were cultured under standard
conditions and maintained at 37 °C in a humidified 5% CO2 atmosphere. ........ 84
Figure 41. Comparisons between the antiproliferative activity of cockle CE
polysaccharides and the common mammalian GAGs on cancer cell lines. The
three cancer cell lines, K-562 (A), Molt-4 (B) and Mero-25 (C), were treated
with increasing doses of cockle CE polysaccharides (0, 0.78, 1.56, 3.12, 6.25,

ix
12.5, 25, 50 µg/mL) or common mammalian-GAGs (0, 0.78, 1.56, 3.12, 6.25,
12.5, 25, 50 µg). Cockle CE polysaccharides was the only agent that show
antiproliferative activity on all cell lines. Cockle CE polysaccharides (●),
mammalian-heparin (♦), mammalian-HS (■), mammalian-CS (▲) and
mammalian-DS (▼). The data are presented as the percentage of viable cells
following treatment with different polysaccharides, relative to the untreated
control. All experiments were conducted in triplicate and the results are shown as
the mean ± the SD. Cells were cultured and maintained at 37 °C in a humidified
5% CO2 atmosphere. ........................................................................................ 86
Figure 42. The effect of heparinase (I, II, III), chondroitinase ABC and α-L-
fucosidase enzymatic digestion on cockle CE polysaccharide antiproliferative
activity. The sensitivity of the cockle CE polysaccharide’s antiproliferative
activity to the enzymatic degradation was determined using MTT assay. The
figure shows the antiproliferative activity of cockle polysaccharides retained part
of the 10 kDa spin filter on the K-562 (A), Molt-4 (B) and Mero-25 (C) cell
lines, with and without enzymes, as cockle CE polysaccharides (●), cockle CE
treated with heparinase-I (■), cockle CE treated with heparinase-II (▲), cockle
CE treated with heparinase-III (▼), cockle CE with heparinase-I, II, III treated
(♦), cockle CE treated with chondroitinase-ABC (○) and cockle CE treated with
fucosidase (□). The data are presented as the percentage of viable cells
following treatment with cockle polysaccharides, relative to the untreated
control. Cockle CE showed high sensitivity to heparinase enzymes (solely and in
combination), while chondroitinase-ABC and fucosidase showed no effect on the
antiproliferative activity. All experiments were conducted in triplicate and the
results are shown as the mean ± the SD. Cells were cultured in suspension and
maintained at 37 °C in a humidified 5% CO2 atmosphere................................. 89
Figure 43. Apoptosis assay Annexin-V FITC/PI. K-562 (A), Molt-4 (B) and Mero-25
(C) cell lines were treated with cockle CE polysaccharides (50 g) for 24 hours,
then cells were stained with Annexin V-FITC and PI stains, in addition to
staining the untreated cells, which left as control. A: K-562 scatter plot of
Annexin V-FITC/PI stained control cells (left) and scatter plot of cells treated
with cockle CE polysaccharides (right). B: Molt-4 scatter plot of Annexin V-
FITC/PI stained control cells (left) and scatter plot of cells treated with cockle
CE polysaccharides (right). C: Mero-25 scatter plot of Annexin V-FITC/PI
stained control cells (left) and scatter plot of cells treated with cockle CE
polysaccharides (right). .................................................................................... 91
Figure 44. FT-IR spectra of cockle CE polysaccharide with wave number (cm-1). ... 96
Figure 45. Anion-exchange chromatography of cockle CE polysaccharides. The
cockle CE polysaccharide sample was injected to the FPLC system using anion-
exchange DEAE-Sepharose resin and it was eluted using linear gradient of 0–1.5
M NaCl over 75 min. Peaks were pooled, as indicated by the bars shown, then,
desalted, lyophilised and stored at -20 °C for further analysis. ......................... 98
Figure 46. Antiproliferative activity of cockle polysaccharide purified fractions.
Assessment of the antiproliferative activity of the purified fractions on K-562

x
(A), Molt-4 (B) and Mero-25 (C) cell lines that were achieved using MTT assay.
Fraction 5 was expressed potent antiproliferative activity, in comparisons to
other inactive fractions in terms of IC50. Fraction one (⚫), fraction two (◼),
fraction three (▲), fraction four (▼), fraction five (♦) and fraction six (). The
data are presented as the percentage of viable cells following treatment with
cockle polysaccharides fractions, relative to untreated control. All experiments
were conducted in triplicate and the results are shown as the mean ± the SD and
the IC50 values were calculated using non-linear regression analysis (GraphPad
Prism 8.0). Cells were cultured and maintained at 37 °C in a humidified 5% CO2
atmosphere. ....................................................................................................101
Figure 47. The effect of heparinase enzymes (individually or in combination) (I, II,
III) or chondroitinase-ABC enzymatic digestion on the antiproliferative activity
of the cockle polysaccharide purified fraction 5. The sensitivity of the cockle
polysaccharide’s purified fraction 5 to the enzymatic degradation on the
antiproliferative activity was determined using MTT assay on the K-562 (A),
Molt-4 (B) and Mero-25 (C) cell lines, in addition to assessing the
antiproliferative activity of undigested fraction 5 in order to confirm the
difference between chains activity. Cockle polysaccharides Fraction 5 (●),
cockle polysaccharides Fraction 5 treated with heparinase-I (■), cockle
polysaccharides Fraction 5 treated with heparinase-II treated (▲), cockle
polysaccharides Fraction 5 treated with heparinase-III treated (▼), cockle
polysaccharides Fraction 5 treated with heparinase I, II, III treated (♦) and cockle
polysaccharides Fraction 5 treated with chondroitinase-ABC (○). The data is
presented as the percentage of viable cells following treatment with cockle
polysaccharides fraction 5 and its digests, relative to untreated control. All
experiments were conducted in triplicate, the results are shown as the mean ± the
SD and the IC50 values were calculated using non-linear regression analysis
(GraphPad Prism 8.0). Cells were cultured and maintained at 37 °C in
humidified 5% CO2 atmosphere. .....................................................................103
Figure 48. Apoptosis assay Annexin V-FITC/PI. K562 (A), Molt-4 (B) and Mero-25
(C) cell lines, were treated with 50 g/mL of cockle polysaccharide purified
fraction 5 for 24 h, then stained using Annexin V-FITC and propidium iodide
(PI). A: K562 scatter plot of Annexin V-FITC/PI stained control cells (left) and
scatter plot of cells treated with cockle polysaccharide purified Fraction 5 (right).
B: Molt-4 scatter plot of Annexin V-FITC/PI stained control cells (left) and
scatter plot of cells treated with cockle polysaccharide purified fraction 5 (right).
C: Mero-25 scatter plot of Annexin V-FITC/PI stained control cells (left) and
scatter plot of cells treated with cockle polysaccharide fraction 5 (right). Cancer
cells treatment with Fraction 5 has led to cellular apotosis. Results are presented
as the mean ± of three independent experiments. ............................................105
Figure 49. 2D 1H-1H NMR-COSY for cockle purified fraction 5. Red lines CH3 linked
to fucopyranose at 5.2 ppm, and green lines indicate possible spin systems found
in mammalian HS. The spectra were recorded at 56.85 °C. .............................110

xi
Figure 50. Cockle CE polysaccharide purification using size-exclusion
chromatography, superpose-12 column. The figure provides two peaks eluted
depending on the materials molecular weight. Namely, high molecular weight
and low molecular weight peaks. ....................................................................121
Figure 51. Cockle CE polysaccharides purification using size-exclusion
chromatography, superdex-75 column. The figure shows only one peak. ........121
Figure 52. Demonstrate cockle polysaccharide elution profile using anion-exchange
chromatography, sephacel-DEAE resin with gradient elution of 0-0.35 M NaCl.
It shows from the first attempt that cockle CE can be purified, as figures shows
about 4 peaks. .................................................................................................122
Figure 53. Demonstrate cockle polysaccharide elution profile using anion-exchange
chromatography, sephacel-DEAE resin with gradient elution of 0-0.5 M NaCl. It
shows better separation of cockle CE, which need more optimisation as still
some cross-peaks ............................................................................................122
Figure 54. Demonstrate cockle polysaccharide elution profile using anion-exchange
chromatography, sephacel-DEAE resin with gradient elution of 0-1 M NaCl.
Improved signal of charged materials, however, major eluted materials seems to
be eluted in two peaks only. ............................................................................123
Figure 55. Demonstrate cockle polysaccharide elution profile using anion-exchange
chromatography, sephacel-DEAE resin with gradient elution of 0-1.5 M NaCl. It
has separated cockle CE into 6 peaks successfully. .........................................123
Figure 56. Demonstrate cockle polysaccharide elution profile using anion-exchange
chromatography, sephacel-DEAE resin with gradient elution of 0-2 M NaCl. It
shown high salts has affected the elution time that resulted in poor purification.
.......................................................................................................................124
Figure 57. Cell proliferation assay MTS assay. 50 µg of cockle CE polysaccharides
was incubated with K562 to check its antiproliferative activity using MTS assay.
No great difference in IC50 values between MTT and MTS results. .................124
Figure 58. Cell proliferation assay of cockle monosaccharide using K562, Molt-4 and
Mero-25 cell lines. ..........................................................................................125
Figure 59. Antiproliferative activity of cockle CE disaccharides on K562 cell line. All
disaccharide samples were inactive. ................................................................127
Figure 60. Antiproliferative activity of cockle purified fraction 5 disaccharides on
K562 cell line. All disaccharide samples were inactive. ..................................127
Figure 61. Antiproliferative activity of cockle CE disaccharides on Molt-4 cell line.
All disaccharide samples were inactive. ..........................................................128
Figure 62. Antiproliferative activity of cockle purified fraction 5 disaccharides on
Molt-4 cell line. All disaccharide samples were inactive. ................................128
Figure 63. Antiproliferative activity of cockle CE disaccharides on Mero-25 cell line.
All disaccharide samples were inactive. ..........................................................129
Figure 64. Antiproliferative activity of cockle purified fraction 5 disaccharides on
Mero-25 cell line. All disaccharide samples were inactive. .............................130
Figure 65. Cell proliferation assay of CE polysaccharides purified fractions using 10
ml fraction of anion-exchange column. 50 µg of cockle CE polysaccharide was

xii
incubated with K562 cell line, which enhanced the cancer cells growth instead of
inhibiting its proliferation. ..............................................................................130
Figure 66. 2D 1H-1H NMR-TOCSY for cockle purified fraction 5. The spectrum was
recorded at 56.85 °C. ......................................................................................145
Figure 67. 2D 1H-1H NMR-TOCSY for Mammalian HS. The spectrum was recorded
at 56.85 °C. .....................................................................................................145
Figure 68. 2D 1H-13C NMR-HSQC for cockle purified fraction 5. The spectrum was
recorded at 56.85 °C. ......................................................................................146
Figure 69. 2D 1H-13C NMR-HSQC for Mammalian HS. The spectrum was recorded at
56.85 °C. ........................................................................................................146
Figure 71. 2D 1H-1H-NMR-COSY for mammalian HS standard. Green lines indicate
possible spin systems found in mammalian HS. The spectra were recorded at
56.85 °C. ........................................................................................................147
List of tables
Table 1. Most common monosaccharides that can bind to a non-carbohydrate moiety
to form glycoconjugates (Varki and Sharon, 2009). ........................................... 7
Table 2. Different CS isomers. ................................................................................ 26
Table 3. Classification of proteoglycans based on their location (Iozzo and Schaefer,
2015). .............................................................................................................. 36
Table 4. NMR proposed CS-like oligosaccharides isolated from king crab
(Tachypleus tridentatus). Fractions 8 and 9 have hexasaccharides with different
pattern of sulphation including 3-O-sulphated GlcA. Fraction 2A has
pentasaccharides structure, whereas fractions 6 and 7 have octasaccharides, all of
them contain both 3-O-sulphated GlcA and 3-O-fucosylated GlcA (Kitagawa et
al., 1997). ........................................................................................................ 65
Table 5: HPAEC solvent gradient setting for monosaccharides and organic acids
analysis ............................................................................................................ 79
Table 6. Present list of IC50 of cockle CE polysaccharide and cisplatin as positive
control on all cell lines. All IC50 values were conducted in triplicate and
calculated using non-linear regression analysis (GraphPad Prism 8.0). ............. 84
Table 7. Present list of IC50 of cockle CE polysaccharide (0, 0.78, 1.56, 3.12, 6.25,
12.5, 25, 50 g/mL) and mammalian GAGs (0, 0.78, 1.56, 3.12, 6.25, 12.5, 25,
50 g/mL) on all cell lines. IC50 was determined when a drug has inhibited the
cancer cells growth by 50% at maximum concentration of 50 g/mL, therefore,
if a drug has inhibited less than 50%, then the drug is considered to be inactive.
All values were conducted in triplicate and the IC50 calculated using non-linear
regression analysis (GraphPad Prism 8.0). ....................................................... 87
Table 8. Present list of IC50 of cockle CE polysaccharide (0, 0.78, 1.56, 3.12, 6.25,
12.5, 25, 50 g/mL) and its digested chains by the action of heparinases,
chondroitinase-ABC or fucosidase on cancer cell lines. All IC50 values were

xiii
conducted in triplicate and calculated using non‐linear regression analysis
(GraphPad Prism 8.0). ..................................................................................... 90
Table 9. Disaccharide composition analysis of cockle CE polysaccharide, mammalian
HS/heparin and mammalian CS/DS. Data are presented as a percentage of the
moles of HS/Heparin1 and CS/DS2 unsaturated disaccharides produced by
heparinase (I, II, III) and chondroitinase-ABC digestion. ................................. 93
Table 10. Monosaccharide composition analysis of the cockle CE polysaccharide. 50
µg of sample was degraded with trifluoroacetic acid prior to HPAEC-PAD
analysis. The peaks observed were identified by comparison with the elution
positions of known monosaccharide standards. Data are presented as a
percentage of the moles of monosaccharide produced by acid hydrolysis. ........ 95
Table 11. Peak assignment of FT-IR spectrum for cockle CE polysaccharide and
standard heparin (bovine)................................................................................. 96
Table 12. Representation of the anion-exchange chromatography elution peaks of
purified cockle CE polysaccharide in minutes and its corresponding NaCl
molarity % was assessed by the electroconductivity on-line monitor. ............... 99
Table 13. Presents list of IC50 of the cockle polysaccharide purified fractions on
cancer cell lines. IC50 was determined when drug inhibited the cancer cells
growth by 50% at maximum concentration of 50 g/mL, therefore, if the drug
has inhibited less than 50%, then the drug is considered to be inactive. All IC50
values were conducted in triplicate and calculated using non‐linear regression
analysis (GraphPad Prism 8.0). .......................................................................101
Table 14. Represents list of IC50 of cockle polysaccharide purified fractions on all cell
lines. IC50 was determined when drug has inhibited the cancer cells growth by
50% at maximum concentration of 50 g/mL, therefore, if the drug has inhibited
less than 50%, then the drug is considered to be inactive. All IC50 values were
conducted in triplicate and calculated using non‐linear regression analysis
(GraphPad Prism 8.0). ....................................................................................104
Table 15. HS disaccharide analysis of cockle polysaccharide anion-exchange purified
fractions. Data are presented as a percentage of the moles of unsaturated
disaccharides produced by heparinases (I, II and III) digestion of all purified
fractions 1-6. ..................................................................................................107
Table 16. CS/DS Disaccharide analysis of anion-exchange purified cockle
polysaccharide fractions. Data are presented as a percentage of the moles of
unsaturated disaccharides produced by chondroitinase-ABC digestion of the
anion-exchange fractions (F1–F6). ..................................................................108
Table 17. HPAEC-PAD analysis of monosaccharides derived from anion-exchange
purified fractions (F1–F6). Samples were hydrolysed to monosaccharides. The
observed peaks were identified by comparison with the elution position of
monosaccharide standards. Data are presented as a percentage of the moles of
monosaccharides produced by acid hydrolysis. ...............................................109
Table 18. Cockle CE polysaccharides purification using anion-exchange column. 10
mL fractions were eluted using 0-3 M gradient elution of NaCl. .....................131

xiv
Abbreviations
2D Two-dimension
ALL Acute lymphoid leukaemia
AML Acute myeloid leukaemia
AS Acharan sulphate
Asn Asparagine
B-ALL B-lymphocyte acute lymphoblastic leukaemia
B-cell B-lymphocyte
B-DNF Brain-derived neurotrophic factor
BSA Bovine serum albumin
CD Cluster of differentiation
CDK Cyclin dependent kinase
CE Crude extract
CLL Chronic lymphoid leukaemia
cm Centimeter
CML Chronic myeloid leukaemia
COSY Correlation spectroscopy
CS Chondroitin sulphate
CS-A Chondroitin sulphate-A
CS-B Chondroitin sulphate-B
CS-C Chondroitin sulphate-C
CS-D Chondroitin sulphate-D
CS-E Chondroitin sulphate-E
CS-K Chondroitin sulphate-K
CS-L Chondroitin sulphate-L
CS-M Chondroitin sulphate-M
CSPG Chondroitin sulphate proteoglycan
D- Dextro-rotary
DBA Dibutylamine

xv
DEAE Diethylaminoethanol
DMSO Dimethyl sulfoxide
DNA Deoxyribonucleic acid
Dolichol-P Dolichol-phosphate
DS Dermatan sulphate
ECM Extracellular matrix
EDTA Ethylenediaminetetraacetic acid
EMA European Medicines Agency
ER Endoplasmic reticulum
EXTL-1 Exostosin-like-1
EXTL-2 Exostosin-like-2
EXTL-3 Exostosin-like-3
F1 Fraction 1
F2 Fraction 2
F3 Fraction 3
F4 Fraction 4
F5 Fraction 5
F6 Fraction 6
FBS Foetal bovina serum
FDA Food and drug administration
FGF Fibroblast growth factor
FGFR Fibroblast growth factor receptor
FITC Fluorescein isothiocyanate
FPLC Fast performance liquid chromatography
FT-IR Fourier transform infrared spectroscopy
Fuc Fucose
Fucp Fucopyranose
G1 Growth phase 1
G2 Growth phase 2
GAG Glycosaminoglycan
Gal Galactose
GalA Galacturonic acid

xvi
GalNAc N-acetylated-galactosamine
GalNH2 Galactosamine
GC-MS Gas chromatography coupled with mass spectrometry
GDP Guanosine diphosphate
Glc Glucose
GlcA Glucuronic acid
GlcNAc N-acetyle-glucosamine
GlcNAcT-I N-acetyl-glucosaminyl-transferase-I
GlcNAcT-II N-acetyl-glucosaminyl-transferase-II
GlcNAcT-IV N-acetyl-glucosaminyl-transferase-IV
GlcNAcT-IX N-acetyl-glucosaminyl-transferase-IX
GlcNAcT-V N-acetyl-glucosaminyl-transferase-V
GlcNAcT-Vb N-acetyl-glucosaminyl-transferase-Vb
GlcNAcT-VI N-acetyl-glucosaminyl-transferase-VI
GlcNH2 Glucosamine
GRIL Glycan reductive isotope labelling
GPI Glycosylphosphatidylinositol
h Hour
HA Hyaluronan
HAS Hyaluronan synthase
HAS-A Hyaluronan-synthase-A
HAS-B Hyaluronan-synthase-B
HAS-C Hyaluronan-synthase-C
HAS-D Hyaluronan-synthase-D
HSC Hematopoietic stem cells
Hexose Monosaccharide with six-carbons
HIF Hypoxia induced transcription factor
HPAEC-PAD High-pH anion-exchange chromatography coupled with pulsed
amperometric detection
HS Heparan sulphate
HSPG Heparan sulphate proteoglycan
HSQC Heteronuclear single quantum correlation

xvii
Hyal-1 Hyaluronidase -1
Hyal-2 Hyaluronidase-2
Hyal-3 Hyaluronidase-3
IC50 Half maximal inhibitory concentration
IdoA Iduronic acid
IU International unit
kDa Kilo-dalton
KS Keratan sulphate
KSPG Keratan sulphate proteoglycan
L- Levo-rotary
LC-MS Liquid Chromatography coupled with mass spectrometry
M Molar
Man Mannose
Mg Milligram
MHz Megahertz
Min Minutes
mIU Milli international unit
mL Milliliter
mm Millimeter
mM Millimolar
MWCO Molecular weight cut-off
NA N-acetylated
NaCl Sodium chloride
NADP Nicotinamide adenine dinucleotide phosphate
NaOAc Sodium acetate
NaOH Sodium hydroxide
nM Nanomolar
NMR Nuclear magnetic resonance spectroscopy
NS N-sulphated
oC Degree Celsius
OST Oligosaccharide transferase
P Phosphate group

xviii
PAPS 3’-Phosphoadenosine 5’-Phosphosulfate
PBS Phosphate buffer saline
PDGF Platelet derived growth factor
PE Purified extract
PEF-1 Purified extract fraction-1
PEF-2 Purified extract fraction-2
Pentose Monosaccharide with 5-carbon
PG Proteoglycan
PI Propidium iodide
pmol Picomole
r-ER Rough Endoplasmic reticulum
RHAMM Receptor for hyaluronan mediated motility
RNA Ribonucleic acid
rpm Round per minutes
S Synthesis phase
Ser Serine
sER Smooth endoplasmic reticulum
Sulf-1 Sulphatase-1
Sulf-2 Sulphatase-2
T-ALL T-lymphocyte acute lymphoblastic leukaemia
Tetrose Monosaccharide with 4-carbon
Thr Threonine
TMS Tetramethylsilane
TOCSY Total correlation spectroscopy
Triose Monosaccharide with 3-carbon
UDP Uridine diphosphate
UMP Uridine monophosphate
VEGF Vascular endothelial growth factor
Xyl Xylose
Δ Delta

xix
Acknowledgement
I owe my deepest gratitude to my supervisor Dr. David Pye for his guidance,
and without his encouragement and support this study would hardly been completed. I
express my warmest gratitude to my research colleagues and ELS staff for their
support during my studies. I also would like to acknowledge Glycotechnology Core
Resource, San Diego, California, USA, for their collaboration as well as Dr Matthew
Cliff for his ultimate help in analysing my samples (NMR facilities, Manchester
institute of biotechnology, University of Manchester, UK).
I would acknowledge Umm Al-Qura University and the ministry of higher
education of Saudi Arabia for giving me this scholarship and a special thanks to
Professor Adel Asiri for his support. My deepest appreciation is expressed to my
mother, my sisters, my wife and my wonderful daughters (Hala and Lana) and all
family and friends, especially (Feras Maslokh) for their support through the whole
years.

xx
DECLARATION
I declare that this thesis, which I submit to the University of Salford as partial
fulfilment of the requirements for a Degree of Doctor of Philosophy, is a presentation
of my own research work. Wherever contributions of others are involved, every effort
is made to indicate this clearly with due reference to the literature and
acknowledgement of collaborative research. The content of this thesis has not been
submitted for a higher degree at this or any other university. Part of the work
presented in this thesis has been published.
Aldairi, A., Ogundipe, O. and Pye, D., 2018. Antiproliferative activity of
glycosaminoglycan-like polysaccharides derived from marine molluscs. Marine
drugs, 16(2), p.63.

xxi
Abstract
Although various anticancer therapeutic tools have been launched, such as
immunotherapy and targeted therapy, newly developed drugs with
antiproliferative/cytotoxic effects are still in demand; hence, newly discovered
anticancer drugs with an improved pharmacological profile are needed to overcome
drug resistance of cancer cells. This study focused on identifying and characterising
novel polysaccharides isolated from the common cockle (Cerastoderma edule) with
antiproliferative activity, using the cetylpyridinium chloride precipitation method.
Marine polysaccharides have exhibited in-vitro potent antiproliferative activity,
leading to induced apoptotic cellular death in three cancer cell lines, which are
chronic myelogenous leukaemia, relapsed acute lymphoblastic leukaemia and
mesothelioma of the pleural cavity with asbestos exposure. Structural analysis has
confirmed the presence of glycosaminoglycan-like polysaccharides in cockle extracts
with potent antiproliferative activity, which are susceptible to three classes of
heparinase enzymes, which has not been seen previously, but not to chondroitinase
enzymes. Cockle polysaccharide purification using anion-exchange chromatography
has generated six peaks (1-6); however, only fraction 5 exhibited antiproliferative
activity, which was determined to be susceptible to heparinase enzymes. Surprisingly,
some sequence of resistance to heparinase was observed within cockle polysaccharide
chains; therefore, a new type of marine-derived heparan sulphate/heparin-like
polysaccharide with potent anticancer properties was suggested, as none of the
mammalian glycosaminoglycans exhibited antiproliferative activity on cancer cell
lines. Overall, the final structural characterisation did confirm the presence of
fucosylated polysaccharide, N- and O-linked glycans, in addition to HS-like
structures. These various chains made creating the final judgment about cockle
polysaccharide structural elucidation very challenging because of sample complexity.

1
1. General introduction
A cell is an organism’s smallest functional unit. They have different shapes and
functions, but basic cellular structure is common in all cells. Mammalian cells are composed
of an extracellular plasma membrane that encloses the cytoplasm and cellular contents from
the extracellular compartments. The cytoplasm contains cellular organelles, which make up
the cells internal structure, including the nucleus, the endoplasmic reticulum, the
mitochondria, the Golgi apparatus, and other cellular vesicles. Depending on the type of cell,
these cellular organelles perform specific cellular functions (Figure 1).
Figure 1. Schematic diagram shows the cell strcuture.
Briefly, the cell membrane is composed of lipids and proteins, and it is essential for
normal cellular function, as it acts as a barrier that regulates the movements of substances to
and from cells. The nucleus is separated from the cellular cytoplasm by a lipid bilayer
membrane known as the nuclear envelope. Inside the nucleus, there is a fine structure known
as deoxyribonucleic acid (DNA), which carries all genetic information, as the nucleus has the
machinery to assemble the cells ribonucleic acid (RNA), which is released through nuclear
envelope pores, in a process called gene expression to synthesise new protein. The
mitochondria are the energy providers for cellular functions such as cell growth and motility.
Mitochondria have outer and inner membranes. The outer membrane is smooth and regular,
whereas the inner membrane is folded.

2
The endoplasmic reticulum (ER) is an extended system around the nucleus that is
found next to the nuclear membrane. The ER can be classified according to its shape into
rough endoplasmic reticulum (rER) and smooth endoplasmic reticulum (sER). Ribosomes are
attached to the rER, which makes it important in protein synthesis as well as the addition of
carbohydrates to proteins. On the other hand, the sER is responsible for the synthesis of
lipids, hormones and storing calcium. The Golgi apparatus is composed of three flattened
membranous sacs that are involved in a carbohydrate and protein modification process known
as glycosylation. The Golgi apparatus is composed of three main faces: cis-face, cisternae,
and trans-face. The Golgi apparatus also has an extended ER function, where transported
vesicles pinch off the ER and fuse in the cis-Golgi before secretion; then, the Golgi modifies
the protein and carbohydrate in cisternae and releases them as secretory vesicles to the trans-
face to the plasma membrane. Finally, the cell membrane has bound vesicles that are
important to cellular function, such as lysosomes and peroxisomes. Lysosomes have
hydrolytic enzymes that recycle cellular contents or materials have been taken up by
endocytosis. Peroxisomes contain several different enzymes involved in various metabolic
reactions, especially in energy metabolism. In addition, a peroxisome can utilise cellular
hydrogen peroxide in oxidation reactions or eliminate it via its enzymes (Pocock et al., 2013).
The extracellular matrix (ECM) is a network of proteins and fibres that are critical for
normal cellular function. The ECM has various key functions, such as mechanical support for
cellular integrity, control of cellular proliferation, basement membrane scaffolding for tissue
renewal, and making the boundary between the epithelium and connective tissues. The ECM
has two basic domains: the interstitial matrix and the basement membrane. The interstitial
matrix is the area between cells to support cellular integrity, which mainly consists of fibres,
collagen, and proteoglycans. The basement membrane is a specialised form of ECM which is
highly condensed and organised layer around the epithelium and other cells that can do a
specific biological function (Bosman and Stamenkovic, 2003).
1.1. The chemical constituents of the body
Multicellular organisms consist of 70% water, and the rest is a mixture of organic
compounds. The organic and inorganic compounds consist largely of four major elements,
oxygen, carbon, hydrogen, and nitrogen, which are combined to make a huge number of
various biomolecules, such as carbohydrates, proteins, fat, minerals, and nucleic acids (Figure
2) (Pocock et al. 2013).

3
Figure 2. The distribution of biomolecules in multicellular organisms. Water contributes
about 70% of the living organism biomolecule, followed by proteins (16.8%), fats (16.5%),
minerals (4.5%), carbohydrates (0.7%) and nucleic acids (0.4%) (Pocock et al., 2013)
1.1.1. Carbohydrates
Carbohydrates are the main source of energy. Carbohydrates consist of three basic
elements, carbon, oxygen, and hydrogen, with the empirical formula (CH2O)n. Simple
carbohydrates can be found freely in the blood, and complex carbohydrates are found
attached to proteins or lipids. There are three classes of carbohydrates based on its chain
length, which are monosaccharides, oligosaccharides, and polysaccharides (Nelson,
Lehninger and Cox, 2008).
1.1.1.1. Monosaccharides
Monosaccharides are the simplest form of carbohydrates, which can be found in linear
or ring forms. Monosaccharides are composed of three-carbons (known as triose), four-
carbons (tetrose), five-carbons (pentose), and six-carbons (hexose). In carbohydrate
chemistry, when a carbon atom is double-bonded with an oxygen atom, that will form a
carbonyl group, whose location can classify monosaccharides as either aldehydes or ketones.
In aldehydes, the carbonyl group is at one end of the monosaccharide structure; by contrast,
in ketones, the carbonyl group is present at any other position. For instance, glucose is an
aldehyde, and fructose is a ketone (Figure 3). In addition, monosaccharides have chiral

4
carbon, which is defined as carbon that is attached to four different atoms or functional
groups. Monosaccharides structural configuration can be in either a dextro-rotary (D) or levo-
rotary (L) isomer. In linear form, when the hydroxyl group on the bottom of chiral carbon is
pointing to the right side, this is the D-configuration. In contrast, if the hydroxyl group on the
bottom of the chiral carbon is pointing to the left side, this is the L-configuration (Bertozzi
and Rabuka, 2009).
Figure 3. Monosaccharides structural differences as aldehydes (glucose) or ketones (fructose)
are assigned in blue colour, in addition to the difference in D- and L-configuration in glucose
as an example in red colour (Nelson, Lehninger and Cox, 2008).
1.1.1.2. Oligosaccharides
Oligosaccharides are composed of small number of monosaccharides in ring form.
Oligosaccharides are made up of short chains of monosaccharides attached with glycosidic
linkages. Indeed, when two monosaccharides are attached together, they will form
disaccharides (double sugars). These two monosaccharides are attached together via
glycosidic linkage; for instance, lactose is composed of one galactose and one glucose
attached together via glycosidic linkage (Figure 4). According to the glycosidic linkage type,
molecules will have different structural properties and biological functions. Glycosidic
linkage is formed between the anomeric carbon and a hydroxyl group from the attached
compound; this will generate either - or β-glycosidic linkages in ring form, resulting in
pyranose or furanose forms. Pyranose is defined as a six-membered ring of five carbons and
one oxygen, by contrast, furanose is defined as five-member ring of four carbons and one
oxygen (Bertozzi and Rabuka, 2009; Pastrana and Jauregi, 2017).

5
Figure 4. Lactose chemical structure as an example of disaccharide. It is composed of
galactopytanose attached to glucopyranose via β-glyosidic linkage (Nelson, Lehninger and
Cox, 2008).
1.1.1.3. Polysaccharides
Polysaccharides consist of long branched or unbranched chains of up to thousands of
monosaccharides attached together via -/β- glycosidic bonds. Polysaccharides differ from
each other by their monosaccharide building blocks, chain length, branching point, and type
of linkage (Figure 5). Amylose and amylopectin polysaccharides are examples that show
some of polysaccharides’ features. Amylose is composed of a chain of unbranched polymers
of glucose (500–20,000 units) attached together via α (1→4) glycosidic linkages. In contrast,
amylopectin is composed of a branched glucose polymer chain (2,000–200,000 units)
attached together via α (1→4) and α (1→6) glycosidic linkages (Nelson, Lehninger and Cox,
2008).
Additionally, polysaccharides can be classified according to their monosaccharide
building blocks into homo-polysaccharides and hetero-polysaccharides, which can combine
any other polysaccharide features such as branching or unbranching, chain length and both
types of glycosidic linkages. Homo-polysaccharides simply consist of only one type of
monosaccharide along the chain. One example is glycogen, which is composed of repeating
glucose units. In contrast, hetero-polysaccharides consist of more than one type of
monosaccharide along the chain—for example, heparan sulphate, which consists of repeating
glucosamine and uronic acid units (Figure 6) (Nelson, Lehninger and Cox, 2008).

6
Figure 5. Demonstrate the main features that can be found in polysaccharide chain
Figure 6. Schematic diagram showing polysaccharides classification according to
monosaccharide building blocks, as homo-polysaccharide chain (A) that consists of repeating
units of only one type monosaccharide or hetero-polysaccharide chain (B), which consist of
more than one monosaccharide along the chain. Both (A) and (B) can have different chain
lengths, glyosidic linkages, branching or unbranching features (Nelson, Lehninger and Cox,
2008).
Polysaccharides
Monosaccharides Building Block
Homopolysaccharides
Heteropolysaccharides
Chain Length
Amylose
(500-20,000 glucose units)
Amylopectin
(2000- 20,0000 glucose units)
Branching
Unbranched
(Amylose 1→4 only)
Branched
(Amylopectin 1→4 and 1→6)
Linkages
α-linkage
(Starch α-D-glucose)
β-linkage
(Cellulose β-D-glucose)

7
1.1.1.3.1. Glycoconjugates
Glycoconjugates are a type of polysaccharides composed of more than 10
monosaccharides covalently attached to non-carbohydrate structures such as proteins and
lipids via glycosidic linkages. There are several monosaccharides in nature that have the
ability to conjugate with non-carbohydrates to form glycoconjugates (Table 1).
Glycoconjugates can be classified into different categories according to their non-
carbohydrate molecule, such as glycolipids, glycoproteins, and proteoglycans. Glycolipids
are defined as carbohydrate chains attached to lipids. Glycoproteins are defined as
carbohydrate chains attached to polypeptide chains. Proteoglycans are a subclass of
glycoproteins, which a particular type of amino-sugars, known as glycosaminoglycan, is
attached to protein chains (Bertozzi and Rabuka, 2009).
Table 1. Most common monosaccharides that can bind to a non-carbohydrate moiety to form
glycoconjugates (Varki and Sharon, 2009).
Monosaccharide Structure Example
Pentoses Five-carbon D-xylose
Hexoses Six-carbon D-glucose
Hexosamine Hexose with an amino group at C-
2
Glucosamine
Deoxyhexose Six-carbon hexose without
hydroxyl group at C-6
L-fucose
Uronic acids Hexose with negatively charged
carboxylate group at C-6
Glucuronic acid
Sialic acids Nine-carbon N-acetylneuraminic
acid
1.2. Glycosaminoglycans
Glycosaminoglycans (GAGs) are a group of long, unbranched hetero-polysaccharides
consisting of repeated disaccharide units of uronic acid covalently attached to hexose-sugar

8
via glycosidic bonds. GAG structures are very diverse, and their synthesis is not template
based, like that of proteins. What is more, each monosaccharide can acquire several structural
modifications via various enzymes, which give GAGs their vast structural heterogeneity. For
instance, a GAG chain can be composed of long polysaccharide chain with different
glycosidic linkages between each monosaccharide, as well as the addition of various possible
functional groups, as sulphates at different points. All these structural modifications give
GAGs their structural heterogeneity and wide range of biological functions (Nelson,
Lehninger and Cox, 2008).
GAGs can be freely released or attached to core proteins to form glycoconjugates
known as proteoglycans (PGs), these are found in the extracellular matrix, on the cell surface,
and intracellularly. GAGs are covalently attached to the core protein polypeptides via N- or
O-linkages by a process known as protein glycosylation. N-linked GAGs are usually attached
to the core protein via asparagine (Asn) residues in the consensus peptide sequence Asn-X-
Ser/Thr; where X represents any amino acid; (Ser) represent serine and (Thr) represent
threonine. These N-linked glycans can be divided into three main classes: hybrid, complex,
and high-mannose glycans. On the other hand, O-linked glycans are usually attached to the
hydroxyl group of Ser or Thr residues on core protein polypeptides (Figure 7) (Esko, 1991;
Yayon et al., 1991; Nelson, Lehninger and Cox, 2008; Sarrazin, Lamanna and Esko, 2011).
Figure 7. Schematic diagram showing GAGs attached to different core proteins at different
locations.

9
1.2.1. Glycosaminoglycan biosynthesis
GAGs can be biosynthesised from different forms of monosaccharide, such as
hexosamines and uronic acids. Hexosamine sugars consist of hexose-sugar structure with an
amine group replacing the hydroxyl group at carbon-2, and uronic acid is composed of
hexose-sugar, where the hydroxyl group at carbon-6 is oxidised to form a carboxylate. Both
biosynthesis pathways are crucial for GAGs biosynthesis and are therefore it’s been discussed
below.
1.2.1.1. Hexosamine biosynthesis pathway
Hexosamines are composed of six-carbon sugar structures with an amine group
attached to carbon-2. They are biosynthesised in cells via breakdown of polysaccharides to
monosaccharides to be used as precursors in GAG synthesis. Glucose (Glc) will be used as an
example to illustrate the synthesis of glucosamine (GlcNH2) (Figure 8). Initially, Glc carbon-
6 is phosphorylated to glucose-6-phosphate by hexokinase enzyme; then, the glucose-6-
phosphate is converted to fructose-6-phosphate via phosphohexose isomerase enzyme. Next,
the fructose-6-phosphate is converted to glucosamine-6-phosphate by a rate-limiting enzyme
known as glutamine-fructosamine transferase; this enzyme converts glutamine, which is used
as an amino group donor, into glutamate, resulting in the formation of glucosamine-6-
phosphate. After that, the glucosamine-6-phosphate is converted to N-acetyl-glucosamine-6-
phosphate by glucosamine-6-phosphate-N-acetyl transferase, which transfers the acetyl group
from acetyl-CoA to glucosamine-6-phosphate C-2, resulting in N-acetyl-glucosamine-6-
phosphate. Afterwards, this N-acetyl-glucosamine-6-phosphate is converted to N-acetyl-
glucosamine-1-phosphate by phosphoacetyl-glucosamine mutase. Finally, the N-acetyl-
glucosamine-1-phosphate is converted to uridine diphosphate (UDP)-N-acetyl-glucosamine
by UDP-N-acetylglucosamine pyrophosphorylase. This UDP-N-acetyl-glucosamine can be
converted to UDP-N-acetyl-galactosamine by UDP-galactose-4-epimerase, which can be
used as a precursor for synthesising GAGs, when required (Schleicher and Weigert, 2000).
1.2.1.2. Uronic acids biosynthesis pathway
Uronic acids are derived from hexose-sugars—for example, Glc, galactose (Gal), and
mannose (Man)—where the hydroxyl group at C-6 of the hexose-sugar is oxidized to a
carboxyl group to form uronic acids, such as glucuronic acid (GlcA), galacturonic acid

10
(GalA), or mannuronic acid (Figure 8). GlcA biosynthesis occurs in many cells, starting with
the phosphorylation of Glc by hexokinase transferase to glucose-6-phosphate, which is then
converted to glucose-1-phosphate by phosphoglucomutase enzyme; then, glucose-1-
phosphate is converted to UDP-glucose by UDP-glucose pyrophosphorylase. Oxidation of
the hydroxyl group at C-6 of the UDP-glucose by UDP-glucose dehydrogenase leads to the
formation of UDP-glucuronic acid. This UDP-glucuronic acid is used as a substrate for GAG
synthesis (Dutton, 1966). GlcA can be further modified to L-iduronic acid (L-IdoA) by
epimerization of glucuronic acid via D-glucuronyl C5-epimerase enzyme, which is the key
enzyme in converting GlcA to L-IdoA (Li, 2010).
Figure 8. Schematic diagram demonstrates an example of the biosynthesis pathway of
glucosamine or glucuronic acid from glucose.
1.3. Core protein glycosylation
Protein glycosylation is defined as the addition of sugar molecules to the polypeptide
sequence of the core protein in order to determine a specific cellular function. Glycosylation
results in the attachment of different types of monosaccharides to a core protein backbone.
The glycosylation process is non–template-driven, so the addition of a particular saccharide
sequence to the chain is random, thus making the structure of these PGs very diverse.
Proteins are targeted for various biological functions, so they can be modified
according to cell function as well as extracellular secretions. The core protein is synthesised
in the rER, then transported via vesicles to the Golgi apparatus, where glycosylation process

11
takes place (Esko et al., 1987; Stanley, Schachter and Taniguchi, 2009). However, Prydz and
Dalen (2000) suggested that the chain could start earlier in the rER.
Principally, protein glycosylation requires various monosaccharides to be used as
saccharide donors, for example, hexoses, hexosamines and uronic acids. These substrates are
synthesised in the cytosol and attached to UDP as derivative precursors such as UDP-
GlcNAc, UDP-GlcA, UDP-Xyl, and UDP-Glc. These substrates from endogenous or
exogenous origins enter the Golgi via antiporter channels from the cytosol to be available for
protein glycosylation (Figure 9) (Hirschberg, Robbins and Abeijon, 1998).
Figure 9. Schematic diagram shows the antiporter mechanism of monosaccharides and the
phosphate donor 3′-phosphoadenosine 5′-phosphosulphate (PAPS) precursors in Golgi
apparatus membrane. As the transporters are functionally like antiporters, except for PAPS,
the antiporter is unknown (Hirschberg, Robbins and Abeijon, 1998).
In the Golgi, protein glycosylation takes place in three consecutive phases—chain
initiation, chain polymerisation, and chain modification. Chain initiation starts by enzymatic
transfer of the sugar residues to the polypeptide residues of the core protein, which results in
either N-linked or O-linked glycans. Next, the chain is elongated by various enzymes that add
more monosaccharides, such as hexosamines and uronic acids. Finally, the chain acquires
multiple modifications, resulting in non–template-driven modifications that gives GAGs their
unique structure (Figure 10). This process is highly dependent on the cell type and the type of
GAG that is required for the biological function (Hassell, Kimura and Hascall, 1986).

12
Figure 10. Schematic diagram of protein glycosylation process: (A) Represents the core
protein formation in the endoplasmic reticulum. (B) The initial addition of saccharides to the
polypeptide residues of the core protein that can be added from the rER or Golgi apparatus,
following by chain elongation (C) and chain modification (D). Finally, according to the cell-
type, the fully synthesised glycosylated core protein can be secreted to its location (Silbert,
1966).
1.3.1. N-linked glycan
If a carbohydrate sequence attaches to the polypeptide residues of core protein via N-
glyosidic linkages, this conjugation is known as an N-linked glycan. This process starts in the
rER surface via a process known as the Dolichol-phosphate pathway, followed by addition of
the sugar sequence to the Asn residues in the core protein sequence. Afterwards, this
glycoconjugated sequence travels to the cis-Golgi, where the first step of sequence
modification takes place, which is known as sequence early modifications. Then this early
modified sequence travels to the medial-Golgi where further modifications take place, which
is known as sequence late modification. Finally, before secretion to its final destination, the
mature sequence is able to travel to trans-Golgi for its final decorations/modifications such as
addition of chain branches, sulphate groups and sialic acids among other decorations (Figure
11) (Stanley, Schachter and Taniguchi, 2009).

13
Figure 11. Schematic diagram showing N-linked glycan biosynthesis following Dolichol-
phosphate pathway (Stanley, Schachter and Taniguchi, 2009).
1.3.1.1. Dolichol precursor formation
N-linked glycans are synthesised through the Dolichol-phosphate pathway. Dolichol is a
poly-isoprenol lipid compound, which is composed of five-carbon isoprene units with a

14
phosphate group (Figure 12). The N-glycan synthesis process starts in the rER, where
Dolichol-phosphate is facing the cytoplasm to allow the addition of different sugar precursors
to Dolichol-phosphate (Dolichol-P), for instance, UDP-N-acetylglucosamine (UDP-GlcNAc).
Figure 12: Dolichol-phosphate chemical structure that is composed of multiple isoprene
monomers that can reach 19 units in mammalian cells (Stanley, Schachter and Taniguchi,
2009).
This step is catalysed by GlcNAc-1-phosphotransferase, which transfers GlcNAc-1-P
from UDP-GlcNAc, resulting in an attached GlcNAc-phosphate unit to the sequence from its
UDP precursor, as Dolichol-P-P-GlcNAc, followed by addition of another GlcNAc unit to
become Dolichol-P-P-GlcNAc-GlcNAc. This is followed by the addition of five Man
residues from its guanosine diphosphate (GDP) precursor, which leads to formation of the
sequence of a Dolichol diphosphate high-mannose structure, as [Dolichol-di-phosphate-
GlcNAc(2)-Man(5)]. Afterwards, this Dolichol high-mannose structure is translocated to face
the rER lumen by an enzyme known as flippase.
Then, four additional Man residues, which are donated from Dolichol-P-Man, by the
action of mannosyltransferases, and three Glc residues are donated from Dolichol-P-Glc by
glucosyltransferases. Those Man and Glc units are formed in the cytoplasm from GDP-Man
and UDP-glucose, respectively, transferred to Dolichol-phosphate and flipped to the rER
lumen. Finally, after the addition of these sugar residues, Dolichol-diphosphate will be
mature to be act as an N-glycan precursor, which acquires this formula [Dolichol-P-P-
GlcNAc(2)-Man(9)-Glc(3)] (Figure 13).

15
Figure 13: Schematic diagram showing synthesis of [Dolichol-P-P-GlcNAc(2)-Man(5)] after
flipping to the rER lumen, followed by chain elongation by addition of 4 Man residues as
well as 3 Glc units after several chain modifications as a result of [Dolichol-P-P-GalNAc(2)-
Man(9)-Glc(3)] (Stanley, Schachter and Taniguchi, 2009).
1.3.1.2. N-glycan precursor addition to the polypeptide sequence
N-glycan precursor [Dolichol-P-P-GlcNAc(2)-Man(9)-Glc(3)] is ready to be attached to
the polypeptide region of Asn-X-Ser/Thr via N-glycosidic linkage. Oligosaccharyltransferase
(OST) enzyme will catalyse the cleavage of the sugar sequence to release it from Dolichol-P-
P, resulting in covalent bonds between sugar complex and Asn [Asn-GlcNAc(2)-Man(9)-
Glc(3)].
1.3.1.3. Early-sequence modifications
Early-sequence modifications start by removing most of the sugar residues from the
polypeptide sequence and prepare the sequence to be transferred to the cis-Golgi via vesicles.
The process begins with the removal of Glc residues by the action of α-glucosidases-I and II,
which remove one terminal Glc (1→2) and two inner Glc (1→3), respectively. After the
removal of glucose residues [Asn-GlcNAc(2)-Man(9)], an additional ER enzyme called -
mannosidase-I is responsible for removing one terminal Man unit (1→2) before the

16
sequence pass through cis-Golgi as [Asn-GlcNAc(2)-Man(8)]. Most N-glycans that pass
through the cis-Golgi can be further modified. In the cis-Golgi, further removal of the
remaining glucose and Man residues by endo-α-mannosidase (1→2) results in [Asn-
GlcNAc(2)-Man(5)], however, Man inhibitors might inhibit the removal of all mannose
residues, which result in uncompleted chain that cannot be modified any further. At this
stage, three types of N-glycans can be formed: oligomannose and hybrid and complex
glycans (Figure 14). Oligomannose will not undergo further modifications, whereas hybrid
and complex glycans will be further modified (Stanley, Schachter and Taniguchi, 2009).
Figure 14. Schematic diagram shows three possible modified glycan structures, namely
oligomannose, complex and hybrid (Stanley, Schachter and Taniguchi, 2009).
1.3.1.4. Late-sequence modifications
In the cis-Golgi, the addition of GlcNAc to the Man α(1→3) by the action of N-
acetyl-glucosaminyl transferase-I (GlcNAcT-I) catalyses the addition of GlcNAc to the
sequence of [Asn-GlcNAc(2)-Man(5)], resulting in [Asn-GlcNAc(2)-Man(5)-GlcNAc]. This
sequence is crucial for further modifications on the sequence in the medial-Golgi, which
modifies the chain to form hybrid or complex glycans. In the medial-Golgi, immediately
following this step, the majority of N-glycans containing terminal α(1→3) and α(1→6) Man
will be trimmed by α-mannosidase-II enzyme to yield [Asn-GlcNAc(2)-Man(3)-GlcNAc].

17
Afterwards, additional GlcNAc will be added to the sequence by N-acetyl-glucosaminyl
transferase-II (GlcNAcT-II) to yield [Asn-GlcNAc(2)-Man(3)-GlcNAc(2)]. This final sequence
is responsible for the formation of complex N-glycans. On the other hand, terminal (1-6)
and (1-3) mannoses on the N-glycan sequence remain intact or incomplete action of α-
mannosidase-II will result in generating the hybrid N-glycan structure [Asn-GlcNAc(2)-
Man(4)-GlcNAc] (Stanley, Schachter and Taniguchi, 2009).
1.3.1.5. Trans-Golgi modification
In the Trans-Golgi, N-glycans will acquire various chain branches. Initially, complex
N-glycans can acquire additional GlcNAc branches at C-4 of core Man (1→3) and at C-6 of
core Man (1→6) by the action of N-acetyl-glucosaminyl transferase-IV (GlcNAcT-IV) and
N-acetyl-glucosaminyl transferase-V (GlcNAcT-V), respectively. In addition to these two
enzymes N-acetyl-glucosaminyl transferase-IX (GlcNAcT-IX), N-acetyl-glucosaminyl
transferase-Vb (GlcNAcT-Vb) can catalyse the addition of GlcNAc to C-6 of core Man
(1→6), and to C-6 of the core Man (1→3). Another possible branching point can be found
in both complex and hybrid N-glycans with the addition of GlcNAc to β-Man by the action of
GlcNAcT-III. These enzymes can result in highly branched and complex N-glycan structures,
which can have further sequence modifications (Stanley, Schachter and Taniguchi, 2009).
The second possible modification to the sequence can be the addition of different
sugar residues to the sequence. For example, fucose can be added to the GlcNAc adjacent to
the Asn. Fucosylation occurs by an enzyme fucosyl-transferase-III, which catalyse the
addition of fucose (1→3) and/or fucosyl-transferase-VIII, which catalyses the addition of
fucose (1→6). In plants, fucose can only be added to the α(1→3) GlcNAc adjacent to the
Asn, in contrast, invertebrates can acquire both fucose in both linkages α(1→3) as well as
α(1→6). Furthermore, xylose (Xyl) can be added to the sequence by the action of xylosyl-
transferase, which catalyses the addition of Xyl (1→2) to the core β-Man. Thirdly, chain
elongation can be achieved by addition of β-linked Gal building blocks [-3 Gal
β(1→4)GlcNAc β1-] known as N-acetyllactosamine. (Stanley, Schachter and Taniguchi,
2009).
Finally, the most important part of N-glycans is known as chain decorations. Chain
decorations can be achieved by the addition of sialic acid, fucose, a sulphate group, and -
linked GalNAc. Chain decoration features α-linkages that would facilitate glycan presentation

18
and interaction with various lectins, as this feature is shared with O-linked glycans (Stanley,
Schachter and Taniguchi, 2009).
1.3.2. O-linked glycan
O-linked glycan chains are initiated in the Golgi apparatus, in contrast to N-linked
glycans which initiate its chain in the rER. O-linked glycans do not require Dolichol-
diphosphate to initiate its chain; in addition, there is no particular sugar sequence to be
transferred to the amino acid residues. However, the addition of sugars to the O-linked chain
heavily depends on the cell-type, which has the specific sugar transferase enzymes to transfer
it to the amino acid residues. O-glycans are linked to the core protein commonly via Ser or
Thr residues, which make it very challenging to analyse and predict within the sequence
(Steen et al., 1998).
Different sugar residues can attach to the core protein to initiate the proteoglycan
sequence. For instance, O-Xyl can be the first monosaccharide attached to the hydroxyl group
of Ser or Thr by the action of Xyl-transferase, which catalyses the addition of a Xyl residues
from its UDP-Xyl precursor to Ser or Thr, resulting in the first glycosylation of the core
protein as Ser-O-β-Xyl. Then, the chain will be elongated and modified according to cell type
and the required proteoglycan (Brockhausen, Schachter and Stanley, 2009).
1.4. Glycosaminoglycan classification
The literature has distinguished six types of GAGs based on their repeating
disaccharide units: heparan sulphate (HS), heparin, chondroitin sulphate (CS), dermatan
sulphate (DS), keratan sulphate (KS), and hyaluronan (Rabenstein, 2002). Hyaluronan is
structurally linked to GAGs; however, it is not bound to a core protein as a side chain; hence,
it is not considered a proteoglycan (Höök et al., 1984).
1.4.1. HS
HS is biosynthesised in almost all mammalian cells with molecular weight 10–70
kDa, and it is found both on the cell surface and in the extracellular matrix. The most
common repeating disaccharide building block is thought to be [GlcA (1→4) GlcNH2],
chemically formulated as [→4 β-D-GlcA (1→4) α-D-GlcNAc (1→]. Although the HS chain
can acquire different structural modifications at different position, the GlcA is usually found

19
non-sulphated, and the GlcNH2 is mainly N-acetylated. Other typical modifications include
the epimerisation of GlcA to IdoA and the addition of the sulphate groups in a number of
positions (Rabenstein, 2002; Köwitsch, Zhou and Groth, 2018).
Figure 15. HS common disaccharide structure. During the modification phase, GlcA can
acquire sulphate group at C-2, while GlcNH2 can acquire sulphate group at C-3 and/or C-6
and the amino group (C-2) can be sulphated or acetylated, depending of cell function (Höök
et al., 1984).
1.4.1.1. HS biosynthesis pathway
The HS chain is biosynthesised in the Golgi apparatus as a long polymer (50–200
disaccharide units) in three consecutive phases: chain initiation, chain polymerisation, and
chain modification. The chain initiation phase starts by the addition of the basic
tetrasaccharide linkers which are Xyl, two Gal residues, and GlcA—to the Ser/Thr residues
of the core protein via O-linkage. Four enzymes are involved in this process, which are
Xylose-transferase, galactose-transferase-I, galactose-transferase-II, and glucuronic-acid-
transferase-I (Figure 16) (Rabenstein, 2002). Xylose-transferase enzyme catalyses the
addition of Xyl from UDP-Xyl to the serine residues via O-linkages; then, two Gal residues
are added by galactose-transferase-I β(1→4) and galactose-transferase-II β(1→3); and
finally, GlcA is added by the action of glucuronyltransferase-I enzyme β(1→3) (Prydz and
Dalen, 2000).
Subsequently, chain polymerisation starts with the addition of the first GlcNAc
(1→4) by GlcNAc-transferase-I, which control HS-GAG synthesis, followed by the

20
addition of GlcA (1→4) by an exotoxin like glycosyltransferase-3 (EXTL3). Next, the chain
is extended by the addition of various GlcA and GlcNAc from their corresponding UDP-
precursors to make the disaccharide building blocks of HS by the action of the copolymerase
enzymes transmembrane glycosyltransferase EXT1 and EXT2. After the HS chain is
extended, it is ready for the modification phase, which gives HS its unique structure (Lin,
2004).
The chain modification phase undertakes a series of adjustments and modifications to
the whole sequence, including deacetylation, acetylation, sulphation, and epimerization. N-
deacetylase and N-sulphotransferase, which are a group of enzymes that catalyse the transfer
of sulphate groups to their respective sites from the sulphate group universal donor PAPS,
lead the removal of the acetyl group from GlcNAc and add a sulphate group to the free amino
group, resulting in the generation of sulphated chain. Epimerization of GlcA by C-5
epimerase enzyme converts GlcA to IdoA. Further sulphation can take place at different
positions of the chain via specific sulphotransferases (Lin, 2004).
The uronic acid can be further modified by O-sulphation at C-2 and/or C-3 as
GlcA(2S/3S), in addition to the epimerised IdoA, which can acquire more sulphates at C-2/C-
3. On the other hand, β-D-GlcNAc can be either acetylated or N-sulphated as (GlcNS). Both
structures can acquire 6-O-sulphate to become GlcNAc(6S) or GlcNS(6S). However, only
GlcNS(6S) can be further modified by the addition of 3-O-Sulphate to become GlcNS(3,6S)
(Rabenstein, 2002). 3-O-Sulphation and/or 6-O-Sulphation of the GlcNAc occur via 3-O-
Sulphotransferase and 6-O-Sulphotransferase, respectively (Blackhall et al., 2001;
Rabenstein, 2002; Lin, 2004).

21
Figure 16. HS biosynthesis pathway in Golgi apparatus that follow HS three phases, namely
chain initiation, chain polymerization and chain modification. HS chain starts by addition of
tetrasaccharide linker, which is Xyl-Gal-Gal-GlcA, to Ser or Thr residues. Following chain
polymerization, where addition of GlcA and GlcNH2 to extend the HS chain. Finally, chain
modification, where several possible modifications can take place to give HS its unique
structure according to cell type, for instance, epimerisation, deacetylation, sulphation for both
the GlcA/IdoA and the GlcNH2 (Lin, 2004).
Lastly, HS chain modifications are highly dependent on the cellular function, so the
HS chain varies along the proteoglycan in terms of HS chain length and sulphation patterns.
HS chain modifications occur in clusters, which means the chain can be divided into different
modified domains across the proteoglycan. These domains are referred to as N-sulphated
(NS), N-acetylated (NA), and mixed domains (NA/NS). NS-domains are characterised by
highly sulphated saccharides on both GlcA and GlcNH2, the NA-domain is characterised by a

22
highly acetylated sequence, and NS/NA contains a mixture of variable sulphated and
acetylated regions. All these variable domains are non–template-driven, which results in
different HS chains, making HS chain sequencing very heterogeneous (Nelson, Lehninger
and Cox, 2008; Esko, Kimata and Lindahl, 2009). Following successful assembly of the
chain in the Golgi apparatus, cells secrete HS-PG to different locations, such as the cell
membrane. Recently identified cell membrane endosulphatases can alter the HS chain on the
cell membrane by removing 6-O-sulphate from GlcNH2 residues (Lamanna, 2008).
1.4.2. Heparin
Heparin is biosynthesised in connective tissues in mast cells attached to a unique
intracellular core protein known as serglycin (Volpi et al., 2014). When a mast cell is
stimulated, it releases heparin by exocytosis, resulting in unfractionated heparin with
molecular weight 12-15 kDa. The most common heparin disaccharide formula is [IdoA
(1→4) GlcNH2], chemically formulated as [→4) α-L-IdoA(2S) (1→4) α-D-GlcNS (1→],
where IdoA is mostly sulphated at C-2, and GlcNH2 is NS, with additional sulphate groups at
C-3 and C-6 can be added to the chain (Figure 17). Hence, heparin is known to be more
sulphated than HS and carry high negative charge along the chain (Sasisekharan and
Venkataraman, 2000; Sasisekharan et al., 2002; Köwitsch, Zhou and Groth, 2018).
Figure 17. Heparin common disaccharide building blocks structure. During modification
phase, IdoA can acquire a sulphate group at C-2, while GlcNH2 can acquire sulphate group at
C-3 and/or C-6, however, the amine group is more likely sulphated or to a lesser extend
acetylated, depending on cell function (Höök et al., 1984).

23
1.4.2.1. Heparin biosynthesis pathway
Heparin is biosynthesised in the Golgi apparatus in a similar biosynthesis pathway to
that of HS, including chain initiation, chain polymerisation, and chain modification.
However, during chain modification, the heparin chain undergoes additional modifications by
N-deacetylation and N-sulphation of the GlcNH2, as well as more epimerisation by the C5-
epimerase enzyme, leading to conversion of about 70% of the GlcA to IdoA. Hence, the
heparin chain has a higher frequency of sulphated IdoA than HS (Sugahara and Kitagawa,
2002).
1.4.2.1.1. Enzymatic degradation of HS/heparin chain
HS and heparin are secreted to the ECM as fully synthesised chains. However, some
chains are shed from the cell through proteolytic cleavage of the core protein and endocytosis
enzymes such as heparinases. Heparinase enzymes are endoglycosidase enzymes that cleave
the glycosidic bonds between GlcNH2 (1→4) and uronic acid in both heparin and HS chains,
resulting in unsaturated disaccharides with double bonds between C-4 and C-5 of the uronic
acid (Figure 18). The heparinase gene in human chromosome 4 is known as HPSE, which is
expressed by the lacrimal gland, lens, cornea, epithelium, and other tissues. Secreted
heparinase is 508 amino acids long, with approximately 57.7 kDa (Zhang et al., 2010).
Heparinase was extracted from bacteria Flavobacterium heparinum, which releases
enzymes that cleave both HS- and heparin-containing molecules. There are three classes of
heparinase enzymes that can cleave heparin/HS (1→4) glycosidic linkage, which are
heparinase-I, heparinase-II and heparinase-III. Heparinase-I is highly specific to this
sequence [α-D-GlcNS (1→4) β-D-GlcA(2S)/α-L-IdoA(2S)]. Heparinase-II is thought to be
the only enzyme that can cleave the glycosidic linkage of [α-D-GlcN(S/Ac) (1→4)
unsulphated or sulphated uronic acid]. Heparinase-III can hydrolyse the glycosidic linkage
between [α-D-GlcNAc/(2S) (1→4) β-D-GlcA] (Linhardt et al., 1990).

24
Figure 18. Heparinase reaction pathway. This figure shows the heparinase enzyme that
catalase the elimination of polysaccharides containing heparin/HS α(1→4), resulting in
unsaturated oligo- and disaccharides.
1.4.3. CS
CS is expressed in the cell membrane, intracellularly, and in the ECM. It can be found
covalently bonded to the core protein to form CS-proteoglycan (CSPG). CS common
repeating disaccharide units are composed of [GlcA (1→3) GalNH2,], with chemical formula
[→4 β-D-GlcA (1→3) β-D-N-GalNAc (1→] (Mizumoto, Yamada and Sugahara, 2015). In
addition, the CS chain can acquire a high negative charge, as it can acquire several sulphates
at different positions on both GalNH2 and GlcA, in addition to the hydroxyl group on the
GlcA (Figure 19) (Huang et al., 2003).

25
Figure 19. CS common disaccharide building block structure. During the modification phase,
GlcA can acquire sulphate group at C-2, and GalNH2 can acquire sulphate group at C-4
and/or C-6 and the amino group either can be sulphated or acetylated, depending on cell
function (Höök et al., 1984).
1.4.3.1. CS biosynthesis pathway
Basically, the CS chain synthesis follows a similar synthesising pathway to HS and
heparin; however, the CS chain is initiated by the addition of GalNAc to the tetrasaccharide
linker region. After the addition of the tetrasaccharide linkers to the core protein sequence,
β(1→4) N-acetylgalactosaminyltransferase-I and β(1→3) glucuronosyltransferase-II—which
catalyse the addition of GalNAc and GlcA, respectively, from their UDP-precursors—create
the CS backbone. Then, the CS chain undergoes polymerisations, which result in several
forms of modified CS structures (Bülow and Hobert, 2006).
CS has been identified to have several isomers according to the disaccharide
posttranslational modifications. Some CS isomers are common in mammals, and others are
rare or not found in mammalian cells (Table 2). Common CS subtypes are CS-A, CS-B, CS-
C, CS-D, and CS-E. CS-A is composed of [GlcA-GalNAc(4S)], and CS-C is composed of
[GlcA-GalNAc(6S)]. CS-B can be distinguished from other CS isomers due to its

26
epimerization of the GlcA to IdoA [IdoA(2S)-GlaNAc(4S)/(6S)] (Lamari and Karamanos,
2006). CS-D structurally possess a disaccharides unit [GlcA(2S)-GalNAc(6S)] (Nadanaka et
al., 1998). Finally, CS-E has repeated disaccharide structure units [GlcA-GalNAc(4,6S)]
(Iwata, 1969).
The rarest CS posttranslational modifications have been identified in marine
invertebrates, including CS-K, CS-L, and CS-M. CS-K was isolated from king crab cartilage
(Tachypleus tridentatus), which has unique disaccharides that contain 2-O-sulphated or 3-O-
sulphated GlcA and GalNS or GalNAc(4S) (Sugahara et al., 1996). CS-L has unique 3-O-
sulphated GlcA, and GalNH2 is acetylated with 6-O-sulphated structure [GlcA(3S)-
GalNAc(6S)]. Finally, CS-M is characterised by 3-O sulphated GlcA, and the GalNH2 is N-
acetylated with 4-O-sulphated structure [GlcA(3S)-GalNAc(4S)] (Lamari and Karamanos,
2006).
According to Vieira & Mourão (1988), a novel marine sourced CS chain with
branched fucose was discovered from sea cucumber (holothurian), which was characterised
as fucosylated-CS. Fucose is attached to the GlcA via (1→3) glycosidic linkage, which
make CS resistant to certain CS-degrading enzymes (Pomin, 2015; Ustyuzhanina et al.,
2015).
Table 2. Different CS isomers.
Chondroitin sulphate subtypes Structure
CS-A GlcA-GalNAc(4S)
CS-B IdoA(2S)-GlaNAc(4S)/(6S)
CS-C GlcA-GalNAc(6S)
CS-D GlcA(2S)-GalNAc(6S)
CS-E GlcA-GalNAc(4S,6S)
CS-K GlcA(2S/3S)-GalN(S)/(4S)
CS-L GlcA(3S)-GalNAc(6S)
CS-M Glc(3S)-GalNAc(4S)
1.4.4. DS
DS is expressed in many cells, and it can be found in high quantities in the skin
(Trowbridge and Gallo, 2002). The basic disaccharide building block is composed of [IdoA

27
(1→3) GalNH2], chemically formulated as [→4 -L-IdoA (1→3) β-D-GalNAc (1→] (Figure
20) (Sugahara et al., 2003). Although 80–90% of the DS chain’s uronic acid is epimerised to
IdoA by C-5 epimerase enzyme, DS is considered as subtype of CS. In addition, the DS chain
can acquire sulphate group at different positions on both IdoA and GalNH2, which makes it
highly negatively charged (Figure 20).
Figure 20. DS common disaccharide building blocks structure. During the modification
phase, IdoA can acquire a sulphate group at C-2, and GalNH2 can acquire a sulphate group at
C-4 and/or at C-6 and the amino group (C-2) can be either acetylated or sulphated, depending
on cell function (Höök et al., 1984).
1.4.4.1. Enzymatic degradation of CS/DS
Human chondroitin sulphatases are hydrolases enzymes, which are lysosomal and
microsomal enzymes that can be found in various cells such as fibroblasts and leukocytes
(Bond et al., 1997). These enzymes can hydrolyse CS-A, CS-B, and CS-C chains, resulting in
the release of unsaturated disaccharides. In case of enzyme deficiency in humans, mainly CS
and, to a lesser extent, DS and hyaluronic acid are accumulated in tissues (Linhardt et al.,
2006).
A CS/DS degrading enzyme, known as chondroitinase-ABC, which is extracted from
bacteria Proteus Vulgars. Chondroitinase-ABC is a broad-spectrum endoglycosidase that can

28
degrade chondroitin-4-sulphate (CS-A), dermatan sulphate (CS-B), chondroitin-6-sulphate
(CS-C) and, to a lesser extent, hyaluronan. Chondroitinase-ABC can catalyse the elimination
of polysaccharides containing a glycosidic linkage between [β-D-GalN (1→4) β-D-GlcA/-α-
L-IdoA], resulting in unsaturated disaccharides (Figure 21) (Salyers and O’Brien, 1980;
Huang et al., 2003).
Figure 21. Chondroitinase-ABC reaction pathway. chondroitinase-ABC enzyme catalase the
elimination of polysaccharides containing CS/DS chain β(1→4), resulting in unsaturated
oligo- and disaccharides.

29
Figure 22. Schematic figure shows CS/DS biosynthesis pathway. Chain starts by addition of
O-linked tetrasaccharides to Ser residues on the core protein. According to the cell type,
specific enzymes catalyse the synthesis of either CS or DS.

30
1.4.5. KS
KS was first isolated from the cornea of a cow (Suzuki, 1939), then Meyer et al.
(1953) isolated KS from bovine cornea, characterising it as keratosulphate, which refers to
both sulphated disaccharide units of KS at Carbon-6. KS is a unique GAG type, as it lacks
uronic acid residues on its basic structure, which consists of a linear polymer of repeated
disaccharides of Gal and GlcNH2 [→3) β-D-galactose (1→4) β-D-GlcNAc (1→] (Figure 23).
Figure 23. KS common disaccharide building blocks structure. During the modification
phase, Gal can acquire sulphate group at C-6 and/or sialic acid at C-3, and GlcNH2 can be
capped with sialic acid at C-4, fucose at C-3 and/or sulphate group at C-4, C-6 and/or C-3
and the amino group (C-2) can be either acetylated or sulphated, depending on cell function.
(Meyer et al., 1953; Funderburgh, 2000; Meininger et al., 2016).
1.4.5.1. KS classification and biosynthesis pathway
After the initial isolation of KS from bovine cornea, keratan sulphate proteoglycan
(KSPG) was isolated from other tissues such as cartilage, which resulted in the discovery of
various types of KS. Hence, KS was found to bind different core proteins in both N- and O-
linked manners. As a consequence, KS was classified according to its linkages to the core
protein into KS-I, KS-II, and KS-III (Krusius et al., 1986).

31
KS-I was first identified in the cornea as N-linked to the core protein via Asn
residues, with molecular weight 20–25 kDa. The KS chain can acquire sulphate group on
both GlcNAc and Gal anywhere on the chain. KS-I can be found non-sulphated, mono-
sulphated, and di-sulphated by the action of sulphotransferases that catalyse the addition of
sulphate groups (Esko, Kimata and Lindahl, 2009). KS-II is found in bovine articular
cartilage, which has major disulphated pattern of sulphation, which act as cell surface ligands.
It is found linked to the core protein, where the GalNAc is O-linked to Ser/Thr residues, in
addition, Gal C-3 is usually capped with sialic acids, but GlcNAc C-3 can also be partially
capped with sialic acids. Finally, KS-III was found to be O-linked to the core protein in the
brain via mannose linked to Ser/Thr residues. Therefore, KS subtypes are not tissue-specific,
it depends on the linkage structure (Funderburgh, 2000).
The KS chain can have variable length and sulphation patterns. Chain length is
managed by the addition of sugar molecules to Gal and GlcNAc, resulting in chain branching
and elongation or chain termination. This step depends on the cell type, and it is adapted in
the trans-Golgi in addition to fucose and sialic acid as the chain’s final decoration step
(Stanley, Schachter and Taniguchi, 2009).
1.4.6. Hyaluronan
Hyaluronan is the simplest GAG type in terms of structure and modifications. It is
composed of long unbranched and unmodified polysaccharide structure. Hyaluronan was
originally called hyaluronic acid (Meyer and Palmer, 1934). Its basic repeating disaccharides
is composed of GlcA (1→3) GlcNAc, which is chemically formulated as [→4 β-D-GlcA
(1→3) β-D-GlcNAc (1→] (Figure 24).
Hyaluronan is not considered a PG for two reasons, firstly, it is not attached to the
core protein as a sidechain (Almond, 2007); secondly, it is synthesised in the cytoplasm near
the plasma membrane, which enables hyaluronan to polymerize more sugars and increase its
mass, unlike other GAGs-related saccharides, (Fraser, Laurent and Laurent, 1997).

32
Figure 24. Hyaluronan saccharides structure, which is consist of long unbranched and
unmodified GlcA-GlcNAc.
1.4.6.1. Hyaluronan biosynthesis pathway
Basically, hyaluronan is a unique type of glycan that differs from other GAGs because
it is synthesized near the plasma membrane. Hyaluronan-synthase (HAS) is the enzyme that
catalyses the addition of GlcNAc and GlcA from their UDP-substrates, resulting in the
formation of hyaluronan building blocks (Figure 25). The HAS enzyme has four isoforms—
HAS-A, HAS-B, HAS-C, and HAS-D. HAS-C is responsible for making UDP-Glc from
glucose-1-phosphate; HAS-B encodes the hydrogenase enzyme to convert UDP-Glc to UDP-
GlcA; HAS-D generates UDP-GlcNAc from UDP-glucosamine-1-phosphate and acetyl CoA.
Finally, HAS-A encodes the synthesis of the hyaluronan chain by catalysing GlcNAc and
GlcA from its precursors (Magee, Nurminskaya and Linsenmayer, 2001; Hascall and Esko,
2015).

33
Figure 25. Schematic diagram of hyaluronan biosynthesis pathway by HAS enzyme family,
where HAS is responsible for catalysing the addition of monosaccharides from their UDP-
precursors. Then, hyaluronan is synthesized and maturated in the ECM (Hascall and Esko,
2015).
1.4.6.2. Hyaluronan degrading enzymes
Hyaluronan can be degraded to monosaccharides by enzymes known as
hyaluronidases. The hyaluronidase gene (HYAL) expresses three enzymes: hyal-1, hyal-2, and
hyal-3. Hyaluronan turnover mostly depends on cell type and can last up to one day.
Degradation of hyaluronan can be achieved by either cellular endocytosis through CD44 or
the lymph node. Hyal-2 is present on the cell membrane and degrades the hyaluronan chain
into smaller fractions so fragments can enter the cell via endocytosis. In the cell, hyaluronan
fragments are directed to the lysosome, as it has hyal-1, which can degrade fragments into
monosaccharides via exoglycosidase enzymes such as β-glucuronidase and β-N-
acetylglucosaminidase (Hascall and Esko, 2015).
1.5. Proteoglycans (PG)
Various cells can produce different types of PGs, which can be found secreted in the
cytosol, bound to the cell membrane, on the basement membrane, or in the ECM. To date,
serglycin is the only intracellular PG that has heparin and CS as glycoconjugates (Iozzo and
Schaefer, 2015). Membrane-bound PGs have the ability to interact with various extracellular
ligands. Extracellular PGs are thought to support cellular stability and function.

34
1.5.1. Secreted PG
The most well-known intracellular PG is known as serglycin (Bourdon et al., 1985).
Serglycin PG carries highly sulphated GAGs, which can be assigned as intracellular PGs as
well as secretory PGs that can secrete their contents into the ECM and onto the cell surface.
Serglycin PGs can be found in various cells such as endothelial cells, haemopoietic cells, and
pancreatic cells. GAGs have been found stored in granules in the mast cells, which contain
heparin and to a lesser extent, CS-E; however, in monocytes and macrophages, they have
been found freely existing without attachment to a protein core (Kolset and Tveit, 2008).
1.5.2. Basement membrane PGs
The basement membrane is one of the extracellular contents, and it plays an important
role in maintaining haemostasis, modification of growth factor activity, and angiogenesis. On
the basement membrane, there are several PGs such as collagen-XVIII, collagen-XV,
perlecan, and agrin. Collagen-XVIII is expressed in cartilage, which belongs to the collagen
family, and is characterised by the N-terminal region–triple-helical collagenous and non-
collagenous domain–C-terminal region. HS can attach to collagen-XVIII via O-linked
linkage on the non-collagenous region (Iozzo, 2005). Collagen-XV is expressed in many
tissues except liver and brain cells. CS and HS can attach to its N-terminal non-collagenous
domain (Amenta et al., 2005). Perlecan PG participates in cellular mitogenesis and adhesion,
and it has HS attached via O-linkages (Iozzo, 2005).
1.5.3. Membrane-bound PGs
This type of PG comprises two large PG superfamilies—syndecan and glypican. The
syndecan superfamily can be subdivided into four syndecan-members (1–4) characterised by
a cytoplasmic domain, transmembrane region and an extracellular domain with G-protein
coupled receptors that most likely have both HS and CS (Iozzo and Schaefer, 2015).
Meanwhile, glypicans have six members (1–6) (Figure 26). According to Filmus et al.
(2008), the glypican superfamily has the extracellular domain attached to the cell membrane
via a glycosylphosphatidylinositol anchor (GPI) that acquires an HS chain (Sarrazin,
Lamanna and Esko, 2011).

35
Figure 26. Schematic diagram showing membrane bound glypican PG via its GPI anchor.
1.5.4. Extracellular PGs
Extracellular PGs can be found in connective tissues. Their major function is to
support the interstitial space between cells. Extracellular PGs can be subdivided into three
superfamilies, namely lectican, leucine-rich, and testican. Lecticans can carry highly
negatively charged GAGs such as CS and KS, and they can be subdivided into four PGs—
aggrecan, versican, neurocan, and brevican.
Aggrecan PG has three regions: amino-terminal, central, and carboxyl-terminal. It is
the major PG of the cartilage, which it supports by resisting compressional force as well as by
retaining water. Leucine-rich PGs have a small molecular weight, about 40 kDa. This type of
PG is known to help the organisation of collagen fibres in the cornea via their KS. Leucine-
rich PGs can be subdivided into biglycan, decorin, fibromodulin, and lumican. Biglycan and
decorin can carry two CS and DS. Fibromodulin has KS as a side chain, and it is expressed in
tendons. Lumican can be found in the cornea and heart valves, and it carries KS (Yanagishita,
1993). Decorin has high binding ability to growth factors such as transforming growth factor
β, and it can keep growth factors isolated in the ECM. Testican is an extracellular

36
proteoglycan, it can be subdivided into testican (1-3). Testicans are expressed in the thalamus
and cerebrum. They can act as metalloproteinase inhibitors (Lee et al., 2018).
Table 3. Classification of proteoglycans based on their location (Iozzo and Schaefer, 2015).
Proteoglycan
Location
Classification Predominant protein
side chain
Predominant
GAG
Intracellular Secretory granules Serglycin Hep/CS-E
Pericellular
Basement membrane
Perlecan
Argin
Collagen-XVIII
Collagen-XV
HS
HS
HS
CS/HS
Membrane-
bound
Transmembrane
GPI-Anchored
Syndecan (1-4)
Glypican (1-6)
HS
HS
Extracellular
Hyalectan lectican
Small leucine rich PGs
Spock
Aggrecan
Versican
Neurocan
Bervican
Biglycan
Decorin
Fibromodulin
Lumican
Testican
CS/KS
CS
CS
CS
CS
DS
KS
KS
HS

37
1.6. Glycosaminoglycan roles in normal cell physiological status
Generally, GAGs are known to have enormous structural heterogeneity, which can
lead to several cellular and extracellular functions. GAGs’ biological functions depend on the
cell type and can vary from simple cellular function to cellular morphogenesis (Edgren et al.,
1997). GAG-PGs have several structural and modulatory functions to maintain cellular
organization, structure, and integrity. Extracellular PGs can protect polypeptides from non-
specific proteolysis enzymes, and they can block antibody binding sites, in addition to storing
several biologically important molecules such as growth factors. For example, the GAG chain
can store heparin-binding growth factors near the cell that needs to be stimulated, which
protects it from degradation and increases its life span (Varki and Gagneux, 2017).
Furthermore, GAGs can increase PGs’ affinity for extracellular ligands due to their negative
charge and structural heterogeneity, acting as co-receptors for several soluble lectins such as
enzymes, proteins, and growth factors (Mythreye and Blobe, 2009; Sarrazin, Lamanna and
Esko, 2011). Stemming from this concept, GAGs can participate in various biological roles in
cell development, adhesion, repair, wound healing, and coagulation (Wight, Heinegård and
Hascall, 1991).
1.6.1. GAG’s role in cellular development
Physiologically, GAGs are involved in normal cell development and growth, since
they have high affinity to a wide range of growth factors. GAGs are thought to be the coupler
between the cell membrane and the extracellular matrix via its PGs. This could be due to their
structural diversity, which allows them to bind specifically to various extracellular lectins
(Bernfield et al. 1999). GAG classes as HS, CS, KS, and hyaluronan have various roles in
cellular development. According to Ornitz (2000), HSPG has a pivotal role in cellular
development, as it plays a key role in activating fibroblast growth factors (FGFs) and their
fibroblast growth factor receptors (FGFRs), which are known to regulate cellular
development (Rabenstein, 2002; Stringer, 2006). HSPG contributes to the FGF-FGFR by
accessing the complex’s stability, sequestration, and activation (Ye et al., 2001). Yayon et al.
(1991) clarified that FGFs essentially bind to surface HSPGs especially a specific highly
sulphated HS sequence before binding to their FGFR to increase the complex’s affinity and
half-life.

38
HSPG interaction with FGF is a tightly regulated process which requires a specific
HS sequence. As a consequence, altered HSPG structure, mutated HS synthesising enzymes,
cells treated with HS degrading enzymes, or cells pre-treated with sulphation inhibitors might
affect the FGF signalling pathway and the FGF-FGFR complex stability (Ornitz, 2000).
Bullock et al. (1998) observed that mice with mutated 2-O-sulphotransferase enzymes had
defective bone and kidney development, which could be due to a defective HS-FGF
signalling pathway.
The literature has indicated a further role of GAGs during cellular morphogenesis,
which is defined as the cellular developmental cascade that leads to the formation of well-
organized and functional tissue, as reported in embryogenesis (Spooncer et al., 1983).
Multiple elements participate in embryogenesis, such as signalling molecules and growth
factors. It has been shown via animal studies that HSPG participates in embryogenesis, while
a lack of HS alleles would result in developmental abnormalities. For instance, in mice with
EXT1, which is an enzyme that extends GAG sequences, a hypomorphic allele has led to the
development of skeletal muscle abnormalities (Bishop, Schuksz and Esko, 2007).
CS plays a key role in cellular development in conjunction with its PGs or as free
GAG. As suggested by Shannon et al. (2003), CSPG plays an important role in supporting
mammals’ lung branching developments by interacting with growth factors. Indeed, lung
cells treated with chondroitinase-ABC show inhibited lung branching, which supports the
role of CSPG in this process. In addition, CS is involved in embryonic morphogenesis, as a
mutated CS chain would result in growth abnormalities; for instance, the glycosyltransferase-
I knockout gene in mouse oocytes has resulted in growth failure (Mikami and Kitagawa,
2013). Moreover, CS is considered to be the richest GAG-type in the central nervous system,
where it can act as co-receptor to various growth factors such as brain-derived neurotrophic
factor (B-DNF). CSPG’s pattern of sulphation can affect its function, as reported in CS-A,
which inhibits axonal regeneration after injury (Laabs et al., 2005), while CS-C appears to
allow axonal regeneration (Mikami and Kitagawa, 2013). Thiele et al. (2004) emphasised that
mutated chondroitin-6-sulphotransferase leads to the development of chondrodysplasia with
spinal involvement.
It is also worth noting that hyaluronan has an important role during cell
morphogenesis. High levels of hyaluronan have been observed in various proliferation and
regeneration regions, as illustrated when mesenchymal stem cells migrate from the corneal
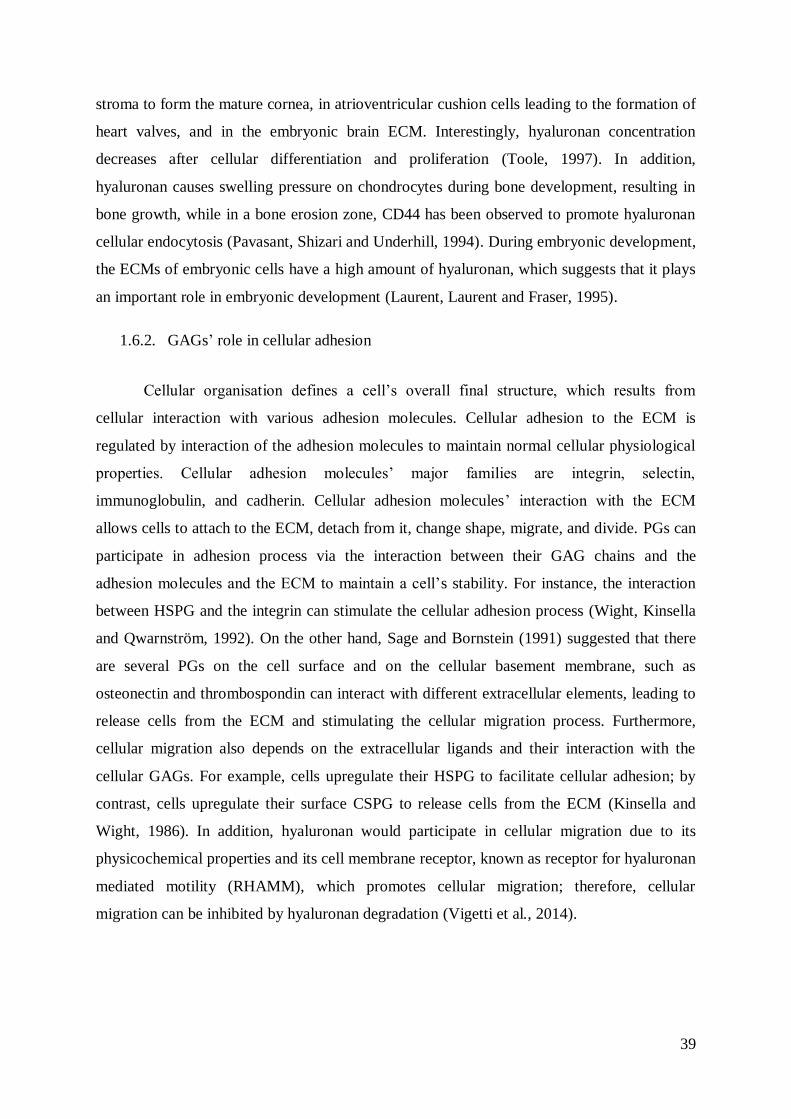
39
stroma to form the mature cornea, in atrioventricular cushion cells leading to the formation of
heart valves, and in the embryonic brain ECM. Interestingly, hyaluronan concentration
decreases after cellular differentiation and proliferation (Toole, 1997). In addition,
hyaluronan causes swelling pressure on chondrocytes during bone development, resulting in
bone growth, while in a bone erosion zone, CD44 has been observed to promote hyaluronan
cellular endocytosis (Pavasant, Shizari and Underhill, 1994). During embryonic development,
the ECMs of embryonic cells have a high amount of hyaluronan, which suggests that it plays
an important role in embryonic development (Laurent, Laurent and Fraser, 1995).
1.6.2. GAGs’ role in cellular adhesion
Cellular organisation defines a cell’s overall final structure, which results from
cellular interaction with various adhesion molecules. Cellular adhesion to the ECM is
regulated by interaction of the adhesion molecules to maintain normal cellular physiological
properties. Cellular adhesion molecules’ major families are integrin, selectin,
immunoglobulin, and cadherin. Cellular adhesion molecules’ interaction with the ECM
allows cells to attach to the ECM, detach from it, change shape, migrate, and divide. PGs can
participate in adhesion process via the interaction between their GAG chains and the
adhesion molecules and the ECM to maintain a cell’s stability. For instance, the interaction
between HSPG and the integrin can stimulate the cellular adhesion process (Wight, Kinsella
and Qwarnström, 1992). On the other hand, Sage and Bornstein (1991) suggested that there
are several PGs on the cell surface and on the cellular basement membrane, such as
osteonectin and thrombospondin can interact with different extracellular elements, leading to
release cells from the ECM and stimulating the cellular migration process. Furthermore,
cellular migration also depends on the extracellular ligands and their interaction with the
cellular GAGs. For example, cells upregulate their HSPG to facilitate cellular adhesion; by
contrast, cells upregulate their surface CSPG to release cells from the ECM (Kinsella and
Wight, 1986). In addition, hyaluronan would participate in cellular migration due to its
physicochemical properties and its cell membrane receptor, known as receptor for hyaluronan
mediated motility (RHAMM), which promotes cellular migration; therefore, cellular
migration can be inhibited by hyaluronan degradation (Vigetti et al., 2014).

40
1.6.3. GAGs’ role in wound healing and tissue repair
Tissue injury can be caused by trauma, heat exposure, cold exposure, or contact with
chemical agents, amongst other factors. Wounds can be defined as damage to the normal
physiological and anatomical structure and/or function of cells, which can be as simple as
epithelial skin injury or as serious as bone injury. As part of the physiological process
following tissue injury, the wound healing repair process is initiated by the surrounding cells
to ensure that tissue regeneration occurs. The wound healing process includes cell
proliferation, cell migration, angiogenesis, cell differentiation, and the synthesis of
extracellular proteins and the release of growth factors and polypeptides to aid the healing
process (Velnar, Bailey and Smrkolj, 2009). PGs can be involved in the wound healing
process by activation of various elements such as heparin. Heparin is thought to support the
wound healing process via the inflammation process. According to Mcpherson et al. (1988),
heparin is released in wounds to support the healing process by increasing vascularization at
the wound site, which can attract different types of growth factors, cytokines as well as
extracellular proteins such as fibronectin to participate in this process, in addition to
thrombocyte degranulation (Kratz et al. 1997). Bernfield et al. (1999) suggested that cell
surface PGs such as syndecan can be over-expressed near the wound site, where syndecan-1
and syndecan-4 levels increase in the wound margins of proliferating cells. Syndecan-1 is
thought to help newly generated keratinocytes to migrate to the wound site after complete
healing. In addition, neutrophils can release heparinase enzymes in the wound site to
depolymerise HS chain from its PG, which is required to activate FGFs that is needed for the
healing process.
DSPG plays a pivotal role in skin wound healing. During skin wound injury, DSPGs
are upregulated through their syndecan-1 and syndecan-4 in keratinocytes to stimulate
endothelial leukocyte adhesion molecules and promote FGF-2 to enhance the repair
mechanism. In addition, the present of high levels of DSPG as decorin or biglycan might
associate with scarring (Trowbridge and Gallo, 2002). Hyaluronan has a very large molecular
weight compared with other GAGs. It has various biological roles including in wound healing
process. According to John and Giovanni (2002), hyaluronan enhances the cellular
inflammatory response via chemotactic pro-inflammatory molecules and increases
inflammatory cells’ infiltration to the injury site, and Sherman et al. (1994) suggested that
hyaluronan enhances cellular migration to the wound healing site.

41
1.6.4. GAGs’ roles in coagulation
The best-studied GAG-type with anticoagulant activities is heparin. Heparin’s
anticoagulation activity was discovered by Howell & Holt (1918). This discovery has led to
an evolution in clinical practise, especially in patients with blood disorders such as
myocardial infarction and pulmonary embolism, amongst other disorders that require well-
maintained circulation (Shriver et al., 2012).
When normal haemostasis condition is impaired, for instance, by blood vessel injury,
this leads to activating primary and secondary haemostasis mechanisms to prevent
haemorrhage. The primary haemostasis mechanism activates platelets to prevent
haemorrhage via initiating plugging and activating the secondary haemostasis mechanism.
The secondary haemostasis mechanism starts by activating coagulation proteins known as
coagulation cascade that ultimately form firm blood clots by converting soluble fibrinogen to
insoluble fibrin via activated thrombin (Hoffbrand and Moss, 2015) (Figure 27).
Figure 27. Schematic diagram of the coagulation cascade (Hoffbrand and Moss, 2015).
However, blood has a counter-protease that can inhibit this coagulation process
known as antithrombin-III, which inhibits the activation of various coagulation proteins,
especially factors II and X. Heparin with 15-19 kDa molecular weight has the capability to
enhance antithrombin-III activities. The major area of interest in heparin’s structure is its

42
minimal, unique pentasaccharide sequence with a potent anticoagulation role, which is
composed of [GlcNAc/S(6S) (1→4) GlcA (1→4) GlcNS(3,6S) (1→4) IdoA(2S)
(1→4)GlcNS(6S)] (Figure 28) , however, unfractionated sequence can be as trisulphated-
(disaccharides)-pentasaccahride-disulphated(disaccahride) (Onishi et al. 2016).
Figure 28. Heparin minimal pentasaccharide structure with unique anticoagulation properties.
This heparin minimal pentasaccharide sequence is required to attach to the
antithrombin-III, which interacts with coagulation factor X to inhibit the conversion of pro-
thrombin to thrombin. As a result, heparin aids in the deactivation of the coagulation cascade
and prevents the formation of blood clots (Rosenberg and Lam, 1979). Furthermore, there is
another protease that can enhance thrombin inhibitory process, known as heparin cofactor-II
(serpin). This particular protease can inhibit the activated thrombin from activating fibrinogen
in the present of several GAGs such as heparin, HS, CS, and DS (Wu, Monroe and Church,
1995).
Although heparin interaction with heparin cofactor-II can result in 1000-folds anti-
thrombin activity, oversulphated DS is considered to be a replacement for heparin therapy in
patients with heparin side-effects such as thrombocytopenia, as DS’s unique hexasaccharides’
structure [(IdoA(2S)-GalNAc(4S)]3 can inhibit the coagulation process by 100-fold through
binding to heparin cofactor-II that inhibit thrombin as well as it can inactivate thrombin
bound to fibrin (Prabhakar and Sasisekharan, 2006).
1.7. Normal cellular growth
Normal cell division is an essential mechanism to maintain the body’s physiological
status. Cells divide following a very tight and rigid process known as the cell cycle. The cell
cycle is a fundamental component of normal living cells, and it consists of the consecutive

43
processes of interphase and mitosis. Interphase consists of three phases, namely growth phase
1 (G1), synthesis phase (S), and growth phase 2 (G2). In G1 phase, cells either become
prepared entering S phase or it can leave the cell cycle by entering G0, where cells don’t
divide, for instance, neurones. During S phase, the most important mechanism is duplication
of centrosomes and DNA duplication, where 23 pairs of chromosomes are duplicated
resulting in 46 pairs of chromosomes. Then the cell enters G2 phase, where cells are prepared
for mitosis; in this phase cells, for example, initiate microtubules that segregate
chromosomes.
Next, cells will enter the mitosis phase, where the cell is divided into daughter cells.
Mitosis is divided into different phases, which are prophase, prometaphase, metaphase,
anaphase, telophase and cytokinesis. Prophase is the first stage of mitosis, where
chromosomes are condensed, and mitotic spindles are formed. Following this, the
prometaphase starts by rupture of the nuclear membrane and microtubules attaching to the
chromosomes. In the metaphase, all microtubules attached to chromosomes and it all rests in
the middle of the cell. During the anaphase, the most important sign is separation of cellular
chromatin into two parts. Finally, in the telophase each chromatid is separated from each
other, which is the end of mitosis, following which cytokinesis, where the parent cell
physically divide into two daughter cells (Park and Lee, 2003).
1.7.1. Cell injury
When cells experience physiological stress like ischemia or potential injury such as
infection or exposure to toxins, they can undergo an adaptation process known as reversible
injury. However, when the cell injury persists, or the injury is severe, the cellular adaptation
mechanism is unable to adapt the physiological status, which makes this injury irreversible,
so cell death is established. In addition, cell death can occur in normal status, as in genetic
abnormalities of the cell cycle.
After irreversible cellular injury occurs, cell death is proposed to occur by different
mechanisms according to the potential cause of cell death, its intensity, and its duration.
Rapid and severe disturbances can cause an uncontrolled cell death known as accidental cell
death that usually caused by toxins, infections, or trauma, which is morphologically
demonstrated as necrosis. In necrosis, all cellular contents leak out, resulting in cellular
digestion, which cannot be avoided by cellular adaptation mechanisms, thus, this type of cell
death promotes inflammation via the substances released from dead cells in order to start the

44
repair process. In contrast, when normal cells are forced to die or when cell injury is not
severe, cells activate a regulated molecular pathway to facilitate the cellular death process,
which is morphologically known as apoptosis. Typically, apoptosis occurs in healthy tissues,
and it does not always refer to a pathological event. Cells with intrinsic abnormalities can
induce apoptosis by activating certain enzymes that degrade their own DNA and cytoplasmic
proteins without causing inflammation; hence, this is called programmed cell death.
Programmed cell death can be caused through intrinsic or extrinsic pathways. Both pathways
ultimately activate intracellular endoprotease enzymes called caspases. This caspase cascade
process cleaves cellular proteins and nucleic acid, resulting in an altered cellular membrane
that allows dead cells to be removed by phagocytes (Elmore, 2007).
During the extrinsic apoptotic pathway, cells express death receptors. When cells
express their own apoptotic receptors, which can be activated by different ligands such as
tumour necrosis factors or T-lymphocytes then the activated receptors activate the cytoplasm
domain, resulting in activating further caspases to induce apoptosis. Meanwhile, the intrinsic
pathway, which is also known as the mitochondrial pathway, has several proteins that can
induce apoptosis. In the mitochondria, there are two families of pro-apoptotic and anti-
apoptotic proteins, which are well-balanced during cellular physiological status. When
cellular physiological status is altered, the mitochondrial membrane becomes permeable, and
the proapoptotic proteins can leak out into the cytoplasm. For instance, cytochrome-c, which
is a proapoptotic protein leaks out from the mitochondria into the cytosol, resulting in the
activation of the caspase cascade mechanism and eventually apoptosis (Kumar, Abbas and
Aster, 2017).
1.8. Cancer progression
Normal cell growth is well regulated by the cell cycle regulator mechanism via the
action of cyclin-dependent kinase (CDK) and cell cycle checkpoints. When the cell cycle’s
function is altered, and the cell cycle repair mechanism is suspended, cancer can develop.
There is a wide range of cell cycle alterations that might occur—for example, cell cycle
mutation in proto-oncogene, tumour suppressor gene or cell cycle misregulated checkpoints.
Each one of these mutations may give rise to tumorigenesis.
Active cyclin and kinases, which have been the subjects of many classic studies on
normal cell cycle division and regulation, are responsible for cell cycle progression. Various
CDK-inhibitors are released to inhibit the cell cycle progression—for example, p53, which is

45
a tumour suppressor gene. In other words, when the p53 tumour suppressor gene
mutates/supressed, this can result in the complete absence of CDK, which alters the cell cycle
division and leads to the progression unregulated cell division. According to Park and Lee
(2003), the development of unregulated cellular division after a point of mutation results in
chromosomal abnormalities that eventually increase the probability of cancer progression
(Figure 29).
Tumours can be divided into benign or malignant. Benign tumours are made up of
differentiated and localised cells and are amenable to surgery without massive fear of
metastasis. Malignant tumours are made up of undifferentiated aggressive cells, and have the
potential to invade other tissues and spread all over the body; this type of tumour is called a
neoplasm, which means “new growth” (Kumar, Abbas and Aster, 2017).
Figure 29. Schematic diagram of cancer progression resulting from inactive tumour
suppressor gene p53 leading to uncontrolled proliferating cells (Kumar, Abbas and Aster,
2017).
1.9. Cancer epidemiology and incidence
Cancer epidemiological studies have linked some risk factors to cancer progression.
Cancer predisposing factors such as age, environment or race can participate in cancer

46
progression. For instance, cancer risk frequently increases with age, smoking cigarettes
increases the risk of lung cancer, and food intake quality and food with less fiber contents
might increase the risk of colon cancer. In the United Kingdom, there were over 360,000 new
cases of cancer in 2015—that’s nearly 990 daily diagnoses with higher incidence of breast,
prostate, lung and bowel cancer. In 2015, 8.8 million people died worldwide due to cancer.
Leukaemia had 9,900 cases diagnosed in 2015 and 4,712 deaths in 2016. There were 2,697
patients diagnosed with mesothelioma in 2015 and 2,496 deaths were reported in 2016
(Cancer Research UK, 2017).
1.10. Glycosaminoglycans’ role in cancer progression
It is well-known that cancer cells’ microenvironment has a major role in stimulating
tumour growth via interaction with ECM molecules. More recently, there has been great
interest in PGs proangiogenic roles. HSPG has significant abilities to bind different growth
factors and their splices that occur in the neoplastic area, such as vascular endothelial growth
factors (VEGFs) and FGFs. As a result, it could alter the body’s physiological status in the
case of malignancy, to promote angiogenesis and cancer metastasis (Zhang, 2010).
A tumour’s angiogenesis process is stimulated by autocrine cancer clonal growth
factors, which in turn stimulate tumour endothelial cell PGs to fine-tune VEGFs to induce
tissue remodelling. Ultimately, this process leads to angiogenesis and tumour growth (Stanley
et al. 1999). The tumour becomes moderately acidic and hypoxic, so tumour cells express
hypoxia-inducible transcription factors (HIFs), which stimulate synthesis of VEGFs,
especially VEGF-A to sustain continued growth by increasing the tumour’s blood supply.
Thereafter, when the neoplastic hypoxic condition is greatly evolved, various types of growth
factors bind to HSPGs to fine-tune tumour growth. According to Zhang (2010), when a
tumour’s hypoxic condition progresses, neoplastic cells alter HSPG’s structure, enabling it to
bind as much as growth factors, which eventually results in cancer metastasis (Witsch, Sela
and Yarden, 2010). As mentioned before, HSPG has two main membrane-bound
proteoglycan families, syndecan and glypicans, and one important basement membrane PG
known as perlecan; thus, it modulates various functions of the neoplastic cells. For instance,
HSPG shows a high ability to bind FGFs, as it is upregulated in angiogenic regions,
suggesting HS’s role in cancer progression (Blackhall et al., 2001; Zhang, 2010).
The cellular response to different pathological conditions can result in up- or down-
regulated CSPGs as it has different roles in cellular proliferation and morphogenesis. CS/DS

47
role is highly dependent on the sulphation pattern and chain length of their structure
(Asimakopoulou et al. 2008; Kalathas et al. 2011). According to Kalathas et al. (2011),
CSPGs’ synthesising and degrading enzymes have been found in colorectal cancer, which
would explain the role of CS in neoplastic cells. In various cancer cells, CSPG has been
observed to be abnormally upregulated, which enable it to interact with enormous
intracellular and extracellular molecules. Versican and aggrecan, which are extracellular PGs
that carry CS as a side chain, might have major roles in cancer metastasis (Asimakopoulou et
al., 2008).
Versican has been detected in high concentrations in prostate, brain, breast, and
gastric cancer. High concentration of versican promotes tumour cells’ growth and metastasis
by interaction with various growth factors, especially platelet-derived growth factors (PDGF),
which are known to promote cellular growth and division by inducing angiogenesis. In
addition, versican has been found upregulated in metastatic melanomas and correlated with
poor prognosis in prostate cancer (Asimakopoulou et al., 2008). Furthermore, versican has
been found upregulated by the action of transforming growth factor-β in osteosarcoma cells,
which indicate a poor prognosis. High levels of CS-E were observed in ovarian
adenocarcinoma as it is thought to modulate growth factor function (Afratis et al., 2012).
Cancer cells’ migration processes require remodelling of the ECM, which can be
induced by depolymerisation of the ECM to promote remodelling and cell migration. For
example, cancer cell metastasis can be stimulated by depolymerisation of aggrecan which
promotes cancer cell motility by binding to adhesion molecules such as selectins on the
endothelial cells via its CS and CD44, resulting in cellular migration. Inhibition of CS
formation by treating cells with chondroitinase would result in great inhibition of cellular
migration. This result elucidates CS’s role in cancer metastasis (Asimakopoulou et al., 2008).
Another extracellular GAG that can promote cancer cell invasion is hyaluronan,
which has been found to regulate cancer cell signals during the tumour invasion process
(Fuster and Esko, 2005). In addition, high levels of hyaluronan have been found in various
malignancies, such as adenocarcinomas, which might indicate its role in cancer
morphogenesis and poor prognosis (Heldin et al., 1996).
Overall, common GAG-types have proangiogenic roles, which can promote cancer
and cancer metastasis. This is due to their potential capabilities to bind to various lectins such
as growth factors and adhesion molecules. Therefore, it is very important to know the role of

48
GAGs in cancer cells’ progression in order to determine the possible therapeutic targets in
regard to GAG anticancer therapies.
1.10.1. Cancer treatment related to GAGs’ pathological roles
As previously discussed, GAGs have various physiological and pathological roles in
cell biology. Targeting GAGs and related products can enhance cancer therapies and inhibit
cancer progression in several ways. Firstly, directly targeting growth factors and cell surface
receptors that are used by GAGs to promote cancer cell growth by using monoclonal
antibodies. As illustrated in certain neoplasms, targeting a tumour’s autocrine VEGFs is
preferred to inhibit tumour growth and metastasis. This is done by administrating
pharmaceutically targeted antibodies against growth factors such as anti-VEGF (Hurwitz et
al., 2004). Unfortunately, there are several drawbacks to using this type of treatment.
Foremost, this type of specific antibody therapy has a fundamental limitation due to the
expression of growth factor splices such as FGF-2, which have a greater capability of
inducing tumour metastasis, and in very acidic tumours VEGFs can result in different
variants as the tumour progresses. Additionally, antibody-based therapy increases treatment
costs (Sandler et al., 2006; Zhang, 2010). Secondly, blocking GAGs’ proangiogenic roles, for
example, blocking HSPG from fine-tuning growth factors to progress cancer growth and
inhibiting heparinases activities that may finally lead to cancer metastasis (Zhang, 2010).
Another selective cancer therapy target is the cell surface transmembrane CD44,
which interacts with several adhesion molecules to aid cellular migration. Therefore, its
expression is very tightly regulated in normal cells, however, it was found to be highly
upregulated in malignant cell surface. CD44 was observed in several tumours as its levels
would indicate tumour behaviour and it was thought to be associated with cancer stem cells
that would lead to cancer resistance (Liu and Jiang, 2006). According to Zöller (2011), CD44
is associated with tumour biological events such as growth and metastasis, and elevated
levels could be related to poor prognosis, which make it a favourable target in cancer
selective therapy. In-vitro anti-CD44 therapy has successfully inhibited tumour cells’ growth
and induced apoptosis on undifferentiated leukemic cells, and it could inhibit their progenitor
cells (Liu and Jiang, 2006).
Thirdly, targeting the angiogenic factors that are released from neoplastic cells. An
example of these tumour angiogenic factors is the epithelial HSPG. Malignant epithelial cells
overexpress HSPG in order to increase cancer cells’ interaction with the extracellular growth

49
factor ligands to promote cell growth. Hence, HSPG has great affinity to various growth
factors that can lead to cell morphogenesis as well as angiogenesis (Zhang, 2010). Therefore,
blocking a tumour cell’s HSPG binding sites would decrease its growth factors’ binding
domains, discontinuing its potential proangiogenic role. Thus, Lamanna (2008), suggested
blocking HSPG’s proangiogenic activities by using sulphatase enzymes. Sulphatases catalyse
the hydrolysis of sulphate groups on GAGs’ structure leading to minimising GAGs’
biological functions. As an illustration, there are two cell surface HS sulphatase enzymes,
known as sulphatase-1 (Sulf-1) and Sulf-2. These sulphatases can contribute to HS structure-
activity via endolytic glucosamine 6-O-sulphate from the HSPG chain; these conformational
changes would lead to a change in HS’s biological function. Furthermore, regarding FGF’s
crystal structure, FGF’s binding to HSPG and its FGFR requires a specific HS sequence with
N-sulphated and 6-O-sulphated molecules to increase complex affinity (Yayon et al., 1991).
Hence, Sulf-1 and Sulf-2 are determined to be potential tools in cancer therapy, especially in
metastatic neoplasms, to minimise cancer cell interaction with extracellular environment as
well as to reduce HSPG’s angiogenic effectiveness.
Another therapeutic intervention could be done by launching new compounds that
have greater affinity for these growth factors than membrane-bound HSPG—for instance,
polysulphated-HS-like with a similar sequence to that of the cell membrane HS would have
greater affinity for various growth factors than malignant cell HSPG (Rusnati and Urbinati,
2009). Zhang (2010) emphasised that novel compounds such as polysulphated-HS-like can
compete with cellular HSPG for growth factors. Johnstone et al. (2010) highlighted that using
either a polysulphated pentasaccharide or a polysulphated tetrasaccharide sequence as an HS-
imitative compound might become a potential angiogenic antagonist.
Another proangiogenic factor is heparinase enzyme, which digests cell surface HSPG
and releases HS unsaturated disaccharides or oligosaccharides. It is physiologically produced
from embryonic placenta and lymphoid organs (Vlodavsky and Friedmann, 2001). According
to Haimov-Kochman et al. (2002), heparinases are found in large amounts in placenta cells,
where their function is thought to involve facilitating growth factors release in the ECM in
order to support placental cell development. Contrary to heparinases’ physiological function,
there is great evidence that suggest heparinases are produced by tumour cells, especially in
poorly differentiated carcinomas, promoting cellular invasion and cancer metastasis. As
revealed by Koliopanos et al. (2001), a patient's blood test with elevated heparinases would
indicate very poor prognosis. It was suggested that after treatment with polysulphated-HS,

50
tumour cells release heparinases to cleave cell surface HSPG and the extracellular
polysulphated-HS-rich in growth factors in order to reactivate the tumour angiogenesis
process (Zhang, 2010). Overexpression of heparinases could lead to cleaving HS from its
syndecan, which plays a crucial role together with VEGF-A, in facilitating the growth of
cancer endothelial cells and accelerates the tumour’s growth by activating full-length HSPG
activity. Indeed, inhibition of neoplastic heparinase activity would be favoured, since it could
reactivate cancer and promote cancer metastasis (Vlodavsky and Friedmann, 2001).
1.11. Blood cancer
Blood cells arise from pluripotent hematopoietic stem cells (HSC) situated in the bone
marrow in long bones. HSC have immunological markers that differentiate it from other cell
types, however, the exact phenotype is unknown (Hoffbrand and Moss, 2015). Cellular
differentiation arises from stem cells to progenitor cells with self-renewal properties, which
are capable of producing different blood cell linages. Progenitor cells give rise to either
common myeloid lineage or common lymphoid lineage progenitor cells. The term myeloid
refers to erythrocytes, megakaryocytes, mast cells, and leukocytes, where leukocytes can be
further subdivided into neutrophils, eosinophils, and basophils. The term lymphoid refers to
T-lymphocytes, B-lymphocytes, and natural killer cells (Figure 30) (Moore, Knight and
Blann, 2016).

51
Figure 30. Schematic diagram represents blood cell lines from the bone marrow. Starting
from haematopoietic stem cell that is arise from the bone marrow. The common myeloid
progenitor cells (left side) that produce red blood cells, platelets, monocytes, neutrophils,
eosinophils and basophils. The lymphoid stem cell (right side) can produce B-lymphocytes,
T-lymphocytes and natural killer cells.
Haematological malignancies can affect any blood cell lineage from cells situated in
the bone marrow to the peripheral lymphoid cells, for instance, leukaemia. Leukaemia is a
type of blood cancer, which affects about 3% of the United Kingdom population who are
diagnosed with cancer (Cancer Research UK, 2017). The haematological cells can become
malignant either due to genetic factors or environmental factors such as radiation and drugs.
Genetic mutations can occur due to defects in either tumour-suppressor gene or proto-
oncogenes, which would lead to point of mutation. For instance, gain of tyrosine kinase
function would affect the secondary messenger resulting in unregulated proliferation of blood
cells. Genetic deletion would result in blocking of B-lymphocyte (B-cell) maturation,
resulting in enormous number of undifferentiated B-cell clone (Vitanza et al., 2014).
Leukaemia can be classified based on disease progression to either chronic or acute.
Chronic leukaemia is characterised by slow development of malignant blood cells with either
myeloid or lymphoid linage. In contrast, acute leukaemia is characterised by fast-growing
malignant cells with either myeloid or lymphoid linage. It is necessary here to clarify what is
haematopoietic pluripotent stem cell
Myeloid progenitor cell
Erythroid progenitors
Red blood cells
Megakaryocyte progenitor
Platelets
Granulocyte monocyte progenitor
Monocytes
Macrophage
Neutrophils
Eosinophil progenitor
Eosinophils
Basophils
Lymphoid stem cell
B-Lymphocyt
es
T-lymphocyte
s
Natural killer cells
52
meant by lymphoma in order to differentiate it from leukaemia. Lymphoma is a malignancy
of blood lymphocytes with lymphoid organs origin, such as lymph nodes. Lymphoma is
diagnosed if there is a link to a primary lymphoid origin (Moore, Knight and Blann, 2016),
however, malignant lymphocytes present in the bone marrow is considered as leukaemia.
There is a strong possibility of differentiating between leukaemia and lymphoma by studying
the bone marrow picture, if more than 25% of bone marrow lymphocytes are affected, it is
considered as leukaemia (Ross et al., 2011).
Regarding chronic leukaemia, it can be difficult to cure as it can be divided into
chronic myeloid leukaemia (CML) or chronic lymphoid leukaemia (CLL). CML can be
subdivided into six-types among the myeloid lineage with 742 new cases in the UK per year;
in addition, CLL affect any lymphocytes lineage with 3709 new cases per year in the UK.
The most common type of CML is known as CML-Philadelphia positive. This type of
malignancy occurs due to abnormal gene translocation between chromosome 9 Abelson
proto-oncogene (ABL) and chromosome-22 (BCR gene), resulting in a fusion protein with
tyrosine kinase activity that cause the pluripotent stem cells to proliferate uncontrollably
(Hoffbrand and Moss, 2015).
Acute leukaemia is presented as bone marrow proliferation of fast-growing immature
blood cells in the blood, which is known to be an aggressive disease, which needs immediate
medical intervention (Rocha et al., 2001). According to which progenitor cell type is affected,
acute leukaemia is either acute lymphoid leukaemia (ALL) or acute myeloid leukaemia
(AML) (Bomken and Josef Vormoor, 2009). ALL incidences are more common than AML.
In the United Kingdom, approximately 300 children are diagnosed with ALL annually
(Bomken and Josef Vormoor, 2009). According to Raimondi et al. (1988), T-lymphocyte
acute lymphoblastic leukaemia (T-ALL) affects about 15% of children with ALL, and it is
believed to affect more boys than girls, with a ratio of 3:1. In comparison to T-ALL, B-
lymphocyte acute lymphoblastic leukaemia (B-ALL) affects about 85% of children. Nearly
90 children are diagnosed with AML per year in the United Kingdom, with moderately
higher incidence in boys than girls (Bomken and Josef Vormoor, 2009). AML incidence is
greater during infancy and late adulthood, which affects about 25% of children (Deschler and
Lübbert, 2006).

53
1.12. Malignant mesothelioma
Mesothelium cells are composed of squamous epithelium that lines several body
cavities, such as thoracic (pleura cavity), peritoneum (abdominal cavity) and mediastinum
(heart sac). Malignant mesothelium cells known as mesothelioma, most frequently occur in
the thoracic cavity with asbestos exposure. Cancer has several risk factors that can affect cell
growth resulting in uncontrolled proliferation, while mesothelioma is type of cancer which
has no definite cause; however, thoracic mesothelioma has a link to asbestos exposure
(American Cancer Society, 2018).
Mesothelioma can be divided to three types based on cell morphology as epithelioid,
sarcomatoid and biphasic. Epithelioid mesothelioma, according to its cell-type can be
treatable with good prognosis. Secondly, sarcomatoid mesothelioma type is uncommon, and
is known to be the most aggressive type with poor prognosis, is characterised by spindle
shape cells. Sarcomatoid mesothelioma can be subdivided into desmoplastic and
lymphohistocytoid mesothelioma. Both subtypes are morphologically similar to other cancer
cells, such as lung carcinoma (Klebe et al., 2010). Thirdly, biphasic mesothelioma is
composed of mixed type of epithelioid mesothelioma and sarcomatoid mesothelioma, which
makes its treatment dependent on the predominant cell type present in the tissues.
1.13. Cancer treatment
There are several types of anticancer treatments such as surgery, chemotherapy,
radiotherapy, stem cell therapy, immunotherapy, hormone-therapy, precision medicine and
many new approaches in clinical trials. Various new cancer treatment regimens have been
launched due to progression of severe forms of cancer that have become more resistant to
standard therapies. Growing evidence suggests the presence of cancer stem cells that can lead
to drug resistance. Cancer stem cells are defined as a small cell population from a tumour’s
lineage with self-renewal properties, leading to tumour regrowth and metastasis even after
treatment. Therefore, the choice between different types of cancer therapies depends heavily
on the disease’s severity and the type of malignant cells, aiming to reduce cancer cell
resistance, which may result in treatment failure (Prieto-Vila et al., 2017). To this end,
various anticancer drugs are used in combination therapy, which defined as using different
type of drugs or treatments to minimise drug resistance. Although most anticancer drugs have
several side-effects such as anaemia, diarrhoea, constipation, hair loss, infection, nausea, and

54
fatigue, commonly used anticancer treatments such as chemotherapy, radiotherapy and stem
cell transplants have cured 50% of cases in the UK (Cancer Research UK, 2017).
Initially, chemotherapy treatment can be defined as using chemical substances to stop
or slow cellular growth, including that of normal and malignant cells, which can make it
unpleasant treatment for patients; however, it is very effective. This type of therapy can be
used solely or in combination with other therapies. Chemotherapy can be considered to be
highly cytotoxic treatment, so its usage may require a specific treatment strategy. For
example, treatment of acute leukaemia is largely dependent on which type of leukaemia-cell
subtype is affected as well as disease aetiology (Greaves and Wiemels, 2003). Basically,
chemotherapy regimens are based on combination chemotherapy, which is been effective on
heterogeneous tumours and reduce cellular resistance in comparison to using single-drug
(Höök et al., 1984).
Combination therapy in treating leukaemia can be divided to induction therapy
followed by post-remission therapy and finally maintenance therapy. Initially, induction
therapy is considered to be first line treatment, which is an intermittent chemotherapy
injection, as it aims to eliminate as many leukaemia cells from the patient’s circulation and
the bone marrow. Following successful induction therapy, the post-remission therapy is
introduced to ensure eradication of all malignant cells from the body using combination of
high-dose chemotherapies, especially with poor prognostic patients. However, patients with
good prognosis may receive maintenance therapy regimens instead of post-remission therapy,
which is defined as continuous low-dose chemotherapy (Rivera et al., 1991).
The main concern about chemotherapy combination treatment is drug cytotoxicity.
Chemotherapy can destroy cells by halting the cell cycle of both normal and malignant cells,
which eventually develop various side effects. For example, it would increase the risk of
developing chronic disorders for cancer survivals, such as heart disease, renal insufficiency,
infertility and myelosuppression (Norris and Adamson, 2012). In addition, most
chemotherapy has a small therapeutic window that would allow giving tolerable doses for the
shortest period of time that ensures killing of most malignant cells. Although, combination
chemotherapy is still the drug regime of choice in childhood leukaemia, chemotherapy-
related toxicity is the main issue about this type of therapies.
Secondly, radiotherapy that refers to using high doses of radiation on the area of solid
tumours leading to cellular death by DNA damage via an internal or external source of
55
radiation. Radiotherapy can be used solely or in combination with other therapies; for
example, in breast cancer post-operative care, radiotherapy is used to ensure full eradication
of all residual malignant cells.
Thirdly, stem cell transplantation therapy is defined as transplanting healthy stem
cells to a patient; it can be from the same patient (autologous), from the patient’s identical
twin (syngeneic), or from someone else (allogeneic). This type of therapy usually indirectly
affects cancer cells, which means the newly transplanted stem cells will help the body to
recover and produce more normal stem cells after extensive loss of stem cells due to other
therapies, as chemotherapy. However, allogeneic stem cell therapy can have direct effects on
cancer cells by providing the patient’s body with fully functional white blood cells that could
attack malignant cells (Copelan, 2006).
Uncommon anti-cancer treatments include immunotherapy and hormone therapy.
Immunotherapy is used to treat patients with cancers by enhancing the host’s immune system,
so it can destroy the cancer cells. Immunotherapy can be achieved either via use synthetic
monoclonal antibodies against various cancer cell markers or boost the body’s immune
system, so it can recognise and attack foreign cells such as malignant cells. Although
immunotherapy appears favourable, it is not effective in every patient and it might cause
wide-range side-effects (Schuster, Nechansky and Kircheis, 2006).
Hormonal therapy is a type of therapy that controls hormone production to treat a
particular cancer. Hormonal therapy is predominantly used to ease cancer symptoms;
however, it can slow tumours’ growth. For instance, testosterone production can be
controlled in order to treat prostate cancer. Finally, precision medicine is a type of medicine
that is based on patient’s cancer’s genetic information, which allows oncologists to select an
appropriate personalised therapy. This type of therapy joins several treatments according to
disease aetiology and it could target the cause of the disease (Cancer research UK, 2017).
Scientists are trying to overcome these issues by identifying natural products-related
compounds with anticancer effects with improved pharmaceutical outcomes. Different
anticancer drugs have been discovered from natural products, for instance, L-asparaginase,
doxorubicin and cytarabine. Even though, these drugs are derived from natural products, they
are classified as chemotherapeutics and it might share some side-effects (Nobili et al., 2009).
Natural products play a pivotal role in biomedical research, especially in cancer
research. Agbarya et al. (2014), over the past century nearly 28% of drugs have been

56
originally derived from natural products or their derivatives, which are widely used as
anticancer or antimicrobial agents that are originally extracted from plants and animals
(Cragg, Newman and Snader, 1997). Natural products are favoured over other synthetic drugs
as they’re naturally sourced, so they could be degraded easily by the normal living cells,
which decrease unfavourable cytotoxicity (Du and Tang, 2014). Therefore, developing novel
anti-cancer drugs that are derived from natural products with minimal side effects would be
preferred instead of using chemically synthesised drugs alone. Marine life has potential
source of promising anticancer drugs, which could play an important role in anticancer
treatments (Nobili et al., 2009).
1.14. Polysaccharides from natural products as pharmaceutical agents
Over the past several years, there has been an increased demand for new cancer
pharmaceutical agents from natural products such as plants, bacteria and animals, including
marine life. The main advantage of natural product–derived anticancer drugs that it has
acceptable side-effects than of other synthetic drugs (Zhang et al., 2013).
There are several drugs either approved by the United State Food and Drug
Administration (US-FDA), European Medicines Agency (EMA) or in clinical trial that have
been derived from marine sources. For instance, Cytarabin that was the first marine-derived
chemotherapeutic drug isolated from a sponge (Tethya crypta) (Wlawick, Roberts and
Dekker, 1959). Dolastatin which is a polypeptide product from marine mollusc (Dolabella
auricularia) can inhibit microtubule assembly as well as tubulin polymerisation, resulting in
cell apoptosis. Although it was not successfully approved, this drug also progressed to
advanced phases in clinical trials and its derivatives are still being considered as anticancer
candidates (Hearn, Shaw and Myles, 2007; Han et al., 2018).
Halichondrin is a tubulin inhibitor, which was isolated from Japanese sponge
(Halichondria okadai). It is synthetic, macrocyclic ketone with enhanced antitumor activities
against breast cancer. The US-FDA has approved its synthetic analogue since 2010 (Osgood
et al., 2017). Cyclic-peptide drug Kahalalide-F was isolated from the mollusc (Elysia
rubefescens) has anti-lysosomal properties. It has entered phase-I clinical trials against
prostate cancer and phase-II against hepatocellular carcinoma, non-small cell lung cancer and
melanoma (Avendaño and Menéndez, 2008; Ning et al., 2018). Didemnin-B isolated from
(Carribean tunicate) shows inhibition of DNA-synthase that leads to cell cycle arrest (Nobili
et al., 2009).

57
One of the largest phyla in the animal kingdom are known as molluscs, including
snails, bivalves, squid, octopuses, oysters, and others. Many molluscs have been used for
dietary intake, as they have great nutritional benefits (Celik 2014). Traditionally, molluscs
have been used as natural treatments in Chinese traditional medicine; therefore, there has
been great interest in investigating their valuable elements to be used as pharmaceutical
sources (Cesaretti et al., 2004).
Generally, mollusc soft-body structural investigations have revealed high amounts of
carbohydrates with some proteins and lipids, which makes carbohydrates a major area of
interest from a pharmaceutical perspective (Amornrut et al., 1999). Polysaccharides from
vertebrates and invertebrates have emerged as powerful platforms for medical utilities, as
they have various biological activities such as immunostimulatory, antioxidant, and antitumor
activities (Liao et al., 2013).
Polysaccharides isolated from invertebrates have shown very different structures to
common mammalian polysaccharides in terms of monosaccharide composition, molecular
weight, degree of sulphation, type of glycosidic linkages, and branching points. For instance,
a novel polysaccharide isolated from the head of a shrimp has a novel combination structure
between heparin and HS known as a hybrid hep/HS structure (Brito et al., 2014). This
structural diversity in polysaccharides has generated additional features for these novel
molecules that could make them potent tools in glycobiology, especially as pharmaceutical
agents.
Polysaccharide (including GAGs) structural analysis is very challenging due to their
structural heterogeneity and polysaccharide structure vary according to species, season of
harvest, and extraction method; accordingly, all these structural differences might interrupt
the structural analysis as well as the biological activities of these molecules (Wang et al.,
2017). In addition, carbohydrates cannot be visualized using UV or fluorescent as it lacks
chromophore, therefore, detection usually requires a derivatization step (Rovio, Yli‐
Kauhaluoma and Sirén, 2007). For that reason, structural analysis has been heavily dependent
on spectroscopic analysis, which is defined as the relationship between light or
electromagnetic radiation and matter, such as nuclear magnetic resonance (NMR) and
Fourier-transform infrared (FT-IR), in addition to chemical analytical methods in order to
allow detection and to determine the final structure of these polysaccharides (Pomin, 2015;
Wang et al., 2017).
The high content of uncommon polysaccharides structures in marine organisms make
them a favourable source of natural products with various pharmaceutical benefits, including

58
in cancer therapy. The following section reviews polysaccharides derived from vertebrates
and invertebrates with different structures and biological and pharmaceutical properties such
as anticoagulation and anti-neoplastic properties.
1.14.1. Head of shrimp—Litopenaeus vannamei
A GAG-like structure was isolated from head of the shrimp Litopenaeus vannamei
with a unique structure of both heparin and HS disaccharides merged together, resulting in an
uncommon GAG-like structure known as hybrid heparin/HS (Brito et al., 2014). This hybrid
Heparin/HS has both heparin and HS properties in addition to their basic disaccharide
structure of glucosamine and iduronic acid/glucuronic acid [→4)-β-D-GlcA/α-L-IdoA (1→4)
-D-GlcNS-(1→] (Figure 31) (Pomin, 2015). The structural analysis was based on both
disaccharides and NMR analysis, which has found a high amount of GlcA (77.6%) not
epimerized to iduronic acid and only 22.4% IdoA; this finding suggests the influence of the
HS chain. On the other hand, there is a high amount of sulphated GlcNS 71.5%, and GlcNAc
represents about 22.5%. In addition, 75.5% of GlcNS was found to be GlcNS(6S), and 5%
was found to have the rarest GlcN(3,6S) disaccharides, which simulates heparin’s structure
(Brito et al., 2014).
As this novel structure is related to heparin, its anticoagulation activity was examined
and compared with that of the well-known heparin pentasaccharide. This novel structure was
found to have anticoagulation activities lower than heparin that facilitate interaction with
antithrombin to prolong the clotting time. Pomin (2015) suggested that this potent
anticoagulant activity might be due to the pattern of N- and O-sulphation. More surprisingly,
this hybrid type has very few side-effects in terms of bleeding.

59
Figure 31. Structural presentation of novel hybrid heparin-HS structure, which isolated from
head of shrimp (Litopenaeus vannamei) (Pomin, 2015).
1.14.2. Bivalve mollusc—Nodipecten nodosus
A novel HS-like structure was isolated from a marine mollusc bivalve known as
Nodipecten nodosus. Structural analysis has revealed a unique highly sulphated HS-like
structure. Structural analysis using multinuclear-NMR has confirmed the presence of novel
structural features of HS-like compound such as α-D-GlcNH2 residues and β-D-GlcA (2,3S)
with no IdoA residues detected. The α-D-GlcNH2 residues contain 61% GlcNAc and 39%
GlcNS. On the other hand, structural analysis has shown that 50% of the GlcA disaccharides
are non-sulphated, 28% are 2-O-sulphated, and 22% 3-O-sulphated. According to Gomes et
al. (2010), despite the presence of disulphated 2,3-O-sulphated GlcA, which is very rare in
nature, an insignificant amount was determined (Figure 32).
This unique structure suggests the presence of an HS-like structure rather than heparin
for several reasons. First, all uronic acids were typically in the β-anomeric configuration, as
β-D-GlcA with no resonance for α-L-IdoA. Second, high levels of -D-GlcNAc were
detected, which indicates a more typically HS-like structure. Therefore, this suggests a novel
HS structure that is uncommon in mammalian HS, especially with the particular pattern of
sulphation on both the GlcA residues (Gomes et al., 2010; Pomin, 2015). Regarding its

60
pharmaceutical outcomes, this novel HS-like compound showed a six-fold decrease in
anticoagulant activity in comparison to porcine heparin; however, this unique HS-like
compound has potent anticoagulant activities in the presence of heparin-cofactor-II, which
can increase the anticoagulant activities to up to 1,000 times stronger (Gomes et al., 2010).
Figure 32. Structural presentation of novel HS-like structure isolated from bivalve mollusc
(Nodipecten nodosus).
1.14.3. Bivalve mollusc—Corbicula fluminea
Corbicula fluminea is an edible bivalve mollusc originating in eastern Asia. This
mollusc has various nutritional value, in addition to its valuable pharmacological benefits
such as antiproliferative activities, antioxidants, and antihypertensive effects (Qiu, Dai and
Li, 2009). Liao et al. (2013) purified three polysaccharide samples from Corbicula fluminea’s
soft body, namely, crude extracts of CFPS and CFPS-2 with anti-tumour activities. CFPS-2
was structurally analysed using various spectroscopic methods including FT-IR and NMR.
The FT-IR structural analysis confirmed the presence of β-glycosidic linkages between
polysaccharides, pyranose rings, sulphate esters, the N-acetyl functional group, the hydroxyl
group, and the carboxyl group. Moreover, NMR structural analysis found pyranoses, β-
glucose, β-galactose, -glucose, and β-fucose. These findings suggest the presence of
polysaccharides; however, no definite structure was determined.
Regarding the biological activities, the purified fractions were tested against various
human cancer cell lines such as prostate, ovarian, and gastric carcinomas to check their anti-

61
proliferative activities. All three types of purified polysaccharides showed dose-dependent
antiproliferation activities on all cancer cells. Liao et al. (2013) claimed, the presence of
highly sulphated contents (8.1%) makes these polysaccharides water-soluble and enhances
their anti-proliferative activities.
1.14.4. Sea cucumber—Ludwigothurea grisea
GAG-like structures were isolated from a sea cucumber known as a holothurian
(Ludwigothurea grisea). This unique, highly sulphated structure shares the common
mammalian CS-like structure; however, the GlcA C-3 has a branched O-linked fucose unit,
so it’s known as fucosylated-CS. This sea cucumber’s unique structure is composed of
sulphated -L-fucopyranose branch linked to β-D-GlcA and β-D-GalNAc [Fucp (1→3)
GlcA β(1→3) GalNAc β(1→] (Vieira and Mourão, 1988; Pomin, 2015) (Figure 33).
Spectroscopic structural analysis using NMR has confirmed a number of patterns of
sulphation on the -L-fucp, as it can acquire mono-sulphate, 2,4-disulphate, and 3,4-
disulphate (Pomin, 2015); in addition, the β-D-GlcA of holothurian-CS can acquire a 3-O-
sulphate. The other disaccharides from this sea cucumber are the typical CS chains, which is
similar to the mammalian CS in terms of structure and sulphate decorations can also be
unsulphated, 4-O-sulphated or 6-O-sulphated (Myron, Siddiquee and Al Azad, 2014). All
these different structures made this GAG-like polysaccharide resistant to chondroitinase
enzymes (Vieira, Mulloy and Mourão, 1991).
Holothurian fucosylated-CS can participate in various biological activities such as
tumour metastasis, coagulation, cellular morphogenesis, inflammation, and angiogenesis
(Pomin, 2015). Borsig et al. (2007) suggested that the sea cucumber’s fucosylated-CS with
di-sulphated fucose-branch plays a role in inhibiting tumour cell metastasis via stopping
adhesion molecules such as selectins. Furthermore, fucosylated–CS has a very potent role in
inhibiting thrombus formation (Mourão et al., 1998). Depolymerised fucosylated-CS was
introduced to reduce the activities of prothrombin, mainly by inhibition of coagulation factor
X, which is responsible for conversion of prothrombin to thrombin (Wu et al., 2015).

62
Figure 33. (A) Shows CS-like disaccharides from Ludwigothurea grisea as GlcA can acquire
3-O-sulphate group. (B) Shows CS-like disaccharide structure from marine Ludwigothurea
grisea with fucp attached α(1→3) to GlcA making this novel fucosylated-CS, where
fucopyranose are attached via (1→2) glycosidic linkages.
1.14.5. Squid cartilage—Ommastrephes sloani pacificus
A novel GAG polysaccharide was purified from squid cartilage (Ommastrephes
sloani pacificus) (Kawai et al. 1966). Habuchi et al. (1977) reinvestigated the squid
cartilage’s CS structure and found a large number of glucose branches linked to C-6 of the
GalNAc moieties, which could be due to incomplete digestion of the PG residues. In
addition, Kinoshita-Toyoda et al. (2004) purified a squid cartilage CS-like polysaccharide
with branched hexose structure. Squid cartilage was digested with chondroitinases that
resulted in four fractions; one of these fractions (fraction II) contains polysaccharides with
glucose branches. Therefore, fraction II was sub-fractionated into 11 fractions. The authors
most interesting observations were in subfractions 2 and 6 that both contained extensive
glucose branches.
For structural analysis, NMR data proposed two structures from fraction-II, which are
fraction-II-2 and fraction-II-6 that have glucose branching structures. Fraction-II-2 proposed
unique structure—[GlcA β(1→3) Glc β(1→6) GalNAc(4S)] (Figure 34)—and fraction-II-6 is

63
characterised by this unique structure—[GlcA β(1→3) Glc β(1→6) GalNAc(4S) β(1→4)
GlcA β(1→3) GalNAc(4,6S)] (Figure 35). In addition to these glucose branches, NMR
structural analysis detected the presence of the rare 3-O-sulphation on the GlcA residues, thus
making this part of the CS-E novel and uncommon to the mammalian CS as [GlcA(3S)
β(1→3) GalNAc(4,6S)] (Kinoshita-Toyoda et al., 2004; Lamari and Karamanos, 2006).
Regarding the biological activities of the squid cartilage CS-like polysaccharide, it has
anticoagulation activities that are different from those of mammalian CS. CS-like
polysaccharide can inhibit the complement pathway through inhibition of the positive
regulator of the complement pathway, known as properdin. This anticoagulation activity is
highly dependent on squid cartilage CS-like polysaccharide size and structure (Kinoshita et
al. 1997).
Figure 34. Structural presentation of squid cartilage (Ommastrephes sloani pacificus) purified
fraction-II-2—[GlcA β(1→3) Glc β(1→6) GalNAc(4S)].

64
Figure 35. Structural presentation of squid cartilage (Ommastrephes sloani pacificus) purified
fraction-II-6—[GlcA β(1→3) Glc β(1→6) GalNAc(4S) β(1→4) GlcA β(1→3)
GalNAc(4S,6S)].
1.14.6. King Crab Cartilage—Tachypleus tridentatus
A GAG-like polysaccharide was isolated from king crab (Tachypleus tridentatus),
which can be related to CS-like structures (Sugahara et al. 1996). Kitagawa et al. (1997)
reinvestigated the structure of king crab CS-like structure by digesting using different
enzymes such as hyaluronidase and chondroitinase, then fractionating using gel-filtration
chromatography, which resulted in nine different oligosaccharides (fractions 1–9). The
structure of each fraction was determined by NMR spectroscopy (Table 4). Most
interestingly, king crab CS-like GAG contains 3-O-sulphated GlcA and 3-O-fucosylated-
GlcA; thus, the fucosylated-GlcA is located in an inner position as an unsulphated and
unbranched.

65
Table 4. NMR proposed CS-like oligosaccharides isolated from king crab (Tachypleus
tridentatus). Fractions 8 and 9 have hexasaccharides with different pattern of sulphation
including 3-O-sulphated GlcA. Fraction 2A has pentasaccharides structure, whereas fractions
6 and 7 have octasaccharides, all of them contain both 3-O-sulphated GlcA and 3-O-
fucosylated GlcA (Kitagawa et al., 1997).
Fraction Oligosaccharides proposed structure
Fraction 8
GlcA(3S) β(1→3) GalNAc(4S) β(1→4) GlcA(3S) β(1→3)
GalNAc(4S) β(1→4) GlcA β(1-3) GalNAc(4S)
Fraction 9
GlcA(3S) β (1→3) GalNAc(4S) β(1→4) GlcA(3S) β(1→3)
GalNAc(4S) β(1→4) GlcA(3S) β(1→3) GalNAc(4S)
Fraction 2A
GlcA(3S) β (1→3) GalNAc(4S) β(1→4) Fuc α(1→3) GlcA β(1→3)
GalNAc(4S)
Fraction 6
GlcA(3S) β(1→ 3) GalNAc(4S) β(1→4) Fuc α(1→3) GlcA β(1→3)
GalNAc(4S) β(1→4) GlcA β(1→3) GalNAc(4S)
Fraction 7 GlcA(3S) β(1→3) GalNAc(4S) β(1→4) GlcA(3S) β(1→3)
GalNAc(4S) β(1→4) Fuc α(1→3) GlcA β(1→3) GalNAc(4S)
1.14.7. African snail—Achatina fulica
A novel acharan sulphate (AS), with a molecular weight 29 kDa, was first isolated
from an African snail Achatina fulica by Kim et al (1996). NMR spectroscopic analysis has
demonstrated the presence of a homogenous structure of IdoA and GlcNAc repeated
disaccharides, formulated as [→4) -L-IdoA(2S) (1→4) α-D-GlcNAc (1→] (Figure 36)
(Vieira et al., 2004; Pomin, 2015). In addition, NMR structural analysis confirmed that the
fully epimerised IdoA has a very low pattern of sulphation. According to Pomin (2015), AS
structure is similar to that of mammalian heparin and HS, as the IdoA can acquire 2-O-
sulphation; however, the GlcNH2 residues are acetylated, which makes it different from
mammalian GAGs.
AS biological activities include the successful inhibition of angiogenesis in fertilised
chicken eggs, which represents the antiangiogenic activities of this novel molecule (Lee et al.
2003). AS has very weak anticoagulation activities in comparison to mammalian heparin (Li
et al., 2004).

66
Figure 36. Structural representation of the AS, isolated from African snail (Achatina fulica).
IdoA can acquire sulphate group at C-2, whereas, the glucosamine residues are acetylated
(Pomin, 2015).
1.14.8. Sea squirt—Ascidian
The ascidian is a form of marine life known as the sea squirt that is considered to be a
rich source of polysaccharides with unique structure. Ascidians have high amounts of DS-like
structures, which are composed of [→4 -L-IdoA (1→3) β-D-GalNAc 1→] (Figure 37).
There are many structural variations on the patterns of sulphation within ascidian species, as
the IdoA can be non-sulphated or 2-O-sulphated, and the GalNAc can be 4-O-sulphated
and/or 6-O-sulphated. Nearly 70% of the ascidian DS-like disaccharides show highly
sulphated structures such as [-IdoA(2S) (1→3) GalNAc(4S)] in comparison to mammalian
DS, which contains lower quantities of di-sulphated disaccharides. This ascidian DS-like
polysaccharide has been tested for various medical purposes, including anticoagulant and
anti-metastatic agent (Pomin, 2015).
Regardless of inter-species variations, sea squirt DS-like polysaccharides show
anticoagulation activities. The DS-like structure [-IdoA(2S) (1→3) GalNAc(4S)] shows
anticoagulation activities, which accelerate the activities of heparin-cofactor-II (Pavão, 2002).
Regarding the anti-metastatic role of ascidians’ DS-like polysaccharide, two DS-like
structures were purified from two different sea squirts known as Styela plicata and Phallusia
nigra, which have the unique structures [IdoA(2S)-GalNAc(4S)] and [IdoA(2S)-

67
GalNAc(6S)], respectively. Both structures have shown anti-metastatic activities by
inhibiting the interaction between cancerous cells and adhesion molecules such as selectins,
on endothelial cells (Kozlowski, Pavao and Borsig, 2011).
Figure 37. Structural representation of the DS-like extracted from two different ascidian
species (Pomin, 2015).
1.14.9. Cuttlefish ink—Sepiella maindroni
Ink from the cuttlefish ink (Sepiella maindroni) was used in Chinese traditional
medicine, and has various haemostatic effects and immunomodulatory functions. Liu et al.
(2008) successfully isolated and characterised a novel polysaccharide structure from Sepiella
maindroni ink. After carbohydrate purifications, monosaccharide analysis was carried out
using gas chromatography coupled with mass spectroscopy (GC-MS), which identified the
presence of fucose, Man, GalNAc, and GlcA with α- and β- linkages. Afterwards, NMR
structural analysis confirmed the presence of hexasaccharide repeating sequence within an
inner branched GlcA α(1→3), as [→4) L-fucose β(1→4) L-fucose β(1→4) D-GalNAc
α(1→6) D-Man α(1→4) GalNAc α(1→], where the GlcA is attached to the Man in α(1→3)
linkages (Figure 38).

68
Sepiella maindroni’s hexasaccharide biological activities were assessed on mice with
sarcomas using an in-vivo analysis. It was found that a combination of chemotherapy and
polysaccharides reduced the mutagenic effects caused in the sarcoma blast cells (Liu et al.
2008).
Figure 38. Structural representation of Sepiella maindroni ink hexasaccharide repeating
structure that is composed of [→4) L-Fucp β(1→4) L-Fucp β(1→4) D-GalNAc α(1→6) D-
Man α(1→4) GalNAc α(1→], where the GlcA is attached to the Man in α(1→3) linkages.
1.14.10. Bivalve mollusc—Ruditapes philippinarum
Ruditapes philippinarum is a bivalve edible mollusc used in Chinese traditional
medicine. Zhang et al. (2008) isolated and purified polysaccharide from Ruditapes
philippinarum, resulting in a crude extract; further purified using gel filtration, which resulted
in sub-fractionated four peaks. All four fractions were assessed for biological function against
human hepatoma cancer cell line, fraction-1 the only peak that showed antiproliferative
activities. A further purification step was carried out on the purified extract, which
successfully separated the PE to two peaks, namely, purified extract fraction-1 (PEF-1) and
purified extract fraction-2 (PEF-2).
Structural analysis was performed using FT-IR and NMR, which demonstrated the
presence of homo-polysaccharide chains with no uronic acid residues. The PEF-1 chain

69
consists of α(1→4) glucopyranosyl residues with (1→6) branching point, while PEF-2 has
co-existent α(1→4) and β(1→6) glucopyranosyl residues. In addition, the presence of protein
residues has suggested the presence of protein-bound polysaccharides within the sequence.
Only the PE has shown potent inhibitory properties against the human hepatoma cell
line in a non-dose-dependent manner, while PEF-1 and PEF-2 have shown lower inhibitory
effects. Zhang et al. (2008) concluded that these antiproliferative activities could be due to
chemical composition, type of glycosidic linkage, molecular mass, degree of branching
and/or the protein-bound polysaccharides, which could be responsible for the antiproliferative
activities against the hepatoma cell line.
2. Aims and objectives
The aim of this study is to isolate marine polysaccharides derived from cockle
bivalve molluscs (Cerastoderma edule), examine their antiproliferative activity on different
cancer cell lines, then characterise their structure in order to correlate a structure-activity
relationship.
The main objectives of this study
• Polysaccharide isolation from common cockle using cetylpyridinium chloride
precipitation methods.
• Assessment of the cockle polysaccharides antiproliferative activities on different
cancer cell lines.
• Application of various structural tools to determine the structure of common cockle
polysaccharides with antiproliferative activity such as monosaccharide, disaccharide
compositional analysis, FT-IR and NMR.
70
3. Materials and methods
3.1. Outline of experimental work
Common cockle (Cerastoderma edule) obtained from the Irish Sea and the British
Isles. The extracted polysaccharide was investigated using various biochemical and structural
tools to check its in-vitro role as an antiproliferative agent against different cancer cell lines,
and to characterise their antiproliferative structures. Firstly, common cockle polysaccharide
was isolated and purified from cockle’s soft body following the cetylpyridinium chloride
precipitation method previously described (Kim et al., 1996). The resulted cockle crude
extract (CE) polysaccharide was tested to check its antiproliferative activity using two
leukaemia cell lines (K-562 and Molt-4) and a mesothelioma cell line (Mero-25). Next,
various structural analysis approaches were conducted to assess the cockle CE
polysaccharide’s structural similarities to mammalian GAGs. Secondly, the cockle CE
polysaccharide with confirmed antiproliferative activity was purified using anion-exchange
resin coupled with fast performance liquid chromatography system (FPLC). The anion-
exchange chromatography successfully separated the cockle CE polysaccharide into six
fractions according to their anionic strength. Then, the cockle polysaccharide purified
fractions’ antiproliferative activity was assessed against the three cancer cell lines to confirm
the activity. Finally, structural analysis was conducted using various structural techniques to
discover this novel antiproliferative structure of the CE polysaccharides as well as the
antiproliferative activity of fraction 5 from the anion-exchange separation.
3.2. Materials
Cockles (Manchester Fish Market, UK), acetone (Sigma-Aldrich, UK), razor blade
blender, alcalase enzyme Bacillus licheniformis (Merck, Millipore, Watford, UK),
tricloroacetic acid (Sigma-Aldrich, UK), cold centrifuge (life sciences, Beckman coulter),
potassium acetate (Sigma-Aldrich, UK), ethanol (Fisher Scientific, UK), sodium chloride
(Sigma-Aldrich, UK), cetylpyridinium chloride (Sigma-Aldrich, UK), dialysis tubes
(Scientific Laboratory Supply, UK), freeze-dryer (Scanvac coolsafe, Labogene, Denmark),
Ethylenediaminetetraacetic acid (EDTA) (Sigma-Aldrich, UK), anion exchange resin
diethylaminoethanol-sepharose (GE Healthcare, Little shallot, UK), FPLC system
(Pharmacia, Stockholm, Sweden), empty column XK 16/20 (GE Healthcare, Little shallot,

71
UK), sodium phosphate monobasic (Sigma-Aldrich, UK), sodium phosphate dibasic (Sigma-
Aldrich, UK), fraction collector (FRAC-100, Pharmacia, Stockholm, Sweden), PD-10
column (GE Healthcare, Little shallot, UK), RPMI-1640 (Lonza group Ltd), DMEM (Fisher
Scientific,UK), fetal bovine serum (Labtech International Ltd, UK), L-glutamine (Labtech
International Ltd, UK), penicillin and streptomycin (Labtech International Ltd, UK),
heparanase from Flavobacterium Heparinum (Grampian Enzymes, Aberdeen, UK),
Chondritinase-ABC (Grampian enzymes, UK), -L-fucosidase (Sigma-Aldrich, UK), sodium
acetate (Sigma-Aldrich, UK), calcium acetate (Sigma-Aldrich), bovine serum albumin
(Thermo fisher scientific, UK), Spectrophotometer (Multiscan, Thermo Fisher, UK), Nanosep
10 kDa spin filter (Pall Laboratory, USA), Tris-HCL (Sigma-Aldrich, UK), sodium citrate
(Sigma-Aldrich, UK), MTT powder (Sigma-Aldrich, UK), Cisplatin (Sigma-Aldrich, UK),
mammalian HS (Celsus, Cincinnati, OH, USA), heparin (Celsus, Cincinnati, OH, USA), CS
(Celsus, Cincinnati, OH, USA), DS (Celsus, Cincinnati, OH, USA), 10 x phosphate buffer
saline (Sigma-Aldrich, UK), Dimethyl sulfoxide (Fisher Scientific UK Ltd), 0.22 µM filter
(Merck, Millipore, Watford, UK), Apoptosis assay kit (BD biosciences, UK), Flow cytometry
(BD FACSVerse, Franklin Lakes, NJ, USA), Dionex ICS-3000 system (Sunnyvale, CA,
USA), MilliQ water (Merck, Millipore, Watford, UK), trifluoroacetic acid (Sigma-Aldrich),
Isopropanol (Fisher Scientific UK Ltd), Dionex CarboPac PA1 column (Thermo fisher
scientific, uk), 4 mm x 50 guard column (Thermo fisher scientific, UK), sodium hydroxide
(Sigma-Aldrich, UK), UV detector (Gilson USA), sodium cyanoborohydride (Sigma-
Aldrich), HS disaccharides standards (Calbiochem and Sigma-Aldrich), CS disaccharides
standards (Oxford Glycosystems), LC/MS (Thermo-Finnigan, San Jose, CA), Dibutylamine
(Sigma-Aldrich), C-18 reversed-phase column (0.46 cm X 25 cm, Vydac), methanol (Fisher
Scientific, uk), FT-IR spectroscopy system (Bruker, Billerica, Massachusetts, United States),
NMR spectroscopy 800 MHz (Bruker, Billerica, Massachusetts, United States), duterum
oxide 99.9% (Sigma-Aldrich, UK), tetramethylsilane (Sigma-Aldrich, UK).
3.3. Methods
3.3.1. Extraction of sulphated polysaccharides from common cockle
This extraction procedure, known as the cetylpyridinium chloride precipitation
method, was previously used to extract GAG-like polysaccharides from invertebrate soft
bodies (Kim et al., 1996). Initially, cockle shells were removed, and 250 g of cockle soft
body tissue was soaked in acetone 400 mL for 72 h to ensure fat removal; the acetone was

72
changed every 24 h. Defatted tissues were left to dry for 24-48 h at room temperature then
ground to a fine powder using a razor blade blender. The powder (50 g) was suspended in of
0.05 M sodium carbonate (500 mL) with pH 9.2 and 25 mL of Alcalase enzyme (30 Anson
units/g) was added, and then the mixture was incubated at 60 °C for 48 h with constant
agitation at 200 rpm.
The mixture was then cooled to 4 °C and 5% trichloroacetic acid (w/v) was added to
the mixture and mixed for 10 min. Then, the precipitated peptides were removed by
centrifugation (8000 rpm for 25 min). After centrifugation, the supernatant was transferred to
a cylinder and three volumes of 5% (w/v) potassium acetate in ethanol were added to one
volume of the supernatant and the mixed solution left overnight at 4 °C.
Subsequently, the precipitated cockle polysaccharide was recovered by centrifugation
(8000 rpm for 30 min). The recovered precipitate (about 12 g) was then dissolved in of 0.2 M
NaCl solution (480 mL) and centrifuged (8000 rpm for 30 min) to remove any insoluble
material. Next, cetylpyridinium chloride (6.25 mL of a 5% (w/v) solution) was added to the
supernatant and the mixture was centrifuged (8000 rpm for 30 min). The precipitate was
subsequently dissolved in of 2.5 M NaCl buffer (125 mL), followed by the addition of 5
volumes of absolute ethanol. The precipitated cockle polysaccharide was recovered by
centrifugation (10,000 rpm for 30 min); the precipitated polysaccharides were recovered and
dissolved in water (30 mL) in order to be ready for dialysis process.
According to cockle preparation procedure which depends heavily on their negative
charge, the dialysis tubing’s were treated prior to adding final polysaccharide mixture to
remove any charged particles attached to it. Initially, tubes were treated with 30 mM sodium
bicarbonate (10 g) and 10 mM EDTA (0.146 g) in distilled water (400 mL) for 10 min. Then,
tubes were washed with boiled distilled water for 10 min. Finally, tubes were washed with 10
mM EDTA (0.146 g) in distilled water (250 mL) and absolute ethanol (250 mL). Afterward,
the polysaccharide mixture, which was dissolved in water (30 mL), was added to the freshly
prepared dialysis tubing with a molecular weight cut-off (MWCO) of 14 kDa against water
for 72 h, as dialysis water was changed every 24 h. The dialysate was lyophilized to obtain a
white powder containing approximately 24 mg of cockle polysaccharide that was coded as
crude extract (CE).

73
3.3.2. Anion-exchange chromatography
The cockle CE polysaccharide preparations were purified using anion-exchange resin
coupled with the fast performance liquid chromatography (FPLC) system. The anion-
exchange column (16 X 200 mm) was packed with fast flow diethylaminoethyl-sepharose
(DEAE-Sepharose) (10 mL) that is composed of cross-linked agarose 6% (Silva, 2006).
Cockle CE polysaccharide was dissolved in distilled water (1 mg/mL) prior to injection into
the FPLC system. The column was pre-washed with 1 column volume (10 mL) of 1.5 M
NaCl, then 1 mL of cockle CE polysaccharide mixture was injected to the FPLC system and
the cockle CE polysaccharide was eluted using a linear gradient 0-1.5 M of NaCl (7.8 g/L) in
50 mM sodium phosphate buffer (7.098 g/L) at pH 7.0 over 75 min at a flow rate of 1
mL/min. Absorbance was monitored at 280 nM (Rovio, Yli‐Kauhaluoma and Sirén, 2007),
and 1 mL fractions were collected using Pharmacia fraction collector, then pooled as
indicated. After each run, the column was washed with 1 column volume (10 mL) of 1.5 M
NaCl to ensure removal of any attached materials as well as to recharge the column.
Pooled fractions corresponding to the peaks in the elution profile were dialysed
extensively against water using a dialysis tube with MWCO 14 kDa over 3 consecutive days.
After the dialysis process, fractions were lyophilised using freeze-drier for 3 days to obtain
the final polysaccharide products. A further desalting step was performed to ensure samples
are salt-free using a desalting column PD-10. The PD-10 column is a desalting column
containing gel filtration sephadex (G-25) resin, using gravity method. The column was
washed with of 10% ethanol (30 mL), and then 2.5 mL of the sample was applied. The first
2.5 mL was discarded, as it was the column void volume; the next 3.5 mL was collected,
lyophilised, and stored at -20 °C (Kitagawa et al., 1997).
3.3.3. Enzymatic digestion
The extracted cockle polysaccharide was digested using different enzymes, namely
heparinase enzymes, chondroitinase-ABC and/or α-L-fucosidase, to be used for further
analysis in order to release unsaturated disaccharides from both cockle CE or cockle purified
fractions, as follows.

74
3.3.3.1. Heparinase dilution and working concentration
Heparinases were purchased in international units (IU) as stock concentrations as
heparinase-I (2.0 IU), heparinase-II (0.2 IU) and heparinase-III (0.5 IU) (Grampian enzymes,
UK). Enzyme dilution was performed following the manufacturer’s recommendations, as
follows. Initially, the enzyme concentration was adjusted to 1.0 IU/ml on the enzyme stock,
by adding 1x heparinase buffer, which is composed of 50 mM sodium acetate and 10 mM
calcium acetate at pH 7.0, containing bovine serum albumin (BSA) 0.2-0.4 µg/mL as a
stabiliser. Then, the adjusted enzyme stock was split into 100 µL aliquots, in which each 100
µL contains 1.0 IU/ml of enzyme that was stored at -80 °C. For the enzyme working
concentration, 400 µL of 1x heparinase buffer was added to one vial (100 µL at 1.0 IU/mL)
of enzyme stock, without BSA, to reach a final volume of 500 µL containing about 200
mIU/mL of the enzyme. This 500 µL (200 mIU/mL) was aliquoted into 10 µL in each vial to
obtain about 5-10 mIU. All enzyme aliquots were stored at -20 °C (Lamanna, 2008).
For cockle polysaccharides digestion, 100 µg of polysaccharide was dissolved in 200
µL of 1 x heparinase buffer and heparinase-I (30 mIU), heparinase-II (30 mIU), heparinase-
III (30 mIU), separately or in combination of all three enzymes. This was incubated at 30 °C
for 24 h. The enzyme digests were monitored spectrophotometrically at 232 nM and the
reactions were terminated by heating at 100 °C for 5 min. The samples were passed through a
10 kDa spin filter, and then both retained materials and flow through materials were dried
prior to further analysis.
3.3.3.2. Chondroitinase-ABC dilution and working concentration
Chondroitinase-ABC was purchased in 5 IU quantities (Grampian enzymes, UK). The
enzyme working concentration was adjusted by reconstitution in 5 mL of 50 mM Tris-HCl
and 50 mM sodium acetate buffer at pH 8.0 with 0.2% BSA to make 1.0 IU/mL. The enzyme
was aliquoted at 1 mL/vial and stored at -80 ºC. Then, 1 mL stock at 1.0 IU/mL was split into
100 µL aliquots, in which each 100 µL at 1.0 IU/mL of enzyme that was stored at -80 °C. For
enzyme working concentration, 400 µL of 1 x condroitinase buffer was added to one vial of
enzyme stock (100 µL at 1.0 IU/mL), without BSA, to reach a final volume of 500 µL
containing 200 mIU/mL of the enzyme. This 500 µL (200 mIU/mL) was aliquoted into 10 µL
in each vial to obtain about 5-10 mIU. All aliquots were stored at -20 °C.

75
For cockle polysaccharides digestion, 100 µg of cockle polysaccharides was dissolved
in 200 µL of chondroitinase-ABC buffer and added to 30 mIU of the enzyme. Then, it was
incubated for 24 h at 37 °C. The enzyme digests were monitored spectrophotometrically at
232 nM and the reactions were terminated by heating at 100 ºC for 5 min. The samples were
passed through a 10 kDa spin filter, and then both retained materials and flow through
materials were dried prior to further analysis.
3.3.3.3. Fucosidase enzyme dilution and working concentration
-L-fucosidase enzyme is a broad-spectrum hydrolase enzyme that cleaves fucose
from proteoglycans, extracted from bovine kidney. It has broad substrate properties that can
cleave [-L-fucose 1→ (2,3,4,6)] from both N- or O-linked glycan (Parekh et al., 1987).
The enzyme was purchased in 0.5 IU quantities in a 3.2 M ammonium sulphate
solution containing 10 mM sodium phosphate monobasic and 10 mM sodium citrate.
Initially, the ammonium sulphate was discarded by centrifugation and the pellet containing
the enzyme was recovered. The enzyme working concentration was adjusted by
reconstitution in 500 µL of 100 mM sodium citrate buffer at pH 5.6 (0.5 IU/500 µL). The
enzyme was aliquot of 100 µL containing 0.1 IU been stored at 2-8 ºC. For the enzyme
working concentration, 400 µL of 1 x enzyme buffer was added to one vial of 100 µL stock,
as the 500 µL containing about 200 mIU/mL, then 10 µL in each vial to obtain about 5-10
mIU. Enzyme check was determined using spectrophotometer at 400 nM.
For cockle polysaccharide digestion, 100 µg of the cockle polysaccharide was
dissolved in 200 µL of α-L-fucosidase buffer and 30 mIU of the enzyme was added. Then, it
was incubated for 24 h at 37 °C. The enzyme digests were monitored spectrophotometrically
at 400 nM and the reactions were terminated by heating at 100 ºC for 5 min. The samples
were passed through a 10 kDa MWCO spin filter, and then both retained materials and flow
through materials were dried before further analysis.
3.3.4. Maintenance of cell lines
Cell culture was conducted using two human leukaemia cell lines, CML-derived cell
line K-562 and ALL-derived cell line Molt-4, and human malignant mesothelioma with
asbestos exposure (pleural cavity) Mero-25 cell line (ECACC 09100102). The human
leukaemia cell lines were grown in RPMI-1640 cell culture medium containing 1 g/L glucose

76
and the Mero-25 cell line was grown in a DMEM cell culture medium containing 3.7 g/L
glucose. All culture media were supplemented with 10% (v/v) inactivated fetal bovine serum
(FBS), 2 mM L-glutamine, 100 units/mL penicillin and 100 µg/mL streptomycin. All cell
lines were maintained in 75 mL flasks under a sterile and humidified atmosphere of 95% air
and 5% CO2 at 37 °C.
3.3.5. Cell proliferation assay
Cell proliferation was assessed using MTT (3-(4,5-dimethylthiazol-2-yl)-2,5-diphenyl
tetrazolium bromide) assay, which is an in-vitro colorimetric technique that is widely used to
assess cell viability and proliferation. Physiologically viable cells’ mitochondria produce an
enzyme known as nicotinamide adenine dinucleotide (phosphate) (NAD(P)H)-dependent
oxidoreductase, which reduces the tetrazolium (MTT-dye) to a compound called formazan (a
crystalline product purple in colour) (Gerlier and Thomasset, 1986). In contrast, non-viable
cells do not catalyse the reduction of the tetrazolium to produce purple-coloured crystal
formazan. Therefore, this assay detects the density of the colour and gives qualitative
indications of viable and non-viable cells using half-maximal inhibitory concentration (IC50),
which is defined as the quantity of a drug required to inhibit the biological activity by half,
thereby illustrating anti-proliferative activity.
Cells were seeded at a density of 5 X 10³ cells per well in 96-well plates containing
100 µL of culture medium prior to treatment with polysaccharide samples for K-562 and
Molt-4 cell lines, however, for Mero-25 cell line, the cells were seeded in 96-well plate and
incubated overnight, to allow cells to attach to the plate. Following that the addition of
different drugs, such as cockle polysaccharide samples with increased dose (0, 0.78, 1.56,
3.12, 6.25, 12.5, 25, 50 (µg/mL)), mammalian GAGs (0, 0.78, 1.56, 3.12, 6.25, 12.5, 25, 50
(µg/mL)), and cisplatin (0, 0.39, 0.78, 1.56, 3.12, 6.25. 12.5, 25 (µM)) that was used as
positive control, in triplicates, then, cells were incubated for 96 h following. Following the
incubation period, 50 µL of the MTT solution (5 mg/mL in PBS) was added to each well and
plate was further incubated for 3 h at 37 °C, then solution was removed by aspiration. Next,
200 µL of dimethyl sulfoxide (DMSO) was added to each well in order to dissolve the
formazan crystal product. The amount of the MTT dye converted to formazan is directly
proportionally to the viable cells. The plate was gently agitated until the colour reaction was
uniform and the absorbance was measured at 570 nM using a multi-well plate reader.

77
Figure 39. MTT assay 96-well U-shaped wells for suspension cell lines or Flat-shaped wells
for adherent cell line. Maximum drug concentration was added in the last row (H), then, drug
was diluted until row (B). Row (A) was used for untreated control cells. Every drug
concentration was tested in triplicates including control cells.
3.3.5.1. Determination of IC50 values
The average cell values were determined from triplicates at each data set in order to
obtain IC50 values using GraphPad Prism 8.0 (La Jolla, CA, USA). First, the values from
untreated cells were considered to have the maximum growth rate and the values from the
treated cells were determined according to the untreated control values. Second, in order to
plot a dose-response curve, all data values were normalised as the largest value was assigned
as 100% growth, and the smallest value was assigned to 0%. Therefore, the y-axis was
defined as the growth percentage and the x-axis was defined as the drug concentration.
Finally, the IC50 values were determined using non-linear regression inhibitor vs normalised
response option.
3.3.6. Annexin-V Apoptosis Assay
There are several biochemical techniques to determine the cellular death process. One
of these techniques is to determine early apoptotic markers of cell death. One early apoptotic
marker is known as phosphatidylserine, which is a phospholipid compound that is part of the
inner cell membrane. During early apoptotic conditions, such as hypoxia, phosphatidylserine
is translocated to the outer cell membrane, which makes it exposed to antibodies, for
example. Phosphatidylserine on the outer cell membrane can bind to a binding protein known
as Annexin-V, therefore, Annexin-V was conjugated with a fluorochrome called fluorescein

78
isothiocyanate (FITC) to visualise this reaction using flow cytometry. In order to differentiate
between apoptosis and necrosis, cells were stained with propidium iodide (PI), which binds to
the necrotic cells, in addition to FITC-Annexin-V. Hence, using flow cytometry as a
quantitative technique to count FITC-Annexin-V and PI-stained cells is very useful to
evaluate cellular death progression (Biosciences, 2011).
To perform the apoptosis assay using FITC-Annexin-V and PI stains, cells were
seeded into a sterile 6-well plate at 5 X 10⁵ / mL at 37 °C. Next, cockle CE polysaccharide or
cockle purified active fraction was added to the cells and left for 24 h. Afterwards, treated
and untreated cells were washed twice with cold PBS and centrifuged at 2000 X g for 5 min,
followed by resuspension in 1 x binding buffer (0.1 M HEPES buffer, 1.4 M NaCl and 25
mM calcium chloride) at a concentration of 1 X 10⁶ cells/mL. Cells (100 µL) were then
stained with Annexin V-FITC (5 µL) and PI (5 µL). Stained cells were gently vortexed and
incubated in the dark for 15 min at room temperature 25 °C. After incubation, 400 µL of 1 x
binding buffer was added to cells prior to analysis using a flow cytometer.
3.3.7. Monosaccharide composition analysis
Monosaccharide composition analysis was conducted using high-pH anion-exchange
chromatography coupled with pulsed amperometric detection (HPAEC-PAD) using a Dionex
ICS-3000 system (Hardy, Townsend and Lee, 1988). This method was favoured for
monosaccharides composition analysis as it does not require sample derivatisation, which
makes it advantageous for an unknown polysaccharide sample. Because polysaccharides lack
a chromophore, an electrochemical detector was chosen which has several advantages. For
instance, it has the ability to discriminate between monosaccharides and the mobile phase,
and is a qualitative, quantitative, sensitive and non-destructive detector.
For cockle monosaccharide composition analysis, 50 µg of cockle CE polysaccharide
or 50 µg of each purified fraction was dissolved in 200 µL MilliQ water. The mixture was
then incubated with 1 mL of 4M trifluoroacetic acid at 100 °C for 6 h to ensure the release of
both monosaccharides and uronic acids. Then the sample was centrifuged at 2000 rpm for 2
min, followed by the removal of acid using a dry nitrogen flush and 50 µL of 50% (v/v)
aqueous isopropyl alcohol as a co-evaporative to remove the remaining acid until the sample
was completely dry.

79
For monosaccharide analysis, 20 µg of the hydrolysed polysaccharide sample was
suspended in 100 µL MilliQ water. Then, 50 µL of the sample was injected into a Dionex
CarboPac PA1 column (4 mm x 250 mm, 4μm, with 4 mm x 50 mm guard column) at a flow
rate of 1 mL/min. Monosaccharides were eluted using gradient elution under strong alkaline
conditions formed from three solvents: high purity H2O as solvent (A); 100 mM sodium
hydroxide (NaOH) with 5 mM sodium acetate (NaOAc) as solvent (B); and 100 mM NaOH
with 250 mM NaOAc as solvent (C) (Table 5). Peaks were detected using a pulsed
amperometric detector with standard quad waveform for carbohydrates and evaluated
according to a standard profile.
Table 5: HPAEC solvent gradient setting for monosaccharides and organic acids analysis
Time (minutes) Solvent A% Solvent B% Solvent C%
0 84 16 0
20 84 16 0
21 79 16 5
50 0 16 84
65 0 16 84
66 84 16 0
80 84 16 0
3.3.8. Disaccharides analysis
Cockle CE polysaccharide (5 g) or cockle purified fraction (5 g) were incubated
with a mixture of 30 mIU for each of heparinases I, II and III in 200 µL heparinase buffer or
they were incubated with 30 mIU of chondroitinase-ABC in 200 µL of chondroitinase buffer.
Samples were incubated overnight at 37 °C and the reaction was terminated by heating to 100
°C for 5 min. The samples were passed through a 10 kDa spin filter then dried before further
analysis.
Glycan reductive isotope labelling (GRIL) using isotopic aniline tagging was used for
composition analysis and mass detection of disaccharide yields from heparinase- or
chondroitinase-treated cockle polysaccharides (Lawrence et al., 2008). 15 µL (165 µmol) of
labelled aniline tagging added to 5 µg of dried heparinase- or chondroitinase-derived
disaccharides, then 15 µL of 1M sodium cyanoborohydride, freshly prepared in DMSO/acetic
acid (7:3, v/v), were added to the sample. Reactions were carried out at 37 °C for 16 h, and

80
then dried using centrifugal evaporator, then the sample was spiked with [13C6] of 5 µL (8
pmol) of unsaturated disaccharide standards tagged. The dried samples were prepared for
liquid chromatography coupled with mass spectrum (LC-MS) analysis by suspension in a
running buffer (8 mM acetic acid, 5 mM in ion-pairing agent dibutylamine (DBA)), then
disaccharides were separated on a C18 reversed-phase column (0.46 cm X 25 cm).
The solvent system for eluting the samples was 100% buffer (A) (8 mM acetic acid, 5
mM DBA) for 10 min, 17% buffer (B) (70%, methanol 8 mM acetic acid 5 mM DBA) for 15
min, 32% buffer (B) for 15 min, 40% buffer (B) for 15 min, 60% buffer (B) for 15 min,
100% buffer (B) for 10 min and 100% buffer (A). Ions of interest were detected in negative
ion mode and the capillary temperature and spray voltage were kept at 140 °C and 4.75 kilo-
volt, respectively, with UV detection set at 232 nM, data shown in appendix XII and XIII.
3.3.9. FT-IR
FT-IR is a type of spectroscopic technique that principally uses the infrared spectrum.
It is simple, non-destructive, fast technique that can indicate the functional groups present
within a sample and can aid in understanding the chemical structure of that sample. The main
principle of the technique is the detection of the bonds between atoms, which can undergo
stretching, bendingn or wagging rotation. IR radiation can pass through the sample and
transmit light to the detector or it can be absorbed by the molecule. Therefore, the IR
spectrum can be represented with an x-axis (wave number cm-1) and it’s corresponding y-
axis (transmittance%) (Movasaghi, Rehman and ur Rehman, 2008).
For the analysis of cockle CE polysaccharide, the sample platform was cleaned using
70% ethanol, followed by 16 scans to resolve any noise prior use. Then, 500 µg of dried
cockle CE polysaccharide was placed on the sample platform and full infrared scan was
determined in 16 scans. Data was analysed using OMNIC software.
3.3.10. NMR
NMR is a powerful spectroscopic technique that allows identifying the presence of
certain physical and chemical properties of a molecule. As a result, it is excellent for
providing the structural properties of an unknown molecule. The NMR instruments interacts
with the nucleus by applying an external magnetic field. It has the ability to identify more
than one nucleus at a time known as multi-dimensional NMR spectroscopy. This technique
gathers more information about the presence of selected atoms. For instance, two-

81
dimensioned NMR can detect the resonance of both 1H and 13C at the same time, resulting in
a correlation between the bonds of these two atoms (Friebolin and Becconsall, 1993).
For cockle polysaccharide analysis, one and two-dimensional (2D) 1H and 13C spectra
of the cockle polysaccharides were recorded using Bruker 800 MHz machine with a triple
resonance probe, and the spectra were analysed using TopSpin software. Approximately 5 mg
of the cockle CE polysaccharide or its purified fraction 5 were dissolved in 0.5 mL of 99.9%
deuterium oxide. All spectra were recorded at 56 ºC in water peak suppression mode. All
chemical shifts were relative to the internal reference tetramethylsilane (TMS) (5 µL).

82
4. Results—Cockle CE polysaccharide biological and structural analysis
Cockle CE polysaccharide was extracted from marine-source cockle (Cerastoderma
edule) using a typical cetylpyridinium chloride precipitation method, which resulted in about
(24 mg) white fluffy material. Several biological and structural analyses tools were
performed on cockle CE polysaccharide in order to assess its role as an antiproliferative agent
as well as to assess its related structure. Firstly, cockle’s CE polysaccharide pharmaceutical
outcome as antiproliferative agent was assessed against two leukaemia cell lines (K-562 and
Molt-4) and a mesothelioma (Mero-25) cancer cell line using a cell proliferation assay
(MTT), this was followed by an apoptosis assay to determine its role in mediating cell death.
Secondly, after confirming the antiproliferative activity against the cancer cell lines, several
structural techniques were implemented such as monosaccharide and disaccharide
compositional analyses, as well as FT-IR and NMR in order to obtain more structural details
about this potent pharmaceutical agent.
4.1. Biological activities of cockle CE polysaccharides
4.1.1. Cockle CE polysaccharides—cell proliferation assay
Numerous studies have shown the potential medicinal properties of marine
polysaccharides. In this study, marine polysaccharides isolated from cockle showed
antiproliferative effects on cancer cell lines in-vitro. Cockle CE polysaccharides
antiproliferative activities were assessed against leukaemia cell lines K-562 and Molt-4 and
mesothelioma cell line Mero-25, which resulted in considerable inhibitory effects as
determined using MTT assay (Figure 40). Some batch-to-batch variability in IC50 values was
determined due to different cockle preparations as well as because of the complex
heterogeneity of the polysaccharide chains present. Cisplatin was used in all assays as a
positive control in the comparisons of different preparations. Typical IC50 values were around
10 ± 2 g/mL, 1.2 ± 0.5 g/mL and 22 ±4 g/mL for the K-562, Molt-4 and Mero-25 cell
lines, respectively.

83

84
Figure 40. The antiproliferative activity of cockle CE polysaccharides on three cancer cell
lines. Cancer cell lines K-562 (A), Molt-4 (B) and Mero-25 (C) were treated with increasing
doses of cockle CE polysaccharides (0, 0.78, 1.56, 3.12, 6.25, 12.5, 25, 50 µg/mL) and cell
viability was determined using MTT assay, as detailed in section 3.3.4. The inserts show the
effects of cisplatin treatment on the number of viable cells. Cell viability is expressed as a
percentage relative to the untreated control cells. All experiments were conducted in triplicate
and the results are shown as the mean ± the SD. Cells were cultured under standard
conditions and maintained at 37 °C in a humidified 5% CO2 atmosphere.
Table 6. Present list of IC50 of cockle CE polysaccharide and cisplatin as positive control on
all cell lines. All IC50 values were conducted in triplicate and calculated using non-linear
regression analysis (GraphPad Prism 8.0).
Drug
List of IC50 on each cell line
K-562 Molt-4 Mero-25
Cockle CE polysaccharide (µg/mL) 9.23 (µg/mL) 1.5 (µg/mL) 19.33 (µg/mL)
Cisplatin (µM) 0.49 (µM) 0.9 (µM) 14.67 (µM)

85
4.1.1.1. Comparisons of cockle CE polysaccharide GAG-like antiproliferative activity
with mammalian GAGs
Further investigations confirmed that mammalian-derived GAGs (porcine) had no
antiproliferative activity on cancer cell lines using MTT assay (Figure 41). Cell proliferation
assay showed that no measurable IC50 could be determined for mammalian heparin, HS, CS
and DS against cancer cell lines; however, the cockle CE polysaccharides continued to show
significant antiproliferative activity. In fact, at low concentrations, mammalian HS showed
slight stimulatory activity on cell growth. These results suggest that, if HS-like-GAG chains
are involved in the antiproliferative activity of cockle CE polysaccharides, then they must
have unique structural features not found in typical mammalian GAGs.

86
Figure 41. Comparisons between the antiproliferative activity of cockle CE polysaccharides
and the common mammalian GAGs on cancer cell lines. The three cancer cell lines, K-562
(A), Molt-4 (B) and Mero-25 (C), were treated with increasing doses of cockle CE
polysaccharides (0, 0.78, 1.56, 3.12, 6.25, 12.5, 25, 50 µg/mL) or common mammalian-
GAGs (0, 0.78, 1.56, 3.12, 6.25, 12.5, 25, 50 µg). Cockle CE polysaccharides was the only
agent that show antiproliferative activity on all cell lines. Cockle CE polysaccharides (●),
mammalian-heparin (♦), mammalian-HS (■), mammalian-CS (▲) and mammalian-DS (▼).
The data are presented as the percentage of viable cells following treatment with different
polysaccharides, relative to the untreated control. All experiments were conducted in
triplicate and the results are shown as the mean ± the SD. Cells were cultured and maintained
at 37 °C in a humidified 5% CO2 atmosphere.

87
Table 7. Present list of IC50 of cockle CE polysaccharide (0, 0.78, 1.56, 3.12, 6.25, 12.5, 25,
50 g/mL) and mammalian GAGs (0, 0.78, 1.56, 3.12, 6.25, 12.5, 25, 50 g/mL) on all cell
lines. IC50 was determined when a drug has inhibited the cancer cells growth by 50% at
maximum concentration of 50 g/mL, therefore, if a drug has inhibited less than 50%, then
the drug is considered to be inactive. All values were conducted in triplicate and the IC50
calculated using non-linear regression analysis (GraphPad Prism 8.0).
Polysaccharides as antiproliferative
agent
List of IC50 on each cell line
K-562 Molt-4 Mero-25
Cockle CE polysaccharide 12.34 (µg/mL) 1.41 (µg/mL) 27.54 (µg/mL)
Mammalian-heparin Inactive Inactive Inactive
Mammalian-HS Inactive Inactive Inactive
Mammalian-CS Inactive Inactive Inactive
Mammalian-DS Inactive Inactive Inactive
4.1.1.2. Effects of enzymatic degradation on cockle CE polysaccharide
antiproliferative activity
The extraction procedure designed to enrich the content of sulphated GAGs or sulphated
GAG-like structures that also could cause attachment of contamination from other marine
polysaccharides. These non-GAG polysaccharides may have contributed, solely or in part, to
the observed antiproliferative activity of the cockle CE polysaccharides. Enzymatic
treatments of the cockle CE polysaccharides were achieved. Heparinases, chondroitinase-
ABC or fucosidase to investigate any link between typical GAG-like structures and the
observed antiproliferative activity. After applying the 10 kDa spin filter, each sample has
separated into two parts, flow through and retained part. The flow through part contained all
the disaccharides, which showed no antiproliferative activity 9.8), while, the retained part has
shown the antiproliferative activity. Figure 42 demonstrates that there was no appreciable
change in the antiproliferative activity of the retained part when cockle CE polysaccharides
were treated with chondroitinase-ABC and fucosidase. Heparinase digestion (individually
and in combination), however, did lead to a significant loss of the antiproliferative activity
within the retained part, with an approximate decrease in IC50 values for combined

88
heparinases (I, II, III) of around 4-, 8- and 2-fold for the K-562, Molt-4 and Mero-25 cell
lines, respectively (Table 8).

89
Figure 42. The effect of heparinase (I, II, III), chondroitinase ABC and α-L-fucosidase
enzymatic digestion on cockle CE polysaccharide antiproliferative activity. The sensitivity of
the cockle CE polysaccharide’s antiproliferative activity to the enzymatic degradation was
determined using MTT assay. The figure shows the antiproliferative activity of cockle
polysaccharides retained part of the 10 kDa spin filter on the K-562 (A), Molt-4 (B) and
Mero-25 (C) cell lines, with and without enzymes, as cockle CE polysaccharides (●), cockle
CE treated with heparinase-I (■), cockle CE treated with heparinase-II (▲), cockle CE
treated with heparinase-III (▼), cockle CE with heparinase-I, II, III treated (♦), cockle CE
treated with chondroitinase-ABC (○) and cockle CE treated with fucosidase (□). The data are
presented as the percentage of viable cells following treatment with cockle polysaccharides,
relative to the untreated control. Cockle CE showed high sensitivity to heparinase enzymes
(solely and in combination), while chondroitinase-ABC and fucosidase showed no effect on
the antiproliferative activity. All experiments were conducted in triplicate and the results are
shown as the mean ± the SD. Cells were cultured in suspension and maintained at 37 °C in a
humidified 5% CO2 atmosphere.

90
Table 8. Present list of IC50 of cockle CE polysaccharide (0, 0.78, 1.56, 3.12, 6.25, 12.5, 25,
50 g/mL) and its digested chains by the action of heparinases, chondroitinase-ABC or
fucosidase on cancer cell lines. All IC50 values were conducted in triplicate and calculated
using non‐linear regression analysis (GraphPad Prism 8.0).
Polysaccharide
as antiproliferative agent
List of IC50 on each cell line
(µg/mL)
K-562 Molt-4 Mero-25
Cockle CE polysaccharide 8.18 0.5 23.5
Cockle CE polysaccharide with heparinase-I 26.43 5.7 48
Cockle CE polysaccharide with heparinase-II 24.52 6.6 32.04
Cockle CE polysaccharide with heparinase-III 25.52 4.33 43.7
Cockle CE polysaccharide with heparinase-I, II and III 38.06 4.7 50
Cockle CE polysaccharide with chondroitinase-ABC 11.07 0.6 21.4
Cockle CE polysaccharide with α-L-fucosidase 9.5 1.4 19
4.1.2. Apoptosis detection assay—Annexin V
Cell apoptosis detection assay using Annexin-V FITC/PI staining, followed by flow
cytometry was used to investigate the mechanism of cell death following treatment with
cockle CE polysaccharides. Cell death mechanism of all cell lines treated with cockle CE
polysaccharides was potentially mediated via apoptosis. K-562 and Molt-4 cell lines showed
a small increase in the late apoptotic phase, Mero-25 cell line did not show any late apoptotic
markers (Annexin V+/PI+), when cells were treated with cockle CE polysaccharide.
However, early apoptosis (Annexin V+/PI−) showed the biggest change in all cell
populations after 24 h incubation. Necrotic cells (Annexin V−/PI+) showed little change over

91
untreated controls. The results shown in Figure 43 clearly implicate apoptosis as the most
likely cause of cellular cytotoxicity following treatment by cockle CE polysaccharides.
However, primary necrosis cannot be ruled out.
Figure 43. Apoptosis assay Annexin-V FITC/PI. K-562 (A), Molt-4 (B) and Mero-25 (C)
cell lines were treated with cockle CE polysaccharides (50 g) for 24 hours, then cells were
stained with Annexin V-FITC and PI stains, in addition to staining the untreated cells, which
left as control. A: K-562 scatter plot of Annexin V-FITC/PI stained control cells (left) and
scatter plot of cells treated with cockle CE polysaccharides (right). B: Molt-4 scatter plot of
Annexin V-FITC/PI stained control cells (left) and scatter plot of cells treated with cockle CE
polysaccharides (right). C: Mero-25 scatter plot of Annexin V-FITC/PI stained control cells
(left) and scatter plot of cells treated with cockle CE polysaccharides (right).

92
4.2. Structural analysis of cockle CE polysaccharides
4.2.1. Disaccharide analysis of cockle CE polysaccharides
Disaccharide analysis was used in the first instance to confirm the presence of typical
unsaturated HS/heparin and CS/DS disaccharides residues following treatment of the cockle
CE polysaccharide with heparinase I, II and III or chondroitinase-ABC. Primary analysis of
the HS/heparin unsaturated disaccharide compositions, which were released after digestion of
the cockle CE polysaccharides with combined heparinases (I, II, III), showed that susceptible
chains within the cockle CE polysaccharide sequence did contain the major disaccharide
types found in mammalian HS/heparin. However, the combined digestion of heparinases (I,II
and III) is suggested to be incomplete, according to the proliferation activity (Figure 42).
The key differences between cockle CE unsaturated disaccharides and mammalian HS
unsaturated disaccharides were the low levels of unsulphated disaccharide of [ΔHexA‐
GlcNAc] and the high levels of the disulphated disaccharide [ΔHexA‐GlcNS(6S)] released
from the cockle polysaccharides (Table 9). On the other hand, other unsaturated disaccharides
were at similar levels to those seen with typical mammalian HS types. As heparinases
treatment of the cockle polysaccharides failed to generate high quantities of this highly
sulphated disaccharide [ΔHexA(2S)-GlcNS(6S)], which could indicate the presence of HS-
like structure within cockle CE polysaccharides is much closer to mammalian HS than
heparin.
Despite the fact that the chondroitinase-ABC treatment of cockle CE polysaccharides
failed to show any significant loss of antiproliferative activity, CS/DS disaccharide analysis
was performed. The principle unsaturated disaccharides were produced by chondroitinase-
ABC digestion as [ΔHexA-GalNAc(4S)], [ΔHexA-GalNAc(6S)] and [ΔHexA-
GalNAc(4,6S)]. The results undoubtedly show that CS/DS-like chains also exist within the
cockle CE polysaccharide preparations.
Overall, information gathered from the disaccharide analysis data support the initial
suggestion that the reduction in the antiproliferative activity, following by treatment of cockle
CE polysaccharides with heparinases, was due to breakdown of HS/Heparin-like chain. Since
it resulted in the release of unsaturated disaccharides that are found in mammalian
HS/heparin types. The presence of heparinase resistant fragments as well as the lack of
antiproliferative activity of the mammalian GAGs suggested the presence of an uncommon

93
HS-like structure, which suggested that active HS-like could be different from the
mammalian HS.
Table 9. Disaccharide composition analysis of cockle CE polysaccharide, mammalian
HS/heparin and mammalian CS/DS. Data are presented as a percentage of the moles of
HS/Heparin1 and CS/DS2 unsaturated disaccharides produced by heparinase (I, II, III) and
chondroitinase-ABC digestion.
HS/Heparin
Disaccharides
Cockle CE disaccharides
produced (mole %)
Standard HS
disaccharides produced
(mole %)
ΔHexA-GlcNAc 26.6 61.5
ΔHexA(2S)-GlcNAc 0.0 1.9
ΔHexA(2S)-GlcNH2 0.0 0.01
ΔHexA-GlcNAc(6S) 4.1 1.9
ΔHexA(2S)-GlcNAc(6S) 4.0 0
ΔHexA-GlcNS 25.5 17.8
ΔHexA(2S)-GlcNS 9.5 11.5
ΔHexA-GlcNS(6S) 24.7 0.8
ΔHexA-GlcNH2(6S) 0.0 0
ΔHexA(2S)-GlcNS(6S) 5.6 4.6
ΔHexA(2S)-GlcNH2(6S) 0.0 0
Total 100% 100%
Type of sulphation Sulphate % Sulphate %
Unsulphated 26.61 61.51
N-SO3- 65.23 34.67
2-O-SO3- 19.06 18.04
6-O-SO3- 38.47 7.32
Number of Sulphates Mole % Mole %
0-SO3- 26.61 61.51
1-SO3- 29.60 21.55
2-SO3- 38.20 12.35
3-SO3- 5.58 4.59
Total GAG disaccharides
produced by heparinase
digestion (µg)
0.06 0.61
Average sulphate per
disaccharides
1.23 0.60

94
CS/DS Disaccharides2 Cockle CE
disaccharides produced
(mole %)
CS standards
disaccharides produced
(mole %)
ΔHexA-GalNAc 3.2 5.08
ΔHexA-GalNAc(4S) 33.5 56.05
ΔHexA-GalNAc(6S) 17.2 37.94
ΔHexA(2S)-GalNAc(4S) 0 0.21
ΔHexA(2S)-GalNAc(6S) 0.7 0.02
ΔHexA-GalNAc(4S)(6S) 45.4 0.7
ΔHexA(2S)-
GalNAc(4S)(6S)
0 0
Total 100% 100%
Type of sulphation Sulphates % Sulphates %
Unsulphated 3.22 5.0
2-O-SO3- 0.68 0.23
4-O-SO3- 78.87 56.9
6-O-SO3- 63.29 38.67
Number of Sulphates Mole % Mole %
0-SO3- 3.22 5.0
1-SO3- 50.73 93.99
2-SO3- 46.05 0.94
3-SO3- 0.00 0.00
Total GAG disaccharides
produced by
chondroitinase-ABC
digestion (µg)
0.12 1.1
Average sulphate per
disaccharides
1.43 0.96
4.2.2. Monosaccharide compositional analysis
The disaccharide analysis employed in this study did not provide adequate
information about the identity of the uronic acid as well as missing some information about
the non-GAG compounds that could be linked to the cockle CE polysaccharide sequence.
These two major issues were resolved by monosaccharide analysis of the cockle CE
polysaccharides. Analysis of the cockle CE polysaccharide preparations revealed the

95
presence of significant quantities of the monosaccharides GalNH2, GlcNH2 and GlcA, which
are typically found following acid hydrolysis of mammalian and marine GAG chains (Table
10). Interestingly, the lack of an IdoA component would suggest the presence of HS-like
chains, rather than heparin. The neutral sugars such as Glc and Gal were by far the most
predominant monosaccharides present in the cockle CE polysaccharide preparations, which
are components typically found in marine N- and O-linked glycans, with about 10% fucose
residues that can be derived from the original N-linked sequence preparations or fucosylated
glycan. The data support the presence of GAG-like chain, as was indicated by both the
susceptibility of cockle CE polysaccharides to heparinase/chondroitinase ABC digestion and
the production of a range of unsaturated disaccharides typically found in mammalian GAG
chains.
Table 10. Monosaccharide composition analysis of the cockle CE polysaccharide. 50 µg of
sample was degraded with trifluoroacetic acid prior to HPAEC-PAD analysis. The peaks
observed were identified by comparison with the elution positions of known monosaccharide
standards. Data are presented as a percentage of the moles of monosaccharide produced by
acid hydrolysis.
Monosaccharide Cockle CE polysaccharide (mole %)
Fucose 11.1
GalNH2 16.7
GlcNH2 9.9
Gal 19.1
Glc 35.2
Man 3.7
GlcA 4.3
IdoA 0
Total 100
4.2.3. FT-IR
FT-IR spectroscopic analysis of cockle CE polysaccharides and qualitative analysis of
functional groups were carried out. Cockle CE polysaccharide’s spectrum is illustrated in
Table 11. The table shows peaks ranging from 814.02 to 3351.09 cm-1. Major peaks are at
814.02, 1043.39, 1223.17, 1417.02, 1644.69, 2927.87 and 3351.09 cm-1. Interestingly, a lack
of signals around 1700 cm-1 confirm the absence of IdoA (Zhang et al., 2008).

96
Figure 44. FT-IR spectra of cockle CE polysaccharide with wave number (cm-1).
Table 11. Peak assignment of FT-IR spectrum for cockle CE polysaccharide and standard
heparin (bovine).
Wavelength (cm-1) Assignments Reference
Standard
heparin
Cockle CE
polysaccharide
1020 ≈ 1043.39 C-O-C pyranose ring (stretching
vibration).
(Charles,
Huang
and
Chang,
2008;
Liao et
al., 2013).
1220.11 ≈ 1223.02 S=O sulfonate stretching vibration. (Cabassi,
Casu and
Perlin,
1978).
1417.4 1417.02 Carboxylate stretching of uronic
acid at C-6.
(Liao et
al., 2013).
1604.44 ≈ 1644.69 Antisymmetric vibration of
carboxylate of uronic acid C-6.
2944.95 ≈ 2927.87 C-H stretching of hexosamine. (Zhang et
al., 2013). 3404.74 ≈ 3351.09 Hydroxyl O-H stretching.

97
4.2.4. NMR spectroscopy
Although NMR is a potent structural technique, especially for carbohydrates, it was
unable to provide useful structural information about cockle CE polysaccharides. It was clear
from disaccharide and monosaccharide analysis that there was considerable heterogeneity in
the types of marine polysaccharides in the cockle CE as well as high structural diversity
within each polysaccharide. Therefore, the cockle CE polysaccharides with the
antiproliferative activity were fractionated according to their anionic charges, by anion-
exchange chromatography, in order to allow a more focused structural analysis, while
separating the contamination from the antiproliferative activity, which could help in
determining the nature of cockle polysaccharides with GAG-like properties.

98
5. Results—Cockle GAGs purification and polysaccharides fractions analysis
Cockle polysaccharide heterogeneous nature has limited the ability to identify the
final structure with antiproliferative activity on cancer cell lines. Therefore, cockle CE
polysaccharides were purified using anion-exchange chromatography in order to determine
structures and to correlate the structures to the novel antiproliferative activity from the
purified fractions. After successful isolation of 6 purified fractions from the anion-exchange
chromatography (Figure 45), biological activity was assessed using the cell proliferation
assay (MTT assay), followed by an apoptosis assay (for active fractions only), on the K-562,
Molt-4 and Mero-25 cell lines. Thereafter, additional structural determinations were to be
performed to evaluate the active fraction structure.
Figure 45. Anion-exchange chromatography of cockle CE polysaccharides. The cockle CE
polysaccharide sample was injected to the FPLC system using anion-exchange DEAE-
Sepharose resin and it was eluted using linear gradient of 0–1.5 M NaCl over 75 min. Peaks
were pooled, as indicated by the bars shown, then, desalted, lyophilised and stored at -20 °C
for further analysis.

99
5.1. Anion-exchange chromatography
Accordingly, cockle CE polysaccharide was purified based on their anionic charge
using anion-exchange chromatography as described in section (3.3.2) (Habuchi, Habuchi and
Kimata, 1995). The eluent was monitored at 280 nM to detect the peptide fragments still
attached to the polysaccharide chains following the initial protease digestion, which resulted
in typical elution profile shown in (Table 12) with six generally occurring peaks. The
absorbance measured under each peak was broadly comparable to the dry weights of
polysaccharides obtained after desalting and lyophilisation.
Table 12. Representation of the anion-exchange chromatography elution peaks of purified
cockle CE polysaccharide in minutes and its corresponding NaCl molarity % was assessed by
the electroconductivity on-line monitor.
Peak number NaCl % Elution time (min)
Peak-one 3-12 7-13
Peak-two 36-52 23-31
Peak-three 71-80 42-47
Peak-four 86-92 50-55
Peak-five 99-100 60-65
Peak-six 44-6 70-75
5.2. Biological activities of cockle polysaccharide purified fractions
5.2.1. Cell proliferation assay—Cockle purified fractions
Following the purification of cockle CE polysaccharide, all fractions were collected,
desalted and lyophilised. Cockle polysaccharide fractions’ antiproliferative activities were
evaluated using a cell proliferation MTT assay on the K-562, Molt-4 and Mero-25 cell lines.
Figure 46 shows that most of the antiproliferative activity was due to fraction 5, with
negligible antiproliferative activity observed with fractions 1–3. The elution profile from the
anion-exchange chromatography suggests that the low levels of activity observed in fractions
4 and 6, which could be due to cross-contamination with fraction 5. The results indicate that

100
the antiproliferative activity of fraction 5 is relatively due to minor component of the CE
polysaccharides (approximately 1-2% of the total dry mass)
.

101
Figure 46. Antiproliferative activity of cockle polysaccharide purified fractions. Assessment
of the antiproliferative activity of the purified fractions on K-562 (A), Molt-4 (B) and Mero-
25 (C) cell lines that were achieved using MTT assay. Fraction 5 was expressed potent
antiproliferative activity, in comparisons to other inactive fractions in terms of IC50. Fraction
one (⚫), fraction two (◼), fraction three (▲), fraction four (▼), fraction five (♦) and fraction
six (). The data are presented as the percentage of viable cells following treatment with
cockle polysaccharides fractions, relative to untreated control. All experiments were
conducted in triplicate and the results are shown as the mean ± the SD and the IC50 values
were calculated using non-linear regression analysis (GraphPad Prism 8.0). Cells were
cultured and maintained at 37 °C in a humidified 5% CO2 atmosphere.
Table 13. Presents list of IC50 of the cockle polysaccharide purified fractions on cancer cell
lines. IC50 was determined when drug inhibited the cancer cells growth by 50% at maximum
concentration of 50 g/mL, therefore, if the drug has inhibited less than 50%, then the drug is
considered to be inactive. All IC50 values were conducted in triplicate and calculated using
non‐linear regression analysis (GraphPad Prism 8.0).
Cockle polysaccharide
purified fraction
List of IC50 on each cell line (µg/mL)
K-562 Molt-4 Mero-25
Fraction-1 Inactive Inactive Inactive
Fraction-2 Inactive Inactive Inactive
Fraction-3 Inactive Inactive Inactive
Fraction-4 Inactive Inactive Inactive
Fraction 5 24 11.4 37
Fraction-6 Inactive Inactive Inactive

102
5.2.2. Effects of enzymatic degradation on cockle polysaccharide Fraction 5
antiproliferative activities
Enzymatic treatment of the cockle polysaccharide purified fraction 5 using heparinases (I, II,
III) or chondroitinase-ABC was used to investigate any link between GAG-like chains and
the observed antiproliferative activity. Cockle polysaccharide fraction 5 treated with
chondroitinase-ABC enzyme has shown no appreciable decrease in antiproliferative activity
on the retained part of the 10 kDa spin filter on all cell lines. On the other hand, treatment of
fraction 5 by heparinase enzymes (individually and in combination) on the K-562 and Mero-
25 cell lines showed a considerable reduction in the antiproliferative activities on the retained
part of the spin filter. There was little difference between the individual heparinase enzymes
on the Molt-4 cell line; however, in replicates heparinase-II significantly destroyed the
antiproliferative activity, while the other heparinase treatments led to significantly loss of
most the antiproliferative activity, as seen with heparinase-I and III, and in combination with
all enzymes including heparinase-II. Taken together, the data suggest that HS/heparin-like-
GAG structure probably exists in the active fraction 5, and it could play an important
contributing role to the antiproliferative activity of ion-exchange purified cockle
polysaccharides (Figure 47).

103
Figure 47. The effect of heparinase enzymes (individually or in combination) (I, II, III) or
chondroitinase-ABC enzymatic digestion on the antiproliferative activity of the cockle
polysaccharide purified fraction 5. The sensitivity of the cockle polysaccharide’s purified
fraction 5 to the enzymatic degradation on the antiproliferative activity was determined using
MTT assay on the K-562 (A), Molt-4 (B) and Mero-25 (C) cell lines, in addition to assessing
the antiproliferative activity of undigested fraction 5 in order to confirm the difference
between chains activity. Cockle polysaccharides Fraction 5 (●), cockle polysaccharides
Fraction 5 treated with heparinase-I (■), cockle polysaccharides Fraction 5 treated with
heparinase-II treated (▲), cockle polysaccharides Fraction 5 treated with heparinase-III
treated (▼), cockle polysaccharides Fraction 5 treated with heparinase I, II, III treated (♦) and
cockle polysaccharides Fraction 5 treated with chondroitinase-ABC (○). The data is presented
as the percentage of viable cells following treatment with cockle polysaccharides fraction 5
and its digests, relative to untreated control. All experiments were conducted in triplicate, the
results are shown as the mean ± the SD and the IC50 values were calculated using non-linear
regression analysis (GraphPad Prism 8.0). Cells were cultured and maintained at 37 °C in
humidified 5% CO2 atmosphere.

104
Table 14. Represents list of IC50 of cockle polysaccharide purified fractions on all cell lines.
IC50 was determined when drug has inhibited the cancer cells growth by 50% at maximum
concentration of 50 g/mL, therefore, if the drug has inhibited less than 50%, then the drug is
considered to be inactive. All IC50 values were conducted in triplicate and calculated using
non‐linear regression analysis (GraphPad Prism 8.0).
Cockle purified fraction 5 treated
with different GAG-related
enzymes
List of IC50 on each cell line (µg/mL)
K-562 Molt-4 Mero-25
Fraction 5 21.42 11.5 37
Fraction 5 treated with
heparinase-I
Inactive 40.35 Inactive
Fraction 5 treated with
heparinase-II
Inactive Inactive Inactive
Fraction 5 treated with
heparinase-III
Inactive 28.60 Inactive
Fraction 5 treated with
heparinase-I, II and III
Inactive 48.67 Inactive
Fraction 5 treated with
chondroitinase-ABC
21 10.70 38.2
5.2.3. Apoptosis detection assay Annexin-V—Cockle polysaccharide purified fraction 5
The antiproliferative activity of cockle polysaccharide fraction 5 was further
investigated on cancer cell lines using an apoptosis assay. Cancer cells were treated with
cockle polysaccharide purified fraction 5, then, cellular apoptosis was assessed using cellular
apoptosis targets Annexin-V FITC/PI, followed by flow cytometry. In-vitro treatment with
fraction 5 was potentially mediated via apoptosis. Early apoptotic markers (Annexin V+/PI−)
showed the biggest change in cell populations after 24 h incubation in all cell lines. However,
the K-562 and Molt-4 cell lines showed small increases in the late apoptotic phase (Annexin
V+/PI+), while, Mero-25 cell line did not show any increase in the late apoptotic phase. K-
562 necrotic cells (Annexin V−/PI+) showed little change over untreated controls. Thus, the
results clearly implicate apoptosis as the most likely cause of the cellular cytotoxicity seen
following treatment by cockle polysaccharide fraction 5 (Figure 48). However, primary
necrosis cannot be ruled out.

105
Figure 48. Apoptosis assay Annexin V-FITC/PI. K562 (A), Molt-4 (B) and Mero-25 (C) cell
lines, were treated with 50 g/mL of cockle polysaccharide purified fraction 5 for 24 h, then
stained using Annexin V-FITC and propidium iodide (PI). A: K562 scatter plot of Annexin
V-FITC/PI stained control cells (left) and scatter plot of cells treated with cockle
polysaccharide purified Fraction 5 (right). B: Molt-4 scatter plot of Annexin V-FITC/PI
stained control cells (left) and scatter plot of cells treated with cockle polysaccharide purified
fraction 5 (right). C: Mero-25 scatter plot of Annexin V-FITC/PI stained control cells (left)
and scatter plot of cells treated with cockle polysaccharide fraction 5 (right). Cancer cells
treatment with Fraction 5 has led to cellular apotosis. Results are presented as the mean ± of
three independent experiments.

106
5.3. Structural analysis of cockle polysaccharides purified fractions
5.3.1. Disaccharide analysis—anion-exchange purified fractions
Disaccharide composition analysis of the cockle purified polysaccharide fractions was
used to identify the nature of the glycan structures presented within the purified fractions in
order to correlate its structure to the antiproliferative activity in comparisons to the known
marine/mammalian GAGs. Table 15 shows the distribution of unsaturated disaccharides of all
purified fractions and the amounts produced in micrograms when each fraction was treated
with a combination of all heparinases (I, II, III). The total weight of disaccharides produced
from each microgram of sample digested indicated that only fraction 5 produced a significant
number of unsaturated disaccharides. Fractions 1, 2, 3 and 4 produced approximately 30-,
150-, 30- and 6- fold less disaccharide than did fraction 5, respectively, suggesting that the
early eluting fraction contains mainly non-HS-like chains.
The compositions of fractions 5 and 6 showed the presence of all major disaccharides
found within mammalian HS/heparin chains. The enrichment of the trisulphated disaccharide
[HexA(2S)-GlcNS(6S)] and the disulphated disaccharide [HexA(2S)-GlcNS] showed
approximately four-fold and three-fold increases, respectively, in comparison to the
unfractionated cockle polysaccharides (Table 9). These likely contributed significantly to the
later elution of these chains from the anion-exchange column.
Fraction 1 appeared to generate the highest proportion of sulphates per disaccharides
than any other fractions; however, the quantity, in micrograms of disaccharides produced was
very small, compared to the total material digested. In fact, there is little correlation between
the increase in the number of sulphates per disaccharide produced from heparinase digestion
and the elution positions. This could be linked to the limited digestion of the glycan chains
contained within them.

107
Table 15. HS disaccharide analysis of cockle polysaccharide anion-exchange purified
fractions. Data are presented as a percentage of the moles of unsaturated disaccharides
produced by heparinases (I, II and III) digestion of all purified fractions 1-6.
HS Disaccharides F1 (%) F2 (%) F3 (%) F4 (%) F5 (%) F6 (%)
∆HexA-GlcNAc 4.6 28 84.4 31.9 9.8 6.8
∆HexA(2S)-GlcNAc 0 0 0 0 0.9 0.4
∆HexA(2S)-GlcNH2 0 0 0 0.1 0.2 0
∆HexA-GlcNAc(6S) 0.2 2.4 1.6 5.3 4.9 3.3
∆HexA(2S)-GlcNAc(6S) 30.4 10.9 0 0 3.1 4.6
∆HexA- GlcNS 0.7 8.6 12.9 28.4 10.4 5.9
∆HexA(2S)-GlcNS 16.6 25.2 0.5 12.8 24.4 34
∆HexA-GlcNS(6S) 4.9 10.9 0.6 15.9 19.4 16.4
∆HexA-GlcNH2(6S) 0 0 0 0.1 0.2 0
∆HexA2S-GlcNS(6S) 42.7 14 0 5.7 26.3 28.6
∆HexA2S-GlcNH2(6S) 0 0 0 0 0.3 0.1
Unsulphated 4.6 28 84.4 31.9 9.8 6.8
N-SO3 64.8 58.8 14 62.6 80.5 84.8
2-O-SO3 89.6 50.2 0.6 18.5 55.3 67.6
6-O-SO3 78.1 38.2 2.2 27 54.2 53
Total GAG disaccharides
produced by heparinase
digestion (g)
0.01 0.002 0.01 0.05 0.29 0.06
Average sulphate per
disaccharide 2.33 1.47 0.17 1.08 1.9 2.05
The relative distribution of unsaturated disaccharides and the amounts produced when
each fraction was treated exhaustively with chondroitinase-ABC enzyme are shown in Table
16. Disaccharide analysis of each fraction also showed that early eluting fractions (1, 2 and 3)
lack correlation between the sulphate content per disaccharides and the fractions’ elution
positions. Again, this is likely linked to the incomplete nature of the digests, as confirmed by
the quantity, in micrograms, of disaccharides released after digestion. The later eluting
fractions (4, 5 and 6) produced disaccharide compositions close to those seen for the

108
unfractionated cockle polysaccharides (Table 9). The later eluting fractions, 5 and 6, contain
a CS-like GAG chain; however, Figure 47 suggests that these chains do not contribute to the
antiproliferative activity of Fraction 5.
Table 16. CS/DS Disaccharide analysis of anion-exchange purified cockle polysaccharide
fractions. Data are presented as a percentage of the moles of unsaturated disaccharides
produced by chondroitinase-ABC digestion of the anion-exchange fractions (F1–F6).
CS/DS Disaccharides F1 (%) F2 (%) F3 (%) F4 (%) F5 (%) F6 (%)
∆HexA-GalNAc 70.6 72.36 86.446 8.75 3.5 3.6
∆HexA-GalNAc(4S) 23.1 26.68 13.55 89.85 56.8 35
∆HexA-GalNAc(6S) 3.8 0.18 0 1.396 3.7 4.3
∆HexA(2S)-GalNAc(4S) 0 0 0 0 0 0
∆HexA(2S)-GalNAc(6S) 0 0 0 0 1.8 3.9
∆HexA-GalNAc(4,6S) 2.5 0.78 0 0 34.2 53.2
∆HexA(2S)-GalNAc(4,6S) 0 0 0 0 0 0
Unsulphated 70.6 72.4 86.4 8.8 3.5 3.6
2-O-SO3 0.0 0.0 0.0 0.0 1.8 3.9
4-O-SO3 25.6 27.5 13.6 89.9 91.0 88.2
6-O-SO3 6.3 1.0 0.0 1.4 39.7 61.5
Total GAG disaccharides
produced by ABC-lyase
digestion (µg)
0.002 0.006 0.006 0.026 0.285 0.086
Average sulphate per
disaccharide 0.32 0.28 0.14 0.91 1.31 1.51
Taken together, the data indicate the presence of heparinases and chondrotinase-ABC
susceptible linkages, therefore, GAG-like structures are present in the cockle purified later
eluting fractions. The production of a significant quantity of HS disaccharides, from the
active fraction 5 confirms the link between HS-GAG-like structures and the antiproliferative
activity of the cockle polysaccharides. However, the retained activity of the heparinase-
resistant chains must also be considered when judging on the structure/activity relationships.

109
5.3.2. Monosaccharide composition analysis—anion-exchange purified fractions
Monosaccharide analysis was carried out on each cockle purified fraction (F1-F6)
(Table 17). The anion-exchange purified fractions analysis showed enrichment of the GAG-
related monosaccharides such as GalNH2, GlcNH2, and GlcA in the later eluting fractions
(Fractions 3–6). The components found in the active fraction 5 showed typical GAG-like
contents with the highest amount of GlcA and no detectable IdoA residues, however, this
does not, on its own, explain the unique activity of the cockle derived HS-like GAG chains.
Table 17. HPAEC-PAD analysis of monosaccharides derived from anion-exchange purified
fractions (F1–F6). Samples were hydrolysed to monosaccharides. The observed peaks were
identified by comparison with the elution position of monosaccharide standards. Data are
presented as a percentage of the moles of monosaccharides produced by acid hydrolysis.
Monosaccharide F1 (%) F2 (%) F3 (%) F4 (%) F5 (%) F6 (%)
Fucose 5.11 5.8 3.3 3.6 14.2 2.1
GalNH2 3 4 11.7 35.6 21.8 9.5
GlcNH2 3.9 2.1 11.9 10.4 14.5 3.6
Galactose 2.3 3 11 14.4 20.1 8.8
Glucose 73.49 57.4 52.8 30 10.4 50.4
Mannose 5.06 28.1 7.4 2.7 4.9 23.5
Glucuronic acid 1.02 0.7 1.9 3.3 14.1 2.1
Iduronic Acid 0 0 0 0 0 0
5.3.3. NMR—anion-exchange purified fractions
Extensive chromatography separation of the cockle CE polysaccharides using anion-
exchange chromatography was inefficient to purify a single polysaccharide chain with
antiproliferative activity. In fact, the disaccharide analysis of the fraction 5 indicated the
presence of HS-like and CS-like components. In addition, the monosaccharide composition
analysis suggested the presence of fucosylated polysaccharides, N-linked and O-linked
glycan and HS-like polysaccharides as represented only a minority of the glycan chain.
Therefore, in order to further characterize the structure of cockle polysaccharides with
antiproliferative activity, an attempt was made to study fraction 5 by NMR spectroscopy.

110
A number of spectra where recorded at 800 MHz including 1H NMR, 13C NMR,
correlation spectroscopy (COSY), total correlation spectroscopy (TOCSY) and heteronuclear
single quantum correlation (HSQC). These spectra are shown in the appendices. It was clear
from the spectra obtained that it would be extremely difficult to make unambiguous
assignments of the various saccharides present due to the complexity of the resonance
patterns observed. Consequently, it was even more difficult to obtain fine structure
differences between mammalian-HS, which has no antiproliferative activity, and the cockle
HS-like structures that had previously, based on heparinase activity, shown to be active at
inhibiting the growth of cancer cells. The COSY spectrum in Figure 49, in the appendices,
shows three of the spin systems linked to fucosylated-CS (red lines) and the GlcNAc and
GlcNS monosaccharides of HS-like cockle glycans (green lines). However, time and complex
signal overlap, resulting from contaminating glycan chains did not allow further assignment
of spin systems.
Figure 49. 2D 1H-1H NMR-COSY for cockle purified fraction 5. Red lines CH3 linked to
fucopyranose at 5.2 ppm, and green lines indicate possible spin systems found in mammalian
HS. The spectra were recorded at 56.85 °C.
Further analysis of these samples might in the future provide more detail regarding
the structural attributes of the cockle GAG-like active structure. However, it is clear that the

111
analysis would benefit from further purification of the active fraction from other
contaminating molecules, such as fucosylated-CS and other N- and O-linked glycans.
Problems with further purification system from the relative abundance of fraction 5 in the
crude cockle GAG mixture, as it is a very minor component (Figure 45). Other methods for
chromatography such as size-exclusion might be useful in removing smaller contaminating
N- and O- linked glycan changes but are unlikely to enable separation between HS, CS and
fucosylated polysaccharides. Different stationary phases and function groups might be
employed along with further ion-exchange chromatography but might be ineffective in the
short term in producing samples that could be worked on more effectively by NMR analysis.

112
6. Discussion
Typical mammalian GAGs chains are composed of long unbranched polysaccharides
characterised by repeating disaccharide building blocks of uronic acid and hexose-sugar.
GAGs are classified into six types according to their disaccharide building blocks—HS,
heparin, CS, DS, KS and hyaluronate (Nelson, Lehninger and Cox, 2008). Each type can
acquire different structural modifications on its disaccharide including chain length, type of
glycosidic linkage, branching point, the addition of various functional groups and the addition
of other saccharides. Chain structural modifications provide GAGs with their unique
structures and biological functions (Vlodavsky and Friedmann, 2001). The aim of this study
focused on the isolation, purification and characterisation of common cockle (Cerastoderma
edule) polysaccharides with in-vitro novel antiproliferative activity against a cancer cell line.
One of the main objectives of this study was to isolate common cockle
polysaccharides and examine their anticancer activity. Therefore, the cockle polysaccharides
were successfully isolated using an anionic cetylpyridinium chloride precipitation method,
which has been used to target the anionic properties within cockle polysaccharides structure.
The antiproliferative activity was assessed in-vitro against three cancer cell lines using cell
proliferation assays (MTT assay), which resulted in potent antiproliferative activity on all cell
lines used (Figure 40) and induced by programmed cell death.
As hypothesised, the cockle polysaccharide is likely to contain GAG-like chain, on
the basis of the isolation method used that could be linked to the antiproliferative activity.
This antiproliferative activity of GAG-like polysaccharides was unusual given that
mammalian GAGs, in this and other studies, failed to show any antiproliferative activities
against cancer cell lines (Figure 41). As a consequence, structural analysis was conducted in
order to determine cockle polysaccharides structure and to correlate it to that of typical
members of the mammalian GAG families, in an attempt to determine the exact structural
nature of the observed antiproliferative activity.
Initially, an important structural and biological characteristic of the mammalian
GAGs is the pattern of sulphation, which can influence the biological activity of a particular
glycan chain. For instance, the highly sulphated heparin pentasaccharide sequence, with
potent anticoagulation activity, make it able to prevent blood coagulation by binding to
antithrombin-III to inhibit the action of factors X and II, which plays an important role in the
coagulation cascade (Rosenberg and Lam, 1979). Besides that HS chains can acquire various
forms of structural heterogeneity, including considerable variation in sulphated and non-

113
sulphated patterns within domains; which are no doubt linked to its important physiological
and pathological roles according to its structure (Höök et al., 1984; Yayon et al., 1991;
Stanley et al., 1999; Ornitz, 2000). Marine glycans pattern of sulphation, are also highly
variable across species. Liao et al. (2013) reported that polysaccharide from bivalve molluscs
(Corbicula fluminea) with a high level of sulphation have very potent antiproliferative activity
against human cancer cell lines, in comparison to other less-sulphated fractions. Hence, the
initial isolation and purification methods were performed to explain the highly variable
anionic properties of the polysaccharides, and to maximise the chances of linking structural
differences with biological activity.
The only clearly defined GAG sequence activity relationship to date continues to be
the highly sulphated heparin pentasaccharide antithrombin-III binding sequence chain with
confers on heparin its potent anticoagulant activity, as it has been used for a long time in
clinical practice (Howell and Holt, 1918). Mammalian heparins have never previously been
shown to have any antiproliferative activity in-vitro, however, chemical modification of
heparin has been reported to have led to inhibitory effects that cannot destroy 50% of cancer
cells (Yu et al. 2010). These results are consistent with the high-molecular-weight porcine
mucosal heparin used in this study, which did not show any antiproliferative activity on
cancer cell lines (Figure 41). Cockle CE polysaccharides show high sulphate content and it
might be argued that this this alone is responsible for the potent antiproliferative activity
observed, with no role for fine structural variation in polysaccharide structure. However, the
disaccharide analysis results from the cockle purified fraction-6 has the highest overall
sulphate content but, with significantly no antiproliferative activity than the earlier eluted
fraction 5 and the CE samples (Table 15).
A possible explanation for these results would therefore be that a specific sequence
and/or type of linkage within cockle polysaccharides chain is playing a pivotal role in
mediating their antiproliferative activity. This difference is also linked to the lack of
antiproliferative activity seen with the mammalian GAGs in this study.
In this study we show for the first time, that marine polysaccharides with
antiproliferative activity are susceptible to the digestion of three different classes of
heparinase enzymes that are typically used to cleave mammalian HS/heparin chains. After the
treatment of cockle polysaccharides with heparinase enzymes, the potent antiproliferative
activities were dramatically decreased on all cell lines. In other words, the cockle CE
polysaccharide treated with combined heparinase enzymes showed an increase of up to 3

114
times in IC50 values, as shown in the K-562 and Mero-25 cell lines, and up to 9 times on the
Molt-4 cell line compared to the untreated cockle CE polysaccharide (Figure 42). More
surprisingly, the purified cockle polysaccharide active fraction 5 lost all its antiproliferative
activity on both K-562 and Mero-25 cell lines, with great loss of activity on the Molt-4 cell
line following treatment with heparinases I,II,III (Figure 47).
Although these findings could be viewed as a direct link between the cockle
polysaccharide’s antiproliferative activity and the presence of a GAG HS-like structure, a
potential structural difference from mammalian-HS is still implicated by the lack of
antiproliferative activity of the latter. Some antiproliferative activity show some resistant to
the heparinase treatment, particularly in the cockle CE, which could be due to structural
differences between the cockle HS-GAG-like and mammalian HS. Consequently, it was
suggested that a new, atypical, marine polysaccharide has been identified in this study, with
GAG-like properties that are linked, at least in part, to the antiproliferative activity observed
in the three cell lines tested. In the future, a reductionist assessment of the structural features
within these heparinase resistant sequences might be an attractive research approach that
could will lead to a more thorough understanding of the precise structural features required to
determine the antiproliferative activity seen in this study.
The disaccharide analysis employed in this study aimed to identify compositional
differences between mammalian GAGs and cockle-derived polysaccharides with potent
antiproliferative activity. The cockle CE polysaccharide or the purified fractions were treated
with a combination of heparinase enzymes (I, II and III), which resulted in the most common
unsaturated disaccharides typically observed in mammalian HS, apart from the rarest 3-O-
sulphated disaccharide, using the method described. The most significant characteristic of the
disaccharide analysis is related to the highest levels of the N-sulphated disaccharides
produced after heparinase digestion. For example, cockle CE polysaccharide has about 66%
of its glycan chain N-sulphated, and the purified fraction 5 has about 80% N-sulphated
glycans, as opposed to the much lower amount from the porcine intestinal mucosal, which
contains approximately 40% N-sulphated HS (Deakin and Lyon, 2008).
Another notable finding is the differences in the levels of the disaccharides
[ΔHexA(2S)-GlcNS] and [ΔHexA(2S)-GlcNS(6S)], which were generated by combined
heparinase digestion of the anion-exchange purified active fraction 5, making up 24% and
26% of the disaccharides, respectively, as opposed to the percentage of these disaccharides in
porcine mucosal heparin (0.9% and 14.6%, respectively) (Saad et al., 2005), and porcine
mucosal HS (11% and 4.59%, respectively). Although fraction 5 showed antiproliferative

115
activity and an increased level of these disaccharides compared to porcine mucosal HS, it
seems unlikely that these disaccharides are solely responsible for the antiproliferative
activity, as described in section (4.1.1.2). In fact, disaccharide analysis of cockle CE
polysaccharide showed less abundance of these particular disaccharides (9.5% and 5.6%,
respectively), which gives no definitive clues about the differences in the biological activity
seen in cockle polysaccharides and mammalian GAGs (Table 9). The anion-exchange
purified fractions (1, 2, 3, 4 and 6) with no antiproliferative activity were enriched with a
significant amount of neutral sugars and comparatively lower GAG-like properties. These
findings would suggest that a particular role of the GAG-like structure within the cockle
polysaccharide would influence the antiproliferative activity.
To date, invertebrate-derived polysaccharides with different pharmacological
outcomes are linked to a non-GAG like structure, as they typically differ from those of
mammalian GAGs in terms of monosaccharide composition, disaccharide composition,
and/or structural homogeneity. The literature has distinguished various types of
polysaccharides isolated from different invertebrates with active pharmaceutical outcomes
such as antiproliferative, anti-metastatic and anticoagulation activities. These polysaccharides
can differ in several ways from typical mammalian GAGs, as their most dramatic structural
differences in the type of linkages, branching, monosaccharide compositions, disaccharides
building blocks, chain length, chain modifications and/or homogeneity. As an illustration, a
polysaccharide derived from the marine bivalve mollusc (Corbicula fluminea) is composed of
neutral sugars such as fucose, glucose and galactose and demonstrates anti-tumour,
antiproliferative and antioxidant activities; however, its final structure has not yet been
determined, and its structural analysis did not confirm any link to mammalian GAGs
polysaccharides (Liao et al., 2013).
Moreover, the marine bivalve mollusc (Ruditapes philippinarum) polysaccharide-
derived chain shows antiproliferative activity against the human hepatoma cell line, but its
structure lacks heterogeneity, as its composed of glucose-based polysaccharides with several
branches, which means it is not structurally linked to mammalian GAGs that are known to be
heterogeneous and unbranched (Zhang et al., 2008). In addition, the unique AS
polysaccharides isolated from the African snail (Achatina fulica) lack structural
heterogeneity, they are composed of IdoA and essentially GlcNAc, which make it different
from mammalian GAGs in terms of structural heterogeneity (Vieira et al., 2004; Pomin,
2015). Similarly, the cuttlefish ink (Sepiella maindroni) novel hexasaccharide, which is
composed of both neutral and acidic sugars. Its structure shows the presence of the

116
unbranched β-fucose and a branched GlcA, which makes it different from mammalian GAGs
in terms of disaccharide building blocks and branching points (Liu et al., 2008).
The highly sulphated DS-like polysaccharide isolated from Ascidian, a fucosylated-
CS isolated from sea cucumber, hybrid heparin/HS chains isolated from head of shrimp and
the highly sulphated GlcA-containing HS chain isolated from bivalve mollusc, have been
suggested. However, none of these unique GAG-like polysaccharides have previously been
reported to have any direct antiproliferative activity.
Monosaccharide composition analysis of cockle polysaccharides showed no evidence
of IdoA residues within the chains; therefore, the presence of the highly sulphated DS-like
structure is unlikely to exist within the cockle polysaccharide preparation (Table 10) (Pavão,
2002; Pomin, 2015). Secondly, regarding the novel fucosylated-CS with GAG-like structures
extracted from sea cucumber, its CS-like structure has been reported to be insensitive to
chondroitinase-ABC without prior removal of the attached fucose chain (Vieira and Mourão,
1988). In contrast, the disaccharide analysis of the cockle GAG-like polysaccharide revealed
susceptibility to chondroitinase-ABC, which resulted in the release of typical mammalian CS-
related disaccharides (Table 9). According to Vieira et al. (1991), the GlcA chain of the
fucosylated-CS either can acquire branched 3-O-fucopyranose or 3-O-sulphate. The rarest 3-
O-sulphate was not determined within cockle GAG-like polysaccharides. Although treatment
of the cockle GAG-like polysaccharide with chondritinase-ABC did not affect its
antiproliferative activity, fucosylated polysaccharide was present in the cockle structure, so
its contribution to the antiproliferative activity cannot be ruled out, however it is not known
to be sensitive to any of the three heparinase enzymes used in this study.
The literature has identified two marine derived polysaccharides with heparinase
sensitive structures, namely hybrid heparin/HS isolated from the head of the shrimp
(Litopenaeus vannamei) (Brito et al., 2014) and the highly sulphated GlcA containing-HS
isolated from bivalve molluscs (Nodipecten nodosus) (Gomes et al., 2010). As the cockle
polysaccharide lost some of its antiproliferative activity following heparinase digestion, its
structure/activity can possibly be linked to the presence of a similar structure to the hybrid
heparin/HS or GlcA-rich HS polysaccharides, although no direct link to antiproliferative data
have been reported with these polysaccharide structures. Some activity remained after
heparinase digestion of the cockle CE polysaccharide, which could suggest the presence of
other uncommon GAG structures that are potentially involved in the antiproliferative activity.

117
The main findings of the monosaccharide composition analysis of cockle
polysaccharides provided two main structural insights into the nature of the cockle
polysaccharides. Firstly, following monosaccharide analysis of cockle CE and the purified
fraction 5, the main monosaccharides identified were closely related to mammalian GAGs.
Cockle CE monosaccharide composition with GAG-like structure represented about 42% of
the chain as fucose (11%), GalNH2 (16.7%), GlcNH2 (9.9%) and GlcA (4.3%) (Table 10).
Likewise, the purified active fraction 5 monosaccharide GAG-like composition represented
approximately 65% as fucose (14.2%), GalNH2 (21.8%), GlcNH2 (14.5%) and GlcA (14.3%)
(Table 17). As expected, the monosaccharide composition of the cockle polysaccharide
represented the main N-linked and O-linked glycan building blocks found in glycan
structures.
Secondly, the non-derivatisation-based method used to confirm the nature of all
monosaccharides within the sequence with minimal structural modification identified the type
of uronic acid in all cockle monosaccharides was 100% GlcA with no detectable
epimerisation to IdoA. However, the absence of IdoA does not on its own, explain the
antiproliferative activity of the HS-GAG-like chain within cockle polysaccharides,
appendices (Figure 58). Overall, the compositional details do not yet represent satisfactory
structural evidence to confirm the final structure of the antiproliferative activity and its
relation to the glycan structure. Therefore, detailed structural analysis was suggested to assess
the nature of the antiproliferative activity that is linked to the cockle polysaccharides, using
NMR spectroscopy.
The NMR spectra recorded from the crude GAG mixtures showed the difficulties that
would have to be met in order to determined definitive structural characterisation of all the
glycan components. The spectra showed complex signal overlap in many key areas, making it
impossible to determine essential structural detail on sequence composition and critically
linkage types within different families of glycan components. To date, the data obtained
from the anion-exchange chromatography indicated that many of the glycan components
might be removed from the active fraction 5. As a result, extensive chromatography runs
where undertaken to produce enough amount of the active fraction 5 polysaccharides for
NMR analysis. This was a challenge as we had already shown that the active fraction 5 was
only a minor component of the initial crude cockle polysaccharide extracts (Figure 45).
Heteronuclear and homonuclear 2D NMR experiments were carried out and spectra
recorded for both purified cockle Fraction 5 and commercially available porcine mucosal HS.
Once again, analysis the spectra of cockle fraction 5 had been achieved considerable

118
challenges still remained in attributing a unique HS-like structures within fraction 5. The
monosaccharide and disaccharide analysis did point the way to identifying a number of spin
systems related to HS-like structures rich in GlcA and fucosylated-CS. However, at the
present time the contaminating CS-related structures and N- and O-linked glycans that are
clearly still present in fraction 5 and in far larger concentrations than the HS like GAG
structures have proven to be extremely challenging for NMR assignment. It is possible that
further study of the available spectra will yield more detailed structure/activity findings, and
perhaps with additional NMR experiments this could allow a meaningful explanation of the
polysaccharide activity. However, it is likely that further purification of the active chains will
be needed to succeed in an NMR based approach to understanding the structural differences
between the cockle HS-like polysaccharides and typical mammalian GAGs such as HS. This
will ultimately lead to a structure-based understanding of the structure/activity relationships
between the antiproliferative polysaccharides isolated from cockles.
7. Conclusion and future study
This study was conducted to isolate cockle polysaccharide and assess its
antiproliferative activity on cancer cell lines using in vitro cell proliferation assay. Cockle
polysaccharide has exhibited potent antiproliferative activity against acute lymphoblastic
leukaemia, chromic myeloid leukaemia and mesothelioma cell lines, where cell death was
induced by apoptosis, which would make this polysaccharide pharmaceutically a candidate
for cancer therapies.
Extensive structural analysis confirmed the presence of GAG-like structures within
cockle preparations, specifically HS-like structures. For the first time, marine polysaccharides
antiproliferative activity was directly affected after treatment with different classes of
heparinase enzymes, which have found to be linked to antiproliferative activity, whereas
mammalian GAGs did not exhibit antiproliferative activity on cancer cell lines.
This provides insights into a new marine polysaccharide with HS-like structures with
influence on a biological activity that is structurally different from its mammalian
counterpart, as the literature exclusively correlates the biological activity in marine
polysaccharides with that in non-GAG glycans.
Further structural analysis showed a number of sulphates per disaccharide. The results
indicated that not only the highly sulphated polysaccharides’ structure would be biologically

119
active, as cockle CE and the purified fraction 5 showed a lower level of sulphation with
potent antiproliferative activity in comparison with fraction 6, which represented a higher
number of sulphates per disaccharide. The results of this study indicate that the level of
sulphation is not a principal reason for biological activity, which depends on various
structural modifications, such as chain length, type of linkages, branching points and addition
of functional groups (Bertozzi and Rabuka, 2009).
Structural characterisation of cockles’ antiproliferative activity, represented in the
purified fraction 5, indicated the presence of not only HS-like structures, but also fucosylated
polysaccharide, N- and O-linked saccharides, which made the final structural elucidation very
difficult because of the complex nature of the sample. Indeed, further purification strategies
may be used to remove non-glycan contaminations, followed by treatment with a
combination of heparinase enzymes to improve structural elucidations using NMR
spectroscopy. This study offers insight into marine polysaccharides with uncommon
therapeutic outcomes from a marine source, as they manifested direct antiproliferative effects
on cancer cells related to GAG-like polysaccharides.
8. Limitations
Study limitations make the creation of an overall conclusion about the cockle
antiproliferative structure extremely difficult. The main limitation of this study was the
evaluation of the nature of the cockle polysaccharide, which has an unknown structure and
lacks any chromophore that affects adopting an appropriate purification step. For instance,
size-exclusion chromatography requires a well-known molecular weight sample, and lectin
affinity chromatography requires knowledge of the exact structure of the antiproliferative
compound. As a result, anion-exchange chromatography was chosen according to the
negatively charged nature of GAG-like structures, which finally resulted in a relatively small
fraction several containing polysaccharides instead of only one purified chain.
Also, because of a lack of a non-destructive sequencing method for polysaccharides, a
major polysaccharide structural analysis heavily depends on NMR spectroscopy. However,
using NMR requires a strong magnetic field to evaluate carbohydrates (over 500 MHz), high
costs of the use of a stronger magnetic field and a sensitive probe and a highly concentrated
sample. Finally, NMR requires a high level of expertise to interpret the NMR raw data
(Mulloy, Hart and Stanley, 2009).

120
9. Appendices
9.1. Appendix I: Extraction of polysaccharides from common cockle
9.2. Appendix II: Cockle polysaccharides purification using size-exclusion
chromatography.
Cockle CE polysaccharide was attempted to be separated using size-exclusion
chromatography coupled with high performance liquid chromatography (HPLC). This
chromatography is based on excluding materials larger than the designated molecular weight
for column. Superose-12 column (GE healthcare, UK) is composed of highly cross-linked
agarose with molecular range 1-300 kDa. 100 µg of cockle CE polysaccharide sample was
dissolved in 200 µL of 0.2 M ammonium bicarbonate buffer (mobile phase) injected to the
system at flow rate 0.5 ml/minutes. Depending on cockle CE polysaccharides molecular
weight, two peaks eluted from the column, the first one has high molecular weight materials
and the second peak was a very wide peak (Figure 50). Another size-exclusion column
coupled with HPLC system was used known as superdex-75. It is composed of cross-linked
agarose and dextran resin with an exclusion range of 3-70 kDa. Superdex-75 column gives
better separation properties for lower molecular weight samples. 100 ug of intact GAG
dissolved in 200 µL 1x PBS as column mobile phase (Figure 51). All chromatographic peaks
recorded using on-line UV detector at 280 nM.

121
Figure 50. Cockle CE polysaccharide purification using size-exclusion chromatography,
superpose-12 column. The figure provides two peaks eluted depending on the materials
molecular weight. Namely, high molecular weight and low molecular weight peaks.
Figure 51. Cockle CE polysaccharides purification using size-exclusion chromatography,
superdex-75 column. The figure shows only one peak.
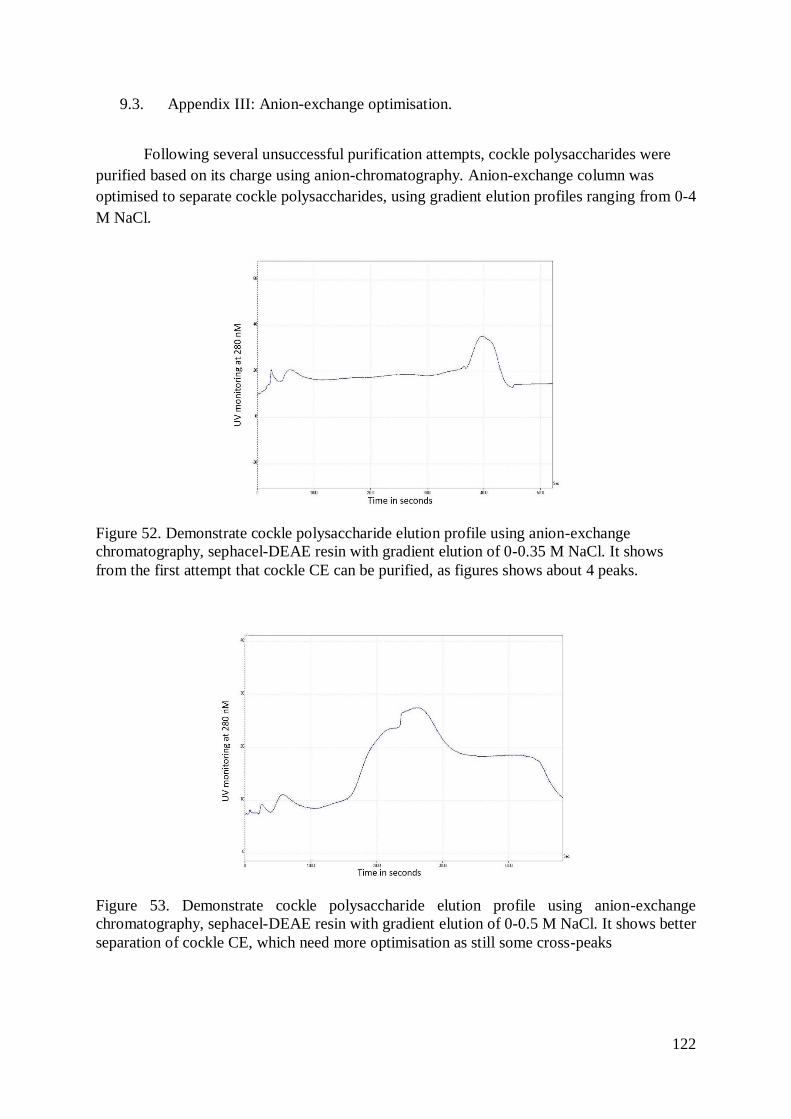
122
9.3. Appendix III: Anion-exchange optimisation.
Following several unsuccessful purification attempts, cockle polysaccharides were
purified based on its charge using anion-chromatography. Anion-exchange column was
optimised to separate cockle polysaccharides, using gradient elution profiles ranging from 0-4
M NaCl.
Figure 52. Demonstrate cockle polysaccharide elution profile using anion-exchange
chromatography, sephacel-DEAE resin with gradient elution of 0-0.35 M NaCl. It shows
from the first attempt that cockle CE can be purified, as figures shows about 4 peaks.
Figure 53. Demonstrate cockle polysaccharide elution profile using anion-exchange
chromatography, sephacel-DEAE resin with gradient elution of 0-0.5 M NaCl. It shows better
separation of cockle CE, which need more optimisation as still some cross-peaks

123
Figure 54. Demonstrate cockle polysaccharide elution profile using anion-exchange
chromatography, sephacel-DEAE resin with gradient elution of 0-1 M NaCl. Improved signal
of charged materials, however, major eluted materials seems to be eluted in two peaks only.
Figure 55. Demonstrate cockle polysaccharide elution profile using anion-exchange
chromatography, sephacel-DEAE resin with gradient elution of 0-1.5 M NaCl. It has
separated cockle CE into 6 peaks successfully.

124
Figure 56. Demonstrate cockle polysaccharide elution profile using anion-exchange
chromatography, sephacel-DEAE resin with gradient elution of 0-2 M NaCl. It shown high
salts has affected the elution time that resulted in poor purification.
9.4. Appendix IV: Cell proliferation assay using MTS on K-562 cell line.
MTS—[3-(4,5-dimethylthiazol-2-yl)-5-(3-carboxymethoxyphenyl)-2-(4-sulfophenyl)-2H-
tetrazolium, inner salt, which is a colorimetric assay that can be used to determined cell
viability. Cockle CE polysaccharide (◼) with IC50 8.65 (µg/mL), and cockle CE treated with
chondroitinase-ABC (▲) with IC50 10.49(µg/mL) were tested in order to check if there are
any differences in the IC50 results between MTS and MTT. It was shown no difference in the
activity prolife when using MTS assay on K-562 cell line (Figure 57).
Figure 57. Cell proliferation assay MTS assay. 50 µg of cockle CE polysaccharides was
incubated with K562 to check its antiproliferative activity using MTS assay. No great
difference in IC50 values between MTT and MTS results.

125
9.5. Appendix V: Monosaccharides cell proliferation assay.
500 g of cockle CE polysaccharide dissolved in 2 mL of MilliQ water, then added
10 mL of 4M trifluoracetic acid then sample was incubated for 6 h at 100 oC. Afterwards,
sample was cooled on room temperature, then centrifuged at 2000 rpm for 2 minutes. Next,
Sample was concentrated by evaporation overnight. Next day, 100 l of 50% isopropanol,
then sample concentrated again. Finally, dried sample was diluted in 2000 L cell culture
media, in order to check the antiproliferative activity using MTT assay using K562, Molt-4
and Mero25 cell lines. As a result, monosaccharide sample shown to be inactive on all cell
lines (Figure 58).
Figure 58. Cell proliferation assay of cockle monosaccharide using K562, Molt-4 and Mero-
25 cell lines.
9.6. Appendix VI: Enzymes activity checks using spectrophotometer.
Each heparinase activity was assessed prior use, as 100 µg of standard mammalian
HS was dissolved in heparinases buffer then 30 mIU of each enzyme was added. The mixture
was incubated at 30 ○C for 30 minutes and the enzymes activity were check
spectrophotometrically at 232 nm. For chondroitinase-ABC, the enzyme was added to
standard mammalian CS.

126
9.7. Appendix VII: α-L-fucosidase activity.
Activity was checked using spectrophotometer. α-L-fucosidase activity was assessed
prior use, as 100 µg of cockle CE polysaccharide was dissolved in fucosidase buffer then 30
mIU of the enzyme was added. The mixture was incubated at 30 ○C for 30 minutes and the
enzymes activity were check spectrophotometrically at 400 nm.
9.8. Appendix VIII: Cell proliferation assay using cockle disaccharides residues from
the 10 kDa spin filter.
Cockle CE polysaccharides treated with heparinase (individually or combination),
chondroitinase-ABC or fucosidase in order to release disaccharide chains. After incubation
period, cockle polysaccharide samples, including CE polysaccharide (Figure 59) and fraction
5 (Figure 60), were filtered using 10 kDa spin filter in order to separate disaccharides. As
disaccharides passed through the filter so it’s known as flow through (FT), which was tested
to check its antiproliferative activity. 50 µg of each FT samples antiproliferative activity was

127
assessed using K562 cell line. As a result, the FT sample, which was enriched with
disaccharides, it was inactive.
Figure 59. Antiproliferative activity of cockle CE disaccharides on K562 cell line. All
disaccharide samples were inactive.
Figure 60. Antiproliferative activity of cockle purified fraction 5 disaccharides on K562 cell
line. All disaccharide samples were inactive.

128
9.9. Appendix IX: Cell proliferation assay using cockle CE polysaccharides treated
with different enzymes on Molt-4 cell line.
Cockle CE polysaccharides treated with heparinase (individually or combination),
chondroitinase-ABC or fucosidase in order to release disaccharide chains. After incubation
period, cockle polysaccharide samples, including CE polysaccharide (Figure 61) and fraction
5 (Figure 62) were filtered using 10 kDa spin filter in order to separate disaccharides. As
disaccharides passed through the filter so it’s known as flow through (FT), which was tested
to check its antiproliferative activity. 50 µg of each FT samples antiproliferative activity was
assessed using Molt-4 cell line. As a result, the FT sample, which was enriched with
disaccharides, it was inactive.
Figure 61. Antiproliferative activity of cockle CE disaccharides on Molt-4 cell line. All
disaccharide samples were inactive.
Figure 62. Antiproliferative activity of cockle purified fraction 5 disaccharides on Molt-4 cell
line. All disaccharide samples were inactive.

129
9.10. Appendix X: Cell proliferation assay using cockle CE polysaccharides treated
with different enzymes.
Cockle CE polysaccharides treated with heparinase (individually or combination),
chondroitinase-ABC or fucosidase in order to release disaccharide chains. After incubation
period, cockle polysaccharide samples, including CE polysaccharide (Figure 63) and fraction
5 (Figure 64), were filtered using 10 kDa spin filter in order to separate disaccharides. As
disaccharides passed through the filter so it’s known as flow through (FT), which was tested
to check its antiproliferative activity. 50 µg of each FT samples antiproliferative activity was
assessed using Mero-25 cell line. As a result, the FT sample, which was enriched with
disaccharides, it was inactive.
Figure 63. Antiproliferative activity of cockle CE disaccharides on Mero-25 cell line. All
disaccharide samples were inactive.

130
Figure 64. Antiproliferative activity of cockle purified fraction 5 disaccharides on Mero-25
cell line. All disaccharide samples were inactive.
9.11. Appendix XI: Cell proliferation assay of purified cockle polysaccharide samples
using 10 mL fractions.
Common cockle polysaccharide was eluted using gradient elution (0-3 M) NaCl and
samples were collected in 10 mL fractions over 70 minutes (F10-F70). Afterwards, cell
proliferation assay was performed on K562 cell line for each fraction (Figure 65).
Surprisingly, no antiproliferative activity was determined and all fractions were inactive.
Figure 65. Cell proliferation assay of CE polysaccharides purified fractions using 10 ml
fraction of anion-exchange column. 50 µg of cockle CE polysaccharide was incubated with
K562 cell line, which enhanced the cancer cells growth instead of inhibiting its proliferation.

131
Table 18. Cockle CE polysaccharides purification using anion-exchange column. 10 mL
fractions were eluted using 0-3 M gradient elution of NaCl.
Fraction number NaCl % (0-3) M IC50 Maximum drug
concentration 50 µg/mL
F-10 0-0.28 (3-9%) Inactive
F-20 0.36-1.0 (12-33%) Inactive
F-30 1.1-1.5 (33-50%) Inactive
F-40 1.6-2.0 (50-66.6) Inactive
F-50 2.1-2.5 (66.6-83) Inactive
F-60 2.58-2.9 (83-96) Inactive
F-70 2.9-3 (96-100) Inactive
9.12. Appendix XII: HS disaccharide mass spectrum profile.
HS disaccharide analysis of mammalian HS, cockle CE polysaccharides and cockle
purified fractions (1-6) using GRIL-LC-MS.

132

133

134

135

136
9.13. Appendix XIII: CS/DS disaccharide mass spectrum profile.
CS disaccharide analysis of mammalian CS, cockle CE polysaccharides and cockle
purified fractions (1-6) using GRIL-LC-MS.

137

138

139

140

141
9.14. Appendix XIV: Monosaccharide composition analysis using HPAEC-PAD.
Monosaccharide composition analysis of mammalian HS, cockle CE polysaccharide
and cockle purified fractions using HPAEC-PAD. All peaks were referred to the
monosaccharide standards.

142

143

144

145
9.15. Appendix XV: NMR figures
Figure 66. 2D 1H-1H NMR-TOCSY for cockle purified fraction 5. The spectrum was
recorded at 56.85 °C.
Figure 67. 2D 1H-1H NMR-TOCSY for Mammalian HS. The spectrum was recorded at 56.85
°C.

146
Figure 68. 2D 1H-13C NMR-HSQC for cockle purified fraction 5. The spectrum was recorded
at 56.85 °C.
Figure 69. 2D 1H-13C NMR-HSQC for Mammalian HS. The spectrum was recorded at 56.85
°C.

147
Figure 70. 2D 1H-1H-NMR-COSY for mammalian HS standard. Green lines indicate possible
spin systems found in mammalian HS. The spectra were recorded at 56.85 °C.

148
10. References
Afratis, N. et al. (2012) ‘Glycosaminoglycans: key players in cancer cell biology and
treatment’, The FEBS journal. Wiley Online Library, 279(7), pp. 1177–1197.
Agbarya, A. et al. (2014) ‘Natural products as potential cancer therapy enhancers: A
preclinical update’, SAGE Open Medicine. doi: 10.1177/2050312114546924.
Almond, A. (2007) ‘Hyaluronan’, Cellular and Molecular Life Sciences. Springer,
64(13), pp. 1591–1596.
Amenta, P. S. et al. (2005) ‘Proteoglycan-Collagen XV in Human Tissues Is Seen
Linking Banded Collagen Fibers Subjacent to the Basement Membrane’, Journal of
Histochemistry & Cytochemistry. Journal of Histochemistry & Cytochemistry, 53(2), pp.
165–176. doi: 10.1369/jhc.4A6376.2005.
American Cancer Society (2018) What Is Malignant Mesothelioma?, American
Cancer Society. Available at: https://www.cancer.org/cancer/malignant-mesothelioma.html
(Accessed: 16 January 2019).
Amornrut, C. et al. (1999) ‘A new sulfated β-galactan from clams with anti-HIV
activity’, Carbohydrate research. Elsevier, 321(1–2), pp. 121–127.
Asimakopoulou, A. P. et al. (2008) ‘The biological role of chondroitin sulfate in
cancer and chondroitin-based anticancer agents’, In vivo. International Institute of Anticancer
Research, 22(3), pp. 385–389.
Avendaño, C. and Menéndez, J. C. (2008) ‘Chapter 10 - Other Approaches to
Targeted Therapy’, in Avendaño, C. and Menéndez, J. C. B. T.-M. C. of A. D. (eds).
Amsterdam: Elsevier, pp. 307–349. doi: https://doi.org/10.1016/B978-0-444-52824-7.00010-
X.
Bernfield, M. et al. (1999) ‘Functions of cell surface heparan sulfate proteoglycans’,
Annual review of biochemistry. Annual Reviews 4139 El Camino Way, PO Box 10139, Palo
Alto, CA 94303-0139, USA, 68(1), pp. 729–777.
Bertozzi, C. R. and Rabuka, D. (2009) ‘Structural basis of glycan diversity’. Cold
Spring Harbor Laboratory Press, Cold Spring Harbor (NY).
Biosciences, B. D. (2011) ‘Detection of Apoptosis Using the BD Annexin V FITC
Assay on the BD FACSVerseTM System’.
Bishop, J. R., Schuksz, M. and Esko, J. D. (2007) ‘Heparan sulphate proteoglycans
fine-tune mammalian physiology’, Nature. Nature Publishing Group, 446(7139), p. 1030.
Blackhall, F. H. et al. (2001) ‘Heparan sulfate proteoglycans and cancer’, British
journal of cancer. Nature Publishing Group, 85(8), p. 1094.
Bomken, S. N. and Josef Vormoor, H. (2009) ‘Childhood leukaemia’, Paediatrics and
Child Health. doi: 10.1016/j.paed.2009.04.003.
Bond, C. S. et al. (1997) ‘Structure of a human lysosomal sulfatase’, Structure.
Elsevier, 5(2), pp. 277–289.
Borsig, L. et al. (2007) ‘Selectin blocking activity of a fucosylated chondroitin sulfate
glycosaminoglycan from sea cucumber effect on tumor metastasis and neutrophil
recruitment’, Journal of Biological Chemistry. ASBMB, 282(20), pp. 14984–14991.

149
Bosman, F. T. and Stamenkovic, I. (2003) ‘Functional structure and composition of
the extracellular matrix’, The Journal of Pathology: A Journal of the Pathological Society of
Great Britain and Ireland. Wiley Online Library, 200(4), pp. 423–428.
Bourdon, M. A. et al. (1985) ‘Molecular cloning and sequence analysis of a
chondroitin sulfate proteoglycan cDNA’, Proceedings of the National Academy of Sciences,
82(5), pp. 1321 LP – 1325. Available at: http://www.pnas.org/content/82/5/1321.abstract.
Brito, A. S. et al. (2014) ‘A non-hemorrhagic hybrid heparin/heparan sulfate with
anticoagulant potential’, Carbohydrate Polymers, 99, pp. 372–378. doi:
https://doi.org/10.1016/j.carbpol.2013.08.063.
Brockhausen, I., Schachter, H. and Stanley, P. (2009) ‘O-GalNAc glycans’, in
Essentials of Glycobiology. 2nd edition. Cold Spring Harbor Laboratory Press.
Bullock, S. L. et al. (1998) ‘Renal agenesis in mice homozygous for a gene trap
mutation in the gene encoding heparan sulfate 2-sulfotransferase’, Genes & development.
Cold Spring Harbor Lab, 12(12), pp. 1894–1906.
Bülow, H. E. and Hobert, O. (2006) ‘The molecular diversity of glycosaminoglycans
shapes animal development’, Annu. Rev. Cell Dev. Biol. Annual Reviews, 22, pp. 375–407.
Cabassi, F., Casu, B. and Perlin, A. S. (1978) ‘Infrared absorption and Raman
scattering of sulfate groups of heparin and related glycosaminoglycans in aqueous solution’,
Carbohydrate Research. Elsevier, 63, pp. 1–11.
Cancer research UK (2017) Treatment for cancer. Available at:
https://www.cancerresearchuk.org/about-cancer/cancer-in-general/treatment.
Cancer Research UK (2017) Cancer survival statistics for all cancers combined.
Available at: https://www.cancerresearchuk.org/health-professional/cancer-
statistics/survival/all-cancers-combined (Accessed: 28 September 2018).
Cesaretti, M. et al. (2004) ‘Isolation and characterization of a heparin with high
anticoagulant activity from the clam Tapes phylippinarum: evidence for the presence of a
high content of antithrombin III binding site’, Glycobiology. Oxford University Press, 14(12),
pp. 1275–1284.
Charles, A. L., Huang, T. C. and Chang, Y. H. (2008) ‘Structural analysis and
characterization of a mucopolysaccharide isolated from roots of cassava (Manihot esculenta
Crantz L.)’, Food hydrocolloids. Elsevier, 22(1), pp. 184–191.
Copelan, E. A. (2006) ‘Hematopoietic stem-cell transplantation’, New England
Journal of Medicine. Mass Medical Soc, 354(17), pp. 1813–1826.
Deakin, J. A. and Lyon, M. (2008) ‘A simplified and sensitive fluorescent method for
disaccharide analysis of both heparan sulfate and chondroitin/dermatan sulfates from
biological samples’, Glycobiology. Oxford University Press, 18(6), pp. 483–491.
Deschler, B. and Lübbert, M. (2006) ‘Acute myeloid leukemia: Epidemiology and
etiology’, Cancer. doi: 10.1002/cncr.22233.
Du, J. and Tang, X. L. (2014) ‘Natural products against cancer: A comprehensive
bibliometric study of the research projects, publications, patents and drugs’, Journal of
cancer research and therapeutics. Medknow Publications, 10(5), p. 27.
Dutton, G. J. (1966) ‘CHAPTER 3 - The Biosynthesis of Glucuronides BT -
Glucuronic Acid Free and Combined’, in. Academic Press, pp. 185–299. doi:
https://doi.org/10.1016/B978-0-12-395501-2.50009-8.

150
Edgren, G. et al. (1997) ‘Glypican (heparan sulfate proteoglycan) is palmitoylated,
deglycanated and reglycanated during recycling in skin fibroblasts’, Glycobiology. Oxford
University Press, 7(1), pp. 103–112.
Elmore, S. (2007) ‘Apoptosis: a review of programmed cell death’, Toxicologic
pathology. Sage Publications, 35(4), pp. 495–516.
Esko, J. D. et al. (1987) ‘Inhibition of chondroitin and heparan sulfate biosynthesis in
Chinese hamster ovary cell mutants defective in galactosyltransferase I.’, Journal of
Biological Chemistry. ASBMB, 262(25), pp. 12189–12195.
Esko, J. D. (1991) ‘Genetic analysis of proteoglycan structure, function and
metabolism’, Current opinion in cell biology. Elsevier, 3(5), pp. 805–816.
Esko, J. D., Kimata, K. and Lindahl, U. (2009) ‘Proteoglycans and sulfated
glycosaminoglycans’, in Essentials of Glycobiology. Cold Spring Harbor Laboratory Press,
pp. 229–248. doi: 10:0-87969-559-5.
Filmus, J., Capurro, M. and Rast, J. (2008) ‘Glypicans’, Genome biology. BioMed
Central, 9(5), p. 224.
Fraser, J. R. E., Laurent, T. C. and Laurent, U. B. G. (1997) ‘Hyaluronan: its nature,
distribution, functions and turnover’, Journal of internal medicine. Wiley Online Library,
242(1), pp. 27–33.
Friebolin, H. and Becconsall, J. K. (1993) Basic one-and two-dimensional NMR
spectroscopy. VCH Weinheim.
Funderburgh, J. L. (2000) ‘MINI REVIEW Keratan sulfate: structure, biosynthesis,
and function’, Glycobiology. Oxford University Press, 10(10), pp. 951–958.
Fuster, M. M. and Esko, J. D. (2005) ‘The sweet and sour of cancer: glycans as novel
therapeutic targets’, Nature Reviews Cancer. Nature Publishing Group, 5(7), p. 526.
Gerlier, D. and Thomasset, N. (1986) ‘Use of MTT colorimetric assay to measure cell
activation’, Journal of Immunological Methods. doi: 10.1016/0022-1759(86)90215-2.
Gomes, A. M. et al. (2010) ‘Unique extracellular matrix heparan sulfate from the
bivalve nodipecten nodosus (linnaeus, 1758) safely inhibits arterial thrombosis after photo
chemically induced endothelial lesion’, Journal of Biological Chemistry. ASBMB, p. jbc-
M109.
Greaves, M. F. and Wiemels, J. (2003) ‘Origins of chromosome translocations in
childhood leukaemia’, Nature Reviews Cancer. Nature Publishing Group, 3(9), p. 639.
Habuchi, H., Habuchi, O. and Kimata, K. (1995) ‘Purification and characterization of
heparan sulfate 6-sulfotransferase from the culture medium of Chinese hamster ovary cells’,
Journal of Biological Chemistry. ASBMB, 270(8), pp. 4172–4179.
Habuchi, O., Sugiura, K. and Kawai, N. (1977) ‘Glucose branches in chondroitin
sulfates from squid cartilage.’, Journal of Biological Chemistry. ASBMB, 252(13), pp. 4570–
4576.
Haimov-Kochman, R. et al. (2002) ‘Localization of heparanase in normal and
pathological human placenta’, MHR: Basic science of reproductive medicine. European
Society of Human Reproduction and Embryology, 8(6), pp. 566–573.
Han, N. et al. (2018) ‘Derivatives of Dolastatin 10 and Uses Thereof’. Google Patents.
Hardy, M. R., Townsend, R. R. and Lee, Y. C. (1988) ‘Monosaccharide analysis of

151
glycoconjugates by anion exchange chromatography with pulsed amperometric detection’,
Analytical biochemistry. Elsevier, 170(1), pp. 54–62.
Hascall, V. and Esko, J. D. (2015) ‘Hyaluronan’. Cold Spring Harbor Laboratory
Press, Cold Spring Harbor (NY).
Hassell, J. R., Kimura, J. H. and Hascall, V. C. (1986) ‘Proteoglycan core protein
families’, Annual review of biochemistry. Annual Reviews 4139 El Camino Way, PO Box
10139, Palo Alto, CA 94303-0139, USA, 55(1), pp. 539–567.
Hearn, B. R., Shaw, S. J. and Myles, D. C. (2007) ‘7.04 - Microtubule Targeting
Agents’, in Taylor, J. B. and Triggle, D. J. B. T.-C. M. C. I. I. (eds). Oxford: Elsevier, pp. 81–
110. doi: https://doi.org/10.1016/B0-08-045044-X/00205-4.
Heldin, P. et al. (1996) ‘Differential synthesis and binding of hyaluronan by human
breast cancer cell lines’, Oncology reports. Spandidos Publications, 3(6), pp. 1011–1016.
Hirschberg, C. B., Robbins, P. W. and Abeijon, C. (1998) ‘Transporters of nucleotide
sugars, ATP, and nucleotide sulfate in the endoplasmic reticulum and Golgi apparatus’.
Annual Reviews 4139 El Camino Way, PO Box 10139, Palo Alto, CA 94303-0139, USA.
Hoffbrand, V. and Moss, P. A. H. (2015) Hoffbrand’s essential haematology. John
Wiley & Sons.
Höök, M. et al. (1984) ‘Cell-surface glycosaminoglycans’, Annual review of
biochemistry. Annual Reviews 4139 El Camino Way, PO Box 10139, Palo Alto, CA 94303-
0139, USA, 53(1), pp. 847–869.
Howell, W. H. and Holt, E. (1918) ‘Two new factors in blood coagulation—heparin
and pro-antithrombin’, American Journal of Physiology--Legacy Content. Am Physiological
Soc, 47(3), pp. 328–341.
Huang, W. et al. (2003) ‘Crystal structure of Proteus vulgaris chondroitin sulfate ABC
lyase I at 1.9 Å resolution’, Journal of molecular biology. Elsevier, 328(3), pp. 623–634.
Hurwitz, H. et al. (2004) ‘Bevacizumab plus irinotecan, fluorouracil, and leucovorin
for metastatic colorectal cancer’, New England journal of medicine. Mass Medical Soc,
350(23), pp. 2335–2342.
Iozzo, R. V (2005) ‘Basement membrane proteoglycans: from cellar to ceiling’,
Nature reviews Molecular cell biology. Nature Publishing Group, 6(8), p. 646.
Iozzo, R. V and Schaefer, L. (2015) ‘Proteoglycan form and function: a
comprehensive nomenclature of proteoglycans’, Matrix Biology. Elsevier, 42, pp. 11–55.
Iwata, H. (1969) ‘Determination and microstructure of chondroitin sulfate isomers of
human cartilage and the pathological cartilage and tissue’, Nihon Seikeigeka Gakkai zasshi,
43(6), pp. 455–473.
JOHN, C. W. Y. and GIOVANNI, A. (2002) ‘Functions of hyaluronan in wound
repair’, Wound Repair and Regeneration. Wiley/Blackwell (10.1111), 7(2), pp. 79–89. doi:
10.1046/j.1524-475X.1999.00079.x.
Johnstone, K. D. et al. (2010) ‘Synthesis and biological evaluation of polysulfated
oligosaccharide glycosides as inhibitors of angiogenesis and tumor growth’, Journal of
medicinal chemistry. ACS Publications, 53(4), pp. 1686–1699.
KAlATHAS, Di. et al. (2011) ‘Chondroitin synthases I, II, III and chondroitin sulfate
glucuronyltransferase expression in colorectal cancer’, Molecular medicine reports.

152
Spandidos Publications, 4(2), pp. 363–368.
KAWAI, Y., SENO, N. and ANNO, K. (1966) ‘Chondroitin polysulfate of squid
cartilage’, The Journal of Biochemistry. The Japanese Biochemical Society, 60(3), pp. 317–
321.
Kim, Y. S. et al. (1996) ‘A new glycosaminoglycan from the giant African snail
Achatina fulica’, Journal of Biological Chemistry. ASBMB, 271(20), pp. 11750–11755.
Kinoshita-Toyoda, A. et al. (2004) ‘Structural determination of five novel
tetrasaccharides containing 3-O-sulfated D-glucuronic acid and two rare oligosaccharides
containing a β-D-glucose branch isolated from squid cartilage chondroitin sulfate E’,
Biochemistry. ACS Publications, 43(34), pp. 11063–11074.
Kinoshita, A. et al. (1997) ‘Novel tetrasaccharides isolated from squid cartilage
chondroitin sulfate E contain unusual sulfated disaccharide units GlcA (3-O-sulfate) β1–
3GalNAc (6-O-sulfate) or GlcA (3-O-sulfate) β1–3GalNAc (4, 6-O-disulfate)’, Journal of
Biological Chemistry. ASBMB, 272(32), pp. 19656–19665.
Kinsella, M. G. and Wight, T. N. (1986) ‘Modulation of sulfated proteoglycan
synthesis by bovine aortic endothelial cells during migration.’, The Journal of cell biology.
Rockefeller University Press, 102(3), pp. 679–687.
Kitagawa, H. et al. (1997) ‘A Novel Pentasaccharide Sequence GlcA (3-sulfate)(β1-3)
GalNAc (4-sulfate)(β1-4)(Fucα1-3) GlcA (β1-3) GalNAc (4-sulfate) in the Oligosaccharides
Isolated from King Crab Cartilage Chondroitin Sulfate K and Its Differential Susceptibility to
Chondroitinases’, Biochemistry. ACS Publications, 36(13), pp. 3998–4008.
Klebe, S. et al. (2010) ‘Sarcomatoid mesothelioma: a clinical–pathologic correlation
of 326 cases’, Modern Pathology. Nature Publishing Group, 23(3), p. 470.
Koliopanos, A. et al. (2001) ‘Heparanase expression in primary and metastatic
pancreatic cancer’, Cancer Research. AACR, 61(12), pp. 4655–4659.
Kolset, S. O. and Tveit, H. (2008) ‘Serglycin – Structure and biology’, Cellular and
Molecular Life Sciences, 65(7), pp. 1073–1085. doi: 10.1007/s00018-007-7455-6.
Köwitsch, A., Zhou, G. and Groth, T. (2018) ‘Medical application of
glycosaminoglycans: a review’, Journal of tissue engineering and regenerative medicine.
Wiley Online Library, 12(1), pp. e23–e41.
Kozlowski, E. O., Pavao, M. S. G. and Borsig, L. (2011) ‘Ascidian dermatan sulfates
attenuate metastasis, inflammation and thrombosis by inhibition of P‐selectin’, Journal of
Thrombosis and Haemostasis. Wiley Online Library, 9(9), pp. 1807–1815.
Kratz, G. et al. (1997) ‘Heparin-chitosan complexes stimulate wound healing in
human skin’, Scandinavian journal of plastic and reconstructive surgery and hand surgery.
Taylor & Francis, 31(2), pp. 119–123.
Krusius, T. et al. (1986) ‘Identification of an O-glycosidic mannose-linked sialylated
tetrasaccharide and keratan sulfate oligosaccharides in the chondroitin sulfate proteoglycan of
brain.’, Journal of Biological Chemistry. ASBMB, 261(18), pp. 8237–8242.
Kumar, V., Abbas, A. K. and Aster, J. C. (2017) Robbins basic pathology e-book.
Elsevier Health Sciences.
Laabs, T. et al. (2005) ‘Chondroitin sulfate proteoglycans in neural development and
regeneration’, Current Opinion in Neurobiology, 15(1), pp. 116–120. doi:
https://doi.org/10.1016/j.conb.2005.01.014.

153
Lamanna, W. C. (2008) Functional characterization of the novel heparan sulfate 6O-
endosulfatases Sulf1 and Sulf2. Cuvillier Verlag.
Lamari, F. N. and Karamanos, N. K. B. T.-A. in P. (2006) ‘Structure of Chondroitin
Sulfate’, in Chondroitin Sulfate: Structure, Role and Pharmacological Activity. Academic
Press, pp. 33–48. doi: https://doi.org/10.1016/S1054-3589(05)53003-5.
Laurent, T. C., Laurent, U. B. and Fraser, J. R. (1995) ‘Functions of hyaluronan.’,
Annals of the rheumatic diseases. BMJ Publishing Group, 54(5), p. 429.
Lawrence, R. et al. (2008) ‘Evolutionary differences in glycosaminoglycan fine
structure detected by quantitative glycan reductive isotope labeling’, Journal of Biological
Chemistry, 283(48), pp. 33674–33684. doi: 10.1074/jbc.M804288200.
Lee, Y. et al. (2018) ‘Testican‐1, as a novel diagnosis of sepsis’, Journal of cellular
biochemistry. Wiley Online Library, 119(5), pp. 4216–4223.
Lee, Y. S. et al. (2003) ‘Suppression of tumor growth by a new glycosaminoglycan
isolated from the African giant snail Achatina fulica’, European Journal of Pharmacology,
465(1), pp. 191–198. doi: https://doi.org/10.1016/S0014-2999(03)01458-4.
Li, D.-W. et al. (2004) ‘Long duration of anticoagulant activity and protective effects
of acharan sulfate in vivo’, Thrombosis Research, 113(1), pp. 67–73. doi:
https://doi.org/10.1016/j.thromres.2004.02.003.
Li, J. (2010) ‘Glucuronyl C5-Epimerase: An Enzyme Converting Glucuronic Acid to
Iduronic Acid in Heparan Sulfate/Heparin Biosynthesis’, in Zhang, L. B. T.-P. in M. B. and
T. S. (ed.) Glycosaminoglycans in Development, Health and Disease. Academic Press, pp.
59–78. doi: https://doi.org/10.1016/S1877-1173(10)93004-4.
Liao, N. et al. (2013) ‘Antioxidant and anti-tumor activity of a polysaccharide from
freshwater clam, Corbicula fluminea’, Food & function. Royal Society of Chemistry, 4(4),
pp. 539–548.
Lin, X. (2004) ‘Functions of heparan sulfate proteoglycans in cell signaling during
development’, Development. The Company of Biologists Ltd, 131(24), pp. 6009–6021.
Linhardt, R. J. et al. (1990) ‘Examination of the substrate specificity of heparin and
heparan sulfate lyases’, Biochemistry. ACS Publications, 29(10), pp. 2611–2617. doi:
10.1021/bi00462a026.
Linhardt, R. J. et al. (2006) ‘CS Lyases: Structure, Activity, and Applications in
Analysis and the Treatment of Diseases’, in Chondroitin Sulfate: Structure, Role and
Pharmacological Activity. Academic Press, pp. 187–215. doi: https://doi.org/10.1016/S1054-
3589(05)53009-6.
Liu, C. et al. (2008) ‘Structural characterisation and antimutagenic activity of a novel
polysaccharide isolated from Sepiella maindroni ink’, Food Chemistry. Elsevier, 110(4), pp.
807–813.
Liu, J. and Jiang, G. (2006) ‘CD44 and hematologic malignancies.’, Cellular &
molecular immunology, 3(5), pp. 359–365. Available at:
https://www.scopus.com/inward/record.uri?eid=2-s2.0-
34848816366&partnerID=40&md5=20f11cfb9575a1ace6a7280e4f4182bb.
M Cragg, G., J Newman, D. and M Snader, K. (1997) ‘Natural products in drug
discovery and development.’, Journal of Natural Products, 60(1), pp. 52–60. Available at:
http://www.mendeley.com/research/natural-products-in-drug-discovery-and-development-1/.

154
Magee, C., Nurminskaya, M. and Linsenmayer, T. F. (2001) ‘UDP-glucose
pyrophosphorylase: up-regulation in hypertrophic cartilage and role in hyaluronan synthesis’,
Biochemical Journal, 360(3), pp. 667 LP – 674. Available at:
http://www.biochemj.org/content/360/3/667.abstract.
Mcpherson, J. M. et al. (1988) ‘The Influence of Heparin on the Wound Healing
Response to Collagen Implants in vivo’, Collagen and Related Research, 8(1), pp. 83–100.
doi: https://doi.org/10.1016/S0174-173X(88)80037-2.
Meininger, M. et al. (2016) ‘Sialic acid-specific affinity chromatography for the
separation of erythropoietin glycoforms using serotonin as a ligand’, Journal of
Chromatography B, 1012–1013, pp. 193–203. doi:
https://doi.org/10.1016/j.jchromb.2016.01.005.
Meyer, K. et al. (1953) ‘The mucopolysaccharides of bovine cornea’, J Biol Chem,
205(2), pp. 611–616.
Meyer, K. and Palmer, J. W. (1934) ‘The polysaccharide of the vitreous humor’,
Journal of Biological Chemistry. ASBMB, 107(3), pp. 629–634.
Mikami, T. and Kitagawa, H. (2013) ‘Biosynthesis and function of chondroitin
sulfate’, Biochimica et Biophysica Acta (BBA) - General Subjects, 1830(10), pp. 4719–4733.
doi: https://doi.org/10.1016/j.bbagen.2013.06.006.
Mizumoto, S., Yamada, S. and Sugahara, K. (2015) ‘Molecular interactions between
chondroitin–dermatan sulfate and growth factors/receptors/matrix proteins’, Current opinion
in structural biology. Elsevier, 34, pp. 35–42.
Moore, G., Knight, G. and Blann, A. (2016) Haematology. Oxford University Press.
Mourão, P. A. S. et al. (1998) ‘Antithrombotic activity of a fucosylated chondroitin
sulphate from echinoderm: sulphated fucose branches on the polysaccharide account for its
antithrombotic action’, British journal of haematology. Wiley Online Library, 101(4), pp.
647–652.
Movasaghi, Z., Rehman, S. and ur Rehman, D. I. (2008) ‘Fourier transform infrared
(FTIR) spectroscopy of biological tissues’, Applied Spectroscopy Reviews. Taylor & Francis,
43(2), pp. 134–179.
Mulloy, B., Hart, G. W. and Stanley, P. (2009) ‘Structural analysis of glycans’. Cold
Spring Harbor Laboratory Press.
Myron, P., Siddiquee, S. and Al Azad, S. (2014) ‘Fucosylated chondroitin sulfate
diversity in sea cucumbers: A review’, Carbohydrate Polymers, 112, pp. 173–178. doi:
https://doi.org/10.1016/j.carbpol.2014.05.091.
Mythreye, K. and Blobe, G. C. (2009) ‘Proteoglycan signaling co-receptors: roles in
cell adhesion, migration and invasion’, Cellular signalling. Elsevier, 21(11), pp. 1548–1558.
Nadanaka, S. et al. (1998) ‘Characteristic hexasaccharide sequences in
octasaccharides derived from shark cartilage chondroitin sulfate D with a neurite outgrowth
promoting activity’, Journal of Biological Chemistry. ASBMB, 273(6), pp. 3296–3307.
Nelson, D. L., Lehninger, A. L. and Cox, M. M. (2008) Lehninger principles of
biochemistry. Macmillan.
Ning, C. et al. (2018) ‘Marine-derived protein kinase inhibitors for
neuroinflammatory diseases’, Biomedical engineering online. BioMed Central, 17(1), p. 46.

155
Nobili, S. et al. (2009) ‘Natural compounds for cancer treatment and prevention’,
Pharmacological Research, 59(6), pp. 365–378. doi: 10.1016/j.phrs.2009.01.017.
Norris, R. E. and Adamson, P. C. (2012) ‘Challenges and opportunities in childhood
cancer drug development’, Nature Reviews Cancer. Nature Publishing Group, 12(11), pp.
776–782. doi: 10.1038/nrc3370.
Onishi, A. et al. (2016) ‘Heparin and anticoagulation’, Front Biosci (Landmark Ed),
21, pp. 1372–1392.
Ornitz, D. M. (2000) ‘FGFs, heparan sulfate and FGFRs: complex interactions
essential for development’, Bioessays, 22(2), pp. 108–112.
Osgood, C. L. et al. (2017) ‘FDA approval summary: eribulin for patients with
unresectable or metastatic liposarcoma who have received a prior anthracycline-containing
regimen’, Clinical Cancer Research. AACR, p. clincanres-2422.
Parekh, R. B. et al. (1987) ‘Tissue-specific N-glycosylation, site-specific
oligosaccharide patterns and lentil lectin recognition of rat Thy-1.’, The EMBO journal, 6(5),
pp. 1233–1244.
Park, M.-T. and Lee, S.-J. (2003) ‘Cell cycle and cancer’, Journal of biochemistry and
molecular biology, 36(1), pp. 60–65.
Pastrana, L. and Jauregi, P. (2017) ‘Basic Biochemistry’, in Current Developments in
Biotechnology and Bioengineering. Elsevier, pp. 33–58.
Pavão, M. S. G. (2002) ‘Structure and anticoagulant properties of sulfated
glycosaminoglycans from primitive Chordates’, Anais da Academia Brasileira de Ciências.
SciELO Brasil, 74(1), pp. 105–112.
Pavasant, P., Shizari, T. M. and Underhill, C. B. (1994) ‘Distribution of hyaluronan in
the epiphysial growth plate: turnover by CD44-expressing osteoprogenitor cells’, Journal of
cell science. The Company of Biologists Ltd, 107(10), pp. 2669–2677.
Pocock, G. et al. (2013) Human physiology. Oxford university press.
Pomin, V. H. (2015) ‘NMR structural determination of unique invertebrate
glycosaminoglycans endowed with medical properties’, Carbohydrate research. Elsevier,
413, pp. 41–50.
Prabhakar, V. and Sasisekharan, R. B. T.-A. in P. (2006) ‘The Biosynthesis and
Catabolism of Galactosaminoglycans’, in Chondroitin Sulfate: Structure, Role and
Pharmacological Activity. Academic Press, pp. 69–115. doi: https://doi.org/10.1016/S1054-
3589(05)53005-9.
Prieto-Vila, M. et al. (2017) ‘Drug resistance driven by cancer stem cells and their
niche’, International journal of molecular sciences. Multidisciplinary Digital Publishing
Institute, 18(12), p. 2574.
Prydz, K. and Dalen, K. T. (2000) ‘Synthesis and sorting of proteoglycans’, J Cell
Sci. The Company of Biologists Ltd, 113(2), pp. 193–205.
Qiu, P. P., Dai, Y. Y. and Li, H. L. (2009) ‘Inhibition effect of Corbicula fluminea
extract on human hepatocarcinoma SMMC–7721 cell’, Journal of Xiamen University
(Natural Science), 48, pp. 406–409.
Rabenstein, D. L. (2002) ‘Heparin and heparan sulfate: structure and function’,
Natural product reports. Royal Society of Chemistry, 19(3), pp. 312–331.

156
Raimondi, S. C. et al. (1988) ‘Cytogenetics of childhood T-cell leukemia’, Blood. Am
Soc Hematology, 72(5), pp. 1560–1566.
Rivera, G. K. et al. (1991) ‘Improved outcome in childhood acute lymphoblastic
leukaemia with reinforced early treatment and rotational combination chemotherapy’, The
Lancet. Elsevier, 337(8733), pp. 61–66.
Rocha, V. et al. (2001) ‘Comparison of outcomes of unrelated bone marrow and
umbilical cord blood transplants in children with acute leukemia’, Blood. Am Soc
Hematology, 97(10), pp. 2962–2971.
Rosenberg, R. D. and Lam, L. (1979) ‘Correlation between structure and function of
heparin’, Proceedings of the National Academy of Sciences. National Acad Sciences, 76(3),
pp. 1218–1222.
Ross, J. A. et al. (2011) ‘Epidemiology of acute childhood leukemia’, in Childhood
leukemia. Springer, pp. 3–26.
Rovio, S., Yli‐Kauhaluoma, J. and Sirén, H. (2007) ‘Determination of neutral
carbohydrates by CZE with direct UV detection’, Electrophoresis. Wiley Online Library,
28(17), pp. 3129–3135.
Rusnati, M. and Urbinati, C. (2009) ‘Polysulfated/sulfonated compounds for the
development of drugs at the crossroad of viral infection and oncogenesis’, Current
pharmaceutical design. Bentham Science Publishers, 15(25), pp. 2946–2957.
Saad, O. M. et al. (2005) ‘Compositional profiling of heparin/heparan sulfate using
mass spectrometry: Assay for specificity of a novel extracellular human endosulfatase’,
Glycobiology, 15(8), pp. 818–826. doi: 10.1093/glycob/cwi064.
Sage, E. H. and Bornstein, P. (1991) ‘Extracellular proteins that modulate cell-matrix
interactions. SPARC, tenascin, and thrombospondin’, J Biol Chem. ASBMB, 266(23), pp.
14831–14834.
Salyers, A. A. and O’Brien, M. (1980) ‘Cellular location of enzymes involved in
chondroitin sulfate breakdown by Bacteroides thetaiotaomicron.’, Journal of bacteriology.
Am Soc Microbiol, 143(2), pp. 772–780.
Sandler, A. et al. (2006) ‘Paclitaxel–carboplatin alone or with bevacizumab for non–
small-cell lung cancer’, New England Journal of Medicine. Mass Medical Soc, 355(24), pp.
2542–2550.
Sarrazin, S., Lamanna, W. C. and Esko, J. D. (2011) ‘Heparan sulfate proteoglycans’,
Cold Spring Harbor perspectives in biology. Cold Spring Harbor Lab, 3(7), p. a004952.
Sasisekharan, R. et al. (2002) ‘Roles of heparan-sulphate glycosaminoglycans in
cancer’, Nature Reviews Cancer. Nature Publishing Group, 2(7), p. 521.
Sasisekharan, R. and Venkataraman, G. (2000) ‘Heparin and heparan sulfate:
biosynthesis, structure and function’, Current opinion in chemical biology. Elsevier, 4(6), pp.
626–631.
Schleicher, E. D. and Weigert, C. (2000) ‘Role of the hexosamine biosynthetic
pathway in diabetic nephropathy’, Kidney international. Elsevier, 58, pp. S13–S18.
Schuster, M., Nechansky, A. and Kircheis, R. (2006) ‘Cancer immunotherapy’,
Biotechnology Journal: Healthcare Nutrition Technology. Wiley Online Library, 1(2), pp.
138–147.

157
Shannon, J. M. et al. (2003) ‘Chondroitin sulfate proteoglycans are required for lung
growth and morphogenesis in vitro’, American Journal of Physiology-Lung Cellular and
Molecular Physiology. American Physiological Society, 285(6), pp. L1323–L1336.
Sherman, L. et al. (1994) ‘Hyaluronate receptors: key players in growth,
differentiation, migration and tumor progression’, Current opinion in cell biology. Elsevier,
6(5), pp. 726–733.
Shriver, Z. et al. (2012) ‘Heparin and heparan sulfate: analyzing structure and
microheterogeneity’, in Heparin-A Century of Progress. Springer, pp. 159–176.
Silbert, J. E. (1966) ‘CHAPTER 6 - Metabolism of Polysaccharides Containing
Glucuronic Acid A2 - DUTTON, GEOFFREY J. BT - Glucuronic Acid Free and
Combined’, in. Academic Press, pp. 385–453. doi: https://doi.org/10.1016/B978-0-12-
395501-2.50012-8.
Silva, L. F. B. T.-A. in P. (2006) ‘Isolation and Purification of Chondroitin Sulfate’,
in Chondroitin Sulfate: Structure, Role and Pharmacological Activity. Academic Press, pp.
21–31. doi: https://doi.org/10.1016/S1054-3589(05)53002-3.
Spooncer, E. et al. (1983) ‘Regulation of haemopoiesis in long-term bone marrow
cultures. IV. Glycosaminoglycan synthesis and the stimulation of haemopoiesis by beta-D-
xylosides.’, The Journal of cell biology. Rockefeller University Press, 96(2), pp. 510–514.
Stanley, M. J. et al. (1999) ‘Syndecan-1 expression is induced in the stroma of
infiltrating breast carcinoma’, American journal of clinical pathology. Oxford University
Press Oxford, UK, 112(3), pp. 377–383.
Stanley, P., Schachter, H. and Taniguchi, N. (2009) ‘N-Glycans’, in Varki, A. et al.
(eds). Cold Spring Harbor (NY), Cold Spring Harbor (NY).
Steen, P. Van den et al. (1998) ‘Concepts and principles of O-linked glycosylation’,
Critical reviews in biochemistry and molecular biology. Taylor & Francis, 33(3), pp. 151–
208.
Stringer, S. E. (2006) ‘The role of heparan sulphate proteoglycans in angiogenesis’.
Portland Press Limited.
Sugahara, K. et al. (1996) ‘Novel sulfated oligosaccharides containing 3-o-sulfated
glucuronic acid from king crab cartilage chondroitin sulfate K unexpected degradation by
chondroitinase ABC’, Journal of Biological Chemistry. ASBMB, 271(43), pp. 26745–26754.
Sugahara, K. et al. (2003) ‘Recent advances in the structural biology of chondroitin
sulfate and dermatan sulfate’, Current opinion in structural biology. Elsevier, 13(5), pp. 612–
620.
Sugahara, K. and Kitagawa, H. (2002) ‘Heparin and heparan sulfate biosynthesis’,
IUBMB life. Wiley Online Library, 54(4), pp. 163–175.
Suzuki, M. (1939) ‘Biochemical studies on carbohydrates’, The Journal of
biochemistry. The Japanese Biochemical Society, 30(2), pp. 185–191.
Thiele, H. et al. (2004) ‘Loss of chondroitin 6-O-sulfotransferase-1 function results in
severe human chondrodysplasia with progressive spinal involvement’, Proceedings of the
National Academy of Sciences. National Acad Sciences, 101(27), pp. 10155–10160.
Toole, B. P. (1997) ‘Hyaluronan in morphogenesis’, Journal of internal medicine.
Wiley Online Library, 242(1), pp. 35–40.

158
Trowbridge, J. M. and Gallo, R. L. (2002) ‘Dermatan sulfate: new functions from an
old glycosaminoglycan’, Glycobiology. Oxford University Press, 12(9), pp. 117R-125R.
Ustyuzhanina, N. E. et al. (2015) ‘Structure and biological activity of a fucosylated
chondroitin sulfate from the sea cucumber Cucumaria japonica’, Glycobiology. Oxford
University Press, 26(5), pp. 449–459.
Varki, A. and Gagneux, P. (2017) ‘Biological functions of glycans’. Cold Spring
Harbor Laboratory Press.
Varki, A. and Sharon, N. (2009) ‘Historical background and overview’, in Essentials
of Glycobiology. 2nd edition. Cold Spring Harbor Laboratory Press.
Velnar, T., Bailey, T. and Smrkolj, V. (2009) ‘The wound healing process: an
overview of the cellular and molecular mechanisms’, Journal of International Medical
Research. Sage Publications Sage UK: London, England, 37(5), pp. 1528–1542.
Vieira, R. P. and Mourão, P. A. (1988) ‘Occurrence of a unique fucose-branched
chondroitin sulfate in the body wall of a sea cucumber.’, Journal of Biological Chemistry.
ASBMB, 263(34), pp. 18176–18183.
Vieira, R. P., Mulloy, B. and Mourão, P. A. (1991) ‘Structure of a fucose-branched
chondroitin sulfate from sea cucumber. Evidence for the presence of 3-O-sulfo-beta-D-
glucuronosyl residues.’, Journal of Biological Chemistry. ASBMB, 266(21), pp. 13530–
13536.
Vieira, T. C. R. G. et al. (2004) ‘Acharan sulfate, the new glycosaminoglycan from
Achatina fulica Bowdich 1822’, The FEBS Journal. Wiley Online Library, 271(4), pp. 845–
854.
Vigetti, D. et al. (2014) ‘Hyaluronan: biosynthesis and signaling’, Biochimica et
Biophysica Acta (BBA)-General Subjects. Elsevier, 1840(8), pp. 2452–2459.
Vitanza, N. A. et al. (2014) ‘Ikaros deletions in BCR–ABL‐negative childhood acute
lymphoblastic leukemia are associated with a distinct gene expression signature but do not
result in intrinsic chemoresistance’, Pediatric blood & cancer. Wiley Online Library, 61(10),
pp. 1779–1785.
Vlodavsky, I. and Friedmann, Y. (2001) ‘Molecular properties and involvement of
heparanase in cancer metastasis and angiogenesis’, The Journal of clinical investigation. Am
Soc Clin Investig, 108(3), pp. 341–347.
Volpi, N. et al. (2014) ‘Analysis of glycosaminoglycan-derived, precolumn, 2-
aminoacridone–labeled disaccharides with LC-fluorescence and LC-MS detection’, Nature
protocols. Nature Publishing Group, 9(3), p. 541.
Wang, L. C. et al. (2017) ‘Elaboration in type, primary structure, and bioactivity of
polysaccharides derived from mollusks’, Critical reviews in food science and nutrition.
Taylor & Francis, pp. 1–24.
Wight, T. N., Heinegård, D. K. and Hascall, V. C. (1991) ‘Proteoglycans’, in Cell
biology of extracellular matrix. Springer, pp. 45–78.
Wight, T. N., Kinsella, M. G. and Qwarnström, E. E. (1992) ‘The role of
proteoglycans in cell adhesion, migration and proliferation’, Current opinion in cell biology.
Elsevier, 4(5), pp. 793–801.
Witsch, E., Sela, M. and Yarden, Y. (2010) ‘Roles for growth factors in cancer
progression’, Physiology. Am Physiological Soc, 25(2), pp. 85–101.

159
Wlawick, R., Roberts, W. and Dekker, C. (1959) ‘Cyclization during phosphorylation
of uridine and cytidine’, Proc. Chem. Soc., (84).
Wu, H. F., Monroe, D. M. and Church, F. C. (1995) ‘Characterization of the
glycosaminoglycan-binding region of lactoferrin’, Archives of biochemistry and biophysics.
Elsevier, 317(1), pp. 85–92.
Wu, M. et al. (2015) ‘Anticoagulant and antithrombotic evaluation of native
fucosylated chondroitin sulfates and their derivatives as selective inhibitors of intrinsic factor
Xase’, European Journal of Medicinal Chemistry, 92, pp. 257–269. doi:
https://doi.org/10.1016/j.ejmech.2014.12.054.
Yanagishita, M. (1993) ‘Function of proteoglycans in the extracellular matrix’,
Pathology International. Wiley Online Library, 43(6), pp. 283–293.
Yayon, A. et al. (1991) ‘Cell surface, heparin-like molecules are required for binding
of basic fibroblast growth factor to its high affinity receptor’, Cell. Elsevier, 64(4), pp. 841–
848.
Ye, S. et al. (2001) ‘Structural Basis for Interaction of FGF-1, FGF-2, and FGF-7 with
Different Heparan Sulfate Motifs’, Biochemistry. American Chemical Society, 40(48), pp.
14429–14439. doi: 10.1021/bi011000u.
Yu, C.-J. et al. (2010) ‘Effect of Fraxiparine, a type of low molecular weight heparin,
on the invasion and metastasis of lung adenocarcinoma A549 cells’, Oncology letters.
Spandidos Publications, 1(4), pp. 755–760.
Zhang, D. et al. (2013) ‘Three sulphated polysaccharides isolated from the mucilage
of mud snail, Bullacta exarata philippi: Characterization and antitumour activity’, Food
chemistry. Elsevier, 138(1), pp. 306–314.
Zhang, L. et al. (2008) ‘Isolation and characterization of antitumor polysaccharides
from the marine mollusk Ruditapes philippinarum’, European Food Research and
Technology. Springer, 227(1), p. 103.
Zhang, L. (2010) Glycosaminoglycans in development, health and disease. Academic
Press.
Zhang, Y. et al. (2010) ‘Focus on Molecules: Heparanase’, Experimental Eye
Research, 91(4), pp. 476–477. doi: https://doi.org/10.1016/j.exer.2010.05.004.
Zöller, M. (2011) ‘CD44: can a cancer-initiating cell profit from an abundantly
expressed molecule?’, Nature Reviews Cancer. Nature Publishing Group, a division of
Macmillan Publishers Limited. All Rights Reserved., 11, p. 254. Available at:
http://dx.doi.org/10.1038/nrc3023.