Characterisation of Tns3 mechanisms in oligodendroglia
220
1 Université Pierre et Marie Curie ED3C: CERVEAU, COGNITION et COMPORTEMENT Institut du Cerveau (ICM), Hôpital de la Pitié Salpêtrière Equipe HASSAN: Développement du Cerveau Characterisation of Tns3 mechanisms in oligodendroglia Par Emeric MEROUR Pour l’obtention du titre de docteur en Neuroscience de Sorbonnes Universités Jury: Pr Ann LOHOF: Présidente du jury Dr Anna WILLIAMS: Rapportrice Dr Elisabeth TRAIFFORT: Rapportrice Dr Jeanette NARDELLI: Examinatrice Dr Lamia BOUSLAMA-OUEGHLANI: Examinatrice Dr Carlos PARRAS: Directeur de thèse
-
Upload
khangminh22 -
Category
Documents
-
view
1 -
download
0
Transcript of Characterisation of Tns3 mechanisms in oligodendroglia

1
Université Pierre et Marie Curie
ED3C: CERVEAU, COGNITION et COMPORTEMENT
Institut du Cerveau (ICM), Hôpital de la Pitié Salpêtrière
Equipe HASSAN: Développement du Cerveau
Characterisation of Tns3 mechanisms in
oligodendroglia
Par Emeric MEROUR
Pour l’obtention du titre de docteur en Neuroscience de Sorbonnes Universités
Jury:
Pr Ann LOHOF: Présidente du jury
Dr Anna WILLIAMS: Rapportrice
Dr Elisabeth TRAIFFORT: Rapportrice
Dr Jeanette NARDELLI: Examinatrice
Dr Lamia BOUSLAMA-OUEGHLANI: Examinatrice
Dr Carlos PARRAS: Directeur de thèse

2

3
Table of contents:
Acronyms ....................................................................................................................................................................................... 5
Acknowledgements .................................................................................................................................................................. 7
INTRODUCTION.......................................................................................................................................................................... 9
CHAPTER I: Biology of CNS development ................................................................................................................ 9
From the neural crest to the CNS ............................................................................................................................ 9
The glial cells................................................................................................................................................................... 18
CHAPTER II: Oligodendrogenesis regulation ...................................................................................................... 27
DNA binding and chromatin remodelling ........................................................................................................ 27
Other regulators of oligodendrogenesis ........................................................................................................... 31
CHAPTER III: Myelination and Remyelination ................................................................................................... 35
Myelin generation and function ............................................................................................................................ 35
Oligodendroglial pathologies and therapeutics ............................................................................................ 47
CHAPTER IV : Tensins proteins .................................................................................................................................. 50
State of the art ................................................................................................................................................................ 50
Tensins known functions ......................................................................................................................................... 54
Physio-pathology of Tensins dysfunction ........................................................................................................ 60
Material and methods ........................................................................................................................................................... 64
Animals and genotyping ........................................................................................................................................... 64
Flox Tns3 knockout by tamoxifen injection .................................................................................................... 67
Electroporation .............................................................................................................................................................. 69
MACS ................................................................................................................................................................................... 69
Western Blot ................................................................................................................................................................... 70
Immunofluorescence .................................................................................................................................................. 71
Plasmids and vectors .................................................................................................................................................. 73
Primary cells culture ................................................................................................................................................... 75
Live cell Imaging ........................................................................................................................................................... 78
Demyelination Lesions .............................................................................................................................................. 79
Objectives and Hypothesis ................................................................................................................................................. 81
Results .......................................................................................................................................................................................... 82
Article....................................................................................................................................................................................... 83
Detailed results ................................................................................................................................................................ 149
Tns3 is regulated by keys oligodendroglial factors ................................................................................. 149
Tns3 is highly expressed in an iOL1 subpopulation ................................................................................ 152
Tns3 expression during remyelination .......................................................................................................... 156
Tns3 constitutive KO induce a sublethal phenotype............................................................................... 157

4
Tns3 exon6 frameshift by CRIPSR-Cas9 in NSCs....................................................................................... 160
Optimisation of the Tns3 CRISPR-Cas9 knockout system .................................................................... 162
Tns3 proteomic expression in oligodendroglia ......................................................................................... 164
Deletion of the whole Tns3 locus by CRIPR-Cas9 ..................................................................................... 166
In vivo Tns3 induced knockout of the postnatal OPCs population .................................................. 170
Assessing Tns3-mutant oligodendrocyte defects by video microscopy in neural progenitor
cultures ........................................................................................................................................................................... 177
Discussion ................................................................................................................................................................................ 181
Perspectives ............................................................................................................................................................................ 185
References ............................................................................................................................................................................... 189
Abstract ..................................................................................................................................................................................... 219
Résumé en français ............................................................................................................................................................. 220

5
Acronyms
AAV Adeno-Associated Virus
ABD Actin Binding Domain
AD Alzheimer’s disease
ALS Amyotrophic Lateral Sclerosis
AP Astrocyte Progenitor
ASD Autism Spectrum Disorder
BBB Blood Brain Barrier
CC Corpus callosum
CHIP Chromatin Immunoprecipitation assay
CNS Central Nervous System
CP Cortical Plate
CRIPSR-Cas9 Clustered Regularly Interspaced Short Palindromic Repeats
CSF Cerebrospinal Fluid
DBD DNA-Binding Domain
DHLP Dorsolateral Hinge Point
E8.5 Embryonic day 8,5
ECM Extracellular Matrix
EM Electron Microscopy
ES cell Embryonic Stem cell
GAP GTPase-Activating Protein
HDAC Histone Deacetylase
HDR Homology Directed Repair
indel insertion or deletion of a random number of nucleotides after CRSIPR-Cas9 cutting
iOL immature Oligodendrocyte
IP Intemrediate Progenitor
LPC Lysolecithin solution
MHP Median Hinge Point
mOL mature Oligodendrocyte
MRI Magnetic Resonance Imaging

6
MS Multiple Sclerosis
NEC Neuroepithelial Cell
NHEJ Non-Homologous End-Joining
NLS Nuclear Localisation Signal
NSC Neural Stem Cell
NTD Neural Tube Defect
OL Oligodendrocyte
ON Optic Nerve
OPC Oligodendrocyte Precursor Cell
P7 Postnatal day 7
PNS Peripheral Nervous System
PPMS Primary Progressive Multiple Sclerosis
PTB Phosphotyrosine Binding Domain
RGC Radial Glial Cell
oRGC outer Radial Glial Cell
RRMS Relapsing–Remitting Multiple Sclerosis
lncRNA long non-codding RNA
scRNA single cell RNA sequencing
gRNA small guidance RNA
siRNA small interference RNA
SH2 Src Homology Domain 2
SNP Short Neural Precursor cell
SVZ Subventricular Zone
VZ Ventricular Zone

7
Acknowledgements
First, I would like to thank my supervisor, Dr Carlos PARRAS for all his guidance and
dedication all along these four years. It was a great experience for me to be formed by
somebody who was both a great scientist and mentor. I would also like to thank Dr
Bassem HASSAN who trusted us at the beginning of this project and gave me the
opportunity to work in his team. I want to make a special thank to Laetitia Vincensini,
who trained me for my first experience in a lab and helped me to find this internship in
the first place.
All my recognition goes also to Hatem, who not only started this project but also formed
me during my internship and a full year after his PhD defence. A special thanks also
to Corentine who helped us a lot with the figures and was always here to give me
precious guidance, even when the answers were just in the drive and of course to
Pierre-Henry, who was my first trainee and worked so much to help us generate these
data, good chance for your future scientific career.
I would like to thank the people working in ICM facilities who helped me a lot
throughout this PhD. ICM Quant for the imaging, especially Aymeric Millecamps for
saving me an incredible amount of time with his macro, and Dominique Languy for his
helpful advice. CELIS for the cell culture, especially David Akbar who helped me so
much for the timelapse culture. Histomics, especially Nicolas Raymond, Anick
Pringent and Bineta Faye for their help. ICMice for the mice, especially to Joana
Droesbeke, Cindy Belson and Melanie Huentz, for their dedication in mice care.
iVECTOR for the generation of the virus. And finally, the communication team of the
ICM, especially Nicolas Brard and of course Patrica Oliviero.
A special thanks first to Elisa, who already defend her PhD, Jean-Baptiste and Lucas,
who are almost done, for all the time spent together discussing about Science or not.
Marlene for her patience when we were discussing my Western Blot data or just
chatting about music. Pauline, for her support and our discussions on Xenopus. Rana
and Sofia for our pass-by discussions. Natalie and Sandra for their help and advice.
Yanis, for our scientific debates and the discussion we still need to have, and to all the
Hassan team and other interesting people I met at the ICM, these years were
significantly more pleasant thanks to you!

8
Of course, I must thank all my friends who were there for me. Thomas C and R, Shao,
Julien, Camille and Florent, who were a source a relaxation and enjoyment. I also
thank Romain, Yasmina and Lydie I met at University of Cergy Pontoise, we were
joking about my PhD since the beginning of my studies.
Finally, I must thank my family for their incommensurable support and affection.
Especially my mother, who was a source of incredible determination all over these
years, my aunt Chantale, for our restful talks and the book she offered me that
changed my vision about science at the University, my grandparents, who were always
supportive, and Jean, for all our fascinating discussions and his support. All of you
were always here for me and I want to dedicate this work to all of you
Some were walking alone, I wasn’t

9
INTRODUCTION
CHAPTER I: Biology of CNS development
From the neural crest to the CNS
Neurulation
Neurulation is the first step of the central nervous system (CNS) development that
starts in the embryo. It consists mainly of the folding of the embryonic neuroectoderm
and its closure to form a neural tube from which will originate the whole CNS. Over 80
genes are involved in this well sequenced biological process. Even if it is not
homogenous across embryo’s regions, neurulation is conventionally divided into two
phases (Copp et al, 2003).
The primary neurulation is the shaping, folding and the midline fusion of the rostral
embryos neuroectoderm area. It will create the primary neural tube from which
originates the brain and most of the spinal cord. On the other hand, secondary
neurulation occurs in the caudal regions, in the caudal eminence, also called tail bud,
and doesn’t involve neural folding like primary neurulation. It consists in the
condensation and the epithelialization of a resident mesenchymal cell population that
will give rise to the secondary neural tube in the continuity of the primary one and form
the lowest portion of the spinal cord.
The newly formed neural tube have then to be closed, which occurs in parallel in three
different places in a caudal to rostral way. In mice, the first closure (closure 1) starts
at E8.5 at the hindbrain/cervical boundary. It then spreads caudally to the posterior
neuropore and rostrally to the hindbrain neuropore in a 36h period. A second closure
(closure 2) appears independently, usually at the forebrain/midbrain boundary and
then spread until the anterior neuropore. Finally, the third neural tube closure (closure
3) appears at the extremity of the forebrain and spreads until it fuse with closure 2 (Fig.
01). The primary neurulation ends with the closing of the posterior neuropore.
Secondary neurulation occurs from the close primary neural tube through the tail bud
canalizations.

10
Figure 01 Timing of neural tube closures in the embryo. Defect in closure 1 lead to craniorachischisis,
closure 2 failing lead to anencephaly and closure 3 defects induces Lumbosacral spina bifida and spina
bifida occulta.From Copp et al, 2003.
Contrary to the closure 1 and 3, closure 2 location is polymorphic and varies across
mice strains. Some presents a closure 2 in caudal midbrain where others could present
a rostral midbrain closure 2 and the proximity with closure 3 makes it hard to
differentiate the two events. This could explain why, in the human brain, the closure 2
have not been consistently observed.
Defects in neural tube closing induce a wide range of malformations named open
neural tube defects (NTDs). It affects 1 per 1000 pregnancy worldwide and is the
second cause of congenital malformation in human pregnancy after heart defects.
Typically, if closure 1 fails, the whole neural tube from the midbrain to the lower spine
will remain open (which is called craniorachischisis). Defects in closure 2 induces
exencephaly, which mean the development of the midbrain and/or the hindbrain
outside the skull. The exposed neural tissues will degenerate and be destroyed during
late gestation, converting the exencephaly in anencephaly (the absence of a major
portion of the brain, skull, and scalp). Finally, closure 3 deficit induces a forebrain-
restricted anencephaly, often combined with split face malformation. Finally, if the
closure fails to spread along the spinal region, the spinal cord will remain open,
resulting in open spina bifida (also called myelomeningocele).

11
Just after the onset of neural tube closing, the neural plate is reshaped into an
elongated keyhole-shaped structure with broad cranial (rostral) and narrow spinal
(caudal) regions. This neural plate shaping is mainly based on convergent extension.
Indeed, cells from both the neuroectoderm and the underlying mesoderm will medially
move, lengthening and narrowing the neural plate. Studies of mutant mice ( loop-tail,
crash, cricletail and dishevelled-1KO; dishevelled-2KO) have shown the importance of
planar cell polarity for closure 1, especially the non-canonical Wnt/frizzled signaling
pathway. Indeed, the mutation in the gene encoding Celsr1, the binding partner protein
of frizzled, or Scrb1 mutation, also required for planar cell polarity, impair closing 1
(Montcouquioi et al., 2003). Dishevelled mutations induce misexpression of Rho
kinase 2, downstream of Wnt1 in the Wnt/frizzled planar cell polarity pathway
(Wallingford et al., 2002; Marlow et al., 2002).
Figure 02 Neural plate folding mecanisms at different levels of the spinal cord. The neural plate initially
undergoes a first general bending (a). Then, the upper spine bending is based on a Median Hinge Point
(MHP) (b), the intermediate spine bending is based both on two paired Dorsolateral Hinge Point (DLHP)
and MHP (c), and lower spine bending finalisation uses only the two DLHP (d). From Copp et al, 2003.
Even if an initial bending of the neural tube (Fig. 02-a) occurs simultaneously, the
timing and the positions of the bending points vary along the spinal region. The upper
spine (Fig. 02-b) is the first to bend (at E8.5 in mice) and fold at a single bending point
named the Median Hinge Point (MHP). The intermediate spine (Fig. 02-c) bent in

12
second (between E9 and 9.5 in mice) and used two bending points, a MHP and a
Dorso-Lateral Hinge Point (DLHP) present in each neural fold. Finally, the lowest
spinal (Fig. 02-d) region bends last (around E10 in mice) and is solely based on DHLP.
A mesodermal internal structure localized below the neural plate, the notochord,
controls this bending through the secretion of Sonic Hedgehog (Shh), which decreases
along the spine. High notochordal Shh levels, like in the upper spine, inhibits bending
at the DLHP but not at the MHP. Indeed, local exogenous Shh release in the lower
spine is sufficient to inhibit DLHP formation in mice (Ybot-Gonzalez et al., 2002).
Moreover, ShhKO mice show normal bending at DLHP but Shh overexpression could
induce NTDs by inhibiting dorsolateral bending (Echelard et al., 1993). Shh also plays
a role in cranial neurulation, as shown in Gli3 mutant mice, a negative regulator of
Shh, which present cranial defects (Hui et al., 1993). On the contrary, Gli1 or Gli2
negative mice, two mediators of the Shh signalling, do not develop NTDs (Ding et al.,
1998; Matisse et al., 1998). In open-brain or Zic2 mutant mice, two mutations where
negative regulators of the Shh signalling are disrupted (Eggenschwiler et al., 2001;
Nakata et al., 1998), the neural tube fails to close both in the brain and the lower spine
area (Günther et al., 1994; Nagai et al., 2000). Interestingly, the dorsal and dorsolateral
cells do not seem to differentiate (Eggenschwiler et al., 2000). One explanation could
be that the negative effect of Shh on DLHP formation in the higher spine prevents
dorsal or dorsolateral cell differentiation at a localization that will later be needed for
bending (DLHP).
After the bending, the two neural folds fuse to finalize the neural tube closing and the
neurulation. Apical cells from both neural folds extend their lamellipodial protrusions
as they approach from the dorsal midline (Fig. 03-a). When these protrusions come in
contact, they interdigitate (Fig. 03-b), fixing the two neural folds together through cell-
cell recognition (Geelen et al., 1979). Indeed, each folds is covered by a ‘cell surface
coat’ of carbohydrate-rich material whose removal impairs neural fold fusion (Moran
et al., 1975; Sadler et al., 1978). Finally, the epithelium is remodelled by apoptosis to
ensure the continuity between the surface ectoderm and the neuroepithelium across
the midline (Fig. 03-c).

13
Figure 03 Finalisation of neural tube closing. The cells of the two folds first contact each other via their
lamellipodia (a). Then the folds adhere to each other (b) and finally, apoptosis and remodelling occurs
to ensure tissue continuity. From Copp et al, 2003.
For a long time, the fusion then the separation of the neural tube and the surface
ectoderm have been thought to be based solely on cell-cell adhesion and cell-
adhesion proteins. Indeed, the neural tube cells present N-CAM and N-cadherin
whereas the surface ectoderm cells express epithelial (E)-cadherin (Rutishauser et al.,
1988). Moreover, the expression of a dominant negative N-cadherin in Xenopus
impairs neural tube formation where dominant negative E-cadherin doesn’t (Levine et
al., 1994). But since N-CAM expression in the surface ectoderm doesn’t inhibit neural
tube closure (Detrick et al, 1990) and N-cadherin KO does not induce any NTD (Radice
et al., 1997), it is likely that cell-adhesion molecules are crucial for neurulation in
mammalians.
Cortical development
After the closure of its most rostral part, the neural tube forms three primary vesicles
that will be the future forebrain, the midbrain and the hindbrain. Two of these brain
regions will later be subdivided. The hindbrain will be divided into the myelencephalon
and the metencephalon and the forebrain will be split into the diencephalon and the
telencephalon. This last area is of particular interest for us because its dorsal part will
give rise to the cerebral cortex, the most enlarged brain area in humans (Fig. 04-A).
The ventral telencephalon part will give rise to the ganglionic eminences from which
some GABAergic interneurons and glial cells will migrate and colonize to the
developing cortex (Fig. 04-B).

14
Figure 04 CNS development and morphogen expression. In embryonic stages, the CNS is divided into
four areas (A), the Forebrain (FB), the Midbrain (MB) the Hindbrain (HB) and the spinal cord (SC) that
will later complexify to give rise to all the CNS regions. Neurons and Glial cells migrate from the
Ganglionic eminence to the cortical areas (B). The telencephalon is regionalised based on gradient
expression of several transcription factors such as Wnts, BMP or Shh (C). From Agirman, Broix and
Nguyen, 2017.
The cortical neuroepithelium is organised from an outside-in perspective. The first
cortical layers created are also the deepest with each layer formed on the top of the
previous one. The classical model of cortical development starts with a neurogenic
phase, occurring between E10.5 and E18.5 in the rodents, followed by the gliogenesis
starting around mid-gestation and continued after birth. Neuroepithelial cells (NECs)
create an initial neuroepithelium, on the top of a basement extra-cellular matrix layer,
pseudostratified by the apico-basal movement of their nuclei during cell cycle
progression . NECs will first undergoes symmetric division, in order to amplify their cell
pool, then asymmetrically to give rise to neural stem cells (NSCs) called Radial Glial
Cells (RGCs), a pool of progenitor cells whose cell body will stay in the ventricular
zone (VZ) (Agirman, Broix and Nguyen, 2017). Like NECs, RGCs have a bipolar
morphology, with a basal cytoplasmic extension to the cortical plate (CP), at the cortex
surface, and an apical extension in the VZ. They also first amplify their pool by
symmetric cell division before generating other cell types by asymmetric division.

15
Figure 05 Corticogenesis and extrinsic factors. Cortex is organised in an outside-in perspective. At
E10, BMPs Wnts, FGF and Shh induces the production of Radial Glial Cells (RGCs) from Neural Stem
Cells (NSCs). RGCs will first give rise to neurons and, latter, to Intermediates progenitors (IPs)
producing neurons. Neurons migrate to the Cortical Plate (CP), forming successively 6 layers on the
top of the previous ones. From Agirman, Broix and Nguyen, 2017.
At the onset of corticogenesis, RGCs asymmetric divisions predominantly generate
projecting neurons, in what is called direct neurogenesis. With time, they stop the
direct generation of neurons and start to produce Intermediate Progenitors (IP), thus
called indirect neurogenesis. IPs first stay attached to RGCs but after their
delamination, they invade the nearest cortical layer: the subventricular zone (SVZ).
There, after an optional unique symmetric division to amplify themselves, they undergo
one symmetric cell division giving rise to two identical neurons.

16
Independently of their origin, newly generated neurons by RGCs or IPs migrate to
reach the cortical plate, where neurons form the layers. The first neurons generated
during corticogenesis go to the CP directly by somal translocation, but the others
transits by a multipolar morphology before adopting a bipolar shape. During this stage,
they attach to the RGCs surface and move on their basal extension towards the upper
layers (Fig. 05). Neurons are produced in waves during corticogenesis, producing six
distinct neuronal layers.
The main population of RGCs in the mouse cortex is referred as ventral RGC (vRGC,
also called apical, aRGC), given that two minor cortical progenitor cell populations also
exist in the cortex: the short neural precursor cells (SNPs, also called truncated RGCs,
tRGC), and the outer RGCs (oRGC), also called basal RGC, bRGC). SNPs are
generated from RGCs but stay in the VZ and often lack the basal extension
attachment. They divide symmetrically only once to give rise to neurons, which helps
the neurogenesis of the deepest cortical layers (Stancik et al., 2010). oRGCs are
similar to the vRGCs but lack their apical extension attachment and reside in the outer
part of the SVZ. The oRGC population is enlarged in the cortex of gyrencephalic
mammals and it is involved in the cortex folding (Hansen et al., 2010).
NECs, SNPs and RGCs all possess at their apical surface a small non-motile primary
cilia protruding in the lateral ventricle, in contact with the cerebrospinal fluid (CSF). It
allows these cells to probe for extracellular signals and initiate intracellular
transduction of specific molecular pathways in response (Lepanto et al., 2016) and is
required for apico-basal polarity maintenance (Higginbotham et al., 2013). This cilia
had also been described on IPs, immature neurons, and interneurons migrating from
the ganglionic eminence (Baudoin JP et al, 2012)
Corticogenesis is also controlled by various regulatory cues, including Shh, Wnt, BMP,
FGF, and Notch signalling pathways. Through their cilia, apical progenitors (NECs,
SNPs and RGCs) are influenced by the CSF, whose composition varies during cortical
development. For example, Shh could be secreted from the ventral telencephalon to
the CSF but also by choroid plexus cells. It could also be locally secreted by Cajal-
Retzius cells at the marginal zone before the cortical plate or the interneurons of the
CP. Shh also contributes to the generation of oligodendrocytes and GABAergic
neurons in the ventral telencephalon. RGCs exposed to Shh also prolongate their self-

17
renewal cell divisions and the decrease of Shh signalling in RGCs impairs their
proliferation, survival and their ability to generate IPs, oRGCs and projecting neurons,
inducing a general microcephaly.
The Wnt/b-catenin signalling pathway also plays different stage-dependent roles. At
the onset of corticogenesis, it promotes NECs and RGCs self-renewal. Indeed, forced
expression of Wnt signalling genes in apical progenitors (APs) increases their
differentiation into neurons (Munji et al., 2011). Interestingly, mouse deficient for Wnt
signalling but with a functional β-catenin presents a loss of APs and a reduction of the
cortical thickness (Draganova et al., 2015), suggesting that Wnt signalling function in
brain development could be b-catenin independent. Inhibition of the Wnt/β-catenin
signalling pathway in spinal neural progenitors also strikingly increases the production
of OPCs, indicating that Wnt/β-catenin pathway inhibits NSCs specification toward the
oligodendroglial lineage (Shimizu T et al, 2005). Furthermore, we will see later that
this pathway plays an opposite role on OL differentiation.
BMPs (Bone Morphogenetic Proteins) family cooperate with Wnt proteins to promote
the telencephalon dorsomedial patterning (Furuta et al., 1997). They also directly
control the specification of the dorsal midline and the generation of the choroid plexus
(Hébert et al., 2002). In the developing cortex, BMP2 and BMP4 supports RGCs
neuronal differentiation during cortical neurogenesis (Li et al., 1998) but
overexpression of BMP4 during the cortical gliogenesis increase astroglial and
decrease oligodendroglial lineage commitment of RGCs (Gomes et al., 2003).
FGF (Fibroblast Growth Factors) play a general role in RGCs stemness maintenance,
therefore controlling brain growth. The knockout of the three FGF receptors in the
dorsal telencephalon by E10 in mice induces a reduction of cortical surface area (Kang
et al., 2009). FGF also enhances the production of IPs, helping the SVZ expansion
(Wang et al., 2016; Rash et al., 2013) and promotes RGCs self-renewal (Sahara S
and O’Leary., 2016). Finally, this growth factor acts in a Shh-dependent manner on
ganglionic eminences interneurons specification (Gutin et al., 2006). Notch signalling
also helps in RGCs stemness maintenance (Kageyama et al., 2008) and can even
partially compensate for FGFR KO (Rash et al., 2011). Notch1 and Notch3 are
expressed by RGCs during corticogenesis where their ligands are present at the

18
neighbouring neurons or IPs surface, activating the Notch pathway in RGCs after cell-
cell contact.
Finally, the integrins play a decisive role in the cortical laminar cytoarchitecture.
Inactivation β1-integrin in RGCs impair their basal process attachment to the
basement membrane, disrupting its assembly (Graus-Porta et al., 2001). On the
contrary, β1-integrin KO in migrating neurons does not affect layer patterning, which
shows that β1-integrin are mainly required for RGCs basal attachment (Belvindrah at
al., 2007). Knocking out integrins in humans or ferrets induce a reduction of oRGCs
proliferation but not of IPs, showing again the importance of the basal process for brain
development (Fietz et al., 2010). Finally, the high levels of integrins and their ligands
in the VZ suggest that integrin signalling also plays a role in RGCs proliferation (Lathia
et al., 2007).
The glial cells
Historically, the term ‘glia’ originates from the assumption that these cells were just
acting as a ‘glue’ for the CNS. During the two last decades, extensive proofs showed
that glial cells were not only providing valuable support in axonal function but could
also play key roles in synaptic plasticity or act as integral mediators for neuronal
connectivity (Barres, 2008). In addition to development and aging, glial cells play
crucial roles in CNS regeneration (Gallo and Deneen, 2014) and its remyelination after
neurodegeneratives diseases or broader disorders (John Lin and Deneen, 2013;
Burda and Sofroniew, 2014). It is now clear that glial cells play much more functions
than just being the CNS “glue”.
Across species, the ratio of glial cells to neurons vary a lot. In the human brain 50%
neuronal and 50% non-neuronal cells were found (Azevedo et al., 2009) whereas
rodent brains contain significantly less non-neuronal cells. For example the capybra’s
whole brain, the closest model to the human brain in rodents based on the size, only
contains 35% of non-neuronal cells (Herculano-Houzel et al., 2006). Despite these
variations in the total number of cells, the ratio varies also depending on the
considered brain area. For example, there are 85.6% of glial cells in the capaybara’s
cerebral cortex but only 32.9% in its cerebellum (Herculano-Houzel, Glia, 2014).

19
Finally, the glial cells subtypes are not equally distributed. Among the glial cells of the
human cortex, oligodendroglia represent 75% of glia, astrocytes represents only 20%,
and the last 5% consist of microglia, the resident immunitary cells of the CNS.
Astrocytes
Astrocytes were first described by Rudolf Virchow in 1846 as neuroglial cells
supporting neuronal function but the term «astrocyte» was proposed by Mihály
Lenhossék, in 1893 referring to their typical star shape (Molofsky and Deneen, 2015).
They are classified based on their morphology and localization as protoplasmic, for
gray matter astrocytes, or fibrous, for white matter astrocytes. For historical reasons,
astrocytes are called Müller glia in the retina and Bergmann glia in the cerebellum.
Fibrous astrocytes presents fewer but thicker processes and express higher levels of
astrocyte intermediate filament protein GFAP (Middelorp and Hol, 2011) where
protoplasmic astrocytes are spatially segregated and exhibits hundreds of fine
processes (Tong X et al., 2013), delimiting their astrocytic domain (Bushong EA et al.,
2003). This diversity reflects their numerous crucial functions in the CNS physiology,
including blood-brain barrier formation or maintenance, synaptogenesis,
neurotransmission, metabolic regulation, and support of synaptic transmission (Allen
and Barres, 2009; Matyash and Kettenmann, 2010).
In rodents, the astrocytogenesis happens around E12.5 in the spinal cord, and
between E16 and E18 (Ge et al., 2012) and start by the specification of neural stem
cells in astrocyte progenitor cells (APCs) that will then mature into astrocytes. NSCs
specification toward the astroglial lineage is regulated by various factors. For example,
Nuclear Factor I-A (NFI-A) and Sox9 have been shown to be both required and
sufficient to induce astrocytogenesis by demethylating astrocyte specific genes
(Deneen et al., 2006; Stolt et al., 2003). Other factors also are involved in NSCs
specification into the astrocytic lineage. Notch ligands are expressed both on
committed neuronal precursors (NPCs) and young neurons and activation of their
receptors in NPCs induce NFI-A expression (Namihira et al., 2008). Embryonic cortical
progenitors from N-CoR KO mice, a transcription repressor, present defects in self-
renewal and differentiation into astrocytes (Hermanson et al., 2002). Finally, the KO in

20
mice of Dnmt1, a methylase controlling the JAK-STAT pathway, also shows astrocyte
generation defects. More generally, the demethylation of JAK-STAT signalling genes
enhances STATs activation, triggering astrocytes differentiation (Fan et al., 2005),
revealing the involvement of the JAK-STAT pathway in astrocytogenesis.
Figure 06 Astrocytogenesis typical steps. NSCs first specify toward the astroglial lineage due to pro-
Astrocytes Transcription Factors (1). The astrocytes’ precursors (APs) then migrate to specific CNS
regions (2), proliferate (3) and finally differentiate into mature astrocytes (4). From Molofsky and
Deneen, 2015.
Once specified, intermediate astrocytes' precursors migrate to colonize the CNS. A
first wave of APCs migrates along RGCs processes but a second one occurs after
birth, after the RGCs lose their processes, which indicates that astrocytes could also
move on their own (Fig. 06). Interestingly, mature astrocytes have been shown to be
tethered to their origin site in the VZ, suggesting a limited migration during
development (Jacobsen and Miller, 2003)
After finding their final destination, APCs start to express the canonical astrocytes
markers in order to initiate their terminal differentiation. Even if an universal astrocyte
marker has not yet been identified, some genes are recurrent in astrocyte subtypes.
GFAP have been broadly used to characterise mature astrocytes and its gene has
been extensively studied (Middeldorp and Hol, 2011). Despite this broad use, GFAP
expression has been shown to be weak or absent in many protoplasmic astrocytes

21
(Alen brain database; Molofsky and Deneen, 2015). New complementary markers for
mature astrocytes have been identified, like S100β, Aldh1L1, AldoC, Ascgb1, Glt1 and
Aqp4 (Molofsky et al., 2012) but none of them seems to be specific to the whole
astrocyte population, which gives insights on how diverse astrocytes could be.
Astrocytes play a broad and diverse function. First they have a crucial function in
neuron support. An in vivo loss of astrocytes induce neuronal death and most neuron
cultures model required to be co-cultivated with astrocytes to survive. They are in the
interface between neurons and the pericyte constituting the brain vasculature and use
this dual interaction to provide metabolic support to neurons (Pellerin et al., 2007).
Interestingly, astrocytes have also shown to influence blood flow through
neurotransmitter-mediated signalling to favorise angiogenesis in neuronal active brain
regions (Attwell et al., 2010).
Three decades ago, the discovery of the astrocytes’ ability to adjust their Ca2+ levels
in response to chemical stimuli, like glutamate (Cornell-Bell et al., 1990), raised the
hypothesis that astrocytes could use Ca2+ as an extra-neuronal signalling system in
the CNS (Newman et al., 1997), especially when the Ca2+ levels from neurons have
shown to increase in response to the elevation of Ca2+ concentration in adjacent
astrocytes (Parpura et al., 1994; Nedergaard et al., 1994).
Their contribution to the analog of the lymphatic system in the CNS, the glymphatic
system, have been recently documented. It is composed of astroglial cells that ensure
a pseudo lymphatic role by eliminating macroscopic wastes from the brain. The
glymphatic system could also play a role in neuronal trophic support by carrying and
distributing non waste molecules, such as nutrient or neurotransmitters, all around the
brain (Jessen et al., 2015). From the discovery of this new brain-clearance system
have emerged hopes for new therapies to drain waste deposits in neurodegenerative
disorders. But even if evidences of deposits clearances have been observed, like tau
CSF clearance or b-amyloid carrying, the effects of the glymphatic systems on
neurodegeneratives disorders are still highly controversy as ventricular tau CSF
clearance was inversely correlated with amyloid deposition (Benveniste H et al, 2019).
The interest in glymphatic clearance mostly originates from the difficulties encountered
by the anti-amyloid-β clinical trials and a better understanding of the natural brain

22
clearance mechanisms could represent a new therapeutic approach to treat
neurodegenerative disorders (Mestre H et al, 2020)
Finally, astrocytes are extensively involved in synapse formation, survival and activity
modulation. For a long time, astrocytes have been known to improve the fidelity of the
synaptic transmission. The smallest processes of protoplasmic astrocytes typically
enwrap neuronal synapses, forming what we now call the “tripartite synapse”
(Reichenbach et al., 2010). There, they remove neurotransmitters at the synaptic cleft,
recycle them, and maintain extracellular ion concentration by buffering potassium
(Frizzo MES et al, 2004; Emmi A et al, 2000). But they are also required for the
formation of functional synapses, like in retinal ganglion cells (Pfrieger FW and Barres
B, 1997). They also control excitatory synapse formation and activation by releasing
proteins (reviewed by Clarke and Barres, 2013; Allen NJ, 2014).
Microglia
When Ramon y Cajal first characterised the brain cells, he described three
components: the neurons, the astrocytes and the third component. Pio del Rio Hortega
later discovered that this third component was instead two cell types: the microglia and
the oligodendroglia (Pérez-Cerdá F et al, 2015). Microglia represents about 5–12%
of CNS cells and are the resident immune cells of the brain. Indeed, brain cells are
insulated from the rest of the body by the Blood Brain Barrier (BBB), which can be
passed only by a restricted number of cells. Contrary to the other glial cells, microglia
have a mesodermal origin and migrates from the yolk sac entering the CNS during
embryogenesis, at E7.5 for the mouse, before the BBB formation (Aguzzi A et al.,
2013; Ginhoux and Prinz, 2015; Casano and Peri, 2015). First, hematopoietic stem
cells in the yolk sac became primitive macrophages that will migrate to the developing
CNS to become microglia. After this time window, the BBB will develop, preventing
any cell migration to the brain. Other CNS macrophages are non-parenchymal, these
are derived from blood monocytes.
Microglia plays different functions in the brain (Hickman and El Khoury, 2019). First,
they constantly scan their environment, by the rapid extension-retraction of their
processes, to sense every environmental change. This way, microglia form a whole

23
network which could scan their immediate surroundings every hour and react if any
injury occurs. More than 100 genes have been described in what is called the
microglial sensome (Hickman SE et al, 2013). Then, they ensure a housekeeping
function by actively remodeling synapses (Zhan Y et al, 2014), phagocyte brain debris
and dead neurons in neuropathological context (Fuhrmann M et al, 2010) or even
getting rid of the myelin to help the tissue to repair in disease contexts like MS (Healy
LM et al, 2016). Finally Microglia are able to be activated to defend the CNS, by
exemple from injuries. In response to their receptors, such as Fc receptors or Toll-like
receptors, microglia are able to initiate a neuroinflammatory response. Similarly to the
inflammatory response observed outside of the CNS, the neuroinflammation is based
on cytokine production and aimed to recruit cells to clear pathogens or antigens and
maintain the brain homeostasis. Unfortunately, neuroinflammation could also damage
or even kill neurons in neurodegenerative disorders such as Multiple Sclerosis,
Alzeimer’s disease, Huntington’s disease or Amyotrophic Lateral Sclerosis. All of
these involved a dysregulation of the microglia neuroinflammation controller genes
pathways such as Trem2, Cx3cr1 or the progranulin pathways.
Oligodendrocytes
The last but not least of the glial cell types are the oligodendrocyte (OLs). OLs are the
myelinating cells of the central nervous system, which mean that they enwrap neuronal
axons with their cytoplasmic extensions, forming an isolating sheath: the myelin. In the
peripheral nervous system, this function is ensured by the Schwann Cells in a similar
manner with the exception that they enwrap only one axon, where OLs could myelinate
up to 80 different neurons. All PNS glial cells (Schwann cell precursors and satellite
glia) are generated by neural crest cells which start their gliogenesis around E11 in
rodents. Like NSCs that could give rise to several cell types, Schwann cells' precursors
are able to differentiate into neurons of the parasympathetic system, melanocytes,
fibroblasts, or even mesenchymal stem cells (reviewed by Jacob C, 2015). Many
transcriptional and signalling pathways involved in Schwann cells PNS myelination are
also present during CNS myelination by OLs that we will later describe in this
manuscript. Several important differences between the two myelination processes
have still been observed (Salzer et al, 2015)

24
Like the other neural cell type (except for the microglia) oligodendrocytes have a
neuroectodermal origin. Oligodendrogenesis, from NSCs to myelinating OLs, is tightly
regulated by the serial expression of intrinsic (transcription factors, signaling
pathways, cytoskeleton remodeling, ...) and extrinsic cues (growth factor, extracellular
matrix, ...). The gliogenesis from NSCs is controlled by Sox9, NFI-A and serum
response factor (Selvaraj et al, 2017). Growth factors also play key roles, like FGF, as
FGFR KO in OPCs greatly impair myelin generation without affecting their proliferation
or differentiation (Furusho M et al; 2011). Platelet-Derived Growth Factor Receptor
alpha (PDGFRa) is required in the developing forebrain both for oligodendrogenesis
and myelin formation. Indeed, Nestin driven Pdgfra KO in the forebrain induce both a
hypomyelination and a reduction in the Olig2 positive cells population in postnatal mice
forebrain (Hamashima T et al; 2020). Olig1 and Olig2 are also crucial for NSCs
specification toward the oligodendroglial lineage (Maire C L et al, 2010). Until the
initiation of their differentiation, cells stay actively blocked in the OPC stage by
transcription factors such as Hes5 (Xiao G et al, 2020) and Id2/4 (Plemmel J R et al,
2013).
OPCs are generated during temporally distinct waves both in the rodent and human
developing forebrain. The first wave occurs in medial ganglionic eminence (at E12.5
in rodents) from Nkx2.1 expressing progenitors. These cells will gradually spread
throughout the telencephalon, from the ventral part to the dorsal areas. At E15.5 in
rodents, a second wave occurs from the lateral ganglionic eminence from Gsh2
expressing progenitors that will migrate and colonise the dorsal areas. Finally the third
wave (around P0 in mice) generates OLs from the cortical V-SVZ progenitors, which
expressed Emx1 (Kessaris N et al, 2006). Despite obvious technical issues compared
to rodent models, it appears that human oligodendrocyte also first originates from
ganglionic eminences and then switches to more dorsal origins (Mo A and Zecevic N,
2009).
OPCs form a stable population of cells in the brain (3~7% of all the brain cells in the
adult brain, depending on the area) (Bribián et al, 2020). Interestingly, they actively
maintain their population even in the adult brain, both by mitosis and apoptosis
(Dawson M L R et al, 2003; Richardson W D et al, 2011), but could also differentiate
into OLs, especially after OL death or demyelination. These newly formed OLs have

25
been observed around lesions of demyelinating diseases such as Multiple Sclerosis
(MS) (Macchi M et al, 2020). However, this natural remyelination decreases with age
(Wolswijk, 2000). A better understanding of the resting OPCs differentiation into new
OLs could help us to design new supporting remyelination therapies.
Growing evidence suggests the existence of distinct OPC subpopulations.
Oligodendrocytes originating from ventral or dorsal OPCs myelinate different kinds of
axon tracts, despite having the same electrical properties (Tripathi RB et al; 2011).
These variations may result from different developmental origins, specificity in the
myelinated neurons population or just unique local cues. PDGFRa and NG2 are the
two most common markers for migrating and proliferative OPCs, despite the fact that
NG2 is not expressed in the whole population (Nishiyama et al, 2009). More generally,
OPCs are sensitive to EGF, FGF and PDGF but lose these receptors when
differentiate into immature OLs. It is possible to induce in vitro OPCs differentiation by
switching NSCs in culture from a EGF/FGF/PDGF rich to a GF null growth medium
(Galli, Gritti and Vescovi, 2008). In the adult stage, each stock OPC controls an area
and avoids the other adult OPCs when they enter in contact.
Figure 07 Oligodendroglial factors expression during cortical gliogenesis. RGCs first differentiate into
an intermediate state, the pre-OPC that will then maturate into early and then late OPC. From Huang
et al, 2020
In humans, cortical OLs seem to be mainly generated from radial glial cells from the
outer SVZ (oRGCs). An intermediate progenitor stage between RGCs (expressing
notably Pax6, GFAP, NES and Vimentin) and OPCs (expressing notably Pdgfra,

26
Nkx2.2, Sox10 and PCDH15) have recently been described and named pre-OPCs
(figure 07). These pre-OPCs express high levels of EGFR and undergo additional
rounds of amplification after EGF exposition to amplify the OPC pool (Huang W et al;
2020).
In the spinal cord, OPCs originate from the pMN domain of the neural tube, which
under the effect of Shh signaling, initially produces motoneurons and later switchs to
OLs production. This production is also regulated by two homeobox transcription
factors: Nkx6.1 and Nkx6.2. Indeed, knocking-out Shh, Nkx6.1 or Nkx6.2 in mice
suppress OL generation by the pMN, even if some Olig2 or PDGFRa positive OPCs
originating from the dorsal spinal cord could be still found after the typical OPC
generation time window (Cai, J. et al; 2005).

27
CHAPTER II: Oligodendrogenesis regulation
To differentiate into OLs, OPCs undergo a series of morphological and biochemical
modifications, tightly controlled in time by a broad variety of markers. Here I will list
non-exhaustively some of the most well-known.
DNA binding and chromatin remodelling
Chromatin remodelling is extensively involved in oligodendrogenesis (Parras C et al,
2020). Indeed, genes present in compacted chromatin are less accessible and
therefore less expressed that those on open accessible chromatin. There are several
kinds of chromatin remodelers and transcription factors, these later ones characterized
for being able to directly bind DNA through a specific binding domain (DBD) and are
classified considering their type of DBD. After binding to a precise motive of 4 to 10
nucleotides on the DNA, they could recruit other the proteins of the transcriptional
machinery, including chromatin remodeler, and link enhancer sequences to the
promoter to enhance transcription efficiency (Panne D, 2008) or, on the contrary,
repress the gene expression by physically blocking the binding of other transcription
factors.
Basic Helix-Loop-Helix transcription factors
The basic Helix-Loop-Helix transcription factor family [CP1] (Bertrand, Castro, &
Guillemot, 2002) is one of largest DNA-binding transcription factors subgroups,
containing many members already implicated in oligodendrogenesis, including Ascl1,
Olig1 and Olig2. Ascl1 (Achaete-Scute Complex-Like 1), also called Mash1, is a gene
encoding a transcription factor expressed in neural progenitors cells both in the CNS
and PNS (Guillemot and Joyner, 1993; Parras et al., 2002, 2004), including in many
neurogenic progenitors and OPCs in the CNS. Interestingly, Ascl1 function in NSCs
seems to be dependent on its modality of expression. A sustained overexpression of
Ascl1 is associated with neuronal differentiation whereas its oscillating expression
seems to favour NSCs differentiation into OPCs and OPC proliferation (Nakatani et al,
2013; Sueda R and Kageyama R, 2021). Olig2 expression is also not restricted to
oligodendroglial lineage, as it is also expressed in motoneuron progenitors and other

28
neuronal progenitors (Zhou Q et al., 2000; Lu RQ et al., 2000). Repression of both
Olig1 and Olig2 expression in the spinal cord totally suppress the oligodendrocyte
differentiation and greatly decreases the motoneuron population. Interestingly, the
Knockout of both Olig1 and Olig2 in pMN progenitors change their differentiation fates.
Instead of producing motoneurons then oligodendrocytes they generate respectively
V2 interneurons and astrocytes (Zhou Q and Anderson DJ, 2002). Therefore Olig1
has already been used in combination with other oligodendroglial markers to
characterise oligodendrogenesis stages as its expression and subcellular localisation
varies over oligodendrocytes differentiation (Nakatani et al, 2013; Marie et al, 2018)
The Sox family
Sox proteins contain a high mobility group box (HMG; Malarkey & Churchill, 2012),
allowing their direct fixation to DNA. They are separated into several subfamilies like
the SoxE, composed of Sox8, Sox9 and Sox10, or the SoxD, including Sox5 and Sox6.
The most important Sox factor during oligodendrogenesis is Sox10, as OPCs do not
manage to differentiate into OLs in Sox10 KO (Stolt CC et al., 2002). Overexpression
of Sox10 in human pluripotent stem cells is sufficient to induce the generation of O4
and MBP expressing OLs in culture (García-León J A et al, 2018). Sox10 also plays a
key role during remyelination. In a cuprizone-induced hippocampal demyelination, the
overexpression of Sox10 is sufficient to restore a normal phenotype, the myelin
ultrastructure and increase the NG2 expression (Shao Y et al, 2020). The
overactivation of Notch suppresses Sox10 induced myelin gene expression, indicating
that the Notch pathway inhibits Sox10 positive effect on OLs maturation (Xiao G,
2020).
Sox9 and Sox8 are mostly coexpressed in oligodendrocyte lineage with Sox10. In this
manuscript, we already described the Sox9 requirement for NSCs specification toward
the glial, both astrocytic and oligodendroglial, lineage, but it appears that Sox9 and
Sox8, contrary to Sox10, are downregulated in the terminal oligodendroglial
differentiation stages for OL maturation (Stolt CC et al, 2003). Moreover, Sox9KO in
spinal cord neural progenitors does not impair OPCs differentiation into OLs (Finzsch
M et al, 2008), suggesting a requirement of Sox9 for NSCs specification toward the

29
glial lineage, especially for NSCs PDGFRa expression during their migration, but not
for the latter stages of OL maturation (Weider M and Wegner M, 2017). Sox8, which
is also expressed mostly in early gliogenic stages and downregulated in differentiating
OL, is likely to have a similar function but its implication remains poorly documented
(Weider M and Wegner M, 2017). More generally, it appear that SoxD proteins,
especially Sox5 and Sox6, are able to interfere with SoxE to regulates
oligodendrogenesis (Stolt et al, 2006)
Chd proteins chromatin remodeling
Chromodomain helicase DNA binding protein (Chd) contains 9 family members. Chd8
has been associated with Autism Spectrum Disorders (O’Roak BJ et al, 2012) and
Chd7, with CHARGE syndrome (Vissers LELM et al, 2004). Previous work from our
team and collaborators also discovered that they were both involved in
oligodendrogenesis. Chd7 is bound both by Brg1 and Olig2 and its loss in neonates
rodent OPCs led to a striking 75% loss in the differentiating oligodendrocytes cortical
population and a decreased expression of oligodendroglial factors such as Sox10 or
Myrf. Co-Immunoprecipitation assays revealed a direct bound between Sox10 and
Chd7, indicating that Chd7 and Sox10 could collaborate to initiate OPCs
oligodendrogenesis (He D et al, 2016). Interestingly, analyses of chromatin
immunoprecipitation followed by sequencing (ChIP-seq) revealed that Chd7 has also
a protective effect on OPCs by closing their chromatin to repress p53 expression. On
the contrary, it opens the chromatin and activates some key oligodendroglial factors
like Sox10, Gpr17 and Nkx2.2. Chd8, a Chd7 paralog, which interacts with Chd7
(Batsukh T et al, 2010), presents a similar binding pattern. These data suggest that,
in OPCs, the pioneer factor Olig2 recruits both Chd7 and Chd8 on oligodendrocyte
differentiation genes, opening the chromatin and facilitates Sox10 binding and the
clustering of other regulators (Marie C et al, 2018).

30
Nkx family
Nkx family shares a DNA binding homeodomain. Nkx2.2 is a marker of immature
oligodendrogenesis stages. Nkx2.2KO induces a strong decrease in the OL population
and an accumulation of Olig1+, Olig2+ and PDGFRa+ progenitors without affecting
the astrogliogenesis (Qi Y et al, 2001). Nkx2.2 could also recruit Groucho 3, the
histone deacetylase 1 and the DNA methyltransferase 3 α with its Nter Tinman domain
and Cter domain. Their recruitment will suppress the expression of oligodendrocyte
repressor genes and promote oligodendrogenesis (Zhang C et al, 2020). Nkx6
proteins play opposite roles in the spinal cord and the hindbrain oligodendrogenesis.
As we mentioned before, Nkx6.1 and Nkx6.2 knockout strongly decrease OL
generation from spinal cord pMN progenitors (Cai J et al, 2005) whereas their
expression in anterior midbrain progenitors suppress their differentiation into OLs,
revealing differences in OL generation mechanisms from spinal cord or hindbrain
progenitors (Vallstedt A et al, 2005).
Histone post-traductional regulation
To affect gene expression without binding directly to the DNA, some proteins could
interact with histones in order to regulate their chromatin compaction activity. Histone
deacetylation by histone deacetylases (HDACs) proteins will induce local chromatin
compaction, resulting in gene silencing by reducing their accessibility and by the
histone-complex physical obstruction (Jacob C et al; 2011). HDAC1 and HDAC2 are
required for oligodendrogenesis by controlling Wnt signalling, known to inhibit OL
differentiation (Marin-Hustege M et al; 2002). Shh also favors OL differentiation by
inducing the histones deacetylation (Wu M et al, 2012). On the contrary, histone
acetylation tends to open the chromatin and favour gene expression by facilitating the
recruitment of the transcription machinery. BMP4 induces histone acetylation, which
favors astrogliogenesis but blocks oligodendrogenesis and in a HDAC-independent
manner (Wu M et al, 2012).

31
Brg1 and Brm transcription factors
Brg1 (or Smarca4) and Brm (or Smarca2) are two ATP-dependent SWI/SWF ATP-
dependent enzymes containing a bromodomain by which they bind acetylated
histones. Brg1 is recruited at the level of Olig2 in OPCs and iOLs (Yu Y et al, 2013).
Brg1 deletion in spinals pMN NSCs and whole brain OPCs does not affect OPCs
generation but greatly impair mature OL generation and myelination, with severe
behavioural phenotypes (Yu et al., 2013). Even Brg1 deletions driven by the NG2 or
CNP promoters induced a partial impairment of OLs generation without affecting
OPCs population. Therefore, it appears that Brg1 is critical for OPC differentiation into
OLs but not for their generation or proliferation. Interestingly, even if Brm and Brg1 are
mostly coexpressed during oligodendrogenesis, ChIP analysis of BrmKO suggests that
Brm does not compensate for Brg1 loss in Brg1KO (Bischof et al., 2015).
Other regulators of oligodendrogenesis
The Wnt/β-catenin pathway
I previously described the Wnt/β-catenin pathways inhibition of OPCs production from
NSCs (Shimizu et al, 2005). But, even if the activation of β-catenin in neural progenitor
cells before gliogenesis does inhibit OPC differentiation, it is also critical for OL
maturation and differentiation. Indeed, β-catenin KO after OPCs formation delays the
OLs formation (Dai ZM et al, 2014). Wnt/β-catenin KO impairs myelin protein genes
expression and proteolipids synthesis, both in Schwann cells and oligodendrocytes
(Tawk M et al, 2011). All of these data indicate a dual role of the Wnt/β-catenin
pathway during oligodendrogenesis. In early stages, it represses NSCs specification
in OPCs, but in later stages, it is also required for proper OLs differentiation and
maturation.
Itpr2
Inositol 1,4,5-Trisphosphate Receptor Type 2 (IP3 R2 or Itpr2) is a receptor whose
activation increases the intracellular Ca2+ levels. Itpr2 expression is involved in cell
migration, cell division, smooth muscle contraction, and neuronal signaling. In the

32
brain, Itpr2 is expressed in immature oligodendrocytes (Zeisel A et al, 2015; Marques
et al., 2016). Little is known about the role of Itpr2 in immature OLs. Itpr2KO mice
present a reduced number of OLs and an increased OPCs population between P7 and
P14, suggesting an involvement of Itpr2 in the initiation of OL differentiation, very likely
by acting on the endoplasmic reticulum Ca2+ release (Zhang M et al, 2021).
Interestingly, Itpr2 is expressed in Schwann cells but also in axon rough endoplasmic
reticulum, suggesting a different function in these cells (Toews JC et al, 2007).
As it controls Ca2+ release from the endoplasmic reticulum, Itpr2 is also involved in
astrocyte Calcium signalling. Itpr2KO mice have been used to suppress calcium
signaling in astrocytes. But, interestingly, calcium modulations could still be found in
edges of Itpr2KO astrocytes processes, suggesting a soma restricted action of Itpr2 in
astrocytes (Srinivasan R et al 2015). These mice also show an impairment for their
astrocytes to prune inefficient synapses, which is rescued by the intracerebral
administration of ATP (Yang J et al, 2016). Finally, genome-wide analysis in human
patients revealed that Itpr2 mutations were associated with an increased risk for
sporadic ALS, very likely due to a dysregulation of the Calcium-dependent ATP
release from astrocytes (Van Es M A et al, 2007).
CNP
The 2',3'-Cyclic Nucleotide 3' Phosphodiesterase (CNP) is an enzyme mostly
expressed in OL cytoplasm and excluded from compact myelin. Furthermore, CNP
overexpression induces aberrant OLs membrane formation, which are surprisingly
highly enriched for CNP but deficient for MBP. This suggests that CNP favours
oligodendrogenesis by targeting MBP to the myelin sheath (Yin X et al, 1997). On the
contrary, CNP disruption is involved in hypomyelinating leukodystrophy (Al-Abdi L et
al, 2020), indicating that CNP is a crucial enzyme for OLs differentiation.
In addition to its enzymatic activity, CNP is also involved in cytoskeletal remodelling.
Indeed, CNP is able to bind to microtubules (Myllykoski M et al, 2016) by its C Terminal
part and is involved in actin cytoskeleton reorganisation (Lee et al., 2005). This C
Terminus also contains a Caax motif, allowing it to bind to membranes after a
mandatory post-traductional modification (De Angelis and Braun, 1994). Moreover,

33
CNP has been shown to bind to membranes in rat myelin sheath (Kim and Pfeiffer,
1999). It therefore is very likely that CNP involvement in myelination is explained by a
combination of all its effects.
APC and CC1
Adenomatous Polyposis Coli (APC) is a tumour suppressor gene whose suppression
induces adenomatous polyposis (the formation of a polyp in the intestinal tract).
Knockout models have demonstrated that APC was involved in oligodendrogenesis.
APC regulates OL differentiation by regulating the Wnt/β-catenin pathway but also
through OL cytoskeleton remodelling (Lang J et al, 2013). Interestingly, even if APC
mRNA is mostly found in CNS neurons (Bhat RV et al, 1994), immunofluorescence
stainings based on anti-APC antibodies, especially one recognising the CC1 epitope,
have been used for more than 20 years to characterise the oligodendroglial lineage in
the brain. For a long time, this difference was known to be due to the recognition of
another epitope by APC-CC1 antibody but this target remains unknown for a long time
(Brakeman et al., 1999). Four years ago, this oligodendroglial-specific other target was
identified. The APC-CC1 antibody recognizes Quacking 7, an RNA-binding protein
highly expressed in CNS myelinating oligodendrocytes (Bin JM et al, 2017). Recent
data shows that the CC1 antibody was also able to recognise astrocytes stained by a
GFAP-driven GFP expression in mice (Behrangi N et al, 2020), suggesting that it could
recognise a broader population than oligodendrocytes.
Opalin
Opalin, or TMEM10, is a brain-specific small transmembrane protein first
characterized in temporal lobe epilepsy and spastic paraplegia (Nobile C et al, 2002).
Opalin starts to be upregulated at the onset of OL differentiation and is more and more
expressed as oligodendrogenesis progresses, with a maximum expression in late
stages of OLs differentiation/maturation. Its first intron contains an enhancer directly
bound by Myt1 and CREB transcription factors. Overexpression of one of these two
proteins activates this region to enhance Opalin expression which promotes

34
oligodendroglial differentiation (Aruga J et al, 2007). Moreover, the overexpression of
Opalin induces an increased expression of myelin genes, such as CNP or MAG, and
OpalinKO in primary cultures induce a dramatic increase of OPCs differentiation and
MBP mRNA expression (de Faria O et al, 2019). Finally, Opalin plays a crucial role in
OL differentiation during MS-related demyelination as leukemia inhibitory factor (LIF)
administration in cuprizon MS mice model induces an increase of both Opalin and
MOG compared to Sham mice (Mashayekhi et al, 2015).
35
CHAPTER III: Myelination and Remyelination
Myelin generation and function
During the development of the brain and all along life, OLs synthesize large amounts
of plasma membrane to enwrap axons called myelin sheaths. The term «myelin» was
invented by Rudolf Virchow in 1864 in reference to the Greek term for «marrow»
(myelos) when he observed a high concentration of myelin in the brain core, also called
the brain marrow. Virchow hypothesized that this substance was secreted by the
neurons but, about one century later, Pio del Rio Hortega proved it was indeed
synthesized by the OLs, a new kind of brain cells he identified with the improvements
of its own staining protocol.
In rodents, myelination first occurs in the spinal cord at embryonic stages, then in the
brain and optic nerve (ON) during the first few postnatal weeks. In humans, myelination
starts also before birth but occurs mainly during a long postnatal period. The study of
the human optic nerve postnatal growth revealed that the ON elongates by 80% during
the 3 firsts postnatal years and reaches its final length only around 15 years old
(Bernstein SL et al, 2016).
In the CNS, study of the white matter progression from birth to 4,5 years in children
revealed that the human brain is almost totally unmyelinated at birth (Aubert-Broche
et al, 2008). In the 9th first months, myelination quickly spread from the most central
parts of the brains to the superficial areas and from the occipital and parietal lobes to
the frontal and temporal lobes (Williamson and Lyons, 2018). Myelination continues
during childhood then during adolescence and is associated with cognitive
development (Mabott et al, 2006) and increased processing speed (Scantlebury N et
al, 2014). Throughout adult life, myelination keeps occuring in the adult brain at a lower
level and is the base of cerebral plasticity, which gives the brain the ability to adapt
itself all along life, and starts declining with aging.

36
Myelin composition
Myelin is a multilayered stack of membranes tightly attached together both at their
cytosolic and extracellular surfaces. A myelinated segment (lamellae) usually covers
150 nm of axonal surface. Myelin is an exceptionally stable structure, maintained both
by its simple molecular composition and its specific architecture. When observed in
electron microscopy, myelin shows a characteristic alternating structure between
electron-dense and electron-light layers. These electron-dense lines come from the
apposition of the inner plasma membrane whereas electron-light lines are created by
the small (~12nm) outer space between two wraps (Figure 08).
Figure 08 Structure of the myelin sheath. Myelin is composed of an alternance of Dense and non dense
layers visibles with electron microscopy. They are formed by superposition of the cell membranes from
the concentric wrap. Myelin sheaths contain less compacted lines in their structure called longitudinal
incisures. From Simons and Nave et al, 2016

37
Myelin composition was first analysed by mass spectrometry or by dyes injection in
OLs. The firsts electronic imaging attempts were impaired by the shrinkage or
collapsing of the intracellular spaces. Tissue architecture preservation was enhanced
in the 1950’s with high-pressure freezing EM imaging, which is the standard tool of
myelin structure evaluation nowadays (Bunge et al., 1962, 1965, 1967).
This structure is so close to its thermodynamic equilibrium state that it has been shown
to remain stable several weeks after OL depletion (Pohl et al., 2011). Even 5000-year-
old myelin samples dissected from the Tyrolean IceMan were still presenting an intact
molecular configuration and retained fine structure (Hess et al., 1998). Evidence based
on carbon dating shows that mOLs themselves remain quite stable, with a turnover
rate in the human adult brain of only 0,3% after 5 years (Bercury and Macklin, 2015).
All myelin components have half-lives of several weeks to months. The strong forces
that bring opposite myelin bilayers together are based on a combination of electrostatic
and hydrophobic forces. Every mismatch in the positive to negative charges ratio
results in repulsion, giving rise to membrane swelling and demyelination.
Lipids are the main component of the myelin (between 73% and 81% of the total dry
weight). Glycosphingolipids (~27%) and plasmalogens (~17%) are the most abundant
in myelin sheaths. Glycosphingolipids (galactosylceramide (GalC) and sulfatide)
present notable differences in myelin sheaths compared to other plasma membranes,
with high levels of fatty acid hydroxylation and a headgroup based on galactose
instead of glucose like in regular plasma membranes. Myelin glycosphingolipids also
incorporate very-long-chain fatty acids with chain lengths up to 26 carbons. Finally,
plasmalogens represent 70% of phosphatidylethanolamine, instead of their diacyl form
found in other membranes.
Proteins are much less represented in myelin and no genetic building plan for its
spatial organisation has yet been identified, suggesting an epigenetic control of
myelination. In a regular plasma membrane, the protein-to-lipid dry weight ratio varies
from 1/1 to 4/1 compared to ~1/4 in myelin. Interestingly, the most represented
proteins in myelin sheaths, like the Myelin Basic Protein (MBP), the Proteolipid protein
(PLP) or the Myelin Oligodendrocytes Glycoprotein (MOG), are mostly dispensable for
myelination itself but are required in OLs or Schwann cells for axonal health.

38
Indeed, several mice models have been studied to understand protein requirements
in myelin but it seems clear that myelin biogenesis in the CNS is indeed relatively
insensitive to perturbations, with a strong capacity to maintain its spatial organization
(Zoller et al., 2008). Moreover, it is a typical feature of self-organizing systems that are
organized in a way that allows redundant control. A lack of UDP-galactose:ceramide
galactosyltransferase (CGT), by example, does not affect myelin formation but induces
a clear reduction of its thickness. Interestingly, FA2H-deficient mice, that lack 2-
hydroxylated galactosylceramide and sulfatide, present normal myelin sheaths at the
beginning but they tend to degenerate in old age (Potter et al., 2011).
Interestingly, PLPKO OLs keep their ability to myelinate axons in mice but also generate
abnormally condensed extracellular leaflets of adjacent myelin membranes, which are
much less stable than regular myelin (Klugmann et al., 1997). Therefore, it is clear that
unknown interactions could partially compensate for the loss of PLP. In pre-
myelinating OLs, a PLP pool accumulates in late endolysosomes, which quickly
disappears once myelination starts (Trajkovic et al., 2006). As OL have shown to
secrete exosomes/microvesicles, it is possible they use these vesicles to get rid of
their wastes (Fitzner D et al, 2011).
All myelin components help the structure to stay stable and repulse all foreign
molecules. For example, most of myelin proteins are hydrophobic to minimize the
amount of cytoplasm inside the membrane. The Myelin Basic Protein (MBP) is also
known to tightly bind the inner membranes together. Strong hydrogen bonds between
galactosylceramide and sulfatide, reinforced by their high fatty acid hydroxylation,
represents one of the most attractive force binding myelin membranes together.
Impairment of MBP mRNA transport into the myelin sheath (by kif1bKO) induces an
accumulation of MBP in the cell body and the formation of stable complexes at
inappropriate cellular locations (Lyons et al., 2010).
Finally, when two lipid molecules are close, their methylene group interacts with each
other and generates Van der Waals forces, stabilizing the whole structure.
Interestingly, models with an impaired lipid metabolism show relatively mild
phenotypes at the myelin sheath level. CerS2 null mice, by example, form less but
relatively normal myelin, with reduced levels of MBP, and present only mild structural
defects (Imgrund S et al, 2009). DAPAT (a substrate of plasmalogen biogenesis) null

39
mice that lack ethanolamine plasmalogens produce normal but reduced amounts of
myelin.
Axon wrapping
Myelination varies a lot in the different brain regions and across the CNS. OLs from
the spinal cord could create up to 150 lamellae on a length of 1500 μm (Remahl and
Hildebrand, 1990), where those from the corpus callosum and the cortex usually form
30 to 80 on a length of 20 to 200 mm with up to 60 lamellae (Matthews and Duncan,
1971; Chong et al., 2012) or those from the ON generate 40 internodes.
A strong relationship links the axon diameter, the number of lamellae and the internode
length. By example, the increase from 1 to 15 mm of the axon diameter induces the
extension of the internode length from 100 to 1500 mm (Murray and Blakemore, 1980;
Hildebrand and Hahn, 1978). OLs produce more myelin wraps around larger caliber
axons and a relatively consistent g-ratio (the ratio of the axon diameter and the
myelinated fiber diameter) have been described using axons of different diameters
(Hildebrand and Hahn, 1978; Friede and Bischhausen, 1982). More recent works even
demonstrated that artificial nanofibers could be myelinated by oligodendrocytes and
are even sufficient to induce the differentiation of OPC into OL in neuron free condition
In Vitro cultures (Li Y et al, 2014).
Myelin sheaths are formed from the inner turn of the oligodendrocyte plasma
membrane extending in a concentric and lateral movement down the axon (Fig. 09-
A,B). First, the OL growth cone contacts and binds to an axon using cytoplasmic
channels(Fig. 09-C,a). Then, this growth cone shapes into a triangle (Fig. 09-C,b), with
its inner part starting to form compact myelin. The outer part of the sheath, on the
contrary, stays relaxed and will turn around the axon and the basal part will extend
laterally to cover the whole internode length (Fig. 09-C,c). After a precise number of
turn (or lamellae), the outer part of the former growth cone also extends laterally and
all the cytoplasmic channels closed themselves, forming a ultra-stable rectangular
shaped sheath (Fig. 09-C,d) tightly wrapped around the axon (Sobottka et al., 2011).

40
Figure 09 Dynamic of the myelin sheath wrapping. After finding an axon to myelinate, the myelin sheath
first extends laterally (A), before wrapping around it (B). In detail, oligodendrocyte growth cones first
contact the axon (C-a) and form a triangle-shaped structure (C-b). This structure will progress around
the axon, producing compact myelin at its base where its edges are mostly uncompacted (C-c). When
the wrapping end, the edges extend laterally to form a stable rectangular structure of compacted myelin
(C-d) From Aggarwal, Yurlova and Simons, 2011
Myelination is a strictly ordered but quick process. In Zebrafish, 5 hour are sufficient
for OLs to undergo the full myelination process from their first to their final myelin
sheath production (Czopka et al., 2013). OLs from other parts of the zebrafish spinal
cord start their myelination at different time points but always within this 5hr time
window.
Furthermore, myelination could be regulated in various ways. More myelin is found in
the 5th and the 6th cortical layers compared to the 2nd and the 3rd. Moreover, these
deeper layers are more uniformly myelinated where upper layers present
unmyelinated segments (Tomassy et al., 2014). This could be explained by the
neuronal diversity with each separate class of cortical neurons having different

41
signalling patterns locally modulating myelination. These neuron-OL interactions could
therefore play a critical role in developing adult brain plasticity.
In medial prefrontal or the barrel cortex, a clear impact between myelination and
neuronal activity have been demonstrated, by whisker trimming (Barrera et al., 2013),
social isolation (Makinodan et al., 2012) or motor learning experiments. Moreover, a
significant increase in the white matter volume can be observed after only several
weeks of practicing piano (Bengtsson et al., 2005), learning to juggle (Scholz J et al.,
2009) or even the learning of a new language (Schlegel AA et al., 2012). Neuronal
activity impacts myelin plasticity which in turn modulates neural electrical activity and
behaviour. For example, the release of neurotransmitters impacts OLs calcium levels,
which modify the local translation of MBP (Wake et al., 2011). Myelination is impaired
by the action potential inhibition using neurotoxins, whereas increasing neuronal
electrical activity promotes myelination (Demerens et al, 1996).
In myelinating co-cultures, the OL response to glutamate could be altered by
neuregulin or other signalling molecules. Interestingly, blocking the differentiation of
OPCs into OLs, or even the expression of myelin proteins in OLs, severely inhibits
motor learning (Gibson et al., 2014; McKenzie et al., 2014), suggesting that
myelination is also a key regulator for brain learning and plasticity. More generally, the
amount of generated myelin and the OL response to axons of various diameters could
be altered by localized cues.
In the uninjured, healthy adult brain, OPCs keep producing OLs and new myelin is
continually generated (Yeung et al., 2014; Young KM et al., 2013). Furthermore,
numerous axons remain unmyelinated, especially in the adult grey matter. In neuron-
free cultures, OLs still generate highly asymmetric cell surfaces and form large myelin
sheaths. Even if no unique myelination signal has been identified in both neurons and
OLs, MBP seems to play a crucial role. Its mRNA is transported from OLs perikaryon
to their growth cone by Kif1b, a motor protein, inside granules (Lyons et al, 2009), in
response to various stimuli like the fyn (White R et al, 2008) or the a6β1 integrin
activation (Laursen et al, 2011). MBP is strongly charged positively and interacts with
the negatively charged cell membrane, which restricts the entry of large cytoplasmic
domains’ protein in myelin sheaths (Aggarwal et al., 2011).

42
Actin cytoskeleton remodelling
During oligodendrogenesis and myelination, OLs change their shape multiple times
(Bauer NG et al., 2009). These shapes modification is based on cytoskeletal
reorganisation, which is composed of two major components: β-tubulin (or
microtubules) and F-actin, also called microfilaments (Brown and Macklin, 2020).
At the onset of their differentiation, iOLs first extend their processes, forming
lamellipodia that will enwrap axons when they find one. The lamellipodia’s tip forms a
structure highly similar to a neuronal growth cone (Rumsby et al., 2003; Fox et al.,
2006). F-actin is mainly concentrated in these edges whereas microtubules are
distributed all along the cell in more stable processes (Lunn et al., 1997). More
generally, F-actin is localised in dynamically active membrane areas whereas β-tubulin
is found in stable parts, away from the moving leading edge (Fig. 010).
Figure 010 Oligodendroglial cytoskeleton dynamic. In oligodendrocytes processes are stabilised by a
microtubule network. On the contrary, the motile oligodendrocytes growth cones contained high levels
of actin (A). The outgrowth of these structures is ensured by actin-associated proteins such as N-WASP,
WAVE1. In parallel, the microtubule polymerisation is inhibited by RhoA (B) From Michalski and
Kothary, 2015

43
As the growth cone progresses, the easily remodelled F-actin, required for the
filopodia progression, is replaced by β-tubulin, which is more stable and will therefore
compact the cytoskeleton in stable straight processes (reviewed in Michalski and
Kothary, 2015). The same phenomenon happen during axon enwrapment: the inner
tongue that will progress all around the axon is mainly composed of F-actin and is
progressively replaced by microtubules to compact the structure, forming a dense
pattern of tendrils snaking between larger pockets of compact membrane (Dyer and
Benjamins, 1989, I and II; Boggs and Wang, 2001).
Maturating OLs acquire a more complex morphology. Their microtubules display
increased levels of acetylated α-tubulin, indicating long-term stability both for
microtubules and their process (Lunn et al., 1997; Song et al., 2001; Lee et al., 2005).
But even if microtubules are a long lasting stabilizing structure, both of the cytoskeletal
components are missing in the final myelin sheath, indicating that the microtubules are
also actively removed during myelin maturation (Dyer and Benjamins, 1989 I and II;
Boggs and Wang, 2001, 2004; Bauer et al., 2009; Aggarwal et al., 2011)
Several key regulating proteins for cytoskeleton remodelling are found at OLs leading
edges (Fox et al, 2006). Among them, the Arp2/3 complex, one of the initiators of the
growth cone formation, stays present all along OL differentiation at the edges. Arp2/3
inhibition in OL cell culture impairs the formation of their growth cone and therefore
reduces OL branching (Zucchero et al, 2015 II). More generally, the OL growth cone
and its actin cytoskeleton could be considered as the driven of all the morphological
changes undergone by OLs during their differentiation (Thomason E.J, 2020)
WASP family proteins also play a key role in OL cytoskeleton remodelling. In the optic
nerve, a chemical inhibition of N-WASP in the optical tract impairs the process
extension and filopodia retraction of OPCs. N-WASP inhibition also reduces axon
ensheathment (Bacon et al., 2007). Interestingly, N-WaspKO mice present both a white
matter general hypomyelination and a focal hypermyelination of unmyelinated axons
or neurons’ cell body, indicating that N-WASP plays controls the inner lip of the OL
growth cone extension (Katanov C et al, 2020). WAVE1KO induces a decreased
number of processes produced by OLs without affecting the neuron or astrocyte
morphology. These mice also present myelination defects in their optic and a
hypomyelination of their corpus callosum (Kim HJ et al., 2006). More generally, it

44
appears that N-WASP, WAVE1 and the Arp 2/3 complex interact together to control
the assembly of the microfilament network at the growth cone level (Ridley, 2011).
The involvement of the small Rho GTPases Rac1, Cdc42, and RhoA in
oligodendrogenesis are unclear even if they can be found in OLs growth cones (Kim
HJ et al., 2006; Bacon et al., 2007). Indeed, the OL-specific ablation of Cdc42 or Rac1,
contrary to the WASP protein inhibition, did not affect OPC proliferation, directed
migration, or their differentiation In Vitro. Furthermore, Cdc42KO or Rac1KO OLs shows
an abnormal cytoplasmic accumulation in their inner tongue (Thurnherr et al., 2006),
suggesting that Cdc42 and Rac1 synergistically regulate myelination in myelinating
OLs (Brown and Macklin, 2019).
P21-activated kinases (PAK) are also critical regulators of OL differentiation and of
their cytoskeletal remodelling. PAKs are divided into two subfamilies, with the group I
containing PAK1 to 3 and the group II containing PAK4 to 6 (Brown and Macklin,
2019). Interestingly, PAKs are able to directly impact the cytoskeleton assembly but
also regulate signalling pathways involved in OL differentiation and maturation. The
double suppression of PAK1 and PAK3 in mice, two PAKs highly expressed in OPCs,
impair brain development but only during postnatal stages. These mice also present a
clear hypomyelination and cognitive deficits (Huang W et al, 2011). Interestingly,
PAK3KO induces alone a reduction of cultured OPCs differentiation without affecting
their morphology or proliferation and PAK3KO mice present a hypomyelination at P14
compensated in adult mice (Maglorius Renkilaraj MRL et al, 2017).
Glial support of myelinated axons
The wrapping of multiple layers of myelin membrane sheaths around an axon is critical
for the function of the nervous system. Its first role is of course to protect axons from
the extracellular medium. If this protection is destroyed, like in demyelinating disease
such as MS, axons enter wallerian degenerescence, ending by the total destruction of
the axon (Nave KA, nov 2010).
Historically, myelin was first considered as an axonal insulator allowing faster
conduction of axon potentials by saltatory conduction compared to unmyelinated

45
segments (Waxman, 1980). This saltatory conduction is the basis for fast processing
of information. Myelin sheaths also clustered Na2+ channels into non-myelinated areas
dispatched regularly along the axon called the nodes of Ranvier. Initially, these nodes
were thought to result from damage or disruption of myelin. We know now that they
concentrate a high density of voltage dependent sodium channels. This way, action
potentials are able to jump from node to node without losing any strength between
each internode. Interestingly, these cytoplasmic channels, found in the nascent
membrane, are present during the development but their number reduces quickly from
P10 to P14 in mice.
Oligodendrocytes also provide metabolic support to the axons (Nave KA, april 2010).
To maintain the BBB, neurons, which mostly use lactate instead of the glucose as an
energy source, never interact directly with the blood vessels and fully depend on glial
cells for their metabolic needs. Oligodendrocytes import glucose from the blood
vessels, metabolize it into lactate and deliver it to myelinated neurons, through the
myelin sheath, with the help of MCT proteins (Rinholm JE et al, 2011; Lee et al.,
2012)). Interestingly, oligodendrocytes also use this lactate as a source of energy and
a precursor for lipid synthesis (Sánchez-Abarca et al, 2001). Astrocytes are also able
to capture the glucose from the brain capillary, metabolize it into lactate, carrying it to
synapses or neuronal cell bodies, and could even transfert it to oligodendrocytes by
coupling with them (Fig. 011). Therefore oligodendrocytes and astrocytes each
contribute to the whole axonal trophic support, (Amaral et al., 2013). It is even
considered that changes in myelination could represent a new kind of CNS plasticity
(reviewed by Fields, 2010; Bercury and Macklin, 2015)

46
Figure 011 Glucose metabolization into lactate by the astrocytes and oligodendrocytes to provide
trophic support to neurons. Astrocytes and oligodendrocytes are able to capture the glucose from blood
vessels and to transform it into lactate, an energy source predominantly used by neurons.
Oligodendrocytes provide lactate to myelinated segments where astrocytes support neurons at the level
of their soma and synapses. Astrocytes are also able to directly export the lactate to oligodendrocyte to
indirectly support neurons’ myelinated segments. From Saab, Tzvetanova and Nave, 2013
PNS Schwann cells, which myelinate a unique axon, also provide metabolic support
through localized myelin uncompaction named the Schmidt–Lanterman incisures. This
structure is formed by the engulfment of the outer cytoplasmic layer to create a network
of interconnected cytoplasmic pockets (1.9 pockets per 10 mm sheath length
(Velumian et al, 2011). It allows the Schwann cells to distribute nutrients and
molecules to the neurons through the internode, all along the axon.
Finally, glial cells are also involved in angiogenesis. Stable HIF1/2α expression in
OPCs, a critical angiogenic factor, induces inhibition of OPCs maturation through the
Wnt canonical pathway but also an increased postnatal angiogenesis. On the contrary,
OPC-specific HIF1/2α deletion strongly impairs the formation of blood vessels in the

47
corpus callosum and leads to a critical neuronal loss. In Vitro studies suggest that
OPCs are able to stimulate endothelial cell proliferation through paracrine effect (Yuen
et al, 2014). During the retina development, astrocytes expressed high levels of VEGF,
which are hypothesized to attract endothelial cells and promote angiogenesis.
VEGF/HIF suppression specifically in astrocytes provides contradictory data with 3
teams over 4 supporting the pro-angiogenic effect of retinal astrocytes (Rattner A et
al, 2019). Finally, CNS vascular defects could be observed in MS lesions (Buch et al,
2020), contributing significantly to disease pathogenesis and progression and
highlighting the contribution of neuron-glia interactions to a proper CNS
vascularisation and its importance for brain health.
Oligodendroglial pathologies and therapeutics
Oligodendrocytes in Neurodegenerative disorders
Most human developmental disorders and neurodegenerative diseases involve subtle
or pronounced white matter deficiencies. Alterations of glial structure, function or
interaction with neurons are seen in human psychiatric disorders (Haroutunian et al.,
2014) and developmental disorders, including autism spectrum disorder (ASD),
sensory processing delay disorder (Owen et al., 2013), attention deficit hyperactivity
disorder (Li et al., 2010; Wu et al., 2014), and Rett syndrome (Mahmood et al., 2010).
Myelin malfunctions are also seen in other adult neurodegenerative disorders.
Alzheimer’s disease (AD) patients present a reduction of their cortex thickness (Cho
H et al, 2013) and lesions in their white matter favor the transition from mild cognitive
impairment to established AD (Defrancesco et al., 2013, 2014). The white matter from
the frontal and temporal parts of the brain from Amyotrophic Lateral Sclerosis (ALS)
patients present atrophy and their corticospinal tract also tend to degenerate (Lillo et
al., 2012; Pettit et al., 2013). An increased proliferation of NG2+ cells have been
observed in ALS mouse models and Oligodendrocyte genes are impaired prior to the
typically observed motoneurons degeneration (Kang SH et al., 2013). Parkinson’s
disease patients also present reduced white matter thickness (Kim HJ et al., 2013). In
Huntington’s disease, finally, an early demyelination of the corpus callosum have been
described even before the onset the onset of the disease in the patients, suggesting

48
that oligodendroglial dysregulation is one of the first step of the disease (Philips et al.,
2013).
Oligodendroglia could also become malignant cancerous cells. Glioma, the most
common intracranial tumor, represents 81% of malignant brain tumors and could
originate from astrocytes (astrocytomas), oligodendroglia (oligodendroglioma) or both
of them (oligoastrocytoma). Gliomas are graded in 4 classes by the World Health
Organisation (WHO) where glioblastoma (WHO type IV gliomas) are the most
malignant and the deadliest, with only 0,05% to 4,7% of patients surviving the 5 years
after their diagnosis (Ostrom QT et al, 2014). In general, gliomas with an
oligodendroglial component have increased survival, as opposed to those with an
astrocytic component (Sant M et al, 2012). Due to a quicker diagnosis and new
treatments, there has been an increasing trend in survival from oligodendroglioma in
the population (Nielsen MS et al, 2009). By example, WHO grade III
oligodendrogliomas, which are not significantly receptive for radiotherapy alone, have
been shown to be uniquely sensitive to chemotherapy. A study on a European cohort
has reported a progression free survival of 2.0 years after radiotherapy plus
administration of procarbazine, lomustine and vincristin chemotherapy compared with
1.1 years after radiotherapy alone (Lecavalier-Barsoum M et al, 2014).
Multiple Sclerosis
MS is an autoimmune neurodegenerative disease affecting 2.5 million people
worldwide, with 75% of the case being women. MS also has the highest prevalence
both in developed and developing countries (Dobson and Giovannoni, 2018).
Even if the precise causes of MS remain unknown, several risk factors have been
clearly identified. Smoking, for example, increases by 50% the risk of MS. There is
also a clear corelation between the evolution of smoking habits of women and the MS
sex ratio during over than one century, starting from 1900 (Palacios et al., 2011). A
symptomatic infection by the Epstein-Barr virus also doubles the chance to develop
MS later on (Handel et al., 2010). Several other environmental factors could interact
with the individual genetic background and induce MS, like Vitamin D (Manousaki et
al., 2017) or UVB exposition. Migration studies support this statement as adult
migrants from MS low risk countries to Europe keep a low risk of developing the

49
disease where their children born in Europe present a high MS risk similar to the rest
of the population (Kurtzke JF, 2013).
MS is an auto-immune disease where the myelin sheath of patients is targeted by their
own immune system. It is composed of 3 phases: the asymptomatic, the prodromal
and the symptomatic phase. During the early phases of the disease, the patient’s CNS
undergoes multiple localized demyelinating assaults by the immune system. It is
estimated that for each clinical attack, approximately 10 ‘asymptomatic’ lesions could
be detected using magnetic resonance imaging (MRI). These lesions stimulate the
differentiation of the residents OPCs and are quickly repaired but the new internodes
are thinner and shorter (Blakemore and Murray, 1981; Gledhill and McDonald, 1977).
After 6 months of recovery, the newly remyelinated fibres are similar in length and
thickness to developmentally myelinated axons (Powers et al., 2013).
Recent work uncovered genetic differences between patients, categorizing MS in two
types (Jia et al., 2018). The relapsing– remitting MS (RRMS) is characterized by an
alternance of phases where the immune system attacks, which could induce clinical
symptoms (the relapsing phases), and of remyelination phases where the patient
recovers from the attacks (the remitting phases). The primary progressive MS (PPMS),
on the contrary, is based on an accumulation of neurological disabilities from the
disease’s onset. It was previously undetected probably due to the under-
representation of PPMS in genome-wide association studies cohorts (Jia et al., 2018).
In the two forms, neuroinflammation increases constantly as the disease progresses
until patients reach the final phases where no repairs of the demyelinated lesions is
possible.
As the disease progresses, OPCs fail to differentiate into OL and repair the myelin
defects. Unprotected axons undergo neuronal death through Wallerian
degenerescence, and symptoms, based on the lesion localisation, appear. MS
differential diagnosis is notably based on monosymptomatic acute optic neuritis, often
associated with severe visual loss), brainstem defects (strokes, space occupying
lesions, brainstem encephalitis, …) or spinal cord syndromes (Oedema, Spinal cord
compression, artery occlusion, …). The broad range of symptoms and their transiency
in RRMS make MRI a powerful tool to directly detect MS lesions in patients after the
appearance of several symptoms (Dobson et al., 2018).

50
CHAPTER IV : Tensins proteins
State of the art
General overview
The Tensin (Tns) is a family of focal adhesion proteins composed of 4 member in
mammals: Tensin1 (Tns1), Tensin2 (Tns2 or TENC1), Tensin3 (Tns3) and Tensin4
(Tns4 or cten). Tensin 1, 2 and 3 proteins interacts respectively with the actin
cytoskeleton and integrins through an actin binding domain (ABD) at their C Terminal
part, and SH2-PTB (Phospho-tyrosine binding) domain at N terminal part, anchoring
actin cytoskeleton to focal adhesion sites. Tns4 is a truncated version of the other
Tensins, sharing the SH2-PTB domain with the other without any ABD. The N-Ter and
C-ter part of Tensins are highly conserved but the medial part could vary a lot. This
could explain the difference in specific functions that have been described over years
for each tensins (Liao and Lo, 2021).
Interestingly, a unique homologous protein, blistery (by), has been described in the
drosophila for the whole Tensin family, critical for the wings unfolding. In mammals,
tensins are broadly expressed and can be found in many various tissues such as
intestines, lung, heart, liver and even the brain. The first Tensin, Tns1, has been
described by (Davis et al in 1991) as a 90 KDa protein fragment immunoprecipitated
from a chicken smooth muscle actin extract. A decade later, three other members,
Tns2 (Chen H et al., 2002 ), Tns3 (Cui Y et al., 2004 ) and Tns4 (Lo SH and Lo TB,
2002 ) were identified.
Tns1 is a gene coding for 1735 amino acid proteins with an estimated size of 186 KDa,
localized on chromosome 2 in humans. Tns1 is the biggest Tns and is characterised
by the presence of a secondary Actin binding domain localised in its medial area
(between amino acid 783 and 882). It’s secondary ABD have been shown to regulate
actin barbed end polymerisation (Lo SH et al, 1994). Over 20 splicing variants have
been identified for Tns1 but surprisingly the regular full-length isoform, containing the
full coding sequence, is predominantly expressed in the brain (Fig. 012).

51
Figure 012 Tensins isoforms expression in the brain. Up: Each line represents a Tensin splicing variant
expression in several brain areas (column). Brightness is correlated with the isoform expression, dark
blue being a strong expression. Down: Representation of each Tensin isoform detected in the brain to
this date. Each square represents an exon. Isoforms from the same Tensin are aligned from their
starting exon. No Tns4 isoform is expressed at detectable levels to this date. Data from GTEX database
(https://gtexportal.org/home/)
Tns2 is a gene coding for 1409 amino acid proteins with an estimated size of 153 KDa,
localized on chromosome 12 in humans. Tns2 is the second Tensin discovered and

52
was initially characterized as a phosphatase homologue to Tensin (1) and containing
a C1 domain, which explains its first name: TENC1, for C1-Ten. A lot of Tns2 splicing
variants have also been identified but only three of them have been found in humans.
They all contain this exclusive C1 domain, absent in other Tns, and are expressed in
brain tissues (Fig. 012). In order to understand theTns2 C1 domain function, a C1-
GFP fusion protein has been expressed in human prostate adenocarcinoma cells.
Interestingly, C1-GFP has been detected in the nucleus, suggesting that this domain
could be a Nuclear localisation signal (Hafizi et al, 2010). Furthermore, no full-length
Tns2 endogenous expression has yet been characterised in the cell nucleus, so the
real function of the Tns2 C1 domain remains to be defined.
Tns3 is a gene coding for a 1445 amino acid protein with an estimated size of 155KDa
and an observed size of 180KDa, localized on chromosome 7 in humans. It contains
32 tyrosines, 13 of them could be potentially phosphorylated. Of the 12 Tns3 isoforms
identified, two are found in brain tissues. Indeed, a small 60 Kda isoform containing
only the Tns3 C Terminal part, that we will call small Tns3, is expressed in addition to
the full-length protein. The small Tns3 isoform is very similar in structure to Tns4 and
is also the most expressed isoform in total brain tissues (Fig. 012). Tns3 is the only
Tensin enhancing GAP activity of DLC1 in osteoclasts (Touaitahuata et al., 2016),
glioblastoma cell lines (Chen HY et al., 2017) and EGF-treated MCF10A non-
malignant mammary cells.
Tns4, formerly c-ten for C-terminus homology Tensin, is a gene coding for 745 amino
acid proteins with an estimated size of 77 KDa, localized on chromosome 17 in
humans. Tns4 shares only its C-terminus with the other Tensins. It also contains a
specific focal adhesion binding (FAB), including a Nuclear Export sequence (NES).
Finally, Tns4 contains a Nuclear localisation signal (NLS) in its SH2-PTB domain and
is currently the only Tensin member known to translocate into the nucleus. Only 4
Tns4 isoforms have been identified and none of them is predominantly expressed in
brain tissues (Fig. 012). By its tridimensional structure, Tns4 could act as a competitive
antagonist for the other Tensin binding to Focal Adhesion.

53
Tensins proteomic structures:
Tns1, Tns2 and Tns3 shared a similar C2-PTP at their N-terminus, named FAB-N (N-
terminus Focal Adhesion Binding domain). These two domains are highly similar to
those found in PTEN, a phospholipid binding protein. (Zhang and Aravind, 2010). Tns1
C2 domain contains a specific binding site to recruit at focal adhesion sites the protein
phosphatase-1α. Tns1 PTP domain lacks an essential cysteine residue and is
considered as an inactive PTP (Alonso and Pulido, 2016). Tns2’s PTP domain is
lacking an arginine residue in its signature motif but still has a PTP activity comparable
to PTEN in vitro (Koh et al., 2013). Finally, even if the Tns3 motif contains both the
arginine and the cysteine, it has yet never been described to have a PTP activity.
Figure 013 Protein domains of the Tensins family members (Tns). Tns1, 2 and 3 shared a C-Terminal
SH2-PTB domain and N-terminal Actin Binding domain (ABD) composed of a PTP and a C2 domain,
and SH2. Tns4 only contains the SH2-PTB domain. Tns2 possesses an additional C1 domain at its C-
terminus and Tns1, a second ABD in its medial part. From Liao and Lo, 2021
The association of these two domains form the Tensins Actin binding domain 1 (ABD
I). It is therefore important to precise that F-actin binding activity has only been attested

54
for Tns1 and confirmed on chicken embryos (Lo SH et al, 1994; Chuang et al., 1995)
but is only assumed by similarity of structure for Tns2 and for Tns3. Tns3 ABD I has
also been reported to bind to Dock5 in osteoclast (Touaitahuata et al., 2016). As
present before, Tns1 possesses a secondary actin binding domain (ABD II). Tns1
fragments containing the ABD I or the ABD II are the only ones to bind to actin
filaments. Exposition of ABD II fragment, but not ABD I, to actin barbed end filament
show an actin polymerization delay similar to the full-length Tns1 (Lo SH et al, 1994)
All Tensins shared their C-terminus domain, composed of a SH2 (Src Homology 2)
and a PTB (Phosphotyrosine binding) domain closely spaced, named FAB-C (C-
terminus Focal Adhesion Binding domain). This tandem allows Tns to bind to a great
variety of proteins at focal adhesion such as integrins. Despite all these common
protein domains, their middle region varies a lot across Tensins, granting each of them
unique properties poorly studied to this date (Fig. 013).
Tensins known functions
Cell adhesion
Due to their binding to integrins, Tensins could be found under focal adhesion plates.
The highly dynamic Tns2 is enriched in focal adhesions at the leading edge of cells,
whereas Tns3 is mainly found in fibrillar adhesions. Interestingly, Tns1 is equally
distributed between focal and fibrillar adhesions (Clark K et al, 2010). Tns1 could
interact with Hic5 in a Src dependent manner, allowing fibrillar focal adhesion plates
formation (Goreczny et al., 2018). Interestingly, AMPKKO in fibroblasts, both for α1 and
α2 subunits, induce an increase of Tns1 and Tns3 expression resulting in more focal
adhesion formation. Both Tns1KO and Tns3KO cells show a reduced fibrillar adhesion
formation and fibronectin fibrillogenesis compared to WT cells levels, indicating that
Tns1 and Tns3 plays a crucial role in focal adhesion genesis, negatively controlled by
AMPK (Georgiadou et al., 2017). However, Tns1KO, Tns2KO or Tns3KO cells do not
exhibit issues in focal adhesion formation, suggesting that Tensin’s function in cell
adhesion could be compensated by other proteins (Clark K et al., 2010; Rainero et al.,
2015).
A specific Tns3 interaction in cell adhesion has also been reported. Osteoclast’s
resorbing activities are based on the formation of a podocytes belt named the sealing

55
zone. Proteomic analyses have shown that Tns3, but not the other Tensins, bind with
and activate Dock5 in the sealing zone. Interestingly, this interaction has been
observed in individual podosomes (Touaitahuata et al., 2016). More generally, the
sealing zone formation is based on two separate phenomena. From one side the
recruitment of Dock5 by Tns3 to activate Rac (Nagai et al., 2013), from the other side,
Tns3 bind through it’s SH2 domain to Src phosphorylated p130Cas, a focal adhesion
protein, and link the actomyosin network to promote the podosome belt formation
(Touaitahuata et al., 2016).
Finally, TP63KO in non-malignant prostatic epithelial cells induce a reduction of Tns4
expression and impair cell adhesion. The ectopic re-expression of Tns4 in these cells
restores cell adhesion, indicating that Tns4 also plays a crucial role in this
phenomenon (Yang et al., 2016). TP63KO in MCF-10A cells also show cell adhesion
loss and a reduction of β1 integrin, β4 integrin and EGFR levels (Carroll DK et al.,
2006). The re-expression of one these receptors partially restore cell adhesion,
indicating that Tns4 interacts with these 2 integrins and the EGF receptor (Katz et al.,
2007; Seo et al., 2017), promoting cell adhesion very likely by stabilizing β1 integrin,
β4 integrin, and EGFR.
Cell Proliferation
All Tensins have been extensively demonstrated to promote cell proliferation.
Endothelial cells from Tns1KO mice or siRNA knock-down present reduced
proliferation, migration, and decreased RhoA activity, which is restored after DLC1
silencing. These data suggest that Tns1 promotes endothelial cell proliferation and
migration by inhibiting DLC1-GAP activity toward RhoA (Shih et al., 2015). Recent
clinical studies have also shown that the downregulation of Tns1 expression by
Prazosin in acute myeloid leukaemia cells was inhibiting their proliferation and
survival. Indeed, the depletion of Tns1 impairs the PI3K/Akt/mTOR signaling pathway,
inhibiting cell viability. On the contrary, the over-expression of Tns1 is sufficient to
reverse the effects of prazosin on viability and apoptosis, confirming the positive role
of Tns1 in cell proliferation and survival (Sun X et al, 2020).

56
On the contrary, Tns2 has a general negative effect on cell proliferation. Indeed Tns2
overexpression reduces HEK293 cell proliferation and survival (Hafizi S et al., 2005)
and its silencing promotes cell proliferation, colony formation and xenograft growth of
HeLa cervical cancer cells and A549 lung cancer cells. But interestingly, Tns2 seems
also to be required to mediate thrombopoietin-induced cell proliferation.
Thrombopoietin binding to its receptor c-Mpl induces Tns2 phosphorylation. Therefore,
Tns2KO in the megakaryocytic UT7-TPO cell line induces a reduction of cell
proliferation and Akt signalling activation, which indicates that p-Tns2 have a positive
role in cell proliferation by activating PI3K/Akt signaling (Jung AS, 2011).
Tns3 is highly expressed in tonsil derived mesenchymal stem cells. Tns3KO induces
an increased expression of the cyclin-dependent kinase (CDK) inhibitors p16 and p21
(CDKN2A and CDKN1A), and reduces cell proliferation (Park et al., 2019). An
accumulation of CDK inhibitors p21 and p27 (CDKN1B) is observed in Tns4KO non-
malignant prostate epithelial cells, as well as an attenuation of their proliferation (Wu
and Liao, 2018). By interacting with E3 ubiquitin ligase c-Cbl, Tns4 also reduces
ligand-induced EGFR degradation in cancer cells, which prolongs EGF signaling
cascade and therefore promotes cell proliferation (Hong et al., 2013). MET and β1
integrin are also known to form a stable complex with Tns4 to prevent their
internalization and degradation (Muharram et al., 2014). Tns4 overexpression has also
been linked to an increased cell proliferation. In human keratinocytes, it binds and
activates β4 integrins, which triggers FAK and ERK activation and promotes cell
proliferation (Seo et al., 2017), and expression of nuclear Tns4 enhance HeLa cells
proliferation (Hong et al., 2019).
The Tns3/Tns4 cell motility switch
EGF signalling directly impacts Tns3 and Tns4 mRNA expressions. Interestingly, low
EGF level are associated with high Tns3 and low Tns4 expression. This induces a
strengthening of the actin cytoskeleton and therefore inhibits the cell motility. At high
EGF levels, Tns4 is upregulated and its protein will compete with Tns3 to bind to the
cytoplasmic tail of β1-integrin. As Tns4 does not bind to the actin cytoskeleton, this
will induce a disintegration of actin stress fiber and a general relaxation of the actin

57
cytoskeleton, favouring cell motility (Katz et al, 2007). It is interesting to note that
OPCs, which are highly motile, are very sensitive to EGF for their survival and lose
this dependence to growth factors when they become immature oligodendrocytes,
where the Tns3 is highly expressed (Fig. 014).
Figure 014 EGF driven Tns3-Tns4 (cten) reciprocal motility switch. In resting cells, Tns3 is bound to
F-Actin and integrin, stabilising the cytoskeleton. EGF expostion induces the repression of Tns3 and
the expression of Tns4. At the intergin level, Tns4 bound to integrin but not to actin, destabilising the
cytoskeleton and therefore promoting cell motility. From Katz et al, 2007
In addition to these competitive effects that will relax the actin cytoskelteon, EGFR
activation also induces the dephosphorylation of FAK and p130Cas and, therefore, the
dissociation of the Tns3-FAK-p130Cas complex. In parallel, EGFR activation induces
its tyrosine phosphorylation, which will enhance Tns3 binding to this residue through
it’s SH2 domain (Cui et al., 2004). So high levels of EGF will not only induce
downregulation of Tns3 but also a change of its binding partners. Under EGFR
activation, the main protein to which the residual Tns3 could bind is EGFR.

58
Figure 015 DLC1 regulation by the EGF driven Tns3/Tns4 motility switch. In resting cells, Tns3
activates DLC1 by binding to its autoinhibitory SAM domain. Activated DLC1 favors RhoA coupling to
GDP, leading to cell resting state. EGFR activation leads to Tns3 repression and Tns4 enhanced
expression. Tns4 does not suppress the autoinhibition of DLC1 by its SAM domain, leading to RhoA
coupling to GTP and increased cell migration. From Cao et al, 2012
Both Tns3 and Tns4 are able bind DLC1 through their SH2-PTB domains but Tns3’s
ABD, not present in Tns4, binds the SAM domain of DLC1. The DLC1 SAM interaction
with Tns3 replaces its auto-inhibiting interaction with its own RhoGAP domain and will
activate it. Activated DLC1 favours the RhoA coupling with GDP and therefore induces
a cell resting state. As Tns4 doesn’t have ABD, its binding to DLC1 does not activate
DLC1 RhoGAP activity, which favours opposite cell migration through RhoA coupling
to GTP (Fig. 015).
In conclusion, there is a Tns3/Tns4, EGF dependent, motility switch in cells. Low levels
of EGF are associated with Tns3 high expression and Tns4 low expression. Tns3 is
able in this situation to bind to integrins, stabilising the cytoskeleton, and to activate
DLC1, which both induces a cell resting state. After EGFR activation, Tns3 is
downregulated and Tns4 will replace it at integrins, relaxing the cytoskeleton, and at
DLC1, which in contrast induce cell motility. The remaining Tns3 is captured by EGF
Receptors, reducing again its chances to win the competition against Tns4.

59
External cues and mechanical sensing
β1-integrin (Itgb1), to which Tensins bind, are activated by an increased fibronectin
density or Mn2+ concentration, two external cues (Lin et al, 2013). This activation leads
to the generation of cellular traction forces. Integrins have been extensively described
as the main mechanotransducers of the cell (Schwarz and Gardel, 2012), especially
β1-integrin, which is a major positive mediator of the cell mechanical state (Baker et
al., 2009).
By following the movement of internalised microspheres inside AMPKKO fibroblasts, it
appears that AMPK loss also increases the intracellular rigidity. Interestingly, both
Tns1 and Tns3 expression are increased, suggesting they could bind and activate β-
integrins without AMPK (Georgiadou et al., 2017). The activation of β-integrins
promotes a wide range of intracellular processes including cell spreading, ECM
assembly, mechanotransduction and intracellular stiffness. Therefore, it seems that
the Tensin activity is indirectly regulated by external cues through AMPK inhibition.
In stiff substrates, Tns1 turnover slows down significantly, increasing cell spreading
and migration (Stutchbury et al., 2017). Integrin stabilization and the formation of
fibrillar adhesions are both based on the interaction between Tns1 and Hic-5, which
require Src and is sensitive to the substrate’s stiffness (Goreczny et al., 2018).
A recent study also shown a shortening of fibrillar adhesion length in Tns1KO fibroblasts
cultivated on stiffness-gradient gel, demonstrating the Tns1 requirement for stiffness-
induced adhesion elongation (Barber-Pérez et al., 2020). Finally, in response to a
stretching stimulus, Src phosphorylates a tyrosine of p130Cas. Tns1 binds this
p130Cas residue and anchors it to the actin cytoskeleton, thus promoting cell
migration (Zhao et al., 2016). It is interesting to note that Tns3 has also been shown
to bind to p130Cas (Qian et al., 2009) but not to Hic-5. Together, these data show the
implication of Tensins in sensing external mechanical cues.

60
Physio-pathology of Tensins dysfunction
Morphological defects of Tensins knockout in different organisms
Contrary to mammals, Drosophila and Caenorhabditis Elegans possess only one
Tensin. In Drosophila, Tensin homologous gene is named blistery, highly similar to
Tns4 structure and is mainly localized in focal adhesion sites. Blistery overexpression
in flies wing disc during development increase JNK activity and induce a massive cell
apoptosis (Lee et al., 2003) where as blisteryKO flies present issues in the wing
unfolding during development, due to a destabilisation of integrins adhesive contacts
(Torgler CN et al., 2004). On the contrary, C. elegans tensin is similar in sequence to
Tns1. Interestingly, TnsKO doesn’t seem to affect worm development or morphology
but reduce pharyngeal pumping and their impair defecation cycles (Bruns AS and Lo
SH, 2020).
In Zebrafish, Tns1 ortholog knockout impairs heart mitral valve development (Dina C
et al., 2015). Tns1KO mice present disruption of their cell-matrix junction and tubule
cells polarity in the kidney. Even if Tns1 is expressed in a wide variety of tissues, no
other organs were affected, implying a probable compensating effect of Tns2 and Tns3
for the loss of Tns1 (Lo SH et al., 1997). In ICGN mouse, a mouse model for nephrotic
syndrome, it appears that loss of Tns2 is associated with renal defects (Cho AR et al.,
2006). Tns3 3’UTR mutation is also associated with higher nephropathy risks in the
chinese Han population (Feng Y et al., 2019), indicating the involvement of Tns3 in
renal development.
Growth retardment in Tns3KO animals models has been described both in mice
(Chiang MK et al., 2005) and Pekin ducks (Deng MT et al., 2019). In mice, Tns3KO
leads to a sublethal phenotype, meaning an increased risk of premature death for
homozygous mutated mice (data from the International Mouse Phenotyping
Consortium; https://www.mousephenotype.org/) and various impairments during
tissue development. Tns3KO impaired villus formation in small intestine,
alveologenesis in lung, with an increased air space in each alveola, and fewer
proliferating cells in the resting zone of their tibias (Chiang MK et al., 2005), probably
linked to Tns3-Dock5 control on osteoclast podosome organization and activity
(Touaitahuata H et al., 2016).

61
Tensins dysfunctions in cancer
Tensins dysfunctions have been extensively reported in cancer studies. Each of them
have been reported to bind to deleted-in-liver-cancer protein 1 (DLC1). DLC1 binding
to Tns3 through its actin binding domain induces the RhoGAP activation that
suppresses tumor growth. Both Src and Akt are able to phosphorylate DLC1, which
leads to destabilisation of the Tns3-DLC1 interaction and favours DLC1 sterile alpha
motif and DLC1 Rho-GAP domain autoinhibitory interaction. The decrease in RhoGAP
activation reduces DLC1 anti-tumorigenic properties, which explain why Src or Akt
inhibitors are able to reduce tumor growth and metastasis formation in a DLC1-
dependent manner and stabilise DLC1-Tns3 interaction (Cao et al., 2012).
Tns1 binding to DLC1 through its C2, SH2 and PTB domains is also known to enhance
RhoA activity and induce tumor suppression (Shih et al., 2015). Tns4 also binds to
DLC1 via its SH2 and inhibition of the DLC1-Tns4 interaction greatly impairs DLC1
tumor suppressor activity (Liao et al., 2007). Tns2, which is by far the least studied
Tns in oncology, also interacts with DLC1 through its PTB domain. Disruption of this
interaction also leads to reduced Rho GTPase activity and less tumor suppression
(Chen L et al., 2012). Therefore, it is clear that Tensins impacts tumorigenicity through
the regulation of DLC1
All Tns are also dysregulated in gastro-intestinal tract associated cancers (gastric,
intestine, liver, bladder and pancreas cancers). This finding is coherent with Tensin’s
pattern of expression, both at the mRNA and the protein levels, from Allen Brain Atlas
(https://mouse.brain-map.org/) and the GTEX database [CP1]
(https://gtexportal.org/home/). Analysis from Gene Expression Omnibus (GEO)
microarray data has designed Tns1 as one of 4 top gene hub genes whose expression
was dysregulated in gastric cancers (Yang G et al., 2019). A recent study of Tensins’
expression in gastric cancers showed that Tns1 was more often observed in
metastatic tumours compared to the others. Tns2 was also more common in
moderately differentiated tumours and those with peritumoral inflammation. Finally,
Tns3 was more prevalent in moderately differentiated tumours than in the poorly or
non-differentiated ones (Nizioł et al., 2021).

62
Tns1, Tns3 and Tns4 have been studied in breast cancer, the first worldwide cause of
cancer in 2020 (Sung H et al., 2021). The involvement of Tns1 is yet debated. Tns1 is
a downstream target of MaTAR lncRNA, a long non-coding RNA known to play a role
in mammary tumorigenicity, and MaTARKO results in Tns1 reduced expression and a
decreased tumorigenicity (Chang KC et al., 2020). A high expression of miR-548j in
breast cancer cells, which targets Tns1 mRNA, is also correlated with higher
invasiveness and Tns1 shRNA inhibition suppress this pro-tumorigenic effect of miR-
548j (Zhan Y et al., 2016). However, Tns1 expression studies have not yet shown
significant changes in breast cancer tumours compared to non-cancerous tissues,
both in mRNA (Kotepui M et al., 2012) and in lncRNA levels (Behtaji S et al., 2021).
Therefore, it is more likely that Tns1 has a limited involvement in breast cancer tissues.
Tns3 expression is reduced by the apport of SUV420H2, a H4K20-specific
methyltransferase downregulated in various cancers, in MDA-MB human breast
cancer cells, reducing cell invasiveness (Shinchi Y et al., 2015). It appears that Tns3
expression is reduced in breast cancer tissues (Veß A et al., 2017) whether Tns4 is
increased (Katz M et al., 2007). Therefore, the Tns3/Tns4 switch, previously
described, favours cell motility in breast cancerous tissues and is associated with a
higher tumour invasiveness and metastasis.
Lung and colorectal cancers are also well represented in Tns oncogenicity studies.
Tns1 expression has been linked, in association with transgrelin (another actin-binding
protein) with colorectal cancer (Zhou et al., 2017). Tns1 is upregulated in non-small
cell lung cancer and miRNA Tns1 inhibition impairs their proliferation (Duan J et al.,
2021). Tns2 silencing in A549 human lung cancer cells and HELA cells up-regulates
the activities of Akt, Mek, and IRS1, and increases tumorigenicity (Hong SY et al.,
2016). Single nucleotide polymorphism in Tns3 3’ untranslated region is associated
with lung lymphatic metastasis (Yan S et al., 2019) and cases of EGFR fusion with
Tns3 have already been reported in lung adenocarcinoma (Zhang G et al., 2021).
Finally, Tns4 is upregulated in colorectal animal models (Raposo TP et al., 2020). As
described before, this upregulation increases cell motility by playing on the Tns3/Tns4
switch but the calpain, a Tns4 inhibitor, seems to act in colorectal cancer without
affecting this switch (Thorpe H et al., 2015). Tns4 is highly expressed in the lung

63
(Wang X et al., 2020) and high levels of Tns4 are again associated with higher tumour
cell invasion (Bennett DT et al., 2015).
More generally, Tns are often dysregulated during oncogenesis as they play a crucial
role on cell motility and migration. Overexpression of Tns4 has been observed in
tumours derived from breast, colon, lung, stomach, skin and pancreas. The growth
factors and cytokines associated with those cancers are known to increase Tns4
expression, which is correlated with an increased tumorigenicity (Lo SH, 2014). It
appears that reduced levels of Tns3 and increased levels of Tns4 in cancer tissues
relax the actin cytoskeleton and favour metastasis formation by affecting the
Tns3/Tns4 motility switch. Furthermore, Tns1 and Tns4 also play crucial roles in the
epithelial-mesenchymal transition, a process where stable epithelial cells convert
themselves into invasive mesenchymal cells (Asiri A et al., 2019). Finally, Tns3 is the
only Tensin described to be involved in glioblastoma. This is of particular interest
because glioblastoma, or WHO grade IV astrocytoma, are extremely aggressive
tumours derived from glial cells. Musashi1, a RNA binding protein broadly expressed
in various cancer tissues including glioblastoma, binds to Tns3 mRNA to repress its
translation in this context. All of these data indicates that Tensins are good targets to
develop new treatments to impair tumour metastasis, especially Tns3 for
glioblastomas.

64
Material and methods
Animals and genotyping
Generation of Tns3KO mice lines by CRISPR Cas9
Mice were generated at the ICM mice facility in collaboration with Phillipe
RAVASSARD. In a mice egg cell were microinjected with the Cas9 protein, a crRNA,
a tracrRNA and a targeting vector containing a DNA sequence surrounded by 2
homology arms in order to be inserted by the CRISPR-Cas9 machinery by Homology
Directed Repair (HDR). Egg cells were then implanted in receptor BL6;JK mice, to give
birth to F0 heterozygous mutated pups. Each pup was genotyped by Sanger
sequencing on PCR amplify DNA segment to detect mutation at the mutation site.
We first designed this approach to integrate a tag in Tns3 coding sequence by HDR
but unfortunately, no knockin mice were generated in this experiment. Instead, Non-
Homologous End Joining (NHEJ) occurred, randomly inserting or suppressing
nucleotides and generating different Tns3KO mutated alleles: 1 nucleotide insertion, 4
nucleotide deletion, 14 nucleotide deletion. Mice were then crossbred in order to
generate homozygous mice for each mutation.
Tns3V5; RosaSTOP-Cas9-GFP mice
Tns3V5 mice were generated at Currie Institute Animal Facility with a similar approach.
Two different sites for the V5-tag insertion were tested, one at the 3’ part of the protein
and the other at 5’ terminus. 100 mice embryos were microinjected (50 with the 5’
plasmid and 50 with the 3’). 55 of them succeed to birth, with only 8 injected with the
5’ plasmid and 47 with the 3’, and only 27 survived the first postnatals weeks, with only
3’ mutated mice.

65
Legend 1: 5’ (Up) and 3’ (Down) Tns3 sequences targeted by our Knock In strategy. Highlighted in red
and in blue, the genomic sequence corresponds respectively to the 5’ and the 3’ homology arms of the
targeting vector. In red, the sequence of the V5 tag.
The 3’ or 5’ ends were amplified by PCR and genotype for each mouse in order to
characterize their potential mutation. Most of the mice presented random nucleotide
insertions or deletions at the mutation locus (indels), like the previous attempt. The
eights 5’ mutated pups born were both presenting a WT allele and a Tns3KO mutant
allele (mostly 4 nucleotide deletions and 1 nucleotide insertion). However, 2 of the 3’
mutated mice presented an insertion of the V5 tag sequence (mice n°531 and 532,
legend 2). One of them (mice n°531) also presented a 1 nucleotide deletion before the
v5 tag sequence that changed his reading frame.
We try to reproduce this experiment by microinjecting 50 new mice egg cells with the
3’ end targeting vector. 45 survived the parturition but unfortunately none of them
presented an insertion of the V5 tag. Mice n° 532 was bred with RosaSTOP-Cas9-GFP mice
in order to produce Tns3V5; RosaSTOP-Cas9-GFP mice both tagged for the Tns3 and
expressing Cas9 under Cre recombination.

66
Legend 2: Sequences of mice 531 (Up) and mice n°532 (Down). A WT sequence was used as a scafold
to deduce the sequence of the mutated allele. Mice n°531 present a 1 nucleotide deletion just before
the V5 tag, in the homology arm ‘(ed).
Tns3flox; PdgfRa-CreERT/WT; Rosa26YFP mice
Legend 3: Generation of the Tns3flox mice line by substitution of exon9 with a floxed sequence.
67
Tns3flox mice were generated at Copenhagen University animal facility with the help of
Javier Martin. We designed a 1.5Kb plasmid construct containing the exon9 gene
sequence flanked by 2 loxP sites. This plasmid has been electroporated in
Embryonic Stem cells (ESCs) and clones with the correct mutation were selected in
vitro. ESCs colonies with a correct floxed Tns3 allele were micro-injected into receiver
blastocyst, creating a series of chimeric mice whose progeny are Tns3flox
heterozygous. Genotyping of each mouse has been performed at Copenhagen
University Animal facility, for both the LoxP upstream and downstream Tns3 exon 9.
Tns3flox/WT heterozygous mice were bred together in order to obtain homozygous
Tns3flox/flox mice then with a PdgfRa-CreERT; Rosa26YFP mice.
Oligodendroglia is known to be altered by the Cre recombinase expression in PdgfRa-
CreERT homozygous mice, so Tns3WT; PdgfRa-CreERT/WT; RosaYFP were exclusively
used as controls. This mice line allows us to induce an OPC-specific deletion of Tns3
with a subcutaneous tamoxifen injection. Quantifications were performed in double-
blind and only on sagittal brain slices presenting a fully formed fimbriae to study similar
brain areas.
Flox Tns3 knockout by tamoxifen injection
30μl from a 20mg/ml tamoxifen solution (diluted in Corn Oil) was injected at P7 in
Tns3flox; PdgfRa-CreERT; RosaYFP (experimental) or Tns3WT; PdgfRa-CreERT;
RosaYFP (Control) pups to induce Tns3 KO. After 14 or 21 days, mice were
anesthetized with a lethal dose of pentobarbital, then perfused with 30mL of
paraformaldehyde 2% (diluted in fresh PBS). Brains were left overnight in a 10%
sucrose solution (diluted in PBS), then transferred in a 20% sucrose solution for half a
day. Brains hemispheres were separated and frozen in OCT using -80°C isopentane.
For the Live imaging experiment, pups were instead injected at P5 with 30μl of a
20mg/ml tamoxifen solution and sacrificed at P7.

68
Floxed Tns3 construct:
TAGGTGGTCAGAATGGAACTGGCTTTGGGTTACCGTTTGCAGAGCCCTGTTAGTAGGTCACAACAGTGTGTTCTG
AAGTTTCAGACCAGTACATGGTTCTCTGTGAGGCTGCACTGCCCCACAGAGCAGTAGAGGAAGCTCTACTATTGG
TGATGTTGACTGTGAATATGGCTGTGTTTAGGAGGATTTCCATAGCACCAGCCTGGGATGTGGTTTCCATGTGTA
TAACCCCCCCCTCCCCCCACACACACACACATACAGTGAATAAAGTGTGAGGTTTGGCACCAGTGTAGGATACAC
CAGTTTACCAGGTTCCGAGGTCCTGCCACTTAGAGCCGTATACACAGACGGCTGTCACTTGTCAGCCCCTGGGCA
GACATTCATTCCTGTTTCACctcgagATAACTTCGTATAGCATACATTATACGAAGTTATgtcgacGTGGTGAGT
GACTGGCTGCTGCCGTGTGGATATGCCCTCCGGGGACTTACACAGACACCCAGCTAGCACCTGCTCTTGTTATGG
GCCCCTGTGTGAAGAGTCTCTGCTTAACTCTGGTGCTCTAATGTTAGGGAGGCAGAGGGGTTAATACTTGTTCTC
TGCTACTCTGTTCATGATTGAGCATGCTCCTGCCTCATTCCGTCGGTATATAGGATTCTATAGAAAGAACATTGG
TTTCTCTCTGGTCTCCTGCAGGGTGGTAAAGGACGCATTGGAGTGGTCATATCGTCCTACATGCACTTCACCAAC
GTCTCAGCCAGGTAAGATGGAGAGGGGGCTCATTTCCACGGGGTGTTGGAAGTTGGTTCACGCATGAGGTCTTCC
TGGGAGTCATCTTGACCTGACTTGTCCCTTAGTGCCAGAGTGTTGTGTGCCTAGTCTCATTGTCCAGCAGGATGG
GAAAGATATATTCTTGTTTGGGCTGTTCTGTGTGACTGATTCCCAGGAGCTCTATGGAGGCAAGCAGACTAAGTG
AGCCCAGTTATTCTCTATGAAAACAGTCGTGTTGATGTCACgtcgacATAACTTCGTATAGCATACATTATACGA
AGTTATctcgagTACACCTTGTAAGTTTAATAAAAACAGCCATCATGTTCTGTTTGTTCTGAAAGTCCACTGTAT
GTTTTTCTCTAAGATGATAGGACCCTGGTCTGTGCCCAGCCATTGTGGCAATGGACAGTCAGGGTGTCTCCTGAT
GTGCTTTCTGAAGAAAGGCCAAATTTCAGTTTGGAAAATGTCATTGTTGGGTAGGAGTATAGTTTTGTTTAATGC
ACTTGCCTAGTGGGTGCAAGACCTCAGCATCCTTCCCAACCCTGCACATGAAAATCATTTGCACGCTCCTGGGTG
CAGGAGCTGTATGCCCAGGCCAGTCATTTGCACACTCCTGGTCGTGCAGGAGCTGTATGCCCAGGCCAGTCACT
Exon 9 sequence
LoxP sequence
Left Homology arm
Right Homology arm
Legend 4: Tns3 exonic sequence at the level of exon9. Highlighted in blue, the loxp sequences.
Highlighted in green, the exon9. In blue and in red the sequences corresponding respectively to the left
and right homology arms. Note that Tns3 exon9 is composed of 65 nucleotides, which deletions induces
Tns3 reading frame shift.

69
Electroporation
The postnatal brain electroporation protocol described in Boutin C et al., 2008 was
adapted to target the dorsal SVZ. P2 pups were cryo-anesthetized for 2min on ice and
1,5 μl of plasmid were injected into the left ventricle using a glass capillary. Plasmids
were injected at the concentration of 5ug/μl. Electrodes (Nepagene CUY650P10) were
applied in the dorso-ventral axis with the positive pole dorsal. Five electric pulses of
100V, 50ms pulse on, 850ms pulse off were applied using a Nepagene CUY21-SC
electroporator. Pups were immediately warmed up in a heating chamber and brought
to their cages at the end of the experiment. Tns3V5; RosaSTOP-Cas9-GFP mice were
injected only with a Tol2-pCAG-gRNA plasmid containing a Tol2 sequence, to allow
CRISPR tools genomic insertion and gRNA sequences. We used a alternatively a
gRNA targeting a region downstream the start codon of the Tns3 gene (exon6 gRNA)
or two gRNA targeting upstream and downstream regions of either Tns3 exon9 (exon9
gRNA) or the whole Tns3 locus (5’-3’ gRNA). A plasmid without gRNA (empty
condition) was used as a Control for half of the electroporated littermates.
MACS
Dissociation of cortex and corpus callosums from V5 mice was done using neural
tissue dissociation kit (P) (Miltenyi Biotec; ref 130–093-231). Briefly, cortices from P7,
P14 or P21 mices were dissected then dissociated using Miltenyi MACS dissociator
(Miltenyi Biotec; ref 130-096-427). Dissociated cortices were then filtered using
Smartstainer 70um (Miltenyi Biotec; ref 130-098-462). For P14 and P21 samples, an
additional step using the debris removal kit (Miltenyi Biotec; ref 130-090-101) to
eliminate the myelin residues. Cells were saturated in a 0,5% NGS solution then
incubated with anti-PdgfRa or anti-O4 coupled-beads (Miltenyi Biotec; ref 130-094-
543 and130-096-670). Non-bound beads-coupled antibodies have been washed away
by centrifugation then bound cells were sorted using MultiMACS Cell24 Separator Plus
(Miltenyi Biotec; ref 130-098-637). Sorted cells were either plated in culture plates for
In Vitro cell study or centrifuged at 1200 rpm and use for Western blot analysis

70
Western Blot
Proteins from MACSorted cells were extracted using RIPA buffer from ThermoFisher
(ref: 89901), supplemented with Halt™ Protease Inhibitor Cocktail (100X) from
ThermoFisher (ref: 87786) at the final concentration of 50µL RIPA buffer + protease
inhibitors for 1 million cells.
The mix has been shaken at 4°C for 30 minutes before being centrifuged at 12000
rpm for 30 minutes. Protein concentration was estimated using the Pierce Detergent
Compatible Bradford Assay Kit from Thermofisher (ref: 23246). For each Western Blot
column, 50ug of proteins have been incubated for 10 minutes at 95°C with β-
mercaptoethanol (24X) and BoltTM LDS Sample Buffer (4X) from ThermoFisher (ref:
B0007) to denature proteins.
Western Blot have been performed using Mini Gel Tank and Blot Module Set from
ThermoFisher (ref: NW2000). 12µl of denatured proteins were first load on Bolt™ 4 to
12%, Bis-Tris, 1.0 mm Mini Protein Gel from ThermoFisher (ref: NW04122BOX) and
immersed in 4°C Bolt™ MOPS SDS Running Buffer (20X) from ThermoFisher (ref:
B0001). Precision Plus Protein™ All Blue Standard from BioRad (ref: 1610373EDU)
has been loaded as a migration control. Proteins were left migrating for 90 minutes at
90V. Then gels have been transferred on Amersham Protran 0,2 µm Nitrocellulose
membranes from Dutscher (ref: 10600001), immersed in 4°C NuPAGE Transfer Buffer
(20X) from ThermoFisher (ref: NP0006-1), for 90 minutes at 60V.
Membranes were incubated 1h in 10% dry milk to saturate non-specific antibodies
binding sites. Primary antibodies, diluted in TBS-T, were incubated with the membrane
overnight at 4°C with shaking. Then membranes were washed 15 minutes with room-
temperature TBS-T 3 times and incubated with HRP-conjugated secondary
antibodies, diluted in TBS-T, for 1h at 4°C with shaking. After being washed 3 times
15 minutes in room temperature TBS-T, proteins in the membranes were revealed
using Pierce™ ECL Western Blotting Substrate from ThermoFisher (ref: 32109).
Membranes were imaged with the ChemiDoc™ Touch Imaging System from BioRad
(ref: 1708370) provided by CELIS ICM facility. GAPDH and Actin were used as loading
controls to estimate variations of protein levels in samples.

71
Immunofluorescence
Mice were anesthetized using 100 μL phenobarbital (euthasol / Virbac USA) at the
time point we wanted and their brains were dissected out. Buprenorphine (30 mg/g)
has been administered to the mice at least 30 minutes before the perfusion in order to
prevent the pain caused by the phenobarbital injection. Postnatal mice brain till 15
days post-natal (P15) were perfused with 15ml of 2%PFA (Sigma), and the older
stages were perfused with 25 ml of 2%PFA, brains from post-natal were dissected out,
cryoprotected in PBS with 10% sucrose overnight, then transferred in PBS with 20%
sucrose for 2h and included in OCT (BDH) before freezing and sectioning (14μm
thickness) in a sagittal plane with a cryostat microtome (Leica). Sections were then
either processed for immunohistochemistry after drying them well for one hour at room
temperature (RT) or stored at -80°C for stock. Later on those frozen sections were dry
for 1 hour at room temperature before adding the blocking solution (Phosphate
Buffered Saline (PBS) with 10% normal goat serum (NGS), 0.1% triton X-100) for one
hour at RT.
The following antibodies, previously diluted at 50% in glycerol, were diluted in the
same blocking solution and used at the concentrations indicated in table 1. Secondary
Antibodies (AlexaFluor 488, 594 and 647) were all diluted at 50% in glycerol and used
at a final concentration of 1:2000. Immunofluorescence was visualized with Zeiss®
Axio Imager.M2 microscope with Zeiss® Apotome system. Pictures were taken as
stacks of 5–10μm with 0.5μm between sections. Image acquisition , Z-projections and
orthogonal projections and processing are achieved by ZEN Microscopy, image
quantification was performed automatically on ImageJ, using a macro provided by ICM
Quant Facility or performed manually on ZEN. Figures were made using Adobe
Illustrator.

72
Table 1:

73
Plasmids and vectors
Tol2pCAG plasmid for Ex6 frameshift (or Empty Ctrl)
Legend 5: CRISPR Cas9 strategy to induce Tns3 exon6 frameshift
We design a plasmid construct (“Ex6 frameshift” plasmid) containing an Ampicilin
resistance gene and its promoter (AmpR), a Cas9 and a GFP reporter under the
control of a pCMV promoter and a pCAG promoter followed by an empty sequence
containing a restriction site for the HindIII (the only one in the plasmid). Plasmid without
gRNA insert has been used as an “Empty” control condition for the electroporation.
Using HindIII digestion, I have inserted a linear sequence containing the gRNA in the
empty sequence to create our experimental plasmid.
Creation and optimization of the gRNA and of the backbone plasmid used in this study
has been previously performed by Dr Hatem HMIDAN during his pHD (more details in
its thesis manuscript). We use a 2A sequence between the Cas9 and the GFP to
produce an equal amount of GFP and Cas9 proteins. All the active parts of the plasmid
have been flanked with Tol2 sequence, in order to facilitate the insertion of the plasmid
in the genome by a transferase expressed by a co-electroporated plasmid.

74
Triple plasmids co electroporation for Ex6 frameshift (and Empty Ctrl)
Co-electroporation of 3 plasmids have been used in WT and Tns3V5 mice in order to
increase the number of targeted cells and the intensity of the GFP signal in late
differentiated oligodendroglial cells. We used a combination of a VENUS reporter
plasmid, of our previously generated “Ex6 frameshift” plasmid and a pCMV
HAhyPBase, encoding for the hyperactive form of the transposase (described in Yusa
K et al, 2011). Plasmids have been injected with a ratio of 1/7 of HAhyPBase, 2/7 of
“Ex6 frameshift” or “Empty” plasmid and 4/7 of VENUS plasmid
Legend 6: VENUS plasmid
gRNA plasmids for Tns3V5;Rosa-STOP-Cas9-GFP mice electroporations
New lighter plasmids were generated after the creation of the Tns3V5; RosaSTOP-Cas9-
GFP mice line. Given the fact these mice already have a mutation reporter gene and
express the Cas9 ubiquitously , we discard the GFP and the Cas9 sequences from
the electroporated plasmid. We also used two newt gRNA targeting either two sites
flanking the exon 9 (“exon9” plasmid) or the whole Tns3 locus (“Whole Tns3” plasmid),
in addition to the previous Exon6 gRNA.

75
Primary cells culture
Neurospheres
P0 to P1 Pups were euthanized by freezing them in ice for 2 minutes then were rapidly
decapitated. Brains were collected in PBS 1X (Invitrogen) containing 1% of
penicillin/streptomycin before dissecting the SVZ. First, Olfactory bulbs and
cerebellum were cutted out. Then, SVZ were dissected (see figure), washed three
times in PBS and transferred in neural stem cell fresh medium prepared as following:
DMEM/F12 (Gibco) up to 50ml, 250µl HEPES buffer 1M (Gibco), 666µl glucose 45%
(Sigma), 0.5ml penicillin/streptomycin (Sigma), 0.5ml N2 supplement (Gibco), 1ml B27
(Gibco), EGF to a final concentration 20ng/ml (Peprotech), FGF to a final
concentration 10ng/ml (Peprotech) and Insulin to a final concentration 20µg/ml
(Sigma),and mechanically dissociated using a pipette.
Legend 7: Dissected brains area for Neurosphere culture
Approximately 1×10^6 cells/mL were cultured in 5 ml NSC fresh medium in a 25 ml
flask, and maintained at 37 °C in a humidified atmosphere of 5% CO2. Under these
proliferating conditions, the cells grow as free-floating neurospheres. After 5 days of
proliferation, Neurospheres were dissociated by accutase treatment followed by a
mechanical dissociation with a pipet (Passage 1). Neurospheres were used directly or
freezed in DMSO for a later use.

76
OPCs differentiation
Legend 8: Protocol for OPC differentiation in vivo culture
Before the culture, neurospheres were pre-incubated in flask for 3 days with OPCs
proliferation medium (NSC fresh medium supplemented with PDGFa at the final
concentration of 10ng/ml). This condition will favor NCS specification toward the
oligodendroglial lineage. After dissociation, NSCs were plated at 30000 to 40000 cells
per mm2 in glass coverslip previously coated with poly-L-Ornithine (Sigma Aldrich,
P4957-50ML). NSCs were left 3 to 4 days in OPCs proliferation medium to proliferate.
Differentiation was induced by switching the culture medium for growth factors free
differentiating medium. Cells were fixed with 4% paraformaldehyde diluted in PBS for
10 minutes and processed for immunostaining characterization.
Tns3 KO with viral vectors
AAV Tns3KO in NSCs from Tns3flox; Pdgfra-CreERT; RosaYFP mice
We design twoo AAV9 vectors to target Tns3flox; Pdgfra-CreERT; RosaYFP
neurospheres. AAV were produced at the ICM vectorology facility, with one containing
an empty gRNA (“AAV Empty”) and the other, the two 5’ and 3’ exon9 gRNA (“AAV
exon9’”) in addition to the typical AAV sequence. AAV were used at MOI of 500 000,
determined empirically. AAV concentrations were determined by AAV ITR sequence
qPCR, following the protocol described in Aurnhammer et al., 2012 (PMID: 22428977).

77
Legend 9: AAV sequence MAP to induce the CRISPR Cas9 deletion of Tns3 in Tns3flox; Pdgfra-CreERT;
RosaYFP neurospheres
Adenovirus for Tns3KO in NSCs from Tns3flox;PdgfRa-CreERT/WT;Rosa26YFP mice
An Adeno-Cre virus (Vector Biolabs, ref: 1045) was used to induce the recombinaison
of Tns3 floxed exon in Tns3flox; Pdgfra-CreERT/WT; Rosa26YFP neurospheres.
Neurospheres extracted from Tns3WT; Pdgfra-CreERT/WT; Rosa26YFP mice were used
as control. Adeno-Cre was used at a MOI of 5.
Viral transduction in primary Neurospheres cultures
Legend 10: Viral transfection in vitro protocol (common for Adeno Cre or AAV)
Frozen Tns3V5;RosaSTOP-Cas9-GFP or Tns3flox;Pdgfra-CreERT;RosaYFP neurospheres,
have been thawed in NSC fresh medium then pre-incubated during 3 days in
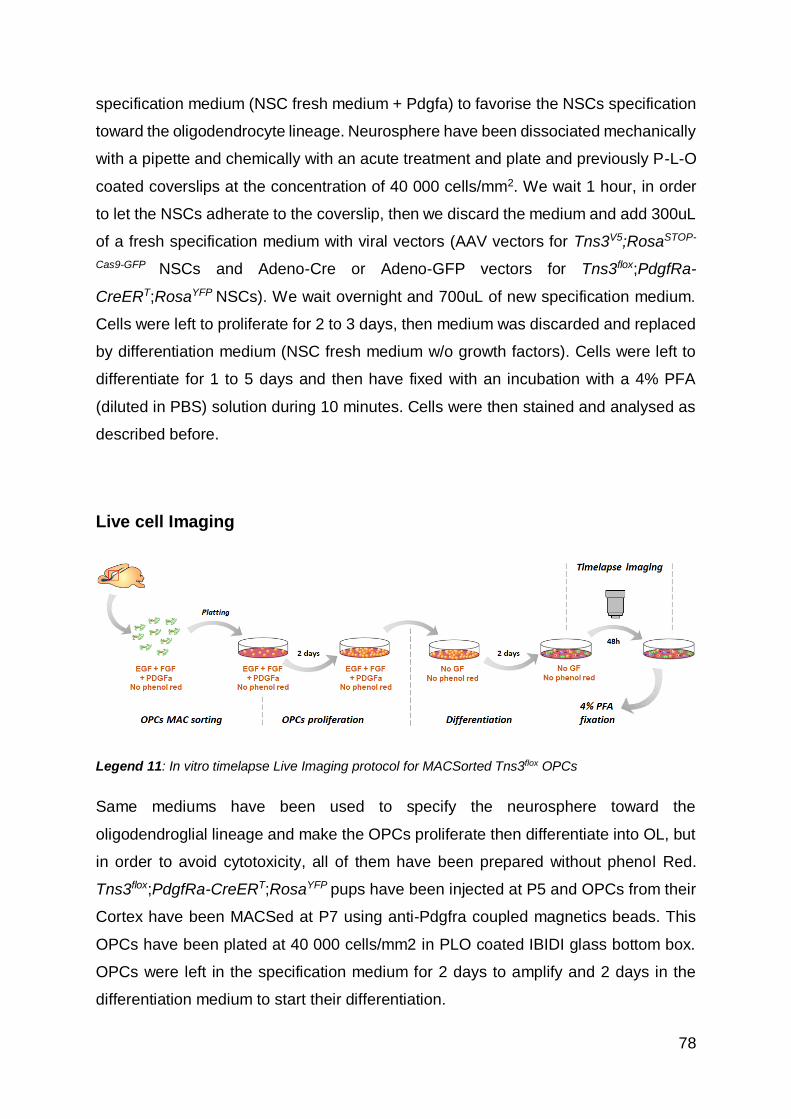
78
specification medium (NSC fresh medium + Pdgfa) to favorise the NSCs specification
toward the oligodendrocyte lineage. Neurosphere have been dissociated mechanically
with a pipette and chemically with an acute treatment and plate and previously P-L-O
coated coverslips at the concentration of 40 000 cells/mm2. We wait 1 hour, in order
to let the NSCs adherate to the coverslip, then we discard the medium and add 300uL
of a fresh specification medium with viral vectors (AAV vectors for Tns3V5;RosaSTOP-
Cas9-GFP NSCs and Adeno-Cre or Adeno-GFP vectors for Tns3flox;PdgfRa-
CreERT;RosaYFP NSCs). We wait overnight and 700uL of new specification medium.
Cells were left to proliferate for 2 to 3 days, then medium was discarded and replaced
by differentiation medium (NSC fresh medium w/o growth factors). Cells were left to
differentiate for 1 to 5 days and then have fixed with an incubation with a 4% PFA
(diluted in PBS) solution during 10 minutes. Cells were then stained and analysed as
described before.
Live cell Imaging
Legend 11: In vitro timelapse Live Imaging protocol for MACSorted Tns3flox OPCs
Same mediums have been used to specify the neurosphere toward the
oligodendroglial lineage and make the OPCs proliferate then differentiate into OL, but
in order to avoid cytotoxicity, all of them have been prepared without phenol Red.
Tns3flox;PdgfRa-CreERT;RosaYFP pups have been injected at P5 and OPCs from their
Cortex have been MACSed at P7 using anti-Pdgfra coupled magnetics beads. This
OPCs have been plated at 40 000 cells/mm2 in PLO coated IBIDI glass bottom box.
OPCs were left in the specification medium for 2 days to amplify and 2 days in the
differentiation medium to start their differentiation.

79
At 2 days of differentiation, we discard the old meidum to get rid of cell debris then we
add 250uL of fresh differentiation medium. Cells were imaged using Axio-Observer 7
provided by David AKBAR from CELIS ICM cell culture facility during 2x24h, with one
picture taken every 10 minutes in phase contrast and in the GFP channel. After the
timelapse, cells were fixed in 4% PFA, stained and imaged as described before.
Demyelination Lesions
Before surgery, adult (2-3months) WT mice were weighted and anesthetized with an
intraperitoneal injection of a ketamine (0.1 mg/g) and xylazine (0.01 mg/g) mix. An
analgesic (buprenorphine, 30 mg/g) was administered intraperitoneally to prevent
postsurgical pain. Focal demyelinating lesions were induced by stereotaxic injection
of 1μl of lysolecithin solution (LPC, Sigma, 1% in 0.9%NaCl) into the corpus callosum
(CC; at coordinates: 1 mm lateral, 1.3 mm rostral to bregma, 1.7 mm deep to brain
surface) using a glass-capillary connected to a 10μl Hamilton syringe. Animals were
left to recover in a warm chamber before being returned into their housing cages.

80

81
Objectives and Hypothesis
Our lab aimed to understand how oligodendrogenesis is regulated in order to provide
insights for new therapeutic approaches in the neurodegenerative context. In MS
patients, OPCs differentiate into OLs to repair the demyelinated lesions and a better
understanding of the natural oligodendrogenesis mechanisms could shed light on new
ways to cope and treat these diseases.
In a previous study, the team screened for the targets of key oligodendroglial factors,
both in OPCs or OLs, using genome-wide transcriptome analysis and chromatin
immuno-precipitation. We identified several gene candidates, like Chd7 and Chd8 that
we and collaborators characterized to be key chromatin remodelers during
oligodendrogenesis (He et al, 2016; Marie C et al, 2018). Among them, I focussed on
Tns3 for my work, an adaptor protein between the integrins and the cytoskeleton, and
which is strongly but transiently expressed during iOLs maturation.
Any induction of a stable mutation in the Tns3 gene is surprisingly challenging. In
humans, human genome studies show a small prevalence of Tns3 mutation in the
human population (Karczewski et al 2020; Lek et al, 2016). Tns3 SNP has been linked
to lung carcinoma (Yan et al, 2019) or nephropathy (Feng et al, 2019) in the Chinese
Han population. Tns3 KO animal models have all shown strong phenotypic impairment
with reduced growth (Chiang et al, 2005) and body mass (Deng et al, 2019). Finally,
Hatem Hmidan, who started this project, demonstrated during his PhD that the
Tns3bgeo mice model was still expressing Tns3 protein in brain cells. These preliminary
data indicates a crucial role of Tns3, but its role in CNS, particularly oligodendrocytes,
is however completely undocumented.
In this project, I aimed 1) to fully characterized the expression of Tns3 all along the
oligodendrogenesis in (re)myelination context, 2) to decipher whether Tns3 is required
for the production of oligodendrocytes in the brain and 3) to provide firsts insights to
explain the function of Tns3 protein in OLs, in order to provide knowledges on the
natural generation of OLs and help to design new efficient remyelinating therapies for
neurodegenerative diseases.

82
Results
In this manuscript, I will first present the article we wrote and are currently editing
before sending it for publication to a peer-reviewed journal and to BioRxiv. In a second
time, I will detail the experiments presented in the article with supplementary
information to present an exhaustive review of our knowledge on this topic.

83
Article
Tns3 is a new marker of immature oligodendrocytes during (re)myelination
required for oligodendrocyte differentiation
Abbreviated title: Tns3 is required for oligodendrocyte differentiation
Emeric Merour1*, Hatem Hmidan1*, Corentine Marie1, Pierre-Henri Helou1, Haiyang Lu1,
Antoine Potel1, Adrien Clavairoly1, Yi Ping Shih2, Sebastien Dussaud1, Phillipe Ravassard1,
Hassan Hafizi3, Shu Hao Lo2, Bassem Hassan1, and Carlos Parras1
1 Paris Brain Institute, Sorbonne Université, Inserm U1127, CNRS UMR 7225, GH Pitié-
Salpêtrière, 75013 Paris, France.
2 US Davis. USA Biochemistry and Molecular Medicine School of Medicine. University of
California-Davis. Sacramento, CA 95817, USA
3 University of Portsmouth. School of Pharmacy and Biomedical Sciences, Portsmouth PO1
2DT, UK
* Equal contribution
Corresponding author: Carlos Parras [email protected]
Number of pages: xx
Number of figures: xx
Words count: Abstract: xx; Introduction: xx; Discussion: xx

84
ABSTRACT
Oligodendroglia play a key role in brain development and neuronal activity support,
and accumulating evidence indicates its fundamental contribution to brain plasticity,
memory, and pathology underlying glioma, neurodevelopmental, neurodegenerative,
and psychiatric diseases. Oligodendrocyte precursor cells (OPCs) constitute a stable
population of the CNS, that generates oligodendrocytes (OLs) on demand both during
development and adulthood, by keeping a tight balance between proliferation, survival,
and differentiation. Both during aging and pathology OPC differentiation diminishes
affecting normal brain homeostasis and myelin repair (Neumann et al., 2019a), such
as in multiple sclerosis patients. To better characterize the mechanisms promoting
OPC differentiation and myelination, we screened for genes regulated by Olig2, Chd7,
& Chd8, key regulators of OL differentiation and identified the focal adhesion protein
Tensin3 (Tns3). Developing new genetic tools to characterize Tns3 expression and
function in the brain, we provide several lines of evidence showing that Tns3 is
expressed in immature oligodendrocytes (iOLs) and is required for normal
oligodendrocyte differentiation. Using that both V5-recognizing antibodies in Tns3Tns3-
V5 knock-in mice and Tns3 validated antibodies, we show that Tns3 protein is restricted
to iOL stage during myelination and remyelination, thus constituting a novel marker for
iOLs. We show that Tns3 loss-of-function mutations are badly tolerated in mice, as
well as in the human population, and that constitutive Tns3 mutant mice escape to
Tns3 deletion in OLs. We demonstrate that postnatal Tns3-deletion reduces by half
the number of OLs generated during the first postnatal month, both by CRISPR-
mediated Tns3-deletion in neonatal neural stem cells and by Tns3 induced knockout
(Tns3-iKO) in postnatal OPCs. Finally, video microscopy of primary oligodendroglial
cultures indicates that Tns3-iKO differentiating OLs present an increased apoptosis,
suggesting that Tns3 function is required for normal OL differentiation.

85
INTRODUCTION
Oligodendrocyte lineage cells, mainly constituted by oligodendrocyte precursor cells
(OPCs) and oligodendrocytes (OLs), not only play a key role during brain development
and neuronal activity support by allowing salutatory conduction of myelinated axons,
but accumulating evidence indicates its fundamental contribution to different aspects
of a type of brain plasticity called adaptive myelination (Mount and Monje, 2017; Yang
et al., 2020). For example, increased oligodendrogenesis due to motor, spatial, and
fear-conditioning learning paradigms is necessary for proper learning and memory
(McKenzie et al., 2014; Pan et al., 2020; Steadman et al., 2019; Wang et al., 2020;
Xiao et al., 2016; Xin and Chan, 2020). Beyond the well-known function in saltatory
conduction of action potentials, OLs have been shown to metabolically support axons
with lactate shuttling through the myelin sheaths (Funfschilling et al., 2012; Lee et al.,
2012). Furthermore, oligodendroglia and myelin pathologies have been recently link,
not only to the development of glioma (Liu et al., 2011), but to neurodevelopmental
(Castelijns et al., 2020; Phan et al., 2020), neurodegenerative (Bryois et al., 2020;
Grubman et al., 2019), and psychiatric (Nott et al., 2019) diseases.
OPCs originate from focal regions of germinal zones in the brain and spinal cord
(Spassky et al., 1998; Tekki-Kessaris et al., 2001), and through proliferation and
migration occupy the whole CNS before starting to differentiate into myelinating OLs
(Rowitch, 2004). Unlike most precursor cells, OPCs remain abundant in the adult CNS,
being one of its neural cell subtypes (Ffrench-Constant and Raff, 1986; Suzuki and
Goldman, 2003). OPCs need to keep a tight balance between proliferation, survival,
and differentiation. This balance is crucial to maintain the OPC pool while contributing
to myelin plasticity in adult life, and to remyelination in diseases such as multiple
sclerosis (MS). Being an inflammatory degenerative disease of the CNS, MS therapies
are mainly based on immuno-suppressant, immuno-modulatory and anti-inflammatory
drugs (Compston and Coles, 2002; Kieseier et al., 2007) but no treatment are yet
available to directly promote remyelination. Demyelinated plaques can be normally
repaired by endogenous OPCs especially in early stages of the disease but with time
this repairing process become more and more inefficient with aging and OPC
differentiation seems to be partially impaired (Chang et al., 2002; Compston and
Coles, 2002; Neumann et al., 2019b). Therefore, understanding the mechanisms

86
inducing OPC differentiation is a critical event for successful remyelination and myelin
pathologies.
A large diversity of extrinsic signals (Bergles and Richardson, 2016) as well as
many intrinsic factors, including transcription factors (TFs, reviewed in (Emery and Lu,
2015)), and chromatin remodelers (reviewed in (Parras et al., 2020)), has been
involved in OPC proliferation, survival, and differentiation. However, the mechanism
for how these signals are integrated in the nucleus to balance OPC behavior is largely
unknown. OPC differentiation requires profound changes in chromatin and gene
expression (Emery and Lu, 2015; Küspert and Wegner, 2016; Wheeler and Fuss,
2016). TFs, such as Olig2, Sox10, Nkx2.2 or Ascl1, are key regulators of OL
differentiation by directly controlling the transcription of genes implicated in this
process (Nakatani et al., 2013; Qi et al., 2001; Stolt et al., 2002; Yu et al., 2013) but
being already expressed in OPCs, it is still unclear how these TFs control the induction
of differentiation. A growing body of evidence suggests that some of these TFs work
together with chromatin remodeling factors during transcriptional initiation/elongation
to drive robust transcription (Zaret and Mango, 2016). Accordingly, Olig2, Sox10 TFs
have been shown to cooperate with chromatin remodelers such as Brg1 (Yu et al.,
2013), Chd7 (He et al., 2016; Marie et al., 2018), Chd8 (Marie et al., 2018; Zhao et al.,
2018), and EP400 (Elsesser et al., 2019), to promote the expression of OL
differentiation genes. Here, to improve our understanding of the mechanisms of OL
differentiation, we searched for novel common targets of these TFs and remodelers,
by generating and combining the binding profiles of Olig2, Chd7, and Chd8, together
with histone regulatory marks in differentiating oligodendroglia. By this strategy,
among the genes commonly regulated by these key regulators, we identified Tensin3
(Tns3) focal adhesion protein. We show that Tns3 is expressed in immature OLs
during myelination and remyelination, and thus constituting a hallmark for this
oligodendroglial stage. Furthermore, using different genetic strategies to induce Tns3
loss-of-function mutations in vivo, we describe for the first time a function for a Tensin
protein in the CNS, demonstrating that Tns3 is required in immature OLs for normal
oligodendrocyte differentiation in the postnatal mouse brain.

87
RESULTS
Tns3 is a direct target gene from key regulators of oligodendrocyte
differentiation
There is a major need to develop treatments enhancing the process of myelin repair
that requires a better understanding of the mechanisms promoting effective
oligodendrocyte differentiation and remyelination (Neumann et al., 2019b). To find new
factors involved in oligodendrocyte differentiation, we screened for gene targets of key
regulators of oligodendrogenesis, Olig2 transcription factor, and Chd7 and Chd8
chromatin remodelers (He et al., 2016; Lu et al., 2002; Lu et al., 2000; Marie et al.,
2018; Parras et al., 2020; Yu et al., 2013; Zhao et al., 2018). To this aim, we generated
and compared the genome-wide binding profiles for these key regulators in
oligodendroglial cells. After purifing O4+ cells by magnetic cell sorting (MACS) from
postnatal mouse brain cortices, composed of both PDGFRa+ OPCs and Nkx2.2+/CC1+
immature oligodendrocytes (iOLs), we performed chromatin immunoprecipitation
followed by sequencing (ChIP-seq) for Olig2 and key regulatory histone marks
(H3K4me3, H3K4me1, H3K27me3, and H3K27ac; Fig. S1A), and combined them with
our previously generated datasets for Chd7 and Chd8 (Marie et al., 2018). Olig2 was
found bound in 16,578 peaks corresponding to 8,672 genes (Fig. S1B), including key
regulators such as Ascl1, Sox10, Myrf, Chd8, and Smarca4/Brg1. Histone marks
activity code (Fig. S1C) showed that Olig2 bound to regulatory elements (60% being
promoters and 40% enhancers) both in active and more poised/repressive state (Fig.
S1D). We obtained 1764 peaks commonly bound by Olig2, Chd7 and Chd8, from
which 47% (832 peaks) were found at active promoters (H3K4me3/H3K27ac marks)
corresponding to 654 protein-coding genes (Fig. S1E). Among these genes, Tensin 3
(Tns3), coding for a cell adhesion protein deregulated in certain cancers
(Martuszewska et al., 2009), was the third with the highest expression in iOLs relative
to other brain cell-types (Zhang et al., 2014; Fig. 1D). Olig2, Chd7 & Chd8 binding
together in Tns3 alternative promoters (for the 2 isoforms), together with active marks
(Fig. 1A) To assess whether Tns3 is a direct target of these key regulators, we
interrogated the transcriptomes of postnatal OPCs/iOLs (P7) purified from brain
cortices of Chd7iKO (Pdgfra-CreERT; Chd7flox/flox) and Chd8cKO (Olig1Cre; Chd8 flox/flox)
and their respective controls (Marie et al., 2018; Zhao et al., 2018). Indeed, Tns3

88
transcripts were largely downregulated upon acute deletion of each of these factors in
postnatal OPCs (Fig. 1B,C), indicating that Tns3 expression in OPCs/iOLs is directly
controlled by Chd7 and Chd8, key regulators of oligodendrocyte differentiation.
We then fetch to characterize Tns3 expression pattern in the brain. We first
verified that the high expression levels of Tns3 transcripts found in iOLs compared to
its low expression in other oligodendroglial stages or brain cells in the postnatal mouse
brain (Fig. 1D; Zhang et al., 2014), was paralleled by the sparse labelling detected by
in situ hybridization with Tns3 probes, enriched in white matter regions of the postnatal
and adult brain (Fig. 1E; Allen Brain atlas, https://portal.brain-map.org/). To better
characterize Tns3 expression pattern in oligodendroglia, we took advantaged of recent
resources profiling the transcriptome of single cells (scRNA-seq) including
oligodendrocyte lineage cells at embryonic, postnatal, and adult stages (Marques et
al., 2016, 2018). We selected the neural stem/progenitor cells and oligodendroglial
cells of these datasets and integrated them following Seurat3 strategy (Stuart et al.,
2019). Unsupervised clustering and visualization of cells in two dimensions (with
uniform manifold approximation and projection, UMAP), identified nine different
clusters following a differentiation trajectory from neural stem cells (NSCs) to mature
oligodendrocytes (MOLs, Fig. 1F). Based on cell subtype specific markers, we could
identify these clusters as (Fig. 1F,H): (1) two types of neural stem/progenitor cells,
that we named NSCs and NPCs according to their expression of stem cell (Vim, Hes1,
Id1) and neural progenitor (Sox11, Sox4, Dcx) markers; (2) OPCs expressing their
known markers (Pdgfra, Cspg4, Ascl1) and cycling OPCs also enriched in cell cycle
markers (Mki67, Pcna, Top2); (3) two stages of iOLs, expressing the recently
proposed iOLs markers Itpr2 and Enpp6 (Marques et al., 2016; Xiao et al., 2016),
which can be distinguished by the expression of Nkx2-2 (iOL1 being Nkx2-2+ and iOL2
being Nkx2-2-), in agreement with our previous characterization by
immunofluorescence (Nakatani et al., 2013; Marie et al., 2018); (4) myelin forming
oligodendrocytes (MFOLs), enriched in markers such as Slc9a3r2, Igsf8; and (5) two
clusters of myelinating OLs, that we named MOL1 and MOL2, expressing transcripts
of myelin proteins (Cnp, Mag, Mbp, Plp1, Mog) and some specific markers of each
cluster, including Mgst3, Pmp22 for MOL1, and Neat1, Grm3, Il33 for MOL2.
Interestingly, Tns3 transcripts were strongly expressed in both iOL1 and iOL2 clusters,
similar to the proposed iOL markers Itpr2 and Enpp6 (Fig. 1G,H), indicating that Tns3

89
expression is strongly upregulated during oligodendrocyte differentiation and
downregulated in mature oligodendrocytes.
Tns3 protein is enriched in the cytoplasm and processes of immature
oligodendrocytes
Given the high expression level of Tns3 transcripts in immature oligodendrocytes, we
then fetch to characterize Tns3 protein expression pattern in the postnatal brain using
commercial and homemade Tns3-recognizing antibodies. Optimization of
immunofluorescence protocols demonstrated signal in CC1+ oligodendrocytes in the
postnatal brain with four different antibodies (P24, Fig. S1). To our surprise, while all
antibodies show signal localized to the main iOL processes (Fig. S1A-E), one Tns3
antibody (Millipore) also presented a strong nuclear signal never reported for Tns3
localization in other tissues (lung, liver, intestine, mammary cells, etc.) (Cao et al.,
2015; Katz et al., 2007; Nishino et al., 2012). To better characterize Tns3 protein
expression pattern and its subcellular localization, we generated a knock-in mice
tagging Tns3 C-terminal side with V5-tag (Tns3Tns3-V5 mice) by microinjecting mouse
zygotes with a single strand oligodeoxinucleotide (ssODN) containing V5 sequence
together with Cas9 protein and a gRNA targeting Tns3 stop codon region (see
methods and Fig. S2A-C). We first, validated by immunofluorescence that Tns3-V5
protein in Tns3Tns3-V5 mice presented the expression pattern reported for Tns3 in other
tissues such as the lung and the kidney (Fig. S2D,E). We then characterized Tns3
protein expression in oligodendroglia using V5 antibodies, and found that Tns3 protein
can be detected at high levels in the cytoplasm and main processes of CC1+ iOLs but
not in their nucleus (Fig. 2A). We then used an antibody recognizing Itpr2, suggested
iOLs marker (Marques et al., 2016), and showed that Tns3 largely overlapped with
Itpr2, despite the lower quality of immunofluorescence obtained with Itpr2 antibody
(Fig. 2B). Using Nkx2.2 and Olig1cytoplamic expression distinguishing iOL1 and iOL2
respectively, we could find that high levels of Tns3 are detected in iOL1s
(Nkx2.2+/Olig1- cells) and a fraction of iOL2s (Nkx2.2-/Olig1cytoplamic cells; Fig. 2C),
suggesting that Tns3 protein expression peaks in early iOLs. Moreover, comparison
with Opalin protein localized in the cell body, processes, and myelin segments of
oligodendrocytes, showed that Tns3 levels decreased with increasing levels of Opalin,
and that myelinating oligodendrocytes, that is Opalin+/CC1+ cells presenting

90
myelinated segments (internodes), had downregulated Tns3-V5 expression (Fig. 2D,
arrowheads). Therefore, the characterization of Tns3Tns3-V5 mice suggests that Tns3
protein present at strong levels in early immature oligodendrocytes. As Tns3 isoforms
can be detected at the transcript level in the human brain (Fig. S2F, GTEX project,
gtexportal.org/home/gene/TNS3), we performed Western blot analysis using V5
antibody in purified O4+ cells from P7, P14, and P21 Tns3Tns3-V5 brains to assess its
specificity. Indeed, we could detect both the full-length and the Tns3 short 3-term
isoforms at P7 and P14 containing many iOLs, but not at P21 having mainly mOLs,
validating the specificity of V5 antibodies to recognize Tns3-V5 protein. Eventually, we
found a Tns3 antibody recognizing the c-Term of Tns3 protein (Sigma Ct) giving
optimal immunofluorescence labeling, and confirming Tns3 expression pattern
obtained with V5 antibodies. Combined with Nkx2.2 and Olig1 immunofluorescence
allowed us to distinguishing with more precision different stages of immature
oligodendrocytes. Indeed, we could find that Tns3 is strongly detected in the cytoplasm
and main cellular processes of all iOL1s, defined as Nkx2.2high/Olig1- cells having a
round nucleus and small cytoplasm (Fig. 2E, white arrows), and segmenting iOL2s,
defined as Nkx2.2-/CC1high cells, into three stages: (1) Tns3high/Nkx2.2-/Olig1- cells
(Fig. 2E, arrowheads), (2) Tns3high/Nkx2.2-/Olig1high-cytoplamic (Fig. 2E, grey arrows), and
(3) Tns3-/Nkx2.2-/ Olig1high-cytoplamic (Fig. 2E). Therefore, Tns3 protein is strongly
expressed in early iOLs (iOL1s and early iOL2s) and then downregulated upon
oligodendrocyte maturation (late iOL2s and mOLs). Similar expression pattern and
Tns3 localization was found in neonatal neural progenitors differentiating cultures,
where Tns3 immunofluorescence was detected in the cytoplasm and cell processes
expressing CNP myelin protein, and excluded from the nucleus (Fig. 2F,G).
Altogether, these results indicate that Tns3 protein is expressed at high levels in early
immature oligodendrocytes, and localized to the cytoplasm and cell processes (Fig.
2H,I).
Finally, we investigated whether other Tensin family members (Tns1,
Tns2/Tenc1, and Tns4/Cten) were expressed in oligodendroglia and found that Tns1
and Tns2 could be also detected at very low levels in iOLs by immunofluorescence
(Fig. S3A,B), in accordance with their low transcript expression (Fig. S3C;
brainrnaseq.org). Therefore, Tns3 is the main Tensin expressed during
oligodendrocyte differentiation, suggesting that Tns3 function in immature

91
oligodendrocytes is likely to be evolutionarily selected, and of biological importance for
CNS myelination.
Tns3 expression is found in immature oligodendrocytes during remyelination
Given the strong Tns3 expression in iOLs during postnatal myelination, we
hypothesized that Tns3 expression could be enriched during remyelination in
differentiating oligodendrocytes contributing to remyelination. To address this
hypothesis, we preformed LPC focal demyelinating lesions in the corpus callosum of
adult (P90) Tns3Tns3-V5 and wild-type mice, and assessed for Tns3 expression at the
peak of oligodendrocyte differentiation (8 days post-lesion) in this remyelinating model
(Nait-Oumesmar et al., 1999). We found that while non-lesioned adult brain regions
contained only sparse iOLs (CC1high/Olig1cyto-high cells) also expressing Tns3,
remarkably many Tns3+ iOLs were found in the remyelinating area both with V5 (Fig.
S5A,C, arrows) and Tns3 antibodies (Fig. S5B, arrows). Quantification of Tns3+ cells
showed a 3-fold increase in Tns3+ iOLs around the lesion borders compared to the
corpus callosum far from the lesion area (Fig. S5D), strongly suggesting that Tns3
expression could be used as a hallmark of on-going remyelination and lesion repair.
Of note, we could also detect Tns3 expression in some microglia/macrophages cells
in the lesion area using a combination of F4/80 antibodies (Fig. S5C, arrowheads).
Altogether, all this data indicates that Tns3 expression peaks at the onset of
oligodendrocyte differentiation, labeling immature oligodendrocytes during both
myelination and remyelination, which prompt us to study its function this process.
Tns3 knockout mice present normal numbers of oligodendroglia in the postnatal
brain and still express Tns3 full length transcripts
To explore the role of Tns3 in oligodendrocyte differentiation, we first analyzed a Tns3
gene trap mouse line (Tns3bgeo) already characterized outside the CNS (Chiang et al.,
2005), where the bgeo cassette is inserted after Tns3 exon 4 (Fig. S6A) driving LacZ
transcription, and predicted to be a Tns3 loss-of-function mutation by inserting a stop
poly-A sequence. Despite the original report of postnatal growth retardation in
Tns3bgeo/bgeo mice, these mice were kept in homozygosity for several generations in a
different genetic background (XX, Shu-Hao Lo). We thus analyzed the impact in

92
oligodendrogenesis in the postnatal brain of Tns3bgeo animals at P21. We first found
bgal immunofluorescence in Olig2+/CC1+ OLs of Tns3bgeo postnatal brain (Fig. S6B,C),
paralleling our characterization of Tns3 expression with V5 and Tns3 antibodies. We
then quantified the number of OPCs and differentiating oligodendrocytes present in
two main white matter areas (corpus callosum and fimbria) of Tns3bgeo/bgeo and
Tns3bgeo/+ littermates, at P21 when many oligodendrocytes are differentiating. The
density of PDGFRa+ OPCs or CC1+ oligodendrocytes was the same in both genotypes
(Fig. S6D,D’,E). Moreover, quantification of three different stages of oligodendrocyte
differentiation (iOL1, iOL2, and mOL) using Olig2/CC1/Olig1 immunofluorescence did
not reveal changes in the rate of oligodendrocyte differentiation (proportion of each
stage) in Tns3bgeo/bgeo mice compared to control littermates (Fig. S6F,F’,G). We
therefore verified whether the Tns3bgeo allele was present in homozygosity in Tns3
locus of Tns3bgeo/bgeo compared to wild type mice. Indeed, we could amplify the
expected PCR products from genomic DNA of P21 brains using primers recognizing
Exon-2 and bgeo only in Tns3bgeo/bgeo mice but not using Exon-2 and Exon-14, that
only amplified in wild type mice; Fig. S6H). We then checked for Tns3 full-length
transcripts using cDNA generated from P21 brains, and to our surprise, primers
flanking Exons 17 and 31 were similarly amplified from cDNA of Tns3bgeo/ bgeo and wild
type brains (Fig. S6I), suggesting that the Tns3bgeo allele still produces Tns3 full-length
transcript, and thus Tns3 protein, in the brain of Tns3bgeo/ bgeo mice. Altogether, these
results indicate that Tns3bgeo allele do not lead to Tns3 loss-of-function in the brain,
different from what previously reported in other tissues (Chiang et al., 2005), and thus
it is not suitable for assessing Tns3 function in the CNS.
Therefore, we decided to generate a new Tns3 knockout mice using
CRISPR/Cas9 technology. In order to generate Tns3 loss-of-function mutations
(indels), we generated integrative plasmids (Fig. S7A) driving Cas9 expression and
gRNAs targeting the start of Tns3 coding sequence (Exon-6), using as control,
plasmids without the Tns3-targeting sequence of the gRNA. We validated the cutting
efficiency of two Tns3-targeting gRNAs by lipofection of neural progenitors (Fig. S7B-
F). We then, used these optimized tools to induce CRISPR-mediated mutations in
mouse zygotes (methods), generating and characterizing two mouse lines having
small deletions after the coding ATG of Tns3 in exon 6 (4-deletion and 14-deletion;
Fig. S8A) and presumably leading to frame shifts and Tns3 loss-of-function.

93
Remarkably, homozygous animals were found in reduced numbers compared to
mendelian ratios (Fig. 8B), with many of them dying during embryonic development
(Fig. S8C) and most homozygous animals presenting major growth retardation in the
second and third postnatal week compared with their littermates (Fig. S8E,F), similar
to the original report of Tns3bgeo mice (Chiang et al., 2005). Furthermore, we could still
detect Tns3 protein in CC1+ immature oligodendrocytes of these homozygous mice
by immunofluorescence with at least two different Tns3 antibodies (Fig. S8G) and
Tns3 transcripts the expression of exons corresponding to Tns3 full-length transcript
by qPCR (Fig. S8H). Altogether, these results suggest that mice carrying constitutive
Tns3 loss-of-function mutations seems to escape the full Tns3 deletion, at least in the
brain, and thus we considered these animals not suitable to study Tns3 function in
oligodendrogenesis.
Finally, to assess whether TNS3 is potentially required during human fetal
development, we queried genetic loss-of-function data obtained from the human
population by the GNOMAD project (Karczewski et al., 2020; Lek et al., 2016). These
analyses reveal that TNS3 has a loss of function observed/expected (LOEUF) score
of 0.19 (Fig. S9A; https://gnomad.broadinstitute.org), meaning that complete loss of
TNS3 causes ~80% developmental mortality, a rate similar to key neurodevelopmental
genes such as SOX10 (LOEUF=0.21; Fig. S9B), CHD7 (LOEUF=0.08; Fig. S9C), and
CHD8 (LOEUF=0.08; Fig. S9D), contrary to less broadly required factors such as
NKX2-2 (LOEUF=0.67; Fig. S9E) and OLIG1 (LOEUF=1.08; Fig. S9F). Therefore,
TNS3 loss-of-function variants are badly tolerated in both mice and humans.
In vivo CRISPR-mediated Tns3 loss-of-function in neonatal neural stem cells
impairs oligodendrocyte differentiation
Given the abovementioned tendency of cells to escape to the full Tns3 deletion in the
whole organism, we then fetch to assess for Tns3 requirement during postnatal
oligodendrogenesis in vivo by inducing acute Tns3-deletion only in few neural stem
cells (NSCs) of the neonatal brain, combining the postnatal electroporation technique
with CRISPR/Cas9 technology. We first used integrative CRISPR plasmids, targeting

94
Tns3 near the first coding ATG (exon 6) and expressing the GFP reporter (Fig. 3A), to
transfect neonatal NSCs by postnatal electroporation (Fig. 3B). We targeted the dorsal
subventricular zone (SVZ) NSCs, which generate large number of oligodendroglial
cells during the first postnatal weeks (Kessaris et al., 2006; Nakatani et al., 2013), and
quantified the GFP+ cells, progeny of targeted NSCs, three weeks later (P22, Fig.
3B,C). We focused our study in glial cells by quantifying the GFP+ cells outside the
SVZ and located in dorsal telencephalon (i.e. corpus callosum and cortex). We
identified the fate of GFP+ cells by immunofluorescence for GFP and glial subtype
markers, using high levels of CC1 for oligodendrocytes, PDGFRα for OPCs, and
recognized astrocytes by their unique branchy morphology and low levels of CC1.
Remarkably, brains electroporated with two different CRISPR plasmids targeting
Tns3, had a 2-fold reduction in GFP+ oligodendrocytes compared to the brains
electroporated with control plasmids, while GFP+ OPCs were found in similar
proportions, and even the proportion of GFP+ astrocytes was increased by 1.5-fold as
a result of the large reduction in oligodendrocytes, the number of GFP+ astrocytes was
not changed (61.3 ± 10.9 in experimental versus 57.2 ± 11.8 in controls; Fig. 3D,D’,E).
To assess whether the reduction in oligodendrocytes from Tns3-deleted NSCs was
the consequence of a reduction in OPCs generated, we assessed for possible
changes in numbers, proliferation, and survival of OPC at P11 (Fig. 3F), when most
cortical OPCs have not yet started differentiation. Noteworthy, we found no differences
in either proportion of GFP cells being OPCs (Fig. 3G), in the proliferative status of
GFP+ OPCs (MCM2+/PDGFRa+ cells; Fig. 3H,H’,J), nor GFP+ OPCs showing traits of
cell death (Fig. 3I,I’), between experimental and control brains, while the reduction of
oligodendrocytes was already marked (Fig. 3G).
Given the presence of two Tns3 isoforms expressed in the brain, we asked
whether a deletion of both isoforms would have a greater impact in the reduction of
oligodendrocytes. To assess this, we took advantage of our two gRNA efficiently
targeting and cutting the beginning and the end of Tns3 coding sequence to delete the
whole Tns3 locus (Fig. S10A-C). Remarkably, the loss of the two Tns3 isoforms had
a similar effect in the reduction of oligodendrocytes to the mutations affecting only
Tns3 full-length (Fig. S10D,D’,E), suggesting that the small Tns3 isoform is not
functionally redundant with Tns3 full-length for oligodendrocyte formation. Altogether,
these results indicate that Tns3 loss-of-function mutations in neonatal SVZ-NSCs

95
impairs normal OPC differentiation without affecting OPC generation, proliferation, or
survival, and thus suggesting that Tns3 is largely required for OPC differentiation into
mature oligodendrocytes in the postnatal brain (Fig. 3K).
OPC-specific Tns3 deletion impairs oligodendrocyte differentiation in the
postnatal brain
Given the limitation to assess the in vivo penetrance of Tns3 loss-of-function induced
by CRISPR/Cas9-mediated mutations, and in order to address in depth the
consequences of Tns3 loss-of-function, we designed a Tns3 conditional knockout
allele, by flanking with LoxP sites the essential exon 9 (Fig. S11A,D). In this Tns3-
floxed allele (Tns3flox), Cre-mediated recombination induces a transcription frame shift
introducing an early stop codon, leading to a small peptide (109 aa) instead of the full
length Tns3 protein (1442 aa; Fig. S11B,C). Mouse embryonic stem cells (ESCs) were
transfected with a plasmid expressing Cas9, GFP, gRNAs flanking Tns3 exon 9, and
Tns3-floxed targeting vector, to induce CRISPR/Cas9-mediated homologous
recombination. After verifying the presence of Tns3-floxed allele in Tns3 locus by
Sanger sequencing, positive ESC clones were injected into blastocysts to generate
Tns3-floxed (Tns3flox) mice. Finally, we combined Tns3flox animals with Pdgfra-CreERT
mice, to induce Cre-mediated Tns3 deletion specifically in OPCs, in presence of a Cre
reporter background (Rosa26stop-YFP) in order to trace Tns3-deleted cells (Fig. 4A).
In order to specifically delete Tns3 in postnatal OPCs, we administered
tamoxifen at P7 to Pdgfra-CreERT; Tns3flox/flox; Rosa26stop-YFP (hereafter called Tns3-
iKO mice) and control pups (Tns3flox/flox; Rosa26stop-YFP littermates), and analyze its
effects in oligodendrogenesis at P14 and P21 (Fig. 4A) both in white matter (corpus
callosum and fimbria) and grey matter regions (cortex and striatum). We first assessed
for the efficiency of Tns3 deletion in Nkx2.2+/GFP+ iOLs from different regions by
immunofluorescence using a Tns3 antibody (Sigma Cterminus), finding an almost
complete elimination of Tns3 in Nkx2.2+/GFP+ iOLs of Tns3-iKO compared control
(Fig. S12B,B’,C, arrows and arrowheads). We then assessed for changes in
oligodendrogenesis. Remarkably, the number of oligodendrocytes (CC1+/GFP+ cells)
was reduced by half in all quantified regions (reduction of 38.95% in the CC, 48.60%

96
in cortex, 50.88% in the fimbria, 38% in the striatum; Fig. 4B-D, Fig. S12E-F’, Fig.
S13B,B’) in Tns3-iKO compared to control, while OPC (PDGFRa+/GFP+ cells) density
was unchanged (Fig. 4B-D). Using markers labeling different stages of
oligodendrocyte differentiation (iOL1 and iOL2/mOL), we found that the density of
early iOL1s (Nkx2.2high cells) which express the highest levels of Tns3 protein were
not changed (Fig. S12B,B’,D), that the density of iOL1s (CC1+/Olig1- cells) were
reduced by 30% in Tns3-iKO compared to controls, while later oligodendrocyte stages
(iOL2/mOLs, CC1+/Olig1+ cells) were reduced by 50%, suggesting that Tns3 is
required for normal oligodendrocyte differentiation (Fig. 4E-F). Finally, we assessed
for possible changes in OPC proliferation and cell death, by immunofluorescence with
Mcm2 and activated-Caspase3 recognizing antibodies respectively, finding only
reduction tendency in the proliferation of Tns3-iKO OPCs compared to controls (Fig.
S13C,C’,D), and no evidence of changes in dying OPCs between genotypes.
Altogether, these results indicates that acute deletion of Tns3 in OPCs reduces by 2-
fold oligodendrocyte differentiation in the postnatal brain, without major changes in
OPC proliferation or survival (Fig. 4G).
Tns3-iKO immature oligodendrocytes present an increased apoptosis in
primary cultures
To get some insight into the cellular defects produced by Tns3-deletion in
oligodendroglia, we investigated their cellular morphology and behavior during their
differentiation by video microscopy. To this goal, we MACS-purified OPCs from Tns3-
iKO and control mice at P7, two days after administration of tamoxifen, plated them in
proliferating medium for three days, and then recorded their behavior during three
days in the presence of differentiation medium. Having the expression of the YFP as
a readout of Cre-mediated recombination, we could compared the behavior of YFP+
cells (Tns3-iKO) with neighboring YFP- cells (internal control) in the same cultures. In
parallel, we used MACSorted cells from control mice as external control.
Quantification of the proportion of YFP+ cells over time, showed a neat reduction (from
80% to 60%) of YFP+ cells during the 3 days in proliferation medium followed by a
reduction to 50% by day 3 in differentiation medium (Fig. 5B), suggesting a competitive
disadvantage of Tns3-mutant cells. Live imaging monitoring of cell behavior showed

97
that once YFP+ cells had developed multiple branched morphology, characteristic of
differentiating oligodendrocytes in culture, they showed 4-fold increase their probability
to die compared to YFP- cells of the same culture (Fig. 5C-E, yellow and white arrows,
respectively) or to cells from control cultures (Fig. 5D). This increase in cell death was
more pronounce in the third day of culture (Fig. 5E). Together, this result point to
cellular defects of Tns3-iKO differentiating oligodendrocytes ending up in an increased
apoptosis.
DISCUSSION
The tight balance of oligodendrocyte precursor cells (OPCs) between proliferation and
differentiation ensures the capacity to respond to myelination needs of the CNS by
generating new oligodendrocytes on demand, and avoid generation brain gliomas
uncontrolled OPC proliferation. Furthermore, the observation that OPCs are present
within demyelinating MS lesions, but fail to differentiate into myelinating cells with
disease progression (Chang et al., 2002), suggests that efforts to foster OPC
differentiation are a critical event for successful remyelination in MS patients. In this
study, we combined the genome wide binding profile of key regulators of
oligodendrocyte differentiation, Olig2, Chd7, and Chd8 (He et al., 2016; Küspert and
Wegner, 2016; Lu et al., 2002; Lu et al., 2000; Marie et al., 2018; Zhao et al., 2018;
Zhou and Anderson, 2002; Zhou et al., 2000), to identify their common gene targets,
and focused our analysis in Tensin3 (Tns3) whose expression matches
oligodendrocyte differentiation. To study Tns3 expression and function, we generate
several genetic tools, including CRISPR/Cas9 vectors to induce in vivo and in vitro
Tns3 mutations, a Tns3Tns3-V5 knock-in mice, two lines Tns3 knockout mice, and a
Tns3Flox mice. Using these tools, we provide several lines of evidence showing that
Tns3 is expressed in immature oligodendrocytes (iOLs) and is required for normal
oligodendrocyte differentiation. First, Tns3 expression is strongly induced at the onset
of oligodendrocyte differentiation, localized to the cytoplasm and main cell processes,
and downregulated in mature oligodendrocytes both at the transcript and protein
levels, thus constituting a novel marker for iOLs, for whom we provide an optimal
immunofluorescence protocol with a commercial antibody (Sigma, Ct). Second, we
show that during remyelination, Tns3 is also expressed in newly formed

98
oligodendrocytes and can be used as a hallmark for on-going remyelination. Third,
analyzing both Tns3bgeo gene trap mice and two Tns3KO mice, we show that
constitutive Tns3 deletion is detrimental for normal development and that the predicted
loss of Tns3 full-length transcript and protein is bypassed in oligodendroglia from
surviving homozygous animals, paralleling the intolerance for TNS3 loss-of-function
variants in the human population. Fourth, in vivo CRISPR-mediated Tns3-deletion in
neonatal stem cells leads to a 2-fold reduction of oligodendrocytes without changes in
OPC generation, proliferation, and survival. Fifth, in vivo Tns3 induced knockout
(Tns3-iKO) in postnatal OPCs leads to a 2-fold reduction of differentiating
oligodendrocytes, without reducing the OPC population, both in grey and white matter
brain regions. Finally, video microscopy of primary OPC differentiation cultures
indicate that Tns3-iKO differentiating oligodendrocytes present an increased
apoptosis compared to control oligodendrocytes from the same cultures, suggesting
that Tns3 function is required for normal oligodendrocyte differentiation.
Tns3 is a novel marker for immature oligodendrocytes
Recent studies has started to uncover genes enriched in iOLs, such as Itpr2 (Marques
et al., 2016; Zeisel et al., 2015), Enpp6 (Xiao et al., 2016), and Bcas1 (Fard et al.,
2017), that could be used as markers for these transient cell population particularly
interesting to label areas of active myelination and remyelination in the context of
oligodendrocyte and myelin pathology, such as preterm brain injury and multiple
sclerosis. Here, we report for the first time that Tns3 protein is a hallmark of iOLs
(figure 2). Tns3 is expressed at high levels in iOLs and downregulated in mature
oligodendrocytes, showing a complete overlap with Itpr2. We found that Tns3 antibody
from Millipore also recognizes a nuclear epitope different from Tns3 that remarkably,
like Tns3 in the cytoplasm, labels at high levels iOLs, similarly to what reported for
CC1 antibody recognizing both APC and Quaking-7 proteins (Bin et al., 2016; Lang et
al., 2013). Remarkably, upon trying several antibodies, we found one (Sigma
Cterminus) working optimal in immunofluorescence on brain sections and
oligodendroglial cultures, while Itpr2 commercial antibody did not match this high
quality of immunofluorescence. The use of BCAS1 antibodies to label iOLs, despite is
peak expression in iOLs, has the caveat of being also expressed in mature

99
oligodendrocytes and myelin (Zhang et al., 2014). Finally, Enpp6 has a very specific
expression in iOLs at the transcript level (Xiao et al., 2016) but to our knowledge Enpp6
recognizing antibodies producing good quality immunofluorescence are yet not
available. Therefore, Tns3 protein expression in the CNS is a hallmark of iOLs and
Tns3 Sigma Cterminus antibody constitute an optimal reagent to label iOLs during
both myelination and remyelination.
Tns3 is required for oligodendrocyte differentiation
Oligodendrocyte differentiation implicates a large generation of membrane and cell
processes composing the 40-60 myelin segments formed by mature oligodendrocytes
(Hughes et al., 2018). Actin cytoskeleton remodeling is an important driver of the OL
morphological changes undergone during their differentiation (Nawaz et al., 2015;
Zuchero et al., 2015). Tensin proteins, linking the extracellular signals received by
integrins with the actin cytoskeleton, are well placed to play a relevant role in these
morphological changes. Indeed, high levels of Tns3 expression coincides which the
phase when iOLs display a large cytoplasm and produce large number of processes,
suggesting an active role in this cellular remodeling. The guiding of the OL cell
processes’ growth cone is based on the sequential activation of Fyn, FAK and
RhoGAP (Thomason et al., 2020). On the other hand, PDGF survival signaling in
OPCs and myelin formation are dependent of α6β1-integrin binding to Fyn (Colognato
et al, 2004). Interestingly, Tns3 can bind β1-integrin, through its PTB domain
(Georgiadou et al, 2017), but also binds FAK by its SH2 domain (Cui et al., 2004) (Liao
et al., 2007), and is thus well placed to mediate integrin signaling to the actin
cytoskeleton. Moreover, β1-integrin, FAK, Fyn, p130Cas, and Tns3 are all highly
expressed in iOLs (https://www.brainrnaseq.org/). Here, using three independent
approaches, we show that loss of Tns3 in iOLs reduces by half the numbers of
oligodendrocytes in the postnatal brain, and increases their apoptosis in
oligodendrocyte differentiating cultures. It is therefore very likely that Tns3 act as a
mediator of α6β1-integrin signaling to promote OL survival and differentiation by
helping their actin cytoskeletal remodeling. If so, an exogenous activation of α6β1-
integrin in cultured OPCs with Mn2+ (Colognato et al., 2004) should not increase
oligodendrogenesis in Tns3-iKO oligodendroglia. Finally, by its binding to EGFR (Cui
et al., 2004), whose activation is another driver of oligodendroglial differentiation, Tns3

100
could also be required to mediate growth factors receptors activation in early iOLs,
explaining the increased death in OLs lacking Tns3.
Tns3 and cancer
Although deregulation of Tensins’ expression is frequently associated with cancer (Lo
and Lo, 2002; Sasaki et al., 2003a; Sasaki et al., 2003b), the roles of the different
Tensins in tumorigenesis and metastasis remain largely undefined (Cao et al., 2012).
All four family members are downregulated in human kidney cancers (Martuszewska
et al., 2009), and reduced levels of Tns3 are detected in breast tumors (Veß et al.,
2017), glioblastoma (Chen et al., 2017) or thyroid carcinoma (Maeda et al., 2009).
EGF is an important regulator of dynamic Tensin expression given that EGF treatment
of epithelial cells decrease Tns3 expression (Katz et al., 2007). Mechanistically, it has
been shown in mammary cells in culture that Tns3 can bind DLC1 (Deleted in Liver
Cancer 1) by its actin binding domain, releasing an auto-inhibitory interaction in DLC1,
and thereby leading to inactivation of RhoA and thus decreasing cell migration (Cao
et al., 2012). Furthermore, EGF-driven cell migration and cellular transformation is
dependent on the inhibition of DLC1 and it implies Tns3 downregulation likely
mediated by p-ERK (Cao et al., 2012). Therefore, all these data suggest a role of Tns3
in maintaining focal cell adhesion and thus preventing migration and metastasis in
tumor cells. Interestingly, EGFR is involved in OPC proliferation and survival (Aguirre
et al., 2007) and it is downregulated in iOLs in parallel with the increase expression of
Tns3.
Intolerance to Tns3 loss-of-function in mice and humans
Tns3bgeo gene trap mice has been reported as a null-allele in the lung and intestine,
resulting in growth retardation and in some cases death within 3 weeks after birth
(Chiang et al., 2005). Histological analysis of this mutant showed smaller digestive
tracts with defects in both villi and enterocyte differentiation as well as a failure in
secondary septation of lung alveoli, with BrdU birth dating experiments indicating a
migration defect of Tns3-mutant epithelial cells of the small intestine (Chiang et al.,
2005). Given that interactions between epithelia and surrounding mesenchyme are
critical for the development of both organs (Minoo and King, 1994; Roberts et al., 1998;

101
Rochette-Egly et al., 1986) and EGF induced migration of epithelial cells requires
modulation of cell–cell and cell–matrix interaction (Pignatelli, 1996), it is possible that
lacking Tns3 impairs the ability of the epithelia to fully process environmental cues,
such as EGF, which normally induces tyrosine phosphorylation of Tns3 (Chiang et al.,
2005; Cui et al., 2004). In this study, we have described specific expression of
bgalactosidase in differentiating oligodendrocytes that corresponds to
immunofluorescence with Tns3 specific antibodies. Analysis of different
oligodendroglial stages in the postnatal brain of Tns3bgeo/bgeo mice did not show any
changes compared to control littermates. Unexpectedly, we found that Tns3
immunofluorescence signal is still present in Tns3bgeo/bgeo brains and detected Tns3
transcripts containing the main exons are present in Tns3 full-length isoform, indicating
that Tns3bgeo allele is not a Tns3-null allele in the CNS. We obtained similar results
using two different CRISPR/Cas9-generated alleles (Tns34del and Tns314del) predicted
to be loss-of-function by inducing a frame shift at the beginning of Tns3 coding
sequence, suggesting that animals escaping embryonic or postnatal death have
prevented the loss Tns3 at least in certain cells or tissues. This result parallels, the
intolerance found in the human population for Tns3 loss-of-function predicted variants,
where less than 20% of the expected alleles could be found in 60,000 human genomes
involved in the GNOMAD project (https://gnomad.broadinstitute.org).
MATERIAL & METHODS
Animals and genotyping
All animal procedures were performed according to the guidelines and regulations of
the Inserm ethical committees (authorization #A75-13-19) and animal experimentation
license A75-17-72 (C.P.). Both males and females were included in the study. Mice
were maintained in standard conditions with food and water ad-libitum in the ICM
animal facilities. For staging of embryos, midday of the vaginal plug was calculated as
E0.5. Polymerase chain reaction was performed with wild type and knock-out primers
to genotype the embryos. Wild type, heterozygous and homozygous mutant embryos

102
were obtained from intercrosses of heterozygous mice. Genotyping of the different
Tns3 alleles was performed by PCR using the following primers and conditions:
Tensin3 gene trap mice line (Tns3bgeo) details are from Su Hao Lu lab (UC Davis,
USA).
Mice used for ChIP-seq analysis are Wild-type Swiss obtained from Janvier Labs.
Tns3flox were crossed with PdgfRa-CreERT; Rosa26stop-YFP mice to generates Tns3flox;
Pdgfra-CreERT; Rosa26stop-YFP mice line. Due to the reported subtle effects of Cre
protein in the biology of cells expressing it, all mice used as control for in Tns3flox study
are Tns3WT; Pdgfra-CreERT; Rosa26stop-YFP mice.
Generation of Tns34del and Tns314del knockout mice
Tns3KO mice were generated at the ICM mice. Briefly, the Cas9 protein, the crRNA,
the tracrRNA and a targeting vector for the Tns3 gene have been microinjected in a
mice egg cell transplanted in a receptor C57BL/6J. Pups with NHEJ mutations
inducing a gene frameshift were selected after genotyping and Sanger sequencing
verification. Finally, only two lines contained indels of 4 and 14 nucleotide deletions
were maintained and studied.
Generation of Tns3Tns3-V5 knockin mice
Tns3V5 mice were generated at the Curie Institute mice facility. Briefly, the Cas9
protein, the crRNA, the tracrRNA and a ssODN targeting vector for the Tns3 gene
have been microinjected in a mice egg cell transplanted in a receptor C57BL/6J-
BALB/cJ female. Pups pups presenting HDR insertion of the V5 tag were selected
after genotyping.
Generation of Tns3Flox mice

103
The Tns3 conditional knockout mouse (LoxP-Exon9-LoxP) was generated at the
Transgenic Core Facility of the University of Copenhagen. The repair template
contained homology arms of 771bp and 759bp length and LoxP sequencing flanking
the Exon-9. It was synthetized by Invitrogen and verified by Sanger sequencing. Two
gRNAs were designed at the Transgenic Core Facility that target a DNA sequence in
the proximity of each LoxP site. The gRNAs were designed in a fashion where the
insertion of the LoxP disrupts the targeting site, thus preventing retargeting of the
repaired DNA. We have used a mES (mouse embryonic stem cell) method for the
generation of this mouse model by transfection (or electroporating) ES cells with the
repair construct (dsDNA) together with two plasmids – each containing each gRNA.
Identification of the positive mES clones was done via a combination of a PCR
genotyping and Sanger sequencing confirmation. Detailed protocols can be provided
upon request.
MACS
Dissociation of cortex and Corpus Callosums from V5 mice was done using neural
tissue dissociation kit (P) (Miltenyi Biotec; ref 130–093-231). Briefly, we dissect
cortices from P7, P14 or P21 mice. Cortices have dissociated using Miltenyi MACS
dissociator (Miltenyi Biotec; ref 130-096-427). Dissociated cortices were then filtered
using Smartstainer 70um (Miltenyi Biotec; ref 130-098-462). Myelin residues were
eliminated from P14 and P21 mice 'cortices during an additional step using the debris
removal kit (Miltenyi Biotec; ref 130-090-101). Cells were saturated in a 0,5% NGS
solution then incubated with anti-PDGFRα or anti-O4 coupled-beads (Miltenyi Biotec;
ref 130-094-543 and 130-096-670).
Non-bound beads-coupled antibodies have been washed by centrifugation then bound
cells have been sorted using MultiMACS Cell24 Separator Plus (Miltenyi Biotec; ref
130-098-637). Sorted cells were either plated in culture plates for in vitro cell study or
centrifuged at 1200 rpm and use for Western blot analysis.
O4+ MACSorted cells from P7 wild-type mouse cortices (80% PDGFRα+ OPCs and
20% Nkx2.2+-Cnp+ iOLs) were used for Olig2 ChIP-seq. O4+ MACSorted cells from

104
P12 wild-type mouse cortices (30-50% PDGFRa+ OPCs and 50-70% Nkx2.2+-Cnp+
iOLs) were used for histone marks ChIP-seq.
Chromatin immunoprecipitation (ChIP)
ChIP-seq assays were performed as described previously (Marie et al; 2018), using
iDeal ChIP-seq kit for Transcription Factors (Diagenode, C01010055). Briefly, O4+
MACSorted cells were fixed in 1% formaldehyde (EMS, 15714) for 10 min at room
temperature and reaction was quenched with 125 mM glycine for 5 min at room
temperature. Lysates were sonicated with a Bioruptor Pico sonicator (Diagenode, total
time 8 min) and 4μg of antibodies were added to sheared chromatin (from 4 million
cells for Olig2 and from 1 million cells for histone marks) and incubated at 4°C
overnight. Antibodies used were: mouse anti-Olig2 antibody (Millipore, MABN50),
rabbit anti-H3K4me3 antibody (Active motif, 39060), rabbit anti-H3K27Ac antibody
(Active motif, 39034), rabbit anti-H3K4me1 antibody (Ozyme, 5326T), mouse anti-
H3K27me3 antibody (Abcam, ab6002). Mock (Rabbit IgG) was used as negative
control. Chromatin-protein complexes were immunoprecipitated with protein A/G
magnetic beads and washed sequentially. DNA fragments were then purified. Input
(non-immunoprecipitated chromatin) was used as control in each individual
experiments.
The ChIP-seq libraries were prepared using ILLUMINA Truseq ChIP
preparation kit and sequenced with ILLUMINA Nextseq 500 platform.
ChIP-seq analysis
All ChIP-seq analysis were done using the Galaxy Project (https://usegalaxy.org/).
Reads were trimmed using Cutadapt (--max-n 4) and Trimmomatic (TRAILING 1;
SLIDINGWINDOW 4 and cutoff 20; LEADING 20; MINLEN 50), and mapped using
Bowtie2 onto mm10 mouse reference genome (-X 600; -k 2; --sensitive). PCR-derived
duplicates were removed using PICARD MarkDuplicates. Bigwig files were generated
with bamCoverage (binsize=1). Peak calling was performed using MACS2 callpeak

105
with Input as control and with options: --qvalue 0.05; --nomodel; --keep-dup 1; --broad
(only for histone marks). Blacklisted regions were then removed using bedtools
Intersect intervals.
Visualization of coverage and peaks was done using IGV ((Robinson et al.,
2011); http://software.broadinstitute.org/software/igv/home). Intersection and analysis
of bound genes were done using Genomatix (https://www.genomatix.de/).
Two replicates were done for Olig2, with one of them of better quality (53,960
peaks for replicate 1 and 14,242 peaks for replicate 2). The peaks found in both
replicates (6,781) and/or peaks from replicate 1, which were found in regulatory
elements (13948) were considered (16578 in total). Three replicates were done for
H3K4me3, two replicates were done for H3K27me3 and one replicate was done for
H3K27Ac and H3K4me1. Intersection of these datasets was done using bedtools
Intersect intervals.
Peaks overlapping with regions between 1000bp upstream of transcription start
site (TSS) and 10bp downstream of TSS were identified as “promoters” (Genomatix).
“Active promoters” contain peaks for H3K4me3 and H3K27Ac. “Repressed promoters”
contain peaks for H3K27me3 and no active marks. “Poised promoters” contain
H3K4me1 and no active or repressed mark. Regions outside promoters containing
histone marks were considered as “enhancers”. “Active enhancers” contain peaks for
H3K27Ac. “Repressed enhancers” contain peaks for H3K27me3 and no active marks.
“Poised enhancers” contain H3K4me1 and no active or repressed mark. Genes are
considered associated if the peaks is present in promoter or a range of 100kb from the
middle of the promoter and the gene expression is medium to high (“active”), low
(“poised”) or not (“repressed”) expressed (based on control RNA-seq dataset in (Marie
et al; 2018))
Analysis of scRNAseq
Counts per gene were downloaded from GEO datasets GSE75330 and GSE95194,
and processed in R (4.0) using the following packages: Seurat (3.0) for data
processing, sctransform for normalization, and ggplot2 for graphical plots. Seurat

106
objects were first generated for each dataset independently using CreateSeuratObject
function (min.cells = 5, min.features = 100). Cell neighbors and clusters were found
using FindNeighbors (dims = 1:30) and FindClusters (resolution = 0.4) functions.
Clusters were manually annotated based on the top 50 markers obtained by the
FindAllMarkers function, adopting mainly the nomenclature from Marques 2016. Using
the subset function, we selected only the clusters containing neural progenitors and
oligodendroglia cells. Using the merge function, we combined both oligodendroglial
datasets into a single Seurat object (OLgliaDP) containing 5516 cells. The new object
was subjected to NormalizeData, FindVariableFeatures, ScaleData, RunPCA, and
RunUMAP functions with default parameters. Different OPC clusters were fused into
a single one keeping apart the cycling OPC cluster. For DimPlots and Dotplots,
clusters were ordered by stages of oligodendrogenesis from neural stem cells (NSCs)
to myelinating OLs.
Postnatal electroporation
Postnatal brain electroporation (Boutin et al., 2008) was adapted to target the dorsal
SVZ. Briefly, postnatal day 2 (P2) pups were cryoanesthetized for 2 min on ice and
1.5 ml of plasmid were injected into their left ventricle using a glass capillary. Plasmids
were injected at a concentration of 2-2.5ug/ul. Electrodes (Nepagene CUY650P10)
coated with highly conductive gel (Signagel, signa250) were positioned in the dorso-
ventral axis with the positive pole dorsal. Five electric pulses of 100V, 50ms pulse ON,
850ms pulse OFF were applied using a Nepagene CUY21-SC electroporator. Pups
were immediately warmed up in a heating chamber and brought to their cages at the
end of the experiment.
Immunofluorescence
Embryonic mice were taken after anesthetizing the mother by 100 μL phenobarbital
(euthasol)(Virbac USA) at the time point we wanted and their brains were dissected
out and fixed for 30 minutes in 2% paraformaldehyde (PFA) freshly prepared from 32%
PFA solution (Electron Microscopy Sciences, 50-980-495). Postnatal mice brain till 15

107
days post-natal (P15) were perfused with 15ml of 2% PFA, and the older stages were
perfused with 25 ml of 2% PFA, brains from post-natal were dissected out,
cryoprotected in PBS with 20% sucrose overnight, and included in OCT (BDH) before
freezing and sectioning (16µm thickness) in a sagittal plane with a cryostat microtome
(Leica). Sections were then either processed for immunohistochemistry after drying
them well for one hour at room temperature (RT) or stored at -80°C for a later use,
and to dry those frozen sections for 20 minutes at room temperature also for 20
minutes before adding the blocking solution (Phosphate Buffered Saline (PBS) with
10% normal goat serum (NGS, Eurobio, CAECHVOO-OU), 0.1% triton X-100) for one
hour at RT. The following primary antibodies were diluted in the same blocking solution
and used at the concentration indicated in Table1. Fluorescent secondary antibodies
included the following: AlexaFluor-488, AlexaFluor-594. Finally, cell nuclei are labeled
with DAPI (1/10000, Sigma-Aldrich®, D9542-10MG), and slices are mounted in
Fluoromount-G® (SouthernBiotech, Inc. 15586276).
In vitro, the same blocking solution and the same antibodies were used than in
vivo. Fixed coverslips were blocked for 30 minutes at RT, incubated in the primary
antibodies for 45 minutes at RT and washed 3 times in 1x PBS. Secondary antibodies
were apply for 45 minutes at RT and washed 3 times in 1X PBS. Coverslips were then
incubate with DAPI solution for 5 minutes at RT. A final washing was done before
mounting the coverslips on slides to be visualized under the microscope.
Immunofluorescence was visualized with Zeiss® Axio Imager.M2 microscope
with Zeiss® Apotome system. Pictures were taken as stacks of 5–10µm with 0.5µm
between sections. Image acquisition and processing are achieved by ZEN Microscopy
and imaging Software, Z-projections and orthogonal projections were done in ImageJ
and processed with Adobe Photoshop. Figures were made using Adobe Illustrator.
Western blot
Proteins from MACsorted cells were extracted 30 minutes at 4°C in RIPA buffer from
ThermoFisher (50 µL per million cells; ref: 89901), supplemented with Halt™ Protease

108
Inhibitor Cocktail (100X) from ThermoFisher (ref: 87786). Protein concentration in the
supernatant was estimated using the Pierce Detergent Compatible Bradford Assay Kit
from Thermofisher (ref: 23246). For each Western Blot, we used 50ug of proteins
denaturated for 10 minutes at 95°C with b-mercaptoethanol (24X) and BoltTM LDS
Sample Buffer (4X) from ThermoFisher (ref: B0007). Western Blot have been
performed on Bolt™ 4 to 12%, Bis-Tris, 1.0 mm Mini Protein Gel from ThermoFisher
(ref: NW04122BOX), immersed in 4°C Bolt™ MOPS SDS Running Buffer (20X) from
ThermoFisher (ref: B0001) using Mini Gel Tank and Blot Module Set from
ThermoFisher (ref: NW2000). Precision Plus Protein™ All Blue Standard from BioRad
(ref: 1610373EDU) has been loaded as a migration control. Proteins have migrated
for 90 minutes at 90V. Then gels have been transferred on Amersham Protran 0,2 µm
Nitrocellulose membrane from Dutscher (ref: 10600001) immersed in 4°C NuPAGE
Transfer Buffer (20X) from ThermoFisher (ref: NP0006-1) for 90 minutes at 60V
Membranes were incubated 1h in TBS-T, 10% dry milk to be saturated from non-
specific antibodies reaction. Primary antibodies, diluted in TBS-T, were incubated with
the membrane overnight at 4°C with shaking. After three TBS-T wash, membranes
were incubated with HRP-conjugated secondary antibodies, diluted in TBS-T, for 1h
at 4°C with shaking, then revealed using Pierce™ ECL Western Blotting Substrate
from ThermoFisher (ref: 32109) and imaged with the ChemiDoc™ Touch Imaging
System from BioRad (ref: 1708370) provided by CELIS ICM facility. Detection of actin
has been used as loading control.
Demyelinating lesions
Before surgery, adult (2-3months) WT mice were weighted and anesthetized by
intraperitoneal injection of mixture of ketamine (0.1 mg/g) and xylacine (0.01 mg/g).
An analgesic (buprenorphine, 30 mg/g) was administered intraperitoneally to prevent
postsurgical pain. Focal demyelinating lesions were induced by stereotaxic injection
of 1µl of lysolecithin solution (LPC,Sigma, 1% in 0.9%NaCl) into the corpus callosum
(CC; at coordinates: 1 mm lateral, 1.3 mm rostral to bregma, 1.7 mm deep to brain
surface) using a glass-capillary connected to a 10µl Hamilton syringe. Animals were
left to recover in a warm chamber before being returned into their housing cages.

109
Development of CRISPR/Cas9 tools
Design of gRNA
In order to produce indel mutations by Non Homologous End Joint (NHEJ) repair
mechanisms after Cas9/gRNA targeting of the coding region we decided to find
efficient sgRNA in the region downstream of the coding ATG. To this purpose, we used
CRISPOR software (http://crispor.tefor.net/) to choose gRNA with predicted cutting
efficiency and minimal off-target and for PCR amplification primer design.
Validation of gRNA cutting efficiency
The validation of tns3-targeting CRISPR/Cas9 system was performed in 3T3 cell lines
by transfection with lipofectamine 3000 of PX459 plasmids containing 4 different
sgRNA sequences. After 2-days incubation, puromycin was added to medium for 4
days allowing survival of cells containing the PX459 plasmid. Three days after
proliferation in fresh medium without puromycin, DNA was extracted using DNeasy
blood & tissue kits (Qiagen), and target DNA for 5’ Tns3 region was amplified by PCR
using primer sequences: Forward: 5’-AGG TGG CCT TCA GCT CAGT -3’, Reverse:
5’-GCT ATC ATC CCC ACT CAC CA-3’; annealing temperature of 64°c, the PCR
result of this primer pairs is 326bp. DNA from 3’ Tns3 target region was amplify using
primer sequences: Forward: 5’- CCAGTCAGTGGTGACATTGTTT -3’, Reverse:
5’- ACTGTTCCCAGGTTGCTATCAT -3’), the annealing temperature 58°c,
giving a band of 419bp, Common PCR settings being: Initial denaturation 95°c for 5
minutes (1 cycle), Denaturation 95°c for 30 seconds, Annealing 64/58°c for 30
seconds, Elongation 72°c for3 minutes (35cycles), and final elongation 72°c for 7
minutes. For the PCR reaction mix (20µl final volume): 4µl of 5x FIREPol master mix
(Solis BioDyne), 1µl each forward and reverse primer (10pmol/µl), 2µl from the DNA
and d H2O to 20µl.
Cutting effecieny of sgRNA was verified by T7 endonuclease I, following beta protocol
of IDTE synthetic biology for amplification of genomic DNA and detect mutations and
using PAGE (Polyacrylamide gel electrophoresis).

110
Generation of Tol2-integrative plasmids
In order to generate plasmids that will insert CRISPR tools into the genome of the
tranfected cells and lead to permanent expression of the targeting tools, we subclone
the PX458 (GFP) or PX459 (Puromycin) plasmids into Tol2 containing sequences
backbone (obtained from Tol2-mCherry expressing plasmid kindly provided by Lean
Livet, Institut de la Vision, Paris).
Data Resources
Raw data files have been deposited in the NCBI Gene Expression Omnibus under
accession number GEO: XX
Contact for Reagent and Resource Sharing
Further information and requests for reagents may be directed to, and will be fulfilled by
the corresponding author Carlos Parras ([email protected]).
ACKNOWLEDGMENTS
We thank D. Bergles for the PDGFRa::CreERT mice. All animal work was conducted
at the ICM PHENOPARC Core Facility. Data generated relied on ICM Core Facilities:
bioinformatics (ICONICS), sequencing, CELIS, histology, and ICM Quant, and we
thank all personnel involved for their contribution and help. The Core Facilities were
supported by the “Investissements d’avenir” (ANR-10- IAIHU-06 and ANR-11-INBS-
0011-NeurATRIS) and the “Fondation pour la Recherche Médicale”. This work was
supported by funding by grants from the National Multiple Sclerosis Society (NMSS
RG-1501-02851), and the Fondation pour l’Aide à la Recherche sur la Sclérose en
Plaques (ARSEP 2014, 2015, 2018, 2019, 2020). E.M, H.H, and C.M. were supported
by funding from Sorbonne Université. C.M. was also supported by Fondation pour la
Recherche Médicale (FRM, FDT20160435662) and ARSEP grant 2018-2020.

111
Figure legends
Figure 1: Tns3 is a gene target of Olig2, Chd7, and Chd8, expressed in immature
oligodendrocytes
(A Up) Schematic from IGV browser of Tns3 gene region depicturing ChIP-seq data
in O4+ cells (OPCs/OLs) for transcription factor Olig2, chromatin remodelling factors
Chd7 and Chd8, and epigenetic marks (H3K4me3, H3K27ac, H3K4me1 and
H3K27me3). (A Down) Zoom on Tns3 alternative promoters. Mock (control IgG)
shows no peaks in the regions of interest. Lines present below peaks indicate
statistical significance (peak calling). (B-C) Barplots showing Tns3 transcript count per
million (CPM) in O4+ cells upon tamoxifen-induced Chd7 deletion (Chd7iKO, B) or
Chd8 deletion (Chd8cKO, C) compared to control (Ctrl). Statistics were done using
EdgeR suite. (D) Barplot of Tns3 mRNA transcript levels (FKPM) in postnatal brain
cell-types (Zhang et al., 2014; brainrnaseq.org). (E) In situ hybridization in sagittal
section of the adult (P56) mouse brain at the level of the lateral ventricles showing
Tns3 transcript expression in sparse white matter cells (Allen brain atlas, portal.brain-
map.org). (F) UMAP representation of neural progenitors and oligodendroglial cells
extracted and integrated using Seurat from scRNA-seq datasets (Marques et al., 2016;
2018), representing different clusters corresponding to different oligodendroglial
stages of NSCs to mOLs. (G) Feature plot representing relative expression levels of
Tns3 transcript. (H) Dot plot representing the transcript expression of key markers for
each cell stage/subtype and key oligodendroglial factors in the different clusters
showing the predominant expression of Tns3 in iOL1s and iOL2s clusters, similar to
Enpp6 and Itpr2. NSC, neural stem cells; NPC, neural progenitor cells; cycOPC,
cycling OPC; MFOL, myelin forming OL; MOL1/2, myelinating OL 1/2.
Figure S1: Tns3 is a gene target of Olig2, Chd7, and Chd8 key oligodendrogenic
regulators
(A) Scheme representing MACSorting of O4+ cells from wild type cortices followed by
ChIP-seq. Olig2 ChIP-seq from P7 mouse cortices containing 80% OPCs and 20%
iOLs. Histone marks ChIP-seq from P12 mouse cortices containing 30-50% OPCs and
50-70% iOLs. (B) Ven diagrams representing the number of Olig2-bound peaks and

112
genes, with showing an example of key oligodendroglial genes bound by Olig2. (C)
Schematic representing gene regulatory elements in O4+ cells as active, poised, and
repressed, according to their histone marks. (D) Pie chart representing the number
and repartition of Olig2 binding sites in regulatory regions with different activity histone
marks. Note that Olig2 binds in both promoters (60%) and enhancers (40%), and that
it is found in either active, poised or repressed regions. (E) Strategy used to identify
Tns3 as a gene target of Olig2, Chd7, and Chd8, potentially involved in
oligodendrogenesis. Left, Venn diagrams depicting the overlap of binding peaks
between Chd7 (blue), Chd8 (cyan) and Olig2 (purple) in O4+ cells. Right, Venn
diagram showing that 832 (47%) of the 1764 common regions have marks of active
promoters, corresponding to 654 genes, including Tns3.
Figure S2: Immunofluorescence with Tns3 antibodies shows its expression in
immature oligodendrocytes the postnatal brain
Tns3 expression in CC1+ OLs (arrows) at the level of the corpus callosum (CC) of P24
mice, using a homemade antibody from Sassan Hafizi lab (University of Portsmouth)
(A), and commercial antibodies from Santacruz (B), ThermoFisher (C), and Millipore
(D). Note that Millipore antibody is the only one to show clear nuclear localization in
OLs. ThermoFisher and Millipore antibodies also recognize a nuclear signal in cortical
neurons (C-D, stars), not found with other Tns3 antibodies. Scale bar, 20 mm.
Figure S3: Generation of Tns3Tns3-V5 knock-in mice
(A) Scheme of V5 tag knock-in strategy in mice. (B) Schematic of Tns3 protein with a
V5 tag. (C) Nucleotide sequence of a wild type mice Tns3 3’ region (Up), of the
targeting ssODN vector (Middle) and of the 3’ region of the first Tns3Tns3-V5 knock-in
mice generated (Down). (D,E) Immunostaining of V5 antibody in kidney (D) and lung
(E) of P14 Tns3Tns3-V5 mice. Note the expression of Tns3 in kidney glomerula and lung
podocytes. (F) Schematic of the two main TNS3 isoforms exon expressed in the
human brain (gtexportal.org/home/gene/TNS3). A dark color is associated with higher
expression. (G) Western blot of V5 antibody in O4+ MACSorted cells from P7

113
OPCs/iOLs (left), P14 (middle) and P21 OLs (right) of Tns3Tns3-V5 brains. Bottom, actin
charge control. Note the presence of the full-length isoform only in OPC/iOLs. (H)
Schematic of Tns3 brain isoforms and their interactions with actin and Integrins.
Figure 2: Tns3 protein is present at high levels in the cytoplasm and main cell
processes of immature oligodendrocytes in the postnatal brain
Immunofluorescence in sagittal sections of postnatal brain at the level of the corpus
callosum at P14 (A-C) and P21 (D-E) with V5 and Tns3 antibodies. Arrows indicate
examples of labelled iOLs. (A) Tns3-V5 is detected at high levels in CC1+ OLs but not
in PDGFRa+ OPCs. (B) Tns3-V5 expression overlap well with Itpr2, with some of them
being Olig1high-cytoplamic cells. (C) Tns3-V5 overlaps with high levels of Nkx2.2
expression (arrows) and also in Nkx2.2-/Olig1high-cytoplamic cells (arrowheads). (D) Tns3-
V5 expression overlap with Opalin in iOLs (arrows, CC1+ cells with large cytoplasm)
but is downregulated in Opalin+ mOLs (arrowheads, CC1+ cells with small cytoplasm
and myelin segments). (E) Tns3 is detected at high levels in Nkx2.2+/Olig1- early iOL1s
(white arrows), in late Nkx2.2-/Olig1- iOL1s (white arrowheads), and in Nkx2.2-/Olig1
high-cytoplamic iOL2s (grey arrows). (F) Tns3-V5 expression NSC cultures after 5 days in
differentiation. Note the Tns3 expression in Nkx2.2+/CNP+ OLs (arrows). (G)
Subcellular localization of Tns3 expression in CNP+ OLs present in the cytoplasm and
in dots distributed along the cell processes, overlapping with CNP signal (arrows). (H)
Schematic representing of Tns3 expression together with key markers of different
oligodendroglial stages summarizing data shown in A- E panels. (I) Schematic
representing Tns3 expression and subcellular localization in oligodendroglia. Scale
bars: A-F, 20 mm; G, 10 mm.
Figure S4: Tns1 and Tns2 proteins are detected at low levels in immature
oligodendrocytes
Immunofluorescence in sagittal section of P24 mice brain. Tns1 (A) and Tns2 (B)
expression in CC1+ OLs of the corpus callosum. Tns1 expression is cytoplasmic and
excluded from OL nucleus (A1), so does Tns2 (B1). (C) Tns1, Tns2 and Tns3 mRNA

114
expression in postnatal brain (brainrnaseq.org). Note that Tns3 is the main Tensin
expressed in OLs. Scale bar, 20 mm.
Figure S5: Tns3 is expressed in newly formed oligodendrocytes during brain
remyelination
(A,B) Tns3-expressing cells in the CC of adult (P90) mice, 7 days after demyelination
showing strong Tns3 expression in CC1+/Olig1- iOL1s (arrowheads) and
CC1+/Olig1citoplasmic iOL2s (arrows) around the lesion using either anti-V5 antibody in
Tns3Tns3-V5 mice (A-A1) or anti-Tns3 antibody in wild-type mice (B-B1). Note the
absence of CC1+/Olig1+ OLs in the lesion. (C-C1) Tns3 expression in CC1high iOLs
(arrows) around the lesion and in some F4/80+ microglia (arrowheads) in the lesion
area. A1, B1 and C1 are higher magnification of corresponding insets (squares). (D)
Quantification of the Tns3+ OLs density every 50mm away from the lesion. Scale bar,
20 mm.
Figure S6: Oligodendrocyte differentiation is normal in Tns3bgeo/bgeo mice, which
express full-length Tns3 transcripts in the brain
(A) Schematic of Tns3bgeo allele, showing localization of primers used for PCR
amplification. (B,C) bgalactosidase immunofluorescence in P21 sagittal brain
sections, correspond to CC1+ OLs (B) or Olig2high/PDGFRa- OLs (C) immature OLs.
(D,D’) Immunofluorescence for PDGFRa+ OPCs and CC1+ OLs showing similar cell
numbers in the CC of Tns3bgeo/+ (D) and Tns3bgeo/ bgeo (D’) brains. (E) Histograms
representing density of PDGFRa+ OPCs and CC1+ OLs in the CC and the fimbria.
(F,F’) Immunofluorescence for Olig2, CC1 and Olig1 allowing to identify three OL
stages: CC1high/Olig1- cells (named iOL1), CC1high/Olig1high-cytoplasmic cells (iOL2) and
CC1low/Olig1cytoplasmic (mOLs), showing similar numbers of each OL stage in the CC of
and Tns3bgeo/+ (F) and Tns3bgeo/ bgeo (F’) brains. (G) Histograms representing the
quantification of the density of iOL1s, iOL2s, and mOLs, in the CC and the fimbria. (H)
PCR from genomic DNA showing the presence of the native Intron 4 only in wild type
(+/+) mice, of the Intron 4-bgeo only in Tns3bgeo/ bgeo mice, and of Intron 5 / Intron 6 in

115
both mice. (I) Caliper visualization of PCR from cDNA showing the presence of Exon17
and Exon31 both in Tns3bgeo/ bgeo and wild type mice, despite the amplification with
primers for Exon2-14 only in wild-type mice, and with primers for Exon2-bgeo only in
Tns3bgeo/ bgeo mice. CC, corpus callosum. Scale bar, 20 mm.
Figure S7: Generation and validation of Tns3-targeting CRISPR/Cas9 tools
(A) Schematic of the Tol2-PX459 CRISPR/Cas9 expression vector allowing Tol2-DNA
integration driving Cas9 & puromycin resistance expression (from polycistronic 2A-
mediated cleaved) driven by CMV promoter and sgRNA expression from U6 promoter.
(B) Scheme of C17.1 neuroblastoma cell line lipofection followed by puromycin
selection of transfected cells used to amplify by PCR the Tns3 targeted region and
assess for indel mutations. (C) Caliper visualization of PCR products obtained after
T7-mediated cleavage of DNA heteroduplex due to the indel mutations, showing
smaller products (arrows) generated by Cas9 cutting with gRNA#1 or gRNA#2. (D).
Visualization Tns3-targetted region amplified by PCR run in a PAGE gel. Note the
extrabands in gRNA#1 or gRNA#2 transfected cells corresponding to Cas9 cut
products, contrary to Tol2-PX459 empty plasmid (control). (E,F) TIDE analysis
representing the percentage of sequences presenting a given indel mutation in cells
transfected with gRNA#1 (E) or gRNA#2 (F).
Figure S8: Generation of Tns34del and Tns314del mutant mice by CRISPR/Cas9
(A) Genotyping by TIDE analysis of Tns34del and Tns314del hezerozygous mice showing
wild type Tns3 allele and the 4 nucleotides deletion in Tns34del allele and the 14
nucleotides deletion in Tns314del allele. (B) Pie charts representing the genotypes
obtained from Tns3KO heterozygous inter-crosses. Note the sub-lethal phenotype
indicated by the reduced number of Tns34de/4del and Tns314de/14del mice generated
compared to Mendelian ratios. (C) Pie charts representing the genotypes of E14.5
embryos obtained from Tns34del heterozygous inter-crosses. Again, the number of
Tns34del embryos is lower than the expected Mendelian ratios. (D) Caliper visualization

116
of PCR genotyping of Tns34del embryos. Note that heterozygous mice present two
extra bands, and homozygous mutant mice can only be distinguished from wild type
by TIDE analysis. (E-F) Tns34del mice presenting growth defects in homozygous pups
(arrows) at both P8 and P14 compared to their heterozygous littermates. (G)
Immunofluorescence showing that Tns3 is still detected in CC1+ OLs of Tns34de/4del
P21 mice, with four different Tns3 recognizing antibodies (Millipore, SantaCruz,
Sigma, and Sassan Hafizi lab). (H) Histogram representing RT qPCR on cDNA from
P21 brains showing no differences in the amplification of Tns3 Exon13-15, Exon 17
and Exon31 (C1) between Tns34de/4del, Tns34de/+ or WT mice, indicating the presence
of a long Tns3 transcript containing these exons.
Figure S9: Intolerance for TNS3 loss-of-function variants in the human
population
(A-F) Data from GNOMAD analysis of 60,000 genomes from the human population for
TNS3 and key regulators of oligodendrogenesis, showing numbers and scores of
different genetic variants: synonymous, missense, and pLOF (nonsense, splice
acceptor, and splice donor variants). The numbers highlighted colored squares
correspond to the LOEF (loss-of-function observed/expected upper bound fraction),
that it is a conservative estimate of the observed/expected ratio. Low LOEUF scores
indicate strong selection against predicted loss-of-function (pLoF) variation in a given
gene, while high LOEUF scores suggest a relatively higher tolerance to inactivation.
Note that Tns3, like Sox10, Chd7, and Chd8 have very low LOEUF scores indicating
high intolerance of their inactivation, contrary to Nkx2-2 or Olig1 that are show more
tolerance to their inactivation.
Figure 3: CRISPR-mediated Tns3 mutation in NSCs reduces oligodendrocyte
differentiation in the postnatal brain
(A) Schematic of the CRISPR/Cas9 expression vector allowing Tol2-DNA integration
driving Cas9 and GFP expression (from polycistronic 2A-mediated cleaved) from CAG
promoter and sgRNA expression from U6 promoter. (B) Schematic of the dorsal SVZ

117
electroporation of CRISPR- plasmid at postnatal day 1 (P1) and immunofluorescence
analysis carried out in sagittal brain sections at P22. (C) Schematic of the Tns3
CRISPR-Cas9 mutation in NSCs and of their differentiation. (D) Immunofluorescence
of representative P22 sagittal sections of the dorsal telencephalon showing GFP+ cells
being either PDGFRa+ OPCs (arrowheads), CC1high OLs (arrows) or CC1low astrocytes
(asterisks) progeny of P1 NSCs electroporated either with Ctrl plasmid (D) or Tns3-
gRNA#1 plasmid (D’). Scale bar, 20 mm. (E) Histogram showing the percentage of
GFP+ glial cell-types found in Ctrl, gRNA#1 or gRNA#2 electroporated brains being
PDGFRa+-OPCs, CC1high-OLs and CC1low-astrocytes. Note the 2-fold reduction of
CC1+ OLs in Tns3-gRNA transfected brains, as illustrated in D’ compared to D. (F)
Scheme of experimental design of data provided in G-J panels. (G) Histograms
representing the percentage of GFP+ differentiated cells at P11. Note the lack of
changes in OPCs, and the incipient reduction in OLs. (H-I’) Immunofluorescence for
PDGFRa from P11 mice electroporated with Ctrl plasmid (H,I) or Tns3-gRNA#1
plasmid (H’,I’) together with MCM2 (H,H’) and activated Caspase3 (I-I’), illustrating
similar MCM2 labeling and the absence of Casp3+/PDGFRa+ OPCs (staining (J)
Histograms quantifying the proportion of proliferative GFP+ OPCs in electroporated
P11 mice brain. (K) Schematic of Tns3 expression in mice (Up) and of the effects of
Tns3 CRISPR-mediated deletion (Down). Scale bar, 20 mm.
Figure S10: CRISPR-mediated Tns3 coding sequence deletion in NSCs reduces
oligodendrocyte differentiation in the postnatal brain
(A) Schematic of the integrative CRISPR/Cas9 expression vector allowing Tol2-DNA
integration driving Cas9 and GFP expression (from polycistronic 2A-mediated
cleaved) from CAG promoter and two sgRNA targeting 5’ and 3’ regions of Tns3
coding sequence from U6 promoter. (B) Schematic of the dorsal SVZ electroporation
of CRISPR-plasmid at postnatal day 1 (P1) and immunofluorescence analysis carried
out in sagittal brain sections at P22. (C) Schematic of the Tns3 CRISPR-Cas9 mutation
in NSCs and of their differentiation. (D) Representative P22 sagittal sections of the
dorsal telencephalon showing GFP+ cells being either PDGFRa+ OPCs (arrowheads),
CC1high OLs (arrows) or CC1low astrocytes (asterisks) progeny of P1 NSCs
electroporated either with Ctrl plasmid (D) or Tns3-5’-3’ targeting plasmid (labeled as

118
5’-3’ gRNAs) (D’). (E) Histograms showing the percentage of GFP+ glial cell-types
found in Ctrl or 3’-5’ gRNA electroporated brains being PDGFRa+-OPCs, CC1high OLs
and CC1low astrocytes in the corpus callosum (CC) and cortex (Ctx). Note the 2-fold
reduction of CC1+ OLs in Tns3-5’-3’ gRNA transfected brains shown in D. Scale bar,
20 mm.
Figure S11: Generation of Tns3 conditional allele
(A) Schematic of Tns3 locus, Tns3Flox allele and targeting vector with LoxP sites
flanking Exon9, used to induce homologous recombination in mouse ESCs. (B) Full-
length Tns3 amino-acid sequence indicating its protein domains. Squared in red
highlights the 109 amino-acid sequence of the Tns3 peptide produced upon Cre-
mediated recombination in Tns3flox expressing cells. (C) Peptide sequence of
predicted for Tns3-iKO expressing cells. (D) Tns3Flox targeting vector sequence used
for homologous recombination in mouse ESCs and generation of Tns3Flox mice, with
LoxP sites highlighted in blue and Exon 9 highlighted in red.
Figure 4: OPC-specific Tns3 deletion reduces oligodendrocyte differentiation in
the postnatal brain
(A) Scheme of tamoxifen administration to Tns3-iKO and control (Cre+; Tns3+/+) mice,
Cre-mediated genetic changes, and timing of experimental analysis. (B-B’, C-C’)
Immunofluorescence in P21 sagittal brain sections for CC1, GFP and PDGFRa
illustrating similar density of OPCs and 2-fold reduction in OL density in Tns3-iKO
(B’,C’) compared to control (B,C) in the fimbria (B) and the cortex (C). (D) Histograms
showing OPC and OL density in P21 Tns3-iKO and control (Ctrl) mice, in the corpus
callosum, fimbria, cortex, and striatum. Note the systematic OLs decrease of 40-50%
in each region. (E-E1’) Immunofluorescence in P21 sagittal brain sections for Olig1,
GFP and CC1 to distinguish three stages of oligodendrogenesis: OPCs (Olig1+/CC1-
), iOL1s (CC1+/Olig1-) and iOL2s/mOLs (CC1+/Olig1+) in Ctrl (E) or Tns3-iKO mice
(E’). E1 and E1’ are higher magnification of the squared area in E and E’. (F)
Histograms showing the OPCs, the iOL1s and the iOL2s/mOLs density in P21 Tns3-

119
iKO and control mice, in the corpus callosum, fimbria, cortex, and striatum. Note the
decrease of iOL1s and iOL2s over 40% in each area quantified (except for iOL1
density in the corpus callosum). (G) Schematic representing defects in
oligodendrogenesis found in Tns3-iKO compared to control.
Figure S12: Efficient OPC-specific Tns3 deletion in the postnatal brain and
reduced oligodendrocyte differentiation
(A) Scheme of tamoxifen administration to Tns3-iKO and control (Cre+; Tns3+/+) mice,
Cre-mediated genetic changes, and timing of experimental analysis. (B-B’)
Immunofluorescence for Tns3, GFP and Nkx2.2 in P21 mice sagittal brain sections at
the level of the corpus callosum, illustrating the loss of Tns3 signal in Nkx2.2high iOL1s
(arrows) but not in vessels (asterisk) of Tns3-iKO (B’) compared to control (B). Note
that Nkx2.2high iOL1s do not change in density in Tns3-iKO compared to control. (C)
Histograms showing the Tns3+ cells density in the corpus callosum, fimbria, cortex,
and striatum, in Tns3-iKO and control. (D) Histograms showing the Nkx2.2high iOL1s
density in the corpus callosum, fimbria, cortex, and striatum, in Tns3-iKO and control.
(E-F’) Immunostaining corresponding to Fig.4B-C’ panels showing individual channels
for CC1, PDGFRa, and DAPI in the fimbria (E,E’) and cortex (F,F’) of control mice
(E,F) and Tns3-iKO mice (E’,F’).
Figure S13: OPC-specific Tns3 deletion reduces oligodendrocyte differentiation
in the postnatal brain
(A) Scheme of tamoxifen administration to Tns3-iKO and control (Cre+; Tns3+/+) mice,
Cre-mediated genetic changes, and timing of experimental analysis. (B-B’)
Immunostaining illustrating at low magnification the reduction in number of CC1+ OLs
but not PDGFRa+ OPCs in the cortex and corpus callosum of Tns3-iKO mice (B’)
compared to control mice (B), showing each individual channel and DAPI. (C-C’).
Immunofluorescence for MCM2 proliferative marker, GFP, and PDGFRa illustrating
similar proportion of proliferative OPCs in control (C) and Tns3-iKO mice (C’). (D)
Histograms quantifying the proliferative fraction of GFP+ OPCs in the fimbria (Up) and

120
corpus callosum (Down). Note the slight reduction (non-significative) in proliferation in
Tns3-iKO OPCs compared to control OPCs.
Figure 5: Video microscopy of OL differentiating cultures shows increased cell
death of Tns3iKO iOLs
(A) Scheme of the videomicroscopy protocol in MACSorted OPCs purified from Tns3-
iKO and control P7 mice. Cells were imaged every 10 minutes during 72h in
differentiation medium. (B) Histograms showing the reduction of the GFP+ cells
proportion from the plating (-72h) to the end of the experiment (72h after differentiation
onset). (C) Time curve quantifying the loss of GFP+ OLs compared to GFP- OLs during
the 72h of differentiation. (D) Histograms representing the quantification of cells lost
per hour during the 72h differentiation, showing a 5-fold increase the loss of GFP+
Tns3-iKO cells compared to the GFP- cells (non-recombined cells from Tns3-iKO mice,
internal negative control) or cells coming from Cre- littermates (Cre-, external negative
control). (E) Time lap frames showing cells every 12 hours illustrating both GFP+
(green arrowheads, recombined Tns3-iKO cells) and GFP- (white arrowheads, non-
recombined Tns3-iKO cells) that die over the time of video microscopy. Note the larger
number of GFP+ OLs (cells with multi-branched OL morphology) dying compared to
GFP- OLs.

121
Table 1
Reagent or Resource Source Identifier Concentration
DAPI Sigma-Aldrich
1023627600
1 1:10000
Fluoromount-G® SouthernBiotech, Inc. 0100-01
Antibodies
Rabbit anti Tensin1 Su Hao Lu, UC davis None 1:100
Rabbit anti Tensin2 Su Hao Lu, UC davis None 1:100
Rabbit anti Tensin3
Sassan HAFIZI, University of
Portsmouth None 1:1000
Rabbit anti Tensin3 Millipore AB229 1:500
Rabbit anti Tensin3 Thermofisher PA5-116022 1:1000
Mouse monoclonal anti
Tensin3 Santa Cruz Biotech sc-376367 1:500
Rabbit anti Tns3 Cterminus Sigma-Aldricht
SAB420020
5 1:200
Rabbit anti V5 tag Millipore AB3792 1:2000
Mouse monoclonal anti V5 tag Invitrogen R960-25 1:1000
Rat anti PDGFRα BD Biosciences 558774 1:250
mouse monoclonal anti Olig1 NeuroMab 75-180 1:1000
Mouse monoclonal anit Olig2 Millipore MABN50 1:500
Rabbit anti Sox10 Ozyme 89356 1:500

122
Mouse monoclonal anti
CNPase Millipore MAB326R 1:250
Rabbit anti IP3 receptor 2
(Itpr2) Millipore AB3000 1:40
mouse polyclonal anti Nkx2.2
Developmental Studies
Hybridoma Bank None 1:4
mouse monoclonal anti CC1
(Quaking 7) Calbiochem OP80 1:100
mouse monoclonal anti MOG ICM, Paris Hybridoma AA3 1:20
Mouse monoclonal anti Opalin Santa Cruz Biotech sc-374490 1:500
chicken polyclonal anti GFP Aves Laboratories GFP-1020 1:1000
Rabbit anti-GFP Life Technologies A6455 1:1000
Mouse anti MCM2 (BM28) BD Biosciences 610701 1:500
Rabbit anti Caspase3 R&D systems AF835 1:100
Rat anti F4/80 Abd Serotec MCA497 1:100
Rat anti Cd68 Abd Serotec MCA1957 1:500
Mouse monoclonal anti beta-
galactosidase Promega Z3783 1:1000
chicken anti GFAP Aveslabs 75-240 1:1000
Mouse monoclonal anti MOG ICM, Paris Hybridoma None 1:20
HRP-conjugated anti Rabbit Biorad 1706515 1:5000
HRP-conjugated anti Mouse Sigma-Aldricht NA931-1ML 1:5000
HRP-conjugated anti Rat Thermo Fisher Scientific A10549 1:5000

123

124

125

126

127

128

129

130

131

132

133

134

135

136

137

138

139

140

141
REFERENCES
Aguirre, A., Dupree, J.L., Mangin, J.M., and Gallo, V. (2007). A functional role for EGFR signaling in
myelination and remyelination. Nat Neurosci 10, 990-1002.
Bergles, D.E., and Richardson, W.D. (2016). Oligodendrocyte Development and Plasticity. Cold
Spring Harbor Perspectives in Biology 8.
Bin, J.M., Harris, S.N., and Kennedy, T.E. (2016). The oligodendrocyte-specific antibody ‘CC1’ binds
Quaking 7. Journal of Neurochemistry 139, 181-186.
Boutin, C., Diestel, S., Desoeuvre, A.l., Tiveron, M.-C., and Cremer, H. (2008). Efficient In Vivo
Electroporation of the Postnatal Rodent Forebrain. PLoS ONE 3, e1883.
Bryois, J., Skene, N.G., Hansen, T.F., Kogelman, L.J.A., Watson, H.J., Liu, Z., Adan, R., Alfredsson,
L., Ando, T., Andreassen, O., et al. (2020). Genetic identification of cell types underlying brain
complex traits yields insights into the etiology of Parkinson’s disease. Nature Genetics 52, 482-493.
Cao, X., Kaneko, T., Li, J.S., Liu, A.-D., Voss, C., and Li, S.S.C. (2015). A phosphorylation switch
controls the spatiotemporal activation of Rho GTPases in directional cell migration. Nature
communications 6, 7721.
Cao, X., Voss, C., Zhao, B., Kaneko, T., and Li, S.S.-C. (2012). Differential regulation of the activity
of deleted in liver cancer 1 (DLC1) by tensins controls cell migration and transformation. Proceedings
of the National Academy of Sciences 109, 1455-1460.
Castelijns, B., Baak, M.L., Timpanaro, I.S., Wiggers, C.R.M., Vermunt, M.W., Shang, P., Kondova,
I., Geeven, G., Bianchi, V., de Laat, W., et al. (2020). Hominin-specific regulatory elements
selectively emerged in oligodendrocytes and are disrupted in autism patients. Nature
communications 11, 301.
Chang, A., Tourtellotte, W.W., Rudick, R., and Trapp, B.D. (2002). Premyelinating oligodendrocytes
in chronic lesions of multiple sclerosis. N Engl J Med 346, 165-173.
Chen, H.-Y., Lin, L.-T., Wang, M.-L., Laurent, B., Hsu, C.-H., Pan, C.-M., Jiang, W.-R., Chen, P.-Y.,
Ma, H.-I., Chen, Y.-W., et al. (2017). Musashi-1 Enhances Glioblastoma Cell Migration and
Cytoskeletal Dynamics through Translational Inhibition of Tensin3. Scientific Reports 7, 8710.
Chiang, M.-K., Liao, Y.-C., Kuwabara, Y., and Lo, S.H. (2005). Inactivation of tensin3 in mice results
in growth retardation and postnatal lethality. Developmental Biology 279, 368-377.
Colognato, H., Ramachandrappa, S., Olsen, I.M., and ffrench-Constant, C. (2004). Integrins direct
Src family kinases to regulate distinct phases of oligodendrocyte development. J Cell Biol 167, 365-
375.

142
Compston, A., and Coles, A. (2002). Multiple sclerosis. The Lancet 359, 1221-1231.
Cui, Y., Liao, Y.C., and Lo, S.H. (2004). Epidermal growth factor modulates tyrosine phosphorylation
of a novel tensin family member, tensin3. Molecular cancer research : MCR 2, 225-232.
Elsesser, O., Fröb, F., Küspert, M., Tamm, E.R., Fujii, T., Fukunaga, R., and Wegner, M. (2019).
Chromatin remodeler Ep400 ensures oligodendrocyte survival and is required for myelination in the
vertebrate central nervous system. Nucleic acids research 47, 6208-6224.
Emery, B., and Lu, Q.R. (2015). Transcriptional and Epigenetic Regulation of Oligodendrocyte
Development and Myelination in the Central Nervous System. Cold Spring Harbor Perspectives in
Biology 7.
Fard, M.K., van der Meer, F., Sánchez, P., Cantuti-Castelvetri, L., Mandad, S., Jäkel, S., Fornasiero,
E.F., Schmitt, S., Ehrlich, M., Starost, L., et al. (2017). BCAS1 expression defines a population of
early myelinating oligodendrocytes in multiple sclerosis lesions. Science Translational Medicine 9,
eaam7816.
Ffrench-Constant, C., and Raff, M.C. (1986). The oligodendrocyte-type-2 astrocyte cell lineage is
specialized for myelination. Nature 323, 335-338.
Funfschilling, U., Supplie, L.M., Mahad, D., Boretius, S., Saab, A.S., Edgar, J., Brinkmann, B.G.,
Kassmann, C.M., Tzvetanova, I.D., Mobius, W., et al. (2012). Glycolytic oligodendrocytes maintain
myelin and long-term axonal integrity. Nature 485, 517-521.
Grubman, A., Chew, G., Ouyang, J.F., Sun, G., Choo, X.Y., McLean, C., Simmons, R.K., Buckberry,
S., Vargas-Landin, D.B., Poppe, D., et al. (2019). A single-cell atlas of entorhinal cortex from
individuals with Alzheimer’s disease reveals cell-type-specific gene expression regulation. Nature
Neuroscience 22, 2087-2097.
He, D., Marie, C., Zhao, C., Kim, B., Wang, J., Deng, Y., Clavairoly, A., Frah, M., Wang, H., He, X.,
et al. (2016). Chd7 cooperates with Sox10 and regulates the onset of CNS myelination and
remyelination. Nat Neurosci advance online publication.
Hughes, E.G., Orthmann-Murphy, J.L., Langseth, A.J., and Bergles, D.E. (2018). Myelin remodeling
through experience-dependent oligodendrogenesis in the adult somatosensory cortex. Nature
Neuroscience 21, 696-706.
Katz, M., Amit, I., Citri, A., Shay, T., Carvalho, S., Lavi, S., Milanezi, F., Lyass, L., Amariglio, N.,
Jacob-Hirsch, J., et al. (2007). A reciprocal tensin-3-cten switch mediates EGF-driven mammary cell
migration. Nat Cell Biol 9, 961-969.

143
Kessaris, N., Fogarty, M., Iannarelli, P., Grist, M., Wegner, M., and Richardson, W.D. (2006).
Competing waves of oligodendrocytes in the forebrain and postnatal elimination of an embryonic
lineage. Nat Neurosci 9, 173-179.
Kieseier, B.C., Wiendl, H., Hemmer, B., and Hartung, H.P. (2007). Treatment and treatment trials in
multiple sclerosis. Curr Opin Neurol 20, 286-293.
Küspert, M., and Wegner, M. (2016). SomethiNG 2 talk about—Transcriptional regulation in
embryonic and adult oligodendrocyte precursors. Brain Research 1638, Part B, 167-182.
Lang, J., Maeda, Y., Bannerman, P., Xu, J., Horiuchi, M., Pleasure, D., and Guo, F. (2013).
Adenomatous Polyposis Coli Regulates Oligodendroglial Development. The Journal of
Neuroscience 33, 3113-3130.
Lee, Y., Morrison, B.M., Li, Y., Lengacher, S., Farah, M.H., Hoffman, P.N., Liu, Y., Tsingalia, A., Jin,
L., Zhang, P.-W., et al. (2012). Oligodendroglia metabolically support axons and contribute to
neurodegeneration. Nature advance online publication.
Liao, Y.-C., Si, L., deVere White, R.W., and Lo, S.H. (2007). The phosphotyrosine-independent
interaction of DLC-1 and the SH2 domain of cten regulates focal adhesion localization and growth
suppression activity of DLC-1. The Journal of cell biology 176, 43-49.
Liu, C., Sage, Jonathan C., Miller, Michael R., Verhaak, Roel G.W., Hippenmeyer, S., Vogel, H.,
Foreman, O., Bronson, Roderick T., Nishiyama, A., Luo, L., et al. (2011). Mosaic Analysis with
Double Markers Reveals Tumor Cell of Origin in Glioma. Cell 146, 209-221.
Lo, S.H., and Lo, T.B. (2002). Cten, a COOH-Terminal Tensin-like Protein with Prostate Restricted
Expression, Is Down-Regulated in Prostate Cancer. Cancer Research 62, 4217-4221.
Lu, Q.R., Sun, T., Zhu, Z., Ma, N., Garcia, M., Stiles, C.D., and Rowitch, D.H. (2002). Common
developmental requirement for Olig function indicates a motor neuron/oligodendrocyte connection.
Cell 109, 75-86.
Lu, Q.R., Yuk, D., Alberta, J.A., Zhu, Z., Pawlitzky, I., Chan, J., McMahon, A.P., Stiles, C.D., and
Rowitch, D.H. (2000). Sonic hedgehog--regulated oligodendrocyte lineage genes encoding bHLH
proteins in the mammalian central nervous system. Neuron 25, 317-329.
Maeda, I., Yamada, H., Takano, T., Nishihara, E., Ito, Y., Matsuzuka, F., Miya, A., Kobayashi, K.,
Yoshida, H., Miyauchi, A., et al. (2009). Increased expression levels of tensin3 mRNA in thyroid
functional adenomas as compared to non-functioning adenomas. Experimental and clinical
endocrinology & diabetes : official journal, German Society of Endocrinology [and] German Diabetes
Association 117, 191-193.

144
Marie, C., Clavairoly, A., Frah, M., Hmidan, H., Yan, J., Zhao, C., Van Steenwinckel, J., Daveau, R.,
Zalc, B., Hassan, B., et al. (2018). Oligodendrocyte precursor survival and differentiation requires
chromatin remodeling by Chd7 and Chd8. Proceedings of the National Academy of Sciences 115
(35).
Marques, S., Zeisel, A., Codeluppi, S., van Bruggen, D., Mendanha Falcão, A., Xiao, L., Li, H.,
Häring, M., Hochgerner, H., Romanov, R.A., et al. (2016). Oligodendrocyte heterogeneity in the
mouse juvenile and adult central nervous system. Science 352, 1326-1329.
Martuszewska, D., Ljungberg, B., Johansson, M., Landberg, G., Oslakovic, C., Dahlbäck, B., and
Hafizi, S. (2009). Tensin3 Is a Negative Regulator of Cell Migration and All Four Tensin Family
Members Are Downregulated in Human Kidney Cancer. PLoS ONE 4, e4350.
McKenzie, I.A., Ohayon, D., Li, H., Paes de Faria, J., Emery, B., Tohyama, K., and Richardson, W.D.
(2014). Motor skill learning requires active central myelination. Science 346, 318-322.
Minoo, P., and King, R.J. (1994). Epithelial-mesenchymal interactions in lung development. Annual
review of physiology 56, 13-45.
Mount, C.W., and Monje, M. (2017). Wrapped to Adapt: Experience-Dependent Myelination. Neuron
95, 743-756.
Nait-Oumesmar, B., Decker, L., Lachapelle, F., Avellana-Adalid, V., Bachelin, C., and Baron-Van
Evercooren, A. (1999). Progenitor cells of the adult mouse subventricular zone proliferate, migrate
and differentiate into oligodendrocytes after demyelination. Eur J Neurosci 11, 4357-4366.
Nakatani, H., Martin, E., Hassani, H., Clavairoly, A., Maire, C.L., Viadieu, A., Kerninon, C.,
Delmasure, A., Frah, M., Weber, M., et al. (2013). Ascl1/Mash1 Promotes Brain Oligodendrogenesis
during Myelination and Remyelination. J Neurosci 33, 9752-9768.
Nawaz, S., Sánchez, P., Schmitt, S., Snaidero, N., Mitkovski, M., Velte, C., Brückner, Bastian R.,
Alexopoulos, I., Czopka, T., Jung, Sang Y., et al. (2015). Actin Filament Turnover Drives Leading
Edge Growth during Myelin Sheath Formation in the Central Nervous System. Developmental Cell
34, 139-151.
Neumann, B., Baror, R., Zhao, C., Segel, M., Dietmann, S., Rawji, K.S., Foerster, S., McClain, C.R.,
Chalut, K., van Wijngaarden, P., et al. (2019a). Metformin Restores CNS Remyelination Capacity by
Rejuvenating Aged Stem Cells. Cell Stem Cell 25, 473-485.e478.
Neumann, B., Segel, M., Chalut, K.J., and Franklin, R.J.M. (2019b). Remyelination and ageing:
Reversing the ravages of time. Multiple Sclerosis Journal 25, 1835-1841.

145
Nishino, T., Sasaki, N., Chihara, M., Nagasaki, K.-i., Torigoe, D., Kon, Y., and Agui, T. (2012).
Distinct Distribution of the Tensin Family in the Mouse Kidney and Small Intestine. Experimental
Animals 61, 525-532.
Nott, A., Holtman, I.R., Coufal, N.G., Schlachetzki, J.C.M., Yu, M., Hu, R., Han, C.Z., Pena, M., Xiao,
J., Wu, Y., et al. (2019). Brain cell type–specific enhancer–promoter interactome maps and disease-
risk association. Science 366, 1134-1139.
Pan, S., Mayoral, S.R., Choi, H.S., Chan, J.R., and Kheirbek, M.A. (2020). Preservation of a remote
fear memory requires new myelin formation. Nature Neuroscience 23, 487-499.
Parras, C., Marie, C., Zhao, C., and Lu, Q.R. (2020). Chromatin remodelers in oligodendroglia. Glia
68: , 1604– 1618.
Phan, B.N., Bohlen, J.F., Davis, B.A., Ye, Z., Chen, H.-Y., Mayfield, B., Sripathy, S.R., Cerceo Page,
S., Campbell, M.N., Smith, H.L., et al. (2020). A myelin-related transcriptomic profile is shared by
Pitt–Hopkins syndrome models and human autism spectrum disorder. Nature Neuroscience 23, 375-
385.
Pignatelli, M. (1996). Modulation of cell adhesion during epithelial restitution in the gastrointestinal
tract. The Yale journal of biology and medicine 69, 131-135.
Qi, Y., Cai, J., Wu, Y., Wu, R., Lee, J., Fu, H., Rao, M., Sussel, L., Rubenstein, J., and Qiu, M.
(2001). Control of oligodendrocyte differentiation by the Nkx2.2 homeodomain transcription factor.
Development 128, 2723-2733.
Roberts, D.J., Smith, D.M., Goff, D.J., and Tabin, C.J. (1998). Epithelial-mesenchymal signaling
during the regionalization of the chick gut. Development 125, 2791-2801.
Robinson, J.T., Thorvaldsdóttir, H., Winckler, W., Guttman, M., Lander, E.S., Getz, G., and Mesirov,
J.P. (2011). Integrative genomics viewer. Nature Biotechnology 29, 24-26.
Rochette-Egly, C., Garaud, J.C., Kedinger, M., and Haffen, K. (1986). Calmodulin in epithelial
intestinal cells during rat development. Experientia 42, 1043-1046.
Rowitch, D.H. (2004). Glial specification in the vertebrate neural tube. Nat Rev Neurosci 5, 409-419.
Sasaki, H., Moriyama, S., Mizuno, K., Yukiue, H., Konishi, A., Yano, M., Kaji, M., Fukai, I., Kiriyama,
M., Yamakawa, Y., et al. (2003a). Cten mRNA expression was correlated with tumor progression in
lung cancers. Lung Cancer 40, 151-155.
Sasaki, H., Yukiue, H., Kobayashi, Y., Fukai, I., and Fujii, Y. (2003b). Cten mRNA Expression Is
Correlated with Tumor Progression in Thymoma. Tumor Biology 24, 271-274.

146
Spassky, N., Goujet-Zalc, C., Parmantier, E., Olivier, C., Martinez, S., Ivanova, A., Ikenaka, K.,
Macklin, W., Cerruti, I., Zalc, B., et al. (1998). Multiple restricted origin of oligodendrocytes. J
Neurosci 18, 8331-8343.
Steadman, P.E., Xia, F., Ahmed, M., Mocle, A.J., Penning, A.R.A., Geraghty, A.C., Steenland, H.W.,
Monje, M., Josselyn, S.A., and Frankland, P.W. (2019). Disruption of Oligodendrogenesis Impairs
Memory Consolidation in Adult Mice. Neuron.
Stolt, C.C., Rehberg, S., Ader, M., Lommes, P., Riethmacher, D., Schachner, M., Bartsch, U., and
Wegner, M. (2002). Terminal differentiation of myelin-forming oligodendrocytes depends on the
transcription factor Sox10. Genes Dev 16, 165-170.
Stuart, T., Butler, A., Hoffman, P., Hafemeister, C., Papalexi, E., Mauck, W.M., Hao, Y., Stoeckius,
M., Smibert, P., and Satija, R. (2019). Comprehensive Integration of Single-Cell Data. Cell 177,
1888-1902.e1821.
Suzuki, S.O., and Goldman, J.E. (2003). Multiple cell populations in the early postnatal
subventricular zone take distinct migratory pathways: a dynamic study of glial and neuronal
progenitor migration. J Neurosci 23, 4240-4250.
Tekki-Kessaris, N., Woodruff, R., Hall, A.C., Gaffield, W., Kimura, S., Stiles, C.D., Rowitch, D.H.,
and Richardson, W.D. (2001). Hedgehog-dependent oligodendrocyte lineage specification in the
telencephalon. Development 128, 2545-2554.
Thomason, E.J., Escalante, M., Osterhout, D.J., and Fuss, B. (2020). The oligodendrocyte growth
cone and its actin cytoskeleton: A fundamental element for progenitor cell migration and CNS
myelination. Glia 68, 1329-1346.
Veß, A., Blache, U., Leitner, L., Kurz, A.R.M., Ehrenpfordt, A., Sixt, M., and Posern, G. (2017). A
dual phenotype of MDA-MB-468 cancer cells reveals mutual regulation of tensin3 and adhesion
plasticity. Journal of Cell Science 130, 2172-2184.
Wang, F., Ren, S.-Y., Chen, J.-F., Liu, K., Li, R.-X., Li, Z.-F., Hu, B., Niu, J.-Q., Xiao, L., Chan, J.R.,
et al. (2020). Myelin degeneration and diminished myelin renewal contribute to age-related deficits
in memory. Nature Neuroscience 23, 481-486.
Wheeler, N.A., and Fuss, B. (2016). Extracellular cues influencing oligodendrocyte differentiation
and (re)myelination. Experimental Neurology.
Xiao, L., Ohayon, D., McKenzie, I.A., Sinclair-Wilson, A., Wright, J.L., Fudge, A.D., Emery, B., Li,
H., and Richardson, W.D. (2016). Rapid production of new oligodendrocytes is required in the
earliest stages of motor-skill learning. Nat Neurosci 19, 1210-1217.

147
Xin, W., and Chan, J.R. (2020). Myelin plasticity: sculpting circuits in learning and memory. Nature
Reviews Neuroscience 21, 682-694.
Yang, S.M., Michel, K., Jokhi, V., Nedivi, E., and Arlotta, P. (2020). Neuron class–specific responses
govern adaptive myelin remodeling in the neocortex. Science 370, eabd2109.
Yu, Y., Chen, Y., Kim, B., Wang, H., Zhao, C., He, X., Liu, L., Liu, W., Wu, Lai Man N., Mao, M., et
al. (2013). Olig2 Targets Chromatin Remodelers to Enhancers to Initiate Oligodendrocyte
Differentiation. Cell 152, 248-261.
Zaret, K.S., and Mango, S.E. (2016). Pioneer transcription factors, chromatin dynamics, and cell fate
control. Curr Opin Genet Dev 37, 76-81.
Zeisel, A., Muñoz-Manchado, A.B., Codeluppi, S., Lönnerberg, P., La Manno, G., Juréus, A.,
Marques, S., Munguba, H., He, L., Betsholtz, C., et al. (2015). Cell types in the mouse cortex and
hippocampus revealed by single-cell RNA-seq. Science 347, 1138-1142.
Zhao, C., Dong, C., Frah, M., Deng, Y., Marie, C., Zhang, F., Xu, L., Ma, Z., Dong, X., Lin, Y., et al.
(2018). Dual Requirement of CHD8 for Chromatin Landscape Establishment and Histone
Methyltransferase Recruitment to Promote CNS Myelination and Repair. Developmental Cell,, 753-
768.e758.
Zhou, Q., and Anderson, D.J. (2002). The bHLH transcription factors OLIG2 and OLIG1 couple
neuronal and glial subtype specification. Cell 109, 61-73.
Zhou, Q., Wang, S., and Anderson, D.J. (2000). Identification of a Novel Family of Oligodendrocyte
Lineage-Specific Basic Helix-Loop-Helix Transcription Factors. Neuron 25, 331-343.
Zuchero, J.B., Fu, M.-m., Sloan, Steven A., Ibrahim, A., Olson, A., Zaremba, A., Dugas, Jason C.,
Wienbar, S., Caprariello, Andrew V., Kantor, C., et al. (2015). CNS Myelin Wrapping Is Driven by
Actin Disassembly. Developmental Cell 34, 152-167.

148

149
Detailed results
Tns3 is regulated by keys oligodendroglial factors
Prior to this project, we performed a chromatin immunoprecipitation analysis (ChIP) in
order to identify the direct binding targets of Olig2, Chd7 and Chd8, three keys
oligodendrogenic regulators, together with key histone marks (H3K4Me1, H3K4Me3,
H3K27Ac, H3K27Me3) for activity of regulatory elements, in OPCs and OLs
MACsorted from mouse brains (Figure1 A). Interestingly, we found three genomic
positions commonly bound by these key regulators, corresponding to Tns3 putative
promoters (middle and right square, Figure 1A Down) of the different Tns3 isoforms.
Indeed, our profiling of histone marks in oligodendroglia indicated that they correspond
to actively expressed promoters in these cells and having histone marks of active
promoter elements (H3K4Me3 and H3K27Ac marks, Figure1 A Down), suggesting an
involvement of Tns3 during oligodendrogenesis.
We observed a clear reduction Tns3 transcripts both in OPCs in which a deletion of
Chd7 (Chd7iKO, Figure 1B) or Chd8 (Chd8iKO, Figure 1C) was acutely induced in the
postnatal brain (Marie C et al, 2018), indicating that Tns3 is upregulated by these two
key regulators of oligodendrocyte differentiation. Transcriptomes from the purified
brain cells (Zhang and Barres Brain RNA-Seq database, www.brainrnaseq.org), show
that Tns3 mRNA was detected at low levels in all mice glial cells (astrocytes, microglia
and OLs) but presented a 5-fold stronger expression in immature OLs (Figure 1D).
This expression pattern was paralleled by the sparse strong labelling detected by in
situ hybridization with Tns3 probes from the Allen mouse Brain Atlas
(https://mouse.brain-map.org), enriched in white matter regions of the postnatal and
adult brain (Figure 1E).

150

151
Figure 1: Tns3 is a target gene of key regulators of oligodendrogenesis and its expression is enriched
in immature oligodendrocytes. (A Up) Schematic representation from IGV browser of Tns3 gene region
depicturing ChIP-seq data in O4+ cells (OPCs/OLs) for transcription factor Olig2, chromatin remodelling
factors Chd7 and Chd8, and epigenetic marks (H3K4me3, H3K27ac, H3K4me1 and H3K27me3). (A
Down) Zoom on Tns3 alternative promoters. Mock (control IgG) shows no peaks in the regions of
interest. Lines present below peaks indicate statistical significance (peak calling). (B-C) Barplots
showing Tns3 transcript count per million (CPM) in O4+ cells upon tamoxifen-induced Chd7 deletion
(Chd7iKO, B) or Chd8 deletion (Chd8cKO, C) compared to control (Ctrl). Statistics were done using
EdgeR suite. (D) Barplot of Tns3 mRNA transcript levels (FKPM) in postnatal brain cell-types (Zhang
et al., 2014; brainrnaseq.org). (E) In situ hybridization in sagittal sections of the adult (P56) mouse brain
at the level of the lateral ventricles showing Tns3 transcript expression in sparse white matter cells
(Allen brain atlas, portal.brain-map.org). (F) UMAP representation of neural progenitors and
oligodendroglial cells extracted and integrated using Seurat from scRNA-seq datasets (Marques et al.,
2016; 2018), representing different clusters corresponding to different oligodendroglial stages of NSCs
to mOLs. (G) Feature plot representing relative expression levels of Tns3 transcript. (H) Dot plot
representing the transcript expression of key markers for each cell stage/subtype and key
oligodendroglial factors in the different clusters showing the predominant expression of Tns3 in iOL1s
and iOL2s clusters, similar to Enpp6 and Itpr2. NSC, neural stem cells; NPC, neural progenitor cells;
cycOPC, cycling OPC; MFOL, myelin forming OL; MOL1/2, myelinating OL 1/2.
Finally, to better characterize Tns3 expression pattern in oligodendroglia, we took
advantaged of recent resources profiling the transcriptome of single cells (scRNA-seq)
including oligodendrocyte lineage cells at embryonic, postnatal, and adult stages
(Marques et al., 2016, 2018). We selected the neural stem/progenitor cells and
oligodendroglial cells of these datasets and integrated them following Seurat3 strategy
(Stuart et al., 2019). Notably, we found that Tns3 was mostly expressed in iOL1/iOL2
clusters (Figure 1F-G), with Tns3 expression correlating well with iOLs markers such
as Itpr2, Nkx2.2 or Enpp6 (Marques et al., 2016; Zeisel et al., 2015; Xiao et al., 2016).
On the contrary, Tns2 or Tns1 were lowly expressed in the whole dataset, mostly in
NPC and NSC clusters. Finally, Tns4 mRNA was not detected in any cluster of this
dataset (Figure 1H). Again, these data confirm that Tns3, and not the other Tensins,
is strongly regulated by key oligodendroglial factors and suggest an involvement of
Tns3 in oligodendrogenesis.

152
Tns3 is highly expressed in an iOL1 subpopulation
Figure 2: Tns3 cytoplasmic expression in oligodendrocytes. Immunostaining using (A) a Millipore
antibody showing a non-specific signal in oligodendrocytes nucleus, (B) a Cterminus Tns3 antibody
from Sigma Aldrich, (C) a homemade Tns3 antibody from our collaborators (Sassan HAFIZI’s team),
(D) a SantaCruz Tns3 antibody and (E) a ThermoFisher antibody. (F-F’) Immunostaining showing Tns1
(F) and Tns2 (F’) expression in oligodendroglia. (G) Immunostaining of sagital brain slice from P14
Tns3V5 mice using a V5 antibody.
To investigate the potential role of Tns3 in oligodendrogenesis, I first characterized its
expression pattern by immunofluorescence using known oligodendroglial markers.
Most of the anti-Tns3 commercial antibodies recognised a similar epitope in the
exon17. Surprisingly, Tns3 antibody from Millipore showed a clear nuclear signal, both
in CC1+ oligodendroglia (arrow) and neurons (stars), so we first hypothesized that this
nuclear localisation could be linked to a novel function of the protein. On the contrary,
four other antibodies only detected a cytoplasmic signal enriched in OLs: (1) a Sigma
Aldrich antibody recognising the Tns3 Cterminal part in iOLs (Figure 2B), (2) an
homemade antibody created by our collaborators from Sassan Hafizi’s team (Figure

153
2C), (3) a Santa Cruz antibody (Figure 2D), and (4) a Thermo Fisher antibody, highly
sensitive to the quality of the tissue perfusion and showing also a nuclear signal in
some cortical cells (Figure E).
To identify the nature of this signal, we hypothesize this could be a non-specific
recognition of similar proteins, like Tns1 or Tns2. Quickly, we looked at the Tns1 and
Tns2 expression in oligodendroglia and surprisingly found a low cytoplasmic signal
excluded from the nucleus (Figure 2F-F’). Therefore, this nonspecific signal is not
caused by a cross recognition of Tns1 or Tns2. However, considering the high levels
of staining detected in OL nuclei with the non-specific Tns3, the identification of the
protein causing this non-specific signal could provide an interesting new marker of the
oligodendrocytes in the brain.
In order to confirm that this signal was really non-specific of Tns3, we generated a
mice knockin line in which the Tns3 was tagged with a V5 sequence (Tns3Tns3-V5 mice),
not found in the mice genome. Immunostaining revealed a cytoplasmic Tns3-V5
expression (Figure 1G), confirming that the nuclear signal previously observed was
non-specific of Tns3 is OLs. For the rest of this study, Tns3-V5 and the Sigma Aldrich
Tns3Cter were exclusively used to avoid this non-specific signal
After validating a proper way to study Tns3 expression in the brain, I compared its
expression with known oligodendroglial markers. I found that Tns3 expression
overlaps with Opalin in P21 mice brains (Figure 3A, arrows), a marker of mature OLs,
but the Tns3 signal quickly fades away as OLs start to exhibit more complex
morphologies (Figure 3A, arrow heads). Using an Olig1/Nkx2.2 staining at P14, I could
show that Tns3 expression started in Nkx2.2+ iOL1s (Figure 3B, cells n°1), persists
after the end of Nkx2.2 (Figure 3B, cells n°2), is still detected in Olig1high-cytoplamic iOL2s
(Figure 3B cells n°3), and finally disappear in mOLs (Figure 3B, cells n°4).

154
Figure 3: Tns3 expression pattern during oligodendrogenesis. (A) Tns3 is expressed in the less mature
Opalin+ cells (arrow) but not in the most mature oligodendrocytes (arrowhead). (B) Tns3 starts to be
expressed in Nkx2.2 positive cells (1) stay expressed after Nkx2.2 extinction (2) and even in Olig1+
cells (3) but decrease as they mature (4). (C) Tns3 expression correlates well with Itpr2 and Nkx2.2,
two iOLs markers. Schematic of the Tns3 pattern of expression during oligodendrogenesis.
As expected, Tns3 expression shows an almost complete overlap with immature
markers, with only a small population of Itpr2+ and almost no Nkx2.2+ cells being
Tns3- (Figure 3C). I summarize the Tns3 expression pattern in a graphical scheme
(Figure 3D). Tns3 peculiar pattern of expression is of particular interest for
oligodendroglia analysis as it represents a specific marker of a precise step of
oligodendrocytes differentiation.

155
Figure 4: Tns3 In Vitro expression in oligodendroglia. (A) At 5 days of differentiation, Tns3 is expressed
in almost all CNP+ cells. (B) Tns3 is expressed not only in oligodendrocyte soma but also in their
processes in small dots. (C) These Tns3 dots overlap with β1 integrin expression in CNP cells. (D)
Schematic of Tns3 binding in cells based on the literature (based on data found in Cui et al., 2004;
Georgiadou et al., 2017 and Liao and Lo, 2021).
I confirmed these findings using in vitro primary NSCs cultures. Tns3 is found in almost
all CNP+ and Nkx2.2+ cells after 5 days (Figure 4A). In these conditions, it is possible
to study more in detail the subcellular localization of Tns3 expression. Indeed, Tns3 is
not restricted to OLs soma and can also be found in sporadic dots all along OLs
processes (Figure 4B). These Tns3 dots colocalized with β1-integrins expression
(Figure 4C), suggesting these areas could be focal adhesion plates but an extensive
study remains to be done. Indeed, Tns3 is known to interact with β1-integrins and key
cytoskeletal proteins in fibroblasts at focal adhesion (Figure 4D), helping the cell
anchoring to its environment (Georgiadou et al., 2017).
From all these data, I proposed a model describing the expression of Tns3 all along
the OL differentiation. Tns3 is not expressed in OPCs but shows a clear peak of
expression in iOLs which decrease quickly in the late stages of OL maturation. From
all of these, it appears clear that Tns3 expression is strictly regulated during all the
oligodendrogenesis, therefore representing a novel marker of iOLs stages.

156
Tns3 expression during remyelination

157
Figure 5: Tns3 is expressed in newly formed oligodendrocytes during brain remyelination (A,B) Tns3-
expressing cells in the CC of adult (P90) mice, 7 days after demyelination showing strong Tns3
expression in CC1+/Olig1- iOL1s (arrowheads) and CC1+/Olig1citoplasmic iOL2s (arrows) around the lesion
using either anti-V5 antibody in Tns3Tns3-V5 mice (A-A1) or anti-Tns3 antibody in wild-type mice (B-B1).
Note the absence of CC1+/Olig1+ OLs in the lesion. (C-C1) Tns3 expression in CC1high iOLs (arrows)
around the lesion and in some F4/80+ microglia (arrowheads) in the lesion area. A1, B1 and C1 are
higher magnification of corresponding insets (squares). (D) Quantification of the Tns3+ OLs density
every 50mm away from the lesion. Scale bar, 20 m.
To assess whether Tns3 was also involved in oligodendrogenesis during
remyelination, I induced an LPC demyelinating lesion in the corpus callosum of 3-
month-old Tns3Tns3-V5 mice and look for remyelination after 7 days of recovery. I found
a Tns3 expression in immature OLs surrounding the lesion core (Figure 5A), indicating
that Tns3 is not only expressed in oligodendroglia during developmental myelination,
but also during remyelination. Interestingly, Tns3 was also expressed in Cd48-F4/80+
microglial cells (Figure 5B). The precise nature of these cells and the involvement of
Tns3 in microglia during demyelination remain to be characterized more precisely.
In order to see whether Tns3 expression was really correlated with remyelination, I
quantify the Tns3+ oligodendrocytes density every 50m from the lesion core (without
quantifying the lesion core itself, due to the background signal induce by the myelin
debris and the high density of microglial cells). I found an accumulation of Tns3+
oligodendrocytes in a 100m area surrounding the lesion core (Figure 5C). Altogether,
this data suggest that Tns3 is not only expressed during myelination, but also in
remyelination context to generate new OLs at the lesion site.
Tns3 constitutive KO induce a sublethal phenotype
In our first attempt to generate the V5-tagged mice line, we created three Tns3 KO
mouse lines by CRISPR-induced Non-Homologous End Joining. Each presented their
own nonsense mutation changing the Tns3 reading frame: 1 nucleotide insertion, 4
nucleotides deletion and 14 nucleotides deletion. No clear deleterious phenotype was
observed in heterozygous Tns3KO mice but Tns34del and Tns314del homozygous mice
presented decreased survival rates (Figure 6A). We asked whether this reduced
number of Tns3KO homozygous mice were present before birth and genotype E14.5

158
embryo. Even at E14.5, a significantly lower number of Tns3KO homozygous was found
(Figure 6B), suggesting an involvement of Tns3 during foetal development. Tns3KO
homozygous mice presented also a growth defect (Figure 6B, arrows) at P8 (Left) and
P14 (Right), coherent with the literature’s data (Chiang et al, 2005)
In parallel with these studies, Tns3KO mice were also generated by the International
Mouse Phenotype consortium (IMPC, https://www.mousephenotype.org/). Several
test to attest the severity of this mutation are currently ongoing but they already found
a so-called “sublethal” phenotype, similar to ours (Figure 6D) and a female specific
increase in bone mineral density in heterozygous Tns3KO mice (Figure 6E). The
reduction in body weight and the increased death for homozygous Tns3KO mice is not
a surprise. Indeed, previous attempts to generate Tns3 knockout models or the study
of natural Tns3 mutants revealed that the loss of this protein is associated with growth
defects and reduction of the carcass size (Chiang et al, 2005; Deng et al, 2019).
A consequent part of our Tns3KO homozygous mice later died after birth at P14 due to
unknown reasons. We sadly lost these three mice lines during the COVID-19
lockdown, blocking us to study more in detail this phenotype. Nevertheless, we were
able to detect Tns3 protein by immunofluorescence (Figure 6E) and Tns3 transcripts
by RT qPCR from Tns3KO mice brain, indicating that the surviving mutant mice still
expressed Tns3 in the brain.

159
Figure 6: Homozygous Tns3KO induces a sublethal phenotype. (A) Genotypes of the newborn mice in
double Tns3KO/WT breedings. (B) Genotypes of E14.5 embryos from double Tns3KO/WT breedings. (C)
Growth defects in homozygous Tns3KO pups (blue arrows) at P8 (left) and P14 (right). (D) Sublethal

160
phenotype identified by the IMPC (https://www.mousephenotype.org/). (E) Histogram of the mean bone
mineral content in Tns3KO compared to WT mice. (F) Immunofluorescence showing that Tns3 is still
detected in CC1+ OLs of Tns34de/4del P21 mice, with four different Tns3 recognizing antibodies (Millipore,
SantaCruz, Sigma, and Sassan Hafizi lab). (G) Histogram representing RT qPCR on cDNA from P21
brains showing no differences in the amplification of Tns3 Exon13-15, Exon 17 and Exon31 (C1)
between Tns34de/4del, Tns34de/+ or WT mice, indicating the presence of a long Tns3 transcript containing
these exons.
Tns3 exon6 frameshift by CRIPSR-Cas9 in NSCs
Given that Tns3 constitutive knockout mice models were not suitable to study the
requirement of Tns3 during oligodendrogenesis, we decided to create our own
knockout model in brain cells. We designed a CRISPR-Cas9 strategy in order to target
the Tns3 expression of only a small OL subpopulation (Figure 7A), to avoid
compensatory effects, by electroporating plasmids in telencephalic NSCs between P1
to P2 (Figure 7B). This strategy was based on the integration of a single plasmid
expressing both the guidance RNA (gRNA), the Cas9 protein and a GFP reporter. We
then quantify the progeny of the mutated NSCs either at P21, after the end of most
OPC differentiation in the cerebral cortex (Figure 7C).
The two best gRNA for their cutting efficiency in vitro and for presenting the lowest off
target effects were selected and used for electroporation. At P21, we stained brain
sections finding a GFP signal in NSCs, astrocytes, OPCs and OLs both in Ctrl (Figure
7D), gRNA#1 and gRNA#2 electroporated mice (Figure 7D’). We found a clear
reduction by over 50% of the OLs generation from NSCs with both Tns3 targeting
gRNAs compared to control (same CRISPR plasmid without Tns3 targeting
sequencing) with no effect on the OPC population (Figure 7E), suggesting that Tns3
is required during oligodendrogenesis.
I then performed similar experiment and analysed the brain at P11 when most cortical
OPCs have not yet started differentiation. Interestingly, I found no changes in the
number of OPCs between experimental and control conditions, and detected a
tendency to decrease in the number of OLs in mutated mice (Figure 7G), suggesting
that Tns3 deletion in NSCs do not impairs OPC generation.

161
Figure 7: CRISPR-mediated Tns3 mutation in NSCs reduces oligodendrocyte differentiation in the
postnatal brain. (A) Schematics of the Tol2-PX458 CRISPR/Cas9 expression vector allowing Tol2-DNA
integration driving Cas9 and GFP expression (from polycistronic 2A-mediated cleaved) from CAG
promoter and gRNA expression from U6 promoter. (B) Schematics of the dorsal SVZ electroporation of
Tol2-P458 plasmid at postnatal day 1 (P1) and immunofluorescence analysis carried out in sagittal
brain sections at P22. (C) Schematics of the Tns3 CRISPR-Cas9 mutation in NSCs and of their
differentiation. (D) Immunofluorescence of representative P22 sagittal sections of the dorsal
telencephalon showing GFP+ cells being either PDGFR+ OPCs (arrowheads), CC1high OLs (arrows)
or CC1low astrocytes (asterisks) progeny of P1 NSCs electroporated either with Ctrl plasmid (D) or
Tns3-gRNA#1 plasmid (D’). Scale bar, 20 m. (E) Histogram showing the percentage of GFP+ glial
cell-types found in Ctrl, gRNA#1 or gRNA#2 electroporated brains being PDGFR+-OPCs, CC1high-
OLs and CC1low-astrocytes. Note the 2-fold reduction of CC1+ OLs in Tns3-gRNA transfected brains,

162
as illustrated in D’ compared to D. (F) Schematics of experimental design of data provided in G-J panels.
(G) Histograms representing the percentage of GFP+ differentiated cells at P11. Note the lack of
changes in OPCs, and the incipient reduction in OLs. (H-I’) Immunofluorescence for PDGFR from P11
mice electroporated with Ctrl plasmid (H, I) or Tns3-gRNA#1 plasmid (H’, I’) together with MCM2 (H,
H’) and activated Caspase3 (I-I’), illustrating similar MCM2 labelling and the absence of
Casp3+/PDGFR+ OPCs (staining (J) Histograms quantifying the proportion of proliferative GFP+ OPCs
in electroporated P11 mice brain. (K) Schematics of Tns3 expression in mice (Up) and of the effects of
Tns3 CRISPR-mediated deletion (Down). Scale bar, 20 m.
I then assessed by immunofluorescence for possible changes in OPC proliferation,
with MCM2 (Figure 7H-H’), or OPC cell death, with Caspase 3 (Figure 7I-I’) at P11.
No clear differences between mutant and control OPC proliferation (Figure 7J), and
no clear evidence of increased cell death could be observed in mutant OPCs using a
Caspase3 staining (not shown).
All together, these data suggest that Tns3 is required for OL differentiation without
affecting OPC proliferation or OPC survival (Figure 7K). However, the small proportion
of targeted cells make it hard to make a clear conclusion from P14 caspase3 and
MCM2 staining. We needed a way to affect a greater number of cells to study Tns3+
cells in detail, as they represent a small transient fraction of the whole oligodendroglial
cell population.
Optimisation of the Tns3 CRISPR-Cas9 knockout system
During my first PhD year, I optimized the CRISPR-Cas9 strategy in order to target a
greater number of cells. I switched the former pCMV promoter controlling the gRNA
expression to a pCAG, known to induce a greater gene expression than the short
cytomegalovirus reporter. In our first strategy, the part containing the gRNA, the Cas9
and the GFP sequences was flanked by two Tol2 sequences, in order to allow their
stable integration in the transfected cell genome by a transposase, encoded a co-
electroporated plasmid. However, it appears this integration was not occurring as the
GFP signal was faint in the most differentiated oligodendrocytes. It is likely that the
GFP produced was indeed diluted among NSCs’ daughter cells at each division,
making it harder and harder to detect recombined oligodendrocytes as they
differentiate.

163
To tackle this problem, we changed our strategy for a co-electroporation of three
plasmids according to the efficient transfection obtained in the lab of our collaborators,
the team of Lucas Tiberi (Trento, Italy), implicating the PiggyBAC transposition system
having better efficiency that the Tol2 system we previously used. In this new strategy,
we first generated a plasmid containing the gRNA and the Cre-recombinase sequence
un a backbone plasmid with pCAG promoter and PB integrative sequences, a PBase
transposase expressing plasmid and a PB integrative plasmid containing the pCAG-
VENUS reporter gene. The strong VENUS fluorescence and expression after host cell
genome integration decreased the number of false negative cells and helped us to
phenotype cells by using their morphology in addition to marker expression. Finally, in
a tour de force, we used our Tns3Tns3-V5;RosaSTOP-Cas9-GFP mice line, expressing the
Cas9 after Cre recombination under the control of an ubiquitous locus, together with
and two plasmids pB-pCAG::Cre-pU6::gRNA plasmid and pBase, in order to quicken
Cas9 cutting after the gRNA is produced. With the high VENUS signal, I also decided
to use an automatic scanner, which quickened the analysis of the brain slices. With
these images, it is also easier to show the overall efficiency of our electroporation
strategy (Figure 8A).
With this new protocol, over five times more NSCs were targeted and five times more
glial were quantified (Figure 8B). I quantified the targeted glial cells, using again CC1
and PDGFRa staining, and also found a decrease by 40% of the number of OL
generated by mutated NSCs at P21 (Figure 8C). Interestingly, it seems that the
phenotype is weaker in this new setup. This could be explained by the fact that our
new co-eletroporation system despite targeting more cells, also seem to induce more
false positive results. Indeed, as a mutagenesis is based on the integration of 3
plasmids, if the VENUS plasmid is integrated without the CRISPR plasmid, some non-
mutated cells could exhibit GFP expression. Still, the strong decrease of the proportion
OLs reinforce our previous results indicating a clear involvement of Tns3 in
oligodendrogenesis.

164
Figure 8: Optimisation of the CRISPR Cas9 strategy. (A) Immunostaining of the oligodendroglia in P21
mice telencephalon electroporated at P1 with a Exon6 frameshift gRNA. (B) Number of cells quantified
per brain. In light grey, the total number of cells targeted with the old protocol. In dark grey, the mean
number of cells quantified with the new system. (C) Histogram showing the percentage of GFP+ glial
cell-types found in Ctrl or gRNA#2 electroporated brains being PDGFR+-OPCs, CC1high-OLs and
CC1low-astrocytes. Note the 40% reduction of CC1+ OLs in Tns3-gRNA transfected brains.
Tns3 proteomic expression in oligodendroglia
Transcriptomic resources from human (gtexportal.org/home/gene/TNS3) and mouse
tissues already suggested that two Tns3 transcripts were expressed in several brain

165
regions and that the smaller isoform was expressed at higher levels (Figure 9A). But
our electroporation CRISPR-Cas9 system was designed in order to get rid of the
expression of only the full length Tns3.
Figure 9: Tns3 isoforms expression in oligodendroglia. (A) Schematic of the two main TNS3 isoforms
exon expressed in the human brain (gtexportal.org/home/gene/TNS3). Dark blue is associated with
higher expression. (B) V5 Western Blot from P35 Tns3V5 mice and oligodendrocytes (OLs) after 4 days
of differentiation in vitro. Note the absence of the Tns3 full length isoform in the total brain extract but
not in cultured OLs. (C) V5 Western Blot from MACSorted oligodendroglial cells. At P7, MACSorted
OPCs and iOLs, both Tns3 isoforms can be found, with the small one predominantly expressed (Left).
At P14, the isoforms are expressed at similar levels in iOLs (Middle). And at P21, only the small tns3
isoform is expressed and at low levels (Right).
My Western blot from Tns3V5;RosaSTOP-Cas9-GFP P35 mice brain confirms literature data
with a high expression of Tns3 small splicing variant(60KDa) and a weak full length
tns3 expression (Figure 9B Left).
I asked whether these data from total brain extracts were representative of the
oligodendroglial population, so I decided to investigate for the presence of Tns3
isoforms in cultured NSCs after 3 days of proliferation and 4 days of differentiation.
Surprisingly, these cells show a clear expression of both isoforms and at similar levels
(Figure 9B). To confirm this in vitro test, I MACSorted OPCs/iOLs from P7 cortex, iOLs
at P14 and more mature OLs at P21 and look at the relative expression of each isoform

166
by Western Blot using a specific anti-V5 antibody. Interestingly, at P7, the two isoforms
are highly expressed, but the small isoform is more than 5 five time more expressed
than the full length (Figure 9C Left). At P14, iOLs still expressed the two isoforms at
lower but similar levels (Figure 9C Middle). Finally, P21 mOLs expressed general low
levels of Tns3 and only the small isoform remains detectable (Figure 9C Right).
Interestingly, it seems that full length Tns3 is specific to early iOLs in the brain, and it
is downregulated during OL maturation only levels of Tns3 can be detected, and
mainly of the small isoform.
Deletion of the whole Tns3 locus by CRIPR-Cas9
Our first CRISPR-Cas9 strategy induces a Tns3 frameshift at the level of the exon 6,
which is the first translated exon of full length Tns3 isoform. On the contrary, this
Knockout is supposed to not affect the small Tns3 60 KDa isoform, by far the most
expressed in the brain and oligodendrocytes. I decided to check whether small Tns3
isoforms could be also involved in oligodendrogenesis by comparing the effect of Tns3
frameshift, affecting only Tns3 full length expression, and the deletion of the whole
locus, affecting the expression of both isoforms.
Instead of inducing an exon6 frameshift by NHEJ, I used either a combination of two
gRNA to get rid of the 9th exon, which deletion induces a frame shift after 100 aa in
the coding region, or two gRNAs to delete the whole Tns3 locus. I also kept a control
condition in which a simple exon6 frameshift was induced (Figure 10A). As before,
mice were electroporated at P1 and perfused at P21 (Figure 10B) to follow the progeny
of the (GFP+) electroporated NSCs’ progeny (Figure 10C).
Immunostaining against PDGFRa, to look at the OPC population, and CC1,
characterizing our OLs, show a good number of GFP+ cells both in control (Figure
10D) or KO conditions (Figure 10D’). The quantification of the NSCs progeny after the
deletion of the whole Tns3 locus show surprisingly a similar reduction of the generation
of OLs (Figure 10E), compared to controls and Exon6 frameshift (Figure 10F-G).

167
Figure 10: CRISPR-mediated Tns3 mutation in NSCs reduces oligodendrocyte differentiation in the
postnatal brain. (A) Schematic of the integrative CRISPR/Cas9 expression vector allowing the
expression in transfected cells of 2 gRNA targeting the Tns3 3’ and 5’ and the expression of the Cas9
protein. (B) Schematic of the dorsal SVZ electroporation of Tol2-P458 plasmid at postnatal day 1 (P1)
and immunofluorescence analysis carried out in sagittal brain sections at P22. (C) Schematics of the
Tns3 CRISPR-Cas9 whole deletion in NSCs and of their differentiation. (D) Representative P22 sagittal
sections of the dorsal telencephalon showing GFP+ cells being either PDGFR+ OPCs (arrowheads),
CC1high OLs (arrows) or CC1low astrocytes (asterisks) progeny of P1 NSCs electroporated either with
Ctrl plasmid (D) or Tns3-5’-3’ plasmid (D’). Scale bar, 20 m. (E) Histogram showing the percentage of
GFP+ glial cell-types found in Ctrl or 3’-5’ gRNA electroporated brains being NSCs in the SVZ or

168
PDGFR+-OPCs, CC1high-OLs and CC1low-astrocytes in the CC & Ctx. Note again the 2-fold reduction
of CC1+ OLs in Tns3-5’-3’ gRNA transfected brains shown in D. (F) Representative P22 sagittal
sections of the dorsal telencephalon electroporated with Exon6 plasmid. (G) Histogram showing the
percentage of GFP+ glial cell-types found in Ctrl or Exon6 gRNA electroporated brains being NSCs in
the SVZ or PDGFR+-OPCs, CC1high-OLs and CC1low-astrocytes in the CC & Ctx. Note again the 2-
fold reduction of CC1+ OLs in Tns3-Exon6 gRNA transfected brains shown in F. (H) Histogram showing
the percentage of GFP+ glial cell-types found in Ctrl or Exon9 gRNA electroporated brains being NSCs
in the SVZ or PDGFR+-OPCs, CC1high-OLs and CC1low-astrocytes in the CC & Ctx. Note the
tendency of CC1+ OLs to decrease in Tns3-Exon9 gRNA transfected brains
However, the deletion of Tns3 exon9 only shows non-significant decrease of the OL
population. This is probably due to the lower cutting efficiency of the gRNAs targeting
exon 9, which is very likely to have a lower penetrance to delete both targeted sites,
and thus increase the number of false positives. Nevertheless, the fact that we did not
obtain further defect in the generation of OLs with the deletion of the whole coding
sequence Tns3 locus compared deleting only the full-length Tns3 isoform by
producing indels in Tns3 exon 6, suggests that Tns3 short isoform do not have an
additional requirement in the generation of OLs that compensates for the loss of Tns3
full-isoform.
Figure 11: Tns3 expression is suppressed in similar proportions with Exon6 frameshift and whole locus
deletions. (A) Representative P22 sagittal sections of the dorsal telencephalon electroporated with the
Empty (Right) or the Exon6 plasmid (Left). (G) Histogram showing the percentage of GFP+ Nkx2.2+
cells found in Ctrl or Exon6 gRNA electroporated brains. In dark grey, the GFP+ Nkx2.2+ cells
expressing Tns3. In light grey, the GFP+ Nkx2.2+ cells with no Tns3 expression. Note the 2-fold
reduction of GFP+ Nkx2.2+ Tns3+ in both conditions and the absence of effect on the GFP+ Nkx2.2+
Tns3- population.
To verify the efficiency of CRISPR Cas9 cutting in these two models and their effect
on Tns3 expression in iOLs cells, I quantified the GFP+/Nkx2.2+/Tns3+ and the

169
GFP+/Nkx2.2+/Tns3- cells proportion in mutant mice using immunostaining (Figure
11A). Interestingly, I found a similar drop of the Tns3 expressing GFP+/Nkx2.2+ cells
(Figure 11B) both with Exon6 frameshift and whole locus depletion (Exon6 deletion: -
64%, p value: 0,02; whole locus deletion: -59%, p value: 0,03), without any effect on
the Tns3- population, suggesting that Tns3 does not plays crucial roles in previous
oligodendroglial stages
As a complementary strategy we design tools to delete Tns3 in NSC cultures by
generating AAVs expressing Tns3-targeting CRISPR tools. In order to do so, I
produced Tns3 deletion by transfecting gRNA and Cre expressing AAV9 virus in
primary NSCs culture from Tns3Tns3-V5; Rosa26stop-Cas9-GFP mice. I stained these
cultures to look Tns3 expression in OLs (Figure 12A) quantifying the number of CNP+
OLs after 2 and 3 days of differentiation. Interestingly, I found no differences in OL
proportions after 2days (Figure 12B) but the NSCs transfected with the Exon6-
frameshit-AAV tended to produce less CNP+ OLs after 3 days of differentiation, at the
onset of Tns3 expression in vitro (Figure 12C).
Figure 12: Tns3 slightly impair OLs differentiation in vitro at 3 days of differentiation. (A) Representative
staining of primary Tns3V5 NSCs cultures transfected with the Empty (Up) or the Exon6 AAV (Down).
(B) Quantification of the OLs percentage among the transfected cells at 2 days (2dd) and at 3 days of

170
differentiation (3dd). Note the absence of difference at 2dd and the 30% decrease at 3dd. (C) Histogram
showing the percentage of GFP+ Tns3+ cells found in cultures after 3dd.
This tendency is associated with a non-significant reduction of Tns3+ expression in
CNP+ OLs in cultures transfected with Tns3-targeting gRNA AAVs. These preliminary
results suggest that the effects of the Tns3 KO are also present in culture, starting at
3 days of differentiation. Nevertheless, none of these data reached statistical
significance, very likely due to the fact we only looked at the onset of Tns3 in vitro
expression, without doing later time point. We are thus currently planning to reproduce
these experiments looking at the effect of Tns3 deletion after 4-5 days differentiation.
In vivo Tns3 induced knockout of the postnatal OPCs population
Even after optimization, one major drawback of the CRISPR-induced Tns3-mutations
by electroporation is the limited number of mutated cells. Given this limitation and the
difficulty to assess the in vivo penetrance of Tns3 loss-of-function induced by
CRISPR/Cas9-mediated mutations, and in order to address in depth the
consequences of Tns3 loss-of-function, we designed a Tns3 conditional knockout
allele, by flanking with LoxP sites the essential exon 9 (Fig. 13A, D). In this Tns3-floxed
allele (Tns3flox), Cre-mediated recombination induces a transcription frame shift
introducing an early stop codon, leading to a small peptide (109 aa) instead of the full
length Tns3 protein (1442 aa; Fig. 13B, C). Mouse embryonic stem cells (ESCs) were
transfected with a plasmid expressing Cas9, GFP, gRNAs flanking Tns3 exon 9, and
Tns3-floxed targeting vector, to induce CRISPR/Cas9-mediated homologous
recombination. After verifying the presence of Tns3-floxed allele in Tns3 locus by
Sanger sequencing, positive ESC clones were injected into blastocysts to generate
Tns3-floxed (Tns3flox) mice.

171
Figure 13: Generation of Tns3 conditional allele. (A) Schematic of Tns3 locus, Tns3Flox allele and
targeting vector with LoxP sites flanking Exon9, used to induce homologous recombination in mouse
ESCs. (B) Full-length Tns3 amino-acid sequence indicating its protein domains. Squared in red
highlights the 109 amino-acid sequence of the Tns3 peptide produced upon Cre-mediated
recombination in Tns3flox expressing cells. (C) Peptide sequence of predicted for Tns3-iKO expressing
cells.

172
Finally, we combined Tns3flox animals with Pdgfra-CreERT mice, to induce Cre-
mediated Tns3 deletion specifically in OPCs, in presence of a Cre reporter background
(Rosa26stop-YFP) in order to trace Tns3-deleted cells (Fig. 14A).
Figure 14: Tns3 iKO impairs OLs generation at P14 in the Cortex but not in the fimbria and the corpus
callosum. (A) Scheme of Tns3 recombination in P7 mice before being analysed at P14. (B)
Representative sagittal sections of Tns3flox or Tns3WT brains. (B) Histograms showing the percentage
of GFP+ glial cell-types found in Tns3flox or Tns3WT brains being NSCs in the SVZ or PDGFR+-OPCs,
CC1high-OLs and CC1low-astrocytes in the CC, the Ctx and the fimbria. Note the 2-fold reduction of
CC1+ OLs only in the Cortex of Tns3flox brains, as shown in B.
I induced Tns3 deletion in pups by administering tamoxifen at P7 and checked for
mutated OPCs progeny first at P14 (Figure 14A) in three different brain regions: the
corpus callosum, the cortex, the fimbria (Figure 14B). A clear decrease of the CC1+

173
OLs density compared to the controls could be observed in the cortex (-65%, p value:
0,003) but not in the fimbria nor the corpus callosum (Figure 14C). Interestingly, OPC
density was not changed in any of the quantified areas, reinforcing our hypothesis that
Tns3 impairs OL generation without affecting OPCs population.
I then looked at the effect of Tns3flox allele recombination at P21 (Figure 15A), using
our CC1/GFP/PDGFRa staining (Figure 15B-B’ and C-C’). I quantified CC1+ OLs and
PDGFRa+ OPCs density in four different brain area: the corpus callosum, the cortex,
the fimbria and striatum, this later one seeming also affected at P14 (Figure 14B, not
quantified). I found a clear decrease of CC1+ OLs in recombined mice (Figure 15D),
with again no significant effect on the OPCs density.
In order to characterized more precisely the oligodendroglial stage at which Tns3 act,
I then stained these brains with an CC1/Olig1 staining (Figure 15E-E’) to quantify
oligodendroglial cells of different stages: OPCs (Olig1+/CC1- cells), iOL1s
(CC1+/Olig1- cells) and iOL2s/mOLs (CC1+/Olig1+ cells). I found a significant
decrease of iOL2s/mOLs in the four areas (cortex: -39%, p value 0,003; fimbria: -57%,
p value 0,0007; corpus callosum: -37%, p value 0,005; striatum: -38%, p value 0,019).
Interestingly, a significant decrease of iOL1s (CC1+/Olig1- cells) is also observed in
the fimbria, the cortex, and the striatum (cortex: -39%, p value 0,005; fimbria: -34%, p
value 0,03; striatum: -49%, p value 0,002) but not in the corpus callosum. Again, no
significant effect was observed in the OPC density (Figure 15F).

174

175
Figure 15: OPC-specific Tns3 deletion reduces oligodendrocyte differentiation in the postnatal brain:
(A) Scheme of tamoxifen administration to Tns3-iKO and control (Cre+; Tns3+/+) mice, Cre-mediated
genetic changes, and timing of experimental analysis. (B-B’, C-C’) Immunofluorescence in P21 sagittal
brain sections for CC1, GFP and PDGFRa illustrating similar density of OPCs and 2-fold reduction in
OL density in Tns3-iKO (B’, C’) compared to control (B, C) in the fimbria (B) and the cortex (C). (D)
Histograms showing OPC and OL density in P21 Tns3-iKO and control (Ctrl) mice, in the corpus
callosum, fimbria, cortex, and striatum. Note the systematic OLs decrease of 40-50% in each region.
(E-E1’) Immunofluorescence in P21 sagittal brain sections for Olig1, GFP and CC1 to distinguish three
stages of oligodendrogenesis: OPCs (Olig1+/CC1-), iOL1s (CC1+/Olig1-) and iOL2s/mOLs
(CC1+/Olig1+) in Ctrl (E) or Tns3-iKO mice (E’). E1 and E1’ are higher magnification of the squared area
in E and E’. (F) Histograms showing the OPCs, the iOL1s and the iOL2s/mOLs density in P21 Tns3-
iKO and control mice, in the corpus callosum, fimbria, cortex, and striatum. Note the decrease of iOL1s
and iOL2s over 40% in each area quantified (except for iOL1 density in the corpus callosum). (G)
Schematic representing defects in oligodendrogenesis found in Tns3-iKO compared to control.
I assessed for the efficiency of Tns3 deletion in Nkx2.2+/GFP+ iOLs from different
regions by immunofluorescence using the Tns3 antibody from Sigma Cterminus
(Figure 16A), finding an almost complete elimination of Tns3 in Nkx2.2+/GFP+ iOLs of
Tns3-iKO compared control (Figure 16B, B’, C, arrows and arrowheads). Using
markers labelling different stages of oligodendrocyte differentiation (iOL1 and
iOL2/mOL), I found that the density of early iOL1s (Nkx2.2high cells) which express the
highest levels of Tns3 protein were not changed (Figure 16B,B’,D), that the density of
iOL1s (CC1+/Olig1- cells) were reduced by 30% in Tns3-iKO compared to controls,
while later oligodendrocyte stages (iOL2/mOLs, CC1+/Olig1+ cells) were reduced by
50%, suggesting that Tns3 is required for normal oligodendrocyte differentiation
(Figure 15E-F).

176
Figure 16: Efficient OPC-specific Tns3 deletion in the postnatal brain and reduced oligodendrocyte
differentiation: (A) Scheme of tamoxifen administration to Tns3-iKO and control (Cre+; Tns3+/+) mice,
Cre-mediated genetic changes, and timing of experimental analysis. (B-B’) Immunofluorescence for
Tns3, GFP and Nkx2.2 in P21 mice sagittal brain sections at the level of the corpus callosum, illustrating
the loss of Tns3 signal in Nkx2.2high iOL1s (arrows) but not in vessels (asterisk) of Tns3-iKO (B’)
compared to control (B). Note that Nkx2.2high iOL1s do not change in density in Tns3-iKO compared to
control. (C) Histograms showing the Tns3+ cells density in the corpus callosum, fimbria, cortex, and
striatum, in Tns3-iKO and control. (D) Histograms showing the Nkx2.2high iOL1s density in the corpus
callosum, fimbria, cortex, and striatum, in Tns3-iKO and control.
Finally, we assessed for possible changes in OPC proliferation and cell death, by
immunofluorescence with Mcm2 and activated-Caspase3 recognizing antibodies
respectively, finding only reduction tendency in the proliferation of Tns3-iKO OPCs
compared to controls (Fig. 17C, C’,D), and no evidence of changes in dying OPCs
between genotypes.

177
Figure 17: (C-C’). Immunofluorescence for MCM2 proliferative marker, GFP, and PDGFRa illustrating
similar proportion of proliferative OPCs in control (C) and Tns3-iKO mice (C’). (D) Histograms
quantifying the proliferative fraction of GFP+ OPCs in the fimbria (Up) and corpus callosum (Down).
Note the slight reduction (non-significative) in proliferation in Tns3-iKO OPCs compared to control
OPCs.
Altogether, these results indicates that acute deletion of Tns3 in OPCs reduces by 2-
fold oligodendrocyte differentiation in the postnatal brain, without major changes in
OPC proliferation or survival.
Assessing Tns3-mutant oligodendrocyte defects by video microscopy in
neural progenitor cultures
I reproduce this experiment In vitro by transfecting Tns3flox; PdgfRa-CreERT; RosaYFP
NSCs with Cre-expressing adenovirus either an empty sequence or our gRNA
targeting Tns3 exon6. After 3 days of differentiation, I stained these cultures with CNP,
GFP and PdgfRa antibodies (Figure 18A-A’). I observed no variation of the total GFP+
cells density (Figure 18B) but found an over 40% decrease in CNP+ OLs density
(Figure 18C). The fact this reduction does affect the total cell density suggests a
specific Tns3 requirement for OL generation and not the other NSCs progeny, which
represent the main part of the culture.

178
Figure 18: Tns3 loss of function in Tns3flox NSCs with an AdenoCre virus decreases the OIL production
after 3 days of differentiation. (A) Representative stainings of primary Tns3WT; Pdgfra-CreERT; RosaYFP
(Up) or Tns3flox; Pdgfra-CreERT; RosaYFP (Down) NSCs cultures transfected with AdenoCre virus after
3dd. (B) Histogram of the total cell density. (C) Histogram showing the percentage of GFP+ OLs found
in cultures after 3dd. Note the 30% reduction of the OL number in Tns3flox; Pdgfra-CreERT; RosaYFP
NSCs cultures.
Considering these findings, I first tried to record a timelapse Live Imaging of the OPCs
differentiation of these cultures (not shown). Unfortunately, the wide diversity of
generated cells makes it hard to record one precise OLs. To tackle this issue, I decided
to reproduce this timelapse Live Imaging but using MACSorted OPCs from Tns3flox;
Pdgfra-CreERT; RosaYFP P7 pups previously recombined by a Tamoxifen injection at
P5. OPCs were left 3 days to proliferate and imaged every 10 minutes during 3 other
days both for YFP fluorescence and phase contrast (Figure 19A).
A first quantification after the plating of these OPCs in culture shows a mean
recombination rate of 80% in OPCs (72h before the medium change to induce their
differentiation). After 3 days of differentiation, GFP+ positive cells represented less
than 50% of the cells (Figure 19B), indicating either that recombined OPCs are more

179
prone to die, differentiate slower or proliferate less than non-recombined OPCs from
the same animals. Another way to represent this data is to look at the percentage of
loss cells from the onset of the differentiation (Figure 19C). During the first 24h, no
clear difference is observed between GFP+ and GFP- cells. From 24h to 48h, the
percentage of GFP+ cells loss tends to be higher than GFP- cells, until reaching the
significancy at 72h.

180
Figure 19: Cellular defects of Tns3iKO iOL by videomicroscopy of OPC differentiating cultures. (A)
Schematics of the videomicroscopy protocol. Tns3flox mice were injected with tamoxifen at P5 and their
OPCs were MACS at P7, cultivated on P-L-O coated culture plates and left proliferating for 3 days.
Cells were imaged every 10 minutes during 72h in differentiating medium. (B) Histogram showing the
reduction of the GFP+ cells proportion from the plating (-72h) to the end of the experiment (72h after
differentiation onset). (C) Time curve showing the increase of mean loss percentage for GFP+
compared to GFP- cells during the 72h of differentiation. (D) Histogram showing the mean number of
loss cells per hour during the 72h differentiation, with a 5 time increase for GFP+ cells from Tns3flox
mice compared to the GFP- non-recombined cells. Note the mean death per hour in Tns3flox;
PdgfRaWT littermates similar to the rate of GFP- cells from Tns3flox; PdgfRa-CreERT/WT mice. (E)
Representative section of the liveimaged cultures.
After 72h, GFP+ positive cells lost 5 times more cells/hour compared to GFP- cells.
Interestingly, OPCs MACSorted from Tns3flox; PdgfRaWT; RosaYFP mice show a profile
similar to GFP- OPCs from Tns3flox; PdgfRa-CreERT; RosaYFP mice (Figure 19D),
suggesting that the absence of these cells is not solely due to a paracrine effect
between GFP+ and GFP- OPCs in each culture. In these preliminary data, I did not
identify yet the cause of this reduced number of GFP+ OPCs in culture. It is very likely
to be due to a mix of a slower differentiation, a decrease cell mobility, and an increased
cell death, by the loss of cell-ECM adhesion (Figure 19E). We still need to finish the
analysis of these data, and to produce the control experiment with MACS OPCs from
Tns3WT; PdgfRa-CreERT; RosaYFP mice, which will be more pertinent as controls.

181
Discussion
Tns3 is a crucial protein involved in numerous biological functions. Tns3 mutations
have been associated mainly with lung dysfunctions or intestinal tract defects. This is
very likely linked to their role in cell-cell GAP junction stabilisation, crucial for epithelial
cells adhesion with each other and lumen stabilisation. Tensins are also heavily
dysregulated in cancer in order to favour tumour metastasis. But each Tensins also
has its own specific function, mostly related to their highly variable medial part. Tns3
seems to be especially involved in the CNS as it is the main expressed Tensin in
oligodendroglia and the only Tensin known to be impacted in Glioblastoma (Chen et
al, 2017). Therefore, this protein represents an interesting target to provide better
insights on brain oligodendrocyte basic biology, both in normal and neurodegenerative
context, and to fight brain tumour metastasis.
By Genome wide profiling of chromatin binding of key regulators of
oligodendrogenesis, we show that Tns3 is directly targeted by key oligodendroglial
transcription factors, such as Olig2, Chd7, and Chd8. Its expression is tightly controlled
in order to be quickly but transiently increased during early oligodendrogenesis in
myelinating and remyelinating context. We also show that Tns3 was found in the OL
soma but was also concentrated in small dots distributed all along the oligodendroglial
processes. The nature of these dots remains to be defined.
Tns3 expression is not exclusive to oligodendroglia in the CNS given that endothelial
cells also present high levels of Tns3 transcripts, present a sustained Tns3 expression,
which could be due to their high level of connectivity. Indeed, Tensins are known to
play a role cell adhesion to each other and the ECM, as described for or smooth
muscle endothelial cells (Charles et al, 2007) and Human aortic abdominal endothelial
cells (Hassanisaber et al, 2018). OLs present instead this peculiar transient peak of
expression, suggesting a critical role of Tns3 only at a precise step of oligodendroglial
differentiation. Surprisingly, we also found a microglial population expressing Tns3 in
demyelinating lesions but the precise nature of these cells remain to be defined. It is
likely that Tns3 could be required for microglial motility to help microglial pseudopodia
formation and their migration to the lesion site.

182
Tns3 mutations are broadly associated with lethal or strongly deleterious phenotypes.
Human genomic studies have identified few genomic Tns3 mutations, being linked
with severe disease such as lung (Yan et al, 2019) or thyroid cancer (Maeda et al,
2009) and even nephropathy (Feng et al, 2019). Tns3 knockout models present strong
lethality and we have a strong difficulty to obtain viable Tns3 mutant animals. We have
also previously demonstrated the non-utility of the Tns3bgeo gene-trap mice to study its
function in oligodendrogenesis due to apparent compensatory effects to re-establish
Tns3 expression in the CNS.
All of these indicate that Tns3 is involved in various biological processes and that is
critical during the development, which makes it hard to study solely its role in brain
development. For this reason, we first focused on the induction of CRISPR/Cas9-
mediated point mutation only in a subpopulation NSCs by the technique of postnatal
electroporation of the lateral ventricle of the telencephalon, in order to induce viable
Tns3-deleted brains. We found that the knockout of Tns3 impair NSCs’ ability to
generate OLs during the third postnatal week. Interestingly, we didn’t see any effects
on OPC population, suggesting that Tns3 play doesn’t play a crucial role for NSCs
specification into the oligodendroglia or for OPCs proliferation.
Knowing the reported presence of a 60KDa Tns3 isoform being predominantly
expressed in the brain (GTEX resource, gtexportal.org/home/gene/TNS3), by Western
blot analysing of MACSorted iOLs, we showed that purified iOLs had significantly
higher levels of Tns3 full-length protein, despite that the small Tns3 isoform remains
highly expressed. Moreover, the CRISPR/Cas9-mediated deletion in NSCs of the
whole Tns3 coding sequence locus induced similar effects to the frameshifting at the
beginning of the full-length isoform, suggesting that the Tns3 full-length isoform is the
Tns3 variant mainly required for OL differentiation.
We also showed, using a Tns3flox mice model we generated, that Tns3 OPC-specific
induced knockout at P7 induces a decrease by 40% to 50% of the mature OL density
two week later. Interestingly, the cortex shows already an effect of the Tns3 loss at
P14, contrary to the corpus callosum for the fimbria, whose effect of Tns3 loss appears
only at P21. This could be explained by a difference in the timing of OL differentiation,
which differs across the brain regions. Interestingly, Tns3 loss does not seem to affect
Nkx2.2 iOLs population, whose density do not show any changes two weeks after

183
Tns3 deletion. These findings corroborate our hypothesis that Tns3 play a role only at
a precise step of oligodendrogenesis and is not required for NSCs specification toward
the OL lineage or OPC survival, even if we see a tendency of decreased proliferation
in Tns3KO OPCs.
In vitro confirmation of these experiments also show a Tns3 requirement only at a
precise step. Tns3 CRISPR/Cas9-induced mutation through AAV transfection of NSC
cultures does not show any impact on OLs population before the third day of
differentiation, which coincides with the start of Tns3 peak in these cultures.
Transfection with Cre-expressing adenovirus of Tns3flox NSCs also show reduced
number of oligodendrocytes only after 4 days of differentiation. Finally, the live imaging
experiments clearly show not effects of Tns3-deletion on cell survival between
recombined and non-recombined OPCs during the first 24h. However, a clear
decrease of the proportion of recombined (GFP+) cells is observed during the 3 days
of OPCs proliferation. An explanation of this could be that some of the OPCs start to
differentiate during the proliferation step. Indeed, MACS is a stressful protocol, which
takes about 5 hours, and the growth factor deprivation is known to induce OPCs
differentiation.
In any case, we show that Tns3 plays a crucial role at a precise step of
oligodendrogenesis. The involvement of actin remodelling protein in
oligodendrogenesis is not new. Before oligodendrogenesis, OPCs migration from their
birthplace to reach their differentiation area strongly required actin cytoskeleton. Then,
at the onset of OLs differentiation, the formation of actin growth cones at the tip of iOLs
processes, to find axons to myelinate, is considered as a major driver for the latter OLs
morphological modifications (Thomason et al, 2020). The progression of the OL’s
edges around the axon during myelination is also extensively based on actin
cytoskeletal reorganisation. But Tns3, which could act at all of these three steps,
seems to be predominantly required for iOL differentiation as it is almost not expressed
in OPCs and myelinating OLs, suggesting a specific role for Tns3 in OPCs processes
formation. [CP1] The precise mechanisms of Tns3 function in differentiating
oligodendrocytes remains to be defined.

184

185
Perspectives
The precise mechanisms by which Tns3 act during OL differentiation need to be further
characterized. Interestingly, Tns3 is already known to be involved in pseudopodia
formation in various cell types, so one possibility could be that Tns3, the most
expressed Tensin in the oligodendroglial lineage, help iOLs to remodel their actin
cytoskeleton and extend their cytoplasmic processes in order to find all the axons
(around 40-60 axons per OL in the mouse cortex) that they myelinate. Without Tns3,
OLs would fail to acquire a more mature oligodendroglial morphology, resulting in the
loss of them and thus reduction to half in the density of oligodendrocytes found in the
third week postnatal.
To investigate this hypothesis, we are currently performing an analysis of the
morphological changes undergone by Tns3-deleted iOLs (Tns3-iKO) during their
differentiation and before their increased cell death in OPC differentiating primary
cultures. Our preliminary results show a clear decrease of the recombined cell
population after three days of differentiation compared to the non-recombined cells
from the same Tns3flox mice, with no differences during the first 24h. Therefore, it
seems that Tns3 is required during a precise time-window of OL differentiation, for
reasons needing further characterization. We are currently analyzing these time lapse
to perform a morphological analysis of recombined cells dying or surviving and non-
recombined cells, in order to identify potential cytoskeletal dysregulation caused by
the absence of Tns3. An immunostaining performed after the experiment on the live
imaged cells revealed a strong expression of Tns3 in the many of the GFP+
(recombined) surviving OLs. We hypothesize that most Tns3 deficient cells have died
during the 3 days of imaging but a time course characterization of Tns3 expression in
similar cultures remains to be done in order to confirm or refute this hypothesis. Finally,
our present controls are either MACS OPCs from Tns3flox; Cre-negative; Rosa26stop-
YFP mice or non-recombined (GFP-) OPCs from Tns3flox; Pdgfra-CreERT; Rosa26stop-
YFP. However, the expression of Cre recombinase in OPC nuclei is already known to
impact the oligodendroglial generation. [CP1] In order to avoid this effect, we used
exclusively Tns3WT; Pdgfra-CreERT; Rosa26stop-YFP mice as controls for our in vivo
experiments. Thus, we still need to perform similar time lapse experiments using the
best control cells before to reinforce our preliminary results showing increase cell
death of differentiating Tns3-iKO oligodendrocytes.

186
Surprisingly, none of our efforts to delete Tns3 have succeeded to delete more that
50% of Tns3 expressing cells, even in Tns3-iKO mice where we achieved more than
80% recombination of OPCs. This suggests the presence of unknown compensatory
mechanisms, as the Tns3 constitutive KO mice mostly failed to survive after P14.
Tns3KO have been extensively reported to present growth issues and impairment of
gastro-intestinal tract, so this increase in death in Tns3KO mice could also be due to
growth defects or even difficulties for these mice to feed and assimilate the nutrients.
We have not identified a clear neurological phenotype in Tns3-iKO mice at P21, even
if they miss half of their oligodendrocytes, but these mice present a non-significant
reduction of their body mass compared to the controls. We planned to look at later
time points, such as two and three month-old mice to assess for long lasting
phenotypic effects of Tns3 deletion. It is likely that these mice end up presenting
neurological defects, due to their lack of OLs, but another possibility is that these mice
have indeed managed to overcome Tns3-deletion in order to keep the minimal number
of OLs required for a functional myelination. In this later scenario, it will be interesting
to challenge the brain by inducing partial demyelination (using the LPC or cuprizone
demyelinating models) and assess the capacity of Tns3-iKO brains to recover from
the induced demyelination. In parallel, it will be important to induce Tns3-deletion using
Tns3-iKO mice in the context of adult brain de/remyelination. We are therefore growing
our Tns3-iKO colony to be able to perform these experiments in the near future using
the LPC-induced demyelination model of the corpus callosum.
The precise involvement of the different Tns3 isoforms in oligodendrogenesis is still
an open question. Indeed, Tns3 mRNA RT-qPCR and Western Blot analyses both
indicate that the small 60kDa Tns3 isoform is the most expressed one in all
oligodendroglial lineages, except in the most matures stages where almost no Tns3 is
detected. But this isoform only contains the C-terminus which contains the SH2-PTB
domain, allowing it to bind only to the C-term interacting proteins of full-lengh Tns3,
especially β1-Integrin, but not to actin. It means that, contrary to full-length Tns3 whose
function is mainly to stabilise the actin cytoskeleton at focal adhesion plates, small
Tns3 binds to the same protein domains, therefore competing with full-length Tns3
binding, without binding actin. We could therefore ask whether small Tns3 acts as a
competitive antagonist to full-length Tns3 to relax the cytoskeleton. Indeed, the small
Tns3 isoform is very similar in its structure to Tns4, a protein which acts as a Tns3

187
competitive antagonist under EGFR activation. As Tns4 is mostly undetected in the
whole oligodendroglial lineage and, more generally, the brain cells, I proposed a
competitive antagonism model similar to the Tns3/Tns4 switch previously described,
with the small Tns3 isoform to play the role of full-length Tns3 regulator.
To challenge or confirm this model, a precise proteomic study of Tns3 isoform remains
to be done. We planned to check at each Tns3 isoform expression level and to
investigate for changes in their binding affinity to their typical binding partners, like β1-
Integrin or Fyn, at the different steps of oligodendrogenesis. A previous study from the
ffrench-Constant laboratory (Colognato H et al, 2004) already showed the sequential
activation of a gene cascade after β1-Integrin activation during OL differentiation in
vitro. Among these genes can be found FAK, coding for a protein bound by Tns3 and
involved in various cell signaling pathways, notably in actin cytoskeleton
reorganisation. Therefore, Tns3 is perfectly placed to mediate β1-Integrin signaling as
it is able to bind with both β1-Integrin, FAK and directly with the actin cytoskeleton. To
test this hypothesis, a complex experiment could be to exogenously express the full-
length Tns3, but not of the small Tns3 splicing variant, in β1-Integrin deficient mice
OPCs to see a potential rescue effect. Considering the difficulty to specifically enhance
the full-length Tns3 expression specifically in OPCs, another simpler way could be to
activate the β1-Integrin pathway, either with genetic mice models or manganese
treatment in culture (Colognato H et al, 2004), in Tns3-iKO mice or cells. If Tns3 is
really a mediator of the β1-Integrin signalling in oligodendroglial cells, then no
difference should be observed after activation.

188

189
References
1. Aggarwal S, Yurlova L, Snaidero N, et al. A Size Barrier Limits Protein Diffusion at the Cell Surface
to Generate Lipid-Rich Myelin-Membrane Sheets. Developmental Cell. 2011;21(3):445-456.
doi:10.1016/j.devcel.2011.08.001
2. Agirman G, Broix L, Nguyen L. Cerebral cortex development: an outside-in perspective. FEBS
Letters. 2017;591(24):3978-3992. doi:10.1002/1873-3468.12924
3. Aguzzi A, Barres BA, Bennett ML. Microglia: Scapegoat, Saboteur, or Something Else? Science.
2013;339(6116):156-161. doi:10.1126/science.1227901
4. Al-Abdi L, Al Murshedi F, Elmanzalawy A, et al. CNP deficiency causes severe hypomyelinating
leukodystrophy in humans. Hum Genet. 2020;139(5):615-622. doi:10.1007/s00439-020-02144-4
5. Allen NJ. Astrocyte regulation of synaptic behavior. Annu Rev Cell Dev Biol. 2014;30:439-463.
doi:10.1146/annurev-cellbio-100913-013053
6. Allen NJ, Barres BA. Glia — more than just brain glue. Nature. 2009;457(7230):675-677.
doi:10.1038/457675a
7. Alonso A, Pulido R. The extended human PTPome: a growing tyrosine phosphatase family. The
FEBS Journal. 2016;283(8):1404-1429. doi:10.1111/febs.13600
8. Amaral AI, Meisingset TW, Kotter MR, Sonnewald U. Metabolic Aspects of Neuron-Oligodendrocyte-
Astrocyte Interactions. Front Endocrinol (Lausanne). 2013;4:54. doi:10.3389/fendo.2013.00054
9. Aruga J, Yoshikawa F, Nozaki Y, Sakaki Y, Toyoda A, Furuichi T. An oligodendrocyte enhancer in a
phylogenetically conserved intron region of the mammalian myelin gene Opalin. Journal of
Neurochemistry. 2007;102(5):1533-1547. doi:10.1111/j.1471-4159.2007.04583.x
10. Asiri A, Toss MS, Raposo TP, et al. Cten promotes Epithelial–Mesenchymal Transition (EMT) in
colorectal cancer through stabilisation of Src. Pathology International. 2019;69(7):381-391.
doi:10.1111/pin.12811
11. Attwell D, Buchan AM, Charpak S, Lauritzen M, MacVicar BA, Newman EA. Glial and neuronal
control of brain blood flow. Nature. 2010;468(7321):232-243. doi:10.1038/nature09613

190
12. Aubert-Broche B, Fonov V, Leppert I, Pike GB, Collins DL. Human brain myelination from birth to
4.5 years. Med Image Comput Comput Assist Interv. 2008;11(Pt 2):180-187. doi:10.1007/978-3-540-
85990-1_22
13. Aurnhammer C, Haase M, Muether N, et al. Universal Real-Time PCR for the Detection and
Quantification of Adeno-Associated Virus Serotype 2-Derived Inverted Terminal Repeat Sequences.
Human Gene Therapy Methods. 2012;23(1):18-28. doi:10.1089/hgtb.2011.034
14. Azevedo FAC, Carvalho LRB, Grinberg LT, et al. Equal numbers of neuronal and nonneuronal cells
make the human brain an isometrically scaled-up primate brain. Journal of Comparative Neurology.
2009;513(5):532-541. doi:10.1002/cne.21974
15. Bacon C, Lakics V, Machesky L, Rumsby M. N-WASP regulates extension of filopodia and
processes by oligodendrocyte progenitors, oligodendrocytes, and Schwann cells—implications for axon
ensheathment at myelination. Glia. 2007;55(8):844-858. doi:10.1002/glia.20505
16. Baker EL, Bonnecaze RT, Zaman MH. Extracellular Matrix Stiffness and Architecture Govern
Intracellular Rheology in Cancer. Biophys J. 2009;97(4):1013-1021. doi:10.1016/j.bpj.2009.05.054
17. Barber-Pérez N, Georgiadou M, Guzmán C, Isomursu A, Hamidi H, Ivaska J. Mechano-
responsiveness of fibrillar adhesions on stiffness-gradient gels. J Cell Sci. 2020;133(12):jcs242909.
doi:10.1242/jcs.242909
18. Barrera K, Chu P, Abramowitz J, Steger R, Ramos RL, Brumberg JC. Organization of Myelin in the
Mouse Somatosensory Barrel Cortex and the Effects of Sensory Deprivation. Dev Neurobiol.
2013;73(4):297-314. doi:10.1002/dneu.22060
19. Barres BA. The Mystery and Magic of Glia: A Perspective on Their Roles in Health and Disease.
Neuron. 2008;60(3):430-440. doi:10.1016/j.neuron.2008.10.013
20. Batsukh T, Pieper L, Koszucka AM, et al. CHD8 interacts with CHD7, a protein which is mutated in
CHARGE syndrome. Human Molecular Genetics. 2010;19(14):2858-2866. doi:10.1093/hmg/ddq189
21. Baudoin J-P, Viou L, Launay P-S, et al. Tangentially Migrating Neurons Assemble a Primary Cilium
that Promotes Their Reorientation to the Cortical Plate. Neuron. 2012;76(6):1108-1122.
doi:10.1016/j.neuron.2012.10.027
22. Bauer NG, Richter-Landsberg C, Ffrench-Constant C. Role of the oligodendroglial cytoskeleton in
differentiation and myelination. Glia. 2009;57(16):1691-1705. doi:10.1002/glia.20885
23. Behrangi N, Lorenz P, Kipp M. Oligodendrocyte Lineage Marker Expression in eGFP-GFAP
Transgenic Mice. J Mol Neurosci. Published online December 21, 2020. doi:10.1007/s12031-020-
01771-w

191
24. Behtaji S, Ghafouri-Fard S, Sayad A, Sattari A, Rederstorff M, Taheri M. Identification of oxytocin-
related lncRNAs and assessment of their expression in breast cancer. Sci Rep. 2021;11:6471.
doi:10.1038/s41598-021-86097-2
25. Belvindrah R, Graus-Porta D, Goebbels S, Nave K-A, Müller U. β1 Integrins in Radial Glia But Not
in Migrating Neurons Are Essential for the Formation of Cell Layers in the Cerebral Cortex. J Neurosci.
2007;27(50):13854-13865. doi:10.1523/JNEUROSCI.4494-07.2007
26. Bengtsson SL, Nagy Z, Skare S, Forsman L, Forssberg H, Ullen F. Extensive piano practicing has
regionally specific effects on white matter development. NATURE NEUROSCIENCE. 2005;8(9):3.
27. Bennett DT, Reece TB, Foley LS, et al. C-terminal tensin-like protein mediates invasion of human
lung cancer cells and is regulated by signal transducer and activator of transcription 3. J Thorac
Cardiovasc Surg. 2015;149(1):369-375. doi:10.1016/j.jtcvs.2014.08.087
28. Benveniste H, Liu X, Koundal S, Sanggaard S, Lee H, Wardlaw J. The glymphatic system and waste
clearance with brain aging. Gerontology. 2019;65(2):106-119. doi:10.1159/000490349
29. Bercury KK, Macklin WB. Dynamics and Mechanisms of CNS Myelination. Dev Cell.
2015;32(4):447-458. doi:10.1016/j.devcel.2015.01.016
30. Bernstein SL, Meister M, Zhuo J, Gullapalli RP. Postnatal growth of the human optic nerve. Eye
(Lond). 2016;30(10):1378-1380. doi:10.1038/eye.2016.141
31. Bertrand N, Castro DS, Guillemot F. Proneural genes and the specification of neural cell types. Nat
Rev Neurosci. 2002;3(7):517-530. doi:10.1038/nrn874
32. Bischof M, Weider M, Küspert M, Nave K-A, Wegner M. Brg1-Dependent Chromatin Remodelling
Is Not Essentially Required during Oligodendroglial Differentiation. J Neurosci. 2015;35(1):21-35.
doi:10.1523/JNEUROSCI.1468-14.2015
33. Blakemore WF, Murray JA. Quantitative examination of internodal length of remyelinated nerve
fibres in the central nervous system. Journal of the Neurological Sciences. 1981;49(2):273-284.
doi:10.1016/0022-510X(81)90084-8
34. Boggs JM, Wang H. Effect of liposomes containing cerebroside and cerebroside sulfate on
cytoskeleton of cultured oligodendrocytes. Journal of Neuroscience Research. 2001;66(2):242-253.
doi:10.1002/jnr.1217
35. Boggs JM, Wang H. Co-clustering of galactosylceramide and membrane proteins in oligodendrocyte
membranes on interaction with polyvalent carbohydrate and prevention by an intact cytoskeleton. J
Neurosci Res. 2004;76(3):342-355. doi:10.1002/jnr.20080

192
36. Boutin C, Diestel S, Desoeuvre A, Tiveron M-C, Cremer H. Efficient In Vivo Electroporation of the
Postnatal Rodent Forebrain. PLoS One. 2008;3(4):e1883. doi:10.1371/journal.pone.0001883
37. Bribián A, Medina-Rodríguez EM, Josa-Prado F, et al. Functional Heterogeneity of Mouse and
Human Brain OPCs: Relevance for Preclinical Studies in Multiple Sclerosis. J Clin Med. 2020;9(6):1681.
doi:10.3390/jcm9061681
38. Brown TL, Macklin WB. The actin cytoskeleton in myelinating cells. Neurochem Res. Published
online March 7, 2019:10.1007/s11064-019-02753-0. doi:10.1007/s11064-019-02753-0
39. Bruns AN, Lo SH. Tensin regulates pharyngeal pumping in Caenorhabditis elegans. Biochem
Biophys Res Commun. 2020;522(3):599-603. doi:10.1016/j.bbrc.2019.11.153
40. Buch S, Subramanian K, Jella PK, et al. Revealing vascular abnormalities and measuring small
vessel density in multiple sclerosis lesions using USPIO. Neuroimage Clin. 2020;29:102525.
doi:10.1016/j.nicl.2020.102525
41. Bunge MB, Bunge RP, Pappas GD. ELECTRON MICROSCOPIC DEMONSTRATION OF
CONNECTIONS BETWEEN GLIA AND MYELIN SHEATHS IN THE DEVELOPING MAMMALIAN
CENTRAL NERVOUS SYSTEM. Journal of Cell Biology. 1962;12(2):448-453. doi:10.1083/jcb.12.2.448
42. Bunge RP, Bunge MB, Peterson ER. AN ELECTRON MICROSCOPE STUDY OF CULTURED RAT
SPINAL CORD. J Cell Biol. 1965;24:163-191. doi:10.1083/jcb.24.2.163
43. Burda JE, Sofroniew MV. Reactive gliosis and the multicellular response to CNS damage and
disease. Neuron. 2014;81(2):229-248. doi:10.1016/j.neuron.2013.12.034
44. Bushong EA, Martone ME, Ellisman MH. Examination of the relationship between astrocyte
morphology and laminar boundaries in the molecular layer of adult dentate gyrus. Journal of
Comparative Neurology. 2003;462(2):241-251. doi:10.1002/cne.10728
45. Cai J, Qi Y, Hu X, et al. Generation of Oligodendrocyte Precursor Cells from Mouse Dorsal Spinal
Cord Independent of Nkx6 Regulation and Shh Signaling. Neuron. 2005;45(1):41-53.
doi:10.1016/j.neuron.2004.12.028
46. Cao X, Voss C, Zhao B, Kaneko T, Li SS-C. Differential regulation of the activity of deleted in liver
cancer 1 (DLC1) by tensins controls cell migration and transformation. Proc Natl Acad Sci U S A.
2012;109(5):1455-1460. doi:10.1073/pnas.1114368109
47. Carroll DK, Brugge JS, Attardi LD. p63, cell adhesion and survival. Cell Cycle. 2007;6(3):255-261.
doi:10.4161/cc.6.3.3799
48. Casano AM, Peri F. Microglia: Multitasking Specialists of the Brain. Developmental Cell.
2015;32(4):469-477. doi:10.1016/j.devcel.2015.01.018

193
49. Chang K-C, Diermeier SD, Yu AT, et al. MaTAR25 lncRNA regulates the Tensin1 gene to impact
breast cancer progression. Nat Commun. 2020;11:6438. doi:10.1038/s41467-020-20207-y
50. Chen H-Y, Lin L-T, Wang M-L, et al. Musashi-1 Enhances Glioblastoma Cell Migration and
Cytoskeletal Dynamics through Translational Inhibition of Tensin3. Sci Rep. 2017;7:8710.
doi:10.1038/s41598-017-09504-7
51. Chen H, Duncan IC, Bozorgchami H, Lo SH. Tensin1 and a previously undocumented family
member, tensin2, positively regulate cell migration. Proc Natl Acad Sci U S A. 2002;99(2):733-738.
doi:10.1073/pnas.022518699
52. Chen L, Liu C, Ko FCF, et al. Solution Structure of the Phosphotyrosine Binding (PTB) Domain of
Human Tensin2 Protein in Complex with Deleted in Liver Cancer 1 (DLC1) Peptide Reveals a Novel
Peptide Binding Mode. J Biol Chem. 2012;287(31):26104-26114. doi:10.1074/jbc.M112.360206
53. Chiang M-K, Liao Y-C, Kuwabara Y, Lo SH. Inactivation of tensin3 in mice results in growth
retardation and postnatal lethality. Developmental Biology. 2005;279(2):368-377.
doi:10.1016/j.ydbio.2004.12.027
54. Cho A-R, Uchio-Yamada K, Torigai T, et al. Deficiency of the tensin2 gene in the ICGN mouse: an
animal model for congenital nephrotic syndrome. Mamm Genome. 2006;17(5):407-416.
doi:10.1007/s00335-005-0167-z
55. Cho H, Jeon S, Kang SJ, et al. Longitudinal changes of cortical thickness in early- versus late-onset
Alzheimer’s disease. Neurobiology of Aging. 2013;34(7):1921.e9-1921.e15.
doi:10.1016/j.neurobiolaging.2013.01.004
56. Chong SYC, Rosenberg SS, Fancy SPJ, et al. Neurite outgrowth inhibitor Nogo-A establishes
spatial segregation and extent of oligodendrocyte myelination. Proc Natl Acad Sci U S A.
2012;109(4):1299-1304. doi:10.1073/pnas.1113540109
57. Chuang JZ, Lin DC, Lin S. Molecular cloning, expression, and mapping of the high affinity actin-
capping domain of chicken cardiac tensin. J Cell Biol. 1995;128(6):1095-1109.
doi:10.1083/jcb.128.6.1095
58. Clark K, Howe JD, Pullar CE, et al. Tensin 2 modulates cell contractility in 3D collagen gels through
the RhoGAP DLC1. J Cell Biochem. 2010;109(4):808-817. doi:10.1002/jcb.22460
59. Clarke LE, Barres BA. Emerging roles of astrocytes in neural circuit development. Nat Rev Neurosci.
2013;14(5):311-321. doi:10.1038/nrn3484
60. Colognato H, Ramachandrappa S, Olsen IM, ffrench-Constant C. Integrins direct Src family kinases
to regulate distinct phases of oligodendrocyte development. J Cell Biol. 2004;167(2):365-375.
doi:10.1083/jcb.200404076

194
61. Copp AJ, Greene NDE, Murdoch JN. The genetic basis of mammalian neurulation. Nat Rev Genet.
2003;4(10):784-793. doi:10.1038/nrg1181
62. Cornell-Bell AH, Finkbeiner SM, Cooper MS, Smith SJ. Glutamate induces calcium waves in
cultured astrocytes: long-range glial signaling. Science. 1990;247(4941):470-473.
doi:10.1126/science.1967852
63. Cui Y, Liao Y-C, Lo SH. Epidermal Growth Factor Modulates Tyrosine Phosphorylation of a Novel
Tensin Family Member, Tensin3. :9.
64. Czopka T, ffrench-Constant C, Lyons DA. Individual Oligodendrocytes Have Only a Few Hours in
which to Generate New Myelin Sheaths In Vivo. Dev Cell. 2013;25(6):599-609.
doi:10.1016/j.devcel.2013.05.013
65. Dai Z-M, Sun S, Wang C, et al. Stage-Specific Regulation of Oligodendrocyte Development by
Wnt/β-Catenin Signaling. J Neurosci. 2014;34(25):8467-8473. doi:10.1523/JNEUROSCI.0311-14.2014
66. Davis S, Lu ML, Lo SH, et al. Presence of an SH2 domain in the actin-binding protein tensin.
Science. 1991;252(5006):712-715. doi:10.1126/science.1708917
67. Dawson M. NG2-expressing glial progenitor cells: an abundant and widespread population of
cycling cells in the adult rat CNS. Molecular and Cellular Neuroscience. 2003;24(2):476-488.
doi:10.1016/S1044-7431(03)00210-0
68. De Angelis DA, Braun PE. Isoprenylation of brain 2′,3′-cyclic nucleotide 3′-phosphodiesterase
modulates cell morphology. Journal of Neuroscience Research. 1994;39(4):386-397.
doi:10.1002/jnr.490390405
69. de Faria O, Dhaunchak AS, Kamen Y, et al. TMEM10 Promotes Oligodendrocyte Differentiation
and is Expressed by Oligodendrocytes in Human Remyelinating Multiple Sclerosis Plaques. Sci Rep.
2019;9:3606. doi:10.1038/s41598-019-40342-x
70. Defrancesco M, Egger K, Marksteiner J, et al. Changes in White Matter Integrity before Conversion
from Mild Cognitive Impairment to Alzheimer’s Disease. PLoS One. 2014;9(8):e106062.
doi:10.1371/journal.pone.0106062
71. Defrancesco M, Marksteiner J, Deisenhammer E, Kemmler G, Djurdjevic T, Schocke M. Impact of
White Matter Lesions and Cognitive Deficits on Conversion from Mild Cognitive Impairment to
Alzheimer’s Disease. JAD. 2013;34(3):665-672. doi:10.3233/JAD-122095
72. Demerens C, Stankoff B, Logak M, et al. Induction of myelination in the central nervous system by
electrical activity. Proc Natl Acad Sci U S A. 1996;93(18):9887-9892.

195
73. Deneen B, Ho R, Lukaszewicz A, Hochstim CJ, Gronostajski RM, Anderson DJ. The Transcription
Factor NFIA Controls the Onset of Gliogenesis in the Developing Spinal Cord. Neuron. 2006;52(6):953-
968. doi:10.1016/j.neuron.2006.11.019
74. Deng M-T, Zhu F, Yang Y-Z, et al. Genome-wide association study reveals novel loci associated
with body size and carcass yields in Pekin ducks. BMC Genomics. 2019;20:1. doi:10.1186/s12864-018-
5379-1
75. Detrick RJ, Dickey D, Kintner CR. The effects of N-cadherin misexpression on morphogenesis in
xenopus embryos. Neuron. 1990;4(4):493-506. doi:10.1016/0896-6273(90)90108-R
76. Dina C, Bouatia-Naji N, Tucker N, et al. Genetic association analyses highlight biological pathways
underlying mitral valve prolapse. Nat Genet. 2015;47(10):1206-1211. doi:10.1038/ng.3383
77. Ding Q, Motoyama J, Gasca S, et al. Diminished Sonic hedgehog signaling and lack of floor plate
differentiation in Gli2 mutant mice. Development. 1998;125(14):2533-2543.
78. Dobson R, Giovannoni G. Multiple sclerosis – a review. European Journal of Neurology.
2019;26(1):27-40. doi:10.1111/ene.13819
79. Draganova K, Zemke M, Zurkirchen L, et al. Wnt/β-Catenin Signaling Regulates Sequential Fate
Decisions of Murine Cortical Precursor Cells. STEM CELLS. 2015;33(1):170-182.
doi:10.1002/stem.1820
80. Duan J, Wang L, Shang L, et al. miR-152/TNS1 axis inhibits non-small cell lung cancer progression
through Akt/mTOR/RhoA pathway. Biosci Rep. 2021;41(1):BSR20201539. doi:10.1042/BSR20201539
81. Dyer CA, Benjamins JA. Organization of oligodendroglial membrane sheets: II. Galactocerebroside:
Antibody interactions signal changes in cytoskeleton and myelin basic protein. Journal of Neuroscience
Research. 1989;24(2):212-221. doi:10.1002/jnr.490240212
82. Dyer CA, Benjamins JA. Organization of oligodendroglial membrane sheets. I: Association of myelin
basic protein and 2′,3′-cyclic nucleotide 3′-phosphohydrolase with cytoskeleton. Journal of
Neuroscience Research. 1989;24(2):201-211. doi:10.1002/jnr.490240211
83. Echelard Y, Epstein DJ, St-Jacques B, et al. Sonic hedgehog, a member of a family of putative
signaling molecules, is implicated in the regulation of CNS polarity. Cell. 1993;75(7):1417-1430.
doi:10.1016/0092-8674(93)90627-3
84. Eggenschwiler JT, Anderson KV. Dorsal and Lateral Fates in the Mouse Neural Tube Require the
Cell-Autonomous Activity of the open brain Gene. Developmental Biology. 2000;227(2):648-660.
doi:10.1006/dbio.2000.9918

196
85. Eggenschwiler JT, Espinoza E, Anderson KV. Rab23 is an essential negative regulator of the mouse
Sonic hedgehog signalling pathway. Nature. 2001;412(6843):194-198. doi:10.1038/35084089
86. Emmi A, Wenzel HJ, Schwartzkroin PA, et al. Do Glia Have Heart? Expression and Functional Role
forEther-A-Go-Go Currents in Hippocampal Astrocytes. J Neurosci. 2000;20(10):3915-3925.
doi:10.1523/JNEUROSCI.20-10-03915.2000
87. Fan G, Martinowich K, Chin MH, et al. DNA methylation controls the timing of astrogliogenesis
through regulation of JAK-STAT signaling. Development. 2005;132(15):3345-3356.
doi:10.1242/dev.01912
88. Feng Y, Su Y, Ma C, et al. 3′UTR variants of TNS3, PHLDB1, NTN4, and GNG2 genes are
associated with IgA nephropathy risk in Chinese Han population. International Immunopharmacology.
2019;71:295-300. doi:10.1016/j.intimp.2019.03.041
89. Fields RD. Change in the Brain’s White Matter. Science. 2010;330(6005):768-769.
doi:10.1126/science.1199139
90. Fietz SA, Kelava I, Vogt J, et al. OSVZ progenitors of human and ferret neocortex are epithelial-like
and expand by integrin signaling. Nat Neurosci. 2010;13(6):690-699. doi:10.1038/nn.2553
91. Finzsch M, Stolt CC, Lommes P, Wegner M. Sox9 and Sox10 influence survival and migration of
oligodendrocyte precursors in the spinal cord by regulating PDGF receptor αexpression. Development.
2008;135(4):637-646. doi:10.1242/dev.010454
92. Fitzner D, Schnaars M, van Rossum D, et al. Selective transfer of exosomes from oligodendrocytes
to microglia by macropinocytosis. Journal of Cell Science. 2011;124(3):447-458.
doi:10.1242/jcs.074088
93. Fox MA, Afshari FS, Alexander JK, Colello RJ, Fuss B. Growth conelike sensorimotor structures
are characteristic features of postmigratory, premyelinating oligodendrocytes. Glia. 2006;53(5):563-
566. doi:10.1002/glia.20293
94. Friede RL, Bischhausen R. How are sheath dimensions affected by axon caliber and internode
length? Brain Research. 1982;235(2):335-350. doi:10.1016/0006-8993(82)91012-5
95. Frizzo MES, Schwarzbold C, Porciúncula LO, et al. 3-Hydroxyglutaric acid enhances glutamate
uptake into astrocytes from cerebral cortex of young rats. Neurochemistry International.
2004;44(5):345-353. doi:10.1016/S0197-0186(03)00169-4
96. Fuhrmann M, Bittner T, Jung CKE, et al. Microglial Cx3cr1 knockout prevents neuron loss in a
mouse model of Alzheimer’s disease. Nat Neurosci. 2010;13(4):411-413. doi:10.1038/nn.2511

197
97. Furusho M, Dupree JL, Nave K-A, Bansal R. Fibroblast Growth Factor Receptor Signaling in
Oligodendrocytes Regulates Myelin Sheath Thickness. Journal of Neuroscience. 2012;32(19):6631-
6641. doi:10.1523/JNEUROSCI.6005-11.2012
98. Furuta Y, Piston DW, Hogan BL. Bone morphogenetic proteins (BMPs) as regulators of dorsal
forebrain development. Development. 1997;124(11):2203-2212.
99. Galli R, Gritti A, Vescovi AL. Adult neural stem cells. Methods Mol Biol. 2008;438:67-84.
doi:10.1007/978-1-59745-133-8_7
100. Gallo V, Deneen B. Glial Development: The Crossroads of Regeneration and Repair in the CNS.
Neuron. 2014;83(2):283-308. doi:10.1016/j.neuron.2014.06.010
101. García-León JA, Kumar M, Boon R, et al. SOX10 Single Transcription Factor-Based Fast and
Efficient Generation of Oligodendrocytes from Human Pluripotent Stem Cells. Stem Cell Reports.
2018;10(2):655-672. doi:10.1016/j.stemcr.2017.12.014
102. Ge W-P, Miyawaki A, Gage FH, Jan YN, Jan LY. Local generation of glia is a major astrocyte
source in postnatal cortex. Nature. 2012;484(7394):376-380. doi:10.1038/nature10959
103. Geelen JA, Langman J. Ultrastructural observations on closure of the neural tube in the mouse.
Anat Embryol (Berl). 1979;156(1):73-88. doi:10.1007/BF00315716
104. Georgiadou M, Lilja J, Jacquemet G, et al. AMPK negatively regulates tensin-dependent integrin
activity. J Cell Biol. 2017;216(4):1107-1121. doi:10.1083/jcb.201609066
105. Gibson EM, Purger D, Mount CW, et al. Neuronal Activity Promotes Oligodendrogenesis and
Adaptive Myelination in the Mammalian Brain. Science. 2014;344(6183):1252304.
doi:10.1126/science.1252304
106. Ginhoux F, Prinz M. Origin of Microglia: Current Concepts and Past Controversies. Cold Spring
Harb Perspect Biol. 2015;7(8):a020537. doi:10.1101/cshperspect.a020537
107. Gledhill RF, McDonald WI. Morphological characteristics of central demyelination and
remyelination: A single-fiber study. Annals of Neurology. 1977;1(6):552-560.
doi:10.1002/ana.410010607
108. Gomes WA, Mehler MF, Kessler JA. Transgenic overexpression of BMP4 increases astroglial and
decreases oligodendroglial lineage commitment. Developmental Biology. 2003;255(1):164-177.
doi:10.1016/S0012-1606(02)00037-4
109. Goreczny GJ, Forsythe IJ, Turner CE. Hic-5 Regulates Fibrillar Adhesion Formation to Control
Tumor Extracellular Matrix Remodeling through Interaction with Tensin1. Oncogene. 2018;37(13):1699-
1713. doi:10.1038/s41388-017-0074-2

198
110. Graus-Porta D, Blaess S, Senften M, et al. 1-Class Integrins Regulate the. Published online
August 16, 2001:13.
111. Guillemot F, Joyner AL. Dynamic expression of the murine Achaete-Scute homologue Mash-1 in
the developing nervous system. Mechanisms of Development. 1993;42(3):171-185. doi:10.1016/0925-
4773(93)90006-J
112. Günther T, Struwe M, Aguzzi A, Schughart K. Open brain, a new mouse mutant with severe neural
tube defects, shows altered gene expression patterns in the developing spinal cord. Development.
1994;120(11):3119-3130.
113. Gutin G, Fernandes M, Palazzolo L, et al. FGF signalling generates ventral telencephalic cells
independently of SHH. Development. 2006;133(15):2937-2946. doi:10.1242/dev.02465
114. Hafizi S, Ibraimi F, Dahlbäck B. C1-TEN is a negative regulator of the Akt/PKB signal transduction
pathway and inhibits cell survival, proliferation, and migration. The FASEB Journal. 2005;19(8):971-
973. doi:10.1096/fj.04-2532fje
115. Hafizi S, Sernstad E, Swinny JD, Gomez MF, Dahlbäck B. Individual domains of Tensin2 exhibit
distinct subcellular localisations and migratory effects. The International Journal of Biochemistry & Cell
Biology. 2010;42(1):52-61. doi:10.1016/j.biocel.2009.09.005
116. Hamashima T, Ishii Y, Nguyen LQ, et al. Oligodendrogenesis and Myelin Formation in the
Forebrain Require Platelet-derived Growth Factor Receptor-alpha. Neuroscience. 2020;436:11-26.
doi:10.1016/j.neuroscience.2020.04.001
117. Handel AE, Williamson AJ, Disanto G, Handunnetthi L, Giovannoni G, Ramagopalan SV. An
Updated Meta-Analysis of Risk of Multiple Sclerosis following Infectious Mononucleosis. PLoS One.
2010;5(9):e12496. doi:10.1371/journal.pone.0012496
118. Hansen DV, Lui JH, Parker PRL, Kriegstein AR. Neurogenic radial glia in the outer subventricular
zone of human neocortex. Nature. 2010;464(7288):554-561. doi:10.1038/nature08845
119. Haroutunian V, Katsel P, Roussos P, Davis KL, Altshuler LL, Bartzokis G. Myelination,
oligodendrocytes, and serious mental illness. Glia. 2014;62(11):1856-1877. doi:10.1002/glia.22716
120. Hassanisaber H, Jafari L, Campeau MA, et al. The effect of substrate bulk stiffness on focal and
fibrillar adhesion formation in human abdominal aortic endothelial cells. Materials Science and
Engineering: C. 2019;98:572-583. doi:10.1016/j.msec.2018.12.130
121. He D, Marie C, Zhao C, et al. Chd7 Cooperates with Sox10 and Regulates the Onset of CNS
Myelination and Remyelination. Nat Neurosci. 2016;19(5):678-689. doi:10.1038/nn.4258

199
122. Healy LM, Perron G, Won S-Y, et al. MerTK Is a Functional Regulator of Myelin Phagocytosis by
Human Myeloid Cells. JI. 2016;196(8):3375-3384. doi:10.4049/jimmunol.1502562
123. Hébert JM, Mishina Y, McConnell SK. BMP Signaling Is Required Locally to Pattern the Dorsal
Telencephalic Midline. Neuron. 2002;35(6):1029-1041. doi:10.1016/S0896-6273(02)00900-5
124. Herculano-Houzel S. The glia/neuron ratio: How it varies uniformly across brain structures and
species and what that means for brain physiology and evolution. Glia. 2014;62(9):1377-1391.
doi:10.1002/glia.22683
125. Herculano-Houzel S, Mota B, Lent R. Cellular scaling rules for rodent brains. Proc Natl Acad Sci
U S A. 2006;103(32):12138-12143. doi:10.1073/pnas.0604911103
126. Hermanson O, Jepsen K, Rosenfeld MG. N-CoR controls differentiation of neural stem cells into
astrocytes. Nature. 2002;419(6910):934-939. doi:10.1038/nature01156
127. Hess MW, Kirschning E, Pfaller K, Debbage PL, Hohenberg H, Klima G. 5000-year-old myelin:
uniquely intact in molecular configuration and fine structure. Current Biology. 1998;8(15):R511-R513.
doi:10.1016/S0960-9822(07)00334-X
128. Hickman SE, El Khoury J. Analysis of the Microglial Sensome. Methods Mol Biol. 2019;2034:305-
323. doi:10.1007/978-1-4939-9658-2_23
129. Hickman SE, Kingery ND, Ohsumi T, et al. The Microglial Sensome Revealed by Direct RNA
Sequencing. Nat Neurosci. 2013;16(12):1896-1905. doi:10.1038/nn.3554
130. Higginbotham H, Guo J, Yokota Y, et al. Arl13b-regulated activities of primary cilia are essential
for the formation of the polarized radial glial scaffold. Nat Neurosci. 2013;16(8):1000-1007.
doi:10.1038/nn.3451
131. Hildebrand C, Hahn R. Relation between myelin sheath thickness and axon size in spinal cord
white matter of some vertebrate species. Journal of the Neurological Sciences. 1978;38(3):421-434.
doi:10.1016/0022-510X(78)90147-8
132. Hong S-Y, Shih Y-P, Li T, Carraway KL, Lo SH. CTEN prolongs signaling by EGFR through
reducing its ligand-induced degradation. Cancer Res. 2013;73(16):5266-5276. doi:10.1158/0008-
5472.CAN-12-4441
133. Hong S-Y, Shih Y-P, Lo A, Hao Lo S. Identification of subcellular targeting sequences of Cten
reveals its role in cell proliferation. Biochim Biophys Acta Mol Cell Res. 2019;1866(3):450-458.
doi:10.1016/j.bbamcr.2018.10.008

200
134. Hong S-Y, Shih Y-P, Sun P, Hsieh W-J, Lin W-C, Lo SH. Down-regulation of tensin2 enhances
tumorigenicity and is associated with a variety of cancers. Oncotarget. 2016;7(25):38143-38153.
doi:10.18632/oncotarget.9411
135. Huang W, Zhou Z, Asrar S, Henkelman M, Xie W, Jia Z. p21-Activated Kinases 1 and 3 Control
Brain Size through Coordinating Neuronal Complexity and Synaptic Properties. Mol Cell Biol.
2011;31(3):388-403. doi:10.1128/MCB.00969-10
136. Huang W, Bhaduri A, Velmeshev D, et al. Origins and Proliferative States of Human
Oligodendrocyte Precursor Cells. Cell. 2020;182(3):594-608.e11. doi:10.1016/j.cell.2020.06.027
137. Hui CC, Joyner AL. A mouse model of greig cephalopolysyndactyly syndrome: the extra-toesJ
mutation contains an intragenic deletion of the Gli3 gene. Nat Genet. 1993;3(3):241-246.
doi:10.1038/ng0393-241
138. Imgrund S, Hartmann D, Farwanah H, et al. Adult Ceramide Synthase 2 (CERS2)-deficient Mice
Exhibit Myelin Sheath Defects, Cerebellar Degeneration, and Hepatocarcinomas. J Biol Chem.
2009;284(48):33549-33560. doi:10.1074/jbc.M109.031971
139. Jacob C. Transcriptional control of neural crest specification into peripheral glia. Glia.
2015;63(11):1883-1896. doi:10.1002/glia.22816
140. Jacob C, Christen CN, Pereira JA, et al. HDAC1 and HDAC2 control the transcriptional program
of myelination and the survival of Schwann cells. Nat Neurosci. 2011;14(4):429-436.
doi:10.1038/nn.2762
141. Jacobsen CT, Miller RH. Control of Astrocyte Migration in the Developing Cerebral Cortex. Dev
Neurosci. 2003;25(2-4):207-216. doi:10.1159/000072269
142. Jessen NA, Munk ASF, Lundgaard I, Nedergaard M. The Glymphatic System – A Beginner’s
Guide. Neurochem Res. 2015;40(12):2583-2599. doi:10.1007/s11064-015-1581-6
143. Jia X, Madireddy L, Caillier S, et al. Genome sequencing uncovers phenocopies in primary
progressive multiple sclerosis. Ann Neurol. 2018;84(1):51-63. doi:10.1002/ana.25263
144. Jung AS, Kaushansky A, MacBeath G, Kaushansky K. Tensin2 is a novel mediator in
thrombopoietin (TPO)-induced cellular proliferation by promoting Akt signaling. Cell Cycle.
2011;10(11):1838-1844. doi:10.4161/cc.10.11.15776
145. Kageyama R, Ohtsuka T, Kobayashi T. Roles of Hes genes in neural development. Development,
Growth & Differentiation. 2008;50(s1):S97-S103. doi:10.1111/j.1440-169X.2008.00993.x

201
146. Kang SH, Li Y, Fukaya M, et al. Degeneration and impaired regeneration of gray matter
oligodendrocytes in amyotrophic lateral sclerosis. Nat Neurosci. 2013;16(5):571-579.
doi:10.1038/nn.3357
147. Kang W, Wong LC, Shi S-H, Hébert JM. The Transition from Radial Glial to Intermediate Progenitor
Cell Is Inhibited by FGF Signaling during Corticogenesis. J Neurosci. 2009;29(46):14571-14580.
doi:10.1523/JNEUROSCI.3844-09.2009
148. Karczewski KJ, Francioli LC, Tiao G, et al. The mutational constraint spectrum quantified from
variation in 141,456 humans. Nature. 2020;581(7809):434-443. doi:10.1038/s41586-020-2308-7
149. Katanov C, Novak N, Vainshtein A, Golani O, Dupree JL, Peles E. N-Wasp Regulates
Oligodendrocyte Myelination. J Neurosci. 2020;40(32):6103-6111. doi:10.1523/JNEUROSCI.0912-
20.2020
150. Katz M, Amit I, Citri A, et al. A reciprocal tensin-3–cten switch mediates EGF-driven mammary cell
migration. Nat Cell Biol. 2007;9(8):961-969. doi:10.1038/ncb1622
151. Kessaris N, Fogarty M, Iannarelli P, Grist M, Wegner M, Richardson WD. Competing waves of
oligodendrocytes in the forebrain and postnatal elimination of an embryonic lineage. Nat Neurosci.
2006;9(2):173-179. doi:10.1038/nn1620
152. Kim HJ, Kim SJ, Kim HS, et al. Alterations of mean diffusivity in brain white matter and deep gray
matter in Parkinson’s disease. Neuroscience Letters. 2013;550:64-68.
doi:10.1016/j.neulet.2013.06.050
153. Kim H-J, DiBernardo AB, Sloane JA, et al. WAVE1 Is Required for Oligodendrocyte
Morphogenesis and Normal CNS Myelination. J Neurosci. 2006;26(21):5849-5859.
doi:10.1523/JNEUROSCI.4921-05.2006
154. Kim T, Pfeiffer SE. Myelin glycosphingolipid/cholesterol-enriched microdomains selectively
sequester the non-compact myelin proteins CNP and MOG. J Neurocytol. 1999;28(4-5):281-293.
doi:10.1023/a:1007001427597
155. Klugmann M, Schwab MH, Pühlhofer A, et al. Assembly of CNS Myelin in the Absence of
Proteolipid Protein. Neuron. 1997;18(1):59-70. doi:10.1016/S0896-6273(01)80046-5
156. Koh A, Lee MN, Yang YR, et al. C1-Ten Is a Protein Tyrosine Phosphatase of Insulin Receptor
Substrate 1 (IRS-1), Regulating IRS-1 Stability and Muscle Atrophy. Mol Cell Biol. 2013;33(8):1608-
1620. doi:10.1128/MCB.01447-12
157. Kotepui M, Thawornkuno C, Chavalitshewinkoon-Petmitr P, Punyarit P, Petmitr S. Quantitative
Real-Time RT-PCR of ITGA7, SVEP1, TNS1, LPHN3, SEMA3G, KLB and MMP13 mRNA Expression

202
in Breast Cancer. Asian Pacific Journal of Cancer Prevention. 2012;13(11):5879-5882.
doi:10.7314/APJCP.2012.13.11.5879
158. Kurtzke JF. Epidemiology in multiple sclerosis: a pilgrim’s progress. Brain. 2013;136(9):2904-
2917. doi:10.1093/brain/awt220
159. Lathia JD, Patton B, Eckley DM, et al. Patterns of laminins and integrins in the embryonic
ventricular zone of the CNS. Journal of Comparative Neurology. 2007;505(6):630-643.
doi:10.1002/cne.21520
160. Laursen LS, Chan CW, ffrench-Constant C. Translation of myelin basic protein mRNA in
oligodendrocytes is regulated by integrin activation and hnRNP-K. J Cell Biol. 2011;192(5):797-811.
doi:10.1083/jcb.201007014
161. Lecavalier-Barsoum M, Quon H, Abdulkarim B. Adjuvant treatment of anaplastic
oligodendrogliomas and oligoastrocytomas. Cochrane Database Syst Rev. 2014;2014(5):CD007104.
doi:10.1002/14651858.CD007104.pub2
162. Lee J, Gravel M, Zhang R, Thibault P, Braun PE. Process outgrowth in oligodendrocytes is
mediated by CNP, a novel microtubule assembly myelin protein. J Cell Biol. 2005;170(4):661-673.
doi:10.1083/jcb.200411047
163. Lee SB, Cho KS, Kim E, Chung J. blistery encodes Drosophila tensin protein and interacts with
integrin and the JNK signaling pathway during wing development. Development. 2003;130(17):4001-
4010. doi:10.1242/dev.00595
164. Lee Y, Morrison BM, Li Y, et al. Oligodendroglia metabolically support axons and contribute to
neurodegeneration. Nature. 2012;487(7408):443-448. doi:10.1038/nature11314
165. Lek M, Karczewski KJ, Minikel EV, et al. Analysis of protein-coding genetic variation in 60,706
humans. Nature. 2016;536(7616):285-291. doi:10.1038/nature19057
166. Lepanto P, Badano JL, Zolessi FR. Neuron’s little helper: The role of primary cilia in neurogenesis.
Neurogenesis (Austin). 2016;3(1):e1253363. doi:10.1080/23262133.2016.1253363
167. Levine E, Lee CH, Kintner C, Gumbiner BM. Selective disruption of E-cadherin function in early
Xenopus embryos by a dominant negative mutant. Development. 1994;120(4):901-909.
168. Li Q, Sun J, Guo L, et al. Increased fractional anisotropy in white matter of the right frontal region
in children with attention-deficit/hyperactivity disorder: a diffusion tensor imaging study. Neuro
Endocrinol Lett. 2010;31(6):747-753.

203
169. Li W, Cogswell CA, LoTurco JJ. Neuronal Differentiation of Precursors in the Neocortical
Ventricular Zone Is Triggered by BMP. J Neurosci. 1998;18(21):8853-8862.
doi:10.1523/JNEUROSCI.18-21-08853.1998
170. Li Y, Ceylan M, Shrestha B, et al. Nanofibers Support Oligodendrocyte Precursor Cell Growth and
Function as a Neuron-Free Model for Myelination Study. Biomacromolecules. 2014;15(1):319-326.
doi:10.1021/bm401558c
171. Liao Y-C, Lo SH. Tensins – emerging insights into their domain functions, biological roles and
disease relevance. Journal of Cell Science. 2021;134(4):jcs254029. doi:10.1242/jcs.254029
172. Liao Y-C, Si L, deVere White RW, Lo SH. The phosphotyrosine-independent interaction of DLC-1
and the SH2 domain of cten regulates focal adhesion localization and growth suppression activity of
DLC-1. J Cell Biol. 2007;176(1):43-49. doi:10.1083/jcb.200608015
173. Lillo P, Mioshi E, Burrell JR, Kiernan MC, Hodges JR, Hornberger M. Grey and White Matter
Changes across the Amyotrophic Lateral Sclerosis-Frontotemporal Dementia Continuum. PLoS One.
2012;7(8):e43993. doi:10.1371/journal.pone.0043993
174. Lin C-CJ, Deneen B. Astrocytes: The missing link in neurological disease? Semin Pediatr Neurol.
2013;20(4):10.1016/j.spen.2013.10.004. doi:10.1016/j.spen.2013.10.004
175. Lin GL, Cohen DM, Desai RA, et al. Activation of beta 1 but not beta 3 integrin increases cell
traction forces. FEBS Lett. 2013;587(6):763-769. doi:10.1016/j.febslet.2013.01.068
176. Lo SH, Weisberg E, Chen LB. Tensin: a potential link between the cytoskeleton and signal
transduction. Bioessays. 1994;16(11):817-823. doi:10.1002/bies.950161108
177. Lo SH. Molecules in focus. Int J Biochem Cell Biol. 2014;51:150-154.
doi:10.1016/j.biocel.2014.04.003
178. Lo SH, Weisberg E, Chen LB. Tensin: A potential link between the cytoskeleton and signal
transduction. BioEssays. 1994;16(11):817-823. doi:10.1002/bies.950161108
179. Lo SH, Yu Q-C, Degenstein L, Chen LB, Fuchs E. Progressive Kidney Degeneration in Mice
Lacking Tensin. J Cell Biol. 1997;136(6):1349-1361.
180. Lu QR, Yuk D, Alberta JA, et al. Sonic Hedgehog–Regulated Oligodendrocyte Lineage Genes
Encoding bHLH Proteins in the Mammalian Central Nervous System. Neuron. 2000;25(2):317-329.
doi:10.1016/S0896-6273(00)80897-1
181. Lunn KF, Baas PW, Duncan ID. Microtubule organization and stability in the oligodendrocyte. J
Neurosci. 1997;17(13):4921-4932.

204
182. Mabbott DJ, Noseworthy M, Bouffet E, Laughlin S, Rockel C. White matter growth as a mechanism
of cognitive development in children. NeuroImage. 2006;33(3):936-946.
doi:10.1016/j.neuroimage.2006.07.024
183. Macchi M, Magalon K, Zimmer C, et al. Mature oligodendrocytes bordering lesions limit
demyelination and favor myelin repair via heparan sulfate production. Elife. 2020;9:e51735.
doi:10.7554/eLife.51735
184. Maeda I, Yamada H, Takano T, et al. Increased Expression Levels of Tensin3 mRNA in Thyroid
Functional Adenomas as Compared to Non-functioning Adenomas. Exp Clin Endocrinol Diabetes.
2009;117(04):191-193. doi:10.1055/s-2008-1078742
185. Maglorius Renkilaraj MRL, Baudouin L, Wells CM, et al. The intellectual disability protein PAK3
regulates oligodendrocyte precursor cell differentiation. Neurobiology of Disease. 2017;98:137-148.
doi:10.1016/j.nbd.2016.12.004
186. Mahmood A, Bibat G, Zhan A-L, et al. White Matter Impairment in Rett Syndrome: Diffusion Tensor
Imaging Study with Clinical Correlations. AJNR Am J Neuroradiol. 2010;31(2):295-299.
doi:10.3174/ajnr.A1792
187. Maire CL, Wegener A, Kerninon C, Nait Oumesmar B. Gain-of-Function of Olig Transcription
Factors Enhances Oligodendrogenesis and Myelination. STEM CELLS. 2010;28(9):1611-1622.
doi:10.1002/stem.480
188. Makinodan M, Rosen KM, Ito S, Corfas G. A Critical Period for Social Experience–Dependent
Oligodendrocyte Maturation and Myelination. Science. 2012;337(6100):1357-1360.
doi:10.1126/science.1220845
189. Malarkey CS, Churchill MEA. The high mobility group box: the ultimate utility player of a cell.
Trends Biochem Sci. 2012;37(12):553-562. doi:10.1016/j.tibs.2012.09.003
190. Manousaki D, Dudding T, Haworth S, et al. Low-Frequency Synonymous Coding Variation in
CYP2R1 Has Large Effects on Vitamin D Levels and Risk of Multiple Sclerosis. Am J Hum Genet.
2017;101(2):227-238. doi:10.1016/j.ajhg.2017.06.014
191. Marie C, Clavairoly A, Frah M, et al. Oligodendrocyte precursor survival and differentiation requires
chromatin remodeling by Chd7 and Chd8. Proc Natl Acad Sci U S A. 2018;115(35):E8246-E8255.
doi:10.1073/pnas.1802620115
192. Marin-Husstege M, Muggironi M, Liu A, Casaccia-Bonnefil P. Histone Deacetylase Activity Is
Necessary for Oligodendrocyte Lineage Progression. J Neurosci. 2002;22(23):10333-10345.
doi:10.1523/JNEUROSCI.22-23-10333.2002

205
193. Marlow F, Topczewski J, Sepich D, Solnica-Krezel L. Zebrafish Rho Kinase 2 Acts Downstream
of Wnt11 to Mediate Cell Polarity and Effective Convergence and Extension Movements. Current
Biology. 2002;12(11):876-884. doi:10.1016/S0960-9822(02)00864-3
194. Marques S, van Bruggen D, Vanichkina DP, et al. Transcriptional Convergence of Oligodendrocyte
Lineage Progenitors during Development. Dev Cell. 2018;46(4):504-517.e7.
doi:10.1016/j.devcel.2018.07.005
195. Marques S, Zeisel A, Codeluppi S, et al. Oligodendrocyte heterogeneity in the mouse juvenile and
adult central nervous system. Science. 2016;352(6291):1326-1329. doi:10.1126/science.aaf6463
196. Mashayekhi F, Hadiyan SP, Salehi Z. Administration of leukemia inhibitory factor increases Opalin
and myelin oligodendrocyte glycoprotein expression in the cerebral cortex in a cuprizone-induced model
of demyelination. Folia Neuropathol. 2015;53(2):147-152. doi:10.5114/fn.2015.52411
197. Masurovsky EB, Bunge MB, Bunge RP. Cytological studies of organotypic cultures of rat dorsal
root ganglia following X-irradiation in vitro. II. Changes in Schwann cells, myelin sheaths, and nerve
fibers. J Cell Biol. 1967;32(2):497-518. doi:10.1083/jcb.32.2.497
198. Matise MP, Epstein DJ, Park HL, Platt KA, Joyner AL. Gli2 is required for induction of floor plate
and adjacent cells, but not most ventral neurons in the mouse central nervous system. Development.
1998;125(15):2759-2770.
199. Matthews MA, Duncan D. A quantitative study of morphological changes accompanying the
initiation and progress of myelin production in the dorsal funiculus of the rat spinal cord. Journal of
Comparative Neurology. 1971;142(1):1-22. doi:10.1002/cne.901420102
200. Matyash V, Kettenmann H. Heterogeneity in astrocyte morphology and physiology. Brain Research
Reviews. 2010;63(1-2):2-10. doi:10.1016/j.brainresrev.2009.12.001
201. McKenzie IA, Ohayon D, Li H, et al. Motor skill learning requires active central myelination.
Science. 2014;346(6207):318-322. doi:10.1126/science.1254960
202. Mestre H, Mori Y, Nedergaard M. The brain’s glymphatic system: current controversies. Trends
Neurosci. 2020;43(7):458-466. doi:10.1016/j.tins.2020.04.003
203. Michalski J-P, Kothary R. Oligodendrocytes in a Nutshell. Front Cell Neurosci. 2015;9:340.
doi:10.3389/fncel.2015.00340
204. Middeldorp J, Hol EM. GFAP in health and disease. Progress in Neurobiology. 2011;93(3):421-
443. doi:10.1016/j.pneurobio.2011.01.005
205. Mo Z, Zecevic N. Human fetal Radial glia cells generate oligodendrocytes in vitro. Glia.
2009;57(5):490-498. doi:10.1002/glia.20775

206
206. Molofsky AV, Krenick R, Ullian E, et al. Astrocytes and disease: a neurodevelopmental
perspective. Genes Dev. 2012;26(9):891-907. doi:10.1101/gad.188326.112
207. Molofsky AV, Deneen B. Astrocyte development: A Guide for the Perplexed. Glia.
2015;63(8):1320-1329. doi:10.1002/glia.22836
208. Montcouquiol M, Rachel RA, Lanford PJ, Copeland NG, Jenkins NA, Kelley MW. Identification of
Vangl2 and Scrb1 as planar polarity genes in mammals. Nature. 2003;423(6936):173-177.
doi:10.1038/nature01618
209. Moran D, Rice RW. An ultrastructural examination of the role of cell membrane surface coat
material during neurulation. J Cell Biol. 1975;64(1):172-181. doi:10.1083/jcb.64.1.172
210. Muharram G, Sahgal P, Korpela T, et al. Tensin-4-Dependent MET Stabilization Is Essential for
Survival and Proliferation in Carcinoma Cells. Dev Cell. 2014;29(4):421-436.
doi:10.1016/j.devcel.2014.03.024
211. Munji RN, Choe Y, Li G, Siegenthaler JA, Pleasure SJ. Wnt Signaling Regulates Neuronal
Differentiation of Cortical Intermediate Progenitors. J Neurosci. 2011;31(5):1676-1687.
doi:10.1523/JNEUROSCI.5404-10.2011
212. Murray JA, Blakemore WF. The relationship between internodal length and fibre diameter in the
spinal cord of the cat. Journal of the Neurological Sciences. 1980;45(1):29-41. doi:10.1016/S0022-
510X(80)80004-9
213. Myllykoski M, Seidel L, Muruganandam G, Raasakka A, Torda AE, Kursula P. Structural and
functional evolution of 2′,3′-cyclic nucleotide 3′-phosphodiesterase. Brain Research. 2016;1641:64-78.
doi:10.1016/j.brainres.2015.09.004
214. Nagai T, Aruga J, Minowa O, et al. Zic2 regulates the kinetics of neurulation. Proc Natl Acad Sci
U S A. 2000;97(4):1618-1623.
215. Nagai Y, Osawa K, Fukushima H, et al. p130Cas, Crk-Associated Substrate, Plays Important Roles
in Osteoclastic Bone Resorption. Journal of Bone and Mineral Research. 2013;28(12):2449-2462.
doi:10.1002/jbmr.1936
216. Nakata K, Nagai T, Aruga J, Mikoshiba K. Xenopus Zic family and its role in neural and neural
crest development. Mechanisms of Development. Published online 1998:9.
217. Nakatani H, Martin E, Hassani H, et al. Ascl1/Mash1 Promotes Brain Oligodendrogenesis during
Myelination and Remyelination. J Neurosci. 2013;33(23):9752-9768. doi:10.1523/JNEUROSCI.0805-
13.2013

207
218. Namihira M, Kohyama J, Semi K, et al. Committed Neuronal Precursors Confer Astrocytic Potential
on Residual Neural Precursor Cells. Developmental Cell. 2009;16(2):245-255.
doi:10.1016/j.devcel.2008.12.014
219. Nave K-A. Myelination and the trophic support of long axons. Nat Rev Neurosci. 2010;11(4):275-
283. doi:10.1038/nrn2797
220. Nave K-A. Myelination and support of axonal integrity by glia. Nature. 2010;468(7321):244-252.
doi:10.1038/nature09614
221. Nave K-A, Ehrenreich H. Myelination and Oligodendrocyte Functions in Psychiatric Diseases.
JAMA Psychiatry. 2014;71(5):582-584. doi:10.1001/jamapsychiatry.2014.189
222. Nedergaard M. Direct signaling from astrocytes to neurons in cultures of mammalian brain cells.
Science. 1994;263(5154):1768-1771. doi:10.1126/science.8134839
223. Newman EA, Zahs KR. Calcium Waves in Retinal Glial Cells. Science. 1997;275(5301):844-847.
224. Nielsen MS, Christensen HC, Kosteljanetz M, Johansen C. Incidence of and survival from
oligodendroglioma in Denmark, 1943–2002. Neuro Oncol. 2009;11(3):311-317. doi:10.1215/15228517-
2008-105)
225. Nishiyama A, Komitova M, Suzuki R, Zhu X. Polydendrocytes (NG2 cells): multifunctional cells
with lineage plasticity. Nat Rev Neurosci. 2009;10(1):9-22. doi:10.1038/nrn2495
226. Nizioł M, Zińczuk J, Zaręba K, Guzińska-Ustymowicz K, Pryczynicz A. Immunohistochemical
Analysis of the Expression of Adhesion Proteins: TNS1, TNS2 and TNS3 in Correlation with
Clinicopathological Parameters in Gastric Cancer. Biomolecules. 2021;11(5):640.
doi:10.3390/biom11050640
227. Nobile C, Hinzmann B, Scannapieco P, et al. Identification and characterization of a novel human
brain-specific gene, homologous to S. scrofa tmp83.5 , in the chromosome 10q24 critical region for
temporal lobe epilepsy and spastic paraplegia. Gene. 2002;282(1-2):87-94. doi:10.1016/S0378-
1119(01)00846-0
228. O’Roak BJ, Vives L, Girirajan S, et al. Sporadic autism exomes reveal a highly interconnected
protein network of de novo mutations. Nature. 2012;485(7397):246-250. doi:10.1038/nature10989
229. Ostrom QT, Bauchet L, Davis FG, et al. The epidemiology of glioma in adults: a “state of the
science” review. Neuro Oncol. 2014;16(7):896-913. doi:10.1093/neuonc/nou087
230. Owen JP, Ziv E, Bukshpun P, et al. Test–Retest Reliability of Computational Network
Measurements Derived from the Structural Connectome of the Human Brain. Brain Connect.
2013;3(2):160-176. doi:10.1089/brain.2012.0121

208
231. Palacios N, Alonso A, Brønnum-Hansen H, Ascherio A. Smoking and Increased Risk of Multiple
Sclerosis: Parallel Trends in the Sex Ratio Reinforce the Evidence. Ann Epidemiol. 2011;21(7):536-
542. doi:10.1016/j.annepidem.2011.03.001
232. Panne D. The enhanceosome. Current Opinion in Structural Biology. 2008;18(2):236-242.
doi:10.1016/j.sbi.2007.12.002
233. Park GC, Kim H-S, Park H-Y, et al. Tensin-3 Regulates Integrin-Mediated Proliferation and
Differentiation of Tonsil-Derived Mesenchymal Stem Cells. Cells. 2019;9(1):89.
doi:10.3390/cells9010089
234. Parpura V, Basarsky TA, Liu F, Jeftinija K, Jeftinija S, Haydon PG. Glutamate-mediated astrocyte–
neuron signalling. Nature. 1994;369(6483):744-747. doi:10.1038/369744a0
235. Parras CM, Galli R, Britz O, et al. Mash1 specifies neurons and oligodendrocytes in the postnatal
brain. EMBO J. 2004;23(22):4495-4505. doi:10.1038/sj.emboj.7600447
236. Parras CM, Schuurmans C, Scardigli R, Kim J, Anderson DJ, Guillemot F. Divergent functions of
the proneural genes Mash1 and Ngn2 in the specification of neuronal subtype identity. Genes Dev.
2002;16(3):324-338. doi:10.1101/gad.940902
237. Parras C, Marie C, Zhao C, Lu QR. Chromatin remodelers in oligodendroglia. Glia.
2020;68(8):1604-1618. doi:10.1002/glia.23837
238. Pellerin L, Bouzier-Sore A-K, Aubert A, et al. Activity-dependent regulation of energy metabolism
by astrocytes: An update. Glia. 2007;55(12):1251-1262. doi:10.1002/glia.20528
239. Pérez-Cerdá F, Sánchez-Gómez MV, Matute C. Pío del Río Hortega and the discovery of the
oligodendrocytes. Front Neuroanat. 2015;9:92. doi:10.3389/fnana.2015.00092
240. Pettit LD, Bastin ME, Smith C, Bak TH, Gillingwater TH, Abrahams S. Executive deficits, not
processing speed relates to abnormalities in distinct prefrontal tracts in amyotrophic lateral sclerosis.
Brain. 2013;136(Pt 11):3290-3304. doi:10.1093/brain/awt243
241. Pfrieger FW, Barres BA. Synaptic efficacy enhanced by glial cells in vitro. Science.
1997;277(5332):1684-1687. doi:10.1126/science.277.5332.1684
242. Plemel JR, Manesh SB, Sparling JS, Tetzlaff W. Myelin inhibits oligodendroglial maturation and
regulates oligodendrocytic transcription factor expression. Glia. 2013;61(9):1471-1487.
doi:10.1002/glia.22535
243. Pohl HBF, Porcheri C, Mueggler T, et al. Genetically Induced Adult Oligodendrocyte Cell Death Is
Associated with Poor Myelin Clearance, Reduced Remyelination, and Axonal Damage. J Neurosci.
2011;31(3):1069-1080. doi:10.1523/JNEUROSCI.5035-10.2011

209
244. Potter KA, Kern MJ, Fullbright G, et al. Central nervous system dysfunction in a mouse model of
FA2H deficiency. Glia. 2011;59(7):1009-1021. doi:10.1002/glia.21172
245. Powers BE, Sellers DL, Lovelett EA, et al. Remyelination reporter reveals prolonged refinement of
spontaneously regenerated myelin. Proc Natl Acad Sci U S A. 2013;110(10):4075-4080.
doi:10.1073/pnas.1210293110
246. Privat A. Postnatal gliogenesis in the mammalian brain. Int Rev Cytol. 1975;40:281-323.
doi:10.1016/s0074-7696(08)60955-9
247. Qi Y, Cai J, Wu Y, et al. Control of oligodendrocyte differentiation by the Nkx2.2 homeodomain
transcription factor. Development. 2001;128(14):2723-2733.
248. Qian X, Li G, Vass WC, et al. The tensin-3 protein, including its SH2 domain, is phosphorylated by
Src and contributes to tumorigenesis and metastasis. Cancer Cell. 2009;16(3):246-258.
doi:10.1016/j.ccr.2009.07.031
249. Radice GL, Rayburn H, Matsunami H, Knudsen KA, Takeichi M, Hynes RO. Developmental
Defects in Mouse Embryos Lacking N-Cadherin. Developmental Biology. 1997;181(1):64-78.
doi:10.1006/dbio.1996.8443
250. Rainero E, Howe JD, Caswell PT, et al. Ligand-Occupied Integrin Internalization Links Nutrient
Signaling to Invasive Migration. Cell Reports. 2015;10(3):398-413. doi:10.1016/j.celrep.2014.12.037
251. Raposo TP, Susanti S, Ilyas M. Investigating TNS4 in the Colorectal Tumor Microenvironment
Using 3D Spheroid Models of Invasion. Advanced Biosystems. 2020;4(6):2000031.
doi:10.1002/adbi.202000031
252. Rash BG, Lim HD, Breunig JJ, Vaccarino FM. FGF Signaling Expands Embryonic Cortical Surface
Area by Regulating Notch-Dependent Neurogenesis. J Neurosci. 2011;31(43):15604-15617.
doi:10.1523/JNEUROSCI.4439-11.2011
253. Rash BG, Tomasi S, Lim HD, Suh CY, Vaccarino FM. Cortical Gyrification Induced by Fibroblast
Growth Factor 2 in the Mouse Brain. J Neurosci. 2013;33(26):10802-10814.
doi:10.1523/JNEUROSCI.3621-12.2013
254. Rattner A, Williams J, Nathans J. Roles of HIFs and VEGF in angiogenesis in the retina and brain.
J Clin Invest. 2019;129(9):3807-3820. doi:10.1172/JCI126655
255. Reichenbach A, Derouiche A, Kirchhoff F. Morphology and dynamics of perisynaptic glia. Brain
Research Reviews. 2010;63(1-2):11-25. doi:10.1016/j.brainresrev.2010.02.003
256. Remahl S, Hildebrand C. Relations between axons and oligodendroglial cells during initial
myelination. II. The individual axon. J Neurocytol. 1990;19(6):883-898. doi:10.1007/BF01186817

210
257. Richardson WD, Young KM, Tripathi RB, McKenzie I. NG2-glia as multipotent neural stem cells –
fact or fantasy? Neuron. 2011;70(4):661-673. doi:10.1016/j.neuron.2011.05.013
258. Rinholm JE, Hamilton NB, Kessaris N, Richardson WD, Bergersen LH, Attwell D. Regulation of
Oligodendrocyte Development and Myelination by Glucose and Lactate. J Neurosci. 2011;31(2):538-
548. doi:10.1523/JNEUROSCI.3516-10.2011
259. Rumsby M, Afsari F, Stark M, Hughson E. Microfilament and microtubule organization and
dynamics in process extension by central glia-4 oligodendrocytes: Evidence for a microtubule
organizing center. Glia. 2003;42(2):118-129. doi:10.1002/glia.10211
260. Rutishauser U, Jessell TM. Cell adhesion molecules in vertebrate neural development.
Physiological Reviews. 1988;68(3):819-857. doi:10.1152/physrev.1988.68.3.819
261. Sadler TW. Distribution of surface coat material on fusing neural folds of mouse embryos during
neurulation. The Anatomical Record. 1978;191(3):345-349. doi:10.1002/ar.1091910307
262. Sahara S, O’Leary DDM. Fgf10 regulates transition period of cortical stem cell differentiation to
radial glia controlling generation of neurons and basal progenitors. Neuron. 2009;63(1):48-62.
doi:10.1016/j.neuron.2009.06.006
263. Salzer JL. Schwann Cell Myelination. Cold Spring Harb Perspect Biol. 2015;7(8):a020529.
doi:10.1101/cshperspect.a020529
264. Sánchez-Abarca LI, Tabernero A, Medina JM. Oligodendrocytes use lactate as a source of energy
and as a precursor of lipids. Glia. 2001;36(3):321-329. doi:10.1002/glia.1119
265. Sant M, Minicozzi P, Lagorio S, et al. Survival of European patients with central nervous system
tumors. International Journal of Cancer. 2012;131(1):173-185. doi:10.1002/ijc.26335
266. Scantlebury N, Cunningham T, Dockstader C, et al. Relations between white matter maturation
and reaction time in childhood. J Int Neuropsychol Soc. 2014;20(1):99-112.
doi:10.1017/S1355617713001148
267. Schlegel AA, Rudelson JJ, Tse PU. White Matter Structure Changes as Adults Learn a Second
Language. Journal of Cognitive Neuroscience. 2012;24(8):1664-1670. doi:10.1162/jocn_a_00240
268. Scholz J, Klein MC, Behrens TEJ, Johansen-Berg H. Training induces changes in white matter
architecture. Nat Neurosci. 2009;12(11):1370-1371. doi:10.1038/nn.2412
269. Schwarz US, Gardel ML. United we stand – integrating the actin cytoskeleton and cell–matrix
adhesions in cellular mechanotransduction. J Cell Sci. 2012;125(13):3051-3060.
doi:10.1242/jcs.093716

211
270. Selvaraj P, Xiao L, Lee C, et al. Neurotrophic factor-α1: A key Wnt-β-catenin dependent anti-
proliferation factor and ERK-Sox9 activated inducer of embryonic neural stem cell differentiation to
astrocytes in neurodevelopment. Stem Cells. 2017;35(3):557-571. doi:10.1002/stem.2511
271. Seo EY, Jin S-P, Kim YK, et al. Integrin-β4–TNS4–Focal Adhesion Kinase Signaling Mediates
Keratinocyte Proliferation in Human Skin. Journal of Investigative Dermatology. 2017;137(3):763-766.
doi:10.1016/j.jid.2016.10.039
272. Shao Y, Ding J, He Q, et al. Effect of Sox10 on remyelination of the hippocampus in cuprizone‐
induced demyelinated mice. Brain Behav. 2020;10(6):e01623. doi:10.1002/brb3.1623
273. Shimizu T, Kagawa T, Wada T, Muroyama Y, Takada S, Ikenaka K. Wnt signaling controls the
timing of oligodendrocyte development in the spinal cord. Developmental Biology. 2005;282(2):397-
410. doi:10.1016/j.ydbio.2005.03.020
274. Shinchi Y, Hieda M, Nishioka Y, et al. SUV420H2 suppresses breast cancer cell invasion through
down regulation of the SH2 domain-containing focal adhesion protein tensin-3. Experimental Cell
Research. 2015;334(1):90-99. doi:10.1016/j.yexcr.2015.03.010
275. Snaidero N, Simons M. Myelination at a glance. J Cell Sci. 2014;127(Pt 14):2999-3004.
doi:10.1242/jcs.151043
276. Sobottka B, Ziegler U, Kaech A, Becher B, Goebels N. CNS live imaging reveals a new mechanism
of myelination: The liquid croissant model. Glia. 2011;59(12):1841-1849. doi:10.1002/glia.21228
277. Song J, Goetz BD, Baas PW, Duncan ID. Cytoskeletal reorganization during the formation of
oligodendrocyte processes and branches. Mol Cell Neurosci. 2001;17(4):624-636.
doi:10.1006/mcne.2001.0974
278. Srinivasan R, Huang BS, Venugopal S, et al. Ca2+ signaling in astrocytes from IP3R2−/− mice in
brain slices and during startle responses in vivo. Nat Neurosci. 2015;18(5):708-717.
doi:10.1038/nn.4001
279. Stancik EK, Navarro-Quiroga I, Sellke R, Haydar TF. Heterogeneity in ventricular zone neural
precursors contributes to neuronal fate diversity in the postnatal neocortex. J Neurosci.
2010;30(20):7028-7036. doi:10.1523/JNEUROSCI.6131-09.2010
280. Stolt CC, Lommes P, Sock E, Chaboissier M-C, Schedl A, Wegner M. The Sox9 transcription factor
determines glial fate choice in the developing spinal cord. Genes Dev. 2003;17(13):1677-1689.
doi:10.1101/gad.259003
281. Stolt CC, Rehberg S, Ader M, et al. Terminal differentiation of myelin-forming oligodendrocytes
depends on the transcription factor Sox10. Genes Dev. 2002;16(2):165-170. doi:10.1101/gad.215802

212
282. Stuart T, Butler A, Hoffman P, et al. Comprehensive integration of single-cell data. Cell.
2019;177(7):1888-1902.e21. doi:10.1016/j.cell.2019.05.031
283. Stutchbury B, Atherton P, Tsang R, Wang D-Y, Ballestrem C. Distinct focal adhesion protein
modules control different aspects of mechanotransduction. J Cell Sci. 2017;130(9):1612-1624.
doi:10.1242/jcs.195362
284. Sueda R, Kageyama R. Oscillatory expression of Ascl1 in oligodendrogenesis. Gene Expression
Patterns. 2021;41:119198. doi:10.1016/j.gep.2021.119198
285. Sun X, Yang S, Song W. Prazosin inhibits the proliferation and survival of acute myeloid leukaemia
cells through down-regulating TNS1. Biomedicine & Pharmacotherapy. 2020;124:109731.
doi:10.1016/j.biopha.2019.109731
286. Sung H, Ferlay J, Siegel RL, et al. Global Cancer Statistics 2020: GLOBOCAN Estimates of
Incidence and Mortality Worldwide for 36 Cancers in 185 Countries. CA: A Cancer Journal for Clinicians.
2021;71(3):209-249. doi:10.3322/caac.21660
287. Tawk M, Makoukji J, Belle M, et al. Wnt/β-Catenin Signaling Is an Essential and Direct Driver of
Myelin Gene Expression and Myelinogenesis. J Neurosci. 2011;31(10):3729-3742.
doi:10.1523/JNEUROSCI.4270-10.2011
288. Thomason EJ, Escalante M, Osterhout DJ, Fuss B. The oligodendrocyte growth cone and its actin
cytoskeleton: a fundamental element for progenitor cell migration and CNS myelination. Glia.
2020;68(7):1329-1346. doi:10.1002/glia.23735
289. Thorpe H, Akhlaq M, Jackson D, et al. Multiple pathways regulate Cten in colorectal cancer without
a Tensin switch. Int J Exp Pathol. 2015;96(6):362-369. doi:10.1111/iep.12154
290. Thurnherr T, Benninger Y, Wu X, et al. Cdc42 and Rac1 Signaling Are Both Required for and Act
Synergistically in the Correct Formation of Myelin Sheaths in the CNS. J Neurosci. 2006;26(40):10110-
10119. doi:10.1523/JNEUROSCI.2158-06.2006
291. Toews JC, Schram V, Weerth SH, Mignery GA, Russell JT. Signaling proteins in the axoglial
apparatus of sciatic nerve nodes of Ranvier. Glia. 2007;55(2):202-213. doi:10.1002/glia.20448
292. Tomassy GS, Berger DR, Chen H-H, et al. Distinct profiles of myelin distribution along single axons
of pyramidal neurons in the neocortex. Science. 2014;344(6181):319-324.
doi:10.1126/science.1249766
293. Tong X, Shigetomi E, Looger LL, Khakh BS. Genetically encoded calcium indicators and astrocyte
calcium microdomains. Neuroscientist. 2013;19(3):274-291. doi:10.1177/1073858412468794

213
294. Torgler CN, Narasimha M, Knox AL, Zervas CG, Vernon MC, Brown NH. Tensin Stabilizes Integrin
Adhesive Contacts in Drosophila. Developmental Cell. 2004;6(3):357-369. doi:10.1016/S1534-
5807(04)00055-3
295. Touaitahuata H, Morel A, Urbach S, Mateos-Langerak J, de Rossi S, Blangy A. Tensin 3 is a novel
partner of Dock5 that controls osteoclast podosome organization and activity. Journal of Cell Science.
Published online January 1, 2016:jcs.184622. doi:10.1242/jcs.184622
296. Trajkovic K, Dhaunchak AS, Goncalves JT, et al. Neuron to glia signaling triggers myelin
membrane exocytosis from endosomal storage sites. J Cell Biol. 2006;172(6):937-948.
doi:10.1083/jcb.200509022
297. Tripathi RB, Clarke LE, Burzomato V, et al. Dorsally and Ventrally Derived Oligodendrocytes Have
Similar Electrical Properties but Myelinate Preferred Tracts. J Neurosci. 2011;31(18):6809-6819.
doi:10.1523/JNEUROSCI.6474-10.2011
298. Vallstedt A, Klos JM, Ericson J. Multiple Dorsoventral Origins of Oligodendrocyte Generation in
the Spinal Cord and Hindbrain. Neuron. 2005;45(1):55-67. doi:10.1016/j.neuron.2004.12.026
299. van Es MA, Van Vught PW, Blauw HM, et al. ITPR2 as a susceptibility gene in sporadic
amyotrophic lateral sclerosis: a genome-wide association study. The Lancet Neurology.
2007;6(10):869-877. doi:10.1016/S1474-4422(07)70222-3
300. Velumian AA, Samoilova M, Fehlings MG. Visualization of cytoplasmic diffusion within living myelin
sheaths of CNS white matter axons using microinjection of the fluorescent dye Lucifer Yellow.
NeuroImage. 2011;56(1):27-34. doi:10.1016/j.neuroimage.2010.11.022
301. Veß A, Blache U, Leitner L, et al. A dual phenotype of MDA-MB-468 cancer cells reveals mutual
regulation of tensin3 and adhesion plasticity. Journal of Cell Science. 2017;130(13):2172-2184.
doi:10.1242/jcs.200899
302. Vissers LELM, van Ravenswaaij CMA, Admiraal R, et al. Mutations in a new member of the
chromodomain gene family cause CHARGE syndrome. Nat Genet. 2004;36(9):955-957.
doi:10.1038/ng1407
303. Vogl MR, Reiprich S, Küspert M, et al. Sox10 Cooperates with the Mediator Subunit 12 during
Terminal Differentiation of Myelinating Glia. J Neurosci. 2013;33(15):6679-6690.
doi:10.1523/JNEUROSCI.5178-12.2013
304. Wake H, Lee PR, Fields RD. Control of Local Protein Synthesis and Initial Events in Myelination
by Action Potentials. Science. 2011;333(6049):1647-1651. doi:10.1126/science.1206998

214
305. Wallace CS, Strike SA, Truskey GA. Smooth muscle cell rigidity and extracellular matrix
organization influence endothelial cell spreading and adhesion formation in coculture. Am J Physiol
Heart Circ Physiol. 2007;293(3):H1978-1986. doi:10.1152/ajpheart.00618.2007
306. Wallingford JB, Harland RM. Neural tube closure requires Dishevelled-dependent convergent
extension of the midline. Development. 2002;129(24):5815-5825. doi:10.1242/dev.00123
307. Wang H, Rusielewicz T, Tewari A, Leitman EM, Einhenber S, Melendez-Vasquez CV. Myosin II is
a negative regulator of oligodendrocyte morphological differentiation. J Neurosci Res. 2012;90(8):1547-
1556. doi:10.1002/jnr.23036
308. Wang L, Hou S, Han Y-G. Hedgehog signaling promotes basal progenitor expansion and the
growth and folding of the neocortex. Nat Neurosci. 2016;19(7):888-896. doi:10.1038/nn.4307
309. Wang X, Shi D, Zhao D, Hu D. Aberrant Methylation and Differential Expression of SLC2A1, TNS4,
GAPDH, ATP8A2, and CASZ1 Are Associated with the Prognosis of Lung Adenocarcinoma. Biomed
Res Int. 2020;2020:1807089. doi:10.1155/2020/1807089
310. Waxman SG. Determinants of conduction velocity in myelinated nerve fibers. Muscle & Nerve.
1980;3(2):141-150. doi:10.1002/mus.880030207
311. White R, Gonsior C, Krämer-Albers E-M, Stöhr N, Hüttelmaier S, Trotter J. Activation of
oligodendroglial Fyn kinase enhances translation of mRNAs transported in hnRNP A2–dependent RNA
granules. J Cell Biol. 2008;181(4):579-586. doi:10.1083/jcb.200706164
312. Williamson JM, Lyons DA. Myelin Dynamics Throughout Life: An Ever-Changing Landscape?
Front Cell Neurosci. 2018;12:424. doi:10.3389/fncel.2018.00424
313. Wolswijk G. Oligodendrocyte survival, loss and birth in lesions of chronic-stage multiple sclerosis.
Brain. 2000;123(1):105-115. doi:10.1093/brain/123.1.105
314. Wu M, Hernandez M, Shen S, et al. Differential Modulation of the Oligodendrocyte Transcriptome
by Sonic Hedgehog and Bone Morphogenetic Protein 4 via Opposing Effects on Histone Acetylation. J
Neurosci. 2012;32(19):6651-6664. doi:10.1523/JNEUROSCI.4876-11.2012
315. Wu W-M, Liao Y-C. Downregulation of C-Terminal Tensin-Like Protein (CTEN) Suppresses
Prostate Cell Proliferation and Contributes to Acinar Morphogenesis. Int J Mol Sci. 2018;19(10):3190.
doi:10.3390/ijms19103190
316. Wu Y, Gau SS, Lo Y, Tseng WI. White matter tract integrity of frontostriatal circuit in attention
deficit hyperactivity disorder: Association with attention performance and symptoms. Hum Brain Mapp.
2012;35(1):199-212. doi:10.1002/hbm.22169

215
317. Xiao G, Du J, Wu H, et al. Differential Inhibition of Sox10 Functions by Notch-Hes Pathway. Cell
Mol Neurobiol. 2020;40(4):653-662. doi:10.1007/s10571-019-00764-7
318. Xiao L, Ohayon D, McKenzie IA, et al. Rapid production of new oligodendrocytes is required in the
earliest stages of motor skill learning. Nat Neurosci. 2016;19(9):1210-1217. doi:10.1038/nn.4351
319. Yan S, Sun R, Wu S, et al. Single nucleotide polymorphism in the 3′ untranslated region of LPP is
a risk factor for lung cancer: a case-control study. BMC Cancer. 2019;19:35. doi:10.1186/s12885-018-
5241-5
320. Yang G, Zhang Y, Yang J. Identification of Potentially Functional CircRNA-miRNA-mRNA
Regulatory Network in Gastric Carcinoma using Bioinformatics Analysis. Med Sci Monit. 2019;25:8777-
8796. doi:10.12659/MSM.916902
321. Yang J, Yang H, Liu Y, et al. Astrocytes contribute to synapse elimination via type 2 inositol 1,4,5-
trisphosphate receptor-dependent release of ATP. Elife. 2016;5:e15043. doi:10.7554/eLife.15043
322. Yang K, Wu W-M, Chen Y-C, Lo SH, Liao Y-C. ΔNp63α Transcriptionally Regulates the Expression
of CTEN That Is Associated with Prostate Cell Adhesion. PLoS One. 2016;11(1):e0147542.
doi:10.1371/journal.pone.0147542
323. Yang L, Li Z, Liu G, Li X, Yang Z. Developmental Origins of Human Cortical Oligodendrocytes and
Astrocytes. Neurosci Bull. Published online August 10, 2021. doi:10.1007/s12264-021-00759-9
324. Ybot-Gonzalez P, Cogram P, Gerrelli D, Copp AJ. Sonic hedgehog and the molecular regulation
of mouse neural tube closure. Development. 2002;129(10):2507-2517.
325. Yeung MSY, Zdunek S, Bergmann O, et al. Dynamics of Oligodendrocyte Generation and
Myelination in the Human Brain. Cell. 2014;159(4):766-774. doi:10.1016/j.cell.2014.10.011
326. Yin X, Peterson J, Gravel M, Braun P e., Trapp B d. CNP overexpression induces aberrant
oligodendrocyte membranes and inhibits MBP accumulation and myelin compaction. Journal of
Neuroscience Research. 1997;50(2):238-247. doi:10.1002/(SICI)1097-4547(19971015)50:2<238::AID-
JNR12>3.0.CO;2-4
327. Young KM, Psachoulia K, Tripathi RB, et al. Oligodendrocyte Dynamics in the Healthy Adult CNS:
Evidence for Myelin Remodeling. Neuron. 2013;77(5):873-885. doi:10.1016/j.neuron.2013.01.006
328. Yu Y, Chen Y, Kim B, et al. Olig2 Targets Chromatin Remodelers To Enhancers To Initiate
Oligodendrocyte Differentiation. Cell. 2013;152(1-2):248-261. doi:10.1016/j.cell.2012.12.006
329. Yuen TJ, Silbereis JC, Griveau A, et al. Oligodendrocyte-encoded HIF function couples postnatal
myelination and white matter angiogenesis. Cell. 2014;158(2):383-396. doi:10.1016/j.cell.2014.04.052

216
330. Yusa K, Zhou L, Li MA, Bradley A, Craig NL. A hyperactive piggyBac transposase for mammalian
applications. Proc Natl Acad Sci U S A. 2011;108(4):1531-1536. doi:10.1073/pnas.1008322108
331. Zeisel A, Muñoz-Manchado AB, Codeluppi S, et al. Cell types in the mouse cortex and
hippocampus revealed by single-cell RNA-seq. Science. 2015;347(6226):1138-1142.
doi:10.1126/science.aaa1934
332. Zhan Y, Paolicelli RC, Sforazzini F, et al. Deficient neuron-microglia signaling results in impaired
functional brain connectivity and social behavior. Nat Neurosci. 2014;17(3):400-406.
doi:10.1038/nn.3641
333. Zhan Y, Liang X, Li L, et al. MicroRNA‐548j functions as a metastasis promoter in human breast
cancer by targeting Tensin1. Mol Oncol. 2016;10(6):838-849. doi:10.1016/j.molonc.2016.02.002
334. Zhang C, Huang H, Chen Z, Zhang Z, Lu W, Qiu M. The transcription factor NKX2-2 regulates
oligodendrocyte differentiation through domain-specific interactions with transcriptional corepressors. J
Biol Chem. 2020;295(7):1879-1888. doi:10.1074/jbc.RA119.011163
335. Zhang D, Aravind L. Identification of Novel Families and Classification of the C2 domain
Superfamily Elucidate the Origin and Evolution of Membrane Targeting Activities in Eukaryotes. Gene.
2010;469(1-2):18-30. doi:10.1016/j.gene.2010.08.006
336. Zhang G, Gao X, Zhao X, et al. Decitabine inhibits the proliferation of human T-cell acute
lymphoblastic leukemia molt4 cells and promotes apoptosis partly by regulating the PI3K/AKT/mTOR
pathway. Oncol Lett. 2021;21(5):340. doi:10.3892/ol.2021.12601
337. Zhang M, Wang J, Zhang K, et al. Ten-eleven translocation 1 mediated-DNA hydroxymethylation
is required for myelination and remyelination in the mouse brain. Nat Commun. 2021;12:5091.
doi:10.1038/s41467-021-25353-5
338. Zhang Y, Chen K, Sloan SA, et al. An RNA-Sequencing Transcriptome and Splicing Database of
Glia, Neurons, and Vascular Cells of the Cerebral Cortex. J Neurosci. 2014;34(36):11929-11947.
doi:10.1523/JNEUROSCI.1860-14.2014
339. Zhao Z, Tan SH, Machiyama H, et al. Association between tensin 1 and p130Cas at focal
adhesions links actin inward flux to cell migration. Biol Open. 2016;5(4):499-506.
doi:10.1242/bio.016428
340. Zhou H, Zhang Y, Wu L, et al. Elevated transgelin/TNS1 expression is a potential biomarker in
human colorectal cancer. Oncotarget. 2017;9(1):1107-1113. doi:10.18632/oncotarget.23275
341. Zhou Q, Anderson DJ. The bHLH Transcription Factors OLIG2 and OLIG1 Couple Neuronal and
Glial Subtype Specification. Cell. 2002;109(1):61-73. doi:10.1016/S0092-8674(02)00677-3

217
342. Zhou Q, Wang S, Anderson DJ. Identification of a Novel Family of Oligodendrocyte Lineage-
Specific Basic Helix–Loop–Helix Transcription Factors. Neuron. 2000;25(2):331-343.
doi:10.1016/S0896-6273(00)80898-3
343. Zöller I, Meixner M, Hartmann D, et al. Absence of 2-hydroxylated sphingolipids is compatible with
normal neural development but causes late-onset axon and myelin sheath degeneration. J Neurosci.
2008;28(39):9741-9754. doi:10.1523/JNEUROSCI.0458-08.2008
344. Zuchero JB, Barres BA. Glia in mammalian development and disease. Development.
2015;142(22):3805-3809. doi:10.1242/dev.129304
345. Zuchero JB, Fu M, Sloan SA, et al. CNS myelin wrapping is driven by actin disassembly. Dev Cell.
2015;34(2):152-167. doi:10.1016/j.devcel.2015.06.011

218

219
Abstract
Multiple sclerosis (MS) is a neurological disease characterized by a loss of
oligodendrocytes, the myelinating cell of the Central Nervous System. Despite recent
advances leading to the suppression of the auto-immune attack on oligodendrocytes,
efficient remyelinating therapies are still lacking. In MS, the spontaneous remyelination
from oligodendrocyte precursor cells (OPCs), present all over the brain, is inefficient
and diminishes with age. The presence of OPCs within demyelinating MS lesions and
their failure to differentiate into myelinating cells suggests that induction of OPC
differentiation is a critical event for successful remyelination.
We identified Tns3 (Tensin 3) as a target of key oligodendrogenic factors such as
Chd7, Chd8 or Olig2 and showed that Tns3 was strongly induced at the onset of
oligodendrocyte differentiation while downregulated in mature oligodendrocytes,
constituting a good marker for immature oligodendrocytes. I characterized Tns3
expression in oligodendroglia to be: 1) mainly restricted to the immature OL stage, 2)
localized in the cytoplasm and cell processes, and 3) overlapping with known
immature oligodendrocytes markers such as Itpr2 and Nkx2.2. Tns3 expression is also
found during adult brain remyelination after LPC injection, especially in newly formed
OLs, therefore constituting a novel marker for immature OLs.
In vivo Tns3 loss-of-function (LOF) by CRISPR/Cas9 technology in neonatal neural
stem cells (NSCs) of the subventricular zone blocks oligodendrocyte differentiation
without affecting OPC survival or proliferation. It seems that a total deletion of the locus
and the suppression by frameshift only of the full-length isoform induces similar effects
on OL population. Moreover, OPCs specific deletion of Tns3 in a floxed Tns3 model
also impair OL production without affecting the OPC population and the Nkx2.2
positive iOLs. Finally, preliminary data on MACSorted OPCs for Tns3flox mice suggest
that Tns3 KO in OPCs delay iOLs differentiation and decrease their survival on the
first 72h. All of these data show the involvement of Tns3 in the oligodendrocyte
generation

220
Résumé en français
La Sclérose en plaques (SEP) est une maladie neurodégénérative causée par la perte
des oligodendrocytes (OLs), les cellules myélinisantes du système nerveux central.
Même si l’attaque auto-immune contre les oligodendrocytes peut désormais être
réduite grâce à l'administration d'immunosuppresseurs, aucun traitement permettant
la remyélinisation des lésions n’existe à ce jour. Chez le cerveau des patients atteints
de SEP, une remyélinisation par les précurseurs d’OLs (OPCs) a lieu mais est
inefficace et diminue avec l'âge. La présence d’OPCs dans ces lésions échouant à se
différencier en cellules myélinisantes suggère que l’induction de la différenciation des
OPCs est une étape indispensable à une remyélinisation efficace.
Nous avons découvert que Tensin3 (Tns3) était une cible directe pour des facteurs
oligodendrogeniques tel que Chd7, Chd8 ou Olig2. Tns3 est fortement induit au début
de la différentiation oligodendrogliale mais est réprimé dans les OLs matures, ce qui
en fait un bon marqueur des OLs immatures. J’ai caractérisé le schéma d’expression
de Tns3 dans durant l'oligodendrogenèse en montrant que la protéine Tns3 était 1)
spécifiquement trouvée durant les stades immatures des OLs, 2) localisée dans le
cytoplasme et les extensions cytoplasmiques oligodendrogliales, et 3) exprimée en
même temps que d’autres marqueurs connus des oligodendrocytes immatures tel que
Itpr2 ou Nkx2.2. Tns3 est aussi exprimée dans les nouveaux OLs formés en réponse
à une démyélinisation induite par injection de LPC, ce qui en fait un nouveau marqueur
des OLs immatures.
La perte à la naissance de Tns3 par CRISPR-Cas9 dans les cellules souches neurales
de la zone sous-ventriculaire bloque leur différenciation en oligodendrocytes sans
affecter la prolifération ou la survie des OPCs. Il semble que la délétion totale du locus
produise les mêmes effets qu’une suppression de l’isoforme complète de Tns3, par
décalage du cadre de lecture. De plus, une suppression de Tns3 spécifique aux OPCs,
dans un modèle de souris floxée pour Tns3, réduit également la production d’OLs
sans affecter les OPCs et les OLs immatures positifs pour Nkx2.2. Enfin, des données
préliminaires suggèrent que la délétion de Tns3 dans des OPCs triés par MACS
retarderait leur différenciation et réduirait leur survie durant les 72 première heures.
Tout cela démontre que Tns3 est impliquée dans la formation d’oligodendrocytes
matures.