Isolation and Characterisation of Novel Glycosaminoglycan ...
Upload
khangminh22Category
view
1download
0
t's. B.o3
Characterisation of ot-expansin genes in
Gossypíum hirsutum
by
Sarah Elizabeth Harmer, B.Sc.(Hons)
A thesis submitted for the degree of Doctor of Philosophy
in
The University of Adelaide
School of Molecular and Biomedical Science
Discipline of Genetics
(Faculty of Sciences)
March,2003

Table of contents
Abstract
Declaration
Acknowledgments
List of Abbreviations
CHAPTER ONE
INTRODUCTIONI.1 TUB COTTON CROP AND INDUSTRY1.2 HIsTORY AND EVOLUTION OF GOSSYPIUIø HIRSUTUM
1.3 THp cULTIVATED corroN PLANT AND FLowER1.4 Tu¡ eUALITY AND DEVELoPMENT oF corroN FIBRES
1.5 CorroN FIBRE GRov/TH AND DEVELoPMENT1.5.1 Initiation1.5.2 Elongation1.5.3 Secondary wall synthesis1.5.4 Maturation
1.6 PI-eNr CELL GROWTH1.6.1 The primary cellwall1.6.2 The expansins1.6. 3 A fibre-specffic u,-expansin
1.7 GpNpnATION OF IMPROVED COTTON VARIETIES1.7.1 Recombinant DNA technologY
1 . 8 TancBuNc TRANScENE EXPRESSIoN1.8.1 Fibre-specific genes and promoters1.8,2 Cottonfibre-specific gene promoters and a-expansin transgene expression
I.9 AruS OF THE PROJECT
CHAPTER TWOMATERIALS AND METHODS
2.1 Merpzuers2.1.1 Samples of plant material2.1.2 Nucleic acids2. l. 3 Chemical reagents2.1.4 Stains and dyes2.1.5 Enzymes2.1.6 Radioactive isotopes and nucleic acids2.1.7 Molecular weight markers2.1.8 Antibiotics and indicators2. l . 9 B acterial strains2.1.10 Cloningvectors2.1 .1 1 Kits and miscellaneous materials
2.2 SorvttoNs, BUFFERS AND MEDIA2.2.1 Solutions and buffers2.2.2 Media
2.3 MBrsors
vlD(
x
xl
I1
JJ445
89
Il12L2121417l7I8t919202T
23
23
25252525252626272727272834343536
1
2.3.1 Plant growth conditions2. 3.2 General techniques2. 3. 2a Restriction digests2.3.2b Electrophoretic separation of DNA2.3.2c Recovery of DNAfrom agarose gels2.3.2d Purffication of DNA using phenol/chloroform extraction2.3.2e Precipitation of DNA2.3.2f Determination of DNA and KNA concentration
2.3.3 PnBpARATToN oF DNA SAMpLES2.3.3a Genomic DNAfrom plants2. 3. 3 b Small-s cale plasmid preparation2.3.3c Large-scøle plasmid preparations for trønsient assays2.3.3d Preparation of plasmid DNAþr automated sequencing2.3.3e Preparation of ), bacteriophage DNA from plate lysates
2.3.4 MeNrpuLATroN oF BACTERTopHAGE2.3.4a Preparation of host cells for phage propagation2.3.4b Plating and isolating bacteriophage
2.3.5 CroNrNG STRATEGTES
2.3.5a Cloning of PCR products2.3.5b Prepøration of insert DNA and plasmid vector2.3.5c Ligations2.3.5d Preparation and transþrmation of competent E. coli
2.3.6 RNA MANTPULATToN2.3.6a Total RNA preparation2.3.6b Electrophoretic separation of RNA
2.3.7 TnaNISFER oF DNA To NYLoN MEMBRANES2. 3.7a Southern blotting2.3.7b Plaque lifting2. 3. 7c Colony hybridis ation
2.3.8 R¡oroACTrvE LABELLTNG oF DNA pRoBES
2.3.9 PneHvBRIDISATIoN, HvBRIDISATIoN AND v/ASHTNG oF FILTERS2. 3.9a Prehybridísation2.3.9b Probe denaturing and hybridisation2. 3.9c Washing offilters2. 3. 9 d Autoradio graphy and s tripping of fi lters
2.3.10 SEquENcruc oF DoUBLE-STRANDED DNA TEMILATES2.3.10a Preparation of template DNA2. 3. I 0b Automqted sequencing reactions
2.3.11 t SrqunNcn ANALysrs soFTV/ARE2.3.lIs Dotplor coMpARrsoNS oF pRoMorER sEeuENCES2.3 .12 OlrcoNuclEorrDE DESTcN
2. 3. 1 2a Sequencing primers2.3.12b Primers þr Polymerase Chain Reaction (PCR)
2.3.13 PoryvpnrsE CHArN R¡ecrroN (PCR)2.3.13a PCR of plasmid and genomic DNA templates2.3.13b Reverse Transcription Polymerase Chain Reaction ßT-PCR)2.3.13c Rapid amplification of 5' cDNA ends (5'-RACE)2. 3. 1 3d GenomeWalker" PCR
2.3.I4 TReNsmur ^ss^ys
usrNc THE pARTICLE TNJECTToN GUN2.3.14a Preparation of gold particles2. 2. 1 4b Preparation oJ' Swinney Jilters2 .3. 1 4c Precipitation of DNA onto gold particles for fibre bombardments2.3.14d Preparation of target tissue
ii

2.3.14e The particle iniection gun2. 3. I 4f Particle bombardment2.3.149 Histochemical staining of bombarded tissues
2.3 .I5 PHYI-OC¡NETIC ANALYSIS
CHAPTER THREE
CHARACTERISATION OF AN CI.EXPANSIN GENE FAMILY IN COTTON(GOSSYPIUM HIRSUTUT4)
3.1 INrnopucrloN3.2 ISOTETION AND PRELIMINARY ANALYSIS OF O(-EXPANSIN GENOMIC CLONES
3.2.1 Subcloning of genomicfragments with homology to pFSl43.2.2 Mapping of genomic subclones
3.3 PNEIIVINARY SEQUENCE ANALYSIS OF PUTATIVE OO-EXPANSIN GENOMIC REGIONS
3.3.1 GhExpI0 sequence3.3.2 GhExpl2 sequence3.3.3 Ghîxpl4 sequence3,3.4 GhExpí sequence3.3.5 GhExpí sequence
3.4 Pn¡TNTIINARY ANALYSIS OF FIVE COTTON EXPANSIN GENES: A SUMMARY
3.5 A SEARCH FORTHE FIBRE-SPECIFIC O¿-EXPANSIN GENE
3.5.1 Obtaining the genes which correspond to gwL4.2 and gwl4.43,5.2 The GhExpI4.2 gene sequence3.5.3 The GhExp14.4 gene sequence
3.6 OsrerNING THE FULL-LENcrH GHExP5 cENE3.6.1 Genome Walker" PCR of GhExPS3.6.2 The GhUxpí gene sequence
3.7 DpranED SEeUENCE ANALYSIS oF sIX o(-EXPANSIN GENES FRoM corroN3.7.1 The coding region of GhUxpl03.7.2 Sequence analysis of the GhExpl} promoter3.7.3 The structure and analysís offive other cotton a-expansin genes3.7.4 Analysis of available promoter sequence of cotton Ø-expansin genes
3.8 ExpnpssloN oF o(-EXPANSIN GENES IN corroN3.8.1 Designing gene-specific primers þr each cotton g-expansin gene3.8.2 Testing the gene-specif,c primers3.8.3 RT-PCR transcription ønalysis of cotton g-expansin genes
3.9 o-pxpnNSIN GENE EXPRESSIoN IN corroN: A DISCUSSIoN3.10 Sutr¿tr¿ARY AND coNCLUSIoNS
CIIAPTER FOUR
EVOLUTIONARY ANALYSIS OF SIX COTTON A-EXPANSIN GENES
49515152
53
53
55556063636377777785859t9I96
101l17117117723123135137140t4l141142142t43r49
151
151
4.1 INrnooUCrroN 153
4.2 GgN¡ REDUNDANCY AND THE EXPANSINS I544.3 TTTS O(-EXPANSIN FAMILY: MAXIMUM PARSIMONY ANALYSIS 155
4.4 TIIF. CT-EXPANSIN PHYLOGENETIC TREE: GENERAL OBSERVATIONS OF THE FOUR CLADES157
4.5 RBTaTIoNSHIP BETwEEN O(-EXPANSIN SUBCLADES AND A SPECIES TREE 160
4.5.1 The a,expansinAclade 1684.5.2 The {x-expansin B clade 1694,5.3 The a-expansin C clade 1704.5.4 The a-expansin D clade 1714.5.5 Database searches in Arabidopsis 171

CHAPTER FIVE I77DEVELOPMENT, OPTIMISATION AND UTILISATION OF A TRANSIENT ASSAYIN COTTON FIBRES I77
4.6 DlscussloN: EvorurIoNARy ASpECTS oF EXpANSTNS4.7 CoNcrusroNs
5.1 INrnooucrroN5,2TUr. PARTICLE INJECTIoN GLIN5.3 OprrursATroN oF THE TRANSTENT ASSAy IN ToBACCo LEAVES5.4 OprIutsATIoN oF THE TRANSIENT ASSAy FoR corroN TrssuES5.5 UTUSNTION OF THE TRANSIENT ASSAY SYSTEM To TEST FIBRE-SPECIFIC PRoMoTERS
5.5. I The promoter: :reporter constructs5.5.2 Transient assay results using the pGUSEXPl4.4 construct5.5.3 Transient assay results using the pGUSEXPL4.2 construct
5.6 DISCUSSION REGARDING TRAI{SIENT ASSAY RESI-]L,TS I-TSING pGUSEXPl4.2 euopGUSEXPl4.45.7 Sul¿veRY AND coNCLUSToNS
172t75
t79180183185t9l197202202
203208
CHAPTER SIX 2ttFUNCTIONAL DISSECTION OF THE GIIEXP(4.2 a.EXPANSIN FIBRE.SPECIF'ICPROMOTER USING A TRANSIENT ASSAY 2LI
6.1 NrnooucrroN 2I36.2 A SEARCH oF THE GnExp14.2 pRoMorER SEeUENCE FoR KNowN cI^s-ACTTNG ELEMENTS
2146.2.1 Dof core bínding site 2156.2.2 Gibberellin response elements 2196.2.3 The prolamin box 22I6.2.4 MYB transcriptionfactor elements 2216.2.5 The E-box 2226.2.6 Summary 223
6.3 SEeu¡NCE ANALvSIS oF corroN FrBRE-spECrFrc pRoMorERS 2236.3.1 A searchfor lcnown elements in thefibre-specific promoters 2256.3.2 Comparisons of ninefibre-specific promoters 225
6.4IsoI¡.TIoNoFTHEFULL.LENGTHpFSI4 cDNA 2326.4.1 Primer design and S'-RACE PCR of pFSI4 2326.4.2 Sequence analysis of pFSl4 S'-RACE products 238
6.5 FTxcuoNAL ANALYSIS oF A FIBRE-SPECIFIC PRoMoTER 2396.5.1 Primer designfor creating gwl4.2 promoter deletions 2396.5.2 PCR amplification and cloning of gw14.2 promoter deletions 2426.5.3 Functionql analysis of a promoter using transient assays 242pEXPl4.2proml (848 bpfull-length) 243pEXPI4.2prom2 (604 bp) 243pEXPl4.2prom3 (384 bp) 243pEXPl4.2prom4 (149 bp) 2436.5.4 Summary of GhExp14.2 promoter deletion transient qssays 251
6.6 SUIT,IVERY AND CONCLUSIONS 252
CHAPTER SEVEN 255
GENERATION OF o-EXPANSIN (PFS14) EXPRESSION AND MISEXPRESSIONCONSTRUCTS FOR ANALYSIS IN TRANSGENIC COTTON PLANTS 255
7.1 INrnonucrroN 2577.2 PnoToNGED cx,-EXPANSIN EXPRESSIoN IN CoTToN FIBRES 259
lv

7.3 INcn¡nSED cx,-EXPANSIN GENE EXPRESSION IN COTTON FIBRES
7.4 DBcnpASED oI-EXpANSIN EXpRESSIoN IN corroN FIBRES
7.5 INcnBeSED AND PRoLoNGED cI,-EXPANSIN GENE EXPRESSIoN IN CoTToN FIBRES
7.6 TnINSFORMATION OF COTTON7.7 CoNCTUSIoNS AND CONSIDERATIONS
APPENDICES
REFERENCES
274275282283287
289
295
{
v

Abstract
Cotton fibres arise from single epidermal cells of the ovule and initiate as protrusions
on the day of flowering (anthesis). Elongation continues for approximately 20 days, resulting
in fibres which are2-3.5 cm in length. As fibres are single cells of homogenous tissue and
their development is synchronous, they are an excellent model system for the analysis of the
molecular processes involved in cell growth.
One type of cell wall protein, the o-expansins, has been implicated in cell wall
modification. c[-expansins have been characterised in a number of plant species and are
encoded by large gene families (31 members inArøbidopsis), with family members often
showing heterogenous patterns of expression (Wu et aL.,2001). In some plant species, rr-
expansins have specifically been implicated in cell elongation, such that a cotton fibre-
specific cr-expansin is an attractive target for cotton biotechnology. Differential screening of
a cotton fibre oDNA library allowed the identification of a fibre-specific o-expansin mRNA
(pFS14) of which accumulated at high levels during fibre cell elongation (Orford and Timmis,
1998). The aims of this project focused on the isolation, characterisation and analysis of the
fibre-specific ø-expansin gene and other cotton cr-expansin family members.
Using, a combination of genomic library screening and PCR-based approaches six
different cotton cx-expansin gene family members were isolated (Chapter Three). One of the
genes, GhExp14.2,was99o/o similar to the pFSl4 cDNA, and therefore it was considered to
be the genomic representative of pFS14 cDNA.
RT-PCR analysis (Chapter Three) showed that five of the six c-expansins have
distinctive expression pattems in different cotton tissues, and that the transcripts of four genes
were detected in elongating fibres. GhExpl4.2 transcnpts were detected at high levels in
elongating fibres, consistent with the results described by Orford and Timmis (1998),
suggesting that GhExp14.2 plays an important role in fibre development.
v1

Evolutionary analysis of ø-expansin genes from cotton and other plant species
(Chapter Four) confirmed previous studies that demonstrate the cx,-expansin family is divided
into four ancient, distinct subclades. Each subclade was further divided into groups on the
basis of gene orthology. In some cases 'orthologous groups' within clades contain multiple
genes that appeared to be expressed in a similar manner to each other and the evolutionary
analysis provides a foundation by which specific orthologous o(-expansin genes could be
identifi ed and characterised.
The development of a transient assay for use in cotton fibres was undertaken (Chapter
Five). Various parameters and conditions were tested on tobacco and cotton tissues until an
appropriate method was rehned, with fibres aged approximately 4 DPA providing the best
results. The validity of the transient assay technique was tested using the GhExpI4.2
promoter, with the full available sequence (8a8 bp up to and including the ATG initiation
codon) directing GUS reporter gene expression only in developing fibre cells and not other
cotton tissues tested. This work describes an efficient, simple method for the functional
dissection of cotton fibre-specific promoters.
Known cis-acting consensus elements in the GhExpI4.2 fibre-specific promoter were
accurately mapped using transcription factor binding site websites (Chapter Six). Detailed
comparisons of multiple fibre-specific promoters allowed identification of four new putative
fibre-specific promoter elements. A deletion analysis was undertaken to dissect the functional
regions of, and putative consensus bindings sites within,Ihe GhExpl4.2 promoter. All
GhÛxp14.2 promoter deletions maintained fibre-specific expression of the GUS reporter gene,
including the smallest, which consisted of only l49bp. Within the GhExpl4.2 I49bp
minimal promoter five previously characterised consensus-binding sites (ACGT box, Q-
element, RY pyrimidine repeat, an E-box and a GCN4 motif) and one novel binding site
(PFE4) were present, and each was suggested to be involved in directing fibre-specific
transcription.
v11

In Chapter Seven, preparation of four constructs using the fibre-specific cDNA pFS14,
under the control of different fibre-specific promoters, is described. These constructs were
designed with a view of modifoing fibre morphologyby altering the temporal expression
pattern of the cr-expansin gene in transgenic cotton. Results from the transgenic cotton,
although not available for incorporation into this thesis, will be used to define the important
role that GhExpl4.2 plays in fibre elongation, and may also facilitate the production of cotton
varieties with improved fibre morphology.
vl11

Declaration
This work contains no material which has been accepted for the award of any other
degree or diploma in any university or other tertiary institution and, to the best of my
knowledge and beliet contains no material previously published or written by another person,
except where due reference has been made in the text.
I give consent to this copy of my thesis, when deposited in the University Library,
being available for loan and photocopying.
Si
Sarah Harmer
24thMarch,2003
1X

Acknowledsements
I wish to thank my two supervisors, Assoc. Prof Jeremy Timmis and Dr. Sharon
Orford for providing me with the opportunity to undertake this project.
I also wish to thank Cotton Seed Distributors Ltd (CSD) for generously providing
financial support for this project.
To past JT Lab members, TamzinDonald, Eun-Lee Jeong, Nigel Percy, Coralie Reich,
Dawn Verlin, Andreas Houben, Kat Malone and Old Jess (Moore) thanks for making the lab
such a great place to work in and helping me out. To current JT Lab members, Sven Delaney,
Damien Lightfoot, John Humphries, New Jess (Roberts), Sharon Orford and the Great Chun-
¡tan Huang, I thank you guys also, for putting up with me (all), science tips (all), reading and
correcting drafts ofjust about everything (thanks Shazz), share tips (Damien), footy tips
(John) and travel tips (Sven). I think you're all great and I feel privileged to have worked in
the same lab with everyone.
To other members of the Discipline of Genetics þast and present), thank you for
helping me out and creating a great working environment. A special thanks goes to Paul
Moir, a great guy with the ability to fix anything and save me from all sorts of disasters. Tash
Boase for being a fantastic fellow PhD mate and netball buddy. Finally, Michelle Coombe,
for being a great undergrad lab partner and such a greatmate.
Thanks goes one of my Year 12 teachers, Mr Botten, for introducing me to genetics
about 2l3rds of the way through Year 72, opening up a whole new world for me and
suggesting that I should study at uni. Jeremy continued my interest in genetics through his
series of lectures in Genetics IW. Thanks JT, you're a great supervisor!
To my family and friends thanks for your interest and support in my project and yes
my uni years are nearly over. Finally a very special thanks goes to Davey'Wheeler. What a
special gUy (but not that kind of special!), You are the greatest guy I have ever known, now
this thesis is finished we can finally leave.
X

A
¡cr-32r1dattbp, kb
BSA
C
CaMVOC
cDNA
C{erminal
cv
Da, kDa
dATP
DEPC
dCTP
dGTP
dHzO
DMSO
DNA
DNase I
DPA
DTT
dTTP
EDTA
EGTA
List of Abbreviations
adenine
alpha-labelled deoxyadenosine triphosphate
base pairs, kilobase pairs
bovine calf serum
cytosine
cauliflower mosaic virus
degrees Celsius
deoxyribonucleic acid complementary to ribonucleic acid
carboxyl terminal
cultivar
Dalton(s), kiloDaltons
2' -deoxyadenosine-5' -triphosphate
diethyl pyrocarbonate
2' -deoxy cylosine-5' -triphosphate
2' -deoxyguanosine- 5' -triphosphate
distilled water
dimethylsulphoxide
deoxyribonucleic acid
deoxyribonuclease I
days post anthesis
dithiothreitol
2'-deoxythymidine-5' -triphosphate
ethylenediaminetetraacetic acid
ethyl ene glyco lb is( B - amino ethyl ether)- N,N,N',N' tetraacetic
acid
ethidium bromide
force of gravity
forward sequencing primer
guanine
gram(s), milli gram(s), mi cro gram(s), nano gram(s)
isopropyl- B-D -thio galactoside
bacteriophage Lambda
litre(s), millilitre(s), microlitre(s)xi
EtBrûÞ
c40)G
8' flg, 1"t8, nB
IPTG
l.
L, m1, pl

LTP
MrnA
min, hr
MOPS
mRNA
cm, mm, pm, nm
MW
N-terminal
nt
oDzoo
oDooo
ORF
Orthologous
lipid transfer protein
moles per litre
milliAmperes
minute(s), hour(s)
3 -(N-Morpholino)propanesulphonic acid
messenger ribonucleic acid
centimetre, millimetre, micrometre, nanometre
molecular weight
amino-terminal
nucleotide(s)
optical density at 260rmt
optical density at 600nm
open reading frame
Two gcncs are orthologous if they diverged after a speciation
event.
Two genes are paralogous if they diverged after a duplication
event.
polSrmerase chain reaction
polyethylene glycol
plaque forming units
particle injection gun
polyadenylated
polyvinylpyrrolidine
random amplification of polymorphic DNA
rapid amplification of 5' oDNA ends
registered
ribonucleic acid
ribonuclease Arevolutions per minute
ribosomal RNA
reverse sequencing primer
sodium dodecyl sulphate
saline sodium citrate
thymidine
Tris-acetate-EDTA
Thermus aquaticusxii
Paralogous
PCR
PEG
ptu
PIG
Poly(A)*
PVP
RAPD
5'-RACE@
RNA
RNase A
rpm
rRNA
RSP
SDS
SSC
T
TAE
Taq

TE
TEMEDTM
Tris
U
UTR
UV
VX-gal
X-gluc
% (vlv)% (wlv)
Tris-EDTA
NNN'N' -Tetramethylethylendiamine
trademarked
Tris[hydroxymethyl] amino methane
unit(s) of enzyme
untranscribed region
ultraviolet
Volts
5' -bromo-4- chloro-3 -indoyl- B-D-galactopyranoside
5 -bromo-4-chloro-3 -indolyl-b-D - glucuronide
percent volume per volume
percent weight per volume
xiii

CHAPTER ONE
Introduction
1

2

1.1 The cotton crop and industrv
Cotton is an annual crop that is grown world wide in tropical and temperate climates,
principally for the fibres (seed coat hairs/lint) for use in textiles. Aside from the fibres, the
other commercially viable products from the cotton plant include the seed (oils) and the seed
hulls, used as feed for livestock. The Australian economy, once said to "ride the sheep's
back" because the country's major export income was wool, now gains more dollars annually
from cotton production.
1.2 Historv and of Gossvníum hirsutum
Cultivated cottons are all members of the genus Gossypium, one of the many genera of
the family Malvaceae. The genus comprises over 50 diverse species, both diploid (2126; the
Old V/orld cottons) and allotetraploid (2n:4x: 52;the New World cottons) cottons.
Although there are many members of the Gossypium genus, only four species are cultivated
commercially.
Analysis of diploid species has revealed that they can be divided into 8 different
genomic groups A to K, based on chromosome size and meiotic pairing (Endizzi et a1.,1985;
Wendel and Cronn, 2002). Different cotton genome groups belong to different geographical
locations, with the A, B, E and F genome groups being Africa/Asia in origin. The C, G and K
genome groups belong to the Australian continent, and the D genome group belongs to the
American continent (Wendel and Cronn, 2002). Seeds of wild cotton species have a varying
degree of pubescence, with most seeds being lintless or having short fibres that are strongly
attached to the seed that are unable to be ginned.
Two cultivated diploid species are the A-genome (old world) representatives (G.
arboreum and G. herbaceum). The two other cultivated species are allotetraploids (G.
hirsutum L. fupland cotton] and G. barbadense L. [Pima]), consisting of the A and D
genomes. The allotetraploids are the most common cultivated cotton, with G. hirsutum
comprising over 90o/o of the world cotton production (Langer and Hill, 1982). The AD
J

allotetraploid cotton is thought to have originated from hybridisation between the A and D
diploid species followed by chromosome doubling. The two closest extant candidates for the
diploid ancestors are considered to be G. herbaceum (A genome) and G. raimondii (D
genome) (Endrizzi et aL.,1985). The hybridisation and polyploidisation event is thought to
have occurred after the ocean migration of the A (Asiatic) genome to the new world (D
genome) 1-2 million years ago (Wendel, 1989).
1.3 The cultivated cotton plant and flower
Cultivated cottons are annual, predominately self-pollinating, shrubs growing to
heights of about 1.5 metres. Approximately 65 days after cotton seeds have germinated, the
planL begins blooming. Developing cotton flowers are encased by the epicalyx, which
consists of three bracts that remain present until after boll maturity (Figure 1.1). An
inconspicuous calyx is present within the epicalyx and this encloses the developing flower,
which consists of five petals fused at their base. The superior ovary is positioned at the base
of the flower and is surrounded by the staminal column. The ovary consists of 3-5 fused
locules and each locule contains up to ten ovules (Figure 1.1). Self-fertilisation of the ovary
occurs on the day of flowering (or anthesis), and following this the ovary develops as a
capsule (or boll) until maturity, 40-80 days after fertilisation.
1.4 The quality and development of cotton fibres
Cotton fibres are epidermal outgrowths of the seed coat. Two types of fibres of
produced. Firstly lint, the long staple fibres easily removed from the seed during the ginning
process. Secondly, fuzz ftbres that are short in length and adhere strongly to the seed after the
removal of the lint fibres. The lint fibres are spun for textile manufacture, with the superiority
of the thread largely depending on cotton fibre quality.
Cotton fibrcs arc 'classcd' according to their quality, with the premier class of fibre
achieving the highest price commercial value. The major determinant of cotton fibre quality
4

in the textile industry is the spinning performance of the lint. This is based primarily to
length, as longer fibres can be spun into finer, stronger yarn, but fibre strength and fineness
are also used for classification of lint, with strong and fine fibres being of highest demand.
Fibre maturity is also considered in classifying cotton lint, with mature fibres, i.e. those that
have completed synthesis of a thick cellulosic secondary wall and have completely
desiccated, being most desirable. Upon desiccation, mature fibres twist into ribbon like
structures, which enhances fibre interactions during the spinning process, increasing fibre
strength and reducing breakages during further processing. Immature fibres are not twisted,
and do not cling together when the fibres are being spun. Mature fibres also have improved
dying quality than immature fibres.
Cotton gradingalso considers the appearance of the lint, with cleanliness (i.e. amount
of 'trash' or non-lint material such as leaves and bracts), fibre colour and fibre length all taken
into account. Different varieties of cotton produce different average staple length, with G.
hirsutumbeing a 'medium' staple, producing fibres between 22-25 mm in length. The
remaining cultivated species, G. arboreum, G. herbqceum, ftoth modern A diploids) are
considered short staple varieties (less than 21 mm), and G. barbadense (Pima or Egyptian
cotton) produces a long fibre (35 mm and longer).
Environmental conditions are known to greatly influence the quality of cotton fibres.
For example, severe deficiencies in soil moisture content can strongly inhibit final staple
length (Sturkie, 1934). Other studies have identified that low temperatures and light levels
can have a negative impact on cotton plant growth, fibre elongation and secondary cell wall
synthesis (Gipson and Joham, 1969; Go¡mes et a1.,1995).
1.5 Cotton fTbre srowth and development
Epidermal seed cells destined to become fibres undergo four over lapping phases of
development: initiation, elongation, secondary wall synthesis and maturation (Basra and
Malik, 1984). On the day of anthesis epidermal cells programmed to become fibres, initiate
5

Figure l.L Morphology of a cotton flower and developing boll
A' Schematic cross-section of a cotton flower on the day of anthesis, showing the
location of or,ules within the ovary. Adapted from Raven et al., (1992).
B. Cotton flower on the day of anthesis.
C. Developing cotton boll, 5 days after flowering.
D. Developing cotton boll 20 days after flowering.
E. Mature cotton boll approximately 50 days after flowering.
F. Electron micrographs of a cotton ovule on the day of anthesis showing initiating
fibres, except the micropylar end (arrowed). From Stewart (1975).
G. Elongatingfibres aged4 DPA.
H. Cross-section of a cotton fibre (50 DPA) showing the thick secondary cell wall
(sw). Primary cell wall (pw) and vacuole (v) is also shown. Bar:1 pm. From
Ryser (1999).
6

B.
E.
H.
3W
-
(.'
l,
C.
F. G.Pwü
gw
,.J'
t
7

outward growth. Initiation is immediately followed by elongation, which continues for
approximately 22 Days Post Anthesis (DPA). Towards the end of the elongation, deposition
of the secondary cell wall commences and continues for approximately a further l8 days.
After secondary wall synthesis the ovary wall splits along the locular suture lines, exposing
the fibres and seeds to the air, causing the fibres to desiccate and collapse. A discussion of
each developmental phase is described below.
1.5.1 Initiation
On the day of anthesis fibre initials expand spherically and protrude above the surface
of the ovule epidermis (Stewart, 1975). Initials first become visible at the funiculus crest
(Figure 1.1) and the initiation proceeds in a 'wave' towards the micropylar end of the ovule.
Initiation and growth of cotton fibres is largely synchronous, but it can de delayed by a few
hours at the micropylar end of the ovule. Fibres that initiate growth on the day of anthesis
develop into 'lint' fibres, while the ovule epidermal cells that initiate in a similar wave-like
manner approximately 4 DPA, develop into fuzz fibres (Basra and Malik, 1984; Stewart,
teTs).
Culturing of fertilised cotton ovules in vitro, has shown that fibre commencement is
dependent on the phytohormones, auxin (IAA) and gibberellin (GA3) (Stewart, 1975).
Further, the 'wave' of fibre initiation is assumed to the caused by difhrsion of phytohorrnones
along the ovule epidermis. Additional studies by Graves and Stewart (1988) demonstrated
that fibres can be initiated and grown from ovules as young as -2 DPA in vitro in response to
GA¡ and IAA. These results suggested that ovule prefibre epidermal cells differentiate as
early as -3 to -2 DPA and are latent, awaiting hormonal initiation stimulus associated with
anthesis in planta.
Although all ovule epidermal cells have the potential to develop into lint initials only
approximately one in four initiate growth at anthesis and these are not spatially ordered
(Stewart, 1975; Triplett and Timpa, 1995). Events that programme an epidermal cell to
8

become a 'lint' or 'non-lint' cell are yet to be determined, though phyohormones (IAA and
GA3) appear to play an important role during ovule culturing (Beasley and Ting, 1974).
Initiating lint cells display many morphological changes these include an enlarged
active nucleolus, presumably for increased ribosome formation and protein synthesis that is
necessary for fibre development (Ramsey and Berlin, 1916a; Ramsey and Berlin, 1976b). An
increase in the number of Golgi complexes is also observed, and these are probably involved
in the formation of cell wall polysaccharides. A large central vacuole is also prominent in
initiating fibres and, by 2 DPA, it occupies most of the cell volume (Ramsey and Berlin,
1976a; Ramsey and Berlin, l9l6b).
1.5.2 Eloneation
Following spherical expansion, initiating fibre cells elongate, and initially longitudinal
developing fibre cells orient their elongating tip towards the micropylar end of the ovule.
After 2-3 days, the tips of the elongating fibre cells become tapered, with spiral growth of the
fibre becoming prominent and fibres no longer growing towards the micropylar ovule end.
Cotton fibres generally elongate for 15 to 30 days, with maximum elongation rates occurring
between 6 and 12 DPA (Meinert and Delmer,1977). The rate and duration of elongation
determines final fibre length, and this in turn is regulated by environmental and genetic cues
(Basra and Saha, 1999). At the end of elongation, cotton fibre cells have enlarged 1,000 to
3,000 times their diameter (Basra and Malik, 1984).
During gtowth, developing cotton fibres are encased in a flexible primary cellwall,
0.2 to 0.4 pm thick. Fibre expansion is dependent on internal turgor pressure and the elastic
nature of the primary cell wall, allowing the integration of new cell wall components while
maintaining the structural integrity of the cell wall. Aspects regarding turgor-driven cell
expansion are presented below, while particulars of the plant cell walls and growth mechanics
will be presented in more detail in Section 1.6.
Turgor-driven growth of plant cells is generated by the influx of water, driven by a
high concentration of osmotically active solutes in the central vacuole. To accommodate the
9

dilution effects caused by the uptake of water, the influx and accumulation of solutes also
occurs (Cosgrove, I997b; McQueen-Mason, 1995). In expanding fibres, malate and
potassium are the predominant forms of osmolytes, and accumulation of both in the central
vacuole increases during fibre elongation (Dhindsa et al., 1975). Malate is s¡mthesised within
the cloplasm by dark metabolism of COz via phosphoenolpynrvate carboxylase (PEPCase),
and analysis of PEPCase gene expression in fibres demonstrated that transcripts are most
abundant immediately prior to maximum fibre elongation rate. In addition, the PEPCase
enzylne accumulates and is active subsequent to the peak of mRNA transcript levels during
maximum fibre elongation rates (Smart et a1.,1998).
While malate is synthesised locally in the cell, potassium must be imported from the
seedcoat and phloem via a potassium channel. A study undertaken by Ruan et al. (2001)
demonstrated high transcript levels of a potassium transport channel associated mRNA during
fibre elongation, correlated with elevated turgor pressure driving cell elongation (Ruan et al.,
2001).
In addition to the findings described above, Dhindsa, et al. (1975) illustrated that a
lack of potassium and CO2 during owle culture conditions inhibited fibre growth,
highlighting the importance of these two osmolytes during turgor-driven fibre elongation.
Also involved in the regulation of cell turgor, are two membrane bound electrogenic
proton pumps, the plasma membrane Hl-ATPase (PM-ATPase) and the vacuolar H+-ATPase
(V-ATPase). The proton pumps hydrolyse ATP and pump H* ions against a concentration
gradient, generating an electrochemical and pH gradient across the membranes. Osmolyte
transport into the vacuole can then be activated due to the energy provided by the membrane
potentials(BasraandSaha, 1999; Smart etal.,l998). AnalysesundertakenbySmart, etal.,
(1998) have shown that transcripts encoding both ATPase pumps were most abundant just
prior to the peak fibre elongation period. Furthermorc, cnzymc activity of both pumps peaked
at l5 DPA, suggesting an important role in the regulation of turgor pressure during fibre
elongation.
10

At approximately l6-18 DPA fibre elongation slows, and the onset of secondarywall
synthesis coÍìmences. The two phases overlap considerably and the onset of secondary wall
synthesis is thought to be a contributing factor in terminating hbre elongation.
1.5.3 Secondary wall synthesis
The formation of the cotton fibre secondary wall is mainly characterised by deposition
of cellulose inside the primary wall, which begins before the cessation of fibre elongation.
Cellulose content, which remains constant during elongation, representing between 20 and
25o/o of the dry weight of the wall, increases greater than 100 fold during secondary wall
synthesis. Cellulose consists of long polymerised P-1,4linked glucose residues, which form
crystalline anays consisting of many parallel chains intra- and inter hydrogen bonded to each
other, producing cellulose microfibrils (Delmer, 1999). Cellulose is synthesised at the plasma
membrane via the rosette terminal complex, a cellulose synthase enzyme (CesA) complex,
consisting of six CesA catalytic subunits (Delmer, 1999; Kimura et a1.,1999). In developing
fibres, the dramatic increase in cellulose synthesis at the onset of secondary wall synthesis,
correlates with increased transcription of two cellulose synthase (GhCesAI and GhCesA2)
genes (Pear et ø1.,1996). The two cotton cellulose synthase genes contain regions of
homology to the well-characterised bacterial (Acetobacter xylinum) cellulose synthase gones.
The regions of homology are thought to be the catalytic sites that bind to UDP-(uridine
diphosphate)-Glc, and transfer the Glc to the growing þ-7,4- glucan chain, and this region of
the GhCesAl peptide was found to bind UDP-gluc in a later over expression analysis (Pear e/
a|.,1996).
The cellulose microfibril deposition pattern during secondary wall synthesis is
structured by the microtubule network, changing from transverse (during elongation) to
helical affays (Seagull, 1992). Further, the orientation of cellulose microfibrils appears to
mirror microtubule orientation, even through cellulose reversal points, where the orientation
of the cellulose microfibrils alters, assumedly due to a new cellulose production point
(Seagull, 1986; Seagull, 1992).
11

The deposition of the cellulose to the secondary cell wall continues for several weeks,
with successive layers of cellulose microfibrils being deposited. At the end of fibre
development, the secondary cell wall is between 3 and 4 pm in breadth and the cotton fibres
consist of approximately 96%o cellulose.
1.5.4 Maturation
Between 40 and 60 days after anthesis, the boll splits open, exposing the fibres to the
environment. As a result of air exposure, the fibres desiccate and collapse. Due to reversal
points of cellulose deposition during secondary wall synthesis, cotton fibres collapse into
ribbonlike structures, and it is this phenomenon which enables the fibres to be spun into
thread (Ryser, 1985).
1.6 Plant cell srowth
Cell expansion is a fundamental process involved in most aspects of growth and
development of plants. The wall that surrounds plant cells serves multiple functions, the most
significant of which are determining cell shape and providing structural support. The intemal
turgor pressure (refer to Section 1.5.2) places high mechanical stress on the surrounding cell
wall, and as cells expand the polymers within the cell wall can be rearranged, permitting the
cell wall to accommodate growth. Relaxation of the cell wall lowers the internal turgor
pressure, causing an uptake of water into the vacuole, leading to increased cell volume,
restoration of cell turgor followed be further wall stress. This phenomenon is known as stress
relaxation and cell growth therefore depends on the ability of the cell wall to withstand and
extend under the turgor pressure. Aspects pertaining to cell wall growth are discussed below.
1.6.1 The primary cell wall
The highly extendable primary cell wall, present during the elongation and expansion
of the fibre, is typical of dicoL primary oell walls, being 0.2 pm to 0.4 pm thick an<l oonsisting
of 20 to 25o/o cellulose (Meinert and Delmer, 1977). The major components of the primary
cell wall are the cellulose microfibrils, hemicellulose (largely xyloglucans in dicot cell walls),
12

polysaccharides (such as pectin) and structural proteins. These components interact to form
interlocking networks, stabilised by the interaction between the wall components, to provide
three types of structural support domains for the cell. Firstly, the cellulosic and hemicellulose
network, consisting of hemicellulose chains hydrogen bonded to the surface of the cellulose
microfibrils, that constitutes approximately 50%o of dry cell wall weight. The cellulose-
hemicellulose network is anchored in a second structural domain, comprised of the pectin
polysaccharide matrix, representing approximately 30o/o of dry cell wall weight and consisting
of two major pectins, polygalaturonic acid (PGAs) a-nd rhamnogalacturonan I (RG I) (Carpita
and Gibeaut, 1993). The final cell wall domain constitutes the structural proteins with the
hydroxyproline-rich glycoprotein (HRGP) 'extensin' being a major peptide.
The cell wall structural components and the three different domains are largely
recognised, but the exact structural architecture of the wall is somewhat debated. Keegstra e/
al.1973,proposed one cell wall structure where non-cellulosic cell wall matrix polymers are
covalently linked to one another to form a large network, with the cellulose microfibrils
stabilised through hydrogen bonding with the xyloglucans. Under this model, it was assumed
that during acid growth of the cell, (a phenomena where cellwall extension increases as the
pH of the wall is lowered), the low wall pH would weaken the hydrogen bonding between the
cellulose microfibrils, allowing microfibril slippage (Keegstra et aL.,1973). This model of
cell wall extension was discarded however, when alater study demonstrated that hydrogen
bonding between the cellulose and the xyloglucans is actually strengthened at lower pH (see
Carpita and Gibeaut, 1993 and references therein).
A possible alternative structure is that cellulose microfibrils are embedded in a
hemicellulose matrix, essentially tethered via long xyloglucans (Carpita and Gibeaut,1993).
The pectin and structural proteins are envisaged to create a cross-linked matrix, embedding
the cellulose and hemicellulose framework (Carpita and Gibeaut,1993; Cosgrove, 2001).
Slight variations of the tethered model have been proposed (Ha et a1.,1997 Talbott and Ray,
1992),but all have the cellulose microfibrils coated to some extent with xyloglucan
T3

(Cosgrove, 2001). Whichever model of cell wall architecture proves to be correct, a
fundamental aspect remains: cell expansion requires the addition, extension and
reaffangement of cell wall matrix polymers, whilst responding to high internal turgor pressure
and growth.
Owing to the mechanical stress placed on the primary cell wall by turgor pressure, the
elongating cells cannot simply add new structural polymers to extend the cell wall. Synthesis
and addition of new cell wall polymers, will only lead to cell wall thickening rather than
growth unless there is a loosening of the polymer matrix. Therefore, relaxation of cell wall
matrix polymers is a prerequisite step in cell growth. This is envisaged to occur by two main
methods, namel¡ cleavage of the matrix polymers andlor disruption of non-covalent bonds
between polysaccharides.
Analysis has established that frozen and thawed cell walls, when placed in acidic pH
conditions under stress, can extend for several hours, without the addition of new wall
polymers (Cosgrove, 1989). To investigate whether the cell wall loosening mechanics were
caused by elastic properties of the wall or by endogenous wall enz)¡rnes, Cosgrove (1989),
studied the effects of proteases and other protein denaturing treatments on cell wall creep
from frozen-thawed cucumber hypocotyls. Treatment of the cell walls to inactivate or
denature endogenous cell wall proteins, inhibited cell wall extension, implying that a cell wall
protein may be involved in wall extension (Cosgrove, 1989).
Moreover, experiments to detect changes in the nature of the wall indicated no
substantial changes in its viscoelasticity further supporting the notion that enzymatic proteins,
closely associated with the cell wall, mediate cell wall extension (Cosgrove, 1989).
1.6.2 The expansins
McQueen-Mason et al. (1992) focused on isolation of cucumber cell wall proteins that
may be involved in cell wall loosening. In this experiment proteins were isolated from the
growing region of cucumber hypocotyls and tested tbr their ability to restore cell wall creep in
heat-inactivated walls. Two extracellular proteins were isolated with the ability to induce cell
I4

wall extension in a pH (acidic) dependent manner, and these are therefore good candidates for
the control of acid growth in plants. The cell wall extension abilities of these two proteins
were restricted to growing regions of the cucumber hlpocotyl, with non-growing regions not
affected. Each protein was effective in inducing extension of the cell wall in other dicot
species, but less so for grass species (McQueen-Mason et a|.,1992). Polysaccharide
hydrolytic activity could not be detected in these experiments, suggesting a novel biochemical
function for these proteins which wero named 'expansins'.(McQueen-Mason et a1.,1992)
Further analysis to elucidate the expansin mode of action revealed that they do not
have xyloglucan endotransglycosylase activity (McQueen-Mason et a1.,1993), but do have
the ability to loosen pure cellulose paper, without any detectable exoglucanase activity
(McQueen-Mason and Cosgrove,7994). The direct loosening of pure cellulose paper
indicates that expansins are able to disrupt the hydrogen bonding between cellulose
microfibrils in paper (McQueen-Mason and Cosgrove, 1994). In vivo, cell wall cellulose
microfibrils are not hydrogen bonded to each other, but are hydrogen bonded to hemicellulose
polysaccharides. Therefore expansins are envisaged to disrupt hydrogen bonding between the
cellulose microfibrils and the matrix polymers, allowing slippage of the wall components
(McQueen-Mason and Cosgrove, 1994).
Using the expansin peptide sequences to design degenerate primers Shcherban, et al.
(1995) were able to isolate two different oDNA clones from cucumber. Database searches
using the cucumber sequences revealed the existence of many expansin homologs in many
other plant species including Arabidopsis, and that grass goup I allergens contained
approximately 25% sequence identity (Shcherban et al., 1995).
Since these initial findings, two main groups of related proteins, the cr and B
expansins, have been determined to comprise the expansin superfamily. All family members
are similar in size (approximately 25 kDa) and have signal peptides, consistent with previous
findings (McQueen-Mason et al.,1992), and they contain a number of conserved amino acid
residues. These include cysteine residues thought to form disulphide bridges that stabilise the
15

protein, and four conserved tryptophan residues, which resemble the spacing of tryptophan
residues in the cellulose binding domain of cellulases (Shcherb an et al., 1995). Expansin
family members also contain a conseryed histidine-phenyalanine-glutamic acid (HFD) motif
which potentially contributes to their mode of action based on sequence similarity to the
catallic site of the family-45 glycosyl hydrolases (Cosgrove, 2000b). N-linked glycosylation
sites are found in the B-expansins, but are absent from the ø-expansins (Wu et ø1.,2001).
Expansins have been identified in all seed plants studied (Lee et a|.,200I), in ferns
(Kim et a1.,2000) and recently in mosses (Li et a1.,2002). These findings demonstrate that
expansins were present at the base of the higher plant lineage and have been conserved
throughout evolution of the land plants. Analysis of expansin gene structure suggests that the
cr and B-expansins have evolved from a common ancestral gene, as the intron/exon structure
is conserved, though the number and length of introns can vary in some genes (Lee et al.,
2ool).
The p-expansins (which include the grass group I allergens) appear to have specialised
roles in loosening the type II cell walls of grasses, which have fewer xyloglucans and pectins
and more glucuronarabinoxylans compared with type I or dicot cell walls (Section 1.6.1).
The B-expansins are abundantly expressed in grass pollen, where they are thought to facilitate
fertilisation by loosening the cell wall of the maternal tissues to allow penetration of the
pollen tube (Cosgrove, 2000b;Wu et a|.,2001).
The ø-expansins have been found to promote cell wall growth in many species,
including monocot (Cho and Kende, 1997c; Huang et aL.,2000) and dicot angiosperms
(Brummell et al.,l999a; Harrison et a1.,2001; Shcherban et a1.,1995), gymnospenns
(Hutchison et al.,1999) and ferns (Kim et a|.,2000). The o-expansins comprise a large
protein family, with the Arabidopsis thaliana genome containing at least 31 genes in this
group (Wu e/ a1.,2001). Detailed analysis of c-exparìsin gene familymembers has shown
that expression patterns are varied and often complex. Many members are expressed in
t6

multiple tissues, while others show high tissue specificity. The activity of cr-expansin has
been associated with internode growth of submerged rice (Cho and Kende, 1997 a), growth
and attachment of parasitic plants (O'Malley and Lynn, 2000), root elongation (Cho and
Kende, 1997a), development and ripening of fruits (Brummell et al.,l999b Civello et al.,
1999) growth of specialised cell types such as Zinnia xylem cells (Cosgrove, 2000b;Ím et al,,
2000) and leaf primordia initiation (Fleming et a|.,1997).
Expansins are attractive candidates for the study of cotton fibre structure and its
potential genetic manipulation firstly because they induce cell wall extension in vitro
(McQueen-Mason et aL.,1992). Secondly, application of endogenous expansins causes cell
enlargement (Link and Cosgrove, 1998). Thirdly, expansins are expressed in manner that
implicates them in cell growth (Cho and Kende, 1997c; Cho and Kende, 1998).
1.6.3 A fibre-specific ct-expansin
A oDNA, (termed pFS14 in this thesis) transcribed from GhUxpl, encoding an clc-
expansin was identified in a previous study of cotton fibre development (Orford and Timmis,
1998). Northern analysis showed that the corresponding mRNA is specific to fibres, where it
is most abundant during the elongation phase. Given the roles of other cr-expansins in cell
growth, and the temporal expression of GhExpI, this protein possibly plays an important role
in fibre development. It is hoped that once a better understanding of the exact role played by
GhExpl is obtained, manipulation of this gene may provide an opportunity to alter fibre
characteristics.
1.7 Generation of cotton varieties
The generation of improved cotton varieties by conventional plant breeding has
utilised hybridisation of different cultivars followed by selection of those with desirable traits
An example is the introduction of the mutant 'okra' leaf phenotype which is smaller, more
dissected, shows less vegetative growth, is earlier maturating, and has increased resistance to
bacterial blight disease than normal leaves (Reid et a1.,1989; Thomson et a1.,1987).
l7

Together these traits allow better insecticide and herbicide penetration, improved cotton
production and reduced amounts of trash in harvested lint. In Australia, the American okra
cultivars have been hybridised with other cotton cultivars to produce the Siokra cultivar,
which incorporates all of the beneficial okra phenotytrles, and is more suited to the Australian
environment. It provides lint yields similar to the American cultivars (Thomson et a1.,1987).
Other cotton cultivars have also been generated by traditional breeding approaches that have
improved resistance to diseases caused by fungi such as Verticillium dahliae (see
www.cotton.crc.org. au).
While traditional breeding approaches have produced many varieties of cotton with
improved characteristics, it suffers from some disadvantages. Conventional breeding via
crossing one cultivar with another compatible cultivar followed by selection can take 10 years
from the initial hybridisation. In addition, although there are many wild Gossypium species
containing desirable characteristics, genetic improvement by species hybridisation is hindered
by problems associated with sexual incompatibility. Additionally, cotton crop improvements
are inherited as quantitative traits, many have negative effects of fibre yields and quality
(Meredith, 1984).
1.7.1 Recombinant DNA technolosv
More recently, genetic engineering technology has become available, which can be
used to transfer single genes into plants, to produce a desired phenotype. Genetic engineering
techniques, in combination with traditional plant breeding approaches, provide many
opportunities to increase cotton fibre quality and yield.
The introduction of desired genes into cotton generally utilises Agrobacterium-
mediated transformation, (normally of Coker cotton varieties) followed by plant regeneration
(Firoozabady et al., 1987; V/ilkins et a|.,2000). Although the Agrobacterium transformed
cotton varieties must eventually be backcrossed to higher yielding varieties of cotton, the
recovery of transgenic cotton plants can be achieved in approximalely 2 years (John, 1997;
'Wilkins et aL.,2000), dramatically reducing production periods when compared with
18

traditionally bred cotton varieties. Another method of gene transfer in cotton utilises the
particle bombardment technique (Finer and McMullen, 1990; John and Stewart, 1992;
McCabe and Martinell, 1993).
Gene transformation techniques have successfully been used to transform insect
resistance to both American and Australian cotton varieties, with new cultivar types showing
increased resistance from damaging insect pests and stable genetic inheritance of the
transgene (Cousins et al., L99l1, Perlak et a1.,1990; Perlak et a1.,200I; Wilkins et a1.,2000).
1.8 Targeting transgene expression
While the generation of transgenic cotton with improved agricultural traits has been
successful, this process generally uses the strong constitutive promoter (35S) to express the
transgene. In many cases it may be preferable to have restricted transgene expression in
transgenic cotton. However before tissue-specific expression or manipulation of a transgene
can be undertaken, the characterisation of tissue-specific promoters must be undertaken.
ers
To date, several cotton fibre-specific genes with differing temporal expression patterns
have been isolated and characterised (Orford et al.,1999; Orford and Timmis,1997; Orford
and Timmis, 1998; Orford and Timmis, 2000). As cotton fibres develop synchronously and
lack cell division, most fibre--specific genes are thought to contribute either to fibre
elongation or cell wall biosynthesis. Although fibre-specific genes are quite well studied, the
characteri s ation o f fibre- sp ecific gene promoters is underdeveloped.
Ultimately, the generation of transgenic cotton with tissue-specific promoters linked to
a reporter gene is the best way to assess tissue-specificity. However, while the generation of
transgenic cotton plants is quicker than traditional plant breeding, it still requires many labour
intensive months of tissue culture before promoter specificity can be monitored. As a result,
the analysis of cotton fibre-specific promoters has been restricted. Highly desirable, in this
regard, is a quick and convenient transient assay for determining promoter activities in fibres
l9

and other cotton tissues. Despite the lack of a transient assay for assessing cotton promoter
specificity, other studies provide evidence for using fibre-specific promoters to alter the
temporal expression profile of the fibre-specific cr-expansin and these are described below.
Previously, John and Keller (1996) described the use of two different fibre-specific
promoters to drive expression of an enzyme involved in the synthesis of a thermoplastic
polyrner (John and Keller, 1996). Analysis of the transgenic cotton showed that the
thermoplastie pollrmer was produeed in ootton fibres under the regulation of both promoters
and the protein was detected during different fibre development stages, consistent with
temporal regulation under the two different promoters (John and Keller,1996).
Thus, the use of fibre-specific promoters, regulating different temporal expression
patterns to drive transgene expression within developing cotton fibres of transgenic cotton has
been successful. In addition, the generation of transgenic plants, in which the expression of
particular ct-expansin cDNAs or genes is altered, has also been described (BrummeIl et al.,
1999a; Brummell et a1.,2002; Cho and Cosgrove,2000; Rochange et a1.,2001).
Brummell et al., (1999) investigated the role of LeExpl, an cr-expansin gene whose
activity is associated with tomato ripening by over expression and suppression of the cDNA
using the 35S promoter in tomato plants. These results showed that over expression of the
LeExpl mRNA and protein, resulted in mature tomato fruit that was much softer than
controls. The suppression of the LeExpl mRNA and protein resulted in tomato fruit that was
much firmer than controls and had increased shelf life due to a reduction of fruit ripening/
softening (Brummell et a|.,2002).
Cho and Cosgrove, 2000, conducted a similar transgenic approach in Arabidopsis,
using the AtExpl0 gene, in a tissue-specific over expression and antisense analysis. The 35S
promoter was used in conjunction with AtExpl0 in a constitutive antisense analysis.
Endogenous expression of AtExpl0 occurs in the petiole and midrib of leaves, at the base of
emerging leaves, at the pedicel abscission region and in trichomes. Over expression of20

AtExpl0 using its own promoter (determined by quantitative RT-PCR), in transgenic
Arabidopsis resulted in plants with increased leaf and rosette size, while antisense expression
reduced these characters (Cho and Cosgrove, 2000). These results indicate that o-expansins
play amajor biological role in cell growth, and that their over expression using native
promoters, results in larger plants (Cho and Cosgrove, 2000).
In contrast, Rochange et al., (2001) reported that the constitutive transgenic expression
of a cucumber o(-expansin cDNA resulted in transgenic tomato plants with impaired growth.
The differences between these two different results may be that Brummell et al., (1999) over
expressed an endogenous tomato o-expansin, while Rochange et al., (2001) over expressed a
heterologous cucumber gene, CsExpl within tomato plants.
1.9 Aims of the proiect
Cotton fibre length is the main determining factor for the quality of spun thread, with
the longest fibres being most commercially desirable. Previous research has shown that a
class of cell wall proteins, the expansins, are able to induce cell wall extension in vitro
(McQueen-Mason et al.,1992), stimulate cell growth when applied endogenously (Link and
Cosgrove, 1998) and are expressed in a manner consistent with a role in plant (Cho and
Cosgrove, 2000 Cho and Kende, 1997b; Cho and Kende, 1997c;Im et a1.,2000; Shcherban
et a1.,1995), and fibre (Orford and Timmis, 1998) growth.
The aims of this project were, firstly to isolate and characterise the gene corresponding
to the fibre-specific cr-expansin cDNA, pFS14, along with other o-expansin family members
and to perform RT-PCR expression analysis using primers specific for each cr-expansin gene,
to determine the expression patterns of the different family members. An evolutionary
analysis also was undefiaken to investigate relationships between the cotton ø-expansins and
those from other species.
The second main aim was to develop and optimise a transient assay for use in cotton
fibres and other cotton tissues. The success of the transient assay was verified by testing the
2l

ability of the pFS14 promoter to drive GUS reporter gene expression in developing cotton
fibres. An experimental and bioinformatic analysis of the pFS14 promoter was undertaken to
identifu previously-characterised cis-acting elements that may be involved fibre-specific gene
expression. Additionally, comparisons of the pFSl4 promoter with other fibre-specific
promoter sequences was undertaken to identify uncharacterised conserved regions, assuming
that functionally significant regions (i.e. that may confer fibre-specificity) should be
conserved amongst fibre-specific promoters. Once identified, an attempt was made to verify
the significance of these regions by a functional dissection of the pFS14 promoter.
The final aim of this project was to create various constructs that will use hybrid fibre-
specific promoters designed to alter the window of expression of the pFSl4 o-expansin
mRNA.
22

CHAPTERTWO
Materials and Methods
23

24
2.1 Materials
2.1.1 Samples of plant material
Sources of plant material utilised in this study are summarised in Table2.l.
2.1.2 Nucleic acids
A number of plasmid clones and oligonucleotides were used in this study and are
presented in Tables 2.2 and Table 2,2.4 respectively. The CGBI cotton Siokra 1-4 genomic
library (in ÀCnV-12") was provided by Dr D. Llewellyn, CSIRO Division of Plant lndustry,
Canberra, Australia.
2.L.3 Chemical reaeents
General laboratory chemicals were of analytical research grade and were purchased
from a range of manufacturers. Specialist reagents and their sources are listed below:
Antifoam A emulsion Sigma Chemical Co, St Louis, MO
BSA Boehringer Mannheim, Germany
p-mercaptoethanol BDH Chemicals, Australia
DEPC Sigma Chemical Co, St Louis, MO
DMSO BDH Chemicals, Australia
Murashige and Skoog Basal Media Sigma Chemical Co, St Louis, MO
PEGeooo Sigma Chemical Co, St Louis, MO
PEG366ç Sigma Chemical Co, St Louis, MO
Spermidine Sigma Chemical Co, St Louis, MO
Spermidine (free base) Sigma Chemical Co, St Louis, MO
2.L.4 Stains and dyes
Bromophenol blue
Ethidium bromide
Orange G
Sigma Chemical Co, St Louis, MO
Sigma Chemical Co, St Louis, MO
Sigma Chemical Co, St Louis, MO
25

Table 2.1. Plant material utilised in this study
Species Source Location
Cotton varietiesG. hirsutum L., cv. Siokra l-4
Cotton Seed Distributors, Wee Waa, NS\ùy'
Dr Sharon Orford, Department of MolecularBiosciences, Discipline of Genetics, University ofAdelaide.
Chapter 3, 5,and 6
G. hirsutum L., cv Siokra l-4fibre tissues Chapter 3
Tobacco varietiesTobacco, Nicotiana t ab acum CSIRO, Plant Industry Horticulture unit, Hartley
Chapter 5Grove. Urrbrae. SA
2.1.5 Enzymes
All restriction enzymes (antl 10 x restriction buffers) were purchased from Boehringer
Mannheim, New England Biolabs (NEB) and Promega. The remaining enzymes were
obtained from the following manufacturers:
DNase I (RNase free)
Klenow fragment
Lysozyme
M-MLV reverse transcriptase
RNase A
RNasin@
T4 DNA ligase
Zøq DNA Polymerase
Boehringer Mannheim, Germany
Boehringer Mannheim, Germany
Sigma Chemical Co, St Louis, MO
Promega, Madison,'WI
Sigma Chemical Co, St Louis, MO
Promega, Madison, WI
New England Biolabs, Beverly, MA
Geneworks, Adelaide, Australia
Reaction buffers (10 x) were supplied with appropriate enzymes and25 mM MgCl2
was supplied with Taq DNA pol5rmerase. Klenow fragment was supplied with the
appropriate buffer at 5 x concontration.
2.1.6 Radioactive isotopes and nucleic acids
Radiochemical Centre, Amersham, UK[o-"p] dATP
26

(l 000-3000 Cilmmole; Redivue)
Mixed random decamers Geneworks, Adelaide, Australia
Oligo(dT)rz-ls Pharmacia, Uppsala, Sweden
Salmon sperm DNA Sigma, Chemical, Co, St Louis, MO
deoxyribonucleotides Boehringer-Mannheim, Germany
Other oligonucleotides used in this project are summarised inTable 2.2.
2.1.7 Molecular weisht markers
DMW-100M l00bp DNA ladder,
DNA ladder, 100 bp
Lambda DNA restricted with Hindlll
RNA Marker, 0.28-6.58 kb
2.1.8 Antibiotics and indicators
Ampicillin
Chloramphenicol
IPTG
Kanamycin
X-gal
X-gluc
Geneworks, Adelaide, Australia
New England Biolabs, Beverly, MA
Progen Industries Ltd, Australia
Promega, Madison, WI
B oehringer-Mannheim, Germany
Progen Industries Ltd, Australia
Progen Industries Ltd, Australia
Sigma, Chemical, Co, St Louis, MO
Progen Industries Ltd, Australia
Progen Industries Ltd, Australia
2.1.9 Bacterial strains
The bacterial strains used in this project are summarised in Table 2.3
2.1.L0 Clonins vectors
Plasmid and phage vectors used in this project are presented in Table 2.4.
27

2.l,ll Kits and miscellaneous materials
Kits and other materials used in this project were obtained from the following
manufacturers:
Bio-Gel P60 (50-100 mesh) Bio-Rad Laboratories, Richmond, CA
Bio-Gel P60 (100-200 mesh) Bio-Rad Laboratories, Richmond, CA
Bio-Rad 1.0 Micron Gold Bio-Rad Laboratories, Richmond, CA
Quantum Prep Plasmid Miniprep Kit Bio-Rad Laboratories, Richmond, CA
Filter paper, 55mm circle Whatman@, Maidstone, England
Glass beads, 150-212 ¡tm Sigma Chemical Co, St Louis, MO
HybondrM-N+ nylon membrane Amersham, UK
MarathonrM oDNA Amplif,rcation Kit CLONTECH, Laboratories, Palo Alto,CA
Millex@ Syringe Driven Filter Unit
Millipore 100pm nylon mesh hlters
mRNA Purification Kit
QIAGEN plasmid midikit
QlAquick Gel Extraction Kit
QlAquick PCR Purification Kit
Sepharose CL-68
Swinney 13 mm plastic filter holder
Universal GenomeWalker'" Kit
Millipore, Bedford, MA
Millipore, Bedford, MA
Pharmacia, Uppsala, Sweden
QIAGEN, Valencia, CA
QIAGEN, Valencia, CA
QIAGEN, Valencia, CA
Pharmacia, Uppsala, Sweden
Gelman Laboratory, Ann Arbor, Ml
CLONTECH Laboratories, Palo Alto,CA
Fuji RX Medical X-ray Film, Fuji PhotoCo, Ltd.
Ultrafree@-Mc 0.45 pm filter unit Millipore, Bedford, MA
X-ray film
28

Table 2.2. Olisonucleotide primers
Primer Sequence (5'->3'l Source and Use Location
T7
Plasmid primersT3 ATTAACCCTCACTAAAG
AATACGACTCACTATAG
RSP AACAGCTATGACCATG
Sequencing of pBluescript@ inserts,Geneworks, Adelaide, Australia
S equencing of pBluescript@ inserts,Geneworks, Adelaide, AustraliaNew England Biolabs, Beverly, MA;Sequencing of pBluescript@ insertsSequencing of pBluescript@ inserts,Geneworks, Adelaide, AustraliaSequencing of pBluescript@ inserts,Geneworks, Adelaide, AustraliaAdapter primer 1 for 5'RACE
Adapter primer 2 for 5'RACE
Chapters 3,5,6 andT
Chapters 3,5,6 andTChapters 3,5,6 andTChapters 3,5,6 andTChapters 3,5,6 and7Chapter 3
and 6Chapter 3
and 6
Chapter 3Chapter 3
Chapter 3
Chapter 3Chapter 3
Chapter 3Chapter 3
Chapter 3
M13c20)c40)
GTAJAJAACGACGGCCAGT
GTTTTCCGAGTCACGAC
CCATCCTAATACGACTCACTATAGGGCACTCACTATAGGGCTCGAGCGGC
AP1
AP2
Primers designed from insert sequencesPrimers Tor GhExpIAElOF1E1ORl
GTT AJAAGACGGGTGCCACCGGTT AJqAC AACTGC AAC AACGTGGCCTCCAGTGTAAGTCTGTCCATGCACCACAGCTCAAGCCGGT AJAAGTGCAGGAGAAGTGGACCGCCCAAGGTTACTGCCCAACTGGATGGAGCAACGTCG
Primer for sequencing GhExpI0Primer for sequencing GhExpl0
Primer for sequencing GhExpl0Primer for sequencing GhExpl0Primer for sequencing GhExpI0
Primer for sequencing GhUxpl0Primer for sequencing GhExpI0,P.T-PCR primer
E103E104E105
E106E1ORTl
Primers for GhExol2EI2F7 CTTAAGTCCACTTGAATGCTT
GGF12F2 TTCACCATTAACGGATTCCGE12F3 GTTTTAGGCGGTGCATGTGGG812R1 GGAAGGGCTGCCGGAGTGEI2R2 CCATTGTTCCAGAAGCATCGCEI2R3 AJqAGAAGGAGCAACTGCGE12R4 GGAACACCATGTGATGTGCCE12R5 AGTTACTACATATGCTTCGCEl2RTI AATGACCACCTCGAACCC
Primers for GhExnI4TGCATATTGCATGCTCCCAGGAGGGGAATAGATAACCGCCTAG AJAATGCC AJAJA.A.GTGCCCAGTGTTTGGGAGCATGCTTTGGTGCCAACCATCTCCCCTTCCTTCGCATCGCCCGCGGCCGGGTAATCGCATTAGAGGTAGGAGATGGAACTCGAGCATTGACTCCCCAATGTTTTGCCATCCACC
Primer for sequencing GhUxpl2
Primer for sequencing GhExpl2Primer for sequencing GhExpl2Primer for sequencing GhExpl2Primer for sequencing GhExpl2Primer for sequencing GhExpI2Primer for sequencing GhExpI2Primer for sequencing GhExpl2Primer for sequencing GhExpI2,RT-PCR primer
Primer for sequencing GhExpl4Primer for sequencing GhUxpl4Primer for sequencing GhExp14Primer for sequencing GhExpI4Primer for sequencing GhExpl4Primer for sequencing GhExpl4Primer for sequencing GhExpl4Primer for sequencing GhExpl4Primer for sequencing GhExpl4Primer for sequencing GhExpl4,P.T-PCR primerPrimer for sequencing GhExpI4,PtT-PCR primer
EI4F1EI4F2E14F3874F4E14F5El4RIEI4R2814R3E14R4E14RTI
Chapter 3Chapter 3Chapter 3
Chapter 3Chapter 3Chapter 3Chapter 3Chapter 3
Chapter 3
Chapter 3
Chapter 3
Chapter 3Chapter 3
Chapter 3
Chapter 3
Chapter 3
Chapter 3
Chapter 3
E14RT2 CTTTTCAGAGATGGCGAGGC
29
Chapter 3

Primers for GhExpíS53F1S53F2S53F3S53F4S53RI
S53R2S53R3S53R4553RTIS53RT2
CAATGGGCTGAGTTGTGGGCAACACCTACCTCAACGGGGTACCATGCAGAAGAAAGGTGCCTTTTGCTGCTTCCCCTCTAATAGGGAGAJA'AAGCAGGCCTGGCTATACAGGTTTCCGTTAACACTGCTGGCGGGTGGGTTTGGAGGGCAGAAATTGGGGGCAACATTGCTGGfuAACCTGCTTTGTCAACAATGGGC
Primer for sequencing GhExpíPrimer for sequencing GhExpíPrimer for sequencing GhExpíPrimer for sequencing GhExpíPrimer for sequencing GhExpí
Primer for sequencing GhExpíPrimer for sequencing GhExp6Primer for sequencing GhExpíRT-PCR primerRT-PCRprimer
Chapter 3Chapter 3Chapter 3Chapter 3Chapter 3
Chapter 3Chapter 3Chapter 3Chapter 3Chapter 3
Chapter 3Chapter 3Chapter 3Chapter 3Chapter 3
Chapter 3
Chapter 3
Chapter 3
Chapter 3
Chapter 3
Chapter 3
Chapter 3
Chapter 3
Chapter 3
Chapter 3Chapter 3Chapter 3
Chapter 3Chapter 3
Chapter 3
Chapter 3
Chapter 3
Chapter 3
Chaptcr 3
Primers for GhExpSS96FI GCTTGTAGTAGGCACCGCS96F2 AAGAGCGCGCTAAGTGCTTCCS96RI GTTATGCCAAGGCTTTAGCCS96R2 AGGTTGACGGTGGTGATTGCGS96R3 GAAGGGAJAJAJAAGAGGAGAGG
C
Primer for sequencing GhExp5Primer for sequencing GhExp5Primer for sequencing GhExpïPrimer for sequencing GhExp5Primer for sequencing GhExpí
Primers ïor pFS14. GhExp14.2 and, GhExp14.4EXP1 CCTCAATGGTGCATTAGTCG Primer for sequencing GhExpl4.2 and
GhExpI4.4, RT-PCR and general PCRprimer
E><P2 CCAGCTTCGTTATCAACACC Primer for sequencing GhExpl4.2 andGhExpl4.4,RT-PCR and general PCRprìmer
EXP3 CCTTTCTTCACACATGACACC PrimerforsequencingGhExpl4.2 andGhExpI4.4, general PCR primer
EXP4 CATTGTTGCACCGGAGCTCGT Primer for sequencingGhExpl4.2 andAGCAGGC GhExpI4.4, general PCR primer
EXP5 CTCAJAAGCTGCTGTGCTCGT"T Primer for sequencing GhExpI4.2 andC CATACC GhExpl4.4, general PCR primer
EXP6 TGTCCATCAAGGGTTCC Primer for sequencing GhExpl4.2 andGhExpl4.4, general PCR primer
E){PT CATTGTAGGCTGTGATAGTCC PrimerforsequencingGh&xpl4.2 andGhExp14.4, general PCR primer
14.2RTl CCGAACCGGCATTCTTGCG RT-PCR gene-specific primer andsequencing of GhExp I 4.2
74.2RT2 CAGCAGGCACTACATTGTAGG RT-PCR gene-specific primer forC GhExpl4.2
l4.4Fl GCACTGCTCGCC Primer for sequencing GhExp14.414.4F2 CACCGGAGCTCGTAGCAGGC Primer for sequencing GhExpl4.414.4R1 GTACAGTCAAGGGTATGGAAC Primer for sequencing GhExpI4.4
G74.4R2 AAGTGACTGCCAGCGATAGC Primer for sequencing GhExpl4.4l4.4RTl CAACATGGTGTTGATAACCG RT-PCR gene-specific primer for
GhExpl4.4l4,4P'T2 AGTTTGGTTCACTATTAGG RT-PCR gene-specific primer for
GhExpI4.4Pl4gwl GGCTTCAATTGCAAGCAATTA GenomeWalker primer for (1' PCR)
GGATACTGC GhExp14.2 andGhExpl4.4Pl4gw2 GTGCCCTTTTAATGTATAGCTT GenomeVy'alkerprimer (2" PCR) for
AAGCC GhExp14.2P74gw3 GCTACGTACGTTACTTAGCTT GenomeWalkerprimer (2'PCR) for
TG CTTGTCG GhExpl4.4pl4.2RACEl CGATTCCAGCTCGATATTCTG Ncstcdprimcrforgcncrating5'pFS14
CTATCC oDNA ends
30

Primers for Gft,E'xp14.2 promoter deletions
pl4.2proml GGATCCATCTTTTGATTGGCACAJAACAGTGCG
pl4.2ptom2 GGATCCGACTTCTTCACCTTCAGTCC
pl4.2prom3 GGATCCAGGCAATTAGGAGACTGCG
pl4.2prom4 GGATCCTCCAJAATTTGTACTCTTTCACC
pl4.2prom10 GGATCCTGGCTACGTACGGTACTTAGCG
Generation of full length GhExpl4.2promoter for cloning into GUS vectorGeneration of 5' deletion of GhExp14.2promoter for cloning into GUS vectorGeneration of 5' deletion of GhExp 14.2promoter for cloning into GUS vectorGeneration of 5' deletion of GhExp 14.2promoter for cloning into GUS vectorGeneration of 5' deletion of GhExp 14.2promoter for cloning into GUS vector
Chapter 6
Chapter 6
Chapter 6
Chapter 6
Chapter 6
Table c¿ft1 strainsStrain Source Use Genotype and ReferenceDH-5crF' CLONTECH Host for general *.Alß"dAl, gyrA%, thll, MV
cloning (r*-, m*+), supE44, relAI, deoR, A, (lacZYA- argF)U169 [F', Q80d tacZ L,
Mlsl; 1983)
KW251 Promega,Madison,'WI
Host for propagationof ÀGEM-12rM cottongenomic library
supE44, galK2, g0lT22, metBl, hsdR2,mcrB-, mcrX, larg\Sl: Tnl 0],recDl0I4
bacteriophaqe vectors
PlasmidVectorpBluescript@ SK-
pGEMT-easy@
pJK.KiwiGUS.ocs.Km(-)(Figure 2.1)
pCB1004
SourceStratagene GmbH,Heidelburg, GermanyPromega, Madison, WI
Dr Danny Llewellyn,CSIRO Division ofPlant Industry,Canberra, AustraliaDr Robin Lockington,Department ofMolecular Biosciences,Adelaide University,AustraliaDr Tricia Franks,CSIRO, Division ofPlant Industry,Adelaide, Australia
UseGeneral cloning andsubcloning vectorCloning of PCRproductsGUS reportervector
Reference(Short et aL,,1988)
(Robles, 1994)
(Kirschman andCramer, 1988)
General cloning andsubcloning vectorwith hygromycinresistance
GUS reporterconstruct derivedfrom pARTT
(Canoll et al.,1e94)
(Franks et al.,1ee8)
pNTG*
3I

PhageÀGEM-12" I.GEM-12 Xho I half-
site arms cloningsystem, Promega,Madison WI
Vector for cottongenomic library,CGBI
(Frischauf et al.,1983; Kamet al.,re84),
32

EcoF'l
NotlSal IXbaIBamHISmaIKpnISacIEcoP.l
Pst ISphIHindIII
Xho I
Fieure 2.1. The B-elucuronidase (GUS) vector
Schematic diagram of the GUS vector used in this project, showing the Kanamycin
resistance marker and the direction of transcription of the GUS reporter gene.
pJK.KiwiGUS..OCS.Km
GUS
endOCS 3'
33

t)Nase I reaction butler
2.2 Solutions. buffers and media
2.2.1 Solutions and buffers
All solutions and buffers were prepared using millipore water and where appropriate,
were autoclaved. Solutions not able to be autoclaved were sterilised by filtration through a
0.2 prn fìlLer, Solutions for RNA work were treated with 0.1% (vlv) DEPC (Sambrook et al.,
1989) prior to autoclaving. Solutions and all other buffers routinely used in this study were as
follows:
Denaturing solution 1.5 M NaCl, 0.5 M NaOH
0.02% (w/v) Ficoll@, 0.02yo (w/v) PVP, 0.02yo (w/v)gelatin
0.1 M NaAc, 5 mM MgSOa þH5.0)
0.25% (w/v) bromophenol blue,40Yo (w/v) sucrose
1 x Denhardt's
6 x DNA loadine buffer
Formamide RNA loadine buffer 50% (v /v) formamide, 17 .5yo formaldehyde,l0% (vlv) 10 x MOPS buffer, 50 mg (w/v) ethidiumbromide
Hot borate buffer 0.2 M Na-borate dehydrate, 30 mM EGTA, 1 %(w/v) SDS, l% Na- deoxycholate
Lysins solution 10 mM glucose, 25 mM Tris-HCl (pH 8.0), l0 mMEDTA, 4mglmllysozyne
10 x MOPS buffer 200 mM MOPS, 50 mM anhydrous Na-Ac, 10 mMEDTA, adjusted to pH 7.0
Neutralisine solution 1.5 M NaCl, I M Tris-HCl (pH 7.2), I mMEDTA
Phenol/chloroform 50% (vlv) phenol, 48% (vlv) chloroform ,2o/o (v/v)isoamyl alcohol, buffered with an equal volume ofTris-HCl (pH 8.0), 0.2% (vlv) B- mercaptoethanol
Preassay buffer for GUS assaE 0.5 mM K-ferricyanide, 0.5mM K- ferrocyanide, 50mM NaPO¿buffer (pH7.0)0.1% (vlv) Triton X-100
81 % (v/v) preassay buffer, 03% (vlv) X-Gluc, 0.1% (vlv) [3-mercaptoethanol, 7 Yo Chloramphenicol,la % @lv) DMSO
Assay buffer for GUS assays
34

Prefixinq solution for GUS assays
buffer
RNA homo eenisation buffer
5 x RNA loadine buffer
I xTAE
IxTBE
lxTE
SM buffer
Stop buffer
IxSSC
1 x SSPE
2.2.2 Nledia
Luria broth (L-broth)
Luria aear fl--Aearl
% MS aear
% MS broth
100 mM NaPO¿ buffer, 0.001% (vlv) 40%formaldehyde. 0. 00 1 % B-mercaptoethanol, 0,0I%Triton X-l00
5 x SSPE, 5 x Denhardt's, 0.5olo (w/v) SDS, 100mglml denatured sonicated salmon speTm DNA
5 M guanidine isothiocyanate, 0.2 M Tris-AcpH8.5), 0.2% (wlv) sarcosyl, with0.7%((v/v) B-mercaptoethanol and lo/o (w/v) PVP freshly added
8% (wlv) Ficoll, 0.02% (w/v) bromophenol blue,0.04% (w/v) xylene cyanol
40 mM Tris-HCl, 20 mM Na-acetate,2mM EDTA,adjusted to pH 7.8 with glacial acetic acid
0.9 M Tris-borate,2m}lf EDTA (pH 8.0)
10 mM Tris-HCl (pH8.0), 1 mM EDTA (pH8.0)
100 mM NaCl, 10 mM MgSOa, 50 mM Tris-HCl (pH 7.5),2o/o (w/v) gelatin
10 mM Tris-HCl (pH 8.0), 1 mM EDTA (pH8.0),0.2% (w/v) SDS
0.15 M NaCl, 0.015 M Na3-citrate, adjusted to pH7.2 withNaOH
0.18 mM Tris-HCl (pH 8.0), 10 mM NaHzPO+, ImM EDTA (pH7.2)
l% (wlv) tryptone, l% (wlv) sodium chloride,05%(wlv) yeast extract. Adjusted to pH 7.2withsodium hydroxide
Luria broth with the addition of 1% (w/v)bacteriological agar No. 1
Murashige and Skoog Basal medium with Gamborgsvitamins, 0.7 5% agarose.
% Murashige and Skoog Basal medium.
l% (wlv) tryptone, 0.5% (w/v) NaCl, 0.01 MMgSOa, Q.7% (wlv)bacteriologicalagar No l oragarose.
TB top aqarlagarose
35

2.3 Methods
2.3.1 Plant qrowth conditions
Cotton seeds were planted in 8 L pots filled with a commercial premium potting mix.
Generally 2-4 seeds were sown per pot. Once planted, the pots were placed in growth
cabinets and plants were grown using the following conditions: daylnight teuperatures
30"C125"C and alightldark cycle of 16/8 hours. The light source used for growth conditions
was fluorescent and incandescent lamps. Tobacco seeds were planted in 8 L pots filled with
potting mix and later thinnedto 2 - 4 seedlings per pot once established.
Cotton flowers and leaves for RNA work were collected from mature cotton plants,
weighed, snap frozen in liquid nitrogen and stored at -80'C until use. Cotton root and
hypocotyl tissues required for RNA work were dissected from seedlings that were
approximately 5 cm in height, weighed, snap frozen in liquid nitrogen and stored at -80oC
until use.
2.3.2 General techniques
2.3.2a Restriction disests
Digestion of DNA by restriction enzymes was performed in a minimal volume, using
conditions that were recommended by the enzyrne manufacturer, for a minimum of two hours.
Five units of restriction enz)ryne were added per pg of DNA, ensuring that the volume of
enzyme never exceeded 10% of the total reaction volume. In all restriction digests
Spermidine and RNase A were added to a final concentration of 3 mM and 20 ¡tglml
respectively.
2.3.2b Electrophoretic separation of DNA
Size fractionation of DNA fragments was performed by submarine electrophoresis on
0.6-1.5% (dv) agarose gels, submerged in 1 x TAE running buffer. Samples were mixed
with 6 x load buffer to give an overall concentration of lx load buffer and were
electrophoresed at 15-75 Volts until the bromophenol blue dye had migrated 213 of theway36

down the gel. The DNA was visualised under ultraviolet light after staining with 5 pglml of
ethidium bromide and destaining in HzO. Where appropriate, DNA fragment size estimation
on agarose gels was accomplished using a computer program, Fragrap, based on Duggleby ø/
al., (1981).
2.3.2c Recovery of DNA from agarose gels
Method l:
A gel slice containing the fragment of interest was frozen, squeezed through a26G
needle into an Ultrafree@-Mc 0.45.pm filter unit and the filter was washed with 200 pl of I x
TAE buffer. The DNA was allowed to elute from the gel at room temperature for 15 minutes.
Centrifugation at 7000 x g for three minutes separated the DNA solution from the agarose in
the upper compartment (adapted from Thuring et al., 1975), and the DNA was recovered by
ethanol precipitation.
Method 2:
The fragment of interest was isolated from the gel using a sterile scalpel blade. The
DNA was isolated, using the QIAGEN gel extraction kit, as per manufacturers instructions.
2.3.2d PurifÏcation of DNA usine phenoVchloroform extraction
If necessary, DNA solutions were made up to 100 pl volume with 1 x TE and purified
by the addition of an equal volume of phenol/chloroform. The emulsion was mixed and
centrifuged at 12000 x g for two minutes and the upper aqueous layer was transferred to a
new tube. Contaminating phenol was removed by the addition of an equal volume of
chloroform, mixing and centrifugation as above. The DNA solution was transferred to a new
tube and concentrated by ethanol precipitation.
2.3.2e of DNA
Precípitation by ethanol
DNA was precipitated by addition of one-tenth the volume of 3 M sodium-acetate, pH
5.2 and2-2.5 volttmes of cold redistilled ethanol. The DNA was left to precipitate at -20"C
for 16 hours and was recovered by centrifugation at 12000 x g for 25 minutes at 4'C. The
37
pellet was washed with coldT0o/o (v/v) ethanol, dried under vacuum and resuspended in a
minimal volume of I x TE.
P r e cipitati on by is opr op ano I
In some cases, one tenth the volume of 3 M sodium-acetate, pH 5.2, and an equal
volume of cold isopropanol was used to precipitate DNA. The DNA was recovered by
centrifugation at 1200 x g for 15 minutes and all traces of isopropanol were removed using a
drawn-out Pasteur pipette. The resulting pellet was washedinT0%o (v/v) ethanol, dried under
vacuum and resuspended in 1 x TE.
23.2f Determination of DNA and RNA concentration
In some cases DNA concentration was estimated by comparison with HindIlI-
digested 1, bacteriophage DNA markers run on the same agarose gel. Otherwise both DNA
and RNA concentrations were determined by UV spectrophotometry.
2.3.3 Preparation of DNA samples
2.3.3a Genomic from nlants
Cotton DNA samples (G. hirsutumL.,cv. Siokra 1-4) were provided by Dr Sharon
Orford, Department of Molecular Biosciences, Discipline of Genetics, University of Adelaide
2.3.3b Small-scale plasmid preparation
Alknline Lysis
Plasmid DNA for all general applications was prepared using the scaled-up version
(for 1 0 ml of overnight bacterial culture) of the alkaline lysis method (Sambrook et al., 1 989).
Rapid Boiling Lysis
Plasmid DNA for quick screening of large number of transformant colonies was
prepared using the boiling lysis method (Holmes and Quigley, 1981).
2.3.3c Large-scale plasmid preparations for transient assays
Plasmid DNA for particle bombardment was prepared using a QIAGEN plasmid
midikit, and the manufacturer's recommended procedures.
38

2.3.3d Prenaration of nlasmid DNA for automated sefluenctno
Plasmids for sequencing were prepared using the Bio-Rad plasmid minikit and the
manufacturer' s instructions.
2.3.3e Preparation of î, bacteriophage DNA from plate lvsates
Purified ¡,GEM-12'" recombinant cloned DNA was prepared from plate lysates using a
modified method from Sambrcok et al., 1989, Lambdabacteriophage were plated to give
confluent plaques on TB agarose plates. To suspend phage particles into solution each plate
was washed with 4 ml of SM buffer followed by gentle shaking at room temperature for two
hours. The solutions from 4 plates were combined into one 30 ml corex@ tube and the plates
were washed with an additional one ml of SM buffer. The pooled solution was then
centrifuged at 8000 x g for 10 minutes to pellet any bacterial debris. The supematant was
transferred to a clean 30 ml "or.*@
tube, both DNase I and RNase I were added, to final
concentrations of 0.1 Wúml and I ¡tglml respectively and the mixture was incubated at37"C
for t hour. After incubation, an equal volume of 2 M NaClz, 20 %P8G6666 wâs added and the
mixed solution was incubated on ice for one hour. The solution was centrifuged at 11000 x g
for 20 minutes to pellet the precipitated bacteriophage. The pellet was resuspended in 0.5 ml
of SM buffer by vigorous vortexing. The resuspended solution was transferred to a sterile
eppendorf tube, 5 pl of both 0.5 M EDTA and 10 % SDS were added and incubated at 68'C
for 20 minutes. The solution was extracted twice with buffered phenol, once with
phenol/chloroform and once with chloroform. Cold isopropanol was added to the final
aqueous phase and the solution was incubated at -80'C for 20 minutes to precipitate the
bacteriophage DNA. The solution was thawed and spun at 14000 x g for 15 minutes, to pellet
DNA. The pellet was rinsed in10 o/o ethanol, resuspended in 100 ¡.tl 0.3 M NaAc plus 200 pl
of 100 o/o e,thanol and incubated at - 80'C for 10 minutes. The DNA was retrieved by
centrifugation at 14000 x g for 15 minutes, and the pellet rinsed in70 o/o ethanol and vacuum
dried before resuspendion in 50 pl of 1 x TE and storage aI -20oC.
39

2.3.4 Manipulation of bacteriophase
2.3.4a Preparation of host cells for phage propagation
An individual E. coli (KW251) bacterial colony from a selective media plate was
grown in 50 ml of L-broth supplemented with 0,2Yomaltose and 10 mM MgSOa at 30oC
overnight. Cells from this culture were prepared using Stratagene instructions for the
predigested ),,ZAP@lIlEco RI Cloning kit and diluted to an ODeoo: 0.5 with 10 mM MgSOa
before use.
2.3.4b Platine and isolatins bacterÍophase
Plaque lifts of the cotton genomic library CGBI were obtained from Dr Sharon Orford.
Positive plaques, which appeared on both the primary and duplicate lifts after
autoradiography, were aligned to the agar plates. Plaques were removed using the large end
of a sterile pasteur pipette, deposited into 0.5 ml of SM buffer containing 20 pl of chloroform
and left to elute for approximately 2 hours at room temperature. Following this the phage
were plated at low density onto 85 mm plates for secondary or tertiary screening.
Dilute KV/251 cells were mixed with phage and incubated at37"C for 18 -20 min
before being plated onto 85 mm L-Agar plates, using 200 pl of plating cells and three ml of
TB top agar, melted and cooled to 48'C. The plates were incubated at 37'C for 8-16 hours.
2.3.5 Clonine strategies
2.3.5a Clonine of PCR products
All PCR products were purified using the QlAquick PCR cleanup kit, following the
manufacturer's instructions, and were ligated into pGEMT-easy@ following the
manufacturer's (Promega) instructions. Ligation reactions were transformed into E. coli
DH5crF' cells as per Section 2.3.5d.
40

2.3.5b Preparation of insert DNA and plasmid vector
DNA fragments for ligation were generated by complete restriction and then purified
in one of two ways. Insert DNA was phenol/chloroform extracted and then ethanol
precipitated and purified by CL-68 column chromatogtaphy (Murphy and Kavanagh, 1988),
or recovered from agarose gels using the freeze-squeeze method.
Vector DNA for use in ligations, was digested with the appropriate restriction enzyme,
purified by extraction with phenol/chloroform, precipitated with ethanol and resuspended to
give a final concentration of 50 nglpl. -:
2.3.5c Lieations
Ligations were performed using 50-100 ng of vector DNA and an approximately
equimolar amount of insert DNA, catalysed by 1 Weiss unit of T¿ DNA ligase in a 10 pl
reaction. All ligations were incubated at 16oC overnight.
2.3.5d Preparation and transformation of competent,E coli
Preparation of DH5crF competent cells for transformation was performed using the
calcium chloride method (Sambrook et ø1., 1989). Transformation of competent E.coli cells
with ligation mixtures was achieved using heat shock at 42"C (Sambrook et al., 1989). The
cells were pelleted at 7000 x g for 30 seconds and resuspended in 400 pl L-broth. Colour
selection of colonies containing recombinant plasmids was achieved by plating on L-Agar
plates containing 100 pglml ampicillin, 200 ¡tglml X-gal and 160 ¡tdml IPTG.
2.3.6 RNA lation
2.3.6a Total RNA preparation
Cotton tissue samples were collected, frozen in liquid nitrogen and stored at -80oC.
After dissection and freezing, RNA for subsequent RT-PCR reactions was isolated from
cotton tissues using the method of Wan and Wilkins (1994), except that amounts of all
reagents were doubled to accommodate 1 g of tissue and a polytron was used in place of a
4l

glass tissue grinder. RNA was stored in aliquots under 80% (vlv) ethanol at -80oC.
2.3.6b Electrophoretic separation of RNA
Samples of 10 pg of RNA were run on denaturing formaldehyde agarose gels,
submerged with I x MOPS as a running buffer. RNA samples under ethanol were recovered
by centrifugation at 12,000 x g for 20 minutes at 4"C, dned in ydcuo and dissolved in 20 pl of
formaldehyde RNA loading buffer. Samples were then heated at 65oC for 5 minutes to
denature the RNA, mixed with 5 x RNA tracking dye and loaded onto a 1.4% (wlv) agarose,
'r59'o (vlv) formaldehyde, I x ÌV{OPS gel. RNA gels were iun at 50 mA for four to five hours
before the RNA was stained with ethidium bromide and photographed under UV light.
2.3.7 Transfer of DNA to nylon membranes
2.3.7a Southern blottine
Following electrophoresis, DNA was transfered and onto HybondrM-N* nylon
membrane, via alkali transfer following the instructions of the manufacturer (Amersham).
2.3.7b Plaque liftine
Plaque imprints were transferred onto Hybond N*(Amersham) following
manufacturer's instructions. Prior to plaque lifting, plates were chilled at 4'C for
approximately two hours to stabilise the top layer of agarose. The Hybond Ñ filters were
then carefully placed on top of the agarose surface and left for one minute at room
temperature. The filters were peeled off and the DNA within the î, bacteriophage particle
imprints was denatured, neutralised and fixed (alkali) onto the filters, according to Amersham
instructions.
2.3.7c Colonv hvbridisation
Colony hybridisations were preformed largely as described by Grunstein and Hogness
(1975). Following overnight regrowth at37"C on supplemented L-Agar plates, the nylon
filter was placed colony side up on a pad of three pieces of Whatman (3MM paper) soaked in
42

lysing solution for 20 minutes, with blotting onto paper towel every 5 minutes. The filter was
transferred to a fresh pad of 3MM paper soaked in denaturing solution plus 1% SDS for a
total of 20 minutes with blotting every seven minutes. This procedure was repeated with 3
MM soaked in neutralising solution before the filter was partially air-dried and washed in2 x
SSC, during which bacterial debris was removed using absorbent cotton wool. The DNA was
alkali-fixed onto the filters as per Alkali instructions,
2.3.8 Radioactive labelline of DNA probes
DNA fragments for radioactive labelling were purified from agarose gels by the
freeze-squeeze method previously described (see Section 2.3.2c) and 50-200 ng was labelled
by primer extension of randgm decamer oligonucleotides (Feinberg and Vogelstein, 1983)
using the method of Hogson and Fisk (1987) and ¡cr-32P1 dATP.
Unincorporated nucleotides were removed by spun column chromatography through
Bio-Gel P60 resin using100 pl G50-100 beads and 400 pl G100-200 beads layered into a 1.5
ml microfuge tube, punctured with a fine needle at the conical point. Columns were packed
and equilibrated with 100 pl stop buffer by centrifugation at 170 x g for two minutes.
Labelled DNA fragments were collected by adding the labelled samples in stop buffer in a
total volume of 100 pl, to the top of the column and recentrifugation at 170 x g for two
minutes.
2.3.9 Prehybridisation. hybridisation and washine of filters
2.3.9a Prehvbridisation
Filters, except plaque lifts, were prehybridised in prehybridisation buffer at 65oC for a
minimum of two hours. Filters were prehybridised in a solution of 5 x SSPE, 5 x Denhardt's,
0.5% (wlv) SDS and 100 pglml denatured sonicated salmon spenn DNA. The volume of
prehybridisation solution was approximately 0.1 mllcrtf of filter. Plaque lift filters were
43

separated from each other using nylon grids and prehybridised using the above described
conditions for at least 16 hours prior to addition of the radioactively labelled probe.
ation
Following addition of 300 pg of sonicated salmon spenn DNA to 100 pl of the
radiolabelled probe, the mixture was denatured by the addition of 34 pl I M NaOH and
incubation at room temperature for ten minutes. The mixture was neutralised by the addition
of 34 pl I M HCI and the probe solution added to the prehybridised filters. Filters were
hybridised by labelled probe at a concentration of approximately 1 x 10⁶ cpm per ml of
hybridisation solution (to a maximum volume of 10 ml). Hybridisation was conducted in
rotating bottles for a minimum of 16 hours at 65'C.
. 2.3.9c Washine of filters
Filters were norTnally washed sequentially in2 x SSC with 0.1% SDS at 65'C for 30
minutes, I x SSC with 0.1% SDS at 65"C for 30 minutes and 0.5 x SSC with 0.1% SDS at
65'C for a further 30 minutes. Southem blots subject to a high stringency washes were
further incubated in 0.1 x SSC, 0.1% SDS at 65'C for two hours. A single low stringency
wash of 2 x SSC, 0.I % SDS at 65"C for 20 minutes was used for some filters.
2.3.9d Autoradiosraphv and strippine of filters
Filters were covered in plastic wrap and exposed to X-ray film at -80"C for
appropriate periods of time, backed by an intensifiiing screen (DuPont Hi-Plus).
After exposure, Southem filters were stripped of probe by boiling for ten minutes in
0.1 x SSC, l% SDS, then rinsed in2 x SSC and stored in plastic wrap at 4"C.
44
2.3.10 Sequencins of double-stranded DNA templates
2.3.\0a of temnlate DNA
Plasmid DNA was prepared using the Bio-Rad Quantum plasmid miniprep kit,
according to the manufacturer's instructions. The DNA concentration of the samples was
determined using UV spectrophotometry.
ons
Sequencing reactions were performed using a Prism Big Dye Terminator kit (Applied
Biosystems-Perkins Elmer). The products were analysed at the Institute of Medical and
Veterinary Science (ABI Prism Model 377), Adelaide, South Australia. Except in specific
instances, DNA templates were sequenced in both directions.
2.3.1 1 a Sequence analvsis software
The compilation and comparison of multiple nucleotide sequences was performed
using various STADEN (Staden, 1980; Staden, 1984) programs and the GCG Sequence
Analysis Software Package version 8 (Genetics Computer Group, WI 1984; Devereux et al.,
1984), available online from the Australian National Genomic Information Service,
University of Sydney (www.angis.org.au). The CLUSTALW program (Thompson et al.,
1994) was used for multiple sequence alignments.
FASTA (Pearson and Lipman, 1988) and BLAST (Altschul et a1.,1990) were used to
search non-redundant nucleotide and protein sequence databases.
2.3.1.Lb I)otplot comparisons of promoter sequences
Sequence comparisons between fibre-specific promoters were carried out using the
two dimensional "dotplot" visual display approach (Maizel and Lenk, 1981). Pairs of
sequences were first aligned using the GCG program COMPARE, and output files from this
program were used as input files for DOTPLOT, also a GCG program. The program settings
used for all comparisons were: window size: seven, and stringency to find match in window
: sevefl.
45

2.3.12 Olieonucleotide desien
Oligonucleotide primers designed manufactured by Geneworks and were adjusted to a
concentration of 10 pM prior to use. Annealing temperatures were calculated using the
formula Tu : 2(A+T)+4(G+C)-5'C.
2.3.12a Sequencinq primers
Primers for sequencing of DNA double-stranded templates were designed to previously
sequenced regions to prime towards a region of unknown sequence. Primers were generally
designed as 2O-mers, with a GC content of at least 509/c.
2.3.12b Primers for Polvmerase Chain Reaction (PCR)
To prime efficiently and at high temperatures, primers for PCR were designed
specifically to a target sequence, preferably with the inclusion of two G/C residues at the 3'
end of the primer. Primers were monitered for their ability to form primer dimers and
hairpins and for feafures such as repeats and palindromes using the Premierbiosoft computer
program, Netprimer (htþ://www.prernierbiosoft.com/netprimer.html¡. Primers used in
GenomeWalker@ PCR and 5' RACE PCR experiments were designed to the specifications of
the kit manufacturers.
2.3.1.3 Polvmerase Chain Reaction (PCRI
2.3.13a PCR of plasmid and senomic DNA templates
PCR reaction mixes were generally made in25 ¡tl volumes. These consisted of 0.4
mM each of dATP, dCTP, dGTP and dTTP, 1 x reaction buffer, approximately 3 mM MgCl2,
100 ng of each primer, 1.5 U of Taq DNA polynrerase and 100 ng of template DNA. DNA
was amplified in a programmable PTC-200 DNA Engine (MJ Research, Inc) as follows:
initial denaturation at 94"C for two minutes, followed by 25-30 cycles using these conditions:
denaturation at94"C for one minute, primer annealing for 30 seconds and extensio¡ at72"C
for approximately one minute.
46

The annealing temperature varied depending on the base composition of the primers,
but generally was between 55oC and 10"C. The extension time also varied depending on size
of the fragment to be amplified (based on a synthesis rate of 1 kb per minute).
2.3.13b Reverse Transcription Polymerase Chain Reaction (RT-PCRI
Prior to reverse transcription, 10 pg of total RNA was treated with DNase I (RNase
free), to eliminate any contaminating DNA. Briefly, the RNA was incubated in I x DNase
buffer containing 40 U of DNase 1 for 30 mins at25"C. Termination of this reaction was
achieved by incubating at 95"C for 5 mins. Following DNase treatment, the RNA was
ethanol precipitated.
Reverse transcription reaction mixes each contained 0.5 mM of dATP, dCTP, dGTP
and dTTP, 5 x reaction mix, 0.1 M DTT, 3.3 pM of primer oligo dT, 13.3 U/pl M-MLV
reverse transoriptase, RNasin@to 1u/pl and approximately 10 Lrg of DNase treated RNA.
Reactions were incubated at 42"C for t hour and then terminated by heat treatment at 80"C
for 3 minutes. Following reserve transcription, gene-specific PCR reactions were performed,
using 2 pl of oDNA as previously described (see Section 2.3.I3a). The remaining oDNA was
stored at -80oC.
2.3.13c Rapid amplifTcation of 5' cDNA ends (S'-RACEI
Extension of the pFSl4 cDNA 5' end was achieved a Marathon oDNA Amplification
Kit (CLONTECH). Poly A* RNA (2 ptÐ from 6 DPA cotton fibres was obtained from Dr
Sharon Orford, and converted into double-stranded oDNA using the oDNA synthesis primers
provided following the manufacturer's instructions (CLONTECH). The PCR products that
resulted from this reaction were cloned as described in Section 2.3.5a.
2.3.13 d GenomeWalker'" PCR
Isolation of some genes was achieved using the Universal GenomeWalker'" Kit
(Clontech) and following manufacturers instructions. Firstly, cotton genomic DNA was
digested with 10 different blunt ending enzymes, five of which were included in the kit (Dra
47

I, Eco RY, Pvu II and Stu l) and five of which (Sma I, Rsa l,Ssp I, Alu I and Hae l) were
added for this study. GenomeWalker'u adapters were then ligated onto the ends of the
genomic fragments, in essence generating ten genomic "libraries". Following this, PCR
reactions using gene-specific primers and primers specific to the adapters were undertaken to
amplift the sequence of interest. The resultant Genome'Walker'u PCR products were cloned
as described in Section2.3.5a.
2.3"14 Transient assavs using the particle iniection gun
2.3.14a Preparation of gold particles
Gold particles (1.0 pm) were treated using a modified method from Franks et al.
(1998). Approximately 8 mg of gold particles were thoroughly resuspended in 100 pl of
100% ethanol by vigorous vortexing for two minutes. After vortexing the gold suspension
was spun down for 10 secs in a mini centrifuge and the ethanol was removed. The gold
particles were then resuspended in 100 pl of sterile dHzO by continual pipetting up and down
to avoid clumping of projectiles. The gold was then spun down for 10 seconds in the mini
centrifuge. This process was repeated several times (up to ten times) until gold projectiles
were clearly dispersed on the side of the eppendorf after the 10 second spin. Following the
washes the gold particles were resuspended in 100 pl of dH2O until required.
2.2.14b Preparation of Swinney filters
Before use, each Swirurey filter was thoroughly washed and scrubbed in dH2O and
autoclaved. Immediately before use, each filter was sterilised in 100%o ethanol by swirling for
approximately 15 minutes. Filters were air-dried and treated with UV light for five minutes
prior to placing in a dessicator.
Using a method based on Franks et al. (1998), 10 ¡tl of plasmid (1 pglpl) was very
slowly added to 8 mg of resuspended gold. Following addition of the plasmid, 40 pl of I M
48

spermidine (free base) was also added slowly while the suspension was vortexed at medium
speed. 100 ¡rl of 2.5 M CaClz was added to the suspension while it was continually mixed by
gentle vortexing. To facilitate the precipitation of the plasmid onto the gold, the mixture was
incubated on ice for 10 minutes. A l0 sec spin was then undertaken to pellet the plasmid-gold
complex. The pellet was thoroughly resuspended in 110 pl of 100% ethanol. l0 pl of
resuspended plasmid/gold complex was added to each of eight sterile Swinney filters. For
tobacco and cotton leaves the same procedure was followed using half of the reagents
required for cotton fibre bombardments.
2.3.14d Preparation of tareet tissue
Tissues required for particle bombardment were isolated under sterile conditions,
using scalpel blades and placed directly on ice. Young cotton leaves and petals isolated on
the day of an anthesis, were placed onto ice. Cotton ovules, 3-4 DPA, which were within the
pericarp wall of the cotton flower, were isolated and placed on ice prior to particle
bombardment. Ovules (and hence fibres) from the cotton ovary were isolated by dissection
(Figure 2.2). First the bracts and calyx were removed to expose the pericarp wall (Figure
2.2A, B and C). Second, the pericarp wall was separated and removed to expose locules
containing ovules (Figure 2.2D andE). Ovules (Figure 2.2F) from each locule were pinned
down onto UV treated cardboard using sterile dressmaker pins for particle bombardment
(Figure 2.2G).
2.3.14e The o iniection sun
A custom-made particle inflow gun (Vain et al.,l993a) was used for delivery of the
particles into plant tissues. The chamber and output areas of the particle inflow gun were
sterilised before use with 70%o ethanol and the entire apparatus was treated with UV light for
approximately 5 minutes. A helium ouþut pressure of 90 psi, an ouþut release time of 0.12
milliseconds and a vacuum pressure of -90 kPa were the conditions used for biolistics, with
the target tissues at various distances from the helium projection point.
49

A. B.
c. D.
E. F.
G.
Extraction of cotton fibres in preparation for particre bombardment.
A. cotton boll aged 4 DPA, cut from fruiting branch of cotton plant.
B. Removal of bracts using sterile scalpel blade to aid fibre isolation.C. Removal of cal¡x using sterile scalpel blade.
D. Removal of one side of the pericarp wall using sterile scalpel blade. At this stage twolocules of cotton fibres are visible.
E. Removal of the remaining pericarp wall to reveal all locules, with ovules wingfibres.
F. Locules are completely removed from the cotton ovary using sterile tweezers andplaced onto cardboard, which has been IJV treated.
G. Anchoring of the cotton fibres. Sterile dressmakers pins were placed through cottonovules and into the cardboard to hold tissue firmly in place. Ovules not secured bydressmaker pins were usually anchored through fibres, which were intertwi¡ed with ,[ibrespresent on anchored ovules (age dependent).
50

2 3 JAf Particle bombardment
Plant leaves and cotton petals were placed in petri dishes, on Whatmann@ filter paper
moistened withYz MS solution containing chloramphenicol (50 pglml). Cardboard containing
whole cotton ovules was placed directly onto the polypropane shelf. Fibres for bombardment
were placed on shelf 4 and leaves and petals on shelf 6 from the projection point. Swinney
filters, with DNA coated gold particles applied,'were attached to the top of the chamber. A
vacuum pressure was slowly applied, until a pressure of -90 kPa was reached and a releasing
pressure of 90 psi was used to project DNA coated gold particles into target tissue. After
bombardment, all tissues were placed onto % MS agar containing chloramphenicol and placed
under fluorescent lights at25"C overnight.
In all cases bombardments were independently repeated at least three times to gain
authenticity of results.
2.3.14e Histochemical stainine of bombarded tissues
Subsequent to the overnight incubation, bombarded tissues were assayed for GUS
activity using a method adapted from Franks et al. (1998). Tissues were placed into 50 ml
falcon tubes and prefixing solution was added (5 ml for leaves and2 ml for fibres) to each
sample. The solution was vacuum infiltrated for 10 minutes. The prefixing solution was
removed and the tissues were washed three times in 0.1 M NaPO+buffer (pH 7.0). After
washing, assaybuffer was added to tissues. The samples were incubated overnight at37oC,
after which the buffer was removed and 70%o ethanol was added. To clear the chlorophyll
from leaf tissues, these samples were placed at 65'C for approximately 15 minutes. After the
incubation , the 70o/o ethanol was removed and replaced and the procedure repeated until all
chlorophyll pigment was removed. Histochemically stained tissues were viewed and
photographed using an Olympus SZH1O microscope with a Polaroid digital microscope
camera.
51

2.3.15 Phvloeenetic analysis
The sequences of six o-expansins isolated from Gossypium hirsutum, and those of a
further 28 available from other plant species, were compared firstly using Maximum
Parsimony (MP) analysis; and secondly using Maximum Likelihood (ML) analysis using the
BAMBE program (version 2.02b;Larget,1999 #951under the TN93 model (Tamura and Nei,
1993). For the ML analysis separate rate characteristics were used for the first and second
codon positions (third positions were excluded). Seven data sets of 2 million topologies were
produced to calculate the final Bayesian posterior probabilities. The LeExp3 sequenoe (as per
Im et a1.,2000) was used as an outgroup for all analyses.
52

CHAPTERTHREE
Characterisation of an ü-expansin gene family in
cotton (Gossypium hirsutum)
53

54
3.1 Introduction
The primary cell wall of plants acts as a rigid exoskeleton. As a result, plant cell
growth is dependent on the ability of the cell wall to extend. Many cell wall proteins and
enzymes have been identified as playing a role in cell growth (Cosgrove, 1999;Pear et al.,
1996) but only one class, the a-expansins, has been found to induce cell wall growth when
added exogenously to plant cell walls (McQueen-Mason, 1995) and cultured cells (Link and
Cosgrove, l99S). Plant a-expansin genes comprise a large family, many of which exhibit
tissue and cell specific expression (Brummell et al.,l999b; Cosgrove, 2000b). Within cotton,
an o-expansin oDNA (pFSla) was identified and its expression was shown to be confined to
developing cotton fibres (Orford and Timmis, 1998). When pFS14 cDNA was used as a
probe in a genomic Southern analysis, it hybridised to two major and at least six minor
fragments within the cotton genome (Figure 3.1). The hybridisation pattern, observed under
conditions of high stringency, indicates that a family of a-expansins with sequence similarity
to pFSl4 existed within cotton. This chapter describes the cloning and characterisation of a
number of cotton a-expansin genes.
Screening of aG. hirsutum cv. Siokra l-4pafüal genomic librarywithpFSl4
resulted in 15 positive plaques (IGhExpl-l"GHExpl5). Plaques IGhExpl- l.GhExp6
hybridised the pFSl4 probe more strongly than ÀGhExpT- î,GhExpl5, suggesting the
possibility that the former group contained the genomic clone corresponding to the pFS14
oDNA, and that the group had higher sequence homology to pFS14 than the remaining seven
plaques. All plaques were selected and 13 DNA samples were purified (Table 3.1).
Restriction patterns of the six genomic isolates with higher signal intensity to the pFSl4
oDNA probe revealed that two different genomic isolates had been obtained (Table 3.1; Dr. S.
Orford, personal communication), represented by l,GhExp5 and IGhExp6. Clones l,GhExp7,
55

G, hirsutum cv. Slokr¡ l-2
23.1
AI)
Genomic Southernblot probed u/ithpFS14 cDNA insert. Each lane contains l0 t g of Siokra
1-2 genomic DNA, digested with the indicated enzymes. Genomic DNAs ûom the
representative A and D diploid ancestors of allotetraploid cotton are shown in the two far
right lanes, both digested with EcoP.l. Molecular weight markers are shown on the left and
the sizes are indicated in kb. This figure is kindly provided by Dr Sharon fford.
ìEq,U
ts
56

Tql¡le ¡r-eyrìârrsin øenomic isolates from cotton3.1
(,-l
representativegene named
GhExp5GhExp6
GhExpl0GhExpI lGhExpl2
GhExpI4
subcloned?
X (section 3.2)X(section 3.2)X (section 3.2)X(section 3.2)
Dr. S Orford (pGhExpS96)Dr. S Odord þGhExpS53)
X(section 3.2)X(section 3.2)X(section 3.2)
This studyThis studyThis study
X (section 3.2)This study
X(section 3.2)
characterised
GhExpí duplicateGhExp6 duplicateGhÛxpï duplicateGhExp5 duplicate
This studyThis study
GhExpI2 duplicateX
GhExpl2 duplicateThis studyThis studyThis study
XThis study
GhExpl4 duplicate
isolated?
{r'{{r'//x/r'//x/{
3oscreen
{{{/{/{x{{{{x//
toscreen
//r'{{/{{///{///
L"screen
{{/{{/{/{//////
Plaque
ÀGhExpll.GhExp2ÀGhExp3lr,GhExp4ÀGhExp5l,GhExp6ÀGhExpT)r.GhExp8ÀGhExp9
?r,GhExp10î,GhExpl1l,GhExpl2î,GhExp13ÀGhExpl4î,GhExp15
Ê

l,GhExp9, ÀGhExpl2, ÀGhExpl4 and ì,GhExpl5 were analysed by digestion with.Eco RI,
Sacl and,Vof I (Figure3.2A and3.2B), all of which have recognition sites in the ÀGEM12'"
vector arms. The restriction patterns of î,GhExp7, ÀGhExpg and fuGhExp12 were identical to
each other (Figure 3.2A) and differed from IGhExp5 and GhExp6 and from ÀGhExpl4 and
l,GhExpl5 (Figure 3.2ts-). Identical restriction pattems for ÀGhExp7, l"GhExpg and
l,GhExpl2 suggested that these three genomic clones were of the same genomic region, and it
appeared that Sac I was the only restriction enzynre of those tested with a recognition site
within the insert (Figure 3.2A). LGhExpl4 and ÀGhExpl5 restriction patterns (Figure 3.28)
were almost identical to each other, with î,GhExpl4 showing the presence of an additional
band (- 11 kb) when digested withEco RI (Figure 3.28). Both î"GhExp14 and IGhExpl5
restriction patterns differed from the other clones (Figure 3.2A), and their similarity to each
other suggests that they are overlapping isolates of the same gene.
Southern blots of the gels depicted in Figure3.2A and3.2B were probed with pFS14,
confirming that each lambda clone contained regions of homology to pFSl4 (Figure 3.2C and
3.2D). The Southern hybridisation results produced identical hybridising fragments for
l,GhExp7, ÀGhExpg and l"GhExpl2, confirming that they contain the same gene and only
ÀGhExpl2 was selected for future study. The different hybridisation intensities between the
three isolates reflect gel loading differences (Figure 3.2A). l"GhExpl4 and ÀGhExpl5
showed almost identical hybridisation patterns to the oDNA, but ÀGhExpl4 contained two
additional hybridising bands of 10 and 1 1 kb in the Eco RI and Sqc I digested lanes
respectively (Figure 3.2D). Taken together, restriction analysis and the Southern
hybridisation implied that l,GhExpl4 and ÀGhExpl5 contained overlapping clones of a single
gene. As the ÀGhExpl4 genomic clone appeared to contain more than one region of
homology to pFS14, demonstrated by the Southern analysis (Figure 3.2D), this clone was
selected for future study.
58

C. ÀExp7 ÀExp9 l,Expl2I p N sllp N slle N s I-tr
D ÀExpl4 l,Exp15| ¡ N slls N s I
t4 l5NS
l:f;] 4s
O IT
ENS ENSB.
23.t-9.4 -6.6-4.4 -2.3-2.0-
0.56 -
23.t -9.4
-6.6 -4.4 -2.3 -2.0 -
0.56 -
23.1-9.4 -6.6 -4.4 -2.32.0
23.1-9.4 -6.6 -4.4 -2.3 -2.0 -
0.56 - 0.56 -
A. Agarose gel showing DNA fragments resulting from restriction of î,GhExp7,l"GhExp9
and ÀGhExpl2. The first lane contains lambda DNA marker (restricted with Hind IID. All
sizes shown are in kb. Each lane contains approximately 3 ¡rg of DNA, restricted with.E'co RI
(E), Not I (N) or Sac I (S) as indicated.
B. Agarose gel showing DNA fragments resulting from restriction of IGhExpl and,
IGhExpl5. The first lane contains lambda DNA marker (restricted with Hind trI). All sizes
shown are in kb. Each lane contains approximately 3 ¡rg of DNA, restricted withEco RI (E),
l/o/ I (N) or Sac I (S) as indicated.
C. Southern blot of gel depicted in 4., hybridised with the pFS14 oDNA insert. Lanes are
labelled as above.
D. Southern blot of gel depicted in 8., hybridised with the pFS14 oDNA insert. Lanes are
labelled as above.
NS
59
The remaining two genomic clones, IGhExpl0 and l,GhExpl l, when digested with I'co RI,
Not I and, Sac l, showed unique restriction patterns when compared with each other and with
other previously-described genomic clones (not shown). Due to the unique restriction
patterns of IGhExplO and ?',GhExpl l, they were selected immediately for further studies. In
total four new isolates (?'"GhExpl0, ÀGhExpl l, IGhExpl2 and IGhExpl4) and two
previously-isolated clones (ÀGhExp5 and ÀGhExp6) were selected for further research (Table
3.1).
3.2.1 Subclonine of eenomic fragments with homolow to pFSl4
Preliminary analysis of genomic isolates obtained from the library screen resulted in
the purification of six unique genomic clones (l,GhExpl0, l,GhExpl l, ÀGhExpl2, I
GhExpl4, IGhExp6 and ?'GhExp5; Table 3.1). Previous Southem blot analysis of IGhExpl2
and ?'GhExp14 (Figure 3.2C and3.2D) identified only large genomic regions that contained
homology to the expansin cDNA, and in the case of IGhExpl4, more than one large
hybridising band was observed. To identify smaller regions of homology within l"GhExpl2
and l,GhExpl4, and to identify regions of homology within IGhExpl0 and l.GhExpl l, each
of these genomic clones was digested with BamHI, EcoRl, SacI andXba I (Figure 3.34-D).
Restriction pattems for ÀGhExpl0 showed that all enzymes, except BamHI,
recognised sites within the insert (Figure 3.34). Probing the Southem blot of digested
l,GhExpl0 with pFS14 showed that regions of homology l¡vere confined to a-7 kb .Eco RI
fragment, a -9 kb,Søc I fragment and - 4 kb Xbal fragment (Figure 3.34'). Digests of
l,GhExpl l showed that all four enzymes recognised sites within the insert (Figure 3.38).
There isno Xba I site in the ÀGEM-12* vector arms, as theywere destroyed during the
ligation of the Sau 3AI digested genomic DNA, to the Xho I sites within the vector.
Therefore the presence of a single band (Figure 3.38) shows that no XbaI recognition site
exists within the ÀGhExpl l genomic clone. 'When the Southern blot was probed with pFS14,
60

llIrll- .l
,l- ..¡
!I
t
A.
23.1-
9.4-6.5-
4.3-
B.
23.
9.4-6.5
0.5
23.1-
9.4-6.5
4.3
2.32.0
23.1
6.5 -
2.32.0
23.1-
9.46.5-
2.3-2.0
23.r-9.4 -6.5
4.3
2.3-2.0-
23.1
9.4
6.5
4.3
05-
2.3-2.0-
A'. B E SX
23.1-
9.4-6.5 -4.3-
2.3-2.0-
BE E SX
2.3-2.0-
0.5
0.5 - 0.5
A-D. Agarose gels showing DNA fragments resulting from restriction of A. ÀGhExpl0' B.
ÀGh¡xpl1, C. î,GhExpl2 and D. l.GhExp14. h all cases except Î.GhExpl4, the first lane
and the last lane contain À DNA marker (î, DNA restricted vnlh Hind III), with sizes indicated
in kb. In the case of l,GhExpl4 only the first lane contains I marker. Each lane contains
approximately 3 pg of DNA digested with the following endonucleases; Bam HI (B), EcoR.I
(E), Sac I (S) and,xØø I (X).
A'-D'. Southern blots of the gels depicted above, probed with pFS14 cDNA insert. Lanes are
labelled as above. Arows depict hybridising bands that were targeted for subcloning.
6l

regions of homology in l"GhExpl I were confined to a -7 kb Bam HI fragment, a -10 kb Eco
RI fragment and a - 6.0 kb Søc I fragment (Figure 3.38').
Digestion of IGhExpl2 showed that all enzymes recognised sites within the insert. A
Southern blot of ÀGhExpl2 probed with pFSl4 showed that regions of homology are largely
confined to a - 6.8 kb BamHlfragment, a - l0 kb EcoRI fragment and a - 8 kb,Søc I
fragment (Figure 3.3C'). Similarly, regions of homology for ÀGhExpl4 were identified in a
-10 kb BamHI fragment, a - 4 kb EcoRl fragment, a -ll kb Saclfragment and a -1.5 kb
Xbal fragment (Figure 3.3D').
Hybridisation of all the Southern blots using pFSl4 as a probe (Figure 3.34'-D')
showed that the hybridisation intensities varied for each l" clone. The hybridisation signal for
ÀGhExpl0 (Figure 3.34') had the highest intensity, suggesting the highest level of sequence
similaritybetween the pFSl4 probe and the genomic DNA contained in ÀGhExpl0. The
IGhExpl2 Southem (Figure 3.3C') showed the second highest hybridisation signal,
suggesting that it contains higher sequence similarity to pFS14 than l.GhExpl l or ÀGhExp14.
The IGhExpl4 hybridisation signal (Figure 3.3D') was considerably less than all others, most
likely due, only in part, to the reduced amount of DNA loaded compared with the other
clones.
For each genomic clone, generally the smallest fragment that hybridised to pFS14
(Figure 3.34'-D') was sub-cloned into an appropriate plasmid vector. In the case of
l.GhExpll and IGhExpl4, a-7 kb BamHI fragment and - 4kb Eco RI fragment (Figure 3.3
B' and D') were sub-cloned despite the presence of a smaller fragments, in order to increase
the probability that the entire genomic region and any flanking regions of interest would be
available for characterisation. In addition to the above-mentioned experiments, a 1.5 kb,Søc I
fragment containing IGhExp5 genomic DNA and a -5.7 kb Saclfragment containing
l"GhExp6 genomic DNA were also targeted for cloning.
62

3.2.2 Mapping of genomic subclones
The genomic regions with homology to pFS14 were sub-cloned as fragments between
approximately 4 kb and 9 kb in size, To further localise regions of homology to the oDNA,
each genomic subclone was mapped by single and double digestion with a variety of
restriction enz)rmes, and Southern analysis was undertaken (Figure3.4A-8,3,54-8,3.64-8
and 3.74-B). In addition to the genomic subclones described in Section 3.2.1, a fifth,
pGhExp6 (Table 3.1, Figure 3.8), was included in the mapping analysis. Restriction mapping
was not undertaken for pGhExp5 due to the.small (1.5 kb) size of the sub-cloned region. For
the remaining five clones, restriction fragment sizes and Southern blot analysis was used to
accurately map regions containing pFSl4 homology (Figure 3.4 - 3.8). These regions were
localised to 2 - 2.5 kb regions in different clones and, using a combination of further genomic
sub-cloning and sequencing, the fragments of interest in pGhExpl0, pGhExpl2, pGhExpl4
and pGhExp6 were sequenced on both DNA strands (Figure 3.4D,3.6D,3.7D and 3.8D).
The coding region of pGhExpl l was not further sub-cloned or sequenced due to time
constraints and information pertaining to the sixth clone, pGhExp5 is discussed in Section
3.3.5.
3.3.1Gh&xpl0 sequence
The hybridising region of pGhExpl0 was confined to a 3.0 kb Eco RVPs/ I DNA
fragment (Figure 3.4). Initial sequencing and searches using BLASTN (GenBank, April
2002) showed that the pGhExpl0 expansin gene was close to the RSP primer and the EcoRl
restriction site (Figure 3.4C). Further sequencing focused on this area, using primers
designed from previously obtained sequence (Figure 3.4D). A total of 1259 bp was obtained
in both directions (Figure 3.9) and the gene was designated GhExplO. Further database
searches confirmed that the GhExpI0 sequence was similar to previously described o-
63

Fisure 3.4. Dieestion. Southern analvsis and mappins of pGhExpl0
A. Agarose gel showing DNA fragments resulting from restriction of pGhExp10, the - 7.2kb
EcoF.l subclone of À GhExp10. The first two lanes contain molecular weight markers (1,
DNA restricted with Hind III and 100 bp marker) with sizes indicated in kb. Each lane
contains approximately 3 pg of DNA digested with the following endonucleases:
l. SalI2. SalU EcoRI
3. Eco RI
4. SalU ClaI5. Clal6. XbaI7. XbaU EcoRI8. XbaU Pstl9. Pstl
B. Southern blot of the gel depicted in 4., probed with pFS14 oDNA insert. Lanes and
marker sizes are labelled as above.
C. Partial restriction map of pGhExpl0, showing the positions of the restriction sites
mentioned above (4.), with the coding region boxed.
D. Schematic diagram of 3.0 EcoRU Psl I fragment subcloned in pBluescript (not to scale),
showing the direction of primers and position of coding sequence.
64

A.
23.1-9.46.s4.3
2.3-2.0-
0.5-
0.4
B.r234567
2.6
34s6789
C.
o4
sFSx04
dúr.l 0.8 2.1
--:-- -a ---
--.Ir-
-
D.t
RSP
À.
El0ó+r> El04<r ERTI<-3.0 kb
65

66

A. 910 B. t23 tt2
23.r-9.4-6.5 -4.3-
2.3-2.0-
0.5
Fisure 3.5. Dieestion and Southern analvsis of pGhExpll
A. Agarose gel showing DNA fragments resulting from restriction of pGhExpl1, the 7 kb
BamH¡subclone of IGhExp11. The first two lanes contain molecular weight markers (1,
DNA marker restricted with Hind III and 100 bp marker) with sizes indicated in kb. Each
lane contains approximately 3 pg of DNA digested with the following endonucleases.
1. BamHI
2. EcoR-I
3. SacI
4. PvUII
5. XbaI6. XhoI7. HindIII8. SalI9. PstI10. ClaI11. -Eco RV
12. SpeI
B. Southern blot of the gel depicted in A, probed with pFS14 oDNA insert.
Lanes and markers are as above.
67

tf,
A. Agarose gel showing DNA fragments resulting from restriction of pGhExpl2,the - ó.5 kb
BamHlsubcloneof)',GhExpl2. Thefirsttwolanescontainmolecularweightmarkers(I
DNA restricted withHind III and 100 bp marker) with sizes indicated in kb. Each lane
contains approximately 3 pg of DNA digested with the following endonucleases:
l. ClaI2. ClaIl BamHI3. BamHI
4. ChA P$f5. Pstl6. HindlII7. HindIA BamHl
8. HindlIAEcoRY
9. EcoRY
B. Southern blot of the gel depicted in A, probed with pFSl4 insert. Lanes and molecular
weight markers are labelled as above.
C. Partial restriction map of pGhExpl2, showing the positions of the restriction sites
mentioned above (4.), and the coding region boxed. The anows indicates the direction of the
El2R5 primer used in sequencing the GhExpl2 subclone.
D. Schematic diagram of 2.0kb HindIII/ EcoRY fragment subcloned into pBluescript (not to
scale) showing direction of primers used in sequencing this and the original pGh¡xpl2
subclone. Position of coding region is also shown.
68

34sA. 234s678923.t-9.4-6.5 -4.3 -
0.5
2.32.0
C
!
\I
ÈlÉ{
sÊqI l.t
I-at
-
- 6.8 kb
D. &()l¡ì
ËE
-20 EI2F1 EI2RTI EI2F2+ + +EI2R3 EI2R1 EI2R2
-+<r+
69

A. Agarose gel showing DNA fragments resulting from restriction of pGhExpl4, the - 3.5 kb
EcoRl subclone of î,GhExpl4. The first two lanes contain molecular weight markers (1,
DNA restricted with Hind III and l00bp marker) with sizes indicated in kb. Each lane
contains approximately 3 pg of DNA digested with the following restriction endonucleases:
1. Eco RI
2. HindIlI3. Xbal4. ClaL
5. EcoRllXbaI
6. EcoRllHindlll7. EcoRIl CIal8. XbaA Hindlll9. XbaA ChI10. HindilAAaI
B. Southern blot of the gel depicted in A, probed with pFS14 cDNA insert. Lanes and
molecular weight markers are as above.
C. Partial restriction map of pGhExpl4, showing positions of the restriction sites mentioned
above (4.), and the coding region (boxed). Arows indicate the direction of primers used to
sequence the coding region of GhExp14 using this original pGhExpl4 subclone and the 1.5
kb subclone.
D. Schematic diagram of the 1.5 kb Xbal subclone of l,GhExp14, with coding region boxed.
70

B' 12345 6i 89lo1234
23.1-9.4-6.5-4.3-
2.3-2.0-
0.5-
-- - (t-=
oa-- -
C ÈñÈ(RSP EI4RT2
- -EI4F2 EI4F3 EI4RI+++
¿,ÞeNUx|l_u.Èrrì EttEI4R2+
kb
EI4RTI EI4FI T7+<r<-
D.¡!
I
ÈÕ\
7l

a
A. Agarose gel showing DNA fragments resulting from restriction of pGhExp6, the -5.7 kb
s¿c I subclone of IGhExp6. The first two lanes contain molecular weight markers (À DNA
restricted withHind III and 100 bp marker) with sizes indicated in kb. Each lane contains
approximately 3 ¡lg of DNA digested with the following endonucleases:
l. Sacl
2. PwII3. PvUIU SacI1. Pst 1
5. P$A SacI
6. XhoI7. BamHI
8. .E'co RV
9. NotI10. ApaIll. NheI12. SaclI
B. Southern blot of the gel depicted in A, probed with the pFS14 cDNA insert. Lanes and
molecular weight markers are as above.
C. Partial restriction map of pGhExp6, showing the positions of the restriction sites
mentioned above (4.), and the coding region (boxed). Arow indicates the direction of the
S53R3 primer used to sequence the coding region.
D. Schematic diagram of the l.l kb PvulI fragment subcloned in pBluescript (not to scale)
showing direction ofprimers used in sequencing this region, and the original pGhExp6
spanning the entire coding region. The position of coding region is indicated by a box.
72

A. B.
t 2 3 4 s 6 7 8 910 t23456
0
S53F2+
l0 ll 12
23.19.46.54.3
-ü
2.32.0
Õ0
05
&qJr¡l
È's\A*
cS53R3+ I'+ t.4
:su>sel%l.l
D.
- 5.7 kb
S53FI S53F4 S53F3
->->
S53R2 S53R4 S53RI
É--20 àa'.
->
+ ++RSP
73

Figure 3.9. Sequence and conceptual translation of GåExp.l0
Nucleotide and deduced amino acid sequence of cotton cr-expansin gene GhExpl0. The
putative start point of translation has been designated +1. All exons and the corresponding
peptide are shown in blue text, with introns (as determined by alignment with pFS14 cDNA)
indicated in green.
Translational start and stop codons are outlined by red boxes. The putative signal peptide,
identified by the rules of von Heijne (1988), is underlined. Putative TATA (at position -l 14)
and CAAT (at position -45) boxes are shown in bold.
Three putative polyadenylation sites (NUEs; Hunt, 1994) are underlined, at positions +1044,
+1098 and +1034. Circles identify two putative cleavage points, which lie l0 and l3
nucleotides downstream from the last NUE, at positions +1149 and +l 151. One putative Far
Upstream Element (FUE; Rothnie, 1996) is in italics at position +1096.
74

ACTAGTCCAJU\TCTTCTTTTTCCTTCCTCCTCCCCCTCCTCCTCCTCCTCTTCTTCTTCT-205 - ---+- ---+- ---+- ---+- ---+- ---+ -145
AGTTAC TGTTTTTGAC TTTAAAACTTCATAIITAGA;U\GAA.ACGAAA.AACAGGTTAGGCAG-1,44 ----+- ---+- ---+- ---+- ---+- ---+ -85
CACTTTACAGTTTTT CATTAGTGTTAACACTTTTAGTTCÀÀTATC TATATTGTTTATGGA-84 - ---+- ---+- ---+- ---+- ---+- ---+ -25
GTATGCTTTTTGGTATGCAGAAC GGCACTTGGGATTTCTTGCAGCTGCATTACTC-24 ----+- ---+- ---+- ---+- ---+---------+
GHI,GFLAAAI,I,+35
+335
+3 95
+455
+5 L5
+575
TCACTCCTCAACTTTGTTCATGGCTC C CTTGGAC C CTGGAC CAATGCTCATGC CACTTTT+36 - ---+- ---+- ---+- ---+- ---+- ---+ +95
S ], L N F VH G S L G P W T NAHA T F
TATGGAGGTGGTGATGCTTCTGG AAC AATGGGTACTTTC CACAÀTCC AAATAT CATATAT+96 - ---+- ---+- ---+- ---+- ---+- ---+ +155
YGGGDASGTMG
ATTTTTCTTATTGATGTATATTTGTCATGTCTGACATGTTATTATATTCATTACAACTTC+l-56 - ---+- ---+- ---+- ---+- ---+- ---+ +2L5
AGGTGGAGCTTGTGGCTATGGA'U\CCTAÀATAGCC AAGGTTATGGTATTAACACAGCAGC+2L6 - ---+- ---+- ---+- ---+- ---+- ---+ +275
GACGYGNI,NSQGYGINTAA
+27 6
+336
+3 96
+456
+5l-6
CTTGAGCAC CGCATTGTTTGACAATGGCTTGAGCTGTGGTGCATGCTATGAGCTGAÀGTG----+- ---+- ---+- ---+- ---+---------+
L S T A L F D N G I, S C G A C Y E I, K C
TGTGAGTGATC CACAATGGTGC CTGC CTGGCTCCATTGTGGTCACTGC CAC CAATTTCTG----+- ---+- ---+- ---+- ---+---------+
V S D P Q W C I, P G S I VV TA T N F C
C C CTC CAGGAGGCTGGTGTGACCCTCCTAATCAC CACTTTGATCTCTCTCAGC CTATTTT----+- ---+- ---+- ---+- ---+---------+
P P G G W C D P P NH H F D I, S Q P I F
TCAACACATTGCCCAATACAGAGCTGGTATTGTTC CTGTAATGTACAGzu\GGT A'U\C fuU\----+- ---+- ---+- ---+- ---+---------+
AHIAOYRAGIVPVMYRR
C N\TGA,\AT'CAC CAACATATATAG TTTTT'C Ai\Ai\TT CATTTT C CAC CGACACACTAACTA----+- ---+- ---+- ---+- ---+---------+
ATAATTATTTTTTATCAGGGT AÀAGTGCAGGAGAAGTGGGGGTATCAGGTTCACAATCAA+576 - ---+- ---+- ---+- ---+- ---+- ---+ +635
VKCRRSGGIRFTIN
TGGACATTC CTACTTCAATTTAGTACTGATCAC CAATGTTGGAGGTGCTGGGGATGTACA+636 - ---+- ---+- ---+- ---+- ---+- ---+ +695
G H S Y F N I, V L I T N V G GA G D VH
TTCAGTATCCATTAÄAGGGTCAÀAGAC CAGATGGCAÄGC AATGTC AAGGAACTGGGGCCA+696 - ---+- ---+- ---+- ---+- ---+- ---+ +755
SVSIKGSKTRWOAMSRNWGA
GAACTGGC AAAGCAATTCTTACCTTAATGGCCAAAGCCTCTCTTTCATCGTCACAAC CAG
+756 - ---+- ---+- ---+- ---+- ---+- ---+ +81-5N W A S N S Y I, N G O S I, S F I V T T S
75
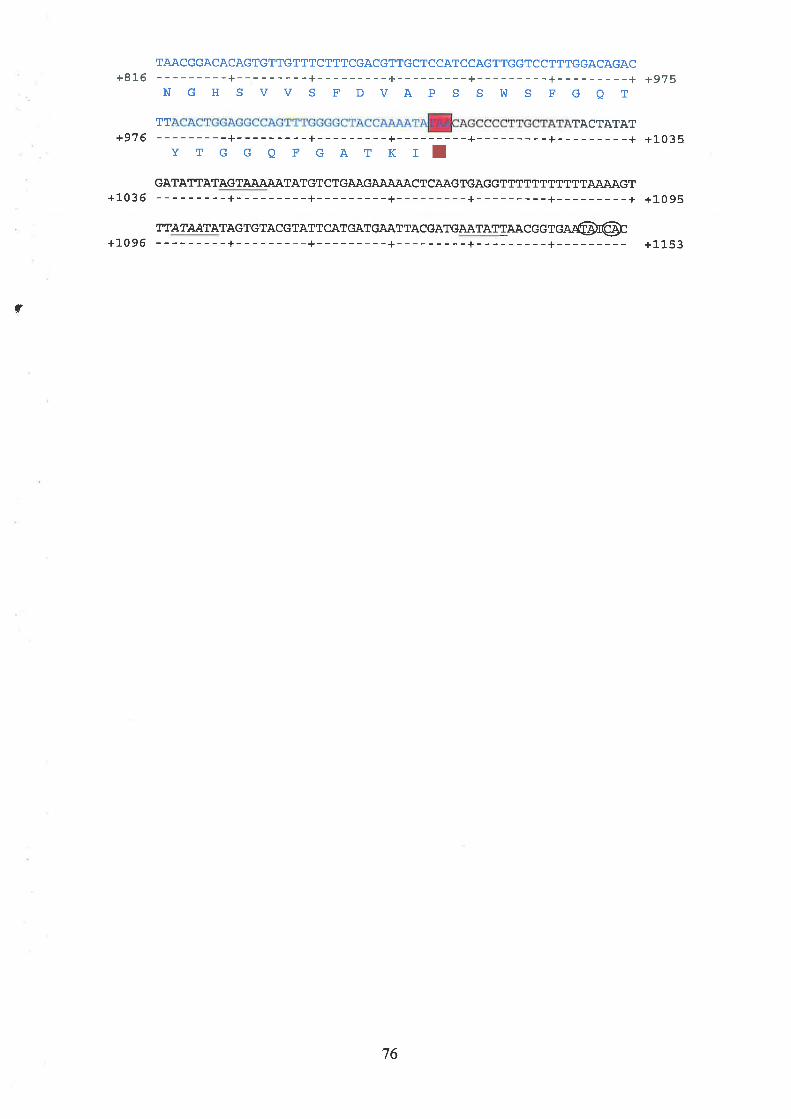
TAACGGACACAGTGTTGTTTCTTTCGACGTTGCTCCATCCAGTTGGTC CTTTGGACAGAC+816 - ---+- ---+- ---+- ---+- ---+- ---+ +975
NGHSVVSFDVAPSSWSFGOT
TT TACTATAT
GATATTATAGTAIUUU\TATGT CTGAAGA,A,AAAC TCAAGTGAGGT TTT T T TTTTTA.AAAGT+1036 ----+- --+-- --+-- --+-- --+-- --+ +1095
+10 96T T ATAAT ATAcTcTAccTATTcATGATcAAT TAccATGAATATTAAc acrcal6Ðr@
----+- ---+- ---+- ---+- ---+- +1153
ç
76

expansin genes, including those from Cicer arietinum (chickpea) (Dopico et al., unpublished),
strawberry (Harrison et a1.,2001), cherry (Yoo and Van Nocker, unpublished), Cucumis
sativus (Link et a1.,2001), tobacco (Link and Cosgrove, 1998) and cotton (pFSla) (Orford
and Timmis, 1998).
3.3.2 GhExpl2 sequence
The smallest fragment of pGhExpl2 which hybridised to pFSl4 was a 2.0 kb HindIlU
Eco RV band (Figure 3.6). Sequence of the subclone (Figure 3.6D) showed homology to ø-
expansins from Cucumis sativus (Link et a1.,2001), cherry (Yoo and van Nocker,
unpublished), pea (Michael, 1996), strawberry (Harrison et aL.,2001) and tomato (Reinhardt
et al., 1998) (GenBank, April2002). Further sequencing by internal primers focused on the
regions close to the Eco RV restriction site on both the 2.0 kb sub-clone and the original 6.8
kb sub-clone, as the GhExp12 codtng region was found to straddle the Eco RV restriction site
(Figure 3.6C and D). The coding region of pGhExpl2, sequenced on both DNA strands,
spanned 1943bp (Figure 3.10).
3.3.3 GhExpl4 sequence
Homology to the pFSl4 oDNA within pGhExpl4 was found to exist on a number of
restriction fragments, the smallest being a 1.5 kb Xba I fragment (Figure 3.7). Therefore the
1.5 kb fragment was sub-cloned and preliminary sequence from the T7 primer was found to
contain homology to cr-expansins in strawberry (Harrison et a1.,2001) and Rumex palustris
species (Vriezen et aL.,2000) (GenBank, 2000), as well as showing that the XbaI sub-cloning
site was within the coding region of the gene. Primers were designed from the existing
sequence and the sequence of the entire 1929 bp coding region was determined, using both
the 1.5 kb Xba I subclone and the original 3.5 kb subclone (Figure 3.7C and D; Figure 3.11),
3.3.4 GhExpó sequence
The smallest region of pGhExp6 that hybridised to the expansin oDNA probe was a
1.3 kb Pvull fragment (Figure 3.8) and this fragment was sub-cloned. The sequence of the
sub-clone showed similarity to cr-expansins from strawberry, cherry, peach, pine tree, apple,
7l
Figure 3.10: Sequence and conceptual translation of GåExpl2
Nucleotide and deduced amino acid sequence of cotton ct-expansin gene GhUxpl2. The
putative start of translation had been designated as *1. Exons and the corresponding peptides
are shown in blue text, with identified introns shown in green text.
Identified translation start and stop codons are outlined by red boxes. The putative signal
peptide, identified by the rules of Von Heijne (1988), is underlined. Putative TATA boxes (at
positions -623, -348, -214 and-206) and CAAT boxes (at positions -431, -444 and-117) are
shown in bold.
One putative polyadenylation site (NUE; Hunt, 1994) is underlined, at position +1223.
Circles identi$ two putative cleavage points, which lie 30-34 nucleotides downstream from
the identified NUEs, at positions +1259 and+1261. One putative Far Upstream Element
(FUE; Sanfacon, et al., 1991) was found at position +1124.
78

CTTÀTTÀÀTAGTTT AAAAA'TTTTGGGTGTAATTCAGCCGTATATTTTTCACATAAATATT-623 ----+- ---+- ---+- ---+- ---+- ---+ -564
TTTTTTC T AAAATTGTCATAATTTAGTATTAT AACT CTTAAGTC CACTTGAATGCTTGGA-563 ----+- ---+- ---+- ---+- ---+- ---+ -504
AGATAÄ,AAGTCTCAÀTGATGAATATGAGATAGGAACCCGAGGAGTTCACACTAATATECT-443 ----+- ---+- ---+- ---+- ---+- ---+ -384
CTCTAGTAATTTGGTTCAÄ'GGATGCATGTGCGGCATGTCEAÀTTÀTTTTGATTAGGTCTT-383 ----+- ---+- ---+- ---+- ---+- ---+ -324
C TA.AAGC CAAACAT T TAT TATAAAGAÄAÄÄAGG CA.AA.AAAAAAGAÄAGGGG TGAT GTG T T-263 ----+- ---+- ---+- ---+- ---+- ---+ -234
TT AÂAGT AAT CGTATCT CATÀTTAÀTTTATTÀÀTATACTTTGATTAC C TTTT CAACATGT-233 ----+- ---+- ---+- ---+- ---+- ---+ -174
CTGTGATTACCTTTTCAACA,ACAGTTTAACCCCCTCCCCCCCCCATTTCAGCTCCTCÀÀT
AÀGTACCCCCACCATCTTCCCGCTTCCCATACGCCCGATATTCAACACATCAGCATTTCT-113 ----+- ---+- ---+- ---+- ---+- ---+ -54
CTTTCTTTACTCTCTTATAATTTTCCCCCATCTTAÄÀACTA,U\GAIUUU\TA,\C CC
-53 ----+- ---+- ---+- ---+- ---+- ---+ +6
GCAGTTGCTCCTTCTTTTTCCTTGAGTGTGCTCTGTTTTGCTTCATTGCTCTCCTTTTTT+7 -- --+-- --+-- --+-- --+-- --+-- --+ +66
AVA P S F S L S V L C F A S L I, S F F
GGCTGGGTG AATGC AAGAATCCCTGGAGTTTTTACTGGTGGAGCTTGGGAAAGTGCCCAT+67 - ---+- ---+- ---+- ---+- ---+- ---+ +726
GWVNARIPGVFTGGAWESAH
GCTACATTTTATGGTGGAAGCGATGCTTCTGGAAC AATGGGTATTTGTTTTTTAGTC CGT+L27 ----+- ---+- ---+- ---+- ---+- ---+ +1-86
ATFYGGSDASGTMG
TAAT CTTC TTC TTTAAC CATAAACTGCTGTAGTTAATACAGTTGTC TTGCACAÄ.G G C CTT+L87 - ---+- ---+- ---+- ---+- ---+- ---+ +246
GTT CTG CATTT C C C T A'UU\C CATGATTTTTTTGCATTGCATTTC C C T' NUU\C CATTAÀÀA+247 ----+- ---+- ---+- ---+- ---+- ---+ +306
TGGTGTTTGAATTTTTTTCGTCCCTTTGTTTTAGGCGGTGCATGTGGGTACGGGAATCTC+307 ----+- ---+- ---+- ---+- ---+- ---+ +366
GACGYGNL
TACAGTCAÄ.GGCTATGGCGTGAATACAGCAGCTTTAAGC CCTGCACTTTTCAATAATGGC+367 - ---+- ---+- ---+- ---+- ---+- ---+ +426
Y S Q G Y G V N T AA I, S P A L F NN G
CTTAGCTGCGGTGCTTGCTTTGAGATTAÄGTGCGCAÄÄCGAC CC CAGATGGTGTCACTCC+427 - ---+- ---+- ---+- ---+- ---+- ---+ +486
LSCGACFEIKCANDPRWCHS
79

GGCAGCCCTTC CATTATTATCACTGCCACTAACTTTTGCCCTCCTAÀCTATGCTCTCCCA+487 - ---+- ---+- ---+- ---+- ---+- ---+ +546
GSPSIIITATNFCPPNYALPAATGACAATGGCGGCTGGTGCAACCCTCCACGCCCTCACTTTGAC CTTGC CATGCCTATG
+547 - ---+- ---+- ---+- ---+- ---+- ---+ +606N D N G G W C N P P R P H F D I, A M P M
TTCCTCAÄAATCGCCGAGTACCGTGCTGGTATTGTCCCCGTCTCTTACCGTAGGTGAGTC+607 - ---+- ---+- ---+- ---+- ---+- ---+ +566
FI,KIAEYRAGTVPVSYRR
CCCAAAATCTTTCC CCTTTTACTGCATTGGGTTTTCTGC CATTGTTATATTCG TACGATT+667 - ---+- ---+- ---+- ---+- ---+- ---+ +726
TCTACAG TTTTCTTGTTCCCAGTTTTCTTCGGAACCAÄACAGATTATATTTACTGCGA+727 - ---+- ---+- ---+- ---+- ---+- ---+ +786
TTAATTAAC TGTTGAT TATT T TTGACAGAGTGC CATGC CGAÄAGCA.AGGGGGGATACGAT+787 - ---+- ---+- ---+- ---+- ---+- ---+ +846
VPCRKOGGIRFTCACCATTAACGGATTCCGTTACTTCAACTTGGTTTTGGTCACCAACGTCGCGGGTGCAG
+847 - ---+- ---+- ---+- ---+- ---+---------+T I N G F R Y F N L V I, V T N V A G A G
GGGATAT CGTGAAGGTG AAGGTGAAGGGAAC CAACAC CAATTGGATGAG CATGAGC CGTA+907 - ---+- ---+- ---+- ---+- ---+---------+
DIVKVKVKGTNTNWMSMSRN
ACTGGGGTCAAÄACTGGCAGTCAAACGCCGTTTTGGTGGGTCAGGCACTCTCGTTCAGAG+967 - ---+- ---+- ---+- ---+- ---+---------+
W G O N W A S NA V I, V G O A I, S F R V
rrcccrccAArr@@eaeaaec
+90 6
+966
+1,026
TCACGGGCAGTGACAGGCGAACCTCCACTTCCTTGAACGTGGCACCTGCTAATTGGCAAT+L027 ----+- ---+- ---+- ---+- ---+---------+
T G S D R R T S T S I, NVA P AN W O F
TCGGCCAAACCTTCACGGGA.AAGAATTTCCGCGT TCTCACACTTGCCCCTTTTTA+1087 ----+- ---+- ---+- ---+- ---+- ---+ +LL26
GOTFTGKNFRVT
G TåATAT CTTCATATATTATTTTC CTTTTTTAAC C CAGCT CTTEAÄAATTC CTGTATTTT+1-1,27 ----+- ---+- ---+- ---+- ---+- ---+ +1186
+L086
80

81

Fisure 3.11: Sequence and conceptual translation of GhExpl4
Nucleotide and conceptual translation of cotton o(-expansin gene GhExpl4. The putative start
point of translation has been designated +1.
All exons and putative peptides are shown in blue text, while introns (as determined by
alignment with pFS14 oDNA and according to Cosgrove (2000)) are depicted in green text.
Translational start and stop codons are outlined by red boxes. The putative signal sequence,
identified by the rules of von Heijne (1988), is underlined.
Putative polyadenylation sites (NUEs; Hunt, L994) are underlined, at positions +1619, +1631,
+1638, +1684, +1709, +1722 and +1843. Two putative Far Upstream Elements (FUEs) are
italicised at positions +1809 (Rothnie, 1996) and +1810 (Sanfacon et al., l99l). Circles
identifli putative cleavage points, which lie between 13-30 nucleotides downstream from the
last identified NUE.
82

AAAGAAAATTGTGTTGATTGGTTAGAGAGAJUU\T GGCCTTTCATCATTCCTTTT-37 - ---+- ---+- ---+- ---+- ---+- ---+ +23
GPFIIPF
GTTAAGGTTTGGCAATTGTTTTTCATTGGTGCCACCATTTTTGGAGGAGTCAATGCTCGA+24 ----+- ---+- ---+- ---+- ---+- ---+ +83
VKVWOLFFIGATTFGGVNAR
GTTAATGGTTGGTTTAATGCCCATGCAACGTTCTATGGGGCTGACC AAAGTCCCTTTTCT+84 - ---+- ---+- ---+- ---+- ---+- ---+ +1-43
VNGWFNAHATFYGADOSPFS
CTTGGTAÄGC CTACATTTTTTAATGGATAATTAATTT CAT AAATTTTTATTTCTTATATT+L44 ----+- ---+- ---+- ---+- ---+- ---+ +203
I,G
ATTGATT A'U\TTTTAGTTCAÀTTAATATCATTATTATTATAÄT AATTAGÀAATATATGAA+2O4 - ---+- ---+- ---+- ---+- ---+- ---+ +263
TTTAÄÄTATTTTTTTTCT CGATTTAGGGATT NUUU\GAATTATTACATATAGTATAG A'\'\+264 ----+- ---+- ---+- ---+- ---+- ---+ +323
AATTATATTTAT C TC CATTTAÄGAATAÀTAÄATCCAÄ.TAA'T CTTATATTTATTATT'A'\'\i\+324 ----+- ---+- ---+- ---+- ---+- ---+ +383
GCATTTGCATGACTAATTC TAGTATAÄATTATATTTTTTTATATATCTATATTCTAGCAT+384 - ---+- ---+- ---+- ---+- ---+- ---+ +443
GATATTATTTTTGTC TTGATTTAAÃTAGAATTGTGGTTAAAATTTTTATTACACACTTAT+444 - ---+- ---+- ---+- ---+- ---+- ---+ +503
TTGGCACTGGTTTGAAC CAC C TCTC CTAC CTCTAATATTATATCGAÄAÀAAATATAAGAA+504 - ---+- ---+- ---+- ---+- ---+- ---+ +563
TATC CTTATGAÄTTTTATTTAAAATTCTTATAA'UUUU\GTTTTTTT CGT N\ATN\i\TATA+564 ----+- ---+- ---+- ---+- ---+- ---+ +623
TAGTCTGAACT C TTTTTTGAÄAÄATAÀÀ,GTTTGTATTTGTTATATTATTTTGAAGTGGAC+624 - ---+- ---+- ---+- ---+- ---+- ---+ +683
ATACTATAACT'C AN\T A'\TGTCATAAÀATATGGAACTTTCTGAGTT N\,\TATTATATCTA+684 ----+- ---+- ---+- ---+- ---+- ---+ +743
GATGTATATATATATATTTGGATAATTATCTATTGATATGTTTCTTTTC CC CTAGA,U\TG+744 ----+- ---+- ---+- ---+- ---+- ---+ +803
C C A'UU\GTGC C CAC CCAATA,\T'TA'\i\'\TTGGAGGATATTTGAÄ'CTTTCAÄTATATATATA+804 ----+- ---+- ---+- ---+- ---+- ---+ +863
CACTTTTACAAATTATTAÀTTGGATGATGATATTATTATATAGGGGGAGC CTGTGGATAT+864 - ---+- ---+- ---+- ---+- ---+- ---+ +923
GACGY
GATAACACTTTGCATGCTGGATTCGGAGCAÄACACAGCAGCACTGAGTGGTGCACTTTTC+924 ----+- ---+- ---+- ---+- ---+- ---+ +983
D N T L H A G F G A N T A A I, S G A I, F
AGAGATGGCGAGGCTTGTGGTGCTTGCTAC CAACTCAGGTGCGATTACCCGGC CGACCCG+984 ----+- ---+- ---+- ---+- ---+- ---+ +1043
RDGEACGACYOLRCDYPADP
AAGTGGTGCCTC CGTCGTGCTGGTGTCACCATAACGGCCAC CAÄCTTTTGTC CTTCCAAC+LO44 ----+- ---+- ---+- ---+- ---+- ---+ +1103
KWCLRRAGVTITATNFCPSN
83

Ç
AACAACGGAGGGTGGTGCAATCC CC CTCATCACCATTTCGACATGTCATTGCCTGC CTTC+l-L04 ----+- ---+- ---+- ---+- ---+- ---+ +1163
NN G G W C N P P HHH F D M S I, P A F
CTTCGCATCGCCCGCCACGGGGATGAAGGCATTGTTCCGGTCCTTTATCGGAGGTACGAT+LL64 ----+- ---+- ---+- ---+- ---+- ---+ +L223
I,RfARHGDEGIVPVLYRR
TAACATTTTTGCATAC CATTAC CAATATCTTAÀ.TAAGACTGTGCTTTT AÄÄÀTTGTTTTT+1-224 ----+- ---+- ---+- ---+- ---+- ---+ +1283
TCTTTATTTGATTTTCGAAGGGTGC CATGCAAGAGGAGAGGCGGAGTCCGGTTCACCTTG+L284 ----+- ---+- ---+- ---+- ---+- ---+ +L343
VPCKRRGGVRFTL
+L344 ----+- ---+- ---+- ---+- ---+- ---+ +l_403KGQSSFNMVMITNVGGSGNV
AAGG CGGCATGGATAAGGGGGT C GAGAAC CAGAACATGG CTAC C TATGAATAGGAATTGG+L404 ----+- ---+- ---+- ---+- ---+- ---+ +L463
KAAWIRGSRTRTWLPMNRNW
GGTGCAÀATTGGCA.AÀGCAGCATTGATC TAAGAÃAC CAÀAGAATGT C TTTTAAG C T CAC T+1-464 ----+- ---+- ---+- ---+- ---+- ---+ +1523
GANWOSSIDLRNQRMSFKLT
TTGGTGGATGGC A.AAACATTGGAATTTCTCAATGTTGTCCCTTCGACGTGGAAGTTTGGC+L524 ----+- ---+- ---+- ---+- ---+- ---+ +1_583
L V D G K T I, E F I, N V V P S T W K F G
CAÄACCTTTGCTTCAACACGACAGTTCTT CAATATTGCCA TTAAGACA.AATT.AAT+1584 ----+- ---+- ---+- ---+- ---+- ---+ +l-643
a r F A s r R Q F Fl
GT C TTAGAJUUU\C CAT TATT T T TAA.AATTGATGGTT T TATAAT TA.AAÀ.AÄÄAGGGAT.AAT
GACATAAIAÄÀ,TACGGTCATTAÄATTTTCCCA.AAGTTTTCATTTAAC CATTTGATGTTAG+t704 ----+- ---+- ---+- ---+- ---+- ---+ +1763
EAÄ.AATTTAÄACATGCAGTGTTTGGGAGCATGCAATATGCAIAIA T"TGTAÄTTTGC TCG
TATAAGGATTTG AAT AÀÄÃÀAT AGAAGAGGAC@AÄÄAT@TC CTTTTTTTTCTTCT
rcrr@rcA+1_892+18 84
84

rice and cotton (pFS1a) (Harrison et a\.,200I; Hutchison et a|.,1999; Orford and Timmis,
1998; Shcherban et al.,1995) (BLASTN, Apnl2002). Primers were designed from existing
sequence and used on both the 1.3kb and 5.1 kb sub-clones (Figure 3.8C and D) to yield a
total of 1719 bp on both strands (Figure 3.12).
3,3.5 GhExp5 sequence
The GhExp5 clone hybridised strongly to the pFS14 cDNA probe and a 1.5 kb Søc I
fragment had previously been sub-cloned into pBluescript SKO(Orford, unpublished; Table
3.1), The subclone was sequenced from both ends and the sequence at one end showed
similarity to o-expansin genes in other plants. When compared to the pFS14 cDNA, the
overall level of sequence similarity was 86o/obut the genomic sequence appeared incomplete.
Further analysis revealed the presence of the left arm of the I,GEM-12'" vector and a Sau 3AI
cloning site located in the coding region of the (Figure 3.13). The l,GhExp5 clone therefore
contained only the 3' end of an o-expansin gene. Conceptual translation of the available
GhExpï sequence showed the presence of an extra termination codon and a frameshift within
the putative peptide product (Figure 3.13), both of which were possibly the result of
sequencing error(s).
3.4 Preliminarv analysis of fïve cotton expansin genes: a summary
Sequence analysis was applied to four full-length and one partial expansin gene,
isolated by screening a cotton genomic DNA library. Although nucleotide database searches
showed that each gene encodes an cx,-expansin, alignment of each sequence with the fibre-
specific oDNA showed that none of the five genes (GhUxpl0, GhÛxpl2, GhÛxpl4, GhUxpí
and GhÛxp5) encodes the fibre-specific transcripts. The degree of nucleotide similarity
between the coding regions of the five genes and the fibre-specific oDNA varied between
65% (GhExpl4) and86% (GhÛxp5) (Table 3.2). Since the fibre-specific expansin gene was
not isolated by genornic library screening, a different approach was utilised in an attempt to
85

Figure 3.12. Sequence and conceptual translation of GåExpó
Nucleotide and deduced amino acid sequence of cotton cr-expansin GhExp6. The putative
translational start point has been designated as *1.
All exons and corresponding peptides are depicted in blue text while introns (as determined
by alignment with pFS14 oDNA and according to Cosgrove (2000) are shown in green text.
Start and stop translational codons are outlined by red boxes. The putative signal sequence,
determined by the rules of von Heijne (1988), is underlined. One putative CAAT box was
identified at position -56 and is shown in bold.
Two putative polyadenylation sites (NUEs; Hunt, 1994) are underlined, at positions +1264
and +1458. One putative Far Upstream Element (FUE) was found to be located at position
+1399 (Rothnie, 1996). Circles identifu putative cleavage points, which lie downstream from
the last identified NUE, which is positioned 3' to a FUE.
86

CAGCTGCCTTGCACTCATCTCCTACCTCTCTTTTTCACTCTTCCAÀTCTTCTTCCTCTTC-2OI - ---+- ---+- ---+- ---+- ---+- ---+ -l-40
ATGTAATCTT CTTATCCATCT CATGTTAGTTTTAGTGCTTTTAJ\GA,¡\GG AAÂ.AAAAAGTG-1-41- - ---+- ---+- ---+- ---+- ---+- ---+ -80
TTACCATTTTGAGTTTTTTTATTGTTTCTTACTCGCAAGTGCTTAAAC A.AACTTCACTCT-81 - ---+- ---+- ---+- ---+- ---+- ---+ -20
GTTGTTTGTTCGCAGG CTTTTGCTAAGGTCTTTCTGTTGGGGTTTCTCGCGAT
AFAKVFI,],GFLAM
GGTCTCTGGTGTTCAGGGATATAGTGGTGATTGGACTAATGCACATGCAÄCCTTTTATGG+4L - ---+- ---+- ---+- ---+- ---+- ---+ +100
VSGV GYSGDWTNAHATFYG
TGGGAGTGATGCTTCAGGAAC AATGGGTATG C TTCAÄÀTGAAGC CATCTTTTAGGCACAA+1-0L - ---+- ---+- ---+- ---+- ---+- ---+ +160
GSDASGTMG
CGGTTTGGGTTGGATGGCTTATTTCACTAATTCTTAACTTGGGTCTTTTTTAGGTGGGGC+1,6L - ---+- ---+- ---+- ---+- ---+- ---+ +220
GA
TTGTGGTTATGGAÄAC CTGTATAGC CAGGGTTATGGGAC AÄATACTGCAGCTTTGAGCAC+22L - ---+- ---+- ---+- ---+- ---+- ---+ +280
C G Y G N I, Y S Q G Y G T N T AA I, S T
+281
+34L
+4 01-
+46L
+52L
TGCTTTGTTC AAC AATGGGCTGAGTTGTGGATCTTGCTATGAGATTAAGTGTATGGATGA----+- ---+- ---+- ---+- ---+---------+
A I, F N N G I, S C G S C Y E I K C M D D
TGGAÄAGTGGGGC CTGCCTGGTTC CTTTGTGGTCACAGCCACCAATTTCTGC C CTCC AAA----+- ---+- ---+- ---+- ---+---------+
GKWGLPGSFVVTATNFCPPN
CAATGCTCTCC CTAATAATGCAGGGGGCTGGTGCAACCCTCCTCTGCAACACTTTGACCT----+- ---+- ---+- ---+- ---+---------+
N A I, P N N A G G W C N P P ], A H F D I,
TTCTCAGC CTGTTTTCCAGCATATTGCTCAATACAGAGCTGGAATTGTGCCTGTTGCTTA----+- ---+- ---+- ---+- ---+---------+
SQPVFQHIAAYRAGTVPVAY
CAGAAGGTATGTTTTGCCTTTTGCTGCTTCCCTGTGAÄÀTGGG CTTTCTAAAGAGGCCTA----+- ---+- ---+- ---+- ---+---------+
RR
+34 0
+400
+460
+52 0
+580
TTTATTTCTCTAACCACTCAGTAATTTTC A'U\TT'T'AACTTGTCTAGTGTTCCAATTCTTT+581 - ---+- ---+- ---+- ---+- ---+- ---+ +640
TAGTAATGTAT'GAAAi\,\C C TTATTTTAAGG CAGTAÀÀAAGGT CAATTTATGAG CTTAÀCT+641, - ---+- ---+- ---+- ---+- ---+- ---+ +700
ATAAAAGGGTTGGAATTAÀTTGTTTTGGCTGCATA'IGAGGCCTGCTTTTCTCCCTATTAG+701 - ---+- ---+- ---+- ---+- ---+- ---+ +760
AGTi\ATATTTAGG GTCAGTTTC TGTTTTG CAAGACAGAC AAACGACACTTTTGGTCATTT+76L - ---+- ---+- ---+- ---+- ---+- ---+ +820
CCACTGGTAAATACATTGCTTTTACTTTCTTTAÀTGGGTAGTAACCGCGCAGTAATATCA
87

q
CTTACTTTTATTAÀC CATTGGGTTTTTTACTTTGTAGGGTACCATGCAGAÄ,GAÄAGGGAG+881 - ---+- ---+- ---+- ---+- ---+- ---+ +940
VPCRRKGGGAATCAGGTT CAC CATTAATGGC CACTC CTACTT CA.A.C CTAGTTCTTAT CAC CAACGTTG
+941 - ---+- ---+- ---+- ---+- ---+- ---+ +1000I R F T I N GH S Y F N I, VL T TNVG
GCGGTGCTGGTGATGTACATGCGGTGGCCATCAAGGGCTCCAGGACTGGTTGGCAGCCCA+1001 ----+- ---+- ---+- ---+- ---+- ---+ +l_060
GAGDVHAVAIKGSRTGWAPMTGT CT AGGAAC TGGGGC CAGAACTGGCAGAGCAACACC TAC CT CAACGGAC A.AAGC C T CT
+1061 ----+- ---+- ---+- ---+- ---+- ---+ +l-1_20SRNWGONWOSNTYLNGOSLS
CATTTAAGGTCACAACAAGCGACGGCCGTACTGTGGTTTCCAGCAATGTTGCCCCAGCTG+LL2L ----+- ---+- ---+- ---+- ---+- ---+ +1180
f ^
V I I Ð U \r t( I V V ù Þ I\ V ¿\ -H A Li
GGTGGTCCTTTGGGCAGACCTTCACTGGCCGCCAATTCCG GAACACATTATTAT+1181 ----+- ---+- ---+- ---+- ---+- ---+ +1,240
W S F G O T F T G R O F RTCTTAGGCTTTTTAAGTTTTAATTAATAATTAETATATAÄATATAC CAGGCAT C CAIU\GTA
GTATTTAÀCTAGCTTGACTTTTAGTATAGCTAGCATATTATATATCTATAGGGC C CTGTA+1301 ----+- ---+- ---+- ---+- ---+- ---+ +L360
GTGGGACTTTCGGGT CACTC AÄÀAATGTGAAGGGCTTA ?TTT¿åAGTAGCC CATTTATCA+L36L ----+- ---+- ---+- ---+- ---+- ---+ +L42O
TTTTGGGTTTTTAGTTTTATTATGGGGTAGGÎGTC CTAATTAAGTTAC C TTTT@ÀAÄA
AAAAAAÄAA@trTAAGGGT@TTTTCCTT CTGTTGTT
88

TCCCGGGAAI }"GEM- ].2 linker Sau 3
CAATGGTGCATTATTTGAAC CAT
AACCGTGACGACCACCAACTTTTGTCC CCCTAACTATGCTTTATCTAGTGACAATGGCGG61 -- --+-- --+-- --+-- --+-- --+-- --+ L20
T V T T T N F C P P N Y A ], S S D N G G
L21_ L80PREHFDLVEPAFI,AIA
WCSPCT AÄÄATTATTCCTGTTCTCTTCAGAAGGT'ATGTT A'U\TTGTTAAATCAT
181- - ---+- ---+- ---+- ---+- ---+- ---+ 240EYRAKIIPVLFRR
CACGATCTTTAAGGTATGTT A/\'\T'TGTCGGCTGTCAGGTGTGAAGA,¡U\GGAGGCATTAGG241- - ---+- ---+- ---+- ---+- ---+- ---+ 300
VKKGGIR
TAACGAAAGTGGGAGGT301
S S MD G L O S Y F N I, V L T T KVGG
GCAGGGTATATATCGTCGGTGTCCATCAAGGGTTCC AAAACAGGGTGGCTAC CTATGTCT361 - ---+- ---+- ---+- ---+- ---+- ---+ 420
AG Y I S S V S I KG S KT G W I, P M S
AGAAACCCGCTGTACGTGTTCTTCTCGACCAC CTCATCAGGTTTCTACAGCGTCCGATCT42L - ---+- ---+- ---+- ---+- ---+- ---+ 480
R N P I, YV F F S T T S S G F Y S VR S
CGGGGAACAGCTCGGAATCAACGGTGTCGTCCAÄT GTAGTTGCCCACCACTCCCT481, - ---+- ---+- ---+- ---+- ---+- ---+ 540
RGTARNORCRPII
GTGCATGC TGC CGCGGCGGGGGAC TTGTGCAAGTGNAAGTG AAAG AÄ.AATGGGGATGGAA----+- ---+- ---+- ---+- ---+---------+
GCTTGTCGGC CGAGGTTTGC CGTGGTGAATTGCGTGGTTGA}üNA,¡\TAGGTTTAC CATGGA----+- ---+- ---+- ---+- ---+---------+
NGAIU\C TTTTTTNAATTTTGCC CGGGGNGGAGGTTGGGGTAGG A.AATAGGTAGAATTTTT----+- ---+- ---+- ---+- ---+---------+
TAAATAGAGGGATAJU\TNA,¡\GzuUUU\TAATTTAATTTTCC AAATTTA.AÄ.AAGAGNTGCTA----+- ---+- ---+- ---+- ---+---------+
T AJ\TAiUU\I{ACAGTTNTGGANAAACAAGGGAAATGGAC TTTATTACATNAGTTGCTC TTT----+- ---+- ---+- ---+- ---+---------+
GAATCC846
Nucleotide soquence of the 1.5 kb Sac I (596) subclone of ÀGhExp5 from the RSP primer,
with the ^S¿c
I subcloning site, the ÀGEM-12 polylinker and Sau 3AI genomic cloning site
boxed. The coding region and corresponding amino acid sequence is indicated in blue text,
and the intron (determined by nucleotide alignment with pFS14 cDNA) ) in green text. The
translational stop codon is outlined by a red box. The position and direction of primers for
later Genome'Walker'. PCR experiments are indicated by orange boxes.
541,
601
66L
72L
78L
841,
600
660
720
780
840
89

Table 3.2. Nucleotide identitv (7o) between six cotton a-expansin codins resions
pFSl4cDNA
GhExpl0
GhExpl2
GhExpl4
GhExp6
GhExp|4.2
GhExp14.4
GhExpS
pFSl4 GhExpI0 GhExpl2 GhExpl4 GhExpf GhExpI4.2 GhExp14.4 GhExpScDNA
65
60
78
70
70
66
62
65
64
65
63
67
68
68
66
70
68
65
70
99
97
88
70
70
68 89
97
88
90

obtain the gene corresponding to the pFS14 oDNA, and also to complete the sequence of the
GhUxp1 gene.
3.5 A search for the fTbre-specific cx,-expansin sene
Later experiments (Chapter Six) required the isolation of the fibre-specific o-expansin
promoter, and this was performed first by applying a GenomeWalker'. PCR method (refer to
Materials and Methods). Using two pFSl4-specific primers, two PCR products were
produced within the same reaction, one of 1.4 kb and the other of l.2kb (Dr. S. Orford,
personal communication). Both were cloned and the larger product was called gwl4.4
(Genome'Walker'" pFSl4 1.4 kb PCR product) and the smaller gwt4.2 (GenomeWalker'u
pFS14 l.2kb PCR product; Dr. S Orford, personal communication).
The two clones, gwl4.4 and gwl4.2, were sequenced in their entirety to yield 1361 bp for
9w74.4, and 1199 bp for gwl4.2. The two promoter regions differed in length by 162 bp, and
were96Yo identical to each other at the nucleotide level, differing mainly at their 5' ends
(Figure 3.14).
Sequence comparisons showed that9SYo identity existed between the pFSl4 oDNA
and the 9w74.4 sequence (Figure 3.154), and 100% sequence identitybetween 9w142 and
pFSl4 oDNA (Figure 3.158), suggestingthat the gwl42 promoterbelonged to thepFS14
cDNA and that the gwl4.4 promoter is derived from a closely related gene. To confirm this,
the GenomeWalker'" based method was used to obtain the coding regions downstream of the
gwl4.2 and gwl4.4 promoters.
3.5.1 Obtainins the eenes which correspond to sw14.2 and ewL4.4
The primary PCR primer, pl4gwI, was designed as a general primer to amplify both
promoters, whilst the secondary PCR primers, p14gw2 and p14gw3, were designed to
differentiate between the two promoter sequences (Figure 3.14). The primary PCR produced
multiple faint bands, ranging from 200 bp to 1.5 kb in size, within each of the 10 genomic
9l

Figure 3.14. Alienment of GenomeWalker* cwl4.4 and sw14.2 promoter sequences
Nucleotide alignment of gwl4.2 promoter and gwl.4 promoter sequences, with the translation
initiation codons boxed in red. The position of the general GenomeWalkerrM PCR primer,
pl4gtrl, for both promoters is shown boxed in green. The gw14.2 promoter-specific primer,
pl4gw2, is shown in orange, whilst the gwl4.4 promoter-specific primer, pl4gw3, is shown
in yellow. All three primers are directed towards the coding region of the gene.
I
92

gwl_4 . 4 - 97 3 AGCTÎTTGATTGGCGCAAGTGGTGCGGATAAAGAAGACCGCACAACAACG - 924I |lllllrrr lll lllll I llllllllll lllll lll
gwL4 . 2 - 14 6 ATCTTTIGATTGGCACAAACAGTGCGA,¡\CN{I\GAi\GACCACACAATAACA - 7 9?
gwL4 .4 - 923 ATTTTAATAACTTAGTAi\TTTÀiA,\TGTAAAGTTTTC.AATAATTTAATGAC - I74lllllll I ll lllllllllll lll llllllllllllllll
gw]-4 . 2 - 7 9 6 ATTTTAACAATATACTAj\TTTA.¡U\TGATUL\,{TTTTCAATAATTTAAT . . . - 7 5 0
gwL4 . 4 -873 CATTTTATAATATTTTCAAGTTAGGTGAGGAÄAACTTACTAAGAGTTAGT -820| il r llllllllllllllllllllllllgw).4.2 -749 . ....AAGTTAACCGAGGAI\j\,\CTTACTAAGAGTTAGT -716
gwr4.4 -819 TACCCCTGTTAACATAACTTTCATGAAGTAj\TAGA.¡U\CTTTTA. . . .GTA -7'74||trllll llllllllllllllllllllllllllllll lll
gw14 . 2 -7r5 TACCCCTGTTryUU\TAj\CTTTCATGAAGTAATAGA.AACTTTTAGTACGTA -666
gw14 . 4 - 7?3 TCATCTTATATAGAACAAITTCTATTTTCACA-AAGTCAAGAIUU\TTGTAT - 724llllllllllllllllllllllllllllll lllllllllllllllllll
gw],A . 2 - 6 6 5 TCATCTTATATAGAACAATTTCTATTTTCAGAAAGTCA,;\GAj\iU\TTGTAT - 6 1 6
gwL4 . 4 -723 TCTA¡UUUU\TGGCGACTTCTTCACCTICAGTCCTTCCCTGATCAGCGCTT - 6 74
llll illllllllllllllllllllllllllllllllllll llllll9w1,4 . 2 - 6 1 5 TCÎAGAAÄATGGCGACTTCTTCACCTTCAGTCCTTCCCTGATCGGCGCTT - 5 6 6
gw\4 .4 - 673 GTGAjU\I\¡\CGN\jUU\CCTGAGTCTGATTGGCTGACTGNUU\TGAACCTAC - 624il lllr il lllllllllllllllllllllllllllllllllllllll
gwl-4 . 2 -565 GTGA¡\,¡\,¡\I\CGAiA,¡U\,¡\CCTGAGTCTGATTGGCTGACTGATqIIqIATGAi\CCTAC - 516
gwL4 . 4 - 623 TCATCACCATTCACTATTACCAACTTCAÀATGATAGGGGAATTAACTGGT - 5 74
||illllllllllllllllllllllllllllllllllllllllllllgwL4 .2 - 5 1 5 TCATCACCATTCACTATTACCAACTTCAAATGATAGGGGAATTAACTGGT - 4 6 6
9w1,4 .4 - 5 73 Aj\I\GTGTAACTCCACCGATGGTTGAGGTGGTTGGCTGGAGTTA.AATGAGA - 524||tIllllllllllllllllllllllllllllllllllllllllll
gv¡l-{ .2 - 4 6 5 AAAGTGTAACTCCACCGATGGTTGAGGTGGTTGGCTGGAGTTAAATGAGA - 4 1 6r]-mer
9w74.4 -523 TTTTTTTT|||l9w14.2 -4L5
gwl-4 . 4 -373
gwl4.2 -367
||9w1,4.2 -217 TGCA
||| || |t -37 4
-368
TÎGTTATGGTTTAA -324r||||rITTGTTAÎGGTTTAA -318
AGTTTT
rrIt It It ll|||llllllllTAACCCCTCGCTCAACCTTCCGCCA
gw).4.4 -323 TT TTATGTTTCCATCCATCTATATTTATATCCATTAJUU\CAJ\GTC - 27 4
| | r r I llllllllllllllllllllllllllllllllllllll I
gwL4.2 -31-7 TTAAACATTATGTTTCCATCCATCTATATTTATATCCATTAIU\I\CAi\GCC -268
gw14 . 4 -273 GTTGAGCAIU\TAI\TGGATACTGGATACCATCATATCTATGATTAAAATTT -224||||llllllllllllllllllllllllllllllllllllllllll
gw14 . 2 -267 GTTGAGCAAATAATGGATACTGGATACCATCATATCTATGATTA,\,¡\åtuTTT - 2 18
9wL4. 4 -223 TGCATGTGCCCTTTTAATGTATAGC. . TTAATTATCCTCCAAATT|||||llllllll -180
-1_68
- 131pL4gw2
9wL4. 4 -179 TGTACTCTTTCACCAC.Tillllllllllrr lllll llllllllll llllllll lllllllgwL4 . 2 - 1 5 7 TGTACTCTTTCACCACTTAATTGGCTACGTACGGTACTTAGCGTTGCTTG - 1 L 8
gw1-4 .4 - 13 0 ACAAACTCTTTCTCTTTTTGTATAÀATAGCTAT - 7 1rrril||t ||||||t|||||||llIgwl4 .2 -LL7 . . . TCATCTTCTGTACTACAAACTCTTTCTCATTTTGTATA.AATAGCTAT - 71
9w14.4 -70 ACACTTTTTCTCCCCTCAÀATCAATAAGGTTAGGTCAGCCAATTGTTTGA -21| | ll r r r lllllllllllllllllllllllllllllllllllllgwL4 .2 -7 0 ACACTTTTTCTCTCCTCAAATCAATAAGGTTAGGTCAGCCAATTGTTTGA - 2 1
gw1-4.4 -20 GCTAGCTAGCTCTTACTC +3il lllllllllllllllgw1-4.2 -20 GCTAGCTAGCTCTTACTC +3
93

A. Nucleotide sequence alignment between the pFSl4 cDNA and the coding region of
the gwl4.4 promoter. Four nucleotide mismatches are shown along with an intron,
indicated in green. The blue region represents coding region and the ATG initiation
codon is shown outlined with a red box.
B. Nucleotide sequence alignment between the pFS14 cDNA and the coding region of
the gwl4.2 promoter. No single nucleotide mismatches were found. One intron is
shown in green and the coding region is indicated in blue. The ATG initiation codon
is outlined by a red box.
94

trr||llllllll ||rtrlllllllll||llllllpFS14 CDNA. seq 2 TAGCTAGC TT 51
ghr14.4.seq 1083 TTCACTTTTCTTCTTTTTGTTCAGTATCTGCAACTCCATTTTCCTTGGTG l-l-32I ||||tilrrllllll llllllllllllllllllllllll
pFSl-4 cDNA.seq 52 TCCACTTTTCTTCTTTTTGTTCAGTGTCTGCAACTCCATTTTCCTTGGTG 101
9hr14.4. seq 1133 CTAATGGAGATGACAATGGTGGT'TGGCA,U\CTGCCCATGCCACCTTTTAC 1182| | r r r | | | | | | | | | | | | | | r llr ll lllpFS14 cDNA. seq L02 CTAATGGAGATGACAATGGTGGTTGGCAAACTGCCCATGCCACCTTCTAC 1-51
A.gwl-4 .4 . seq
gw1-4.4. seq 1183
pFS14 CDNA.seq l-52
gv¡14 .4 . seq L233
pFS14 CDNA.seq l-79
gwl-4.4. seq L283
pFS14 CDNA.seq L79
ghr14.4. seq 1333 GAGCACAGCAGCTTTGAG l-350||ll||!|||pFS14 CDNA. aeq 226 GAGCACAGCAGCTTTGAG 243
1033 TAGCTAGCTCTTACT
GGTGGTGCTGATGCTACCGGCACAATGGGTGAGTTTCAÄACTTTCAÄAC C||trl||||||lItIGGTGGTGCTGATGCTACCGGCACAATGG. . . .
ATTAC C TACAT AiUUU\TCTCTAGGCTATGTTCTTAÄ,TTTGTGATGTTTCT
ATAGGGGGAGCTTGTGGTTATGGA'U\C CTGTGCAGTCAAGGGTATGGAAC
| | r il | | | | | | | | | r lI lllllllllllll. . . . GGGGAGCTTGTGGTTATGGAAACCTGTACAGTCAAGGGTATGGAAC
TT 1082
L232
t78
1,282
1,7 9
].332
225
B.9wL4.2. seq 864 TAGCTAGCTCTTACT
|||||||lpFS14 CDNA.seq 2 TAGCTAGCTCTTACT
I ||||TTGCAÄAT
ATT 9].3ItATT 51.
gwl4.2.seq 914 TCCACTTTTCTTCTTTTTGTTCAGTGTCTGCAACTCCATTTTCCTTGGTG 963|||||rrrlIlllllllllllllllllllllllllllllllpFS14 cDNA.seq 52 TCCACTTTTCTTCTTTTTGTTCAGTGTCTGCAACTCCATTTTCCTTGGTG 101
9wL4.2. seq 964 CTAATGGAGATGACAATGGTGGTTGGCAAACTGCCCATGCCACCTTCTAC L01-3
||||||||||||||||||llllllllllllllpFS14 cDNA.seq 102 CTAATGGAGATGACAATGGTGGTTGGCA-AACTGCCCATGCCACCTTCTAC 151
gw14 .2 . seq 1-014
pFSl-4 CDNA.seq 152
gwl-4 .2 . seq 1,064
pFSL4 CDNA. seq 179
gwL4.2 . seq 11,1,4
pFS14 CDNA. seq 179
gw14 .2 . seq L1,64
pFS14 cDNA. seq 21-7
GGTGGTGCTGATGCTACCGGCACAATGGGTGAGTTTCAÀA,C TTTCAÀÄC C
|||||||||||lIlllGGTGGTGCTGATGCTACCGGCACAATGG. . . .
ATTACG G CATTAC CTACAT' AiUU\i\TC TCTAGGCTATGTTC TTAATTTGTG
ATGTTCTC TATAGGGGGAGCTTGTGGTTATGGAÄAC CTGTACAGTCAAGG||rrrIr|||||||||||t. . . GGGGAGCTTGTGGTTATGGA.AACCTGTACAGTCAAGG
GTATGGAACGAGCACAGCAGCTTTGAG 1 1 9 OIrrr|||||||rIrGTATGGAACGAGCACAGCAGCTTTGAG 2 4 3
1063
1,7 I
1_1. l_3
L79
11_63
21,6
95

lf,
"libraries" (refer to Materials and Methods: results not shown). The presence of a band
within the positive controls showed that the PCR conditions were appropriate and the absence
of bands in the negative control demonstrated that the PCR reactions were free of
contamination (results not shown). The secondary PCR, using specific primers within gwl4.2
or gtrl4.4 promoter sequences, amplified sequences from each of the 10 "libraries" (Figure
3.164 and 3.16B). The bands produced using the gvrl4.2 specific primer were different in
size from those using the gwl4.4 primer (Figure 3.164 and 3.168), suggesting that the
genomic regions of gvvl4.2 and gwl4.4 are situated in different sequence contexts and hence
that each is a distinct gene.
Probing of the GenomeW'alkerrM PCR products with the pFSl4 cDNA (Figure 3.16C
and 3.16D) showed that most of the fragments hybridised the probe. To increase the
likelihood that the entire coding regions were isolated, those PCR fragments of at least I kb in
size that hybridised most strongly to the probe (Figure 3.16C and 3.16D) were selected for
cloning. Cloned PCR fragments were screened by colony hybridisation, using pFSl4 as a
probe, and the colonies that hybridised most strongly (result not shown) were selected for
sequencing.
3.5.2 The GhExp14.2 eene sequence
Sequencing of a 1.1 kb PCR clone (Figure 3.16C) revealed that the 3' end of the
contained gene was missing, and a larger hybridising -1.5 kb band (Figure 3.16C, lane 6) was
cloned into pGEM@-T Easy. The cloned fragment was sequenced in its entirety in both
directions, to give 1415 bp of sequence (Figure 3.17).
Comparison between the Genome'Walker'"GhExp14.2 sequence (Figure 3.17) and that
of the Genome Walker"-derived gwll.2promoter (Figure 3.14) revealed that, as expected,
the sequences were 100% identical over the 521bp of overlap (not shown). Since the region
of identity included an intron found to be variable in length and sequence between the other
available cotton expansin genes (Figure 3.9-3.12) it was concluded that the gene
96
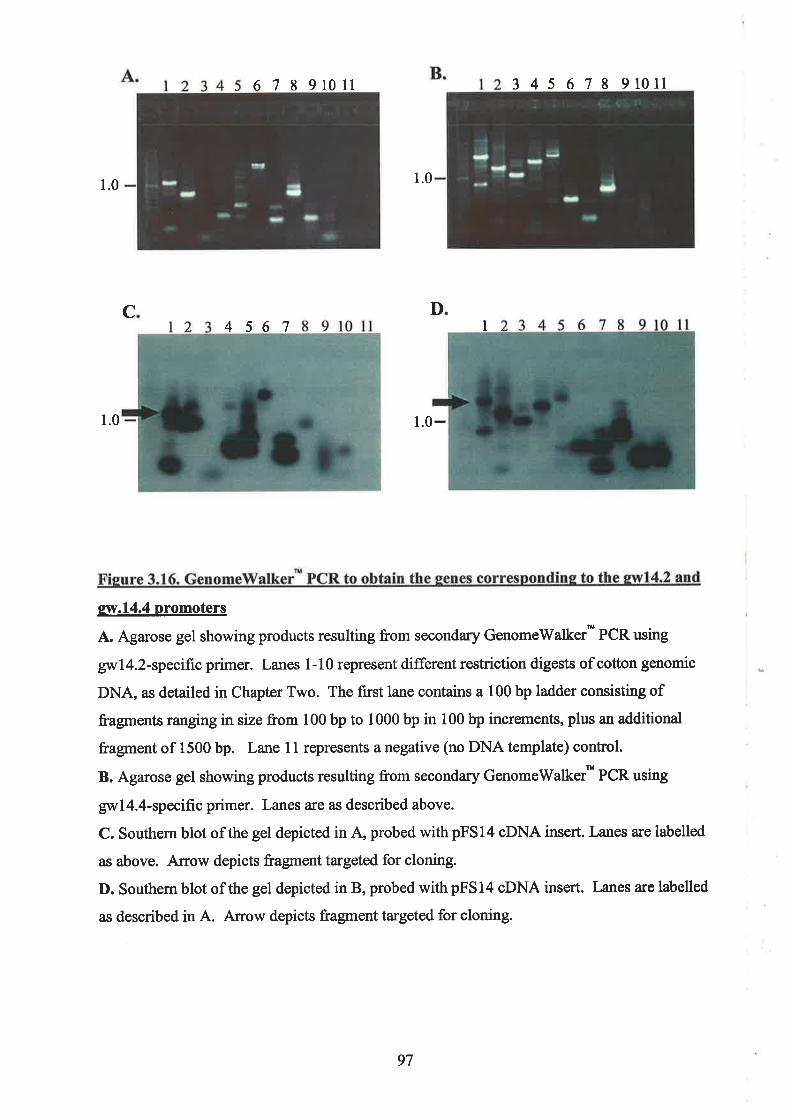
6 7 8 91011
4s67
3 4 5 6 7 8 91011
1.01.0
1.0
DCI
1.0-
sw.14.4 promoters
A. Agarose gel showing products resulting from secondary GenomeWalker* PCR using
gwl{.2-specific primer. Lanes 1-10 represent different restriction digests of cotton genomic
DNA, as detailed in Chapter Two. The first lane contains a 100 bp ladder consisting offragments ranglng in size from 100 bp to 1000 bp in 100 bp increments, plus an additional
fragment of 1500 bp. Lane l1 represents a negative (no DNA template) control.
B. Agarose gel showing products resulting from secondary Genome'Walker" PCR using
gwl4.4-specific primer. Lanes are ¿N described above.
C. Southern blot of the gel depicted in A, probed with pFS14 oDNA insert. Lanes are labelled
as above. Arrow depicts fragment targeted for cloning.
D. Southern blot of the gel depicted in B, probed with pFSl4 oDNA insert. Lanes are labelled
as described in A. Arow depicts fragment targeted for cloning.
97
Nucleotide and deduced amino acid sequence of cotton o-expansin gene GhExpI4.2. The
putative hanscription start point has been designated +1, after comparison with pFS14 cDNA,
and is indicated by an arrorw.
All exons and the corresponding peptide are shown in blue text, with introns (determined by
alignment with the pFS14 oDNA) indicated in green text.
Translational start and stop codons are outlined by red boxes. The putative signal sequence,
identified by the rules of von Heijne (1988), is underlined. Putative TATA (at position -65)
and CAAT (at positions -31 and -13) boxes are shown in bold.
The orange box, positioned at the 5' end of the gene, represents the pl4gw3 primer used in
the secondary Genomerüalker'* PCR reactions. The far 3' end of the -1.5 kb
Genome'Walker" fragment, which contained the AP2 primer, was not sequenced in both
directions and hence was omitted from the final 1415 bp sequence.
Three putative polyadenylation sites (NUEs; Hunt, 1994) are underlined, at positions +959,
+978 and +980. Two putative FUEs (italicised) were found to be located at positions +1136
and +1176 (Rothnie,1996). Circles identify putative cleavage points.
98

-192 -t-35
CTTAATTAGCTACGTACGGTAC TTAGCGTTGCTTGT CAT CTTCTGTACTAC AÄACTCTTT-1,34 ----+- ---+- ---+- ---+- ---+- ---+ -75
CTCATTTTGTÀTÀÀATAGCTATACAC TTTTTCTCTC CT C AAATCAÀTAAGGTTAGGTCAG-74 ----+- ---+- ---+- ---+- ---+- ---+ -L5
TAATTATCCTCCAÄATTTGTACTCTTTCACCA-+--- -+--- -+---------+
cc^ÀTTcrrrcacf,ccrAccrcrrAcrc cAi\ccNUU\..ATGATGTTGCAÄA-L4 ----+- ---+- ---+- ---+- ---+---------+
TATKTMMI,QT
TATTTCCACTTTTCTTCTTTTTGTTCAGTGTCTGCAACTCCATTTTCCTTGGTGCTAATG+47 ----+- ---+- ---+- ---+- ---+- ---+ +106
FPLFFFLFSVCNSIFLGANG
GAGATGACAATGGTGGTTGGCAAACTGCC CATGCCACCTTCTACGGTGGTGCTGATGCTA+1-07 ----+- ---+- ---+- ---+- ---+- ---+ +l-66
DDNGGWOTAHATFYGGADAT
CCGGCACAATGGGTGAGTTTC A,U\CTTTCAAAC CATTACGGCATTAC CTACATAÀÃÀATC+1-67 ----+- ---+- ---+- ---+- ---+- ---+ +226
GTMG
TCTAGGCTATGTTCTTAÀTTTGTGATGTTC TCTATAGGGGGAGCTTGTGGTTATGGAÄAC+227 - ---+- ---+- ---+- ---+- ---+- ---+ +286
GACGYGN
CTGTACAGTCAAGGGTATGGAACGAGCACAGCAGCTTTGAGCACTGCACTTTTCAACAAT+287 ----+- ---+- ---+- ---+- ---+- ---+ +346
L Y S Q G Y G T S T A A I, S T A I, F N N
GGCTTGAGCTGCGGTGCCTGTTACGAGCTCCGGTGC AAC AATGATCCTCAATGGTGCATT+347 ----+- ---+- ---+- ---+- ---+- ---+ +406
G I, S C G A C Y E I, R C N N D P Q W C I
+46
+466
+526
+5 86
+646
+706
+7 66
+407
+467
+52'7
+587
+647
+7 O'7
AGTCGA.ACCATAAC CGTGACAGCCACCAACTTTTGTC CAC CTAACTATGCTTTATCTAGT----+- ---+- ---+- ---+- ---+---------+
S R T I T V T A TN F C P P N Y A I, S S
GACAATGGCGGGTGGTGCAATCC CC CACGAGAACACTTTGATTTGGCCGAACCGGCATTC----+- ---+- ---+- ---+- ---+---------+
D N G G W C N P P R E H F D I, A E P A F
TTG CGGATAGCAGAATATCGAGCTGGAATCGTCCCTGTTATGTTCAGAAGGTGGTGAATA----+- ---+- ---+- ---+- ---+---------+
I,RIAEYRAGIVPVMFRR
AiU\CTC fu\T'T C Al\l\T'CAT CAC T C TTTAÀGGTATGTTAAAC TGTTGGGTGTTTGAC CTTTT----+- ---+- ---+- ---+- ---+---------+
G CAGGGTGTCATGTGTGA.AGAÄAGGAGGCATCAGGTACACCATGAATGGACATTCGTACT----+- ---+- ---+- ---+- ---+---------+VSCVKKGGIRYTMNGHSYF
T CAACATGGTGTTGATAACGAACGTGGGAGGGG CAGGGGATATAACGT CAGAGTC CAT CA----+- ---+- ---+- ---+- ---+---------+
NMVLITNVGGAGDÏTSESIK
AGGGTTCCAGAACAGGATGGCTACCTATGTCCAGA.AATTGGGGC C NU\'\CTGGCAGAGCA+767 ----+- ---+- ---+- ---+- ---+- ---+ +826
G S R T G W ], P M S R N W G A N W A S N
99

ATGCTTACCTCAÄ'CGGACAAAGCCTCTCTTTTAÄÀGTGACTGCCAGCGATGGCAGGACTA+827 - ---+- ---+- ---+- ---+- ---+- ---+ +885
AY I, N G O S L S F KVTA S D G R T IT CACAGC C TACAATGTAGTGC C TGCTGGTTGGCAATTCGGACAAACTTTTGAAGGAGGC C
+887 - ---+- ---+- ---+- ---+- ---+- ---+ +946TAYNVVPAGWOFGATFEGGA
AGTTT CAATATTATAATGTCTGTCTAATATAAAACTGGAATTGACATATTACTTA
FT@@ec@ArcAcccrrrrArcc ccAe@ceeaarccccc c cccrcccrr@rcre
CTATTAAG "TTGååCTCTAGAGGATATAT
C CATAATGT CTGAJU\TTTG T??G?TGATGAT+LL27 ----+- ---+- ---+- ---+- ---+- ---+ +1186
TGACCATGATATTTATGCTTTTCATTATTGAAATA+11-87 ----+- ---+- ---+----- +L222
C
100

coffesponding to the gwl4.2 promoter had been correctly amplified.
An alignment between the sequence of pGhBxpl4.2 and that of the oDNA revealed
99.5 % identity, with only seven nucleotide differences observed between the two sequences
(Figure 3.1 8; Table 3 ,2). The minor nucleotide differences may be attributed to sequencing
andlor PCR errors in the genomic clone or the pFS14 oDNA, or due to varietal differences
between cultivar Siokra 1-2, from which the pFS14 oDNA is derived, and Siokra l-4, from
which the gene was isolated. The extremely high level of sequence identity between the
pFSl4 oDNA and the GhExp14.2 genomic clone lead to the conclusion that the gene
corresponding to the fibre-specific cx-expansin oDNA had been cloned.
3.5.3 The GhExp14.4 gene sequence
A PCR fragment approximately 2kb in size, (Figure 3.76C,lane 1) was cloned and
sequenced in both directions, yielding 1622bp in total (Figure 3.19). Sequence comparisons
between the GhExp14.4 gene sequence and gwl4.4 promoter (Figure 3.14), demonstrated that
100 % identity existed between the two sequences and that the primer designed from the
gvvl4.4 promoter had successfully amplified its corresponding gene (not shown).
Comparisonbetween the GhExpl4,4 sequence and thepFSl4 oDNA showed 97o/oidentity
(Figure 3 .20; T able 3 .2).
An alignment betweenthe GhExpl4.2 and GhExpI4.4 gene sequences (Figure3.2l)
revealed that they were 97 o/o identical over a 1344 bp overlap, with the main nucleotide
differences occurring within intronic regions and towards the 3' ends of the genes. Whilst
being very similar in sequence, the two genes can be amplified separately from the cotton
genome and are clearly distinct from one another, with GhExpl4.2 probably encoding the
fibre-specifi c transcripts corresponding to pFS I 4.
101

Nucleotide sequence alignment between the pFSl4 oDNA and the GhExpI4.2
GenomeWalker'" PCR product. The orange box depicts the nested GenomeWalker'" primer,
pl4gur2, used to obtain the genomie region (Figure 3.14). Nucleotide matches are indicated
by asterisks and intron sequences by green text.
102

10 30 40 50 60
1,4AATTATC C TCC AAATTTGTACTCTTTCACCA
CTTAATTAGCTACGTACGGTACTTAGCGTTGCTTGTCATCTTCTGTACTAC AÄACTCTTT
CTCATTTTGTAT AÄATAGCTATACACTTTTT CT C TC CTC AJU\TCAI\TAAGGTTAGGTCAG
TCCAATTGTTTGAGCT
TGATGTTGCAAATGTTGCAAA****************** ***********************
TATTTCCACTTTTCTTCTTTTTGTTCAGTGTCTGCAACTCCATTTTCCTTGGTGCTAATGTATTTCCACTTTTCTTCTTTTTGTTCAGTGTCTGCAACTCCATTTTCCTTGGTGCTAATG* * * ìÈ * * * * * * * * * * * * * * * * * * ** * * * * * * * * * * * * * * * * t * * * * * * * * * * * * * * * * * * *
GAGATGACA.A'TGGTGGTTGGC AJU\CTGC CCATGC CAC CTTCTACGGTGGTGCTGATGCTAGAGATGACAATGGTGGTTGGC NU\CTGC CCATGC CACCTTCTACGGTGGTGCTGATGCTA* * * * * * * * * * * * * * * * * * * * * * * * * * !t * t * * * * * * * * * * * * * * * * * * * * * * * * **** * * *
CCGGCACAATGG- -CCGGCACAÄ.TGGGTGAGTTT'C NU\CTT'T'C fu\'\CCATTACGGCATTACCTACATAAÀAÄ,TC************
;;;ä;;;;; ;;;;;il;;;;;; ;; ;;;¿3:3:î3:ii:i::iiåi::ffi:*****************t *****
CTGTACAGTCAAGGGTATGGAACGAGCACAGCAGCTTTGAGCACTGCACTTTTCAACAATCTGTACAGTCAAGGGTATGGAACGAGCACAGCAGCTTTGAGCACTGCACTTTTCAACAAT************************************************************
GGCTTGAGCTGCGGTGCCTGCTACGAGCTCCGGTGC A.ACAATGATCCTCAATGGTGCATTGGCTTGAGCTGCGGTGC CTGTTACGAGCT C CGGTGCAACAÄ'TGAT CCTCAATGGTGCATT* * * * * * * * * * * * * * * * * * * * * * * * * * * * * * * * * * * * * * * * * * * * * * * * * * * * * * * * * * *
AGT CGAACCATAACCG TGACAGC CAC CAACTTTTGTC CAC CTAACTATGCTTTATCTAGTAGT CGAAC CATAAC CGTGACAGC CAC CAACTTTTGTC CAC CTAACTATGCTTTATCTAGT* * * * * * * * * * * * * * * * * * * * * * * * * * * * * t * * * * * * * * * * * * * * * * * * * ** * * ** * * * * *
GACAATGGCGGGTGGTGCAATC CC C CACGAGAACACTTTGATTTGGCCGAAC CGCGATTCGACAATGGCGGGTGGTGCAATCC C C CACGAGAACACTTTGATTTGGCCGAAC CGGCATTC* * * * * * * * * * * * * * * * * * * ** * * * * * * * * * * * * * * * * * * * * * * * * * * * * * * * ** * * * *
TTGCGGATAG CAGAATAT CGAGCTGGAATCGTC CCTGTTATGTTC AGAAGTTGCGGATAGCAGAATAT CGAGCTGGAATCGTC CCTGTTATGTTCAGAAGGTGGTGAATA* * t * * * * * * * * * * * * * * * * * * * * * * * * * * * * * * * * * * * * * * * * * * * * * * *
AAACTC AATTCA-AAT CAT CAC TCTTTAAG GTATGTTAAAC TGTTGGGTGTTTGACC TTTT
- - - - GGTGTCATGTGTGAAGAAAGGAGGCATCAGGTACACCATGAATGGACATTCGTACTG CAGGGTGTCATGTGTGAAGAJU\GGAGGCATCAGGTACACCATGAATGGACATTCGTACT*******************************************************
TCAACATGGTGTTGAT AACGAACGTGGGAGGGGCAGGGGATATAACGTCAGTGTCCATCATCAACATGGTGTTGAT AACGAACGTGGGAGGGGCAGGGGATATAACGTCAGAGTCCATCA* * * * * * * * * * * * * * * * ** * * * * * * * * * * * * * * * * * * * * * * * * * * * * * ** * * * * ** * * **
20
l_merpFS14 CDNAGhExp74.2
pFS14 cDNAGh4xp74.2
pFS14 CDNAGhExpl4.2
pFSl-4 CDNAGhExpl4.2
pFSL4 CDNAGh4xpl- .2
pFSl-4 CDNAGhExpT4 .2
pFSl4 CDNAGh4xp74.2
pFSl-4 CDNAGh4xp74.2
pFSl- CDNAGhExp74.2
pFSL4 CDNAGhExpl4 .2
pFS14 CDNAGhExpl4.2
pFS14 cDNAGhExp74.2
pFS14 cDNAGhExpl-4.2
pFS14 CDNAGh4xp74.2
pFS14 CDNAGhExpL4.2
pFS14 cDNAGhExpTA .2
103

C
pFS14 CDNAGhExpT .2
pFS14 CDNAGhExp1,4.2
pFSl-4 CDNAGhdxpl- .2
pFS14 cDNAGhÛxpl4 .2
pFSl-4 CDNAGhExpT4 - 2
pFS14 CDNAGhExpT4 .2
pFS14 cDNAGhExpl- .2
pFSl-4 CDNAGhExpT4 .2
AGGGTT C CAGAACAGGATGGCTAC CTATGTCCAGA,U\TTGGGGC CAA.AACTGGCAGAGCAAGGGTTC CAGAACAGGATGGCTAC CTATGTCCAGNU\TTGGGGC C A.A.AACTGGCAGAGCA************************************************************ATGCTTAC CTTAACGGACAAAGCCTC TC TTTTAJU\GTGACTGCCAGCGATGGCAGGACTAATGCTTACCTC CGGACAAAGCCTCTCTTTTAAAGTGACTGCCAGCGATGGCAGGACTA* * * * * * * * * * * * * * * * * * * * * * * * * * * * * * * * * * * * * * * * * * * * * * * * * * * * * * * * * * *
TCACAGC CTACAATGTAGTGCCTGCTGGTTGGCAATTCGGACAAACTTTTGAAGGAGGC CTCACAGC CTACAATGTAGTGC CTGCTGGTTGGCAATTCGGACAAAETTTTGAÄ'GGAGGC C************************************************************
***************************************TATAAGGCACATGAGCGTTTTATGC CGAGGTAGCA.AÀATGGCCGC CG CTGGCTTTATGTGTATAAGGCACATGAGCGTTÎTATGC CGAGGTAGCA,q,CATGGCGC C CGCTGGCTTTATGTG* * * * * * * * * * * * * * * * * * * * * * * * * * * * * * * * * * * * * * * * * * * * * * * * * * * * * * * * * *
TGA,AATAGGCGAGCAAGTGC CATTAGC CTATAATCTATACATTTC TTATAGTG C CAAATGAJU\TAGGCAAGCAAGTGCCATTAGCC TATAATCTATACATTTC TTATAGTGAAC C A.AA* * * * * * * * * * lr * * * * * * * * * * * * * * * * * * * * * * * * * * * * * * * * * * * * * t * * * lr * * * * * *
C TATTAAGTTTGAAC TCTAGAGGATATAT C CATAATGTCTGÆU\TTTGTTTGTTGATGATCTATTAAGTTTGAACTC TAGAGGATATAT CCATAATGTCTGzu\I\TTTGTTTGTTGATGAT* * * rr * * * * * * * * * * * * * * * * * * * * * * * * * * * * * * ¡t * * * * * * * * * * * * * * * * * * * * * * * * *
TGAC CATGATATTTATGGTTTTCATÎATTGAAATAC CTTTTTTTATAATTÎTGAC CATGATATTTATG CTTTTCATTATTGAÄATA -* rk* * * * * * * * * * * * * * * * * * * * * * * * * * * * * * * *
t04

10s

GhExp14.4
Nucleotide and deduced amino acid sequence of cotton cr-expansin gene GhExpI4.4. The
putative start point of translation has bccn dcsignatcd as +1.
All exons and the corresponding peptide are shown in blue text, with introns (as determined
by alignment with pFSl4 cDNA) indicated in green text.
Translation start and stop codons are outlined by red boxes. The putative signal peptide,
identified by the rules of von Heijne (1988), is underlined. Putative TATA (at position -83)
and CAAT (at positions -54 and -49) boxes are shown in bold.
The yellow box, positioned at the 5' end of the gene, represents the pl4gw2 primer used in
the secondary GenomeWalker'" PCR reactions. Thc far 3' cnd of thc -2kb GcnomcWalker"
fragment, which contained the AP2 primer, was not sequenced in both directions and hence
was omitted from the final I622bp sequence.
Recognised Far Upstream Elements (FUEs; Rothnie, 1996; Sanfacoî et al., l99l) are shown
italicised and boxed at positions +1111, +1147, +1752, +1165, +1 166, +1451, +1752, +1 155,
+1471,+1512 and +1513. Putative polyadenylation sites (NUEs; Hunt, 1994) are shown
underlined atpositions,+1214,+1218,+1242,+1275,+1300, +1319, +1350, +1390, +1395,
+1408, +1464 and+1468.
106

ACAAACTCTTTCTCTT
TTTGTATÀ.AÀTAGCTATACACTTTTTCTC CC CTCA.AATCÀÀTAAGGTTAGGTCAGC CAAT-87 ----+- ---+- ---+- ---+- ---+- ---+ -28
TGTTTGAGCTAGCT ATTT-27
TCACTTTTCTTCTTTTTGTTCAGTATCTGCAACTCCATTTTC CTTGGTGCTAATGGAGAT+34 ----+- ---+- ---+- ---+- ---+- ---+ +93
SLFFFLFSICNSIFLGANGD
GACAA'TGGTGGTTGGC A.AACTGCC CATGCCAC CTTCTACGGTGGTGCTGATGCTACCGGL+94 - ---+- ---+- ---+- ---+- ---+- ---+ +153
DNGGWOTAHATFYGGADATG
ACAATGGGTGAGTTTC N\\CTTTCAÀAC CGTTAC C TACAT A-AÃÀATCTC TAGGCTATGCT+154 ----+- ---+- ---+- ---+- ---+- ---+ +213
TMG
CTTAÄTTTGTGATGTTTC TATAGGGGGAGCTCGTGGTTATGGAAACCTGTACAGTCAAGG+2L4 ----+- ---+- ---+- ---+- ---+- ---+ +273
GARGYGNLYSQG
ATKTMMLOÏF
+27 4
+334
+394
+454
+51-4
+57 4
Y G T S T AA L S T A ], F N N G T, S C G
TGCCTGCTACGAGCTCCGGTGCAACAATGATCCTCAATGGTGCATTAGTCGAAC CATAAC----+- ---+- ---+- ---+- ---+---------+
ACYELRCNNDPQWCISRTIT
CGTGACAGCCAC CAACTTTTGTCC CCCTAACTATGCTTTATCTAGTGACAÀTGGCGGGTG----+- ---+- ---+- ---+- ---+---------+
V T A T N F C P P N Y A I, S S D N G G W
GTGCAATC CCC CACGAGAACACCTTGATTTGGCCGAACCGGCATTCTTGCAGATCGCGGA----+- ---+- ---+- ---+- ---+---------+
C N P P R E H I, D I, A E P A F I, A Ï A E
ATATCGAGCTGGGATCGTC CCTGTTATGTTCAGAAGGTGGTGAÄT AiUU\CTC A'\TTCAAA----+- ---+- ---+- ---+- ---+---------+
YRAGIVPVMFRR
T CATCACACTCTTTAAGGTATG TT AAAC TGTTGGGTGTTTAAC CTTTTGCAGGGTGTCAT----+- ---+- ---+- ---+- ---+---------+vsc
+3 93
+453
+5 13
+573
+63 3
GTGTGAAGAAÄGGAGGCATCAGGTACACCATGAATGGACATTCGTACTTCAACATGGTGT+634 ----+- ---+- ---+- ---+- ---+- ---+ +693
V K K G G I R Y T M N G H S Y F NM V I,
TGATAAC CGAC GTGGGAGGGGCAGGGGATATAAC GTCAGTGT C CAT CAAGGGTT C CAÄ.AA+694 ----+- ---+- ---+- ---+- ---+- ---+ +753
TTDVGGAGDITSVSIKGSKT
CAGGATGGCTACCTATGTCCAGAÀATTGGGGCC AAAACTGGCAGAGCAATGCTTACCTTA+754 ----+- ---+- ---+- ---+- ---+- ---+ +8L3
G W I, P M S R N W G O N W O S NAY L N
t07

ACGGC CA.AAGC CTC T CTTTCAÄÄ,GTGAC TGC CAG CGATAGCAGGAC TAT CACAÂ.ACTACA+814 ----+- ---+- ---+- ---+- ---+- ---+ +873
G O S I, S F KV TA S D S R T T T N Y N
ATGTAGTGCCCGCTGGTTGGCAATTCGGACAÄACTTTTGAAGGAGGCCAGTT' EA+8'74 - ---+- ---+- ---+- ---+- ---+- ---+ +933
VVPAGWOFGATFEGGOFI
ATATTATAGTGTTCGT CTAATATTAIUU\CTGGAATTGACATATTACTTATATAAGGCACA
AGEAAGT G C CATTAG C C TATAACATACACAT T T C C TATAGTGAAC CAÄAC TAT TAAGF"FI
lÆþrcracaccrcArArccA TGATTGACCATGATA
TTTATGGTTTTEATTATTGAJU\TACTTTTTTATTATAATTTATA,AATAATGAGTCATTTC
t
+1234
+1294
TTTTTAC AÄATATTTTCGACATATTTTATCeIì?rCrc¿þCTAi\TATTATTAATCAAÄATT----+- ---+- ---+- ---+- ---+---------+
----+- ---+- ---+- ---+- ---+---------+AÄAGATGTATCATCTTTTTTAGGTTGAGTACTCATACAJ\TAJUUITTAAT CT C CT AAT AAA
ac@@rr r cA@ r@rc r rcAArcc rAA c@c cA44l4adFrfl
lcccþeacctGcTATGTAGcAGAGAGcGGGAGTTGcA"@TAcTTTAGGGAGecA
AAC CATGCAATGGATTTCATGGCCAAGATGGTCATTGGGGTCGGGACTCCCAAAATTTTA
+]-293
+1-3 5 3
ATTAGTCC CTC CTTCAAGTTTTTC TAJU\T+L594 ----+- ---+- --- +L622
108

109

Fisure 3.20. Alienment of pFSL4 cDNA and, GhExp14.4
Nucleotide sequence alignment between the pFSl4 oDNA and the GhExp14.4
GenomeWalker'" product. The yellow box depicts the nested GenomeWalker'" PCR primer,
p14gw3, used to obtain the genomic region. Nucleotide matches are represented by asterisks
and intron sequences by green text. Red boxes indicate translation start and stop points.
110

ACGTACGTTACTTpFSL4 CDNAGhExpl{.4
pFS14 CDNAGhExp74.4
10 20 30 40 50 60
TCTTCTGTACTAC A.AACTCTTTCTCTT
TTTGTATAÄATAGCTATACACTTTTTCTCCCCTC AAATCAATAAGGTTAGGTCAGCCAAT
TGTTGCAAATATTTTGTTGCAÂATATTT
GACAATGGTGGTTGGCAAACTGCCCATGCCACCTTCTACGGTGGTGCTGATGCTACCGGCGACAATGGTGGTTGGC A.AACTGCCCATGCCACCTTCTACGGTGGTGCTGATGCTACCGGC* * * * ** * * * t * * * * * * * * * * * * * * * * * * * * * * * * * * * * * * * * * * * * * * * * * * * * ** * * * *
TCATCACACTCTTTAAGGTATGT'TAi\i\CTGTTGGGT"'''OO""';;;ä::i:i:åi********
***************** *****************************pFS14 cDNA CCACTTTTCTTCTTTTTGTTCAGTGTCTGCAACTCCATTTTCCTTGGTGCTAATGGAGATGhExpl- . 4 TCACTTTTCTTCTTTTTGTTCAGTATCTGCAACTCCATTTTCCTTGGTGCTAATGGAGAT
* * * * * * * * * * * * * * * ,. * * * * * * * * * * * * t * * * * * * * * * * * rt rt * tr * * * * * * * * * * * * * * *
pFSl-4 CDNAGhExpl4.4
pFS14 CDNAGhExp74.4
pFS14 CDNA ACAATGG-----GhExP1.4 . 4 ACAATGGGTGAGTT'T'Cfu\i\CTTT.CA,U\CCGTTACCTACATAÄAÀÀTCTCTAGGCTATGCT*******
pFSl-4 cDNA - --GGGGAGCTTGTGGTTATGGAIU\CCTGTACAGTCAAGGGhExpT4 .4 CTTAATTTGTGATGTTTCTATAGGGGGAGCTCGTGGTTATGGA,U\CCTGTACAGTCAAGG
* * rr * * * * * * * * * * * * * * * * * * * * * * * * * * * * * * * * *
pFSl-4 cDNA GTATGGAACGAGCACAGCAGCTTTGAGCACTGCACTTTTCAACAATGGCTTGAGCTGCGGGhExpl4 . 4 GTATGGAACGAGCACAGCAGCTTTGAGCACTGCACTTTTCAÄ.CAATGGCTTGAGCTGCGG
* * * * * * * * * * * * * * * * tr * * * * * * * * * * * rk * * * * * * * * * * * * * * * * * * * tr * rr * * * * * tr rt * *
pFSl-4 cDNA TGCCTGCTACGAGCTCCGGTGCAACAATGATCCTCAATGGTGCATTAGTCGAACCATAACGhExpT4 .4 TGCCTGCTACGAGCTCCGGTGCAACAATGATCCTCAATGGTGCATTAGTCGAACCATAAC
* * * * * * * * * * * * * * * * * * * * * * * * * * * * * * * * * * * * * * * * * * * * * * * * * * ìk * * * * * * * * *
pFSL4 cDNA CGTGACAGCCACCAACTTTTGTCCACCTAACTATGCTTTATCTAGTGACAATGGCGGGTGGhExpT4 .4 CGTGACAGCCACCAACTTTTGTCCCCCTAACTATGCTTTATCTAGTGACAATGGCGGGTG
* !k * * * * * * * * * * * * * * * * * * * * * * * * t * * * * * * * * * * * * * * * * * * * * * * * * * * * * * * * *
pFS14 cDNA GTGCAATCCCCCACGAGAACACTTTGATTTGGCCGAACCGCGATTCTTGCGGATAGCAGAGhExpL4 .4 GTGCAATCCCCCACGAGAACACCTTGATTTGGCCGAACCGGCATTCTTGCAGATCGCGGA
*rþ******************** ***************** ******** *** ** **
pFS 14 cDNA ATATCGAGCTGGAATCGTCCCTGTTATGTTCAGAAGGh4xpL4 .4 ATATCGAGCTGGGATCGTCCCTGTTATGTTCAGAAGGTGGTGAATNUU\CTCN\TTCAAA
rt***tr**rkt *** *******************i.***
pFS14 cDNAGhExp74.4
pFSl-4 cDNA GTGTGAAGAAAGGAGGCATCAGGTACACCATGAATGGACATTCGTACTTCAACATGGTGTGhExpTA . 4 GTGTGAAGAAAGGAGGCATCAGGTACACCATGAATGGACATTCGTACTTCAACATGGTGT
* rt * * * * * * * * * * * * * * * * * * * * * * * * * * * * * * * * * * * * * * * * * * * * * * * * * * * * * * * * * *
pFS14 cDNA TGATAACGAAGCTGGGAGGGGCAGGGGATATAACGTCAGTGTCCATCAAGGGTTCCAGAAGhExpT4 .4 TGATAACCGACGTGGGAGGGGCAGGGGATATAACGTCAGTGTCCATCAAGGGTTCCAAAA
* * * * * * * * * * * * * * * * * * * * * * * * * * * * * * * * * * * * * * * * * * * * r, * * ** * * * * * *
111

pFS14 CDNA CAGGATGGCTACCTATGTCCAGA.AATTGGGGCCA.A.AACTGGCAGAGCAATGCTTACCTTAGhExpT4 . 4 CAGGATGGCTACCTATGTCCAGAAÀTTGGGGCCNU\,¡\CTGGCAGAGCAATGCTTACCTTA************************************************************pFS14 CDNA ACGGACAÄAGCCTCTCTTTTAÄAGTGACTGCCAGCGATGGCAGGACTATCACAGCCTACAGhExpT4 . 4 ACGGCCAAAGCCTCTCTTTCAAAGTGACTGCCAGCGATAGCAGGACTATCACAAACTACA
**** ************** ****************** ************** *****
pFSl-4 cDNA ATGTAGTGCCTGCTGGTTGGC.AAGhExp74. 4 ATGTAGTGCCCGCTGGTTGGCAA
** * * * * * ** * * * * * ** * ** * * * * *** * * * ** ** * * * * * * * * rk * * * * * * * * ***
pFS14 CDNA ATATTATAGTGTCTGTCTAATAT-AÄ.AACTGGAATTGACATATTACTTATATAAGGCACAGhExpT . 4 ATATTATAGTGTTCGTCTAATATTA.¡UU\CTGGAATTGACATATTACTTATATAAGGCACA
* rk * * * * * * * * * * * * * * * * * * * * * * * * * * * * * * * * * * * * * * * * * * * ìk * * * * * * * * * * *
C pFS14 cDNAGhExpTA .4
TGAGCGTTTTATGCCGAGGTAGCAAÄATGGC CGC CGCTGGCTTTATGTGTGAIU\TAGGCGTGAGCGTTTTATGC CGAGGTAGCAÄAGTGGCGC CCGCTGGCTTTATGTGTGAAATAGGCGdr * * * * * * * dr * * * dr * * * * * * * * * * * * * * * * * * * * * * * * * * * * * * * * * * * * * * * * ìt * * *
TTTATGGTTTTCATTATTGAA - TACCTTTTT - TTATAATTT -TTTATGGTTTT CATTATTGAJU\TAC TTTTTTATTATAATTTATAJU\TAJ\TGAGTCATTTC
*** *****
TTTTTAC AAATATTTT CGACATATTTTATGATTTGT CAGCTAATATTATTAAT C AAAATT
AGGATG CAATAT T GAAT CAAGAATGTAT A.AATGAAT TAT TGAGACAT CATATAAGATATA
AAAGATGTAT CATCTTTTTTAGGTTGAGTACTCATAC N\TA¡UU\TTAATCTCCTAATAAA
AGATAGTATTTCAGTAGTGCATATGTTGAATGGTAAC TTTGTTGTGAGGCAAATAATTTT
GC C CAAGGTGCTATGTAGCAGAGAGCGGGAGTTGCACATTTGT CATACTTTAGGGAG C CA
AACCATGCAATGGATTTCATGGCCAAGATGGTCATTGGGGTCGGGAC TC C CA.AAATTTTA
ATTAGT C C CTC CTTCAAGTTTTTCT AAAT
pFSl-4 CDNA AGCAAGTGCCATTAGCCTATAATCTATACATTTCTTATAGTGAACCAAACTATTAAGTTT
*****rt**************** ** *****ìÈ* ****************t********
pFS14 cDNA GAACTCTAGAGGATATATCCATAATGTCTGAA_TTTGTTTGTTGATGATTGACCATGATAGhExpi-4 . 4 GAACTCTAGAGGTGATATCCATAATGTCTGAAATTTGATTGTTGATGATTGACCATGATA
* * * * * * ** * * * * * * * * * * * * * * ** * * *** * * ** * * * * * * * * * * * * * * * * * * * *:t * *
pFS14 CDNAGh8xpL4.4
pFSl- CDNAGhExpl+.4
pFS14 cDNAGhgxp74.4
pFS14 CDNAGhExpT .4
pFS14 cDNAGhExpl4.4
pFS14 CDNAGh&xpl4.4
pFS14 CDNAGhExpT4 .4
pFSl- cDNAGhExpT .4
tt2

113

Fisure 3.21. Comparison between tlne Gh&xp14.2 and, GhExp14.4 GenomeWalker'u
sequences
Nucleotide sequence alignment between lhe GhExpl4.2 and GhExpI4.4 GenomeWalker'"
PCR products. The blue text represents coding regions, with introns shown in green text.
Translational start and stop codons are shown in red boxes. Nucleotide matches are shown by
a 'line' between the two sequences.
tt4

GhExp74.2
Gh J-4 .4
GhExp74.2
GhExp74.4
GhExpl4.2
GhExp74.4
Gh 74.2
GhExp74,4
GhExp74.2
GhExp74.4
GhExpl4.2
GhExp74.4
GhExpT .2
Gh t_4.4
GhExp74.2
GhExp74.4
Gh4xpl4.2
GhExp14.2
Gh4xp74.2
GhExpT4 .4
GhExp74.2
GhExpL4.4
GhExpTA .2
Gh4xp74.4
Gh4xp74.2
GhExp74.4
GhExp74.2
GhExpT .4
Gh8xp74.2
GhExpT .4
69
t-
116
51_
L66
101
2L6
l_5 1_
266
201,
316
25r
366
301
416
343
466
392
516
442
566
492
61,6
542
666
592
716
642
766
692
GCTACGTACGGTACTTAGCGTTGCTTG. . . TCATCTTCTGTACTACAAAC 1-].5
||||| |||| |||t ||||||||llllGCTACGTACGTTACTTAGCTTTGCTTGTCGTCATCTTCTGTACTAC C 50
TCTTTCTCATTTTGTATAÄATAGCTATACACTTTTTCTCTCCTCAAATCA 1 6 5rrrr ril||||||||l|||t rrrrITCTTTCTCTTTTTGTATAÄATAGCTATACACTTTTTCTCCCCTCA.AATCA 1 O O
ATAAGGTTAGGTCAGCCAÀTTGTTTGAGCTAGCTAGCTCTTACTC 21,5||||||||||||||||||||lIItATAAGGTTAGGTCAGCCAÄ,TTGTTTGAGCTAGCTAGCTCTTACTC ]-50
GhExp74.2 8L4
Gh4xp74.4 742
| | | | | | | | | | | | | | | | | | | | | | | | l
GC A'\CC A,UU\CGATGATGTTGCAÄATATTTTCACTTTTCTTCTTTTTGTT 2 O O
CAGTGTCTGCAACTCCATTTTCCTTGGTGCTAÄTGGAGATGACAATGGTG 3 15|| ||||||||il|||||ll|||||||CAGTATCTGCAACTCCATTTTCCTTGGTGCTAATGGAGATGACAATGGTG 2 5 O
GTTGGCAÀACTGCCCATGCCACCTTCTACGGTGGTGCTGATGCTACCGGC 3 65l||||||||||||||||||||||tItGTTGGCAAACTGCCCATGCCACCTTCTACGGTGGTGCTGATGCTACCGGC 3 O O
ACAATGGG TGAGTTTCAAACTTTCAAAC CATTACGGCATTACCTACATAA 4 1 5||lIi ltl r rrtl lr r ||||||ACAATGGGT'GAGTTTCAAACTTTCAAAC ..CGTTACCTACATAA 342
AAATCTCTAGGCTATGTTCTTAATTTGTGATGTTCTCTATAGGGGGAGCT 4 6 5llIlrlrIrr ||r r||||t rl||llllllllAAATCTCTAGGCTATGCTCTTAATTTGTGATGTT . TCTATAGGGGGAGCT 3 91
TGTGGTTATGGAAACCTGTACAGTCAAGGGTATGGAACGAGCACAGCAGC 5 1-5llIlll|||||||||l|||||||||lllllCGTGGTTATGGA.AACCTGTACAGTCAAGGGTATGGAACGAGCACAGCAGC 4 4 1
TTTGAGCACTGCACTTTTCAACAATGGCTTGAGCTGCGGTGCCTGTTACG 5 65| | l| | | | | | | | | | | | l| | | | l| | ll lI t
TTTGAGCACTGCACTTTTCAACAATGGCTTGAGCTGCGGTGCCTGCTACG 4 91
AGCTCCGGTGCAACAATGATCCTCAATGGTGCATTAGTCGAACCATAACC 6 ]. 5|||||||||||||l||||||||||lIAGCTCCGGTGCAACAATGATCCTCAATGGTGCATTAGTCGAAC CATÀÄCC 5 4 1
GTGACAGCCACCAACTTTTGTCCACCTAACTATGCTTTATCTAGTGACAA 6 6 5lllllllt l| ! ! 1il | l llr l| | | ! | l| | | lI l
GTGACAGCCACCAACTTTTGTCCCCCTAÄ,CTATGCTTTATCTAGTGACAA 5 9 ].
TGGCGGGTGGTGCAATCCCCCACGAGAACACTTTGATTTGGCCGAACCGG 7 ].5l| | | | | | | | | lll | | | | t l| | | | | | | | t
TGGCGGGTGGTGCAATCCCCCACGAGAACACCTTGATTTGGCCGAACCGG 64 1
CATTCTTGCGGATAGCAGAATATCGAGCTGGAATCGTCCCTGTTATGTTC 7 65lllt|| |t | |||lIil|t |||||||||CATTCTTGCAGATCGCGGAATATCGAGCTGGGATCGTCCCTGTTATGTTC 6 9 1
AGAAGGTGGTGAATAAAAC'TCAATTCAAATCAT'., CACTCT'TTAAGGTAT 813llIt I ttrIlr rIllrIl l| | |||tlAGAAGGTGGTGAATAAAACTCAÀTTCA AATCATCACACTCTTTAAGGTAT 7 4 1
GTTAAACTGTTGGGTGTTTGACCTTTTGCAGGGTGTCATGTGTGAAGAÀÀ, 8 6 3|1rIt IrrIr l||t r||||||||||GTTAAACTGTTGGGTGTTTA-ACCTTTTGCAGGGTGTCATGTGTGAAGAÄA 7 9 ]-
115

GhExpl+.2 864
GhExp74.4 792
GhExpL4.2 aLa{ AAIGhExp74.4 1-042 AA
||||rIrllllllllllllllll TATTATAATG 1-]-63|||t ITATTATAGTG 109].
GGAGGCATCAGGTACACCATGAATGGACATTCGTACTTCAACATGGTGTT 9 1 3||||||r||||||ll||||ll||lIl||GGAGGCATCAGGTACACCATGAATGGACATTCGTACTTCAACATGGTGTT 8 4 1
chExp74. 2 91-4 GATAACGAACGTGGGAGGGGCAGGGGATATAACGTCAGAGTCCATCAAGG 963||| ||||||||||||||| |||||tGhExp74. 4 842 GATAACCGACGTGGGAGGGGCAGGGGATATAACGTCAGTGTCCATCAAGG 891
GhExpT4 .2 964 GTTCCAGAACAGGATGGCTACCTATGTCCAGAAATTGGGGCCAÄ-AÀCTGG 1-013
| | | | | | | | | | | lllll| llllllllllllllllllllGhExp74. 4 892 GTTCCAÄÄACAGGATGGCTACCTATGTCCAGAÀATTGGGGCCAÄÀACTGG 941
ch4xpT{ . 2 LO1-4 CAGAGCAATGCTTACCTCAACGGACAÄAGCCTCTCTTTTAAAGTGACTGC 1063||||||||t ||t |||||lIt |||||tGhExp7{. 4 942 CAGAGCAATGCTTACCTTAACGGCCA-AAGCCTCTCTTTCAÀAGTGACTGC 991
GhExpT .2 L064 CAGCGATGGCAGGACTATCACAGCCTACAATGTAGTGCCTGCTGGTTGGC 1l-l-3l||| ||||||ll rItltllllll llllllIllGhExpl-4 . 4 9 92 CAGCGATAGCAGGACTATCACAAACTACAATGTAGTGCCCGCTGGTTGGC 1 04 l-
GhExpl{ .2 LL64 TCTGTCTAATA. TAA.AACTGGAATTGACATATTACTTATATAAGGCACAT 12 12I |||| rrril||||||||||||lllIGhExpl{ . 4 LO92 TTCGTCTAATATTAÄ.AACTGGAATTGACATATTACTTATATAAGGCACAT l- l-41
GhExpT .2 L21-3 GAGCGTTTTATGCCGAGGTAGCA.AÄATGGCGCCCGCTGGCTTTATGTGTG l-2 62| | | | | t r t | | | | t | | | | | | | | | ll | |GhExpT .4 LL42 GAGCGTTTTATGCCGAGGTAGCA.AAGTGGCGCCCGCTGGCTTTATGTGTG 1l-91-
GhExpl- .2 T263 NU\TAGGCAj\GCAAGTGCCATTAGCCTATAATCTATACATTTCTTATAGT l-3l-2|ll|| rr|||||il||r | |||t |||GhExpl.4 .4 TL92 A-AATAGGCGAGCAAGTGCCATTAGCCTATAACATACACATTTCCTATAGT 124 1
Gh8xpl{ .2 L3 13 Gzu\CCA;U\CTATTAAGTTTGAACTCTAGAGGATATATCCATAATGTCTGA L3 62| | t r r | | | | r r il r r ll Il| | llllllllllrGhExpTA .4 L242 GAACCAAACTATTAAGTTTGAACTCTAGAGGTGATATCCATAATGTCTGA 12 91,
GhExpT . 2 L3 63 AATTTGTTTGTTGATGATTGACCATGATATTTATGCTTTTCATTATTGAA 14 12Irr ||trrrilllllllllllllll llllllllllllllGhExp14 .4 L292 AATTTGATTGTTGATGATTGACCATGATATTTATGGTTTTCATTATTGAA 134 L
GhExpl4.2 L4L3 ATA 141-5ItGhExpl4.4 1-342 ATA 1344
116
3.6 Obtainins the full-lensth GhExo5 sene
3.6.1 Genome Walker* PCR of GlrÆx¿S
Analysis of the GhExp5 clone isolated from the genomic library showed that the 5'
end of the geno was missing (Figure 3.13). Therefore an attempt was made to obtain the
complete sequence and the promoter region of the gene. An alignment of the sequence with
the pFSl4 oDNA (not shown) suggested that268 bases of coding sequence, plus an intron of
unknown size, were probably missing. Nested primers were designed specifically for the
GhExpí sequence, based on single nucleotide differences (insertions, deletions and
mismatches) between the pFSl4 oDNA and the GhExpí sequence. The primers were situated
within the putative exon two of GhExpí (Figure 3.13). Genome Walker'u PCR amplified
sequences in all ten "libraries" (Figure 3.22A), most of which showed strong hybridisation to
the GhExp5 probe (Figure 3.228). The two longest and strongest of these (Figure 3.228,
lanes 1 and 4) were cloned into pGEM@-T Easy.
3.6.2 The GhExp5 eene sequence ì
Initially, an -800 bp fragment (Figure 3.22B,lane l), which hybridised strongly to the
GhExpï probe, was cloned and used as a template for sequencing reactions. Since the
GenomeWalker'" PCR primer is situated in the second exon of the gene (Figure 3.13), it was
thought that the -800 bp band should provide enough 5' region to span the entire GhExpí
gene. Both -20 and RSP primers yielded sequence which was assembled into a single 782bp
contiguous sequence. Comparison of this sequence with the original GhExpí sequence
revealed 100% identity in the l92bp of overlap (Figure 3.23), such that at least an extra 500
bp of upstream sequence had been obtained compared with GhExp5. However, alignment of
the extra sequence with the pFS14 cDNA sequence indicated only 35 bp of similarity (Figure
3.23), and conceptual translation showed that the assumed 5' region of GhExpï did not
contain any of the residues which are normally present within the N-termini of a-expansin
proteins. In addition, the termination codon and the frameshift found in the original GhExpí
tt7

BA.
I
1234s678910 1234s678910
GhExoS
A. Agarose gel showing products resulting from secondary Genome'Walker'u PCR using
GhExpï-specific primer, pS96gw2 (refer to Figure 5.13). Lanes 1-10 represent different
restriction digest of cotton genomic DNA, as detailed in Chapter Two. The first lane contains
a 100 bp ladder, consisting of fragments ranging from 100 bp to 1000 bp in 100 bp
increments, plus an additional fragment of 1500 bp.
B. Southern blot of the gel de,picted in A, probed with GhExpJ 1.5 kb insert. Lanes are
labelled as above. Arows show fragments targeted for cloning.
118

I19

Alignment between the original GhExp5 sequence and the 782bp of extra 5' sequence,
derived from Genome'Walker'" PCR with GhExp5-specific primers.
The orange box denotes pS96gw2 primer site and the purple box shows AP2 and adapter site.
Asterisks denote nucleotide identity match between the two sequences.
The blue sequence represents areas with c-expansin homology. The green region represents
an identified intron in the GhExpí gene (as determined by alignment with pFSl4 oDNA).
t20

Gw1.Exp5.
Gw1Exp5.
Gr^rl--Exps.
Gl^Il-Exps.
Gw1Exp5.
Gw1.Exp5.
Gwl-.Exp5.
Gw1.Exp5.
GwlExp5.Gw1Exp5.
seqsegseqseqseqsegseqsegseqseq
TAAAA'TTAAGGTT
ACGAATGTTGTGACGCGATTAI\GTGTAJ\GTAATTGGAC AAdATTAAGTGTAAGTAATTGG
AATGATAGTGAAC C C AAGTATAI\TGzu\TGTTGTATAGCATAGAJU\TTTTATTGTAAATAT
GTTCT AAACTTATTTATTACAACATTTTTTTATTTTGTTTATCTTT AATTAATG AAAAAG
TAAGTTTAATTTTTGTTGTACTTACTAAGTTTTAAGATGCTTAC CGTGTTATTTTTAATG
CATAGGTAÄAGACTTAAGCTGAGGATTTATTGAGGATCAGTCTTTCACATATCATCCCAT
CTTAAGAGTTTGGAGAAGAGTATGTTAT CTC CACTATGACATGTACTTAGATGAATGTTT
ATGTAAGT AÄ AT AGGAÄÀCTAATTGATT CTCGTAC TTGTGTTTTATGCGTTTTGGTGAGT
AAATATAAGGTATTATTTGATATAGGAGTTATGGATAGTGTTTAGAATGATTATGGATAA
TTTTGGTACCGTTTGGATGTGATCGGTATAACCTTTATTAG CTGCGGTGCCTA
CGAY
CTACAAGCTCCGGTGCAACGA TGGTGCATTATTTGAAC CATAAC CGTGACTGGTGCATTATTTGAAC CATAACCGTGAC
*****************************tr***
Gw1.Exp5. segGhExp5
GwLExps. seqGh4xp5
Gw1Exp5. segGhExp5
Gw1--Exp5. segGhExp5
GhExpS
GhExp5
Gh4xp5
Gh4xp5
Gh4xp5
GhExp5
GhExp5
GhExp5
GhExp5
GhExp5
YKLRCNDDPQWCII*TTTVT
GACCACCAACTTTTGTCCCCCTAACTATGCTTTATCTAGTGACAATGGCGGGTGGTGCAGGACCACCAACTTTTGTCCCC CTAACTATGCTTTATCTAGTGACAATGGCGGGTGGTGCAG*************************rk**********************************
T T N F C P P N Y A ], S S D N G G W C S
TCC CCTCGAGAACACTTCGATTTGGTCGÀACTCC C CTCGAGAACACTTCGATTTGGTCGAAC********************************
PREHFDLVEP FLOIAEYRP
AKITPVLFRRTAÄGGTATGTT' Ai\i\TTGTCGGCTGTCAGGTGTGAAGAAAGGAGGCATTAGGTCCAGCATG
VKKGGIRSSMGATGGACTACAATCCTACTTCAAC CTGGTGTTA.A,TAACGA'U\GTGGGAGGTGCAGGGTATD G I, O S Y F N L V I, I T K V G G A G YATATCGTCGGTGTCCATCAAGGGTTC CAÄÄACAGGGTGGCTAC CTATGTCTAGAÄACCCGI S S V S ] KG S KT G W I, P M S RN PCTGTACGTGTTCTTCTCGACCACCTCATCAGGTTTCTACAGCGTCCGATCTCGGGGAACALYVFFSTTSSGFYSVRSRGT
AÄ.AATTATTCCTGTTCTCTTCAGAAGG TATGTT fu\AT'TGTT A'\'\T'CATCACGATCTT
GCTCGGAATCAACGGTGTCGTCARNARCRP
CAAT GTAGTTGCCCACCACTCCCTGTGCATGCTJ*
GC CGCGGCGGGGGACTTGTGCAAGTGNAAGTG AAAGAAAATGGGGATGGAAGCTTGTCGG
CCGAGGTTTGC CGTGGTGAATTGCGTGGTTGAIüNAJ\TAGGTTTACCATGGAIüGAJU\CTTT
TTTNAATTTTGC C CGGGGNGGAGGTTGGGGTAGGAJU\TAGGTAGÄATTTTTTAAATAGAG
GGAT NU\TNA,¡\GAJUUU\TAJ\TTTAATTTTC CAÄATTTAAÄÄAGAGNTGCTATAAT AAAAN
ACAGTTNTGGATüA,¡qJ\C AJ\GGGAÄATGGACTTTATTACATNAGTTGCTCTTTGAATCC
t2l

sequence and assumed to be sequencing effors (Section 3.3.5) were also present within the
GenomeW'alker'u product (Figure 3.23).
Since the sequence similarity to pFS14 was limited to only 35 bp of the
GenomeWalker* sequence (Figure 3.23), it is possible that the 5' end of the GhExp| sequence
contains an unusual additional intron. The exon/intron structure of expansins is conserved
amongst both the a-and B families, but in some cases the number (and length) of introns can
vary amongst single genes, with up to five introns present in some expansin genes (Lee et al.,
2001). One a-expansin gene,AtExpl0inArabidopsis, contains anintronwithinthe 5'UTR
region of the gene, in addition to the two conserved introns (Cho and Cosgrove, 2000).
However, analysis of the GenomeWalker'"-derived region of GhExpï for intron consensus
splicing sites revealed that none was present.
To overcome the possibility that the gene isolated was not GhExp5, a 3kb
GenomeWalker'u PCR product (Figure 3.22;lane 7) was also sequenced using the -20, RSP
primer and internal primers. Comparison of the resultant 2858 bp sequence to the smaller
GenomeWalker'u fragment revealed I00% identity between the two sequences until the
sequencing information ceased for the 782bp Genome'Walker'u fragment (not shown). The
larger clone did not show any further sequence similarity to pFS14. Conceptual translation of
the2614 bp DNA sequence also did not reveal any significant open reading frames and a
search of possible introns within this sequence yielded negative results. Taken together, the
lack of 5' similarity to pFS14, the presence of an internal stop codon and the existence of a
frame-shift mutation (Figure 3.23) suggest that GhExpï is a pseudogene. Studies of polyploid
genomes have shown multiple genetic phenomena including gene duplication, gene silencing,
gene conversion and gene loss (Comai, 2000; Comai et aL.,2000), and cotton is an
allotetraploid that was produced by the hybridisation of two diploid ancestors 1-2 million
years ago (Wendel, 1989). Other pseudogenes have been described in cotton (Cronn et al.,
1999; Loguercio and V/ilkins, 1998). Alignment of the GhExpï sequence with that of pFSl4
t22

revealed the presence of a termination signal 1 6 bp downstream from the Sau 3.LI site and a
frameshift caused by a 1 bp deletion in putative exon II of GhExpï (when compared with
pFS14 oDNA; not shown). The presence of these sequence ilifferences in three independent
isolates of the gene, suggests that they are not due to sequencing errors. Since no c-expansin
sequence was identified in the 3 kb of upstream, further searches for the 5' coding region of
GhExpï were not undertaken.
In all, six fulllength cx,-expansin genes and one pseudogene from cotton were isolated
and characterised in this study. Each of the genes contained the conserved intron/exon
structure characteristic of almost all cr-expansin genes, with three exons intemrpted by two
introns (Figure 3.24)(Lee et a1.,2001;Li et a1.,2002). Comprehensive sequence analysis was
undertaken for all six genes, and the detailed sequence analysis of one of the genes, GhExpI0,
is presented here. Analyses of the remaining five, whilst being carried out to the same extent,
are presented in shortened form in Section 3.1 .3.
3.7.1 The codine reeion of GhExpl0
A sequence comparison between GhExpl} and the fibre-specific oDNA, pFS14,
revealed 70% similarity at the nucleotide level (Tabl e 3.2) and 690/o identity at the peptide
level (Table 3.3). Conceptual translation revealed a putative o-expansin protein of 245 amino
acids, with a calculated molecular weight of 26000 Da and a pI of 8.4 (Table 3.4). These
values are in accordance with o-expansins of other species (Shcherban et al.,1995), and the
GhExpl0 peptide contains many other features characteristic of o-expansin proteins. These
included a signal peptide of 24 amino acids at the N-terminus, with a hydrophobic core
beginning at the 1lth residue (Lys) and extending for eight residues. Relative to the start of
the mature protein, a Gly residue is present at the -1 position of the predicted signal peptide
and a Ser residue at the (predicted) -3 site of the signal sequence (Figure 3.9), supporting the
123

Fisure 3.24. Schematic diagrams of six ctr-expansin genes from cotton
Partial restriction maps of the six full-length cr-expansin genes isolated from cotton. Boxed
areas represent coding regions of each gene and smaller striped boxed regions represents
intronic sequences. Start and stop codons are also indicated, with direction of transcriptional
shown with an affow.
124

\.,ì
Þ¡r È' \ -ì ie 7f d
\l Þ:i È' \ \) I oo Þf d
a Þ¡1 S¿' \ \ \ UJ þ Þf ct
\J l'¡ sJ- \j a\ (-
¡t \ tf 5
O lir ñ \ s \ P o\ Þf
d
a t'¡r
È'
f- s t\) .NJ þ PI -
çzl
Sac
lB
amH
.l
Eco
Rl
P @ Nhe
lA
TG
Eco
Rl
Nhe
lA
TG Eco
Rl
\ ATG Xba
l
Bam
H'l
Hin
dlll
A Eco
RV
TGA
@ I o
Eco
Rl
Spe
l
Eco
Rl
Hin
dill
Io iu
lv ot
¿n
TAA
Eco
R
t\)o
tA
pal
Pvu
llA
TG Þ
tt
(^) È
AA
O) T
È
(¡) o
Pvu
llTA
GA
A
Xba
l
Eco
Rl
I f\)
Pst
IE
coR
V
Pvu
llS
acl
Cla
l P Þ
Sal
lX
ba
I @P
st I
Bam
H.l
o b o ñ
Xba
l
Sa/
I
Cla
l
I
N
Eco
Rl

Table 3.3. Amino aci identitv (7o) befween six cotton c[-exn ansin amino acids and one
cDNA sequence
pFS14cDNA
GhExpl4.2 GhExp14.4 GhExpl0 GhExp12 GhExp14 GhExp6
pFSl4cDNA
GhExp14.2
GhExp14.4
GhExpl0
GhExpl2
GhExpl4
GhExp6
99
96
69
67
55
70
96
69
66
55
10
61
65 67
53 53 56
68 '7',| 70 56
t26
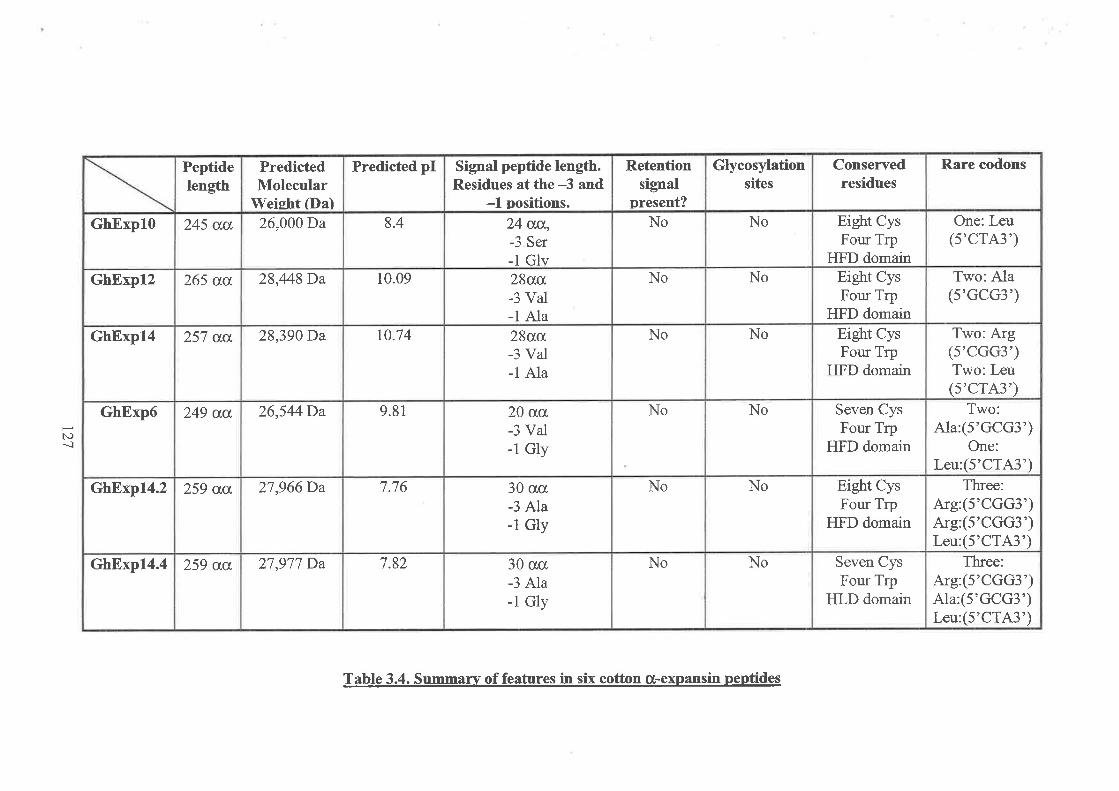
Rare codons
One: Leu(5'CTA3')
Tn'o: Ala(5',GCG3')
Two: Arg(5',CGG3',)Tw-o: Leu(5'CTA3')
Two:Ala:(-S'GCG3')
One:Leu:(5'CTA3')
Three:Arg:(5'CGG3')Arg:(5'CGG3')Leu:(5'CTA3')
Three:Arg:(5'CGG3')Ala:(5'GCG3')Leu:(5'CTA3')
Conservedresidues
Eight CysFour Trp
HFD domainEight CysFour Trp
HFD domainEight CysFour Trp
HFD domain
Seven CysFour Trp
HFD domain
Eight CysFour Trp
HFD domain
Seven CysFour Trp
HLD domain
Glycosylationsites
No
No
No
No
No
No
Retentionsignal
present?No
No
No
No
No
No
Signal peptide length.Residues at the -3 and
-1 positions.24 uu,-3 Ser-1 Glv28au-3 Val-1 Ala28uo"-3 Val-1 Ala
20 aa-3 Val-1 Gly
30 crcr-3 Ala-1 Gly
30 crø-3 Ala-1 Gly
Predicted pI
8.4
10.09
t0.74
9.81
7.76
7.82
PredictedMolecular
Weisht (Da)26,000Da
28,448Da
28,390Da
26,544Da
27,966Da
27,977 Da
Peptidelength
245 aa
265 ua
257 au
249 ua
259 aa
259 aa
GhExpl0
GhExpl2
GhExpl4
GhExp6
GhExp14.2
GhBxp14.4
N)-ì
Table 3.4. Summarv of features in six cotton cr-expansin peptides

notion that small uncharged residues are usually located at these positions within signal
peptides that direct the export of the peptides through the plasma membrane (von Heijne,
1985; von Heijne, 1988). Thus the signal sequence of the GhExpl0 peptide is characteristic
of other signal peptides in secreted proteins. Previous research has shown that the presence of
a signal peptide and the absence of an endoplasmic reticulum retention signal are sufficient
for plant proteins to be secreted to the cell wall (Denecke et aL.,1992). A search for any
retention signals (KDEL or HDEL) in the GhExpl0 peptide was unsuccessful. Therefore the
GhExpl0 peptide is likely to be targeted to the endoplasmic reticulum for secretion into the
cell wall, which is in agreement with a role for ø-expansin in cell wall loosening (Shcherban
et ø1.,1995).
Other attributes present in the GhExplO peptide and characteristic of c-expansins
include the presence of eight Cys residues, a conserved Histidine-Phenylalanine-Aspartic
motif (HFD) and four Trp residues within the C-terminal portion of the protein (Cosgrove,
2000c) (Figure 3.25). The Cys residues are found at conserved positions within cr-expansin
peptides, with characteristic spacing that is thought to stabilise the protein via the formation
of disulphide bonds. The HFD domain is highly conserved within ct-expansins and is thought
to constitute part of the catalytic domain of the eîzymq based on loose homology to the
bacterial family-45-gylcosyl endoglucanases. The spacing of four Trp residues in the C-
terminus also resembles that within a domain of cellulase (Shcherban et a1.,1995), which is
envisaged to be involved in cellulose binding in plant cell walls. The presence of the
conserved residues described above is considered a clear identifier of members of the cr-
expansin family.
Comparison of the GhExpI} codon usage to the available G. hirsutum consensus
codon database (Nakamura et aL.,2000) revealed that, of the five rare codons that exist in
Gossypium hirsutum coding regions (i.e. occur at frequencies between 8- I 0 Yo), only one was
present within the GhExpl0 open reading frame. This rare codon (5'CTA3'), encoding Leu,
128

pFS14 cDNA:GhExpl4.2 :
GhExpl4.4 :
GhExplÌ :GhExpI2 :GhExpl4 :GhExp6 :
pFSl4 cDNA:GhExp|4.2 :GhExp14.4 :GhExpl0 :GhExpl2 :GhExpl4 :GhExp6 :
43434332453932
89898978918578
13 t_
L 3l_l_31tL2135725720
t'|6157l_8 0t'tL165
22L2212212022252L't2to
pFSl4 cDNA:GhExpI4.2 :GhExpl4.4 :GhExpl0 :GhExpl2 :
GhExpl4 :
GhExp6 :
pFSl4 cDNA:GhExp14.2 :GhExpI4.4 :GhExpl0 :
GhExpl2 :GhExpI4 :GhExp6 :
1,'t 6L'7 6
pFSl4 cDNA:GhExpI4.2 :GhExpI4.4 :
GhExpl0 :
GhExpI2 :GhExpl4 :
GhExp6 :
pFSl4 cDNA:GhExp14.2 .GhExp14.4 :
GhExpl0 :GhExnI2 :GhEipl4 :GhExp6 :
TA[A
258258258244264256248
Sequence alignment between the conceptual translations of six ü,-expansin genes and one
cDNA sequence. The darkly shaded boxes indicate identical amino acid residues, and the
lightly shaded boxes show conservative residues. The Cysteine (C) and Tryptophan (V/)
residues which are common to all expansins in all plants are maxked with astericks. Putative
signal peptides are underlined and the conserved intron positions are indicated by boxes.
-------------Y
,.i
LI1,,i,
inEron I
PFS
a
aO
Y¡YY'YY.
EY
1\;r\ i,ii\i\ ;
i\r\ I
t¡Ìr-
i rG,
Tlvl ti ì,rC : , Gl j
i(,r'Ci jrGi'l
'l'/\Tl,J þ-(t I
,/\.lll'l
r / | ; I l'
NI'l]J
I r¡lI\}J
iYt ¡.t Fr.iA tl l,t'ii \l ll,-l
/\'t'i,l t,r' l
I
intron II
I
i v l,\,llvl
I Vf ''"itl'I \
IV;IV
lFt '
iFl ,
IF
riFllrFi,Fl
s;ri,ii r, Qlli l
sir.ltii Q tii[rr,r,rflrrr.S lìlJl ' rÇiil t
rLI
riN\l(;Ql,lìt. :1
Ì1llì i( rQi j,,i . .
;ilir ii .QÌ ;ì ,, ,
WlLT'i'
t29

\¡vas located at position+241and has an approximate frequency of 8olo within expressed genes
of G. hirsutum. This suggests that the peptide is probably efficiently translated in vivo, as the
presence of minimal rare codons within an open reading frame is thought to increase
translation accuracy, maximise elongation rates and minimise proof reading (Akashi,200l;
Kurland, 1991; Kurland, 1992).
Detailed sequence analysis oî GhExpl0 revealed that the putative peptide was
encoded by three exons, separated by two introns (Figure 3.9; Figure 3.24;Figlre 3.25), as
described for other a-expansin genes (Lee et a\.,2001;Li et a\.,2002). Intron I was found to
be a phase I intron, intemrpting the codon for Gly at position 43 of the peptide, consistent
with the finding of Fedorov et al., (2001), who showed that 70o/o of phase I introns were
found to intemrpt Gly residues. Intron II is a phase II intron that intemrpts the codon for Arg
at position 139 of the peptide. The two introns intemrpt the coding sequence at exactly the
same amino acids as in most other c-expansin genes (Lee et a1.,2001; Vriezen et a1.,2000).
Research by Fedorov et al. (2001) and de Souza et al., (1998) has shown that "modern" genes
(that is, genes that have diverged far from the ancestral form) contain more phase I and phase
II, and less phase 0 introns, compared with ancestral genes (de Souza et al.,1998). The most
common hypothesis to account for this observation is that ancient genes contain mostly phase
0 genes to aid in exon shuffling, while the presence of phase I and II introns prevents exon
shuffling (Fedorov et a1.,2001). Thus far, a-expansin genes have been found to be confined
to the land plant lineage (Cosgrove, 2000b), in that only rare 'expansin-like' sequences have
been identified in non-plant species (Li et a1.,2002). Therefore, the presence of a phase I and
phase II intron within GhExpl0 supports the notion that expansins are genes that have
diverged greatly from their prokaryotic ancestor.
The mechanism of intron recognition and removal within eukaryotes is largely
mediated by the spliceosome complex and specific sequences present within the pre-mRNA.
In dicotyledonous plants, the most important sequences are the splice site dinucleotides 5'-
GT-3' and 5'-AG-3' found at the 5' and 3' ends, respectively, of the intron (Brown, 1986;
130

Brown and Simpson, 1998; Lorkovic et al.,2000). The two introns of GhExpI0 contain these
exact splice signals (Figure 3.9). A further contribution to dicot intron recognition and
removal concems the minimal length of the intron. Efficient processing of introns in dicots
requires them to be at least 70bp long (Goodall and Filipowicz, 1990). Intron Iof GhUxpI0
contains 91 bp and intron II contains 87 bp, such that both satisfy the length criterion.
In addition to the dinucleotide splice sites, efficient removal of introns requires the
presence of a branch point signal, matching the consensus 5'C[INAN3' and located
approximately 30 nucleotides upstream from the 3' splice site (Liu and Filipowicz,1996).
The branch point signal mediates intron lariat formation through a transesterification reaction
that joins the 5'-phosphate from the cleaved 5' intron site to the 2'-hydroxyl of the adenosine
residue within the branch point signal (Liu and Filipowicz,1996). Following lariat formation,
usually the next available 3' intron splice site is cleaved, freeing the intron lariat for
degradation and allowing the flanking exons to be ligated together (Brown, 1986; Brown and
Simpson, 1998; Lorkovic et aL.,2000). An attempt to identiff the putative plant branch points
within GhExp l 0 introns I and II revealed that intron I contains a 5'CTGAC3' motif at
position +286 within intron I (Figure 3.9), which lies - 29bp upstream of the 3' splice site,
satisffing branch point motif and position criteria. Two putative branch point signals are
recognisable within intron II, the first consisting of 5'CTAAC3' at position +569 and the
secondis 5'CTAAT3'atposition+573 (Figure3.9; Table 3.5). Bothputativebranchpoints
are compatible with consensus dicot branch point sequences (Brown, 1986) and are located22
bp and 18 bp upstream from the 3' AG splice site. As the branch point sequences lie adjacent
to each other and no putative 3' AG splice sites lie between, it is probable that both branch
points are active in pre-mRNA processing.
In addition to splice site and branch point sequences, dicot introns must have a greater
than600/o A/T content. The A/T nucleotides are distributed throughout the entire intron and
they are essential for efficient and correct splicing in vivo (Baynton et al., 1996; Gniadkowski
et aL.,7996; Goodall and Filipowicz, 1989; Goodall and Filipowicz, I99I). The T residue is
131

more prevalent than the A residue (Ko et al., 1998) and, in some cases, the A/T nucleotides
are present as islands within the intron (Merritt et a1.,1997). The A/T richness is thought to
contribute to intron splicing by defining the exon/intron border, as exons are generally 15%
higher in GC nucleotides than introns (Lorkovic et aL.,2000). Intron I of GhExpl0 is - 75%o
A/T rich (with the T residue contributing33%o), distributed in six A/T islands (Figure 3.9;
Table 3.5, Table 3.6). Intron II of GhExpl0 is also -75% A/T, with the T residue contributing
approximately 33 Yo of the A/T richness and five A/T islands were found within intron II.
Both introns of GhExpl0 therefore satisfy the requirements fordicot introns and are likely to
be correctly spliced from the pre-mRNA.
Polyadenylation of pre-mRNAs is the final step of mRNA processing which is
achieved, at least within vertebrates, by the recognition of a cis-acting sequence
5'A.A.Ufu\A3' by a polyadenylation complex. Following recognition of this sequence,
cleavage occurs and the poly-A tail is added downstream (Li and Hunt, 1995; Rothnie, 1996).
Table 3.5. Intron and exon characteristics of six cotton c-expansins
exon 1 (bp)
^ToÁ
intron 1(bp)
^TVo
exon 2 (bp)ATo/o
intron2 (bp)
^ToÁ
exon 3 (bp)
^To/oGhExpl0 15950%
847s%
312s2%
737s%
303s4%
GhExpl2 ló0s4%
7567%
31348%
766s%
30347%
GhExp14 12657%
908r%
28844%
867s%
31852%
GhExp6 16654%
17362%
31852%
15466%
30945%
GhExp14.2 147s4%
75867%
30950%
866s%
31252%
GhExp14.4 127s6%
8667%
31248%
38066%
306s2%
132
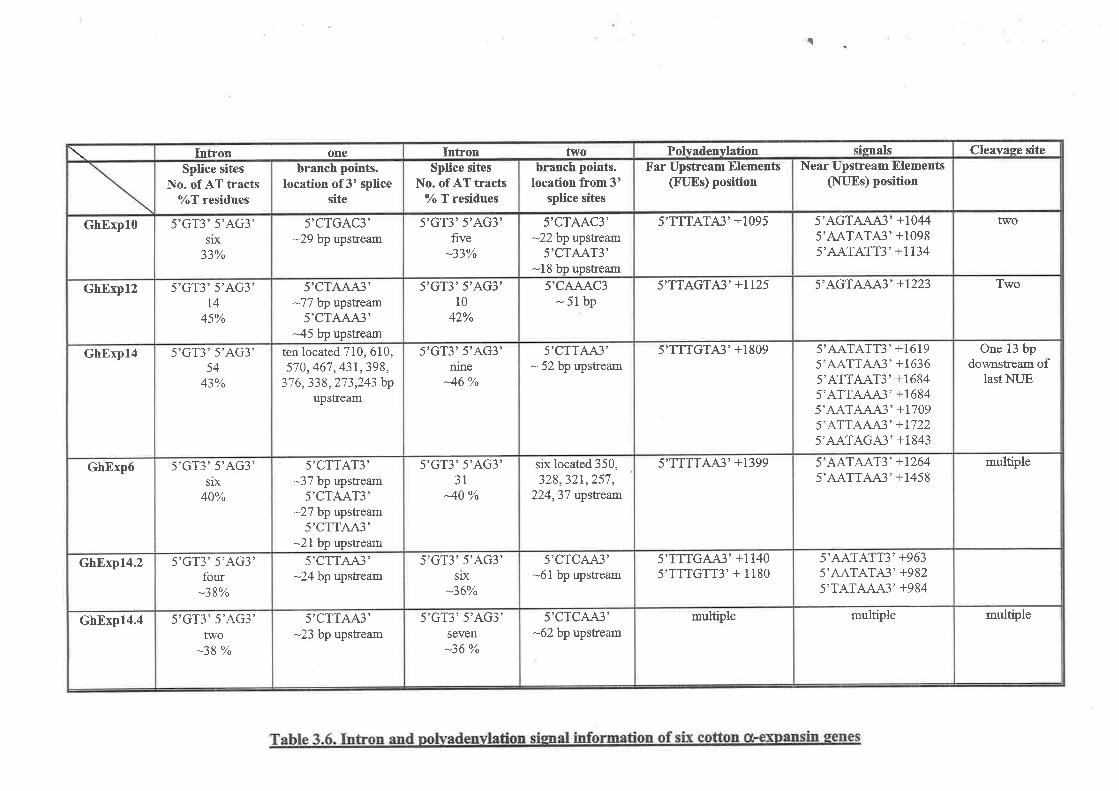
I
Cleavase site
two
Two
One 13 bpdownstrerm of
lastNUE
multiple
multþle
Poh-adenvlation sienalsNear Upstream Elements
(NUEs) position
5'AGTAAT{?'+10445'AATATA3'+10985'AATATT3'+1134
5'AGTAJAÁ3' +1223
5'AATATT3'+16195'A\TT'A\3', +16365'ATTAAT3'+16845'ATTAJAA3' +16845'A6TAJA"{3' +tj095'ATTAJ!\3' +17225'AATAGA3'+18435,A\TAAT3,+12645'A{TTAÁ3'+1458
5'AATATT3'+9635'AATATA3'+9825'TATAJAÁ3'+984
multþle
Far Upstream Elements(FUEÐ position
5'TTTATA3'+1095
5,TTAGTA3,+1125
5'TTTGTA3'+I809
5'TTTTAA3'+1399
5'TTTGAA3'+11405'TTTGTT3'+ 1190
multþle
Intron twobranch points.
location from 3'splice sites
5'CTAAC3'^22W upstream
5'CTAAT3'-18 bp upsteam
5'CAJAÁC3-51bp
5'CTTAA3'- 52bp upsteam
six located 350,328,321,25',7,
224,37 upste2m
5'CTCAA3',.'61 bp upstream
5'CTCAA3'-62bp upsteam
Splice sitesNo. of AT tracts
7o T residues
5'GT3'5',4c3'five
-33%
5'GT3'5'AG3'l0
^ao/aL /o
5'GT3'5'AG3'nme
46%
5'GT3'5'AG3'31
40%
5'GT3'5'AG3',SIx
-36%
5'GT3'5'AG3'seven-36%
Infron onebranch points.
location of 3' splicesite
5'CTGAC3'^29bp upsteam
5'CTAJô'JA? '-77 bp upstream
5'CTAAA3'^45 bp upstream
ten located 710, 610,570, 467 , 431,398,
376,338,273,243 bpupstream
5'CTTAT3'-37 bp upstream
5'CTAAT3'-27 bp upstream
5'CTTAA3'-2lbp upstream
5'CTTAA3'^24bp upstream
5'CTTAA3'-23bp upsteam
Splice sitesNo. of AT tracts
7oT residues
5'GT3'5'AG3'SIX
33Yr
5',GT3'5'AG3't4
45%
5'GT3'5'AG3'54
43%
5'GT3'5'AG3'SlX
40%
5'GT3'5'AG3'four
-38o/o
5'GT3'5'AG3'two
-38%
GhExpl0
GhExp12
GhExpl4
GhExp6
GhExp14.2
GhExp14.4

In plants, 3' processing of mRNAs is mediated by the presence of at least three elements
within the 3'region of the mRNA. The first crs acting element is a "Far Upstream Element"
(FUE) that consists of the consensus sequence 5'UUUGUA3' (Rothnie, 1996) or
5'UUGUAA3' (Sanfacon et al.,1997), which is located approximately 90 bp upstream of the
polyadenylation site. The second crs element is a "Near Upstream Element" (NUE) that
consists of the consensus sequence 5'AAUfuqA3', which is situated 13-30 nucleotides from
the polyadenylation site and is similar to the vertebrate poly-A site (Hunt, 1994). The third
c¿s element is a YA dinucleotide, which lies downstream of the FUE and NUE and is the
cleavage and polyadenylation site (Hunt, 1994). These elements act in conjunction with the
poly (A) polyrnerase (Rothnie, 1996) and presumably other associated trans acting factors
that recognise the polyadenylation elements (Keller, 1995) but have not been defined in plants
(Rothnie, 1996).
Analysis of the GhExpl0 3' sequence revealed the existence of three possible NUEs
(Figure 3.9). The first NUE, consisting of the sequence 5'AGTAAA3', is located at +1044
and it matches five of the six nucleotides identified within the consensus site. The second
contains the sequence 5'AATATA3', that also matches five of the six consensus nucleotides,
was found at position +1098. The third site, located at +1134 and consists of the sequence
5'AATATT3', matches four of the six consensus nucleotides. A single putative FUE, located
at +1095, consisted of the sequence 5'TTTATA3', of which five nucleotides matched the
consensus. FUEs commonly lie as far as 70 bases upstream from the NUE with which they
interact (Rothnie, 1996). The FUE identified in GhExpl0 is located 40 bp upstream from the
third putative NUE site, a spacing which is comparable with those reported in other plant
genes (Rothnie, 1996). Two potential cleavage sites, matching the 5'YA3' consensus
dinucleotide, \ryere located l0 and 13 bp downstream from the third NUE (at positions +1148
and +1 151 respectively). Therefore it is likely that that the FUE and the third NUE, together
with the cleavage sites, function as a unit in polyadenylation of GhExpl0 mRNA transcripts,
134

The presence of multiple NUEs is a common feature of plant genes (Dean et a1,,1986; Hunt,
1994; MacDonald et a1.,1991) and several NUEs may controlled by a single FUE.
In 1991, Joshi er a/. composed a context sequence of the translation initiation codon in
plant genes. Their analyses and that of others (Sawant et al., 1999) suggested that nucleotides
surrounding dicot plant ATG initiation codons are comprised of the consensus:
5'AAA(A/C)AAUGGCU3'. The nucleotide sequence flanking the GhÐxpl} initiation codon
was found to consist of the nucleotides: 5'GAACAAUGGGG3' which matches eight of the
11 nucleotides present within the consensus sequence. Three additional ATG initiation
codons were found in the GhExpl0 sequence, between the recognised CAAT box and the
TATA box (Figure 3.9), but although the 'first AUG' rule holds for the vast majority of plant
genes (Joshi, 1987;Kozak,1984), all matched less than four nucleotides within the dicot
optimal translation context. Additionally, initiation of translation at the other three ATG
codons would produce only small peptides of 40, 44 and73 uo', providing further support for
the ATG codon at position +1. No other in frame initiation codons were found in the
GhExpl0 sequence, and no other significant open reading frames were present.
3.7.2 Sequence analvsis of the Gl¡,Expl0 promoter
The majority of transcriptional regulatory elements lie within the 5' promoter region
of plant genes (Chandler and Vaucheret, 2001; Fickett andHatzigeorgiou, l99l; Singh,
1998). The specificity of transcription depends on the presence of crs elements in this
promoter region and their interaction with specific transcription factors. The 205 bp of
sequence immediately upstream of the translation start site of GhExpl0 was searched for
elements that may control transcription using the PLACE (PLAnt Cis Element) website (Higo
et al., 1999). The minimal elements required for transcription in vivo are the TATA box and
the CAAT boxes (Joshi, 1987). The 5' region of GhExpl0 contained both these elements
(Figure 3.9; Appendix 1), with a putative TATA box at position -116 and a CAAT box at
position -46, suggesting that the gene is transcriptionally active. Other elements that were
found in the 205 bp promoter region of GhExpl0 include a'W-box binding site at position -135
134 to -128. W-box elements are binding sites for the plant-exclusive WRKY zinc frnger
type transcription factors (Eulgem et a1.,2000). The binding of WRKY transcription factors
to the W-box generally occurs in stress-related environments such as during fungal infection
(Eulgem et aL.,1999), mechanical stimulation or senescence (Eulgem et a1.,2000; Gus-Mayer
et al., 1998; Hara et a1.,2000). Recently, a study by Johnson, et al. (2002) showed that the
trichome gene Transparent Testa Glabra 2 is a WRKY family member, implying that WRKY
transcription factors may have a role in plant morphogenesis as well as in stress response.
A GTI consensus binding site was located at -102 to -97 . GTI binding sites were first
identified as light response elements within the promoter of the pea Ribulose 1,5-
bisphosphate carboxylase/oxygenase (Rubisco) small subunit gene (Gilmafün et al., 1990;
Green et a|.,1987). Since their initial identification, GTI elements have been associated with
both positive and negative gene regulation, usually mediated in combinational control with
associated cis-actingpromoter elements (Le Gourrierec et al., 1999; Zhou,1999). One
interesting finding reported by Eyal et al. (1995) showed that the GTl consensus site, in
combination with a pollen-specific crs element, mediates pollen-specific expression of two
tomato pollen genes, LAT52 and LAT59. A search for the pollen specific consensus
sequence 5'AGAAA3', within ttre GhUxpl0 promoter revealed two probable sites. One was
located at-Il2 and another at-103. The spacing of these elements and the GTl consensus
binding site within the GhExpl0 promoter is similar to that of the elements identified by (Eyal
et a1.,1995), and suggests that GhExpl} may be expressed in pollen.
Additional elements that were located within the GhExpl0 promoter included a
DofcoreZM element, consisting of the sequence 5'AAAG3' at position -110. Dof proteins
are plant transcription factors that contain a highly conserved single zinc-finger DNA binding
domain (Yanagisawa and Schmidt, 1999). Studies have shown that Dof transcription factors
are involved in expression of many genes, including those encoding seed storage proteins
(Diaz et aL.,2002; Mena et al., 1998), photosynthetic genes and genes that are responsive to
particular hormones (Diaz et a1.,2002; Washio, 2001). As Dof proteins are associated with a
136

tl
variety of transcriptional processes, it is likely that this element plays a role in GhExp I 0
transcription.
Two NtBBFI recognition sites found to lie at positions -130 to -125 and -82 to -77.
The target sequence of NIBBFl, identified within the rolB oncogene of plants, is essential for
gene expression within the shoot apex (Baumarut et aL.,1999). As two of these target sites
were found within the GhExpl0 promoter, the gene may be expressed in cotton apical
meristems. In addition, research by Allen et al. (1989), found that nuclear extracts bound to
upstream elements within the gene encoding the alpha'-subunit of beta-conglycinin, expressed
during soybean seed development. One of these factors, SEF (Soybean Embryo Factor) 4,
was found to bind to the sequence 5'RTTTTTR3', which is present within the GhExpI0
promoter at position -134, suggestive of GhExpIO expression within developing seeds.
The multiple elements within the GhExpl0 promoter may all contribute to the
transcriptional regulation of the gene, but detailed mutational and deletion studies of specific
elements are required to determine their specific roles. Furthermore, regulation of gene
expression occurs at a combinational level with associated factors such as co-activators and
co-repressors, transcription factors and other cis and trans acting elements (Singh, 1998).
Thus the presence of known cls elements may not necessarily mean that they are all
functionally si gni fi cant within this particular promoter.
Five other cotton cr-expansin genes (GhExpl2, Figure 3.10; GhExpl4,Fígure 3.11;
GhÛxp6, Figure 3.12 GhExp14.2, Figare3.lT and GhExpl4.4,Figre 3.19) were
characterised in a similar marìner to that presented in detail for GhExpl0. Sequence
comparisons of all the coding regions revealed them to be 60 to 99%o similar to each other and
to pFS 14 at the nucleotide level (Tabl e 3.2) and between 53o/o and 99Yo at the amino acid
level (Table 3,3). The sequence of GhUxpl4.2 was 99Yo identical to the pFS14 cDNA and
thus is considered its genomic clone, as discussed in Section3.6.2. Conceptual translations of
the genes revealed that they encode potential cr-expansin peptides of between 249 aar37

(GhExp6) and265 crø (GhExpl2) in length and between26,544 Da (GhExp6) and 28,448Da
(GhExp12) in molecular weight (Table 3.4). An alignment of the amino acid sequences is
presented in Figure 3.25. The predicted pls of the five cr-expansins ranged between7.76
(GhExp14.2) andl0,74 (GhExpl4), values consistent with other characterised cx,-expansin
peptides (Shcherban et aL.,1995).
Present at the N-terminus of each of the five cotton c-expansin peptides was a
hydrophobic signal peptide sequence, varying in size from 20 cxcr (GhExp6) to 30 øo
(GhExp14.2 and GhExp14.4) (Table 3.4). Each signal peptide contained a hydrophobic core
extending for between 11 and 16 cro residues and mostly small uncharged residues were
present at the -3 and -1 sites of the signal sequence (Table 3.4) (von Heijne, 1985; von
Heijne, 1988; Watson, 1984). All five ø-expansin peptides lacked an endoplasmic reticulum
retention signal (KDEL or HDEL) (Denecke et al.,1992), as did GhExpl0 (Table 3.4). The
presence of signal peptide and the lack of an endoplasmic reticulum retention signal suggest
that the peptides are secreted like other plant cr-expansins and is consistent with the assumed
role of o-expansins within the cell wall (Cosgrove, 2000b; McQueen-Mason et a1.,1992;
Shcherban et al., 1 995).
A search for characteristic ct-expansin motifs within the five putative peptides
revealed that most key amino acid residues were present (Table 3.4). GhExpl2, GhBxpl4
and GhExpl4.2 each contained the eight conserved Cys residues, the HFD motif and the four
aromatic Try residues that specify ø-expansin peptides (Figure 3.25). GhExp6 contained the
HFD domain and seven of the eight conserved Cys residues, with the fifth Cys being
substituted with a Gly residue (Figure 3.25). Interestingly, the presence of seven Cys residues
instead eight is not common within published cr-expansins. As the Cys residues are thought
to contribute to folding of the cr-expansin protein through disulphide bond formation, it is
probable that the conformation of the GhBxp6 protein is altered by the loss of a Cys residue.
GhExp14.4 also contained seven Cys residues, with the first Cys being substituted with Arg
138

(Figure 3.25), and the highly conserved HFD motif is altered to a HLD domain (His-Lys-Asp)
in GhExp 1 4.4 (Figure 3 .19; 3 .25). Although variations in the HFD domain have been
observed in the B- expansins (unpublished data; identified through blastp searches), only two
such variations have been described in ø-expansins (O'Malley and Lynn, 2000; Reidy et al.,
2001), and the motif is thought to constitute the catalytic domain of the protein (Section 3.8.1;
(Cosgrove, 2000b). Direct mutational analysis of the conserved o-expansin residues has not
been undertaken, so the functional effect of changing the conserved Phe residue to a Leu
residue is unknown.
Comparisons of the codon usage of each cr-expansin showed that a low number of rare
codons (< 10%) are present in all open reading frames (Table 3.4), implying that these
transcripts will be efficiently translated in vivo.
The five cotton crc-expansins were encoded by three exons, separated by two introns
(Figure 3.10; 3.1 l;3.12;3.17;3.19; Table 3.5), as found in GhExpI} and many other
described cx-expansin genes (Cosgrove, 2000a;Lee et aL.,200I) (Figure 3.24). Each of the
exons was approximately 15 o/o more GC rich than its flanking introns (Table 3.5), providing
the required contrast in GC and AT content that aids in intron recognition (Lorkovic et al.,
2000). The introns were variable in size, with intron 1, a phase I intron, ranging from 75 to
758 bp in different genes and intron 2, a phase II intron (Lee et a1.,2001), varying from 73 to
390 bp (Table 3.5). All the introns were greater than 62 % AT rich and consisted of multiple
AT tracts, both of which are required for correct mRNA processing in plants (Goodall and
Filipowicz, 1989; Merritt et al., 1997). In addition, each of the introns contained branch
points (Table 3.6) which matched the recognised consensus 5'CtINAN3'(Table 3.6) (Brown,
1986; Brown and Simpson, 1998; Lorkovic et a1.,2000).
Putative polyadenylation elements, including FUEs, NUEs and cleavage sites, were
located between 2bp and 535 bp after the recognised stop codon in different genes and in
general, matched the recognised consensus for plant sequences (Hunt, 1994; Rothnie, 1996;
Sanfacon et al.,l99l), (Table 3.6; Figure 3.10. 3.11,3.12,3.77 and 3.19).139

Analysis of the initiation codons and the surrounding nucleotides for each gene
revealed that all matched between 7-9 of the 11 bp consensus for dicot sequences described
by Joshi et al. (1997) (Table 3.5). Initiation of translation is therefore likely to occur at the
designated ATG codons (Figure 3.10; 3.1 l; 3.12, 3.17 , 3.19).
3.7.4 Analvsis of available promoter sequence of cotton ctr-expansin genes
Of the five cr-expansin genes, 5' promoter sequence analysis was undertaken for all
except GhExp14.2. Analysis of the GhExpI4.2 promoter is described in Chapter Seven and
will not be further discussed here. The GhÐxpl4 promoter was only 37 bp in length and
therefore limited in the information it could provide (Figure 3.11). Of the remaining three,
654bp of5'sequencefor GhExpl2,20lbp of5'sequencefor GhExp6,andl0lT bpof5'
sequence for GhExpI4.4 (available as the original gw74.4 Genome Walker'" PCR promoter)
was available for analysis. All promoters were analysed for crs acting elements within region
5' of the ATG initiation codon using the PLACE website (Higo et al.,1999). The GhExpl2,
GhExpí and GhExpI4.4 promoters contained the minimal promoter elements necessary for
transcription, namely the TATA box and the CAAT box (Appendix 1).
Two common elements were present within all promoters; namely Dof core binding
sites and secondly GTI consensus sites (Appendix 1). Both sites are associated with various
tlpes of transcriptional responses (refer to Section 3.7 .2) and their presence in all cotton a-
expansin promoters strongly suggests that these transcription factors play a regulatory role in
o-expansin transcription.
Myb transcription factors binding sites (although not always the same consensus sites)
were also present in all of the o(-expansin promoters (Appendix 1), implying that Myb
transcription factors are likely to play a role in transcriptional regulation of the cotton o-
expansins. Myb transcription factors have been found within a variety of different organisms,
and contribute to gene expression via transcriptional regulation (Martin and Paz-Ares, 1997).
In plants, Myb transcription factors are associated with the regulation of cell shape (Martin
140

J
andPaz-Ares, 1997) and have been associated with epidermal patterning in the seed coat of
Arabidopsis thaliana (Penfield et aL.,2001), Antiruhinumpetals andA. thaliana roots.
Furthermore, Myb transcription factors are known to be involved in initiation of Arabidopsis
trichomes (Hauser et a1.,2001; Payne et al., 1999; Walker and Marks, 2000), and a family of
myb proteins are specifically expressed within developing cotton fibres (Loguerico et al.,
1999). It is therefore possible that Myb transcription factors regulate the expression of these
o-expansin promoters.
A variety of other elements were present within the ø-expansin:promoters (Appendix
1), but detailed functional analysis is required to determine the role or significance that these
elements may play in the oc-expansin gene regulation.
3.8 Expression of G-expansin genes in cotton
To determine the transcription pattern of individual o-expansins in cotton, an RT-PCR
approach was undertaken. Northern analysis was inappropriate because of the high degree of
sequence identity between the six genes (Table 3.2). Using one of the isolated ct-expansin
genes as a probe to a Northern blot would most likely result in cross-hybridisation amongst
the known and probably some uncharacterised ø-expansin genes within the cotton genome.
Utilising the gene structure and the sequence differences between the cotton cr-
expansin genes, which included single nucleotide mismatches, deletions and insertions,
primer pairs were designed that were specific for the processed transcription products
(Chapter 2;Table2.2). lnall cases except Ghîxp14.4, primers pairs were designed to flank
an intron so that genomic contamination of the RT-PCR experiment could be detected by the
presence of a larger amplified band. Due to the high sequence similarity between Gh&xp 14.2
and GhUxp14,4, pnmers for GhExp14.4 were designed within the third exon and the putative
r4t

3'UTR. Although considered a pseudogene (Section 3.7), GhExpi was included in the
experiment to determine whether or not it was expressed.
3.8.2 Testing the gene-specific primers
The cotton cr-expansin gene-specific primers were tested using genomic subclones and
the pFSl4 cDNA. In addition to the crc-expansin sequences, templates also included cotton
genomic DNA cv. Siokra l-4 and Siokra 1-2 (from which the GenomeWalker-u libraries and
the genomic library were made) (Figure 3.26). In all cases except when differentiating
between GhExp14.2 and GhExpI4.4, the pGhExpl4.2 subclone was used as a representative
for both subclones, due to the high level of sequence identity between the two genes. The
GhExpï template was excluded as a template, as the partial nature of this gene would in any
case not allow amplification using the remaining gene-specific primers. The annealing
temperatures were adjusted until each primer pair amplified a product only from the
corresponding genomic subclone and not the other subclones or the pFSl4 oDNA (Figure
3.26).
3.8.3 RT-PCR transcription analvsis of cotton g-expansin genes
To investigate the expression patterns of the isolated cotton cr-expansin genes, RT-
PCR analysis was performed on cDNA samples from a variety of different cotton tissues,
including a range of fibre ages (Figure3.27). Actin primers were included as a control for the
amount of template oDNA. Transcripts were detected for five of the six full-length o-
expansin genes in at least one cotton tissue type. Neither GhExpl4 nor GhExp5 transcripts
were detected in the tissues examined in this analysis (result not shown). GhExpl0 mRNA
accumulated at high levels in flowers, leaves and stems, whilst GhUxpl2 mRNA was present
at low levels in flowers, leaves, roots, stems, ovules, and during the first 10 days of fibre
development (Figure 3.27). Low levels of GhUxpí mRNA were observed in flowers,leaves,
roots, stems, ovules and during early fibre development (up to 8 DPA). GhUxp14.4 mRNA
was found in fibres aged 6-26 DPA only after two rounds of amplification, implying the
presence of a very low abundance mRNA. The lack of GhExpl4.4 mRNA transcripts within742

the26 DPA fibre mRNA (Figure 3.27) is probably due to a PCR error during the original or
second PCR, as transcripts were detected within the 24 and 28 DPA samples.
Surprisingly, the primers designed from the Ghîxp14.2 sequence amplified transcripts
in ovules, flowers and leaves as well as developing cotton fibres (Figure 3.27 , GhBxpl4.Za), a
result that contrasts with previous Northern analyses (Orford and Timmis, 1998) in which
mRNA transcripts for GhExpI4.2 appeared to be exclusive to the developing cotton fibre.
Since it is possible that the GhExpI4.2a primers were amplifying an uncharacterised o-
expansin, this RT-PCR experiment was repeated using a second set of primers designed for
GhExpl4.2. The second set of primers for GhExpI4.2 would be expected to ampliff both
GhExp14.2 and GhExpl4.4but amplification of the latter would not affect the result due to
the low abundance of the GhExp14.4 transcripts (Figure 3.27). The second set of primers for
GhExp14.2 produced the expected result, amplifying transcripts that were almost exclusive to
the cotton fibre (Figure 3.27; GhExpl4.2b). The mRNA for GhExpI4.2 was highly abundant
at 6 DPA and persisted throughout the extensive fibre elongation phase before declining at the
onset of secondary cell wall synthesis at about 20 DPA. The RT-PCR results for GhExpl4.2b
are consistent with the previous Northern analyses (Orford and Timmis, 1998) and confirm
the presence of a highly abundant cr-expansin mRNA that is specific to elongating fibre cells.
3.9 o-expansin gene expression in cotton: a discussion
Three of the seven gene-specific primer sets detected low-level cx-expansin transcripts
(Figure 3.27; GhExp14.4, GhExpl2 and GhExp6), while two of them amplified transcripts of
greater abundance (Figure 3.27; GhExpI4.2 and GhExpI}). The lack of mRNA transcripts
for GhExpï, even after two rounds of amplification, supports the assertion that GhExpï is an
inactive pseudogene (Section 3,6). Transcripts for GhÛxpl4 were also not detected in any of
the cotton tissues sampled here. As o-expansins can have expression patterns limited to very
specific cell types (Chen and Bradford, 2000; Rose ¿/ al.,1997), GhExpl4 could be expressed
t43

Figure 3.26. Testing of gene specific primers usinq available cotton cl-expansin senomic
clones and genomic DNA
A. Testing of gene-specific primers for GhExpl}, GhExpI2, GhExpI4 and GhExp6. Primers
used in each PCR reaction are shown on the left hand side of the figure and expected sizes ofeach PCR product are shown on the right hand side of the figure.
1. pGhExpl0 plasmid2. pGhExpl2 plasmid3. pGhExpl4 plasmid4. pGhExp6 plasmid5. pGhExpl4.2 plasmid6. pFS14 cDNA
l. pGhExpl0 plasmid2. pGhExpl2 plasmid3. pGhExpl4 plasmid4. pGhExp6 plasmid5. pGhExp14.2 plasmid6. pFS14 cDNA
1. pGhExplO plasmid2. pGhExpl2 plasmid3. pGhExpl4 plasmid4. pGhExpS53 plasmid5. pGhExpS96 plasmid6. pGhExpl4.2 plasmid7. pFSl4 cDNA
7. G. hirsutum, cv Siokra 1-28. G. hirsutum, cv Siokra 1-49. negative control
7. pGhExp14.4 plasmid8. G. hirsutum, cv Siokra 1-29. G. hirsutum. cv Siokra 1-410. negative control
8. pGhExpl4.4 plasmid9. G. hirsutum, cv Siokra 1-210. G. hirsutum, cv Siokra 1-4I 1. negative control
B. Testing of gene-specific primers for GhExpI4.2 and GhExpI4.4. Primers used within each
PCR reaction are shown of the left hand side of the figure and expected sizes of each PCR
product are shown on the right hand side of the figure.
C. Testing of gene-specific primers for GhExpS. The expected product size is shown on the
right.
r44

A.
GhExpl0 primers
GhExp I2 prir.ners
GhExpl4 primers
GhExp6 plimers
123 4 s6789620 bp
414bp
ç
655 bp
1283 bp
328 bp
420bp
287 bp
B.
GhEx¡tl4.2a primers
GhExp 14.4 prirners
GhExp5 primers
C.
| 2 3 4 5 6 7 8 910
34 9
- '41
C.t
o O'
t45

C)to
fibre (DPA) lr(,)ÈoÉ6 8 t0t2l4 18 20 222426 28
qrcÉo
z¡r C)gocD li
GhExpl4.2a < 330 bp
GhExpl4.2b <270bp
GhExpI4.4 < 450 bp
GhExpl0 < 450 bp
GhExpl2 <240bp
GhExp6 < 420bp
actrn < 120 bp
Figure 3.27. Expression of c¿-expansin genes in cotton
RT-PCR analysis of cotton a-expansin gene expression using gene-specific primers.
The tissue from which the template mRNA was derived is shown on the top of the diagram
The names of the left denote the primer pairs and the gene for which they are specific. The
right hand side denotes observed product size. All results are from one round of
amplification, except for those of GhExpI4.4, whichunderwent two rounds of PCR.
.lrettrlö -
ï*t}f*fffÜI}ry.þro
-1r¡ Ü
ilra*{ft
t46
elsewhere in the cotton plant or at levels undetected in this experiment.
GhExpl0 and GhExp14.2 mRNA transcripts were detected at relatively high levels
compared to the transcript accumulation of other cotton oc-expansin genes (Figure 3.27). u-
expansin peptides normally constitute a minor component of the cell wall (one part cr-
expansin to 5,000 parts dry weight cell wall proteins) and in vitro, have been shown to induce
cell wall extension in a ratio as small as 1:10,000 (Cosgrove, 2000b; McQueen-Mason and
Cosgrove, 1995). Additionally, cr-expansins are the only proteins known to induce cell
growth when added exogenously (Link and Cosgrove, 1998), therefore the high transcript
abundance and the tissue-specificity of Ghilxpl4.2 suggests that the peptide plays a
significant role in cell wall extension within developing fibres (Figure 3.27). Similarly,
GhExpl0 peptides are likely to be involved in cell wall extension in the flower, leaf and stem
tissue (Figure 3.27).
GhExp14.4, which displayed 9TYonucleotide identity to GhExpl4.2 over the coding
regions (Table 3.2), displayed very low levels of transcript accumulation within fibres. The
high level of identity of these two genes could indicate that they are alleles of the same gene
but three lines of evidence argue against this possibility. Firstly, differences between the
GhExpl4.2 and the GhExp14.4 promoters, and between the introns were observed (Section
3.6; Figure 3.24). Secondly, results from the GenomeWalker'" experiment (Figure 3.16) show
that different-sized PCR products were obtained using the two different sets of gene-specific
primers, suggesting that GhUxpl4.2 a¡d GhExp14.4 are situated at different loci and are
distinct genes. The possibility of GhExpl4.2 arrd GhUxpl4.4being alloalleles (one
originating from each diploid ancestor) was also disregarded, as Southern hybridisation
results showed that pFSl4 hybridisation is confined to the putative ancestral D diploid
genome (Figure 3.1). Therefore, the most likely explanation for the high level of nucleotide
identity observed in the GhExpl4.2 and GhExp14.4 genes is that they result from a recent
gene duplication, which probably occurred after polyploidisation 1-2 million years ago
(Wendel, 1989).
r47

The process of gene duplication is often associated with functional divergence or gene
extinction, as the function of one of the duplicates becomes redundant at the time of
duplication. The halÊlife of a duplicate gene is approximately four million years (Lynch and
Conery, 2000), Two lines of evidence suggest that GhExpI4.4 is accumulating mutations that
may lead to its extinction. Firstly, it is expressed at very low levels and secondly, changes
were observed in two amino acids that are conserved in almost all previously characterised ø-
expansin proteins (Section 3.7.3; Figure 3.25). To date, studies have not been undertaken to
determine the role of the consewed amino acids within cx,-expansins, so the functional
significance of alteration of these strongly conserved amino acid residues is unknown. It
should also be noted that transcripts were detected for GhExp6, the deduced peptide sequence
of which lacks a Cysteine residue, and a previous study by O'Malley and Lynn (2000),
described a distantly related crc-expansin that lacked two conseryed amino acid residues,
although its mRNA transcripts could be detected.
The transcription of cr-expansin genes within multiple tissue t1pes, such as those
observed here for GhExpI\, GhExpI2 and GhUxp6, has been described previously in other
species (Harrison et aL.,2001; Rose e/ ø1.,2000), yet little is known about the functional
significance of the differences in expression patterns. Redundancy of o-expansin genes
suggests that each ø-expansin may be responsive to independent regulation mechanisms, act
on different components of the cell wall and be active in different cell environments. In
support of this notion, Im et al. (2000) described the differential localisation of ø-expansin
mRNA in the basal or apical tip of vascular cells, depending on the type of o-expansin gene
being expressed, suggesting that each type of c-expansin acts locally and specifically on
different parts of the cell wall. Although cx-expansin transcripts have been detected in
multiple tissues, it is possible that the gene-specific primers designed here may amplify
mRNA transcripts from one or more of the as yet uncharacterised cr-expansin genes within the
cotton genome, as is the case clearly for the GhUxpl4.2ø primers.
148

a
The presence of o-expansin mRNA transcripts within some cotton tissues is consistent
with the findings of certain elements within the promoter regions of these genes (Section
3.1.2). For example, the presence of GhExpl0 mRNA transcripts within stem tissue of cotton
is consistent with the finding of a NtBBFl binding site within the GhExpl0 promoter (Section
3.7.2)(Baumann et a|.,1999). However, a correlation was not always present and the
relevance of all of the recognised elements within all the cotton o-expansin promoters
remains to be determined through deletion and motif analyses.
3.10 Summarv and conclusions
In summary, seven cr-expansin genes were cloned and analysed, one of which
corresponds to the cotton fibre-specific oDNA, pFSl4 (Orford and Timmis, 1998) and one of
which is a pseudogene. As expected, expansins occur in allotetraploid cotton as a gene
family, and the genomic clones isolated in this study only account for three major and one
minor hybridising band in the genomic Southern blot (Figure 3.1). Larger o-expansin gene
families have been described in other plant species (Brummell et al.,I999b; Harrison et al.,
2001;Wu et a1.,2001),with26 o-expansin members in Arabidopsis alone (Li et a1.,2002).
Therefore, a number of cx-expansin gene family members remain to be identified in cotton.
Five of these six isolated cotton cr-expansin genes showed distinctive expression
patterns in different tissues of cotton. GhÛxpl4.2, the gene corresponding to the pFS14
oDNA, was expressed almost exclusively in cotton fibres, supporting the Northern analysis
previously described by (Orford and Timmis, 1998). The abundance of GhExp14.2 mRNA
transcripts (Figure 3.27) is high compared with the other described cotton o-expansins. Such
high mRNA abundance supports the hypothesis that this particular cr-expansin may play an
important role in cellwall extension during fibre cell elongation.
149

150

CHAPTERFOUR
Evolutionary analysis of six cotton o(-expansin genes
151

r52

q
4.1 Introduction
Following their discovery in plants, the sequence similarity and substrate specificity of
expansins were used to divide them into two subfamilies, the ø and the B-expansins
(Cosgrove, 1997a). However, a recent analysis of Arabidopsis expansin genes revealed the
existence of a third subfamily, which was named y-expansin (Li et a1.,2Q02), though the
classification of the third expansin subfamily is considered debatable (Cosgrove et aL.,2002).
The detection of expansin-like genes in the cellulolytic fungus (Trichoderma reesii), slime
mould (Dictyostelium discoidium) andbacteria demonstrates that expansins are encoded by an
ancient gene family (Cosgrove, 2000b; Li et a1.,2002; Saloheimo et a1.,2002). The
identification of o- and y-expansin sequences in mosses (Li et aL.,2002) indicate that the
expansin families existed at the base of the lineage leading to higher plants (Li et a\.,2002).
The important role of o-expansins in plant growth and development has led to these genes
being the focus of increased research interest.
The largest of the subfamilies, which contains the ot-expansin genes, has been
tentatively divided into four clades (4, B, C and D) on the basis of phylogenetic nucleotide
sequence analysis. However, the legitimacy of these subdivisions is somewhat uncertain, as
the phylogenies on which they are based were poorly resolved at critical nodes in the trees
(Im et a1.,2000;Li et a1.,2002; Link and Cosgrove, 1998; Rose e/ aL.,2000). The availability
of a detailed phylogenetic framework portraying the evolutionary relationships amongst the
various o-expansins would be a valuable resource in understanding the various roles of plant
cr-expansins. In addition, elucidation of the various plant species relationships, combined
with evolutionary analysis of cr-expansin sequences, will allow predictions regarding the
numbers of potential cr-expansin genes that remain uncharacterised in the cotton genome.
This chapter describes the analysis of multiple o-expansin sequences, including the six
full-length cotton genes described in Chapter Three, in the evolutionary context of gene
duplication, polyploidy, orthology and paralogy.
153

4.2 Gene and the exnansins
The importance of the role of duplication in plant genome evolution is emphasised by
the wide occuffence of polyploids in higher plants. Approximat ely 80o/o of angiosperms have
a pollploid history (Masterson,1994; Stebbins, 1966). As a result of polyploidy, individuals
within a species are potentially significantly more heterozygous than their diploid ancestors.
A polyploid species is also provided with genetic redundancy such that many duplicated
genes are released from the effects ofnatural selection and free to degenerate or evolve novel
functions. Gossypium hírsutum is a tetraploid species, formed after the hybridisation and
doubling of the maternal "A" Old'World diploid genome and the paternal "D" New'World
genome (Wendel, 1989).
After a gene duplication event, one of the copies becomes "functionally redundant"
and, thus freed from the effects of purifying selection, can accumulate mutations that rarely
may lead to the acquisition of modified or novel functions (Lynch and Conery, 2000).
Although members of gene families that have arisen through gene duplication might carry out
diverse roles, their proteins will often have similar biochemical modes of action as a result of
their shared evolutionary histories. V/ith this in mind the three clearly defined expansin
subfamilies, o(, P and y-expansins, share amino acid and biochemical similarities while also
portraying features that are unique to each subfamily. For example, the signal peptide, the
disulphide bond.forming cysteine residues and the HFD box are global characteristics of the
expansin superfamily. Conversely, o-expansins generally have eight conseryed cysteine
residues, a specific 'insertion' of 14 amino acids and they lack any N-linked glycosylation
sites. B-expansin members contain a single conserved putative glycosylation site at the amino
terminus and generally contain another N-linked site near the carboxyl terminus. A seven
amino acid specific insertion is also found in B-expansins, as are six conserved cysteine
residues. The y-expansin peptides are structurally distinct from the a- and the B- expansins,
being significantly shorter as they lack a C-terminal domain. The cr-expansin and the B-
expansin specific inserts are not found in the y-expansins (Li et aL.,2002)154

Although the exact role of the y-expansins is unknown, current research indicates that
the cx,-and B-expansins have distinct effects on cell walls. For example, c[-expansins cause
cell wall extension in dicot walls (Type I cell walls) but are very ineffective in inducing
extension of grass coleoptile walls. In contrast, the group I allergens, members of the B-
expansin subfamily, are highly effective at inducing extension of grass cell walls (Cosgrove,
1997a). The differential effects of the ct-expansin and the B-expansin group I allergens have
been attributed to interactions of various dicot or monocot specific cell wall components
(Cosgrove, 1997 a;McQueen-Mason et al., 1992).
The expansins therefore constitute a large and divergent gene family and in the
following sections, only the crc-expansin subfamily will be discussed.
4.3 The ct-expansin familv: maximum parsÍmonv analysis
Phylogenetic analysis predicts that at least five members of the o-expansin gene
subfamily were present in the common ancestor of monocots and dicots (Li et a1.,2002).
Extant members of these ancient gene lineages now perform diverse roles in plants. Their
preservation over such long periods of evolutionary time underlines the functional
significance of these divergent lineages.
A maximum parsimony analysis was undertaken to investigate the evolutionary
relationships amongst the cotton cx,-expansin gene family and other available cr-expansin
genes and cDNAs. The data set used in these analysis was composed of the six cotton o-
expansin sequences described in Chapter Three and28 other genes that were selected on the
basis of availability of full-length sequences, detailed expression analysis and sequence
similarity to the cotton ø-expansin genes (Appendix 2). The maximum parsimony methods
reoonstruct the evolutionary history of a set of aligned sequences, assuming that the most
likely history of each site involves the least number of substitutions (Sober, 1988). The core
assumptions behind maximum parsimony arcthat each site evolves independently, all
155

nucleotides are equally likely to be changed, and that substitutions are rare (Felsenstein,
1988). The usefulness of maximum parsimony techniques is based on the simplicity of the
underlying assumptions and the rapid speed of analysis, especially when large data sets are
examined. Using the maximum parsimony method, the set of 34 cr-expansin DNA sequences
were analysed with intron, signal sequences and the third codon positions excluded. Third
nucleotide positions of a codon evolve much more rapidly than the first and second positions,
and thus are likely to be saturated at the level of inter-family divergence (Link and Cosgrove,
1998). Four clades (4, B, C and D), were observed in the phylogenetic tree, similar to those
described by Link and Cosgrove (1998), with one or more cotton ø-expansin gene represented
in each clade (Figure 4.1). The A, B, C and D clades \Mere supported by bootstrap values of
99,37,73and79respectively. Thebootstrapvaluesweresignificant(>70o/o)forthreeofthe
four clades, but the B clade was supported by a very low value of 37Yo (Figure 4.1) and was
not significant.
In an attempt to improve resolution at critical nodes and to determine whether a
similar tree would be obtained when this data set was analysed using a different method,
maximum likelihood analysis was performed using the BAMBE program (Larget and Simon,
1999; Chapter Two). The assumptions behind maximum parsimony approaches are often
criticised for lacking biological relevance and for being over-simplistic (Steel and Penny,
2000 and references therein). Maximum likelihood methods attempt to overcome these
problems by applying a biologically relevant model of sequence evolution under which the
evolutionary history of a group of sequences is then inferred. The resultant phylogenetic tree
is the one that provides the highest likelihood of yielding the observed sequences assuming a
particular model of the evolutionary process. The TN93 model used in this analysis takes into
account variations in the frequencies of transitions/transversion substitutions, as well as
unequal base change frequencies (Tamura and Nei, 1993). An advantage of BAMBE over the
other maximum likelihood programs is that it uses Bayesian statistical principles to give the
resulting branching order a direct confidence probability (Larget and Simon, 1999). Other
156

Ç
reliability testing methods, such as bootstrapping, require the independent analysis of many
pseudo-replicates to measure the inherent variation within the data. When using a
computational intensive maximum likelihood approach, this process is unfeasible for all but
the simplest of data sets. Hence a maximum likelihood approach, using the BAMBE program
was undertaken using the set of 34 o-expansin sequences (Appondix 2).
The four A, B, C and D cx,-expansin clades were again observed in the maximum
likelihood phylogeny, with probability support of 100% for all clades except the B clade
(92%) (Figure 4.2). The observed probability values of >9Ùo/o associated with critical nodes
strongly support the subdivision of the o-expansin gene family into four distinct sub-clades.
It should be noted that the branching order of the maximum likelihood !¡ee (Figure 4.2) was
consistent with that derived by maximum parsimony (Figure 4.1).
4.4 The c-expansin phvlogenetic tree: general observations of the four clades
The A clade includes GhExpl2, which appears to be transcribed within a number of
cotto.n tissues (Figure 3.27). The A clade also contains three tomato o(-exprmsin genes, two of
which have been associated with cell wall disassembly during germination (Chen and
Bradford, 2000) and fruit ripening (Rose et a\.,1997). Clade B contains many c-expansin
genes tha-t.are expressed in rapidly growing tissues and it includes both GhExpI4.2 and
GhExpL4.4, which are transcribed in elongating cotton fibres (Figure 3.27). Within this clade,
CsExpl, CsExp2, LeUxp2 and OsExp4 are expressed in elongating hypocotyls in a variety of
species (Catala et al. , 2000; Cho and Kende, 1997 c; Shcherban et al. , 1995). Other o-
expansins within the B clade are expressed in expanding fruit tissue such as cherries, apricots,
strawberry and tomatoes.
157

Figure 4.L. Maximum parsimonv analvsis of 34 q.expansin qenes
Phylogenetic tree obtained from maximum parsimony analysis of 34 o-expansin genes from
plants. In this analysis the third nucleotide position of each codon, intron sequences and
signal sequences were excluded for the dataset. The four clades (4, B, C and D), as doscribed
by Link and Cosgrove, 1998, are indicated by brackets
LeEXP3
7g
GhEXPl4
97
LeEXPS
30
CSEXPl
osEXP4.se
61
56
ZeEXP3
24
97
91
A(EXP8
CSEXP2
69
OSEXPl
FpEXP I
PraEXP2
GhEXPS3
SaEXP3
DNtEXPl
LeEXPS
36
5738 C55
AIEXPI
AIEXPIO
81 AtEXPs
GhEXPIO
88PaEXP2
FaEXP2
PraEXPl
PâEXP1
91
30
22
100
LeEXP4 ,
63 45
LeEXPI
GhEXPl42
GhEXP144
FSEXPl
LeEXPl0
GhEXPl2
B
A
40lg0
100NtEXPS
LeEXP2
29
100BnEXPI
AlEXP6
J0
49
40
158

LeExp3LeExpS
AtExpS
98 101
100NtExpl D
LeExpS00 OsExpl
64 1
100 OsExp492
NtExpS2
LeExp400
00
GhExpl2LeExplS
0. 1 substitutionsisite
Phylogenetic tree obtained after maximum likelihood analysis using the BAMBE (TN93 model) program. Full-length ø-expansin genes were used with
signal sequences removed, and excluded the third nucleotide of every codon. The tree is rooted by LeExp3 (Im et ø1. 2000). Probabilities of each branch
are shown, with probability values of each subclade shown in bold. The cotton ü-expansin genes are also depicted in bold.
C84
91
0099
I
(,lr\o
B
A14.4

GhExpl} (transcribed in flower, leaf and stem tissue; Figure 3.27) and GhUxpí
(transcribed in flower, leaf, ol'ules and root tissues; Figure 3.27) fall within clade C (Figure
4.2), which contains other o-expansin genes with heterogeneous expression patterrrs. Some
members are transcribed in multiple tissues, such as LeExpí (Brummell et a1.,1999b) and
AtExpï (Shcherban et al., 1995), while others appeæ to have more specialised roles (Ze0xp3,
AtExpI and AtExpl0) (Cho and Cosgrove, 2000; Cosgrove, 2000b; Im et a1.,2000).
Members of the D clade appear also to contain ø-expansin genes that are transcribed
in tissues undergoing rapid growth, includingNtÐxpl that is expressed in tobacco suspension
culture cells (Link and Cosgrove, 1998) and OsUxpl, whose expression was observed in
shoots and developing seeds of rice (Cho and Kende, 1997c; Huang et aL.,2000). CsExp2 is
expressed in hypocotyl tissue (Shcherban et aL.,1995) and SaExp3 in whole seedlings
(O'Malley and L1mn, 2000). GhExpl4 fell within this clade but RT-PCR analysis did not
detect any corresponding transcripts for this gene in cotton (Figure 3.27).
It has previously been postulated that the oc-expansins within each clade may act in a
similar manner to each other and/or be responsive to similar signals (Link and Cosgrove,
1998). The different transcription patterns of the cotton cr-expansins presented in Chapter
Three, in addition to the observation that the six cotton genes are widely distributed
throughout the phylogenetic tree, largely supports this notion. The idea is, however,
somewhat undeveloped as the phylogenetic tree indicates that each clade contains paralogous
relationships (divergence after duplication), a pattern that is likely to lead to significant
functional divergence within each clade. Shared expression patterns of paralogous genes
could be equally attributed to evolutionary convergence or simply to coincidence, as apposed
to conservation of function.
The identification of orthologous genes (divergence after speciation) within each of
the cr-expansin clades may provide a clearer picture of possible functional relationships160

lf,
amongst these genes. Although orthologous genes are more likely to have conserved / similar
functions than paralogous genes, it should be noted that orthology does not equate to
functional homology. A detailed analysis of possible orthologous and paralogous genes
within each clade (as depicted in Figure 4.2) was performed using a species tree based on
(Soltis et al., 1999) (Figure 4.3). The angiosperm phylogeny described by Soltis et al. (1999),
is derived Íiom analyses of DNA sequences from nuclear 18S rDNA and plastid rbcL and
atpB genes of 560 species, and provides the best available angiosperm phylogeny for
comparative analyses (Figure 4.3).
Apart from describing evolutionary relationships between sequences in a dataset,
phylogenetic analysis also allows one to predict the existence of as-yet uncharacterised genes
by comparison of the gene tree affangement with the proposed species relationships (Page and
Cotton, 200I). For example, if an outgroup species A has ingroup species B and C, the
identification of orthologous genes in species A and B would imply its existence in C also,
since this gene must have been present in the common ancestor of species B and C (Figure
4.4). Besides representing genes that await discovery, "missing" lineages also include
characterised sequences that were not part of the dataset used to estimate the phylogenetic
tree. Another possibility is that the missing sequences have become extinct within the lineage
leading to the species under examination.
A comparative analysis of the oc-expansin phylogeny (Figure 4.2) and the species tree
(Figure 4.3) revealed that the four cr-expansin clades (Figure 4.2) colldbe further divided into
several orthologous subclades; these are discussed below. The red lineages in Figure 4.5-4.8
correspond to sequences that are predicted to exist when the gene tree is constrained to fit the
predicted species tree.
161

monocot
]euasterid II
o\N)
euasterid I
cotton Malvales
eurosid II
pea Fabales
eurosid I
Figure 4.3. Phvlogenetic species tree :il
Phylogenetic species tree representing relationships of plants used in the previous phylogenetic analysis (Figure 4.land 4.2). This species tree is
based on that described by Soltis et al. (1999). The plant species are shown with family groups indicated in coloured boxes. The grouping of the
families is also indicated.

Outgroupspecies A
species B
species C
A diagram showing how a phylogeny can be used to predict the existence of orthologues
that were not included in the original dataset. In this example a hlpothetical gene tree,
represented by the solid blue lines, is drawn within the constraints of a species tree. As
species A, B, and C share a common ancestor, the identification of orthologous sequences
in species A and C will imply its existence in species B (broken blue line). The missing
orthologue in species B may not have been included in the analysed dataset, or has become
extinct after species B and C diverged from a common ancestor.
r63

A4
elegansasiatica
tomatotobaccocottonArabidopsisrapeseedpea
RosecucumberZinnia elegans
Striga astomato
iatica
tobaccocottonArabidopsirapeseedpeaRosecucumberZinnia elegansStriga asiaticatomatotobacco
A2
cottonArabidopsisrapeseedpeaRosecucumber
GhEXPI2 A1
Comparison of the a-expansin A clade to the species tree. Sequences represented by red
colour are predicted to be present on the basis of the species tree. Genes represented in black,
were included in the initial dataset of 34 o-expansin genes.
Festuca pratensisnceZinnia elegansStriga ctsiaticatomatotobaccocottonArabidopsisrapeseedpeaRosecucumber
LeE 4
LeEXPI
AtEXP6BnEXPIPSEXPl
LeEXPl8
A3
t64

Festuca pratenisnce
nnta
B1
FaEXP2PaEXP2PaEXPI
PraEXPlCsEXPl
Festuca pratenisrice OsÐG4Zinnia elegansStrigia asiaticatomato LeEXP2tobacco NtEXP5cottonArabidopst AtEXPSrapeseed
B2
cucumberFestuca pratenisriceZinnia elegansStrigia asiaticatomatotobacco
B3cotton GhEXP14.2cotton GhEXP14.4ArabidopsisrapeseedpeaRosecucumber
Comparison of the cr-expansin B clade to the species tree. Sequences represented by the red
colour are predicted to be exist, on the basis of the species tree, whilst those in shown in black
were included in the original dataset of 34 a-expansin genes.
elegansasrutrca
Ç
tomatotobaccocottonArabidopsisrapeseedpeaRoseRoseRoseRosecucumber
DeaRose
165
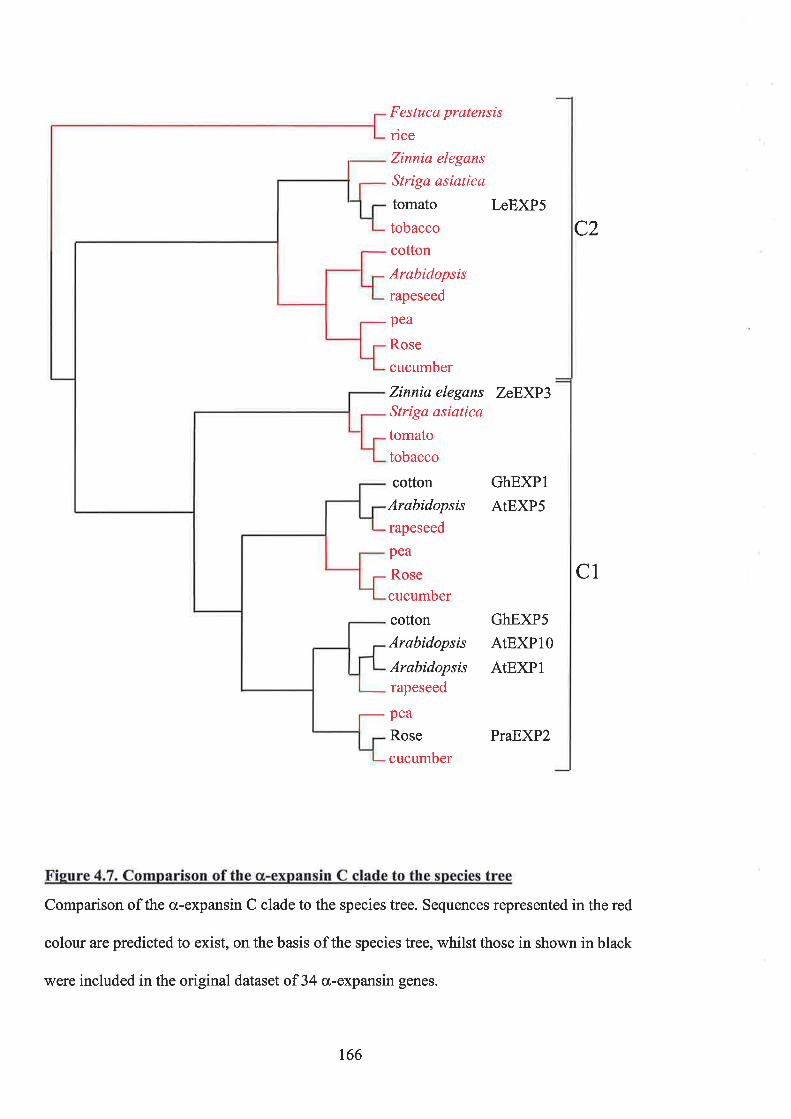
Festuca pratensisriceZinnia elegans
Striga asiaticatomato LeEXP5tobaccocottonArabidopsisrapeseed
pea
Rose
cucumber
Zinnia elegans ZeEXP3Striga asiaticatomatotobacco
cotton GhEXPIArabidopsis AtEXPSrapeseed
pea
Rosecucumber
cotton GhEXP5Arabidopsis AtEXPl0Arabidopsis AtEXPIrapeseed
pea
Rose PraEXP2cucumber
C2
C1
Comparison of the cr-expansin C clade to the species tree. Sequences represented in the red
colour are predicted to exist, on the basis of the species tree, whilst those in shown in black
were included in the original dataset of 34 cr-expansin genes.
166

Festuca pratensisriceZinnia elegansStriga asiaticatomatotobaccocottonArabidopsisrapeseedpeaRosecucumber
tuca pratensisriceZinnia elegansStriga asiaticatomatotobaccocottonArabidopsisrapeseedpeaRosecucumber
GhEXPI4
OsEXPl
SaEXP3LeEXP8NTEXPI
CsEXP2
D2
D1
Comparison of the D clade to the species tree. Sequences represented by the red colour
are predicted to exist on the basis of the species tree, whilst those shown in black were
included in the initial dataset of 34 cr-æxpansin genes.
r67

4.5.1 The a-expansin A clade
The A clade is divided into four groups by three ancient duplication events that date at
least to the base of the dicot lineage. On the basis of the species tree, Ghîxpl2 is orthologous
to LeExpIS (Figure 4.5). The low abundance of LeExplS transcripts and a lack of
accumulation of these transcripts in response to growth stimuli (such as light or hormones)
suggest that LeExplS is not a regulator of extensive growth in tomato stems or hlpocotyls
(Caderas et a1.,2000). In addition, an earlier study identified the elevationof LeExpIS
transcripts in the 11 cells, which are the cells of incipient leaf primordium (Reinhardt et al.,
1998), and LeExplS expression has since been utilised as a molecular marker for leaf
initiation rather than as a presumed regulator of elongation growth. One would predict the
presence of genes orthologous to LeExplS and GhExpI 2 in other members of the core eudicot
group, together with their characterisation if they still exist, may shed more light on possible
functional roles of this subclade.
Two other tomato a-expansin sequences, paralogous to LeExpl8, fell within clade A,
namely LeExpI and LeExp4 (Figure 4.5). Analysis of these has shown that both are involved
in cell wall disassembly. LeExpI mRNA and protein is expressed in ripe tomato fruit and
thought to assist in fruit ripening through cell wall disassembly (Brummell et aL.,1999a; Rose
et a1.,2000; Rose e/ a1.,1997). Over-expression of the LeExpl protein within tomato led to
fruit with increased softness and, consistent with these findings, the suppression of the
LeExpl protein leads to firmer tomato fruit with improved shelf life (Brummell et al.,l999a;
Brummell et a1.,2002). LeExp4 transcripts were expressed in the endosperm cap of
germinating seeds, consistent with the weakening of the endosperm cap in radial emergence
(Chen and Bradford, 2000). These results suggest that three paralogous genes in tomato have
been recruited for roles in the stem, fruit, developing seed and the hypocotyl of tomatoes. At
least two of these (LeExpI and LeExp4)have maintained a function in cell wall disassembly.
The remaining orthologous group of genes within the A clade includes AtExp6, BnExpI, and
PsExpl (Figure 4.5). AtExpó mRNA was isolated from an EST pool, BnExpl is a oDNA of168

q
young Brassica nqpus seedlings and PsExpl is a oDNA isolated from pea petals. Data from
these three genes are limited and therefore any functional characteristics of this group cannot
be firmly established.
4.5.2 The ct-expansin B clade
Eleven ø-expansin genes were located in clade B which can be divided into three
subclades (Figure 4.6). PaExpI and PaExp2, two apricot genes preferentially expressed in
developing fruit, appear to be paralogous sequences and probably arose from a recent gene
duplication. Orthologues of PaExpI and PaExp2 are found in strawberry (FaExp2) and
cherry (PraExpl) respectively, with all of these genes playing some role in fruit development.
The most basal sequence in the B1 group is cucumber CsUxpl, with the gene tree suggesting
that the duplication that gave rise to PaExpI and PaExp2 occurred after apricots diverged
from cucumberc. CsExpl transcripts are present within the growing hlpocotyl of the plant,
but it is not known whether CsExpI is expressed in the cucumber fruit (Shcherban et al.,
1995). A second group within the B clade includes the orthologous sequences Os&xp4,
LeExp2, NtUxpï and AtExpS. Limited expression data is available for AtExpS, as the AtExpS
cDNA was isolated as an EST from 5 day-old seedlings. However, the other members of this
goup are involved in the process of rapid cell expansion (Caderas et aL.,2000; Catala et al.,
2000; Cho and Kende, I997c; Huang et a1.,2000).
The fibre-specific cotton genes, GhExpL4.2 and GhExpI4.4, represent the most
anciently diverged genes within the B clade and their high level of nucleotide similarity
suggests they result from a recent gene duplication within the cotton lineage. Neither
GhExp14.2 nor GhExpl4.4 have'fatal' mutations that are characteristic of pseudogenes, but
GhExpL4.4 is lowly expressed and its protein contains uncharacteristic amino acids, which are
usually highly conserved in cr-expansins (Section 3.9). Therefore GhExpl4.4 appears to have
accumulated deleterious mutations that have reduced its expression levels and possibly
affected its biological role, suggesting that it is a functionally redundant duplicate of
GhUxp14.2. The paralogous relationship of GhÛxpl4.2 and GhExp14.4 to the other members
169
of the B clade would suggest that gene or pseudogene orthologs exist in other dicot and
monocot species.
4.5.3 The c-expansin C clade
ZeUxp3, which is expressed in the xylem cells of Zinnia elegans and is envisaged to
contribute to the intrusive growth of the primary walls of differentiating xylem cells (Im er
a1.,2000), falls at the base of two sets of paralogous genes that include members from cotton
and Arabidopsrs (Figure 4.7). An Arabidopsrs-specific duplication in one of these paralogous
lineages has given rise to AtExpI and AtExpl0. The finding that the latter are paralogous is
consistent with the chromosomal location of these genes, both on chromosome I,
approximately 17 Mb apart (Li et aL.,2002). Although not present as tandem duplication,
these two regions of the Arabidops¡s chromosome I were found to have undergone segmental
duplication (The Arabidopsis Genome Initiative). The widely expressed cotton gene,
GhExp6, is orthologous to the Arabidopsis AtExpI and AtÛxpl0 sequences, as is the cherry
gene PraExp2.
Expression analysis of these genes demonstrates heterogenous expression patterns.
ZeExp3, AtExpl and AtExpI0 all appear to have specialised roles in the tissues where they are
expressed (Cho and Cosgrove, 2000; Cosgrove, 2000c; kn et a1.,2000). AtExpI}, through
over expression, suppression and promoter analyses, was found to be involved in leaf growth
and pedicle abscission, while Cosgrove (2000) reported ttrat AtExpl expression was confined
to the guard ceIls. PraÛxp2, a cheny fruit expansin mRNA, was isolated during fruit ripening
and limited expression data is available. Two of the cotton genes, GhExpl0 and GhExp6, arc
paralogous and were produced by a duplication that occurred after the divergence of tomatoes
from the eurosid lineage (refer to Figure 4.3). Paralogous to the Cl clade lies the tomato
LeÛxpí gene, which would be predicted to have orthologous genes or pseudogenes in other
dicot species, on the basis of the gene and species brees. LeExpS, which is transcribed in
multiple tissues, was situated within its own subclade, to the exclusion of the remaining C
clade members (Figure 4.7). This may indicate that the LeExp5 gene acts in a different
170

manner to other members of the C clade, a possibility that would not be surprising
considering the paralogous nature of the relationship and the ancient placement of the
duplication that produced the Cl group, at least to the base of the dicot lineage.
4.5.4 The c-expansin D clade
The D clade cr-expansin genes can be divided into two paralogous groups and, as
members of each group are found in monocots and dicots, the duplication that produced these
genes must have occurred before the species diverged from a common ancestor (Figure 4.8).
The D1 group contains seven orthologous genes, which appear to be associated with rapid :',
growth. The Dl group cr-expansin members are expressed within elongating hypocotyls
(CsUxp2, NtExpI), developing shoots of embryos (LeExpS), the apical region of growing root
tips (FpExpl), tl;re apical growing region of rice coleoptile (OsExpI) and finally SaExpI , an
cr-expansin which is expressedin Strigia asiaticq over the induction period of parasitic plant
host attachment. The cotton crc-expansin GhExpl4 is paralogous to the sequences within the
D1 group therefore the roles of the D1 group may not be very informative in determining the
functional roles of this gene.
4.5.5 Database searches in lrøáid¿psis
Examination of the trees in Figures 4.5- 4.8 reveals that all four cr-expansin clades
contain several potential orthologues that were not included in the dataset analysed here.
Unfortunately, the ability to determine whether "missing" genes represent extinct or
undiscovered lineages is arduous unless the complete genome sequence of the organism is
available. The completion of the Arabidopsls genome sequence has allowed us to gauge the
levels of gene extinction represented by the missing gene lineages. For this approach,
database searches were used to find missing Arabidopsis sequences, the existence of which is
predicted by the phylogenetic trees (Figure 4.5- 4.8). The electronic probe used in these PSI-
BLAST searches was the protein sequence (with signal sequence removed) encoded by the
most closely related ortholog to the predicted Arabidopsis gene. For example, the GhExp14.2
peptide was used as 'bait' to search the Arabídopsis database for missingArabidopsis177

members of the B3 subgroup (Figure 4.6). In case the peptide with the highest sequence
identity to GhExpl 4.2 was Arabidopsrs AtExp2 ('prey'). The top "hit" was then examined
and one of two conclusions could be made: (1) If the identified sequence appeared elsewhere
in the phylogeny, then it could be predicted that the missing gene is now extinct or greatly
diverged; or (2) if the identified sequence was not found in the tree then it could be assumed
that this represents the missing gene. The results of this analysis are summarised in Table 4.1
and they show that five of the seven Arabidopsls sequences predicted to exist on the basis of
the phylogenetic tree (Figure 4.5- 4.8) could be preliminarily identified on the basis of amino
acid identity to a characterised orthologue. In two of the seven cases, paralogous sequences
within the tree had the highest identity to the "electronic probe", implying that the predicted
Arabidopsrs target sequences has diverged extensively or been lost through a process of
extinction. Therefore, it is likely that a significant proportion of the genes predicted by the
phylogenetic tree are functional, and represent either genes not included in the data set or
genes that await discovery.
4.6 Discussion: Evolutionarv aspects of expansins
The phylogenetic analysis carried out here (Figure 4.2) strongly supports the previous
subdivision of plant cr-expansins into four clades, with all the critical nodes supported by a
probability value of >90 %. These four gene lineages are derived from ancient duplication
events that predate the divergence of monocots and dicots from a common ancestor 200-150
MYA, as is evident from the observation that sequences from both plant groups are
represented within each clade (Li et aL.,2002). However, the phylogeny in Figure 4.2 does
not support the application of fi.rnctional classifications to each of the clades, probably
because each ø-expansin sub-clade appears to contain sequences that have been subject to
several further rounds of duplication and are now composed of many paralogous gene
lineages. The important role that duplication plays in the recruitment of genes to new
biological pathways has probably lead to significant functional divergence amongst members
72

I
Bait I"ç.þge:i---B.-"r-; Is the prey â possible ortholoque of the bait protein?
GhBxpl4.2
LeExpl
FaBxp2
CsExp2
LeExp5
B
D
A
B
þ: As AtBxp2 was not included in the dataset
Yes: As AtExp4 was not included in the dataset
No: AtExpS is paralogous to FaExp2
Yes: As the potential orthologue (AtExpl l) was not included in initial analysis
Yes: As the potential orthologue (AtExpl5) was not included in initial analysis
$: As AtExp6 was included in the phylogenybut was shown to be paralogous toGhExpl2
{(¿)
GhExpl2
GhExpl4
A
D
C AtExpl513
AtExp6cu30480)
AtExpl2(ACo24o81)
þ: As the potential orthologue (AtExpl2) was not included in initial analysis
Table 4.1. Results of database searches for missinu Arøbídoosß seouences
The bait was the complete protein sequence (signal sequence removed) encoded by the closest orthoþgue to the Arabidopsis gene predicted to exist on the
basis of the phylogeny presented in Figures 4.5-4.8. Possible orthologues (PO) were sequences identified by PSI-BLAST as having the highest arnino acid
identity amongst sequences encoded within the Arabidopsis genome, which were not found elsewhere in the phylogenetic tree.

of each ø-expansin sub-clade. This could explain the observation that proteins of diverse
function are found within each clade, though all are involved generally with cell wall growth
and development.
In an attempt to overcome this difficulty each of the four o-expansin clades was
further subdivided using orthology as the criterion. As genes that are related through
speciation, rather than duplication, are more likely to be functionally homologous, it was
hoped that adoption of this strategy would allow the functional relationships to be defined
more clearly. The initial observations tëntatively support this proposal, as most of the
orthologous gene groups appear to have similar functions or are at least expressed in similar
tissues. For example, members of the Bl group (Figure 4.6) all appear to be expressed within
developing fruit, while members of the 82 group appear to associated with rapid cell
expansion during elongation and growth. Likewise, members of the Dl group all appear to be
associated with rapid growth (Figure 4.7).
The main limitation of this preliminary analysis is that many of the orthologous
groups are poorly represented by sequences in the dataset used to construct the phylogenetic
tree, thus there are insufficient genes to confidently identify a common function. This
problem is compounded by the fact that a number of the orthologous groups contain poorly
characterised members that provide limited functional information (for example see Figure
4.5; A1 goup). Strict criteria (Section 4.3) were used in selecting the sequences for this
analysis, as the size of the data set exponentially effects the computer processing time
required to estimate the phylogeny. Therefore many sequences that could represent "missing"
gene lineages, especially several poorly characterised ESTs, were not included in the dataset.
It is hoped that, as the ø-expansin sequence information in databases such as GenBank
becomes more comprehensive and computer phylogeny methods are refined, these analyses
can be repeated using larger datasets for each ofthe four sub-clades. Previously, such
approaches would have been hazardous due to the uncertainty associated with the deep
branches in the o-expansin phylogenies (Li et a1.,2002; Link and Cosgrove, 1998; Rose ¿/
74

al., 2000;Im et a|.,2000) but the robustness of the tree in Figure 6.2 at these critical nodes
has remove this ambiguity.
Some of the missing genes predicted to exist by this phylogenetic analysis provide
good targets of future gene finding projects, based on the relationship between orthology and
functional homology. Such analysis in turn may provide the information required to explain
specific molecular relationships amongst the monophyletic clades observed in the
phylogenetic tree. However, if speciation events were followed by extensive periods of gene
extinction, then many of these potential orthologs may have been lost. The availability of the
complete Arabidopszs genome sequence provided a means to explore the number of genes
that have potentially been affected by species-specific extinction events. Although the results
obtained suggest that a significant proportion of putative orthologues still exist, it will be
important to verify that these Arabidopsrs genes are truly orthologous by phylogenetic
analyses.
4.7 Conclusions
The evolutionary analysis of the o-expansin genes, described here and in related
research, provides a basis for understanding the process of ø-expansin evolution in
angiosperms. Firstly, this analysis confirmed that the cr-expansin family is comprised of four
old, but distinct subclades, each supported with high probability values (Figure 4.3).
Secondly, comparison of the phylogenetic tree to the plant species tree revealed that each cr-
expansin subclade may be further divided into groups which contain representatives from
multiple plant species and, in some cases, appear to act in a similar manner to each other.
This finding is also supported by the fact that the common ancestor of monocots and dicots is
predicted to have contained five oc-expansin members and, given the predicted (and known)
polyploid incidence of angiosperms, it is expected that the cr-expansin clades would be broken
into groups of genes with closely related functions. Thus it appears that the previous proposal
of the different ø-expansin clades acting similarly is simplistic, given the high level of genet75

duplication and divergence within each clade. The identification of frrrther orthologous and
paralogous cr-expansin genes, along with the predicted existence of many orthologs and
paralogs will help target specific genes that maybe of commercial benefit. Further, inclusion
of more o-expansin sequences in specific clades may help identify group functionality.
t76

ç
CHAPTERFIVE
Development, optimisation and utilisation of a
transient assay in cotton fïbres
177

178

5.L Introduction
The generation of transgenic cotton fibres that express foreign traits such as dyes or
fìre retardants requires the isolation and characterisation of promoters which lead to fibre-
specific expression, A number of such promoters have been isolated in different laboratories,
and their in vivo evaluation traditionally involves the generation of whole-plant transformants
(John and Keller, 1996). However, such characterisation of fibre-specific promoters is
problematic because at least l-2 years is required for their evaluation, and multiple
transformed lines must be generated.
Klein et al. (1987) described the first use of microprojectiles for delivery of genetic
material into plant cells, transferring both DNA and RNA into onion epidermal cells where
both nucleic acid types were expressed. This demonstrated that microprojectiles were able to
penetrate plant cell walls and membranes and that the procedure did not destroy the impacted
cells. Since this initial finding, the microprojectile bombardment technique has been widely
usedin avaiety ofplants(ClarkeandAppels, 1998;Eyaletal.,l995;Hoeren eta1.,1998;
Hwang et a1.,2001; Saito et a1.,2000; Yamauchi, 200I; Yanagisawa and Sheen, 1998), and it
can be used in transient assays to test the specificity of a promoter within 7-2 days. However,
a method for such a transient assay in cotton fibres had not been described at the beginning of
this project.
The lack of an efficient transient assay in cotton fibre tissue, and the difficulties with
transgenic cotton, has lead to analysis of cotton fibre-specihc promoters in transformed
tobacco plants (Delaney, unpublished; Hsu et al., 1999;Liu et aL.,2000) and Arabidopsis
(Delaney, unpublished; Kim and Triplett, 2001). Hsu e/ al. (1999) and Liu et al. (2000) have
shown that cotton fibre-specific promoters were able to express the GUS reporter gene
specifically within tobacco trichomes. However, the generation of transgenic tobacco is also
a lengthy process when compared with a transient assay that may be completed within l-2
days. Additionally, the use of a heterologous system for analysis of cotton promoters may not
provide the necessary environment for the promoter to mimic its native expression pattems.
119

Plant transient assay techniques involving biolistic bombardment of explants have
been widely described and techniques use the same basic protocol (Finer and McMullen,
1990; Klein et a1.,1987; Romano et a1.,2001; Sanford, 1990; Southgate et a1.,1995;Yaínet
al.,I993a; Wetterauer et ø1.,2000; Yamashita et aL.,1991). This chapter describes the
development, optimisation and testing of a transient assay for use in cotton fibres, using a
biolistic apparatus.
5.2 The particle iniection sun
A custom-made particle injection gun (Figure 5.1) was modelled on that described by
Yain et al., (1993a). During the biolistic procedure a helium blast is discharged through a
Swinney filter on which DNA coated gold particles are placed, which subsequently leads to
the projection of the particles into target tissue (Figure 5.1).
To determine the precise target area of the helium ouþut, a Swinney filter was loaded
with 6 pl of electrophoresis load buffer (containing bromophenol blue), placed in the chamber
and projected onto Whatmannt paper placed onto the shelf. Drawn onto the Whatmann@
pap$, with respect to the middle of the shelf, was an outer circle the size of a petri dish and
an inner circle. The Whatmantr@ puper and the shelf were placed on level 5 (15 cm from the
source) and shot using a0.12 second output time (Figure 5.24). Results indicated that
particle projection was slightly off-centre with respect to the centre of the shelf. This result
was confirmed by another independent 'shot' with a reduced output time (0.03 seconds)
(Figure 5.28). The placement of the target tissue was therefore adjusted accordingly.
180

a
A.
grooves in side ofchamberYACUUIn pressure
gauge
polypropane insert('shelf)
Perspexdoor
vacuum releasevalves
helium output timer
helium projectionpoint
helium blast button
vacuum pump switch
A. The Particle Injection Gun. This angle displays the vacuum pressure gauge and release
valves, and the grooves inserted into the sides of the chamber which allow the polypropane
shelf to be adjusted. The perspex door is also shown.
B. This angle displays the helium projection point at the top of the chamber and the controls
at the front of the Particle Injection Gun.
C. The 'Swinney' Filter. The circular region of the filter represents the sieve plate, on whichDNA coated particles are placed. The sieve plate is placed into the filter, depicted below it,and the entire filter is screwed into the top of the helium projection point.
B.
181

A.
left
back
back
front
a
1eft right
Figure 5.2. Target area of biolistic apparatus
Target area of the particle injection gun, revealed by shooting load buffer onto'Whatman@
paper.
A. Whatmann@ paper shot on shelf six, with a helium ouþut time of 0.12 seconds.
B. Whatmann@ paper, shot as above, with helium ouþut time of 0.03 seconds.
182

5.3 Optimisation of the transient assay in tobacco leaves
Tobacco leaves were chosen to test the biolistic apparatus because methods for this
tissue were well-established (Klein et a\.,1988b). The control construct was pNTG* lFranks
et a1.,1998), which contains the GUS gene linked to the constitutive 35S promoter. Before
bombardment, the tobacco leaves (from plants aged 4-6 weeks) were covered with nylon
mesh (180 pm sized grids) to protect the leaves from severe damage from the helium blast
impact and to act as diffusion screens to aid in dispersal of microprojectiles over a wide area
of the target tissue. After bombardment and histochemical staining, the tobacco leaves
examined under the dissection microscope for spots of B-glucuronidase activity (Table 5.1 :
shot numbers 1 and 2). Initially, two different shelf heights (shelf 7 and 8; 20 and 22.5 cm
from the source) were chosen for the tobacco transient assay and no differences in B-
glucuronidase activity were observed for either of these settings. To determine whether the
nylon grids enhanced or reduced transient expression, tobacco leaves were placed on shelves
7 and 8 (as before) and bombarded with and without grids (Table 5.1 : shot numbers 3-6).
Overall, the number of foci of B-glucuronidase activity did not increase significantly with the
presence of the grids and the tobacco leaves appeared to have the same level of damage under
both conditions. Therefore, future bombardments were undertaken without the nylon gnds.
In an attempt to achieve a higher level of transient expression, shelf six (17.5cm from
the source) was selected to increase particle speed and intensity. Tobacco leaves bombarded
under these conditions (Table 5.1: shot number 7) contained numerous foci with B-
glucuronidase activity, yet with minimal tissue damage.
A recurring problem throughout the initial experiments was tissue displacement which
appeared to reduce bombardment efficiency. This observation had been reported previously
in biolistic experiments carried out on maize cells (Klein et aL.,1988a). Therefore, attempts
were made to reduce tissue displacement by varyingthe size of the target tissue and adjusting
the pressure at which the helium blast was delivered. Different-sized tobacco leaves were
183

Table
oo5
35S
Shotnumber
J
SheHheight
Grids
yes
yes
yes
no
yes
no
no
Ouþut time(secs)
0.12
0.t2
0.12
0.12
0.12
0.12
0.05
OutputPressure
(psi)
90
90
90
90
90
90
90
p-glucuronidaseactivity (number of blue
33,46,5 and 41
16, 109,8 and 30
82 artd5
l3l and2l
I and62
16 and 3
Multiple
VacuumCkPa)
7
Tobacco leaves
Tobacco leaves(x4)
Tobacco leaves
Tobacco leaves
Tobacco leaves
Tobacco leaves
Tobacco leaves(x8)
90
90
90
90
90
90
90
I 8
2. 7
8
4 8
5 7
76.
6

Ç
placed on shelf six and shot with varying helium pressures and output times (Table 5.2).
The results indicated that medium-sized tobacco leaves (approximately 5 cm in
length) responded better to bombardment than smaller sized tobacco leaves (approximately 3
cm in length)(Table 5.2; 8 -10). Decreasing helium output times reduced tissue displacement
(Table 5.2), but an output time of 0.12 secs was maintained since the target area testing
experiment (Figure 5.2) suggested that an increased the number of projectiles reached the
target area using 0.12 secs as the output time. Therefore a projection pressure of 90 psi, an
output time of 0.12 sec and shelf six produced optimum B-glucuronidase activity in tobacco
leaves (Figure 5.3) and was therefore adopted for tobacco transient assays. These conditions
were used as a base for optimising a transient assay in cotton fibres.
5.4 Optimisation of the transient assav for cotton tissues
Two types of cotton tissue, namely cotton ovules with attached fibres and leaves, were
bombarded with the pNTG+ positive control construct, using the conditions optimised for
tobacco leaves. As tissue displacement had previously decreased biolistic efficiency, cotton
fibres were handled in a manner to reduce tissue dislodgement. Initially, the pericarp wall of
a 10 DPA cotton boll was removed and the intact boll was stabilised using a bulldog clip on
shelf 6. Cotton leaves were treated in the same manner as tobacco leaves and both tissues
were bombarded (Table 5.3: shot numbers I and2). The conditions caused displacement of
the ovules, and B-glucuronidase activity was detected in cotton leaves but was absent in the
10 DPA fibres, suggesting that the conditions were inappropriate for fibre tissue.
As 10 DPA fibres are single elongating cells with a thick primary cell wall of between
0.2-0.4 pm (Ryser, 1985), it was considered likely that particle penetration was not achieved.
To reduce the distance between the target tissue and the projection point 10 DPA fibres and
cotton leaves were bombarded using the same conditions on shelf five. In addition, as the
bulldog clip in the previous bombardments failed to reduce tissue displacement, the 10 DPA
185

displacement durins particle bombardment
number tputOuTobacco leafsize
Shelf level Pressure i
used(pq,i)
r
result
unmoved
slightly
t É e,P!ry"slightly
time
1 medium 6 40 0.05
2 small 6 40 0.05
J
4.
medium 6 50 0.05 unmovedsmall 6 50 0.05
medium 6 55 0.05 unmoved6
7
small 6 55 0.05 mi?e+i0.08 displacedmedium 6 55
8
9
medium 6 55
600.03 unmoved0.05 unmovedmedium 6
10. smallmedium
mediummedium
6 60 0.05
0.0311. 6 70
t2. 6 70 0.0s
13.
t4.
6 15 0.03
0.03medium 6 80
Medium tobacco leaves: approximately 5 cm in diameter
Small tobacco leaves: approximately 3 cm in diameter
5
186

A.
B. c.
oa
Particle bombardment of tobacco leaves after optimisation.
A. - C. Three different tobacco leaves bombarded with the pNTG+ positive control construct.
Scale bar: lmm
187

T 35S:
Special conditions?f sh"t
I number
[,-_i :]
=r',
Target tissue(no. of independent
shots
Shelfheight
Outputtime(secs)
0.12
0.72
0.t20.12
0.12
0.12
VacuumCkPa)
OutputPressure
(psi)9090
B-glucuronidaseactivity?
37,67,3 and 29 spots
none90
90cotton leaves
I cottonboll (10 DPA),each locule shot.
6
J cotton leaves x
4 Cotton bolls (10 DPA)x
5 cotton leaves (x4) 2
Held with bulldog cliP
dissected and separatedonto dish
I shot locule
90 90 5 I and3
90
90
90
none
10, 0, 0, 0 a lot ofbruised tissue
Some blue spots present'bruised tissue.
Some isolated fibres,raÍe
Blue fibres present butdifficult to find.
9,1 5and0Some blue fibres present,rare. More present in 5
DPA than 9 DPA
90
90
6.I
1 Cotton boll DP
l cotton leaves (x4) aJ
8.
9
10
11. Cotton leaves X
T2 Fibres (9/5 DPA) 4 double-sided stickY taPe 0.08
100
0.08 100
100
90
90
100 90
90
0.12
0.r2
90
90(10 DPA)
Cotton fibre (7/6DPA)
J
4 2 locules per shot 0.08leaves x4
90
90
0.08
blue stain
4and07,rl
6
5
5
2 90
4
4

e
fibres were simply dissected from the pericarp wall and the four locules placed in a petri dish
containing Whatmannt paper premoistened with yz}y'rs solution plus chloramphenicol. Once
again, B-glucuronidase expressing cells were present on control cotton leaves, but were absent
in the fibres (Table 5.3: shot numbers 3 and 4).
The level of B-glucuronidase activity in cotton leaves (not shown) was not as high as
that detected in tobacco leaves (Figure 5.3), therefore the procedure was repeated with the
target tissue on shelf two (7.5 cm from the source). Severe bruising was present within cotton
leaves undcr these conditions and p-glucuronidase foci were greatly reciuced in number;
implying that the distance between the cotton leaves and the projectile point was too small.
Inspection of the cotton fibres revealed that no fibres showed B-glucuronidase activity, though
some weak diffuse blue stain, likely to be 'leaky' GUS expression from a damaged cotton
fibre, appeared to be present. This implied that the shorter projectile distance may be more
efficient for particle bombardment in fibres. However, as major tissue displacement occurred
on level two, subsequent bombardments were undertaken using similar conditions but with
1ODPA fibre/ovule tissue on shelf 3 (Table 5.3: shot numbers 7 and 8). Results from particle
bombardment using shelf 3 showed that bruising was present in cotton leaves but rare very
weakly stained blue cotton fibres were observed (results not shown). To avoid tissue
displacement in further bombardment experiments whilst still maintaining a high level of
projection, the shelf height was lowered to shelf four, the output time reduced to 0.08 secs and
the helium pressure was increased to 100 psi. In addition, the amount of fibre tissue was
reduced to two locules per shot and younger fibres (aged 6-7) DPA were used. B-
glucuronidase activity was detectèd in cotton leaves and rare blue fibres were also present
within theT and 6 DPA fibres (Table 5.3: shot numbers 9 and 10). The next succession of
shooting utilised fibre material aged 9 DPA and 5 DPA, immobilised on a dry petri dish using
double-sided sticky tape (Table 5.3: shot numbers 11 and 12). B-glucuronidase activity was
detected in cotton leaves and a small number of blue cotton fibres were also observed.
189

Comparison between reporter gene expression in 5 DPA and 9 DPA fibres showed that the
younger tissue was far more amenable to the transient assay than older ovules. Therefore,
although inefficient, the bombardment of cotton f,rbres was able to lead to expression of the
GUS reporter gene.
There are a number of reasons to explain the low bombardment efficiency of cotton
fibres. Birch and Bower (1991) suggested that2-4 pg DNA/mg of particles was the upper
limit for precipitation onto microprojectiles, as higher DNA concentrations increased particle
agglomeration. The cotton bombardment used 1.25 ¡tgDNA/mg of gold, suggesting that
particle agglutination is not responsible for the low efficiency of the transient assay in cotton
fibres. Particle load (¡rg of particles per shot) has also been shown to influence transient gene
expression (Klein et a1.,1988a), with concentrations of 80-250 Frg per 'shot' being optimal.
In this experiment, the particle load was at least double (500 pg of gold particles per 'shot')
this optimal level but no adverse affects were obseryed in the tobacco leaves at this
concentration (Figure 5.3). Franks et al. (1998) used 500 ¡rg of gold particles per 'shot' with
no obvious decline in transient expression. Therefore it seemed unlikely that the relatively
high concentrations of gold particles per shot used in this protocol was responsible for the low
transient expression of B-glucuronidase in cotton fibres.
Bombardment experiments carried out by Yamashita et al. (1991) using tobacco cells
demonstrated that approximately 80% of cells that received a gold particle received the
projectile within their vacuole. They also established that 90% of the GUS expressing cells
had received a particle within their nucleus. Therefore, in order for the GUS reporter gene to
be eff,rciently expressed, the particle was required to enter the nucleus (Yamashita et al.,
1991). As cotton fibres contain a large vacuole that is prominent early in fibre development
(Orford, 1996), the likelihood of the vacuole being penetrated rather than the nucleus is high
and this likelihood increases as the fibre develops, explaining why the transient assay has a
generally low efficiency in cotton fibres, which declines fuither as the fibre age. Therefore
190

methods that increase the likelihood of the cotton fibre nuclei being penetrated by gold
particles were investigated.
During elongation, growth of fibres exceeds 2 mm a day, with the majority of
expansion occurring between 6 DPA and 12 DPA (Meinert and Delmer, 1977). Therefore the
use of 6 DPA and younger fibres may improve transient assay results, as growth of the fibres
at this early stage has not reached its maximum rate and the nucleus takes up a proportionally
larger volume of the cell (i.e. effective target volume is increased). The observation that a
greater number of younger fibres (5 DPA) express the GUS reporter gene compared with
older fibres (9 DPA) supports this proposal (Table 5.3; shot number l2). In addition, the
amount of gold particles was doubled while maintaining the amount of DNA per particle
(1.25 ¡tglmg of gold). An increase in the amount of microprojectiles has previously resulted
in a broader coverage of target tissue (Klein et aL.,1988a). To prevent aggregation of the gold
particles, they were washed with sterile water until the emulsion tumed from a 'muddy gold'
colour to a vivid 'gold' colour prior to DNA precipitation.
The particle bombardment (Table 5.4: number 1) was carried out with 6 DPA fibres
that were anchored to the petri dish with glue, a method which was found to be more effective
than tape. Four shots were undertaken and each bombardment used one entire boll, with
fibres, dissected from the pericarp wall. On staining some blue fibres were obseryed and also
some diffuse blue staining, presumably due to ovule epidermal hits (Table 5.4; shot number
1). The results from this assay were very encouraging, achieving an increase in the number of
fibre cell foci expressing the B-glucuronidase reporter gene. To further increase the number
of B-glucuronidase expressing cells, several trails were undertaken using shelf two (rather
than shelf four) as atarget point and two dissected cotton bolls per shot (Table 5.4).
However, no fuilher increase in the efficiency of the transient expression analysis was
achieved, presumably because of the high tissue displacement that occurred on shelf two.
191

Shotnumber
Target tissue(no. of independent
shots)
cotton fibres (6 DPA)(xa)
Two cottonbolls (6DPA)
Cotton bolls (7 DPA)(x4)
cottonbolls (7 DPA)(xa)
Cottonboll (2 DPA)x4
cottonboll (4 DPA)(x4)
cottonboll (3 DPA)(xa)
Dissected and pinnedwith dressmaker pins
and cardboañ,12 ¡i ofectiles
OutputPressure,
(Psi)
100
100
90
90
90
90
90
90
p-glucuronidaseactivity?
Blue fibres prese,lrt andovule hits
Some fibre hits
Some fibre hits
Some fibre hits
Some fibre hits
Multiple fibre and ovulehits
Fibre and ovule hits
Fibre and ovule hits
SheHheight
Outputtime(secs)
0.12
0.r2
0.12
0.t2
0.12
0.72
0.72
0.r2
VacuumCkPa)
90
90
90
90
90
90
\oN)
90
905
4
Special conditions?
Held with glue, 12 Pl ofmicroprojectiles
Held with glue, 12 Pl ofmiøoprojectiles
Held with glue, 12 Pl ofmicroprojectiles
I
2 2
J J
4 4
Two cotton bolls (6DPA (x2
dissected and pinnedwith dressmaker pirs
and cardboard,12 ¡i ofectiles
4
6. 4 2 locules per shot, as
above
4locules per shot, 12 ¡,tlof microprojectiles
4locules per shot, 12 ¡tlof microprojectiles
l 4
48.
c
tf,
To decrease tissue displacement, subsequent bombardments were undertaken on shelf
four with 90 psi as the helium output pressure and sterile dressmakers pins with cardboard to
anchor the dissected ovules and fibre tissue, rather than glue (Table 5.4; shot numbers 4-8).
Cotton fibres ranging from 2 to 7 DPA were used, with those aged between 3 and 4 DPA
producing the most fibre and ovule epidermal hits (Table 5.4). The use of younger fibres (2
DPA) as targets produced the greatest number of B-glucuronidase expressing cells (Table 5.4;
shot number 6), but the anchoring process was more amenable with fibre tissue aged3-4
DPA.
Repetitions using these bombardment conditions, namely shelf four, tissues anchored
with sterile dressmaker pins and cardboard, confirmed that a consistently high transformation
frequency could be achieved in cotton fibres. Particle bombardment of cotton fibres using the
35S::GUS positive control clearly resulted in the presence of single fibres expressing the p-
glucuronidase gene (Figure 5.44-D). In addition, clumps of blue fibres were also observed
(Figure 5.44-D). This observation may be due to 'hits' of ovule epidermal cells in close
proximity to each other, all of which are expressing the GUS reporter gene. Alternatively it
may be the result of damage to a single fibre transiently expressing the GUS reporter gene.
Plant cells with large vacuoles may be subject to more damage during bombardment due to a
disruption of cellular compartments (Birch and Bower, 1994) and this probably is the case for
cotton fibres. As cotton fibres have large vacuoles and high internal turgor pressure,
penetration of a DNA coated microprojectile into the nucleus may result in cell wall damage,
extrusion of the protoplasm, that subsequently allows the GUS protein to diffuse giving rise to
the appearance of clumps of blue fibres.
Cell injury during particle bombardment is common (Birch and Franks, l99l;Klein et
ø/., 1988b) and osmotic treatment can prevent damage. Osmotic treatment is thought to
reduce vacuole volume and decrease internal pressure, which causes cell plasmolysis, altering
cell wall permeability and reducing the loss of cellular compartments after bombardment
193

.¡
B.
D.
F.
+t
\
jI
c.
-
-
-
1räa" /
Particle bombardment method optimised in cotton fibres and leaves, all tissues bombarded
with pNTG+. Arows denote single fïbres expressing the GUS reporter gene.
A. 3 DPA cotton fibres.
B. 3 DPA cotton fibres.
C. 3 DPA cotton fibres.
D. 3 DPA cotton fibres.
E. cotton leaf.
F. cotton leaf.
The scale bar represents 100 pm in panels A-D and 1 mm in E and F.
The brown spots present on cotton leaves are secretory cell structures.
194

(Vain et a1.,1993b). The same study undertaken by Vain et al. (1993) also demonstrated that
osmotic treatment of embryonic maize cells resulted in a 43o/o increase in transient expression
of the GUS reporter gene (Vain et aL.,1993b) and a similar treatment was caried out with
cotton fibres prior to bombardment.
Cotton fibres aged 3 DPA, were placed in a solution of 0.4 M sorbitol and 0.4 M
mannitol for 30 minutes prior to bombardment, as per Vain et al. (1993). A control consisting
of untreated cotton fibres was included for comparison. After bombardment and
histochemical staining, fibres were assessed for p-glucuronidase activity (Figure 5.5). Cotton
fibres that were treated with osmotic solution prior to bombardment contained less fibre cells
and less clumps of fibres expressing the GUS reporter gene (Figure 5.54), compared with the
untreated control (Figure 5.58). Thus it appears that osmotic treatment of the cotton tissue
prior to bombardment decreases transient reporter gene expression, probably reduced fibre
vacuole volume and internal turgor pressure which decreases the ability of the
microprojectiles to penetrate the cell wall of fibres. To further investigate the effect of the
osmotic treatment on cotton fibres, treated and untreated fibres were viewed under the light
microscope. Examination of treated fibres revealed that the cloplasm of each fibre had a
shrivelled, plasmolysed appearance, with the membrane becoming detached from the cell wall
(Figure 5.5C and E). The untreated fibres appeared normal with no visible shrivelling of the
cytoplasm away from the cell wall, indicative that the cells were not plasmolyzed (Figure 5.5
D and F). Overall, these results show that osmotic treatment of cotton fibres does induce cell
plasmolysis (Figure 5.5 C and E), but did not increase the transient expression of the GUS
reporter gene (Figure 5.54 and B). The difference between the results and those described by
Yain et al., 1993 is most likely due to the use of different target tissues. Since osmotic
treatment resulted in a reduction in GUS reporter gene expression, osmotic treatment of fibres
was not built into the standard protocol.
195

TREATED I.]NTREATED
c. D.
E. F.
cotton fibres
Cotton fibres after treatment with osmotic solution (0.1 M sorbitol and 0.1 M mannitol).
A, B. 3 DPA cotton fibres treated (and untreated) with osmoticum solution followed by
bombardment with pNTG*. Scale bar represents 1 mm
C-F'. 5 DPA cotton fibres, treated (and untreated) with osmoticum solution and viewed
under light microscopy. Scale bar represents 20 pm.
B.
196

Ç
5;5.1 The promoter: :reporter constructs
To obtain the promoter conesponding to the pFSl4 oDNA, a GenomeWalker'" PCR
method was applied (refer to Materials and Methods; Chapter Three). Using two pFSl4-
specific primers, two PCR products (gwl4.2 and gwl4.4) were isolated from the same
Genome'Walker'" PCR reaction. The two promoter regions differed in length by l62bp, with
gv'r14/ being larger than the gxl4.2 promoter (Figure 5.6 and 5.7). The two sequences were
approximately 96% identical to each other at the nucleotide level, differing mainly at their 5'
ends (Figure3.l4; Section 3.5).
Comparison of both gwl4.2 and gwl4.4 PCR clones to the pFSl4 oDNA
demonstrated that the gwl4.2 promoter belonged to the pFSl4 oDNA (100% nucleotide
identity to the protein coding region; Figure 3.158). However, as the gwl4.4 promoter was
also extremely similar in sequence to the overlapping pFsl4 oDNA (Figure 3.154), it was
decided to test both promoters by insertion into a reporter construct for transient assay and
whole plant transformation (refer to Chapter Seven). The expression data (Figure 3.27) was
unavailable at the time of this experiment. The reporter construct was the
pJK.KiwiGUS.ocs.Kmf(-) B-glucuronidase expression (GUS) vector (Figure 2.1). This vector
contains the pUCl9 Multiple Cloning Site upstream of the E. coli GUS coding region,
allowing the directional insertion of promoter regions 5' to the GUS gene. It also contains a
Kanamycin resistance gene allowing antibiotic resistance as a selection marker in transgenic
plants.
Both the gwl42 and gwI4.4 promoter sequences were searched for restriction sites
that would allow their directional cloning upstream of the GUS gene in
pJK.KiwiGUS.ocs.Kmf(-). Two restriction sites were located, a unique NheI site, which lies
5' of the ATG translation initiation codon in both promoters (Figure 5.6 and 5.7), and a Sma I
site situated within the AP2 Genome V/alker primer positioned 5' of both promoters. Within
197

Figure 5.6. Sequence of the 9w14.4 promoter
Nucleotide sequence of the GenomeWalker'u derived putative pFSl4 promoter (gw14.4). The
coding region, based on sequence alignments with the pFSl4 cDNA, is shown in blue text,
with intronic sequences shown in green text. The ATG initiation codon is shown in a red box
The putative transcription start point, also based on a sequence alignment with the pFSl4
oDNA, is indicated by an affow. The putative TATA and CAAT boxes are shown in bold
text. The NheI site used in the cloning of the gwl4.4 promoter upstream of the GUS
expression vector is outlined. The GenomeWalker'u Adapter, and the EXP5 primer used to
amplify the promoter in the original experiment are shown outlined at the beginning and end
ofthe sequence.
198

1Genome'Walker'u
ATTGACGAGT
101_
t_5 t_
20L
251,
301
351
401,
45L
501
55r-
601
651
70r_
7 51,
8 01_
851
9 01-
951
10 01
l_051_
1_101
1t_51
t20t
1251,
13 01
AAAGAAAGCT
TTCATAJUUU\
ATTGGCGCAA
AACTTAGTAA
AATATTTTCA
TTAACATAAC
GAACAATTTC
CGACTTCTTC
AÀACCTGAGT
ACTATTACCA
CACCGATGGT
TTGGTTTTAA
AACTCCTTGC
TTTCCATCCA
ATGGATACTG
TTTAATGTAT
TTAGCTACGT
AACTCTTTCT
ATTTGGATTT
AGAACTAÄ.GG
GTGGTGCGGA
TTTAAATGTA
AGTTAGGTGA
TTTCATGAAG
TATTTTCACA
ACCTTCAGTC
CTGATTGGCT
ACTTCAAATG
TGAGGTGGTT
GTGGCTTCAA
TCAÄ,CCTTCC
TCTATATTTA
GATACCATCA
AGCTTAATTA
ACGTTACTTA
CTTTTTGTÀT
TGATTCGTAA
TGTAGGAGGA
TAAAGAAGAC
AAGTTTTCAA
GGAAAACTTA
Tzu\TAGzuU\C
AAGTCAAGAA
CTTCCCTGAT
GACTGAJ\ÄAT
ATAGGGGAAT
GGCTGGAGTT
TTGCAAGCAA
GCCATTGTTA
TATCCATTAA
TATCTATGAT
TCCTCCAÄAT
GCTTTGCTTG
ÀÀÀTAGCTAT
ATTCATGACT
A¡\GGGGAI\GA
CGCACAACAA
TAATTTAATG
CTAAGAGTTA
TTTTAGTATC
AATTGTATTC
CAGCGCTTGT
GAACCTACTC
TAACTGGTAA
AAATGAGATT
TTAGGATACT
TGGTTTAATT
AACAAGTCGT
TÆUU\TTTTG
TTGTACTCTT
TCGTCATCTT
ACACTTTTTCNheI
TGAÀAGTTGG
AAAGCTTTTG
CGATTTTAAT
ACCATTTTAT
GTTACCCCTG
ATCTTATATA
TA.AÄ.4ÄATGG
GAAAAACGAA
ATCACCATTC
AGTGTAÄ'CTC
TTTTTTAGTT
GCGCTGGAAC
AAACATTATG
TGAGCAAATA
CATGTGCCCT
TCACCACTAA
CTGTACTACA
TCCCCTCAÀÀ
TCTTACTCAAAATTGTCAATAAGGT TAGGTCAGCC GCT
CAÄ'CCA AÄACGATGAT GTTGCNU\TA TTTTCACTTT TCTTCTTTTT
GTTCAGTATC TGCAACTCCA TTTTCCTTGG TGCTAATGGA GATGACAATG
GTGGTTGGCA AÀCTGCCCAT GCCACCTTTT ACGGTGGTGC TGATGCTACC
GGCACAATGG GTGAGTTTCA AACTTTCAAA CCATTACCTA CATA,\iUU\TC
TCTAGGCTAT GTTCTTAATT TGTGATGTTT CTATAGGGGG AGCTTGTGGT
TGGA ACGAGCACAGTATGGNU\CC TGTGCAGTCA
r99

Fisure 5.7. Sequence of the swl4.2 Dromoter
Nucleotide sequence of the GenomeV/alker'u derived putative pFSl4 promoter (gw1a.2). The
coding region, based on sequence alignments with the pFS14 cDNA, is shown in blue text,
with intronic sequences shown in green text. The ATG initiation codon is shown in a red box.
The putative transcription start point, also based on a sequence alignment with the pFS14
cDNA, is indicated by a arrow. The putative TATA and CAAT boxes are shown in bold text.
The Nhe I site used in the cloning of the gurl4.2 promoter upstream of the GUS expression
vector is outlined. The GenomeWalker'u adapter and the EXP5 primer used to amplify the
promoter region are shown outlined at the beginning and the end of the sequence.
200

I
1_
51
l_0 1_
r_5 1
20t
251,
301
351
401
45L
501
55 r_
601
551
70t
751
8 01_
85 t-
9 01-
95l_
l_0 0 l_
105 t
1101
115 1
ACAAACAGTG
CTAj\TTTA¡U\
CTTACTAAGA
AAACTTTTAG
GTCAJ\GA;qJU\
TCCCTGATCG
CTGA.A.AATGA
AGGGGAATTA
CTGGAGTTAA
Ai\GCAI\TTAG
TTGTTATGGT
CATTAAAACA
TATGATTA.AA
TTATCCTCCA
CTTAGCGTTG
TÀÀÀTAGCTA
ICAATTGlITTG
I+TGTTGCAAAT
ATTTTCCTTG
TGCCACCTTC
AÄACTTTCAA
TTCTTAATTT
TGTACAGTCA
GenomeWalker'u
CGAACAAAGA AGACCACACA
TGAÀ,AAATTT TCAATAATTT
GTTAGTTACC CCTGTTAAAA
TACGTATCAT CTTATATAGA
TTGTATTCTA GAJUU\TGGCG
GCGCTTGTGA AAAACGAAAA
ACCTACTCAT CACCATTCAC
ACTGGTA,¡U\G TGTAACTCCA
ATGAGATTTT TTTAGTTTTG
GAGACTGCGC TGGAATAACC
TTAATTA,AAC ATTATGTTTC
AGCCGTTGAG CA,qJ\TAJ\TGG
ATTTTGCATG TGCCCTTTTA
AATTTGTACT CTTTCACCAC
CTTGTCATCT TCTGTACTAC
TACACTTTTT CTCTCCTCAANheIeccr@þcrrAcrcA
ATTTCCACTT TTCTTCTTTT
GTGCTAATGG AGATGACAAT
TACGGTGGTG CTGATGCTAC
ACCATTACGG CATTACCTAC
GTGATGTTCT CTATAGGGGG
TCT
ATAACAATTT
AJ\TAI\GTTAI\
TAACTTTCAT
ACAATTTCTA
ACTTCTTCAC
ACCTGAGTCT
TATTACCAAC
CCGATGGTTG
TTTCAAGTGG
CCTCGCTCAA
CATCCATCTA
ATACTGGATA
ATGTATAGCT
TTAATTGGCT
AÄACTCTTTC
ATCÀÀTAAGG
CAÄ'CC
TGTTCAGTGT
GGTGGTTGGC
CGGCACAATG
ATAiU\i\i\TCT'
AGCTTGTGGT
TTT TTGGC
TAACAATATA
CCGAGGA;UU\
GAJ\GTAJ\TAG
TTTTCAGAJU\
CTTCAGTCCT
GATTGGCTGA
TTCAAÀTGAT
AGGTGGTTGG
CTTCAÄ'TTGC
CCTTCCGCCA
TATTTATATC
CCATCATATC
TAAGCCTTAA
ACGTACGGTA
TCATTTTGTA
TTAGGTCAGC
A.AAACGATGA
CTGCAACTCC
AAACTGCCCA
GGTGAGTTTC
CTAGGCTATG
TATGGAAACC
ACTA GGC ACGCGTGGTC GACGGCCCGG
TGGA ACGAGCACAG
201

the multiple cloning site of the vector there is an Xba I restriction site, which contains
compatible "sticky ends" to the Nhel restriction site of the promoters, along with a SmaI
restriction site (Figure 5.84). The cloning of either the gwl4.2 or gwl4.4 promoter upstream
of the GUS gene was confirmed by the presence of a larger EcoRI fragment when compared
to the pJK.KiwiGUS.ocs.Km(-) vector (Figure 5.88).
To further confirm that the gwl4.2 and gw14.4 promoters had been correctly cloned,
both constructs were sequenced and compared with the original gwl4.2 and gwl4.4 promoter
sequences. The comparisons (not shown) revealed that the two promoters had been
successfully cloned in the correct orientation. Both promoter constructs were tested using the
particle bombardment method optimised here and described in Chapter Two (Section 2.3.13)
for its ability to drive GUS expression in fibre tissue.
5.5.2 Transient assav results usins the pGUSEXP14.4 construct
Bombardment of pGUSEXP14.4 into cotton fibres and leaves revealed that this
promoter construct was able to drive expression of the GUS reporter gene in fibres (Figure
5.94-D) whereas no p-glucuronidase activity could be detected in leaf tissue (Figure 5.9E and
F). To confirm the fibre-specific expression of the GUS reporter gene, the pGUSEXPI4.4
construct was bombarded a number of times into cotton fibres (3 and 4 DPA) and also cotton
leaves. In each case expression was seen exclusively in cotton fibres (as per Figure 5.94-D),
with occasionally a 'clump' of blue fibres being observed (not shown). This suggests that the
gwl4.4 promoter contains all the necessary regulatory regions to drive fibre-specific gene
expression.
5.5.3 Transient assav results using the pGUSEXP14.2 construct
Histochemical staining of 3 DPA cotton fibres and leaves after particle bombardment
with pGUSEXPI4.2 revealed GUS reporter gene expression in the cotton fibres (Figure
5.104-D), that was absent in the leaves (Figure 5.10E and F). Further bombardments using
the pGUSE){PI .Z construct confirmed this result (not shown), and it was concluded that the
202

gw142 promoter also contained 5' regulatory promoter regions required for fibre-specific
expressron.
Transient assay analyses of the two o-expansin promoters, gwl42 and gwl4.4,
revealed that both have the ability to drive fibre-specific expression of the GUS reporter gene,
such that, from this experiment, it would be impossible to determine which promoter
regulates the expression of the fibre-specific u-expansin gene. The transient expression of the
GUS reporter construct specifically in cotton fibres is consistent with the RT-PCR results
(Figure 3.27), where transcripts for GhExpI4.2 and, GhExpI4.4 were also detected exclusively
in developing cotton fibres.
Comparison of the intensity of GUS staining between the two experiments suggests
that grul4.2 directs higher levels of expression than the gwl4.4 promoter (Figure 5.104-D
compared with 5.94-D), and this is consistent with the RT-PCR results (Figure 3.27).
However it should be noted that the transient assay is not quantifiable and measuring the
different promoter activities is not possible. No evidence of GUS activity was observed in
cotton tissues bombarded with gold particles alone and no GUS reporter gene expression was
seen when cotton leaves and fibres were bombarded with the pJK.KiwiGUS.ocs.Km(-)
vector alone (result not shown), confirming that the observed results are not artefacts of the
particle bombardment process. Furthermore, GUS staining of un-bombarded tissues also
showed no B-glucuronidase staining (result not shown).
The transient assays using these two promoters demonstrate that cis acting elements
required for fibre-specific expression are present within the -1017 bp (gwla.a) and -830bp
Gwla.Ð tested. It is hoped that comparisons of these two fibre-specific promoters and others
may allow the identification of elements that are important for the expression of genes
203

Fieure 5.8 pGUSEXP14.4 and pGUSEXP14.2 constructs
A. Schematic diagram of the directional cloning of the gw14.4 and ryI4.2 promoters
upstream of the GUS reporter gene. Excision of the promoter regions was achieved through
digestion with Sma I and Nhe I restriction enzyrnes. The recipient vector,
pJK.KiwiGUS.ocs.Kmf(-) was digested with Sma I and Xba L
B. Agarose gel showing DNA fragments resulting from restriction of plasmid DNA from a
pJK.KiwiGUS.ocs.Kmf(-) vector and two recombinant vectors. The first lane contains a
molecular weight marker (î, DNA marker restricted with Hind III) with sizes indicated in kb.
Each lane contains approximately 3 pg of DNA restricted with Eco RI enzyme, with contents
indicated below.
l. pJK.KiwiGUS.ocs.Km(-) digested with EcoP.I
2. pGUSEXP14.2 construct digested with Eco RI
3. pGUSEXPl4.4 construct digested with,E'co RI.
204

@
A.
1l
I
AI AI
SmaI
23.1-
9.4-6.5-
4.4-
P JK. KiwiGUS. ocs.Kmf(-)
el
Xba I
B. 123PJK.KiwiGUS. ocs.Km(-)
oromoters
2.32.0
20s

A. B.
c
DGUSEXl4.4
Examples of results obtained when cotton tissues were bombarded with the pGUSEX14.4
construct.
A. A-D. 3 DPA cotton ovule, showing blue fibres expressing the GUS reporter construct.
E- F. Cotton leaf bombarded with the same construct showing no GUS reporter gene
expression. The brown spots present on the cotton leaves are secretory cell structures.
Scale bars 100 ¡rm in A-D and F, and 1 mm in E.
F.
206

A. B.
C. D
E. F.
Fisure 5.10. expression of the GUS renorterpGUSEX14.2
Examples of results obtained when cotton tissues were bombarded with the pGUSEX1.2
construct,
A-D. 3 DPA cotton ovule, showing blue fibres expressing the GUS reporter construct.
E-F. Cotton leaf bombarded with the s e construct, showing no GUS reporter gene
expression. Brown spots on the cotton leaves are cell secretory structures.
Scale bars represent 100 ¡rm in A-E, and 1 mm in F.
in cotton tissues:
207

specifically within this tissue (refer to Chapter Seven). The results of the transient assays
support those obtained in previously, where it was shown the pFS14 transcripts were detected
exclusively in the cotton fibres (Figure 3.27; Orford and Timmis, 1998). These experiments
validate the use of the transient assay system developed here to investigate the expression
profiles of other cotton promoters.
5.7 Summarv and conclusions
This chapter described the development and optimisation of a transient assay for
assessing gene promoters in cotton fibres. The system was successfully used to investigate
the expression of two promoter regions, and both drove specific expression of the GUS
reporter gene in cotton fibres. Optimisation of the assay, including tissue age and distance of
target tissue from helium ouþut, provided necessary conditions for the penetration of DNA
coated gold particles into the nucleus of the cotton fibre. Therefore, this assay technique
provides a simple method to test putative fìbre-specific promoters to partially circumvent the
lengthy and expensive process of whole plant transgenesis, the system previously employed
to investigate expression profiles of cotton fibre-specific promoters.
This transient assay can successfully be used to detect promoter regulation early in
fibre development (6 DPA fibres and younger). However, its use in detection of promoter
activity that occurs later in fibre development, for example after the onset of secondary wall
synthesis, could prove difficult. The difficulty of the transient assay in older cotton fibres is
most likely due to the inability of the particles to penetrate the nuclei, given the large size of
the cell and the thick fibre wall. Possible procedural modifications that may help overcome
these difficulties are currently under investigation, but as yet the particle bombardment
technique is only acceptably efficient when used with fibres younger than -5 DPA.
The inability to quantify the level of reporter gene expression in this transient assay
system provides a further limitation to the particle bombardment technique. Other biolistic
approaches are able to quantify promoter expression levels through comparisons to an internal
208

control, which is often a constitutive construct, such as LUC/GFP (Hwang et aL.,2001). In
this case, comparisons between the GUS and LUC protein levels enable the activity of a
promoter to be determined in a quantitative manner. The success of this co-bombardment
approach in a number of different plant species (Hwang et aL.,2001) suggests that this
approach may be applicable for quantification in the cotton transient assay described here.
However, preliminary quantification co-bombardment experiments in cotton fibres using
GUS/GFP have indicated that it is a difficult task (Delaney, personal communication).
Reeently, Kim et al. (2002) described the optimisation of a transient assay in cotton
ovules/ fibres prior to ovule culturing. This study demonstrated that transient expression of
the GUS reporter gene using the fibre specific promoter, GhCesA4, continued after
bombardment and culturing of cotton ovules for many days. Given that culturing produces
cotton fibres with reduced length and reduced cell wall thickening (Basra and Saha, 1999),
expression assays that rely on such approaches are likely to be subject to artefacts ofthe
experimental procedure itself. The transient assay described here assesses the ability of a
promoter within l-2 days without culturing, more closely maintaining the integrity of the
native genetic environment of cotton ovules and fibres.
In summary, a transient assay was developed that allows a rapid method for the
evaluation of promoter activity in developing cotton fibres, The low cost of the custom-made
particle injection gun, the acceptably high transformation efficiency and speedy results make
the transient assay in cotton fibres an attractive method for assessment of promoters.
209

210

CHAPTER SIX
Functional dissection of the GhExp14.2 u¡expansin
fTbre-specific promoter using a transient assay
2tl

212

lf,
6.1 Introduction
Recent advances in cotton biotechnology have led to the development of insect and
herbicide resistant cotton plants, which require fewer applications of chemicals to control pest
species (Perlak et aL.,200I; Wilkins et a|.,2000). Modification of the cotton genome to
produce these commercially desirable traits has been achieved through expression of foreign
transgenes using a strong, constitutive promoter from the cauliflower mosaic virus (CaMV),
35S. The use of constitutive promoters in transgenic plants is common practice, but it has
been shown in some cases to be detrimental to growth and vigour (Bohmert et aL.,2002;
Burkhardt et a|.,1997;Fray et al.,1995). Thus, development of methods that will allow
restricted expression of transgenes to specific tissues, or developmental stages, would be
advantageous. One approach utilises the promoters from endogenous genes, which display
specific patterns of spatial and temporal gene expression, to drive expression of a particular
transgene.
Evaluation of tissue-specific promoters within plants is largely achieved through the
generation of whole plant transformants with the promoter under scrutiny fused with the B-
glucuronidase reporter gene. Histochemical staining then allows detection of B-glucuronidase
activity to identify tissues in which the promoter is active. Generation of transgenic cotton
plants for the evaluation of candidate promoters is, however, a lengthy process which takes
one to two years (John, 1994). In contrast, using transient assays avoids the need to generate
whole plant transformants, thus reducing the time required to evaluate promoters to within
one to two days.
As part of this study, a transient assay was developed that allows the tissue-specific
expression pattern of promoters to be studied efficiently in cotton (refer to Chapter Five).
Initially, the promoter from Lhe GhExpl4.2 colton gene, which was shown to be specifically
expressed in cotton fibres by RT-PCR (Chapter Three) and Northern analysis (Orford and
Timmis, 1998), was used to assess the utility of this transient assay technique. The
GhExpl4.2 promoter was shown to drive expression of the GUS reporter gene specifically is
213

developing cotton fibres (Figure 5.10), with no p-glucuronidase activity detected in other
bombarded tissues. This established that an 830 bp region upstream of the GhExp14.2 coding
region must contain fibre-specific elements, and confirmed the applicability of this technique
for promoter dissection studies.
This chapter describes a detailed search for consensus binding sites of known crs-
acting regulatory elements within the GhExpl4.2 promoter. Comparisons between
GhExpl4.2 promoter and ten other putative fibre-specific promoters were also used to
identiff candidate cis-acting elements that may comprise these promoters. Transient assays
were then preformed using a series of promoter deletion constructs to test which regions of
the 848 bp GhUxpL4.2 promoter were necessary for fibre-specific expression.
6.2 A search of the GhExp14.2 promoter sequence for known cis-acting elements
The most common mechanism of gene regulation occurs bymodulation of the
efficiency of transcription initiation (Meisel and Lam, 1997; Singh, 1998). Generally,
specific trans-acting factors bind to sites in the promoter region of a gene, and interact with
the Pol II transcription initiation complex to regulate transcription (Chandler and Vaucheret,
20Ol; Fickett andHatzigeorgiou, 1997; Singh, 1998). Thusvarious combinations of c¿s-
acting elements that bind specific trans-acting factors confer particular spatially and
developmentally restricted patterns of expres sion.
The GhExp14.2 promoter sequence is able to direct fibre-specific expression of the
GUS reporter gene (Chapter Five), indicating that all regulatory cis-acÍing elements necessary
for fibre-specific expression are located within the 830 bp upstream of the gene.
Consequently, the 830 bp promoter was searched for known elements/motifs, using the
PLACE and the PlantCARE website software (Higo et a1.,1999; Lescot et a1.,2002;
Rombauts et al.,1999). This search revealed the presence of consensus binding sites for
multiple transcription factors, on both the sense and anti-sense DNA strands. Regulatory
elements within promoters are able to function in both the sense and antisense strands (Tyagr,
2t4

2001) but in this initial analysis only those elements present on the sense DNA strand were
scrutinised (Figure 6.1). The position of putative binding sites for regulatory factors in the
GhExpl4.2 promoter was then taken into consideration when generating the promoter
deletion constructs. It should be noted that the identification of consensus binding sites only
forms part of the initial promoter characterisation process, and the presence of an element
does not indicate that any factors actually bind to such sites in vivo. However, as past studies
have shown that plant cis-acting elements often act in concert with each other, and since the
element/s conferring fibre-specificity remain elusive, it was considered important to consider
all possible GhExpI4.2 promoter motifs. A description of each putative regulatory element
identified in the GhExpI4.2 promoter is presented in Table ó.1 and an explanation of motifs
that maybe implicated in the regulation of GhExpl4.2. based on previous studies, follows.
6.2.1 Dof core bindine site
Three Dof core binding sites (5'ArAr{G3') were situated within the GhExp14.2
promoter, at positions J94, -612 and443 (Figure 6.1; Table 6.1). Dof core binding sites are
the targets of Dof (pNA binding with qne finger) proteins, which contain one highly
conserved zincfrnger motif (Yanagisawa and Schmidt,1999). Initially characterisedinmaize
(Vicente-Carbajosa et al., 1991 Yanagisawa,2000; Yanagisawa andlzui, 1993), Dof proteins
have since been describedinArabidopsis (Kang and Singh, 2000), tobacco (Baumann et al.,
1999), barley (Mena et a|.,1998) and rice (Washida et al., 1999). Dof transcription factors
regulate plant gene expression in both a positive and negative manner (Yanagisawa and
Sheen, 1998) and do so in response to a number of different stimuli, including light,
developmental stage and plant hormones such as gibberellins (Diaz et a1.,2002; Mena et al.,
1998; Washio, 2001; Yanagisawa,2000; Yanagisawa and Schmidt,1999; Yanagisawaand
Sheen, 1998).
In some cases, restricted transcriptional regulation by Dof proteins is achieved through
the regulation of expression of the Dof protein itself. For example, some hordeins, a class of
215

Fisure 6.1. Known cis-actins elements in the GhExpI4,2 promoter
Complete 848 bp sequence of the GhExpI4.2 promoter, showing elements identified by
PLACE and plantCARE websites are indicated by grey boxes. Boxed red regions represent
TATA/CAAT boxes and the ATG initiation codon. The arrow indicates the predicted start of
transcription, as identified in Orford and Timmis (1998).
2t6

AGTGCGAA GACDof
-823 ATCTTTTGAT TGGCACAJU\C
-300 element/GTl-773 TACT TT
-5'73 TCACCTTCAG TCCTTCCCTG ATCGGCGCTT
CAATA ATTTAATAAG
GTCTGA
TCATCACCAT TCACTATTAC
1/DofAA,C TCCACCGATG
CA
q
mvb-core-723 TTAAcc rrACT AAGAGTTAcT racccfie.iurrAAcrr
x-673 TCATGAAGTA T TTA TCATCTTATA TAGAACAATT
polle 1 P-623 TCTATTTT T TC C CTTCT
GTlTEGAACCTAC-523 GTCTGATTGG CTGAC
-]-23
-73 TTTCTCATTT
-373 TTAGGAGACT GCGCTGGAAT AACCCCTCGC
-323 TCAACCTTCC GCCATTGTTA TGGTTTAATT A,¡\j\CATTATG TTTCCATCCA
-I73 AGCTTAAGCC TTAATTATCC TCCNU\TTTG TACTCTTTCA CCACTTAATT
seflmotif/box1(GA) mvb-core- z t J -'-rffi,*ri r'á!É'*-*üLra¡'a,å -¿å'
myb-223 CA TATCTATGAT TA¡UU\TTTTG TGTAT
-4'73
-423 GTTGAGGTGG TTGGCTGGAG TTA'U\TGAGA TTTTTTTAGTE-box
TTTGTTTE
&"t"ffi.AAGcAA
ACGTA boxcccrfec GGTACTTAGC GTTGCTTGTC ATCTTCTGTA CTACA,¡U\CTC
RYGCTATACACT
GCN4 motif
owimidine reoeat C x
-O-element
-
Il+-23
2t7
TAG CTAGCT +25
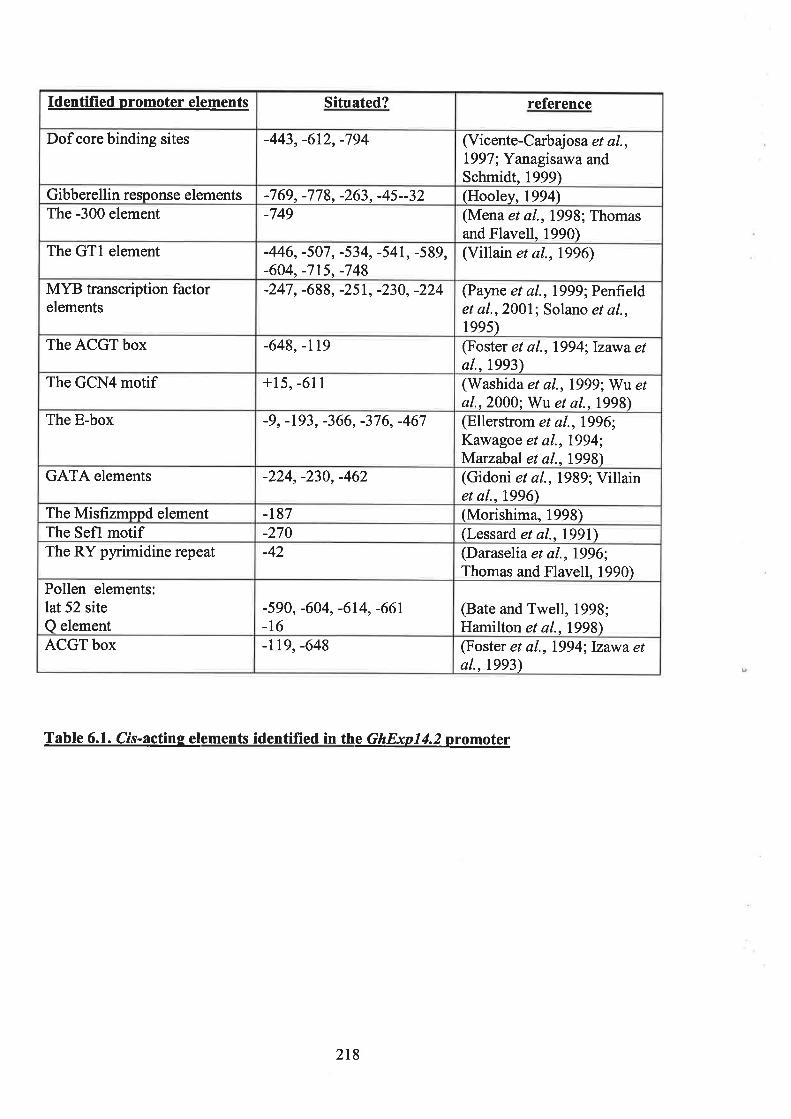
Identified promoter elements Situated? reference
Dof core binding sites -443, -612, -794 (Vicente-Carbajosa et al.,1997; Yanagisawa andSchmidt, 1999)
Gibberellin response elements -769, -779, -263, -45--32 (Hooley, 1994)The -300 element -749 (Mena et a1.,1998; Thomas
and Flavell, 1990)The GTl element -446, -507, -534, -541, -599,
-604, -715, -749(Villain et al.,1996)
MYB transcription factorelements
-247, -688, -25I, -230, -224 (Payne et aL.,1999; Penfieldet a1.,20011' Solano et al.,tees)
The ACGT box -648, -ll9 (Foster et a1.,1994;lzawa etaL.,1993)
The GCN4 motif +15, -611 (Washida et al.,1999; Wu e/a1., 2000; Wt et al., 1998\
The E-box -9, -193, -366, -376, -467 (Ellerstrom et al., 1996Kawagoe et a1.,1994;Marzabalet aL.,1998)
GATA elements -224, -230, -462 (Gidoni et aL.,1989; Villainet a1.,1996)
The Misfizmppd element -187 (Morishima, 1998)The Sefl motif -270 (Lessard et aL.,1991)The RY pyrimidine repeat -42 (Daraselia et al., 1996;
Thomas and Flavell, 1990)Pollen elements:lat 52 siteQ element
-590, -604, -614, -661-16
(Bate and Twell, 1998;Hamilton et aL.,1998)
ACGT box -119, -649 (Foster et aL.,1994;Izawa etaL.,1993)
Table ó.1. Crb-actine elements identified in th'e GhExp14.2 promoter
218

seed storage proteins specifically expressed within the barley endosperm, were found to be
regulated by the binding of endosperm specific Dof transcription factors to a core-binding site
within their promoters (Diaz et aL.,2002; Mena et aL.,1998). A Dof protein, BPBF, which
binds within the B-hordein promoter and activates transcription, was also found to be
specifically expressed within the barley endosperm (Mena et ø1.,1998). Another plant
promoter containing Dof-core binding sites is the KSTI promoter, a guard cell specific K+
influx channel in potato. Disruption of the Dof core binding sites within the KSTI promoter
was shown to greatly reduce expression of the GUS reporter gene within guard cells (Plesch
et aL,2001). In addition to showing that the Dof core binding site within KSZ1promoter was
partially responsible for regulating expression of a GUS reporter gene, this study also isolated
a Dof protein from an epidermal cell layer enriched with guard cells that specifically
interacted with the Dof core target sites within the KSTI promoter (Plesch et a|.,2001). Dof
proteins also regulate the transcriptional status of plant genes by interacting with other
transcription factors. Vicente-Carb ajosa et al., (1997) showed by transient assay studies that
transcriptional activation of a reporter gene was achieved through the binding of both a Dof
protein and another transcription factor, 02. Another transient assay study byDiaz,
2002,showed that a Dof factor interacts with a GAMYB transcriptional factor protein in vítro
to trans-activate a native hordein promoter in barley. As Dof transcription factor proteins
have been implicated in cell and tissue-specific gene regulation in developing seeds
(Baumann et al., 1999; Yanagisawa,2000; Yanagisawa and Sheen, 1998) and shown to be
responsive to the plant growth factor gibberellin, a hormone known to act on developing
fibres and to up-regulate o-expansin gene expression (Chen and Bradford,2000; Cho and
Kende, 7997c), it was considered possible that Dof transcription factors contribute to the
transcriptional regulation of GhExp I 4. 2.
6.2.2 Gibberellin response elements
Gibberellins are a member of the isoprenoid family, consisting of chemical
compounds involved in a number of different processes of plant growth and development
219

(Hooley, 1994; Ritchie and Gilroy, 1998; Skriver et aL.,1991). The actions of gibberellins
were largely determined by studies of cereal aleurone layers (Ritchie and Gilroy, 1998). The
aleurone layer of cereal grain forms digestive tissue that surrounds the endosperm. Upon
germination, gibberellin from the embryo promotes the transcription of hydrolases within the
aleurone layer. Such hydrolases (most commonly cr-amylases) digest endosperm reserves for
use by the growing embryo (Gubler et a1.,2002; Gubler et a1.,1995; Hooley,1994; Ritchie
and Gilroy, 1998). The responsiveness of o-amylases promoters to gibberellins is mediated
by three main cis-acting elementS (Skriver et aL.,1991). The first: a GA-response element
(GARE; 5'TAACA{T3'), the second: the box 1 (5'TATCCAT3') element and the third, a
pyrimidine rich element, usually consisting of the sequence 5'CCTTTT3'. The GhExpI4.2
promoter contained two GARE elements at positions -778 and -769 and one box I element at
position -263 (Figure 6.1; Table 6.1). A complete match with the recognised pyrimidine box
was not present within the GhExp(4.2 promoter but a pyrimidine rich area was present
between 45 and-32, which may substitute the pyrimidine box.
Gibberellins are also associated with the induction of growth in plant vegetative
tissues and the induction of flowering and fruit development. It should be noted that it is not
known whether the above-mentioned cis acting elements act as the 'universal' signalling
system (Hooley, 19941'Perazza et a|.,1998; Rijnders et al.,1997; Ritchie and Gilroy, 1998;
Rodrigo et a\.,1997).
Gibberellins are likely to play a role in the regulation of GhExp14.2 expression
because they are known to contribute to fibre initiation on the epidermis of the ovule and are
required for fibre elongation in culture (Beasley and Ting, 1974). They also have been shown
to promote trichome formation in Arabidopsrs by up-regulating one of the two genes required
for trichome initiation (Perazza et al., 1998). As the development of cotton fibres is thought
to be analogous to trichome development in Arabidopsß, this implies that gibberellins may
also act on genes involved in cotton fibre development. A particular gibberellin was found to
be expressed specifically within the seed coat of developing watermelon seeds suggesting a
220

role in regulating the expression of genes involved in seed coat development (Kang et al.,
1999). Finally, gibberellins contribute to the regulation of transcription of a number of o and
p-expansin genes, including those involved in cell elongation (Chen and Bradford, 2000; Cho
and Kende,I997c; Lee and Kende, 2001; van den Heuvel et ø1.,2001).
Taken together, these observations suggest that it is likely that the gibberellin response
elements within the GhExp[4.2 promoter are functional and that Gh&xpl4.2 transcription is,
in part, regulated by gibberellins.
6.2.3 The prolamin box
One prolamin box (5' TGHAAARK3') was found within the GhExp14.2 promoter
situated at -148 (Figure 6.1). The prolamin box, also known as the -300 element or
endosperm motif, mediates expression of seed storage genes in the endosperm of barley
(Mena et a\.,1998; Thomas and Flavell, 1990) and the endosperm of rice (V/u e/ aL.,2000)
andmaize (MarzabaI et a1.,1998), where it cooperates with other cis acting elements, in most
cases the GCN4 moti{ to mediate endosperm-specific expression. The prolamin box is
targeted by a number of different transcription factors, including a Dof protein (Mena et ø1.,
1998) andbZlP proteins (Onate et al.,1999; Vicente-Carbajosa et aL.,1997; Vicente-
Carbajosa et a\.,1998). In one case a Dof transcription factor and a gibberellin-mediated
Myb transcription factor were found to interact in vivo with each other and the interaction was
dependent on a functional prolamin crs acting box (Diaz et a1.,2002). The prolamin box
mediates gene expression largely in combination with other cis-acting elements. Therefore the
possibility exists that the motif interacts with additional cis actittg elements (known or
unknown) in the GhÛxp14.2 promoter to direct transcription in elongating cotton fibres.
6.2.4 MYB transcription factor elements
MYB transcription factors constitute the largest family of transcriptional regulators in
plants and all contain a cofltmon DNA-binding domain (MYB domain)(Martin and Paz-Ares,
1997). MYB transcription factors are involved in the regulation of many genetic responses,
including the determination of plant epidermal cell shape (Penfield et aL.,2001; Solano et al.,
227

1995) andArøbidops¡s trichome development (Lee and Schiefelbein, 1999; Payne et al.,
1999; Ulm and Mittelsten Scheid, 2001; Wada et al.,1997).
Support for the contribution of MYB transcription factors to fibre development is
provided by the observation that over-expression of a MYB transcription factor (CotMYBA)
isolated from developing cotton ovules activates trichome initiation in tobacco (Payne et al.,
1999). Since this discovery, six members of the cotton Myb transcription factor family were
isolated from a cotton ovule cDNA library (Loguerico et a1.,1999). Phylogenetic analysis of
thcsc cotton MYBs showcd that thrcc (GhMyb2, GhMyb3 and GhMyb4) fall within thc cladc
that also contains Glabrous I (GLl), a key regulator of Arabidops¿s trichome initiation. The
proposed cotton homologue of GLl has yet to be identified.
Analyscs of two fibrc-spccific LTP promotcrs, (LTP6 and LTP3) (Hsu e/ a1.,1999;
Liu et a1.,2000), identified MYB transcription factor recognition sites present in both
promoters. Three types of MYB transcription factor binding sites were identified in the
GhExp14.2 promoter: Myb core motifs (5'CNGTTR3') at positions -ó88 and -247, a
Myb2AT site (5'TAACTG3') at position --257 and Mybstl elements (5'GGATA3') at
positions 130 and,-224. Therefore, the existence of MYB recognition sites in the both the
LTP promoters (Hsu et a1.,1999;Lirtt et a1.,2000) and GhExpI4.2 promoter suggests that
MYB transcription factors contribute not only to epidermal cell differentiation (as described
above) but also to fibre elongation.
6.2.5 The E-box
In the GhExpI4.2 promoter five E-boxes were found at positions 467 , -376, -366, -
193 and -9 (Figure 6.1). E-box motifs have been described within a number of plant
promoters, including the Phaseolus vulgaris B-phaseolin promoter (Kawagoe et al., 1994), y-
zeinmaize promoter (Marzabal et al., 1998), and Brassica napus napin promoter (Ellerstrom
et al.,1996), all of which encode seed storage proteins. Functional dissection of these seed
storage promoters suggests that E-boxes are most likely to act in concert with other cls acting
motifs. The detection of an E-box in the promoter of GhExp14.2 may be correlated with the
222

RT-PCR expression patterns (Figure 3.21), where transcripts were detected in ovules and
developing fibre cells (elongated ovule epidermal cells). Thus the E-box elements in the
promoter of GhExp14.2 possibly play a role in the regulation of GhExp14.2 fibre-specific
expression.
6.2.6 Summary
The functional significance of the above-mentioned elements, and those mentioned in
Table 6.1 , in the GhExp I 4 . 2 promoter remain tentative. Furthermore the functionality of
these c¡s elements in the GhExpI4.2 promoter may differ from their function described in
other plant promoters. However, the location of these elements provides a basis for the
design of 5' promoter deletions to facilitate a functional analysis of the GhUxp14.2 promoter.
6.3 Sequence analvsis of cotton fibre-specific promoters
To aid in the discovery of novel cis actingelements that direct fibre-specific
expression, eleven putative fibre-specific promoters (including the GhExpl4.2 promoter)
were compared to identiff coÍrmon features. As a functionally important c¿s element should
display a high degree of sequence conservation amongst fibre-specific promoters, it was
hoped that this analysis would allow the identification of binding sites for transcription factors
that generally underpin fibre-specific gene expression.
For this study the promoters of eleven cotton genes were chosen (Table 6.2), nine isolated in
this laboratory and two previously published (Hsu et al., 1999;Lht et aL.,2000). It should be
noted that subsequent to this analysis FSltpl, FSltp3 and FS18A, were found not to be
uniquely expressed in the fibre (Orford et aL.,1999; Orford and Timmis, 2000). The size of
the promoter sequences scrutinised was initially limited to 500 bp upstream of the ATG
translation initiation codon, as most tissue-specific elements are found within 200 bp of the
transcription start site (Tyagi, 2001).
223

Table 6.2. Details of eleven fïbre-specific qene promoters
Promoter Length Expressed? Testedtransiently orwhole plant?
Reference
GhExp14.2 830 bp Fibre-specific (Fi gure3.27)
Tested transientlyin cotton fibres(Figure 5.10)
(Harmer et al.,2002)
GhExp14.4 1017 bp Fibre-specific (Figure3.27)
Tested transientlyin cotton fibres
(Figure 5.9)
(Harmer et al.,2002)
pFSl7 1256bp Predominantly fibre-specific (Northern
analysis)
No (Orford andTimmis, 1997)
pFS3 I436bp Predominantly fibre-specific (Northern
analysis)
No (Orford andTimmis, 1997)
pFS6 1342bp Predominantly fibre-specific (Northem
analysis and RT-PCR)
No (Orford andTimmis, 1997;
Orford andTimmis,2000)
pFS18 1024bp Predominantly fibre-specific (Northem
analysis and RT-PCR)
No (Orford et al.,1999; Orford andTimmis, 1997')
FS18A 1043 bp Predominantly fibre-specific (RT-PCR)
No (Orford et al.,teee)
FSLTPl ll74bp Fibres, leaves flowersand stems (RT-PCR)
No (Orford andTimmis,2000)
FSLTP3 1812 bp Fibres,leaves flowersand stems (RT-PCR)
No (Orford andTimmis,2000)
GhLtp3 1548 bp Fibre-specific(Northem analysis),trichomes (tobacco)
(Liu et a1.,2000;Ma et al.,1995)
GhLtp6 447 bp Fibre-specific(Northern analysis),trichomes bacco
Tested in wholeplant transgenics
tobaccoTested in wholeplant transgenics
(tobacco)
(Hsu e/ a1.,1999;Ma et a1.,1995)
224

6.3.1 A search for known in the fibre-snecific nromoters
Using the PLACE website (Rombauts et al.,1999), the eleven fibre-specific promoters
were searched for known cis acting elements common to the majority of the promoters.
Elements identified by this approach included multiple Dof core binding sites (5'AAAG3'),
present in ten of the eleven promoters, with only GhLtpílacking a site. Nine of the eleven
promoters contained an E-box consensus site (5'CANNTG3'), with only FSltpl and FSltp3
promoters lacking this motif. A GATA consensus site (5'GATA3') was identified in ten of
the promoters, with onlydhe pFS3 promoter lacking a GATA binding site. GTl consensus
sites (5'GRWAAW3') were also identified in ten of the promoters, with only the pFS17
promoter lacking this site. These elements potentially represent the binding sites for a
coflrmon set of transcription factors expressed in fibre tissue.
6.3.2 Comnarisons of nine fïbre-specifTc promoters
The specific expression of certain genes within developing cotton fibres suggests that
novel transcription factors may exist, that bind to the promoters of the fibre-specific genes
activating their expression. Therefore a comparison between putative fibre-specific promoters
should allow the identification of common potential transcription factor binding sites.
In comparisons between divergent promoter sequences, using traditional alignment
programs such as ECLUSTLW (Thompson et al.,1994), it is difficult to detect the relatively
small regions of DNA similarity representing the shared transcription factor binding sites.
However, the visual approach provided by the dotplot method (Maizel and Lenk, 1981) is
likely to be effective. Therefore, the 500 bp of promoter sequence (up until the ATG codon)
of nine promoters (excluding GhLtp3 and GhLtpó; Hsu et al.l999;Liu et aL.2000)were
analysed in a pair-wise fashion using the Dotplot program.
The Dotplot program allows the identification of conserved segments between two
DNA sequences and represents these conserved regions as a 'dot' on a graphical output. All
nine promoters were compared using highly stringent conditions and conserved motifs that
were common to a number of promoters were examined further. The usefulness of the dotplot
225

technique in the detection of small regions of sequence similarity between promoters, was
demonstrated by the successful identification of CAAT boxes common to all promoters
(result not shown).
Four novel conserved elements, designated Putative Fibre Elements PFEI-PFE4, were
identified by this approach (Table 6.3), The first element, PFE1 (5'CAACTWH33), which
was identified in all nine promoters (Figure 6.2; Figure 6.3) is situated at a variable distance
(491 bp in Ghtxp I 4 . 2 to 1 09 bp in FSltp3) upstream of the ATG translation initiation codon.
A single copy of the PFEI element was identified in all'but one of the ptotnoters, FSLtp3,
which contained two.
The PFE2 element (5'CTCCAW3') was identified within all nine promoters, at
positions ranging between l624bp and 4l bp upstream fi'om the ATG codon. PFE2 was
located 93 bp upstream of the TATA box in tlrre GhExpI4.2 ptomoter (Figure 6.2).
The PFE3 (5'ACCTAHW3') element was present in eight of the nine cotton
promoters: all except FSltpI (Table 6.3). When present, the PFE3 element was positioned
between 1501 bp and227 bp upstream of the ATG initiation codon of the promoter. In the
GhÛxp14.2 promoter PFE3 was situated 438 bp upstream of the recognised TATA box
(Figure 6.2).
All nine promoters contained between two and eight identified copies of the PFE4
element (5'GCTA3') at very variable positions (Table 6.3), and the location of at least one
PFE4 element was approximately 60-70 bp upstream of the TATA box (Table 6.3 and 6.4).
In the cases of genes whose transcripts were detected exclusively in developing cotton
fibres, (i.e. pFSl7, pFS3, pFS6, pFSl8, GhExpI4.2 and GhExpl4.4), at least one PFE4 was
found 25 to 63 bp upstream of the TATA box, suggesting that a putative PFE4 binding
protein may interact with the transcription initiation complex.
To determine if the PFE1-4 elements were present in fibre-specific promoters other
than those analysed here, two LTP promoters (GhLtp3 and GhLtp6) were scalìned manually
226

promoter
GhExp14.2
GhExp14.4
PF'E25'CTCCAW3'
PF.Els'CAACTWH3'
5'CTCCAA3'located 178bp upstream of ATG
5'CAACTTC 3' located 497 bpupstream of ATG
5'CTCCAA3'located 180bp upstrearn of ATG5'CTCCAA3' located 56bp upstream of ATG
5'CAACTAA3' 188 bp upstream ofATG5'CAACTTT3' located 144 bp
of ATG5'CAACTTT3' located 168 bp
of ATG5'CAACTTT3' located 114 bpupstream of ATG5'CAACTAT3' located 355 bpupstream of ATG5'CAACTAC3' located 189 bpupstream of ATG
5'CTCCAT3' located299bp upstream of ATG5'CTCCAA3' located 53bp upstream of ATG5'CTCCAA3' located 53bp upstream of ATG5'CTCCAA3' located 53bp upstrearn of ATG5'CTCCAA3' located 53
of ATG
PFE3s'ACCTA}W3'
5'ACCTACT3' located523bp upstream of ATG5'ACCTACT3' located520bp upstearn of ATG5'ACCTAJAA3' located315 bp upstream of ATG5'ACCTACA3' located350 of ATG
5'ACCTATT3' located 3 15bp upstream of ATG
5'ACCTAAT3' &,5'ACCTATA3' located1501 bp and 556 bpupstream of ATG5'ACCTAAT3: locatedl62bp upstream of ATG
PFE45'GCTA3'
4 sites: 146bp,67 bp,22bp and17 bp upstream of ATG.5 sites: 945bp,149bp,77 bp,
and 19 of ATG2 sites:411bp andT2bpupstrearn of ATG.3 sites: 1200 bp, 385 bp and 170bp upstream of ATG4 sites: 1132bp,154 bp, 125bpand 110 bp upstrea:n of ATG
2 sites: 524bp and 510 bpupstream from the ATG.2 sites: 339 bp upstream and 174
from the ATG8 sites: 1805 bp¡ 1734bp,1728bp, 1054bp, 1038 bp,920bp,797bp and 100bp upstream of theATG
1 site located immediatelydownstream of ATG
7pFSl
pFS3
gwpFS6
pFSl8
8AFSl
FSLTPl
FSLTP3
GhLq3ø1.,et(Liu
5'CTCCAA3'&5' CTCCAA3' located 1624bp and 41 bp upstream ofATG
5'CAACTAC3' &, 5'CAACTTT3'located 176bp and 109 bp upstreamof ATG
5'CTCCAA3' located 54bp upstream of ATG
2 sites: 5'CTCCAA3'located 88 bp and 61 bpupstrearn of ATG
5'CAACTTT3' & 5'CAACTTA3'located 203 and 169 bp upstream ofATG5'CAACTAA3' & 5'CAACTTT3'located 175bp and 109 bp upstreamof ATG
GhLtp6(Ifsu et aI.,
1
5'CAACTTC3' located 495 bp
2 sites: 149bp and 105 bpupstrearn from the ATG.
5'ACCTAAT3' located227 bp upstream of ATG5'ACCTATC3' located740bp upsteam of ATG
7 sites: 1393 bp, 1327bp,7060bp,625 bp 155 bp, I27 bp and
of ATGtt4
Table 6.3. Identification of novel elements in eleven cotton oromoters

Complete 848 bp sequence of the GhExpI4.2 promoter, showing previously identified
elements in greyboxes. Boxed red regions represent TATA/CAAT boxes and the ATG
initiation codon. The boxed green sequences represent unique motifs identified within nine
fibre-specific cotton promoters. Arrow represents the start of transcription. The regions
outlined in blue represent primers designed for the generation of deletion constructs (Section
6.s.1).
228

BamHI
-823Dof GAßL
ñAAcAccA "o.*EGARE -300 element/GTl
T TTTCAATA-773
-723
- 673
-623 TCTA
-473
-423
AATT ATTTAATAAG
TT
CTGA
T TCACTATTAC
TCCACCGATG
E-boxTTTGTTTE
GTIttoo"""@TTACT AA.AGTTAGT
rcArcAAcrA t tt^åffi;.ITTA
I-573 TCCCTG ATCGGCGCTT G
PFE3-523 GTCTGATTGG
A
GTTGAGGTGG TTGGCTGGAG TTNU\TGAGA TTTTTTTAGTBo.m.HI
-273 rc AA AAcAAfficcN\,¡\rAmvbSTl/ GATA,-
-223 le4-TÀlccATcA TATCTATGAT TA;uu\TTTTcI
-373 T AACCCCTCGC
-323 TCAACCTTCC GCCATTGTTA TGGTTTAATT A,¡U\CATTATG TTTCCATCCA
E-BoxA4nftzmppclTGTAT
Bam t4 BamPFE2
_I73 AGCTTAAGCC TTAA
-L23 ATCTTCTGTA CTACNU\CTC
CAAT boxC TCNU\-73 TTTCTCATTT
-23 TT
229
pl4.2prom5Nco I + TGCA

TG
TG
GhUxp14.2
GhExpI4.4
pFSlT TG
pFS3 TG
pFS6 TG
pFSl8 TG
FS]84
FSLTPl TG
TG
I\r
FSLTP3
GhLtp3
GhLtp6
I TATA boxI PFE1I ppnzI PFE3I pre+I CAAT
Four novel elements were identified using doþlot analysis, all four have been mapped to 500
bp of upstream promoter region in eleven cotton promoters. TATA and CAAT box locations
have also been included. Not to scale.
230

GhLtp6
63 bpupstrearnand 3bpdownstream24bp and51 bpdownstream
N/A
1 sitelocatedirmrediatelydownstream of ATG
GhLtp3
91 bp and57 bpupstream
58 bpdown-stream
50 bpupstrearnl28lbp,1275bp,948 bp,513 bp,43bp, 15 bpard 2bpupstrearrr
FSLTP3
78 bp and 4 bpupstream
7526bpupstream; 57 bpdownstrearn
1403bp and 458bp upstream1707 bp,1636bp, 1630 bp,956bp,940bp,822bp,699bp and2bp upstream
FSLTPl
77 bpupstrearn
59 bpdown-stream
N/A
227 bpand2bpupstream
F'S18A
252bpupstream
50 bpdownstrea¡n
2t2bpupstrearn421bp and407 bpupstream.
pF'S18
11 bpupstream
50 bpdownstream
637 bpupstream46bp and2bpupstream
pFS6
58 bpupstream
57 bpdownstream
ll7 bpupstrearn1032bp,44bp, 15 bparrd2bpupstream
pFS3
27 bpupstream
182 bpupstream
233bpupstream1083 bp,268bpand 53bpupstream
pFS17
141 bpupstream
12bpupstream
268bpupstream364bpand25bpupstream
GhExpl4.4
410 bpupstream
95 bpupstream
435bpupstream860 bp and64bpupstream,8bp, 63 bpand67 bpdownstream.
GhExp14.2
411 bpupstream
92bpupstream
437 bpupstream61 bpupstream.16 bp, 63and 66 bpdownstream
PF'E1
PFE2
PFE3
PFE4

for each element. This search revealed the existence of all four elements in the GhLtp3
promoter, while three of the four elements were present in the GhLtpí promoter (Table 6.3).
A schematic diagram of all promoters, with common novel motifs mappecl is shown in Figrrre
6.3.
The action of a single motif in tissue-specific expression has been demonstrated for
the promoter of the B-conglycinin gene, a soybean storage protein (Allen et aL.,1989;
Fujiwara and Beachy,1994; Reidt et aL,,2000). In this case, the RY element (distinct from
tlre RY pylimidine repeat identified by Daraselia et al. (1996)) was identified as the key factor
in the control of seed-specific expression of the cr' subunit. Further analysis showed that the
RY elements are present in several seed specific genes. Evidence suggests that the RY
pyrimidine elements act in concert with other promoter factors to regulate seed specific
expression (Allen et a1.,1989; Fujiwara and Beachy,1994; Reidt et a1.,2000).
6.4 Isolation of the full-lensth pFSl4 cDNA
Studies of plant promoters have shown that cis acting elements can be present on
either side of the transcription initiation site (Bate et a1.,1996; Daraselia et al.,1996; Faktor
et a1.,1996). Obtaining full-length cDNAs is difficult when using oligo-dT priming, and
incomplete cDNAs are frequently recovered. The pFS14 cDNA clone was isolated from a
oDNA library (Orford and Timmis, 1998), with first strand synthesis primed by oligo-dT, and
is 1102 bp in length. The 5'UTR was only 19 bp in length, which is quite short for a 5'UTR
(Gallie, 1993). However, given the 1 kb size of the hybridising band in Northern analysis
(Orford and Timmis, 1998), it was assumed that only a small region, if any, of 5'UTR was
missing. The exact transcription start site is required for the design of promoter deletions, so
a 5'-RACE strategy was employed to ensure that the fuIl-length pFS14 oDNA was recovered.
l Primer and S'-RACE PCR
Phylogenetic analysis and sequence comparisons showed that pFS14 anó GhExp14.4
are closely related (Sections 3.5,2,3.5.3 and 3.7) andboth sequences encode almost identical
232
proteins. The gene-specific primer, pl4.2RT2, was shown to be specific for GhExp14.2 in the
RT-PCR analysis (Figures 3.26 and3.27). This primer was located approximately 750 bp
from the putative 5' end of the pFS14 oDNA (Figure 6.4), and was used with the AP1 primer
(Table 2.1) in the primary 5'-RACE PCR (Figure 6.54).
Two independent experiments were undertaken to ensure that amplification of pFSl4
using 5'-RACE was successful. The primary PCR, using oDNA synthesised from 6 DPA
fibre RNA as a template, resulted in two main products (Figure 6.5A, lanes 3- 6, arrowed) of
approximately 400 and 800 bp, and a smear of products, which probably represents the
amplification of non-specific mRNA transcripts. Included in the primary 5'-RACE were
three controls, a positive control for the Marathon@ RACE kit, an internal positive control
using primers specific for the pFS14 oDNA and negative control. The positive control
produced a weak band of approximately 300 bp (Figure 6.54, lane l0), as expected. The
internal positive controls, using primers specific for the pFS14 cDNA, produced PCR
products of approximately 160 bp, as expected (Figure 6.54, lanes 7 -10), suggesting that the
cDNA primed from fibre polyA+ RNA was not degraded. Finally the absence of any bands
in the negative control (Figure 6.54, lane 12) illustrated that the amplification was not due to
contamination. Since the expected size of the primary 5'-RACE PCR product was -750 bp
(Figure 6.4), the appearance of an 800 bp product suggested that additional 5' sequence of
pFS14 had been obtained.
A secondary PCR was undertaken using the nested primer, pl4.2RACEl (Figure 6.4)
and the AP2 primer. The p14.2 RACEI primer was designed approximately 470bp from the
putative pFSl4 cDNA (Figure 6.4) start point and secondary 5'-RACE PCR, produced a
major band of approximately 500 bp (Figure 6.5B lanes 2-5). One internal positive control
for the pFS14 oDNA was also included in the experiment and clear bands of approximately
233

t_
51
101
t-5 1_
20]-
251,
3 01_
3 51-
40r_
457
501
55r-
601
651
707
757
801
851
90l_
951
r"001
10 51
110 1
TTAGCTAGCT
TTCCACTTTT
GCTAATGGAG
CGGTGGTGCT
ACCTGTACAG
CTTTTCAACA
CTTCTTTTTG
ATGACAATGG
GATGCTACCG
TCAAGGGTAT
ATGGCTTGAG
TTCAGTGTCT
TGGTTGGCAA
GCACAATGGG
GGAACGAGCA
CTGCGGTGCC
AACGATGATG
GCAACTCCAT
ACTGCCCATG
GGGAGCTTGT
CAGCAGCTTT
TGCTACGAGC
CAÎAACCGTG
GTGACAATGG
TTGCAÄATAT
TTTCCTTGGT
CCACCTTCTA
GGTTATGGAA
GAGCACTGCA
TCCGGTGCAA
ACAGCCACCA
CGGGTGGTGC
CTTACTC GCAACCAA
CAATGA
ACTTTTGTCC ACCTAACTAT
AATCCCCCAC GAGAACACTT
GCTTTATCTA
TATGTTCAGA AGGGTGTCAT
GTGTGAAGAA AGGAGGCATC AGGTACACCA TGAATGGACA TTCGTACTTC
GCAGGGGATA TAACGTCAGT
GTCCATCA.A.G GGTTCCAGAA CAGGATGGCT ACCTATGTCC AGA,¡U\TTGGG
AAAGTGACTG CCAGCGATGG CAGGACTATC
UI IUU CAATTCGGGC AAACTTTTGA AGGAGGCCAG TT CA
ATATTATAGT
TAAGGCACAT
TTTATGTGTG
TTCTTATAGT
TAATGTCTGA
ATTATTGAAT
AA
GTCTGTCTAA
GAGCGTTTTA
AAATAGGCGA
GAJ\CCAiU\CT
ATTTGTTTGT
ACCTTTTTTT
TATAÄAACTG
TGCCGAGGTA
GC.AAGTGCCA
ATTAAGTTTG
TGATGATTGA
ATAATTTAAA
GAATTGACAT
GCAÄÄATGGC
TTAGCCTATA
AACTCTAGAG
CCATGATATT
A,¡U\,¡UUUUUU\
ATTACTTATA
CGCCGCTGGC
ATCTATACAT
GATATATCCA
TATGGTTTTC
NUU\jUUU\JqJ\
Fisure 6.4. Nucleotide sequence of pFSl4 cDNA showins primers desisned for S'-RACE
Complete sequence of the pFS14 cDNA clone (Orford and Timmis, 1998). Start and stop
codons are depicted by red boxes.
Primers for 5'-RACE are shown in blue boxes with names shown above. Primers were
designed on the basis of nucleotide difference/mismatches and insertions between the pFS14
cDNA sequence and other available c-expansin clones. The primer shown in the pink box
was used in conjunction with the p14.2RT2 primers as an internal control during the primary
5'-RACE PCR reactions. The primers indicated by yellow boxes are those used as an internal
control during the secondary 5'-RACE PCR reactions.
CT CAATGGTGCA TT
TGATAACGAA
234

23s

Figure 6.5. PCR and clonine of pFSl4 S'-RACE products
A. Agarose gel depicting primary PCR products obtained using the gene-specific primer
p14.2RT1 and the API primer. A 10 pl sample of each PCR product was loaded onto the
1.5%o agarose gel. Lanes contain the following:
1. ?u Hind III marker
2. 100 bp ladder
3. primary 5'RACE ;1/50 dilution of cDNA
4. primary 5'RACE; 11250 dilution of oDNA
5. primary 5' RACE; 1/50 dilution of oDNA'\ 6. primary 5'RACE; 11250 dilution of cDNA
7. internal control using pFSl4 oDNA specific primers 1/50 dilution
8. intemal control using pFSl4 cDNA specific primers 11250 dilution
f . internal control using pFS14 oDNA specific primers 1/50 dilution
10. intemal control using pFS14 cDNA specific primers 11250 dilution
11. positive control from marathon RACE kit.
12. negative control.
B. Agarose gel depicting secondary PCR products obtained using the gene specific primer
p|4.2RACE1 and the AP2 primer. A 10 pl sample of each PCR reaction was loaded into a
1.5 % agarose gel. Each lane contains the following:
l.100bpladder2. secondary 5' RACE; 1/50 dilution of oDNA
3. secondary 5' RACE 11250 dilution of oDNA
4. secondary 5' RACE 1/50 dilution of oDNA
5. secondary 5' RACE 11250 dilution of oDNA
6. intemal control using pFSl4 oDNA specific primers 1/50 dilution
7. internal control using pFSl4 oDNA specific primers 11250 dilution
8. intemal control using pFS14 cDNA specific primers 1/50 dilution
f . intemal control using pFS14 oDNA specific primers 11250 dilution
10. negative control.
C. Colony hybridisation of pFSl4 5'-RACE PCR clones. The filter was hybridised with 32P-
labelled pFS14 oDNA. Arrows depict the four strongest hybridising colonies selected for
further study.
236

A. t234 910 lll2 B.t2 3 4 5 6 7 8 910
+
-t>
c.
237

250 bp in size were generated (Figure 6.58, lanes 6-9), as expected on amplification from the
EXPI and EXP2 primer binding sites (Figure 6.4). The negative control (Figure 6.58, lane
l0) did not amplify any transcripts. Like the primary PCR, the secondary PCR also produced
a smear of heterogeneous products and modification of the PCR conditions did not reduce this
non-specific amplification (result not shown). The 500 bp band produced in the secondary 5'-
RACE PCR reaction was cloned into pGEM@T-easy. The resultant colonies were screened
using pFS14 cDNA as a probe (Figure 6.5C) and four strongly hybridising colonies were
selected and purificd (Figure 6.5C).
6.4.2 Sequence analvsis of pFSl4 S'-RACE products
The four independent 5'-RACE clones wore sequenced in their entirety. The resultant
sequences ranged on length from 521 bp to 525 bp and each contained the pl4.2RACEl and
AP2 primer sequences at their termini (Figure 6.6). Comparison between the RACE
sequences and pFS14 cDNA showed that they were almost identical in the regions of overlap,
thus extending the known pFS14 sequence by l4-18 bp. 5'RACE product 3 had an additional
14 bp at the 5' end when compared with the pFSl4 cDNA. Both 5'-RACE sequences 1 and 4
contained an additional 16 bp at the 5' end, while RACE 2 contained an additional 18 bp
(Figure 6.6). The sequences were otherwise identical to each other over a 500 bp region
(Figure 6.6).
Three nucleotide differences were observed between the 5'-RACE sequences alr!ttre
pFS14 oDNA sequence. The first was present at the 5'terminus of the pFSl4 oDNA
sequence, with a T residue present within pFS14 compared with a C in the 5'-RACE clones.
The remaining two differences occur towards the 3' end of the sequences, where the pFS14
oDNA contains a GC and the four RACE clones contain a CG. The presence of a CG within
the 5'-RACE clones is consistent with the results obtained from the GhExpt4.2
GenomeWalker" clone (Section 3.5.2). The nucleotide differences may be attributed to
varietal differences between the source of the RACE mRNA (Siokra l-4) andthe pFSl4
cDNA (Siokra l-2). The longest 5'-RACE clone, (RACE2), was terminated by a G residue,
238

indicating the presence of the 7-methyl guanosine mRNA cap, which can appear as a G after
reverse transcription (Hirzmann et aL.,1993). Thus, as the RACE2 sequence contained an
additional 18 bp with a G residue at the 5' end, it was concluded that this clone was a fuIl-
length oDNA containing a37 bp 5' UTR (Figure 6.6), consistent with most plant nuclear
genes (reviewed by Gallie, 1993).
6.5 Functional analvsis of a fibre-specific promoter
To determine which regions of the GhExpl4.2 promoter confer fibre-specific
expression, a series of 5'promoter deletions were linked to the GUS reporter gene and each
was tested for its ability to drive fibre-specific expression in the fibre transient assay (Chapter
Five).
6.5.1 Primer design for creatins sw14.2 promoter deletions
Four primers were designed to amplify different selected regions of the GhExp14.2
promoter, such that each would encompass known and novel putative control elements
(Figure 6.2). 'fhree primers þ14.2promI,pl4.2prom2 andp14.2prom4) were designed to
prime towards the 3'end of the promoter, each with a Bam HI site at its 5' end to facilitate
directional cloning into the GUS promoterless vector. Primer pl4.2proml is expected to
ampliff the entire GhExp14.2 promoter, and was included as a positive control. The fourth
primer, pl4.2prom5, designed to prime towards the 5' end of the promoter, included the ATG
initiation codon for translation of GUS and the region of DNA immediately upstream (Figure
6.2). This primer included anNco I restriction site (5'CCATGG3') at its 5' terminus, with an
additional4 bp to facilitate directional cloning into pJK.KiwiGUS.ocs.Kmf(1. In all cases,
minimal promoter elements were included to ensure that the observed result was not due to
disruption of the basal transcription elements such as the TATA or CAAT box.
239

Fisure 6.6. Alisnment of pFSl4 S'-RACE clone sequences
Alignment of four insert sequences derived from pFSl4 5' RACE clones, with the pFSl4
sequence. Complementary regions are depicted by stars undemeath the sequences. The pink
boxed regions indicate primers that were used in the secondary 5'RACE PCR. The start of
the pFSl4 sequence denotes the original 5' end. The region adjacent to the AP2 primer in the
SH2.seq is noted as the new 5' start sequence.
240

ATAGGGCTCGAGCGGCCGCCATAGGGCTCGAGCGGCCGCCAA
RACEI-. seqRÀC82. seqRACE3. seqRÀCE4. seqpFSl-4. seq
R.A'CEl-. revRÀ,CE2. seqRjACE3 . revRACE4. revpFS14. seq
RÀCEI-. seqR-A.CE2. seqRÄ,CE3. seqRÀCE4. seqpFSl-4. seq
RACE1. seqRACE2. seqRACE3 . seqRACE4. seqpFS14. seq
RÄ'CEI-. seqRACE2. seqRÀCE3 . seqRACE4. seqpFS14. seq
RACEl. seqRACE2 . seqRACE3. seqRÀC84. seqpFSL4. seq
10 20 30 40 50 60
- CAGCCAATTGTTTGAGCTAGCTTTGTTTGAGCTAGCT
- - - GCCAATTGTTTGGGCTAGCT- CAGCCAATTGTTTGAGCTAGCT
-TTAGCT*****
TATTTCCACTTTTCTTCTTTATTTCCACTTTTCTTCTT
TGTTGC NU\TATTTCCACTTTTCTTCTT
AGCTCTTACTTGATGTTGCAAATATTTCCACTTTTCTTCTTTGATGTTGC AAATATTTCCACTTTTCTTCTT************ *******************************************
TTTGTTCAGTGTCTGCAACTCCATTTTCCTTGGTGCT AATGGAGATGACAATGGTGGTTGTTTGTTCAGTGTCTGCAAC TCCATTTTCCTTGGTGCT AATGGAGATGAC AATGGTGGTTGTTTGTTCAGTGTCTGCAAC TCCATTTTC CTTGGTGCT AATGGAGATGAC AATGGTGGTTGTTTGTTCAGTGTCTGCAAC TCCATTTTCCTTGGTGCT AATGGAGATGACAATGGTGGTTGTTTGTTCAGTGTCTGCAACTCCATTTTCCTTGGTGCTAATGGAGATGACAATGGTGGTTG* * * * * * * * lr * * * * t * * * * * * * * * * t * * * * * * * * * * * * * *:t * * * * * * * * * * * * * * * * * * * *
GCAAACTGC CCATGC CAC CTTC TACGGTGGTGCTGATGCTAC CGGCACAATGGGGGGAGCGCAAACTGC CCATGC CAC CTTCTACGGTGGTGCTGATGCTAC CGGCACAATGGGGGGAGCGCAAACTGC CCATGC CAC CTTCTACGGTGGTGCTGATGC TAC CGGCACAATGGGGGGAGCGCAÄACTGCCCATGCCACCTTCTACGGTGGTGCTGATGCTACCGGCACAATGGGGGGAGCGCAA.A'CTGC C CATGC CAC CTTCTACGGTGGTGCTGATGC TACCGGCACAATGGGGGGAGC* * * * * * * tr * * * * * * * * * * * * tr * * * * * * * ìk * * * * * * * * * * * * * * * * * * * * * * * * * * * * * * *
TTGTGGTTATGGAJU\C CTGTACAGTCAAGGGTATGGAACGAGCACAGCAGCTTTGAGCACTTGTGGTTATGGAJU\C CTGTACAGTCAAGGGTATGGAACGAGCACAGCAGCTTTGAGCACTTGTGGTTATGGAj\]\C CTGTACAGTCAAGGGTATGGAACGAGCACAGCAGCTTTGAGCACTTGTGGTTATGGAJ\,\C CTGTACAGTCAAGGGTATGGAÄ'CGAGCACAGCAGCTTTGAGCACTTGTGGTTATGGA,AAC CTGTACAGTCAAGGGTATGGAACGAGCACAGCAGCTTTGAGCAC* * * * * * * * * * * * * * * * * * * * * * * * * * * * * * * * * rt * * * * * * * * * * * * * * * * * * * * * * * * * *
TGCACTTTTCAACAATGGCTTGAGCTGCGGTGCCTGCTACGAGCTCCGGTGCAACAATGATGCACTTTTCAACA.ATGGCTTGAGCTGCGGTGCCTGCTACGAGCTC CGGTGCAACAATGATGCACTTTTCAACAATGGCTTGAGCTGCGGTGC CTGCTACGAGCTC CGGTGCAACAATGATGCAC TTTTCAACAATGGCTTGAGCTGCGGTGC CTGCTACGAGCTC CGGTGCAACAATGATGCAC TTTTCAACAATGGCTTGAGCTGCGGTGC CTGCTACGAGCT C CGGTGCAACAATGA* * * * * * * * * * * * * * * * * * * rk * * * * * * * * ìk * * it * * * * * * * * * * * * * * * * * * * * * * * * * * * *
T C CTCAATGGTGCATTAGTCGAAC CATAAC CGTGACAGCCAC CAACTTTTGTC CACCTAATC CTCAATGGTGCATTAGTCGAAC CATAAC CGTGACAGCCACCAÀCTTTTGTC CACCTAATCCTCAATGGTGCATTAGTCGAAC CATAAC CGTGACAGCCACCAACTTTTGTC CACCTAATCCTCAATGGTGCATTAGTCGAAC CAT AAC CGTGACAGC CACCAACTTTTGTC CACCTAATC CTCAATGGTGCATTAGTCGAACCATAAC CGTGAC AGC CAC C AACTTTTGTC CACCT^AA* * * * * * * * * * * * * * * * * * * * * * * * * * * * * * * * * * * * * * * * * * * r. * * * * * * * * * * * * ** * *
C TATGC TTTATC TAGTGACAATGGCGGGTGGTGCAATCC C CCACGAGAACACTTTGATTTC TATGCTTTATC TAGTGACAATGGCGGGTGGTGCAATCC C CCACGAGAACACTTTGATTTC TATGC TTTATCTAGTGACAATGGCGGGTGGTGCAAT CC C CCACGAGAACACTTTGATTTCTATGCTTTATC TAGTGACAATGGCGGGTGGTGCAATCC C CCACGAGAACACTTTGATTTCTATGCTTTATC TAGTGACAATGGCGGGTGGTGCAATC C C CCACGAGAACACTTTGATTT* * * * * * * * * * * * * * * * * * * * * * ** * * * * * * * rk * * * * * * * * * * * * * * ** * * * * * * * * ** * *
GGCCGAACCGGCAGGCCGAACCGGCAGGCCGAACCGGCAGGCCGAACCGGCAGGCCGAACCGCGA
R-A,CEt_RÀCE2R.A'CE3RACE4pFS14
seqseqseqseqseq
SHI-. seqSH2. seqSH3. seqSH4. seqpFS14. seq
RACE1. seqRACE2. seqRACE3. seqR ACE4 . seqpFSl-4. seq
ATCGAGCTGGAATCG-ATCGAGCTGGAATCG-ATCGAGCTGGAATCG-
TATCGAGCTGGA.A'TCG-TA
********dr* ********
241
TGTT

Three progressive deletions of the Gh0xp|4.2 promoter \¡/ere generated by PCR
amplification of the original gwl4.2 promoter sequence and in each case the size of the
amplicon was as expected (Figure 6.7A). Primers pl4.2prom4 andpl4.2prom5 amplified
poorly (Figure 6.7A,lane 5) and modification of the PCR conditions failed to improve matters
(result not shown). The reason for the poor PCR amplifïcation using these two primers is
unclear, but it may be possible that the A/T rich region of sequence (Figure 6.2) inwhich
pl4.2prom4 binds is affecting the specificity of this primer. A new primer þ14.2prom10)
wasdesignedinanearbyGC-richregionofthe GhExpI4.2 promoter(Figure 6.2). The
pl4.2promlO and thepl4.2prom5 primers amplified a product of approximately 150 bp
(Figure 6.78, lane 2), which is in agreement with the expected size (Figure 6.2). Each PCR
product was restricted with BamHIandNco I and cloned into pJK.KiwiGUS.ocs.Kmf(-)
vector. Resultant colonies that hybridised to labelled GhExpl4.2 (full-length) promoter DNA,
were selected for further analysis (Figure 6.7C-F).
In all cases the sequences of plasmids in the positive clones were identical in the
region of overlap to the GhExpI4.2 promoter (result not shown), with the Nco I cloning site
intact in all four cases. The full-length and three 5' promoter deletions of GhExpI4.2
promoter were cloned into pJK.KiwiGUS.ocs.Km() (Figure 6.8).
6.5.3 Functional analvsis of a promoter usins transient assavs
The biolistic assay (Chapter Five) was used to define regions of the GhExpL4.2
promoter that are important in fibre-specific expression. All of the GhExpI4.2
promoter::GUS constructs (Figure 6.8) were introduced into 3DPA cotton fibres, cotton
leaves and cotton flowers. After bombardment, each sample was washed in 70 o/o ethanol,
cleared of chlorophyll if required and viewed for GUS reporter gene expression. The results
are detailed below.
242

pEXPl4.2proml (848 bp full-leneth)
The GhExpl4.2 promoter has been previously shown (Section 5.5.3) to give rise to
fibre-specihc expression, however the full-length promoter was also included here as a
positive control for the PCR-based cloning experiment. The only other difference between
this experiment and that previously described for pGUSEX14.2 (Section 5.5.3) is that the
pBXPl4.Zproml contains 15 bp immediately upstream of the ATG that was absent from
pGUSEXP 1 4.2 (Section 5.5.3).
.- The full-lengfh GhUxp14.2 promoter showed GUS activity within cotton fibres
(Figure 6.94-F) with no GUS expression observed in leaf (Figure 6.9G) or petal tissue
(Figure 6.9H). This result, which is consistent with previous results (Figure 5.10) also
demonstrated that the GhExpL4.2 promoter does not direct GUS reporter gene expression in
cotton petals.
pEXPl4.2prom2 (604 bpl
The first deletion construct, pEXPl4.2promZ,lacked 244bp from its 5' end compared
with the full-length promoter. It showed the ability to direct fibre-specific expression of GUS
to the developing cotton fibre (Figure 6.10) with no expression in bombarded leaf or petal
tissue. This result shows that sequences within 604 bp of the ATG initiation codon are
suffici ent to drive fibre-sp ecific expres sion.
pEXPl4.2prom3 (384 bp)
Transient assay analysis of tissues bombarded with pEXPl4.2prom3 showed that GUS
activity was present in developing cotton fibres (Figure 6.114-F), but absent from cotton
leaves and cotton petals (Figure 6.11G and 6.1lH) indicating that only 384 bp of the expansin
promoter is required for fibre-specific expression.
pEXPl4.2prom4 (149 bpl
Following bombardment with the smallest GhExpl4.2 construct, GUS expression was
present within developing cotton fibres (Figure 6.12A-D) and absent from cotton leaves and
petals (Figure 6.128 -F). The intensity of GUS reporter gene expression was somewhat lower
243

Fisure 6.7. PCR and cloning of 9w14.2 5' promoter deletions
A. Agarose gel (1.5%) showing products obtained using primers designed from the
GhUxp14.2 promoter (Figure 6.2). Lanes2- 6 are each loaded with 1Opl sample from
a 50pl reaction. The lanes are:
1. Molecular weight markers (100 bp ladder) consisting of fragments ranging in
size from 100 bp to 3 kb in 100bp increments.
2. PCR of gw I 4.2 promoter using primers pI 4.2proml and pl 4.2prom5.
3 . PCR of gw I 4.2 promoter using primers pl 4.2prom2 and pI 4.2prom5
4. PCR of gw I 4.2 promoter using primers pl 4.2prom3 and pl 4.2prom5
5. PCR of gwl4.2 promoter using primers p14.2prom4 andpl4.2prom5.
6. Negative control reaction, using primers pI4.2proml andpl4.2prom5, without
a DNA template.
B. Agarose gel showing product obtained using a modified primer. Lanes 2 and 3 each
contain 10 pl samples from a 50 pl PCR reaction.
1. Molecular weight marker (100 bp ladder) containing fragments ranging in size
from 100 bp to 1000 bp, with two additional fragments of 1200 bp and 1500
bp.
2. PCR of GhExp14.2 promoter using primers pl4.2prom10 and pl4.2prom5.
3. Negative control reaction using primers as described for lane 2 and no template
DNA.
C-F. Colony hybridisation of putative promoter deletion constructs, probed with the full-length gtvl4.2 promoter. In each case arrows denote the hybridising colonies selected for
further study.
C. Colonies containing putative PCR products from primers pl4.2proml and
pl4.2prom5.
D. Colonies containing putative PCR products from primers pl4.2prom2 and
pI4.2prom5. A negative control colony is at position 1.
E. Colonies containing putative PCR products from primers p74.2prom3 and pI4.2
prom5.
F. Colonies containing putative PCR products from primers pI4.2proml0 and p14.2
prom5. A negative control colony is at position 1.
244

A. B.23456 2
r*
Ð
h
*
245

(full-length)
4 2
pEXPt4.Zprom3 384 bp
pEXPl4.âprom4 149 bp
Diagram representing the four gwl4.2::GUS deletion constructs, with names as indicated.
Red box indicates TATA box
I Green box indicates CAAT box
AT
ATG
AT
AT
246

A. B.
D.C
-F'.E.
- -
Transient assay results of cotton tissues after particle bombardment with the pEXPl4.2ptoml
(full-length) construct.
A-F. Cotton fibres aged 3DPA showing fibres expressing the GUS reporter gene (50 x mag).
G. Cotton leaf; no GUS reporter gene detected (70 x mag)
H. Petal of cotton flower; no GUS reporter gene detected (10 x mag). The brown spots on
the cotton leaves and flowers are secretory cell structures.
Scale bar represents 100pm is A-F and lmm in G and H'
247

A. B.
c.
H.
Transient assay results of cotton tissues after particle bombardment with pBXpl4.2prom2(60abp of promoter sequence)
A-F. Cotton fibres, aged 3 DPA showing fibres expressing the GUS reporter gene (50 x mag)
G. Petal of cotton flower; no GUS reporter gene detected (10 x mag).
H' Cotton leaf;no GUS reporter gene detected (70 x mag). The brown spots on the cottonleaves and flowers are secretory cell structures. Scale bar represents 100 pm in A-F and lmmin G-H.
F.
G.
248

C
A. B.
D.
E.
G H.
Transient assay results of cotton tissues after particle bombardment with pEXPl4.2prom3
(3 84bp of promoter sequence)
A-F. Cotton fibres aged3 DPA showing fibres expressing the GUS reporter gene (50 x maÐ
G. Cotton leaf; no GUS reporter gene detected (70 x mag)
H. Petal of cotton flower, no GUS reporter gene detected (10 x mag). The brown spots of
the cotton leaves and petals are secretory cell structures.
Scale bar represents 100 pm in A-F and 1 mm in G-H.
249

A. B.
D.
E. F.
Transient assay results of cotton tissues after particle bombardment with pBXPl4.2prom4
(1a9bp of promoter sequence).
A-D. Cotton fibres aged3 DPA shot with pEXPl4.2prom4 construct. Alrows show the fibres
expressing the S reporter gene (50 x mag).
E. Cotton leaf; no GUS reporter gene detected (25 x mag).
F. Petal of cotton flower; no GUS reporter gene detected (10 x mag). The brown spots on
the cotton leaves and petals are secretory cell structures.
Scale bar represents 100 ¡rm in A-D and I mm in E-F.
C
250
than that observed for the other three promoter constructs (Figures 6.9-6.11). Therefore it
appears that only 149 bp of upstream sequence is suffrcient for fibre-specific expression but
the level of expression is up-regulated by sequences which lie 5' of this region.
6.5.4 Summarv of Gft-E'xp14.2 promoter deletion transient assavs
Progressive 5' promoter deletions and transient assay demonstrated that fibre-
specificity was maintained in all promoter deletion constructs, including the smallest, which
contained only 149 bp upstream of the translational start codon (Figure 6.8 and 6.I2), These
results show that GhExpl4.2 ftbre-specificity is regulated by a positively acting mechanism,
as loss of a negatively regulating element would result in GUS activity in other bombarded
plant tissues.
The proximal promoter is generally considered important for correct initiation of
transcription by RNA polymerase II transcriptional machinery (for an example see Zhu et al.,
1995). Here, the region from -l 12 to +37 controls fibre-specific expression. If -1 12 to +37
was considered the basal promoter, expression of the GUS reporter gene should be observed
in other bombarded cotton tissues. However, expression of the GUS reporter gene in the
smallest construct was confined to the developing cotton fibres, demonstrating that the 149 bp
promoter is sufficient to drive tissue specific expression. Other plant 5' promoter deletion
studies have also shown that tissue-specific elements lie within -150 bp from the ATG
initiation codon of the gene (Ellerstrom et al.,1996; Stalberg et ø1.,1996; Tyagi,2001).
The I 49 bp of the GhExp I 4. 2 promoter contained four copies of the unique element
PFE4 (Section 6.3.2) as well as five consensus sequences for known transcription factors, the
ACGT box, RY pyrimidine repeat, Q-element, E-box and a GCN4 motif. The presence of the
E-Box, an element known to direct seed-specific expression, is consistent with expression of
GhUxpL4.2 within the developing fibres, which can be considered cells of the seed epidermis
(Stalberg et a|.,1996; Washida et al.,1999). The Q-element and the RY pyrimidine repeat
have both been implicated in high transcription levels, but not in directing tissue specificity
(Hamilton et aL.,1998; Thomas and Flavell, 1990). The unique element, PFE4, is therefore a
251

good candidate for directing fìbre-specific expression, possibly in conjunction with the seed-
specific c¿s element, the E-box. Each fibre-specific promoter analysed in this study contained
PFE4 at a conserved location, providing further support for PFE4 acting as a fibre-specific
element. This observation provides preliminary evidence for a common mechanism of gene
control during cotton fibre development. The location of PFE4 near to the TATA box
suggests that the putative trans act\ng factor binding to the PFE4 sequence may cooperate
with the basal transcription initiation complex.
6.6 Summary and conclusions
Sequence analysis of nine fibre-specific gene promoters identified a number of known
elements as well as four novel sequence motifs, present in all promoters. Deletion analysis of
one of the promoters, GhExp14.2 by means of a previously-established cotton transient assay,
confined the region of fibre-specificity to just 149 bp upstream of the initiation codon. The
presence of one of the novel motifs within the I49 bp region suggests that this element may
act as a positive cis-acting element in fibre-specific gene expression, and is indicative of the
existence of a common regulatory pathway in fibre-specific expression.
To date, no study has been undertaken to determine the c¿s-acting elements that
contribute to fibre-specificity. Previous work has demonstrated the activity of cotton
promoters within trichomes of tobacco (Hsu e/ ø1., 1999; Liu et al., 2000) and developing
cotton fibres (Harmer et a1.,2002; Kim and Triplett, 2001;Kim et a1.,2002), and one study
has defined a minimal region that confers trichome-specific expression (Lil et aL.,2000).
This chapter describes, for the first time, identification of a putative cis-actíng element,
present within all cotton fibre-specific promoters that may control gene expression in cotton
fibres. This is the first novel element to be discovered in cotton fibre-specific gene
promoters.
Future work would involve establishment of the functional significance of the
identified cofiìmon cis-elements in fibre-specific expression, probably by mutational analysis.
2s2

In addition, isolation and characterisation of any trans-acting factors that interact with the c¡s-
acting elements identified within the GhExpl4.2 promoter (by methods such as yeast one-
hybrid assay) may reveal the regulatory pathway that contributes to cotton fibre-specific gene
expression.
253

254

CHAPTER SEVEN
Generation of cr-expansin (pFSla) expression and
misexpression constructs for analysis in transgenic
cotton plants
255

256

7.1 Introduction
Traditional plant breeding programs require between 10 and 15 years before a
desirable trait can be introduced into a new commercial variety. Recently, biotechnology
using transgenic approaches has provided a means of altering crop traits in a significantly
reduced period of time (I- 2 years). The first commercially viable transgenic plant product
was the 'Flavr Savr' tomato, in which ftiit softening is reduced due to expression of an
antisense gene which suppresses the polygalacturonase eîzpe (Sheehy et a1.,1988; Smith e/
al., 1988). Since 'Flavr Savr', research has aimed to improve field crops by reducing the
damaging effects of pests. In cotton, transgenic modification involved the constitutive
expression of the Bacillus thuringiensß (Bt) CrylAc gene, and Bt-cotton (Bollgard or Ingard
in Australia) was commercialised by Monsanto@ in1996 (Perlak et a1.,2001; Wilkins et al.,
2000). The CrylAc protein had previously been shown to act as an effective and specific
insecticide against cotton pests (cotton boll weevil, tobacco budworm and pink bollworm),
and B. thuringiens¡s is a naturally occurring soil born organism which has no adverse effects
on humans and non target species (McClintock et a1.,1995; Wilkins et aL.,2000). Bt-
expressing cotton plants require about half the number of insecticide applications compared
with conventional cotton, thus lowering the cost of production and environmental damage
(Edge et al.,20Ol; Wilkins et a1.,2000). The Austra1ian2000l2001 season saw Monsanto
commercialise transgenic Roundup Ready@ cotton. The Roundup@ herbicide is a broad-
spectrum knockdown glyphosate, which binds to and inhibits the 5-enolpyruvylshikimate-3-
phosphate synthase (EPSP) in plants. The transgenic cotton constitutively expresses an
AgrobacteriumEPSP gene which has low affinity for glyphosate, thereby allowing effìcient
weed control whilst maintaining a viable cotton crop (Wilkins et aL.,2000;
http ://www. aenews.wsu. edu/S eptOOAENews/S eptO0AENews.htm).
A second generation of transgenic cotton, Bollgard II@, which constitutively expresses
both the Cry2Ab2 gene and the CryIAc gene to increase the spectrum of pest control, has
been developed and is currently being trailed in Australia (www.csiro.com.au).
251

Since the development of herbicide and pesticide resistant transgenic cotton, a number of
cotton genes have become available which, through genetic manipulation, have potential to
further cotton crop improvements such as yield. The detection of pFS14 transcripts during
the elongation phase of fibre development (6 DPA through to approximately 20 DPA) and the
presumed role of cr-expansins in cell growth, make the pFS14 gene an attractive target for
altering fibre morphology by extending the window of expression.
The generation of transgenic plants using strong, constitutive promoters is widely used
prooedure. However, in some cases the use of these regulatory regions to drive transgene
expression has a detrimental effect on growth, vigour and fertility of transgenic plants
(Bohmert et aL.,2002; Burkhardt et aL.,1997 Fray et a|.,1995). Therefore, the
characterisation of tissue-specific promoters that could be used to restrict the pattern of
transgene expression is highly desirable. In Golden Rice, this method has been successfully
utilised to restrict transgene-directed Vitamin A biosynthesis to the developing endosperm of
the plant (Ye et a1.,2000). Similarly, the use of fibre-specific promoters to drive expression
of transgenes in cotton fibres has also been described (John and Crow, 1992; John and Keller,
1996; Rinehart et a1.,1996). In particular, two cotton fibre specific promoters, E6 and
FbL2A, were used to direct expression of an enzyme (phaB) involved in the synthesis of a
thermoplastic polymer within the cotton fibres (John and Keller, 1996). Furthermore, the use
of either the E6 or the FbL2A promoters could restnct phaB expression to early or late fibre
development, respectively (John, 1992; John and Keller, 1996).
This chapter describes the assembly of four misexpression constructs, designed to
modify the expression profile of a cotton ø-expansin gene, by using three different fibre-
specific promoters. These promoters were chosen on the basis of their ability to drive
expression of the pFS14 oDNA at varying levels and at different times during cotton fibre
development.
258

7.2 Prolonged o-expansin expression in cotton fibres
The coding region of the cr-expansin cDNA, consisting of 990 bp as an Eco RU Xba I
fragment, was available for use in the generation of transgene constructs using fibre-specific
promoters to alter the o-expansin expression profile (Figure 7.1). The native window of
pFS14 expression is from 6 DPA through to 20 DPA, with maximum accumulation of
transcripts occurring at 8-12 DPA (Figure 3.27; Orford and Timmis, 1998). A number of
promoters corresponding to other fibre-specific genes and with different expression profiles
were available to develop pFSl4 oDNA misexpression constructs, the hrst of which was from
the previously isolated FSl8A gene which encodes an LTP-like protein (Carney, 1996;
Olesnicky, 1995) and is expressed in cotton fibres after the onset of secondary wall synthesis,
and at a low level in flower tissue (Orford et al.,1999). As the FS18A gene was isolated from
a genomic library, alarge upstream region was available for the generation of specific
transgene constructs. A 4.4kb BamHU Sac I fragment, containing the promoter region and
209 bp of coding sequence, was previously subcloned into pBluescript (Carney, 1996).
Partial sequencing of pBS4.4 had identified the putative core promoter elements as well as a
unique Nhe I restriction site located at the beginning of the FS 18A coding region, the presence
of which was verified by restriction mapping (Figure 7.2).
The Nhe I restriction site was used in combination with the unique -trØo I restriction
site within the Multiple Cloning Site of pBluescript to excise the FSL8A promoter from
pBS4.4 (Figure 7 .3A). 'fhe 4.2kb FSI\A Nhe U Xho I fragment was then ligated upstream of
the pFS 14 expansin oDNA using a unique Nhe I site within the 5'UTR of pFS 1 4, and the Xho
I site within the Multiple Cloning Site of pBluescript (Figure 7.3A). Colony hybridisation
using pBS4.4 as a probe identified a number of colonies containing the FSI8A promoter
(Figure 7.38). Plasmid DNA from four colonies was digested with,Sac I to verify the
prosence of the promoter and the coding sequence (Figure 7.3C). Three of the four clones
contained both FS 1 8A promoter and pFS 14 sequence, as indicated by the generation of bands
259

Fiqure 7.1. The pFSl4 cDNA sequence
Nucleotide sequence of the fibre-specific o-expansin pFS14, cloned as an EcoP.I andXbal
fragment in the pBluescript vector. The coding region is depicted in blue text with the
conceptual translation shown in single letters below. Start and stop codons are shown
outlined by red boxes. Boxes outline the restriction sites used in the generation and
identification of all constructs. The Exp4 primer, used in sequencing of constructs, is also
shown outlined.
260

Nhe Ime@þcrrAcrc cAACcaAAAccATGATcrrccA-AATATTTccAcrrrr
1 --- -+--- -+--- -+--- -+--- -+--- -+ 60TATKTMMI,OIFPI,F
CTTCTTTTTGTTCAGTGTCTGCAACTCCATTTTCCTTGGTGCTAATGGAGATGACAATGG6L -- --+-- --+-- --+-- --+-- --+-- --+ L20
FFLFSVCNSIFLGANGDDNG
TGGTTccC A-AACTGCCCATGCCACCTTCTACGGTGGTGCTGATGCTACCGGCACAATGGT'1,21 - ---+- ---+- ---+- ---+- ---+- ---+ L80
GWOTAHATFYGGADATGTMG
GGGAGCTTGTGGTTATGGAAACCTGTACAGTCAAGGGTATGGA.ACGAGCACAGCAGCTTT1-8L - ---+- ---+- ---+- ---+- ---+- ---+ 240
G A C G Y G N I, Y S Q G Y G T S T AA L
GAGCACTGCACTTTTCAACAAr
S T A L F N N G I, S C G A C Y E I, R C N
3 01-
36L
42L
481
544
5 01_
661
CTCAATGGTGCATTAGTCG AACCATAACCGTGACAGCCACCAACTTTTGTC C
----+- ---+- ---+- ---+- ---+---------+NDPQWCISRTITVTATNFCP
AC CTAACTATGCTTTATCTAGTGACAATGGCGGGTGGTGCAATC C C CCACGAGAACACTT----+- ---+- ---+- ---+- ---+---------+
PNYALSSDNGGWCNPPREHF
TGATTTGGC CGAACCGCGATTCTTGCGGATAGCAGAATATCGAGCTGGAATCGTCC CTGT----+- ---+- ---+- ---+- ---+---------+
D L A E P R F I, R I A E Y RA G T V P V
TATGTT CAGAAGGGTGT CATGTGTGAAG A'U\GGAGGCAT CAGGTACAC CATGAATGGACA----+- ---+- ---+- ---+- ---+---------+
MFRRVSCVKKGGIRYTMNGH
TTCGTACTTCAACATGGTGTTGATAACGAAGCTGGGAGGGGCAGGGGATATAACGTCAGT----+- ---+- ---+- ---+- ---+---------+
S Y F N M V I, T T KL G G AG D T T S V
GTCCATCAAGGGTTCCAGAACAGGATGGCTACCTATGTC CAGAÃÄ'TTGGGGC CAÄÄACTG----+- ---+- ---+- ---+- ---+---------+
SIKGSRTGWLPMSRNWGANW
GCAGAGCAATGCTTACCTT AACGGAC A AAGCCTCTCTTTTAAAGTGACTGCCAGCGATGG----+- ---+- ---+- ---+- ---+---------+
A S NAY L N G O S ], S F KV TA S D G
360
420
480
540
600
660
720
ATTACTTATATAAGGCACATGAGCGTTTTATGCCGAGGTAGC NUU\TGGC CGC CGCTGGC----+- ---+- ---+- ---+- ---+- ---+ 900
TTTATGTGTGAJU\TAGGCGAGCAAGTGC CATTAGC C TATAATCTATACATTTCTTATAGT----+- ---+- ---+- ---+- ---+- ---+ 960
Xba IGAACCAÀÄ'CTATTAAGTTTGAAdTTJ-õTãGA
----+- ---+- --- 990
CAGGACTATCACAGCCTACAATGTAGTGC CTGCTGGTTGGCAATTCGGAC A AACTTTTGA'72L - ---+- ---+- ---+- ---+- ---+- ---+ 780
RTTTAYNVVPAGWAFGATFE
AGGAGGCCAGTT CAATATTATAGTGTCTGTCTAATATAAAACTGGAATTGACAT78L - ---+- ---+- ---+- ---+- ---+- ---+ 840
G G A FI
84 r_
901
CTGCT
CAA
96L
261

A. Diagram dçicting the pBS4.4 (FSI9A BamHIl SacI) subclone, which contains the 5' end
of the FSISA open reading frame and approximately 4.0 kb of upstream promoter region
(From Carney, 1996).
B. Partial sequence of the FSI8A gene (pBS4.4 subclone). The protein coding regions of
FSl8A are depicted in blue text, with ATG initiation codon shown outlined in a red box. The
,Søc I site used for subcloning of the 4.4kb fragment is shown outlined. The NheIandNdcI
restriction sites used for further construct generation are also shown outlined. Two putative
transcription start points are indicated by arrows (as described in Orford, et al., 1999). The
putative TATA and CAAT boxes in the promoter are shown in bold lettering.
262

A.
pB54.4
AAATTTTTAGGTTAC CTATTTTGGGAGGGGGGATTATGATTCAAGTGA¡U\GAJU\GTTGGC1 --- -+--- -+--- -+--- -+--- -+--- -+ 60
ACACACACAÄ'T CAGTACATCTGTTTTGACAGATACACAGC CT AAAAACAGCAGC AAACAA6L -- --+-- --+-- --+-- --+-- --+-- --+ 1-20
GCCTA.AAGGAATCACCCAÄ,AÄACAACAACCAAÄAGTACAGAGGA,UU\C AAAÄ.GAATCCCTL2L - ---+- ---+- ---+- ---+- ---+- ---+ 180
GTTAC CAC CAAGCTG AÄÄAÄÄAGAA.AATÀÀAACTCAACTTTTGGCÀÀTAIUUU\C C CTC CT181- - ---+- ---+- ---+- ---+- ---+- ---+ 240
Èôx
tiÉi
na
RSP<-
B.
r+ r+þcccrcaaccccraAccAccdAAcAATcAccAATAcrccA.a'ccAAccATTTTccrrAcAA
24L - ---+- ---+- ---+- ---+- ---+- ---+ 300Nde I IVhe I
GTTTGTTTTTCTTGTGATTAATC CCATGTCCCTTAÀGCTTGCATGTC301- - ---+- ---+- ---+- ---+- ---+- ---+ 360
ASSMSLKLAC],
TGCTAGTGTTGTGCATGGTGGTGGGTGCACC CCTGGCTCAAGGGGACGTAACC CGTGCTG361- - ---+- ---+- ---+- ---+- ---+- ---+ 420
LVLCMVVGAPLAOGDVTRAD
ATGGCGTAGTCACC CTTC CACGCTGC CTTC CTTTATTGATAGGGAÀTGGTAATGGTGCTG42L - ---+- ---+- ---+- ---+- ---+- ---+ 480
G V V T ], P R C L P L L I GN GN G ADSac I
ATGCTGATGTTGATGCCC CAGCTTGCTGCGACAT+ 535
263

X'ieure 7.3. The seneration of the pFSI.SAEXP construct
A. Schematic diagram of the directional cloning of the FSISA promoter upstream of the
pFSl4 oDNA. Excision of tne ¡'S,l¡,1 promoter region, also containing the FSlSAATG
initiation codon, was achieved through digestion with Xho I and Nhe I restriction enzymes.
The recipient clone, the pFSl4 ø-expansin oDNA was digestedwithXho I and Nhe I to allow
the directional cloning of the FSl8A promoter.
B. Colony hybridisation of putative FS18AEXP constructs using the pBS4.4 insert as a
probe. The colony shown at position I represents a positive control. Arrows indicate the four
positively hybridising colonies selected for further digestion analysis.
C. Agarose gel showing DNA fragments resulting from restriction of plasmid DNA from the
four colonies shown in B. The first lane and the last lane contain molecular weight markers
(1, DNA marker restricted withHind III and 100 bp marker) with sizes indicated in kb. Each
lane contains approximately 3 pg of DNA, with contents and restriction endonucleases used
indicated below
l. pFS14 cDNA parent clone digested with Søc I.
2. Colony 122 digested with SacI.
3. Colony 154 digested with SacI.
4. Colony 167 digested with Sacl.
5. Colony 212 digesled with SacI.
6. pBS4.4 parent clone digested with ^Søc I.
264

FSl8A promoter (-4.0 kb)
A.
B.
Xho I
I I
oBluescriot
XhoI
pBluescript
C
23.1-9,46.54.4-
2.3-2.0-
NheI SacI
34
SacIFSl8A Dromoter (-4.0 kb)
--. r_ r_ -
G,r,.-
rJ-ff ¡¡¡r,
e
-1.0

of 6.5 kb and 700 bp in the ^Søc
ldigest (Figure 7.3C, lanes 2,3 and 5). The 6.5 kb band
corresponded to the pBS4.4 parent clone (Figure 7.3C, lane 6), while the 700 bp product
reflected the pFS14 cDNA parent (Figure 7.3C,lane 1). The remaining clone contained a
larger than expected 1.0 kb ^Sac I fragment (Figure 7 .3C,lane 4) and was disregarded, while
clone 212 (Figure 7.3c, lane 5) was selected for further analysis.
The junction in the plasmid was sequenced using the internal pFS14 cDNA primer,
EXP4 (Figure 7.1; Table 2.1). Analysis of the sequence showed the intact Nhelrestriction
site used to generate the construct, the pFS14 cDNA ATG translation initiation codon and the
FSISA ATG initiation codon (Figure 7.4). Anucleotide alignment between the 2l2plasmid
and the FSl8A promoter revealed l0O % identity over a 335 bp overlap, with the alignment
terminating, as expected, at the Nhe I restriction site within the 212 construct (not shown).
Similarly, a nucleotide alignment between the2l2plasmid and the pFS14 .DNA sequence
demonstrated 100% identity over a 268 bp overlap (not shown). Again the alignment ended
at the NheI restriction site used to clone the FSlSApromoter upstream of the pFSl4 .DNA
sequence (not shown).
Since translation initiation of plant genes generally occurs at the first ATG codon
encountered by the 40S ribosomal subunit (Joshi, lg87), it was important to remove the
FSl8A ATG codon from the construct, as initiation of translation from this site would not be
in the correct reading frame to produce the cr-expansin peptide (Figure 7.4). Digestion with
Nde I and' Nhe I restriction enz)¡mes, followed by end filling using Klenow, would enable
removal of the FSISA initiation codon (Figure 7.5). After ensuring that Nde I did not restrict
elsewhere in the construct (result not shown), a double digest using Nde I and Nhe I was
undertaken followed by Klenow treatment, religation and transformation. As Klenow
treatment of the plasmid should destroy both the Nde I and the Nhe Irestriction sites, an
approach using Nhe I digestion was used to screen Klenow-treated colonies. Those that
remained undigested by Nhe I were selected for further analysis.
266

To ensure that that the lack of digestion using the Nhe I restriction enzpe was caused
by deletion of the Nhe I restriction site, further restriction analysis was undertaken using the
parent construct as a control and a putative construct that lacked the FSl8A ATG translation
initiation codon (termed pFSl8A::EXP). Both the parental and the Klenow treated construct
weredigestedwith BamHl,NdeI,Nhel,SacI,XbaI,andBam HIand NdeU Nhelindouble
digest reactions (Figure 7.6A). The enzymes were selected on their ability to excise
fragments of known size in the original promoter, the pFSl4 coding region, and the
pFS18A::EXP clones. Single enzyme digestion using the Bqm HI enzyme produced an 8 kb
fragment in both the parent and new construct (Figure 7.6A,lanes I and2), consistent with
the presence of only one Bam HI site at the 5'end of the FSISA promoter. Digestion of the
parent construct with both Nde I and Nhe I enzyn'res produced an 8 kb band (Figure 7 .6A,
lanes 2 and 3), as expected. While the Klenow-treated construct, when restricted with the
:, Snrrro two enzymes, remained undigested (Figure l.6A,lanes 2 and 3), implying that both the
' Ndel and Nhe I sites had been destroyed. The remaining restriction patterns (Figure 7 .6A,
, lanes 1-8) for the pFSl8A::EXP construct, showed the presence of both the FSL9A promoter
..' " and the pFS14 oDNA and implied the absence of the FSISA ATG translation initiation codon.
Sequencing of pFSl8A::EXP using the pFSl4 internal primer EXP4 confirmed that the
Klenow treatment had removed the FSISA ATG initiation codon (Figure 7.68).
A construct (pFSl8A::EXP) using the FSL8A promoter to direct expression of the
fibre-specif,rc ø-expansin cDNA was created. The generation of transgenic plants using
pFSl8A::EXP enables the FSl8A promoter to drive expression of the pFSl4 cDNA later in
fibre development, prolonging the expression to the onset of secondary cell wall synthesis. If
the ø-expansin is a controlling factor in fibre growth, it is possible that prolonging the
expression of the fibre-specific cr-expansin cDNA until after the onset on secondary wall
synthesis will change the morphology of the fibres.
267

Fieure 7.4. The pFSl8A::EXP constructPartial sequence of the pFSl8A::EXP construct, with the pFSl4 oDNA coding region and
conceptual translation shown in blue text. The FSISA ATG translation initiation codon and
the pFS14 cDNA ATG translation initiation codons are shown in red boxes. The putative
translation beginning from the FSISA ATG codon is also depicted.
The Nde I site used in the cloning of the FS I 8A promoter is outlined, as is the Nhe I site used
in future Klenow treatments. The TATA and CAAT boxes, as described by Orford et al.,
(1999), are shown in bold text.
268

GGACGTTATGGAAGTTGGTTTNTTTTATGGTGTTAANT AACANTGTATTNAATTAATAGN1 --- -+--- -+--- -+--- -+--- -+--- -+ 60
GNGGAACNTTGNTTAAGCATTGTTNTTGAÀ'TTTAGTGGAAAGTTGGGGGGGGGAGNTNNG6L -- --+-- --+-- --+-- --+-- --+-- --+ L2O
TANGNTGGATTATGATTGAAGCTTTTAATTCNGAT CGGAATTGGAJU\C AJ\TGAAGTNTTTI2L - ---+- ---+- ---+- ---+- ---+- ---+ l-80
GTGCNTGATTGC CAAC CC CAi\TAIUU\GTGTGTAGGTTTAACNATGTTTATGAAAGATAAG181 - ---+- ---+- ---+- ---+- ---+- ---+ 240
TTTNTTTTTTTATGAGCANGCAANTATAGGGGTTTATTTCNGTGCGC AAATTTTTAGGTT24J. - ---+- ---+- ---+- ---+- ---+- ---+ 300
GTACATCTGTTTTGACAGATACACAGCCT AAAAACAGCAGC AAACAJ\GCTT AIU\GGAATC
AC CCAA.AÄACAACAAC CAAAAGTACAGAGG AIUU\C A'UU\GAJ\TC CCTGTTAC CACCAAGC42L - ---+- ---+- ---+- ---+- ---+- ---+ 480
TGAAAAAAAGAÄÄATA.AÀACTCAACTTTTGGCÀÀT AÄ.A.AAC CTTCTTAC C CTCAAC C C CT481 - ---+- ---+- ---+- ---+- ---+- ---+ 540
AACCACGCAACA.A'T CAGCAATACTC CAAGCÄÄ'C CATTTT C C TTACAAGTTTGTTTTTCTT541 - ---+- ---+- ---+- ---+- ---+- ---+ 600
fVde I fVhe I
601- - ---+- ---+- ---+- ---+- ---+- ---+ 660MASSYSNGNONDDVAN
MATKTMMLQI
TATTTCCACTTTTCTTCTTTTTGTTCAGTGTCTGCAACTC CATTTTCCTTGGTGCTAATG66L - ---+- ---+- ---+- ---+- ---+- ---+ 720
I S T F L L F V O C L O L H F P I¡I C *F P L F F F ], F S V C N S I F I, G AN G
GAGATGACAATGGTGGTTGGCAAACTGC CCATGC CACCTTCTACGGTGGTGCTGATGCTA'72L - ---+- ---+- ---+- ---+- ---+- ---+ 780
DDNGGWATAHATFYGGADAT
CCGGCACAÄ.TGGGGGGAGCTTGTGGTTATGGzuU\CCTGTACAGTCAAGGGTATGGAACGA78L - ---+- ---+- ---+- ---+- ---+- ---+ 840
GTMGGACGYGNLYSQGYGTS
GCACAGCAGCTTTGAGCANTGCANTTTTC.AACAATGGCTTGAGCTGGG841 - ---+- ---+- ---+- ---+- -- 888
TAAI,S?A?FNNGLSW
269

210

ÄIde I Nhe I5' TGATTAAT3'
TGATTACT
CTTACT CAAC 3'TTG 5'
Nhe I and Nde I digestion
TACT GCAAC 3'TGAGTTTACCGTTG 5'
Klenow treatment (end fills 5' overhangs)
5 TACT CAAC 3 '
5',3'
5',3',
A3'TGATTACT 5t 3'GAT TGAGTTTACCGTTG 5'
ligation
5' TGATTAATCCATACTAGCTCTTACT GCAAC 3'3' ACTAATTAGGTATGATCGAGAATGAGTTTACCGTTG 5'
Diagram depicting digestion and Klenow treatment of the Nde I and Nhe I restriction sites of
the construct, to result in removal of the FSISA ATG initiation codon.
CTAG
CTAG
27t

A. Agarose gel showing DNA fragments resulting from restriction of the pFS18A::EXP
parent (P) construct and a Klenow treated construct (K). The first lane, second last and the
last lane contain molecular weight markers (i, DNA marker restricted with Hind III and 100
bp marker) with sizes indicated in kb. Each lane contains approximately 3 ¡,rg of DNA
restricted with the following enzyrnes.
1. BamHI
2. NdeI
3. Nhel
4. SacI
5. XbaI
6. BamHA NdeI
7. BamHA NheI
8. undigested
B. Partial sequence alignment between parent and Klenow treated pFS18A::EXP. Both the
FSL9A ATG initiation codon and the pFS14 cDNA initiation codon are shown in red boxes,
and the pFS14 coding region is indicated in blue text. The NheI and the Ndel restriction
sites within the parent construct are shown boxed, with the deletion of the FSl8A ATG
initiation codon indicated in the final construct.
272

e!ffi
ü *r*
{'.$#
q*- ;;,¡¡#+g
{!,ú
*õ
æ#*,*9,ç'*
*î*t
A.
I6.5
4,4
2.3-2.0-
2L2.seq 337
2l2g.Beq 317
27-2 . aeq 287
2l2g.eeq 267
TGAIrTGA
ll|| ||||il
-23.1-9.4-6.5
4.4
2.32.0
åzurccruuurcåarcel|||llllllllCAACCAAAACGATGA
l2?4567R
23
1.0
-0.5
B.
2L2 . seq 3 I 7 CAÀCTTTTGGCÀ.trTAAAAACCTTCCTACCCTCAACCCCTAACCACGCAAC 3 3 I|||ll||||||llllil1|lllllllllllllllllllll
2L2g . s eq 3 6 ? CAACTTTTGGCÀÀTAA.AAACCTTCCTACCCTCAACCCCTAACCACGCAAC 3 1 8
0
AATCAGCAÀTACTCCAAGCAACCATTTTCCTTACAAGTTTGTTTTTCTTG||||il|llllllllllllllllllllllllllllllllllllllAI\TCAGCAI\TACTCCAAGCAACCATTTTCCTTACAAGTTTGTTTTTCTTG
Nde I I
288
268
238
22LTTAATCCATA..
2L2 . seq 2 3 ? TGTTGCAAATATTTCCACTTTTCTTCTTTTTGTTCAGTGTCTGCAACTCC 18 I||l||||ll||||||||lllllllllllllllllll
2L2g.seq 220 TGTTGCAÀATATTTCCACTTTTCTTCTTTTTGTTCAGTGTCTGCAACTCC 171
2L2.aeq 187 ATTTTCCTTGGTGCTAATGGAGATGACAATGGTGGTTGGCAAÀCTGCCCA 138||||ll|||||||||lIlllllllllllllllllll
2L2g . eeg 1 7 0 ATTTTCCTTGGTGCTAATGGAGATGACAATGGTGGTTGGCA,AACTGCCCA 12 1
273

T.3Increased cr-expansin sene expression in cotton fibres
Following the generation of pFSI8A::EXP, the promoters which correspond to two
fibre-specific cDNAs (Orford and Timmis, 1997), were obtained using a GenomeWalker'u
PCR approach (Dr. S Orford, personal communication). One of these promoters
corresponded to the fibre-specific cDNA pFS6. The pFS6 cDNA encodes a lipid transfer
protein (Orford and Timmis,1997; Orford and Timmis, 2000) and transcription analyses
(Northern blots and RT-PCR) detected the greatest accumulation of pFS6 transcripts during
the elongation phase of fibre development (Orford and Timmis,1997; Orford and Timmis,
2000). Importantly, of the available fibre-specific cDNAs, pFS6 transcrþts were the most
abundant, reaching approximately four times the level of pFSl4 (Dr. S Orford, personal
communication). The highly active pFS6 promoter is therefore an excellent driver for over-
expression of pFSl4and also for the generation of an antisense construct.
Approximately 2.0 kb of genomic sequence upstream of pFS6 was amplified by
Genome Walker*PCR and sequencing of this region demonstrated that - 600 bp of the
coding region had been amplified, along with approximately 1.4 kb ofpromoter sequence
Orford, personal communication). Analysis of the sequence (not shown) and restriction
mapping showed that digestion with ClaI md Apal could facilitate the isolation and
directional cloning of the pFS6 promoter upstream of the pFSl4 cDNA (Figure 7.7A).
The directional cloning was undertaken as indicated in Figure 5.104 and resultant
colonies were screened via duplicate colony hybridisation using the pFS6 promoter and the
pFSl4 cDNA as probes (Figure 7 .78, C). Four colonies (37, 38,73 and 99), which
hybridised to both probes, were selected for further digestion analysis (Figure 7.7D). A
double digest using Apa I and Cla I allows the excision of the pFS6 promoter from the
putative pPRP6EXP constructs, while the remainder of the construct (the pFS14 oDNA)
should be the same size as that of pFS14 parent clone (Figure 7.7A). All four constructs
contained the pFS6 promoter of which three contained bands that were of equal size to pFSl4
(Figure 7.7D,lanesl-5). A smaller fragment than expected was obtained for colony 99
274

(Figure 7 .7D,lane 5) and this probably represents a pFS6 parental contaminant. Plasmid
DNA from one of the three constructs, colony 37 (Figure 7.7D,lane2), was further restricted
with Nhe I and Xba I in single and double digests to verify the presence of the pFSl4 oDNA
by "dropout" analysis and size comparison with the pFS14 oDNA parent clone (Figure 7.7D,
lanes 6-9). Sequence of the plasmid from colony 37 rcvealed that the pFS6 promoter had
successfullybeen cloned upstream of the pFSl4 cDNA (Figure 7.8).
The resultant (pPR6EXP) construct contains the pFS14 oDNA, downstream of the
LTP promoter. This promoter should direct transcription of the pFS14 cDNA at a rate four
times greater than the native pFS14 promoter and should therefore result in expansin over-
expression in elongating cotton fibres.
7.4 I)ecreased cl-expansin expression in cotton fibres
The generation of an antisense pFSl4 oDNA construct was undertaken using the fibre-
specific pFS6 promoter clone (as above) and the pFS14 oDNA. Restriction mapping of both
clones showed that it was easier to insert the promoter sequence into the pFS14 oDNA clone
than to place the coding sequences (in the reverse orientation) into the promoter clone. Sac lI
and Nhe I restriction enzymes recognised sites that would allow the isolation of the pFS6
promoter and its directional insertion into the pFSl4 oDNA downstream of the coding
sequences, such that the pFS6 promoter would direct transcription of an antisense mRNA
(Figure 7.9A). Whilst the construct would then contain both the pFS6 and pFSl4 translation
initiation codons, antisense constructs are known to exert their effects at the transcript level
(Sandler et a|.,1988), so the presence of a second ATG should have no adverse effect on
antisense suppression. Therefore the pFSl4 oDNA and the pFS6 promoter were digested with
the appropnale enzymes and a directional cloning was undertaken (Figure 7.94). The
resultant clones were screened by duplicate colony hybridisation using both the pFS14 oDNA
and the pFS6 promoter as probes and one colony that hybridised to both probes was selected
for further analysis (Figure 7.98 and C). Restriction analysis of the putative pFS14 cDNA
275

truct
A. Schematic diagram of the directional cloning of the pFS6 promoter upstream of the pFSl4
cDNA.
B. Colony hybridisation of putative pPR6EXP constructs using the pFSl4 oDNA insert as a
probe. The colony shown at position 1 represents a positive control.
C. Colony hybridisation of putative pPR6EXP constructs using the pPR6(3) insert as a probe.
The colony shown at position I represents a positive control.
Four colonies which positively hybridised to both probes are indicated by affo\rys.
D. Agarose gel showing DNA fragments resulting from restriction of four colonies indicated
above. The first lane and the last lane contain molecular weight markers (¡, DNA marker
restricted withHind III and 100 bp marker) with sizes indicated in kb. Each lane contains
approximately 3 pg of DNA, with clones and restriction endonucleases as indicated below.
l. pFSl4 cDNA parent clone digested withApall ClaI.
2. Colony 37 digested with Apa U Cla L
3. Colony 38 digested withApaU Clal.4. Colony 73 digested with Apa U Cla l.
5. Colony 99 digested wtth Apa U Cla I.
6. pFSl4 oDNA parent digested withXbaI.7. Colony 37 (pPR6EXP) digested with NheI.
8. Colony 37 (pPR6EXP) digestedwíthXbaI.
9. Colony 37 (pPR6EXP) digested with NheU Xbal.
276

ATG
pFS6 promotor (1.4 kb)
A.
I I
oBluescriot
ClaIApaI
B


AJ\TTAJU\TAGATGCTTGGGTGAGTCGTAATACCAATTCAATTAIU\GACTTAJ\TATATAJU\1- --- -+--- -+--- -+--- -+--- -+--- -+ 60
AGTATATATC C C AACAATTATAAAT CAAATTACTTTTTAAT AÄ.AATGGTATCATTC TGAC61 -- --+-- --+-- --+-- --+-- --+-- --+ L20
AATAÄATG CATT TATA.AAITACAT CAAATGTAIU\T C T CATG T TTATAJ\GAJU\I\CAC C TAGAL21, - ---+- ---+- ---+- ---+- ---+- ---+ 1-80
AA.A.AAGTT AAACCAATATTTGAGTCCTAGCTGTGGAGGCATGATTGAGTGAJU\TC AJU\TG181 - ---+- ---+- ---+- ---+- ---+- ---+ 240
GACGCTGGTTTTAATTGTATTGzuU\GAJUU\CAATAATCACGTAGGTTGGCAGTTGAAC CT241, - ---+- ---+- ---+- ---+- ---+- ---+ 300
AATTGAATGGTC TCAACTTTTAATGTGGTGTGTTAATGTTTGGATCGGATAATCTCAACT301- - ---+- ---+- ---+- ---+- ---+- ---+ 360
TACCTAATAGCTAGGAAAGT AJUU\TTCAGACATCACCCGCTACTACTTTTGGCTÀTÀÀÀA361- - ---+- ---+- ---+- ---+- ---+- ---+ 420
AC CCTC CTACCCTCAAGC CCTAAC CACGACAATCAGCAATAGTACTACTACTC CA¡\GCAJ\421, - ---+- ---+- ---+- ---+- ---+- ---+ 480
Cl,a IGCATTTT CCTTACAAGTTTGTTTTTC TTCTCETTIFCÃTInaCCTTGATATcGAATTcG
CGGCCGCTTAGCTAGCTCTTACTC CAJ\CCNUU\CGATGATGTTGCAÄATATTTC54]. - ---+- ---+- ---+- ---+- ---+- ---+ 600
MATKTMMLAIFP
CACTTTTCTTCTTTTTGTTCAGTGTCTGCAACTC CATTTTCCTTGGTGCTAATGGAGATG601- - ---+- ---+- ---+- ---+- ---+- ---+ 660
LFFFLFSVCNSIFLGANGDD
ACAATGGTGGTTGGCAÄACTGCCCATGCCACCTTCTACGGTGGTGCTGATGCTACCGGCA66L - ---+- ---+- ---+- ---+- ---+- ---+ 720
NGGWOTAHATFYGGADATGT
CAATGGGGGGAG C TTGTGGTTATGG A.AAC CTGTACAGT CAAGGGTATGGAACGAGCACAG72L - ---+- ---+- ---+- ---+- ---+- ---+ 780
MGGACGYGNLYSQGYGTSTA
CAGCTTTGAGCACTGCACTTTTCAACAA78]- - ---+- ---+- -- 808
ALSTAI,FN
Figure 7.8. The pPR6EXP construct
Nucleotide sequence of the pPR6EXP construct at the site of fusion between the pFSl4
oDNA coding region (blue text) and the pFS6 promoter (black text).
The Cla I site used in the cloning of the pFS6 promoter is outlined and the TATA and CAAT
boxes in the promoter (Dr S. Orford, personal communication) are shown in bold text.
279

Fisure 7.9. Generation of the nPR6antiEXP construct
A. Schematic diagram of the directional cloning of the pFS6 promoter downstream of the
pFSl4 oDNA.
B. Colony hybridisation of putative pPR6antiEXP constructs using the pFS14 cDNA insert as
a probe.
C. Colony hybridisation of putative pPR6antiEXP constructs using the pPR6(3) insert as a
probe. An arrow indicates the colony chosen for further analysis and which hybridises
positively to both probes.
280

A.
Sac I
III
pBluescript
II NheA XbaI
B.
pBluescript
C.
nFS6 nromoter 11.4 khl
oFS6 oromoter 11.4 kb)
281

antisense construct and the two parent clones showed that the pFS6 promoter was inserted at
the 3' end of the pFS14 cDNA and, to further confirm the antisense construct, dequencing was
undertaken using the T3 andTT primers. Nucleotide sequence comparison confirmed that the
pFS6 promoter was directionally cloned ão*nrt .urn of the pFSl4 oDNA (not shown).
Taken together, the hybridisation, restriction and sequen"ing r.rllts demonstrated that
the construct (pPR6antiEXP) had successfully been generated, with the aim of reducing
expansin expression during cotton fibre elongalion in planta. Analysis of transgenic plants
generated using this construct should demonstrate the important role that the fibre-speciflc a-
expansin plays in fibre elongation.
Ì
In addition to the pFS6 promoter, the promoter coresponding to the pFSlS cDNA was
also isolatedusing the GenomeWalker" PCR method (Dr S. Orford, personal
communication). The pFSl8 promoter directs maximal transcript accumulation in fibres from
12- 14 DPA, just prior to the transition between elongation and secondary wall synthesls, but
transcripts remain until at least24 DPA (Orford et al., t9991' Orford and Timmis, 1997). In
addition, pFSl8 transcripts are more abundant than those of pFSl4 (Dr. S Orford, personal
communication). Using the pFSl8 promoter to direct pFSl4 expression should prolong the
presence of the cr-expansin protein, into secondary wall synthesis phase of fibre development.
The -1.2 kb region of pFSl8 promoter had been previously cloned into the Smal
restriction site of the pJK.KiwiGUS.ocs.Kmf(-) vector (Dr. S Orford, personal
communication; Figure 7.104). Restriction analysis of the pFS18 promoter sequerice
revealed two Xba I restriction sites that would readily allow a 'dropout' of the pFSl8
promoter (Figure 7.104). Cloning of the pFSl8 promoter upstream of the pFSl4 cDNA
could be achieved though the presence of the Nhe I site, which has compatible 'sticky ends'
with the Xbal site, in the 5'UTR of the pFS14 oDNA (Figure 7.104). Although the cloning
procedure is not "directional", it allows a 50% chance of the pFS 1 8 promoter being cloned in
the right orientation. After transformation, the resultant colonies were screened by colony282

hybridisation with the pFS 1 8 promoter (Figure 7.108). Three positively hybridising colonies
were selected for further digestion analysis (Figure 7.108). Digestion of the three clones with
Xbal showed that two of the three clones produced a single band of approximately 5.0 kb, the
predicted fragment size if the pFS 1 8 promoter had successfully ligated upstream of the pFS 14
cDNA (Figure 7.l}C,lanes 2-4). Sequencing of the one of the constructs (Figure 7.10C lane
2) showed that the pFS 18 promoter had been cloned in the required orientation (Figure 7 .lt).
Taken together, the sequencing, colony hybridisation analysis and digest information
showed that a construct, in which the pFS18 promoter was designed to direct transcription of
the pFSl4 cDNA, had been created.
7.6 Transformation of cotton
In total four constructs were generated which aim to alter the expression profile of
pFSl4 cDNA. Due to the lack of appropriate facilities, Cotton transformations of the four
misexpression constructs and the GhExpl4.2 and GhExpl4.4 promoter reporter constructs
were undertaken by Dr. D Llewellyn at CSIRO, Division of Plant lndustry, Canberra. This
process firstly involved the addition of transcriptional terminators to the four misexpression
constructs, followed by transformation of each construct into the Ti plasmid virulent
Agrobacterium tumefacians strain The Gossypium hirsutum L. cv. Coker 315, cultivar is
used for the recipient of the misexpression constructs, as it behaves most appropriately in
tissue culture. Following appropriate selection, culturing and maturation conditions,
transgenic Coker 315 plants must eventually be crossed to the Australian adapted G. hirsutum
L. cv. Siokra 1-4. Resultant progeny must then be 'selfed' to produce further generations
which are homozygous to both antibiotic selection and the introduced transgene.
Transgenic T1 Coker 315 cotton plants, of all constructs exceptthe GhExpI4.4
promoter reporter construct, are currently being grown for first round analyses. This will
involve Southern analysis and PCR to detect the presence of the constructs, after which gene
283
X'isure 7.10. Generation of the pLSBEXP construct
A. Schematic diagram representing the cloning of the pFSl8 promoter upstream of the pFSl4
oDNA,
B. Colony hybridisation of putative pFSISBEXP constructs using the pFSl8 promoter clone
as a probe.
Three colonies which positively hybridised to the pFSl8 promoter probe are indicated by
alTows.
C. Agarose gel showing DNA fragments resulting from restriction of the three positively
hybridising colonies selected above. Thc first lanc contains a molccular wcight marker (1,
DNA marker restricted with Hind III) with sizes indicated in kb. Each lane contains
approximately 3 pg of DNA, with clones and restriction endonucleases used indicated below.
10. pFS14 oDNAparent clone digested withXbal.
1l. Colony45 OFSISBEXP) digested withXbal.
12. Colony 62 (pFSISBEXP) digested withXbal
13. Colony 104 (pFSI8BEXP) digested withxbal.
Colony 62 was selected for further analysis.
284

NdeA SmaIIoFS18 oromoter (1.2 kb)
A
pBluescript
-)
pBluescript
I
I
Xba I XbaA NheI
1-
C.
23964
oFSl8 oromoter (1.2 kb)
285

CTTGTTTTAT TAAGCAACTTATAGGGAGTTTAACTTCGGGTGCGCAAATTTTTAGGT61 -- --+-- --+-- --+-- --+-- --+-- --+ L2O
1,21,TAACTGTTTTGGGAAGGGC CATTATGATTC AATTGA.AAG A AAGTTGGCACACACAAAATC
----+- ---+- ---+- ___+_ ___+_ ___+ 190
181ACATACATCTGTTTTGACAGAGACAEAGCCTAIUU\,¡\CAGCAGCAAAC Ã AGCCTAJU\GGAJ\
----+- ---+- ---+- ___+_ ___+_ ___+ 240
TCACCCAÀAAACAACAACEAA,AAGTACAGAGGAA.AACA.AAAGAATCCCTGCTACCACCGA24L - ---+- ---+- ---+- ---+- ---+- -__+ 3OO
30r_GETGAAÄÃ AÄAGAJUU\TAJUUU\CTEAAETTTTGGETATÀ.AÀAAEC ET CTTACE CTCAACC
----+- ---+- ---+- -__+_ ___+_ ___+ 360
CCTAACCACGCAACÀÀTCAGCAATACTC CAAGCAAECATTTTC C TTACAAGTCTGTTTTT361- - ---+- ---+- ---+- ---+- ---+- ---+ 420
Nde I Sma f Xba 1 Nhe ICTTGTGATTAA CAACCAÄAÀ,CGATGAT
GTTGCAAATATTTCCACTTTTCTTCTTTTTGTTCAGTGTCTGCAACTCCATTTTCCTTGG481 - ---+- ---+- ---+- ---+- ---+- ---+ 540L Q T F P L F F F L F S V CN S I F IJ G
TGCT TGGAGATGACAATGGTGGTTGGCAAACTGCCCATGCCACCTTCTACGGTGGTGC547 - ---+- ---+- ---+- ---+- ---+- ___+ 600ANGDDNGGWATAHATFYGGA
TGATGCTACCGGCACAATGGGGGGAGCTTGTGGTTATGGA.A ACCTGTACAGTCAAGGGTA601 - ---+- ---+- ---+- ---+- ---+- ___+ 660DATGTMGGACGYGNLYSQGY
TGGAACGAGCACAGCAGCTTTGAGCTCTGCACTTTT661- - ---+- ---+- ---+------ 696
GTSTAAI,SSAI.
Nucleotide sequence of the pFSI8BEXP constmct, with the pFS14 cDNA coding region and
conceptual translation shown in blue text. The pFSl4 cDNA ATG translation initiation codon
is shown in a red box. The NheIl Xba I site used in the cloning of the pFS18 promoter is
shown outlined. The SmaA Nde I site used in the original cloning of the pFSIS promoter into
the pJK.KiwiGUS.ocs.KmfC) GUS expression vector is also outlined. The pFS18 TATA and
CAAT boxes shown in bold text (Dr s. orford, personal communication).
286
expression analysis shall be undertaken on plants with the constructs integrated into their
genome. Expression analyses will involve GUS assays, for the two reporter constructs and
Real-Time PCR for the misexpression constructs, where transcript levels of the fibre-specific
ct- expansin can be quantified and compared with endogenous fibre-specific o-expansin in
non-transgenic Coker 315 plants. In addition to expression analysis of the transgenic cottons,
analysis of fibre length, strength and fineness shall also be undertaken and compared with a
non-transgenic Coker 31 5 control. If fibre morphology is altered, crossing of transgenics with
commercial benefit to the G. hirsutum cv. Siokra 1-4 plants can proceed.
7.7 Conclusions and considerations
Four constructs were generated which were designed to increase, prolong or decrease
the fibre-specific o-expansin gene (Orford and Timmis, 1998) in transgenic cotton plants.
Such transgenic cotton plants may produce cotton fibres that have an increased length and, in
the case if the antisense construct def,rne the exact role the fibre-specific oc-expansin plays in
fibre elongation. Analysis of the transgenic cotton will shed light on the role that the fibre-
specific cr-expansin plays during fibre development. If the fibre morphology is modified in
any of the transgenic plants, the genotypes may be used in breeding programs in combination
with other desirable traits such as insect or herbicide resistance to produce a field crop that is
environmentally and economically improved.
Previous results in cotton and other species suggest that, the use of fibre-specific
promoters to alter the expression profile of a fibre specific cr-expansin oDNA in transgenic
plants is promising. Not only have fibre-specific promoters been previously shown to direct
transgene expression in developing cotton fibres (John and Keller, 1996), but the over
expression of ø-expansins has also shown to induce larger Arabídopsis leaves (Cho and
Cosgrove, 2000), and increase tomato fruit softening in transgenic tomato compared with
wildtype (Brummell and Harpster, 2001). Therefore it is likely that transgenic cotton plants
produced from the constructs described in this Chapter will have altered fibre morphology287

However the generation of transgenic cotton plants is a lengthy process, and the results are
not available for incorporation into this thesis.
288

APPENDICES
289

290

GhExpl0 GhExpI2(654 bp) Figure 3.10
GhExpl4(37 bp) Figure 3.11
TATÄ box
CAAT box
ACGT box (5
AGL2ATConsensus(5',NNV/NCCAWWWWTRGWWAN3')AMYBox2 (5'TATCCAT3')
I asrttvrmlrcalrrv (s'rcncõti -I
B2GMAUX28 (5
BOXIINTPATPB (5'ATAGAA3')
I - 423;34s;214,-no---I
-431, 444, -n7
DofcoreZM (5'AAAG3')
E-box (5'CANNTG3')
GTlconsensus (5'GRWAAW3')
L1BOXATPDF1 (5'TAAATGYA3')
MRD1 (5'TGCRCNC3')
MYBcore (5'CNGTTR3')
MybSTl (5'GGATA3')
MycATRD22 (5'CACATG3')
POLASTG2 (S',AATTAAA3' )
PollenlLetlat52 (5'AGAAA3')
QELEMENTZMZMIS ( s', AGGTCA3', )
RÂVIAAT CAACA3')
RootmotifTAloxl (5' ATATT3' )SEF'IMOTIF'
SEF4MotifGMTs
TATCCAYMOTIF'OSR (5'TATCCAY3' )
vvBoxATNPRl (5',TTGAC3',)
-519, -359, -31t,-295
I cÁrÀ soi tjrcAfÀi') ,t: f 484;f42,4t6,-1i ---"--li
-506,470, -442, -239, -10
, -306, -243, -t7t
I
FqryqTryI---_lr -îrd.Ð*-__l
LTlry - l -476,4'1r, -240, -212, -tt
-181, -1s8, -1ss, -71
-538, -579, -568, -21s, -
- 138
I
WBBOXPCWRKYI (5',TTTGACT3',) -134
291

BOXIINTPATPB (5'A IAGAA3')
DofcoreZM (5'AAAG3')
E-box (5'CANNTG3')
Box
GTlconsensus (5'GRV/AAV/3')
I-box core (5'GATA3')
(5'TAAATGYA3')
GhExp14.4(1017 bp) Figure 3.19
-83
-54, -49
-r45
-280
-1008
-t24
-9 5t, -946, -908, -892, -87 r, -860, -829, -78t , -63r, 462
-843,486, -383, -210, -31,
-9s9, -832, -729, -623, -s60, -5s3, -526, -464
-833
-788
-703
-833,-367,-249,
--t
-7'.12, -254
GhExp6(201 bp) Figure 3.12
TATA box
CAÄT box
ACGT (s'TAGCTA3')
AGL2ATConsensus(5'NNWNCCAWWWWTRGWWAN3')
AMYBox2 (5'TATCCAT3')
ASFIMOTIFCaMV (5'TGACG3
-56, -s5
-201,44
MÄRTbox -66
MRE1 (5'TGCRCNC3') - 190
(5',CNGTTR3',)
-179
MybSTl (s'GGATA3')
MycATRD22 (5'CACATG3')
POLASTG2 (s',AA
(5'AATAAT3')
Ilj
') -816
-7s9, -287RootmotifTAPoxl (5'ATATT3')
WVú3')
SEF 4MotifGMTs (5' RTTTTTR3' )
(s'TATCCAY3',)
wBoxATNPRI (s',TTGAC3',)
292
-1009

o(-expansln Plant species Reference GenbankAccessionNumber
Arabidopsis thaltqna : Shcherban et al., 1995 I AC073178AtÛxp5 Arabidopsis thaliana 1995 u30478
T- Att.p;j Arabi thaliana u30480At0xpS 4C002336AtExpl0 A thalianq Cho and Cosgrove,2000 /^F229431
BnExpl Brassica napus Geshi, et al., 1998 4J000885CsExpl Cucumber sativus Shcherban et ql., 1995 u30382CsExp2 Cucumber sativus Shcherban et al., 1.995 u30460FaÛxp2 Fragaria x ønaassa Harrison et aL.,2001 4F1s9563FpExpI Festuca pratensis Reidy et a1.,2001 ¡'1276006
GhUxpI4.2 Gossypíum hirsutum Harmer et a1.,2002 l^F512539
GhExpl4. 4 Go,spypiyry_c Harmer et a1.,2002 4F512540hirsutum Harmer et a1.,2002 AF5I254I
GhUxpl2 hirsutum Harmer et a1.,2002 /^F512542
GhExpl4 hirsutum Harmer et al.,2OO2 /^F5t2543GhExp6 hirsutum Harmer et a1.,2002
^F512544esulentum Rose, et aL.,2000 u82123LeExp2 Lycopersicon esulentum Catala et al., 2000 1^F096776
LeExp3 Ly c9p e rp.i c o n e.s ul entum Brummell et al., 1999 4F0s9487LeExp4 Ly c o. p er s i c o n e s ul entum Brummell et al., 1999 4F059488LeExp5 Lycoperqiggry equlentum Brummell et a1.,1999 4F059489LeExpS con esulentum Chen and Bradford, 2000 /^F184232
L esulentum Reinhardt et al., 1998 /^J004997
NtExpl Nicotiana tabacum I.ink u"d Cosgrove, 1998 4F049350
PaExp2
Oryza satíva
Prunus armeniaca
Prunus armeniaca
ChoMbeguie-A- Mbeguie D.,
et a1.,2Q02Mbeguie-A- Mbeguie D.,
et aL.,2002
/^F0493541997 Y07782
u93r67
4F03881s
Nicotiana tabacum Link and Cosgrove, 1998
Cho
OsExp4 Oryza sativa u_8s2,.46-
PraUxpl Prunis avium 4F297521Prunis avium 4F297522
PsExpI Pisum sativum Michael, 1996 x85187SaUxp3 Strigø asiatica O'Malley and Lynn, 2000 l^F291659
ZeExp3 Zinnia elegans Im et a1.,2000 4F230333
Appendix 2, Tlne ctr-expansin dataset
The 34 ø-expansin dataset used in phylogenetic analysis, with reference (if applicable) and
Genbank accession number indicated.

S. Harmer, S. Orford and J. Timmis (2002) Characterisation of six α-expansin genes
in Gossypium hirsutum (upland cotton).
Molecular Genetics and Genomics, v. 268 (1), pp. 1-9, September 2002
NOTE: This publication is included in the print copy of the thesis
held in the University of Adelaide Library.
It is also available online to authorised users at:
http://dx.doi.org/10.1007/s00438-002-0721-2

REFERENCES
29s

7
Akashi, H. (2001). Gene expression and molecular evolution. Curr Opin Genet Dev,ll(6),660-6.
Allen, R. D., Bernier, F., Lessard, P. 4., and Beachy, R. N. (1989). Nuclear factors interactwith a soybean beta-conglycinin enhancer. Plant Cell, l(6'¡, 623-31.
Altschul, S. F., Gish,'W., Miller,'W., Myers, E. W., and Lipman, D. J. (1990). Basic localalignment search tool. J Mol Biol,2l5,403-4t0.
Basra, A. S., and Malik, C.P. (1984). Development of the cotton fibre.Int Rev Cytol,89,65-1t2.
Basra, A. S., and Saha, S. (1999). Growth Regulation of Cotton Fibres. Cotton Fibres,Developmental Biology, Quality Improvement and Textile Processing, A. S. Basra,ed., The Hawthom Press, [nc., New York, 47-58.
Bate, N., Spurr, C., Foster, G. D., and Twell, D. (1996). Maturation-specific translationalenhancement mediated by the S'-UTR of a late pollen traäscr-ipt. Plant i,10(4), 6i3-23.
Bate, N., and Twell, D. (1998). Functional architecture of a late pollen promoter: pollen-specific transcription is developmentally regulated by multiple stage-specific and co-dependent activator elements. Plant Mol Biol,37(5), 859-69.
Baumann, K., De Paolis,4., Costantino, P., and Gualberti, G. (1999). The DNA bindingsite of the Dof protein NtBBFl is essential for tissue-specific and auxin-regulatedexpression of the rolB oncogene in plants. Plant Cell,llQ),323-34.
Baynton, C.8., Potthoff, S. J., McCullough, A. J., and Schuler, M. A. (1996). U-richtracts enhance 3' splice site recognition in plant nuclei. Plant J,l0(4),703-ll.
Beasley, C. 4., and Ting, l. P. (1974). Effects of plant growth substances on in vitro ftbredevelopment from unfertilised cotton ovules. Amer J Bot,61, 188-194.
Birch, R. G., and Bower, R. (1994). Principles of gene transfer using particle bombardment.Particle bombardment for gene transfer, N.-S. Y. a. A. Christou, ed.,I-37.
Birch, R. G., and Franks, T. (1991). Development and optimisation of microprojectilesystems for genetic transformation. Australian Journal of Plant Physiology,lS, 453-469.
BohmerÇ K., Balbo, I., Steinbuchel, ,4.., Tischendorf, G., and Willmitzer,L. (2002).Constitutive expression of the beta-ketothiolase gene in transgenic plants. A majorobstacle for obtaining polyhydroxybutyrate-producing plants. Plant Physiol,l2S(4),1282-90.
Brown, J. W. (1986). A catalogue of splice junction and putative branch point sequencesfrom plant introns. Nucleic Acids Res,14(24),9549-59.
Brown, J. W. S., and Simpson, C. G. (1998). Splice site selection in plant pre-mRNAsplicing. Annual Review of Plant Physiology ønd Plant Molecular Biology,49,77-95.
Brummell, D.4., and Harpster, M. H. (2001). Cell wall metabolism in fruit softening andquality and its manipulation in transgenic plants. Plant Molecular Biology,4T(l-2),3lt-340.
Brummell, D.4., Harpster, M.H., Civello, P. M., Palys, J. M., Bennett, A.8., andDunsmuir,P. (1999a). Modification of expansin protein abundance in tomato fruitalters softening and cell wall polymer metabolism during ripening. Plant Cell,1l(ll),2203-2216.
Brummell, D.4., Harpster, M. H., and Dunsmuir, P. (1999b). Differential expression ofexpansin gene family members during growth and ripening of tomato fruit. PlantMolecular Biology, 39(1), 161 -I69.
Brummell, D.4., Howie, W. J., Ma, C., and Dunsmuir, P. (2002). Postharvest fi:uit qualityof transgenic tomatoes suppressed in expression of a ripening- related expansin.P o s tharv es t B io lo gy and Tec hno lo gy, 25, 209 -220.
Burkhardt, P. K., Beyer, P., Wunn, J., Kloti, 4., Armstrong, G.^{., Schledz, M., vonLintig, J., and Potrykus, l, (1997). Transgenic nce (Oryza sativa) endosperm
296

expressing daffodil (Narcissus pseudonarcissus) phytoene synthase accumulatesphytoene, a key intermediate of provitamin A biosynthesis. Plant ¿ 11(5), 1071-8.
Caderas, D., Muster, M., Vogler, H., Mandel, T., Rose, J. K. C., McQueen-Mason, S.,and Kuhlemeier, C. (2000). Limited correlation between expansin gene expressionand elongation growth rate. Plant Physiology, \23(4), 1399-1413.
Carney, T. J. (1996). Analysis of a candidate fibre-specifìc gene from cotton, HonoursThesis, University of Adelaide, Adelaide.
Carpita, N. C., and Gibeaut, D. M. (1993). Structural models of primary cell walls inflowering plants: consistency of molecular structure with the physical properties of thewalls during growth. Plant J, 3, l-30.
Carroll, A. M., Sweigard, J. M., and Valent,B, (1994). Improved vectors for selectingresistance to hygromy cin. Fungal genetics news letter, 41, 22'
Catala,C., Rose, J. K. C., and Bennett, A. B. (2000). Auxin-regulated genes encoding cellwall-modiffing proteins are expressed during early tomato fruit growth. PlantPhy s io I o gt, 122 (2), 527 - 53 4.
Chandler, V. L., and Vaucheret, H. (2001). Gene activation and gene silencing. PlantPhysio l, 125(l), I 45-8.
Chen, F., and Bradford, K. J. (2000). Expression of an expansin is associated withendosperm weakening during tomato seed germination. Plant Physiology,l24Q),1265-1274.
Cho, II. T., and Cosgrove, D. J. (2000). Altered expression of expansin modulates leafgrowth and pedicel abscission in Arabidopsis thaliana. Proc Natl Acad Sci U S A,97(17),9783-8.
Cho, H. T., and Kende, H. (1997a). Expansin in deepwater rice internodes. Plant Physiol,113,1137-1143.
Cho, H. T., and Kende, H. (1997b). Expansins and internodal growth of deepwaterrice.Plant Physiologt, tl3(4), 1145-1 151.
Cho, II. T., and Kende, II. (1997c). Expression of expansin genes is correlated with growthin deepwater rice. Plant Cell, 9 (9), 166I -7 67 7 .
Cho, H. T., and Kende, II. (1993). Tissue localization of expansins in deepwater rice. PlantJournal,15(6), 805-8 I 2.
Civello, P. M., Powell, A. L. T., Sabehat,4., and Bennett, A. B. (1999). An expansin geneexpressed in ripening strawberry fruit. Plant Physiology,l2l(4),1273-1279.
Clarke, B. C., and Appels, R. (1998). A transient assay for evaluating promoters in wheatendosperm tissue. Genome, 4l(6), 865 -l 7.
Comai, L. (2000). Genetic and epigenetic interactions in allopollploid plants. Plant Mol Biol,43(2-3),387-99.
Comai, L., Tyagi, A. P.r'Winter, K., Holmes-I)avis, R., Reynolds, S.II., Stevens, Y., andByers, B. (2000). Phenotypic instability and rapid gene silencing in newly formedarabidopsis allotetraplo ids. The P lant C ell, l2(9), l 5 5 l -1 5 67 .
Cosgrove, D. J. (1989). Characterization of long-term extension of isolated cell walls fromgrowing cucumber hlpocotyls . Planta,l77, 721-30.
Cosgrove, D. J. (1997a). Assembly and enlargement of the primary cell wall in plants.Annual Review of Cell and Developmental Biology,13,171-207.
Cosgrove, D. J, (1997b). Relaxation in a high-stress environment: the molecular bases ofextensible cell walls and cell enlargement. Plant Cell,9(1), 1031-41'
Cosgrove, D. J. (1999). Enzymes and other agents that enhance cell wall extensibility.Annual Review of Plant Physiology and Plant Molecular Biology,50,391-417 .
Cosgrove, D. J. (2000a). Expansive growth of plant cell walls. Plant Physiology andB io chemi s try, 38(1-.2\, I 09 -124.
Cosgrove, D. J. (2000b). Loosening of plant cell walls by expansins. Nature, 407(6802),321-326.
297

Cosgrove, D. J. (2000c). New genes and new biological roles for expansins. Current Opinionin Plant Biology, 3(1\, 73-7 8.
Cosgrove, D. J. (2001). Wall structure and wall loosening. a look backwards and forwards.Plant Physiol, 125(1), 13l -4.
Cosgrove, D. J., Li, L. C., Cho, H, T., Hoffmann-Benning, S., Moore, R. C., and Blecker,D. (2002). The growing world of expansins. Plant Cell Physiol,43(12),1436-44.
Cousins, Y. L., Lyon, B. R., and Llewellyn, D. J. (1991). Transformation of an Australiancotton cultivar: prospects for cotton improvement through genetic engineering. Aust JP lant Physiol, 18, 48I -494.
Cronn, R. C., Small, R. L., and Wendel, J. F. (1999). Duplicated genes evolveindependently after polyploid formation in cotton. Proc Natl Acad Sci U S A,96(25),r4406-tt.
Daraselia, N. D., Tarchevskaya, S., and Narita, J. O. (1996). The promoter for tomato 3-h¡rdroxy-3-methylglutaryl coenzyme A reductase gene 2 has unusual reg.rlatoryelements that dircct high-lcvcl cxprcssion . Plant Physiol,llzp),727-33.
de Souza, S. J., Long, M., Klein, R. J., Roy, S., Lin, S., and Gilbert, \ü. (1998). Toward aresolution of the introns earlyllate debate: only phase zero introns are correlated withthe structure of ancient proteins. Proc Natl Acad Sci U S A,95(9), 5094-9.
Dean, C., Tamaki, S., Dunsmuir, P., Favreau, M., Katayama, C., Dooner, H., andBedrock, J. (1986). mRNA transcripts of several plant genes are polyadenylated atmultiple sites iz vívo. Nucleic Acids Res,I4(5),2229-2240.
Delaney, S. V. (unpublished).Delmer, D. P. (1999). Cellulose Biosynthesis: Exciting Timies for a Difficult Field of Study.
Annual Review of Plant Physiology and Plant Molecular Bío\og1t,50,245-276.Denecke, J.r I)e Rycke, R., and Botterman, J. (1992). Plant and mammalian sorting signals
for protein retention in the endoplasmic reticulum contain a conserved epitope. EmboJ,11,2345-2355.
Devereux, J., Ilaeber[, P., and Smithies, O. (1984). A comprehensive set of sequenceanalysis programs for the VAX. Nucleic Acids Res,l2(l Pt 1), 387-95.
Dhindsa, R. S., Beasley, C.4., and Ting,I. P. (1975). Osmoregulation in cotton fibre:accumulation of potassium and malate during growth. Plant Physiol,56,394-398.
Diazr I., Vicente-Carbajosa, J., Abraham,2., Martinez, M., Isabel-La Moneda, I., andCarbonero,P. (2002). The GAMYB protein from barley interacts with the DOFtranscription factor BPBF and activates endosperm-specific genes during seeddevelopment. Plant J, 29 (4), 453-464.
Duggleby, R. G., Kinns, H., and Rood, J. I. (1981). A computer program for determiningthe size of DNA restriction fragments. Anal Biochem,ll0(l), 49-55.
Edge, J. M.o Benedict, J. H., Carroll, J. P., and Reding, H.IC (2001). Contempory Issues.Bollgard Cotton: An Assessment of Global Economic, Environmental, and SocialBenefits. The Journal of Cotton Scíence,5, 12l-136.
Ellerstrom, M., Stalberg, K., Ezcurr4l., and Rask, L. (1996). Functional dissection of anapin gene promoter: identification of promoter elements required for embryo andendosperm-specific transcription. Plant Mol Biol,32(6), l0I9-27 .
Endrwz| J. E., Turcotte, E. L., and Kohel, R. J. (1985). Genetics, cytology and evolutionof Gos sypium. Advances in Genetics, 23, 27 7 -31 5 .
Eulgem, T., Rushton, P. J., Robatzek, S., and Somssich,I. E. (2000). The WRKYsuperfamily of plant transcription factors. Trends Plant,Sci, 5(5), 199-206.
Eulgem, T., Rushton, P. J., Schmelzer,8., Hahlbrock, K., and Somssich, I. E. (1999).Early nuclear events in plant defence signalling: rapid gene activation by WRKYtranscription factors. Embo J, 18(17), 4689-99.
Eyal, Y., Curie, C., and McCormick, S. (1995). Pollen specificity elements reside in 30 bpof the proximal promoters of two pollen-expressed genes. Plant Cell,7(3),373-84.
298

Faktor, O., Kooter, J. M., Dixon, R. A.o and Lamb, C. J.(1996). Functional dissection of abean chalcone synthase gene promoter in transgenic tobacco plants reveals sequencemotifs essential for floral expression . Plqnt Mol Biol,32(5),849-59.
Fedorov,4., Cao, X., Saxonov, S., de Souza, S. J., Roy, S.W., and Gilbert' W. (2001).Intron distribution difference for 27 6 ancient and 13 I modern genes suggests theexistence of ancient introns. Proc Natl Acad Sci U S A,98(23), l3Il7-82.
Feinberg, A. P.o and Vogelstein, B. (1983). A technique for radiolabeling DNA restrictionendonuclease fragments to high specific activity. Anal Biochem,l32(l),6-13.
Felsenstein, J. (1988). Phylogenies from molecular sequences: inference and reliability. AnnuRev Genet, 22(52I-565).
Fickett, J. W., andHatzigeorgiou, A. G. (1997). Eukaryotic promoter recognition. GenomeRes,7(9),861-78.
Finer, J. J., and McMullen, M. D. (1990). Transformation of cotton Gossypium hirsutumL.)via particle bombardment. Plant CelI Reporls, 8, 586-589.
Firoozabady,E,., DeBoer, D. L., Merlo, D. J., Halk, E. L., Amerson, L. N., Rashka, K.8.,and Murray, E. E. (19S7). Transformation of cotton (Gossypium hirsutum L.) byAgrobacterium tumefaciens and regeneration of transgenic plants. Plønt Mol Biol,10,,105-1 16.
Fleming, A. J., McQueenMason, S., Mandel, T., and Kuhlemeier, C. (1997). Induction ofleaf primordia by the cell wall protein expansion. Science,276(5317),1415-1418.
Foster, R., Izawa, T., and Chua, N. H. (1994).PlantbZIP proteins gather at ACGTelements. Faseb J, 8(2), L92-200.
Franks, T.,IIe, D. G., and Thomas, M. (1998). Regeneration of transgenic Vitis viniferaL.Sultana plants: genotypic and phenotypic analysis. Molecular Breeding,4,321-333.
Fray, R. G., \ilallace,4., Fraser, P. D., Valero, D., Heddetr, P., Bramley, P. M., andGrierson, D. (1995). Constitutive expression of a fruit phyoene synthase gene intransgenic tomatoes causes dwarfism by redirecting metabolites from the gibberellinpathway. The Plant Journal, S(5), 693-701.
Frischauf, A. M., Lehrach, H., PoustkÐ, Ã., and MurraY, N. (1983). Lambda replacementvectors carrying polylinker sequences. J Mol Biol,170(4),827-42.
Fujiwara, T., and Beachy, R. N. (1994). Tissue-specific and temporal regulation of abeta-conglycinin gene: roles of the RY repeat and other cis-acting elements. Plant MolBiol,24Q),261-72,
Gallie, D. R. (1993). Postranscriptional regulation of gene expression on plants. Annu RevPlønt Physiol Plønt Mol 8io1, 44, 77 -105.
Gidoni, D., Brosio, P., Bond-Nutter, D., Bedbrook, J., and Dunsmuir' P. (1989). Novelcis-acting elements in Petunia Cab gene promoters. Mol Gen Genet,2l5(2),337-44.
Gilmartin, P. M., Sarokin, L., Memelink, J., and Chua, N. II. (1990). Molecular lightswitches for plant genes. Plqnt Cell,2(5),369-78.
Gipson, J. R., and Joham, H. E. (1969).Influence of night temperature on growth anddevelopment of cotton (Gossypium hirsutum L.) III Fibre elongation. Crop Sci,9,l27-129.
Gniadkowski, M., Hemmings-Mieszczak, M., Klahre, U., Liu, H. X., and Filipowicz,'W.(1996). Charactenzation of intronic uridine-rich sequence elements acting as possibletargets for nuclear proteins during pre-mRNA splicing in Nicotiana plumbaginifolia.Nucleic Acids Res, 24(4), 619-27 .
Goodall, G. J., and Filipowicz,W. (1989). The AU-rich sequences present in the introns ofplant nuclear pre-mRNAs are required for splicing. Cell,58(3), 473-83.
Goodall, G.J., and Filipowicz,W. (1990). The minimum functional length of pre-mRNAintrons in monocots and dicots. Plant Mol Biol,14(5), 727-33.
Goodall, G. J., and Filipowicz, W. (1991). Different effects of intron nucleotide compositionand secondary structure on pre-mRNA splicing in monocot and dicot plants. Embo J,10(9), 2635-44.
299

J
Goynes, W. R., Ingber, B. F., and Triplett, B. A. (1995). Cotton fibre secondary walldevelopment- time versus thickness. Textile Res J,65(7),400-408.
Graves, D 4., and Stewart, J. M., (1988). Chronology of the differentiation of cotton(Gos sypium hirsutum L.) fiber cells. Planta, 17 5, 254-258.
Green, P. J., Kay, S.4., and Chua, N. H. (1987). Sequence-specific interactions of a peanuclear factor with light-responsive elements upstream of the rbcs-3A gene. Embo J,6(9),2543-9.
Gubler, F., Chandler, P. M., White, R. G., Llewellyn, D. J., and Jacobsen, J. V. (2002).Gibberellin Signaling in Barley Aleurone Cells. Control of SLN1 and GAMYBExpression . Plant Physiol, 129 (l), l9l -200.
Gubler, F., Kalla, R., Roberts, J. K., and Jacobsen, J. V. (1995). Gibberellin-regulatedexpression of a myb gene in barley aleurone cells: evidence for Myb transactivation ofa high-pl alpha-amylase gene promoter. Plant Cell,7(11),1879-91.
Gus-Mayer, S., Natoil,8., Hahlbrock, K., and Schmelzer, E. (1998). Local mechanicalstirrrulatiurt itrtluucs components of the pathogeir defense response inparcley. ProcNatl Acad Sci U S A,95(14), 8398-403.
Ha, M. A., Apperley, D. C., and Jarvis, M. C. (1997). Molecular Rigidity in Dry andHydrated Onion Cell Walls . Plant Phys iol, ll5(2), 593 -598.
Hamilton, D. 4., Schwarz, Y. H., and Mascarenhas, J. P. (1998). A monocot pollen-specific promoter contains separable pollen-specific and quantitative elements. PlantMol Biol,38(4), 663-9.
Hanahan, D. (1983). Studies on transformation of Escherichia coli with plasmids. J Mol Biol,166(4),557-80.
Hara, K., Yagi, M., Kusano, T., and Sano, H. (2000). Rapid systemic accumulation oftranscripts encoding a tobacco WRKY transcription factor upon wounding. Mol GenGenet,263(l),30-7 .
Harmer, S. 8., Orford, S. J., and Timmis, J. N. (2002). Characterisation of six alpha-expansin genes in Gossypium hirsutum (upland cotton). Mol Genet Genomics,268(1),l-9.
Harrison, E. P., McQueen-Mason, S. J., and Manning, K. (2001). Expression of sixexpansin genes in relation to extension activity in developing strawberry fruit. Journalof Experimental Botany, 52(360), 1437-1446.
Hauser, M. T., Harr, 8., and Schlotterer, C. (2001). Trichome distribution in Arabidopsisthaliana and its close relative Arabidopsis lyrata: molecular analysis of the candidategene GLABROUSI . Mol Biol Evol,lS(9),1754-63.
Higo, K., Ugawa, Y., Iwamoto, M., and Korenaga, T. (1999). Plant cis-acting regulatoryDNA elements (PLACE) database: 1999. Nucleic Acids Res,27(l),297-300.
Hirzmann, J., Luo, D.r llahnen, J., and llobom, G. (1993). Determination of messengerRNA 5'-ends by reverse transcription of the cap structure. Nucl Acids Res,21,3597-3598,
Hoeren, F. U., Dolferus, R., Wu, Y., Peacock, W. J., and I)ennis, E. S. (1998). Evidencefor a role for AtMYB2 inthe induction of the Arabidopsis alcohol dehydrogenasegene (ADHI) by low oxygen. Genetics,149(2),479-90.
Holmes, D. S., and Quigley, M. (1981). A rapid boiling method for the preparation ofbacterial plasmids. Anal B i o chem, ll4(l), 193 -l .
Hooley, R. (1994). Gibberellins: perception, transduction and responses. Plqnt Mol Biol,26(5), t529-55.
Hsu, C. Y., Creech, R. G., Jenkins, J. N., and Ma, D. P. (1999). Analysis of promoteractivity of cotton lipid transfer protein gene LTP6 in transgenic tobacco plants. PlantScience, 143 (l), 63 -7 0.
Huang, J., Takano, T., and Akita, S. (2000). Expression of alpha-expansin genes in youngseedlings of rice (Oryza sativa L.). Planta,2ll(4),467-473.
300

Hunt, A. G. (1994). Messenger RNA 3' end formation in plants. Annual Review of PlantPhysiology and Plant Molecular Biology, 45, 47 -60.
Hutchison, K. W., Singer, P.8., Mclnnis, S., Diaz'SalazrC., and Greenwood, M. S.(1999). Expansins are conserved in conifers and expressed inhypocotyls in responseto exogenous auxin. Plant Physiology, 120(3), 821-831.
Hwang, Y.-S., McCullar, C., and Huang, N. (2001). Evaluation of expression cassettes indeveloping rice endosperm using a transient expression assay. Plant Science,16l,ll07-1116.
Im, K. H., Cosgrove, D. J., and Jones, A. M. (2000). Subcellular localization of expansinmRNA in xylem cells. Plant Physiol,123(2),463-10.
lzawa, T., Foster, R., and Chua, N. H. (1993). PlantbZIP protein DNA binding specificity.J Mol Biol, 230(4), ll3l-44.
John, M. E. (1992). An efficient method for isolation of RNA and DNA from plantscontaining polyphenolics. Nucl Acids Res, 20, 2381.
John, M. E. (1994). Re-engineering Cotton Fibre. Chemistry and Industry,676- 619.John, M. E. (1997). Cotton crop improvement through genetic engineering. Critical Reviews
in Biotechnology, l7 (3), 1 85-208.John, M.8., and CrowrL. J. (1992). Gene expression in cotton (Gossypium hirsutum L.)
fiber: cloning of the mRNAs. Proc Natl Acad Sci U S A,89(13), 5'769-73.John, M. E., and Keller, G. (1996). Metabolic pathway engineering in cotton: Biosynthesis
of polyhydroxybutyrate in fiber cells. Proc Natl Acad Sci U S A,93(23),12768-12773.John, M. E., and Stewart, J. (1992). Genes for genes: biotechnological advances in cotton.
Trends Biotech, 10, 1 65-170.Joshi, C. P. (1987). An inspection of the domain between the putative TATA box and the
translation start site in79 plant genes. Nucleic Acíds Aes, 15(16),6643-6653.Kang, H. G., Jun, S. H., Kim, J., Kawaid€, H., Kamiya, Y., and An, G. (1999). Cloning
and molecular analyses of a gibberellin 20-oxidase gene expressed specifically indeveloping s eeds of watermelon. P I ant P hy s i o l, 121(2), 31 3 -82.
Kang, H. G., and Singh, K. B. (2000). Charactenzation of salicylic acid-responsive,arabidopsis Dof domain proteins: overexpression of OBP3 leads to growth defects.Plant J,2L(4),329-39.
Karn, J., Matthes,II. W., Gait, M. J., and Brenner, S. (1984). A new selective phagecloning vector, lambda 2007, with sites for XbaI, BamHI, HindIII, EcoRI, SstI andXhoI. Gene, 32(1-2\, 217 -24.
Kawagoe, Y., Campbell, B. R., and Murai, N. (1994). Synergism between CACGTG (G-box) and CACCTG cis-elements is required for activation of the bean seed storageprotein beta-phaseolin gene. Plant ¿ 5(6), 885-90.
I(eegstra, K., Talmadge, K. \il., Bauer, W. D., and Albersheim, P. (1973). Structure ofplant cell walls. III. A model of the walls of suspension-cultured sycamore cells basedon the interconnections of the macromolecular components. Plant Physiol,sl, 188-196.
I(eller, W. (1995). No end yet to messenger RNA 3'processingl Cell,81(6), 829-32.Kim, fI. J., and Triplett, B. A. (2001). Cotton fiber growth in planta and in vitro. Models for
plant cell elongation and cell wall biogenesis. Plant Physiol,l2T(4), 136l-6.Kim, H. J., Williams, M. Y., and Triplett, B. A. (2002). A novel expression assay system
for fibre-specific promoters in developing cotton fibres. Plant Molecular BiologyReporter,20,7-18.
Kim, J. H., Cho, II. T., and Kende, H. (2000). alpha-Expansins in the semiaquatic fernsMarsilea quadrifolia and Regnellidium diphyllum: evolutionary aspects andphysiological role in rachis elongation. Planta,2l2(l), 85-92.
Kimura, S., Laosinchai, W.r Itoh, T., Cui, X., Linder, C.R., and Brown, R. M., Jr.(1999).Immunogold labeling of rosette terminal cellulose-synthesizing complexes inthe vascular plant vigna angularis. Plqnt Cell, ll(11),207 5-86.
301

Kirschman, J. 4., and Cramer, J. H. (1988). Two new tools: multi-purpose cloning vectorsthat cany kanamycin or spectinomycin/streptomycin resistance markers. Gene, 68(1),163-5.
Klein, T. M., Gradziel, T., Fromm, M. E., and Sanford, J. C. (1988a). Factors influencinggene delivery into Zea mays cells by high- velocity microprojectiles. Biotechnolog!, 6,559-563.
Klein, T. M., Harper, E. C., Svab,2., Sanford, J. C., Fromm, M. 8., and Maliga, P.(1988b). Stable transformation of intact Nicotania cells by particle bombardmentprocess. Proc Natl Acad Sci U S A,85, 8502-8505.
Klein, T.M., Wolf,8.D.,'Wu, R., and Sanford, J. C. (1987). High-velocitymicroprojectiles for delivering nucleic acids into living cells. Nature,327 ,10- 13.
Ko, C. H., Brendel, V., Taylor, R. D., and'Walbot, V. (1998). U-richness is a definingfeature of plant introns and may function as an intron recognition signal inmaize.Plant Mc! Bio!, 36(4), 573:83.
Kozak, M. (1984), Coupilal.iott attd attalysis of scquerroes upstream frorn Lhe translationalstart site in eukaryotic mRNAs . Nucl Acids Res,12,857-872.
Kurland, C. G. (1991). Codonbias and gene expression. FEBS Lett,285(2'),165-9.Kurland, C. G. (1992). Translational accuracy and the fitness of bacteria. Annu Rev Genet,
26,29-50.Langer, R. II. M., and Hill, G. D. (1982). Malvaceae. Agricultural plants, Cambridge
University Press, Canrbridge, 259 -263.Larget,8., and Simon, D. L. (1999). Markov Chain Monte Carlo Algorithms for the
Bayesian Analysis of Phylogenetic Trees. Molecular Biology and Evolution,16(6\,7s0-759.
Le Gourrierec, J., Li, Y. F., and Zhort, D. X. (1999). Transcriptional activation byArabidopsis GT-l may be through interaction with TFIIA-TBP-TATA complex. Plant¿ 18(6), 663-8.
Lee, M. M., and Schiefelbein, J. (1999). WEREWOLF, a MYB-related protein inArabidopsis, is a position-dependent regulator of epidermal cell patteming. Cell,99(5), 473-83.
Lee, Y., Choi, D., and Kende, H. (2001). Expansins: ever-expanding numbers and functions.Curr Opin Plant Biol,4(6),527-32.
Lee, Y., and Kende, II. (2001). Expression of beta-expansins is correlated with intemodalelongation in deepwater rice. Plant Physiol, 127 (2), 645 -54.
Lescot, M., Dehais, P., Thijs, G., Marchal, K., Moreau, Y., Van de Peer, Y., Rouze, P.,and Rombauts, S. (2002). PlantCARE, a database of plant cis-acting regulatoryelements and a portal to tools for in silico analysis of promoter sequences. NucleicAcids Aes, 30(1), 325-7.
Lessard, P.4., Allen, R. D., Bernier, tr'., Crispino, J. D., Fujiwarao T., and Beachy, R. N.(1991). Multiple nuclear factors interact with upstream sequences of differentiallyregulated beta-conglycinin genes. Plant Mol Biol,16(3), 397-413.
Li, Q., and Hunt, A. G. (1995). A near-upstream element in a plant polyadenylation signalconsists of more than six nucleotides. Plqnt Mol Biol,28(5), 927-34.
Li, Y., Darley, C. P., Ongaro, V., Fleming, A., Schipper, O., Baldauf, S. L., andMcQueen-Mason, S. J. (2002). Plant expansins are a complex multigene family withan ancient evolutionary origin. Plant Physiol,128(3), 854-64.
Link, B. M., and Cosgrove, D. J. (1998). Acid-growth response and alpha-expansins insuspension cultures of bright yellow 2 tobacco. Plant Physiology, 118(3), 907-916.
Link, B. M., Wagner, E. R., and Cosgrove, D. J. (2001). The effect of a microgravity(space) environment on the expression of expansins from the peg and root tissues ofCucumis s ativus. P hy s i o I o g i a P I ant ar um, ll3 (2), 29 2 -3 00,
302

Liu, H. C., Creech, R. G., Jenkins, J. N., and Ma, D. P. (2000). cloning and promoteranalysis of the cotton lipid transfer protein gene Ltp3(l). Biochim Biophys Actø,1487(1), 106-1 1.
Liu, H. X., and Filipowicz, W. (1996). Mapping of branchpoint nucleotides in mutant pre-mRNAs expressed in plant cells. Plant J,9(3),381-9.
Loguercio rL.L., and Wilkins, T. A. (199S). Structural analysis of a hmg-coA-reductasepseudogene: insights into evolutionary processes affecting the hmgr gene family inallotetraploid cotton (Gossypium hirsutum L.). Curr Genet, 34(4), 241 -9 .
Loguerico,L,L.,Zhang,J. Q., and Wilkins, T. A. (1999). Differential regulation of sixnovel MYB-domain genes defines two distinct expression patterns in allotetraploidcotton (Gossypium hirsutum L.). Mol Gen Genet,26l(4'5),660-71'
Lorkovic, Z. J.rKirk, D. A. W., Lambermon, M. H. L., and Filipowicz' \il. (2000). Pre-mRNA splicing in higher plants. Trends in Plant Science,5(4'),160-161 .
Lynch, M., and Conery, J. S. (2000). The evolutionary fate and consequences of duplicategenes. Science, 290(5494), I I 51 -5.
Ma, D. P., Tan, H., Si, Y., Creech, R. G., and Jenkins, J. N. (1995). Differential expressionof a lipid transfer protein gene in cotton ftbre. Biochim Biophys Acta,1257, 8l-84.
MacDonald, M. H., Mogen, B. D., and Hunt, A. G. (1991). Charactenzation of thepolyadenylation signal from the T-DNA-encoded octopine synthase gene. NucleicAcids Res, 19(20), 5575-8 1 .
Maizel, J. V., Jr., and Lenk, R. P. (1981). Enhanced g¡aphic matrix analysis of nucleic acidand protein sequences. Proc Natl Acad Sci U S A,78(12),7665-9.
Martin, C., and Paz-Ares, J. (1997). MYB transcription factors in plants. Trends Genet,t3(2),67-73.
Marzabal, P., Busk, P. K., Ludevid, M. D., and Torrent, M. (1998). The bifactorialendosperm box of gamma-zein gene: characterisation and function of the Pb3 andGZM cis-acting elements. P I ønt J, 16(l), 4l -52.
Masterson, J. (1994). Stomatal size in fossil plants: Evidence for polyploidy in marjority ofangiosperms. Science, 264, 421 -424.
MeCabe, D. 8., and Martinell, B. J. (1993). Transformation of elite cotton cultivars viaparticle bombardment of meristems. Bíotech,11, 596-598.
McClintock, J. T., Schaffer, C. R., and Sjoblad, R. D. (1995). A comparative review of themammalian toxicity of Bacillus thuriensis-based pesticides. Pesticide Science,45,95-105.
McQueen-Mason, S., Durachko, D. M., and Cosgrove, D. J. (1992). Two endogenousproteins that induce cellwall extension in plants. Plant Cell,4,1425-33.
McQueen-Mason, S. J. (1995). Expansins and cell wall expansion. J Exp Bot,46,1639'1650.
McQueen-Mason, S. J., and Cosgrove, D. J. (1994). Disruption of hydrogen bondingbetween plant cell wall polymers by proteins that induce wall extension. Proc NatlAcad Sci USA, 9\,' 657 4-6578.
McQueen-Masono S. J., and Cosgrove, D. J. (1995). Expansin Mode of Action on Cell-Walls - Analysis of Wall Hydrolysis, Stress-Relaxation, and Binding. PlantPhysiology, 107(1), 87-1 00.
McQueen-Mason, S. J., Fry, S. C., Durachko, D. M., and cosgrove, D. J. (1993). Therelationship between xyloglucan endotransglycosylase and in-vitro cell wall extensionin cucumber hypocotyls . Planta,190(3), 327 -31.
Meinert, M. C., and Delmer, D. P. (1977). Changes in biochemical composition of the cellwall of the cotton fibre during development. Plant Physiol,59, 1088-1097.
Meisel, L., and Lam, E. (1997). Switching on gene expression: Analysis of the facotrs thatspatially and temporally regulate plant gene expression. Genetic Engineering, 19, 183-199.
303

a
Mena, M., Vicente-Carbajosa, J., Schmidt, R.J., and Carbonero, P. (1998). Anendosperm-specific DOF protein from barley, highly conserved in wheat, binds to andactivates transcription from the prolamin-box of a native B-hordein promoter in barleyendosperm. Plant J,16(l), 53-62.
Meredith, \il. R. (1984). Quantitative Genetics. Cotton, R. J. Kohcl and L. C. F., eds., 131-1 50.
Merritt, H., McCullough, A. J., and Schuler, M. A. (1997).Internal AU-rich elementsmodulate activity of two competing 3' splice sites in plant nuclei. Plant Journal,l2(4),937-943.
Michael, A. J. (1996). A oDNA from pea petals with sequence similarity to pollen allergen,cytokinin-induced and genetic tumour-specific genes: identification of a new family ofrelated sequences. Plant Mol Biol,30(1), 219-24.
Morishima, A. (1998). Identification of preferred binding sites of a light-inducible DNA-binding factor (MNFI) within 5'-upstrearn sequence of C4-t5.'pe phosphoenolpynivatecatboxylase gene in naize. Plunt Mol Biol,38(4), 633-46.
Murphy, G., and Kavanagh, T. (1988). Speeding-up the sequencing of double-strandedDNA. Nucleic Acíds Res, 16(11), 5198.
Nakamura, Y., Gojobori, T., and lkemura, T. (2000). Codon usage tabulated fromintemational DNA sequence databases: status for the year 2000. Nucleic Acids Res,28(l),292.
Olesnicky, N. S. (1995). Characterisation of fibre-specific transcripts from ootton (Gossypiumhirsutum)., Honours Thesis, University of Adelaide, Adelaide.
OrMalley, R. C., and Lynn, D. G. (2000). Expansin message regulation in parasiticangiosperms: Marking time in development . Plant Cell, l2(8), I 45 5-l 465 .
Onate, L., Vicente-Carbajosa, J., LarrarP,rDiazr I., and Carbonero, P. (1999). BarleyBLZZ, a seed-speciftcbZlP protein that interacts with BLZI in vivo and activatestranscription from the GCN4-like motif of B-hordein promoters in barley endosperm.J Biol Chem, 27 4(L4), 9Il 5-82.
Orford, S. J. (1996). Analysis of gene expression during cotton fibre development, PhDThesis, University of Adelaide, Adelaide.
Orford, S. J., Carney, T. J., Olesnicky, N. S., and Timmis, J. N. (1999). Characterisationof a cotton gene expressed late in fibre cell elongation. Theoretical and AppliedGenetics, 98(5), 7 57 -7 64.
Orford, S. J., and Timmis, J. M. (1997). Abundant mRNA's specific to the developingcotton fibr e. Theoretical and App lied Genetics (6-7), 9 09 -9 1 8.
Orford, S. J., and Timmis, J. N. (1998). Specific expression of an expansin gene duringelongation of cotton fibres. Biochimica Et Biophysica Acta-Gene Structure andExpression, 1398(3), 342-346.
Orford, S. J., and Timmis, J. N. (2000). Expression of a lipid transfer protein gene familyduring cotton fibre development. Bíochim Biophys Acta, 1483(2), 27 5 -84.
Page, R. D. M., and Cotton, J. A. (2001). Vertebrate phylogenomics: reconciled trees andgene duplications. Proceedings of the Pacific Syposium on Biocomputing2}}2, A. K.D. Russ B Altman, Lawrence Hunter, Kevin Launderdale and Teri E. Klein, ed.,V/orld Scientific Publishing, Singapore, 12.
Payne, T., Clement, J., Arnold, D., and Lloyd, A. (1999). Heterologous myb genes distinctfrom GLI enhance trichome production when overexpressed in Nicotiana tabacum.D evelopment, 126(4), 67 | -82.
Pear, J. R., Kawagoe, Y., Schreckengost, W. 8., Delmer, D. P., and Stalker, D. M. (1996).Higher plants contain homologs of the bacterial celA genes encoding the catalyticsubunit of cellulose synthase. Proc Natl Acad Sci U S A,93(22), 12637 -42.
Pearson, W. R., and Lipman, D. J. (1988). Improved tools for biological sequencecomparison. Proc Natl Acad Sci U S A,85(8), 2444-8.
304

Penfield, S., Meissner, R. C., Shoue, D. 4., Carpita, N. C., and Bevan, M. W. (2001)'MYB61 Is Required for Mucilage Deposition and Extrusion in the Arabidopsis Seed
Coat. Plant Cell, t3(12), 27 7 7 -91.Perazza,D., Vachon, G., and Herzog, M. (1998). Gibberellins promote trichome formation
by Up-regulating GLABROUS 1 in arabidopsis. Plant Phys io l, 117 (2), 3 75- 8 3.
Perlak, F. J., Deaton, R. \il., Armstrong, T. 4., Fuchs, R. L., Sims, S.R., Greenplate, J.T., and Fischhoff. (1990). Insect resistant cotton plants. Biotech,8,939-943.
Perlak, F. J., Oppenhuizen, M., Gustafson, K., Voth, R., Sivasupramaniam, S., Heering,D., Carey, B.,Ihrig, R.4., and Roberts, J. K. (2001). Development and commercialuse of Bollgard cotton in the USA--early promises versus today's reality. Plant J,27(6\,489-501.
Plesch, G., Ehrhardt, T., and Mueller-Roeber, B. (2001). Involvement of TAAAGelements suggests a role for Dof transcription factors in guard cell-specific gene
expression . Plant J, 28(4), 455 -64.Ramsey, J. C., and Berlin, J. D. (I916a). Ultrastructure of early stages of cotton fibre
differentiation. Bot Gaz, 137, I 1 -1 9.Ramsey, J. C., and Berlin, J.D. (1976b). Ultrastructure of early stages of cotton fibre
elongation. Am J Bot,63, 868-876.Raven, P. H., Evert, R. F., and Eichorn, S. ß,. (lgg2) Biology of Plants . 4th edn, V/orth
Publishers, NY.Reid, P. E., Thomson, N. J., Lawrence, P. K., Luckett, D. J., T., M. G., and Williams, E.
R. (19S9). Regional evaluation of cotton cultivars in eastern Australia, I974-1985.Aus t r ali an J ourna I of E xp e r im ent a I A gr i cultur e, 29, 67 9 - 689 .
Reidt, W., Wohlfarth, T., Ellerstrom, M., Czihal,4., Tewes,4., Ezcurrar I., Rask, L',and Baumlein, H. (2000). Gene regulation during late embryogenesis: the RY motifof maturation-specific gene promoters is a direct target of the FUS3 gene product.Plant J,2I(5),401-8.
Reidy,8., McQueen-Mason, S., Nosberger, J., and Fleming, A. (2001). Differentialexpression of alpha- and beta-expansin genes in the elongating leaf of Festucapratensis. P lant Molecular B iolo gy, 46(4), 497-504'
Reinhardt, D.,'\ryittwer, F., Mandel, T., and Kuhlemeier' C. (1998). Localizedupregulation of a new expansin gene predicts the site of leaf formation in the tomatomeristem. Plant Cell, l0(9), 1427 -7437 .
Rijnders, J. G. II. M., Yang, Y.-Y., Kamiya, Y., Takahashi, N., Barendse, G. w. M.,Blom, C. W. P. M., and Voeseneþ A. C. J. (1997). Ethylene enhances gibberellinlevels and petiole sensitivity in flooding-tolerant Rumex paluslr¿s but not in flooding-intolerant R. acetosa. Planta, 203, 20-25.
Rinehart, J.4., Petersen, M. W., and John, M. E. (1996). Tissue-specific anddevelopmental regulation of cotton gene FbL2A. Demonstration of promoter activityin transgenic plants. Plant Physiol,ll2(3), 1331-41.
Ritchie, S., and Gilroy, S. (199S). Transley Review No. 100 Gibberellins: regulating genes
and germination. New Phytologist, 140, 363-383.Robles. (1994). pGEM-T vector systems troubleshooting guide . Promega notes, 45,I9-2Q.Rochange, S. F., Wenzel, C.L., and McQueen-Mason, S. J. (2001). Impaired growth in
transgenic plants over-expressing an expansin isoform. Plant Molecular Biology,46(5), 581-589.
Rodrigo, M. J., Garcia-MartinezrJ.L., Santes, C. M., Gaskin, P., and Hedden, P. (1997).The role of gibberellins Al and A3 in fruit growth of Pisum sativum L. and theidentification of gibberellins A¿ and A7 in young seeds. Planta,20l, 446-455.
Romano,4., Raemakers, K., Visser, R., and Mooibroek, H. (2001). Transformation ofpotato (Solanum tuberosum) using particle bombardment. Plant Cell Reports,20,198-204.
30s

Rombauts, S., Dehais, P., Van Montagu, M., and Rouze, P. (1999). PlantCARE, a plantcis-acting regulatory element database. Nucleic Acids Res, 27 (1), 29 5 -6.
Rose, J. K., Cosgrove, D. J., Albersheim, P., Darvill, A. G., and Bennett, A. B. (2000).Detection of expansin proteins and activity during tomato fruit ontogeny. PlantPhysiolo gy, 123(4), 1 5 83 - 1 592.
Rose, J. K., Lee, H. H., and Bennett, A. B. (1997). Expression of a divergent expansin geneis fruit-specific and ripening-regulated. Proc Natl Acad Sci U S A,94(ll),5955-60.
Rothnie, H. M. (1996). Plant mRNA 3'-end formation. Plant Mol Biol,32(l-z\,43-61.Ruan, Y.L., Llewellyn, D. J., and Furbank, R. T. (2001). The control of single-celled
cotton fiber elongation by developmentally reversible gating of plasmodesmata andcoordinated expression of sucrose and K+ transporters and expansin. Plant Cell,l3(I),47-60.
Ryser, U. (1985). Cell wall biosynthesis in differentiating cotton fibres. Eur J Cell Biol,39,236-256.
Ryscr, U. (1999) Cotton Fibre Initiation and Ilistodifferentiation. Cotton Fibers,Developmental Biology, Quality Improvement and Textile Processing, A. S. Basra,ed., The Hawthorn Press, Inc., New York,l-47.
saito, M., chikazùw^, T., Matsuoka, H., Nishizawa, Y., and shibuya, N. (2000). Elicitoraction via cell membrane of a cultured rice cell demonstrated by the single-celltransient assay. J B iotechnol, 7 6(2-3\, 227 -32.
Salohcimo, M., Paloheimo, M., Ilakola, S., Pere, J., Swansotr,8., Nyyssonerr, E., Bhatia,4., Ward, M., and Penttila, M. (2002). Swollenin, a Trichoderma reesei protein withsequence similarity to the plant expansins, exhibits disruption activity on cellulosicmaterials. Eur J Biochem, 269(17), 4202-ll.
Sambrook, J., Fritsch, E. F., and Maniatis, T. (1989). Molecular cloning: A laboratorymanual..
Sandler, S. J., Stayton, M., Townsend, J.4., Ralston, M. L., Bedbrook, J. R., andI)unsmuir, P. (1988). Inhibition of gene expression in transformed plants by antisenseRNA. Plant Mol Biol,11,301-310.
Sanfacon, H., Brodmann, P., and Hohn, T. (1991). A dissection of the cauliflowermosaicvirus polyadenylation signal. Genes Dev,5(l), l4l-9.
Sanford, J. C. (1990). Biolistic plant transformation. Physiologia Plantarum,79,206-209.Sawant, S. Y., Singh, P. K., Gupta, S. K., Madnala, R., and Tuli, R. (1999). Conserved
nucleotide sequences in highly expressed genes in plants. Journal of Genetics,TS(2),123-13t.
Seagull, R. W. (1986). Changes in microtubule organisation and wall microfibril orientationduring in vitro cotton fibre development: an immunofluorescent study. Can J Bot,64,1 373-1 38 1.
Seagull, R. W. (1992). A quantitative electron microscopic study of changes in microtubulealrays and wall microfibril orientation during in vitro cotton fibre development. J CeltSci, l0l,56l-577.
Shcherban, T. Y., Shi, J., Durachko, D. M., Guiltinan, M. J., McQueenmason, S. J.,Shieh, M., and Cosgrove, D. J. (1995). Molecular-Cloning and Sequence-Analysis ofExpansins - a Highly Conserved, Multigene Family of Proteins That Mediate Cell-V/all Extension in Plants. Proceedings of the National Academy of Sciences of theUnited States of America, 92(20), 9245 -9249.
Sheehy, R. 8., Kramer, M., and Hiatt, W. R. (1983). Reduction of polygalacturonaseactivity in tomatio fruit by antisense RNA. Proc Natl Acad Sci U S A,85, 8805-8809.
Short, J. M., Fernandez, J. M., Sorge, J.4., and Huse, \ry. D. (1983). Lambda ZAp: abacteriophage lambda expression vector with in vivo excision properties. NucleicAcids Res, 16(15), 7583-600.
Singh, K. B. (1998). Transcriptional regulation in plants: the importance of combinatorialcontrol. Plqnt Physiol, 118(4), lIlI-20
306

Skriver, K., Olsen, F. L., Rogers, J. C., and Mundy, J. (1991). cis-acting DNA elementsresponsive to gibberellin and its antagonist abscisic acíd. Proc Natl Acad Sci U S A,88(16),7266-70.
Smart, L.8., Vojdani, F., Maeshima, M., and Wilkins, T. A. (1998). Genes involved inosmoregulation during turgor-driven cell expansion of developing cotton fibers aredifferentially re gulate d. P I ant P hy s i o l, 11,6(4), | 53 9 - 49 .
Smith, C. J. S., Watson, C. F., Ray, J., Bird' C. R., Morris, P. C., Schuch, W., andGrierson, D. (1988). Antisense RNA inhibition of polygalacturonase gene expressionon transgenic tomatoes . Nature, 334, 1 24-726.
Sober, E. (1988). Reconstructing the past : parsimony, evolution, and inference, MIT press,Cambridge, Massachusetts.
Solano, R., Nieto, C., Avila, J., Canas, L.rDiazr I., and Paz-Ares, J. (1995). Dual DNAbinding specificity of a petal epidermis-specific MYB transcription factor (MYB.Ph3)from Petunia hybrida. Embo ¿ 14(8), 1773-84.
Soltis, P. S., Soltis, D.8., and Chase, M. W. (1999). Á,ngiosperm phylogeny inferred frommultiple genes as a tool for comparative biology.Pc - 402-4. Nature,402(6760\,402-4.
Southgate,8.M., Davey, M. R., Power, J.8., and Marchant, R. (1995). Factors affectingthe genetic engineering of plants by microprojectile bombardment. BiotechnologyAdv anc es, 13 (4), 63 1 - 6 5 7 .
Staden, R. (1980). A new computer method for the storage and manipulation of DNA gelreading data. Nucleic Acids Res, 8(L6), 3673-94.
Staden, R. (19S4). Computer methods to aid the determination and analysis of DNAsequences. Biochem Soc Trans, 12(6), 1005-8.
Stalberg, K., Ellerstom, M., Ezcurra,I., Ablov, S., and Rask, L. (1996). Disruption of anoverlapping E-box/ABRE motif abolished high transcription of the napA storage-protein promoter in transgenic Brassica napus seeds. Plantø,199(4),515-9.
Stebbins, G. L. (1966). Chromosomal variation and evolution. Science,l52,1463-1469.Steel, M., and Penny, D., (2000) Parsimony, likelihood, and the role of models in molecular
phylogenetics. Mol Biol Evol, L7(6),839-850.Stewart, J. M. (1975). Fibre initiation on the cotton ovule (Gossypium hirsutum). Amer J
Bot,62Q)),123-730.Sturkie, D. G. (1934). A study of lint and seed development in cotton as influenced by
environmental factors. Am Soc Agron,26,1-24.Talbott, L. D., and Ray, P. M. (1992). Molecular size and separability features of pea cell
wall polysaccharides: implications for models of primary wall structure. Plant Physiol,98, 357-368.
Tamura, K., and Nei, M. (1993). Estimation of the number of nucleotide substitutions in thecontrol region of mitochondrial DNA in humans and chimpanzees. Mol Biol Evol,10(3), 512-26.
Thomas, M. S., and Flavell, R. B. (1990). Identification of an enhancer element for theendosperm-specific expression of high molecular weight glutenin. Plant Cell,2(12),1171-80.
Thompson, J.D., Higgins, D.G., and Gibson, T. J. (1994). CLUSTAL W: improving thesensitivity of progressive multiple sequence alignment through sequence weighting,position-specific gap penalties and weight matrix choice. Nucleic Acíds Res,22(22),4673-80.
Thomson, N. J., Reid, P. 8., and \Milliams, E. R. (1987). Effects of the okra leaf,nectariless, frego bract and glabrous conditions on yield and quality of cotton lines.Euphytica, 36, 545-553.
Tripleff, J.D., and Timpa, B. A. (1995). Characterisation of cell wall polymers from cottonovule culture fibre cells by gel permeation chromatography. In Vitro Cell Dev Biol-Plant,3l,17l-775.
301

J
Tyagi, A. K. (2001). Plant genes and their expression. Current Science, S0(2), 16l-169.Ulm, R., and Mittelsten Scheid, O. (2001). A hairy tale: Glabrous meets Werewolf. Trends
Plant Sci,6(8),343.Vain, P., Keen, N., Murillo, J., Rathus, C., Nemes, C., and Finer, J. J. (1993a).
Developmcnt of thc Particlc Inflow Gun, Plant Cell, Tissue and Organ Culture,33,237-246.
Vain, P., McMullen, M. D., and Finer, J. J. (1993b). Osmotic treatment enhances particlebombardment-mediated transient and stable transformation of maize. Plant CellReports, 12, 84-88.
van den Heuvel, K., Barendse, G. W. M., and Wullems, G. J. (2001). Effect of gibberellicacid on cell division and cell elongation in anthers of the gibberellin deficient gib-1mutant of tomato. Plqnt Biology,3Q), 124-131.
Vicente-Carbajosa, J., Moose, S. P., Parsons, R. L., and Schmidt, R. J. (1997). Amaizezinc-finger protein binds the prolamin box inzein gene promoters and interacts rn'ithLlre basir,leu<;ine zipper transcriptional activator Opaque2. Proc Natl Acad Sci'U S A,94(14),7685-90.
Vicente-Carbajosa, J., Onate, L.rLararP.rDiazr I., and Carbonero, P. (1998). BarleyBLZI: abZlP transcriptional activator that interacts with endosperm-specific genepromoters. Plant ¿ 13(5), 629-40.
Villain, P., Mache, R., and Zhou, D. X. (1996). The mechanism of GT element-mediatedcell type-specihc transoriptional control . J Biol Chem,271(51),32593-8.
von Heijne, G. (1985). Signal sequences. The limits of variation. J Mol Biol,184(l), 99-105.von Heijne, G. (1988). Transcending the impenetrable: how proteins come to terms with
membrane s. B io chim B iophys Acta, 947 Q), 307 -33 .Vriezen, W. H., De Graaf, 8., Mariani, C., and Voesenek, L. (2000). Submergence induces
expansin gene expression in flooding- tolerant Rumex palustris and not in flooding-intolerant R- acetosa. Planta, 2 10(6), 9 56-963 .
Wada, T., Tachibana, T., Shimura, Y., and Okada, K. (1997). Epidermal celldifferentiation in Arabidopsis determined by a Myb homolog, CPC. Science,277(5329),1 I l3-ó.
Walker, A. R., and Marks, M. D. (2000). Trichome initiation onArabidopsis. Advances inB otanical Res earch, 31, 219 -23 6.
Washidar II.r'Wu, C. Y., Suzuki,4., Yamanouchi, U., AkihamîrT., Harada, K., andTakaiwa, F. (1999). Identification of cis-regulatory elements required for endospermexpression of the rice storage protein glutelin gene GluB-1. Plant Mol Biol,40(1), 1-12.
Washio, K. (2001). Identification of Dof proteins with implication in the gibberellin-regulated expression of a peptidase gene following the germination of rice grains.Biochim B iophys Acta, 1520(l), 54-62.
Watson, M. E. (1984). Compilation of published signal sequences. Nucleic Acids Res,12(13),5t45-64.
Wendel, J. F. (1989). New World tetraploid cottons contain Old V/orld cytoplasm. Proc NatlAcad Sci U S A, 86, 4132-4136.
Wendel, J. F., and Cronn, R. C. (2002). Polyploidy and the evolutionary history of cotton.Advances in Agronomy.
Wetterauer, 8., Salger, K., Demel, P., and Koop, H. (2000). Efficient transformation ofDictyostelium discoideum with a particle inflow glr:r. Biochim Biophys Acta,l499(l-2), 139-143.
\Milkins, T.4., Rajasekaran, K., and Anderson, D. M. (2000). Cotton Biotechnology.Critical Reviews in Plant Sciences,19(6), 511-550.'Wu, C., Washida, H., Onodera, Y., Harada, K., and Takaiwa, F. (2000). Quantitativenature of the Prolamin-box, ACGT and AACA motifs in a rice glutelin gene promoter:
308
minimal cis-element requirements for endosperm-specific gene expression. Plant J,23(3),415-21.
Wu, C. Y., Suzuki,4., Washida, H., and Takaiwa' F. (1998). The GCN4 motif in a riceglutelin gene is essential for endosperm-specific gene expression and is activated byOpaque-2 in transgenic rice plants. Plønt J,14(6), 673-83.
\ilu, Y. J., Meeley, R. 8., and Cosgrove, D. J. (2001). Analysis and expression of the alpha-expansin and beta-expansin gene families in maize. Plant Physiology,126(l),222-232.
Yamashita, T., Asako,I., and Morikawa, H. (1991). Evidence that more than9}o/o of beta-glucuronidase expressing cells after particle bombardment directly recieve the foreigngene in their nucleus. Plant Physiol,9T , 829-831.
Yamauchi, D. (2001). A TGACGT motif in the 5'-upstream region of alpha-amylase genefrom Vigna mungo is a cis-element for expression in cotyledons of germinated seeds.
Plant Cell Physiol, 42(6), 63 5 -41.Yanagisawa, S. (2000). Dofl and Dof2 transcription factors ale associated with expression of
multiple genes involved in carbon metabolism in maize. Plant J,2lQ),281-8.Yanagisawa, S., and lzui, K. (1993). Molecular cloning of two DNA-binding proteins of
maize that are structurally different but interact with the same sequence motif. J BiolChem, 268Q1), | 6028-3 6.
Yanagisawa, S., and Schmidt, R. J. (1999). Diversity and similarity among recognitionsequences of Dof transcription factors. Plant J,17(2),209-14'
Yanagisawa, S., and Sheen, J. (1998). Involvement of maize Dof zinc finger proteins intissue-specific and light-regulated gene expression. Plant Cell,10(l),75-89.
Ye, X., Al-Babili, S., Kloti, A'.rZhang, J., Lucca, P., Beyer, P., and Potrykus,I. (2000).Engineering the provitamin A (beta-carotene) biosynthetic pathway into (carotenoid-free) rice endosperm . S ci ence, 287 (5451'), 3 03 -5.
Zlrrolu, D. X. (1999). Regulatory mechanism of plant gene transcription by GT-elements andGT-factors . Trends Plant Sci, 4(6), 210-214.
Zlnu, Q., Dabi, T., Lamb, C. J. (1995) TATA box and lnitiator Functions in the AccurateTranscription of a Plant Minimal Promoter in Vitro. The Plant Cell, 7,1681-1689.
309

AddendumPage 4,line 25
Page3l,Table2.4
Page 46, line 1
Page 47,line 18
Page 103-104, Figure 3.18
Page 166
Page 197 ,line 20-21
Page 208, line 5
Page226,line 5
Page240,line 6
Page 242,line 23
Page257,line 13
Page 257 ,line 27
Page 267 ,line 25
Page283,line 16-17
Page283 line 20-21
delete "commercial value"
replace "GUS repofier construct" with "35SGUS reporter construct"
insert "wefe" between "designed" and "manufactured"
insett "using" between "achieved" and"a"
the red boxes should be shifted one nucleotide to the left to enclose the
ATG and TAA triplets
"GhEXPl" should read "GhEXP1O"
replace "allowing antibiotic resistance as a selection marker in transgenic
plants" with "allowing selection for the plasmid in bacteria"
insert "It should be noted that the promoters analysed here may control
expression in cotton tissues not tested or under conditions not used in this
assay."
replace "(5'CAACTWH33)" with "(5'CAACTWH3')"
replace "SH2" with "RACE2"
inseft "stained overnight in X-gluc," between "was" and "washed"
replace "boll weevil" with "bollwotm"
replace "is currently being trailed in Australia" with "and has been
approved for commercial release in Australia"
insert "It is impossible to predict the nature of such morphological
changes, but longer and stronger fibres are the ultimate aim of the
experiments."
replace "constructs, followed by transfotmation of each construct into Ti
plasmid virulent Agrobacterium tumefacians sftain" with "constructs,
cloning into a binary plant transformation vector carrying a plant
selectable marker, followed by transformation of each construct into an
A gr o b ac t e r i um tum efa ci en s str ain harb ouring the dis arrned Ti-plasmid. "
replace "G. ltirsutttmL. cv. Siokra 1-4" with "elite G. hirsutum varieties"
Copyright © 2022 FDOKUMEN