The potential of herbaceous native Australian legumes as grain crops: a review
Upload
khangminh22Category
view
8download
0
The characterisation of low temperature
tolerance in legumes.
James William Cooper
Submitted in accordance with the requirements for the degree of Doctor of Philosophy
The University of Leeds
School of Biology
Centre for Plant Sciences
August 2016
Page | ii
Declaration and Publications
The candidate confirms that the work submitted is their own, except where work which has formed
part of jointly authored publications has been included. The contribution of the candidate to this work
has been explicitly indicated below. The candidate confirms that appropriate credit has been given
with the thesis where reference has been made to the work of others.
Chapter 1:
Foyer, C. H., Lam, H-M., Nguyen, H. T., Siddique, K. H. M., Varshney, R. K., Colmer, T. D.,
Cowling, W., Bramley, H., Mori, T. A., Hodgson, J. M., Cooper, J. W., Miller, A. J., Kunert, K. J.,
Vorster, J., Cullis, C., Ozga, J. A., Wahlqvist, M. L., Liang, Y., Shou, H., Shi, K., Yu, J., Fodor, N.,
Kaiser, B. N., Wong, F. L., Valliyodan, B., Considine, M. J. (2016). Neglecting legumes has
compromised human health and sustainable food production. Nature Plants, 2.
DOI:10.1038/nplants.2016.112
The candidate was responsible for the generation of figure 3 and contributed to the body of the review
text.
Quain M. D., Makgopa, E. M., Cooper, J. W., Kunert, K. J., Foyer, C. H. (2015). Ectopic
phytocystatin expression increases nodule numbers and influences the responses of soybean (Glycine
max) to nitrogen deficiency. Phytochemistry, 112, 179-187. DOI:10.1016/j.phytochem.2014.12.027
The candidate was responsible for the generation of the graphical abstract and contributed to the
writing of the text.

Page | iii
Chapter 3:
Marquez-Garcia, B., Shaw, D., Cooper, J. W., Karpinska, B., Quain, M. D., Makgopa, E. M.,
Kunert., K. J., Foyer, C. H. (2015). Redox markers for drought-induced nodule senescence, a process
occurring after drought-induced senescence of the lowest leaves in soybean (Glycine max). Annals of
botany,116(4). 497-510. DOI:10.1093/aob/mcv030
The candidate was responsible for the extraction of RNA and the generation of figures pertaining to
the regulation of redox-related transcripts in drought exposed soybean crown root nodules.
Chapter 5:
Cooper, J. W., Dasgan, H. Y., Foyer, C. H. (2015). Understanding chilling tolerance in legumes.
Aspects of Applied Biology, 124. 117-121.
The candidate was responsible for the generation of all data and figures within this publication.
Chapter 6:
Cooper, J. W., Wilson, M., Derk, M., Smit, S., Kunert, K. J., Cullis, C., Foyer, C. H. (2016).
Application of short sequence reads provides improved genomic resources in faba bean (Vicia faba
L.). Journal of Experimental Botany – submitted.
The candidate was responsible for the sequencing and assembly and interpretation and representation
of all data.
© 2016 The University of Leeds and James William Cooper

Page | iv
Acknowledgments
Firstly I wish to thank my supervisor, Professor Christine Foyer, whose guidance and support have
helped me to become a better scientist. I would also like to give a special thanks to Professor Karl
Kunert, for helping to pioneer this project and for providing stimulating discussions over the past 4
years. Many thanks go to my industrial partner, Wherry and Sons Ltd, and to the BBSRC for funding
this project. Thanks also to Peter Smith, whose foresight laid the foundation for this research.
I thank my Mother, Deirdre, and my Father, Graeme, for their love and support throughout my
studies. They have always been available to provide advice on life, the universe and everything. I
couldn’t ask for better parents. I would also like to thank Adam Churchman, for his patience,
understanding and unwavering support.
I thank Barbara Karpinska for helping me take my first steps in the lab. She taught me that with
enough coffee and willpower you can master anything. I would also like to thank the other members
of the Foyer lab, both past and present, for providing such a wonderfully diverse environment to work
in. In particular I should mention my fellow PhD Students, Daniel Shaw and Ambra de Simone. My
PhD journey would have been infinitely blander without them.
Special thanks go to Dr Mary O’Connell, Dr Sandra Smit and Martijn Derks for helping me to take
my first fledgling steps into bioinformatics. Perhaps my biggest mention of gratitude goes to Dr
Michael Wilson, who has been a friend, mentor and a general source of peace and knowledge. My
understanding of bioinformatics has been due to his guidance and assistance. May the force be with
you!
I thank my collaborators: Dr Jeremy Harbinson for his assistance in constructing the freezing
chamber, Professor Christopher Cullis for his help with genomic sequencing, Dr Stefan van Wyk for
his knowledge of legumes and Professor Yildiz Dasgan, who guided me through the subtleties of
plant growth. I also thank Masters Student, Leila Beyouddh, who taught me how to be a better
teacher and whose efforts have been so greatly appreciated.
Finally I wish to thank Grace Hoysted and the rest of the PhD group, as well as the Leeds University
Union Sub-Aqua Club and my pub quiz group. Without them life would have been very boring
indeed. Special thanks go to Jamie Bojko and Jack Goode for their limitless moral support.

Page | v
Dedicated to my Nan, Doreen Cooper, who was never too old to be young.

Page | vi
Abstract
Legumes underpin the global food network, providing the majority of the world’s dietary protein.
However, global productivity of grain legumes is limited by environmental stresses, particularly
chilling and freezing. For example, chilling temperatures (0-15 ºC) limit the production of soybean
(Glycine max; a tropical legume), while extreme freezing temperatures (<0 ºC) limit use of temperate
legumes such as faba bean (Vicia faba L). The following studies were performed to gain new insights
into chilling and freezing tolerance in these two important legumes. Transgenic soybean lines,
overexpressing the rice cysteine protease inhibitor, oryzacystatin I (OCI), showed decreased chilling-
induced inhibition of photosynthesis compared to wild type (Wt). These lines also showed an
increased abundance of transcripts encoding the strigolactone (SL) biosynthesis enzymes: carotenoid
cleavage dioxygenases 7 and 8 (CCD7, CCD8). Pea (rms3, rms4, rms5) and Arabidopsis thaliana
(max2-1, max3-9, max4-1) mutants, deficient in SL synthesis and signalling, showed enhanced
sensitivity to dark-chilling. Differences in chilling and freezing sensitivity were also identified in 5
faba bean cultivars. Transcriptome profiling comparisons were performed on the most chilling
sensitive (Wizard) and most chilling tolerant (Hiverna) cultivars to identify specific differences in
gene expression, underpinning stress tolerance. Moreover, genome sequencing of the Wizard cultivar
enabled the assembly and annotation of the mitochondrial and chloroplast genomes. Single nucleotide
polymorphisms (SNP) were found in several organelle genes, when comparing read sequences to
published references. Furthermore, based on published SNP orientated linkage maps, contiguous read
sequences could be mapped to chromosomal loci, leading to the identification of 8 putative nuclear
gene sequences and an increase in sequence length data at 147 loci. Together with these new genomic
resources, the discovery that cysteine proteases, phytocystatins and SL are important in legume low
temperature tolerance will enable the development of stress tolerance markers, for use in faba bean
selective breeding programs.
.

Page | vii
Table of Contents
Acknowledgments ............................................................................................................................ iv
Table of Contents............................................................................................................................. vii
List of Abbreviations ........................................................................................................................ xi
List of tables ................................................................................................................................... xiii
List of figures....................................................................................................................................xv
1. Introduction..................................................................................................................................... 2
1.1. Low temperature stress ................................................................................................................... 2
1.2. Low temperature stress: damage, perception and transduction ...................................................... 3
1.3. Low temperature gene induction: acclimation and vernalization ................................................... 6
1.4. Cold associated hormone signalling ............................................................................................... 9
1.5. Mechanisms of protection from low temperature stress ............................................................... 12
1.6. Stress induced protein turnover .................................................................................................... 14
1.7. Legumes........................................................................................................................................ 16
1.8. Legume responses to low temperature exposure .......................................................................... 19
1.9. Genetic resources for grain legumes............................................................................................. 21
1.10. Hypothesis and objectives..................................................................................................... 23
2. Materials and Methods.................................................................................................................. 25
2.1. Plant material and growth conditions ........................................................................................... 25
2.1.1. Vicia faba .............................................................................................................................. 25
2.1.1.2. Growth on vermiculite under control conditions .................................................................. 25
2.1.1.3. Growth on vermiculite under dark chilling conditions ......................................................... 25
2.1.1.4. Growth on compost – acclimation and freezing ................................................................... 25
2.1.2. Glycine max .......................................................................................................................... 28
2.1.2.2. Growth on vermiculite .......................................................................................................... 28
2.1.2.2.1. Nodulation and drought exposure......................................................................................... 28
2.1.2.2.2. Nodulation and chilling exposure ......................................................................................... 28
2.1.2.2.3. Nodule development ............................................................................................................. 29
2.1.2.2.4. Chilling exposure in young plants ........................................................................................ 29
2.1.2.3. Growth on compost............................................................................................................... 30
2.1.2.3.1. Developmental analysis ........................................................................................................ 30
2.1.2.3.2. Chilling exposure in young plants ........................................................................................ 30
2.1.3. Pisum sativum ....................................................................................................................... 30
2.1.3.2. Growth on compost and chilling exposure ........................................................................... 30
2.1.4. Arabidopsis thaliana............................................................................................................. 31

Page | viii
2.1.4.2. Growth on compost and chilling exposure ........................................................................... 31
2.1.4.3. Growth on ½ MS media and chilling exposure .................................................................... 31
2.2. Physiological measurements......................................................................................................... 33
2.2.1. Nodule harvest and measurement ......................................................................................... 33
2.2.2. Shoot and root measurement................................................................................................. 33
2.3. Arabidopsis rosette measurements................................................................................................ 33
2.3.1. Photosynthetic parameters: gas, fluorescence and pigments ................................................ 33
2.4. Construction of dark freezing chamber......................................................................................... 34
2.4.1. Temperature control module................................................................................................. 34
2.4.2. The dark freezing chamber. .................................................................................................. 37
2.5. Nucleic acid extraction ................................................................................................................. 39
2.5.1. DNA extraction from Vicia faba embryonic axis ................................................................. 39
2.5.2. DNA extraction from leaf tissue ........................................................................................... 39
2.5.3. RNA extraction from plant tissue ......................................................................................... 40
2.6. Genomic and transcriptomic sequencing and bioinformatics ....................................................... 40
2.6.1. Genomic sequencing............................................................................................................. 40
2.6.2. Transcriptome sequencing .................................................................................................... 40
2.7. Bioinformatics .............................................................................................................................. 42
2.7.1. De novo genome assembly.................................................................................................... 42
2.7.2. Contig database for BLAST.................................................................................................. 42
2.7.3. Linkage enhanced genome contigs ....................................................................................... 42
2.7.4. Organellar genome comparisons........................................................................................... 42
2.7.5. Transcriptomic dataset analysis ............................................................................................ 43
2.8. qPCR and PCR.............................................................................................................................. 43
3. The characterisation of OCI expressing soybean under drought and chilling .............................. 46
3.1. Introduction................................................................................................................................... 46
3.2. Results........................................................................................................................................... 49
3.2.1. Effect of OCI expression on shoot morphology ................................................................... 49
3.2.2. The effect of OCI expression on root nodules and their responses to chilling ..................... 50
3.2.3. 3 nights dark-chilling: photosynthetic parameters ................................................................ 54
3.2.4. 3 nights dark-chilling: biomass accumulation ...................................................................... 56
3.2.5. 9 nights dark-chilling: phenotype ......................................................................................... 62
3.2.6. 9 nights dark-chilling: photosynthesis .................................................................................. 63
3.2.7. 9 nights dark-chilling: biomass accumulation ...................................................................... 65
3.2.8. Dark-chilling’s effect on the levels of CCD7 and CCD8 transcripts.................................... 68
3.2.9. Transcript changes in the nodules of soybean plants exposed to drought ............................ 71

Page | ix
3.3. Discussion..................................................................................................................................... 76
4. A role for strigolactone pathways on chilling tolerance in pea and Arabidopsis.......................... 80
4.1. Introduction................................................................................................................................... 80
4.2. Results........................................................................................................................................... 83
4.2.1. The effect of dark chilling stress on pea mutants that are defective in strigolactone synthesis
or signalling .......................................................................................................................................... 83
4.2.2. The effect of dark-chilling and GR24 on the growth of wild type and strigolactone-deficient
A. thaliana mutants grown on plates..................................................................................................... 96
4.2.3. The effect of dark-chilling on strigolactone deficient mutants and the wild type plants
grown on soil ...................................................................................................................................... 102
4.3. Discussion................................................................................................................................... 105
5. Characterising the low-temperature tolerance of 5 Vicia faba cultivars..................................... 108
5.1. Introduction................................................................................................................................. 108
5.2. Results......................................................................................................................................... 111
5.2.1. The effect of dark chilling stress on the growth of five faba bean cultivars....................... 111
5.2.2. The effect of acclimation on faba bean photosynthesis and freezing tolerance.................. 115
5.3. Discussion................................................................................................................................... 123
6. DNA sequencing and genomic assembly in Vicia faba .............................................................. 126
6.1. Introduction................................................................................................................................. 126
6.2. Results......................................................................................................................................... 128
6.2.1. Genomic imaging and read assembly ................................................................................. 128
6.2.2. De novo assembly and linkage map integration.................................................................. 131
6.2.3. Single nucleotide polymorphisms in the organellar genomes of Vicia faba....................... 139
6.2.4. Comparison of legume organelle genome sequences ......................................................... 143
6.3. Discussion................................................................................................................................... 148
7. Transcriptomic analysis of Vicia faba cultivars differing in low temperature tolerance, following
acclimatory growth and following exposure to dark-freezing ............................................................ 152
7.1. Introduction................................................................................................................................. 152
7.2. Results......................................................................................................................................... 154
7.2.1. Read data and cultivar comparison under control conditions ............................................. 155
7.2.2. Principal component analysis ............................................................................................. 157
7.2.3. Differential gene expression between genotypes under acclimation .................................. 158
7.3. Discussion................................................................................................................................... 163
8. General Discussion ..................................................................................................................... 168
8.1. The importance of legumes in a changing world........................................................................ 168
8.2. Proteases and protease inhibitors as targets for crop improvement ............................................ 172
8.3. The strigolactone pathway as a mediator of stress tolerance ...................................................... 174

Page | x
8.4. Enhancing low temperature tolerance in Vicia faba ................................................................... 175
8.5. Conclusions................................................................................................................................. 177
9. References................................................................................................................................... 178
Appendices ..............................................................................................................................................I

Page | xi
List of Abbreviations
°C – Degrees Celsius
Ca2+ - Calcium ion
CaM – Calmodulin
ROS – Reactive oxygen species
AFP – Antifreeze proteins
CBF – Cold binding factor
DREB – Dehydration responsive element binding factor
ERD – Early response to dehydration
COR – Cold responsive (genes)
GA – Gibberellic acid
BR – Brassinosteroids
CK – Cytokinin
ABA – Abscisic acid
ET – Ethylene
SA – Salicylic acid
JA – Jasmonic acid
SL – Strigolactone
LHC – Light harvesting complex
PET –Photosynthetic electron transport
MET – Mitochondrial electron transport
NADH – Nicotinamide adenine dinucleotide
NADPH – Nicotinamide adenine dinucleotide phosphate
ROS – reactive oxygen species
UV - Ultraviolet
CDPK – Calcium dependent protein kinase
CRT/DRE – C-repeat/dehydration responsive element
PQ – Plastoquinone
PC-Plastocyanin
ATP – Adenine triphosphate
FD – Ferrodoxin
FNR – Ferrodoxin-NADP+ reductase
RuBisCO – Ribulose-1,5-bisphosphate carboxylase/oxygenase
OCI – Oryzacystatin I
CP – cysteine protease
NFR –Nodulation factor receptor

Page | xii
MATK – Maturase K
Pi – Inorganic phosphate
Da – Dalton
kDA – Kilodalton
PCD – Programmed cell death
RNA – Ribonucleic acid
DNA – Deoxyribonucleic acid
PolyA – Polyadenylated
CT – Thermocycle number
MS – Murashige and Skoog
SL – Strigolactone
Wt - Wild type
CO2 - Carbon Dioxide
Col-0 - Colombia-0
EMS - Ethyl methanesulphonate
CCD7 – Carotenoid cleavage dioxygenase 7
CCD8 – Carotenoid cleavage dioxygenase 8
µmol – Micromoles
µM - Micromolar
cm – Centimetre
m – Metre
s – Second
h – Hour
µl – Microliters
ml – Millilitres
l – Litres
g – Gram
g – Gravity (units of)
V – Volts
v/v – Volume/Volume
bp – Base pairs
Page | xiii
List of tables
Table 1: Legume species for which genome databases are available. .................................................. 22
Table 2: Composition of modified Hoaglands plant media; Nitrogen repelete and Nitrogen deficient
(brought to pH 6 using HCl). ................................................................................................................ 27
Table 3: Materials needed for construction of temperature control module......................................... 35
Table 4: qPCR primers for use with Glycine max ................................................................................ 44
Table 5: : EMS mutants, their associated proteins and function in pea and A. thaliana....................... 83
Table 6: Quality-trimmed genomic read data for DNA extracted from Vicia faba (Wizard cv)
detailing read number and coverage. .................................................................................................. 129
Table 7: Quality-trimmed genomic read data aligned against repeat element databases, showing
repetitive element identities, the number of paired reads mapped to these repetitive sequences and the
total number of reads accounted for as a percentage. ......................................................................... 130
Table 8: Lengths and identities of SNP based synteny markers on Vicia faba chromosome 1 and the
increase in loci sequence length through contig mapping. Data presented show SNP based linkage
marker ID, the length of the SNP based linkage marker, the length of the mapped contig and the
subsequent increase in marker length at the identified loci. ............................................................... 133
Table 9: Lengths and identities of SNP based synteny markers on Vicia faba chromosome 2 and the
increase in loci sequence length through contig mapping. Data presented show SNP based linkage
marker ID, the length of the SNP based linkage marker, the length of the mapped contig and the
subsequent increase in marker length at the identified loci. ............................................................... 134
Table 10: Lengths and identities of SNP based synteny markers on Vicia faba chromosome 3 and the
increase in loci sequence length through contig mapping. Data presented show SNP based linkage
marker ID, the length of the SNP based linkage marker, the length of the mapped contig and the
subsequent increase in marker length at the identified loci. ............................................................... 135
Table 11: Lengths and identities of SNP based synteny markers on Vicia faba chromosome 4 and the
increase in loci sequence length through contig mapping. Data presented show SNP based linkage
marker ID, the length of the SNP based linkage marker, the length of the mapped contig and the
subsequent increase in marker length at the identified loci. ............................................................... 136
Table 12: Lengths and identities of SNP based synteny markers on Vicia faba chromosome 5 and the
increase in loci sequence length through contig mapping. Data presented show SNP based linkage
marker ID, the length of the SNP based linkage marker, the length of the mapped contig and the
subsequent increase in marker length at the identified loci. ............................................................... 137
Table 13: Lengths and identities of SNP based synteny markers on Vicia faba chromosome 6 and the
increase in loci sequence length through contig mapping. Data presented show SNP based linkage
marker ID, the length of the SNP based linkage marker, the length of the mapped contig and the
subsequent increase in marker length at the identified loci. ............................................................... 137
Table 14: The linkage map identities and corresponding mapped genomic contigs of V. faba. Contigs
were identified through a BLAST search against the M. truncatula database to determine probable
gene identity and function. Query length, alignment length and single nucleotide variation (SNV)
and gap number are shown. ................................................................................................................ 138
Table 15: Single nucleotide polymorphisms in the chloroplast genome of Vicia faba, comparing the
Wizard cultivar to the reference sequence published by Sabir et al., (2014)...................................... 140
Table 16: Single nucleotide polymorphisms in the mitochondrial genome of Vicia faba, comparing
the Wizard cultivar to the reference sequence published by Negruk, (2013). .................................... 142
Table 17: Total number of reads resulting from RNA sequencing of 24 samples, and the number of
reads that could be mapped to transcriptomic databases to produce a reference transcriptome. Of the

Page | xiv
69,784 transcripts that comprised the reference transcriptome, 16,687 showed evidence of
transcription in at least 1 time point or genotype................................................................................ 155
Table 18: Transcription factors differentially regulated between the Wizard and Hiverna cultivars
under acclimatory conditions. Log fold changes show the difference in gene expression in Wizard,
compared to Hiverna, thus a negative values show gene down-regulation in Wizard and positive
values show up-regulation. Conversely, if a gene is down-regulated in Wizard it will be up-regulated
in Hiverna. .......................................................................................................................................... 161
Table 19: Repetitive element identities and corresponding faba bean transcripts, determined by
repetitive element database BLAST of uncharacterised sequences differentially expressed between
genotypes under acclimatory conditions............................................................................................. 162

Page | xv
List of figures
Chapter 1
Figure 1.2 1: The impact of chilling and freezing stress on cellular function and plant physiology. 4
Figure 1.3 1: Schematic representation of the Arabidopsis thaliana cold acclimation pathway. 7
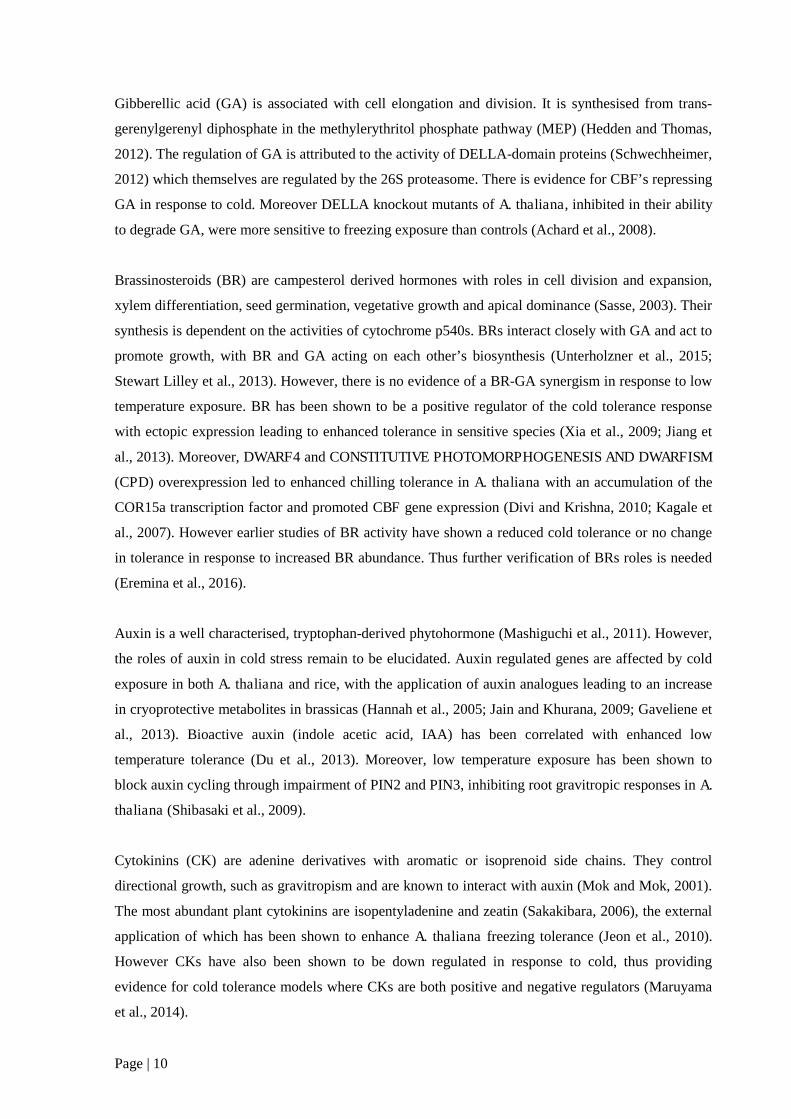
Figure 1.5 1: Schematic representation of a chloroplast, showing the reactions underpinning C3
photosynthesis. 15
Figure 1.6 2: The complex structure of tarocystatin (Colocasia esculenta) and papain, showing the
inhibition of the papain active site. 15
Figure 1.7 1: A) Determinate form nodules (demodioid) B) Indeterminate form nodules (lupinoid)17
Figure 1.7 2: A simplified representation of determinate nodule formation. 18
Figure 1.8 1: A molecular phylogeny of the legume family. 20
Chapter 2
Figure 2.1.1.4 1: Experimental design for Vicia faba dark chilling and dark freezing experiments. 26
Figure 2.4.1 1: A) Schematic diagram of dark freezing chamber temperature control module. 36
Figure 2.4.2 1: Control and power units for the dark freezing chamber. 37
Figure 2.4.2 2: Dark freezing chamber internal configuration. 38
Figure 2.4.2 3: The time taken for internal chamber temperature to reach target value . 38
Figure 2.6.2 1: DNA sequencing on an Illumina HiSeq2500 paired end platform. 41
Chapter 3
Figure 3.2.1 1: Shoot phenotype (A) and branch number (B) in 12 week old soybean wild type (Wt)
and OCI expressing lines (SOC-1, SOC-2, SOC-3). 49
Figure 3.2.2 1: Root phenotypes of 4 week old soybean; Wt and OCI lines (SOC-1, SOC-2 and SOC-
3). 50
Figure 3.2.2 2: Root fresh weight of 4 week old soybean, wild type; (Wt) and three independent
transformed lines expressing OCI; SOC-1, SOC-2, SOC-3. 51
Figure 3.2.2 3: Crown root nodules of 4 week old soybean wild type; (Wt) and three independent
transformed lines expressing OCI (SOC-1, SOC-2 and SOC-3). 52
Figure 3.2.2 4: Nodule diameter of 4 week old soybean, displaying wild type; (Wt) and three
independent transformed lines expressing OCI; SOC-1, SOC-2 and SOC-3. 52

Page | xvi
Figure 3.2.2 5: Number of crown and lateral root nodules of 4 week old soybean plants, displaying
wild type; (Wt) and three independent transformed lines expressing the rice cysteine protease
inhibitor oryzacystatin I (OCI); SOC-1, SOC-2 and SOC-3. 53
Figure 3.2.3 1: Carbon assimilation rates of soybean after 1, 2 and 3 consecutive nights of dark-
chilling or maintenance under control conditions. Panels show; A) Wild type soybean; three
independent transformed lines expressing OCI; B) SOC-1 C) SOC-2 and D) SOC-3. 54
Figure 3.2.3 2: Transpiration rates of soybean after 1, 2 and 3 consecutive nights of dark-chilling or
maintenance under control conditions. Panels show; A) Wild type soybean; three independent
transformed lines expressing OCI; B) SOC-1 C) SOC-2 and D) SOC-3 55
Figure 3.2.4 1: Shoot dry weight of soybean after 1, 2 and 3 consecutive nights of dark-chilling or
maintenance under control conditions. Panels show; A) Wild type soybean; three independent
transformed lines expressing OCI; B) SOC-1 C) SOC-2 and D) SOC-3. 56
Figure 3.2.4 2: : Root dry weight of soybean after 1, 2 and 3 consecutive nights of dark-chilling or
maintenance under control conditions. Panels show; A) Wild type soybean; three independent
transformed lines expressing OCI; B) SOC-1 C) SOC-2 and D) SOC-3. 57
Figure 3.2.4 3: Shoot: Root ratio of soybean after 1, 2 and 3 consecutive nights of dark-chilling or
maintenance under control conditions. Panels show; A) Wild type soybean; three independent
transformed lines expressing OCI; B) SOC-1 C) SOC-2 and D) SOC-3. 58
Figure 3.2.4 4: Total fresh weight of soybean after 1, 2 and 3 consecutive nights of dark-chilling or
maintenance under control conditions. Panels show; A) Wild type soybean; three independent
transformed lines expressing OCI; B) SOC-1 C) SOC-2 and D) SOC-3. 59
Figure 3.2.4 5: Total dry weight of soybean after 1, 2 and 3 consecutive nights of dark-chilling or
maintenance under control conditions. Panels show; A) Wild type soybean; three independent
transformed lines expressing OCI; B) SOC-1 C) SOC-2 and D) SOC-3. 60
Figure 3.2.4 6: Fresh weight: dry weight ratio (FW/DW) of soybean after 1, 2 and 3 consecutive
nights of dark-chilling or maintenance under control conditions. Panels show; A) Wild type soybean;
three independent transformed lines expressing OCI; B) SOC-1 C) SOC-2 and D) SOC-3 61
Figure 3.2.5 1: A comparison of the shoot phenotypes of soybean, displaying wild type; Wt (Glycine
max ‘Williams 82’) and three independent transformed lines expressing the rice cysteine protease
inhibitor oryzacystatin I (OCI); SOC-1, SOC-2 and SOC-3. 62
Figure 3.2.6 1 A comparison of the photosynthetic rates of soybean wild type ( Wt) and three
independent transformed lines expressing oryzacystatin I (OCI); SOC-1, SOC-2 and SOC-3. 63
Figure 3.2.6 2: A comparison of the transpiration rates of soybean, wild type ( Wt) and three
independent transformed lines expressing oryzacystatin I (OCI); SOC-1, SOC-2 and SOC-3. 64
Figure 3.2.7 1: A) shoot: root ratio; B) shoot dry biomass; C) soot: root ratio; of soybean wild type
(Wt) and three independent transformed lines expressing OCI; SOC-1, SOC-2 and SOC-3. 65

Page | xvii
Figure 3.2.7 2: A) fresh weight; B) dry weight; C) fresh weight: dry weight ratio (FW/DW); of
soybean wild type (Wt) and three independent transformed lines expressing OCI; SOC-1, SOC-2 and
SOC-3. 66
Figure 3.2.8 1: The relative levels of CCD7 and CCD8 transcripts in soybean leaf, stem and root
tissues. 68
Figure 3.2.8 2: The relative levels of CCD7 transcript in soybean leaves (A), stems (B) and roots (C)
69
Figure 3.2.8 3 The relative levels of CCD8 transcript in soybean leaves (A), stems (B) and roots (C).
70
Figure 3.2.9 1: The abundance of manganese or iron superoxide dismutase (MSD), copper-zinc
superoxide dismutase (CSD)1 and CSD2 transcript read fragments in senescing soybean crown root
nodules. 72
Figure 3.2.9 2 The abundance of manganese/iron superoxide dismutase 1 (MSD), copper-zinc
superoxide dismutase (CSD)1 and CSD2 transcripts in drought exposed soybean crown root nodules.
72
Figure 3.2.9 3:The abundance of monodehydroascorbate reductase 1 (MDAR1), dihydrolipoyl
dehydrogenase (DLD) and aldehyde dehydrogenase (ALDH) transcript read fragments in senescing
soybean crown root nodules. 73
Figure 3.2.9 4: The relative abundance of monodehydroascorbate reductase 1 (MDAR1),
dihydrolipoyl dehydrogenase (DLD) and aldehyde dehydrogenase (ALDH) transcripts in drought
exposed soybean crown root nodules. 73
Figure 3.2.9 5: The abundance of glutathione reductase 1 (GR1), glutathione reductase 2 (GR2),
glutaredoxin 2 (GRX2), glutaredoxin 3 (GRX3), glutaredoxin 4 (GRX4) and glutathione s-transferase
(GST) transcript read fragments in senescing soybean crown root nodules. 75
Figure 3.2.9 6 The relative abundance of glutathione reductase 1 (GR1), glutathione reductase 2
(GR2), glutaredoxin 2 (GRX2), glutaredoxin 3 (GRX3), glutaredoxin 4 (GRX4) and glutathione s-
transferase (GST) in drought exposed soybean crown root nodules. 75
Chapter 4
Figure 4.1 1: Model for the synthesis of strigolactone. 82
Figure 4.2.1 1: Shoot phenotypes of pea wild type; (L107; Wt) and three SL mutant lines deficient in
either strigolactone synthesis or signalling proteins. 85
Figure 4.2.1 2: Number of branches in pea wild type; (L107; Wt) and three SL mutant lines deficient
in either strigolactone synthesis or signalling proteins. 86
Figure 4.2.1 3: Number of leaves in pea wild type; (L107; Wt) and three SL mutant lines deficient in
either strigolactone synthesis or signalling proteins. 87
Page | xviii
Figure 4.2.1 4: Fresh shoot biomass of pea wild type; (L107; Wt) and three SL mutant lines deficient
in either strigolactone synthesis or signalling proteins. 88
Figure 4.2.1 5: Dry shoot biomass of pea wild type; (L107; Wt) and three SL mutant lines deficient
in either strigolactone synthesis or signalling proteins. 89
Figure 4.2.1 6: Fresh weight: dry weight ratios (FW/DW) of pea wild type; (L107; Wt) and three SL
mutant lines deficient in either strigolactone synthesis or signalling proteins. 90
Figure 4.2.1 7: Photosynthetic carbon assimilation rates (µmol CO2.m-2.s-1) of pea wild type; (L107;
Wt) and three SL mutant lines deficient in either strigolactone synthesis or signalling proteins. 91
Figure 4.2.1 8: Stomatal conductance (mmol H2O.m-2.s-1) of pea wild type; (L107; Wt) and three SL
mutant lines deficient in either strigolactone synthesis or signalling proteins. 92
Figure 4.2.1 9: Intracellular CO2 concentrations (µmol CO2 mol-1) of pea wild type; (L107; Wt) and
three SL mutant lines deficient in either strigolactone synthesis or signalling proteins. 93
Figure 4.2.1 10: Transpiration rates (mmol H2O.m2.s-1) of pea wild type; (L107; Wt) and three SL
mutant lines deficient in either strigolactone synthesis or signalling proteins. 94
Figure 4.2.1 11: A comparison of the A) chlorophyll a B) chlorophyll b C) chlorophyll a+b D)
carotenoid composition of pea leaves; wild type; (L107; Wt) and three SL mutant lines deficient in
either strigolactone synthesis or signalling proteins. 95
Figure 4.2.2 1: Shoot phenotypes of A. thaliana Wt plants (Col-0) and three mutant lines deficient in
strigolactone signalling (max2-1) or strigolactone synthesis (max3-9, max4-1). 97
Figure 4.2.2 2: The rosette diameter of A. thaliana wild type (Col-0) and three mutant lines deficient
in either strigolactone signalling max2-1 or strigolactone synthesis (max3-9; max4-1). 98
Figure 4.2.2 3: A comparison of the rosette diameters of 4 A. thaliana genotypes, showing Col-0
(Wt), the strigolactone signalling mutant max2-1 and the strigolactone synthesis mutants; max3-9,
max4-1. 99
Figure 4.2.2 4: A comparison of the rosette diameters of 4 A. thaliana genotypes, showing Col-0
(Wt), the strigolactone signalling mutant max2-1 and the strigolactone synthesis mutants; max3-9,
max4-1. 100
Figure 4.2.2 5: A comparison of the rosette diameters of 4 A. thaliana genotypes, showing Col-0
(Wt), the strigolactone signalling mutant max2-1 and the strigolactone synthesis mutants; max3-9,
max4-1. 101
Figure 4.2.2 6: Rosette diameters of 4 A. thaliana genotypes, showing Col-0 (Wt), the strigolactone
signalling mutant max2-1 and the strigolactone synthesis mutants; max3-9, max4-1. 102
Figure 4.2.3 1: A) Fresh weight; B) Dry weight; C) Fresh weight: dry weight ratio; of Col-0 (Wt), the
strigolactone signalling mutant max2-1 and the strigolactone synthesis mutants; max3-9, max4-1. 103
Figure 4.2.3 2: Carbon assimilation rates of Col-0 (Wt), the strigolactone signalling mutant max2-1
and the strigolactone synthesis mutants; max3-9, max4-1. 104

Page | xix
Figure 4.2.3 3: Transpiration rates of Col-0 (Wt), the strigolactone signalling mutant max2-1 and the
strigolactone synthesis mutants; max3-9, max4-1. 105
Chapter 5
Figure 5.1 1: Stages of faba bean germination and growth 110
Figure 5.2.1 1: Biomass measurements of 5 V. faba cultivars grown under control conditions or
exposed to dark-chilling conditions 113
Figure 5.2.1 2: Shoot and root dry weight measurements of 5 V. faba cultivars grown under control
conditions or exposed to dark-chilling conditions 114
Figure 5.2.2 1: Photosynthetic carbon assimilation of 5 V. faba cultivars grown in the presence or
absence of dark-chilling. 116
Figure 5.2.2 2: Stomatal conductance of 5 V. faba cultivars grown in the presence or absence of dark-
chilling. 117
Figure 5.2.2 3: Intracellular CO2 concentration of 5 V. faba cultivars grown in the presence or
absence of dark-chilling. 118
Figure 5.2.2 4: Transpiration rates of of 5 V. faba cultivars grown in the presence or absence of dark-
chilling. 119
Figure 5.2.2 5: Chlorophyll fluorescence (Fv/Fm) of of 5 V. faba cultivars grown in the presence or
absence of dark-chilling. 120
Figure 5.2.2 6: Shoot phenotypes of 5 V. faba cultivars grown in the presence or absence of dark-
chilling. 121
Figure 5.2.2 7: A) Shoot fresh weight of 5 Vicia faba cultivars grown under control conditions, before
and after 30 minutes of exposure to -5 ºC; B) Shoot fresh weight of 5 Vicia faba cultivars grown
under acclimatory conditions, before and after 30 minutes of exposure to -5 ºC; C) Percentage
reduction in shoot fresh weight of 5 Vicia faba cultivars, grown under either control or acclimatory
conditions and subjected to 30 minutes of freezing at -5 ºC. 123
Chapter 6
Figure 6.2.1 1: Light microscope image of V. faba chromosomes in metaphase, shown by Feulgen
staining of DNA against a FastGreen cytoplasm stain. 129
Figure 6.2.2 1: A) The log10 contig abundance over a range of contig sizes, produced from 32bp and
64bp kmers 132
Figure 6.2.2 2: Enhanced synteny based SNP map of V. faba, showing the grouping of M. truncatula
orthologous into 6 linkage groups, corresponding to each of the six V. faba chromosomes 133
Figure 6.2.3 1: V. faba chloroplast genome map showing coverage and SNP identities 140

Page | xx
Figure 6.2.3 2: V. faba mitochondrial genome map showing coverage and SNP identities. 142
Figure 6.2.4 1: The percentage of homology for chloroplast encoded genes, showing the average data
for a 55-way alignment for individual chloroplast genes of 11 species. 144
Figure 6.2.4 2: Representative examples of percentage homology maps drawn for the highly
homologous psaB gene and the clpP gene with low homology. Maps were constructed from a multi-
way homology comparison between 7 legume species. 146
Figure 6.2.4 3: The percentage of homology for genes encoded in the mitochondrial genome showing
the average data for individual mitochondrial genes from 6 species. 147
Figure 6.2.4 4: Percentage homology maps for cox3 and nad2. Maps were constructed from a multi-
way homology comparison of 7 legume species. 148
Chapter 7
Figure 7.2 1: Agarose gel electrophoresis of RNA extracted from Hiverna and Wizard cultivars
grown under control conditions, acclimatory conditions, control conditions followed by freezing or
acclimatory conditions followed by freezing. 155
Figure 7.2.1 1: The total number of transcripts expressed in the Wizard and the Hiverna cultivars
when grown under control conditions. 156
Figure 7.2.1 2: Metabolic process gene ontology showing the number of genes differentially
expressed, and corresponding gene families, between the Wizard and Hiverna cultivars under control
conditions. 157
Figure 7.2.2 1: Principal component analysis of transcriptomic data sets, showing 3 repeats for both
the Hiverna and Wizard cultivars that had been: maintained under control conditions for 24 days;
grown for 14 days under control conditions and subjected to acclimatory night temperatures for 10
consecutive nights; maintained under control conditions for 24 days, culminating in a 30 minute
freezing period on the 24th night; grown for 14 days under control conditions followed by 10
consecutive nights of growth under acclimatory conditions, culminating in a 30 minute freezing
period on the 10th night of acclimation. 158
Figure 7.2.3 1 The total number of transcripts differentially expressed in the Wizard and the Hiverna
cultivars, comparing control conditions to acclimatory conditions 159
Figure 7.2.3 2 Venn diagram to show the set of differentially regulated transcripts between
acclimation and control in both genotypes. The overlapping segment shows transcripts which are
shared in the acclimation response of Wizard and Hiverna. Table gives an alternate presentation of
Venn diagram data. 160
Figure 7.2.3 3: Metabolic process gene ontology showing the number of genes, and corresponding
gene families, of differentially expressed transcripts between the Wizard and Hiverna cultivars under
acclimatory conditions. 161
Page | xxi
Chapter 8
Figure 8.1 1: A graphical representation of the two states of the NAO, drawn from consensus data. In
the negative phase (NAO-) cold air is drawn into Europe from the Siberian and Arctic regions. In the
positive phase (NAO+) warm air is drawn into Europe from Central and Northern America. 170
Figure 8.1 2: Average minimum daily temperatures for the months of January and February, years
2012 and 2013. 171
Figure 8.1 3: Annual global yield averages in dry metric tons per hectare for each year from 1961 to
2008 for maize, rice, wheat and soybean. Solid lines show projected yields to 2050. 172

Page | 1
“Look deep into nature, and then you will understand everything better.”
-Albert Einstein

Page | 2
1. Introduction
1.1. Low temperature stress
Plants are sessile organisms that are constantly subjected to changes in their environment. When a
plants environment prevents it from fulfilling its genotypic potential, it is considered to be under
stress (Osmond et al., 1987; Kranner et al., 2010). To survive stress, plants must alter their biological
processes in accordance with environmental change (Qin et al., 2011). Their ability to alter both
metabolism and biochemical makeup is dependent on their underlying genetic composition. Thus,
stress acts as a major component for selection, with stress tolerance being the product of a plants
evolutionary history (Wassink and Stolwijk, 1956).
Stresses can be classified as biotic or abiotic. Biotic stresses are biological factors which act to inhibit
an organism’s functionality, for example the activities of pathogens and herbivores (Atkinson and
Urwin, 2012). Abiotic stresses include passive environmental factors such as extreme temperatures,
poor water availability and nutrient deficiency (Mahajan and Tuteja, 2005). Stress exposure is the
major limiting factor to agricultural productivity, with more than 50% of projected yield loss in crops
being attributed to abiotic stress (Boyer, 1982; Wang et al., 2003). Moreover, abiotic stresses such as
low temperature limit the agricultural distributions of key crop species, such as soybean (Van
Heerden et al., 2003).
Low temperature is a collective term, incorporating two distinct but related stresses - chilling and
freezing. Chilling temperatures fall in the range of 0 – 15 ºC, while freezing temperatures are below
0 ºC. While there is some commonality between the metabolic impact of chilling and freezing, their
physiological impacts differ. However, both chilling and freezing can have extremely harmful effects
on plant functions (Thomashow, 1999). Those plant species unable to withstand exposure to chilling
are referred to as “chilling sensitive”, while plants unable to withstand freezing temperatures are
referred to as “freezing sensitive”. The sensitivities of plants to low temperatures are broadly
correlated with their agro-environmental distribution. For example, plants of temperate zone origin
may exhibit chilling injury in the 0 – 4 ºC range and have varying degrees of freezing tolerance.
However plants of tropical origin will exhibit signs of chilling induced injury at a much higher
temperature range of 8 - 12 ºC, and have no inherent capacity to withstand freezing exposure (Lyons,
1973).

Page | 3
1.2. Low temperature stress: damage, perception and transduction
Several visual symptoms of chilling injury are exhibited by sensitive plant species. The most
noticeable of these is the wilting of aerial organs, resulting from reduced water retention capacity.
This is attributed both to cytoplasmic thickening in leaves and inhibited water uptake by the roots
(Lukatkin, 2005). The appearance of leaf surface lesions is also characteristic of chilling sensitive
plant species. Moreover, prolonged chilling exposure can cause accelerated ageing that is
characterised by a loss of leaf colouration. Ultimately the prolonged exposure of sensitive plant
species to chilling stress results in tissue necrosis or plant death (Figure 1.2-1; Lukatkin et al., 2012).
However, the processes underpinning the initiation and regulation of programmed cell death are not
yet fully understood (Van Durme and Nowack, 2016).
Freezing occurs in plants when they cannot avoid nucleation – the process whereby water molecules
come together to form a stable ice nucleus. Ice crystal nucleation is unlikely to occur spontaneously,
with the homogenous nucleation of pure water occurring only at extremely low temperatures
(-38.5 C; Franks, 1985). However, homogenous nucleation is more likely to occur in moist climates
(Pearce, 2001). The catalysed formation of ice crystals (heterogeneous nucleation) is facilitated by the
production of nucleating agents, which comprise of various organic and inorganic molecules. These
nucleating agents are either extrinsic to the plant, stimulating ice crystal formation on its surface, or
they localise nucleation to the extracellular spaces. However, following the formation of extracellular
ice, subsequent freezing exposure leads to intracellular ice formation (Figure 1.2-1). When ice is
formed in the intracellular spaces the result is cell death (Pearce, 2001). This can be attributed to a
number of causes, for example: large ice masses affecting tissue or organ structure, opportunistic
pathogen infection through ice induced lesions, or ice-encasement resulting in secondary hypoxic
stress (Pearce, 2001). Moreover the formation of extracellular ice can lead to cellular dehydration,
attributed to the difference in water potential between liquid water and ice. Freeze-induced
dehydration can cause plasma membrane phase-transition and additional mechanical stresses, leading
to electrolyte leakage and a loss of cell compartmentation (Pearce, 2001; Yamazaki et al., 2009).
Every cellular compartment is affected by low temperature exposure. Moreover, membrane bilayers
themselves are directly affected by chilling and freezing exposure. Indeed, temperature-dependent
changes in bilayer structure are believed to be essential to the perception and transduction of
temperature information (Murata and Los, 1997). Upon exposure to chilling membrane bilayers
undergo a reduction in fluidity. Membrane fluidity is used to describe molecular motion within the
bilayer, with reduced fluidity being attributed to the unsaturation of membrane lipids (Murata and
Los, 1997). Loss of fluidity can result in a phenomenon known as leakage – the loss of essential

Page | 4
solutes from the plant cell, indicating a loss of the membranes semi-permeable nature. However,
when membrane fluidity is reduced the altered physical state of the membrane may also regulate the
conformation and activity of bound proteins, such as calcium ion channels (Los and Murata, 2004).
This has been proposed to enable the transduction of temperature perception to the nucleus via
calcium ion influx (Ca2+). Thus the plasma membrane itself it thought to act as a “biological
thermometer”, playing an integral role in the plant temperature-sensing machinery (Los and Murata,
2004).
Figure 1.2-1: The impact of chilling and freezing stress on cellular function and plant physiology. Chillingstress induces the formation of reactive oxygen species (ROS) in cellular organelles, promotes stress hormonebiosynthesis, alters membrane permeability, facilitates the influx of calcium ions (Ca2+), kinetically limitscellular enzymes and proteins, and causes changes to protein conformation/induces protein damage. Freezingstress may either cause extracellular ice crystal formation, thereby creating a difference in water potentialleading to cellular dehydration and increased solute concentration, or cause intracellular ice crystal formationleading to direct disintegration of membrane bilayers. Both chilling and freezing may lead to a loss of plantwater content through reduced soil water uptake and/or increased transpiration, reduced photosynthesis,chlorophyll loss, leaf deformation and/or necrosis, cessation of growth, premature senescence or programmedcell death.
Page | 5
An increase in cytoplasmic Ca2+ is essential to the low temperature signalling cascade. While the
mechanisms of Ca2+ influx are not fully understood, (Carpaneto et al., 2007), down-stream receptors
have been classified. Increased Ca2+ concentration is detected by receptors such as calmodulin (CaM),
calcineurin-B-like proteins and calcium dependent protein kinases (Yang et al., 2010). These in turn
are upstream of the plant-stress response. The influx of Ca2+ from both apoplastic and intracellular
storage spaces is facilitated by proteins encoding for numerous channels, pumps and transporters. The
routes of entry for Ca2+ into the cytosolic space are numerous, and whilst many facilitating proteins
have been putatively characterised on the molecular level, few channels have been physiologically
characterised. However it has been found that some calcium transport proteins are responsive to the
presence of reactive oxygen species (ROS; Hetherington and Brownlee, 2004). As such ROS
signalling is another component of the low temperature signalling network.
The presence of ROS is central to the transduction of stress (Suzuki and Mittler, 2006). ROS are a
natural by-product of oxygen metabolism, playing essential roles in cell signalling and homeostasis.
However ROS are highly chemically active and perturbations to the reduction-oxidation balance of a
cell (redox homeostasis) can lead to ROS accumulation and subsequently cell damage. This is known
as oxidative stress. ROS are the result of partial reduction of atmospheric O2, forming a superoxide
radical (O2.-), hydrogen peroxide (H2O2) or a hydroxyl radical (HO-). O2 can also be excited to form
singlet oxygen (1O2) where a valance electron moves to a high energy state via photonic energy
transfer (Mittler, 2002). Singlet oxygen is the most chemically active form of reactive oxygen. In the
absence of cellular redox control mechanisms ROS would uncontrollably oxidise all components of
the cell, resulting in a range of destructive effects such as; disintegration of the lipid bilayer, RNA
destabilisation and protein damage (Schmidt and Kunert, 1986). In plants, ROS are produced
primarily at the photosynthetic electron transport chain (PET) with photosystems I and II being the
major sites of production for O21 and O2
-. The mitochondrial electron transport chain (MET) also acts
as a site for the generation of O2- with the specific sites being complex I (NADH dehydrogenase),
complex II (reverse electron flow) and the ubiquinone-cytochrome region of complex III (Gill and
Tuteja, 2010). ROS are also formed at the plasma membrane through the activities of NADPH
oxidase, the cell wall (via cell wall associated peroxidases), the apoplast (via cell wall associated
oxalate oxidase) and in the peroxisome (xanthine oxidase; Hasanuzzaman et al., 2009). Despite their
destructive potential, ROS primarily act as secondary messengers and regulate a range of cellular
processes. Therefore the tight regulation of redox state is essential in ensuring that ROS function to
correctly regulate, rather than inhibit plant cell function (Mittler et al., 2004).
Chilling sensitive plant species are unable to withstand prolonged exposure to low temperatures.
However, tolerant species are able to activate suites of protective genes through the effective
translation of perceived environmental change into cytosolic signals, generally via Ca2+ and ROS

Page | 6
dependent pathways. The process whereby a plant acquires tolerance to a given stress is known as
acclimation, with acclimation to chilling and freezing temperatures (sometimes referred to as
hardening) being dependent on an earlier period of exposure to chilling (Penfield, 2008). Tolerance to
low temperatures is the result of three distinct cellular events; the initial perception of low
temperature, the transduction of temperature sensing, and the induction of protective genes (Winfield
et al., 2010). While gene induction is primarily attributed to Ca2+ and ROS, the non-specific nature of
these signals makes the presence of specific parallel signals likely (Monroy et al., 1998; Mahajan and
Tuteja, 2005).
1.3. Low temperature gene induction: acclimation and vernalization
Cold-response genes encode many proteins that act to protect the plant, either directly or through
acting as transcription factors (Riechmann et al., 2000). Encoded proteins include: enzymes that are
linked to cellular respiration and carbohydrate metabolism, lipid synthesis and stability,
phenylpropanoid and antioxidant pathways, molecular chaperones, antifreeze proteins (AFP) and
proteins linked to dehydration (Chinnusamy et al., 2003). These genes play an essential role in the
plant acclimatory response to cold (Figure 1.3-1).
Numerous cold-response factors and genes have been identified in Arabidopsis thaliana, many of
which are dependent on Ca2+ signal transduction via kinases (Knight et al., 1996). In A. thaliana the
kinases responsible for Ca2+ signalling belong to the CDPK/SNF1-related kinase family, a unique
family that couples calcium sensing with direct kinase binding (Sanders et al., 2002). These kinases
may act directly, or feed into mitogen-activated protein kinase cascades (Sinha et al., 2011).
Thomashow (1999) demonstrated that the A. thaliana CRT/DRE regulon is calcium responsive and
enhances freezing tolerance, playing a central role in the acclimatory response. This transcription
factor binds to the cold binding factor (CBF) drought responsive element binding factor (DREB)
(Kasuga et al., 1999), responsible for the regulation of; cold responsive genes (COR), early response
to dehydration (ERD) genes and presumably unidentified cold-regulated gene families (XYZ). Taken
together these form the cold binding factor regulon (CBF) (Thomashow, 2001; Figure 1.3-1).
The genes responsible for low temperature acclimation are also involved in drought response,
highlighting the often shared nature of stress responses (cross-talk). CBF induced genes act to protect
plant function at low temperature, though the mechanisms of protection have not yet been fully
elucidated. This is with the exception of the COR15a gene which is targeted to the chloroplastic
stroma and is believed to prevent deleterious lipid phase shift upon freezing (Artus et al., 1996).
There is also evidence to suggest that the activation of CBF genes leads to the sustained transcription

Page | 7
and subsequent translation of other CBF family members, notably in the case of ERD10 and
CBF/DREB (Kim and Nam, 2010). Additional factors have been identified that act to regulate
CBF/DREB; these are the ICE1 transcription factor (Inducer of CBF Expression 1) and the sensitive
to freezing mutants (sfr). Constitutive expression of ICE1 has been shown to enhance freezing
tolerance in A. thaliana through interaction with the CBF regulon (Chinnusamy et al., 2003), whilst
sfr mutants have shown an increase in freezing sensitivity. The genomic identities of the sfr mutants
have not been resolved in full, though identified mutants have been shown to play various roles in
sugar metabolism (Amid et al., 2012; Thorlby et al., 2004). Additionally it is thought that SFR genes
may act to regulate CBF/DREB elements, or COR/ERD genes directly (Thomashow, 2001).
Figure 1.3-1: Schematic representation of the Arabidopsis thaliana cold acclimation pathway, derived fromThomashow, (2001) and Xin and Browse, (2000). Chilling exposure causes the rapid induction of CBF/DREgenes, including the Cold Responsive genes (COR), Early Response to Dehydration genes (ERD) and probablyundiscovered genes (XYZ). The activation of COR, ERD and XYZ may cause a positive feedback, stimulatingthe continued expression of the CBF regulon (grey dashed arrows). The activation of the CBF regulon is likelyto be downstream of a calcium activated kinase cascade, though calcium may activate the CBF regulonindependently of kinases. Chilling temperatures are thought to activate the Inducer of Cold Expression (ICE)transcription factor, or its interacting partners. SFR mutants display increased sensitivity to low temperaturesand are thought to act between CRT/DRE transcription and the induction of CBF genes. Mutants of theESKIMO1 gene have shown increased chilling sensitivity, thus ESKIMO1 is thought to be a negative regulatorof low temperature acclimation.
Page | 8
Taken together, the CBF/DREB regulatory elements would seem to act as master integrators of the
acclimation response in A. thaliana. However Xin and Browse (1998) described a cold acclimation
gene, ESKIMO1, that appears to act independently of the CBF regulon. In mutant lines of ESKIMO1
the accumulation of proline and increase of dehydrin associated transcripts was observed, thus the
gene is thought to act as a negative regulator of acclimation. In a proteomic analysis of acclimated
cultivars of red clover (Trifolium pratense L.), acclimated plants were found to have an increased
abundance of vegetative storage proteins (necessary for plant regrowth) and dehydrins –a group II
late embryogenesis abundance protein family member that are required for the survival of
dehydration, though their current mechanisms are unknown (Bertrand et al., 2016). The acclimatory
response pathways found in A. thaliana appear to be conserved in other plant species, including
tomato and wheat (Jaglo et al., 2001). CBF/DREB family genes are also found in soybean, though
there is an apparent inability of soybean CBFs to regulate downstream gene expression (Yamasaki
and Randall, 2016). The regulation of the genetic elements responsible for cold tolerance is
multifactorial, with the roles of many identified elements yet to be characterised. Moreover, while
some effort has been made to translate studies into soybean, there is still progress to be made in the
understanding of the genetic basis of acclimation in legumes as a plant family. However, there is
potential for the identification of novel genes and regulatory factors that have not been identified in
the well-studied A. thaliana model (Calzadilla et al., 2016).
Broadly, plants will aim to regulate their growth and development to maximise reproductive success.
This is dependent on perception of environmental conditions and retention of this information. For
example many plants depend on a prolonged period of exposure to cold in order to transition from
vegetative growth to flowering – a process known as vernalization (Sheldon et al., 2000).
Vernalisation is a multifactorial process, reliant upon a plants ability to perceive both photoperiod and
temperature in relation to developmental stage. Vernalization is a metabolically active process and as
such freezing temperatures are ineffective for its initiation (Kim et al., 2009). The molecular basis of
vernalization in A. thaliana (in which flowering is best characterised) is dependent on many genes.
Flowering itself results from the induction of floral meristem identity genes, i.e. the MADS-box
family of transcription factors which are conserved in the plant kingdom (Smaczniak et al., 2012).
Upstream of the floral meristem identity genes are floral integrators – FD (a bZIP transcription
factor), FT (FLOWERING LOCUS T) and SOC1 (SUPPRESSOR OF CONSTANS 1) (Abe et al.,
2005; López-González et al., 2014). Floral integrator expression is regulated by flowering pathways,
themselves responsive to environmental conditions (photoperiod/cold) or developmental cues such as
gibberellic acid (GA). Whilst flowering is dependent on the coordination of all associated pathways,
the FLC clade of genes (FLOWERING LOCUS C) has been identified as a major factor in
development. FLC acts antagonistically to floral integrator genes, however it demonstrates a low
temperature-dependent down regulation which is attributed to the initiation of the flowering response

Page | 9
(Sheldon et al., 2000). Studies of flowering in cereal grains have shown a high degree of conservation
in the vernalization pathway, whilst legumes show some degree of evolutionary divergence.
Crop legumes are divided between two sister clades; the phaseoloid and the galegoid (Foyer et al.,
2016). These clades represent temperately adapted long day plants (galegoid) and tropically adapted
short day plants (phaseoloid). Whilst studies of vernalization in legumes are comparatively limited,
two models have emerged for each lineage – pea (Pisum sativum), representing temperate legumes
and soybean (Glycine max) representing tropical legumes (Weller and Ortega, 2015). Although the
genes and gene families central to flowering time are largely conserved between legumes and A.
thaliana, there are numerous examples of gene duplication and loss. For example legumes lack the
phyC clade of photoreceptor genes, having only three phytochromes for the detection of day length
(phyA, phyB and phyE (Hecht et al., 2007). With regards to the flowering locus gene family,
FT/TFL1, both clades show gene family expansion, with the galegoid clade showing two distinctly
divergent sequences from A. thaliana. Interestingly the FLC clade, shown to be critical in the A.
thaliana flowering response, is apparently absent among galegoid legumes and soybean. These data
indicate that within the legume family there are fundamental differences with regards to the initiation
of flowering and the perception of light and temperature.
1.4. Cold associated hormone signalling
Stress induced changes in gene expression may participate in the generation and regulation of plant
hormones (Mahajan et al., 2005). Moreover, hormones themselves can regulate gene expression
through a complex interaction of molecular circuits. Cold adaptation requires transcriptional
reprogramming and it is hypothesised that growth suppression allows for the reallocation of resources
to tolerance development and maintenance (Eremina et al., 2016). Suppression of growth is induced
by plant hormones – low molecular weight compounds that signal information from their site of
synthesis to their site of action. Homeostasis is maintained through the biosynthesis, catabolism and
transport of plant hormones, with sensitivity being determined by the presence and responsiveness of
specific hormone receptors (Eremina et al., 2016). Hormone action in response to low temperature
stress is influenced by cross-talk with signalling cascades, initiated as a result of other environmental
stimuli and developmental phase transition cues (Penfield, 2008; Franklin, 2009). The role of
hormones in the cold tolerance response is not well characterised and species-specific differences in
hormonal roles are common. However general roles have been identified for the major classes of
phytohormone (Eremina et al., 2016), which are discussed here.
Page | 10
Gibberellic acid (GA) is associated with cell elongation and division. It is synthesised from trans-
gerenylgerenyl diphosphate in the methylerythritol phosphate pathway (MEP) (Hedden and Thomas,
2012). The regulation of GA is attributed to the activity of DELLA-domain proteins (Schwechheimer,
2012) which themselves are regulated by the 26S proteasome. There is evidence for CBF’s repressing
GA in response to cold. Moreover DELLA knockout mutants of A. thaliana, inhibited in their ability
to degrade GA, were more sensitive to freezing exposure than controls (Achard et al., 2008).
Brassinosteroids (BR) are campesterol derived hormones with roles in cell division and expansion,
xylem differentiation, seed germination, vegetative growth and apical dominance (Sasse, 2003). Their
synthesis is dependent on the activities of cytochrome p540s. BRs interact closely with GA and act to
promote growth, with BR and GA acting on each other’s biosynthesis (Unterholzner et al., 2015;
Stewart Lilley et al., 2013). However, there is no evidence of a BR-GA synergism in response to low
temperature exposure. BR has been shown to be a positive regulator of the cold tolerance response
with ectopic expression leading to enhanced tolerance in sensitive species (Xia et al., 2009; Jiang et
al., 2013). Moreover, DWARF4 and CONSTITUTIVE PHOTOMORPHOGENESIS AND DWARFISM
(CPD) overexpression led to enhanced chilling tolerance in A. thaliana with an accumulation of the
COR15a transcription factor and promoted CBF gene expression (Divi and Krishna, 2010; Kagale et
al., 2007). However earlier studies of BR activity have shown a reduced cold tolerance or no change
in tolerance in response to increased BR abundance. Thus further verification of BRs roles is needed
(Eremina et al., 2016).
Auxin is a well characterised, tryptophan-derived phytohormone (Mashiguchi et al., 2011). However,
the roles of auxin in cold stress remain to be elucidated. Auxin regulated genes are affected by cold
exposure in both A. thaliana and rice, with the application of auxin analogues leading to an increase
in cryoprotective metabolites in brassicas (Hannah et al., 2005; Jain and Khurana, 2009; Gaveliene et
al., 2013). Bioactive auxin (indole acetic acid, IAA) has been correlated with enhanced low
temperature tolerance (Du et al., 2013). Moreover, low temperature exposure has been shown to
block auxin cycling through impairment of PIN2 and PIN3, inhibiting root gravitropic responses in A.
thaliana (Shibasaki et al., 2009).
Cytokinins (CK) are adenine derivatives with aromatic or isoprenoid side chains. They control
directional growth, such as gravitropism and are known to interact with auxin (Mok and Mok, 2001).
The most abundant plant cytokinins are isopentyladenine and zeatin (Sakakibara, 2006), the external
application of which has been shown to enhance A. thaliana freezing tolerance (Jeon et al., 2010).
However CKs have also been shown to be down regulated in response to cold, thus providing
evidence for cold tolerance models where CKs are both positive and negative regulators (Maruyama
et al., 2014).

Page | 11
Abscisic acid (ABA) is an isoprenoid hormone that plays a central role in seed dormancy, abscission
and abiotic stress signalling (Nakashima et al., 2014). Accumulation of ABA is correlated with
increased freezing tolerance. Recent evidence has emerged showing that MYB96, an ABA
transcription factor, is cold-induced and controls CBF induction (Lee and Seo, 2015). Further
evidence suggests a role for MYB96 in HEPTAHELICAL PROTEIN (HHP) activity. HHP in turn
interacts with ICE1, ICE2 and CAMTA. Thus MYB96 would interact with all CBF family members,
possibly acting as a central regulator for low temperature tolerance (Lee and Seo, 2015; Chen et al.,
2010), though further evidence for this is needed.
Ethylene (ET) is a gaseous hormone synthesised from methionine. The role of ET in the cold
response is not yet clear, with evidence supporting its conference of both sensitivity and tolerance
(Tian et al., 2011; Zhang et al., 2009). However current models suggest that is it a negative regulator
of tolerance (Eremina et al., 2016). Decreases in ET are attributed to decreased biosynthesis (Catala
et al., 2014), though cold responsive abundance is species specific (Ciardi et al., 1997; Kosová et al.,
2012; Guo et al., 2014). In Medicago truncatula ET application reduced freezing tolerance, whereas
biosynthesis inhibition promoted tolerance (Shi et al., 2012; Zhao et al., 2014). Whilst the role of ET
is currently unclear current evidence suggests that it restricts plant growth in response to low
temperature exposure.
Salicylic acid (SA) is a phenolic compound associated with low-temperature induced growth
retardation. SA is causative of the hypersensitive response (HR) and leads to the formation of
necrotic lesions (Rivas-San Vicente and Plasencia, 2011). A chorismate derived phytohormone (Chen
et al., 2009), cold has been shown to induce SA content in plant species (Dong et al., 2014; Kim et
al., 2013; Huang et al., 2010). However the mechanisms of cold-induced SA biosynthesis are
unknown. Low SA levels in plants treated with L-α-aminooxy-β-phenylpropinoic acid (AOPP) had
suppressed expression of CBFs and COR47 in low temperature treatment of cucumber. Low SA
correlated with reduced photosynthetic activity and increased membrane damage (Dong et al., 2014).
However SA has apparent species-specific effects, with no evidence of SA influencing photosynthetic
efficiency in A. thaliana (Scott et al., 2004).
Jasmonic acid (JA) is an oxylipin involved in biotic and abiotic stress responses. Cold exposure
increases JA levels in plant species such as rice and A. thaliana. This increase is associated with an
increase in JA biosynthetic genes and a repression of genes linked to JA catabolism. JA is synthesised
from linolenic acid and is activated by isoleucine conjugation, enabling binding to an F-box receptor
– COI1 (CORONATINE INSENSITIVE 1). COI1 initiates JA signalling by ubiquitinating and
stimulating proteasome dependent degradation of JASMONATE ZIM DOMAIN (JAZ) proteins,

Page | 12
which repress expression of JA responsive genes. In A. thaliana, JA application enhanced induction
of CBFs and CBF regulated genes, promoting freezing tolerance (Hu et al., 2013). Moreover, JA
compromised plants were more sensitive to freezing. JA mediated growth suppression occurs through
DELLA protein stabilisation, therefore cold induced JA accumulation may contribute to plant growth
suppression through GA crosstalk (Kosová et al., 2012; Schwechheimer, 2012).
The roles of phytohormones in low temperature-tolerance responses are diverse, varying in a species
dependent manner. However, while the general roles of the major phytohormone classes have been
explored in the literature, the influence of each of these hormones on cold-stress adaptation is likely
to be species specific.
1.5. Mechanisms of protection from low temperature stress
As poikilothermic organisms the temperature of plants is at equilibrium with their environment.
However there are exceptions whereby plants may raise the temperature of specific systems above
ambient. For example the sacred lotus (Nelumbo nucifera) may raise its floral temperature through
the alternative oxidase pathway (Watling et al., 2006). Optionally plants may lower organ
temperature through transpirational cooling, as seen in Arabidopsis thaliana leaves when grown at
high temperature (Crawford et al., 2012). Generally, plants are dependent upon environmental cues
such as temperature and day length for developmental transition. The perception of environment is
also essential for stress tolerance, where the detection of stressful environmental conditions (biotic or
abiotic) is crucial for the initiation of defensive pathways. The plant-temperature response can be
divided into three separate events; temperature perception, signal transduction and response induction
(Ruelland and Zachowski, 2010).
Following the transduction of low-temperature and the induction of cold-responsive genes and
hormones, plant cells adjust their chemical composition to protect against the negative effects of low
temperatures (Sanghera et al., 2011). The dominant constraints placed on plants by chilling are:
reduced water uptake, lower enzymatic rate and decreased membrane stability. As such cold-induced
genes act to protect water status through the production of soluble osmolytes which prevent the
osmotic movement of water from within the cell (Warren, 1998). Reduced enzyme activity places
inherent restrictions on growth rate through decreased photosynthetic efficiency (Kingston-Smith et
al., 1997; Du et al., 1999; Figure 1.5-1). Moreover the speed at which toxic cellular elements, such as
ROS, can be processed is decreased (Lee and Lee, 2000). To mitigate the accumulation of ROS,
plants may increase the abundance of enzymatic and non-enzymatic antioxidant components such as:
superoxide dismutases, specific peroxidases, ascorbate and glutathione reductases (Lee and Lee,
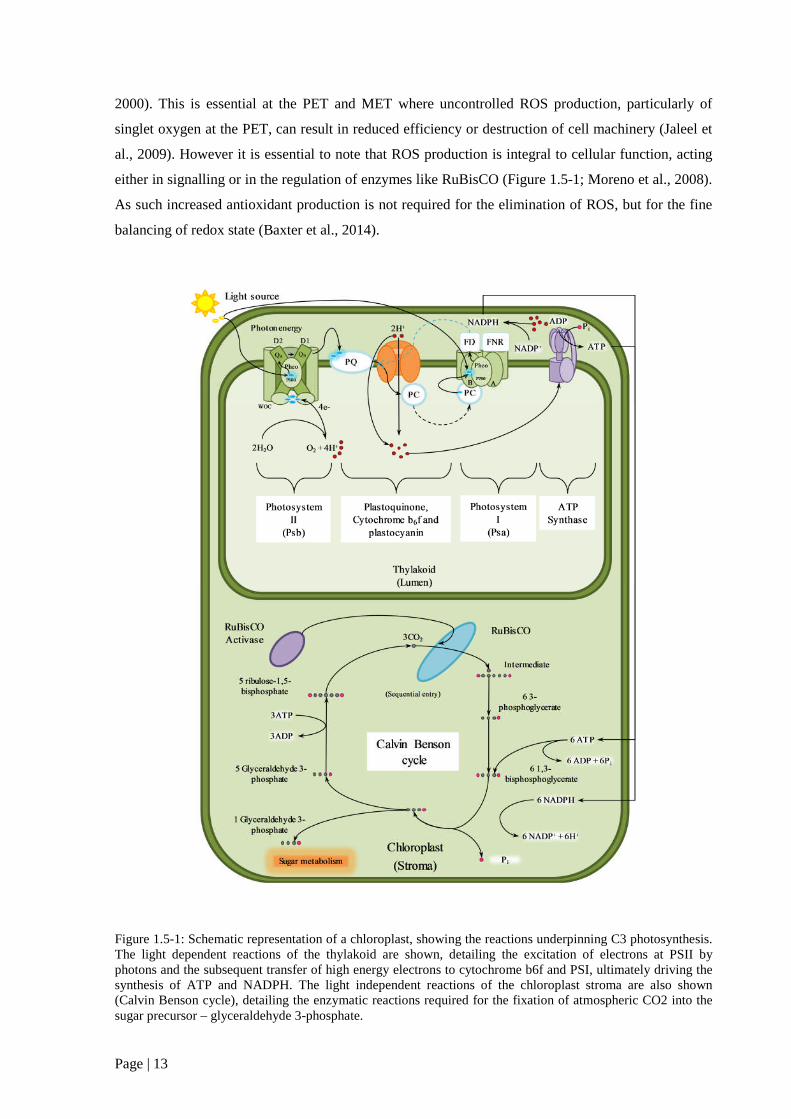
Page | 13
2000). This is essential at the PET and MET where uncontrolled ROS production, particularly of
singlet oxygen at the PET, can result in reduced efficiency or destruction of cell machinery (Jaleel et
al., 2009). However it is essential to note that ROS production is integral to cellular function, acting
either in signalling or in the regulation of enzymes like RuBisCO (Figure 1.5-1; Moreno et al., 2008).
As such increased antioxidant production is not required for the elimination of ROS, but for the fine
balancing of redox state (Baxter et al., 2014).
Figure 1.5-1: Schematic representation of a chloroplast, showing the reactions underpinning C3 photosynthesis.The light dependent reactions of the thylakoid are shown, detailing the excitation of electrons at PSII byphotons and the subsequent transfer of high energy electrons to cytochrome b6f and PSI, ultimately driving thesynthesis of ATP and NADPH. The light independent reactions of the chloroplast stroma are also shown(Calvin Benson cycle), detailing the enzymatic reactions required for the fixation of atmospheric CO2 into thesugar precursor – glyceraldehyde 3-phosphate.

Page | 14
There is some overlap between chilling and freezing protection, with genes acting to confer tolerance
to chilling also conferring tolerance to the effects of freezing. For example the osmolytes that
increase cellular water potential will also increase the freezing temperature of the cell (Warren,
1998). These soluble factors may also act as nucleation points, directing ice crystal formation to the
extracellular spaces of the plant cell or presenting on the outer surface of the plant. The process
whereby cytoplasm thickens and the osmotic potential of plant cells is increased is referred to as
vitrification (the acquisition of a “liquid glass” state). Vitrification is thought to be responsible for the
extreme low temperature tolerance demonstrated by tree species, such as poplar (Pearce, 2001).
1.6. Stress induced protein turnover
The growth and development of plants occurs as a result of the balance between protein synthesis and
degradation. Protein degradation is essential in processes such as germination, cell biogenesis,
senescence and programmed cell death (Palma et al., 2002), and is carried out by proteolytic enzymes
called proteases. These can act at the terminus of a polypeptide chain (exopeptidases) or within a
chain (endopeptidases; González-Rábade et al., 2011). Proteolytic enzymes in plants are divided into
four classes: serine proteases, aspartic proteases, metallo-proteases and cysteine proteases (van der
Hoorn, 2008). In addition to their roles in development, proteases are essential to plant stress
tolerance. Their abundance and activity is central to both the degradation of aberrant proteins and the
subsequent provision of amino acids for protein synthesis (Vierstra, 1996). Moreover, the redox state
of cellular compartments has been shown to regulate both proteases and protein kinases. For example,
redox controlled thylakoid protein kinases allow the exposure of dephosphorylated photosynthetic
Light Harvesting Complex II (LHCII) proteins to acclimative proteolysis (Yang et al., 2001).
Cysteine proteases (CPs) are redox responsive proteases, possessing a redox-active thiol group on the
cysteine residue of their active site. As such their activity is highly responsive to their redox
environment (Wang et al., 2012). CPs are essential to plant development and stress related protein
turnover (Toyooka et al., 2000). They are induced in response to biotic stress factors such as fungal
infiltration, but their abundance also increases in response to biotic stresses such as wounding,
drought and low temperature (Harrak et al., 2001). There are currently thought to be 140 cysteine
proteases in plants, belonging to 15 families and 5 clans, with each having a distinct structure (van
der Hoorn, 2008).
Together with biochemical environment, the activity of cysteine proteases is regulated by the
presence or absence of dedicated inhibitors called cystatins (Benchabane et al., 2010). Cystatins
constitute a large super-family of proteins, ranging in size from 5->25 kDa (Figure 1.6-1). Analysis of

Page | 15
the structural biology of the first characterised cystatin, chicken egg white cystatin, and the first
characterised plant cystatin, oryzacystatin I (OCI), has shown their functional biology to be highly
similar, with both proteins containing multiple sites for the inhibition of protease activity (Kiggundu,
2008; Benchabane et al., 2010). OCI was originally derived from the seeds of rice (Oryza sativa L.)
in the work of Abe et al., (1987). It acts to inhibit the activity of the papain-like cysteine proteases –
the most numerous family of cysteine proteases (Arai et al., 1991).
Figure 1.6-1: General classification of the cystatin super-family. Phytocystatins are grouped as members of thecystatin family containing single and multiple domain cysteines. Adapted from Kiggundu, (2008).
The three-dimensional structure of OCI shows the main body to consist of an α-helix and a five-
stranded antiparallel β-sheet (Nagata et al., 2000). The inhibitory action of OCI is dependent on the
action of a primary cystatin loop structure that directly inhibits the active site of papain and papain-
like proteases (Figure 1.6-2).
Figure 1.6-2: The complex structure of tarocystatin (Colocasia esculenta) and papain, showing the inhibition ofthe papain active site (grey) by the conserved cystatin loop structure (blue). Derived from Chu et al., (2011).
Cystatins
Stefin Cystatin Kininogens
Phytocystatins Single domain cystatins
Multi-cystatins
Super-family
Family
~12 kDaNo disulfide bond
2 disulfidebonds
Large glyco-proteins (60-120kDa)Contain 3 or morecystatin repeats

Page | 16
Protease inhibitors regulate many metabolic functions, and can suppress programmed cell death
(PCD) triggered by oxidative stress (Levine et al., 1999). Like their cysteine proteinase targets,
cystatins are also regulated by developmental and environmental cues (Belenghi et al., 2003).
Moreover, their expression has been shown to enhance tolerance to a range of biotic and abiotic
stresses. For example cystatins were shown to be differentially regulated in maize plants in response
to cold stress and drought (Massonneau et al., 2005). Additionally the constitutive expression of
cysteine protease inhibitors in A. thaliana has been shown to confer protection against oxidative
stresses, salt stress, drought and cold stress (Tan et al., 2014; Zhang et al., 2008). As such,
phytocystatins have been highlighted as having the potential to improve agronomic traits in crop
species, with a particular focus on legumes (Kunert et al., 2015).
1.7. Legumes
Grain legumes (also known as pulses, including: pea, bean, chickpea, and lentil) are important
sources of dietary protein for much of the world’s population. They are rich in amino acids,
containing high amounts of leucine, lysine, aspartic acid, glutamic acid and arginine (Boye et al.,
2010). Moreover they offer a complimentary nutritional profile to cereal crops and are a mineral rich
food source. Their dietary inclusion has been shown to have positive health effects, such as a
reduction in cholesterol, cardiovascular disease and a reduced incidence of all-cause mortality
(Trinidad et al., 2010; Nothlings et al., 2008; Chang et al., 2012). Moreover, legumes are key
components of sustainable agriculture and their use in crop rotation leads to a reduction in
agricultural CO2 emissions and a decrease in nitrogen fertiliser application (Lassaletta et al., 2014;
Barton et al., 2014).
Legumes are botanically characterised by their dehiscence pod structure, unusual flower morphology
and capacity for nitrogen fixation. Interestingly, the nitrogen fixing capacity of legumes is not a
ubiquitous trait, with approximately 88% of described legumes showing this ability (Graham and
Vance, 2003). However, the capacity of legumes for nitrogen fixation is central to their agricultural
and economic importance. Nitrogen fixation is achieved through symbiotic interactions with
organisms in the soil microbiome, consisting of bacterial species belonging to the α-protobacteria and
the order Rhizobiales (collectively called rhizobia), and arbuscular mycorrhizal fungi (Spaink, 2000).
Whilst most land plants develop some form of beneficial interaction with soil microorganisms,
leading to enhanced water and nutrient supply (in particular phosphate, Parniske, 2008), legumes are
able to access atmospheric nitrogen fixed in the forms of ammonia (NH3), nitrate (NO3-) or ureides
(Atkins, 1987). This is due to a symbiosis occurring in nodules - specially developed organs located
in the roots of plant. Nodulation is a phenomenon that is thought to have arisen on 4 separate
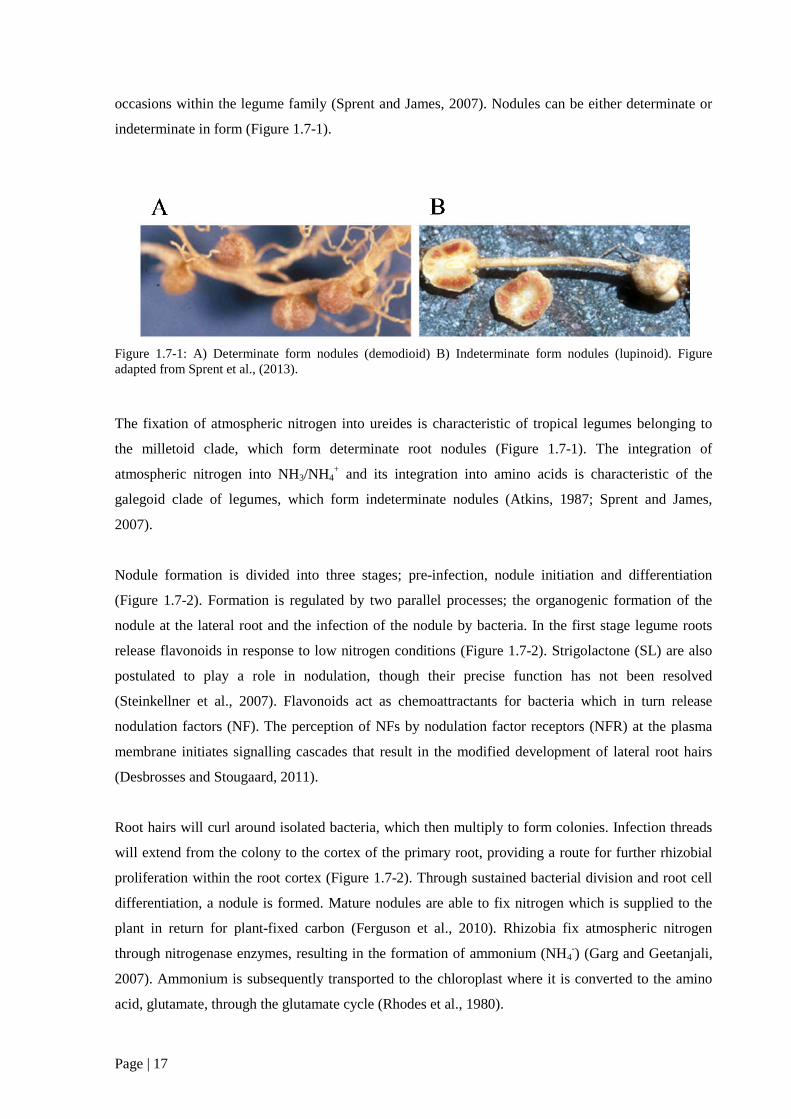
Page | 17
occasions within the legume family (Sprent and James, 2007). Nodules can be either determinate or
indeterminate in form (Figure 1.7-1).
Figure 1.7-1: A) Determinate form nodules (demodioid) B) Indeterminate form nodules (lupinoid). Figureadapted from Sprent et al., (2013).
The fixation of atmospheric nitrogen into ureides is characteristic of tropical legumes belonging to
the milletoid clade, which form determinate root nodules (Figure 1.7-1). The integration of
atmospheric nitrogen into NH3/NH4+ and its integration into amino acids is characteristic of the
galegoid clade of legumes, which form indeterminate nodules (Atkins, 1987; Sprent and James,
2007).
Nodule formation is divided into three stages; pre-infection, nodule initiation and differentiation
(Figure 1.7-2). Formation is regulated by two parallel processes; the organogenic formation of the
nodule at the lateral root and the infection of the nodule by bacteria. In the first stage legume roots
release flavonoids in response to low nitrogen conditions (Figure 1.7-2). Strigolactone (SL) are also
postulated to play a role in nodulation, though their precise function has not been resolved
(Steinkellner et al., 2007). Flavonoids act as chemoattractants for bacteria which in turn release
nodulation factors (NF). The perception of NFs by nodulation factor receptors (NFR) at the plasma
membrane initiates signalling cascades that result in the modified development of lateral root hairs
(Desbrosses and Stougaard, 2011).
Root hairs will curl around isolated bacteria, which then multiply to form colonies. Infection threads
will extend from the colony to the cortex of the primary root, providing a route for further rhizobial
proliferation within the root cortex (Figure 1.7-2). Through sustained bacterial division and root cell
differentiation, a nodule is formed. Mature nodules are able to fix nitrogen which is supplied to the
plant in return for plant-fixed carbon (Ferguson et al., 2010). Rhizobia fix atmospheric nitrogen
through nitrogenase enzymes, resulting in the formation of ammonium (NH4-) (Garg and Geetanjali,
2007). Ammonium is subsequently transported to the chloroplast where it is converted to the amino
acid, glutamate, through the glutamate cycle (Rhodes et al., 1980).

Page | 18
Figure 1.7-2: A simplified representation of determinate nodule formation; 1, initial flavonoid and nodulationfactor signalling; 2, rhizobial adherence to a newly formed root hair; 3, root hair bending and deformation toaccommodate the rhizobial colony; 4, the growth of an infection thread into the root cortex; 5, the start of rootcell differentiation and the propagation of rhizobia in the cortex; 6, the fully mature root nodule withdifferentiated root cells and the formed nitrogen fixing zone. Figure adapted from Ferguson et al., 2010.
Lownitrogen
Flavonoid
NF
Rhizobia
Root hairs form under lownitrogen conditions andflavonoids are secreted.
Rhizobia release nodulationfactors in response.
1
Rhizobia migrate towards thenewly formed root hair andattach to its surface. Nodulation
factors are detected by NFreceptors, inducing nodule
formation.
2
Root hair architecture changes,curling around the rhizobia toform a protective layer.
3
4
Cortical cells begin to divideand an infection thread isformed, progressing from the
rhizobia to the outer cortex.
5
Cortex
Epidermis
Endodermis
Pericycle
Steele
Infection threads progress towards noduleprimordium and rhizobia differentiate. Root cellsbegin differentiation to form nodule.
6
Continued rhizobial invasion and root celldifferentiation lead to the formation of thenodule. The mature nodule consists of a
rhizobial core surrounded by a later of boundarycells, fed by a vasculature connected to the plant
body.
Fixed nitrogen is then transported to the plant
where it is fixed into biologically accessibleglutamate.
Vasculature
N fixingzone
Boundarycell layer
Scleroidallayer

Page | 19
Despite the proven benefits of legume utilisation, yield increases have not kept pace with those of
cereal crops. Global increases in legume production are a result of increased land usage, rather than a
direct increase in crop productivity (Siddique et al., 2012; Foyer et al., 2016). Pulse crops are
members of a diverse family of plants, the ecological and nutritional characteristics of which are well
matched to the varied challenges of climate change, calorific provision and nutritional demand.
However in order to sufficiently address these challenges a greater level of research must be
conducted into legume biology, with a specific focus on the enhancement of legume survival and
productivity under stress conditions (Foyer et al., 2016). Low temperatures in particular place a
significant constraint on global legume yields and those legumes of significant dietary importance
must be studied further.
1.8. Legume responses to low temperature exposure
While the general mechanisms of low-temperature tolerance have been characterised in the plant
kingdom, extensive research has not been conducted on the factors underpinning low temperature
tolerance in legumes. However, cereal crops have received some dedicated interest (Winfield et al.,
2010). Research has highlighted the importance of cell membrane composition changes in enhancing
low temperature tolerance (Vigh et al., 1985). Additionally redox state, protease activity and the
abundance of specific transcription factors are integral to the low temperature tolerance response.
While these mechanisms are likely conserved between cold tolerant plant species, diverse and unique
strategies have evolved across all kingdoms for the management of exposure to cold (Huston et al.,
2000) and species-specific strategies are likely to exist within the plant kingdom. Recent evidence has
emerged showing that cold tolerance may be enhanced through favourable interactions between
plants and the soil microbiome (Subramanian et al., 2016). This finding is particularly interesting
when considered in the context of legumes, which are characterised by their intimate links with the
soil microbiome.
Low temperature is a phenomenon that impacts agricultural productivity on every continent. In the
United States an estimated 25% of the reduction in crop productivity was attributed to low
temperatures (Boyer, 1982). Exposure to cold is also a limiting factor in the agricultural distribution
of legume crops in Australia (Maqbool et al., 2010) and Africa. Africa in particular has warm day
temperatures, but can encounter chilling and freezing temperatures during the night – a problem that
is exacerbated by high elevation. Indeed elevation is a key limiting factor in the productivity of
soybean crops grown in Africa (Van Heerden et al., 2003). Moreover in Europe severe cold weather
events limit overwintering legumes such as faba bean (Vicia faba) and chickpea (Cicer arietinum;
Link et al., 2010; Hekneby et al., 2006; Singh et al., 1993). As such, the development of low
Page | 20
temperature tolerant legume crops is of critical importance for the protection of food security
(Herzog, 1987; Link et al., 2010).
Figure 1.8-1: A molecular phylogeny of the legume family based on the protein sequence similarity of maturaseK (MATK). Tree is rooted from the Arabidopsis thaliana MATK sequence and shows the major legume speciesused for food and feed. Coloured circles show evolutionary clades. Lotus japonicus and Medicago truncatula,denoted by ●, have been included as model legumes. Figure adapted from (Foyer et al., 2016).
Yield reduction is the dominant consequence of stress exposure. Plants are vulnerable to cold stress at
all stages of development, with susceptibility being particularly high during seedling establishment
and seed formation. However, plants employ numerous strategies for the survival of low temperature
stress. Indeed temperature adaptation is a defining characteristic of the hologalegina clade of the
legume family, which has adapted to temperate climates and is considered to be chilling tolerant
(Figure 1.8-1). Conversely, the phaseoloid clade is adapted to tropical climates and considered
chilling sensitive.

Page | 21
While the genetic and biochemical factors underpinning low temperature tolerance have been
extensively characterised in A. thaliana and cereals (Thomashow, 2001; Winfield et al., 2010),
limited research has been conducted on the mechanisms of low temperature tolerance in legumes.
Biotechnology has provided some insight into the genetic factors contributing to stress tolerance;
however focus has been placed on abiotic stresses. Moreover, the resolution of causative genetic
factors tends only to extend to the level of genomic loci. As such progress needs to be made in the
elucidation of single gene location and function (Dita et al., 2006). However, some understanding of
the mechanisms through which plants protect against abiotic stress exposure has been gained through
transgenic studies. For example the activity of cysteine proteases, as determined by the transgenic
expression of a rice cysteine protease inhibitor, has been shown to enhance tolerance to drought and
low nitrogen in soybean (Quain et al., 2014, 2015). These transgenic lines also displayed enhanced
shoot branching, leading to the proposal of a model whereby the expression of cystatins influenced
the production of the phytohormone strigolactone (SL). Additionally, transgenic lines of tobacco
overexpressing the rice cysteine protease inhibitor, oryzacystatin I, were shown to have enhanced
tolerance to chilling stress (Van der Vyver et al., 2003b). As such cysteine proteases present a
promising target for the enhancement of tolerance to a range of abiotic stresses, including low
temperature (Kunert et al., 2015). However, the legume family is diverse and gene based tools must
be developed to further understand its under-represented taxa (Young et al., 2003).
1.9. Genetic resources for grain legumes
The enhancement of stress tolerance depends upon understanding an organism’s genetic makeup.
Through characterising the genes and networks underpinning tolerance, tools can be developed to
enhance agronomically favourable traits (Mickelbart et al., 2015). The enhancement of abiotic stress
tolerance is particularly important within the legume family (Foyer et al., 2016). Legumes comprise
the majority of the world’s dietary protein, either as direct components of human diets, or through
their use a feed and forage crops. Soybean (Glycine max) is the world’s most abundant protein crop,
occupying an estimated 6% of the world arable land. However, it is primarily grown for the
production of oil and protein meal (Hartman et al., 2011). The primary dietary legumes for humans
are pea (Pisum sativum), chickpea (Cicer arietinum), broad bean (Vicia faba), pigeon pea (Cajanus
cajan), cowpea (Vigna unguiculata) and lentil (Lens sp.), (Graham and Vance, 2003).
Soybean maintains one of the best characterised genomes among the grain legumes (Schmutz et al.,
2010; Goodstein et al., 2012). Its genome size is 1.085 Gb, with a haploid chromosome number of
n=40 arranged in pairs (Foyer et al., 2016). However, the genomic resources available for other
legumes are comparatively limited with 13 legume genome sequences available at varying levels of
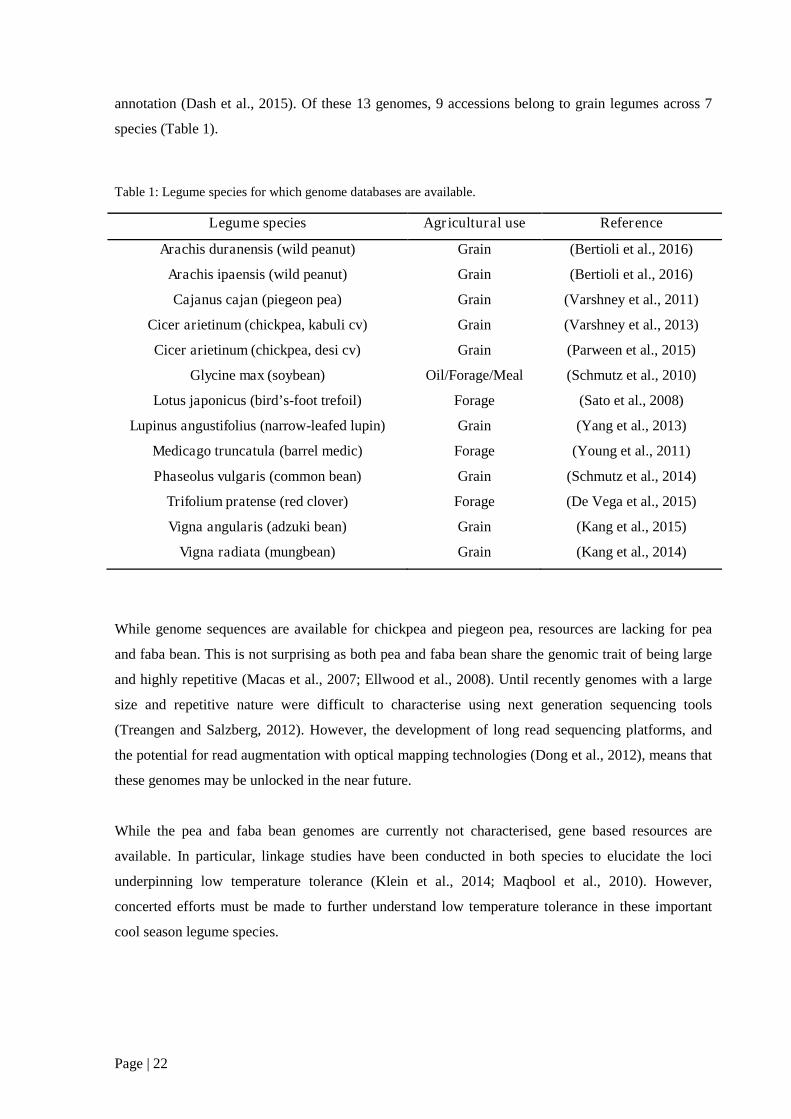
Page | 22
annotation (Dash et al., 2015). Of these 13 genomes, 9 accessions belong to grain legumes across 7
species (Table 1).
Table 1: Legume species for which genome databases are available.
Legume species Agricultural use Reference
Arachis duranensis (wild peanut) Grain (Bertioli et al., 2016)
Arachis ipaensis (wild peanut) Grain (Bertioli et al., 2016)
Cajanus cajan (piegeon pea) Grain (Varshney et al., 2011)
Cicer arietinum (chickpea, kabuli cv) Grain (Varshney et al., 2013)
Cicer arietinum (chickpea, desi cv) Grain (Parween et al., 2015)
Glycine max (soybean) Oil/Forage/Meal (Schmutz et al., 2010)
Lotus japonicus (bird’s-foot trefoil) Forage (Sato et al., 2008)
Lupinus angustifolius (narrow-leafed lupin) Grain (Yang et al., 2013)
Medicago truncatula (barrel medic) Forage (Young et al., 2011)
Phaseolus vulgaris (common bean) Grain (Schmutz et al., 2014)
Trifolium pratense (red clover) Forage (De Vega et al., 2015)
Vigna angularis (adzuki bean) Grain (Kang et al., 2015)
Vigna radiata (mungbean) Grain (Kang et al., 2014)
While genome sequences are available for chickpea and piegeon pea, resources are lacking for pea
and faba bean. This is not surprising as both pea and faba bean share the genomic trait of being large
and highly repetitive (Macas et al., 2007; Ellwood et al., 2008). Until recently genomes with a large
size and repetitive nature were difficult to characterise using next generation sequencing tools
(Treangen and Salzberg, 2012). However, the development of long read sequencing platforms, and
the potential for read augmentation with optical mapping technologies (Dong et al., 2012), means that
these genomes may be unlocked in the near future.
While the pea and faba bean genomes are currently not characterised, gene based resources are
available. In particular, linkage studies have been conducted in both species to elucidate the loci
underpinning low temperature tolerance (Klein et al., 2014; Maqbool et al., 2010). However,
concerted efforts must be made to further understand low temperature tolerance in these important
cool season legume species.

Page | 23
1.10. Hypothesis and objectives
The hypothesis on which the following studies were based is that low temperature tolerance is
influenced by phytocystatin expression and the strigolactone pathway.
These studies were conducted on chilling sensitive soybean, and the chilling tolerant species: pea, A.
thaliana and faba bean.
The specific objectives of this thesis were:
To characterise the effects of OCI expression on dark-chilling tolerance in soybean.
To characterise the effects of the strigolactone pathway on the dark-chilling tolerance of pea
and A. thaliana.
To physiologically and genetically characterise low temperature tolerance in faba bean and
provide genetic information for tolerance marker development.

Page | 24
“Measure what is measurable, and make measurable what is not so.”
Attributed to Galileo Galilei
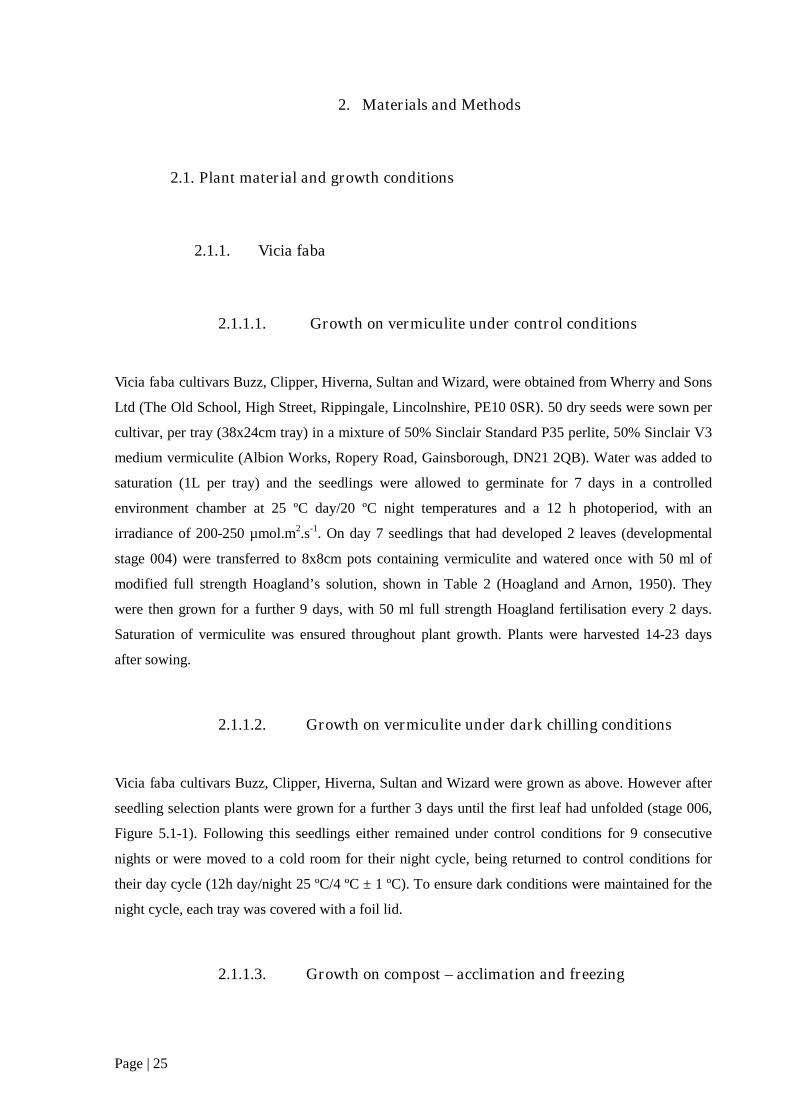
Page | 25
2. Materials and Methods
2.1. Plant material and growth conditions
2.1.1. Vicia faba
2.1.1.1. Growth on vermiculite under control conditions
Vicia faba cultivars Buzz, Clipper, Hiverna, Sultan and Wizard, were obtained from Wherry and Sons
Ltd (The Old School, High Street, Rippingale, Lincolnshire, PE10 0SR). 50 dry seeds were sown per
cultivar, per tray (38x24cm tray) in a mixture of 50% Sinclair Standard P35 perlite, 50% Sinclair V3
medium vermiculite (Albion Works, Ropery Road, Gainsborough, DN21 2QB). Water was added to
saturation (1L per tray) and the seedlings were allowed to germinate for 7 days in a controlled
environment chamber at 25 ºC day/20 ºC night temperatures and a 12 h photoperiod, with an
irradiance of 200-250 µmol.m2.s-1. On day 7 seedlings that had developed 2 leaves (developmental
stage 004) were transferred to 8x8cm pots containing vermiculite and watered once with 50 ml of
modified full strength Hoagland’s solution, shown in Table 2 (Hoagland and Arnon, 1950). They
were then grown for a further 9 days, with 50 ml full strength Hoagland fertilisation every 2 days.
Saturation of vermiculite was ensured throughout plant growth. Plants were harvested 14-23 days
after sowing.
2.1.1.2. Growth on vermiculite under dark chilling conditions
Vicia faba cultivars Buzz, Clipper, Hiverna, Sultan and Wizard were grown as above. However after
seedling selection plants were grown for a further 3 days until the first leaf had unfolded (stage 006,
Figure 5.1-1). Following this seedlings either remained under control conditions for 9 consecutive
nights or were moved to a cold room for their night cycle, being returned to control conditions for
their day cycle (12h day/night 25 ºC/4 ºC ± 1 ºC). To ensure dark conditions were maintained for the
night cycle, each tray was covered with a foil lid.
2.1.1.3. Growth on compost – acclimation and freezing

Page | 26
100 dry seeds of the above mentioned cultivars were sown in trays (38x24 cm) containing compost
(Petersfield potting supreme, Petersfield Growing Mediums, 45 Cambridge Road, Cosby, Leicester,
LE9 1SJ). Each tray was watered with 1 l of tap water and placed in a controlled environment
chamber under optimal conditions; 25 ºC day/20 ºC night temperatures, 12 hour photoperiod,
irradiance of 200-250 µmol.m2.s-1. Plants were allowed to grow for 7 days before seedlings having
reached emergence (stage 004, Figure 5.1-1) were transferred to individual 6x6 cm pots. Plants were
allowed to grow for a further 7 days until their first leaf had unfolded (stage 006, Figure 5.1-1).
At this stage 24 plants of each genotype were either; maintained under control conditions for 10
consecutive nights; subjected to chilling temperatures during their night cycle for 10 consecutive
nights (25 ºC day/4 ºC ± 1 ºC night, 12 hour photoperiod, irradiance of 200-250 µmol.m2.s-1). 10
nights was described by Herzog (1989) as being the minimum necessary period of chilling exposure
to induce acclimation in V. faba. On the 10th night of dark chilling plants were moved to a freezing
chamber 0-4 hours prior to the end of their night cycle. Here they were exposed to freezing
temperature stresses of - 5 ºC for 30 minutes. Experimental design detailed in Figure 2.1.1.3-1.
Figure 2.1.1.3-1: Experimental design for Vicia faba dark chilling and dark freezing experiments.
Buzz Clipper Hiverna Sultan Wizard
2 trays - 100 seeds sown per trayCompost
O ptimal conditions:12h day/night
25ºC day/20ºC night200-250 µmol m2 s-1
Seedling selection: emerged seedlings of similar size (stage 004), 48 plants per genotype
Growth under optimal conditions until unfolding of first leaf (stage 006)
Continued growth under optimal conditions
Growth under acclimatory conditions – dark chilling12h day/night
25ºC day/4ºC night200-250 µmol m2 s-1
7d
ays
Harvest ofacclimated plants and control plants (6 per genotype and condition)
24plants
24plants
24plants
24plants
24plants
24plants
24plants
24plants
24plants
24plants
7d
ays
9d
ays
1-4 hours prior to end of night cycle, subject plants from each cultivarand growth condition to;-5ºC 30 minutes.
1d
ay

Page | 27
Table 2: Composition of modified Hoaglands plant media; Nitrogen replete and Nitrogen deficient (brought topH 6 using HCl).
Nitrogen replete MW Stock molarity (mM) Per litre Hoagland (ml/L) Final molarity(µM)
Macronutrients
Ca(NO3).4H2O 236.15 999.37 2.5 2.5
MgSO4.7H2O 246.5 1030.42 5 5.15
NH4NO3 80.04 999.5 1 1.00
KH2PO4 136.09 999.34 3 3.00
Fe-EDTA 367.05 34.46 1 0.034
Micronutrients
H3BO3 61.83 46.26 2 0.093
MnCl2.4H2O 197.9 9.15 2 0.018
ZnSO4.7H2O 287.55 0.77 2 0.002
CuSO4.5H2O 249.69 0.32 2 0.001
Na2MoO4.2H2O 241.95 0.5 2 0.001
Nitrogen deficient MW Stock molarity (mM) Per litre Hoagland (ml/L) Final molarity(µM)
Macronutrients
K2SO4 172.259 500 6 3.00
MgSO4.7H2O 246.5 1000 5 5.00
Ca3(PO4)2 310.1767 49.97 20 1.00
Fe-EDTA 367.05 34.46 1.5 0.052
Micronutrients
H3BO3 61.83 46.26 2 0.093
MnCl2.4H2O 197.9 9.15 2 0.018
ZnSO4.7H2O 287.55 0.77 2 0.002
CuSO4.5H2O 249.69 0.32 2 0.001
Na2MoO4.2H2O 241.95 0.5 2 0.001
Page | 28
2.1.2. Glycine max
2.1.2.1. Growth on vermiculite
2.1.2.1.1. Nodulation and drought exposure
In experiments performed by Dr Belen Marquez-Garcia, University of Leeds (UK), seeds of Glycine
max (Williams 82 variety) were obtained from Iowa State University (Plant Transformation Facility,
Iowa State University, G405 Agronomy Hall, Ames, Iowa 50011-1010, United States of America).
Seeds were inoculated with 0.5 grams per seed of a cell powder of Bradyrhizobium japonicum strain
WB74-1 (Soygro bio-fertilized Limited, South Africa) and placed in 3x3 cm pots (one seed per pot)
filled with vermiculite (Sinclair V3 medium vermiculite (Albion Works, Ropery Road,
Gainsborough, DN21 2QB). Seedlings were watered twice per week with nitrogen free Hoagland’s
nutrient solution (Table 2) and demineralised water was added on the remaining days to keep
optimum conditions. Plants were kept in a glass house with 16 h day length and 30/25 °C day/night
temperature, with a light intensity of 1000 μmol m-2.s-1. The drought treatment was started at the age
of five weeks, when the plants presented a developmental stage of the fifth trifoliate leaves. A total of
30 plants were divided into two groups: control and drought. Control plants received nutrients and
water normally for 3 weeks, while drought exposed plants were deprived of both for 3 weeks.
2.1.2.1.2. Nodulation and chilling exposure
Soybean wild type (Glycine max cultivar Williams 82) and 3 independent transformed transgenic
lines expressing the rice cysteine protease inhibitor, oryzacystatin I (SOC-1, SOC-2 and SOC-3),
were obtained from Iowa State University (Plant Transformation Facility, Iowa State University,
G405 Agronomy Hall, Ames, Iowa 50011-1010, United States of America). Seeds were grown on
100% vermiculite in 3x3 cm pots for 7 days under glasshouse conditions of 25 ºC day/20 ºC night
temperatures, 16 h photoperiod. 20 seedlings of the same developmental stage were then selected for
further growth and were transplanted to 4l pots containing 100% vermiculite and inoculated with with
0.5 grams per seed of a cell powder of Bradyrhizobium japonicum strain WB74-1 (Soygro bio-
fertilized Limited, South Africa). Seedlings were maintained under glasshouse conditions for 3 weeks
and watered on alternate days with 1 l of distilled water or 1 l of nitrogen free Hoaglands media
(Table 2). Following this half the plants of each genotype were either maintained under glasshouse
conditions or were subjected to 7 consecutive nights of dark chilling with night temperatures of 4 ºC

Page | 29
±1 ºC. This work was performed with the assistance of Dr Stefan van Wyk (University of Pretoria,
SA).
2.1.2.1.3. Nodule development
The growth of soybean for developmental analysis was conducted by Dr Stefan van Wyk and
associates at the University of Pretoria, South Africa. Soybean (Glycine max) cultivar Prima 2000
was obtained from Pannar Seed, South Africa. Each pot was inoculated with 0.5 g of SoyGro
inoculum (SoyGro Bio-Fertilizer Limited, RSA), containing Bradyrhizobium japonicum of the strain
WB74-1, prior to planting in fine vermiculite (Mandoval PC, RSA). Plants were grown under
controlled conditions in a greenhouse, 13h photoperiod at an average light intensity of 1600
µmol.m-2.s-1, with 3 h of supplementary light from metal-halide lamps and using a day/night
temperature of 25 °C/17 °C and 60% relative humidity. Distilled water was used for plant watering
and twice a week watered with a nitrogen-poor nutrient solution. Crown nodules were harvested from
a minimum of three plants at developmental time points, 4, 8 and 14 weeks and were then flash
frozen in liquid nitrogen.
2.1.2.1.4. Chilling exposure in young plants
Soybean wild type (Glycine max cultivar Williams 82) and 3 independent transformed transgenic line
expressing the rice cysteine protease inhibitor, oryzacystatin I (SOC-1, SOC-2 and SOC-3), were
obtained from Iowa State University (Plant Transformation Facility, Iowa State University, G405
Agronomy Hall, Ames, Iowa 50011-1010, United States of America). Seeds were grown on 100%
vermiculite in 3x3cm pots for 7 days under optimal conditions of 25 ºC Day/20 ºC night
temperatures, 12 h photoperiod and an irradiance of 200-250 µmol.m-2.s-1. Seedlings were then
transferred to individual 10x10cm pots containing vermiculite and supplied with full strength
Hoagland’s medium, and grown for a further 7 days. 14 days after sowing seedlings were selected on
the basis developmental stage (2 fully formed trifoliates). Plants from each the wild type and the
transgenic lines were then either maintained under optimal conditions or were subjected to 9
consecutive nights of dark chilling (25 ºC Day/4 ºC night temperatures, 12 h photoperiod and an
irradiance of 250-300 µmol.m-2.s-1). This work was conducted in collaboration with Professor H.
Yildiz Dasgan.
Page | 30
2.1.2.2. Growth on compost
2.1.2.2.1. Developmental analysis
Soybean wild type (Glycine max cultivar Williams 82) and 3 independent transformed transgenic
lines expressing the rice cysteine protease inhibitor, oryzacystatin I were sown in 10x10cm pots
containing compost (Petersfield potting supreme, Petersfield Growing Mediums, 45 Cambridge Road,
Cosby, Leicester, LE9 1SJ). Plants were allowed to grow for 4 weeks before being transferred to 4l
pots, with a final transfer to 10l pots 6 weeks after sowing. Plants were maintained under glasshouse
conditions with 16 h day length and 30/25 °C day/night temperature and an average light intensity of
1500 μmol m-2.s-1. 3 plants were harvested from each genotype at 2 weeks, 4 weeks, 6 weeks and 8
weeks.
2.1.2.2.2. Chilling exposure in young plants
Soybean wild type (Glycine max cultivar Williams 82) and 3 independent transformed transgenic line
expressing the rice cysteine protease inhibitor, oryzacystatin I (SOC-1, SOC-2 and SOC-3), were
obtained from Iowa State University (Plant Transformation Facility, Iowa State University, G405
Agronomy Hall, Ames, Iowa 50011-1010, United States of America). Seeds were sown on 100%
vermiculite in 28x24cm trays and watered to saturation with tap water before being moved to a
controlled environment chamber. Seeds were allowed to germinate for 7 days under control
conditions of 25 ºC Day/20 ºC night temperatures, 12 h photoperiod and an irradiance of 200-250
µmol m-2 s-1. Seedlings were selected on the basis developmental similarity before being transferred
to individual 10x10 cm pots. 14 days after sowing Plants from each the wild type and the transgenic
lines were then either maintained under optimal conditions or were subjected to 9 consecutive nights
of dark chilling (25 ºC Day/4 ºC night temperatures, 12 h photoperiod and an irradiance of 250-300
µmol m-2 s-1).
2.1.3. Pisum sativum
2.1.3.2. Growth on compost and chilling exposure
Pisum sativum genotypes; L107, BL298, K164, K487 and K564 were obtained from the laboratory of
Professor Christine Bevridge (University of Queensland, Australia). Cultivars were either wild type
Page | 31
(L107, Torsdag cultivar) or had been subjected to EMS mutation and were deficient in strigolactone
biosynthesis and perception (BL298, rms5-3; K164, rms4-1; K487, rms3-1). Seeds were first placed
on paper towel lined petri dishes saturated with distilled water and allowed to germinate for 5 days
under control conditions (12h day length, 25/20 °C day/night temperature and a light intensity of 250-
300 μmol.m-2.s-1). Given the sensitivity of peas to hypoxic conditions, ventilation was allowed by
leaving the petri dish lids partially open. Following germination, seedlings of similar developmental
stages (plumule apparent) were transferred to individual 10x10 cm pots containing compost
(Petersfield potting supreme, Petersfield Growing Mediums, 45 Cambridge Road, Cosby, Leicester,
LE9 1SJ) and maintained under control conditions. Following 2 weeks of growth under control
conditions, half of the plants from each genotype were either maintained under these conditions for 7
days, or were exposed to 7 consecutive nights of dark chilling at 4 ºC.
2.1.4. Arabidopsis thaliana
2.1.4.2. Growth on compost and chilling exposure
Arabidopsis thaliana ecotype Colombia-0 (col-0/Wt) and mutagenic lines max2-1, max3-9 and max4-
1 seeds were obtained from Dr Belen Marquez-Garcia, University of Leeds (UK). All mutagenic lines
were a product of EMS treatment and were deficient in either strigolactone biosynthesis or signalling
proteins. Seeds were sown, 4 per pot, in 6x6 cm pots containing compost (Petersfield potting
supreme, Petersfield Growing Mediums, 45 Cambridge Road, Cosby, Leicester, LE9 1SJ) before
being placed into a tray (38x24cm). Each tray was watered with 1L of tap water and placed in a
controlled environment chamber under optimal conditions; 25 ºC day/20 ºC night temperatures, 12
hour photoperiod, irradiance of 200-250 µmol.m2.s-1. Plants were allowed to grow for 7 days before
seedlings were transferred to either; individual 6x6cm pots and allowed to grow for a further 7 days
or individual 50 ml Falcon tubes containing compost and having been watered to saturation. In both
cases plants were grown for a further 2 weeks before being either; maintained under control
conditions or subjected to 7 consecutive nights of dark chilling at 4 ºC.
2.1.4.3. Growth on ½ MS media and chilling exposure
Wild type, max 2-1, max 3-9 and max 4-1 seeds were surface sterilised using chlorine gas. Microfuge
tubes containing approximately 200 seeds were placed into a sealed Nalgene® desiccator with a
beaker containing 300 ml of bleach to which 4 ml of concentrated hydrochloric acid was added for

Page | 32
the evolution of chlorine gas. Seeds were sterilised for a period of 3 hours, sealed and stored at room
temperature. Sterilised seeds were sown on 12x12cm square, ventilated petri dishes containing ½
Murashige and Skoog (MS) base medium. Per litre of distilled water; 10g agar-agar, 10 g sucrose, 2.2
g MS, 0.1 g myo-inisitol (Fisher scientific, Bishop Meadow Rd, Loughborough, Leicestershire LE11
5RG, UK), 0.5g MES (4-Morpholineethanesulfonic acid monohydrate, Alfa Aesar, Shore Rd, Port of
Heysham Industrial Park, Heysham LA3 2XY, UK) was added. Media pH was brought to 5.7 using
potassium hydroxide, following which media was autoclaved for 20 minutes at 121 °C. Media was
allowed to cool to 50 °C before being supplemented with the synthetic strigolactone, GR24. 1 mg of
GR24 (Prof. Dr. Binne Zwanenburg, Utrecht University, NL) was dissolved in 330 µl of 100%
acetone and 100 µl was added per litre of ½ MS media, to a final concentration of 2 µM GR24. Non-
supplemented control media had 100 µl of 100 % acetone added. Following supplementation media
was poured onto plates under a UV sterile laminar flow hood. Surface sterilised seeds of each
genotype were suspended in sterile water and were sown onto ½ MS plates using a p200 pipette.
Plates were sealed with Parafilm® and placed in a 4 °C cold room to imbibe for 72 hours. Imbibed
seed plates were then transferred to a controlled environment chamber (12h day length, 25/20°C
day/night temperature and a light intensity of 250-300 μmol.m-2.s-1). Seeds were allowed to germinate
for 4 days before being either; subjected to 7 consecutive nights of dark chilling (4 °C) or maintained
under control conditions. This work was conducted in collaboration with Masters Student Leila
Beyyoudh.
Page | 33
2.2. Physiological measurements
2.2.1. Nodule harvest and measurement
The entire plant was excised from its vermiculite growth media and the root system was gently
washed in distilled water to eliminate vermiculite particulate. The total number of nodules per plant
was counted and crown root nodules were harvested from soybean roots using a scalpel. The diameter
of harvested nodules was measured using ImageJ (Rasband, 2015).
2.2.2. Shoot and root measurement
The number of leaves and stems per plant was counted. The shoot was then cut from the root using a
scalpel and the fresh weight was measured on a balance (Ohaus PA413, Ohaus Europe GmbH,
Heuwinkelstrasse 3, CH-8606 Nänikon, CH). Tissue was placed in pre-weighed aluminium foil and
dried at ~80 °C for 3 days for dry weight measurement. For plants grown on vermiculite the plant was
excised from the media and the roots were thoroughly washed in distilled water, with care being
taken to preserve lateral roots. The root system was cut from the plant and dried with tissue before
being measured for fresh weight. Dry weight was determined by removing the root system to pre
weighed aluminium foil and drying for 3 days at ~ 80 °C before weighing.
2.3. Arabidopsis rosette measurements
The rosette area of A. thaliana plants was measured by photographing plants with a Nikon D5100
DSLR digital camera. Each photo contained a reference scale and ImageJ (Rasband, 2015) was used
to calculate whole rosette area.
2.3.1. Photosynthetic parameters: gas, fluorescence and pigments
Photosynthetic gas exchange measurements were made using a LI-6400XT portable photosynthesis
system (LI-COR Biotechnology UK Ltd, St. John's Innovation Centre, Cowley Road, Cambridge,
CB4 0WS, UK). Photosynthetic carbon assimilation, stomatal conductance and intracellular CO2
concentration were measured using infra-red gas analysis. The LI-6400XT delivered a light intensity
of 800 µmol.m-2.s-1 and a CO2 level of 400 µmol mol-1. When measuring faba bean, soybean and pea,

Page | 34
the oldest leaf of each plant was inserted into a 3x2 cm 6400-02B LED gas exchange chamber. When
measuring Arabidopsis the whole plant was placed in a 6400-17L lighted whole plant Arabidopsis
chamber. Plants were allowed to photosynthetically stabilise for 15 minutes prior to data recording.
The protocol followed was essentially that of Soares et al. (2008).
Chlorophyll fluorescence (Fv/Fm) was determined by fluorepen measurement of dark adapted leaves
(Photon Systems Instruments, Drasov 470, 664 24 Drasov, Czech Republic). Leaf pigment content
was determined via the method of Lichtenthaler, (1987) with weighed leaf samples being ground in
liquid N2 and having their pigment extracted via centrifugation with 95% ethanol at 10,000 g.
Pigment content (µg/ml) was calculated as follows; calculate the pigment concentrations (µg/mL):
Chlor a = 13.36A664 – 5.19649, Chlor b = 27.43A649 – 8.12A664, Ca+b = 5.24A664 + 22.24A649
Carotene = (1000A470 – 2.13Ca – 97.64Cb)/209.
2.4. Construction of dark freezing chamber
To conduct experiments into low temperature tolerance an environment chamber capable of freezing
temperatures was constructed. This was performed in collaboration with Dr Jeremy Harbinson
(University of Wageningen, Netherlands) who designed and constructed the temperature control
module, and Mr Tarsem Hunjan (University of Leeds, United Kingdom) who assisted in the assembly
of the freezing chamber. The dark freezing chamber was operated by running a commercial freezer,
capable of achieving temperatures of -20 °C, to its maximum capacity. The freezer, having attained
its minimum possible temperature, could then have its internal temperature raised through the
application of heat. Through frequent applications of small levels of heat, a stable internal
temperature could be maintained. Monitoring of the chambers internal temperature and calculation of
the level of heat application was carried out by a temperature control module (Figure 2.4.1-1). The
module was able to self-calibrate and monitor the rate and extent of temperature change relative to
the amount of energy delivered to the heating cable.
2.4.1. Temperature control module
The temperature control module (Figure 2.4.1-1) was constructed using the materials listed in Table
3. Construction was conducted at the University of Wageningen (NL) by Dr Jeremy Harbinson.
Testing of the module and its implementation in a controlled environment system was carried out at
the University of Leeds.

Page | 35
Table 3: Materials needed for construction of temperature control module.
Part Manufacturer Item number Quantity
Plastic-aluminium case Multicomp 1526705 1
3-pin fused power inletswitch
Multicomp 1516059 1
3 pin power outlet Schruter 9657029 2
Type K thermocouplesocket
Labfacility 7086386 1
Green rocker switch,illuminating
Multicomp 1454388 2
Fuse holders Littelfuse 9516395 2
Solid state relay Crydom 1200213 1
RS232 D connector ITT cannon 1760329 1
CAL3300200temperature controller
West control solutions - 1
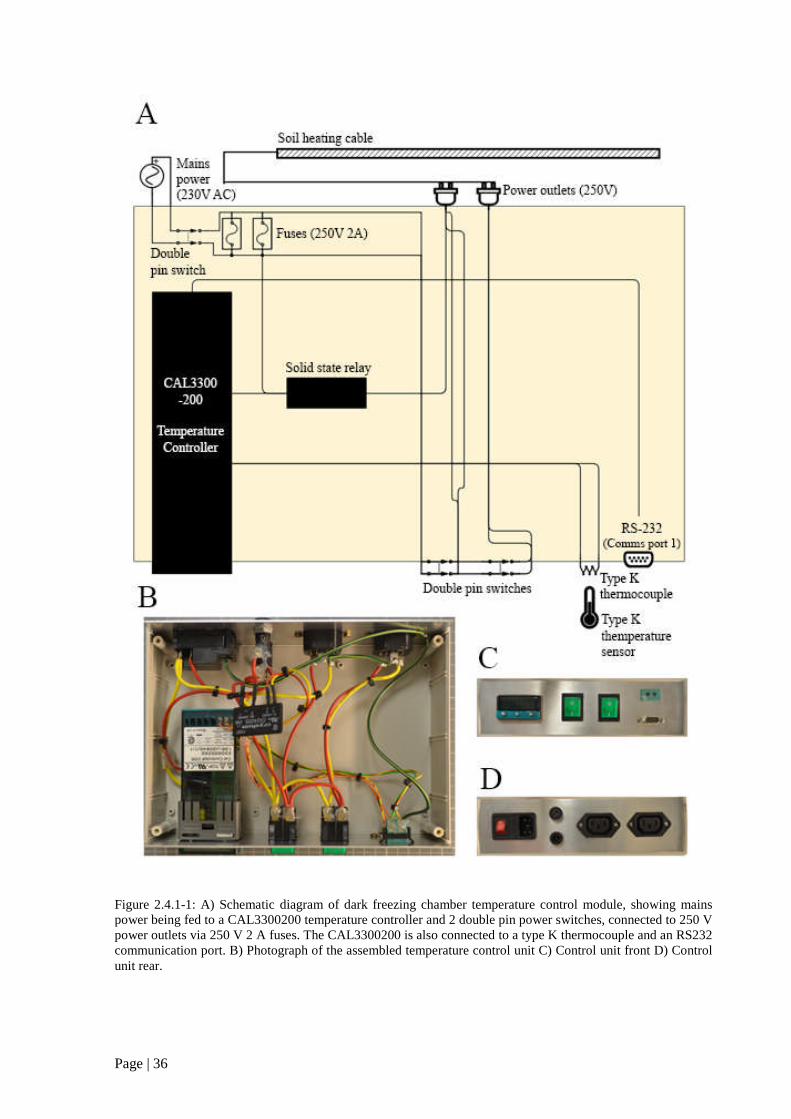
Page | 36
Figure 2.4.1-1: A) Schematic diagram of dark freezing chamber temperature control module, showing mainspower being fed to a CAL3300200 temperature controller and 2 double pin power switches, connected to 250 Vpower outlets via 250 V 2 A fuses. The CAL3300200 is also connected to a type K thermocouple and an RS232communication port. B) Photograph of the assembled temperature control unit C) Control unit front D) Controlunit rear.

Page | 37
2.4.2. The dark freezing chamber.
Figure 2.4.2-1: Control and power units for the dark freezing chamber showing; a laptop attached to athermocouple data logger as a confirmatory temperature sensing system; a voltage adjustable power packattached to 12 V fans for air circulation; a temperature controller to accurately maintain chamber temperatureby delivering heat through a soil heating cable.
A commercial household freezer (Candy Chest Freezer, CHZE 6089, Pentrebach, Merthyr Tydfil,
Mid Glamorgan, CF48 4TU, UK) was fitted with an aluminium scaffold on which soil heating cable
was hung. Computer fans (San Ace 92L fans, Farnell Electronics, Maybrook Industrial Estate,
Castleton Rd, Leeds LS12 2EN, UK) were attached to the scaffolding to circulate air in the chamber
and maintain a constant temperature (Figure 2.4.2-2). Fans were powered by a voltage adjustable
power pack. Type K temperature sensors was mounted near the fans, with the data being fed to both a
thermocouple data logger (TC-08 thermocouple data logger, Picotech Ltd, James House, Colmworth
Business Park, St Neots, Cambridgeshire, PE19 8YP, UK) and the temperature control module. The
thermocouple data logger was USB linked to a laptop where chamber temperature could be
monitored and recorded in real time.
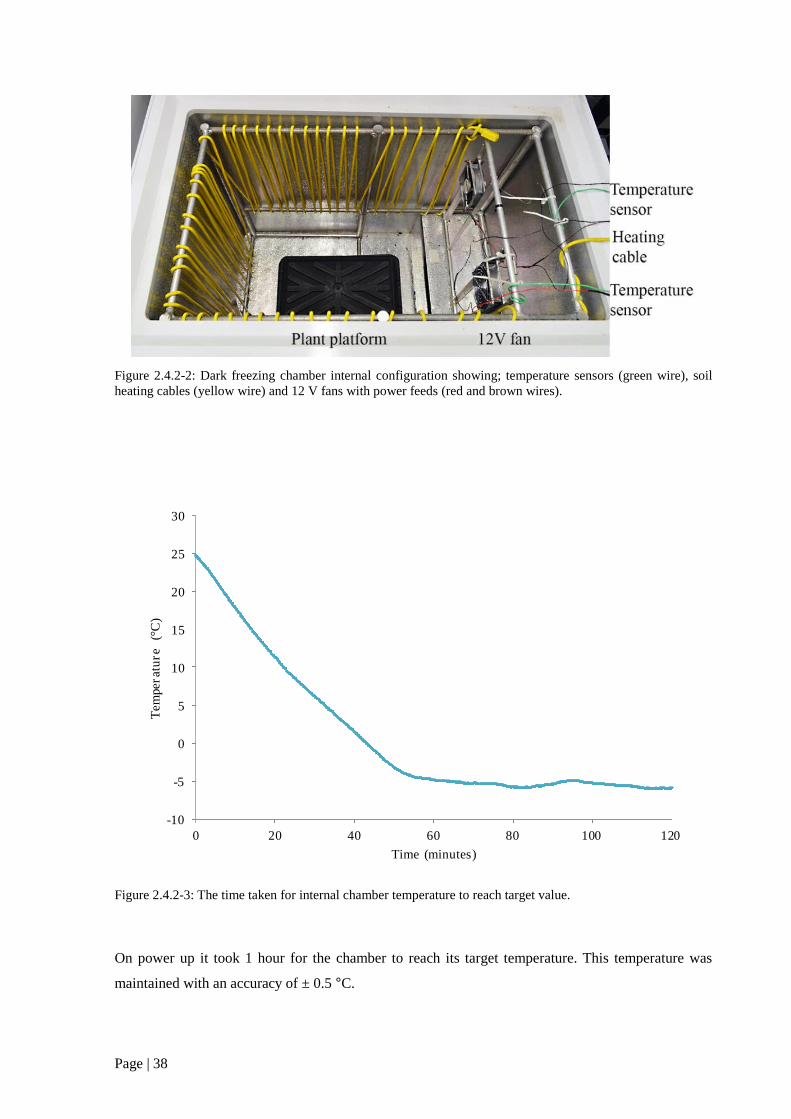
Page | 38
Figure 2.4.2-2: Dark freezing chamber internal configuration showing; temperature sensors (green wire), soilheating cables (yellow wire) and 12 V fans with power feeds (red and brown wires).
Figure 2.4.2-3: The time taken for internal chamber temperature to reach target value.
On power up it took 1 hour for the chamber to reach its target temperature. This temperature was
maintained with an accuracy of ± 0.5 °C.
-10
-5
0
5
10
15
20
25
30
0 20 40 60 80 100 120
Tem
pera
ture
(°C
)
Time (minutes)

Page | 39
2.5. Nucleic acid extraction
2.5.1. DNA extraction from Vicia faba embryonic axis
DNA extraction was performed using the Qiagen DNeasy plant mini kit (Qiagen Ltd, Skelton House,
Lloyd Street North, Manchester, M15 6SH, UK) employing a modified protocol. 10 seeds of Vicia
faba (Wizard cv) were incubated in distilled water for 72 hours. Embryonic axes were extracted and
ground in liquid N2 in a pestle and mortar. 800 µl of buffer AP1 was added to the mortar and allowed
to thaw, followed by the addition of 8µl of RNAse. Lysate was added to a 1.5 ml microfuge tube. The
mortar was rinsed with an additional 400 µl of AP1 which was also added to the microfuge tube.
Tube was incubated at 65 °C for 10 minutes. Into a separate 1.5 mL microfuge tube 800 µl of lysate
was transferred and 260 µl of buffer P3 was added (3:1 v/v P3:AP1). This was incubated on ice for 5
minutes and spun at 20,000 g for 5 minutes. Supernatant was divided equally into 2 shredder columns
and spun for 2 minutes at 20,000 g. This process was repeated until all supernatant had been spun
through the shredder column with each flow through being collected into a separate 2 ml microfuge
tube. Volumes of each tube were measured and 1.5 volumes of buffer AW1 were added to each.
From each subsample 650 µl was added to a DNeasy spin colum and spun at 6000g for 1 minute.
This was repeated for any remaining sample. Spin columns were placed into new collection tubes,
washed with 500 µl of buffer AW2 by spinning at 6000 g for 1 minute and further washed with an
additional 500 µl of AW2 by spinning at 20,000 g for 2 minutes. Column membrane was dried by
spinning at 20,000 g for 2 minutes. Columns were placed into new collection tubes and 50 µl of
distilled, nuclease free water was added directly to the membrane. Column was left at room
temperature for 5 minutes, following which it was spun at 6000 g for 1 minute to elute the column
bound DNA. This step was repeated to produce a second column elution. The two elutes were then
combined. Quality and abundance was confirmed by agarose gel electrophoresis, running 10 µl of
sample on a 1% gel at 80 V for 1 hour.
2.5.2. DNA extraction from leaf tissue
DNA was extracted from leaf tissue using a Qiagen DNeasy plant kit, as per manufacturer protocol
(Qiagen Ltd, Skelton House, Lloyd Street North, Manchester M15 6SH, UK). A minimum of 80 mg
and a maximum of 100 mg of plant tissue was used per extraction.
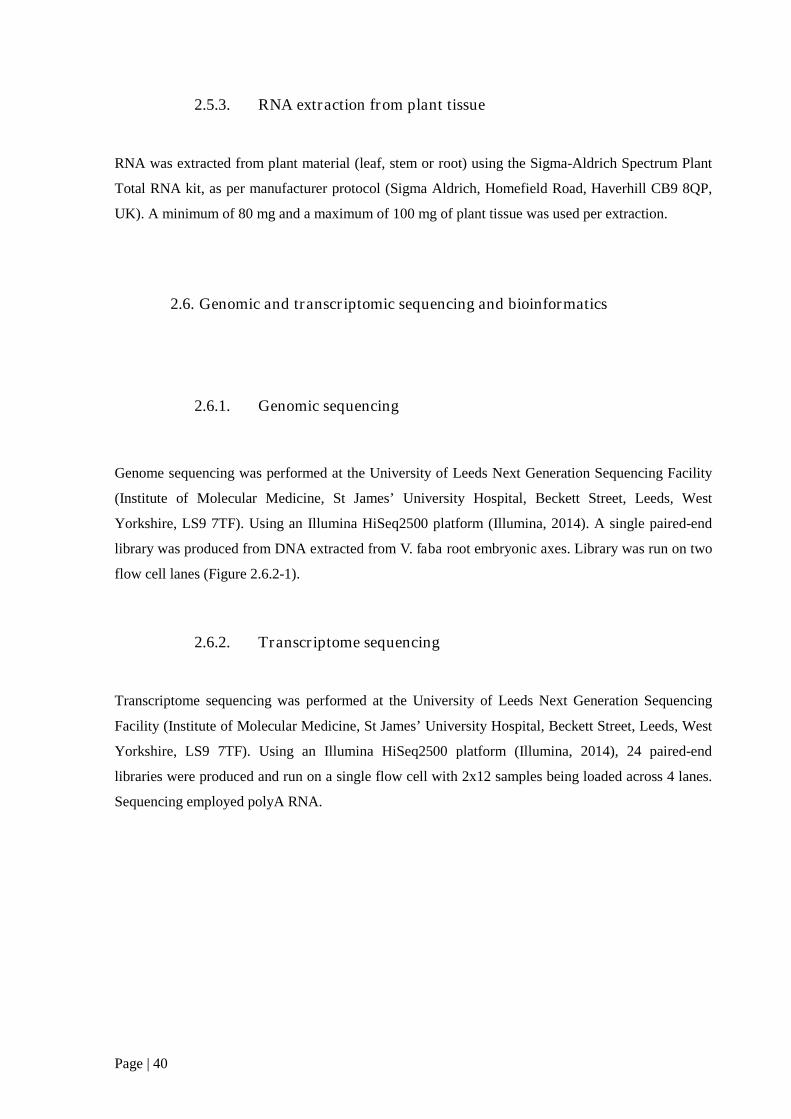
Page | 40
2.5.3. RNA extraction from plant tissue
RNA was extracted from plant material (leaf, stem or root) using the Sigma-Aldrich Spectrum Plant
Total RNA kit, as per manufacturer protocol (Sigma Aldrich, Homefield Road, Haverhill CB9 8QP,
UK). A minimum of 80 mg and a maximum of 100 mg of plant tissue was used per extraction.
2.6. Genomic and transcriptomic sequencing and bioinformatics
2.6.1. Genomic sequencing
Genome sequencing was performed at the University of Leeds Next Generation Sequencing Facility
(Institute of Molecular Medicine, St James’ University Hospital, Beckett Street, Leeds, West
Yorkshire, LS9 7TF). Using an Illumina HiSeq2500 platform (Illumina, 2014). A single paired-end
library was produced from DNA extracted from V. faba root embryonic axes. Library was run on two
flow cell lanes (Figure 2.6.2-1).
2.6.2. Transcriptome sequencing
Transcriptome sequencing was performed at the University of Leeds Next Generation Sequencing
Facility (Institute of Molecular Medicine, St James’ University Hospital, Beckett Street, Leeds, West
Yorkshire, LS9 7TF). Using an Illumina HiSeq2500 platform (Illumina, 2014), 24 paired-end
libraries were produced and run on a single flow cell with 2x12 samples being loaded across 4 lanes.
Sequencing employed polyA RNA.
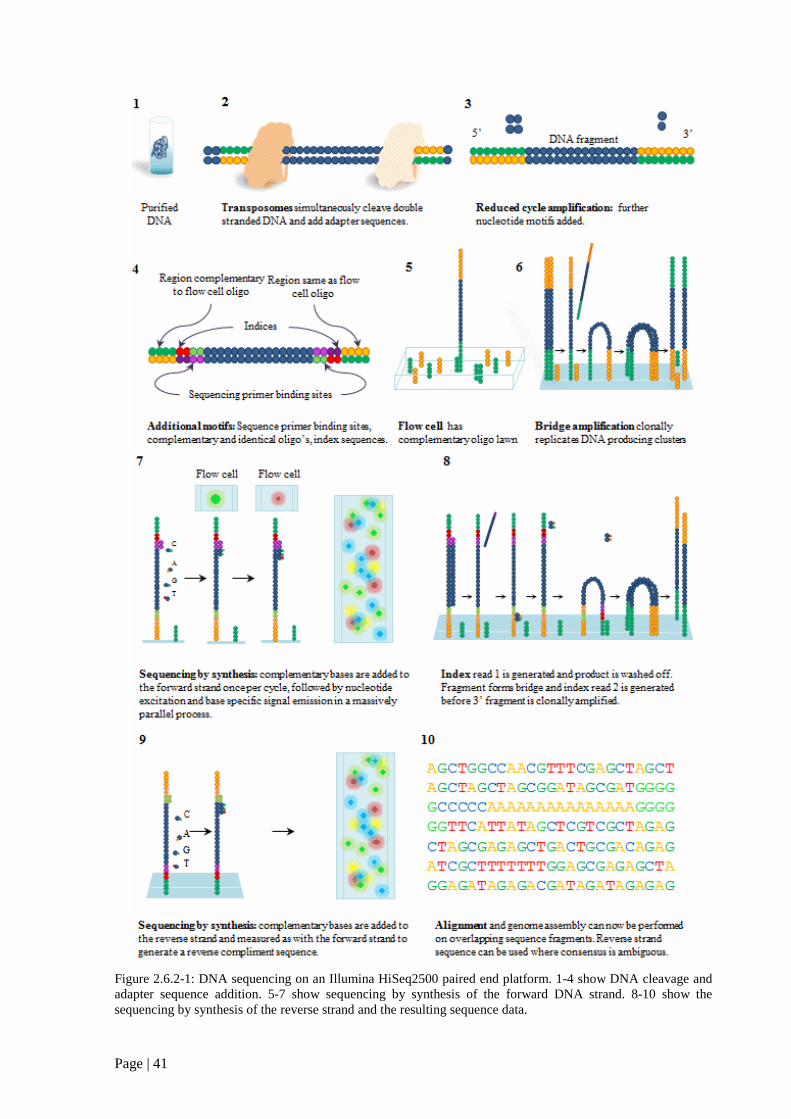
Page | 41
Figure 2.6.2-1: DNA sequencing on an Illumina HiSeq2500 paired end platform. 1-4 show DNA cleavage andadapter sequence addition. 5-7 show sequencing by synthesis of the forward DNA strand. 8-10 show thesequencing by synthesis of the reverse strand and the resulting sequence data.

Page | 42
2.7. Bioinformatics
2.7.1. De novo genome assembly
FastQC analysis (Andrews, 2010) was performed on raw sequenced reads and TrimGalore!
(Andrews, 2015)was used to remove adapter sequences and all bases below a moving window
average Phred quality score of 30. ABySS (Simpson et al., 2009) was used for de novo paired end
sequence assembly, with kmer sizes of 32 and 64.
2.7.2. Contig database for BLAST
The NCBI BLAST toolkit was used to create a BLAST+ nucleotide database of ABySS assembled
Vicia faba genomic contigs.
2.7.3. Linkage enhanced genome contigs
Linkage marker sequences were obtained from the cool season grain legume database (Humann et al.,
2016) on the basis of work conducted by Webb et al., (2016). Linkage markers were BLASTED
against the contig BLAST+ database. Homologous reads were selected, where length and identity
were >90%. Successful BLAST hits could be putatively mapped to V. faba chromosomes, whereby
genomic DNA scaffolds were searched against the Medicago truncatula DNA database (Phytozome)
and gene orthologues were identified.
2.7.4. Organellar genome comparisons
Chloroplast and mitochondrial reference sequences for Vicia faba and several related species,
together with publicly available DNA-seq reads, were downloaded from NCBI. Bowtie2 (Langmead
and Salzberg, 2012) was used to align the DNA-seq reads and relevant reference genome for
chloroplast, and mitochondria where available. Samtools mpileup (Li, 2011) was used to identify
single nucleotide variants (SNV). A core set of chloroplast and mitochondrial genes was assembled
by BLAST between pairs of species, where one or more genes were present in annotated reference
sequences from all species. SNVs in DNA-seq reads were visualised using IGV (Thorvaldsdóttir et

Page | 43
al., 2013). Further comparisons were made of between-species variance, with homology being
assessed within a 10 bp window. A multi-species homology map was constructed for each core gene
of the chloroplast and mitochondria with map visualisation being performed in Microsoft Office
Excel.
2.7.5. Transcriptomic dataset analysis
Raw transcriptome reads were quality trimmed using the Tim Galore! bioinformatics program, using
FastQC to identify primer and adapter sequences, to a quality score (phred) of 30 (Andrews, 2015).
To eliminate the possibility of contaminants sequences were scanned against a 106 Gb contaminant
database (Wood and Salzberg, 2014). The Salmon program (Patro et al., 2015)was used to quantity
the RNA Seq against the Cool Season Food Legume database (Humann et al., 2016). The quantified
RNA Seq data was imported into R/Bioconductor (R Core Team, 2015; Huber et al., 2015) using
tximport (Soneson et al., 2015) and counts were normalised using EdgeR (Robinson et al., 2010).
Differential expression was calculated using LIMMA (Ritchie et al., 2015) Gene ontology was
determined using FATIGO (Al-Shahrour et al., 2004). Principle component analysis was conducted
and visualised in R (R Core Team, 2015) using pcaMethods (Stacklies et al., 2007) and ggplot2
(Wickham, 2009).
2.8. qPCR and PCR
Polymerase chain reaction (PCR) was carried out using BioMix Red reaction mix (Bioline reagents
limited, Unit 16 The Edge Business Centre, Humber Road, London, NW2 6EW). 5 µl of DNA was
added to 10 µl of BioMix red and 5 µl of PCR primer (Table 4). Reaction volume was brought to 20
µl using distilled water. PCR was run on a thermocycle program of 5:00 minute denaturation at 95ºC,
a further denaturation for 1:00 minute at 95 °C, elongation at appropriate temperature for 0:30
minutes with 44 repetitions of 1:00 minute denaturation and 0:30 minute of elongation. PCR products
were run on a 1% Agarose gel in 1% TAE buffer against a 1 kb+ gene rule (3 Fountain Drive,
Inchinnan Business Park, Paisley PA4 9RF, UK) to determine product size and identity.
Quantitative real time polymerase chain reaction (qPCR) was performed using a Quiagen QuantiTect
SYBR Green PCR Kit and a BIO RAD CFX96 Real Time System with C1000 Thermal Cycler
(www.bio-rad.com). Samples were pipetted on to clear, low skirted 96 well plates (StarLabs,
www.starlab.co.uk). Each well contained; cDNA 4μl (10 ng/μl), SYBR Green 10 μl, Forward and
reverse primers 1.8 μl (5mM), Distilled water (DNAse free) 4.2 μl. The BIORAD qPCR system was

Page | 44
programmed to run a 2 step melting curve using the following program: Initial denaturation at 95 °C
for 5:00 minutes; a further denaturation step at 95 °C for 1:00 minute; an elongation step at
appropriate temperature for 0:30 seconds; 44 repeats of 1:00 minute denaturation and 0:30 second
elongation; melting curve analysis from 55 °C to 95 ºC in 0.5 °C increments for 0:05 seconds. qPCR
data was processed using the Livak method (2−ΔΔCt) (Schmittgen and Livak, 2008). Calculated as:
[(CT gene of interest – CT internal control) sample A – (CT gene of interest – CT internal control)
sample B)]
Table 4: qPCR primers for use with G. max
Accession ID Forward sequence Reverse sequence Function
Glyma02g08180
GR1 TCCGCCACTTTCTGTAGTTG
GTGAAAACCAACAGATCGCC
Glutathione reductase(Mt)
Glyma02g16010
GR2 CCTCAAGCTATCACGAAGTCAG
TTTCACACCAACAGACTCCAG
Glutathione reductase(Chlor)
Glyma06g44050
GRX2
CGATTGCTATTGGGTCTTGGG
AAACCGCTGGAAATTGCATC
Glutaredoxin
Glyma08g22430
GRX3
ACTTGGTTCACTCGAATGGC
CCATTTAAGGGTCTGCTGAGAG
Glutaredoxin
Glyma09g07040
GRX4
TCTCCAATCTTCAGCTTCAGC
CTTCTACAGTACGGGCAATAGG
Glutaredoxin
Glyma20g3844
GST TGAATCCTGAAGGGAAGGTG
TATCTTTGATCCCACGGAGG
Glutathione S transferase
Glyma06g41610
TX1 CAGTGGATAAAATTGTGGGTGC
GGCAACTGTTCAATGTGTTCG
Thioredoxin
Glyma03g40280
CSD1 ATTCCTCTCACTGGACCAAAC
GATACCACAAGCTACTCTGCC
Cu-Zn superoxidedismutase
Glyma16g27020
CSD2 AGTGACAGGGTTGTCCAAG
GAGGACCTGGGGTAGAGGAG
Cu-Zn superoxidedismutase
Glyma04g39930
MSD CGATCTGGATTACGACTATGGC
AGTTGGTGATGTAAGTCTGGTG
Fe-Mn superoxidedismutase (Mt)
Glyma10g07820
MDAR1
TTGATCATTCTCGCAAATCG
TCGTTTACCAAAATCCGTCC
Monodehydroascorbatereductase
Glyma17g04210
DLD CTAACTCTTGAACCGGCTGC
TCGTTTACCAAAATCCGTCC
Dihydrolipoyldehydrogenase
Glyma08g04370
ALDH
AATTAGTCTCAGTCCCCAACG
AGAGCTTGGTGAACTTGATCG
Aldehyde dehydrogenase
Glyma11g16370
CCD7 CACCAAACCCCTCCCTCTAT
CCTTCCACGGTGCTTAGAGT
Carotenoid cleavagedehydrogenase
CCD8 CCD8 CTTGTTCCTGACATGCCTCA
CTAGTCCATGCAACGTGGT
Carotenoid cleavagedehydrogenase
Glyma16g10700
40S GCCAGCCTGCTAACACTAAG
AAGAGTCTGAGTACGCACAAG
40S ribosomal subunit
Glyma18g52780
Actin TGTTCCCTGGTATTGCTGAC
AAGGTGCTAAGAGATGCCAAG
Actin
Glyma02g44460
Elf 1-β
GTGGTACGATGCTGTCTCTC
CCACTGAATCTTACCCCTTGAG
Ribosomal elongationfactor
TC224926 CYP2 CGGGACCAGTGTGCTTCTTCA
CCCCTCCACAAAGGCTCG
Cyclophilin 2 – Proteinfolding
N/A OCI ATGTCGAGCGACGGAGGG
TTGCACTGGCTACGACAGGC
Oryzacystatin I

Page | 45
“The fact that we live at the bottom of a deep gravity well, on the surface of a gas covered planet
going around a nuclear fireball 90 million miles away and think this to be normal is obviously some
indication of how skewed our perspective tends to be.”
-Douglas Adams, The Salmon of Doubt: Hitchhiking the Galaxy One Last Time

Page | 46
3. The characterisation of OCI expressing soybean under drought and chilling
3.1. Introduction
The growth and productivity of soybean plants is limited by environmental stresses such as low
temperatures and drought (Kunert et al., 2016),which can inhibit both leaf and nodule functions. For
example, both stresses alter the nodule oxygen diffusion barrier, particularly by effects on respiratory
activity (Van Heerden et al., 2008). Nitrogen fixation in the nodules depends on the absence of
oxygen. Nodule respiration is therefore supported by oxygen transfer via leghaemoglobin (Goldberg
et al., 1987). When nodules are exposed to stress the delicate oxygen balance of the system is
perturbed leading to inhibition of symbiotic nitrogen fixation, increasing the likelihood of reactive
oxygen species production. However, the nodules have a robust antioxidant system comprised of;
metallo-protein superoxide dismutases, catalases, ascorbate and glutathione, all serving to protect
against enhanced oxidation (Naya et al., 2007).
Soybean (G. max) is inherently sensitive to chilling with temperature-dependent limitations on
growth, development and yield being apparent below 15 ºC (Gass et al., 1996). Soybeans are
particularly sensitive to lower temperatures during flowering with a single night of dark-chilling
(8 °C minimum), being sufficient to inhibit pod formation (Hume and Jackson, 1981). In addition,
soybean photosynthesis is highly sensitive to inhibition by dark-chilling, a trait that is linked to loss
of photosynthetic enzyme activity (Van Heerden et al., 2003) and effects on photosystem II efficiency
(Krüger et al., 2014). Moreover, the sensitivity of photosynthesis to dark-chilling in nodulated
soybeans is strongly contributed to by chilling-induced inhibition of symbiosis (Van Heerden et al.,
2008). Despite the importance of soybean in world agriculture, relatively little information is
available in the literature about the mechanisms that cause or contribute to chilling sensitivity.
Indeed, the most studied aspect of chilling tolerance in soybean have focused on stress exposure
during seed germination (Cheng et al., 2010), and yield reduction as a product of chilling exposure
during flowering (Gass et al., 1996). However, enhanced tolerance to chilling is an important trait at
every stage of plant development, with photosynthetic efficiency being inherently linked to crop yield
(Richards, 2000; Zhu et al., 2010). Thus the maintenance of photosynthesis in soybean that are
exposed to chilling temperatures is a desirable trait, though limited research has been conducted in
this area (Van Heerden et al., 2004b).
Both drought and dark-chilling lead to extensive loss of chlorophyll from the leaves, suggesting that
the chilled soybean leaves enter premature senescence (Van Heerden et al., 2003, 2008; Kunert et al.,

Page | 47
2016). Senescence occurs as genetically-programmed stage of leaf development but it can also be
induced at earlier developmental stages by environmental exposure to stresses. Senescence is
reversible until the final stages, where accumulation of salicylic acid induces programmed cell death
(PCD) (Van Doorn and Woltering, 2004; Zhang et al., 2013). The onset of PCD and senescence is
marked by changes in protein content and composition, particularly a shift from protein metabolism
to catabolism. Cysteine proteases are particularly important enzymes catalysing protein degradation
during senescence, but their precise functions in stress-induced senescence are not well understood
(Beers et al., 2000; Bhalerao et al., 2003; Guo, 2013). Whilst many cysteine proteases are localised in
the vacuole and cytosol, they are also observed in senescence-associated vesicles (SAV, also known
as senescence associated vacuoles). In leaves, these vesicles have a lower pH than the primary cell
vacuole and are believed to transport chloroplast proteins to the central vacuole for degradation
during senescence (Otegui et al., 2005; Carrión et al., 2014; Martínez et al., 2008). RuBisCO is the
most abundant plant protein, with functions both in photosynthesis and in nitrogen storage, prior to
nitrogen remobilization to the developing seed during senescence. The pathway of RuBisCO
degradation remains uncertain but evidence shows that the protein may be degraded both inside and
outside of the chloroplast (Irving and Robinson, 2006). Whilst metallo-proteases and aspartic
proteases participate in chloroplast protein turnover (Nair and Ramaswamy, 2004; Kato et al., 2004),
cysteine proteases have also been implicated in chloroplast protein degradation (Prins et al., 2008).
The activity of cysteine proteases in plant cells is predominantly modulated through the presence of
specific inhibitors called cystatins. The best characterised plant cystatin is oryzacystatin I (OCI),
derived from rice (Oryza sativa) (Masoud et al., 1993). Transgenic tobacco lines that constitutively
express OCI under the control of the cauliflower mosaic virus 35S promoter have a slower growth
phenotype and show enhanced tolerance to chilling temperatures (Van der Vyver et al., 2003b).
Moreover, the leaves of OCI expressing tobacco plants show increased accumulation of RuBisCo
compared to Wt controls, (Prins et al., 2008). Additionally ectopic cystatin expression blocks stress-
induced PCD in soybean (Solomon et al., 1999).
To explore the role of cysteine proteases and their inhibitors in the regulation of stress responses,
independent transgenic soybean lines expressing OCI (SOC1, SOC-2 and SOC-3) were produced and
characterised in terms plant growth and sensitivity to drought (Quain et al., 2014) and low nitrogen-
induced senescence (Quain et al., 2015). The following studies were designed to characterise
transgenic soybean lines ectopically expressing OCI, focussing particularly on responses to dark-
chilling. In addition, experiments were performed to identify senescence-associated redox transcripts
in soybean nodules and to compare how these transcripts were changed in response to drought. For
these studies, Wt plants and plants of the three independent transgenic soybean lines expressing OCI
(SOC1, SOC-2 and SOC-3) were grown to maturity in the absence of stress to compare the effects of

Page | 48
OCI expression on the shoot phenotype. Subsequently, the effects of dark-chilling on nodule, root and
shoot parameters were assessed in the Wt and transgenic lines. Finally, the effects of drought stress
on gene expression in the nodule were determined. Together, these measurements provide a brief
overview of the effects of OCI expression on soybean phenotype in the absence and presence of
stress.
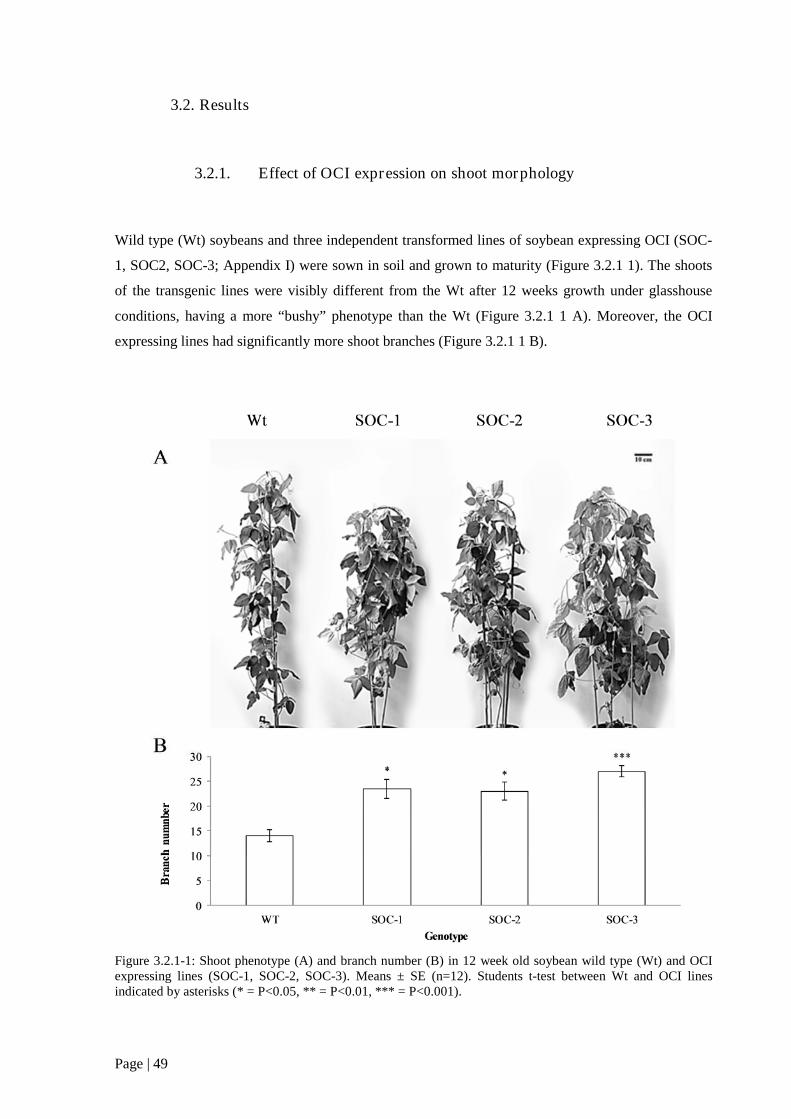
Page | 49
3.2. Results
3.2.1. Effect of OCI expression on shoot morphology
Wild type (Wt) soybeans and three independent transformed lines of soybean expressing OCI (SOC-
1, SOC2, SOC-3; Appendix I) were sown in soil and grown to maturity (Figure 3.2.1 1). The shoots
of the transgenic lines were visibly different from the Wt after 12 weeks growth under glasshouse
conditions, having a more “bushy” phenotype than the Wt (Figure 3.2.1 1 A). Moreover, the OCI
expressing lines had significantly more shoot branches (Figure 3.2.1 1 B).
Figure 3.2.1-1: Shoot phenotype (A) and branch number (B) in 12 week old soybean wild type (Wt) and OCIexpressing lines (SOC-1, SOC-2, SOC-3). Means ± SE (n=12). Students t-test between Wt and OCI linesindicated by asterisks (* = P<0.05, ** = P<0.01, *** = P<0.001).

Page | 50
3.2.2. The effect of OCI expression on root nodules and their responses
to chilling
For these experiments, the Wt and OCI (SOC-1, SOC-2 and SOC-3) expressing lines (Quain et al.,
2015) were inoculated with Bradyrhizobium japonicum and grown on vermiculite with nitrogen-free
Hoagland’s solution for 3 weeks. Half of the plants were grown under these conditions for a further 7
days (Control conditions) and half were exposed to 7 consecutive nights of dark-chilling (4 °C;
Chilled). After the 7th night of dark-chilling the root systems were removed from vermiculite and
gently washed with distilled water. A visual inspection of the root systems (Figure 3.2.2-1) revealed
that in the absence of stress root architecture was more extensive in the Wt and SOC-3 plants than the
other two lines (Figure 3.2.2-1, Control). Surprisingly, the root systems of the plants that had been
exposed to 7 nights of dark-chilling (Figure 3.2.2-1, Chilled) were visibly more extensive than the
roots of unstressed controls (Figure 3.2.2-1, Control).
Figure 3.2.2-1: Root phenotypes of 4 week old soybean; Wt and OCI lines (SOC-1, SOC-2 and SOC-3). Plantswere inoculated with Bradyrhizobium japonicum on vermiculite media and grown in glasshouse for 3 weeksbefore exposure to either 7 consecutive nights of dark-chilling or maintenance under glasshouse conditions.Large and small black arrows on Wt control indicate crown root nodules and lateral root nodules respectively.Scale bar represents 2 cm.
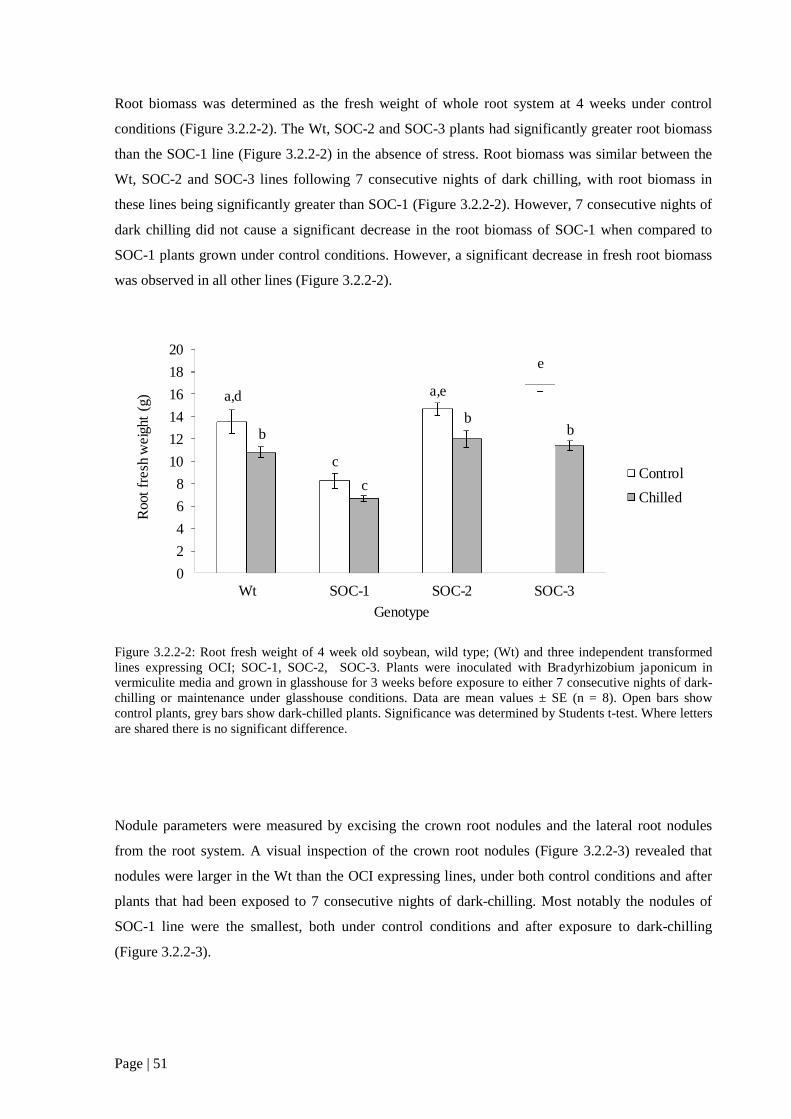
Page | 51
Root biomass was determined as the fresh weight of whole root system at 4 weeks under control
conditions (Figure 3.2.2-2). The Wt, SOC-2 and SOC-3 plants had significantly greater root biomass
than the SOC-1 line (Figure 3.2.2-2) in the absence of stress. Root biomass was similar between the
Wt, SOC-2 and SOC-3 lines following 7 consecutive nights of dark chilling, with root biomass in
these lines being significantly greater than SOC-1 (Figure 3.2.2-2). However, 7 consecutive nights of
dark chilling did not cause a significant decrease in the root biomass of SOC-1 when compared to
SOC-1 plants grown under control conditions. However, a significant decrease in fresh root biomass
was observed in all other lines (Figure 3.2.2-2).
Figure 3.2.2-2: Root fresh weight of 4 week old soybean, wild type; (Wt) and three independent transformedlines expressing OCI; SOC-1, SOC-2, SOC-3. Plants were inoculated with Bradyrhizobium japonicum invermiculite media and grown in glasshouse for 3 weeks before exposure to either 7 consecutive nights of dark-chilling or maintenance under glasshouse conditions. Data are mean values ± SE (n = 8). Open bars showcontrol plants, grey bars show dark-chilled plants. Significance was determined by Students t-test. Where lettersare shared there is no significant difference.
Nodule parameters were measured by excising the crown root nodules and the lateral root nodules
from the root system. A visual inspection of the crown root nodules (Figure 3.2.2-3) revealed that
nodules were larger in the Wt than the OCI expressing lines, under both control conditions and after
plants that had been exposed to 7 consecutive nights of dark-chilling. Most notably the nodules of
SOC-1 line were the smallest, both under control conditions and after exposure to dark-chilling
(Figure 3.2.2-3).
a,d
c
a,e
e
b
c
bb
0
2
4
6
8
10
12
14
16
18
20
Wt SOC-1 SOC-2 SOC-3
Roo
tfr
esh
wei
ght
(g)
Genotype
Control
Chilled

Page | 52
Figure 3.2.2-3: Crown root nodules of 4 week old soybean wild type; (Wt) and three independent transformedlines expressing OCI (SOC-1, SOC-2 and SOC-3). Plants were inoculated with Bradyrhizobium japonicum invermiculite media and grown in glasshouse for 3 weeks before exposure to either 7 consecutive nights of dark-chilling or maintenance under glasshouse conditions. Scale bar represents 5mm.
Although the nodules of all three transgenic lines appeared to be smaller than the Wt, only the SOC-1
and SOC-3 nodules had a significantly smaller diameter than the Wt, in the absence of chilling stress
(Figure 3.2.2-4). The diameter of the Wt, SOC-1 and SOC-2 nodules was not significantly decreased
after 7 consecutive nights of dark-chilling (Figure 3.2.2-4). However, the diameter of SOC-1 nodules
was significantly smaller as a result of exposure to chilling stress. Although the SOC-2 and SOC-3
lines tended towards a smaller nodule diameter following dark-chilling, values were not significantly
different from those measured in the absence of stress (Figure 3.2.2-4).
Figure 3.2.2-4: Nodule diameter of 4 week old soybean, displaying wild type; (Wt) and three independenttransformed lines expressing OCI; SOC-1, SOC-2 and SOC-3. Plants were inoculated with Bradyrhizobiumjaponicum in vermiculite media and grown in glasshouse for 3 weeks before exposure to either 7 consecutivenights of dark-chilling or maintenance under glasshouse conditions. Data are mean values ± SE (n = 8). Openbars show control plants, grey bars show dark-chilled plants. Significance was determined by Students t-test.Where letters are shared no significant difference is present.
ab
a,bb
a,b
c
bb
0.0
0.1
0.2
0.3
0.4
0.5
Wt SOC-1 SOC-2 SOC-3
Dia
met
er(m
m)
Genotype
Control
Chilled

Page | 53
The number of nodules per plant was determined by counting both crown and lateral root nodules. In
the absence of stress all three transgenic lines had significantly greater nodule numbers than the Wt
(Figure 3.2.2-5). The roots of the Wt plants that had been exposed to 7 consecutive nights of dark-
chilling has significantly more nodules than those that had been maintained at higher night
temperatures (Figure 3.2.2-5). In contrast, nodule numbers per plant tended to be lower in the root
systems all the transgenic lines after exposure to chilling stress than in plants maintained without
chilling (Figure 3.2.2-5). However, nodule numbers were only significantly decreased after dark-
chilling in the SOC-2 roots (Figure 3.2.2-5).
Figure 3.2.2-5: Number of crown and lateral root nodules of 4 week old soybean plants, displaying wild type;(Wt) and three independent transformed lines expressing the rice cysteine protease inhibitor oryzacystatin I(OCI); SOC-1, SOC-2 and SOC-3. Plants were inoculated with Bradyrhizobium japonicum in vermiculitemedia and grown in glasshouse for 3 weeks before exposure to either 7 consecutive nights of dark-chilling ormaintenance under glasshouse conditions. Open bars show control plants, grey bars show dark-chilled plants.Data are mean values ± SE (n = 8). Significance was determined by Students t-test. Where letters are shared nosignificant difference is present.
a
b,c
c
a,b,cb,c
a,b a,ba,b
0
5
10
15
20
25
30
Wt SOC-1 SOC-2 SOC-3
Nod
ule
num
ber
Genotpye
Control
Chilled

Page | 54
3.2.3. 3 nights dark-chilling: photosynthetic parameters
In the following experiments, soybean plants were grown without nodulation for 2 weeks on
vermiculite media with full strength Hoagland’s solution. Half of the plants were then grown under
these conditions for a further 3 days (Control conditions) and half were exposed to up to 3
consecutive nights of dark-chilling (4 °C; Chilled).
Figure 3.2.3-1: Carbon assimilation rates of soybean after 1, 2 and 3 consecutive nights of dark-chilling ormaintenance under control conditions. Panels show; A) Wild type soybean; three independent transformed linesexpressing OCI; B) SOC-1 C) SOC-2 and D) SOC-3. Significant difference between control grown and chilledplants has been determined using Students t-test, indicated by asterisks (* = P<0.05, ** = P<0.01, *** =P<0.001). Data are mean values ± SE (n = 12). Open bars show control plants, grey bars show dark-chilledplants.
Under control conditions photosynthetic rates were similar in all lines. However, Wt photosynthesis
was significantly decreased after 1 night of dark-chilling (Figure 3.2.3-1 A). The rates of
***
*
***
0
2
4
6
8
10
12
14
16
1 2 3
A(µ
mo
lC
O2.m
-2.s
-1)
Time (Days)
Wt Wt chilled
*
0
2
4
6
8
10
12
14
16
1 2 3
A(µ
mo
lC
O2.m
-2.s
-1)
Time (Days)
SOC-1 SOC-1 chilled
**
0
2
4
6
8
10
12
14
16
1 2 3
A(µ
mo
lC
O2.m
-2.s
-1)
Time (Days)
SOC-2 SOC-2 chilled
*
0
2
4
6
8
10
12
14
16
1 2 3
A(µ
mo
lC
O2.m
-2.s
-1)
Time (Days)
SOC-3 SOC-3 chilled
B
D
A
C
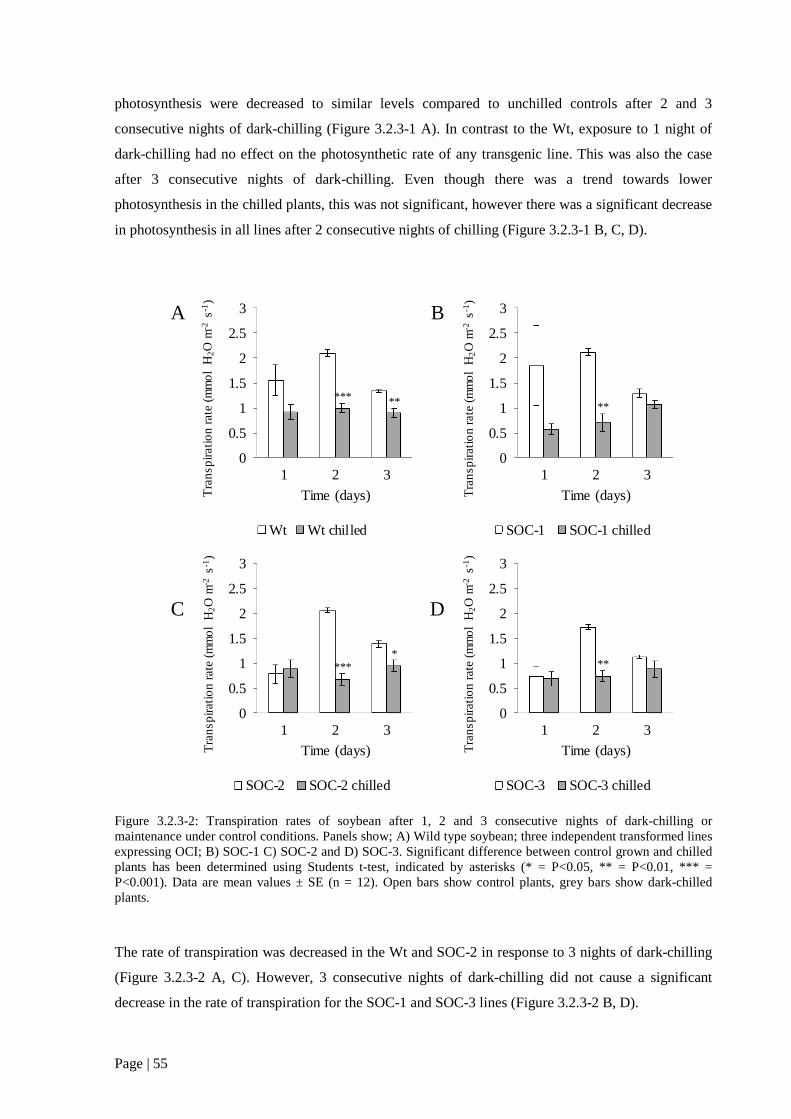
Page | 55
photosynthesis were decreased to similar levels compared to unchilled controls after 2 and 3
consecutive nights of dark-chilling (Figure 3.2.3-1 A). In contrast to the Wt, exposure to 1 night of
dark-chilling had no effect on the photosynthetic rate of any transgenic line. This was also the case
after 3 consecutive nights of dark-chilling. Even though there was a trend towards lower
photosynthesis in the chilled plants, this was not significant, however there was a significant decrease
in photosynthesis in all lines after 2 consecutive nights of chilling (Figure 3.2.3-1 B, C, D).
Figure 3.2.3-2: Transpiration rates of soybean after 1, 2 and 3 consecutive nights of dark-chilling ormaintenance under control conditions. Panels show; A) Wild type soybean; three independent transformed linesexpressing OCI; B) SOC-1 C) SOC-2 and D) SOC-3. Significant difference between control grown and chilledplants has been determined using Students t-test, indicated by asterisks (* = P<0.05, ** = P<0.01, *** =P<0.001). Data are mean values ± SE (n = 12). Open bars show control plants, grey bars show dark-chilledplants.
The rate of transpiration was decreased in the Wt and SOC-2 in response to 3 nights of dark-chilling
(Figure 3.2.3-2 A, C). However, 3 consecutive nights of dark-chilling did not cause a significant
decrease in the rate of transpiration for the SOC-1 and SOC-3 lines (Figure 3.2.3-2 B, D).
*** **
0
0.5
1
1.5
2
2.5
3
1 2 3
Tra
nsp
irat
ion
rate
(mm
ol
H2O
m-2
s-1)
Time (days)
Wt Wt chilled
**
0
0.5
1
1.5
2
2.5
3
1 2 3T
ran
spir
atio
nra
te(m
mo
lH
2O
m-2
s-1)
Time (days)
SOC-1 SOC-1 chilled
****
0
0.5
1
1.5
2
2.5
3
1 2 3
Tra
nsp
irat
ion
rate
(mm
ol
H2O
m-2
s-1)
Time (days)
SOC-2 SOC-2 chilled
**
0
0.5
1
1.5
2
2.5
3
1 2 3
Tra
nsp
irat
ion
rate
(mm
ol
H2O
m-2
s-1)
Time (days)
SOC-3 SOC-3 chilled
A
C
B
D

Page | 56
3.2.4. 3 nights dark-chilling: biomass accumulation
Shoot and root dry biomass was determined in soybean plants that had been grown for 2-weeks under
control conditions and then grown for a further 3 days under these conditions or subjected to 3
consecutive nights of dark-chilling. Under control conditions the shoots of the Wt plants had
significantly greater dry weight than the transgenic lines (Figure 3.2.4-1). Dark-chilling had little
effect on the dry biomass of the shoots in any of the lines; although the SOC-1 and SOC-3 shoots had
a significantly greater mass after exposure to dark-chilling for 3 nights than the plants maintained
under control conditions (Figure 3.2.4-1).
Figure 3.2.4-1: Shoot dry weight of soybean after 1, 2 and 3 consecutive nights of dark-chilling or maintenanceunder control conditions. Panels show; A) Wild type soybean; three independent transformed lines expressingOCI; B) SOC-1 C) SOC-2 and D) SOC-3. Significant difference between control grown and chilled plants hasbeen determined using Students t-test, indicated by asterisks (* = P<0.05, ** = P<0.01, *** = P<0.001). Dataare mean values ± SE (n = 12). Open bars show control plants, grey bars show dark-chilled plants.
*
0
0.1
0.2
0.3
0.4
0.5
1 2 3
Sho
otd
ryw
eigh
t(g
)
Time (days)
*
0
0.1
0.2
0.3
0.4
0.5
1 2 3
Sho
otdr
yw
eigh
t(g
)
Time (days)
0
0.1
0.2
0.3
0.4
0.5
1 2 3
Shoo
td
ryw
eigh
t(g
)
Time (days)
**
0
0.1
0.2
0.3
0.4
0.5
1 2 3
Shoo
td
ryw
eigh
t(g
)
Time (days)
A B
C D

Page | 57
Like the shoots, the roots of the Wt plants had significantly greater dry weight than the transgenic
lines in the absence of stress (Figure 3.2.4-2). Dark-chilling did not inhibit dry biomass accumulation
in the roots in any of the lines. The Wt roots had a significantly greater biomass after 2 or 3 nights of
dark-chilling compared to the plants maintained under control conditions (Figure 3.2.4-2). This trend
was also observed in the roots of the transgenic lines but in this case values were not always
significant.
Figure 3.2.4-2: : Root dry weight of soybean after 1, 2 and 3 consecutive nights of dark-chilling or maintenanceunder control conditions. Panels show; A) Wild type soybean; three independent transformed lines expressingOCI; B) SOC-1 C) SOC-2 and D) SOC-3. Significant difference between control grown and chilled plants hasbeen determined using Students t-test, indicated by asterisks (* = P<0.05, ** = P<0.01, *** = P<0.001). Dataare mean values ± SE (n = 12). Open bars show control plants, grey bars show dark-chilled plants.
**
*
0
0.02
0.04
0.06
0.08
0.1
0.12
0.14
0.16
1 2 3
Roo
tdry
wei
ght
(g)
Time (days)
0
0.02
0.04
0.06
0.08
0.1
0.12
0.14
0.16
1 2 3
Ro
otdr
yw
eigh
t(g
)
Time (days)
*
0
0.02
0.04
0.06
0.08
0.1
0.12
0.14
0.16
1 2 3
Ro
otdr
yw
eigh
t(g
)
Time (days)
0
0.02
0.04
0.06
0.08
0.1
0.12
0.14
0.16
1 2 3
Ro
otdr
yw
eigh
t(g
)
Time (days)
A B
C D
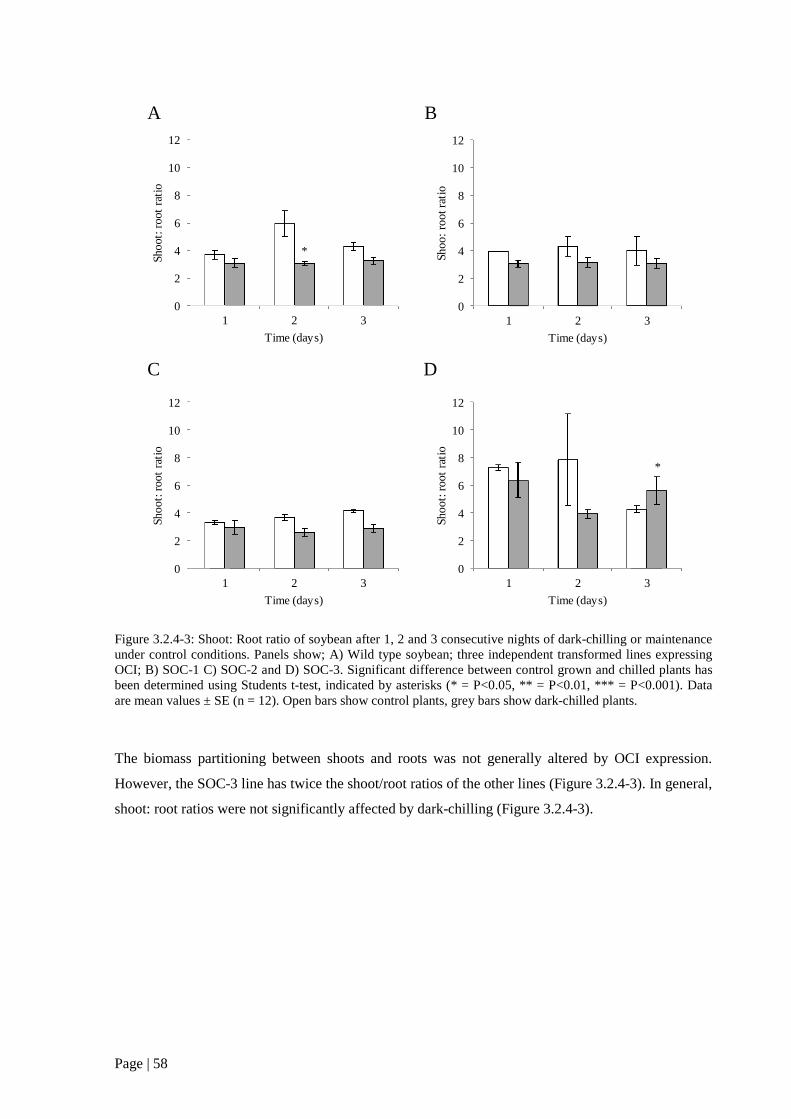
Page | 58
Figure 3.2.4-3: Shoot: Root ratio of soybean after 1, 2 and 3 consecutive nights of dark-chilling or maintenanceunder control conditions. Panels show; A) Wild type soybean; three independent transformed lines expressingOCI; B) SOC-1 C) SOC-2 and D) SOC-3. Significant difference between control grown and chilled plants hasbeen determined using Students t-test, indicated by asterisks (* = P<0.05, ** = P<0.01, *** = P<0.001). Dataare mean values ± SE (n = 12). Open bars show control plants, grey bars show dark-chilled plants.
The biomass partitioning between shoots and roots was not generally altered by OCI expression.
However, the SOC-3 line has twice the shoot/root ratios of the other lines (Figure 3.2.4-3). In general,
shoot: root ratios were not significantly affected by dark-chilling (Figure 3.2.4-3).
*
0
2
4
6
8
10
12
1 2 3
Sho
ot:
root
rati
o
Time (days)
0
2
4
6
8
10
12
1 2 3
Shoo
:ro
otra
tio
Time (days)
0
2
4
6
8
10
12
1 2 3
Sho
ot:
root
rati
o
Time (days)
*
0
2
4
6
8
10
12
1 2 3
Sho
ot:
root
rati
o
Time (days)
A B
C D

Page | 59
Figure 3.2.4-4: Total fresh weight of soybean after 1, 2 and 3 consecutive nights of dark-chilling ormaintenance under control conditions. Panels show; A) Wild type soybean; three independent transformed linesexpressing OCI; B) SOC-1 C) SOC-2 and D) SOC-3. Significant difference between control grown and chilledplants has been determined using Students t-test, indicated by asterisks (* = P<0.05, ** = P<0.01, *** =P<0.001). Data are mean values ± SE (n = 12). Open bars show control plants, grey bars show dark-chilledplants.
Whole plant biomass measured as fresh weight was only about half in the OCI-expressing lines than
the Wt (Figure 3.2.4-4). Dark-chilling had little effect on whole plant fresh weight (Figure 3.2.4-4).
*
0
1
2
3
4
5
6
7
1 2 3
Tot
alfr
esh
wei
ght
(g)
Time (days)
0
1
2
3
4
5
6
7
1 2 3
Tot
alfr
esh
wei
ght
(g)
Time (days)
0
1
2
3
4
5
6
7
1 2 3
To
talf
resh
wei
ght
(g)
Time (days)
0
1
2
3
4
5
6
7
1 2 3
To
talf
resh
wei
ght
(g)
Time (days)
A B
C D
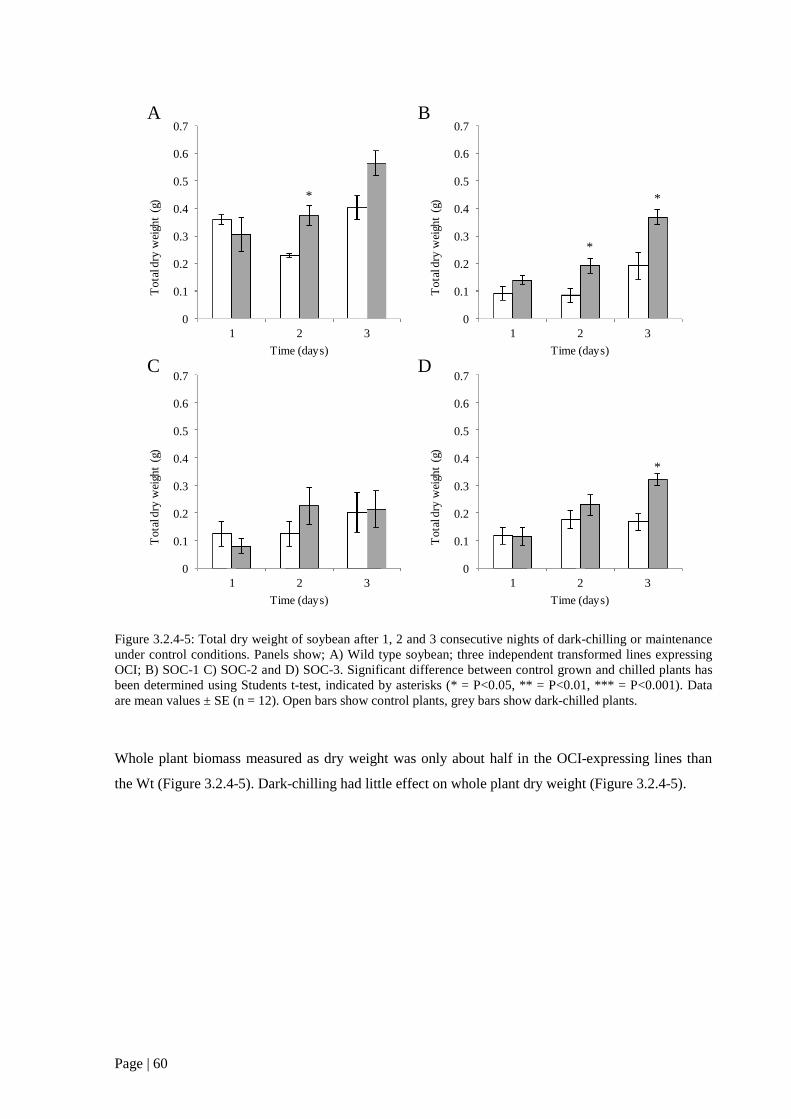
Page | 60
Figure 3.2.4-5: Total dry weight of soybean after 1, 2 and 3 consecutive nights of dark-chilling or maintenanceunder control conditions. Panels show; A) Wild type soybean; three independent transformed lines expressingOCI; B) SOC-1 C) SOC-2 and D) SOC-3. Significant difference between control grown and chilled plants hasbeen determined using Students t-test, indicated by asterisks (* = P<0.05, ** = P<0.01, *** = P<0.001). Dataare mean values ± SE (n = 12). Open bars show control plants, grey bars show dark-chilled plants.
Whole plant biomass measured as dry weight was only about half in the OCI-expressing lines than
the Wt (Figure 3.2.4-5). Dark-chilling had little effect on whole plant dry weight (Figure 3.2.4-5).
*
0
0.1
0.2
0.3
0.4
0.5
0.6
0.7
1 2 3
To
tald
ryw
eigh
t(g
)
Time (days)
*
*
0
0.1
0.2
0.3
0.4
0.5
0.6
0.7
1 2 3
To
tald
ryw
eigh
t(g
)
Time (days)
0
0.1
0.2
0.3
0.4
0.5
0.6
0.7
1 2 3
Tot
ald
ryw
eigh
t(g
)
Time (days)
*
0
0.1
0.2
0.3
0.4
0.5
0.6
0.7
1 2 3
Tot
ald
ryw
eigh
t(g
)
Time (days)
A B
C D

Page | 61
Whole plant fresh/dry weight ratios were about double in the OCI-expressing lines than the Wt
(Figure 3.2.4-6). Dark-chilling tended to decrease FW/DW (Figure 3.2.4-6) but this effect was
independent of genotype.
Figure 3.2.4-6: Fresh weight: dry weight ratio (FW/DW) of soybean after 1, 2 and 3 consecutive nights of dark-chilling or maintenance under control conditions. Panels show; A) Wild type soybean; three independenttransformed lines expressing OCI; B) SOC-1 C) SOC-2 and D) SOC-3. Significant difference between controlgrown and chilled plants has been determined using Students t-test, indicated by asterisks (* = P<0.05, ** =P<0.01, *** = P<0.001). Data are mean values ± SE (n = 12). Open bars show control plants, grey bars showdark-chilled plants.
*
0
5
10
15
20
25
30
35
40
1 2 3
Fre
shw
eigh
t:d
ryw
eigh
tra
tio
Time (days)
0
5
10
15
20
25
30
35
40
1 2 3F
resh
wei
ght:
dry
wei
ght
rati
o
Time (days)
0
5
10
15
20
25
30
35
40
1 2 3
Fre
shw
eigh
t:dr
yw
eigh
tra
tio
Time (days)
**
0
5
10
15
20
25
30
35
40
1 2 3
Fre
shw
eigh
t:dr
yw
eigh
tra
tio
Time (days)
A B
C D
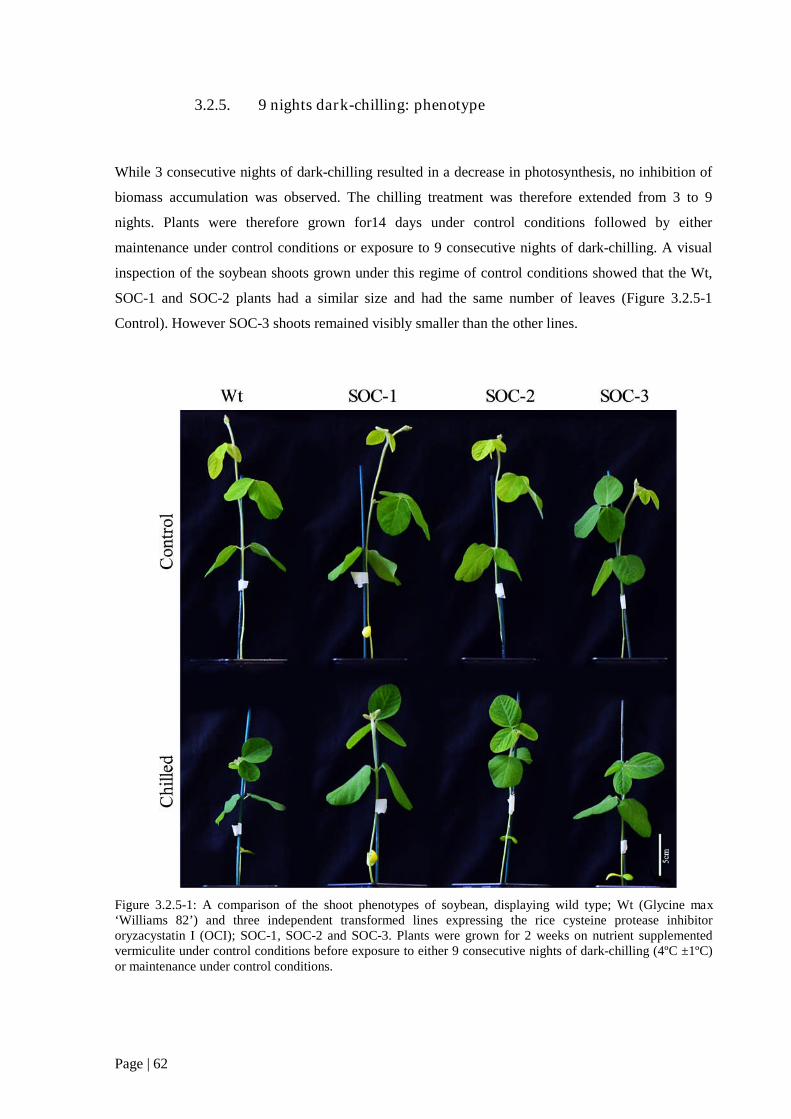
Page | 62
3.2.5. 9 nights dark-chilling: phenotype
While 3 consecutive nights of dark-chilling resulted in a decrease in photosynthesis, no inhibition of
biomass accumulation was observed. The chilling treatment was therefore extended from 3 to 9
nights. Plants were therefore grown for14 days under control conditions followed by either
maintenance under control conditions or exposure to 9 consecutive nights of dark-chilling. A visual
inspection of the soybean shoots grown under this regime of control conditions showed that the Wt,
SOC-1 and SOC-2 plants had a similar size and had the same number of leaves (Figure 3.2.5-1
Control). However SOC-3 shoots remained visibly smaller than the other lines.
Figure 3.2.5-1: A comparison of the shoot phenotypes of soybean, displaying wild type; Wt (Glycine max‘Williams 82’) and three independent transformed lines expressing the rice cysteine protease inhibitororyzacystatin I (OCI); SOC-1, SOC-2 and SOC-3. Plants were grown for 2 weeks on nutrient supplementedvermiculite under control conditions before exposure to either 9 consecutive nights of dark-chilling (4ºC ±1ºC)or maintenance under control conditions.

Page | 63
Nine consecutive nights of dark-chilling led to a decrease in the stem height, together with the
presence of fewer leaves in all of the lines (Figure 3.2.5-1 Chilled). The control plants had developed
a second trifoliate leaf but this was absent from the plants exposed to dark-chilling. Wt plants were
visibly smaller after the dark-chilling treatment, and showed the greatest chilling-induced reduction in
height. Moreover, 2 of the OCI expressing lines (SOC-1 and SOC-2), showed a greater shoot height
after chilling compared to the Wt (Figure 3.2.5-1).
3.2.6. 9 nights dark-chilling: photosynthesis
In the absence of stress, photosynthetic carbon assimilation was the similar in all the lines (Figure
3.2.6-1 Control). Photosynthesis was significantly decreased in all the lines after 9 consecutive nights
of exposure to dark-chilling. However, SOC-1, SOC-2 and SOC-3 leaves displayed significantly
higher rates of carbon assimilation compared to Wt after chilling treatment (Figure 3.2.6-1 Chilled).
Figure 3.2.6-1 A comparison of the photosynthetic rates of soybean wild type ( Wt) and three independenttransformed lines expressing oryzacystatin I (OCI); SOC-1, SOC-2 and SOC-3. Data are the mean values ofphotosynthesis ± SE (n = 12). Significance is shown by t-test (P=<0.05). Where letters are shared there is nosignificant difference.
Exposure to 9 consecutive nights of dark-chilling significantly decreased transpiration rates in the Wt
leaves. In comparison, the chilled leaves of the SOC-1, SOC-2 and SOC-3 lines either displayed
comparable rates of transpiration to the leaves maintained under control conditions, or in the case of
SOC-2, the leaves showed a higher rate after chilling exposure (Figure 3.2.6-2).
a
a a
a
c
b b
b
0
2
4
6
8
10
12
14
Wt SOC-1 SOC-2 SOC-3
A(µ
mol
CO
2.m
-2.s
-1)
Genotype
Control
Chilled
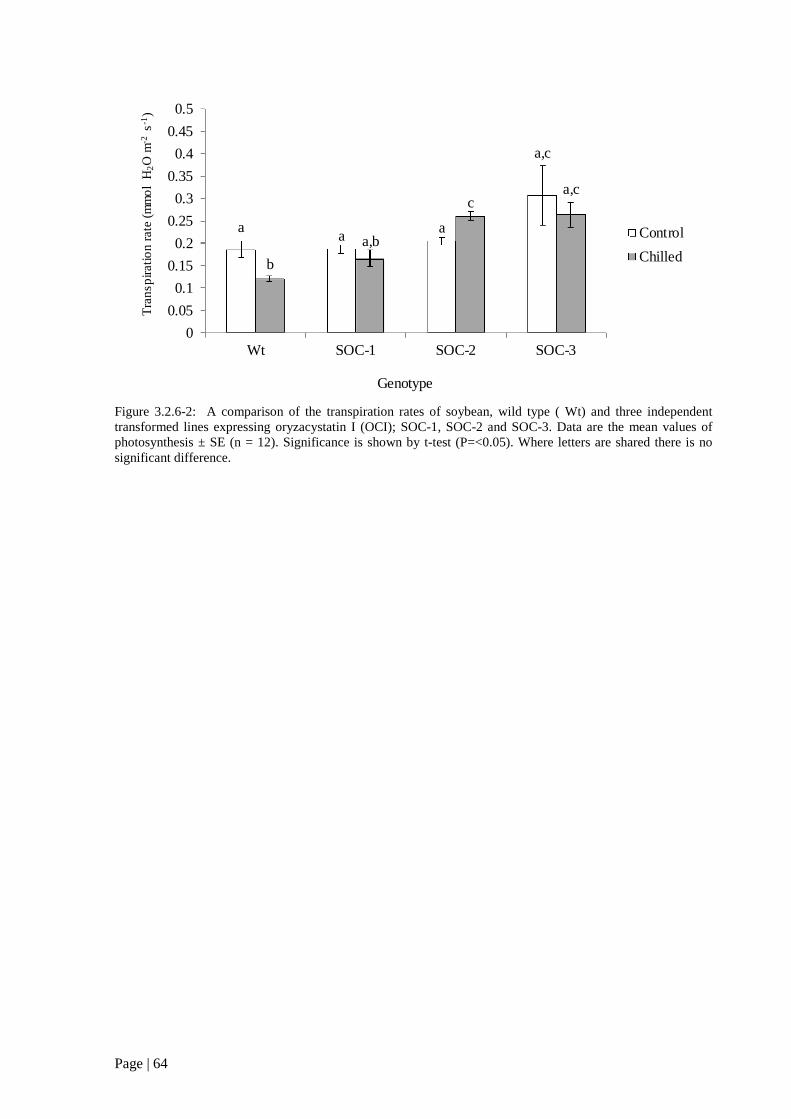
Page | 64
Figure 3.2.6-2: A comparison of the transpiration rates of soybean, wild type ( Wt) and three independenttransformed lines expressing oryzacystatin I (OCI); SOC-1, SOC-2 and SOC-3. Data are the mean values ofphotosynthesis ± SE (n = 12). Significance is shown by t-test (P=<0.05). Where letters are shared there is nosignificant difference.
aa
a
a,c
b
a,b
ca,c
0
0.05
0.1
0.15
0.2
0.25
0.3
0.35
0.4
0.45
0.5
Wt SOC-1 SOC-2 SOC-3
Tra
nsp
irat
ion
rate
(mm
ol
H2O
m-2
s-1)
Genotype
Control
Chilled
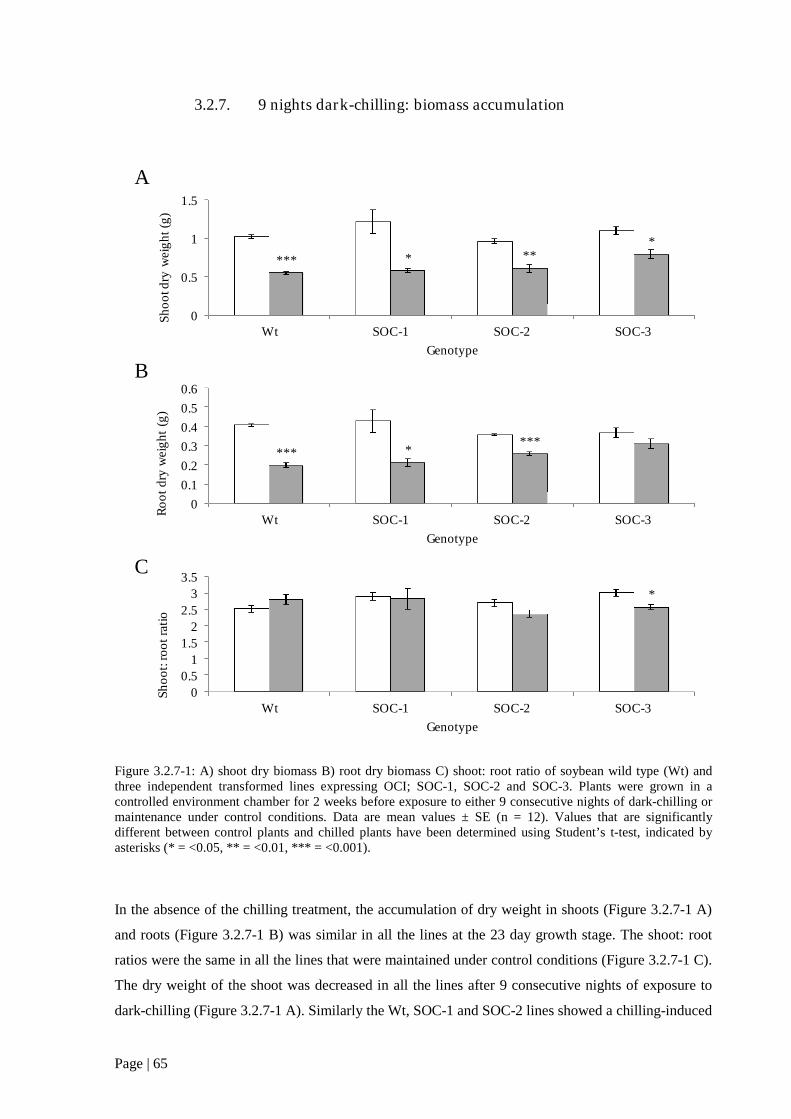
Page | 65
3.2.7. 9 nights dark-chilling: biomass accumulation
Figure 3.2.7-1: A) shoot dry biomass B) root dry biomass C) shoot: root ratio of soybean wild type (Wt) andthree independent transformed lines expressing OCI; SOC-1, SOC-2 and SOC-3. Plants were grown in acontrolled environment chamber for 2 weeks before exposure to either 9 consecutive nights of dark-chilling ormaintenance under control conditions. Data are mean values ± SE (n = 12). Values that are significantlydifferent between control plants and chilled plants have been determined using Student’s t-test, indicated byasterisks (* = <0.05, ** = <0.01, *** = <0.001).
In the absence of the chilling treatment, the accumulation of dry weight in shoots (Figure 3.2.7-1 A)
and roots (Figure 3.2.7-1 B) was similar in all the lines at the 23 day growth stage. The shoot: root
ratios were the same in all the lines that were maintained under control conditions (Figure 3.2.7-1 C).
The dry weight of the shoot was decreased in all the lines after 9 consecutive nights of exposure to
dark-chilling (Figure 3.2.7-1 A). Similarly the Wt, SOC-1 and SOC-2 lines showed a chilling-induced
*
0
0.5
1
1.5
2
2.5
3
3.5
Wt SOC-1 SOC-2 SOC-3
Sh
oo
t:ro
ot
rati
o
Genotype
*** * ***
0
0.5
1
1.5
Wt SOC-1 SOC-2 SOC-3
Sh
oo
tdry
wei
gh
t(g
)
Genotype
*** ****
0
0.1
0.2
0.3
0.4
0.5
0.6
Wt SOC-1 SOC-2 SOC-3
Ro
ot
dry
wei
gh
t(g
)
Genotype
A
B
C

Page | 66
decrease in root dry weight after chilling (Figure 3.2.7-1 B). However, the SOC-3 plants showed no
significant reduction in root dry weight after chilling treatment (Figure 3.2.7-1 C). The shoot: root
ratios were not altered by chilling. Under dark-chilling conditions, there were no apparent differences
in the Wt, SOC-1 and SOC-2 lines in terms of shoot: root ratio. However there was an observable
difference in the shoot: root ratio of SOC-3 after dark-chilling exposure (Figure 3.2.7-1 C).
Figure 3.2.7-2: A) fresh weight; B) dry weight; C) fresh weight: dry weight ratio (FW/DW); of soybean wildtype (Wt) and three independent transformed lines expressing OCI; SOC-1, SOC-2 and SOC-3. Plants weregrown in a controlled environment chamber for 2 weeks before exposure to either 9 consecutive nights of dark-chilling or maintenance under control conditions. Data are mean values ± SE (n=12). Values that aresignificantly different between control plants and chilled plants have been determined using Students t-test,indicated by asterisks (* = P<0.05, ** = P<0.01, *** = P<0.001).
*** **
0
2
4
6
8
10
Wt SOC-1 SOC-2 SOC-3Fre
shw
eigh
t:dr
yw
eigh
tra
tio
Genotype
*** ** **
*
0
5
10
15
20
Wt SOC-1 SOC-2 SOC-3
Fre
shw
eig
ht
(g)
Genotype
*** * ***
0
0.5
1
1.5
2
Wt SOC-1 SOC-2 SOC-3
Dry
wei
gh
t(g
)
Genotype
A
B
C

Page | 67
In the absence of dark-chilling treatment the fresh weight of all genotypes was comparable (Figure
3.2.7-2 A). However, a significant decrease in their total fresh biomass was observed in all genotypes
after exposure to 9 consecutive nights of dark-chilling (Figure 3.2.7-2 A). Similarly, the total dry
weight was the same in all lines after 23 days of growth under control conditions. Dark-chilling
caused a significant reduction in dry biomass accumulation in all genotypes (Figure 3.2.7-2 B). The
FW/DW was comparable in all lines that had been maintained under control conditions. However,
while dark-chilling exposure caused a decrease in the FW/DW ratio in the SOC-1 and SOC-2 lines,
chilling treatment had no apparent effect on this parameter for the Wt and SOC-3 lines (Figure
3.2.7-2 C).
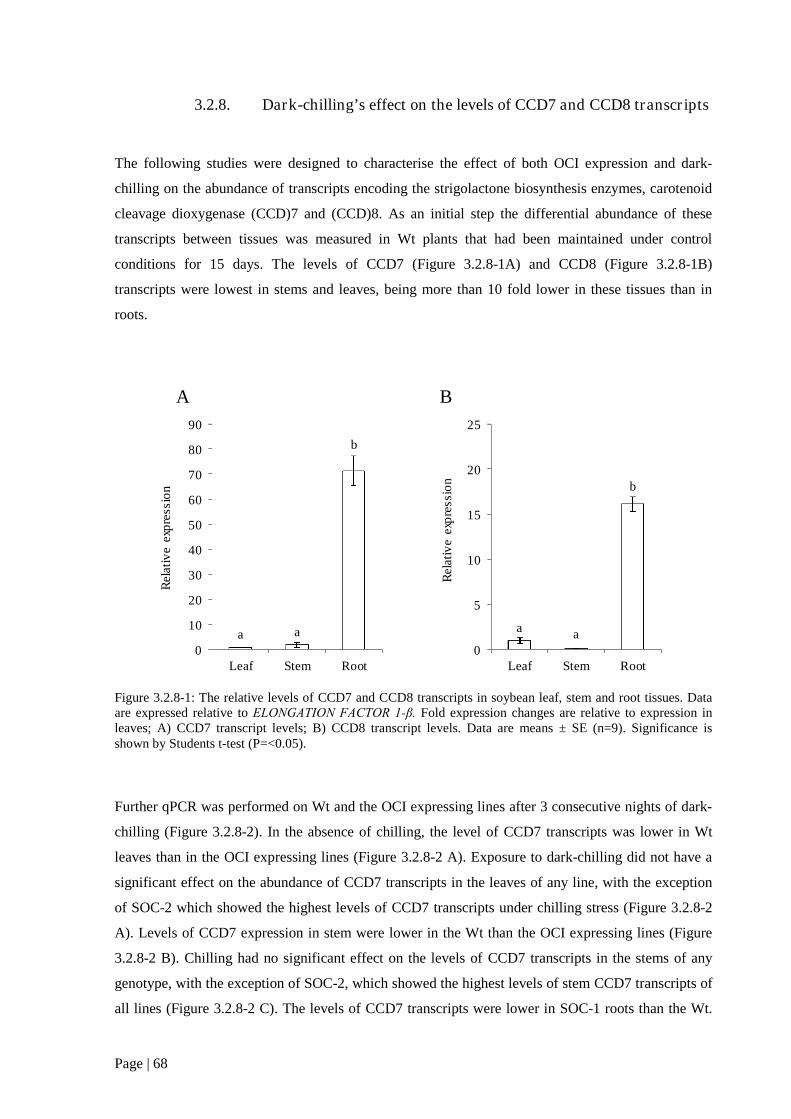
Page | 68
3.2.8. Dark-chilling’s effect on the levels of CCD7 and CCD8 transcripts
The following studies were designed to characterise the effect of both OCI expression and dark-
chilling on the abundance of transcripts encoding the strigolactone biosynthesis enzymes, carotenoid
cleavage dioxygenase (CCD)7 and (CCD)8. As an initial step the differential abundance of these
transcripts between tissues was measured in Wt plants that had been maintained under control
conditions for 15 days. The levels of CCD7 (Figure 3.2.8-1A) and CCD8 (Figure 3.2.8-1B)
transcripts were lowest in stems and leaves, being more than 10 fold lower in these tissues than in
roots.
Figure 3.2.8-1: The relative levels of CCD7 and CCD8 transcripts in soybean leaf, stem and root tissues. Dataare expressed relative to ELONGATION FACTOR 1-β. Fold expression changes are relative to expression inleaves; A) CCD7 transcript levels; B) CCD8 transcript levels. Data are means ± SE (n=9). Significance isshown by Students t-test (P=<0.05).
Further qPCR was performed on Wt and the OCI expressing lines after 3 consecutive nights of dark-
chilling (Figure 3.2.8-2). In the absence of chilling, the level of CCD7 transcripts was lower in Wt
leaves than in the OCI expressing lines (Figure 3.2.8-2 A). Exposure to dark-chilling did not have a
significant effect on the abundance of CCD7 transcripts in the leaves of any line, with the exception
of SOC-2 which showed the highest levels of CCD7 transcripts under chilling stress (Figure 3.2.8-2
A). Levels of CCD7 expression in stem were lower in the Wt than the OCI expressing lines (Figure
3.2.8-2 B). Chilling had no significant effect on the levels of CCD7 transcripts in the stems of any
genotype, with the exception of SOC-2, which showed the highest levels of stem CCD7 transcripts of
all lines (Figure 3.2.8-2 C). The levels of CCD7 transcripts were lower in SOC-1 roots than the Wt.
a a
b
0
10
20
30
40
50
60
70
80
90
Leaf Stem Root
Rel
ativ
eex
pre
ssio
n
a a
b
0
5
10
15
20
25
Leaf Stem Root
Rel
ativ
eex
pre
ssio
n
A B
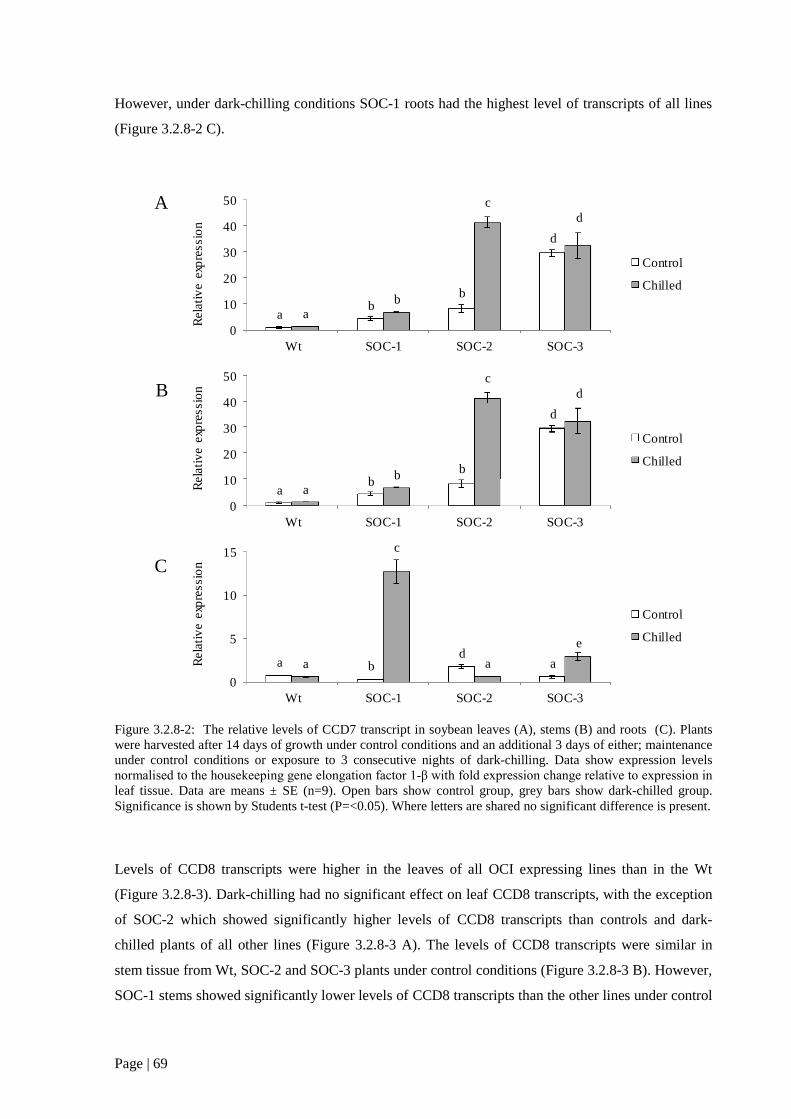
Page | 69
However, under dark-chilling conditions SOC-1 roots had the highest level of transcripts of all lines
(Figure 3.2.8-2 C).
Figure 3.2.8-2: The relative levels of CCD7 transcript in soybean leaves (A), stems (B) and roots (C). Plantswere harvested after 14 days of growth under control conditions and an additional 3 days of either; maintenanceunder control conditions or exposure to 3 consecutive nights of dark-chilling. Data show expression levelsnormalised to the housekeeping gene elongation factor 1-β with fold expression change relative to expression in leaf tissue. Data are means ± SE (n=9). Open bars show control group, grey bars show dark-chilled group.Significance is shown by Students t-test (P=<0.05). Where letters are shared no significant difference is present.
Levels of CCD8 transcripts were higher in the leaves of all OCI expressing lines than in the Wt
(Figure 3.2.8-3). Dark-chilling had no significant effect on leaf CCD8 transcripts, with the exception
of SOC-2 which showed significantly higher levels of CCD8 transcripts than controls and dark-
chilled plants of all other lines (Figure 3.2.8-3 A). The levels of CCD8 transcripts were similar in
stem tissue from Wt, SOC-2 and SOC-3 plants under control conditions (Figure 3.2.8-3 B). However,
SOC-1 stems showed significantly lower levels of CCD8 transcripts than the other lines under control
A
B
C
ab
b
d
ab
cd
0
10
20
30
40
50
Wt SOC-1 SOC-2 SOC-3
Control
Chilled
ab
b
d
ab
cd
0
10
20
30
40
50
Wt SOC-1 SOC-2 SOC-3
Control
Chilled
a bd
aa
c
a
e
0
5
10
15
Wt SOC-1 SOC-2 SOC-3
Control
Chilled
Rel
ativ
eex
pre
ssio
nR
elat
ive
exp
ress
ion
Rel
ativ
eex
pre
ssio
n

Page | 70
conditions. Dark-chilling had no significant effect on CCD8 transcripts in the stems of any line.
Similarly, root tissue displayed no OCI or chilling dependent difference in CCD8 expression (Figure
3.2.8-3 C).
Figure 3.2.8-3 The relative levels of CCD8 transcript in soybean leaves (A), stems (B) and roots (C). Plantswere harvested after 14 days of growth under control conditions and an additional 3 days of either; maintenanceunder control conditions or exposure to 3 consecutive nights of dark-chilling. Data show expression levelsnormalised to the housekeeping gene elongation factor 1-β with fold expression change relative to expression in leaf tissue. Data are means ± SE (n=9). Open bars show control group, grey bars show dark-chilled group.Significance is shown by Students t-test (P=<0.05). Where letters are shared no significant difference is present.
A
B
C
ab
b
d
ab
cd
0
10
20
30
40
50
Wt SOC-1 SOC-2 SOC-3
Control
Chilled
a b
a
a
aa
aa
0
2
4
6
8
Wt SOC-1 SOC-2 SOC-3
Control
Chilled
a
a
a,b
a,ba
ba,b
c
0
1
2
3
4
5
Wt SOC-1 SOC-2 SOC-3
Control
Chilled
Rel
ativ
eex
pre
ssio
nR
elat
ive
exp
ress
ion
Rel
ativ
eex
pre
ssio
n

Page | 71
3.2.9. Transcript changes in the nodules of soybean plants exposed to
drought
A further series of experiments were performed to determine whether exposure to drought resulted in
changes in the levels of redox-associated transcripts in the nodules of soybean plants exposed to
drought (for which many signalling pathways are shared with chilling). The drought studies were
performed by Dr Belen Marquez Garcia, who grew nodulated soybean under well-watered glasshouse
conditions for 2 weeks. Thereafter, plants were either maintained under control conditions or
deprived of water for up to 21 days. Nodules were harvested and RNA was extracted from the
nodules of well-watered (control) plants and the drought-exposed plants. The levels of selected
redox-associated transcripts (superoxide dismutase (CSD and MSD), glutathione-related (GR. GRX,
GST), monodehydroascorbate reductase (MDAR), Dihydrolipoyl dehydrogenase (DLD) and aldehyde
dehydrogenase (ALDH)), that had been identified previously in a soybean nodule transcriptome, and
shown to be expressed in the developmental senescence of soybean nodules by Professor Karl Kunert
(University of Pretoria, South Africa), were measured by quantitative real time PCR (qPCR).
A previous transcriptome comparison of the profiles of crown nodules harvested from 4 and 14 week-
old plants had showed that copper-zinc superoxide dismutase 1 (CSD1) mRNAs were increased at the
later stage of development (Figure 3.2.9-1) but copper-zinc superoxide dismutase 2 (CSD2) mRNAS
were similar at both growth stages. The levels of magnesium/iron superoxide dismutases (MSD)
mRNAs decreased at 14 weeks compared to the earlier developmental stages (Figure 3.2.9-1). qPCR
analysis of these transcripts in soybean nodules from well-watered plants compared to those deprived
of water for 21 days. The levels of CSD1 transcripts were significantly lower under drought
compared to well-watered conditions (Figure 3.2.9-2). In contrast the abundance of CSD2 transcripts
was increased in the nodules subjected to drought (Figure 3.2.9-2). Drought had no significant effect
on the MSD transcript levels (Figure 3.2.9-2).

Page | 72
Figure 3.2.9-1 The abundance of manganese or iron superoxide dismutase (MSD), copper-zinc superoxidedismutase (CSD)1 and CSD2 transcript read fragments in soybean crown root nodules harvested from plants at4, 8 and 14 weeks of development. Data show the fragments per Kilobase of transcript per million mappedreads (FPKM). Transcriptome sequencing was performed by Professor Karl Kunert (University of Pretoria,South Africa).
Figure 3.2.9-2 The abundance of manganese/iron superoxide dismutase 1 (MSD), copper-zinc superoxidedismutase (CSD)1 and CSD2 transcripts in soybean crown root nodules from 5 week old plants, that had eitherbeen subjected to drought 21 days (open bars) or maintained under well-watered conditions (grey bars). Dataare the mean ± SE (n = 3). Values that are significantly different between control plants and drought exposedplants have been determined using Students t-test, indicated by asterisks (* = P<0.05).
0
20
40
60
80
100
120
4w 8w 14w
FP
KM
Age (weeks)
CSD1
CSD2
MSD
*
*
0
1
2
3
4
5
6
CSD1 CSD2 MSD
Rel
ativ
eex
pres
sion
Transcript
Control Drought
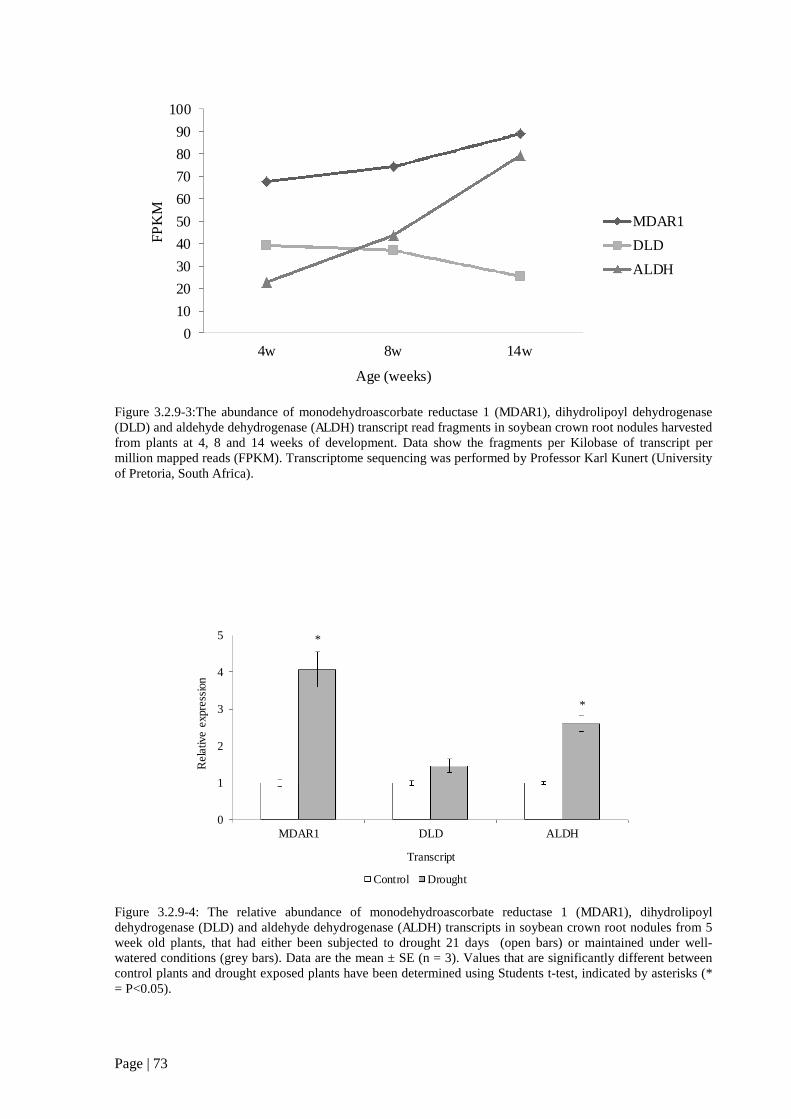
Page | 73
Figure 3.2.9-3:The abundance of monodehydroascorbate reductase 1 (MDAR1), dihydrolipoyl dehydrogenase(DLD) and aldehyde dehydrogenase (ALDH) transcript read fragments in soybean crown root nodules harvestedfrom plants at 4, 8 and 14 weeks of development. Data show the fragments per Kilobase of transcript permillion mapped reads (FPKM). Transcriptome sequencing was performed by Professor Karl Kunert (Universityof Pretoria, South Africa).
Figure 3.2.9-4: The relative abundance of monodehydroascorbate reductase 1 (MDAR1), dihydrolipoyldehydrogenase (DLD) and aldehyde dehydrogenase (ALDH) transcripts in soybean crown root nodules from 5week old plants, that had either been subjected to drought 21 days (open bars) or maintained under well-watered conditions (grey bars). Data are the mean ± SE (n = 3). Values that are significantly different betweencontrol plants and drought exposed plants have been determined using Students t-test, indicated by asterisks (*= P<0.05).
0
10
20
30
40
50
60
70
80
90
100
4w 8w 14w
FP
KM
Age (weeks)
MDAR1
DLD
ALDH
*
*
0
1
2
3
4
5
MDAR1 DLD ALDH
Rel
ativ
eex
pres
sion
Transcript
Control Drought

Page | 74
Transcriptional profiling showed differential expression of monodehydroascorbate reductase
(MDAR1), dihydrolipoyl dehydrogenase (DLD) and aldehyde dehydrogenase (ALDH) between 4 and
14 weeks. Both MDAR1 and ALDH showed an increased abundance between 4-14 weeks, whilst
DLD showed a decreased abundance (Figure 3.2.9-3). When these transcripts were measured by
qPCR in nodules that had been grown under 21 days of drought, or maintained under well-watered
conditions MDAR1 and ALDH showed increased expression under drought conditions. However the
abundance of DLD was not significantly affected by drought exposure (Figure 3.2.9-4).
Transcriptomic data showed glutathione reductases (GR1, GR2), glutaredoxins (GRX) and glutathione
S-transferases (GST) to be differentially regulated with age. During senescence there was an apparent
decrease in GRX2, GRX3, GRX4, GR1 and GST. GR2 was the only transcript that demonstrated an
increase in abundance throughout nodule aging (Figure 3.2.9-5). When these transcripts were
measured by qPCR there was a demonstrably different trend in regulation under drought (Figure
3.2.9-6). GR1 showed up regulation under drought conditions, whilst GR2 remained stable. GRX2
showed no significant expression change in response to drought; however GRX3 and GRX4 showed
significant up regulation. GST also showed an increase in abundance under drought conditions
(Figure 3.2.9-6).

Page | 75
Figure 3.2.9-5: The abundance of glutathione reductase 1 (GR1), glutathione reductase 2 (GR2), glutaredoxin 2(GRX2), glutaredoxin 3 (GRX3), glutaredoxin 4 (GRX4) and glutathione s-transferase (GST) transcript readfragments in soybean crown root nodules harvested from plants at 4, 8 and 14 weeks of development. Datashow the fragments per Kilobase of transcript per million mapped reads (FPKM). Transcriptome sequencingwas performed by Professor Karl Kunert (University of Pretoria, South Africa).
Figure 3.2.9-6 The relative abundance of glutathione reductase 1 (GR1), glutathione reductase 2 (GR2),glutaredoxin 2 (GRX2), glutaredoxin 3 (GRX3), glutaredoxin 4 (GRX4) and glutathione S-transferase (GST) insoybean crown root nodules from 5 week old plants, that had either been subjected to drought 21 days (openbars) or maintained under well-watered conditions (grey bars). Data are the mean ± SE (n = 3). Values that aresignificantly different between control plants and drought exposed plants have been determined using Studentst-test, indicated by asterisks (* = P<0.05).
0
10
20
30
40
50
60
70
4w 8w 14w
FP
KM
Age (weeks)
GR1
GR2
GRX2
GRX3
GRX4
GST
**
*
*
0
1
2
3
4
5
GR1 GR2 GRX2 GRX3 GRX4 GST
Rel
ativ
eex
pres
sion
Transcript
Control Drought

Page | 76
3.3. Discussion
The studies described in this chapter were performed to assess the effect of OCI expression on
soybean growth, together with leaf (photosynthesis, transcript levels) and nodule characteristics (size,
transcript levels) in the presence and absence of stress. These studies were conducted on three
independent OCI transformed lines; SOC-1, SOC-2 and SOC-3, that had been characterised
previously (Quain et al., 2015, 2014). As shown previously, the shoots of soybean plants expressing
OCI were more branched and had a “bushy” phenotype compared to the Wt, when grown under
control conditions. Transgenic tobacco plants overexpressing OCI had previously been shown to have
a slow growth phenotype at the early stages of development (Prins et al., 2008). This was also seen in
the soybean seedlings for up to 2 weeks after germination. Thereafter, the biomass accumulation in
roots and shoots was similar in the soybean plants overexpressing OCI to the Wt. While the roots of
transgenic soybean plants overexpressing OCI had similar fresh and dry weights, OCI expression had
a marked effect on the nodulated roots. The OCI lines had greater nodule numbers compared to Wt
under control conditions. However, the nodules tended to be smaller on the OCI lines than the Wt.
Taken together, these observations show that inhibition of plant cysteine proteases by OCI had a
significant effect on growth and development and this extends as far as nodule development. While
the mechanisms that underpin these observations are unknown, previous studies have linked the
developmental changes to effects on phytohormones, particularly strigolactones (Foo and Davies,
2011). The data presented here show that CCD7 and CCD8 transcripts are more highly expressed in
roots than in stems or leaves and are concordant with previous findings (Al-Babili and Bouwmeester,
2015). Moreover, these transcripts were more highly expressed in the OCI lines than the Wt. It is
therefore possible that OCI-mediated effects on strigolactone signalling alter the nodule parameters
measured here. Addition of the artificial strigolactone GR24 has previously been shown to influence
nodule numbers in a concentration-dependent manner; high levels of GR24 causing a decrease in
nodule number and low concentrations increasing the number of nodules formed (De Cuyper et al.,
2015).
The data presented here show that the abundance of CCD7 and CCD8 transcripts was very low in
leaves of the Wt. However, CCD7 and CCD8 transcripts were higher in the leaves of the OCI-
expressing lines than the Wt. This finding is in contrast to that reported by Quain et al., (2014), who
found that CCD7 and CCD8 transcripts were lower in the leaves of the OCI-expressing lines than Wt.
This discrepancy is hard to explain and merits further investigation, particularly because branching
properties are determined by the interplay between several phytohormones and not just strigolactone
alone. The higher levels of CCD7 and CCD8 transcripts observed in the OCI-expressing lines is not
consistent with the enhanced branching measured in the transgenic plants, as discussed previously

Page | 77
(Quain et al., 2014). However Drummond et al., (2011) noted that strigolactone transcript abundance
differs with age. The increased abundance of the CCD7 and CCD8 transcripts described in these
studies may help to explain the enhanced chilling stress tolerance, discussed below.
The data presented here confirm that soybean plants are sensitive to inhibition by dark-chilling, as
shown previously (Van Heerden et al., 2003; Strauss et al., 2007; Krüger et al., 2014). However,
taken together, the data show that the OCI expressing lines are less sensitive to dark chilling than the
Wt. Whilst significant differences were apparent in the relative sensitivities of Wt and OCI
expressing soybean after 3 consecutive nights of dark-chilling, longer exposures to stress showed that
the OCI expressing lines were more resistant to the stress in terms of maintenance of photosynthesis
rates and growth. For example, data obtained from plants exposed to 9 consecutive nights of dark-
chilling treatment showed that the OCI expressing lines had better growth and higher rates of
photosynthesis compared to Wt. Although all lines had reduced photosynthesis compared to unchilled
controls, all of the OCI expressing lines had higher carbon assimilation rates after the chilling
treatment than the Wt, These findings are consistent with those reported by Van der Vyver et al.,
(2003), who found that OCI expressing tobacco lines were better able to maintain photosynthesis
after chilling treatment.
Despite a chilling-induced reduction in the total fresh biomass and total dry weight in all lines, the
fresh weight: dry weight ratios were significantly reduced only in the SOC-1 and SOC-2 lines. This
indicates that the SOC-1 and SOC-2 lines lost more water under dark-chilling conditions than the
SOC-3 and Wt lines. This finding might be attributed to differences in the transpiration rates between
the lines after chilling stress. All three OCI expressing lines tended to have higher transpiration rates
after chilling compared to the Wt. The SOC-2 and SOC-3 lines maintained significantly higher
transpiration rates after 9 nights of chilling compared to the SOC-1 and Wt lines.
Taken together, the data on chilling-mediated inhibition of carbon assimilation and its alleviation in
the OCI expressing lines presented in this chapter provides further evidence that cysteine proteases
play a role in the regulation of photosynthesis under stress conditions (Prins et al., 2008). Previous
evidence has suggested that RuBisCO protein turnover is altered in plants overexpressing OCI (Prins
et al., 2008).
The enhanced photosynthesis rates observed in the OCI lines under dark-chilling might also be
related to the higher levels of CCD7 and CCD8 transcripts observed in the stems and leaves of OCI
expressers under these conditions. Some mutants that are defective in strigolactone signalling show
delayed leaf senescence and maintain leaf chlorophyll even under stress, an effect that might be
related to changes in nutrient availability (Yamada and Umehara, 2015). In addition Arabidopsis

Page | 78
thaliana strigolactone-deficient mutants show increased sensitivity to drought and osmotic stress
(NaCl) conditions (van Ha et al., 2014). As the abundance of strigolactone encoding transcripts was
increased in OCI expressing lines, these data form the basis for a model where strigolactone may
confer tolerance to abiotic stresses. Strigolactone signalling has also been linked to ROS signalling
and redox responses (Pandey et al., 2016). Redox signalling is essential in plant defence to
environmental stresses, such as chilling and drought. While relatively few parameters related to redox
processes have been measured in these studies, the nodule senescence transcriptome revealed a
number of redox-related transcripts, which were examined in terms of responsiveness to drought. A
qPCR analysis of soybean nodules that had been exposed to 21 days of drought showed that the
expression of several superoxide dismutases (SODs) including CSD1 was regulated by this stress.
The nodule antioxidant system has previously been shown to be important in protection against stress
(Tausz et al., 2004), but the specific roles of genes identified here in nodule functions has not been
characterised in detail.
CSD1 transcripts had higher abundance in senescent nodules than mature nodules, suggesting that
this transcript functions in the nodule senescence process. While CSD2 mRNAs were similar in
mature and senescing nodules, the level of these transcripts was increased in nodules exposed to
drought. In contrast, CSD1 transcripts were decreased in drought-induced senescence. These data
show that CSD1 and CSD2 are differentially regulated in response to developmental and stress-
induced senescence in a way that might be important for H2O2 removal (Bowler et al., 1992).
Similarly, the expression of other SODs and DLD appear to be differentially regulated by
developmental senescence, but not by drought. While the roles of DLD have not been extensively
studied in plants the protein is likely to be mitochondrially targeted. Saccharomyces cerevisiae
mutants deficient in DLD synthesis showed decreased production of ROS (Tahara et al., 2007). In
contrast, the levels of MDAR1 and ALDH transcripts were increased during both developmental
senescence and drought.
Glutathione reductases (GR) are encoded by the GR1 and GR2 genes. GR1 transcripts, which encode
the cytosolic form of GR, were decreased during developmental senescence but increased in nodules
of plants exposed to drought. Like CSD1 and CSD2, GR1 expression therefore appears to be
differentially regulated in response to developmental and stress-induced senescence. GR2 transcripts,
which encode plastid and mitochondrial forms, were increased during developmental senescence but
were unaffected by drought exposure. Similarly GRX3 was increased under drought-induced
senescence whereas GRX4 was down regulated. Taken together, the data a show that the patterns of
accumulation of redox-related transcripts differ under drought-induced and developmental
senescence, suggesting that these processes are different in terms of gene expression and
programming.

Page | 79
“One thing my pea plants taught me: always do science with things you can make into a soup.”
-Gregor Mendel

Page | 80
4. A role for strigolactone pathways on chilling tolerance in pea and Arabidopsis
4.1. Introduction
Strigolactones (SL), which were first identified as a component of root exudates in cotton (Gossypium
sp; Cook et al., 1972), were initially shown to break seed dormancy and stimulate the growth of
parasitic plants. These carotenoid-derived plant metabolites are not only released into the rhizosphere
but they have also been shown to possess phytohormone activity in different plants, where they play a
significant role in plant development. Molecular genetic approaches to investigate the regulation of
bud growth led to the identification of SL as an auxiliary branching regulator. Branching has
historically been attributed to the hormones auxin and cytokinin. Thus the identification of SL as a
third regulator added an additional layer of control to this model (Dun et al., 2009). The garden pea
(Pisum sativum) has the most extensively described range of non-pleiotropic increased branching
mutants and has become a model in branching study (Johnson et al., 2006). Five branching mutant
backgrounds in pea, termed ramosus (rms), are currently available comprising over 30 distinct lines.
The five rms branching loci are; rms1-rms5. Each locus is directly or putatively attributed to a protein
involved in the synthesis or the signalling of SL (Johnson et al., 2006). In addition to inhibiting shoot
branching, SL also control root architecture. SLs also act as exogenous signals leading to the
establishment of symbiotic interactions with arbuscular mycorrhizal fungi (Lopez-Obando et al.,
2015).
The synthesis of SL involves the sequential cleavage of β-carotene (Figure 4.1-1), in a pathway that is
conserved across the plant kingdom. Together with pea, A. thaliana presents a second species for
which well characterised branching mutants are available (Bennett et al., 2006). These are termed the
more axillary branching (max) mutants. Each identified stage of SL synthesis and signalling, together
with known mutants, is described in Figure 4.1-1. The carotenoid cleavage dioxygenase (CCD) 7 and
CCD8 enzymes, together with a cytochrome p450, have been definitively attributed to the
RMS5/MAX3, RMS1/MAX4 and MAX1 loci respectively. However, the proteins coded at the RMS2
and RMS3 loci remain to be elucidated, though the RMS2 locus has been tentatively linked to SL
feedback signalling via interactions with the PsBRC1 transcription factor (Braun et al., 2012).
Evidence has also identified RMS4/MAX2 as an F-box signalling protein (Arite et al., 2009).
Considerable progress has been made recently in our understanding of the SL signalling pathway
DWARF14 (D14) and KARRIKIN INSENSITIVE 2 (KAI2) are two closely related alpha/beta-
hydrolases that have been shown to perceive specific enantiomers of the synthetic SL analogue,
GR24. Both receptor proteins interact with MAX2. This F-box protein family interacts with the
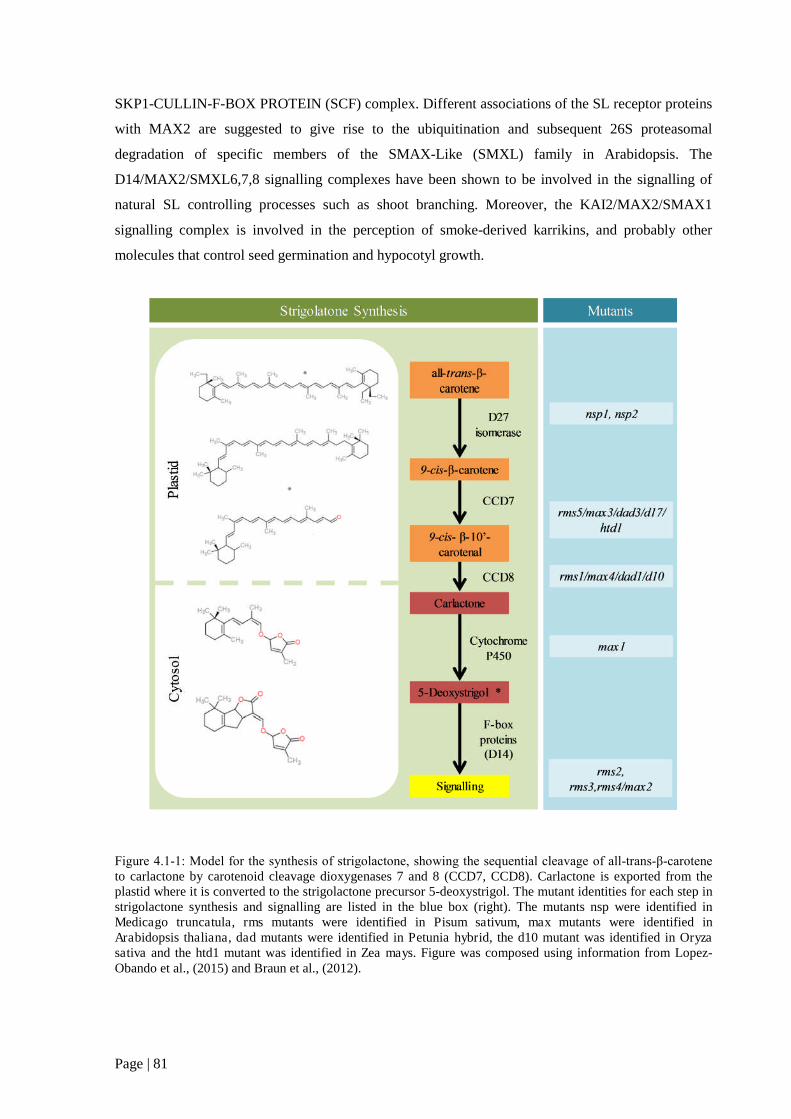
Page | 81
SKP1-CULLIN-F-BOX PROTEIN (SCF) complex. Different associations of the SL receptor proteins
with MAX2 are suggested to give rise to the ubiquitination and subsequent 26S proteasomal
degradation of specific members of the SMAX-Like (SMXL) family in Arabidopsis. The
D14/MAX2/SMXL6,7,8 signalling complexes have been shown to be involved in the signalling of
natural SL controlling processes such as shoot branching. Moreover, the KAI2/MAX2/SMAX1
signalling complex is involved in the perception of smoke-derived karrikins, and probably other
molecules that control seed germination and hypocotyl growth.
Figure 4.1-1: Model for the synthesis of strigolactone, showing the sequential cleavage of all-trans-β-carotene to carlactone by carotenoid cleavage dioxygenases 7 and 8 (CCD7, CCD8). Carlactone is exported from theplastid where it is converted to the strigolactone precursor 5-deoxystrigol. The mutant identities for each step instrigolactone synthesis and signalling are listed in the blue box (right). The mutants nsp were identified inMedicago truncatula, rms mutants were identified in Pisum sativum, max mutants were identified inArabidopsis thaliana, dad mutants were identified in Petunia hybrid, the d10 mutant was identified in Oryzasativa and the htd1 mutant was identified in Zea mays. Figure was composed using information from Lopez-Obando et al., (2015) and Braun et al., (2012).

Page | 82
In addition to functions in branching regulation, studies on the A. thaliana mutants called ore9,
which is analogous to max2, showed that SL have a role in senescence (Woo et al., 2001). Moreover,
the max2, max3 and max4 lines of A. thaliana have shown increased sensitivity to both drought and
salt stresses. As such the role of SL appears to extend beyond branching regulation, acting in both
development and stress tolerance responses. However, the role of SL in temperature stress tolerance
has not yet been characterised (Pandey et al., 2016). The results presented in chapter 3 provide
evidence that OCI expression in soybean led to an increase in the abundance of the transcripts
encoding the CCD7 and CCD8 dioxygenases, and conferred tolerance to dark chilling, as determined
by measurements of photosynthesis and growth. Mutants defective in SL synthesis and signalling are
not yet available in soybean. The following experiments were therefore performed in A. thaliana and
pea, where such mutants are available, in order to investigate whether SL plays a role in chilling
tolerance. Unlike soybean, A. thaliana and pea are chilling tolerant. If the tolerance to chilling in
these species is dependent on SL then it might be predicted that sensitivity to dark chilling will be
increased when SL synthesis and signalling are impaired.
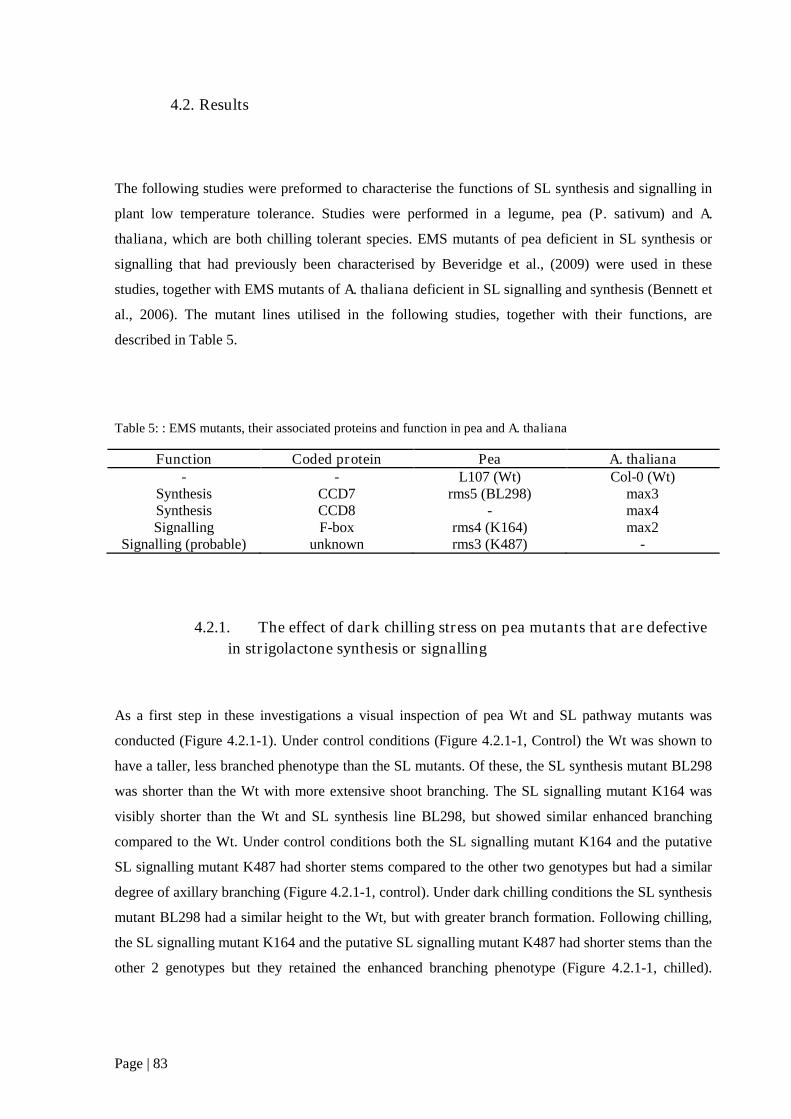
Page | 83
4.2. Results
The following studies were preformed to characterise the functions of SL synthesis and signalling in
plant low temperature tolerance. Studies were performed in a legume, pea (P. sativum) and A.
thaliana, which are both chilling tolerant species. EMS mutants of pea deficient in SL synthesis or
signalling that had previously been characterised by Beveridge et al., (2009) were used in these
studies, together with EMS mutants of A. thaliana deficient in SL signalling and synthesis (Bennett et
al., 2006). The mutant lines utilised in the following studies, together with their functions, are
described in Table 5.
Table 5: : EMS mutants, their associated proteins and function in pea and A. thaliana
Function Coded protein Pea A. thaliana- - L107 (Wt) Col-0 (Wt)
Synthesis CCD7 rms5 (BL298) max3Synthesis CCD8 - max4Signalling F-box rms4 (K164) max2
Signalling (probable) unknown rms3 (K487) -
4.2.1. The effect of dark chilling stress on pea mutants that are defective
in strigolactone synthesis or signalling
As a first step in these investigations a visual inspection of pea Wt and SL pathway mutants was
conducted (Figure 4.2.1-1). Under control conditions (Figure 4.2.1-1, Control) the Wt was shown to
have a taller, less branched phenotype than the SL mutants. Of these, the SL synthesis mutant BL298
was shorter than the Wt with more extensive shoot branching. The SL signalling mutant K164 was
visibly shorter than the Wt and SL synthesis line BL298, but showed similar enhanced branching
compared to the Wt. Under control conditions both the SL signalling mutant K164 and the putative
SL signalling mutant K487 had shorter stems compared to the other two genotypes but had a similar
degree of axillary branching (Figure 4.2.1-1, control). Under dark chilling conditions the SL synthesis
mutant BL298 had a similar height to the Wt, but with greater branch formation. Following chilling,
the SL signalling mutant K164 and the putative SL signalling mutant K487 had shorter stems than the
other 2 genotypes but they retained the enhanced branching phenotype (Figure 4.2.1-1, chilled).

Page | 84
These mutants were visibly smaller than the other two genotypes after exposure to 7 consecutive
nights of dark-chilling (Figure 4.2.1-1).
Figure 4.2.1-1: Shoot phenotypes of pea wild type; (L107; Wt) and three SL mutant lines deficient in eitherstrigolactone synthesis or signalling proteins; BL298 (rms5-3; SL synthesis mutant); K164 (rms4-1; SLsignalling); K487 (rms3-1; SL signalling). Plants were grown for either 3 weeks on compost under controlconditions (Control) or for 2 weeks under control conditions followed by 7 consecutive nights of dark chilling(4ºC ±1ºC; Chilled). Scale bar shows 5cm.
Exposure to dark chilling did not significantly change the number of shoot branches within each
genotype. However, branch number varied between genotypes under control and dark chilled
conditions (Figure 4.2.1-2).
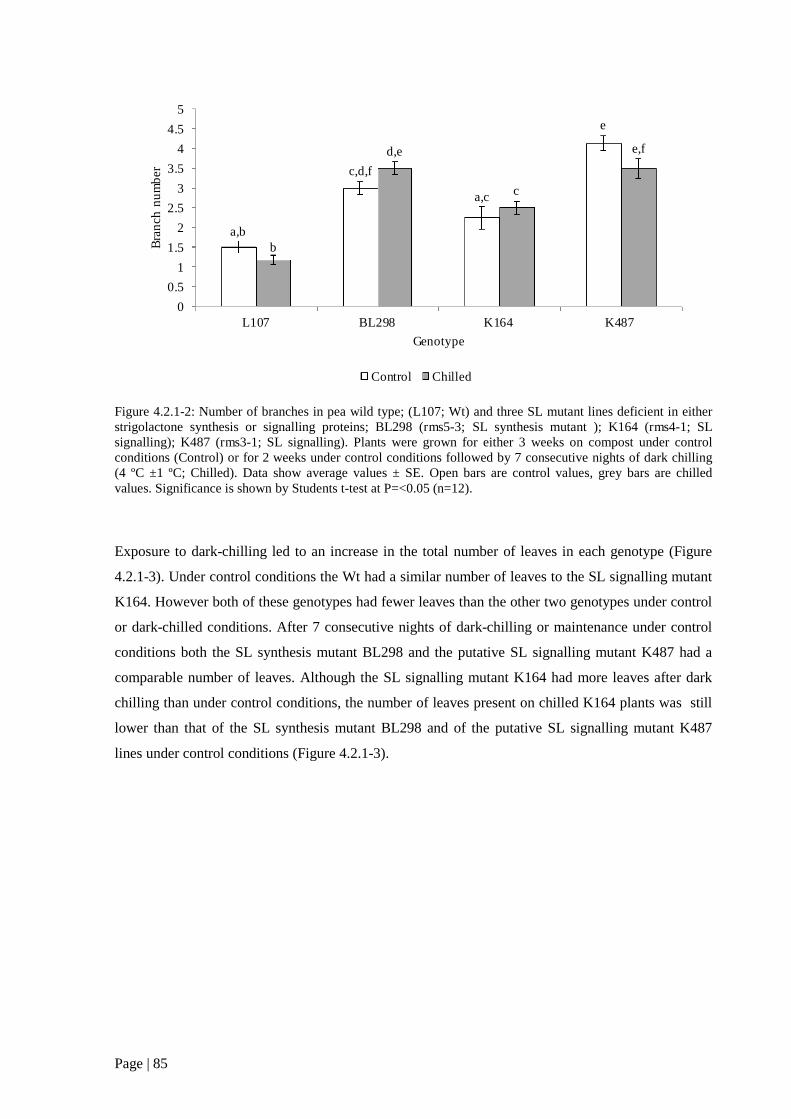
Page | 85
Figure 4.2.1-2: Number of branches in pea wild type; (L107; Wt) and three SL mutant lines deficient in eitherstrigolactone synthesis or signalling proteins; BL298 (rms5-3; SL synthesis mutant ); K164 (rms4-1; SLsignalling); K487 (rms3-1; SL signalling). Plants were grown for either 3 weeks on compost under controlconditions (Control) or for 2 weeks under control conditions followed by 7 consecutive nights of dark chilling(4 ºC ±1 ºC; Chilled). Data show average values ± SE. Open bars are control values, grey bars are chilledvalues. Significance is shown by Students t-test at P=<0.05 (n=12).
Exposure to dark-chilling led to an increase in the total number of leaves in each genotype (Figure
4.2.1-3). Under control conditions the Wt had a similar number of leaves to the SL signalling mutant
K164. However both of these genotypes had fewer leaves than the other two genotypes under control
or dark-chilled conditions. After 7 consecutive nights of dark-chilling or maintenance under control
conditions both the SL synthesis mutant BL298 and the putative SL signalling mutant K487 had a
comparable number of leaves. Although the SL signalling mutant K164 had more leaves after dark
chilling than under control conditions, the number of leaves present on chilled K164 plants was still
lower than that of the SL synthesis mutant BL298 and of the putative SL signalling mutant K487
lines under control conditions (Figure 4.2.1-3).
a,b
c,d,f
a,c
e
b
d,e
c
e,f
0
0.5
1
1.5
2
2.5
3
3.5
4
4.5
5
L107 BL298 K164 K487
Bra
nch
nu
mb
er
Genotype
Control Chilled
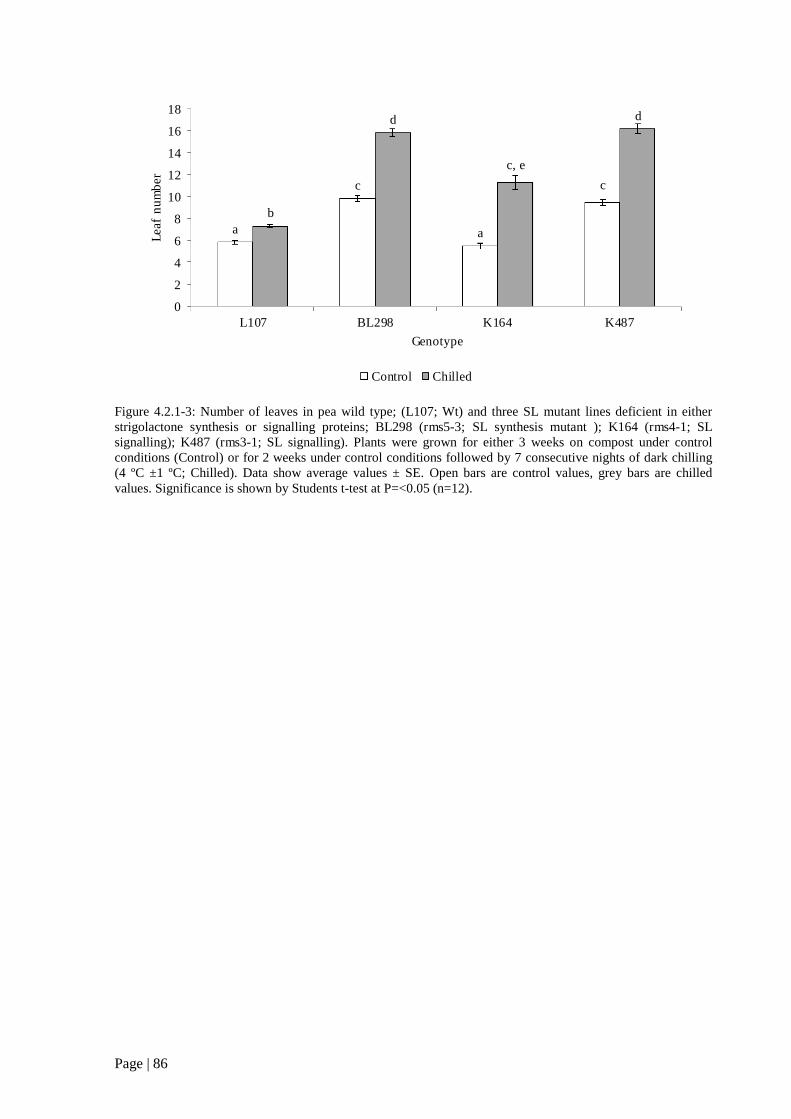
Page | 86
Figure 4.2.1-3: Number of leaves in pea wild type; (L107; Wt) and three SL mutant lines deficient in eitherstrigolactone synthesis or signalling proteins; BL298 (rms5-3; SL synthesis mutant ); K164 (rms4-1; SLsignalling); K487 (rms3-1; SL signalling). Plants were grown for either 3 weeks on compost under controlconditions (Control) or for 2 weeks under control conditions followed by 7 consecutive nights of dark chilling(4 ºC ±1 ºC; Chilled). Data show average values ± SE. Open bars are control values, grey bars are chilledvalues. Significance is shown by Students t-test at P=<0.05 (n=12).
a
c
a
c
b
d
c, e
d
0
2
4
6
8
10
12
14
16
18
L107 BL298 K164 K487
Lea
fn
um
ber
Genotype
Control Chilled

Page | 87
Under control conditions the L107, BL298 and K487 shoots had comparable fresh biomasses;
however K164 displayed a significantly lower fresh biomass than the other genotypes (Figure 4.2.1-4
Control). Similarly L107, BL298 and K487 had a comparable fresh shoot biomass under dark chilling
conditions, and K164 had the lowest shoot biomass under these conditions (Figure 4.2.1-4 Chilled).
All genotypes were reduced in terms of fresh shoot biomass as a result of exposure to 7 consecutive
nights of dark-chilling; however K164 had the lowest fresh shoot biomass of all genotypes under
dark-chilling conditions (Figure 4.2.1-4).
Figure 4.2.1-4: Fresh shoot biomass of pea wild type; (L107; Wt) and three SL mutant lines deficient in eitherstrigolactone synthesis or signalling proteins; BL298 (rms5-3; SL synthesis mutant ); K164 (rms4-1; SLsignalling); K487 (rms3-1; SL signalling). Plants were grown for either 3 weeks on compost under controlconditions (Control) or for 2 weeks under control conditions followed by 7 consecutive nights of dark chilling(4 ºC ±1 ºC; Chilled). ). Data show average values ± SE. Open bars are control values, grey bars are chilledvalues. Significance is shown by Students t-test at P=<0.05 (n=12).
aa
b
a
b b
c
b
0
1
2
3
4
5
6
L107 BL298 K164 K487
Fre
shw
eig
ht
(g)
Genotype
Control Chilled

Page | 88
Under control conditions L107, BL298 and K487 showed similar dry shoot weights, however K164
showed a significantly lower dry shoot weight than the other genotypes when grown under control
conditions (Figure 4.2.1-5). After exposure to 7 consecutive nights of dark-chilling, L107 had the
highest dry shoot biomass of all genotypes. K487 had a higher dry shoot biomass than BL298 and
K164 after exposure to dark chilling, with dark-chilled BL298 and K164 plants having statistically
comparable dry biomasses. Interestingly whilst BL298 and K487 showed significant reductions in dry
shoot biomass after exposure to dark-chilling, K164 was not significantly affected by chilling
exposure.
Figure 4.2.1-5: Dry shoot biomass of pea wild type; (L107; Wt) and three SL mutant lines deficient in eitherstrigolactone synthesis or signalling proteins; BL298 (rms5-3; SL synthesis mutant ); K164 (rms4-1; SLsignalling); K487 (rms3-1; SL signalling). Plants were grown for either 3 weeks on compost under controlconditions (Control) or for 2 weeks under control conditions followed by 7 consecutive nights of dark chilling(4ºC ±1ºC; Chilled). ). Data show average values ± SE. Open bars are control values, grey bars are chilledvalues. Significance is shown by Students t-test at P=<0.05 (n=12).
.
a a
b,c
a
a
b b
c
0
0.05
0.1
0.15
0.2
0.25
0.3
0.35
0.4
0.45
L107 BL298 K164 K487
Dry
wei
gh
t(g
)
Genotype
Control Chilled

Page | 89
Figure 4.2.1-6: Fresh weight: dry weight ratios (FW/DW) of pea wild type; (L107; Wt) and three SL mutantlines deficient in either strigolactone synthesis or signalling proteins; BL298 (rms5-3; SL synthesis mutant );K164 (rms4-1; SL signalling); K487 (rms3-1; SL signalling). Plants were grown for either 3 weeks on compostunder control conditions (Control) or for 2 weeks under control conditions followed by 7 consecutive nights ofdark chilling (4 ºC ±1 ºC; Chilled). ). Data show average values ± SE. Open bars are control values, grey barsare chilled values. Significance is shown by Students t-test at P=<0.05 (n=12).
The fresh weight to dry weight ratios (FW/DW) were measured under control and dark-chilling
conditions. FW/DW was similar in the L107, BL298 and K487 lines but BL298 had a lower FW/DW
than K164 under control conditions (Figure 4.2.1-6 Control). There were significant differences in
FW/DW between genotypes after 7-consecutive nights of exposure to dark-chilling (Figure 4.2.1-6).
L107 and K164 had a comparably low FW/DW when compared to K487 and BL298. BL298 had the
highest FW/DW after dark-chilling (Figure 4.2.1-6 Chilled). Both L107 and K164 had a significantly
lower FW/DW after chilling, whilst BL298 had a significantly higher ratio. The FW/DW of K487
was not significantly affected by dark-chilling (Figure 4.2.1-6).
a,c,df d,f
a,ca,c,de,f
b,g
c
b,e
f,g
0
5
10
15
20
25
L107 BL298 K164 K487
Fre
shw
eig
ht:
dry
wei
gh
tra
tio
Genotype
Control Chilled

Page | 90
To further investigate the effect of dark-chilling on growth and metabolism, photosynthetic
parameters were measured in all genotypes. All genotypes had similar photosynthetic carbon
assimilation rates under control conditions (Figure 4.2.1-7 Control). The leaves of Wt (L107) plants
that had been exposed to dark-chilling had similar rates of photosynthesis whether they were grown
under control or dark chilling conditions (Figure 4.2.1-7). Moreover, the L107 leaves had
significantly higher rates of carbon assimilation than those of the other genotypes (BL298, K164 and
K487) dark chilling conditions. There was a significant chilling-dependent inhibition of carbon
assimilation in the BL298, K164 and K487 leaves after exposure to 7 consecutive nights of dark-
chilling (Figure 4.2.1-7).
Figure 4.2.1-7: Photosynthetic carbon assimilation rates (µmol CO2.m-2.s-1) of pea wild type; (L107; Wt) and
three SL mutant lines deficient in either strigolactone synthesis or signalling proteins; BL298 (rms5-3; SLsynthesis mutant ); K164 (rms4-1; SL signalling); K487 (rms3-1; SL signalling). Plants were grown for either 3weeks on compost under control conditions (Control) or for 2 weeks under control conditions followed by 7consecutive nights of dark chilling (4 ºC ±1 ºC; Chilled). Measurements were taken at an atmospheric CO2
concentration of 400 µmol at 20 ºC and a light concentration of 800 µmol.m..-2.s-1. ). Data show average values± SE. Open bars are control values, grey bars are chilled values. Significance is shown by Students t-test atP=<0.05 (n=12).
a,b,c bb
a,b,c
b
c,d c,d
d
0
2
4
6
8
10
12
14
16
L107 BL298 K164 K487
A(µ
mo
lC
O2.m
-2.s
-1)
Genotype
Control Chilled

Page | 91
Figure 4.2.1-8: Stomatal conductance (mmol H2O.m-2.s-1) of pea wild type; (L107; Wt) and three SL mutantlines deficient in either strigolactone synthesis or signalling proteins; BL298 (rms5-3; SL synthesis mutant);K164 (rms4-1; SL signalling); K487 (rms3-1; SL signalling). Plants were grown for either 3 weeks on compostunder control conditions (Control) or for 2 weeks under control conditions followed by 7 consecutive nights ofdark chilling (4 ºC ±1 ºC; Chilled). Measurements were taken at an atmospheric CO2 concentration of 400 µmolat 20 ºC and a light concentration of 800 µmol.m.2.s-1. ). Data show average values ± SE. Open bars are controlvalues, grey bars are chilled values. Significance is shown by Students t-test at P=<0.05 (n=12).
All genotypes had similar stomatal conductance rates under control conditions. The L107 and K164
leaves showed similar stomatal conductance under dark-chilling as in control conditions (Figure
4.2.1-8). However, the BL298 and K487 leaves had significantly lower rates of stomatal conductance
after dark-chilling (Figure 4.2.1-8). BL298 and K487 had the lowest rates of stomatal conductance
following dark-chilling (Figure 4.2.1-8).
a,b aa
a
a
b,c
a
c
0
0.05
0.1
0.15
0.2
0.25
0.3
L107 BL298 K164 K487Sto
mat
alco
nd
uct
ance
(mo
lH
2O
.m-2
.s-1
)
Genotype
Control Chilled
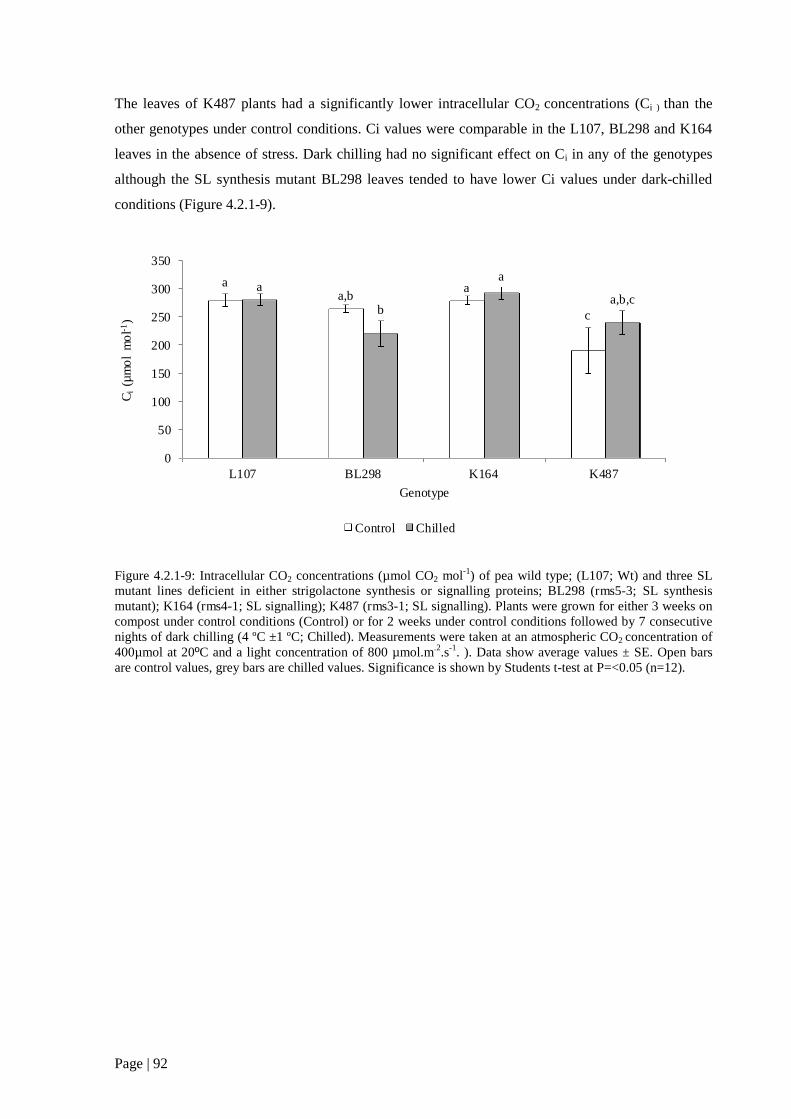
Page | 92
The leaves of K487 plants had a significantly lower intracellular CO2 concentrations (Ci ) than the
other genotypes under control conditions. Ci values were comparable in the L107, BL298 and K164
leaves in the absence of stress. Dark chilling had no significant effect on Ci in any of the genotypes
although the SL synthesis mutant BL298 leaves tended to have lower Ci values under dark-chilled
conditions (Figure 4.2.1-9).
Figure 4.2.1-9: Intracellular CO2 concentrations (µmol CO2 mol-1) of pea wild type; (L107; Wt) and three SLmutant lines deficient in either strigolactone synthesis or signalling proteins; BL298 (rms5-3; SL synthesismutant); K164 (rms4-1; SL signalling); K487 (rms3-1; SL signalling). Plants were grown for either 3 weeks oncompost under control conditions (Control) or for 2 weeks under control conditions followed by 7 consecutivenights of dark chilling (4 ºC ±1 ºC; Chilled). Measurements were taken at an atmospheric CO2 concentration of400µmol at 20ºC and a light concentration of 800 µmol.m.2.s-1. ). Data show average values ± SE. Open barsare control values, grey bars are chilled values. Significance is shown by Students t-test at P=<0.05 (n=12).
aa,b
a
c
a
b
a
a,b,c
0
50
100
150
200
250
300
350
L107 BL298 K164 K487
Ci
(µm
ol
mo
l-1)
Genotype
Control Chilled
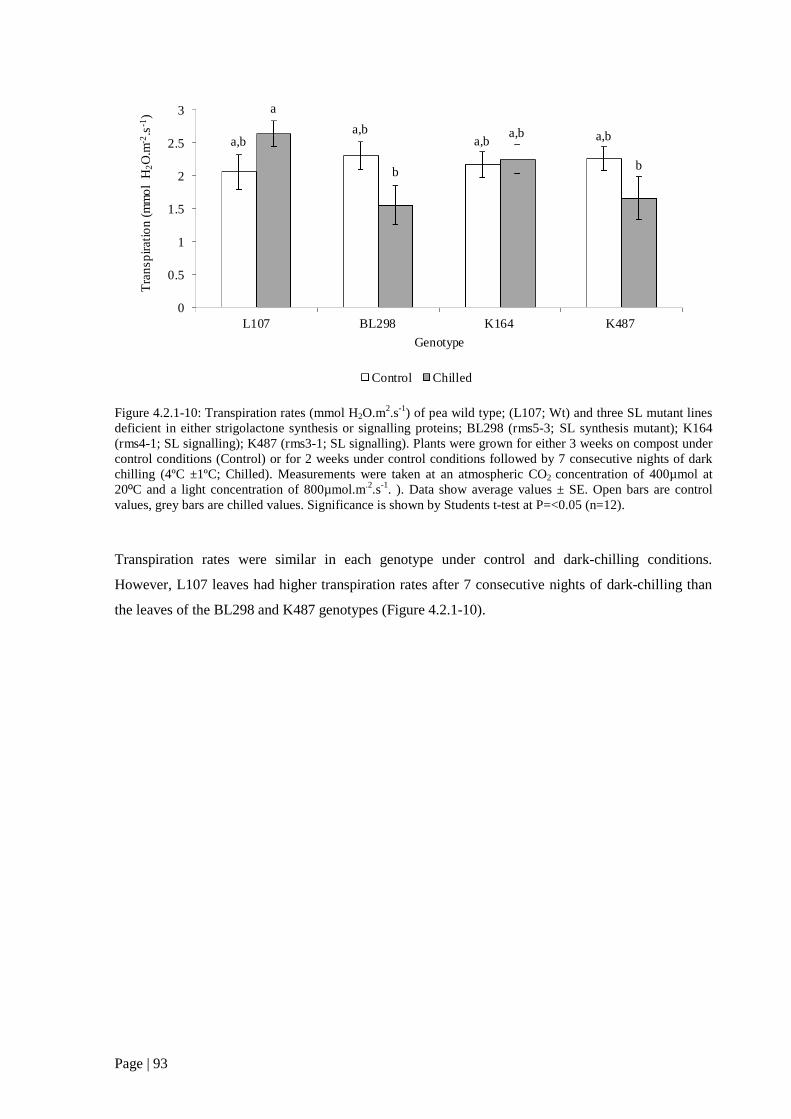
Page | 93
Figure 4.2.1-10: Transpiration rates (mmol H2O.m2.s-1) of pea wild type; (L107; Wt) and three SL mutant linesdeficient in either strigolactone synthesis or signalling proteins; BL298 (rms5-3; SL synthesis mutant); K164(rms4-1; SL signalling); K487 (rms3-1; SL signalling). Plants were grown for either 3 weeks on compost undercontrol conditions (Control) or for 2 weeks under control conditions followed by 7 consecutive nights of darkchilling (4ºC ±1ºC; Chilled). Measurements were taken at an atmospheric CO2 concentration of 400µmol at20ºC and a light concentration of 800µmol.m.2.s-1. ). Data show average values ± SE. Open bars are controlvalues, grey bars are chilled values. Significance is shown by Students t-test at P=<0.05 (n=12).
Transpiration rates were similar in each genotype under control and dark-chilling conditions.
However, L107 leaves had higher transpiration rates after 7 consecutive nights of dark-chilling than
the leaves of the BL298 and K487 genotypes (Figure 4.2.1-10).
a,ba,b
a,b a,b
a
b
a,b
b
0
0.5
1
1.5
2
2.5
3
L107 BL298 K164 K487
Tra
nsp
irat
ion
(mm
ol
H2O
.m-2
.s-1
)
Genotype
Control Chilled
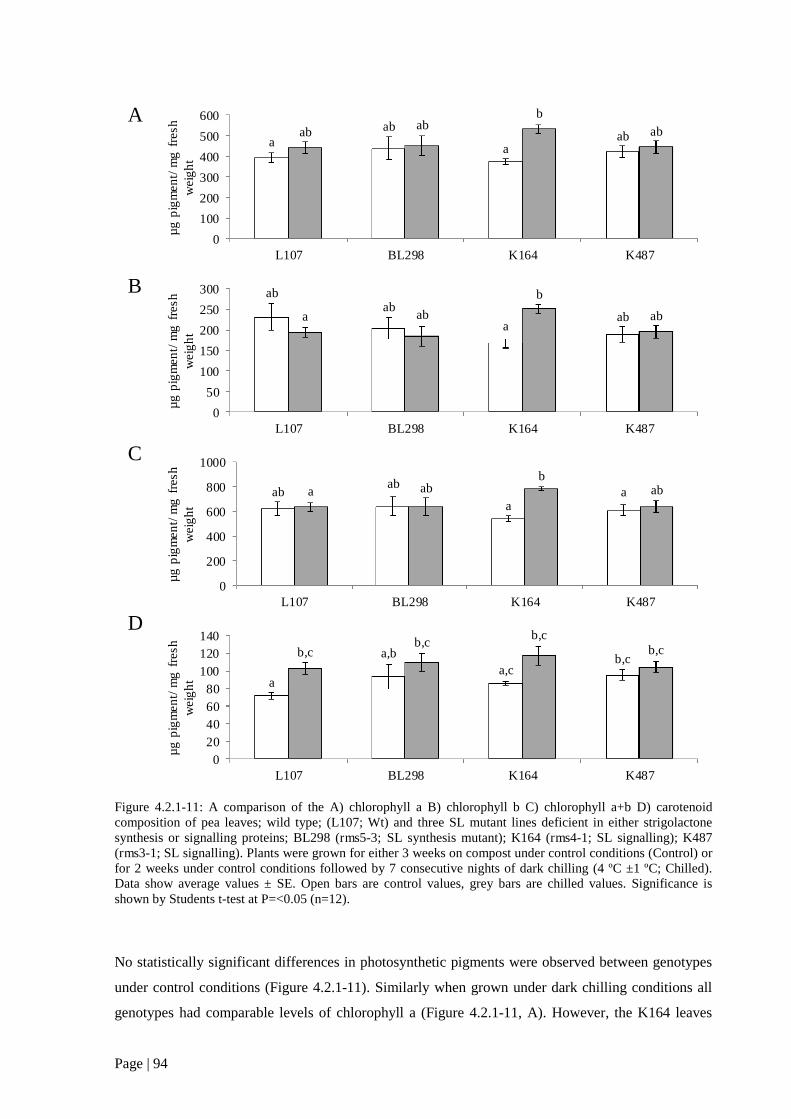
Page | 94
Figure 4.2.1-11: A comparison of the A) chlorophyll a B) chlorophyll b C) chlorophyll a+b D) carotenoidcomposition of pea leaves; wild type; (L107; Wt) and three SL mutant lines deficient in either strigolactonesynthesis or signalling proteins; BL298 (rms5-3; SL synthesis mutant); K164 (rms4-1; SL signalling); K487(rms3-1; SL signalling). Plants were grown for either 3 weeks on compost under control conditions (Control) orfor 2 weeks under control conditions followed by 7 consecutive nights of dark chilling (4 ºC ±1 ºC; Chilled).Data show average values ± SE. Open bars are control values, grey bars are chilled values. Significance isshown by Students t-test at P=<0.05 (n=12).
No statistically significant differences in photosynthetic pigments were observed between genotypes
under control conditions (Figure 4.2.1-11). Similarly when grown under dark chilling conditions all
genotypes had comparable levels of chlorophyll a (Figure 4.2.1-11, A). However, the K164 leaves
abab
aaba ab
b
ab
0
50
100
150
200
250
300
L107 BL298 K164 K487
µg
pig
men
t/m
gfr
esh
wei
gh
t
aab
aabab
abb
ab
0
100
200
300
400
500
600
L107 BL298 K164 K487
µg
pig
men
t/m
gfr
esh
wei
gh
t
abab
aaa ab
bab
0
200
400
600
800
1000
L107 BL298 K164 K487
µg
pig
men
t/m
gfr
esh
wei
gh
t
a
a,b
a,cb,c
b,cb,c
b,cb,c
0
20
40
60
80
100
120
140
L107 BL298 K164 K487
µg
pig
men
t/m
gfr
esh
wei
gh
t
A
B
C
D
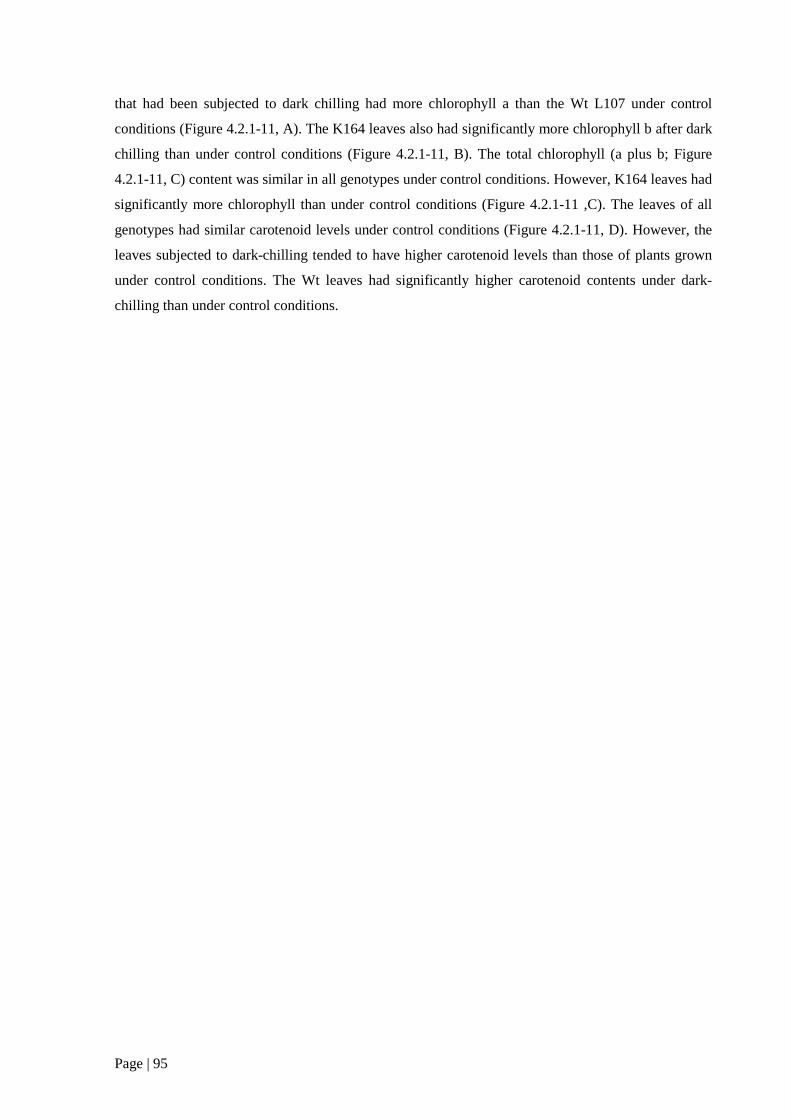
Page | 95
that had been subjected to dark chilling had more chlorophyll a than the Wt L107 under control
conditions (Figure 4.2.1-11, A). The K164 leaves also had significantly more chlorophyll b after dark
chilling than under control conditions (Figure 4.2.1-11, B). The total chlorophyll (a plus b; Figure
4.2.1-11, C) content was similar in all genotypes under control conditions. However, K164 leaves had
significantly more chlorophyll than under control conditions (Figure 4.2.1-11 ,C). The leaves of all
genotypes had similar carotenoid levels under control conditions (Figure 4.2.1-11, D). However, the
leaves subjected to dark-chilling tended to have higher carotenoid levels than those of plants grown
under control conditions. The Wt leaves had significantly higher carotenoid contents under dark-
chilling than under control conditions.
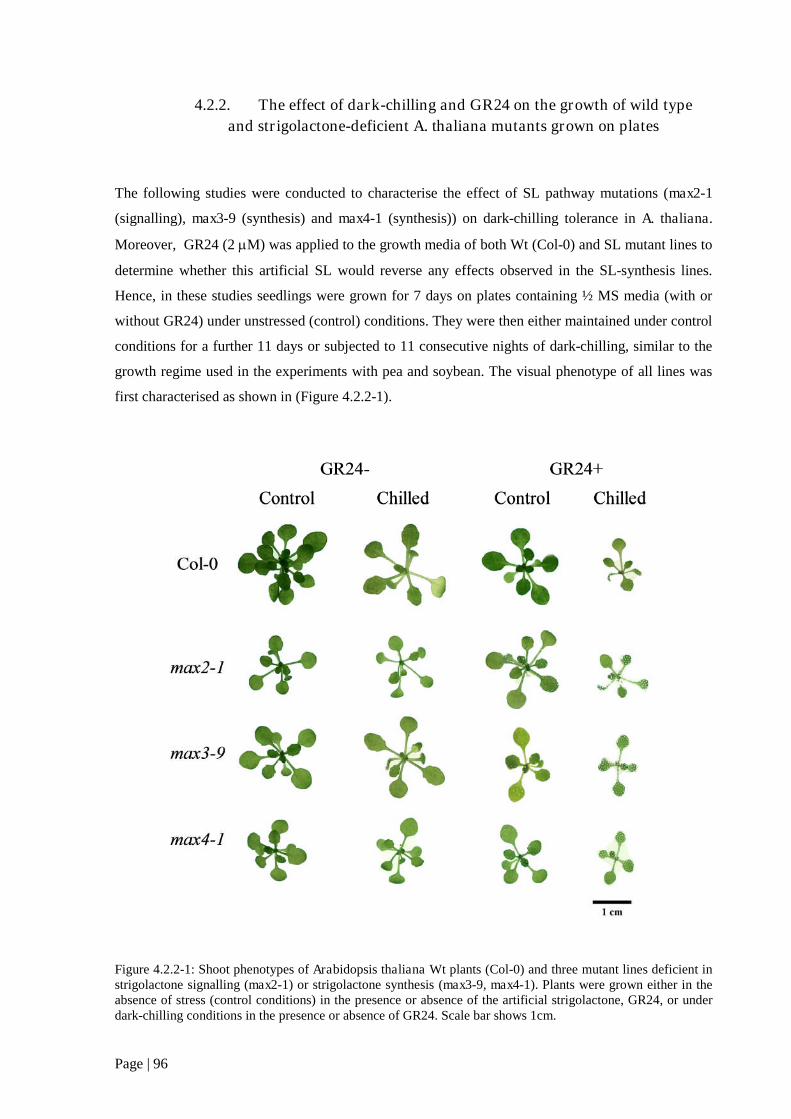
Page | 96
4.2.2. The effect of dark-chilling and GR24 on the growth of wild type
and strigolactone-deficient A. thaliana mutants grown on plates
The following studies were conducted to characterise the effect of SL pathway mutations (max2-1
(signalling), max3-9 (synthesis) and max4-1 (synthesis)) on dark-chilling tolerance in A. thaliana.
Moreover, GR24 (2 M) was applied to the growth media of both Wt (Col-0) and SL mutant lines to
determine whether this artificial SL would reverse any effects observed in the SL-synthesis lines.
Hence, in these studies seedlings were grown for 7 days on plates containing ½ MS media (with or
without GR24) under unstressed (control) conditions. They were then either maintained under control
conditions for a further 11 days or subjected to 11 consecutive nights of dark-chilling, similar to the
growth regime used in the experiments with pea and soybean. The visual phenotype of all lines was
first characterised as shown in (Figure 4.2.2-1).
Figure 4.2.2-1: Shoot phenotypes of Arabidopsis thaliana Wt plants (Col-0) and three mutant lines deficient instrigolactone signalling (max2-1) or strigolactone synthesis (max3-9, max4-1). Plants were grown either in theabsence of stress (control conditions) in the presence or absence of the artificial strigolactone, GR24, or underdark-chilling conditions in the presence or absence of GR24. Scale bar shows 1cm.

Page | 97
A visual inspection showed that Col-0, grown under control conditions in the absence of GR24 had
the largest rosette. Under the same conditions all of max2-1, max3-9 and max4-1 showed a smaller
rosette size than Col-0, with max2-1 presenting the smallest phenotype (Figure 4.2.2-1, GR24-
control). Under dark-chilling conditions, in the absence of GR24, all genotypes showed a decrease in
rosette area, the chilled plants having visually smaller rosettes than those grown under control
conditions (Figure 4.2.2-1, GR24- chilled). The Col-0 rosettes were visibly smaller when treated with
GR24 under control growth temperatures. In contrast, the max2-1 rosettes were visibly larger in the
presence of GR24 and a smaller phenotype was shown by max3-9 and max4-1 (Figure 4.2.2-1,
GR24+ control). When grown in the presence of GR24 under dark-chilling conditions, all genotypes
displayed a smaller rosette. There were no apparent visual differences between genotypes under dark-
chilling conditions in the presence of GR24 (Figure 4.2.2-1, GR24+ chilled).
Figure 4.2.2-2: The rosette diameter of Arabidopsis thaliana wild type (Col-0) and three mutant lines deficientin either strigolactone signalling max2-1 or strigolactone synthesis (max3-9; max4-1). Plants were grown for 7days under control temperatures, either in the presence or absence of GR24. Time 0 indicates the point when 11consecutive nights of dark chilling were imposed; A) Control temperature in the absence of GR24; B) Controltemperature in the presence of GR24; C) Dark-chilling in the absence of GR24; D) Dark chilling in the presenceof GR24. Bars represent the SE of the mean. Each data point represents an n>=90.
To further investigate the effects of dark-chilling exposure on plant growth, rosette area was
measured at daily intervals for all genotypes from the point where the dark chilling stress was
0
0.1
0.2
0.3
0.4
0.5
0.6
0.7
0.8
0.9
0 1 2 3 4 5 6 7 8 9 10 11
Ros
ette
area
(cm
2)
Time (days)
A
0
0.1
0.2
0.3
0.4
0.5
0.6
0.7
0.8
0.9
0 1 2 3 4 5 6 7 8 9 10 11
Ros
ette
area
(cm
2)
Time (days)
B
0
0.1
0.2
0.3
0.4
0.5
0.6
0.7
0.8
0.9
0 1 2 3 4 5 6 7 8 9 10 11
Ros
ette
area
(cm
2)
Time (days)
C
0
0.1
0.2
0.3
0.4
0.5
0.6
0.7
0.8
0.9
0 1 2 3 4 5 6 7 8 9 10 11
Ros
ette
area
(cm
2)
Time (days)
D
Col-0 max2-1 max3-9 max4-1
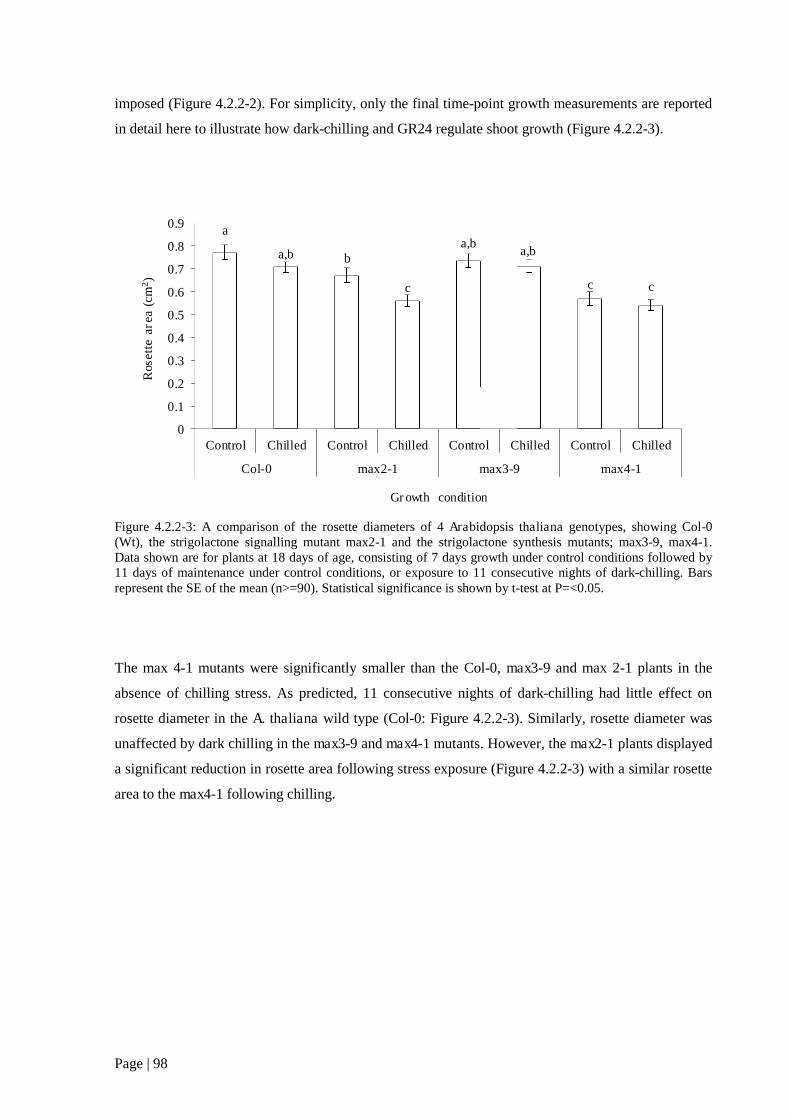
Page | 98
imposed (Figure 4.2.2-2). For simplicity, only the final time-point growth measurements are reported
in detail here to illustrate how dark-chilling and GR24 regulate shoot growth (Figure 4.2.2-3).
Figure 4.2.2-3: A comparison of the rosette diameters of 4 Arabidopsis thaliana genotypes, showing Col-0(Wt), the strigolactone signalling mutant max2-1 and the strigolactone synthesis mutants; max3-9, max4-1.Data shown are for plants at 18 days of age, consisting of 7 days growth under control conditions followed by11 days of maintenance under control conditions, or exposure to 11 consecutive nights of dark-chilling. Barsrepresent the SE of the mean (n>=90). Statistical significance is shown by t-test at P=<0.05.
The max 4-1 mutants were significantly smaller than the Col-0, max3-9 and max 2-1 plants in the
absence of chilling stress. As predicted, 11 consecutive nights of dark-chilling had little effect on
rosette diameter in the A. thaliana wild type (Col-0: Figure 4.2.2-3). Similarly, rosette diameter was
unaffected by dark chilling in the max3-9 and max4-1 mutants. However, the max2-1 plants displayed
a significant reduction in rosette area following stress exposure (Figure 4.2.2-3) with a similar rosette
area to the max4-1 following chilling.
a
a,b b
c
a,ba,b
c c
0
0.1
0.2
0.3
0.4
0.5
0.6
0.7
0.8
0.9
Control Chilled Control Chilled Control Chilled Control Chilled
Col-0 max2-1 max3-9 max4-1
Ros
ette
area
(cm
2)
Growth condition

Page | 99
Figure 4.2.2-4: A comparison of the rosette diameters of 4 Arabidopsis thaliana genotypes, showing Col-0(Wt), the strigolactone signalling mutant max2-1 and the strigolactone synthesis mutants; max3-9, max4-1. Datashown are for plants at 18 days of age, consisting of 7 days growth under control conditions followed by 11days of maintenance under control conditions, or exposure to 11 consecutive nights of dark-chilling. Plantswere grown either in the presence (GR24+) or absence (GR24-) of 2 µmol GR24. Bars represent the SE of themean (n>=90). Statistical significance is shown by t-test at P=<0.05.
When grown under control conditions, the application of GR24 had a significant inhibitory effect on
the growth of Col-0 (Figure 4.2.2-4) but not on the max2-1 mutants. However, rosette area was
decreased as a result of GR24 application in the max3-9 and max4-1 mutants (Figure 4.2.2-4). The
rosette area was similar in the max3-9 and max2-1 plants to Col-0 in the presence of GR24 (Figure
4.2.2-4).
a
b,d
c,d
a,c a,c
d,eb,e,f
f
0
0.1
0.2
0.3
0.4
0.5
0.6
0.7
0.8
0.9
GR24- GR24+ GR24- GR24+ GR24- GR24+ GR24- GR24+
Col-0 max2-1 max3-9 max4-1
Ros
ette
area
(cm
2)
Growth condition

Page | 100
Figure 4.2.2-5: A comparison of the rosette diameters of 4 Arabidopsis thaliana genotypes, showing Col-0(Wt), the strigolactone signalling mutant max2-1 and the strigolactone synthesis mutants; max3-9, max4-1. Datashown are for plants grown on ½ MS media, either in the absence or presence of 2µM GR24. Plants weregrown to 18 days, consisting of 7 days growth under control conditions followed by 11 consecutive nights ofdark-chilling. Bars represent the SE of the mean (n>=90). Statistical significance is shown by t-test at P=<0.05.
Under dark-chilling conditions Col-0 and max3-9 had a similar rosette area, but the rosette areas were
significantly lower in max2-1 and max4-1 plants (Figure 4.2.2-5 GR24-). GR24 caused a significant
decrease in rosette area in all genotypes that had been exposed to 11 consecutive nights of dark-
chilling (Figure 4.2.2-5). Under dark-chilling conditions in the presence of GR24 (GR24+), max2-1
had the greatest rosette area, being comparable to both max3-9 in the absence of GR24 (Figure
4.2.2-5 GR24+).
a
b
cd
a
b,dc,d
h
0
0.1
0.2
0.3
0.4
0.5
0.6
0.7
0.8
0.9
GR24-Chilled
GR24 +Chilled
GR24-Chilled
GR24 +Chilled
GR24-Chilled
GR24 +Chilled
GR24-Chilled
GR24 +Chilled
Col-0 max2-1 max3-9 max4-1
Ros
ette
area
(cm
2)
Growth condition

Page | 101
Figure 4.2.2-6: Rosette diameters of 4 Arabidopsis thaliana genotypes, showing Col-0 (Wt), the strigolactonesignalling mutant max2-1 and the strigolactone synthesis mutants; max3-9, max4-1. Data shown are for plantsgrown on ½ MS media, either in the absence of GR24 grown under control conditions, or presence of 2µMGR24 grown under 11 consecutive nights of dark-chilling. Plants were grown to 18 days, consisting of 7 daysgrowth under control conditions followed by 11 consecutive nights of dark-chilling. Bars represent the SE ofthe mean (n>=90). Statistical significance is shown by T-test at P=<0.05.
Col-0 plants grown in the presence of 2µM GR24 under dark-chilling conditions were significantly
smaller (by about 50%) than those grown without GR24 in the absence of stress (Figure 4.2.2-6). In
contrast, the inhibitory effect of GR24 was smaller (up to 25%) in the mutant lines (Figure 4.2.2-6).
a
b
c
d
a,c
b,d,e
e
f
0
0.1
0.2
0.3
0.4
0.5
0.6
0.7
0.8
0.9
GR24-Control
GR24+Chilled
GR24-Control
GR24+Chilled
GR24-Control
GR24+Chilled
GR24-Control
GR24+Chilled
Col-0 max2-1 max3-9 max4-1
Ros
ette
area
(cm
2)
Growth condition

Page | 102
4.2.3. The effect of dark-chilling on strigolactone deficient mutants and
the wild type plants grown on soil
The A. thaliana mutants were also grown together with the wild type on soil. In these experiments,
plants were grown for 3 weeks under optimal temperatures and then exposed to either 7 consecutive
nights of dark-chilling or maintained under control conditions.
Figure 4.2.3-1: A) Fresh weight; B) Dry weight; C) Fresh weight: dry weight ratio; of Col-0 (Wt), thestrigolactone signalling mutant max2-1 and the strigolactone synthesis mutants; max3-9, max4-1. Plants weregrown for 28 days, consisting of 21 days growth under control conditions followed by 7 consecutive nights ofdark-chilling. Data are average values ± SE (n=12). Open bars show control values, grey bars show dark-chilledvalues. Statistical significance is shown by t-test at P=<0.05.
a,c
a,b
a,cc
a
b
a
b
0
0.5
1
1.5
2
2.5
Col-0 max 2-1 max 3-9 max 4-1
Fre
shW
eigh
t(g
)
a
b
a
a
a,b
b
a
b
0
0.1
0.2
Col-0 max 2-1 max 3-9 max 4-1
Dry
wei
gh
t(g
)
a
b bb
b c c
d
0
2
4
6
8
10
12
14
16
Col-0 max2-1 max3-9 max4-1
Fre
shw
eig
ht:
dry
wei
gh
tra
tio
A
B
C

Page | 103
When grown on soil under control conditions all genotypes had a similar fresh shoot biomass than
max2-1 (Figure 4.2.3-1 A). After exposure to 7 consecutive nights of dark-chilling there was no
significant reduction in fresh weight in Col-0. In contrast, the fresh weight of all the mutant
genotypes was significantly decreased by the stress (Figure 4.2.3-1 A). Exposure to dark-chilling
caused a significant reduction in dry biomass in all the lines (Figure 4.2.3-1 B). Under control
conditions the fresh weight: dry weight ratios were higher in all mutant lines than Col-0 (Figure
4.2.3-1 C). However, exposure to dark-chilling caused a significant increase in the fresh weight: dry
weight ratios in the Col-0 and max4-1 lines. In contrast, the fresh weight: dry weight ratios were
reduced by dark-chilling for max2-1 and max3-9 (Figure 4.2.3-1 C).
As a further step in these investigations the effect of dark-chilling on photosynthetic parameters was
measured.
Figure 4.2.3-2: Carbon assimilation rates of Col-0 (Wt), the strigolactone signalling mutant max2-1 and thestrigolactone synthesis mutants; max3-9, max4-1. Plants were grown for 28 days, consisting of 21 days growthunder control conditions followed by 7 consecutive nights of dark-chilling. Data are average values ± SE(n=12). Open bars show control values, grey bars show dark-chilled values. Statistical significance is shown byt-test at P=<0.05.
Under control conditions, photosynthetic carbon assimilation was comparable in all lines. However,
while exposure to 7 consecutive nights of dark-chilling had not effect on photosynthesis in Col-0, the
stress caused a significant decrease in photosynthesis in all lines deficient in SL pathway proteins
(Figure 4.2.3-2).
a
a a aa
b b b
0
5
10
15
20
25
Col-0 max2-1 max3-9 max4-1
A(µ
mo
lC
O2.m
2.s
1)
Genotype

Page | 104
Figure 4.2.3-3: Transpiration rates of Col-0 (Wt), the strigolactone signalling mutant max2-1 and thestrigolactone synthesis mutants; max3-9, max4-1. Plants were grown for 28 days, consisting of 21 days growthunder control conditions followed by 7 consecutive nights of dark-chilling. Data are average values ± SE(n=12). Open bars show control values, grey bars show dark-chilled values. Statistical significance is shown byt-test at P=<0.05.
Under control conditions the transpiration rate of all lines was comparable. Exposure to 7
consecutive nights of dark-chilling caused a reduction in transpiration in all lines (Figure 4.2.3-3).
a
aa
aa
bb
b
0
0.5
1
1.5
2
2.5
3
3.5
4
4.5
Col-0 max2-1 max3-9 max4-1
Tra
nsp
irat
ion
rate
(mm
ol
H2O
m-2
.s-1
)
Genotype

Page | 105
4.3. Discussion
These studies described in this chapter sought to determine the role of strigolactone (SL) in the low
temperature tolerance of pea and A. thaliana. Taken together, the data presented here show that SL
synthesis and signalling are required for low temperature tolerance in both species. While
photosynthesis was unaffected by 7 nights of dark chilling in the Wt peas, a chilling-induced
inhibition of photosynthesis was observed in the mutants defective in either SL synthesis (BL298) or
signalling (K164 and K487). Similarly, photosynthesis was unaffected by dark chilling in Wt A.
thaliana. However, photosynthesis was susceptible to inhibition by dark chilling in mutant lines
defective in SL synthesis (max3-9 and max4-1) or signalling (max2-1) when plants were grown on
soil. While chilling had no effect on leaf Ci in any of the pea lines, chilling had an inhibitory effect on
stomatal conductance and transpiration in the SL synthesis (BL298) and signalling (K487) lines.
These findings suggest that SL has an effect on chilling sensitivity that is linked its effects on
stomatal density and functions. However, chilling had a similar negative impact on all the A. thaliana
genotypes. This observation is surprising given that the A. thaliana max mutants have increased
stomatal densities relative to Wt (Ha et al., 2014). The max mutants exhibited increased leaf water
loss during dehydration (Ha et al., 2014) but this did not appear to occur following dark chilling, the
max mutants showing a variable response in terms of leaf fresh weight/dry weight ratios.
The max mutants have also been shown to exhibit slower ABA-induced stomatal closure. Moreover,
the max2 mutants accumulated less ABA than Wt plants (Yao and Finlayson, 2015). ABA has a
central role in the tolerance of A. thaliana plants to chilling and freezing (Jarillo et al., 1993; Shi et
al., 2014), it is possible that the absence of SL pathways alters chilling sensitivity through its effects
on ABA. However, SL are positive regulators of ABA synthesis and ABA-regulated gene expression
was shown to be enhanced in max2 mutants (Bu et al., 2014). Thus, it is unlikely that SL influence
dark chilling sensitivity through its effects on ABA, because chilling sensitivity is enhanced in the
mutants defective in SL pathways. However, as in the case of chilling, the max2 mutant seedlings
were also hypersensitive to osmotic stress, SL may play a role in the control of plant responses to
these stresses through the regulation of ABA-independent pathways, as described by Shinozaki et al.,
(2003).
In contrast to the hypothesis that SL exert a positive control on plant chilling stress tolerance, the
addition of the artificial SL, GR24, enhanced chilling sensitivity in all A. thaliana genotypes when
the plants were grown on plates. This apparent contradictory result may be explained either by the
concentration of GR24 used, which might not be optimal for induction of chilling responses, or that
other factors in the growth media such as sucrose also had an impact on chilling sensitivity that

Page | 106
counteracts the effects of loss of SL functions. However, GR24 has an effect on chilling sensitivity
even in the max2-1 mutants suggesting that the negative effect of GR24 on chilling sensitivity is not
dependent on SL-signalling pathways. In a similar manner. the length of the primary roots of the A.
thaliana Wt and max mutants has been shown to be negatively regulated by increasing concentrations
of GR24 (Ruyter-Spira et al., 2011). Moreover, phytopathogenic fungi have been shown to have a
decreased colony area with increased concentrations of GR24 in their growth media (Dor et al.,
2011).
While the enhanced sensitivity of the SL-deficient pea and A. thaliana mutants is not always
translated into effects on biomass accumulation, a decrease in dry biomass was found to accompany
an enhanced sensitivity of photosynthesis to dark chilling in both species. In cases where this
relationship was not observed, the apparent anomaly might be explained by slower growth and
biomass accumulation rates. Taken together, the data presented here show that lack of SL functions
increase sensitivity to dark-chilling exposure in pea and A. thaliana plants grown in soil. Further
work is required to determine the mechanisms by which SL influences chilling tolerance, especially
through crosstalk with other hormones that control stress tolerance.

Page | 107
“The two most powerful warriors are patience and time”
-Leo Tolstoy
Page | 108
5. Characterising the low-temperature tolerance of 5 Vicia faba cultivars
5.1. Introduction
Faba bean (Vicia faba L) is one of the three most important cool season food legumes globally
(O’Sullivan and Angra, 2016; FAOSTAT, 2016). There are two seasonal groupings of faba bean:
winter and spring. While the protein content of spring types is marginally higher than winter types
(Bond and Toynbee-clarke, 1968), winter types have a greater yield and better tolerance to low
temperatures (Inci and Toker, 2011). Within the winter and spring types there are a multitude of
different cultivars, each bred for a specific agronomic trait (Knott et al., 1994).
The genus Vicia comprises of approximately 166 members (Enneking, 1994), with V. faba containing
4 distinct agricultural varieties; major, minor, equina and paucijuga. However, the phylogenetic
placement of V. faba is contentious and the evolutionary history of the Leguminosae remains an
active field of study (Wojciechowski et al., 2004). Moreover, the evolutionary history of V. faba itself
is unresolved. It has a high level of intraspecies diversity; as well as being divided into 4 varieties,
each variety can be further subdivided into spring and winter cultivars (Knott et al., 1994). Historic
landraces of V. faba are thought to be extinct, however anthropological research has suggested its
history to be closely tied to early crop domestication practices, extending back approximately 10,000
years (Duc et al., 2010).
Traces of the Vicia genus have been found at stone, bronze and iron age sites, particularly in the near
east and Mediterranean basin. It is thought that the centre of origin for the Vicia genus is in the fertile
crescent, in northern Iraq (Cubero, 1974). From its proposed centre of origin in the Near East, V. faba
has prevailed as a crop of agricultural interest in Europe. Whilst the breeding history remains
somewhat obscure, a possible route of entry for a winter variety faba bean into the United Kingdom
has been proposed (Bond and Crofton, 1999). Two winter types, named “Russian” and “Little
Winter”, were introduced into the United Kingdom in 1825 (though their sources are unknown). The
‘Russian’ type in particular was recommended for growth in Scotland, indicating that it had been bred
for cold tolerance traits. However it should be noted that no record exists as to whether these cultivars
were introduced into the current V. faba breeding germplasm pool.
The obscure evolutionary and breeding history of V. faba makes the phylogenetic resolution of the
crop challenging. However, the modern day prevalence of faba bean in North America, South
America, Europe, Asia, India and Australia, highlight the adaptability of faba bean to a range of
different agro-environmental conditions (de la Vega et al., 2012). The utilisation of modern genomic
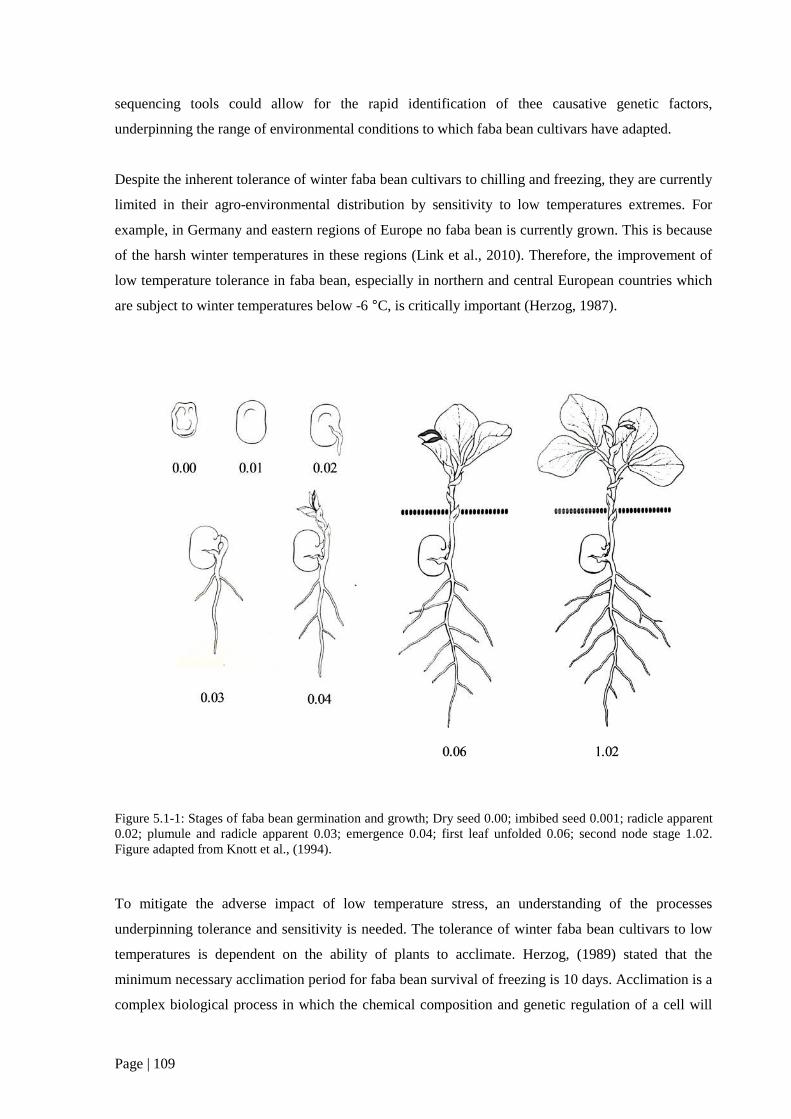
Page | 109
sequencing tools could allow for the rapid identification of thee causative genetic factors,
underpinning the range of environmental conditions to which faba bean cultivars have adapted.
Despite the inherent tolerance of winter faba bean cultivars to chilling and freezing, they are currently
limited in their agro-environmental distribution by sensitivity to low temperatures extremes. For
example, in Germany and eastern regions of Europe no faba bean is currently grown. This is because
of the harsh winter temperatures in these regions (Link et al., 2010). Therefore, the improvement of
low temperature tolerance in faba bean, especially in northern and central European countries which
are subject to winter temperatures below -6 °C, is critically important (Herzog, 1987).
Figure 5.1-1: Stages of faba bean germination and growth; Dry seed 0.00; imbibed seed 0.001; radicle apparent0.02; plumule and radicle apparent 0.03; emergence 0.04; first leaf unfolded 0.06; second node stage 1.02.Figure adapted from Knott et al., (1994).
To mitigate the adverse impact of low temperature stress, an understanding of the processes
underpinning tolerance and sensitivity is needed. The tolerance of winter faba bean cultivars to low
temperatures is dependent on the ability of plants to acclimate. Herzog, (1989) stated that the
minimum necessary acclimation period for faba bean survival of freezing is 10 days. Acclimation is a
complex biological process in which the chemical composition and genetic regulation of a cell will

Page | 110
change, resulting in enhanced tolerance to low temperature stress (Xin and Browse, 2000). While
research has been conducted to identify the factors underpinning successful acclimation in faba bean,
this has focused primarily on leaf fatty-acid content (Arbaoui and Link, 2008). In general, trait
improvement of faba bean has employed traditional quantitative trait loci mapping (QTL) approaches.
While such approaches have been useful in the development of stress tolerance, there are inherent
limitations, such as the poor sampling of allelic variation; low resolution and lack of segregation
(Long et al., 2013; Sallam and Martsch, 2015). Moreover QTL mapping does not give a clear idea of
which physiological, cellular and genetic processes underpin desirable traits. Potential phenotypic
traits have been suggested as freezing tolerance markers, such as flower colour (Inci and Toker,
2011). However, such markers are imprecise. Therefore, in order to accelerate faba bean breeding
programs molecular and metabolic markers should be identified for use in marker assisted selection
programs (O’Sullivan and Angra, 2016).
Faba bean is generally sown in the UK in October/November, with optimal sowing ensuring the
establishment of the 1-2 node stage for over-wintering (Figure 5.1-1). While most commercial winter
cultivars of faba bean are hardy to chilling and freezing temperatures, exceptionally severe winter
freezing can cause the total destruction of the vegetative mass (Knott et al., 1994). A better
understanding of the factors underpinning stress tolerance in young plants is needed. The results
shown in chapters 3 and 4 have identified photosynthetic carbon assimilation as a metabolic marker
of chilling stress tolerance. The following studies were undertaken to characterise the relative
tolerances of 5 faba bean cultivars to chilling and freezing stress, using photosynthesis and growth as
stress markers. These studies were performed with a view to identifying cultivars differing in low
temperature tolerance, for use in further investigations.
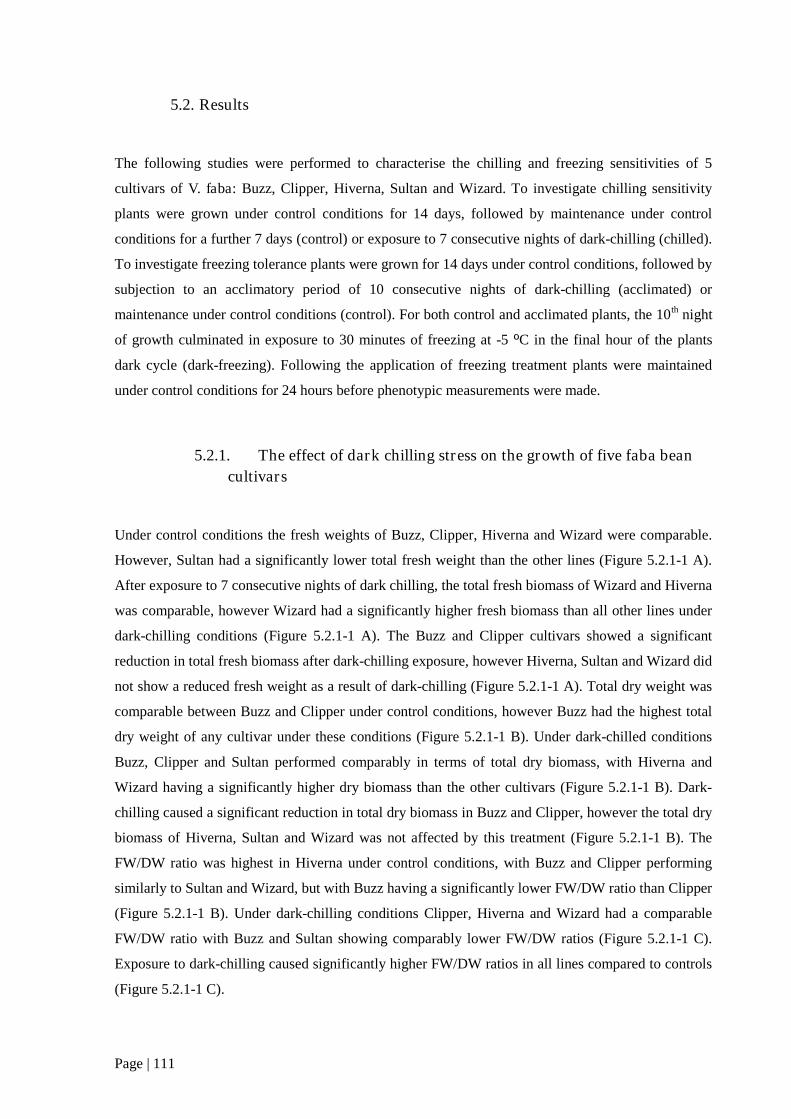
Page | 111
5.2. Results
The following studies were performed to characterise the chilling and freezing sensitivities of 5
cultivars of V. faba: Buzz, Clipper, Hiverna, Sultan and Wizard. To investigate chilling sensitivity
plants were grown under control conditions for 14 days, followed by maintenance under control
conditions for a further 7 days (control) or exposure to 7 consecutive nights of dark-chilling (chilled).
To investigate freezing tolerance plants were grown for 14 days under control conditions, followed by
subjection to an acclimatory period of 10 consecutive nights of dark-chilling (acclimated) or
maintenance under control conditions (control). For both control and acclimated plants, the 10th night
of growth culminated in exposure to 30 minutes of freezing at -5 ºC in the final hour of the plants
dark cycle (dark-freezing). Following the application of freezing treatment plants were maintained
under control conditions for 24 hours before phenotypic measurements were made.
5.2.1. The effect of dark chilling stress on the growth of five faba bean
cultivars
Under control conditions the fresh weights of Buzz, Clipper, Hiverna and Wizard were comparable.
However, Sultan had a significantly lower total fresh weight than the other lines (Figure 5.2.1-1 A).
After exposure to 7 consecutive nights of dark chilling, the total fresh biomass of Wizard and Hiverna
was comparable, however Wizard had a significantly higher fresh biomass than all other lines under
dark-chilling conditions (Figure 5.2.1-1 A). The Buzz and Clipper cultivars showed a significant
reduction in total fresh biomass after dark-chilling exposure, however Hiverna, Sultan and Wizard did
not show a reduced fresh weight as a result of dark-chilling (Figure 5.2.1-1 A). Total dry weight was
comparable between Buzz and Clipper under control conditions, however Buzz had the highest total
dry weight of any cultivar under these conditions (Figure 5.2.1-1 B). Under dark-chilled conditions
Buzz, Clipper and Sultan performed comparably in terms of total dry biomass, with Hiverna and
Wizard having a significantly higher dry biomass than the other cultivars (Figure 5.2.1-1 B). Dark-
chilling caused a significant reduction in total dry biomass in Buzz and Clipper, however the total dry
biomass of Hiverna, Sultan and Wizard was not affected by this treatment (Figure 5.2.1-1 B). The
FW/DW ratio was highest in Hiverna under control conditions, with Buzz and Clipper performing
similarly to Sultan and Wizard, but with Buzz having a significantly lower FW/DW ratio than Clipper
(Figure 5.2.1-1 B). Under dark-chilling conditions Clipper, Hiverna and Wizard had a comparable
FW/DW ratio with Buzz and Sultan showing comparably lower FW/DW ratios (Figure 5.2.1-1 C).
Exposure to dark-chilling caused significantly higher FW/DW ratios in all lines compared to controls
(Figure 5.2.1-1 C).

Page | 112
Figure 5.2.1-1: A) Total fresh weight of 5 V. faba cultivars grown under control conditions or subjected to dark-chilling treatment; B) Total dry weight of 5 V. faba cultivars grown under control conditions or subjected todark-chilling treatment; C) Fresh weight: dry weight ratio of 5 V. faba cultivars grown under control conditionsor subjected to dark-chilling treatment. The cultivars Buzz, Clipper, Hiverna, Sultan and Wizard were grown oncompost for 21 days, either under control conditions or for 2 weeks under control conditions followed by 7consecutive nights of exposure to temperatures of 4 °C. Grey bars show plants grown under control conditionsand open bars show plants grown under acclamatory conditions ± SE (n = 16). Significance is shown byStudent’s t-test.
aa a
ba,bb b
a,b
b
a
0
1
2
3
4
5
6
Buzz Clipper Hiverna Sultan Wizard
Fre
shw
eig
ht
(g)
Control Chilled
aa,c
c c,b cb
bc
bc
0
0.1
0.2
0.3
0.4
0.5
0.6
Buzz Clipper Hiverna Sultan Wizard
Dry
wei
gh
t(g
)
Control Chilled
ab
d
a,ba,bb,c,d
c,e ed
e
0
2
4
6
8
10
12
14
16
Buzz Clipper Hiverna Sultan Wizard
Fre
shw
eig
ht:
dry
wei
gh
tra
tio
Control Chilled
A
B
C
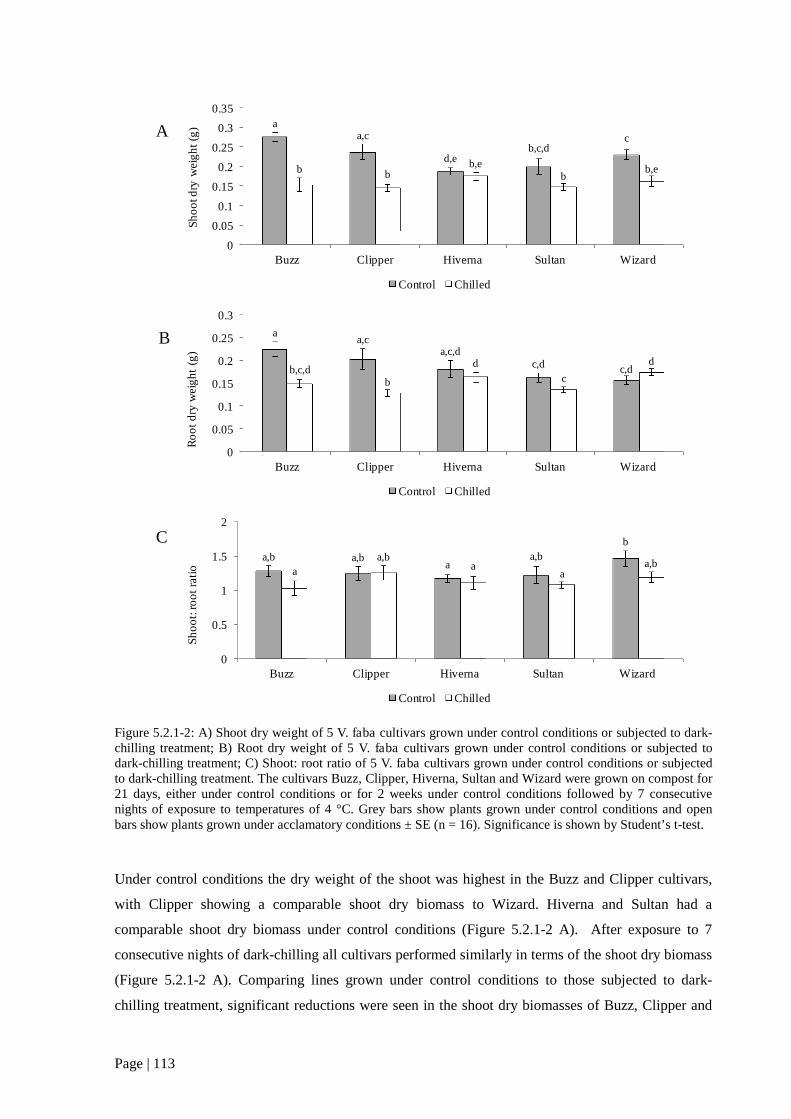
Page | 113
Figure 5.2.1-2: A) Shoot dry weight of 5 V. faba cultivars grown under control conditions or subjected to dark-chilling treatment; B) Root dry weight of 5 V. faba cultivars grown under control conditions or subjected todark-chilling treatment; C) Shoot: root ratio of 5 V. faba cultivars grown under control conditions or subjectedto dark-chilling treatment. The cultivars Buzz, Clipper, Hiverna, Sultan and Wizard were grown on compost for21 days, either under control conditions or for 2 weeks under control conditions followed by 7 consecutivenights of exposure to temperatures of 4 °C. Grey bars show plants grown under control conditions and openbars show plants grown under acclamatory conditions ± SE (n = 16). Significance is shown by Student’s t-test.
Under control conditions the dry weight of the shoot was highest in the Buzz and Clipper cultivars,
with Clipper showing a comparable shoot dry biomass to Wizard. Hiverna and Sultan had a
comparable shoot dry biomass under control conditions (Figure 5.2.1-2 A). After exposure to 7
consecutive nights of dark-chilling all cultivars performed similarly in terms of the shoot dry biomass
(Figure 5.2.1-2 A). Comparing lines grown under control conditions to those subjected to dark-
chilling treatment, significant reductions were seen in the shoot dry biomasses of Buzz, Clipper and
aa,c
d,eb,c,d
c
b bb,e
bb,e
0
0.05
0.1
0.15
0.2
0.25
0.3
0.35
Buzz Clipper Hiverna Sultan Wizard
Sh
oo
tdry
wei
gh
t(g
)
Control Chilled
aa,c
a,c,dc,d c,db,c,d
b
d
c
d
0
0.05
0.1
0.15
0.2
0.25
0.3
Buzz Clipper Hiverna Sultan Wizard
Ro
ot
dry
wei
gh
t(g
)
Control Chilled
a,b a,ba
a,b
b
a
a,ba
aa,b
0
0.5
1
1.5
2
Buzz Clipper Hiverna Sultan Wizard
Sh
oo
t:ro
ot
rati
o
Control Chilled
A
B
C

Page | 114
Wizard. However, Hiverna and Sultan were not significantly affected by this treatment (Figure
5.2.1-2 A). Under control conditions the root dry biomass was comparable between Buzz, Clipper
and Hiverna with Sultan and Wizard having comparably lower values (Figure 5.2.1-2 B). After
exposure to 7 consecutive nights of dark-chilling Buzz, Hiverna and Wizard displayed comparably
high root dry biomass values. Buzz also showed a statistically similar root dry biomass to Clipper and
Sultan, however Sultan had the lowest root dry biomass of all cultivars after 7 consecutive nights of
dark chilling (Figure 5.2.1-2 B). Exposure to dark-chilling stress caused a decrease in root dry
biomass for the Buzz and Clipper cultivars, however Hiverna, Sultan and Wizard all performed
similarly to controls under dark-chilling conditions (Figure 5.2.1-2 B). Under control conditions the
shoot to root ratio was comparable between all cultivars, with the exception of Wizard which showed
a higher shoot: root ratio than Hiverna (Figure 5.2.1-2 C). Under dark-chilling conditions all cultivars
performed similarly and there was no significant change in shoot: root ratio when comparing dark-
chilled plants to those grown under control conditions (Figure 5.2.1-2 C).

Page | 115
5.2.2. The effect of acclimation on faba bean photosynthesis and freezing
tolerance
Following exposure to 9 consecutive nights of dark-chilling (the minimum period necessary for low
temperature acclimation) the photosynthetic parameters of the 5 V. faba cultivars were measured.
Figure 5.2.2-1: Photosynthetic carbon assimilation of 5 V. faba cultivars: Buzz, Clipper, Hiverna, Sultan andWizard. Plants were grown on compost for 21 days, either under control conditions or for 2 weeks under controlconditions followed by 9 consecutive nights of dark-chilling. Grey bars show plants grown under controlconditions and open bars show plants grown under dark-chilling conditions ± SE (n=16). Measurements weretaken at an atmospheric CO2 of 400 µmol and a light intensity of 800 µmol.m2.s-1. Significance is shown by t-test.
Under control conditions Sultan displayed the highest rate of photosynthetic carbon assimilation,
while carbon assimilation rate was comparable between the Buzz, Clipper, Hiverna and Wizard
cultivars (Figure 5.2.2-1). After exposure to dark-chilling the rates of carbon assimilation were
comparable between all cultivars. However when comparing assimilation values between plants
grown under control conditions and plants exposed to 9 consecutive nights of dark-chilling, cultivar
specific differences can be seen. The rate of carbon assimilation was not significantly decreased in
the Hiverna cultivar, however all other cultivars showed a decreased carbon assimilation rate
following dark-chilling (Figure 5.2.2-1).
a,d
a
a,d,e
b
a,d
c c
c,d
c,e c,e
0
5
10
15
20
25
Buzz Clipper Hiverna Sultan Wizard
A(µ
mol
CO
2.m
-2.s
-1)
Control Chilled

Page | 116
Under control conditions the stomatal conductance rates of all cultivars was comparable. Under dark-
chilling conditions the rate of conductance was also similar between cultivars. However, the rate of
stomatal conductance appeared to be higher in all cultivars under dark-chilling conditions. This
increase in conductance was significantly higher in the Buzz and Clipper cultivars (Figure 5.2.2-2).
Figure 5.2.2-2: Stomatal conductance of 5 Vicia faba cultivars: Buzz, Clipper, Hiverna, Sultan and Wizard.Plants were grown on compost for 21 days, either under control conditions or for 2 weeks under controlconditions followed by 9 consecutive nights of dark-chilling. Grey bars show plants grown under controlconditions and open bars show plants grown under dark-chilling conditions ± SE (n=16). Measurements weretaken at an atmospheric CO2 of 400 µmol and a light intensity of 800 µmol.m2.s-1. Significance is shown by t-test.
a
a
a,b,ca,c a,c
b,c b,c
b
b,c
b,c
0
0.02
0.04
0.06
0.08
0.1
0.12
0.14
0.16
0.18
0.2
Buzz Clipper Hiverna Sultan Wizard
Sto
mat
alco
nd
ctan
ce(m
ol
H2O
.m-2
.s-1
)
Control Chilled
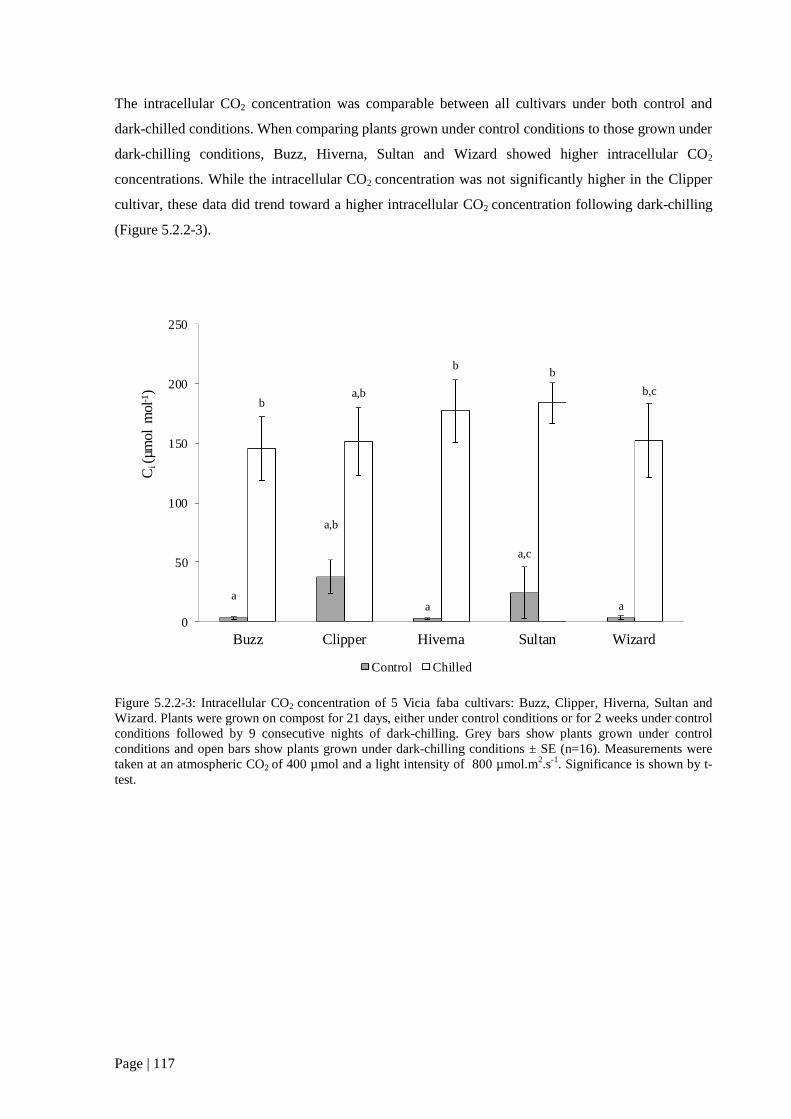
Page | 117
The intracellular CO2 concentration was comparable between all cultivars under both control and
dark-chilled conditions. When comparing plants grown under control conditions to those grown under
dark-chilling conditions, Buzz, Hiverna, Sultan and Wizard showed higher intracellular CO2
concentrations. While the intracellular CO2 concentration was not significantly higher in the Clipper
cultivar, these data did trend toward a higher intracellular CO2 concentration following dark-chilling
(Figure 5.2.2-3).
Figure 5.2.2-3: Intracellular CO2 concentration of 5 Vicia faba cultivars: Buzz, Clipper, Hiverna, Sultan andWizard. Plants were grown on compost for 21 days, either under control conditions or for 2 weeks under controlconditions followed by 9 consecutive nights of dark-chilling. Grey bars show plants grown under controlconditions and open bars show plants grown under dark-chilling conditions ± SE (n=16). Measurements weretaken at an atmospheric CO2 of 400 µmol and a light intensity of 800 µmol.m2.s-1. Significance is shown by t-test.
a
a,b
a
a,c
a
ba,b
bb
b,c
0
50
100
150
200
250
Buzz Clipper Hiverna Sultan Wizard
Ci(
µmol
mol
-1)
Control Chilled
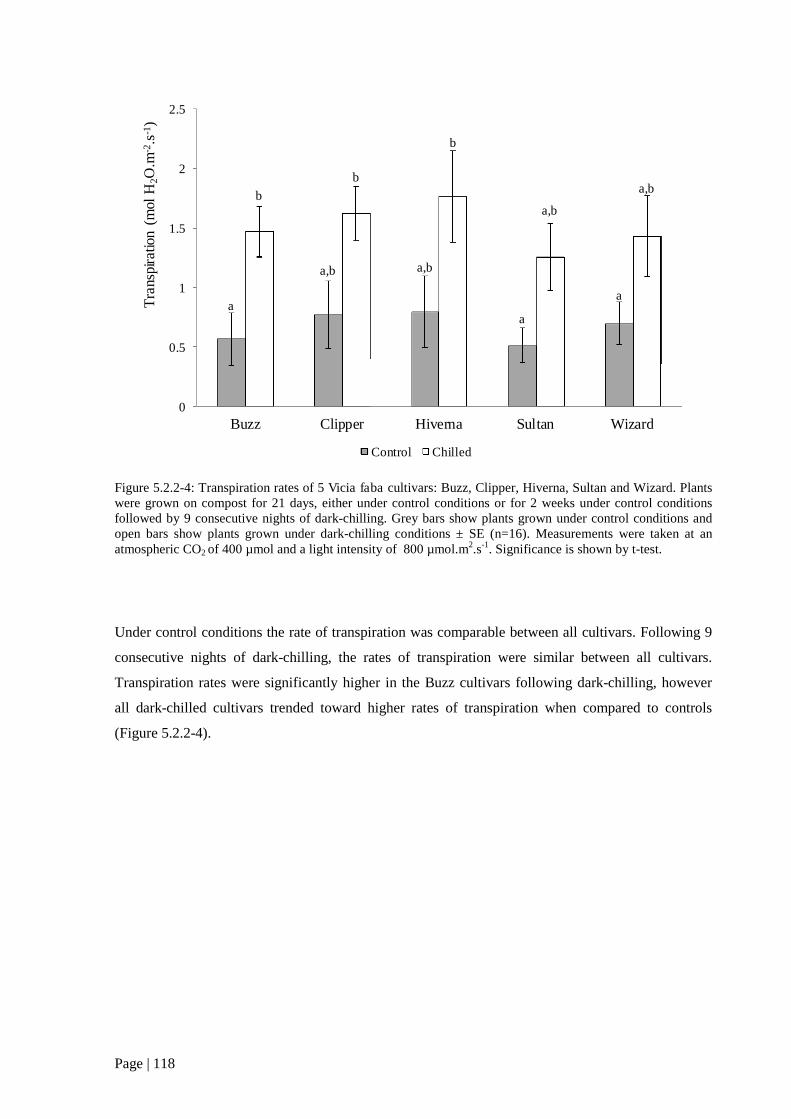
Page | 118
Figure 5.2.2-4: Transpiration rates of 5 Vicia faba cultivars: Buzz, Clipper, Hiverna, Sultan and Wizard. Plantswere grown on compost for 21 days, either under control conditions or for 2 weeks under control conditionsfollowed by 9 consecutive nights of dark-chilling. Grey bars show plants grown under control conditions andopen bars show plants grown under dark-chilling conditions ± SE (n=16). Measurements were taken at anatmospheric CO2 of 400 µmol and a light intensity of 800 µmol.m2.s-1. Significance is shown by t-test.
Under control conditions the rate of transpiration was comparable between all cultivars. Following 9
consecutive nights of dark-chilling, the rates of transpiration were similar between all cultivars.
Transpiration rates were significantly higher in the Buzz cultivars following dark-chilling, however
all dark-chilled cultivars trended toward higher rates of transpiration when compared to controls
(Figure 5.2.2-4).
a
a,b a,b
a
a
b
b
b
a,b
a,b
0
0.5
1
1.5
2
2.5
Buzz Clipper Hiverna Sultan Wizard
Tra
nspi
ratio
n(m
olH
2O.m
-2.s
-1)
Control Chilled

Page | 119
Figure 5.2.2-5: Chlorophyll fluorescence (Fv/Fm) of 5 Vicia faba cultivars: Buzz, Clipper, Hiverna, Sultan andWizard. Plants were grown on compost for 21 days, either under control conditions or for 2 weeks under controlconditions followed by 9 consecutive nights of dark-chilling. Grey bars show plants grown under controlconditions and open bars show plants grown under dark-chilling conditions ± SE (n=16). Significance is shownby t-test.
Under control conditions chlorophyll fluorescence values (Fv/Fm) were highest in the Hiverna and
Sultan cultivars, with these values being comparable to those of Wizard and Buzz when grown under
control conditions. Clipper showed a comparable Fv/Fm to Buzz and Wizard under control conditions
(Figure 5.2.2-5). Following 9 consecutive nights of dark-chilling the Fv/Fm values were comparable
between all cultivars, however Hiverna showed a significantly higher Fv/Fm than Clipper and Wizard
following chilling treatment. Comparing plants grown under control conditions to those grown under
the acclimatory conditions of 9 consecutive nights of dark-chilling, chlorophyll fluorescence was
significantly reduced in all cultivars (Figure 5.2.2-5).
a,b
a,c
b ba,b
c,d,e
d
ec,d,e
c,d
0.7
0.71
0.72
0.73
0.74
0.75
0.76
0.77
0.78
0.79
0.8
Buzz Clipper Hiverna Sultan Wizard
Fv
/Fm
Control Acclimated
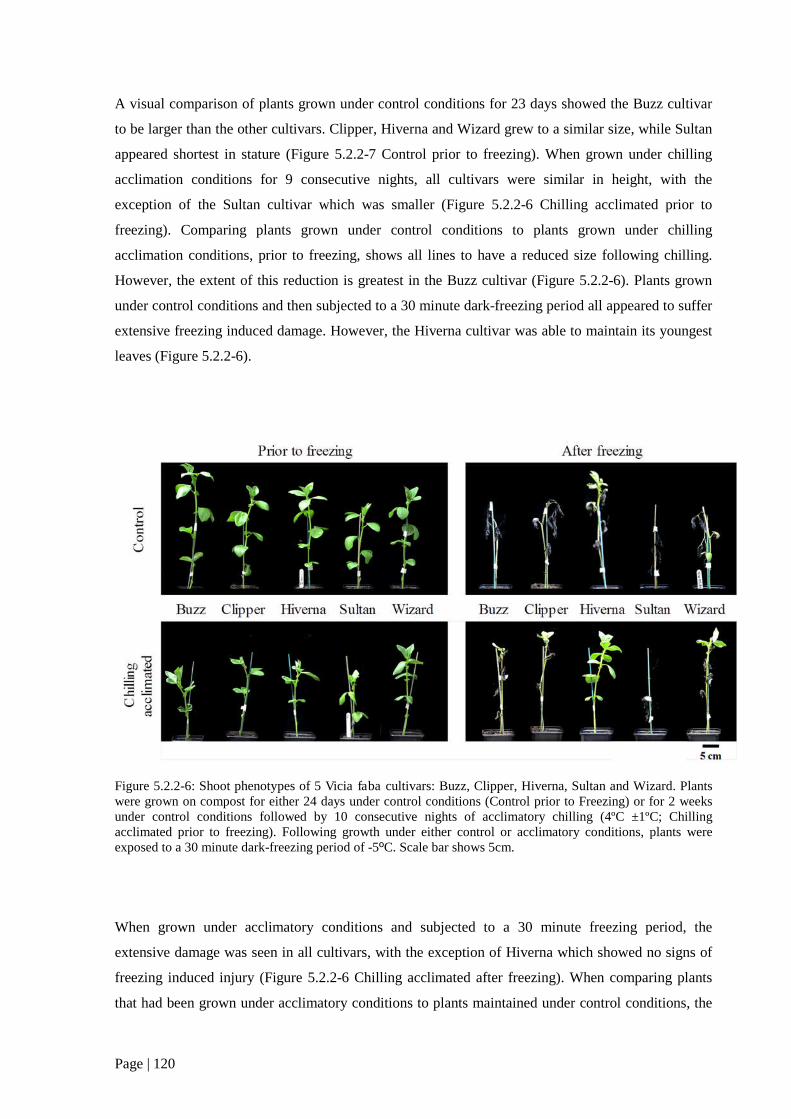
Page | 120
A visual comparison of plants grown under control conditions for 23 days showed the Buzz cultivar
to be larger than the other cultivars. Clipper, Hiverna and Wizard grew to a similar size, while Sultan
appeared shortest in stature (Figure 5.2.2-7 Control prior to freezing). When grown under chilling
acclimation conditions for 9 consecutive nights, all cultivars were similar in height, with the
exception of the Sultan cultivar which was smaller (Figure 5.2.2-6 Chilling acclimated prior to
freezing). Comparing plants grown under control conditions to plants grown under chilling
acclimation conditions, prior to freezing, shows all lines to have a reduced size following chilling.
However, the extent of this reduction is greatest in the Buzz cultivar (Figure 5.2.2-6). Plants grown
under control conditions and then subjected to a 30 minute dark-freezing period all appeared to suffer
extensive freezing induced damage. However, the Hiverna cultivar was able to maintain its youngest
leaves (Figure 5.2.2-6).
Figure 5.2.2-6: Shoot phenotypes of 5 Vicia faba cultivars: Buzz, Clipper, Hiverna, Sultan and Wizard. Plantswere grown on compost for either 24 days under control conditions (Control prior to Freezing) or for 2 weeksunder control conditions followed by 10 consecutive nights of acclimatory chilling (4ºC ±1ºC; Chillingacclimated prior to freezing). Following growth under either control or acclimatory conditions, plants wereexposed to a 30 minute dark-freezing period of -5ºC. Scale bar shows 5cm.
When grown under acclimatory conditions and subjected to a 30 minute freezing period, the
extensive damage was seen in all cultivars, with the exception of Hiverna which showed no signs of
freezing induced injury (Figure 5.2.2-6 Chilling acclimated after freezing). When comparing plants
that had been grown under acclimatory conditions to plants maintained under control conditions, the
Page | 121
Sultan cultivar showed no difference in low temperature tolerance. The Buzz cultivar showed a slight
increase in freezing tolerance following acclimation when compared to control, with stem and
youngest leaves better maintaining green colouration. The Clipper and Wizard cultivars showed an
increase in their capacity to maintain vegetative tissues, however this was only visible in the stem and
the youngest leaves. The Hiverna cultivar was the least affected by freezing exposure, both after
maintenance under control conditions and growth under acclimatory conditions (Figure 5.2.2-6).
Measurement of the shoot fresh weight of plants that had been maintained under control conditions
prior to freezing showed that the Clipper and Sultan cultivars had the lowest fresh weights. Following
freezing the fresh shoot weights of all cultivars was comparable (Figure 5.2.2-7 A). However, while
freezing exposure caused a reduction in the shoot fresh weights of Buzz, Clipper, Hiverna and
Wizard; Sultan showed no significant change in weight following freezing (Figure 5.2.2-7 A). In
plants grown under acclimatory conditions, prior to freezing the shoot fresh weight was comparable
between all lines. Following freezing exposure the shoot fresh weight of acclimated plants was lowest
in Sultan and Wizard, with fresh weight being comparable between Buzz and Clipper and highest in
Hiverna (Figure 5.2.2-7 B). Comparing the fresh weight values of acclimated plants before and after
freezing showed a significant decrease in values for Buzz, Sultan and Wizard. However there was no
significant decrease in fresh weight for Clipper and Hiverna following freezing (Figure 5.2.2-7 B).
When comparing the decrease in fresh weight between plants maintained under control conditions, all
cultivars retained approximately 70% of their fresh weight following freezing (Figure 5.2.2-7 C).
Plants that had been grown under 10 nights of acclimatory chilling, followed by 30 minutes of dark-
freezing, also retained 70% of their fresh weight, with the exception of the Hiverna cultivar which
maintained approximately 85% of its fresh weight following freezing (Figure 5.2.2-7 C). Following
acclimation the Hiverna cultivar showed the highest maintenance of fresh weight of any cultivar.

Page | 122
Figure 5.2.2-7: A) Shoot fresh weight of 5 Vicia faba cultivars grown under control conditions, before and after30 minutes of exposure to -5 ºC; B) Shoot fresh weight of 5 Vicia faba cultivars grown under acclimatoryconditions, before and after 30 minutes of exposure to -5 ºC; C) Percentage reduction in shoot fresh weight of 5Vicia faba cultivars, grown under either control or acclimatory conditions and subjected to 30 minutes offreezing at -5 ºC. The cultivars Buzz, Clipper, Hiverna, Sultan and Wizard were grown on compost for 24 days,either under control conditions or for 2 weeks under control conditions followed by 10 consecutive nights ofacclimatory chilling. Following growth under control or acclimatory conditions, plants were exposed to a 30minute dark-freezing period of -5ºC and allowed to recover under control conditions for 24 hours. Grey barsshow plants grown under control conditions and open bars show plants grown under acclimatory conditions ±SE (n=12). Significance is shown by t-test.
a
b
a
b
a
b
b
b b b
0
1
2
3
4
5
6
Buzz Clipper Hiverna Sultan Wizard
Sho
otfr
esh
wei
ght
(g)
Prior to freezing After freezing
a
a
a
a,b
a
ba,b
a
c c
0
1
2
3
4
5
6
Buzz Clipper Hiverna Sultan Wizard
Shoo
tfr
esh
wei
ght
(g)
Prior to freezing After freezing
aa a a a
a a
b
a a
0
20
40
60
80
100
Buzz Clipper Hiverna Sultan Wizard
%fr
esh
wei
ght
rela
tive
toco
ntr
ol
Control Acclimated
A
B
C
Page | 123
5.3. Discussion
The studies undertaken in this chapter sought to characterise the effect of chilling and freezing on the
growth and photosynthesis of 5 V. faba cultivars. Taken together the data presented here show that
cultivars differ in their response to both chilling and freezing exposure.
In terms of plant growth, following 7 consecutive nights of dark-chilling only the Buzz and Clipper
cultivars saw a reduction in fresh weight. The Hiverna and Wizard cultivars were able to maintain
comparable dry biomass to controls following dark-chilling treatment. The Hiverna cultivar showed
the highest FW/DW ratio under control conditions, with FW/DW ratio being comparably high
between the Hiverna and Wizard cultivars following dark-chilling. There was no effect of dark-
chilling on the shoot: root biomass partitioning in any cultivar. Exposure to 9 consecutive nights of
dark-chilling caused significant decreases in the photosynthetic carbon assimilation of all cultivars
except Hiverna. However, the level of photosynthesis was comparable between all cultivars following
dark-chilling, indicating that Hiverna may have a lower basal rate of photosynthesis. The lower
stomatal conductance seen under control conditions is difficult to explain, as stomatal conductance
would be expected to be lower following exposure to chilling stress. Similarly the lower levels of
intracellular CO2 concentration and transpiration following dark-chilling stress were unexpected.
Dark-chilling caused a reduction in the Fv/Fm of all lines, indicating that chilling exposure causes a
reduction in the efficiency of the photosystems. This finding is concordant with studies of other plant
species exposed to chilling-stress, which show that low temperature exposure causes a reduction in
chlorophyll fluorescence (Hakam et al., 2000; Van Heerden et al., 2004a; Strauss et al., 2006).
Although dark-chilling caused a decrease in the Fv/Fm value of Hiverna, chilled Hiverna plants had a
higher fluorescence value than other chilled cultivars. This suggests that the light harvesting
machinery of Hiverna is better protected from chilling stress than the other cultivars. Given that
chilling stress was applied during the night, when no light was present, damage to the photosystems is
perhaps unusual. However, these findings are similar to studies conducted on soybean where dark
chilling was found to have an inhibitory effect on photosynthetic electron transport, with tolerance to
chilling being linked to leaf nitrate content (Van Heerden et al., 2004a).
The cultivars responded differently to both 10 consecutive nights of acclimatory chilling and
exposure to freezing, both with and without acclimation. The most freezing tolerant cultivar was
Hiverna, showing minimal freezing-induced damage and fresh biomass loss. To better understand the
basis for these differences in stress tolerance, a deeper understanding of the genetic composition and
breeding history of V. faba is needed.

Page | 124
Taken together the results presented in this chapter show that the Hiverna cultivar of V. faba is
tolerant to both dark-chilling and dark-freezing stress. Of the other cultivars examined, levels of low-
temperature stress tolerance were comparable. However, to identify the factors underpinning low-
temperature tolerance, better genetic resources for faba bean are needed.

Page | 125
“Every component of the organism is as much of an organism as every other part.”
-Barbara McClintock

Page | 126
6. DNA sequencing and genomic assembly in Vicia faba
6.1. Introduction
Despite its importance in world agriculture, the development of gene based resources in legumes such
as Vicia faba has not kept pace with cereal crops. However V. faba has a rich history of scientific
utility, due in part to its large diploid genome (n=6) which made it an ideal tool for cytogenetic
studies in the 1960s and 1990s (O’Sullivan and Angra, 2016). Since the pioneering work of Adela
Erith (Erith, 1930), who characterised several important Mendelian inheritance characteristics for the
faba bean crop, research in the field of V. faba genetics has seen only intermittent periods of interest.
Classical genetic analyses of V. faba initially focused on the cytogenetic characterisation of stress-
induced chromosomal breaks. Links between these studies and modern molecular genetics were made
by Sjodin, (1970, 1971), who identified asynaptic mutants, from which a series of trisomic lines were
developed and analysed. Subsequently, genetic markers were assigned to physical chromosomes
(Patto et al., 1999) and genes controlling rhizobial symbiosis and cotyledon pigmentation respectively
were identified (Duc and Picard, 1986; Duc et al., 1999). The Mendelian inheritance of a seed
dormancy gene was established through use of segregating Recombinant Inbred Lines (RIL;
(Ramsay, 1997)). While few inbred populations have survived from these early studies, parental
germplasm resources are still available (O’Sullivan and Angra, 2016). However, the characterisation
of desirable oligogenic traits is dependent on high resolution molecular genetic profiling. Thus, the
use of classical genetic approaches alone is no longer sufficient to identify the genes associated with
quantitative trait loci (QTLs) for important traits (O’Sullivan and Angra, 2016).
The first molecular marker map for V. faba was produced by Torres et al., (1993) who used a
combination of 66 isozymes and RAPD markers to identify 11 distinct linkage groups. The combined
use of RILs with molecular markers (Restriction Fragment Length Polymorphism (RFLP), Amplified
Fragment Length Polymorphism (AFLP), Random Amplification of Polymorphic DNA (RAPD),
Simple Sequence Repeat (SSR or Microsatellite), Single Nucleotide Polymorphism (SNP)) has
dominated the landscape of V. faba genetics over the last 20 years, allowing the identification of
QTLs and the production of high resolution linkage maps (Torres et al., 2010). Moreover, these high
resolution linkage-based sequences have been used, in part, to produce syntenic maps. For example,
Webb et al., (2016) were able to identify and map 687 SNP markers in V. faba. These SNP markers
were each assigned to individual orthologues in Medicago truncatula, with each marker belonging to
a linkage group, analogous to one of the six V. faba chromosomes. This allowed putative alignment
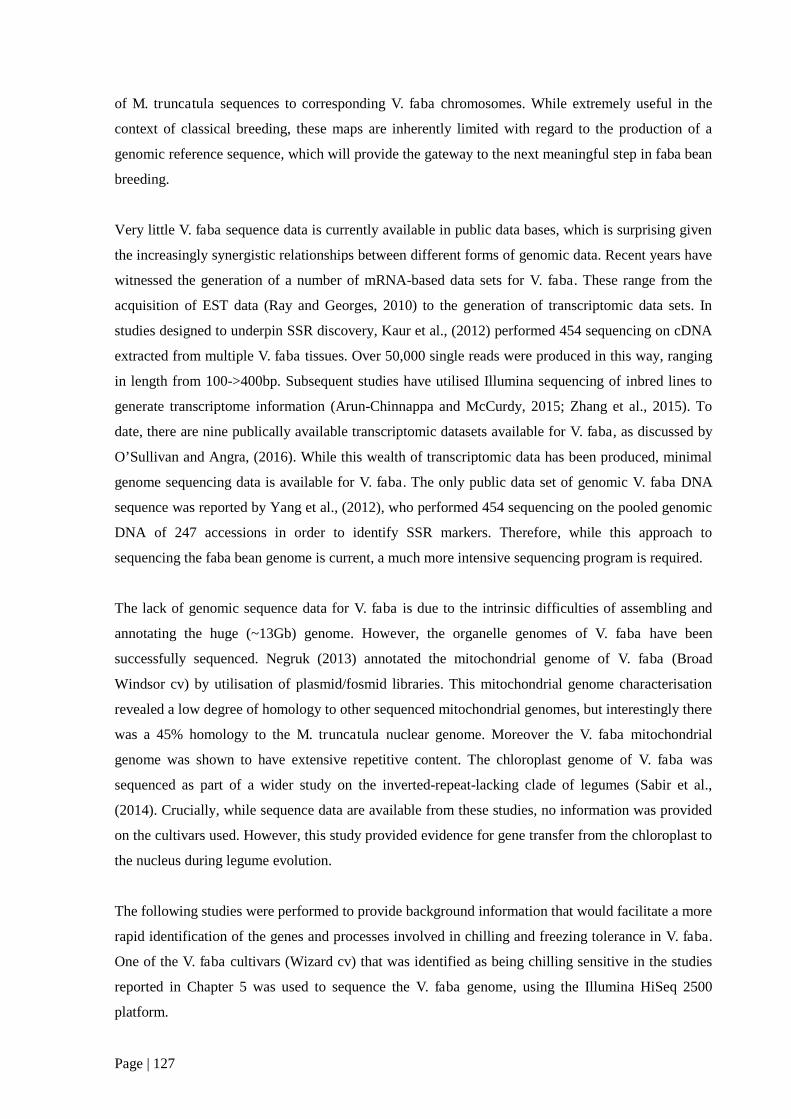
Page | 127
of M. truncatula sequences to corresponding V. faba chromosomes. While extremely useful in the
context of classical breeding, these maps are inherently limited with regard to the production of a
genomic reference sequence, which will provide the gateway to the next meaningful step in faba bean
breeding.
Very little V. faba sequence data is currently available in public data bases, which is surprising given
the increasingly synergistic relationships between different forms of genomic data. Recent years have
witnessed the generation of a number of mRNA-based data sets for V. faba. These range from the
acquisition of EST data (Ray and Georges, 2010) to the generation of transcriptomic data sets. In
studies designed to underpin SSR discovery, Kaur et al., (2012) performed 454 sequencing on cDNA
extracted from multiple V. faba tissues. Over 50,000 single reads were produced in this way, ranging
in length from 100->400bp. Subsequent studies have utilised Illumina sequencing of inbred lines to
generate transcriptome information (Arun-Chinnappa and McCurdy, 2015; Zhang et al., 2015). To
date, there are nine publically available transcriptomic datasets available for V. faba, as discussed by
O’Sullivan and Angra, (2016). While this wealth of transcriptomic data has been produced, minimal
genome sequencing data is available for V. faba. The only public data set of genomic V. faba DNA
sequence was reported by Yang et al., (2012), who performed 454 sequencing on the pooled genomic
DNA of 247 accessions in order to identify SSR markers. Therefore, while this approach to
sequencing the faba bean genome is current, a much more intensive sequencing program is required.
The lack of genomic sequence data for V. faba is due to the intrinsic difficulties of assembling and
annotating the huge (~13Gb) genome. However, the organelle genomes of V. faba have been
successfully sequenced. Negruk (2013) annotated the mitochondrial genome of V. faba (Broad
Windsor cv) by utilisation of plasmid/fosmid libraries. This mitochondrial genome characterisation
revealed a low degree of homology to other sequenced mitochondrial genomes, but interestingly there
was a 45% homology to the M. truncatula nuclear genome. Moreover the V. faba mitochondrial
genome was shown to have extensive repetitive content. The chloroplast genome of V. faba was
sequenced as part of a wider study on the inverted-repeat-lacking clade of legumes (Sabir et al.,
(2014). Crucially, while sequence data are available from these studies, no information was provided
on the cultivars used. However, this study provided evidence for gene transfer from the chloroplast to
the nucleus during legume evolution.
The following studies were performed to provide background information that would facilitate a more
rapid identification of the genes and processes involved in chilling and freezing tolerance in V. faba.
One of the V. faba cultivars (Wizard cv) that was identified as being chilling sensitive in the studies
reported in Chapter 5 was used to sequence the V. faba genome, using the Illumina HiSeq 2500
platform.
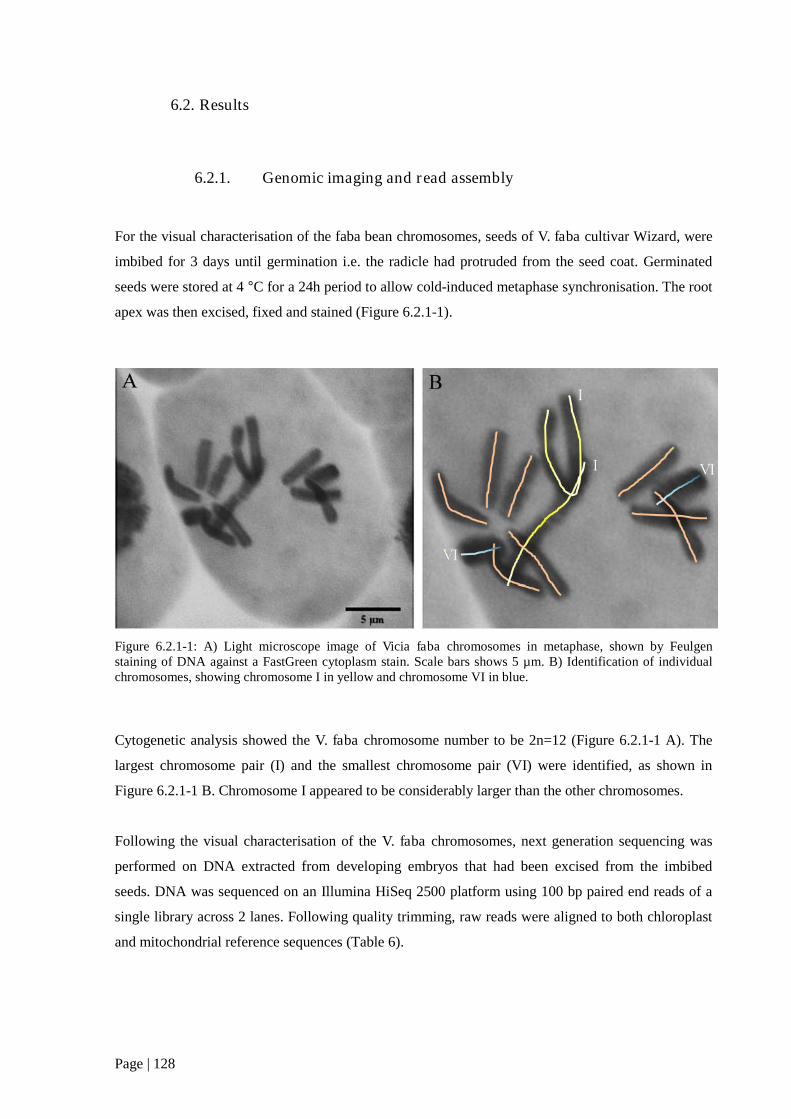
Page | 128
6.2. Results
6.2.1. Genomic imaging and read assembly
For the visual characterisation of the faba bean chromosomes, seeds of V. faba cultivar Wizard, were
imbibed for 3 days until germination i.e. the radicle had protruded from the seed coat. Germinated
seeds were stored at 4 °C for a 24h period to allow cold-induced metaphase synchronisation. The root
apex was then excised, fixed and stained (Figure 6.2.1-1).
Figure 6.2.1-1: A) Light microscope image of Vicia faba chromosomes in metaphase, shown by Feulgenstaining of DNA against a FastGreen cytoplasm stain. Scale bars shows 5 µm. B) Identification of individualchromosomes, showing chromosome I in yellow and chromosome VI in blue.
Cytogenetic analysis showed the V. faba chromosome number to be 2n=12 (Figure 6.2.1-1 A). The
largest chromosome pair (I) and the smallest chromosome pair (VI) were identified, as shown in
Figure 6.2.1-1 B. Chromosome I appeared to be considerably larger than the other chromosomes.
Following the visual characterisation of the V. faba chromosomes, next generation sequencing was
performed on DNA extracted from developing embryos that had been excised from the imbibed
seeds. DNA was sequenced on an Illumina HiSeq 2500 platform using 100 bp paired end reads of a
single library across 2 lanes. Following quality trimming, raw reads were aligned to both chloroplast
and mitochondrial reference sequences (Table 6).

Page | 129
Table 6: Quality-trimmed genomic read data for DNA extracted from Vicia faba (Wizard cv) detailing readnumber and coverage.
Number of paired
reads
Reads accounted for
(%)
Coverage
Total number of reads 812,092,660 100.00 6x
Number of reads aligned to
chloroplast reference
7,712,928 0.95 3466x
Number of reads aligned to
mitochondria reference
8,657,582 1.07 650x
Number of reads aligned to faba
bean transcriptome database
104,668,765 12.89 30x
Number of unaligned reads 691,053,385 85.10 <6x
12.89% of reads mapped to the CDS of V. faba with a coverage of 30 x. A small percentage (0.95%)
of the reads aligned to the chloroplast reference genome with a coverage of 3466 x (Sabir et al.,
2014). Similarly 1.07% of reads aligned to the mitochondrial reference genome with a coverage of
650 x (Negruk, 2013). However, 85.1% of reads could not be aligned to either the organellar
genomes or the V. faba reference transcriptome (Table 6, Humann et al., (2016)).
Of the reads that could not be aligned, only 10.07% were identified in a repetitive element database
(Bao et al., 2015). The Gypsy class of LTR retrotransposons formed the majority of the repetitive
elements, accounting for 3.61% of the total reads. The VicSatellite, LTR (uncharacterised) and Copia
class LTR elements comprised 2.49%, 2.09% and 0.99% of the genome respectively (Table 7).

Page | 130
Table 7: Quality-trimmed genomic read data aligned against repeat element databases, showing repetitiveelement identities, the number of paired reads mapped to these repetitive sequences and the total number ofreads accounted for as a percentage.
Repetitive element Number of
paired reads
Total reads accounted for
(%)
LTR/Gypsy 29,358,977 3.615225
VicSatellite 20,274,464 2.496570
LTR (uncharacterised) 16,974,274 2.090189
LTR/Copia 8,090,787 0.996289
rRNA 1,986,302 0.244591
Ogre 1,708,252 0.210352
Other/Simple 1,199,173 0.147665
Uncharacterised 1,054,668 0.129870
MobileElement 411,832 0.050712
DNA/En-Spm 332,062 0.040890
Retroelement 92,278 0.011363
Non LTR 53,835 0.006629
Other 45,904 0.005653
DNA 40,982 0.005046
DNA/MuDR 36,393 0.004481
DNA/hAT 34,576 0.004258
LINE 21,923 0.002700
Satellite 9,917 0.001221
DNA/Harbinger 8,519 0.001049
tRNA 7,049 0.000868
DNA/TcMar 6,118 0.000753
DNA/Mite 3,643 0.000449
RC/Helitron 1,874 0.000231
SINE 883 0.000109
DNA/hAT-Ac 815 0.000100
DNA/Stowaway 344 0.000042
DNA/Tourist 55 0.000007
Other/Centromeric 52 0.000006
DNA/TcMar-Pogo 6 0.000001
Repetitive element total 81755957 10.07
Genome uncharacterised 609297428 75.03

Page | 131
6.2.2. De novo assembly and linkage map integration
Following this analysis of trimmed read data, ABySS was used to perform a de novo genome
assembly of short reads. This resulted in the generation of 361,137,728 contigs, which varied in
length from 50 bp to in excess of 5 kb (Figure 6.2.2-1 A, B).
Figure 6.2.2-1: A) The log10 contig abundance over a range of contig sizes, produced from 32 bp kmers; B) Thelog10 contig abundance over a range of contig sizes, produced from 64 bp kmers.
The abundance of contigs that were generated was highly dependent on kmer size (Figure 6.2.2-1 A)
with 32 bp kmers showing a wider range of contig sizes, together with a higher number of contigs
compared to those produced using a kmer size of 64 bp (Figure 6.2.2-1 B).
1
10
100
1000
10000
100000
1000000
10000000
100000000
1E+09
log
10o
fco
nti
gn
um
ber
Contig size (bp)
1
10
100
1000
10000
100000
1000000
10000000
100000000
log
10o
fco
nti
gn
um
ber
Contig size (bp)
A
B
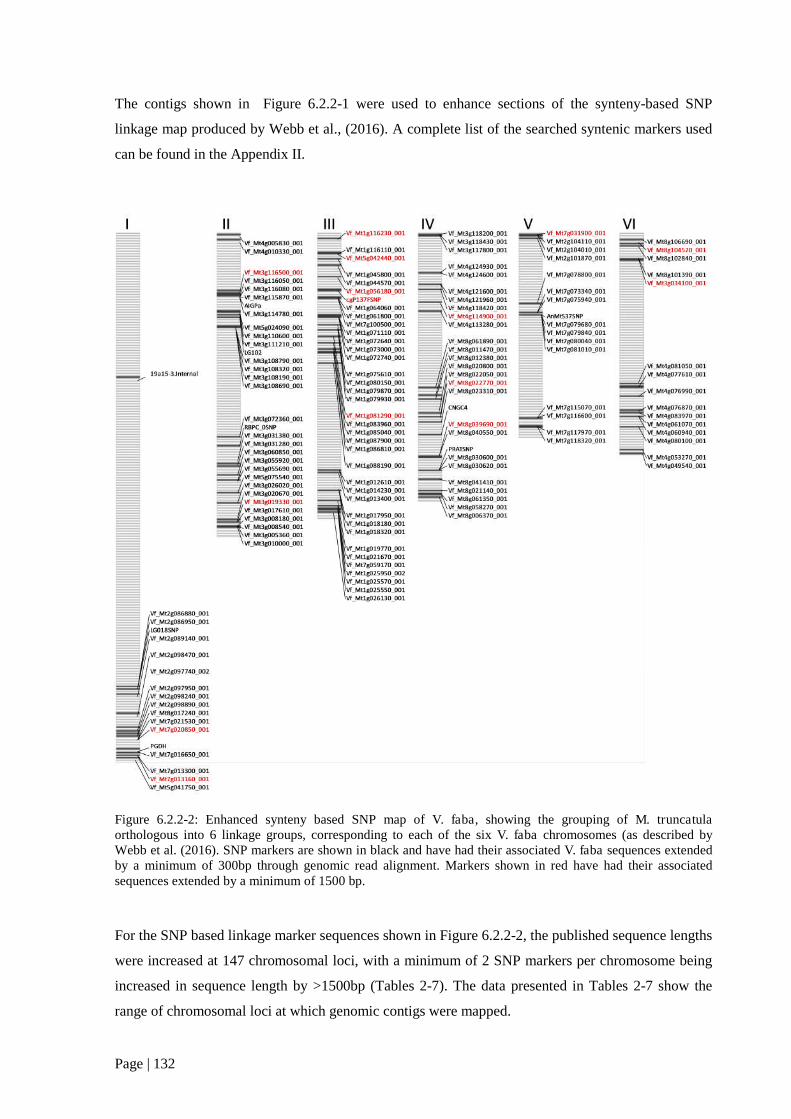
Page | 132
The contigs shown in Figure 6.2.2-1 were used to enhance sections of the synteny-based SNP
linkage map produced by Webb et al., (2016). A complete list of the searched syntenic markers used
can be found in the Appendix II.
Figure 6.2.2-2: Enhanced synteny based SNP map of V. faba, showing the grouping of M. truncatulaorthologous into 6 linkage groups, corresponding to each of the six V. faba chromosomes (as described byWebb et al. (2016). SNP markers are shown in black and have had their associated V. faba sequences extendedby a minimum of 300bp through genomic read alignment. Markers shown in red have had their associatedsequences extended by a minimum of 1500 bp.
For the SNP based linkage marker sequences shown in Figure 6.2.2-2, the published sequence lengths
were increased at 147 chromosomal loci, with a minimum of 2 SNP markers per chromosome being
increased in sequence length by >1500bp (Tables 2-7). The data presented in Tables 2-7 show the
range of chromosomal loci at which genomic contigs were mapped.

Page | 133
Table 8: Lengths and identities of SNP based synteny markers on Vicia faba chromosome 1 and the increase inloci sequence length through contig mapping. Data presented show SNP based linkage marker ID, the length ofthe SNP based linkage marker, the length of the mapped contig and the subsequent increase in marker length atthe identified loci.
SNP marker loci Original marker length (bp) Mapped contiglength (bp)
Lengthincrease (bp)
Vf_Mt7g020850_001 143 2043 1900Vf_Mt7g013160_001 198 1782 1584Vf_Mt2g098240_001 31 1494 1463Vf_Mt2g086950_001 151 1477 1326Vf_Mt2g098890_001 185 1432 1247Vf_Mt2g086880_001 168 1429 1261Vf_Mt5g041750_001 189 1362 1173Vf_Mt2g098470_001 172 1256 1084Vf_Mt7g013300_001 149 1243 1094Vf_Mt7g016650_001 135 1007 872Vf_Mt2g097740_002 31 840 809Vf_Mt2g089140_001 200 737 537
LG018SNP 31 674 643PGDH 17 636 619
19a15-3.Internal 19 591 572Vf_Mt8g017240_001 196 583 387Vf_Mt7g021530_001 196 583 387Vf_Mt2g097950_001 149 571 422

Page | 134
Table 9: Lengths and identities of SNP based synteny markers on Vicia faba chromosome 2 and the increase inloci sequence length through contig mapping. Data presented show SNP based linkage marker ID, the length ofthe SNP based linkage marker, the length of the mapped contig and the subsequent increase in marker length atthe identified loci.
SNP Marker loci Original marker length Mapped contiglength
Lengthincrease (bp)
Vf_Mt3g019330_001 176 3310 3134LG102 19 2041 2022
Vf_Mt3g116500_001 201 1997 1796Vf_Mt3g108320_001 31 1419 1388Vf_Mt3g115870_001 31 1391 1360Vf_Mt3g008540_001 198 1200 1002Vf_Mt3g005360_001 201 1158 957Vf_Mt3g055690_001 202 1128 926
AIGPa 19 1088 1069Vf_Mt3g111210_001 31 1085 1054Vf_Mt3g055920_001 189 1020 831Vf_Mt3g008180_001 31 996 965Vf_Mt5g075540_001 31 992 961Vf_Mt4g010330_001 31 945 914Vf_Mt3g020670_001 194 931 737Vf_Mt3g108190_001 151 882 731Vf_Mt3g110600_001 118 846 728Vf_Mt3g010000_001 190 841 651Vf_Mt3g116050_001 201 811 610Vf_Mt3g060850_001 31 797 766
RBPC_0SNP 31 705 674Vf_Mt3g017610_001 146 689 543Vf_Mt3g108690_001 31 654 623Vf_Mt3g116080_001 31 639 608Vf_Mt4g005830_001 193 632 439Vf_Mt3g114780_001 31 620 589Vf_Mt3g031280_001 31 618 587Vf_Mt3g072360_001 156 617 461Vf_Mt3g026020_001 31 615 584Vf_Mt5g024090_001 31 591 560Vf_Mt3g031380_001 169 538 369Vf_Mt3g108790_001 199 533 334
Page | 135
Table 10: Lengths and identities of SNP based synteny markers on Vicia faba chromosome 3 and the increase inloci sequence length through contig mapping. Data presented show SNP based linkage marker ID, the length ofthe SNP based linkage marker, the length of the mapped contig and the subsequent increase in marker length atthe identified loci.
SNP Marker loci Original marker length Mapped contiglength
Lengthincrease (bp)
Vf_Mt1g116230_001 31 2472 2441Vf_Mt5g042440_001 176 1763 1587
cgP137FSNP 31 1611 1580Vf_Mt1g056180_001 185 1611 1426Vf_Mt1g081290_001 139 1575 1436Vf_Mt1g079930_001 194 1407 1213Vf_Mt1g072740_001 201 1353 1152Vf_Mt7g100500_001 138 1281 1143Vf_Mt1g021670_001 162 1203 1041Vf_Mt1g019770_001 196 1184 988Vf_Mt7g059170_001 185 1169 984Vf_Mt1g075610_001 153 1135 982Vf_Mt1g012610_001 31 1084 1053Vf_Mt1g017950_001 200 1019 819Vf_Mt1g083960_001 184 970 786Vf_Mt1g088190_001 31 964 933Vf_Mt1g045800_001 202 945 743Vf_Mt1g025570_001 182 944 762Vf_Mt1g072640_001 31 860 829Vf_Mt1g087900_001 155 827 672Vf_Mt1g079870_001 31 805 774Vf_Mt1g018180_001 31 780 749Vf_Mt1g014230_001 31 777 746Vf_Mt1g071110_001 31 767 736Vf_Mt1g026130_001 199 763 564Vf_Mt1g018320_001 190 724 534Vf_Mt1g085040_001 31 718 687Vf_Mt1g044570_001 31 713 682Vf_Mt1g025950_002 31 669 638Vf_Mt1g013400_001 31 639 608Vf_Mt1g061800_001 31 632 601Vf_Mt1g080150_001 163 594 431Vf_Mt1g073000_001 119 565 446Vf_Mt1g086810_001 31 556 525Vf_Mt1g025550_001 143 538 395Vf_Mt1g116110_001 31 513 482Vf_Mt1g064060_001 158 511 353

Page | 136
Table 11: Lengths and identities of SNP based synteny markers on Vicia faba chromosome 4 and the increase inloci sequence length through contig mapping. Data presented show SNP based linkage marker ID, the length ofthe SNP based linkage marker, the length of the mapped contig and the subsequent increase in marker length atthe identified loci.
SNP Marker loci Original marker length Mapped contiglength
Lengthincrease (bp)
Vf_Mt4g114900_001 201 1733 1532Vf_Mt8g022770_001 170 1579 1409Vf_Mt8g039690_001 201 1565 1364
PRATSNP 31 1456 1425Vf_Mt8g020800_001 31 1451 1420Vf_Mt8g022050_001 147 1451 1304Vf_Mt4g121960_001 31 1397 1366
CNGC4 31 1384 1353Vf_Mt8g021140_001 176 1315 1139Vf_Mt8g061890_001 31 1293 1262Vf_Mt8g012380_001 134 1239 1105Vf_Mt4g124600_001 167 1222 1055Vf_Mt3g117800_001 31 1180 1149Vf_Mt8g006370_001 184 1162 978Vf_Mt8g023310_001 164 1027 863Vf_Mt4g113280_001 151 923 772Vf_Mt8g030600_001 169 866 697Vf_Mt4g121600_001 172 865 693Vf_Mt8g030620_001 175 863 688Vf_Mt8g058270_001 201 797 596Vf_Mt8g041410_001 185 784 599Vf_Mt4g118420_001 198 754 556Vf_Mt8g011470_001 31 752 721Vf_Mt3g118200_001 31 739 708Vf_Mt4g124930_001 31 712 681Vf_Mt3g118430_001 31 698 667Vf_Mt8g061350_001 31 648 617Vf_Mt8g040550_001 160 525 365

Page | 137
Table 12: Lengths and identities of SNP based synteny markers on Vicia faba chromosome 5 and the increase inloci sequence length through contig mapping. Data presented show SNP based linkage marker ID, the length ofthe SNP based linkage marker, the length of the mapped contig and the subsequent increase in marker length atthe identified loci.
SNP Marker loci Original marker length Mapped contig length Lengthincrease (bp)
Vf_Mt7g031900_001 169 3412 3243Vf_Mt7g080040_001 196 1417 1221Vf_Mt7g079680_001 200 1368 1168Vf_Mt7g116600_001 31 1257 1226
AnMtS37SNP 31 1229 1198Vf_Mt2g104010_001 180 1150 970Vf_Mt7g115070_001 201 937 736Vf_Mt7g081010_001 132 852 720Vf_Mt2g101870_001 31 817 786Vf_Mt7g073340_001 191 692 501Vf_Mt7g075940_001 184 686 502Vf_Mt7g078800_001 31 637 606Vf_Mt7g117970_001 196 605 409Vf_Mt2g104110_001 188 551 363Vf_Mt7g118320_001 31 527 496Vf_Mt7g079840_001 193 520 327
Table 13: Lengths and identities of SNP based synteny markers on Vicia faba chromosome 6 and the increase inloci sequence length through contig mapping. Data presented show SNP based linkage marker ID, the length ofthe SNP based linkage marker, the length of the mapped contig and the subsequent increase in marker length atthe identified loci.
SNP Marker loci Original marker length Mapped contig length Lengthincrease (bp)
Vf_Mt8g104520_001 31 1718 1687Vf_Mt3g034100_001 196 1514 1318Vf_Mt4g077610_001 179 1105 926Vf_Mt4g081050_001 123 968 845Vf_Mt4g053270_001 31 960 929Vf_Mt4g076870_001 201 949 748Vf_Mt8g102840_001 185 926 741Vf_Mt4g080100_001 182 862 680Vf_Mt4g076990_001 183 789 606Vf_Mt4g083970_001 125 784 659Vf_Mt8g101390_001 31 755 724Vf_Mt8g106690_001 31 731 700Vf_Mt4g060940_001 161 547 386Vf_Mt4g049540_001 153 504 351Vf_Mt4g061070_001 31 500 469

Page | 138
All mapped contigs shown in Tables 7-12 were compared against the M. truncatula genome database
(Young et al., 2011). Gene orthologues for contigs that had an alignment length equal to or in excess
of the query length with a percentage identity >85% are shown in Table 8. Out of a total of 271
BLAST hits obtained in this way, probable gene identities were obtained for 5 V. faba genes (Table
8). The putative gene identifications are: subunit 8 of the anaphase promoting complex; a pre-mRNA
splicing factor; polyadenylate binding protein II; a zinc finger family protein and an
arogenate/prephenate dehydratase (Table 14).
Table 14: The linkage map identities and corresponding mapped genomic contigs of V. faba. Contigs wereidentified through a BLAST search against the M. truncatula database to determine probable gene identity andfunction. Query length, alignment length and single nucleotide variation (SNV) and gap number are shown.
V. fabaLinkage
ID
V. fabacontig ID
Gene function M.t IDQuerylength
Alignlength
ID%
SNV Gaps
Vf_Mt8g021140_0
01
1768620971315694
2
anaphase promotingcomplex subunit 8
MTR_1g103750
1315 1323 89 130 6
Vf_Mt1g072740_0
01
1156655431353728
7
Pre-mRNA splicingfactor
MTR_4g102520
1353 1377 89 130 8
Vf_Mt1g073000_0
01
2498106125652516
polyadenylate-binding protein II
MTR_1g073000
565 566 86 54 8
Vf_Mt3g111210_0
01
2850992881085417
7
zinc finger (C3HC4-type RING finger)
family protein
MTR_3g111210
1085 1089 86 131 6
Vf_Mt4g061070_0
01
104720015001890
arogenate/prephenatedehydratase
MTR_4g061070
500 502 85 67 3

Page | 139
6.2.3. Single nucleotide polymorphisms in the organellar genomes of
Vicia faba
To investigate species level variation within the organellar genomes of V. faba raw DNA sequence
reads were mapped against the reference sequences for the chloroplast and mitochondria (Negruk,
2013; Sabir et al., 2014). The map shown in Figure 6.2.3-1 reveals the locations of gene-based
variation within the V. faba chloroplast genome, obtained by aligning the raw DNA sequence reads to
the faba bean chloroplast sequence published by Sabir et al. (2014).
Figure 6.2.3-1: Vicia faba chloroplast genome map. Outermost circle shows gene identities and read directionwith out-facing genes being in the positive direction and inward facing genes being in the negative direction.SNPs are denoted by grey triangles with the location and nature of polymorphism detailed. Read depth is shownfor the forward reads (blue ring) and reverse reads (red ring). GC content (%) is shown by the innermost greycircle with 50% being denoted by the dark grey line. Gene mapping and annotation was performed inOGDRAW.

Page | 140
A high level of homology was found between the published reference sequence (Sabir et al., 2014)
and the chloroplast genome of the Wizard cultivar. However, a number of single nucleotide
polymorphisms were present (Table 15).
Table 15: Single nucleotide polymorphisms in the chloroplast genome of Vicia faba, comparing the Wizardcultivar to the reference sequence published by Sabir et al., (2014).
Mapidentifier
Gene identitySNP
positionReferenced
baseSequenced
base
rpoC1 RNA polymerase β chain 67132 A C
atpF ATPase subunit I 76393 C A
trnQ-UUG tRNA 82093 G A
accDAcetyl-CoA carboxylase
subunit82977 A C
accDAcetyl-CoA carboxylase
subunit83041 A C
accDAcetyl-CoA carboxylase
subunit83677 G T
rps3 Ribosomal protein S3 108099 T G
Four genes encoding the RNA polymerase β chain, ATPase subunit I, tRNA Q and ribosomal protein
S3 had a single polymorphism (Table 15). The gene encoding acetyl-CoA carboxylase subunit (accD)
showed 3 single nucleotide polymorphisms.

Page | 141
The level of in-species variation for the mitochondrial genome that is depicted in Figure 6.2.3-2
shows high number of SNPs in the gene coding and the intergenic regions. This map is based on
genomic read alignment to the faba bean mitochondrial genome reference, constructed for the cultivar
Broad Windsor (Negruk, 2013).
Figure 6.2.3-2: Vicia faba mitochondrial genome map. Outermost circle shows gene identities and readdirection with out-facing genes being in the positive direction and inward facing genes being in the negativedirection. SNPs are denoted by grey bars on the second concentric circle. Base pair positioning is detailed in thethird circle. GC content (%) is shown by the innermost grey circle with 50% being demarked by the dark greyline. Legend details mitochondrial gene families. Gene mapping and annotation was performed in OGDRAW.
While a high level of homology was found between the gene space published by Negruk, (2013) and
that assembled from raw genomic reads of the Wizard cultivar, 7 genes were found to have
polymorphisms (Table 16).

Page | 142
Table 16: Single nucleotide polymorphisms in the mitochondrial genome of Vicia faba, comparing the Wizardcultivar to the reference sequence published by Negruk, (2013).
Map identifier Gene identity SNPposition
Reference base Sequenced base
rrn26.r01 26S ribosomal RNA 167803 T A
rrn18.r01 18S ribosomal RNA 321111 T G
rps14 ribosomal protein S14 36460 T G
rps14 ribosomal protein S14 36461 C G
rps14 ribosomal protein S14 36462 C A
rps14 ribosomal protein S14 36463 A T
rps14 ribosomal protein S14 36490 G T
rps14 ribosomal protein S14 36616 A G
nad6 NADH dehydrogenase subunit 6 101407 A T
nad6 NADH dehydrogenase subunit 6 101508 G T
nad4.CDS.3 NADH dehydrogenase subunit 4 361807 T G
matR Maturase R 90908 G T
matR Maturase R 92082 A C
cox2.p01.CDS.1 cytochrome c oxidase subunit II 25588 C A
cox2.p01.CDS.1 cytochrome c oxidase subunit II 25760 C A
cox2.p01.CDS.1 cytochrome c oxidase subunit II 25862 T A
cox2.p01.CDS.1 cytochrome c oxidase subunit II 25863 T A
cox2.p01.CDS.1 cytochrome c oxidase subunit II 25588 C A
cox2.p01.CDS.1 cytochrome c oxidase subunit II 25760 C A
The number of polymorphisms present varied between genes, with the genes encoding 26S ribosomal
RNA, 18S ribosomal RNA and NADH dehydrogenase subunit 4 having 1 SNP and the genes
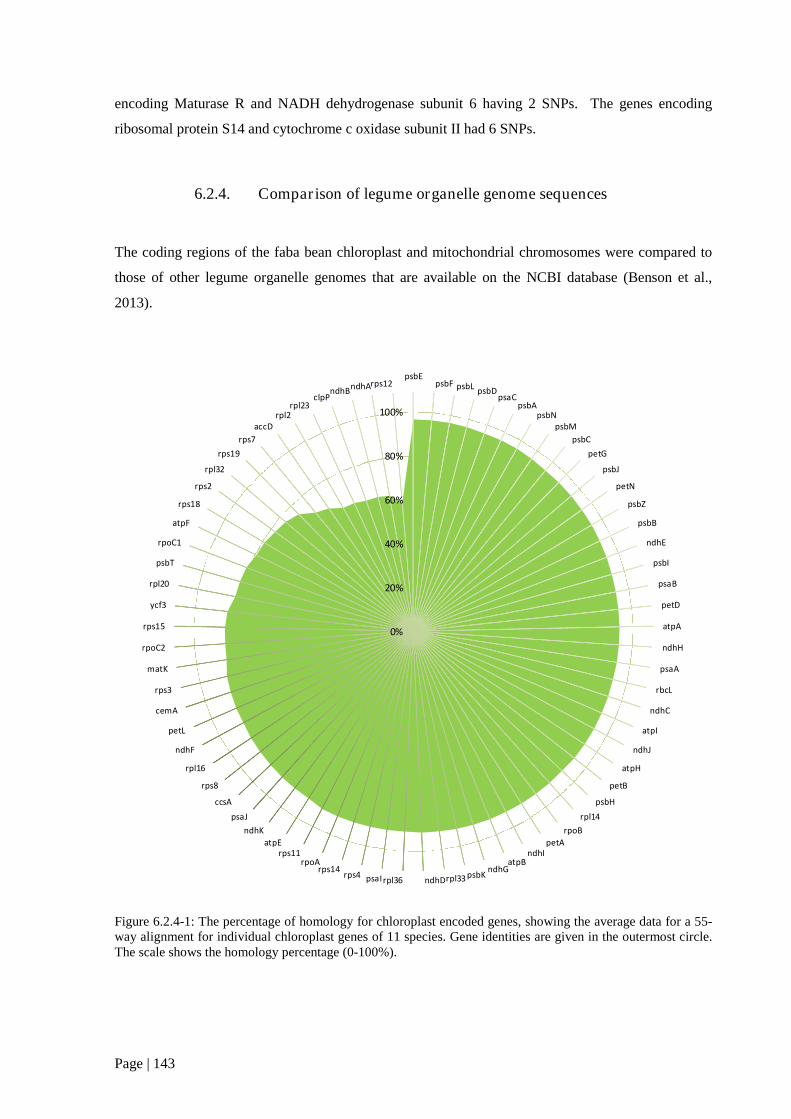
Page | 143
encoding Maturase R and NADH dehydrogenase subunit 6 having 2 SNPs. The genes encoding
ribosomal protein S14 and cytochrome c oxidase subunit II had 6 SNPs.
6.2.4. Comparison of legume organelle genome sequences
The coding regions of the faba bean chloroplast and mitochondrial chromosomes were compared to
those of other legume organelle genomes that are available on the NCBI database (Benson et al.,
2013).
Figure 6.2.4-1: The percentage of homology for chloroplast encoded genes, showing the average data for a 55-way alignment for individual chloroplast genes of 11 species. Gene identities are given in the outermost circle.The scale shows the homology percentage (0-100%).
0%
20%
40%
60%
80%
100%
psbEpsbF psbL psbD
psaCpsbA
psbNpsbM
psbC
petG
psbJ
petN
psbZ
psbB
ndhE
psbI
psaB
petD
atpA
ndhH
psaA
rbcL
ndhC
atpI
ndhJ
atpH
petB
psbH
rpl14
rpoB
petAndhI
atpBndhG
psbKrpl33ndhDrpl36psaIrps4rps14
rpoArps11
atpE
ndhK
psaJ
ccsA
rps8
rpl16
ndhF
petL
cemA
rps3
matK
rpoC2
rps15
ycf3
rpl20
psbT
rpoC1
atpF
rps18
rps2
rpl32
rps19
rps7
accDrpl2
rpl23clpP
ndhBndhArps12
Page | 144
Genome sequence alignment of the 11 reference chloroplast sequences that are available for grain
legumes (Glycine max; Lotus japonicus; Vigna ungulicata; Lens culinaris; Cicer arietinum; Vigna
radiata; Pisum sativum; Medicago truncatula; Arachis hypogaea; Phaseolus vulgaris) allowed for the
identification of a core set of chloroplast genes that are conserved across all legumes (Figure 6.2.4-1).
The extent of homology between all 11 chloroplast sequences was well conserved. For example, the
average sequence homology in the majority of genes encoding photosynthetic electron transport
proteins was more than 80%. However, the percentage of homology was lower in genes encoding
ribosomal proteins. Between the plastid genomes, the greatest sequence variations were found in
clpP, ndhA and rps12, which showed less than 60% homology. The least variable genes were psbE,
psbF and psbD, all of which had a homology greater than 95%.

Page | 145
Figure 6.2.4-2: Representative examples of percentage homology maps drawn for the highly homologous psaBgene and the clpP gene with low homology. Maps were constructed from a multi-way homology comparisonbetween 7 legume species; Glycine max (G.m); Lotus japonicus (L.j); Vigna ungulicata (V.u); Lens culinaris(L.c); Cicer arietinum (C.a); Vigna radiata (V.r); Pisum sativum (P.s); Medicago truncatula (M.t); Arachishypogaea (A.h); Phaseolus vulgaris (P.v). High degrees of homology are shown in dark red whilst a lack ofdetectable matches is shown in white, as shown in the homology scale bar. Homology was determined across a10 bp frame, i.e. a single polymorphism would give a 90% homology.
Chloroplast genome variation was further analysed in homology maps in a pairwise manner for each
gene and species. However, for simplicity, representative examples are shown in Figure 6.2.4-2 for
the psbA and clpP genes. While psbA shows a very high homology across all species, clpP shows far
more inter species variation, with large regions being absent from the coding sequences of L.
culinaris, M. truncatula and P. sativum (Figure 6.2.4-2).
G.m L.j
G.m V.u
G.m L.c
G.m C.a
G.m V.r
G.m V.f
G.m P.s
G.m M .t
G.m A.h
G.m P.v
L.j V.u
L.j L.c
L.j C.a
L.j V.r
L.j V.f
L.j P.s
L.j M .t
L.j A.h
L.j P.v
V.u L.c
V.u C.a
V.u V.r
V.u V.f
V.u P.s
V.u M .t
V.u A.h
V.u P.v
L.c C.a
L.c V.r
L.c V.f
L.c P.s
L.c M .t
L.c A.h
L.c P.v
C.a V.r
C.a V.f
C.a P.s
C.a M .t
C.a A.h
C.a P.v
V.r V.f
V.r P.s
V.r M .t
V.r A.h
V.r P.v
V.f P.s
V.f M .t
V.f A.h
V.f P.v
V.f M .t
P.s A.h
P.s P.v
M .t A.h
M .t P.v
A.h P.v
Homology (%)0 10 20 30 40 50 60 70 80 90 100
G.m L.j
G.m V.u
G.m L.c
G.m C.a
G.m V.r
G.m V.f
G.m P.s
G.m M .t
G.m A.h
G.m P.v
L.j V.u
L.j L.c
L.j C.a
L.j V.r
L.j V.f
L.j P.s
L.j M .t
L.j A.h
L.j P.v
V.u L.c
V.u C.a
V.u V.r
V.u V.f
V.u P.s
V.u M .t
V.u A.h
V.u P.v
L.c C.a
L.c V.r
L.c V.f
L.c P.s
L.c M .t
L.c A.h
L.c P.v
C.a V.r
C.a V.f
C.a P.s
C.a M .t
C.a A.h
C.a P.v
V.r V.f
V.r P.s
V.r M .t
V.r A.h
V.r P.v
V.f P.s
V.f M .t
V.f A.h
V.f P.v
V.f M .t
P.s A.h
P.s P.v
M .t A.h
M .t P.v
A.h P.v
psbA clpP

Page | 146
Figure 6.2.4-3: The percentage of homology for genes encoded in the mitochondrial genome. Average data forindividual mitochondrial genes from 6 species were subjected to a 15-way alignment. Gene identities are givenin the outermost circle. The scale shows the homology percentage (0-100%).
Reference mitochondrial genomes were available for 6 legume species on the NCBI database
(Benson et al., 2013). These sequences were compared to define a core set of conserved
mitochondrial genes. The extent of homology in mitochondrial genomes was well conserved, as
shown in a multi-way comparison of the 6 genomes (Figure 6.2.4-3). All of the cytochrome-
associated genes had an average sequence homology of more than 90%. However, genes encoding
ribosomal proteins and the NADH dehydrogenase complex had a lower average sequence homology
(Figure 6.2.4-3). The most variable genes across the mitochondrial genomes were nad5, nad1 and
nad2 which showed less than 60% homology across the legume sequences analysed. The least
variable genes were nad4L, cox1 and cox3, all of which had a homology greater than 95%.
0%
20%
40%
60%
80%
100%
nad4Lcox1
cox3
rps12
cob
ccmB
cox2
atp4
atp1
matR
rps4
mttB
atp8
rps10
nad3
nad6rps1
atp9
ccmFn
rps14
rpl5
nad4
ccmC
rpl16
atp6
nad9
rps3
nad7
ccmFc
nad5
nad1
nad2
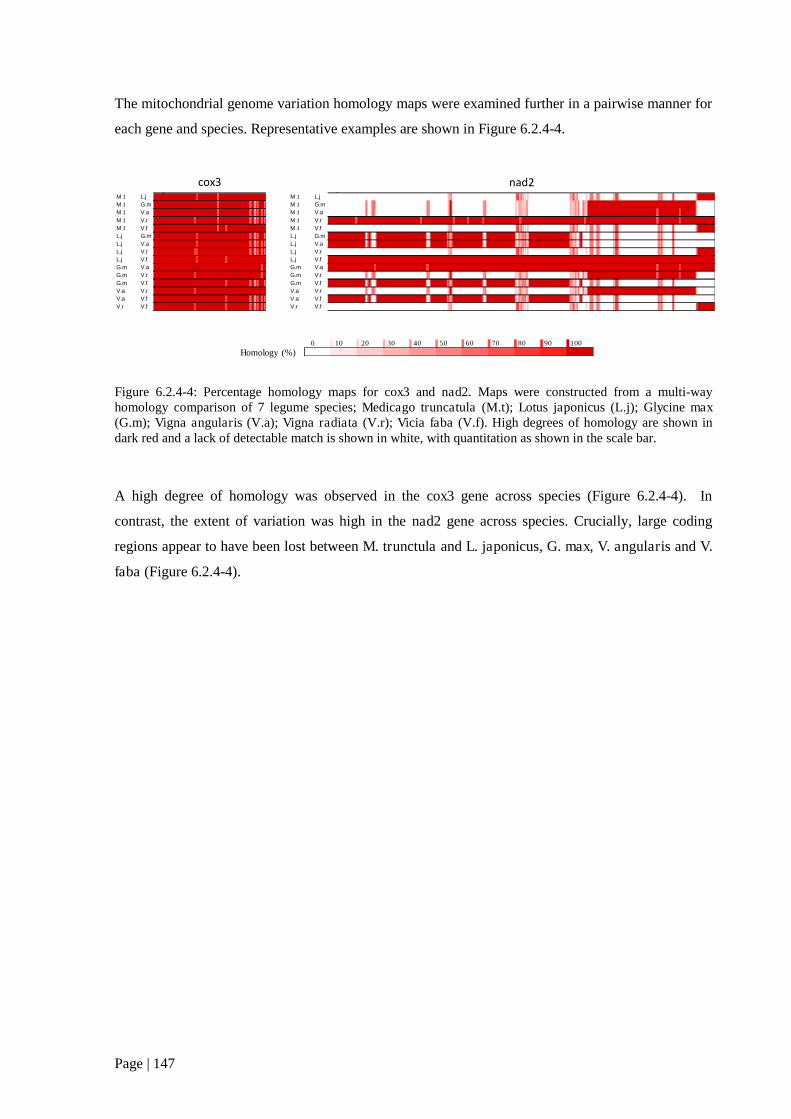
Page | 147
The mitochondrial genome variation homology maps were examined further in a pairwise manner for
each gene and species. Representative examples are shown in Figure 6.2.4-4.
Figure 6.2.4-4: Percentage homology maps for cox3 and nad2. Maps were constructed from a multi-wayhomology comparison of 7 legume species; Medicago truncatula (M.t); Lotus japonicus (L.j); Glycine max(G.m); Vigna angularis (V.a); Vigna radiata (V.r); Vicia faba (V.f). High degrees of homology are shown indark red and a lack of detectable match is shown in white, with quantitation as shown in the scale bar.
A high degree of homology was observed in the cox3 gene across species (Figure 6.2.4-4). In
contrast, the extent of variation was high in the nad2 gene across species. Crucially, large coding
regions appear to have been lost between M. trunctula and L. japonicus, G. max, V. angularis and V.
faba (Figure 6.2.4-4).
M .t L.j
M .t G.m
M .t V.a
M .t V.r
M .t V.f
L.j G.m
L.j V.a
L.j V.r
L.j V.f
G.m V.a
G.m V.r
G.m V.f
V.a V.r
V.a V.f
V.r V.f
cox3M .t L.j
M .t G.m
M .t V.a
M .t V.r
M .t V.f
L.j G.m
L.j V.a
L.j V.r
L.j V.f
G.m V.a
G.m V.r
G.m V.f
V.a V.r
V.a V.f
V.r V.f
nad2
Homology (%)0 10 20 30 40 50 60 70 80 90 100

Page | 148
6.3. Discussion
Genetic improvement in faba bean requires a much deeper characterisation and understanding of the
genome sequence and its regulation under optimal and stress conditions. The genes underpinning
tolerance to stresses such as chilling and freezing can only be defined by the correct annotation of
sequences. The data presented here lay the foundations for the generation of a draft nuclear genome
sequence, together with the characterisation of polymorphic regions in the genomes housed in the
chloroplast and mitochondria.
Previous studies on V. faba have suggested that chromosomal fusion has occurred particularly in
chromosome I (Fuchs et al., 1998). However, the giant size of genome size at ~13 Gb is surprising
given that V. faba is diploid (2n=12 chromosomes). While the majority of plants have small genomes
(Kelly and Leitch, 2011) the data presented here confirm that faba bean belongs to those lineages that
have giant genomes. As with other large genomes, genome size expansion can be accounted for by
repetitive DNA sequences that consist of different types of transposable elements. However, in the
case of V. faba only ~10% of reads could be identified in a repetitive element database (Bao et al.,
2015). Larger plant nuclear genomes, such as maize, can contain 85% repetitive DNA made up of
intact and simply organised RTs (Schnable et al., 2009). Many RTs that use element-encoded
mRNAs as transposition intermediates can rapidly proliferate in copy number, resulting in large
differences in genome sizes between related species. The action of these mobile elements can
restructure the genome, resulting in a high level of genetic variability. Moreover these RT-induced
mutations are usually stable and can be used as molecular tools to study gene tagging and functional
analysis (Bennetzen, 2000). The gypsy and copia type RTs belong to the long terminal repeat (LTR)
family and are referred to as Metaviridae and Pseudoviridae elements respectively (Grandbastien,
2015). LTR replication via an RNA template is reminiscent of retroviral proliferation, and
interestingly these are the predominant RTs in plants. Genome fluidity arising from the activities of
these mobile elements has long been recognised as an opportunity for the genome to evolve in
response to environmental challenges (Wicker et al., 2007; Lisch, 2002). The expression of LTR RTs
is important in host functional plasticity, with regulation being coordinated in response to a diverse
array of external stresses. Transposable elements can act as dispersible regulatory modules that
redirect stress responses to adjacent plant genes, an action that may be crucial for stress avoidance,
escape or tolerance (Grandbastien, 2015). The activation of LTR retrotransposons results from
interplay between the release of epigenetic silencing and the recruitment by LTRs of specific
regulatory factors. While evidence for major mobilisations of LTR RTs is rare (Reichmann et al.,
2012; Giordani et al., 2016), future sequencing of the faba bean genome will allow the identification
of specific RTs and their movement in optimal and stress conditions.
Page | 149
The datasets obtained in the present study, combined with sequence data with linkage marker data
(Webb et al., 2016) have facilitated an enhancement of linkage sequences at 141 chromosomal loci.
While 272 BLAST hits were obtained for linkage-anchored contigs, only 5 of these had sufficient
alignment length and identity to classify gene orthologues. However, this analysis has allowed
resolution of the putative sequences of 5 V. faba genes, based on homology to M. truncatula (Webb
et al., 2016). Since the majority of the V. faba genome consists of repetitive sequences, and >90% of
the assembled contigs having no homology to the coding regions of M. truncatula, it is clear that a
much more varied sequencing approach is required. Given the rapid advances in sequencing
technologies, it is feasible that much more genome information can be rapidly gained within the next
few years by an intense sequencing and bioinformatics approach.
Although the present characterisation of the nuclear genome proved to be challenging given the
length and coverage of genomic reads, the mapping of the organellar genomes was much more
informative. Relatively few differences in the coding regions of the faba bean chloroplast genome
were identified in comparisons of genome reads to the chloroplast reference (Sabir et al., 2014).
However, SNPs were identified in the genes encoding the RNA polymerase subunit C1 (rpoC1), the
ATpase β subunit (atpF), glutamine tRNA (trnQ-UUG) and the β-carboxyl transferase subunit of
acetyl co-A carboxylase (accD). Among these accD contained the most SNPs with 3 detectable
polymorphisms. This finding might at first glance be surprising because the activity of the acetyl co-
A carboxylase is essential for plastid functions and for fatty acid biosynthesis, with tobacco accD
knockout mutants being lethal (Kode et al., 2005). However, the accD gene has previously been
shown to be highly variable across 24 M. truncatula ecotypes (Csanad and Pal, 2014). Ecotype
specific accD gene sequences ranging from 650-796 amino acids in length were reported (Csanad and
Pal, 2014). Despite this variability a conserved carboxylase domain was always present and gene
length expansion and contraction was attributed to repetitive sequence integration in intronic regions
(Csanad and Pal, 2014). Moreover, despite the essential functions that accD plays in plants, it has
been lost during evolution in a number of species (Rousseau-Gueutin et al., 2013). In these situations
the gene either moves to the nuclear genome or is functionally replaced by a nuclear encoded
analogue(Rousseau-Gueutin et al., 2013).
The high level of conservation of the plastid genome sequences between legumes is highlighted in the
data presented here. The data show a low level of gene sequence variation amongst the 11 legumes
analysed in this study. There were notable exceptions however, particularly in the rps2, rpl32, rps19,
rps7, accD, rpl2, rpl23, clpP, ndhB, ndhA and rps12 genes, which showed sequence homologies of
only between 60-79%. These findings are consistent with the view that most photosynthesis-related
genes are conserved to a higher level than ribosomal genes, with chloroplast genomes showing far

Page | 150
higher degrees of conservation than the nuclear and mitochondrial genomes (Xu et al., 2015).
Interestingly, despite the high level of variation in the rps12 gene, loss of rps12 function might be
predicted to lead to a loss of chloroplast translation capacity (Ramundo et al., 2013). Intra-species
comparisons of faba bean chloroplast genes may form the basis for future cultivar genotyping.
The number of polymorphisms in the mitochondrial genome were greater than those detected in the
chloroplast genome, with 6 genes showing single base pair mutations compared to the reference
sequence (Negruk, 2013). Two SNPs were identified in NADH dehydrogenase subunit 6 and
Maturase R, with Ribosomal protein S14 and cytochrome c-oxidase subunit II having 6 SNPs. While
the relatively small number of polymorphisms in the coding regions is unlikely to have extensive
functional repercussions, genes showing polymorphisms between faba bean cultivars are well
conserved across the mitochondrial genomes of 6 other legume species. However, in comparison to
the chloroplasts the mitochondria were shown to be more prone to the accumulation of mutations,
though this was restricted to the intergenic spaces.
Plant mitochondrial genomes are characterised by their very large size, ranging from 200 to 2500 kb.
They contain many introns and repeated elements, experiencing frequent gain/loss of genes, gene
transfer and duplication and genome rearrangements (Kitazaki et al., 2010). Intriguingly, despite the
affinity of plant mitochondrial genomes for rearrangement, their rate of nucleotide substitution is low.
Moreover, mitochondrial genome variation within species is derived from double-stranded DNA
breakage and repair, via highly efficient recombination of asymmetric sequences (Davila et al., 2011).
Thus, while the genomes are prone to structural changes, the encoded content is well conserved. The
mechanisms underpinning mitochondrial genome recombination are key to within- and between-
species variation (Galtier, 2011).
Taken together, the data presented in this chapter provide new insights into the large and highly
repetitive faba bean genome. Moreover, these data show the extent of species-level variation within
the legume family and identify genes which are more prone to the accumulation of mutations.
Interestingly, while the chloroplast genome is well conserved on an intraspecies level, the
mitochondrial genome is more prone to sequence variation. Future studies of the type described here
should provide enhanced genomic information in faba bean, allowing the generation of novel
breeding tools. Unravelling the nuclear and organellar genomes of faba bean, their plasticity, and
regulation in response to environmental challenges, will not only increase our understanding of how
stress tolerance is regulated but it will also bring faba bean science into the 21st century and so
accelerate breeding progress.

Page | 151
“There are three kinds of lies: lies, damned lies and statistics”
-Benjamin Disraeli

Page | 152
7. Transcriptomic analysis of Vicia faba cultivars differing in low temperature
tolerance, following acclimatory growth and following exposure to dark-
freezing
7.1. Introduction
Plants vary in their responses to cold stress, with cellular changes ranging from altered membrane and
protein composition (Pearce, 2001; Kosová et al., 2011) to cryoprotectant production and changes in
ROS scavenging activity (Apel and Hirt, 2004). Cold temperatures can also induce secondary
metabolic pathways. Flavonoids in particular have been identified as a primary target of study in cold
stress. This large family of metabolites has been linked to plant protection from the effects of chilling
and freezing. Notably anthocyanin is thought to confer protection to the photosynthetic machinery
and the water status of plants cells (Calzadilla et al., 2016; Chalker-Scott, 1999).
Cold stress responses are dependent on changes in gene expression, for which a number of
transcription factors have been identified as central regulators (Chinnusamy et al., 2007). Of these the
most well characterised is the Cold Binding Factor (CBF) regulon, which acts upstream of several
genes that confer protection to chilling and freezing (Thomashow, 2001; Yamaguchi-Shinozaki and
Shinozaki, 2006). While the specific activities of CBF regulated genes have not been elucidated in
full, late embryogenesis abundance (LEA) proteins are thought to be central to CBF-depdendent
cryoprotection, playing diverse roles in protein and membrane stabilisation (Sanghera et al., 2011).
Next-generation sequencing technologies have increased the knowledge of which genes and gene
families underpin plant stress tolerance (Pang et al., 2013). However, research into the biochemical
and genetic factors contributing to low temperature tolerance has predominantly focused on A.
thaliana (Kaplan et al., 2007). Nevertheless, there is an emerging body of research into the cold stress
responses of legumes. Amplified fragment length polymorphism (AFLP) studies in cold tolerant
chickpea (C. arietinum) identified 77 transcripts that were upregulated in response to chilling. These
were related to metabolism, signal transduction and transcription, with a further 22 transcripts having
unknown function (Dinari et al., 2013). Moreover, in freezing sensitive and freezing tolerant cultivars
of pea, microarray analysis allowed cold-induced global gene expression to be profiled. Chilling
tolerance was related to genes downstream of the CBF regulon, with the chilling tolerant cultivar
showing earlier expression of cold-inducible genes. These gene expression changes were paired with
physical measurements of cellular osmotic stabilisation, photosynthesis modifications and antioxidant
production (Lucau-Danila et al., 2012). The most in-depth study of cold acclimation in legumes was
conducted on L. japonicus (Calzadilla et al., 2016). In these studies high throughput RNA sequencing
Page | 153
was used to identify 1077 differentially expressed genes, 713 of which were up-regulated in response
to chilling and 364 which were down-regulated. Up-regulated genes were related to lipid, cell wall,
phenylpropanoid, sugar and proline regulation (Calzadilla et al., 2016). Down-regulated genes
affected photosynthetic processes and chloroplast development, and a total of 41 cold-inducible
transcription factors were identified. These belonged to the APETALA 2/ethylene-responsive element
binding factor (AP2/ERF), NAC (acronym derived from three genes discovered to contain the
binding domain (Nuruzzaman et al., 2013), MYB (a conserved binding domain (Stracke et al., 2001),
WRKY (named after a conserved N-terminus amino acid sequence) and DREB/CBF families.
Taken together these studies have been useful in the characterisation of chilling and freezing
tolerance in legumes. However they have been limited, either by the depth of information provided or
the breadth of the studies undertaken. As such there is still a tangible knowledge gap in the current
understanding of legume tolerance to low temperatures, with particular regard to differences in gene
regulation between cultivars of varying low temperature sensitivity, under both acclimation and
freezing stress.
The results provided in chapter 5 identified 2 cultivars of Vicia faba with differing tolerance to both
chilling and freezing stress. The Hiverna cultivar was shown to be chilling and freezing tolerant,
while the Wizard cultivar was shown to be comparatively sensitive to low temperatures. The
following study employed RNA sequencing to characterise the transcriptomes of both Hiverna and
Wizard, under control conditions after low temperature exposure during their night cycle.

Page | 154
7.2. Results
In the following studies RNA was extracted from leaf discs, taken from the oldest leaves of the
Hiverna and Wizard cultivars. Plants had been subjected to one of four growth regimes: maintained
growth under control conditions for 24 days (control); maintained growth under control conditions for
24 days with subjection to a 30 minute freezing period during the final hour of the last night cycle
(control, frozen), maintained growth under control conditions for 14 days and grown under
acclimatory conditions for a further 10 days (acclimated) and maintained growth under control
conditions for 14 days and growth under acclimatory conditions for a further 10 days with subjection
to a 30 minute freezing period during the final hour of the last night cycle (acclimated, frozen).
RNA samples consisted of RNA extracted from the leaf tissue of 3 pooled biological replicates. 3
experimental replicates were produced per genotype and conditions, totalling 24 RNA samples
(Figure 7.2-1).
Figure 7.2-1: Agarose gel electrophoresis of RNA extracted from Hiverna and Wizard cultivars grown undercontrol conditions, acclimatory conditions, control conditions followed by freezing or acclimatory conditionsfollowed by freezing. All numbered lanes contain 5 µl of RNA sample. Lanes 1-3: Wizard control. Lanes 4-6:Hiverna control. Lanes 7-9: Wizard control and freezing. Lanes 10-12: Hiverna control and freezing. Lanes 13-15: Wizard acclimated. Lanes 16-18: Hiverna acclimated. Lanes 19-21: Wizard acclimated freezing. Lanes 22-24: Hiverna acclimated freezing. Lane L contained 3 µl of 1 kb plus GeneRule DNA ladder. Gel was 1 %agarose stained with SYBR Safe ®, run for 1 hour at 80 V.
Extracted RNA was sent to the Institute of Molecular Medicine at St James’ Hospital, University of
Leeds. RNA quantification and quality control nuclear DNA depletion were performed, before high
throughput sequencing was conducted on an Illumina HiSeq 2500 platform using paired end 150 bp
sequencing of polyadenylated transcripts. Sequence data was then analysed.
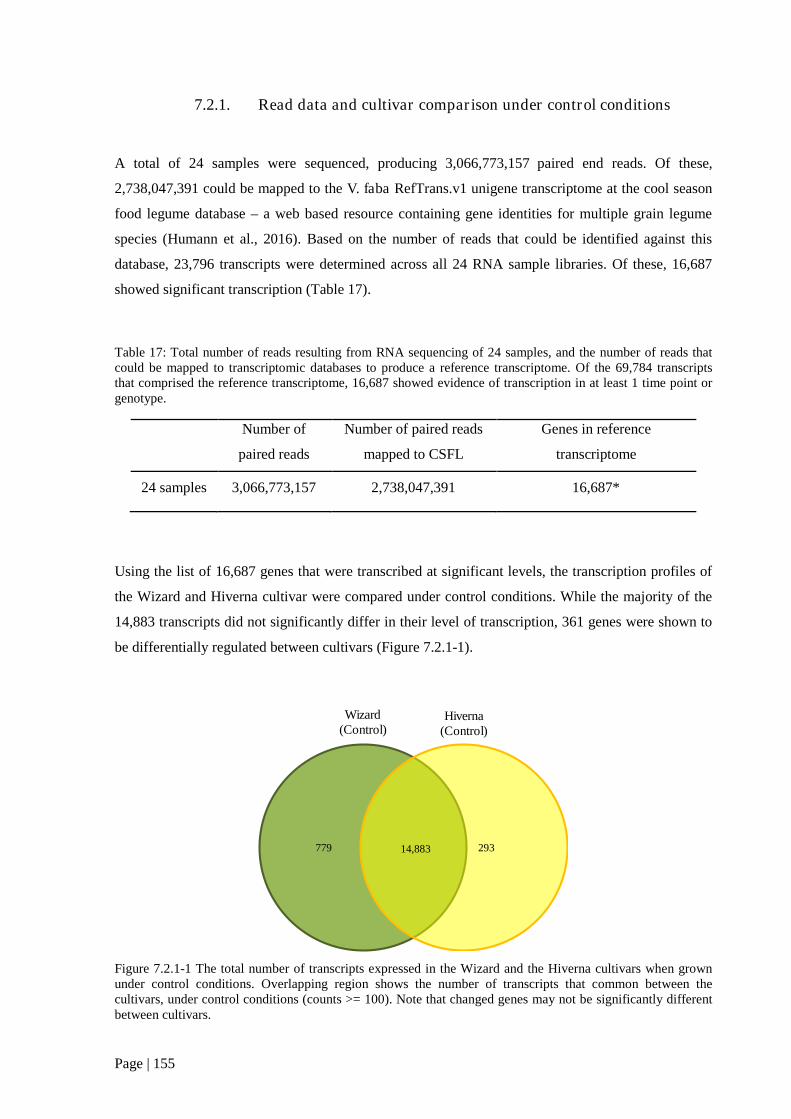
Page | 155
7.2.1. Read data and cultivar comparison under control conditions
A total of 24 samples were sequenced, producing 3,066,773,157 paired end reads. Of these,
2,738,047,391 could be mapped to the V. faba RefTrans.v1 unigene transcriptome at the cool season
food legume database – a web based resource containing gene identities for multiple grain legume
species (Humann et al., 2016). Based on the number of reads that could be identified against this
database, 23,796 transcripts were determined across all 24 RNA sample libraries. Of these, 16,687
showed significant transcription (Table 17).
Table 17: Total number of reads resulting from RNA sequencing of 24 samples, and the number of reads thatcould be mapped to transcriptomic databases to produce a reference transcriptome. Of the 69,784 transcriptsthat comprised the reference transcriptome, 16,687 showed evidence of transcription in at least 1 time point orgenotype.
Number of
paired reads
Number of paired reads
mapped to CSFL
Genes in reference
transcriptome
24 samples 3,066,773,157 2,738,047,391 16,687*
Using the list of 16,687 genes that were transcribed at significant levels, the transcription profiles of
the Wizard and Hiverna cultivar were compared under control conditions. While the majority of the
14,883 transcripts did not significantly differ in their level of transcription, 361 genes were shown to
be differentially regulated between cultivars (Figure 7.2.1-1).
Figure 7.2.1-1 The total number of transcripts expressed in the Wizard and the Hiverna cultivars when grownunder control conditions. Overlapping region shows the number of transcripts that common between thecultivars, under control conditions (counts >= 100). Note that changed genes may not be significantly differentbetween cultivars.
Wizard(Control)
Hiverna(Control)
779 29314,883

Page | 156
A gene ontology analysis of these transcripts showed several families to be differentially regulated
between Wizard and Hiverna (Figure 7.2.1-2). More genes related to cellular responses to nitrogen
compounds were expressed in Hiverna compared to Wizard, incorporating genes acting to regulate
movement, secretion, enzyme production and gene expression. Genes related to isoprenoid metabolic
processes (the metabolism of isoprenoid compounds) were more highly expressed in Wizard
compared to Hiverna. Coenzyme metabolic processes had a higher number of underpinning genes
expressed in the Wizard cultivar than the Hiverna cultivar. There were more genes related to
responses to organonitrogen expressed in Hiverna than Wizard, however isopentyl diphosphate
biosynthetic process genes were only expressed in Wizard and not Hiverna. Genes linked to the
isopentyl diphosphate pathway are not inclusive of the mevalonate/MEP pathway. Genes involving
the cellular response to chitin (movement, secretion, enzyme production and gene expression) were
expressed in higher numbers in Hiverna compared to Wizard.
Figure 7.2.1-2: Metabolic process gene ontology showing the number of genes differentially expressed, andcorresponding gene families, between the Wizard and Hiverna cultivars under control conditions.
Interestingly, genes involved in glyceraldehyde-3-phosphate metabolism (glycolysis) were expressed
in Wizard but not Hiverna, under control conditions. Similarly genes involved in isopentyl
diphosphate biosynthesis were expressed in Wizard but not Hiverna. Conversely, Hiverna had a
higher number of genes expressed that were related to responses to endogenous stimuli, than did
Wizard. Genes related to isoprenoid biosynthetic processes were more abundant in Wizard than
0 10 20 30 40 50 60 70
pyruvate metabolic process
isopentenyl diphosphate metabolic process
isoprenoid biosynthetic process
response to endogenous stimulus
isopentenyl diphosphate biosynthetic process
glyceraldehyde-3-phosphate metabolic process
response to chitin
isopentenyl diphosphate biosynthetic process, MEP
response to organonitrogen compound
coenzyme metabolic processes
response to nitrogen compounds
Number of gene expressed
Hiverna Wizard

Page | 157
Hiverna, while Hiverna did not express any genes related to isopentyl diphosphate metabolism or
pyruvate metabolism (Figure 7.2.1-2).
7.2.2. Principal component analysis
A principal component analysis (PCA) was performed, combining the 24 transcriptomic data sets to
determine which factors contributed the highest level of variance in gene expression (Figure 7.2.2-1).
Figure 7.2.2-1: Principal component analysis of transcriptomic data sets, showing 3 repeats for both the Hivernaand Wizard cultivars that had been: maintained under control conditions for 24 days; grown for 14 days undercontrol conditions and subjected to acclimatory night temperatures for 10 consecutive nights; maintained undercontrol conditions for 24 days, culminating in a 30 minute freezing period on the 24th night; grown for 14 daysunder control conditions followed by 10 consecutive nights of growth under acclimatory conditions,culminating in a 30 minute freezing period on the 10th night of acclimation.

Page | 158
The PCA analysis assessed 5 factors; genotype (Hiverna/Wizard) and the four treatment conditions.
Grouping could be seen for both genotypes that had been subjected to acclimation conditions, and
acclimation conditions followed by a freezing period (Figure 7.2.2-1, lower middle). A lesser degree
of grouping could be seen for both genotypes that had been maintained under control conditions, and
maintained under control conditions followed by freezing exposure (Figure 7.2.2-1,upper). Moreover,
the variation in the transcriptome profiles of plants that had been subjected to control and freezing
conditions was grouped to a lesser extent than samples that had undergone acclimation (Figure
7.2.2-1).
7.2.3. Differential gene expression between genotypes under acclimation
The quantification and subsequent PCA identified a set of 16,687 genes that demonstrated a
significant level of differential expression, when comparing any 2 factors. A significance boundary of
P=<0.05 was introduced with a log fold change value of =>1 for up-regulated genes and =<-1 for
down-regulated genes. This set was then used to compare gene expression between both Wizard and
Hiverna under control and acclimatory conditions (Figure 7.2.3-1).
Figure 7.2.3-1 The total number of transcripts differentially expressed in the Wizard and the Hiverna cultivars,comparing control conditions to acclimatory conditions. Overlapping region shows the number of transcriptsthat are commonly expressed between the conditions.
In the Wizard cultivar 770 genes were found to be differentially regulated when plants were subjected
to acclimatory conditions. In the Hiverna cultivar 1321 genes were differentially regulated under
acclimation (Figure 7.2.3-1).
Wizard Hiverna
Control Acclimated Control Acclimated
711 770 542 132114,63414,951

Page | 159
Figure 7.2.3-2 Venn diagram to show the set of differentially regulated transcripts between acclimation andcontrol in both genotypes. The overlapping segment shows transcripts which are shared in the acclimationresponse of Wizard and Hiverna. The numbers represented by a star (*) are shared between Wizard andHiverna, but respond in a different manner, indicated by the left hand arrow (Wizard) and right hand arrow(Hiverna). Numbers in non-overlapping segments are specific in the acclimation response for the cultivar.Bracketed numbers show the total number of transcripts that are specific to either Wizard or Hiverna. Tablegives an alternate presentation of Venn diagram data.
Wizard(Acclimated)
Hiverna(Acclimated)
↑689
↓ 774
↑1131
↓ 953
↑75*↓
↑1333
(2695)
↓1191
↓96*↑
Number of transcripts Expression in response to acclimation
1191 Down in both
953 Down in Hiverna
774 Down in Wizard
96 Up in Hiverna, Down in Wizard
75 Down in Hiverna, Up in Wizard
10445 No change in either
1131 Up in Hiverna
689 Up in Wizard
1333 Up in both
(1463)(2084)

Page | 160
A between-cultivar comparison of the genes differentially expressed under acclimatory conditions
showed 284 genes to be expressed differently between Wizard and Hiverna under acclimatory
conditions (Figure 7.2.3-3).
Figure 7.2.3-3: Metabolic process gene ontology showing the number of genes, and corresponding genefamilies, of differentially expressed between the Wizard and Hiverna cultivars under acclimatory conditions.
A gene ontology analysis showed that the differentially expressed genes belonged to 6 metabolic
families (Figure 7.2.3-3). Fewer genes relating to ultraviolet radiation (UV) and UV-B were
differentially expressed in Hiverna compared to Wizard. Interestingly, while no genes relating to
chloroplast organisation were differentially expressed in Hiverna, 14 were differentially regulated in
Wizard. Hiverna also had lower levels of differential gene expression for the metabolic processes
underpinning plastid organisation, pigment biosynthesis and organelle organisation (Figure 7.2.3-3).
When searching the 284 differentially regulated genes for transcription factors, 12 were shown to be
differentially regulated between Wizard and Hiverna (Table 18). Of these, 2 were GRAS family
transcription factors, 3 were NAC family transcription factors and the remainder were a BEL-1
domain like transcription factor, a MYB like transcription factor, an E2F transcription factor, a
PLATZ family transcription factor and a transcription factor jumonji domain protein. A plastid
transcriptionally active protein and a putative transcription co-factor were also differentially
expressed (Table 18). All of these transcription factors were less expressed in Wizard than Hiverna,
0 5 10 15 20 25 30 35 40 45
organelle organization
pigment biosynthetic process
plastid organization
chloroplast organization
response to UV-B
response to UV
Hiverna Wizard

Page | 161
with the exception of the plastid transcriptionally active protein and the putative transcription co-
factor.
Table 18: Transcription factors differentially regulated between the Wizard and Hiverna cultivars underacclimatory conditions. Log fold changes show the difference in gene expression in Wizard, compared toHiverna, thus a negative values show gene down-regulation in Wizard and positive values show up-regulation.Conversely, if a gene is down-regulated in Wizard it will be up-regulated in Hiverna.
Transcript ID Homologous element, species and gene IDlog foldchange
P value
vf_0024348GRAS family transcription (Medicago truncatula
MTR_2g082090)-1.93 0.00303
vf_0056807GRAS family transcription factor (Medicago truncatula
MTR_2g097463)-1.72 0.04826
vf_0023632BEL1-like homeodomain transcription factor (Trifolium
pratense)-1.40 0.00003
vf_0008457MYB-like transcription factor family protein (Medicago
truncatula MTR_2g100930)-1.29 0.02549
vf_0024415NAC transcription factor-like protein (Medicago
truncatula MTR_2g079990)-1.20 0.00483
vf_0023048E2F transcription factor (Medicago
truncatulaMTR_4g052000)-1.20 0.00003
vf_0041085Transcription factor jumonji (JmjC) domain protein
(Medicago truncatula MTR_7g117445)-1.18 0.00025
vf_0033376NAC transcription factor-like protein (Medicago
truncatula MTR_4g075980)-1.12 0.04197
vf_0042236PLATZ transcription factor family protein (Medicago
truncatula MTR_8g066820)-1.05 0.00409
vf_0043576NAC-like transcription factor (Medicago truncatula
MTR_3g096920)-1.02 0.00409
vf_0065067Plastid transcriptionally active protein (Medicago
truncatula MTR_4g064750)1.46 0.03578
vf_0060938Transcription cofactor, putative (Medicago
truncatulaMTR_2g104400)1.63 0.01841

Page | 162
Table 19: Repetitive element identities and corresponding faba bean transcripts, determined by repetitiveelement database BLAST of uncharacterised sequences differentially expressed between genotypes underacclimatory conditions.
Transcript ID Repetitive element ID and species Identity (%)v.faba_csfl_reftransV1_0022101 RLX_72950 G. max LTR 87.5v.faba_csfl_reftransV1_0022101 RLC_167431 Gossypium LTR/Copia 90.323v.faba_csfl_reftransV1_0039937 RLX_76673 Medicago LTR 71.5v.faba_csfl_reftransV1_0039937 MTIS112A 69.149v.faba_csfl_reftransV1_0040437 RLG_158021 Hordeum LTR/Gypsy 79.63v.faba_csfl_reftransV1_0040437 RLX_160954 Hordeum LTR 80v.faba_csfl_reftransV1_0010268 RLG_43598 Zea mays LTR/Gypsy 96.296v.faba_csfl_reftransV1_0010268 RLC_124140 Lycopersicon LTR/Copia 87.5v.faba_csfl_reftransV1_0010268 RLC_124140 Lycopersicon LTR/Copia 96.154v.faba_csfl_reftransV1_0025006 RLX_163326 Gossypium LTR 82.979v.faba_csfl_reftransV1_0025006 RLX_163326 Gossypium LTR 83.333v.faba_csfl_reftransV1_0025006 RLX_70522 Glycine LTR 85v.faba_csfl_reftransV1_0009781 RLG_76427 Medicago LTR 69.784v.faba_csfl_reftransV1_0009781 RLG_76422 Medicago LTR 69.784v.faba_csfl_reftransV1_0011950 RLX_75637 Lotus LTR 91.667v.faba_csfl_reftransV1_0011950 TXX_169408 Gossypium Mobile element 96v.faba_csfl_reftransV1_0035145 RLX_123952 Lycopersicon LTR 96v.faba_csfl_reftransV1_0035145 Copia-8_ATr-I 96v.faba_csfl_reftransV1_0020813 RLX_39536 Sorghum LTR 86.047v.faba_csfl_reftransV1_0020813 RLX_76648 Medicago LTR 87.805v.faba_csfl_reftransV1_0020813 RLX_76648 Medicago LTR 65.806v.faba_csfl_reftransV1_0026937 RLX_123398 Lycopersicon LTR 80.952v.faba_csfl_reftransV1_0026937 RLX_164440 Gossypium LTR 77.778v.faba_csfl_reftransV1_0012615 RLX_122977 Solanum LTR 81.818v.faba_csfl_reftransV1_0012615 RLG_163287 Gossypium LTR 95.833v.faba_csfl_reftransV1_0044038 RLX_70727 Glycine LTR 87.5v.faba_csfl_reftransV1_0044038 RLX_70727 Glycine LTR 84.375v.faba_csfl_reftransV1_0044038 RLX_76542 Medicago LTR 82.5v.faba_csfl_reftransV1_0044038 RLX_76542 Medicago LTR 78.571v.faba_csfl_reftransV1_0027409 RLX_70164 Glycine LTR 93.333v.faba_csfl_reftransV1_0027409 RLX_55442 Arabidopsis LTR 89.189v.faba_csfl_reftransV1_0026277 Gypsy4-VV_I 93.103v.faba_csfl_reftransV1_0026277 RLX_72063 Glycine LTR 86.111v.faba_csfl_reftransV1_0004886 RLG_72410 Glycine LTR 87.5v.faba_csfl_reftransV1_0004886 RLX_51444 Zea LTR 81.579
Of the transcripts that were significantly differentially regulated, 36 had no identifying homologue in
the cool season food legume database. When comparing these transcript sequences to the known
sequences of repetitive elements, significant homology was found. These repetitive elements
consisted predominantly of LTR retrotransposons (31), with the remaining elements being gypsy,
copia or uncharacterised mobile genetic elements (Table 19).

Page | 163
7.3. Discussion
In the present study the transcriptome profiles of 2 faba bean cultivars, Hiverna and Wizard were
characterised under control and acclimatory conditions. As few studies have been conducted on the
regulation of gene expression under low temperatures in legumes (Calzadilla et al., 2016), this study
provides novel information on the genetic differences underpinning chilling and freezing tolerance in
legumes. Moreover, the depth of the data generated will assist greatly in the characterisation of the
faba bean gene space. In this study Wizard was found to have a higher number of differentially
expressed genes than Hiverna under control conditions. However, Hiverna had more differentially
expressed genes than Wizard under acclimatory conditions.
Ontology analysis of differentially regulated genes under control conditions showed that the principle
metabolic families were involved with energy metabolism and the biosynthesis of isoprenoid
compounds. Isoprenoids have previously been linked to enhanced abiotic stress tolerance, acting as
ROS scavengers (Vickers et al., 2009). Moreover, isoprenoid compounds provide the chemical
precursors to chlorophyll, carotenoids and their derivatives, thus presenting the most diverse group of
plant metabolites (Vranová et al., 2012). There are few resources in the literature which elaborate on
the potential reasons for differences in isoprenoid pathway transcription. Indeed, as such a diverse
group of metabolites, much remains to be elucidated about isoprenoid regulation (Vranová et al.,
2011).
While detailed transcriptome comparisons have not been performed on contrasting legume cultivars,
studies have been conducted in rice (Shankar et al., 2016). In comparisons of the drought tolerant
cultivar Nagina 22 and the drought sensitive cultivar IR64 grown under control conditions, 1076
transcripts were found to be differentially regulated (674 + 402), however these studies did not detail
the gene family differences between cultivars (Shankar et al., 2016). Interestingly the number of
differentially expressed genes in rice was comparable to faba bean, for which 1072 (779+293)
transcripts were differentially expressed between cultivars under control conditions.
Little is known about the regulation of gene expression in legume acclimation to low temperatures.
Of the studies conducted, the majority have utilised array technologies, thus the identification of
novel genes has not been possible (Lucau-Danila et al., 2012). The most in depth study to date was
conducted on L. japonicus (Calzadilla et al., 2016). Through analysing the transcript profile of cold-
exposed plants over a 24 hour period a total of 1077 differentially expressed genes were identified.
These were related to lipid synthesis, cell wall regulation and chloroplast development. Moreover, 41
transcription factors were identified from several families (Calzadilla et al., 2016).
Page | 164
Legume genomes encode upwards of 2000 transcription factors, but less than 1% of these have been
genetically characterised in model species (Udvardi et al., 2007). Transcription factors act as
molecular switches for the regulation of gene expression and are usually composed of at least four
domains: a DNA-binding domain, a nuclear-localisation signal, a transcription-activation domain, and
an oligomerisation site (Reichmann et al., 2012). In the present study 12 transcription factors were
shown to be differentially regulated in response to dark-chilling. The low-temperature tolerant
Hiverna cultivar expressed 10 transcription factors to a higher level than the sensitive Wizard
cultivar. These are discussed in turn.
Two GRAS proteins were found to be differentially regulated between Wizard and Hiverna under
acclimatory conditions. GRAS proteins are plant-specific and their name is derived from the first
three members; GIBBERELIC-ACID INSENSITIVE (GAI), REPRESSOR OF GAI (RGA) and
SCARECROW (SCR; Hirsch and Oldroyd, 2009). They play diverse roles in gibberellic acid (GA)
signalling, shoot development and phytochrome-A signal transduction (Bolle, 2004). In the model
legumes M. truncatula and Lotus japonicus GRAS proteins are required for nodule morphogenesis
(Heckmann et al., 2006). Moreover, their role as transcription factors has recently become
established, particularly in the control of arbuscule development (Xue et al., 2015).
Under acclimatory conditions 3 NAC-like transcription factors were found to be upregulated in
Hiverna compared to Wizard. The NAC transcription factor family is named after the three genes that
were initially discovered to contain the NAC domain: NAM (no apical meristem), ATAF1 and -2 and
CUC2 (cup-shaped cotyledon; Souer et al., 1996; Aida et al., 1997; Nuruzzaman et al., 2013). NAC
transcription factors play central roles in regulating plant growth and development processes,
including responses to abiotic stresses (Shao et al., 2015). However, the precise downstream targets
of NAC transcription factors are still unknown (Shao et al., 2015).
BEL1-like homeodomain transcription factors are members of the three-amino-acid-loop-extension
(TALE) class of homeoproteins, which constitute the major regulators of meristematic activity
(Arnaud and Pautot, 2014). BEL1-like transcription factors may function as heterodimers with
KNOTTED-like (KNOX) proteins, arranging in many conformations to regulate distinct aspects of
plant morphogenesis (Arnaud and Pautot, 2014). They have been shown to act as long-distance
signals, being detected in the phloem sap of solanaceous species (Campbell et al., 2008) and have
been shown to have differential expression in Arabidopsis leaves, resulting in differences to leaf
phenotype (Kumar et al., 2007). However, while the roles of BEL1-like transcription factors have
been explored in plant development, there are no known references to their regulation or function
under stress conditions.

Page | 165
One MYB-like transcription factor was more highly expressed in Hiverna than Wizard under
acclimatory conditions. The MYB superfamily constitutes one of the most abundant groups of
transcription factors in plants (Du et al., 2012), acting to regulate numerous metabolic functions such
as phenylpropanoid biosynthesis, cell morphogenesis and the cell cycle (Roy, 2016; Weisshaar and
Jenkins, 1998). In particular the R2R3-type MYB family members have been linked to abiotic stress
tolerance in A. thaliana, a result of their interaction with genes of phenylpropanoid pathway and the
consequent effects on sinapate ester and flavonoid abundance (Roy, 2016). These metabolites are
essential in UV-B absorption, thus up regulation of MYB transcription factors could reasonably be
attributed to enhanced UV-B tolerance (Bieza and Lois, 2001).
E2F transcription factors are crucial in the regulation of genes required for G1/S cell cycle transition
and S-phase progression (Trimarchi and Lees, 2002). A single E2F transcription factor was found to
be more highly expressed in Hiverna than Wizard. However, the mechanisms of E2F function are not
fully understood (Ramirez-Parra et al., 2003). Roles have been identified for the E2F family in the
mediation of A. thaliana responses to non-stress temperatures, however its wider roles in abiotic
stress tolerance remain to be characterised (Zhou et al., 2014).
PLATZ is an AT-rich sequence and zinc-binding protein family, the members of which act as
transcription factors in plants (Nagano et al., 2001). A single PLATZ gene transcript was found to be
more highly expressed in Hiverna than Wizard. In the initial identification of the PLATZ
transcription factor it was found to have a conserved binding domain that targeted AT-rich regions
and appeared to have specific regulatory functions in plastid gene expression (Nagano et al., 2001). In
soybean PLATZ was shown to be responsive to ABA, drought and high salinity, and was implied in
developmental processes such as germination under osmotic stress (So et al., 2015). To date,
functional characterisation of PLATZ factors has focused on legume species
Transcription factor jumonji (JmjC) belongs to a class of transcription factors that regulate histone
methylation (Klose et al., 2006). A conserved class of proteins within higher eukaryotes, jumonji
domain-containing proteins are linked to the epigenetic regulation of gene expression (Hu et al.,
2015). Thus the differential expression of JMJC in Hiverna presents an interesting target for the
investigation of potential epigenetic factors that contribute to low temperature tolerance.
In addition to the differential expression of transcription factors, a number of mobile genetic elements
were identified. Mobile genetic elements, in particular retrotransposons of the long terminal repeat
family (LTR) class, are capable of propagating in the plant genome via a “copy and paste”
mechanism. However, evidence has suggested that they play roles in the regulation of gene
expression (Grandbastien, 2015). As such, an analysis of the differential expression of transposable

Page | 166
genetic elements would be an interesting step to take in the elucidation of low temperature defence
mechanisms in plants.
Plant responses to abiotic stress require rapid and coordinated changes at the transcriptional level.
Through characterising those transcription factors that are differentially regulated between sensitive
and tolerant cultivars under chilling stress, specific gene targets may be identified for the further
exploration of low temperature tolerance traits in faba bean. The data presented in the present study
enhance current knowledge of the faba bean genome and its regulation in response to cold
temperatures. However, a more comprehensive approach needs to be taken, including the
construction of a de novo reference transcriptome which may be used as a foundation for the
identification of novel genes.

Page | 167
“If I have seen further, it is by standing on the shoulders of giants.”
-Isaac Newton

Page | 168
8. General Discussion
The hypothesis upon which this thesis was based is that low temperature tolerance is influenced by
phytocystatin expression and the strigolactone pathway. The specific objectives of the work were:
To characterise the effects of OCI expression on dark-chilling tolerance in soybean.
To characterise the effects of the strigolactone (SL) pathway on the dark chilling tolerance of
pea and A. thaliana.
To physiologically and genetically characterise low temperature tolerance in faba bean, for
the development of tolerance markers.
The studies reported in this thesis have explored the effects of low temperatures on photosynthesis
and biomass production in 4 species; the legumes soybean, pea and faba bean, and the model plant A.
thaliana. Moreover, the specific objectives of the work have been met. Chilling temperatures were
found to inhibit photosynthesis in Wt soybean, a tropical legume. However photosynthesis was not
affected in the Wt of other species, which were of temperate origin. The inhibition of photosynthesis
and biomass accumulation was decreased in OCI expressing soybean compared to Wt. Moreover,
chilling sensitivity in soybean, pea and A. thaliana was linked to SL. Increased abundance of SL
synthesis transcripts in OCI expressing soybean was linked to enhanced chilling tolerance.
Additionally, the impaired synthesis or signalling of SL in pea and A. thaliana increased sensitivity to
low temperatures. Crucially, high resolution genomic information on faba bean was produced in these
studies, together with transcriptome profiles of sensitive and tolerant cultivars under chilling and
freezing stress. Taken together the data presented in this thesis provide physiological, metabolic and
genetic information that can be used to develop markers for the accelerated breeding of low
temperature tolerance in faba bean, as discussed below.
8.1. The importance of legumes in a changing world
Legumes, such as soybean, pea and faba bean will be central components of crop production,
underpinning future food security (Foyer et al., 2016). Legumes are integral to sustainable farming
systems (Lassaletta et al., 2014; Barton et al., 2014) and comprise the majority of the world’s dietary
protein (Graham and Vance, 2003). Moreover, they have numerous proven health benefits. However,
the growth and productivity of legumes is currently limited by abiotic stress factors, in particular
chilling and freezing temperatures (Maqbool et al., 2010). The incidence of extreme low temperature
events is predicted to increase in the next 50 years (Olesen et al., 2011). Additionally, with the current

Page | 169
rate of population growth, the increased production of nutritionally beneficial crops is essential. Thus
the development of legume cultivars that are more tolerant to low temperatures is a key concern in
food security.
Changes to the world’s climate are characterised by: rising temperatures, an increase in atmospheric
CO2 concentration, and an increase in the incidence of extreme weather events (Vitousek, 1994).
These changes are partly due to an expanding global population, with an associated increase in
greenhouse gas emissions being the driving factor for global warming. Indeed global average
temperatures have risen by approximately 0.13ºC per decade since 1950 (Lobell et al., 2011).
However, an underappreciated aspect of global warming is the increase in frequency of extreme cold
weather events despite rising temperatures (Jones and Moberg, 2003; Olesen et al., 2011).
Figure 8.1-1: A graphical representation of the two states of the NAO, drawn from consensus data. In thenegative phase (NAO-) cold air is drawn into Europe from the Siberian and Arctic regions. In the positive phase(NAO+) warm air is drawn into Europe from Central and Northern America. Geographical features are shownin grey, cold air in blue and warm air in orange. Figure adapted from Wanner et al (2001).
While extreme cold events are localised in nature, their induction is a result of large scale changes in
hemispheric air circulation patterns, caused by global warming (Zhang et al., 2012). In Eurasia, for

Page | 170
example, the past decade has seen an increase in the incidence of extreme cold weather events,
resulting from changes in the position of the North-Atlantic Oscillation (NAO). The NAO is a
meteorological phenomenon comprising two interacting areas of atmospheric pressure; the Icelandic
low and the Azores high. A large difference in pressure between these two regions (NAO+) leads to
an increase in wind drawn from the warm, humid regions of America. However, a low difference in
pressure (NAO-) causes colder winds to be drawn into Europe from Siberia (Figure 8.1-1; Wanner et
al., 2001).
Figure 8.1-2: Average minimum daily temperatures for the months of January and February, years 2012 and2013. Each panel represents a 9-10 day period. Figure constructed using resources from the EuropeanCommission’s Monitoring Agricultural Resources Agri4Cast web page (European Comission Joint ResearchCentre, 2011).

Page | 171
Severe cold weather events have a detrimental effect on agricultural productivity, with different crops
and agro-environmental strata being influenced to differing degrees (Olesen and Bindi, 2002). Recent
years have seen European winters with freezing temperatures that may be considered extreme (below
-15 °C; Figure 8.1-2). Moreover the current intergovernmental Panel on Climate Change report stated
that future weather will consist of frequently high temperatures, corresponding dry spells and the
continued occurrence of occasional cold temperature extremes (IPCC, 2014). This is a particular
danger for overwintering crops which are autumn sown and establish during the winter months, and
which can be killed by exposure to extreme low temperatures. The need for the development of cold
tolerant legumes is two-fold, stemming from the need to mitigate the impact of future climatic
variability, but also to increase the current area upon which crops can be grown.
Figure 8.1-3: Annual global yield averages in dry metric tons per hectare for each year from 1961 to 2008 formaize, rice, wheat and soybean. Solid lines show projected yields to 2050. Dashed line shows the trend of the~2.4% yield improvement required each year to double the production of these crops by 2050 withoutcultivating additional land. Taken from Ray et al., (2013).

Page | 172
Agriculture occupies approximately 38% of the Earths terrestrial surface constituting the largest use
of land on the planet (Foley et al., 2011). However despite the comparatively large area dedicated to
agriculture, food security remains a pressing concern – particularly in the context of population
growth (Godfray and Garnett, 2014). The global population is growing at a rate of 1.8% per year and
is estimated to reach approximately 9.7 billion by 2050 (United Nations Department of Economic and
Social Affairs Population Division, 2015).
Current projections of crop yields show a large gap between the world’s future needs and what can be
provided by current improvement rates (Figure 8.1-3; Ray et al., 2013). As such, the threats to global
food security are multifaceted with major challenges coming from climate change and land use
competition. The latter is a result of various industrial demands, for example animal feed and biofuels
(Baldos and Hertel, 2014). Furthermore, to portray global food needs in the context of caloric
provision alone is inadequate. Malnutrition is a widespread phenomenon, thus the provision of
sufficiently nutritious food for the growing population is an equally pressing concern (Godfray et al.,
2010).
Threats to food security are multifaceted, comprising population expansion, climate change and land
use competition. Legumes are well suited to meet the dietary needs of the world’s population, being
rich in proteins and other essential dietary components (Foyer et al., 2016). However, more extensive
research must be conducted into the factors that limit legumes, in particular low temperature stresses.
In order to mitigate the influence of chilling and freezing stress on legume productivity, a
multidisciplinary approach is needed. The pairing of mathematical modelling with a thorough
understanding of the biological mechanisms underpinning stress tolerance traits will help to reduce
threats to the global food network (Prasad et al., 2010). Moreover, through understanding low
temperature tolerance traits in legumes, the agricultural land available for their growth may be
expanded. However, in order to breed more tolerant legume crops, the processes that regulate
acclimation to low temperatures must be understood.
8.2. Proteases and protease inhibitors as targets for crop improvement
Acclimation to chilling and freezing requires substantial turnover of proteins, so that the leaf
proteome is appropriate to the metabolic conditions pertaining under chilling and freezing stress
(Kosová et al., 2011). The results presented in chapter 3 showed that constitutive expression of OCI
conferred protection to the chilling-induced inhibition of photosynthesis in soybean. Constitutive
Page | 173
expression of protease inhibitors has previously been shown to enhance plant tolerance to biotic
stresses, such as nematode infection and coleopteran herbivory (Liang et al., 1991; Zhang et al.,
2012a). However, the impact of protease inhibitors on abiotic stress tolerance has been relatively
unexplored (Kunert et al., 2015).
Protein breakdown resulting from stress exposure involves many proteases, regulators, and dynamic
protein trafficking processes which ensure the complete transformation of proteins into transportable
and useful products (Diaz-mendoza et al., 2016). Through inhibiting the activity of proteases, the
protein restructuring of cells in response to stress is modified (Kunert et al., 2015). A model has
previously been shown whereby the transgenic expression of OCI prevents the breakdown of the key
photosynthetic enzyme, RuBisCo (Prins et al., 2008). Additional research has shown that the
expression of phytocystatins in broccoli delays the onset of post-harvest senescence (Eason et al.,
2014). Thus, the expression of protease inhibitors appears to have pleiotropic effects. However, while
the precise mechanisms of cystatin-protease interactions in abiotic tolerance need to be explored,
their use in the development of agronomically favourable crop traits is promising (Kunert et al.,
2015).
Many plant encoded cystatins contain a DRE/CRT transcription factor binding element (Seki et al.,
2002). The role of DRE binding factors in the regulation of cystatin expression is exemplified by the
A. thaliana cystatin, AtCYSa (Zhang et al., 2008). Interestingly while the DRE/CBF family is
conserved in soybean, chilling sensitivity in still displayed (Kidokoro et al., 2015). In the present
studies constitutive OCI expression was shown to confer protection to the chilling-dependent
inhibition of photosynthesis in soybean. The interacting partners of DRE/CRT binding factor
elements in soybean would therefore be interesting to explore, as studies show that DREB family
members have highly specific functions in response to abiotic stresses (Li et al., 2005). Therefore it is
possible that the transcriptional networks acting to protect tolerant plant species from low temperature
stress are not present in soybean, despite members of the transcription factor family being conserved.
With the advent of gene editing technologies such as CRISPR/CAS9, the activities of transcription
factors may be modified so that their downstream genes functioned to protect against low temperature
as well as other abiotic stresses (Bortesi and Fischer, 2015).
The effect of OCI expression on the abundance of SL synthesis enzyme transcripts has been reported
previously (Quain et al., 2014). However the precise interaction between cysteine proteases and SL
pathway proteins is currently unknown. SL is known to regulate a wide range of processes, including
natural and stress-induced senescence (Hye et al., 2004; Woo et al., 2001). Thus SL presents an
interesting target for the development of stress tolerance. Moreover, the interaction between
proteases, inhibitors and the SL pathway should be explored further.
Page | 174
8.3. The strigolactone pathway as a mediator of stress tolerance
In addition to the protective effect of OCI expression against the chilling-dependent inhibition of
photosynthesis in soybean, low temperature sensitivity was also linked to SL in all of the species
studied. Previous studies have reported a link between SL synthesis and signalling, and the tolerance
of plants to drought stress (van Ha et al., 2014). This is interesting as the regulatory factors
underpinning tolerance to drought and chilling are often conserved (Thomashow, 1999). The work
presented in chapter 4 showed that SL synthesis and signalling mutants of pea and A. thaliana had a
lower tolerance to chilling stress than the respective wild types. However, when A. thaliana Wt and
mutants were grown on plates in the presence of 2 µM GR24, sensitivity to chilling temperatures was
increased. Relatively few studies have been conducted on the role of SL in abiotic stress tolerance.
However, SL deficiency has been linked to increased drought and salt sensitivity (van Ha et al., 2014;
Pandey et al., 2016), and a delay in senescence (Woo et al., 2001). While the mechanisms
underpinning the effect of SL on abiotic stress tolerance are not yet clear, SL levels have been shown
to be responsive to abscisic acid (ABA; López-Ráez et al., 2010). Moreover, research suggests that
the concentration of SL is integral to its effect on plant physiology and metabolism. Thus, future
studies should aim to characterise the effects of SL concentration on plant physiology and stress
tolerance (Cheng et al., 2013). Moreover, the interactions between SL and other plant hormones
should be explored.
SL signalling is essential to the composition of the plants microbiome, with low concentrations of SL
inducing the growth of arbuscular mycorrhizal (AM) fungi in legumes (Besserer et al., 2006).
Interactions with the rhizosphere have been shown to have direct effects on plant health, both during
development and in response to stress (Philippot et al., 2013). The composition of the rhizosphere is
dependent on plant-microbe and microbe-microbe interactions. As such, while the diversity of
organisms in the soil is the key factor in microbiome constitution, the host genotype also has a strong
influence on microbial community composition (Lareen et al., 2016). While the link between plants
and their symbiotic microorganisms has long been recognised, the importance of this interaction has
only recently become a research focus. Indeed, the root microbiome is considered by some to act as a
“secondary genome”, providing host plants with a range of beneficial metabolites (Lareen et al.,
2016; Rout and Southworth, 2013; Berendsen et al., 2012).
The potential benefit of the soil microbiome has been exemplified in work conducted on A. thaliana.
When plants were grown in soil having a history of exposure to A. thaliana (sympatric), plant

Page | 175
biomass accumulation was significantly increased when compared to plants grown on non-sympatric
soils (Zolla et al., 2013). In addition, AM symbiosis has been shown to induce SL biosynthesis under
drought conditions in lettuce and tomato, resulting in enhanced drought tolerance and increased AM
proliferation (Ruiz-Lozano et al., 2016). Moreover the presence of AM communities has been shown
to protect P. vulgaris from reduced root-water uptake in response to chilling stress (Aroca et al.,
2007). Taken together these studies could, in part, explain why soil grown SL mutants of A. thaliana
performed differently to those grown on plates (Chapter 4). Crop species need to be considered in the
broader context of the ecological niche that they inhabit. Biotechnological approaches to crop
improvement would benefit from recognising the diverse community of microorganisms that
contribute to plant development and environmental stress tolerance traits (Coleman-Derr and Tringe,
2014). As such SL research should not be considered in the context of the plant alone, but also the
environment that it inhabits. The link between plants, their microbiome and stress tolerance traits is
particularly interesting in the context of legumes, which are characterised by their symbiotic
interactions. However, in order to fully understand the dynamic processes underpinning legume
responses to abiotic stresses, more comprehensive genetic resources must be developed.
8.4. Enhancing low temperature tolerance in Vicia faba
Faba bean is a globally important legume, the growth of which is restricted in Europe by the
incidence of extreme freezing (Herzog, 1987; Link et al., 2010). However, while classical genetic
approaches have gone some way toward the development of improved faba bean cultivars, a lack of
in-depth sequence information (O’Sullivan and Angra, 2016) has hindered modern breeding
approaches, such as marker assisted selection. As such, the studies undertaken in this thesis
characterised the low temperature tolerance of 5 faba bean cultivars and transcriptomic analysis was
performed on the most sensitive and tolerant of these. Additionally, genetic resources were enhanced
for V. faba through the genome sequencing of the Wizard cultivar. Thus, these studies have increased
the physiological understanding of low temperature tolerance in faba bean, but crucially they have
significantly contributed to the currently available genetic data.
The results presented in chapter 6 showed the faba bean genome to be large and highly repetitive,
with some polymorphisms being present in the coding regions of chloroplast and mitochondrial
genomes. The nuclear genome of faba bean is fascinating, not least because it is very large for a
diploid species (~13 Gb), with a largely repetitive composition and a high number of retrotransposons
(RT). RTs are considered to be the raw material for evolutionary innovation in plant genomes
(Grandbastien, 2015), allowing the inclusion of new genes, regulating gene expression and
contributing to histone modification and DNA methylation (Cavrak et al., 2014). However, the
Page | 176
relative organization of these retroelements in complex plant genomes and their regulation during
environmental stress remains poorly understood. The results presented in chapter 7 showed a number
of transcription factors to be up-regulated in the cold tolerant cultivar, Hiverna, as compared to
Wizard. Among these was transcription factor jumonji, which is linked to histone methylation and the
epigenetic regulation of gene expression (Hu et al., 2015). Moreover, 36 repetitive elements were
identified as being actively transcribed under acclimatory conditions. As such, the epigenetic factors
contributing to low temperature tolerance would be an interesting target for future work. The
establishment and application of retrotransposon and single nucleotide polymorphism marker systems
should be explored, together with the characterisation of genome methylation patterns and
retrotransposon activation in response to alterations in cellular redox state resulting from exposure to
chilling (Peng and Zhang, 2009; Cavrak et al., 2014; Alzohairy et al., 2014). However, such
investigations would be contingent on the availability of a comprehensive reference genome.
In the low temperature acclimation transcriptome presented in chapter 7, 12 transcription factors were
shown to be more highly expressed in Hiverna than Wizard. Transcription factors have been proposed
as selection markers in their own right for the accelerated breeding of favourable agronomic traits
(Han et al., 2010; Bianchi et al., 2015; Pandey et al., 2016). Thus these studies present interesting
targets for further investigation. Moreover, the sequence data generated in these studies may assist in
the identification of novel genes, specific to faba bean. However, efforts must be made to fully
characterise the transcriptomic data generated, with particular regard to the generation of a
comprehensive reference transcriptome, for which current annotations remain inadequate (Humann et
al., 2016). Furthermore, the data arising from these studies can be utilised to understand the
differences in gene expression between chilling and freezing stresses in faba bean.
Subsequent studies in faba bean genetics should aim to define the gene space of faba bean by whole
genome sequencing, and to order these genes into physical and genetic maps using methods such as
optical mapping (Tang et al., 2015). Through combining molecular genetics, bioinformatics, whole
plant physiology, and biochemistry; new fundamental information concerning the evolution and
regulation of the faba bean genome may be provided. The adoption of next-generation sequencing
approaches in faba bean research will facilitate the identification of new stress tolerance markers, that
will accelerate breeding programs (Paszkowski, 2015).

Page | 177
8.5. Conclusions
The studies presented in this thesis have highlighted the effect of phytocystatins and strigolactones on
low temperature tolerance in legume species. The development of chilling and freezing tolerant
legumes is an essential step in the protection of global food security. However, few comprehensive
genetic resources exist for important legume crops, such as faba bean. Thus to date, cultivar
development has not kept pace with cereal crops. These studies have generated genetic and
transcriptomic data for faba bean. Through combining transcriptomic data analysis with experimental
approaches, based on the findings in pea, soybean and Arabidopsis, markers may be identified for the
accelerated breeding of low temperature tolerance in this crop. Moreover, the depth of the gene based
data will allow for the construction of genomic and transcriptomic resources that will be integral to
further research in the field of faba bean biology.

Page | 178
9. References
Abe, K., Kondo, H., and Arai, S. (1987). Purification and characterization of a rice cysteineproteinase inhibitor. Agric. Biol. Chem 51: 2763–2768.
Abe, M., Kobayashi, Y., Yamamoto, S., Daimon, Y., Yamaguchi, A., Ikeda, Y., Ichinoki, H.,Notaguchi, M., Goto, K., and Araki, T. (2005). FD, a bZIP protein mediating signals from thefloral pathway integrator FT at the shoot apex. Science 309: 1052–1056.
Achard, P., Gong, F., Cheminant, S., Alioua, M., Hedden, P., and Genschik, P. (2008). The cold-inducible CBF1 factor-dependent signaling pathway modulates the accumulation of the growth-repressing DELLA proteins via its effect on gibberellin metabolism. Plant Cell 20: 2117–29.
Aida, M., Ishida, T., Fukaki, H., Fujisawa, H., and Tasaka, M. (1997). Genes involved in organseparation in Arabidopsis: . An analysis of the cup-shaped cotyledon mutant. Plant Cell Am.Soc. Plant Physiol. 9: 841–857.
Al-Babili, S. and Bouwmeester, H.J. (2015). Strigolactones, a novel carotenoid-derived planthormone. Annu. Rev. Plant Biol. 66: 161–86.
Al-Shahrour, F., Díaz-Uriarte, R., and Dopazo, J. (2004). FatiGO: A web tool for findingsignificant associations of gene ontology terms with groups of genes. Bioinformatics 20: 578–580.
Alzohairy, A.M., Sabir, J.S.M., Gyulai, G., Younis, R.A.A., Jansen, R.K., and Bahieldin, A.(2014). Environmental stress activation of plant long-terminal repeat retrotransposons. Funct.Plant Biol. 41: 557–567.
Amid, A., Lytovchenko, A., Fernie, A.R., Warren, G., and Thorlby, G.J. (2012). The sensitive tofreezing3 mutation of Arabidopsis thaliana is a cold-sensitive allele of homomeric acetyl-CoAcarboxylase that results in cold-induced cuticle deficiencies. J. Exp. Bot. 63: 5289–5299.
Andrews, S. (2015). Babraham Bioinformatics - Trim Galore! Trim Galore! wrapper Scr. Autom.Qual. Adapt. trimming Qual. Control.
Andrews, S. (2010). FastQC: A quality control tool for high throughput sequence data.Bioinformatics: 1.
Apel, K. and Hirt, H. (2004). Reactive oxygen species: metabolism, oxidative stress, and signaltransduction. Annu. Rev. Plant Biol. 55: 373–99.
Arai, S., Watanabe, H., Kondo, H., Emori, Y., and Abe, K. (1991). Papain-inhibitory activity oforyzacystatin, a rice seed cysteine proteinase inhibitor, depends on the central Gln-Val-Val-Ala-Gly region conserved among cystatin superfamily members. J. Biochem. 109: 294–8.
Arbaoui, M. and Link, W. (2008). Effect of hardening on frost tolerance and fatty acid compositionof leaves and stems of a set of faba bean (Vicia faba L.) genotypes. Euphytica 162: 211–219.
Arite, T., Umehara, M., Ishikawa, S., Hanada, A., Maekawa, M., Yamaguchi, S., and Kyozuka,J. (2009). D14, a strigolactone-insensitive mutant of rice, shows an accelerated outgrowth oftillers. Plant Cell Physiol. 50: 1416–1424.
Arnaud, N. and Pautot, V. (2014). Ring the BELL and tie the KNOX: roles for TALEs ingynoecium development. Front. Plant Sci. 5: 93.
Aroca, R., Porcel, R., and Ruiz-Lozano, J.M. (2007). How does arbuscular mycorrhizal symbiosisregulate root hydraulic properties and plasma membrane aquaporins in Phaseolus vulgaris underdrought, cold or salinity stresses? New Phytol. 173: 808–816.
Page | 179
Artus, N.N., Uemura, M., Steponkus, P.L., Gilmour, S.J., Lin, C., and Thomashow, M.F. (1996).Constitutive expression of the cold-regulated Arabidopsis thaliana COR15a gene affects bothchloroplast and protoplast freezing tolerance. Proc. Natl. Acad. Sci. U. S. A. 93: 13404–13409.
Arun-Chinnappa, K.S. and McCurdy, D.W. (2015). De novo assembly of a genome-widetranscriptome map of Vicia faba (L.) for transfer cell research. Front. Plant Sci. 6: 217.
Atkins, C.A. (1987). Metabolism and translocation of fixed nitrogen in the nodulated legume. PlantSoil 100: 157–169.
Atkinson, N.J. and Urwin, P.E. (2012). The interaction of plant biotic and abiotic stresses: fromgenes to the field. J. Exp. Bot. 63: 3523–3543.
Baldos, U.L.C. and Hertel, T.W. (2014). Global food security in 2050: the role of agriculturalproductivity and climate change. Aust. J. Agric. Resour. Econ. 58: 554–570.
Bao, W., Kojima, K.K., and Kohany, O. (2015). Repbase update, a database of repetitive elementsin eukaryotic genomes. Mob. DNA 6: 11.
Barton, L., Thamo, T., Engelbrecht, D., and Biswas, W.K. (2014). Does growing grain legumes orapplying lime cost effectively lower greenhouse gas emissions from wheat production in a semi-arid climate? J. Clean. Prod. 83: 194–203.
Baxter, A., Mittler, R., and Suzuki, N. (2014). ROS as key players in plant stress signalling. J. Exp.Bot. 65: 1229–1240.
Beers, E.P., Woffenden, B.J., and Zhao, C. (2000). Plant proteolytic enzymes: Possible roles duringprogrammed cell death. Plant Mol. Biol. 44: 399–415.
Belenghi, B., Acconcia, F., Trovato, M., Perazzolli, M., Bocedi, A., Polticelli, F., Ascenzi, P., andDelledonne, M. (2003). AtCYS1, a cystatin from Arabidopsis thaliana, suppresseshypersensitive cell death. Eur. J. Biochem. 270: 2593–2604.
Benchabane, M., Schluter, U., Vorster, J., Goulet, M.C., and Michaud, D. (2010). Plant cystatins.Biochimie 92: 1657–1666.
Bennett, T., Sieberer, T., Willett, B., Booker, J., Luschnig, C., and Leyser, O. (2006). TheArabidopsis MAX pathway controls shoot branching by regulating auxin transport. Curr. Biol.16: 553–563.
Bennetzen, J.L. (2000). Transposable element contributions to plant gene and genome evolution.Plant Mol. Biol. 42: 251–269.
Benson, D.A., Cavanaugh, M., Clark, K., Karsch-Mizrachi, I., Lipman, D.J., Ostell, J., andSayers, E.W. (2013). GenBank. Nucleic Acids Res. 41.
Berendsen, R.L., Pieterse, C.M.J., and Bakker, P.A.H.M. (2012). The rhizosphere microbiomeand plant health. Trends Plant Sci. 17: 478–486.
Bertioli, D.J. et al. (2016). The genome sequences of Arachis duranensis and Arachis ipaensis, thediploid ancestors of cultivated peanut. Nat Genet 48: 438–446.
Bertrand, A., Bipfubusa, M., Castonguay, Y., Rocher, S., Szopinska-Morawska, A.,Papadopoulos, Y., and Renaut, J. (2016). A proteome analysis of freezing tolerance in redclover (Trifolium pratense L.). BMC Plant Biol. 16: 65.
Besserer, A., Puech-Pagès, V., Kiefer, P., Gomez-Roldan, V., Jauneau, A., Roy, S., Portais, J.C.,Roux, C., Bécard, G., and Séjalon-Delmas, N. (2006). Strigolactones stimulate arbuscular

Page | 180
mycorrhizal fungi by activating mitochondria. PLoS Biol. 4: 1239–1247.
Beveridge, C. a, Dun, E. A, and Rameau, C. (2009). Pea has its tendrils in branching discoveriesspanning a century from auxin to strigolactones. Plant Physiol. 151: 985–990.
Bhalerao, R., Keskitalo, J., Sterky, F., Erlandsson, R., Björkbacka, H., Birve, S.J., Karlsson, J.,Gardeström, P., Gustafsson, P., Lundeberg, J., and Jansson, S. (2003). Gene expression inautumn leaves. Plant Physiol. 131: 430–342.
Bianchi, V.J., Rubio, M., Trainotti, L., Verde, I., Bonghi, C., and Martínez-Gómez, P. (2015).Prunus transcription factors: breeding perspectives. Front. Plant Sci. 6: 443.
Bieza, K. and Lois, R. (2001). An Arabidopsis mutant tolerant to lethal ultraviolet-B levels showsconstitutively elevated accumulation of flavonoids and other phenolics. Plant Physiol. 126:1105–1115.
Bolle, C. (2004). The role of GRAS proteins in plant signal transduction and development. Planta218: 683–692.
Bond, D.A. and Crofton, G.R.A. (1999). History of winter beans (Vicia faba) in the UK. J. R. Agric.Soc. Engl. 160: 200–209.
Bond, D.A. and Toynbee-clarke, G. (1968). Protein content of spring and winter varieties of fieldbeans ( Vicia faba L .) sown and harvested on the same dates. J. Agric. Sci. Cambridge 70: 403–404.
Bortesi, L. and Fischer, R. (2015). The CRISPR/Cas9 system for plant genome editing and beyond.Biotechnol. Adv. 33: 41–52.
Bowler, C., Montagu, M. V, and Inze, D. (1992). Superoxide dismutase and stress tolerance. Annu.Rev. Plant Physiol. Plant Mol. Biol. 43: 83–116.
Boye, J., Zare, F., and Pletch, A. (2010). Pulse proteins: Processing, characterization, functionalproperties and applications in food and feed. Food Res. Int. 43: 414–431.
Boyer, J.S. (1982). Plant productivity and environment. Science (80-. ). 218: 443–448.
Braun, N. et al. (2012). The pea TCP transcription factor PsBRC1 acts downstream of Strigolactonesto control shoot branching. Plant Physiol. 158: 225–38.
Bu, Q., Lv, T., Shen, H., Luong, P., Wang, J., Wang, Z., Huang, Z., Xiao, L., Engineer, C., Kim,T.H., Schroeder, J.I., and Huq, E. (2014). Regulation of drought tolerance by the F-boxprotein MAX2 in arabidopsis. Plant Physiol. 164: 424–39.
Calzadilla, P.I., Maiale, S.J., Ruiz, O.A., and Escaray, F.J. (2016). Transcriptome responsemediated by cold stress in Lotus japonicus. Front. Plant Sci. 7: 347.
Campbell, B.A., Hallengren, J., and Hannapel, D.J. (2008). Accumulation of BEL1-liketranscripts in solanaceous species. Planta 228: 897–906.
Carpaneto, A., Ivashikina, N., Levchenko, V., Krol, E., Jeworutzki, E., Zhu, J.-K., and Hedrich,R. (2007). Cold transiently activates calcium-permeable channels in Arabidopsis mesophyllcells. Plant Physiol. 143: 487–494.
Carrión, C., Martínez, D., Costa, M., and Guiamet, J. (2014). Senescence-associated vacuoles, aspecific lytic compartment for degradation of chloroplast proteins? Plants 3: 498–512.
Catala, R., Lopez-Cobollo, R., Mar Castellano, M., Angosto, T., Alonso, J.M., Ecker, J.R., and

Page | 181
Salinas, J. (2014). The Arabidopsis 14-3-3 Protein RARE COLD INDUCIBLE 1A Links Low-Temperature Response and Ethylene Biosynthesis to Regulate Freezing Tolerance and ColdAcclimation. Plant Cell 26: 1–18.
Cavrak, V. V., Lettner, N., Jamge, S., Kosarewicz, A., Bayer, L.M., and Mittelsten Scheid, O.(2014). How a retrotransposon exploits the plant’s heat stress response for its activation. PLoSGenet. 10.
Chalker-Scott, L. (1999). Environmental significance of anthocyanins in plant stress responses.Photochem. Photobiol. 70: 1–9.
Chang, W.C., Wahlqvist, M.L., Chang, H.Y., Hsu, C.C., Lee, M.S., Wang, W.S., and Hsiung,C.A. (2012). A bean-free diet increases the risk of all-cause mortality among Taiwanesewomen: the role of the metabolic syndrome. Public Health Nutr. 15: 663–672.
Chen, C.C., Liang, C.S., Kao, A.L., and Yang, C.C. (2010). HHP1, a novel signalling componentin the cross-talk between the cold and osmotic signalling pathways in Arabidopsis. J. Exp. Bot.61: 3305–3320.
Chen, Z., Zheng, Z., Huang, J., Lai, Z., and Fan, B. (2009). Biosynthesis of salicylic acid in plants.Plant Signal. Behav. 4: 493–496.
Cheng, L., Gao, X., Li, S., Shi, M., Javeed, H., Jing, X., Yang, G., and He, G. (2010). Proteomicanalysis of soybean [Glycine max (L.) Meer.] seeds during imbibition at chilling temperature.Mol. Breed. 26: 1–17.
Cheng, X., Ruyter-Spira, C., and Bouwmeester, H. (2013). The interaction between strigolactonesand other plant hormones in the regulation of plant development. Front. Plant Sci. 4: 199.
Chinnusamy, V., Ohta, M., Kanrar, S., Lee, B. ha, Hong, X., Agarwal, M., and Zhu, J.K. (2003).ICE1: A regulator of cold-induced transcriptome and freezing tolerance in arabidopsis. GenesDev. 17: 1043–1054.
Chinnusamy, V., Zhu, J., and Zhu, J.-K. (2007). Cold stress regulation of gene expression inplants. Trends Plant Sci. 12: 444–51.
Chu, M.H., Liu, K.L., Wu, H.Y., Yeh, K.W., and Cheng, Y.S. (2011). Crystal structure oftarocystatin-papain complex: Implications for the inhibition property of group-2 phytocystatins.Planta 234: 243–254.
Ciardi, J.A., Deikman, J., and Orzolek, M.D. (1997). Increased ethylene synthesis enhanceschilling tolerance in tomato. Physiol. Plant. 101: 333–340.
Coleman-Derr, D. and Tringe, S.G. (2014). Building the crops of tomorrow: Advantages ofsymbiont-based approaches to improving abiotic stress tolerance. Front. Microbiol. 5.
Cook, C.E., Whichard, L.P., Wall, M., Egley, G.H., Coggon, P., Luhan, P. A., and McPhail, A.T. (1972). Germination stimulants. II. Structure of strigol, a potent seed germination stimulantfor witchweed (Striga lutea). J. Am. Chem. Soc. 94: 6198–6199.
Crawford, A.J., McLachlan, D.H., Hetherington, A.M., and Franklin, K.A. (2012). Hightemperature exposure increases plant cooling capacity. Curr. Biol. 22.
Csanad, G. and Pal, M. (2014). Two distinct plastid genome configurations and unprecedentedintraspecies length variation in the accD coding region in Medicago truncatula. DNA Res. 21:417–427.
Cubero, J.I. (1974). On the Evolution of Vicia faba L . Theor Appl Genet 45: 47–51.
Page | 182
De Cuyper, C., Fromentin, J., Yocgo, R.E., De Keyser, A., Guillotin, B., Kunert, K., Boyer,F.D., and Goormachtig, S. (2015). From lateral root density to nodule number, thestrigolactone analogue GR24 shapes the root architecture of Medicago truncatula. J. Exp. Bot.66: 137–146.
Dash, S. et al. (2015). Legume information system (LegumeInfo.org): a key component of a set offederated data resources for the legume family. Nucleic Acids Res. 44: gkv1159.
Davila, J.I., Arrieta-Montiel, M.P., Wamboldt, Y., Cao, J., Hagmann, J., Shedge, V., Xu, Y.-Z.,Weigel, D., and Mackenzie, S.A. (2011). Double-strand break repair processes drive evolutionof the mitochondrial genome in Arabidopsis. BMC Biol. 9: 64.
Desbrosses, G.J. and Stougaard, J. (2011). Root nodulation: A paradigm for how plant-microbesymbiosis influences host developmental pathways. Cell Host Microbe 10: 348–358.
Diaz-mendoza, M., Velasco-arroyo, B., Santamaria, M.E., González-melendi, P., Martinez, M.,and Diaz, I. (2016). Plant senescence and proteolysis : two processes with one destiny. Genet. Mol. Biol. 39: 329–338.
Dinari, A., Niazi, A., Afsharifar, A.R., and Ramezani, A. (2013). Identification of upregulatedgenes under cold stress in cold-tolerant chickpea using the cDNA-AFLP approach. PLoS One 8.
Dita, M.A., Rispail, N., Prats, E., Rubiales, D., and Singh, K.B. (2006). Biotechnology approachesto overcome biotic and abiotic stress constraints in legumes. Euphytica 147: 1–24.
Divi, U.K. and Krishna, P. (2010). Overexpression of the brassinosteroid biosynthetic geneAtDWF4 in Arabidopsis seeds overcomes abscisic acid-induced inhibition of germination andincreases cold tolerance in transgenic seedlings. J. Plant Growth Regul. 29: 385–393.
Dong, C.-J., Li, L., Shang, Q.-M., Liu, X.-Y., and Zhang, Z.-G. (2014). Endogenous salicylic acidaccumulation is required for chilling tolerance in cucumber (Cucumis sativus L.) seedlings.Planta 240: 687–700.
Dong, Y. et al. (2012). Sequencing and automated whole-genome optical mapping of the genome ofa domestic goat (Capra hircus). Nat. Biotechnol. 31: 135–141.
Van Doorn, W.G. and Woltering, E.J. (2004). Senescence and programmed cell death: Substanceor semantics? J. Exp. Bot. 55: 2147–2153.
Dor, E., Joel, D.M., Kapulnik, Y., Koltai, H., and Hershenhorn, J. (2011). The syntheticstrigolactone GR24 influences the growth pattern of phytopathogenic fungi. Planta 234: 419–427.
Drummond, R.S.M., Sheehan, H., Simons, J.L., Martínez-Sánchez, N.M., Turner, R.M.,Putterill, J., and Snowden, K.C. (2011). The expression of petunia strigolactone pathwaygenes is altered as part of the endogenous developmental program. Front. Plant Sci. 2: 115.
Du, H., Liu, H., and Xiong, L. (2013). Endogenous auxin and jasmonic acid levels are differentiallymodulated by abiotic stresses in rice. Front. Plant Sci. 4: 397.
Du, H., Yang, S.-S., Liang, Z., Feng, B.-R., Liu, L., Huang, Y.-B., and Tang, Y.-X. (2012).Genome-wide analysis of the MYB transcription factor superfamily in soybean. BMC PlantBiol. 12: 106.
Du, Y.C., Nose, A., and Wasano, K. (1999). Effects of chilling temperature on photosynthetic rates,photosynthetic enzyme activities and metabolite levels in leaves of three sugarcane species.Plant, Cell Environ. 22: 317–324.

Page | 183
Duc, G., Bao, S., Baum, M., Redden, B., Sadiki, M., Suso, M.J., Vishniakova, M., and Zong, X.(2010). Diversity maintenance and use of Vicia faba L. genetic resources. F. Crop. Res. 115:270–278.
Duc, G., Moussy, F., Zong, X., and Ding, G. (1999). Single gene mutation for green cotyledons as amarker for the embryonic genotype in faba bean, Vicia faba. Plant Breed. 118: 577–578.
Duc, G. and Picard, J. (1986). Note on the presence of the Sym-1 gene in Vicia faba hampering itssymbiosis with Rhizobium leguminosarum. Euphytica 35: 61–64.
Dun, E.A., Brewer, P.B., and Beveridge, C.A. (2009). Strigolactones: discovery of the elusive shootbranching hormone. Trends Plant Sci. 14: 364–372.
Van Durme, M. and Nowack, M.K. (2016). Mechanisms of developmentally controlled cell deathin plants. Curr. Opin. Plant Biol. 29: 29–37.
Eason, J.R., West, P.J., Brummell, D.A., Watson, L.M., Somerfield, S.D., and McLachlan,A.R.G. (2014). Overexpression of the protease inhibitor BoCPI-1 in broccoli delays chlorophyllloss after harvest and causes down-regulation of cysteine protease gene expression. PostharvestBiol. Technol. 97: 23–31.
Ellwood, S.R., Phan, H.T.T., Jordan, M., Hane, J., Torres, A.M., Avila, C.M., Cruz-Izquierdo,S., and Oliver, R.P. (2008). Construction of a comparative genetic map in faba bean (Viciafaba L.); conservation of genome structure with Lens culinaris. BMC Genomics 9: 380.
Enneking, D. (1994). The toxicity of Vicia species and their utilisation as grain legumes (TheUniversity of Adelaide, AUS, Thesis).
Eremina, M., Rozhon, W., and Poppenberger, B. (2016). Hormonal control of cold stressresponses in plants. Cell. Mol. Life Sci. 73: 797–810.
Erith, A.G. (1930). The inheritance of colour, size and form of seeds, and of flower colour in Viciafaba L. Genetica 12: 477–510.
European Comission Joint Research Centre (2011). Monitoring of agricultural resources. 2016.
FAOSTAT (2016). United Nations Food and Agriculture Organisation Website. 2016.
Ferguson, B.J., Indrasumunar, A., Hayashi, S., Lin, M.H., Lin, Y.H., Reid, D.E., and Gresshoff,P.M. (2010). Molecular analysis of legume nodule development and autoregulation. J. Integr.Plant Biol. 52: 61–76.
Foley, J.A. et al. (2011). Solutions for a cultivated planet. Nature 478: 337–342.
Foo, E. and Davies, N.W. (2011). Strigolactones promote nodulation in pea. Planta 234: 1073–1081.
Foyer, C.H. et al. (2016). Neglecting legumes has compromised human health and sustainable foodproduction. Nat. Plants 2: 1–10.
Franklin, K.A. (2009). Light and temperature signal crosstalk in plant development. Curr. Opin.Plant Biol. 12: 63–68.
Franks, F. (1985). Biophysics and biochemistry at low temperatures (Cambridge University Press:Cambridge).
Fuchs, J., Strehl, S., Brandes, A., Schweizer, D., and Schubert, I. (1998). Molecular-cytogeneticcharacterization of the Vicia faba genome - Heterochromatin differentiation, replication patternsand sequence localization. Chromosom. Res. 6: 219–230.

Page | 184
Galtier, N. (2011). The intriguing evolutionary dynamics of plant mitochondrial DNA. BMC Biol. 9:61.
Garg, N. and Geetanjali (2007). Symbiotic nitrogen fixation in legume nodules: process andsignaling. A review. Agron. Sustain. Dev. 27: 59–68.
Gass, T., Schori, A., Fossati, A., Soldati, A., and Stamp, P. (1996). Cold tolerance of soybean(Glycine max (L.) Merr.) during the reproductive phase. Eur. J. Agron. 5: 71–88.
Gaveliene, V., Novickiene, L., and Pakalniškyte, L. (2013). Effect of auxin physiologicalanalogues on rapeseed (Brassica napus) cold hardening, seed yield and quality. J. Plant Res.126: 283–292.
Gill, S.S. and Tuteja, N. (2010). Reactive oxygen species and antioxidant machinery in abiotic stresstolerance in crop plants. Plant Physiol. Biochem. 48: 909–930.
Giordani, T., Cossu, R.M., Mascagni, F., Marroni, F., Morgante, M., Cavallini, A., and Natali,L. (2016). Genome-wide analysis of LTR-retrotransposon expression in leaves of Populus ×canadensis water-deprived plants. Tree Genet. Genomes 12: 75.
Godfray, H.C.J., Beddington, J.R., Crute, I.R., Haddad, L., Lawrence, D., Muir, J.F., Pretty, J.,Robinson, S., Thomas, S.M., and Toulmin, C. (2010). Food Security: The challenge offeeding 9 billion people. Science (80-. ). 327: 812–818.
Godfray, H.C.J. and Garnett, T. (2014). Food security and sustainable intensification. Philos.Trans. R. Soc. B-Biological Sci. 369.
Goldberg, I., Nadler, V., and Hochman, A. (1987). Mechanism of nitrogenase switch-off byoxygen. J. Bacteriol. 169: 874–879.
González-Rábade, N., Badillo-Corona, J.A., Aranda-Barradas, J.S., and Oliver-Salvador,M.D.C. (2011). Production of plant proteases in vivo and in vitro--a review. Biotechnol. Adv.29: 983–96.
Goodstein, D.M., Shu, S., Howson, R., Neupane, R., Hayes, R.D., Fazo, J., Mitros, T., Dirks, W.,Hellsten, U., Putnam, N., and Rokhsar, D.S. (2012). Phytozome: A comparative platform forgreen plant genomics. Nucleic Acids Res. 40.
Graham, P.H. and Vance, C.P. (2003). Legumes: Importance and constraints to greater use. PlantPhysiol. 131: 872–877.
Grandbastien, M.A. (2015). LTR retrotransposons, handy hitchhikers of plant regulation and stressresponse. Biochim. Biophys. Acta - Gene Regul. Mech. 1849: 403–416.
Guo, Y. (2013). Towards systems biological understanding of leaf senescence. Plant Mol. Biol. 82:519–528.
Guo, Z., Tan, J., Zhuo, C., Wang, C., Xiang, B., and Wang, Z. (2014). Abscisic acid, H2O2 andnitric oxide interactions mediated cold-induced S-adenosylmethionine synthetase in Medicagosativa subsp. Falcata that confers cold tolerance through up-regulating polyamine oxidation.Plant Biotechnol. J. 12: 601–612.
van Ha, C. et al. (2014). Positive regulatory role of strigolactone in plant responses to drought andsalt stress. Proc. Natl. Acad. Sci. U. S. A. 111: 851–6.
Hakam, N., Khanizadeh, S., DeEll, J.R., and Richer, C. (2000). Assessing chilling tolerance inroses using chlorophyll fluorescence. HortScience 35: 184–186.
Page | 185
Han, Y.H., Khu, D.M., Torres-Jerez, I., Udvardi, M., and Monteros, M.J. (2010). Planttranscription factors as novel molecular markers for legumes. Sustain. Use Genet. Divers.Forage Turf Breed.: 421–425\n572.
Hannah, M.A., Heyer, A.G., and Hincha, D.K. (2005). A global survey of gene regulation duringcold acclimation in Arabidopsis thaliana. PLoS Genet. 1: 0179–0196.
Harrak, H., Azelmat, S., Baker, E.N., and Tabaeizadeh, Z. (2001). Isolation and characterizationof a gene encoding a drought-induced cysteine protease in tomato (Lycopersicon esculentum).Genome 44: 368–374.
Hartman, G.L., West, E.D., and Herman, T.K. (2011). Crops that feed the World 2. Soybean-worldwide production, use, and constraints caused by pathogens and pests. Food Secur. 3: 5–17.
Hasanuzzaman, M., Nahar, K., and Fujita, M. (2009). Extreme temperature responses , oxidativestress and antioxidant defense in plants. In Abiotic Stress - Plant Responses and Applications inAgriculture, pp. 169–205.
Hecht, V., Knowles, C.L., Vander Schoor, J.K., Liew, L.C., Jones, S.E., Lambert, M.J.M., andWeller, J.L. (2007). Pea LATE BLOOMER1 is a GIGANTEA ortholog with roles inphotoperiodic flowering, deetiolation, and transcriptional regulation of circadian clock genehomologs. Plant Physiol. 144: 648–61.
Heckmann, A.B., Lombardo, F., Miwa, H., Perry, J.A., Bunnewell, S., Parniske, M., Wang,T.L., and Downie, J.A. (2006). Lotus japonicus nodulation requires two GRAS domainregulators, one of which is functionally conserved in a non-legume. Plant Physiol 142: 1739–1750.
Hedden, P. and Thomas, S.G. (2012). Gibberellin biosynthesis and its regulation. Biochem. J. 444:11–25.
Van Heerden, P.D.R., Kiddle, G., Pellny, T.K., Mokwala, P.W., Jordaan, A., Strauss, A.J., deBeer, M., Schlüter, U., Kunert, K.J., and Foyer, C.H. (2008). Regulation of respiration andthe oxygen diffusion barrier in soybean protect symbiotic nitrogen fixation from chilling-induced inhibition and shoots from premature senescence. Plant Physiol. 148: 316–327.
Van Heerden, P.D.R., Kruger, G.H.J., Loveland, J.E., Parry, M.A.J., and Foyer, C.H. (2003).Dark chilling imposes metabolic restrictions on photosynthesis in soybean. Plant Cell Environ.26: 323–337.
Van Heerden, P.D.R., Strasser, R.J., and Krüger, G.H.J. (2004a). Reduction of dark chillingstress in N2-fixing soybean by nitrate as indicated by chlorophyll α fluorescence kinetics. Physiol. Plant. 121: 239–249.
Van Heerden, P.D.R., Viljoen, M.M., De Villiers, M.F., and Krüger, G.H.J. (2004b). Limitationof photosynthetic carbon metabolism by dark chilling in temperate and tropical soybeangenotypes. Plant Physiol. Biochem. 42: 117–124.
Hekneby, M., Antolín, M.C., and Sánchez-Díaz, M. (2006). Frost resistance and biochemicalchanges during cold acclimation in different annual legumes. Environ. Exp. Bot. 55: 305–314.
Herzog, H. (1987). Freezing resistance and development of faba beans as affected by ambienttemperatures, soil moisture and variety. J. Agron. Crop Sci. 159: 90–100.
Herzog, H. (1989). Influence of pre-hardening duration and dehardening temperatures on varietalfreezing resistance in faba beans ( Vicia faba L.). Agronomie 9: 55–61.
Hetherington, A.M. and Brownlee, C. (2004). The generation of Ca(2+) signals in plants. Annu.
Page | 186
Rev. Plant Biol. 55: 401–27.
Hirsch, S. and Oldroyd, G.E.D. (2009). GRAS-domain transcription factors that regulate plantdevelopment. Plant Signal. Behav. 4: 698–700.
Hoagland, D.R. and Arnon, D.I. (1950). The water-culture method for growing plants without soil.Calif. Agric. Exp. Stn. Circular 3: 30–32.
van der Hoorn, R. A. (2008). Plant proteases: from phenotypes to molecular mechanisms. Annu.Rev. Plant Biol. 59: 191–223.
Hu, Y., Jiang, L., Wang, F., and Yu, D. (2013). Jasmonate regulates the inducer of cbf expression-C-repeat binding factor/DRE binding factor1 cascade and freezing tolerance in Arabidopsis.Plant Cell 25: 2907–24.
Hu, Y.-J., Belaghzal, H., Hsiao, W.-Y., Qi, J., Bradner, J.E., Guertin, D.A., Sif, S., andImbalzano, A.N. (2015). Transcriptional and post-transcriptional control of adipocytedifferentiation by Jumonji domain-containing protein 6. Nucleic Acids Res. 43: 7790–804.
Huang, X., Li, J., Bao, F., Zhang, X., and Yang, S. (2010). A gain-of-function mutation in theArabidopsis disease resistance gene RPP4 confers sensitivity to low temperature. Plant Physiol.154: 796–809.
Huber, W. et al. (2015). Orchestrating high-throughput genomic analysis with Bioconductor. NatMethods 12: 115–121.
Humann, J.L. et al. (2016). Cool Season Food Legume Genome Database: An up-to-date resourceenabling genetics, genomics and breeding research in pea, lentil, faba bean and chickpea. InProceedings of the International Plant and Animal Genome Conference (San Diego, CA, USA).
Hume, D.J. and Jackson, A.K.H. (1981). Frost Tolerance in Soybeans. Crop Sci. 21: 689–692.
Huston, A.L., Krieger-Brockett, B.B., and Deming, J.W. (2000). Remarkably low temperatureoptima for extracellular enzyme activity from Arctic bacteria and sea ice. Environ. Microbiol. 2:383–388.
Hye, R.W., Jin, H.K., Hong, G.N., and Pyung, O.L. (2004). The delayed leaf senescence mutantsof Arabidopsis, ore1, ore3, and ore9 are tolerant to oxidative stress. Plant Cell Physiol. 45: 923–932.
Illumina (2014). Sequencing Methods Review (A review of publications featuring IlluminaTechnology). Illumina Protoc. 199: 27.
Inci, N.E. and Toker, C. (2011). Screening and selection of faba beans (Vicia faba L.) for coldtolerance and comparison to wild relatives. Genet. Resour. Crop Evol. 58: 1169–1175.
IPCC (2014). Summary for Policymakers.
Irving, L.J. and Robinson, D. (2006). A dynamic model of Rubisco turnover in cereal leaves. NewPhytol. 169: 493–504.
Jaglo, K.R., Kleff, S., Amundsen, K.L., Zhang, X., Haake, V., Zhang, J.Z., Deits, T., andThomashow, M.F. (2001). Components of the Arabidopsis C-repeat/dehydration-responsiveelement binding factor cold-response pathway are conserved in Brassica napus and other plantspecies. Plant Physiol. 127: 910–7.
Jain, M. and Khurana, J.P. (2009). Transcript profiling reveals diverse roles of auxin-responsivegenes during reproductive development and abiotic stress in rice. FEBS J. 276: 3148–3162.

Page | 187
Jaleel, C.A., Riadh, K., Gopi, R., Manivannan, P., Inès, J., Al-Juburi, H.J., Chang-Xing, Z.,Hong-Bo, S., and Panneerselvam, R. (2009). Antioxidant defense responses: Physiologicalplasticity in higher plants under abiotic constraints. Acta Physiol. Plant. 31: 427–436.
Jarillo, J.A., Leyva, A., Salinas, J., and Martinez-Zapater, J.M. (1993). Low temperature inducesthe accumulation of alcohol dehydrogenase mRNA in Arabidopsis thaliana, a chilling-tolerantPlant. Plant Physiol 101: 833–837.
Jeon, J., Kim, N.Y., Kim, S., Kang, N.Y., Novák, O., Ku, S.J., Cho, C., Lee, D.J., Lee, E.J.,Strnad, M., and Kim, J. (2010). A subset of cytokinin two-component signaling system plays arole in cold temperature stress response in Arabidopsis. J. Biol. Chem. 285: 23371–23386.
Jiang, Y.P., Huang, L.F., Cheng, F., Zhou, Y.H., Xia, X.J., Mao, W.H., Shi, K., and Yu, J.Q.(2013). Brassinosteroids accelerate recovery of photosynthetic apparatus from cold stress bybalancing the electron partitioning, carboxylation and redox homeostasis in cucumber. Physiol.Plant. 148: 133–145.
Johnson, X., Brcich, T., Dun, E.A., Goussot, M., Haurogné, K., Beveridge, C.A., and Rameau,C. (2006). Branching genes are conserved across species. Genes controlling a novel signal inpea are coregulated by other long-distance signals. Plant Physiol. 142: 1014–26.
Jones, P.D. and Moberg, A. (2003). Hemispheric and large-scale surface air temperature variations:An extensive revision and an update to 2001. J. Clim. 16: 206–223.
Kagale, S., Divi, U.K., Krochko, J.E., Keller, W.A., and Krishna, P. (2007). Brassinosteroidconfers tolerance in Arabidopsis thaliana and Brassica napus to a range of abiotic stresses.Planta 225: 353–364.
Kang, Y.J. et al. (2015). Draft genome sequence of adzuki bean, Vigna angularis. Sci. Rep. 5: 8069.
Kang, Y.J. et al. (2014). Genome sequence of mungbean and insights into evolution within Vignaspecies. Nat. Commun. 5: 5443.
Kaplan, F., Kopka, J., Sung, D.Y., Zhao, W., Popp, M., Porat, R., and Guy, C.L. (2007).Transcript and metabolite profiling during cold acclimation of Arabidopsis reveals an intricaterelationship of cold-regulated gene expression with modifications in metabolite content. Plant J.50: 967–981.
Kasuga, M., Liu, Q., Miura, S., Yamaguchi-Shinozaki, K., and Shinozaki, K. (1999). Improvingplant drought, salt, and freezing tolerance by gene transfer of a\nsingle stress-inducibletranscription factor. Nat. Biotechnol. 17: 287–291.
Kato, Y., Murakami, S., Yamamoto, Y., Chatani, H., Kondo, Y., Nakano, T., Yokota, A., andSato, F. (2004). The DNA-binding protease, CND41, and the degradation of ribulose-1,5-bisphosphate carboxylase/oxygenase in senescent leaves of tobacco. Planta 220: 97–104.
Kaur, S., Pembleton, L.W., Cogan, N.O., Savin, K.W., Leonforte, T., Paull, J., Materne, M., andForster, J.W. (2012). Transcriptome sequencing of field pea and faba bean for discovery andvalidation of SSR genetic markers. BMC Genomics 13: 104.
Kelly, L.J. and Leitch, I.J. (2011). Exploring giant plant genomes with next-generation sequencingtechnology. Chromosom. Res. 19: 939–953.
Kidokoro, S., Watanabe, K., Ohori, T., Moriwaki, T., Maruyama, K., Mizoi, J., Myint Phyu SinHtwe, N., Fujita, Y., Sekita, S., Shinozaki, K., and Yamaguchi-Shinozaki, K. (2015).Soybean DREB1/CBF-type transcription factors function in heat and drought as well as coldstress-responsive gene expression. Plant J. 81: 505–518.

Page | 188
Kiggundu, A. (2008). Engineering plant cysteine protease inhibitors for the transgenic control ofbanana weevil, Cosmopolites sordidus (Germar) (Coleoptera: Curculionidae) and othercoleopteran insects in transgenic plants. (University of Pretoria, SA, Thesis).
Kim, D.-H., Doyle, M.R., Sung, S., and Amasino, R.M. (2009). Vernalization: winter and thetiming of flowering in plants. Annu. Rev. Cell Dev. Biol. 25: 277–299.
Kim, S.Y. and Nam, K.H. (2010). Physiological roles of ERD10 in abiotic stresses and seedgermination of Arabidopsis. Plant Cell Rep. 29: 203–209.
Kim, Y., Park, S., Gilmour, S.J., and Thomashow, M.F. (2013). Roles of CAMTA transcriptionfactors and salicylic acid in configuring the low-temperature transcriptome and freezingtolerance of Arabidopsis. Plant J. 75: 364–376.
Kingston-Smith, A.H., Harbinson, J., Williams, J., and Foyer, C.H. (1997). Effect of chilling oncarbon assimilation, enzyme activation, and photosynthetic electron transport in the absence ofphotoinhibition in maize leaves. Plant Physiol. 114: 1039–1046.
Kitazaki, K., Kubo, T., Kitazaki, K., and Kubo, T. (2010). Cost of having the largestmitochondrial genome: Evolutionary mechanism of plant mitochondrial genome. J. Bot. 2010:1–12.
Klein, A., Houtin, H., Rond, C., Marget, P., Jacquin, F., Boucherot, K., Huart, M., Rivière, N.,Boutet, G., Lejeune-Hénaut, I., and Burstin, J. (2014). QTL analysis of frost damage in peasuggests different mechanisms involved in frost tolerance. Theor. Appl. Genet. 127: 1319–1330.
Klose, R.J., Kallin, E.M., and Zhang, Y. (2006). JmjC-domain-containing proteins and histonedemethylation. Nat. Rev. Genet. 7: 715–27.
Knight, H., Trewavas, A.J., and Knight, M.R. (1996). Cold calcium signaling in Arabidopsisinvolves two cellular pools and a change in calcium signature after acclimation. Plant Cell 8:489–503.
Knott, C.M., Biddle, A.J., and McKeown, B.M. (1994). Field Bean Handbook (The PGRO:Peterborough, UK).
Kode, V., Mudd, E.A., Iamtham, S., and Day, A. (2005). The tobacco plastid accD gene is essentialand is required for leaf development. Plant J. 44: 237–244.
Kosová, K. et al. (2012). Complex phytohormone responses during the cold acclimation of twowheat cultivars differing in cold tolerance, winter Samanta and spring Sandra. J. Plant Physiol.169: 567–576.
Kosová, K., Vítámvás, P., Prášil, I.T., and Renaut, J. (2011). Plant proteome changes under abioticstress - Contribution of proteomics studies to understanding plant stress response. J. Proteomics74: 1301–1322.
Kranner, I., Minibayeva, F. V, Beckett, R.P., and Seal, C.E. (2010). What is stress? Concepts,definitions and applications in seed science. New Phytol. 188: 655–673.
Krüger, G.H.J., De Villiers, M.F., Strauss, A.J., de Beer, M., van Heerden, P.D.R., Maldonado,R., and Strasser, R.J. (2014). Inhibition of photosystem II activities in soybean (Glycine max)genotypes differing in chilling sensitivity. South African J. Bot. 95: 85–96.
Kumar, R., Kushalappa, K., Godt, D., Pidkowich, M.S., Pastorelli, S., Hepworth, S.R., andHaughn, G.W. (2007). The Arabidopsis BEL1-LIKE HOMEODOMAIN proteins SAW1 andSAW2 act redundantly to regulate KNOX expression spatially in leaf margins. Plant Cell 19:2719–2735.

Page | 189
Kunert, K.J., Vorster, B.J., Fenta, B.A., Kibido, T., Dionisio, G., and Foyer, C.H. (2016).Drought Stress Responses in Soybean Roots and Nodules. Front. Plant Sci. 7: 1–7.
Kunert, K.J., Van Wyk, S.G., Cullis, C.A., Vorster, B.J., and Foyer, C.H. (2015). Potential use ofphytocystatins in crop improvement, with a particular focus on legumes. J. Exp. Bot. 66: 3559–3570.
de la Vega, M.P., Torres, A.M., Cubero, J.I., and Kole, C. (2012). Genetics, genomics andbreeding of cool season grain legumes C. Kole, ed (Science Publishers: Enfield, NewHampshire, USA).
Langmead, B. and Salzberg, S.L. (2012). Fast gapped-read alignment with Bowtie 2. Nat Methods9: 357–359.
Lareen, A., Burton, F., and Schäfer, P. (2016). Plant root-microbe communication in shaping rootmicrobiomes. Plant Mol. Biol. 90: 575–587.
Lassaletta, L., Billen, G., Grizzetti, B., Anglade, J., and Garnier, J. (2014). 50 year trends innitrogen use efficiency of world cropping systems: the relationship between yield and nitrogeninput to cropland. Environ. Res. Lett. 9.
Lee, D.H. and Lee, C.B. (2000). Chilling stress-induced changes of antioxidant enzymes in theleaves of cucumber: In gel enzyme activity assays. Plant Sci. 159: 75–85.
Lee, H.G. and Seo, P.J. (2015). The MYB96-HHP module integrates cold and abscisic acidsignaling to activate the CBF-COR pathway in Arabidopsis. Plant J.: 962–977.
Levine, A., Belinghi, B., Solomon, M., and Delledonne, M. (1999). Regulation of programmed celldeath in cultured soybean cells by a cysteine protease inhibitor. In Plant Biotechnology and InVitro Biology in the 21st Century, A. Altman, M. Ziv, and S. Izhar, eds (Kluwer AcademicPublishers: Jerusalem, Israel), pp. 421–424.
Li, H. (2011). A statistical framework for SNP calling, mutation discovery, association mapping andpopulation genetical parameter estimation from sequencing data. Bioinformatics 27: 2987–2993.
Li, X.P., Tian, A.G., Luo, G.Z., Gong, Z.Z., Zhang, J.S., and Chen, S.Y. (2005). Soybean DRE-binding transcription factors that are responsive to abiotic stresses. Theor. Appl. Genet. 110:1355–1362.
Liang, C., Brookhart, G., Feng, G.H., Reeck, G.R., and Kramer, K.J. (1991). Inhibition ofdigestive proteinases of stored grain Coleoptera by oryzacystatin, a cysteine proteinase inhibitorfrom rice seed. FEBS Lett. 278: 139–142.
Lichtenthaler, H.K. (1987). Chlorophylls and carotenoids: Pigments of photosyntheticbiomembranes. Methods Enzymol. 148: 350–382.
Link, W., Balko, C., and Stoddard, F.L. (2010). Winter hardiness in faba bean: Physiology andbreeding. F. Crop. Res. 115: 287–296.
Lisch, D. (2002). Mutator transposons. Trends Plant Sci. 7: 498–504.
Lobell, D.B., Schlenker, W., and Costa-Roberts, J. (2011). Climate trends and global cropproduction since 1980. Science (80-. ). 333: 616–620.
Long, N.V., Dolstra, O., Malosetti, M., Kilian, B., Graner, A., Visser, R.G.F., and van derLinden, C.G. (2013). Association mapping of salt tolerance in barley (Hordeum vulgare L.).Theor. Appl. Genet. 126: 2335–2351.

Page | 190
López-González, L., Mouriz, A., Narro-Diego, L., Bustos, R., Martínez-Zapater, J.M., Jarillo, J.a, and Piñeiro, M. (2014). Chromatin-dependent repression of the Arabidopsis floral integratorgenes involves plant specific PHD-containing proteins. Plant Cell 26: 3922–38.
Lopez-Obando, M., Ligerot, Y., Bonhomme, S., Boyer, F.-D., and Rameau, C. (2015).Strigolactone biosynthesis and signaling in plant development. Development 142: 3615–9.
López-Ráez, J.A., Kohlen, W., Charnikhova, T., Mulder, P., Undas, A.K., Sergeant, M.J.,Verstappen, F., Bugg, T.D.H., Thompson, A.J., Ruyter-Spira, C., and Bouwmeester, H.(2010). Does abscisic acid affect strigolactone biosynthesis? New Phytol. 187: 343–354.
Los, D.A. and Murata, N. (2004). Membrane fluidity and its roles in the perception ofenvironmental signals. Biochim. Biophys. Acta - Biomembr. 1666: 142–157.
Lucau-Danila, A., Toitot, C., Goulas, E., Blervacq, A.S., Hot, D., Bahrman, N., Sellier, H.,Lejeune-Henaut, I., and Delbreil, B. (2012). Transcriptome analysis in pea allows todistinguish chilling and acclimation mechanisms. Plant Physiol. Biochem. 58: 236–244.
Lukatkin, A.S., Brazaityte, A., Bobinas, C., and Duchovskis, P. (2012). Chilling injury in chilling-sensitive plants: a review. Agriculture 99: 111–124.
Lukatkin, A.S. (2005). Initiation and development of chilling injury in leaves of chilling-sensitiveplants. Russ. J. Plant Physiol. 52: 542–546.
Lyons, J.M. (1973). Chilling injury in plants. Annu. Rev. Plant Physiol. 24: 445–466.
Macas, J., Neumann, P., and Navrátilová, A. (2007). Repetitive DNA in the pea (Pisum sativumL.) genome: comprehensive characterization using 454 sequencing and comparison to soybeanand Medicago truncatula. BMC Genomics 8: 427.
Mahajan, S., Mahajan, S., Tuteja, N., and Tuteja, N. (2005). Cold, salinity and drought stresses:an overview. Arch. Biochem. Biophys. 444: 139–58.
Mahajan, S. and Tuteja, N. (2005). Cold, salinity and drought stresses: An overview. Arch.Biochem. Biophys. 444: 139–158.
Maqbool, A., Shafiq, S., and Lake, L. (2010). Radiant frost tolerance in pulse crops-a review.Euphytica 172: 1–12.
Martínez, D.E., Costa, M.L., Gomez, F.M., Otegui, M.S., and Guiamet, J.J. (2008). “Senescence-associated vacuoles” are involved in the degradation of chloroplast proteins in tobacco leaves.Plant J. 56: 196–206.
Maruyama, K., Urano, K., Yoshiwara, K., Morishita, Y., Sakurai, N., Suzuki, H., Kojima, M.,Sakakibara, H., Shibata, D., Saito, K., Shinozaki, K., and Yamaguchi-Shinozaki, K. (2014).Integrated analysis of the effects of cold and dehydration on rice metabolites, phytohormones,and gene transcripts. Plant Physiol. 164: 1759–71.
Mashiguchi, K. et al. (2011). The main auxin biosynthesis pathway in Arabidopsis. Proc. Natl.Acad. Sci. 108: 18512–18517.
Masoud, S. A., Johnson, L.B., White, F.F., and Reeck, G.R. (1993). Expression of a cysteineproteinase inhibitor (oryzacystatin-I) in transgenic tobacco plants. Plant Mol. Biol. 21: 655–63.
Massonneau, A., Condamine, P., Wisniewski, J.P., Zivy, M., and Rogowsky, P.M. (2005). Maizecystatins respond to developmental cues, cold stress and drought. Biochim. Biophys. Acta -Gene Struct. Expr. 1729: 186–199.

Page | 191
Mickelbart, M. V., Hasegawa, P.M., and Bailey-Serres, J. (2015). Genetic mechanisms of abioticstress tolerance that translate to crop yield stability. Nat. Rev. Genet. 16: 237–251.
Mittler, R. (2002). Oxidative stress, antioxidants and stress tolerance. Trends Plant Sci. 7: 405–410.
Mittler, R., Vanderauwera, S., Gollery, M., and Van Breusegem, F. (2004). Reactive oxygen genenetwork of plants. Trends Plant Sci. 9: 490–498.
Mok, D.W.S. and Mok, M.C. (2001). Cytokinin metabolism and action. Annu. Rev. Plant Physiol.nad Plant Mol. Biol. 52: 89–118.
Monroy, A.F., Sangwan, V., and Dhindsa, R.S. (1998). Low temperature signal transduction duringcold acclimation: Protein phosphatase 2A as an early target for cold-inactivation. Plant J. 13:653–660.
Moreno, J., Garcia-Murria, M.J., and Marin-Navarro, J. (2008). Redox modulation of Rubiscoconformation and activity through its cysteine residues. In Journal of Experimental Botany, pp.1605–1614.
Murata, N. and Los, D. A. (1997). Membrane fluidity and temperature perception. Plant Physiol.115: 875–879.
Nagano, Y., Furuhashi, H., Inaba, T., and Sasaki, Y. (2001). A novel class of plant-specific zinc-dependent DNA-binding protein that binds to A/T-rich DNA sequences. Nucleic Acids Res. 29:4097–105.
Nagata, K., Kudo, N., Keiko, A., Arai, S., and Tanokura, M. (2000). Three-dimensional solutionstructure of oryzacystatin-I , a cysteine proteinase. Biochemistry 39: 14753–14760.
Nair, J.S. and Ramaswamy, N.K. (2004). Chloroplast Proteases. Biol. Plant. 48: 321–326.
Nakashima, K., Yamaguchi-Shinozaki, K., and Shinozaki, K. (2014). The transcriptionalregulatory network in the drought response and its crosstalk in abiotic stress responses includingdrought, cold, and heat. Front. Plant Sci. 5: 170.
Naya, L., Ladrera, R., Ramos, J., González, E.M., Arrese-Igor, C., Minchin, F.R., and Becana,M. (2007). The response of carbon metabolism and antioxidant defenses of alfalfa nodules todrought stress and to the subsequent recovery of plants. Plant Physiol. 144: 1104–1114.
Negruk, V. (2013). Mitochondrial genome sequence of the legume Vicia faba. Front. Plant Sci. 4:128.
Nothlings, U. et al. (2008). Intake of vegetables, legumes, and fruit, and risk for all-cause,cardiovascular, and cancer mortality in a European diabetic population. J. Nutr. 138: 775–781.
Nuruzzaman, M., Sharoni, A.M., and Kikuchi, S. (2013). Roles of NAC transcription factors in theregulation of biotic and abiotic stress responses in plants. Front. Microbiol. 4.
O’Sullivan, D.M. and Angra, D. (2016). Advances in faba bean genetics and genomics. Front.Genet. 7: 1–12.
Olesen, J.E. and Bindi, M. (2002). Consequences of climate change for European agriculturalproductivity, land use and policy. Eur. J. Agron. 16: 239–262.
Olesen, J.E., Trnka, M., Kersebaum, K.C., Skjelvag, A.O., Seguin, B., Peltonen-Sainio, P.,Rossi, F., Kozyra, J., and Micale, F. (2011). Impacts and adaptation of European cropproduction systems to climate change. Eur. J. Agron. 34: 96–112.

Page | 192
Osmond, C.B., Austin, M.P., Berry, J.A., Billings, W.D., Boyer, J.S., Dacey, J.W.H., Nobel, P.S.,Smith, S.D., and Winner, W.E. (1987). Stress physiology and the distribution of plants.Bioscience 37: 38–48.
Otegui, M.S., Noh, Y.S., Martínez, D.E., Vila Petroff, M.G., Staehelin, L.A., Amasino, R.M.,and Guiamet, J.J. (2005). Senescence-associated vacuoles with intense proteolytic activitydevelop in leaves of Arabidopsis and soybean. Plant J. 41: 831–844.
Palma, J.M., Sandalio, L.M., Javier Corpas, F., Romero-Puertas, M.C., McCarthy, I., and DelRio, L.A. (2002). Plant proteases, protein degradation, and oxidative stress: Role ofperoxisomes. In Plant Physiology and Biochemistry, pp. 521–530.
Pandey, A., Sharma, M., and Pandey, G.K. (2016). Emerging roles of strigolactones in plantresponses to stress and development. Front. Plant Sci. 7: 1–17.
Pang, T., Ye, C.-Y., Xia, X., and Yin, W. (2013). De novo sequencing and transcriptome analysis ofthe desert shrub, Ammopiptanthus mongolicus, during cold acclimation using Illumina/Solexa.BMC Genomics 14: 488.
Parniske, M. (2008). Arbuscular mycorrhiza: the mother of plant root endosymbioses. Nat. Rev.Microbiol. 6: 763–75.
Parween, S., Nawaz, K., Roy, R., Pole, A.K., Venkata Suresh, B., Misra, G., Jain, M., Yadav, G.,Parida, S.K., Tyagi, A.K., Bhatia, S., and Chattopadhyay, D. (2015). An advanced draftgenome assembly of a desi type chickpea (Cicer arietinum L.). Sci. Rep. 5: 12806.
Paszkowski, J. (2015). Controlled activation of retrotransposition for plant breeding. Curr. Opin.Biotechnol. 32: 200–206.
Patro, R., Duggal, G., and Kingsford, C. (2015). Salmon: Accurate, versatile and ultrafastquantification from RNA-seq data using lightweight-alignment. bioRxiv: 21592.
Patto, M.C. V., Torres, A.M., Koblizkova, A., Macas, J., and Cubero, J.I. (1999). Developmentof a genetic composite map of Vicia faba using F2 populations derived from trisomic plants.Theor. Appl. Genet. 98: 736–743.
Pearce, R. (2001). Plant freezing and damage. Ann. Bot. 87: 417–424.
Penfield, S. (2008). Temperature perception and signal transduction in plants. New Phytol. 179: 615–628.
Peng, H. and Zhang, J. (2009). Plant genomic DNA methylation in response to stresses: Potentialapplications and challenges in plant breeding. Prog. Nat. Sci. 19: 1037–1045.
Philippot, L., Raaijmakers, J.M., Lemanceau, P., and van der Putten, W.H. (2013). Going backto the roots: the microbial ecology of the rhizosphere. Nat. Rev. Microbiol. 11: 789–799.
Prasad, D.H., Wibig, J., and Rzepa, M. (2010). Numerical modeling of the severe cold weatherevent over central Europe (January 2006). Adv. Meteorol.
Prins, A., van Heerden, P.D.R., Olmos, E., Kunert, K.J., and Foyer, C.H. (2008). Cysteineproteinases regulate chloroplast protein content and composition in tobacco leaves: a model fordynamic interactions with ribulose-1,5-bisphosphate carboxylase/oxygenase (Rubisco) vesicularbodies. J. Exp. Bot. 59: 1935–50.
Qin, F., Shinozaki, K., and Yamaguchi-Shinozaki, K. (2011). Achievements and challenges inunderstanding plant abiotic stress responses and tolerance. Plant Cell Physiol. 52: 1569–1582.

Page | 193
Quain, M.D., Makgopa, M.E., Cooper, J.W., Kunert, K.J., and Foyer, C.H. (2015). Ectopicphytocystatin expression increases nodule numbers and influences the responses of soybean(Glycine max) to nitrogen deficiency. Phytochemistry 112: 179–187.
Quain, M.D., Makgopa, M.E., Márquez-Garcáa, B., Comadira, G., Fernandez-Garcia, N.,Olmos, E., Schnaubelt, D., Kunert, K.J., and Foyer, C.H. (2014). Ectopic phytocystatinexpression leads to enhanced drought stress tolerance in soybean (Glycine max) and Arabidopsisthaliana through effects on strigolactone pathways and can also result in improved seed traits.Plant Biotechnol. J. 12: 903–913.
R Core Team (2015). R: A Language and Environment for Statistical Computing. R Found. Stat.Comput. Vienna Austria 0: {ISBN} 3-900051-07-0.
Ramirez-Parra, E., Fründt, C., and Gutierrez, C. (2003). A genome-wide identification of E2F-regulated genes in Arabidopsis. Plant J. 33: 801–811.
Ramsay, G. (1997). Inheritance and linkage of a gene for testa-imposed seed dormancy in faba bean(Vicia faba L.). Plant Breed. 116: 287–289.
Ramundo, S., Rahire, M., Schaad, O., and Rochaix, J.-D. (2013). Repression of essentialchloroplast genes reveals new signaling pathways and regulatory feedback loops inchlamydomonas. Plant Cell 25: 167–86.
Rasband, W. (2015). ImageJ [Software]. U. S. Natl. Institutes Heal. Bethesda, Maryland, USA://imagej.nih.gov/ij/.
Ray, D.K., Mueller, N.D., West, P.C., and Foley, J.A. (2013). Yield trends are insufficient todouble global crop production by 2050. PLoS One 8.
Ray, H. and Georges, F. (2010). A genomic approach to nutritional, pharmacological and geneticissues of faba bean (Vicia faba): Prospects for genetic modifications. GM Crops 1: 99–106.
Reichmann, J., Crichton, J.H., Madej, M.J., Taggart, M., Gautier, P., Garcia-Perez, J.L.,Meehan, R.R., and Adams, I.R. (2012). Microarray analysis of LTR retrotransposon silencingidentifies Hdac1 as a regulator of retrotransposon expression in mouse embryonic stem cells.PLoS Comput. Biol. 8.
Rhodes, D., Sims, A.P., and Folkes, B.F. (1980). Pathway of ammonia assimilation in illuminatedLemna minor. Phytochemistry 19: 357–365.
Richards, R.A. (2000). Selectable traits to increase crop photosynthesis and yield of grain crops. J.Exp. Bot. 51: 447–58.
Riechmann, J.L. et al. (2000). Arabidopsis transcription factors: genome-wide comparative analysisamong eukaryotes. Science 290: 2105–2110.
Ritchie, M.E., Phipson, B., Wu, D., Hu, Y., Law, C.W., Shi, W., and Smyth, G.K. (2015). Limmapowers differential expression analyses for RNA-sequencing and microarray studies. NucleicAcids Res. 43: e47.
Rivas-San Vicente, M. and Plasencia, J. (2011). Salicylic acid beyond defence: Its role in plantgrowth and development. J. Exp. Bot. 62: 3321–3338.
Robinson, M.D., McCarthy, D.J., and Smyth, G.K. (2010). edgeR: A bioconductor package fordifferential expression analysis of digital gene expression data. Bioinformatics 26: 139–40.
Rousseau-Gueutin, M., Huang, X., Higginson, E., Ayliffe, M., Day, A., and Timmis, J.N. (2013).Potential functional replacement of the plastidic acetyl-CoA carboxylase subunit (accD) gene by

Page | 194
recent transfers to the nucleus in some angiosperm lineages. Plant Physiol. 161: 1918–29.
Rout, M.E. and Southworth, D. (2013). The root microbiome influences scales from molecules toecosystems: The unseen majority. Am. J. Bot. 100: 1689–1691.
Roy, S. (2016). Function of MYB domain transcription factors in abiotic stress and epigenetic controlof stress response in plant genome. Plant Signal. Behav. 11: e1117723.
Ruelland, E. and Zachowski, A. (2010). How plants sense temperature. Environ. Exp. Bot. 69: 225–232.
Ruiz-Lozano, J.M., Aroca, R., Zamarreno, A.M., Molina, S., Andreo-Jimenez, B., Porcel, R.,Garcia-Mina, J.M., Ruyter-Spira, C., and Lopez-Raez, J.A. (2016). Arbuscular mycorrhizalsymbiosis induces strigolactone biosynthesis under drought and improves drought tolerance inlettuce and tomato. Plant, Cell Environ. 39: 441–452.
Ruyter-Spira, C., Kohlen, W., Charnikhova, T., van Zeijl, A., van Bezouwen, L., de Ruijter, N.,Cardoso, C., Lopez-Raez, J.A., Matusova, R., Bours, R., Verstappen, F., andBouwmeester, H. (2011). Physiological effects of the synthetic strigolactone analog GR24 onroot system architecture in Arabidopsis: another belowground role for strigolactones? PlantPhysiol 155: 721–34.
Sabir, J., Schwarz, E., Ellison, N., Zhang, J., Baeshen, N.A., Mutwakil, M., Jansen, R., andRuhlman, T. (2014). Evolutionary and biotechnology implications of plastid genome variationin the inverted-repeat-lacking clade of legumes. Plant Biotechnol. J. 12: 743–754.
Sakakibara, H. (2006). Cytokinins: activity, biosynthesis, and translocation. Annu. Rev. Plant Biol.57: 431–449.
Sallam, A. and Martsch, R. (2015). Association mapping for frost tolerance using multi-parentadvanced generation inter-cross (MAGIC) population in faba bean (Vicia faba L.). Genetica143: 501–514.
Sanders, D., Pelloux, J., Brownlee, C., and Harper, J.F. (2002). Calcium at the crossroads ofsignaling. Plant Cell 14 Suppl: S401–S417.
Sanghera, G.S., Wani, S.H., Hussain, W., and Singh, N.B. (2011). Engineering cold stresstolerance in crop plants. Curr. Genomics 12: 30–43.
Sasse, J.M. (2003). Physiological actions of brassinosteroids: An update. J. Plant Growth Regul. 22:276–288.
Sato, S. et al. (2008). Genome structure of the legume, Lotus japonicus. DNA Res. 15: 227–239.
Schmidt, A. and Kunert, K.J. (1986). Lipid peroxidation in higher plants : The role of glutathione reductase. Plant Physiol. 82: 700–702.
Schmittgen, T.D. and Livak, K.J. (2008). Analyzing real-time PCR data by the comparative CTmethod. Nat. Protoc. 3: 1101–1108.
Schmutz, J. et al. (2014). A reference genome for common bean and genome-wide analysis of dualdomestications. Nat. Genet. 46: 707–13.
Schmutz, J. et al. (2010). Genome sequence of the palaeopolyploid soybean. Nature 463: 178–83.
Schnable, P.S. et al. (2009). The B73 maize genome: complexity, diversity, and dynamics. Science326: 1112–5.
Page | 195
Schwechheimer, C. (2012). Gibberellin signaling in plants – The extended version. Front. Plant Sci.2: 1–7.
Scott, I.M., Clarke, S.M., Wood, J.E., and Mur, L. a J. (2004). Salicylate accumulation inhibitsgrowth at chilling temperature in Arabidopsis. Plant Physiol. 135: 1040–1049.
Seki, M. et al. (2002). Monitoring the expression profiles of 7000 Arabidopsis genes under drought,cold and high-salinity stresses using a full-length cDNA microarray. Plant J. 31: 279–292.
Shankar, R., Bhattacharjee, A., and Jain, M. (2016). Transcriptome analysis in different ricecultivars provides novel insights into desiccation and salinity stress responses. Sci. Rep. 6:23719.
Shao, H., Wang, H., and Tang, X. (2015). NAC transcription factors in plant multiple abiotic stressresponses: progress and prospects. Front. Plant Sci. 6: 902.
Sheldon, C.C., Rouse, D.T., Finnegan, E.J., Peacock, W.J., and Dennis, E.S. (2000). Themolecular basis of vernalization: the central role of FLOWERING LOCUS C (FLC). Proc. Natl.Acad. Sci. U. S. A. 97: 3753–3758.
Shi, H., Ye, T., Zhong, B., Liu, X., Jin, R., and Chan, Z. (2014). AtHAP5A modulates freezingstress resistance in Arabidopsis through binding to CCAAT motif of AtXTH21. New Phytol.203: 554–567.
Shi, Y., Tian, S., Hou, L., Huang, X., Zhang, X., Guo, H., and Yang, S. (2012). Ethylene signalingnegatively regulates freezing tolerance by repressing expression of CBF and type-A ARR genesin Arabidopsis. Plant Cell 24: 2578–2595.
Shibasaki, K., Uemura, M., Tsurumi, S., and Rahman, A. (2009). Auxin response in Arabidopsisunder cold stress: underlying molecular mechanisms. Plant Cell 21: 3823–38.
Siddique, K.H.M., Johansen, C., Turner, N.C., Jeuffroy, M.H., Hashem, A., Sakar, D., Gan,Y.T., and Alghamdi, S.S. (2012). Innovations in agronomy for food legumes. A review. Agron.Sustain. Dev. 32: 45–64.
Simpson, J.T., Wong, K., Jackman, S.D., Schein, J.E., Jones, S.J.M., and Birol, I. (2009).ABySS: A parallel assembler for short read sequence data. Genome Res. 19: 1117–1123.
Singh, K.B., Malhotra, R.S., and Saxena, M.C. (1993). Relationship between cold severity andyield loss in chickpea (Cicer Arietinum L). J. Agron. Crop Sci. 170: 121–127.
Sinha, A.K., Jaggi, M., Raghuram, B., and Tuteja, N. (2011). Mitogen-activated protein kinasesignaling in plants under abiotic stress. Plant Signal. Behav. 6: 196–203.
Sjodin, J. (1970). Induced asynaptic mutants in Vicia faba L. Hereditas 66: 215–232.
Sjodin, J. (1971). Induced morphological variation in Vicia faba L. Hereditas 67: 155–180.
Smaczniak, C., Immink, R.G.H., Angenent, G.C., and Kaufmann, K. (2012). Developmental andevolutionary diversity of plant MADS-domain factors: insights from recent studies.Development 139: 3081–3098.
So, H.-A., Choi, S.J., Chung, E., and Lee, J.H. (2015). Molecular characterization of stress-inducible PLATZ gene from soybean (Glycine max L.). Plant Omics 8: 479–484.
Soares, A.S., Driscoll, S.P., Olmos, E., Harbinson, J., Arrabaça, M.C., and Foyer, C.H. (2008).Adaxial/abaxial specification in the regulation of photosynthesis and stomatal opening withrespect to light orientation and growth with CO2 enrichment in the C4 species Paspalum

Page | 196
dilatatum. New Phytol. 177: 186–198.
Solomon, M., Belenghi, B., Delledonne, M., Menachem, E., and Levine, A. (1999). Theinvolvement of cysteine proteases and protease inhibitor genes in the regulation of programmedcell death in plants. Plant Cell 11: 431–44.
Soneson, C., Love, M.I., and Robinson, M.D. (2015). Differential analyses for RNA-seq: transcript-level estimates improve gene-level inferences. F1000Research 4: 1521.
Souer, E., Van Houwelingen, A., Kloos, D., Mol, J., and Koes, R. (1996). The no apical meristemgene of petunia is required for pattern formation in embryos and flowers and is expressed atmeristem and primordia boundaries. Cell 85: 159–170.
Spaink, H.P. (2000). Root nodulation and infection factors produced by rhizobial bacteria. Annu.Rev. Microbiol. 54: 257–288.
Sprent, J.I., Ardley, J.K., and James, E.K. (2013). From north to south: A latitudinal look atlegume nodulation processes. South African J. Bot. 89: 31–41.
Sprent, J.I. and James, E.K. (2007). Legume evolution: Where do nodules and mycorrhizas fit in?Plant Physiol. 144: 575–581.
Stacklies, W., Redestig, H., Scholz, M., Walther, D., and Selbig, J. (2007). pcaMethods - Abioconductor package providing PCA methods for incomplete data. Bioinformatics 23: 1164–1167.
Steinkellner, S., Lendzemo, V., Langer, I., Schweiger, P., Khaosaad, T., Toussaint, J.P., andVierheilig, H. (2007). Flavonoids and strigolactones in root exudates as signals in symbioticand pathogenic plant-fungus interactions. Molecules 12: 1290–1306.
Stewart Lilley, J.L., Gan, Y., Graham, I.A., and Nemhauser, J.L. (2013). The effects of DELLAson growth change with developmental stage and brassinosteroid levels. Plant J. 76: 165–173.
Stracke, R., Werber, M., and Weisshaar, B. (2001). The R2R3-MYB gene family in Arabidopsisthaliana. Curr. Opin. Plant Biol. 4: 447–456.
Strauss, A.J., Krüger, G.H.J., Strasser, R.J., and Heerden, P.D.R. Van (2006). Ranking of darkchilling tolerance in soybean genotypes probed by the chlorophyll a fluorescence transient O-J-I-P. Environ. Exp. Bot. 56: 147–157.
Strauss, A.J., Krüger, G.H.J., Strasser, R.J., and Van Heerden, P.D.R. (2007). The role of lowsoil temperature in the inhibition of growth and PSII function during dark chilling in soybeangenotypes of contrasting tolerance. Physiol. Plant. 131: 89–105.
Subramanian, P., Kim, K., Krishnamoorthy, R., Mageswari, A., Selvakumar, G., and Sa, T.(2016). Cold stress tolerance in psychrotolerant soil bacteria and their conferred chillingresistance in tomato (Solanum lycopersicum Mill.) under low temperatures. PLoS One 11:e0161592.
Suzuki, N. and Mittler, R. (2006). Reactive oxygen species and temperature stresses: A delicatebalance between signaling and destruction. Physiol. Plant. 126: 45–51.
Tahara, E.B., Barros, M.H., Oliveira, G. a, Netto, L.E.S., and Kowaltowski, A.J. (2007).Dihydrolipoyl dehydrogenase as a source of reactive oxygen species inhibited by caloricrestriction and involved in Saccharomyces cerevisiae aging. FASEB J. 21: 274–283.
Tan, Y., Qin, Y., Li, Y., Li, M., and Ma, F. (2014). Overexpression of MpGR-RBP1, a glycine-richRNA-binding protein gene from Malus prunifolia (Willd.) Borkh., confers salt stress tolerance

Page | 197
and protects against oxidative stress in Arabidopsis. Plant Cell. Tissue Organ Cult. 119: 635–646.
Tang, H., Lyons, E., and Town, C.D. (2015). Optical mapping in plant comparative genomics.Gigascience 4: 3.
Tausz, M., Šircelj, H., and Grill, D. (2004). The glutathione system as a stress marker in plantecophysiology: Is a stress-response concept valid? In Journal of Experimental Botany, pp.1955–1962.
Thomashow, M.F. (1999). Plant cold acclimation: Freezing tolerance genes and regulatorymechanisms. Annu. Rev. Plant Physiol. Plant Mol. Biol. 50: 571–599.
Thomashow, M.F. (2001). So what’s new in the field of plant cold acclimation? Lots! Plant Physiol.125: 89–93.
Thorlby, G., Fourrier, N., and Warren, G. (2004). The SENSITIVE TO FREEZING2 gene,required for freezing tolerance in Arabidopsis thaliana, encodes a beta-glucosidase. Plant Cell16: 2192–2203.
Thorvaldsdóttir, H., Robinson, J.T., and Mesirov, J.P. (2013). Integrative Genomics Viewer(IGV): High-performance genomics data visualization and exploration. Brief. Bioinform. 14:178–192.
Tian, Y., Zhang, H., Pan, X., Chen, X., Zhang, Z., Lu, X., and Huang, R. (2011). Overexpressionof ethylene response factor TERF2 confers cold tolerance in rice seedlings. Transgenic Res. 20:857–866.
Torres, A.M., Avila, C.M., Gutierrez, N., Palomino, C., Moreno, M.T., and Cubero, J.I. (2010).Marker-assisted selection in faba bean (Vicia faba L.). F. Crop. Res. 115: 243–252.
Torres, A.M., Weeden, N.F., and Martín, A. (1993). Linkage among isozyme, RFLP and RAPDmarkers in Vicia faba. Theor. Appl. Genet. 85: 937–945.
Toyooka, K., Okamoto, T., and Minamikawa, T. (2000). Mass transport of proform of a KDEL-tailed cysteine proteinase (SH-EP) to protein storage vacuoles by endoplasmic reticulum-derived vesicle is involved in protein mobilization in germinating seeds. J. Cell Biol. 148: 453–463.
Treangen, T.J. and Salzberg, S.L. (2012). Repetitive DNA and next-generation sequencing:Computational challenges and solutions. Nat. Rev. Genet. 13: 36–46.
Trimarchi, J.M. and Lees, J. a (2002). Sibling rivalry in the E2F family. Nat. Rev. Mol. Cell Biol.3: 11–20.
Trinidad, T.P., Mallillin, A.C., Loyola, A.S., Sagum, R.S., and Encabo, R.R. (2010). Thepotential health benefits of legumes as a good source of dietary fibre. Br. J. Nutr. 103: 569–574.
Udvardi, M.K., Kakar, K., Wandrey, M., Montanari, O., Murray, J., Andriankaja, A., Zhang,J.-Y., Benedito, V., Hofer, J.M.I., Chueng, F., and Town, C.D. (2007). Legume TranscriptionFactors: Global Regulators of Plant Development and Response to the Environment. PlantPhysiol. 144: 538–549.
United Nations Department of Economic and Social Affairs Population Division (2015). Worldpopulation prospects: The 2015 revision, key findings and advance tables.
Unterholzner, S.J., Rozhon, W., Papacek, M., Ciomas, J., Lange, T., Kugler, K.G., Mayer, K.F.,Sieberer, T., and Poppenberger, B. (2015). brassinosteroids are master regulators of

Page | 198
gibberellin biosynthesis in Arabidopsis. Plant Cell: 1–13.
Varshney, R.K. et al. (2013). Draft genome sequence of chickpea (Cicer arietinum) provides aresource for trait improvement. Nat Biotechnol 31: 240–246.
Varshney, R.K. et al. (2011). Draft genome sequence of pigeonpea (Cajanus cajan), an orphanlegume crop of resource-poor farmers. Nat. Biotechnol. 30: 83–89.
De Vega, J.J. et al. (2015). Red clover (Trifolium pratense L.) draft genome provides a platform fortrait improvement. Sci. Rep. 5: 17394.
Vickers, C.E., Gershenzon, J., Lerdau, M.T., and Loreto, F. (2009). A unified mechanism ofaction for volatile isoprenoids in plant abiotic stress. Nat. Chem. Biol. 5: 283–291.
Vierstra, R.D. (1996). Proteolysis in plants: mechanisms and functions. Plant Mol. Biol. 32: 275–302.
Vigh, L., Horvàth, I., van Hasselt, P.R., and Kuiper, P.J. (1985). Effect of frost hardening on lipidand fatty acid composition of chloroplast thylakoid membranes in two wheat varieties ofcontrasting hardiness. Plant Physiol. 79: 756–9.
Vitousek, P.M. (1994). Beyond global warming - Ecology and global change. Ecology 75: 1861–1876.
Vranová, E., Coman, D., and Gruissem, W. (2012). Structure and dynamics of the isoprenoidpathway network. In Molecular Plant, pp. 318–333.
Vranová, E., Hirsch-Hoffmann, M., and Gruissem, W. (2011). AtIPD: A curated database ofArabidopsis isoprenoid pathway models and genes for isoprenoid network analysis. PlantPhysiol. 156: 1655–1660.
Van der Vyver, C., Schneidereit, J., Driscoll, S., Turner, J., Kunert, K., and Foyer, C.H.(2003a). Oryzacystatin I expression in transformed tobacco produces a conditional growthphenotype and enhances chilling tolerance. Plant Biotechnol. J. 1: 101–112.
Van der Vyver, C., Schneidereit, J., Driscoll, S., Turner, J., Kunert, K., and Foyer, C.H.(2003b). Oryzacystatin I expression in transformed tobacco produces a conditional growthphenotype and enhances chilling tolerance. Plant Biotechnol. J. 1: 101–112.
Wang, W., Vinocur, B., and Altman, A. (2003). Plant responses to drought, salinity and extremetemperatures: Towards genetic engineering for stress tolerance. Planta 218: 1–14.
Wang, Y., Yang, J., and Yi, J. (2012). Redox sensing by proteins: oxidative modifications oncysteines and the consequent events. Antioxid. Redox Signal. 16: 649–57.
Wanner, H., Bronnimann, S., Casty, C., Gyalistras, D., Luterbacher, J., Schmutz, C.,Stephenson, D.B., and Xoplaki, E. (2001). North Atlantic Oscillation - Concepts and studies.Surv. Geophys. 22: 321–382.
Warren, G.J. (1998). Cold stress: Manipulating freezing tolerance in plants. Curr. Biol. 8: R514–R516.
Wassink, E.C. and Stolwijk, J.A.J. (1956). Effects of light quality onplant growth. Annu. Rev. PlantPhysiol. Plant Mol. Biol. 7: 373–400.
Watling, J.R., Robinson, S. a, and Seymour, R.S. (2006). Contribution of the alternative pathwayto respiration during thermogenesis in flowers of the sacred lotus. Plant Physiol. 140: 1367–1373.

Page | 199
Webb, A. et al. (2016). A SNP-based consensus genetic map for synteny-based trait targeting in fababean (Vicia faba L.). Plant Biotechnol. J. 14: 177–185.
Weisshaar, B. and Jenkins, G.I. (1998). Phenylpropanoid biosynthesis and its regulation. Corresp.Gareth I Jenkins Curr. Opin. Plant Biol. 1: 251–257.
Weller, J.L. and Ortega, R. (2015). Genetic control of flowering time in legumes. Front. Plant Sci.6: 207.
Wicker, T. et al. (2007). A unified classification system for eukaryotic transposable elements. Nat.Rev. Genet. 8: 973–982.
Wickham, H. (2009). ggplot2: Elegant graphics for data analysis (New York).
Winfield, M.O., Lu, C.G., Wilson, I.D., Coghill, J.A., and Edwards, K.J. (2010). Plant responsesto cold: transcriptome analysis of wheat. Plant Biotechnol. J. 8: 749–771.
Wojciechowski, M.F., Lavin, M., and Sanderson, M.J. (2004). A phylogeny of legumes(Leguminosae) based on analysis of the plastid matK gene resolves many well-supportedsubclades within the family. Am. J. Bot. 91: 1846–1862.
Woo, H.R., Chung, K.M., Park, J.H., Oh, S.A., Ahn, T., Hong, S.H., Jang, S.K., and Nam, H.G.(2001). ORE9, an F-box protein that regulates leaf senescence in Arabidopsis. Plant Cell 13:1779–1790.
Wood, D.E. and Salzberg, S.L. (2014). Kraken: ultrafast metagenomic sequence classification usingexact alignments. Genome Biol. 15: R46.
Xia, X.-J., Wang, Y.-J., Zhou, Y.-H., Tao, Y., Mao, W.-H., Shi, K., Asami, T., Chen, Z., and Yu,J.-Q. (2009). Reactive oxygen species are involved in brassinosteroid-induced stress tolerancein cucumber. Plant Physiol. 150: 801–814.
Xin, Z. and Browse, J. (2000). Cold comfort farm: the acclimation of plants to freezingtemperatures. Plant Cell Environ. 23: 893–902.
Xin, Z. and Browse, J. (1998). Eskimo1 mutants of Arabidopsis are constitutively freezing-tolerant.Proc. Natl. Acad. Sci. U. S. A. 95: 7799–7804.
Xu, J.H., Liu, Q., Hu, W., Wang, T., Xue, Q., and Messing, J. (2015). Dynamics of chloroplastgenomes in green plants. Genomics 106: 221–231.
Xue, L., Cui, H., Buer, B., Vijayakumar, V., Delaux, P.-M., Junkermann, S., and Bucher, M.(2015). Network of GRAS transcription factors involved in the control of arbusculedevelopment in Lotus japonicus. Plant Physiol. 167: 854–71.
Yamada, Y. and Umehara, M. (2015). Possible roles of strigolactones during leaf senescence.Plants 4: 664–677.
Yamaguchi-Shinozaki, K. and Shinozaki, K. (2006). Transcriptional regulatory networks incellular responses and tolerance to dehydration and cold stresses. Annu. Rev. Plant Biol. 57:781–803.
Yamasaki, Y. and Randall, S.K. (2016). Functionality of soybean CBF/DREB1 transcriptionfactors. Plant Sci. 246: 80–90.
Yamazaki, T., Kawamura, Y., and Uemura, M. (2009). Extracellular freezing-induced mechanicalstress and surface area regulation on the plasma membrane in cold-acclimated plant cells. PlantSignal. Behav. 4: 231–233.

Page | 200
Yang, D.H., Andersson, B., Aro, E.M., and Ohad, I. (2001). The redox state of the plastoquinonepool controls the level of the light-harvesting chlorophyll a/b binding protein complex II (LHCII) during photoacclimation: Cytochrome b6f deficient Lemna perpusilla plants are locked in astate of high-light acclimat. Photosynth. Res. 68: 163–174.
Yang, H., Tao, Y., Zheng, Z., Zhang, Q., Zhou, G., Sweetingham, M.W., Howieson, J.G., and Li,C. (2013). Draft genome sequence, and a sequence-defined genetic linkage map of the legumecrop species Lupinus angustifolius L. PLoS One 8.
Yang, T., Bao, S., Ford, R., Jia, T., Guan, J., He, Y., Sun, X., Jiang, J., Hao, J., Zhang, X., andZong, X. (2012). High-throughput novel microsatellite marker of faba bean via next generationsequencing. BMC Genomics 13: 602.
Yang, T., Chaudhuri, S., Yang, L., Du, L., and Poovaiah, B.W. (2010). A calcium/calmodulin-regulated member of the receptor-like kinase family confers cold tolerance in plants. J. Biol.Chem. 285: 7119–7126.
Yao, C. and Finlayson, S.A. (2015). Abscisic acid is a general negative regulator of Arabidopsisaxillary bud growth. Plant Physiol. 169: 611–26.
Young, N.D. et al. (2011). The Medicago genome provides insight into the evolution of rhizobialsymbioses. Nature 480: 520–524.
Young, N.D., Mudge, J., and Ellis, T.H.N. (2003). Legume genomes: More than peas in a pod.Curr. Opin. Plant Biol. 6: 199–204.
Zhang, H., Mao, J., Liu, F., and Zeng, F. (2012a). Expression of a nematode symbiotic bacterium-derived protease inhibitor protein in tobacco enhanced tolerance against Myzus persicae. PlantCell Rep. 31: 1981–1989.
Zhang, H.-M., Wheeler, S., Xia, X., Radchuk, R., Weber, H., Offler, C.E., and Patrick, J.W.(2015). Differential transcriptional networks associated with key phases of ingrowth wallconstruction in trans-differentiating epidermal transfer cells of Vicia faba cotyledons. BMCPlant Biol. 15: 103.
Zhang, K., Halitschke, R., Yin, C., Liu, C.-J., and Gan, S.-S. (2013). Salicylic acid 3-hydroxylaseregulates Arabidopsis leaf longevity by mediating salicylic acid catabolism. Proc. Natl. Acad.Sci. U. S. A. 110: 14807–12.
Zhang, X., Liu, S., and Takano, T. (2008). Two cysteine proteinase inhibitors from Arabidopsisthaliana, AtCYSa and AtCYSb, increasing the salt, drought, oxidation and cold tolerance. PlantMol. Biol. 68: 131–143.
Zhang, X.D., Lu, C.H., and Guan, Z.Y. (2012b). Weakened cyclones, intensified anticyclones andrecent extreme cold winter weather events in Eurasia. Environ. Res. Lett. 7.
Zhang, Z., Zhang, H., Quan, R., Wang, X.-C., and Huang, R. (2009). Transcriptional regulation ofthe ethylene response factor LeERF2 in the expression of ethylene biosynthesis genes controlsethylene production in tomato and tobacco. Plant Physiol. 150: 365–377.
Zhao, M., Liu, W., Xia, X., Wang, T., and Zhang, W.H. (2014). Cold acclimation-induced freezingtolerance of Medicago truncatula seedlings is negatively regulated by ethylene. Physiol. Plant.152: 115–129.
Zhou, S., Sun, H., Zheng, B., Li, R., and Zhang, W. (2014). Cell cycle transcription factor E2F2mediates non-stress temperature response of AtHSP70-4 in Arabidopsis. Biochem. Biophys.Res. Commun. 455: 139–146.

Page | 201
Zhu, X.G., Long, S.P., and Ort, D.R. (2010). Improving photosynthetic efficiency for greater yield.Annu Rev Plant Biol 61: 235–261.
Zolla, G., Badri, D. V., Bakker, M.G., Manter, D.K., and Vivanco, J.M. (2013). Soil microbiomesvary in their ability to confer drought tolerance to Arabidopsis. Appl. Soil Ecol. 68: 1–9.

Page | I
Appendices

Page | II
Appendix 1
Agarose gel electrophoresis of products from a PCR amplification of OCI transgene in soybean. DNA was
extracted from the leaf tissue of soybean Wt and 3 independent transgenic lines expressing the rice cysteine
protease inhibitor oryzacystatin I: SOC-1, SOC-2, SOC-3. 5 µl of DNA was loaded per PCR reaction. Lane M
contains ThermoScientific 1 kb+ gene ruler (6 µl, 1 µg/µl). Wt, SOC-1, SOC-2 and SOC-3 contains 6 µl of
PCR mix. Gel consited of 1 % Agarose and was run at 80 V for 1h.

Page | I
Appendix 2
List of SNP linkage markers used in genome sequence enrichment, chapter 6.
Chromosome I
19a15-3
LG018SNP
Vf_Mt2g086560_001
Vf_Mt2g086880_001
Vf_Mt2g086950_001
Vf_Mt2g089140_001
Vf_Mt2g093280_001
Vf_Mt2g098470_001
Vf_Mt2g097740_002
Vf_Mt2g097950_001
Vf_Mt2g098240_001
Vf_Mt2g098890_001
Vf_Mt8g017240_001
Vf_Mt7g021530_001
Vf_Mt7g020850_001
PGDH
Vf_Mt7g016650_001
Vf_Mt7g013300_001
Vf_Mt7g010100_001
Vf_Mt7g013160_001
Vf_Mt7g080730_001
Vf_Mt5g041750_001
Vf_Mt2g088750_001
Vf_Mt5g039210_001
Vf_Mt5g039000_001
Chromosome II
AIGPa
LG102
RBPC_0SNP
AnMtL8
GLIP135
Vf_Mt3g116500_001
Vf_Mt3g116050_001
Vf_Mt3g115990_001
Vf_Mt3g116080_001
Vf_Mt3g115870_001
Vf_Mt3g114780_001
Vf_Mt3g114850_001
Vf_Mt5g024090_001
Vf_Mt3g110630_001
Vf_Mt3g110600_001
Vf_Mt3g111210_001
Vf_Mt3g109330_001
Vf_Mt3g109200_001
Vf_Mt3g108790_001
Vf_Mt3g108320_001
Vf_Mt3g108190_001
Vf_Mt3g108460_001
Vf_Mt3g108630_001
Vf_Mt3g108690_001
Vf_Mt3g108160_001
Vf_Mt3g107970_001

Page | II
Vf_Mt3g072360_001
Vf_Mt3g072390_001
Vf_Mt3g072080_001
Vf_Mt3g071620_001
Vf_Mt3g070310_001
Vf_Mt3g065190_001
Vf_Mt3g064740_001
Vf_Mt3g031380_001
Vf_Mt3g031280_001
Vf_Mt3g061590_001
Vf_Mt3g031380_001
Vf_Mt3g031280_001
Vf_Mt3g061590_001
Vf_Mt3g061640_001
Vf_Mt3g060850_001
Vf_Mt3g055920_001
Vf_Mt3g055690_001
Vf_Mt3g052760_001
Vf_Mt3g051280_001
Vf_Mt5g075540_001
Vf_Mt5g075540_001
Vf_Mt3g026020_001
Vf_Mt3g020670_001
Vf_Mt3g019330_001
Vf_Mt3g017610_001
Vf_Mt3g008180_001
Vf_Mt3g008540_001
Vf_Mt3g010290_001
Vf_Mt3g010000_001
Vf_Mt3g005360_001
Vf_Mt3g005050_001
Vf_Mt4g006200_001
Vf_Mt4g005830_001
Vf_Mt4g007030_001
Vf_Mt4g009920_001
Vf_Mt4g010330_001
Chromosome III
cgP137FSNP
GLPSNP
LG038
REPSNP
BGALSNP
Vf_Mt1g116810_001
Vf_Mt1g116230_001
Vf_Mt1g050730_001
Vf_Mt1g116110_001
Vf_Mt1g114560_001
Vf_Mt5g042440_001
Vf_Mt1g045800_001
Vf_Mt1g044570_001
Vf_Mt4g080370_001
Vf_Mt1g056180_001
Vf_Mt1g064060_001
Vf_Mt1g061800_001
Vf_Mt7g100500_001
Vf_Mt1g071110_001
Vf_Mt1g072640_001
Vf_Mt1g072740_001
Vf_Mt1g073000_001
Vf_Mt1g075140_001
Vf_Mt1g075610_001
Vf_Mt7g035110_001
Vf_Mt1g079520_001
Vf_Mt1g080150_001
Vf_Mt1g079870_001
Vf_Mt1g079930_001
Vf_Mt1g081290_001
Vf_Mt1g082210_001
Vf_Mt1g083450_001
Vf_Mt1g083460_001
Vf_Mt1g083960_001
Vf_Mt1g085040_001
Vf_Mt1g087900_001
Vf_Mt1g086810_001

Page | III
Vf_Mt1g088190_001
Vf_Mt1g089980_001
Vf_Mt1g094870_001
Vf_Mt1g012610_001
Vf_Mt1g014230_001
Vf_Mt1g013400_001
Vf_Mt1g016390_001
Vf_Mt1g017950_001
Vf_Mt1g018180_001
Vf_Mt1g018320_001
Vf_Mt1g018790_001
Vf_Mt1g019810_001
Vf_Mt1g019770_001
Vf_Mt1g021760_001
Vf_Mt1g021670_001
Vf_Mt7g059170_001
Vf_Mt1g025570_001
Vf_Mt1g025550_001
Vf_Mt1g025950_001
Vf_Mt1g025950_002
Vf_Mt1g026130_001
Chromosome IV
GLIP137
PPHSNP
13n10-1
CNGC4
PRATSNP
GLIP089
Vf_Mt4g133070_001
Vf_Mt3g118200_001
Vf_Mt3g118430_001
Vf_Mt3g117800_001
Vf_Mt3g118320_001
Vf_Mt4g124930_001
Vf_Mt4g124600_001
Vf_Mt4g124640_001
Vf_Mt4g124070_001
Vf_Mt4g122670_001
Vf_Mt4g121600_001
Vf_Mt4g121960_001
Vf_Mt4g118420_001
Vf_Mt4g114900_001
Vf_Mt4g113280_001
Vf_Mt3g077990_001
Vf_Mt4g095440_001
Vf_Mt8g066180_001
Vf_Mt8g073580_001
Vf_Mt8g074010_001
Vf_Mt8g061890_001
Vf_Mt7g070290_001
Vf_Mt8g011470_001
Vf_Mt8g012400_001
Vf_Mt8g012380_001
Vf_Mt8g014660_001
Vf_Mt8g018770_001
Vf_Mt8g020800_001
Vf_Mt8g022290_001
Vf_Mt8g022050_001
Vf_Mt8g022770_001
Vf_Mt8g023310_001
Vf_Mt4g090120_001
Vf_Mt8g087440_001
Vf_Mt7g038120_001
Vf_Mt8g030430_001
Vf_Mt7g076160_001
Vf_Mt8g038880_001
Vf_Mt8g039690_001
Vf_Mt8g040150_001
Vf_Mt8g040550_001
Vf_Mt8g030600_001
Vf_Mt8g030620_001
Vf_Mt8g032450_001
Vf_Mt8g041410_001
Vf_Mt8g043510_001

Page | IV
Vf_Mt8g061230_001
Vf_Mt8g021140_001
Vf_Mt8g061350_001
Vf_Mt8g058270_001
Vf_Mt8g008870_001
Vf_Mt8g006370_001
Chromosome V
AnMtS37
Vf_Mt2g101430_001
Vf_Mt7g031900_001
Vf_Mt2g104110_001
Vf_Mt2g104010_001
Vf_Mt2g101870_001
Vf_Mt7g108490_001
Vf_Mt7g078800_001
Vf_Mt7g073340_001
Vf_Mt7g073970_001
Vf_Mt7g075940_001
Vf_Mt7g078730_001
Vf_Mt7g079680_001
Vf_Mt7g079840_001
Vf_Mt7g080040_001
Vf_Mt7g080250_001
Vf_Mt7g081010_001
Vf_Mt7g114940_001
Vf_Mt7g115070_001
Vf_Mt7g116600_001
Vf_Mt7g117970_001
Vf_Mt7g118320_001
Chromosome VI
New_GLIP307SNP
HYPTE3SNP
Vf_Mt8g107140_001
Vf_Mt8g107640_001
Vf_Mt8g106690_001
Vf_Mt8g105250_001
Vf_Mt8g104520_001
Vf_Mt8g103840_001
Vf_Mt8g102840_001
Vf_Mt8g102920_001
Vf_Mt8g102770_001
Vf_Mt8g102250_001
Vf_Mt8g101390_001
Vf_Mt3g034100_001
Vf_Mt4g081050_001
Vf_Mt4g077840_001
Vf_Mt4g078200_001
Vf_Mt4g077610_001
Vf_Mt4g075200_001
Vf_Mt4g075050_001
Vf_Mt4g076990_001
Vf_Mt4g078660_001
Vf_Mt4g068010_001
Vf_Mt4g076870_001
Vf_Mt4g083970_001
Vf_Mt4g061670_001
Vf_Mt4g061070_001
Vf_Mt4g061010_001
Vf_Mt4g060940_001
Vf_Mt4g080100_001
Vf_Mt2g094640_001
Vf_Mt4g053880_001
Vf_Mt4g053270_001
Vf_Mt4g053250_001
Vf_Mt4g053520_001
Vf_Mt4g049540_001
Copyright © 2022 FDOKUMEN