Measurement of glass transition in native wheat flour by dynamic mechanical thermal analysis (DMTA
Upload
khangminh22Category
view
0download
0
energies
Article
Mechanical and Thermal PerformanceCharacterisation of Compressed Earth Blocks
Elisabete R. Teixeira 1 , Gilberto Machado 1, Adilson de P. Junior 1 , Christiane Guarnier 2,Jorge Fernandes 1 , Sandra M. Silva 1 and Ricardo Mateus 1,*
1 Department of Civil Engineering, Institute for Sustainability and Innovation in StructuralEngineering (ISISE), University of Minho, 4800-058 Guimarães, Portugal; [email protected] (E.R.T.);[email protected] (G.M.); [email protected] (A.d.P.J.); [email protected] (J.F.);[email protected] (S.M.S.)
2 Federal Center for Technological Education “Celso Suckow da Fonseca” (CEFET/RJ),Rio de Janeiro-RJ 20271-110, Brazil; [email protected]
* Correspondence: [email protected]; Tel.: +351-253-510-200
Received: 30 April 2020; Accepted: 2 June 2020; Published: 10 June 2020
Abstract: The present research is focused on an experimental investigation to evaluate the mechanical,durability, and thermal performance of compressed earth blocks (CEBs) produced in Portugal.CEBs were analysed in terms of electrical resistivity, ultrasonic pulse velocity, compressive strength,total water absorption, water absorption by capillarity, accelerated erosion test, and thermaltransmittance evaluated in a guarded hotbox setup apparatus. Overall, the results showed thatcompressed earth blocks presented good mechanical and durability properties. Still, they had someissues in terms of porosity due to the particle size distribution of soil used for their production.The compressive strength value obtained was 9 MPa, which is considerably higher than the minimumrequirements for compressed earth blocks. Moreover, they presented a heat transfer coefficient of2.66 W/(m2
·K). This heat transfer coefficient means that this type of masonry unit cannot be used inthe building envelope without an additional thermal insulation layer but shows that they are suitableto be used in partition walls. Although CEBs have promising characteristics when compared toconventional bricks, results also showed that their proprieties could even be improved if optimisationof the soil mixture is implemented.
Keywords: compressed earth blocks (CEBs); compressive strength; durability; guarded hot box;thermal transmittance
1. Introduction
Earth has been used as a building material since ancient times in several different ways aroundthe world [1–4]. Industrialised building systems and the dissemination of materials, like concrete [5],have replaced earthen construction. Today, earthen construction is associated with poverty [2], and mostof this type of construction is located in developing countries. The continuous increase in the energycost of some building materials (cement and ceramic bricks) and environmental issues are promotingthe use of sustainable materials, such as the earthen materials known by their abundance and low-costproduction [5–7].
Compressed earth blocks (CEBs) are one of the most widespread earthen building techniques.They represent a modern descendent of the moulded earth block, commonly called as the adobeblock [7]. The compaction of earth improves the quality and performance of the blocks [4] but alsopromotes several environmental, social, and economic benefits [8,9]. Regarding the environmentaladvantages of using earthen products, a previous study showed that in a cradle-to-gate analysis of
Energies 2020, 13, 2978; doi:10.3390/en13112978 www.mdpi.com/journal/energies

Energies 2020, 13, 2978 2 of 22
different walls, the use of earthen building elements could result in reducing the potential environmentalimpacts by about 50% when compared to the use of conventional building elements [2].
Earthen construction is known to undergo rapid deterioration under severe weather conditions [10].If not built adequately, earthen buildings have lower durability and are more vulnerable to extremeweather conditions and rainfall than conventional buildings. This situation means higher maintenanceand repair costs during the life cycle of a building [11].
In the last few years, there has been increasing interest in overcoming the mechanical and durabilityissues related to earthen blocks. Different stabilisation techniques were used to improve durability andcompressive strength [6,11–13]. Dynamic compaction alone or together with chemical stabilisationusing several additives has been shown to considerable improve the mechanical performance ofCEBs [10,13]. In contrast, compaction increases thermal conductivity [14]. The stabilisation process ofraw earth refers to any mechanical, physical, physicochemical, or combined methods that enhanceits properties [10]. Bahar et al. [15] studied the effect of several stabilisation methods on mechanicalproperties. The results showed that the combination of compaction and cement stabilisation isan effective solution for increasing the strength of earth blocks. Amoudi et al. [16,17] developedan experimental program to study the mechanical properties of cement-stabilised earth blocks.They verified that cement in the presence of water forms hydrated products that occupy the voidsand wrap the soil particles. That process leads to an improvement in compressive strength, waterabsorption, dimensional stability, and durability. In many countries, CEBs are stabilised with cementor lime, and there are successful examples of their use in the construction of buildings. Severalstudies highlighted their lower construction cost, simpler construction processes, and the contributionof this material to maintaining a better indoor environment quality when comparing to the use ofconventional building materials [8,11,18–20]. Besides that, some studies show that the addition of limeto compressed earth blocks can improve their mechanical and hydrous properties [21,22].
Regarding the thermal proprieties of earthen building products, since they are massive,they contribute to increasing the thermal inertia of the buildings. This feature can have a positiveinfluence on the thermal performance of buildings in certain climates. A previous study showedthat in locations with hot summers and temperate winters, such as the Mediterranean areas, earthenconstruction could provide comfortable indoor temperature by passive means alone [23]. This propertycan reduce heating and cooling energy needs and therefore contribute to lower life cycle environmentaland financial costs. Nevertheless, compared to the number of studies focusing on mechanical properties,there are fewer studies related to the thermal properties of compressed earth blocks [11]. Adam andJones [24] measured the thermal conductivity of lime and cement stabilised hollow and massive earthblocks using a guarded hot box method. The authors verified that the thermal conductivity washigher on stabilised blocks (0.20 W/m2
·K and 0.50 W/m2·K). The compressive strength used in the
compaction of the blocks, the type of soil, and the additives used can significatively influence thethermal conductivity of a CEB building element [24]. For that reason, in the literature, it is possible tofind very different thermal conductivity values for earthen products. For example, according to thePortuguese thermal regulation [25], the thermal conductivity to consider for adobe, rammed earth,and compressed earth blocks is 1.10 W/(m2
·K). At the same time, other studies show quite differentvalues, also depending on the considered earthen building technique—earth materials with fibres(0.42–0.90 W/(m2
·K)), adobe (0.46–0.81 W/(m2·K)), or rammed earth (0.35–0.70 W/(m2
·K)) [1,26].When designing a sustainable building, the design team must have comprehensive information
regarding the different building products they can use [19]. Information should include that relatedto the life cycle environmental (e.g., embodied energy and global warming potential), functional(e.g., mechanical and thermal) and economic (e.g., construction and maintenance cost) performances.
Based on this context, this research is within a series of studies that are being developed bythe same authors to develop comprehensive information about earthen construction. Past studiesinclude those related to analysing the contribution of this type of construction in improving the indoorenvironmental quality [23] and reducing the embodied environmental impacts [2].
Energies 2020, 13, 2978 3 of 22
The present research is focused on an experimental investigation to evaluate the mechanical,durability and thermal performances of compressed earth blocks produced by a Portuguese company.This study aims to analyse the functional quality of the abovementioned product and assess its potentialto be used in the construction of buildings.
2. Materials and Methods
The compressed earth blocks tested are a commercial product made by a manufacturer located inthe city of Serpa, district of Beja (southern Portugal), which is also a contractor that builds earthenand conventional buildings. This contractor is one of the leading earth building systems builders inPortugal. The share of the earthen building systems corresponds to around 12% of the total company’sactivity, and during the year 2014, the company produced 338 m3 of rammed earth and 36 m3 ofcompressed earth blocks. Usually, rammed earth is used to build 60-cm-thick walls, and the dimensionsof the CEBs produced by this company varies. In this work, 30 cm × 15 cm × 7 cm compressed earthblocks were studied, since it is the most common block produced by the company. Additionally,this size is the most used in the Portuguese construction. The soil mixture is stabilised by using 6%by weight (wt) of hydraulic lime and 1% wt of hydrated lime. The mix also uses water, generallyextracted on-site (groundwater) (10% by weight), which evaporates during the drying process. In themajority of cases, earthen building elements are built from soil extracted from the construction site.Additionally, according to the company’s data, the compressed earth blocks are made and compactedusing a mechanical tapping machine. The company provided compressed earth blocks and the soilused for their production. They were experimentally analysed in different labs of the Departmentof Civil Engineering of the University of Minho, located in the city of Guimarães, district of Braga(northern Portugal).
2.1. Soil Characterisation
The soil was characterised in terms of particle size distribution, sand equivalent, clay content,cohesion limits, and compaction properties. These properties evaluate the quality of soil to be usedin earthen construction. The particle size distribution was determined according to the EN 196:1966standard [27]. The main goal of the sand equivalent test is to estimate the percentage of sand that existin a soil fraction with particles with less than 2 mm. This test was done according to EN 933-8:2002 [28].The methylene blue test allows the quantification of clay content present in a soil sample throughthe ionic change between the cations that exist in the soil particles and was done according to EN933-9:2002 [29]. The cohesion limits of soil are fundamental for the final quality of CEBs. The main goalof this test is assessing the liquid limit (LL), the plastic limit (LP), and the index of plasticity (IP) of thesoil. The cohesion limits were determined and calculated according to the EN 143:1969 standard [30].
The compaction properties of soil are fundamental in earthen products since there is a directrelation between dry density and compressive strength of a product. A more compact product presentshigher strength. The main goal of the Proctor compaction test consists in analysing the optimumwater content. This water content corresponds to the water content of a soil that allows it to achieveits dry density for specific energy of compaction. This test was done according to LNEC E 197:1966standard [31], considering two types of compaction (light and hard) in a small mould.
Table 1 and Figure 1 summarise the characteristics of the soil used for CEBs production. The soilpresented a good particle size distribution and showed the four types of particles in significantpercentages (15.9% pebble, 47.2% sand, 17.6% silt, and 19.4% clay). As shown in Table 1, the soil hasa liquid limit of 29% and a plasticity index of 11%. Therefore, it can be classified as a fair to poorclayed soil (type A6) according to the American Association of State Highway Transportation Officials(AASHTO) system [32]. However, according to the CRATerre group [33], these figures are within thelimits of the recommended classes for soil to be used as a construction material. The methylene bluetest shows 2.28 g of methylene blue per 100 g of soil, indicating a low degree of expansion, as alsoconfirmed by the plasticity index, suggesting a low clay content in the studied soil [34]. This result

Energies 2020, 13, 2978 4 of 22
is good since expansive soils are affected by humidity variations that change its consistency [35].The analysed soil has a maximum dry density between 1.95 g/cm3 and 1.99 g/cm3, which means thatthis soil is classified as “very good” to be used as construction material [33].
Table 1. Particle size distribution and Atterberg limits of the soil used.
Property Parameter Value
Particle size distributionGravel (>4.75 mm) 15.90
Sand (2.00–0.06 mm) 47.20Clay and silt (<0.06 mm) 36.95
Atterberg limitsLiquid limit Ll (%) 29.00
Plasticity limit Lp (%) 18.00Plasticity index Ip (%) 11.00
Sand equivalent - (%) 23.49
Fine content by methylene blue test Methylene blue value (g/100 g soil) 2.28
Modified Proctor test—Light Optimum water content (%) 12.00Maximum dry density (g/cm3) 1.95
Modified Proctor test—Heavy Optimum water content (%) 11.80Maximum dry density (g/cm3) 1.99
Energies 2020, 13, x FOR PEER REVIEW 4 of 21
consistency [36]. The analysed soil has a maximum dry density between 1.95 g/cm3 and 1.99 g/cm3, which means that this soil is classified as “very good” to be used as construction material [34].
Figure 1. Particle size distribution of the soil, according to the results of the sedimentation test.
Table 1. Particle size distribution and Atterberg limits of the soil used.
Property Parameter Value
Particle size distribution Gravel (> 4.75 mm) 15.90
Sand (2.00–0.06 mm) 47.20 Clay and silt (< 0.06 mm) 36.95
Atterberg limits Liquid limit Ll (%) 29.00
Plasticity limit Lp (%) 18.00 Plasticity index Ip (%) 11.00
Sand equivalent - (%) 23.49 Fine content by methylene blue test Methylene blue value (g/100g soil) 2.28
Modified Proctor test—Light Optimum water content (%) 12.00
Maximum dry density (g/cm3) 1.95
Modified Proctor test—Heavy Optimum water content (%) 11.80
Maximum dry density (g/cm3) 1.99
2.2. Compressed Earth Blocks Characterisation
2.2.1. Electrical Resistivity
The electrical resistivity was measured using the ResipodProceq equipment, made by Proceq SA (Schwerzenbach, Switzerland), which comprises four equidistant (38 mm) electrodes (Figure 2). During this test, an alternate current was provided between the external electrodes and the electrical potential difference between the internal electrodes was measured. The electrical resistivity was measured through the Ohm’s law and computed by the equipment used. The tested samples were the ones used for the water absorption by capillarity test after they achieved the saturation point. Four measurements were done for each saturated compressed earth block sample.
(a)
(b)
Figure 2. Electric resistivity test: measurements were done in two samples faces—(a) width and (b) length.
0.001 0.01 0.1 1 10 10005
101520253035404550556065707580859095
100
Particle size (mm)
Perc
ent P
assi
ng (%
)
Figure 1. Particle size distribution of the soil, according to the results of the sedimentation test.
2.2. Compressed Earth Blocks Characterisation
2.2.1. Electrical Resistivity
The electrical resistivity was measured using the ResipodProceq equipment, made by Proceq SA(Schwerzenbach, Switzerland), which comprises four equidistant (38 mm) electrodes (Figure 2). Duringthis test, an alternate current was provided between the external electrodes and the electrical potentialdifference between the internal electrodes was measured. The electrical resistivity was measuredthrough the Ohm’s law and computed by the equipment used. The tested samples were the ones usedfor the water absorption by capillarity test after they achieved the saturation point. Four measurementswere done for each saturated compressed earth block sample.

Energies 2020, 13, 2978 5 of 22
Energies 2020, 13, x FOR PEER REVIEW 4 of 21
consistency [36]. The analysed soil has a maximum dry density between 1.95 g/cm3 and 1.99 g/cm3, which means that this soil is classified as “very good” to be used as construction material [34].
Figure 1. Particle size distribution of the soil, according to the results of the sedimentation test.
Table 1. Particle size distribution and Atterberg limits of the soil used.
Property Parameter Value
Particle size distribution Gravel (> 4.75 mm) 15.90
Sand (2.00–0.06 mm) 47.20 Clay and silt (< 0.06 mm) 36.95
Atterberg limits Liquid limit Ll (%) 29.00
Plasticity limit Lp (%) 18.00 Plasticity index Ip (%) 11.00
Sand equivalent - (%) 23.49 Fine content by methylene blue test Methylene blue value (g/100g soil) 2.28
Modified Proctor test—Light Optimum water content (%) 12.00
Maximum dry density (g/cm3) 1.95
Modified Proctor test—Heavy Optimum water content (%) 11.80
Maximum dry density (g/cm3) 1.99
2.2. Compressed Earth Blocks Characterisation
2.2.1. Electrical Resistivity
The electrical resistivity was measured using the ResipodProceq equipment, made by Proceq SA (Schwerzenbach, Switzerland), which comprises four equidistant (38 mm) electrodes (Figure 2). During this test, an alternate current was provided between the external electrodes and the electrical potential difference between the internal electrodes was measured. The electrical resistivity was measured through the Ohm’s law and computed by the equipment used. The tested samples were the ones used for the water absorption by capillarity test after they achieved the saturation point. Four measurements were done for each saturated compressed earth block sample.
(a)
(b)
Figure 2. Electric resistivity test: measurements were done in two samples faces—(a) width and (b) length.
0.001 0.01 0.1 1 10 10005
101520253035404550556065707580859095
100
Particle size (mm)
Perc
ent P
assi
ng (%
)
Figure 2. Electric resistivity test: measurements were done in two samples faces—(a) width and(b) length.
2.2.2. Ultrasonic Pulse Velocity
The Ultrasonic Pulse Velocity (UPV) test evaluates some materials properties, such as elasticitymodulus, homogeneity, mechanical resistances, and cracking. It is also possible to calculate thepropagation velocity [36]. The UPV tests consists of measuring the time that a given sound pulse takesto pass through a known section of a specimen. This is based on the wave propagation theory, wherea sound pulse propagates faster in a dense material and slowly in a porous material. It is thereforepossible to calculate the propagation velocity [36], and this test allows the indirect determination ofthe intrinsic characteristics of a given sample [36]. There is almost nothing in the literature about theuse of this test in compressed earth blocks. Nevertheless, there are some studies that have alreadybeen performed on rammed earth [37,38] that disclose that there is a relation between the UPV andthe compressive strength of earthen products. The UPV measurement was developed according toEN 12504-4:2007 [39] in two directions (direct and indirect—see Figure 3). The measure of UPV inthe direct position was obtained with the transmitter and receiver transducers positioned on twoopposite sides. The indirect measurements were done by placing the transmitter on one face and thereceiver on a perpendicular side. An appropriate coupling gel was applied between the transducersand the sample to prevent the existence of voids in the contact area. Three independent readings wereregistered for each sample. Equation (1) is used to calculate the UPV, which is the ratio between thedistance (L) between the transductors (emission and receptor) and the propagation time (t).
UPV (m/s) =Lt
(1)
Energies 2020, 13, x FOR PEER REVIEW 5 of 21
2.2.2. Ultrasonic Pulse Velocity
The Ultrasonic Pulse Velocity (UPV) test evaluates some materials properties, such as elasticity modulus, homogeneity, mechanical resistances, and cracking. It is also possible to calculate the propagation velocity [37]. The UPV tests consists of measuring the time that a given sound pulse takes to pass through a known section of a specimen. This is based on the wave propagation theory, where a sound pulse propagates faster in a dense material and slowly in a porous material. It is therefore possible to calculate the propagation velocity [37], and this test allows the indirect determination of the intrinsic characteristics of a given sample [37]. There is almost nothing in the literature about the use of this test in compressed earth blocks. Nevertheless, there are some studies that have already been performed on rammed earth [38,39] that disclose that there is a relation between the UPV and the compressive strength of earthen products. The UPV measurement was developed according to EN 12504-4:2007 [40] in two directions (direct and indirect—see Figure 3). The measure of UPV in the direct position was obtained with the transmitter and receiver transducers positioned on two opposite sides. The indirect measurements were done by placing the transmitter on one face and the receiver on a perpendicular side. An appropriate coupling gel was applied between the transducers and the sample to prevent the existence of voids in the contact area. Three independent readings were registered for each sample. Equation (1) is used to calculate the UPV, which is the ratio between the distance (L) between the transductors (emission and receptor) and the propagation time (t). (m/s) = (1)
(a)
(b)
Figure 3. Ultrasonic Pulse Velocity (UPV) test—(a) direct method and (b) indirect method.
2.2.3. Compressive Strength
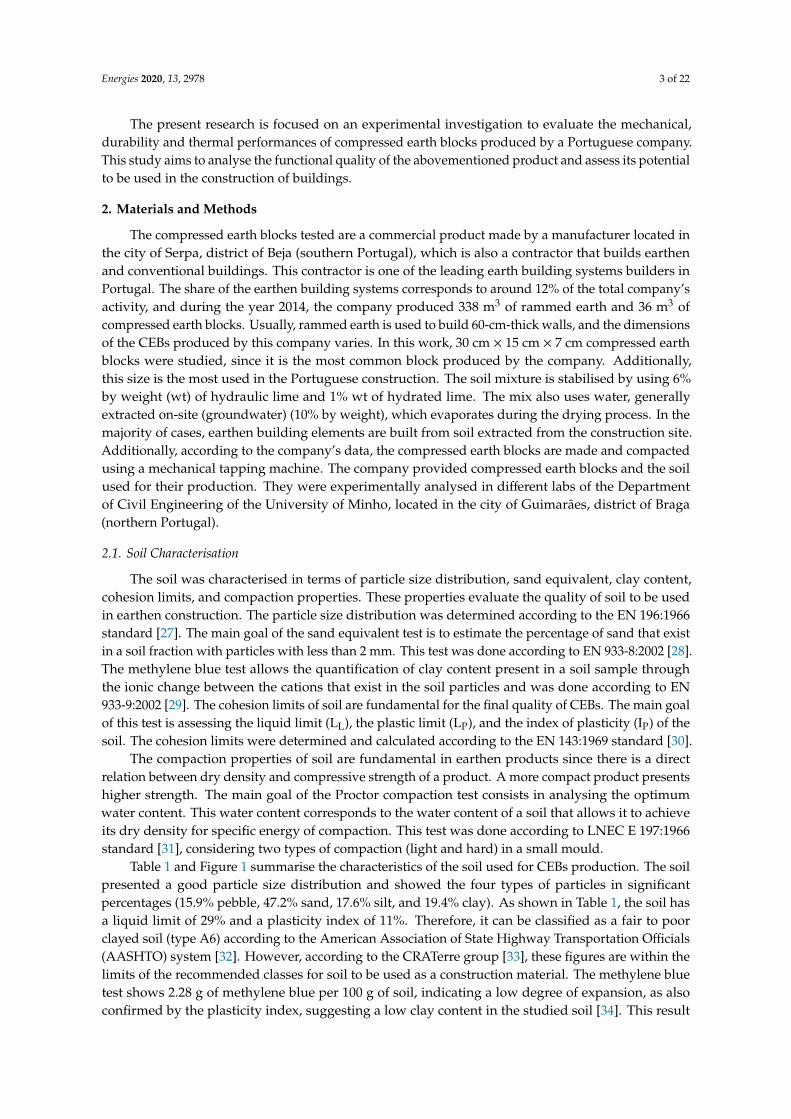
The compressive strength test used a hydraulic press machine with a capacity of 3000 kN (Figure 4), coupled with a hydraulic control system, according to NP EN 772-1 [41]. For the test, two transducers were used, one that belongs to the press and another external to measure the vertical displacement (LVSTs). The test used displacement control, with a regular load velocity of 0.5 kN/s. The experiment consisted of applying an increasing compressive load until the load achieved 40% to 50% of the failure value after registering the maximum load peak. Six samples were tested to assess the compressive strength of CEBs.
Figure 3. Ultrasonic Pulse Velocity (UPV) test—(a) direct method and (b) indirect method.
2.2.3. Compressive Strength
The compressive strength test used a hydraulic press machine with a capacity of 3000 kN (Figure 4),coupled with a hydraulic control system, according to NP EN 772-1 [40]. For the test, two transducerswere used, one that belongs to the press and another external to measure the vertical displacement
Energies 2020, 13, 2978 6 of 22
(LVSTs). The test used displacement control, with a regular load velocity of 0.5 kN/s. The experimentconsisted of applying an increasing compressive load until the load achieved 40% to 50% of the failurevalue after registering the maximum load peak. Six samples were tested to assess the compressivestrength of CEBs.Energies 2020, 13, x FOR PEER REVIEW 6 of 21
Figure 4. Compressive strength test.
2.2.4. Total Water Absorption
The assessment of the total water absorption of a block is essential since it can be used for routine quality checks, classification according to required durability and structural use, and to estimate the volume of voids [4,42]. Usually, the less water a block absorbs and retains, the better its structural performance and durability. Reducing the total water absorption capacity of a block has often been considered as one way of improving its quality [42].
The total water absorption test consists of immersing a block in the water until no further increase in apparent mass is observed. This experiment followed the LNEC E 394:1993 standard [43]. It is considered that there was no increase in the apparent mass when two consecutive measurements did not differ by more than 0.1% by mass. The test was carried out at atmospheric pressure in which three samples were immersed in water for 1, 2, 3, 4, and 5 hours. After each period, the surface of the specimen was wiped with a cloth to remove any adsorbed water. Then the samples were weighed. Initially, the test was done for 24 h, as recommended by the standard and observed in other studies [4,42]. However, after 24 h immersion in water, the CEBs disintegrated, and it was not possible to measure its wet weight. The percentage of water absorbed (A) was calculated using Equation (2). Wh is the weight of the specimen after each period of immersion, and Ws is the dry block weight. (%) = ( − )
(2)
2.2.5. Water Absorption by Capillarity
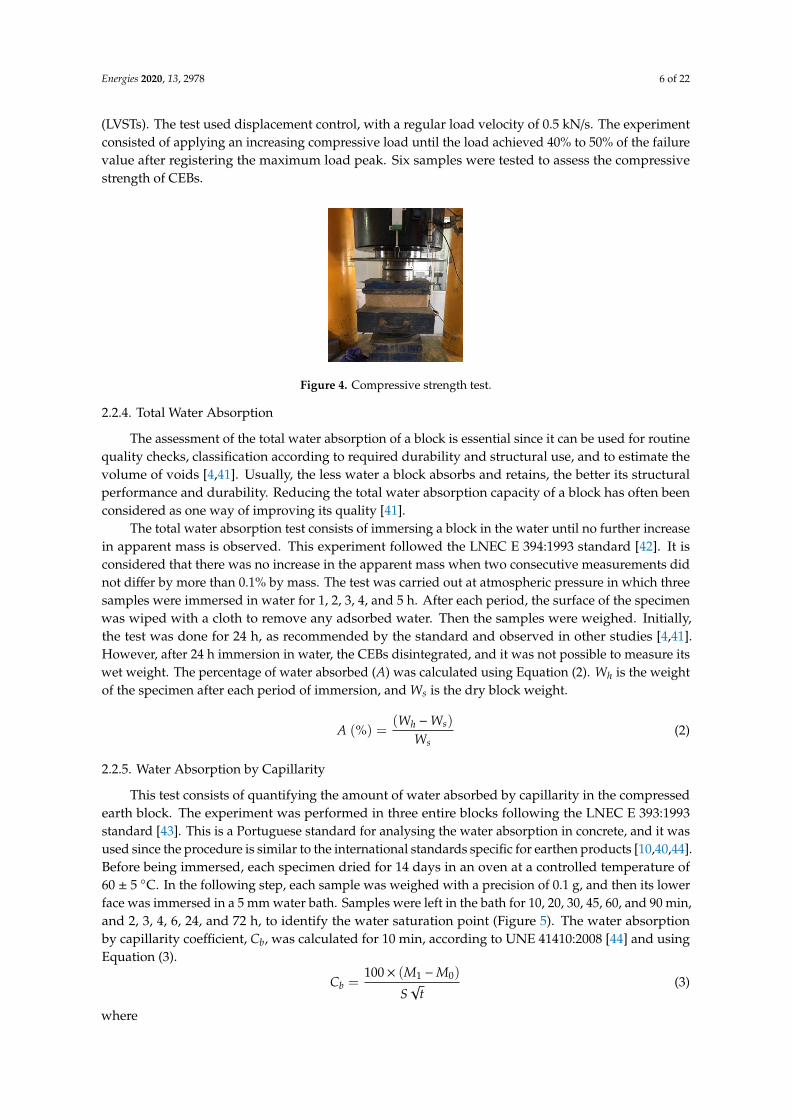
This test consists of quantifying the amount of water absorbed by capillarity in the compressed earth block. The experiment was performed in three entire blocks following the LNEC E 393:1993 standard [44]. This is a Portuguese standard for analysing the water absorption in concrete, and it was used since the procedure is similar to the international standards specific for earthen products [11,41,45]. Before being immersed, each specimen dried for 14 days in an oven at a controlled temperature of 60 ± 5 °C. In the following step, each sample was weighed with a precision of 0.1 g, and then its lower face was immersed in a 5 mm water bath. Samples were left in the bath for 10, 20, 30, 45, 60, and 90 min, and 2, 3, 4, 6, 24, and 72 h, to identify the water saturation point (Figure 5). The water absorption by capillarity coefficient, Cb, was calculated for 10 min, according to UNE 41410:2008 [45] and using Equation (3). = 100 × ( − )√ (3)
where Cb is the water absorption by capillarity coefficient (g/cm2·min0.5); M1 is the weight of the block after immersion in water (g); M0 is the weight of the block before immersion in water (g); S is the immersed area (cm2); t is the immersion time (min).
Figure 4. Compressive strength test.
2.2.4. Total Water Absorption
The assessment of the total water absorption of a block is essential since it can be used for routinequality checks, classification according to required durability and structural use, and to estimate thevolume of voids [4,41]. Usually, the less water a block absorbs and retains, the better its structuralperformance and durability. Reducing the total water absorption capacity of a block has often beenconsidered as one way of improving its quality [41].
The total water absorption test consists of immersing a block in the water until no further increasein apparent mass is observed. This experiment followed the LNEC E 394:1993 standard [42]. It isconsidered that there was no increase in the apparent mass when two consecutive measurements didnot differ by more than 0.1% by mass. The test was carried out at atmospheric pressure in which threesamples were immersed in water for 1, 2, 3, 4, and 5 h. After each period, the surface of the specimenwas wiped with a cloth to remove any adsorbed water. Then the samples were weighed. Initially,the test was done for 24 h, as recommended by the standard and observed in other studies [4,41].However, after 24 h immersion in water, the CEBs disintegrated, and it was not possible to measure itswet weight. The percentage of water absorbed (A) was calculated using Equation (2). Wh is the weightof the specimen after each period of immersion, and Ws is the dry block weight.
A (%) =(Wh −Ws)
Ws(2)
2.2.5. Water Absorption by Capillarity
This test consists of quantifying the amount of water absorbed by capillarity in the compressedearth block. The experiment was performed in three entire blocks following the LNEC E 393:1993standard [43]. This is a Portuguese standard for analysing the water absorption in concrete, and it wasused since the procedure is similar to the international standards specific for earthen products [10,40,44].Before being immersed, each specimen dried for 14 days in an oven at a controlled temperature of60 ± 5 C. In the following step, each sample was weighed with a precision of 0.1 g, and then its lowerface was immersed in a 5 mm water bath. Samples were left in the bath for 10, 20, 30, 45, 60, and 90 min,and 2, 3, 4, 6, 24, and 72 h, to identify the water saturation point (Figure 5). The water absorptionby capillarity coefficient, Cb, was calculated for 10 min, according to UNE 41410:2008 [44] and usingEquation (3).
Cb =100× (M1 −M0)
S√
t(3)
where
Energies 2020, 13, 2978 7 of 22
Cb is the water absorption by capillarity coefficient (g/cm2·min0.5);
M1 is the weight of the block after immersion in water (g);M0 is the weight of the block before immersion in water (g);S is the immersed area (cm2);t is the immersion time (min).Energies 2020, 13, x FOR PEER REVIEW 7 of 21
(a)
(b)
(c)
(d)
Figure 5. Water absorption by capillarity test: (a) after 10 min of water immersion; (b) after 30 min of water immersion; (c) after 45 min of water immersion; and (d) after 60 min of water immersion.
2.2.6. Accelerated Erosion
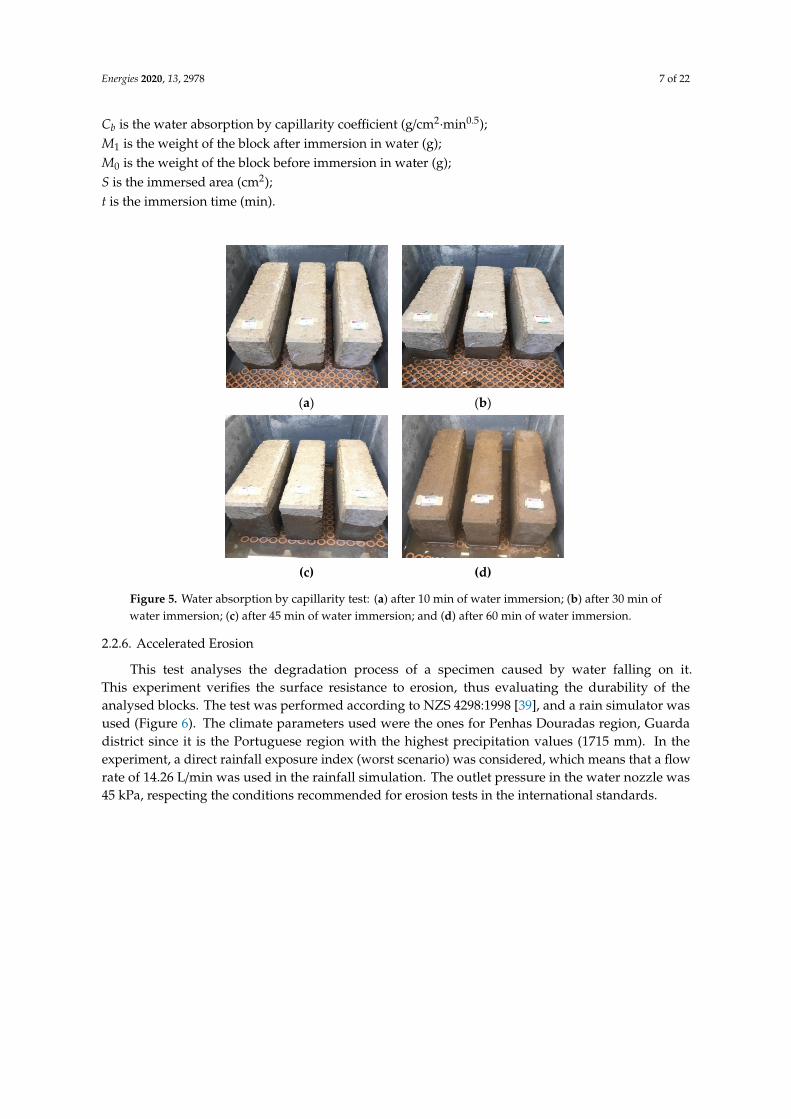
This test analyses the degradation process of a specimen caused by water falling on it. This experiment verifies the surface resistance to erosion, thus evaluating the durability of the analysed blocks. The test was performed according to NZS 4298:1998 [40], and a rain simulator was used (Figure 6). The climate parameters used were the ones for Penhas Douradas region, Guarda district since it is the Portuguese region with the highest precipitation values (1715 mm). In the experiment, a direct rainfall exposure index (worst scenario) was considered, which means that a flow rate of 14.26 l/min was used in the rainfall simulation. The outlet pressure in the water nozzle was 45 kPa, respecting the conditions recommended for erosion tests in the international standards.
(a)
(b)
(c)
(d)
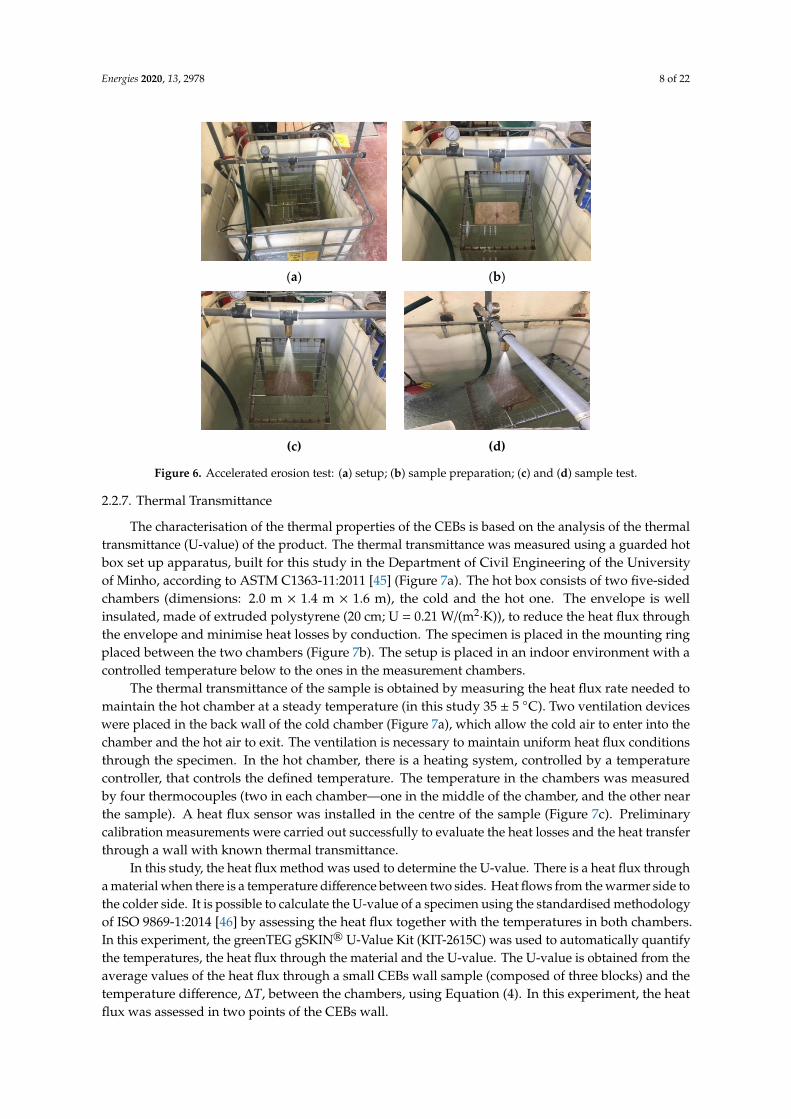
Figure 6. Accelerated erosion test: (a) setup; (b) sample preparation; (c) and (d) sample test.
Figure 5. Water absorption by capillarity test: (a) after 10 min of water immersion; (b) after 30 min ofwater immersion; (c) after 45 min of water immersion; and (d) after 60 min of water immersion.
2.2.6. Accelerated Erosion
This test analyses the degradation process of a specimen caused by water falling on it.This experiment verifies the surface resistance to erosion, thus evaluating the durability of theanalysed blocks. The test was performed according to NZS 4298:1998 [39], and a rain simulator wasused (Figure 6). The climate parameters used were the ones for Penhas Douradas region, Guardadistrict since it is the Portuguese region with the highest precipitation values (1715 mm). In theexperiment, a direct rainfall exposure index (worst scenario) was considered, which means that a flowrate of 14.26 L/min was used in the rainfall simulation. The outlet pressure in the water nozzle was45 kPa, respecting the conditions recommended for erosion tests in the international standards.
Energies 2020, 13, 2978 8 of 22
Energies 2020, 13, x FOR PEER REVIEW 7 of 21
(a)
(b)
(c)
(d)
Figure 5. Water absorption by capillarity test: (a) after 10 min of water immersion; (b) after 30 min of water immersion; (c) after 45 min of water immersion; and (d) after 60 min of water immersion.
2.2.6. Accelerated Erosion
This test analyses the degradation process of a specimen caused by water falling on it. This experiment verifies the surface resistance to erosion, thus evaluating the durability of the analysed blocks. The test was performed according to NZS 4298:1998 [40], and a rain simulator was used (Figure 6). The climate parameters used were the ones for Penhas Douradas region, Guarda district since it is the Portuguese region with the highest precipitation values (1715 mm). In the experiment, a direct rainfall exposure index (worst scenario) was considered, which means that a flow rate of 14.26 l/min was used in the rainfall simulation. The outlet pressure in the water nozzle was 45 kPa, respecting the conditions recommended for erosion tests in the international standards.
(a)
(b)
(c)
(d)
Figure 6. Accelerated erosion test: (a) setup; (b) sample preparation; (c) and (d) sample test. Figure 6. Accelerated erosion test: (a) setup; (b) sample preparation; (c) and (d) sample test.
2.2.7. Thermal Transmittance
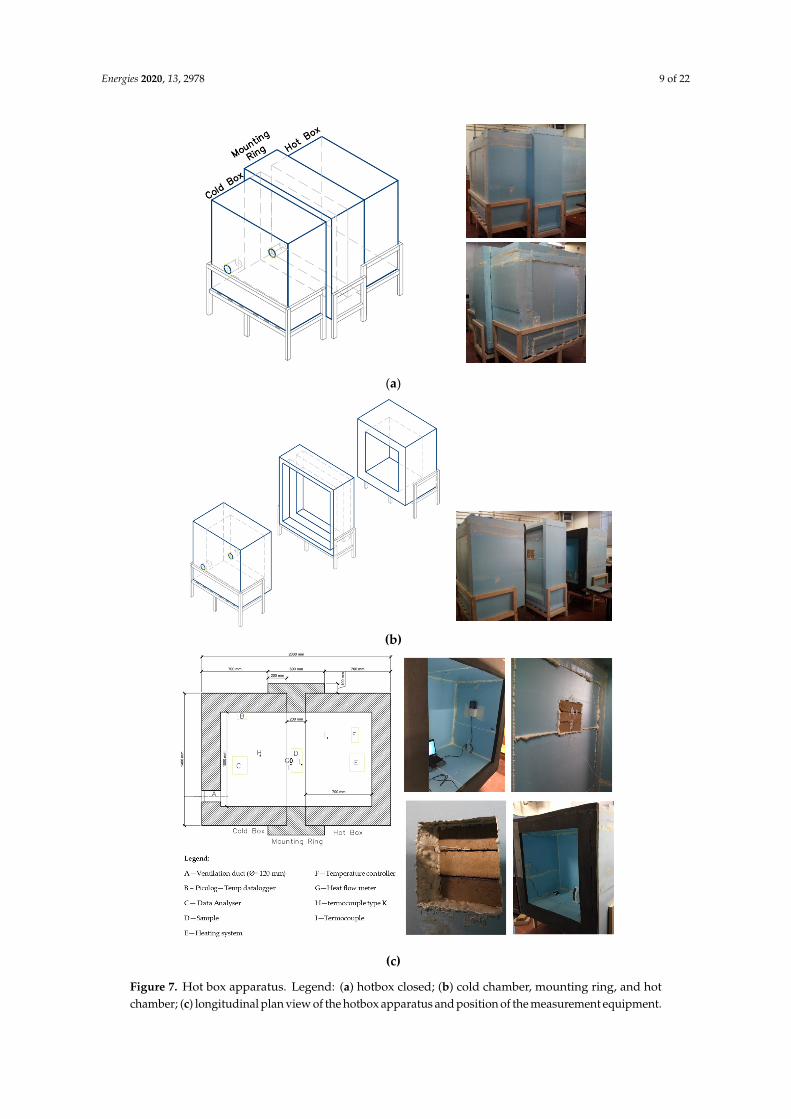
The characterisation of the thermal properties of the CEBs is based on the analysis of the thermaltransmittance (U-value) of the product. The thermal transmittance was measured using a guarded hotbox set up apparatus, built for this study in the Department of Civil Engineering of the Universityof Minho, according to ASTM C1363-11:2011 [45] (Figure 7a). The hot box consists of two five-sidedchambers (dimensions: 2.0 m × 1.4 m × 1.6 m), the cold and the hot one. The envelope is wellinsulated, made of extruded polystyrene (20 cm; U = 0.21 W/(m2
·K)), to reduce the heat flux throughthe envelope and minimise heat losses by conduction. The specimen is placed in the mounting ringplaced between the two chambers (Figure 7b). The setup is placed in an indoor environment with acontrolled temperature below to the ones in the measurement chambers.
The thermal transmittance of the sample is obtained by measuring the heat flux rate needed tomaintain the hot chamber at a steady temperature (in this study 35 ± 5 C). Two ventilation deviceswere placed in the back wall of the cold chamber (Figure 7a), which allow the cold air to enter into thechamber and the hot air to exit. The ventilation is necessary to maintain uniform heat flux conditionsthrough the specimen. In the hot chamber, there is a heating system, controlled by a temperaturecontroller, that controls the defined temperature. The temperature in the chambers was measuredby four thermocouples (two in each chamber—one in the middle of the chamber, and the other nearthe sample). A heat flux sensor was installed in the centre of the sample (Figure 7c). Preliminarycalibration measurements were carried out successfully to evaluate the heat losses and the heat transferthrough a wall with known thermal transmittance.
In this study, the heat flux method was used to determine the U-value. There is a heat flux througha material when there is a temperature difference between two sides. Heat flows from the warmer side tothe colder side. It is possible to calculate the U-value of a specimen using the standardised methodologyof ISO 9869-1:2014 [46] by assessing the heat flux together with the temperatures in both chambers.In this experiment, the greenTEG gSKIN® U-Value Kit (KIT-2615C) was used to automatically quantifythe temperatures, the heat flux through the material and the U-value. The U-value is obtained from theaverage values of the heat flux through a small CEBs wall sample (composed of three blocks) and thetemperature difference, ∆T, between the chambers, using Equation (4). In this experiment, the heatflux was assessed in two points of the CEBs wall.
Energies 2020, 13, 2978 9 of 22
Energies 2020, 13, x FOR PEER REVIEW 8 of 21
2.2.7. Thermal Transmittance
The characterisation of the thermal properties of the CEBs is based on the analysis of the thermal transmittance (U-value) of the product. The thermal transmittance was measured using a guarded hot box set up apparatus, built for this study in the Department of Civil Engineering of the University of Minho, according to ASTM C1363-11:2011 [46] (Figure 7a). The hot box consists of two five-sided chambers (dimensions: 2.0 m × 1.4 m × 1.6 m), the cold and the hot one. The envelope is well insulated, made of extruded polystyrene (20 cm; U = 0.21 W(m2·K)), to reduce the heat flux through the envelope and minimise heat losses by conduction. The specimen is placed in the mounting ring placed between the two chambers (Figure 7b). The setup is placed in an indoor environment with a controlled temperature below to the ones in the measurement chambers.
The thermal transmittance of the sample is obtained by measuring the heat flux rate needed to maintain the hot chamber at a steady temperature (in this study 35 ± 5 °C). Two ventilation devices were placed in the back wall of the cold chamber (Figure 7a), which allow the cold air to enter into the chamber and the hot air to exit. The ventilation is necessary to maintain uniform heat flux conditions through the specimen. In the hot chamber, there is a heating system, controlled by a temperature controller, that controls the defined temperature. The temperature in the chambers was measured by four thermocouples (two in each chamber—one in the middle of the chamber, and the other near the sample). A heat flux sensor was installed in the centre of the sample (Figure 7c). Preliminary calibration measurements were carried out successfully to evaluate the heat losses and the heat transfer through a wall with known thermal transmittance.
In this study, the heat flux method was used to determine the U-value. There is a heat flux through a material when there is a temperature difference between two sides. Heat flows from the warmer side to the colder side. It is possible to calculate the U-value of a specimen using the standardised methodology of ISO 9869-1:2014 [47] by assessing the heat flux together with the temperatures in both chambers. In this experiment, the greenTEG gSKIN® U-Value Kit (KIT-2615C) was used to automatically quantify the temperatures, the heat flux through the material and the U-value. The U-value is obtained from the average values of the heat flux through a small CEBs wall sample (composed of three blocks) and the temperature difference, ΔT, between the chambers, using Equation 4. In this experiment, the heat flux was assessed in two points of the CEBs wall. − = ∑∑ ∆ ( /( · ), (4)
where n is the total number of data points; φ is the heat flux in (W/m2); ΔT is the temperature (°C) difference between the two sides of the specimen.
Energies 2020, 13, x FOR PEER REVIEW 9 of 21
(a)
(b)
(c)
Figure 7. Hot box apparatus. Legend: (a) hotbox closed; (b) cold chamber, mounting ring, and hot chamber; (c) longitudinal plan view of the hotbox apparatus and position of the measurement equipment.
Figure 7. Hot box apparatus. Legend: (a) hotbox closed; (b) cold chamber, mounting ring, and hotchamber; (c) longitudinal plan view of the hotbox apparatus and position of the measurement equipment.
Energies 2020, 13, 2978 10 of 22
U − value =
∑nj=1 ϕ j∑n
j=1 ∆T j
(W/(m2
·K)), (4)
where
n is the total number of data points;ϕ is the heat flux in (W/m2);∆T is the temperature (C) difference between the two sides of the specimen.
3. Results
In this section, the mechanical, durability, and thermal characterisation of the CEBs will bedescribed and discussed.
3.1. Electrical Resistivity
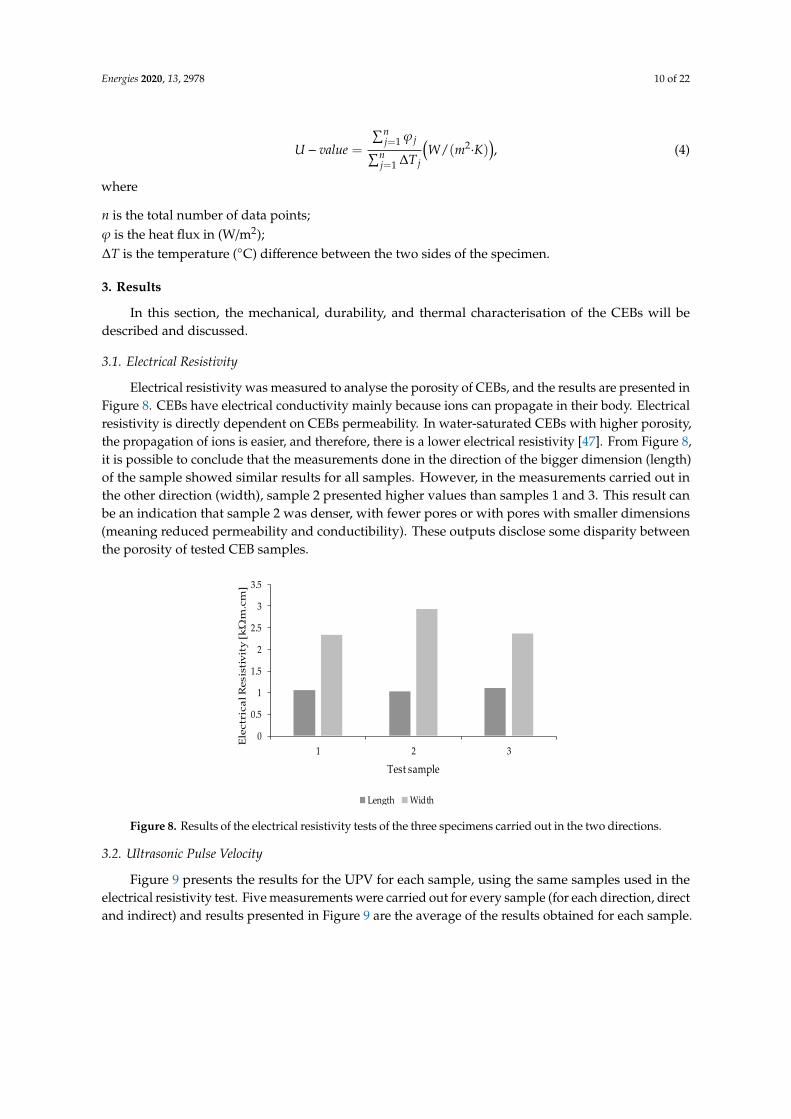
Electrical resistivity was measured to analyse the porosity of CEBs, and the results are presented inFigure 8. CEBs have electrical conductivity mainly because ions can propagate in their body. Electricalresistivity is directly dependent on CEBs permeability. In water-saturated CEBs with higher porosity,the propagation of ions is easier, and therefore, there is a lower electrical resistivity [47]. From Figure 8,it is possible to conclude that the measurements done in the direction of the bigger dimension (length)of the sample showed similar results for all samples. However, in the measurements carried out inthe other direction (width), sample 2 presented higher values than samples 1 and 3. This result canbe an indication that sample 2 was denser, with fewer pores or with pores with smaller dimensions(meaning reduced permeability and conductibility). These outputs disclose some disparity betweenthe porosity of tested CEB samples.
Energies 2020, 13, x FOR PEER REVIEW 10 of 21
samples 1 and 3. This result can be an indication that sample 2 was denser, with fewer pores or with pores with smaller dimensions (meaning reduced permeability and conductibility). These outputs disclose some disparity between the porosity of tested CEB samples.
Figure 8. Results of the electrical resistivity tests of the three specimens carried out in the two directions.
3.2. Ultrasonic Pulse Velocity
Figure 9 presents the results for the UPV for each sample, using the same samples used in the electrical resistivity test. Five measurements were carried out for every sample (for each direction, direct and indirect) and results presented in Figure 9 are the average of the results obtained for each sample.
A sonic impulse propagates with lower velocity in a porous body and with higher velocity in a denser one. Therefore, according to the analysis of the results, it is possible to conclude that sample 2 presented slightly lower UPV, which can be an indication of a higher number of voids. These results are similar to the electrical resistivity test results. The sample performance differences could be due to the incorrect homogenisation of the soil mixture and/or cracking.
Figure 9. Ultrasonic Pulse Velocity measurements.
3.3. Compressive Strength
The compressive strength test is considered a reference test for CEBs since it is regarded as an essential indicator of masonry strength. Figure 10 presents the results obtained for the compressive strength of six samples, as well as the average value obtained for this parameter. The results showed a variation on compressive strength between 7.8 MPa and 11.0 MPa, being the average 9.0 ± 1.3 MPa.
0
0.5
1
1.5
2
2.5
3
3.5
1 2 3
Ele
ctri
cal R
esis
tivi
ty [kΏ
m.c
m]
Test sample
Length Width
0200400600800
10001200140016001800
1 2 3
Ult
raso
nic
Pu
lse
Vel
ocit
y [m
/s]
Test sample
Direct Indirect
Figure 8. Results of the electrical resistivity tests of the three specimens carried out in the two directions.
3.2. Ultrasonic Pulse Velocity
Figure 9 presents the results for the UPV for each sample, using the same samples used in theelectrical resistivity test. Five measurements were carried out for every sample (for each direction, directand indirect) and results presented in Figure 9 are the average of the results obtained for each sample.

Energies 2020, 13, 2978 11 of 22
Energies 2020, 13, x FOR PEER REVIEW 10 of 21
samples 1 and 3. This result can be an indication that sample 2 was denser, with fewer pores or with pores with smaller dimensions (meaning reduced permeability and conductibility). These outputs disclose some disparity between the porosity of tested CEB samples.
Figure 8. Results of the electrical resistivity tests of the three specimens carried out in the two directions.
3.2. Ultrasonic Pulse Velocity
Figure 9 presents the results for the UPV for each sample, using the same samples used in the electrical resistivity test. Five measurements were carried out for every sample (for each direction, direct and indirect) and results presented in Figure 9 are the average of the results obtained for each sample.
A sonic impulse propagates with lower velocity in a porous body and with higher velocity in a denser one. Therefore, according to the analysis of the results, it is possible to conclude that sample 2 presented slightly lower UPV, which can be an indication of a higher number of voids. These results are similar to the electrical resistivity test results. The sample performance differences could be due to the incorrect homogenisation of the soil mixture and/or cracking.
Figure 9. Ultrasonic Pulse Velocity measurements.
3.3. Compressive Strength
The compressive strength test is considered a reference test for CEBs since it is regarded as an essential indicator of masonry strength. Figure 10 presents the results obtained for the compressive strength of six samples, as well as the average value obtained for this parameter. The results showed a variation on compressive strength between 7.8 MPa and 11.0 MPa, being the average 9.0 ± 1.3 MPa.
0
0.5
1
1.5
2
2.5
3
3.5
1 2 3
Ele
ctri
cal R
esis
tivi
ty [kΏ
m.c
m]
Test sample
Length Width
0200400600800
10001200140016001800
1 2 3
Ult
raso
nic
Pu
lse
Vel
ocit
y [m
/s]
Test sample
Direct Indirect
Figure 9. Ultrasonic Pulse Velocity measurements.
A sonic impulse propagates with lower velocity in a porous body and with higher velocity in adenser one. Therefore, according to the analysis of the results, it is possible to conclude that sample 2presented slightly lower UPV, which can be an indication of a higher number of voids. These resultsare similar to the electrical resistivity test results. The sample performance differences could be due tothe incorrect homogenisation of the soil mixture and/or cracking.
3.3. Compressive Strength
The compressive strength test is considered a reference test for CEBs since it is regarded as anessential indicator of masonry strength. Figure 10 presents the results obtained for the compressivestrength of six samples, as well as the average value obtained for this parameter. The results showed avariation on compressive strength between 7.8 MPa and 11.0 MPa, being the average 9.0 ± 1.3 MPa.These values are very good ones since it is known that the minimum compressive strength requirementsfor CEBs, varying between 1.0 MPa and 2.8 MPa [7,21]. These higher values can be related to thecompaction process used since compacting the soil using a press improves the quality of the material.The higher density obtained by compaction significantly increases the compressive strength of theblocks [48]. Another reason for the higher compressive strength is the presence of lime in the mixture.Lime allows the development of calcium silicate hydrate (CSH) together with the formation of minoramounts of calcite, which causes increased strength [21].
Energies 2020, 13, x FOR PEER REVIEW 11 of 21
These values are very good ones since it is known that the minimum compressive strength requirements for CEBs, varying between 1.0 MPa and 2.8 MPa [7,22]. These higher values can be related to the compaction process used since compacting the soil using a press improves the quality of the material. The higher density obtained by compaction significantly increases the compressive strength of the blocks [49]. Another reason for the higher compressive strength is the presence of lime in the mixture. Lime allows the development of calcium silicate hydrate (CSH) together with the formation of minor amounts of calcite, which causes increased strength [22].
Figure 10. Compressive strength results.
3.4. Total Water Absorption
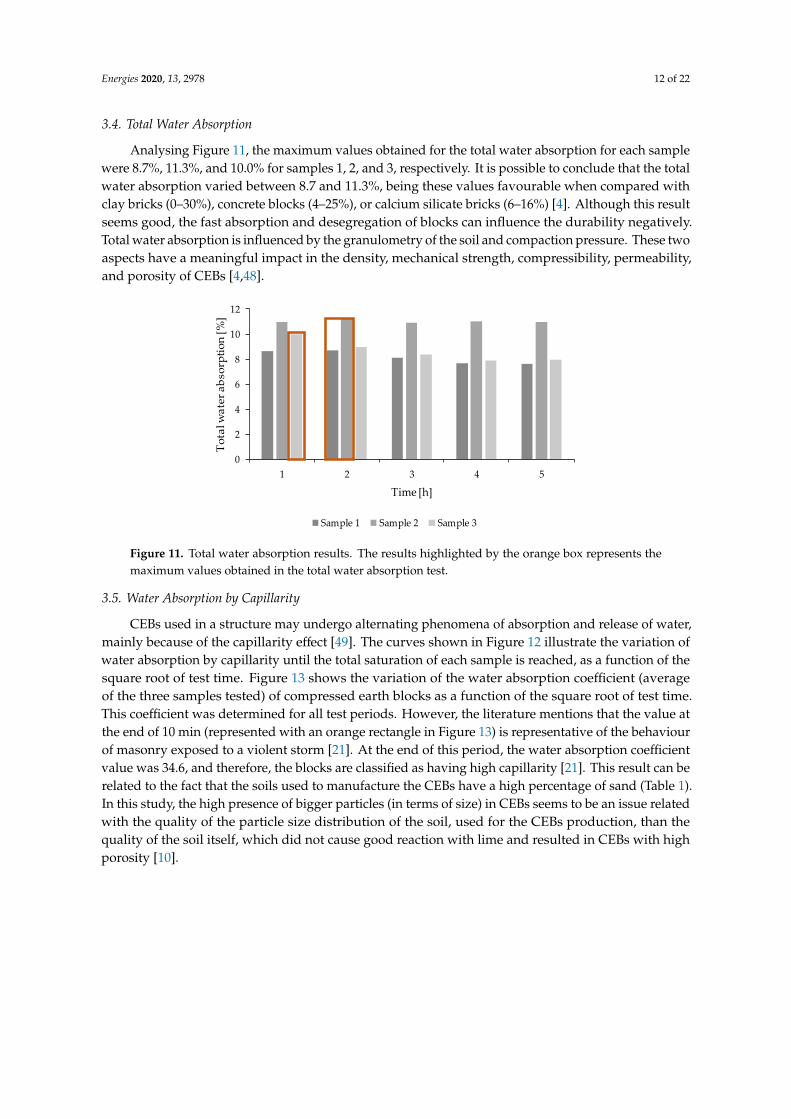
Analysing Figure 11, the maximum values obtained for the total water absorption for each sample were 8.7%, 11.3%, and 10.0% for samples 1, 2, and 3, respectively. It is possible to conclude that the total water absorption varied between 8.7 and 11.3%, being these values favourable when compared with clay bricks (0%–30%), concrete blocks (4%–25%), or calcium silicate bricks (6%–16%) [4]. Although this result seems good, the fast absorption and desegregation of blocks can influence the durability negatively. Total water absorption is influenced by the granulometry of the soil and compaction pressure. These two aspects have a meaningful impact in the density, mechanical strength, compressibility, permeability, and porosity of CEBs [4,49].
Figure 11. Total water absorption results. The results highlighted by the orange box represents the maximum values obtained in the total water absorption test.
3.5. Water Absorption by Capillarity
0
2
4
6
8
10
12
1 2 3 4 5 6
Com
pres
sive
str
engt
h [M
Pa]
Test sample
9.0 ± 1.3 MPa
0
2
4
6
8
10
12
1 2 3 4 5
Tot
al w
ater
abs
orpt
ion
[%]
Time [h]
Sample 1 Sample 2 Sample 3
Figure 10. Compressive strength results.
Energies 2020, 13, 2978 12 of 22
3.4. Total Water Absorption
Analysing Figure 11, the maximum values obtained for the total water absorption for each samplewere 8.7%, 11.3%, and 10.0% for samples 1, 2, and 3, respectively. It is possible to conclude that the totalwater absorption varied between 8.7 and 11.3%, being these values favourable when compared withclay bricks (0–30%), concrete blocks (4–25%), or calcium silicate bricks (6–16%) [4]. Although this resultseems good, the fast absorption and desegregation of blocks can influence the durability negatively.Total water absorption is influenced by the granulometry of the soil and compaction pressure. These twoaspects have a meaningful impact in the density, mechanical strength, compressibility, permeability,and porosity of CEBs [4,48].
Energies 2020, 13, x FOR PEER REVIEW 11 of 21
These values are very good ones since it is known that the minimum compressive strength requirements for CEBs, varying between 1.0 MPa and 2.8 MPa [7,22]. These higher values can be related to the compaction process used since compacting the soil using a press improves the quality of the material. The higher density obtained by compaction significantly increases the compressive strength of the blocks [49]. Another reason for the higher compressive strength is the presence of lime in the mixture. Lime allows the development of calcium silicate hydrate (CSH) together with the formation of minor amounts of calcite, which causes increased strength [22].
Figure 10. Compressive strength results.
3.4. Total Water Absorption
Analysing Figure 11, the maximum values obtained for the total water absorption for each sample were 8.7%, 11.3%, and 10.0% for samples 1, 2, and 3, respectively. It is possible to conclude that the total water absorption varied between 8.7 and 11.3%, being these values favourable when compared with clay bricks (0%–30%), concrete blocks (4%–25%), or calcium silicate bricks (6%–16%) [4]. Although this result seems good, the fast absorption and desegregation of blocks can influence the durability negatively. Total water absorption is influenced by the granulometry of the soil and compaction pressure. These two aspects have a meaningful impact in the density, mechanical strength, compressibility, permeability, and porosity of CEBs [4,49].
Figure 11. Total water absorption results. The results highlighted by the orange box represents the maximum values obtained in the total water absorption test.
3.5. Water Absorption by Capillarity
0
2
4
6
8
10
12
1 2 3 4 5 6
Com
pres
sive
str
engt
h [M
Pa]
Test sample
9.0 ± 1.3 MPa
0
2
4
6
8
10
12
1 2 3 4 5
Tot
al w
ater
abs
orpt
ion
[%]
Time [h]
Sample 1 Sample 2 Sample 3
Figure 11. Total water absorption results. The results highlighted by the orange box represents themaximum values obtained in the total water absorption test.
3.5. Water Absorption by Capillarity
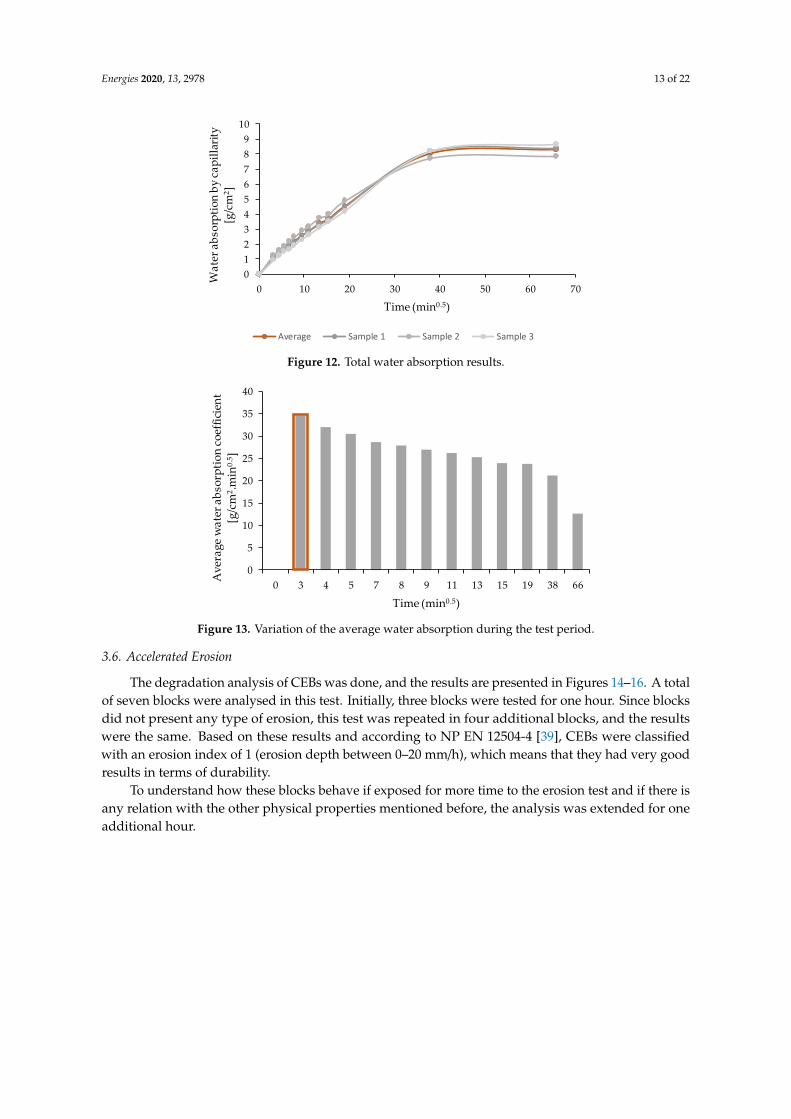
CEBs used in a structure may undergo alternating phenomena of absorption and release of water,mainly because of the capillarity effect [49]. The curves shown in Figure 12 illustrate the variation ofwater absorption by capillarity until the total saturation of each sample is reached, as a function of thesquare root of test time. Figure 13 shows the variation of the water absorption coefficient (averageof the three samples tested) of compressed earth blocks as a function of the square root of test time.This coefficient was determined for all test periods. However, the literature mentions that the value atthe end of 10 min (represented with an orange rectangle in Figure 13) is representative of the behaviourof masonry exposed to a violent storm [21]. At the end of this period, the water absorption coefficientvalue was 34.6, and therefore, the blocks are classified as having high capillarity [21]. This result can berelated to the fact that the soils used to manufacture the CEBs have a high percentage of sand (Table 1).In this study, the high presence of bigger particles (in terms of size) in CEBs seems to be an issue relatedwith the quality of the particle size distribution of the soil, used for the CEBs production, than thequality of the soil itself, which did not cause good reaction with lime and resulted in CEBs with highporosity [10].
Energies 2020, 13, 2978 13 of 22
Energies 2020, 13, x FOR PEER REVIEW 12 of 21
CEBs used in a structure may undergo alternating phenomena of absorption and release of water, mainly because of the capillarity effect [50]. The curves shown in Figure 12 illustrate the variation of water absorption by capillarity until the total saturation of each sample is reached, as a function of the square root of test time. Figure 13 shows the variation of the water absorption coefficient (average of the three samples tested) of compressed earth blocks as a function of the square root of test time. This coefficient was determined for all test periods. However, the literature mentions that the value at the end of 10 min (represented with an orange rectangle in Figure 13) is representative of the behaviour of masonry exposed to a violent storm [22]. At the end of this period, the water absorption coefficient value was 34.6, and therefore, the blocks are classified as having high capillarity [22]. This result can be related to the fact that the soils used to manufacture the CEBs have a high percentage of sand (Table 1). In this study, the high presence of bigger particles (in terms of size) in CEBs seems to be an issue related with the quality of the particle size distribution of the soil, used for the CEBs production, than the quality of the soil itself, which did not cause good reaction with lime and resulted in CEBs with high porosity [11].
Figure 12. Total water absorption results.
Figure 13. Variation of the average water absorption during the test period.
3.6. Accelerated Erosion
The degradation analysis of CEBs was done, and the results are presented in Figures 14–16. A total of seven blocks were analysed in this test. Initially, three blocks were tested for one hour. Since blocks did not present any type of erosion, this test was repeated in four additional blocks, and the results were the same. Based on these results and according to NP EN 12504-4 [40], CEBs were classified with an erosion index of 1 (erosion depth between 0–20 mm/h), which means that they had very good results in terms of durability.
0123456789
10
0 10 20 30 40 50 60 70
Wat
er a
bsor
ptio
n by
capi
llarit
y [g
/cm
2 ]
Time (min0.5)
Average Sample 1 Sample 2 Sample 3
0
5
10
15
20
25
30
35
40
0 3 4 5 7 8 9 11 13 15 19 38 66Ave
rage
wat
er a
bsor
ptio
n co
effic
ient
[g
/cm
2 .min
0.5 ]
Time (min0.5)
Figure 12. Total water absorption results.
Energies 2020, 13, x FOR PEER REVIEW 12 of 21
CEBs used in a structure may undergo alternating phenomena of absorption and release of water, mainly because of the capillarity effect [50]. The curves shown in Figure 12 illustrate the variation of water absorption by capillarity until the total saturation of each sample is reached, as a function of the square root of test time. Figure 13 shows the variation of the water absorption coefficient (average of the three samples tested) of compressed earth blocks as a function of the square root of test time. This coefficient was determined for all test periods. However, the literature mentions that the value at the end of 10 min (represented with an orange rectangle in Figure 13) is representative of the behaviour of masonry exposed to a violent storm [22]. At the end of this period, the water absorption coefficient value was 34.6, and therefore, the blocks are classified as having high capillarity [22]. This result can be related to the fact that the soils used to manufacture the CEBs have a high percentage of sand (Table 1). In this study, the high presence of bigger particles (in terms of size) in CEBs seems to be an issue related with the quality of the particle size distribution of the soil, used for the CEBs production, than the quality of the soil itself, which did not cause good reaction with lime and resulted in CEBs with high porosity [11].
Figure 12. Total water absorption results.
Figure 13. Variation of the average water absorption during the test period.
3.6. Accelerated Erosion
The degradation analysis of CEBs was done, and the results are presented in Figures 14–16. A total of seven blocks were analysed in this test. Initially, three blocks were tested for one hour. Since blocks did not present any type of erosion, this test was repeated in four additional blocks, and the results were the same. Based on these results and according to NP EN 12504-4 [40], CEBs were classified with an erosion index of 1 (erosion depth between 0–20 mm/h), which means that they had very good results in terms of durability.
0123456789
10
0 10 20 30 40 50 60 70
Wat
er a
bsor
ptio
n by
capi
llarit
y [g
/cm
2 ]
Time (min0.5)
Average Sample 1 Sample 2 Sample 3
0
5
10
15
20
25
30
35
40
0 3 4 5 7 8 9 11 13 15 19 38 66Ave
rage
wat
er a
bsor
ptio
n co
effic
ient
[g
/cm
2 .min
0.5 ]
Time (min0.5)
Figure 13. Variation of the average water absorption during the test period.
3.6. Accelerated Erosion
The degradation analysis of CEBs was done, and the results are presented in Figures 14–16. A totalof seven blocks were analysed in this test. Initially, three blocks were tested for one hour. Since blocksdid not present any type of erosion, this test was repeated in four additional blocks, and the resultswere the same. Based on these results and according to NP EN 12504-4 [39], CEBs were classifiedwith an erosion index of 1 (erosion depth between 0–20 mm/h), which means that they had very goodresults in terms of durability.
To understand how these blocks behave if exposed for more time to the erosion test and if there isany relation with the other physical properties mentioned before, the analysis was extended for oneadditional hour.

Energies 2020, 13, 2978 14 of 22
Energies 2020, 13, x FOR PEER REVIEW 13 of 21
To understand how these blocks behave if exposed for more time to the erosion test and if there is any relation with the other physical properties mentioned before, the analysis was extended for one additional hour.
After two hours of water exposition, CEBs presented different behaviour. Sample 1 did not show significant damage in the majority of faces exposed to water but presented a loss in one part of the block where there was already a small defect before the test (Figure 14). Sample 2 showed similar behaviour to sample 1. Samples 3 (Figure 15), 4m and 5 presented some damage in the two smaller faces, even though the face in contact with the water was the one with a larger area (highlighted with a red cross in Figure 14). Samples 6 (Figure 16) and 7 suffered significant damage, and at the end of two hours, they were almost destroyed. It is then essential to analyse the reasoning behind the different deterioration levels of CEBs since they were manufactured using the same soil, mixture, and compaction process. The most probable explanation for the differences is the inadequate particle size distribution in the soil used. According to the literature in the field of earthen blocks, the soil should only present particles below 5 mm of diameter [49]. Nevertheless, it was possible to see particles with higher dimensions in the most damaged samples (Figure 16d,f,h)). These big size particles affected the homogeneity of the mixture, which negatively influenced the porosity and the porous structure of the CEBs. The lack of uniformity in the structure of the blocks worsens their behaviour to water. This problem also explains the results achieved in the total water absorption and water absorption by capillarity tests. The presented porosity and durability issues can be minimised if proper soil preparation and/or selection is considered [19].
(a)
(b)
(c)
(d) Energies 2020, 13, x FOR PEER REVIEW 14 of 21
(e)
(f)
(g)
(h)
Figure 14. Accelerated erosion test. (a), (c), (e), and (g)—four sides of the exposed face of sample 1 before the test; (b), (d), (f), and (h)—four sides of the exposed face of sample 1 after two hours of testing.
(a)
(b)
(c)
(d)
Figure 14. Accelerated erosion test. (a,c,e,g)—four sides of the exposed face of sample 1 before the test;(b,d,f,h)—four sides of the exposed face of sample 1 after two hours of testing.

Energies 2020, 13, 2978 15 of 22
Energies 2020, 13, x FOR PEER REVIEW 14 of 21
(e)
(f)
(g)
(h)
Figure 14. Accelerated erosion test. (a), (c), (e), and (g)—four sides of the exposed face of sample 1 before the test; (b), (d), (f), and (h)—four sides of the exposed face of sample 1 after two hours of testing.
(a)
(b)
(c)
(d)
Energies 2020, 13, x FOR PEER REVIEW 15 of 21
(e)
(f)
(g)
(h)
Figure 15. Accelerated erosion test. (a), (c), (e), and (g)—four sides of the exposed face of sample 3 before the test; (b), (d), (f), and (h)—four sides of exposure face of sample 3 after two hours testing.
(a)
(b)
Figure 15. Accelerated erosion test. (a,c,e,g)—four sides of the exposed face of sample 3 before the test;(b,d,f,h)—four sides of exposure face of sample 3 after two hours testing.

Energies 2020, 13, 2978 16 of 22
Energies 2020, 13, x FOR PEER REVIEW 15 of 21
(e)
(f)
(g)
(h)
Figure 15. Accelerated erosion test. (a), (c), (e), and (g)—four sides of the exposed face of sample 3 before the test; (b), (d), (f), and (h)—four sides of exposure face of sample 3 after two hours testing.
(a)
(b)
Energies 2020, 13, x FOR PEER REVIEW 16 of 21
(c) (d)
(e)
(f)
(g)
(h)
Figure 16. Accelerated erosion test. (a), (c), (e), and (g)—four sides of the exposed face of sample 6 before the test; (b), (d), (f), and (h)—four sides of the exposed face of sample 6 after testing.
3.7. Thermal Transmittance
Regarding the thermal transmittance, Figure 17 shows the measurement results for the XPS wall (Figure 17a) and the compressed earth blocks small wall (Figure 17b,c). From the analysis of Figure 17, it is possible to verify that the values measured for temperature and the heat flux were very stable during the test period, in both cases. The temperature in the hot chamber practically did not change since the heat input to the box was controlled so that the temperature established was maintained (35 °C). The heating system turns on when the temperature drops below 35 °C and turns off when the temperature rises to 40 °C. The heat flux is presented as negative values due to heat flux sensor placement in the sample.
(a)
00.10.20.30.40.50.60.70.80.91
-30-20-10
01020304050
U-v
alue
[W/(m
2 K)]
Tem
pera
ture
[ºC
] /
Hea
t Flu
x [W
/m2 ]
Temperature, hot chamber [ºC] Temperature, cold chamber [ºC]
Heat Flux [W/m2] U-Value [W/(m2/K)]
Figure 16. Accelerated erosion test. (a,c,e,g)—four sides of the exposed face of sample 6 before the test;(b,d,f,h)—four sides of the exposed face of sample 6 after testing.
Energies 2020, 13, 2978 17 of 22
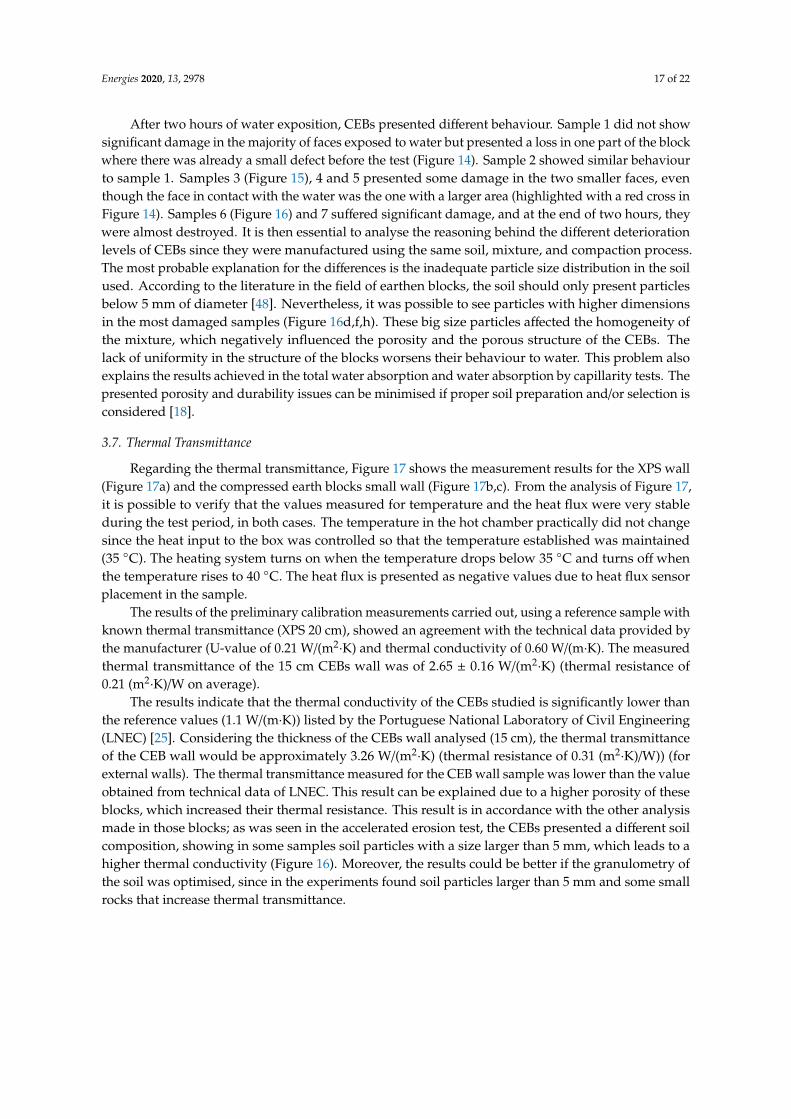
After two hours of water exposition, CEBs presented different behaviour. Sample 1 did not showsignificant damage in the majority of faces exposed to water but presented a loss in one part of the blockwhere there was already a small defect before the test (Figure 14). Sample 2 showed similar behaviourto sample 1. Samples 3 (Figure 15), 4 and 5 presented some damage in the two smaller faces, eventhough the face in contact with the water was the one with a larger area (highlighted with a red cross inFigure 14). Samples 6 (Figure 16) and 7 suffered significant damage, and at the end of two hours, theywere almost destroyed. It is then essential to analyse the reasoning behind the different deteriorationlevels of CEBs since they were manufactured using the same soil, mixture, and compaction process.The most probable explanation for the differences is the inadequate particle size distribution in the soilused. According to the literature in the field of earthen blocks, the soil should only present particlesbelow 5 mm of diameter [48]. Nevertheless, it was possible to see particles with higher dimensionsin the most damaged samples (Figure 16d,f,h). These big size particles affected the homogeneity ofthe mixture, which negatively influenced the porosity and the porous structure of the CEBs. Thelack of uniformity in the structure of the blocks worsens their behaviour to water. This problem alsoexplains the results achieved in the total water absorption and water absorption by capillarity tests. Thepresented porosity and durability issues can be minimised if proper soil preparation and/or selection isconsidered [18].
3.7. Thermal Transmittance
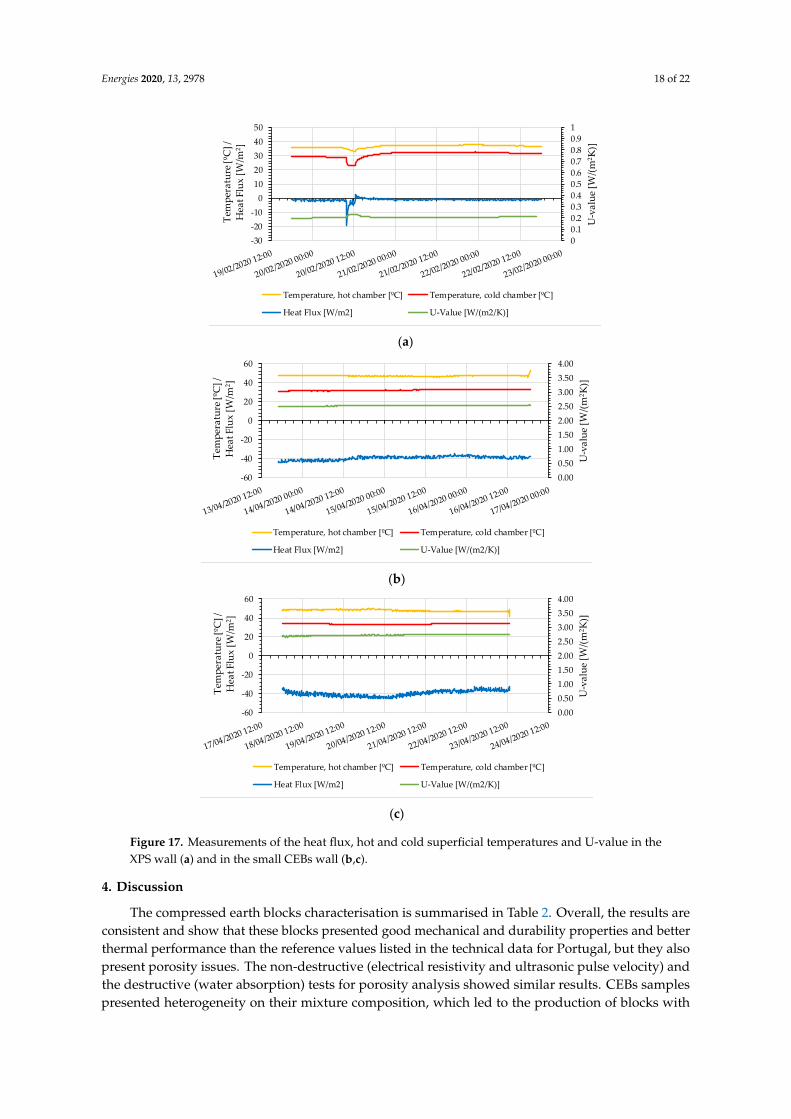
Regarding the thermal transmittance, Figure 17 shows the measurement results for the XPS wall(Figure 17a) and the compressed earth blocks small wall (Figure 17b,c). From the analysis of Figure 17,it is possible to verify that the values measured for temperature and the heat flux were very stableduring the test period, in both cases. The temperature in the hot chamber practically did not changesince the heat input to the box was controlled so that the temperature established was maintained(35 C). The heating system turns on when the temperature drops below 35 C and turns off whenthe temperature rises to 40 C. The heat flux is presented as negative values due to heat flux sensorplacement in the sample.
The results of the preliminary calibration measurements carried out, using a reference sample withknown thermal transmittance (XPS 20 cm), showed an agreement with the technical data provided bythe manufacturer (U-value of 0.21 W/(m2
·K) and thermal conductivity of 0.60 W/(m·K). The measuredthermal transmittance of the 15 cm CEBs wall was of 2.65 ± 0.16 W/(m2
·K) (thermal resistance of0.21 (m2
·K)/W on average).The results indicate that the thermal conductivity of the CEBs studied is significantly lower than
the reference values (1.1 W/(m·K)) listed by the Portuguese National Laboratory of Civil Engineering(LNEC) [25]. Considering the thickness of the CEBs wall analysed (15 cm), the thermal transmittanceof the CEB wall would be approximately 3.26 W/(m2
·K) (thermal resistance of 0.31 (m2·K)/W)) (for
external walls). The thermal transmittance measured for the CEB wall sample was lower than the valueobtained from technical data of LNEC. This result can be explained due to a higher porosity of theseblocks, which increased their thermal resistance. This result is in accordance with the other analysismade in those blocks; as was seen in the accelerated erosion test, the CEBs presented a different soilcomposition, showing in some samples soil particles with a size larger than 5 mm, which leads to ahigher thermal conductivity (Figure 16). Moreover, the results could be better if the granulometry ofthe soil was optimised, since in the experiments found soil particles larger than 5 mm and some smallrocks that increase thermal transmittance.
Energies 2020, 13, 2978 18 of 22
Energies 2020, 13, x FOR PEER REVIEW 16 of 21
(c) (d)
(e)
(f)
(g)
(h)
Figure 16. Accelerated erosion test. (a), (c), (e), and (g)—four sides of the exposed face of sample 6 before the test; (b), (d), (f), and (h)—four sides of the exposed face of sample 6 after testing.
3.7. Thermal Transmittance
Regarding the thermal transmittance, Figure 17 shows the measurement results for the XPS wall (Figure 17a) and the compressed earth blocks small wall (Figure 17b,c). From the analysis of Figure 17, it is possible to verify that the values measured for temperature and the heat flux were very stable during the test period, in both cases. The temperature in the hot chamber practically did not change since the heat input to the box was controlled so that the temperature established was maintained (35 °C). The heating system turns on when the temperature drops below 35 °C and turns off when the temperature rises to 40 °C. The heat flux is presented as negative values due to heat flux sensor placement in the sample.
(a)
00.10.20.30.40.50.60.70.80.91
-30-20-10
01020304050
U-v
alue
[W/(m
2 K)]
Tem
pera
ture
[ºC
] /
Hea
t Flu
x [W
/m2 ]
Temperature, hot chamber [ºC] Temperature, cold chamber [ºC]
Heat Flux [W/m2] U-Value [W/(m2/K)]
Energies 2020, 13, x FOR PEER REVIEW 17 of 21
(b)
(c)
Figure 17. Measurements of the heat flux, hot and cold superficial temperatures and U-value in the XPS wall (a) and in the small CEBs wall (b, c).
The results of the preliminary calibration measurements carried out, using a reference sample with known thermal transmittance (XPS 20 cm), showed an agreement with the technical data provided by the manufacturer (U-value of 0.21 W/(m2·K) and thermal conductivity of 0.60 W/(m·K). The measured thermal transmittance of the 15 cm CEBs wall was of 2.65 ± 0.16 W/(m2·K) (thermal resistance of 0.21 (m2·K)/W on average).
The results indicate that the thermal conductivity of the CEBs studied is significantly lower than the reference values (1.1 W/(m·K)) listed by the Portuguese National Laboratory of Civil Engineering (LNEC) [26]. Considering the thickness of the CEBs wall analysed (15 cm), the thermal transmittance of the CEB wall would be approximately 3.26 W/(m2·K) (thermal resistance of 0.31 (m2·K)/W)) (for external walls). The thermal transmittance measured for the CEB wall sample was lower than the value obtained from technical data of LNEC. This result can be explained due to a higher porosity of these blocks, which increased their thermal resistance. This result is in accordance with the other analysis made in those blocks; as was seen in the accelerated erosion test, the CEBs presented a different soil composition, showing in some samples soil particles with a size larger than 5 mm, which leads to a higher thermal conductivity (Figure 16). Moreover, the results could be better if the granulometry of the soil was optimised, since in the experiments found soil particles larger than 5 mm and some small rocks that increase thermal transmittance.
4. Discussion
The compressed earth blocks characterisation is summarised in Table 2. Overall, the results are consistent and show that these blocks presented good mechanical and durability properties and better thermal performance than the reference values listed in the technical data for Portugal, but they also present porosity issues. The non-destructive (electrical resistivity and ultrasonic pulse
0.000.501.001.502.002.503.003.504.00
-60
-40
-20
0
20
40
60
U-v
alue
[W/(m
2 K)]
Tem
pera
ture
[ºC
] /
Hea
t Flu
x [W
/m2 ]
Temperature, hot chamber [ºC] Temperature, cold chamber [ºC]
Heat Flux [W/m2] U-Value [W/(m2/K)]
0.000.501.001.502.002.503.003.504.00
-60
-40
-20
0
20
40
60
U-v
alue
[W/(m
2 K)]
Tem
pera
ture
[ºC
] /
Hea
t Flu
x [W
/m2 ]
Temperature, hot chamber [ºC] Temperature, cold chamber [ºC]
Heat Flux [W/m2] U-Value [W/(m2/K)]
Figure 17. Measurements of the heat flux, hot and cold superficial temperatures and U-value in theXPS wall (a) and in the small CEBs wall (b,c).
4. Discussion
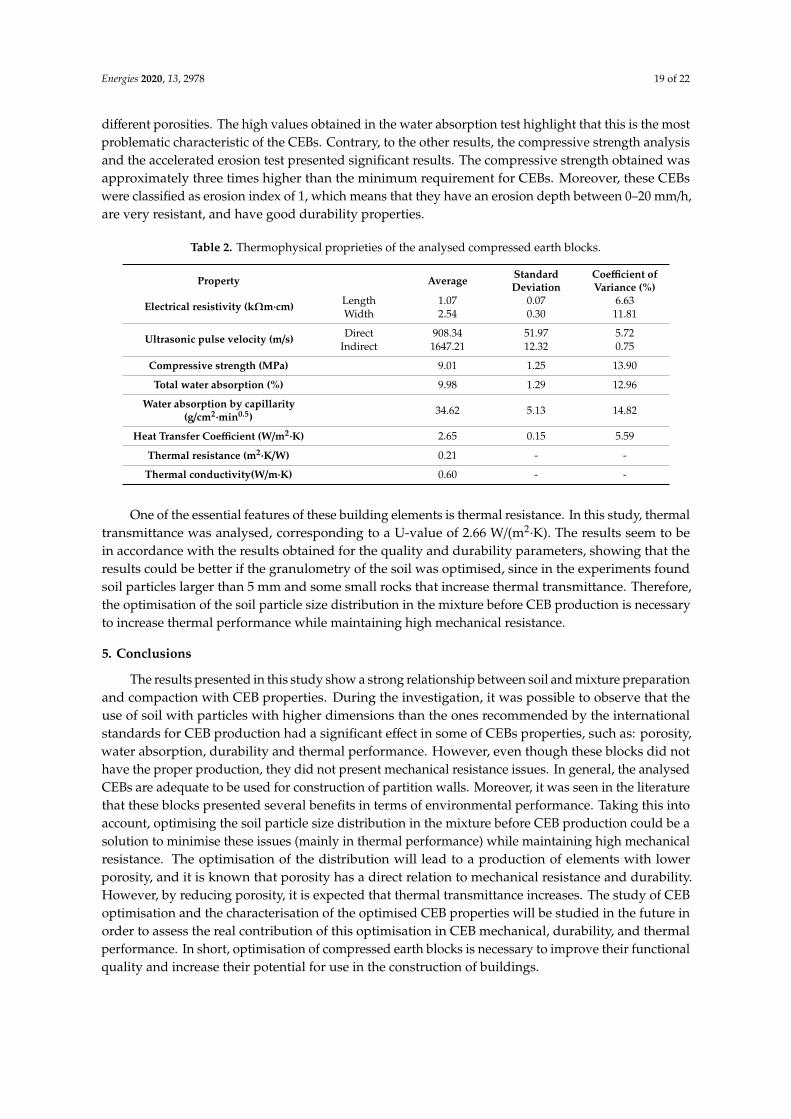
The compressed earth blocks characterisation is summarised in Table 2. Overall, the results areconsistent and show that these blocks presented good mechanical and durability properties and betterthermal performance than the reference values listed in the technical data for Portugal, but they alsopresent porosity issues. The non-destructive (electrical resistivity and ultrasonic pulse velocity) andthe destructive (water absorption) tests for porosity analysis showed similar results. CEBs samplespresented heterogeneity on their mixture composition, which led to the production of blocks with
Energies 2020, 13, 2978 19 of 22
different porosities. The high values obtained in the water absorption test highlight that this is the mostproblematic characteristic of the CEBs. Contrary, to the other results, the compressive strength analysisand the accelerated erosion test presented significant results. The compressive strength obtained wasapproximately three times higher than the minimum requirement for CEBs. Moreover, these CEBswere classified as erosion index of 1, which means that they have an erosion depth between 0–20 mm/h,are very resistant, and have good durability properties.
Table 2. Thermophysical proprieties of the analysed compressed earth blocks.
Property Average StandardDeviation
Coefficient ofVariance (%)
Electrical resistivity (kΩm·cm) Length 1.07 0.07 6.63Width 2.54 0.30 11.81
Ultrasonic pulse velocity (m/s) Direct 908.34 51.97 5.72Indirect 1647.21 12.32 0.75
Compressive strength (MPa) 9.01 1.25 13.90
Total water absorption (%) 9.98 1.29 12.96
Water absorption by capillarity(g/cm2·min0.5) 34.62 5.13 14.82
Heat Transfer Coefficient (W/m2·K) 2.65 0.15 5.59
Thermal resistance (m2·K/W) 0.21 - -
Thermal conductivity(W/m·K) 0.60 - -
One of the essential features of these building elements is thermal resistance. In this study, thermaltransmittance was analysed, corresponding to a U-value of 2.66 W/(m2
·K). The results seem to bein accordance with the results obtained for the quality and durability parameters, showing that theresults could be better if the granulometry of the soil was optimised, since in the experiments foundsoil particles larger than 5 mm and some small rocks that increase thermal transmittance. Therefore,the optimisation of the soil particle size distribution in the mixture before CEB production is necessaryto increase thermal performance while maintaining high mechanical resistance.
5. Conclusions
The results presented in this study show a strong relationship between soil and mixture preparationand compaction with CEB properties. During the investigation, it was possible to observe that theuse of soil with particles with higher dimensions than the ones recommended by the internationalstandards for CEB production had a significant effect in some of CEBs properties, such as: porosity,water absorption, durability and thermal performance. However, even though these blocks did nothave the proper production, they did not present mechanical resistance issues. In general, the analysedCEBs are adequate to be used for construction of partition walls. Moreover, it was seen in the literaturethat these blocks presented several benefits in terms of environmental performance. Taking this intoaccount, optimising the soil particle size distribution in the mixture before CEB production could be asolution to minimise these issues (mainly in thermal performance) while maintaining high mechanicalresistance. The optimisation of the distribution will lead to a production of elements with lowerporosity, and it is known that porosity has a direct relation to mechanical resistance and durability.However, by reducing porosity, it is expected that thermal transmittance increases. The study of CEBoptimisation and the characterisation of the optimised CEB properties will be studied in the future inorder to assess the real contribution of this optimisation in CEB mechanical, durability, and thermalperformance. In short, optimisation of compressed earth blocks is necessary to improve their functionalquality and increase their potential for use in the construction of buildings.
Energies 2020, 13, 2978 20 of 22
Author Contributions: Conceptualization, E.R.T., J.F., and R.M.; methodology, E.R.T., S.M.S., and R.M.; validation,S.M.S. and R.M.; formal analysis, E.R.T. and J.F.; investigation, E.R.T., G.M., A.d.P.J., and C.G.; resources, R.M.;writing—original draft preparation, E.R.T.; writing—review and editing, E.R.T., A.d.P.J., C.G., J.F., S.M.S., and R.M.;supervision, S.M.S. and R.M.; project administration, R.M.; funding acquisition, R.M. All authors have read andagreed to the published version of the manuscript.
Funding: The authors would like to acknowledge the support granted by the FEDER funds throughthe Competitively and Internationalization Operational Programme (POCI) and by national funds throughFCT (the Foundation for Science and Technology) within the scope of the project with the referencePOCI-01-0145-FEDER-029328, and of the Ph.D. grant with the reference PD/BD/113641/2015, which werefundamental for the development of this study.
Acknowledgments: The authors would like to acknowledge the support granted by DANOSA “Derivados asfálticosnormalizados, S.A.” industry for the hotbox construction by providing all the necessary insulation material.
Conflicts of Interest: The authors declare no conflict of interest.
References
1. Minke, G. Building with Earth: Design and Technology of a Sustainable Architecture; Birkhäuser: Basel, Switzerland,2012; ISBN 9783034608725.
2. Fernandes, J.; Peixoto, M.; Mateus, R.; Gervásio, H. Life cycle analysis of environmental impacts of earthenmaterials in the Portuguese context: Rammed earth and compressed earth blocks. J. Clean. Prod. 2019,241, 118286. [CrossRef]
3. Pacheco-Torgal, F.; Jalali, S. Earth construction: Lessons from the past for future eco-efficient construction.Constr. Build. Mater. 2012, 29, 512–519. [CrossRef]
4. Taallah, B.; Guettala, A.; Guettala, S.; Kriker, A. Mechanical properties and hygroscopicity behavior ofcompressed earth block filled by date palm fibers. Constr. Build. Mater. 2014, 59, 161–168. [CrossRef]
5. Leitão, D.; Barbosa, J.; Soares, E.; Miranda, T.; Cristelo, N.; Briga-Sá, A. Thermal performance assessment ofmasonry made of ICEB’s stabilised with alkali-activated fly ash. Energy Build. 2017, 139, 44–52. [CrossRef]
6. Ruiz, G.; Zhang, X.; Edris, W.F.; Cañas, I.; Garijo, L. A comprehensive study of mechanical properties ofcompressed earth blocks. Constr. Build. Mater. 2018, 176, 566–572. [CrossRef]
7. Mansour, M.B.; Jelidi, A.; Cherif, A.S.; Jabrallah, S.B. Optimizing thermal and mechanical performance ofcompressed earth blocks (CEB). Constr. Build. Mater. 2016, 104, 44–51. [CrossRef]
8. Saidi, M.; Cherif, A.S.; Zeghmati, B.; Sediki, E. Stabilization effects on the thermal conductivity and sorptionbehavior of earth bricks. Constr. Build. Mater. 2018, 167, 566–577. [CrossRef]
9. Chaibeddra, S.; Kharchi, F. Performance of Compressed Stabilized Earth Blocks in sulphated medium.J. Build. Eng. 2019, 25, 100814. [CrossRef]
10. Mahdad, M.; Benidir, A. Hydro-mechanical properties and durability of earth blocks: Influence of differentstabilisers and compaction levels. Int. J. Sustain. Build. Technol. Urban. Dev. 2018, 9, 44–60.
11. Zhang, L.; Gustavsen, A.; Jelle, B.P.; Yang, L.; Gao, T.; Wang, Y. Thermal conductivity of cement stabilizedearth blocks. Constr. Build. Mater. 2017, 151, 504–511. [CrossRef]
12. Lavie Arsène, M.I.; Frédéric, C.; Nathalie, F. Improvement of lifetime of compressed earth blocks by addinglimestone, sandstone and porphyry aggregates. J. Build. Eng. 2020, 29, 101155. [CrossRef]
13. Islam, M.S.; Elahi, T.E.; Shahriar, A.R.; Mumtaz, N. Effectiveness of fly ash and cement for compressedstabilized earth block construction. Constr. Build. Mater. 2020, 255, 119392. [CrossRef]
14. Narayanaswamy, A.H.; Walker, P.; Venkatarama Reddy, B.V.; Heath, A.; Maskell, D. Mechanical and thermalproperties, and comparative life-cycle impacts, of stabilised earth building products. Constr. Build. Mater.2020, 243, 118096. [CrossRef]
15. Bahar, R.; Benazzoug, M.; Kenai, S. Performance of compacted cement-stabilised soil. Cem. Concr. Compos.2004, 26, 811–820. [CrossRef]
16. Al-Amoudi, O.S.B.; Khan, K.; Al-Kahtani, N.S. Stabilization of a Saudi calcareous marl soil. Constr. Build.Mater. 2010, 24, 1848–1854. [CrossRef]
17. Guettala, A.; Abibsi, A.; Houari, H. Durability study of stabilized earth concrete under both laboratory andclimatic conditions exposure. Constr. Build. Mater. 2006, 20, 119–127. [CrossRef]
18. Kariyawasam, K.K.G.K.D.; Jayasinghe, C. Cement stabilized rammed earth as a sustainable constructionmaterial. Constr. Build. Mater. 2016, 105, 519–527. [CrossRef]
Energies 2020, 13, 2978 21 of 22
19. Toure, P.M.; Sambou, V.; Faye, M.; Thiam, A. Mechanical and thermal characterization of stabilized earthbricks. Energy Procedia 2017, 139, 676–681. [CrossRef]
20. Gouny, F.; Fouchal, F.; Pop, O.; Maillard, P.; Rossignol, S. Mechanical behavior of an assembly ofwood-geopolymer-earth bricks. Constr. Build. Mater. 2013, 38, 110–118. [CrossRef]
21. Taallah, B.; Guettala, A. The mechanical and physical properties of compressed earth block stabilized withlime and filled with untreated and alkali-treated date palm fibers. Constr. Build. Mater. 2016, 104, 52–62.[CrossRef]
22. Guettala, A.; Houari, H.; Mezghiche, B.; Chebili, R. Durability of lime stabilized earth blocks. Courr. Savoir2002, 2, 61–66.
23. Fernandes, J.; Mateus, R.; Gervásio, H.; Silva, S.M.; Bragança, L. Passive strategies used in Southern Portugalvernacular rammed earth buildings and their influence in thermal performance. Renew. Energy 2019, 142,345–363. [CrossRef]
24. Adam, E.A.; Jones, P.J. Thermophysical properties of stabilised soil building blocks. Build. Environ. 1995, 30,245–253. [CrossRef]
25. Pina dos Santos, C.A. ITE50—Coeficientes de Transmissão Térmica de Elementos da Envolvente dos Edifícios;National Laboratory of Civil Engineering: Lisboa, Portugal, 2006.
26. Berge, B. The Ecology of Building Materials, 2nd ed.; Elsevier: Amsterdam, The Netherlands, 2009;ISBN 9781856175371.
27. LNEC. 196: Solos - Análise Granulométrica; Especificação do Laboratório Nacional de Engenharia Civil: Lisboa,Portugal, 1966; Volume 10.
28. IPQ. EN, NP. 933-8, Norma Portuguesa (Setembro de 2002). In Ensaios das Propriedades Geométricas dosAgregados: Determinação do Teor de Finos - Ensaio do Equivalente de Areia; IPQ: Lisboa, Portugal, 2002.
29. IPQ. EN, NP. 933-9. In Ensaios das Propriedades Geométricas dos Agregados Parte 9: Determinação de Finos - Ensaiodo Azul de Metileno; IPQ: Lisboa, Portugal, 2002.
30. IPQ. NP, NP. 143: 1969. In Determinação dos Limites de Consistência; IPQ: Lisboa, Portugal, 1969.31. LNEC. 197: Solo-Cimento. Ensaio de Compactação; Especificação do Laboratório Nacional de Engenharia Civil:
Lisboa, Portugal, 1966; Volume xiii.32. Standard A.S.T.M. D3282 (2009) Standard Practice for Classification of Soils and Soil-Aggregate Mixtures for
Highway Construction Purposes; ASTM International: West Conshohocken, PA, USA, 2004. [CrossRef]33. Doat, P.; Hays, A.; Houben, H.; Matuk, S.; Vitoux, F.; CraTerre, F. Building with Earth, 1st ed.; The Mud Village
Society: New Delhi, India, 1991.34. Arab, P.B.; Araújo, T.P.; Pejon, O.J. Identification of clay minerals in mixtures subjected to differential thermal
and thermogravimetry analyses and methylene blue adsorption tests. Appl. Clay Sci. 2015, 114, 133–140.[CrossRef]
35. Yukselen, Y.; Kaya, A. Suitability of the methylene blue test for surface area, cation exchange capacity andswell potential determination of clayey soils. Eng. Geol. 2008, 102, 38–45. [CrossRef]
36. Duarte Gomes, N. Caracterização de Blocos de Terra para Construção de Alvenarias Ecoeficientes. Master’sThesis, University Nova, Lisbon, Portugal, 2015.
37. Canivell, J.; Martin-del-Rio, J.J.; Alejandre, F.J.; García-Heras, J.; Jimenez-Aguilar, A. Considerations on thephysical and mechanical properties of lime-stabilized rammed earth walls and their evaluation by ultrasonicpulse velocity testing. Constr. Build. Mater. 2018, 191, 826–836. [CrossRef]
38. Martín-del-Rio, J.J.; Canivell, J.; Falcón, R.M. The use of non-destructive testing to evaluate the compressivestrength of a lime-stabilised rammed-earth wall: Rebound index and ultrasonic pulse velocity. Constr. Build.Mater. 2020, 242, 118060. [CrossRef]
39. IPQ. EN, NP. 12504-4. 2007, Ensaios de Betão nas estruturas—Parte 4: Determinação da velocidade de propagaçãodos ultra-sons; IPQ: Lisboa, Portugal, 2009.
40. IPQ. EN, NP. 772-1. 2002, Methods of Test for Masonry Units—Part 1: Determination of Compressive Strength; IPQ:Lisboa, Portugal, 2002.
41. Kerali, A.G. Durability of Compressed and Cement-Stabilised Buildings Blocks. Ph.D. Thesis, University ofWarwick, Coventry, UK, 2001.
42. LNEC. 394, Betões, Determinação da Absorção de Água por Imersão, Ensaio à Pressão Atmosférica; LaboratórioEngenharia Civil: Lisboa, Portugal, 1993.
Energies 2020, 13, 2978 22 of 22
43. LNEC. 393, Concrete—Determination of the Absorption of Water through Capillarity; Test at environment pressure(in Portuguese); Laboratório Nacional de Engenharia Civil: Lisboa, Portugal, 1993.
44. UNE 41410. Bloques de tierra comprimida para muros y tabiques Definiciones, especificaciones y métodosde ensayo. Asoc. Española Norm. Y Certif. —Aenor 2008, 26.
45. Standard A.S.T.M. C1363-11, Standard Test Method for Thermal Performance of Building Materials and EnvelopeAssemblies by Means of a Hot Box Apparatus; ASTM International: West Conshohocken, PA, USA, 2011.
46. BSI. BS ISO 9869-1: 2014: Thermal Insulation–Building Elements–in situ Measurement of Thermal Resistance andThermal Transmittance—Part 1: Heat Flow Meter Method; BSI: London, UK, 2014.
47. Motahari Karein, S.M.; Ramezanianpour, A.A.; Ebadi, T.; Isapour, S.; Karakouzian, M. A new approach forapplication of silica fume in concrete: Wet granulation. Constr. Build. Mater. 2017, 157, 573–581. [CrossRef]
48. Rigassi, V.; CRATerre-EAG. Compressed Earth Blocks: Manual of Production; Deutsches Zentrum fürEntwicklungstechnologien—GATE: Eschborn, Germany, 1985; Volume I, ISBN 3528020792.
49. Adam, E.A.; Agib, A.R.A. Compressed Stabilised Earth Block Manufacture in Sudan; Graphoprint for UNESCO:Paris, France, 2001.
© 2020 by the authors. Licensee MDPI, Basel, Switzerland. This article is an open accessarticle distributed under the terms and conditions of the Creative Commons Attribution(CC BY) license (http://creativecommons.org/licenses/by/4.0/).
Copyright © 2022 FDOKUMEN