Measurement of glass transition in native wheat flour by dynamic mechanical thermal analysis (DMTA
10
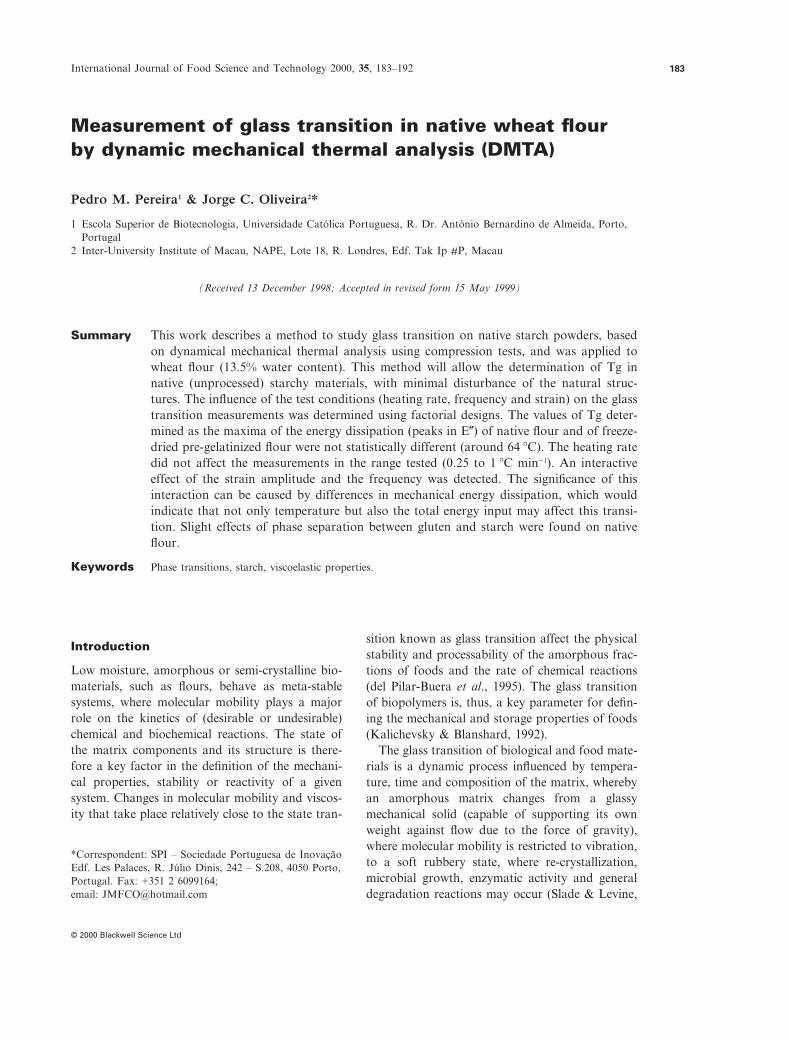
*Correspondent: SPI – Sociedade Portuguesa de Inovação Edf. Les Palaces, R. Júlio Dinis, 242 – S.208, 4050 Porto, Portugal. Fax: +351 2 6099164; email: [email protected] Measurement of glass transition in native wheat flour by dynamic mechanical thermal analysis (DMTA) Pedro M. Pereira 1 & Jorge C. Oliveira 2 * 1 Escola Superior de Biotecnologia, Universidade Católica Portuguesa, R. Dr. António Bernardino de Almeida, Porto, Portugal 2 Inter-University Institute of Macau, NAPE, Lote 18, R. Londres, Edf. Tak Ip #P, Macau (Received 13 December 1998; Accepted in revised form 15 May 1999) Summary This work describes a method to study glass transition on native starch powders, based on dynamical mechanical thermal analysis using compression tests, and was applied to wheat flour (13.5% water content). This method will allow the determination of Tg in native (unprocessed) starchy materials, with minimal disturbance of the natural struc- tures. The influence of the test conditions (heating rate, frequency and strain) on the glass transition measurements was determined using factorial designs. The values of Tg deter- mined as the maxima of the energy dissipation (peaks in E) of native flour and of freeze- dried pre-gelatinized flour were not statistically different (around 64 C). The heating rate did not affect the measurements in the range tested (0.25 to 1 C min 1 ). An interactive effect of the strain amplitude and the frequency was detected. The significance of this interaction can be caused by differences in mechanical energy dissipation, which would indicate that not only temperature but also the total energy input may affect this transi- tion. Slight effects of phase separation between gluten and starch were found on native flour. Keywords Phase transitions, starch, viscoelastic properties. Introduction Low moisture, amorphous or semi-crystalline bio- materials, such as flours, behave as meta-stable systems, where molecular mobility plays a major role on the kinetics of (desirable or undesirable) chemical and biochemical reactions. The state of the matrix components and its structure is there- fore a key factor in the definition of the mechani- cal properties, stability or reactivity of a given system. Changes in molecular mobility and viscos- ity that take place relatively close to the state tran- sition known as glass transition affect the physical stability and processability of the amorphous frac- tions of foods and the rate of chemical reactions (del Pilar-Buera et al., 1995). The glass transition of biopolymers is, thus, a key parameter for defin- ing the mechanical and storage properties of foods (Kalichevsky & Blanshard, 1992). The glass transition of biological and food mate- rials is a dynamic process influenced by tempera- ture, time and composition of the matrix, whereby an amorphous matrix changes from a glassy mechanical solid (capable of supporting its own weight against flow due to the force of gravity), where molecular mobility is restricted to vibration, to a soft rubbery state, where re-crystallization, microbial growth, enzymatic activity and general degradation reactions may occur (Slade & Levine, International Journal of Food Science and Technology 2000, 35, 183–192 © 2000 Blackwell Science Ltd 183
-
Upload
independent -
Category
Documents
-
view
3 -
download
0
Transcript of Measurement of glass transition in native wheat flour by dynamic mechanical thermal analysis (DMTA
*Correspondent: SPI – Sociedade Portuguesa de InovaçãoEdf. Les Palaces, R. Júlio Dinis, 242 – S.208, 4050 Porto,Portugal. Fax: +351 2 6099164; email: [email protected]
Measurement of glass transition in native wheat flourby dynamic mechanical thermal analysis (DMTA)
Pedro M. Pereira1 & Jorge C. Oliveira2*
1 Escola Superior de Biotecnologia, Universidade Católica Portuguesa, R. Dr. António Bernardino de Almeida, Porto,Portugal
2 Inter-University Institute of Macau, NAPE, Lote 18, R. Londres, Edf. Tak Ip #P, Macau
(Received 13 December 1998; Accepted in revised form 15 May 1999)
Summary This work describes a method to study glass transition on native starch powders, basedon dynamical mechanical thermal analysis using compression tests, and was applied towheat flour (13.5% water content). This method will allow the determination of Tg innative (unprocessed) starchy materials, with minimal disturbance of the natural struc-tures. The influence of the test conditions (heating rate, frequency and strain) on the glasstransition measurements was determined using factorial designs. The values of Tg deter-mined as the maxima of the energy dissipation (peaks in E�) of native flour and of freeze-dried pre-gelatinized flour were not statistically different (around 64 �C). The heating ratedid not affect the measurements in the range tested (0.25 to 1 �C min�1). An interactiveeffect of the strain amplitude and the frequency was detected. The significance of thisinteraction can be caused by differences in mechanical energy dissipation, which wouldindicate that not only temperature but also the total energy input may affect this transi-tion. Slight effects of phase separation between gluten and starch were found on nativeflour.
Keywords Phase transitions, starch, viscoelastic properties.
Introduction
Low moisture, amorphous or semi-crystalline bio-materials, such as flours, behave as meta-stablesystems, where molecular mobility plays a majorrole on the kinetics of (desirable or undesirable)chemical and biochemical reactions. The state ofthe matrix components and its structure is there-fore a key factor in the definition of the mechani-cal properties, stability or reactivity of a givensystem. Changes in molecular mobility and viscos-ity that take place relatively close to the state tran-
sition known as glass transition affect the physicalstability and processability of the amorphous frac-tions of foods and the rate of chemical reactions(del Pilar-Buera et al., 1995). The glass transitionof biopolymers is, thus, a key parameter for defin-ing the mechanical and storage properties of foods(Kalichevsky & Blanshard, 1992).
The glass transition of biological and food mate-rials is a dynamic process influenced by tempera-ture, time and composition of the matrix, wherebyan amorphous matrix changes from a glassymechanical solid (capable of supporting its ownweight against flow due to the force of gravity),where molecular mobility is restricted to vibration,to a soft rubbery state, where re-crystallization,microbial growth, enzymatic activity and generaldegradation reactions may occur (Slade & Levine,
International Journal of Food Science and Technology 2000, 35, 183–192
© 2000 Blackwell Science Ltd
183
1991). The transition from a glassy to a rubberystate and the accompanying loss of stiffness, hard-ness, or strength are traditionally described by arelationship between the magnitudes of these para-meters and temperature, moisture content, orwater activity (Peleg, 1994). A material in glassystate is generally regarded as stable, while rubberystate is necessary for processability.
The glass transition, as a second order transition(a change of state but not of phase – Roos, 1995),takes place over a range of temperatures, being themidpoint of the range determined by differentialscanning calorimetry (DSC) conventionally taken asthe single reference point, named Tg. However,whether Tg should be the midpoint, the onset or theendset of glass transition is a matter of discussion(Oliveira et al., 1999). The importance of the glasstransition temperature range as a reference parame-ter for an increasing number of applications in foodscience and engineering involving stability and reac-tion kinetics in amorphous matrixes is very clear(Roos, 1995). The measurement of Tg for any givensubstance is crucial for the application of these con-cepts in product and process design and optimiza-tion. Available methods rely on the changes of themacroscopic material properties (such as heatcapacity, thermal expansion coefficient, viscosity,elasticity, etc) associated to the changes of molecu-lar mobility around the glass transition (Roos,1995).
In dynamic mechanical thermal analysis (DMTA)three major changes are detected when the vis-coelastic properties of the materials are analyzedagainst temperature: a significant drop in the stor-age modulus (E�), which is constant in the glassystate; a peak in the loss modulus (E�), related to theresonance frequency of the molecular motions(Allen, 1993); and a peak in the viscoelasticity ratio(tan �), which is also frequency-dependent. Thesechanges have been correlated with, respectively, theonset, midpoint and endset of the transition asdetected by DSC (MacInnes, 1993; Roos, 1995).Moreover, DMTA is a frequency-response analysis,that is, the parameters measured will show a fre-quency dependence which is a mirror image of thetime-dependence of the state transition. While rais-ing problems on how to compare Tg measurementsbetween DMTA and DSC, this offers new possibil-ities to investigate glass transition.
Wheat flour is one of the most used food raw
materials world-wide, presenting a very complexstructure partially crystalline, partially amorphous,comprising a number of components that canundergo a glass transition process. Most of the rel-evant components have been thoroughly studiedindividually, as isolated substances (wheat starch –Biliaderis et al., 1986; Zeleznak & Hoseney, 1987;amylopectin – Kalichevsky et al., 1992; Kalichevsky& Blanshard, 1993; gluten – Hoseney et al., 1986;Kalichevsky et al., 1992; glutenin – Kalichevskyet al., 1992; gliadin – Graaf et al., 1993) or as bina-ry mixtures of the pure substances (amylose andgluten – Kalichevsky & Blanshard, 1992). Althoughthis approach enables a more precise insight intothe behaviour of each component, the effect of thecomplexity of the whole structure on glass transi-tion cannot be accurately inferred from model sys-tems (e.g. the granular structure of flour, withcrystalline and amorphous regions, the interactionsbetween components that cannot be reproduced onartificial mixtures, the intra-granular structure). It isalso noted that in most methods used to determineTg in flours (DSC for example), either the samplepreparation process can be disrupting in terms ofthe native structure and component distribution,which can potentially affect the measured value or,at low moisture contents, the transitions are notclearly defined and the methods do not have a verygood accuracy.
The objective of this work was the developmentof a glass transition measurement method thatcould be applied to native flours, based on DMTA.A study of the influence of the test parameters onthe Tg values determined and of the influence of thenative structure (e.g. crystallinity) on the glass tran-sition was also required to understand and validatethe method.
Materials and methods
Principles of DMTA
The Rheometrics Solids Analyser RSAII(Rheometrics, Inc, Piscataway, NJ, USA) machinewas used to compress the sample between twoplates. The lower plate was moved by the actuatorat a specified frequency for a specified length, thuscausing an oscillatory strain input. The top platemoved to adjust a force sensor, thus measuring theresulting sinusoidal stress.
DMTA of native flour Pedro M. Pereira & Jorge C. Oliveira
International Journal of Food Science and Technology 2000, 35, 183–192
184
© 2000 Blackwell Science Ltd

After some time the output stress frequency isthe same as the input strain frequency, but thewave is deviated by the so-called phase angle,rotating between 0 � for an elastic solid to 90 � fora pure viscous liquid. From this phase angle andthe ratio of the amplitudes of the input and outputsinusoids, the relationship between stress andstrain is fully quantified by the following relation-ships:
Input strain wave: � � �0 sin(�t)Output stress wave: � � �0 sin(�t �)Complex elastic
modulus: E* � �0/�0 � E� iE�Storage modulus: E� � E* cos �Loss modulus: E� � E* sin �
This is a typical frequency-response analysis, wide-ly used in process dynamic studies of chemicalengineering (Luyben, 1990).
E� quantifies the energy that is stored by thematerial during the compression movement of theplates and is released back during expansion andis known as storage modulus. E� quantifies theenergy that is dissipated, that is, is supplied duringcompression but lost as thermal energy or used inmolecular rearrangements and is known as lossmodulus.
These relationships apply only if the materialexhibits linear viscoelasticity, which implies thatE�, E� and tan � must be independent of the strainamplitude. This usually requires that measure-ments can only be made at sufficiently low strainamplitudes. According to the frequency-responsetheory, E* is also the value of the transfer functionof the relationship between stress and strain in the Laplace domain, obtained by replacing theLaplace variable by �i.
In DMTA, measurements can be continuouslytaken while the temperature is changed inside themeasuring chamber.
Native flour (NF) samples
Commercial wheat flour was used (FarinhaExtreme 75, MOANOR, Porto, Portugal). Theflour was equilibrated at 50% relative humidity at25 �C for 2 weeks prior to measurement, corre-sponding to a final moisture content of 13.5g ofwater/100g of flour (determined gravimetrically byoven drying, norm ISO 1666 1973, method II).
Pre-gelatinized flour (PGF) samples
The same commercial wheat flour (MOANOR,Porto, Portugal) was gelatinized by preparing anaqueous solution of 10g of flour / 100g of water andheating at 80 �C for sufficient time to ensure fullgelatinization (this was verified by DSC – Shimadzu,Japan). The resulting gel was cooled to �28 �C (inan air freezer) and freeze-dried at 1 psi and 20 �C(ARMFIELD FT33, Armfield Limited, Hampshire,England). The resulting solid (moisture content 5 gof water/100g of solids) was then ground and equi-librated at 50% relative humidity at 25 �C for 2weeks achieving a final moisture content of 14.2 g ofwater/100g of solids (determined gravimetrically byoven drying, norm ISO 1666 1973, method II).
Sample preparation
Cylindrical pellets ( � 13 mm, h � 18 mm) wereobtained by pressing the powders at 2 bar forapproximately 5 min in a pellet press (SPECAC,Porto, Portugal Model 15.011). The pellets wereimmediately wrapped in aluminium foil to protectfrom moisture exchange.
DMTA mechanical spectra measurement
Prior to the measurements, a full cycle at all fre-quencies and strain amplitudes, but at room tem-perature, was performed in each sample, to smoothout the effect of residual compressibility in the pel-lets. Samples were then tested using a linear tem-perature increase, in the compression mode, withcylindrical plate tools (plate diameter: 13 mm). Thetests were conducted from ambient temperature upto 100 �C. Water loss during testing was determinedby weighing the initial and final samples.
The values of temperature, storage modulus (E�),loss modulus (E�), viscoelastic ratio (tan �) and thevariation of sample length (�L) were recorded dur-ing the tests by the equipment software (Rhios, ver-sion 4.44, Rheometrics, Inc, Piscataway, NJ, USA).It was not possible to repeat runs with the samesample due to significant degradation at high tem-peratures. Replicates were performed with differentsamples.
Moisture loss during testing
Without protective means, samples would dehy-
DMTA of native flour Pedro M. Pereira & Jorge C. Oliveira
International Journal of Food Science and Technology 2000, 35, 183–192
185
© 2000 Blackwell Science Ltd

drate during measurement and therefore theywere wrapped. Polyethylene film and aluminiumfoil were tested, comparing the weight loss duringtesting with the one observed with unwrappedpellets.
Different wrappings were also tested: (1) com-pletely wrapped samples, being wrapped on thetop, bottom and side; (2) partially wrapped sam-ples, only on the side, leaving top and bottom indirect contact with the DMTA tool plates.
The samples were tested in the DMTA cham-ber with a temperature ramp default test, fromambient temperature to 90 �C, with a strainamplitude of 0.0013 and a frequency of 1Hz.
Heat transfer efficiency measurements
In situ measurements of the sample temperaturewere made by a thermocouple (Fe-CuNi (Iron-Constantan) wire,) placed as close to the centre ofthe sample as possible, with the thermocouple endbeing insulated with PTFE to prevent heat con-duction through the wire. Another thermocouplewas placed inside the DMTA chamber to moni-tor chamber temperature. Both thermocoupleswere connected to a temperature acquisition sys-tem. Tests were then performed at different heat-ing rates (0.5 and 1 �C min�1). The frequency andstrain amplitude were 1 Hz and 0.0013, respec-tively.
Measuring conditions
To assess the influence of the test parameters onthe DMTA results, native flour samples were test-ed using different combinations of heating rate,frequency and strain amplitude according to areplicated full factorial design at two levels.
Table 1 shows the values of the levels considered.The more significant effects were then detailed bymeans of a full factorial design at four levels, withthree replicates, for the two input factors strainamplitude and frequency, as shown in Table 2.The heating rate was then constant and set to1 �C min�1.
In order to assess the influence of the nativestructure of flour, pre-gelatinized samples weretested at five different frequencies (0.1, 0.2, 0.5,0.8 and 1 Hz), with a strain amplitude of 0.0004and at a heating rate of 1 �C min�1.
Results and discussion
Moisture loss
The glass transition temperature is very sensitiveto water content (Zeleznak & Hoseney, 1987)
DMTA of native flour Pedro M. Pereira & Jorge C. Oliveira
International Journal of Food Science and Technology 2000, 35, 183–192
186
© 2000 Blackwell Science Ltd
Experiment Heating rate (�C min�1) Frequency (Hz) Strain amplitude
(� 1000)
1 1 1 42 1 1 1.33 1 0.2 44 1 0.2 1.35 0.25 1 46 0.25 1 1.37 0.25 0.2 48 0.25 0.2 1.3
Table 2 Experimental design for four level factorial designfor two factors
Experiment Frequency (Hz) Strain amplitude
(*1000)
1 0.2 42 0.2 73 0.2 104 0.2 135 0.5 46 0.5 77 0.5 108 0.5 139 0.8 4
10 0.8 711 0.8 1012 0.8 1313 1 414 1 715 1 1016 1 13
Table 1 Experimental design forthe two level factorial design forthree factors

and though the starch was compressed in pelletsthat only had the sides exposed to the air in thechamber, the moisture loss during testing was toohigh to allow for accurate measurements, asshown in Fig. 1. However, when wrapping thesamples completely in aluminium foil, moistureloss was prevented. This would not be achieved ifwrapping only the sides (partial wrapping) or ifusing polyethylene film instead of aluminium foil,as can be seen in Fig. 1.
It must be noted that aluminium foil does notgo through significant changes in the range oftemperatures in question (ambient to 90 �C) and
as the measurements are based on variations ofthe values of E� and E� (that is, relative changesrather than absolute values), this procedure isacceptable.
Thermal lag
Ideally, the thermal lag between chamber and sam-ple temperature should be negligible or constantfor all test conditions, as otherwise the heatingrates established in the experimental design mightbe slightly different from the real ones, as the ther-mal lag would vary somewhat with the heatingrate. Moreover, the temperature gradient in thesample itself (from surface to centre temperature)might be too high and affect the desired accuracyof the readings. Figure 2 shows the thermal lag interms of the real pellet temperature versus thechamber temperature readings. It can be seen thatwith full aluminium foil wrapping, the thermal lag is approximately constant, around 2 �C, up to70 �C for the maximum heating rate used –1 �C min�1. This is not the case of the unwrappedsamples, which may be due also to the effect of thewater evaporation.
Mechanical spectra
The mechanical spectra of the native flour (NF)samples showed a clear change of the viscoelasticproperties according to the expected glass transi-tion effects: a drop of E� around 55 �C, a peak of
DMTA of native flour Pedro M. Pereira & Jorge C. Oliveira
International Journal of Food Science and Technology 2000, 35, 183–192
187
© 2000 Blackwell Science Ltd
Figure 1 Moisture loss during testing. A – unwrappedsample; B – sample partially wrapped in aluminium foil;C – sample totally wrapped in aluminium foil; D –sample partially wrapped in polyethilene film; E – sampletotally wrapped in polyethilene film.
Figure 2 Thermal lag duringtesting for unwrapped (�) andwrapped (�) samples inaluminium foil.
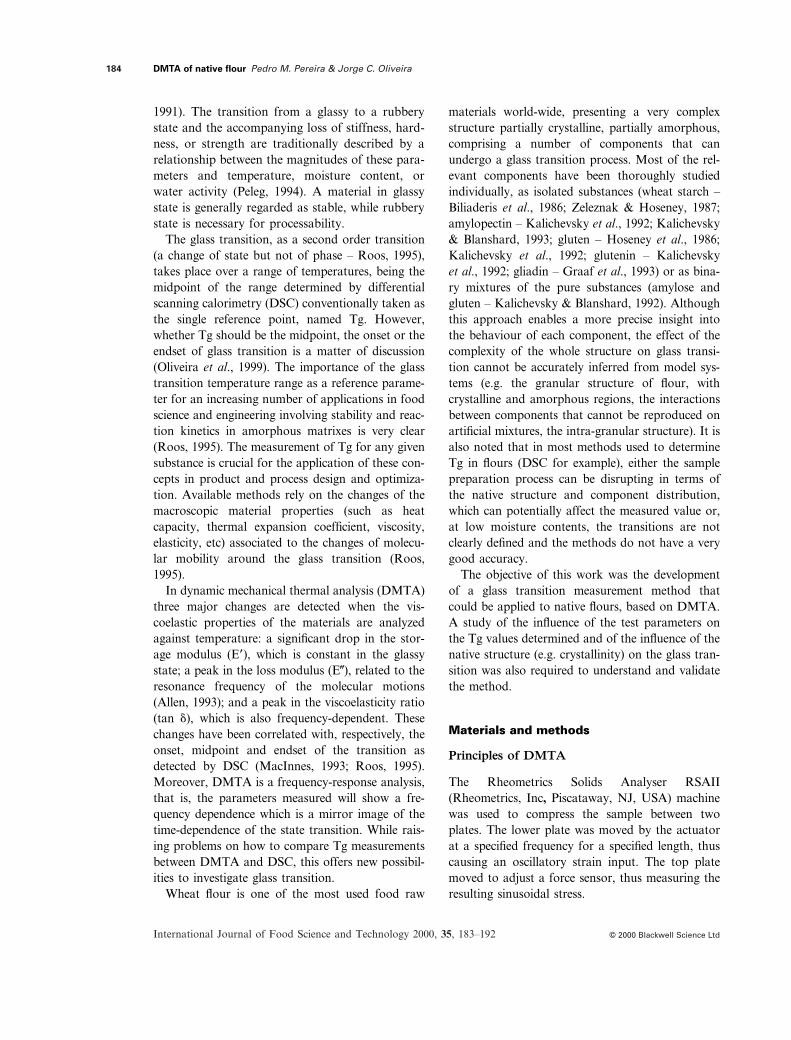
E� around 65 �C and a peak of tan � around 85 �C.The E� peak was sufficiently well defined to allowfor accurate measurements of its maxima. This wasdone by fitting the data points around the peak toa parabola and take the maximum as the maxi-mum of this parabola, to smooth out the effect ofthe experimental error.
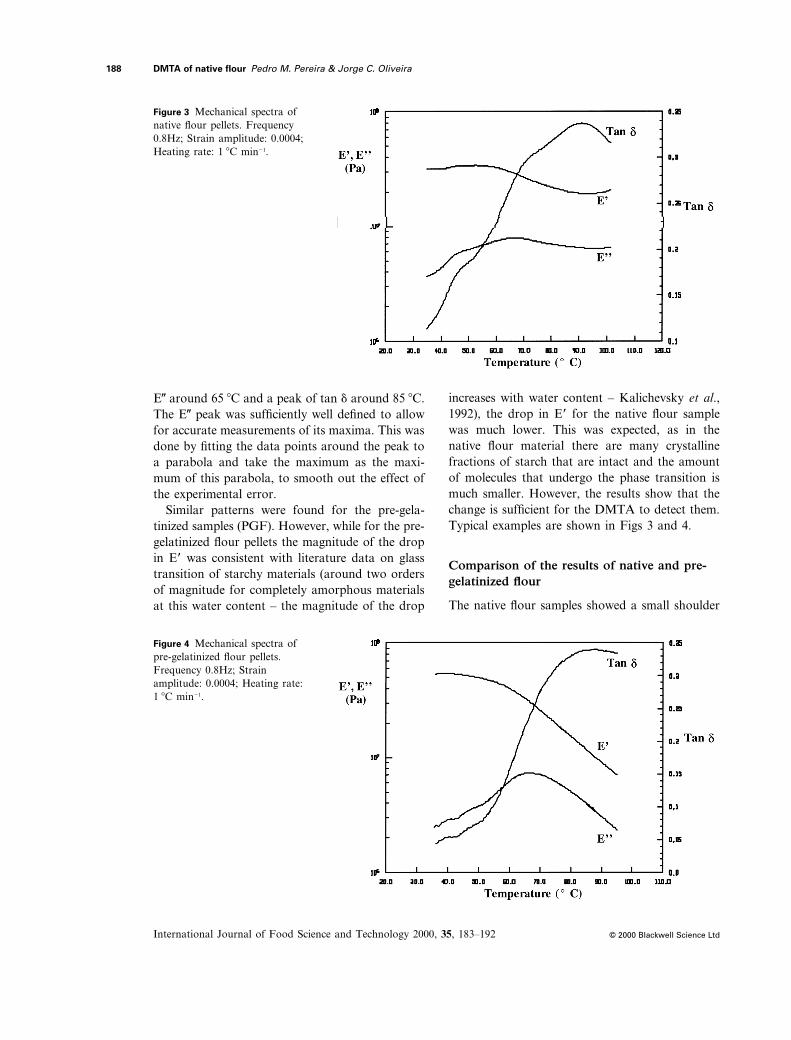
Similar patterns were found for the pre-gela-tinized samples (PGF). However, while for the pre-gelatinized flour pellets the magnitude of the dropin E� was consistent with literature data on glasstransition of starchy materials (around two ordersof magnitude for completely amorphous materialsat this water content – the magnitude of the drop
increases with water content – Kalichevsky et al.,1992), the drop in E� for the native flour samplewas much lower. This was expected, as in thenative flour material there are many crystallinefractions of starch that are intact and the amountof molecules that undergo the phase transition ismuch smaller. However, the results show that thechange is sufficient for the DMTA to detect them.Typical examples are shown in Figs 3 and 4.
Comparison of the results of native and pre-gelatinized flour
The native flour samples showed a small shoulder
DMTA of native flour Pedro M. Pereira & Jorge C. Oliveira
International Journal of Food Science and Technology 2000, 35, 183–192
188
© 2000 Blackwell Science Ltd
Figure 3 Mechanical spectra ofnative flour pellets. Frequency0.8Hz; Strain amplitude: 0.0004;Heating rate: 1 �C min�1.
Figure 4 Mechanical spectra ofpre-gelatinized flour pellets.Frequency 0.8Hz; Strainamplitude: 0.0004; Heating rate:1 �C min�1.

in both tan � and E� around 45 �C, which may bean indication of some other thermal transition atthat temperature, not visible in the pre-gelatinizedsamples (this can be seen in Fig. 3 and 4). Thisthermal event was affected by the applied frequen-cy and could therefore be related to the glass tran-sition of a second component of the flour,indicating a phase separation. However, it is alsopossible that a small water loss could have lead tohardening and the slight increase of E� around40 �C, although the moisture loss of wrapped sam-ples is below 0.5%. Wheat gluten has been consid-ered a generally amorphous random polymer(Hoseney et al., 1986) and these shoulders may beindicating its glass transition. Although it is asmall fraction of the flour (around 12%), as in thenative samples most of the starch is in the crys-talline form, it is a relatively significant component
of the amorphous phases of the NF samples.Phase separation between gluten and starch hasalready been reported in literature (Kalichevsky &Blanshard, 1992) and is obviously significant innative flours. After gelatinizaton, this effect is nolonger visible, as the thermal transition of starchnow dominates the response. Furthermore, thegelatinization process may promote some mixingbetween starch and gluten. However, it is notedthat even after cooking, starch and gluten aremostly still phase-separated.
As the samples were equilibrated to the samewater activity, the pre-gelatinized flour had aslightly higher water content, due to the loss ofcrystallinity (14.2% w/w, compared to 13.5% w/wof the native flour pellets).
The results of the glass transition temperaturesobtained are shown in Table 3 and it can be seen
DMTA of native flour Pedro M. Pereira & Jorge C. Oliveira
International Journal of Food Science and Technology 2000, 35, 183–192
189
© 2000 Blackwell Science Ltd
Glass transition temperature (�C)
Substance water content water content Reference
13.5% (w/w) 14.2% (w/w)
Amylopectin 72.5 67.2 Kalichevsky et al., 1992Starch 58.1 52.7 Hancock & Zografi (1993)
Hoseny et al. 1986Gluten 33.6 29.6 Kalishevski et al., 1993
Table 4 Tg values interpolatedfrom literature data
Frequency Native wheat Pre-gelatinized
(Hz) flour (NF) wheat flour(PGF)
Onset(initial drop of E�) 0.10 57 3 54 1
0.20 56 4 52 50.50 58 3 58 30.80 58 3 56 11.00 58 3 57 2
Average 57 3 55 3
Midpoint(E� peak) 0.10 66 4 60 3
0.20 65 6 62 20.50 65 2 66 40.80 69 4 64 51.00 66 2 66 2
Average 66 4 63 3
Endset(tan δ peak) 0.10 87 4 70 1
0.20 85 6 71 40.50 87 3 74 40.80 89 3 79 61.00 90 2 76 2
Average 87 4 74 5
Table 3 Glass transitionmeasurements for native (NF)and pre-gelatinised (PGF) flourpellets. Strain amplitude: 0.0004,heating rate: 1°C min–1. Averageand standard deviation of 3–5replicates

that the onset and midpoint of the glass transitionfor NF and PGF (taken as, respectively, the initialdrop in E� and the peak in E�) are not statistical-ly different at a 95% confidence level. The valuesof the NF samples are slightly higher, which wouldagree with the fact that crystallinity has been con-sidered to shift glass transition temperatures, asshown by the results of Zeleznak & Hoseney, 1987concerning measurements of gelatinized and unge-latinized wheat starch by DSC. In this case, thecrystallinity is also translated by a slightly lowerwater content in NF then in PGF, which wouldjustify a shift of 4–6 �C, as shown in Table 4 fromliterature data. The range of temperatures of theglass transition was high in both cases (between 15and 30 �C), which is also in agreement with report-ed literature data for regions of low water contentwhere the glass transition is broad and not verywell defined (Zeleznak & Hoseney, 1987).
The data obtained correlate well with thosereported in literature for starch. The onset (drop inE�) was equal to published glass transition tem-peratures of starch, while the midpoint (taken asTg in our work) was more close to the publishedTg of amylopectin (see Table 3 and 4). However,it is not possible to compare different starches,because the composition of starch (and particular-ly the ratio amylose/amylopectin and degree ofbranching) greatly affects Tg.
It is interesting to note that the endset of glasstransition (taken as the peak in tan �) was signifi-cantly higher for the native flour samples. Thismay be due to the larger heterogeneity of the mol-ecular arrangements in the native flour, or morelikely to the difference in actual water content.
Effect of the test parameters on the glasstransition measurements
As a frequency-response analysis, DMTA resultsare obviously influenced by the applied frequen-cy, but it is necessary to analyze the influence ofthe two other major test parameters: the heatingrate and the strain amplitude.
The influence of frequency can be related to theaverage molecular relaxation time. It can beproved that for a first-order mechanistic model,the peak of the loss modulus (maximum of theenergy dissipation) corresponds to the resonancepoint between the applied frequency and the aver-age molecular relaxation time (Allen, 1993). Thiswould imply that several measurements of the E�peak at different frequencies would relate to thevariation of the molecular relaxation time in glasstransition (Oliveira et al., 1999).
The strain amplitude should not affect theresults. It must be noted that the DMTA proce-dure requires that measurements are taken in the
DMTA of native flour Pedro M. Pereira & Jorge C. Oliveira
International Journal of Food Science and Technology 2000, 35, 183–192
190
© 2000 Blackwell Science Ltd
Figure 5 Normalized Pareto chartof the effects of test parameterson the measured Tg value ofwheat flour. Effects forinteractions that affect theresponse (Tg) significantlycorrespond to bars that cross the95% line (vertical dashed line).

linear viscoelastic region, which must be ensuredby a frequency sweep test in preliminary tests.The acceptable range of strain amplitudes is thusdetermined. However, the strain amplitude affectsthe amount of mechanical energy that is suppliedto the sample and if this has a relevant effectcompared to the major source of energy (heat), itcould affect the results somewhat.
The heating rate would affect the results if themolecular rearrangements that are involved in theglass transition are not (relatively) instantaneousand a lag would occur between the measured tem-perature and the observed effects.
The first factorial design allowed for an analy-sis of the effects of these 3 parameters, for a rea-sonable range of values. Figure 5 shows thePareto chart of the normalized effects of the fac-tors and their interactions (a factor or interac-tions that have a significant effect on the responsecorrespond to bars that cross the specified confi-dence level line). It can be seen that strain ampli-tude has no effect, indicating the linearviscoelastic behaviour, and that the heating raterange was insufficient to cause a significant vari-ation also, at a 95% confidence level. However, arather curious interactive effect of strain ampli-
tude and frequency was detected and to analysethis effect in more detail, the second factorialdesign was performed.
Figure 6 shows the response surface plot of theinteractive effect of frequency and strain ampli-tude on the Tg measurements (E� peak). It can beseen that the interactive effect is due to a largerinfluence of the frequency on Tg for strain ampli-tudes above 0.001 and that only at the higher fre-quencies (above 0.8 Hz) the strain amplitude hasa significant effect on the results. It can be con-cluded that the region of high frequency and highstrain amplitude should be avoided. This result isconsistent with the possibility of the mechanicalenergy input affecting the results slightly, at theseconditions, supplementing the thermal energyinput and thus facilitating glass transition. It isnoted that the measuring conditions were stillconsidered to be in the linear viscoelastic range.
Conclusions
DMTA measurements of compressed pellets ofnative flour give adequate indication of the Tg ofthe starch, with minimal disturbance of the nat-ural structure. The glass transition midpoint of
DMTA of native flour Pedro M. Pereira & Jorge C. Oliveira
International Journal of Food Science and Technology 2000, 35, 183–192
191
© 2000 Blackwell Science Ltd
Figure 6 Interactive effect betweenfrequency and strain. Valuespresented are averages of threereplicate experiments.

the main thermal event of NF and PGF was notstatistically different, but the temperature rangewas slightly larger in the native flour samples.Slight effects of phase separation between glutenand starch were observed in the native materials.A slight influence of the strain amplitude at highfrequencies was observed, that may be due to theinfluence of the mechanical energy input on thesample, meaning that not only temperature butprobably total energy input could play a role inthis transition.
References
Allen, G. (1993). A history of the glassy state. In: TheGlassy State in Foods. (eds. J. M. V. Blanshard & P. JLillford), Chapter 1. Nottingham, UK: NottinghamUniversity Press.
Biliaderis, C.G., Page, C.M., Maurice, T.J. & Juliano,B.O. (1986). Thermal characterization of rice starches:a polymeric approach to phase transitions of granularstarch. Journal of Agriculture and Food Chemistry, 34,6–14.
Graaf, E.M., Madeka, H., Cocero, A.M. & Kokini, J.L.(1993). Determination of the effect of moisture ongliadin glass transition using mechanical spectrometryand differential scanning calorimetry. BiotechnologyProgress, 9, 213–216.
Hancock, B.C. & Zografi, G. (1993). The relationshipbetween the glass transition temperature and the watercontent on amorphous pharmaceutical solids.Pharmaceutical Research, 11, 471–477.
Hoseney, R.C., Zeleznak, K. & Lai, C.S. (1986). Wheatgluten: a glassy polymer. Cereal Chemistry, 63,285–286.
Kalichevsky, M.T. & Blanshard, J.M.V. (1992). A studyon the effect of water on the glass transition of 1: 1mixtures of amylopectin, casein and gluten using DSCand DMTA. Carbohydrate Polymers, 19, 271–278.
Kalichevsky, M.T. & Blanshard, J.M.V. (1993). Theeffect of fructose and water on the glass transition of
amylopectin. Carbohydrate Polymers, 20, 107–113.Kalichevsky, M.T., Jaroszkiewicz, E.M., Ablett, S.,
Blanshard, J.M.V. & Lillford, P.J. (1992). The glasstransition of amylopectin measured by DSC, DMTAand NMR. Carbohydrate Polymers, 18, 77–88.
Kalichevsky, M.T., Jaroszkiewicz, E.M. & Blanshard,J.M.V. (1992a). Glass transition of gluten. I. Glutenand gluten–sugar mixtures. International Journal ofBiological Macromolecules, 14, 257–266.
Kalichevsky, M.T., Jaroszkiewicz, E.M. & Blanshard,J.M.V. (1992b). Glass transition of gluten. II. Theeffect of lipids and emulsifiers. International Journal ofBiological Macromolecules, 14, 267–273.
Luyben, W.M. (1990). Process Modeling, Simulation andControl for Chemical Engineering. 2nd edn. New York,USA: MacGraw Hill.
MacInnes, W.M. (1993). Dynamic mechanical thermalanalisys of sucrose solutions. In: The Glassy State inFoods, Chapter 11. (eds. J.M.V. Blanchard & P.J.Lillford). Nottingham, UK: Nottingham UniversityPress.
Oliveira, J.C., Pereira, P.M., Frias, J.M., Cruz, I.B. &MacInnes, W.M. (1999). Application of the concepts ofbiomaterials science to the quality optimization offrozen foods. In: Processing Foods: Quality Optiizationand Process Assessment, Chapter, 7, (eds. Oliveira,F.A.R. & Oliveira, J.C.) Boca Raton, FL, USA: CRCPress.
Peleg, M. (1994). A model of mechanical changes inbiomaterials at and around their glass transition.Biotechnology Progress, 10, 385–388.
del Pilar-Buera, M., Chirife, J. & Karel, M. (1995). Astudy of acid-catalyzed sucrose hydrolysis in anamorphous polymeric matrix at reduced moisturecontents. Food Research International, 28, 359–365.
Roos, Y. (1995). Characterization of food polymers usingstate diagrams. Journal of Food Engineering, 24,339–360.
Slade, L. & Levine, H. (1991). Beyond Water Activity:Recent Advances Based on an Alternative Approach tothe Assessment of Food Quality and Safety. CriticalReviews in Food Science and Nutrition, 30, 115–360.
Zeleznak, K.J. & Hoseney, R.C. (1987). The glasstransition in starch. Cereal Chemistry, 64, 121–124.
DMTA of native flour Pedro M. Pereira & Jorge C. Oliveira
International Journal of Food Science and Technology 2000, 35, 183–192
192
© 2000 Blackwell Science Ltd