Prediction of Mechanical Properties of Thermally Sprayed Coatings Using Finite Element Method
Application of Structure-Based Modelsof Mechanical and Thermal Properties
on Plasma Sprayed CoatingsMonika Vilemova, Jirı Matejıcek, Radek Musalek, and Jirı Nohava
(Submitted October 31, 2011; in revised form December 16, 2011)
Mechanical and thermal properties of thermal sprayed coatings, especially ceramics, are strongly influ-enced by cracks and pores that are present in the coating microstructure. In the recent past, there havebeen efforts to find an analytical model describing the coating properties based on the microstructuralcharacteristics. Various analytical models were developed and published in the literature. In this study,several major models were applied to ceramic and metal coatings to describe their elastic modulus andthermal conductivity. The sensitivity of the models to the variations in the microstructure and relevancyof their use in specific cases were examined. The results were compared with those obtained by FEMmodeling and experimentally measured values.
Keywords analytical model, elastic modulus, finite elementmodeling, image analysis, modeling of properties,thermal conductivity, water stabilized plasma
1. Introduction
The microstructure of thermal spray coatings is gener-ally very complex. Besides thin lamellae known as splats,the most characteristic feature of the microstructure isporosity. The total porosity of thermal spray deposits isusually between 2 and 15% (Ref 1) and is comprised ofnumerous voids, such as cracks and pores. They can bedivided into two families, i.e., intersplat cracks/pores andintrasplat cracks/pores. The orientation of the intersplatcracks or voids tends to be parallel to the substrate whilethe orientation of the intrasplat cracks is rather normal tothe substrate with some orientational scatter (Ref 2)around the preferential directions. Pores of differentshapes and sizes are usually also present in the coatingmicrostructure. Intrasplat pores are generally smaller than
intersplat pores and usually have spherical shape, whileintersplat pores can have very diverse shapes.
Due to the heterogeneous structure, thermal spraycoatings possess unique properties that can be advanta-geously used to improve or alter the properties of the basicmaterial (substrate). Therefore, establishing and under-standing a structure-property relationship is desirable toenable the production of coatings tailored for specificapplications. Behavior of a body containing spherical poresor randomly oriented ribbon or penny shaped cracks hasbeen theoretically studied (Ref 3-6). However, the resultscan not be simply applied to thermal spray coatings becauseof their unique lamellar structure with strongly oblate poresdistributed in preferential orientations. In the recent past,several analytical models describing coating properties inthe terms of microstructural parameters were developed.
The parameters used in the models should representthe individual defects according to their actual contribu-tions to the considered property (Ref 2). For Young�smodulus and thermal conductivity, the contribution ofboth cracks and pores scales with the third power of theirradius. Some early models for plasma sprayed coatingsrepresented the porous space by ellipsoidal voids or pen-ny-shaped voids with fixed aspect ratios, and includedpreferential orientations (Ref 7-9). However, these mod-els were sensitive to volume fraction and aspect ratios ofthe voids. As demonstrated in studies by Sevostianov andKachanov, reviewed in Ref 2, the volume of a void is ofsecondary importance, while the largest dimension is themost relevant. Similarly, for strongly oblate voids, domi-nant in plasma sprayed coatings, the exact aspect ratio isunimportant, besides being difficult to determine. Due tothe third-power influence of the size and the fact that thelargest cracks are typically larger than the largest pores,the contribution of the cracks is dominant.
In this study, several major models, based mostly onscalar crack density (see section 2.1), were used to quan-
This article is an invited paper selected from presentations at the2011 International Thermal Spray Conference and has beenexpanded from the original presentation. It is simultaneouslypublished in Thermal Spray 2011: Proceedings of theInternational Thermal Spray Conference, Hamburg, Germany,September 27-29, 2011, Basil R. Marple, Arvind Agarwal,Margaret M. Hyland, Yuk-Chiu Lau, Chang-Jiu Li, Rogerio S.Lima, and Andre McDonald, Ed., ASM International, MaterialsPark, OH, 2011.
Monika Vilemova, Jirı Matejıcek, and Radek Musalek,Department of Materials Engineering, Institute of PlasmaPhysics AS CR, v. v. i, Za Slovankou 3, 182 00 Prague 8, CzechRepublic; and Jirı Nohava, CSM Instruments SA, Rue de la Gare4, 2034 Peseux, Switzerland. Contact e-mail: [email protected]
JTTEE5 21:372–382
DOI: 10.1007/s11666-012-9739-0
1059-9630/$19.00 � ASM International
372—Volume 21(3-4) June 2012 Journal of Thermal Spray Technology
Peer-
Revie
wed
tify mechanical and thermal properties of plasma sprayedcoatings. Three alumina (Al2O3) and three tungstencoatings with different microstructural features werechosen to test the sensitivity of the models to micro-structure variations.
2. Summary of the Tested Models
2.1 Analytical Description of GeneralMicrostructure Features
All the analytical models use general microstructuralcharacteristics such as pore content P of roughly sphericalor equiaxial pores contained in a representative volume V(Eq 1) and crack lengths expressed by so-called scalarcrack densities q (Eq 2):
P ¼ 1
V
Xn
k¼1
4
3
� �� p � R3
k; ðEq 1Þ
where Rk is the radius of the k-th pore,
qi ¼1
V
Xm;q
k¼1
r3ik; ðEq 2Þ
where rik is the radius of the k-th crack. The direction-dependent formulas are listed with ‘‘i’’ subscript; wherei = 1 or 3 and represents the direction parallel to the sub-strate or normal to the substrate, respectively. In the fol-lowing text, subscript 0 indicates properties of the bulkmaterial.
2.2 Elastic Modulus
2.2.1 Kroupa. The theoretical model of the coatingstructure, as used by Kroupa in Ref 1, consists of randomlydistributed spherical pores Rk and two families of cracks,i.e., r1k for cracks whose normal is parallel to the substrateand r3k for cracks whose normal is perpendicular to thesubstrate. The elastic moduli are described as:
Ei ¼E0
1þ ciP
ð1�PÞ þ aiqi
1�Pð Þ
n o ; ðEq 3Þ
where ci and ai are positive coefficients depending onPoisson�s ratio:
ci ¼3ð1� t0Þð9þ 5t0Þ
2ð7� 5t0ÞðEq 4Þ
a1 ¼8 1� t2
0
� �1� 3t0
8
� �
3 1� t0
2
� � ; a3 ¼16ð1� t2
0Þ3
; ðEq 5Þ
P and qi are defined by Eq 1 and 2, respectively.2.2.2 Sevostianov. The model describes a plasma
sprayed coating using two families of cracks r1k and r3k,but supposes the families have an orientational scatterabout the preferential orientation described by subscript 1and 3. As a result, the parameter q is transformed to anasymmetric second rank crack density tensor aij (in thecase of transverse isotropy to aii) (Ref 2).
aij ¼1
V
X
k
a3ninj
� �ðkÞ ðEq 6Þ
where ak is the radius of k-th microcrack and ni, nj arecomponents of a unit vector nk normal to k-th microcrack.
Then, elastic moduli can be expressed as:
Ei ¼ E0 1þ32 1� t2
0
� �
3 2� t0ð Þaii
1� P
�þ 3 1� t0ð Þ 9þ 5t0ð Þ
2 7� 5t0ð ÞP
1� P
��1
ðEq 7Þ
where t0 is Poisson number of the bulk material of thedeposit. Sevostianov et al. suggests in Ref 10 to describethe orientational distribution by function Pkð/Þ, contain-ing scatter parameter k.
Pkð/Þ ¼1
2pk2 þ 1� �
� e�k�/ þ ke�kp=2h i
ðEq 8Þ
Knowing the orientational distribution, aii can beexpressed in terms of k (for details see Ref 2) and theelastic modulus can be calculated using Eq 7.
2.2.3 Li and Ohmori. The idealized microstructure ofthe model supposes an even distribution of horizontalcracks between the lamellae showing a staggered config-uration (Ref 11). In contrast to the previous two describedmodels, only E3 is predicted and the effect of verticalcracks is neglected. The interface between the splats isdescribed using parameter c, i.e., the ratio of the totallength of bonded interfaces to the total length of allinterfaces. The model for the relative elastic modulusconsiders the bending of the unbonded parts of thelamellae. The resulting formula has the following form:
E3
E0¼ c � 1þ 2p
a
d
� 4
b2f ðbÞ� ��1
for c < 40% ðEq 9Þ
E3
E0¼ c; for c > 40% ðEq 10Þ
where b is a parameter depending on c, d is the meanlamellar thickness, a is the radius of bonded region, andf ðbÞ is a function of b:
f ðbÞ¼ 3ð1�t2Þ2p
1þ1
2
1�t1þt
� �b2�1
b
!þ1þt
1�t2
b2�1ln2 b
" #
� 3
2p
1�tð Þ b2�1� �
þ2 1þtð Þb2 lnb �2
b2ðb�1Þ 1þtð Þb2þð1�tÞ � : ðEq 11Þ
2.2.4 Numerical Modeling (FEM). For each coating,five images with magnification of 500-8009, representativeof the overall coating microstructure, were selected andbinarized according to Ref 12. Finite element meshes werecreated with OOF2 software (version 2.0.5a11) (Ref 13,14) using standard automatic meshing function. Resultingmeshes consisted of circa 35000 elements with averagehomogeneity index 0.966. Meshes were submitted foranalysis in Abaqus 6.9-2, where 0.2% overall strain wasapplied for each model in the directions parallel or per-pendicular to the substrate. Small deformations and planestress conditions were considered. Ratio of stiffness of the
Journal of Thermal Spray Technology Volume 21(3-4) June 2012—373
Peer-R
evie
wed
elements representing splats and voids was set to1000000:1. From the resulting reaction forces, meaneffective elastic moduli were estimated for each coatingand both directions.
2.3 Thermal Conductivity
2.3.1 Sevostianov. In this model, thermal conductivi-ties are expressed using crack density tensor (Eq 6) andporosity (Ref 2) (Eq 1) as:
ki ¼ k0 1þ 8aii
3 1� Pð Þ þ3
2� P
1� P
� ��1
: ðEq 12Þ
Thermal convection and radiation in the pores areneglected.
2.3.2 Li, Ohmori, and McPherson. The idealizedmicrostructure, valid also for the thermal conductivitymodel, was described in the Elastic modulus section.Based on the idealized microstructure, the coating�s ther-mal conductivity kC can be described by the followingequation (Ref 11, 15):
kC
k0¼ 2c
p� da� 1þ 2cd
ap
� ��1
ðEq 13Þ
Thermal convection and radiation in the pores are ne-glected (Ref 11).
2.3.3 Golosnoy. The idealized microstructure of acoating is modeled using a unit cell consisting of a bridge(contact area of splats) between two pores of width d=2. Thetop and bottom surfaces of the unit cell are taken as mid-planes of neighboring splats, and the pores representintersplat cracks (Ref 16). The height of the unit cell isassigned as Lv and width Lh, the thickness of the pore dv,and an interbridge (or interpore) distance d. The effectivethermal conductivity is given by Eq 14 and consists of theconductivities of two zones within the unit cell havingconductivities k1 and k2. In the first zone, which includes thebridge, heat flow is assumed to take place only through thesolid material, i.e., the heat is funneled through the bridge.The effective conductivity of this zone depends on its area S.The second region contains two layers of solid material andthe pore between them. To establish the sizes of the zones,keffðSÞ must be maximized according to Eq 17.
keffðSÞ ¼S
Stotk1ðSÞ þ
Stot � S
Stotk2; ðEq 14Þ
k2 ¼ 1� dv
Lv
� � 1
k0þ dv
Lv
1
kp
� ��1
; ðEq 15Þ
k1 ¼ 1� dv
Lv
� � 1
kresðSÞþ dv
Lv
S
Sbrk0
� ��1
; ðEq 16Þ
keff ¼ maxS2 Sbr;Stot½ �
keffðSÞ; ðEq 17Þ
where Stot is total area of the unit cell, kresðSÞ is the contactresistance of the bridge (for details see Ref 16) and Sbr isthe area of the bridge.
2.3.4 Boire-Lavigne. The theoretical model of thecoating microstructure is similar to the model of Li andOhmori. The model considers the problem from the pointof view of electrical resistance of metallic contacts, inother words, the interfacial resistance depends on thenumber of true contact zones and their radius (Ref 17):
1
aC¼ qCCPC
kC¼ ð1� PÞ
a01þ 1
2nrd
� �; ðEq 18Þ
where aC and a0 is the thermal diffusivity of the coatingand bulk material, respectively, kC is the thermal con-ductivity of the coating, d is the lamella thickness, n is thenumber of true contact zones in a given interfacial plane, ris the radius of these contact zones, qC is the coatingdensity and CPC is the thermal capacity of the coating. Thefull model considers also the effect of the oxides at thesplat interfaces, but also points out the fact that the ther-mal resistance of the oxide layer is about 24 times lowerthan the interface resistance.
3. Experimental Methods
3.1 Spraying Conditions
The Al2O3 coatings were prepared by a water-stabi-lized plasma system WSP� (Institute of Plasma Physics,Praha, Czech Republic) using two different sprayingconditions (Table 1) with the aim to produce pronounceddifferences in the microstructure and by a gas-stabilized(GSP) F4 system (Sulzer Metco Inc., Westbury, NY,USA). White Al2O3 powder with a 30-80 lm particle sizedistribution was used as a feedstock in the case of WSPcoatings and 15-45 lm in the case of GSP coating.
The tungsten coatings were prepared by three differentspraying techniques—water-stabilized plasma systemWSP�, hybrid water-argon stabilized plasma systemWSP�H-500 (Institute of Plasma Physics, Praha, CzechRepublic), and induction plasma spraying (IPS) torchTekna PL-50 (Tekna Plasma Systems Inc., Sherbrooke,Canada). Spraying conditions are summarized in Table 1.For both WSP sprayed coatings, 63-80 lm tungsten pow-der was used as a feedstock; for IPS coating, 45-90 lmtungsten powder was used.
Phase composition of the Al2O3 coatings was deter-mined by x-ray diffraction, using the reference intensityratio method (Ref 18). The elastic modulus of Al2O3
coatings was measured in both in-plane and out-of-planedirections by an instrumented indentation device Nanotest(Micro Materials Limited, Wrexham, UK) using a WC-Cospherical indenter (r = 0.79 mm) with a maximum load of5 N. Elastic modulus of tungsten coatings was measuredby a CSM Micro Indentation Tester (CSM Instruments,Peseux, Switzerland) using a Vickers indenter with amaximum load of 5 N. Alternatively, in-plane coatingmodulus was also evaluated by a four-point bend (4PB)technique performed on a universal testing machine Ins-pekt 100 (Hegewald-Peschke, Nossen, Germany) as
374—Volume 21(3-4) June 2012 Journal of Thermal Spray Technology
Peer-
Revie
wed
described in Ref 19. Due to its dependency on the appliedstrain, coating modulus was interpolated for zero strain, toprovide a value for comparison with analytical andnumerical models.
Thermal conductivity normal to the coating surface wasmeasured using the xenon flash method on an FL-3000instrument (Anter, USA) in the temperature range of 100-400 �C. The value used for comparison with analyticalmodels was obtained as an extrapolation of the measuredvalues to room temperature.
All samples were ground and polished using standardmetallographic methods. Photomicrographs were takenusing an SEM EVO� MA 15 (Carl Zeiss SMT AG,Germany) in backscattered mode. Micrographs were pro-cessed using ImageJ software (Ref 20). A compromise hadto be made between statistical representativeness (largearea) and ability to capture fine cracks (high magnification,small area). The micrograph dimensions were thereforeadjusted according to the size of prevalent splats. For eachcoating, the elastic modulus and thermal conductivity pre-dicted by the analytical and numerical models were basedon the average of measurements from five micrographs.
3.2 Quantitative Characterization of the CoatingMicrostructure
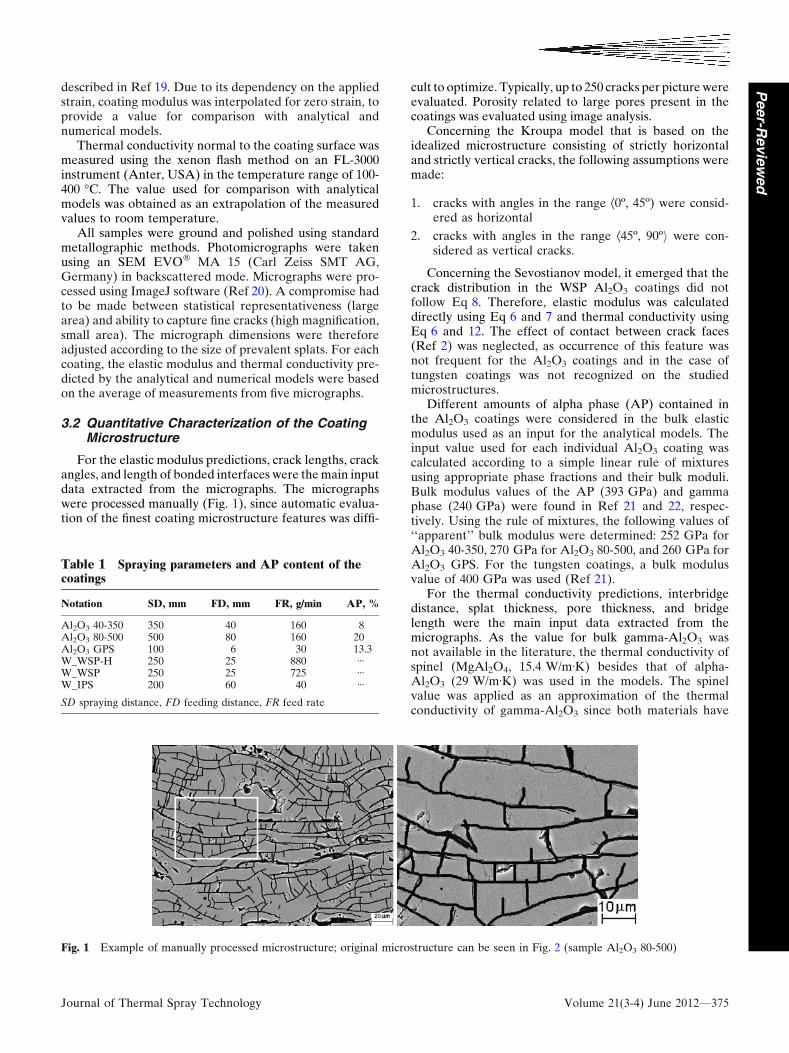
For the elastic modulus predictions, crack lengths, crackangles, and length of bonded interfaces were the main inputdata extracted from the micrographs. The micrographswere processed manually (Fig. 1), since automatic evalua-tion of the finest coating microstructure features was diffi-
cult to optimize. Typically, up to 250 cracks per picture wereevaluated. Porosity related to large pores present in thecoatings was evaluated using image analysis.
Concerning the Kroupa model that is based on theidealized microstructure consisting of strictly horizontaland strictly vertical cracks, the following assumptions weremade:
1. cracks with angles in the range Æ0º, 45º) were consid-ered as horizontal
2. cracks with angles in the range Æ45º, 90ºi were con-sidered as vertical cracks.
Concerning the Sevostianov model, it emerged that thecrack distribution in the WSP Al2O3 coatings did notfollow Eq 8. Therefore, elastic modulus was calculateddirectly using Eq 6 and 7 and thermal conductivity usingEq 6 and 12. The effect of contact between crack faces(Ref 2) was neglected, as occurrence of this feature wasnot frequent for the Al2O3 coatings and in the case oftungsten coatings was not recognized on the studiedmicrostructures.
Different amounts of alpha phase (AP) contained inthe Al2O3 coatings were considered in the bulk elasticmodulus used as an input for the analytical models. Theinput value used for each individual Al2O3 coating wascalculated according to a simple linear rule of mixturesusing appropriate phase fractions and their bulk moduli.Bulk modulus values of the AP (393 GPa) and gammaphase (240 GPa) were found in Ref 21 and 22, respec-tively. Using the rule of mixtures, the following values of‘‘apparent’’ bulk modulus were determined: 252 GPa forAl2O3 40-350, 270 GPa for Al2O3 80-500, and 260 GPa forAl2O3 GPS. For the tungsten coatings, a bulk modulusvalue of 400 GPa was used (Ref 21).
For the thermal conductivity predictions, interbridgedistance, splat thickness, pore thickness, and bridgelength were the main input data extracted from themicrographs. As the value for bulk gamma-Al2O3 wasnot available in the literature, the thermal conductivity ofspinel (MgAl2O4, 15.4 W/mÆK) besides that of alpha-Al2O3 (29 W/mÆK) was used in the models. The spinelvalue was applied as an approximation of the thermalconductivity of gamma-Al2O3 since both materials have
Table 1 Spraying parameters and AP content of thecoatings
Notation SD, mm FD, mm FR, g/min AP, %
Al2O3 40-350 350 40 160 8Al2O3 80-500 500 80 160 20Al2O3 GPS 100 6 30 13.3W_WSP-H 250 25 880 ÆÆÆW_WSP 250 25 725 ÆÆÆW_IPS 200 60 40 ÆÆÆ
SD spraying distance, FD feeding distance, FR feed rate
Fig. 1 Example of manually processed microstructure; original microstructure can be seen in Fig. 2 (sample Al2O3 80-500)
Journal of Thermal Spray Technology Volume 21(3-4) June 2012—375
Peer-R
evie
wed

the same crystallographic structure (cubic, space groupFd3m) and close composition (Ref 23). Applying thethermal conductivity for spinel and alpha-Al2O3 to therule of mixtures, conductivity values for the ‘‘aluminacoatings� skeletons’’ were calculated: 16.5 W/Km forAl2O3 40-350, 18.1 W/Km for Al2O3 80-500, and 17.2 W/mÆK for Al2O3 GSP.
4. Results and Discussion
Characteristic microstructures of the tested coatingscan be seen in Fig. 2. In the case of the Al2O3 WSPcoatings, different spraying conditions led to the creationof a more dense structure of vertical cracks and a lessdense structure of horizontal cracks in the microstructureof Al2O3 80-500 coating. When compared with WSPcoatings, crack orientations in the microstructure of anAl2O3 GPS coating are more random.
A remarkable difference in the structure of tungstencoatings can be noticed when comparing WSP and WSP-Hcoatings with IPS coatings. WSP coatings have higheroxide content, making the boundaries between splatsmore visible. In the microstructure of IPS tungsten, novertical cracks and pores are apparent. The main differ-ence between the microstructure of W_WSP-H andW_WSP is in the content of pores and unmelted particles,which is higher for the W_WSP coating.
Statistical description of the coating microstructurescan be found in Fig. 3 showing a crack distribution in themicrostructure of Al2O3 (Fig. 3a) and tungsten coatings(Fig. 3b) in the form of relative number of cracks (numberof cracks in each 5� range divided by the total number ofcracks) vs. corresponding angle (middle of a given range).The distribution functions have quite distinct character forthe Al2O3 and tungsten coatings. As can be seen, for theAl2O3 coatings, two preferential crack orientations arecharacteristic, i.e., around 0� and 90�, whereas tungstencoatings show only preferential orientation around 0�.However, a common feature can be found for all testedcoatings—the most frequent crack orientation falls withinthe range (0�, 25�).
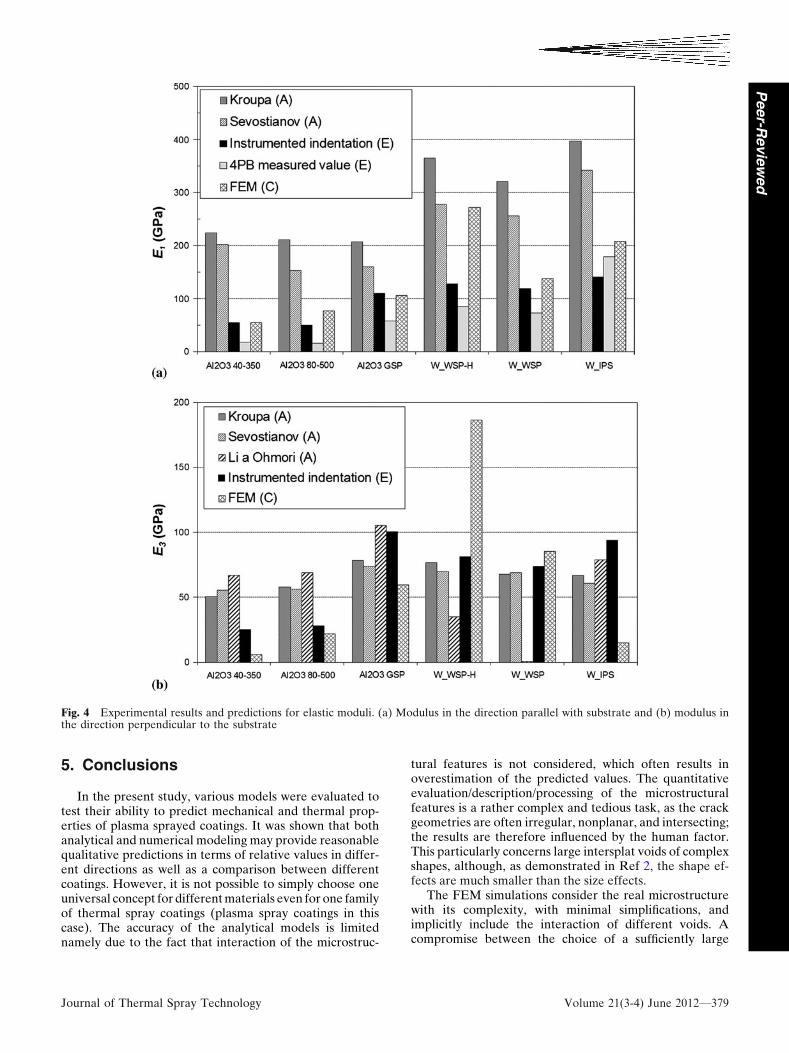
Results of all performed measurements are summarizedin Table 2. Results of experimental measurements of elasticmodulus are presented in plots in Fig. 4. As can be seen,similar microstructures of the Al2O3 WSP coatings led tosimilar experimental values for E1 (Fig. 4a) as well as E3
(Fig. 4b) elastic moduli. Also, the difference in the tungstencoating�s microstructure had a relatively small effect on theelastic modulus. Comparing the results from W_WSP-Hwith W_WSP, it can be noticed that the measured values ofelastic modulus are close for E1 as well as E3. Regardingelastic modulus predictions, results of the analytical models,experimental data, and finite element simulation are com-pared in Fig. 4. The following statements can be drawn:
Elastic modulus: experiments vs. predictions of the models
– none of the tested models could be selected as the mostsuitable for all materials,
– predictions of the analytical models and experimentalresults are in better agreement for the case of E3
modulus than for E1 modulus, which was overestimatedin all cases,
– however, the results for E1 are consistent with the trendof the experimental results, with respect to the differentcoatings
– the models correctly predict E1/E3 > 1, as was con-firmed by experimental measurement. This indicates animportant size effect—that a small number of largerhorizontal voids reduces the modulus more than a largenumber of smaller vertical cracks,
– analytical models seem to be more suitable for predic-tions of tungsten coating properties,
– best quantitative results for E3 modulus were receivedusing models of Kroupa and Sevostianov when appliedon tungsten coatings,
– the model of Li and Ohmori strongly underestimatesthe measured values of the E3 modulus of WSP tungstencoatings,
– compared to analytical models, FEM simulations gen-erally provided E1 moduli closer to the experimentalvalues. However, this method demands a lot of opti-mization (e.g., the choice of representative area, mesh-ing scheme, boundary conditions, etc.) to providetrustworthy predictions. This is obvious from the pre-dictions for W_WSP-H coating, where the intrasplatvoids were too small to be representatively meshedresulting in a significantly overestimated coating stiff-ness in both directions.
Elastic modulus: coating microstructure vs. sensitivity ofthe models
– the models showed good sensitivity to microstructuralvariation, i.e., slight changes in the microstructure arereflected in the results for Al2O3 as well as for tungsten,
– the differences in the microstructure of tungsten coat-ings were best reflected in the results of Kroupa andSevostianov model; moreover, the predicted E1 as wellas E3 follow the trends of the experimental results,
– for the plasma sprayed coatings, orientational scatterseems to have little effect in the case of E3 modulus;therefore, to simplify evaluation, the Kroupa model canbe used instead of the Sevostianov model,
– the effect of orientational scatter is more pronouncedfor E1 modulus due to the contribution of long hori-zontal cracks,
– despite relatively high scatter, the FEM simulationswere generally sensitive to the nature of the coatingmicrostructure. The predicted values of E3 moduli weresystematically lower than for E1, which corresponds tothe lamellar character of the coatings and the synergiceffect of numerous oriented pores (see Fig. 5),
– as illustrated in Fig. 6, the advantage of the FEMmodeling is that this technique reflects the interactionbetween voids. The relative modulus evaluated for the
376—Volume 21(3-4) June 2012 Journal of Thermal Spray Technology
Peer-
Revie
wed
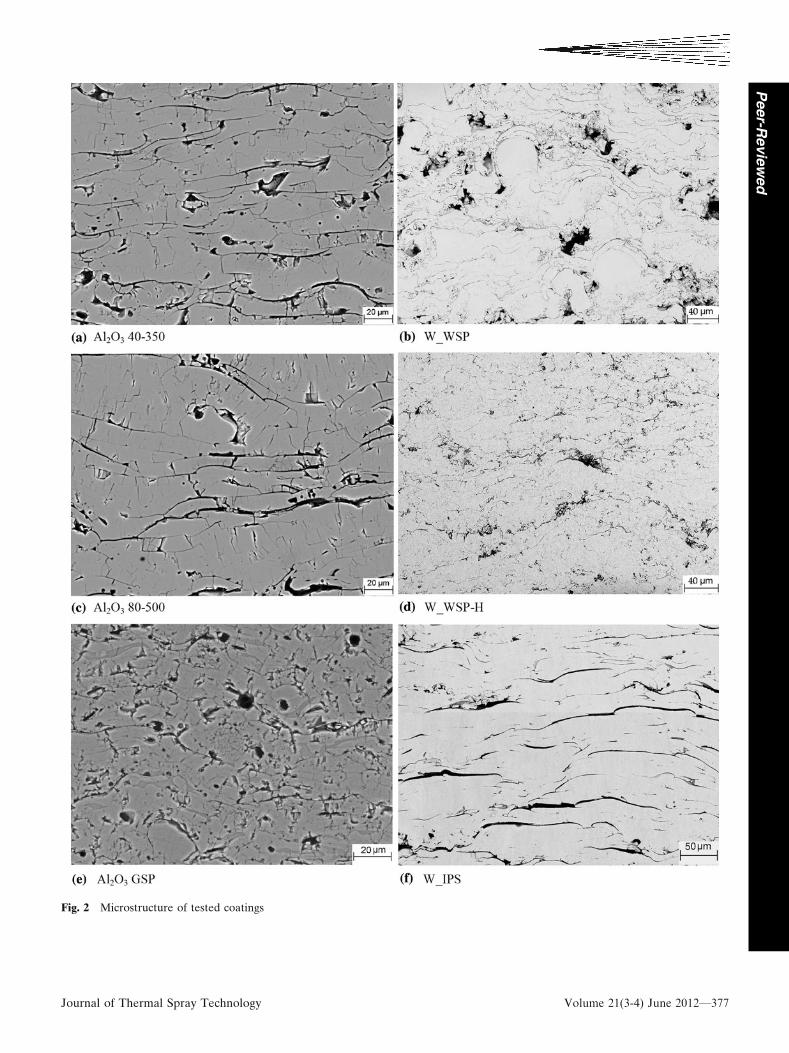
Fig. 2 Microstructure of tested coatings
Journal of Thermal Spray Technology Volume 21(3-4) June 2012—377
Peer-R
evie
wed

model shown in Fig. 6(d) is not only a linear superpo-sition of models shown in Fig. 6(b) and (c), but thedecrease of the microstructure stiffness was significantlyhigher.
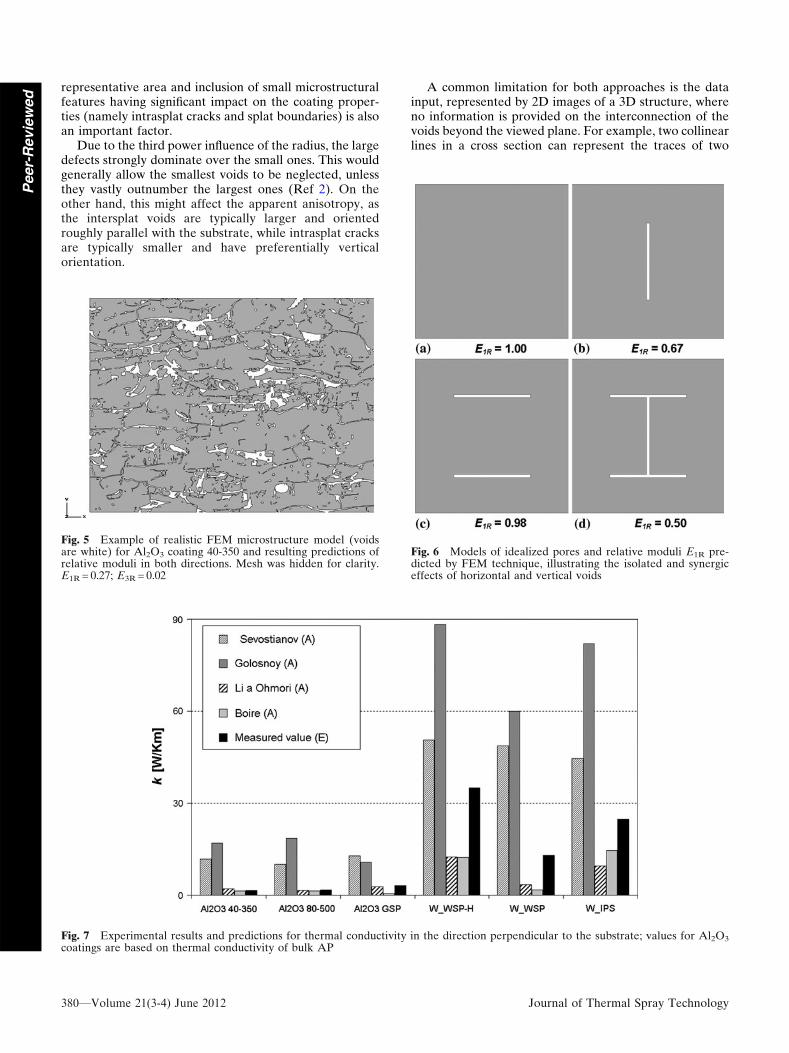
Regarding the thermal conductivity, results of theapplication of analytical models together with experi-mental data are summarized in Fig. 7; values for the Al2O3
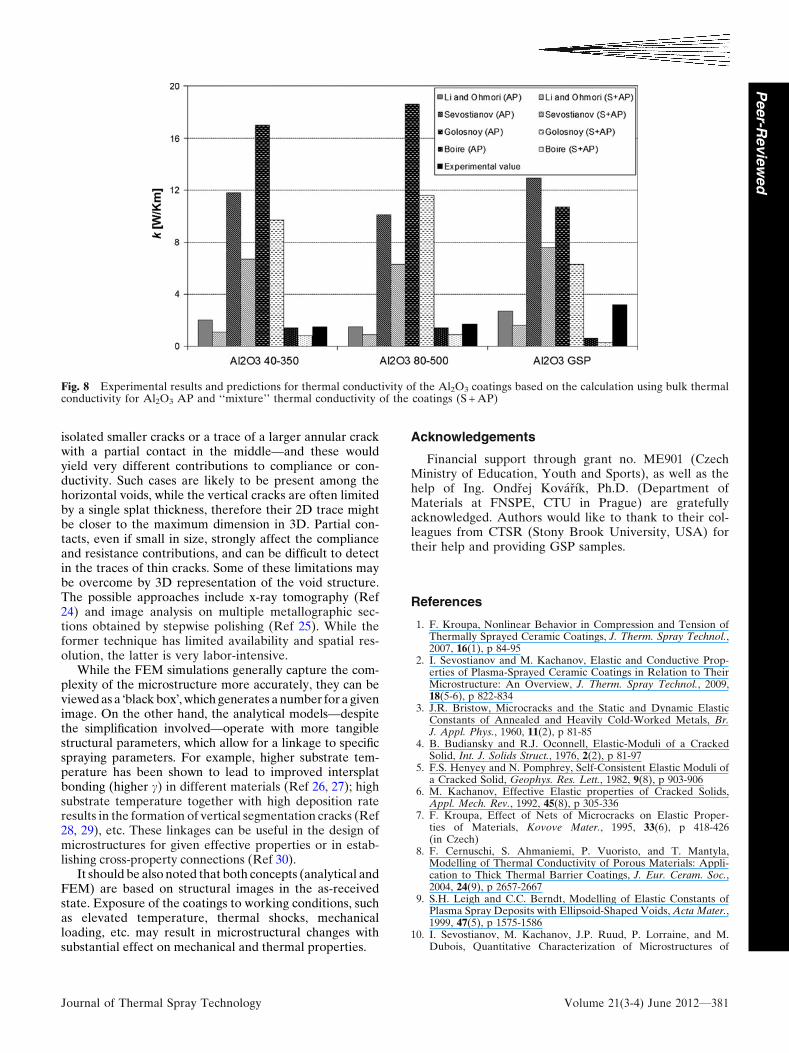
coatings are based on the thermal conductivity of bulkAl2O3 AP. Figure 8 provides a comparison of resultsobtained using bulk thermal conductivity for Al2O3 APonly and ‘‘apparent’’ thermal conductivity of the coatingsbased on the mixture rule applied for spinel phase andAl2O3 AP (S + AP) . The following statements can bedrawn from the results:
Thermal conductivity: experiments vs. predictions
– none of the tested models could be selected as the mostsuitable for all materials,
– best quantitative results were received using the modelof Li and Ohmori when applied to the Al2O3 coatings,
– the models of Golosnoy and Sevostianov markedlyoverestimate the measured value of thermal conduc-tivity of Al2O3 as well as tungsten coatings.
Thermal conductivity vs. sensitivity of the models
– the models showed a good sensitivity to microstructuralvariations, i.e., slight changes in the coatings micro-structure are reflected in the results for Al2O3 as well asfor tungsten.
Fig. 3 Distribution of cracks in the coatings with respect to theirangles. (a) Distribution of cracks in Al2O3 coatings and (b) dis-tribution of cracks in tungsten coatings
Table 2 Summary of the results obtained from analytical/FEM modeling and experiments
Notation Kroupa Sevostianov Li and Ohmori Golosnoy Boire FEM Measured value(a) Measured value(b)
E1 (GPa)Al2O3 40-350 223.8 ± 3.7 201.9 ± 14.2 ÆÆÆ ÆÆÆ ÆÆÆ 54.2 ± 12.9 55 ± 16 18.0 ± 2.9Al2O3 80-500 211.1 ± 5.7 152.9 ± 6.7 ÆÆÆ ÆÆÆ ÆÆÆ 76.1 ± 33.4 50 ± 6 16.0 ± 2.5Al2O3 GSP 206.3 ± 6.4 159.8 ± 7.3 ÆÆÆ ÆÆÆ ÆÆÆ 105.8 ± 6.4 109 ± 7 57.6 ± 9.2W_WSP-H 364.2 ± 15.0 278.0 ± 27.4 ÆÆÆ ÆÆÆ ÆÆÆ 271.2 ± 15.8 128 ± 12 85.0 ± 13.5W_WSP 320.6 ± 7.7 255.2 ± 13.8 ÆÆÆ ÆÆÆ ÆÆÆ 137.6 ± 67.5 119 ± 10 73.0 ± 11.6W_IPS 396.9 ± 0.5 341.4 ± 28.0 ÆÆÆ ÆÆÆ ÆÆÆ 207.7 ± 34.0 140 ± 16 179.0 ± 28.5
E3 (GPa)Al2O3 40-350 50.7 ± 4.5 55.3 ± 6.5 66.7 ± 12.9 ÆÆÆ ÆÆÆ 6.0 ± 3.9 25 ± 7 ÆÆÆAl2O3 80-500 57.8 ± 10.4 56.3 ± 11.6 68.8 ± 30.5 ÆÆÆ ÆÆÆ 22.1 ± 22.1 28 ± 7 ÆÆÆAl2O3 GSP 78.2 ± 14.3 73.7 ± 13.6 105.3 ± 6.8 ÆÆÆ ÆÆÆ 59.4 ± 5.4 100.0 ± 6.5 ÆÆÆW_WSP-H 76.5 ± 10.8 69.8 ± 9.8 35.0 ± 19.4 ÆÆÆ ÆÆÆ 186.4 ± 20.1 81 ± 7 ÆÆÆW_WSP 67.5 ± 13.3 69.1 ± 12.9 0.5 ± 0.3 ÆÆÆ ÆÆÆ 85.2 ± 50.6 74 ± 14 ÆÆÆW_IPS 66.7 ± 11.1 60.9 ± 9.8 80.1 ± 59.1 ÆÆÆ ÆÆÆ 14.8 ± 14.2 94.0 ± 12.5 ÆÆÆ
k (AP) (W/Km)Al2O3 40-350 ÆÆÆ 12.4 ± 3.2 2.0 ± 0.2 17.1 ± 1.4 1.60 ± 0.04 ÆÆÆ 1.50 ± 0.01 ÆÆÆAl2O3 80-500 ÆÆÆ 10.4 ± 1.7 1.5 ± 0.2 18.4 ± 1.5 1.3 ± 0.2 ÆÆÆ 1.70 ± 0.01 ÆÆÆAl2O3 GSP ÆÆÆ 13.2 ± 1.9 2.7 ± 0.3 10.6 ± 0.7 0.50 ± 0.04 ÆÆÆ 3.2 ± 0.2 ÆÆÆW_WSP-H ÆÆÆ 51.2 ± 5.8 12.3 ± 1.9 88.3 ± 6.6 12.3 ± 2.2 ÆÆÆ 35.0 ± 1.1 ÆÆÆW_WSP ÆÆÆ 50.3 ± 8.0 3.3 ± 1.0 67.8 ± 26.8 1.8 ± 0.4 ÆÆÆ 13.0 ± 0.1 ÆÆÆW_IPS ÆÆÆ 45.6 ± 6.4 9.6 ± 2.5 82.1 ± 1.0 14.5 ± 1.0 ÆÆÆ 24.8 ± 0.1 ÆÆÆ
k (S + AP) (W/Km)Al2O3 40-350 ÆÆÆ 7.0 ± 1.8 1.1 ± 0.1 9.7 ± 0.8 1.08 ± 0.05 ÆÆÆ ÆÆÆ ÆÆÆAl2O3 80-500 ÆÆÆ 6.5 ± 1.0 0.9 ± 0.1 11.5 ± 1.0 0.8 ± 0.1 ÆÆÆ ÆÆÆ ÆÆÆAl2O3 GSP ÆÆÆ 7.8 ± 1.1 1.6 ± 0.2 6.3 ± 0.4 0.30 ± 0.02 ÆÆÆ ÆÆÆ ÆÆÆ
(a) Elastic modulus measured by instrumented indentation and thermal conductivity by xenon flash method(b) Elastic modulus measured by 4PB
378—Volume 21(3-4) June 2012 Journal of Thermal Spray Technology
Peer-
Revie
wed
5. Conclusions
In the present study, various models were evaluated totest their ability to predict mechanical and thermal prop-erties of plasma sprayed coatings. It was shown that bothanalytical and numerical modeling may provide reasonablequalitative predictions in terms of relative values in differ-ent directions as well as a comparison between differentcoatings. However, it is not possible to simply choose oneuniversal concept for different materials even for one familyof thermal spray coatings (plasma spray coatings in thiscase). The accuracy of the analytical models is limitednamely due to the fact that interaction of the microstruc-
tural features is not considered, which often results inoverestimation of the predicted values. The quantitativeevaluation/description/processing of the microstructuralfeatures is a rather complex and tedious task, as the crackgeometries are often irregular, nonplanar, and intersecting;the results are therefore influenced by the human factor.This particularly concerns large intersplat voids of complexshapes, although, as demonstrated in Ref 2, the shape ef-fects are much smaller than the size effects.
The FEM simulations consider the real microstructurewith its complexity, with minimal simplifications, andimplicitly include the interaction of different voids. Acompromise between the choice of a sufficiently large
Fig. 4 Experimental results and predictions for elastic moduli. (a) Modulus in the direction parallel with substrate and (b) modulus inthe direction perpendicular to the substrate
Journal of Thermal Spray Technology Volume 21(3-4) June 2012—379
Peer-R
evie
wed
representative area and inclusion of small microstructuralfeatures having significant impact on the coating proper-ties (namely intrasplat cracks and splat boundaries) is alsoan important factor.
Due to the third power influence of the radius, the largedefects strongly dominate over the small ones. This wouldgenerally allow the smallest voids to be neglected, unlessthey vastly outnumber the largest ones (Ref 2). On theother hand, this might affect the apparent anisotropy, asthe intersplat voids are typically larger and orientedroughly parallel with the substrate, while intrasplat cracksare typically smaller and have preferentially verticalorientation.
A common limitation for both approaches is the datainput, represented by 2D images of a 3D structure, whereno information is provided on the interconnection of thevoids beyond the viewed plane. For example, two collinearlines in a cross section can represent the traces of two
Fig. 5 Example of realistic FEM microstructure model (voidsare white) for Al2O3 coating 40-350 and resulting predictions ofrelative moduli in both directions. Mesh was hidden for clarity.E1R = 0.27; E3R = 0.02
Fig. 6 Models of idealized pores and relative moduli E1R pre-dicted by FEM technique, illustrating the isolated and synergiceffects of horizontal and vertical voids
Fig. 7 Experimental results and predictions for thermal conductivity in the direction perpendicular to the substrate; values for Al2O3
coatings are based on thermal conductivity of bulk AP
380—Volume 21(3-4) June 2012 Journal of Thermal Spray Technology
Peer-
Revie
wed
isolated smaller cracks or a trace of a larger annular crackwith a partial contact in the middle—and these wouldyield very different contributions to compliance or con-ductivity. Such cases are likely to be present among thehorizontal voids, while the vertical cracks are often limitedby a single splat thickness, therefore their 2D trace mightbe closer to the maximum dimension in 3D. Partial con-tacts, even if small in size, strongly affect the complianceand resistance contributions, and can be difficult to detectin the traces of thin cracks. Some of these limitations maybe overcome by 3D representation of the void structure.The possible approaches include x-ray tomography (Ref24) and image analysis on multiple metallographic sec-tions obtained by stepwise polishing (Ref 25). While theformer technique has limited availability and spatial res-olution, the latter is very labor-intensive.
While the FEM simulations generally capture the com-plexity of the microstructure more accurately, they can beviewed as a �black box�, which generates a number for a givenimage. On the other hand, the analytical models—despitethe simplification involved—operate with more tangiblestructural parameters, which allow for a linkage to specificspraying parameters. For example, higher substrate tem-perature has been shown to lead to improved intersplatbonding (higher c) in different materials (Ref 26, 27); highsubstrate temperature together with high deposition rateresults in the formation of vertical segmentation cracks (Ref28, 29), etc. These linkages can be useful in the design ofmicrostructures for given effective properties or in estab-lishing cross-property connections (Ref 30).
It should be also noted that both concepts (analytical andFEM) are based on structural images in the as-receivedstate. Exposure of the coatings to working conditions, suchas elevated temperature, thermal shocks, mechanicalloading, etc. may result in microstructural changes withsubstantial effect on mechanical and thermal properties.
Acknowledgements
Financial support through grant no. ME901 (CzechMinistry of Education, Youth and Sports), as well as thehelp of Ing. Ondrej Kovarık, Ph.D. (Department ofMaterials at FNSPE, CTU in Prague) are gratefullyacknowledged. Authors would like to thank to their col-leagues from CTSR (Stony Brook University, USA) fortheir help and providing GSP samples.
References
1. F. Kroupa, Nonlinear Behavior in Compression and Tension ofThermally Sprayed Ceramic Coatings, J. Therm. Spray Technol.,2007, 16(1), p 84-95
2. I. Sevostianov and M. Kachanov, Elastic and Conductive Prop-erties of Plasma-Sprayed Ceramic Coatings in Relation to TheirMicrostructure: An Overview, J. Therm. Spray Technol., 2009,18(5-6), p 822-834
3. J.R. Bristow, Microcracks and the Static and Dynamic ElasticConstants of Annealed and Heavily Cold-Worked Metals, Br.J. Appl. Phys., 1960, 11(2), p 81-85
4. B. Budiansky and R.J. Oconnell, Elastic-Moduli of a CrackedSolid, Int. J. Solids Struct., 1976, 2(2), p 81-97
5. F.S. Henyey and N. Pomphrey, Self-Consistent Elastic Moduli ofa Cracked Solid, Geophys. Res. Lett., 1982, 9(8), p 903-906
6. M. Kachanov, Effective Elastic properties of Cracked Solids,Appl. Mech. Rev., 1992, 45(8), p 305-336
7. F. Kroupa, Effect of Nets of Microcracks on Elastic Proper-ties of Materials, Kovove Mater., 1995, 33(6), p 418-426(in Czech)
8. F. Cernuschi, S. Ahmaniemi, P. Vuoristo, and T. Mantyla,Modelling of Thermal Conductivity of Porous Materials: Appli-cation to Thick Thermal Barrier Coatings, J. Eur. Ceram. Soc.,2004, 24(9), p 2657-2667
9. S.H. Leigh and C.C. Berndt, Modelling of Elastic Constants ofPlasma Spray Deposits with Ellipsoid-Shaped Voids, Acta Mater.,1999, 47(5), p 1575-1586
10. I. Sevostianov, M. Kachanov, J.P. Ruud, P. Lorraine, and M.Dubois, Quantitative Characterization of Microstructures of
Fig. 8 Experimental results and predictions for thermal conductivity of the Al2O3 coatings based on the calculation using bulk thermalconductivity for Al2O3 AP and ‘‘mixture’’ thermal conductivity of the coatings (S + AP)
Journal of Thermal Spray Technology Volume 21(3-4) June 2012—381
Peer-R
evie
wed
Plasma-Sprayed Coatings and Their Conductive and ElasticProperties, Mater. Sci. Eng. A, 2004, 386(1-2), p 164-174
11. C.J. Li and A. Ohmori, Relationships Between the Microstruc-ture and Properties of Thermally Sprayed Deposits, J. Therm.Spray Technol., 2002, 11(3), p 365-374
12. R. Musalek, O. Kovarik, and J. Matejicek, Prediction ofMechanical Properties of Thermally Sprayed Coatings UsingFinite Element Method, Proceedings of Vrstvy a povlaky, 2008,p 117-122
13. http://www.ctcms.nist.gov/oof/oof2/. Accessed 10 Oct 201114. http://nanohub.org/resources/oof2. Accessed 10 Oct 201115. R. McPherson, A Model for the Thermal-Conductivity of Plas-
ma-Sprayed Ceramic Coatings, Thin Solid Films, 1984, 112(1),p 89-95
16. I.O. Golosnoy, S.A. Tsipas, and T.W. Clyne, An AnalyticalModel for Simulation of Heat Flow in Plasma-Sprayed ThermalBarrier Coatings, J. Therm. Spray Technol., 2005, 14(2), p 205-214
17. S. Boire-Lavigne, C. Moreau, and R.G. Saintjacques, The Rela-tionship between the Microstructure and Thermal-Diffusivity ofPlasma-Sprayed Tungsten Coatings, J. Therm. Spray Technol.,1995, 3, p 261-267
18. P. Chraska, J. Dubsky, K. Neufuss, and J. Pisacka, Alumina-BasePlasma-Sprayed Materials part I: Phase Stability of Alumina andAlumina-Chromia, J. Therm. Spray Technol., 1997, 6(3), p 320-326
19. R. Musalek, J. Matejicek, M. Vilemova, and O. Kovarik, Non-Linear Mechanical Behavior of Plasma Sprayed Alumina UnderMechanical and Thermal Loading, J. Therm. Spray Technol.,2010, 19(1-2), p 422-428
20. ImageJ software, http://rsbweb.nih.gov/ij/. Accessed 10 Oct 201121. Temperature Dependent Elastic & Thermal Properties Database,
MPDB v.6.60, JAHM Software, Inc., North Reading, 1999
22. M.R. Gallas and G.J. Piermarini, Bulk Modulus and YoungsModulus of Nanocrystalline Gamma-Alumina, J. Am. Ceram.Soc., 1994, 77(11), p 2917-2920
23. C.J. Li, A. Ohmori, and R. McPherson, The RelationshipBetween Microstructure and Young�s Modulus of ThermallySprayed Ceramic Coatings, J. Mater. Sci., 1997, 32(4), p 997-1004
24. A. Kulkarni, S. Sampath, A. Goland, H. Herman, and B. Dowd,Computed Microtomography Studies to Characterize Micro-structure-Property Correlations in Thermal Sprayed AluminaDeposits, Scr. Mater., 2000, 43(5), p 471-476
25. P. Ctibor, R. Lechnerova, and V. Benes, Quantitative Analysis ofPores of Two Types in a Plasma-Sprayed Coating, Mater. Cha-ract., 2006, 56(4-5), p 297-304
26. J. Matejıcek, S. Sampath, and H. Herman, Processing Effects onSplat Formation, Microstructure and Quenching Stress in PlasmaSprayed Coatings, Thermal Spray: Meeting the Challenges of the21st Century, C. Coddet, Ed., 25-29 May 1998 (Nice), ASMInternational, 1998, p 419-424
27. S. Sampath, X.Y. Jiang, J. Matejıcek, A.C. Leger, and A.Vardelle, Substrate Temperature Effects on Splat Formation,Microstructure Development and Properties of Plasma SprayedCoatings Part I: Case Study for Partially Stabilized Zirconia,Mater. Sci. Eng. A, 1999, 272(1), p 181-188
28. P. Bengtsson, T. Ericsson, and J. Wigren, Thermal Shock Testingof Burner Cans Coated with a Thick Thermal Barrier Coating,J. Therm. Spray Technol., 1998, 7(3), p 340-348
29. H.B. Guo, R. Vassen, and D. Stover, Atmospheric PlasmaSprayed Thick Thermal Barrier Coatings with High Segmenta-tion Crack Density, Surf. Coat. Technol., 2004, 186(3), p 353-363
30. M. Kachanov and I. Sevostianov, On Quantitative Character-ization of Microstructures and Effective Properties, Int. J. SolidsStruct., 2005, 42(2), p 309-336
382—Volume 21(3-4) June 2012 Journal of Thermal Spray Technology
Peer-
Revie
wed
Copyright © 2022 FDOKUMEN