Author's personal copy Eye Movement Abnormalities in Multiple Sclerosis
Upload
kalasalingamCategory
view
3download
0
This article appeared in a journal published by Elsevier. The attachedcopy is furnished to the author for internal non-commercial researchand education use, including for instruction at the authors institution
and sharing with colleagues.
Other uses, including reproduction and distribution, or selling orlicensing copies, or posting to personal, institutional or third party
websites are prohibited.
In most cases authors are permitted to post their version of thearticle (e.g. in Word or Tex form) to their personal website orinstitutional repository. Authors requiring further information
regarding Elsevier’s archiving and manuscript policies areencouraged to visit:
http://www.elsevier.com/copyright

Author's personal copy
Technical Report
Microstructural, physico-chemical and mechanical characterisation of Sansevieriacylindrica fibres – An exploratory investigation
V.S. Sreenivasan a, S. Somasundaram b, D. Ravindran c,*, V. Manikandan d, R. Narayanasamy e
a Department of Mechanical Engineering, Dr. Sivanthi Aditanar College of Engineering, Tiruchendur 628 215, Tamil Nadu, Indiab Government Sidha Medical College, Palayamkottai 627 002, Tamil Nadu, Indiac Department of Mechanical Engineering, National Engineering College, Kovilpatti 628 503, Tamil Nadu, Indiad S. Veerasamy Chettiyar College of Engineering and Technology, Puliankudi 627 855, Tamil Nadu, Indiae Department of Production Engineering, National Institute of Technology, Tiruchirapalli 620 015, Tamil Nadu, India
a r t i c l e i n f o
Article history:Received 15 March 2010Accepted 2 June 2010Available online 8 June 2010
a b s t r a c t
The microstructural, physical, chemical and mechanical properties of Sansevieria cylindrica fibres aredescribed for the first time in this work. A microstructural analysis of S. cylindrica leaves showed the pres-ence of structural fibres and arch fibres. Polarised light microscopy and scanning electron microscopy ofthese fibres revealed a hierarchical cell structure that consisted of a primary wall, a secondary wall, afibre lumen and middle lamellae. The cross-sectional area and porosity fraction of the fibre were esti-mated to be approximately 0.0245 mm2 and 37%, respectively. The fibre density and fineness wereapproximately 0.915 ± 0.005 g/cm3 and 9 Tex, respectively. An X-ray diffraction and Fourier transforminfrared analysis of the fibres showed the presence of cellulose Ib with a crystallinity index of 60%. Tensiletests showed that the corrected Young’s modulus was approximately 7 GPa, the tensile strength was658 MPa, and the total elongation was between 10% and 12%.
� 2010 Elsevier Ltd. All rights reserved.
1. Introduction
Environmental awareness groups all over the world have fo-cused their attention on the use of cellulose fibres to reinforcepolymer matrixes. The attractive features of natural fibres includetheir low cost, light-weight, moderate strength, high specific mod-ulus, renewability, biodegradability, lack of health hazards andamenability to chemical modification. Therefore, natural fibre-based composites have good potential for use as building materi-als. Several authors have reported the use of natural fibres suchas palmyra [1], sisal [2], banana [3], oil palm [4], henequen [5], jute[6], hemp [7] and wood pulp [8] as reinforcements in polymermatrixes.
The industrial use of natural fibres as reinforcements in com-posite materials started at the beginning of the 20th century withthe manufacturing of large quantities of sheets, tubes and pipes forelectronic purposes. For example, the seats and fuel tanks of air-craft were made of natural fibres with a small content of polymericbinders [9]. When cost-effective synthetic fibres that were lesssensitive to temperature and moisture were brought onto the mar-ket, natural fibres were largely abandoned in these industries.
More recently, stringent environmental regulations and an in-creased interest in the use of natural resources have led to a posi-tive change among composite industries and end users. Efforts arebeing made to find alternate reinforcements and resin systems thatare eco-friendly and provide the same performance as their syn-thetic counterparts [10].
Today, a revolution in the use of natural fibres as reinforce-ments in technical applications is taking place, primarily in theautomotive industry. European renewable fibres such as flax andhemp are now used to manufacture door panels and the roofs ofautomobiles [10]. However, accelerating the substitution of syn-thetic fibres by natural fibres requires the greater availability ofsuch fibres, and their current production level does not meet to-day’s demand. New plants must be found that enable easy andcost-effective extraction methods that do not impair the propertiesof the fibre. These new fibres must be analysed to determine theirphysical, chemical and mechanical properties. Microscopy (eitheroptical or electron) is an invaluable tool to strengthen our knowl-edge of the morphology of fibres. This knowledge is essential toevaluate or efficiently simulate the properties of these fibres.
In this paper, the Sansevieria cylindrica and fibres extracted fromit are described. The present study aims to investigate the potentialuse of S. cylindrica fibres (SCFs) as reinforcements in polymericmaterials. The physical, chemical and mechanical properties ofthe SCFs were measured and compared with other natural fibres.A pycnometer was used to assess the density of the fibres, and a
0261-3069/$ - see front matter � 2010 Elsevier Ltd. All rights reserved.doi:10.1016/j.matdes.2010.06.004
* Corresponding author. Tel.: +91 94432 57441; fax: +91 4632 232749.E-mail addresses: [email protected] (V.S. Sreenivasan), pkssomasundar
[email protected] (S. Somasundaram), [email protected] (D. Ravindran), [email protected] (V. Manikandan), [email protected] (R. Narayanasamy).
Materials and Design 32 (2011) 453–461
Contents lists available at ScienceDirect
Materials and Design
journal homepage: www.elsevier .com/locate /matdes

Author's personal copy
chemical analysis was performed to determine their lignin, cellu-lose, hemicellulose, wax and moisture content. The chemical anal-ysis of the SCF was fine tuned using X-ray diffraction (XRD) andFourier transform infrared (FTIR) analysis. A microscopic examina-tion was carried out with a polarised light microscope and a scan-ning electron microscope (SEM). The tensile properties of the fibrewere measured using an INSTRON universal testing machine.
2. Natural fibre material
Plants of S. cylindrica Wenceslas Bojer [11], belongs to Ruscaceaewere collected from Papanasam in Western Ghats, Tamil Nadu,South India, and established in a home garden at Vickramasingapu-ram in Tamil Nadu, India. This plant was used to obtain the naturalfibres.
2.1. S. cylindrica and its leaves
S. cylindrica (Ruscaceae), also known as the Cylindrical SnakePlant or Spear Sansevieria, is a succulent plant native to Angola.S. cylindrica grows in a fan shape with stiff leaves growing fromthe base of the plant in a rosette pattern. Fig. 1 shows a typicalspecimen of S. cylindrica, which is naturally available in India. Thisplant has striped, round leaves that are smooth and green–gray incolor1. In Fig. 1, the plant contains eight leaves. A single leaf isabout 30 mm thick and grows to a height between 1000 mm and2000 mm. The S. cylindrica leaf consists of a sandwich structurecomposed of approximately 5% fibre, 1% cuticle, 10% dry matterand 84% water.
S. cylindrica produces 100–150 leaves before flowering. Each ofthese leaves contains approximately 600–1000 fibre bundles thatare approximately 1000–2000 mm long. A S. cylindrica leaf yieldsa strong white elastic fibre, which has long been used by the nativeinhabitants for mats, hammocks, bowstrings and other types ofcrude cordage. SCF can be used as a reinforcement in cement andpolymer-based composites [12]. The SCFs were removed fromthe leaf by hand or mechanically. SCFs can be incorporated as
short, randomly distributed fibres, long oriented fibres or as a fi-bre-fabric in matrixes.
2.2. Extraction procedure for SCFs
The SCFs were separated from the S. cylindrica leaves, whichwere collected from farms around the city of Tirunelveli in TamilNadu, India, using a mechanical process called decortication. In thisprocess, the S. cylindrica leaves were fed into a fibre-extracting ma-chine called a mechanical decorticator. A schematic diagram of amechanical decorticator is shown in Fig. 2. The machine consistsof a pair of feed rollers and a beater. The leaves were fed into thebeater through the feed rollers between a squeezing roller and ascrapper roller. The fibres were extracted, and the pulps were sep-arated. The decorticated fibres were dried in the sunlight to re-move the moisture content, and machine combed for separation.In this study, the washed SCFs were dried for 24 h in sunlightand then used for characterisation. The separated SCFs are shownin Fig. 3.
3. Experimental procedure
3.1. Microstructural studies of S. cylindrica leaf and fibres
3.1.1. Preparation of specimens and sectioningHealthy S. cylindrica leaf was collected for microstructural anal-
ysis. For anatomical studies, the leaf was cut into small pieces(10 mm � 10 mm) and fixed in FAA (5 ml formaldehyde + 5 ml ace-tic acid + 90 ml 70% ethyl alcohol). After 24 h, the specimens weredehydrated through a graded tertiary-butyl alcohol series andembedded in paraffin [13]. Sections of 10–12 lm were cut on a ro-tary microtome, affixed to a glass slide and stained with a mixtureof Toluidine blue, safranine, fast green and Lugo’s iodine solution[14]. Polarised light micrographs were taken with a Nikon Lab-photo 2 microscopic unit. For normal observations, bright fieldimaging was used. For the crystal (starch grains and lignified cells)studies, polarised light was employed.
3.1.2. Scanning electron microscopyTransverse sections of S. cylindrica leaf and fibres were exam-
ined using a scanning electron microscope, HITACHI ModelS3000H. The leaf section and fibres were given uniform gold coat-ing on all sides except their cross-sections to make the surfacesconductive. The cross-sections of the S. cylindrica leaf and fibres
Fig. 1. Sansevieria cylindrica with striped, round, green–gray leaves.
Fig. 2. Schematic diagram of a mechanical decorticator.
1 For interpretation of color in Figs. 1,3–7,9,11–14, the reader is referred to the webversion of this article.
454 V.S. Sreenivasan et al. / Materials and Design 32 (2011) 453–461

Author's personal copy
were examined at different magnifications. In addition, the longi-tudinal view of the fibre was also observed.
3.2. Physical analysis of SCFs
The goal of this section is to describe the methodology for mea-suring the fibre cross-section, its microstructural features and thephysical properties of fibre (i.e., its density and fineness).
Optical microscopy was used to investigate the shape of thefibre. The fibre cross-sections were roughly irregular. To measurethe cross-sectional area of the fibre, an adjacent piece of tensiletested fibre (the piece close to the broken portion) was examinedusing the SEM. To evaluate the variability of the cross-sectionalarea through the length, a 40-mm-long fibre was cut into four sec-tions of 10 mm each, and four micrographs were taken. The imageswere post-processed using ImageJ. A contour line was drawn todelineate the fibre cross-section (Fig. 4), and the area wasdetermined.
The dimensions of various microscopic features (i.e., the middlelamellae, primary wall, secondary wall and fibre lumen) of the SCF
were calculated using the SEM and ImageJ. Moreover, the porosityfraction of the SCF cross-section was computed using SEM and Im-ageJ. The relation between the real section (needed to compute thestresses efficiently) and the raw section was then established.
The density measurement of the SCF was carried out using apycnometer for solids with toluene as the immersion liquid follow-ing the procedure of Beakou et al. [10]. The fibres were dried for96 h in a desiccator containing silica. They were then cut intolengths of 5–15 mm and introduced into the pycnometer, whichwas then placed in the desiccator for 24 h. The temperature inthe room was 18.1 �C. The hygrometry was 57% in the room andonly 3% in the desiccator. Before carrying out the hydrostaticweighing with toluene, the fibres were impregnated in toluenefor 2 h to evacuate the micro bubbles in the fibres. The density oftoluene is qt = 0.866 g/cm3.
The density of the SCF was calculated using the followingformula:
qSCF ¼ðm2 �m1Þ
ðm3 �m1Þðm4 �m2Þqt ð1Þ
where qSCF is the density of the SCF (g/cm3), qt is the density of thetoluene (g/cm3), m1 is the mass of the empty pycnometer (kg), m2 isthe mass of the pycnometer filled with chopped fibres (kg), m3 isthe mass of the pycnometer filled with toluene (kg) and m4 is themass of the pycnometer filled with chopped fibres and toluene (kg).
The fineness of the SCF was determined in terms of linear den-sity in accordance with ASTM D 1577-92. The linear density wasobtained as Tex and denier from the weight of 100 single fibres thatwere each 60 mm in length.
3.3. Chemical analysis of the SCFs
The goal of this analysis was to determine the content of lignin,cellulose, hemicelluloses, wax and moisture of the SCF using con-ventional chemical, XRD and FTIR analyses.
The determination of the lignin content was carried out accord-ing to the Klason method [15]. The samples were crushed andextracted with dichloromethane before being hydrolysed in a72% solution of sulphuric acid. Lignin, which was the only insolublecomponent, was separated from the fibre and quantified. The cel-
Fig. 3. Dried SCFs are strong and white.
Fig. 4. Area calculation using ImageJ from the polarised light micrograph showing a transverse section of the structural fibre (40�).
V.S. Sreenivasan et al. / Materials and Design 32 (2011) 453–461 455

Author's personal copy
lulose content was measured according to Kurshner and Hoffer’smethod [16]. The samples were crushed and extracted with dichlo-romethane, and then a mixture of ethanol and 95% nitric acid wasadded. The cellulose that corresponded to the insoluble fraction ofthe samples was weighed. The determination of hemicellulose wascarried out according to standard NFT 12-008. The samples wereheated in hydrobromic acid. The hemicellulose was transformedinto furfural, and the latter was extracted by distillation and mea-sured by spectrophotometry.
The wax content in the SCF was determined following themethod developed by Conrad [17].The SCF samples were crushedand subjected to soxlet extraction using ethanol for 6 h. The result-ing solution contained sugar, wax and other alcohol-soluble sub-stances. The solution was transferred to a separator funnel, andchloroform was added to extract the wax from the alcohol solution.Purified water was then added, and two separate layers of chloro-form and alcohol were formed. After separation, the chloroformevaporated from the solution, leaving a waxy residue. After extrac-tion, the dried residue and the SCF samples were weighed, and thewax content was expressed in terms of the original weight of theSCF samples.
The moisture content in the SCF was determined by the follow-ing procedure. Weighed SCF samples were dried in an oven at104 �C for 4 h, and the dried samples were weighed. The moisturecontent in the SCF was determined using the following expression:
%of moisture content in SCF
¼ fSample weight before dryingg � fSample weight after dryinggSample weight before drying
� 100 ð2Þ
X-ray spectra (scan range (2h) = 10–80�; h = diffraction angle;scan speed = 5.0 deg/min) of the SCF were obtained with a RigakuX-ray diffractometer D/Max Ultima III with an X-ray tube produc-ing monochromatic Cu Ka radiation. The integrated intensities ofthe Bragg peaks in the spectrum of the SCF were identified, andtheir crystallinity indices were estimated.
FTIR spectra of the SCF were recorded using a Perkin ElmerSpectrum RXI FTIR spectrometer in a KBr matrix with a scan rateof 32 scans per minute and a resolution of 2 cm�1 in the wavenumber region from 400–4000 cm�1. The SCF samples werechopped into small particles using scissors and ground to a finepowder using a mortar and pestle. This powder was mixed withKBr and pelletised by pressurisation to record the FTIR spectra un-der standard conditions.
3.4. Tensile behaviour of the SCFs
The dried SCFs were tested in dry conditions under tensile load-ing at gauge lengths (GL) of 10, 20, 30 and 40 mm in an INSTRONuniversal testing machine of type 5500 R (Fig. 5) according to theASTM D 3822-01 standard. The GL was varied to determine its ef-fect on the tensile properties. Pneumatic grips were used to clampthe fibre with a pressure of 0.4 MPa. A 1.0 kN capacity load cell wasused to measure the load. The displacement of the fibre was mea-sured by a short-stroke transducer with a resolution of approxi-mately 0.1 lm. The tensile tests were conducted with a crosshead speed of 0.1 mm/min. The average strain rates were on theorder of 0.6 s�1 and 0.15 s�1 for the gauge lengths of 10 mm and40 mm, respectively. Due to the variability of the natural fibres,20 samples were tested at each GL, and the average value was re-ported. All testing was conducted at ambient temperature (�21 �C)and a relative humidity of about 65%.
The compliance of the loading and gripping systems was deter-mined by obtaining the force versus displacement behaviour of thefibre at various gauge lengths following the methodology used by
Chawla et al. [18]. The total cross–head displacement during fibretesting, dt, is expressed using the following expression:
dt=F ¼ ð1=EAÞ þ c ð3Þ
where F is the applied force, l is the GL, E is the Young’s modulus ofthe fibre, A is the cross-sectional area of the fibre and c is themachine compliance.
A plot of dt/F versus GL (l) yields a straight line of Slope 1/(EA)and intercept c, which is the compliance of the load train.
4. Results and discussion
4.1. Microstructural analysis of S. cylindrica leaf and fibres
In the transverse sections, the leaf displayed a dermal tissuesystem, a ground tissue system and a vascular tissue system.
The dermal tissue consisted of a well-defined epidermis withradially oblong, fairly wide cells that have thick cuticles (seeFig. 6a). The epidermal layer had cuticles that were 70 lm thick.The ground tissue was homogeneous and parenchymatous. Thecells were circular to polygonal, thin walled and compact. Fibrebundles were observed in the ground tissue (Fig. 6a). The vascularbundles were mostly located in the central portion of the groundtissue. The vascular bundles had two lateral rows of wide, angular,thick-walled xylem elements and three or four small nests ofphloem elements situated along the outer part of the xylemstrands (Fig. 6b). The xylem elements were 50 lm wide, and theirwalls were 5 lm thick. The lumen of the xylem elements was40 lm. Fibres were also present at one end of the vascular bundle.
Within the leaf, there were two basic types of fibres: a struc-tural fibre or fibre bundle and an arch fibre or bundle-cap fibre.The structural fibres provide stiffness for the S. cylindrica leaf andwere found in the periphery of the leaf (see Fig. 6a). The cross-sec-tion of the structural fibre was polyhedral in outline and compact(Fig. 6c). Fig. 7 shows an SEM image of the transverse section of thestructural fibre. In this image, a flaky cell structure with smallvoids is observed. The equivalent diameter of the structural fibreswas in the range of 50–100 lm. The structural fibres were sur-rounded by ordinary ground parenchyma cells. The structural fi-
Fig. 5. INSTRON universal testing machine used for tensile testing.
456 V.S. Sreenivasan et al. / Materials and Design 32 (2011) 453–461

Author's personal copy
bres are of great importance commercially because they almostnever split during the extraction process.
The arch fibres grow at one end of the vascular bundle and wereusually found in the middle of the leaf (Fig. 6a). The cross-sectionalview of the arch fibres shows a semi-elongated circular shape (Figs.6b and 8). These fibres run from the base to the tip of the plant. Thestructural fibres were less lignified than the arch fibres.
The SCFs had a hierarchical structure. Each fibre containednumerous elongated individual fibre cells that were approximately6–30 lm in diameter. Each fibre cell is made up of three mainparts: the primary wall, the secondary wall and the fibre lumen(Fig. 9). The fibre cell walls were heavily lignified and responsiblefor fibre strength. The primary wall contained cellulose, and thesecondary wall consisted of lignin. The fibre lumen was approxi-mately 6–10 lm wide. The fibre cells were linked together by themiddle lamellae, which consisted of hemicellulose and lignin.Fig. 10 shows a longitudinal view of the SCF. The longitudinalsurface of the SCF resembled a combination of the linear fibre seg-ments. The longitudinal surface of the SCF also consisted of severalsurface irregularities that provide good interfaces between the fi-bre and the resin when SCFs are used to manufacture composites.
Our results are in according with the findings of Murherjee et al.[19] and Nutman et al. [20]. Both groups conducted a microstruc-tural analysis of various types of sisal fibres and fibre cells. They
Fig. 6. (a) Transverse section of a Sansevieria cylindrica leaf showing fibre bundles and vascular bundles. (polarised light micrograph; 10�). (b) An enlarged vascular bundleshowing two parallel rows of xylem elements, four phloem strands along the periphery and a thick bundle-cap fibre (40�). (c) Magnified view of a transverse section of astructural fibre (40�).
Fig. 7. SEM view of a transverse section of a structural fibre.
Fig. 8. SEM view of a transverse section of an arch fibre.
Fig. 9. Transverse section of fibres showing primary walls, secondary walls andlumens (polarised light micrograph; 60�).
V.S. Sreenivasan et al. / Materials and Design 32 (2011) 453–461 457

Author's personal copy
observed the presence of structural, arch and xylem fibres in sisalleaves. Beakou et al. [10] analysed the microstructure of a Rhecto-phyllum camerunense plant fibre. They observed that R. camerun-ense fibres extracted from the air roots of a plant contain primarywalls, secondary walls and lumen.
4.2. Physical and chemical analysis of SCF
Fig. 6b and c shows that the fibre cross-section is irregular. Be-cause SCFs have irregular cross-sections, simply measuring thediameter at a given location may result in an erroneous measure-ment of the cross-sectional area of the fibre. Image analysis pro-vides a very precise method for measuring the area. An areameasurement at four randomly selected, equally spaced pointson a 40 mm SCF sample resulted in values of 0.023, 0.028, 0.024,and 0.023 mm2. The average value of the area was calculated andreported.
The porosity fraction in the fibres was determined by imageprocessing using ImageJ. The porosity fraction of the fibres is de-fined as the ratio of the total surface area of the fibre lumens tothe raw surface area of the fibre cross-section [10]. In this study,the porosity fraction was calculated using a sample of 10 sections,and the results indicated that the porosity fraction varied from 32%
to 37%. This high porosity fraction promotes good impregnationwhen a low viscosity resin is used for composite fabrication. Thesame analysis also allowed us to evaluate the various featuredimensions in the microscopic structures of SCFs using the imageshown in Fig. 9. These dimensions are reported in Table 1.
The data in Table 1 indicate that the primary wall is the thickestlayer. Its thickness was approximately triple that of the secondarywall. The cellulose content of the primary wall was also the highestof all layers in the fibre cell.
As expected by the high porosity fraction, the density of the SCFcomputed using Eq. (1) was 0.915 ± 0.005 g/cm3. This low density(Table 2) is favourable for light-weight applications. Another appli-cation for this low density and high porosity fraction is in the con-struction of thermal and acoustic insulation using panelsreinforced with SCF. The fineness of SCF was determined in termsof the linear density, which was 8.95 Tex or 80.52 denier.
The density and chemical composition of SCFs and the reportedvalues of other natural fibres are shown in Table 2. The chemicalcomposition of the fibre influences its properties and, in manyways, the fibres themselves can be considered fibrous compositematerials [23]. For example, the cellulose content has an importantinfluence on the mechanical properties of natural fibres [24]. Asshown in Table 2, SCFs contain 79.7% cellulose, which is �85%greater than that of coir fibre and 2% less than that of pineapplefibre.
SCFs also contain 10.13% hemicellulose, 3.8% lignin, 0.09% waxand 6.08% moisture. The hemicellulose content in SCFs is less thanother natural fibres. The lignin content influences the fibre struc-ture, properties and morphology [23], and the wax content inraw fibres affects the interfacial bond between the fibre and matrixduring composite formation. However, SCFs contain only 0.09%wax, which is a negligible quantity. Therefore, the interfacial bondbetween raw SCFs and the resin is not affected by wax.
4.2.1. XRD analysisFig. 11 displays a typical X-ray spectrum for SCFs. This spectrum
contains two peaks, which are particularly well-defined for a rawfibre. The presence of these diffraction peaks indicates that the fi-bre is semi-crystalline. According to several authors [25,26], thetwo peaks situated at 2h = 15.4� and 2h = 22.5� can be attributedto cellulose I and IV, both of which exhibit a monoclinic structure[25–27]. However, the FTIR analysis also showed a characteristicband for cellulose Ib [26–28]. This result indicated that the typeof cellulose present in the fibre is cellulose Ib.
These two peaks are attributed to the (2 0 0) and (1 1 0) crystal-lographic planes [25,29,30]. The crystallinity index (CI) was esti-mated using the following expression [31]:
CI ¼ H22:5 � H18:5
H22:5ð4Þ
where H22.5 is the height of the peak at 2h = 22.5�. This is due to thecontribution of both the amorphous and the crystalline fractions.
Fig. 10. SEM image of a longitudinal view of SCF.
Table 1Average thickness of various features in the microstructure of SCFs.
Fiber microstructuralfeatures
Middlelamellae
Primarywall
Secondarywall
Fiberlumen
Thickness average(nm)
1112 ± 55 1558 ± 82 667 ± 28 8889 ± 424
Table 2Chemical composition and density of SCFs and different cellulose-based natural fibres.
Fiber Cellulose (%) Hemicelluloses (%) Lignin (%) Wax (%) Moisture (%) Density (g/cm3) References
SCF 79.7 10.13 3.8 0.09 6.08 0.915 –Banana 63–64 19 5 – 10–11 1.35 [21,22]Coir 43 – 45 – – 1.15 [22]Sisal 67 12 12 – – 1.45 [9,22]Pineapple 81 – 12 – – 1.44 [22]Jute 64.4 12 11.8 – – 1.3 [9]Flax 64.1 16.7 2 – – 1.5 [9]Ramie 68.6 13.1 0.6 – – – [9]Rhectophyllum camerunense 68.2 16 15.6 – – 0.947 [10]
458 V.S. Sreenivasan et al. / Materials and Design 32 (2011) 453–461

Author's personal copy
H18.5 is the diffracted intensity at 2h = 18.5� and is attributed to theamorphous fraction [30,32]. This calculation yields a CI value of60%. This value is higher than that of the Wrighitia tinctoria seed fi-bre (49.2%) and ramie (58%); it is equal to the value for cotton (60%)and smaller than the value for raffia textilis (64%), sisal (71%), jute(71%), flax (80%) and hemp (88%) [26,30–32]. This result suggeststhat the crystallites of SCF are less ordered than those of raffia tex-tilis, sisal, flax and hemp. An estimate of crystallite size (L) was per-formed using Scherrer’s formula [31]:
L ¼ Kkb cos h
ð5Þ
where K = 0.89 is Scherrer’s constant, b is the peak’s full-width athalf-maximum and k is the wavelength of the radiation[25,27,33]. When Eq. (5) was applied to the (2 0 0) peak, the crystal-lite size (L) was 86 nm. This value is more than twice that of thecrystallite size of raffia textilis fibres (L = 32 nm) calculated usingthe same framework [31], and it is far larger than that of ramie fi-bres (16 nm) [34], cotton fibres (5.5 nm), cornstalk fibres (3.8 nm)and flax fibres (2.8 nm), as reported by Reddy and Yang [29]. Thislarge crystallite size (L = 86 nm) reduces the chemical reactivityand water absorption capacity of the material.
4.2.2. FTIR analysisThe FTIR spectra for SCF are presented in Fig. 12. The reported
values of the band positions vary from author to author[27,28,32,35,36]. The positions of the vegetable fibre bands varyby about 16 cm�1, and a given band can have several origins[36]. Therefore, the band positions vary between studies. When
the variability of the position is taken into account, the bands at3400 cm�1 (3407.33 in Fig. 12) and 760 cm�1 (771.67 in Fig. 12)can be attributed to cellulose Ib [27,28]. The bands at 1740 cm�1
(1730 in Fig. 12) and 1510 cm�1 (1509.15 in Fig. 12) are attributedto lignin [27].
The CH stretch at 2936.51 cm�1 is present in the spectrum. Thecarbonyl band at 1730 cm�1 can be seen in the spectrum. The bandat 1730 cm�1 is also attributed to the C@O stretch of the acetylgroups of hemicelluloses [37,38]. The COOH bending band andthe CH2 symmetric bending band were present at 662.41 cm�1
and 1361.87 cm�1, respectively. The band at 1260.31 cm�1 is theCAO stretch of the acetyl group of lignin [38]. The C@O bonds onthe hemicelluloses are represented by the band 1612.85 cm�1
[30]. The band at 771.67 cm�1 represents the presence of saline[39].
4.3. Tensile behaviour of SCF
A total of 20 fibres were randomly chosen from a given batchand tested for each GL. The Young’s modulus was calculated inthe elastic portion of the stress–strain curve and then correctedfor compliance by measuring the force versus the displacementat various gauge lengths using Eq. (3) (Fig. 13). These results areshown in Table 3. The GL does not influence the modulus of the fi-bre. The variability in the modulus for a given GL is due to the var-iability in the microstructure of S. cylindrica fibres and also due topossible damage that occurred during the extraction process.
Fig. 12. FTIR spectra of SCF.
Fig. 11. X-ray spectrum of SCF.
Fig. 13. Normalised displacement versus GL plot showing a linear relationship witha slope of 1/(EA). The machine compliance, which is given by the intercept(c = 0.014), was also determined from this plot.
V.S. Sreenivasan et al. / Materials and Design 32 (2011) 453–461 459
Author's personal copy
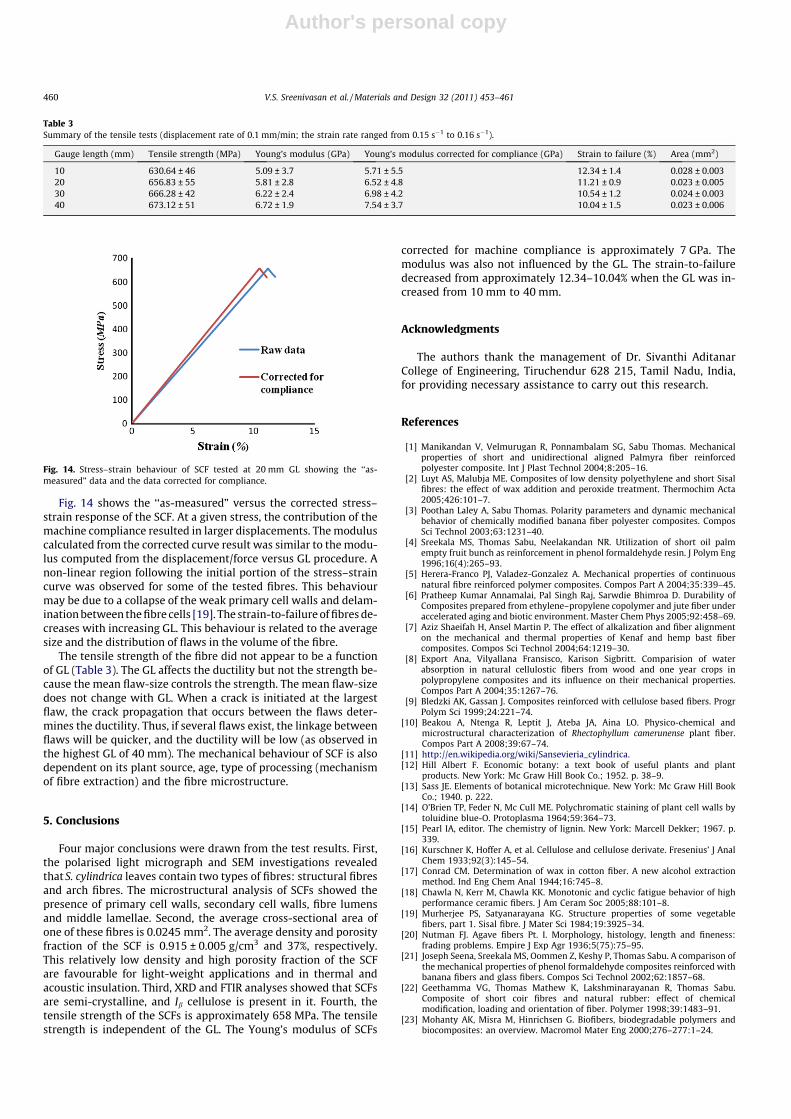
Fig. 14 shows the ‘‘as-measured” versus the corrected stress–strain response of the SCF. At a given stress, the contribution of themachine compliance resulted in larger displacements. The moduluscalculated from the corrected curve result was similar to the modu-lus computed from the displacement/force versus GL procedure. Anon-linear region following the initial portion of the stress–straincurve was observed for some of the tested fibres. This behaviourmay be due to a collapse of the weak primary cell walls and delam-ination between the fibre cells [19]. The strain-to-failure of fibres de-creases with increasing GL. This behaviour is related to the averagesize and the distribution of flaws in the volume of the fibre.
The tensile strength of the fibre did not appear to be a functionof GL (Table 3). The GL affects the ductility but not the strength be-cause the mean flaw-size controls the strength. The mean flaw-sizedoes not change with GL. When a crack is initiated at the largestflaw, the crack propagation that occurs between the flaws deter-mines the ductility. Thus, if several flaws exist, the linkage betweenflaws will be quicker, and the ductility will be low (as observed inthe highest GL of 40 mm). The mechanical behaviour of SCF is alsodependent on its plant source, age, type of processing (mechanismof fibre extraction) and the fibre microstructure.
5. Conclusions
Four major conclusions were drawn from the test results. First,the polarised light micrograph and SEM investigations revealedthat S. cylindrica leaves contain two types of fibres: structural fibresand arch fibres. The microstructural analysis of SCFs showed thepresence of primary cell walls, secondary cell walls, fibre lumensand middle lamellae. Second, the average cross-sectional area ofone of these fibres is 0.0245 mm2. The average density and porosityfraction of the SCF is 0.915 ± 0.005 g/cm3 and 37%, respectively.This relatively low density and high porosity fraction of the SCFare favourable for light-weight applications and in thermal andacoustic insulation. Third, XRD and FTIR analyses showed that SCFsare semi-crystalline, and Ib cellulose is present in it. Fourth, thetensile strength of the SCFs is approximately 658 MPa. The tensilestrength is independent of the GL. The Young’s modulus of SCFs
corrected for machine compliance is approximately 7 GPa. Themodulus was also not influenced by the GL. The strain-to-failuredecreased from approximately 12.34–10.04% when the GL was in-creased from 10 mm to 40 mm.
Acknowledgments
The authors thank the management of Dr. Sivanthi AditanarCollege of Engineering, Tiruchendur 628 215, Tamil Nadu, India,for providing necessary assistance to carry out this research.
References
[1] Manikandan V, Velmurugan R, Ponnambalam SG, Sabu Thomas. Mechanicalproperties of short and unidirectional aligned Palmyra fiber reinforcedpolyester composite. Int J Plast Technol 2004;8:205–16.
[2] Luyt AS, Malubja ME. Composites of low density polyethylene and short Sisalfibres: the effect of wax addition and peroxide treatment. Thermochim Acta2005;426:101–7.
[3] Poothan Laley A, Sabu Thomas. Polarity parameters and dynamic mechanicalbehavior of chemically modified banana fiber polyester composites. ComposSci Technol 2003;63:1231–40.
[4] Sreekala MS, Thomas Sabu, Neelakandan NR. Utilization of short oil palmempty fruit bunch as reinforcement in phenol formaldehyde resin. J Polym Eng1996;16(4):265–93.
[5] Herera-Franco PJ, Valadez-Gonzalez A. Mechanical properties of continuousnatural fibre reinforced polymer composites. Compos Part A 2004;35:339–45.
[6] Pratheep Kumar Annamalai, Pal Singh Raj, Sarwdie Bhimroa D. Durability ofComposites prepared from ethylene–propylene copolymer and jute fiber underaccelerated aging and biotic environment. Master Chem Phys 2005;92:458–69.
[7] Aziz Shaeifah H, Ansel Martin P. The effect of alkalization and fiber alignmenton the mechanical and thermal properties of Kenaf and hemp bast fibercomposites. Compos Sci Technol 2004;64:1219–30.
[8] Export Ana, Vilyallana Fransisco, Karison Sigbritt. Comparision of waterabsorption in natural cellulostic fibers from wood and one year crops inpolypropylene composites and its influence on their mechanical properties.Compos Part A 2004;35:1267–76.
[9] Bledzki AK, Gassan J. Composites reinforced with cellulose based fibers. ProgrPolym Sci 1999;24:221–74.
[10] Beakou A, Ntenga R, Leptit J, Ateba JA, Aina LO. Physico-chemical andmicrostructural characterization of Rhectophyllum camerunense plant fiber.Compos Part A 2008;39:67–74.
[11] http://en.wikipedia.org/wiki/Sansevieria_cylindrica.[12] Hill Albert F. Economic botany: a text book of useful plants and plant
products. New York: Mc Graw Hill Book Co.; 1952. p. 38–9.[13] Sass JE. Elements of botanical microtechnique. New York: Mc Graw Hill Book
Co.; 1940. p. 222.[14] O’Brien TP, Feder N, Mc Cull ME. Polychromatic staining of plant cell walls by
toluidine blue-O. Protoplasma 1964;59:364–73.[15] Pearl IA, editor. The chemistry of lignin. New York: Marcell Dekker; 1967. p.
339.[16] Kurschner K, Hoffer A, et al. Cellulose and cellulose derivate. Fresenius’ J Anal
Chem 1933;92(3):145–54.[17] Conrad CM. Determination of wax in cotton fiber. A new alcohol extraction
method. Ind Eng Chem Anal 1944;16:745–8.[18] Chawla N, Kerr M, Chawla KK. Monotonic and cyclic fatigue behavior of high
performance ceramic fibers. J Am Ceram Soc 2005;88:101–8.[19] Murherjee PS, Satyanarayana KG. Structure properties of some vegetable
fibers, part 1. Sisal fibre. J Mater Sci 1984;19:3925–34.[20] Nutman FJ. Agave fibers Pt. I. Morphology, histology, length and fineness:
frading problems. Empire J Exp Agr 1936;5(75):75–95.[21] Joseph Seena, Sreekala MS, Oommen Z, Keshy P, Thomas Sabu. A comparison of
the mechanical properties of phenol formaldehyde composites reinforced withbanana fibers and glass fibers. Compos Sci Technol 2002;62:1857–68.
[22] Geethamma VG, Thomas Mathew K, Lakshminarayanan R, Thomas Sabu.Composite of short coir fibres and natural rubber: effect of chemicalmodification, loading and orientation of fiber. Polymer 1998;39:1483–91.
[23] Mohanty AK, Misra M, Hinrichsen G. Biofibers, biodegradable polymers andbiocomposites: an overview. Macromol Mater Eng 2000;276–277:1–24.
Table 3Summary of the tensile tests (displacement rate of 0.1 mm/min; the strain rate ranged from 0.15 s�1 to 0.16 s�1).
Gauge length (mm) Tensile strength (MPa) Young’s modulus (GPa) Young’s modulus corrected for compliance (GPa) Strain to failure (%) Area (mm2)
10 630.64 ± 46 5.09 ± 3.7 5.71 ± 5.5 12.34 ± 1.4 0.028 ± 0.00320 656.83 ± 55 5.81 ± 2.8 6.52 ± 4.8 11.21 ± 0.9 0.023 ± 0.00530 666.28 ± 42 6.22 ± 2.4 6.98 ± 4.2 10.54 ± 1.2 0.024 ± 0.00340 673.12 ± 51 6.72 ± 1.9 7.54 ± 3.7 10.04 ± 1.5 0.023 ± 0.006
Fig. 14. Stress–strain behaviour of SCF tested at 20 mm GL showing the ‘‘as-measured” data and the data corrected for compliance.
460 V.S. Sreenivasan et al. / Materials and Design 32 (2011) 453–461

Author's personal copy
[24] Baley C. Analysis of the flax fibers tensile behavior and analysis of the tensilestiffness increase. Compos Part A 2002;33:939–48.
[25] D’Almeida JRM, Aquino RCMP, Monteiro SN. Tensile mechanical properties,morphological aspects and chemical characterization of piassava (Attalafunifera) fibers. Compos Part A 2006;37(9):1473–9.
[26] Helbert W, Sugiyma J, Ishihara M, Yamanaka S. Characterization of nativecrystalline cellulose in the cell walls of Oomycota. J Biotechnol 1997;57(1–3):29–37.
[27] Akerholm M, Hinterstoisser B, Salmen L. Characterization of the crystallinestructures of cellulose using static and dynamic FTIR spectroscopy. CarbohydrRes 2004;339(3):569–78.
[28] Sugiyama J, Person J, Chanzy H. Combined infrared and electron diffractionstudy of the polymorphism of celluloses. Macromolecules 1991;24(9):2461–6.
[29] Reddy N, Yang Y. Structure and properties of high quality natural cellulosefibers from cornstalks. Polymer 2005;46(15):5494–500.
[30] Mwaikambo LY, Ansell MP. Chemical modification of hemp, sisal, jute, andkapok fibers by alkalisation. J Appl Polym Sci 2002;84(12):2222–3.
[31] Elenga RG, Dirras GF, Goma Maniongui J, Djemia P, Biget MP. On themicrostructure and physical properties of untreated raffia textilis fiber.Compos Part A 2009;40:418–22.
[32] Subramanian K, Kumar PS, Jeyapal P, Venkatesh N. Characterization oflignocellulosic seed fiber from Wrightia tinctoria plant for textileapplications an exploratory investigation. Eur Polymer J 2005;41(4):853–61.
[33] Hindeleh AM, Johnson DJ. An empirical estimation of Scherrer parameters forthe estimation of the crystallite size in fibrous polymers. Polymer1980;21(8):929–35.
[34] Ishikawa A, Okano T, Sugiyama J. Fine structure and tensile properties oframies in the crystalline form of cellulose I, II, III and IV. Polymer1997;38(2):463–8.
[35] Oh SY, Yoo DI, Shin Y, Kim HC, Kim HY, Chung YS, et al. Crystalline structureanalysis of cellulose treated with sodium hydroxide and carbon dioxide bymeans of X-ray diffraction and FTIR spectroscopy. Carbohydr Res2005;340(15):2376–91.
[36] Zhbankov RG, Firsov SP, Buslov DK, Nikonenko NA, Marchewka MK, RatajczakH. Structural physico-chemistry of cellulose macromolecules. Vibrationalspectra and structures of cellulose. J Mol Struct 2002;614(13):117–25.
[37] Biagiotti J et al. A systematic investigation on the influence of the chemicaltreatment of natural fibers on the properties of their polymer matrixcomposites. Polym Compos 2004;25(5):470–9.
[38] Liu W, Mohanty AK, Drzal LT, Askel P, Misra M. Effects of alkali treatment onthe structure, morphology and thermal properties of native grass fibers asreinforcements for polymer matrix composites. J Mater Sci 2004;39:1051–4.
[39] Khan MA, Drzal LT. Characterization of 2-hydroxyethyl methacrylate (HEMA)-treated jute surface cured by UV radiation. J Adhes Sci Technol2004;18(3):381–93.
V.S. Sreenivasan et al. / Materials and Design 32 (2011) 453–461 461
Copyright © 2022 FDOKUMEN


![Descriptors for Sponge Gourd [Luffa cylindrica (L.) Roem.]](https://static.fdokumen.com/doc/165x107/63187e763394f2252e02b92e/descriptors-for-sponge-gourd-luffa-cylindrica-l-roem.jpg)