AUTHOR'S GUIDELINES - GEOMATE Journal
14
36 THE EFFECT OF TREE CANOPY STRUCTURE ON SPATIAL RAINFALL REDISTRIBUTION DURING POST-ERUPTION RECOVERY OF MOUNT MERAPI, JAVA ISLAND Ahmad Reza Kasury 1 , *Rachmad Jayadi 1 and Joko Sujono 1 1 Department of Civil and Environmental Engineering, Faculty of Engineering, Universitas Gadjah Mada Yogyakarta, Indonesia *Corresponding Author, Received: 02 Sept. 2021, Revised: 04 Oct. 2021, Accepted: 17 Oct. 2021 ABSTRACT: The tree canopy around Merapi Volcano, Yogyakarta, Indonesia, has a unique structure. The frequency of volcanic eruptions influences the uniqueness of the structure, as it is a response to volcanic ash and rainfall characteristics. This research was conducted on eight species that have different canopy structures. In contrast to the trees canopy that was not affected by eruptions, the tree canopy around the Volcano has more dynamic canopy surface characteristics during the recovery period. The redistribution of rainfall in the tree canopy was traced by calculating unit area discharge and droplets' probability in each canopy structure segment. The results of empirical throughfall calculation and throughfall direct observation were tested using ANOVA. Most of the throughfall occurs simultaneously under the canopy during rain with a depth of 3.5 - 72.5 mm or intensity of 10 - 20 mm/hour (observed = 58% and empirical = 57%). The existing range of rainfall intensity or rainfall depth shows that the process of redistribution of rainfall in the canopy has time constraints and canopy storage capacity constrain. The canopy surface characteristics have a more significant effect than the canopy structure on the redistribution of rainfall. The canopy surface serves as a sheet of rainfall concentration to the next section. The important canopy surface structure parameters to rainfall concentration are leaves characteristics, branches stiffness, and crown density. Knowledge of the tree canopy's rainfall flow distribution process will help manage conservation-based rehabilitation activities in areas prone to volcanic disasters. Keywords: Rainfall redistribution, Canopy parameter, Empirical method, Throughfall distribution 1. INTRODUCTION Land cover recovery is strongly influenced by the type of disturbance, the period and area affected, abiotic conditions that suppress other abiotic factors and interactions between biotic components on a spatial scale [1]. Succession after a volcanic eruption is an activity that integrates vegetation factors and abiotic components, such as soil and rainfall. The interaction between biotil and abiotic components significantly influences the post- eruption succession. Succession of volcanoes have shown that vegetation characteristics have a significant influence on land recovery [2]. Merapi Volcano is one of the most active volcanoes in Indonesia. Since 2000 Merapi Volcano has had an eruption frequency of 2 to 5 years. Between 2000 and 2019, Merapi Volcano experienced six significant eruptions [3]. During this period, Mount Merapi experienced six significant eruptions. The frequency and impact of the Merapi Volcano eruption substantially influence tree characteristics and the behavior of the people around the Volcano. Despite having a close eruption frequency, spatially and temporally, the trees around Merapi Volcano have a chance to recover. Land cover restoration has an impact on the micro-hydrology around Merapi Volcano Java. The tree canopy structure plays a vital role in the rainfall redistribution into throughfall (Tf) and stem flow (Sf). The density of the canopy affects the dimensions of Tf droplets, kinetic energy, and re- interception by the canopy below [4]. This study observed the dominant trees that represent the tree architecture around Merapi Volcano. In addition, these tree species are commonly found in areas around the other active volcanoes of Java Island. Knowledge of the rain redistribution process by the canopy will provide insight into community tree management. The canopy of woody trees was a dynamic multi-segment structure. Each canopy layer had a different response to the rainfall redistribution. The concentration of raindrops on the leaf surface was determined mainly by leaf roughness, surface free energy, and work-of-adhesion [5]. The canopy layer will hold the concentration of raindrops on the leaf surface, dripping by gravity or flowing to the next canopy segment. 2. RESEARCH SIGNIFICANCE Global climate change has been observed through terrestrial change. The terrestrial component, considered one of the crucial components in climate modeling, is the tree canopy. International Journal of GEOMATE, Nov., 2021, Vol.21, Issue 87, pp.36-49 ISSN: 2186-2982 (P), 2186-2990 (O), Japan, DOI: https://doi.org/10.21660/2021.87.j2309 Geotechnique, Construction Materials and Environment
-
Upload
khangminh22 -
Category
Documents
-
view
1 -
download
0
Transcript of AUTHOR'S GUIDELINES - GEOMATE Journal

36
THE EFFECT OF TREE CANOPY STRUCTURE ON SPATIAL
RAINFALL REDISTRIBUTION DURING POST-ERUPTION
RECOVERY OF MOUNT MERAPI, JAVA ISLAND
Ahmad Reza Kasury1, *Rachmad Jayadi1 and Joko Sujono1
1Department of Civil and Environmental Engineering, Faculty of Engineering, Universitas Gadjah Mada
Yogyakarta, Indonesia
*Corresponding Author, Received: 02 Sept. 2021, Revised: 04 Oct. 2021, Accepted: 17 Oct. 2021
ABSTRACT: The tree canopy around Merapi Volcano, Yogyakarta, Indonesia, has a unique structure. The
frequency of volcanic eruptions influences the uniqueness of the structure, as it is a response to volcanic ash
and rainfall characteristics. This research was conducted on eight species that have different canopy structures.
In contrast to the trees canopy that was not affected by eruptions, the tree canopy around the Volcano has more
dynamic canopy surface characteristics during the recovery period. The redistribution of rainfall in the tree
canopy was traced by calculating unit area discharge and droplets' probability in each canopy structure
segment. The results of empirical throughfall calculation and throughfall direct observation were tested using
ANOVA. Most of the throughfall occurs simultaneously under the canopy during rain with a depth of 3.5 -
72.5 mm or intensity of 10 - 20 mm/hour (observed = 58% and empirical = 57%). The existing range of rainfall
intensity or rainfall depth shows that the process of redistribution of rainfall in the canopy has time constraints
and canopy storage capacity constrain. The canopy surface characteristics have a more significant effect than
the canopy structure on the redistribution of rainfall. The canopy surface serves as a sheet of rainfall
concentration to the next section. The important canopy surface structure parameters to rainfall concentration
are leaves characteristics, branches stiffness, and crown density. Knowledge of the tree canopy's rainfall flow
distribution process will help manage conservation-based rehabilitation activities in areas prone to volcanic
disasters.
Keywords: Rainfall redistribution, Canopy parameter, Empirical method, Throughfall distribution
1. INTRODUCTION
Land cover recovery is strongly influenced by
the type of disturbance, the period and area affected,
abiotic conditions that suppress other abiotic factors
and interactions between biotic components on a
spatial scale [1]. Succession after a volcanic
eruption is an activity that integrates vegetation
factors and abiotic components, such as soil and
rainfall. The interaction between biotil and abiotic
components significantly influences the post-
eruption succession. Succession of volcanoes have
shown that vegetation characteristics have a
significant influence on land recovery [2].
Merapi Volcano is one of the most active
volcanoes in Indonesia. Since 2000 Merapi Volcano
has had an eruption frequency of 2 to 5 years.
Between 2000 and 2019, Merapi Volcano
experienced six significant eruptions [3]. During
this period, Mount Merapi experienced six
significant eruptions. The frequency and impact of
the Merapi Volcano eruption substantially influence
tree characteristics and the behavior of the people
around the Volcano. Despite having a close
eruption frequency, spatially and temporally, the
trees around Merapi Volcano have a chance to
recover. Land cover restoration has an impact on the
micro-hydrology around Merapi Volcano Java.
The tree canopy structure plays a vital role in the
rainfall redistribution into throughfall (Tf) and stem
flow (Sf). The density of the canopy affects the
dimensions of Tf droplets, kinetic energy, and re-
interception by the canopy below [4].
This study observed the dominant trees that
represent the tree architecture around Merapi
Volcano. In addition, these tree species are
commonly found in areas around the other active
volcanoes of Java Island. Knowledge of the rain
redistribution process by the canopy will provide
insight into community tree management.
The canopy of woody trees was a dynamic
multi-segment structure. Each canopy layer had a
different response to the rainfall redistribution. The
concentration of raindrops on the leaf surface was
determined mainly by leaf roughness, surface free
energy, and work-of-adhesion [5]. The canopy layer
will hold the concentration of raindrops on the leaf
surface, dripping by gravity or flowing to the next
canopy segment.
2. RESEARCH SIGNIFICANCE
Global climate change has been observed
through terrestrial change. The terrestrial
component, considered one of the crucial
components in climate modeling, is the tree canopy.
International Journal of GEOMATE, Nov., 2021, Vol.21, Issue 87, pp.36-49 ISSN: 2186-2982 (P), 2186-2990 (O), Japan, DOI: https://doi.org/10.21660/2021.87.j2309
Geotechnique, Construction Materials and Environment

International Journal of GEOMATE, Nov., 2021, Vol.21, Issue 87, pp.36-49
37
The ability of tree canopies to hold and redistribute
rainfall significantly affects the formation of
surface runoff and flow concentration in the
watershed [6].
Land used that was converted to agroforestry is
potential for water management [6]. In secondary
forest and growing forest (succession forest),
variation of canopy partition is caused by dynamic
natural process. The partition in these forests tends
to get smaller, and the forest canopy is closer to a
certain extent [7].
The study of rainfall redistribution by single
trees is getting more detailed attention from
researchers [8], which is in line with the need to
understand partial and micro hydrological cycles.
Previous studies have shown the effect of canopy
structure on the rainfall redistribution process [4]
but did not give detailed rainfall redistribution flow
in the canopy structure. This study investigated the
interaction between tree canopy structure
parameters and rainfall characteristics. The results
of this study provide an overview of tree canopy
management.
3. THEORY
3.1 Canopy Surface Flow
The canopy surface of a tropical tree has a
dynamic structure with a curved shape [9]. Water
flows on the canopy surface are significantly
influenced by the characteristics and structure of the
canopy. The mass water transfer of each element in
the same or different layer is influenced by the
interactions between the leaf blades [10]. The water
on the canopy surface flows along the canopy
surface or is dropped within the canopy gaps. The
water that flows through the canopy gap fills the
canopy storage (S) [9]. Water flow on the canopy
surface flows once the canopy changes its form [11].
Equation (1) describes the flow continuity of the
canopy surface.
( ) ( )2
,
0
. .prob down i cszQcs A T q d
=
(1)
where Qcsdown = discharge at the canopy surface in
mm3/s; T(θ, z) = gap or porosity in the canopy [12];
Āi = average area of leaf blade in mm2; qcs = width
unit of canopy surface discharge in mm/s; and θ =
vertical leaf angle in degree [13].
Canopy characteristics influence the
distribution of raindrops above the leaf to twigs and
branches [14]. In the early stages of flow
distribution above the leaf, rainfall is assumed to be
evenly distributed over the leaf [15]. Rainfall flow
distribution on the canopy surface has been formed
on the leaves with 90ᵒ deformation. Leaf
deformation occurs after the Cmin exceeds the limit.
In simple leaves, the leaves angle affects the gaps in
the canopy [16], and Cmin slowly exceeds the limit
[17].
The canopy gap (T0(θ, z)) is strongly influenced
by leaf density and leaf angle [16]. Gap or canopy
porosity describes the characteristics of the canopy
cover of each tree segment. As soon as the
minimum canopy surface holding capacity (Cmin)
has exceeded the limit, water flowed immediately.
In this condition, the water depth above the leaf
surface is assumed to be the same as the critical
depth (yc). The yc can be written as Eq. (2) as
follows [18]:
2
3cs
c
qy
g=
(2)
where yc = critical depth or water depth above the
leaf surface just before it flows through the surface,
in mm; and g = acceleration due to gravity (mm/s2);
Canopy surface critical depth occurs during the
initial phase of filling the canopy storage. Once the
critical depth at the surface of the canopy has
exceeded the limit, water flows to the next segment
(qcs). The value of qcs is based on the kinematic
viscosity of the leaves just before the water flows,
as shown in Eq. (3), and the flow velocity is
presented in Eq. (4) [18]. The flow distribution is
formed under the canopy, influenced by gravity and
interactions between canopy segments [4]. The
discharge below the canopy surface (Qcsdown) is
estimated with [18]:
( )3 3
mincos ( ) cos3 3
cs i
k k
g gq y I C
v v = = − (3)
2
min( ) cos3
cs
k
gv I C
v= −
(4)
( ) ( )0 ,. . .cs
cs l lZ Z
cs
qy a y
v
=
(5)
( ),. . . .down l cs cs z
Qcs f q v T CPA
=
(6)
where vk = kinematic viscosity of water in mm2/s; yi
= depth of water above the leaf surface at time i in
mm; I = rainfall intensity in mm/min; �̅�𝑐𝑠= average
velocity of water over the canopy surface in
mm/min; fl = coefficient of leaf configuration on
twigs for 0<fl<1; 0(θ,Z) = ratio of leaf shade to
previous leaf segment; al(Z) = leaf density per area
observed; T(θ,Z) = canopy gap; Δyl = distance
between leaves in average (mm) and CPA = Crown
Projection Area.
Qcsdown in Eq. (6) is assumed to be
simultaneously below the canopy surface. The
distribution of Qcsdown was different for each tree,
even in the same species. The difference in Qcsdown

International Journal of GEOMATE, Nov., 2021, Vol.21, Issue 87, pp.36-49
38
occurs due to different dimensions of the branches
and twigs, distribution, and angles of the branches
and twigs, phyllotaxis, and angular leaf distribution
to the branches. Plant Area Index (PAI) has a more
significant effect on Leaf Area Index (LAI) [7]. LAI
can be described as density and leaf density based
on light interpretation [19].
3.2 Flow-Through to Canopy Storage
Water flows to the canopy surface through the
funnel to fill the canopy storage (S) [20]. In the
woody tropical pine trees, filling the canopy storage
starts by Qcdown flows from twigs to branches [21].
The change in canopy storage volume (Vs)
according to the time can be written as follows:
( ).S
t down t s cs
dVf Qc Vs Vs Ve
dt= − − −
(7)
where Vs = canopy storage volume in mm3; ft =
branch flow coefficient for 0<ft<1; Vecs = water
evaporation volume on the crown surface in mm3;
Vst = the volume of water content on the surface of
the twigs in mm3; and Vss = the volume of water
content on the branches surface in mm3.
In the interception tank model [22], Tf occurs
after the minimum canopy storage exceeds the limit,
even though it is not saturated (Smin <S <Smax) [17].
In this phase, Tf has not occurred in all CPAs [23].
Tf occurs under the entire canopy after the saturated
canopy [20]. The water flow occurs in 2 phases, i.e.,
dripped and flowed [4]. The flow that occurs in the
branches only happens after Vst and Vss in Eq. (7)
are saturated.
Water flows through a twig after the water flow
has a more significant force than the friction force
(Ft-rigid). If the twig capacity to recharge water flows
to branches is assumed as Cmin [11], then the friction
force in the twig surface of the unit width (Ft-rigid) is
calculated using Eq. (8).
min. . . . .t rigid t t t wF y A C g − = = (8)
The water that flows to the twig on width unit
(mt) towards the branch for a particular duration of
time can be written as follows:
. .cos . .t cs t wm q t = (9)
The force that occurs on the twig due to the
canopy surface flow to the branch for a particular
time duration (Fti) is calculated with Eq. (10). On
the twig, the force has changed due to velocity
changes [5]. The velocity in the wide twig is
presented in Eq. (11). If the value of Ft-rigid≥Fti, the
water will be detained in the twig and became part
of Smin [17].
( ). . .sin . . . cs
ti t t cs t w
vF m a q A t
t
= =
(10)
sint csv v = (11)
The force that rapidly changes in the channel
downstream can be described as the relationship
between the large unit of discharge and the
difference in water depth at upstream and
downstream [18]. For water that flows through the
twigs, the water depth at the upstream is assumed as
the Smin, and the downstream depth is ycs [4]. The
water depth in the twigs (yt) is written in Eq. (12)
[5]. Thus, the flow at the meeting point between
twig and branch for each unit area (qts) in a
particular time is calculated with Eq. (13).
min min( ) cost csy y S S= − + (12)
. .ts ts t tq y v= (13)
The flow force on the branch's surface is
assumed to be evenly distributed [10]. The increase
in angle β also increases the probability of water
dripping off the branch [24]. The flow force on the
branch happens at the point closest to the branch
after the branch was saturated with water as shown
in Eq. (14).
( )( )1 . .sin . .ti ti ts ts t w tF F q A v + = +
(14)
where Fti = flows force that occurs on the surface of
the branch in mm3; mt = water mass on the twig in
gr; φts = ratio of the distance between the closest
leaves on the twig to the twig length for 0<φts<1;
tA = area of twig surface per segment in mm2; yt =
flow depth on the branch surface in mm; tv =
average flow velocity above the twig in mm/s.
3.3 Throughfall Distribution Below Canopy
Rainfall redistribution to a throughfall starts
after the saturated canopy surface [25]. The flow
from the twigs to the branches (qts) is partly dripped
as a Tft-drip [17]. The depth of Tft-drip at CPA can be
estimated by Eq. (15).
. . . .cos . .
.
ts ti ts t
t drip
t
F q t L CPATf
n
−
= (15)
The canopy structure gives influence to the qts.
The qts flows in the branch once the flow force is
greater than the flow resistance force in the branch
(Fs> Fs-rigid) [18]. If Fs≤Fs-rigid, there is no water flow
along the branch, and water fills the branch segment
near the branch point. The water depth in the

International Journal of GEOMATE, Nov., 2021, Vol.21, Issue 87, pp.36-49
39
downstream area is influenced by upstream
discharge and the channel friction coefficient [5].
The water depth at the saturated branch can be
assumed as the ratio between dry weight (sdry) and
wet weight of the branch (swet) [23]. Thus, the Fs-rigid
of the width can be calculated by Eq. (16).
. . .dry
s rigid s w
wet
sF A g
s− =
(16)
The flow of water from branches to stem starts
at an angle formed between the stem and the branch,
i.e., between 0ᵒ-90ᵒ (0-π/2). Once the flow occurred
on the branch's junction, the water depth on the
branch's surface (ys) is estimated by Eq. (17).
3
5.
sin
ts s rigid
s
q Fy
− =
(17)
Branches storage (vs) is the branch surface that
effectively holds water [26]. Water has not been
evenly retained over the branch surface [27]. On
the canopy with an angular distribution between 2ᵒ-
60ᵒ from the horizontal axis, the distribution on the
branch flows to the underside of the branch [24].
The branches storage volume calculation can be
written as Eq. (18).
𝑣𝑠 = 𝑣𝑡 𝑐𝑜𝑠 𝛼 (18)
The discharge per unit area on the branch is as
follows.
.s s sq y v=
(19)
The diameter and roughness of the branches
have a significant effect on the depth of direct water
droplets (Tfdrip) [14], or the flow on the branches, or
drop from the limb (canstem-drip) [17]. There is no
splash of throughfall in rainfall with intensity (I)
less than 100 mm/hour [28].
The flow that occurs at the joint area of the twigs
and branch (qts) is assumed to flow through the
branch due to gravity [20]. Water flows and fills up
the branches and canopy capacity (Vs). The process
of water drip or flow on the branches is different
from the processes that occur on the surface of the
canopy and branches. To calculate Vs is presented
in Eq. (20).
.s ss
s rigid
q AV
F −
=
(20)
Water flows from twig to branches starts to drip
at the twig growth point. The depth of Tfs-drip is
influenced by the volume of water flow to the
branch and the number of twig points on the branch
[7]. Assuming that the growing point of the branch
is saturated, Tfs-drip depth can be written in Eq. (21).
. .cos .
.
s
s drip
s s
q t CPATf
n V
−
= (21)
Water from the twig to the branch is not
completely dripped as Tfs-drip. Some of the water
flows along the branches due to gravity. Water
flows to filled branches storage or became a
stemflow or drips onto the ground. Water drips from
the branch to the ground (canstem-drip) can be
calculated by Eq. (22).
3
5.. . .
. cos
s s s
stem drip
t
q t L Vcan
n −
=
(22)
Tf's depth is the throughfall cumulative value
from twigs and branches, as shown in Eq. (23).
t drip s drip stem dripTf Tf Tf can− − −= + + (23)
where Tfs-drip = depth of Tf from the branch at CPA
in mm; canstem-drip = drip from the lowest crown
layer to the soil surface in mm; Tft-drip = depth of Tf
from branches at CPA in mm; α = angle of the
branch to the horizontal axis in degrees; Vs =
volume of the branch storage width in mm3; φts =
flow coefficient due to twig flexibility with 0< φts
≤10); nt = number of branch points; ns = number of
canopy column branches; As = surface area of the
branch in mm2; yc-s = depth of water in the branch
before it flows on the branch surface in mm; φvs =
stem funneling ratio for 0 <φvs <1; Vs = depth of
water retained in the branch for a specified time in
mm; 𝐿�̅� = average length of the branch in mm; 𝐿�̅� =
average length of twigs in mm; qs = flow rate in the
branch width in mm; sdry = weight of the branch in
dry conditions in gr; swet = weight of the branch in
wet conditions in gr; Σnt = the number of branches
that grows along the tree branch.
4. METHODOLOGY
Meteorological factors and canopy
characteristics significantly affect rainfall
redistribution by the trees [29]. Canopy
characteristics that affect the process of rainfall
redistribution, i.e., crown density [20], canopy
structure [24], composition or cropping patterns,
and tree adaptation to the seasons [11]. Klamerus-
Iwan [27] stated that it is more challenging to have
a standard of canopy factor in Tf redistribution on
all trees, both the same or different species. The
thickness of the canopy [4], the slope of the

International Journal of GEOMATE, Nov., 2021, Vol.21, Issue 87, pp.36-49
40
branches and twigs, the composition of the crown
[20], the morphology of the trunk, the angle of the
leaves, the turgidity of the leaves [9], the size and
shape of the leaves, and the nature of the
hydrophobicity of the leaves are biotic parameters
that affect Tf [28].
4.1 Research Location
The research was conducted in the Petung
village, Kalurahan (sub-district) Cangkringan,
located on the south side of Merapi Volcano. The
location was categorized as a severe and moderate
level of damage due to the eruption of Merapi in
2010. This location is chosen because it is relatively
protected from extreme climatological changes [30].
The research location is relatively protected from
strong winds. Calder [31] states that wind gusts
significantly affect the throughfall (Tf) droplet
characteristics. Wind gusts affect the interaction
between canopy segments [11]. The interaction
between canopy segments affected water flows into
the canopy storage or between canopy segments.
Petung village was chosen to minimize the
probability of bias data due to extreme rainfall.
Research location point relative to the level of
vegetation damage is shown in Fig. 1 modified from
the corresponding map [32].
Fig.1 Research location
The level of vegetation damage in Fig. 1
identified based trees condition at 2010 eruption. In
heavy damage, all tree canopies was wither and fall
off (leaves and branches). At moderate damage,
only compound leaves trees was wither and fall off.
Broadleaves tree tend to wither but not fall. In light
damage, the entire tree canopy only withers.
Petung village is one of the settlements directly
affected by the Volcano eruption [32]. Before the
2010 Merapi eruption, Petung village was one of the
producers of Coffea canephora and cow's milk in
Yogyakarta [33]. After the 2010 eruption, all
Petung residents were relocated from the eruption
danger zone. Most of the population still used the
land in the previous area for horticultural
plantations and animal husbandry [31, 32]. In
addition, this area has developed into a tourist
location for disaster education.
Measurement of field data in the Petung village
settlement was carried out from December 2016 to
February 2019. Currently, the spot, which is the
research area, has turned into a secondary forest and
traditional farm with 12 species of woody trees and
four shrubs. The research area characterized by
sandy soil with hilly and relatively flat topography
[34].
4.2 Trees Selection
The tree canopy is a dynamic structure with very
heterogeneous characteristics. Heterogeneity in the
tree canopy occurs in the same species or between
species. In this study, the selected species represent
the characteristics of vegetation canopy around
volcanoes on Java Island [32]. The tree canopy
characteristics that were used as the sample are
presented in Table 1.
Table 1. Characteristics of the tree canopy samples
Species
code Species name Phyllotaxis
Branch
orientation
1 Acaciad wild.
Australi Sparsa Patens
2 Artocarpus hete. Sparsa Patens
3 Pinus merk. Verticillata Patens 4 Ceiba pent. Randu Sparsa Horizontalis
5 Alstonia sch. Verticillata Horizontalis
6 Coffea can.
Robusta Opposita Declinatus
7 Leucaena leu. Sparsa Patens
8 Tectona gran. Sparsa Patens
In general, the tree canopy around Merapi
Volcano has four forms of canopy with three leaf
shapes. On the slopes of Merapi, the type of canopy
is parabolic, elliptic, cone, and spheroid.
Meanwhile, the composition of leaves is dominated
by compound leaves, needle leaves, and simple
leaves. Most of the woody trees' branch's
characteristics are patens and horizontalize. The
observation on crown characteristics in this study
includes the diameter (ϕ), leaf angle (θ), twigs angle
(β), and the angle between the branch and tree (α).
The characteristics of the trees that became the
observation parameters are described in Fig. 2 and
Table 2.
Deformation of the tree canopy is caused by
wind gusts, snows, and rainfall energy [35]. In the
sparse tree, canopy characteristics have a very
significant effect on rainfall redistribution [15].
Holder [24] states that rainfall-water flow from the
surface to the canopy is influenced by leaf angle and
leaf hydrophobicity.
International Journal of GEOMATE, Nov., 2021, Vol.21, Issue 87, pp.36-49
41
Fig.2 Measured parameters sketch
Table 2 Diameter and angular distribution of twigs
and branches
Species
Code
ϕ (mm) α° β° θ°
Twig Branch
1 3.7 14.0 74.5 30.0 35.0
2 5.0 43.5 38.0 72.0 37.0
3 5.2 22.0 41.5 36.5 57.0
4 3.9 48.5 43.5 56.0 74.0
5 5.0 32.5 45.5 38.0 32.5
6 3.4 13.5 55.5 87.0 74.0
7 3.6 13.5 73.0 25.0 69.0
8 3.8 49.0 57.5 43.0 47.5
The canopy density was estimated using LAI
and was measured by the hemispherical method
(Table 3). The photo was taken using a DX
NIKKOR 10.5mm f / 2.8G AF lens with the Gap
Light Analyzer ver2.0 [19].
Table 3 LAI, twigs, and branches lengths
Species
Code LAI
L (mm)
Twig Branch
1 2.5 105 328
2 3.8 54 1425
3 2.5 130 1661
4 2.3 172 1480
5 3.0 75 633
6 3.2 63 1074
7 2.3 75 363
8 3.0 74 1765
4.3 Canopy Surface Storage Capacity
The estimation of canopy surface capacity (C)
was calculated using saturated leaf weight [36]. In
this study, leaf weight was measured in two
conditions. The water-saturated leaf weight was
measured immediately after the water had dripped
through the leaf tips and was assumed to be the
maximum canopy surface storage (Cmax). After 30
minutes, the leaf weight was considered as
minimum canopy surface capacity (Cmin).
Leaf weight measurement was carried out
between 09:00 to 10:00 am. This period was chosen
to reduce the effect of dew on the leaves' weight
before spraying. The measurements were taken
below the canopy of the sample trees and protected
from direct sunlight. The wind speed ranged from
2-5 knots at the measurement time, and the air
temperature was around 21-26ᵒC.
Analytic digital scales were used to measure leaf
weights. There were 40 leaves taken from each tree
to be observed. C is considered to be evenly
distributed above the leaves. The depth of C was
calculated with Eq. (24).
-b k
d
W WC
A= (24)
where C = canopy surface storage capacity in mm;
Wb = leaf weight after spraying until saturated or
dripping in gr; and Wk = leaf weight before spraying
water in gr.
The canopy capacity can be assumed as the
water depth that is evenly distributed over the
surface. The measured value of Cmin, which is the
highest value for each tree, is assumed to be the
tree's critical depth (yc). Meanwhile, the highest
measured value of Cmax is considered as the
minimum canopy storage capacity (Smin).
4.4 Throughfall Distributed Collector
The rainfall data in this study are collected by
the volume and duration of rainfall and Tf. All data
obtained has been converted into rainfall intensity
data in mm/hour.
The throughfall at each point was measured
using a 3.2 liters PVC tube and inlet funnel with a
diameter of 26.4 cm. The funnel was placed
horizontally (angle 0 ° horizontal).
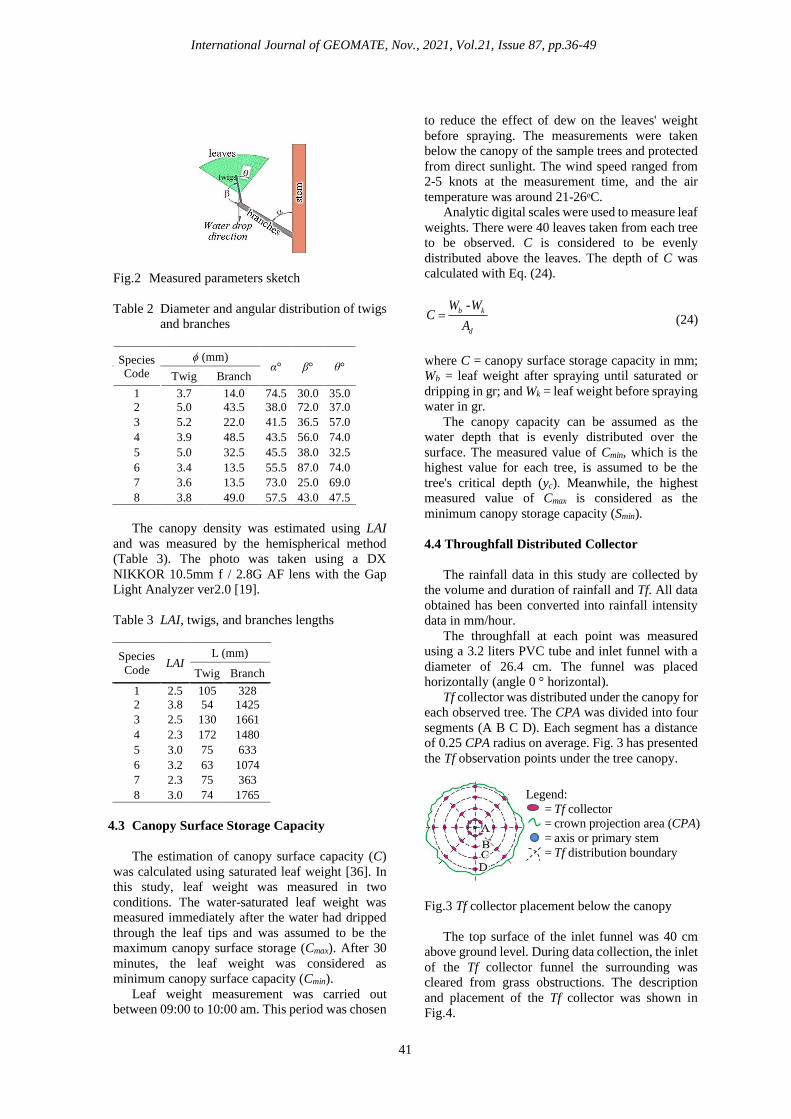
Tf collector was distributed under the canopy for
each observed tree. The CPA was divided into four
segments (A B C D). Each segment has a distance
of 0.25 CPA radius on average. Fig. 3 has presented
the Tf observation points under the tree canopy.
Fig.3 Tf collector placement below the canopy
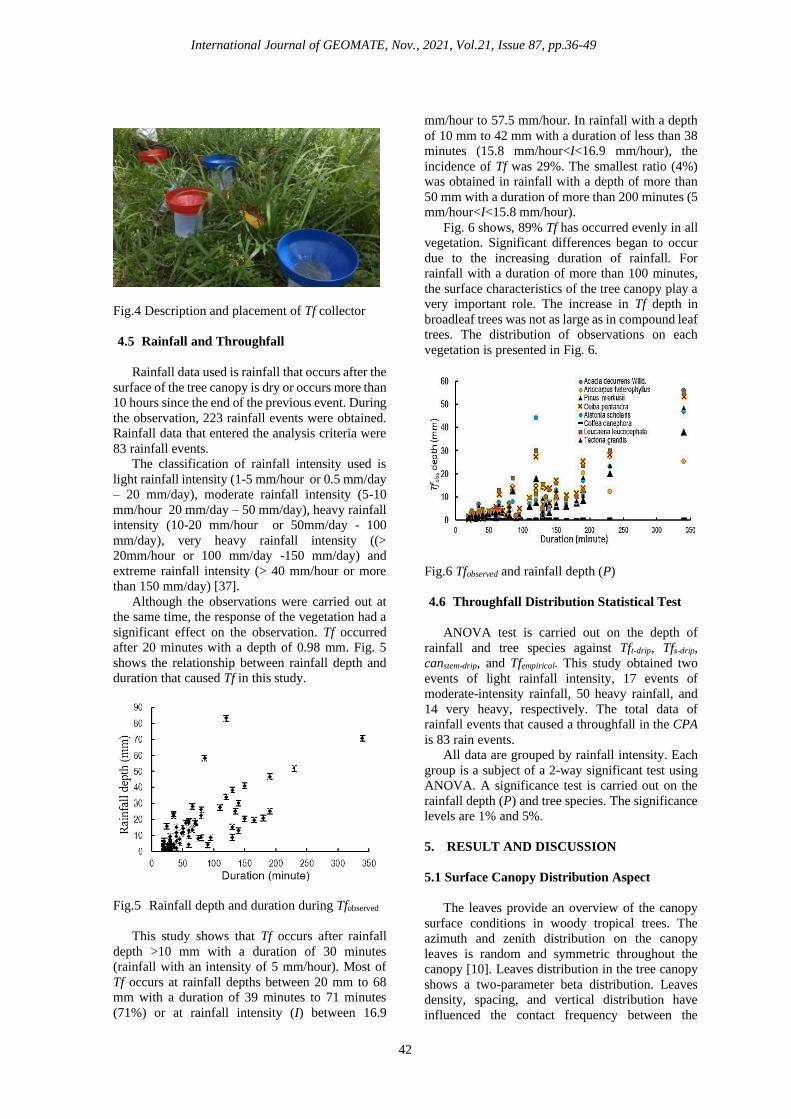
The top surface of the inlet funnel was 40 cm
above ground level. During data collection, the inlet
of the Tf collector funnel the surrounding was
cleared from grass obstructions. The description
and placement of the Tf collector was shown in
Fig.4.
Legend:
= Tf collector = crown projection area (CPA)
= axis or primary stem
= Tf distribution boundary
International Journal of GEOMATE, Nov., 2021, Vol.21, Issue 87, pp.36-49
42
Fig.4 Description and placement of Tf collector
4.5 Rainfall and Throughfall
Rainfall data used is rainfall that occurs after the
surface of the tree canopy is dry or occurs more than
10 hours since the end of the previous event. During
the observation, 223 rainfall events were obtained.
Rainfall data that entered the analysis criteria were
83 rainfall events.
The classification of rainfall intensity used is
light rainfall intensity (1-5 mm/hour or 0.5 mm/day
– 20 mm/day), moderate rainfall intensity (5-10
mm/hour 20 mm/day – 50 mm/day), heavy rainfall
intensity (10-20 mm/hour or 50mm/day - 100
mm/day), very heavy rainfall intensity ((>
20mm/hour or 100 mm/day -150 mm/day) and
extreme rainfall intensity (> 40 mm/hour or more
than 150 mm/day) [37].
Although the observations were carried out at
the same time, the response of the vegetation had a
significant effect on the observation. Tf occurred
after 20 minutes with a depth of 0.98 mm. Fig. 5
shows the relationship between rainfall depth and
duration that caused Tf in this study.
Fig.5 Rainfall depth and duration during Tfobserved
This study shows that Tf occurs after rainfall
depth >10 mm with a duration of 30 minutes
(rainfall with an intensity of 5 mm/hour). Most of
Tf occurs at rainfall depths between 20 mm to 68
mm with a duration of 39 minutes to 71 minutes
(71%) or at rainfall intensity (I) between 16.9
mm/hour to 57.5 mm/hour. In rainfall with a depth
of 10 mm to 42 mm with a duration of less than 38
minutes (15.8 mm/hour<I<16.9 mm/hour), the
incidence of Tf was 29%. The smallest ratio (4%)
was obtained in rainfall with a depth of more than
50 mm with a duration of more than 200 minutes (5
mm/hour<I<15.8 mm/hour).
Fig. 6 shows, 89% Tf has occurred evenly in all
vegetation. Significant differences began to occur
due to the increasing duration of rainfall. For
rainfall with a duration of more than 100 minutes,
the surface characteristics of the tree canopy play a
very important role. The increase in Tf depth in
broadleaf trees was not as large as in compound leaf
trees. The distribution of observations on each
vegetation is presented in Fig. 6.
Fig.6 Tfobserved and rainfall depth (P)
4.6 Throughfall Distribution Statistical Test
ANOVA test is carried out on the depth of
rainfall and tree species against Tft-drip, Tfs-drip,
canstem-drip, and Tfempirical. This study obtained two
events of light rainfall intensity, 17 events of
moderate-intensity rainfall, 50 heavy rainfall, and
14 very heavy, respectively. The total data of
rainfall events that caused a throughfall in the CPA
is 83 rain events.
All data are grouped by rainfall intensity. Each
group is a subject of a 2-way significant test using
ANOVA. A significance test is carried out on the
rainfall depth (P) and tree species. The significance
levels are 1% and 5%.
5. RESULT AND DISCUSSION
5.1 Surface Canopy Distribution Aspect
The leaves provide an overview of the canopy
surface conditions in woody tropical trees. The
azimuth and zenith distribution on the canopy
leaves is random and symmetric throughout the
canopy [10]. Leaves distribution in the tree canopy
shows a two-parameter beta distribution. Leaves
density, spacing, and vertical distribution have
influenced the contact frequency between the

International Journal of GEOMATE, Nov., 2021, Vol.21, Issue 87, pp.36-49
43
canopy surface and raindrops [36]. It can be
concluded that leaf characteristics play a significant
role in grain distribution and Tf volume. qcs depth
becomes a parameter to trace rainfall redistribution
in the tree canopy.
Visual observation on these eight different tree
species shows that the canopy surface of
broadleaves trees has a more significant effect on
rainfall redistribution than on needle trees [17,37].
Broadleaves trees, such as Artocarpus hete. and
Tectona gran. have the largest sheet concentration
area than Pinus merkusii. In addition, leaf
distribution and leaves angle against the branches
affect water distribution on the tree's canopy surface.
Eq. (3) shows that the depth of qcs in the Artocarpus
hete. is more extensive than Tectona gran The
results of the calculation of qcs for each species have
been presented in Fig.7.
Fig.7 qcs (mm/sec) vs I (mm/sec)
Apart from the canopy surface structure, the
increasing depth of qcs is also influenced by the
rainfall intensity. The calculation result shows that
the increase of qcs value against I has a polynomial
distribution trend.
This study shows that qcs in the Acacia d wild. is
similar to qcs in Leucaena leu. Canopy surface
characteristic and leaf distribution on the Acacia d
wild. and Leucaena leu. is almost similar. The
increase in qcs for each species is various at I>0.35
mm/min. The difference in the cumulative increase
of qcs is more significant after I>0.45 mm/minute.
This study shows that the leaf angle distribution
and the interaction between segments on the canopy
surface give a more significant effect than the shape
and leaf area ratio. Flow distribution to the branches
formed on Pinus merkusii is considered to be better
than that in the Acacia d wild. and Leucaena leu.
The surface of Acacia d wild. and Leucaena leu. is
more responsive to rainfall than the canopy surface
of other species. This study found that the
interactions at the canopy have a more significant
effect on the canopy capacity than the leaf area
factors.
The canopy surface capacity affects the
throughfall process. The calculation results show
that flow distribution on the canopy surface is
strongly influenced by the response of the leaves on
the branches to the rainfall. In this study, the canopy
surface flow through to the branches is not always
become qt.
During water flow-through processed, the
branch characteristics and distance between leaf
and the branch base significantly affect. The result
of branch flow calculation with Eq. (13) is
presented in Fig.8.
Fig.8 qts (mm/sec) vs I (mm/sec)
The flow on the branches' surface is formed
because of the interaction between canopy
segments and the flow in the canopy surface. The
water flow process on the branches has a similar
character to the flow on the canopy surface.
Water flow duration and depth that occurs when
the canopy surface has been saturated, is
determined by the canopy structure [8]. The
dynamic structure of the canopy causes a complex
flow redistribution process. This research shows
that the flow from the canopy surface and raindrops
from the leaves gap have been fragmented.
5.2 Troughfall Distribution
The flow on the canopy surface is separated into
two zones, the leaf canopy surface zone and the
branches canopy surface zone. Visual observation
shows that the throughfall started at the twigs
canopy zone. qcs and canopy droplets are segmented
and distributed on the twigs.
The direction of qts is determined by the
characteristics of the species. The species with
horizontal/paten canopy structure (such as the
Acacia d wild. and Leucaena leu.), tends to have
water flows to the tips of the leaves. Meanwhile, in
trees with upward inclined twig structures
(Artocarpus hete), water flows down along the
surface of the twigs. Some of the water flows down
and directly drips down to the ground [27].
0.00
0.02
0.04
0.06
0.08
0.10
0.12
0.00 0.20 0.40 0.60 0.80
q cs
(mm
)
I (mm/mnt)
Acacia decurrens Willd.Artocarpus heterophyllusPinus merkusiiCeiba pentandraAlstonia scholarisCoffea canephoraLeucaena leucocephalaTectona grandis
0.00
0.05
0.10
0.15
0.20
0.25
0.30
0.35
0.00 0.10 0.20 0.30 0.40 0.50 0.60 0.70 0.80
qts
(mm
)
I (mm/mnt)
Acacia decurrens
Willd.
Artocarpus
heterophyllus
Pinus merkusii

International Journal of GEOMATE, Nov., 2021, Vol.21, Issue 87, pp.36-49
44
Equation (15) shows the influence of twigs, qcs,
and rainfall duration on Tft-drip. The ratio of water
that flows through the branch as qs to Tft-drip is
influenced by the number of twigs on the branch. In
this segment, the concentration of energy that forms
the flow in the branches is more influenced by the
depth of rainfall than the duration of rainfall. The
duration of water trough from the canopy surface
had no effect on the increase in flow energy from
twigs to branch. Fig. 9 presents the Tft-drip of each
vegetation.
Fig.9 Tft-drip (mm) vs P (mm)
The most profound Tft-drip depth was counted on
Leucaena leu. and the smallest was on Tectona gran.
Tft-drip on Tectona gran. increased due to rainfall. Tft-
drip on Tectona gran. and Tft-drip on Coffea can. has
an almost similar value for rainfall less than 50 mm.
For rainfall more than 50 mm, Tft-drip on Tectona
gran. has a similar Tft-drip with Leucaena leu.
This study shows that the density of the canopy
structure affects the Tft-drip depth. A similar result is
found from a previous study stating that the Tf depth
is affected by the canopy density [28]. ANOVA
analysis showed tree species had a significant effect
on Tft-drip at each test level (Table 4).
Table 4 ANOVA Tft-drip test
Source of
Variation MS F
Fcrit
(5%)
Fcrit
(1%)
Light P (mm) 1.39 1.12 5.32 11.26
Species 14.90 12.02 3.44 6.03
Moderate P (mm) 8.04 1.18 1.72 2.14
species 242.24 35.55 2.01 2.65
Heavy P (mm) 35.12 1.44 1.39 1.58
Species 1188.56 48.85 1.96 2.56
Very
heavy
P (mm) 52.58 6.11 1.83 2.33
Species 93.42 10.85 2.11 2.84
The calculation result shows that the from light
to moderate rainfall intensity has not affected the
twigs' throughfall depth. The throughfall from the
twigs is affected by heavy rainfall intensity. The
depth of rainfall has a significant effect on 5% of
the test level for heavy rainfall intensity. If the
analysis range is reduced to 1%, heavy rainfall
intensity has no significant effect on the Tft-drip.
The distribution of Tft-drip trend against P shows
heterogeneous results between the tree species.
Similar results are also found for the same species
[26]. The distribution of Tft-drip in more than 25 mm
rainfall depth happens due to the characteristics of
the rainfall and trunk characteristics [24] and the
roughness of the branches' surface [27].
The twigs that did not drip into Tft-drip flows to
the branch and become twigs discharge (qt). The
characteristics of branches and twigs significantly
affect canopy flow and throughfall. Water that does
not drip and flows along the branch is considered to
stem discharge (qs).
The increase in qs during less than 0.35
mm/minute rainfall intensity did not show a
significant difference. Due to increasing rainfall
intensity, the difference in qs between tree species
becomes more significant. This situation generates
a different value between qcs and qt. The flow on the
branch has either been dripped by gravity or flowed
down through the branch. Tft-drip and qs calculations
show that trees with dominant water droplets from
the canopy produced a large recharge concentration
to the branches.
The value of qs is calculated using Eq. (19).
Based on the calculation, trees that have dominant
Tft-drip produce a large concentration of stem
discharge. Fig.10 shows that an increase in qs.
Fig.10 qs (mm/sec) vs I (mm/sec)
The Tfs-drip depth is calculated using Eq. (21).
Fig.11. show that the increased rainfall depth has a
significant effect on the Tfs-drip depth. Throughfall at
each tree species is affected by canopy
characteristics and rainfall depth. Both parameters
have a significant influence on the canopy flow
concentration [28].
Water flows along the stem is then dripped at a
certain point as a canstem-drip or dripped as Tfs-drip. Tfs-
drip and canstem-drip co-occur or overtake each other.
The distribution and characteristics of Tfs-drip and
canstem-drip are strongly influenced by the canopy
0.0
2.5
5.0
7.5
10.0
12.5
15.0
17.5
20.0
0.0 10.0 20.0 30.0 40.0 50.0 60.0 70.0 80.0 90.0
Tf td
rip(m
m)
P (mm)
Acacia decurrens Willd.Artocarpus heterophyllusPinus merkusiiCeiba pentandraAlstonia scholarisCoffea canephoraLeucaena leucocephala
0.00
0.02
0.04
0.06
0.08
0.10
0.12
0.00 0.10 0.20 0.30 0.40 0.50 0.60 0.70 0.80
q s(m
m)
I (mm/mnt)
Acacia decurrens Willd.Artocarpus heterophyllusPinus merkusiiCeiba pentandraAlstonia scholarisCoffea canephoraLeucaena leucocephala

International Journal of GEOMATE, Nov., 2021, Vol.21, Issue 87, pp.36-49
45
architecture and characteristics of the branches
(Fig.11). ANOVA test is performed to analyze the
dominant parameters that influence the Tfs-drip
process (Tabel 5). Tfs-drip is affected by rainfall
depth and tree species at the 5% and 1% test levels.
Fig.11 Tfs-drip (mm) vs P (mm)
Table 5 ANOVA Tfs-drip test
Source of
Variation MS F
Fcrit
(5%)
Fcrit
(1%)
Light P (mm) 14.85 18.95 5.32 11.26
Species 9.37 11.97 3.44 6.03
Moderate P (mm) 69.05 15.28 1.72 2.14
Species 157.08 34.76 2.01 2.65
Heavy P (mm) 120.10 6.27 1.39 1.58
Species 932.96 48.67 1.96 2.56
Very heavy
P (mm) 94.17 2.03 1.82 2.31
Species 931.59 20.05 2.03 2.69
Tfs-drip is affected by rainfall depth and tree
species at the 5% and 1% test levels. The branch
structure contributes significantly to the throughfall
characteristics [5]. Fragmentation at the droplet
concentration and flows from the above segment
affects the depth of the Tfs-drip.
Recharge to canopy storage and stemflow in-
branch funneling is influenced by the branch
structure, branch characteristics, and distribution
angle. The depth of canstem-drip is calculated using Eq.
(22). The funneling characteristics of the branches
have a significant effect on canstem-drip presented in
Fig. 12.
The recharge process from a twig that flows
through the stem becomes the giant droplet on the
canopy on Ceiba pent. The minor canstem-drip
calculation is found on Acacia d wild. and Coffea
can. In the Leucaena leu., the increase of canstem-drip
is strongly influenced by rainfall intensity. ANOVA
determines parameters that have a significant effect
on canstem-drip depth. Rainfall depth did not
significantly affect canstem-drip rate at all rainfall
intensity classifications presented at Tabel 6.
The canstem-drip is influenced by rainfall intensity
at very heavy rainfall. The depth of the canstem-drip is
affected by canopy characteristics for all tree
species. Tree species affect the throughfall
distribution in all rainfall intensity classifications.
Fig.12 canstem-drip (mm) vs P (mm)
Table 6 canstem-drip ANOVA test
Source of
Variation MS F
Fcrit
(5%)
Fcrit
(1%)
Light P (mm) 1.26 1.00 5.32 11.26
Species 15.02 11.98 3.44 6.03
Moderate P (mm) 6.97 1.01 1.72 2.14
Species 245.67 35.52 2.01 2.65
Heavy P (mm) 27.14 1.09 1.39 1.58
Species 1,208.84 48.60 1.96 2.56
Very
heavy
P (mm) 493.81 10.29 1.82 2.31
Species 873.24 18.19 2.03 2.69
The stemflow discharge at branches with βb≥60ᵒ
and P>5mm, gives 80% of the water flows through
the branches. At a branch with an angle of 15ᵒ, the
flow is 20%. Fig.13 shows the results of Tfempirical.
The calculation result is presented in Fig. 13,
similar to the previous studies [4, 17].
Fig.13. Tfempirical (mm) vs. P (mm)
The parameters that are calculated empirically
in this study show the process of rainfall
0
2
4
6
8
10
12
14
16
18
20
0 10 20 30 40 50 60 70 80 90
Tf s
drip
(mm
)
P (mm)
Acacia decurrens Willd.Artocarpus heterophyllusPinus merkusiiCeiba pentandraAlstonia scholarisCoffea canephoraLeucaena leucocephalaTectona grandis
0
5
10
15
20
25
30
35
40
0 10 20 30 40 50 60 70 80 90
can
ste
m-d
rip
(mm
)
P (mm)
Acacia decurrens Willd.
Artocarpus heterophyllus
Pinus merkusii
Ceiba pentandra
Alstonia scholaris
Coffea canephora
Leucaena leucocephala
Tectona grandis
0
10
20
30
40
50
60
0 10 20 30 40 50 60 70 80 90
Tf e
mpi
rical
(mm
)
P (mm)
Acacia decurrens Willd.
Artocarpus heterophyllus
Pinus merkusii
Ceiba pentandra
Alstonia scholaris
Coffea canephora
Leucaena leucocephala
Tectona grandis

International Journal of GEOMATE, Nov., 2021, Vol.21, Issue 87, pp.36-49
46
distribution to throughfall. ANOVA test shows that
the rainfall depth and tree species affect the depth
of Tfempirical. Tabel 7 shows that the Tfempirical depth
of each tree has a significant difference, which
depends on the tree characteristics and the rainfall
depth.
Table 7. Tfempirical ANOVA test
Source of Variation
MS F Fcrit (5%)
Fcrit (1%)
Light P (mm) 15.31 19.61 5.32 11.26
Species 9.40 12.05 3.44 6.03
Moderate P (mm) 72.48 16.16 1.72 2.14
Species 156.11 34.80 2.01 2.65
Heavy P (mm) 144.37 7.76 1.39 1.58
Species 902.34 48.50 1.96 2.56
Very
heavy
P (mm) 963.38 18.38 1.82 2.31
Species 829.05 15.81 2.03 2.69
Table 7 and Table 8 have shown that the results of
the ANOVA test for observations give similar
results with the empirical. Empirical distribution
and observations that have been conducted during
light rainfall to heavy rainfall show a similar effect
on rainfall depth and tree species. The theoretical
difference occurs at a very heavy rainfall intensity.
Table 8. Tfobserved ANOVA test
Source of Variation
MS F Fcrit (5%)
Fcrit (1%)
Light P (mm) 19.73 15.62 5.32 11.26
Species 11.91 9.43 3.44 6.03
Moderate P (mm) 158.88 32.44 1.72 2.14
Species 150.21 30.67 2.01 2.65
Heavy P (mm) 480.37 25.77 1.39 1.58
Species 760.93 40.82 1.96 2.56
Very
heavy
P (mm) 272.46 31.80 1.83 2.33
Species 86.94 10.15 2.11 2.84
The relationship between Tfempirical and Tfobserved with
rainfall intensity (I) can be presented in graphical
form (Fig. 14). In this study, the graphical
presentation has shown the similar distribution for
the Tfdepth analysis with I and P (Fig.14).
This study did not find a very significant
difference between Tfobserved and Tfempirical in the
distribution of total data and calculations. The
results of calculations and observations show
almost the same distribution. At I<5mm/hr, only
4.5% caused Tf to be evenly distributed under the
tree canopies. The depth ratio Tf differed slightly at
5<I<10 mm/hr for empirical and observed. At
5<I<10 mm/hr, Tfobserved was measured as 20% of
the total rainfall incidence (Tfempirical = 19%). The
highest Tf incidence ratio was obtained at 10<I<20
mm/hour. At 10<I<20 mm/h, 58% Tf was observed
simultaneously under the tree canopy (Tfempirical =
57%). In this study, it was seen that the increased in
rainfall intensity up to >20 mm/hour did not change
the rate of increase in Tf depth. At I>20 mm/hour,
the ratio of Tf simultaneously under tree canopy is
17.4% (Tfempirical = 17.1%).
Fig.14. Tfdepth (mm) vs. I (mm)
5.3 Tree Canopy as an Indicator of Post-
Eruption Succession
After the eruption of Merapi Volcano in 2010,
most of the vegetation was damaged to several
levels. The level of damaged is determined by the
distance from the top of the crater, wind direction,
and land cover. Landcover damage was also related
to the surface flow conditions and hydraulic
conditions of the rivers around the Merapi Volcano.
This phenomenon was observed during the
rehabilitation phase of the landcover and soil after
the eruption of the Merapi Volcano. Landcover
succession in dynamic canopy shade (such as
Acacia d wild.) was more successful than rigid
canopy (such as Arthocarpus hete. and Ceiba pent.).
The Merapi Volcano area is upstream of 3
watersheds, i.e., the Progo in the west, the Opak in
the south, and the Begawan Solo in the eastern part.
There are 27 rivers flow from these three
watersheds. The hydrological impact from the
Merapi Volcano eruption also impacts the water
availability and tourism activities in this area [32].
The Merapi Volcano eruption in 2010 reduced the
springs of Umbul Lanang and Umbul Wadon.
These two springs are located in the upper area of
Kali Kuning river. Another impact caused by
decreasing supply from the spring is the loss of a
waterfall in Kaliurang Park.
The interview with residents shows that most of
the upstream area at Kali Kuning river became open
land after the 2010 eruption. All vegetation in this
area was covered by volcanic ash. All leaves were
fallen from the trees canopy. The soil substrate in
this area is volcanic ash and sand, which is acidic.
The species that can grow and develop in the open
areas are generally pioneer species.
0
5
10
15
20
25
30
35
40
45
50
0 5 10 15 20 25 30 35 40 45
Tf d
ep
th(m
m)
Rainfall intensity (mm/hr)
TfobservedTfempiricalI =5 mm/hrI = 10 mm/hrI = 20 mm/hr

International Journal of GEOMATE, Nov., 2021, Vol.21, Issue 87, pp.36-49
47
Areas with the pioneer vegetation show better
recovery capabilities [38]. It can be seen from the
land cover under the shade of acacia d wild. On the
hilly slopes, there are acacia d w that grows in the
basal area, which is wetter than other areas. In
addition, the erosion spot/line in the area is
dominated by acacia d wild, which tends to have
smaller dimensions than the other areas. The results
of this study are similar to previous studies on
Mount Merapi [34] for compound leaf vegetation.
6. CONCLUSION
This research shows the detailed process of
rainfall redistribution in the tropical woody trees
canopy. The interactions between the leaves on the
canopy surface will affect the dimensions and
measured volume of Tf. The interactions between
the leaves and/or twigs show that the canopy is a
dynamic structure.
The initial phase of redistribution is the rainfall
concentration on each sheet of the canopy surface.
The water concentration flows to the next segment
of the canopy surface. The flow formed on the
canopy surface flows according to the gravity from
twigs zone to branches. The process in the segments
below the canopy surface is influenced by the
branch roughness and the canopy stiffness. As for
the dynamic canopy of woody trees, throughfall
distribution is spread more evenly below the canopy
than the rigid ones.
This condition continues until the entire canopy
surface dries up again. Once tree with a rigid canopy
has recovered, the stemflow in the rigid canopy
species has better condition than the dynamic
canopy. The increase in the stemflow ratio and
volume has increased the water flow through to the
basal area. The basal structure of the tree around
Mount Merapi tends to have basal tandon. Increased
flow in the basal area will increase the amount of
water that can be absorbed and conserved by the soil.
This study did not find a very significant
difference between Tfobserved and Tfempirical in the
distribution of total data and calculations. The
results of calculations and observations show
almost the same distribution. At 10<I<20 mm/hour,
58% Tfobserved occurred simultaneously under tree
canopies. At this rainfall intensity, the empirical
calculation results obtained 57% of the occurrences
simultaneously under the tree canopies. Tf did not
occur homogeneously under the tree canopy at I<5
mm/hour. The results of Tfobserved and Tfempirical
showed that at I<5 mm/hour, only 4.5% caused Tf
to be evenly distributed under the tree canopy.
The results of visual observations during this
study showed that the effect of erosion under a rigid
canopy was more dominant than that of erosion
under a dynamic canopy during the early
successional phase. The early phases of post-
eruption recovery are the determining factors for
post-eruption ecological recovery [39]. More
detailed research on the post-eruption succession
process in volcanoes is still an interesting research
object to be developed in the future.
7. ACKNOWLEDGMENTS
This research was conducted with the support of
the LPDP (Indonesia Endowment Fund for
Education) through the Beasiswa Unggulan Dosen
Indonesia (BUDI-DN) program of 2016. The author
would like to thank the Petung village community
for their support during field data observation. The
author would also thank the Department of Civil
and Environmental Engineering, Faculty of
Engineering, Universitas Gadjah Mada, for
supporting this research.
8. REFERENCES
[1] Prach K., Tichý L., Lencová K., Adámek M.,
Koutecký T., Sádlo J., Bartošová A., Novák J.,
Kovář P., Jírová A., Šmilauer P., Řehounková K.
and Bott-Dukát Z., Does succession run towards
potential natural vegetation? An analysis across
seres, Journal of Vegetation Science, vol. 27, no.
3, pp. 1-13, 2016.
[2] Chang C. C., Halpern C. B., Antos J. A.,
Avolio M. L., Biswas A., Cook J. E., del Moral
R., Fischer D. G., Holz A., Pabst R. J., Swanson
M. E. and Zobel D. B., Testing conceptual
models of early plant succession across a
disturbance gradient, Journal of Ecology
(Oxford), vol. 107, no. 2, pp. 517-530, 2019.
[3] The Yogyakarta Geological Disaster
Technology Research and Development Center,
Annual Report 2020, Kementerian Energi dan
Sumber Daya Mineral, Yogyakarta - Indonesia,
2020.
[4] Nanko K., Onda Y., Ito A., and Moriwaki H.,
Effect of canopy thickness and canopy
saturation on the amount and kinetic energy of
troughfall: An experimental approach,
Geophysical Research Letters, p. L05401, 2008.
[5] Wang A., Diao Y., Pei T., Jin C., and Zhu J., A
semi-theoritical model of canopy rainfall
interception for a broad-leaved tree,
Hydrologycal Processes, vol. 21, pp. 2458-2463,
May 2007.
[6] Azmeri and Isa A. H., An Analysis of Physical
Vulnerability to Flash Floods in the small
Mountainous Watershed of Aceh Besar
Regency, Aceh Province, Indonesia, Jàmbá
Journal of Disaster Risk Studies, vol. 10, no. 1,
pp. 1-6, 2018.
[7] Livesley S., Baudinette B., and Glover D.,
Rainfall interception and stem flow by eucalypt
street trees – The impacts of canopy density and

International Journal of GEOMATE, Nov., 2021, Vol.21, Issue 87, pp.36-49
48
bark type, Urban Forestry & Urban Greening,
vol. 13, pp. 192-197, 2014.
[8] Levia D. F., Hudson S. A., Llorens P., and
Nanko K., Throughfall drop size distributions:
A review and prospectus for future research,
WIREs Water, vol. 4, pp. 1-18, 2017.
[9] Wang W.-M., Li Z.-L., and Su H.-B.,
Comparison of leaf angle distribution functions;
Effects on extinction coefficient and fraction of
sunlit foliage, Agricultural and Forest
Meteorology, vol. 143, pp. 106-122, 2007.
[10] Aparecido L. M., Miller G. R., Cahill A. T., and
Moore G. W., Leaf surface traits and water
storage retention affect photosynthetic
responses to leaf surface wetness among wet
tropical forest and semiarid savanna plants, Tree
Physiology, vol. 37, pp. 1285-1300, 2017.
[11] Staelens J., Schrijve A. D., Verheyen K., and
Verhoes N., Rainfall partitioning into
throughfall, stemflow, and interception within a
single beech (Fagus sylvatica L.) canopy:
influence of foliation, rain event characteristics,
and meteorology, Hydrological Processes, vol.
22, pp. 33 - 45, 2008.
[12] Haverd V., Lovell J., Cuntzc M., Juppa D.,
Newnham G., and Sea W., The Canopy Semi-
analytic Pgap And Radiative Transfer
(CanSPART) model: Formulation and
application, Agricultural and Forest
Meteorology, vol. 160, pp. 14-35, 2012.
[13] Goel N. S., and Strebel D. E., Simple Beta
Distribution Representation of Leaf Orientation
in Vegetation Canopies, Agronomy Journal, vol.
76, no. 5, pp. 800-802, 1984.
[14] Herwitz S. R., Raindrop impact and water flow
on the vegetative surfaces of trees and the
effects on stemflow and throughfall generation,
Earth Surface Processes and Landform, vol. 12,
pp. 425-423, 1987.
[15] Gash J. H. C., Lloyd C. R., and Lachaud G.,
Estimating sparce forest rainfall interception
with an analytical model, Journal of Hydrology,
vol. 170, pp. 79-86, 1995.
[16] Verhoef W., Light Scattering by Leaf Layers
with Application to Canopy Reflectance
Modeling: The SAIL Model, Remote Sensing
and Environment, vol. 16, no. 2, pp. 125-141,
1984.
[17] Keim R., Skaugset A., and Weiler M., Storage
of water on vegetation under simulated rainfall
of varying intensity, Advances in Water
Resources, vol. 29, pp. 974-986, 2006.
[18] Xiao Q., McPherson E. G., Ustin S. L., and
Grismer M. E., A new approach to modelling
tree rainfall interception, Journal of Geophysical
Research, vol. 105, pp. 29.173-29.188,
December 2000.
[19] Frazer G., Canham C., and Lertzman K. 1., Gap
Light Analyzer (GLA), Version 2.0: Imaging
software to extract canopy structure and gap
light transmission indices from true-colour
fisheye photographs, users manual and program
documentation, Simon Fraser University,
Burnaby, British Columbia, and the Institute of
Ecosystem Studies, Millbrook, New York.,
1999.
[20] Li X., Xiao Q., Niu J., Dymond S., van Doorn
N. S., and Yu X., Process-based rainfall
interception by small trees in Northern China:
The effect of rainfall traits and crown structure
characteristics, Agriculture and Forest
Meteorology, pp. 65-73, 2016.
[21] Loescher H. W., Powers J. S. and Oberbauer S.
F., Spatial Variation of Throughfall Volume in
an Old-Growth Tropical Wet Forest, Costa Rica,
Journal of Tropical Ecology, vol. 18, no. 3, pp.
397-407, 2002.
[22] Hashino M., Yao H., and Yoshida H., Studies
And Evaluations On Interception Processes
During Rainfall Based On A Tank Model,
Journal of Hydrology, pp. 1-11, 2002.
[23] Ahmad R. K., Sujono J., and Jayadi R., Canopy
saturation and troughfall for accaciella
angustissima, arturocarpus heterohyllus, pinus
merkusii and athocephalus cadamba related to
rainfall intensity, in 21th IAHR-APD Congress,
Yogyakarta, 2018.
[24] Holder C. D., and Gibbes C., Influence of leaf
and canopy characteristics on rainfall
interception and hydrology, Hydrological
Sciences Journal, pp. 1-9, 2016.
[25] He Z.-B., Yang J.-J., Du J., Zhao W.-Z., Liu H.,
and Chang X.-X., Spatial variability of canopy
interception in a spruce forest of the semiarid
mountain regions of China, Agricultural and
Forest Meteorology, vol. 188, p. 58–63, 2014.
[26] Crockford R., and Richardson D. P.,
Partitioning of rainfall in a eucalypt forest and
pine plantation in southeastern Australia: IV the
relationship of interception and canopy storage
capacity, the interception of these forests, and
the effect on interception of thinning the pine
plantation, Hydrological Processes, vol. 4, no. 2,
pp. 168-188, 1990.
[27] Klamerus-Iwan A., Rainfall parameters affect
canopy storage capacity under controlled
conditions, Forest Research Papers, vol. 75, no.
4, pp. 353-358, 2014.
[28] Levia D. F., Nanko K., Amasaki H.,
Giambelluca T. W., Hotta N., Iida S., Mudd R.
G., Nullet M. A., Sakai N., Shinohara Y., Sun
X., Suzuki M., Tanaka N., Tantasirin C., and
Yam, Throughfall partitioning by trees,
Hydrological Processes, vol. 33, p. 1698–1708,
2019.
[29] Crockford R. H., and Richardson D. P.,
Partitioning of raifall into troughfall stemflow
and interception: effect of forest type, ground

International Journal of GEOMATE, Nov., 2021, Vol.21, Issue 87, pp.36-49
49
cover and climate, Hydrology Processes, vol. 14,
no. 16-17, pp. 2903-2920, 2000.
[30] Sujono J., Jayadi R., Nurrochmad F., Heavy
Rainfall Characteristics At South-West Of Mt.
Merapi - Yogyakarta And Central Java Province,
Indonesia, International Journal of GEOMATE,
vol. 14, no. 45, pp. 184-191, 2018.
[31] Calder I. R., A stochastic model of rainfall
interception, Journal of Hydrology, vol. 89, pp.
65-71, 1986.
[32] Gunawan H., Sugiarti, Wardani M., Tata M. H.
L., and Prajadinata, Restoration of the Post-
Eruption Merapi Volcano Ecosystem (Restorasi
Ekosistem Gunung Merapi Pasca Erupsi),
Research and Development Center for
Conservation and Rehabilitation - Forestry
Research and Development Agency, Ministry of
Forestry (Pusat Penelitian dan Pengembangan
Konservasi dan Rehabilitasi - Badan Penelitian
dan Pengembangan Kehutanan Kementerian
Kehutanan), Bogor, 2013.
[33] Alviawati E., Livelihood strategies for dairy
farmers in Kepuharjo Village, Cangkringan
District, before and after the 2010 Merapi
eruption (Strategi penghidupan rumahtangga
peternak sapi perah di Desa Kepuharjo
Kecamatan Cangkringan pra dan pasca erupsi
Merapi 2010), Majalah Geografi Indonesia, vol.
27, no. 2, pp. 104-117, 2013.
[34] Gunawan H., Heriyanto N. M., Subiandono E.,
Mas'ud A. F., and Krisnawati H., Invasion of
exotic species in post-eruption degraded areas in
Merapi Volcano National Park (Invasi jenis
eksotis pada areal terdegradasi pasca erupsi di
Taman Nasional Gunung Merapi), in Seminar
Nasional Masyarakat Biodiv. Indonesia,
Yogyakarta, 2015.
[35] Horton R. E., Rainfall Interception, Mountly
Weather Review 47, pp. 608-623, 1919.
[36] Gash J. H. C., An Analytical Model of Rainfall
Interception by Forests, Journal of Royal
Meteorology, vol. 105, pp. 43-45, 1979.
[37] Badan Meteorologi Klimatologi dan Geofisika
Indonesia, Standar Penentuan Iklim
/Meteorological, Climatological, and
Geophysical Agency of Indonesia, Climate
Determination Standard, 1990.
[38] Dohnal M., Černý T., Votrubová J., and Tesař
M., Rainfall interception and spatial variability
of throughfall in spruce stand, J. Hydrol.
Hydromech., vol. 62, no. 4, p. 277–284, 2014.
[39] Putra T. H. A., Istijono B., Aprisal, Rusman B.,
Ophiyandri T., Putra, T. H. A.; Istijono, B.;
Aprisal; B., Rusman; T., Ophiyandri, The
Dynamics Of Land Cover Change And Causal
Factors In The Kuranji Watershed, International
Journal of GEOMATE, pp. 69-75, 2021.
Copyright © Int. J. of GEOMATE All rights reserved, including making copies unless permission is obtained
from the copyright proprietors.