Reviewers' comments - Author's response - Modified - CP
88
Point-by-point response to referee comments Response to reviewer Key: - Reviewers’ comments - Author’s response - Modified text in the manuscript Anonymous Referee #1 Received and published: 18 July 2019 Review Zou et al ‘Millennial-scale variations of sedimentary oxygenation in the westernsubtropical North Pacific and its link to North Atlantic climate. Zou et al. study sedimentary redox conditions in the Okinawa Trough, and use this as a proxy to infer bottom water oxygen concentrations (I think, it is not always very clear from the manuscript). The title promises more than the paper delivers; the link with North Atlantic climate is only mentioned briefly and explanation is sometimes unclear. The authors present interesting data, but the paper itself needs work. There is so much information (several times incorrectly referenced), and some information seems irrelevant. There is also a lot of internal discussion within the paper without reaching firm conclusions. While the authors are critical about their own proxy, they are less so about others and this needs to be improved. Reply#1: We thank Reviewer#1 for taking the time to review our manuscript and for the constructive comments, which contribute improving our manuscript. Our work adds an important element to understand the process in the subtropical North Pacific during the last deglaciation. Our data suggest a substantial impact of NPIW on sedimentary oxygenation in the western subtropical North Pacific and also an expansion of oxygen minimum zone in the North Pacific during the B/A. According to the comments of Reviewers #1 and #2, we have carried out a thorough revision of our entire manuscript, including Figures 3-7, and use the "track changes" to display our revisions the text. In the revised manuscript, we re-phrased
-
Upload
khangminh22 -
Category
Documents
-
view
0 -
download
0
Transcript of Reviewers' comments - Author's response - Modified - CP

Point-by-point response to referee comments
Response to reviewer
Key:
- Reviewers’ comments
- Author’s response
- Modified text in the manuscript
Anonymous Referee #1
Received and published: 18 July 2019
Review Zou et al ‘Millennial-scale variations of sedimentary oxygenation in the
westernsubtropical North Pacific and its link to North Atlantic climate.
Zou et al. study sedimentary redox conditions in the Okinawa Trough, and use
this as a proxy to infer bottom water oxygen concentrations (I think, it is not always
very clear from the manuscript). The title promises more than the paper delivers; the
link with North Atlantic climate is only mentioned briefly and explanation is
sometimes unclear.
The authors present interesting data, but the paper itself needs work. There is so
much information (several times incorrectly referenced), and some information seems
irrelevant. There is also a lot of internal discussion within the paper without reaching
firm conclusions. While the authors are critical about their own proxy, they are less so
about others and this needs to be improved.
Reply#1: We thank Reviewer#1 for taking the time to review our manuscript and
for the constructive comments, which contribute improving our manuscript. Our work
adds an important element to understand the process in the subtropical North Pacific
during the last deglaciation. Our data suggest a substantial impact of NPIW on
sedimentary oxygenation in the western subtropical North Pacific and also an
expansion of oxygen minimum zone in the North Pacific during the B/A.
According to the comments of Reviewers #1 and #2, we have carried out a
thorough revision of our entire manuscript, including Figures 3-7, and use the "track
changes" to display our revisions the text. In the revised manuscript, we re-phrased

the abstract, amended the age model (see new Figure 3), changed sentences and
paragraphs as outlined in the revised text, added new evidence of benthic foraminifera
abundance of core E017 (see new Figure 6) and added text to the discussion on the
connection of our time series to North Atlantic climate. We hope that we have
addressed Reviewer #1’ concerns appropriately.
In the following we provide point-by-point responses to all the Reviewer’s
comments in blue as well as excerpts from the manuscript in green.
Comments: Authors should check that their references are appropriate. Several
references are not put in the right context.
Reply#2: Thanks. Checked and Revised.
The following references were included in the revised MS:
in Line 66 for reference Hoogakker et al., 2015
in Line 75 for reference Addison et al., 2012
in Lines 100 for reference Max et al 2017; Rippert et al. 2017
in Line 107 for reference Sibuet et al., 1987
in Line 170 for reference Morford and Emerson, 1999
in Line 333 for references Cartapanis et al., 2011; Lembke-Jene et al., 2017
in Line 348 for reference Shi et al., 2014
in Line 356 for reference Chang et al., 2009
in Line 368 for reference Zhu et al., 2015
in Line 372 for reference Lim et al., 2017
in line 396 for reference Bianchi et al. 2012
in lines 444-445 for references Galbraith and Jaccard, 2015; Moffitt et al., 2015;
Praetorius et al., 2015
in line 465 for reference Brewer and Peltzer, 2016
in line 496 for reference Galbraith et al., 2007
in line 530 for reference Lim et al., 2017
in line 535 for reference Andres et al., 2015
in line 551 for reference Kubota et al., 2015
in line 578 for reference Kubota et al., 2015

in line 623 for reference Lynch-Stieglitz, 2017
in lines 625-630 for references Böhm et al., 2015; McManus et al., 2004; Liu et
al., 2009; Zhang et al., 2017; Barker et al., 2010; Knorr and Lohmann, 2007;
in lines 697-698 for references Galbraith and Jaccard, 2015; Jaccard and
Galbraith, 2012; Moffitt et al., 2015
in lines 709-710 for references Addison et al., 2012; Cartapanis et al., 2011;
Crusius et al., 2004; Galbraith et al., 2007; Lembke-Jene et al., 2017; Shibahara et al.,
2007
The following original references were removed in the revised MS:
in line 65 Lu et al., 2016;
in line 400 Savrda and Bottjer, 1991
in line 471 Benson and Krause, 1984
in line 541 Matsumotoet al. (2002)
in line 557 Kubota et al., 2010
in line 565 Wang and Wang, 2008
in line 584 Kubota et al., 2010
There are several other studies that deal with the North Pacific and NPIW, which
are not referenced here; this includes work by Rippert et al. (2017), Max et al. (2017).
Reply#3: Thanks. These two references have been included in the revised
manuscript and we briefly introduced their main findings.
In particular, both these papers highlight the substantial effects of NPIW on
subsurface water composition of Eastern Tropical North Pacific and potent roles in
regulating global climate. Likewise, the effect of NPIW's ventilation on the western
subtropical North Pacific is observed in our study. Our study further validates the role
of NPIW in its downstream oceanic environment.
We have added Lines 97-100
"In contrast, substantial effects of intensified NPIW formation during Marine
Isotope Stage (MIS) 2 and 6 on the ventilation and nutrient characteristics of lower
latitude mid-depth Eastern Equatorial Pacific have been suggested by recent studies
(Max et al., 2017; Rippert et al., 2017)."

Abstract: Lines 44-50: these sentences go around the bushes. Really what you
want to say is that sedimentary oxygenation conditions at mid-depth in the subtropical
western North Pacific were more or less similar over the last 50,000 years, apart from
the Bolling-Allerod and Pre-boreal. However, it may not be possible to compare with
Holocene data, as this may be compromised by ash. This is not made very clear in the
manuscript.
Reply#4: Thanks for your suggestion. We have rephrased these sentences in the
revised manuscript. The sentence was amended as follows. The text was modified as
follows (Lines 42-45):
"Our results suggest that enhanced mid-depth western subtropical North Pacific
(WSTNP) sedimentary oxygenation occurred during cold intervals and after 8.5 ka,
while oxygenation decreased during the Bölling-Alleröd (B/A) and Preboreal. "
As suggested by the Reviewer, our data suggest well-oxygenated water during
the cold intervals apart from the B/A and Preboreal. For the Holocene, increased
sedimentary oxygenation is attributed to an intensified Kuroshio Current, although
discrete volcanic materials, indicating by positive Eu anomaly (Zhu et al., 2015),
would dilute the Holocene data. Modern observation suggest the Kuroshio can reach
to the seafloor at 1200 m in isobath in the East China Sea (Andres et al., 2015). In the
geological past, both various proxy data and modeling simulation suggest intensified
Kuroshio re-entered the OT at early Holocene 9-9.6 ka (Chang et al., 2015; Diekmann
et al., 2008; Dou et al., 2016; Lim et al., 2017; Zheng et al., 2016). In our previous
study based on the same core CSH1 (Zhu et al., 2015), we have suggested that the
occurrence of discrete volcanic materials during the Holocene is closely related to
enhanced Kuroshio intensity. More recently, increased total Hg concentration in the
sediments from the middle Okinawa since 9.3 ka (Lim et al., 2017) was also
suggested, which was explained to be hydrothermal Hg source (due to much higher
concentrations than potential terrigenous end-members) and to be brought to the site
location by intensified Kuroshio Current. Although the focus of this manuscript is not
the ventilation changes during the Holocene, the Kuroshio Current does play a crucial
role in controlling the ventilation of the OT during the Holocene.

We have now added more information into the section 5.2 Redox-sensitive
Elements. Lines 366-372:
"Pronounced variations in U concentration after 8.5 ka are related to the
occurrence of discrete volcanic materials. A significant positive Eu anomaly (Zhu et
al., 2015) confirms the occurrence of discrete volcanic materials and its dilution
effects on terrigenous components since 7 ka. Occurrence of discrete volcanic
material is likely related to intensified Kuroshio Current during the mid-late Holocene,
as supported by higher hydrothermal Hg concentrations in sediments from the middle
OT (Lim et al., 2017)."
Lines 59-61: how does it seem to be driven? Is this not something you are
proposing? Then it is not seem.
Reply#5: Thanks. Revised. "seem to be driven" is replaced by "was likely
driven". Lines 48-51 in the revised MS. The sentence now reads:
"The enhanced formation of NPIW during Heinrich Stadial 1 (HS1) was likely
driven by the perturbation of sea ice formation and sea surface salinity oscillations in
high-latitude North Pacific."
The authors mix up NADW and the Atlantic Meridional Overturning Circulation.
For a good description of AMOC see recent paper by Frajke-Williams et al. (2019).
Reply#6: Thanks. We checked the paper by Frajke-Williams et al. (2019). In the
revised manuscript, we replaced AMOC by North Atlantic Deep Water and reworded
these sentences. Lines 51-57 in the revised MS. The sentences now read:
"The diminished sedimentary oxygenation during the B/A due to decreased
NPIW formation and enhanced export production, indicates an expansion of oxygen
minimum zone in the North Pacific and enhanced CO2 sequestration at mid-depth
waters, along with termination of atmospheric CO2 concentration increase. We
attribute the millennial-scale changes to intensified NPIW and enhanced abyss
flushing during deglacial cold and warm intervals, respectively, closely related to
variations in North Atlantic Deep Water formation."

Introduction: Lines 70-73: not sure how to interpret this. Where is the respired
carbon stored? At the sediment-seawater interface, in sedimentary pore-waters, or in
seawater? The study of Lu et al. (2016) deals with I/Ca in planktic foraminifer in the
Pacific Sector of the Southern Ocean, to reconstruct upper ocean oxygenation, the part
of respired carbon in their paper refers to a different study (Hoogakker et al., 2015).
Reply#7: We have reworded the first sentence for a clearer statement.
Additionally, the reference (Lu et al., 2016) was replaced by reference (Hoogakker et
al., 2015).
The sentence was amended as follows, Lines 61-66:
"A more sluggish deep ocean ventilation combined with a more efficient
biological pump widely thought to facilitate enhanced carbon sequestration in the
ocean interior, leading to atmospheric CO2 drawdown during glacial cold periods
(Sigman and Boyle, 2000). These changes are tightly coupled to bottom water
oxygenation and sedimentary redox changes on both millennial and orbital timescales
(Hoogakker et al., 2015; Jaccard and Galbraith, 2012; Sigman and Boyle, 2000)."
Lines 76-83: the study of Cartapanis is from the northeastern Pacific, but not
high latitude or subarctic.
Reply#8: The study by Cartapanis et al. (2011) presents high-resolution
redox-sensitive trace metals in a sediment core from the Eastern Tropical North
Pacific and proposed improved intermediate water oxygenation during Heinrich
events. The enhanced ventilation during Heinrich intervals is consistent with our
inference. Therefore, we would like to continue to keep this reference in the revised
manuscript and rephrased the expression of the context in Lines 69-72. Now the
sentence reads:
"Previous studies from North Pacific margins as well as open subarctic Pacific
have identified drastic variations in export productivity and ocean oxygen levels at
millennial and orbital timescales using diverse proxies such as trace elements
(Cartapanis et al., 2011; Chang et al., 2014; Jaccard et al., 2009; Zou et al.,
2012), ......"

Line 92: explain what cabbeling is, not everyone will have heard of the term.
Reply#9: Done. Cabbeling is a mixing process to form a new water mass with
increased density than that of parent water masses. Lines 85-86 in the revised MS.
The sentence was changed to:
"...... that cabbeling, a mixing process to form a new water mass with increased
density than that of parent water masses, is the principle mechanism responsible
for ......"
Lines 95- 97: do the data really show this? The one core at 1km is about 0.04 per
mil lighter (and within error), but crucially there is no Holocene equivalent for the 0.7
km core.
Reply#10: These two studies show enhanced formation of North Pacific
Intermediate Water during the last glaciation. On the basis of >30 sediment cores on
the northern Emperor Seamounts and in the Okhotsk Sea with a water depth of 1000
to 4000 m, Keigwin (1998) found that there was a better ventilated and relatively
fresher water mass above 2000 m in the far northwestern Pacific compared to deep
waters. Matsumoto et al. (2002) compiled and compared available nutrient proxies
(δ13C) in sediment cores with water depth of 740 m to 3320 m in the North Pacific
and found a presence of distinctive water masses below and above 2000 m water
depth in the glacial Pacific with higher benthic δ13C in the upper 2000 m water.
Line2 149-152: do you mean ‘is governed by’ instead of ‘is the balance
between’.
Reply#11: Revised. Lines 150-153 in the revised MS. Now the sentence reads:
"The sedimentary redox conditions are governed by the rate of oxygen supply
from the overlying bottom water and the rate of oxygen removal from pore water
(Jaccard et al., 2016), processes that are related to the supply of oxygen by ocean
circulation and organic matter respiration, respectively."
Figure 1. O2 map, and locations of cores. Are all the cores discussed in the paper?
Is it worrying that the main core CSH1 is from just south of Japan and perhaps should
not be considered an open ocean core? What do the letters A to E stand for?

Reply#12: All cores shown in Figure 1b have been discussed in this manuscript.
For example, benthic δ13C in core PN-3 was used to indicate ventilation change in the
OT. Concentrations of CaCO3 and reactive phosphorus recorded in core MD01-2404
were used to correlate with our productivity proxy. Benthic foraminiferal assemblages
in cores E017 and 225 retrieved from the middle and southern OT were used to
indicate the ventilation of deep water mass in the OT. Deep-water temperatures in
cores GH08-2004 and GH02-1030, benthic δ13C in core PC23A and benthic
foraminiferal assemblages in ODP Site 1017 have implicated the ventilation of North
Pacific Intermediate Water.
Core CSH1 is situated in the northern Okinawa Trough at a water depth of 703 m.
In this area, both surface and deep water can be continuously replenished by water
masses from open ocean.
Letters A to E stand for sediment cores previously reported in and near the
Okinawa Trough and are shown in Table 1.
Setting: Do details of discharge and SSS add anything to this study?
Reply#13: Sea surface salinity (SSS) in the East China Sea is closely related to
the intensity of the summer East Asian Monsoon (EAM). On the basis of this
relationship, a recent study from the northern Okinawa Trough (U1429) has extended
this relationship back to 400 ka (Clemens et al., 2018). In order to discern
millennial-scale variability, we correlate planktic δ18O of core CSH1 with Chinese
stalagmite δ18O, an indicator of summer EAM to establish the age model for core
CSH1 in our study. We would like to add the details of discharge and SSS in the
manuscript to let the readers know the details.
Material and methods: What causes the high accumulation rates in this core? As
the accumulation rates vary significantly, how do these influence the patterns in redox
elements etc?
Reply#14: In the northern Okinawa Trough, previous sediment provenance
studies suggested the terrigenous sediments are mainly sourced from the Yellow and
Changjiang Rivers, from China and short mountainous rivers (Japanese or even

Taiwanese rivers) from the surrounding islands, as well as eolian dust, volcanic and
hydrothermal materials from Yellow River, Changjiang and part of Korea and Japan
Rivers (Beny et al., 2018; Li et al., 2015; Zhao et al., 2018; Zhao et al., 2017).
Variation in sedimentation rate has been attributed to changes in eustatic sea level,
EAM intensity, path and/or intensity of Kuroshio Current. Generally, sea level is
thought to be the first-order factor for controlling linear sedimentation rate changes
(Beny et al., 2018; Li et al., 2015; Zhao et al., 2017).
Our data show that there is no coherent relationship between linear
sedimentation rate and concentrations of redox sensitive elements. For example, high
sedimentation rate between 24.2 ka and 32.4 ka (around 40 cm/ka) corresponds to
decreasing concentrations of redox sensitive elements. On the other hand, lower
sedimentation between 16 ka and 19.8 ka also corresponds to lower concentrations of
redox sensitive elements. Therefore, linear sedimentation rate is not deemed to be a
crucial factor in controlling concentrations of redox sensitive elements in core CSH1.
Lines 339-340: preservation of TOC and CaCO3 are influenced by many factors
and not a widely used paleo-export proxy.
Reply#15: We fully agree that preservation of TOC and CaCO3 are influenced
by many factors, including supply, dissolution, organic matter degradation,
terrigenous dilution, etc. Some factors can be ruled out and at times these two proxies
have been used to reconstruct export productivity. In this study, C/N molar shows
substantial contribution of terrigenous organic matter to total organic carbon,
therefore it is not a suitable proxy for productivity reconstruction.
In the revised manuscript, we showed multiple lines of evidence to support the
utility of CaCO3 as a reliable productivity proxy, including (1) a strong negative
correlation with terrigenous Al of core CSH1; (2) weak dilution effects of terrigenous
material on CaCO3; (3) similar pattern to sea surface temperature of core CSH1 (Shi
et al., 2014) (the data have been included in Figure 6); (4) similar deglacial trends in
CaCO3 and reactive phosphorus reported in core MD012404 retrieved from the
middle OT (Chang et al., 2009; Li et al., 2017). All these lines of evidence support
CaCO3 as a proxy for productivity in the study area. We have added these information

in lines 339-358 in the revised MS:
"Several lines of evidence support CaCO3 as a reliable productivity proxy,
particularly during the last deglaciation. The strong negative correlation coefficient (r
= – 0.85, p<0.01) between Al and CaCO3 in sediments throughout core CSH1
confirms the biogenic origin of CaCO3 against terrigenous Al (Figure 4f). Generally,
terrigenous dilution decreases the concentrations of CaCO3. An inconsistent
relationship between CaCO3 contents and sedimentation rates indicates a minor effect
of dilution on CaCO3. Furthermore, the increasing trend in CaCO3 associated with
high sedimentation rate during the last deglacial interval indicates a substantial
increase in export productivity (Figures 4a and d). The high coherence between
CaCO3 content and alkenone-derived sea surface water (SST) (Shi et al., 2014)
indicates a direct control on CaCO3 by SST. Moreover, a detailed comparison between
CaCO3 concentrations and the previously published foraminiferal fragmentation ratio
(Wu et al., 2004) shows, apart from a small portion within the LGM, no clear
co-variation between them. These evidence suggest that CaCO3 changes are driven
primarily by variations in carbonate primary production, and not overprinted by
secondary processes, such as carbonate dissolution through changes in the lysocline
depth and dilution by terrigenous materials. Likewise, a similar deglacial trend in
CaCO3 is also observed in core MD01-2404 (Chang et al., 2009), indicating a
ubiquitous, not local picture in the OT. All these lines of evidence thus support CaCO3
of core CSH1 as a reliable productivity proxy to a first order approximation."
Line 354-357: have you checked that it is an extant biological component that
makes up the high CaCO3 going from B/A to ~ 8000 years? Can you explain the
differences in the LSR figures between Figures 3 and 4? For examples, in Figure 3
highest rates occur centred around 22 kyrs as part of a large interval of high LSR
(from 30 to 20), whereas in Figure 4 this occurs earlier (33 to 24 kyrs).
Reply#16: Seven samples at 8.23ka (120-124cm), 9.26ka (144-148cm), 10.98ka
(184-188cm), 11.66ka (200-204cm), 12.92ka (232-236cm), 14.05ka (264-268cm),
and 15.18ka (296-300cm) in core CSH1 were analyzed by Modular Stereo

Microscope (Zeiss SteREO Discovery V12) to look into the sediment components. It
is clear that abundant biogenic tests, especially foraminiferal tests, are observed
during these sediment intervals (Figure A1). On the other hand, increased
concentration of CaCO3 is highly coherent with the abundance of planktic
foraminifera species G.ruber and SST (Shi et al., 2014), indicating a substantial effect
of SST on CaCO3.
In the original manuscript, we made a mistake for LSR in Figure 3. In the revised
manuscript, this issue has been corrected (Figure 3).
In addition, high sedimentation (>40-60 cm/ka) in the original manuscript mainly
occurred during HS2 and HS3. This can be caused by uncertainties of age control
points at 23.476 ka (DO2) and 29.995 ka (H3). In the revised manuscript, these two
age control points have been eliminated from the Chinese Stalagmite tuned age model.
Even with this more conservative tuning approach, the conclusions on sedimentary
oxygenation variations remain the same as before and robust.
Lines 365-266: if U concentrations are affected by volcanic material over the last
8.5 yrs, then surely so are other sedimentary properties? I would like to see an
argument in the main text discussing why certain proxy methods are deemed not to be
influenced by this volcanic material, whilst others are. If it turns out that interval
should not be used than this creates the complication of not being able to compare the
down core data with more modern.
Reply#17: The occurrence of volcanic material has been confirmed by positive
Eu anomalies and it has substantial effects on concentration of terrigenous materials
(Zhu et al., 2015). This argument has been included in the revised text. Although the
focus of this manuscript is not the ventilation changes during the Holocene, the
Kuroshio Current does play a crucial role in controlling the ventilation of the OT
during the Holocene. Please see Reply#4.
Line 370: change ‘seems’ to ‘may’.
Reply#18: Revised.“seem to” was replaced by ‘may”. Line 376.

Lines 372-377: are there any other studies that use Mo/Mn ratios as a
sedimentary oxygenation proxy, to support your interpretation?
Reply#19: To our knowledge, Mo/Mn ratios are not used as sedimentary
oxygenation proxy in previous studies. In this study, we use both Mo/U ratio and
excess U concentration to reconstruct sedimentary oxygenation changes. Among these,
excess U concentration has been widely used for past sedimentary oxygenation
changes (Jaccard and Galbraith, 2013; Jaccard et al., 2016; Jaccard et al., 2009). The
strong positive correlation coefficient between excess U and Mo/Mn ratio in core
CSH1 indicates its reliability and supports our interpretation. In contrast the ratio of
Mo/Mn is easier to qualitatively assess indication of low vs. high oxygen
environments, supported by the individual contents of Mn and Mo, respectively.
Line 380: define oxygen deficient.
Reply#20: . In the revised manuscript, "oxygen-deficient" was replaced by
"suboxic". The sentence now reads as follows, Lines 387-388:
"......together with lower Mn concentrations suggest suboxic depositional conditions
during the late deglacial period (15.8 ka‒9.5 ka)......"
The oxygen thresholds was given in lines 396-398.
Discussion: Lines 387-392: I would recommend the authors to use more
appropriate scheme that is used for sea-water that includes hypoxic, for example as
defined by Bianchi et al. (2012). You will also found that suboxic is classified as <
2-10 µmol/l.
Reply#21:Thanks. The oxygen content scheme for seawater developed by
Bianchi et al.(2012) has been adopted in the revised manuscript. Lines 396-398 in the
revised MS. Following the Reviewer’s suggestion we changed the sentence to:
" Here, we adopt the definition of oxygen thresholds by Bianchi et al. (2012) for
oxic (>120 µmol/kg O2), hypoxic (<60–120 µmol/kg O2) and suboxic (<2–10
µmol/kg O2) conditions, whereas anoxia is the absence of measurable oxygen."

Lines 403-405: I do not understand this reasoning. You have not linked weakly
restricted basin settings with euxinia?
Reply#22: We thank the reviewer for this suggestion. The previous manuscript
had inaccurate statement. Now, we changed this sentence to make it more explicit.
The sentence was amended as follows. Lines 409-410 in the revised MS.
"Given that the northern OT is located in an open oceanic setting, we use these
two proxies to evaluate the degree of oxygenation in sediments."
It is confusing talking about ppm in the main text, whilst Figure 4 gives
concentrations in µg/g.
Reply#23: Corrected. In the revised manuscript, the uniform concentration unit,
µg/g has been used for all trace elemental concentrations in the main text. Lines 411
and 417 in the revised MS.
Lines 406-412: Mo/U ratios are not shown in the manuscript. This is out of the
blue.
Reply#24: Revised. Mo/U ratio has been included in new Figure 4m.
Lines 413-425: two studies. More importantly though, Figure 4 shows no benthic
foraminifera data, and it is therefore impossible to confirm this claim of ventilation
pattern from benthic foraminiferal assemblages to be similar to that of the RSEs. It
would also be good to see a more critical discussion about this proxy.
Reply#25: We understand the point raised by the Reviewer. For this study, the
benthic foraminiferal species were not counted in core CSH1. The benthic
foraminiferal census data in cores E017 (1826 m water depth), 255 (1575 m water
depth) are used to indicate the variations in ventilation of the middle and southern OT.
The age model for core 255 (core length 655cm) was determined by two AMS 14C
dates of N. dutertrei at depth 370 cm (9.17 ka) and 590 cm (18.8 ka) (Jian et al., 1996),
whereas the age model for core E017 was established by six age control points (Li et
al., 2005). Although the down-core abundance of hypoxia-affine species in both
studies are similar to each other (Li et al., 2005), we here focus on the benthic
foraminiferal census data from core E017.
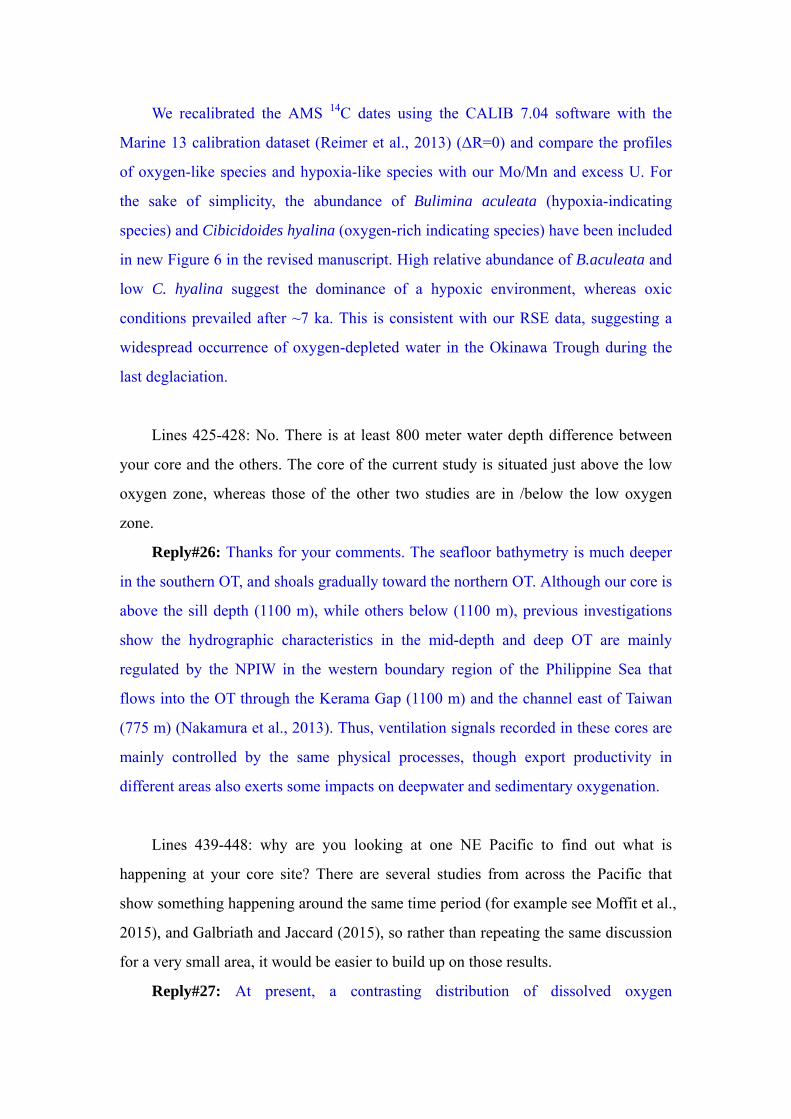
We recalibrated the AMS 14C dates using the CALIB 7.04 software with the
Marine 13 calibration dataset (Reimer et al., 2013) (ΔR=0) and compare the profiles
of oxygen-like species and hypoxia-like species with our Mo/Mn and excess U. For
the sake of simplicity, the abundance of Bulimina aculeata (hypoxia-indicating
species) and Cibicidoides hyalina (oxygen-rich indicating species) have been included
in new Figure 6 in the revised manuscript. High relative abundance of B.aculeata and
low C. hyalina suggest the dominance of a hypoxic environment, whereas oxic
conditions prevailed after ~7 ka. This is consistent with our RSE data, suggesting a
widespread occurrence of oxygen-depleted water in the Okinawa Trough during the
last deglaciation.
Lines 425-428: No. There is at least 800 meter water depth difference between
your core and the others. The core of the current study is situated just above the low
oxygen zone, whereas those of the other two studies are in /below the low oxygen
zone.
Reply#26: Thanks for your comments. The seafloor bathymetry is much deeper
in the southern OT, and shoals gradually toward the northern OT. Although our core is
above the sill depth (1100 m), while others below (1100 m), previous investigations
show the hydrographic characteristics in the mid-depth and deep OT are mainly
regulated by the NPIW in the western boundary region of the Philippine Sea that
flows into the OT through the Kerama Gap (1100 m) and the channel east of Taiwan
(775 m) (Nakamura et al., 2013). Thus, ventilation signals recorded in these cores are
mainly controlled by the same physical processes, though export productivity in
different areas also exerts some impacts on deepwater and sedimentary oxygenation.
Lines 439-448: why are you looking at one NE Pacific to find out what is
happening at your core site? There are several studies from across the Pacific that
show something happening around the same time period (for example see Moffit et al.,
2015), and Galbriath and Jaccard (2015), so rather than repeating the same discussion
for a very small area, it would be easier to build up on those results.
Reply#27: At present, a contrasting distribution of dissolved oxygen

concentration of the subsurface water can be observed in the eastern and western
North Pacific margins (Figure 1) , which is characterized by strong Oxygen Minimum
Zone in the eastern margin and oxic condition in the western margin. The benthic
foraminiferal assemblages from ODP site 1017 exhibit a strengthening of the OMZ
during warm periods and weakening during cold periods (Cannariato and Kennett,
1999). The question whether an expanded OMZ can extend toward the western NW
Pacific remains elusive in the geological past during warming intervals. In fact, the
key question involved is how to explain the cause of oxygenation variation on basin-
wide scale. Comparison of our results from the western North Pacific with those of
the eastern North Pacific aids to understand the mechanism behind sedimentary
oxygen changes.
We have now added more information into the section 6.2 and all these
references have been included in Lines 442-457.
"These processes have been invoked in previous studies to explain the deglacial
Pacific-wide variations in oxygenation by either one or a combination of these factors
(Galbraith and Jaccard, 2015; Moffitt et al., 2015; Praetorius et al., 2015). Our data
also suggest drastic variations in sedimentary oxygenation over the last 50 ka.
However, the mechanisms responsible for sedimentary oxygenation variations in the
basin-wide OT and its connection with ventilation of the open North Pacific remain
unclear. In order to place our core results in a wider regional context, we compare our
proxy records of sedimentary oxygenation (Uexcess concentration and Mo/Mn ratio)
and export productivity (CaCO3) (Figures 6a, b, c) with abundance of Pulleniatina
obliquiloculata (an indicator of Kuroshio strength) and sea surface temperature (Shi et
al., 2014), bulk sedimentary nitrogen isotope (an indicator of denitrification) (Kao et
al., 2008), benthic foraminifera δ13C (a proxy for ventilation) in cores PN-3 and
PC23A (Rella et al., 2012; Wahyudi and Minagawa, 1997), abundance of benthic
foraminifera (an indicator of hypoxia) in core E017 (Li et al., 2005) and ODP Site
1017 (Cannariato and Kennett, 1999) (Figures 6d-k). "
Lines 454-457: no, at those high temperatures you would only get a reduction in
O2 of ~ 3 for one degree warming, and 15 for a four degree warming (assuming no

large salinity changes). Higher glacial salinity would cause less reduction in O2.
Reply#28: Corrected. The reference by Brewer and Peltzer (2016) has been
included in the revised manuscript. Lines 463-465. The sentence was changed to:
"Based on thermal solubility effects, a hypothetical warming of 1°C would
reduce oxygen concentrations by about 3.5 μmol/kg at water temperatures around
22°C (Brewer and Peltzer, 2016), ......"
Lines 457-458: sentence does not make sense.
Reply#29:We have removed the sentence in the revised manuscript.
Lines 848-846(484-486?): does not make sense. How does subsurface water
oxygen consumption lead to lower oxygen concentrations in deeper waters?
Reply#30: Thanks for your suggestion. We have removed the sentence in the
revised manuscript. The replenishment of oxygen in deep water is controlled by both
lateral advection and vertical supply. The oxygen consumption in subsurface water
would reduce the oxygen supply, thus lead to a lower oxygen concentration in deeper
waters.
Lines 491-494: again not taking into account other factors that influence CaCO3
accumulation and preservation in sediments. For discussion on Kuroshio Current: see
Lim et al. (2017).
Reply#31: Please see Reply #16 for CaCO3.
Total Hg concentrations (Lim et al., 2017) has been invoked to explain variations
in the intensity of Kuroshio. Interestingly, they concluded that the intensity of
Kuroshio strengthened rapidly since 9.3 ka, whereas weakening and/or changing path
of Kuroshio occurred during the last glaciation (20 ka - 9.3 ka). This conclusion
further confirms weakening effect of Kuroshio on ventilation during the glacial period
but an increase since 8.5 ka, consist with our inference. We have added Lines
528-531.
"More recently, lower hydrothermal total Hg concentration during 20 ka - 9.6 ka,
associated with reduced intensity and/or variation in flow path of KC, relative to that
of Holocene recorded in core KX12‐3 (1423 water depth) (Lim et al., 2017), further

validates our inference."
Line 544-550: coined? Matsumoto et al. (2002) discuss one radiocarbon age
from the Santa Barbara basin in relation to oxygen content, but at no point do they
propose that GNPIW was stronger oxygenated. Cartapanis et al. (2011) and Ohkushi
et al. (2013) discuss that the NE OMZ Pacific strengthened and weakened at
millennial time scales, not glacial interglacial timescales. Also around the equatorial
Pacific it is suggested that there was no difference in intermediate water oxygenation
between the last glacial and Holocene (Hoogakker et al., 2018). Further down in the
South Pacific Lu et al. (2016) suggest that upper waters were depleted in oxygen
during the last glacial period.
Reply#32:In Matsumoto et al. (2002), published in Quaternary Science Reviews
(2002, 21, 1693-1704), they used a compilation of benthic foraminiferal δ13C to reveal
the deep hydrography of the North Pacific. On page 1700 of this paper, they stated
that "Although a water mass that reaches 2000 m should not be called intermediate
water in the sense of modern physical oceanography, here we will refer to it as glacial
NPIW (GNPIW) for the lack of a better name."
According to our understanding, GNPIW refers to the nature of NPIW during
cold intervals in the geological past, which is used to describe the state of NPIW at a
variety of timescales, such as glacials, stadials, and Heinrich cold events. It should be
noted that, since then, this term have been widely used in the literature related to
NPIW (Cartapanis et al., 2011; Max et al., 2017; Worne et al., 2019).
Lines 550-556: generalised comment, what about brine (aka Kim et al. 2011).
Reply#33: Thanks. In the revised Manuscript, we shorten these sentences. Lines
562-563 in the revised MS. The sentence now was changed to:
"The intensified formation of GNPIW due to additional source region in the
Bering Sea was proposed by Ohkushi et al. (2003) and Horikawa et al. (2010)."
Lines 556-559: what is intensified GNPIW?
Reply#34:"intensified GNPIW" means improved formation of NPIW. Here, we

also use enhanced NPIW formation to replace intensified GNPIW. Lines 569-570 in
the revised MS. The sentence was amended as follows.
"......validate such inference, suggesting pronounced effects of intensified NPIW
formation in the OT."
Discussion lines 560-571: needs tightening, it is unclear where this goes and how
it relates to this study?
Reply#35: We have rewrote these sentences. In the revised manuscript, the aim
of this paragraph is to clarify the process of intensified GNPIW during HS1 and its
substantial control on sedimentary oxygenation of the northern OT. Lines 571-586 in
the revised MS. We have changed the sentences as follows:
"During HS1, a stronger formation of GNPIW was supported by proxy studies
and numerical simulations. For example, on the basis of paired benthic-planktic (B-P)
14C data, enhanced penetration of NPIW into a much deeper water depth during HS1
relative to the Holocene has been revealed in several studies (Max et al., 2014;
Okazaki et al., 2010; Sagawa and Ikehara, 2008), which was also simulated by several
models (Chikamoto et al., 2012; Gong et al., 2019; Okazaki et al., 2010). On the other
hand, increased intermediate water temperature in the subtropical Pacific recorded in
core GH08-2004 (1166 m water depth) (Kubota et al., 2015) and young deep water
observed in the northern South China Sea during HS1 (Wan and Jian, 2014) along
downstream region of NPIW are also related to intensified NPIW formation.
Furthermore, the pathway of GNPIW from numerical model simulations (Zheng et al.,
2016) was similar to modern observations (You, 2003). Thus, all these evidence imply
a persistent, cause and effect relation between GNPIW ventilation, the intermediate
and deep water oxygen concentration in the OT and sediment redox state during HS1.
In addition, our RSEs data also suggested a similarly enhanced ventilation in HS2
(Figures 6b and c) that is also attributed to intensified GNPIW formation."
Line 629: what is ocean ventilation seesaw? There is hardly any explanation for
this in the main text, and Figure 7 shows strength of AMOC in the Atlantic and

compares this with the current study.
Reply#36: In the revised manuscript, the "ocean ventilation seesaw" has been
replaced by "the mechanism behind such out-of-phase pattern between the ventilation
in the subtropical North Pacific and the North Atlantic deep water formation" Lines
647-649 in the revised MS.
On the other hand, we also have added some discussion about the North Atlantic
Climate in the 1st paragraph of section 6.3 and modified the text of the following
sections to make it more logical.
Lines 619-630
"One of the characteristic climate features in the Northern Hemisphere, in
particular the North Atlantic is millennial-scale oscillation during glacial and deglacial
periods. These abrupt climatic events have been widely thought to be closely related
to varying strength of Atlantic Meridional Overturning Circulation (AMOC)
(Lynch-Stieglitz, 2017). One of dynamic proxies of ocean circulation, 231Pa/230Th
reveals that severe weakening of AMOC only existed during Heinrich stadials due to
increased freshwater discharges into the North Atlantic (Böhm et al., 2015; McManus
et al., 2004). On the other hand, several mechanisms, such as sudden termination of
freshwater input (Liu et al., 2009), atmospheric CO2 concentration (Zhang et al.,
2017), enhanced advection of salt (Barker et al., 2010) and changes in background
climate (Knorr and Lohmann, 2007) were proposed to explain the reinvigoration of
AMOC during the B/A."
Lines 631-632
"Our RSEs data in the Northern OT and endobenthic δ13C in the Bering Sea
(Figures 7a-c) both......"
Lines 647-649
"However, the mechanism behind such out-of-phase pattern between the
ventilation in the subtropical North Pacific and the North Atlantic deep water
formation remains unclear."
References Andres, M., Jan, S., Sanford, T. B., Mensah, V., Centurioni, L. R., and Book, J. W.: Mean

structure and variability of the Kuroshio from northeastern Taiwan to southwestern Japan,
Oceanography, 26, 84–95, 2015.
Beny, F., Toucanne, S., Skonieczny, C., Bayon, G., and Ziegler, M.: Geochemical provenance of
sediments from the northern East China Sea document a gradual migration of the Asian Monsoon belt
over the past 400,000 years, Quaternary Science Reviews, 190, 161-175, 2018.
Cannariato, K. G. and Kennett, J. P.: Climatically related millennial-scale fluctuations in strength
of California margin oxygen-minimum zone during the past 60 k.y, Geology, 27, 975-978, 1999.
Cartapanis, O., Tachikawa, K., and Bard, E.: Northeastern Pacific oxygen minimum zone
variability over the past 70 kyr: Impact of biological production and oceanic ventilation,
Paleoceanography, 26, PA4208, doi: 4210.1029/2011PA002126, 2011.
Chang, F., Li, T., Xiong, Z., and Xu, Z.: Evidence for sea level and monsoonally driven variations
in terrigenous input to the northern East China Sea during the last 24.3 ka, Paleoceanography, 30,
642-658, 2015.
Chang, Y.-P., Chen, M.-T., Yokoyama, Y., Matsuzaki, H., Thompson, W. G., Kao, S.-J., and
Kawahata, H.: Monsoon hydrography and productivity changes in the East China Sea during the past
100,000 years: Okinawa Trough evidence (MD012404), Paleoceanography, 24, PA3208, doi:
3210.1029/2007PA001577, 2009.
Clemens, S. C., Holbourn, A., Kubota, Y., Lee, K. E., Liu, Z., Chen, G., Nelson, A., and
Fox-Kemper, B.: Precession-band variance missing from East Asian monsoon runoff, Nature
Communications, 9, 3364, doi: 3310.1038/s41467-41018-05814-41460, 2018.
Diekmann, B., Hofmann, J., Henrich, R. I., Futterer, D. K., Rohl, U., and Wei, K. Y.: Detrital
sediment supply in the southern Okinawa Trough and its relation to sea-level and Kuroshio dynamics
during the late Quaternary, Marine Geology, 255, 83-95, 2008.
Dou, Y., Yang, S., Shi, X., Clift, P. D., Liu, S., Liu, J., Li, C., Bi, L., and Zhao, Y.: Provenance
weathering and erosion records in southern Okinawa Trough sediments since 28ka: Geochemical and
Sr–Nd–Pb isotopic evidences, Chemical Geology, 425, 93-109, 2016.
Hoogakker, B. A. A., Elderfield, H., Schmiedl, G., McCave, I. N., and Rickaby, R. E. M.:
Glacial–interglacial changes in bottom-water oxygen content on the Portuguese margin, Nature
Geoscience, 8, 40-43, 2015.
Jaccard, S. L. and Galbraith, E. D.: Direct ventilation of the North Pacific did not reach the deep
ocean during the last deglaciation, Geophysical Research Letters, 40, 199-203, 2013.
Jaccard, S. L. and Galbraith, E. D.: Large climate-driven changes of oceanic oxygen
concentrations during the last deglaciation, Nature Geoscience, 5, 151-156, 2012.
Jaccard, S. L., Galbraith, E. D., Martínez-García, A., and Anderson, R. F.: Covariation of deep
Southern Ocean oxygenation and atmospheric CO2 through the last ice age, Nature, 530, 207-210,
2016.
Jaccard, S. L., Galbraith, E. D., Sigman, D. M., Haug, G. H., Francois, R., Pedersen, T. F., Dulski,
P., and Thierstein, H. R.: Subarctic Pacific evidence for a glacial deepening of the oceanic respired
carbon pool, Earth and Planetary Science Letters, 277, 156-165, 2009.
Jian, Z. M., Chen, R. H., and Li, B. H.: Deep-sea benthic foraminiferal record of the
paleoceanography in the southern Okinawa trough over the last 20000 years, Science in China Series
D-Earth Sciences, 39, 551-560, 1996.
Keigwin, L. D.: Glacial-age hydrography of the far northwest Pacific Ocean, Paleoceanography,
13, 323-339, 1998.

Li, D., Zheng, L.-W., Jaccard, S. L., Fang, T.-H., Paytan, A., Zheng, X., Chang, Y.-P., and Kao,
S.-J.: Millennial-scale ocean dynamics controlled export productivity in the subtropical North Pacific,
Geology, 45, 651-654, 2017.
Li, T., Xu, Z., Lim, D., Chang, F., Wan, S., Jung, H., and Choi, J.: Sr–Nd isotopic constraints on
detrital sediment provenance and paleoenvironmental change in the northern Okinawa Trough during
the late Quaternary, Palaeogeography, Palaeoclimatology, Palaeoecology, 430, 74-84, 2015.
Li, T. G., Xiang, R., Sun, R. T., and Cao, Q. Y.: Benthic foraminifera and bottom water evolution
in the middle-southern Okinawa Trough during the last 18 ka, Science in China Series D-Earth
Sciences, 48, 805-814, 2005.
Lim, D., Kim, J., Xu, Z., Jeong, K., and Jung, H.: New evidence for Kuroshio inflow and
deepwater circulation in the Okinawa Trough, East China Sea: Sedimentary mercury variations over
the last 20 kyr, Paleoceanography, 32, 571-579, 2017.
Lu, Z., Hoogakker, B. A. A., Hillenbrand, C.-D., Zhou, X., Thomas, E., Gutchess, K. M., Lu, W.,
Jones, L., and Rickaby, R. E. M.: Oxygen depletion recorded in upper waters of the glacial Southern
Ocean, Nature Communication, 7, doi: 10.1038/ncomms11146, 2016.
Matsumoto, K., Oba, T., Lynch-Stieglitz, J., and Yamamoto, H.: Interior hydrography and
circulation of the glacial Pacific Ocean, Quaternary Science Reviews, 21, 1693-1704, 2002.
Max, L., Rippert, N., Lembke-Jene, L., Mackensen, A., Nürnberg, D., and Tiedemann, R.:
Evidence for enhanced convection of North Pacific Intermediate Water to the low-latitude Pacific under
glacial conditions, Paleoceanography, 32, 41-55, 2017.
Nakamura, H., Nishina, A., Liu, Z. J., Tanaka, F., Wimbush, M., and Park, J. H.: Intermediate and
deep water formation in the Okinawa Trough, Journal of Geophysical Research-Oceans, 118,
6881-6893, 2013.
Reimer, P. J., Bard, E., Bayliss, A., Beck, J. W., Blackwell, P. G., Bronk Ramsey, C., Buck, C. E.,
Cheng, H., Edwards, R. L., Friedrich, M., Grootes, P. M., Guilderson, T. P., Haflidason, H., Hajdas, I.,
Hatté, C., Heaton, T. J., Hoffmann, D. L., Hogg, A. G., Hughen, K. A., Kaiser, K. F., Kromer, B.,
Manning, S. W., Niu, M., Reimer, R. W., Richards, D. A., Scott, E. M., Southon, J. R., Staff, R. A.,
Turney, C. S. M., and van der Plicht, J.: IntCal13 and Marine13 Radiocarbon Age Calibration Curves
0–50,000 Years cal BP, Radiocarbon, 55, 1869-1887, 2013.
Shi, X., Wu, Y., Zou, J., Liu, Y., Ge, S., Zhao, M., Liu, J., Zhu, A., Meng, X., Yao, Z., and Han, Y.:
Multiproxy reconstruction for Kuroshio responses to northern hemispheric oceanic climate and the
Asian Monsoon since Marine Isotope Stage 5.1 (~88 ka), Climate of the Past, 10, 1735-1750, 2014.
Sigman, D. M. and Boyle, E. A.: Glacial/interglacial variations in atmospheric carbon dioxide,
Nature, 407, 859-869, 2000.
Worne, S., Kender, S., Swann, G. E. A., Leng, M. J., and Ravelo, A. C.: Coupled climate and
subarctic Pacific nutrient upwelling over the last 850,000 years, Earth and Planetary Science Letters,
522, 87-97, 2019.
Zhao, D., Wan, S., Clift, P. D., Tada, R., Huang, J., Yin, X., Liao, R., Shen, X., Shi, X., and Li, A.:
Provenance, sea-level and monsoon climate controls on silicate weathering of Yellow River sediment in
the northern Okinawa Trough during late last glaciation, Palaeogeography, Palaeoclimatology,
Palaeoecology, 490, 227-239, 2018.
Zhao, D., Wan, S., Toucanne, S., Clift, P. D., Tada, R., Révillon, S., Kubota, Y., Zheng, X., Yu, Z.,
Huang, J., Jiang, H., Xu, Z., Shi, X., and Li, A.: Distinct control mechanism of fine-grained sediments
from Yellow River and Kyushu supply in the northern Okinawa Trough since the last glacial,

Geochemistry, Geophysics, Geosystems, 18, 2949-2969, 2017.
Zheng, X., Li, A., Kao, S., Gong, X., Frank, M., Kuhn, G., Cai, W., Yan, H., Wan, S., Zhang, H.,
Jiang, F., Hathorne, E., Chen, Z., and Hu, B.: Synchronicity of Kuroshio Current and climate system
variability since the Last Glacial Maximum, Earth and Planetary Science Letters, 452, 247-257, 2016.
Zhu, A., Shi, X., Zou, J., Wu, Y., Zhang, H., and Bai, Y.: Sediment Provenance and Fluxes in the
Northern Okinawa Trough During the last 88ka, Marine Geology & Quaternary Geology, 35, 1-8 (in
Chinese with English Abstract), 2015.
Captions
Figure A1 Photomicrographs with Modular Stereo Microscope (Zeiss SteREO
Discovery V12) show that both detrital and biogenic components of sediment coarse
fraction (>63 µm) for 8.23 ka (120-124 cm), 9.26 ka (144-148 cm), 10.98 ka (184-188
cm), 11.66 ka (200-204 cm), 12.92 ka (232-236 cm), 14.05 ka (264-268 cm), and
15.18 ka (296-300 cm) in core CSH1 at 200 X magnification.
Figure 3. (a) Lithology and oxygen isotope (δ18O) profile of planktic
foraminifera species Globigerinoides ruber (G.ruber) in core CSH1. (b) Plot of ages
versus depth for core CSH1. Three known ash layers are indicated by solid red
rectangles. (c) Time series of linear sedimentation rate (LSR) from core CSH1. (d)
Comparison of age model of core CSH1 with Chinese Stalagmite composite δ18O
curve of (Cheng et al., 2016). Tie points for CSH1 core chronology (Table 2) in
Figures 3c and d are designated by colored crosses.
Figure 6. Proxy-related reconstructions of mid-depth sedimentary oxygenation at
site CSH1 (this study) compared with oxygenation records from other locations of the
North Pacific and published climatic and environmental records from the Okinawa
Trough.

Figure A1

Figure 3
Figure 6

Point-by-point response to referee comments
Response to reviewer
Key:
- Reviewers’ comments
- Author’s response
- Modified text in the manuscript
Anonymous Referee #2
Received and published: 24 July 2019
Zou et al., present a rather interesting study focusing on reconstructing the
oxygenation history in the Okinawa Trough covering the last 50 kyrs. Specifically, the
authors attempt to disentangle the typically confounding influence of export
production (and by inference the oxygen consumption related to organic matter
degradation) and bottom water ventilation on the sedimentary redox condition. Their
geochemical records largely corroborate previous findings in that oxygenation
patterns at intermediate depths in the North Pacific were primarily controlled by the
production and ventilation of North Pacific Intermediate Water. Specifically,
conditions were generally better oxygenated during stadials, when NPIW was
generally better ventilated and vertically expanded. Furthermore, their data support a
general expansion of oxygen-depleted waters at intermediate depths during the B/A
occupying large swaths of the North Pacific.
The manuscript is well documented and quite detailed in places. The
argumentation could be somewhat streamlined (see comments below) and would
certainly benefit from editorial support. I would also recommend the argumentation to
focus on the aspects outlined in the title and abstract.
Reply#1: We thank the reviewer for the recognition of significance of this study.
Based on the suggestions of the reviewer, we revised our manuscript thoroughly with
a focus on sedimentary oxygenation changes in the subtropical North Pacific and its
linkages to North Atlantic Climate. In the following, we address each specific point

raised by the reviewer.
l. 35 – deep ocean carbon sequestration is certainly one the reasons potentially
explaining lower glacial pCO2 concentrations, but certainly not the only one. Please
rephrase to avoid unnecessary confusion
Reply#2: Thanks for your suggestion. We rephrased this sentence as the
following. Lines 32-34 in the revised MS.
"The deep ocean carbon cycle, especially carbon sequestration and outgassing, is
one of the mechanisms to explain variations in atmospheric CO2 concentrations on
millennial and orbital timescales."
l. 36 – I would suggest rephrasing as follows – However, the potential role of
subtropical North Pacific subsurface waters in modulating.
Reply#3: Agreed and we have done so. Thanks. Lines 34-36. The sentence was
amended as follows.
"However, the potential role of subtropical North Pacific subsurface waters in
modulating atmospheric CO2 levels on millennial timescales is poorly constrained."
l. 48 and throughout – why is HS1 so much different from HS2 when
considering their respective oxygenation history?
Reply#4: During HS1 and HS2, our RSEs suggest enhanced sedimentary
oxygenation. As suggested by the Reviewer, a slight difference in the structure of
ventilation mode can be observed (Figure 7). We think this slight discrepancy could
be related to different climatic background of HS1 and HS2. Records from
paleoclimate archives, such as ice core and Chinese cave stalagmites, show some
differences in structure, duration, amplitude between HS1 and HS2. Such differences
are thought to be related to the climate background state, such as, CO2 concentration,
ice sheet volume, AMOC intensity, sea ice extent and source of freshwater, etc.
(Flückiger et al., 2006; Hemming, 2004; Kaspi et al., 2004; Lynch-Stieglitz et al.,
2014) . The response of NPIW to HS1 and HS2 events could be different, and thus
cause a slight difference in sedimentary oxygenation. On the other hand, the
discrepancy in export productivity (CaCO3) during these two cold intervals in core

CSH1 could also play a role in controlling sedimentary oxygenation.
l. 62 – agreed. But I would add that in addition of the flushing of a poorly
ventilated deep water mass upon the resumption of NADW, many export production
records show a drastic increase during the B/A (e.g. Kohfeld& Chase, 2011), which
could account for enhance oxygen removal associated with organic matter respiration
upstream of the core site location.
Reply#5: Agreed with your suggestion and revised. Lines 51-52. The sentence
was changed to
"......due to decreased NPIW formation and enhanced export production......"
l. 70 – AT the sediment-water interface
Reply#6: We reworded the sentence. Lines 61-66 in revised Manuscript. It was
amended as follows.
"A more sluggish deep ocean ventilation combined with a more efficient
biological pump widely thought to facilitate enhanced carbon sequestration in the
ocean interior, leading to atmospheric CO2 drawdown during glacial cold periods
(Sigman and Boyle, 2000). These changes are tightly coupled to bottom water
oxygenation and sedimentary redox changes on both millennial and orbital timescales
(Hoogakker et al., 2015; Jaccard and Galbraith, 2012; Sigman and Boyle, 2000)."
l. 83 . . . in marine sediment cores
Reply#7: Corrected. Line 76. The sentence was amended as follows.
"......in marine sediment cores."
l. 86 . . . in the subarctic North Pacific.
Reply#8: Corrected. Line 78. The sentence was amended as follows.
"...... last glaciation and Holocene in the subarctic North Pacific."
l. 92 – I would suggest to briefly explain what cabbelingmeans
Reply#9: Done. Cabbeling is a mixing process to form a new water mass with
increased density than that of parent water masses. We have added in Lines 85-86.
"......that cabbeling, a mixing process to form a new water mass with increased

density than that of parent water masses, is the principle mechanism responsible......"
l. 96 and throughout (incl. Fig. 6) – this may well be a semantic issue, but
benthic d13C cannot be considered as a ventilation proxy per se, as the isotopic value
can be obfuscated by air-sea gas exchange in locations where subsurface water masses
form.
Reply#10: We agree with the comment by the Reviewer that benthic δ13C
changes are influenced by a variety of factors, such as air-sea equilibration,
ocean-circulation changes, and productivity changes, etc. Previous studies also
revealed benthic δ13C patterns at basin-wide scales can reflect ocean-circulation
changes (Charles and Fairbanks, 1992; Charles et al., 1996; Ninnemann and Charles,
2002). In this study we also noticed similar trends in benthic δ13C during ~22 ka and
~14 ka between cores PN-3 (Okinawa Trough) and PC23A (Bering Sea) (Figure 4),
despite their great distance. In the revised manuscript, we add additional information
for benthic δ13C. The sentence was amended Lines 89-92.
"Benthic foraminiferal δ13C, a quasi-conservative tracer for water mass, from the
North Pacific suggested an enhanced ventilation (higher δ13C) at water depths of <
2000 m during the last glacial period (Keigwin, 1998; Matsumoto et al., 2002)."
l. 151 – processes that are related to the supply of oxygen by ocean circulation
and. . .
Reply#11: Revised. Lines 150-153. The sentence was changed to:
"The sedimentary redox conditions are governed by the rate of oxygen supply
from the overlying bottom water and the rate of oxygen removal from pore water
(Jaccard et al., 2016), processes that are related to the supply of oxygen by ocean
circulation and organic matter respiration, respectively."
l. 163 – technically one should specify that under reducing conditions it is the
authigenic fraction of Mn (as opposed to its detrital background) that remains low.
Reply#12: Revised. Lines 162-163. The sentence was amended as follows:
"Under reducing conditions, the authigenic fraction of Mn (as opposed to its
detrital background) ......"
l. 168 – please add adequate reference

Reply#13: The reference (Morford and Emerson 1999) has been included in the
revised manuscript. Line 170.
l. 195 – volcanism
Reply#14: Revised. Line 198. "volcanic " has been changed to "volcanism".
§3 – I would suggest to substantially shorten this paragraph as the general
oceanographic setting is already outlined in the introduction. I would recommend
focusing on the aspects directly relevant to the argumentation (nutrient, dissolved
O2).
Reply#15: Thanks for your suggestion. In the revised manuscript, we removed
the 1st paragraph of section 3 and then we reworded some sentences of previous 3rd
paragraph of section 3. Lines 218-227. The paragraph was amended as follows.
"A lower sea surface salinity (SSS) zone in summer relative to the one in winter
in the ECS migrates toward the east of OT, indicating enhanced impact of the
Changjiang discharge associated with summer EAM (Figures 2a and b). An estimated
~80% of the mean annual discharge of the river Changjiang is supplied to the ECS
(Ichikawa and Beardsley, 2002) and in situ observational data show a pronounced
negative correlation between the Changjiang discharge and SSS in July (Delcroix and
Murtugudde, 2002). Consistently, previous studies from the OT reported such close
relationship between summer EAM and SSS back to the late Pleistocene (Chang et al.,
2009; Clemens et al., 2018; Kubota et al., 2010; Sun et al., 2005)."
l. 287 – why is the sedimentation rate so high during HS2 when both export
production and detrital input (based on Al) are low? I would suggest verifying the age
pointers for that interval.
Reply#16: Thanks for your suggestion and we have verified the age control
points (Figure 3 and Table 2). In the original manuscript, higher sedimentation rate
mainly occurred during HS2 and HS3 (> 40-60 cm/ka) and is mainly caused by
uncertainties of age control points at 23.476 ka (DO2) and 29.995 ka (H3). In the
revised manuscript, these two age control points have been eliminated. Even with this

more conservative tuning approach, the conclusions remain the same as before and
robust.
l.291 – 85 samples covering 50 kyrs cannot provide an average time resolution of
200 yrs.
Reply#17: We thank the reviewer to point out this mistake. Now we have
corrected it to ~ 600 years. Lines 286-287 in revised manuscript. The sentence was
changed to:
"...... representing a temporal resolution of about 600 years (every 4 cm
interval)......"
l. 345-346 – Maybe. But it may also suggest that the sedimentary CaCO3 content
could be directly controlled by dilution. I would interpret the export productivity
records with caution.
Reply#18: We thank the reviewer for the very helpful comments and suggestions.
In the revised manuscript, we have ruled out the effects of some factors, such as
dilution and dissolution, on CaCO3. On the other hand, we have reworded this section
to cautiously interpret CaCO3 as a reliable proxy for export production at core CSH1.
We have added the following information to Lines 339-358.
"Several lines of evidence support CaCO3 as a reliable productivity proxy,
particularly during the last deglaciation. The strong negative correlation coefficient (r
= – 0.85, p<0.01) between Al and CaCO3 in sediments throughout core CSH1
confirms the biogenic origin of CaCO3 against terrigenous Al (Figure 4f). Generally,
terrigenous dilution decreases the concentrations of CaCO3. An inconsistent
relationship between CaCO3 contents and sedimentation rates indicates a minor effect
of dilution on CaCO3. Furthermore, the increasing trend in CaCO3 associated with
high sedimentation rate during the last deglacial interval indicates a substantial
increase in export productivity (Figures 4a and d). The high coherence between
CaCO3 content and alkenone-derived sea surface water (SST) (Shi et al., 2014)
indicates a direct control on CaCO3 by SST. Moreover, a detailed comparison between
CaCO3 concentrations and the previously published foraminiferal fragmentation ratio
(Wu et al., 2004) shows, apart from a small portion within the LGM, no clear
co-variation between them. These evidence suggest that CaCO3 changes are driven
primarily by variations in carbonate primary production, and not overprinted by
secondary processes, such as carbonate dissolution through changes in the lysocline
depth and dilution by terrigenous materials. Likewise, a similar deglacial trend in
CaCO3 is also observed in core MD01-2404 (Chang et al., 2009), indicating a
ubiquitous, not local picture in the OT. All these lines of evidence thus support CaCO3
of core CSH1 as a reliable productivity proxy to a first order approximation."
l.371-372 – interesting idea!
Reply#19: Thanks.
l. 427 (438?) – supply seems more adequate than provision.
Reply#20: Agreed and revised. Line 440. "provision" was replaced by "supply".
l. 487-488 – please also consider citing Galbraith et al., 2007.
Reply#21: The paper has been included in the revised manuscript. Line 496.
l. 489-490 – please keep in mind that O2 can be consumed upstream of the core
site location as the removal of O2 in relation to organic matter degradation is
integrated over the flow path of a give subsurface water mass.
Reply#22: Thanks for your suggestion. We agree with the comment.
Fig. 6C – shouldn’t the grey triangle right of the vertical axis be flipped upside
down (i.e. high Mo/Mn coincident with low oxygenation)?
Reply#23: Thanks. High Mo/Mn ratio indicates low oxygen condition. The sign
in Fig. 6c has been corrected.
References Chang, Y.-P., Chen, M.-T., Yokoyama, Y., Matsuzaki, H., Thompson, W. G., Kao, S.-J., and
Kawahata, H.: Monsoon hydrography and productivity changes in the East China Sea during the past
100,000 years: Okinawa Trough evidence (MD012404), Paleoceanography, 24, PA3208, doi:

3210.1029/2007PA001577, 2009.
Charles, C. D. and Fairbanks, R. G.: Evidence from Southern Ocean sediments for the effect of
North Atlantic deep-water flux on climate, Nature, 355, 416-419, 1992.
Charles, C. D., Lynch-Stieglitz, J., Ninnemann, U. S., and Fairbanks, R. G.: Climate connections
between the hemisphere revealed by deep sea sediment core/ice core correlations, Earth and Planetary
Science Letters, 142, 19-27, 1996.
Clemens, S. C., Holbourn, A., Kubota, Y., Lee, K. E., Liu, Z., Chen, G., Nelson, A., and
Fox-Kemper, B.: Precession-band variance missing from East Asian monsoon runoff, Nature
Communications, 9, 3364, doi: 3310.1038/s41467-41018-05814-41460, 2018.
Delcroix, T. and Murtugudde, R.: Sea surface salinity changes in the East China Sea during
1997–2001: Influence of the Yangtze River, Journal of Geophysical Research: Oceans, 107, 8008,
doi:8010.1029/2001JC000893, 2002.
Flückiger, J., Knutti, R., and White, J. W. C.: Oceanic processes as potential trigger and
amplifying mechanisms for Heinrich events, Paleoceanography, 21, 2006.
Hemming, S. R.: Heinrich events: Massive late Pleistocene detritus layers of the North Atlantic
and their global climate imprint, Reviews of Geophysics, 42, 2004.
Hoogakker, B. A. A., Elderfield, H., Schmiedl, G., McCave, I. N., and Rickaby, R. E. M.:
Glacial–interglacial changes in bottom-water oxygen content on the Portuguese margin, Nature
Geoscience, 8, 40-43, 2015.
Ichikawa, H. and Beardsley, R. C.: The Current System in the Yellow and East China Seas,
Journal of Oceanography, 58, 77-92, 2002.
Jaccard, S. L. and Galbraith, E. D.: Large climate-driven changes of oceanic oxygen
concentrations during the last deglaciation, Nature Geoscience, 5, 151-156, 2012.
Jaccard, S. L., Galbraith, E. D., Martínez-García, A., and Anderson, R. F.: Covariation of deep
Southern Ocean oxygenation and atmospheric CO2 through the last ice age, Nature, 530, 207-210,
2016.
Kaspi, Y., Sayag, R., and Tziperman, E.: A “triple sea-ice state” mechanism for the abrupt
warming and synchronous ice sheet collapses during Heinrich events, Paleoceanography, 19, 2004.
Keigwin, L. D.: Glacial-age hydrography of the far northwest Pacific Ocean, Paleoceanography,
13, 323-339, 1998.
Kubota, Y., Kimoto, K., Tada, R., Oda, H., Yokoyama, Y., and Matsuzaki, H.: Variations of East
Asian summer monsoon since the last deglaciation based on Mg/Ca and oxygen isotope of planktic
foraminifera in the northern East China Sea, Paleoceanography, 25, PA4205,
doi:4210.1029/2009pa001891, 2010.
Lynch-Stieglitz, J., Schmidt, M. W., Gene Henry, L., Curry, W. B., Skinner, L. C., Mulitza, S.,
Zhang, R., and Chang, P.: Muted change in Atlantic overturning circulation over some glacial-aged
Heinrich events, Nature Geoscience, 7, 144, 2014.
Matsumoto, K., Oba, T., Lynch-Stieglitz, J., and Yamamoto, H.: Interior hydrography and
circulation of the glacial Pacific Ocean, Quaternary Science Reviews, 21, 1693-1704, 2002.
Ninnemann, U. S. and Charles, C. D.: Changes in the mode of Southern Ocean circulation over
the last glacial cycle revealed by foraminiferal stable isotopic variability, Earth and Planetary Science
Letters, 201, 383-396, 2002.
Shi, X., Wu, Y., Zou, J., Liu, Y., Ge, S., Zhao, M., Liu, J., Zhu, A., Meng, X., Yao, Z., and Han, Y.:
Multiproxy reconstruction for Kuroshio responses to northern hemispheric oceanic climate and the

Asian Monsoon since Marine Isotope Stage 5.1 (~88 ka), Climate of the Past, 10, 1735-1750, 2014.
Sigman, D. M. and Boyle, E. A.: Glacial/interglacial variations in atmospheric carbon dioxide,
Nature, 407, 859-869, 2000.
Sun, Y. B., Oppo, D. W., Xiang, R., Liu, W. G., and Gao, S.: Last deglaciation in the Okinawa
Trough: Subtropical northwest Pacific link to Northern Hemisphere and tropical climate,
Paleoceanography, 20, PA4005, doi:4010.1029/2004pa001061, 2005.
Wu, Y., Cheng, Z., and Shi, X.: Stratigraphic and carbonate sediment characteristics of Core CSH1
from the northern Okinawa Trough, Advances in Marine Science, 22, 163-169 (in Chinese with English
Abstract), 2004.

Millennial-scale variations of sedimentary oxygenation in the western 1
subtropical North Pacific and its links to the North Atlantic climate 2
3
Jianjun Zou1,2, Xuefa Shi1,2, Aimei Zhu1, Selvaraj Kandasamy3, Xun Gong4, Lester 4
Lembke-Jene4, Min-Te Chen5, Yonghua Wu1,2, Shulan Ge1,2, Yanguang Liu1,2, Xinru 5
Xue1, Gerrit Lohmann4, Ralf Tiedemann4 6
1Key Laboratory of Marine Sedimentology and Environmental Geology, First Institute 7
of Oceanography, MNR, Qingdao 266061, China 8
2Laboratory for Marine Geology, Qingdao National Laboratory for Marine Science 9
and Technology, Qingdao, 266061, China 10
3Department of Geological Oceanography and State Key Laboratory of Marine 11
Environmental Science, Xiamen University, Xiamen361102, China 12
4Alfred-Wegener-Institut Helmholtz-Zentrum für Polar- und Meeresforschung, Am 13
Handelshafen 12Bussestr. 24, 27570 Bremerhaven, Germany 14
5Institute of Applied Geosciences, National Taiwan Ocean University, Keelung 20224, 15
Taiwan 16
17
Corresponding authors: 18
Jianjun Zou ([email protected]); Xuefa Shi ([email protected]) 19
20
Key Points 21
1. This study reconstructs the History history of sedimentary oxygenation processes at 22
mid-depths in the western subtropical North Pacific since the Last last gGlacial period 23
is reconstructed using sediment-bound geochemical proxies. 24
2. Sediment-bound rRedox-sensitive proxies reveal millennial-scale variations in 25
sedimentary oxygenation that correlated closely to changes in the North Pacific 26
Intermediate Water. 27
3. A millennial-scale out-of-phase relationship between deglacial ventilation in the 28
western subtropical North Pacific and the formation of North Atlantic Deep Water is 29
suggested. 30
带格式的: 无下划线, 字体颜色: 自动设置
带格式的: 无下划线, 字体颜色: 自动设置
带格式的: 无下划线, 字体颜色: 自动设置
带格式的: 无下划线, 字体颜色: 自动设置
带格式的: 无下划线, 字体颜色: 自动设置
带格式的: 无下划线, 字体颜色: 自动设置
带格式的: 无下划线, 字体颜色: 自动设置
带格式的: 无下划线, 字体颜色: 自动设置
带格式的: 无下划线, 字体颜色: 自动设置

4. A larger CO2 storage at mid-depths of the North Pacific corresponds to the 31
termination of atmospheric CO2 rise during the Bölling-Alleröd interval. 32
33
带格式的: 无下划线, 字体颜色: 自动设置

Abstract 34
The deep ocean carbon cycle, especially carbon sequestration and outgassing, is 35
one of the mechanisms to explain variations inLower glacial atmospheric CO2 36
concentrations on millennial and orbital timescales have been attributed to carbon 37
sequestration in deep oceans. However, the potential roles of voluminous subtropical 38
North Pacific subsurface waters in modulating atmospheric CO2 levels on millennial 39
timescales are is poorly constrained. Further, aAn increase in respired CO2 40
concentration in the glacial deep ocean due to biological pump generally is coeval 41
withcorresponds to less deoxygenation in the subsurface layer. This link thus offers a 42
chance to visit study oceanic ventilation and the coeval export productivity based on 43
redox-controlled, sedimentary geochemical parameters. Here, we investigate a suite of 44
sediment geochemical proxies in a sediment core from the Okinawa Trough to 45
understand the sedimentary oxygenation variations in the subtropical North Pacific 46
(core CSH1) over the last 50,000 thousand years (50 ka). Our resultsOur results 47
suggest that enhanced mid-depth western subtropical North Pacific (WSTNP) 48
sedimentary oxygenation suggest that enhanced occurred occurred at mid-depths of 49
the subtropical Northwest Pacific duringduring cold the past glacial periodintervals 50
and after 8.5 ka, while oxygenation decreased during the Bölling-Alleröd (B/A) and 51
Preboreal. The especially pronounced for the North Atlantic millennial-scale abrupt 52
cold events of the Younger Dryas, Heinrich Stadial (HS) 1 and 2. On the other hand, 53
oxygen-depleted seawater is found during the Bölling - Alleröd (B/A) and Preboreal. 54
Our findings of enhanced sedimentary oxygenation in the subtropical North 55
PacificWSTNP is aligned with intensified formation of North Pacific Intermediate 56
Water (NPIW) during cold spells, while the amelioratedbetter sedimentary 57
oxygenation since 8.5 ka seems to be linked with to the an intensified Kuroshio 58
Current after 8.5 ka. The enhanced formation of NPIW during Heinrich Stadial 1 59
(HS1) was likely driven by the perturbation of sea ice formation and sea surface 60
salinity oscillationss in the high-latitude North Pacific. The In our results, ddiminished 61
sedimentary oxygenation during the B/A due to decreased NPIW formationdecreased 62
NPIW formation and enhanced export production, indicates an expansion of oxygen 63
带格式的: 无下划线, 字体颜色: 自动设置
带格式的: 无下划线, 字体颜色: 自动设置
带格式的: 无下划线, 字体颜色: 自动设置
带格式的: 无下划线, 字体颜色: 自动设置
带格式的: 无下划线, 字体颜色: 自动设置
带格式的: 无下划线, 字体颜色: 自动设置
带格式的: 无下划线, 字体颜色: 自动设置
带格式的: 无下划线, 字体颜色: 自动设置
带格式的: 无下划线, 字体颜色: 自动设置
带格式的: 无下划线, 字体颜色: 自动设置
带格式的: 无下划线, 字体颜色: 自动设置
带格式的: 无下划线, 字体颜色: 自动设置
带格式的: 无下划线, 字体颜色: 自动设置
带格式的: 无下划线, 字体颜色: 自动设置
带格式的: 无下划线, 字体颜色: 自动设置
带格式的: 无下划线, 字体颜色: 自动设置
带格式的: 无下划线, 字体颜色: 自动设置
带格式的: 无下划线, 字体颜色: 自动设置
带格式的: 无下划线, 字体颜色: 自动设置
带格式的: 无下划线, 字体颜色: 自动设置
带格式的: 无下划线, 字体颜色: 自动设置
带格式的: 非突出显示
带格式的: 无下划线, 字体颜色: 自动设置
带格式的: 无下划线, 字体颜色: 自动设置
带格式的: 无下划线, 字体颜色: 自动设置
带格式的: 无下划线, 字体颜色: 自动设置
带格式的: 无下划线, 字体颜色: 自动设置
带格式的: 无下划线, 字体颜色: 自动设置
带格式的: 无下划线, 字体颜色: 自动设置

minimum zone in the North Pacific and enhanced CO2 sequestration at mid-depth 64
waters, along with slight increasetermination of in atmospheric CO2 concentration 65
increase. Mechanistically, we We speculate thatattribute these millennial-scale 66
changes were linked to the intensified NPIW and enhanced abyss flushing(also a 67
drastic increase in export productivity) during deglacial cold and warm intervals, 68
respectively, closely related to variations in strength of North Atlantic Deep Water 69
formation, leading to intensification of NPIW formation and enhanced abyss flushing 70
during deglacial cold and warm intervals, respectively. Enhanced formation of NPIW 71
seem to be driven by the perturbation of sea ice formation and sea surface salinity 72
oscillation in high latitude North Pacific through atmospheric and oceanic 73
teleconnection. During the B/A, decreased sedimentary oxygenation likely resulted 74
from an upward penetration of aged deep water into the intermediate-depth in the 75
North Pacific, corresponding to a resumption of Atlantic Meridional Overturning 76
Circulation. 77
Keywords: sedimentary oxygenation; millennial timescale; North Pacific 78
Intermediate Water; North Atlantic Deep WaterAtlantic Meridional Overturning 79
Circulation; subtropical North Pacific 80
81
82
带格式的: 无下划线, 字体颜色: 自动设置
带格式的: 无下划线, 字体颜色: 自动设置
带格式的: 无下划线, 字体颜色: 自动设置
带格式的: 无下划线, 字体颜色: 自动设置
带格式的: 无下划线, 字体颜色: 自动设置
带格式的: 无下划线, 字体颜色: 自动设置
带格式的: 无下划线, 字体颜色: 自动设置
带格式的: 无下划线, 字体颜色: 自动设置
带格式的: 无下划线, 字体颜色: 自动设置
带格式的: 首行缩进: 0 字符, 行距:1.5 倍行距
带格式的: 缩进: 首行缩进: 0 字符,行距: 1.5 倍行距

1. Introduction 83
The A more sluggish deep ocean ventilation combined with a more efficient 84
biological pump widely thought to depletes dissolved oxygen in the sediment-water 85
interface and facilitates enhanced the carbon storage sequestration of respiredin the 86
ocean interior carbon, leading to atmospheric CO2 drawdown during glacial cold 87
periods (Sigman and Boyle, 2000). These changes are tightly coupled towhich in turn 88
playss a role in regulating bottom water oxygenation and sedimentary oxygenredox 89
changes, potentially linking to atmospheric CO2 changes on both millennial and 90
orbital and millennial timescales (Hoogakker et al., 2015; Jaccard and Galbraith, 2012; 91
Sigman and Boyle, 2000). The rReconstruction of past sedimentary oxygenation is 92
therefore crucial for understanding changes in export productivity and the renewal 93
rate of deep ocean circulation (Nameroff et al., 2004). Previous studies from both 94
high-latitude North Pacific marginss as well as open subarctic Pacific have identified 95
drastic variations in export productivity and marine ocean oxygen levels at millennial 96
and orbital millennialglacial-interglacial timescales using diverse proxies such as 97
trace elements (Cartapanis et al., 2011; Chang et al., 2014; Jaccard et al., 2009; Zou et 98
al., 2012), benthic foraminiferal assemblages (Ohkushi et al., 2016; Ohkushi et al., 99
2013; Shibahara et al., 2007) and nitrogen isotopic composition (δ15N) of organic 100
matter (Addison et al., 2012; Chang et al., 2014; Galbraith et al., 2004; Riethdorf et al., 101
2016) in marine sediment cored sediments. These studies further suggested that both 102
North Pacific Intermediate Water (NPIW) and export of organic carbon matter 103
regulate the sedimentary oxygenation variation during the last glaciation and 104
Holocene in the northeast subarctic North Pacific. By contrast, little information 105
exists on millennial-scale oxygenation changes to date in the western subtropical 106
North Pacific (WSTNP). 107
The modern NPIW precursor waters areis mainly sourced from the NW Pacific 108
marginal seas (Shcherbina et al., 2003; Talley, 1993; You et al., 2000), and then it 109
spreadings into the subtropical North Pacific at intermediate depths of 300 to 800 m 110
(Talley, 1993). The pathway and circulation of NPIW have been identified by You 111
(2003), who suggested that cabbeling, a mixing process to form a new water mass 112
带格式的: 无下划线, 字体颜色: 自动设置
带格式的: 无下划线, 字体颜色: 自动设置
带格式的: 无下划线, 字体颜色: 自动设置
带格式的: 无下划线, 字体颜色: 自动设置
带格式的: 无下划线, 字体颜色: 自动设置
带格式的: 无下划线, 字体颜色: 自动设置
带格式的: 无下划线, 字体颜色: 自动设置
带格式的: 无下划线, 字体颜色: 自动设置
带格式的: 无下划线, 字体颜色: 自动设置
带格式的: 无下划线, 字体颜色: 自动设置
带格式的: 无下划线, 字体颜色: 自动设置
带格式的: 无下划线, 字体颜色: 自动设置
带格式的: 无下划线, 字体颜色: 自动设置
带格式的: 无下划线, 字体颜色: 自动设置
带格式的: 无下划线, 字体颜色: 自动设置
带格式的: 无下划线, 字体颜色: 自动设置
带格式的: 无下划线, 字体颜色: 自动设置
带格式的: 无下划线, 字体颜色: 自动设置
带格式的: 无下划线, 字体颜色: 自动设置
带格式的: 无下划线, 字体颜色: 自动设置
带格式的: 无下划线, 字体颜色: 自动设置
带格式的: 无下划线, 字体颜色: 自动设置
带格式的: 无下划线, 字体颜色: 自动设置
带格式的: 无下划线, 字体颜色: 自动设置
带格式的: 无下划线, 字体颜色: 自动设置
带格式的: 无下划线, 字体颜色: 自动设置
带格式的: 无下划线, 字体颜色: 自动设置
带格式的: 无下划线, 字体颜色: 自动设置

with increased density than that of parent water masses, is the principle mechanism 113
responsible for transforming subpolar source waters into subtropical NPIW along the 114
subarctic-tropical frontal zone. More specifically, You et al. (2003) argued that a 115
lower subpolar input of about 2 Sv (1 Sv = 106 m3/s) is sufficient for subtropical 116
ventilation (You et al., 2003). Benthic foraminiferal δ13C data, a quasi-conservative 117
tracer for water mass, from the North Pacific suggested indicates an enhanced 118
ventilation (enrichedhigher δ13C) at water depths of < 2000 m during the last glacial 119
period (Keigwin, 1998; Matsumoto et al., 2002). Furthermore, on the basis of both 120
radiocarbon data and modeling results, Okazaki et al. (2010) provided further 121
insightsuggested into the formation of deep water in the North Pacific during the early 122
deglaciation in Heinrich Stadial 1 (HS1). Enhanced NPIW penetration is was further 123
explored using numerical model simulations (Chikamoto et al., 2012; Gong et al., 124
2019; Okazaki et al., 2010). The downstream effects of intensified GNPIW can be 125
seen in the record of δ13C of Cibicides wuellerstorfi in core PN-3 from the middle 126
Okinawa Trough (OT), whereas lower deglacial δ13C values were attributed to 127
enhanced OC accumulation rates due to higher surface productivity by Wahyudi and 128
Minagawa (1997). In contrast, substantial effects of intensified NPIW formation 129
during Marine Isotope Stage (MIS) 2 and 6 on the ventilation and nutrient 130
characteristics of lower latitude mid-depth Eastern Equatorial Pacific have been 131
suggested by recent studies (Max et al., 2017; Rippert et al., 2017). Rippert et al. 132
(2017)The downstream effects of intensified NPIW are also reflected in the record of 133
δ13C of Cibicides wuellerstorfi in core PN-3 from the middle Okinawa Trough (OT), 134
where lower deglacial δ13C values were attributed to enhanced OC accumulation rates 135
due to higher surface productivity by (Wahyudi and Minagawa, 1997). 136
The Okinawa Trough is separated from the Philippine Sea by the Ryukyu Islands 137
and is an important channel of the northern extension of the Kuroshio in the western 138
subtropical North PacificWSTNP (Figure 1). Initially the OT opened at the middle 139
Miocene (Sibuet et al., 1987) and since then, it has been a depositional center in the 140
East China Sea (ECS), receiving large sediment supplies from nearby rivers (Chang et 141
al., 2009). Surface hydrographic oceanographic characteristics of the OT over 142
域代码已更改
带格式的: 无下划线, 字体颜色: 自动设置
带格式的: 无下划线, 字体颜色: 自动设置
带格式的: 无下划线, 字体颜色: 自动设置
带格式的: 无下划线, 字体颜色: 自动设置
带格式的: 无下划线, 字体颜色: 自动设置
带格式的: 无下划线, 字体颜色: 自动设置
带格式的: 无下划线, 字体颜色: 自动设置
带格式的: 无下划线, 字体颜色: 自动设置
带格式的: 无下划线, 字体颜色: 自动设置
带格式的: 无下划线, 字体颜色: 自动设置
带格式的: 无下划线, 字体颜色: 自动设置
带格式的: 无下划线, 字体颜色: 自动设置
带格式的: 无下划线, 字体颜色: 自动设置
带格式的: 无下划线, 字体颜色: 自动设置
带格式的: 无下划线, 字体颜色: 自动设置
带格式的: 无下划线, 字体颜色: 自动设置
带格式的: 无下划线, 字体颜色: 自动设置
带格式的: 无下划线, 字体颜色: 自动设置
带格式的: 无下划线, 字体颜色: 自动设置
带格式的: 无下划线, 字体颜色: 自动设置
带格式的: 无下划线, 字体颜色: 自动设置
带格式的: 无下划线, 字体颜色: 自动设置
带格式的: 无下划线, 字体颜色: 自动设置
带格式的: 无下划线, 字体颜色: 自动设置
带格式的: 无下划线, 字体颜色: 自动设置
带格式的: 无下划线, 字体颜色: 自动设置
带格式的: 无下划线, 字体颜色: 自动设置
带格式的: 无下划线, 字体颜色: 自动设置
带格式的: 无下划线, 字体颜色: 自动设置
带格式的: 无下划线, 字体颜色: 自动设置
带格式的: 无下划线, 字体颜色: 自动设置

glacial-interglacial cycles are largely influenced by the Kuroshio and East China 143
SeaECS Coastal Water (Shi et al., 2014); the latter is related to the strength of summer 144
East Asian monsoon (EAM) sourced from the western tropical Pacific. Modern 145
physical oceanographic investigations showed that intermediate waters in the OT are 146
mainly derived from horizontal advection and mixture mixing of NPIW and South 147
China Sea Intermediate Water (Nakamura et al., 2013). These waters intrude into the 148
OT through two ways (Nakamura et al., 2013): (i) deeper part of the Kuroshio enters 149
the OT through the channel east of Taiwan (sill depth 775 m) and (ii) through the 150
Kerama Gap (sill depth 1100 m). In the northern OT, the occupied subsurface water 151
mainly flows through horizontal advection through the Kerama Gap through 152
horizontal advection from the Philippine Sea (Nakamura et al., 2013). Recently, 153
Nishina et al. (2016) found that an overflow through the Kerama Gap controls the 154
modern deep-water ventilation in the southern OT. 155
Both surface characterisitics hydrography and deep ventilation in the OT varied 156
greatly significantly since the last glaciation. During the last glacial periods, the 157
mainstream of the Kuroshio likely migrated to the east of the Ryukyu Islands or and 158
also became weaker due to lower sea levels (Shi et al., 2014; Ujiié and Ujiié, 1999; 159
Ujiié et al., 2003) and the hypothetical emergence of a Ryukyu-Taiwan land bridge 160
(Ujiié and Ujiié, 1999). In a recent study, based on the Mg/Ca-derived temperatures in 161
surface and thermocline waters, and planktic foraminiferal indicators of water masses 162
from two sediment cores located in the northern and southern OT, Ujiié et al. (2016) 163
further argued that the hydrological conditions of the North Pacific Subtropical Gyre 164
since MIS 7 is modulated by the interaction between the Kuroshio and the NPIW. 165
Besides the Kuroshio, the flux of East Asian rivers to the East China Sea (ECS), 166
which is related to the summer EAM and the sea level oscillations coupled with 167
topography are alsohave also been regulating the surface hydrography in the Okinawa 168
TroughOT (Chang et al., 2009; Kubota et al., 2010; Sun et al., 2005; Yu et al., 2009). 169
Based on benthic foraminiferal assemblages, previous studies have implied a 170
reduced oxygenation in deep waters of the middle and southern OT during the last 171
deglacial period (Jian et al., 1996; Li et al., 2005), but a strong ventilation during the 172
带格式的: 无下划线, 字体颜色: 自动设置
带格式的: 无下划线, 字体颜色: 自动设置
带格式的: 无下划线, 字体颜色: 自动设置
带格式的: 无下划线, 字体颜色: 自动设置
带格式的: 无下划线, 字体颜色: 自动设置
带格式的: 无下划线, 字体颜色: 自动设置
带格式的: 无下划线, 字体颜色: 自动设置
带格式的: 无下划线, 字体颜色: 自动设置
带格式的: 无下划线, 字体颜色: 自动设置
带格式的: 无下划线, 字体颜色: 自动设置
带格式的: 无下划线, 字体颜色: 自动设置
带格式的: 无下划线, 字体颜色: 自动设置
带格式的: 无下划线, 字体颜色: 自动设置
带格式的: 无下划线, 字体颜色: 自动设置
带格式的: 无下划线, 字体颜色: 自动设置
带格式的: 无下划线, 字体颜色: 自动设置
带格式的: 无下划线, 字体颜色: 自动设置
带格式的: 无下划线, 字体颜色: 自动设置
带格式的: 无下划线, 字体颜色: 自动设置
带格式的: 无下划线, 字体颜色: 自动设置
带格式的: 无下划线, 字体颜色: 自动设置
带格式的: 无下划线, 字体颜色: 自动设置
带格式的: 无下划线, 字体颜色: 自动设置
带格式的: 无下划线, 字体颜色: 自动设置
带格式的: 无下划线, 字体颜色: 自动设置
带格式的: 无下划线, 字体颜色: 自动设置
带格式的: 无下划线, 字体颜色: 自动设置
带格式的: 无下划线, 字体颜色: 自动设置
带格式的: 无下划线, 字体颜色: 自动设置
带格式的: 无下划线, 字体颜色: 自动设置
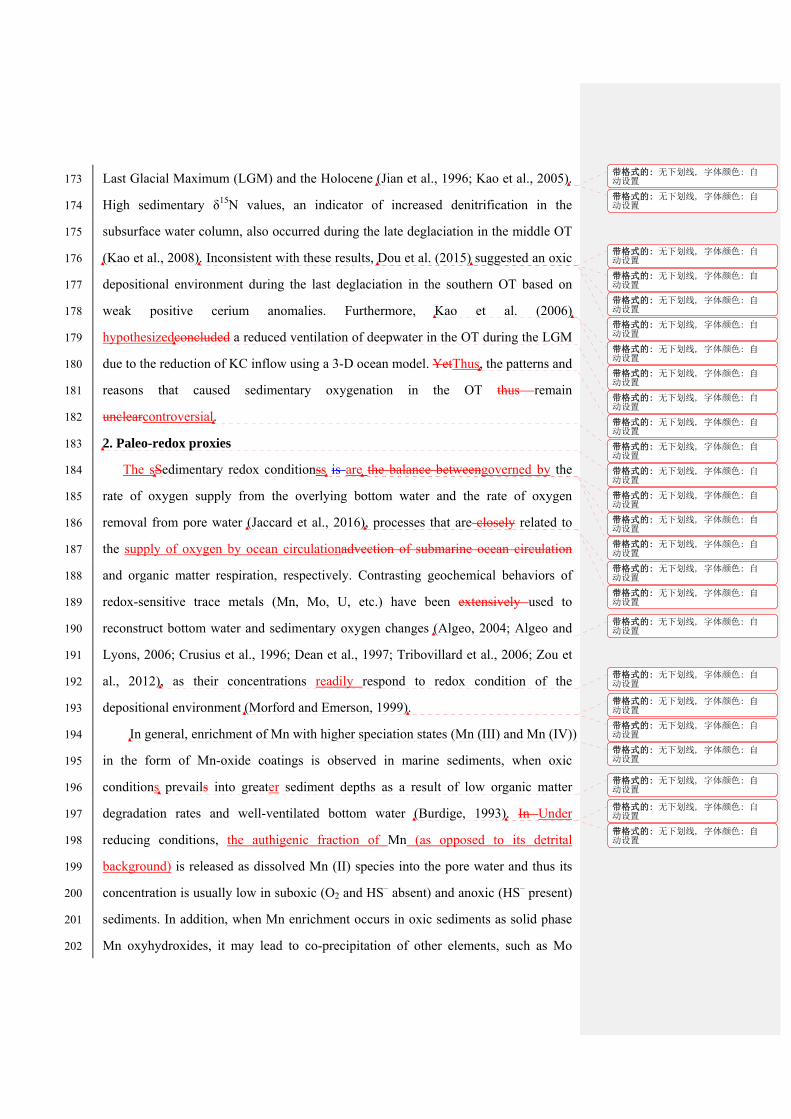
Last Glacial Maximum (LGM) and the Holocene (Jian et al., 1996; Kao et al., 2005). 173
High sedimentary δ15N values, an indicator of increased denitrification in the 174
subsurface water column, also occurred during the late deglaciation in the middle OT 175
(Kao et al., 2008). Inconsistent with these results, Dou et al. (2015) suggested an oxic 176
depositional environment during the last deglaciation in the southern OT based on 177
weak positive cerium anomalies. Furthermore, Kao et al. (2006) 178
hypothesizedconcluded a reduced ventilation of deepwater in the OT during the LGM 179
due to the reduction of KC inflow using a 3-D ocean model. YetThus, the patterns and 180
reasons that caused sedimentary oxygenation in the OT thus remain 181
unclearcontroversial. 182
2. Paleo-redox proxies 183
The sSedimentary redox conditionss is are the balance betweengoverned by the 184
rate of oxygen supply from the overlying bottom water and the rate of oxygen 185
removal from pore water (Jaccard et al., 2016), processes that are closely related to 186
the supply of oxygen by ocean circulationadvection of submarine ocean circulation 187
and organic matter respiration, respectively. Contrasting geochemical behaviors of 188
redox-sensitive trace metals (Mn, Mo, U, etc.) have been extensively used to 189
reconstruct bottom water and sedimentary oxygen changes (Algeo, 2004; Algeo and 190
Lyons, 2006; Crusius et al., 1996; Dean et al., 1997; Tribovillard et al., 2006; Zou et 191
al., 2012), as their concentrations readily respond to redox condition of the 192
depositional environment (Morford and Emerson, 1999). 193
In general, enrichment of Mn with higher speciation states (Mn (III) and Mn (IV)) 194
in the form of Mn-oxide coatings is observed in marine sediments, when oxic 195
conditions prevails into greater sediment depths as a result of low organic matter 196
degradation rates and well-ventilated bottom water (Burdige, 1993). In Under 197
reducing conditions, the authigenic fraction of Mn (as opposed to its detrital 198
background) is released as dissolved Mn (II) species into the pore water and thus its 199
concentration is usually low in suboxic (O2 and HS‒ absent) and anoxic (HS‒ present) 200
sediments. In addition, when Mn enrichment occurs in oxic sediments as solid phase 201
Mn oxyhydroxides, it may lead to co-precipitation of other elements, such as Mo 202
带格式的: 无下划线, 字体颜色: 自动设置
带格式的: 无下划线, 字体颜色: 自动设置
带格式的: 无下划线, 字体颜色: 自动设置
带格式的: 无下划线, 字体颜色: 自动设置
带格式的: 无下划线, 字体颜色: 自动设置
带格式的: 无下划线, 字体颜色: 自动设置
带格式的: 无下划线, 字体颜色: 自动设置
带格式的: 无下划线, 字体颜色: 自动设置
带格式的: 无下划线, 字体颜色: 自动设置
带格式的: 无下划线, 字体颜色: 自动设置
带格式的: 无下划线, 字体颜色: 自动设置
带格式的: 无下划线, 字体颜色: 自动设置
带格式的: 无下划线, 字体颜色: 自动设置
带格式的: 无下划线, 字体颜色: 自动设置
带格式的: 无下划线, 字体颜色: 自动设置
带格式的: 无下划线, 字体颜色: 自动设置
带格式的: 无下划线, 字体颜色: 自动设置
带格式的: 无下划线, 字体颜色: 自动设置
带格式的: 无下划线, 字体颜色: 自动设置
带格式的: 无下划线, 字体颜色: 自动设置
带格式的: 无下划线, 字体颜色: 自动设置
带格式的: 无下划线, 字体颜色: 自动设置
带格式的: 无下划线, 字体颜色: 自动设置
带格式的: 无下划线, 字体颜色: 自动设置
带格式的: 无下划线, 字体颜色: 自动设置

(Nameroff et al., 2002). 203
The elements Mo and U behave conservatively in oxygenated seawater, but are 204
preferentially enriched in oxygen-depleted water (Morford and Emerson, 1999). 205
However, these two trace metals behave differently in several ways. Molybdenum can 206
be enriched in both oxic sediments, such as the near surface manganese-rich horizons 207
in continental margin environments (Shimmield and Price, 1986) and in anoxic 208
sediments (Nameroff et al., 2002). Under anoxic conditions, Mo can be reduced either 209
from the +6 oxidation state to insoluble MoS2, though this process is known to occur 210
only under extremely reducing conditions, such as hydrothermal and/or diagenesis 211
(Dahl et al., 2010; Helz et al., 1996) or be converted to particle-reactive 212
thiomolybdates (Vorlicek and Helz, 2002). Zheng et al. (2000) suggested two critical 213
thresholds for Mo scavenging from seawater: 0.1 µM hydrogen sulfide (H2S) for 214
Fe-S-Mo co-precipitation and 100 µM H2S for Mo scavenging as Mo-S or as 215
particle-bound Mo without Fe. Although Crusius et al. (1996) noted insignificant 216
enrichment of sedimentary Mo under suboxic conditions, Scott et al. (2008) argued 217
that burial flux of Mo is not so low in suboxic environments. Excess concentration of 218
Mo (Moexcess) in sediments thus suggests the accumulation of sediments either in 219
anoxic (H2S occurrence) or well oxygenated conditions (if Moexcess is in association 220
with Mn-oxides). 221
In general, U is enriched in anoxic sediments (>1 μM H2S), but not in oxic 222
sediments (>10 μM O2) (Nameroff et al., 2002). Accumulation of U depends on the 223
content of reactive organic matter (Sundby et al., 2004) and U precipitates as uraninite 224
(UO2) during the conversion of Fe (III) to Fe (II) in suboxic conditions (Morford and 225
Emerson, 1999; Zheng et al., 2002). One of the primary removal mechanisms for U 226
from the ocean is via diffusion across the sediment-water interface of reducing 227
sediments (Klinkhammer and Palmer, 1991). Under suboxic conditions, soluble U (VI) 228
is reduced to insoluble U (IV), but free sulfide is not required for U precipitation 229
(McManus et al., 2005). Jaccard et al. (2009) suggested that the presence of excess 230
concentration of U (Uexcess) in the absence of Mo enrichment is indicative of a suboxic, 231
but not sulfidic condition, within the diffusional range of the sediment-water interface. 232
带格式的: 无下划线, 字体颜色: 自动设置
带格式的: 无下划线, 字体颜色: 自动设置
域代码已更改
域代码已更改
域代码已更改
域代码已更改
域代码已更改
域代码已更改
域代码已更改
域代码已更改
域代码已更改
域代码已更改
域代码已更改
域代码已更改
域代码已更改
域代码已更改
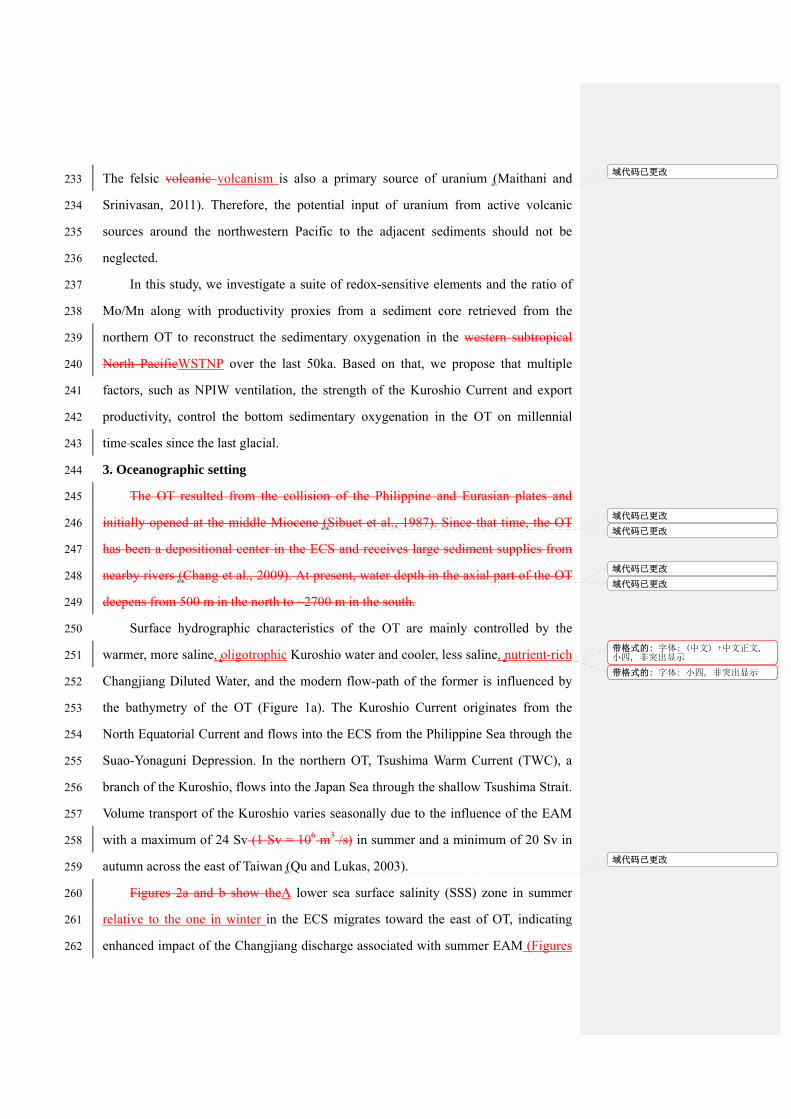
The felsic volcanic volcanism is also a primary source of uranium (Maithani and 233
Srinivasan, 2011). Therefore, the potential input of uranium from active volcanic 234
sources around the northwestern Pacific to the adjacent sediments should not be 235
neglected. 236
In this study, we investigate a suite of redox-sensitive elements and the ratio of 237
Mo/Mn along with productivity proxies from a sediment core retrieved from the 238
northern OT to reconstruct the sedimentary oxygenation in the western subtropical 239
North PacificWSTNP over the last 50ka. Based on that, we propose that multiple 240
factors, such as NPIW ventilation, the strength of the Kuroshio Current and export 241
productivity, control the bottom sedimentary oxygenation in the OT on millennial 242
time scales since the last glacial. 243
3. Oceanographic setting 244
The OT resulted from the collision of the Philippine and Eurasian plates and 245
initially opened at the middle Miocene (Sibuet et al., 1987). Since that time, the OT 246
has been a depositional center in the ECS and receives large sediment supplies from 247
nearby rivers (Chang et al., 2009). At present, water depth in the axial part of the OT 248
deepens from 500 m in the north to ~2700 m in the south. 249
Surface hydrographic characteristics of the OT are mainly controlled by the 250
warmer, more saline, oligotrophic Kuroshio water and cooler, less saline, nutrient-rich 251
Changjiang Diluted Water, and the modern flow-path of the former is influenced by 252
the bathymetry of the OT (Figure 1a). The Kuroshio Current originates from the 253
North Equatorial Current and flows into the ECS from the Philippine Sea through the 254
Suao-Yonaguni Depression. In the northern OT, Tsushima Warm Current (TWC), a 255
branch of the Kuroshio, flows into the Japan Sea through the shallow Tsushima Strait. 256
Volume transport of the Kuroshio varies seasonally due to the influence of the EAM 257
with a maximum of 24 Sv (1 Sv = 106 m3 /s) in summer and a minimum of 20 Sv in 258
autumn across the east of Taiwan (Qu and Lukas, 2003). 259
Figures 2a and b show theA lower sea surface salinity (SSS) zone in summer 260
relative to the one in winter in the ECS migrates toward the east of OT, indicating 261
enhanced impact of the Changjiang discharge associated with summer EAM (Figures 262
域代码已更改
域代码已更改
域代码已更改
域代码已更改
域代码已更改
带格式的: 字体: (中文) +中文正文,小四, 非突出显示
带格式的: 字体: 小四, 非突出显示
域代码已更改

2a and b). An estimated ~80% of The the mean annual discharge of the river 263
Changjiang is 0.028 Sv and ~80% of its total discharge is supplied to the ECS 264
(Ichikawa and Beardsley, 2002). In and in situ observational data of surface 265
hydrography along the ship track from Taiwan Strait to Korea Strait and around the 266
entrance of the Tsushima Strait in the northern part of the ECS show a lower SSS in 267
summer and a pronounced negative correlation between the Changjiang discharge and 268
SSS in July (Delcroix and Murtugudde, 2002). Lower SSS in summer than that in 269
winter suggests stronger effects of summer EAM on surface hydrography over the 270
Kuroshio Current (Sun et al., 2005). Consistently, previous studies from the Okinawa 271
TroughOT reported such close relationship between summer EAM and SSS back to 272
the late Pleistocene (Chang et al., 2009; Clemens et al., 2018; Kubota et al., 2010; Sun 273
et al., 2005). 274
Despite the effects of EAM and the Kuroshio, evidence of geochemical tracers 275
(temperature, salinity, oxygen, nutrients and radiocarbon-Δ14C) collected during the 276
World Ocean Circulation Experiment (WOCE) Expeditions in the Pacific (transects 277
P24 and P03) favors the presence of low salinesalinity, nutrient-enriched intermediate 278
and deep waters (Talley, 2007). Dissolved oxygen content is <100 μM mol/kg at water 279
depths of below 600 m in the OT, along WOCE transects PC03 and PC24 (Talley, 280
2007). Modern oceanographic observations at the Kerama Gap reveal that upwelling 281
in the OT is associated with the inflow of NPIW and studies using a box model 282
predicted that overflow through the Kerama Gap is responsible for upwelling (3.8‒7.6 283
× 10‒6m s‒1) (Nakamura et al., 2013; Nishina et al., 2016). 284
4. Materials and methods 285
4.1. Chronostratigraphy of core CSH1 286
A 17.3 m long sediment core CSH1 (31° 13.7' N, 128° 43.4' E; water depth: 703 287
m) was collected from the northern OT, close to the main stream of Tsushima Warm 288
Current (TWC) (Figure 1b) and within the depth of NPIW (Figure 1c) using a piston 289
corer during Xiangyanghong09 Cruise in 1998, carried out by the First Institute of 290
Oceanography, Ministry of Natural Resources of China. This location is thus enabling 291
us to reconstruct millennial-scale changes in the properties of TWC and NPIW. The 292
域代码已更改
域代码已更改
域代码已更改
域代码已更改
域代码已更改
域代码已更改
域代码已更改
域代码已更改

expedition was carried out by the First Institute of Oceanography, Ministry of Natural 293
Resources of China. Core CSH1 mainly consists of clayey silt and silt with 294
occurrence of plant debris at some depth intervals (Ge et al., 2007) (Figure 3a). In 295
addition, three layers of volcanic ash were observed at depths of 74−106 cm, 782−794 296
cm, 1570−1602 cm and t. These three intervals can be correlated with well-known ash 297
layers, Kikai-Akahoya (K-Ah; 7.3 ka), Aira-Tanzawa (AT; 29.24 ka) and Aso-4 298
(roughly around MIS 5a) (Machida, 1999), respectively. The core was split and 299
sub-sampled at every 4 cm interval and then stored in the China Ocean Sample 300
Repository at 4 °C until analysis. 301
Previously, some paleoceanographic studies have been conducted and a set of 302
data have has been investigated for core CSH1, including the contents of planktic 303
foraminifers as well as their carbon (δ13C) and oxygen isotope (δ18O) compositions 304
(Shi et al., 2014), pollen (Chen et al., 2006), paleomagnetism (Ge et al., 2007) and 305
CaCO3 (Wu et al., 2004). An age model for this core has been constructed by using 306
ten Accelerator Mass Spectrometry (AMS) 14C dates and six oxygen isotope (δ18O) 307
age control points. The whole 17.3 m core contains ca. 88 ka-long record of 308
continuous sedimentation (Shi et al., 2014). 309
It is noteworthy thatNotably, previous the original age control pointsmodel, 310
which used with constant radiocarbon reservoir ages throughout core CSH1 are used 311
suitable to reveal orbital-scale Kuroshio variations (Shi et al., 2014), but insufficient 312
to investigate millennial-scale climatic events. On the basis of original age model, Aa 313
higher abundance of Neogloboquadrina pachyderma (dextral), e. g. that occurred 314
during warmer intervals, such as the Bölling-Alleröd (B/A), has been challenging to 315
explain reasonably. On the other hand, paired measurements of 14C/12C and 230Th ages 316
from Hulu Cave stalagmites suggest magnetic field changes has have greatly 317
contributed to high atmospheric 14C/12C values at HS4 and the YD (Cheng et al., 318
2018). Thus a constant reservoir age (ΔR=0) assumed when calibrating foraminiferal 319
radiocarbon dates using CALIB 6 software and the Marine 13 calibration dataset 320
(Reimer et al., 2013) for Core core CSH1 may cause large chronological 321
uncertainties. 322
域代码已更改
域代码已更改
域代码已更改
域代码已更改
域代码已更改
域代码已更改
域代码已更改
域代码已更改
域代码已更改
域代码已更改

Here, we therefore recalibrated the radiocarbon dates using updated CALIB 7.04 323
software with Marine 13 calibration dataset (Reimer et al., 2013). Moreover, on the 324
basis of significant correlation between planktic foraminiferal species Globigerinoides 325
ruber δ18O and Chinese stalagmite δ18O (Cheng et al., 2016), a proxy of summer 326
EAM related to SSS of the ECS, we re-establishedimprove the age model for core 327
CSH1 (Figures 3b-d). Overall, the new chronological framework is similar to the one 328
previously reported by Shi et al. (2014), but with more dates. In order to compare with 329
published results associated with ventilation changes in the North Pacific, here we 330
mainly report the history of sedimentary oxygenation in the northern OT since the last 331
glacial period. Linear sedimentation rate varied between ~10 and 60 40 cm/ka with 332
higher sedimentation rates (around 30-40 cm/ka) between ~24 ka and 32.5 ka. The 333
new age control points were are shown in Table 2. 334
4.2. Chemical analyses 335
Sediment subsamples for geochemical analyses were freeze-dried and ground to 336
a fine powder with an agate mortar and pestle. Based on the age model, 85 337
subsamples from core CSH1, representing a with a temporal resolution of about 600 338
years (every 4 cm sampling interval) were selected for detailed geochemical analyses 339
of major and minor elements, and total contents of carbon (TC), organic carbon (TOC) 340
and nitrogen (TN) contents. The pretreatment of sediment and other analytical 341
methods have been reported elsewhere (Zou et al., 2012). 342
TC and TN were determined with an elemental analyzer (EA; Vario EL III, 343
Elementar Analysen systeme GmbH) in the Key Laboratory of Marine Sediment and 344
Environment Geology, First Institute of Oceanography, Ministry of Natural Resources 345
of China, Qingdao. Carbonate was removed from sediments by adding 1M HCl to the 346
homogenized sediments for total organic carbon (TOC) analysis using the same 347
equipment. The content of calcium carbonate (CaCO3) was calculated using the 348
equation: 349
CaCO3 = (TC−TOC) × 8.33 350
where 8.33 is the ratio between the molecular weight of carbonate and the atomic 351
weight of carbon. National reference material (GSD-9), blank sample and replicated 352
域代码已更改
域代码已更改
域代码已更改
带格式的: 字体颜色: 自动设置
域代码已更改

samples were used to control the analytical process. The relative standard deviation of 353
the GSD-9 for TC, TN and TOC is ≤ 3.4%. 354
About 0.5 g of sediment powder was digested in double distilled HF:HNO3 (3:1), 355
followed by concentrated HClO4, and then re-dissolved in 5% HNO3. Selected major 356
and minor elements such as aluminum (Al) and manganese (Mn) were determined by 357
inductively coupled plasma optical emission spectroscopy (ICP-OES; Thermo 358
Scientific iCAP 6000, Thermo Fisher Scientific), as detailed elsewhere (Zou et al., 359
2012). In addition, Mo and U were analyzed with inductively coupled plasma mass 360
spectrometry (ICP-MS; Thermo Scientific XSERIES 2, Thermo Fisher Scientific), as 361
described in Zou et al. (2012). Precision for most elements in the reference material 362
GSD-9 is ≤ 5% relative standard deviation. The excess fractions of U and Mo were 363
estimated by normalization to Al: 364
Excess fraction = totalelement— (element/Alaverage shale×Al),with U/Alaverage shale = 365
0.307×10⁻⁶ and Mo/Alaverage shale = 0.295×10⁻⁶ (Li and Schoonmaker, 2014). 366
In addition, given the different geochemical behaviors of Mn and Mo and 367
co-precipitation and adsorption processes associated with the redox cycling of Mn, we 368
calculated the ratio of Mo to Mn, given assuming that higher Mo/Mn ratio indicates 369
lower oxygen content in the depositional environment and vice versa. In combination 370
with the concentration of excess uranium, we infer the history of sedimentary 371
oxygenation in the subtropical North Pacific since the last glaciation. 372
5. Results 373
5.1. TOC, TN, and CaCO3 374
The content of CaCO3 varies from 8.8 to 35% (Figure 4a) and it mostly shows 375
higher values with increasing trends during the last deglaciation. In contrast, the 376
content of CaCO3 is low and exhibits decreasing trends during the late MIS 3 and the 377
LGM (Figure 4a). TN content shows a larger variation compared to TOC (Figure 4b), 378
but it still strongly correlates with TOC (r = 0.74, p<0.01) throughout the entire core. 379
Concentration of TOC ranges from 0.5 to 2.1% and it shows higher values with stable 380
trends during the last glacial phase (MIS 3) (Figure 4c). Molar ratios of TOC/TN vary 381
around 10, with higher ratios at the transition into the LGM (Figure 4d), 382
域代码已更改
域代码已更改
带格式的: 字体: Times New Roman
域代码已更改

corresponding to higher linear sedimentation rate (Figure 4a4e). The content of 383
CaCO3 varies from 8.8 to 35% (Figure 4e) and it mostly shows higher values with 384
increasing trends during the last deglaciation. Conversely, the content of CaCO3 is low 385
and exhibits decreasing trends during late MIS 3 and the LGM (Figure 4e). 386
Both TOC and CaCO3 have been are widely used as proxies for the 387
reconstruction of past export productivity (Cartapanis et al., 2011; Lembke-Jene et al., 388
2017; Rühlemann et al., 1999). Molar C/N ratios of >10 (Figure 4c) suggest that 389
terrigenous organic sources significantly contribute to the TOC concentration in core 390
CSH1. The TOC content therefore may be not a reliable proxy for the reconstruction 391
of surface water export productivity during times of the LGM and late deglaciation, 392
when maxima in C/N ratios co-occur with decoupled trends between CaCO3 and TOC 393
concentrations. 394
Several lines of evidence support CaCO3 as a reliable productivity proxy, 395
particularly during the last deglaciation. (Shi et al., 2014)In addition, tThe strong 396
negative correlation coefficient (r = – 0.85, p<0.01) between Al and CaCO3 in 397
sediments throughout core CSH1 confirms the biogenic origin of CaCO3 against 398
terrigenous Al (Figure 4f). Generally, terrigenous dilution decreases the 399
concentrations of CaCO3. An inconsistent relationship between CaCO3 contents and 400
sedimentation rates indicates a minor effect of dilution on CaCO3. Furthermore, the 401
increasing trend in CaCO3 associated with high sedimentation rate during the last 402
deglacial interval indicates a substantial increase in export productivity (Figures 4a 403
and d). The high coherence between CaCO3 content and alkenone-derived sea surface 404
water (SST) (Shi et al., 2014) indicates a direct control on CaCO3 by SST. Moreover, 405
a detailed comparison between CaCO3 concentrations and the previously published 406
foraminiferal fragmentation ratio (Wu et al., 2004) clearly shows, apart from a small 407
portion within the LGM, no clear co-variation between them. This These evidence 408
suggests that CaCO3 changes are primarily driven primarily by variations in carbonate 409
primary production, and not overprinted by secondary processes, such as carbonate 410
dissolution through changes in the lysocline depth and dilution by terrigenous 411
materialsthrough changes in the lysocline depth. Likewise, a similar deglacial trend in 412
域代码已更改
域代码已更改
域代码已更改
带格式的: 下标
带格式的: 下标
域代码已更改
域代码已更改

CaCO3 is also observed in core MD01-2404 (Chang et al., 2009), indicating a 413
ubiquitous, not local picture in the OT. On the other hand, terrigenous dilution 414
generally decreases the content of CaCO3. All these lines of evidence thus support 415
CaCO3 of core CSH1 as a reliable productivity proxy to a first order 416
approximation.The increasing trend of CaCO3 associated with high sedimentation rate 417
(Figures 4a, e) indicates a substantial increase in export productivity during the last 418
deglacial interval. Thus, we can confidently use CaCO3 content as productivity proxy 419
to a first order approximation. 420
5.2. Redox-sensitive Elements 421
Figure 4 shows time series of selected redox-sensitive elements (RSEs) and 422
proxies derived from them. Mn shows higher concentrations during the LGM and 423
HS1 (16 ka‒22.5 ka) and middle-late Holocene, but lower concentrations during the 424
last deglacial and Preboreal periods (15.8 ka‒9.5 ka) (, Figure 4g). Generally, 425
concentrations of excess Mo and excess U (Figures 4j and , l) show coherent patterns 426
with those of Mo and U (Figures 4i and , k), but both are out-of-phase with Mn over 427
the last glacial period (Figure 4h). It should be noted that pPronounced variations in U 428
concentration since after 8.5 ka isare related to the occurrence of discrete volcanic 429
materials. A significant positive Eu anomaly (Zhu et al., 2015),(Zhu et al., 2015) 430
confirms the occurrence of discrete volcanic materials and its dilution effects on 431
terrigenous components since 7 ka. Occurrence of discrete volcanic material is likely 432
related to intensified Kuroshio Current during the mid-late Holocene, as supported by 433
higher hydrothermal Hg concentrations in sediments from the middle OT (Lim et al., 434
2017). A negative correlation between Mn and Moexcess during the last glaciation and 435
the Holocene, and the strong positive correlation between them during the LGM and 436
HS1 (Figures 5a and 5b) further corroborate the complicated complex geochemical 437
behaviors of Mn and Mo. A strong positive correlation between Moexcess and Mn 438
(Figure 5b) seems tomay be attributed to co-precipitation of Mo by Mn-oxyhydroxide 439
under oxygenated conditions. Here, we thus use the Mo/Mn ratio, instead of excess 440
Mo concentration to reconstruct variations in sedimentary redox stateconditions in our 441
study area. Overall, the Mo/Mn ratio shows similar downcore pattern to that of 442
域代码已更改
域代码已更改
域代码已更改
域代码已更改
域代码已更改

Moexcess with higher values ratios during the last deglaciation, but lower values ratios 443
during the LGM and HS1. A strong correlation (r = 0.69) between Mo/Mn ratio and 444
excess U concentration (excluding the data of Holocene, due to the contamination 445
with volcanic material, Figure 5c) further corroborates the integrity of Mo/Mn as an 446
indicator of sedimentary oxygenation changes. 447
Rapidly decreasing Mo/Mn ratios indicates an well oxygenated sedimentary 448
environment since after ~8 ka (Figure 4h). Both higher Mo/Mn ratios and excess U 449
concentrations, together with lower Mn concentrations suggest an oxygen-deficient 450
suboxic sedimentary depositional conditions environment during the late deglacial 451
period (15.8 ka‒9.5 ka), whereas lower values ratios during the LGM, HS1 and HS2 452
indicate relatively better oxygenated sedimentary conditions. A decreasing trend in 453
Mo/Mn ratio and excess U concentration from 50 ka to 25 ka also suggest higher 454
sedimentary oxygen levels. 455
6.Discussion 456
6.1. Constraining paleoredox conditions in the Okinawa Trough 457
In general, three different terms, hypoxia, suboxia and anoxia, are widely used to 458
describe the degree of oxygen depletion in the marine environment (Hofmann et al., 459
2011). Here, we adopt the definition of oxygen thresholds by Bianchi et al. (2012) for 460
oxic (>120 µmol/kg O2), hypoxic (<60–120 µmol/kg O2) and suboxic (<2–10 461
µmol/kg O2) conditions, whereas anoxia is the absence of measurable 462
oxygenGenerally, redox states in waters can be classified as oxic (>89 μmol /L O2), 463
suboxic (~8.9-89 μmol/LO2), anoxic–nonsulfidic (<89 μmol/L O2, 0 μmol/L H2S), 464
and anoxic– sulfidic or euxinic (0 ml O2/L, >0 μmol/L H2S) (Savrda and Bottjer, 465
1991). 466
Proxies associated with RSEs, such as sedimentary Mo concentration (Lyons et 467
al., 2009; Scott et al., 2008) have been used to constrain the degree of oxygenation in 468
seawater. Algeo and Tribovillard (2009) proposed that open-ocean systems with 469
suboxic waters tend to yield Uexcess enrichment relative to Moexcess a, nd to 470
resultresulting in sediment (Mo/U)excess ratio less than that of seawater (7.5-7.9). 471
Under increasingly reducing and occasionally sulfidic conditions, the accumulation of 472
带格式的: 字体: (中文) 宋体
带格式的: 字体: (中文) 宋体
带格式的: 字体: (中文) 宋体
带格式的: 字体: (中文) 宋体, 下标
带格式的: 字体: (中文) 宋体
带格式的: 字体: (中文) 宋体, 下标
带格式的: 字体: (中文) 宋体
带格式的: 字体: (中文) 宋体, 下标
带格式的: 字体: (中文) 宋体
带格式的: 字体: (中文) 宋体
带格式的: 字体: (中文) 宋体
带格式的: 字体: (中文) 宋体
带格式的: 字体: (中文) 宋体
带格式的: 字体: (中文) 宋体
域代码已更改
域代码已更改

Moexcess increase relative to that of Uexcess leading the (Mo/U)excess ratio either is equal 473
to or exceeds with that of seawater. Furthermore, Scott and Lyons (2012) suggested a 474
non-euxinic condition with the presence of sulfide in pore waters, when Mo 475
concentrations range from> 2 ppmµg/g, the crustal average to < 25 ppmµg/g, a 476
threshold concentration for euxinic condition. Given that the northernOkinawa Trough 477
OT is located in an open oceanic settingweakly restricted basin settings, we use these 478
two above mentioned proxies to evaluate the degree of oxygenation in sediments. 479
Both bulk Mo concentration (1.2-9.5 ppmµg/g) and excess (Mo/U) ratio (0.2-5.7) 480
in core CSH1 suggest that oxygen-depleted conditions may have prevailed in the deep 481
water of the northern OT over the last 50 ka (Figure 4m). However, increased excess 482
Mo concentrations with enhanced higher Mo/U ratios during the last termination (18 483
ka-9 ka) indicate a strongermore reducing conditions compared to the Holocene and 484
the last glacial period, though Mo concentrations is were less than 25 ppmµg/g, a 485
threshold for euxinic deposition proposed by Scott and Lyons (2012). 486
The relative abundance of benthic foraminiferal species that thrive in different 487
oxygen concentrations also haves also been widely used to reconstruct the variations 488
in bottom water ventilation, such as the enhanced abundance of Bulimina aculeata, 489
Uvigerina peregrina and Chilostomella oolina found under oxygen-depleted 490
conditions in the central and southern OT duringfrom the last deglaciation18 ka to 491
9.2 ka (Jian et al., 1996; Li et al., 2005). An oxygenated bottom water condition is 492
also indicated by abundant benthic foraminifera species Cibicidoides hyalina and 493
Globocassidulina subglobosa after 9.2 ka (Jian et al., 1996; Li et al., 2005) in cores 494
E017 (1826 m water depth) and 255 (1575 m water depth) and high benthic δ13C 495
values (Wahyudi and Minagawa, 1997) in cores E017 (water depth 1826 m) , 225 496
(water depth 1575 m) in core and PN-3 (water depth 1058 m water depth) from the 497
middle and southern OT (Figures 1 and 3) during the postglacial period. The inferred 498
ventilation patternpoorly-ventilated deep water in the middle and southern OT 499
inferred from by benthic foraminiferal assemblages during the last deglaciation is 500
correlatesconsistent with the one inferred from RSEs in theis northern OTstudy 501
referring to our RSEs (Figure 4). A link thus can be hypothesized between deep-water 502
域代码已更改
带格式的: 字体: 小四
带格式的: 字体: 小四
域代码已更改
带格式的: 字体: 非倾斜
域代码已更改
带格式的: 字体: 非倾斜
域代码已更改
域代码已更改

ventilation and sedimentary oxygenation in the OT. Although we did not carry out 503
benthic foraminiferal species analyses for our core CSH1, it is reasonable to infer 504
based on RSEs that the deepwater in the northern OT was also in a prominent 505
oxygen-poor condition during the late deglacial interval. A clear link thus can be built 506
between the ventilation of deep water and the sedimentary oxygenation in the OT. In 507
briefOverall, a combination of our proxy records of RSEs in core CSH1 with other 508
records shows oxygen-rich conditions during the last glaciation and middle and late 509
Holocene (since 8.5 ka) intervals, but oxygen-poor conditions during the late last 510
deglaciation.deglacial period. 511
6.2. Causes for sedimentary oxygenation variations 512
As discussed above, theOur observed pattern of RSEs in core CSH1 suggests 513
that drastic changes in sedimentary oxygenation occurred on orbital and millennial 514
timescales over the last glaciation in the Okinawa TroughOT. In general, four factors 515
can regulate the redox condition in the deep water column: (i) O2 solubility, (ii) export 516
productivity and subsequent degradation of organic matter, (iii) vertical mixing, and 517
(iv) lateral provision supply of oxygen through intermediate and deeper water masses 518
(Ivanochko and Pedersen, 2004; Jaccard and Galbraith, 2012). These processes have 519
been invoked in previous studies to explain the deglacial Pacific-wide variations in 520
oxygenation by either one or a combination of these factors (Galbraith and Jaccard, 521
2015; Moffitt et al., 2015; Praetorius et al., 2015).In the OT, the oxygen deficiency 522
during the late deglacial period can be caused either by one and/or a combination of 523
more than one of these factors. Our data also suggest drastic variations in sedimentary 524
oxygenation over the last 50 ka. However, In order to uncover the mechanisms 525
responsible for sedimentary oxygenation variations in the basin-wide OTin the 526
basin-wide OT and its connection with ventilation of the open North Pacific remain 527
unclear., In order to place our core results in a wider regional context, we compare our 528
proxy records of sedimentary oxygenation (Uexcess concentration and Mo/Mn ratio) 529
and export productivity (CaCO3) (Figures 6a, b, c) with abundance of Pulleniatina 530
obliquiloculata (an indicator of Kuroshio strength) and sea surface temperature (Shi et 531
al., 2014), bulk sedimentary nitrogen isotope (an indicator of denitrification) (Kao et 532
带格式的: 字体: (中文) 宋体
域代码已更改
带格式的: 字体: (中文) 宋体
带格式的: 字体: 小四
带格式的: 字体: (中文) 宋体
带格式的: 字体: (中文) 宋体
域代码已更改
域代码已更改

al., 2008), benthic foraminifera δ13C (a proxy for ventilation) in cores PN-3 and 533
PC23A (Rella et al., 2012; Wahyudi and Minagawa, 1997), a proxy for water mass, in 534
core PC23A (Rella et al., 2012), abundance of benthic foraminifera (an indicator of 535
hypoxia) in core E017 (Li et al., 2005) and ODP Site 1017 (Cannariato and Kennett, 536
1999)the NE Pacific, an indicator of anoxic condition (Cannariato and Kennett, 1999), 537
abundance of Pulleniatina obliquiloculata, an indicator of the Kuroshio strength (Shi 538
et al., 2014) (Figures 6d-k). 539
6.2.1. Effects of regional ocean temperature on deglacial deoxygenation 540
Warming ocean temperatures lead to lower oxygen solubility. In the geological 541
past, solubility effects connected to temperature changes of the water column thought 542
to enhance or even trigger hypoxia (Praetorius et al., 2015). For instance, Shi et al. 543
(2014) reported an increase in SST of around 4°C (from ~21°C to ~24.6°C) during the 544
last deglaciation in core CSH1 (Figure 6d). Based on thermal solubility effects, a 545
hypothetical warming of 11°C at our site would reduce oxygen concentrations by 546
about 8 3.5 μMmol/kg at water temperatures around 22°C (Brewer and Peltzer, 2016) 547
(Benson and Krause, 1984), which therefore a ~ 4°C warming at core CSH1 (Shi et al., 548
2014) could drive a conservative estimate of a drop of <15 μmol/kg drastic in drop of 549
oxygen concentration by, assuming no large salinity changes <30 μM in subsurface 550
water of the OT. Therefore, we assume that the late deglacial hypoxia in the OT 551
underwent a similar increase in ocean temperatures. However, given the 552
semi-quantitative nature of our data about oxygenation changes, which seemingly 553
exceed an amplitude of >30 15 μmol/kgM, we suggest that other factors, in particular 554
processes likee.g. local changes in export productivity, regional influences such as 555
vertical mixing due to changes of the Kuroshio Current, as well asand far-field effects 556
all may have played some decisive roles in shaping the oxygenation history of the OT. 557
6.2.2. Links between deglacial primary productivity and sedimentary 558
deoxygenation 559
Previous studies have suggested the occurrence of high primary productivity in 560
the entire OT during the last deglacial period (Chang et al., 2009; Jian et al., 1996; 561
Kao et al., 2008; Li et al., 2017; Shao et al., 2016; Wahyudi and Minagawa, 1997). 562
带格式的: 字体: (中文) 宋体
域代码已更改
带格式的: 字体: (中文) 宋体
域代码已更改
带格式的: 字体: (中文) 宋体
带格式的: 字体: (中文) 宋体
带格式的: 字体: (中文) 宋体, 字体颜色: 自动设置
带格式的: 字体: (中文) 宋体
域代码已更改
带格式的: 字体: (中文) 宋体
域代码已更改
带格式的: 字体: (中文) 宋体
带格式的: 字体: (中文) 宋体
带格式的: 字体: (中文) 宋体
域代码已更改
带格式的: 字体: (中文) 宋体
域代码已更改
域代码已更改
域代码已更改
域代码已更改
域代码已更改
域代码已更改
域代码已更改
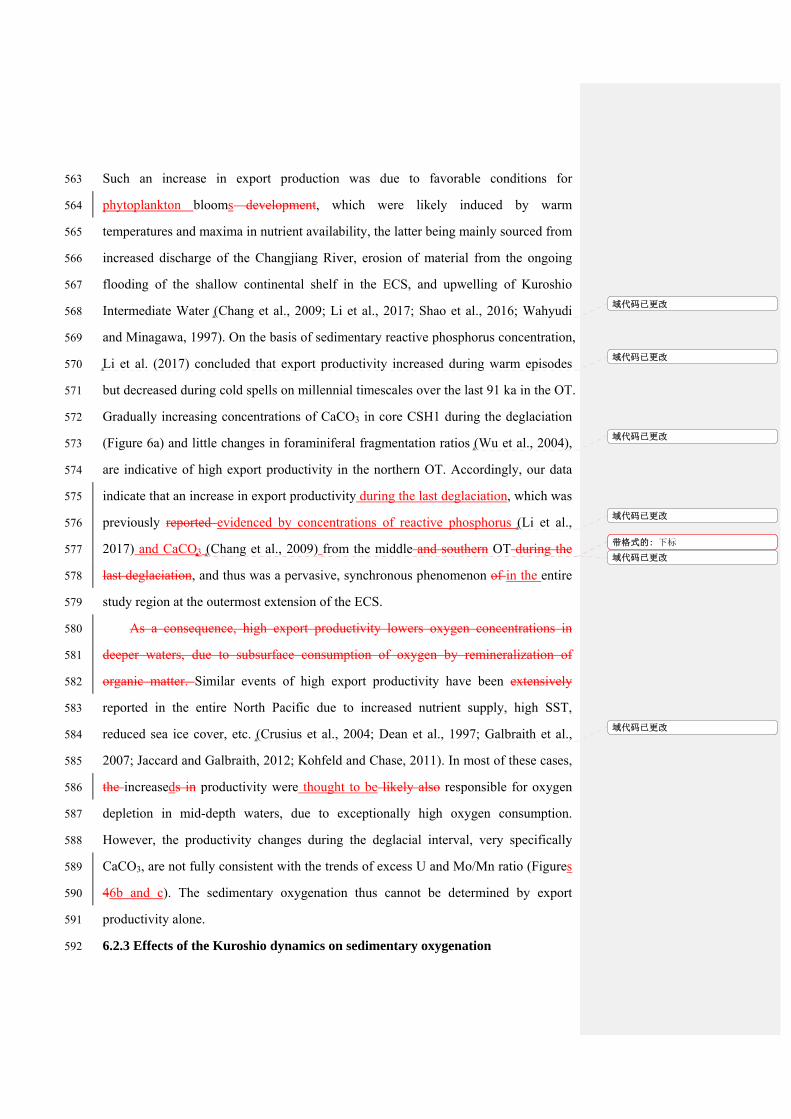
Such an increase in export production was due to favorable conditions for 563
phytoplankton blooms development, which were likely induced by warm 564
temperatures and maxima in nutrient availability, the latter being mainly sourced from 565
increased discharge of the Changjiang River, erosion of material from the ongoing 566
flooding of the shallow continental shelf in the ECS, and upwelling of Kuroshio 567
Intermediate Water (Chang et al., 2009; Li et al., 2017; Shao et al., 2016; Wahyudi 568
and Minagawa, 1997). On the basis of sedimentary reactive phosphorus concentration, 569
Li et al. (2017) concluded that export productivity increased during warm episodes 570
but decreased during cold spells on millennial timescales over the last 91 ka in the OT. 571
Gradually increasing concentrations of CaCO3 in core CSH1 during the deglaciation 572
(Figure 6a) and little changes in foraminiferal fragmentation ratios (Wu et al., 2004), 573
are indicative of high export productivity in the northern OT. Accordingly, our data 574
indicate that an increase in export productivity during the last deglaciation, which was 575
previously reported evidenced by concentrations of reactive phosphorus (Li et al., 576
2017) and CaCO3 (Chang et al., 2009) from the middle and southern OT during the 577
last deglaciation, and thus was a pervasive, synchronous phenomenon of in the entire 578
study region at the outermost extension of the ECS. 579
As a consequence, high export productivity lowers oxygen concentrations in 580
deeper waters, due to subsurface consumption of oxygen by remineralization of 581
organic matter. Similar events of high export productivity have been extensively 582
reported in the entire North Pacific due to increased nutrient supply, high SST, 583
reduced sea ice cover, etc. (Crusius et al., 2004; Dean et al., 1997; Galbraith et al., 584
2007; Jaccard and Galbraith, 2012; Kohfeld and Chase, 2011). In most of these cases, 585
the increaseds in productivity were thought to be likely also responsible for oxygen 586
depletion in mid-depth waters, due to exceptionally high oxygen consumption. 587
However, the productivity changes during the deglacial interval, very specifically 588
CaCO3, are not fully consistent with the trends of excess U and Mo/Mn ratio (Figures 589
46b and c). The sedimentary oxygenation thus cannot be determined by export 590
productivity alone. 591
6.2.3 Effects of the Kuroshio dynamics on sedimentary oxygenation 592
域代码已更改
域代码已更改
域代码已更改
域代码已更改
带格式的: 下标
域代码已更改
域代码已更改

The Kuroshio Current, one of the main drivers of vertical mixing, has been 593
identified as the key factor in controlling modern deep ventilation in the Okinawa 594
TroughOT (Kao et al., 2006). However, the flow path of the Kuroshio in the Okinawa 595
TroughOT during the glacial interval remains a matter of debate. Planktic 596
foraminiferal assemblages in sediment cores from inside and outside the Okinawa 597
TroughOT indicated that the Kuroshio have migrated to the east of the Ryukyu 598
Islands during the LGM (Ujiié and Ujiié, 1999). Subsequently, Kao et al. (2006) 599
based on modeling results suggested that the Kuroshio still enters into the Okinawa 600
TroughOT, but the volume transport was reduced by 43% compared to the 601
present-day transport and the outlet of Kuroshio switches from the Tokara Strait to the 602
Kerama Gap at -80 and -135m lowered sea level. Combined with sea surface 603
temperature (SST) records and ocean model results, Lee et al. (2013) argued that there 604
was little effect of deglacial sea-level change on the path of the Kuroshio, which still 605
exited the Okinawa TroughOT from the Tokara Strait during the glacial period. 606
Because the main stream of the Kuroshio Current is at a water depth of ~150 m, the 607
SST records are insufficient to decipher past changes of the Kuroshio (Ujiié et al., 608
2016). On the other hand, low abundances of P. obliquiloculata in core CSH1 in the 609
northern OT (Figure 6e) indicate that the main flow path of the Kuroshio may have 610
migrated to the east of the Ryukyu Island (Shi et al., 2014). Such a flow change would 611
have been caused by the proposed block of the Ryukyu-Taiwan land bridge by low 612
sea level (Ujiié and Ujiié, 1999) and an overall reduced Kuroshio intensity (Kao et al., 613
2006), effectively suppressing the effect of the Kuroshio on deep ventilation in the OT. 614
Our RSEs data show that oxygenated sedimentary conditions were dominant in the 615
northern OT throughout the last glacial period (Figures 6a, b, c, d). The Kuroshio thus 616
likely had a weak or even no effect on the renewal of oxygen to the sedimentary 617
environment during the last glacial period. More recently, lower hydrothermal total 618
Hg concentration during 20 ka - 9.6 ka, associated with reduced intensity and/or 619
variation in flow path of KC, relative to that of Holocene recorded in core KX12‐3 620
(1423 water depth) (Lim et al., 2017), further validates our inference(Lim et al., 621
2017). 622
域代码已更改
域代码已更改
域代码已更改
域代码已更改
域代码已更改
域代码已更改
域代码已更改
域代码已更改
域代码已更改
域代码已更改
域代码已更改

On the other hand, the gradually increasingincreased alkenone-derived SST and 623
abundance of P.obliquiloculata (Figures 6d and e) from 15 ka onwards indicates an 624
intensified Kuroshio Current. . At present, mooring and float observations revealed 625
that the KC penetrates to 1200 m isobath in the East China Sea (Andres et al., 2015). 626
Matsumoto et al. (2002) suggested that the influence of the present Kuroshio can 627
reach to the bottom depth of the permanent thermocline, which is approximately at 628
1000 m water depth. However, as mentioned above, the effect of Kuroshio on the 629
sedimentary oxygenation was likely very limited during the glacial period and only 630
gradually increasing throughout the last glacial termination. Therefore, while its effect 631
on our observed deglacial variation in oxygenation may provide a slowly changing 632
background condition in vertical mixing effects on the sedimentary oxygenation in the 633
OT, it cannot account for the first order, rapid oxygenation changes, including 634
indications for millennial-scale variations, that we observe between 18 ka and 9 ka, 635
including indications for millennial-scale variations (Figure 6). 636
Better oxygenated sedimentary conditions since 8.5 ka coincided with intensified 637
Kuroshio (Li et al., 2005; Shi et al., 2014), as indicated by rapidly increased SST and 638
P. obliquiloculata abundance in core CSH1 (Figures 6d and e) and C.hyalinea 639
abundance in core E017 (Figure 6i). The rRe-entrance of the Kuroshio into the OT 640
(Shi et al., 2014) with rising eustatic sea level likely enhanced the vertical mixing and 641
exchange between bottom and surface waters, ventilating the deep water in the OT. 642
Previous comparative studies based on epibenthic δ13C values indicated 643
well-ventilated deep water feeding both inside the OT and outside off the Ryukyu 644
Islands during the Holocene (Kubota et al., 2015; Wahyudi and Minagawa, 1997). In 645
summary, during the Holocene our observed enhanced sedimentary oxygenation 646
regime observed in the OT during the Holocene is mainly related to the intensified 647
Kuroshio, while the effect of the Kuroshio on OT oxygenation was limited before 15 648
ka. 649
6.2.4. Effects of GNPIW on sedimentary oxygenation 650
Relatively stronger oxygenated Glacial North Pacific Intermediate Water 651
(GNPIW), coined by (Matsumoto et al., 2002), has been widely documented in the 652
域代码已更改
域代码已更改
域代码已更改
带格式的: 字体: 倾斜
域代码已更改
域代码已更改
域代码已更改

Bering Sea (Itaki et al., 2012; Kim et al., 2011; Rella et al., 2012), the Okhotsk Sea 653
(Itaki et al., 2008; Okazaki et al., 2014; Okazaki et al., 2006; Wu et al., 2014), off east 654
Japan (Shibahara et al., 2007), the eastern North Pacific (Cartapanis et al., 2011; 655
Ohkushi et al., 2013) and western subarctic Pacific (Keigwin, 1998; Matsumoto et al., 656
2002). The intensified ventilation formation of GNPIW due to additional source 657
region in the Bering Sea is firstly attributable to was proposed by the displacement of 658
formation source region to the Bering Sea Ohkushi et al. (2003) and and then is 659
further confirmed by Horikawa et al. (2010). Under such conditions, the invasion of 660
well-ventilated GNPIW into the OT through the Kerama Gap would have replenished 661
the water column oxygen in the OT, although the penetration depth of GNPIW 662
remains under debate (Jaccard and Galbraith, 2013; Max et al., 2014; Okazaki et al., 663
2010; Rae et al., 2014). Both a gradual decrease in excess U concentration and an 664
increase in Mo/Mn ratio during the last glacial period (25 ka-50 ka) validate such 665
inference, suggesting pronounced effects of intensified GNPIW formation in the OT. 666
During HS1, a stronger formation of GNPIW was supported by proxy studies 667
and numerical simulations(Chikamoto et al., 2012; Gong et al., 2019; Jaccard and 668
Galbraith, 2013; Max et al., 2014; Okazaki et al., 2010). recorded in the North Pacific 669
by a variety of studies.For example, oOn the basis of paired benthic-planktic (B-P) 670
14C data, eand model simulations, nhanced penetration of Okazaki et al. (2010) 671
suggested that NPIW penetrated into a much deeper water depth of ~2500 to 3000 m 672
during HS1 relative to the Holocene has been revealed in several studies (Max et al., 673
2014; Okazaki et al., 2010; Sagawa and Ikehara, 2008), which was also simulated by 674
several models (Chikamoto et al., 2012; Gong et al., 2019; Okazaki et al., 2010). On 675
the other hand, increased intermediate water temperature in the subtropical Pacific 676
recorded in core GH08-2004 (1166 m water depth) (Kubota et al., 2015) and young 677
deep water observed in the northern South China Sea during HS1 (Wan and Jian, 678
2014) along downstream region of NPIW are also related to intensified NPIW 679
formation. Furthermore, In contrast, Max et al. (2014) argued against deep water 680
formation in the North Pacific and showed that GNPIW was well-ventilated only to 681
intermediate water depths (< 1400 m). Various mid- and high-latitude North Pacific 682
域代码已更改
域代码已更改
域代码已更改
域代码已更改
域代码已更改
带格式的: 字体颜色: 自动设置
域代码已更改
域代码已更改
域代码已更改
域代码已更改
域代码已更改
域代码已更改
域代码已更改
域代码已更改
域代码已更改
域代码已更改
域代码已更改
域代码已更改
域代码已更改
域代码已更改
域代码已更改

records of B-P 14C age offsets at the intermediate water depth (<600‒2000 m) showed 683
an active production of GNPIW during HS1 (Max et al., 2014; Sagawa and Ikehara, 684
2008). (Kubota et al., 2015)Moreover, Kubota et al. (2010) reported increased 685
subsurface water temperatures related to enhanced GNPIW contributions during HS1 686
at a water depth of 1166m (GH08, and young deep water was observed in the northern 687
South China Sea during HS1 (Wan and Jian, 2014). 688
All these multiple lines of evidence imply the presence of well-ventilated 689
intermediate water in the upper 2000 m of the North Pacific during HS1. At this point, 690
the effect of a strong GNPIW likely reached the South China Sea (Wan and Jian, 2014; 691
Zheng et al., 2016), further to the south the Okinawa Trough. Tthe pathway of 692
GNPIW from numerical model simulations (Zheng et al., 2016) was similar to 693
modern observations (You, 2003). Thus, all these evidence imply a persistent, cause 694
and effect relation has been established between GNPIW ventilation, the intermediate 695
and deep water oxygen concentration in theof OT deepwater and sediment redox state 696
during HS1. In addition, our RSEs data also suggested a similarly enhanced 697
ventilation in HS2 (Figures 6b and c) (Figure 6) that must is also also be attributed to 698
intensified GNPIW formation. 699
Hypoxic conditions during the Bölling-Alleröd (B/A) have been also widely 700
observed in the mid- and high-latitude North Pacific (Jaccard and Galbraith, 2012; 701
Praetorius et al., 2015). Our data, both of excess U concentrations and Mo/Mn ratio 702
recorded in core CSH1 (Figures 6b- and cd), together with enhanced denitrification 703
and B.aculeata abundance (Figures 6f and h), further reveal the expansion of 704
oxygen-depletion at mid-depth waters down to the subtropical NW Pacific during the 705
late deglacial period. Based on high relative abundances of radiolarian species, 706
indicators of upper intermediate water ventilation in core PC-23A, Itaki et al. (2012) 707
suggested that a presence of well-ventilated waters was limited to the upper 708
intermediate layer (200 m‒500 m) in the Bering Sea during warm periods, such as the 709
B/A and Preboreal. Higher B-P foraminiferal 14C ages, together with increased 710
temperature and salinity at intermediate waters temperature and salinity recorded in 711
core GH02-1030 (off East Japan) supported a weakened formation of NPIW during 712
域代码已更改
域代码已更改
域代码已更改
域代码已更改
域代码已更改
域代码已更改
域代码已更改
域代码已更改
域代码已更改
域代码已更改
域代码已更改
域代码已更改
域代码已更改
域代码已更改
带格式的: 字体: 倾斜
域代码已更改

the B/A (Sagawa and Ikehara, 2008). These lines of evidence indicate that the 713
boundary between GNPIW and North Pacific Deep Water shoaled during the B/A, in 714
comparison to HS1. Based on a comparison of two benthic foraminiferal oxygen and 715
carbon isotope records from off northern Japan and the southern Ryukyu Island, 716
Kubota et al. (2015) found a stronger influence of Pacific Deep Water on 717
intermediate-water temperature and ventilation at their southern than the northern 718
locations, although both sites are located at similar water depths (1166 m and 1212 719
m for cores GH08-2004 and GH02-1030, 1212 m, respectively). Higher excess U 720
concentration and low Mo/Mn ratio in our core CSH1 during the B/A and Preboreal 721
suggest reduced sedimentary oxygenation, consistent with reduced ventilation of 722
GNPIW, contributing to the subsurface water suboxia deoxygenation in the OT. 723
During the YD, both Mo/Mn ratio and excess U show a slightly decreased 724
oxygen condition in the northern OT. In By contrast, benthic foraminiferal δ18O and 725
δ13C values in a sediment core collected from the Oyashio region suggested a 726
strengthened formation and ventilation of GNPIW during the YD (Ohkushi et al., 727
2016). This pattern possibly indicates a time-dependent, varying contribution of distal 728
GNPIW to the deglacial OT oxygenation history, and we presume a more pronounced 729
contribution of organic matter degradation due to high export productivity during this 730
period, as suggested by increasing CaCO3 content. 731
6.3. Subtropical North Pacific ventilation links to North Atlantic Climate 732
One of the characteristic climate features in the Northern Hemisphere, in 733
particular the North Atlantic is millennial-scale oscillation during glacial and deglacial 734
periods. These abrupt climatic events have been widely thought to be closely related 735
to varying strength of Atlantic Meridional Overturning Circulation (AMOC) 736
(Lynch-Stieglitz, 2017). One of dynamic proxies of ocean circulation, 231Pa/230Th 737
reveals that severe weakening of AMOC only existed during Heinrich stadials due to 738
increased freshwater discharges into the North Atlantic (Böhm et al., 2015; McManus 739
et al., 2004). On the other hand, several mechanisms, such as sudden termination of 740
freshwater input (Liu et al., 2009), atmospheric CO2 concentration (Zhang et al., 741
2017), enhanced advection of salt (Barker et al., 2010) (Liu et al., 2009)and changes 742
域代码已更改
域代码已更改
域代码已更改
域代码已更改
带格式的: 字体: 小四
域代码已更改
带格式的: 字体: 小四
域代码已更改
域代码已更改
带格式的: 下标
域代码已更改
域代码已更改
域代码已更改
域代码已更改

in background climate (Knorr and Lohmann, 2007) were proposed to explain the 743
reinvigoration of AMOC during the B/A. 744
Our RSEs data in the Northern OT and endobenthic δ13C in the Bering Sea 745
(Figures 7a-c) both show a substantial millennial variability in intermediate water 746
ventilation in the subtropical North Pacific. Notably, both enhanced ventilation during 747
HS1 and HS2 and oxygen-poor condition during the B/A respectively correspond to 748
the collapse and resumption of Atlantic meridional overturning circulation (AMOC) 749
(Bohm et al., 2015; McManus et al., 2004) (Figure 7 d). Such out-of-phase 750
millennial-scale pattern This is consistent with the results of various modeling 751
simulations (Chikamoto et al., 2012; Menviel et al., 2014; Okazaki et al., 2010; 752
Saenko et al., 2004), although these models had different scenarios boundary 753
conditions and causes for the observed effects in GNPIW formation, and ventilation 754
ages derived from B-P 14C (Freeman et al., 2015; Max et al., 2014; Okazaki et al., 755
2012). These lines of evidence reveal confirm a persistent link between the ventilation 756
of North Pacific and the North Atlantic climate (Lohmann et al., 2019). Such links 757
have also been corroborated by using proxy data and modeling experiment between 758
AMOC and East Asian monsoon during the 8.2 ka event (Liu et al., 2013), the 759
Holocene (Wang et al., 2005) and 34 ka‒60 ka (Sun et al., 2012). The mechanism 760
linking East Asia with North Atlantic has been attributed to an atmospheric 761
teleconnection, such as the position and strength of Westerly Jet and 762
Mongolia-Siberian High (Porter and Zhisheng, 1995). However, the mechanism 763
behind such oceanic ventilation seesaw out-of-phase pattern between the ventilation 764
in the subtropical North Pacific and the North Atlantic deep water formation and 765
North Pacific is still remains unclear. 766
Increased NPIW formation of during HS1 may have been caused by enhanced 767
salinity-driven vertical mixing through higher meridional water mass transport from 768
the subtropical Pacific. Previous studies have proposed that intermediate water 769
formation in the North Pacific hinged on a basin-wide increase in sea surface salinity 770
driven by changes in strength of the summer EAM and the moisture transport from 771
the Atlantic to the Pacific (Emile-Geay et al., 2003). Several modeling studies found 772
域代码已更改
带格式的: 字体: (默认) Times NewRoman, (中文) +中文正文
带格式的: 上标
域代码已更改
域代码已更改
域代码已更改
域代码已更改
域代码已更改
域代码已更改
域代码已更改
域代码已更改
域代码已更改
域代码已更改
域代码已更改

that freshwater forcing in the North Atlantic could cause a widespread surface 773
salinification in the subtropical Pacific Ocean (Menviel et al., 2014; Okazaki et al., 774
2010; Saenko et al., 2004). This idea has been tested by proxy data (Rodríguez-Sanz 775
et al., 2013; Sagawa and Ikehara, 2008), which indicated a weakened summer EAM 776
and reduced transport of moisture from Atlantic to Pacific through Panama Isthmus 777
owing to the southward displacement of Intertropical Convergence Zone TCZ caused 778
by a weakening of AMOC. Along with this process, as predicted through a general 779
circulation modeling, a strengthened Pacific Meridional Overturning Circulation 780
would have transported more warm and salty subtropical water into the high-latitude 781
North Pacific (Okazaki et al., 2010). In accordance with comprehensive Mg/Ca 782
ratio-based salinity reconstructions, however, Riethdorf et al. (2013) found no clear 783
evidence for such higher salinity patterns in the subarctic northwest Pacific during 784
HS1. 785
On the other hand, a weakened AMOC would deepen the wintertime Aleutian 786
Low based on modern observation (Okumura et al., 2009), which is closely related to 787
the sea ice formation in the marginal seas of the subarctic Pacific (Cavalieri and 788
Parkinson, 1987). Once stronger Aleutian Low, Intense intense brine rejection due to, 789
accompanied by expanded sea ice expansionformation, would have enhanced the 790
NPIW formation. Recently our modeling-derived evidence suggests confirmed that 791
enhanced sea ice coverage occurred in the southern Okhotsk Sea and off East 792
Kamchatka Peninsula during HS1 (Gong et al., 2019). In addition, higher stronger 793
advection of low-salinity water via the Alaskan Stream to the subarctic NW Pacific 794
was probably enhanced during HS1, related to a shift of the Aleutian Low pressure 795
system over the North Pacific, which could also increase sea ice formation, brine 796
rejection and thereafter intermediate water ventilation (Riethdorf et al., 2013). 797
During the late deglaciation, ameliorating global climate conditions, such as 798
warming Northern Hemisphere, and a strengthened Asian summer monsoon, are a 799
result of changes in insolation forcing, greenhouse gases concentrations, and variable 800
strengths of the AMOC (Clark et al., 2012; Liu et al., 2009). During the B/A, a 801
decrease in sea ice extent and duration was, as well as reduced advection of Alaska 802
域代码已更改
域代码已更改
域代码已更改
域代码已更改
域代码已更改
域代码已更改
域代码已更改
域代码已更改
域代码已更改

Stream waters were indicated by combined reconstructions of SST and mixed layer 803
temperatures from the subarctic Pacific (Riethdorf et al., 2013). At that time, the 804
rising eustatic sea level (Spratt and Lisiecki, 2016) would have supported the 805
intrusion of Alaska Stream into the Bering Sea by deepening and opening glacial 806
closed straits of the Aleutian Islands chain, while reducing the advection of the Alaska 807
Stream to the subarctic Pacific gyre (Riethdorf et al., 2013). In this scenario, saltier 808
and more stratified surface water conditions would have inhibited brine rejection and 809
subsequent formation and ventilation of NPIW (Lam et al., 2013), leading to a 810
reorganization of the Pacific water mass, closely coupled to the collapse and 811
resumption modes of the AMOC during these two intervals. 812
6.4 Increased storage of CO2 at mid-depth water in the North Pacific at the B/A 813
One of the striking features of RSEs data is higher Mo/Mn ratios and excess U 814
concentrations at across the B/A, indicating supporting an expansion of Oxygen 815
Minimum Zonea substantial oxygen-poor condition in the subtropical North Pacific 816
(Galbraith and Jaccard, 2015; Jaccard and Galbraith, 2012; Moffitt et al., 2015) and , 817
coinciding with the termination of atmospheric CO2 concentration rise (Marcott et 818
al., 2014) (Figure 7a7e). As described above, it can be related to the upwelling of 819
nutrient- and CO2-rich Pacific Deep Water due to resumption of AMOC and enhanced 820
export production. Notably, bAlthough here we are unable to distinguish these two 821
reasons from each other, boron isotope data measured on surface-dwelling 822
foraminifera in core MD01-2416 situated in the western subarctic North Pacific did 823
reveal a decrease in near-surface pH and an increase in pCO2 at the onset of B/A at 824
this time (Gray et al., 2018). That is to say, indicating that the subarctic North Pacific 825
is a source of relatively high atmospheric CO2 concentration at that time at the B/A. 826
Here we cannot conclude that the same processes could have occurred in the 827
subtropical North Pacific due to the lack of well-known drivers to draw out of the old 828
carbon in the deep sea into the atmosphere. In combination with published records 829
from the North Pacific (Addison et al., 2012; Cartapanis et al., 2011; Crusius et al., 830
2004; Galbraith et al., 2007; Lembke-Jene et al., 2017; Shibahara et al., 2007), 831
However, aan expansion of oxygen-depletion zone during the BA in the entire North 832
域代码已更改
域代码已更改
域代码已更改
域代码已更改
域代码已更改
域代码已更改
域代码已更改

Pacific suggest an increase in respired carbon storage at intermediatemid-depth waters 833
of in the subtropical North Pacific, which likely stalls the rise of atmospheric CO2. 834
Our results support the findings by Galbraith et al. (2007) and are consistent with the 835
hypothesis of deglacial flushing of respired carbon dioxide from an isolated, deep 836
ocean reservoir(Marchitto et al., 2007; Sigman and Boyle, 2000). Given the sizeable 837
volume of the North Pacific, potentially, once the respired carbon could be emitted to 838
the atmosphere in stages, which would play an important role in propelling the Earth 839
bring the planet out of the last ice age (Jaccard and Galbraith, 2018). 840
7. Conclusions 841
Our geochemical results of sediment core CSH1 revealed substantial changes in 842
intermediate water redox conditions in the northern Okinawa Trough over the last 50 843
ka on orbital and millennial timescales in the past. Enhanced sedimentary oxygenation 844
mainly occurred during cold intervals, such as the last glacial period, Heinrich stadials 845
1 and 2, and during the middle and late Holocene, while diminished sedimentary 846
oxygenation prevailed during the Bölling-Alleröd and Preboreal. The sedimentary 847
oxygenation variability presented here provides key evidence for the substantial 848
impact of ventilation of NPIW on the sedimentary oxygenation in the subtropical 849
North Pacific and highlights shows out-of-phase pattern with North Atlantic Climate 850
during the last deglaciationthe major role of Atlantic Meridional Overturning 851
Circulation in regulating the variations in sedimentary oxygenation in the Okinawa 852
Trough through ventilation of NPIW. The linkage is attributable to the disruption of 853
NPIW formation caused by climate changes in the North Atlantic, which is transferred 854
to the North Pacific via atmospheric and oceanic teleconnections. Combined with 855
other published records, Wwe also suggest an expansion of oxygen-depleted zone and 856
accumulation of respired carbon at the mid-depth waters from previously reported 857
subarctic locations into the western subtropical of the North Pacific at during the B/A, 858
coinciding with the termination of atmospheric CO2 rise. A step-wise injection of such 859
respired carbon into the atmosphere would be helpful to maintain high atmospheric 860
CO2 levels during the deglaciation and bring the planet out of the last ice age. 861
Once the release of the sequestered carbon into the atmosphere in stages, it would 862
域代码已更改
域代码已更改
域代码已更改
带格式的: 字体: 小四
带格式的: 字体: 小四
带格式的: 字体: 小四, 下标
带格式的: 字体: 小四
带格式的: 字体: 小四

be helpful to maintain high atmospheric CO2 levels during the deglaciation and to 863
propel the earth out of the glacial climate. 864
865
Data availability. All raw data are available to all interested researchers upon request. 866
867
Author Contributions. J.J.Z. and X.F.S. conceived the study. A.M.Z. performed 868
geochemical analyses of bulk sediments. J.J.Z., X.F.S. K.S. and X.G. led the write up 869
of the manuscript. All other authors provided comments on the manuscript and 870
contributed to the final version of the manuscript. 871
872
Competing interests: The authors declare no competing interests. 873
874
Acknowledgements 875
Financial support was provided by the National Program on Global Change and 876
Air-Sea Interaction (GASI-GEOGE-04), by the National Natural Science Foundation 877
of China (Grant Nos.: 41476056, 41876065, 41420104005, 41206059, and U1606401) 878
and by the Basic Scientific Fund for National Public Research Institutes of China 879
(No.2016Q09) and International Cooperative Projects in Polar Study (201613) and 880
Taishan Scholars Program of Shandong. This study is a contribution to the bilateral 881
Sino-German collaboration project (funding through BMBF grant 03F0704A – 882
SIGEPAX). XG, LLJ, GL, RT thank the bilateral Sino-German collaboration 883
NOPAWAC project (BMBF grant No. 03F0785A).LLJ and RT acknowledge financial 884
support through the national Helmholtz REKLIM Initiative. We would like to thank 885
the anonymous reviewers, who helped to improve the quality of this manuscript. The 886
data used in this study are available from the authors upon request 887
([email protected]). 888
889
References 890
Addison, J. A., Finney, B. P., Dean, W. E., Davies, M. H., Mix, A. C., Stoner, J. S., and Jaeger, J. M.: 891
Productivity and sedimentary δ15N variability for the last 17,000 years along the northern Gulf of 892
带格式的: 两端对齐
域代码已更改

Alaska continental slope, Paleoceanography, 27, PA1206, doi:1210.1029/2011PA002161, 2012. 893
Algeo, T. J.: Can marine anoxic events draw down the trace element inventory of seawater?, Geology, 894
32, 1057-1060, 2004. 895
Algeo, T. J. and Lyons, T. W.: Mo-total organic carbon covariation in modern anoxic marine 896
environments: Implications for analysis of paleoredox and paleohydrographic conditions, 897
Paleoceanography, 21, PA1016, doi: 1010.1029/2004pa001112, 2006. 898
Algeo, T. J. and Tribovillard, N.: Environmental analysis of paleoceanographic systems based on 899
molybdenum–uranium covariation, Chemical Geology, 268, 211-225, 2009. 900
Andres, M., Jan, S., Sanford, T. B., Mensah, V., Centurioni, L. R., and Book, J. W.: Mean structure and 901
variability of the Kuroshio from northeastern Taiwan to southwestern Japan, Oceanography, 26, 84–95, 902
2015. 903
Böhm, E., Lippold, J., Gutjahr, M., Frank, M., Blaser, P., Antz, B., Fohlmeister, J., Frank, N., Andersen, 904
M. B., and Deininger, M.: Strong and deep Atlantic meridional overturning circulation during the last 905
glacial cycle, Nature, 517, 73-76, 2015. 906
Barker, S., Knorr, G., Vautravers, M. J., Diz, P., and Skinner, L. C.: Extreme deepening of the Atlantic 907
overturning circulation during deglaciation, Nature Geoscience, 3, 567-571, 2010. 908
Bianchi, D., Dunne, J. P., Sarmiento, J. L., and Galbraith, E. D.: Data-based estimates of suboxia, 909
denitrification, and N2O production in the ocean and their sensitivities to dissolved O2, Global 910
Biogeochemical Cycles, 26, doi:10.1029/2011gb004209, 2012. 911
Brewer, P. G. and Peltzer, E. T.: Ocean chemistry, ocean warming, and emerging hypoxia: Commentary, 912
Journal of Geophysical Research: Oceans, 121, 3659-3667, 2016. 913
Burdige, D. J.: The biogeochemistry of manganese and iron reduction in marine sediments, 914
Earth-Science Reviews, 35, 249-284, 1993. 915
Cannariato, K. G. and Kennett, J. P.: Climatically related millennial-scale fluctuations in strength of 916
California margin oxygen-minimum zone during the past 60 k.y, Geology, 27, 975-978, 1999. 917
Cartapanis, O., Tachikawa, K., and Bard, E.: Northeastern Pacific oxygen minimum zone variability 918
over the past 70 kyr: Impact of biological production and oceanic ventilation, Paleoceanography, 26, 919
PA4208, doi: 4210.1029/2011PA002126, 2011. 920
Cavalieri, D. J. and Parkinson, C. L.: On the relationship between atmospheric circulation and the 921
fluctuations in the sea ice extents of the bering and okhotsk seas, Journal of Geophysical 922
Research-Oceans, 92, 7141-7162, 1987. 923
Chang, A. S., Pedersen, T. F., and Hendy, I. L.: Effects of productivity, glaciation, and ventilation on 924
late Quaternary sedimentary redox and trace element accumulation on the Vancouver Island margin, 925
western Canada, Paleoceanography, 29, doi: 10.1002/2013PA002581, 2014. 926
Chang, Y.-P., Chen, M.-T., Yokoyama, Y., Matsuzaki, H., Thompson, W. G., Kao, S.-J., and Kawahata, 927
H.: Monsoon hydrography and productivity changes in the East China Sea during the past 100,000 928
years: Okinawa Trough evidence (MD012404), Paleoceanography, 24, PA3208, doi: 929
3210.1029/2007PA001577, 2009. 930
Chen, J., Zhang, D., Zhang, W., and Li, T.: The paleoclimatic change since the last galciation in the 931
north of Okinawa Trough based on the spore-pollen records, Acta Oceanologica Sinica, 28, 85-91(in 932
Chinese with English Abstract), 2006. 933
Cheng, H., Edwards, R. L., Sinha, A., Spötl, C., Yi, L., Chen, S., Kelly, M., Kathayat, G., Wang, X., Li, 934
X., Kong, X., Wang, Y., Ning, Y., and Zhang, H.: The Asian monsoon over the past 640,000 years and 935
ice age terminations, Nature, 534, 640-646, 2016. 936

Cheng, H., Edwards, R. L., Southon, J., Matsumoto, K., Feinberg, J. M., Sinha, A., Zhou, W., Li, H., Li, 937
X., Xu, Y., Chen, S., Tan, M., Wang, Q., Wang, Y., and Ning, Y.: Atmospheric 14C/12C changes during 938
the last glacial period from Hulu Cave, Science, 362, 1293-1297, 2018. 939
Chikamoto, M. O., Menviel, L., Abe-Ouchi, A., Ohgaito, R., Timmermann, A., Okazaki, Y., Harada, N., 940
Oka, A., and Mouchet, A.: Variability in North Pacific intermediate and deep water ventilation during 941
Heinrich events in two coupled climate models, Deep Sea Research Part II: Topical Studies in 942
Oceanography, 61-64, 114-126, 2012. 943
Clark, P. U., Shakun, J. D., Baker, P. A., Bartlein, P. J., Brewer, S., Brook, E., Carlson, A. E., Cheng, H., 944
Kaufman, D. S., Liu, Z., Marchitto, T. M., Mix, A. C., Morrill, C., Otto-Bliesner, B. L., Pahnke, K., 945
Russell, J. M., Whitlock, C., Adkins, J. F., Blois, J. L., Clark, J., Colman, S. M., Curry, W. B., Flower, 946
B. P., He, F., Johnson, T. C., Lynch-Stieglitz, J., Markgraf, V., McManus, J., Mitrovica, J. X., Moreno, P. 947
I., and Williams, J. W.: Global climate evolution during the last deglaciation, Proceedings of the 948
National Academy of Sciences of the United States of America, 109, E1134-E1142, 2012. 949
Clemens, S. C., Holbourn, A., Kubota, Y., Lee, K. E., Liu, Z., Chen, G., Nelson, A., and Fox-Kemper, 950
B.: Precession-band variance missing from East Asian monsoon runoff, Nature Communications, 9, 951
3364, doi: 3310.1038/s41467-41018-05814-41460, 2018. 952
Crusius, J., Calvert, S., Pedersen, T., and Sage, D.: Rhenium and molybdenum enrichments in 953
sediments as indicators of oxic, suboxic and sulfidic conditions of deposition, Earth and Planetary 954
Science Letters, 145, 65-78, 1996. 955
Crusius, J., Pedersen, T. F., Kienast, S., Keigwin, L., and Labeyrie, L.: Influence of northwest Pacific 956
productivity on North Pacific Intermediate Water oxygen concentrations during the Boiling-Allerod 957
interval (14.7-12.9 ka), Geology, 32, 633-636, 2004. 958
Dahl, T. W., Anbar, A. D., Gordon, G. W., Rosing, M. T., Frei, R., and Canfield, D. E.: The behavior of 959
molybdenum and its isotopes across the chemocline and in the sediments of sulfidic Lake Cadagno, 960
Switzerland, Geochimica et Cosmochimica Acta, 74, 144-163, 2010. 961
Dean, W. E., Gardner, J. V., and Piper, D. Z.: Inorganic geochemical indicators of glacial-interglacial 962
changes in productivity and anoxia on the California continental margin, Geochimica et Cosmochimica 963
Acta, 61, 4507-4518, 1997. 964
Delcroix, T. and Murtugudde, R.: Sea surface salinity changes in the East China Sea during 1997–2001: 965
Influence of the Yangtze River, Journal of Geophysical Research: Oceans, 107, 8008, 966
doi:8010.1029/2001JC000893, 2002. 967
Dou, Y., Yang, S., Li, C., Shi, X., Liu, J., and Bi, L.: Deepwater redox changes in the southern Okinawa 968
Trough since the last glacial maximum, Progress in Oceanography, 135, 77-90, 2015. 969
Emile-Geay, J., Cane, M. A., Naik, N., Seager, R., Clement, A. C., and van Geen, A.: Warren revisited: 970
Atmospheric freshwater fluxes and “Why is no deep water formed in the North Pacific”, Journal of 971
Geophysical Research: Oceans, 108, doi:10.1029/2001JC001058, 2003. 972
Freeman, E., Skinner, L. C., Tisserand, A., Dokken, T., Timmermann, A., Menviel, L., and Friedrich, T.: 973
An Atlantic–Pacific ventilation seesaw across the last deglaciation, Earth and Planetary Science Letters, 974
424, 237-244, 2015. 975
Galbraith, E. D. and Jaccard, S. L.: Deglacial weakening of the oceanic soft tissue pump: global 976
constraints from sedimentary nitrogen isotopes and oxygenation proxies, Quaternary Science Reviews, 977
109, 38-48, 2015. 978
Galbraith, E. D., Jaccard, S. L., Pedersen, T. F., Sigman, D. M., Haug, G. H., Cook, M., Southon, J. R., 979
and Francois, R.: Carbon dioxide release from the North Pacific abyss during the last deglaciation, 980

Nature, 449, 890-893, 2007. 981
Galbraith, E. D., Kienast, M., Pedersen, T. F., and Calvert, S. E.: Glacial-interglacial modulation of the 982
marine nitrogen cycle by high-latitude O2 supply to the global thermocline, Paleoceanography, 19, 983
PA4007, doi:4010.1029/2003PA001000, 2004. 984
Ge, S., Shi, X., Wu, Y., Lee, T., Xiong, Y., and Saito, Y.: Rock magnetic property of gravity core CSH1 985
from the northern Okinawa Trough and the effect of early diagenesis, Acta Oceanologica Sinica, 26, 986
54-65, 2007. 987
Gong, X., Lembke-Jene, L., Lohmann, G., Knorr, G., Tiedemann, R., Zou, J. J., and Shi, X. F.: 988
Enhanced North Pacific deep-ocean stratification by stronger intermediate water formation during 989
Heinrich Stadial 1, Nature Communications, 10, 656, doi:610.1038/s41467-41019-08606-41462, 2019. 990
Gray, W. R., Rae, J. W. B., Wills, R. C. J., Shevenell, A. E., Taylor, B., Burke, A., Foster, G. L., and 991
Lear, C. H.: Deglacial upwelling, productivity and CO2 outgassing in the North Pacific Ocean, Nature 992
Geoscience, 11, 340-344, 2018. 993
Helz, G. R., Miller, C. V., Charnock, J. M., Mosselmans, J. F. W., Pattrick, R. A. D., Garner, C. D., and 994
Vaughan, D. J.: Mechanism of molybdenum removal from the sea and its concentration in black shales: 995
EXAFS evidence, Geochimica et Cosmochimica Acta, 60, 3631-3642, 1996. 996
Hofmann, A. F., Peltzer, E. T., Walz, P. M., and Brewer, P. G.: Hypoxia by degrees: Establishing 997
definitions for a changing ocean, Deep Sea Research Part I: Oceanographic Research Papers, 58, 998
1212-1226, 2011. 999
Hoogakker, B. A. A., Elderfield, H., Schmiedl, G., McCave, I. N., and Rickaby, R. E. M.: 1000
Glacial–interglacial changes in bottom-water oxygen content on the Portuguese margin, Nature 1001
Geoscience, 8, 40-43, 2015. 1002
Horikawa, K., Asahara, Y., Yamamoto, K., and Okazaki, Y.: Intermediate water formation in the Bering 1003
Sea during glacial periods: Evidence from neodymium isotope ratios, Geology, 38, 435-438, 2010. 1004
Ichikawa, H. and Beardsley, R. C.: The Current System in the Yellow and East China Seas, Journal of 1005
Oceanography, 58, 77-92, 2002. 1006
Itaki, T., Khim, B. K., and Ikehara, K.: Last glacial-Holocene water structure in the southwestern 1007
Okhotsk Sea inferred from radiolarian assemblages, Marine Micropaleontology, 67, 191-215, 2008. 1008
Itaki, T., Kim, S., Rella, S. F., Uchida, M., Tada, R., and Khim, B. K.: Millennial-scale variations of 1009
late Pleistocene radiolarian assemblages in the Bering Sea related to environments in shallow and deep 1010
waters, Deep-Sea Research Part Ii-Topical Studies in Oceanography, 61-64, 127-144, 2012. 1011
Ivanochko, T. S. and Pedersen, T. F.: Determining the influences of Late Quaternary ventilation and 1012
productivity variations on Santa Barbara Basin sedimentary oxygenation: a multi-proxy approach, 1013
Quaternary Science Reviews, 23, 467-480, 2004. 1014
Jaccard, S. L. and Galbraith, E. D.: Direct ventilation of the North Pacific did not reach the deep ocean 1015
during the last deglaciation, Geophysical Research Letters, 40, 199-203, 2013. 1016
Jaccard, S. L. and Galbraith, E. D.: Large climate-driven changes of oceanic oxygen concentrations 1017
during the last deglaciation, Nature Geoscience, 5, 151-156, 2012. 1018
Jaccard, S. L. and Galbraith, E. D.: Push from the Pacific, Nature Geoscience, 11, 299-300, 2018. 1019
Jaccard, S. L., Galbraith, E. D., Martínez-García, A., and Anderson, R. F.: Covariation of deep 1020
Southern Ocean oxygenation and atmospheric CO2 through the last ice age, Nature, 530, 207-210, 1021
2016. 1022
Jaccard, S. L., Galbraith, E. D., Sigman, D. M., Haug, G. H., Francois, R., Pedersen, T. F., Dulski, P., 1023
and Thierstein, H. R.: Subarctic Pacific evidence for a glacial deepening of the oceanic respired carbon 1024

pool, Earth and Planetary Science Letters, 277, 156-165, 2009. 1025
Jian, Z. M., Chen, R. H., and Li, B. H.: Deep-sea benthic foraminiferal record of the paleoceanography 1026
in the southern Okinawa trough over the last 20000 years, Science in China Series D-Earth Sciences, 1027
39, 551-560, 1996. 1028
Kao, S. J., Horng, C. S., Hsu, S. C., Wei, K. Y., Chen, J., and Lin, Y. S.: Enhanced deepwater 1029
circulation and shift of sedimentary organic matter oxidation pathway in the Okinawa Trough since the 1030
Holocene, Geophysical Research Letters, 32, L15609, doi:15610.11029/12005GL023139, 2005. 1031
Kao, S. J., Liu, K. K., Hsu, S. C., Chang, Y. P., and Dai, M. H.: North Pacific-wide spreading of 1032
isotopically heavy nitrogen during the last deglaciation: Evidence from the western Pacific, 1033
Biogeosciences, 5, 1641-1650, 2008. 1034
Kao, S. J., Wu, C.-R., Hsin, Y.-C., and Dai, M.: Effects of sea level change on the upstream Kuroshio 1035
Current through the Okinawa Trough, Geophysical Research Letters, 33, L16604, 1036
doi:16610.11029/12006gl026822, 2006. 1037
Keigwin, L. D.: Glacial-age hydrography of the far northwest Pacific Ocean, Paleoceanography, 13, 1038
323-339, 1998. 1039
Kim, S., Khim, B. K., Uchida, M., Itaki, T., and Tada, R.: Millennial-scale paleoceanographic events 1040
and implication for the intermediate-water ventilation in the northern slope area of the Bering Sea 1041
duriing the last 71 kyrs, Global and Planetary Change, 79, 89-98, 2011. 1042
Klinkhammer, G. P. and Palmer, M. R.: Uranium in the oceans: Where it goes and why, Geochimica et 1043
Cosmochimica Acta, 55, 1799-1806, 1991. 1044
Knorr, G. and Lohmann, G.: Rapid transitions in the Atlantic thermohaline circulation triggered by 1045
global warming and meltwater during the last deglaciation, Geochemistry, Geophysics, Geosystems, 8, 1046
DOI: 10.1029/2007gc001604, 2007. 1047
Kohfeld, K. E. and Chase, Z.: Controls on deglacial changes in biogenic fluxes in the North Pacific 1048
Ocean, Quaternary Science Reviews, 30, 3350-3363, 2011. 1049
Kubota, Y., Kimoto, K., Itaki, T., Yokoyama, Y., Miyairi, Y., and Matsuzaki, H.: Bottom water 1050
variability in the subtropical northwestern Pacific from 26 kyr BP to present based on Mg/Ca and stable 1051
carbon and oxygen isotopes of benthic foraminifera, Climate of the Past, 11, 803-824, 2015. 1052
Kubota, Y., Kimoto, K., Tada, R., Oda, H., Yokoyama, Y., and Matsuzaki, H.: Variations of East Asian 1053
summer monsoon since the last deglaciation based on Mg/Ca and oxygen isotope of planktic 1054
foraminifera in the northern East China Sea, Paleoceanography, 25, PA4205, 1055
doi:4210.1029/2009pa001891, 2010. 1056
Lam, P. J., Robinson, L. F., Blusztajn, J., Li, C., Cook, M. S., McManus, J. F., and Keigwin, L. D.: 1057
Transient stratification as the cause of the North Pacific productivity spike during deglaciation, Nature 1058
Geosci, 6, 622-626, 2013. 1059
Lee, K. E., Lee, H. J., Park, J.-H., Chang, Y.-P., Ikehara, K., Itaki, T., and Kwon, H. K.: Stability of the 1060
Kuroshio path with respect to glacial sea level lowering, Geophysical Research Letters, 40, 392–396, 1061
doi:310.1002/grl.50102, 2013. 1062
Lembke-Jene, L., Tiedemann, R., Nürnberg, D., Kokfelt, U., Kozdon, R., Max, L., Röhl, U., and 1063
Gorbarenko, S. A.: Deglacial variability in Okhotsk Sea Intermediate Water ventilation and 1064
biogeochemistry: Implications for North Pacific nutrient supply and productivity, Quaternary Science 1065
Reviews, 160, 116-137, 2017. 1066
Li, D., Zheng, L.-W., Jaccard, S. L., Fang, T.-H., Paytan, A., Zheng, X., Chang, Y.-P., and Kao, S.-J.: 1067
Millennial-scale ocean dynamics controlled export productivity in the subtropical North Pacific, 1068

Geology, 45, 651-654, 2017. 1069
Li, T. G., Xiang, R., Sun, R. T., and Cao, Q. Y.: Benthic foraminifera and bottom water evolution in the 1070
middle-southern Okinawa Trough during the last 18 ka, Science in China Series D-Earth Sciences, 48, 1071
805-814, 2005. 1072
Li, Y. H. and Schoonmaker, J. E.: Chemical Composition and Mineralogy of Marine Sediments. In: 1073
Treatise on Geochemistry (Second Edition), Turekian, K. K. (Ed.), Elsevier, Oxford, 2014. 1074
Lim, D., Kim, J., Xu, Z., Jeong, K., and Jung, H.: New evidence for Kuroshio inflow and deepwater 1075
circulation in the Okinawa Trough, East China Sea: Sedimentary mercury variations over the last 1076
20 kyr, Paleoceanography, 32, 571-579, 2017. 1077
Liu, Y. H., Henderson, G. M., Hu, C. Y., Mason, A. J., Charnley, N., Johnson, K. R., and Xie, S. C.: 1078
Links between the East Asian monsoon and North Atlantic climate during the 8,200 year event, Nature 1079
Geosci, 6, 117-120, 2013. 1080
Liu, Z., Otto-Bliesner, B. L., He, F., Brady, E. C., Tomas, R., Clark, P. U., Carlson, A. E., 1081
Lynch-Stieglitz, J., Curry, W., Brook, E., Erickson, D., Jacob, R., Kutzbach, J., and Cheng, J.: Transient 1082
Simulation of Last Deglaciation with a New Mechanism for Bølling-Allerød Warming, Science, 325, 1083
310-314, 2009. 1084
Lohmann, G., Lembke-Jene, L., Tiedemann, R., Gong, X., Scholz, P., Zou, J., and Shi, X.: Challenges 1085
in the Paleoclimatic Evolution of the Arctic and Subarctic Pacific since the Last Glacial Period—The 1086
Sino–German Pacific–Arctic Experiment (SiGePAX), Challenges, 10, 13, doi:10.3390/challe10010013, 1087
2019. 1088
Lynch-Stieglitz, J.: The Atlantic Meridional Overturning Circulation and Abrupt Climate Change, 1089
Annual Review of Marine Science, 9, 83-104, 2017. 1090
Lyons, T. W., Anbar, A. D., Severmann, S., Scott, C., and Gill, B. C.: Tracking Euxinia in the Ancient 1091
Ocean: A Multiproxy Perspective and Proterozoic Case Study, Annual Review of Earth and Planetary 1092
Sciences, 37, 507-534, 2009. 1093
Machida, H.: The stratigraphy, chronology and distribution of distal marker-tephras in and around 1094
Japan, Global and Planetary Change, 21, 71-94, 1999. 1095
Maithani, P. B. and Srinivasan, S.: Felsic Volcanic Rocks, a Potential Source of Uranium - An Indian 1096
Overview, Energy Procedia, 7, 163-168, 2011. 1097
Marcott, S. A., Bauska, T. K., Buizert, C., Steig, E. J., Rosen, J. L., Cuffey, K. M., Fudge, T. J., 1098
Severinghaus, J. P., Ahn, J., Kalk, M. L., McConnell, J. R., Sowers, T., Taylor, K. C., White, J. W. C., 1099
and Brook, E. J.: Centennial-scale changes in the global carbon cycle during the last deglaciation, 1100
Nature, 514, 616-619, 2014. 1101
Matsumoto, K., Oba, T., Lynch-Stieglitz, J., and Yamamoto, H.: Interior hydrography and circulation of 1102
the glacial Pacific Ocean, Quaternary Science Reviews, 21, 1693-1704, 2002. 1103
Max, L., Lembke-Jene, L., Riethdorf, J. R., Tiedemann, R., Nurnberg, D., Kuhn, H., and Mackensen, 1104
A.: Pulses of enhanced North Pacific Intermediate Water ventilation from the Okhotsk Sea and Bering 1105
Sea during the last deglaciation, Climate of the Past, 10, 591-605, 2014. 1106
Max, L., Rippert, N., Lembke-Jene, L., Mackensen, A., Nürnberg, D., and Tiedemann, R.: Evidence for 1107
enhanced convection of North Pacific Intermediate Water to the low-latitude Pacific under glacial 1108
conditions, Paleoceanography, 32, 41-55, 2017. 1109
McManus, J., Berelson, W. M., Klinkhammer, G. P., Hammond, D. E., and Holm, C.: Authigenic 1110
uranium: Relationship to oxygen penetration depth and organic carbon rain, Geochimica et 1111
Cosmochimica Acta, 69, 95-108, 2005. 1112

McManus, J. F., Francois, R., Gherardi, J. M., Keigwin, L. D., and Brown-Leger, S.: Collapse and rapid 1113
resumption of Atlantic meridional circulation linked to deglacial climate changes, Nature, 428, 834-837, 1114
2004. 1115
Menviel, L., England, M. H., Meissner, K. J., Mouchet, A., and Yu, J.: Atlantic-Pacific seesaw and its 1116
role in outgassing CO2 during Heinrich events, Paleoceanography, 29, 58-70, 2014. 1117
Moffitt, S. E., Moffitt, R. A., Sauthoff, W., Davis, C. V., Hewett, K., and Hill, T. M.: Paleoceanographic 1118
Insights on Recent Oxygen Minimum Zone Expansion: Lessons for Modern Oceanography, PLOS 1119
ONE, 10, e0115246, doi, 0115210.0111371/journal.pone.0115246, 2015. 1120
Morford, J. L. and Emerson, S.: The geochemistry of redox sensitive trace metals in sediments, 1121
Geochimica et Cosmochimica Acta, 63, 1735-1750, 1999. 1122
Nakamura, H., Nishina, A., Liu, Z. J., Tanaka, F., Wimbush, M., and Park, J. H.: Intermediate and deep 1123
water formation in the Okinawa Trough, Journal of Geophysical Research-Oceans, 118, 6881-6893, 1124
2013. 1125
Nameroff, T. J., Balistrieri, L. S., and Murray, J. W.: Suboxic trace metal geochemistry in the Eastern 1126
Tropical North Pacific, Geochimica et Cosmochimica Acta, 66, 1139-1158, 2002. 1127
Nameroff, T. J., Calvert, S. E., and Murray, J. W.: Glacial-interglacial variability in the eastern tropical 1128
North Pacific oxygen minimum zone recorded by redox-sensitive trace metals, Paleoceanography, 19, 1129
PA1010, doi:1010.1029/2003PA000912, 2004. 1130
Nishina, A., Nakamura, H., Park, J.-H., Hasegawa, D., Tanaka, Y., Seo, S., and Hibiya, T.: Deep 1131
ventilation in the Okinawa Trough induced by Kerama Gap overflow, Journal of Geophysical Research: 1132
Oceans, 121, 6092-6102, 2016. 1133
Ohkushi, K., Hara, N., Ikehara, M., Uchida, M., and Ahagon, N.: Intensification of North Pacific 1134
intermediate water ventilation during the Younger Dryas, Geo-Mar Lett, 36, 353-360, 2016. 1135
Ohkushi, K., Itaki, T., and Nemoto, N.: Last Glacial-Holocene change in intermediate-water ventilation 1136
in the Northwestern Pacific, Quaternary Science Reviews, 22, 1477-1484, 2003. 1137
Ohkushi, K., Kennett, J. P., Zeleski, C. M., Moffitt, S. E., Hill, T. M., Robert, C., Beaufort, L., and Behl, 1138
R. J.: Quantified intermediate water oxygenation history of the NE Pacific: A new benthic foraminiferal 1139
record from Santa Barbara basin, Paleoceanography, 28, 453-467, 2013. 1140
Okazaki, Y., Kimoto, K., Asahi, H., Sato, M., Nakamura, Y., and Harada, N.: Glacial to deglacial 1141
ventilation and productivity changes in the southern Okhotsk Sea, Palaeogeography Palaeoclimatology 1142
Palaeoecology, 395, 53-66, 2014. 1143
Okazaki, Y., Sagawa, T., Asahi, H., Horikawa, K., and Onodera, J.: Ventilation changes in the western 1144
North Pacific since the last glacial period, Climate of the Past, 8, 17-24, 2012. 1145
Okazaki, Y., Seki, O., Nakatsuka, T., Sakamoto, T., Ikehara, M., and Takahashi, K.: Cycladophora 1146
davisiana (Radiolaria) in the Okhotsk Sea: A key for reconstructing glacial ocean conditions, Journal of 1147
Oceanography, 62, 639-648, 2006. 1148
Okazaki, Y., Timmermann, A., Menviel, L., Harada, N., Abe-Ouchi, A., Chikamoto, M. O., Mouchet, 1149
A., and Asahi, H.: Deepwater Formation in the North Pacific During the Last Glacial Termination, 1150
Science, 329, 200-204, 2010. 1151
Okumura, Y. M., Deser, C., Hu, A., Timmermann, A., and Xie, S.-P.: North Pacific Climate Response to 1152
Freshwater Forcing in the Subarctic North Atlantic: Oceanic and Atmospheric Pathways, Journal of 1153
Climate, 22, 1424-1445, 2009. 1154
Porter, S. C. and Zhisheng, A.: Correlation between climate events in the North Atlantic and China 1155
during the last glaciation, Nature, 375, 305-308, 1995. 1156

Praetorius, S. K., Mix, A. C., Walczak, M. H., Wolhowe, M. D., Addison, J. A., and Prahl, F. G.: North 1157
Pacific deglacial hypoxic events linked to abrupt ocean warming, Nature, 527, 362-366, 2015. 1158
Qu, T. and Lukas, R.: The Bifurcation of the North Equatorial Current in the Pacific, Journal of 1159
Physical Oceanography, 33, 5-18, 2003. 1160
Rühlemann, C., Müller, P. J., and Schneider, R. R.: Organic Carbon and Carbonate as Paleoproductivity 1161
Proxies: Examples from High and Low Productivity Areas of the Tropical Atlantic. In: Use of Proxies 1162
in Paleoceanography: Examples from the South Atlantic, Fischer, G. and Wefer, G. (Eds.), Springer 1163
Berlin Heidelberg, Berlin, Heidelberg, 1999. 1164
Rae, J. W. B., Sarnthein, M., Foster, G. L., Ridgwell, A., Grootes, P. M., and Elliott, T.: Deep water 1165
formation in the North Pacific and deglacial CO2 rise, Paleoceanography, 29, 645-667, 2014. 1166
Reimer, P. J., Bard, E., Bayliss, A., Beck, J. W., Blackwell, P. G., Bronk Ramsey, C., Buck, C. E., 1167
Cheng, H., Edwards, R. L., Friedrich, M., Grootes, P. M., Guilderson, T. P., Haflidason, H., Hajdas, I., 1168
Hatté, C., Heaton, T. J., Hoffmann, D. L., Hogg, A. G., Hughen, K. A., Kaiser, K. F., Kromer, B., 1169
Manning, S. W., Niu, M., Reimer, R. W., Richards, D. A., Scott, E. M., Southon, J. R., Staff, R. A., 1170
Turney, C. S. M., and van der Plicht, J.: IntCal13 and Marine13 Radiocarbon Age Calibration Curves 1171
0–50,000 Years cal BP, Radiocarbon, 55, 1869-1887, 2013. 1172
Rella, S. F., Tada, R., Nagashima, K., Ikehara, M., Itaki, T., Ohkushi, K., Sakamoto, T., Harada, N., and 1173
Uchida, M.: Abrupt changes of intermediate water properties on the northeastern slope of the Bering 1174
Sea during the last glacial and deglacial period, Paleoceanography, 27, PA3203, 1175
doi:3210.1029/2011pa002205, 2012. 1176
Riethdorf, J.-R., Max, L., Nuernberg, D., Lembke-Jene, L., and Tiedemann, R.: Deglacial development 1177
of (sub) sea surface temperature and salinity in the subarctic northwest Pacific: Implications for 1178
upper-ocean stratification, Paleoceanography, 28, doi:10.1002/palo.20014, 2013. 1179
Riethdorf, J.-R., Thibodeau, B., Ikehara, M., Nürnberg, D., Max, L., Tiedemann, R., and Yokoyama, Y.: 1180
Surface nitrate utilization in the Bering sea since 180kA BP: Insight from sedimentary nitrogen 1181
isotopes, Deep Sea Research Part II: Topical Studies in Oceanography, 125-126, 163-176, 2016. 1182
Rippert, N., Max, L., Mackensen, A., Cacho, I., Povea, P., and Tiedemann, R.: Alternating Influence of 1183
Northern Versus Southern-Sourced Water Masses on the Equatorial Pacific Subthermocline During the 1184
Past 240 ka, Paleoceanography, 32, 1256-1274, 2017. 1185
Rodríguez-Sanz, L., Mortyn, P. G., Herguera, J. C., and Zahn, R.: Hydrographic changes in the tropical 1186
and extratropical Pacific during the last deglaciation, Paleoceanography, 28, 529-538, 2013. 1187
Saenko, O. A., Schmittner, A., and Weaver, A. J.: The Atlantic-Pacific seesaw, Journal of Climate, 17, 1188
2033-2038, 2004. 1189
Sagawa, T. and Ikehara, K.: Intermediate water ventilation change in the subarctic northwest Pacific 1190
during the last deglaciation, Geophysical Research Letters, 35, 5, doi: 10.1029/2008gl035133, 2008. 1191
Scott, C. and Lyons, T. W.: Contrasting molybdenum cycling and isotopic properties in euxinic versus 1192
non-euxinic sediments and sedimentary rocks: Refining the paleoproxies, Chemical Geology, 324–325, 1193
19-27, 2012. 1194
Scott, C., Lyons, T. W., Bekker, A., Shen, Y., Poulton, S. W., Chu, X., and Anbar, A. D.: Tracing the 1195
stepwise oxygenation of the Proterozoic ocean, Nature, 452, 456-459, 2008. 1196
Shao, H., Yang, S., Cai, F., Li, C., Liang, J., Li, Q., Hyun, S., Kao, S.-J., Dou, Y., Hu, B., Dong, G., and 1197
Wang, F.: Sources and burial of organic carbon in the middle Okinawa Trough during late Quaternary 1198
paleoenvironmental change, Deep Sea Research Part I: Oceanographic Research Papers, 118, 46-56, 1199
2016. 1200
Shcherbina, A. Y., Talley, L. D., and Rudnick, D. L.: Direct observations of North Pacific ventilation: 1201
Brine rejection in the Okhotsk Sea, Science, 302, 1952-1955, 2003. 1202
Shi, X., Wu, Y., Zou, J., Liu, Y., Ge, S., Zhao, M., Liu, J., Zhu, A., Meng, X., Yao, Z., and Han, Y.: 1203
Multiproxy reconstruction for Kuroshio responses to northern hemispheric oceanic climate and the 1204
Asian Monsoon since Marine Isotope Stage 5.1 (~88 ka), Climate of the Past, 10, 1735-1750, 2014. 1205
Shibahara, A., Ohkushi, K., Kennett, J. P., and Ikehara, K.: Late Quaternary changes in intermediate 1206
water oxygenation and oxygen minimum zone, northern Japan: A benthic foraminiferal perspective, 1207
Paleoceanography, 22, PA3213, doi:3210.1029/2005pa001234, 2007. 1208
Shimmield, G. B. and Price, N. B.: The behaviour of molybdenum and manganese during early 1209
sediment diagenesis — offshore Baja California, Mexico, Marine Chemistry, 19, 261-280, 1986. 1210
Sibuet, J. C., Letouzey, J., Barbier, F., Charvet, J., Foucher, J. P., Hilde, T. W. C., Kimura, M., Chiao, 1211
L.-Y., Marsset, B., Muller, C., and Stéphan, J. F.: Back Arc Extension in the Okinawa Trough, Journal 1212
of Geophysical Research: Solid Earth, 92, 14041-14063, 1987. 1213
Sigman, D. M. and Boyle, E. A.: Glacial/interglacial variations in atmospheric carbon dioxide, Nature, 1214
407, 859-869, 2000. 1215
Spratt, R. M. and Lisiecki, L. E.: A Late Pleistocene sea level stack, Clim. Past, 12, 1079-1092, 2016. 1216
Sun, Y., Clemens, S. C., Morrill, C., Lin, X., Wang, X., and An, Z.: Influence of Atlantic meridional 1217
overturning circulation on the East Asian winter monsoon, Nature Geosci, 5, 46-49, 2012. 1218
Sun, Y. B., Oppo, D. W., Xiang, R., Liu, W. G., and Gao, S.: Last deglaciation in the Okinawa Trough: 1219
Subtropical northwest Pacific link to Northern Hemisphere and tropical climate, Paleoceanography, 20, 1220
PA4005, doi:4010.1029/2004pa001061, 2005. 1221
Sundby, B., Martinez, P., and Gobeil, C.: Comparative geochemistry of cadmium, rhenium, uranium, 1222
and molybdenum in continental margin sediments, Geochimica et Cosmochimica Acta, 68, 2485-2493, 1223
2004. 1224
Talley, L. D.: Distribution foramtion of North Pacific Intermediate water, Journal of Physical 1225
Oceanography, 23, 517-537, 1993. 1226
Talley, L. D.: Hydrographic Atlas of the World Ocean Circulation Experiment (WOCE). In: Volume 2: 1227
Pacific Ocean, Sparrow, M., Chapman, P., and Gould, J. (Eds.), International WOCE Project Office, 1228
Southampton, UK, 2007. 1229
Tribovillard, N., Algeo, T. J., Lyons, T., and Riboulleau, A.: Trace metals as paleoredox and 1230
paleoproductivity proxies: An update, Chemical Geology, 232, 12-32, 2006. 1231
Ujiié, H. and Ujiié, Y.: Late Quaternary course changes of the Kuroshio Current in the Ryukyu Arc 1232
region, northwestern Pacific Ocean, Marine Micropaleontology, 37, 23-40, 1999. 1233
Ujiié, Y., Asahi, H., Sagawa, T., and Bassinot, F.: Evolution of the North Pacific Subtropical Gyre 1234
during the past 190 kyr through the interaction of the Kuroshio Current with the surface and 1235
intermediate waters, Paleoceanography, 31, 1498-1513, 2016. 1236
Ujiié, Y., Ujiié, H., Taira, A., Nakamura, T., and Oguri, K.: Spatial and temporal variability of surface 1237
water in the Kuroshio source region, Pacific Ocean, over the past 21,000 years: evidence from 1238
planktonic foraminifera, Marine Micropaleontology, 49, 335-364, 2003. 1239
Vorlicek, T. P. and Helz, G. R.: Catalysis by mineral surfaces: Implications for Mo geochemistry in 1240
anoxic environments, Geochimica et Cosmochimica Acta, 66, 3679-3692, 2002. 1241
Wahyudi and Minagawa, M.: Response of benthic foraminifera to organic carbon accumulation rates in 1242
the Okinawa Trough, Journal of Oceanography, 53, 411-420, 1997. 1243
Wan, S. and Jian, Z.: Deep water exchanges between the South China Sea and the Pacific since the last 1244

glacial period, Paleoceanography, 29, 1162-1178, 2014. 1245
Wang, Y., Cheng, H., Edwards, R. L., He, Y., Kong, X., An, Z., Wu, J., Kelly, M. J., Dykoski, C. A., 1246
and Li, X.: The Holocene Asian Monsoon: Links to Solar Changes and North Atlantic Climate, Science, 1247
308, 854-857, 2005. 1248
Wu, Y., Cheng, Z., and Shi, X.: Stratigraphic and carbonate sediment characteristics of Core CSH1 1249
from the northern Okinawa Trough, Advances in Marine Science, 22, 163-169 (in Chinese with English 1250
Abstract), 2004. 1251
Wu, Y., Shi, X., Zou, J., Cheng, Z., Wang, K., Ge, S., and Shi, F.: Benthic foraminiferal δ 13C 1252
minimum events in the southeastern Okhotsk Sea over the last 180ka, Chinese Science Bulletin, 59, 1253
3066-3074, 2014. 1254
You, Y. Z.: The pathway and circulation of North Pacific Intermediate Water, Geophysical Research 1255
Letters, 30, doi:10.1029/2003gl018561, 2003. 1256
You, Y. Z., Suginohara, N., Fukasawa, M., Yasuda, I., Kaneko, I., Yoritaka, H., and Kawamiya, M.: 1257
Roles of the Okhotsk Sea and Gulf of Alaska in forming the North Pacific Intermediate Water, Journal 1258
of Geophysical Research-Oceans, 105, 3253-3280, 2000. 1259
You, Y. Z., Suginohara, N., Fukasawa, M., Yoritaka, H., Mizuno, K., Kashino, Y., and Hartoyo, D.: 1260
Transport of North Pacific Intermediate Water across Japanese WOCE sections, Journal of Geophysical 1261
Research-Oceans, 108, doi: 10.1029/2002jc001662, 2003. 1262
Yu, H., Liu, Z. X., Berne, S., Jia, G. D., Xiong, Y. Q., Dickens, G. R., Wei, G. J., Shi, X. F., Liu, J. P., 1263
and Chen, F. J.: Variations in temperature and salinity of the surface water above the middle Okinawa 1264
Trough during the past 37 kyr, Palaeogeography Palaeoclimatology Palaeoecology, 281, 154-164, 1265
2009. 1266
Zhang, X., Knorr, G., Lohmann, G., and Barker, S.: Abrupt North Atlantic circulation changes in 1267
response to gradual CO2 forcing in a glacial climate state, Nature Geoscience, 10, 518-524, 2017. 1268
Zheng, X., Kao, S., Chen, Z., Menviel, L., Chen, H., Du, Y., Wan, S., Yan, H., Liu, Z., Zheng, L., Wang, 1269
S., Li, D., and Zhang, X.: Deepwater circulation variation in the South China Sea since the Last Glacial 1270
Maximum, Geophysical Research Letters, 43, 8590-8599, 2016. 1271
Zheng, Y., Anderson, R., van Geen, A., and Fleisher, M.: Remobilization of authigenic uranium in 1272
marine sediments by bioturbation, Geochimica et Cosmochimica Acta, 66, 1759-1772, 2002. 1273
Zheng, Y., Anderson, R., van Geen, A., and Kuwabara, J.: Authigenic molybdenum formation in marine 1274
sediments: a link to pore water sulfide in the Santa Barbara Basin, Geochimica et Cosmochimica Acta, 1275
64, 4165-4178, 2000. 1276
Zhu, A., Shi, X., Zou, J., Wu, Y., Zhang, H., and Bai, Y.: Sediment Provenance and Fluxes in the 1277
Northern Okinawa Trough During the last 88ka, Marine Geology & Quaternary Geology, 35, 1-8 (in 1278
Chinese with English Abstract), 2015. 1279
Zou, J., Shi, X., Liu, Y., Liu, J., Selvaraj, K., and Kao, S.-J.: Reconstruction of environmental changes 1280
using a multi-proxy approach in the Ulleung Basin (Sea of Japan) over the last 48 ka, Journal of 1281
Quaternary Science, 27, 891-900, 2012. 1282
1283

Captions 1284
Table 1. Locations of different sediment core records and their source references 1285
discussed in the text. 1286
1287
Table 2. Age control points adopted between planktic foraminifera species 1288
Globigerinoides ruber δ18O of Core CSH1 and Chinese stalagmite δ18O (Cheng et al., 1289
2016) for tuning the age model between 10 ka and 60 ka in this study. A linear 1290
interpolation was assumed between age control points. 1291
1292
Figure 1. (a) Spatial distribution of dissolved oxygen content at 700 m water depth in 1293
the North Pacific. Black arrows denote simplified Kuroshio and Oyashio circulations 1294
and North Pacific Intermediate Water (NPIW) in the North Pacific. The red thick 1295
dashed line indicates transformation of Okhotsk Sea Intermediate Water (OSIW) by 1296
cabbeling the subtropical NPIW along the subarctic-tropical frontal zone (You, 2003). 1297
The light brown solid line with arrow indicates the spreading path of subtropical 1298
NPIW from northeast North Pacific southward toward the low-latitude northwest 1299
North Pacific (You, 2003). Yellow solid lines with arrow represent two passages 1300
through which NPIW enter into the Okinawa Trough. This figure was created with 1301
Ocean Data View (odv.awi.de). (b) Location of sediment core CSH1 investigated in 1302
this study (red diamond). Also shown are locations of sediment cores PN-3,E017,255 1303
and MD012404 investigated previously from the Okinawa Trough, GH08-2004 from 1304
the East of Ryukyu Island, GH02-1030 off (PN-3,E017,255 and MD012404; white 1305
cross line), the east of Japannorthern and southern Japan (GH08-2004 and 1306
GH02-1030), PC-23A from the Bering Sea (PC-23A) and ODP Site 1017 from the 1307
northeastern Pacific (ODP167-1017). Letters A to E represent the sediment cores from 1308
and near the OT. The detailed information for these cores can beis shown seen in 1309
Table 1. 1310
1311
Figure 2. Spatial distribution of sea surface salinity in the East China Sea. (a) summer 1312
(July to September); (b) winter (January to March). Lower sea surface salinity in 1313
带格式的: 两端对齐
带格式的: 字体: 倾斜
域代码已更改
域代码已更改

summer relative to that of winter indicates strong effects of summer East Asian 1314
Monsoon. 1315
1316
Figure 3. (a) Lithology and oxygen isotope (δ18O) profile of planktic foraminiferal 1317
species Globigerinoides ruber (G.ruber) in core CSH1. (b) Plot of ages versus depth 1318
for core CSH1. Three known ash layers are indicated by solid red rectangles. (c) Time 1319
series of linear sedimentation rate (LSR) from core CSH1. (d) Comparison of age 1320
model of core CSH1 with Chinese Stalagmite composite δ18O curve of (Cheng et al., 1321
2016). Tie points for CSH1 core chronology (Table 2) in Figures 2b 3c and 2c 3d are 1322
designated by blue and red solidcolored dotscrosses. 1323
1324
Figure 4. Age versus (a) CaCO3 concentration, linear sedimentation rate (LSR), (b) 1325
Total nitrogen (TN) concentration, C/N molar ratio, (c) Total organic carbon (TOC) 1326
concentration, (d) C/N molar ratio, Total nitrogen (TN) concentration, (e) linear 1327
sedimentation rate (LSR), CaCO3 concentration, (f) Al concentration, (g) Mn 1328
concentration, (h) Mo/Mn ratio, (i) Mo concentration, (j) excess Mo concentration, (k) 1329
U concentration and (l) excess U concentration and (m) (Mo/U)excess ratio in core 1330
CSH1. Light gray and dark grayGray and black vertical bars indicate different 1331
sediment intervals in core CSH1. MIS indicates Marine Isotope Stage. 8.2 ka, PB, YD, 1332
B/A, HS1, LGM and HS2 refer to 8,200 year cold event, Preboreal, Younger Dryas, 1333
Bölling - Alleröd, Heinrich Stadial 1, Last Glacial Maximum and Heinrich Stadial 2, 1334
respectively, which were identified in core CSH1. Blue solid diamonds in Figure 3l 1335
4m indicate the age control points. 1336
1337
Figure 5. Scatter plots of Moexcess vs Mn concentrations and Uexcess concentration vs 1338
Mo/Mn ratio at different time intervals in core CSH1. A various correlation is present 1339
in core CSH1 at different time intervals, which shows their complicated geochemical 1340
behaviors (Figs.5a and b). Strong positive correlation between Uexcess concentration 1341
and Mo/Mn ratio and Uexcess concentration (Fig.5c) suggest that Mo/Mn ratiothey are 1342
is a reliable proxy suitable to track sedimentary redox conditions in the geological 1343
域代码已更改
带格式的: 字体: 五号
带格式的: 下标

past. 1344
1345
Figure 6. Proxy-related reconstructions of intermediate watermid-depth sedimentary 1346
oxygenation at site CSH1 (this study) compared with oxygenation records from other 1347
locations of the North Pacific and published climatic and environmental records from 1348
the Okinawa Trough. From top to bottom: (a) CaCO3 concentration, (b) Uexcess 1349
concentration, (c) Mo/Mn ratio, and (d) Mn concentrationsea surface temperature 1350
(SST ) (Shi et al., 2014), and (e) abundance of P.obliquiloculata in core CSH1 (Shi et 1351
al., 2014) and, (f) bulk sedimentary organic matter δ15N of TOC in core MD01-2404 1352
(Kao et al., 2008), (g) δ13C of epibenthic foraminiferal C.wuellerstorfi in core PN-3 1353
(Wahyudi and Minagawa, 1997), (h) relative abundance of B. aculeata 1354
(hypoxia-indicating species) and (i) C.hyalinea (oxygen-rich indicating species) (Li et 1355
al., 2005), (hj) Dysoxic dysoxic taxa (%) in core ODP 167-1017 in the northeastern 1356
Pacific (Cannariato and Kennett, 1999) and (ik) δ13C of benthic foraminiferal 1357
Uvigerina akitaensisthe in core PC23A in the Bering Sea (Rella et al., 2012). Light 1358
gray Gray and dark grayblack vertical bars are the same as those in Figure 4. 1359
1360
Figure 7. Proxy records favoring the existence of out-of-phase connections oceanic 1361
ventilation seesaw between the subtropical North Pacific and North Atlantic during 1362
the last deglaciation and enhanced carbon storage at mid-depth waters. (a) U excess 1363
concentration in core CSH1;Atmospheric CO2 concentration (Marcott et al., 2014) (b) 1364
Mo/Mn ratio in core CSH1;Indicator of strength of Atlantic Meridional Ocean 1365
Circulation (231Pa/230Th) (Böhm et al., 2015; McManus et al., 2004); (c) benthic δ13C 1366
record in core PC-23A in the Bering Sea (Rella et al., 2012); (d) Indicator of strength 1367
of Atlantic Meridional Ocean Circulation (231Pa/230Th) (Böhm et al., 2015; McManus 1368
et al., 2004); Mo/Mn ratio in core CSH1; (e) Atmospheric CO2 concentration (Marcott 1369
et al., 2014) U excess concentration in core CH1. Light gray and dark gray vertical bars 1370
are the same as those in Figure 4.Blue diamonds are the same as those in Figure 3. 1371
1372
域代码已更改
域代码已更改
域代码已更改
域代码已更改
带格式的: 字体: 倾斜
带格式的: 字体: 倾斜
带格式的: 字体颜色: 自动设置
域代码已更改
域代码已更改
域代码已更改
域代码已更改
域代码已更改
域代码已更改
域代码已更改
域代码已更改
域代码已更改
域代码已更改
域代码已更改

Table 1 Label in
Figure 1b Station Latitude (°N) Longitude (°E) Water depth (m) Area Reference
CSH1 31.23 128.72 703 Okinawa Trough this study
A PN-3 28.10 127.34 1058 Okinawa Trough Wahyudi and Minagawa,
(1997)
B MD012404 26.65 125.81 1397 Okinawa Trough Kao et al., (2008)
C E017 26.57 126.02 1826 Okinawa Trough Li et al., (2005)
D 255 25.20 123.12 1575 Okinawa Trough Jian et al., (1996)
E GH08-2004 26.21 127.09 1166 East of Ryukyu
Island Kubota et al. (20102015)
GH02-1030 42.23 144.21 1212 Off Japan Sagawa and Ikehara,
(2008)
PC-23A 60.16 179.46 1002 Bering Sea Rella et al.,(2012)
ODP SSite
167- 1017 34.54 239.11 955 NE Pacific
Cannariato and Kennett,
(1999)
带格式的: 两端对齐
带格式表格
带格式的: 段落间距段前: 0 磅, 段后:0 磅, 行距: 单倍行距, 与下段不同页,段中分页
带格式表格
带格式的: 到齐到网格, 制表位: 不在 19.78 字符 + 39.55 字符
带格式的: 段落间距段前: 0 磅, 段后:0 磅, 行距: 单倍行距, 与下段不同页,段中分页
带格式的: 段落间距段前: 0 磅, 段后:0 磅, 行距: 单倍行距, 与下段不同页,段中分页
带格式的: 到齐到网格, 制表位: 不在 19.78 字符 + 39.55 字符
带格式的: 段落间距段前: 0 磅, 段后:0 磅, 行距: 单倍行距, 与下段不同页,段中分页

Table 2 1
2
Depth(cm) AMS 14C (yr) Error (yr) Calibrated Age (yr) Tie Point Type LSR (cm/ka) Source
10 3420 ±35 3296 14C Shi et al., (2014)
106 7060 ± 40 7545 14C 22.59 Shi et al., (2014)
218 12352 Stalagmite, YD 23.30 This study
322 16029 Stalagmite, H1 28.28 This study
362 19838 Stalagmite 10.50 This study
466 23476 Stalagmite, DO2 28.59 This study
506 24163 Stalagmite, H2 58.2233.29 This study
698 28963 Stalagmite, DO4 40.00 This study
746 29995 Stalagmite, H3 46.51 This study
834 32442 Stalagmite, DO5 3539.0996 This study
938 37526 Stalagmite, DO8 20.46 This study
978 39468 Stalagmite, H4 20.60 This study
1058 46151 Stalagmite, DO12 11.97 This study
1122 49432 Stalagmite, DO13 19.51 This study
1242 52831 Stalagmite, DO14 35.30 This study
1282 57241 Stalagmite, DO16 9.07 This study
1346 61007 Stalagmite, H6 16.99 This study
1530 ±2590 73910 MIS4/5 14.26 Shi et al., (2014)
1610 ±3580 79250 MIS 5.1 14.98 Shi et al., (2014)
3
4
5
带格式的 ... [1]
带格式的 ... [2]
带格式的 ... [3]
带格式的 ... [4]
带格式的 ... [5]
带格式的 ... [6]
带格式的 ... [7]
带格式的 ... [8]
带格式的 ... [9]
带格式的 ... [10]
带格式的 ... [11]
带格式的 ... [12]
带格式的 ... [13]
带格式的 ... [14]
带格式的 ... [15]
带格式的 ... [16]
带格式的 ... [17]
带格式的 ... [18]
带格式的 ... [19]
带格式的 ... [20]
带格式的 ... [21]
带格式的 ... [22]
带格式的 ... [23]
带格式的 ... [24]
带格式的 ... [25]
带格式的 ... [26]
带格式的 ... [27]
带格式的 ... [28]
带格式的 ... [29]
带格式的 ... [30]
带格式的 ... [31]
带格式的 ... [32]
带格式的 ... [33]
带格式的 ... [34]
带格式的 ... [35]
带格式的 ... [36]
带格式的 ... [37]
带格式的 ... [38]
带格式的 ... [39]
带格式的 ... [40]
带格式的 ... [41]
带格式的 ... [42]
带格式的 ... [43]
带格式的 ... [44]
带格式的 ... [45]
带格式的 ... [46]
带格式的 ... [47]
带格式的 ... [48]
带格式的 ... [49]
带格式的 ... [50]
带格式的 ... [51]
带格式的 ... [52]
带格式的 ... [53]

Fig.1 6
7
8
9
10
11

Fig.2 12
13
14
Fig.3 15
16
17
18
19
带格式的: 字体: 小四

Fig.4 20
21
带格式的: 字体: 小四

22
带格式的: 字体: 小四

23
24
Fig.5 25
26
27
28
带格式的: 字体: 小四
带格式的: 字体: 小四

Fig.6 29
30
带格式的: 字体: 小四

31
32

Fig.7 33
34
带格式的: 字体: 小四

35
带格式的: 字体: 小四