AUTHOR'S GUIDELINES - Pasca Unila - Universitas Lampung
233
,x
-
Upload
khangminh22 -
Category
Documents
-
view
0 -
download
0
Transcript of AUTHOR'S GUIDELINES - Pasca Unila - Universitas Lampung

,x

Proceeding of International Conference of 4th SHIELD 2019
https://pasca.unila.ac.id/seminar-internasional-shield/
ISBN : 978-602-51393-9-0
PROCEEDING
INTERNATIONAL CONFERENCE 4TH
SHIELD
2019
Theme :
Social Sciences and Humanities, Economics, Education, Law,
and Sustainable Development (SHIELD)
Bandar Lampung, August 27-28th
2019
Publisher
Program Postgraduate University Lampung

Proceeding of International Conference of 4th SHIELD 2019
https://pasca.unila.ac.id/seminar-internasional-shield/
ISBN : 978-602-51393-9-0
Foreword
In this globalization era, advancement in science and technology has led to remarkable gains in
life. However, despite the remarkable gains, many countries particularly Asian countries face
inequalities and uneven progress. Even worse, these countries are facing many problems such as
poverty, terrorism, drug abuse, and other social issues. These problems are complex and
multidimensional. We should give a real contribution to solving these problems. Because the
problems are multidimensional, we need people from cross-disciplinary interests to work hand in
hand with strong commitment, not only to face, but also to change these problems into
opportunities.
Therefore, the Postgraduate Program in collaboration with Institute of Research and Community
Service of University of Lampung provides a place for academicians, practitioners, policy
makers, researchers and professionals from multi-disciplines related to Social Sciences and
Humanities, Economics, Education, Law, and Sustainable Development (SHIELD) to meet and
interact with members inside and outside their own particular disciplines. All participants are
challenged to give their real contribution to helping solve the real-world problems.
The authors of Proceeding of 4th
SHIELD International Conference come from academicians,
practitioners, policy makers, researchers and professionals from multi-disciplines related to
Social Sciences and Humanities, Economics, Education, Law, and Sustainable Development.
This conference aims to share information and discuss resent developments and innovations
arising from research in a wide range of disciplines. Through this conference, it is expected that
the research articles can be documented and communicated throughout the countries.
Head of Commite
Dr.Ir. Zainal Abidin, M.E.S.

Proceeding of International Conference of 4th SHIELD 2019
https://pasca.unila.ac.id/seminar-internasional-shield/
ISBN : 978-602-51393-9-0
DAFTAR ISI
No. Paper Page:
1 COMPENSATION PATTERN OF LAND ACQUISITION FOR PUBLIC
INTEREST AND ITS IMPLICATION Muhammad Akib
1, HS. Tisnanta
2, FX Sumarja
3, and *Thio Haikal Anugerah
4
1 - 5
2
ANALYSIS OF COMMUNITY FOREST FARMER’S INTEREST ON
IMPLEMENTATION OF AGRICULTURAL INSURANCE IN
PRINGSEWU DISTRICT, LAMPUNG PROVINCE Revi Ameliya, Slamet Budi Yuwono, Christine Wulandari and Indra Gumay
Febryano
6-10
3 THE ANALYSIS OF MATHEMATICS REFLECTIVE THINKING SKILLS OF
HIGH SCHOOL STUDENTS IN COMPLETING TRIGONOMETRY PROBLEMS
O. Andriawan1*
and S. H. Noer2
11 - 16
4
CHARACTERISTICS OF LAUNDRY AND DETERGENT LEVEL
(MBAS) EFFLUEN LAUNDRY LIQUID WASTE IN IRINGMULYO
REGION Siti Choiriyah
1*, Indra Gumay Febryano
2, Endro P. Wahono
3, Nuning Nurcahyani
4
17 - 23
5
DEVELOPMENT OF INTERACTIVE MULTIMEDIA BASED ON
SCIENCE PROCESS SKILLS IN FORCE AND ENERGY IN
ELEMENTARY SCHOOL Fauzie
1, Hartono
2, and Sri Sumarni
3
24 - 30
6 LOCAL REGULATION DESIGN OF IRRIGATION
BASED ON PENGAYOMAN LAW Ade Arif Firmansyah
1, M. Iwan Satriawan
2 and Malicia Evendia
3
31 – 37
7 EXPORT COMPETITIVENESS OF INDONESIA’S PALM OIL
COMMODITIES Maria Ulfah
1, Raden Hanung Ismono
2 and Ktut Murniati
3
38 - 46
8 THE DEVELOPMENT OF NATION CHARATER-BASED INDONESIAN
LAW: THE ACTUALIZATION OF PANCASILA PRINCIPLES 1Topan Indra Karsa,
2Dwi Nurahman,
3Destoprani Brajannoto
47 -52
9 THE INFLUENCE OF NOISE FROM TRAIN ROAD TRAFFIC ON LISTENING
FUNCTION OF ELEMENTARY SCHOOL STUDENTS
Kornella Restianti, Eng. Yul Martin, Tugiyono, Mustofa,
53- 59
10 SELECT RIGHTS FOR CITIZENS WITH MENTAL DISABILITIES
IN GENERAL ELECTION IN 2019
Eni Lestari dan Hertanto
60 - 68
11
THE VILLAGERS’ PREPAREDNESS OF TOUGH VILLAGE DISASTER
IN THE SUKARAJA VILLAGE, DISTRICT RAJABASA, SOUTH
LAMPUNG Dedy Miswar, Buchori Asyik, Nani Suwarni, dan Maruli Tua Sinaga
69 – 82
12
STUDY OF THE IMPLEMENTATION OF MINISTRY OF TRADE
REGULATION NO. 47 OF 2017 CONCERNING THE HIGHEST RETAIL PRICE
OF BEEF IN BANDARLAMPUNG
Rasinta Hotnaida Nainggolan, Zainal Abidin, dan KtutMurniati
83- 92

Proceeding of International Conference of 4th SHIELD 2019
https://pasca.unila.ac.id/seminar-internasional-shield/
ISBN : 978-602-51393-9-0
13
THE DIFFERENCE OF MOODLE BASED LEARNING OUTCOMES
VIEWED FROM THE APPLICATION OF THE GROUP
INVESTIGATION LEARNING MODEL AND CRITICAL THINKING
ABILITY Nashar and Rikza Fauzan
93-99
14 CYBERCRIME POLICIES: JURIDIC EVIDENCE AND LAW
ENFORCEMENT POLICIES 1Dwi Nurahman,
2Destoprani Brajannoto
100 – 107
15
ROADMAPPING LOCAL REGULATION REQUIREMENT TO
SUPPORT THE DEVELOPMENT OF A SUSTAINABLE TOURISM
INDUSTRY Candra Perbawati1 , Malicia Evendia2 , and Ahmad Saleh3
108 - 114
16 HOW TO USE A GOOD SMALL WRITE BOARD IN SUPPORTING THE
LEARNING PROCESS Yopi Permana
1 , Sugeng Sutiarso
2
115 – 120
17
FEASIBILITY STUDY OF LEMPASING BEACH COASTAL FISHING
PORT AS AN ENVIRONMENTALLY FRIENDLY FISHING PORT (ECO
FISHING PORT) Zainal K
1, Indra Gumay Febryano
1, Endro P. Wahono
1, Nuning Nur Cahyani
1,
Abdullah Aman Damai ke-11, Zainal Abidin-2
1
121 – 125
18 THE APPLICATION OF MIND MAP CONCEPTS IN THE BLENDED
LEARNING CLASS OF MATHEMATICAL LOGIC MATERIAL Marchamah Ulfa
126 - 133
19
THE DESCRIPTION OF PRE-SERVICE TEACHERS ABILITY OF
CREATING TEST ITEMS IN COURSE OF MATHEMATICS
LEARNING’S EVALUATION Nicky Dwi Puspaningtyas
134 - 138
20 COMPANY COMPLIANCE IN SOUTH LAMPUNG DISTRICT TOWARDS
ENVIRONMENTAL PERMITS
Feri Bastian, Agus Setiawan, Slamet Budi Yuwono, Muhammad Akib.
139 - 143
21
PREDICTION MODEL OF STUNTING TODDLER'S EVENTS BASED
ON SOCIAL DETERMINANTS AND RISK FACTORS IN TELUK
BETUNG SELATAN DISTRICT, BANDAR LAMPUNG CITY Marita Wulandari1,2, Dyah Wulan S.R Wardani3 , Betta Kurniawan4 , Erdi Suroso5
144 - 151
22 VILLAGE, HUMAN RESOURCES AND NAWACITA Siti Khoiriah43, Rudy, Afri Aripin
152 - 160
23 THE EFFECT OF HALAL BRANDING DIMENSION TO PURCHASE
INTENTION ON ORIFLAME LIPSTICK Mutiara Fitri Andini1 , Dorothy Rouly Haratua Pandjaitan2 , Faila Shofa2
161 - 170
24
DISASTER VILLAGE MANAGEMENT BASED ON PANCASILA LAW
PARADIGM (Study on Tsunami Disaster Management in South Lampung
Regency) HS. Tisnanta1 , Fathoni2 , Agus Triyono3 and Dauri4
171 - 177
25
MOTIFS INNOVATIONS OF LAMPUNG TAPIS: CARING FOR LOCAL
WISDOM, SOCIO-ECONOMIC AND TOURISM NETWORK
Bartoven Vivit Nurdin and Dea Oktavian
178 - 186

Proceeding of International Conference of 4th SHIELD 2019
https://pasca.unila.ac.id/seminar-internasional-shield/
ISBN : 978-602-51393-9-0
26
SANITARIAN WORKERS’ COMPLIANCE ON THE MEDICAL WASTE
TREATMENT PROCEDURE: STUDY IN HEALTH CENTERS OF
METRO MUNICIPALITY AND CENTRAL LAMPUNG REGENCY Ari Kuswantari1), Agus Setiawan2), Yul Martin2), and Samsul Bakri2*)
187 - 192
27 STUDENT ATTITUDETO LGBT BEHAVIOR (LESBIAN, GAY,
BISEXUAL AND TRANSGENDER) IN BANDAR LAMPUNG Anita Florencya and TubagusHasanuddin
193 - 197
28 UTILIZATION INFORMATION AND PEPPER PRODUCTION IN EAST
LAMPUNG Tubagus Hasanudin and Kiki Ambarwati
198 – 204
29 FOREST HEALTH MONITORING IN THREE FUNCTIONS OF FOREST
IN LAMPUNG PROVINCE Rahmat Safe‟i1 , Hari Kaskoyo1 and Arief Darmawan1
205 - 212
30 IMPLICATIONS OF USE OF FOREIGN WORKERS
TO NATIONAL INTERESTS Fithriatus Shalihah
213 - 223

Proceeding of International Conference of 4th SHIELD 2019
https://pasca.unila.ac.id/seminar-internasional-shield/
ISBN : 978-602-51393-9-0
1
COMPENSATION PATTERN OF LAND ACQUISITION FOR PUBLIC INTEREST AND ITS IMPLICATION
Muhammad Akib1, HS. Tisnanta2, FX Sumarja3, and *Thio Haikal Anugerah4
123 Lecturer at Law Faculty, University of Lampung, Indonesia 4 Student at Law Faculty, University of Lampung, Indonesia
*Corresponding Author
ABSTRACT
This study aims to analyze the compensation pattern and implication of land acquisition regulated in Law No. 2, 2012 concerning Land Acquisition for Development of Public Interest. Using the method of doctrinal legal research with a conceptual and statute approach, the findings of this study indicate that there are five patterns of compensation in the land acquisition for development in the public interest, namely, money, replacement land, resettlement, share ownership, and other forms agreed upon by both parties. Of the five patterns, compensation in the form of money is most often done, while the other four patterns are rarely even not used. This is due to the existence of three aspects that have not been fulfilled. First the legal aspects, there are no regulations that can accommodate the four patterns of compensation. Second, from the social aspect, the implementation of compensation through the four patterns requires no small amount of social costs. Third, from the economic aspect, compensation through these four patterns is considered to be less effective and efficient.
Keywords: Pattern, Compensation, Land Acquisition, Implication.
INTRODUCTION
The government as the organizer of the governance has a variety of program plans in order to realize the objectives as stated in the fourth paragraph of the opening of the constitution which is to protect the entire nation of Indonesia and the whole of Indonesia's blood, to advance public welfare, educate the nation's life and participate in carrying out world order based on independence, eternal peace, and social justice. One of the programs is infrastructure development.
Infrastructure according to Stone are physical facilities developed by public agencies for government functions. 1 Infrastructure development means the construction of physical facilities by public agencies in order to carry out government functions, such as roads, ports, airports, terminals and reservoirs. In an infrastructure development, land plays an important role as the locus where the infrastructure is built.
Land is an important thing in human life since most of life depends on the land. For this important function and role of land for human life, it is necessary to have a legal basis that serves as a guideline and as a form of guarantee of legal certainty, in the implementation and settlement of land issues, especially in the matter of land acquisition for public interests.2
The need for land as a medium for infrastructure development in the public interest makes the government as the organizer implement the land acquisition policy. Land acquisition is an activity of providing land by giving appropriate and fair compensation to the right parties.3
Appropriate providing of fair compensation to the party entitled to a land
1 Robert J. Kodoatie, 2005, Pengantar Manajemen Infrastruktur, Yogyakarta: Pustaka Pelajar.
2 Fauzi Noer, 1997, Tanah dan Pembangunan, Jakarta: Pustakan Sinar Harapan. P. 7.
3 Article 1 Number 2 Undang-Undang Nomor 2 Tahun 2012 tentang Pengadaan Tanah Bagi
Pembangunan Untuk Kepentingan Umum.

Proceeding of International Conference of 4th SHIELD 2019
https://pasca.unila.ac.id/seminar-internasional-shield/
ISBN : 978-602-51393-9-0
2
acquisition means providing compensation to the party, both those who own or own the object of land acquisition with a fair compensation value and prioritize aspects of justice. The object of land acquisition is defined as land, space above the ground and below it, buildings, plants, objects related to land or other that can be valued.
Regarding to compensation, Article 36 of Law Number 2 of 2012 concerning Land Acquisition for Development and Public Interest stipulates that compensation for a public land acquisition can be provided in one of the following forms: money, replacement land, resettlement, share ownership, and other forms agreed by both parties.
The large variety of patterns about compensation in land acquisition for public purposes results in the emergence of a variety of implications resulting from the compensation received to the rightful party. This study aims to analyze the various patterns of compensation as above and the implications that arise from each of the compensation patterns.
LITERATURE REVIEW
Development for public interest is the basis for the government to conduct land acquisition. According to Schenk, as quoted by Muchsan defines the public interest as the interests that provide more benefits than the losses incurred.4 Different from Schenk, Van Wijk interpreted the public interest as a community law suit that must be served by the government, for the realization of people's welfare. 5 Whereas, the terminology of public interest in Law Number 2 of 2012 concerning Land Acquisition for Development for Public Interest means the interests of the nation, state and society that must be realized by the government and used as much as possible for the prosperity of the people. Although there are various notions of the public interest, in essence a public interest cannot ignore personal interests, it must even characterize the following matters:6 a. The interests of landowners are not ignored; b. Does not cause landowners to experience setbacks in subsequent lives both
socially and economically; c. Landowners benefit directly or indirectly from the use of their relinquished
land; d. There is a feasibility of compensation given to the land owner.
Besides the concept of public interest, in a land acquisition, the concept of compensation also plays an important role. Basically, compensation is a concept found in civil law as a result of breach of contract and unlawful conduct. In Law Number 2 of 2012, compensation is an appropriate and fair compensation to those who are entitled to the land acquisition process. Compensation is given to the right party based on the results of the assessment determined in the deliberations on determining compensation and/or decisions of the District Court/Supreme Court. The party entitled to receive compensation is responsible for the correctness and validity of the evidence of ownership or possession submitted. And for those who violate this matter, criminal sanctions will be subject to compliance with applicable laws and regulations.7
4 Muwahid, Implikasi Yuridis Kekaburan Makna Kepentingan Umum dalam Undang-Undang
Pengadaan Tanah Bagi Pembangunan Untuk Kepentingan Umum, Al Hikmah, Jurnal Studi
Keislaman, Volume 5 Nomor 2, September 2015. 5 Muchsan, 1997, Perbuatan Pemerintah dalam Memperoleh Tanah Untuk Kepentingan Umum,
Disertasi, Yogyakarta: Pascasarjana UGM, P. 45. 6 Soetandyo Wignjosoebroto, 1991, Pengertian Kepentingan Umum dalam Pembebasan Hak Atas
Tanah, Majalah Gema, Clipping Service Bidang Hukum. 7 Rahayu Subekti, Kebijakan Pemberian Ganti Kerugian Dalam Pengadaan Tanah Bagi
Pembangunan Untuk Kepentingan Umum. Jurnal Yustisia, Vol 5 No. 2, Mei-Agustus 2016. P 382-
383.

Proceeding of International Conference of 4th SHIELD 2019
https://pasca.unila.ac.id/seminar-internasional-shield/
ISBN : 978-602-51393-9-0
3
RESEARCH METHODS
This research belongs to the category of doctrinal legal research,8 where there are two types of approaches used in this study, namely the statutory approach and the conceptual approach. The data used in this study are secondary data or data from literature studies. The data obtained were then analyzed qualitatively and explained descriptively.
DISCUSSION
Compensation for land acquisition for public purposes in Article 36 of Law Number 2 of 2012 has many types, namely compensation in the form of money, replacement land, resettlement, share ownership and agreements in accordance with the agreed form. Each pattern or type of compensation due to land acquisition for public purposes has advantages and disadvantages of each. In addition, the different patterns of compensation provided have different impacts or implications on the party entitled to the compensation.
The advantages and disadvantages of the five patterns of compensation for land acquisition for public use can be clearly seen in the table below. Table 1. Comparison of Money and Non-Money Compensation9
No
Compensation Patterns
Advantages Deficiency
Executor of Land
Acquisition
The Rights Party
Executor of Land Acquisition
The Rights Party
1 Money Easy to Do, No Additional Procedures Required, No Monitoring and Evaluation Required
Can be directly utilized
Less Responsibilities
Without good management it can run out quickly, it needs additional effort to find a replacement location
2 Non-Money Responsible for the conditions and lives of those who are entitled
Conditions before and after land acquisition remains the same, no need for additional effort to find a replacement location
Hard to do, need more additional regulation, monitoring and evaluation are required
Takes time to utilized
Comparison of the pattern of compensation above, in practice has implications
for the general use of compensation patterns in the form of money10 against those entitled to a land acquisition for public use.11 Not without reason, giving
8 Peter Mahmud Marzuki, 2013, Penelitian Hukum, Jakarta: Kencana.
9 Andrio Firstiana Sukma, Stock as an Alternative Compensation in Land Acquisition for Road
Construction, Jurnal Sosek Pekerjaan Umum, Vol. 6 No. 1, April 2014. 10
See https://ekonomi.bisnis.com/read/20190221/9/891672/ini-skema-ganti-rugi-pembebasan-
lahan-jalan-tol-medan-binjai-seksi-i 11
http://www.lampost.co/berita-uang-ganti-rugi-proyek-jtts-di-lamsel-dibayar-pekan-depan

Proceeding of International Conference of 4th SHIELD 2019
https://pasca.unila.ac.id/seminar-internasional-shield/
ISBN : 978-602-51393-9-0
4
compensation, in the perspective of land acquisition executor it is very easy to do without going through a variety of procedures compared to other compensation patterns, and its use raises little responsibility for the executor party.
For those who have the right to provide compensation in the form of money is very practical because it can be directly used according to needs, although it does not rule out the possibility that the party entitled to receive money needs to try to find a replacement location, and if it does not have good financial management, then the money can be used up quickly.
There are at least three other aspects, apart from the practical use of money as a pattern of compensation in a land acquisition for public use, namely: 1. Juridical Aspect; 2. Social Aspect; 3. Economical Aspect.
In the juridical aspect, the pattern of non-monetary compensation requires further regulation or regulation regarding the mechanism or procedure for providing compensation. This is because the existing regulations are still not sufficient to implement the use of non-monetary compensation patterns. Examples such as the pattern of compensation for resettlement. This pattern of compensation requires a special study, regarding the authority, indicators used, and procedures for implementation. So that additional regulations are needed to suffice.
In the social aspect, the use of non-monetary compensation patterns requires social costs that are not cheap. This is because some people are generally dissatisfied with the facilities provided plus the need for adaptation in the new place.
Finally, on the economic aspect, the use of non-monetary compensation patterns is considered less effective and efficient. Ineffective and efficient because in a land acquisition for public interest, such as the Trans Sumatra toll road project, the land acquisition is carried out on thousands of residents' land so it will be less effective if the non-monetary compensation pattern is applied considering the non-financial compensation pattern requires long process.
CONCLUSIONS
Of the five patterns of compensation, namely money, replacement land, resettlement, share ownership, and agreement of the two parties, the most commonly used compensation pattern is compensation in the form of money. This is because, in addition to being practical, compensation through this pattern is very effective and efficient in large-scale land acquisition such as in the trans-Sumatran toll road development project.
Ideally the use of non-monetary compensation patterns, such land replacement, resettlement, share ownership, and in other agreed forms can be effective on small scale land acquisition. This is because the pattern of non-monetary compensation requires a long and convoluted process. In addition, the government needs to form further regulations or policies regarding the implementation and procedures for applying non-monetary compensation so that they are adequate.
REFERENCES
Kodoatie, and Robert, J. 2005. Pengantar Manajemen Infrastruktur. Yogyakarta: Pustaka Pelajar.
Marzuki, and Peter, M. 2013. Penelitian Hukum. Jakarta: Kencana Muchsan. 1997. Perbuatan Pemerintah dalam Memperoleh Tanah untuk
Kepentingan Umum, Disertasi. Yogyakarta: Pascasarjana UGM. Muwahid. 2015. Implikasi yuridis kekaburan makna kepentingan umum dalam

Proceeding of International Conference of 4th SHIELD 2019
https://pasca.unila.ac.id/seminar-internasional-shield/
ISBN : 978-602-51393-9-0
5
undang-undang pengadaan tanah bagi pembangunan untuk kepentingan umum. Al Hikmah, Jurnal Studi Keislaman. 5(2).
Fauzi, N. 1997. Tanah dan Pembangunan. Jakarta: Pustakan Sinar Harapan. Subekti and Rahayu. 2016. Kebijakan Pemberian Ganti Kerugian dalam
Pengadaan Tanah Bagi Pembangunan untuk Kepentingan Umum. Jurnal Yustisia. 5(2).
Sukma, A.F. 2014. Stock as an Alternative Compensation in Land Acquisition for Road Construction. Jurnal Sosek Pekerjaan Umum. 6(1).
Soetandyo, W. 1991, Pengertian Kepentingan Umum dalam Pembebasan Hak Atas Tanah. Majalah Gema. Clipping Service Bidang Hukum.
Undang-Undang Nomor 2 Tahun 2012 tentang Pengadaan Tanah Bagi Pembangunan Untuk Kepentingan Umum (Law No. 2 of 2012 concerning concerning Land Acquisition for Development of Public Interest)
https://ekonomi.bisnis.com/read/20190221/9/891672/ini-skema-ganti-rugi-pembebasan-lahan-jalan-tol-medan-binjai-seksi-i
http://www.lampost.co/berita-uang-ganti-rugi-proyek-jtts-di-lamsel-dibayar-pekan-depan.

Proceeding of International Conference of 4th SHIELD 2019
https://pasca.unila.ac.id/seminar-internasional-shield/
ISBN : 978-602-51393-9-0
6
ANALYSIS OF COMMUNITY FOREST FARMER’S INTEREST ON
IMPLEMENTATION OF AGRICULTURAL INSURANCE IN PRINGSEWU
DISTRICT, LAMPUNG PROVINCE
Revi Ameliya, Slamet Budi Yuwono, Christine Wulandari and Indra Gumay
Febryano
Magister Ilmu Kehutanan, Fakultas Pertanian, Universitas Lampung
Jln. Prof. Dr. Soemantri Brojonegoro No. 1 Gedung Meneng, Bandar Lampung
Email: [email protected]
ABSTRACT
Forest management is referring to the paradigm of community-based forest management. The benefit of community forests is expected to be not only an ecological support but also be able to support their daily needs. The government was start an encouragement to plant fast growing trees such as sengon because of the wood‟s demand never drops from time to time. Sengon trees are vulnerable to caterpillar pest attacks, therefore farmers have to lose money and need business protection. From the agricultural sector, the Indonesian Government has issued an agricultural insurance policy to protect rice farmers and livestock from crop failure. The purpose of this study was to analyze community forest farmer‟s interest on implementation of agricultural insurance in their forests. The analytical method is quantitative description, to determine the farmers level of interested on agricultural insurance implementation using the Likert scale determination technique. Based on the results of the study showed that the interest of community forest farmers in implementing agricultural insurance in Sukoharjo 1 Village, Pringsewu District amounted to 58% included in the category of doubt. Factors that influence the level of farmer interest are age, income, farming experience, education, management constraints, farmer group activities, extension activities, and information access. Keywords: community forest, agricultural insurance, sengon
INTRODUCTION
The community forest plays an important role because it has an economic function as the livelihood of the people around the forest, and besides that the ecological function can support environmental conditions such as reducing the danger of flooding, carbon sequestration, preventing erosion and improving the water system (Aminah et al, 2013). According to Forestry Department data in 2018, the estimated potential area of community forests in Lampung Province reaches 13,801 ha. The existence of community forests is now very important and strategic because it has developed into one of the mainstays in the community's economy. Community forests play a role in providing wood supply for both domestic and export consumption, food security and protecting the environment. This sector is vulnerable to risks that can have an impact on the income of farmers (Anindyka, 2014).
In the agricultural sector, the government has issued Law No. 19 of 2013 concerning Farmer Protection and Empowerment, which mandates that the state must provide protection, empowerment to farmers in a planned, directed and sustainable manner. Besides the current environmental conditions of farmers such as increased climate change, vulnerability of natural disasters, globalization

Proceeding of International Conference of 4th SHIELD 2019
https://pasca.unila.ac.id/seminar-internasional-shield/
ISBN : 978-602-51393-9-0
7
and global economic turmoil, as well as a market system that is not pro-farmer, makes farmers need protection and empowerment. Efforts made in the context of protecting farmers to transfer the risk of crop failure are by implementing rice farming business insurance (AUTP) launched by the government since 2015. The government has also appointed a state-owned company PT. Jasindo Insurance as the executor. The benefits of agricultural insurance have been felt by farmers in Indonesia, especially in Lampung Province.
The agricultural insurance that has been rolled out only applies to rice, livestock and fisheries farmers. This raises the pros and cons in the midst of society. Is not the law mandating "farmers" which means all farmers with various commodities without distinguishing the proportion of rights between rice farmers, crops, horticulture, plantations, forestry, etc.
Forests that have a position in the upper reaches of the river have a very important role in controlling soil erosion and absorbing water as an effort to prevent flooding. However, various forest management risks from planting to marketing still occur frequently. This has an impact on the welfare of farmers both upstream and downstream. To anticipate the risk, it needs a flexible action which its implementation can be done well by the government and independently by the community. One of them is by insuring farmers' crops. Therefore, it is necessary to conduct an analysis of community forest farmers' interest on implementation of agricultural insurance in KTH Ngudi Luhur, Sukoharjo District I, Pringsuwu Regency, Lampung Province.
RESEARCH METHODS
Location and time of research The research was carried out in Sukoharjo I Subdistrict, Pringsewu District,
Lampung Province in April 2019.
Research Objects and Tools The object of this study is the members of KTH Ngudi Luhur which is the only
group of forest farmers among the 9 farmer groups in Sukoharjo I Village. Sukoharjo I Village is also one of the villages in Pringsewu District following the agricultural insurance program and making claims due to crop failure in 2018 . Research tools used are stationery, calculators, computers, raffia ropes, measuring tapes, questionnaires in the form of questionnaires, digital cameras, recording devices and other supporting tools.
Data Types and Sources The data used in this study are primary data and secondary data. Primary
data is data obtained directly from the field. Primary data needed in this study include: name, age, gender, education, land ownership status, knowledge about insurance, interest in community forest insurance. Secondary data used in this study are the general condition of the study site, including: location, physical environment and socioeconomic conditions of the community sourced from data that has been in the village and local government. Study of literature from research results and reports, books and the internet.
Sample Determination Method Sampling of respondents was conducted using a purposive sampling method,
namely in the KTH Ngudi Luhur in Pringsewu Regency, Lampung Province as
many as 30 people. According to Arikunto 2011, if the study population numbered
less than 100 then the samples taken are all. Data obtained using survey
methods, observations, interviews, and recording secondary data. Interviews
were conducted using questionnaires to find out the identity of respondents, the

Proceeding of International Conference of 4th SHIELD 2019
https://pasca.unila.ac.id/seminar-internasional-shield/
ISBN : 978-602-51393-9-0
8
economic potential of farmers, income farmer households both from the forestry
sector and other income and interests of community forest farmers in
implementing agricultural insurance in the area.
Data Processing and Analysis Methods
Data and information obtained in the study will be analyzed using a Likert scale, which is a rating scale to assess something with a tiered choice (Amirin, 2010). In the survey to find out the respondents' interests or not interested, they are classified into 5 categories based on Likert scale, as follows (Table 1).
Table 1. Category on likert scale
Category Very Interested
Interested Doubt Not Interested
Very Not Interested
Score 5 4 3 2 1
Formula: T x Pn T = Total number of respondents who voted Pn = Choice of Likert score
Interpretation of Calculation Score In order to obtain the results of interpretation, the highest score (X) and the
lowest score (Y) must be known for the assessment using the following formula: Y = highest score Likert x number of respondents X = lowest score Likert x number of respondents Formula Index% = Total Score / Y x 100 Interval formula I = 100 / Total Score (Likert) Then = 100/5 = 20 Results (I) = 20 (This is the interval from the lowest 0% to the highest 100%) The following criteria for interpretation of scores based on intervals (Tabel 2) Tabel 2. Category on intervals
Number (Percentage) Category
0 % - 19,99 % Very Not Interested
20 % – 39,99 % Not Interested
40 % - 59,99 % Doubt
60 % - 79,99 % Interested
80 % - 100 % Very Interested
RESULTS AND DISCUSSION
The following summarizes the results of the assessment of 30 respondents in
Desa Sukoharjo 1:

Proceeding of International Conference of 4th SHIELD 2019
https://pasca.unila.ac.id/seminar-internasional-shield/
ISBN : 978-602-51393-9-0
9
Table 3. Summarize of respondents
Category Score 5 Score 4 Score 3 Score 2 Score 1
Very Interested
1 respondent
Interested 9 respondent
Doubt 9 respondent
Not Interested
8 respondent
Very Not Interested
3 respondent
Note: Respondents who answered were very interested (1) = 1 x 5 = 5 Respondents who answered were interested (9) = 9 x 4 = 36 Respondents who answered doubt (9) = 9 x 3 = 27 Respondents who answered were not interested (8) = 8 x 2 = 16 Respondents who answered were not interested (3) = 3 x 1 = 3 All results add up, total score = 87
The highest number of scores for the item "very interested" is 5 x 30 = 150, while the item "very not interested" 1 x 30 = 30. So, if the total score of the respondent's score is 115, then the respondents' interpretation of the product's taste is The resulting value is generated using the % index formula. Formula Index % = Total Score / Y x 100 = 87/150 x 100 = 58% are in the doubt category.
Based on the questionnaire data obtained and analyzed using the Likert scale it was found that the percentage index obtained was 58% included in the doubt category. The farmers are not too enthusiastic (hesitant) to insure both the land and plants for several reasons including: 1. Farmers do not know the advantages and benefits of insurance. 2. Farmers no longer receive the guidance and accompaniment from forestry
extension officers or forestry NGOs. 3. Farmers have tended to start converting their forest land into seasonal
agriculture so they can immediately enjoy the results. Based on the General Guidance on Forestry Extension in 2004, that
mentoring is an activity carried out together with the community in examining the real problems faced in the field and then discussing together to find alternative solutions towards increasing capacity of communities productivity. Furthermore, it was said that mentoring was core as an effort to involve the community in developing various potentials owned so as to achieve a better quality of life. Accompaniment to KTH Ngudi Luhur, Sukoharjo Village I really needs to be restarted so that community awareness of forest conservation can return to good.
Based on the data obtained from the results of the questionnaire, it can be seen that the factors that influence the level of interest of farmers are age, income, farming experience, education, management constraints, farmer group activities, extension activities, and access to information. The higher the factors

Proceeding of International Conference of 4th SHIELD 2019
https://pasca.unila.ac.id/seminar-internasional-shield/
ISBN : 978-602-51393-9-0
10
listed above, the higher interest in community forest insurance (very interested) and vice versa.
CONCLUSION
Based on the results and discussion of this study, it can be concluded: 1. The results of an analysis of community forest farmers' interest in
implementing forest insurance in Sukoharjo I Village, Pringsewu Regency Lampung, using a Likert scale found that the percentage index obtained was 58% included in the doubt category.
2. The farmers are not too opposed (hesitant) to insure both the land and the plants.
3. Factors affecting the level of interest of farmers, age, income, farming experience, education, maintenance, farmer group activities, extension activities, and access to information.
REFERENCE
Aminah, L.N. Qurniati, R. dan Hidayat, W. 2013. Kontribusi hutan rakyat terhadap petani di Desa Buana Sakti Kecamatan Batanghari Kabupaten Lampung Timur. J. Sylva Lestari. 1(1): 47-54.
Amirin, M. dan Tatang. 2010. Skala Likert : Penggunaan dan Analisis Datanya. Tatangmanguny’s blog.
Anindyka, D. 2014. Asuransi di Hutan Indonesia. Kompetisi Esay dan Karya Tulis Ilmiah. Malang: Universitas Brawijaya.
Arikunto, S. 2011. Prosedur Penelitian Suatu Pendekatan Praktik. Buku. Jakarta: Rineka Cipta.
Departemen Kehutanan. 1997. Keputusan Menteri Kehutanan Nomor 49/Kpts-II/1997. Jakarta, Indonesia.
Departemen Kehutanan. 2004. Keputusan Menteri Kehutanan Nomor SK. 132/Menhut-II/2004, Pedoman Penyuluhan Kehutanan. Jakarta, Indonesia.
Departemen Pertanian. 2010. Peraturan Menteri Pertanian Republik Indonesia Nomor 40/Permentan/SR.230/7/2010. Jakarta, Indonesia.
Departemen Pertanian. 2013. Undang-Undang nomor 19 tahun 2013. Jakarta. Indonesia.
Djunedi, P. 2016. Analisis asuransi pertanian di indonesia: konsep, tantangan
dan prospek. pusat kebijakan anggaran pendapatan dan belanja negara,
Badan Kebijakan Fiskal, Kementerian Keuangan. Jurnal Borneo
Administrator. 12(1).

Proceeding of International Conference of 4th SHIELD 2019
https://pasca.unila.ac.id/seminar-internasional-shield/
ISBN : 978-602-51393-9-0
11
THE ANALYSIS OF MATHEMATICS REFLECTIVE THINKING SKILLS OF HIGH SCHOOL STUDENTS IN COMPLETING TRIGONOMETRY PROBLEMS
O. Andriawan1* and S. H. Noer2
1Mathematics Education, Postgraduate Program, FKIP Lampung University,
Jl. Prof. Dr. Sumantri Brojonegoro No. 1 Bandar Lampung, Lampung, Indonesia. 2Mathematics Education, FKIP Lampung University,
Jl. Prof. Dr. Sumantri Brojonegoro No. 1 Bandar Lampung, Lampung, Indonesia. Email: [email protected]
ABSTRACT
This study aims to determine the students' mathematical reflective thinking skills in trigonometric material. The subjects in this study were the students of 11th Sciece grade of SMAN 1 Gedong Tataan, totaling 30 students. The method used in this research is descriptive qualitative. The data were collected using instruments that measure the reflective thinking skills in trigonometric learning consisting of two essays containing three indicators of the students' mathematical reflective thinking skills, namely Reacting (reflective thinking for action), Comparing (reflective thinking for evaluation) and Contemplating (reflective thinking for critical inquiry) ). The data were analyzed qualitatively and quantitatively to get a comprehensive description related to the students' mathematical reflective thinking skills. The results showed that the students' reflective thinking skills was still low. These results prove that students' reflective thinking skills still need to be trained further in order to be improved
INTRODUCTION
Mathematics is one of the sciences taught in the schools from the basic education to the high education. Even early on, a child has been introduced to mathematics by his parents through knowing numbers and counting. The role of mathematics is very important in the field of education. Mathematics can be used as a tool to overcome the problems encountered in everyday life. As in the opinion of Suherman (2003) mathematics is the queen and stewards of science.It is intended that mathematics is as a source of other sciences. Therefore, the role of mathematics in the development of science and technology is clearly very important.
Learning mathematics in schools is not only aimed at making students understand the mathematics taught. Other main objectives, for example the ability of mathematical reasoning, mathematical communication, mathematical connections, mathematical representation and mathematical problem solving, and certain behaviors that students must obtain after they study mathematics.
In studying mathematics people must think so that they are able to understand the mathematical concepts learned and be able to use these concepts appropriately when they have to find the answers to various mathematical problems. Mathematical problems faced by someone are often not immediately able to find a solution while they are expected and demanded to be able to solve the problem. Therefore they need to have thinking skills so that they can find the right way to solve the problems they face. Activities or thought processes undertaken so that someone is able to solve a mathematical problem has a relationship with the ability to remember, recognize the relationship between mathematical concepts, realize the existence of a causal relationship, an analogy

Proceeding of International Conference of 4th SHIELD 2019
https://pasca.unila.ac.id/seminar-internasional-shield/
ISBN : 978-602-51393-9-0
12
or difference, which can then bring up the original ideas, and smoothly and flexible in making decisions or conclusions quickly and precisely.
Learning activities that emphasize the learning process will certainly bring thinking activities in various forms and levels. The thought process that is built from the beginning in an effort to solve a problem should take place intentionally and through to completion. Completeness in this case is meant that the students must undergo the process so that they have been trained and have the opportunity to empower and functioning their abilities so that they understand and mastering what they learn and do. Thus the students must be trained in order to have the mathematical thinking skills, one of which is reflective thinking of mathematics.According to Chee (Suharna: 2012) states that the reflective thinking is an awareness of what is known and what is needed, this is very important to bridge the learning situation gap. In addition, Gurol (2011) defines the reflective thinking as a process of directed and appropriate activities where individuals realize to be followed, analyze, evaluate, motivate, get deep meaning, use appropriate learning strategies. Thus the teacher's reflective thinking aims to achieve the learning targets and produce new learning approaches that have a direct impact on the learning process.
Choy (2012) states that the reflective thinking is defined as awareness of what is known and what is needed, this is very important to bridge the learning situation gap. Reflective thinking is a thinking activity that can make the students try to connect the knowledge they have acquired to solve new problems related to their old knowledge. In mathematics learning, reflective thinking skills is said to be important, because several previous studies by Noer (2010) have shown that the learning strategies that use reflective thinking processes provide better results when compared to the students who study with an ordinary learning.
To find out the students 'reflective thinking skills, a teacher needs to provide the activities that can see the students' reflective thinking skills. One of these activities is solving mathematical problems related to the students' daily activities. But so far the teacher still has not optimized the student's reflective thinking skills, the teacher tends to give mathematical problems in accordance with existing problems without modifying in accordance with students' daily activities. This makes students think that mathematics lacks benefits in daily activities of students and teachers also do not optimize the student reflective thinking optimally and effectively. This is in line with Mason (2002) who says that reflective thinking activities are often not carried out effectively. Noer (2008) divides the three steps in reflective thinking ability, namely Reacting Phase, Comparing Phase, Contemplanting Phase. Table 1. Indicators of reflective thinking ability
No Indicators of Reflective Thinking
Indicator Description
1 Reacting
Reflective thinking for action. Write down the characteristics possessed by the situation then answer the problem.
2 Comparing Reflective thinking for evaluation. Comparing a reaction with a general principle or theory by giving the reasons why choosing the action.
3 Contemplating Reflective thinking for critical inquiry. Inform the answers based on the problem situations, contrast the answers with others then reconstruct situations.
With the description above, the researcher tries to analyze the students' reflective thinking skills by solving mathematical problems. In this study

Proceeding of International Conference of 4th SHIELD 2019
https://pasca.unila.ac.id/seminar-internasional-shield/
ISBN : 978-602-51393-9-0
13
trigonometric material was chosen, using trigonometric problem forms that connect the students in daily activities.
METHODS
The method used in this research is descriptive qualitative. This research was conducted at SMAN 1 Gedong Tataan Pesawaran District. The subjects of this study were 30 students of 11th Science grade of SMAN 1 Gedong Tataan in the odd semester of 2019-2020 who had taken Trigonometry material and the subjects were selected by purposive sampling through interviews in the high, medium and low categories. From the interview results obtained 10 students in the high category, 12 students in the medium category and 8 students in the low category. In this study the data were obtained from the results of the reflective thinking skills test which consisted of two essay items.
RESULTS AND DISCUSSION
The reflective thinking skills test used by the researchers to retrieve data consists of two problems regarding trigonometric material. Problem number 1 "Andi is the leader of the ceremony at the 74th anniversary of the Republic of Indonesia which was held at one of the schools, at the moment of raising the flag all the participants of the ceremony saluted the flag including Andi. The distance of the flagpole is 8 meters with an elevation angle of 450 and the height of 2 meters, calculate the height of the flagpole? Problem number 2" A plane sank in the middle of the sea at a depth of 850 meters. The rescue ship was prepared to find the plane. The rescue ship detected an aircraft that sank with sonar. The rescue ship detected an angle of 30o. A diver will dive straight from the rescue ship to the sinking plane. What is the distance the diver must travel to the plane? ”Two questions were given to 30 students of 11th grade class with 30 minutes to work on.
The results of these tests obtained the data in the form of student work which then the researcher analyzes based on the rubric that the researcher has compiled. For problem number 1, the reacting indicator, as many as 13 students can meet the reacting indicator very well. The thirteen students can express in their own sentence what is known from the problem and be able to describe the problem exactly according to the problem given. On the other hand, there are also 17 students who are able to express in their own sentence what is known from the problem and what is asked on the problem, but have not been able to describe the problem correctly from the given problem. This shows that the initial knowledge of the students is still lacking. From this result, it indicates that the students' reacting skills is still low because only 43.3% of students can meet the reacting indicators well.
In the Comparing indicator, as many as 9 students who can answer correctly on problems that have been solved and use methods that are considered effective for solving problems, can explain the relationships and the problems that have been faced with the problems currently faced. Meanwhile, 9 students can explain the methods that have been and will be used to solve problem number 1, but the students' explanations are still wrong. While 12 other students have not been able to use effective methods in solving questions number 1 given. These results indicate that the students on the comparing indicator are still low because only 30% of students are able to solve the answers correctly on the problems given and use methods that are considered effective for solving problems.
In the Contemplating indicator, 9 students can complete the given problem, and they are able to deduce the answer to the problem correctly. While 9 other students were able to make a solution of the problem but could not make a conclusion. While 12 other students have not been able to make a solution of the

Proceeding of International Conference of 4th SHIELD 2019
https://pasca.unila.ac.id/seminar-internasional-shield/
ISBN : 978-602-51393-9-0
14
problem and have not been able to make conclusions. From these results it indicates that students on the Contemplating indicator are still low because only 30% of students in this phase are able to make a solution correctly.
Picture 1. Photo of student answers
In Figure 1 in reacting phase the students can review the information contained in the problem, in this phase they can mention what is known and asked properly according to the information in the problem. Then the comparison phase here they can describe the information they can and at this stage they‟re able to analyze well the methods they can use in solving the problems presented. Furthermore, for the contemplating phase they can solve the problem correctly and can conclude the results they got correctly. In figure no. 1 with question number one, the students have good reflective thinking skills.
Picture 2. Photo of student answers
In figure number 2 in the reacting phase the students can review the information contained in the problem, in this phase the students can mention what is known and asked properly according to the information in the problem

Proceeding of International Conference of 4th SHIELD 2019
https://pasca.unila.ac.id/seminar-internasional-shield/
ISBN : 978-602-51393-9-0
15
but in the comparison phase they lack in analyzing the problem, this is proportional to what they described in solving the problem. In the contemplating phase the students cannot deduce correctly the given problem. In figure number 2 with question number one the students have low reflective thinking skills.
For problem number 2, the reacting indicator, as many as 16 students can meet the reacting indicator very well. The sixteen students are able to express in their own sentence what is known from the problem and what is asked, able to describe the information contained in the problem correctly. On the other hand, there are also 14 students who are able to express in their own sentences what is known from the problem and what is asked about the problem, but have not been able to describe the information provided correctly. From this result, it indicates that the students' reacting skills is still low because only 53.3% of students can meet the reacting indicators well.
In the Comparing indicator, as many as 11 students who can explain answers to problems that have been solved and use effective methods to solve problems, can explain the relationships and problems that have been faced with the problems currently being faced. Meanwhile, 10 students can use the methods that have been and will be used to solve problem number 2, but students' explanations are still wrong. While 9 other students have not been able to use effective methods in solving questions number 2 given. From these results it indicates that the students on the Comparing indicator are still low because only 36.6% of students solve the problems given correctly.
In the Contemplating indicator, 10 students can complete the given problem, and students are able to deduce the answer to the problem correctly. While 8 other students were able to make a solution of the problem but could not make a conclusion. While 12 other students have not been able to make a solution of the problem and have not been able to make conclusions. From this result, it indicates that the students on the Contemplating indicator are still low because only 33.3% of students in this phase are able to make a solution correctly.
Picture 3. Photo of student answers
In figure number 3 in the reacting phase the students cannot understand the problem so they cannot write what is known and what is asked according to the problem in the problem. In the comparison phase the students are able to use the method appropriately in solving given problems but in solving problems students are still wrong in answering. In the contemplating phase the students cannot conclude the answers correctly. In figure number 3 with question number two the students have low reflective thinking skills.

Proceeding of International Conference of 4th SHIELD 2019
https://pasca.unila.ac.id/seminar-internasional-shield/
ISBN : 978-602-51393-9-0
16
CONCLUSION
Based on the results of the data analysis in the results and disscussion sub-chapter, it can be concluded that the reflective thinking skills of the students of SMAN 1 Gedong Tataan at 11th grade class is still relatively low. That is because the students who meet each indicator of reflective thinking skills are still under 50%. Especially the reacting, comparing and contemplating indicators which are still very low. This condition is due to the fact that most students still experience difficulties in building a deep understanding of the problem and the inability to convey what they understand in the form of appropriate reasons, this is indicated by the inability of students to provide answers at the comparative and contemplating stages so that students do not can conclude the answer correctly. The results of the analysis of students 'reflective thinking skills are expected to be considered by the teacher in making improvements, thus encouraging students' thinking in order to obtain the best strategy to achieve the learning objectives.
REFERENCES
Choy, S.C. dan Oo, P.S. 2012. Reflective thinking and teaching practices: A precursor for incorporating critical thinking into the classrom? International Journal of Instructuon. 5(1): 167-182. (e-ISSN: 1308-1470).
Gurol, A. 2011. Determining the reflective thinking skills of pre-service teacher in learning and teaching process. Energy Education Science and Technology Part B : Social and Educational Studies. 3(3): 387-402.
Suharna, H. 2012. Berfikir Reflektif Siswa (Reflective Thinking) Siswa SD Berkemampuan Matematika Tinggi dalam Pemecahan Masalah Pecahan. Prosiding Seminar Nasional Matematika dan Pendidikan Matematika. ISBN: 978-979-16353-8-7. Hal 378-386. Yogyakarta: FMIPA UNY.
Mason, J. 2002. Researching your own Practice; The discipline of Noticing. New York: Routlege Falmer.
Noer, S.H. 2008. Problem-based learning dan kemampuan berpikir reflektif dalam pembelajaran matematika. Seminar Nasional Matematika dan Pendidikan Matematika.
Noer, S.H. 2010. Peningkatan Kemampuan Berpikir Kritis, Kreatif, Reflektif (K2R)
Matematis Siswa SMP Melalui Pembelajaran Berbasis Masalah. Bandung: FPMIPA UPI.
Suherman, E. 2003. Strategi Pembelajaran Matematika Kontemporer. Bandung: PT Remaja Rosdakarya.

Proceeding of International Conference of 4th SHIELD 2019
https://pasca.unila.ac.id/seminar-internasional-shield/
ISBN : 978-602-51393-9-0
17
CHARACTERISTICS OF LAUNDRY AND DETERGENT LEVEL (MBAS) EFFLUEN LAUNDRY LIQUID WASTE IN IRINGMULYO REGION
Siti Choiriyah1*, Indra Gumay Febryano2, Endro P. Wahono3, Nuning
Nurcahyani4, 1Jurusan Ilmu Lingkungan Universitas Lampung
2Jurusan Kehutanan Fakultas Pertanian Universitas Lampung 3Jurusan Teknik Sipil Fakultas Teknik Universitas Lampung
4Jurusan Biologi Fakultas Biologi Universitas Lampung Korespondensi : Jalan Prof. Sumantri Brojonegoro No.1 Bandar Lampung 35145
*E-mail : [email protected]
ABSTRACT Laundry washing services have a positive economic impact with the opening of jobs for the community and providing convenience for users of their services; but on the other hand also has a negative impact on the decline in environmental quality. This study aims to determine the laundry business characteristics and the level of MBAS of laundry effluent at Iringmulyo Urban Village. Data retrieval is done by means of interviews, questionnaires, and sampling of wastewater. The data obtained in the form of laundry business characteristics were analyzed descriptively, while the effluent of liquid waste was measured by its MBAS level. The results of the study show that all laundry businesses do not have a business permit and IPAL, because there are no regional regulations that govern the business. Examination of laundry liquid waste samples at the effluent has MBAS levels ranging from 0.1 to 3 mg / L. These levels still meet the quality standards according to PermenLH No. 5 of 2014. Pollution of wastewater originating from laundry can be minimized by making wastewater treatment plant and making laws and regulations governing the operationalization of these businesses. Keywords: detergent, effluent, laundry, liquid waste, MBAS
INTRODUCTION
The rapid increase in population causes an increase in the need for goods and services. One of the service needs that is currently increasing is laundry laundry services. Laundry laundry services which are currently popping up, economically have a positive impact because they can open jobs for the community and make it easy for users of these services, but in addition to having a positive impact these laundry business activities can have a negative impact, namely a decrease in environmental quality. Laundry waste in the form of detergent liquid in large quantities risks contaminating groundwater quality, if it is discharged into the environment continuously without prior treatment, and is only absorbed into the soil or drainage that is nearby then within a certain period of time can potentially cause pollution to the environment, especially in water body.
Liquid waste generated by the laundry business comes from detergents used during the laundry washing process. Detergents generally contain surfactants. The surfactant in detergent functions as a wetting agent that causes a decrease in the surface tension of the water, with a decrease in the surface tension of the water so water can more easily seep into washed clothes. Surfactants (surface active agents) or wetting agents (wetting agents) are organic substances that act as active ingredients in detergents, soaps, and shampoos (Effendi, 2003). Apart from the detergent surfactant, it also contains a builder. The builder's function is

Proceeding of International Conference of 4th SHIELD 2019
https://pasca.unila.ac.id/seminar-internasional-shield/
ISBN : 978-602-51393-9-0
18
to increase the washing efficiency of surfactants by deactivating minerals that cause water hardness.
Liquid waste is one form of waste that is generally produced by industries which in the process use a lot of water. The resulting liquid waste can be a source of environmental pollutants depending on the amount, type and quality of the contaminants it contains, both physical, chemical and biological as well as the quality and quantity of the environment as recipients (Ginting, 1995).
Efforts to overcome the pollution problems that can be caused by laundry liquid waste is to curb all existing laundry businesses by controlling the wastewater generated, as a first step in formulating these efforts, information on MBAS effluent levels and the conditions of laundry business characteristics need to be well and comprehensively available. This research will analyze based on these data in order to formulate an optimal laundry liquid waste control strategy in accordance with the characteristics of the laundry business in Iringmulyo Village.
METHODOLOGY
This research was conducted in March to June 2019 in the Iringmulyo Urban
Metro District. This type of research used in this study is the type of explanatory research (explanatory research) with survey methods, interviews, questionnaires and measurements. This study aims to look at the characteristics of the laundry business and the measurement of MBAS levels in the effluent of washing process activities in the form of laundry liquid waste in 10 laundry businesses in Iringmulyo Urban Village.
Iringmulyo Urban Village is one of the urban villages in Metro City that has the most laundry business activities compared to other urban villages in Metro City, because Iringmulyo Urban Village is an educational center that makes this area a densely populated area in Metro City and also an area directly adjacent to East Lampung Regency which makes this village a bustling community activity. Analysis of the data obtained related to the characteristics of the laundry business was done descriptively and the laundry effluent effluent was MBAS levels carried out by measurements in the laboratory. The measurement results are compared with the quality standard used, namely Minister of Environment Regulation No. 5 of 2014 concerning Wastewater Quality Standards. Laboratory measurements of MBAS levels were carried out at the Lampung Provincial Environmental Agency Laboratory. The location of laundry liquid waste sampling is 10 laundry businesses in Iringmulyo Village. Determination of MBAS (surfactant) levels was carried out in accordance with the Standard Methods for the Examination of Water and Waste Water procedures (Arneli, 2010), namely:
a. As much as 50 mL of seawater sample was put into a separating funnel, a few
drops of 30% H2O2 were added, then the solution was shaken, a few drops of 0.01 N NaOH were added and a few drops of phenolphthalein were formed, to form a pink color.
b. A few drops of 0.02 N H2SO4 solution is added to the solution while being shaken until the pink color disappears, then 10 mL of methylene blue is added as an anionic surfactant complexing and shaken for half a minute.
c. The sample solution was extracted with 10 mL chloroform, extraction was repeated twice using 5 mL chloroform (CHCl3). The collected chloroform phase was extracted again with 2 mL washing solution. The chloroform phase is flowed into a 25 mL volumetric flask, the volume is adjusted to the limit mark with chloroform. This analysis is duplicated for each sample solution.
d. Determination of anionic surfactant by spectrophotometric method at a wavelength of 652 nm, where cationic methylene blue dyes are associated with anionic surfactants to form Methylene Blue Active Substances (MBAS) complex.

Proceeding of International Conference of 4th SHIELD 2019
https://pasca.unila.ac.id/seminar-internasional-shield/
ISBN : 978-602-51393-9-0
19
RESULTS AND DISCUSSION
Iringmulyo Urban Village is one of the urban villages in the East Metro District. Iringmulyo Urban Village has an area of 1.89 Km2. Iringmulyo urban village topography is in the form of alluvial plains. The height of the area ranges from 5-100 asl and has a slope of 0% - 15%. The residents of Iringmulyo Urban Village consist of heterogeneous ethnic groups. In 2017 Iringmulyo Urban Village has a population of 15,021 people with a population density of 7948 people / km2. Judging from the level of education, the population in Iringmulyo Village consists of elementary school (1612 people), junior high school (1827 people), high school / vocational school (4167 people), academy (1951 people). (BPS City of Metro, 2018). The distribution of laundry business can be seen in Figure 1.
Figure 1. Map of Laundry distribution in Iringmulyo Village.
Iringmulyo Urban Village is one of the urban villages in Metro City which is the
center of education because in this Urban Village there are two of the largest tertiary institutions in the City of Metro namely Muhammadiyah University and STAIN Jurai Siwo and there are many other educational activities in this kelurahan. High community activity in this Kelurahan has made laundry laundry services develop rapidly to meet the demands of the community for these services. The number of laundry business services if not regulated by the local government in the process of its operations, in a certain period of time can cause problems to the environment that is a decrease in the quality of the environment in the presence of wastewater from the washing process. The name of the business and the length of laundry operation in Iringmulyo Village are presented in Table 1. Table 1. Names of Laundry Business Services in Kelurahan Iringmulyo years 2019
No Names of laundry Business life (years)
1 (L1) 5

Proceeding of International Conference of 4th SHIELD 2019
https://pasca.unila.ac.id/seminar-internasional-shield/
ISBN : 978-602-51393-9-0
20
2 (L2) 3
3 (L3) 1
4 (L4) 5
5 (L5) 5
6 (L6) 2
7 (L7) 1
8 (L8) 1
9 (L9) 1
10 (L10) 5
Laundry Business Characteristics
Laundry business characteristics are presented in the form of a frequency distribution table. Based on Table 2, the results of the tabulation of questionnaires and interviews about the characteristics of laundry business in Iringmulyo Village, the results show that based on the length of business all laundry businesses are classified as household businesses owned by individuals, with operational time intervals ranging from 1-6 years. Laundry laundry services in Iringmulyo Village are still running for <10 years on average. The length of a business is the length of time someone has pursued a business. The length of a business is the time an entrepreneur has spent in running his business. The length of effort determines experience, the longer the business, the better the quality of the business. This research emphasizes the length of business that has been carried out with the amount of liquid waste generated and discharged into water bodies, the longer the business, the more waste is discharged into sewers or water bodies.
100% results are obtained for all laundry businesses that do not have a business permit, while according to PP No. 27 of 2012 concerning environmental permits, business licenses or permits are environmental legal instruments that have a preventive nature, namely to control environmental impacts, this is because there are no rules made by local governments regarding the implementation of laundry business activities. Permits that are not yet owned by all laundry businesses cause there is no definite list of how many laundry businesses there are, and also the absence of guidance and supervision from the government of all activities carried out by the laundry business.
The average amount of laundry produced by a laundry business per day is related to the length of the laundry business, the longer the business is established, the greater the amount of laundry. Laundry business that has been running for more than 5 years, the average amount of laundry is above 30 kg per day, with the amount of liquid waste produced 20,000 m3 (Ciabatti 2009 in Nasir, S 2013), while the business under 5 years the amount of laundry <30 kg per day. Liquid waste generated by the laundry business in the form of detergents that contain chemical elements in it such as surfactants. Surfactant as the main component in detergents has a chemical chain that is difficult to be degraded by nature (Widiyani, 2010). Examples of surfactants, one of which is from the quaternary ammonium group that can form nitrosamine compounds where these compounds are known to be carcinogenic that can trigger cancer. Additives for example sodium lauryl sulfate (SLS) compounds are known to cause skin irritation, slow the healing process and cause cataracts in adult eyes. The

Proceeding of International Conference of 4th SHIELD 2019
https://pasca.unila.ac.id/seminar-internasional-shield/
ISBN : 978-602-51393-9-0
21
presence of foam closes the surface of the water so that limited air and water contact results in a decrease in the amount of dissolved oxygen. This will cause aquatic organisms to lack oxygen and can cause death (Ahsan, 2005).
There is no significant difference between the use of liquid type detergent and powder type dertergen in the MBAS content check, because the detergent used is a factory detergent that has received an SNI permit and has been environmentally friendly. Research conducted by Ardiyanto, P., et al in Muktiharjo Village in 2016, found that the use of detergents from self-concoctions that did not yet have SNI showed a high MBAS level of 33.9 mg / l, this had already exceeded the quality standard. This research although MBAS levels in liquid waste still meet quality standards, but it is feared that liquid waste that still contains chemicals and is discharged into the environment continuously, especially for laundry, which washing clothes> 50 kg per day without prior processing can pollute the environment. Based on the detergent on the market, it can be powder detergent and liquid detergent. In general, both types of detergents have the same function. The thing that distinguishes the two is the shape. Initially, liquid detergents are more widely used in cleaning kitchen utensils. But along with the times, liquid detergents are also widely applied to industrial needs and cleaning clothes. This is because liquid detergents are easier to handle and more practical in their use (Fauziah, 2010).
Based on the presence or absence of WWTPs, all laundry businesses do not have WWTPs even though WWTPs are simple because there are no rules governing this business, so that in carrying out its business, the resulting waste is not processed first and only flowed directly into the drainage channels, if this is the case carried out continuously it is feared that within a certain period of time it can cause pollution to the environment. The purpose of making WWTPs is to filter and clean up polluted water from both domestic and industrial chemicals, treating domestic or industrial wastewater, so that the water can be reused according to their individual needs.
Table 2. Characteristics of laundry businesses
Pertanyaan Frekuensi
(f=10) Persentase
(100%)
Old Business Establishment 1-5 years 7 70 % > 5 years 3 30 % Business license from the relevant department
Yes 0 0 % No 10 100 % Washing is done on an average daily basis < 30 kg 6 60 % > 30 kg 4 40 %
The type of detergent used Liquid 3 30 % Powder 7 70 % the presence or absence of IPAL Yes 0 0 % No 10 100 % Number of employees owned 1 6 60 % >1 4 40 % Work operational time 9 hours 4 40 % < 9 hours 6 60 %

Proceeding of International Conference of 4th SHIELD 2019
https://pasca.unila.ac.id/seminar-internasional-shield/
ISBN : 978-602-51393-9-0
22
Level of Laundry Effluent Liquid Waste MBAS
Based on the results of the examination of liquid waste from the effluent of all laundry businesses conducted in the Department of Environment of Lampung Province, the results of all laundry liquid waste that have been inspected from all laundry businesses show that the results of MBAS levels still meet the quality standards for wastewater based on PermenLH No 5 of 2014, namely the average range is 0.1 - 3 mg / L.
Picture 1. Results of measurements of MBAS levels in effluent laundry liquid
waste (PermenLH No.5 tahun 2014 tentang Baku Mutu Air Limbah).
Detergent residual wastewater produced in large volumes is very dangerous for the preservation of rivers and soils, where the water needs for the laundry industry on average require 15 L of water to process 1 kg of clothing and produce about 400 m3 of liquid waste per day (Ciabatti 2009 in Nasir, S 2013). Liquid waste that is discharged into the environment directly can cause disturbed natural balance that is soil pollution that can change soil pH, mineral content changes and nutrient disorders from the soil for plant life and polluted groundwater sources. Surfactants contained in detergents will reduce the ability of aquatic organisms to breed. Detergents also have a big role in reducing water quality. According to the results of Makruf's research (2007) it was found that the surfactant concentration (MBAS) of 0.6 mg / l resulted in a significant change in the respiratory rate of tilapia. The results from Suparjo's (2010) study also found that detergent affects mortality and structural damage to gill tissue as an important respiration organ in tilapia (Oreochromis niloticus), the higher the detergent concentration, the higher the mortality of tilapia.
The results of measurements carried out on all laundry businesses show the results still meet the quality standards according to PermenLH No.5 of 2014 concerning Quality Standards for Wastewater, and currently there has been no pollution caused by laundry liquid waste, but within a certain period of time can cause adverse effects for the environment, if the liquid waste produced is discharged continuously into water bodies without any prior treatment.
CONCLUSIONS AND RECOMMENDATIONS
It was concluded that all laundry businesses in Iringmulyo Metro City did not have a business permit and did not yet have an WWTP in running their business.
2
1
0,1
3 3
1
0,3 0,4
1
2
5 5 5 5 5 5 5 5 5 5
0
1
2
3
4
5
6
L1 L2 L3 L4 L5 L6 L7 L8 L9 L10
KADAR MBAS EFFLUEN(mg/l)
* BAKU MUTU mg/l

Proceeding of International Conference of 4th SHIELD 2019
https://pasca.unila.ac.id/seminar-internasional-shield/
ISBN : 978-602-51393-9-0
23
The measurement results of MBAS levels in laundry effluent effluent still meet the quality standards (PermenLH No.5 of 2014 concerning Waste Water Quality Standards), even though within a certain period of time it has the potential to cause pollution to the environment. therefore the laundry business is expected to be able to make a liquid waste treatment plant before being discharged into the drainage flow.
For the government to be able to make regional regulations governing laundry business and conduct supervision and guidance to all laundry business activities.
REFERENCESS Ahsan, S. 2005. Effect of temperature on wastewater treatment with natural and
waste materials. Clean Technology Enviroment Policy.7: 198- 202. Ardiyanto, P. 2016. Analisis Limbah Laundry Informal Dengan Tingkat
Pencemaran Lingkungan di Kelurahan Muktiharjo Kidul Kecamatan Pedurungan Semarang. Jukung Jurnal Teknik Lingkungan. 2 (1): 1-12.
Arneli, 2010, Sublasi surfaktan dari larutan detergen dan larutan detergen sisa cucian serta penggunaannya kembali sebagai detergen, Jurnal Kimia Sains dan Aplikasi. 13 (1): 4-7.
Badan Pusat Statistik Kota Metro, 2018. Kecamatan Metro Timur dalam Angka 2018. Metro: Badan Pusat Statistik. 84 hlm.
Ciabatti, I, F., Cesaro, L., Faralli, E., Fatrella and Togotti, F. 2009. Demonstration of a Treatment System for Purification and Reuse of Laundry Wastewater, Desalination. Jakarta: Penebar Swadaya.
Effendi, H. 2003. Telaah Kualitas Air, Bagi Pengelolaan Sumber Daya dan Lingkungan. Yogyakarta: Kanisius.
Fauziah, I.N. 2010. Formulasi Detergen Cair : Pengaruh Konsentrasi Dekstrin dan Metil Ester Sulfonat (MES). Bogor : Fakultas Teknologi Pertanian Institut Pertanian Bogor.
Ginting, P. 1995. Mencegah dan Mengendalikan Pencemaran Industri. Jakarta: Pustaka Sinar Harapan
Justitia, M. 2015. Analisis Srufactan Anionik (Detergen) pada Limbah Cair Domestik Menggunakan Sperktrofotometer Metode MBAS. repository.usu.ac.id/bitstream/123456789/26000/6/Cover. 27 Agustus 2015
Makruf., 2007. Uji Toksisitas Subletal Air Limbah Industri menggunakan Ikan Nila sebagai Alat Pemantauan Biologis. Tesis. Jawa Tengah. Teknik Manajemen Lingkungan, ITS.
Nasir, S., Budi, S.A., Teguh, and Silviaty. I. 2013. Aplikasi filter keramik berbasis tang liat alam dan zeolit pada pengolahan air limbah hasil proses laundry. Jurnal Bumi Lestari. 13(1): 45-51.
Padmaningrum, R.T., Aminatun,T., and Yuliati. 2014. Pengaruh biomasa melati air (Echinodorus paleafolius) dan teratai (Nyphaea firecrest) terhadap kadar fosfat, BOD, COD, TSS, dan derajat keasaman limbah cair laundry. Jurnal Penelitian Saintek. 19(2).
Prodjosantoso, A.K. and Padmaningrum, R.T. 2011. Kimia lingkungan: Teori dan aplikasinya. Yogyakarta: Kanisius
Suparjo. M.N. 2010. Kerusakan jaringan insang ikan nila (Oreochromis niloticus L) akibat detergen. Jurnal Saintek Perikanan. 5(2): 1-7.
Widiyani, P. 2010. Dampak dan Penanganan Limbah Deterjen. Bogor: Program Studi Kesehatan Masyarakat Veteriner Fakultas Kedokteran Hewan Institut Pertanian Bogor.

Proceeding of International Conference of 4th SHIELD 2019
https://pasca.unila.ac.id/seminar-internasional-shield/
ISBN : 978-602-51393-9-0
24
DEVELOPMENT OF INTERACTIVE MULTIMEDIA BASED ON SCIENCE PROCESS SKILLS IN FORCE AND ENERGY IN
ELEMENTARY SCHOOL
Fauzie1, Hartono2, and Sri Sumarni3
1Teacher of Maitreyawira School Palembang 2,3Lecturer of Sriwijaya University Palembang Correspondence: [email protected]
ABSTRACT
The research aims to develop interactive multimedia material science process skills in force and energy of the fourth grade elementary schools that are valid, practical, and effective against science process skills students. Development research is carried out by using the Alessi and Trollip models which have three stages, namely the planning, design, and development stages. The multimedia products produced were validated by material experts, expert in learning design, and media experts with the results of 0.95, 0.76, 0.92 in very good categories and good categories, so that multimedia is declared valid and feasible to use. The results of practicality through the beta test using a questionnaire obtained a mean number of 0.83, which was declared valid with a very high category. Viewed from the side of 6 (six) indicators of science process skills in the questions grained by students, then the n-gain score for observations is 0.90, classification is 0.78, measurement is 0.74, prediction is 0.74, communication of 0.70, and a conclusion of 0.88. The average result of the n-gain score for the six science process skills indicators in the item is 0.79 with a high category. The results of the field test showed that student learning achievements increased with an average pre-test of 48.52 while the post-test score was 85.41 with a n-gain score of 0.73 (high category). Based on the results obtained, it could be concluded that interactive multimedia is valid, practical and effective against increasing of science process skills students. Keywords: Development, interactive multimedia, force, energy, science process
skills, learning achievements.
INTRODUCTION
Natural Science (IPA) is important learning object in a school curriculum. In science learning it should be taught interestingly by participating students in learning to find their own knowledge because it relates to everyday life. In science learning at the elementary school level, it is expected that real learning can be felt by students, especially considering that science lessons are how students can recognize nature and the environment around them in a real way. According to Samatowa (2010) science learning is able to train children's ability to think critically and objectively. Science has 3 dimensions, namely scientific processes, scientific products, and scientific attitudes. The scientific process is a scientific activity carried out in order to obtain a scientific product. The scientific process includes the process of observing, then classifying, followed by predicting, designing, and conducting experiments.
Science process skills are contained in the ability of scientific processes. According to Trianto (2010) the scientific process that has been carried out is usually in the form of skills so that they discover and develop their own facts and concepts as well as scientific attitudes in students. The concepts, processes, and methods found in science are used in other disciplines. Science process skills are

Proceeding of International Conference of 4th SHIELD 2019
https://pasca.unila.ac.id/seminar-internasional-shield/
ISBN : 978-602-51393-9-0
25
also inseparable in practice with conception (Karamustafaoglu, 2011). According to Chabalengula (2011) basic process skills include observing, concluding, measuring, communicating, classifying, predicting, using relationships of space and time, and using numbers. Educators are currently still very rarely using the science process skills approach in science learning, even though the material to be delivered is very suitable in its use.
The researcher wanted to combine science learning especially the force and energy that prioritized science process skills with the use of computer technology in interactive multimedia so that students could better understand and find knowledge and be skilled in finding knowledge itself. With the help of computers through interactive multimedia, it is expected that science process skills in students can be increased to help students understand the objects that are around that are difficult to see and achieve to be more concrete in their learning. In relevant research on the Development of Web Assisted Science Practical Program in Remote Higher Education of Primary School Teachers that was conducted by Hartono (2010) through a dissertation that discusses the learning of web assisted science process skills. The research conducted by Duran et al. (2011) with learning force with science process skills, it is seen that the value of students is higher than those of students who have other learning force. Learning with science process skills provides a positive effect in the form of improving learning achievements, students' ability to think critically, and the ability to associate science learning in everyday life (Ergin, 2008).
Research conducted by Huppert, et al. (2010) says that the impact of computer assisted learning, including experiments in the form of simulations, has a major influence to overcome problems ranging from low reasoning levels of students to increased science process skills and cognitive skills tall one. The formulation of the problem from the introduction is how to develop interactive multimedia based science process skills in force and energy in elementary schools that are valid and practical, and effective against student learning achievements.
RESEARCH METHODS
This research is development research, namely research carried out to produce a product. This study uses the Alessi and Trollip research models because this model is a special development model for multimedia and has a simple and easy to understand development stage.
According to Alessi and Trollip (2001), the stages of interactive multimedia development consist of three stages, namely the planning process (planning), the design stage (design), and the stage of development (development). The planning phase consists of setting the scope, identifying characteristics of students, setting constraints or obstacles, making planning documents, making implementation instructions, gathering resources, discussing initial ideas, determining media, and obtaining approval from clients/users.
Design is the stage for researchers to design. At the design stage, the activities carried out are exploring and developing ideas, analyzing concepts, making program descriptions, preparing prototypes, creating flowcharts and storyboards, preparing scripts, and getting approval from clients.
The last stage is the development stage, namely the process of realizing the design into reality. At the development stage, the activities carried out are preparing text, writing program code, creating graphics, producing audio and video, assembling pieces, preparing supporting materials, conducting alpha tests, making revisions, conducting beta tests, making final revisions, and validate the program.
To obtain the data needed in the study used data collection techniques including interviews, questionnaires, and test results. Interviews were carried out

Proceeding of International Conference of 4th SHIELD 2019
https://pasca.unila.ac.id/seminar-internasional-shield/
ISBN : 978-602-51393-9-0
26
at the beginning of the study, namely by interviewing teachers and students of fourth grade Maitreyawira Palembang Elementary School with the aim of knowing the obstacles in the use of instructional media that occurred in science learning. Furthermore, researchers used a questionnaire for expert validation (alpha test) as a step to obtain information about the weaknesses of instructional materials in the form of interactive multimedia and their weaknesses to be revised (Warsita, 2008). The questionnaire uses a validation sheet that is evaluated by the validator with each material validation sheet, media, and learning design. Questionnaire is used to get data about the responses of students to learning media (beta test). Learning achievements tests are used to measure student learning achievements after using interactive multimedia based material science process skills in force and energy in elementary schools.
RESULTS AND DISCUSSION
This research is the development of interactive multimedia based on process skills science in force and energy in elementary schools has produced interactive multimedia products that have been tested on fourth grade students of Maitreyawira Palembang Elementary School. The planning phase begins with analyzing the needs of students, identifying the characteristics of students, collecting supporting materials in the making of interactive multimedia, and determining the media.
The second stage is the design phase, where the researcher explores and develops the initial idea by designing content, text, images, audio, video, information, and interactivity and programming that will be included in interactive multimedia. The next step is to make a prototype after the researcher has managed to collect all the material to create interactive multimedia. Prototype is an interactive multimedia product based on the science process skills of force and energy that has not undergone a process of validation and revision. The research prototype consists of 6 (six) main menus, namely competency, force material, energy material, simulation, pre-test, and post-test. The display of the prototype main page developed is shown in Figure 1.
Figure 1. Prototype.
The next stage is creating a flowchart, storyboard, and script. The purpose of the flowchart in interactive multimedia is to explain the flow of interactive multimedia based science process skills in force and energy starting from the opening page, the main page, and how to close interactive multimedia. The storyboard serves to describe in detail the parts in interactive multimedia that are being developed.
The design that has been created and produces a prototype, flowchart and storyboard will move to the development stage which is the final stage of the research. At this stage the researcher collects supporting materials related to the

Proceeding of International Conference of 4th SHIELD 2019
https://pasca.unila.ac.id/seminar-internasional-shield/
ISBN : 978-602-51393-9-0
27
material in interactive multimedia, the process of material science and energy, including audio, video, and images. Audio and video are made independently, while some images are obtained from internet pages and taken from surrounding images. The next stage tests the validity of interactive multimedia by material experts, media experts, and learning design experts. Azwar (2018) said that processing questionnaires using the V Aiken formula provides evidence of compatibility to test the validity of a product. The results of the expert validation can be seen in Table 1.
Table 1 Results of Expert Validation
No Validator Nilai V Kategori
1. Ahli Materi 0, 95 Sangat Tinggi 2. Ahli Media 0, 92 Sangat Tinggi 3. Ahli Desain Instruksional 0, 76 Tinggi
The results of the questionnaire filled with experts also resulted in comments
and suggestions which became a guide for researchers to improve and develop interactive multimedia. After doing the alpha test, the next step is to do a beta test to test the practicality of interactive multimedia.
In the beta test phase, researchers selected nine random students representing the target population, namely students with low, medium and high abilities. The trial was conducted through filling out a questionnaire that produced quantitative data and qualitative data. The results of the questionnaire on the beta test obtained a mean value of 0.83 which included a very practical category. Qualitative data in the form of suggestions and comments from students becomes guidelines for improving multimedia. The beta test results from multimedia were tested in the real class through field test activities.
After conducting a beta test and completing the final revision, the researcher tested the product. This product trial aims to measure the effectiveness of interactive multimedia developed on student learning achievements. At the last meeting, the researcher held a post-test to measure the learning achievements of students after participating in interactive multimedia learning. Post-test was attended by 27 students with an average value of 85.41. 24 students or 88.89% were declared complete because they exceeded the minimum completeness criteria. These learning achievements are shown in Table 2.
Table 2 Learning Achievements of Students
Score Interval Learning Achievements
Category Amount Percentage
90 – 100 13 48,15% Very Good 80 – 89 9 33,33% Good 70 – 79 2 7,41% Enough 0 – 69 3 11,11% Less
The science process skills that have been tested obtained results from the six
indicators in the questions that have been done by the students obtained by the n-gain score for each indicator of the science process skills shown in Figure 1 below.

Proceeding of International Conference of 4th SHIELD 2019
https://pasca.unila.ac.id/seminar-internasional-shield/
ISBN : 978-602-51393-9-0
28
Teaching materials in the form of interactive multimedia are needed to support interesting and fun learning for students. The use of this media also helps students to reach something that is in
The scope of research in developing interactive multimedia based on science process skills is material style and energy in elementary schools nature so that it can be seen directly without having to go to the location in question.
The science process skills in this study are based on indicators that will be achieved, namely the skills of observation (observing), quantification (measuring), classification (classifying), prediction (estimating), communicating, and inference (inferring). Science process skills activities can be applied for example in practical activities in the laboratory and/or virtual/ web-assisted. (Hartono N. R., 2010).
The steps in interactive multimedia research in science process skills consist of doing an alpha test, conducting a beta test, and field testing. The interactive multimedia alpha test developed was declared valid. The alpha test phase involved 3 experts who became validators, namely material experts, media experts, and learning design experts. The results obtained by experts in the form of quantitative data and qualitative data. The stages passed after the alpha test and improving the product developed on the advice of experts are beta tests. In the beta test phase, the product developed will be re-tested in terms of its practicality with 9 (nine) respondents with high, medium, and low academic abilities. Assessment on beta test is the result in the form of qualitative and quantitative. The last stage is a field test where researchers conduct pre-test and post-test on 27 students. Of the three stages that have been carried out stated that interactive multimedia science process skills in force and energy in elementary schools are valid, practical, and effective against student learning achievements.
The results of this study are in line with the most active multimedia development research that has been carried out by several previous researchers, especially in the impact of influencing the learning achievements of students. Research conducted by Wibowo, et al. (2013) using interactive multimedia proved to be able to improve the quality of biology learning based on student responses, increased student knowledge, and improved performance/performance shown in students' science process skills. In addition, the use of multimedia also increases the average value of students' science process skills based on performance assessment. Siahaan's research, et al. (2017) also use multimedia to improve science process skills with the highest indicator in predictive ability. In the study also shows that the use of interactive multimedia can support the limitations of teachers in presenting real objects into the classroom. Research using computer assisted programs that are able to improve the skills of science processes and student learning achievements is also done by Huppert, et al. (2010) which shows that abilities using formal reasoning such as the ability to measure, communicate, interpret data, and predict able to improve the science process skills and cognitive abilities of students.
0
0,5
1
observing measuring communicating
Rerata Hasil
Indikator
Hasil…

Proceeding of International Conference of 4th SHIELD 2019
https://pasca.unila.ac.id/seminar-internasional-shield/
ISBN : 978-602-51393-9-0
29
CONCLUSIONS AND SUGGESTIONS
The interactive multimedia developed was declared valid and had a very high
level of practicality. The alpha test results to measure the level of interactive multimedia validity showed 0.92 for the assessment of media experts categorized as very high, 0.95 for the assessment of material experts who were also categorized as very high, and 0.76 for the assessment of learning design experts categorized as high. Qualitative data from experts in the form of comments and suggestions for multimedia improvement. So, the developed interactive multimedia is declared valid and can be tested according to the suggestions. The beta test results in a qualitative assessment in the form of comments and suggestions for multimedia improvement and quantitative assessment in the form of a mean score of 0.83 which falls into the very high category. The beta test results show that the interactive multimedia developed has a very high level of practicality.
Interactive multimedia process science skills in force and energy also use field testing as evidence of the effectiveness of student learning achievements. Proof is seen from the results of the pre-test with an average of 48.52 which experienced an increase in the post-test results to mean 85.41. The increase was also seen from the six indicators of science process skills contained in the questions starting from indicators of observation, classification, measurement, estimation, delivery to the indicator of confusion. This shows that interactive multimedia is developed effectively against student learning achievements.
Based on the results of research that has been carried out regarding the development of interactive multimedia process science skills in force and energy in elementary schools, we can conclude a number of things as follows.
1. For schools, interactive multimedia products build science process skills in force and energy produced can be one source of learning from students.
2. For teachers, the interactive multimedia products developed can be used as teaching media or aids in learning in the millennial era so that students can more easily understand force and energy in a fun way.
3. For students, this interactive multimedia product can help understand in force and energy more pleasantly because it is presented with various animations, videos, and simulations.
4. For other researchers, this interactive multimedia product can be used as one of the references and even references so that it can improve even better interactive mulmedia in the force and energy.
REFERENCESS
Alessi, S.M., and Trollip, S.R. 2001. Multimedia for Learning : Method and
Development. Boston: Allyn and Bacon. Azwar, S. 2018. Reabilitas dan Validitas. Yogyakarta: Pustaka Pelajar. Chabalengula, V. M, Mumba, F., and Mbewe, S. 2011. How pre-service teachers
understand and perform science process skills. Eurasia Journal of Mathematics, Science and Technology Education. 167-176.
Duran, M., Isik, H., Mihladiz, G., and Ozdemir, O. 2011. The relationship between the pre-service science teachers' scientific process skilss and learning styles. Western Anatolia Journal of Educational Science. 467-476.
Ergin, H. A. 2008. The effect of scientific process skills education on students' scientific creativity, science attitudes and academic achievements. Asia Pacific Forum on Science Learning and Teaching. 9: 1-21.

Proceeding of International Conference of 4th SHIELD 2019
https://pasca.unila.ac.id/seminar-internasional-shield/
ISBN : 978-602-51393-9-0
30
Hartono and Rustaman, N. 2010. Teaching science process skills in blended learning environment: A case study at strata-1 elementary teacher education. Konferensi Pendidikan Dasar Tingkat Internasional. 221-227.
Huppert, J., Lomask, S. M., and Lazawowitz, R. 2010. Computer simulations in the high school: Students' cognitive stages, science process skills and academic achievement in microbiology. International Journal of Science Education. 24(8): 803-821.
Karamustafaoglu, S. 2011. Improving the science process skills ability of science student teachers using diagrams. Eurasian Journal of Physics and Chemistry Education.1: 26-38.
Samatowa, U. 2010. Pembelajaran IPA di Sekolah Dasar. Jakarta: Indeks. Siahaan, P., Suryani, A., Kaniawati, I., Suhendi, E., and Samsudin, A. 2017.
Improving students‟ science process skills through simple computer simulations on linear motion conceptions. IOP Journal of Physics: Conf. Series 812. 1-5.
Trianto. 2010. Mendesain Model Pembelajaran Inovatif-Progresif. Jakarta: Rineka Cipta.
Warsita, B. 2008. Teknologi Pembelajaran : Landasan dan Aplikasinya. Jakarta: Rineka Cipta.
Wibowo, H., Syamsurizal, and Yelianti, U. 2013. Pengembangan multimedia interaktif untuk meningkatkan keterampilan proses sains siswa pada materi struktur dan fungsi jaringan tumbuhan kelas XI IPA SMA Xaverius I Jambi. Edu Sains. 1(2): 12-18.

Proceeding of International Conference of 4th SHIELD 2019
https://pasca.unila.ac.id/seminar-internasional-shield/
ISBN : 978-602-51393-9-0
31
LOCAL REGULATION DESIGN OF IRRIGATION BASED ON PENGAYOMAN LAW
*Ade Arif Firmansyah1, M. Iwan Satriawan2 and Malicia Evendia3
Faculty of Law, University of Lampung, Indonesia *Corresponding Author
ABSTRACT This study aims to formulate the design of local regulations on irrigation based on the pengayoman law to support food sovereignty policies. Using the method of doctrinal legal research with a conceptual and statute approach, the design of local regulations on irrigation based on pengayoman law consists of minimal regulatory material: general provisions; principles, objectives and scope; irrigation management planning; irrigation management institutions; irrigation system management; coaching, supervision and empowerment; financing of irrigation management; investigation; criminal provisions; transitional provisions (optional); and closing provisions. The minimum regulatory material for the design of local regulations on irrigation based on the pengayoman law needs to be prioritized by the local government and local legislative bodies in the formation program of local regulations so that can be immediately realized into the applicable local regulations and have a positive impact on food sovereignty policies. Keywords: Local regulation, pengayoman law, irrigation, food sovereignty.
INTRODUCTION
The role of the agricultural sector is very strategic in the national economy. The aim of agricultural development is to preserve food security, increase farmers' incomes, increase employment opportunities in rural areas and improve family nutrition, as well as in line with the spirit of democracy, decentralization, and openness in the fabric of communities life. The existence of decentralization with the enactment of Law Number 32 of 2004 concerning Local Government which has now been changed to Law Number 23 of 2014 concerning Local Government, has a very large impact on local government. This is due to the enactment of these laws, local governments have full authority in carrying out development in their respective regions, including agricultural development. It is also inseparable that the purpose of forming an autonomous region is basically to empower the region, including improving people's welfare.12
The implementation of local autonomy based on this law has laid a strong legal basis on the regions to carry out broad, real and responsible local autonomy. 13 Law Number 23 of 2014 concerning Local Government also mandates that local governance be carried out based on the principles of decentralization, deconcentration, and assistance tasks. In the implementation of decentralization, freedom is given to the regions to carry out local autonomy with the principle of a service approach to the community in various fields including irrigation management.
12
Rozali Abdullah, Pelaksanaan Otonomi Luas dengan Pemilihan Kepala Daerah secara
Langsung, (Jakarta: PT Raja Grafindo Persada, 2005), Pg. 12. 13
Hoessein, B., Prospek Resolusi Kebijakan dan Implementasi Otonomi Daerah dari Sudut
Pandang Hukum Tata Negara, delivered on National Seminar and Workshop Strategi Resolusi
Kebijakan dan Implementasi Otonomi Daerah Dalam Kerangka Good Governance, (Jakarta:
Lembaga Administrasi Negara, 2001).

Proceeding of International Conference of 4th SHIELD 2019
https://pasca.unila.ac.id/seminar-internasional-shield/
ISBN : 978-602-51393-9-0
32
Regarding local authority in the field of irrigation contained in Article 12 paragraph (1) of Law Number 23 of 2014, which states that the Mandatory Government Affairs relating to Basic Services include, inter alia, a) education; b.) health; c). public works and spatial planning; d.) public housing and residential areas; e.) peace, public order and community protection; and f.) social. One of the mandatory government affairs related to these basic services is affairs in the field of public works and spatial planning. Where further in the appendix to the law has been further specified that in the sub-affairs concerning water resources, the local regency government has the authority and responsibility one of which is "Development and management of primary and secondary irrigation systems in irrigation areas whose area is less than 1000 are in 1 (one) Regency area."
Irrigation as one of the supporting components of the success of agricultural development has a very important role. This is because agricultural activities cannot be separated from water. Normatively, irrigation is an effort to supply, regulate, and dispose of irrigation water to support agriculture of which its type includes surface irrigation, swamp irrigation, underground water irrigation, pump irrigation, and pond irrigation.14
Irrigation management as part of utilizing the potential of artificial resources is still a sector of water resource development which is very important in supporting agricultural production and food security. Therefore, the use of irrigation needs to be managed properly. Irrigation is managed to arrange for the development and management of irrigation systems to be carried out efficiently and effectively, directed and sustainably, and prioritizing the interests of farmers. Local governments have a significant role in irrigation management. The role must be covered by local regulations whose substance will protect the process towards food sovereignty through a powerful and effective irrigation system.
LITERATURE REVIEW AND HYPOTHESIS DEVELOPMENT
The development of the agricultural sector as an effort to fulfill food in the era of high demand for food and food products is an indicator of the beginning of the era of environmentally friendly economy and industry based on various input creations and innovations, processes and products of agriculture, fisheries, animal husbandry and forestry, both from the aspect of environmental management, fairness of the value cycle (value cyclic) and fairness of supply cycle management.15
The agricultural sector is one of the important sectors as an input provider for other sectors, so this sector is said to have an influence on the structure of the Indonesian economy. The agricultural sector itself is not limited to farming or crop cultivation (food crops, plantations, and horticulture), but includes the fisheries, animal husbandry and forestry sectors, with upstream cultivation activities to distribution activities to consumers downstream, as well as changing inputs be output in the form of clothing, food, shelter and a comfortable environment for living things. Agriculture is not just planting and gardening. The above shows how wide the agricultural sector is.16 The agricultural sector is very closely related to the administration of irrigation.
According to Abdullah Angoedi in his book, "The History of Irrigation in Indonesia", it was stated that in the Dutch government's report, irrigation was defined as follows: "technically channeling water through carrying channels to the
14
Article 1 Number 3 Government Regulations No 20 of 2006 concerning Irrigation. 15
E. H. Khaeron. Model Pengembangan Diversifikasi Pangan Dalam Mendukung Ketahanan
Pangan Nasional (Suatu Kasus Di Provinsi Jawa Barat). Disertation, Fakultas Pertanian,
Universitas Padjadjaran Bandung, Bandung, 2016. 16
Drafting Team, Naskah Akademik Dan Rancangan Undang-Undang tentang Sistem Budidaya
Pertanian Berkelanjutan, Komisi IV DPRRI, 2017.

Proceeding of International Conference of 4th SHIELD 2019
https://pasca.unila.ac.id/seminar-internasional-shield/
ISBN : 978-602-51393-9-0
33
agricultural land and after the water is taken the most benefit is channeling it to sewers continue to the river." 17 Irrigation is any human effort related to the planning and making of facilities to channel and distribute water to plots of agricultural land regularly, and to dispose of excess water that is no longer needed.18
Irrigation is generally defined as the use of water in the soil for the purposes of providing fluids needed for plant growth. However, a more general definition and includes irrigation is the use of water in the soil for each of the following eight uses: a. Adding water to the soil to provide fluids needed for plant growth. b. To provide a guaranteed harvest during the short dry season. c. To cool the soil and atmosphere, giving rise to a good environment for the
growth of plants. d. To reduce the danger of freezing. e. To wash or reduce salt in the soil. f. To reduce the danger of soil erosion. g. To soften plowing and lumps of soil.
h. To slow the formation of buds by cooling down due to evaporation.19
Technically, irrigation is intended to reduce the amount of transportation costs for agricultural products, then in the era of the 1970s until In the 1990s, the government actively worked on building irrigation networks to develop all agricultural land in Indonesia. Irrigation land development is carried out through the provincial irrigation development project (PIDP).20 Thus irrigation is seen as a primary factor in development in agriculture, in addition to land and farmers. The development of the agricultural sector absolutely requires a good and integrated irrigation system.21
The relationship between irrigation systems and agriculture ultimately relates to farmers as water users. Irrigation activities always foster cooperation between farmers in the construction and maintenance of irrigation buildings and canals. The distribution of water between paddy fields and between paddy fields in the same stretch of land requires well-organized cooperation between farmers in the irrigation network concerned.22
One of the factors of efforts to increase food production, especially rice, is the availability of irrigation water in the fields according to need. If the supply of irrigation water is done properly and correctly, it can support an increase in rice production so that national food needs can be met. The development of irrigation to support increased food production and increased income of farmers has also become a government program. For this reason, irrigation networks, both carrier channels and disposal channels and irrigation structures, must be able to operate properly.23
17
Abdullah Angoedi, Sejarah Irigasi di Indonesia, Jakarta: ICID, 1985, Pg. 21 18
Effendi Pasandaran, Irigasi di Indonesia: Strategi Dan Pengembangan, Jakarta: Lembaga
Penelitian, Pendidikan dan Penerangan, Ekonomi dan Sosial, 1991, Pg. 34 19
Hansen, V. E., dkk, 1992. Dasar-dasar dan Praktek Irigasi. Jakarta: Erlangga, Pg. 20 20
Kedi Suradisastra, dan Effendi Pasandaran, Menyoroti Dinamika Pembangunan Pertanian
Kawasan Timur Indonesia: Prosiding Lokakarya, Jakarta: Departemen Pertanian, Badan
Penelitian dan Pengembangan Pertanian, Pg. 107. 21
Kartasapoetra, A. G., dan Mul Mulyani Sutedjo, Tekhnologi Pengairan, Jakarta: Bumi Aksara,
1994. 22
Siskel, S.E. dan Hutapea, S.R., Irigasi di Indonesia Peran Masyarakat dan Penelitian. Jakarta:
LP3ES. 1995, Pg. 21. 23
Mawardi, E., Desain Hidraulik Bangunan Irigasi, Bandung: Alfabeta, 2007

Proceeding of International Conference of 4th SHIELD 2019
https://pasca.unila.ac.id/seminar-internasional-shield/
ISBN : 978-602-51393-9-0
34
The need for irrigation for agricultural land is very important to support the need for water for the growth of rice plants, especially at this time many agricultural lands are being converted into non-agricultural land. Irrigation is important to increase agricultural production, both in terms of quality and quantity of rice to be produced. The design of Local Regulations for Implementing Irrigation under the aegis of law to support food sovereignty policies as a result of this research is expected to be a reference for local governments in the preparation of Local Regulations for Irrigation Implementation in their regions.
RESEARCH METHODS
This research is conducted by corridor of doctrinal research which only use secondary data. The legal research model is a comprehensive and analytical study of primary legal materials and secondary legal materials. The problem approach uses statute approach and conceptual approach. The data were analyzed qualitatively by describing the data generated from the research into the form of explanation systematically so as to obtain a clear picture of the problem under study, the results of data analysis deductive concluded.
DISCUSSIONS AND ANALYSIS OF RESULTS
Article 33 paragraph (3) of the 1945 Constitution mandates that the utilization of water resources must be aimed to the greatest extent possible for the prosperity of the people. The understanding contained in the article is that the state is responsible for the availability and distribution of the potential of water resources for all Indonesian people, and thus the utilization of the potential of water resources must be planned in such a way that meets the principles of usefulness, justice, independence, and sustainability.
The local government has the obligation to maintain a good and healthy environment for all communities, through the implementation of sustainable development by harmonizing economic, social and environmental development in a good and harmonious manner. By examining the condition of watershed water resources in particular and the environment in general at this time, if not anticipated with appropriate policies and actions will be faced with three threats, namely the food crisis, water crisis, and energy crisis. These three crises are a contribution to the national long-term crisis that needs to be watched out so as not to have a negative impact on the lives of the people and the nation, namely the threat of national unity, an increase in the spirit of separatism, and a decline in public health.
Other problems that encourage the strengthening of the role of local governments in the management of natural resources are due to the deterioration in the condition of forests due to rapidly increasing deforestation and deteriorating land cover in the upstream watershed causing a decrease in water availability which threatens the decline in reservoir and river water discharge in the dry season. Water resources that are most related to watershed management are rivers, because rivers are one source of raw water as well as waste disposal sites, both industrial and domestic. Potential water resources related to watersheds are forests as water catchment areas. The forest is an upstream area of the river, so that the preservation of the forest must be maintained in order to maintain the sustainability of water resources. If the forest is damaged, the water catchment area will decrease because there is nothing that can hold water when it rains. Even if the forest in the upstream area is damaged, the watershed will be affected, both in quality and quantity. Erosion that carries materials and minerals from the upstream area will also cause river siltation, so the river's capacity will

Proceeding of International Conference of 4th SHIELD 2019
https://pasca.unila.ac.id/seminar-internasional-shield/
ISBN : 978-602-51393-9-0
35
decrease. This certainly will affect various aspects that depend on the water needs of the river, such as irrigation of rice fields (irrigation), ponds, cages, and raw water. Thus, the need for local law in the form of Local Regulations on Irrigation based on protecting law becomes important to support irrigation systems that will sustain agricultural development and food sovereignty in the regions.
The concept of pengayoman law according to Arief Sidharta is related to Pancasila as a legal ideal for realizing humanity,24 which is to protect people passively by preventing arbitrary actions, and actively by creating humane social conditions that allow social processes to take place fairly so that each person is fair in every manner humans have broad and equal opportunities to develop their full potential for humanity. The guarding is carried out by efforts to realize:25
a. order that gives rise to predictability; b. peaceful peace; c. justice (distributive, cumutative, vindikative, protective); d. welfare and social justice; and e. fostering noble morals based on the Almighty God.
Through this pengayoman context, it is necessary to identify the legislation as a legal framework in designing local regulations on irrigation based on pengayoman law. The results of the identification of laws and regulations that are the source of the authority of the Regency/City are presented in table one below.
Table 1. Identification of Legislation as a Legal Framework in Designing Local
Regulations on Irrigation No. Types of Legislation
1. Law No 26 of 2007 concerning Spatial Planning 2. Law No 23 of 2014 concerning Local Government 3. Government Regulation No 22 of 1982 concerning Water Management 4. Regulation of the Minister of Public Works and Housing of the Republic of
Indonesia No 08/Prt/M/2015 concerning determination of irrigation network border lines
5. Regulation of the Minister of Public Works and Housing of the Republic of Indonesia No 12/PRT/M/2015 concerning Exploitation and Maintenance of Irrigation Networks
6. Regulation of the Minister of Public Works and Housing of the Republic of Indonesia No. 14 /Prt/M/2015 concerning Criteria and Determination of Irrigation Area Status
7. Regulation of the Minister of Public Works and Housing of the Republic of Indonesia No. 17/Prt/M/2015 concerning Commission Irrigation
8. Regulation of the Minister of Public Works and Housing of the Republic of Indonesia No. 23/Prt/M/2015 concerning Irrigation Asset Management
9. Regulation of the Minister of Public Works and Housing of the Republic of Indonesia No. 30/Prt/M/2015 concerning Irrigation System Development and Management
24
Word pengayoman pertama kali diperkenalkan dalam bidang hukum oleh Sahardjo. Menurut
Daniel S. Lev, in 1960 Sahardjo was replaced the blindfolded lady with scales by a stylized
Banyan tree as Indonesia’s symbol of justice, that inscribed with the Javanese word
Pengajoman-protection and succor. It also represented a quickening of the process of
transformation of the heritage of Dutch colonial law into Indonesian law. Daniel S. Lev, The
Lady and the Banyan Tree: Civil-Law Change in Indonesia, The American Journal of
Comparative Law, Vol. 14. No. 2 (spring, 1965). P. 282. 25
Bernard Arief Sidharta, Ilmu Hukum Indonesia, Upaya Pengembangan Ilmu Hukum Sistematik
Yang Responsif Terhadap Perubahan Masyarakat, Genta Publishing, Yogyakarta, 2013. hlm.
105.

Proceeding of International Conference of 4th SHIELD 2019
https://pasca.unila.ac.id/seminar-internasional-shield/
ISBN : 978-602-51393-9-0
36
Based on the identification in table one, the design of local regulations on irrigation based on pengayoman law consists of minimal regulatory material: general provisions; principles, objectives and scope; irrigation management planning; irrigation management institutions; irrigation system management; coaching, supervision and empowerment; financing of irrigation management; investigation; criminal provisions; transitional provisions (optional); and closing provisions. The minimum regulatory material for the design of local regulations on irrigation based on the pengayoman law needs to be prioritized by the local government and local legislative bodies in the formation program of local regulations so that can be immediately realized into the applicable local regulations and have a positive impact on food sovereignty policies.
CONCLUSIONS
Based on the previous section, it can be concluded that the design of local regulations on irrigation based on pengayoman law consists of minimal regulatory material: general provisions; principles, objectives and scope; irrigation management planning; irrigation management institutions; irrigation system management; coaching, supervision and empowerment; financing of irrigation management; investigation; criminal provisions; transitional provisions (optional); and closing provisions. The minimum regulatory material for the design of local regulations on irrigation based on the pengayoman law needs to be prioritized by the local government and local legislative bodies in the formation program of local regulations so that can be immediately realized into the applicable local regulations and have a positive impact on food sovereignty policies.
ACKNOWLEDGEMENTS
This research can be done well thanks to the funds provided by the DIPA BLU University of Lampung 2019 fund through a novice lecturer research grant scheme. We would like to thank for the financial support of this research.
REFERENCES
Abdullah, A. 1985. Sejarah Irigasi di Indonesia (Irrigation History in Indonesia). Jakarta: ICID.
Daniel, S. 1965. The lady and the banyan tree: civil-law change in Indonesia. The American Journal of Comparative Law. 14(2).
Government Regulation No 22 of 1982 concerning Water Management Hansen, V. E. 1992. Dasar-dasar dan Praktek Irigasi. Jakarta: Erlangga. Hoessein, B. 2001. Prospek Resolusi Kebijakan dan Implementasi Otonomi
Daerah dari Sudut Pandang Hukum Tata Negara, disampaikan pada Seminar dan Lokakarya Nasional Strategi Resolusi Kebijakan dan Implementasi Otonomi Daerah Dalam Kerangka Good Governance, Jakarta: Lembaga Administrasi Negara.
Kartasapoetra, A. G., and Sutedjo, M. 1994. Tekhnologi Pengairan. Jakarta: Bumi Aksara.
Khaeron, E.H. 2016. Model Pengembangan Diversifikasi Pangan Dalam Mendukung Ketahanan Pangan Nasional (Suatu Kasus Di Provinsi Jawa Barat). Disertasi. Bandung: Fakultas Pertanian, Universitas Padjadjaran Bandung.
Law No 23 of 2014 concerning Local Government Law No 26 of 2007 concerning Spatial Planning Mawardi, E. 2007. Desain Hidraulik Bangunan Irigasi. Bandung: Alfabeta.

Proceeding of International Conference of 4th SHIELD 2019
https://pasca.unila.ac.id/seminar-internasional-shield/
ISBN : 978-602-51393-9-0
37
Pasandaran, E. 1991. Irigasi di Indonesia: Strategi dan Pengembangan. Jakarta: Lembaga Penelitian, Pendidikan dan Penerangan, Ekonomi dan Sosial.
Regulation of the Minister of Public Works and Housing of the Republic of Indonesia No 08/Prt/M/2015 concerning determination of irrigation network border lines
Regulation of the Minister of Public Works and Housing of the Republic of Indonesia No 12/PRT/M/2015 concerning Exploitation and Maintenance of Irrigation Networks
Regulation of the Minister of Public Works and Housing of the Republic of Indonesia No. 14 /Prt/M/2015 concerning Criteria and Determination of Irrigation Area Status
Regulation of the Minister of Public Works and Housing of the Republic of Indonesia No. 17/Prt/M/2015 concerning Commission Irrigation
Regulation of the Minister of Public Works and Housing of the Republic of Indonesia No. 23/Prt/M/2015 concerning Irrigation Asset Management
Regulation of the Minister of Public Works and Housing of the Republic of Indonesia No. 30/Prt/M/2015 concerning Irrigation System Development and Management
Rozali, A. 2005. Pelaksanaan Otonomi Luas dengan Pemilihan Kepala Daerah secara Langsung. Jakarta: PT Raja Grafindo Persada.
Sidharta, B.A. 2013. Ilmu Hukum Indonesia, Upaya Pengembangan Ilmu Hukum Sistematik Yang Responsif Terhadap Perubahan Masyarakat. Yogyakarta: Genta Publishing.
Siskel, S.E. and Hutapea, S.R. 1995. Irigasi di Indonesia Peran Masyarakat dan Penelitian. Jakarta: LP3ES. 1995.

Proceeding of International Conference of 4th SHIELD 2019
https://pasca.unila.ac.id/seminar-internasional-shield/
ISBN : 978-602-51393-9-0
38
EXPORT COMPETITIVENESS OF INDONESIA’S PALM OIL COMMODITIES
*Maria Ulfah1, Raden Hanung Ismono2 and Ktut Murniati3
1Student of Agribusiness Department, Faculty of Agriculture, University of Lampung, Jl. Prof. Dr. Soemantri Brodjonegoro No. 1 Bandar Lampung 35145,
Indonesia ; 2,3 Agribusiness Department, Faculty of Agriculture University of Lampung, Indonesia
*Telp. 081379592255, e-mail: [email protected]
ABSTRACT
This study aims to analyze the competitiveness of Indonesian palm oil commodities compared to Malaysia, Thai, and Colombian. The Indonesian palm oil commodities studied consist of crude palm oil or CPO and processed palm oil or OPO (Other Palm Oil). The time series data used in this study was data from 1991 to 2016. The study was analyzed using the Revealed Comparative Advantage (RCA) method, the Trade Specialization Index (ISP), and market share. The RCA and ISP methods are used to measure the comparative advantage and competitive advantage of Indonesian, Malaysian, Thai and Colombian palm oil commodities. The results of this study indicate that the level of competitiveness of Indonesian CPO was the highest among countries in Malaysia, Colombia and Thailand. Indonesia's CPO export share in the international market was 52% also the highest among Malaysia, Colombia and Thailand. The competitiveness of processed palm oil (OPO) in Indonesia was the second highest after Malaysia. The share of Indonesia's OPO exports in the international market in 1991-2012 was 20% the second highest position after Malaysia. However, in 2013-2016 the share of Indonesia's OPO commodity exports was 53% able to exceed the share of Malaysian OPO exports. Keywords: Export, market share, palm oil, RCA, ISP
INTRODUCTION
The development of the Indonesian palm oil industry has accelerated after successfully strengthening the National Private Large Plantation (PBSN I, II, III) and applying the oil palm plantation model of synergy between farmers and corporations known as Nucleus Estates and NES (Nucleus Estate and Smallholders). The success of NES trials (NES I-IV) financed by the World Bank, then developed into various PIR models (1970). Through these PIR patterns, oil palm plantations develop from North Sumatra-Aceh, to Riau, Kalimantan and other regions in Indonesia (GAPKI, 2017).
The development of the palm oil industry is driving economic growth, regional development, increasing GDP and alleviating poverty in several production centers in Indonesia. In addition, exports of palm oil products also have an important contribution to the Indonesian economy through the contribution of foreign exchange and employment.
Indonesia's palm oil exports continue to grow in line with the shift in world vegetable oil consumption. Indonesia is the largest palm oil producing country in the world, followed by Malaysia and Thailand. In addition, producing countries from America such as Colombia, Guatemala and Honduras also continue to increase exports of palm oil. Taking into account the conditions of competition, it

Proceeding of International Conference of 4th SHIELD 2019
https://pasca.unila.ac.id/seminar-internasional-shield/
ISBN : 978-602-51393-9-0
39
is important to know how the competitiveness of Indonesian palm oil and its derivatives on the international market (Kemenperin, 2011).
In the development of world vegetable oil exports, Indonesia as a producer of palm oil is in a weak position so that efforts are needed to improve Indonesia's bargaining position in determining world palm oil export prices. Fluctuations in world palm oil prices and changes in Indonesian palm oil export duty policies have triggered a decline in Indonesia's palm oil exports in 2016. The decline in crude palm oil exports has indeed occurred in the last five years. However, the decline in processed palm oil exports is enough to worsen the performance of Indonesian palm oil. The decline in palm oil exports causes domestic stockpiles to increase so that domestic oil prices decline. The decline in domestic palm oil prices will certainly reduce the consumer surplus and producer surplus, namely farmers and downstream industries. So that the reduction in the producer surplus will also be charged to farmers in the form of falling prices for TBS (fresh fruit bunches). This will reduce incentives for farmers to improve the quality of TBS due to suboptimal maintenance. This condition certainly has an impact on competitiveness and export earnings. Low export income causes demand for the results of various domestic sectors to decline. This causes the level of domestic economic activity to decline and the number of unemployed to increase. Therefore, this study aims to analyze the performance of Indonesia's palm oil exports in the international market.
MATERIAL AND METHOD
This research was conducted in the coverage area of Indonesia. The research location was chosen purposively based on the consideration that Indonesia is one of the largest palm oil producers and exporters in the international market (BPS, 2016). Data collection is carried out in May-June 2017.
Secondary data used was the volume and value of Indonesian palm oil exports to countries on five continents, namely the Asian Continent, the European Continent, Africa, the American Continent, and the Australian Continent. Five continents were chosen to see the development of Indonesia's palm oil exports in each continent. Harmonized System (HS) used in this study is HS 4 digit level, namely HS 1511 with commodity Palm oil (Palm Oil and its fraction) consisting of oil HS 151110 or crude palm oil (CPO) and HS 151190 or oil refined palm (OPO).
The type of data used in this study is secondary data in the form of time series data for 26 years, namely the period 1991 to 2016. Secondary data obtained from the Badan Pusat Statistik, Direktorat Jendral Perkebunan Kementrian Pertanian Republik Indonesia (Ditjenbun Kementan RI), United Nations Commodity of Trade (UN Comtrade), Pusat Data dan Sistem Informasi Pertanian, Kementerian Perdagangan (Kemendag), Kementerian Keuangan, previous research, research journals, books, and literature relating to competitiveness and trade international palm oil.Metode yang digunakan dalam penelitian ini, yaitu metode deskriptif dan metode kuantitatif. Metode deskritif digunakan untuk menginterpretasikan data-data mengenai perkembangan ekspor dan kinerja minyak kelapa sawit Indonesia. Pengolahan data dalam penelitian ini menggunakan software Microsoft Excel 2010 dan Eviews.
To analyze the competitiveness of Indonesia's palm oil exports on the international market, the Revealed Comparative Advantage (RCA) analysis method is used. According to Tambunan (2001) mathematically, the RCA formula was follows:

Proceeding of International Conference of 4th SHIELD 2019
https://pasca.unila.ac.id/seminar-internasional-shield/
ISBN : 978-602-51393-9-0
40
Information: RCA = Competitiveness level of Indonesian palm oil / competing countries Xij = Export value of Indonesian palm oil / competitor countries Xt = Total export value of all commodities of Indonesia / competitors Wij = Value of world palm oil exports Wt = total export value of all world commodities
RCA index with a value of equal to or more than 1 (RCA ≥ 1) indicates that a country has a comparative advantage above the world average so that the commodity has strong competitiveness. Conversely, if the RCA index value is less than 1 (RCA <1), it means that a country has a comparative advantage below the world average so that the commodity lacks the advantage to compete in international markets.
In addition, this study also measures the competitive advantage of Indonesian palm oil in the international market by using the analysis of the Trade Specialization Index (ISP). The ISP index can also be used to analyze the stages of the industrialization process and the development of the commodity's trade patterns. This index can be calculated using the following formula:
Information : ISP = trade specialization index Xia = export value of Indonesian palm oil / competing countries (US $) Mia = Value of imported Indonesian palm oil / competing countries (US $)
The position of competitiveness is divided into 5 stages, according to the product cycle theory, which is as follows: ISP values between -l to +1. If the ISP value ranges from -1 to - 0.5 means that the palm oil commodity is in the introduction phase. If between -0.5 to 0 means that the palm oil commodity is in the import substitution stage. If between 0 and 0.8 means that the palm oil commodity is at the stage of expanding exports, then if the value is close to +1 it means that the palm oil commodity is at the maturation stage.
RESULT AND DISCUSSION
Development of Indonesia's Palm Oil Exports
Palm oil exports (HS 1511) consist of exports of crude palm oil or CPO (Crude Palm Oil) with the code HS 151110 and exports of processed palm oil or OPO (Other Palm Oil) with the HS code 151190. Indonesia's competing countries in the oil trade palm oil in international markets, namely Malaysia, Thailand and Colombia. The development of CPO export value of four palm oil producing countries in the international market in the 1991-2016 period in this study can be seen in Figure 1.
Based on Figure 1 it is known that the amount of CPO exports to the international market during the 1991-2016 period was dominated by the Indonesian state with an export value of US $ 67.753.833.643. The second position is occupied by the country of Malaysia with a CPO export value of US $ 30.832.030.480. The third and fourth positions are occupied by Colombia and

Proceeding of International Conference of 4th SHIELD 2019
https://pasca.unila.ac.id/seminar-internasional-shield/
ISBN : 978-602-51393-9-0
41
Thailand with export values of US $ 2.102.831.844 and US $ 1.753.178.413 respectively.
Figure 1. CPO export value of the four main palm oil producing countries in 1991-
2016. Source: UN Comtrade, 2017 (Processed).
In addition to the CPO commodity, this study also analyzed the commodity of processed palm oil or Other Palm Oil (OPO). The OPO export value of four palm oil producing countries in 1991 to 2016 in this study can be seen in Figure 2.
Figure 2. Developments in the value of OPO exports of four palm oil producing
countries in 1991-2016. Source: UN Comtrade, 2017 (Processed).
The value of OPO commodity exports in Figure 15 shows that Malaysia is the largest exporter of OPO commodities in the international market. But in 2012 Malaysia's position was replaced by Indonesia in OPO exports in the international market. The countries of Thailand and Colombia occupy the third and fourth positions in OPO trade on the international market. Analysis of Indonesian CPO Competitiveness in the International Market
The level of competitiveness of Indonesian palm oil in the international
market is measured using an RCA (Revealed Comparative Advantage) analysis tool. The use of the RCA index in this study is to determine the position of
-
2.000.000
4.000.000
6.000.000
8.000.000
10.000.000
19
91
19
93
19
95
19
97
19
99
20
01
20
03
20
05
20
07
20
09
20
11
20
13
20
15
CP
O E
xpo
rt V
alu
e (
.00
0 U
S$)
CPO Export Value of the Four Major Producing
Countries
Palm oil
IndonesiaMalaysia
Thailand
Colombia
-
2.000.000
4.000.000
6.000.000
8.000.000
10.000.000
12.000.000
14.000.000
16.000.000
19
91
19
93
19
95
19
97
19
99
20
01
20
03
20
05
20
07
20
09
20
11
20
13
20
15O
PO
Exp
ort
Val
ue
(.0
00
US$
)
OPO Export Value of the Four Major Producers of Palm Oil
Indonesia
Malaysia
Thailand
Colombia

Proceeding of International Conference of 4th SHIELD 2019
https://pasca.unila.ac.id/seminar-internasional-shield/
ISBN : 978-602-51393-9-0
42
competitiveness of Indonesian palm oil among other palm oil producing (competing) producing countries in the international market. The results of the calculation of the CPO RCA value of the four main palm oil producing countries in the 1991-2016 period can be seen in Figure 3.
Based on the calculation of the value of RCA (Figure 3) in the period 1991-2016 shows that Indonesian CPO commodities have a strong competitiveness or above the world average, because the value of Indonesian RCA CPO is more than one (> 1). The development of Indonesia's CPO RCA values from 1991 to 2016 tends to fluctuate. In 1991 to 1997, Indonesia's CPO RCA value increased from 55,44 to 88,31. This happens because the price of CPO on the international market continues to increase, encouraging Indonesia to export CPO. However, the high CPO exports caused Indonesia to experience a scarcity of CPO which caused high domestic cooking oil prices. So in 1998, the Indonesian government banned CPO exports in January-April 1998 and imposed export levies on palm oil commodities (Rifin and Feriyanto, 2017). The prohibition of exports and CPO export levies had an impact on the decline in the value of Indonesia's RCA CPO at the lowest rate of 30,31.
Figure 3. Development of RCA values for four CPO producing countries in 1991-
2016. Source: UN Comtrade, 2017 (Processed).
The RCA value of Indonesian CPO from 1999 to 2008 has increased. This happens because world CPO prices are increasing and the Indonesian economy is getting better, so that export levies on palm oil commodities are relatively constant for a fairly long period of time. Then in 2009-2016, Indonesia's CPO RCA value fluctuated and tended to decline. The decline in the value of the RCA is due to fluctuations in world CPO prices and a decrease in the volume of CPO exports, especially in 2016. The ups and downs of the Indonesian CPO RCA value cannot be separated from the export volume and fluctuations in world CPO prices. In addition, the ups and downs of the CPO RCA value are marked by the ups and downs of the Indonesian market share for CPO commodities in the international market (Figure 4).
Indonesia's CPO RCA value ranks first while Malaysia ranks second, Colombia ranks third and Thailand ranks fourth. The second highest RCA CPO value or the country that has the second competitiveness in CPO commodities is achieved by Malaysia. Malaysia is the second largest palm oil producing country accompanying Indonesia in the trade of palm oil in the international market. The RCA value of Malaysian CPO in the 1991-2016 period is more than 1 (> 1) which
0
20
40
60
80
100
19
91
19
93
19
95
19
97
19
99
20
01
20
03
20
05
20
07
20
09
20
11
20
13
20
15
RCA CPO Value of Four Producing Countries
Thai
Ind
Mal
Col

Proceeding of International Conference of 4th SHIELD 2019
https://pasca.unila.ac.id/seminar-internasional-shield/
ISBN : 978-602-51393-9-0
43
means that the Malaysian state has strong competitiveness or above the world average in CPO commodities.
The State of Colombia in 1991-2016 had a CPO RCA value of more than 1, except for 1991 and 1993. This shows that Colombia has a strong competitiveness after Indonesia and Malaysia in CPO commodities. The RCA value of CPO in Thailand during the period 1991 to 2016 tends to fluctuate. Thailand's RCA CPO value shows good results but there are still some Thai RCA values below 1 (<1). This shows that Thailand's CPO commodity has a strong competitiveness but is not yet optimal. The high and low competitiveness of CPO in the four palm oil producing countries can also be seen from the mastery of market share in the international market. The market share of four CPO producing countries in 1991-2016 can be seen in Figure 4.
Figure 4. Market share of four CPO producing countries in 1991-2016. Source: UN Comtrade, 2017 (Processed).
Based on Figure 4 it is known that in 1991-2016, Indonesia's CPO market share experienced fluctuations but tended to decline. This is related to the ups and downs in the volume and value of CPO exports and will affect the position of Indonesia's CPO competitiveness. Indonesia is the country with the largest market share with the first position of 84,24 percent in 1991, down to 52,82 percent in 2016. Meanwhile, the CPO market share in Malaysia has fluctuated but tends to increase every year. Despite having the lowest market share of 0,02 percent, CPO Colombia is still able to dominate the world market and has high competitiveness with an RCA value of 14,97. Thailand has a larger average market share compared to Colombia, but Thailand's CPO has weak competitiveness compared to the other three producing countries. Analysis of Indonesia's OPO Competitiveness in International Markets
In addition to the CPO commodity, this study also analyzed the commodity of processed palm oil or Other Palm Oil (OPO). The results of the calculation of the RCA values of the four main palm oil producing countries for OPO commodities (HS 151190) during the 1991-2016 period can be seen in Figure 5.
0
20
40
60
80
100
19
91
19
93
19
95
19
97
19
99
20
01
20
03
20
05
20
07
20
09
20
11
20
13
20
15
CPO Market Share of Four Producing Countries (%)
Thai
Mal
Col
Ind

Proceeding of International Conference of 4th SHIELD 2019
https://pasca.unila.ac.id/seminar-internasional-shield/
ISBN : 978-602-51393-9-0
44
Figure 5. Development of RCA values for four OPO producing countries in 1991-
2016. Source: UN Comtrade, 2017 (Processed).
The results of the calculation of RCA value in Table 3 shows that in the 1991-2016 Indonesian processed palm oil (OPO) commodity has a strong competitiveness or is above the world average, because the value of Indonesia's RCA OPO is more than one (> 1). Indonesia's RCA OPO value has fluctuated and tends to increase during the period 1991 to 2016. Along with the increasing processing industry (downstream) of Indonesian palm oil, the performance of Indonesia's OPO commodity competitiveness is increasing. The highest RCA value of Indonesian OPO commodities in 2015 was 58.99 and the lowest in 1992 was 0.83. When compared with the three world palm oil producing countries, the average RCA value for Indonesian processed palm oil or OPO commodities is only ranked second, while Malaysia ranked first.
The RCA value of Malaysian OPO commodities from 1991 to 2016 has shown quite good results where the RCA value of OPO is more than 1 (RCA> 1). This means that Malaysian OPO commodities have strong competitiveness or above the world average. Malaysia's RCA OPO value during the 1991-2016 period fluctuated and tended to decline. In 2012-2016 the value of Malaysian OPO RCA continued to decline. This happened because of a decrease in the number of OPO commodity exports and was accompanied by a decrease in market share control (Figure 6). The highest RCA value of Malaysian OPO was in 1998 at 54,88 and the lowest in 2016 was 25,84.
Thailand's OPO RCA value has not shown good results, where the OPO RCA value is below 1 (RCA <1). This means Thailand's OPO commodity has weak competitiveness or is below the world average. The RCA value of OPO Colombia commodities during the 1991-2016 period fluctuated and tended to increase. Even so, OPO Colombia's RCA value has not shown optimal results where there are still many OPO RCA values below 1 (RCA <1). This means that OPO Colombia's commodity competitiveness is still weak or below the world average.
The high and low competitiveness of OPO commodities in the four palm oil producing countries can also be seen from their market share control in the international market. The market share of four OPO producing countries in 1991-2016 can be seen in Figure 6.
0
10
20
30
40
50
60
70
19
91
19
93
19
95
19
97
19
99
20
01
20
03
20
05
20
07
20
09
20
11
20
13
20
15
Nilai RCA OPO Empat Negara Produsen
Col
Ind
Thai
Mal

Proceeding of International Conference of 4th SHIELD 2019
https://pasca.unila.ac.id/seminar-internasional-shield/
ISBN : 978-602-51393-9-0
45
Figure 6. Market share of four OPO producing countries in 1991-2016. Source: UN Comtrade, 2017 (Processed).
Based on Figure 6 it is known that in 1991-2016, Indonesia's OPO market share experienced fluctuations and tended to increase. This is related to the ups and downs in the volume and value of OPO exports and will affect the position of Indonesia's OPO competitiveness. For OPO commodities, Indonesia ranks second in controlling market share among other OPO producing countries. In 1991-2012 Indonesia's OPO export share was still below that of Malaysia. However, in 2013-2016 Indonesia's OPO commodity export share was able to dominate the market share above Malaysia. This is due to the increasing downstream palm oil processing industry, Indonesia's OPO competitiveness also improved. Indonesia's highest OPO market share in 2016 was 57,69 percent and the lowest in 1992 was 1,15 percent.
Malaysia's OPO market share fluctuated and tended to decline in the 1991-2016 period. Nevertheless, Malaysia still occupies the first position in controlling the market share of OPO commodities until 2012. The decline in market share control in the last four years is because Malaysia is more focused on palm oil exports in the form of CPO, so there is a decrease in the amount of exports in the form of OPO. The downstream industry (processing) of Malaysian palm oil is already quite developed from the beginning of 1991. Malaysia has been able to produce more than 105 types of processed palm oil products, while there are only about 47 types of processed palm oil products that have been produced in Indonesia (Kemenperin, 2011).
Thailand occupies the third position in controlling the market share of OPO commodities. During the 1991-2016 Thailand OPO market share tended to fluctuate. Thailand is only able to dominate the OPO commodity market by 0,25 percent so that Thailand's OPO competitiveness is still weak. This is because Thailand is still focusing its palm oil production for domestic needs. Colombia has the lowest market share for OPO commodities compared to the other three producing countries at 0,14 percent. Despite having the lowest market share, OPO Colombia commodities have better competitiveness compared to Thailand's OPO commodities. The Competitive Advantage of Indonesian Palm Oil in the International Market
The competitive advantage of Indonesian palm oil in the international market is measured using the analysis of the Trade Specialization Index (ISP). The ISP
0
20
40
60
80
100
19
91
19
93
19
95
19
97
19
99
20
01
20
03
20
05
20
07
20
09
20
11
20
13
20
15
(%
)
OPO Export Share of Four Producing Countries
IndonesiaMalaysiaThailand

Proceeding of International Conference of 4th SHIELD 2019
https://pasca.unila.ac.id/seminar-internasional-shield/
ISBN : 978-602-51393-9-0
46
index can also be used to analyze the process of the stages of industrialization and the development of trading patterns of palm oil commodities.
Based on the calculation of the ISP index, it is known that the Indonesian CPO commodity for the 1991-2016 period is 1. Based on the existing criteria, if the ISP value approaches +1 is at the maturation stage. This shows that Indonesia's net export of CPO (Crude Palm Oil) is greater than the total trade and at this stage Indonesia is a net exporter.
The average calculation result of the Malaysian CPO commodity ISP index in the 1991-2016 period was 0,3. While Thailand and Colombia have ISP index values of 0.6 and 0.7. Based on existing criteria, if the ISP value between 0 to 0,8 is at the stage of expanding exports. This shows that Malaysia, Thailand and Colombia produce large-scale production and begin to increase CPO exports in the international market.
The results of the calculation of the ISP index for OPO commodities (Other Palm Oil) in the 1991-2016 period revealed that the value of the Indonesian OPO ISP index was 0,8. Whereas Thailand and Colombia have ISP index values of 0,7 and 0,1 respectively. Based on existing criteria, if the ISP value between 0 to 0,8 is at the stage of expanding exports. This shows that the countries of Indonesia, Thailand and Colombia are producing large scale and have begun to increase OPO exports in the international market. The ISP index of the OPO commodity in Malaysia is 1. Based on existing criteria, if the ISP value approaches +1 is at the maturation stage. This shows that Malaysia's OPO net exports are greater than the total trade and at this stage Malaysia is a net exporter.
CONCLUTIONS Based on the results and discussion, it can be concluded that the level of
competitiveness of Indonesian CPO was the highest among countries in Malaysia, Colombia and Thailand. Indonesia's CPO export share in the international market was 52% also the highest among Malaysia, Colombia and Thailand. The competitiveness of processed palm oil (OPO) in Indonesia was the second highest after Malaysia. The share of Indonesia's OPO exports in the international market in 1991-2012 was 20% the second highest position after Malaysia. However, in 2013-2016 the share of Indonesia's OPO commodity exports was 53% able to exceed the share of Malaysian OPO exports. The trade specialization index shows that Indonesia's CPO is at the net exporter stage and Indonesia's OPO commodity is at the stage of expanding exports.
REFERENCES Badan Pusat Statistik. 2016. Statistik Kelapa Sawit Indonesia 2015. Jakarta:
Badan Pusat Statistik. GAPKI. 2017. Refleksi Industri Kelapa Sawit 2016 dan Prospek 2017.
http://gapki.td/refleksi-industri-kelapa-sawit-2016-prospek-2017/#morel848 diakses pada tanggal 21 Februari 2017.
Kementerian Perindustrian. 2011. Industri Hilir Kelapa Sawit Indonesia. Jakarta: PT. Mitra Media Nusantara.
Kementerian Perindustrian. 2011. Profile of Palm Cooking Oil Industry. Jakarta: PT. Mitra Media Nusantara.
Rifin, A. and Feriyanto. 2017. Kebijakan bea keluar minyak kelapa sawit Indonesia: Siapa yang untung. Warta Pengkajian Perdagangan. 2(14): 25-29.
Tambunan, T. 2001. Perdagangan Internasional dan Neraca Pembayaran. Cetakan I. Jakarta: LP-FEUI.
UN Comtrade. 2017.http://comtrade.un.org/data/ diakses pada tanggal 27 Mei 2017.

Proceeding of International Conference of 4th SHIELD 2019
https://pasca.unila.ac.id/seminar-internasional-shield/
ISBN : 978-602-51393-9-0
47
THE DEVELOPMENT OF NATION CHARATER-BASED INDONESIAN LAW: THE ACTUALIZATION OF PANCASILA PRINCIPLES
1Topan Indra Karsa, 2Dwi Nurahman, 3Destoprani Brajannoto, 1Law Faculty, University of Lampung, Indonesia 2Law Faculty, University of Lampung, Indonesia
3Language Education, State University of Jakarta, Indonesia [email protected]; [email protected];
ABSTRACT
This study aims to investigate how to build Indonesian national law based on the character of Pancasila. it used socio-legal research as the methods and concluded that Laws that are built not based on the character of the nation will bring influence to the enforcement of the law itself, meaning that the response of the community as the subject as well as the object of the law is not optimal. This happens as the existing laws cannot be accepted sociologically, juridically or philosophically. As a result, the law is not effective in carrying out its functions to realize security, peace,and justice. Such ineffectiveness, if it continues to occur, then the desire to make the law as commander will be difficult to realize. The development of Indonesian law which is characterized by Pancasila is an effort to realize the precepts values in Pancasila as the basis of the development of Indonesian law , as well as becoming a reference and manifestation of the values in the preparation, practice and enforcement of Indonesian law. Some steps in the formation of common law in Indonesia are taken through various ways including: legislation, judge made law, and customary & contract. Keywords: actualization, pancasila, development, Indonesian law, nation
character
INTRODUCTION
Pancasila is the main foundation in the making of Laws and Regulation as well as the replacement of old laws (legal politics), so that the values of Godhead, Humanity and Society (nationalistic; democratic; social justice) must be actualized into the legal substance, legal structure and the legal culture that will be built and it is expected to strengthen the nation's integration, democratization of the law, the achievement of welfare as well as social justice. The elements of Pancasila included values, goals and also the actualization. all of which are embedded into various existing legal fields; criminal law, civil law, state administration as well as the internalization of the legal structure and legal culture of Pancasila.
Pancasila as a legal political foundation, if included in political and legal determination, will focus on the determinant law over politics because every political agenda must be subject to law. In this case, law is defined as a written law or regulation made and determined by an authorized party, not a law in another sense, for example; court decisions, nor laws that live in the community.
As a result, the legal products of law no longer reflect public justice but rather the victory of the interests of the winning political parties. Pancasila values are not developed anymore (not really applied). Not surprisingly, the spiritual values of Pancasila increasingly fade where it was compounded by the fall of the New

Proceeding of International Conference of 4th SHIELD 2019
https://pasca.unila.ac.id/seminar-internasional-shield/
ISBN : 978-602-51393-9-0
48
Order which was identified with the end of Pancasila. In addition to the disappearance of justice as a legal spirit derived from the ethics and morals of Pancasila, another problem that we face is the relationship between law and politics as two subsystems of society. In certain important matters, law is dominated by politics, making the ethical and moral basis weakened. Law making and enforcement is often characterized by the political interests of dominant groups that are not substantial and have a short-term orientation.
In addition, reality shows that positive law in Indonesia is still strongly influenced by foreign cultural values. this happened as a result of the Dutch colonialism in Indonesia for hundreds of years. This condition is made worse by the lack of opportunity or courage of the "Government of Indonesia" to transform the legal development inspired by Indonesian values, which are contained in the principles of Pancasila.
Legal development that has the character of Indonesia will be implemented if the elements or elements related to lawmaking have a high commitment and enthusiasm to make it happen, including institutions that have authority in making laws, institutions that hold roles and implementing institutions of sanctions, and are supported by factors other than legal corridors such as social, cultural, political environment and others. Laws that are built without being based on the character of the nation will have an effect on the suboptimal law enforcement
This happens as the existing laws cannot be accepted sociologically, juridically or philosophically. As a result, the law is not effective in carrying out its functions to realize security, peace,and justice. Such ineffectiveness, if it continues to occur, then the desire to make the law as commander will be difficult to realize. For this reason, building a law with an Indonesian character is very urgent and cannot be negotiated. Now is the right time to evaluate law enforcement in Indonesia which is not working as expected.
LITERATURE REVIEW AND HYPOTHESIS DEVELOPMENT
The law imbued by Pancasila is a law based on a spirit of harmony. Therefore, law is directed at the realization of social justice and welfare (material and spiritual) that is evenly distributed in a proportional balance. Adhered to the principle of harmony is the principle of propriety. This principle is also the principle of how to establish relations between members of the community, in which, citizens are expected to behave in appropriateness in accordance with social realities. Also, in exercising legal rights and obligations, members of the community are expected to pay attention to the appropriateness of not degrading their own dignity and/or others. Another trait that characterizes the Pancasila Law is the principle of harmony. This principle requires harmony in social life. Based on this principle, then, solving concrete problems, aside from having to be based on consideration of the truth and the rules of the applicable law, must also be accommodated in the social process as a whole as by considering the feelings that truly live in society.
The theories used in this paper are the Grundnorm theory by Hans Kelsen and the Volkgeist Theory by Von Savigny. The next hypothesis in scientific writing is this: the legal aspects of cybercrime proving have been firmly regulated in several laws and regulations in positive law in Indonesia, namely: the development of Indonesian law which is characterized basically as an effort to realize the precepts in Pancasila as the basis for legal development and Indonesian law, as a reference, the manifestation of the values of the Pancasila in the preparation, practice and enforcement of Indonesian law relevant to Pancasila.

Proceeding of International Conference of 4th SHIELD 2019
https://pasca.unila.ac.id/seminar-internasional-shield/
ISBN : 978-602-51393-9-0
49
RESEARCH METHODS
This study uses the method of Sociological Law Research (socio legal research) which is a study that focuses on the law as Norms (rules) that are positive law. This study aims to describe the reality in accordance with the phenomenon in detail and thoroughly, as well as collecting data from a natural setting by utilizing the researcher as a key instrument in analyzing the issues to be examined. This study also uses a qualitative approach in the research process that produces descriptive data in the form of observable written or oral data.
DISCUSSION AND ANALYSIS 1. Actualization of Pancasila as the Foundation of Indonesian Legal
Politics
The position of Pancasila in the national legal system has also been regulated in various statutory regulations, as in Article 2 of Law Number 12 of 2011 concerning the Formation of Statutory Regulations stating that Pancasila is the source of all sources of state law. The status is in accordance with the Preamble of Indonesian constitution placing Pancasila as the basis and ideology of the state as well as the philosophical basis of the nation, consequently, each Content of Legislative Regulations may not conflict with the values contained in Pancasila. Hence, it is clear that the values of Pancasila must always underlie every legal politics in Indonesia. a. In addition, in order to actualize Pancasila in National legal politics, the
principles of Pancasila must be viewed as a system of values, which in essence, Pancasila is valued as a single unit. The values contained in each precept are as follows:
1. The precept of the Godhead contains the value that all matters relating to the administration of the state even the morals of the state, the morals of the state administrators, state politics, state governance, laws and regulations of the state, freedom and human rights of citizens must be imbued with the values of the Godhood.
2. The Precept of Humanity is the embodiment of human values as creatures that are cultured, religious, and righteous in relation to themselves, others and their environment.
3. The principle of Democracy implies that Indonesia is an alliance in diversity which is described in the term "Bhineka Tunggal Ika". This relates to the view that nationalism values must be reflected in all aspects of the administration of the state.
4. The Precept of democracy contains value that the state is administered from, by and for the people. The value is absolutely applied in the life of the state, both concerning aspects of state morality, political aspects, as well as legal and legislative aspects.
5. The Precept of Social Justice for All Indonesian People contains values which are the common goal of the state. The value of justice must be realized in a shared life (social justice) aimed at the welfare of all citizens.
Furthermore, Barda Nawawi stated that the National Legal System is
,essentially, the Pancasila Legal System. If we elaborate further, the system is based on / oriented to the three pillars / basic values of Pancasila: 1. the orientation of the values of "Godhead" (religious moral); 2. the orientation of the values of "Humanity" (humanistic);
3. orientation of "Community values” (nationalistic; democratic; social justice).

Proceeding of International Conference of 4th SHIELD 2019
https://pasca.unila.ac.id/seminar-internasional-shield/
ISBN : 978-602-51393-9-0
50
Mochtar Kusumaatmadja also stated that in the Rule of law of the Republic of Indonesia must adhere to the principles and concepts of Pancasila contained in the Preamble of the 1945 Constitution, namely: 1. Principle of Godhead (there should be no anti-religious national law products). 2. The Principle of Humanity (national law must guarantee, protect human
rights). 3. Principle of nationalism (Indonesian law must be a national law that applies to
all Indonesians, functioning as nation unifier). 4. The principle of Democracy ( every power must be subject to fair and
democratic laws). 5. The principle of Social Justice (All people are equal before the law).
Based on the explanation above, Pancasila becomes the foundation of Indonesian legal politics. Legal products may be changed in accordance with the times and societies, but the values of the Pancasila must remain the main frame of thought as it is the guide of national legal politics in various fields. 2. The Development of Indonesian National Law Characterized by
Pancasila
Pancasila as the ideology of the nation is a teaching / doctrine / material that is believed to be true and systematically arranged, as well as, given instructions for its implementation in responding and resolving problems in society, nation and state. Pancasila, in essence, is a spiritual principle, a source of ideals, value expectations, and norms that are considered good. Characterized Indonesian law is law that is based on Pancasila, which, would not have been realized without any effort to make it happen, especially for those who have competence in the formation / development of Indonesian law. Some steps in the formation of a common law must be through various ways, including: legislation, judge made law, and customary & contract. Related to the development of legal character, of course, we must pay attention to the legal system in which there are 3 (three) subsystems: legal substance, legal structure and legal culture.
To be able to determine the legal development agenda, we must first identify the problems that exist in each legal subsystem. Legal substance is a matter of legal norms, both of which were born in the form of laws and court decisions. The substance of the law as it will be implemented and enforced, as well as being used as a basis and reference in the implementation and enforcement of the law. The substance of the law has been arranged in stages and interrelated; and is expected to realize the legal image in achieving national goals. The constitution, as the highest law, must be the basis of the substance of all applicable legal norms. Furthermore, in the development of law, we should look at it fully through a holistic approach, remembering that law is not merely a formality or dealing with normative matters, but also a cultural element that needs more attention.
Legal development for the future is not merely about legal compliance but how it should be able to realize justice. This has not been realized so that the formation of law / legal norms is more patchy and pragmatic. As a result, it is not uncommon to find conflicting and overlapping laws and regulations. Therefore, formulating Indonesian law with character means building Indonesian law based on Pancasila. This means that Pancasila should be made as the "Margin of Appreciation Doctrine" which always animates the spirit of the development of law in Indonesia. Disciplines, especially in the field of law, is demanded to be able to respond to basic processes and changes which in turn create conditions that are full of challenges and new opportunities.
The development of the world with actual issues such as Human Rights, Globalization and Democratization must be accepted by the Indonesian people

Proceeding of International Conference of 4th SHIELD 2019
https://pasca.unila.ac.id/seminar-internasional-shield/
ISBN : 978-602-51393-9-0
51
even though they always say that they have their own pattern with the term "Pancasila Democracy". Therefore, Indonesian law with Pancasila principles must be able to be the basis for the development of legal science in Indonesia which must be seen comprehensively (not only considering the legal product, but also how the legal science process affects the law). Furthermore, the characters above also include how the linkage of the functions of Pancasila can be a foothold in the development of legal science whose starting point is from the formation of human resources, not the law. In this case the law is created for humans, not vice versa. Therefore basic values included in the principles of Pancasila must be embodied in the philosophical development of legal science discourse (the application of normative and aspects of the usefulness of law).
The development of law in Indonesia must be emphasized on humanity aspects such as, recognizing human position, mandating humans as planners and subjects, not buying progress by making others miserable, all of which can be seen from the second precept of pancasila. Then, legal development in Indonesia must be carried out with a dialogical and participatory pattern by considering the views of the community - not forced nor paternalistic. this kind of thing is in accordance with the realization of the fourth precept. In addition, Law development must strive to uphold concrete human dignity and values, which means guaranteeing human aspects / upholding human rights. the character above is the manifestation of the 2nd and 4th precepts. Furthermore, the development of Indonesian law should prioritize the principle of respect for human dignity embedded into the structure and institutions of all forms of community life. this is the manifestation of Pancasila in the 5th precepts. And finally, the development of Indonesian law should pay attention to development priorities while maintaining respect for human dignity as its main capital. This is the manifestation of the second and the third precepts of the Pancasila.
Building Indonesian law with character, in essence, is about how we are able to make the values in Pancasila incarnate and inspire the ideals and objectives of the law, as stipulated in the opening of the 1945 Constitution of paragraph 4, namely justice, protection and welfare of the people. In other words, Pancasila should be able to alleviate inequality in development by not forgetting the elements that exist in human beings, namely the body and spirit that contain creativity, taste and intention that must be developed harmoniously (not taking place individually and carried out in a balanced manner).
Characterized Indonesian law can be termed as a law that always upholds the values of justice, truth and honesty. such legal character is considered the embodiment of God's law maintaining the value of universality, and, of course, the harmonious nature of the law and does not leave human values. having high moral value means that a law is the fruit of the conviction and practice of values that has been transformed into a character which certainly has gone through a long process and is not deprived the origin (Pancasila). Therefore it is not a exaggeration to say that the character of Indonesian law is certainly a law which is the embodiment of the manifestation of the values contained in the precepts of the Pancasila and not incarnated from values that contradict the cultural values of the Indonesian nation.
CONCLUSION
Pancasila is the main foundation in the making of new laws and regulations as well as the replacement of old laws (legal politics), which embed nationalistic, democratic, actualized social justice values into every legal substance, legal structure, and legal culture that will be built. as such, it is expected to strengthen the nation's integration and democratization of the law for the achievement of

Proceeding of International Conference of 4th SHIELD 2019
https://pasca.unila.ac.id/seminar-internasional-shield/
ISBN : 978-602-51393-9-0
52
social welfare and justice by placing Pancasila (values, goals and actualization) in various existing legal fields such as criminal law, civil law, state administration and others; or internalization of the legal structure and legal culture of Pancasila. Building a characterized law is basically an effort to realize the precepts in the Pancasila to be the basis for the development of law and the science of law in Indonesia. Furthermore, Pancasila is also a parameter in the development of Indonesian law. Its implementation can be seen in the ability of Pancasila values to inspire, enlighten and inspire the birth of Pancasila-based Indonesian law. Therefore, in the development of Indonesian law, Pancasila as the basis of guidelines for implementing legal development is mandatory.
ACKNOWLEDGEMENT
This research can be done well thanks to the facilities provided by the government of the Republic of Indonesia through Lampung University. Therefore, we would like to thank all speakers at the 2019 SHIELD International Conference, University of Lampung.
REFERENCES Janedri, M.G. 2014. Pembangunan Hukum, Opini. Jakarta: Koran SINDO,
Selasa, 11 Nopember 2014. Kusumaatmadja, M. 1972. Pembinaan Hukum dalam Rangka Pembangunan
Nasional. Bandung: Bina Citra. Mansyur, M.A. 2006. Menggagas Hukum Progresif Indonesia. Semarang:
Pustaka Pelajar, IAIN Walisongo dan Program Doktor Ilmu Hukum UNDIP. Mansyur, M.A. 2010. Aneka Persoalan Hukum. Semarang. Universitas Islam
Sultan Agung bekerjasama dengan Penerbit Teras Pustaka. Muladi. 2010. Pancasila Sebagai Margin of Appreciation dalam Hukum yang
Hidup di Indonesia, dalam Menggagas Hukum Progresif Indonesia. Semarang: Pustaka Pelajar, IAIN Walisongo dan PDIH UNDIP.
Rahardjo, S. 1996. Ilmu Hukum. Bandung: Citra Aditya Bakti.

Proceeding of International Conference of 4th SHIELD 2019
https://pasca.unila.ac.id/seminar-internasional-shield/
ISBN : 978-602-51393-9-0
53
THE INFLUENCE OF NOISE FROM TRAIN ROAD TRAFFIC ON LISTENING FUNCTION OF ELEMENTARY SCHOOL STUDENTS
Kornella Restianti, Eng. Yul Martin, Tugiyono, Mustofa,
Postgraduate Program, University of Lampung Corresponding Author: [email protected], HP: 0811722722
ABSTRACT Background: Train is a type of transportation that can have a negative impact in the form of air pollution due to noise. Noise is one factor in relation to physiological, psychological, pathological disorders and communication health disorders. The disturbance is very likely to occur in people who live around the railway. The purpose of this study was to determine the effect of noise from railway toward on the listening function of elementary school students who attend school on the outskirts of railroad tracks. This study used an observational analytic method with a cross sectional approach. The study population was students at elementary school 01 Rajabasa Raya and elementary school 02 Kampung Baru. The samples were as many of 57 respondents calculated using the Lameshow formula. The sampling technique uses stratified random sampling. Data analysis used univariate analysis, bivariate with chi square formula and multivariate analysis with multiple logistic regression formula. There showed that 55.6% of respondents experienced noise intensity ≥55dB and 44.4% experienced noise intensity <55 dB. The respondents who experienced hearing dirsorder were as much as 42.9% while 57.1% did not experience hearing disorders. Chi Square statistical test results prove the influence of noise intensity (p = 0,000), residence (p = 0.039), heredity (p = 0.002), earphone use (p = 0.042) on hearing impairment in elementary school students. The variable duration of exposure (p = 0.118), history of ear infection (p = 0.070), school building construction materials (p = 0.212) and barrier (p = 0.071) did not affect the hearing impairment of elementary school students. The results of multivariate analysis showed that there was a significant influence between noise from railway on the hearing function of elementary school students (p = 0,000) without being controlled by the variable duration of exposure, residence, hereditary history, history of previous hearing ailments, the use of earphones or headsets, school building construction materials and school environment barriers. Based on this study it can be concluded that Train noise exposure with noise intensity ≥55 dB received by students of Public elementary school 01 Rajabasa Raya and 02 Kampung Baru who attend school on the outskirts of railway causes hearing disorder in students.
INTRODUCTION
The sense of hearing is one of the human senses that functions to recognize various kinds of sounds and is not only needed for communication between fellow humans but also to recognize conditions around the body. While the sound is a vibration originating from an object that causes a wave that produces a high pitch or low pitch. The human sense of hearing can hear sounds between 20 Hz-20 thousand Hz. Based on the value of the frequency of noise due to noise can be divided into 3 categories (Occupational noise, Audible Noise, Impulse Noise) which are distinguished based on the source of the noise.
Noise is defined as unwanted sound originating from natural activities such as speech and man-made activities such as transportation equipment, whether land,

Proceeding of International Conference of 4th SHIELD 2019
https://pasca.unila.ac.id/seminar-internasional-shield/
ISBN : 978-602-51393-9-0
54
sea or air. Sometimes the noise that is around us is a common disturbance, but loud noise that lasts for a long time can cause health problems. The main influence of noise on health is the effect on the listener's senses which can cause progressive deafness. Based on the Decree of the Minister of Environment No. 48 of 1996 defines it as an unwanted sound from a business or activity at a certain time and level that can cause human health problems and environmental comfort. The decree stipulates that the maximum noise level standard in the environment of activities such as hospitals, places of worship, and schools is 55dB, as well as the standard level in residential areas. Noise levels that exceed the established standard level allow the public who are exposed to health problems.
Health problems arising from exposure to noise in a certain time and intensity such as: sleep disorders, stress reactions, communication disorders, fatigue, hearing disorders in children, mental health disorders, to hearing loss (Hanum, 2007). On the other hand, hearing loss is not only caused by noise, but is also influenced by several other factors, namely: duration of exposure, residence distance from sources of noise, hereditary hearing loss, history of previous ear infections, use of earphones or headphones, school building materials and barrier in the school environment (Marisdayana, 2016)
The railroad world has positive impacts on society, among others, cheap, fast, low pollution, mass, and adaptive to technological changes but at the same time has a negative impact that can cause air pollution such as noise and vibrations produced which will affect public health especially those that are often exposed (Rusli, 2009). Research by Rahayu (2016) regarding the level of traffic noise to the comfort level of students when teaching and learning states that the average noise level in exposed schools is 66.4 dBA with a maximum noise of 71.3 dBA and a minimum of 61.1 dBA.
Based on data obtained from monitoring, it can be seen that schools close to the railroad tracks will potentially cause noise and possibly affect the hearing function of students. Some of these schools include Public Primary School 01 Rajabasa Raya and 02 Kampung Baru which are located at a distance of less than 100 meters from the railroad crossing. Based on these descriptions, the authors are interested in analyzing the relationship of noise originating from trains toward the hearing function of elementary school students who attend school on the outskirts of the railroad tracks.
METHODOLOGY
This research uses quantitative methods with a cross-sectional comparative research design. The purpose of the cross-sectional method is to describe the characteristics of the target population based on observations on the sample. The principle of representation is very important, so that the description is accurate. Therefore, in cross-sectional studies the selection of subjects is recommended using a simple random sampling procedure. This method is used to describe the disease and its causes. Data generated from this cross-sectional study design are prevalence data (Murti, 2011). In this study, researchers will look at the relationship between noise generated by the train with the hearing function of elementary school students in grades 3 and 5 at Public Primary School 02 Kampung Baru and Public Primary SchooL 01 Rajabasa Raya in Bandar Lampung by conducting an audiometry examination. Noise measurements are carried out tentatively according to the train schedule
The method used to collect data is done in 3 ways, namely by field studies (observations), interviews and questionnaires. Observations were carried out to obtain noise data in and in classrooms of PUBLIC Primary School 02 Kampung Baru and Public Primary School 01 Rajabasa Raya. Audiometry measurements

Proceeding of International Conference of 4th SHIELD 2019
https://pasca.unila.ac.id/seminar-internasional-shield/
ISBN : 978-602-51393-9-0
55
performed by certified experts from the Adventist hospital. While interviews with respondents were elementary school students which included data on habits of being in school after hours of study, the use of earphones / headsets and data on symptoms of ear disorders. Other data such as home demographics, school history, hereditary history, and previous disease history were answered by parents by filling out a questionnaire that was provided by researchers and filling it out at home. School building data and school environment barriers are answered by teachers by filling out questionnaires and matched through direct observation by researchers
This research was conducted at an elementary school in the city of Bandar Lampung and near the railroad crossing. After searching through Google Maps, the location of the elementary school is close to the railroad crossing. The distance between the railroad crossing railroad and the elementary school is less than 100 meters. This study uses primary data that will be carried out in June 2019. From the results of the above sample size calculation, a minimum sample of 36 people was obtained by calculating the number of samples for this study using the total population of the two schools was 291. After the calculation, a minimum sample size is obtained 57 samples. To anticipate a sample coming out of this study, the number of samples was added by 10%, so there were 63 samples.
The number of respondents in each school is based on proportions. Calculation of the proportion obtained for Public Primary School 02 Kampung Baru and Public Primary School 01 Rajabasa Raya is 1: 4.2. Based on these calculations, the number of respondents obtained from Public Primary School 02 Kampung Baru was 12 students and Public Primary School 01 Rajabasa Raya was 51 students.
Selected respondents must meet the following inclusion criteria: a. Respondents are students in grades 3 and 5 both male and female. b. Respondents are students who attend Public Primary School 02 Kampung
Baru and Public Primary School 01 Rajabasa Raya Bandar Lampung. Measurements are made by taking data when the train crosses a
predetermined measurement point. Leq, Max, and Min data will be obtained from the reading of the Sound Level Meter tool directly by looking at the display / LCD screen sound level meter. The measurement time is adjusted to the train's departure and arrival schedule. The data obtained is processed through the editing and coding process with the help of a computer using the SPSS program as follows: a. Univariate Analysis
This analysis was conducted descriptively with frequency distribution of variables of duration of exposure, residence, hereditary history, history of previous hearing ailments, use of earphones or headsets, school building construction materials and school environment barriers.
b. Bivariate Analysis This analysis was conducted to see the effect of the independent and
dependent variables using the Chi Square test at a 95% confidence level (α = 0.05).
c. Multivariate Analysis The analysis used is multiple logistic regression, because the types of data
are independent variables and the dependent variable in this study is categorical. In this study multivariate analysis was conducted to see the independent variables together with the dependent variable.

Proceeding of International Conference of 4th SHIELD 2019
https://pasca.unila.ac.id/seminar-internasional-shield/
ISBN : 978-602-51393-9-0
56
RESULTS AND DISCUSSION
Noise measurements are carried out in order to determine the value of noise during ongoing school activities or activities. After measuring noise in each class using a Sound Level Meter then data collection is carried out for the variable duration of exposure, residence, hereditary history, history of previous hearing ailments, the use of earphones or headsets, school building construction materials and school environment barriers. measurement results as follows: Table 1. Univariate Analysis Results
Variabel Kategori Frekuensi Persentase
Intensitas Kebisingan
≥55 dB <55 dB≥
35 28
55,6 44,4
Lamanya paparan <5 jam ≥5 jam
40 23
63,5 36,5
Tempat tinggal < 50 m ≥50 m
36 27
57,1 42,9
Riwayat keturunan
Tidak ada Ada
29 34
46,0 54,0
Riwayat penyakit pendengaran
Tidak ada Ada
37 26
58,7 41,3
Penggunaan earphone
Tidak Ya
31 32
49,2 50,8
Bahan konstruksi bangunan sekolah
Sesuai Tidak sesuai
34 29
54,0 46,0
Barrier lingkungan sekolah
Ada barrier Tidak ada barrier
25 38
39,7 60,3
Gangguan Fungsi Pendengaran
Tidak ada Ada gangguan
36 27
57,1 42,9
Total 63 100,0
The proportion of respondents who experienced noise intensity was 55.6%. As
many as 63.5% of respondents felt that the duration of noise exposure was <5 hours, there were 57.1% who had a residence with a distance of <50 m. Distributed respondents who have a hereditary history of 54.0%, there are as many as 58.7% have a history of hearing ailments. 50.8% of respondents have the habit of wearing earphones. Respondents stated that the category of school construction materials was 54.0%, 60.3% of respondents said there were no barriers in the school environment. The results also showed the proportion of respondents who experienced hearing loss as much as 42.0%.
Chi Square statistical test results prove the influence of noise intensity (p = 0,000), residence (p = 0.039), heredity (p = 0.002), earphone use (p = 0.042) on hearing impairment in elementary school students. The variable duration of exposure (p = 0.118), history of ear infection (p = 0.070), school building construction materials (p = 0.212) and barrier (p = 0.071) did not affect the hearing impairment of elementary school students.
Multivariate analysis was carried out through the interaction test and confounding tests. After confounding analysis, there is no confounding variable on the effect of noise from railroad crossings on the hearing function of elementary school students (p = 0,000) where the effect of noise shows the main effect on the hearing function disorder without being controlled by the variable

Proceeding of International Conference of 4th SHIELD 2019
https://pasca.unila.ac.id/seminar-internasional-shield/
ISBN : 978-602-51393-9-0
57
duration of exposure, residence, hereditary history, disease history previous hearing, use of earphones or headsets, school building construction materials and school environment barriers. This multivariate final model can explain that respondents who feel noise intensity ≥55 dB from a railroad crossing risk 10 times experiencing hearing impairment compared to respondents who feel noise intensity <55 dB.
The effect of students' hearing function is not only obtained from the intensity of train noise that reaches <55 dB, but also comes from sound sources, other that are obtained by students when and after students have finished school, including the sound of children who are studying in in the classroom, the voice of the teacher teaching in the classroom, the sound of children playing outside the classroom, and the sound of motor vehicles, listening to music with earphones, watching TV, etc., which reaches 30%.
The results of a study conducted by Purnanta et al (2008) explained that the noise intensity in primary schools located far from the highway was already close to the maximum allowable value, while for primary schools that were located close to the highway the value had exceeded the maximum threshold allowed. Purnanta et al (2008) also continued, if a generalization or equalization is made it is likely that around 85% of elementary schools in the city of Yogyakarta have noise levels that exceed the allowable environmental noise threshold. Research conducted by Croskey & Devens (1975) in Purnanta et al (2008) also states that there are only 1 in 9 schools that meet the noise level criteria of 40-50 dB.
Based on the results and concordance of the theories described above, it can be concluded that the noise level generated at Public Primary School 02 Kampung Baru and Public Primary School 01 Rajabasa Raya Bandar Lampung has exceeded the threshold value set by the Minister of Environment Decree No. 48 / MNLH / 11/1996 concerning the limitation of noise level values for school areas and the like.
CONCLUSIONS AND RECOMMENDATIONS
From the results of the research that has been carried out the following conclusions can be obtained: Noise produced by the train is above the threshold value to a distance of 100 meters from the railroad tracks (> = 55 dB to <55 dB) even though in school hours there are 10 trains that pass <15-> 15 minutes mean that approximately local residents are exposed to noise between 100 minutes to more than 150 minutes per time they enter school. There is a significant influence between noise on hearing impairment in students of Public Primary School 02 Kampung Baru and Public Primary School 01 Rajabasa Raya Bandar Lampung. Based on the results of research that has been done and observations during the study, it can be put forward some suggestions as follows: a. For PT KAI: Currently PT. Kereta Api (Persero) has not made concrete fences
along the tracks around the school and it is hoped that PT KAI can utilize vacant land along the railroad tracks for vegetation planting such as Japanese bamboo, angsana trees, etc. to reduce the intensity of the noise generated from the trains passing by.
b. For District and District Health Offices: For health workers / sanitarians to arrange counseling programs due to noise for public health, especially schools on the outskirts of the railroad tracks
GRATEFUL NOTE
In making this paper many people helped the writer so that he could finish this paper, so the author would like to thank the leaders, teachers and students of Public Primary School 02 Kampung Baru and Public Primary School 01 Rajabasa

Proceeding of International Conference of 4th SHIELD 2019
https://pasca.unila.ac.id/seminar-internasional-shield/
ISBN : 978-602-51393-9-0
58
Raya, the Department of Health and the Postgraduate Program, University of Lampung.
REFFERENCES
Afrina. Y. 2007. Hubungan Pajanan Kebisingan Terhadap Penurunan Fungsi Pendengaran Tenaga Kerja PT ABC Intercalline Indonesia Jakarta Barat Tahun 2006. Tesis. Jakarta: Universitas Indonesia.
Anonim. 1996. Menteri Negara Lingkungan Hidup. Baku Tingkat Kebisingan, Surat Keputusan Menteri Negara Lingkungan Hidup Nomor: Kep 48/MENLH/1996/25 November 1996. Jakarta.
Arsyad. 2007. Buku Ajar Ilmu Kesehatan Telinga, Hidung, Tenggorokan, Kepala dan Leher. Ed. 6. Jakarta: Penerbit FK UI.
Bailey. 1993. Head and Neck Surgery-Otolaryngology. 2 ED. Philadelphia: JB Lippincott Company.
Bruel and Kjaer. 1975. Environmental Noise Measurement. Denmark. Carpenter, P.L., Walker, T.D., and Lanphear, F.O. 1975. Plants in the landscape.
W.H. Freeman and Co, San Fransisco. Departemen Kesehatan RI. 1995. Prosedur Kerja Pemantauan Kebisingan di
Kawasan Bandara Internasional. Direktorat Penyehatan Lingkungan (Ditjen P2M & PL). Jakarta: Departemen Kesehatan Indonesia.
Faller, A. and Schuenke, M. 2004. The Human Body: An Introduction to Structure and Function. New York:Thieme.
Gabriel, J.F. 1996. Fisika Kedokteran. Jakarta : EGC. Gilavand, A., and Jamshidnezhad, A. 2016. The effect of noise in educational
institutions on learning and academic achievement of elementary students in Ahvaz, South-West of Iran. International Journal of Pediatrics. 4(3): 1453-1463.
Goswani, B., Hassan, Y., and Sarma, A. 2018. The effect of noise on students at school: A review. International Journal of Latest Engineering and Management Research. 3(1): 43-45.
Hetu, R., Truchon-Hahnon, C., and Bilodeau, S.A. 1990. Problems of noise in school settings: A review of literature and the results of an exploratory study. Journal Speech Lang Pathol Audiol. 4(3): 31 – 39
Hobbs, F.D. 1995. Perencanaan dan Teknik Lalu Lintas. Yogyakarta: Gadjah Mada University Press.
Kementerian Lingkungan Hidup Republik Indonesia. 1996. Keputusan Menteri Negara Lingkungan Hidup Nomor Kep-48/MENLH/11/1996 tentang Baku Tingkat Kebisingan. Jakarta.
Keputusan Menteri Kesehatan Republik Indonesia No. 118 Tahun 2014 Tentang Kompendium Alat Kesehatan. Jakarta.
Keputusan menteri Kesehatan Republik Indonesia No. 428 Tahun 2006 Tentang Pedoman Manajemen Kesehatan Indera Penglihatan dan pendengaran. Jakarta.
Keputusan Menteri Lingkungan Hidup No. 48 Tahun 1996 tentang Nilai Ambang Batas Kebisingan di Kawasan atau wilayah.
Lemeshow, S. 1997. Besar Sampel dalam Penelitian Kesehatan. Yogyakarta: Gadjah Mada University.
Peraturan Menteri Kesehatan No. 718 tahun 1987 tentang Kebisingan Terhadap Kesehatan.
Sihite, W.L.W., Chahaya, I. and Dharma, S. 2013. Analisis Tingkat Kebisingan pada Sekolah Dasar Negeri di Kecamatan Medan Baru dan Kecamatan Medan Petisah Tahun 2013. Medan: USU.
Snedecor, G.W. and Cochran, W.G. 1967. Statistical Methods 6th ed, Ames, IA: Iowa State University Press.

Proceeding of International Conference of 4th SHIELD 2019
https://pasca.unila.ac.id/seminar-internasional-shield/
ISBN : 978-602-51393-9-0
59
Tuomi S.K., and Jellimann, M. 2009. Hear today-hearing loss tomorrow: A preliminary survey of the personal audio player user habits and knowledge of south afrian first – year university student. SA Fam Pract. 51(2): 166-167.
Willem, PJ. 2000. Genetic Causes of Hearing Loss. In : Mechanissm of Diseases. Department of Clinical Erasmus University Rotterdam and Department of Biochemistry. Belgia. Physiology and Genetics University and Antwerp.
World Health Organization (WHO). 1980. Noise Environmental Health Criteria 12. Geneva.
World Health Organization (WHO). 1999. Guidelines for Community Noise. World Health Organization. Geneva.
World Health Organization (WHO). 1999. Occupational and Community Noise. Fact Sheet No. 258 Revised February 2001.

Proceeding of International Conference of 4th SHIELD 2019
https://pasca.unila.ac.id/seminar-internasional-shield/
ISBN : 978-602-51393-9-0
60
SELECT RIGHTS FOR CITIZENS WITH MENTAL DISABILITIES IN GENERAL ELECTION IN 2019
Eni Lestari dan Hertanto
Magister Ilmu Pemerintahan Universitas Lampung
Email: [email protected] Email: hertanto. [email protected]
ABSTRACT To achieve a legimate election in 2019, it took efforts to maintain the integrity and quality of the simultaneous election. Participion and support from all aspects are significant, hence one of the indicator of succesfull election is the voter turnout. In order to give vote, people must be registered in voter‟ list. This include the mentally disable whose constitutionally also have the right to vote, proviking the pros and cons of his issue. The pros relying on citizen and basic humn rights, while the cons doubting the capacity and cometence to vote based on common sense. Dealing with the isuue, KPU must be very clear about the guidelines based on the constitution that the ones who can be registered as voters are those who passed the examination and qualified the standards of mental health and have an electronic resident ID card. Therefore, coordination and support from stakeholders such as hospital, mental institution, psychiatric clinic, and public socialization are urgenty required. Keywords : Voters, Mental Disabilities, 2019 Election
INTRODUCTION
The 2019 general election is the first simultaneous election in Indonesia held
in the legislative, presidential and vice-presidential elections held on April 17, 2019. In the warmth of the rising political temperature this 2019 election gave rise, the circulation of deceptions and issues that developed rapidly quickly. causing unrest in the community. These negative tricks and issues include news about the existence of 7 (seven) ballot boxes that have been punched, controversy over ballot box material, and also assumptions about crazy people who have been granted the right to vote by the KPU that lead to suspicion of ballooning ballots for profit. . Related to the last issue, the use of the word "crazy" does provide a negative connotation which ultimately leads to the opinion that the KPU records crazy people on the streets and gives them the right to vote. Meanwhile, the distinction must first be made straightforward between "crazy" in the sense of replacing one's sanity that causes him to be unable to improve the humanity needed to use oriented voting rights, with mental or psychological disabilities related to temporary time spans to mental disorders. permanent.
The General Election Commission as a state institution that organizes general elections and in its implementation includes guaranteeing the right to vote by citizens, taking responsibility for safety and ensuring that all citizens in accordance with the mandate of legislation can use their voting rights including citizens with mental disabilities. Law number 19 of 2011 and Law number 08 of 2016 concerning Persons with Disabilities, the right to vote in elections is a very basic human right so that it can be used as a mental disability also requires the same rights as those associated with other diseases Even with healthy people though.

Proceeding of International Conference of 4th SHIELD 2019
https://pasca.unila.ac.id/seminar-internasional-shield/
ISBN : 978-602-51393-9-0
61
According to the National Coalition for Disability Organizations (KNOD), people with psychiatric disorders are part of a group of people with disabilities. Law Number 08 Year 2016 concerning disability which is a revision of Law Number 19 Year 2011 concerning Ratification of the UN Convention on the Rights of Persons with Disabilities (Convention on the Rights of Persons with Disabilities / CRPD) which has been ratified by Indonesia. Therefore, people with psychiatric disorders get guarantees for their rights, one of which is the right to complete in political life, including to be registered as voters in elections.
The granting of suffrage to citizens with mental disabilities has actually been done since the 2014 elections, at which time the KPU had collected data on mental hospitals and social institutions and people with mental disabilities had used their voting rights and continued in the elections in the year. 2015 until 2018. The granting of the right to vote is a tangible manifestation of the recognition and guarantee of citizens' political rights by the KPU as the state agency organizing the general election.
Research on the suffrage of persons with disabilities in elections was conducted by Nadya Kharisma (2016) in a journal entitled "Problems with Persons with Disabilities in Elections Case Study of the 2014 Legislative Elections in Jakarta" (Volume 5, Number 1, June 2016), which states that although the KPU has issued policies such as: making a KPPS handbook that contains access for disabilities, the KPU involves DPOs in creating Braile templates, and enforces punctuation marks that were previously ticked. However, this policy has not been able to support access to persons with disabilities in elections, so there are still obstacles in fulfilling their voting rights, namely: a) the number of persons with disabilities who have invalid voting rights, b) the location of polling stations that have not yet been accessed by persons with disabilities, c) the minimum KPPS understanding of election with accessibility, and d) lack of understanding of persons with disabilities regarding accessibility in elections.
Whereas in a study conducted by Afrilia Sabatini (2017) in a journal titled "Political Participation of Persons with Disabilities in Pekanbaru City Election in the District of Tenayan Raya" (Volume 5, Number 1, April 2018), states that there are still obstacles voters with disabilities in the election process, among others: a) obstacles in the form of administration (difficulty in data collection by officers so that they do not understand the condition of persons with disabilities), b) obstacles in the form of accessibility (difficulties in accessing polling stations at polling stations), and c) obstacles in form of assistance (not accompanied by family or KPPS officers).
Another study also conducted by Sandra Febriyani Nur (2015) in a journal entitled "Political Participation of Persons with Disabilities in the City of Semarang in Pilwalkot 2015", which states that the factors that affect the level of participation of persons with disabilities are: 1) data collection (data collection difficulties experienced by due to lack of openness from family members who have family members with disabilities), 2) election socialization (persons with disabilities who are members of the organization or have wide association tend to have the opportunity to participate in socialization programs carried out by the KPU or other parties) and 3) facilities and accessibility (the lack of Braile templates and the absence of assistance that tends to make people with disabilities reluctant to vote).
However, there are still parties who criticize the participation of people with mental disabilities in enlivening the 2019 general election. people with mental disabilities and / or KPU as the organizer of the election itself. In fact, people with mental disabilities have gone through various processes to be able to blend in with the community. Therefore, this paper aims to provide a clearer understanding of the right to vote for citizens with mental disabilities in relation to

Proceeding of International Conference of 4th SHIELD 2019
https://pasca.unila.ac.id/seminar-internasional-shield/
ISBN : 978-602-51393-9-0
62
the holding of elections based on human rights and guarantees of suffrage for each citizen as mandated by law.
METHODOLOGY
This paper is based on literature study studies in the form of documentation, review of similar studies in various scientific journals, and focus discussions with several commissioners organizing the general election in Lampung. The data obtained are then analyzed with reference to the theoretical framework and the results are set forth in this paper.
POLITICAL ELECTION AND PARTICIPATION
According to Law No. 7 of 2017, General Election is a means of popular
sovereignty to elect members of the People's Legislative Assembly, members of the Regional Representative Council, the President and Vice President, and to elect members of the Regional People's Representative Council, which is carried out directly, publicly, freely, confidential, honest and fair in the Unitary State of the Republic of Indonesia based on Pancasila and the 1945 Constitution of the State of the Republic of Indonesia.
Political participation of voters in elections in developing countries has experienced a significant development. Fairer growth requires a reorientation of policies, social and economic programs. In terms of the context of the political problem, renewal will be opposed by a number of smaller and upper middle class elites. For this reason, political leaders must overcome the resistance of the elite and upper middle class if they want to make fundamental changes to their development policies by choosing between or a combination of the "Three Basic Strategies" according to Huntington and Nelson (1974), namely: a. Bargaining
Some parts of the upper and middle classes were persuaded to stop or soften their opposition. Bargaining can also be done to obtain compensation to individuals or groups as a reward or concession. b. Bullying or repression
This strategy requires military power or politicians who are loyal and efficient. c. Political mobilization
Groups that are passive or active but are not effectively mobilized to offset or overcome opposition.
Meanwhile, according to Budiarjo (1982: 1) that political participation is the activity of a person or group of people to participate actively in political life, namely by choosing state leaders directly or indirectly influence government policy. Such actions include voting at general elections or voting at general meetings. Meanwhile, according to Surbakti (1992: 40) defines political participation as the involvement of ordinary citizens in determining all decisions concerning or affecting him. Voters and Voter Requirements
Voters are all parties as the main goal of the contestants to influence and
ensure that they support and then be able to vote on the contestants concerned. Voters in this case can be in the form of constituents and society in general. Constituents are groups of people who feel represented by a certain ideology which then manifests in political institutions such as political parties (Prihatmoko in Puspasari, 2012: 16).
There are several approaches to look at voter behavior (Nursal, 2004: 54-73), namely: Sociological Approach, Psychological Approach, Rational Approach, and Marketing or cognitive domain approaches. On the basis of the similarity and

Proceeding of International Conference of 4th SHIELD 2019
https://pasca.unila.ac.id/seminar-internasional-shield/
ISBN : 978-602-51393-9-0
63
closeness of ideology and Policy-Problem-Solving, there are four types of voter typology (Firmanzah, 2008: 99-109). The four typologies consist of: Rational Voters, Critical Voters, Traditional Voters, and Skeptical Voters.
Based on Law no. 7 of 2017 concerning General Elections, to be able to use the voting rights of Indonesian citizens must be registered as a voter. The requirements are: a. Even 17 years old or already married b. Not being revoked of his right to vote based on a court decision c. Domiciled in the administrative area of the voter d. Having an electronic KTP e. Not a member of the TNI or Police
Rights and Obligations of Persons with Disabilities
Disability is defined as the inability to engage in important activities that are
useful. Because of physical / mental limitations that can result in death or have been ongoing or are expected to take place continuously in a period of less than 12 months.
According to the World Health Organization (WHO) in 2008, disability as a condition of limited ability to carry out activities within limits is considered normal by humans. Government Regulation Number 36 of 1980 regarding Social Welfare Enterprises states that "A person with a disability is someone who according to medical science is declared to have a physical or mental disorder, which is therefore an obstacle or obstacle for him to carry out activities properly". Consists of: bodily disabilities, blind disabilities, mental disabilities, deaf speech impairments, and disabilities used by chronic disease.
Meanwhile, according to Law No. 19 of 2011 concerning Ratification of Persons with Disabilities, persons with disabilities are people who have physical, mental, intellectual, or sensory limitations in the long term in interacting with the environment can participate fully and effectively based on equal rights. In this case every citizen, regardless of the type of disability whether mental, physical, mental, neurological, or other types of disabilities, has the rights and opportunities: a. To get access based on general requirements about equal rights in carrying
out community activities directly through representatives, or indirectly through freely chosen representatives.
b. To participate based on general requirements regarding equal rights in making elections.
c. To register as voters and to vote in pure and periodic elections, and plebesite votes based on the same suffrage.
d. To give voting rights in elections in a secret ballot. e. To vote, be elected, and to carry out orders after these rights are chosen are
guaranteed without discrimination, including persons with disabilities
RESULTS AND DISSCUSSION
According to the National Coalition for Disability Organizations, there are
several reasons underlying mental disabilities for persons with political rights, especially the right to vote by the state, namely: 1. Philosophically, people with mental disabilities are human beings who have
equal human rights since birth. One of the human rights (HAM) in question is a political right, especially in this case the right to vote that is not limited by the state, except based on a court decision or law.

Proceeding of International Conference of 4th SHIELD 2019
https://pasca.unila.ac.id/seminar-internasional-shield/
ISBN : 978-602-51393-9-0
64
2. Legally, persons with mental disabilities are Indonesian citizens (WNI) who have the same constitutional rights and must be respected, protected and fulfilled by the state. Article 28D paragraph (1) of the 1945 Constitution states that "Everyone has the right to recognition, guarantee, protection and fair legal certainty and equal treatment before the law", the provisions of this article expressly prohibit the existence of differential treatment before the law, including in the case arrangements regarding voting rights. Even in article 5 of Law number 7 of 2017 concerning General Elections it is
stated that persons with disabilities who meet the requirements have the same opportunity as voters, as candidates for DPR, DPD, DPRD, President / Vice President and as Election Organizer. Law number 8 of 2016 article 75 paragraph (1) states that the government and regional governments are obliged to ensure that persons with disabilities can participate effectively and fully in political and public life and directly or through representation, and in article 75 paragraph (2) it is stated that the government and regional governments must guarantee the rights and opportunities for persons with disabilities to vote and be elected. Whereas article 77 states that the government and regional government are obliged to guarantee the political rights of persons with disabilities by taking into account the diversity of disabilities in elections, governors, regents / mayors and village head elections or other names, including: (a) participating directly in participating in election activities general, election of governor, regent / mayor and election of village heads or other names; (b) obtaining the right to be registered as a voter in general elections, elections for governors, regents / mayors and village head elections or other names. Law number 36 of 2009 concerning Health in article 148 paragraph (1) states that: people with mental disorders have the same rights as citizens.
Medically, a person's capacity to vote in an election is not determined by the diagnosis or symptoms experienced by the patient, but from the ability to think (cognitive) means that people with mental disabilities such as schizophrenics, bipolar or severe depression do not automatically lose the capacity to make choices. Persons with mental disabilities with severe cognitive dysfunction will affect their capacity, but cognitive function can still be improved by learning and training. Generally, people with mental disabilities are chronic and episodic (recurrent). If a recurring period occurs on election day, especially during the voting it is certainly not possible to force him to come to the polling station to participate to vote. But outside the episodic, thoughts, attitudes, memories and behavior of sufferers still have the capacity to vote in elections. The obstacle to recovery of people with serious mental disabilities is not clinical treatment, but psychosocial factors faced by them. Many sufferers with symptoms that have disappeared or at a minimum after receiving treatment relapse due to various psychosocial pressures when they are with their family and community.
Therefore, to achieve optimal recovery, negative stigma from the community towards sufferers must be reduced by providing appropriate information about mental disorders, as well as with various policies that protect sufferers and encourage community acceptance of people with mental disabilities. Sociologically, the development of Indonesian society after the ratification of the law of persons with disabilities has led to the establishment of an inclusive environment. Various activities have involved persons with disabilities. Persons with mental disabilities are included in the variety of persons with disabilities, so that all efforts to socialize and increase the interaction of persons with disabilities with society in general also involve people with mental disabilities.
Historically, the prohibition of the right to vote for persons with disabilities is not compatible with the development of human rights internationally. In 1996 the right to vote in the ICCPR (Convention on Civil and Political Rights) was still restricted, only in 2006 through the Convention on the Rights of Persons with

Proceeding of International Conference of 4th SHIELD 2019
https://pasca.unila.ac.id/seminar-internasional-shield/
ISBN : 978-602-51393-9-0
65
Disabilities provided support in the fulfillment of the rights of persons with disabilities. Then in 2013 the Human Right Council stated that the state must take appropriate actions including in terms of legislation, namely eliminating regulations, traditional policies and culture that gave birth to discrimination against persons with disabilities. In this way, international human rights increasingly guarantee political rights for persons with disabilities, including persons with mental disabilities.
Based on the Decision of the Constitutional Court (MK) Number 135 of 2015 states that mental / memory disorders in terms of time / duration can be divided into 2 (two), namely permanent / chronic and non-permanent / episodic. While in terms of quality can be divided into 3 (three), namely mild, moderate and severe. In the ruling also explained that crazy is only one type of mental abnormality, many other types are the presence of pressure (stress), depression, anxiety, feeling threatened (paranoid), talkative, excessive fear (phobia) and bad thoughts. These types of disturbances are not understood by many people, even though each has a different level of recovery, both in terms of speed and quality.
According to Chairperson of the Association for Elections and Democracy (Perludem) Titi Anggraini (Kompas.com 20 November 2018), said that people with mental disabilities must be recorded and given the right to vote in elections. With the condition that there is a certificate from the health official who said he was able to vote. The issue they will use their voting rights or not is another matter. But the state must fulfill the rights of every citizen to be registered as a voter in the 2019 election. For this reason, the KPU as a state organ and tool that puts forward a rights-based approach that sees persons with mental disabilities as other human beings who have political rights through elections and it is very important because elections provide opportunities for participation and change public perceptions of the abilities of persons with disabilities, which results in persons with disabilities having a stronger political voice and being more recognized as citizens. The role of the General Election Commission
The role of the General Election Commission as a constitutional election body
is constitutionally obliged to facilitate persons with mental disabilities as voters in every election, this is an effort to protect citizens' voting rights in accordance with Election Commission Regulation (PKPU) number 11 of 2018 which has now been revised to PKPU Number 38 of 2018 concerning the Preparation of the Domestic Voter List in the Election Organization, namely the constitutional rights of every citizen.
Regarding the right to vote for mental disabilities, Law No. 07 of 2017 regarding General Elections, especially Article 5, has been enacted, in which the law exclusively regulates the rights of persons with disabilities including mental disabilities. Legally persons with mental disabilities are constitutionally entitled to have the same suffrage regardless of group, caste or social status and certain mental categories. For this reason, the KPU does not only target people with mental disabilities but also the management of social institutions, managers of mental hospitals, nurses and other health workers who have been caring for people with mental disabilities as well as the entire community. One of the material presented was the technical use of voting rights at polling stations by persons with mental disabilities. Then the KPU announced the number of voters from mental disabilities to avoid the use of votes from certain groups or elements.
According to the Indonesian KPU Commissioner, Pramono Ubaid Thantowi, the voter data collection by the general election commission was carried out in 3 (three) ways, namely:

Proceeding of International Conference of 4th SHIELD 2019
https://pasca.unila.ac.id/seminar-internasional-shield/
ISBN : 978-602-51393-9-0
66
1. Going door-to-door by asking if a family has a person with a mental disability and if so, what type of disability.
2. Receive reports from the public 3. Request data on residents of social institutions and mental hospitals
The explanation above can be seen that the KPU does not carry out arbitrary data collection, does not record crazy people on the streets, because that is not the way it works and psychotic / crazy people, who are characterized by vagrancy, careless eating, asocial, and not even aware of its existence, we can be sure that it will not be recorded as a voter. For this reason, KPU cooperates with the Ministry of Social Affairs and the Ministry of Health.
Based on data from the Indonesian KPU for the 2019 elections, voters registered in the Permanent Voter List (DPT) were 190,770,329 domestic voters and 2,058,191 foreign voters, so the total number was 192,828,520. Disability Voter Data can be seen in table 1 as follows:
Table 1. Number of National Disability Voters
No Disability type Amount Persen
1. Tuna Daksa 100.765 0.053 %
2. Blind 61.899 0.033 %
3. Deaf 68.246 0.036 %
4. Mentally disabled 54.295 0.029 %
5. Others 77.995 0.041 %
Amount 363.200 0.191 %
Source: Data KPU RI
While the number of registered voters in the Lampung Province DPT was 6,074,137 voters, with a disability turnout of 6,362 or 0.105 percent of the total. The disability voter data in Lampung Province can be seen in table 2 as follows:
Table 2. Number of Disability Voters in Lampung Province
No Disability type Amount Persen
1. Tuna Daksa 1.589 0.026%
2. Blind 1.372 0.023%
3. Deaf 1.040 0.017%
4. Mentally disabled 909 0.015%
5. Others 1.452 0.024%
Amount 6.362 0.105%
Source: Data KPU
The KPU Challenge
But in its implementation, the KPU experienced problems in the data collection process of people with mental disabilities, because at the time of matching and research (coklit) many families did not allow family members with disabilities to be recorded and dicoclite and then included in the voter list, be it a provisional voter list ( DPS) and permanent voter list (DPT), with the reason of being ashamed if the condition of one of his family with mental disabilities is known to many people. If the person with disability is not included in the permanent voter list (DPT), it turns out that at the time of the vote he is healthy then he will lose his voting rights and or at least experience difficulties / obstacles. For this reason, the

Proceeding of International Conference of 4th SHIELD 2019
https://pasca.unila.ac.id/seminar-internasional-shield/
ISBN : 978-602-51393-9-0
67
KPU has tried to provide guidance that at the time of voting, persons with disabilities must bring a letter of recommendation or information from a psychiatrist stating that persons with disabilities are in good health to be able to exercise their right to vote at the polling station (TPS).
CONCLUSIONS
Conclusions Even though the data collection of people with mental disabilities by the KPU is pros and cons in the midst of the community, the KPU must continue to carry out what has been mandated in the laws and regulations. For this reason, the KPU needs the support and cooperation of all parties in conducting the data collection. Although at the time of the vote it is not certain that they can give their right to vote, at least the KPU has given the same opportunity as a citizen. But there are still parties who disagree or doubt the KPU's decision on the grounds that the voice of a person with a mental disability can be manipulated or influenced by one person because his mind is considered still unstable and unable to think clearly. This is a challenge that must be faced by the KPU as the organizer of the election and how to react to it by explaining or socializing to various parties related to the technical data collection. Most important are people with mental disabilities who fulfill the requirements that are recorded as voters, one of which has an electronic KTP, and at the time of the vote must have a letter of recommendation from a health worker in order to vote.
SUGGESTION
First, the KPU needs to pay more attention through socialization and simulation to persons with disabilities because of the large number of ballots that must be punched in the April 17, 2019 elections. The number of ballots is because the legislative and presidential elections are held simultaneously, so voters must cast five ballots. Second, the KPU should always remind the voting committee at the TPS to pay special attention to persons with disabilities so that they can exercise their right to vote. Third, the KPU should coordinate on an ongoing basis with PPK and PPS as well as with organizations of persons with disabilities in terms of data collection of voters with disabilities, so that the needs of voters with disabilities can be met through the provision of procedures and facilities with a disability perspective. Fourth, the implementation of electoral technical guidance (bimtek) for KPPS is really optimally pursued, so that KPPS officers can understand the existence of persons with disabilities and provide the needs of voters with disabilities at polling stations. Fifth, the implementation of election socialization, especially for persons with disabilities, is not only carried out on groups of people with disabilities, the KPU can request assistance from KPPS to carry out socialization so that voters with disabilities who do not belong to the group continue to get election socialization in hopes of creating voters who intelligent.
REFERENCES
Afrilia, S. 2018. Partisipasi politik penyandang disabilitas dalam pemilihan kepala
daerah Kota Pekanbaru tahun 2017 di Kecamatan Tenayan Raya. 5(1). Pekanbaru. https://jom.unri.ac.id/index.php/JOMFSIP/article/viewFile/17463/16867, diakses tanggal 20 Februari 2018 09.15 AM.

Proceeding of International Conference of 4th SHIELD 2019
https://pasca.unila.ac.id/seminar-internasional-shield/
ISBN : 978-602-51393-9-0
68
https://nasional.kompas.com/read/2018/11/20/23173601/perludem-penyandang-disabilitas-mental-harus-diberi-hak-pilih-dalam-pemilu, diakses tgl. 01 Januari 2019 jam 10.50 PM
https://nasional.kompas.com/read/2018/11/24/06112491/dokter-spesialis-kesehatan-jiwa-dukung-kpu-beri-hak-pilih-untuk-penyandang, di akses tgl. 31 Desember 2018 11.19 PM
https://www.wartaekonomi.co.id/read206076/kpu-ada-43769-pemilih-disabilitas-mental.html, diakses tanggal 1 Februari 2019 Jam 06:16 PM
Huntington, Samuel and Joan Nelson. 1974. No Easy Choice: Political Participation in Development Countries. Harvard University.
Nadya, K. 2016. Problematika penyandang disabilitas dalam pemilu tudi kasus pemilu legislatif 2014 di Jakarta. 5(1). Jakarta.
Republik Indonesia. 2018. Peraturan KPU nomor 11 tahun 2018 tentang Penyusunan Daftar Pemilih di Dalam Negeri dalam Penyelenggaraan Pemilu
Republik Indonesia. 2011. Undang-undang Nomor 19 tahun 2011 tentang Pengesahan Penyandang Disabilitas.
Republik Indonesia. 2017. Undang-Undang Nomor 7 Tahun 2017 tentang Pemilihan Umum.
Sandra, F. 2015. Partisipasi Politik Penyandang Disabilitas di Kota Semarang Pada Pilwalkot 2015. Semarang.
Surbakti, R. 1992. Memahami Ilmu Politik. Jakarta: PT Gramedia Widiasarana Indonesia.

Proceeding of International Conference of 4th SHIELD 2019
https://pasca.unila.ac.id/seminar-internasional-shield/
ISBN : 978-602-51393-9-0
69
THE VILLAGERS’ PREPAREDNESS OF TOUGH VILLAGE DISASTER IN THE SUKARAJA VILLAGE, DISTRICT RAJABASA, SOUTH
LAMPUNG
Dedy Miswar, Buchori Asyik, Nani Suwarni, dan Maruli Tua Sinaga
Faculty of Teacher Training and Education, University of Lampung [email protected]‟ Phone: 081369270577
ABSTRACT
This research aims to describe the preparedness of the village community tough disaster in the village of Sukaraja, District of Rajabasa, South Lampung. Measured by 5 parameters, namely knowledge and attitude, policy, emergency response plans, disaster warning system, and mobility of resources, this research uses percentage descriptive method. The population of the research were villagers of Sukaraja consisting of 30 people, both those who had participated in the village tough disaster program and who had never been joined. The data were collected by using observation, interviews, and questionnaires. The research results show that: (1) On the parameter of knowledge and attitudes, about 90% of the people said that they are ready in dealing with disasters; (2) On the parameter off all policies, all of the members within communities have been ready in implementing the policy in handling disaster preparedness; (3) On the parameter of emergency response plans, 56% of the people stated that they are less readiness in handling disaster; (4) On the parameter of disaster management warning system, the people express that they are also less readiness because their disaster early warning facilities was low; (5) On the parameter of mobilization of resources, 53% of th people said that they are less readiness in handling disaster. Keywords: Tough Village Disaster, Disaster Preparedness
INTRODUCTION
Observing geographical, geological, hydrological and demographic conditions, in reality the territory of the Unitary Republic of Indonesia has a high level of vulnerability to disasters, whether caused by natural factors, non-natural factors or human factors. The main effects of disasters often result in human casualties, environmental damage, property losses, and the impact of non-material or psychological damage. Even though development planning in Indonesia has been designed in such a way as to aim at improving people's welfare, increasing a sense of justice, and minimizing the impact of damage on the environment and protecting the community against the threat of disasters, the reality of its implementation is still often constrained by efforts that are not systemic and less coordinated.
Frequent disasters such as volcanic eruptions, earthquakes, tsunamis, floods, droughts, tornadoes and forest fires in Indonesia. Based on data collected by the National Disaster Management Agency (BNPB) that the disasters that occurred in Indonesia during 2016 reached 2,384 events dominated by disasters such as floods, landslides and tornadoes (hydro-meteorological disasters). This number, according to Sutopo Purwo Nugroho as Head of the BNPB Information and

Proceeding of International Conference of 4th SHIELD 2019
https://pasca.unila.ac.id/seminar-internasional-shield/
ISBN : 978-602-51393-9-0
70
Public Relations Data Center, is the highest number since the recording of disaster events in 2015 which reached 1,732 events.
Lampung Province is a province located in the southernmost of the island of Sumatra with an area of 35,376.50 km2 which has different regional characteristics such as coastal areas and highlands and Lampung including to the territory of Indonesia which is also crossed by the Pacific Ring of Fire. Seeing that there was once a major volcano eruption accompanied by a tsunami in Lampung Province which caused extensive damage and fatalities, namely when the Krakatoa volcano erupted with a very devastating eruption on 26-27 August 1883 which caused a burst of hot clouds and tsunamis that killed around 36,000 fatalities. The following is a disaster risk index data per Regency/City of Lampung Province.
Table 1. Disaster Risk Index per Regency/City of Lampung Province
No. District/City Index Risk Class
1 Lampung Barat 214 High
2 Tanggamus 201 High
3 Lampung Selatan 187 High
4 Lampung Timur 183 High
5 Kota Bandar Lampung 182 High
6 Pesawaran 182 High
7 Tulang Bawang 144 High
8 Lampung Tengah 131 Medium
9 Lampung Utara 131 Medium
10 Way Kanan 131 Medium
11 Mesuji 120 Medium
12 Tulang Bawang Barat 120 Medium
13 Kota Metro 114 Medium
14 Pringsewu 95 Medium
Source: BNPB Lampung Province, 2012.
With reference to the data above, that South Lampung district has a high disaster risk index, in 2012 BNPB in collaboration with the Regional Disaster Management Agency (BPBD) of Lampung province provided disaster programs for the community, one of which was a disaster resilient village regulated in the BNPP Perka Number 1 year 2012. The Resilient Village Program is intended to provide knowledge to people living in disaster prone areas so that the community is able to know how to respond to potential disasters that threaten, so that the community is able to independently respond to disasters at any time.
Sukaraja Village, Rajabasa Subdistrict, South Lampung Regency, which is on the coast of the Sunda Strait and is located close to Mount Anak Krakatau and under the foot of Mount Rajabasa is one of the areas that has a threat of disaster. Sukaraja village topography like that makes this village has a threat of disaster as according to the South Lampung BPBD data including tidal floods, landslides and is most likely if at any time Mount Anak Krakatau erupts can cause heat clouds and tsunamis. Therefore the people who are in the Village Sukaraja must get education about dealing with disasters that can happen at any time. In this study will discuss the preparedness of members of disaster resilient village community programs in Sukaraja Village, Rajabasa District, South Lampung Regency.
Laws Number 24 Article 26 year 2007 concerning disaster management explains that the community has the right to receive education, training and skills in the implementation of disaster management, because Indonesia has a high

Proceeding of International Conference of 4th SHIELD 2019
https://pasca.unila.ac.id/seminar-internasional-shield/
ISBN : 978-602-51393-9-0
71
risk of natural disasters, including Sukaraja Village, Rajabasa District, South Lampung Regency.
The National Disaster Management Agency (2012:2) states that disaster management is a series of efforts that include the establishment of development policies that are at risk of disaster, disaster prevention activities, emergency response and rehabilitation. Disaster management or disaster management is an activity, art, method, style, organization, leadership, control in controlling or managing activities starting from the planning, implementation, supervision, operational and maintenance stages, organization, leadership, control until the evaluation and monitoring stage (Robert J. Kodoatie and Roestam Sjarief, 2006:69).
The objectives of disaster management in Perka BNPB Number 1 year 2012 concerning disaster resilient villages include: 1) provide protection to the community from the threat of disaster; 2) ensure the implementation of disaster management in a planned, integrated, coordinated, comprehensive, and sustainable manner; 3) protect cultural heritage and the entire natural environment along with its biodiversity; 4) reduce vulnerability and increase community capacity in dealing with disasters; 5) building public and private participation and partnerships; 6) encourage the spirit of mutual cooperation, solidarity and generosity; and 7) creating peace in community life and preventing social and non-natural disasters and minimizing the impact of natural disasters, non-natural disasters and social disasters.
Disaster management has several stages as revealed by Grigg (Robert J. Kodoatie & Roestam Sjarief, 2006:69-79) that the main phases of disaster management include planning programs, organizing programs, leadership programs, coordinating, controlling, monitoring, budgeting and finance. From the above opinion it can be concluded that disaster management is a stage that aims to monitor and evaluate disasters to reduce the consequences of disasters: 1) Planning Planning is generally carried out by the steps of problem identification, data collection, object determination, analysis, and solution determination; 2) Organizing Organizing is an arrangement in the division of labor included in unit groups; 3) Leadership Leadership in disaster management includes the process of leadership, guidance, guidance, direction, motivator, counselor and trainer; 4) Coordination It is an effort to organize Human Resources (HR) to get involved, have a sense of ownership, and be able to play a good and appropriate role in the organization; 5) Control Control can be in the form of evaluation, supervision and monitoring of HR. Control functions as a tool to find out how the activity works; 6) Supervision Supervision is needed to find out HR can work in accordance with the tasks and functions; and 7) Budgeting and Financial Budgeting is an important tool in the sustainability of disaster management programs.
The indicators used to see the progress of the disaster management program in disaster resilient villages use the BNPB 2010-2014 strategic plan: 1) Increased coordination of emergency response handling at the center and disaster area; 2) Increased coordination of planning, controlling and carrying out search, rescue and evacuation of disaster victims; and 3) Implementation of monitoring and evaluation of the implementation of disaster emergency response programs.
The above theory can be concluded that disaster management is a stage that aims to monitor and evaluate disasters to reduce the negative impacts caused by disasters. Resilient resilient village according to Perka BNPB Number 1 year 2012 is a village or village that has the ability to recognize threats that occur in its area and be able to organize community resources to reduce vulnerability and increase capacity to reduce disaster risk. Disaster-resilient villages are expected to have an independent capacity to adapt and deal with potential disaster threats, and to recover quickly from adverse disaster impacts. A disaster resilient village

Proceeding of International Conference of 4th SHIELD 2019
https://pasca.unila.ac.id/seminar-internasional-shield/
ISBN : 978-602-51393-9-0
72
is one manifestation of the government's responsibility to provide protection to the community from the threat of disaster. From the above theory it can be concluded that a disaster resilient village is a village that has a disaster mitigation program to the community in order to reduce the impact and reduce the threat of disasters that occur.
The objectives of the disaster resilient village program include: 1) Protecting people living in hazard-prone areas from adverse impacts of disasters; 2) Increasing community participation, especially vulnerable groups in managing resources in order to reduce disaster risk; 3)Increase the community institutional capacity in managing resources and maintaining local wisdom for disaster risk reduction; 4) Increase the capacity of the government in providing resource and technical support for disaster risk reduction; and 5) Increase cooperation with stakeholders in disaster risk reduction (DRR), among others: local parties, the private sector, universities, NGOs, community organizations, and other concerned groups.
Components of a disaster resilient village based on Perka BNPB No. 1 year 2012 include: 1) Legislation It is an activity in formulating village regulations that regulate risk reduction and disaster management at the village level; 2) Planning Formulation of Village Disaster Management plans, which include: contingency plans when facing certain threats, and Community Disaster Risk Reduction Action Plans. 3) Institutional Formation of the Village Disaster Management forum originating from government and community elements, voluntary disaster management groups/teams in the hamlet, RW and RT, as well as developing cooperation between sectors and stakeholders in encouraging disaster risk reduction efforts. 4) Funding Plans for mobilizing funds and resources (from district/city APBD, APBDes/ADD, community independent funds and the private sector or other parties if needed; 4) Capacity building Training, education, dissemination of information to the community, especially volunteer groups and disaster management actors so they have the ability and play an active role as the main actor in planning, implementing and evaluating disaster risk reduction activities; and 5) Implementation of Disaster Management Structural and non-physical physical mitigation activities, early warning systems, preparedness for emergency response, and all efforts risk reduction through development interventions and recovery programs both structural-physical and non-structural in nature.
The above theory can be concluded that a disaster resilient village is a village that has a disaster mitigation program for the community to be responsive in dealing with disasters if at any time a disaster occurs and reduce the impact and reduce the threat of disasters that occur. Sutton and Tierney in (Dodon, 2013:129) preparedness is an active protection activity carried out when a disaster occurs and provides short-term solutions to provide support for long-term recovery. According to Nick Carter in (LIPI/UNESCO-ISDR, 2006:5), regarding the preparedness of a government, a group of people or individuals that is, actions that enable the government, organizations, society, communities and individuals to be able to respond to a situation disaster quickly and effectively including in preparedness measures is the preparation of disaster management plans, maintenance of resources and training of personnel.
Indicators in assessing community preparedness in facing disasters according to LIPI-UNESCO/ISDR (2006): 1) Knowledge and attitude knowledge and attitude towards disaster risk. Knowledge is a major factor and is the key to preparedness. Knowledge possessed by individuals and communities can influence attitudes and concerns to be ready and alert in anticipating disasters, especially for those who live in coastal and mountain areas that are vulnerable to natural disasters; 2) Policy policies that are closely related to preparedness to anticipate natural disasters that will occur and that have not yet occurred. Policy

Proceeding of International Conference of 4th SHIELD 2019
https://pasca.unila.ac.id/seminar-internasional-shield/
ISBN : 978-602-51393-9-0
73
in natural disaster preparedness is very important and is a real effort to carry out disaster preparedness activities; 3) Emergency response plan Emergency response plan. This plan is an important part of disaster preparedness, especially related to evacuation, rescue and rescue so that victims caused by disasters can be minimized. This effort is crucial, especially during disasters and post-disaster before assistance from the government and outsiders come; 4) Disaster warning system disaster warning system where this system includes warning signs and information distribution about disaster occurrence. With this disaster warning, the community can take appropriate action to reduce the loss of life, property and damage caused by the disaster. Therefore it takes practice and simulation what to do if you hear the warning and where then how to save yourself to a safer location; and 5) Resource mobilization mobilization of available resources, both human resources (HR), funding and infrastructure essential for emergencies is a potential that can support or otherwise become obstacles in natural disaster preparedness. Based on the above theory, it can be concluded that preparedness is a responsive action and community solution to disaster by preparing individuals and communities to respond in the face of disaster in order to reduce the negative impact of a disaster.
METHOD
The research method used in this study is the survey research method. According to Moh. Pabundu Tika (2005:6) survey is a research method that aims to collect large amounts of data in the form of variables, units or individuals at the same time. Based on this opinion, the research will collect data through individuals by distributing questionnaires or certain physical samples in the form of photos of research locations relating to the level of community preparedness in the Disaster resilient Village in Sukaraja, Rajabasa District, South Lampung Regency with the aim of being able to generalize to what was studied. The population in this study were all members of the Disaster resilient Village community program in Sukaraja Village, Rajabasa District, South Lampung Regency, amounting to 40 people spread over 4 hamlets and each hamlet numbered 10 people. Data collection techniques by observation, documentation, interviews, and questionnaires. The data collected was analyzed in a descriptive manner using a spatial approach.
RESULT AND DISCUSSION
Regulation of the Head of the National Disaster Management Agency Number 1 year 2012 states that the Disaster resilient Village program is intended to provide knowledge to people living in disaster prone areas so that people are able to know how to respond to potential disasters that threaten, so that communities are able to independently respond to disasters if any time it happens. Seeing the area of Sukaraja Village, Rajabasa Subdistrict, South Lampung Regency which has geological, geographic and hydrological conditions that are potentially prone to disaster, on October 17, 2012, a Resilient Disaster Village program was formed in Sukaraja Village, Rajabasa Subdistrict, South Lampung Regency.
The government through BNPB has the obligation and responsibility to provide protection to the public from the threat of disaster. The most appropriate way is to provide education and outreach about disaster mitigation and the provision of emergency response facilities as an effort to overcome and recover during disasters and post-disasters. With the establishment of the Resilient Village Disaster program, it is hoped that the community will be able to respond and

Proceeding of International Conference of 4th SHIELD 2019
https://pasca.unila.ac.id/seminar-internasional-shield/
ISBN : 978-602-51393-9-0
74
respond quickly when disasters occur so as to reduce risks and negative impacts during disasters.
Sukaraja Village, Rajabasa Subdistrict, South Lampung Regency in 2012 by BNPB was designated as Tagguh Disaster Village due to geological, geographical, hydrological, demographic and sociographic conditions that are potentially prone to natural and non-natural disasters. During the course of the disaster resilient Village program there was a management structure formed by the people of Sukaraja Village. The establishment of the Disaster resilient Village Program in Sukaraja Village has a variety of work programs to support community preparedness in the face of disasters. The work program that has been carried out has been conducting training and evaluation of disaster response to the community in 2012 in collaboration with the Lampung Province BPBD 2 times, the availability of disaster response facilities such as tents and tarpaulins even though the amount is insufficient and the opening of new evacuation routes to multiply evacuation point if a disaster occurs.
Preparedness of community members participating in the Resilient Village training program in Sukaraja Village, Rajabasa District, South Lampung Regency according to LIPI-UNESCO/ISDR: Knowledge and Attitudes, Policies, Emergency Response Plans, Disaster Warning Systems and Resource Mobilization. a. Knowledge a.1. Types of Disasters and Their Mitigation
The results of the study there are 2 types of disasters that have occurred in Sukaraja Village, Rajabasa Subdistrict, South Lampung Regency, such as tidal floods caused by rising sea levels to settlements and which only occurred on December 22, 2018, namely the tsunami disaster due to the eruption of Mount Anak Krakatau in the Strait Sunda so that Sukaraja Village was affected by the disaster. The following is the type of disaster data in Sukaraja Village in table 2 below. Table 2. Disaster Types Sukaraja Village, Rajabasa District, Lampung
Regency South 2018 No. Disaster Type Amount (%)
1 Tsunami 23 57,50
2 Rob floods 17 42,50
Amount 40 100,00
Source: 2018 Research Questionnaire.
Based on table 2 above, it can be seen that the types of disasters that occurred in Sukaraja Village, Rajabasa District, South Lampung Regency are tsunamis and tidal floods. As many as 23 people (57.50%) know the signs of a tsunami disaster such as: shrinking sea levels, earthquakes, roaring sounds and signs from nature such as strange animal behavior. While as many as 17 people (42.50%) knew of the signs of a tidal flood such as: extreme weather, high rainfall and seawater.
On December 22, 2018, a tsunami occurred due to the eruption of Mount Anak Krakatau in the Sunda Strait hit the coastal areas of Banten and Lampung, Indonesia. At least 426 people were killed and 7,202 injured while 23 people were missing in this incident. For the Lampung region, especially the research area, namely Sukaraja Village, Rajabasa District, South Lampung Regency, the data on the number of victims due to the tsunami can be seen in table 3 below.

Proceeding of International Conference of 4th SHIELD 2019
https://pasca.unila.ac.id/seminar-internasional-shield/
ISBN : 978-602-51393-9-0
75
Table 3. Number of Tsunami Disaster Victims in Sukaraja Village, Rajabasa District South Lampung Regency in 2018 No. Victim Disaster Amount (%)
1 Death 3 0,51
2 Lose 6 1,03
3 Minor injuries 568 98,4
Amount 577 100,00
Source: Media Center of South Lampung Regency Government Disaster Emergency Post in 2019.
Based on table 3 above, it was found that the number of victims due to the Tsunami disaster in Sukaraja Village, Rajabasa Sub-district, South Lampung Regency was 3 people (0.51%) declared dead, 6 people (1.03%) were declared missing and as many as 568 people (98 , 4%) suffered minor injuries. The following are the current conditions of post-tsunami settlement settlements in Sukaraja Village, Rajabasa District, South Lampung Regency. a.2. Disaster Frequency
During the past one year there have been two disasters that occurred in Sukaraja Village, Rajabasa Subdistrict, South Lampung Regency, including the tidal flood disaster and the new one that occurred on December 22, 2018, namely the tsunami. The following is the frequency of disaster data in Sukaraja Village in table 4 below. Table 4. Frequency of Disasters in Sukaraja Village, Rajabasa District South Lampung Regency in 2018
No. Disaster type Disaster Frequency
Amount (%) 1 Time/Year 2 Time/Year
1 Tsunami 23 0 23 57,50
2 Rob floods 0 17 17 42,50
Amount 23 17 40 100,00
Source: 2018 Research Questionnaire.
Based on table 4 above, it is found that the number of frequency of disasters in Sukaraja Village, Rajabasa District, South Lampung Regency in the past one year is 23 people (57.50%) stating that the tsunami occurred once a year in Sukaraja Village and 17 people (42,50%) stated that the tidal flood occurred twice a year in Sukaraja Village. a.3. Response When a Disaster Occurs
The level of community knowledge in responding to disasters greatly affects to reduce the number of victims that would result from a disaster. With knowledge about disaster mitigation owned by the community, it is expected that the community will be responsive in dealing with disasters and be able to respond to disasters quickly. The following is data on community response during disasters in table 5 below.
Table 5. Community Response When Disasters Occur in Sukaraja Village Rajabasa District, South Lampung Regency in 2018

Proceeding of International Conference of 4th SHIELD 2019
https://pasca.unila.ac.id/seminar-internasional-shield/
ISBN : 978-602-51393-9-0
76
No. Response Amount (%)
1 Running to a safe place 21 52,50
2 Not panic 19 47,50
Amount 40 100,00
Source: 2018 Research Questionnaire.
Based on table 5 above about the response of the people of Sukaraja Village when disaster struck, 21 people (52.50%) chose to run to safer places such as terrain and evacuation points in Sukaraja Village, while 19 people (47,50%) choose not to panic when disaster strikes. a.4. Disaster Location
The geographical position of Sukaraja Village, Rajabasa Subdistrict, South Lampung Regency, which is on the coast of the Sunda Strait, makes Sukaraja Village side close to natural disasters. Research results show that as many as 40 people (100%) stated that the location of the frequent disasters in Sukaraja Village was around the coast. Communities whose dwellings are right on the shoreline must always be vigilant if at any time a disaster occurs. The following is a place for residents to live near the disaster site and the shoreline. a.5. Distance of Resident's House to the Coastline
The average distance of the settlements of the residents of Sukaraja Village, Rajabasa District, South Lampung Regency and the coastline is very diverse. The following is the result of research on the distance of a resident's house to the coastline in table 6 below.
Table 6. Distance of Resident Houses and Coastal Lines in Sukaraja Village
Rajabasa District, South Lampung Regency in 2018
No. Distance (m) Amount (%)
1 20 5 12,5 2 50 7 17,5 3 75 9 22,5 4 80 8 20 5 1.000 4 10 6 2.000 3 7,5 7 3.000 4 10
Amount 40 100
Source: 2018 Research Questionnaire.
Based on table 6 above shows that the average distance of residential settlements from the location of the shoreline in the Village of Sukaraja, District of Rajabasa, South Lampung Regency, many do not meet the requirements as there are still many settlements that are too close to the coastline. According to the Indonesian Institute of Sciences (LIPI) contained in one of the articles. "The ideal distance is 300 meters from the surface of the shoreline, this is done to anticipate the risk of the impact of natural disasters that often occur such as tsunamis and tidal floods". There are still many settlements that are very close to the shoreline because residents do not know the ideal distance besides the lack of socialization from the government, especially the local government, to the community in Sukaraja Village, Rajabasa District, South Lampung Regency.

Proceeding of International Conference of 4th SHIELD 2019
https://pasca.unila.ac.id/seminar-internasional-shield/
ISBN : 978-602-51393-9-0
77
b. Attitude b.1. Disaster Resilient Village Program
The Disaster Resilient Village Program in Sukaraja Village, Rajabasa District, South Lampung Regency is a program established by BNPB in 2012. This program is expected to form a community that is resilient to disasters by conducting socialization, evaluation and mitigation of disasters to the community. Based on the results of the study showed that 40 people (100%) of the Sukaraja Village community agreed that the Disaster resilient Village program was an effective program to be implemented in Sukaraja Village given the village's condition that was vulnerable to disasters.
The purpose of the establishment of the Disaster Resilient Village program based on the Regulation of the Village Head Number: D/360/01/VI.11.08/IX/2013 concerning the implementation of disaster management: 1. Providing protection to the community from the threat of disaster. 2. Ensuring the implementation of disaster management in a planned,
integrated, coordinated, comprehensive and sustainable manner. 3. Protecting cultural heritage and the entire natural environment and
biodiversity. 4. Reducing vulnerability and increasing community capacity in dealing with
disasters. 5. Building public and private participation and partnerships. 6. Encouraging the spirit of mutual cooperation, solidarity and generosity. b.2. Disaster Mitigation Equipment
Disaster mitigation equipment is a support in disaster risk reduction. Based on the results of research in Sukaraja Village, Rajabasa District, South Lampung Regency, it was shown that 40 people (100%) of the community agreed that each individual should have simple rescue and evacuation equipment in each house to anticipate if a disaster occurs. The simple evacuation equipment includes disaster prepared bags containing clothes, jackets, blankets, shoes, flashlights, medicines, drinking water and practical food.
b.3. Community Involvement in Disaster Mitigation Facility Development
The role of the community in the development of disaster mitigation facilities is very important given that the community must build and maintain disaster mitigation facilities. Based on the results of the study showed that 40 people (100%) of the people of Sukaraja Village, Rajabasa Subdistrict, South Lampung Regency agreed that each community member should be actively involved in the construction of disaster mitigation facilities. The involvement includes maintaining the evacuation point location, improving access to the evacuation point and providing direction directions for the evacuation route. b.4. Learn about Disaster Preparedness and Mitigation
Studying disaster preparedness and mitigation is a must for the community to be responsive in dealing with disasters and reduce disaster risk. Based on the results of the study showed that 40 people (100%) of the people of Sukaraja Village, Rajabasa Subdistrict, South Lampung Regency agreed that each one of his family members learned about disaster preparedness and mitigation so that each family had one person who was experienced in dealing with disasters and could guide other family members. in the face of disaster

Proceeding of International Conference of 4th SHIELD 2019
https://pasca.unila.ac.id/seminar-internasional-shield/
ISBN : 978-602-51393-9-0
78
c. Policy Based on the results of the study showed as many as 40 people (100%)
stated that there was an agreement between the communities to take part in a disaster evacuation simulation, this showed that the people of Sukaraja Village, Rajabasa Subdistrict, South Lampung Regency were aware that they lived in disaster prone areas so it was important for them to take an evacuation simulation. disaster. Disaster evacuation simulation aims to educate the public how to deal with disasters so as to minimize losses and casualties from disasters. d. Emergency Response Plan d.1. Dissemination and Disaster Mitigation Exercise
The provision of socialization and disaster mitigation exercises is very important for the community because it is an effort to reduce the risk of disasters, both through physical development and awareness raising and capacity to deal with the threat of disaster. The following is data of community members both who have participated in and not yet participated in socialization and disaster mitigation exercises in table 7 below. Table 7. Provision of Disaster Socialization and Mitigation in Sukaraja Village
District, South Lampung Regency in 2018 No. Disaster Socialization and Mitigation Amount (%)
1 Already 17 42,50 2 Not yet 23 57,50
Amount 40 100,00
Source: 2018 Research Questionnaire.
Based on table 7 above shows that in Sukaraja Village, Rajabasa District, South Lampung Regency, as many as 17 people (42.50%) had received disaster socialization and mitigation. While as many as 23 people (57.50%) have not received information about disaster mitigation and mitigation, this is due to the fact that some people were unable to attend during the socialization, in addition there were some people who did not have the awareness of the importance of socialization about disaster response in Sukaraja Village Rajabasa District, South Lampung Regency. d.2. Medication during a Disaster Emergency
As the first anticipation and treatment during a disaster emergency, the availability of medicines in each family member of the Disaster resilient Village in Sukaraja Village, Rajabasa District, South Lampung Regency is very important to prevent the occurrence of diseases that often occur during disasters such as diseases in respiratory and digestive disorders. The availability of medicines in each family member in Sukaraja Village can be seen in table 8 below. Table 8. Availability of Medicines for Each Family Member of the Tangguh Village
Disasters in Tangguh Village Disasters in Sukaraja Village, Rajabasa District South Lampung Regency in 2018
No. Availability of medicines Amount (%)
1 There Are 15 37,50 2 None 25 62,50
Amount 40 100,00

Proceeding of International Conference of 4th SHIELD 2019
https://pasca.unila.ac.id/seminar-internasional-shield/
ISBN : 978-602-51393-9-0
79
Source: 2018 Research Questionnaire.
Based on table 8 above shows that in Sukaraja Village, Rajabasa Subdistrict, South Lampung Regency as many as 15 people (37.50%) provided medicines at their respective homes to anticipate during a disaster emergency and as many as 25 people (62.50%) did not providing medicines at home. This shows that community members of the Disaster resilient Village training program in Sukaraja Village, Rajabasa Subdistrict, South Lampung Regency are not ready in terms of disaster response because there are still many people who are less aware and have not prepared medicines as first aid during a disaster emergency. d.3. Evacuation route
Evacuation routes are routes that connect all areas to the safest point of the area. Evacuation routes are very important for people living in disaster prone areas such as in Sukaraja Village to avoid the threat of natural disasters. Based on the results of the study showed that as many as 40 people (100%) of the community stated that in Sukaraja Village there was an evacuation route as a gathering point during a disaster emergency. In Sukaraja Village there are 4 evacuation routes or gathering points in each hamlet where 3 points are located in the hills of the Rajabasa mountain forest and 1 point is in the hamlet of Cukuh: 1. The first evacuation route can be accessed through the Kenali Hamlet and
stops at evacuation point 1 which is on the slopes of Mount Rajabasa. 2. The second evacuation route can be accessed through Cukuh Hamlet which
will stop at the second gathering/evacuation point. While the evacuation route. 3. The third evacuation route can be accessed through Dusun Pangkul 1 which
stops at the third evacuation point on the slopes of Mount Rajabasa. 4. The fourth evacuation route can be accessed through Pangkul II Hamlet which
will stop at the fourth gathering/evacuation point on the slopes of Mount Rajabasa.
Figure 1. Map of the Evacuation and Disaster Preparedness Pathway. e. Disaster Warning System e.1. Availability of Disaster Warning Information Sources
The source of disaster warning information is to inform the public about the occurrence of natural disasters, so that the community can respond quickly and precisely when a disaster will occur. In the Resilient Village program the availability of disaster warning information resources is the main thing as a support for the community's preparedness in the Sukaraja Village, Rajabasa District, South Lampung Regency in dealing with disasters.

Proceeding of International Conference of 4th SHIELD 2019
https://pasca.unila.ac.id/seminar-internasional-shield/
ISBN : 978-602-51393-9-0
80
Based on the results of the study showed data as many as 40 people (100%) stated that the unavailability of disaster warning information sources in Sukaraja Village, Rajabasa District, South Lampung Regency. Many factors cause the unavailability of disaster warning information sources, including damage and loss of buoys or sea wave height detection devices and the minimal number of sirens as a disaster early warning. This shows that the people of Sukaraja Village are not ready to face disaster risks in terms of disaster mitigation facilities. f. Resource Mobilization f.1. Simulation of Disaster Mitigation Preparedness
Simulation about disaster mitigation is an absolute thing that must be done by people who are in disaster prone areas such as in Sukaraja Village, Rajabasa District, South Lampung Regency. The following is the data of disaster resilient village community members conducting simulations of disaster mitigation preparedness in table 9 below.
Table 9. Simulation of Disaster Mitigation in Sukaraja Village, Rajabasa District South Lampung Regency in 2018
No. Disaster Socialization and Mitigation Amount (%)
1 Already 17 42,50 2 Not yet 23 57,50
Amount 40 100,00
Source: 2018 Research Questionnaire.
Based on the data in table 9 above, there are 17 people (42.50%) who have done disaster mitigation simulations, at which time they attended disaster mitigation socialization activities so as to get disaster preparedness material. Disaster mitigation simulation activities in Sukaraja Village have only been carried out 2 times and to date have not been continued. While as many as 23 people (57.50%) have not done a disaster mitigation simulation because they did not attend the disaster mitigation socialization activities so they did not have material on disaster mitigation. f.2. Special Allocation Relating to Disaster Emergency Response
Insurance, funding and logistics are closely related to disaster emergency response. The existence of these allocations will greatly help the community in the face of a disaster if outside assistance for disaster victims cannot reach the disaster site. Based on the results of the study showed as many as 40 people (100%) stated that there was no special allocation for disaster emergency response in Sukaraja Village, Rajabasa District, South Lampung Regency. This is due to lack of coordination between communities and it is not considered important to prepare allocations for disaster emergencies
CONCLUSION
Data obtained after conducting a series of research steps regarding disaster resilient community preparedness in Sukaraja Village, Rajabasa District, South Lampung Regency, can be concluded as follows: 1. The level of knowledge and attitude of the community in dealing with disasters
in Sukaraja Village is quite good because some people already know naturally

Proceeding of International Conference of 4th SHIELD 2019
https://pasca.unila.ac.id/seminar-internasional-shield/
ISBN : 978-602-51393-9-0
81
what actions should be taken if a disaster occurs and where to save themselves.
2. The level of policy in dealing with disasters in Sukaraja Village is quite good because there is already a mutual agreement in the community in terms of evacuation and following disaster evacuation simulations.
3. The level of emergency response plans in dealing with disasters in Sukaraja Village is classified as not good because many people do not prepare first aid medicines and disaster prepared bags.
4. The level of disaster warning system in dealing with disasters in Sukaraja Village is classified as not good because it only relies on Kentongan as a tool for disaster warning system.
5. The level of resource mobilization in dealing with disasters in Sukaraja Village is classified as not good, because there are still many people who do not have preparedness materials and many who have never attended a disaster preparedness seminar and training.
REFERENCES
Arikunto, S. 2010. Prosedur Penelitian Suatu Pendekatan Praktik. Rineka Cipta. Jakarta
Asdak, C. 2010. Hidrologi dan Pengelolaan Daerah Aliran Sungai. Buku. Yogyakarta: Universitas Gadjah Mada.
Bintarto, R. 1983. Interaksi Desa Kota dan Permasalahannya. Ghalia. Yogyakarta.
BNPB. 2012. Perka BNPB No. 1 tahun 2012. Pedoman Desa Tangguh Bencana. diakses dari http://www.gitews.org/tsunami-dokit/en/E6/further_resources/national_level/peraturan_kepala_BNPB/pe rkaBNPB012012_pedomanUmumDesaKelurahanTangguhBencana.pdf pada tanggal 15 November 2017 pukul 10.15 WIB.
Bungin, B. 2007. Analisis Data Penelitian Kualitatif. Jakarta: Grafindo Persada. Darmawan, D. 2007. Metodologi Penelitian Kuantitatif, Penelitian Tindakan dan
Quantitative Research. Bandung: Remaja Rosdakarya. Departemen Komunikasi dan Informasi Republik Indonesia. 2008. Memahami
Bencana Informasi Masyarakat Mengurangi Bencana. Jakarta: Departemen Komunikasi dan Informasi Republik Indonesia:
Dodon. 2013. Indikator dan perilaku kesiapsiagaan masyarakat di permukiman padat penduduk dalam antisipasi berbagai fase bencana banjir. Jurnal Perencanaan Wilayah dan Kota. 24(2).
Effendi, S. 1989. Unsur-Unsur Penelitian Survei. Metode Penelitian survei. Dalam Masri Singarimbun dan Sofian Effendi (Editor). Jakarta: LP3ES.
Kartika, D. 2011. Manajemen Bencana Banjir Oleh Kampung Tangguh Bencana di Kampung Jetisharjo Kelurahan Cokrodiningratan Kecamatan Jetis Yogyakarta. Yogyakarta: Program Studi Pendidikan Geografi. Universitas Sunan Kalijaga.
Kodoatie, R. dan Sjarief, R. 2006. Pengelolaan Bencana Terpadu Banjir, Longsor, kekeringan dan Tsunami: Jakarta: Yarsif Watampone.
LIPI-UNESCO/ISDR. 2006. Kajian Kesiapsiagaan Masyarakat dalam Mengantisipasi Bencana Gempa Bumi dan Tsunami.
Mantra, I.B. 2003. Demografi Umum. Yogyakarta: Pustaka Belajar. Priambodo, A. 2013. Panduan Praktis Menghadapi Bencana Badai-Banjir-
Gempa Bumi-Letusan Gunung Berapi, Kerusuhan Massal-Terror Bom, Kebakaran-Polusi Lingkungan. Yogyakarta: Kanisius.

Proceeding of International Conference of 4th SHIELD 2019
https://pasca.unila.ac.id/seminar-internasional-shield/
ISBN : 978-602-51393-9-0
82
Sariwati. 2012. Efektivitas Program Desa Tangguh Bencana di Desa Poncosari dan Desa Srigading Kabupaten Bantul. Yoyakarta: Fakultas Geografi. Universitas Gadjah Mada.
Sugiyono. 2012. Metode penelitian kuantitatif kualitatif dan R&D. Bandung: Alfabeta.
Suharyono dan Amien, M. 1994. Pengantar Geografi Filsafat. Jakarta: Direktorat Jenderal Pendidikan Tinggi Departemen Pendidikan dan Kebudayaan.
Sumaatmadja, N. 1981. Studi Geografi Suatu Pendekatan dan Analisa Keruangan. Bandung: Alumni.
Sutantono, B. 2004. Revolusi Transportasi. Jakarta: Gramedia Pustaka Utama.
Tika, M.P. 2005. Metode Penelitian Geografi. Jakarta: Bumi Aksara. Undang-Undang Nomor 24 Tahun 2007 Tentang Penanggulangan Bencana.
BNPB. Jakarta Yunus, H.S. 2010. Metodologi Penelitian Wilayah Kontemporer. Yogyakarta:
Pustaka Pelajar.

Proceeding of International Conference of 4th SHIELD 2019
https://pasca.unila.ac.id/seminar-internasional-shield/
ISBN : 978-602-51393-9-0
83
STUDY OF THE IMPLEMENTATION OF MINISTRY OF TRADE REGULATION NO. 47 OF 2017 CONCERNING THE HIGHEST RETAIL PRICE OF BEEF IN
BANDARLAMPUNG
Rasinta Hotnaida Nainggolan, Zainal Abidin, dan KtutMurniati
Departement of Agribusiness, Faculty of Agriculture, Lampung University, Jl. Prof. Dr. Soemantri Brodjonegoro No. 1 Bandar Lampung Indonesia 35145,
Telp. 085368263869, e-mail: [email protected]
ABSTRACT
The aims of this study are to evaluated the implementation of the Ministry of Trade regulation No. 47 2017 concerning the highest retail price of 10 commodity in Indonesia and to identity the supporting and inhibiting factors of the regulation. This study specifically observed the implementation of the regulation in Bandar Lampung city and its surroundings. This study involved 2 cattle ranchers, 2 slaughterhouses, 12 traders, and 6 beef consumers in Bandar Lampung. The data was colected in March 2019. The study used qualitative analysis to answer the first purpose and Ripley and Franklin‟s analysis for the second purpose. The study shows that implementation of said regulation has been unsuccessful because there were no supporting factors, lack of information, lack of compliance, lack of public curiosity, and lack of publication from the Ministry of Trade. Keywords: beef, implementation, regulation, trade
INTRODUCTION
Food is a basic human need, its availability must be guaranteed and fulfilled as the main requirements for realizing quality of human resources (HR). The development of human resources quality is closely related to improvement the community nutrition, health, and education level. One source of nutrition and high protein is a food source of animal protein.
Based on Law Number 18 of 2012 article 1 paragraph 1 concerning food. Food is anything that comes from biological sources of agricultural products, plantations, forestry, fisheries, livestock, the waters, and water, whether processed or not processed that is served as a food or a drink for human consumption, including food additives, food raw materials, and other materials used in the process of preparing, processing and making food or drinks. Law number 18 article 1 paragraph 4 concerning food security. Food Security is "the condition of the fulfillment of food for the state up to the individual, which is reflected in the availability of sufficient food, both in quantity and quality, safe, diverse, nutritious, equitable, and affordable and does not conflict with religion, beliefs, and culture of the community, to be able healthy, active and productive lives in a sustainable way ".
One of the obstacles for realizing food independence and food resistance in Indonesia at this time is related to the fact that food demand growth is faster than supply growth. Consumer demand to suffice the needs of daily life can be said to be quite large, especially to suffice the food needs that must be consume by consumers every day. However, it can be seen that currently the price of foodstuffs must be fulfilled by the community. One type of food that is usually consume by the public is meat to suffice the protein in the human body.
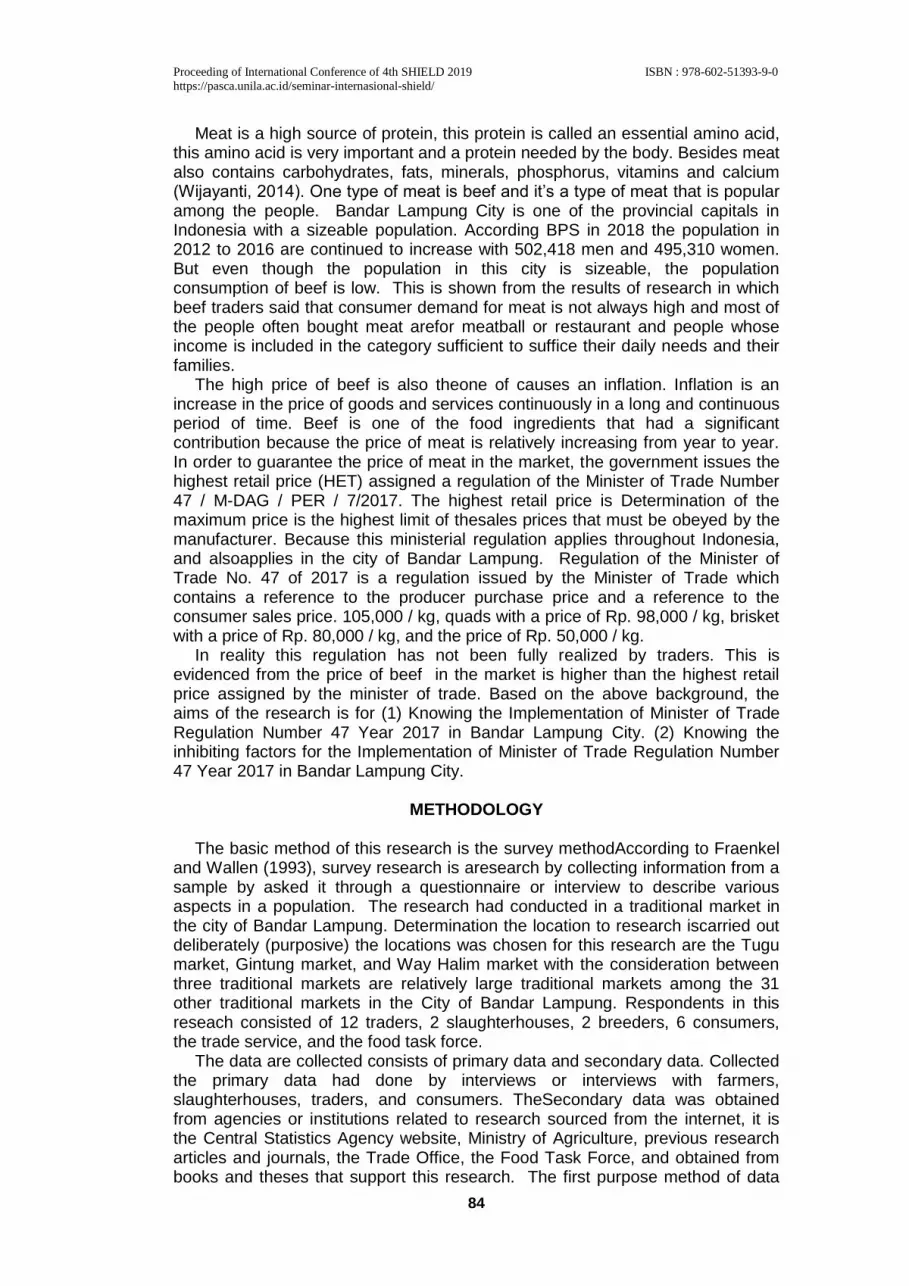
Proceeding of International Conference of 4th SHIELD 2019
https://pasca.unila.ac.id/seminar-internasional-shield/
ISBN : 978-602-51393-9-0
84
Meat is a high source of protein, this protein is called an essential amino acid, this amino acid is very important and a protein needed by the body. Besides meat also contains carbohydrates, fats, minerals, phosphorus, vitamins and calcium (Wijayanti, 2014). One type of meat is beef and it‟s a type of meat that is popular among the people. Bandar Lampung City is one of the provincial capitals in Indonesia with a sizeable population. According BPS in 2018 the population in 2012 to 2016 are continued to increase with 502,418 men and 495,310 women. But even though the population in this city is sizeable, the population consumption of beef is low. This is shown from the results of research in which beef traders said that consumer demand for meat is not always high and most of the people often bought meat arefor meatball or restaurant and people whose income is included in the category sufficient to suffice their daily needs and their families.
The high price of beef is also theone of causes an inflation. Inflation is an increase in the price of goods and services continuously in a long and continuous period of time. Beef is one of the food ingredients that had a significant contribution because the price of meat is relatively increasing from year to year. In order to guarantee the price of meat in the market, the government issues the highest retail price (HET) assigned a regulation of the Minister of Trade Number 47 / M-DAG / PER / 7/2017. The highest retail price is Determination of the maximum price is the highest limit of thesales prices that must be obeyed by the manufacturer. Because this ministerial regulation applies throughout Indonesia, and alsoapplies in the city of Bandar Lampung. Regulation of the Minister of Trade No. 47 of 2017 is a regulation issued by the Minister of Trade which contains a reference to the producer purchase price and a reference to the consumer sales price. 105,000 / kg, quads with a price of Rp. 98,000 / kg, brisket with a price of Rp. 80,000 / kg, and the price of Rp. 50,000 / kg.
In reality this regulation has not been fully realized by traders. This is evidenced from the price of beef in the market is higher than the highest retail price assigned by the minister of trade. Based on the above background, the aims of the research is for (1) Knowing the Implementation of Minister of Trade Regulation Number 47 Year 2017 in Bandar Lampung City. (2) Knowing the inhibiting factors for the Implementation of Minister of Trade Regulation Number 47 Year 2017 in Bandar Lampung City.
METHODOLOGY
The basic method of this research is the survey methodAccording to Fraenkel and Wallen (1993), survey research is aresearch by collecting information from a sample by asked it through a questionnaire or interview to describe various aspects in a population. The research had conducted in a traditional market in the city of Bandar Lampung. Determination the location to research iscarried out deliberately (purposive) the locations was chosen for this research are the Tugu market, Gintung market, and Way Halim market with the consideration between three traditional markets are relatively large traditional markets among the 31 other traditional markets in the City of Bandar Lampung. Respondents in this reseach consisted of 12 traders, 2 slaughterhouses, 2 breeders, 6 consumers, the trade service, and the food task force.
The data are collected consists of primary data and secondary data. Collected the primary data had done by interviews or interviews with farmers, slaughterhouses, traders, and consumers. TheSecondary data was obtained from agencies or institutions related to research sourced from the internet, it is the Central Statistics Agency website, Ministry of Agriculture, previous research articles and journals, the Trade Office, the Food Task Force, and obtained from books and theses that support this research. The first purpose method of data

Proceeding of International Conference of 4th SHIELD 2019
https://pasca.unila.ac.id/seminar-internasional-shield/
ISBN : 978-602-51393-9-0
85
analysis is to using a qualitative approach. The research method was carried out through interviews, questionnaires and observations on different respondents. Traders are the benchmark to show the respondents for the next, i.e. RPH, breeders, and consumers. The data obtained will indicate whether the regulation is well realized or not traded or farmed.
The second objective analysis method is to find out the supporting and inhibiting factors for implementing regulations using Ripley and Franklin's theory. This theory emphasizes the effort to identify what factors that influence a policy can run successfully in the field. In this theory there are three dominant ways that greatly influence the success of policy implementation, i.e. (1) The level of compliance to applicable regulations, (2) a smooth implementation of routine functions, (3) Realization some performance and the impact.
RESULT AND DISCUSSION Characteristics of Respondents
Based on the research that has been done, it is obtained that the age of farmers in this research were 29 years and 52 years oldwith the gender is male/male gender. All farmers live, on average the time for a business of farm is 10.5 years, the last education of farmers isatjunior and senior high school. There were 12 traders in this research. The range is start from 27 years until 65 years with the gender is male, on5 years until 35 years of business, all traders has came from city of Bandar Lampung, and the last educationof traders was junior until senior high school. There are two respondents owne rof RPH agedis 48 years old and 53 years old, the gender is male, the range of business is start from 8 years until 15 years, come from city of Bandar Lampung, and the last education was at junior high school and S1. The last, 6 consumers aged are between 36 yearsuntil 55 years, the all of consumers are female, the last education were at junior high school, high school, and S1. The occupation of consumers variesis from housewives, entrepreneurs, and civil servants. Means of Production and Price of cattle in Breeders
Production facilities had used by farmers are a general with different amounts according to the needs that are adjusted to the number of each animal. Several production facilities are used, such as cowshed with the spacious 40m x 50 m, hoes, buckets, shovels, arco, pickup cars, labor, cattle feed, and others. The production facilitieshad adifferences in prices caused by differences in the place for a purchase or differences in the type and quality of production facilities used by each farmer. The cows will be fattened have bought from people around the environment at a price of Rp 10,000.00 - Rp 15,000,000 per head weighing 200kg-300kg. The process of fattening cattle until they are ready to sell is 6-7 months old, weighing from 500kg-1000kg per animal. In this study it was found that the selling price of cattle in farmers was Rp. 42,000-Rp. 45,000/kg on normal days, while on Eid day the selling price of cattle increased to Rp. 49,000 / kg.The price of the cows upgrade bythe farmer can be seen in Table 1.
Table 1. Prices of cattle to breeders
No Breeders name Price of cattle(Rp/kg) Average sales(Kg/day)
1 Sukamto 42.000 1.052
2 Martinus 45.000 945

Proceeding of International Conference of 4th SHIELD 2019
https://pasca.unila.ac.id/seminar-internasional-shield/
ISBN : 978-602-51393-9-0
86
Average 43.500 998,5
Table 2. Beef prices at slaughterhouses
No Name Origin of Cows
PriceBuy Cow(RP)
Purchase Amount(tail / day)
Selling price of beef(Rp)
1 Agus Lamsel 43.500 15 105.000 2 Tampan Lamsel 42.500 10 105.000
Average 43.000 13 105.000
Beef prices in Slaughterhouses (RPH)
Slaughterhouses (RPH) are slaughterhouses to produce meat. Cows are usually slaughtered at slaughterhouses, where every trader in this researchboughta beef is directly from slaughterhouses. Amount of a cows purchased each RPH varies RPH Agus usually buy 15 cowsevery two days and the Handsome RPH buys 10 cows once every two days with the weight of cows are bought from both of RPH areranging from 450kg until 700kg per cow.
Table 2 shows the RPH are buying a cow to farmers with an average of IDR 43,000 / kg and the price for selling of typical beef in IDR 105,000 / kg, outside typical IDR 100,000 / kg, gravel IDR 40,000 / kg, Ribs IDR 50,000 / kg, settings Rp.25,000 / kg, and brisket Rp.45,000 / kg. Every slaughterhouse havea differentcapacity to purchase and capacity to sale depending on demand from traders, labor and the number of cows are available. Beef prices at traders
A beef was sale with different types from some type with another typeand also with different prices, but in this researchis not foundthat price is very different from oneof trader with another trader. Details of prices at beef traders can be seen in Table 3. Table 3 shows that nothingmany prices variation in the type of beef even it is relatively same between the traders. The price of beef was sold to consumers are differentdepands the consumer demand and the type of meat will bebought. Traders buy beef from slaughterhouses in different amounts, ranging from 60kg to 150kg/day. The price for sellinga beef was circulating at merchants is relatively same as the highest price of meat, i.e. typical meat at a price of Rp120,000.00 / kg and the lowest type of meat is Rp50,000.00-Rp55,000.00 / kg. In this researchis nothing a very different price.
The different price is usually found in types of meat such as ribs, tetelan, gravel, and brisket. The unique inside and outside parts of the traders sell at relatively the same prices, both traders in the Tugu Market, PasirGintung Market and Way Halim Market. The diversity of prices is caused by the origin of cattle and beef are relatively same starting from cattle breeders / PT cattle to slaughterhouses, then traders and even consumers. Beef prices to consumers
A consumer is someone whose using or buying a product. In this research there were 6 consumers of beef who were used as arespondents. Every consumer have a different capacity for consuming a beef consumption capacity. A description of the price of beef to consumers can be seen in Table 4. The highest price of beef is a typical type of beef in the price of Rp120,000 / kg from the Gintung Sand Market and every sword in the three research sites is relatively similar beef selling prices and lower beef prices, namely beef tetelan with price of IDR 25,000-IDR 30,000 / kg.

Proceeding of International Conference of 4th SHIELD 2019
https://pasca.unila.ac.id/seminar-internasional-shield/
ISBN : 978-602-51393-9-0
87
Table 4. Description of the price of beef to consumers
No Name Types of Beef Origin Of Beef Beef Prices(Rp/Kg)
1 Sena Quads Pasar gintung 120.000
2 Yoselin Bone soup Pasar gintung 80.000
3 Nilam outside typical Pasar w. halim 110.000
4 Tuty Setting Pasarw.halim 60.000
5 Amih Outside typical Pasar tugu 110.000
6 Sumi Quads Pasar tugu 120.000
Average 100.000
Table 3. Beef prices at the merchant level
No
Shope Name
Types of beef, selling prices, and the number of beef purchases by traders every day
Quads outside
typical gravel ribs settings brisket
Price (Rp)
Total
(Kg)
Price (Rp)
Total
(Kg)
Price (Rp)
Total
(Kg)
Price (Rp)
Total
(Kg)
Price (Rp)
Total
(Kg)
Price (Rp)
Total
(Kg)
1 Elmi 120.000
30 110.000
15 65.000
8 85.000
6 50.000
4 65.000
4
2 Ujang
120.000
20 110.000
10 60.000
5 80.000
5 50.000
3 60.000
3
3 Taufiq
120.000
15 110.000
10 65.000
5 75.000
5 50.000
4 65.000
4
4 Pian 120.000
20 110.000
10 60.000
6 80.000
6 50.000
5 60.000
5
5 H. Sudiro
120.000
30 110.000
15 60.000
10 80.0
00
8 50.000
6 60.000
4
6 Junaidi
120.000
20 110.000
10 65.000
6 85.000
4 50.000
4 65.000
2
7 Alim 120.000
20 110.000
10 60.000
5 80.000
3 50.000
5 60.000
3
8 Jumr 120. 25 110. 15 65.0 8 75.0 4 50.0 5 65.0 3
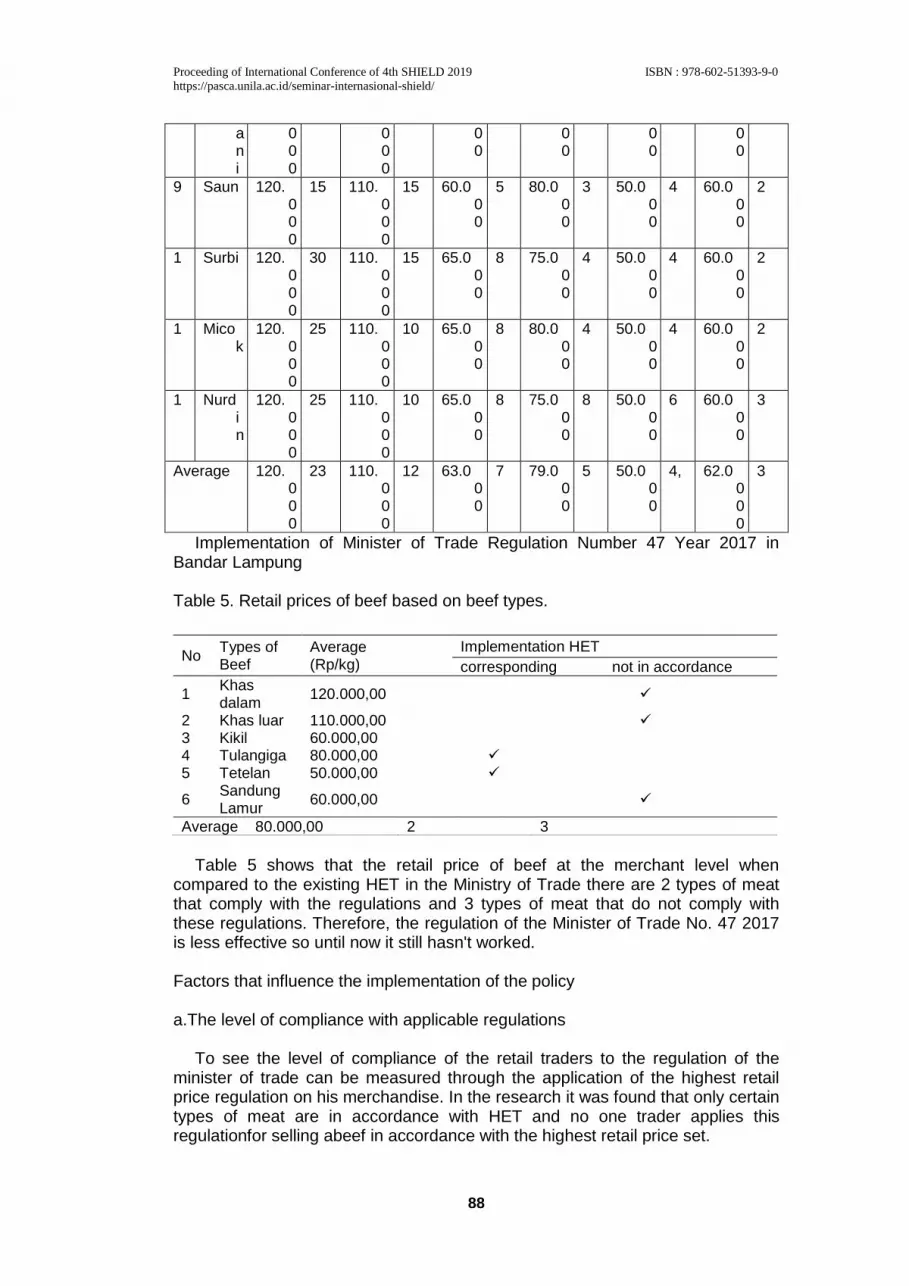
Proceeding of International Conference of 4th SHIELD 2019
https://pasca.unila.ac.id/seminar-internasional-shield/
ISBN : 978-602-51393-9-0
88
ani
000
000
00
00
00
00
9 Saun 120.000
15 110.000
15 60.000
5 80.000
3 50.000
4 60.000
2
10 Surbi 120.
000
30 110.000
15 65.000
8 75.000
4 50.000
4 60.000
2
11 Mico
k 120.
000
25 110.000
10 65.000
8 80.000
4 50.000
4 60.000
2
12 Nurd
in
120.000
25 110.000
10 65.000
8 75.000
8 50.000
6 60.000
3
Average 120.000
23 110.000
12 63.000
7 79.000
5 50.000
4,5 62.0
000
3
Implementation of Minister of Trade Regulation Number 47 Year 2017 in Bandar Lampung Table 5. Retail prices of beef based on beef types.
Table 5 shows that the retail price of beef at the merchant level when
compared to the existing HET in the Ministry of Trade there are 2 types of meat that comply with the regulations and 3 types of meat that do not comply with these regulations. Therefore, the regulation of the Minister of Trade No. 47 2017 is less effective so until now it still hasn't worked. Factors that influence the implementation of the policy a.The level of compliance with applicable regulations
To see the level of compliance of the retail traders to the regulation of the minister of trade can be measured through the application of the highest retail price regulation on his merchandise. In the research it was found that only certain types of meat are in accordance with HET and no one trader applies this regulationfor selling abeef in accordance with the highest retail price set.
No Types of Beef
Average (Rp/kg)
Implementation HET
corresponding not in accordance
1 Khas dalam
120.000,00
2 Khas luar 110.000,00 3 Kikil 60.000,00 4 Tulangiga 80.000,00 5 Tetelan 50.000,00
6 Sandung Lamur
60.000,00
Average 80.000,00 2 3

Proceeding of International Conference of 4th SHIELD 2019
https://pasca.unila.ac.id/seminar-internasional-shield/
ISBN : 978-602-51393-9-0
89
This shows that retailers are not obeyingto the regulation of the Minister of Trade No. 47 of 2017, in other words, a low level of compliance, including obstacles to the implementation of this regulation. 1) a. Implementation of function routines. The smooth implementation of routine
functions can be seen through obstacles from the application of this regulation such as.
2) Lack of information received by the trader. In this research only three respondents were found to know of this regulation from a total of 21 respondents. This is caused by several things, including respondents are not updated an information about market prices, the trade minister is lacking in socializing this regulation. Lack of information is a reterdant factor for the implementation of this regulation.
3) Fill in regulations that are not appropriate to the situation in the field. The respondent are knows the existence of regulation of the minister of trade number 47 of 2017 does not apply it on the grounds the pricewas set is not in accordance with the prices in the market, even lower than the amount of capital issued by traders so it is not possible to implement it. The content of the regulations that are not appropriate is a limiting factor for the implementation of this regulation.
b. The realization of the desired performance and impact
The Minister of Trade's determination of this regulation certainly has goals, including achieving the stable price of a beef, to decrease food inflation and to decrease price fraud. However, the evidence from the field, none of the respondents applied this regulation, so the minister of commerce would be achieved the goals. Manyinhibiting factors causes the realization cannot reach the desired performance and impact. Beef Supply Chain Supply chain structure
According to Punjawan (2005) Supply Chain is a network of companies which is work togetherfor creatingand delivering a product to the last consumer. The supply chain consists to several elements and partiesareinvolved either directly (primary) or indirectly (secondary). In this supply chain of beefthere are only primary members, include: 1). Breeder
System of beef supply chain in Bandar Lampung starts from upstream, i.e. breeders as a producers in the form of live beef which carry out livestock business activities including maintenance. Afterthe cows hadaged 6-7 months, the cowswill be selling to the slaughterhouse with hopes will get more of profit. The price of cattle had influenced by the weight and health of the cow. If the cattle was selling not in accordance with the age of the cattle for proper slaughter, and the cattle was sellingexceed the age of a cattle will ready to slaughter, the selling price will be cheap and the meat will be hard and certainly wouldademand byconsumers.
If the sale of cattle is carried out on religious holidays, especially on Eid, the price of cattle sold to the RPH ranges from Rp 45,0000-49,000 / kg. Ithashappened because on the Eid day the price of cattle was very high while the demand was even higher too. The selling price hasgiven by farmers on normal days is IDR 42,000-IDR 45,000 / kg. The number of live cattle sold by farmers every day is 2 cows weighing 998.5 kg.

Proceeding of International Conference of 4th SHIELD 2019
https://pasca.unila.ac.id/seminar-internasional-shield/
ISBN : 978-602-51393-9-0
90
2). Slaughterhouses(RPH)
The activities was doing by the RPH is buying cows and receive a services to slaughter a cowby traders who want to process their cows into a beef. In this case, the slaughterhouses also incur significant transportation costs because they must pick up the cows from the breeder or PT cattle sales, but there are also breeders deliveredtheir cows to the slaughterhouse. Slaughterhouses set a selling price to traders for one or typical quality meat in the amount of Rp 120,000 / kg and two or special quality outside Rp 110,000 / kg and other types of beef sold at relatively with low prices compared to the price of quality beef one and quality two. The amountof cattle purchased when the religious holiday or Eid is around 30-40 head of cattle weighing 455kg / head -575 kg / head and on normal days the number of cattle slaughtered by RPH is 7-12 head of cattle each day. 3). Traders
The activity was doing by traders is buy beef in large quantities from slaughterhouses, then sell their merchandise to consumers both in large and small quantities. In this activity traders sell beef to market their wares in the markets. Traders sell a beef with an average price of one quality beef of Rp. 120,000.00 and two quality beef for Rp. 110,000.00. The average purchase quantity of traders from RPH is 60-150 kg per day, but there are also traders who buy beef once every two days. Pemeblian once every two days if the beef purchased today does not run out then the next day the trader will resell the beef. 4). Consumer
Beef consumers usually buy beef in different amounts each consumer, somebody buy in large quantities and another personbuy in small amounts. Most of consumers usually buy with period of time per month and there are also consumers who buy beef every day or every other day, consumers also buy a beef to produce into other food. The average price of beef circulating among consumers is Rp 110,000-Rp 120,000 / kg, but the traders also provide types of beef such as kikil, tetelan, the inside, ribs, tail bones, brisket and so on so that consumers from any group can afford beef even in small amounts. Flow Patterns in the Supply Chain
In a supply chain there are three types of flow that must be managed, namely, the flow of material that flows from upstream to downstream, financial flow that flows from downstream to upstream and the flow of information that flows downstream upstream to downstream or vice versa. Beef supply chain flow patterns can be seen in Figure 1. Figure 1. Beef supply chain flow patterns
Information :
: Material Flow
: Financial Flow
: Information Flow
Breed
er
RPH Traders Consumer

Proceeding of International Conference of 4th SHIELD 2019
https://pasca.unila.ac.id/seminar-internasional-shield/
ISBN : 978-602-51393-9-0
91
Figure 1 show in the beef supply chain there are three types of flow, namely the flow of goods (material), the flow of money (financial), and the flow of information, when the flow is always related to one flow with another. Starting from breeders to slaughterhouses, there is a purchase of a cattle from breeders to slaughterhouses and the process of slaughtering cattle in slaughterhouses, and then from slaughtering to traders will sell beef that is ready to sell to traders with various types of beef and the price had bought by traders and then the meat will be selling to consumers and consumers will be processed into afood with different processing methods such as rendang, meatballs, soup, and etc. Accordance with the wants and the needs of consumers.
CONCLUSION
Implementation of regulation of the minister of trade number 47 of 2017 in Bandar Lampung has not reached. This is proven by the fact that there are still many traders don‟t know about this regulation, so they do not apply the highest retail price regulation. The inhibiting factors of the implementation of the Minister of Trade Regulation number 47 of 2017 in Bandar Lampung are the very low level of compliance, the lack of information had received by respondents due to the lack of curiosity of respondents and the lack of publication from the Ministry of Trade, as well as the contents of regulations that are not appropriate to the conditions in the field.
BIBLIOGRAPHY Akib, H. 2010. Implementasi Kebijakan: Apa, Mengapa, dan Bagaimana. Jurnal
Administrasi Publik, 1(1) :1-4. Badan Pusat Statistik. 2017. Bandar Lampung dalam Angka. Bandar Lampung:
Badan Pusat Statistik Provinsi Lampung. Badan Pusat Statistik. 2017.Konsumsi rata-rata perkapita seminggu bahan
makanan penting di Indonesia. Jakarta: Badan Pusat Statistik Indonesia. Badan Pusat Statistik. 2018. Bandar Lampung dalam Angka. Bandar Lampung:
Badan Pusat Statistik Provinsi Lampung. Direktorat Gizi Departemen Kesehatan RI. 2000. Daftar Komposisi Bahan
Makanan. Jakarta: Persatuan Ahli Gizi Indonesia (PERSAGI). Djogo, T., Sunaryo, Suharjito D., dan Sirait M. 2003. Kelembagaan dan
Kebijakan dalam Pengembangan Agroforestri. Bogor. ICRAF. Kementerian Pertanian RI. 2018. Prospek dan arah pengembangan agribisnis:
sapi. 2018. http://www.litbang.pertanian.go.id/special/komoditas/files/00-sapi.pdf.
Kotler, A. 1999. Teori Ekonomi Makro Intermediate. Jakarta: Raja Grafindo
Persada. Kotler, P. 2002. Dasar-dasar Pemasaran. Jakarta: Erlangga. Moleong, L.J. 2004. Metodologi Penelitian Kualitatif. Bandung: IKAPI. Pratama, M. 2008. Pengantar Ilmu Ekonomi (edisi ketiga). Jakarta: Lembaga
Penerbit FEUI. Safawi, I., Sujianto dan Rusly, Z. 2010. Implementasi kebijakan. Jurnal Kebijakan
Publik. Saragih, F. 2018. Implementasi Peraturan Menteri Perdagangan Nomor 47
Tahun 2017 Pada Pedagang Beras di Bandar Lampung. Bandar Lampung: Fakultas Pertanian Universitas Lampung.
Sugiyono. 2007. Metode Penelitian Pendidikan. Bandung: Alfabeta.

Proceeding of International Conference of 4th SHIELD 2019
https://pasca.unila.ac.id/seminar-internasional-shield/
ISBN : 978-602-51393-9-0
92
Suharto,E. 2005. Analisis Kebijakan Publik. Bandung: Alfabeta. Surakhmad. 1994. Pengantar Penelitian Ilmiah Metode Teknik. Bandung: Tarsito. Wicaksono, A. 2012. Optimalisasi kepemimpinan nasional dalam melaksanakan
kebijakan distribusi pangan dapat mewujudkan ketahanan nasional. Agriekonomika. 1(1): 36-46.
Winarno, B. 2002. Teori dan Proses Kebijakan Publik. Yogyakarta: Penerbit Media Pressindo.

Proceeding of International Conference of 4th SHIELD 2019
https://pasca.unila.ac.id/seminar-internasional-shield/
ISBN : 978-602-51393-9-0
93
THE DIFFERENCE OF MOODLE BASED LEARNING OUTCOMES VIEWED FROM THE APPLICATION OF THE GROUP INVESTIGATION
LEARNING MODEL AND CRITICAL THINKING ABILITY
Nashar and Rikza Fauzan Lecturer of History Study Program FKIP Sultan Ageng Tirtayasa University
ABSTRACT
This study aims to determine differences in moodle-based learning outcomes and group investigative learning models in terms of critical thinking skills. This research is a quantitative study using a 2x2 treatment by level design. The research data was taken from the results of observations, tests and questionnaires. Data analysis techniques used the two way ANOVA test and t test to determine differences in moodle-based learning outcomes after being treated. The results showed that (1) moodle-based learning outcomes using a group investigation learning model were better than using conventional learning models; (2) there is an interaction between learning models and critical thinking skills on moodle-based learning outcomes; (3) moodle-based learning outcomes using a group investigation learning model with high critical thinking skills, better than using conventional learning models with high critical thinking skills; (4) moodle-based learning outcomes using conventional learning models with low critical thinking skills, better than using a group investigation learning model with low critical thinking skills. Theoretically, the results of this study can be used as a reference to develop learning models and evaluation tools based on e-learning. Furthermore, it is hoped that there will be research that uses learning models and evaluation tools based on e-learning with other independent variables that also influence learning outcomes. Keyword: group investigation, critical thinking skills and moodle-based learning outcomes
INTRODUCTION
As the development of information and communication technology, the world of education also requires innovations that are in accordance with the times without ignoring human values and local wisdom. It cannot be denied, in the era of the industrial revolution 4.0, educators as professional educators with the main task of transforming, developing and disseminating science and technology are demanded to continue to innovate learning. Learning innovation in question is in the selection of models and evaluation of learning based on e-learning. E-learning is learning that is structured with the aim of using an electronic or computer system so that it can support the learning process (Michael, 2013: 27). This is in line with what Psycharis, et al said that learning styles in traditional learning are considered less relevant but e-learning learning is considered very important (Psycharis, Chalatzoglidis, & Kalogiannakis, 2013).
One e-learning application that can be used is moodle. Moodle is included in the Learning Management System (LMS) which has important features that can support learning such as assignments, quizzes, and evaluations. Moodle application in this study is used as a medium for delivering learning material and evaluations. As we know, evaluations of learning today often use manual learning evaluations. So sometimes students are reluctant and bored in working on learning evaluations.

Proceeding of International Conference of 4th SHIELD 2019
https://pasca.unila.ac.id/seminar-internasional-shield/
ISBN : 978-602-51393-9-0
94
In addition to evaluating learning, the learning model is one of the important learning components and is crucial in the success of the learning process. One of the existing learning models is the cooperative learning model of group investigation. Cooperative learning is a form of social learning model that is based on constructivism learning theory. Cooperative learning emphasizes student involvement in study groups. The involvement of students in groups opens opportunities for them to evaluate and improve understanding (Agus Suprijono, 2012: 55).
Therefore, to determine learning models and evaluations that are appropriate to the character of students, educators also need to look at students' critical thinking skills. This is also to prove the interaction between learning models and critical thinking skills on student learning outcomes (Nashar, 2015). So students will be more comfortable and happy to follow the learning process.
Moodle-based e-Learning
E-learning is a learning process that uses electronic media especially the internet as a learning system. E-learning applies distance learning using computer technology and the internet (Setiyo & Anang, 2013). So e-learning is the basis and logical consequence of the development of information and communication technology. Elearning represents innovative ideas in the field of learning, providing quick access to specific knowledge and information (Sheshasaayee & Bee, 2017). E-learning is an innovation that can be utilized in the learning process, not only in the delivery of learning material but also changes in the abilities of various competencies of students including the evaluation of learning. Through e-learning, students not only listen to the material description from the educator, but also actively observe, do, demonstrate, evaluate and so on. Teaching material material can be virtualized in various formats so that it is more interesting and more dynamic able to motivate students to go further in the learning process (Wiwin Hartano, 2016).
One of the causes of the increasing use of e-learning in educational institutions is the availability of various LMS (learning management system) software. One of the open source LMS tools is Moodle. Cole and Foster (2008) define Moodle as an abbreviation of Modular Object-Oriented Dynamic Learning Environment, which means a dynamic learning place using object-oriented models. The Moodle application was first developed by Martin Dougiamas in 2002 with Moodle version 1.0. Moodle is designed using pedagogical principles to help educators create effective elearning systems. Moodle has important features that can support learning such as assignments, quizzes, online discussions, evaluations, value management, displaying grades and transcripts and can upload various types of material formats learning. Investigation Group Learning Model
Soekamto in Trianto defines a learning model is a conceptual framework that
describes a systematic procedure in organizing learning experiences to achieve certain learning goals and serves as a guide for learning designers and educators in planning learning activities. (Trianto, 2007: 5). Based on this opinion it can be concluded that the learning model can be interpreted as a way or way taken to condition the classroom atmosphere that allows for learning.
One form of learning models is cooperative learning models. According to Sanjaya, the cooperative learning model is a series of learning activities carried out in certain groups to achieve the learning objectives that have been formulated (Sanjaya, 2013: 241). This is in line with what Sugiyanto said, that cooperative
Proceeding of International Conference of 4th SHIELD 2019
https://pasca.unila.ac.id/seminar-internasional-shield/
ISBN : 978-602-51393-9-0
95
learning is learning that focuses on the use of small groups of students to work together in maximizing learning conditions to achieve learning goals (Sugiyanto, 2010: 37).
Cooperative learning is a form of social learning model that is based on constructivism learning theory. According to Slavin, cooperative learning models have a variety of differences. However, cooperative learning can be categorized according to six principle characteristics: (a) group goals; (b) individual responsibility; (c) the same chance of success; (d) team competition; (e) specialization of tasks and (f) adaptation to group needs. (Slavin, 2009: 26).
Presseisen in Sharan, views the relationship of cooperative learning and improvement programs in ways of thinking as a natural result of the psychology of cognitive development. (Sharan, 2012: 262). Therefore, it allows students to keep thinking of finding solutions or ideas that can strengthen the arguments of their respective groups. This is where the critical power of student thinking occurs.
Although the basic principles of cooperative learning do not change, there are several variations of the model. One of them is an investigation group learning type. The investigation group model is one type of cooperative learning model that uses small groups with a number of members of each group of 4 to 5 students, each member of the heterogeneous group according to their level of achievement, gender, and ethnicity, students choose the topic to be investigated, and investigating selected topics, which they then prepare and present reports to the whole class and end with evaluations and feedback.
Students in the investigation group learning model are required to be more active in developing their attitudes and knowledge in accordance with their respective abilities in constructing their own knowledge. Communication and cooperative interaction between students will achieve the best results if done in small groups so that cooperative attitudes can continue. The investigative group learning model will be more effective if the educator understands an important component in cooperative learning. In addition, in the investigative learning model the educator group only acts as a resource and facilitator. Educators oversee the course of investigative groups as they occur, to see if they can manage their tasks, and help each of the difficulties they face in group interactions, including problems in performance of tasks related to learning. (Slavin, 2009: 217).
The steps of the investigative group learning model are based on cooperative steps consisting of six steps or phases as stated by Sharan et al. (Trianto, 2007: 80)
Critical Thinking Ability
According to Paul and Elder, critical thinking is a way for someone to improve
the quality of the results of thinking using systemic systems of thinking techniques and generate intellectual power in ideas that are initiated (Imron, 2013). Someone who thinks critically will be able to answer important issues well. In addition, it can use abstract ideas to effectively model problem solving. While Stine states that critical thinking is the mental activity of someone in an effort to connect or compare facts, objects, human traits, etc. that can be reached by the brain (Stine, 2003: 119).
According to Ennis in Hassoubah, critical thinking is thinking reasoned and reflective with an emphasis on making decisions about what to believe or do (Hassoubah, 2007: 87). Therefore, indicators of critical thinking ability can be derived from students' critical activities as (a) Looking for clear statements of each question, (b) Looking for reasons, (c) Trying to know information well, (d) Using sources that have credibility and mentioning them, (e) Paying attention to

Proceeding of International Conference of 4th SHIELD 2019
https://pasca.unila.ac.id/seminar-internasional-shield/
ISBN : 978-602-51393-9-0
96
the situation and condition as a whole, (f) Trying to remain relevant to the main idea, (g) Considering original and fundamental interests, (h) Looking for alternatives, (i) Being and thinking open, (j) Taking a position when there is sufficient evidence to do something, (k) seeking as much explanation as possible when possible, (l) Acting systematically and regularly with parts of the whole problem.
Critical thinking, in general requires the ability to think higher than just knowing, understanding, application, analysis, synthesis and evaluation. But these abilities can be trained and developed, which is integrated in learning that allows for the development of that thinking. The ability to think critically is nothing but the ability of students to gather various information and then make an evaluation conclusion from the various information. The process of inference is called critical thinking, which can produce creative thinking. Critical thinking is strongly influenced by the scientific basis, mastery of learning material will enable students to develop science with that critical power.
RESEARCH METHODOLOGY
The method used to carry out this research is an experiment, while the experimental design applied is the treatment design by level 2x2. In this study, the research variables consisted of two independent variables namely the learning method consisting of the investigation group learning method (A1) and the conventional learning method (A2), and the critical thinking ability of students consisted of high critical thinking skills (B1) and low critical thinking skills (B2), and one dependent variable is Y = moodle based learning outcomes. The treatment design by level 2x2 can be illustrated as follows:
critical thinking skills (A) Learning model (A)
High (B1)
Low (B2)
investigation group (A1) A1B1 A1B2
Conventional (A2) A2B1 A2B2
Information: A1B1: Moodle-based learning outcomes for students who are given investigative group learning methods and have high critical thinking skills. A1B2: Moodle-based learning outcomes for students who are given investigative group learning methods and have low critical thinking skills. A2B1: Moodle-based learning outcomes for students who are given conventional learning methods and have high critical thinking skills. A2B2: Moodle-based learning outcomes for students who are given conventional learning methods and have low critical thinking skills.
The subjects of this study were the first semester of FKIP Untirta History Education students consisting of 2 classes, with each class of 40 students. Before being given the learning treatment, students are given a questionnaire to get a student's critical thinking skills score data. The results are then sorted from the highest score to the lowest score. Then divided into 2 groups, namely the high critical thinking ability score group (50%) and the low critical thinking ability score group (50%).

Proceeding of International Conference of 4th SHIELD 2019
https://pasca.unila.ac.id/seminar-internasional-shield/
ISBN : 978-602-51393-9-0
97
The data in this study include data on learning outcomes of kebantenan study subjects taken using moodle-based learning outcomes test instruments in the form of multiple choice and critical thinking skills data taken using a questionnaire instrument with a Likert scale.
Based on the results of testing the validity of the test results the learning outcomes show that out of the 45 test items declared as valid as many as 40 items, the items with moderate difficulty level are 40 items and the power difference with a minimum criteria is quite as many as 40 questions. While the reliability test results show a reliability index of 0.9067, which means the reliability of the questions is very high. Then for the instrument of critical thinking skills from 45 questionnaires tested, the validity test results were declared as many as 40 items. While the reliability calculation shows 0.9278 which means that the reliability of the instrument is very high. Data analysis technique
Hypothesis testing in this study uses a two-way variance analysis technique (Anava 2x2), because the number of n / cells is the same, further test calculations use the Tukey test. Before being analyzed using Anava, the analysis requirements test is first performed, which includes the data normality test and the variance homogeneity test. To see the normality of the data will be used Lilifors test, while to see the homogeneity of variance with the Bartlet test.
RESEARCH RESULTS AND DISCUSSION Based on the calculation of the test requirements analysis, and the results of
the analysis of the calculation shows that the Lmax value for each group is less than the Ltable value. This means that at the 0.05 significance level the null hypothesis (H0) for each group is accepted. All samples come from populations that are normally distributed and have the same variance (homogeneous), then the hypothesis test can then be performed using two-way analysis of variance. Hypothesis testing is done to find out whether there are differences in influence between learning methods, critical thinking skills, and their interactions with moodle-based learning outcomes.
Tukey test results for hypotheses one through four show that Ho is rejected while H1 is accepted. The following table presents a summary of Tuckey's test results:
The group being compared Qhitung Qtabel Conclusion
A1 dan A2 3,20 2,94 Significant
A1B1 dan A2B2 4,75 3,95 Significant
A1B1 dan A2B1 6,34 3,95 Significant
A1B2 dan A2B2 6,82 3,95 Significant
Tuckey test calculation results show, moodle-based learning outcomes given
learning using investigative group learning methods are higher than students who are given conventional learning methods because investigative group learning requires students to be individually responsible with the division of tasks. The results of this study indicate that the existence of learning methods and critical thinking skills can influence student learning outcomes. So it can be concluded that there is an influence of learning methods and critical thinking skills on moodle-based learning outcomes. For students who have high critical thinking ability categories, the results of moodle-based learning provided by investigative group learning methods are better than students who are given conventional learning methods. This is because the learning methods of the investigation group and the work on moodle-based questions are more demanding for

Proceeding of International Conference of 4th SHIELD 2019
https://pasca.unila.ac.id/seminar-internasional-shield/
ISBN : 978-602-51393-9-0
98
students' critical thinking skills. For students who have low critical thinking abilities, the results of moodle-based learning provided learning using investigative group learning methods are lower than students who are given conventional learning methods. This is because the learning methods of the investigation group and the working of moodle-based questions are more demanding of the ability to think critically students so that every student with low critical thinking skills is unable to absorb lessons and is difficult in working on e-learning based problems.
CONCLUSIONS AND RECOMMENDATIONS
Based on the results of calculations on the research hypothesis testing it can be concluded that: 1. the results of the study show that the results of moodle-based learning
provided by the investigation group learning methods are higher than students who are given conventional learning methods.
2. there is an interaction effect between learning methods and critical thinking skills on moodle-based learning outcomes.
3. the results of the study show the results of moodle-based learning that have high critical thinking skills and are given higher learning using group investigation methods than students who are given conventional methods.
4. the results of the study show the results of moodle-based learning that have low critical thinking skills and are given learning using the investigation group method no higher than given the conventional method.
After paying attention to the conclusions of the research results, the researcher gives several recommendations: 1. in learning, educators can use investigative group learning methods and
conventional learning methods. 2. in the use of investigative group learning methods and conventional learning
methods, educators should pay attention to the level of critical thinking skills of students in an effort to improve student learning outcomes.
3. educators should be able to choose appropriate learning methods and in accordance with the characteristics of students so that effective and efficient learning will be created which will ultimately have implications for increasing student learning outcomes.
4. Measuring learning outcomes can also utilize moodle-based e-learning.
REFERENCES
Barry, K and King, L. 2004. Beginning Teaching, A development Text for Effective Teaching. New York : Social Science Press.
Cole, J. and Foster, H. 2008. Using Moodle. San Fransico: O‟Reilly Media. Hardini and Puspitasari. 2012. Startegi Pembelajaran Terpadu: Teori, Konsepdan
Implementasi. Yogyakarta: Familia. Hartono. 2012. PAIKEM: Pembelajaran AktifInovatif Kreatif Efektif dan
Menyenangkan. Riau: Zanafa Publishing. Nashar. 2015. Pengaruh metode pembelajaran dan kemampuan berpikir kritis
terhadap hasil belajar mahasiswa. Jurnal Candrasangkala. Neil, Moore, B. and Parker, R. 2010. Critikal Thinking Evaluating and
Argumentsin Everyday Life. California State University. California: Mayfield Publishing Company.
Psycharis, S., Chalatzoglidis, G., and Kalogiannakis, M. 2013. Moodle as a learning environment in promoting conceptual understanding for secondary

Proceeding of International Conference of 4th SHIELD 2019
https://pasca.unila.ac.id/seminar-internasional-shield/
ISBN : 978-602-51393-9-0
99
school students. Eurasia Journal of Mathematics, Science and Technology Education, 9(1), 11–21.
Sharan, S. 2012. Handbook Of Cooperative Learning, terjemahan Sigit Prawoto. Yogyakarta: Familia.
Sheshasaayee, A. and Bee, M.N. 2017. Evaluating user experience in moodle learning management systems. IEEE International Conference on Innovative Mechanisms for Industry Applications, ICIMIA 2017 - Proceedings, (Icimia): 735–738.
Slavin, R.E. 2009. Cooperative Learning: Teori, Riset dan Praktek, terjemahan Nurulita. Bandung: Nusa Media.
Stine, J.M. 2003. Mengoptimalkan Daya Berpikir. Jakarta: Delaparsa. Sugiyono. 2010. Metode Penelitian Pendidikan: Pendekatan Kuantitatif,
Kualitatifdan R&D, Bandung: Alfabeta. Suprijono, A. 2012. Cooperative Learning: Teoridan Aplikasi PAIKEM.
Yogyakarta: Pustaka Pelajar. Trianto. 2007. Inovasi-Inovasi dalam Pembelajaran Kreatif. Jakarta: Rineka
Cipta. Wilcox, L. 2012. Psikologi Kepribadian, terjemahan Kumalahudi P. Jogjakarta:
IRCiSoD.

Proceeding of International Conference of 4th SHIELD 2019
https://pasca.unila.ac.id/seminar-internasional-shield/
ISBN : 978-602-51393-9-0
100
CYBERCRIME POLICIES: JURIDIC EVIDENCE AND LAW ENFORCEMENT POLICIES
1Dwi Nurahman, 2Destoprani Brajannoto
1Law Faculty, University of Lampung, Indonesia 2Language Education, State University of Jakarta, Indonesia [email protected]; [email protected]
ABSTRACT
This Study is oriented to find out how the legal aspects of Cybercrime Proving and law enforcement policies against cybercrime. This Study uses the method of Sociological Law Research (socio-legal research). Based on the results of the study it can be seen that: the legal aspects of Cybercrime Proving have been firmly regulated in several laws and regulations in positive law in Indonesia, namely: Indonesian Criminal Procedure Code, Law Number 19 of 2016 concerning Amendments to Law Number 11 Year 2008 concerning in Information and Electronic Transactions, Decision of the Constitutional Court Number 20/PUU-XIV/2016 and so on. Provisions regarding cybercrime are also regulated in international regulationsnamely the 2001 Convention on Cybercrime initiated by the European Union. The European Council Convention as the Protection of Human Rights and the 1966 United Nations Covenant on Political and Civil Rights in overcoming cybercrime, without reducing the opportunity for each individual to continue to develop their creativity in developing information technology. The policy of law enforcement against cybercrimeis carried out with an approach that is both penal and non-penal. Seen from the perspective of criminal policy, cybercrime prevention efforts certainly cannot be done partially with criminal law (penal), but must also be taken with an integral/systemic approach or a preventative approach (non-penal). Keywords: Crime, cybercrime, proof, law enforcement
INTRODUCTION
The rapid development of telecommunications and computer technology has resulted in a multifunctional internet. This development brings us to the threshold of the fourth revolution in the history of human thought when viewed from the construction of human knowledge which is characterized by a way of thinking without limits. Technological acceleration is increasing which is the cause of ongoing material changes in all interactions and activities of the information society.
Technological advances have brought about rapid change and movement in unlimited life. Utilization of this technology has driven rapid business growth because the various information provided through long-distance relationships and those who want to do transactions do not have to meet progress, will be quite adequate through computer and telecommunications equipment. The development of information technology also makes a new world society that is no longer obstructed by territorial boundaries and has turned everything far away so that the imaginary near becomes real. But behind that progress, it has also produced new concerns with sophisticated conversation in the form of cybercrime.
The current era was born a new legal regime known as cyberlaw or telematics law. Cyberlaw is internationally used for legal terms related to the use of information and communication technology. Likewise, telematics law which is an

Proceeding of International Conference of 4th SHIELD 2019
https://pasca.unila.ac.id/seminar-internasional-shield/
ISBN : 978-602-51393-9-0
101
embodiment of the convergence of telecommunications law, media law, and information technology law (law of information technology), virtual world law, and Mayantara law. wider. Human activities that were originally national in nature have changed to become international. So, it is only natural that cybercrime is included in the types of crimes that are international in nature based on the United Nations Convention Against Transnational Organized Crime (Palermo Convention) November 2000 and based on the ASEAN Declaration of December 20, 1997, in Manila. documentary evidence) that does not meet the provisions of the Indonesian criminal law system.
Efforts to ensnare Mayantara (cybercrime) criminals must continue, efforts to expand evidence into solutions to enforce the law. Evidence of Mayantara crime in the Indonesian criminal justice system has become an important topic, especially with the enactment of Law Number 19 of 2016 concerning Amendment to Law Number 11 of 2008 concerning Information and Electronic Transactions. In this law, there is an expansion of evidence of what is stipulated in the Criminal Procedure Code. Proof regulations must be based on systems and principles of proof of criminal procedural law that apply in Indonesia. It can be seen that Mayantara (cybercrime) knows no boundaries and times of events because victims and perpetrators are often in various countries. All actions can be carried out only from computers that have internet access without fear of being known by others/witnesses, so this crime is included in transnational /inter-state crime whose disclosure often involves law enforcement in more than one country.
Observing this matter, it can be agreed that cybercrime has a different character from general crime both in terms of the perpetrators, victims, modus operandi and the crime scene. evidentiary systems in the current era of information technology face great challenges and need serious handling, especially in efforts to eradicate crime in cyberspace (cybercrime). To be able to conduct in-depth discussions on this issue it is necessary to conduct in-depth research to provide a clear picture in terms of proving Mayantara crime (cybercrime) both regulated in Indonesian criminal procedure law and the verification and study of the jurisdiction in the transnational sphere.
LITERATURE REVIEW AND HYPOTHESIS DEVELOPMENT
In general, what is meant by computer crime or cybercrime is "efforts to enter and or use computer facilities or computer networks without permission and against the law with or without causing changes and or damage to computer facilities that are entered or used”. many new types of crimes that are not only transnational but also manifest in virtual actions have made the international community aware of the need for new international legal instruments that can be used as international legal norms in dealing with cybercrime cases (crimes in the virtual world).
Crimes related to computers are all forms of crime directed against computers, computer networks and their users, and traditional forms of crime that use or with the help of computer equipment. The crime is divided into two categories namely cybercrime in the narrow sense and the broad sense. Cybercrime in the narrow sense is a crime against a computer system, whereas cybercrime in a broad sense covers crimes against a computer system or network and crimes that use computer facilities.
The theory used in this study is the theory of law enforcement. The next hypothesis in scientific writing is this: the legal aspects of Cybercrime Proving have been firmly regulated in several laws and regulations in positive law in Indonesia, namely: Indonesian Criminal Procedure Code, Law Number 19 of 2016 concerning Amendments to Laws Law No. 11/2008 concerning Information

Proceeding of International Conference of 4th SHIELD 2019
https://pasca.unila.ac.id/seminar-internasional-shield/
ISBN : 978-602-51393-9-0
102
and Electronic Transactions and so on. Provisions regarding cybercrime are also regulated in international regulations (Convention on Cybercrime) namely the 2001 Convention on cybercrime initiated by the European Union. The policy of law enforcement against cybercrime is carried out with an approach that is both penal and non-penal.
RESEARCH METHOD
This study uses the method of Sociological Law Research (socio-legal research). Sociological Law Research (sociolegal research) is a research that focuses on the law as Norms (rules) and thus is positive legal research. This study aims to describe the reality in accordance with the phenomenon in detail and thoroughly, as well as collecting data from a natural setting by utilizing the researcher as a key instrument as a peeler of the problem to be studied. Scientific writing uses a qualitative approach as a research process that produces descriptive data in the form of observed written or oral data.
DISCUSSION AND ANALYSIS
Legal Aspects of Cybercrime Proving
An important substance regulated in Act Number 19 of 2016 concerning Amendment to Act Number 11 of 2008 concerning Information and Electronic Transactions is regarding the regulation of electronic transactions and concerning cybercrime. Material Law Number 19 of 2016 concerning Amendments to Law Number 11 of 2008 concerning Information and Electronic Transactions is an implementation of several principles of international provisions. Law Number 19 of 2016 concerning Amendments to Law Number 11 of 2008 concerning Information and Electronic Transactions contains prohibited acts in Article 27 to Article 36. Provisions of Article 42 of Law Number 19 of 2016 concerning Amendments to Laws Number 11 of 2008 concerning Information and Electronic Transactions also regulates the provisions of the investigation, namely: "the investigation referred to in this law is conducted based on the provisions in the Criminal Procedure Code and the provisions in this law".
Therefore, the system of evidence adopted is a system/theory of evidence based on the law in a negative manner, that is the system adopted in the Criminal Procedure Code and based on Article 183 of the Criminal Procedure Code, which states: "Judges must not impose a crime on someone unless with at least two legal pieces of evidence he gained the conviction that a crime had actually taken place and that the defendant was guilty of it ”. Thus, it means that the evidence must be based on the provisions of the law, namely the legal evidence set out in Article 184 of the Criminal Procedure Code accompanied by the judge's conviction obtained from the evidence.
Here are some of the evidence set out in Article 184 of the Criminal Procedure Code as a reference in proving Mayantara crime (cybercrime), namely:
1. Witness testimony
Formal requirements for witness statements set out in the Criminal Procedure Code, among others, are stated at court and an oath or appointment is taken before the witness gives a statement. Whereas the material requirements for witness testimonies include: a. the information given is about the event that he heard, saw, and experienced
himself by stating the reason for his knowledge;

Proceeding of International Conference of 4th SHIELD 2019
https://pasca.unila.ac.id/seminar-internasional-shield/
ISBN : 978-602-51393-9-0
103
b. not opinions, inventions or expert statements; c. there is more than one witness following the principle of unus testis nullus
testis; d. not the information he obtained from other people (testimonium de auditu); e. there is a match between one witness's testimony with another and one
witness's information with other evidence. In the case of cybercrime, due to its virtual nature, evidence using witness
statements cannot be obtained directly. Witness statements can only be in the form of the results of conversations or only hear other people. This testimony is known as testimonium de auditum or hearsay evidence, although this kind of testimony is not used as evidence, in practice, it can still be used as consideration for the judge to strengthen his conviction before making a decision. The possibility that can be used as witness testimony is through the results of interactions in the cyber world, such as chatting and e-mail between internet users, or also through the information of a certified computer system administrator. 2. Expert statements
In Article 186 of the Criminal Procedure Code, the formal conditions of expert testimony are stipulated that the expert statement is what an expert declares in a court hearing. The so-called experts are judicial medicine experts and other experts. The expert's statement becomes significant if the prosecutor submits electronic evidence to prove the culprit of cybercrime. The role of expert statements here is to provide an explanation in court that the electronic documents/data submitted are legal and can be legally accounted for.
3. Letter of evidence (Article 184 letter c and Article 187 of the Criminal Procedure Code) Types of letters recognized based on evidence are letters made on oath of
office or strengthened with an oath as stated in Article 187 of the Criminal Procedure Code. "Letters" in the case of cybercrime have changed from their written form to unwritten and online. There are two categories of evidence in a computer that has been certified. First, if a computer system has been certified by an authorized body, then the results of the computer print-out can be trusted for authenticity. For example, receipts issued by a bank in an ATM transaction. This evidence has the power of proof, although further trials are needed in the trial. Secondly, proof of certification from the authorized body can be categorized as documentary evidence, because it was made by and or an authorized official. Other types of evidence can be in the form of electronic evidence that can be printed or printed out and letters posted on the monitor screen of a computer network. As long as both of this evidence are issued/made by the authorities in a computer network system and a computer network system can be trusted, then the letter has the same evidentiary power as the documentary evidence as specified in the Criminal Procedure Code.
4. Proof of evidence (Article 184 (1) letter d and Article 188 of the Criminal
Procedure Code) The Criminal Procedure Code sets limits in terms of the source of instructions,
namely that instructions can only be obtained from witness statements, letters, and statements of the accused. To be used as a source of guidance, all three

Proceeding of International Conference of 4th SHIELD 2019
https://pasca.unila.ac.id/seminar-internasional-shield/
ISBN : 978-602-51393-9-0
104
pieces of evidence must be valid, and therefore, the instructions produced will also be valid.
In cybercrime, physical evidence collection is difficult to fulfill. The easiest way to gather evidence is to look for clues that indicate the existence of an evil intention in the form of unauthorized access. For example, by seeing and listening to witness testimony in court, or electronic mail or print out of data, or also from the defendant's statement in court. 5. Defendant's statement (Article 184 letter e and Article 189 of the Criminal
Procedure Code)
The defendant's statement is what the defendant stated in court about the actions that he did or which he knew or experienced himself. For the defendant's statement to be declared valid, the formal requirements that are stated at the hearing and the material requirements of the information about the actions the defendant did or knew or experienced himself must be fulfilled.
The provisions of Article 5 paragraphs (1) and (2) of Law Number 19 of 2016 concerning Amendments to Law Number 11 of 2008 concerning Electronic Information and Transactions describe that Electronic Documents and Electronic Information are valid evidence. In addition to article 44 the same law says: "Evidence of investigation, prosecution and examination in court according to the provisions of this law is as follows: a. evidence as referred to in statutory provisions; b. other evidence in the form of Electronic Information and/or Electronic
Documents as referred to in Article 1 number 1 and number 4 and Article 5 paragraph (1), paragraph (2), and paragraph (3). Electronic Information and Electronic Documents can be used as valid
evidence according to the law on Information Technology and Electronic Transactions, although it is difficult to be classified as valid evidence as referred to in Article 184 paragraph (1) of the Indonesian Criminal Procedure Code. Electronic Information and/or Electronic Documents are declared valid if using Electronic Systems under the provisions stipulated in Act Number 19 of 2016 concerning Amendments to Act Number 11 of 2008 concerning Electronic Information and Transactions.
Post Constitutional Court Decision Number 20/PUU-XIV/2016 related to Article about Article 5 paragraph (1) and paragraph (2) and Article 44 letter b of Law Number 19 of 2016 concerning Amendment to Law Number 11 of 2008 concerning Information and Electronic Transactions, it is necessary to reorganize the position of electronic evidence and its acquisition procedures in the Indonesian criminal justice system. The Constitutional Court has stated the phrase "electronic information and/or electronic documents" in the above provisions contrary to the 1945 Constitution. The Constitutional Court then changes the phrase to "Specifically Electronic Information and/or electronic documents as evidence carried out in the context of law enforcement at the request of the police, prosecutors and / or other law enforcement institutions determined under the law as determined in Article 31 paragraph ( 3) Law Number 19 of 2016 concerning Amendment to Law Number 11 of 2008 concerning Information and Electronic Transactions ”
Provisions of Article 5 of Law Number 19 of 2016 concerning Amendments to Law Number 11 of 2008 concerning Information and Electronic Transactions:
1) Specifically Electronic Information and/or electronic documents as evidence is
carried out in the context of law enforcement at the request of the police, prosecutors and/or other law enforcement institutions determined based on
Proceeding of International Conference of 4th SHIELD 2019
https://pasca.unila.ac.id/seminar-internasional-shield/
ISBN : 978-602-51393-9-0
105
the law as determined in Article 31 paragraph (3) of Law Number 19 of 2016 concerning Amendments to Law Number 11 Year 2008 concerning Information and Electronic Transactions and / or printouts are legal proofs.
2) Specifically Electronic Information and/or electronic documents as evidence is carried out in the context of law enforcement at the request of the police, prosecutors and/or other law enforcement institutions determined based on the law as specified in Article 31 paragraph (3) of Law Number 19 of 2016 concerning Amendment to Law Number 11 of 2008 concerning Information and Electronic Transactions and / or printouts as referred to in paragraph (1) is an extension of valid evidence in accordance with the applicable Procedure Law in Indonesia. The provisions of Article 44 of Law Number 19 Year 2016 concerning
Amendments to Law Number 11 of 2008 concerning Information and Electronic Transactions states that the evidence of investigation, prosecution and examination in court according to the provisions of this Law is "other evidence in the form of Information Specifically Electronic and/or electronic documents as evidence are carried out in the context of law enforcement at the request of the police, prosecutors and/or other law enforcement institutions determined based on the law as determined in Article 31 paragraph (3) of Law Number 11 the Year 2008 concerning information and Electronic Transactions referred to in Article 1 number 1 and number 4 and Article 5 paragraph (1), paragraph (2) and paragraph (3) ”.
Decision of the Constitutional Court to change the status of electronic information and electronic documents in criminal law enforcement which consequently makes all electronic information / electronic documents that can become evidence must be obtained based on procedures in accordance with article 31 paragraph (3) of Law Number 19 the Year 2016 concerning Amendments to Law Number 11 the Year 2008 concerning Information and Electronic Transactions, beyond that electronic information / electronic documents are not allowed as evidence.
Law Enforcement Policy Against Cybercrime
1. Penal Approach
Judging from the criminal policy (crime prevention policy), criminal law is not a primary/strategic policy tool. A fundamental/strategic policy is to prevent and eliminate the causes or conditions that cause crime. Seen from the perspective of criminal policy, efforts to tackle crime (including combating cybercrime) certainly cannot be done partially with criminal law (a means of punishment), but must also be taken with an integral/systemic approach. As one form of high-tech crime, it is natural that cybercrime prevention efforts must also be pursued with technology (techno prevention). Besides that, a cultural/cultural, moral/educational, and even global (international cooperation) approach is needed because cybercrime can transcend national boundaries (transnational/transborder nature).
In an effort or policy to tackle cybercrime with criminal law, a workshop on "computer-related crimes" held at the UN Congress X in 2000 stated that member states should try to harmonize the provisions relating to criminalization, verification, and procedure. So the problem is not only how to make criminal law policies (criminalization policies, formulations, and legislation) in the field of dealing with cybercrime, but how there is harmonization of criminal policies in various countries. This means that the criminalization policy on the problem of

Proceeding of International Conference of 4th SHIELD 2019
https://pasca.unila.ac.id/seminar-internasional-shield/
ISBN : 978-602-51393-9-0
106
cybercrime is not only a matter of national policy (Indonesia) but also related to regional and international policies.
Criminalization policy is a policy in determining an act that was not a criminal offense (not convicted) into a criminal act (an act that can be convicted). So in essence, the criminalization policy is part of a criminal policy using the means of criminal law (penal), and therefore includes part of the "criminal law policy" (penal policy), especially the formulation policy.
2. Non-Penal Approach
The non-penal approach according to Hoefnagels is the crime prevention approach without the use of punishment without prevention, which includes community planning mental health, national mental health, social worker and child welfare, and the use of civil and administrative law. The "non-penal" crime prevention policy is more a precautionary measure before the crime. Therefore, the main goal is to deal with the factors that are conducive to the occurrence of crime which is centered on social problems or conditions which can directly or indirectly cause or foster crime. Thus seen from the crime prevention policy, these non-criminal businesses have a strategic position and play a key role that must be intensified and made effective.
Mayantara crime (cybercrime) requires global action in its response, considering that these crimes are often transnational in nature. Some important steps that must be taken by each country in dealing with cybercrime are:
a. Modernizing the national criminal law and its procedural law, harmonized with
international conventions related to the crime. b. Improve national computer network security systems according to international
standards. c. Increase the understanding and expertise of law enforcement officials
regarding efforts to prevent, investigate, and prosecute cases relating to cybercrime.
d. Increase citizen awareness about cybercrime issues and the importance of preventing these crimes from happening.
e. Increasing cooperation between countries, whether bilateral, regional and multilateral, in efforts to deal with cybercrime, including through extradition agreements and mutual assistance treaty.
f. Harmonization of the issue of jurisdiction to uphold state sovereignty that applies because it is transnational.
CONCLUSION
1. The legal aspects of proving cybercrimehave been firmly regulated in several laws and regulations in positive law in Indonesia, namely: Indonesian Criminal Procedure Code, Law Number 19 of 2016 concerning Amendments to Law Number 11 of 2008 concerning Information and Electronic Transactions, Decision of the Constitutional Court Number 20/PUU-XIV/2016 and so on. Provisions regarding cybercrime are also regulated in international regulationsnamely the 2001 Convention on Cybercrime initiated by the European Union. The European Council Convention as the Protection of Human Rights and the 1966 United Nations Covenant on Political and Civil Rights in overcoming cybercrime, without reducing the opportunity for each individual to continue to develop their creativity in developing information technology.

Proceeding of International Conference of 4th SHIELD 2019
https://pasca.unila.ac.id/seminar-internasional-shield/
ISBN : 978-602-51393-9-0
107
2. Law enforcement policies against cybercrime are carried out with a penal and non-penal approach. Penal can be in the form of criminalization to streamline positive laws related to cybercrime. Non-Penal, in the form of an approach to prevent the occurrence of Mayantara (cybercrime) crimes, such as increasing the knowledge of law enforcement officers about technology and information, increasing facilities and infrastructures in proving efforts, and increasing international cooperation.
ACKNOWLEDGEMENT
This research can be done well thanks to the facilities provided by the government of the Republic of Indonesia through Lampung University. Therefore, we would like to thank all speakers at the 2019 SHIELD International Conference, University of Lampung.
REFERENCES
Barda, N.A. 2006. Tindak Pidana Mayantara : Perkembangan Cyber Crime di Indonesia.Jakarta: RajaGrafindo Persada.
Lagazio, M., Sherif, N., and Cushman, M. 2016. A Multi-level Approach to Understanding the Impact of Cyber Crime on the Financial Sector, Computers & Security. doi: 10.1016/ j.cose.2014.05.006
Mansur, Arief, D.M., dan Gultom, E. 2005. Cyber Law – Aspek Hukum Teknologi Informasi. Bandung: Refika Aditama.
Mulyadi, M. 2008. Criminal Policy Pendekatan Integral Penal Policy dan Non-Penal Policy dalam Penanggulangan Kejahatan Kekerasan. Medan: Pustaka Bangsa Press.
Nitibaskara, and Rachman, R. 2009. Perangkap Penyimpangan dan Kejahatan. Jakarta: YPKIK.
Suhariyanto, B. 2012. Tindak Pidana Teknologi Informasi (Cybercrime). Jakarta: , Raja Grafindo Persada.
Suseno, S. 2012. Yurisdiksi Tindak Pidana Siber. Bandung: Refika Aditama. Undang-Undang Nomor 19 Tahun 2016 tentang Perubahan atas Undang-
Undang Nomor 11 Tahun 2008 tentang Informasi dan Transaksi Elektronik. Wahid, A. and Labib, M. 2005. Kejahatan Mayantara. Bandung: Refika Aditama. Widodo. 2013. Aspek Hukum Pidana Kejahatan Mayantara. Yogyakarta: Aswaja
Pressindo.

Proceeding of International Conference of 4th SHIELD 2019
https://pasca.unila.ac.id/seminar-internasional-shield/
ISBN : 978-602-51393-9-0
108
ROADMAPPING LOCAL REGULATION REQUIREMENT TO SUPPORT THE DEVELOPMENT OF A SUSTAINABLE TOURISM INDUSTRY
Candra Perbawati1, Malicia Evendia2 , and Ahmad Saleh3
Faculty of Law, University of Lampung, Indonesia
ABSTRACT
This study aims to analyze the local legal needs in order to encourage the development of a sustainable tourism industry. The huge potential of the tourism industry in Indonesia requires the role of local governments to ensure its sustainability. Using the method of doctrinal legal research with a conceptual and statute approach, the results of this study indicate that: Roadmapping of local legal requirements for the development of a sustainable tourism industry is sourced from the local authority of the local government legal regime regulated in Law No. 23 of 2014 concerning Local Government and the tourism sectoral legal regime regulated in Law no. 10 of 2009 concerning Tourism. At least there are local regulations needed in the framework of sustainable tourism industry development, namely Local Regulations on Local Tourism Development Master Plans (RIPPDA), Local Regulations on Industrial Development Plans, Local Regulations on Licensing for Tourism Businesses, Local Regulations on Preservation of Local Culture, Local Regulations concerning Development of Creative Economy and Local Regulations on the Protection of Cultural Heritage. The Local Government and DPRD need to prioritize the formation of these local regulations in their local regulation formation program. Keywords: Tourism Industry, sustainable development, local government, regulation.
INTRODUCTION
Tourism is a sector that is very potential for foreign exchange earnings and local income, besides the development of the tourism sector is also shown as an alternative in economic development. Tourism development as part of national development has the aim of, inter alia, expanding business and employment opportunities. In line with the stages of national development, the implementation of national tourism development is carried out in a comprehensive, balanced, gradual, and sustainable manner. It seems clear that development in the field of tourism has the ultimate goal of increasing people's income, which in turn can improve people's welfare.26
Tourism is included in the national development program in Indonesia as one of the economic development sectors. 27 Therefore, tourism development in Indonesia needs to be increased. Through tourism, the government is trying to increase the country's income or foreign exchange, especially with the influx of foreign tourists.
Tourism is a new style industry that is able to spur rapid economic growth in terms of employment opportunities, incomes, living standards, and in activating other sectors in tourist recipient countries. In addition, tourism as a complex
26
Harry Waluyo (et al), Dukungan Budaya Terhadap Perkembangan Ekonomi (Jakarta:
Departemen Pendidikan dan Kebudayaan, 1993), Pg. 30. 27
Selo Soemardjan, Pariwisata dan Kebudayaan, dalam Prisma No. 1 Tahun III Feb 1974, Pg. 56.

Proceeding of International Conference of 4th SHIELD 2019
https://pasca.unila.ac.id/seminar-internasional-shield/
ISBN : 978-602-51393-9-0
109
sector, is able to revive other sectors including industries such as the handicraft industry, souvenir industry, lodging, and transportation.28 It is stated that tourism as a service industry which is classified as the third industry is quite an important role in establishing policies regarding employment opportunities, citing the increasingly pressing demands for permanent employment opportunities in connection with the always increasing tourism in the future.29
With the enactment of local autonomy where the government gives authority to the regions to take care of their own households, then in the framework of accelerating development, it must be utilized to the maximum extent possible by the local government to develop the potential of the region including tourism potential that can be used as one of the potential has the opportunity to bring in Local Original Revenue and economic growth in the local community.
Good and sustainable tourism management should be able to provide opportunities for economic growth in a tourism destination. One of the elements in the development of local autonomy is the tourism sector. In accordance with the principle of local autonomy in force, the development of tourism is also part of the process of developing autonomous regions. It is expected that the development of tourism can have an impact on the region, namely through increasing local revenue.
Therefore, whether or not the development and implementation of tourism is highly dependent on the policies set by the Government as outlined in various regulations in the field of tourism, both the regulations relating to aspects of government administration (directing or controlling activities protect certain objects, prevent danger to the environment, etc.) as well as those related to economic or business aspects (trade in tourism services).
As mandated in Law Number 10 of 2009 concerning Tourism as the legal basis for tourism development, it is stated in Article 18 that "the Government and/or Local Governments regulate and manage tourism affairs in accordance with the provisions of the legislation. Besides that, in Article 12 paragraph (3) of Law Number 23 of 2014 concerning Local Government also stipulates that one of the matters of concurrent government affairs includes tourism. The above provisions contain that there is local government authority in the aspect of tourism. Thus, in order to encourage the development of a sustainable tourism industry, the initial step that needs to be taken is to conduct a roadmap in what local legal needs are needed to support this.
LITERATURE REVIEW AND HYPOTHESIS DEVELOPMENT
Tourism is things related to tourism which in English is called "tourism". The term "tourism" includes people who travel away from their homes and companies that serve them by surfing or making their trips easier or more enjoyable.30 The definition of tourism according to Yoeti is a trip that is carried out for a while, which is organized from one place to another, with the intention not to try or make a living at the place visited but solely to enjoy life's journey for sightseeing and recreation or to meet diverse desires.31
Tourism needs to be developed on the grounds that tourism development in a particular region depends on policy makers through research or study of all
28
Salah Wahab, Manajemen Kepariwisataan Terjemahan Frans Gromang (Jakarta: PT Pradnya
Paramita, 1976), Pg. 5. 29
James J. Spillane, Ekonomi Pariwisata: Sejarah dan Prospeknya (Yogyakarta: Kanisius,1993),
Pg. 47. 30
Sofjan Jusuf, Ekonomi Pariwisata, (Jakarta: Gramedia Pustaka, 1997), hlm. 4 31
Oka A. Yoeti, Perencanaan Dan Pengembangan Pariwisata, Jakarta: PT. Pradnya Paramita,
hlm. 108

Proceeding of International Conference of 4th SHIELD 2019
https://pasca.unila.ac.id/seminar-internasional-shield/
ISBN : 978-602-51393-9-0
110
aspects related to tourism. Starting from the potential of the area, the living habits of the people around him, the beliefs held, up to the behavior or habits of tourists who are planned to be drawn to visit the area. 32
The development of tourism in a tourist destination is very closely related to the economic development of a region or country. Tourism development will always take into account the benefits and benefits for many people. Terminology of tourism development according to James J. Spillane. 33 Namely: "tourism development in a tourist destination area either locally, locally or national scope in a country is very closely related to the economic development of the region or country. In other words, the development of tourism in a tourist destination will always be taken into account with the benefits and benefits for many people." The development of the tourism industry brings a lot of influence, especially the economic influence in terms of providing employment.
According to Suzanna Ratih Sari, 34 the role of organizing tourism in development is as one of the sectors that the central/local government relies on to get non-oil and gas income and to create and expand business fields, increase community income, encourage environmental preservation, encourage preservation and development of the nation's culture and encourage local development. The multipurpose impact of tourism, the growth of the tourism industry not only raises a good role in the survival of the community, but at the same time gives rise to unfavorable impacts, especially in terms of nature conservation and environmental pollution.
The implementation of tourism from the sociological aspect, namely to provide clarity that tourism is not only related to economic problems but is closely related to aspects that arise, including social, cultural, environmental, political, and security aspects. Even tourism has become a prime-mover in socio-cultural changes in various regions. The tourism sector can develop rapidly along with advances in transportation and communication technology, increasing prosperity, changing lifestyles, and increasing holidays or free time. The great potential of natural wealth in Indonesia is potential capital to attract tourists.
The approach of organizing tourism is an economic approach, as a knife for analyzing problems that are part of the history, social, economy, which has a role in improving the standard of living and welfare of the community. Socio-economic life is social life that is influenced by economic factors and must be fulfilled so that people can live and carry on life. 35
The economic phenomenon in the administration of tourism is a tool to achieve economic goals. As expressed by A. Hari Karyono, 36 the macro described the development of the implementation of tourism can have a positive impact that is increasing local real income and income of the community around the tourist destination and increasing demand for local results.
It cannot be denied that one of the important part of economic development is development in the industrial field. Development as a process of realizing prosperity, one of which is through accelerating the economy has a very close relationship with the law. De Soto in his book Mystery of Capital stated the
32
Ibid. 33
James J. Spillane, Ekonomi Pariwisata: Sejarah dan Prospeknya, (Yogyakarta: Penerbit
Kanisius, 1987). 34
Suzanna Ratih Sari, Peran Pariwisata Dalam Pembangunan (Semarang: Badan Penerbit
Universitas Diponegoro, 2003). 35
Rusian H. Prawira, Ekonomi Sumber Daya, (Bandung: Alumni, 1980), Pg. 7. 36
Hari Karyono, Kepariwisataan (Jakarta: Gramedia, 1997), Pg. 10.

Proceeding of International Conference of 4th SHIELD 2019
https://pasca.unila.ac.id/seminar-internasional-shield/
ISBN : 978-602-51393-9-0
111
important role of legal institutions in the economic success of a country.37 From the legal context, tourism policies at the national level need to be supported by local government legal policies in the form of local regulations that are able to stimulate the development of a sustainable tourism industry.
RESEARCH METHODS
This research is conducted by corridor of doctrinal research which only use secondary data. The legal research model is a comprehensive and analytical study of primary legal materials and secondary legal materials. The problem approach uses statute approach, analytical approach and conceptual approach. The data were analyzed qualitatively by describing the data generated from the research into the form of explanation systematically so as to obtain a clear picture of the problem under study, the results of data analysis deductive concluded.
DISCUSSIONS
In the legal and development framework, the legal product in the form of laws and regulations is one of the inputs in the development planning and implementation. On the other hand, the development plan is a political process whose output is a legal product which is the operational basis for implementing development. In addition, the agreed development plan document will be the basis for establishing political policies in the form of legal products as a legal basis for implementing the development plan. Order and regularity of the development process will only be realized if supported by the existence of legal rules that are responsive to development efforts. Such law can be a means to maintain balance, harmony between various interests in society.38
Thus, law is the basis and guideline for society in their daily lives. For this reason, regions are also given the authority by the constitution directly to create laws to regulate the general public in the form of local regulations. From the legal regime of the local government, Law Number 23 of 2014 concerning Local Government gives authority to the regions to regulate tourism affairs as a concurrent choice matter. From the aspect of the tourism sectoral legal regime, Article 30 of Law Number 10 Year 2009 concerning Tourism also outlines the authority of Regency/City Regions in the Field of Tourism. The authority of the Regency/City Region in the Field of Tourism in the field of tourism is presented comparatively between the legal regimes in table one below. Table 1. Regency/City Local Authority in the Field of Tourism
Regency/City Local Authority
Local Government Regulation Regime Tourism Sector Regulation Regime
Management of regency/city tourist attractions;
Management of regency/city tourism strategic areas;
Management of regency/city tourism destination;
Develop and establish a master plan for regency/city tourism development;
Establish regency/city tourism destinations;
Establish regency/city tourist
37 Hernando De Soto, Mystery of Capital, (Transworld, 2010), sebagaimana dikutip Rudy, Hukum Pemerintahan Daerah Perspektif Konstitusionalisme Indonesia, (Bandar Lampung: Indepth Publishing, 2012), Pg.87 38 Sunaryati Hartono, Politik Hukum Menuju Satu Sistem Hukum Nasional, (Bandung: Alumni,
1991), Pg. 30.

Proceeding of International Conference of 4th SHIELD 2019
https://pasca.unila.ac.id/seminar-internasional-shield/
ISBN : 978-602-51393-9-0
112
Determination of regency/city tourism business registration marks;
Marketing of domestic and foreign tourism attractions, destinations and strategic regencies/cities tourism;
Providing infrastructure (creative zone/creative space/creative city) as a space for expression, promotion and interaction for creative people in the regency/city area;
Implementation of capacity building for tourism and creative economy at the basic level.
attractions; Carry out registration,
registration, and data collection of tourism business registration;
Organize tourism management and management in the region;
Facilitating and promoting tourism destinations and tourism products in their regions;
Facilitating the development of new tourist attractions;
Organizing tourism training and research within the regency/city scope;
Maintain and preserve tourist attractions in the region;
Organizing community-aware tourist guidance; and
Allocate the tourism budget.
Based on table one, according to Bagir Manan, in law the authority also
means rights and obligations (rechten en plichten).39 The authority will give birth to governmental actions. For this reason, it is also necessary to explain the deeds of government (bestuurhandeling). Government actions are material actions and legal actions carried out by the authorities in carrying out the functions of government. According to Van Vollenhoven, government actions are spontaneous actions on their own initiative in dealing with circumstances and needs that arise without waiting for orders from superiors, and for their own responsibilities in the public interest.40
In order to guarantee and provide a legal basis that the governmental act (bestuurhendeling)41 carried out by the government as an act that is legitimate and justified, can be accountable and responsible and liable, then every government action must be based on law fair, dignified and democratic.42 The legal basis in this context is local regulations that are part of the laws and regulations.
Based on the comparison of table one, roadmapping of local legal needs so that the development of a sustainable tourism industry development comes from the local authority of the local government legal regime regulated in Law No. 23 of 2014 concerning Local Government and the tourism sectoral legal regime
39
Bagir Manan, Wewenang Provinsi, Kabupaten dan Kota Dalam Rangka Otonomi Daerah,
Makalah pada Seminar Nasional FH UNPAD, 13 mei 2000, hlm. 1-2. Dalam Ridwan HR, Hukum
Administrasi Negara, (Jakarta: PT Raja Grafindo, 2006), Pg. 102.
40 Bewa Ragawino, Hukum Administrasi Negara, Soft File, Pg. 65.
41 There are differences of opinion from the experts on state administration and state
administration on the understanding of the term bestuurhandelingen. Some interpreted it as an act
of government (Kuntjoro Purbopranoto, Djenal Hoesen Koesoemahatmadja and Hadjon) and some
interpreted it as an act of government (E. Utrecht). 42
Winahyu, Peranan Hukum Dalam Pertanggungjawaban Perbuatan Pemerintahan
(Bestuurhandeling) Suatu Kajian Dalam Kebijakan Pembangunan Hukum, Jurisprudence, Vol. 1,
No. 2, September 2004, Pg. 137-157.

Proceeding of International Conference of 4th SHIELD 2019
https://pasca.unila.ac.id/seminar-internasional-shield/
ISBN : 978-602-51393-9-0
113
regulated in Law no. 10 of 2009 concerning Tourism. Local regulations needed in the framework of sustainable tourism industry development are Local Regulations on Local Tourism Development Master Plans (RIPPDA), Local Regulations on Industrial Development Plans, Local Regulations on Licensing for Tourism Businesses, Local Regulations on Preservation of Local Culture, Local Regulations on Economic Development Creative and Local Regulations on the Protection of Cultural Heritage. Roadmapping of the local regulation needs as presented in the following exercise.
Pigure 1. Roadmapping Local Regulation Needs for the Sustainable
Development of the Tourism Industry.
CONCLUSIONS
Based on the previous section, it can be concluded that roadmapping of local legal needs in order to establish a sustainable development of the tourism industry comes from the local authority of the local government legal regime regulated in Law No. 23 of 2014 concerning Local Government and the tourism sectoral legal regime regulated in Law no. 10 of 2009 concerning Tourism. Local regulations needed in the framework of sustainable tourism industry development are Local Regulations on Local Tourism Development Master Plans (RIPPDA), Local Regulations on Industrial Development Plans, Local Regulations on Licensing for Tourism Businesses, Local Regulations on Preservation of Local Culture, Local Regulations on Economic Development Creative and Local Regulations on the Protection of Cultural Heritage.
ACKNOWLEDGEMENTS
This research can be done well thanks to the funds provided by the government of the Republic of Indonesia through a basic research grant scheme at the University of Lampung. We would like to thank for the financial support of this research.
Local Regulations on Local Tourism
Development Master Plans (RIPPDA)
Local Regulations on Licensing for
Tourism Businesses
Peraturan Daerah tentang
Pengembangan Eknomi Kreatif
Local Regulations on Preservation of Local
Culture
Local Regulations on Industrial
Development Plans
Local Regulations on the Protection of Cultural Heritage

Proceeding of International Conference of 4th SHIELD 2019
https://pasca.unila.ac.id/seminar-internasional-shield/
ISBN : 978-602-51393-9-0
114
REFERENCES Bagir, M. 2000. Wewenang provinsi, kabupaten dan kota dalam rangka otonomi
daerah.Makalah pada Seminar Nasional FH UNPAD. 13 mei 2000. Hartono, S. 1991. Politik Hukum Menuju Satu Sistem Hukum Nasional. Bandung:
Alumni. Jusuf, S. 1997. Ekonomi Pariwisata. Jakarta: Gramedia Pustaka. Karyono, H. 1997. Kepariwisataan. Jakarta: Gramedia. Prawira, R.H. 1980. Ekonomi Sumber Daya. Bandung: Alumni. Ridwan, H.R. 2006. Hukum Administrasi Negara. Jakarta: PT Raja Grafindo. Rudy. 2012. Hukum Pemerintahan Daerah Perspektif Konstitusionalisme
Indonesia. Bandar Lampung: Indepth Publishing. Sari, S.R. 2003. Peran Pariwisata Dalam Pembangunan. Semarang: Badan
Penerbit Universitas Diponegoro. Soemardjan, S. 1974. Pariwisata dan kebudayaan. Prisma. 1(3). Soto, H.D. 2010. Mystery of Capital. Transworld. Spillane, J.J. 1993. Ekonomi Pariwisata: Sejarah dan Prospeknya. Yogyakarta:
Kanisius. Wahab, S. 1976. Manajemen Kepariwisataan. Jakarta: PT Pradnya Paramita. Waluyo, H. 1993. Dukungan Budaya Terhadap Perkembangan Ekonomi, Jakarta:
Departemen Pendidikan dan Kebudayaan. Winahyu. 2004. Peranan hukum dalam pertanggungjawaban perbuatan
pemerintahan (bestuur handeling) suatu kajian dalam kebijakan pembangunan hukum. Jurisprudence. 1(2).

Proceeding of International Conference of 4th SHIELD 2019
https://pasca.unila.ac.id/seminar-internasional-shield/
ISBN : 978-602-51393-9-0
115
HOW TO USE A GOOD SMALL WRITE BOARD IN SUPPORTING THE LEARNING PROCESS
Yopi Permana 1 , Sugeng Sutiarso 2
1Master of Mathematics Education Study Program , University of Lampung 2 ,
Indonesia Email: [email protected]
ABSTRACT
The use of whiteboards in the field of education is one of the important things in creating an effective learning process between instructors and students. As a learning media the blackboard is the main means needed by the teacher to be able to help students in learning and achieve the competence of the learning process. Although various new presentation media have been used widely, but the blackboard still has a main function in supporting the learning process in the classroom. This media has long been known as a supporter of the cheapest and easiest classroom learning process. The blackboard is also the most accurate answer in overcoming the problem of the high application of various modern educational technologies. Given the very frequent use of whiteboard media in the learning process, it is necessary to use utilization innovations on the board so that the learning process is more interesting. In this case the author is compelled to use small whiteboard media in the learning process as other supporting tools to develop and explore the whiteboard potential for the achievement of student competencies and skills. Keywords : small blackboard , use of small blackboard, learning process
INTRODUCTION
In making the planning of the learning process, all teachers still mention the use of the blackboard as a medium or learning support tool in the classroom, even this media is permanently installed in every class in all schools. The use of blackboards in the field of education is one of the important things in creating an effective learning process between teachers and students. The intensity of the use of blackboards in supporting the learning process is still greater in portions when compared to other learning media.
The blackboard can be categorized as a learning medium if it is used or used to provide information or is used to explain the lesson material or the blackboard itself functions to provide information to students. Blackboard is a tool commonly used, but the question is how to use the blackboard properly, effectively, and efficiently in explaining lessons in class ( Ray , 2009) .
In the observation of the learning process in class it is seen that the speed of teaching the material seems to be good and in activities the questions and answers really seem to flow and whether it then becomes clear that only a small proportion of students answer the question and some other students do not answer. The small blackboard requires all students to answer some of the questions in the activity, especially those that investigate and assess real understanding. Examples of activities include asking students a question "Do you all understand?" Or even "Who doesn't understand?" Often there is no point with

Proceeding of International Conference of 4th SHIELD 2019
https://pasca.unila.ac.id/seminar-internasional-shield/
ISBN : 978-602-51393-9-0
116
some groups of students . With a small blackboard can provide simple insights into the answers to the two questions without asking them.
LITERATURE REVIEW
Blackboard is the most well-known two-dimensional media and has been used for a long time in various places. The use of blackboards is not only in the school environment, but also in offices and educational institutions. When the blackboard began to be used people could not be known with certainty. For centuries, blackboards have been used for various types of blackboards. Black painted wooden boards need chalk to use them as learning media. In addition to black board, there is also a white board with a smoother surface. White board (white board) requires a marker for the stationery. Today the whiteboard's color is quite varied, not only black and white, but also other colors.
According to Tegeh (2010) that written writing in general has the following functions. The place to write the main points of the teacher's explanation in classical, group and individual learning. Where to write charts, graphs, illustrated drawings, concept maps, etc. to support the teacher's explanation. A place to write a summary of learning material, assignments, practice questions, and test questions. The blackboard can motivate students by giving students the opportunity to work on the board. The blackboard also functions as a place to put graphic media such as charts, foster, pictures, photographs, etc., when the teacher uses the graphic media in explaining a subject matter.
A whiteboard that is used correctly can have several advantages. The advantages of using a blackboard are as follows. Blackboards can be used at all types and levels of education. In the use of blackboards, it is easy for the teacher to monitor the activities of the class. Whiteboard is more economical compared to other board media because it is easy to write and erase again, and can be used repeatedly. If needed, the teacher can prepare the writing or subject matter in advance on the board, then turn it over or cover it with black paper or cloth.
Besides having advantages, the use of a blackboard also has several disadvantages. Activities pe m learning or student difficult to control if the teacher is too long to write on the chalkboard dust chalk can contaminate the environment and when inhaled by the teacher and student can be detrimental to health, writing teacher who is not good to give less favorable impact, both teachers and student. A good blackboard must meet several requirements. The requirements for a good whiteboard can be viewed from several aspects, including (1) color, (2) shape and size, and (3) installation and location.
Based on the aspects of shape and size, there are three things that need attention. These three things are as follows. Previously, a commonly used blackboard was a blackboard that had a backrest. Nowadays, there is a lot of blackboard that is attached to the classroom wall. The size of the whiteboard should be adjusted to class size. In general, the size of the blackboard is at least 3 meters x 1.20 meters.
Al-Otaibi (2017) concludes that learning by using blackboards proves effective in developing academic achievement, but not effective in developing learning skills and confidence, further study is needed to determine the use of blackboards in developing student skills which are an important cause of skill development scientific thinking and improve student academic achievement.
Observing the current high application of various modern educational technologies including learning media and the need for further studies on the use of blackboards . Therefore, an idea emerged to carry out the learning process by using a small blackboard. In this case the authors are encouraged to use the small blackboard media in the learning process as another supporting tool to

Proceeding of International Conference of 4th SHIELD 2019
https://pasca.unila.ac.id/seminar-internasional-shield/
ISBN : 978-602-51393-9-0
117
develop and explore the potential of the blackboard for the achievement of students' competencies and skills.
DISCUSSION
The learning process of teachers in the middle class actively seeks to engage students and change their teaching style to a more interactive approach. The small blackboard seems to be a simple way to communicate students' ideas and responses to move their learning forward and increase learning speed and fun. The use of a small blackboard as a learning medium requires some technical tools including markers, rulers and erasers. The use of blackboards in the field of education is one of the important things in creating an effective learning process between teachers and students .
According to Skeet (2012) states a small blackboard is an A4-sized plastic board as a supporting tool for the CLIL ( Content and Language Integrated Learning ) learning approach . The use of a small blackboard requires each student to be involved in an activity because each student has a small blackboard that is used when the teacher asks a question then all students are expected to give answers by holding and lifting the small blackboard. With the use of this small blackboard can avoid one of the problems with the traditional approach of raising hands to the teacher giving questions that are too often the same students who offer answers.
A small blackboard is great for brainstorming and quickly expressing rough ideas. In mathematics, we are really interested in thinking skills and often record questions in detail or routine settings routinely reduce the pace of lessons and the free flow of thinking. There is a place to record key ideas and consolidate the teacher's work in exercise books but often after some exploration and clarification of ideas.
Emeny (2012) suggests some tips on managing and getting the most out of using a small whiteboard : a. Give questions to students to answer before you give the board. It makes
them focus on it directly. b. The other alternative they will have is a creative bomb to draw and accept it.
Give them 1 minute to draw the best picture , then choose the winner. Then say "now we start with mathematics " . They know they have time to excite their creative desires and will then focus on mathematics, especially if they know this is an agreement.
c. Ask them to answer their questions on the mini blackboard but then ask them to collect together . This avoids students who are a little slower than just copying what they see most students do.
d. Make one question then submit. Ask students to make questions and then give them to other students to solve . Then it is forwarded to other students to be examined, funded , and if necessary justified. Interesting discussions about mathematics can be followed.
e. Go around the room and pick the blackboard with the students' answers . Some are true and some are with misunderstandings. Randomize their position , then discuss the main problem . With so not immediately clear answer to that one being in the study . Students often times feel less worried about making mistakes and more willing to go.
Good Use of Chalkboards in the Learning Process
Some activities of the learning process that can take advantage of a small blackboard include:
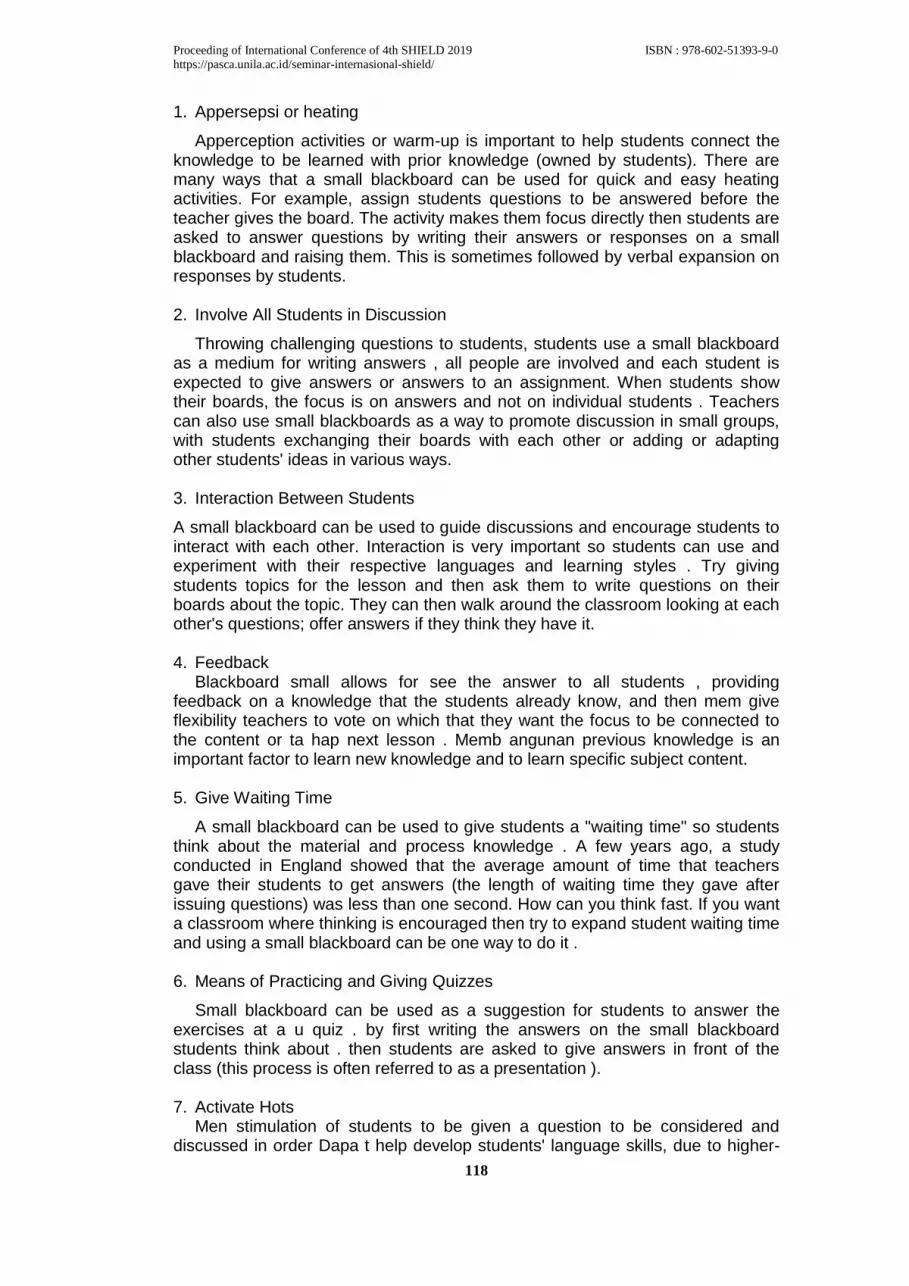
Proceeding of International Conference of 4th SHIELD 2019
https://pasca.unila.ac.id/seminar-internasional-shield/
ISBN : 978-602-51393-9-0
118
1. Appersepsi or heating
Apperception activities or warm-up is important to help students connect the knowledge to be learned with prior knowledge (owned by students). There are many ways that a small blackboard can be used for quick and easy heating activities. For example, assign students questions to be answered before the teacher gives the board. The activity makes them focus directly then students are asked to answer questions by writing their answers or responses on a small blackboard and raising them. This is sometimes followed by verbal expansion on responses by students.
2. Involve All Students in Discussion
Throwing challenging questions to students, students use a small blackboard as a medium for writing answers , all people are involved and each student is expected to give answers or answers to an assignment. When students show their boards, the focus is on answers and not on individual students . Teachers can also use small blackboards as a way to promote discussion in small groups, with students exchanging their boards with each other or adding or adapting other students' ideas in various ways.
3. Interaction Between Students
A small blackboard can be used to guide discussions and encourage students to interact with each other. Interaction is very important so students can use and experiment with their respective languages and learning styles . Try giving students topics for the lesson and then ask them to write questions on their boards about the topic. They can then walk around the classroom looking at each other's questions; offer answers if they think they have it. 4. Feedback
Blackboard small allows for see the answer to all students , providing feedback on a knowledge that the students already know, and then mem give flexibility teachers to vote on which that they want the focus to be connected to the content or ta hap next lesson . Memb angunan previous knowledge is an important factor to learn new knowledge and to learn specific subject content.
5. Give Waiting Time
A small blackboard can be used to give students a "waiting time" so students think about the material and process knowledge . A few years ago, a study conducted in England showed that the average amount of time that teachers gave their students to get answers (the length of waiting time they gave after issuing questions) was less than one second. How can you think fast. If you want a classroom where thinking is encouraged then try to expand student waiting time and using a small blackboard can be one way to do it .
6. Means of Practicing and Giving Quizzes
Small blackboard can be used as a suggestion for students to answer the exercises at a u quiz . by first writing the answers on the small blackboard students think about . then students are asked to give answers in front of the class (this process is often referred to as a presentation ).
7. Activate Hots
Men stimulation of students to be given a question to be considered and discussed in order Dapa t help develop students' language skills, due to higher-

Proceeding of International Conference of 4th SHIELD 2019
https://pasca.unila.ac.id/seminar-internasional-shield/
ISBN : 978-602-51393-9-0
119
level thinking requires longer and more complex responses, thus requiring more use of the language and ways . Students answer by showing the board they wrote, the question of the teachers at this stage of the answers on the board can be used to further stimulate the HOTS (the ability to think a high level ). For example, the teacher can ask students to compare their answers, to look for patterns or differences, or to evaluate their responses in various ways.
8. Reflection
The blackboard can also be used as a great way to reflect at the end of the lesson. For example, ask students to write in their board , what is most important they learn in the material lesson today is . These activities can help to consolidate their learning and also allow teachers to examine and evaluate what has happened .
CONCLUSION
The use of a small whiteboard has benefits:
1) For teachers as the main means or learning media needed by teachers to be able to assist students in learning and achieve competence from the learning process.
2) For students as a means of students to develop and explore the potential for achievement of students' competencies and skills including answering question exercises or quizzes, discussion processes , interactions between students in learning.
ACKNOWLEDGMENTS
This article can be done well thanks to the support of the Head of Mathematics
Education Postgraduate Masters in Mathematics Education University of Lampung. In addition, we also want to thank our colleagues at the Postgraduate Mathematics Education , University of Lampung , Indonesia for the convenience of sharing data and advice provided in the preparation of this article.
REFERENCE Al-Otaibi, and Wadha, H. 2017. The effectiveness of blackboard-based blended
teaching in the development of academic achievement, study skills and self-confidence among students of Princess Nourah bint Abdulrahman University . Canadian Center of Science and Education; International Education Studies. Vol. 10, No. 11 . [On line].https://doi.org/10.5539/ies.v10n11p100
Abdel, A.G. 2014. The impact of e-learning level in teaching courses using the learning management system blackboard on the academic achievement and the students' learning competence. Arabic studies in Education and Psychology. 52(2): 113-158.
Emeny, W. 2012. Are mini-whiteboards the ultimate teaching and learning resource?. http://www.greatmathsteachingideas.com.
Ray, R. 2009. Interactive teaching using mini-white boards in secondary mathematics + ideas for group work. www.eriding.net/resources/maths/040818_rray_maths_ks3_using_mini_white_board
Skeet, J. 2012. Getting the max out of mini-whiteboards.http://clilmagazine.nl/.

Proceeding of International Conference of 4th SHIELD 2019
https://pasca.unila.ac.id/seminar-internasional-shield/
ISBN : 978-602-51393-9-0
120
Tegeh, I.M. 2010. Media Pembelajaran. Singaraja: Universitas Pendidikan Ganesha.
http://www.greatmathsteachingideas.com/2012/09/27/are-mini-whiteboards-the-ultimate-teaching-and-learning-resource/
http://dinbakir.wordpress.com/2009/05/30/media-pembelajaran/ http://mothekcuyy.blogspot.com/2012/04/sejarah-papan-tulis.html http://peningkatanmutupembelajaran.blogspot.com/2011/02/optimalisasi-
penggunaan-papan-tulis.html
Proceeding of International Conference of 4th SHIELD 2019
https://pasca.unila.ac.id/seminar-internasional-shield/
ISBN : 978-602-51393-9-0
121
FEASIBILITY STUDY OF LEMPASING BEACH COASTAL FISHING PORT AS AN ENVIRONMENTALLY FRIENDLY FISHING PORT (ECO
FISHING PORT)
Zainal K1, Indra Gumay Febryano1, Endro P. Wahono1, Nuning Nur Cahyani1, Abdullah Aman Damai ke-11, Zainal Abidin-21
Magister of Environmental Science, Universitas Lampung Jl. Prof. Soemantri Brodjonegoro No. 1, Bandar Lampung
ABSTRACT The concept of Eco Fishing Port is a fisheries port management concept that not only pays attention to economic and social aspects, but also the ecological aspects in its management. The purpose of this study was to assess the feasibility of Lempasing Beach Coastal Fishing Port in Lampung as an Eco Fishing Port. Data collection was done by interview, observation, and study documentation. The data obtained were analyzed based on the criteria and indicators of Eco Fishing Port management and were subsequently described descriptively qualitative. The results showed that the Lempasing Coast Fishing Port has not yet met the requirements as an Eco Fishing Port. This can be seen from the following indicators: (1) No environmental management documents and no application of them in the management of fishing ports, and also no EIA / UKL-UPL documents, (2) No integrated waste treatment facilities, (3) Not enough public service infrastructure facilities components (trash / drainage / kiosk / canteen / shop / restaurant management), (4) Little attention to the environment in the management of fishing ports (ecological, social, economic, and economic growth of the port), and (5) Little attention to sanitation and hygiene of fish marketing places (construction sites and spatial planning of fish marketing buildings in accordance with the Sanitation Operational Procedure Standard. Keywords: Eco Fishing Port, Feasibility, Lempasing Lampung Beach Fishing Port, Fish Marketing Places.
INTRODUCTION
A fisheries port in its management not only pays attention to economic and social aspects, but ecological aspects are also important to pay attention to in the management of fishing ports. The combination of ecological, economic and social aspects is an approach to the management of an environmentally friendly fishing port (Eco Fishing Port) for the sustainability of its development. Its management is based on the Regulation of the Minister of Maritime Affairs and Fisheries of the Republic of Indonesia Number: 08/MEN/2012 concerning Ports of Fisheries, which fall into the group of functional facilities, among others (Hygiene and Waste Treatment) such as Waste Water Treatment Plants and Temporary Disposal Sites.
Lubis (2012) states that (Eco Fishing Port) is a predicate of a port that has implemented systematic efforts, methods, or steps to build and maintain an environmentally friendly port, and utilizes management strategies that has been deemed effective such as by implementing ISO 14001 Eco Management and Audit Scheme (EMAS) environmental management system.

Proceeding of International Conference of 4th SHIELD 2019
https://pasca.unila.ac.id/seminar-internasional-shield/
ISBN : 978-602-51393-9-0
122
A study conducted by Setiyawan (2017) shows that public perception in the management of an environmentally friendly fishing port (Eco Fishing Port) must pay attention to 5 aspects, among others, (1). EIA / RKL-RPL documents to supplement the environmental management system and its application, (2) Waste management and supporting systems, (3). Components of Public Service Infrastructure Facilities, (4) The attention of the fishing port management to the local ecology, (5). The Condition and Sanitation of the Fish Marketing Place that must be regulated in accordance with the Sanitation Operational Procedure Standard.
Based on this the authors conducted research on "Feasibility Study of the Lempasing Beach Coastal Fishing Port as an Environmentally Friendly Fishing Port (Eco Fishing Port)". This research is important because it is capable of making the implementation of the development and management of fishing ports remain continuous and sustainable, and the environment along with the existing ecosystems remain sustainable, healthy and beautiful and can be used as recommendations in decision making. The purpose of this study was to analyze the feasibility of the Lempasing Beach Coastal Fishing Port as an Environmentally Friendly Fishing Port.
RESEARCH METHOD
The research was conducted at the Lempasing Beach Coastal Fishing Port of Bandar Lampung City, Lampung Province from April to August of 2019. Data collection was carried out by interview, observation, and documentation study. Interviews were done with a Fish Stall Trader (1 person), Technical Implementation Unit Officer of the Department of Fisheries and Marine Ports of Fisheries (1 person), Lampung Provincial Environment Agency (1 person), and fishing boat owners who unloaded and loaded fish (3 people) , Forum for the environment (1 person) Regional Leadership Council of the Indonesian Fishermen Association of Lampung Province (1 person). The data obtained were then analyzed based on the criteria and indicators of Eco Fishing Port (Supriyanto, 2013) and subsequently described in a descriptive qualitative manner. The criteria and indicators include: (1) environmental management documents, (2) integrated waste treatment facilities, (3) public service infrastructure facilities, (4) ecological, social, economic and port economic growth aspects, and (5) sanitation and hygiene of the Fish Marketing Place.
RESULTS AND DISCUSSIONS General Condition of the Research Location
The Lempasing Coastal Fisheries Port is managed by the Technical Implementation Unit (Unit Pelaksana Teknis Dinas) of the Region I Ports of Fisheries from the Department of Maritime Affairs and Fisheries of the Lampung Province, which is on Jalan R.E. Martadinata km 6 Bandar Lampung in the District of Teluk Betung Barat Bandar Lampung City. The location of the port has a coordinate point of 05 ° 29' 15" South and 105 ° 15' 12.5" East with tropical climate conditions. The fishing port is a type C fishing port based on the Decree of the Minister of Maritime Affairs and Fisheries No. 12 Men / 2004 concerning the Improvement of the Status of The Fish Landing Base to be a Coastal Fishing Port, the location of the Coastal Fishing Port is shown in Figure 1.

Proceeding of International Conference of 4th SHIELD 2019
https://pasca.unila.ac.id/seminar-internasional-shield/
ISBN : 978-602-51393-9-0
123
Figure 1. Research Location, 2019
Some fishing gears and fishing vessels operating in Lampung waters were landed at the Lempasing Beach Fishing Port. Bagan and arad are the most widely used fishing gear at 25.38% and 23.86%, respectively, due to the effectiveness and efficiency of the fishing equipments used by fishermen, because the fishing gears are traditional and inexpensive, and also the condition of available fish resources has much more pelagic and demersal fish. The fishing gears are presented in Table 1.
Table 1. Number of fishing tools
No Fishing Tool Quantity %
1 Purse seine 19 7,20
2 Bagan 67 25,38
3 Rampus (Fishing nets) 25 9,47
4 Pancing (Fishing rods) 24 9,10
5 Payang (Trawl) 39 14,77
6 Arad (Trawl) 63 23,86
7 Pelele / Pengangkut (Lifting gear / Carrier)
27 10,22
Total 264 100
Source : Technical Implementation Unit Regional one Fishing Port, 2018
Most of the ships anchored at Lempasing Beach Fishery Port are fishing vessels weighing <5 gross-tonnage (GT), comprising as much as 51.90% of the ships, and followed by fishing vessels weighing 10-30 GT at 29.54%. This is due to the fishermen using the fishing vessels are traditional and small scale fishermen. The data are presented in Table 2. Table 2. Number of ships according to GT in Lempasing Beach Fisheries Port
2018
No Vessel GT Quantity %
1 < 5 137 51,90
2 5-10 49 18,56
3 10-30 78 29,54
Total 264 100
Source : Technical Implementation Unit Regional One Fishing Port , 2018

Proceeding of International Conference of 4th SHIELD 2019
https://pasca.unila.ac.id/seminar-internasional-shield/
ISBN : 978-602-51393-9-0
124
In the years leading up to 2017, can be seen that the number of fish landed the most at the Lempasing Beach Fishery Port was found in 2013 with a total of 1,438,288 kilograms and it is visible that from 2013 to 2017 there was a significant decrease due to the policy by the Minister of Maritime Affairs and Fisheries Republic of Indonesia Number 71 / PERMEN-KP / 2016 concerning Fishing Track and the Placement of Fishing Equipment in the Fisheries Management Region of the Republic of Indonesia. Table 3. Number of Fish Landed at Lempasing Beach Fishery Port from 2013 to
2017 No Year Number of Fish Landed (kg)
1 2013 1.438.288 2 2014 937.332 3 2015 592.994 4 2016 406.883 5 2017 470.855
Total quantity 3.846.352
Average per year 7693.270
Source : Technical Implementation Unit Regional One Fishing Port , 2018 Feasibility as an Eco Fishing Port
Until now, Lempasing Beach Coastal Fishery Port has not met the requirements for an Eco Fishing Port. The data can be seen in Table 4. Table 4. Criteria and Indicators of the Lempasing Beach Coastal Fishery Port
Management No Criteria and Indicators Condition
1 Environmental Management Documents (UKL-UPL) None 2 Integrated Waste Management Facility (IPAL) None 3 Public Service Infrastructure Facilities None 4 Ecological, social, economic and economic growth
aspects of the fishing port Not fully implemented yet
5 Sanitation and Hygiene of the Fish Marketing Places. Fish Marketing Places are hygienic but has not been fully implemented
Source: Gathered data, 2019
The management of Lempasing Beach Coastal Fisheries Port does not yet have documents of environmental management and its application in the operation and management of the fishing port. This is due to the planning and construction being carried out in 1998 on reclaimed land that was carried out in stages which was directly operated by the Regional Government, consequently impacting the environmental management performance indicators of the fishing port.
The management does not yet have an Integrated Waste Treatment Facility due to limited understanding of environmental management. This causes an impact on garbage and sewage in the drainage ditches in the fishing port environment that may have the potential to decrease sea water quality standards and the port pond waters ecosystem.
Inadequate components of public service infrastructure facilities (rubbish, drainage, management of kiosks, canteen, shop, restaurant management). This is due to lack of funding to build public toilets, inadequate waste bin facilities,

Proceeding of International Conference of 4th SHIELD 2019
https://pasca.unila.ac.id/seminar-internasional-shield/
ISBN : 978-602-51393-9-0
125
disorganized trader kiosk building layout, garbage overcapacity and impacting the environment in an unhealthy way.
There is a lack of attention to the environment in the management of the fishing port (ecological, social, economic, and economic growth aspects of the port), due to limited understanding of the management of environmental controls that impacts the fishing port area, making it untidy and shoddy.
Not yet fully paying attention to sanitation and hygiene of the Fish Marketing Places, construction sites and spatial planning of fish marketing buildings in accordance with Sanitation Operational Procedure Standards due to the management of Fish Marketing Places by the third party Mina Jaya Village Unit Cooperatives. The Fish Marketing Services are used by small-scale fishermen and merchant traders who do not yet have a culture of cleanliness, who should pay attention to the Quality and Environmental Control of an environmentally friendly fishing port (Eco Fishing Port) and due to this the Lempasing Beach Coastal Fishing Port has not met the requirements in meeting the indicators of an Eco Fishing Port.
CONCLUSION
Lempasing Coast Fishing Port has not yet met the requirements as an Eco Fishing Port. This result can be seen from the following indicators: (1) No environmental management documents, no application of them in the management of fishing ports, and also no EIA / UKL-UPL documents, (2) No integrated waste treatment facilities, (3) Not enough public service infrastructure facilities components (trash / drainage / kiosk / canteen / shop / restaurant management), (4) Little attention to the environment in the management (ecological, social, economic, and economic growth of the port), and (5) Little attention to sanitation and hygiene of fish marketing places (construction sites and spatial planning of fish marketing buildings in accordance with the Sanitation Operational Procedure Standard). The Provincial Government of Lampung should increase funding and budget for the development of basic, functional, and supporting facilities and pay attention to environmental and hygiene controls.
REFERENCES
BPS Provinsi Lampung. 2018. Badan Pusat Statistik Provinsi Lampung dalam angka Tahun 2018. Lampung.
Kementerian Kelautan dan Perikanan. 2012. Peraturan Menteri Kelautan dan Perikanan Republik Indonesia Nomor : PER.08/MEN/2012 Tentang Kepelabuhanan Perikanan.
Lubis, E. 2012. Pengantar Pelabuhan Perikanan. Bogor: Institut Pertanian Bogor. Pemerintah Provinsi Lampung Dinas Kelautan dan Perikanan. 2017. Laporan
Akhir Perencanaan dan Pengembangan Pelabuhan Perikanan Pantai (PPP) (Review Masterpland / DED). Final Report of the Planning and Development of Coastal Fisheries Ports.
Unit Pelaksana Teknis Dinas Pelabuhan Perikanan Wilayah I. 2018. Laporan Tahunan Dinas Kelautan dan Perikanan Provinsi Lampung. Bandar Lampung
Supriyanto. 2013. Analisis pengelolaan pelabuhan perikanan berwawasan lingkungan di Pelabuhan Perikanan Samudera Nizam Zachman Jakarta Jurnal Ilmu Lingkungan. 7(2).
Setyawan. 2014. Persepsi Masyarakat perikanan terhadap pengembangan eco fishing port di Pelabuhan Perikanan Samudera Bitung. Jurnal Perikanan.

Proceeding of International Conference of 4th SHIELD 2019
https://pasca.unila.ac.id/seminar-internasional-shield/
ISBN : 978-602-51393-9-0
126
THE APPLICATION OF MIND MAP CONCEPTS IN THE BLENDED LEARNING CLASS OF MATHEMATICAL LOGIC MATERIAL
Marchamah Ulfa
Mathematic Education, Indonesian Technocrat Universities Jl. Zainal Abidin Pagaralam, No. 9-11, Labuhanratu Bandarlampung
ABSTRACK This study aims to determine the effect of understanding student concepts. mind map strategies are given to mathematical logic classes subject to blended learning. This research is a type of Quasi Experimental research. The population is all students of the Indonesian technocrat university with samples chosen by students from the 2018 mathematics education study program. The technique of collecting data is a test of learning achievement. The data analysis technique used is the t-test analysis. The results of the t-test with a significance level of 5% indicate that there is an effect of applying the mind map concept to the mastery of students' mathematical logic concepts in the blended learning class. The magnitude of the effect is obtained from the calculation of N gain which is 0.7 in high criteria. Keywords: Mind Map, blended learning, mathematical logic
INTRODUCTION
The education system at the university level has different qualities. Not all education in universities produces high quality graduates. To produce good quality graduates, one way is to create a learning system that can make students comfortable, easy to understand and remember the material. Facing 4.0 era as it is now certainly requires that the learning system in universities also adjust to the times. Means (2013) said that online learning is one of the fastest growing trends in educational uses of technology. Nguyen (2015) said that is imperative that researchers and educators consider the effectiveness of online learning compared to traditional face-to-face format and the factors that influence the effectiveness of online courses. The current learning system requires lecturers to be ready to apply blended learning (BL) in every subject they teach. Where this learning requires lecturers to apply face-to-face learning (direct) combined with learning online . Bryan (2016) said that The definitions of blended learning developed by Graham and Friesen, noted above, revolve around bimodal delivery, involving a face-to-face or „co-present‟ element, and a computer mediated element. Zainuddin (2018) revealed that the BL method emphasizes that learning activities should not only occur in the classroom but also outside of the class through online media. Dziuban (2018) contends that BL coalesces around access, success, and students' perception of their learning environments. Furthermore, Sudarman (2014) revealed that blended learning became part of efforts to use technological advances in improving the quality of learning.
Banyen (2016) revealed that undergraduate students were satisfied with the blended learning model which was due to the change in the learning system as well as being tasked with interesting and challenging computer based lessons outside the class. Besides it, Isti'anah (2017) also revealed that in the end of the semester, most students found that online activities help them comprehend and practice the materials.

Proceeding of International Conference of 4th SHIELD 2019
https://pasca.unila.ac.id/seminar-internasional-shield/
ISBN : 978-602-51393-9-0
127
Mathematical logic is one of the courses that must be implemented online. The material in this course contains many similar concepts, for example about conjunction, disjunction, implications and biimplication. This results in many students being mistaken when solving problems related to these materials. There are more problems in this course because the application of BL lectures results in students not always being able to ask questions directly.
To anticipate these problems, an appropriate learning strategy must be applied so that students can maximize their learning and develop their creativity in thinking, which will result in increased understanding of concepts. One learning strategy that can be applied is mind map. Jones (2012) said that Mind maps help students learn information by forcing them to organize it and add images and color to it. Aji (2018) said that the strategy is formulated to achieve a certain goal, which means that the direction of all strategy-making decisions is the achievement of objectives, that the compilation of learning steps, the utilization of various facilities and learning resources are all directed to achieve the objectives. Parikh (2016) said that the mind mapping technique first main idea is specified and then the linear view is explained. It is also useful for self and group in which it can have more effects than written reviews. In addition, Bukhari (2016) also said that mind maps can work as a tool to facilitate the learners to plan ideas in the pre-writing process. Setyowati (2019) also revealed that the method of concept mapping effectively increased the social skills.
RESEARCH METHODS
The population in this study were all students of Indonesian Technocrat Universities. The selected sample is students majoring in mathematics education in class 2018 odd semester. This research is a quantitative type of quasi-experimental study. In this study, the pretest-posttest control pattern was used. The initial stage of the research is determining the research subjects, then determining the experimental group. Next is to test the normality and homogeneity of the experimental group, then give a pretest. The learning provided is in the form of BL learning where there are 60% face-to-face learning and the remaining 40% is learning in the network. During the learning process, students are asked to start designing mindmaps according to their creativity. So that the mindmap has been completed at the end of the lesson. Then, at the end of the subject, the researcher gives a post-test. The data obtained from the results of the study were analyzed using the t test, and after that researchers made conclusions based on the results of data analysis. The implementation of the research is presented in the following chart.

Proceeding of International Conference of 4th SHIELD 2019
https://pasca.unila.ac.id/seminar-internasional-shield/
ISBN : 978-602-51393-9-0
128
Figure 1. Chart of Research Implementation.
The data in this study are quantitative data obtained from the pre-test and post-test scores. The instrument used in this study was a written test. The test is an understanding test of the concept of mathematical logic. The purpose of the test is to find out the level of mastery of students' mastery of concepts after participating in learning. The compilation of the test questions begins with the compilation of the questions grid. The lattice questions are arranged by paying attention to each indicator that wants to be addressed in the study of mathematical logic. This is intended to guarantee the validity of the contents of the test questions tested in the research. The test is tested for validity and reliability. Data from the final test (post-test) obtained is used as a basis for testing research hypotheses that have previously been tested for normality and homogeneity.
DISCUSSION
Subjects were given the task of making a mind map in accordance with their imagination. The material that must be written in the mind map is the material from the beginning of learning to the end of learning. The following are the results of the mindmap answers made by several students.

Proceeding of International Conference of 4th SHIELD 2019
https://pasca.unila.ac.id/seminar-internasional-shield/
ISBN : 978-602-51393-9-0
129
Figure 2. Answer mindmap subject 1.
Based on Figure 2, it appears that students have begun to develop their creativity in making mind maps. Students have written the complete material in accordance with the sub-chapter on mathematical logic material. Students also give other colors to the mindmap lines so that the mindmap that is created is not monotonous in one color.
Figure 3. Answer mindmap subject 2.
Based on Figure 3, it appears that students' imagination resembles subject 1. However, students only thicken the lines on the mindmap and do not provide color so that it looks rather monotonous. Mindmap results made by subject 2 indicate that the material is complete. So this mindmap can be used as a reference for learning.

Proceeding of International Conference of 4th SHIELD 2019
https://pasca.unila.ac.id/seminar-internasional-shield/
ISBN : 978-602-51393-9-0
130
Figure 4. Answer mindmap subject 3.
In Figure 4, it can be seen that students' imagination is more creative compared to students on subjects 1 & 2. Students have made a mindmap with a model / picture that is different from other students. In addition, mindmaps are also made in various colors so that they look more beautiful and create enthusiasm in learning. The material in this mindmap is also complete so that the mindmap created can already be used as a reference.
The results showed that learning with mind maps in BL class was more effective to be applied, especially logic material. In the results of this study it has been mentioned that the average value of understanding mathematical logic concepts is 88.95 with a standard deviation of 5.9. If seen from the concept understanding, the gain in the experimental class is 0.89. This data shows that students in the experimental class have a good increase in understanding concepts in mathematical logic material. The same thing can also be seen from the achievement of concept understanding indicators. The indicator that was achieved well by students in the experimental class was to restate a concept that is equal to 96.5% with the average size of the indicator achieved was 77.7%. While indicators that are not well achieved by students are classifying objects according to certain characteristics according to the concept (63.4%). This data shows that students master the concepts so that students are more able to answer questions correctly.
This happens because in the implementation of BL learning with a mindmap students are more eager to learn. This is in accordance with Yunus (2016) which states that the use of mind mapping helps students in planning their writing, adapting a deeper level of understanding of the writing topics and promoting creativity in writing. In line with this, Wirda (2014) states that there was a significant difference from the improvement of the students' reading comprehension through mind mapping technique. It means the mind mapping technique was effective. In addition, Sari (2016) also revealed that the mind

Proceeding of International Conference of 4th SHIELD 2019
https://pasca.unila.ac.id/seminar-internasional-shield/
ISBN : 978-602-51393-9-0
131
mapping that has been developed and validated could be a viable and effective media used in the learning process.
In BL learning, students use computer-based learning which also requires them to access the internet while looking for material from other sources and then use their creativity to create a mindmap. Students are also more explored by their imagination through making the mindmap. This BL learning process will always require students to be active in finding their own information and expressing opinions on their own initiative. This will have a positive effect because students not only know and memorize concepts but students also know why the formula can be used. By providing learning directly and in the network, it is hoped that later concepts will be embedded in students. Then, with good mastery of concepts students will gain unlimited knowledge and understanding of concepts will also increase.
One reason students in the experimental class answer more questions correctly is the students in the experimental class have a good understanding of concepts. When learning students work on the task of making mindmaps and exercises to work on problems so students are required to develop their creativity and imagination and make their own problem solving. When learning is finished the lecturer gives further assignments which will be discussed at the next meeting. Questions given when direct learning, in the network or assignments given for homework are questions that have been adapted to the seven indicators of concept understanding.
The results of the discussion above, have been tested through hypothesis testing using t-test. From the results of hypothesis testing, obtained a true hypothesis with a significant level of 5% so that it can be concluded that learning with mindmaps in blended learning classes is more effectively applied than learning mathematical logic. In addition, if seen from the magnitude of the gain it can be concluded also that the increase in students' understanding of mathematical concept skills is very high. This means students who are given learning by mindmap in BL class are better at understanding and mastering concepts.
As for some of the weaknesses in this study namely during learning in the network, there were some technical obstacles. Technical constraints that generally occur are related to internet signals. Some students access the internet from their home / boarding house while some others access it from campus hotspots. This causes the online learning process to take longer than before because of slow internet access. To anticipate this problem, students are required to access the internet in a place that has signal access smoothly and without obstacles. Another obstacle is the lack of awareness of students working on the task of making mindmaps on time. Some students are still waiting for other students to do their assignments then they see the shape and contents of the mindmap. In other words there are still many students who do plagiarism because they feel their lack of creativity. This has been anticipated by asking students to re-create mind maps that are indicated as plagiarism so that the results of mindmaps that are made are truly original according to their imagination and creativity.
Based on research that has been done, to get optimal results from the application of mindmaps in BL classes, each component of learning must be co-operative, namely the interaction between students, positive interdependence between students, individual responsibility, and interpersonal skills students must walk well. In the application of mindmaps in BL classes, the ability of lecturers to manage learning directly or in networks is very necessary because it is an important part of learning. In addition, the ability of lecturers to motivate and

Proceeding of International Conference of 4th SHIELD 2019
https://pasca.unila.ac.id/seminar-internasional-shield/
ISBN : 978-602-51393-9-0
132
provide reinforcement to students is needed so that they are enthusiastic about learning inside and outside the classroom.
CONCLUSION
Based on the results of data analysis, hypothesis testing and discussion, it was concluded that the application of mindmaps in BL classes had a positive effect on students' understanding of concepts. In general, students who obtained learning with a mindmap in BL class showed better results in the following cases: 1. The average of conceptual understanding as seen from the average student
final test score. 2. The average achievement of indicators of concept understanding, namely
seven indicators of understanding of concepts achieved by students. 3. Average gain (gain) understanding of the concept of students who are
included in the category of "high" gain.
REFERENCES
Aji, W.N. and Budiyono, S. 2018. The teaching strategy of bahasa Indonesia in curriculum 2013. International Journal of Active Learning. 3(2): 58-64.
Banyen, W., Viriyavejakul, C., and Ratanaolarn, T. 2016. A blended learning model for learning achievement enhancement of thai undergraduate students. iJET. 11(4).
Bryan, A. and Volchenkova. 2016. Blended learning: definition, models, implications for higher education. Bulletin of the South Ural State University. Ser. Education. Educational Sciences. 8(2): 24–30.
Bukhari, S.S. 2016. Mind mapping techniques to enhance EFL writing skill. International Journal of Linguistics and Communication. 4(1): 58-77.
Dziuban, C.; Graham, C.R.; Moskal, P.D.; Norberg, A., and Sicilia, A. 2018. Blended learning: the new normal and emerging technologies. International Journal of Educational Technology in Higher Education. 15(3).
Isti‟anah, A. 2017. The effect of blended learning to the students‟ achievement in grammar class. Indonesian Journal of English Education. 4(1): 16-30.
Jones, B.D., Ruff, C., Snyder, J.D., Petrich, B., and Koonce, C. 2012. The effects of mind mapping activities on students' motivation. International Journal For the Scholarship of Teaching And Learning. 6(1).
Means, B., Toyama, Y., Murphy, R., and Bakia, M. 2013. The effectiveness of online and blended learning: A meta-analysis of the empirical literature. Teachers College Record. 115(3): 1-47.
Nguyen, T. 2015. The effectiveness of online learning: beyond no significant difference and future horizons. Journal of Online Learning and Teaching. 11(2).
Parikh, N.D. 2016. Effectiveness of teaching through mind mapping technique. The International Journal of Indian Psychology. 3(3).
Sari, S.A. and Sakdiyah, H. 2016. The development of mind mapping media in flood material using addie model. Journal of Education and Learning. 10(1). 53-62.
Setyowati, D., Samsudi, and Raharjo, T.J. 2019. The effectiveness of concept mapping on social skills of students in social learning of elementary school. Journal of Primary Education. 9(1): 16-24.
Sudarman. 2014. Pengaruh strategi pembelajaran blended learning terhadap perolehan belajar konsep dan prosedur pada mahasiswa yang memiliki self-regulated learning berbeda. Jurnal Pendidikan dan Pembelajaran. 21(1).

Proceeding of International Conference of 4th SHIELD 2019
https://pasca.unila.ac.id/seminar-internasional-shield/
ISBN : 978-602-51393-9-0
133
Wirda; Sulaiman, H., and Wahyudin. 2014. Using mind mapping technique to improve reading comprehension of the second year students. e-Journal of English Language Teaching Society. 2(3).
Yunus, M.M. and Chien, C.H. 2016. The use of mind mapping strategy in Malaysian University english test (muet) writing. Creative Education. 7: 619-626.

Proceeding of International Conference of 4th SHIELD 2019
https://pasca.unila.ac.id/seminar-internasional-shield/
ISBN : 978-602-51393-9-0
134
THE DESCRIPTION OF PRE-SERVICE TEACHERS ABILITY OF CREATING TEST ITEMS IN COURSE OF MATHEMATICS LEARNING’S
EVALUATION
Nicky Dwi Puspaningtyas
Faculty of Arts and Education, Universitas Teknokrat Indonesia, Indonesia Email: [email protected]
ABSTRACT This is a qualitative-descriptive research that aims to describe the ability of pre-service teacher of mathematics in creating test. The subjects of this research are the forth semester students of Mathematics Education Department, Universitas Teknokrat Indonesia who have taken course of Evaluation in Mathematics Learning. Furthermore, the subjects were given task to create a test that consists of five essay questions and the scoring rubric of it. After creating test questions, content validity of the test made is tested by lecturer. It consists of the aspects of content, construction, and language. Since the test questions stated valid, the pre-service teachers tested the questions into several students and analyzed the result of that. The analysis results is that 12,5% of pre-service teachers have made reliable tests in very high criteria, 12,5% of the have made it in high criteria, another 75% created moderate, low, and very low criteria of reliability questions. The subjects created questions in various levels of difficulty and most of questions are easy as many as 52,5%. Lastly, the discrimination power of question is mostly poor. It is about 47,5%. Keywords: evaluation, pre-service teacher, test items.
INTRODUCTION
Education is a human need to survive the times. The next generation of the nation must have education in order to be able to compete nationally and internationally. This is in line with the ideals of the Indonesian state listed in The 1945 Constitution, namely to educate the life of the nation. The Indonesian nation must be a smart nation. This can be achieved through formal education obtained through classroom learning.
The success of learning is influenced by several factors. One of the supporting factors is the role of the teacher. According to Law No. 14 of 2015, Teachers are professional educators with the main task of educating, teaching, guiding, directing, training, assessing, and evaluating students in early childhood education in formal education, primary education, and secondary education. Furthermore, it is also explained that professionals are jobs or activities carried out by someone and become a source of income for life that requires expertise or skill that meet certain quality standards or norms and require professional education.
Because teacher is a professional job, it requires special expertise. There are four competencies that must be possessed by the teacher, namely pedagogical, social, personality, and professional competencies. The four competencies must be owned by the teacher so that classroom learning activities take place effectively and the learning objectives are achieved.

Proceeding of International Conference of 4th SHIELD 2019
https://pasca.unila.ac.id/seminar-internasional-shield/
ISBN : 978-602-51393-9-0
135
The success of learning can be measured through assessment and evaluation. Arikunto (2015) a teacher must be able to carry out learning evaluations, from making test questions to analyzing the results, then getting feedback to improve the learning. Moreover, Thorndike (in Santrock, 2011: 3) especially promoted the idea that educational psychology must have a scientific base and should focus strongly on measurement. Therefore, pre-service teachers are provided with evaluation knowledge which is learned in the Mathematics Learning Evaluation course. This article describes the ability of prospective mathematics students to make test questions, scoring rubrics, test the questions they make to students, until item analysis.
LITERATUR REVIEW
As the assessment practices are changing, the principles and practices of creating test items are changing as well (Gierl, dkk. 2015). It is caused by the rapid changing of technology, so the eductional measurement can be done by computer. However it is done, Arikunto (2015), stated that a good test item has to be valid and realible.
According to Arikunto (2015; 80), a test is valid if it measures what it purpose to measure. The are several kinds of validity, namely content validity, construct validity, concurrent validity, and predictive validity. In this validation, expert tested the content validity that concern in three aspects of test items creation, specifically material, construction, and language. After the validator stated that the test items are valid, subjects tested it to the high school students, which were then tested the reliability, level of difficulty, and discrimination power.
Reliability is related to the consistency of the test results. Andreson (in Arikunto, 2015: 101) argues that a reliable measure in one that provides consistent and stable indication of the characteristic being investigated. To determine the reliability of objective test items, the Alpha formula as follow is used (Arikunto 2015: 122).
(
( )) (
∑
)
In which,
= Reliability coefficient of the whole test
∑ = Total variance of each test item
= Variance of the total test
The reliability coefficient is interpreted as follow. Table 1. Criteria of Reliability Reliability coefficient (r11) Criteria
r11≤ 0,20 Very low 0,20 < r11 ≤ 0,40 Low 0,40 < r11≤ 0,60 Moderate 0,60 < r11≤ 0,80 High 0,80 < r11≤ 1,00 Very High
In creating test items, it would be important to know whether an item is too
easy or too difficult for the intended audience and uses of the test. Thus, estimating accurately an item‟s difficulty index is important for good measurement and high-quality test design (Everson on Frey, 2018: 521). The formula used in determining the difficulty index is as follow.

Proceeding of International Conference of 4th SHIELD 2019
https://pasca.unila.ac.id/seminar-internasional-shield/
ISBN : 978-602-51393-9-0
136
In which, P = Difficulty index B = The number of students who answer selecting item correctly JS = The total number of students who answer the test According to Arikunto (2015: 225), difficulty index is classified as follows. Table 2. Criteria of Difficulty Index
Difficulty Index (P) Criteria
0,00 < P ≤ 0,30 Difficult 0,30 < r11 ≤ 0,70 Moderate 0,70 < r11≤ 1,00 Easy
Besides difficulty index, it is also important to analyze the discrimination index which is ability of test items to discriminate among and between examinees with varying
levels of the abilities (Everson on Frey, 2018: 532). In determining the discrimination index with the numbers of examinees is less than 100, the examinees are divided into two groups, namely upper group and lower group (Arikunto, 2015: 227). The formula for determining discrimination index is as follows.
In which, D = discrimination index
= rightly answered in upper group = rightly answered in lower group
= numbers of examinees in upper group = numbers of examinees in lower group
After the discrimination index is determined, the test makers shouls classified the criteria of it as the Table 3. Table 3. Criteria of Discrimination Index Discrimination Index (D) Criteria
0,00 - 0,20 Poor 0,21 – 0,40 Satisfactory 0,41 - 0,70 Good 0,71 – 1,00 Excellent
RESEARCH METHOD
This is a qualitative descriptive research that aims to describe the data obtained from subjects. According to Sugiyono (2013: 13), a descriptive research is a research conducted to determine the value of independent variables, either one or more variables (independent) without making comparison or connecting with other variables. This research is held to describe the ability of pre-service teacher of mathematics in creating test items. The subjects of this research are

Proceeding of International Conference of 4th SHIELD 2019
https://pasca.unila.ac.id/seminar-internasional-shield/
ISBN : 978-602-51393-9-0
137
eight forth semester students of Mathematics Education Department, Universitas Teknokrat Indonesia who have taken course of Evaluation in Mathematics Learning.
In this research, subjects were given task to create a test and its scoring rubric. Afterwards, the validity of tests were evaluated by expert judgment (lecturer) and subjects fixed the test items according to experts‟ suggestion. After the test item was appropriate testing, it was given to high school students. Then, subjects corrected the test result and analyzed the reliability, level of difficulty, and discrimination power of their created tests.
In this research, subjects were asked to create objective test. Objective test is a test that can be carried out in an objective manner (Arikunto, 2015; 179). It has several strengths, such as more represent material, more objective, and avoiding subjective factors. Eight pre-service teachers are asked to create five essay questions and its rubric scoring. After the subjects creating the test items, the validation of that were checked by expert.
The data analysis technique used in this study is by analyzing data qualitatively to process information obtained by researchers in the form of research data. According to Miles and Huberman (2014: 31), qualitative data analysis is carried out interactively and continues until it is complete with data analysis activities, namely data condensation, data display, and conclusion drawing or verification.
DISCUSSIONS AND ANALYSIS OF RESULTS
The data of this research is the ability of the fourth semesters‟ Mathematics Education students, Universitas Teknokrat Indonesia, who have taken the course of Mathematics Learning Evaluation in creating five objective questions. Test items that have been created by subject then checked by validator. There were several mistakes that made by the subjects in writing test question, such as the instruction was not clear that could make test takers confused to understand the question, the wrong used of punctuations or symbols, and unrealistic problems. Besides, there were also several mistakes in the scoring rubrics, such as error in using symbols, the answer is uncorrect, some even did not create the scoring rubrics. After the test items were checked, subjects improves the writing of the questions according to the validator‟s suggestion. Once the test items was valid, subjects tested their created test to the high school students.
Subjects tested the test and supervised by themselves. Then, they check the results of student answers based on the scoring rubric that they have made before. After checking and scoring, subject were grading the student answers. The grades of students were then analyzed for reliability, difficulty index, and discrimination index.
Based on item test analysis of reliability, there is only one pre-service teacher of Mathematics who makes a question with very high reliability criterion with a reliability coefficient of 0.803. It is only 12,5% of subjects. On the other hand, another pre-service teacher got 0,64 of reliability coefficient, which is high criterion of reliability. The other two pre-service teachers got 0,425 and 0,53 of reliability coefficient those mean moderate. Besides, the rest of subject created test item in low or very low reliability. The coefficients are 0.36, 0.24, 0.06, and 0.01. According to the reliability coefficients obtained from subject‟s item test analysis, it can be seen that the ability of pre-service teachers in creating reliable test item is mostly low, means that they have not able to create realible test items.
Since the number of subject in this research is eight, and each created five objective questions, means there are 40 questions created. From whole

Proceeding of International Conference of 4th SHIELD 2019
https://pasca.unila.ac.id/seminar-internasional-shield/
ISBN : 978-602-51393-9-0
138
questions created, 21 questions classified as easy questions and 11 questions are moderate. In addition, the one fifth remained questions belong to difficult. It is clearly shown that more than 50% of questions created are easy. It can be conclude that the subject tend to create easy questions.
The last component that has to be owned by a good test item is discriminant index. A good question must be able to differentiate test takers with high or low abilities. Based on the data collected, most of questions created is question with poor classification of discriminant index. Precisely, it is 19 questions in range of 0.00-0.20. Moreover, 8 questions categorized as satisfactory. The rest 6 and 7 questions have discrimination index that classified as good and excellent consecutively.
CONCLUSIONS
A preservice teacher have to be able to create good test item since they are going to be teachers that have to evaluate their learning processes to determine wheter it succed or not. Based on data analysis above, it can be concluded that the abilities of pre-service teachers of mathematics, Universitas Teknokrat Indonesia, in creating test items are not good. It can be seen from the test result of validity, reliability, difficulty index, and discrimination index. However, this ability can be improved by a lot of practices. This is in accordance with the opinion of Arikunto (2015: 180) that the difficulty in preparing objective tests can be overcome by practicing a lot until it is truly proficient. Because of the importance of the ability to make questions owned by a teacher, lecturer also have to guide and motivate students or pre-service teacher in the practice of creating test items. So that when they become teachers, they can already make good quality of questions.
ACKNOWLEDGEMENTS
This research can be completed well as the moril and material support of Universitas Teknokrat Indonesia. Moreover, thanks to the support of our colleagues at the Faculty of Arts and Education, Universitas Teknokrat Indonesia for the suggestions and motivation given in the preparation of this article.
REFERENCES Arikunto, S. 2015. Dasar-dasar Evaluasi Pendidikan. Jakarta: Bumi Aksara. Frey, B.B. 2018. The SAGE Encyclopedia of Educational Research,
Measurement, and Evaluation. London: SAGE. Gielr. 2015. A method for generating educational test items that are aligned to the
common core state standards. Journal of Applied Testing Technology. 16(1).
Miles, H. and Saldana. 2014. Qualitative Data Analysis. Arizona: SAGE. Peraturan Pemerintah Nomor 14 Tahun 2015 tentang Guru dan Dosen. Santrock, J.W. 2011. Educational Psychology (5th Edition). New York: McGraw-
Hill. Sugiyono. 2013. Metode Penelitian Kualitatif, Kuntitatif, dan R&D. Bandung:
Alfabeta.

Proceeding of International Conference of 4th SHIELD 2019
https://pasca.unila.ac.id/seminar-internasional-shield/
ISBN : 978-602-51393-9-0
139
COMPANY COMPLIANCE IN SOUTH LAMPUNG DISTRICT TOWARDS ENVIRONMENTAL PERMITS
Feri Bastian, Agus Setiawan, Slamet Budi Yuwono, Muhammad Akib. Program Studi Magister Ilmu Lingkungan – Universitas Lampung
Email: [email protected]
ABSTRACT Ownership of environmental documents on businesses/ activities in South Lampung Regency does not guarantee the occurrence of pollution and environmental damage in the region. It is still often found by companies that do not comply with the management and monitoring of the environment listed in the environmental permit so that it adversely affects the quality of the environment around the site. The company's compliance with environmental permits is influenced by many factors, including supervision factors, company profile and application of policies (disposition, communication) from environmental permits. The purpose of the research in this thesis is to determine the level of compliance and assess the influence of supervision, company profile, and policy implementation on the compliance of companies in South Lampung Regency. This study uses a sample research method with a number of respondents as many as 30 companies and uses quantitative and qualitative analysis. The results of the analysis show that the level of compliance of companies in South Lampung is 0,7. The supervision factor has a significant effect on company compliance by 95,1 %; company profile factor has a significant effect on company compliance with contribution contribution of 45%; the factor of policy implementation has a significant effect on the compliance of companies with a contribution of influence of 46,8%; supervisory factors and company profile factors together have a significant effect on company compliance with a contribution of 96,4%; factors of supervision and implementation of policies jointly have a significant effect on company compliance with a contribution of 47,2%; company profile and implementation of policies jointly have a significant effect on company compliance with a contribution of 96,4%; supervision, company profile and implementation of policies jointly have a significant effect on company compliance with a joint contribution of 96,4%. The conclusion of this study states that supervision, company profile and policy implementation have a significant effect on company compliance with environmental permits Keywords: Supervision, company profile, policy implementation, compliance,
environmental permit
INTRODUCTION
The industrial sector is a sector that is very instrumental in economic development because it can increase economic growth. The increasing development of the industrial sector in South Lampung Regency has led to an increase in the level of demand for raw materials both sourced from nature and from industrial products. This is in line with the increased impact, both negative and positive impacts on the surrounding environment.
One of the efforts made by the government in the context of environmental protection and management in order to minimize negative impacts and maximize the positive impacts of industrial activities is through policies

Proceeding of International Conference of 4th SHIELD 2019
https://pasca.unila.ac.id/seminar-internasional-shield/
ISBN : 978-602-51393-9-0
140
requiring employers to prepare Environmental Documents (Environmental Impact Analysis (AMDAL) / Environmental Management Efforts and Environmental Monitoring Efforts (UKL- UPL)) before starting its activities. EIA and UKL-UPL documents owned by these entrepreneurs will then be used as the basis for the issuance of environmental permits which are a prerequisite for obtaining a business / activity permit.
In reality, environmental feasibility studies conducted by entrepreneurs in the form of Environmental Impact Analysis (AMDAL) and recommendations on Environmental Management Efforts and Environmental Monitoring Efforts (UKL-UPL) do not always get optimal results. Currently there is still a lot of pollution and environmental damage everywhere, even though these business activities have environmental protection and management instruments such asenvironmental documents (AMDAL/UKL-UPL). The industries in the South Lampung Regency Government are no exception. This is evidenced by the still many complaints of pollution both water pollution and pollution of solid waste both B3 and non B3 which are disposed of randomly.
Based on this background, the purpose of this study is to find out how the level of compliance of business actors / activities in South Lampung Regency and what factors influence the level of compliance of business actors in South Lampung Regency
RESEARCH METHODS
This study uses the dominant less dominant design method where the quantitative method is the dominant method and the qualitative method as the less dominant method (Cresswell, 2010). The aspects studied are aspects of compliance, supervision, company profile and policy implementation. Data collection is done by observation, questionnaires and interviews. Sample criteria are 30 businesses / activities in the South Lampung Regency. The qualitative data analysis technique was done by descriptive narrative, while the quantitative analysis technique used linear regression analysis through the SPSS application and scoring tools. RESULTS AND DISCUSSION. Obedience
Some things that are included in the compliance aspect here are ownership of environmental permits, implementation of RKL-RPL, monitoring and reporting. The results of the research and analysis of scoring aspects of compliance from business actors / activities in South Lampung regency are 0, 7 from a scale of 0 to 1. Where the lowest obedience factor is at the reporting aspect of 0.5 then monitoring at 0.6, implementation RKL-RPL of 0.7 and ownership of environmental permits of 1.

Proceeding of International Conference of 4th SHIELD 2019
https://pasca.unila.ac.id/seminar-internasional-shield/
ISBN : 978-602-51393-9-0
141
Oversight factors, business profile and policy implementation
The supervisory factor significantly affected the company's compliance by 95.1%; company profile factors significantly influence company compliance with an influence contribution of 45%; policy implementation factors significantly affect company compliance with an influence contribution of 46.8%; supervision factors and company profile factors together have a significant effect on company compliance with a contribution of 96.4%; the supervision factor and the application of policies together have a significant effect on company compliance with a contribution of 47.2%; company profile and the application of policies together have a significant effect on company compliance with a contribution of 96.4%; supervision, company profile and application of policies together have a significant effect on company compliance with a joint influence contribution of 96.4%.
Furthermore, the results of the scoring analysis show that the weakest side of the oversight factor that inhibits obedience comes from the follow-up aspects of supervision, budget and HR quality with scores of 0.58, 0.50 and 0.50, respectively.
The policy implementation factors include communication, resources,
disposition and institutions. incentive / disinsetive from the aspect of disposition and fragmentation from the institutional aspect being the weakest side with a score of 0.47 and 0.37, respectively.

Proceeding of International Conference of 4th SHIELD 2019
https://pasca.unila.ac.id/seminar-internasional-shield/
ISBN : 978-602-51393-9-0
142
Based on the results of the study above, it was found that one aspect that affected the implementation of company compliance with environmental permits was the inadequate system of supervision and law enforcement. In relation to supervision, several problems that arise are not running routine supervision, which is the obligation of the licensor. In addition, the lack of documentation of information and data as well as coordination in conducting supervision is also one of the causes (Rangkuti, 2016).
Rangkuti (2016) also said that the lack of supervision is very likely to have implications for the tendency of business actors and/or activities to violate the provisions in licensing and legislation. The violation will show the impact on aspects of environmental quality, for example decreasing river water quality, decreasing air quality and so on. The decline in the quality of the environment will result in losses that often lead to disputes between the parties suffering losses and those deemed to cause losses. Stipulation of obligations to business actors and/or activities in environmental management is still not enough if it is not followed by strict supervision.
In addition, there is also a business profile, one of which is the distance of the business location which is very far from the regulatory agency/ licensor. The distance between the licensing agency and the companies that are classified as far and the support system for supervision activities has also not been developed optimally to be one of the supporters of the weak supervision of the company/ business actor. The farther the business location, the less frequent a business actor/ activity to be monitored. This is the reason for the higher level of violations of environmental permits in areas far from the Department of the Environment.
CONCLUSIONS AND SUGGESTIONS
This study states that the level of company compliance is good enough with a value of 0.7 on a scale of 0-1. Factors that have a big influence on the level of compliance are the factors of supervision and application of policies. As for the company profile factor, it does not significantly influence compliance. In the aspect of supervision, the aspect that influences the level of obedience is in the aspects of follow- up, budget and quality of human resources. The aspects that obstruct the level of adherence to the policy implementation factors are the aspects of incentives / disincentives and the delegation of authority to the company organization. Based on research conducted on businesses/activities in the South Lampung District, suggestions that can be given by the author in terms of supervision are so that government agencies can improve the performance of supervision of the sector of activity/business through improving the process of follow-up of supervision, increasing the supervision budget and improving the quality of human resources in the field of supervision further, there are aspects of

Proceeding of International Conference of 4th SHIELD 2019
https://pasca.unila.ac.id/seminar-internasional-shield/
ISBN : 978-602-51393-9-0
143
the application of policies that need to be addressed are the need for improvement of incentives/disincentives for environmental management staff and simplifying the system of delegating authority to business/activity organizations.
REFERENCES Arikunto, S. 2002. Prosedur Penelitian: Suatu Pendekatan Praktek. Yogjakarta:
Rineka Cipta. Cresswel, J.W. 2013. Research Design, pendekatan kualitatif, kuantitatif dan
mixed, Cetakan III. Yogjakarta: Pustaka Pelajar. Hunter, H.M. 2017. Efektifitas penerapan amdal dalam pengelolaan lingkungan
hidup pada pembangkit listrik di bali-studi kasus PLTD/G Pesanggaran. Jurnal Ecothropic. 11(1).
Prasetyo, B. 2005. Metode Penelitian Kuantitatif. Jakarta: PT. Radja Grafindo Persada.
Riduwan. 2013. Skala Pengukuran Variable-Variabel Penelitian. Bandung: Alfabeta.
Soemarwoto, O. 2014. Analisis Mengenai Dampak Lingkungan. Yogyakarta: Gadjah Mada University Press.
Tias, N.P. 2009. Efektifitas Pelaksanaan Amdal dan UKL-UPL dalam Pengelolaan Lingkungan Hidup di Kabupaten Kudus. Semarang: Universitas Diponegoro.
Wahyono, S. and Sutarno. 2012. Efektifitas pelaksanaan dokumen lingkungan dalam perlindungan dan pengelolaan lingkungan hidup di Kabupaten Pacitan. Jurnal Ekosains. 4(2).

Proceeding of International Conference of 4th SHIELD 2019
https://pasca.unila.ac.id/seminar-internasional-shield/
ISBN : 978-602-51393-9-0
144
PREDICTION MODEL OF STUNTING TODDLER'S EVENTS BASED ON SOCIAL DETERMINANTS AND RISK FACTORS IN TELUK BETUNG
SELATAN DISTRICT, BANDAR LAMPUNG CITY Marita Wulandari1,2, Dyah Wulan S.R Wardani3, Betta Kurniawan4, Erdi Suroso5
1Department of Environmental Sciences, University of Lampung
2Staff of The Surveillance and Immunization Section of The Health Department of Bandar Lampung City
3Parts of Community Medical Sciences and Public Health, Faculty of Medicine, Lampung University
4Parts of Parasitology and Microbiology, Faculty of Medicine, Lampung University 5Department of Agricultural Product Technology, Faculty of Agriculture, University
of Lampung Jl. Prof. Sumantri Brojonegoro No.1 Bandar Lampung 35145
E-mail : [email protected],[email protected], [email protected],
[email protected], [email protected]
ABSTRACT The prevalence of stunting toddlers in Teluk Betung Selatan Subdistrict of Bandar Lampung City has increased, the results of the PSG in Bandar Lampung City in 2015 were found 90 toddlers and based on the results of the TB/U measurement activities in 2018 310 children were found. This study aims to analyze the influence of social determinants and risk factors on the incidence of stunting of children aged 12-59 This study was conducted with case control design method, conducted in April-May 2019 in the Teluk Betung Selatan subdistrict Bandar Lampung City, the number of samples was 50 cases 50 controls. The independent variables in the study are social determinants (the level of education, and the level of income) environmental determinants (access and fisical quality of clean water, sanitation access, SPAL), health determinants (distance, transportation, health insurance ownership), and household food security (vulnerability access, food diversity). The dependent variable is stunting toddlers. Data was collected through interviews and observations. analysis technique uses the Structural Equation Model Partial Least Square . The results of the study state that social determinants through determinants of household food security significantly influence the incidence of stunting toddlers with R2 31.4%. The strongest indicator that explains each latent variable is the level of income, distance to health service facilities, access to clean water and access to food insecurity. Based on these results, the prevention of the incidence of stunting toddlers must be strengthened by increasing income and education of parents to reduce access to family food insecurity Keywords : Perdiction model, social determinants, stunting.
INTRODUCTION
The prevalence of stunting toddlers from 2005 to 2017 was 36.4%, and by this number Indonesia was in the third position as a country with highest stunting prevalence in South East Asia region (Ministry of Health of Republic of Indonesia,

Proceeding of International Conference of 4th SHIELD 2019
https://pasca.unila.ac.id/seminar-internasional-shield/
ISBN : 978-602-51393-9-0
145
2018). Bandar Lampung was the capital city of Lampung province with 33.4% stunting toddlers prevalence based on the nutrition status monitoring in 2017, and this was a high prevalence rate according to WHO that a region would belong to good category of stunting toddlers prevalence at less than 20% (Ministry of Health of Republic of Indonesia, 2018).
South Teluk Betung sub district is one of sub districts in Bandar Lampung municipal with an increased stunting toddlers prevalence increase. Nutrition status monitoring result showed 90 toddlers with stunting in 2015 (Health Office of Bandar Lampung, 2015). Body weight and age measurement of toddlers in public health centers from November to December 2015 showed 310 toddlers with stunting (Health Office of Bandar Lampung, 2018).
Stunting, if not mitigated immediately, shall not only affect the individual but it may affect to economy in forms of increasing expense for health cost and reduced ability and working capacity, and finally it affects nation development in forms of reduced learning achievement and capacity (WHO, 2013). The factors that are both directly and indirectly affect stunting case can be seen from aspects of social, health, environment and food sustainability (Unicef, 2013).
Social determinants include levels of education and income of families (Health Research and Development Agency, 2013). Family income can influence the stunting case. A study by Ni‟mah and Nadiroh (2015) states that lower income becomes a risk factor of toddlersstunting. Unicef in 2013 suggested that significant effects of low economy status included possibilities of children stunting and wasting. Maternal low education level is a risk factor for and associated significantly with stunting toddlers cases (Ni‟mah and Nadiroh,
2015; Tiwari et.al., 2014). Studies in some developing countries as well as in South East Asia suggest that children with low education level mothers have 1.67 folds of risk to suffer stunting and low-income families have 2.1 folds risk causing stunting toddlers cases (Apriliana and Fikawati, 2018). Knowledge concerning how social determinants and risk factors for stunting toddlers cases is required to complement and strengthen stunting toddlers mitigation strategy.
The objective of this research was to develop a model to predict stunting toddlers case based on social determinants and risk factors for stunting toddlers case . PLS method was used to identify determinants and indicators that significantly influenced stunting toddlers case. Results from prediction model would provide information about determinants and indicators that should be considered for intervention programs to mitigate stunting toddlers case.
RESEARCH METHOD AND SAMPLE
This was an observational analytic research by using case control design that was conducted in South Teluk Betung sub district of Bandar Lampung municipal from April to May 2019. Population was all toddlersof 12-59 months old living in South Teluk Betung sub district and who were measured for body weight from November to December 2018. 50 respondents for case group and 50 respondents for control group were taken as samples by using purposive smapling. Respondents were mothers with toddlersof 12-59 months old living in South Teluk Betung sub district and who were measured for body weight from November to December 2018.
Variables to use in this research were latent variables with their indicators. Social determinant variables were measured with maternal education level indicators (they were: uneducated when a mother did not pass elementary school, elementary school when a mother graduated elementary school and junior high school, higher education level when a mother graduated senior high school or higher education) (Government Regulation No. 47 in 20018) and

Proceeding of International Conference of 4th SHIELD 2019
https://pasca.unila.ac.id/seminar-internasional-shield/
ISBN : 978-602-51393-9-0
146
income per capita (they were low: < Rp. 1,500,000/month; moderate: Rp. 1,500,000 - < Rp. 3,750,000/month; high: ≥ Rp. 3,750,000 /month (Central Bureau of Statistics, 2016). Environment determinant variable was measured by indicators of acces to clean water, sanitation access (they were poor: having no toiletry; moderate: having open toiletry; good: having toiletry better than swan necked toilet) (Health Research and Development Agency, 2014), and household waste/liquid waste disposal (they were poor: a household did not have the waste disposal facility; moderate: a household had open waste disposal; good: a household had closed waste disposal) (STBM, 2015). Health determinant variable was seen from the easiness level to access health services to be measured by distance indicators (they were > 5 km, 1-5 5 km, and < 1 km) and transportation types (they were public transportation, private transportation, and needing no transportation means) (National Development Planning Agency, 2010). Household food sustainability variable was measured by food supply vulnerability indicators (they were categories of severe vulnerability, moderate vulnerability, mild vulnerability, and sustainable), and food diversity (Coates et.al., 2007) (they were low category: ≤ 3 food types; moderate category: 4-5 food types; and high category: > 6 food types) (FAO, 2016).
Data were collected by using interviews and observations and followed with questionnaires in close question form. Data were analyzed by using Structural Equation Modeling – Partial Least Square (SEM-PLS) that had higher flexibility for regression research that correlated theories and data, and that was able to do path analysis with latent variables (Ghozali, 2014). SEM-PLS analysis uses measurement model and structural model of evaluation analyses. The measurement model evaluation is done to figure out relationship specification between latent variables with their indicators and it defines how each indicator relates to its latent variable and this is evaluated by using loading factor value (λ). The structural model evaluation is done to describe relationship between latent variable and dependent variable that is evaluated by using R2, t value and path coefficient value (γ).
This research owned ethical permit from Faculty of Medicine in Lampung University. Respondents involved in this research were explained about this research and they participated voluntarily by joining interviews and observations processes.
RESULT AND DISCUSSION
This research results contain of measurement model evaluation and structural model evaluation. The PLS path model is presented in figure 1.

Proceeding of International Conference of 4th SHIELD 2019
https://pasca.unila.ac.id/seminar-internasional-shield/
ISBN : 978-602-51393-9-0
147
Picture 1. Social determinant, risk factor, and stunting toddlers.
Description: The deciding legend Social determinant, Health determinant, Environment determinant, Household food sustainability, Toddler stunting, A1 : Maternal education level, A2 : Income per capita, B1 : Distance to access health services, B2 : Transportation types to access health services, C1 : Clean water, C2 : Sanitation access, C3: Household waste/liquid waste disposal, D1 : Food supply vulnerability, D2 : Food diversity, E1 : Anthropometric measurements.
The SEM-PLS analysis is done with measurement model evaluation that defines how each block of indicator relates to its latent variable. The indicator can be expressed as ideal and valid to measure its latent variable when the loading factor value (λ) > 0.7. Loading factor value (λ) of 0.5 to 0.6 are still acceptable. Loading factor value (λ) < 0.5 indicates that the indicator is invalid.
All stunting toddlers case indicators such as social determinants, health determinants, environment determinants, and household food sustainability could be expressed as suitable to measure their latent variables except health insurance ownership and clean water quality. They are presented in table 1. Table 1 Value of loading factor (λ)
Latent variable Indicator (λ)
Social determinant Maternal education level 0,780 Income per capita 0,881 Health determinant Distance to access health services 0,827 Transportation types to access health
services 0,665
Environment determinant Access to clean water 0,698 Sanitation access 0,584 Household waste/liquid waste disposal 0,610 Household food Food supply vulnerability 0,535 sustainability Household food diversity 0,928 Toddler stunting Anthropometric measurements 1,000
Source: SmartPLS analysis results in 2019
The loading factor value can identify the most significant indicator in explaining its latent variable. Table 1 shows that indicators of family income level, distance to health service facility, clean water access, and food supply vulnerability are the strongest influencing indicators to describe its latent variable.
Structural model evaluation can be seen from R square (R2) value, tvalue and path coefficient estimation (γ). The R2 value interpretation is used to assess all independent latent variable influences to dependent latent variables, whether they are having substantial influences. T value shows if there is any relationship between latent variables. The path coefficient estimation (γ) describes influences between independent latent variables and dependent latent variables.
R2 values from structural model evaluation show that social determinant can explain 3,2% health determinant variant, 5.9% environment determinant variant and 26% household food sustainability. R2 value for stunting toddlers case is 0.314 and this indicates that dependent variable variant can be explained 31.4% by independent variable variant. The rest of 68.6% can be explained by other variables beyond that had been studied in this research. This is presented in table 2.

Proceeding of International Conference of 4th SHIELD 2019
https://pasca.unila.ac.id/seminar-internasional-shield/
ISBN : 978-602-51393-9-0
148
Table 2. R Square values (R2) Variabel R Square
Health determinant 0,032
Environment determinant 0,059
Household food sustainability 0,260
Toddler stunting 0,314
Source: SmartPLS analysis results in 2019
The significant correlation of structural model evaluation is shown by 95% trust level, so that precision level or threshold of inaccuracy is (α) = 5% = 0.05 and t-value is higher than 1.96. The structural model evaluation is presented in table 3 and it shows four significant paths out of seven paths that correlates social determinant to environment determinant (t- value 2.332), to household food sustainability (t-value 7.646), to stunting toddlers case (t- value 3.331), and that correlates household food sustainability to stunting toddlers case (t- value 2.369). The path coefficient (γ) significance explains that social determinant significantly influences environment determinant by 0.242, household food sustainability by 0.510, stunting toddlers case by 0.324. Household food sustainability significantly influences stunting toddlers case by 0.231. Social determinant through household food sustainability significantly influences stunting toddlers case by 0.118 (0.510 x 0.231). Table 3. PLS output path coefficient values Path (γ) t
-0,035 0,353
0,163 1,727
stunting
-0,180
1,811
Environment 0,242 2,332
determinant
0,510
7,646
vulnerability
0,324
3,331
0,231 2,369
stunting
Source: SmartPLS analysis results in 2019
The structural model evaluation model shows that the social determinant through household food sustainability influences stunting toddlers case, and it is supported by social determinant influences to household food sustainability and to stunting toddlers case. Social determinant indicators in this research are maternal education level and family income level (Health Research and Development Agency, 2013). The family income level is the strongest indicator to explain social determinant variable. Social determinant becomes an important factor that influences annual reduced stunting case, where gross domestic product per capita shows significant correlation in an analysis that is adapted with time (Huicho et.al., 2017). Low family income, low maternal education level, and poor maternal nutrition knowledge are factors related to stunting toddlers case (Ni‟mah et.al., 2016). The main determinant of 6 months old baby stunting case is the family income level (Mustikaningrum et.al., 2016). A study done by

Proceeding of International Conference of 4th SHIELD 2019
https://pasca.unila.ac.id/seminar-internasional-shield/
ISBN : 978-602-51393-9-0
149
Association of Economy Faculty Students in Airlangga University (2018) shows that family income is a factor related to stunting toddlers case. Most toddlerssuffering growth disorder have relatively low economy status (Aridiyah, 2015).
In this research the social determinant correlates to household food sustainability with food supply vulnerability indicator as a strongest indicator explaining the household food sustainability. The Ministry of Agriculture (2015) suggests that food in a particular area may not be able to access by particular households because some limitations including: i) physical access – market infrastructure, method to reach the market, and market function; ii) economy accesses – financial capacity to buy sufficient and nutritious food. High quality food availability (food supply) and affordable nutritious food (social and economy status) shall influence a household to provide healthy diet and to prevent children stunting (WHO, 2014).
Family income correlates to the household ability to fulfil primary, secondary, and tertiary life necessities. Limited family income shall influence food material quality and quantity that shall be consumed by the family members (Khotimah, 2014). A mild and moderate food vulnerable families possess more possibility to have stunting children than other families with sustainable food supply (Sarma et.al., 2017). Babies of 6-23 months old inside families with vulnerable food supply have 2.7 folds of risk for suffering stunting compared to those babies inside families with sustainable food supply (Masrin, 2014). Family‟s food supply vulnerability in a long term can influence food consumption by continuously reducing food quantity and quality for all family members including children under five, so that insufficiency of nutrition required the child‟s body shall affect negatively to the child under five growth especially to the body height (Chaparro, 2012).
The stunting toddlers mitigation programs can be done by improving food supply access economically that is more influenced by buying capacity and income. Therefore, economy empowerment through efforts for creating employments and providing access to public for being able to involve actively in productive activities. One of poverty factors is because getting good and proper job shall require educated and skilled work force, so that public education improvement can be done not only by formal education, but also by informal education such as skill training and course to prepare work force with sufficient competence, knowledge, and skill. The implementations of stunting mitigation programs shall be running smoothly by participations and cooperation from varying parties like government, public, and private parties.
CONCLUSION AND RECOMMENDATION
Social determinant significantly influences stunting toddlers case in South
Teluk Betung sub district of Bandar Lampung municipal with family income as the strongest indicator influencing family vulnerability of access to food supply. This research result can be used to support stunting mitigation programs in Bandar Lampung.
REFERENCES Apriluana, G. and Fikawati, S., 2018. Analisis faktor-faktor risiko terhadap
kejadian stunting pada balita (0-59 bulan) di negara berkembang dan Asia Tenggara. Media Litbangkes. 28(4): 247-256.

Proceeding of International Conference of 4th SHIELD 2019
https://pasca.unila.ac.id/seminar-internasional-shield/
ISBN : 978-602-51393-9-0
150
Aridiyah, F. O., Rohmawati, N. and Ririanty, M., 2015. Faktor-faktor yang mempengaruhi kejadian stunting pada anak balita di wilayah pedesaan dan perkotaan. e-Jurnal Pustaka Kesehatan. 3
Badan Penelitian dan Pengembangan Kesehatan, 2014. IPKM : Indeks Pembangunan Masyarakat. Jakarta
Badan Penelitian dan Pengengenbangan Kesehatan, 2013. Determinan Sosial Kesehatan Ibu dan Anak. Yogyakarta: Penerbit Kanisius. 223 p.
Badan Perencana Pembangunan Nasional. 2010. Peningkatan Akses Masyarakat Terhadap Kesehatan Yang Lebih Berkualitas (Improving Community Access to Qualified Health).
Badan Pusat Statistik Provinsi Lampung. 2016. Indikator Makro Ekonomi Regional Provinsi Lampung 2016. Bandar Lampung
Chaparro, C. 2012. Household Food Insecurity and Nutritional Status of Women of Reproductive Age and Children under 5 Years of Age in Five Departments of he Western Highlands of Guatemala: An Analysis of Data from the National MaternalInfant Health Survey 2008–09 of Guatemala. Washington, DC.
Coates,J., Swindale, A., and Bilinsky, P. 2007. Household Food Insecurity Access Scale (HFIAS) for Measurement of Food Access: Indicator Guide. Food and Nutrition Technical Assistance III Project (FANTA). Connecticut Avenue, NW Washington, DC.
Dewan Ketahanan Pangan, Kementerian Pertanian and World Food Programme Dinas Kesehatan Kota Bandar Lampung, 2015. Hasil Survei Pemantauan Gizi
(PSG) Kota Bandar Lampung tahun 2015. Seksi Gizi Bidang Kesehatan Masyarakat. Dinas Kesehatan Kota Bandar Lampung. Bandar Lampung.
Dinas Kesehatan Kota Bandar Lampung. 2019. Laporan tahunan Seksi Gizi Dinas Kesehatan Kota Bandar Lampung tahun 2018. Bandar Lampung.
Food and Agriculture Organization (FAO). 2011. Guidelines for measuring household and individual dietary diversity. Nutrition and Consumer Protection Division, Food and Agriculture Organization of the United Nations. Rome, Italy.
Ghozali, I. 2014. Structural Equation Modeling Metode Alternatif dengan Partial Least Squares (PLS). Semarang: Universitas Diponegoro. 410 p.
HIMA EP Universitas Airlangga, 2018. Stunting di Indonesia. Surabaya: Universitas Airlangga. http://himaep.feb.unair.ac.id/thinking-out-cloud/128-stunting-di- indonesia.html
Huicho, L., Espinoza,CAH., Perez, EH., Segura, ER., de Guzman,JN., María Rivera,M.Ch., and Barros, A.J.D. 2017. Factors behind the success story of under- five stunting in Peru: a district ecological multilevel analysis. BMC Pediatrics. 17(29).
Kementrian Kesehatan RI, 2018. Buku Saku Pemantauan Status Gizi Provinsi LampungTahun 2017. Direktorat Gizi Mayarakat. Dirjend Kesehatan Masyarakat. Jakarta
Kementrian Kesehatan RI. 2015. Peraturan Menteri Kesehatan Republik Indonesia Nomor 3 Tahun 2014 tentang Sanitasi Total Berbasis Masyarakat. Jakarta.
Kementrian Kesehatan RI. 2018. Situasi Balita Pendek (Stunting) di Indonesia. Buletin Jendela Data dan Informasi Kesehatan.
Khotimah, H. and Kuswandi, K. 2014. Hubungan karakteristik ibu dengan status
gizi balita di Desa Sumur Bandung Kecamatan Cikulur Kabupaten Lebak Tahun 2013. Jurnal Obstretika Scienta. 2(1): 146-162.

Proceeding of International Conference of 4th SHIELD 2019
https://pasca.unila.ac.id/seminar-internasional-shield/
ISBN : 978-602-51393-9-0
151
Masrin, Paratmanitya, Y., and Aprilia, V. 2014. Ketahanan pangan rumah tangga berhubungan dengan stunting pada Anak Usia 6-23 Bulan. Jurnal Gizi dan Dietetik Indonesia. 2(3): 103-115.
Mustikaningrum, A.C., Subagio, H.W., and Margawati, A. 2016. Determinan
kejadian stunting pada bayi usia 6 bulan di Kota Semarang. Jurnal Gizi Indonesia. 4(2): 82-88.
Ni'mah, K. and Nadhiroh, S.R. 2015. Faktor yang berhubungan dengan kejadian stunting pada balita. Media Gizi Indonesia. 10(1): 13-19.
Pemerintah Republik Indonesia. 2008. Peraturan Pemerintah Republik Indonesia Nomor 47 Tahun 2008 Tentang Wajib Belajar. Jakarta.
Sarma,H., Asaduzzaman, M., Khan,JR., Tarannum,S., Uddin, F., Rahman, AS., Hasan, M., and Ahmed, T. 2017. Factors influencing the prevalence of stunting among children aged below five years in Bangladesh. Food and Nutrition Bulletin. 38(3): 291-301.
Tiwari, R., Ausman, L. M., Argho, K. E., 2014. Determinants of stunting and severe stunting among under-fives: evidence from 2011 Nepal Demographic and Health Survey. BMC Pediatrics. 14(239).
UNICEF, 2013. Improving child nutrition, the achievable imperative for global progress. United Nations Children‟s Fund. New York.
WFP. 2015. Food security and vulnerability atlas of Indonesia. 196p. World Health Organizatition, 2013. Childhood Stunting: Context, Causes and
Consequences. WHO Conceptual Framework. http://www.who.int/nutrition/events/2013_ ChildhoodStunting_colloquium_14Oct_ ConceptualFramework_colour.pdf . Diakses pada 09 Juli 2019.
World Health Organizatition, 2014. Global Nutrition Targets 2025: Stunting Policy Brief. Departement of Nutrition for Health and Defelopment. World Health Organizatition. Switzerland.

Proceeding of International Conference of 4th SHIELD 2019
https://pasca.unila.ac.id/seminar-internasional-shield/
ISBN : 978-602-51393-9-0
152
VILLAGE, HUMAN RESOURCES AND NAWACITA
Siti Khoiriah43, Rudy, Afri Aripin
ABSTRACT The Village Law creates new positions and new relations between the state and citizens, where the state through the Village Law has recognized (acknowledged and respected) the existence of the village. Noting the 1945 Constitution, especially in the article-by-chapter explanation section, for Chapter VI, Article 18, it contains the State's recognition of the existence of village autonomy with its original rights. Based on Article 1 Number 1 of Law Number 6 of 2014 concerning Villages, it is defined that villages are customary villages and villages or what are called by other names hereinafter referred to as villages are legal community units that have territorial limits that are authorized to regulate and manage government affairs, interests local communities based on community initiatives, traditional origin and/or rights that are recognized and respected in the system of government of the Unitary State of the Republic of Indonesia. The state provides or establishes government affairs mandates and interests of the local community to the village, the state carries out redistribution in the form of money and some state assets, besides that the State carries out guidance, empowerment and supervision of the village. On the other hand for village community, the village becomes a social basis for community members, becoming an arena for knitting social capital. Keywords: village, village community, development.
INTRODUCTION
The village has a very strategic position in the Indonesian government system considering that the village is the smallest government unit that has a fundamental role for the country. Human resources (HR) as one of the challenges that need to be improved where human resources (HR) are the main capital in national development. Developing Indonesia from the periphery by strengthening regions and villages using the framework of a unitary state and revolutionizing the nation's character is one of the goals in Nawacita.
RESEARCH METHODS
This paper is a socio-legal legal research (sociolegal research) that uses primary and secondary data, so the approach also uses a normative approach. The researcher used a national development policy mapping model in order to manifest nawacita, a regulation regarding village autonomy and human resources in the village. Analysis of the data was undertaken qualitatively in a prescriptive-analytical way, which examines legal concepts and legal norms relating to research problems.
43 Universitas Lampung. Jl. Sumantri Brojonegoro, Rajabasa, Bandar Lampung, Lampung, Indonesia. Email: [email protected].

Proceeding of International Conference of 4th SHIELD 2019
https://pasca.unila.ac.id/seminar-internasional-shield/
ISBN : 978-602-51393-9-0
153
RESULTS AND DISCUSSION
Village Constitutionalism
The existence of the village is affirmed in Article 18B Paragraph (2) of the 1945 Constitution of the Republic of Indonesia which states that "The State recognizes and respects customary law units along with their traditional rights as long as they are alive and in accordance with the development of the people of the Republic of Indonesia in law ". In addition, it is also emphasized in Article 28I paragraph (3) which states that "Cultural identity and the rights of traditional communities are respected in accordance with the development of the times and civilizations.44
Noting the 1945 Constitution, especially in the article-by-chapter explanation section, for Chapter VI, Article 18, it contains the State's recognition of the existence of village autonomy with its original rights. In the explanation section, it is stated that in the territory of the State of Indonesia there are approximately 250 zelfbestturende lanshappen and volksgemeenschappen, such as villages in Java and in Bali, nagari in Minangkabau, hamlets and clans in Palembang and so on. These regions have an original arrangement, and therefore can be considered as special areas. The Republic of Indonesia respects the position of these special regions and all state regulations concerning these regions will remember the rights of the origin of the region (Kushandayani, et al. 2011: 67). 45
Based on Article 1 Number 1 of Law Number 6 of 2014 concerning Villages, it is defined that villages are customary villages and villages or what are called by other names hereinafter referred to as villages are legal community units that have territorial limits that are authorized to regulate and manage government affairs, interests local communities based on community initiatives, traditional origin and / or rights that are recognized and respected in the system of government of the Unitary State of the Republic of Indonesia.46
In the RPJMN it is stated that For the Indonesian people, specifically the national development goals have been outlined in the Preamble of the 1945 Constitution, namely to protect the entire nation and all of Indonesia's bloodshed; advance public welfare; enrich the life of a nation; and participate in carrying out world order based on freedom, eternal peace and social justice. If the objectives mandated by the Constitution are summarized, it will appear that the mandate given by the State to stakeholders, especially state administrators and government in the Unitary State of the Republic of Indonesia (NKRI), is to glorify humans and community life from the smallest scope to the world.47 Efforts to realize state goals are carried out through a gradual, planned, integrated and sustainable process. Law No. 17 of 2007 concerning the 2005-2025 National Long-Term Development Plan stipulates that the vision of national development is to realize an independent, developed, just and prosperous Indonesia.
The vision is realized through 8 (eight) missions, namely: Realizing a noble, moral, ethical, cultured and civilized society based on the philosophy of Pancasila, Realizing a competitive nation by building quality human resources
44 Putera Astomo, ”Position and Testing of the Constitutionality of Village Regulations in Legislation Regulations", Constitutional Journal, Volume 15, No. 2 (Juni 2018):283. 45 Muhammad A. Rauf, “The Political Law of the Formation of Aat Villages in Government Systems in Indonesia”, De Lega Lata, Volume I, No. 2 (Juli–Desember2016):414. 46 Rauf, “The Political Law of the Formation of Aat Villages in Government Systems in Indonesia” 415. 47 Rencana Pembangunan Jangka Menengah Nasional Buku Agenda Pembangunan Nasional, Kementerian perencanaan Nasional/Badan Perencanaan Pembangunan Nasional, 2014, Hlm 1-1.

Proceeding of International Conference of 4th SHIELD 2019
https://pasca.unila.ac.id/seminar-internasional-shield/
ISBN : 978-602-51393-9-0
154
and competitiveness, Creating a democratic society based on law, Creating Indonesia safe, peaceful, and united, Realizing equitable development and justice, Realizing a beautiful and sustainable Indonesia, Realizing Indonesia to be an independent, developed, strong and nationally based archipelagic country, and Creating Indonesia plays an important role in the international community.48
The challenges in national development include: political and security stability, governance: effective and efficient bureaucracy, eradicating corruption, economic growth, accelerating equity and justice, sustainable development, improving the quality of human resources, disparity between regions, accelerating maritime development.49
Human resources (HR) as one of the challenges that need to be improved which human resources (HR) are the main capital in national development. Therefore the quality of human resources needs to be continually improved so that it is able to provide high competitiveness which, among others, is marked by the increase in the Human Development Index (HDI), the Gender Development Index (IPG), and the Gender Empowerment Index (IDG), which is achieved through population control , improving the level of education, and increasing the degree of health and nutrition of the community.50 Concept of Human Resources
Watkins (1991: 253) defines the development of human resources as follows: "The field of study and practice is responsible for the fostering of a long term, work-related learning capacity at the individual, group, and organizational level of organizations. The organization needs to enhance individuals' capacity to learn, to help groups overcome barriers, and to help in the creation of a culture that promotes continuous learning ". This definition related to human capital theory is assumed by Schultz (1993) that the factors of knowledge and skills acquired during education and training will have a positive impact on the organization.
Meanwhile, Garavan et al. (2001) further explained that human resources are useful for organizations because of four main things, namely: (1) flexibility and adaptability; (2) individual improvement; (3) competence; (4) development of organizational competencies; and (5) individual work. Seleim et al. (2007) agree that human capital is positively related to organizational performance. As the development of human resources such as a significant impact on improving the ability of employees to perform tasks in achieving organizational goals.51
Werther and Davis (1996), states that human resources are employees who are ready, capable and alert to achieving organizational goals. As stated that the main dimension of the resource side is its contribution to the organization, while the basic dimensions of humanity are the treatment of contributions in turn will determine the quality and capability of his life.
According to Sugeng (2002), the quality of human resources is a person's knowledge, skills and abilities that can be used to produce professional services. Ahbdullah (1990) and Acok (1991), agree that the quality of human resources will always not be separated from a professional work. So that a quality of work, must be involved in the context of work which is one's profession. Therefore, it is not surprising that the quality of high human resources is expected to emerge in professionals who have the expertise, organization and ethical code that makes it
48 Ibid, Hlm 2-1 – 2-3 49 Ibid, disarikan dari Hlm 2-6 - 2-16 50 Ibid, Hlm 2-13 -2-14 51 Roosje Kalangi, “Human Resource Development and Performance of State Civil Servants in the Sangihe Islands Regency of North Sulawesi Province,” Jurnal Lppm Bidang Ekososbudkum, Volume 2 No. 1 (2015): 3.

Proceeding of International Conference of 4th SHIELD 2019
https://pasca.unila.ac.id/seminar-internasional-shield/
ISBN : 978-602-51393-9-0
155
easier for them to develop concepts, rejects, measures, and even measures that they can use to assess and shape their self-image. Therefore, greater attention must be given to HR Management itself.
The development of the village community is essentially a process of change towards a better life for the community, by conditioning and trusting the community itself to build itself in accordance with the capabilities it has, the standard understanding of community development has been established by the PPB, in the Subrata Konkon (1991: 4) that; "Community development is a process that is cultivated to create conditions for the economic progress of the entire social community to the initiative of the community".52 Nawacita
The idea of Nawacita Jokowi was born in the midst of a crisis of mentality that hit the Indonesian nation. So, Jokowi launched a mental revolution to make a political breakthrough. Therefore, Nawacita was used as the main program or purpose of the Jokowi government in implementing its government.
The government led by Joko Widodo and Jusuf Kala (Jokowi-JK) in 2014-2019, has established its development priority programs which are summarized in nine programs called Nawa Cita. Nawa Cita is a development paradigm concept which according to Jokowi tries to get out of the mainstream development paradigm, namely the paradigm of growth as the main goal of development in Indonesia.53
The success of development in Indonesia, which is shown by high and stable economic growth, and has ushered Indonesia into the developed world order, turns out to still cause several problems, such as the problem of equitable development, sovereignty and economic independence and threats to the nation's personality. Therefore, since the beginning Nawa Cita asserted that Indonesia's development goals were to create economic independence, be sovereign in politics, and have a personality in culture
When nominating himself as president, Jokowi and Jusuf Kala (JK) in addition to delivering their vision and mission to nominate president and vice president also included nine priority agendas to realize their vision and mission. This agenda is referred to as Nawa Cita, namely:54 1. Presenting the country to protect all nations and provide security for all
citizens. 2. Make the government not absent by building clean, effective, democratic and
reliable governance. 3. Build Indonesia from the periphery by strengthening regions and villages
within the framework of a unitary state. 4. Refusing weak countries by implementing system reform and law enforcement
that are corruption-free, dignified, and trusted. 5. Improving the quality of life of Indonesian people. 6. Increasing people's productivity and competitiveness in the international
market. 7. Realizing economic independence by moving strategic sectors of the domestic
economy. 8. Conduct a revolution of national character.
52 Tenius Kulla et al., “Quality of Human Resources in Improving the Development of Tinggilbet Distrilk Beoga Village in the Peak District of Papua Province,”:4 53 Syam Surya Syamsi, “Nawa Cita Jokowi-Jk in the Economic Development Paradigm,” Surya Octagon Interdisciplinary Journal of Science & Technology, Vol.1, No. 1 (September2015):73 54 Syamsi, “Nawa Cita Jokowi-Jk in the Economic Development Paradigm,,” 78

Proceeding of International Conference of 4th SHIELD 2019
https://pasca.unila.ac.id/seminar-internasional-shield/
ISBN : 978-602-51393-9-0
156
9. Strengthening diversity and strengthening Indonesia's social restoration (Jokowi-JK Vision Mission, 2014, p.6-7). Wasisto Raharjo Jati (Raharjo Jati: 2015), stated; "Nawacita is a broad
extension of what Bung Karno called as three (3) fields which have become nine fields, namely police, food independence, science and everything else. Meanwhile, Jokowi saw that 6 fields other than police were the practices of Trisakti which were implemented.
For him "Nawacita is the main foundation for reforming Indonesia's development back, because current development refers to economic growth, while, at that time, Bung Karno and Trisakti supported economic equality. Likewise in the infrastructure aspects of the development program that has been formed so far refers to materialism, while the Trisakti Bung Karno is dialectical "(Raharjo Jati: 2015).55 Evaluation of Village Development
Different regional characteristics, of course, can bring up different criteria for problems depending on the needs and available resources. The resources in question are natural resources, cultural environment and social environment that exist in the form of cultural patterns and patterns of social interaction that are already valid in the community, so that the needs of the recipient community can be identified correctly. Thus, the lifestyle in a society determines how these communities fulfill their life needs, both physically, psychologically and socially and how they utilize the resources available in their environment both human, natural and social resources (Rudito, 2008).56
Potentially every community has a mechanism to overcome welfare problems in its life. Potential exists in the form of natural resources, human resources, and social resources in the form of the ability to organize natural or human resources or a combination of both. In order to maintain their lives, the community uses and organizes all these resources in various activities such as economic activities, politics, religion, arts, mutual cooperation and so on. When faced with challenges, changes occur in people's lives. As confirmed by Bambang Rudito (2008), the community and the culture in it will always experience changes, both changes that occur slowly and quickly. These changes are considered as something natural because the knowledge and physical condition of the community will develop. Changes that run fast are generally caused by the presence of a number of development programs implemented in people's lives that change daily habits. Or also the existence of other communities that live in a shared area as a community with different lifestyles between each community. These differences can lead to social problems.57
According to Law No. 6 of 2014 concerning Villages Article 18 village authority includes authority in the field of village administration, village development management, village community development, and empowerment of village communities based on community initiatives, origins, and village customs.58
Utilization of Village Funds that have been rolling since 2015 as the implementation of Law No. 6 of 2014 concerning Villages and Government Regulation No. 60 of 2014 concerning Village Funds sourced from the National Budget presents irrefutable facts. Namely, Indonesia's development moves
55 Mochdar Soleman & Muhammad Noer, "Nawacita as Jokowi's Special Strategy for October 2014 - October 24, 2015," Journal of Political Studies and Development Problems, Vol. 13 No. 1 (2017). 56 Indah Huruswati, “Most Social Welfare Services in the Village through Social House, ” Sosio Konsepsia, Vol. 04, No. 02 (Januari – April 2015): 74-75. 57 Huruswati, Most Social Welfare Services in the Village through Social House, 75. 58 Syahrul Haidin, “Implementation of Village Financial Management After the Implementation of Law Number 6 of 2014 concerning Villages"(Study in Dompu District), Jurnas IUS Vol V No. 1 (April 2017):147.

Proceeding of International Conference of 4th SHIELD 2019
https://pasca.unila.ac.id/seminar-internasional-shield/
ISBN : 978-602-51393-9-0
157
simultaneously from Sabang to Merauke and from Sangihe to Rote Island. On several occasions the President said that the use of village funds in 2019 which totaled Rp. 73 trillion should be shifted from basic infrastructure development. But it also began to be directed towards improving human resources (HR), the welfare and health of children and economic development of rural communities including Village-Owned Enterprises (BUMDes).59
On one occasion the Village Minister, Development of Disadvantaged Regions, and Transmigration (Mendes PDTT), Eko Putro Sandjojo, said that the government through Nawacita was committed to building Indonesia from the edge. This is for the sake of increasing the development of villages in Indonesia, which until now are still in the category of lagging and very lagging.60
The economic perspective portrays the village as a community that has a distinctive production capital and is a barn of raw material and manpower. While the juridical-political perspective that the village is often seen as the lowest government in Indonesia or the legal community unit has an identity, different entities and has regional boundaries that are authorized to regulate and manage the interests of the local community based on local origins and customs that are recognized and respected in the NKRI government system.61
The development of human resources is aimed at realizing human development that is virtuous, resilient, intelligent and skilled, independent and has a sense of solidarity, work hard, productive, creative, and innovative, disciplined and oriented towards the future to create a better life.62
The implementation and implementation of village autonomy is expected to bring about the spirit of change in realizing the goals of development, namely improving the welfare of the village community. The village as the smallest government in the Republic of Indonesia is very necessary to have an established system and the importance of conducting village structuring as an effort to realize effective and efficient village governance.
Village finance is explained in Law No. 6 of 2014 concerning Villages Article 71 paragraph (1), namely all village rights and obligations that can be valued with money and everything in the form of money and goods related to the implementation of village rights and obligations. Furthermore Article 71 Paragraph (2) states that Rights and obligations lead to income, expenditure, financing, and management of Village Finance.63
Regulation of the Village Minister, Development of Disadvantaged Regions, and Transmigration Number 16 of 2018 concerning Priority Determination of the Use of Village Funds in 2019 Chapter III Article 4 states that: (1) The use of Village Funds is prioritized to finance the implementation of
programs and activities in the field of village development and empowerment of village communities.
(2) The priority of using the Village Fund as referred to in paragraph (1) can be used to finance the implementation of programs and priority activities that are cross-sectoral in nature.
59 https://regional.kompas.com/read/2018/10/13/12032221/kemendes-pdtt-dana-desa-program-nawacita-dirasakan-langsung-masyarakat. 60 https://kominfo.go.id/content/detail/9545/melalui-nawacita-pemerintah-berkomitmen-bangun-desa/0/berita. 61 Siti Khoiriah & Utia Meylina, “Analysis of Village Fund Management Systems Based on Village Financial Regulations,”, Journal of Legal Issues, Jilid 46 No ( Januari 2017): 21. 62 Onius Wakerkwa, “The Role of Human Resources in Improving Community Development in the Village of Umbanume, Pirimekab Subdistrict, Lanny Jaya Regency,” Journal Holistik, Tahun Ixno. 17a/ (Januari-Juni 2016):4. 63 Wakerkwa, “The Role of Human Resources in Improving Community Development in the Village of Umbanume, Pirimekab Subdistrict, Lanny Jaya Regency, 148.

Proceeding of International Conference of 4th SHIELD 2019
https://pasca.unila.ac.id/seminar-internasional-shield/
ISBN : 978-602-51393-9-0
158
(3) The priority of the use of village funds as referred to in paragraph (1) and paragraph (2), is expected to provide the greatest benefit for the village community in the form of improving quality of life, improving welfare and poverty reduction and improving public services at the village level. In Article 5 there is an emphasis on the quality of life of rural communities in
the field of basic social services that have a direct impact on improving the quality of life of the community. The basic social services include: a. procurement, construction, development, and maintenance of basic
infrastructure for meeting needs: 1. residential environment; 2. transportation; 3. energy; and 4. information and communication
b. procurement, development, development, and maintenance of basic social service infrastructure facilities to meet needs: 1. public health; and 2. education and culture.
c. procurement, construction, development and maintenance of economic facilities for rural communities include: 1. agricultural business for food security; 2. productive scale agricultural economic activities covering aspects of
production, distribution and marketing that are focused on the establishment and development of superior village products and / or superior products in rural areas; and
3. productive scale non-agricultural economic enterprises covering aspects of production, distribution, and marketing that are focused on the establishment and development of superior village products and / or superior products in rural areas
d. procurement, construction, development, and maintenance of environmental facilities to meet needs: 1. preparedness for natural disasters and social conflicts; 2. handling natural disasters and social disasters; and 3. environmental
preservation. 3. procurement, construction, development, and maintenance of infrastructure
and other infrastructure in accordance with the authority of the village and decided through village meetings.
In terms of the use of village funds for poverty alleviation in the village and several activities carried out to encourage increased human resources in the village, this is regulated in Article 8. (1) Village poverty reduction as referred to in Article 4 paragraph (3) is prioritized
to finance the implementation of cash-intensive programs and activities to provide employment for unemployed, underemployed, poor families, and prevent stunting.
(2) Cash labor intensive activities as referred to in paragraph (1) shall be carried out in a self-managed manner by the Village by utilizing natural resources, technology, and human resources in the Village.
(3) Utilization of human resources as referred to in paragraph (2) is carried out by utilizing Village Fund financing for the Village development sector at least 30% (thirty percent) is used to pay wages of the Village community in order to create employment.
(4) Work wages are paid on a daily or weekly basis in the implementation of activities funded by the Village Fund.
(5) The implementation of cash labor intensive activities is not carried out during the harvest season.

Proceeding of International Conference of 4th SHIELD 2019
https://pasca.unila.ac.id/seminar-internasional-shield/
ISBN : 978-602-51393-9-0
159
Article 10 in terms of the use of village funds for community empowerment is regulated that: (1) Village Funds are used to finance programs and activities in the field of Village
Community Empowerment aimed at increasing the capacity and capability of the Village community in applying the results of the development of science and technology, appropriate technology, and new findings for the economic and agricultural progress of the village community by utilizing potential and its own resources.
(2) Prioritized village community empowerment activities include: a. increasing community participation in the process of planning,
implementing and monitoring village development; b. capacity building of village communities carried out in the local village; c. development of resilience of the village community; d. development of family resilience; e. management and development of village information systems through
capacity building and procurement of software applications and computer hardware for data collection and dissemination of information on development and empowerment of village communities managed in an integrated manner;
f. support management of basic social service activities in the fields of education, health, empowerment of the poor, empowerment of women and children, and empowerment of marginalized communities and members of the village community with disabilities;
g. support management of environmental conservation activities; h. preparedness support for natural disasters and social conflicts and their
handling; i. capital support and management of productive economic businesses
managed by BUMDesa and / or BUMDesa Bersama; j. support for economic business management by community groups,
cooperatives and / or other village economic institutions; k. utilization of natural resources for village independence and improving the
welfare of the community; l. the application of appropriate technology for the utilization of natural
resources and the improvement of productive scale agricultural economic business;
m. the development of cooperation between villages and village cooperation with third parties; and
n. other Village community empowerment activities that are in accordance with the authority of the Village and are decided through Village meetings
CONCLUSION AND RECOMMENDATION
Village as a social entity of the village community. The application and implementation of village autonomy brings the spirit of change in realizing the goals of development, namely improving the welfare of rural communities. This can be seen in the planning up to the evaluation of development in the village carried out by the village. The community has an important role in each of these stages. The quality of human resource management in the village is currently undergoing significant changes, village funds provided by the government to the villages and resources in the village are a big capital to develop the potential and increase the quality of human resources in the village. This is done to improve the welfare of rural communities in realizing the ideals of nawacita to build Indonesia from the periphery by strengthening regions and villages within the framework of a unitary state and carrying out a revolution of national character.

Proceeding of International Conference of 4th SHIELD 2019
https://pasca.unila.ac.id/seminar-internasional-shield/
ISBN : 978-602-51393-9-0
160
REFERENCES
Astomo, P. 2018. Position and testing of the constitutionality of village regulations
in legislation regulations. Constitutional Journal. 15(2). Haidin, S. 2017. Implementation of village financial management after the
implementation of law number 6 of 2014 concerning Villages: Study in Dompu District). Jurnas IUS. 5(1).
https://kominfo.go.id/content/detail/9545/melalui-nawacita-pemerintah-berkomitmen-bangun-desa/0/berita.
https://regional.kompas.com/read/2018/10/13/12032221/kemendes-pdtt-dana-desa-program-nawacita-dirasakan-langsung-masyarakat.
Huruswati, I. 2015. Most social welfare services in the village through social house. Sosio Konsepsia. 04(02).
Kalangi, R. 2015. Human resource development and performance of state civil servants in the Sangihe Islands Regency of North Sulawesi Province. Jurnal Lppm Bidang Ekososbudkum. 2(1).
Soleman, M. and Noer, M. 2017. Nawacita as Jokowi's special strategy for October 2014 - October 24, 2015. Journal of Political Studies and Development Problems. 13(1).
Rauf, M. 2016. Politik Hukum Pembentukan Desa Adat Dalam Sistem Pemerintahan Di Indonesia,” De Lega Lata, Volume I, No.2.
Khoiriah, S. dan Meylina, U. 2017. Analysis of village fund management systems based on village financial regulations. Journal of Legal Issues. 46(1).
Syamsi, S.S. 2015. Nawa Cita Jokowi-JK in the economic development paradigm. Surya Octagon Interdisciplinary Journal of Science & Technology. 1(1).
Undang-Undang Dasar NKRI 1945. Undang-Undang Nomor 6 Tahun 2014 tentang Desa.

Proceeding of International Conference of 4th SHIELD 2019
https://pasca.unila.ac.id/seminar-internasional-shield/
ISBN : 978-602-51393-9-0
161
THE EFFECT OF HALAL BRANDING DIMENSION TO PURCHASE INTENTION ON ORIFLAME LIPSTICK
Mutiara Fitri Andini1, Dorothy Rouly Haratua Pandjaitan2, Faila Shofa2
1Student of Management Study Program, Faculty of Economics and Business, University of Lampung
2 Lecturer at Faculty of Economics and Business, University of Lampung FEB University of Lampung Jl. Prof. Dr. Soemantri Brodjonegoro No.1
Bandarlampung 1e-mail: [email protected] Telp.: +6282288830224
ABSTRACT The purpose of this paper is to elaborate the effect among halal branding dimension which include halal brand image, halal brand trust, halal brand loyalty, and halal brand satisfaction on consumer purchase intention of Oriflame lipstick. A multiple regression analysis is tested with the help of SPSS version 25, and the sampling technique is non probability sampling. The research used the online questionnaire to collect data from 200 respondents in Bandar Lampung who meet the criteria. The findings shows that halal brand image and halal brand trust does not have significant and positive effect to purchase intention on Oriflame lipstick. Meanwhile, halal brand loyalty and halal brand satisfaction has a significant and positive effect to purchase intention on Oriflame lipstick. The sample in this research is limited to only mosleem female consumer in Bandar Lampung. Findings related to the effects of halal brand image, halal brand trust, halal brand satisfaction, and halal brand loyalty towards the purchase intentions may not be equally valid for female mosleem consumers in other region or countries and for other types of cosmetics or non cosmetics products. Although previous research has explored the relevant issues about halal brand image, halal brand trust, halal brand satisfaction, and halal brand loyalty, this study is the first to investigate the traditional construct of branding to an unexplored field of halal products in terms of cosmetics context in Indonesia. Keywords: Mosleem, halal brand image, halal brand trust, halal brand loyalty, halal brand satisfaction
INTRODUCTION
In recent years, halal certification has attracted attention from both practitioners and academicians. Mosleem consumers are cautious in their buying behaviour in order to ensure that the products they purchase both halal (lawful) and tayyib (pure) according to their religion (Wilson and Liu, 2011). The halal concept is part of a belief system and moral code of conduct of mosleem consumers that touches every single facet of Islamic life (Baker, 2011). Although the perception of halal is generally limited to food products, the halal concept covers non-food products (Ibrahim et al., 2012). The halal brand incorporates a variety of products and services in hospitality, banking and finance, insurance, beverages and cosmetics (Talib and Johan, 2012; Borzooei and Asgari, 2013). Apart from the emergence of the halal concept as a mosleem brand identifier, halal is transcending from a religious issue confined to mosleem, to being a global symbol synonymous with quality in the mainstream market (Hanzaee and

Proceeding of International Conference of 4th SHIELD 2019
https://pasca.unila.ac.id/seminar-internasional-shield/
ISBN : 978-602-51393-9-0
162
Ramezani, 2011). In the multi-racial and culturally-diverse society found in Indonesia, it is vital for the general public to be aware of the cultural and religious imperatives affecting mosleem, and this requires an emphasis being placed on the halal image based on the halal certification available for products or services.
When Halal trends emerged in recent years, various halal products competed to gain consumer trust. As reported in the State of the Global Islamic Economy report (2018/2019) issued by Thomson Reuters and the Dinar Standard, one the most promising opportunities in the economic sector for halal products is halal pharmaceutical and cosmetics. The top five mosleem markets with cosmetics expenditure were India ($5,4 billion), Indonesia ($3.9 billion), Russia ($3.6 billion), Turkey ($3.4 billion), Malaysia ($3,1 billion) (Reuters and Standard, 2018). Halal products that have become women's basic needs are cosmetics. Cosmetics themselves have become a woman's main needs. Cosmetics is used as a beauty aid to help build up the self esteem and confidence of an individual. Among the various cosmetics available on the market, lipstick is one of the most important cosmetics for Indonesian women with a percentage of 80% followed by compact powder 59% and loose powder 51% (www.id.yougov.com, 2016). There is a growing trend of “halal cosmetics in Indonesia” as mosleem women are halal conscious in their cosmetics purchase. The result showed that Indonesian mosleem female place a greater emphasize on halal by 85% over price 76.10% and country of origin by 59.30% (Yacob, et.al 2018). Along with the increasing trend of halal cosmetics in Indonesia, various cosmetics brands have begun to compete for market share in the halal cosmetics sector. Local and international cosmetic brands are fighting to steal the hearts of Indonesian women consumers.
Including Wardah as a market leader with a percentage of 21.30% followed by Pixy 9.80%, Red-A 9.50%, Oriflame 4.70% and Puteri 4.40% (www.topbrand-award.com, 2017). Interestingly, among the brands that compete in the halal cosmetics market in Indonesia is Oriflame. By using a multi-level marketing strategy without a physical store, in fact Oriflame is able to compete with local brands in Indonesia. Oriflame is an international brand, its wide portfolio of Swedish, nature-inspired, innovative beauty products that sell various kinds of beauty products that have been long operating in Indonesia. With the majority of Indonesia‟s population who are mosleem, making Oriflame issue halal products to be enjoyed by the Indonesian market. The problem faced by Oriflame when entering Indonesian market is halal certification from LPPOM MUI as a trusted institution that issues halal certification. The problem was that the MUI would not issue halal certificate for products that is not produced in Indonesia. Hence to overcome this, Oriflame cooperates with PT Cosmax Indonesia as the manufacturer of cosmetics by producing one of its cosmetic brands, namely "Oriflame The One Color Stylist Lipstick" with various color variants, with halal certification number 00150070831114.
There are several reasons for focusing on the halal itself as an aspect or branding. First, halal is able to go beyond just the indication of a pure and healthy products, and halal currently has only an insignificant image relevance in Western consumer minds (Temporal, 2011). Second, it assist companies to penetrate new markets by adding value to its products in the competitive environment (Borzooei & Asgari, 2013). The research on the halal market segment and halal purchasing is at the nascent stage (Ali et al, 2018). Citation from it is statement, understanding the customer intention towards halal brands is important for the marketers, because most of the consumers in Indonesia are mosleem. Previous study has fact, that there is a relationship between halal brand image, halal brand trust, halal brand satisfaction and halal brand loyalty to customer purchase intention (Ali et.al, 2018) which only focused to predict on the consumer‟s responses towards halal products in the Pakistani milk brand

Proceeding of International Conference of 4th SHIELD 2019
https://pasca.unila.ac.id/seminar-internasional-shield/
ISBN : 978-602-51393-9-0
163
contexts. However, none highlights the traditional construct of branding to an unexplored field of halal products in terms of cosmetics context in Indonesia. Therefore the current research wanted to fill the research gap. The remaining paper is organized as follows. The following section undertakes a brief review of literature and research hypotheses. The subsequent sections provide details of data and methodology and present the data analysis and results. The final section discusses the conclusions and implications, and limitations of the findings and provides suggestions for future research.
METHODOLOGY
Sampling and Data Collection
This study applied the online questionnaire to verify the hypotheses and research framework. Questions on the questionnaire are guided by variable indicators, the process by selecting one alternative answer that is adjusted. Each question item is accompanied by five answers using a score. Scale measurement is using a Likert scale. With a Likert scale, the variables to be measured are translated into variable indicators. In addition, the indicator is used as a starting point to compile instrument items in the form of statements or questions that need to be answered by the respondent. The answer from each instrument that uses a Likert scale has a positive gradation to very negative. a Likert scale was used with a scale of 1-5 In this research, the sampling technique used is nonprobability sample. Non probability sampling is used because sampling is based on certain criteria. This is done in order to get precise samples according to the research objectives. Meanwhile, the selection of population members uses purposive sampling method. A representative assessment of respondents was determined based on the category of control. The control categories used by researchers in this study are as follows: 1. Female consumers above 17 years old. 2. Consumers that use cosmetic products, especially lipstick. 3. Consumers which have knowledge about halal skin care and cosmetics. 4. Aware of halal branding on Oriflame lipstick.
The population size in this study is very broad and can not be known with certainty. According to hair et.al (2010) at least five times as many observations as the number of variables to be analyzed, and the more acceptable sample size would have 10:1 ratio. From the results of the calculations, the number of samples studied was 200 respondents. 200 respondents are rounded from 170 because the researcher cannot estimate the total number of respondents, and to reduce the error. Measurement of Variables
The current research referred to previous studies to design questionnaire items in the Halal brand context. Besides, the researchers adapted already developed, validated items of scales, and the language of items was, to some extent, customised to make the language understandable. As the questionnaire was modified, a pre-test was conducted to test the suitability of the instruments used in this study. A total of 47 respondents, apart from sample size, were collected from target respondents and analysed, to test respondents‟ understanding level with modified questionnaire items, and to secure high levels of reliability and validity. Based on 17 indicators available, all indicators met the criteria of validity and reliability, thus it can be proceed to retrieve data to 200 respondents. The measure of halal brand image consisted of four items which

Proceeding of International Conference of 4th SHIELD 2019
https://pasca.unila.ac.id/seminar-internasional-shield/
ISBN : 978-602-51393-9-0
164
was adopted from previous studies (e.g Chen, 2010; Kang and Hur, 2012; Mourad and Ahmed, 2012). Halal brand trust was measured with four items (Ali et al. 2018; Chen, 2010). Halal brand satisfaction was adopted from previous studies (Kang and Hur, 2012; Mourad and Ahmed, 2012). Halal brand loyalty was adopted from the study of Kang and Hur (2012). Purchase intention was measured with two items, adopted from previous studies (Ali et al. 2018; Rahman, 2015). Characteristics of the Respondents
Based on the questionnaire that has been processed, a general description of the respondents in detail can be seen in table 1. Table 1 describes that out of 200 respondents, and overall dominance of between 18 – 27 years old (39.60%) age group category respondents, followed by between 28 – 37 yeard old (26.70%) age group category respectively. In addition, the majority of the respondents are university graduates (73.30%). Out of 200 respondents, 39.60% are government employees, all respondents (100%) have heard and used halal cosmetics, and 80.70% used halal cosmetics due to guaranteed quality and safety of halal cosmetics Table 1. Demographic profile of the respondents Frequency Percent Frequency Percent
Age Have Heard of Halal Cosmetics
Between 18 – 27 Years Old
80 39.60% Yes 200 100%
Between 28 – 37 Years Old
54 26.70% No 0 0%
Between 38 – 47 Years Old
44 21.80%
Above 47 Years Old
22 10.90%
Educational Background
Use Halal Cosmetics
Senior High School Graduates
52 25.70% Yes 200 100%
University Graduates
148 73.30% No 0 0%
Occupation Reason for Using Halal Cosmetics
Housewives 33 11.90% Islamic Thoughts 22 10.90% Government Employees
80 39.60% Recommendation from family/friends/doctors
13 7.90%
Private Employees
33 16.30% Guaranteed Quality and Safety of Halal Cosmetics
163 80.70%
Students 63 31.20%

Proceeding of International Conference of 4th SHIELD 2019
https://pasca.unila.ac.id/seminar-internasional-shield/
ISBN : 978-602-51393-9-0
165
Tools for Analysis
This study applied the multiple regression analysis. The regression analysis is being calculated using IBM SPSS Statistic version 25. , after the result is revealed then the research will proceed to calculations of the multiple regression equation as follows: Y = a + b1X1 + b2X2 + b3X3 + b4X4 + e Explanation: Y = Purchase Intention a = Constants b (1,2,3,4) = Regression coefficient X1 = Halal Brand Image X2 = Halal Brand Trust X3 = Halal Brand Satisfaction X4 = Halal Brand Loyalty e = Standard error
Data analysis method in this research used validity and reliability test. The stages of looking at the validity test including the KMO, anti-image, and factor loading. Validity criteria for an indicator are stated valid if it is equal to 0.5 (≥ 0.5). While for reliability, The method used to test the reliability of the questionnaire inside this research is using the Cronbach Alpha coefficient formula (Malhotra 2014: 318). The indicator of each variables would be reliable, if the Cronbach‟s Alpha is > 0,6 and Cronbach‟s Alpha value is greater than the Cronbach‟s Alpha if item is deleted. As for the hypothesis test, t-test is conducted to discover significant effect of each independent variable on dependent variable in a partial way. In addition, Fisher test is is used to determine whether there is influence between independent variables and dependent variable. In testing the t-test and f-test, the significance value used is 95%. Finally coefficient of determination (R2) is used to test measures the ability of the model to explain variations in independent variables. The coefficient of determination is between 0 and 1. If the value of R2 is close to one, it means that the independent variables provide almost all of the information needed to predict variations in the dependent variable.
RESULTS AND DISCUSSION
Results of Multiple Linear Regression Analysis Based on the result of regression test in Table 2, hence the regression
equation for this research is as follows: Y = 0.078 X1 + 0.005 X2 + 0.169 X3 + 0.617 X4 Table 2. Results of multiple regression analysis Coefficients
a
Model Unstandardized Coefficients
Standardized Coefficients
t Sig.
B Std. Error
Beta
1 (Constant) 1.220 .674 1.809 .072
Halal_Brand_Image .084 .071 .078 1.182 .239
Halal_Brand_Trust .005 .066 .005 .076 .940

Proceeding of International Conference of 4th SHIELD 2019
https://pasca.unila.ac.id/seminar-internasional-shield/
ISBN : 978-602-51393-9-0
166
Halal_Brand_Satisfaction .201 .089 .169 2.268 .024
Halal_Brand_Loyalty .439 .057 .617 7.659 .000
a. Dependent Variable: Purchase_Intention
Interpretation of the results of this regression test is the coefficient of halal
brand image (X1) is 0.078. This indicates if the better the management of halal brand image on halal lipstick in general on the market, the more it will affect the purchase intention of Oriflame lipstick by 7.80%. The coefficient is positive, but the value is relatively small, it can be said that there is no significant effect of halal brand image on the purchase intention of lipstick oriflame. The halal brand trust coefficient (X2) is 0.005. This could be interpreted that the higher the respondent's level of trust in the halal lipstick market, the more it will affect the purchase intention of Oriflame lipstick by 0.50%. The coefficient is positive, but the value is relatively small, it can be said that there is no significant effect of halal brand image on the purchase intention of lipstick Oriflame. The halal brand satisfaction coefficient (X3) is 0.169. The coefficient is positive, meaning there is an unidirectional relationship between the halal brand satisfaction and purchase intention of Oriflame lipstick.
When customers are satisfied, they show interest on other products that are perceived to have the same value or quality, which can be interpreted if the respondents were more satisfied with the quality of halal lipstick on the market, the more it will affect the purchase intention of Oriflame halal lipstick by 16.90%. The halal brand loyalty coefficient (X4) is 0.617. The coefficient is positive, meaning there is a unidirectional relationship between the halal brand loyalty and the purchase intention of Oriflame lipstick. Brand loyalty is a commitment that promises consumers will repurchase their favorable brands in the future, and they will not change their loyalty under any circumstance. In this case, the more loyal respondent to halal lipstick, the more it will affect the purchase intention of Oriflame halal lipstick by 61.70%. Results of Coefficient of Determination (R2)
Based on the results of the analysis in table 7, 67.80% of purchase intention variable can be explained by the 4 independent variables which are halal brand image, halal brand trust, halal brand satisfaction and halal brand loyalty. The remaining 32.2% is explained by the other variables which is not examined in the research. Table 3. Results of Coefficient of Determination (R2)
Model Summary
Model R R Square Adjusted R Square Std. Error of the Estimate
1 .824a .678 .672 1.29343
a. Predictors: (Constant), Halal_Brand_Satisfaction, Halal_Brand_Image, Halal_Brand_Trust, Halal_Brand_Loyalty

Proceeding of International Conference of 4th SHIELD 2019
https://pasca.unila.ac.id/seminar-internasional-shield/
ISBN : 978-602-51393-9-0
167
CONCLUSSION
Halal products are in great demand since consumers are very concern about the concept of halalan toyyiban in recent era. Especially in Indonesia, with the majority of the mosleem population reaching 87%. Halal awareness among mosleem has widened from being concerned with meat-based products, to a wide range of products such as pharmaceuticals, cosmetics, personal care, insurance, travel, and even entertainment. The demand for halal cosmetics is continuously growing, as consumer want to expand their awareness of cosmetics while remaining loyal to Islamic values. According to the trends, it is important for marketers to know the factors that influence the purchase intention of halal cosmetics in Indonesia. The empirical results suggest that halal brand image (H1) and halal brand trust (H2) does not has a positive and significant effect towards purchase intention on Oriflame lipstick, meanwhile halal brand satisfaction (H3) and halal brand satisfaction (H4) has a positive and significant effect towards purchase intention on Oriflame lipstick. The findings have significant implications which may help the marketers to develop suitable strategies for halal brands, especially Oriflame lipstick and its purchasing. With the rise of mosleem population and halal products demand, consumers nowadays are more willing to purchase products which are halal. In addition, it can help Oriflame to target new segments and implement effective marketing based halal communication strategies. A Communication messages regarding perceptions of Oriflame quality in accordance with the concept of halal and conformity with Islamic Sharia and improvement in the design and appearance of Oriflame lipstick with emphasize on halal logo is also very important in shaping and enhancing the halal brand image for customer. Limitation and Future Research
This research was conducted with Oriflame lipstick as research object, therefore there might be a different result if research is conducted with the other cosmetics brands or Islamic brand from other industries or in other countries. The sample in this research is limited to only female consumer in Bandar Lampung. Future research can choose other regions with wider consumer coverage, so the answers will be more varied. Besides, the sample in this study was only 200 people, so it was recommended to add samples for more accurate data, and the majority of the respondents in this research is student, therefore, it is recommended to focus on sample which fulfills the criteria to discover more information and in order to elaborate this topic even further. It is highly recommended for future research to expand the span of attributes that affects purchase intention as this study only considered halal brand trust, halal brand image, halal brand loyalty and halal brand satisfaction.
The insignificant effect of halal brand trust, and halal brand loyalty towards purchase intention could be cause because this research did not restrict the price and perceived quality of Oriflame lipstick. There might be other factors that should be considered, for instance, Islamic religiousity, and moral obligation in order to get an in depth and more clear picture about its effect on purchase intention. Further studies are needed to re-research the halal brand image and halal brand trust variables. This is because the author in this research has not found sufficient evidence to prove if halal brand image and halal brand trust to have significant influence toward Oriflame purchase intention. Thus, further research will help to prove whether halal brand image and halal brand trust on particular companies really does not have significant influence or not.

Proceeding of International Conference of 4th SHIELD 2019
https://pasca.unila.ac.id/seminar-internasional-shield/
ISBN : 978-602-51393-9-0
168
REFERENCES
Aaker, D.A. 1991. Managing Brand Equity: Capitalizing on the Value of a Brand Name. New York: The Free Press.
Afzaal, A., Guo, X., Sherwani, M., Ali, A. 2018. Antecedents of consumers‟ Halal brand purchase intention: an integrated approach. Management Decision.
Dollah, A.B., Zulkifli, M.Y., Jamaliah, N. 2012. Halal concept according to Abu Mansur al-Maturidi: A thematic study. Journal of Social and Behavioral Sciences.
Ajzen, I. 2015. Consumer attitudes and behavior: The theory of planned behavior applied to food consumption decisions. Rivista di Economia Agraria, Anno. 70(2): 121-138.
Anwar, S. 2009. Pemahaman Individu, Observasi, Checklist, Interview, Kuesioner, dan Sosiometri. Yogyakarta: Pustaka Pelajar.
Augusty, F. 2006. Metode Penelitian Manajemen: Pedoman Penelitian untuk skripsi, Tesis dan Disertai Ilmu Manajemen. Semarang: Universitas Diponegoro.
Awan, H. M., Siddiquei, A. N., dan Haider, Z. 2015. Factors affecting Halal purchase intention – evidence from Pakistan‟s Halal food sector. Management Research Review. 38(6): 640–660.
Ercis, A., Unal, S., Candan, B., and Yildirim, H. 2012. The effect of brand satisfaction, trust, brand commitment on loyalty and repurchase intention. Journal of Social and Behavioral Sciences. 58: 1395-1404.
Baker, A. 2011. The Principles of Islamic Marketing. Surrey: Gower Publishing Ltd.
Belaid, S. and Behi, A.T. 2011. The role of attachment in building consumer-brand relationships: an empirical investigation in the utilitarian consumption context. Journal of Product and Brand Management. 20(1), 37-47.
Boorzoei, M. and Asgari, M. 2013. The halal brand personality and its effect on purchase intention. Interdisciplinary Journal of Contemporary Research in Business. 5(3).
Bouhlel, O., Mzoughi, N., Hadiji, D., and Slimane, I.O. 2011. Brand personality‟s influence on the purchase intention: A mobile marketing case. International Journal of Business and Management. 6(9).
Bungin, B. 2009. Metodologi Penelitian Kuantitatif: Komunikasi, Ekonomi, dan Kebijakan Publik, Serta Ilmu-ilmu Sosial Lainnya. Jakarta: Kencana.
Burhanuddin. 2011. Pemikiran Hukum Perlindungan Konsumen dan Sertifikat Halal. Malang: UIN Maliki Press.
Chen, Y.S. and Chang, C.H. 2013. Towards green trust: the influences of green perceived quality, green perceived risk, and green satisfaction. Management Decision. 5(1): 63-82.
Chernev, A., Hamilton, R. and Gal, D. 2011. Competing for consumer identity: Limits to selfexpression and the perils of lifestyle branding. Journal of Marketing. 75(3): 66-82.
Kwandy, P.K. 2017. Effect of brand image and price toward purchase intention In Beef-Jerky Company. Review of Management and Entrepreneurship. 01(1).
Nyoman, D. 2012. Metode Penelitian. Yogyakarta: ANDI Drucker, P. F. 2008. The essential Drucker: The best of sixty years of Peter
Drucker's essential writings on management. New York: Collins Business Essentials.
Gayatri, G., Hume, M., and Mort, G.S. 2011. The role of Islamic culture in service quality research. Asian Journal on Quality. 12(1): 35-53.

Proceeding of International Conference of 4th SHIELD 2019
https://pasca.unila.ac.id/seminar-internasional-shield/
ISBN : 978-602-51393-9-0
169
Ghozali, I. 2012. Aplikasi Analisis Multivariate dengan Program IBM SPSS 20. Semarang: UNDIP.
Hair, J. F., Black. W. C., Babin. B. J. and Anderson. R. E. 2010. Multivariate Data Analysis, 7th ed. Pearson Prentice Hall, New Jersey.
Hameed, S. and Kanwal, M. 2018. Effect of Brand Loyalty on Purchase Intention in Cosmetics Industry. Research in Business Management. 5.
Hanzaee, K.H. and Ramezani, M.R. 2011. Intention to Halal products in the world markets. Interdisciplinary Journal of Research in Business. 1(5): 1-7.
He, H., Li, Y. and Harris, L. 2012. Social identity perspective on brand loyalty. Journal of Business Research. 65(5): 648-657.
Heidarzadeh and Andervazh. 2012. The Influence of Brand Loyalty on Cosmetics purchase Intention of Iranian female consumers. Journal of Basic and Applied Scientific Research. 2(5).
Jackson, V., Stoel, L., and Brantley, A. 2011. Mall Attributes and Shopping Value: Differences by Gender and General Cohort. Journal of Retailing and Consumer Services. 18(1): 1-9
Jalilvand, M. R., Samiei, N., and Mahdavinia, S.H. 2011. The effect of brand equity components on purchase intention: An application of Aaker‟s model. International Business and Management. 2(2), 149-158.
Kang, S. and Hur, W.M. 2012. Investigating the antecedents of green brand equity: a sustainable development perspective. Corporate Social Responsibility and Environmental Management. 19(5): 306-316.
Khadka. K., and Maharjan S. 2017. Customer Satisfaction and Customer Loyalty. Centria University of Applied Sciences Pietarsaari.
Kotler, P. and Keller, K.L. 2013. Marketing Management Volume 2, 13th edition". Erlangga.
Lin, Y.T., Chen, S.C., and Hung, C.S. 2011. The impacts of brand equity, brand attachment, product involvement and repurchase intention on bicycle users. African Journal of Business Management. 5(14): 5910-5919.
Liza, N.H. 2011. Intention to Purchase Halal Products among Consumer. Universiti Utara Malaysia. Malaysia.
Lu, Y.-C. and Chen, K.-N. (2017). Consumer knowledge, brand image, openness to experience and involvement: A case in cosmetic consumption. Journal of Cosmetics, Dermatological Sciences and Applications. 7: 349-361.
Malhotra, N.K. 2014. Marketing Research: An Applied Approach. 6th Edition. Prentice Hall, Upper Saddle River.
Ministry of Trade of Republic Indonesia. 2015. Live Healthy with Halal Products. Jalilvand, M.R. and Samiei, N. 2012. The effect of electronic word of mouth on
brand image and purchase intention: An empirical study in the automobile industry in Iran. Marketing Intelligence and Planning. 30(4): 460-476.
Mohamed, R.N., and Daud, N.M. 2012. The impact of religious sensitivity on brand trust, equity and values of fast food industry in Malaysia. Business Strategy Series. 13(1): 21-30.
Mohamed, S.A.B. and Mohd, R.M.J. 2012. Issues in halal packaging: A conceptual paper. International Business and Management. 5(2): 94-98.
Mourad, M. and Ahmed, Y.S.E. 2012. Perception of green brand in an emerging innovative market. European Journal of Innovation Management. 15(4): 514-537.
Phing-Li, C. 2017. Effects of brand image, perceived price, perceived quality, and perceived value on the purchase intention towards sports and tourism products of the 2016 Taichung International Travel Fair. Journal of International Management Studies. 12(2).

Proceeding of International Conference of 4th SHIELD 2019
https://pasca.unila.ac.id/seminar-internasional-shield/
ISBN : 978-602-51393-9-0
170
Rahbar, R. and Wahid, N.A. 2011. Investigation of green marketing tools‟ effect on consumers‟ purchase behavior. Business Strategy Series. 12(2): 73-83.
Rahman, A.A., Asrarhaghighi, R. and Rahman, S.A. 2015. Consumers and Halal cosmetic products: knowledge, religiosity, attitude and intention. Journal of Islamic Marketing. 6(1): 148-163.
Ruževičius, J. 2012. Products quality religious-ethnical requirements and certification. Economics and Management. 17(2): 761-777.
Schmitt, B., Brakus, J.J. and Zarantonello, L. 2015. From experiential psychology to consumer experience. Journal of Consumer Psychology. 25(1): 166-171.
Sekaran, U. and Bougie, R. 2016. Research Methods For Business: A Skill Building Approach 7th Edition. United Kingdom: John Wiley & Sons Ltd.
Shaari, J.A.N. and Arifin, N.S. 2010. Dimension of halal purchase intention: A preliminary study. International Review of Business Research Papers. 6(4): 444–456.
Shah, S. S. H., Aziz, J., Jaffari, A. r., Waris, S., Ejaz, W., Fatima, M., and Sherazi, S. K. 2012. The Impact of Brands on Consumer Purchase Intentions. Asian Journal of Business Management. 4(2): 105-110.
Shakil, S. and Majeed, S. 2017. Brand purchase intention and brand purchase behavior in halal meat brand. Journal of Marketing and Logistics. Vol. 1.
Sugiyono. 2017. Metode Penelitian Kuantitatif, Kualitatif, dan R&D. Bandung: Alfabeta.
Temporal, P. 2011. Islamic Brandingsugi and Marketing: Creating a Global Islamic Business. John Wiley &Sons. Singapore.
Thomson Reuters. 2018. “The State of Global Islamic Economy Report 2018/2019”, Retrieved from http://www.dinarstandard.com/state-of-the-global-islamic-economy-report-2018/. [Accesed at January, 21st 2018]
Toklu, I. and Kucuk, H. 2017. The impact of brand crisis on consumers‟ green purchase intention and willingness to pay more. Journal of International Business Research. 10(1).
Widiyoko, E.P. 2012. Teknik Penyusunan Instrumen Penelitian. Yogyakarta: Pustaka Pelajar.
Wilson, J.A. and Liu, J. 2011. The challenges of Islamic branding: navigating emotions and Halal. Journal of Islamic Marketing. 2(1): 28-42.
Wu, P.C.S., Yeh, G.Y.Y., and Hsiao, C.R. 2011. The effect of store image and service quality on brand image and purchase intention for private label brands. Australasian Marketing Journal. 19: 30-39.
Yacob, S., Zainol, R., and Hussin, H. 2018. Local branding strategies in South East Asian Islamic culture. Journal of South East Asian Studies. 23(1): 102-131.
Yougov. 2016. APAC Agrees in Terms of Cosmetics; Lipstick is Absolute and Quality is More Important Than Price. Retrieved from https://id.yougov.com/id/news/2016/12/02/make-up-culture-id/ Accesed at December, 2nd 2018.

Proceeding of International Conference of 4th SHIELD 2019
https://pasca.unila.ac.id/seminar-internasional-shield/
ISBN : 978-602-51393-9-0
171
DISASTER VILLAGE MANAGEMENT BASED ON
PANCASILA LAW PARADIGM
(Study on Tsunami Disaster Management in South Lampung Regency)
*HS. Tisnanta1, Fathoni2, Agus Triyono3and Dauri4
123 Lecturer at Law Faculty, University of Lampung, Indonesia 4 Student at Law Faculty, University of Lampung, Indonesia
*Corresponding Author
ABSTRACT
This study aims to analyze regulation and implementation of disaster
management in the regions by empowering social capital, so that regional
resilience and independence are built. Social capital in rural communities in
helping disaster management is very large in the form of institutions and mutual
cooperation. The stages of disaster management include: pre-disaster, during
emergency response and post-disaster. In fact the community often fails to face
disasters. Research place chosen was the South Lampung regency with the
consideration that the area had a high level of natural disaster vulnerability,
especially in the presence of the Anak Krakatao Mountain. The Pancasila legal
paradigm prioritizes human values and mutual cooperation and local institutions
and values are social capital to build a resilient village of disasters. Resilient
village prevention efforts are inseparable from the aspects of legislation,
institutional and cultural communities that exist in each stage of disaster
management. Efforts to strengthen disaster resilient villages are carried out by
reconstructing the relationship between regulatory and institutional aspects with
disaster management stages. Building a resilient village of disaster is carried out
by placing the values of Pancasila and the value of the local wisdom of the
people of Lampung, namely piil peseng giri. Various elements of value contained
in it as social capital to refer to disaster resilient areas are placed within the
framework of the Pancasila law with nurturing characters.
Keywords: Paradigm, Law Pancasila, Disaster Village Management, South
Lampung.
INTRODUCTION
Lampung Province is one of the provinces in Indonesia which is prone to disasters, both natural disasters and social disasters. Some notes of major natural disasters that have occurred in Lampung Province. 64 The disaster event should be an experience for learning in anticipation that losses and victims can be minimized through disaster management. Legally, disaster management in Indonesia has been regulated by Law Number 24, 2007 concerning Disaster Management and then followed by various implementing regulations at the central, sectoral and local levels.
64
From Various Source, inter alia (1) Liwa Earthquakes (15 February 1994, 6,5 skala Richter)
caused 196 people dead, more than 2.000 people injured, and more than 75.000 houses wreck;
(2) Eruption of Anak Krakatoa Mountain; (3) Tsunami that occur because of the material erosion
from Anak Krakatoa Mountain in Sunda Strait caused 116 people died in South Lampung
Regency.

Proceeding of International Conference of 4th SHIELD 2019
https://pasca.unila.ac.id/seminar-internasional-shield/
ISBN : 978-602-51393-9-0
172
Based on the law, the process of disaster management is in 3 (three) stages, namely: (1) pre-disaster; (2) during a disaster/emergency response; and (3) post-disaster, according to the disaster management framework. However, when each disaster occurs, the focus of response is often only to focus on handling during an emergency response (when a disaster occurs). Dewald (2015) said that disaster risk management in developing countries is only an academic rhetoric.65 The pre-disaster and post-disaster stages are often ignored, so that the problem of disaster management is not resolved properly. On the other hand, during the emergency response, various problems often arise, such as the distribution of aid, suspicion of the origin of aid and so on, as stated by Ole Damayanti (2016)66 and M. Alie Humaedi (2015).67 Therefore, disaster management should pay attention to the social dimension as stated by Samasul Maarif (2016). 68 The existence of the Disaster Management Law, it has been recognized that the substance of the regulation is quite good, as the results of a report from the International Federation of Red Cross and Red Crescent Societies (2015). 69 However, efforts are needed to strengthen its implementation, especially with regard to policies to increase the resilience of regions in the face of disasters, each region has a unity of people who live in a place where social capital is very high, namely rural communities.
Social capital in rural community are in the form of Prana and mutual cooperation which makes its own characteristics in the village community. Such social capital must be able to be maximized by the village community in handling disasters that will occur, both during pre-disaster, during a disaster, and after a disaster. The existing social capital in the village community should be able to take action so that the village community is able to optimize all efforts in disaster management, so that a disaster resilient village is created.
In the effort to overcome disaster resilient villages, it is inseparable from the aspects of laws, institutions and community culture that exist at every stage of disaster management. To build a disaster resilient village, it is done by placing the values of Pancasila and the values of local wisdom of the community, especially the people of Lampung, namely piil peseng giri. Efforts are made to strengthen disaster-based community-based regulations both functional and structural. The functional meaning is to strengthen the regulation of the participation of the humanitarian community in disaster relief at each stage. While the structural meaning is to strengthen the role of village governments and village communities in dealing with disasters by empowering the value of local wisdom.
Based on the description above, it can be formulated that the urgency of this research is related to the efforts to form a systematic structure and mechanism for each disaster stage based on the legal value of Pancasila and the value of
65
See, Dewald Van Niekark.,2015., Disaster Risk Reduction, Disaster Risk Managemant And
Disaster Managemant: Academic Rhetoric Or Practical Reality? Research Focus Area 7.2:
Sustainable Social Development. North-West University, Potchefstroom Campus. 66
Wardyaningrum, Damayanti., 2016. Model Sosial Inklusif Dalam Jaringan Komunikasi
Bencana. Jurnal Aspikom, Volume 3 No. 1, Page 33-55. 67
Alie. M Humaedi, 2015. Disaster Management Based On The Perspective Of Inter-Relegious
Conection And Lokal Wisdom. Analisa Journal Of Social Science And Religion. Volume 22 No.
02, Page 213-226. 68
Syasul Maarif., Rilus A.,Kinseng., Rudy Pramono., 2016. Dimensi Sosial Dalam Penanganan
Bencana (Studi Kasus Pananganan Gempa Bumi Di Kecamatan Pengalengan, Management
(Case Studi: Earthquake Disaster At Pangalengan Sub District, Bandung). Jurnal Riset
Kebencanaan Indonesia. Julnal Riset Kebencanaan Indonesia Vol. 2 No.2. 69
Laporan Penilaian, 2015,International Federation Of Red Cross And Red Crescent Societies.
Memperkuat Undang-Undang Dan Pengurangan Risiko Bencana (PRB) Di Indonesia

Proceeding of International Conference of 4th SHIELD 2019
https://pasca.unila.ac.id/seminar-internasional-shield/
ISBN : 978-602-51393-9-0
173
local wisdom as social capital. 70 In accordance with the research locus, the output of this research is oriented to be implemented in South Lampung Regency as a disaster prone area.
LITERATURE REVIEW
The Pancasila Law Paradigm in disaster management contained in the principles of law as regulated in Article 3 paragraph (1) and paragraph (2) of Law No. 24 of 2007. As part of the legal system, the Act cannot be separated from the ideals of the Pancasila law. Both at the level of theory and practice of law.71 Within the framework of the legal system, disaster management will always be related to substantive, structural and cultural aspects and the operation of legal functions as stated by Friedman.72 While the principles are inseparable from the value of Pancasila which is social capital to increase community resilience in dealing with all forms of disaster that can undoubtedly occur at any time. Important social capital to be mapped that is oriented towards efforts to develop a response attitude and behavior that can be described in the following chart.
Picture 1. Thinking Plot of Pancasila Law Paradigm in Disaster Management.
This research is a series of research and policy advocacy processes that have been carried out. Researchers' experience in formulating academic texts and the Metro City Disaster Management Regulation (2015), the BPBD Regional Regulation of Tanggamus Regency (2017), and the formulation of the Pengayoman Law as a character of Pancasila Law through the National Scheme grant research scheme, are standing points in this study. The research roadmap and further stages can be illustrated in the following chart:
70
See Ginanjar Kartasasmita, Memperkuat Modal Sosial Dalam Menghadapi Bencana, in Dies
Natalis of Universitas Paramadina 19th, Jakarta 10 January 2017. 71
See, B. Arief Sidharta, 2013, Ilmu Hukum Indonesia: Upaya Pengembangan Ilmu Hukum
Sistematis yang Responsif Terhadap Perubahan Masyarakat, Gentha Publishing, Yogyakarta. 72
Lawrence M. Friedman: Tehe Legal System: A Social Scince Prespective, Russel Sage
Faundation, New York, 1975.
Hukum Pancasila
1.Peraturan
2. Kelembagaan
3. Budaya
Penenggulagan Bencana
Tanggap Bencana
Asas dan Prinsip
Undang-Undang
Nomor 24
Tahun 2007
Modal sosial
- Kemenusiaan
- Gotong Royong
- Nilai Kearifan Lokal
1. Pra Bencana
2. Saat Bencana
3. Pasca Bencana

Proceeding of International Conference of 4th SHIELD 2019
https://pasca.unila.ac.id/seminar-internasional-shield/
ISBN : 978-602-51393-9-0
174
Picture 2. Research Roadmap
.
On the other hand, preparedness also has an important meaning in the post-disaster stages. The psychological impact of disasters requires an independent attitude from the community to rise from adversity over the disasters that occur. Therefore, a systematic structure and emergency response mechanism is needed so that the community is resilient in facing disasters. To strengthen the implementation of the provisions on disaster management, strengthening social capital is needed. The concept and definition of social capital is always related to values or passion based on trust, goodwill, reciprocity, solidarity, civic engagement. Various authors emphasize trust, which by Fukuyama (1995, 1997) means the same as social capital, and by Coleman as a form of social capital, while by Lin (1999) as a collective asset produced by social capital. Other authors emphasize goodwill (Adler, Kwon, 2002) as a source of social capital.
RESEARCH METHODS
The problem approach in this research uses the socio legal approach method, which is studying the law as a social phenomenon associated with disaster management. In accordance with the scientific character of the science of law as a practical science that is authoritative normology, a statutory approach73 is also used in the framework of the Pancasila legal system. The Pancasila legal system places community social capital as the principle and principle of handling at each stage of disaster management which includes the pre-disaster, during and after disasters. Data collection includes three stages, namely (a) mapping the positive legal system governing disaster management; (b) institutional mapping that handles disasters; (c) mapping of socio-cultural aspects. This mapping is oriented to formulate community-based areas/regions/communities that are disaster-based.
73
Peter Mahmud Marzuki, Penelitian Hukum. Prenada Media, Jakarta, 2005
PenyusunanNAdan
RanperdaBPBDkabtanggamusdanmetro
(kerjasamaPKKP-HAM)
2014-2017
2018-2019
2020-2021
Pemetaanmodalsosial
Paradigmahukumpancasila(hibah
stranas)
Policybrieftentang
modalsosial
Naskahakademik/modelpengaturan
daerahtahanbencana

Proceeding of International Conference of 4th SHIELD 2019
https://pasca.unila.ac.id/seminar-internasional-shield/
ISBN : 978-602-51393-9-0
175
DISCUSSIONS
Indonesia is one of the countries in the world most affected by disasters with a variety of different disaster risks each year. Geographical position and as a country of origin, Indonesia is at risk from hazards including floods, landslides and earthquakes, to volcanic eruptions, tsunamis, tropical storms and forest fires. The big picture of Indonesia's vulnerability also occurs in South Lampung Regency, Lampung Province, this is due to the geographic contours and the presence of highly active Anak Krakatoa mountain requiring preparedness for the threat of earthquakes, tsunami, flood, landslides that are always life-threatening, environmental damage, loss property, and psychological impact. This vulnerability requires disaster preparedness that is efforts which enable communities (individuals, groups, organizations) to overcome the danger of natural events.
Disasters occurred because there are 2 (two) conditions, namely the existence of events or disturbances that threaten and damage (hazard) and vulnerability (vulnerability) of the community. If there is a hazard, but the community is not vulnerable, it means that the community can handle the disturbing event by themselves, while if the condition of the community is vulnerable, but no threatening event will occur, there will be no disaster. Therefore, efforts are needed to prepare the community especially the village in dealing with such a disaster.
Disaster preparedness is carried out within the framework of the principles and principles of Pancasila law as regulated in Article 3 paragraph (1) and paragraph (2) of Law No. 24 of 2007 concerning Disaster Management. These principles are inseparable from the value of Pancasila, which is social capital to increase community resilience in dealing with all forms of disasters that undoubtedly can occur. Based on Law No. 24 of 2007, disaster preparedness was formulated in three stages, namely pre-disaster, during disaster and after disaster. However, it must be recognized that disaster management is often only focused on when a disaster occurs. At the time of the disaster, all elements will move in various forms of activities. But after the emergency response period is over, the problem seems to have also been resolved. Supposedly, the occurrence of disasters makes the experience and learning that life in disaster-prone areas should be prepared, because disasters will inevitably occur even if the time is unknown. In this case, preparedness in the pre-disaster stage is an important stage that must be prepared by the community, government, local government and village government. The important meaning of community preparedness is to minimize the possibility of casualties as a detrimental impact caused by hazard and/or vulnerability.
The people of Lampung have social capital related to the spirit of mutual cooperation, empathy and generosity which have been strong so far, so they must be encouraged. The sense of humanity that arises and is strengthened by the Lampung people's way of life in the form of "Pi'il Pesenggiri”74, especially "sakai Sambayan" which means mutual cooperation, "Meet Nyimah" which means the excellence for living in harmony in society, "Nengah Nyampur", easy to get along and tolerant , and "Bejuluk Baedak", which is to maintain identity/good name.
74
Pi'il Pesenggiri interpreted as anything related to self-esteem, behavior, and life attitudes that
can maintain and uphold the good name and dignity of individuals and groups that are always
maintained. In certain matters a person (Lampung) can risk anything (including his life) in order
to maintain his Pi'il Pesenggiri. Apart from that, with his Pi’il Pesenggiri, a person can do
something or not do something, even though it harms him materially.

Proceeding of International Conference of 4th SHIELD 2019
https://pasca.unila.ac.id/seminar-internasional-shield/
ISBN : 978-602-51393-9-0
176
The overall potential of social capital owned by the people of Lampung, especially the people of the village of South Lampung in disaster management must be strengthened (empowering), so that disaster preparedness is formed in all stages of disaster management starting from pre-disaster, emergency response and post-disaster. All of these stages have their own problems, so disaster management must be prepared in a coordinated, planned and integrated manner that takes into account aspects of good governance and prudence that will ultimately reduce disaster risk and form a resilient community. Thereby building community structure in a disaster resilient region (disaster resilient village).
CONCLUSIONS
Based on explanation above, it can be concluded, that in the handling of disaster management, it is divided into 3 (three), namely, pre-disaster, when disaster occurs and post-disaster. The pre-disaster and post-disaster stages are often ignored, and cause the problem of disaster management is not resolved properly. Social capital in the village community in the form of Prana and mutual cooperation which makes its own characteristics in the village community. The principles are inseparable from the value of Pancasila which is social capital to increase community resilience in dealing with all forms of disaster that can undoubtedly occur at any time. The people of Lampung have social capital related to the spirit of mutual cooperation, empathy and generosity that have been strong. The overall potential of social capital owned by the people of Lampung, especially the people of the village of South Lampung in disaster management must be strengthened (empowering), so that disaster preparedness is formed in all stages of disaster management starting from pre-disaster, emergency response and post-disaster. So that it will form a disaster resilient village.
REFERENCES
Ahangama, N. and Prasanna, R. 2015. Disaster risk managemant and resilience: What remains untouched? Journal of Managemant. 1(1).
Alie, M.H. 2015. Disaster management based on the perspective of inter-religious connection and lokal wisdom. Journal Social Science and Religion. 2(02).
Amri, R.M., Yulianti, G., Yunus, R., Wiguna, S., Adi, A.W., Ichwana, A.N., Randongkir, R.E., and Septian, R.T. 2016. Resiko Bencana Indonesia. Badan Nasional Penanggulangan Bencana (BNPB).
Anuar, A. and Daud, M.N. 2015. Payment of adequate compensation for land acquisition in Malaysia. Pacific Rim Property Research Journal. 12(3).
Badan Nasional Penanggulangan Bencana (BNPB). Laporan Utama Jilid 2-2: Rencana Nasional Penanggulangan Bencana 2009. Kajian Tentang Penanggulangan Bencana Alam di Indonesia.
Bardhan, P. 2011, Land Acquisition: Currently A Major Stumbling Blockfor Development Policy. World Bank.
Craig. J. and Chakravarty, A. 2013. Re-Thinking the Role of Compensation in Urban Land Acquisition: Empirical Evidence from South Asia.Land..
Harmadi, Hadiwijoyo, D., and Solimun, F. 2014. Land acquisition cijago toll road development in Depok City, West Java Indonesia. Journal of Business and Management. 16(5).
International Federation of Red Cross and Red Crescent Societies. 2015 Memperkuat Undang-Undang dan Pengurangan Risiko Bencana (PRB) di Indonesia. Jakarta: PMI.

Proceeding of International Conference of 4th SHIELD 2019
https://pasca.unila.ac.id/seminar-internasional-shield/
ISBN : 978-602-51393-9-0
177
Kartasasmita, G. 2017. Memperkuat Modal Sosial dalam Menghadapi Bencana. Pidato Acara Dies Natalis Universitas Paramadina ke-19.
Klaus, D., Harris, S., and Burns, A. 2012. The Land GovernanceAssessment Framework The Land Governance Assessment Framework, Identifying And Monitoring Good Practice In The Land Sector. The International Bank for Reconstruction and Development / The World Bank 1818 H Street NW.
Niekark, D.V. 2015. Disaster Risk Reduction, Disaster Risk Managemant And Disaster Managemant: Academic Rhetoric Or Practical Reality? Research Focus Area 7.2: Sustainable Social Development. North-West University, Potchefstroom Campus.
Purnama, S.G. 2017. Modul Manajemen Bencana. Fakultas Kedokteran Universitas Udayana Program Studi Kesehatan Masyarakat.
Satish, M. 2010., Introduction To Disaster Managemant. Macmillan Publishers India.
Sidharta, B.A. 2013. Ilmu Hukum Indonesia: Upaya Pengembangan Ilmu Hukum Sistematis yang Responsif terhadap Perubahan Masyarakat. Gentha Publishing. Yogyakarta.
Sihombing, L., Budi, S., Soepandji, Ismeth, S., Abidin, and Latief, Y. 2010. The impact of land acquisition delay in toll road development. SSRN Electronic Journal.
Subash, G., Tuladhar, A., and Sharma, S.R. 2017. Governance in land acquisition and compensation for infrastructure development. American Journal of Civil Engineering. 5(3).

Proceeding of International Conference of 4th SHIELD 2019
https://pasca.unila.ac.id/seminar-internasional-shield/
ISBN : 978-602-51393-9-0
178
MOTIFS INNOVATIONS OF LAMPUNG TAPIS: CARING FOR LOCAL WISDOM, SOCIO-ECONOMIC AND TOURISM NETWORK
Bartoven Vivit Nurdin and Dea Oktaviani
Sociology Department Faculty of Social and Political Sciences
University of Lampung
ABSTRACT
This paper examines fabric weaving called tapis of Lampung. Lampung tapis is a cloth worn by Lampung women and woven by Lampung women in their homes. As it develops, nowadays tapis is not only made by the owners of the culture origin but also supported by various ethnic groups in Lampung as Lampung is a multi-ethnic area whose majority of the population is inhabited by ethnic of Javanese. The changes in the political era gave rise to innovations and changes. As the result, the weaving of tapis is currently developing in Javanese villages while in the villages of Lampung, it experiences a drastic reduction. The interest of Lampung youth to make tapis weaving has declined considerably. Business ventures of tapis have been developing in Javanese villages in Lampung. As a business venture, people tend to adapt the motifs of tapis to the desired motifs of the market. This research applied ethnographic methods with a qualitative approach. The data collection is obtained by in-depth interview and observation techniques. The data analysis was done by triangulation. The results showed that there were a lot of elements of Lampung culture experienced reduction and even extinction especially in areas where Lampung ethnic population is minority. However, Lampung tapis became one of the core cultures that was difficult to become extinct. Even though there were fewer women in the Lampung family weave tapis, but as a symbol and pride of culture, the meaning was not lost. Many tapis weaving businesses were run by business ventures in Javanese villages. It means that tapis becomes an artefact or cultural product that survives with innovations from artisans to attract tourists. Keywords: Weaving, Innovation, Motif, Lampung and Local Wisdom
INTRODUCTION
This paper examines Lampung's tapis woven cloth, as one of the distinctive characteristics of Lampung's cultural products. Tapis is Lampung women's clothing which was woven by Lampung women in the past. Not only as clothing, tapis have meanings from motifs and symbols applied, varying from patterns, colors, thread types and so on, which determine the social structure in indigenous people. In line with socio-cultural changes in the community, tapis has also experienced major changes. Innovators appear in tapis designers in such a way that they follow market tastes. This paper views tapis as an ancestral cultural heritage which must not change the meaning and symbols of indigenous values, where Lampung indigenous people themselves no longer produce or weave this cloth themselves at home. Most of the products are produced by commercial business units, and interestingly most of the innovators and designers are Javanese. It is interesting to learn what innovations are attempted in capturing the world of the tourism market especially with various socio-economic networks that ensnare it.
This research is one of the impacts of the research team's study on the ethno-ecotourism model at the Keratuan Semaka Museum in Tanggamus Regency.

Proceeding of International Conference of 4th SHIELD 2019
https://pasca.unila.ac.id/seminar-internasional-shield/
ISBN : 978-602-51393-9-0
179
One of the collections of the museum is Lampung tapis. However, it is very unfortunate that the cloth is no longer produced by the local indigenous people; fewer people who work on tapis weaving. According to them it is no longer efficient because the younger generation is not interested in doing it. Many young people move to cities to go to school or find jobs, some of them even work abroad to become migrant workers. Weaving tapis requires precision, talent, interest as well as patience due to the long process. This is one of the causes of reduced interest in youth. On the other hand, it is interesting to learn that a lot of Javanese villagers have developed tapis weaving activities. The Javanese women work as tapis weavers opened by people in villages. One of them is in the village of Tanjung Resjo of Pesawaran regency, where there are some residents who make tapis weaving businesses. This research looks at how weaving tapis as one of the potentials of the creative economy develops into a social economic business network.
Weaving tapis Lampung is one type of traditional craft that harmonizes life both with its environment and the creator of the universe. Therefore the emergence of this tapis cloth was taken through the time stages which led to the perfection of its weaving techniques, as well as ways to provide its decoration in accordance with the cultural development of the people, in which Lampung people themselves have woven tapis cloth since the 2nd century BC (Van Der Hoop, 1949).
Literally, 'tapis' comes from the word 'tapih' (Javanese) which means long cloth. The tapis itself is originally a traditional cloth that is usually worn by Lampung ethnic women in the form of cloth made of cotton yarn. Generally basic motifs are on the color of the fabric with horizontal directions. In certain fields, they are given a single motif or some forms of motif with embroidered gold, silver, or silk thread with embroidery techniques or usually called cucuk. Tapis cloth undergoes various improvements both in terms of manufacturing techniques, form of motifs, as well as methods of applying motifs to basic fabrics (Intani, 2006).
Weaving tapis is one type of traditional crafts of Lampung society in harmonizing life both between the environment and the creator of the universe. The tapis cloth itself is a traditional dress for Lampung tribal women in the form of sarong made from woven cotton yarn with motifs or decorations made from sugi – silver thread or gold thread with a embroidery system or cucuk (Hamy, 2011).
According to Junaidi (1996), weaving tapis comes with decorative motifs of animals, plants and multiple gyre. Tapis clothes are made with embroidery techniques by binding thread in the form of a predetermined decorative pattern. Knowledge of weaving techniques is a continuation of the knowledge of making handicrafts with weaving techniques made of fiber and in the form of leaves, wood fibers used as clothing. The development of Indonesian weaving motifs has a lot of influence from China, India and Arab, including one of them is Lampung weaving tapis from Sumatra
The motif is a picture of a shape that is the nature and style of an embodiment. It can be interpreted that the motif is part of the point which is the beginning or base to form a pattern. Motif is a pattern that is formed in such a way as to produce a variety of forms. Motives are designs that are seen from parts of a shape, various kinds of lines or elements that are sometimes so strongly influenced by forms of natural situations, objects with their own style and characteristics (Suhersono, 2005).
The motifs of tapis fabrics continue to grow as the contact, interaction and communication of Lampung indigenous people with other cultures is developed. The meeting with other cultures caused acculturation between the elements of the local (old) cultural results and the ornamental elements of foreign cultures

Proceeding of International Conference of 4th SHIELD 2019
https://pasca.unila.ac.id/seminar-internasional-shield/
ISBN : 978-602-51393-9-0
180
(new). The foreign elements that come do not eliminate the old elements, but enrich the existing style, variety, and style. The various cultures are integrated in one intact concept that cannot be separated and gives birth to a new and unique style. Among the cultures which has an influence on the formation of decorative cloth art styles is Dongson culture from mainland Asia, Hindu Buddhism, Islam, and Europe (Eko, 2012).
RESEARCH METHOD
The research method used in this study is ethnographic method with a qualitative approach. According to Denzin and Lincoln (2009) qualitative research is aimed at obtaining a fundamental understanding through an experience of researchers who directly process and merge into one by mixing and becoming an inseparable unity with the subject and background that will be examined in the form of actual, valid and factual field notes. The data analysis technique is done by triangulation. Triangulation was chosen because it uses several data sources originated from interviews and documentation. Triangulation is a technique for checking the validity of data that uses something other than data for checking or comparing data. The research was conducted at the tapis center in Lampung, one of them in the village of Tanjung Rejo, Pesawaran as one of the tapis manufacturing sites. It is known that the Keratuan Semaka Museum in Tanggamus Regency is one of the museums resulted from the empowerment of local communities which stores ancient items including tapis, but no longer produces the tapis anymore. Many villages that produce tapis are villages whose weavers are Javanese, one of which is Tanjung Rejo village.
RESULTS AND DISCUSSION Innovation in Tapis Motifs and Caring for Local Wisdom
Tapis is a Lampung women's cloth that is worn as a sarong for daily use as well as certain occasions. In line with the development of the community, the tapis began to be decorated with various motifs with gold thread. The motifs actually have its own meaning in accordance with the social structure of the people who wear it. Even more, tapis motifs are associated with one's hierarchy and position in the adat (ethnic). Tapis motifs were very limited in the past, looking at natural examples such as plants or animals and other natural scenery. Since becoming a market commodity, there have been many innovations in tapis motifs.
The motif in the tapis cloth itself is also often referred to as decoration. The use of decorative items besides intended to beautify fabrics, also illustrates the background of the values of society. The creation of this ornament is based on human knowledge about the environment that can stimulate to create a variety of decorations. The following are the motives of the tapis that developed in the business in Tanjung Rejo village: 1. Tajuk Ayun Motif

Proceeding of International Conference of 4th SHIELD 2019
https://pasca.unila.ac.id/seminar-internasional-shield/
ISBN : 978-602-51393-9-0
181
Picture 1. Tapis cloth with Tajuk Ayun motif. Source : Researcher’s document (Tanjung Rejo 14 Desember 2018)
In Lampung society, the motif is usually called "tapis jung sarat". This kind of tapis is originated from the pepadun tribe which is made with 100 grams of gold thread and has an ornamental motif of tajuk besarung also known as pucuk rebung (bamboo shoots). This tapis cloth is worn by the bride during traditional wedding ceremonies as well as groups of older relatives of wives who attend the ceremony for taking the title or cakak pepadun and muli cangget (dancer girls).
2. Wajikan motif
Picture 2. Tapis cloth with Wajikan motif Source : Researcher’s document (Tanjung Rejo 14 Desember 2018)
This motif is often combined with various other types of motifs, as in the picture below, which is combined with the Sasab motif, and the belah ketupat (rhombus) motif given beads in the middle.
3. Pucuk Rebung Motif
Picture 3. Tapis cloth with pucuk rebung motif Source : Researcher’s document (Tanjung Rejo 14 Desember 2018)
The pucuk rebung motif resembles a decorative motif of bamboo shoots,
rhombus and tajuk beketik. The basic fabric is red, orange, and black made of cotton yarn. However, the most commonly used fabric base material is red and black. This motif is embroidered with gold thread stacked in layers. The gold thread pattern follows the basic weaving motif below. This motif is usually worn by the bride when attending a traditional ceremony or when dancing. 4. Sasab motif

Proceeding of International Conference of 4th SHIELD 2019
https://pasca.unila.ac.id/seminar-internasional-shield/
ISBN : 978-602-51393-9-0
182
Picture 4. Tapis cloth with sasab motif Source : Researcher’s document (Tanjung Rejo 14 Desember 2018)
The Lampung tapis woven cloth with the sasab motif is one of the most
difficult motifs to create. This motif is usually applied on a selendang (a kind of scarf) as the basic cloth. In the process of making this motif, accuracy and neatness are needed to fit the tajuk shape to produce beautiful motif and high selling value.
5. Mata Kibau Motif
Picture 5. Tapis cloth with mata kibau motif Source : Researcher’s document (Tanjung Rejo 14 Desember 2018)
Mata Kibau (buffalo‟s eye) motif is considered complicated as the line space in the base cloth must be fully filled according to the motif. In the manufacturing process, it takes precision to produce a neat and beautiful motif. Hence, it may take a long time to produce a piece of tapis with mata kibau motif. The mata kibau tapis cloth is worn as decoration for women's sarong in Lampung traditional ceremonies. 6. Bayun Motif
Picture 6. Tapis cloth with Bayun motif Source : Researcher’s document (Tanjung Rejo 14 Desember 2018)
Tapis with bayun motif patterned is very easy to combine or match with other
motifs because it has an empty space in the middle of the motif. Not only matched with floral motifs, it is also filled with sequins or beads.
7. Cuping (cucuk pinggir) Motif

Proceeding of International Conference of 4th SHIELD 2019
https://pasca.unila.ac.id/seminar-internasional-shield/
ISBN : 978-602-51393-9-0
183
Picture 7. Tapis cloth with Cuping motif Source : Researcher’s document (Tanjung Rejo 14 Desember 2018)
The cucuk ujung motif comes from the tribe of pepadun. This type of pattern is usually worn by groups of wives in attending traditional parties and bridesmaids at traditional wedding ceremonies. It is sometimes also worn by men but in the form of a short sarong (setelan) and without slempang (scarf) while women usually wear it in the form of a long sarong (setelan) completed with a slempang. The cucuk pinggir can be classified into tapis abung group. The motif on the cloth should be done carefully and neatly to produce a beautiful tapis woven fabric and have a higher selling value. 8. Ayat Kursi Bordir and Ayat Kursi Sulam Motifs
Picture 8. Tapis with Ayat Kursi motis Source : Researcher’s document (Tanjung Rejo 14 Desember 2018)
This motif is usually matched or combined with other tapis motifs, such as
gunung (mountain), lereng-lereng (slopes), unik-unik, sasab and other motifs. The versatile pattern of woven tapis woven cloth is usually displayed as exhibitions in an activity or can also be used as wall decoration in various rooms at home or office.
9. Tapis with Wool yarn
Picture 9. Tapis woven with wool yarn Source : Researcher’s document (Tanjung Rejo 14 Desember 2018)
Unlike other forms of tapis, this kind of tapis cloth is woven with different
materials which are pink and light green wool with a red and black tapis cloth base. The motif applied is the bayun motif. Making tapis woven cloth using wool yarn requires precision and patience to produce neat and beautiful woven fabrics.
The tapis woven cloth that uses wool yarn base material is also competitive with tapis woven fabrics using gold thread and other threads. There are few producers of tapis woven fabric with wool yarn in the village of Tanjung Rejo because the collectors only choose and trust the weavers who are really diligent and neat in embroidering the threads of the tapis cloth. If the woven product is not neat, the collector might lose some benefits due to the price of the wool yarn

Proceeding of International Conference of 4th SHIELD 2019
https://pasca.unila.ac.id/seminar-internasional-shield/
ISBN : 978-602-51393-9-0
184
that is not cheap. If the tapis woven fabric is made with precision of neatness, the result will will be apparently beautiful. 10. Tapis with cristal thread
Picture 10. Tapis woven with blue cristal thread Source : Researcher’s document (Tanjung Rejo 14 Desember 2018)
The basic fabric material of this tapis is a colorful base cloth. White threads
are usually applied for compounding or binding application in weaving. The motifs can be adjusted to the tastes demand of each market. The motifs that are usually applied are the tajuk ayun and bukit motifs. The establishment of tapis woven cloth production with various motifs may greatly influences the economic income of the weavers, collectors and distributors of tapis cloth. Analysis: Tapis from Culture Value to the Socio-Economic Network
The result of this study indicates that tapis weaving processes have no longer been interesting for Lampung families. With an increasing demand of tapis market, many tapis weaving craftsmen are from Javanese villagers. Tapis production is increasing to be a promsing business. The study found that this line of business in the village of Tanjung Rejo has become a successful and growing field of business ranging from craftsmen, business owners, collectors to their marketers. This is very reasonable because today the tapis is one of the tourism commodities.
Social networks are relationships that are created between many individuals in a group or between groups with other groups. Relationships that occur can be in the form of formal or informal forms. Social relations is a picture or reflection of cooperation and coordination among citizens that is realized by reciprocal social bonds (Damsar, 2002).
According to Granovetter (2005), socio-economic networks are regular relationships or social relationships between individuals or groups. Social networks work as a way of grouping consisting of a number of people of at least three people, each of which has its own identity and each of them is connected between one another through existing social relations, through which they can grouped as a social entity
In simple terms, socio-economic networks are actually a form of strategy and actions taken by individuals, groups and communities in the face of erratic work environments or are covered by various limitations that they have. Socio-economic networks can be identified both at the level between individuals and at the level of the structure. At the level of between individuals, social networks are seen through a range of distinctive relationships among a number of people with additional traits, the characteristics of those relationships are used to interpret the social behavior of the individuals involved. While at the level of structure, it shows that the pattern or structure of social relations can increase or inhibit people's behavior to be involved in various forms of social life.

Proceeding of International Conference of 4th SHIELD 2019
https://pasca.unila.ac.id/seminar-internasional-shield/
ISBN : 978-602-51393-9-0
185
The process of making tapis woven cloth in this case includes interdependence from the manufacturing process to the marketing process until it reaches the users. Among them all are related to one another, both among weavers, weavers with collectors and collectors with consumers to reach their goals together especially in economic matters. The craftswomen of tapis woven cloth can be classified into two types: there are pure laborer women weavers and non laborer women weavers.
The women laborers are weavers who totally work for a certain collector. In this case, all the materials needed to produce and the types of motifs to apply are all provided by the collectors. All the products produced will be given to the collector who will then share the profit obtained. Unlike the pure laborer, the non-laborer weaver women buy all weaving materials from any collectors. These women also determine the motifs to apply by themselves. The products they make then will be sold to any collectors they prefer.
In term of collectors, there are also two types of collectors in this line of business. There are collectors who simply collect the product from weavers and directly distribute them to markets or distribution stores. On the other hand, there are collectors who manage to develop the clothes they collect by changing the clothes into various kinds of handicrafts combined with the Lampung tapis. The clothes are used to produce clothes, trousers, and shirts, bags, veils, cap, belt, scarf, graduation scarf, tablecloths, wall decorations, and many more various kinds of handicrafts with tapis motifs applications.
Lampung tapis woven fabric crafts will not fully succeed and help the economic income of the community in Tanjung Rejo Village if there is no contribution from consumers. Consumers in this case have a big influence on increasing the economic income of the community, in this case there are several types of consumers who play an active role in the Lampung tapis woven cloth. There are consumers who order by determining the motif in advance. They usually visit the fabric weavers directly. The products which are usually ordered to produce are paired clothes or dress and wall ornaments or decorations, both for the need of exhibitions and other functions. There are consumers who order it through collectors or directly buy it at fabric stores that are specialized in providing finished products from various ready to use or wear Lampung tapis woven fabrics.
The relationships built are the most important network to support maintaining the continuity of the Lampung tapis weaving business. With limited capital conditions, the craftsmen will try to build a good network among tapis weaving craftsmen, between weaving craftsmen and collectors, and weaving craftsmen with consumers. The network built by craftsmen and tapis collectors will make it easier for them in terms of capital both material and process of fabric distribution of the tapis itself. In addition, the loan system can occur by making use of the products to work as collaterals for the collectors. This means that those who borrow some amount of money will not sell their products to other collectors. In addition, the network also serves to provide certainty for craftsmen to measure their income after finishing their work. The network between collectors and consumers also greatly influences the continuity of the weaving business. Through the communication that exists, collectors will easily know the tastes or forms of motives that consumers want and are in demand in the market, especially for tourism market demands.
CONCLUSION
From the results of the study, it can be concluded that nowadays there have been major socio-cultural changes from the innovation of tapis weaving motifs

Proceeding of International Conference of 4th SHIELD 2019
https://pasca.unila.ac.id/seminar-internasional-shield/
ISBN : 978-602-51393-9-0
186
which adjust with market tastes. As a matter of fact, most of the meanings of the motifs are no longer understood especially by the young generation of Lampung. So, even though they really like tapis as the pride of society and culture, they no longer understand the tapis motifs and their relation to the socio-cultural structure. Nowadays, despite the fact that the people no longer understand the meaning behind the motifs, the pluralistic people of Lampung prefer to use or wear tapis for certain events as something beautiful and to be proud of as an icon of Lampung society.
Tapis weaving is no longer interesting for women of Lampung family who used to work at home. Weaving tapis are currently being developed by tapis weaving businesses in Javanese villages by the Javanese weavers. As a business, the motifs are tailored to market tastes with many innovations in them. In this tapis business there is a socio-economic network where the tapis becomes a market and tourism commodity. ***
REFERENCES
Damsar. 2002. Pengantar Sosiologi Ekonomi. PT. Kharisma Putra Utama: Jakarta.
Eko, B. 2012. Mengenal Ragam Sulaman Tapis Lampung. Pelita: Bandar Lampug.
Granovetter, M. 2005. The impact of social structure on economic outcomes. Journal of Economis Prerspectives. 19(1).
Hamy, S. 2011. Sulam Tapis Lampung. Gramedia Pustaka Utama: Jakarta. Intani, R. 2006. Tapis Lampung. Bandung : Laporan Perekaman BPSNT. Junaidi, F. 1996. Mengenal Sulaman Tapis Lampung. Gunung Pesagi. Bandar
Lampung. Kartiwa, S. 2007. Tenun Ikat : Ragam Kain Tradisional Indonesia.Gramedia
Pustaka Utama. Jakarta. Norman, K. Denzin and Yvonna, S.L. 2009. Handbook of Qualitative Research.
Pustaka Pelajar. Yogyakarta. Soepratno. 1984. Mengenal Budaya Bangsa Inonesia. PT. Effhar. Semarang. Sugiarto, S.W. 2003. Teknologi Tekstil. PT. Pradnya Paramita, Jakarta. Suhersono, H. 2005. Desain Bordir Motif Geometris. Gramedia Pustaka Utama.
Jakarta. Van Der Hoop, A.N.J. Th.a, Th. 1949. Ragam - Ragam Perhiasan Indonesia.
Jakarta: Uitgegeven Door Het Koninklijk Bataviaasch Genootschap Van Kunsten En Wetenschappen.

Proceeding of International Conference of 4th SHIELD 2019
https://pasca.unila.ac.id/seminar-internasional-shield/
ISBN : 978-602-51393-9-0
187
SANITARIAN WORKERS’ COMPLIANCE ON THE MEDICAL WASTE TREATMENT PROCEDURE: STUDY IN HEALTH CENTERS OF METRO MUNICIPALITY AND CENTRAL LAMPUNG REGENCY
Ari Kuswantari1), Agus Setiawan2), Yul Martin2), and Samsul Bakri2*)
1)Committee Secretary for Health and Safety (K3) Affair of The General Hospital of Ahmad Yani, Metro Municipality
2)Acossiate Professor of the School of Enviromental Science, The Graduate Program, Universitas Lampung
Jl Sumanteri Brojonegoro #1, Bandar Lampung 35145_Indonesia *) Coresponding Author : [email protected]
ABSTRACT
The sanitarian worker‟s compliance on fulfiling the guidline on medical waste treatment until nowadys have not yet been elucidated especially for whom employed in the district health care centres. Thi issue was come to be extreemly important in relation to their duties include to manage the hazardeous and toxic waste produce by district health care centre (puskesmas). The aim of this research was to develop a model of sanitarian‟s worker compliance on the procedure for medical waste management. Ordinal Logistic Regression was aplied as the postulat which respon variable was [Y]i that scored by 0, 1, or 2 as represents for non, fair, or high compliant respectively to follow the precedure of managing the materials of hazardous an toxic waste. The predictor variables were included of age, gender, and knowledge sanitarian workers acompanied with of the performance of the facility, licency holding, and the survilience. Data were collected by interviewing and observing of 22 puskesmas owened by the Authorities of Metro and Central Lampung Municipalities. The result sugested that: (1) The Model was realiable for predicting the complience of the sanitarian workerwer‟s complience by the 6 predictor variables, (2) The sanitarian workers. compliance (a) were not affected by age, gender, or the licence holding, but (b) were reduce significatly by merely 0,09 (P-value=0.025), (c) by 0,18 (P-value=0.062), by 0.07 (P-value=0.064) with their knowlege achievement, the quality of puskesmas‟ facilities, and the supervion performace respectively. Keywords: compliance, sanitarian, medical waste, hazardeous and toxic material guide line
INTRODUCTION
The district‟s health care center (Puskesmas) as a first-level health service facility that provides basic health services based on Republic of Indonesia Government Regulation number 47 of 2016 concerning health service facilities. The center must be available at least one unit for each district. As a basic health service facility, the Puskesmas become a place of pooling of various diseases as well. These centers, therefore, produce some medical waste, include the hazardous and toxic material. a side effect of these services.
Medical waste produce by Puskesmas activities, could bring some risks on the environment and the community sanity. The risk more intensely exposured to sanitarian workers or everyone who close and touch the waste. Because every district has a Puskesmas, where each Puskesmas produces medical waste, which means that every sub-district is a producer of medical waste, the impact on the community and the environment is very high. Especially if the Puskesmas in

Proceeding of International Conference of 4th SHIELD 2019
https://pasca.unila.ac.id/seminar-internasional-shield/
ISBN : 978-602-51393-9-0
188
this case the medical waste manager and the Puskesmas leader are not compliant in managing medical waste.
The impact of medical waste on health and society occurs at every stage of waste management, from generation to collection, to the final management stage of medical waste (Ngambut, 2017). Exposure to health service waste can result in illness or injury to health workers, patients, visitors and the community around the health facility environment, which allows the risk of spread of diseases including infectious diseases such as hepatitis, diarrhea, measles and influenza. Unfortunately the management of medical waste in health care facilities such as Puskesmas is still below professional standards because managing and disposing of medical waste does not comply with applicable regulations (Yuwono et al, 2017).
Based on the Minister of Environment and Forestry Regulation number 56 of 2015 concerning Procedures and Technical Requirements for the Management of Hazardous and Toxic Waste from Health Service Facilities, B3 waste management arising from health service facilities includes the following stages: 1. Reduction and sorting of B3 Waste; 2. B3 waste storage; 3. Transportation of B3 waste; 4. Hazardous Waste Management; 5. burial of B3 waste; and 6. Landfill B3 waste. Waste management generated at Puskesmas is conducted by Puskesmas sanitarians in accordance with Ministry of Health regulation no 32/2013. Sanitarians as medical waste managers must really know and understand the laws and regulations relating to the management of Puskesmas medical waste as well as existing SOPs so that adverse effects do not occur. Knowledge or cognitive is a very important domain for the formation of action. Behavior that is based on knowledge and awareness will last longer than behavior that is not based on knowledge and awareness (Widiartha, 2012).
Besides knowledge, the important thing in the management of medical waste is a supporting device in the waste management process, namely the facilities, facilities and infrastructure used for these activities. Although the determination of the entire tool must consider aspects of budget availability, number of visits and various other technical considerations. (Fadhli, 2013). In the process of management, there is often a negligence committed by sanitarians, and therefore supervision is needed both from the leadership of the Puskesmas as an internal supervisor and from the relevant offices for supervisors from external parties.
Metro Municipality as a Municipality with a population of 160,729 (BPS in 2016), with an area of 68.74 km2 is a small Municipality with a fairly dense population with 5 districts and has 12 Puskesmas. Of the 12 existing Puskesmas, it generates quite a lot of medical waste and is spread in each district. Because in one district there are 2-3 Community Health Centers. Central Lampung with a population of 1,271,566 people (BPS in 2017) consists of 28 districts and has 38 health centers. With an area of 4,789.82 km2. With medical waste produced, without being managed properly, it will have a negative impact on the community around the Puskesmas and especially the waste management itself.
RESEARCH METHOD
This research was conducted from August 2018 to August 2019 in two districts namely Metro Municipality and Central Lampung Regency. Using qualitative research methods, with a sample of Metro Municipality Puskesmas as many as 6 Puskesmas and 16 Puskesmas from Lampung Tengah District, interviews were then conducted using a questionnaire to determine the level of sanitary compliance of the Puskesmas and the variables that affected the level of compliance. The response variable (Yi) is in the form of an ordinal variable, that is, if sanitarians are very compliant in managing medical waste at the Puskesmas

Proceeding of International Conference of 4th SHIELD 2019
https://pasca.unila.ac.id/seminar-internasional-shield/
ISBN : 978-602-51393-9-0
189
given a score of 2, obediently given a score of 1, and non-compliant is given a score of 0.
Estimating variables used are (Xih), among others: sanitarian age, gender (women are given a score of 1 and 0 if other), level of knowledge (both given a score of 2, enough is given a score of 1, and less given a score of 0), ownership of facilities and infrastructure facilities Puskesmas (both given a score of 2, enough given a score of 1, and less given a score of 0), ownership of permits related to environmental management, and supervision carried out both by the leadership of the puskesmas and supervision by external parties such as the Office of the Environment or the Office of Health on waste management carried out by the sanitarian Puskesmas. In a more concise manner, Table 1 presents estimator variables, symbol assignments, in the model and scores for the qualitative opportunity models in this study. Table 1. Predictive variables (predictors) symbolization and scoring in the model
Variable Predictor Symbol the Scoring Model of Values and
Units
1 Age [AGE] year 2 Gender [GEND] = 1 if female, = 0 if other 3 Knowledge [KNW] = 2 if good, = 1 if enough, = 0 less 4 Waste Treatmen Facilites [FACT] = 2 if good, = 1 if enough, = 0 less 5 Licence for waste treatment [PRMT] = 1 if present, = 0 if other 6 Supervision [SURV] = 1 if present, = 0 if other
The we propoed the postluat model of ordinal logistic regression as the folowing:
= ß0 + ß1 + ß2 [AGE]i + ß3[GEND]i + ß4[KNW]i + ß5[FAC]i + ß6[PRMT]i + ß7[FAC] I + ß7[SURV]i + €i
Note:
Ln = ꬲlog, with ꬲ = 2,718281 (natural number) Where [P(y=1)] was the chance y=0, 1, or 2 [1-P(y=1)] was the chance to fail ß0, ß1 = Intersep ß2, ß7= Model Parameter € = galat (error)
Optimization of model parameters using Minitab Version 16. With a goodness
test of fit against the model using the Gald Test with a confidence level of 5% and 10%.
RESULTS AND DISCUSSION
The Model Obtained
Based the optimation parameters model, we obtained the Gald test with Loglikelyhood = - 11.859with P=0.000. This implied that the good fit of the model is very good. This claim was proved by the P=0.001, meaning that if modeling reapeted as many as 1.000 there would be only 1 time the result missed. This is also means the 6 predictor vaiables are very realible to forcase the level of
[P(y=1)]
Ln
[1-P(y=1)]

Proceeding of International Conference of 4th SHIELD 2019
https://pasca.unila.ac.id/seminar-internasional-shield/
ISBN : 978-602-51393-9-0
190
compliance of the sanitarian workers. We then could expressed the model as the following
=
3.2135+ 6.2279-0.0459[AGE]i -1.0799[GEND]i -2.3831[KNW]i 0.7224[FACT]-0.5062[PRMT]-
2.68544[SUVR]
The Effect of Inpendent Variables on the Compliance
The results of parameter analysis with qualitative opportunity ordinal regression are presented in Table 2. In table 2 it can be seen that the parameter value constant [ß1] = 0.93 with P-value = 0.352 and constant [ß2] = 1.65 with P-value = 0.099 . Which means that if some variables do not change (for example amended by a policy), then the sanitarian opportunity to comply with medical waste management is very small even though the value is positive. This means that in order for sanitarians to be obedient in managing Puskesmas medical waste in accordance with laws and regulations, it is necessary to change several variables by conducting certain policy interventions, for example by providing specialized training in medical waste management, better fulfillment of facilities, facilities and infrastructure, conducting supervision by providing reward and punishment for waste management, and other policies that can result in better waste management in Puskesmas. Tabel 2. The results of the optimization of the parameters of each variable along
with the Odds Ratio in the ordinal regression qualitative probability
model of the level of sanitarian compliance
No Predictor Variable Symbol Coef. P-value Odds Ratio
1) Constant 1 - 3.2136 0.352 - 2) Constant 2 - 6.2279 0.099 - 3) Age [AGE] 0.0458615 0.594 1.05 4) Gender [GEND] -1.07985 0.397 0.34 5) Knowledge [KNW] -2.38310 0.025 0.09 6) Waste Treatmet facilities [FACT] -1.72244 0.062 0.18 7) Licence for waste treatment [PRMT] -0.506189 0.695 0.60 8) Supervision [SURV] -2.68544 0.064 0.07
The Effect of Sanitarian Age Variables
Of the 22 sanitarians managing the Puskesmas waste, there was a positive increase for sanitarians aged around 1.05 years older than sanitarians aged younger in managing Puskesmas waste. So it was concluded that older sanitarians tend to be better at managing the medical waste of their Puskesmas compared to younger sanitarians. This can be proven by the value in the predictor in table 2. Namely ß3 = 0.52; P-value = 0.594 and Odds Ratio = 1.05. The Effect of Gender Variable
The gender of the Puskesmas waste management has an effect on the level
of compliance in Puskesmas medical waste management, although it has a negative meaning, namely sanitarians with male sex tend to be better in managing the Puskesmas medical waste. In female sanitarians, the management of Puskesmas medical waste is 0.34 of men. This is indicated by its Odds Ratio = 0.34 and P-value = 0.39. In this case, it can be seen that the management of
[P(y=1)]i
Ln
[1-P(y=1)]i

Proceeding of International Conference of 4th SHIELD 2019
https://pasca.unila.ac.id/seminar-internasional-shield/
ISBN : 978-602-51393-9-0
191
sanitary Puskesmas medical waste is better if carried out by male sanitarians. In this context it seems that men are more free in managing medical waste and determining their decision to seek information about waste management.
The Effect of Sanitarian Knowledge Variables
Sanitarian knowledge in managing Puskesmas medical waste effects its
behavior and compliance in the management of medical waste generated at its Puskesmas. But it is negative in the sense that if sanitarians better understand the rules and SOPs on waste management, then compliance in waste management is 0.09 times less compliant than sanitarians with 0.09 times the knowledge below. With Odds Ratio = 0.09 and P-value = 0.39.
Compliance should be in line with the knowledge possessed, so that the behavior exhibited by someone who has good knowledge will be interpreted as the results will be according to applicable standards. The sanitarian non-compliance of the Puskesmas in the management of medical waste which is associated with better knowledge but with lower compliance is possible because of the effect of reward and punishment as well as lack of supervision. The Effect of Facilities, Facilities and Infrastructure Variables owned by the Puskesmas
Facilities, supporting facilities and infrastructure owned by the Puskesmas in managing medical waste also effect the management of medical waste carried out by sanitarians. For Puskesmas with better facilities, facilities and infrastructure, it turns out to have a lower level of compliance, which is 0.18 times compared to Puskesmas with lower facilities, supported facilities and infrastructure (Odds Ratio = 0.18) with P-value = 0.062.
The effect of the completeness of facilities, supported facilities and infrastructure owned by Puskesmas with this level of compliance shows that sanitarians whose Puskesmas have better facilities and infrastructure tend to manage medical waste poorly. Completeness of facilities and infrastructure owned by the Puskesmas should make sanitarians easier in managing medical waste generated at the Puskesmas. Effect of Community Health Center Environmental Permit Variable
Environmental permits owned by Puskesmas have a 0.60 times lower effect on the level of compliance in medical waste management with an Odds Ratio = 0.60 and a P-value = 0.695. Based on PP no. 101 of 2014, all health service facilities must have a permit for environmental management which means that Puskesmas or other health service facilities are able to manage their environment in accordance with applicable regulations. So with the environmental permit that is owned, it states that the Puskesmas medical waste manager has the capability in environmental management of the impacts that may occur in the operation of a Puskesmas with waste which is a negative side effect of the health services provided. Effect of Monitoring Variables on Puskesmas Medical Waste Management
Survey of 22 Puskesmas, the results show that Puskesmas, in this case the management of medical waste, which is given both internal and external supervision has a 0.07 times lower effect than Puskesmas that is not given supervision with Odds Ratio = 0.07 and P-value = 0.064. In the implementation

Proceeding of International Conference of 4th SHIELD 2019
https://pasca.unila.ac.id/seminar-internasional-shield/
ISBN : 978-602-51393-9-0
192
of Puskesmas medical waste management, supervision is needed. This supervision can be carried out internally, namely supervision conducted by the head of the Puskesmas on the management of medical waste, as well as supervision from relevant agencies or external oversight. The lower effect of supervision on sanitarian noncompliance in medical waste management has a tendency that supervision that is not carried out routinely does not have a better effect. With routine supervision, it will be possible for changes in behavior and compliance in the management of Puskesmas medical waste.
CONCLUSIONS
The result sugested that: 1. The model was realiable tool for predicting the complience of the sanitarian
worker by the 6 predictor variables as the following
=
3.2135+ 6.2279-0.0459[AGE]i -1.0799[GEND]i -2.3831[KNW]i 0.7224[FACT]i -0.5062[PRMT]i -
2.68544[SUVR]i
2. The sanitarian workers compliance (a) were not affected by age, gender, or the licence holding, but (b) were reduce significatly by merely 0,09 (P-value=0.025), (c) by 0,18 (P-value=0.062), by 0.07 (P-value=0.064) with their knowlege achievement, the quality of puskesmas‟ facilities, and the supervion performace respectively.
RECOMENDATION
It is recomend that conduct further research to validate the model for others regencies i.e.: North Lampung, South Lampung, West Lampung, Pesawaran, Tulang Bawang, Way Kanan, Pring Sewu,Tanggamus, Pesisir Barat, Tulang Bawang Barat.
REFERENCES
Ngambut, Y. 2017. Management of Medical Waste Pukskesmas in
Kupang Regency,Nusa tenggara Province. Jurnal Info Kesehatan,
15(2): 417-427.
Fadhli. 2013. Description of the behavior of Puskesmas Officers in the
Medical Waste Management System in UPTD Puskesnas Jeuram
Nagan Raya District. Skripsi. Aceh: Universitas Meulaboh Aceh
Barat.
Widiartha, K.Y. 2012. Analysis of Puskesmas Medical Waste
Management System in Jember Regency. Skripsi. Jawa Timur: FKM
Universitas Jember.
Peraturan Pemerintah No. 47 tahun 2016 tentang Fasilitas Pelayanan
Kesehatan.
Peraturan Menteri Lingkungan Hidup dan Kehutanan nomor 56 tahun 2015 tentang Tata Cara dan Persyaratan Teknis Pengelolaan Limbah Bahan Berbahaya dan Beracun dari Fasilitas Pelayanan Kesehatan.
Peraturan Pemerintah No. 101 tahun 2014 tentang Pengelolaan Limbah
Berbahaya dan Beracun.
[P(y=1)]i
Ln
[1-P(y=1)]i

Proceeding of International Conference of 4th SHIELD 2019
https://pasca.unila.ac.id/seminar-internasional-shield/
ISBN : 978-602-51393-9-0
193
STUDENT ATTITUDETO LGBT BEHAVIOR (LESBIAN, GAY, BISEXUAL AND TRANSGENDER) IN BANDAR LAMPUNG
Anita Florencya and TubagusHasanuddin
Department of Extention and Community Development Graduate School, University of Lampung
Email: [email protected]
ABSTRACT
The existence of groups of lesbians, gays, bisexuals and transgender (LGBT) in Indonesia is become a problem. This study aims to 1) determine the attitudes of students to LGBT behavior, and 2) determine differences attitudes student to LGBT behavior. This research was conducted using descriptive research methods. The student respondens in this study were 84 person randomly selected. Analysis of data using statistic non parametric Kendallcorrelation and Mann Whitney U test with α = 0.10. The results research shown that the level of student religiousity and values in the family were related to student attitudes to LGBT behavior. There is no difference attitudes student to LGBT behavior. Keywords: Attitude, Students, LGBT
INTRODUCTION
The term LGBT is used to indicate anyone who has a distorted sexual orientation. The people who have sexual orientation and non-heterosexual identities such as homosexual, bisexual, or others can be called LGBT (Galink, 2013). Currently, LGBT become an interesting social phenomenon to discuss because of its existence in the community always leaves a negative image and causes controversy among the people.LGBT people tend to be closed with the wider community and only interact with fellow LGBT people in the community.
In the religious perspective, LGBT people also have the right to embrace religion in accordance with their respective beliefs. Religion can occupy an important position in the daily lives of individuals, families and community groups. Part of society tends to be tolerant of the existence of LGBT, but on the other reject to existence of these LGBT people.What about the student's attitude to LGBT behavior? What is student‟s attitude to LGBT behavior are difference?
LITERATURE REVIEW AND HYPOTHESES
Attitude is one of the concepts which is the main concern in the science of social psychology. Attitude is also an internal subjective evaluation process that takes place within a person and cannot be directly observed, but can be seen if the attitude has been realized into behavior. Therefore attitude can be seen as positive and negative. If someone likes something, his attitude is positive and tends to approach him, but if someone does not like something, his attitude tends to be negative and away. Apart from behavior, attitudes can also be known through knowledge, beliefs, and feelings towards a particular object. So, attitudes can be measured because we can see someone's attitude from the previously mentioned.
In language, the Oxford Advanced Learner Dictionary (Hornby, 1974) states that the attitude is a way of placing or carrying oneself, or a way of feeling, way of thinking, and behavior. The otherliterature review that attitudes as a complex mental state involving beliefs and feelings and values and dispositions to act in certain ways. Attitude is a complex mental state that involves beliefs and feelings, and disposition to act in a certain way.

Proceeding of International Conference of 4th SHIELD 2019
https://pasca.unila.ac.id/seminar-internasional-shield/
ISBN : 978-602-51393-9-0
194
Related to LGBT behavior, Sinyo (2014) explains that homosexuals began to appear in big cities in the Dutch East Indies era. In Indonesia there is a small LGBT community even though during the Dutch East Indies era it had not yet emerged as a social movement. Around 1968 the term wadam (adam woman) was used as a substitute for the word sissy or spout which was considered negative. So that the first transgender organization was established, assisted and facilitated by the governor of DKI Jakarta, Mr Ali Sadikin. The wadam organization is called the Djakarta Wadam Association (HIWAD). In 1980, because Adam was the name of a prophet for Muslims, most Islamic leaders rejected to usedterm of Wadamand changed to Waria.
In 1985, a gay community in Yogyakarta established a gay organization. The organization is called the Gay Gay Association of Yogyakarta (PGY). In 1988 PGY changed its name to Indonesian Gay Society (IGS). On August 1, 1987 the gay community in Indonesia was re-established, namely the establishment of the Lesbian and Archipelago Style Working Group (KKLGN) which was later abbreviated to GAYa Nusantara (GN). At the end of 1993 the first meeting was held between LGBT communities in Indonesia. The meeting was held in Kaliurang, Yogyakarta and was named the First Indonesian Lesbian and Gay Congress or known as KLG I.Dramatic changes that occurred in the political and government system in May 1998 opened to movement and developedthis community until the Indonesian Women's Congress carried out.
RESEARCH METHODS
The type of this research is descriptive method. The population in this study were students of the University of Lampung.The sampling technique used in this study is simple random sampling technique and the number of respondents are 84 respondents.
This research was conducted at Lampung University because the problem regarding LGBT issues was one of the social problems in the community. Data collection used to deep interview techniques and data processing used the SPSS program.The data analysis used to Kendall Correlation test and Mann-Whitney U test with α = 0.10
RESULTS AND DISCUSSION
Respondents in this study were a number of University of Lampung students. The characteristic of respondents very different in gender and religion. The characteristic of respondentscan be seen in the following table:
Table 1. Identity of Respondents by Gender Gender Frequency Percentase (%)
Male 36 42,9
Female 48 57,1
Total 84 100,0
Source: Primary Data, 2019
Based on table 1 seen there were 36 male respondents with a percentage of 42.9% and 48 female respondents with a percentage of 57.1%. The characteristic of respondents according to their religion, it can be seen in the following picture:

Proceeding of International Conference of 4th SHIELD 2019
https://pasca.unila.ac.id/seminar-internasional-shield/
ISBN : 978-602-51393-9-0
195
Source: Primary Data 2019 Figure 1. Identity of respondents according to their religion
Based on 84 respondents, 69 respondents religion of Islam, 9 respondents religion of Christianity, 5 respondents religion of Hindu, and 1 respondent religion of Buddhist. To find out the identity of respondents by age, can be seen in the following table: Table 2. Identity of Respondents by Age
Age Frequency Percentase (%)
20 years 5 6,0
21 years 50 59,5
22 years 25 29,8
23 years 4 4,8
Total 84 100,0
Source: Primary Data 2019
Based on Table 2, it is known that the largest number of respondents by age is dominated at the age of 21 years and the smallest number of respondents at the age of 23 years.
Based on Kendall correlation analysis seen that religioucity of student‟s and values in the family haved correlation to attitude student‟s to LGBT behavior. The following table showed that correlation religiouscity of student‟s and values in the family to LGBT behavior.
Correlations
Religiouscity of
Student Knowledge of LGBT
Values in the family
Attitude to LGBT
behavior
Kendall's
tau_b
Religiouscity of Student
Correlation Coefficient
1.000 .068 .057 .165
Sig. (2-tailed) . .434 .523 .066
N 84 84 84 84
Knowledge of LGBT
Correlation Coefficient
.068 1.000 -.004 .111
Sig. (2-tailed) .434 . .959 .179
N 84 84 84 84
Values in the family
Correlation Coefficient
.057 -.004 1.000 -.185*
Sig. (2-tailed) .523 .959 . .030
Identity of respondents
according to religion
Islam
Kristen
Hindu
Budha

Proceeding of International Conference of 4th SHIELD 2019
https://pasca.unila.ac.id/seminar-internasional-shield/
ISBN : 978-602-51393-9-0
196
N 84 84 84 84
Attitude to LGBT behavior
Correlation Coefficient
.165 .111 -.185* 1.000
Sig. (2-tailed) .066 .179 .030 .
N 84 84 84 84
*. Correlation is significant at the 0.05 level (2-tailed).
To knowed difference of attitude student‟s based on gender to LGBT behavior used to Mann-Whitney U test. Based on Mann-Whitney U test seen that attitude student‟s to LGBT behavior are not some difference between Male student‟s and female student, but values in the family haved significant correlation to attitude student‟s to LGBT behavior. The following table showed that differences attitude student‟s to LGBT behavior of male and female student‟s.
Test Statisticsa
Religiouscity of student‟s
Knowledge of LGBT Values in the family
Attitude to LGBT behavior
Mann-Whitney U
816.500 772.500 676.500 783.500
Wilcoxon W 1992.500 1438.500 1342.500 1959.500
Z -.454 -.832 -1.727 -.742
Asymp. Sig. (2-tailed)
.650 .406 .084 .458
a. Grouping Variable: jenis kelamin mahasiswa
Based on Table 4 it can be seen that values in the family haved significant
correlation to attitude student‟s to LGBT behavior.
CONCLUSION
1. The religiouscity of student‟s and values in the familyhaved correlation to attitude student‟s to LGBT behavior.
2. The attitude student‟s to LGBT behavior are not some difference between Male student‟s and female student, but values in the family haved significant differences to attitude student‟s to LGBT behavior
REFERENCE
Afrizal. 2014. Qualitative Research Methods. Jakarta: Rajawali Press Milles and Huberman. 1992. Qualitative Data Analysis (about new methods).
Jakarta: UI-Press Singarimbun, M. and Effendi, S. 2008. Survey Research Methods. Jakarta:
Library LP3ES. Sinyo. 2014. My Children Asking about LGBT. Jakarta : PT. Elex Media
Komputindo Sugianto. 2007. Data Processing Methods. Bandung

Proceeding of International Conference of 4th SHIELD 2019
https://pasca.unila.ac.id/seminar-internasional-shield/
ISBN : 978-602-51393-9-0
197
Research and Development Division and National Commission for Women. From Lesbian, Gay, Bisexual and Transgender (LGBT) Voices - Another Way to Understand Minority Rights. Quoted from the website
http://www.komnasperempuan.or.id/wp-content/uploads/2008/10/dari-suara-lgbt-jalan-lain-memend-hak-minoritas-1-1.doc
Harris Chaiklin. 2011. Journal of Sociology and Social Welfare: Attitudes, Behavour, and Social Practice. Quoted on the website:
https://www.wmich.edu/hhs/newsletters_journals/jssw_institutional/institutional_subscribers/38.1.Chaiklin.pdf
Neila Ramadhani. ATTITUDE & BEHAVIOR: Psychological Dynamics Regarding Changes in Attitudes and Behavior. Quoted on the website http://neila.staff.ugm.ac.id/wordpress/wp-content/uploads/2008/03/definisi.pdf (

Proceeding of International Conference of 4th SHIELD 2019
https://pasca.unila.ac.id/seminar-internasional-shield/
ISBN : 978-602-51393-9-0
198
UTILIZATION INFORMATION AND PEPPER PRODUCTION IN EAST LAMPUNG
Tubagus Hasanudin and Kiki Ambarwati
Department Of Extention and Community Development
Graduate School, Lampung University Email : [email protected]
ABSTRACT
The availability of information about farming is needed by farmers. The purpose of this study was to analyze the the correlation between information utilization of farmer and pepper production. This research was conducted in Sukadana Baru Village, Marga Tiga District, East Lampung regency. This location was chosen purposively with the consideration that Sukadana Baru Village with the largest amount of pepper production in East Lampung. The number of samples in this study were 43 pepper farmers randomly determined. This study used a survey method, and data were analyzed using descriptive analysis and rank Spearman test. The results showed that there was a significant relationship correlation between the types of information and media information used by farmers and pepper production, while the source of information is not correlated with pepper production. Keywords: information, pepper, production
INTRODUCTION
Lampung is one of the provinces in Indonesia that has contributed to make Indonesia a major produce of pepper in the world (Ditjenbun 2012). Lampung second ranks largest pepper produce after Bangka Belitung Province. Pepper produced by Lampung is black pepper with distinctive taste and aromatic characteristics that have been known in world market under the name "Lampung Black Pepper".
East Lampung is one of the regencies in Lampung Province, where most of the residents earn a living as farmers with the main agricultural commodity being cultivated as pepper. East Lampung is one of the pepper crop production centers in the province which received support for the development of a national pepper plant of 550 hectares in 2016 and is one of the black pepper centers with a plantation area of 4,815 ha (Ditjenbun 2016).
Area of pepper production in East Lampung decrease every year, so the government through the Department of Plantation promotes the intensification of pepper plants by providing production facilities. These efforts were made in order to improve the quality and quantity of pepper. Dewi (2017) said that “the low productivity is also related to the quality of farmers, such as the low level of education allegedly is one of the causes of low productivity of farmers”. Farmer education is related to the knowledge they have, while the involvement of access to information is the key to increasing knowledge, in other words if someone who has adequate information will have an impact on their level of knowledge. Based on the description above, the purpose of this study is to analyze the relationship between the use of information of farmers to pepper farming and the production of pepper of farmers.

Proceeding of International Conference of 4th SHIELD 2019
https://pasca.unila.ac.id/seminar-internasional-shield/
ISBN : 978-602-51393-9-0
199
RESEARCH METHODS
This research using a survey method in Sukadana Baru village, Marga Tiga Subdistrict, East Lampung Regency. This location was chosen purposively with the consideration that Sukadana Baru is village the largest amount of pepper production.
Determination of the number of samples refers to the theory of Arikunto (2013), which states that if the population is large then the number of samples can be take between 10-15 percent or 20-25 percent or more. The population in this study was 432 pepper farmers from 18 farmer groups in the village of Sukadana Baru, so the number of pepper farmers can be calculated using the sample measurement formula, Gay and Diehl (1992) in Arikunto (2013):
n= 0,1 xN...........................................................(1) Note: n = Number of samples N = Number of population
Based on equation 1, the calculation of the number of samples for pepper farmers is as follows: n = 0.1 x 432 = 43.2 ≈ 43
Samples from each population of farmer group members are determined using
the formula of sample proportion allocation, Nazir (1988):
ni= [Ni
N] n...........................................................(2)
Note: ni = Number of samples for each group Ni = Total population of each group N = Total population of the group n = Total sample size
Determination of the sample using simple random tables so that each unit of
the population sample has the same opportunity to be selected as a sample. The type of data used are primary data and secondary data. The primary data collection method was obtained through direct interviews with farmer respondents using a questionnaire. Secondary data were obtained from related institutions or agencies such as the Central Statistics Agency, Ministry of Agriculture, Agricultural Counseling Agency, journals, and other literature publications that are relevant and relevant to research. To determine relationship between the use of information used by farmers with the production of pepper produced used the Spearman rank correlation test (rs).
RESULTS AND DISCUSSION
Characteristic of Respondents
The age of respondents ranged from 30-62 years, with an average age of 42 years. Mantra (2004) explains that the population aged 15 - 64 years is the productive age. Formal education farmers ranging from elementary school to high school. The average farmer is a primary school graduate. The average area of farmers' arable land is 2.00 ha and included in the classification of narrow land. The average number of pepper sticks that the respondents worked for was 1,600

Proceeding of International Conference of 4th SHIELD 2019
https://pasca.unila.ac.id/seminar-internasional-shield/
ISBN : 978-602-51393-9-0
200
sticks per hectare and the average age of the tree was 19 years. The average farmer respondent has been cultivating pepper for 22 years. The total income of farmers comes from the activities of pepper farming, non-pepper farming, off-farm, and non-farming Utilization of Pepper Farming Information
Respondents in this study were farmers who worked with pepper in Marga Tiga District in 2018. Variables in information utilization included, types of information find by farmers, media used by farmers, and sources of information by farmers in the past one year. The types of information related to pepper farms find by farmers include pepper varieties, types of medicines, planting techniques, garden maintenance, harvesting and post-harvest activities, as well as pepper sales and prices. Figure 1 shows the percentage of types of information find by farmers.
types of medicines,
76.74 %
planting techniques,
23.26 %
garden maintenance,
100 %
harvesting and post-harvest ,
65.12 %
sales abd prices, 100 %
Figure 1. Types of farming information find by farmers.
Based on Figure 1, the information most find after by farmers is information about maintaining the garden and the price and sale of pepper. While information about pepper varieties is not find by farmers. That is because farmers are hereditary and it has been proven that the pepper varieties that are currently used by farmers are the most suitable varieties to be planted in research locations, the type of pepper varieties is Natar 1.
Based on the results of the research, the media used by pepper of farmers to get formation related to pepper farming are internet cellphones, agricultural magazines, and brochures. Figure 2 shows the percentage of information media usage.
internet, 81.40 %
agricultural magazines,
11.63 %
brochures, 16.28 %
Figure 2. Information media used by farmers.

Proceeding of International Conference of 4th SHIELD 2019
https://pasca.unila.ac.id/seminar-internasional-shield/
ISBN : 978-602-51393-9-0
201
Most farmers have used the internet to find information related to the pepper farming they run. Information media such as brochures and agricultural magazines are only a few farmers who use, generally farmers rarely read print media (newspapers, brochures, magazines), they read if it is available and claim no information about pepper farming is available in most print media. Even farmers claim that various types of print media are still rarely found by farmers because of access to the research village which far from the city center.
Farmers admit that they get more information that can increase their knowledge through people who can meet and communicate directly than looking for information through the media. This is in line with research by Oktavia, Muljono, Amanah, and Hubeis (2017) that the small number of agribusiness actors always uses mass media to search for information, because information is less relevant to the needs and limited access to the internet network. Fuady, Lubis and Lumintang (2012) stated that the low access of farmers to information through mass media is due to several factors, among others, the lack of agricultural information published in the mass media, farmers lacking sufficient time to access the mass media, especially electronic media whose broadcasts when farmers are still working, and the low interest of farmers to access mass media.
Based on the research results obtained, the information sources of farmers related to pepper farming include middlemen, other farmers, extension, official services, and farmer groups. Figure 3 shows the percentage of pepper farming information sources.
middlemen, 100 %
other farmers, 100 %
extension, 72.09 %
official services, 27.91 % farmer groups,
100 %
Figure 3. Sources of information on pepper farming.
Figure 3 shows that all farmers use middlemen, farmer groups and other farmers as sources of information related to pepper farming. The role of farmers and farmer groups is the main source of farmers to obtain information about pepper varieties, types of medicines, planting techniques, garden maintenance, harvesting and post-harvest activities, while the role of middlemen is to be a source of information on pepper sales and prices. Agricultural extension workers are also a source of information, extension activities that are often followed by farmers in the study area range from 2-4 times a year. The offices that have visited the research villages related to pepper farming include, the plantation office, the tourism office and the industrial office.
Pepper Production The smallest land area of farmers is 0.25 ha and the largest area is 7.00 ha with a spacing of trees 2.5x2 meters. Based on the results in the field that overall pepper production produced by farmers can be seen in Table 1.

Proceeding of International Conference of 4th SHIELD 2019
https://pasca.unila.ac.id/seminar-internasional-shield/
ISBN : 978-602-51393-9-0
202
Table 1. Distribution of respondent farmers based on pepper production per kg / ha / year
Source: Primary data of research results
Table 1 showed that production of pepper is mostly in the low classification, (72.09%). The average pepper production is 902.50 kg / year and is still relatively low, given the potential for pepper production can reach 4 tons per hectare (BPTP Lampung, 2016). Suwanto (2017), Pepper production in East Lampung has decreased in recent years. The problem faced by East Lampung pepper farmers is that most of the management of smallholder plantations on a small scale and limited capital capability. This has an impact on the lack of application of technological recommendations including the use of superior seeds, cultivation methods and post-harvest handling. Actually, to increase the number and quality of pepper there are guidelines for the production of good and right peppers, namely IPC (International Pepper Community) based on GAP (Good Agriculture Practice) which includes how to select plants to store dried pepper products, but there are still many farmers who have not know the guidelines.
Relationship of Information Utilization that is Used by Farmers with Pepper Production
The hypothesis of this study is that there is a relationship between the use of
information used by farmers with the production of pepper produced. Utilization of information includes, types of information find by farmers, information media and sources of information by farmers. The results of data processing using the SPSS 16.0 For Windows application using the Spearman Test (rs) at an alpha level of 0.05 can be seen in Table 2.
Table 2. Results of an analysis of the relationship between the use of information
used by farmers and pepper production
Note: * Real at the α level of 0.05
Table 2 showed that there is haved relationship between the information utilization variable used by farmers and the pepper production variable, including the type of information and information media used by farmers. Based on statistical test results obtained by the correlation coefficient of 0.333 significance of 0.029 less than alpha 0.05, it can be concluded conclusions accept H1. The type of information is significantly related to the production of pepper, meaning that the more the type of information find by farmers increases the pepper
Classification Production/Kg ∑ %
Low 228,57 – 619,05 31 72,09
Middle 619,06 – 1.009,52 10 23,26
High 1.009,53 – 1.400,00 2 4,65
Total 43 100,00
Variable Y
Variable X
Coefficient correlation (r)
Significance (p-value)
Pepper Production
- types of information 0,333* 0,029
-information media 0,301* 0,050 - sources of
information 0,037 0,815

Proceeding of International Conference of 4th SHIELD 2019
https://pasca.unila.ac.id/seminar-internasional-shield/
ISBN : 978-602-51393-9-0
203
production produced. This is because the main job of farmers is pepper farming and farmers realize that the amount of information find by farmers is crucial to the production achieved. Therefore farmers try to obtain information about pepper farming as much as possible from various sources to be able to develop their farming.
Based on the results of statistical tests obtained by the correlation coefficient of 0.301 significance of 0.050 less than alpha 0.05, it can be concluded conclusions accept H1. Media information is significantly related to pepper production, meaning that the more information media used by farmers, the more pepper production is produced. This is supported by the fact in the field that most farmers have used information technology facilities easily. Specifically for mobile phones, all farmers have and use them to make phone calls or send messages. Besides being used to call and send messages, mobile phones are used by farmers to access the internet because it is easy, complete and diverse, and fast.
Based on statistical test results obtained by the correlation coefficient of 0.037 significance of 0.815 more than alpha 0.05, it can be concluded accept H0. Information sources do not have a real relationship with pepper production, the data indicates that there is a grouping of data on the information source variable. The results of the research in the field of farmers admitted that in general they started farming activities "since childhood" and continues to this day. The average farm length of respondents is 22 years and no followed by the development of farming because farmers claimed to have been quite satisfied follow the way of farming that has been taught for generations, as well as information obtained from various sources have all been applied by farmers in farm management.
CONCLUSION
The information of the price and sale of pepper are information most important by pepper farmer. As many as 81.40 percent of pepper farmers have used the internet to find information related to the pepper farming. Tengkulak institution (marketing agency), farmer groups and the other farmers as a source of information to pepper farming of farmers. The average production of pepper farmers are 902.50 kg/ha/years. There is a significant relationship between the type of information find by farmers and the media used by farmers with the production of pepper produced, while the source of information is not related to the production of pepper produced.
REFERENCE
Arikunto S. 2013. Research Procedure A Practical Approach. Jakarta: Rineka Cipta.
BI Mantra. 2004. General Demographics. Yogyakarta: Student Library. Dewi R. 2017. Factors influencing the productivity of farming and the success of
the symantry program in Klungkung Regency. Journal of Economics and Business. 6(2): 701-728.
Ditjenbun. 2012. Statistics of Indonesian Plantations. Jakarta: Directorate General of Plantations.
Ditjenbun. 2016. Indonesian Plantation Statistics 2015-2017 Pepper Commodities. Jakarta: Directorate General of Plantations.
Fuady, I., Lubis, D.P., and Lumintang, R.W.E. 2012. Farmer communication behavior in the search for organic farming information (the case of shallot farmers in Srigading Village, Bantul Regency). Journal of Development Communication. 2(10): 10-18.

Proceeding of International Conference of 4th SHIELD 2019
https://pasca.unila.ac.id/seminar-internasional-shield/
ISBN : 978-602-51393-9-0
204
Lampung Agricultural Technology Study Center. 2016. Cultivation of Pepper Plants. Lampung BPTP.
Nazir, M. 1988. Research Methods. Jakarta: Ghalia Indonesia. Oktavia, Y., Muljono, P., Amanah, S., and Hubeis, M. 2017. Relationship
between communication behavior and capacity building of freshwater fisheries agribusiness behavior in Padang, West Sumatra. Journal of Counseling. 2(13): 157-165.
Suwanto 2017. Analysis of Competitiveness and Marketing of Black Pepper in East Lampung Regency. Thesis. Lampung: Agribusiness Masters. University of Lampung.

Proceeding of International Conference of 4th SHIELD 2019
https://pasca.unila.ac.id/seminar-internasional-shield/
ISBN : 978-602-51393-9-0
205
FOREST HEALTH MONITORING IN THREE FUNCTIONS OF FOREST
IN LAMPUNG PROVINCE
Rahmat Safe‟i1, Hari Kaskoyo1 and Arief Darmawan1 1Faculty of Agriculture, University of Lampung, Indonesia
*Corresponding Author
ABSTRACT
Forest health monitoring (FHM) is intended to determine the current state of
forest health, changes, and trends that may occur. Periodically forest health
monitoring can support the achievement of sustainable forest management. Until
now, awareness of the importance of forest health monitoring in achieving
sustainable forest management in three functions of forests (protection forests,
conservation forests, and production forests) in Lampung Province has not
received serious attention. This study aimed to obtain the category of status
values of forest health conditions in three forest functions in Lampung Province.
This research was carried out on cluster-plot FHM in the KPHL Kota Agung
Timur, Tanggamus District; Tahura Wan Abdul Rahman, Pesawaran District; and
Privat Forest, East Lampung District. The stages of this study consisted of
making cluster-plot FHM on three forest functions, forest health monitoring in
three forest functions, processing data, and assessing forest health in cluster-plot
FHM of three forest functions. The results showed that the status value of forest
health conditions in each of the cluster-plot FHM was 8.79 and 5.36 (protection
forest); 5.51 and 11.49 (conservation forest); and 4.61 and 10.25 (production
forest). Thus, the category of status value of forest health conditions in the three
functions of forests in Lampung Province is good (protection forest); moderate
and good (conservation forest); and poor and good (production forest).
Keywords: Forests health monitoring, protection forests, conservation forests,
production forests, Lampung Province.
INTRODUCTION
Awareness of the importance of forest health in order to achieve sustainable forest management is still lacking. Forest health issues have not received serious attention although the problems in the three forest functions are different. According to the law no. 41 of 1999, Forests are based on their function include: protection forest, production forest and conservation forest. These three forest functions are limited and influenced by local ecosystem conditions and the silvicultural system applied and the forest management perspective to be achieved. Forest health monitoring is an effort to control the level of forest destruction that remains below the acceptable economic threshold (Safe'i et al 2014; Safe'i et al 2015) so as to guarantee the protection, production and conservation functions as well as other forest functions from three forest functions can be realized.
Healthy forest means that the forest can still fulfill its function as the main function that has been previously determined, namely the protection, conservation and production function (Nuhamara et al, 2001). Forest health assessment is intended to determine the current condition of forests, changes, and trends that might occur (Mangold 1997). Information on the health condition

Proceeding of International Conference of 4th SHIELD 2019
https://pasca.unila.ac.id/seminar-internasional-shield/
ISBN : 978-602-51393-9-0
206
of forest ecosystems in many countries has become the goal of forest management, such as in the United States which has become a national program, namely by conducting periodic forest health monitoring so that the assessment of forest health is carried out thoroughly (USDA-FS 1999). This study aims to obtain the value of the status of forest health conditions in three different forest functions, namely protection forests, conservation forests and production forests.
METHOD
Research Location
This research was carried out in Protection Forests (Protection Forest Management Unit/Kesatuan Pengelolaan Hutan Lindung(KPHL) Kota Agung Utara), Conservation Forests (Grand Forest/Taman Hutan Raya Wan Abdur Rachman) and Production Forests (Privat Forest in Buana Sakti Village, East Lampung Regency). Making a Forest Health Measurement Plot
The forest health monitoring (FHM) method was used in making forest health measurement plots is (Mangold 1997; USDA-FS 1999). The number of forest health measuring plots was made as many as six cluster plots (24 measuring plots), with each of the two cluster plots in protection forest (KPHL Kota Agung Utara), conservation forest (Tahura WAR) and production forest (Privat Forest on East Lampung Regency). The FHM plot cluster design on three forest functions in Lampung Province is presented in figure 1.
Figure 1. Design of FHM Cluster Plot
Retrieval of Forest Health Data
Data collection on forest health is carried out on several ecological indicators that have been formulated. The collection of forest health data is based on the FHM method. The technique of collecting forest health data is as follows. a. Productivity. Productivity measurement is done by measuring tree growth.
Measurement of tree growth is carried out on trees that are in the subplot. Tree growth is measured by increasing the diameter of the tree. The diameter
Radius of sub plot Radius of annular plot
Point of soil sample plot Distance between center of plot
plot
Distance of point of soil sample from
center of sub plot 18 m
Radius
Distance from center of
sub plot

Proceeding of International Conference of 4th SHIELD 2019
https://pasca.unila.ac.id/seminar-internasional-shield/
ISBN : 978-602-51393-9-0
207
of the tree is measured at an altitude of 1.3 m above ground level. Trees that have a diameter of ≥20 cm are categorized as trees, trees with a diameter of 10-19.9 cm are categorized as poles and trees with diameter <10 cm are categorized as saplings.
b. Vitality. Vitality measurement is done by measuring the condition of tree damage and canopy conditions. Measurement of tree damage and canopy conditions were carried out on trees inside the subplot. The condition of tree damage is measured based on the location of the damage found, namely: roots, stems, branches, crowns, leaves, shoots, and shoots in the FHM method. Tree canopy condition in the FHM method was measured based on the following parameters (Nuhamara and Kasno 2001): live crown ratio (LCR), crown density (crown Density / Cden), transparency of the crown (Foliage Transparentcy / FT), diameter diameter crown (Crown Diameter Width and Crown Diameter at 900), and dieback (CDB).
c. Site quality. The quality of the site was measured by taking soil samples from three circular points located between two subplots with each circle having a diameter of 15 cm. Soil sampling is done with a depth of 0-10 cm. Soil samples are measured for acidity (pH).
d. Biodiversity. Biodiversity is done by measuring the diversity of species (flora). Species diversity measurements were carried out on flora within the subplot. The Shanon Wiener Index is used to determine the biodiversity of flora in the sub-plot.
Data Analysis
Data obtained from measurements of ecological indicators of forest health are then processed for the following data: tree growth is calculated as growth in basal area (Cline 1995), tree damage conditions are calculated based on damage value of Cluster plot Level (the Cluster plot Level Index/CLI) (Nuhamara and Kasno 2001; Nuhamara et al 2001; Putra 2004; Safe'i 2005; Safe'i et al 2014; Safe'i et al 2015; Safe'i 2015), canopy conditions were calculated based on the rating of the appearance of the crown (Visual Crown Ratio / VCR) (Putra 2004), flora / fauna species diversity using the Shannon-Whiener species diversity index (Soerianegara and Indrawan 2005), and soil fertility is represented by the Cation Exchange Capacity (CEC) resulting from soil analysis (Hardjowigeno 2003).
Forest Health Assessment
The assessment of forest health in three forest functions in Lampung Province was obtained from the final value of forest health conditions in three forest functions. The final value of forest health conditions is obtained from the multiplication of the weighted values with the parameter score values of each forest health indicator in the three forest functions. Equation Formula 1, which is the final value of forest health (Safe'i et al 2015). In equation 1, NKH is the final value of forest health conditions, NT is the weighted value of the parameters of each forest health indicator, and NS is the parameter score value of each forest health indicator.
NKH = ∑ (NT x NS) .……………………………………..Equation (1)
The weighted value is in the form of eigenvalues obtained using the ANP (Analytic Networking Process) method (Saaty 1996; 2003; 2005). Scores are obtained through transformation of the values of each parameter of the ecological indicators of forest health in various forest types.

Proceeding of International Conference of 4th SHIELD 2019
https://pasca.unila.ac.id/seminar-internasional-shield/
ISBN : 978-602-51393-9-0
208
RESULT AND DISCUSSION
Protection Forest Health Condition Status
The concept of forest health assessment according to its damage assesses the health of the forest based on the health of its constituent trees, while the health of the tree is affected by the damage that occurs to the tree itself (Mangold, 1997). Damage to trees and canopy conditions will affect tree growth so that it will have an impact on overall forest health (Kasno et al, 2007). importance (priority scale) ecological indicators of protection forest health are successively indicators of biodiversity, vitality, productivity, and site quality (Safe‟i et al, 2019)
Tabel 1. Value of H‟, CLI, VCR, dan LBDS in each cluster plot.
Klaster Plot H‟ CLI VCR LBDS
1 1,41 4,83 3,25 0,96
2 0,55 3,26 3,08 0,61
Information: H‟= Shannon-Wiener Species Diversity Index CLI= Cluster plot Level
Index, VCR= Visual Crown Ratio, LBDS= Basal area
The value of H '(species diversity) in first cluster plot is greater than that in second cluster plot. According to Soerianegara and Indrawan (2005) if the value of H> 2, the vegetation community with environmental conditions is very stable. This shows that the vegetation community in cluster plot 1 is very stable in environmental conditions. Low CLI and VCR values are found in cluster plot 1 and large values are found in cluster plot 1 too. This shows that in order for the health condition of protection forest to be healthy, the trees that make up the stands must be in a healthy state because the damage of trees and unhealthy canopy conditions will affect the rate of tree growth. Tree growth can be calculated as tree LBDS growth (Safe‟i 2015). Larger LBDS values found in cluster plot 1 showed that the rate of change in tree growth was higher than cluster plot 2.
To find out the value of the condition of the health condition of the protection forest is done by calculating the final value of the health condition of the protection forest. The final value of the health condition of the protection forest is the result of the multiplication between the weighted value and the parameter score value of each ecological indicator of the health of the protection forest. The results of the protection forest health assessment (the health status value of protection forest) in each cluster plot is presented in Table 3.
Table 2. The value of the protection forest indicator (HKm) score in each cluster
plot
Cluster Plot H‟ CLI VCR LBDS
1 9 1 10 6
2 1 8 8 3
Information: H‟= Shannon-Wiener Species Diversity Index CLI= Cluster plot Level
Index, VCR= Visual Crown Ratio, LBDS= Basal Area
The first Cluster plot has a final value of protection forest health of 8.79 and has a good category of protection forest health. The health condition of the forest is caused by the high value of the tree growth score (LBDS) and canopy condition (VCR) (Table 2). This shows that the high and low scores can indicate

Proceeding of International Conference of 4th SHIELD 2019
https://pasca.unila.ac.id/seminar-internasional-shield/
ISBN : 978-602-51393-9-0
209
the level of health of a forest ecosystem. As stated by Safe'i et al (2015) that the higher the score indicates that the level of forest health is higher, conversely the lower the score the forest health level will be lower.
Table 3. Value of health status of protection forest.
Cluster Plot Final Value of Protection Forest Health
Protection Forest Health Conditions Category
1 8,79 Good
2 5,36 Moderate
Status of Health Conditions of Conservation Forests
Indicators of biodiversity and productivity in conservation forests are able to guarantee quality and support in measuring what you want to measure in the health of conservation forests. The quality of the site and vitality are less able to provide quality assurance and support in measuring what you want to measure in the health of conservation forests (Safe'i et al, 2019).
The value of tree species diversity in first cluster plot is lower than that in second cluster plot (Table 4). This shows that the higher the diversity value of tree species in an area will also increase the diversity of ecological functions which will ultimately result in an increase in the level of ecological stability. The highest LBDS value is in second cluster plot. LBDS height will affect tree growth. Where tree growth is one of the parameters of tree productivity that is easily measured and has a high level of accuracy and consistency (Philip 1994). The results of conservation forest health measurements are presented in Table 4.
Tabel 4. LBDS and H values for each cluster plot.
Klaster Plot LBDS H‟
1 0,83 0,76
2 1,11 1,55
Information: LBDS = Basal Area, H‟ = Shannon-Wiener Species Diversity Index
To find out the value of the status of the health condition of the conservation forest is done by calculating the final value of the health condition of the conservation forest. The final value of the conservation forest health condition is the result of the multiplication between the weighted value and the parameter score values of each conservation forest ecological indicator (Table 5).
Table 5. The value of the conservation forest indicator score in each cluster plot.
Cluster Plot LBDS H‟
1 6 1
2 10 10
Information : LBDS = Basal Area, H‟ = Shannon-Wiener Species Diversity Index
The second cluster plot has the highest value of conservation forest health at 11.49 and has a good category of conservation forest health (Table 6). The value of the health condition of a conservation forest is influenced by the size of the weighted value and the score value of each parameter of the ecological indicator of the health of the conservation forest. The greater the weighted value and the score value of each parameter of the conservation forest ecological indicator health, the final value of the health condition of the conservation forest will be higher (Safe, 2015).

Proceeding of International Conference of 4th SHIELD 2019
https://pasca.unila.ac.id/seminar-internasional-shield/
ISBN : 978-602-51393-9-0
210
Table 6. Value of status condition of conservation forest health
Cluster Plot Conservation Forest Health
Conservation Forest Health Condition Category
1 5,51 Bad
2 11,49 Good
Health Status of Production Forests
The success of production forest management can be seen through the high and low levels of productivity of the production forest. On the other hand, the level of productivity is determined by two factors: the condition of the site and the vitality of the stand (Supriyanto et al 2001). Site quality indicators show the ability of the soil to support tree productivity; especially land to support tree growth (Ginting and Nuhamara 2001). Vitality indicators have a significant influence on the achievement of the health conditions of production forests. Vitality can be characterized by tree damage which is very influential on tree growth so that it will affect the quantity and quality of processed wood produced (Safe'i et al, 2019). The results of production forest (privat forest) health measurements are presented in Table 7.
Table 7. Value of LBDS, CLI, VCR, and KTK on each cluster plot.
Cluster Plot LBDS CLI VCR pH of soil
1 0,4 2,5 2,3 6,2
2 4,1 2,5 3,0 6,3
Information: LBDS= Basal Area, CLI= Cluster plot Level Index, VCR= Visual
Crown Ratio, pH of soil = Soil Acidity
To determine the status of the health status of production forests is done by calculating the final value of the health conditions of production forests. The final value of the health condition of the production forest is the result of the multiplication between the weighted value and the parameter score value of each ecological indicator of the health of the production forest (Table 8 and 9). Table 8. Scores of production forest (privat forest) indicator scores on each
cluster plot.
Cluster Plot LBDS CLI VCR Site Quality
1 1 1 1 9
2 10 1 10 10
Information: LBDS= Basal Area, CLI= Cluster plot Level Index, VCR= Visual
Crown Ratio
Table 9. Value of the health status of production forest (privat forest).
Cluster Plot Value of Production Forest Health
Health Conditions of the Production Forest
1 4,61 Bad
2 10,25 Good
The value of the health of the production forest is in the second cluster plot with a value of 10.25 and has a good health category. The status condition is caused by the high value of tree growth (LBDS) and canopy condition (VCR). This shows that in order to obtain the health status of a healthy production forest,

Proceeding of International Conference of 4th SHIELD 2019
https://pasca.unila.ac.id/seminar-internasional-shield/
ISBN : 978-602-51393-9-0
211
the trees that make up the stands must be healthy, because tree damage will affect the rate of tree growth. In addition, a good quality of site and place to grow trees which can be shown by the condition of soil fertility will be able to support the optimal growth of stands (Safe'i 2015).
CONCLUSION
The value of the status of forest health conditions in 3 forest functions in Lampung Province are bad, moderate and good. The health status of protection forest is moderate and good, the health status of conservation forest is bad and good, and the health status of production forest is good and bad. The condition of forest health status is based on indicators of forest health assessment for each forest type.
AKNOWLEDGEMENT
This research was funded by the Directorate of Research and Community
Service and the Directorate General of Research and Technology Strengthening
Ministry of Research, Technology and Higher Education of the Republic of
Indonesia for the Applied research scheme in 2019 in accordance with Research
Contract Number: 065 / SP2H / LT / DRPM / 2019
REFERENCES
Cline SP. 1995. FHM: Environmental Monitoring and Assessment Program. Environmental Protection Agency, Office of Research and Development, Washington D.C.: U.S. 296p.
Ginting AN. dan Nuhamara ST. 2001. Soil Indicator: Present Status of Site Quality. Di dalam: Forest Health Monitoring to Monitor the Sustainability of Indonesian Tropical Rain Forest. Volume I. Japan: ITTO dan Bogor: SEAMEO-BIOTROP. 124p.
Hardjowigeno S. 2003. Ilmu Tanah. Akademika Pressindo, Jakarta. 305p. Kasno, Haneda NF., Syaufina L, dan Putra E.I. 2007. Pengembangan metode
penilaian kesehatan hutan lindung dan hutan tanaman. 28 Juli 2019. http://www.respository.ipb. ac.id/614.
Mangold R. 1997. Forest Health Monitoring: Field Methods Guide. USDA Forest Service, USA. 197p.
Nuhamara ST. dan Kasno. 2001. Present Status of Crown Indicators. Di dalam: Forest Health Monitoring to Monitor The Sustainability of Indonesian Tropical Rain Forest. Volume I. Japan: ITTO dan Bogor: SEAMEO-BIOTROP. 124p.
Nuhamara ST. dan Kasno. 2001. Present Status of Forest Vitality. Di dalam: Forest Health Monitoring to Monitor The Sustainability of Indonesian Tropical Rain Forest. Volume II. Japan: ITTO dan Bogor : SEAMEO-BIOTROP. 176p.
Nuhamara ST., Kasno, dan Irawan US. 2001. Assessment on Damage Indicators in Forest Health Monitoring to Monitor the Sustainability of Indonesian Tropical Rain Forest. Di dalam: Forest Health Monitoring to Monitor The Sustainability of Indonesian Tropical Rain Forest. Volume II. Japan: ITTO dan Bogor : SEAMEO-BIOTROP. 176p.
Philip MS. 1994. Measuring Trees and Forest. CAB International, Wallingford. 324p.

Proceeding of International Conference of 4th SHIELD 2019
https://pasca.unila.ac.id/seminar-internasional-shield/
ISBN : 978-602-51393-9-0
212
Saaty TL. 1996. The Analytic Hieararchy Process: Planning, Priority Setting, Resource Allocation. RWS Publications, Pittsburgh. 287p.
Saaty TL. 2003. Decision-Making with the AHP: Why is The Proncipal Eigenvector Necessary. European Journal of Operational Research 145(2003):85-91.
Saaty TL. 2005. Theory and Applications of the Analytic Network Process. RWS Publications, Pittsburgh. 324p.
Safe‟i R. 2005. Penilaian Areal Hutan Bekas Terbakar Berdasarkan Metode Fire Severity dan Forest Health Monitoring. Tesis. Program Pascasarjana, Institut Pertanian Bogor. 101p.
Safe‟i R., Hardjanto, Supriyanto, Leti Sundawati. 2014. Value of Vitality Status in Monoculture and Agroforestry Planting Systems of the Community Forest. International Journal of Sciences: Basic and Applied Research 18(2):340-353.
Safe‟i R., Hardjanto, Supriyanto, dan Sundawati L. 2015. Pengembangan Metode Penilaian Kesehatan Hutan Rakyat Sengon. Jurnal Penelitian Hutan Tanaman 12(3):175-187.
Safe‟i R. 2015. Kajian Kesehatan Hutan Dalam Pengelolaan Hutan Rakyat di Provinsi Lampung. Disertasi. Program Pascasarjana Institut Pertanian Bogor. 124p.
Safe‟i R., Wulandari C., Kaskoyo H. 2019. Penilaian Kesehatan Hutan pada Berbagai Tipe Hutan di Provinsi Lampung. Jurnal Sylva Lestari. 7(1) : 95-109.
Supriyanto, Stolte KW., Soekotjo, dan Gintings AN. 2001. Present Status of Crown Indicators. Di dalam: Forest Health Monitoring to Monitor The Sustainability of Indonesian Tropical Rain Forest. Volume I. Japan: ITTO dan Bogor: SEAMEOBIOTROP. 124p.
United States Development Agency-Forest Service (USDA-FS). 1999. Forest Health Monitoring: Field Methods Guide (International 1999). USDA Forest Service Research Triangle Park, Asheville NC. 199p.

Proceeding of International Conference of 4th SHIELD 2019
https://pasca.unila.ac.id/seminar-internasional-shield/
ISBN : 978-602-51393-9-0
213
IMPLICATIONS OF USE OF FOREIGN WORKERS TO NATIONAL INTERESTS
Fithriatus Shalihah
Faculty of Law Ahmad Dahlan University Yogyakarta
ABSTRACT Before the Asean Economic Community (AEC) stipulates the provisions relating to the field of employment in the Southeast Asian region in terms of the freedom of the employment market, Indonesia's employment law has also made restrictions on labor skills As stated in the AEC agreement. In addition to the main purpose is to transfer knowledge to local workers, this restriction is also due to the high need for work for local workers. Some of these years the issue of foreign workers especially those from China is a concern for many parties. Because of the numerous numbers and coloring of the work market in various sectors in Indonesia. The Government considers that Indonesia is still in need of foreign investment in national development. Ultimately, the interest of investment is to ignore the provisions of the existing employment law. Various issues arose along with the foreign investment policy of a package with its workers. The latest is the birth of presidential Regulation number 20 the year 2018 on the use of foreign workers, which provides a lot of convenience to the foreign workers ' licensing that will work in Indonesia. This, of course, has the potential to raise social problems considering the gaps in the unemployment rate is still high in Indonesia. State from the beginning concerned with the intervention of the working relationship, because it aims to be the balance, justice and collateral rights of workers, where the worker referred by the law is an Indonesian citizen. It can also be interpreted as the birth of Law 13, 2003 is the Act of the mandate of the constitution 1945 article 27 (1) stating that each citizen is entitled to a livelihood and a decent occupation. That is why the country comes in a working relationship that is actually in the private sphere. That is, the arrangement of the use of foreign workers in the law is favoring the interests of many people. Keywords: Foreign Workers, National Interests
INTRODUCTION
Labor has a very important role in national development. This is because labor is the perpetrator and the subject of development as well as a destination or object of national development that will determine the survival of the Indonesian nation. In subsequent developments, after Indonesia submitted itself as a member of The World Trade Organization (WTO), by ratifying The Agreement of World Trade Organization Establishment through Law No. 7 of 1994 with State Gazette No. 57 year 1994 resulted in Indonesia having to enter the provisions of the WTO as part of Indonesian positive law and accept the consequences of the law arising in accordance with the implementation of the provision.
On the other hand, in the perspective of GATT/WTO, Protective labor regulations are considered to violate the WTO rules that require no discrimination in all respects including the position of article 27 paragraph (2) of constitution 1945 which confirms, Each citizen is entitled to proper employment and livelihood for humanity, and article 28 D clause (2) confirms that, everyone has the right to work and be rewarded and fair and appropriate treatment in working relationship,

Proceeding of International Conference of 4th SHIELD 2019
https://pasca.unila.ac.id/seminar-internasional-shield/
ISBN : 978-602-51393-9-0
214
regulatory The basis of the use of foreign workers in Indonesia on the condition of domestic work market, investment needs, international agreement and free-market liberalization relating to national interests to provide protection of the Indonesian Labour Opportunity (here in after called foreign workers).
In the early years (2016) ASEAN countries have officially implemented a joint commitment called the Asean Economic Society (AEC). The spirit of the stretcher is the spirit of ASEAN economic integration. In the AEC, the skilled workforce in the region is given the freedom to work anywhere in the ASEAN region. However, each country still has its licensing restrictions. act no. 13 the year 2003 becomes the main pillar that governs the licensing of foreign workers, especially in chapter VIII starting from article 42 to article 49.
ASEAN Economic Community (AEC) is the economic integration of ASEAN in the face of free trade between ASEAN countries. AEC has a pattern of integrating ASEAN economies by forming a free trade system or free trade between ASEAN member countries. The use of foreign worker is not intended to improve the ability and knowledge of human resources in the country, within a certain period, the expected foreign workers can transfer technology in particular, transfers of knowledge and has been mastered or at least Well understood by the domestic workforce.75
The formation of AEC is based on the four pillars, namely, first, making ASEAN a single market and production center. Secondly, it becomes a competitive economic area. Thirdly, creating a balanced economic growth, and the fourth pillar is the integration into the global economy. The unification is aimed to increase the competitiveness of the region, promote economic growth, suppress the poverty rate and improve the living standards of ASEAN society.76
According to the Executive director of the Center of Reform on Economics (core) Hendri Saparini, Indonesia's readiness in the face of the new AEC 2015 reaches 82 percent. It is driven from four (4) important issues that the government needs to have immediately anticipated in the face of AEC 2015, namely: 1) Indonesia could potentially only supplier of energy and raw materials for the industrial industry in the ASEAN region, so the benefits gained from The wealth of Indonesian trade balance that is currently the greatest among ASEAN countries is increasing, 2) widening the trade of goods, 3) liberate the flow of manpower so that Indonesia should anticipate by setting up a strategy Because of the potential of foreign workers, and 4) the entry of investments to Indonesia from within and outside ASEAN. Thus in free trade, there will be positive and negative things that will be experienced by each country involved therein. The challenge for Indonesia is to make changes to the community to prepare for free trade in the intention77 , In this case, it is certainly a challenge for Indonesia which is a hope and a challenge for the Indonesian nation.
The impact of knowledge transfer on foreign subsidiary performance has been a major focus of research on knowledge management in multinational enterprises (MNEs). By integrating the knowledge-based view and the expatriation literature, this study examines the relationship between a multinational firm's knowledge (i.e. marketing and technological knowledge), its use of expatriates, and the
75
May Yanti Budiarti, Perizinan Penggunaan Tenaga Kerja Asing Dengan Berlakunya Masyarakat
Ekonomi Asean Vol 10,2016. http://jurnal.fh.unila.ac.id/index.php/fiat,
76Edi Cahyono,Tenaga Kerja Asing (Tka) Dalam Perspektif Masyarakat Ekonomi Asean (MEA) :
Peluang Atau Ancaman Bagi Sdm Indonesia,Vol 3 JBMA, 2016.
77 Umar Congge, Masyarakat Ekonomi Asean (Mea) Harapan Dan Tantangan Dalam
Perekonomian Bangsa.2015.

Proceeding of International Conference of 4th SHIELD 2019
https://pasca.unila.ac.id/seminar-internasional-shield/
ISBN : 978-602-51393-9-0
215
performance of its foreign subsidiaries. We conceptualize that expatriates play a contingent role in facilitating the transfer and redeployment of a parent firm's knowledge to its subsidiary, depending on the location specificity of the organizational knowledge being transferred and the time of transfer. Our analysis of 1660 foreign subsidiaries of Japanese firms over a 15-year period indicates that the number of expatriates relative to the total number of subsidiary employees (1) strengthened the effect of a parent firm's technological knowledge (with low location specificity) on subsidiary performance in the short term, but (2) weakened the impact of the parent firm's marketing knowledge (with high location specificity) on subsidiary performance in the long term. We also found that the expatriates' influence on knowledge transfer eventually disappeared. The implications for knowledge transfer research and the expatriate management literature are discussed.78
The arrangement of the foreign workers set in Law No. 13 the year 2003 in chapter VIII on the use offoreign workers, foreign worker is a foreign citizen visa holder with the intention of working in the territory of Indonesia79. The birth of the ASEAN Economic Community (AEC) or known as Asean Economic Community (AEC) in the regional scope of countries in Southeast Asia, in terms of employment agreement is limited to the manpower that has expertise ( Skills) that the treatment has been determined, meaning that it is still in line with the provisions on the use of a mandated foreign workers article 42-Article 49 Law number 13 year 2003 on employment.
Similarly, the order of article 45 paragraph 1b which requires entrepreneurs who use foreign workers to conduct education and training for Indonesian workers who become the companion of the foreign workers. However, the implementation of AEC has not been following the purpose of the acquisition of Law No. 13 of 2003 on manpower, because in the sense of implementation of the purpose of technological outsourcing in the use of foreign workers is not a concern entrepreneur. The enforcement of laws referring to these chapters shall be increased and urged the Government to comply with the contents of article 42-Article 49 of Law No. 13 of 2003 in implementing AEC. The main problem arising from AEC is the readiness of Indonesian labor competence and the availability of employment for Indonesian workers.
The fact above is a problem for Indonesian workers in this AEC era. Entrepreneurs in Indonesia will be more likely to recruit for foreign workers compared to Indonesian workers. In addition to the competency problem, the entrepreneurs will prefer to recruit the foregn workers because of foreign workers, according to article 42 paragraph 4 of Law No. 13 of 2003, was employed in Indonesia with a certain period.
Foreign WORKERS are obliged and obedient to the law No. 13 years 2003 governing the provisions of foreign WORKERS working in the territory of Indonesia, the provisions are: ● Employers who employ foreign workers must have written authorization from a
designated minister or officer; ● Foreign workers with a specific position; ● A certain period; ● The user plan of foreign workers;
78
Fang, Y., Jiang, G. L. F., Makino, S., & Beamish, P. W. (2010). Multinational firm knowledge,
use of expatriates, and foreign subsidiary performance. Journal of Management Studies.
https://doi.org/10.1111/j.1467-6486.2009.00850.
79TenagaKerjaAsing (TKA) Dalam Data dan Informasi, Direktorat Jendral Binapenta Kemnaker
RI, 2014.

Proceeding of International Conference of 4th SHIELD 2019
https://pasca.unila.ac.id/seminar-internasional-shield/
ISBN : 978-602-51393-9-0
216
● Competency standards; ● Prohibitions to occupy certain positions; ● Liabilities of compensation Fund; ● and the obligation to return foreign workers.
Employers of foreign workers are legal entities or other agencies who employ foreign workers by paying wages or remuneration in other forms, while the employer, including: 1. Government agencies, 2. International agencies, 3. Representatives of foreign countries, 4. International organizations, 5. Foreign Trade Representative Office, Representative Office of Foreign
Company, the representative office of Foreign News, 6. Foreign private companies, foreign business entities registered in authorized
institutions, 7. A legal entity established under Indonesian law in the form of a limited liability
company or Foundation, 8. Social, religious, educational and cultural institutions, 9. The business of Impresariat Services is a management activity in the
entertainment sector in Indonesia, whether to bring or to spend foreign workers in the field of art and sports.80
Foreign workers seek overseas employment without sponsorship from a firm in their home country and hold temporary work visas in the host country. Despite the rising numbers of foreign workers, there is very little research that examines employment relationships and work behaviors of foreign workers. In this study, we draw on social exchange theory and predict differences in work perceptions, attitudes, and behaviors of foreign versus local employees based on differences in their exchange relationships. We then draw on social comparison theories and propose that these differences in perceptions, attitudes, and behaviors will be accentuated for workers in jobs with high task interdependence.We examined these hypotheses in a field study of 466 ethnic Chinese employees (213 foreign workers from the Peoples Republic of China and 253 local workers in Singapore with ongoing employment status). Results demonstrate lower distributive justice judgments, performance, and organizational citizenship for foreign versus local employees. Furthermore, results demonstrate that differences in distributive and procedural justice, performance, and organizational citizenship were heightened by task interdependence. We discuss findings and the implications of employing foreign workers.81
Before there was a presidential decree No. 20 the year 2018 The surge in the number of foreign workers has been high so that after the birth of the presidential decree is certainly higher again. With the high number of foreign workers who come and work in Indonesia become a new problem in the community and some people also consider the surge of the salty labor that mostly originated from China is not a Tgidak possible It is thus creating unrest for local workers. What is the provision of labor skills that are allowed to compete in the Indonesian job
80
Minister of Manpower RI Decree Number Number 12 of 2015.
81Ang, S., Van Dyne, L., & Begley, T. M. (2003). The employment relationships of foreign
workers versus local employees: A field study of organizational justice, job satisfaction,
performance, and OCB. Journal of Organizational Behavior. https://doi.org/10.1002/job.202

Proceeding of International Conference of 4th SHIELD 2019
https://pasca.unila.ac.id/seminar-internasional-shield/
ISBN : 978-602-51393-9-0
217
market in the fact that violations are found This paper will raise the implications of the use of foreign workers for the national interest
RESULTS AND DISCUSSION
Economic and trade developments are carried on the flow of globalization
communication that has divided the boundaries of the state and geographic partition that materialized through transnational trade and business patterns through such rapid cyber communication. " The world Without Borders ", as stated by Futurology Kenichi Ohmae is not a delusion but a reality that must be faced.
The birth of world Organization in world trade or commonly called the WTO in 1994 is an organization that produces multilateral conventions that provide a cornerstone with the rules or norms governing the trade relationship and produce laws binding to the Member States, particularly in the field of trade.82
The inception of the WTO on a global level is a significant indication of world trade globalization including the globalization of manpower. This globalization makes the traffic trade of goods and services as well as the displacement of people to borderless or almost indefinitely83. The employment policy in Indonesia should be directed to provide protection and welfare for TKI. But as part of the international community, the WTO provisions on the Natural Movement of Persons need to be adopted in the placement policy of foreign workers by observing the implementation experience in other countries in the interests of local workers. Currently, there are many BILLS included in the national legislation Program (Prolegnas) to anticipate the provisions of globalization and regionalization.
Globalization does pose a variety of challenges for Indonesia but on the other hand, it gives an opportunity. Indonesia needs to utilize the opportunity of manpower liberalization in the WTO by building a working structure that supports the effort. The transfer mechanism of knowledge of foreign workers needs to be repaired to better support the quality improvement of local workers.
The birth of the WTO is not a compulsion but rather an agreement traveled by the founding countries in consideration of the economic gaps that occurred in every state. So that the WTO was foundered as an organization of anti-discrimination that is believed to provide opportunities for each State to conduct international cooperation in the field of trade to advance the economy of each country. This cooperation is engaged in various sectors including the provision of foreign WORKERS who are expected to help vacancies in work skills, increased wages, and welfare.
Presidential Decree No. 20 of 2018 is a necessity, because if judging from the history of the arrangement, in the year 1994 Indonesia has established itself as a member of the World Trade Organization (WTO). The game rules are GATS (General Agreement On Trade in Services, as opening market access between the WTO member countries and the Asean Economic Community (AEC) in 2015. But the problem of foreign workers is always inviting the pros and cons of the community.
82
SoedjonoDirdjosisworo, Kaidah-kaidah Hukum Perdagangan Internasional versi Organisasi
Perdagangan Dunia, CV Utomo, Bandung, 2004, p.19.
83Ahmad M Ramli, Seminar Nasional Penempatan Tenaga Kerja Asing di Indonesia”,
http://bphn.go.id/data/documents/keynoot_speechrevisi.html , pada tanggal 14 April 2019 on 09.54
pm

Proceeding of International Conference of 4th SHIELD 2019
https://pasca.unila.ac.id/seminar-internasional-shield/
ISBN : 978-602-51393-9-0
218
Since the opening of the free working market in the 20th century, along with globalization and liberalization has encouraged the shifting flow of capital and investment to various worlds, there is also the current migration of population and labor between countries. The movement of the workforce took place because the investments needed direct supervision from the capital owners or investors so needed skilled personnel who could be trusted to manage and secure investments In the destination country. For such purposes, the owners of foreign capital carry as well as labor from their country or foreign countries to work as foreign workers in the destination country. This invasion of liberalization requires Indonesia to prepare the quality of human resources as a workforce to compete to seize local and international work markets.
The foreign worker is a foreign citizen visa holder to work in the Indonesian region84. Meanwhile, according to Budiono, foreign workers are people who are not Indonesian citizens who can do the work, both inside and outside the work relationship, to produce services or goods to meet the needs of the community.85
The existence of foreign workers or abbreviated foreign workers in a country including Indonesia is generally more associated with the impact on economic growth, employment opportunities and wage rates, as well as a foreign exchange that flies abroad and Resource factors. It is difficult to avoid that at the particular scope of work especially the jobs that require the mastery of high technology or that require special skills generally still cannot be fulfilled by the local workforce. Besides, the presence of foreign workers assessed can have a positive impact on local workers in the form of transfer of knowledge and become a capital to work at an international class level.
The basic philosophy of using foreign workers is as a series of efforts to increase investment, Transfer of Technology and Transfer of Skill to local workers, as well as an expansion of employment opportunities.86 However, the problem in one side of Indonesia as developing country requires experts to run and support the wheels of the nation's economy that has not been able to be filled by local personnel, on the other hand, the higher the unemployment rate in Indonesia is a result of unavailability and there is no opportunity to be used by Indonesian citizen because most jobs are filled by foreign workers. Although the normative existence of foreign workers is limited by the laws of the State, on the practice in its field is often encountered inconsistency. In this case, the government simply says that the state requires a lot of professional personnel who have not been possessed by the indigenous people themselves so that the increasing need for foreign workers is inevitable.
The need for legal devices, especially in the field of manpower, is to get attention because of the existence of foreign workers working in Indonesia as part of migrant workers who also have to get protection based on labor regulations. Indonesia, on the other hand, the development of increased skills of Indonesian workers need to be improved to be able to compete in accordance with the needs of the ASEAN Economic Community, and which is not less important is the role of the Labour Department And transmigration in this case the role of supervision officers on foreign workers working in Indonesia.87
84
Article 1(13) Undang-undang Nomor 13 Tahun 2003 tentang Ketenagakerjaan. 85
Abdul Hakim, Dasar-dasar Hukum Ketenagakerjaan Indonesia Cetakan ke IV Edisi Revisi, PT
Citra Aditya Bakti, Bandung, 2014, p. 24. 86
Ahmadi Miru, Hukum Kontrak dan Perancangan Kontrak, Jakarta: PT. Rajagrafindo Persada,
2008, p.35. 87
Suhandi. Pengaturan Ketenagakerjaan Terhadap Tenaga Kerja Asing Dalam Pelaksanaan
Masyarakat Ekonomi Asean Di Indonesia, Jurnal Fakultas Hukum Universitas Wijaya Kusuma
Surabaya, Perspektif Volume XXI No. 2, 2016 Edisi Mei, p. 136.

Proceeding of International Conference of 4th SHIELD 2019
https://pasca.unila.ac.id/seminar-internasional-shield/
ISBN : 978-602-51393-9-0
219
This kind of condition will be alarming if it is constantly maintaining without efforts to improve the quality of migrant workers and the provision of training facilities and training needed to improve the quality Considering that Indonesia is a country with great human resources. According to the population census of 2018, the population of Indonesia ranks fourth in the world after China, India, and the United States of 265.015 million88. When studied this is a big capital in running the economy from the employment and marketing aspects of production goods. The government only needs to provide access for the citizens to have skills as needed by the State so that citizens do not like the audience in their own country.
The number of Indonesian citizens who are idle is a form of government failure to fulfill the rights of citizens as stated in the Indonesian Constitution. Although Indonesia is part of the international community that requires Indonesia to comply with all international regulations, especially regarding the implementation of this free work market, the Indonesian nation should not forget that there are still Many Indonesian citizens who need jobs to fulfill and continue their lives. The growing number of foreign citizens in Indonesia will result in Indonesia's national interest.
In this case, of course, the constraints are always in the field, with the increasing (high) arrival of foreign workers, then also increased the potential of immigration violations conducted by foreigners such as the number of illegal foreign affairs phenomenon. The existence of illegal foreign workers is detrimental to the community because they are taking a job opportunity that should be the right of Indonesian citizens as many are found some of the workers from China who do abusive work, jobs that are not Need special skills, and this can also be a matter of national interest89
Looking at the things that happen in the field, many foreign workers originating from China to Indonesia will bring new problems in the world of manpower. If the existence of foreign workers in Indonesia is done as a form of transfer of knowledge to bring a foreign worker, the company is obliged to recruit local workers as a companion, this is a requirement for the application of using an approved foreign worker. This mentoring is intended for the transfer of knowledge as the government can run as it should. Thus, there will be no importation of skilled personnel to do.
Besides, the flood of labor from China in various projects in Indonesia becomes a boomerang for local workers. The more concerning, the government, in this case, the Ministry of Manpower and Transmigration claimed to have found new information that the Chinese foreign workers were majority have been equipped by the hiring of foreign licenses (IMTA), i.e. the documents That explain about legal status or not the foreigners working in Indonesia. Based on the decree of the Minister of Manpower and Transmigration No. 247 the year 2011, foreign workers can only fill positions that require certain skills.90
In-Law No. 13 of 2003 on employment starting from chapters 42 up to article 49 governs the placement of foreign workers required to have a permit to employ foreign workers (IKTA). The process of obtaining IKTA adheres to sponsorship principle which means the use of foreign workers is at the request of the company, it also means that foreign workers cannot work independently. The use of foreign workers should be beneficial to the growth of national economies, helping to expand job opportunities, embrace the income balance system and technological outsourcing programs. Most importantly, foreign workers who will
88
http://id.m.wikipedia.org/jumlah-penduduk-indonesia-tahun-2018 89
Yustisia Merdeka Analisis Kebijakan Penggunaan Tenaga Kerja Asing Di Indonesia (Dampak
Dikeluarkannya Peraturan Presiden (Perpres) Nomor 20 Tahun 2018 Tentang Penggunaan Tenaga
Kerja Asing),jurnal ilmiah ,Krista Yitawati, Volume 4 No 2 September 2018. 90
Zabur Kaburu, “Banjir Pekerja Dari Negeri Panda”, Majalah Tempo, 2015, p.98

Proceeding of International Conference of 4th SHIELD 2019
https://pasca.unila.ac.id/seminar-internasional-shield/
ISBN : 978-602-51393-9-0
220
work in Indonesia are allocated to positions that have not been filled by Indonesian labor, which means that if foreign workers are not able to work forever in Indonesia until local workers Ready to fill the post. However, the arrangement is still not able to protect local workers because of the implementation of unprecise provisions also the very broad freedom given to the foreign workers in filling strategic positions.
Such conditions are certainly discrimination that can threaten national interests. The country is obliged to ensure the welfare of its citizens by fulfilling each of its citizens ' rights to make the ideals of the nation possible. But in reality, the government forgets this side because it only focuses on foreign investments coming from abroad. Not to mention the problems that come from these foreign workers. If the government only focuses on the use of foreign workers to attract a lot of foreign investment into Indonesia, it will be feared if this will give a very bad impact on the stability of the country, because if citizens Committing rebellion for feeling that their right had been taken in his land, there would be an inevitable problem.
Besides, if there are many areas of employment that are filled by foreign workers compared to local workers, the state of Indonesia will be dominated by foreign countries and this will also have the effect of being found by some confidential state documents Impact on the country's stability. Because if the number of foreign workers continues to grow and the ratio of fullness exceeds the population ratio of local citizens, then the foreign worker will sabotage all matters relating to the interests of the State.
The constitution of the state of Indonesia has asserted in article 27 paragraph (2) that each citizen shall be entitled to employment and livelihood which is worthy based on humanity, meaning that the State is obliged to conduct the mandate of state constitution without An exception as a manifestation that the state conducts the mandate of national interest to promote and enrich its people. Although Indonesia is in a very onslaught in advancing foreign investment to advance the nation's economy, Indonesia also the provisions contained in MEA are currently running. But in practice, not all foreign workers in Indonesia entered the category of skilled labor as specified in the AEC agreement. Based on existing data there have been hundreds of thousands of foreign workers residing in Indonesia, where the majority are dominated by Chinese migrant workers. The inclusion of overseas investments makes the existence of foreign workers in Indonesia increasingly unstoppable. In addition to the AEC agreement factor, the influx of foreign workers is also supported by Indonesia's regulatory policies that facilitate the access of foreign parties in the management of natural resources in Indonesia.
The positive impact with the AEC will certainly spur the growth of both outside and domestic investments and will open new jobs. Besides, residents of Indonesia will be able to find employment in ASEAN countries. As for the negative impact of MEA, namely the market of free goods and services will cause foreign workers to easily enter and work in Indonesia resulting in a tougher labor competition in the field of employment.91
Of the 17,500 islands, the land area of Indonesia reaches 1.9 million km2 and the seawater area of approximately 7.9 million km2 with the length of the coastline reaches 95,181 km. Ninety-two small islands are the outlying islands. 92Thousands of islands with all the natural resources that are in it are a valuable 91
Bagus Prasetyo, Menilik Kesiapan Dunia Ketenagakerjaan Indonesia Menghadapimea,Rechts
vinding online, 2014,
92Syamsul Ma’arif, “Pengelolaan Pulau Terluar Dalam Manajemen Pulau Terluar”, Makalah,
Fakultas Geografi UGM, 2009, p.8.

Proceeding of International Conference of 4th SHIELD 2019
https://pasca.unila.ac.id/seminar-internasional-shield/
ISBN : 978-602-51393-9-0
221
asset to be used fully for the prosperity of the people of Indonesia, as the purpose of the establishment of NKRI. However, there is a phenomenon at this time the attention of Indonesian people to natural resources today more criticize the problem of oil and gas that is said to be very liberal beneficial to foreign parties. This becomes more logical when looking at the Mineral and Coal Act No. 4 the year 2009 has been far from the values of Pancasila, it can be said to be more viscous with the liberalism. Where can be seen in the act of business license mining can be obtained through auction, meaning that the natural resourses of Indonesia can be bought by anyone important at the highest price, including the nation is entitled to buy its origin can bargain for the highest price.
According to Friedman's theory, a component of good substance (legal product) is always produced by good structural components. Where the structural component is a component that has the authority to create the rules. If the structural components are not good, then the one that will be born is an immoral law that has no alignments to the interests of the community. So that the people who are in the structural components are not enough to only have the ability to hard/professional in working to make the rules, but what is needed in building this nation is a professional human and Immoral.
The Moral in question is a high sense of nationality and a strong spirit of nationalism. So that in any condition and any civilization in this world, then the participation of each generation always adhere to the mandate of the national development purpose of realizing Indonesia's fair and prosperous society. In the management of natural resources is also not less important to do further discussion. All the potential of nature that can produce prosperity and increase the life of the crowd desperately needed the attention of the government in its management. The problems that have been coloring the natural resources management in the border area are the many natural resourses assets that are more manageable with a percentage of more profit to foreigners. Foreign investment becomes an easy way for exploitation of natural resourses which is no longer in the interest of Indonesian people, but merely the interests of the investors. So in addition to the hard that has been qualified by the son of the Indonesian princess, it is still needed high soft skills to national moral, so that in any policy taken by the Government and in its implementation in the community has one understanding that the natural resourses should be utilized for the benefit of the people of Indonesia as mandated by Constitution 1945.
The high number of labor and unskill migrant workers in Indonesia finally can not be avoided as a result of the investment of a package with its workforce. Chinese workers occupy the highest position of the spread of working relations in Indonesia in the working relationship of various companies. It should be recognized that the start of the enactment of MEA since the beginning of 2016 and the inclusion of foreign workers from China becomes a labor problem in the homeland. Moreover, with the enactment of visa-free to 160 countries brought the increasing impact of the rapid inflow of migrant workers to Indonesia. Foreign workers and the Indonesian labor force . The birth of the International Labour Organization aims to monitor and encourage honest and humane labor conditions. The contents of the Convention govern discrimination in employment and positions which have been ratified by Law No. 21 of May 7, 1999, where all Member States promote the similarity of opportunity and treatment through promotion National policy to end all forms of discrimination in employment and employment opportunities.
In terms of foreign labour supervision is also a problem and the implications of the national interest of obstacles faced in terms of supervision of foreign workers ie the number of supervisors of foreign workers who are not comparable to The number of foreign workers working in the company, a complex foreign worker

Proceeding of International Conference of 4th SHIELD 2019
https://pasca.unila.ac.id/seminar-internasional-shield/
ISBN : 978-602-51393-9-0
222
licensing procedures that cause a large number of companies that use foreign workers illegally and the absence of evaluation set The use of foreign workers. 93
Because of the limited ability of the relevant personnel to carry out its supervision. Especially for Chinese citizens who are usually often caught hands abusing the permission to stay visits given to him such as being a foreign workers illegal in surveillance activities conducted by duty in the field.94
CONCLUSSION
As a member of the ILO, Indonesia has a moral obligation to implement
international provisions including international employment standards. Entering the era of liberalization of the free working market, labor mobility among the WTO members increased in line with the existence of "request" and "offer" to open the opportunity to the foreign professional workforce to work in Indonesia. Following free and active foreign politics, Indonesia is ready to cooperate with all trading partners, both developed and developing countries, following the needs of trade, financing, and development of Indonesia in the trading system A firm, fair and open International. However, the challenges of national development related to employment are increasing by free trade and globalization of industry. This causes the presence of foreign workers to be a necessity as well as unavoidable challenges. Their presence is a necessity because Indonesia still needs foreign experts in the development of human resources in various economic sectors in Indonesia.
However, the existence of foreign workers can be seen as a threat if its existence is not able to contribute to economic growth, employment and wage opportunities for local workers considering the current increase in the number of foreign trade works in various sectors Indonesian employment. This means that the existence of foreign workers is considered a competitor of local workers if the level of proficiency and skills owned by local workers is very low. So, to prevent this occurrence should be held a regulation to supervise the use of foreign workers in Indonesia because it is feared if the capacity of foreign workers is not limited to its existence and position it will threaten national interest in terms of welfare as intended for national development purposes. Indonesia should have a defense to supervise the stability of the nation by not complaining of the laws in Indonesia. So that Indonesia does not forget its obligations as a country incorporated in the international world, as well as the state that is obliged to guarantee the rights of every citizen. Furthermore, preparing the human resources of Indonesia is also indispensable to improve the competitiveness of Indonesian workers in dealing with global competition. The government should emphasize the attention of the procedures for the admission of foreign workers to Indonesia so that the government can provide protection and welfare to an Indonesian citizen.
REFERENCE Books
Abdul Hakim, Dasar-dasar Hukum Ketenagakerjaan Indonesia Cetakan ke IV Edisi Revisi, PT Citra Aditya Bakti, Bandung, 2014. Soedjono Dirdjosisworo, Kaidah-kaidah Hukum Perdagangan Internasional versi Organisasi Perdagangan Dunia, CV Utomo, Bandung, 2004.
93
Nina Juwitasari,Sonhaji Solechan ,Implikasi Yuridis Keberadaan Tenaga Kerja Asing Sebagai
Tenaga Kerja Di Indonesia, 2016. 94
Tony Mirwanto Sistem Hukum Pengawasan Tenaga Kerja Asing Terhadap Penyalahgunaan Izin
Tinggal Kunjungan Untuk Bekerja Pada Perusahaan Penanaman Modal Asing Di Indonesia, Lex
Et Societatis, Vol. IV/No. 3/Mar/2016.

Proceeding of International Conference of 4th SHIELD 2019
https://pasca.unila.ac.id/seminar-internasional-shield/
ISBN : 978-602-51393-9-0
223
Ahmadi Miru, Hukum Kontrak dan Perancangan Kontrak, Jakarta: PT. Rajagrafindo Persada, hlm. 35 2008.
Legislations Undang-Undang No 13 Tahun 2003 Kepmenakertrans Nomor 12 tahun 2015 Perpres Nomor 20 Tahun 2018
Journals May Yanti Budiarti, Perizinan Penggunaan Tenaga Kerja Asing Dengan Berlakunya Masyarakat Ekonomi Asean,Vol 10, 2016. http://jurnal.fh.unila.ac.id/index.php/fiat Umar Congge, Masyarakat Ekonomi Asean (Mea) Harapan Dan Tantangan Dalam Perekonomian Bangsa, 2015. Nina Juwitasari,Sonhaji Solechan, Implikasi Yuridis Keberadaan Tenaga Kerja Asing Sebagai Tenaga Kerja Di Indonesia,2016. Bagus Prasetyo, Menilik Kesiapan Dunia Ketenagakerjaan Indonesia Menghadapimea, Rechts Vinding Online,2014, Edi Cahyono,Tenaga Kerja Asing (Tka) Dalam Perspektif Masyarakat Ekonomi Asean (Mea) : Peluang Atau Ancaman Bagi Sdm Indonesia,Vol 3 JBMA, 2016. Suhandi. Pengaturan Ketenagakerjaan Terhadap Tenaga Kerja Asing Dalam Pelaksanaan Masyarakat Ekonomi Asean Di Indonesia, Jurnal Fakultas Hukum Universitas Wijaya Kusuma Surabaya, Perspektif Volume XXI No. 2 Tahun 2016 Edisi Mei, hlm 136. Krista Yitawati, Analisis Kebijakan Penggunaan Tenaga Kerja Asing Di Indonesia (Dampak Dikeluarkannya Peraturan Presiden (Perpres) Nomor 20 Tahun 2018 Tentang Penggunaan Tenaga Kerja Asing), jurnal ilmiah Yustisia Merdeka, Volume 4 Nomor 2 September 2018. Ang, S., Van Dyne, L., & Begley, T. M. (2003). The employment relationships of foreign workers versus local employees: A field study of organizational justice, job satisfaction, performance, and OCB. Journal of Organizational Behavior. https://doi.org/10.1002/job.202 Fang, Y., Jiang, G. L. F., Makino, S., & Beamish, P. W. (2010). Multinational firm knowledge, use of expatriates, and foreign subsidiary performance. Journal of Management Studies. https://doi.org/10.1111/j.1467-6486.2009.00850. Tony Mirwanto Sistem Hukum Pengawasan Tenaga Kerja Asing Terhadap Penyalahgunaan Izin Tinggal Kunjungan Untuk Bekerja Pada Perusahaan Penanaman Modal Asing Di Indonesia, Lex Et Societatis, Vol. IV/No. 3/Mar/2016. Syamsul Ma‟arif, “Pengelolaan Pulau Terluar Dalam Manajemen Pulau Terluar”, Makalah, Fakultas Geografi UGM, 2009, hlm.8. Zabur Kaburu, “Banjir Pekerja Dari Negeri Panda”, Majalah Tempo, 2015, hlm.98 Ahmad M Ramli, Seminar Nasional Penempatan Tenaga Kerja Asing di Indonesia” diakses dari http://bphn.go.id/data/documents/keynoot_speechrevisi.html , pada tanggal 14 April 2019 pukul 21.54. Tenaga Kerja Asing (TKA) Dalam Data dan Informasi, Direktorat Jendral Binapenta Kemnaker RI, Cetakan I, 2014.

Proceeding of International Conference of 4th SHIELD 2019
https://pasca.unila.ac.id/seminar-internasional-shield/
ISBN : 978-602-51393-9-0
224
PROCEEDING INTERNATIONAL CONFERENCE 4TH
SHIELD 2019
Social Sciences and Humanities, Economics, Education, Law, and Sustainable
Development (SHIELD)
The Composition of the Advisory Board
Prof. Dr. Ir. Hasriadi Mat Akin, M.P. : Rektor Universitas Lampung
Prof. Dr. Bujang Rahman, M.Si. : Wakil Rektor Bidang Akademik
Prof. Dr. Muhammad Kamal, M.Sc. : Wakil Rektor Bidang Umum dan Keuangan
Prof. Drs. Mustofa, MA.,Ph.D. : Direktur Program Pascasarjana
Dr. M. Fakih, S.H., M.S ; Wakil Direktur Bidang Umum
Prof. Dr. Lindrianasari, S.E., M.Si.
Akt. : Wakil Direktur Bidang Akademik
Streering Committee
Chairman : Dr.Ir. Zainal Abidin, M.E.S.
Secretary : Yulia Rahma Fitriana, S.Hut., M.Sc., Ph.D
Treasure Haspita Satur Eka, S.E
Section of Seminar
Coordinator : Dr. Christine Wulandari
Member
Parallel Session
: Yulia Kusuma Wardani, S.H., M.H
: Drs. Tugiyono, Ph.D
: Dr. Eng. Dikpride Despa, S.T., M.T
: Yunia Amalia, S.E., M.Si
: Dr. Samsul Bakri, M.Si
: Dr. Hasan Hariri, M.Sc
Dr. Sudarma Widjaya
: Dr. Tubagus Hasanudin, M.Si
: Dr. Rudy LLM
: Dr. Eng. Yul Martin, S.T., M.T.
: Gede Eka Putrawan, M.Hum
Section of Secretariat and Proceedings
Coordinator : Dr. Abdul Muntholib, M.S
Member : Yuliana Saleh, S.P., M.S.
: Shinta Dewi Marcelina, S.Hut
: Ade Oktariatas K

Proceeding of International Conference of 4th SHIELD 2019
https://pasca.unila.ac.id/seminar-internasional-shield/
ISBN : 978-602-51393-9-0
225
: Pingkan Retno
: Jane Rosalina
: Muher Sukmayanto, S.P
: Rika Agustina, S.P
: Ibrohim Saputra, S.P
: Dian Aprianto, S.Hut.
: Salsabila Khairunnisa
: Yuga Narazua Khanza
IT and Communication
Coordinator : Aristoteles, S.Si., M.Si
Member : M. Iqbal, S.Kom., M.Kom
: Stefanus Alvin Susanto
: Bisri Mustofa
: Rangkas
Equipment Committee
Coordinator : Anzor, S.H
Member : Hasan Azhari Nawi, S.Kom
: Sofyan Rivandi
: Donny Saputra
: Angger Hadi Purwanto
: Aljauzi
: Hendri Saputra
: Andre vayona
: Rohmad Surono
Public relations and Documentation
Comitte
Cordinator : Haidawati, M.Si
Member : Elisilvia Agustina, S.P
Consumtion Committee
Coordinator : Nurmiyati
Member : Devi Aulia Sari

Proceeding of International Conference of 4th SHIELD 2019
https://pasca.unila.ac.id/seminar-internasional-shield/
ISBN : 978-602-51393-9-0
226
Proceddings
Coordinator : Dr. Wahyu Hidayat, S.Hut., M.Sc
:
Prof. Muhajir Utomo, M.Sc, Ph.D
: Prof. Dr. Sudjarwo, M.S
: Prof. Dr. Mohammad Akib, S.H., M.H
: Prof. Dr. Jamalam Lumbanraja., M.Sc
: Prof. Udin Hasanuddin
: Dr. Ir. Slamet B Yuwono , M.Si
: Dr. Abdul firman Ashaf, S.I.P., M.
Reviewers
Coordinator : Prof. Drs. Mustofa, MA., Ph.D
: Prof. Dr. Lindrianasari, S.E., M.Si
: Prof. AG. Bambang Setiadi, M.A., Ph.D
: Prof. Dr. Sudjarwo, M.S
: Prof. Muhajir Utomo, M.Sc, Ph.D
: Prof. Dr. Mohammad Akib, S.H., M.H
Editor
Coordinator Hernadi Susanto, S.H
Ardian Sanjaya, S.Pd
Publisher
Program Postgraduate University Lampung

Publisher
Program Postgraduate University Lampung