Thermal–Mechanical FEM Analyses of a Liquid Rocket ... - MDPI
19
Citation: Ferraiuolo, M.; Perrella, M.; Giannella, V.; Citarella, R. Thermal– Mechanical FEM Analyses of a Liquid Rocket Engines Thrust Chamber. Appl. Sci. 2022, 12, 3443. https://doi.org/10.3390/app12073443 Academic Editor: Maria Grazia De Giorgi Received: 4 February 2022 Accepted: 24 March 2022 Published: 28 March 2022 Publisher’s Note: MDPI stays neutral with regard to jurisdictional claims in published maps and institutional affil- iations. Copyright: © 2022 by the authors. Licensee MDPI, Basel, Switzerland. This article is an open access article distributed under the terms and conditions of the Creative Commons Attribution (CC BY) license (https:// creativecommons.org/licenses/by/ 4.0/). applied sciences Article Thermal–Mechanical FEM Analyses of a Liquid Rocket Engines Thrust Chamber Michele Ferraiuolo 1, * , Michele Perrella 2 , Venanzio Giannella 3 and Roberto Citarella 3 1 Italian Aerospace Research Center (CIRA), Via Maiorise snc, 81043 Capua, Italy 2 Department of Chemical, Materials and Production Engineering, University of Naples “Federico II”, 80125 Naples, Italy; [email protected] 3 Department of Industrial Engineering, University of Salerno, 84084 Fisciano, Italy; [email protected] (V.G.); [email protected] (R.C.) * Correspondence: [email protected] Abstract: The Italian Ministry of University and Research (MIUR) funded the HYPROB Program to develop regeneratively cooled liquid rocket engines. In this type of engine, liquid propellant oxygen–methane is used, allowing us to reach very good performances in terms of high vacuum specific impulse and high thrust-to-weight ratio. The present study focused on the HYPROB final ground demonstrator, which will be able to produce a 30 kN thrust in flight conditions. In order to achieve such a thrust level, very high chamber pressures (up to 50 bar) and consequently high thermal fluxes and gradients are expected inside the thrust chamber. Very complex and high-fidelity numerical FEM models were adopted here to accurately simulate the thermal–mechanical behavior of the thrust chamber cooling channels, accounting for plasticity, creep, and low-cycle fatigue (LCF) phenomena. The aim of the current work was to investigate the main failure phenomena that could occur during the thrust chamber’s service life. Results demonstrated that LCF is the main cause of failure. The corresponding number of loading cycles to failure were calculated accordingly. Keywords: liquid rocket engine; finite element method; simulation; thermal stress; low-cycle fatigue; creep; plasticity 1. Introduction The aim of the HYPROB Program is to design, manufacture, and test a ground demon- strator of a liquid rocket engine employing liquid methane and liquid oxygen. Such a propulsion technology may cover a wide range of aerospace propulsion systems, from launcher main stages up to small thrusters. When the requested levels of thrust are rela- tively high, heavy heat fluxes and high chamber pressures are expected in the combustion chamber. Therefore, active cooling techniques can be used to keep the selected materials at acceptably low temperature values. The thrust chamber considered in the current in- vestigation comprised an inner structure made of a CuCrZr alloy, and an external cold structure made of electrodeposited nickel. Methane, before being injected as fuel into the combustion chamber, also acts as a coolant fluid flowing through axial cooling channels, so as to partially remove heat from the inner structures, see Figure 1. Even though temperature levels are lowered with such a cooling process, very high thermal gradients occur within the structure, separating the hot gas from the cooling channels, where the fuel temperature is considerably lower. Appl. Sci. 2022, 12, 3443. https://doi.org/10.3390/app12073443 https://www.mdpi.com/journal/applsci
-
Upload
khangminh22 -
Category
Documents
-
view
1 -
download
0
Transcript of Thermal–Mechanical FEM Analyses of a Liquid Rocket ... - MDPI

�����������������
Citation: Ferraiuolo, M.; Perrella, M.;
Giannella, V.; Citarella, R. Thermal–
Mechanical FEM Analyses of a
Liquid Rocket Engines Thrust
Chamber. Appl. Sci. 2022, 12, 3443.
https://doi.org/10.3390/app12073443
Academic Editor: Maria Grazia De
Giorgi
Received: 4 February 2022
Accepted: 24 March 2022
Published: 28 March 2022
Publisher’s Note: MDPI stays neutral
with regard to jurisdictional claims in
published maps and institutional affil-
iations.
Copyright: © 2022 by the authors.
Licensee MDPI, Basel, Switzerland.
This article is an open access article
distributed under the terms and
conditions of the Creative Commons
Attribution (CC BY) license (https://
creativecommons.org/licenses/by/
4.0/).
applied sciences
Article
Thermal–Mechanical FEM Analyses of a Liquid Rocket EnginesThrust ChamberMichele Ferraiuolo 1,* , Michele Perrella 2 , Venanzio Giannella 3 and Roberto Citarella 3
1 Italian Aerospace Research Center (CIRA), Via Maiorise snc, 81043 Capua, Italy2 Department of Chemical, Materials and Production Engineering, University of Naples “Federico II”,
80125 Naples, Italy; [email protected] Department of Industrial Engineering, University of Salerno, 84084 Fisciano, Italy; [email protected] (V.G.);
[email protected] (R.C.)* Correspondence: [email protected]
Abstract: The Italian Ministry of University and Research (MIUR) funded the HYPROB Programto develop regeneratively cooled liquid rocket engines. In this type of engine, liquid propellantoxygen–methane is used, allowing us to reach very good performances in terms of high vacuumspecific impulse and high thrust-to-weight ratio. The present study focused on the HYPROB finalground demonstrator, which will be able to produce a 30 kN thrust in flight conditions. In orderto achieve such a thrust level, very high chamber pressures (up to 50 bar) and consequently highthermal fluxes and gradients are expected inside the thrust chamber. Very complex and high-fidelitynumerical FEM models were adopted here to accurately simulate the thermal–mechanical behaviorof the thrust chamber cooling channels, accounting for plasticity, creep, and low-cycle fatigue (LCF)phenomena. The aim of the current work was to investigate the main failure phenomena that couldoccur during the thrust chamber’s service life. Results demonstrated that LCF is the main cause offailure. The corresponding number of loading cycles to failure were calculated accordingly.
Keywords: liquid rocket engine; finite element method; simulation; thermal stress; low-cycle fatigue;creep; plasticity
1. Introduction
The aim of the HYPROB Program is to design, manufacture, and test a ground demon-strator of a liquid rocket engine employing liquid methane and liquid oxygen. Such apropulsion technology may cover a wide range of aerospace propulsion systems, fromlauncher main stages up to small thrusters. When the requested levels of thrust are rela-tively high, heavy heat fluxes and high chamber pressures are expected in the combustionchamber. Therefore, active cooling techniques can be used to keep the selected materialsat acceptably low temperature values. The thrust chamber considered in the current in-vestigation comprised an inner structure made of a CuCrZr alloy, and an external coldstructure made of electrodeposited nickel. Methane, before being injected as fuel into thecombustion chamber, also acts as a coolant fluid flowing through axial cooling channels, soas to partially remove heat from the inner structures, see Figure 1. Even though temperaturelevels are lowered with such a cooling process, very high thermal gradients occur withinthe structure, separating the hot gas from the cooling channels, where the fuel temperatureis considerably lower.
Appl. Sci. 2022, 12, 3443. https://doi.org/10.3390/app12073443 https://www.mdpi.com/journal/applsci

Appl. Sci. 2022, 12, 3443 2 of 19
Appl. Sci. 2022, 12, 3443 2 of 20
Figure 1. Rocket engine thrust chamber (a) and related functional scheme (b).
Several works can be found in the literature regarding the thermal–mechanical be-
havior of liquid rocket engines thrust chambers under cyclic loading conditions. These
have demonstrated that plasticity effects should be modeled by means of both isotropic
and kinematic hardening models. Additionally, a nonlinear kinematic hardening model
should be adopted to simulate shakedown and ratcheting phenomena [1–3]. In particular,
when employing the Chaboche kinematic hardening model [4], at least three nonlinear
hardening models should be considered to simulate ratcheting behavior properly, i.e., the
progressive plastic strain accumulation during cycling [5]. Other researchers also demon-
strated that low-cycle fatigue (LCF) and creep can be the main possible causes of failure,
in turn, highlighting the need to accurately investigate these phenomena [6–8]. Creep ef-
fects can be dominant when temperatures and stresses reach significantly high values [9–
12]. Even if Norton secondary creep law [13] has been usually considered for these appli-
cations in literature, the authors have chosen to adopt a more complete creep model taking
account of both primary and secondary creep effects through combined time hardening
rules. With regard to the LCF phenomenon, uniaxial fatigue criteria are usually adopted
Figure 1. Rocket engine thrust chamber (a) and related functional scheme (b).
Several works can be found in the literature regarding the thermal–mechanical behav-ior of liquid rocket engines thrust chambers under cyclic loading conditions. These havedemonstrated that plasticity effects should be modeled by means of both isotropic andkinematic hardening models. Additionally, a nonlinear kinematic hardening model shouldbe adopted to simulate shakedown and ratcheting phenomena [1–3]. In particular, whenemploying the Chaboche kinematic hardening model [4], at least three nonlinear hardeningmodels should be considered to simulate ratcheting behavior properly, i.e., the progres-sive plastic strain accumulation during cycling [5]. Other researchers also demonstratedthat low-cycle fatigue (LCF) and creep can be the main possible causes of failure, in turn,highlighting the need to accurately investigate these phenomena [6–8]. Creep effects canbe dominant when temperatures and stresses reach significantly high values [9–12]. Evenif Norton secondary creep law [13] has been usually considered for these applications in

Appl. Sci. 2022, 12, 3443 3 of 19
literature, the authors have chosen to adopt a more complete creep model taking accountof both primary and secondary creep effects through combined time hardening rules. Withregard to the LCF phenomenon, uniaxial fatigue criteria are usually adopted for these kindof applications, since circumferential plastic strains are the dominant contributors with re-spect to the radial and axial ones. However, authors have adopted a critical plane approach,namely, the Wang-Brown criterion [14], to consider the effects of the multi-axiality of thestress-strain fields and non-proportionality of the loading conditions, because the influenceof multiaxial and non-proportional loading effects is not negligible when evaluating theservice life of these kind of structures. The latest advances of numerical methods, such asthe finite element method (FEM), allowed us to study these complex structures and loadingconditions, reducing the burden of expensive experimental tests.
The aim of the present work was to conduct a numerical investigation on the 3Dthermal–mechanical behavior of a cooling channel of the thrust chamber by employingstate-of-the-art numerical FEM models. This allowed us to take account of plasticity, creep,and LCF phenomena simultaneously. These analyses were conducted by means of theFEM code ANSYS. A preliminary work involving the same case study and concerning theadoption of global/local approaches can be found in [15]. As a continuation of [15], inthe present work, plasticity effects were studied adopting the von Mises yield criterion,Prandtl-Reuss flow rule, and both isotropic and non-linear Chaboche kinematic hardeningmodels. Multiaxial LCF evaluations were carried out by employing experimental fatiguetest data available in literature [16]. Finally, the combined time hardening creep modelwas adopted to simulate primary and secondary creep stages [17]. A cumulative damagemodel, considering the effects of plastic instability (thermal ratcheting), creep, and fatigue,was employed so as to evaluate the number of cycles up to failure.
The rest of this document can be summarized as follows. Section 2 describes theadopted mathematical models with the related governing equations. Section 3 describesthe numerical FEM models. Section 4 describes the thermal–mechanical loading condi-tions, whereas Section 5 presents the life prediction models adopted here. Finally, resultsare presented and discussed in Section 6, whilst the concluding remarks are reportedin Section 7.
2. Mathematical Model
A weak coupling between thermal and structural problems was considered, so thattemperature distribution affects the strain/stress fields but not vice-versa (see Figure 2).This is a common practice for these kinds of thermal–mechanical simulations since it allowsone to strongly reduce the computational efforts without appreciable detrimental effects onaccuracy [18–23]. In particular, the body temperatures calculated by means of a thermaltransient analysis were transferred to a static non-linear structural analysis, where strainand stress fields were evaluated. Finally, the stress-strain fields were employed for the lifeprediction assessment, so as to eventually estimate the thrust chamber service life.
Appl. Sci. 2022, 12, 3443 3 of 20
for these kind of applications, since circumferential plastic strains are the dominant con-
tributors with respect to the radial and axial ones. However, authors have adopted a crit-
ical plane approach, namely, the Wang-Brown criterion [14], to consider the effects of the
multi-axiality of the stress-strain fields and non-proportionality of the loading conditions,
because the influence of multiaxial and non-proportional loading effects is not negligible
when evaluating the service life of these kind of structures. The latest advances of numer-
ical methods, such as the finite element method (FEM), allowed us to study these complex
structures and loading conditions, reducing the burden of expensive experimental tests.
The aim of the present work was to conduct a numerical investigation on the 3D
thermal–mechanical behavior of a cooling channel of the thrust chamber by employing
state-of-the-art numerical FEM models. This allowed us to take account of plasticity,
creep, and LCF phenomena simultaneously. These analyses were conducted by means of
the FEM code ANSYS. A preliminary work involving the same case study and concerning
the adoption of global/local approaches can be found in [15]. As a continuation of [15], in
the present work, plasticity effects were studied adopting the von Mises yield criterion,
Prandtl-Reuss flow rule, and both isotropic and non-linear Chaboche kinematic harden-
ing models. Multiaxial LCF evaluations were carried out by employing experimental fa-
tigue test data available in literature [16]. Finally, the combined time hardening creep
model was adopted to simulate primary and secondary creep stages [17]. A cumulative
damage model, considering the effects of plastic instability (thermal ratcheting), creep,
and fatigue, was employed so as to evaluate the number of cycles up to failure.
The rest of this document can be summarized as follows. Section 2 describes the
adopted mathematical models with the related governing equations. Section 3 describes
the numerical FEM models. Section 4 describes the thermal–mechanical loading condi-
tions, whereas Section 5 presents the life prediction models adopted here. Finally, results
are presented and discussed in Section 6, whilst the concluding remarks are reported in
Section 7.
2. Mathematical Model
A weak coupling between thermal and structural problems was considered, so that
temperature distribution affects the strain/stress fields but not vice-versa (see Figure 2).
This is a common practice for these kinds of thermal–mechanical simulations since it al-
lows one to strongly reduce the computational efforts without appreciable detrimental
effects on accuracy [18–23]. In particular, the body temperatures calculated by means of a
thermal transient analysis were transferred to a static non-linear structural analysis, where
strain and stress fields were evaluated. Finally, the stress-strain fields were employed for
the life prediction assessment, so as to eventually estimate the thrust chamber service life.
Figure 2. Workflow of the thermal–mechanical FEM analyses.
Figure 2. Workflow of the thermal–mechanical FEM analyses.

Appl. Sci. 2022, 12, 3443 4 of 19
2.1. Thermal Model
Transient non-linear thermal analyses of the cooling channels were performed. Thethermal problem was nonlinear because of the temperature-dependent material propertiesthat were considered. The associated heat conduction problem is governed by the followingdifferential equation [24,25]:
∇2T =1a
∂T∂θ
(1)
where a is the thermal diffusivity, T is the temperature, and θ is the time. Continuity of tem-perature and heat fluxes at the interface between chamber layers, made of CuCrZr alloy, elec-troformed copper, and electroformed nickel, were enforced through the following equations:
ki∂Ti∂n
= k j∂Tj
∂n(2)
Ti = Tj (3)
where i and j represent two generic materials in contact, k is the thermal conductivity, andn is the direction of the heat flow. Convective boundary conditions were applied to the hotgas side and to surfaces wetted by the coolant flow:
− k∂T∂n
= h·(Tw − T∞) (4)
where h is the convective heat transfer coefficient, Tw is the wall temperature, and T∞ is theadiabatic wall temperature.
2.2. Structural Model2.2.1. Plasticity
The equilibrium equation was combined with compatibility equations, constitutivelaws, and the relationship between temperature variation and strain tensor. The tempera-ture variation was evaluated with respect to a reference temperature at which no thermalstrain was present. The total strain tensor ε can be decomposed into:
εij = εelij + ε
plij (5)
where εelij and ε
plij represent the elastic and plastic components of ε, respectively. Plasticity
was modeled through the von Mises yield surface criterion, Chaboche kinematic harden-ing rule, a multilinear isotropic hardening model, and a Prandtl-Reuss flow rule, whilecreep phenomena were modeled by means of a combined time hardening law. A detaileddescription of the characteristics of the present viscoplastic model in comparison to otherones can be found in [11]. Materials subjected to cyclic loading harden both kinematicallyand isotropically. The multilinear isotropic model parameters were obtained by extrap-olating data from the experimental stabilized stress vs. plastic strain curves at differenttemperatures for CuCrZr materials [15]. The Chaboche kinematic hardening model withthree back stresses (each one corresponding to the Armstrong–Frederick nonlinear model)was chosen in order to consider the effects of kinematic hardening (see Figure 3) [26].
The total backstress tensor α can be expressed as follows:
α =∆σ
2− σ0 =
3
∑i=1
Ciγi
[(1− exp
(−γi ∗ εpl
))](6)
where Ci and γi are material parameters and σ0 is the yield surface size. The calibration ofthe six coefficients (Ci, γi) was performed using a single stabilized stress–strain hysteresisloop for each temperature value [4]. This data elaboration was performed by means of theMATLAB “Curve Fitting” Toolbox [27] that allowed us to write custom equations adopted

Appl. Sci. 2022, 12, 3443 5 of 19
in combination with the nonlinear least square method. The corresponding coefficient ofdetermination R2 is equal to 0.98, where R2 is evaluated as follows:
R2 = 1− ∑i (yi − fi)2
∑i (yi − y)2 (7)
where yi are the original experimental data, fi are the predicted values, and y is the meanof the experimental data set [28].
1
Figure 3
Figure 3. Temperature-dependent stress-strain curves for CuCrZr [16].
2.2.2. Creep
The creep phenomenon was analyzed by means of the “combined time hardening”model that describes both primary and secondary creep stages [17]. Such a model incor-porates both time hardening and the Norton model. As time increases, the influence oftime hardening component becomes irrelevant, while the Norton model for the secondarycreep regime starts to be dominant. The material viscous behavior as a function of tempera-ture was governed by the Arrhenius term. The combined time hardening model can bedescribed through the following relationship:
εcr =D1σD2 tD3+1e−
D4T
D3 + 1+ D5σD6 te−
D7T (8)
Material coefficients D1, . . . , D7 are taken from the work of Li et al. [10], and are listedinto Table 1.
Table 1. Material coefficients for combined time hardening law, where stress is expressed in MPa,time in s, and temperature in K [10].
D1 D2 D3 D4 D5 D6 D7
6.05× 10¹⁰ 3 −0.92 23,695 2.82× 10⁻²² 14 23,695
3. Numerical Model Description
Since the maximum heat flux values from the combustion chamber are expected in thethroat, a local model of the throat region of the thrust chamber was examined in order tosave the computation time required to investigate the whole chamber, see Figures 4 and 5.
Appl. Sci. 2022, 12, 3443 6 of 19
Appl. Sci. 2022, 12, 3443 6 of 20
Table 1. Material coefficients for combined time hardening law, where stress is expressed in MPa,
time in s, and temperature in K [10].
D1 D2 D3 D4 D5 D6 D7
6.05 × 10¹⁰ 3 −0.92 23,695 2.82 × 10⁻²² 14 23,695
3. Numerical Model Description
Since the maximum heat flux values from the combustion chamber are expected in
the throat, a local model of the throat region of the thrust chamber was examined in order
to save the computation time required to investigate the whole chamber, see Figures 4 and
5.
Figure 4. Thrust chamber geometry.
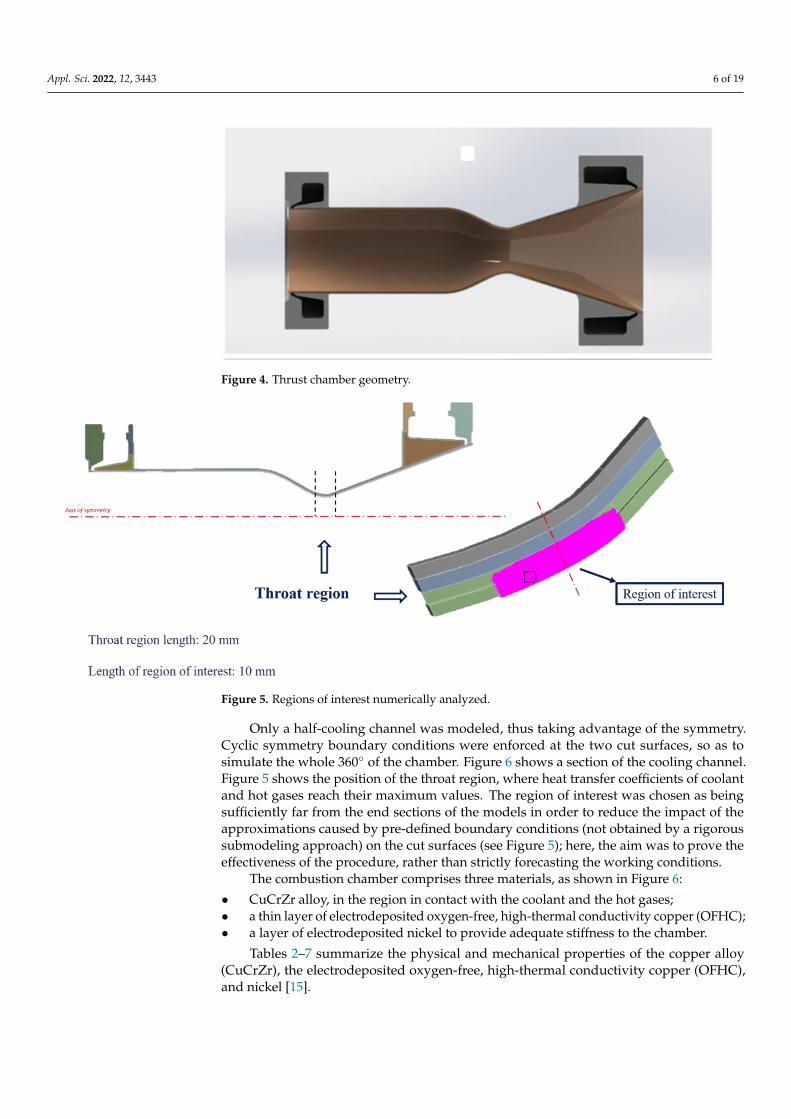
Figure 5. Regions of interest numerically analyzed.
Only a half-cooling channel was modeled, thus taking advantage of the symmetry.
Cyclic symmetry boundary conditions were enforced at the two cut surfaces, so as to sim-
ulate the whole 360° of the chamber. Figure 6 shows a section of the cooling channel. Fig-
ure 5 shows the position of the throat region, where heat transfer coefficients of coolant
and hot gases reach their maximum values. The region of interest was chosen as being
sufficiently far from the end sections of the models in order to reduce the impact of the
approximations caused by pre-defined boundary conditions (not obtained by a rigorous
submodeling approach) on the cut surfaces (see Figure 5); here, the aim was to prove the
effectiveness of the procedure, rather than strictly forecasting the working conditions.
Figure 4. Thrust chamber geometry.
Appl. Sci. 2022, 12, 3443 6 of 20
Table 1. Material coefficients for combined time hardening law, where stress is expressed in MPa,
time in s, and temperature in K [10].
D1 D2 D3 D4 D5 D6 D7
6.05 × 10¹⁰ 3 −0.92 23,695 2.82 × 10⁻²² 14 23,695
3. Numerical Model Description
Since the maximum heat flux values from the combustion chamber are expected in
the throat, a local model of the throat region of the thrust chamber was examined in order
to save the computation time required to investigate the whole chamber, see Figures 4 and
5.
Figure 4. Thrust chamber geometry.
Figure 5. Regions of interest numerically analyzed.
Only a half-cooling channel was modeled, thus taking advantage of the symmetry.
Cyclic symmetry boundary conditions were enforced at the two cut surfaces, so as to sim-
ulate the whole 360° of the chamber. Figure 6 shows a section of the cooling channel. Fig-
ure 5 shows the position of the throat region, where heat transfer coefficients of coolant
and hot gases reach their maximum values. The region of interest was chosen as being
sufficiently far from the end sections of the models in order to reduce the impact of the
approximations caused by pre-defined boundary conditions (not obtained by a rigorous
submodeling approach) on the cut surfaces (see Figure 5); here, the aim was to prove the
effectiveness of the procedure, rather than strictly forecasting the working conditions.
Figure 5. Regions of interest numerically analyzed.
Only a half-cooling channel was modeled, thus taking advantage of the symmetry.Cyclic symmetry boundary conditions were enforced at the two cut surfaces, so as tosimulate the whole 360◦ of the chamber. Figure 6 shows a section of the cooling channel.Figure 5 shows the position of the throat region, where heat transfer coefficients of coolantand hot gases reach their maximum values. The region of interest was chosen as beingsufficiently far from the end sections of the models in order to reduce the impact of theapproximations caused by pre-defined boundary conditions (not obtained by a rigoroussubmodeling approach) on the cut surfaces (see Figure 5); here, the aim was to prove theeffectiveness of the procedure, rather than strictly forecasting the working conditions.
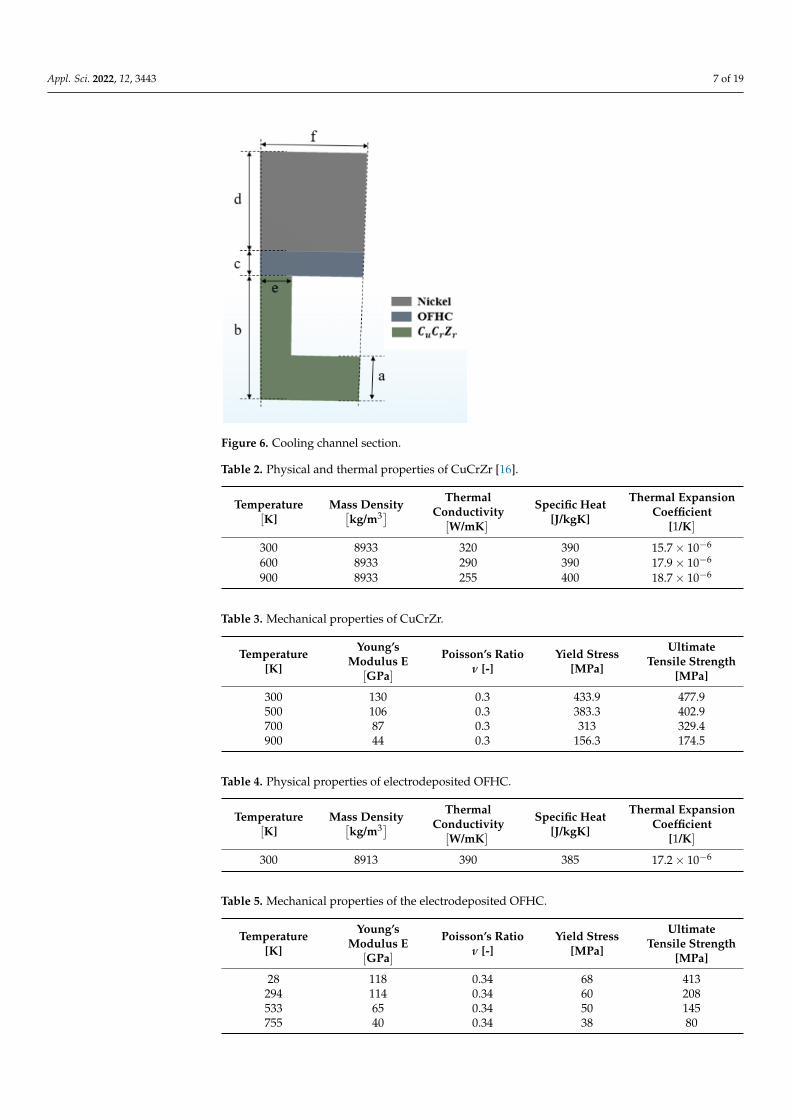
The combustion chamber comprises three materials, as shown in Figure 6:
• CuCrZr alloy, in the region in contact with the coolant and the hot gases;• a thin layer of electrodeposited oxygen-free, high-thermal conductivity copper (OFHC);• a layer of electrodeposited nickel to provide adequate stiffness to the chamber.
Tables 2–7 summarize the physical and mechanical properties of the copper alloy(CuCrZr), the electrodeposited oxygen-free, high-thermal conductivity copper (OFHC),and nickel [15].
Appl. Sci. 2022, 12, 3443 7 of 19Appl. Sci. 2022, 12, 3443 7 of 20
Figure 6. Cooling channel section.
The combustion chamber comprises three materials, as shown in Figure 6:
• CuCrZr alloy, in the region in contact with the coolant and the hot gases;
• a thin layer of electrodeposited oxygen-free, high-thermal conductivity copper
(OFHC);
• a layer of electrodeposited nickel to provide adequate stiffness to the chamber.
Tables 2–7 summarize the physical and mechanical properties of the copper alloy
(CuCrZr), the electrodeposited oxygen-free, high-thermal conductivity copper (OFHC),
and nickel [15].
Table 2. Physical and thermal properties of CuCrZr [16].
Temperature
[𝐊]
Mass Density
[𝐤𝐠 𝐦𝟑⁄ ] Thermal Conductivity
[𝐖 𝐦𝐊⁄ ]
Specific Heat
[𝐉 𝐤𝐠𝐊⁄ ]
Thermal Expan-
sion Coefficient
[𝟏 𝐊⁄ ]
300 8933 320 390 15.7 × 10⁻⁶
600 8933 290 390 17.9 × 10⁻⁶
900 8933 255 400 18.7 × 10⁻⁶
Table 3. Mechanical properties of CuCrZr.
Temperature
[K] Young’s Modulus E
[𝑮𝑷𝒂]
Poisson’s Ratio ν
[-]
Yield Stress
[MPa]
Ultimate Tensile
Strength [MPa]
300 130 0.3 433.9 477.9
500 106 0.3 383.3 402.9
700 87 0.3 313 329.4
900 44 0.3 156.3 174.5
Table 4. Physical properties of electrodeposited OFHC.
Temperature
[𝐊]
Mass Density
[𝐤𝐠 𝐦𝟑⁄ ] Thermal Conductivity
[𝐖 𝐦𝐊⁄ ]
Specific Heat
[𝐉 𝐤𝐠𝐊⁄ ]
Thermal Expan-
sion Coefficient
[𝟏 𝐊⁄ ]
300 8913 390 385 17.2 × 10⁻⁶
Figure 6. Cooling channel section.
Table 2. Physical and thermal properties of CuCrZr [16].
Temperature[K]
Mass Density[kg/m3] Thermal
Conductivity[W/mK]
Specific Heat[J/kgK]
Thermal ExpansionCoefficient
[1/K]
300 8933 320 390 15.7× 10⁻⁶
600 8933 290 390 17.9× 10⁻⁶
900 8933 255 400 18.7× 10⁻⁶
Table 3. Mechanical properties of CuCrZr.
Temperature[K]
Young’sModulus E
[GPa]
Poisson’s Ratioν [-]
Yield Stress[MPa]
UltimateTensile Strength
[MPa]
300 130 0.3 433.9 477.9500 106 0.3 383.3 402.9700 87 0.3 313 329.4900 44 0.3 156.3 174.5
Table 4. Physical properties of electrodeposited OFHC.
Temperature[K]
Mass Density[kg/m3] Thermal
Conductivity[W/mK]
Specific Heat[J/kgK]
Thermal ExpansionCoefficient
[1/K]
300 8913 390 385 17.2× 10⁻⁶
Table 5. Mechanical properties of the electrodeposited OFHC.
Temperature[K]
Young’sModulus E
[GPa]
Poisson’s Ratioν [-]
Yield Stress[MPa]
UltimateTensile Strength
[MPa]
28 118 0.34 68 413294 114 0.34 60 208533 65 0.34 50 145755 40 0.34 38 80
Appl. Sci. 2022, 12, 3443 8 of 19
Table 6. Physical properties of the electrodeposited nickel.
Temperature[K]
Mass Density[kg/m3] Thermal
Conductivity[W/mK]
Specific Heat[J/kgK]
Thermal ExpansionCoefficient
[1/K]
300 8913 90 444 12.2× 10⁻⁶
Table 7. Mechanical properties of the electrodeposited nickel.
Temperature[K]
Young’sModulus E
[GPa]
Poisson’s Ratioν [-]
Yield Stress[MPa]
UltimateTensile Strength
[MPa]
28 193 0.3 344 551
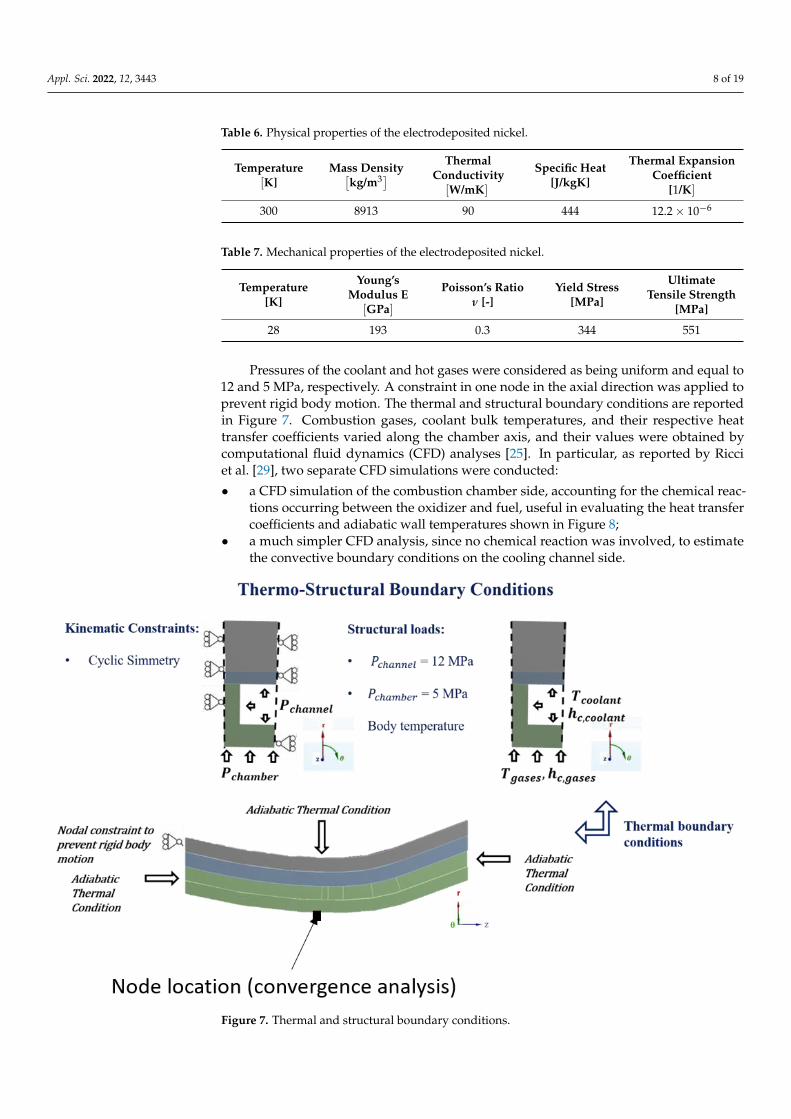
Pressures of the coolant and hot gases were considered as being uniform and equal to12 and 5 MPa, respectively. A constraint in one node in the axial direction was applied toprevent rigid body motion. The thermal and structural boundary conditions are reportedin Figure 7. Combustion gases, coolant bulk temperatures, and their respective heattransfer coefficients varied along the chamber axis, and their values were obtained bycomputational fluid dynamics (CFD) analyses [25]. In particular, as reported by Ricciet al. [29], two separate CFD simulations were conducted:
• a CFD simulation of the combustion chamber side, accounting for the chemical reac-tions occurring between the oxidizer and fuel, useful in evaluating the heat transfercoefficients and adiabatic wall temperatures shown in Figure 8;
• a much simpler CFD analysis, since no chemical reaction was involved, to estimatethe convective boundary conditions on the cooling channel side.
Appl. Sci. 2022, 12, 3443 9 of 20
Figure 7. Thermal and structural boundary conditions.
Figure 8. Convective boundary conditions.
Figure 7. Thermal and structural boundary conditions.

Appl. Sci. 2022, 12, 3443 9 of 19
Appl. Sci. 2022, 12, 3443 9 of 20
Figure 7. Thermal and structural boundary conditions.
Figure 8. Convective boundary conditions. Figure 8. Convective boundary conditions.
A convergence analysis on the FEM mesh was carried out in order to identify the bestsuited numerical grid to be considered in the analyses, see Figure 9. In particular, in orderto illustrate that grid convergence is reached, a node on the internal surface of the coolingchannel, where maximum temperatures and plastic strains are envisaged, was selected(see Figure 7).
Appl. Sci. 2022, 12, 3443 10 of 20
Figure 9. FEM mesh adopted in the numerical analyses as derived from the convergence analysis.
4. Thermal–Structural Cycle Description
Each thermal–structural loading cycle consisted of three sequential phases:
• a purging phase of 3 s, in which the liquid oxygen is injected into the channels to
eliminate any waste;
• an ignition transient phase of 3 s, in which the thermal loads are activated;
• the hot phase of 100 s, during which the creep analysis is activated.
No combustion occurs in the thrust chamber in the first three seconds and, therefore,
heat convective transfer coefficients and pressures are null. During the ignition phase,
combustion occurs, and chamber pressures and convective heat fluxes are generated on
the internal surface. The hot phase lasts 100 s, during which creep effects are considered.
Table 9 summarizes the load steps and the corresponding time steps ∆t adopted in the
thermal–structural analyses.
Table 9. Load and time steps considered in the numerical analyses.
Load Steps [-] ∆t [s] Duration [s] Phase
10 0.1 1 Purging
5 0.4 2 Purging
15 0.2 3 Ignition Transient
1 100 100 Hot Phase
5. Life prediction models
5.1. Ratcheting
With regard to ratcheting, the accumulation of plastic strain 휀𝑒𝑞 was evaluated by
summing up the increment of plastic strain, cycle after cycle:
휀𝑒𝑞 = ∑ ∆휀𝑒𝑞,𝑖
𝑖
(9)
where the subscript 𝑖 refers to the 𝑖𝑡ℎ cycle. The increment in the 𝑖𝑡ℎ cycle was evalu-
ated by means of the following relationship:
Figure 9. FEM mesh adopted in the numerical analyses as derived from the convergence analysis.
Plastic strains, creep strains, and temperature values were compared for three gridconfigurations characterized by four, six and eight elements in the ligament thickness(Figure 9 shows the “eight elements” configuration). In Table 8, the results obtained at theend of the “hot phase” are summarized. The same considerations could be done for othernodes, but for the sake of simplicity, no other results are shown. The computation timeneeded to perform a thermo-structural analysis with 35 loading cycles is 70 h, adopting atwo-core processor.

Appl. Sci. 2022, 12, 3443 10 of 19
Table 8. Plastic strains, creep strains, and temperature values at the end of the hot phase.
Number of Elements in theLigament Thickness [-]
Equivalent CreepStrain [-]
Equivalent PlasticStrain [-] Temperature [K]
4 0.004896 0.001415 5566 0.00497 0.001541 5568 0.00499 0.001599 556
4. Thermal–Structural Cycle Description
Each thermal–structural loading cycle consisted of three sequential phases:
• a purging phase of 3 s, in which the liquid oxygen is injected into the channels toeliminate any waste;
• an ignition transient phase of 3 s, in which the thermal loads are activated;• the hot phase of 100 s, during which the creep analysis is activated.
No combustion occurs in the thrust chamber in the first three seconds and, therefore,heat convective transfer coefficients and pressures are null. During the ignition phase,combustion occurs, and chamber pressures and convective heat fluxes are generated onthe internal surface. The hot phase lasts 100 s, during which creep effects are considered.Table 9 summarizes the load steps and the corresponding time steps ∆t adopted in thethermal–structural analyses.
Table 9. Load and time steps considered in the numerical analyses.
Load Steps [-] ∆t [s] Duration [s] Phase
10 0.1 1 Purging5 0.4 2 Purging15 0.2 3 Ignition Transient1 100 100 Hot Phase
5. Life Prediction Models5.1. Ratcheting
With regard to ratcheting, the accumulation of plastic strain εeq was evaluated bysumming up the increment of plastic strain, cycle after cycle:
εeq = ∑i
∆εeq,i (9)
where the subscript i refers to the ith cycle. The increment in the ith cycle was evaluated bymeans of the following relationship:
∆εeq,i =1
√2(1 + ν
)√(∆εxx,i − ∆εyy,i)2
+(∆εyy,i − ∆εzz,i
)2+ (∆εzz,i − ∆εxx,i)
2 +32
(∆γ2
xy,i + ∆γ2yz,i + ∆γ2
zx,i
)(10)
where ∆ε jk,i are evaluated as follows:
∆ε jk,i= ε jk,e − ε jk,b (11)
with ε jk,e and ε jk,b representing the plastic strain at the end and at the beginning of the ithcycle (j = x, y, z; k = x, y, z), respectively.
A significant number of thermal–mechanical cycles was simulated so as to be asaccurate as possible in simulating the ratcheting phenomenon and evaluating whether itoccurs in the ligament of the thrust chamber. If ratcheting stopped, no contribution of theplastic instability would be considered when evaluating the total usage factor, which sumsthe effects of creep, fatigue, and ratcheting. On the other hand, if ratcheting increased, witha continuous increment of plastic strains after a significant number of cycles, the service life

Appl. Sci. 2022, 12, 3443 11 of 19
of the cooling channel Ni associated with plastic instability was evaluated by means of anextrapolation of the obtained plastic strain curve, up to reaching the elongation at break εu.
5.2. Creep
The number of cycles to failure Nc, as coming from the creep phenomenon, wasevaluated by the following relationship:
Nc =tdamage
tcycle(12)
where tdamage is the temperature-dependant rupture time for a steady stress state σg and tcycleis the time interval during which the creep phenomenon occurs, see Figure 10 where theexperimental curves refer to one-dimensional creep tests at several temperature values [16].
Appl. Sci. 2022, 12, 3443 11 of 20
∆휀𝑒𝑞,𝑖 =1
√2(1 + 𝜈)√(∆휀𝑥𝑥,𝑖 − ∆휀𝑦𝑦,𝑖)
2+ (∆휀𝑦𝑦,𝑖 − ∆휀𝑧𝑧,𝑖)
2+ (∆휀𝑧𝑧,𝑖 − ∆휀𝑥𝑥,𝑖)
2+
3
2(∆𝛾𝑥𝑦,𝑖
2 + ∆𝛾𝑦𝑧,𝑖2 + ∆𝛾𝑧𝑥,𝑖
2 ) (10)
where ∆휀𝑗𝑘,𝑖 are evaluated as follows:
∆휀𝑗𝑘,𝑖 = 휀𝑗𝑘,𝑒 − 휀𝑗𝑘,𝑏 (11)
with 휀𝑗𝑘,𝑒 and 휀𝑗𝑘,𝑏 representing the plastic strain at the end and at the beginning of the
𝑖𝑡ℎ cycle (j = x, y, z; k = x, y, z), respectively.
A significant number of thermal–mechanical cycles was simulated so as to be as ac-
curate as possible in simulating the ratcheting phenomenon and evaluating whether it
occurs in the ligament of the thrust chamber. If ratcheting stopped, no contribution of the
plastic instability would be considered when evaluating the total usage factor, which
sums the effects of creep, fatigue, and ratcheting. On the other hand, if ratcheting in-
creased, with a continuous increment of plastic strains after a significant number of cycles,
the service life of the cooling channel 𝑁𝑖 associated with plastic instability was evaluated
by means of an extrapolation of the obtained plastic strain curve, up to reaching the elon-
gation at break 휀𝑢.
5.2. Creep
The number of cycles to failure 𝑁𝑐, as coming from the creep phenomenon, was eval-
uated by the following relationship:
𝑁𝑐 =𝑡𝑑𝑎𝑚𝑎𝑔𝑒
𝑡𝑐𝑦𝑐𝑙𝑒 (12)
where 𝑡𝑑𝑎𝑚𝑎𝑔𝑒 is the temperature-dependant rupture time for a steady stress state 𝜎𝑔
and 𝑡𝑐𝑦𝑐𝑙𝑒 is the time interval during which the creep phenomenon occurs, see Figure 10
where the experimental curves refer to one-dimensional creep tests at several temperature
values [16].
Figure 10. Steady stress vs. damage time [16].
When the pressure in the cooling channel is low, the tangential compressive stresses
arising during the hot phase remain compressive up to the end of the creep period; on the
contrary, if the pressure in the cooling channel is high, the compressive stresses rapidly
Figure 10. Steady stress vs. damage time [16].
When the pressure in the cooling channel is low, the tangential compressive stressesarising during the hot phase remain compressive up to the end of the creep period; on thecontrary, if the pressure in the cooling channel is high, the compressive stresses rapidlyrelax and become tensile before the end of the hot phase. In the former case, creep is not apotential failure mode, while in the latter, creep rupture damage could occur.
An analytical relationship between the equivalent stress and the number of cyclesto failure was used by adopting a multiple linear regression model to fit the CuCrZrexperimental creep tests.
The following relationship between steady state stress σg and tdamage was derived:
σg = A + B·(
tdamage
)−0.28+ C·T −→ tdamage (13)
where A, B, and C are constants equal to 596.87 MPa, 799.87 MPa s0.28, and −0.72 MPa/K,respectively. The corresponding coefficient of determination, R2, is equal to 0.95.
In the next section it will be shown that, in the present test case, compressive stressesdo not reverse to tensile ones, making, in such a way, the creep rupture damage not relevant.
5.3. Multiaxial LCF—Non Proportional Loading
Many structural components, such as thrust chambers, experience complex mechanicaland thermal loads during their normal working conditions. Such loads can generate multi-axial stress–strain histories and also changes in the principal stress directions. Therefore,

Appl. Sci. 2022, 12, 3443 12 of 19
fatigue criteria, taking into account both multi-axiality and non-proportional loading, haveto be adopted in these cases [18,19,30,31]. Most of the fatigue criteria propose to estimatethe value of a uniaxial equivalent strain, which can be considered as being equivalentto the multiaxial strain field. The relationship between this uniaxial equivalent strainand the number of cycles to failure can be obtained through the Basquin–Manson–Coffinrelationship [30], represented through the following equation:
εa,eq =σ′f − 2σn,mean
E(2N f )
b + ε′f (2N f )
c (14)
where the fatigue strength coefficient σ′f and exponent b are parameters of Basquin law,
whereas fatigue ductility coefficient ε′f and exponent c are parameters of Coffin–Manson
curve, σn,mean represents the mean stress normal to the maximum shear plane, and 2Nf isthe number of reversals to failure.
The Wang-Brown criterion is based on a critical plane approach. As demonstratedthrough numerous experiments [14], fatigue life is usually dominated by crack–growthalong either shear planes or tensile planes. This criterion is then based on the idea thatshear strains help to nucleate cracks, while normal strain contributes to their growth. Theamplitude of the equivalent strain is evaluated according to the following equation:
εa,eq =γmax + Sδεn
1 + υ′ + S(1− υ′)(15)
where γmax is the maximum shear strain amplitude on the critical plane, δεn is the normalstrain excursion, and υ′ is the effective Poisson’s ratio. The experimental data regardingfatigue tests on CuCrZr coupons are reported in Figure 11 [16]. An analytical relationshipbetween the equivalent strain amplitude and the number of cycles to failure was evaluatedby adopting a multiple linear regression model to fit the CuCrZr experimental fatiguetests. Then, the equivalent strain amplitude εa,eq, estimated according to the Wang-Brownmethod, was used to estimate the fatigue life according to the following relationship:
εa,eq = D + H( N f
10, 000
)− 0.25T1000
+ FT
1000(16)
where D, H, and F are constants set as equal to 0.1684, 0.4580, and −0.5987, respectively.The corresponding coefficient of determination, R2, is equal to 0.96.
Appl. Sci. 2022, 12, 3443 13 of 20
Figure 11. Strain range vs. number of cycles to failure [16].
Finally, a usage factor 𝑈𝐹 was defined in order to sum the effects of all the described
thermal–mechanical phenomena:
𝑈𝐹 =1
𝑁 (17)
whereas the total number of cycles prior to failure 𝑁𝑡𝑜𝑡 was evaluated as:
𝑁𝑡𝑜𝑡 =1
𝑈𝐹𝑡𝑜𝑡=
1
𝑈𝐹𝑖 + 𝑈𝐹𝑐 + 𝑈𝐹𝑓=
1
1𝑁𝑖
+1
𝑁𝑐+
1𝑁𝑓
(18)
where 𝑈𝐹𝑖, 𝑈𝐹𝑐, and 𝑈𝐹𝑓 are, respectively, the usage factors associated with plastic insta-
bility, creep, and low-cycle fatigue.
6. Results and Discussions
The main results of the thermal–mechanical analyses performed on the throat regions
are described in this paragraph. Figure 12 shows the temperature and the von Mises stress
contour plots for the CuCrZr liner at the end of the purging phase, 0.3 s after starting the
ignition phase, and at the end of it. The maximum temperature value of 545 K was still
too small for the creep failure occurrence. Indeed, as shown in Figure 12, the lowest tem-
perature value considered in the creep tests is about 100 K greater than the maximum
temperature value obtained in the thermal analysis. Furthermore, the ligament compres-
sive stresses in the tangential direction detected in the hot phase remain compressive up
to the end of the creep period. Therefore, no creep failure evaluations were needed for the
life assessment. On the other hand, creep failure can become dominant when higher thrust
levels are required; in fact, higher pressure values are expected in the thrust chamber in
this case. However, it is clear that creep relaxation strongly influences the stress–strain
response of the structure, leading to an asymmetrical hysteresis curve, which is the cause
of an accumulation of tensile plastic strains in the ligament (see Figure 13). Creep effects
produce an upward trend of the stress–strain curve, leading to yielding in tension during
the following purging phase.
Figure 11. Strain range vs. number of cycles to failure [16].
Appl. Sci. 2022, 12, 3443 13 of 19
Finally, a usage factor UF was defined in order to sum the effects of all the describedthermal–mechanical phenomena:
UF =1N
(17)
whereas the total number of cycles prior to failure Ntot was evaluated as:
Ntot =1
UFtot=
1UFi + UFc + UFf
=1
1Ni
+ 1Nc
+ 1N f
(18)
where UFi, UFc, and UFf are, respectively, the usage factors associated with plastic instabil-ity, creep, and low-cycle fatigue.
6. Results and Discussions
The main results of the thermal–mechanical analyses performed on the throat regionsare described in this paragraph. Figure 12 shows the temperature and the von Mises stresscontour plots for the CuCrZr liner at the end of the purging phase, 0.3 s after startingthe ignition phase, and at the end of it. The maximum temperature value of 545 K wasstill too small for the creep failure occurrence. Indeed, as shown in Figure 12, the lowesttemperature value considered in the creep tests is about 100 K greater than the maximumtemperature value obtained in the thermal analysis. Furthermore, the ligament compressivestresses in the tangential direction detected in the hot phase remain compressive up to theend of the creep period. Therefore, no creep failure evaluations were needed for the lifeassessment. On the other hand, creep failure can become dominant when higher thrustlevels are required; in fact, higher pressure values are expected in the thrust chamber inthis case. However, it is clear that creep relaxation strongly influences the stress–strainresponse of the structure, leading to an asymmetrical hysteresis curve, which is the causeof an accumulation of tensile plastic strains in the ligament (see Figure 13). Creep effectsproduce an upward trend of the stress–strain curve, leading to yielding in tension duringthe following purging phase.
On the other hand, when creep is not modeled, the ligament tensile yielding couldnot occur and, in turn, a stabilization of the stress–strain curve could be envisaged aftera few cycles, leading to a non-conservative estimation of the thrust chamber service life.Therefore, the creep modeling is crucial when studying the ratcheting behavior of thecooling channel. Particularly, primary creep effects, i.e., when creep deformation rate isnot constant, are dominant with respect to secondary creep ones, especially in the firstten loading cycles.
With regard to purging and ignition phases, a significant number of time steps wereconsidered (see Table 9). This was due to their very small duration and because very highthermal gradients stresses could be reached especially in initial time intervals. Conse-quently, a coarse time discretization of these phases could lead to inaccurate results in termsof accumulated plastic strains.
Plastic strains at the end of the ignition phase were reported in Figure 14. It was clearthat the tangential strains were dominant with respect to other directions. However, theaxial strains were non-negligible, since their maximum value was about one third of themaximum plastic strain in the tangential direction. This demonstrated the need to adopt amultiaxial fatigue criteria.

Appl. Sci. 2022, 12, 3443 14 of 19
2
Figure 12
Figure 12. Temperature and von Mises stress contour plots: (a) end of purging phase, (b) 0.3 s fromthe start of the ignition phase, (c) end of the ignition phase.
3
Figure 13 Figure 13. Circumferential stress vs. time.

Appl. Sci. 2022, 12, 3443 15 of 19Appl. Sci. 2022, 12, 3443 16 of 20
Figure 14. Plastic strains at the end of the ignition phase.
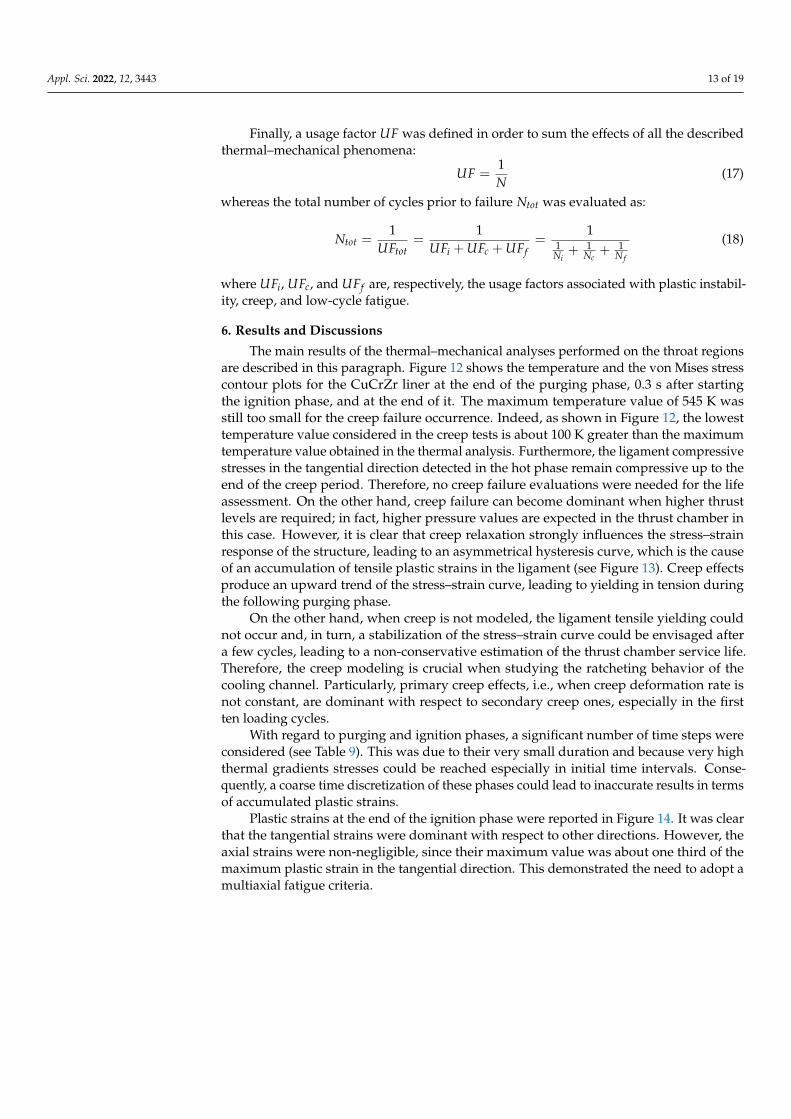
Figures 15 and 16 show that the equivalent plastic strain increased cycle after cycle
as a consequence of thermal ratcheting occurring in the ligament. The chosen kinematic
hardening model with the three back stresses was capable of simulating ratcheting phe-
nomena even after ten thermal–mechanical cycles. This result is in accordance with the
results obtained in [3], showing that at least three Frederick–Armstrong kinematic hard-
ening models should be considered when employing the Chaboche model, in order to
properly allow for ratcheting. In fact, if just two hardening models were considered, the
shakedown effect would anyway occur after very few cycles. A trendline was extrapo-
lated from the FEM results and a stabilization of the equivalent plastic strains is expected
to happen within 30–35 cycles, see Figure 16. As illustrated in Figures 15–17, the increment
of plastic strain decreased cycle after cycle. Therefore, it is very likely that a stabilization
of the stress–strain curve could occur, even though there is no assurance that it will hap-
pen. In this case, LCF could then become the only type of possible failure for the cooling
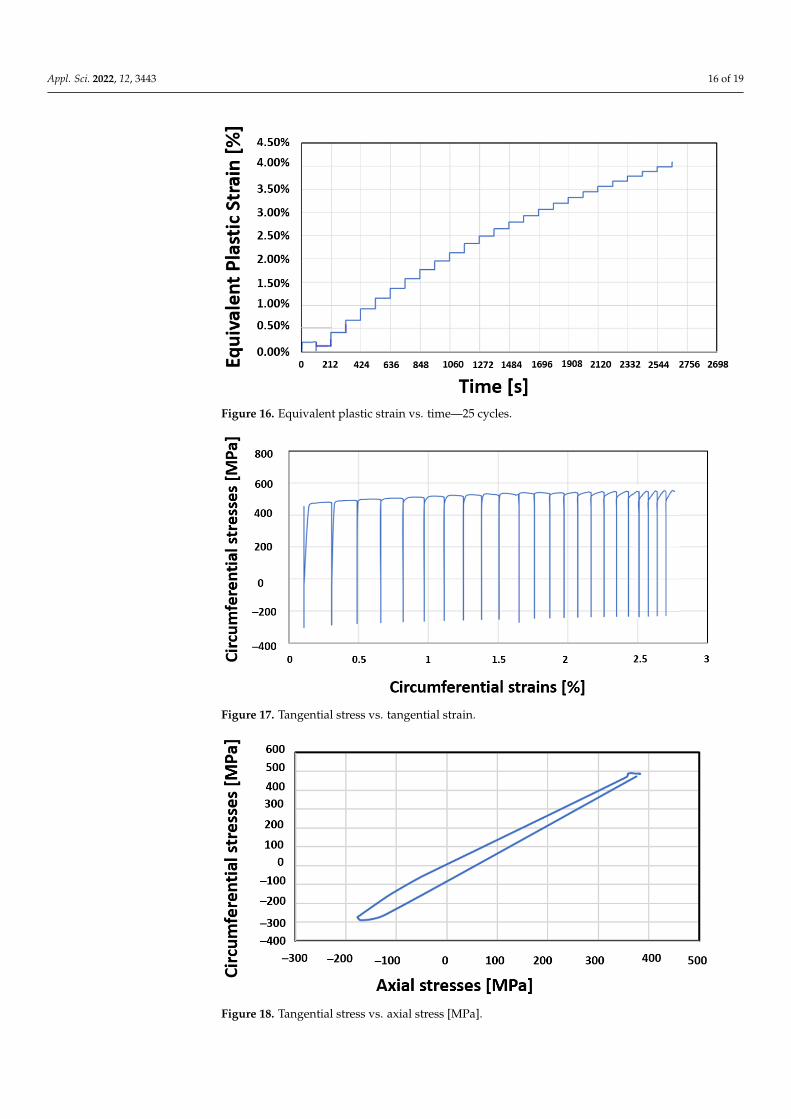
channel. Non-proportional loading effects should be considered; as a matter of fact, the
plot of tangential stress vs. tangential strain for a node on the internal surface of the cham-
ber does not depict a straight line passing through the origin of the axes, see Figure 18.
Finally, fatigue evaluations were carried out adopting the Wang-Brown criterion.
Figure 19 shows the service life contour plot obtained employing the abovementioned
criterion, highlighting the minimum value of 4776 cycles.
Figure 14. Plastic strains at the end of the ignition phase.
Figures 15 and 16 show that the equivalent plastic strain increased cycle after cycleas a consequence of thermal ratcheting occurring in the ligament. The chosen kinematichardening model with the three back stresses was capable of simulating ratcheting phe-nomena even after ten thermal–mechanical cycles. This result is in accordance with theresults obtained in [3], showing that at least three Frederick–Armstrong kinematic hard-ening models should be considered when employing the Chaboche model, in order toproperly allow for ratcheting. In fact, if just two hardening models were considered, theshakedown effect would anyway occur after very few cycles. A trendline was extrapolatedfrom the FEM results and a stabilization of the equivalent plastic strains is expected tohappen within 30–35 cycles, see Figure 16. As illustrated in Figures 15–17, the increment ofplastic strain decreased cycle after cycle. Therefore, it is very likely that a stabilization ofthe stress–strain curve could occur, even though there is no assurance that it will happen.In this case, LCF could then become the only type of possible failure for the cooling channel.Non-proportional loading effects should be considered; as a matter of fact, the plot oftangential stress vs. tangential strain for a node on the internal surface of the chamber doesnot depict a straight line passing through the origin of the axes, see Figure 18.
Appl. Sci. 2022, 12, 3443 17 of 20
Figure 15. Equivalent plastic strain evolution with number of cycles.
Figure 16. Equivalent plastic strain vs. time—25 cycles.
Figure 15. Equivalent plastic strain evolution with number of cycles.
Appl. Sci. 2022, 12, 3443 16 of 19
Appl. Sci. 2022, 12, 3443 17 of 20
Figure 15. Equivalent plastic strain evolution with number of cycles.
Figure 16. Equivalent plastic strain vs. time—25 cycles. Figure 16. Equivalent plastic strain vs. time—25 cycles.
Appl. Sci. 2022, 12, 3443 18 of 20
Figure 17. Tangential stress vs. tangential strain.
Figure 18. Tangential stress vs. axial stress [MPa].
Figure 19. Number of cycles to failure—Wang-Brown criterion.
Figure 17. Tangential stress vs. tangential strain.
Appl. Sci. 2022, 12, 3443 18 of 20
Figure 17. Tangential stress vs. tangential strain.
Figure 18. Tangential stress vs. axial stress [MPa].
Figure 19. Number of cycles to failure—Wang-Brown criterion.
Figure 18. Tangential stress vs. axial stress [MPa].

Appl. Sci. 2022, 12, 3443 17 of 19
Finally, fatigue evaluations were carried out adopting the Wang-Brown criterion.Figure 19 shows the service life contour plot obtained employing the abovementionedcriterion, highlighting the minimum value of 4776 cycles.
Appl. Sci. 2022, 12, 3443 18 of 20
Figure 17. Tangential stress vs. tangential strain.
Figure 18. Tangential stress vs. axial stress [MPa].
Figure 19. Number of cycles to failure—Wang-Brown criterion.
Figure 19. Number of cycles to failure—Wang-Brown criterion.
7. Conclusions
A numerical investigation was conducted with the aim of predicting the service lifeof a liquid rocket engine thrust chamber. The throat region of the chamber was examined,since the maximum heat fluxes coming from the combustion chamber were expected tooccur in this area. A damage model accounting for creep, plastic instability, and multiaxiallow-cycle fatigue was adopted to estimate the service life of the chamber.
Results demonstrated that the influence of creep on the thrust chamber failure isnegligible with the current geometry, whereas ratcheting is expected to stop after about30–35 thermal–mechanical loading cycles. Low-cycle fatigue might therefore be the primarycause of failure and, adopting the Wang-Brown multi-axial fatigue criterion, the coolingchannel in the throat region was calculated to withstand more than 4000 cycles. This resultwas consistent with those achieved with similar geometries and loading conditions.
In general, the present work allows us to understand the main factors the designershould consider when sizing a thrust chamber. As an example, the cooling efficiency shouldbe as high as possible in order to reduce temperatures, thermal gradients, and stresses inthe throat area, where creep could become a major factor, limiting the service life of thechamber significantly. Furthermore, creep should always be modeled with high fidelitynumerical models because it can deeply affect the stress–strain behavior of the component.
As a future activity, submodeling approaches will be adopted in order to obtain morerealistic boundary conditions in the cut sections of the local model. A damage model willbe also implemented so as to predict the local damage initiation and its further evolutionthrough the material.
Author Contributions: Conceptualization, M.F., R.C., V.G. and M.P.; Data curation, M.F., M.P., V.G.and R.C.; Investigation, M.F., V.G., R.C. and M.P.; Writing—original draft, M.F. and R.C. All authorshave read and agreed to the published version of the manuscript.
Funding: This research received no external funding.
Institutional Review Board Statement: Not applicable.
Informed Consent Statement: Not applicable.
Data Availability Statement: Not applicable.
Acknowledgments: This research has been supported by the Italian Ministry of University andResearch (MIUR), in the frame of the HYPROB Program.
Conflicts of Interest: The authors declare no conflict of interest.

Appl. Sci. 2022, 12, 3443 18 of 19
References1. Chaboche, J.L. Time-independent constitutive theories for cyclic plasticity. Int. J. Plast. 1986, 2, 149–188. [CrossRef]2. Chaboche, J.L. A review of some plasticity and viscoplasticity constitutive theories. Int. J. Plast. 2008, 24, 1642–1693. [CrossRef]3. Asraff, A.K.; Sheela, S.; Paul, A.; Mathew, A.; Savithri, S. Cyclic stress analysis of a rocket engine thrust chamber using chaboche,
voce and creep constitutive models. Trans. Indian Inst. Met. 2016, 69, 495–500. [CrossRef]4. Palma, M.D. Hardening parameters for modelling of CuCrZr and OFHC copper under cyclic loadings. In Proceedings of the 2013
IEEE 25th Symposium on Fusion Engineering (SOFE), San Francisco, CA, USA, 10–14 June 2013; pp. 1–5. [CrossRef]5. Song, J.; Sun, B. Thermal-structural analysis of regeneratively-cooled thrust chamber wall in reusable LOX/Methane rocket
engines. Chin. J. Aeronaut. 2017, 30, 1043–1053. [CrossRef]6. Riccius, J.R.; Haidn, O.J.; Zametaev, E.B. Influence of time dependent effects on the estimated life time of liquid rocket combustion
chamber walls. In Proceedings of the 40th AIAA/ASME/SAE/ASEE Joint Propulsion Conference and Exhibit, Fort Lauderdale,FL, USA, 11–14 July 2004.
7. Thiede, R.G.; Riccius, J.R.; Reese, S. Life prediction of rocket combustion-chamber-type thermomechanical fatigue panels. J.Propuls. Power 2017, 33, 1529–1542. [CrossRef]
8. Riccius, J.; Hilsenbeck, M.; Haidn, O. Optimization of geometric parameters of cryogenic liquid rocket combustion chambers. InProceedings of the 37th Joint Propulsion Conference and Exhibit, Salt Lake City, UT, USA, 8–11 July 2001.
9. You, J.-H.; Miskiewicz, M. Material parameters of copper and CuCrZr alloy for cyclic plasticity at elevated temperatures. J. Nucl.Mater. 2008, 373, 269–274. [CrossRef]
10. Li, G.; Thomas, B.G.; Stubbins, J.F. Modeling creep and fatigue of copper alloys. Metall. Mater. Trans. A 2000, 31, 2491–2502.[CrossRef]
11. Ferraiuolo, M.; Russo, V.; Vafai, K. A comparative study of refined and simplified thermo-viscoplastic modeling of a thrustchamber with regenerative cooling. Int. Commun. Heat Mass Transf. 2016, 78, 155–162. [CrossRef]
12. Ferraiuolo, M.; Petrillo, W.; Riccio, W. On the thermo-structural response of a composite closeout in a regeneratively cooled thrustchamber. Aerosp. Sci. Technol. 2017, 71, 402–411. [CrossRef]
13. Golan, O.; Arbel, A.; Eliezer, D.; Moreno, D. The applicability of Norton’s creep power law and its modified version to asingle-crystal superalloy type CMSX-2. Mater. Sci. Eng. A 1996, 216, 125–130. [CrossRef]
14. Wang, C.H.; Brown, M.W. A path-independent parameter for fatigue under proportional and non-proportional loading. FatigueFract. Eng. Mater. Struct. 1993, 16, 1285–1297. [CrossRef]
15. Ferraiuolo, M.; Leo, M.; Citarella, R. On the adoption of global/local approaches for the thermomechanical analysis and design ofliquid rocket engines. Appl. Sci. 2020, 10, 7664. [CrossRef]
16. Porowski, J.S.; O’Donnell, W.; Badlani, M.L.; Kasraie, B.; Kasper, H.J. Simplified design and life prediction of rocket thrustchambers. J. Spacecr. Rocket. 1985, 22, 181–187. [CrossRef]
17. Calì, C.; Cricrì, G.; Perrella, M. An advanced creep model allowing for hardening and damage effects. Strain 2010, 46, 347–357.[CrossRef]
18. Giannella, V.; Citarella, R.; Fellinger, J.; Esposito, R. LCF assessment on heat shield components of nuclear fusion experiment“Wendelstein 7-X” by critical plane criteria. Procedia Struct. Integr. 2018, 8, 318–331. [CrossRef]
19. Giannella, V.; Citarella, R.; Fellinger, J.; Esposito, R. Multiaxial LCF assessment on plasma facing components of nuclear fusionexperiment wendelstein 7-X. In Proceedings of the 23rd Conference of the Italian Association of Theoretical and AppliedMechanics (AIMETA 2017), Salerno, Italy, 4–7 September 2017; Volume 1, pp. 1047–1061.
20. Citarella, R.; Giannella, V.; Vivo, E.; Mazzeo, M. FEM-DBEM approach for crack propagation in a low pressure aeroengine turbinevane segment. Theor. Appl. Fract. Mech. 2016, 86, 143–152. [CrossRef]
21. Giannella, V.; Vivo, E.; Mazzeo, M.; Citarella, R. FEM-DBEM approach to simulate crack propagation in a turbine vane segmentundergoing a fatigue load spectrum. Procedia Struct. Integr. 2018, 12, 479–491. [CrossRef]
22. Fellinger, J.; Citarella, R.; Giannella, V.; Herold, F.; Stadler, R. Overview of fatigue life assessment of baffles in Wendelstein 7-X.Fusion Eng. Des. 2018, 136, 292–297. [CrossRef]
23. Sepe, R.; Giannella, V.; Greco, A.; De Luca, A. Fem simulation and experimental tests on the smaw welding of a dissimilar t-joint.Metals 2021, 11, 1016. [CrossRef]
24. Liu, D.; Sun, B.; Wang, T.; Song, J.; Zhang, J. Thermo-structural analysis of regenerative cooling thrust chamber cylinder segmentbased on experimental data. Chin. J. Aeronaut. 2019, 33, 102–115. [CrossRef]
25. Ferraiuolo, M.; Ricci, D.; Battista, F.; Roncioni, P.; Salvatore, V. Thermo-structural and thermo-fluid dynamics analyses supportingthe design of the cooling system of a methane liquid rocket engine. In Proceedings of the ASME 2014 International MechanicalEngineering Congress and Exposition, Montreal, QC, Canada, 14–20 November 2014; Volume 1. [CrossRef]
26. Bari, S.; Hassan, T. Anatomy of coupled constitutive models for ratcheting simulation. Int. J. Plast. 2000, 16, 381–409. [CrossRef]27. Marzec, J.; Marzec, L.; Martus, P.; Zips, D.; Müller, A.-C. MATLAB®-based fitting method to evaluate survival fractions after
multimodal treatment. Clin. Transl. Radiat. Oncol. 2018, 10, 36–41. [CrossRef]28. Steel, R.G.D.; Torrie, J.H. Principles and Procedures of Statistics; With Special Reference to the Biological Sciences; McGraw-Hill
Book Company: New York, NY, USA; Toronto, ON, Canada; London, UK, 1960. [CrossRef]29. Ricci, D.; Battista, F.; Fragiacomo, M. Numerical investigation on the thermal behaviour of a LOx/LCH4 demonstrator cooling
system. Aerospace 2021, 8, 151. [CrossRef]

Appl. Sci. 2022, 12, 3443 19 of 19
30. Itoh, T.; Sakane, M.; Ohsuga, K. Multiaxial low cycle fatigue life under non-proportional loading. Int. J. Press. Vessel. Pip. 2013,110, 50–56. [CrossRef]
31. Gowhari-Anaraki, A.R.; Hardy, S.J. Low cycle fatigue life predictions for hollow tubes with axially loaded axisymmetric internalprojections. J. Strain Anal. Eng. Des. 1991, 26, 133–146. [CrossRef]