FEM for Impact Energy Absorption with Safety Plastic
12
8 th International LS-DYNA Users Conference Crash/Safety (2) 5-57 FEM for Impact Energy Absorption with Safety Plastic Iulian Lupea, Joel Cormier and Sital Shah The Oakwood Group Abstract For the engineering design process to benefit from finite element modeling (FEM), it must adequately represent any condition being studied. This paper presents methodologies for using the LS-DYNA non-linear finite element solver to model a patented energy absorbing technology called SafetyPlastic ® . SafetyPlastic ® offers a performance, cost, and mass competitive energy management solution, and has been embraced by the automotive industry in both head and side impact occupant protection applications. It is characterized by a connected plurality of structural recesses that repeatedly give resistance, and then buckle when impacted. Due to the nature of SafetyPlastic ® and its preferred manufacturing method, a somewhat unique FEM challenge presents itself. The paper provides details related to: • Modeling the strain rate dependent polymeric materials used in SafetyPlastic ® • Using a proper mesh size; • Specification of the mesh pattern suitable for the assumptions made when manually inputting thickness profile; • Predicting the wall thickness profile for thermoformed designs via FEM with T-SIM ® software; • Transferring and mapping data between T-SIM ® and LS-DYNA for FEM; • Selecting the proper responses to evaluate the FEM versus experiment results; • Validating the FEM via quasi static and dynamic impacts with a flat plate; • Validating the FEM via dynamic impacts with a free motion headform; • Assessing the correlation of FEM with experimental results; • Optimizing the size and shape of recesses to promote annular buckling. The data presented show that FEM with LS-DYNA can be performed today with a degree of accuracy that will aid upfront SafetyPlastic ® design. This leads to the prospect of conducting optimization studies via design of experiments or otherwise without prototype tooling expenses. However, there is room to improve the overall synchronization of a simulated SafetyPlastic® impact response with a real one. Work to refine and better the FEM methodology is an ongoing effort. 1. Introduction For the engineering design process to benefit from finite element modeling (FEM), it must be as representative as possible of the condition being studied. This paper presents a methodology for using the LS-DYNA non-linear finite element solver to model a patented energy absorbing technology called SafetyPlastic ® [3], [12], [13]. SafetyPlastic ® is characterized by a connected plurality of structural recesses that repeatedly give resistance, and then buckle when impacted. The recesses take the form of truncated cones, which henceforth will be referred to as ‘cones’. SafetyPlastic ® offers a performance, cost, and mass competitive energy management solution, and has been embraced by the automotive industry in both head and side impact occupant protection applications. In either case, the manufactured countermeasure is mounted between the interior trim and the body structure where space is usually limited. Designs can and do vary
-
Upload
independent -
Category
Documents
-
view
0 -
download
0
Transcript of FEM for Impact Energy Absorption with Safety Plastic

8th International LS-DYNA Users Conference Crash/Safety (2)
5-57
FEM for Impact Energy Absorption with Safety Plastic
Iulian Lupea, Joel Cormier and Sital Shah The Oakwood Group
Abstract
For the engineering design process to benefit from finite element modeling (FEM), it must adequately represent any condition being studied. This paper presents methodologies for using the LS-DYNA non-linear finite element solver to model a patented energy absorbing technology called SafetyPlastic®. SafetyPlastic® offers a performance, cost, and mass competitive energy management solution, and has been embraced by the automotive industry in both head and side impact occupant protection applications. It is characterized by a connected plurality of structural recesses that repeatedly give resistance, and then buckle when impacted. Due to the nature of SafetyPlastic® and its preferred manufacturing method, a somewhat unique FEM challenge presents itself. The paper provides details related to: • Modeling the strain rate dependent polymeric materials used in SafetyPlastic® • Using a proper mesh size; • Specification of the mesh pattern suitable for the assumptions made when manually inputting thickness profile; • Predicting the wall thickness profile for thermoformed designs via FEM with T-SIM® software; • Transferring and mapping data between T-SIM® and LS-DYNA for FEM; • Selecting the proper responses to evaluate the FEM versus experiment results; • Validating the FEM via quasi static and dynamic impacts with a flat plate; • Validating the FEM via dynamic impacts with a free motion headform; • Assessing the correlation of FEM with experimental results; • Optimizing the size and shape of recesses to promote annular buckling. The data presented show that FEM with LS-DYNA can be performed today with a degree of accuracy that will aid upfront SafetyPlastic® design. This leads to the prospect of conducting optimization studies via design of experiments or otherwise without prototype tooling expenses. However, there is room to improve the overall synchronization of a simulated SafetyPlastic® impact response with a real one. Work to refine and better the FEM methodology is an ongoing effort.
1. Introduction
For the engineering design process to benefit from finite element modeling (FEM), it must be as representative as possible of the condition being studied. This paper presents a methodology for using the LS-DYNA non-linear finite element solver to model a patented energy absorbing technology called SafetyPlastic® [3], [12], [13]. SafetyPlastic® is characterized by a connected plurality of structural recesses that repeatedly give resistance, and then buckle when impacted. The recesses take the form of truncated cones, which henceforth will be referred to as ‘cones’. SafetyPlastic® offers a performance, cost, and mass competitive energy management solution, and has been embraced by the automotive industry in both head and side impact occupant protection applications. In either case, the manufactured countermeasure is mounted between the interior trim and the body structure where space is usually limited. Designs can and do vary

Crash/Safety (2) 8th International LS-DYNA Users Conference
5-58
greatly when customizing them to fit and perform within the geometrical environments into which they are packaged. In general, a mechanical energy absorber is best assessed by observing its force versus displacement response when impacted. With the area under the curve equating to the work done, a constant load maintained through the available space for intrusion is considered most efficient. However, the standards by which automotive occupant protection is measured are based on probability of injury. Thus, the measurements presented are mostly related to United States’ Federal Motor Vehicle Safety Standard (FMVSS) 201u for upper interior head impact protection, which is evaluated via the Head Injury Criterion (HIC). The physical FMVSS 201u test is performed by launching a 10lb (4.5 kg) modified anthropomorphic Hybrid III Free Motion Headform (FMH) at 15mph towards a target within a vehicle. The FMH is equipped with a tri-axial accelerometer at its centre of mass. For the calculation of the HIC, the relation (1) is used, where a is the resultant acceleration expressed as multiples of gravitational acceleration g, and t1 and t2 are any two successive instants during the contact between the head and the target.
( )12
5.2
12
2
1
1ttadt
ttHIC
t
t
−
−= ∫
or
( ) 5.112
5.22
1
−−
= ∫ ttadtHIC
t
t (1)
HIC(d) = HIC * 0.75446 + 166.4 (2) Relation (2) is used to account for absence of an entire body representation in the test. HIC(d) of less than 1000 is deemed as compliant; though automotive manufacturers typically aim for HIC(d) values less than 800. Chest injury in FMVSS 214 and Lateral Impact New Car Assessment Program (LINCAP) tests for side impact protection is represented by the dummy Thoracic Trauma Index [TTI(d)]. TTI is given by the relation TTI = 0.5(ar(max) + as(max) ) where ar(max) is the peak rib acceleration and as(max) is the peak lower spine acceleration, and both are expressed in multiples of gravitational acceleration. As the name suggests, SafetyPlastic® products are made from polymers. For various reasons, the preferred (but not exclusive) method of manufacture of SafetyPlastic® is thermoforming. Balancing, cost, performance, and formability a selection of polypropylene (PP) and acrylonitrile butadiene styrene (ABS) material grades are employed. Specifically, these include Basell Polyolefins Pro-fax SV152 Polypropylene Copolymer (SV152), BP Petrochemicals Homopolymer 6015 Sheet Extrusion Resin (6015), and General Electric Cycolac EX75 (EX75). Modeling of SafetyPlastic® needs to account for material behavior at high and various rates of strain. Strain rates experienced can be up to 600 [1/s] at velocities up to 6700 mm/s. Because the cones can buckle multiple times, attention to mesh density is required to capture deformation adequately. In addition, the variation in part thickness and residual stresses embedded in the structure after cooling are important inputs for the finite element model.
2. Modeling Aspects 2.1. Material modeling It is known [2], [4], [6], [8], [9] that the yield stress of a thermoplastic is affected by strain rate and the fact that yield stress (at different temperatures) increases linearly with a logarithmic increase in strain rate. Some of the LS-DYNA material models available to capture this

8th International LS-DYNA Users Conference Crash/Safety (2)
5-59
phenomenon are type 24 *MAT_PIECEWISE_LINEAR_PLASTICITY, type 89 *MAT_PLASTICITY_POLYMER, and type 101 *MAT_GEPLASTIC_SRATE_2000a. The latter two also account for the effect of strain rate on failure strain or the brittle-ductile transition. In the studies pertaining to this paper, the most used material type was no. 24. For SV152, nominal stress-strain curves were experimentally measured at five different strain rates: 0.05, 5, 50, 250 and 450 [1/s] and transformed in true (effective) stress versus true (effective) plastic strain curves. Effective stress versus total effective strain curves were used for the model no. 89. The characterization of the ABS was through a unique quasi-static known curve, scaled up and down by the assumption of a 7% increase in yield stress per decade increase in strain rate. Other material models that can be used are: model no. 123 *MAT_MODIFIED_PIECEWISE_LINEAR_PLASTICITY or for a quick run the model 19 *MAT_STRAIN_RATE_DEPENDENT_PLASTICITY. 2.2. Material model validation The high strain rate tests were simulated with LS-DYNA in order to validate the material characterization data with the element formulation chosen for the SafetyPlastic® simulation. A unique shell quad element, of Belytschko-Tsay (B-T) formulation, was submitted to different constant stretching speeds in accordance with the strain rates of the test samples. Its dimensions were 3mm long, 2 mm wide, and assigned 0.8 mm thickness. The simulated deformation was continued until 100% strain was reached. Nodout and spcout output files were requested, to give the element deformation and reaction force histories. From these the stress and strain versus time relationships for the finite element were derived. The elemental, simulated stress versus strain curve at each strain rate compared well with its respective experimental curve. The data were also tested with material model type 89 *MAT_PLASTICITY_POLYMER with five strain rates for true stress versus true total strain curves. The correlation between simulation and experiment for stress versus strain curve and the strain rate 50 1/s is depicted in Figure 1. The type of finite element was quad B-T (element formulation 2) with 3 integration points.
Figure 1
When the type of the finite element used is Hughes-Liu (element formulation 1) with 3 integration points, the results are the same as for Belytschko-Tsay element formulation. 2.3 Thickness Modeling It is essential to represent part thickness correctly in order to properly simulate the crushing of structures like SafetyPlastic®. Thermoforming involves stretching a heated plastic sheet of constant thickness over a tool in the shape of the desired part. The stretching results in thinning of the sheet and ultimately a non-uniform thickness distribution within the part formed (Figure

Crash/Safety (2) 8th International LS-DYNA Users Conference
5-60
2). With SafetyPlastic®, many factors, including cone geometry and spacing, can affect that distribution, making it sometimes difficult to predict and model.
Figure 2
2.3.1 Manual Assignment of Thickness By measuring actual parts with an electromagnetic micrometer, it has been determined that the greatest variation for a given cone size and material occurs along the height of the wall. For efficiency, it is assumed the thickness at any height on the wall is constant around its circumference, and the cone is divided into a fixed number of discrete components to which different thicknesses may be assigned (Figure 3).
Figure 3
The thicknesses are determined from the measurement of actual cones and assigned to the FEM. The base area plays little part in energy management, and thus is given a constant thickness in the entire component. 2.3.2 Automated Thickness Assignment By using computational methods, it is feasible to predict and map the thickness distribution in a thermoformed part to a fine resolution. Transferring that data to a structural model can lend to greater accuracy of impact performance prediction. A T-SIM® supplementary routine has been written to map some nodal thicknesses (white nodes in Figure 4) of the triangular T-SIM mesh to the nodal thickness of the LS-DYNA deck. In this process the *ELEMENT_SHELL_THICKNESS cards play the main role.
A further possibility, yet to be explored in detail, is to retrieve residual stresses from the thermoforming process simulation and similarly transferring them to an LS-DYNA input.

8th International LS-DYNA Users Conference Crash/Safety (2)
5-61
Figure 4 Because a SafetyPlastic® cone will buckle multiple times and its relative size is small, the stack up of surfaces as they fold onto each other must be accounted for. It is not enough to have contacts defined, but to also make sure the shell thickness is considered in the contact. Thus, it is necessary to appropriately use the ISTUPD field in *CONTROL_SHELL as well as the SHLTHK and the SSTHK fields in *CONTROL_CONTACT. 2.4. Mesh Size It is known that deformation modes are better captured in LS-DYNA with a finer mesh. However choice of mesh size must be balanced with the cost of computation time. Standard practice in the automotive industry is a target time-step of one microsecond. It is especially important for it not to be less when representing SafetyPlastic® in a large model such as a one simulating a full vehicle side impact. Based on this, we can find the minimum characteristic length (CL) of a shell element from the acoustical wavespeed of the material in question. For SV152 (E= 1650MPa, specific gravity = 0.9) it is 1.44mm and for EX75 (E= 2137 MPa, specific gravity = 1.04) it is 1.43mm.
Figure 5
Table 1 shows that a nominal mesh size much higher than the characteristic lengths given above will significantly affect the accuracy of results. Additionally, under-predicting performance is not desirable. For the same impact location, orientation and geometry (the cone has 20mm height and SV152 sheet of 0.050 inch gage), relatively coarse and fine meshes (Figure 5) were used to model a matrix of cones subjected to the kinetic energy of a FMH in an FMVSS 201u test.
Table 1
Mesh Density / Element Size
HIC(d) ∆t (ms)Peak
Acceleration (g)
Coarse / 4mm 909.7 6.5 (3.8, 10.3) 148.7
Fine / 2mm 1033.2 5.8 (4.5, 10.3) 162
% Change 13.6 -10.7 8.9

Crash/Safety (2) 8th International LS-DYNA Users Conference
5-62
Using Hypermesh software to automatically model cone geometry with a 1.5mm element size yields some elements smaller then the desired minimum CL. However, with the mass scaling feature in *CONTROL_TIMESTEP, the timestep can be maintained at one microsecond. Usually the number of small elements and thus the added mass will not significantly affect the inertial properties of the part modeled. Thus 1.5 mm is the target element size in practice.
3. Modeling Validation The concordance between FEA and experiment for compression or crash tests is assessed by observing indicators like CG headform acceleration and displacement versus time, peak of the acceleration, reaction force versus displacement, plastic or total energy absorbed by SafetyPlastic versus displacement, kinetic energy lost by the headform or flat impactor or their displacements versus time, Head Injury Criterion (dummy) (HICd) and dt (t2-t1) the time interval for which HICd is calculated. Other aspects observed are the shape of the buckling modes (two or three sided or annular buckling) and their positions along the height of the truncated cone shape. Head model accuracy versus the dummy head is not considered in the study. 3.1. Quasi-static compression A quasi-static crush test was used for initial validation. This method avoids the introduction of the many potential sources of error in a dynamic condition. An INSTRON testing machine was used to obtain experimental results. The constant velocity crush was at 16 in/min (6.77mm/s). Among the various sample types tested, cone heights ranged from 15mm to 40mm, draft angles from 10 and 15 degrees, initial plastic sheet gages from 0.030inch to 0.060inch, and the material was either SV152 or ABS. The reaction forces over displacement were compared. In Figure 6 the first and the second buckling modes are shown, and axial views of totally compressed cones and their two and three sided buckling modes can be seen in Figure 7. The proper strain rate associated with the deformation speed was evaluated considering the height of the cone and the compression velocity. To obtain the stress versus strain curve for the evaluated strain rate a coefficient was derived to scale the closest available stress versus strain curve for the material.
Figure 6
8th International LS-DYNA Users Conference Crash/Safety (2)
5-63
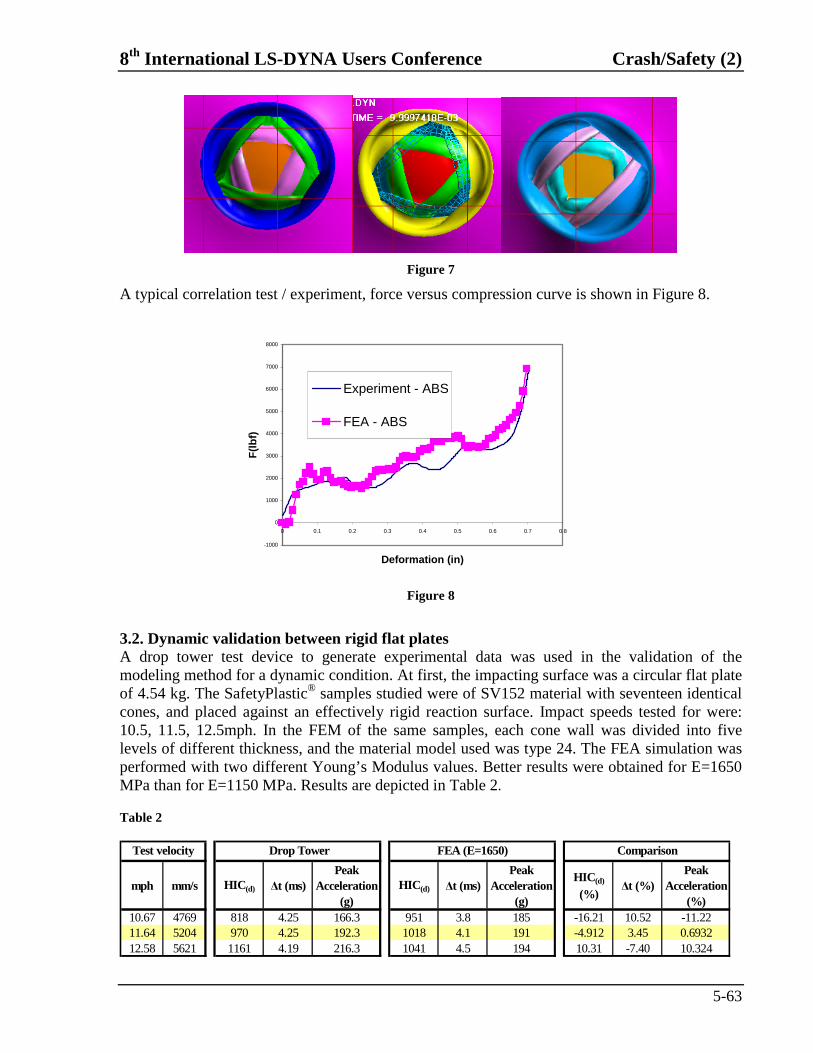
Figure 7
A typical correlation test / experiment, force versus compression curve is shown in Figure 8.
-1000
0
1000
2000
3000
4000
5000
6000
7000
8000
0 0.1 0.2 0.3 0.4 0.5 0.6 0.7 0.8
Deformation (in)
F(l
bf)
Experiment - ABS
FEA - ABS
Figure 8
3.2. Dynamic validation between rigid flat plates A drop tower test device to generate experimental data was used in the validation of the modeling method for a dynamic condition. At first, the impacting surface was a circular flat plate of 4.54 kg. The SafetyPlastic® samples studied were of SV152 material with seventeen identical cones, and placed against an effectively rigid reaction surface. Impact speeds tested for were: 10.5, 11.5, 12.5mph. In the FEM of the same samples, each cone wall was divided into five levels of different thickness, and the material model used was type 24. The FEA simulation was performed with two different Young’s Modulus values. Better results were obtained for E=1650 MPa than for E=1150 MPa. Results are depicted in Table 2. Table 2
mph mm/s HIC(d) ∆t (ms)Peak
Acceleration (g)
HIC(d) ∆t (ms)Peak
Acceleration (g)
HIC(d)
(%)∆t (%)
Peak Acceleration
(%)10.67 4769 818 4.25 166.3 951 3.8 185 -16.21 10.52 -11.2211.64 5204 970 4.25 192.3 1018 4.1 191 -4.912 3.45 0.693212.58 5621 1161 4.19 216.3 1041 4.5 194 10.31 -7.40 10.324
Drop TowerTest velocity FEA (E=1650) Comparison

Crash/Safety (2) 8th International LS-DYNA Users Conference
5-64
Resulted acceleration versus time curves from the 11.64 mph experiment and the FEM are compared in Figure 9.
Figure 9
3.3. Adaptive mesh A simulation with a flat impacting surface was performed using adaptive mesh this time. In Figure 10 we can observe the simulation of the first buckling mode and the initiation of the second one. The position of the first buckling mode is right under the top, hence being closer to the position observed in experiment. The computer time is increased and not very practical for a large number of simulations.
Figure 10
3.4. Dynamic validation with FMH A second round of validation work was conducted, but this time the conditions better represented an in vehicle head impact situation. For the reaction surface, an experimental workbench was created in order to simulate the stiffness of a vehicle body structure. In practice, the FMH response is a function of both the vehicle and SafetyPlastic® structures. The workbench (Figure 11) is composed of a rectangular flat plate attached to a support by four bolts. The inclination of the workbench was variable to test different impact angles. Various impact conditions were studied. Initial sheet thickness (prior to thermoforming) of the SafetyPlastic® samples was 0.03 or .050 inches. The angle of FMH longitudinal axis (drop direction) to cone axes was 12 or 22 degrees. The first point of contact of the FMH was either directly on top of a cone or between cones.

8th International LS-DYNA Users Conference Crash/Safety (2)
5-65
Figure 11 The reaction surface thickness was 2mm or 3mm. Constants included: cone heights (20mm), cone draft angles (10°), and material (SV152). The mean of three repetitions of each condition was calculated to obtain final experimental results. The results of the test (reaction surface of 3mm) are shown in Table 3.
Table 3
The simulation of the deformation in general and the buckling modes for each cone in particular (Figure 12) are similar with those seen in experiment.
Figure 12
.
HIC(d) ∆tPeak
Acceleration
FEM vs. Experiment
6.3% 9.4% 6.7%

Crash/Safety (2) 8th International LS-DYNA Users Conference
5-66
4. Parametric Optimization of a Cone for a Particular Task
An optimization study was conducted to minimize the HIC(d) value for a single cone subjected to an impact with a rigid moving flat plane. The rigid plane was given an initial downward velocity of 6700m/s and a tuned mass of 0.2438kg, so it would have energy comparable to that a single cone may be expected to manage within a part. The cone mesh was been divided into nine horizontal layers (*PART designation) plus the roof or top surface area (Figure 13) to allow thickness to be assigned independently. Each layer or level was numbered such that “1” was at the cone bottom, “2” was next lowest, up to “10” at the top. All layers were assigned an initial thickness of 0.5mm for the first iteration, and using LS_DYNA for crush simulation and Altair HyperStudy® software to manage the optimization of the layer thicknesses, the levels were constrained to be a minimum and maximum of 0.2 and 0.8 mm respectively.
Figure 13 After 140 iterations (Figure 14) of changing layer thicknesses, the HIC(d) was decreased in value from 1750 to 791. The optimum thicknesses for the layers giving the 791 value were: L1 = 2.702E-01 L4 = 5.125E-01 L7 = 3.031E-01 L9 = 5.554E-01 L2 = 5.595E-01 L5 = 4.236E-01 L8 = 5.550E-01 L10 = 3.481E-01 L3 = 6.504E-01 L6 = 6.950E-01 When comparing first and optimal iterations, the buckling mode changes dramatically from a familiar one with two or three sides shown in Figure 15 (left) to the annular one depicted in Figure 15 (right). Also, the mass decreases from the initial of 0.409g to 0.397g for the optimal shape. For verification purpose, a second optimization was performed. The only difference being a 0.21mm starting constant wall thickness of the cone as opposed to 0.5mm previously. The same optimal thickness distribution was obtained. As an alternate approach the optimization of a constant thickness side wall was performed for the same impact conditions (i.e. no independent layers were created this time). The initial thickness for the entire wall was 0.21mm, and again the variation of the thickness through the optimization was constrained to 0.2mm to 0.8mm. The optimal or lowest HIC(d) of 1598 was obtained with a wall thickness of 0.637508mm. The process was repeated with an initial thickness of 0.5mm to yield an optimal HIC(d) of 1613 after 13 iterations. We can conclude by saying that using an optimal thickness variation in annular shapes can promote annular buckling with an increase of energy absorption capability of cones without any increase in mass. Some conclusions were derived on the thickness variations pattern along the cone height but not presented in this paper.

8th International LS-DYNA Users Conference Crash/Safety (2)
5-67
0.00E+00
5.00E+02
1.00E+03
1.50E+03
2.00E+03
2.50E+03
0 20 40 60 80 100 120 140
Iterations
HIC
d
Figure 14
Figure 15
By using morphing capabilities of HyperMesh the initial profile of the cone was modified. The cone diameter was slightly increased and decreased alternatively along the cone height paying attention to the drafting angles so that the thermoformed part remains extractable from the tool. A shape optimization study was performed again with LS-DYNA for the crash and HyperStudy to manage the optimization by changing the diameter of each concavity and convexity along the cone height. Hence, annular buckling will be promoted obtaining a target weakening of the cone structure.
5. Conclusions The data presented show that FEM with LS-DYNA can be performed today with a degree of accuracy that will aid upfront SafetyPlastic® design. This leads to the prospect of conducting optimization studies via design of experiments or otherwise without prototype tooling expenses. However, there is room to improve the overall synchronization of a simulated SafetyPlastic® impact response with a real one. Work to refine and better the FEM methodology is an ongoing effort. Future efforts may be directed towards: - improving simulation accuracy by using T- SIM® to represent thickness variation at a higher resolution than achieved by manual thickness mapping, - determine the influence of wall thickness variation on the buckling shape, - improving material modeling by considering the change of polymer mechanical properties after thermoforming, - initialization of the shell elements used in modeling with the residual stresses found in SafetyPlastic® after part cooling.

Crash/Safety (2) 8th International LS-DYNA Users Conference
5-68
References 1. Bellora, V. A. and Krauss, R. “Meeting Interior Head Impact Requirements: A Basic Scientific Approach”, SAE Technical Paper 2001-01-0469. 2. Clark, C., Johnson, P. and Frost, C., “High Strain Rate Characterization of Thermoplastics Used For Energy Management Applications”, SAE Technical Paper 940882. 3. Cormier, J. and Brooks, R., “Design of Thermoformed Plastic Mechanical Energy Absorbers for FMVSS 201 Head Injury Applications”, 2001 Detroit Auto Interiors Show Conference Proceedings. 4. Goral, T., “Material Modeling For Engineering Thermoplastics In FEA Under High-Strain Loading”, SAE Technical Paper 2000-01-1167. 5. Hallquist, J.O., LS-DYNA Theoretical Manual, (Livermore Software Technology Corporation, Livermore, CA, 1997. 6. Martin, P. and Crandall, J.R., “Constitutive Modeling of Polymers Subjected to High Strain Rates”, SAE Technical Paper 2001-01-0472. 7. Murthy, T.K.S. and Brebbia, C.A., “Structural Design and Crashworthiness of Automobiles”, Springer Verlag, Berlin, 1987. 8. Hill, S.I. and Sjoblom, P., “Practical Considerations in Determining High Strain Rate Material Properties”, SAE Technical Paper 981136. 9. Woods, J.T. and Trantina, G.G., “Material Characterization for Predicting Impact Performance of Plastic Parts” SAE Technical paper 1999-01-3178. 10. *HyperStudy® and HyperMesh® are registered trademarks of Altair Engineering, Inc. 11. * LS-DYNA version 960 Keyword User’s Manual, Part 1 and 2. 12. *SafetyPlastic® is a registered trademark of The Oakwood Group. 13. * The Oakwood Group patents: US Patent No. 6682128, Pat. No. 6679967, Pat. No. 6247745, Pat. No. 6199942, Pat. No. 6017084. 14. *T-SIM® is a registered trademark of Accuform, Ltd.