Developing FEM Procedures for Four-Sided Structural Sealant ...
30
Buildings 2021, 11, 597. https://doi.org/10.3390/buildings11120597 www.mdpi.com/journal/buildings Article Developing FEM Procedures for Four‐Sided Structural Sealant Glazing Curtain Wall Systems with Reentrant Corners Ali M. Memari 1,2 , Nicholas Simmons 3 and Ryan L. Solnosky 2, * 1 Civil and Environmental Engineering Department, The Pennsylvania State University, University Park, PA 16802, USA; [email protected] 2 Architectural Engineering Department, The Pennsylvania State University, University Park, PA 16802, USA 3 Simpson Gumpertz & Heger (SGH), Waltham, MA 02451, USA; [email protected] * Correspondence: [email protected] Abstract: In the cyclic racking evaluation of curtain wall systems, physical testing with instrumen‐ tation is the standard method for collecting performance data by most design professionals. The resulting testing of full‐scale mockups can provide many types of data, including load and displace‐ ment values at different stages of loading through failure. While this type of data is valuable for product/system development/fabrication and design, such data can also provide a means for simu‐ lation validation of the curtain wall cyclic performance under simulated earthquake loading. Once the simulation study is validated using the test results, then parametric studies by designers can be conducted with greater ease, ideally with commercial software packages, without the need for test‐ ing. For the results of this research study, a practical industry formulated finite element modeling (FEM) approach was used to predict the performance of the curtain wall mockups. Here, unitized four‐sided structural sealant glazing (4SSG) curtain wall system mockups that incorporate a re‐en‐ trant corner were subjected to cyclic racking displacements per the American Architectural Manu‐ facturers Association (AAMA) 501.6 Structural Sealant protocol. System performances, including displacements, were obtained from the FEM study and used to calculate the effective shear strain of the structural silicone and the drift capacity of the system. This paper describes the details of the techniques developed for FEM, the analysis results, and shows an example application of the nu‐ merical modeling approach for mockups with racking test results available. The goal of this model‐ ing approach was to create and test methods that practicing consulting engineers can quickly con‐ duct in their offices on common commercially available software often available to them. Keywords: finite element modeling; structural sealant; glazing; curtain wall; earthquake simulation testing 1. Introduction In regards to architectural glass curtain wall systems, there have been several studies using finite element modeling (FEM), in particular for point‐supported glass systems [1–3] and for curtain wall performance under wind loading and debris impact mitigation [4]. However, a literature review showed few studies focused their FEM simulation investiga‐ tions on the racking performance of curtain wall systems [5,6] for seismic loading response. In Memari et al. [7,8], the curtain wall systems used were dry‐glazed and were modeled using ANSYS software. Limited work has been done to either experimentally measure or model glass failures caused by edge stresses in contact with mullions [9–11], but none of these studies considered seismic loading along the edges. An additional model considera‐ tion is that the glazing strength along the edges is a function of how the edges are finished [12]. For example, depending on whether or not glass panels have cut, ground, seamed, or polished finish will impact crack initiation during drift due to the flaws of each finish type, which differ in their severity and distribution [12]. Knowing these contributing factors, FEM Citation: Memari, A.M.; Simmons, N.; Solnosky, R.L. Developing FEM Procedures for Four‐Sided Structural Sealant Glazing Curtain Wall Systems with Reentrant Corners. Buildings 2021, 11, 597. https://doi.org/10.3390/ buildings11120597 Academic Editor: Giuseppina Uva Received: 5 September 2021 Accepted: 26 November 2021 Published: 29 November 2021 Publisher’s Note: MDPI stays neu‐ tral with regard to jurisdictional claims in published maps and institu‐ tional affiliations. Copyright: © 2021 by the authors. Li‐ censee MDPI, Basel, Switzerland. This article is an open access article distributed under the terms and con‐ ditions of the Creative Commons At‐ tribution (CC BY) license (http://crea‐ tivecommons.org/licenses/by/4.0/).
-
Upload
khangminh22 -
Category
Documents
-
view
3 -
download
0
Transcript of Developing FEM Procedures for Four-Sided Structural Sealant ...
Buildings 2021, 11, 597. https://doi.org/10.3390/buildings11120597 www.mdpi.com/journal/buildings
Article
Developing FEM Procedures for Four‐Sided Structural Sealant
Glazing Curtain Wall Systems with Reentrant Corners
Ali M. Memari 1,2, Nicholas Simmons 3 and Ryan L. Solnosky 2,*
1 Civil and Environmental Engineering Department, The Pennsylvania State University, University Park, PA
16802, USA; [email protected] 2 Architectural Engineering Department, The Pennsylvania State University, University Park, PA 16802, USA 3 Simpson Gumpertz & Heger (SGH), Waltham, MA 02451, USA; [email protected]
* Correspondence: [email protected]
Abstract: In the cyclic racking evaluation of curtain wall systems, physical testing with instrumen‐
tation is the standard method for collecting performance data by most design professionals. The
resulting testing of full‐scale mockups can provide many types of data, including load and displace‐
ment values at different stages of loading through failure. While this type of data is valuable for
product/system development/fabrication and design, such data can also provide a means for simu‐
lation validation of the curtain wall cyclic performance under simulated earthquake loading. Once
the simulation study is validated using the test results, then parametric studies by designers can be
conducted with greater ease, ideally with commercial software packages, without the need for test‐
ing. For the results of this research study, a practical industry formulated finite element modeling
(FEM) approach was used to predict the performance of the curtain wall mockups. Here, unitized
four‐sided structural sealant glazing (4SSG) curtain wall system mockups that incorporate a re‐en‐
trant corner were subjected to cyclic racking displacements per the American Architectural Manu‐
facturers Association (AAMA) 501.6 Structural Sealant protocol. System performances, including
displacements, were obtained from the FEM study and used to calculate the effective shear strain
of the structural silicone and the drift capacity of the system. This paper describes the details of the
techniques developed for FEM, the analysis results, and shows an example application of the nu‐
merical modeling approach for mockups with racking test results available. The goal of this model‐
ing approach was to create and test methods that practicing consulting engineers can quickly con‐
duct in their offices on common commercially available software often available to them.
Keywords: finite element modeling; structural sealant; glazing; curtain wall; earthquake simulation
testing
1. Introduction
In regards to architectural glass curtain wall systems, there have been several studies
using finite element modeling (FEM), in particular for point‐supported glass systems [1–3]
and for curtain wall performance under wind loading and debris impact mitigation [4].
However, a literature review showed few studies focused their FEM simulation investiga‐
tions on the racking performance of curtain wall systems [5,6] for seismic loading response.
In Memari et al. [7,8], the curtain wall systems used were dry‐glazed and were modeled
using ANSYS software. Limited work has been done to either experimentally measure or
model glass failures caused by edge stresses in contact with mullions [9–11], but none of
these studies considered seismic loading along the edges. An additional model considera‐
tion is that the glazing strength along the edges is a function of how the edges are finished
[12]. For example, depending on whether or not glass panels have cut, ground, seamed, or
polished finish will impact crack initiation during drift due to the flaws of each finish type,
which differ in their severity and distribution [12]. Knowing these contributing factors, FEM
Citation: Memari, A.M.; Simmons,
N.; Solnosky, R.L. Developing FEM
Procedures for Four‐Sided Structural
Sealant Glazing Curtain Wall
Systems with Reentrant Corners.
Buildings 2021, 11, 597.
https://doi.org/10.3390/
buildings11120597
Academic Editor: Giuseppina Uva
Received: 5 September 2021
Accepted: 26 November 2021
Published: 29 November 2021
Publisher’s Note: MDPI stays neu‐
tral with regard to jurisdictional
claims in published maps and institu‐
tional affiliations.
Copyright: © 2021 by the authors. Li‐
censee MDPI, Basel, Switzerland.
This article is an open access article
distributed under the terms and con‐
ditions of the Creative Commons At‐
tribution (CC BY) license (http://crea‐
tivecommons.org/licenses/by/4.0/).
Buildings 2021, 11, 597 2 of 30
is a challenge to engineers because crack initiation along glass edges is a function of glass‐
to‐frame contact stresses and glass‐edge finish conditions. Experimental testing can be used
to calculate appropriate glass‐panel failure states during design review. In addition to its
aforementioned successful use in predicting the wind resistance of a given glass panel, FEM
has also been used successfully to predict local stresses caused by wind‐borne debris impact
in glass [4,13–15], blast loading [16], modal analysis of laminated glass [17], glass tempering
[18,19], and thermal and residual stresses in annealed glass and other settings for unique
loadings [20–22].
1.1. Challenges in Finite‐Element Modeling of Curtain Walls
Travis and Carbary [23] developed finite element models for a 4SSG skylight that
they used to predict stresses and strains on a 6 mm by 6 mm (0.24 in by 0.24 in) sealant
joints loaded with negative (uplift) wind pressures. Both 3D and several 2D models were
used in the study, which gave similar results indicating that simplification of sealant joints
and loading is possible without losing accuracy [23]. Weggel and Zapata [24] studied con‐
ventional laminated glass curtain walls by adopting both linear elastic and non‐linear elas‐
tic modeling techniques under low‐level blast loading. Comparisons were made between
dry‐glazed and 4SSG [24]. In these studies, the FEM was calibrated to small‐amplitude
static and dynamic experimental results. The use of different boundary conditions caused
changes in modal frequencies and the appearance or disappearance of significant re‐
sponse modes [24]. Both Travis and Carbary [23] and Weggel and Zapata [24] identified
that glass pane dynamic behavior depends on the support conditions.
Memari et al. [7,8,25] are among the very few sources that discuss the use of FEM for
curtain wall systems exposed to simulated seismic loading. The software used for such
works was ANSYS [8]. The curtain wall systems tested were only dry‐glazed, not a 4SSG
or two‐sided structural sealant glazing (2SSG) configuration that is now more popular
with designers [7,8,25]. In Memari et al. [8], they conducted a pilot study to develop FEM
of architectural glass curtain walls with only a static load being applied. One of the goals
of the study was to predict the seismic drift at which glass cracking and then fallout would
occur. Outside of the glazing portion of the curtain wall, Memari et al. [7] modeled the
aluminum mullions as frame elements, while the glass was modeled as area elements with
a uniform thickness. This approach to frame and area elements was similar to the method
employed in this present study by using SAP2000. In Memari et al. [7], they modeled dry
gaskets resistance around the glazing using link elements in SAP2000.
More recently, Angelides et al. [26] looked into quasi‐static load modeling to simulate
high‐strain rates on in‐plane loaded laminated glass. Sucuoglu and Vallabhan [27] at‐
tempted to develop a glass failure prediction model based on in‐plane glass‐plate buckling
for dry‐glazed architectural glass under seismic‐induced, in‐plane diagonal forces. This fail‐
ure prediction approach is based on the assumption that glass strength is a function of the
combined proximity of tensile stresses and stress‐raising flaws on the glass surface [26,27].
This type of assumption for the developed flexural stress has been used to develop glass‐
thickness charts under wind‐loading conditions and has been shown to be a valid assump‐
tion for out‐of‐plane bending failures [9,28]. For very large and thin glass plates, buckling
under in‐plane loading could govern the response. However, repeated observations during
in‐plane racking tests of glass plate geometries representative of typical building applica‐
tions (e.g., [12,29–31]) have shown that glass damage initiates as a result of glass‐to‐frame
contacts that occur along glass‐panel edges in corner regions. The flaw distribution and in‐
tensity along glass edges are more pronounced (because of the conventional edge finishes
such as scored and broken in “cut” edges and sand belting in “ground” edges) compared
with that on the face of glass panels [32], and this difference must be accounted for in glass‐
failure prediction models. Quaglini et al. [33] looked at cantilevered glass plates and lites
that could have applications in structural and enclosure applications.
Adding to curtain wall modeling research, the structural silicone (SS) portion of the
enclosure is critical in the FEM modeling. Descamps et al. [34] compared the effects of

Buildings 2021, 11, 597 3 of 30
FEM modeling and more approximate modeling of silicone glazing joint deformations via
spring models to ease computational demand and complexity. Major contributions to the
study of SS have been investigated by Drass and Kraus [35] and Drass et al. [36], who
provide details into the complexity of modeling the non‐linear behavior of the SS. Com‐
plexities arise due to SS being non‐linear in terms of stiffness [36], having time‐dependent
loading properties that can creep over their life span [37,38], and how it responds to load‐
ing, but also in that it changes volumetrically, which makes the selection of the elements
challenging [35,39].
In 2016, ASTM [40] published the analytical method allowing commercially available
finite‐element analysis software to determine stresses and deflections in glass lites. As re‐
ported by [41], the analytical method [40] does not provide specific modeling guidance to
ensure that the results from a finite‐element analysis match similar results obtained from
the chart‐based method [42]. More recently, researchers have been working on developing
modeling techniques for glass utilizing a non‐linear finite‐element model to determine the
probability of breakage for selected flat rectangular glass panels [41] as well as oddly
shaped panels [43]. The results of their analyses compare favorably with values in model
building codes and standards.
1.2. Research Contributions to FEM of Curtain Walls
The focused objective of this study stemmed from a larger study by Simmons [44]
and Memari et al. [45] that looked at four‐sided structural sealant glazing (4SSG) curtain
wall system performances in seismic regions. This sub‐part to the larger study, as pre‐
sented in this paper, was to develop an FEM analysis technique based on a full‐scale
mockup testing experimental data in order to calibrate the FEM [44,46]. In particular, it
was of interest to evaluate the translations and rotations of the glass relative to the frame
and to numerically determine critical stresses and strains that will lead to sealant failure
or glass‐to‐glass contact.
The developed FEM approach was to simulate how professional structural engineers or
curtain wall designers at firms might go about modeling curtain walls and to provide tech‐
niques that are reasonably accurate. The information presented in this paper is useful in de‐
veloping a better understanding of the behavior of four‐sided structural sealant glazing (4SSG)
curtain wall systems for seismic design. The benefit of such an outcome will be to avoid a trial
and error method of designing a 4SSG curtain wall system but without spending significant
time in developing a highly detailed and complex FEM model. This is significant since the
American Architectural Manufacturers Association (AAMA) 501.6 testing process takes time
and consumes resources, and many design professionals do not have detailed FEM software
(such as ANASYS) available to them or have never used such programs.
2. Test Setup and Specimen Assembly
Within the larger study, the presented research is a part of [44]. Physical testing of
curtain wall mockups is key to developing FEM techniques. This paper summarizes a
portion of the physical testing that is detailed in [44,45], such that the analytical compo‐
nent has proper context. The following is a highlighted summary from the physical test
focusing on the constants, variables, test setup, and testing observations [44].
Two sets of identical mockups were tested in this study (Figures 1 and 2); they are
referred to here as mockups B and C. Both mockups were constructed with glazing at‐
tached to aluminum mullions with Dow Corning 983 Structural Glazing Sealant. Key
mockup dimensions are shown in Figure 2. The primary difference between Mockups B
and C is the boundary conditions, with Mockup B having conventional stick‐built bound‐
ary conditions, while Mockup C was similar to Mockup B but allowed vertical‐slip. Given
these slight differences, Mockup B resembled a more pure‐racking behavior, whereas
Mockup C allowed the panels to slip vertically past each other.

Buildings 2021, 11, 597 4 of 30
Figure 1. BECRL Racking Test Facility with a Mounted Mockup.
(a) (b)
Figure 2. Layout of panels of a 4SSG curtain wall system. (a) Elevation views of the panels; (b) plan view of the panels
(note that 1 in = 25.4 mm).
Mockups were tested according to the displacement‐controlled racking protocol rec‐
ommended in AAMA 501.6 [47]. AAMA 501.6 is characterized by monotonically increas‐
ing‐amplitude sinusoidal drift cycles that determine the serviceability and ultimate drift
limits for architectural glass components subjected to cyclic, in‐plane racking displace‐
ments [30,31,48]. The “stepwise” test method of AAMA 501.6 requires a series of alternat‐
ing “ramp up”, “constant amplitude”, and “ramp down” intervals, each comprised of four
sinusoidal cycles where each step increases by 1/4 in (6.4 mm) increments.
In this research study, the racking was stopped after each 1/4 in (6.4 mm) step for in‐
spection of any structural sealant damage. Additionally, Figure 3 depicts both the positive
and negative drift amplitudes imposed on the mockup during the sixth cycle (as labeled as
C6.25 and C6.75). These two points indicate the targeted moments to study in the video
analysis [49]. Due to cost, each mockup was tested several times but only after it was
deemed applicable for follow‐up tests if it had not sustained significant damage. Table 1
provides a summary of each mockup and its varied boundary conditions that were adopted.
Each mockup was first tested with a unitized sway condition (Table 1). After as‐
sessing the damage conditions of both Mockup B and Mockup C, both were determined
to be in acceptable condition for more testing. After Mockup B was tested with a stick‐
built boundary condition, it was then tested with the stick‐built‐with‐vertical‐slip condi‐
tion. Observed mockup failure modes are defined similarly to those in Memari et al.
[12,25,30] for consistency.

Buildings 2021, 11, 597 5 of 30
Figure 3. Dynamic racking drift vs. time plot at Step 12 (Modeled after AAMA 501.6 [47]) (note that
1 in = 25.4 mm).
Table 1. Physical experiment testing matrix for boundary conditions and connections [44].
Mockup Test # Boundary Condition Upper Connection Lower Connection
B 1 Sway Two separate bolts with angles No connection
B 2 Racking Two separate bolts with angles One bolt with two angles (one
on each side)
C 1 Sway Two separate bolts with angles No connection
C 2 Racking with vert slip Two separate bolts with angles Two angles (one on each side,
no bolt)
3. Finite Element Model Generation
In general, finite element modeling can be used to develop the prediction of the re‐
sponse, e.g., stresses and strains of the glazing system under applicable loading condi‐
tions. Such modeling needs to be validated, preferably using testing results. Once the
modeling can reasonably predict critical response parameters, the approach can be an af‐
fordable alternative to full‐scale testing. In particular, it can be used for the parametric
study where key parameters can be varied toward reaching the desirable design.
Careful development of the models as part of this FEM study in curtain wall perfor‐
mance was critical. Two objectives drove the modeling criteria, selection of software, ap‐
proximations, and techniques used. The first was to have a numerical modeling approach
for mockups with racking test results available that closely align in terms of performance.
The second was to create and test methods that practicing consulting engineers can
quickly conduct in their offices on common commercially available software often avail‐
able to them. In this Section 3 and the following Section 4, we discuss the details of the
model developed in this study, including the selection of element types and input values
for the FEM. The study presented here follows such a general objective in addition to
providing a practical technique using a ubiquitous software.
Validation of the computer model was done along with the development by compar‐
ing the performance of key attributes of the curtain wall mockup performance. These at‐
tributes included: drift of the mockups, the shear strain in the SS, rotation of the glass
panes and mullions, and lastly, the load vs. displacement performance.

Buildings 2021, 11, 597 6 of 30
3.1. Software Selection and Capabilities
For this study, SAP2000 was used to develop an FEM similar to what curtain wall de‐
signers might utilize. Advanced FEM software such as ABAQUS and ANSYS were not
adopted as they are rarely used by most industry professionals for new curtain wall design.
While they have been used for research [15,16,22,35,39], Memari et al. [7,8] found that com‐
mercial software SAP2000 can be equally comparable in most performance levels of curtain
walls under loading. Additionally, SAP has a low boundary to learn with both linear and non‐
linear capabilities and can be more directly integrated into the full building design [50].
Due to the complexity of curtain wall systems, including 4SSG configurations, FEM
models of curtain walls were created in multiple stages. These stages include (1) a large
full picture model of the curtain wall with basic boundary conditions and materials, (2) a
model with the added complexity of material behavior and applied loading, and lastly
(when applicable) (3) a sub‐model of individual behaviors in great detail localized to an
area. For this research study, stages one and two were done with SAP, whereas ABAQUS
and ANSYS can be used for a stage three simulation.
FEM models in this research were created using a combination of frame, area, and
link elements within SAP2000 that follows simplified assumptions to more accurate mod‐
eling for three distinct models [44]. Table 2 describes different elements used for each ma‐
jor material, some key underlying assumptions of the elements according to CSI and
SAP2000 [50], and lastly, parameters that can be adjusted by the modelers when making
the models for this study. Along with the element behavior, SAP2000 permits modelers to
adjust properties and behaviors through property modifications. The most common ap‐
plication of these properties is to adjust the stiffness of an element. Additionally, different
constraints can be applied to elements and nodes to mimic certain behaviors, such as the
diaphragm constraint that allows elements to rotate and translate but not deform.
Table 2. SAP Elements utilized in the finite element modeling from [based on 50].
Element Type Usage in This Study SAP Details and Assumptions Element Adjustable Variables
Multi‐Linear Link Structural Silicone
Special element that constrains and
links behavior of different types that
can turn off at targets or constrain
behavior.
Input of force [lb] vs. displace‐
ment [in] for each translation direc‐
tion
Input of moment [lb‐in] vs. ro‐
tation [rad] for each rotational direc‐
tion
Area Element
(Shell Formulation) Structural Silicone Shell‐layered/nonlinear.
Each layer for linear and non‐
linear behavior, hysteresis behaviors.
Longitudinal shear and trans‐
verse shear.
Flexure and axial in each direc‐
tion.
Area Element
(Shell Formulation) Glass Pane
A 4‐node quadrilateral area element
utilizing 2‐by‐2 Gauss integration
points with a thick shell formulation.
3 nodes that record moment,
membrane action, axial, and shear.
10 property modifiers.
Diaphragm Con‐
straint Glass Pane
Rigidly constrains nodes to only
translate and rotate but not relatively
deform.
NA
Frame Elements Aluminum Transoms
and Mullions
General, three‐dimensional, beam‐
column formulation, which includes
the effects of bi‐axial bending, tor‐
sion, axial deformation, and bi‐axial
shear deformations.
12 degrees of freedom and 8
property modifiers
Note: SAP nomenclature comes from the software documentation manual [50].

Buildings 2021, 11, 597 7 of 30
Based on the physical testing of the curtain wall mockups, as recorded by Memari et al.
[45,49], and in conjunction with findings presented by Memari et al. [7,51], the model utilized
linear behavior elements that were either single behavior linear or multi‐staged linear ele‐
ments (set to change linear behavior at pre‐set values). While aluminum and structural silicone
(SS) can behave both linearly or non‐linearly, testing has shown that for typical performance
levels in seismic applications, linear behavior is acceptable before other, more critical, safety
failures occur to the building.
3.2. Model Configurations
Due to the complexity of 4SSG glazing curtain wall systems, the FEM used in this
study was developed in several key stages. The process of development followed: first,
the individual elements were modeled exclusively; second, by portions of the system; and
finally, the third step was the entire system being modeled. As a result of this refinement
process, three models were generated. They are (Figure 4a–c): (1) a single‐panel curtain
wall, (2) a three‐panel curtain wall, and lastly (3) a three‐panel curtain wall perpendicular
(re‐entrant corner) panel. To properly consider this system in the model, the stiffness of
the system was verified to be consistent with prior studies. In this context, stiffness refers
to the required applied load to achieve a unit lateral displacement, which will vary with
each of the three models because of different mockup properties such as geometry, size,
mullion cross‐section, and structural silicone (SS) properties and dimensions.
(a) (b)
(c)
Figure 4. Panel configuration of frame and glass (frame = dashed lines, glass panes = solid lines). (a) Single panel model;
(b) planer 3 panel model; (c) reentrant corner 3 panel model.
The single‐panel curtain wall (Figure 4a) was first created based on the physically‐
tested mockup design. This panel consists of three glass panes where the model only ap‐
plied the stick‐built support conditions. In addition, the stiffness of this model should be
Buildings 2021, 11, 597 8 of 30
about one‐third of a model that features three panels that utilized the verified method
discussed from testing (e.g., for this study, the results of Memari et al. [45] were used).
The three‐panel curtain wall (Figure 4b) was modeled second and was based on the
physically‐tested mockup design. Each panel in this configuration has three glass panes
that are in the plane of the racking. The vertical mullions were all continuous, but the
horizontal transoms were not continuous and were instead discrete between vertical mul‐
lions. Depending on connectivity, horizontal transoms may be modeled as having a pin
connection or parity fixity. First, the model was built with stick‐built support conditions,
where the stiffness of the system was verified as reasonably consistent compared to prior
studies (e.g., Memari et al. [7]). Specifically for this model, the stiffness was reasonably
close to the hysteresis data from the physical testing; if this was not the case, the model
would have needed to be modified. Next, this three‐panel model was adjusted to have
vertical slip support conditions. This modification required another verification and mod‐
ification of the model to ensure the stiffness of the system was reasonably close to the
hysteresis data from the physical testing.
The complete 4SSG system, which consisted of three planar panels and one perpen‐
dicular panel, was created last and is represented in Figure 4c. To create this model, first,
the unitized sway support condition was modeled, considering two comparisons along
the way. The first is comparing the stiffness of the system with the hysteresis data from
the physical testing, and the second is by comparing the movement of the glass pane cor‐
ners relative to the frame from the video analysis. After the unitized sway modeling was
validated, the stick‐built support condition was then modeled within the configuration.
Again, two verifications were considered based on the above approach to ensure accurate
modeling. The last phase of Model 3 generation was the inclusion of the stick‐built with
vertical‐slip‐support condition. Here, similar validations for both the stiffness of the sys‐
tem with the hysteresis data from the physical testing and the movement of the glass pane
corners relative to the frame from the video analysis were considered.
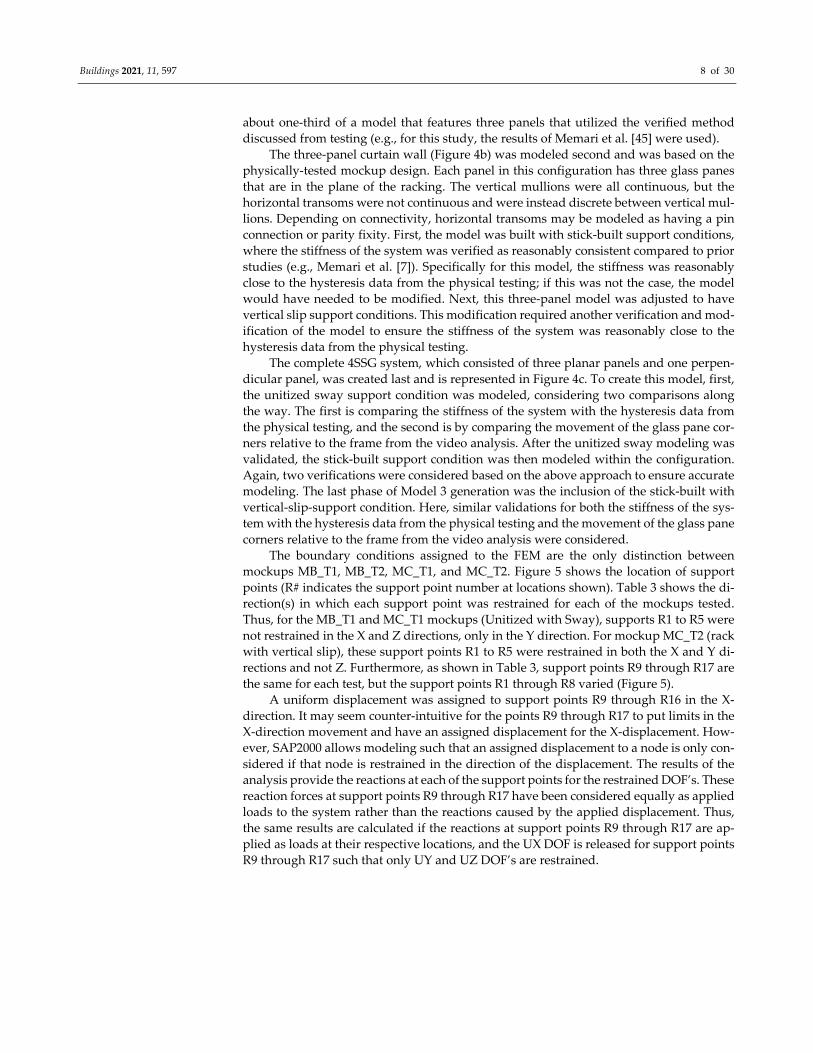
The boundary conditions assigned to the FEM are the only distinction between
mockups MB_T1, MB_T2, MC_T1, and MC_T2. Figure 5 shows the location of support
points (R# indicates the support point number at locations shown). Table 3 shows the di‐
rection(s) in which each support point was restrained for each of the mockups tested.
Thus, for the MB_T1 and MC_T1 mockups (Unitized with Sway), supports R1 to R5 were
not restrained in the X and Z directions, only in the Y direction. For mockup MC_T2 (rack
with vertical slip), these support points R1 to R5 were restrained in both the X and Y di‐
rections and not Z. Furthermore, as shown in Table 3, support points R9 through R17 are
the same for each test, but the support points R1 through R8 varied (Figure 5).
A uniform displacement was assigned to support points R9 through R16 in the X‐
direction. It may seem counter‐intuitive for the points R9 through R17 to put limits in the
X‐direction movement and have an assigned displacement for the X‐displacement. How‐
ever, SAP2000 allows modeling such that an assigned displacement to a node is only con‐
sidered if that node is restrained in the direction of the displacement. The results of the
analysis provide the reactions at each of the support points for the restrained DOF’s. These
reaction forces at support points R9 through R17 have been considered equally as applied
loads to the system rather than the reactions caused by the applied displacement. Thus,
the same results are calculated if the reactions at support points R9 through R17 are ap‐
plied as loads at their respective locations, and the UX DOF is released for support points
R9 through R17 such that only UY and UZ DOF’s are restrained.

Buildings 2021, 11, 597 9 of 30
Figure 5. 3D Mockup perspective view of restraint locations (when applicable) and support points.
Table 3. Restrained Translation DOF’s as defined in SAP2000 FEM for each test.
Support Point Number
Restrained DOF Direction
MB_T1 and MC_T1 MC_T2 MB_T2
Unitized Sway Rack with
Vertical Slip Rack
R1 to R5 Y X, Y X, Y, Z
R6 Y Y X, Y, Z
R7 to R8 None None X, Y, Z
R9 to R16 X, Y, Z X, Y, Z X, Y, Z
R17 X, Y, Z restrained
A 2D model was sufficient when the SS materials were modeled as link elements, and
all the panels were in‐plane with the racking. Otherwise, a 3D model was needed if the SS
elements chosen were solid objects/elements and/or the re‐entrant corner was included.
Both a 2D and a 3D model allow for the elements to be offset in the out‐of‐plane direction
for better representation of overall behavior. For example, the plane of the glass elements
can be offset from the plane of the aluminum frame elements by about half the mullion or
transom depth. The index clips were modeled as constraints in the X‐direction and Y‐
direction, but not in the Z‐direction (vertical), on nodes adjacent to each other on the frame
elements for the intermediate mullions.
3.3. Materials in the Model
To construct the model, material properties needed to be determined from manufac‐
turer data and/or from experimental tests of samples [34,42]. The utilized material input
values for the structural silicone, glass, and aluminum mullions are summarized in Tables
4–6. These tables served as a reference when defining the elements and sections in
SAP2000 for each model [44,51].
Buildings 2021, 11, 597 10 of 30
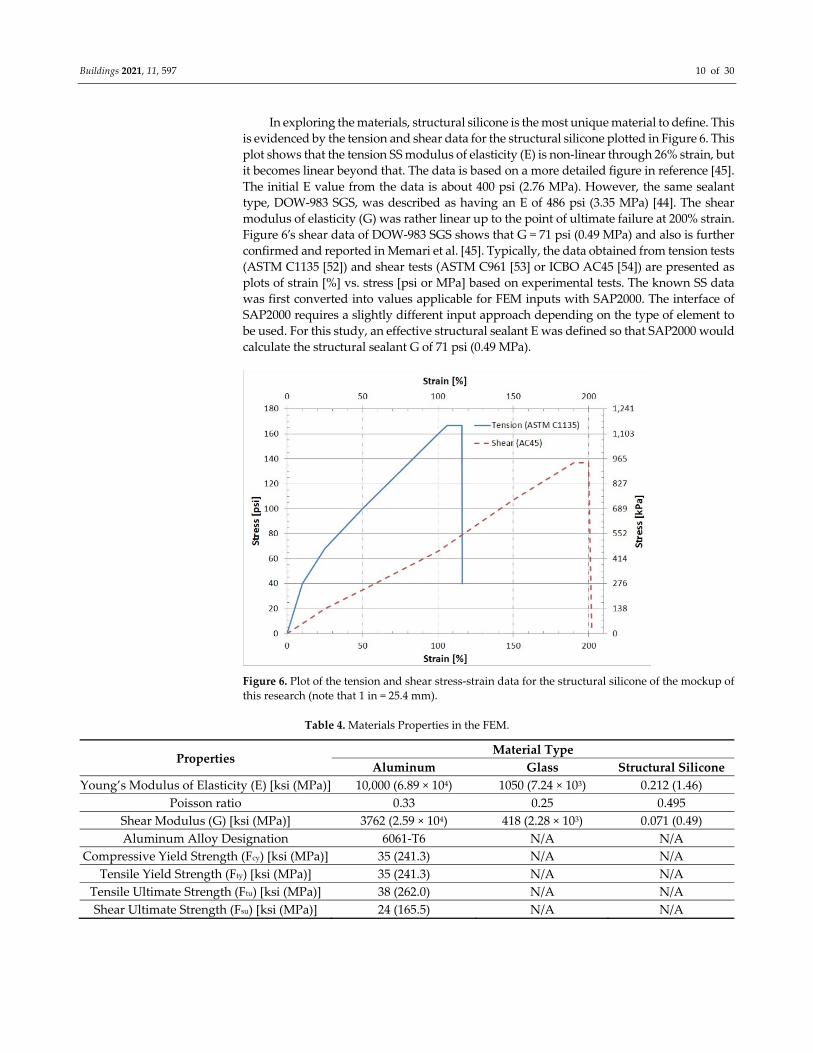
In exploring the materials, structural silicone is the most unique material to define. This
is evidenced by the tension and shear data for the structural silicone plotted in Figure 6. This
plot shows that the tension SS modulus of elasticity (E) is non‐linear through 26% strain, but
it becomes linear beyond that. The data is based on a more detailed figure in reference [45].
The initial E value from the data is about 400 psi (2.76 MPa). However, the same sealant
type, DOW‐983 SGS, was described as having an E of 486 psi (3.35 MPa) [44]. The shear
modulus of elasticity (G) was rather linear up to the point of ultimate failure at 200% strain.
Figure 6′s shear data of DOW‐983 SGS shows that G = 71 psi (0.49 MPa) and also is further
confirmed and reported in Memari et al. [45]. Typically, the data obtained from tension tests
(ASTM C1135 [52]) and shear tests (ASTM C961 [53] or ICBO AC45 [54]) are presented as
plots of strain [%] vs. stress [psi or MPa] based on experimental tests. The known SS data
was first converted into values applicable for FEM inputs with SAP2000. The interface of
SAP2000 requires a slightly different input approach depending on the type of element to
be used. For this study, an effective structural sealant E was defined so that SAP2000 would
calculate the structural sealant G of 71 psi (0.49 MPa).
Figure 6. Plot of the tension and shear stress‐strain data for the structural silicone of the mockup of
this research (note that 1 in = 25.4 mm).
Table 4. Materials Properties in the FEM.
Properties Material Type
Aluminum Glass Structural Silicone
Young’s Modulus of Elasticity (E) [ksi (MPa)] 10,000 (6.89 × 10⁴) 1050 (7.24 × 10³) 0.212 (1.46)
Poisson ratio 0.33 0.25 0.495
Shear Modulus (G) [ksi (MPa)] 3762 (2.59 × 10⁴) 418 (2.28 × 10³) 0.071 (0.49)
Aluminum Alloy Designation 6061‐T6 N/A N/A
Compressive Yield Strength (Fcy) [ksi (MPa)] 35 (241.3) N/A N/A
Tensile Yield Strength (Fty) [ksi (MPa)] 35 (241.3) N/A N/A
Tensile Ultimate Strength (Ftu) [ksi (MPa)] 38 (262.0) N/A N/A
Shear Ultimate Strength (Fsu) [ksi (MPa)] 24 (165.5) N/A N/A
Buildings 2021, 11, 597 11 of 30
Table 5. Properties assigned to the FEM frame elements.
Properties Edge Mullion Split Mullion Transom
Frame Section Type Tube Tube Tube
Material Aluminum Aluminum Aluminum
Outside depth (t3) 3 in (76.20 mm) 1 in (25.40 mm) 3 in (76.20 mm)
Outside width (t2) 5.1875 in (131.70 mm) 5.1875 in (131.70 mm) 5.5 in (139.70 mm)
Flange thickness (tf) 0.125 in (3.18 mm) 0.125 in (3.18 mm) 0.125 in (3.18 mm)
Web thickness (tf) 0.1875 in (4.76 mm) 0.1875 in (4.76 mm) 0.125 in (3.18 mm)
Property modifiers none None none
Table 6. Properties assigned to the FEM shell elements.
Properties Structural Sealant along
Transoms
Structural Sealant along
Mullions Glass
Element type Shell‐thick Shell‐thick Shell‐thick
Material Angle 0 0 0
Membrane thickness in (mm) 0.5625 (14.29) 0.5625 (14.29) 0.5 (12.70)
Bending thickness in (mm) 0.5625 (14.29) 0.5625 (14.29) 0.5 (12.70)
Property Modifiers *
Membrane f12 0.9091 0.9091 1
Shear v13 1 1.2 1
Shear v23 1.2 1 1
All other modifiers 1 1 1
Note: * Property modifiers are adjustments to behavior and correspond in this study to SAP2000′s notation.
4. Creating the Finite Element Model of the Mockups
The components of the 4SSG curtain wall system were modeled in the FEM as fol‐
lows: (a) the aluminum frame consisting of transoms and mullions as frame elements, (b)
structural sealant as area element type shell‐thick, and (c) glass as either an area element
type shell‐thick or as sets of diaphragm constraints applied to the nodes of the structural
sealant that are shared with the glass. The element type that is critical in this modeling is
the area element, which can be used to model a membrane, plate, or shell depending on
the dominating deformation mode.
Here, we will discuss the options and reasoning for the selection of specific element
types, input values, and sample calculations to convert SS material data into input values.
Figure 7a shows the area element used for SS when oriented along the transom, while
Figure 7b–d illustrate the position and orientation of transverse and longitudinal shear.
The FEM model described in Memari et al. [7,8] modeled the aluminum frame as a frame
element with properties E = 10,000 ksi (69,000,000 kPa) and a Poisson ratio of 0.33. In this
study, the 4SSG curtain wall system poses a modeling issue with the intermediate tran‐
som. Figure 8 shows the intermediate horizontal detail of the mockup, which includes the
transom. Each transom has two strips of SS attached to it, in which one strip is for an
upper glass pane, and the other is for a lower glass pane. Thus, the representation of the
transom must interface with two strips of area elements without the area elements inter‐
acting with each other directly. This issue does not occur with the mullion because the
intermediate stack joint is a split‐mullion design, as shown in Figure 9.

Buildings 2021, 11, 597 12 of 30
(a) (b)
(c) (d)
Figure 7. SAP2000 shell element properties and directions. (a) 3D representation segment of SS along a horizontal transom; (b)
membrane forces; (c) bending forces; (d) shear forces.
Figure 8. Curtain wall intermediate horizontal detail.
Figure 9. Curtain wall stack mullion detail.

Buildings 2021, 11, 597 13 of 30
4.1. Parametric Model (A–C) Development and Composition
All three models (A–C) were considered as a proper interface of transom and SS by
taking into account how the SS interacts with the glass and frame elements. Model A uses
a single frame element to represent the transom, while the SS is modeled with area ele‐
ment (shell formulation), and the glass is modeled as a diaphragm constraint that mimics
an area element’s programmable infinite modulus of elasticity (E). Model A’s representa‐
tion is depicted in Figure 10. Here, one node of the SS is moved to the centerline of the
transom, and the other node is at a distance equal to the thickness of the SS. The links are
drawn in opposite directions so that the area element of one strip of SS does not directly
affect the other area elements. A drawback to Model A is that with the out‐of‐plane forces
being transferred from the Row 2 glass panes above, it may counteract with the out‐of‐
plane forces transferred from the Rows 1 and 3 glass panes. The out‐of‐plane forces were
determined to be negligible when comparing results to the physical test. However, prior
to this discovery, Model B (Figure 11) was developed so that all of the glass panes could
be modeled on the same side offset from the frame element.
Figure 10. Idealized representation of FEM Model A.
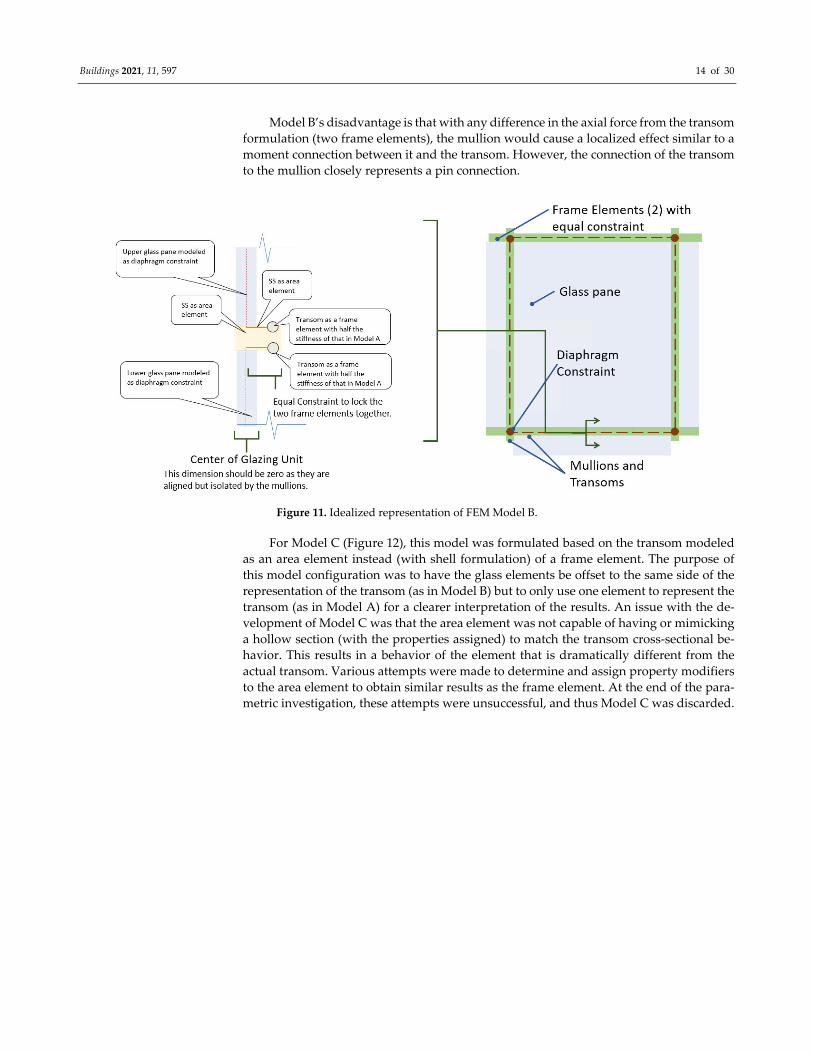
Model B (Figure 11) utilizes two frame elements to represent a single transom. Here,
the axial, shear, and flexural stiffness of each frame element was reduced by half so that
the summation of the two element’s properties would represent the single transom. Equal
constraints [50,51] were applied along the frame element linking programmed constraints
so that both frame elements would have the same response characteristics. The distance
between the frame elements was set to 1/2 in (12.70 mm), which represented the vertical
gap between the glass panes. This distance was selected so that the size of the gap between
the edges of the glass would be the same for the physical mockup and the FEM. As a result
of this gap, glass‐to‐glass contact could be determined from the FEM by visual inspection
of the deformed shape of the mockup. This gap in the model proves to have an advantage
over Model A, which requires the user to read the displacement values of the glass pane
corners, then calculate the relative movement, and compare it to the 1/2 in (12.70 mm)
vertical gap between the glass panes. The horizontal distance between panels was drawn
in the FEM as 3/4 in (19.05 mm) so that the horizontal distance between glass panes was
3/4 in (19.05 mm) for the same reason.
Buildings 2021, 11, 597 14 of 30
Model B’s disadvantage is that with any difference in the axial force from the transom
formulation (two frame elements), the mullion would cause a localized effect similar to a
moment connection between it and the transom. However, the connection of the transom
to the mullion closely represents a pin connection.
Figure 11. Idealized representation of FEM Model B.
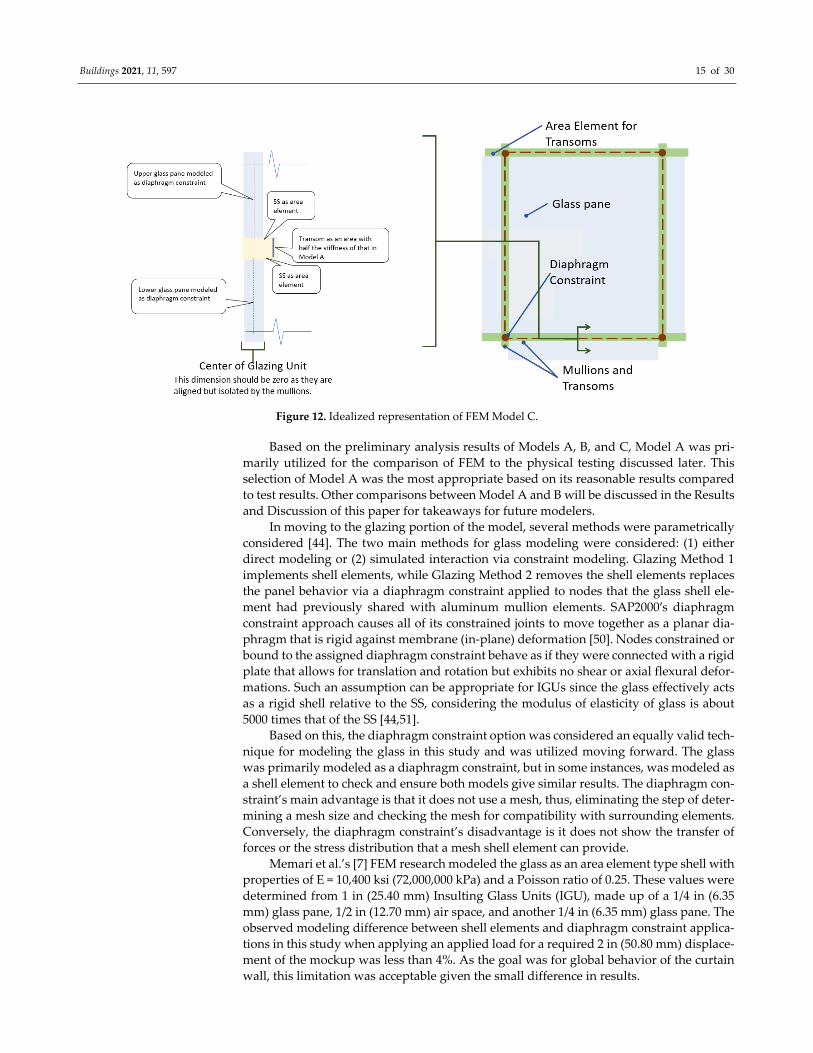
For Model C (Figure 12), this model was formulated based on the transom modeled
as an area element instead (with shell formulation) of a frame element. The purpose of
this model configuration was to have the glass elements be offset to the same side of the
representation of the transom (as in Model B) but to only use one element to represent the
transom (as in Model A) for a clearer interpretation of the results. An issue with the de‐
velopment of Model C was that the area element was not capable of having or mimicking
a hollow section (with the properties assigned) to match the transom cross‐sectional be‐
havior. This results in a behavior of the element that is dramatically different from the
actual transom. Various attempts were made to determine and assign property modifiers
to the area element to obtain similar results as the frame element. At the end of the para‐
metric investigation, these attempts were unsuccessful, and thus Model C was discarded.
Buildings 2021, 11, 597 15 of 30
Figure 12. Idealized representation of FEM Model C.
Based on the preliminary analysis results of Models A, B, and C, Model A was pri‐
marily utilized for the comparison of FEM to the physical testing discussed later. This
selection of Model A was the most appropriate based on its reasonable results compared
to test results. Other comparisons between Model A and B will be discussed in the Results
and Discussion of this paper for takeaways for future modelers.
In moving to the glazing portion of the model, several methods were parametrically
considered [44]. The two main methods for glass modeling were considered: (1) either
direct modeling or (2) simulated interaction via constraint modeling. Glazing Method 1
implements shell elements, while Glazing Method 2 removes the shell elements replaces
the panel behavior via a diaphragm constraint applied to nodes that the glass shell ele‐
ment had previously shared with aluminum mullion elements. SAP2000′s diaphragm
constraint approach causes all of its constrained joints to move together as a planar dia‐
phragm that is rigid against membrane (in‐plane) deformation [50]. Nodes constrained or
bound to the assigned diaphragm constraint behave as if they were connected with a rigid
plate that allows for translation and rotation but exhibits no shear or axial flexural defor‐
mations. Such an assumption can be appropriate for IGUs since the glass effectively acts
as a rigid shell relative to the SS, considering the modulus of elasticity of glass is about
5000 times that of the SS [44,51].
Based on this, the diaphragm constraint option was considered an equally valid tech‐
nique for modeling the glass in this study and was utilized moving forward. The glass
was primarily modeled as a diaphragm constraint, but in some instances, was modeled as
a shell element to check and ensure both models give similar results. The diaphragm con‐
straint’s main advantage is that it does not use a mesh, thus, eliminating the step of deter‐
mining a mesh size and checking the mesh for compatibility with surrounding elements.
Conversely, the diaphragm constraint’s disadvantage is it does not show the transfer of
forces or the stress distribution that a mesh shell element can provide.
Memari et al.’s [7] FEM research modeled the glass as an area element type shell with
properties of E = 10,400 ksi (72,000,000 kPa) and a Poisson ratio of 0.25. These values were
determined from 1 in (25.40 mm) Insulting Glass Units (IGU), made up of a 1/4 in (6.35
mm) glass pane, 1/2 in (12.70 mm) air space, and another 1/4 in (6.35 mm) glass pane. The
observed modeling difference between shell elements and diaphragm constraint applica‐
tions in this study when applying an applied load for a required 2 in (50.80 mm) displace‐
ment of the mockup was less than 4%. As the goal was for global behavior of the curtain
wall, this limitation was acceptable given the small difference in results.
Buildings 2021, 11, 597 16 of 30
As mentioned in the literature review cited papers [35–39], modeling structural sili‐
cone can be a challenge due to its non‐linear traits after certain loading. Due to the non‐
linearity and the level of modeling typically conducted by structural engineers and façade
designers [55], simplifications were made on the type of model elements. While volumet‐
ric elements are ideal, this study modeled the SS through a “shell‐thick” element formu‐
lation [50] because it combines membrane shear to represent the longitudinal shear and
plate shear to represent the transverse shear. The main drawback to modeling the SS with
the shell‐thick element is that only the linear material data can be used. Since the shear
behavior is linear, the user must check the shear strains of the SS elements to ensure that
the maximum shear strain of 190% has not been exceeded.
The SS physical properties are classified as isotropic; thus, it makes sense to define
the FEM material for the SS as isotropic as well. The shear behavior of the area element
with an isotropic material was calculated by SAP2000 [50] from the value of E using Equa‐
tion (1). The primary deformation of the SS under the AAMA 501.6 [47] testing protocol
is transverse shear and longitudinal shear. Thus, it is more important to have the shear
behavior correct over the tension behavior. It was considered appropriate to calculate an
effective modulus of elasticity, Eeffective, which would lead to SAP2000 to calculate the cor‐
rection value of the shear modulus of elasticity, G = 71 psi (0.49 MPa). Eeffective was calculated
using Equation (2), which is simply Equation (1) rearranged.
𝐺𝐸
2 1 𝜗 (1)
𝐸 𝐺 2 1 𝜗 71𝑝𝑠𝑖 2 1 0.495 212.29𝑝𝑠𝑖 1463.7𝑘𝑃𝐴 (2)
Property modifiers are coefficients that are multiplied with the gross stiffness to ob‐
tain the effective stiffness. For an area element, there are eight property modifiers (one per
each deformation direction), as shown in Figure 7b–d.
4.2. Example of FEM Development with Property Modifiers
The following is an example of how the property modifier values were determined
for the FEM of the 4SSG curtain wall system. The calculation of the effective shear stiffness
is shown as Equation (3) for an area element of material type “concrete” or “other”. This
is based on the classic equation for the shear stiffness of a concrete member, where the
shear area is taken as the gross shear area divided by a 1.2 factor. It does not seem neces‐
sary for the shear stiffness of the SS to include this 1.2 factor, which is an internal calcula‐
tion of SAP2000 [50]. However, the material property was left as “other”, and the 1.2 factor
was counteracted with a property modifier. This was achieved by modeling a coupon of
the SS with dimensions: thickness = joint width = length = 1 in (25.40 mm). The theoretical
shear stiffness would be according to Equation (4) without the 1.2 factor.
SAP2000 Shear stiffness is: . .
𝐺.
(3)
Theoretical Shear stiffness is: ” ”
”119.7𝑝𝑠𝑖 825.3𝑘𝑃𝑎 (4)
This element also incorporates deformation due to plate bending, which is not incor‐
porated into Equation (3). The deformation due to plate bending can be mitigated by
changing the property modifier for plate bending, m22, from 1 to 106. Without changing
any of the other property modifiers, the results from SAP2000 are 1.20 in (30.48 mm) due
to transverse shear and 0.91 in (23.11 mm) due to longitudinal shear. It was observed that
transverse shear was approximately the same as the 1.00 in (25.40 mm), i.e., the theoretical
value times the 1.2 factor from Equation (3) used by SAP2000. Thus, changing the property
modifier for plate shear, v23 from 1 to 1.2, will lead to SAP2000 resulting in the value of
1.00 in (25.40 mm) for the theoretical displacement in transverse shear. However, this is
not also the case for the longitudinal shear, which implies that a slightly different factor
such as 0.9 instead of 1.2 should be used. Alternatively, another coefficient such as 0.75

Buildings 2021, 11, 597 17 of 30
could be incorporated, which would result in 0.75×1.2 = 0.9. To achieve the theoretical
solution with SAP2000, the property modifier for membrane shear (f12) was changed from
1 to 0.91. Table 7 summarizes all the property modifiers determined for the shell elements
used. The modifiers m11 and m22 and the modifiers v13 and v23 swap due to the rotation
orientation of the elements along the mullion and transoms. The FEM of the entire 4SSG
curtain wall system of this research with these property modifiers was 4.2% less stiff than
the FEM with these property modifiers all set to one.
Table 7. Property modifiers assigned to the area elements representing the SS (see Figure 7 for directions).
Property Modifier According to
SAP2000
SS along Mullion
(% of Base Value)
SS along Transom
(% of Base Value)
Membrane f11 1 1
Membrane f22 1 1
Membrane Shear f12 0.91 0.91
Plate Bending m11 1 1
Plate Bending m22 1 1
Plate Bending m12 1 1
Plate Shear v13 1.2 1
Plate Shear v23 1 1.2
Figure 13 shows the SAP2000 sketch of the detail of the joint between P7, P8, P4, and
P5 identified in Figure 5. This detail shows the meshing of the area elements, which is set
to be 2.00 in (50.80 mm) or less, and also shows that the mockup of this research has a
different thickness for the SS along the mullion than the SS along the transom. The SS was
meshed such that at each corner, the SS along the mullion shared only one node with the
SS along the transom. The SS along the mullion could have been meshed through its thick‐
ness so that two nodes were shared. However, this is detrimental to the use of the dia‐
phragm constraint representing the glass. The SS was not meshed through its thickness
for the original models. Note that the common node shared is in the plane of the frame
elements representing the mullions and transoms. In reality, this common node is shared
in the plane of the glass surface that interfaces with the SS. This switch was made for the
convenience of simplifying the model.
Figure 13. 3D perspective view of SAP2000 FEM for the mockup of this research (close‐up of inter‐
section of transoms with the mullions).

Buildings 2021, 11, 597 18 of 30
The diaphragm constraint functions the same way regardless of the offset (Y‐direc‐
tion) between the nodes. If the configuration was switched so that the common node was
shared at the plane of the glass surface, then one of three alterations would be necessary:
1. Option 1 would be to move the transom frame element to share nodes with the area
elements. Here, the mullion frame element is no longer connected with the transom
frame element. Due to this, the modeler can compensate for the lack of connection by
drawing another frame element with rigid stiffness (axial, shear, and flexure) prop‐
erties along the length of the Y‐direction offset of 1/4 in (6.35 mm). This has been tried
and had varying results.
2. Option 2 would be to keep the transom and mullion elements in the same plane.
Here, the modeled SS thickness would be increased from 5/16 in (7.94 mm) to 9/16 in
(14.29 mm) so that it would then share nodes with the frame and the glass. However,
increasing the drawn thickness of the area element will decrease its effective stiffness.
3. Option 3 implements Option 2, but now property modifiers are computed (9/5 =
(9/16)/(5/16)) on the SS along the transom then applied, thus, modifying the modulus
of elasticity (E) to be 9/5 larger. The 9/5 modifier was not applied to the SS material
value along the mullion. Option 3 also keeps the transom and mullion elements in
the same plane.
Options 1 and 3 presented above could also be achieved by a combination of different
types of “constraints” applied to the nodes if SAP2000 is utilized [50,51]. However, con‐
straints are more advanced features of FEM, and they do not directly show how forces
and displacements are transferred. The excessive use of constraints is not recommended,
since the purpose of developing the FEM technique is for its use by practicing engineers,
and thus should be as simplified and user‐friendly as possible. The selected representation
of the change in SS thickness in the FEM for this study (as shown in Figure 13) with the
common node in the plane of the frame element does not encounter any such additional
problems or require additional elements or constraints. However, this modeling choice
depends on the use of the diaphragm constraint to represent the glass. The constrained
nodes along the transom are not co‐planar with the nodes along the mullion.
5. FEM Results on the Approximation of the Re‐Entrant Corner
As many research studies have used planer curtain wall tests [4,12,25,29,30], the be‐
havior of the re‐entrant corner in this study was unknown prior to this research due to
several variables, including (1) the resistance of the aluminum channel, (2) the interface of
the two dissimilar materials, and (3) the gasket and the tape down of the re‐entrant corner.
This section of the paper describes these unknowns, followed by how the resistance was
approximated using link elements [50] in the FEM, which were calibrated based on the
unitized sway condition test data [44,45].
The resistance of the aluminum channel holding the wall to the testing frame can be as‐
sumed to be the flexure resistance of the flange. However, the height at which the transom
makes contact with the channel varies throughout the test due to a lack of vertical restriction
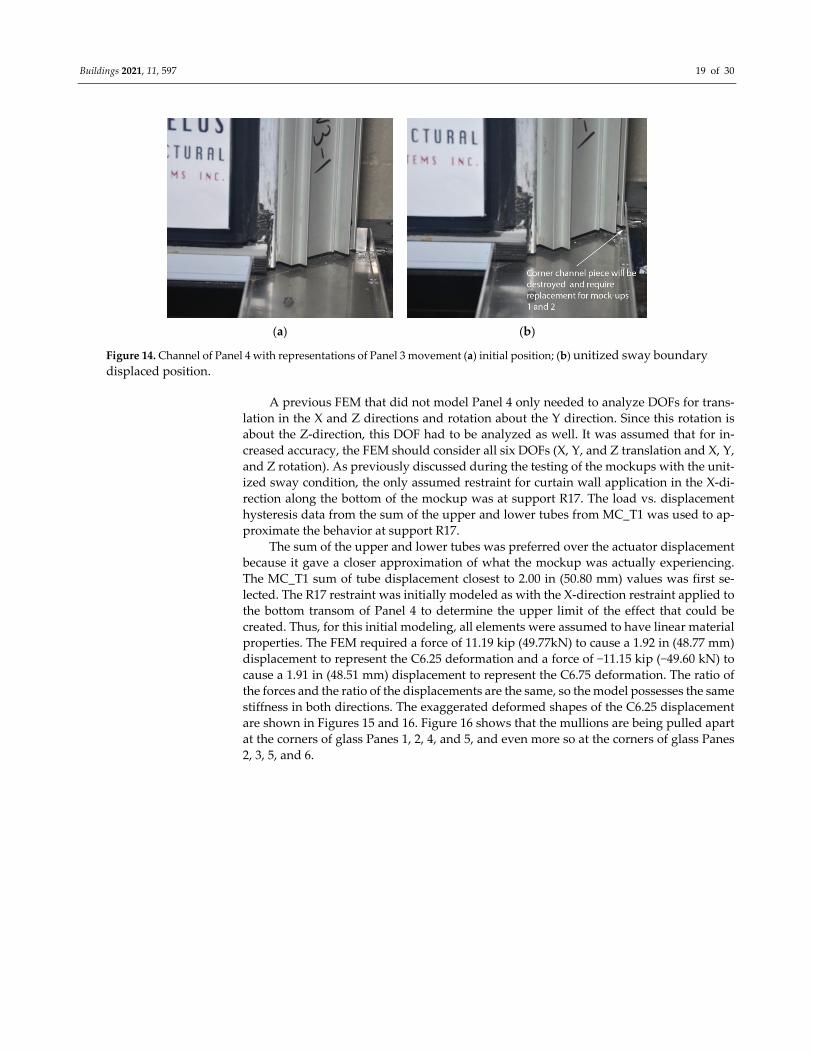
(Z‐direction) at the bottom of the panels for the unitized sway condition (Figure 14). Figure
14a,b shows the re‐entrant corner with Panel 4 removed, which allows for a view of how Panel
3 (parallel to testing) fits inside during the test. The other complication of the re‐entrant corner
is that the deformation of the channel is significantly greater at the re‐entrant corner than an‐
ywhere along Panel 4 (perpendicular to testing). All panels (1–4) initially have a small clear‐
ance from the bottom of the channel. However, during testing, the panels tend to rotate and
sometimes make contact at one end and slightly pivot about the channel.
Buildings 2021, 11, 597 19 of 30
(a) (b)
Figure 14. Channel of Panel 4 with representations of Panel 3 movement (a) initial position; (b) unitized sway boundary
displaced position.
A previous FEM that did not model Panel 4 only needed to analyze DOFs for trans‐
lation in the X and Z directions and rotation about the Y direction. Since this rotation is
about the Z‐direction, this DOF had to be analyzed as well. It was assumed that for in‐
creased accuracy, the FEM should consider all six DOFs (X, Y, and Z translation and X, Y,
and Z rotation). As previously discussed during the testing of the mockups with the unit‐
ized sway condition, the only assumed restraint for curtain wall application in the X‐di‐
rection along the bottom of the mockup was at support R17. The load vs. displacement
hysteresis data from the sum of the upper and lower tubes from MC_T1 was used to ap‐
proximate the behavior at support R17.
The sum of the upper and lower tubes was preferred over the actuator displacement
because it gave a closer approximation of what the mockup was actually experiencing.
The MC_T1 sum of tube displacement closest to 2.00 in (50.80 mm) values was first se‐
lected. The R17 restraint was initially modeled as with the X‐direction restraint applied to
the bottom transom of Panel 4 to determine the upper limit of the effect that could be
created. Thus, for this initial modeling, all elements were assumed to have linear material
properties. The FEM required a force of 11.19 kip (49.77kN) to cause a 1.92 in (48.77 mm)
displacement to represent the C6.25 deformation and a force of −11.15 kip (−49.60 kN) to
cause a 1.91 in (48.51 mm) displacement to represent the C6.75 deformation. The ratio of
the forces and the ratio of the displacements are the same, so the model possesses the same
stiffness in both directions. The exaggerated deformed shapes of the C6.25 displacement
are shown in Figures 15 and 16. Figure 16 shows that the mullions are being pulled apart
at the corners of glass Panes 1, 2, 4, and 5, and even more so at the corners of glass Panes
2, 3, 5, and 6.

Buildings 2021, 11, 597 20 of 30
Figure 15. 3D perspective of exaggeratedly deformed SAP2000 FEM with unitized sway boundary
condition (first trial of R17).
Figure 16. Elevation view of exaggeratedly deformed SAP2000 FEM with unitized sway boundary
condition (first trial of R17).
The load required for the FEM to deform the same amount as the physical mockup
ranges from 201% to 387% (Table 8) of that recorded for the physical mockup. This means
that the restraint at this location is not perfectly rigid. For the second trial, the restraints
along the transom were removed, and link elements were drawn at a spacing of 2 in (50.80
mm) along the transom with one node of the link connected to the transom and the other
node connected to a specially drawn node. These specially drawn nodes were not shared
with any other elements of the FEM and were restrained in the translation X‐direction.
Incorporating the link elements allows for the resistance provided by R17 to be adjusted.
If the links were made infinitely rigid, the mockup would approach the resistance of trial
1. A similar stiffness would be reached but would never surpass it. For the second trial,
the link elements were defined as a linear link with a stiffness of 3.72 kip (16.55 kN) di‐
vided by 1.92 in (48.77 mm) divided by 19 links = 0.102 k/in. For the third trial, the stiffness
of the springs was reduced by 25% to 0.75×0.102 k/in = 0.0765
The difference between the positive loading cycle and the negative loading cycle of
34% and 47% for MC_T1 and MB_T1, respectively, indicate that non‐linear links must be
used in order to reproduce these results. A “Multi‐Linear Elastic” link element was se‐
lected for the fourth trial because it allows for non‐linear material properties to be consid‐
ered. The input for a Multi‐Linear Elastic link element is displacement vs. force that will
simulate the behavior before the index clips fail. For the fourth trial, the displacement
values were taken exactly like those of MC_T1; the force value was calculated as the values
from MC_T1 divided by 19 links and multiplied by 0.75. The 0.75 factor represents the

Buildings 2021, 11, 597 21 of 30
same 0.75 factor that was used for the third trial. The ratio of the FEM results to the phys‐
ical testing differed for cycles 6.25 and 6.75. This seems appropriate as, during the physical
testing, the points of contact and transfer of compression forces occur at diagonal corners
and alternates to the test cycles. It seemed appropriate to modify the negative force values
for Trial 4 by the 0.495 ratio and the positive force values by the 0.616 ratio, since neither
cycle 6.25 nor 6.75 caused all of the links to deform in the same direction. The definition
of the link element was simplified to just three values. A few trials and adjustments to the
definition were required to achieve results that were within 2% of the physical testing.
The definitions obtained from the final trial and used for all of the following FEM discus‐
sions are presented in Table 9.
Table 8. Summary of three trial comparisons supporting R17 with applied restraints.
Trial # Category C6.25 + Load C6.75 − Load
FEM
[kip (kN)]
1 11.19 (49.77) −11.15
2 4.46 (19.84) −4.44 (−19.75)
3 3.70 (16.46) −3.72 (−6.55)
MC_T1
[kip (kN)]
1 3.72 (16.55) −2.46 (−10.94)
2 3.72 (16.55) −2.46 (−10.94)
3 3.72 (16.55) −2.46 (−10.94)
Difference
%
1 201% 353%
2 20% 80%
3 −1% 51%
MB_T1
[kip (kN)]
1 3.38 (15.03) 2.30 (10.23)
2 3.38 (15.03) 2.30 (10.23)
3 3.38 (15.03) 2.30 (10.23)
Difference
%
1 231% 385%
2 32% 93%
3 9% 62%
Table 9. SAP2000 FEM input for R17 Multi‐Linear Elastic Links Finalized.
Displacement
(in (mm))
Load
(kip (kN))
Stiffness
(k/in (N/mm))
−0.344 (−8.74) −0.158 (−0.703) 0.46 (0.08)
0.000 0.000 N/A
1.250 (31.75) 0.218 (0.970) 0.17 (0.03)
6. FEM Results Compared to Hysteresis Data for Load vs. Displacement
The hysteresis data for Mockup B Test 2 had a pure racking boundary condition
change in stiffness response after Step 13, which is due to the yielding of the SS, and also
after Step 16, due to other behavior changes because of the failure of the SS. Since the FEM
here is based on using linear material properties for the SS, the FEM is only expected to
be accurate prior to the failure of the SS. Figure 17 shows a plot of both the FEM results
for the pure‐rack boundary condition and the physical test data of MB_T2. This shows
that the FEM approximates the physical data at small drifts very well. However, the FEM
acts relatively linearly, which means that the influence of the links at R17 is not large
enough to cause the non‐linear behavior seen in the test data. It is possible that the R17
applied restraint should be redefined as a Multi‐Linear Plastic Link, and the load case type
is changed from static to multi‐step static. Figure 18 shows a plot of both the FEM results
for the rack‐with‐vertical‐slip boundary condition and the physical test data of MC_T2.

Buildings 2021, 11, 597 22 of 30
This shows that the FEM approximates the physical data of small drifts very well. How‐
ever, the FEM acts relatively linearly, which means that the influence of the links at R17 is
not large enough to cause the non‐linear behavior seen in the test data.
Figure 17. SAP2000 FEM with pure‐rack boundary condition compared to physical test data of
MB_T2 (note that 1 in = 25.4 mm) [based on [44] and [51]].
Figure 18. SAP2000 FEM with rack‐with‐vertical‐slip boundary condition compared to physical test
data (note that 1 in = 25.4 mm) [based on [44] and [51]].
The SAP2000 FEM results are presented in Table 10 with a comparison to the results
from the physical testing. For MB_T2, the FEM predicted a force 47% and 23% larger than
what was recorded during the physical testing of the mockup at approximately the same
drift ds, respectively, for the positive and negative loading cycles. For MC_T2, the FEM
predicted a force 31% and 59% larger than what was recorded during the physical testing
of the mockup at approximately the same drift ds, respectively, for the positive and neg‐
ative loading cycles. Despite such differences, they are acceptable considering that the
SAP2000 FEM uses linear material properties for the SS and static loading.
The SAP2000 FEM also does not account for drops in stiffness of any of the materials
due to fatigue or failure of the materials. It is noticeable that the FEM predicts the same

Buildings 2021, 11, 597 23 of 30
value for the positive and negative loading cycles. This then prompted interest in the effect
of the restraint R17, which is supposed to be the primary cause of the FEM to have differ‐
ent stiffness in the positive and negative direction. The restraint R17 was deactivated, and
the results were very similar, which means that the restraint as defined was not very in‐
fluential for the racking boundary condition. This was to be expected because of the exist‐
ence of the bolted connections on Panel 4. These connections are much more rigid than
the channel and, thus, should attract most of the force being transferred from the testing
facility to the mockup. This means that the difference in the positive and negative loading
cycles of the physical testing is caused more so by the flexibilities of the testing facility
than the effect of the channel.
Table 10. Summary of FEM and physical testing.
Time Point in Testing
for Comparison
FEM
(kip (kN))
Physical Testing
(kip (kN)) D%
FEM with
R17 Links
Deactivated
(kip (kN))
D%
MB_T2 MC_T2 MB_T2 MC_T2 MB_T2 MC_T2 MB_T2 MC_T2 MB_T2 MC_T2
C6.25 + Load for 1.95 in
(49.53 mm) drift
10.27
(45.68)
10.74
(47.68)
7.81
(34.74)
7.28
(32.38) 31% 48%
10.24
(45.55)
10.72
(47.68) −0.3% −0.2%
C6.75 − Load for 1.99 in
(50.55 mm) drift
10.48
(46.62)
−10.95
(−48.70)
−6.58
(−26.27)
−8.88
(−39.50) 59% 23%
−10.45
(−46.48)
−10.94
(−48.57) −0.3% −0.1%
7. FEM Movement of Glass Relative to Frame and the Effect of SS Failure on Mockup
Behavior
The movement of glass pane corners was determined relative to the frame by the
deformation of the SS nodes at corner locations in the horizontal and vertical directions,
from which effective shear strain was calculated. Table 11 shows the measured values of
the rotations of glass panes from the FEM of the mockup with the stick‐built boundary
condition and applied displacement of 1.99 in (50.55 mm) in the C6.75 direction. These
rotations were very similar to values calculated from a video analysis reported in Memari
et al. [49]. Knowing the amount of rotation per applied drift can be useful in developing
kinematic equations for approximating the drifts at which structural sealant fails or glass‐
to‐glass contact occurs. The FEM was able to make reasonable predictions for the drift at
which glass‐to‐glass contact occurs. MB_T2 did have glass‐to‐glass contact; however, this
occurred after structural sealant failure and non‐linear behavior. Comparison of the FEM
and video analysis from racking tests showed that while the drifts are still in the linear
range of the system, there is good consistency between FEM and testing. However, as
discussed subsequently, when drifts go beyond the elastic limits, there will be significant
discrepancies between such results. This then defines the useful range of the approach to
be within the elastic response.
Table 11. Summary of rotations of the glass determined from FEM of MB_T2_S12_6.75.
Rotation of Glass Panes in Rad for Each Pane Average Rotation of Glass Pane in
Rad of Each Row
P7: −0.00543 P8: −0.00455 P9: −0.00722 Row 3: −0.00573
P4: −0.01263 P5: −0.01210 P6: −0.01250 Row 2: −0.01241
P1: −0.00475 P2: −0.00362 P3: −0.00313 Row 1: −0.00383
A technique was used to measure the movement of the glass corners relative to the
mullions and transoms, which is the same as the deformation of the structural sealant. The
FEM calculated the displacement of nodes, which directly correlated to the longitudinal
shear (Δr) and transverse shear (Δs) of the structural sealant. These values were used to

Buildings 2021, 11, 597 24 of 30
calculate the effective shear (Δt) based on two methods. The first method is a linear rela‐
tionship of longitudinal shear plus transverse shear, Equation (5). The second method is
a quadratic relationship of the square root of the sum of longitudinal shear squared plus
transverse shear squared, Equation (6).
∆ |∆ | |∆ | (5)
∆ ∆ ∆ (6)
The displacements of the nodes were recorded from the FEM analysis and used to
determine the horizontal and vertical deformation components of the structural sealant at
glass pane corners. Then, the effective shear strain was calculated by two methods. These
results are presented in Table 12. The calculated effective shear stains from a video anal‐
ysis presented in Memari et al. [49] are shown in Table 13 for comparison. These values
from the FEM (Table 11) are very consistent for each of the six locations.
Table 12. Movement of glass corners relative to frame, determined from FEM of MB_T2_S12_6.75 [44,45].
Pane # Measurement Point
on Pane
Horizontal
Displacement
[in/mm]
Vertical
Displacement
[in/mm]
Method 1 Linear
Strain [%]
Method 2 SQRT
Strain [%]
P5 Top Left 0.29 (7.37) −0.29 (−7.37) 185% 131%
P5 Top Right 0.29 (7.37) 0.29 (7.37) 185% 131%
P6 Top Left 0.29 (7.37) −0.30 (−7.62) 188% 133%
P5 Bottom Left −0.28 (−7.11) −0.29 (−7.37) 181% 128%
P5 Bottom Right −0.28 (−7.11) 0.29 (7.37) 181% 128%
P6 Bottom Left −0.27 (−6.86) −0.27 (−6.86) 175% 124%
Table 13. Movement of glass corners relative to frame of MB_T2_S12_6.75 [44,45].
Pane # Measurement Point on
Pane
Horizontal
Displacement
[in (mm)]
Vertical
Displacement
[in (mm)]
Method 1 Linear
Strain [%]
Method 2 SQRT
Strain [%]
P5 Top Left 0.11 (2.79) −0.30 (−7.62) 133% 104%
P5 Top Right 0.10 (2.54) 0.21 (5.33) 100% 75%
P6 Top Left 0.02 (0.51) −0.14 (−3.55) 52% 45%
P5 Bottom Left −0.05 (−1.27) −0.22 (−5.59) 87% 73%
P5 Bottom Right −0.11 (−2.79) 0.14 (−3.56) 82% 59%
P6 Bottom Left −0.20 (−5.08) −0.12 (−3.05) 103% 74%
Figures 19 and 20 show three similar FEMs, which display how the aluminum frame
deforms and how glass Pane 5 translates and rotates. The three models are shown for
comparison of how the behavior changes as the SS progresses and propagates. Figures
19a and 20a include link elements around its entire perimeter to model the SS. This dis‐
cussion is equally true if the SS were to be modeled with area element‐type shell‐thickness.
The observations previously noted suggest that during Step 21, the SS failed along the top
edge, but not the bottom edge. Figures 19b and 20b show the deformed shape of the same
model, except the link elements representing the SS were removed along the top edge.
This removal of the link elements is to represent that the SS in that area no longer provides
any resistance. Figures 19c and 20c show the model once again, but with almost the entire
top half of the SS elements removed. As the region of the failed SS propagates down the
sides of the glass pane, the remaining SS then only serves to hold the self‐weight of the
glass pane and not resist the seismic forces. The glass would then rotate freely and trans‐
late relatively freely to accommodate the SS, so it may have minimal stress levels.

Buildings 2021, 11, 597 25 of 30
(a) (b) (c)
Figure 19. Exaggerated deflected shape of aluminum frame with respect to glass Pane 5. (a) SS modeled all around the
perimeter; (b) SS removed along top edge; (c) SS removed halfway down the sides.
(a) (b) (c)
Figure 20. Close up of the bottom left corner of each model shown in previous figure. (a) SS modeled; (b) SS removed; (c)
SS removed halfway.
8. Discussion of the Results
As the structural silicone (SS) damage to MC_T2 was much less than that of MB_T2,
comparisons between the load vs. displacement hysteresis loop data and the FEM were
not limited to Steps 1 through 12 like they were for MB_T2. During Step 12, results show
displacements of 2.07 in (52.6 mm) for C6.25 and −2.02 in (−51.3 mm) for C6.75 for MC_T2.
When comparing the plot of the FEM (Figure 17) against the pure‐rack boundary condi‐
tion (Figure 17), there were almost identical behaviors. This indicates that releasing the
constrained Z‐direction DOF at R1 through R8 and the X‐direction DOF at R6 through R8
had very little influence on the model. The physical data similarly showed very little in
the positive direction and a slight offset in the negative direction (Figure 21). The cause of
this difference between MB_T2 and MC_T2 could likely be due to the compression and
tension interaction and/or plastic deformation of the index clips at the re‐entrant corner.
Another possible cause could be the plastic deformation of the channel at the re‐entrant
corner. It is therefore recommended that future FEM studies on these elements be system‐
atically modeled as Multi‐Linear Plastic links using trial values for the material properties,
and the load case type is changed from static to multi‐step static.

Buildings 2021, 11, 597 26 of 30
Figure 21. Comparison of physical test data of MB_T2 and MC_T2 with the FEM results (note that
1 in = 25.4 mm).
The FEM was relatively symmetric and was not significantly influenced by the per‐
pendicular panel or the channel. However, the values from physical testing showed some
significant variances among the six locations. The average differences of 349% for the hor‐
izontal direction and 66% for the vertical direction of the FEM resulting from the physical
tests were quite large. The majority of this variance is most likely caused by the FEM’s
lack of non‐linear representation of the plastic deformation of the frame and channel at
higher drifts or due to the failure of the structural sealant before a shear strain of 200%,
possibly because of workmanship. Another possible source for the variance between the
FEM and the physical result is that the behavior of structural sealant was verified based
on a 2 in long coupon test rather than a significantly longer strip of structural sealant,
which might better represent the structural sealant along a single edge of a glass pane.
Throughout the study, parametric modeling was done to determine the parameters
that would have the largest influence on specific results. Table 14 summarizes the vari‐
ances discussed in previous sections, such as Model A compared to Model B, the effect of
the restraints used, etc. The variation shown is for changing the SS modulus of elasticity
from 358 psi (2468 KPA) [baseline iteration] to 486 psi (3350 KPa) [upper bound iteration].
The most common result presented in Table 14 is the load required to displace the mockup
at a specific drift. This is useful to make a general statement/comparison to the stiffness of
the entire mockup.
The current FEM with the static load case takes about one to three minutes to run per
load case. A multi‐step static analysis is expected to take about the same amount of time
to run, except at least three or four steps should be analyzed for each load case. These
steps could represent cycles 6.25, 6.75, 7.25, and 7.75 for the desired AAMA step. The def‐
inition of the time history could represent a portion of an individual AAMA racking step,
an entire individual AAMA racking step, or a continuous run through all 24 AAMA rack‐
ing steps. A portion of an AAMA step, such as the two constant amplitude cycles, should
be sufficient, and the analysis would be faster than using an entire step and especially
faster than using all 24 steps. The time history analysis (THA) is expected to take much
longer than the multi‐step static analysis for the same amount of cycles (two cycles is rec‐
ommended). The analysis time will depend mostly on the number of steps that are to be
calculated per load case and the time interval used to define the sinusoidal time history
applied displacement. The time history analysis is expected to give a more accurate result,
because it can model the displacement as a sinusoidal wave. The calculated applied load
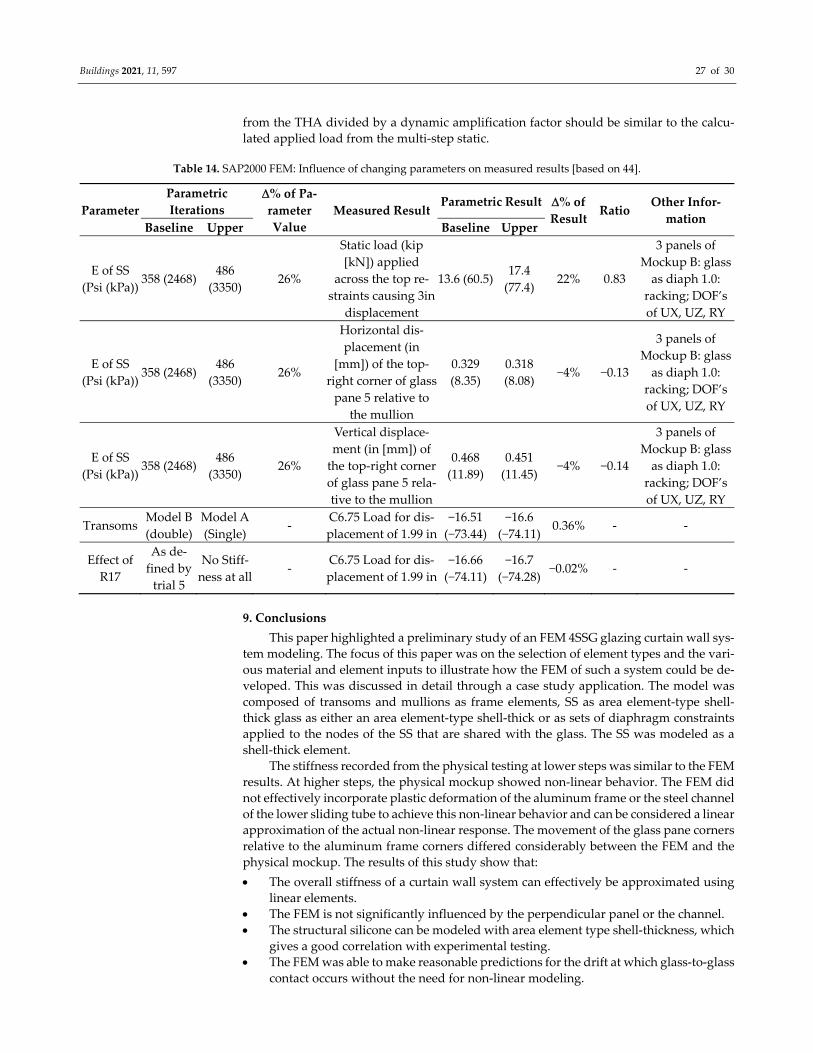
Buildings 2021, 11, 597 27 of 30
from the THA divided by a dynamic amplification factor should be similar to the calcu‐
lated applied load from the multi‐step static.
Table 14. SAP2000 FEM: Influence of changing parameters on measured results [based on 44].
Parameter
Parametric
Iterations
% of Pa‐rameter
Value
Measured Result Parametric Result % of
Result Ratio
Other Infor‐
mation Baseline Upper Baseline Upper
E of SS
(Psi (kPa)) 358 (2468)
486
(3350) 26%
Static load (kip
[kN]) applied
across the top re‐
straints causing 3in
displacement
13.6 (60.5) 17.4
(77.4) 22% 0.83
3 panels of
Mockup B: glass
as diaph 1.0:
racking; DOF’s
of UX, UZ, RY
E of SS
(Psi (kPa)) 358 (2468)
486
(3350) 26%
Horizontal dis‐
placement (in
[mm]) of the top‐
right corner of glass
pane 5 relative to
the mullion
0.329
(8.35)
0.318
(8.08) −4% −0.13
3 panels of
Mockup B: glass
as diaph 1.0:
racking; DOF’s
of UX, UZ, RY
E of SS
(Psi (kPa)) 358 (2468)
486
(3350) 26%
Vertical displace‐
ment (in [mm]) of
the top‐right corner
of glass pane 5 rela‐
tive to the mullion
0.468
(11.89)
0.451
(11.45) −4% −0.14
3 panels of
Mockup B: glass
as diaph 1.0:
racking; DOF’s
of UX, UZ, RY
Transoms Model B
(double)
Model A
(Single) ‐
C6.75 Load for dis‐
placement of 1.99 in
−16.51
(−73.44)
−16.6
(−74.11) 0.36% ‐ ‐
Effect of
R17
As de‐
fined by
trial 5
No Stiff‐
ness at all ‐
C6.75 Load for dis‐
placement of 1.99 in
−16.66
(−74.11)
−16.7
(−74.28) −0.02% ‐ ‐
9. Conclusions
This paper highlighted a preliminary study of an FEM 4SSG glazing curtain wall sys‐
tem modeling. The focus of this paper was on the selection of element types and the vari‐
ous material and element inputs to illustrate how the FEM of such a system could be de‐
veloped. This was discussed in detail through a case study application. The model was
composed of transoms and mullions as frame elements, SS as area element‐type shell‐
thick glass as either an area element‐type shell‐thick or as sets of diaphragm constraints
applied to the nodes of the SS that are shared with the glass. The SS was modeled as a
shell‐thick element.
The stiffness recorded from the physical testing at lower steps was similar to the FEM
results. At higher steps, the physical mockup showed non‐linear behavior. The FEM did
not effectively incorporate plastic deformation of the aluminum frame or the steel channel
of the lower sliding tube to achieve this non‐linear behavior and can be considered a linear
approximation of the actual non‐linear response. The movement of the glass pane corners
relative to the aluminum frame corners differed considerably between the FEM and the
physical mockup. The results of this study show that:
The overall stiffness of a curtain wall system can effectively be approximated using
linear elements.
The FEM is not significantly influenced by the perpendicular panel or the channel.
The structural silicone can be modeled with area element type shell‐thickness, which
gives a good correlation with experimental testing.
The FEM was able to make reasonable predictions for the drift at which glass‐to‐glass
contact occurs without the need for non‐linear modeling.
Buildings 2021, 11, 597 28 of 30
It is recommended that future studies further develop FEM to incorporate plastic de‐
formation of the mockup and the channel of the lower sliding tube of the test facility. This
can be accomplished by modeling the channel (R17) as multi‐linear plastic links and
changing the load case type from static to either multi‐step static or using a time history
load. Both the multi‐step static load and time history analysis should be displacement‐
controlled rather than applied load‐controlled. Additionally, the glazing modeling should
be further studied parametrically by considering glass as a diaphragm constraint and as
a shell‐thick element. Both models would require the nodes of the SS shared with the glass
to be co‐planar. Lastly, there should be an FEM that is accurate beyond the failure of the
SS so that one can evaluate the remaining limit state of glass‐to‐glass contact. Once devel‐
oped, this FEM may be useful for designing a glazing curtain wall system to be able to
handle a particular amount of drift without SS failure, and also at a higher drift amount
to prevent glass‐to‐glass contact, while at this state, some SS failure may have occurred.
Author Contributions: Conceptualization, A.M.M.; methodology, A.M.M. and N.S.; software, N.S.;
validation, N.S.; formal analysis, N.S.; investigation, N.S.; writing—original draft preparation,
A.M.M. and R.L.S.; writing—review and editing, A.M.M. and R.L.S.; visualization, R.L.S. and N.S.;
supervision, A.M.M.; project administration, A.M.M.; funding acquisition, A.M.M. All authors have
read and agreed to the published version of the manuscript.
Funding: This research was partially funded by Dow and Bagatelos for supplying the materials and
financial resources necessary to conduct these tests. The results of the study presented here are those
of the authors and do not necessarily reflect those of the sponsors.
Institutional Review Board Statement: Not Applicable.
Informed Consent Statement: Not Applicable.
Data Availability Statement: All Data can be found in the referneces provided, mainly publicaiton
under the name Memari, A. M.
Conflicts of Interest: The authors declare no conflict of interest.
References
1. Dharani, L.R.; Yu, J. Failure Modes of Glass Panels Subjected to Soft Missile Impact. In Damage and Fracture Mechanics VIII:
Computer Aided Assessment and Control; WIT Press: Southampton, UK, 2004; pp. 163–171.
2. Antolinc, D.; Rajčić, V.; Zarnic, R. Analysis of hysteretic response of glass infilled wooden frames. J. Civ. Eng. Manag. 2014, 20,
600–608.
3. Caterino, N.; Zoppo, M.D.; Maddaloni, G.; Bonati, A.; Cavanna, G.; Occhiuzzi, A. Seismic assessment and finite element mod‐
elling of glazed curtain walls. Struct. Eng. Mech. 2017, 61, 77–90, doi:10.12989/sem.2017.61.1.077.
4. Memari, A.M. Curtain Wall Systems—A Primer, Consisting of 12 Chapters. In American Society of Civil Engineers (ASCE); ASCE:
Reston, VA, USA, 2013; 217p., ISBN 978‐0‐7844‐1270‐1.
5. Sivanerupan, S.; Wilson, J.L.; Gad, E.F.; Lam, N.T.K. Seismic Assessment of Glazed Façade Systems. In Proceedings of the An‐
nual Technical Conference of the Australian Earthquake Engineering Society, Newcastle, Australia, 11–13 December 2009.
6. Broker, K.A.; Fisher, S.; Memari, A.M. Seismic Racking Test Evaluation of Silicone Used in a Four‐Sided Structural Sealant
Glazed Curtain Wall System. J. ASTM Int. 2012, 9, 473–504, doi:10.1520/jai104144.
7. Memari, A.M.; Shirazi, A.; Kremer, P.A.; Behr, R.A. Development of Finite‐Element Modeling Approach for Lateral Load Anal‐
ysis of Dry‐Glazed Curtain Walls. J. Arch. Eng. 2011, 17, 24–33, doi:10.1061/(asce)ae.1943‐5568.0000027.
8. Memari, A.; Shirazi, A.; Kremer, P. Static finite element analysis of architectural glass curtain walls under in‐plane loads and
corresponding full‐scale test. Struct. Eng. Mech. 2007, 25, 365–382.
9. Beason, W.L.; Lingnell, W.A. Emerging Uses for Window Glass. In Emerging Materials for Civil Infrastructure State of the Art;
Lopez‐Anido, R.A., Naik, T.R., Eds.; ASCE: Reston, VA, USA, 2008; Chapter 8, pp. 190–216.
10. Carre, H.; Dauderville, L. Load‐bearing capacity of tempered structural glass. J. Eng. Mech. 1999, 125, 914–921,
doi:10.1061/(ASCE)0733‐9399(1999)125:8(914).
11. Pantelides, C.P.; Behr, R.A. Dynamic in‐plane racking tests of curtain wall glass elements. Earthq. Eng. Struct. Dyn. 1994, 23,
211–228.
12. Dean, S.; Memari, A.; Chen, X.; Kremer, P.; Behr, R. Seismic Performance of Two‐Side Structural Silicone Glazing Systems. J.
ASTM Int. 2006, 3, 40–49, doi:10.1520/jai100407.
13. Dharani, L.R.; Ji, F.; Behr, R.A.; Minor, J.E.; Kremer, P.A. Breakage Prediction of Laminated Glass Using the “Sacrificial Ply”
Design Concept. J. Arch. Eng. 2004, 10, 126–135, doi:10.1061/(asce)1076‐0431(2004)10:4(126).

Buildings 2021, 11, 597 29 of 30
14. Flocker, F.W.; Dharani, L.R. Low Velocity Impact Resistance of Laminated Architectural Glass. J. Arch. Eng. 1998, 4, 12–17,
doi:10.1061/(asce)1076‐0431(1998)4:1(12).
15. Ji, F.S.; Dharani, L.R.; Behr, R.A. Damage probability in laminated glass subjected to low velocity small missile impacts. J. Mater.
Sci. 1998, 33, 4775–4782, doi:10.1023/a:1004457624817.
16. Dharani, L.R.; Wei, J.; Yu, J.; Minor, J.E.; Behr, R.A.; Kremer, P.A. Laminated architectural glass subjected to blast, impact load‐
ing. Am. Ceram. Soc. Bull. 2005, 84, 42–44.
17. Zemanová; A.; Plachý; T.; Schmidt, J.; Janda, T.; Zeman, J.; Šejnoha, M. Numerical and Experimental Modal Analysis of Lami‐
nated Glass Beams. In Dynamical Systems in Applications; Awrejcewicz, J., Ed.; Springer: Cham, Switzerland, 2017; Volume 249,
doi:10.1007/978‐3‐319‐96601‐4_43.
18. Blanchet, S.; Morse, S.; Norville, H.S. Effects of Silicone Coatings on Heat Strengthened and Fully Tempered Glass. J. Arch. Eng.
2020, 26, 04020009.
19. Béchet, F.; Siedow, N.; Lochegnies, D. Two‐dimensional finite element modeling of glass forming and tempering processes,
including radiative effects. Finite Elements Anal. Des. 2015, 94, 16–23.
20. Beason, W.L.; Kohutek, T.L.; Bracci, J.M. Basis for ASTM E 1300 Annealed Glass Thickness Selection Charts. J. Struct. Eng. 1998,
124, 215–221, doi:10.1061/(asce)0733‐9445(1998)124:2(215).
21. Timmel, M.; Kolling, S.; Osterrieder, P.; Du Bois, P. A finite element model for impact simulation with laminated glass. Int. J.
Impact Eng. 2007, 34, 1465–1478.
22. Jain, A.; Yi, A.Y. Finite element modeling of structural relaxation during annealing of a precision‐molded glass lens. J. Manuf.
Sci. Eng. 2006, 128, 683–690.
23. Travis, H.S.; Carbary, L.D. Finite element analysis of a structural silicone shear bead used in skylight applications. ASTM Spec.
Tech. Publ. 1999, 1334, 229–242.
24. Weggel, D.; Zapata, B. Laminated Glass Curtain Walls and Laminated Glass Lites Subjected to Low‐Level Blast Loading. J.
Struct. Eng. 2008, 134, 466–477, doi:10.1061/(ASCE)0733‐9445(2008)134:3(466).
25. Memari, A.M.; Hartman, K.H.; Kremer, P.A. Racking Test Evaluation of EN‐WALL 7250 Unitized Curtain Wall System with 3M™
VHB™ Structural Glazing Tape; Report Submitted to 3M Industrial Adhesives & Tapes Division: St. Paul, MN, USA, 2011; 72p.
26. Angelides, S.C.; Talbot, J.P.; Overend, M. The effects of high strain‐rate and in‐plane restraint on quasi‐statically loaded lami‐
nated glass: A theoretical study with applications to blast enhancement. Glass Struct. Eng. 2020, 4, 403–420, doi:10.1007/s40940‐
019‐00107‐4.
27. Sucuoglu, H.; Vallabhan, C.V.G. Behavior of window glass panels during earthquakes. Eng. Struct. 1997, 19, 685–694,
doi:10.1016/S0141‐0296(96)00130‐7.
28. Beason, W.L.; Morgan, J.R. Glass failure prediction model. J. Struct. Eng. 1984, 110, 197–212, doi:10.1061/(ASCE)0733‐
9445(1984)110:2(197).
29. Behr, R.A. Seismic performance of architectural glass in mid‐rise curtain wall. J. Archit. Eng. 1998, 4, 94–98,
doi:10.1061/(ASCE)10760431(1998)4:3(94).
30. Memari, A.M.; Behr, R.A.; Kremer, P.A. Seismic behavior of curtain walls containing insulating glass units. J. Archit. Eng. 2003,
9, 70–85, doi:10.1061/(ASCE)1076‐0431(2003)9:2(70).
31. Memari, A.M.; Kremer, P.A.; Behr, R.A. Dynamic racking crescendo tests on architectural glass fitted with anchored ‘PET’ film.
J. Archit. Eng. 2004, 10, 5–14, doi:10.1061/(ASCE)1076‐0431(2004)10:1(5).
32. Sglavo, V.M.; Muller, C.; Righetti, F. Influence of Edge Finishing on the Resistance to Thermal Stresses of Float Glass. In Glass
Performance Days, Proceedings of the 10th Interior Conference, 20 June 2007; Glass Performance Days: Tampere, Finland; pp. 668–672.
33. Quaglini, V.; Cattaneo, S.; Biolzi, L. Numerical assessment of laminated cantilevered glass plates with point fixings. Glass Struct.
Eng. 2020, 5, 187–204, doi:10.1007/s40940‐020‐00119‐5.
34. Descamps, P.; Van Wassenhove, G.; Hayez, V. Simulating structural silicone glazing joint deformation with spring models.
Glass Struct. Eng. 2020, 5, 171–185, doi:10.1007/s40940‐019‐00105‐6.
35. Drass, M.; Kraus, M.A. Dimensioning of silicone adhesive joints: Eurocode‐compliant, mesh‐independent approach using the
FEM. Glass Struct. Eng. 2020, 5, 349–369, doi:10.1007/s40940‐020‐00128‐4.
36. Drass, M.; Bartels, N.; Schneider, J.; Klein, D. Pseudo‐elastic cavitation model—part II: Extension to cyclic behavior of transpar‐
ent silicone adhesives. Glass Struct. Eng. 2020, 5, 67–82, doi:10.1007/s40940‐019‐00103‐8.
37. Kraus, M.A.; Schuster, M.; Kuntsche, J.; Siebert, G.; Schneider, J. Parameter identification methods for visco‐ and hyper‐elastic
material models. Glass Struct. Eng. 2017, 2, 147–167, doi:10.1007/s40940‐017‐0042‐9.
38. Botz, M.; Wilhelm, K.; Siebert, G. Experimental investigations on the creep behaviour of PVB under different temperatures and
humidity conditions. Glass Struct. Eng. 2019, 4, 389–402, doi:10.1007/s40940‐019‐00098‐2.
39. Drass, M.; Du Bois, P.A.; Schneider, J.; Kolling, S. Pseudo‐elastic cavitation model—part I: Finite element analyses on thin sili‐
cone adhesives in façades. Glass Struct. Eng. 2020, 5, 41–65.
40. ASTM. Standard Practice for Determining Load Resistance of Glass in Buildings; ASTM E1300‐16; ASTM: West Conshohocken, PA,
USA, 2016.
41. Soules, J.G.; Morse, S.M.; Norville, H.S. Application of the Glass Failure Prediction Model to Flat Odd‐Shaped Glass Using
Finite‐Element Modeling. J. Archit. Eng. 2020, 26, 04020037.

Buildings 2021, 11, 597 30 of 30
42. Morse, S.M. New Provisions in ASTM E1300‐16: A Comparison of the Basic and New Analytical Procedures for Determining
the Load Resistance of Window Glass. In Proceedings of the Façade Tectonics 2018 World Congress, Los Angeles, CA, USA, 12–13
March 2018; De Noble, K.K., Elder, M., Eds.; Tectonic: Los Angeles, CA, USA, 2018; Volume 2, pp. 529–541.
43. James, G.S.; Stephen, M.; Morse, H.; Scott, N. Application of Glass Failure Prediction Model to Bent Glass Using Finite‐Element
Modeling. J. Archit. Eng. 2021, 27, 04021001.
44. Simmons, N. Analytical Evaluation of Racking Performance of Four‐Sided Structural Silicone Glazing Curtain Wall Systems.
Master’s Thesis, The Pennsylvania State University, University Park, PA, USA, 2011. Available online: https://etda.librar‐
ies.psu.edu/paper/12618/ (accessed on 21 August 2021).
45. Memari, A.M.; Simmons, N.C.; Solnosky, R. Unitized Curtain wall Systems Joint Performance with Re‐entrant Corners under
Seismic Racking Testing. Elsevier J. Build. Eng. 2021, 40, 18, doi:10.1016/j.jobe.2021.102715.
46. Memari, A.M.; Fisher, S.; Krumenacker, C.; Broker, K.A.; Modrich, R.‐U. Evaluation of the Structural Sealant for Use in Four‐
Sided Structural Sealant Glazing Curtain Wall System for a Hospital Building. J. ASTM Int. 2012, 4, 505, doi:10.1520/JAI104143.
47. American Architectural Manufacturers Association (AAMA). Recommended Dynamic Test Method for Determining the Seismic Drift
Causing Glass Fallout from a Wall System; Publication No. AAMA 501.6‐09; AAMA: Palatine, IL, USA, 2009.
48. Memari, A.M.; Chen, X.; Kremer, P.A.; Behr, R.A. Prediction of Seismic Failure of Silicone Sealant in Two‐Sided Structural
Sealant Glazing Systems. ASCE J. Archit. Eng. 2012, 1, 16–26.
49. Memari, A.M.; Simmons, N.C.; Solnosky, R. Video Capture Technique Analysis of Four‐Sided Structural Sealant Glazing Cur‐
tain Wall Systems for Racking Performance. Int. J. Archit. Eng. Constr. 2018, 4, 19.
50. CSI Analysis Reference Manual for SAP2000®, ETABS®, SAFE® and CSiBridge®; Computers & Structures, Inc.: Walnut Creek, CA,
USA, 2013.
51. Simmons, N.C.; Memari, A.M. Finite Element Modeling to Predict Racking Test Results and Performance of Four‐sided Struc‐
tural Sealant Glazing Curtain Wall Systems. In Proceedings of the 2013 Architectural Engineering Conference, University Park,
PA, USA, 3–5 April 2013; pp. 735–744.
52. American Society for Testing and Materials. ASTM C1135‐19—Standard Test Method for Determining Tensile Adhesion Properties
of Structural Sealants; ASTM International: West Conshohocken, PA, USA, 2019.
53. American Society for Testing and Materials. ASTM C961‐15—Standard Test Method for Lap Shear Strength of Sealants; ASTM
International: West Conshohocken, PA, USA, 2015.
54. ICBO. Acceptance Criteria for Type I Structural Silicone Glazing Sealants (Adhesive), AC45; International Conference of Building
Officials (ICBO) Evaluation Services, Inc.: Whittier, CA, USA, 1991.
55. Solnosky, R.L. Analytical, Communication, and Information Technology Directions in the Structural Industry. Pr. Period. Struct.
Des. Constr. 2016, 21, 04015002, doi:10.1061/(asce)sc.1943‐5576.0000253.