Comparison of different internal drainage systems based on FEM
10
Simposio Internacional Sobre Drenaje interno de Firmes y Explanadas. Granada (España), Noviembre de 1998. 153 COMPARISON OF DIFFERENT INTERNAL DRAINAGE SYSTEMS BASED ON FEM COMPARAISON DE DIFFÉRENTS SYSTÈMES DE DRAINAGE PAR SIMULATIONS MEF COMPARACION DE DIFERENTES SISTEMAS DE DRENAJE POR SIMULACIONES MEF M. Lebeau & J. Lafleur Department of Civil, Geological and Mining Engineering Ecole Polytechnique de Montréal. QC. Canadá Y. Savard Ministry of Transportation of Quebec. QC. Canadá ABSTRACT: The proper design and installation of internal drainage systems are essential to the improvement of pavement durability. This paper presents a comparison of the three mostly used systems: daylighting, geocom- posite edge drains and pipe drains at the subgrade level. A typical rural highway cross-section is analysed under summer conditions, considering different positions for the drainage elements and the presence of paved or unpa- ved shoulders. The comparison results from finite element analyses that considered the unsaturated properties of the materials and a two-dimensional transient isothermal flow. The results established that geocomposite edge drains at the pavement edge provide excellent confinement of the infiltrated water under the shoulder when the surface course is exempt of cracks. However, when a crack is considered, all types of drainage systems are redu- ced to outlets at the subbase/subgrade interface and their effectiveness is proportional to the outlet depth. RÉSUMÉ : La conception et l’installation adéquates de systèmes de drainage assurent la pérennité des chaus- sées. Dans cet article on présente une collation des trois systèmes les plus utilisées : extension de la sous-fon- dation, écrans drainants en rive de chaussées et tuyau de drainage au niveau de la ligne d’infrastructure. On a analysé une section transversale typique d’une route rurale en conditions estivales, en considérant différentes positions des éléments drainants et la présence d’accotements revêtus ou non. Cette comparaison est basée sur des simulations par éléments finis d’écoulements transitoires isothermes et bidimensionnels qui tiennent compte des propriétés hydrauliques en conditions non saturées. Les simulations numériques ont démontré que l’écran drainant en rive de chaussée à la ligne de rive confine l’écoulement sous l’accotement lorsque le revêtement est exempt de fissures. Cependant, lorsque le revêtement est fissuré, tous les systèmes sont réduits à un exutoire à la ligne d’infrastructure et leur efficacité est proportionnelle à la profondeur dudit exutoire. RESUMEN: El diseño e instalación adecuados de los sistemas de drenaje resultan esenciales para mejorar la durabilidad de los firmes. En esta ponencia se comparan los tres sistemas más utilizados: extensión de la sub- base, diafragma lateral de geocompuesto y tubos de drenaje a nivel de explanada. Se ha procedido al análisis de una sección transversal típica de una vía rural en condiciones estivales, situando los elementos de drenaje en diferentes posiciones y teniendo en cuenta la existencia de arcenes, afirmados o no. Esta comparación se basa en simulaciones por elementos finitos de movimientos transitorios isotermos y bidimensionales, en los que se tiene en cuenta las propiedades hidráulicas en condiciones no saturadas. Los resultados demuestran que los dia- fragmas laterales de geocompuesto colocados en el borde del firme proporcionan un excelente confinamiento del agua infiltrada debajo del arcén en los casos en que la superficie de rodadura se encuentra exenta de fisuras. No obstante, cuando existen fisuras, todos los tipos de drenaje se reducen a desagües en el punto de contacto sub- base/explanada y su efectividad es proporcional a la profundidad de dichos desagües.
Transcript of Comparison of different internal drainage systems based on FEM
Simposio Internacional Sobre Drenaje interno de Firmes y Explanadas.
Granada (España), Noviembre de 1998.
153
COMPARISON OF DIFFERENT INTERNAL DRAINAGE SYSTEMS BASED ON FEM COMPARAISON DE DIFFÉRENTS SYSTÈMES DE DRAINAGE PAR SIMULATIONS MEF COMPARACION DE DIFERENTES SISTEMAS DE DRENAJE POR SIMULACIONES MEF
M. Lebeau & J. Lafleur
Department of Civil, Geological and Mining Engineering Ecole Polytechnique de Montréal. QC. Canadá
Y. Savard
Ministry of Transportation of Quebec. QC. Canadá
ABSTRACT: The proper design and installation of internal drainage systems are essential to the improvement of pavement durability. This paper presents a comparison of the three mostly used systems: daylighting, geocom-posite edge drains and pipe drains at the subgrade level. A typical rural highway cross-section is analysed under summer conditions, considering different positions for the drainage elements and the presence of paved or unpa-ved shoulders. The comparison results from finite element analyses that considered the unsaturated properties of the materials and a two-dimensional transient isothermal flow. The results established that geocomposite edge drains at the pavement edge provide excellent confinement of the infiltrated water under the shoulder when the surface course is exempt of cracks. However, when a crack is considered, all types of drainage systems are redu-ced to outlets at the subbase/subgrade interface and their effectiveness is proportional to the outlet depth.
RÉSUMÉ : La conception et l’installation adéquates de systèmes de drainage assurent la pérennité des chaus-sées. Dans cet article on présente une collation des trois systèmes les plus utilisées : extension de la sous-fon-dation, écrans drainants en rive de chaussées et tuyau de drainage au niveau de la ligne d’infrastructure. On a analysé une section transversale typique d’une route rurale en conditions estivales, en considérant différentes positions des éléments drainants et la présence d’accotements revêtus ou non. Cette comparaison est basée sur des simulations par éléments finis d’écoulements transitoires isothermes et bidimensionnels qui tiennent compte des propriétés hydrauliques en conditions non saturées. Les simulations numériques ont démontré que l’écran drainant en rive de chaussée à la ligne de rive confine l’écoulement sous l’accotement lorsque le revêtement est exempt de fissures. Cependant, lorsque le revêtement est fissuré, tous les systèmes sont réduits à un exutoire à la ligne d’infrastructure et leur efficacité est proportionnelle à la profondeur dudit exutoire.
RESUMEN: El diseño e instalación adecuados de los sistemas de drenaje resultan esenciales para mejorar la durabilidad de los firmes. En esta ponencia se comparan los tres sistemas más utilizados: extensión de la sub-base, diafragma lateral de geocompuesto y tubos de drenaje a nivel de explanada. Se ha procedido al análisis de una sección transversal típica de una vía rural en condiciones estivales, situando los elementos de drenaje en diferentes posiciones y teniendo en cuenta la existencia de arcenes, afirmados o no. Esta comparación se basa en simulaciones por elementos finitos de movimientos transitorios isotermos y bidimensionales, en los que se tiene en cuenta las propiedades hidráulicas en condiciones no saturadas. Los resultados demuestran que los dia-fragmas laterales de geocompuesto colocados en el borde del firme proporcionan un excelente confinamiento del agua infiltrada debajo del arcén en los casos en que la superficie de rodadura se encuentra exenta de fisuras. No obstante, cuando existen fisuras, todos los tipos de drenaje se reducen a desagües en el punto de contacto sub-base/explanada y su efectividad es proporcional a la profundidad de dichos desagües.
154
INTRODUCTION
During construction, the compaction at Proctor reference density produces materials near optimal water contents (70 ≤ Sr ≤ 90%). Following this stage, pore-water pressures attain equilibrium with the local system of groundwater flow and usually remain negative. Thus, the unsaturated conditions must be considered in the evaluation and selection of internal drainage systems subjected to time-dependent changes in the inflows and outflows at ground surface.
Although the general study of unsaturated flow in pavement base and subbase materials has received some attention (Wallace, 1977), few integrate the unsaturated approach with internal drainage system evaluation. This paper presents analyses of surface water infiltration into the pavement structure at the longitudinal joints and the unpaved shoulders. The subsequent quasi-stationary state for different types of internal drainage systems are then compared. Thus, the objective of the present paper is twofold: (1) To determine hydraulic properties of
unsaturated base and subbase materials used in Quebec (Canada).
(2) To evaluate different internal drainage systems and their optimal positioning via theoretical analyses of two-dimensional transient flow through unsaturated base/subbase materials.
In order to better comprehend unsaturated flow processes in pavement structures, the present study is carried out with summer conditions. The essential study of water flow during the freeze/thaw period is currently underway and results will be presented in a later communication. INFLUENCE OF WATER ON BASE AND SUBBASE MATERIALS
The effect of soil water on shear strength
can be established with the extended Mohr-Coulomb failure envelope for unsaturated soil. The linear shear strength equation for unsaturated soil proposed by Fredlund et al. (1978) can be rewritten to account for the
nonlinearity in the shear strength versus matric suction failure envelope observed in different test results (e.g. Escario and Sáez, 1986). Fredlund et al. (1996) reformulated the equation as follows
')u-(u')u-(c' fwafafff φβφστ tantan ⋅⋅+⋅+= [1]
where τff is the shear strength on the failure plane at failure of an unsaturated soil (F⋅L-2); c' is the effective cohesion of a saturated soil; (σf - ua)f is the net normal stress on the failure plane at failure (F⋅L-2); φ' is the effective angle of shearing resistance for a saturated soil; (ua - uw)f is the matric suction of the soil on the failure plane at failure (F⋅L-2); β = tan φb/tan φ' represents the decrease in effective stress resistance with an increase in matric suction; and φb is the angle of shearing resistance with respect to matric suction; equal to φ' at saturation then decreasing with suction.
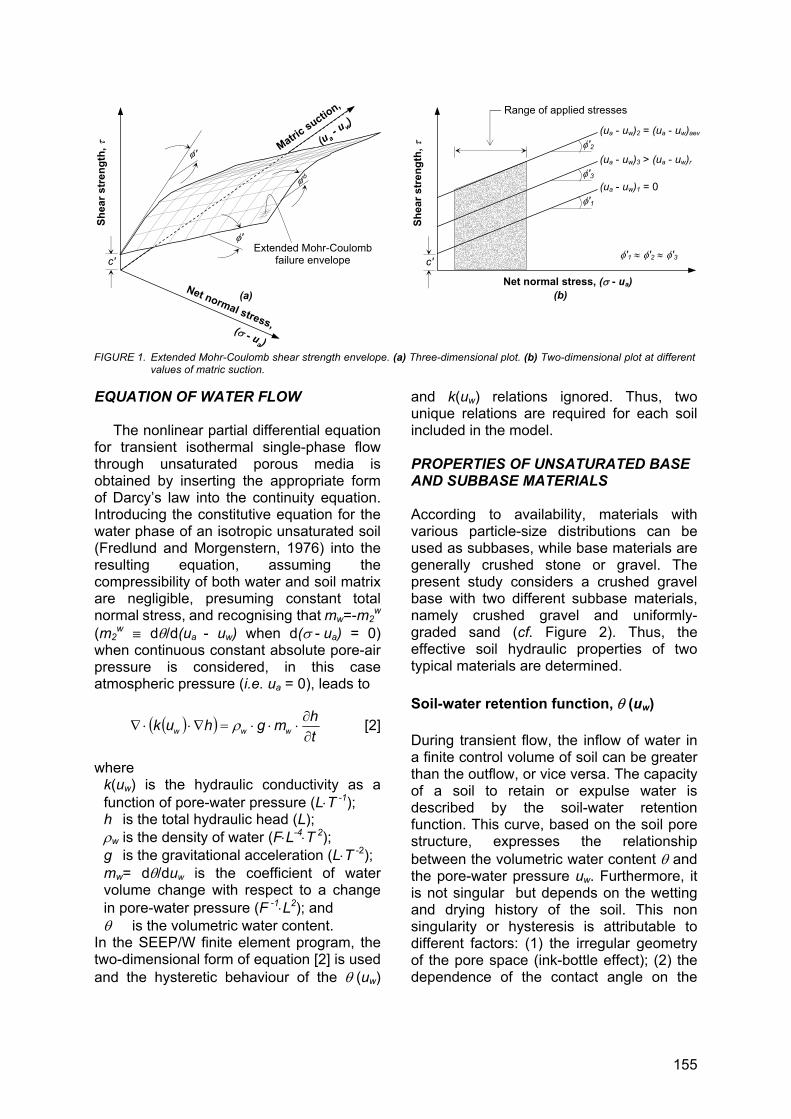
From equation [1] or its graphical representation (Figure 1(a)), it is recognised that a water content increase diminishes matric suction and thus, reduces apparent cohesion ((ua - uw)f ⋅ β ⋅ tan φ'). For cohesionless material (c' ≈ 0), the effect of a decrease in matric suction is mostly apparent at low net normal stresses where the saturated shear strength is quite small (compare (ua - uw)1 and (ua - uw)2 of Figure 1(b)). Similar decreases of resistance with matric suction (or degree of saturation) have also been observed for resilient moduli (e.g. Rada and Witczak, 1981). Moreover, at low confining pressures, the shear strength of soils that desaturate relatively quickly (e.g. sands and silts) may rise and then fall with increasing matric suction (Figure 1). Indeed, the water content of sands and silts can become quite low following an increase in matric suction and may not transmit suction effectively to the soil particle or aggregate contact points (Vanapalli et al., 1996). Thus, it is generally preferable to maintain ideal matric suctions (i.e. (ua - uw)aev ≤ (ua - uw) ≤ (ua - uw)r) to take advantage of the increase in shear strength.
155
EQUATION OF WATER FLOW
The nonlinear partial differential equation for transient isothermal single-phase flow through unsaturated porous media is obtained by inserting the appropriate form of Darcy’s law into the continuity equation. Introducing the constitutive equation for the water phase of an isotropic unsaturated soil (Fredlund and Morgenstern, 1976) into the resulting equation, assuming the compressibility of both water and soil matrix are negligible, presuming constant total normal stress, and recognising that mw=-m2
w (m2
w ª dθ/d(ua - uw) when d(σ - ua) = 0) when continuous constant absolute pore-air pressure is considered, in this case atmospheric pressure (i.e. ua = 0), leads to
( )( )thmghuk www ∂
∂⋅⋅⋅=∇⋅⋅∇ ρ [2]
where k(uw) is the hydraulic conductivity as a function of pore-water pressure (L⋅T -1); h is the total hydraulic head (L); ρw is the density of water (F⋅L-4⋅T 2); g is the gravitational acceleration (L⋅T -2); mw= dθ/duw is the coefficient of water volume change with respect to a change in pore-water pressure (F -1⋅L2); and θ is the volumetric water content.
In the SEEP/W finite element program, the two-dimensional form of equation [2] is used and the hysteretic behaviour of the θ (uw)
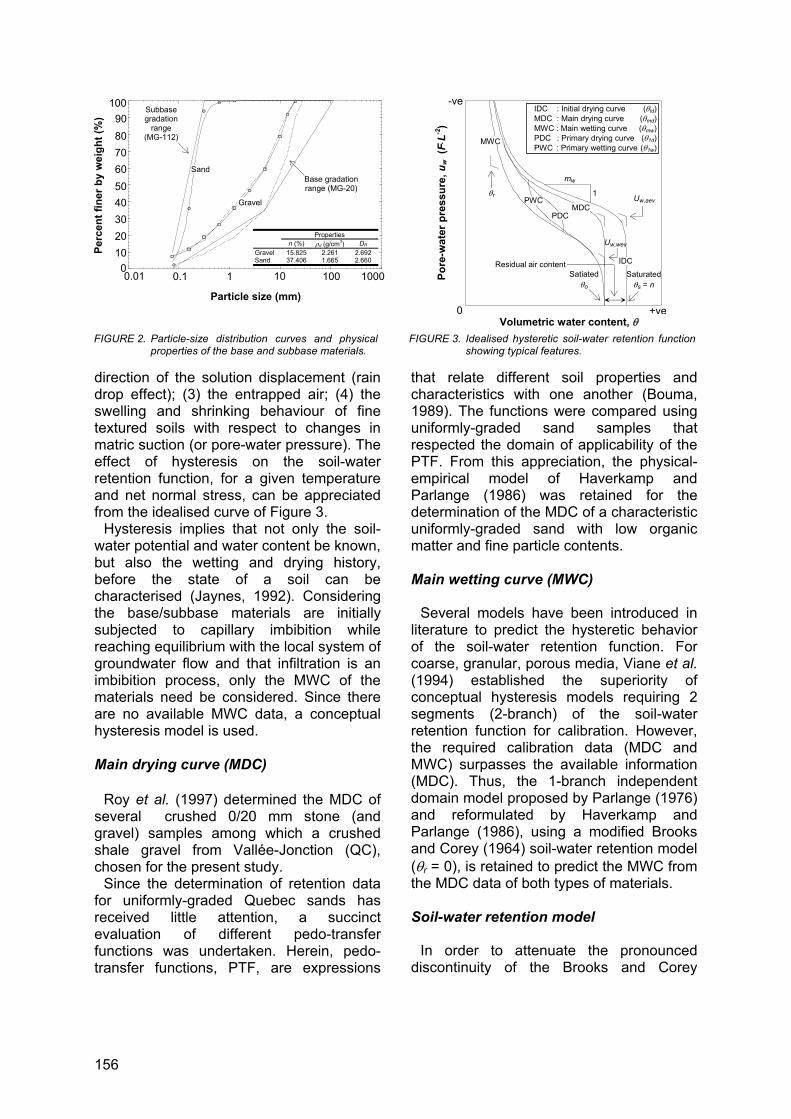
and k(uw) relations ignored. Thus, two unique relations are required for each soil included in the model. PROPERTIES OF UNSATURATED BASE AND SUBBASE MATERIALS According to availability, materials with various particle-size distributions can be used as subbases, while base materials are generally crushed stone or gravel. The present study considers a crushed gravel base with two different subbase materials, namely crushed gravel and uniformly-graded sand (cf. Figure 2). Thus, the effective soil hydraulic properties of two typical materials are determined. Soil-water retention function, θ (uw) During transient flow, the inflow of water in a finite control volume of soil can be greater than the outflow, or vice versa. The capacity of a soil to retain or expulse water is described by the soil-water retention function. This curve, based on the soil pore structure, expresses the relationship between the volumetric water content θ and the pore-water pressure uw. Furthermore, it is not singular but depends on the wetting and drying history of the soil. This non singularity or hysteresis is attributable to different factors: (1) the irregular geometry of the pore space (ink-bottle effect); (2) the dependence of the contact angle on the
Shea
r str
engt
h, τ
φ'
φ'
φb
c' Extended Mohr-Coulomb
failure envelope
(a)
FIGURE 1. Extended Mohr-Coulomb shear strength envelope. (a) Three-dimensional plot. (b) Two-dimensional plot at different values of matric suction.
c'
Net normal stress, (σ - ua)
Shea
r str
engt
h, τ
(b)
φ'2 (ua - uw)2 = (ua - uw)aev
Range of applied stresses
φ'1 (ua - uw)1 = 0
φ'3 (ua - uw)3 > (ua - uw)r
φ'1 ≈ φ'2 ≈ φ'3
Matric suctio
n,
(u a - u w
)
Net normal stress,(σ - ua)
156
direction of the solution displacement (rain drop effect); (3) the entrapped air; (4) the swelling and shrinking behaviour of fine textured soils with respect to changes in matric suction (or pore-water pressure). The effect of hysteresis on the soil-water retention function, for a given temperature and net normal stress, can be appreciated from the idealised curve of Figure 3.
Hysteresis implies that not only the soil-water potential and water content be known, but also the wetting and drying history, before the state of a soil can be characterised (Jaynes, 1992). Considering the base/subbase materials are initially subjected to capillary imbibition while reaching equilibrium with the local system of groundwater flow and that infiltration is an imbibition process, only the MWC of the materials need be considered. Since there are no available MWC data, a conceptual hysteresis model is used.
Main drying curve (MDC)
Roy et al. (1997) determined the MDC of several crushed 0/20 mm stone (and gravel) samples among which a crushed shale gravel from Vallée-Jonction (QC), chosen for the present study.
Since the determination of retention data for uniformly-graded Quebec sands has received little attention, a succinct evaluation of different pedo-transfer functions was undertaken. Herein, pedo-transfer functions, PTF, are expressions
that relate different soil properties and characteristics with one another (Bouma, 1989). The functions were compared using uniformly-graded sand samples that respected the domain of applicability of the PTF. From this appreciation, the physical-empirical model of Haverkamp and Parlange (1986) was retained for the determination of the MDC of a characteristic uniformly-graded sand with low organic matter and fine particle contents. Main wetting curve (MWC)
Several models have been introduced in literature to predict the hysteretic behavior of the soil-water retention function. For coarse, granular, porous media, Viane et al. (1994) established the superiority of conceptual hysteresis models requiring 2 segments (2-branch) of the soil-water retention function for calibration. However, the required calibration data (MDC and MWC) surpasses the available information (MDC). Thus, the 1-branch independent domain model proposed by Parlange (1976) and reformulated by Haverkamp and Parlange (1986), using a modified Brooks and Corey (1964) soil-water retention model (θr = 0), is retained to predict the MWC from the MDC data of both types of materials. Soil-water retention model
In order to attenuate the pronounced discontinuity of the Brooks and Corey
0.01 0.1
Perc
ent f
iner
by
wei
ght (
%)
40
20
50
30
100
10 0
60 70 80 90
Particle size (mm)
1 10 100 1000
Properties n (%) ρd (g/cm3) DR
Gravel 15.825 2.261 2.692 Sand 37.406 1.665 2.660
Sand
Gravel
Subbase gradation
range (MG-112)
Base gradation range (MG-20)
FIGURE 2. Particle-size distribution curves and physical properties of the base and subbase materials.
Volumetric water content, θ
Pore
-wat
er p
ress
ure,
uw (
F⋅L-2
)
IDC : Initial drying curve (θid) MDC : Main drying curve (θmd) MWC : Main wetting curve (θmw) PDC : Primary drying curve (θ1d) PWC : Primary wetting curve (θ1w)
Uw,aev
Uw,wev
Saturated θs = n
Satiated θo
Residual air content IDC
MDC
MWC
PDC
-ve
PWC
+ve0
mw
1 θr
FIGURE 3. Idealised hysteretic soil-water retention function showing typical features.
157
(1964) retention model near the air-entry value (uw, aev) and to reflect the small but important changes in water content that take place in pore ranges distant from the main pore system (Durner, 1994), the predicted θ - uw data (0 ≥ uw ≥ -100 kPa) is fitted with the following extended retention model (Fredlund and Xing, 1994):
ωυ
α
θθ
+
⋅
⋅−+
+
−=
w
o
rw
rw
w
uu
uu
eln1011ln
1ln
1
,
6
, [3]
where e is the natural number, 2.71828…; α, υ, ω are three different soil parameters; θo is the satiated volumetric water
content; and uw,r is the pore-water pressure
corresponding to the residual water content, θr (F⋅L-2).
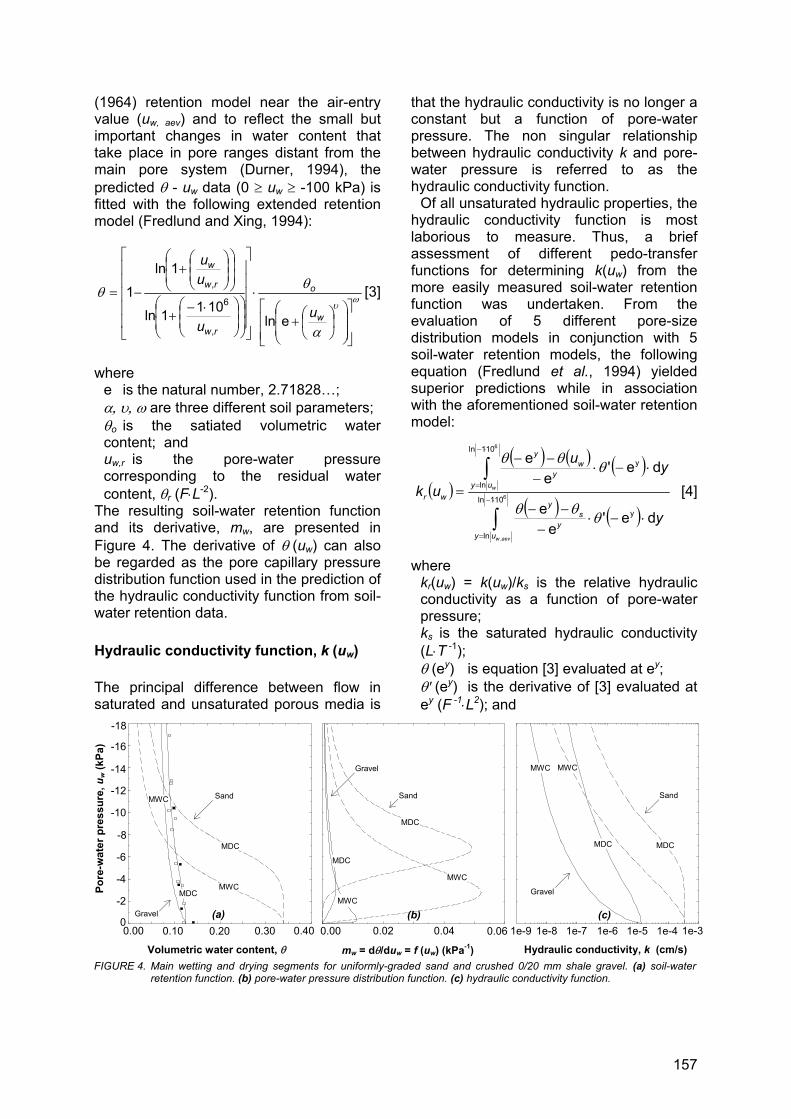
The resulting soil-water retention function and its derivative, mw, are presented in Figure 4. The derivative of θ (uw) can also be regarded as the pore capillary pressure distribution function used in the prediction of the hydraulic conductivity function from soil-water retention data. Hydraulic conductivity function, k (uw) The principal difference between flow in saturated and unsaturated porous media is
that the hydraulic conductivity is no longer a constant but a function of pore-water pressure. The non singular relationship between hydraulic conductivity k and pore-water pressure is referred to as the hydraulic conductivity function.
Of all unsaturated hydraulic properties, the hydraulic conductivity function is most laborious to measure. Thus, a brief assessment of different pedo-transfer functions for determining k(uw) from the more easily measured soil-water retention function was undertaken. From the evaluation of 5 different pore-size distribution models in conjunction with 5 soil-water retention models, the following equation (Fredlund et al., 1994) yielded superior predictions while in association with the aforementioned soil-water retention model:
( )
( ) ( ) ( )
( ) ( )∫
∫⋅−
=
⋅−
=
⋅−⋅−
−−
⋅−⋅−
−−
= 6
,
6
101ln
ln
y
101ln
ln
y
de'e
e
de'e
e
aevw
w
uyy
sy
uyy
wy
wr
y
yu
uk
θθθ
θθθ
[4]
where kr(uw) = k(uw)/ks is the relative hydraulic
conductivity as a function of pore-water pressure;
ks is the saturated hydraulic conductivity (L⋅T -1);
θ (ey) is equation [3] evaluated at ey; θ' (ey) is the derivative of [3] evaluated at
ey (F -1⋅L2); and
FIGURE 4. Main wetting and drying segments for uniformly-graded sand and crushed 0/20 mm shale gravel. (a) soil-water retention function. (b) pore-water pressure distribution function. (c) hydraulic conductivity function.
0.00 0.10
Volumetric water content, θ
0.20 0.30 0.40
Pore
-wat
er p
ress
ure,
uw (k
Pa)
-8
-4
-10
-6
-18
-2
0
-12
-14
-16
mw = dθ/duw = f (uw) (kPa-1)
0.00 0.02 0.06
MDC
MDC MWC
MWC
Gravel
Sand
MDC
MWC
MDC
MWC
Sand
Gravel
(a) (b)
Hydraulic conductivity, k (cm/s)
MDC MDC
MWC MWC
1e-9 1e-8 1e-7 1e-6 1e-5 1e-4 1e-3
Sand
Gravel
(c) 0.04
158
y is a dummy variable of integration representing the logarithm of pore-water pressure.
Furthermore, Kunze et al. (1968) established that pore-size distribution models are equally valid for any wetting and drying process. The ensuing hydraulic conductivity functions are presented in Figure 4(c). RESULTS AND DISCUSSION One-dimensional flow
Prior to the study of infiltration with SEEP/W, the finite element program was comparatively tested with the CHEMFLO program (Nofziger et al., 1989), which uses a previously validated implicit finite difference scheme with explicit linearization to solve Richards equation. It was found that both programs yield comparable results.
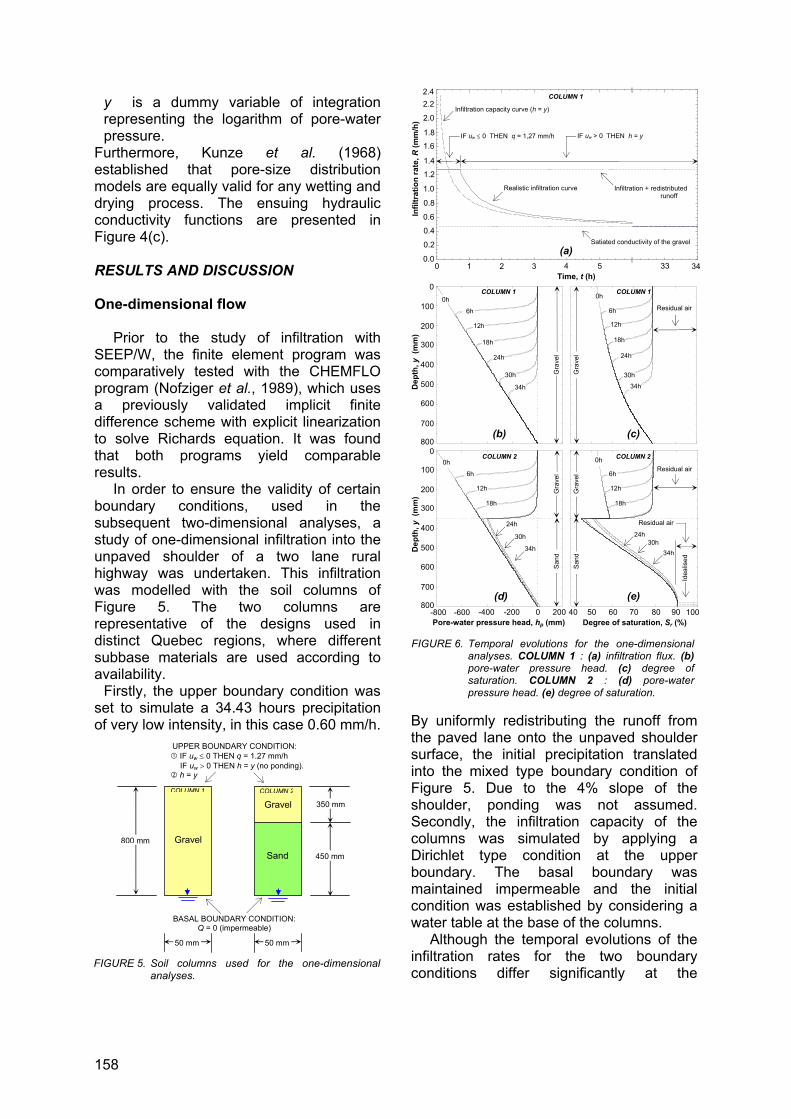
In order to ensure the validity of certain boundary conditions, used in the subsequent two-dimensional analyses, a study of one-dimensional infiltration into the unpaved shoulder of a two lane rural highway was undertaken. This infiltration was modelled with the soil columns of Figure 5. The two columns are representative of the designs used in distinct Quebec regions, where different subbase materials are used according to availability.
Firstly, the upper boundary condition was set to simulate a 34.43 hours precipitation of very low intensity, in this case 0.60 mm/h. By uniformly redistributing the runoff from
the paved lane onto the unpaved shoulder surface, the initial precipitation translated into the mixed type boundary condition of Figure 5. Due to the 4% slope of the shoulder, ponding was not assumed. Secondly, the infiltration capacity of the columns was simulated by applying a Dirichlet type condition at the upper boundary. The basal boundary was maintained impermeable and the initial condition was established by considering a water table at the base of the columns.
Although the temporal evolutions of the infiltration rates for the two boundary conditions differ significantly at the
350 mm
450 mm
Gravel
COLUMN 1
Gravel
Sand
COLUMN 2
UPPER BOUNDARY CONDITION: IF uw ≤ 0 THEN q = 1.27 mm/h IF uw > 0 THEN h = y (no ponding). h = y
BASAL BOUNDARY CONDITION: Q = 0 (impermeable)
800 mm
50 mm 50 mm
FIGURE 5. Soil columns used for the one-dimensional analyses.
200
400
100
300
0
500
600
700
800
Dep
th, y
(m
m)
Residual air
Gra
vel
0h
6h
12h 12h
18h 18h
6h
0h
24h 24h
30h 30h
34h 34h
(b) (c)
Dep
th, y
(m
m)
0h Residual air
Residual air
Idea
lised
200
400
100
300
0
500
600
700
800
6h
12h
18h
24h
30h
34h
0h
6h
12h
18h
24h 30h
34h
(d) (e) -200-400 -600 -800 0 200 70 60 50 40 80 90 100
Pore-water pressure head, hp (mm) Degree of saturation, Sr (%)
(a)
Infil
trat
ion
rate
, R (m
m/h
)
Infiltration capacity curve (h = y)
IF uw ≤ 0 THEN q = 1,27 mm/h IF uw > 0 THEN h = y
Infiltration + redistributed runoff
Satiated conductivity of the gravel
Realistic infiltration curve
1.2
0.8
1.4
1.0
2.4
0.6
0.4
0.2
0.0
1.6
1.8
2.0
2.2
3 2 1 0 4 5 Time, t (h)
34 33
COLUMN 2 COLUMN 2
COLUMN 1 COLUMN 1
COLUMN 1
FIGURE 6. Temporal evolutions for the one-dimensional analyses. COLUMN 1 : (a) infiltration flux. (b) pore-water pressure head. (c) degree of saturation. COLUMN 2 : (d) pore-water pressure head. (e) degree of saturation.
Gra
vel
Gra
vel
Sand
Gra
vel
Sand
159
beginning of precipitation (Figure 6(a)), their impact on the propagation of the imbibition fronts are negligible (Figures 6(b), (c), (d), (e)). Thus, an excessively high intensity precipitation has the same effect on the degree of saturation of the foundation materials as a low intensity precipitation of same duration; the higher intensity only creates more runoff. This is a meaningful observation since low intensity precipitation can be sustained for longer periods of time. In his empirical study, Ridgeway (1976) presented similar conclusions for joints and cracks in the surface course. Hence, due to its simplicity of application, the Dirichlet type boundary condition will be used in the following two-dimensional analyses.
A further examination of these results enables a better comprehension of the unsaturated flow processes in the foundation materials. Generally, at the initiation of infiltration, the degrees of saturation, the pore-water pressure heads and the total hydraulic heads increase with time while the vertical downward hydraulic gradient decreases. This decline is compensated by the increase of the hydraulic conductivity associated with the increase of the pore-water pressure head and thus, the pore-water pressure. The drop of infiltration rate (Figure 6(a)) occurs when the combination of gradients and conductivities can no longer accept all the available water (vy = -ky(uw)⋅∑h/∑y < q). Subsequently, it decreases asymptotically toward the satiated conductivity of the gravel (vy = -ky(uw)⋅∑h/∑y = -ko⋅(-1) = 0.468 mm/h).
In the one-layer system (column 1), the constant evolution of the imbibition front translates into a stabilisation of the pore-water pressure head with time (i.e. hp = 0). Although the column has globally attained its satiated degree of saturation (79.05%), the eventual rise of the water table will constitute the only pore water that can be evacuated by a drainage system (hp > 0). A similar stabilisation process can be observed in the base material of the two-layer system (column 2). The noticeably higher hydraulic conductivity of the subbase material of column 2 allows the water to
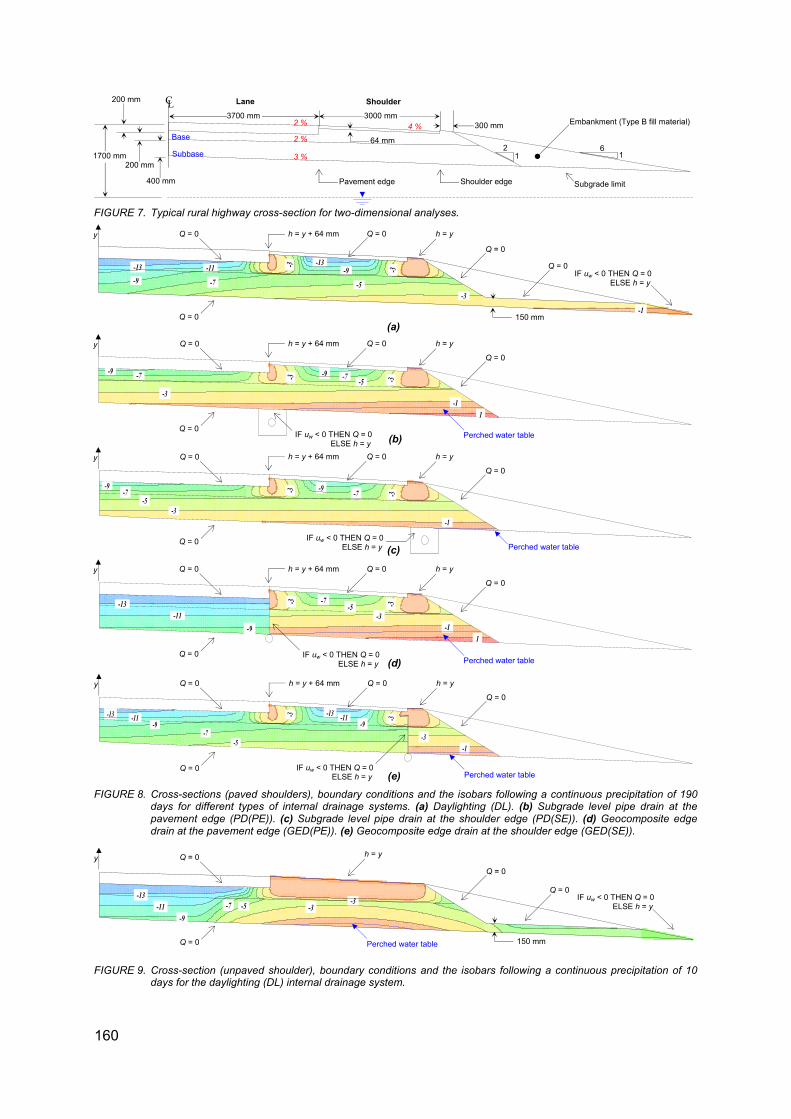
flow directly to the water table without significantly increasing the degree of saturation of the aforementioned layer. There is no free water (hp > 0) at the base/subbase interface of such a system and once again, the rising water table constitutes the only water that can be captured by a drainage system (800 to 778 mm). Although the sand subbase is more permeable than the gravel subbase, the degree of saturation of the base is more or less the same for both columns. However, the degree of saturation of the sand subbase is lower than the one of gravel in the range of high applied stresses. This does not necessarily imply that the sand is a better alternative than gravel as a subbase, since the evolution of shear strength with degree of saturation is not the same for both materials. Two-dimensional flow In order to compare three commonly used internal drainage systems (daylighting (DL), geocomposite edge drains (GED) and pipe drains at the subgrade level (PD)), and to determine their optimal positions, a typical rural highway cross-section (mirror plane symmetry through the centre line (Figure 7)) is submitted to a continuous precipitation of 190 days, hence the comparison of quasi-stationary conditions. However, in some cases, quasi-stationary conditions do not ensue and thus, extrapolated results are used. Furthermore, the continuous precipitation boundary condition cannot be applied to all types of pavement geometry. Indeed, for unpaved shoulders and one-layer foundations, this boundary condition does not simulate the long term effect of transient (intermittent) precipitation since it omits the essential redistribution period. The positions of the different drainage systems and the applied boundary conditions are illustrated on Figure 8(a) through (e) which also present the isobars following the aforementioned precipitation. Although the filter material of the pipe drain (Figure 8(b) and (c)) is not capillary (e.g. uniformly-graded gravel), capillary filter material such as uniformly-graded sand is
160
-9 -9 -7 -7 -5 -3
-3
-3
-1 1
-13 -13 -11
-9 -9
-7 -5 -3
-3
-3
-1
-13 -11
-9
-7 -5 -3
-3
-3
-1 1
-13 -13 -11 -11 -9 -9
-7 -5
-3
-3
-3 -1
-9 -9 -7 -7 -5
-3
-3
-3
-1
IF uw < 0 THEN Q = 0 ELSE h = y
-13 -11
-9 -7 -5 -3
-3
FIGURE 8. Cross-sections (paved shoulders), boundary conditions and the isobars following a continuous precipitation of 190 days for different types of internal drainage systems. (a) Daylighting (DL). (b) Subgrade level pipe drain at the pavement edge (PD(PE)). (c) Subgrade level pipe drain at the shoulder edge (PD(SE)). (d) Geocomposite edge drain at the pavement edge (GED(PE)). (e) Geocomposite edge drain at the shoulder edge (GED(SE)).
1700 mm
200 mm
200 mm
400 mm
C L
Base
Subbase
300 mm 3700 mm 3000 mm
Shoulder
2 %
2 %
3 %
4 %
64 mm
Lane
Pavement edge
2 1
6 1
Shoulder edge
Embankment (Type B fill material)
Subgrade limit
(c)
(d)
(a)
h = y + 64 mm Q = 0 h = y
Q = 0
Q = 0
Q = 0 IF uw < 0 THEN Q = 0 ELSE h = y
150 mm
FIGURE 7. Typical rural highway cross-section for two-dimensional analyses.
y Q = 0
y
Q = 0
h = y + 64 mm Q = 0 h = y
Q = 0
Perched water table
Q = 0
(b) Q = 0
h = y + 64 mm Q = 0 h = y
Q = 0 y
Perched water table
Q = 0
(e)
y
Q = 0
h = y + 64 mm Q = 0 h = y
Q = 0
Perched water table
Q = 0
Q = 0
h = y + 64 mm Q = 0 h = y
Q = 0 y
Perched water table
Q = 0
FIGURE 9. Cross-section (unpaved shoulder), boundary conditions and the isobars following a continuous precipitation of 10 days for the daylighting (DL) internal drainage system.
y
Q = 0
h = y
Q = 0
Perched water table
Q = 0
Q = 0
150 mm
IF uw < 0 THEN Q = 0 ELSE h = y
IF uw < 0 THEN Q = 0 ELSE h = y
IF uw < 0 THEN Q = 0 ELSE h = y
IF uw < 0 THEN Q = 0 ELSE h = y
161
also considered for comparison purposes. General observations as to water
infiltration in typical cross-sections can be ascertained from Figure 8 and precedent results. Similarly to one-dimensional flow, water initially progresses to the subgrade level which is herein considered impermeable due to the high hydraulic conductivity contrast with the aggregates. Concurrently, a horizontal displacement occurs in the base which is manifested by an imbibition bulb. Subsequently, the infiltrated water flows along the subbase/subgrade interface towards the embankment and/or the drainage element. Depending on the type of drainage system, a perched water table can be created between the drainage element and the embankment with time. Once the effusion of the perched water table is limited by the drainage element, water distributes in the pavement foundation until the total hydraulic head of the base and subbase materials is equal or superior to that of the drainage element; the outlet (h = hp + y = y). At this stage, water generally circulates directly from the entrance points to the outlet, hence the use of quasi-stationary conditions. Notice that the water cannot be evacuated unless its total hydraulic head is greater than the one of the drainage system and that this condition solely occurs at the subbase/subgrade interface.
Furthermore, since the horizontal propagation of the imbibition front is
predominantly controlled by the base thickness and the hydraulic conductivity of the subbase (compare the imbibition bulb of Figure 8(a) and Figure 9), it can be hypothesised that ensuing quasi-stationary conditions for rural highways with paved and unpaved shoulders would be similar if an intermittent precipitation had been considered. Thus, the following comparison is considered applicable to both designs.
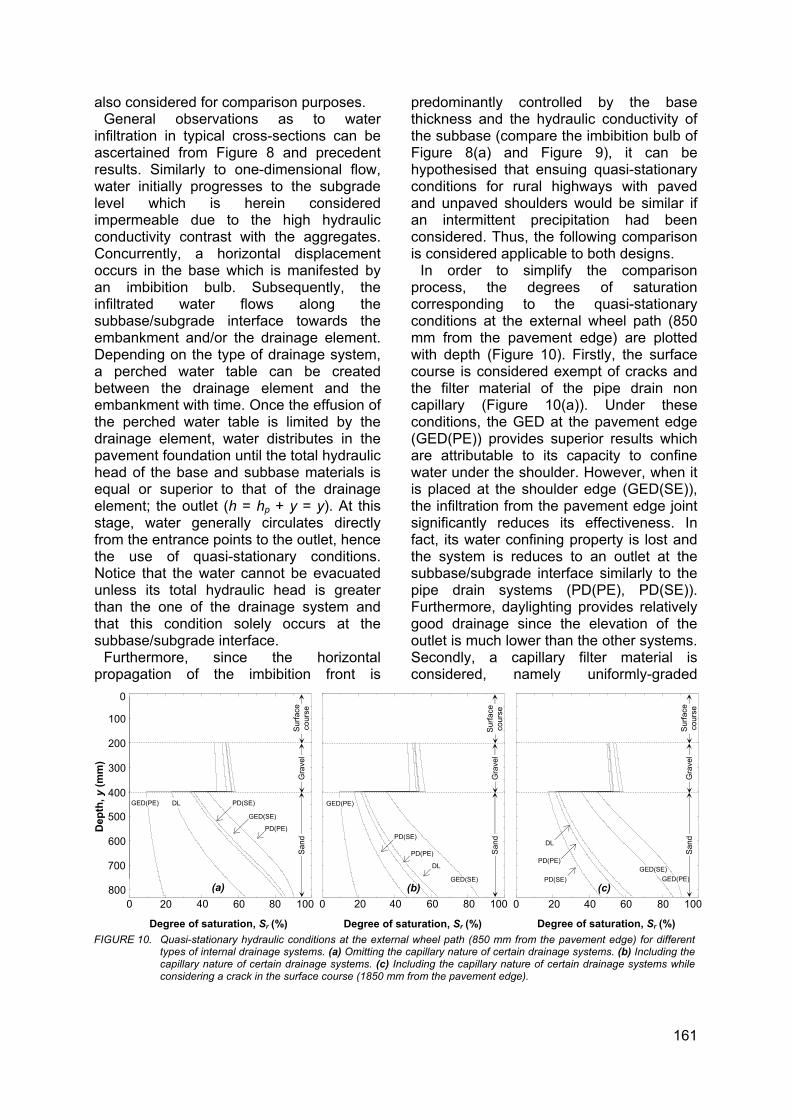
In order to simplify the comparison process, the degrees of saturation corresponding to the quasi-stationary conditions at the external wheel path (850 mm from the pavement edge) are plotted with depth (Figure 10). Firstly, the surface course is considered exempt of cracks and the filter material of the pipe drain non capillary (Figure 10(a)). Under these conditions, the GED at the pavement edge (GED(PE)) provides superior results which are attributable to its capacity to confine water under the shoulder. However, when it is placed at the shoulder edge (GED(SE)), the infiltration from the pavement edge joint significantly reduces its effectiveness. In fact, its water confining property is lost and the system is reduces to an outlet at the subbase/subgrade interface similarly to the pipe drain systems (PD(PE), PD(SE)). Furthermore, daylighting provides relatively good drainage since the elevation of the outlet is much lower than the other systems. Secondly, a capillary filter material is considered, namely uniformly-graded
FIGURE 10. Quasi-stationary hydraulic conditions at the external wheel path (850 mm from the pavement edge) for different types of internal drainage systems. (a) Omitting the capillary nature of certain drainage systems. (b) Including the capillary nature of certain drainage systems. (c) Including the capillary nature of certain drainage systems while considering a crack in the surface course (1850 mm from the pavement edge).
0 20
Degree of saturation, Sr (%)
40 60 80
Dep
th, y
(mm
)
500
700
400
600
0
800
300
200
100
Degree of saturation, Sr (%)
100 0 100(a) (b)
Degree of saturation, Sr (%)
0 20 40 60 80 100(c)
20 40 60 80
Gra
vel
San
d
Gra
vel
San
d
Gra
vel
Sur
face
co
urse
S
and
PD(PE)
GED(PE) DL PD(SE)
GED(SE)
GED(PE)
DL
PD(SE)
PD(PE)
GED(SE) PD(SE) GED(PE)
PD(PE) GED(SE)
DL
Sur
face
co
urse
Sur
face
co
urse

162
subbase sand (Figure 10(b)). This lowers the PD systems outlets to the pipe base and greatly improves the performance of the drainage systems. Indeed, the outlets are now low enough to outperform all types of drainage systems relying on drainage (as opposed to confinement). Lastly, the systems are compared with the presence of a crack in the surface course at 1850 mm from the pavement edge (Figure 10(c)). In this case, all systems are reduced to outlets at the subbase/subgrade interface and the effectiveness of the drainage system is proportional to the outlet depth, hence the importance of maintaining a watertight surface course for GED(PE). Under these conditions, it seems favourable to use a PD(SE) with capillary filter material. However, in northern climates, one must consider the freeze/thaw period before selecting an internal drainage system (i.e. water is confined in the upper portion of the foundation by the thaw front).
Furthermore, under summer conditions, paved shoulders or adequately placed edge drains provide the added benefit of reducing evapotranspiration that would increase matric suction and possibly reduce shear strength.
CONCLUSION
The application of a model for water flow in unsaturated pavement base and subbase materials has been presented. Brief details of the theoretical formulation and the properties of the unsaturated materials have been given. A theoretical approach, has been used to evaluate different internal drainage systems under summer conditions and enlightening results ensue. REFERENCES BOUMA, J. (1989). “Using soil survey data for quantitative
land evaluation”. Advances in Soil Science, 9, 177-213. BROOKS, R.H. and COREY, A.T. (1964). “Hydraulic
properties of porous media”. Hydrology Paper 3, Colorado State University, Fort Collins, Colorado.
DURNER, W. (1994). “Hydraulic conductivity estimation for soils with heterogeneous pore structure”. Water Resources Research, 30 (2), 211-223.
ESCARIO, V. and SÁEZ, J (1986). “The shear strength of partly saturated soils”. Géotechnique, 36 (3), 453-456.
FREDLUND, D.G. and MORGENSTERN, N.R. (1976). “Constitutive relations for volume change in unsaturated
soils”. Canadian Geotechnical Journal, 13, 261-276. FREDLUND, D.G., MORGENSTERN, N.R. and WIDGER,
R.A. (1978). “The shear strength of unsaturated soils”. Canadian Geotechnical Journal, 15, 313-321.
FREDLUND, D.G. and XING, A (1994). “Equations for the soil-water characteristic curve”. Canadian Geotechnical Journal, 31, 521-532.
FREDLUND, D.G., XING, A. and HUANG, S. (1994). “Predicting the permeability function for unsaturated soils using the soil-water characteristic curve”. Canadian Geotechnical Journal, 31, 533-546.
FREDLUND, D.G., XING, A., FREDLUND, M. D., BARBOUR, S.L. (1996). “The relationship of unsaturated soil shear strength to the soil-water characteristic curve”. Canadian Geotechnical Journal, 33, 440-448.
HAVERKAMP, R. and PARLANGE, J.-Y. (1986). “Predicting the water-retention curve from particle-size distribution: 1. Sandy soils without organic matter”. Soil Science, 142 (6), 325-339.
JAYNES, D.B. (1992). “Estimating hysteresis in the soil water retention function”. In: Proceedings of the International Workshop on Indirect Methods for Estimating the Hydraulic Properties of Unsaturated Soils. University of California, Riverside, California, 219-232.
KUNZE, R.J., UEHARA, G. and GRAHAM, K. (1968). “Factors important in the calculation of hydraulic conductivity”. Soil Science Society of America Proceedings, 32, 760-765.
NOFZIGER, D.L., RAJENDER, K., NAYUDU, S.K. and SU, P.-Y. (1989). “CHEMFLO one-dimensional water and chemical movement in unsaturated soils”. EPA/CR-812808.
PARLANGE, J.-Y. (1976). “Capillary hysteresis and the relationship between drying and wetting curves”. Water Resources Research, 12 (2), 224-228.
RADA, G. and WITCZAK, M.W. (1981). “Comprehensive evaluation of laboratory resilient moduli results for granular material”. Transportation Research Record, 810, 23-33.
RIDGEWAY, H.H. (1976). “Infiltration of water through the pavement surface”. Transportation Research Record, 616, 98-100.
ROY, M., CÔTÉ, J., KONRAD, J.M. et ROBERT, C. (1997). «Influence des particules fines sur la conductivité hydraulique des matériaux non saturés de fondation de chaussées». 32e congrès annuel de l’Association Québécoise du Transport et des Routes, tome 1, 317-335.
GEO-SLOPE INTERNATIONAL (1997). “SEEP/W : software for ground seepage, version 4.05”. Geo-Slope International, Calgary, Canada.
VANAPALLI, S.K., FREDLUND, D.G., PUFAHL, D. E., CLIFTON, A.W. (1996). “Model for the prediction of shear strength with respect to soil suction”. Canadian Geotechnical Journal, 33, 379-392.
VIAENE, P., VEREECKEN, H., DIELS, J. and FEYEN, J. (1994). “A statistical analysis of six hysteresis models for the moisture retention characteristic”. Soil Science, 157 (6), 345-355.
WALLACE, K.B. (1977). “Moisture transients at the pavement edge: analytical studies of the influence of materials and cross-section design”. Géotechnique, 27 (4), 497-516.