IMPROVING DESIGN FITNESS THROUGH TOLERANCE ANALYSIS AND TOLERANCE ALLOCATION
14
IMPROVING DESIGN FITNESS THROUGH TOLERANCE ANALYSIS Milberg, Tommelein, and Alves AND TOLERANCE ALLOCATION 3 rd INTERNATIONAL CONFERENCE ON CONCURRENT ENGINEERING IN CONSTRUCTION 181 1-2 July 2002 – University of California, Berkeley IMPROVING DESIGN FITNESS THROUGH TOLERANCE ANALYSIS AND TOLERANCE ALLOCATION Colin Milberg 1 , Iris D. Tommelein 2 , and Thais Alves 3 ABSTRACT Stepping back to look at a system and its lifecycle as a whole, it is clear that costs resulting from variability regularly exceed the benefits of more efficient components, processes, and their interfaces within that system. Designers then should pay close attention to how their choices affect variability of the system throughout its lifecycle. A major source of variability often ignored in AEC systems is tolerances. Many problems that manifest themselves during construction and operations are due to a lack of consideration for tolerances in the various components and processes involved in creating civil structures. Application of tolerance visualization can at a minimum allow designers to see the effects of tolerances and thereby enable them to proactively address fixes for a wider range of scenarios, much wider than a single, deterministic one, thus minimizing impacts on process flow. Tolerance allocation tools also may provide a means for achieving concurrent engineering goals by helping to align product design with lifecycle (e.g., construction and maintenance) processes to reduce the overall cost and increase the robustness of the system. Tolerance allocation and visualization increase the opportunity for concurrency by relating two sources of tolerances (variability): design constraints (product) and process capacity (process). In this paper, 3-D modeling is used to visualize the effects of construction process tolerances on alternative designs for a roof-to-wall connection based on design criteria from a real project. The objective of the paper is to present the potential for tolerance allocation techniques to promote concurrent engineering practice and help generate, evaluate, and select more robust designs. 1 Ph.D. Student, Construction Engineering and Management Program, Civil and Environmental Engineering Department, University of California, Berkeley, E-MAIL: [email protected] 2 Professor, Construction Engineering and Management Program, Civil and Environmental Engineering Department, University of California, 215-A McLaughlin Hall #1712, Berkeley, CA 94720-1712, USA, TEL: +1 (510) 643-8678, FAX: +1 (510) 643-8919, E-MAIL: [email protected], WWW: http://www.ce.berkeley.edu/~tommelein 3 Ph.D. Student, Construction Engineering and Management Program, Civil and Environmental Engineering Department, University of California, Berkeley, E-MAIL: [email protected].
Transcript of IMPROVING DESIGN FITNESS THROUGH TOLERANCE ANALYSIS AND TOLERANCE ALLOCATION

IMPROVING DESIGN FITNESS THROUGH TOLERANCE ANALYSIS Milberg, Tommelein, and Alves AND TOLERANCE ALLOCATION
3rd INTERNATIONAL CONFERENCE ON CONCURRENT ENGINEERING IN CONSTRUCTION 181 1-2 July 2002 – University of California, Berkeley
IMPROVING DESIGN FITNESS THROUGH TOLERANCE ANALYSIS AND TOLERANCE ALLOCATION
Colin Milberg1, Iris D. Tommelein2, and Thais Alves3
ABSTRACT Stepping back to look at a system and its lifecycle as a whole, it is clear that costs resulting from variability regularly exceed the benefits of more efficient components, processes, and their interfaces within that system. Designers then should pay close attention to how their choices affect variability of the system throughout its lifecycle. A major source of variability often ignored in AEC systems is tolerances. Many problems that manifest themselves during construction and operations are due to a lack of consideration for tolerances in the various components and processes involved in creating civil structures. Application of tolerance visualization can at a minimum allow designers to see the effects of tolerances and thereby enable them to proactively address fixes for a wider range of scenarios, much wider than a single, deterministic one, thus minimizing impacts on process flow. Tolerance allocation tools also may provide a means for achieving concurrent engineering goals by helping to align product design with lifecycle (e.g., construction and maintenance) processes to reduce the overall cost and increase the robustness of the system. Tolerance allocation and visualization increase the opportunity for concurrency by relating two sources of tolerances (variability): design constraints (product) and process capacity (process).
In this paper, 3-D modeling is used to visualize the effects of construction process tolerances on alternative designs for a roof-to-wall connection based on design criteria from a real project. The objective of the paper is to present the potential for tolerance allocation techniques to promote concurrent engineering practice and help generate, evaluate, and select more robust designs.
1 Ph.D. Student, Construction Engineering and Management Program, Civil and Environmental Engineering
Department, University of California, Berkeley, E-MAIL: [email protected] 2 Professor, Construction Engineering and Management Program, Civil and Environmental Engineering
Department, University of California, 215-A McLaughlin Hall #1712, Berkeley, CA 94720-1712, USA, TEL: +1 (510) 643-8678, FAX: +1 (510) 643-8919, E-MAIL: [email protected], WWW: http://www.ce.berkeley.edu/~tommelein
3 Ph.D. Student, Construction Engineering and Management Program, Civil and Environmental Engineering Department, University of California, Berkeley, E-MAIL: [email protected].
182 3rd INTERNATIONAL CONFERENCE ON CONCURRENT ENGINEERING IN CONSTRUCTION 1-2 July 2002 – University of California, Berkeley
INTRODUCTION A tenet of production management (and particularly of lean production) is to reduce variability (Womack and Jones 1996, Koskela 1992, Schmenner 1993, Taguchi 1999). Variability will take its toll sooner or later in a production process. Examples of costs to be paid due to variability are: long cycle times and high work-in-progress levels; wasted capacity due to low utilization of resources; lost throughput, and a general increase in waste such as poor quality and increased scrap (Hopp and Spearman 1996).
“Tolerance” is a method used to describe variability in a product or production process. It defines the acceptable ranges in the actual performance of a system or its components, across one or more parameters of interest, under the conditions considered during design, for which the system or components are fit for purpose, i.e., meet the specifications and/or customer expectations. Tolerances historically provide the means for communication between product and process designers.
In the 1800s, the move towards interchangeable parts created the need for tolerance representation. Tolerance standards and techniques have been evolving ever since. ASME Y14.5 and 10 ISO standards are governing current dimensioning and tolerancing practices (Voelcker 1997), but researchers in field of tolerances concur that these standards are lacking. Complaints include inadequate mathematical representation of the Y14.5 standard, approaches for analyzing tolerance stacking in complex assemblies (many parts or 3D assemblies), formulas for describing function, and integration of strategies in design and production, and computer tools (Zhang 1997, Houten and Kals 1999, Trabelsi et al. 2000). Due to lack of training (from separating product and process design) and the complexity of the analysis, many times even mechanical designers fail to evaluate the effects of tolerances at component interfaces and on assemblies as a whole. Problems are ‘thrown over the wall’ and left to the shop workers to fix (Henzold 1995, Zhang 1997, Gerth 1997, Houten and Kals 1999). Yet, the concepts and goals of these tools should not be ignored. Researches have made advances in tools to optimize allocation of tolerances to components in a way that minimizes lifecycle cost while maximizing quality (Zhang 1997, Whybrew et al 1997, Chase et al. 1990, Dong 1997, Dong and Shi 1997).
For the most part, AEC practitioners don’t explicitly acknowledge tolerances in design. They assume that design codes and common practice automatically provide allowances for them. For example, structural engineers in California may argue that the variability in plumb-ness of an erected structure and the resulting redistribution of loads is immaterial compared to the dynamic loading conditions they consider for seismic design. Of course, codes and common practice provide a minimum standard but they cannot cover all conceivable structures. Not surprisingly, explicit accounting for tolerances is more prevalent in some engineering disciplines than in others. For example, civil engineers do consider variability in the resistance of pile foundations and roundness of large diameter pipe during design calculations and include accommodations in the specifications.
Even when AEC practitioners specify tolerances for components, they seldom consider how these tolerances will interact. This is likely due to industry fragmentation, lack of data on AEC process variability, and lack of tolerance standards or training. Hence the reliance on craftsmanship to deal with changes during construction, show flexibility in applying multiple
IMPROVING DESIGN FITNESS THROUGH TOLERANCE ANALYSIS Milberg, Tommelein, and Alves AND TOLERANCE ALLOCATION
3rd INTERNATIONAL CONFERENCE ON CONCURRENT ENGINEERING IN CONSTRUCTION 183 1-2 July 2002 – University of California, Berkeley
or non-standard operations procedures, and remedy problems that could have been avoided by more judicious decision making upstream in the process (e.g., Tsao et al. 2000). Too often, last minute changes result in lower product quality and increased maintenance.
Three strategies exist for dealing with tolerances or variability: (1) reduction of operations variability concerned with the resultant component tolerances, (2) detection and correction of assembly variability concerned with the stacking and interaction of component tolerances, and (3) robustness concerned with allocation of component tolerances (Zhang 1997, Trabelsi et al. 2000). Unfortunately, strategy 1 is limited in AEC, because many building processes are ‘manual’ processes that have large intrinsic variability. Though substantial improvements can be made, there are often substantial limits to reducing the variability both in terms of process time and product precision. Strategy 2 is more promising. Tolerance visualization and analysis provide means to detect and correct for variability in the components or the process (Schultheiss et al. 1999). Even better, strategy 3 is embodied in tolerance allocation and minimizes the impacts of process variability on the rest of the system by aligning or decoupling components and processes through robust interface and component redesign (Howell et al. 1993, Soderberg et al. 1999).
Tolerance analysis views component-related tolerances as a range of values in terms of variation from a nominal value. Tolerance analysis takes a given set of component tolerances, usually based on designer experience or standards, and calculates the resultant variation in the assembly. Through iteration, component tolerances are tightened to meet assembly tolerances, establishing both the product and process design requirements. In contrast, tolerance allocation looks at a range of component designs around a functional or assembly description to absorb the variability. Tolerance allocation is used to maximize quality, minimize production cost, or both. The result can be looser component tolerances and better matching of product and process (Trabelsi et al. 2000, Gerth 1997). Tolerance allocation creates robustness.
Taguchi et al. (1999) define robustness as “The state where the technology, product, or process performance is minimally sensitive to factors causing variability (either in the manufacturing or user’s environment) and aging at the lowest unit manufacturing cost.” They also state that “It is more effective to conduct experimentation at the upstream stage when fewer factors have been decided upon, and design changes are less expensive.” Following this logic, the design phase is the most cost effective time to consider tolerances. Tolerance allocation can even be applied in the conceptual design phase when multiple interfaces can be evaluated for robustness (Soderberg et al. 1999).
To explore issues pertaining to tolerances in AEC system design, this paper examines a connection that, from the first author’s experience, had problems during construction. The connection is used to investigate the application of tolerance visualization, analysis, and synthesis as a means for stimulating concurrent engineering (CE) practice and generating more robust design for a product’s lifecycle.
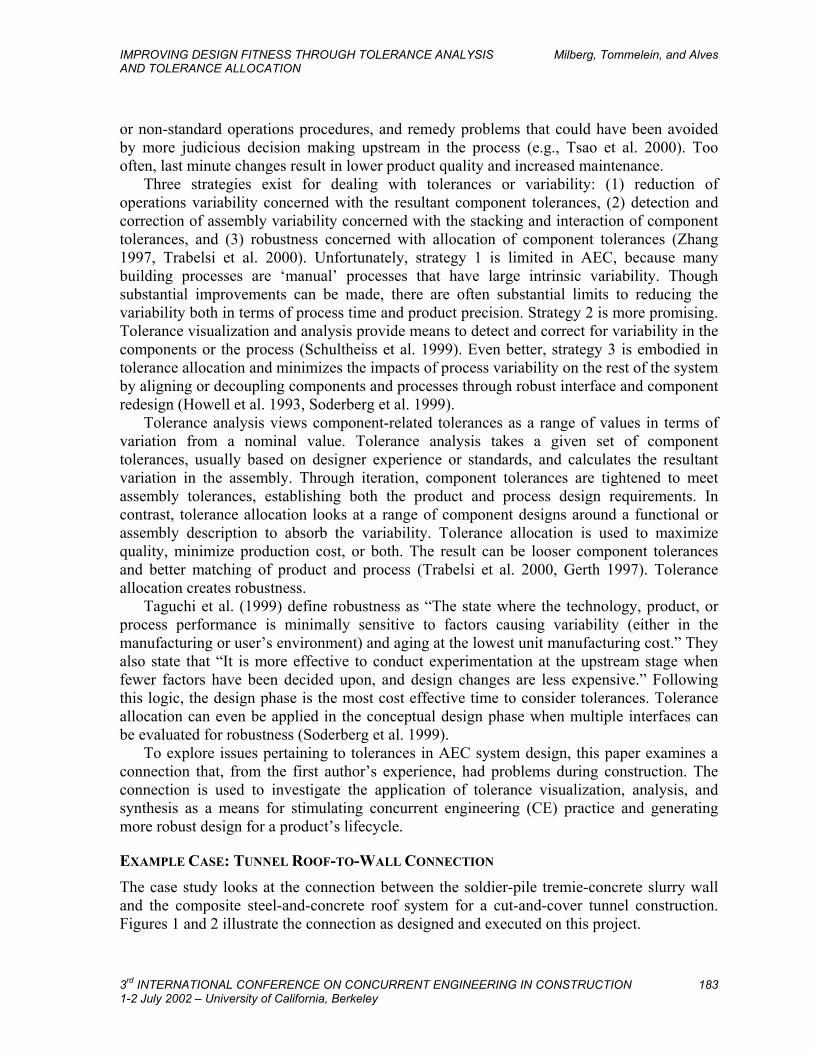
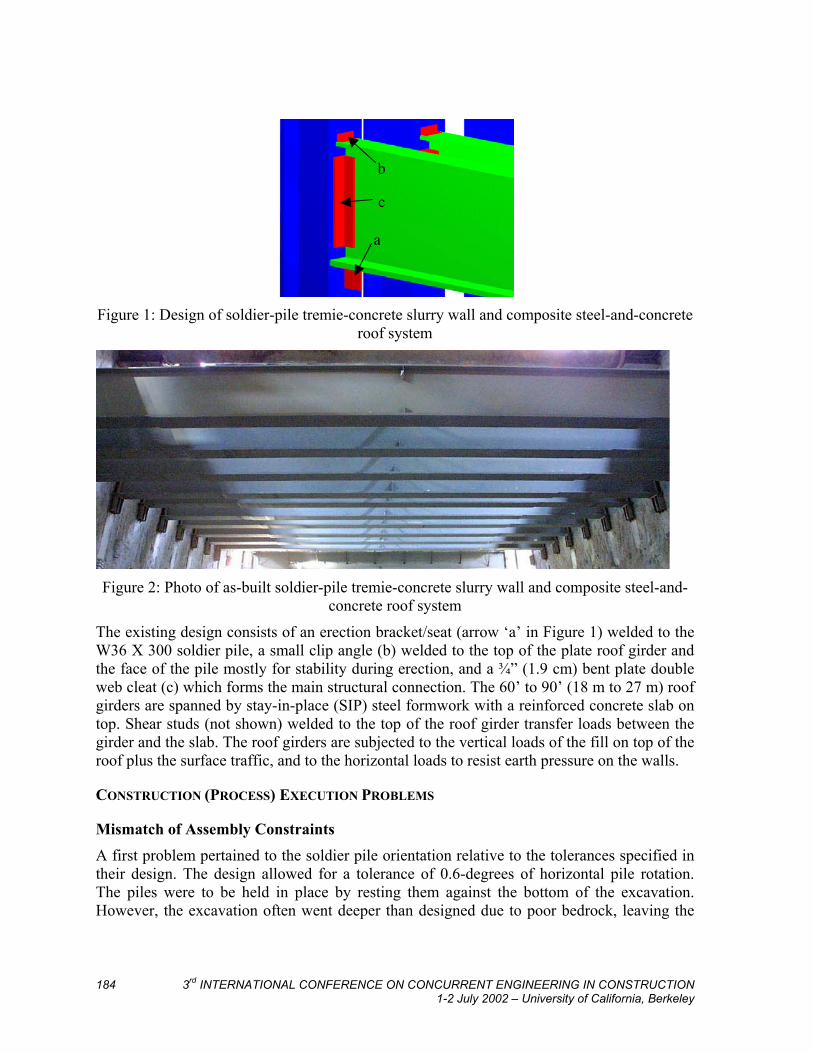
EXAMPLE CASE: TUNNEL ROOF-TO-WALL CONNECTION The case study looks at the connection between the soldier-pile tremie-concrete slurry wall and the composite steel-and-concrete roof system for a cut-and-cover tunnel construction. Figures 1 and 2 illustrate the connection as designed and executed on this project.
184 3rd INTERNATIONAL CONFERENCE ON CONCURRENT ENGINEERING IN CONSTRUCTION 1-2 July 2002 – University of California, Berkeley
Aa
b
c
a
Figure 1: Design of soldier-pile tremie-concrete slurry wall and composite steel-and-concrete
roof system
Figure 2: Photo of as-built soldier-pile tremie-concrete slurry wall and composite steel-and-
concrete roof system
The existing design consists of an erection bracket/seat (arrow ‘a’ in Figure 1) welded to the W36 X 300 soldier pile, a small clip angle (b) welded to the top of the plate roof girder and the face of the pile mostly for stability during erection, and a ¾” (1.9 cm) bent plate double web cleat (c) which forms the main structural connection. The 60’ to 90’ (18 m to 27 m) roof girders are spanned by stay-in-place (SIP) steel formwork with a reinforced concrete slab on top. Shear studs (not shown) welded to the top of the roof girder transfer loads between the girder and the slab. The roof girders are subjected to the vertical loads of the fill on top of the roof plus the surface traffic, and to the horizontal loads to resist earth pressure on the walls.
CONSTRUCTION (PROCESS) EXECUTION PROBLEMS
Mismatch of Assembly Constraints A first problem pertained to the soldier pile orientation relative to the tolerances specified in their design. The design allowed for a tolerance of 0.6-degrees of horizontal pile rotation. The piles were to be held in place by resting them against the bottom of the excavation. However, the excavation often went deeper than designed due to poor bedrock, leaving the

IMPROVING DESIGN FITNESS THROUGH TOLERANCE ANALYSIS Milberg, Tommelein, and Alves AND TOLERANCE ALLOCATION
3rd INTERNATIONAL CONFERENCE ON CONCURRENT ENGINEERING IN CONSTRUCTION 185 1-2 July 2002 – University of California, Berkeley
piles short of the bottom. Thus, in reality, two piles installed as a connected pair could swing 2 degrees horizontally before hitting the sides of the hole on either side. The design also specified the roof girder to be absolutely (!) plumb. Even if the girder did not have to be plumb there is no guarantee that the pile on the opposite wall was rotated the same direction. With a 2-degree horizontal rotation, for roof girders over 4’ (1.2 m) tall, the problem shown in Figure 3 resulted. The cleat angle does not fit on the pile and cannot accommodate the required ¾” (1.9 cm) fillet weld (a) between the angle and the face of the pile.
Figure 3: Inconsistency in the
as-designed tolerance constraints for the roof wall interface
Figure 4: Effect of pile installation process variation: Connection C,
Original Assembly Design
The fix was to trim down the clip angle to accommodate the weld, requiring additional engineering calculations, delaying the construction schedule, and increasing inspection requirements. These effects can be viewed as creating additional flow variability in construction, in delays as well as rework, and operations variability in construction, inspection, and maintenance.
Tight Coupling of Sequential Construction Processes and Manufacturing Steps
A second problem pertained to the connection tolerance of ¾” to 1½” (1.9 cm to 3.8 cm) between the face of the pile and roof girder. This tightly coupled the manufacturing of the roof to the position of the piles. Detailed survey had to be done and sent to the roof and stay-in-place (SIP) steel formwork fabricators once the face of the pile at the roof elevation was exposed. The roof girder fabricator then required two weeks to make the final cut on the roof to match the pile, paint the end, bend the cleat angles to match the pile, and ship all to site. This ruined much efficiency on site by having to remobilize crews and equipment to an area if and when the girders arrived two weeks later. This also resulted in increased wall movement as the roof girder was part of the wall support. A main concern in the design was to limit wall movement because of the effects on the surrounding buildings. The sensitivity to wall movement also limited the amount of wall that could be exposed at once to take measurements to fabricate the next girders, meaning more delay in all operations.
2 Degree Rotation
a
Trimming Req’d To Fit Weld

186 3rd INTERNATIONAL CONFERENCE ON CONCURRENT ENGINEERING IN CONSTRUCTION 1-2 July 2002 – University of California, Berkeley
TOLERANCE VISUALIZATION AND ANALYSIS
Identifying Potential Problems using Tolerance Visualization at Detailed Design A 3-dimensional (3D) visualization of the assembly showing the tolerance envelopes, the range of possible positions for the connections based on the allowable design tolerances similar to that shown in figure 4 would have revealed these problems (Schultheiss et al. 1999). Current add-ons for mechanical packages such as Sigmund3D (EDS–Ideas) or CETOL6 (PTC-ProEngineer) will perform 2 or 3D assembly analyses while other modules generate kinematic assembly animations (Glancy et al. 1999, SDRC.com 2002).
Although visualization can be timeconsuming because of the amount of data entry required even with new computer aided tolerance tools, it has benefits. At a minimum, the fix for the assembly constraint problem of trimming the angle could have been detected and corrected in the design phase. The procedure could have been added to the specifications, problem piles identified during the contractor survey of the piles, thicker angles used for the cleats and trimmed in the shop. Alternatively, the connection could have been checked: would moving the seat off center allow the cleat angles to fit and remain structurally sound, or could a pile with a wider flange face be used? Such solutions involve redesign of the components and are thus tolerance allocation solutions. In addition, they concurrently design and align the product and assembly process thus avoiding downstream interruptions. Problem two was identified even without visualization and had no identifiable solution given the constraints of the connection.
The tolerance analysis solution and typical reaction to these problems is to tighten the tolerances required for the orientation of the pile. Given tight enough tolerances on pile position, the girders might even be cut in the shop to theoretical length. Regardless of the approach, tolerance visualization helps the designer to identify potential problems in the design phase so that the proper product tolerances are specified and information about potential problems is passed on to those designing the process.
Matching Tolerances to Process Capabilities Tolerances specified for pile orientations often are much tighter than the process of slurry-wall pile installation can achieve, as shown. So even when designers specify tolerances that accommodate the assembly and connection constraints, the process needs to be checked to ensure it can meet the tolerances. Figure 4 represents the possible orientations of the soldier pile based on the pile installation procedure in yellow. Basing the tolerance analysis on the process capability is a much more appropriate assessment for use in design. Structural design principles dictate that design values are chosen from the worst case 5% of the variability in the distribution of material properties and loads (Holmes and Martin 1983). Accordingly, the tolerance specified in the design should accommodate 95% of the variability in the process capability.
Figure 4 does not illustrate the type of output one might generate for this analysis. More likely it would be an animation of the assembly’s kinematic range of motion. However, the analysis illustrates that the process capability is neither well matched to the design tolerances, nor more broadly to the assembly constraints in this case. With process information, the
IMPROVING DESIGN FITNESS THROUGH TOLERANCE ANALYSIS Milberg, Tommelein, and Alves AND TOLERANCE ALLOCATION
3rd INTERNATIONAL CONFERENCE ON CONCURRENT ENGINEERING IN CONSTRUCTION 187 1-2 July 2002 – University of California, Berkeley
analysis triggers the need for CE to match the design tolerances with the process by redesigning one or both. Even better, one might use this information to trigger process improvement or redesign of the assembly concepts, iterating back to systems design level.
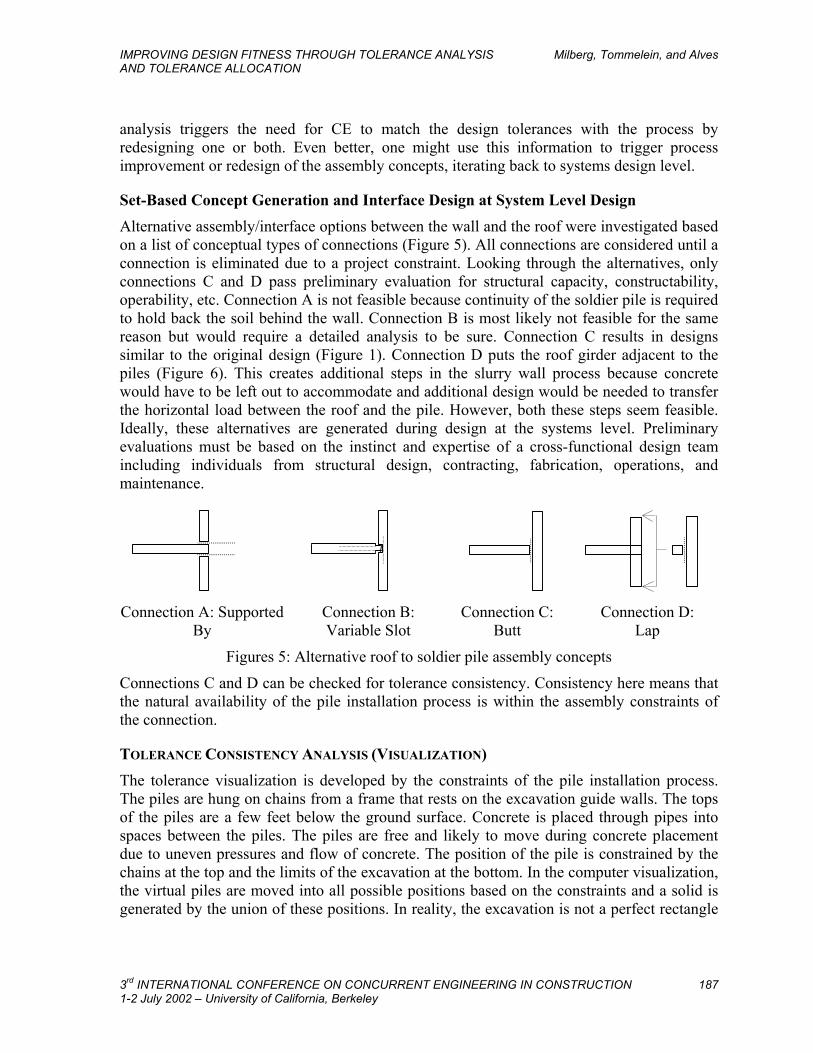
Set-Based Concept Generation and Interface Design at System Level Design Alternative assembly/interface options between the wall and the roof were investigated based on a list of conceptual types of connections (Figure 5). All connections are considered until a connection is eliminated due to a project constraint. Looking through the alternatives, only connections C and D pass preliminary evaluation for structural capacity, constructability, operability, etc. Connection A is not feasible because continuity of the soldier pile is required to hold back the soil behind the wall. Connection B is most likely not feasible for the same reason but would require a detailed analysis to be sure. Connection C results in designs similar to the original design (Figure 1). Connection D puts the roof girder adjacent to the piles (Figure 6). This creates additional steps in the slurry wall process because concrete would have to be left out to accommodate and additional design would be needed to transfer the horizontal load between the roof and the pile. However, both these steps seem feasible. Ideally, these alternatives are generated during design at the systems level. Preliminary evaluations must be based on the instinct and expertise of a cross-functional design team including individuals from structural design, contracting, fabrication, operations, and maintenance.
Connection A: Supported By
Connection B: Variable Slot
Connection C: Butt
Connection D: Lap
Figures 5: Alternative roof to soldier pile assembly concepts
Connections C and D can be checked for tolerance consistency. Consistency here means that the natural availability of the pile installation process is within the assembly constraints of the connection.
TOLERANCE CONSISTENCY ANALYSIS (VISUALIZATION) The tolerance visualization is developed by the constraints of the pile installation process. The piles are hung on chains from a frame that rests on the excavation guide walls. The tops of the piles are a few feet below the ground surface. Concrete is placed through pipes into spaces between the piles. The piles are free and likely to move during concrete placement due to uneven pressures and flow of concrete. The position of the pile is constrained by the chains at the top and the limits of the excavation at the bottom. In the computer visualization, the virtual piles are moved into all possible positions based on the constraints and a solid is generated by the union of these positions. In reality, the excavation is not a perfect rectangle

188 3rd INTERNATIONAL CONFERENCE ON CONCURRENT ENGINEERING IN CONSTRUCTION 1-2 July 2002 – University of California, Berkeley
nor perfectly plumb. The piles are not straight because they consist of spliced sections that may be misaligned, and steel sections that may not be straight. Further still, after installation the wall bends due to earth pressures. Though possible to include these considerations, we have chosen to ignore the dimensional and form variations in the wall and the piles and focus only on the kinematic variation between the piles and the wall (this highlights the difficulty of modeling actual site conditions). The resultant solids, shown in yellow in figures 4 and 7, represent the process capacity of the pile installation procedure for plumb-ness and orientation of the piles. The distribution of the capacity is assumed to be uniform, i.e., all possible positions are equally likely because of the lack of control in the process.
Unlike manufacturing, process-capability data is often hard to collect in AEC systems as they tend not to be repetitive, as is the case here. Experimental data to determine the actual distribution with alternative processes would not have benefited this job because the pile orientations could not be determined until excavated, which occurs after the walls were mostly complete. However the data could have been used to inform the next slurry wall job. AEC industry might consider means for gathering process data through mockups, virtual production, or sensors for faster feedback. Figure 7 shows the process capacity solid for connection D. The circles show where the piles potentially interfere with the roof girder.
Figure 6: Connection D Conceptual
Assembly Design Figure 7: Effect of pile installation process variation: Connection D Assembly Design
This leads to another decision point on how to proceed: there are three non-exclusive choices for dealing with the lack of consistency.
1. Process Quality Improvement and Variability Reduction or Component Redesign One could go back and try to redesign the processes to reduce the variability in the process capacity, now given a better understanding of what types of variability have large effects on the assembly. The literature regarding process improvement for all industries including construction is extensive (Kubal 1994, Oglesby et al. 1989, Deming 1982, Juran 1979, Schmenner 1993, and Taguchi 1999). Alternatively, we could redesign a component to avoid the inconsistency like the earlier example, reducing the clip angle leg size and increasing its thickness. Further detail is outside of the scope of this paper.
2. Modification of the Product Architecture or Sub-system Breakdown One could reconsider earlier design decisions such as the material choice for components thus changing the constraints of the interface design. Ulrich and Eppinger (2000) state that

IMPROVING DESIGN FITNESS THROUGH TOLERANCE ANALYSIS Milberg, Tommelein, and Alves AND TOLERANCE ALLOCATION
3rd INTERNATIONAL CONFERENCE ON CONCURRENT ENGINEERING IN CONSTRUCTION 189 1-2 July 2002 – University of California, Berkeley
“The purpose of the product architecture is to define the basic physical building blocks of the product in terms of what they do and what their interfaces are to the rest of the device.” So, from changes in the product architecture a whole new set of interface designs can be generated and evaluated to hopefully find one that is consistent. For example, if the slurry wall above the roof did not serve the added purpose of a retaining wall for construction, connections A and B in figure 5 could be considered. If the wall had been made of reinforced concrete throughout instead of soldier piles, the assembly constraints would change significantly. Though this option has the potential to lead to a more optimal solution, its further pursuit can be very time consuming with no guaranteed results and therefore must be considered carefully along with other project constraints.
3. Detailed Fitness Evaluation Including Tolerance Assembly Reliability
One could measure the reliability of each connection to determine which connection minimized risk. ‘Reliability’ as used here means the probability that the pile position will be consistent with the assembly constraints given the existing pile installation process capabilities. This method has a similar concept to statistical tolerance analysis techniques. Statistical tolerance analysis recognizes that it is not cost effective to design for a stacking interference that will rarely if ever occur. One could then choose the best connection based on the fitness and reliability of the connection and the cost of fix when required. This option provides us with a better understanding of the system and is an effective decision tool when running out of time for further system level exploration.
A theoretical reliability of the connection can be determined by repeating the visualization process while adding the assembly constraint that the cleat angles cannot be less then ¾” (1.9 cm) from the edge of the pile. The resultant solid is the design demand. Again, the distribution is assumed to be uniform. If we then take a cross-section of the process capacity and the design demand at the elevation of the top of the cleat angle (where the additional constraint is located), the ratio of the area of the cross-section of design demand to the area of the cross-section of the process capacity is the reliability of the connection or the likelihood that the pile position will accommodate the roof-to-pile connection.
Similarly, the reliability can be checked for connection D. The dashed red line in Figure 7 shows approximately the design demand for connection D. The choice between the connections cannot be made on the basis of the reliability alone. The different designs and their respective fixes must be evaluated on cost, structural integrity, manufacturability, constructability, operability, and maintainability as well. The advantage of this analysis is that it provides a sense of process reliability when no historical or field data is available. This method is similar to an analysis and decision making tools of Failure Mode and Effect Analysis (FMEA). FMEA is a qualitative approach. “The objective of these analyses is to identify the combination of events that could lead to different degrees of quality and characterize the effects of these different degrees of quality in terms of their potential consequences” (Bea 2002).
Unfortunately, the reliability of connection C and D could not be compared here. Connection C is only unreliable for girder heights greater than 4’ (1.2 m) and information on the number of girders over this height was not available. On the job, there were approximately 10 occurrences of the fit-up problem over 640 connections. Most likely, the

190 3rd INTERNATIONAL CONFERENCE ON CONCURRENT ENGINEERING IN CONSTRUCTION 1-2 July 2002 – University of California, Berkeley
reliabilities are comparable. Connection D did have several advantages including decoupling the roof fabrication from the wall as-built information, increasing standardization of other parts of the roof assembly including the stay-in-place formwork and diaphragms, potentially easier maintenance of the connection, and potentially faster roof installation minimizing wall movement and schedule. However, Connection D also involves significantly more detailed slurry-wall work, additional steel and work to transfer the horizontal load between the roof and the piles, and a lot of excavation support work above the roof elevation. A detailed cost analysis by a cross-functional design team would be required to determine if connection D provides any benefit.
CONCLUSIONS Tolerance analysis and synthesis techniques encourage CE by acknowledging the relationships between product- and process tolerances. At the component design level tolerance tools improve robustness by better matching product and process tolerances to avoid downstream problems. Application at the system design level needs further investigation but is recommended. Given the lack of complexity typical in most AEC assemblies and less stringent component constraints than in many mechanical applications, tolerance techniques may prove more immediately beneficial in AEC applications. Table 1 summarizes when tolerance analysis and synthesis techniques are recommended based on the case study presented.
Table 1: Summary of when and why to apply tolerance analysis and synthesis techniques for AEC practice
System Design Component Design Fabrication Construction
Process Capacity
Visualization
For process selection
For process selection &
improvement
For process selection &
improvement
For process selection, problem
detection and improvement
Tolerance Consistency Analysis and Synthesis of
Assembly
For assembly process selection
For assembly problem
detection and component and spec. redesign for correction
Consistency detection between
fabrication tolerances and
component design
Selection of component or
process if multiple
generated in earlier phase
Assembly Reliability and
Fitness
For assembly process selection
For detailed assembly selection
All downstream participants should participate in upstream analyses. Upstream participants are not necessarily needed for downstream analyses. In practice, determining which participants are needed when is an issue of project team design and participant skills, motivation, and incentives.

IMPROVING DESIGN FITNESS THROUGH TOLERANCE ANALYSIS Milberg, Tommelein, and Alves AND TOLERANCE ALLOCATION
3rd INTERNATIONAL CONFERENCE ON CONCURRENT ENGINEERING IN CONSTRUCTION 191 1-2 July 2002 – University of California, Berkeley
As for future work, one thought is to find a way to represent other aspects of fitness such as constructability and maintainability in terms of geometric constraints, so that the tolerance analysis can be used to evaluate them as well. Further study of construction and maintenance processes may allow for modeling of these activities in terms of geometric constraints. Ease of constructability and maintainability are often a function of access. Study could provide an association between the shape and size of the area around the connection and grades or levels of access for construction and maintenance. Another thought is to use tolerance analysis for the design of QA/QC. Informed understanding of tolerances may provide a better insight for problem detection. Given the slower nature of construction relative to manufacturing processes there might be opportunity for in-process correction before the problem compounds.
ACKNOWLEDGMENTS This research was funded by grant CMS-0116877 from the National Science Foundation, whose support is gratefully acknowledged. Any opinions, findings, conclusions, or recommendations expressed in this report are those of the authors and do not necessarily reflect the views of the National Science Foundation.
Modern Continental Construction, State Street Project Staff is gratefully acknowledged for their time and support in providing background and information for this case study.
REFERENCES Bea, R.G. (2002). Human & Organizational Factors: Risk Assessment and Management of
Engineered Systems. CE 290A Course Reader. Civil and Envir. Engrg. Dept., U.C. Berkeley, CA.
Bjork, O. (1989). Computer Aided Tolerancing. New York: ASME Press. Chase, K.W., Greenwood, W.H., Loosli, B.G., and Hauglund, L.F. (1990). Least cost
Tolerance Allocation for Mechanical Assemblies with Automated Process Selection. Manufacturing Review, v. 1 (1), pp. 50-59.
Chase, K.W., Magleby, S.P., and Gao, J. (1997). Tolerance Analysis of Two- and Three-Dimensional Mechanical Assemblies with Small Kinematic Adjustments. Chpt. 5 in Advanced Tolerancing Techniques. Zhang, G. (ed.). New York: Wiley & Sons.
Deming, W.E. (1982). Quality, Productivity and Competitive Position. Cambridge, MA: MIT Center for Advanced Engineering Study.
Dong, J. and Shi, Y. (1997). Tolerance Analysis and Synthesis in Variational Design. Chpt. 12 in Advanced Tolerancing Techniques. Zhang, G. (ed.). NY: Wiley.
Dong, Z. (1997). Tolerance Synthesis By Manufacturing Cost Modeling and Design Optimization. Chpt. 8 in Adv. Tolerancing Techniques. Zhang, G. (ed.). NY: Wiley.
Gerth, R. (1997). Tolerance Analysis: A Tutorial of Current Practice. Chpt. 4 in Advanced Tolerancing Techniques. Zhang, G. (ed.). NY: Wiley.
Glancy, C.G. and Bogard, T.V. Innovations in Integrating Tolerance Analysis Technologies for a Computer-Aided Tolerancing System. Proc. 6th CIRP Int. Sem. on CAT. Houten, F. and Kals H. (eds.) The Netherlands: Kluwer Academic Publishers
Henzold, (1995). Handbook of Geometrical Tolerancing. Wiley & Sons, England.

192 3rd INTERNATIONAL CONFERENCE ON CONCURRENT ENGINEERING IN CONSTRUCTION 1-2 July 2002 – University of California, Berkeley
Holmes, M. and Martin, L.H. (1983). Analysis and Design of Structural Connections. Wiley & Sons, NY.
Hopp, W.J. and Spearman, M.L. (1996). Factory Physics: Foundations of Manufacturing Management. Irwin/McGraw-Hill, Boston, Massachusetts.
Houten, F. and Kals, H. (eds.)(1999). Global Consistency of Tolerance: Proceedings of the 6th CIRP Int. Sem. on Computer-Aided Tolerancing. Univ. of Twente, Enshede, Netherlands, March. Dordrecht, The Netherlands: Kluwer Academic Publishers.
Howell, G., Laufer, A., and Ballard, G. (1993). Interaction Between Subcycles: One Key to Improved Methods. J. Construction Eng. and Mgmt, ASCE, NY, 119 (4) 714-728.
Juran, J. (1979). Quality Control Handbook. New York: McGraw-Hill Koskela, L. (1992). Application of the New Production Philosophy to Construction.
Technical Report No. 72. Center for Integrated Facility Engineering, Stanford Univ. Kubal, M.T. (1994). Engineering Quality in Construction. New York: McGraw-Hill. Kusiak, A. (ed.) (1993). Concurrent Engineering: Automation, Tools and Techniques. New
York: Wiley & Sons. Prasad, B. (1996). Concurrent Engineering Fundamental, Vol. 1. NJ: Prentice Hall PTR. Schmenner, R.W. (1993). Production/Operations Management. NJ: Prentice Hall. Schultheiss, R. and Hinze, U. (1999). “Detect the Unexpected – How to Find and Avoid
Unexpected Tolerance Problems in Mechanisms.” Proc. 6th CIRP Int. Sem. on CAT. Houten, F. and Kals H. (eds.) The Netherlands: Kluwer Academic Pub.
Sdrc4me.com/images/prodfiles/assmbset.pdf (2002). Assembly Module Description. Shingo, Shigeo (1988). Non-Stock Production: The Shingo System for Continuous
Production. Cambridge, MA: Productivity Press. Soderberg, R. and Lindkvist, L. (1999). Two-Step Procedure for Robust Design Using CAT
Technology. Proc. 6th CIRP Int. Sem. on CAT. Houten, F. and Kals H. (eds.) Dordrecht, The Netherlands: Kluwer Academic Publishers
Taguchi, G. (1993). Taguchi on Robust Technology Development: Bringing Quality Engineering Upstream. ASME Press, New York.
Taguchi, G., Chowdhury, S., Taguchi, S. (1999). Robust Engineering. McGraw-Hill, NY. Trabelsi, A. and Delchambre, A. (2000). Assessment on Tolerance Representation and
Tolerance Analysis in Assemblies. Concurrent Engineering: Research and Applications v. 8 (4). Technomic Publishing Co., Lancaster, PA, Dec., pp. 244-262.
Tsao, C.C.Y., Tommelein, I.D., Swanlund, E., and Howell, G.A. (2000). “Case Study for Work Structuring: Installation of Metal Door Frames.” Proc. Eighth Annual Conference of the International Group for Lean Construction (IGLC-8), 17-19 July, held in Brighton, UK. Available at, www.sussex.ac.uk/spru/imichair/iglc8/34.pdf
Ulrich, K.T. and Eppinger, S.T. (2000). Product Design and Development. Second edition. McGraw-Hill Higher Education, Boston, Massachusetts.
Voelcker, H.B. (1997). Dimensional Tolerancing Today, Tomorrow, and Beyond. Chpt. 1 in Advanced Tolerancing Techniques. Zhang, G. (ed.). New York: Wiley & Sons.
Wang, W. and Tsai, J. (1999). “Development of a Computer-Aided Tolerancing System in CAD Environment.” Proc. 6th CIRP Int. Sem. on CAT. Houten, F. and Kals H. (eds.) Dordrecht, The Netherlands: Kluwer Academic Publishers

IMPROVING DESIGN FITNESS THROUGH TOLERANCE ANALYSIS Milberg, Tommelein, and Alves AND TOLERANCE ALLOCATION
3rd INTERNATIONAL CONFERENCE ON CONCURRENT ENGINEERING IN CONSTRUCTION 193 1-2 July 2002 – University of California, Berkeley
Whybrew, K. and Britton, G.A. (1997). Tolerance Analysis in Manufacturing and Tolerance Charting. Chpt. 2 in Advanced Tolerancing Techniques. Zhang, G. (ed.). New York: Wiley & Sons.
Womack, J.P. and Jones, D.T. (1996). Lean thinking: Banish waste and create wealth in your corporation. Simon and Schuster, New York.
Zhang, G. (ed.)(1997). “Simultaneous Tolerancing for Design and Manufacturing.” Chpt. 8 in Advanced Tolerancing Techniques. New York: Wiley & Sons.

194 3rd INTERNATIONAL CONFERENCE ON CONCURRENT ENGINEERING IN CONSTRUCTION 1-2 July 2002 – University of California, Berkeley