
Strategy for qualitative and quantitative analysis in proteomics based on signature peptides
14
Journal of Chromatography B, 745 (2000) 197–210 www.elsevier.com / locate / chromb Strategy for qualitative and quantitative analysis in proteomics based on signature peptides Junyan Ji, Asish Chakraborty, Ming Geng, Xiang Zhang, Ahmad Amini, * Minou Bina, Fred Regnier Department of Chemistry, Purdue University, Lafayette, IN 47907, USA Abstract This paper describes a new analytical strategy for identifying proteins in concentration flux based on isotopic labeling peptides in tryptic digests. Primary amino groups in peptides from control and experimental samples were derivatized with acetate and trideuteroacetate, respectively. After mixing samples thus labeled from these two sources, the relative concentration of peptides was determined by isotope ratio analysis with MALDI and ESI mass spectrometry. More than a 100-fold difference in relative concentration could be detected. Simplification of complex tryptic digests prior to mass spectral analysis was achieved by selection of histidine-containing peptides with immobilized metal affinity sorbents or of glycopeptides by lectin columns. Because most of these peptides have sequences that are unique to a single protein, they are a signature of the protein from which they were derived; providing a facile route to protein analysis. 2000 Elsevier Science B.V. All rights reserved. Keywords: Proteomics; Signature peptides; Proteins 1. Introduction will still not understand the dynamics of how living things respond to stimuli. Critical elements of ho- Molecular biology and molecular medicine have meostasis and how systems succumb to diseases will as their focus the explanation of biological phenom- evade us in most cases, unless we also know how ena in terms of molecular structure. This has led to biological systems are regulated. A major component the enormous effort to identify all the molecular of understanding cellular regulation is in being able elements of biological systems and the mechanism to identify proteins in flux in the complex milieu of by which they function. The Human Genome Project the proteome. [1] and proteomics [2] are both examples of efforts Two approaches for examining cellular dynamics to define the molecular elements of biological sys- have been suggested. One is to follow genetic tems and understand how they interact. Within the expression through the synthesis of specific mRNA next 5–10 years it is likely that the world will species [3,4]. This approach assumes that most identify most of the ‘‘molecular players’’ in humans, changes of protein concentration are the result of de domestic plants and animals, some pathogens, and novo protein synthesis. The second is by identifying many common microorganisms. Yet with all this, we changes in specific proteins themselves. It has been found that the correlation between the two is poor [5]. This is not surprising. Changes in protein *Corresponding author. E-mail address: [email protected] (F. Regnier). concentration in response to regulatory stimuli are 0378-4347 / 00 / $ – see front matter 2000 Elsevier Science B.V. All rights reserved. PII: S0378-4347(00)00192-4
-
Upload
independent -
Category
Documents
-
view
1 -
download
0
Transcript of Strategy for qualitative and quantitative analysis in proteomics based on signature peptides
Journal of Chromatography B, 745 (2000) 197–210www.elsevier.com/ locate /chromb
Strategy for qualitative and quantitative analysis in proteomicsbased on signature peptides
Junyan Ji, Asish Chakraborty, Ming Geng, Xiang Zhang, Ahmad Amini,*Minou Bina, Fred Regnier
Department of Chemistry, Purdue University, Lafayette, IN 47907, USA
Abstract
This paper describes a new analytical strategy for identifying proteins in concentration flux based on isotopic labelingpeptides in tryptic digests. Primary amino groups in peptides from control and experimental samples were derivatized withacetate and trideuteroacetate, respectively. After mixing samples thus labeled from these two sources, the relativeconcentration of peptides was determined by isotope ratio analysis with MALDI and ESI mass spectrometry. More than a100-fold difference in relative concentration could be detected. Simplification of complex tryptic digests prior to massspectral analysis was achieved by selection of histidine-containing peptides with immobilized metal affinity sorbents or ofglycopeptides by lectin columns. Because most of these peptides have sequences that are unique to a single protein, they area signature of the protein from which they were derived; providing a facile route to protein analysis. 2000 ElsevierScience B.V. All rights reserved.
Keywords: Proteomics; Signature peptides; Proteins
1. Introduction will still not understand the dynamics of how livingthings respond to stimuli. Critical elements of ho-
Molecular biology and molecular medicine have meostasis and how systems succumb to diseases willas their focus the explanation of biological phenom- evade us in most cases, unless we also know howena in terms of molecular structure. This has led to biological systems are regulated. A major componentthe enormous effort to identify all the molecular of understanding cellular regulation is in being ableelements of biological systems and the mechanism to identify proteins in flux in the complex milieu ofby which they function. The Human Genome Project the proteome.[1] and proteomics [2] are both examples of efforts Two approaches for examining cellular dynamicsto define the molecular elements of biological sys- have been suggested. One is to follow genetictems and understand how they interact. Within the expression through the synthesis of specific mRNAnext 5–10 years it is likely that the world will species [3,4]. This approach assumes that mostidentify most of the ‘‘molecular players’’ in humans, changes of protein concentration are the result of dedomestic plants and animals, some pathogens, and novo protein synthesis. The second is by identifyingmany common microorganisms. Yet with all this, we changes in specific proteins themselves. It has been
found that the correlation between the two is poor[5]. This is not surprising. Changes in protein*Corresponding author.
E-mail address: [email protected] (F. Regnier). concentration in response to regulatory stimuli are
0378-4347/00/$ – see front matter 2000 Elsevier Science B.V. All rights reserved.PI I : S0378-4347( 00 )00192-4

198 J. Ji et al. / J. Chromatogr. B 745 (2000) 197 –210
frequently achieved through post-translational modi- proteins and isotopic labeling of the resulting pep-fications not tightly coupled to expression. Direct tides. Following selection of labeled peptides con-measurement of the concentration of specific proteins taining rare amino acids or post-translational modi-is obviously the most definitive approach to the study fications, the peptide mixtures were fractionatedof cellular regulation. chromatographically and fractions analyzed by
Cells may express a few thousand to 20 000 MALDI-MS. This approach to identifying peptidesproteins, depending on the cell type [6]. Determining in flux is based on changes in isotope ratios ofwhich protein(s) changed in response to a stimulus is peptides differentially labeled in control and ex-like looking for a needle in a haystack. Elegant perimental samples. Peptide identification wasstudies using two-dimensional gel electrophoresis achieved by comparing experimentally derived prop-have shown that regulatory changes in a few to erties to those of tryptic peptides in sequence data-several hundred proteins can be seen in the E. coli bases.proteome [7]. The power of two-dimensional gelelectrophoresis in such studies is that under propercircumstances it can resolve 4000 to 6000 protein 2. Materials and methodscomponents [8]. Relative changes in the concen-tration of specific proteins among samples are gener- 2.1. Materialsally measured by comparing the difference betweentwo gels based on staining; one from the control and N-Hydroxysuccinimide, N-acetoxysuccinimide,the other from the experimental trial. The possibility monobasic sodium phosphate, dibasic sodium phos-that the concentration of different proteins in regula- phate, tris(hydroxymethyl)aminomethane (Tris base),
3 4tory flux varies 10 –10 in the same gel exaggerates iodoacetic acid, 4-vinyl pyridine, tris(hydrox-the detection and quantitation problem. It is very ymethyl)aminomethane hydrochloride (Tris acid),difficult to locate small amounts of protein in a gel cysteine, dithiothreitol (DTT), N-tosyl-L-lysyl chlo-by staining. Comparing concentrations between two romethyl ketone (TLCK), a-cyano-4-hydroxy-gels has a very high level of uncertainty. The current cinnamic acid, N-acetylglucosamine (NacGlc) wereprotocol for identifying proteins in gels is as follows. purchased from Sigma (St. Louis, MO, USA).Subsequent to locating protein components, either by Acetic-d -anhydride was purchased from Aldrich3
staining or autoradiography of biosynthetically (Milwaukee, WI, USA). All the peptides used werelabeled species, they are (i) excised from the gel, (ii) purchased from Bachem Bioscience (CA, USA).reduced and alkylated, and (iii) trypsin digested. The Nuclear extracts were prepared from human cell linetryptic digest is then subjected to matrix-assisted U937 as previously described [10]. High-perform-laser desorption ionization mass spectrometry ance liquid chromatography (HPLC)-grade trifluoro-(MALDI-MS) and the parent protein can often be acetic acid (TFA) was purchased from Pierce (Rock-identified by matching the mass of peptides against a ford, IL, USA). HPLC-grade water and acetonitrilesequence database [9]. This process frequently takes (ACN) were purchased from EM Science (Gibbs-2–5 days, depending on the exact protocol. When town, NJ, USA). All reagents were used directlypeptides cannot be identified from a sequence data- without further purification. Escherichia coli wasbase, they must be at least partially sequenced, cultured in our laboratory.generally by MS–MS. Limitations of this approachare quantification, reproducibility, difficulty in deal- 2.2. Synthesis of N-acetoxy-d -succinimide3
ing with very high molecular mass and basic pro-teins, the process is lengthy, and it is difficult to A solution of 4.0 g (34.8 mmol) of N-hydroxy-
1automate. succinimide in 10.7 g (105 mmol) of d -C acetic3
This paper proposes a new strategy for recogniz- anhydride was stirred at room temperature. Whiteing changes in the concentration of a protein when it crystals began to deposit in 10 min. After 15 h theis in a complex milieu of compounds having similar liquid phase was allowed to evaporate and thestructures. The technique is based on proteolysis of crystalline residue was treated with hexane and dried
J. Ji et al. / J. Chromatogr. B 745 (2000) 197 –210 199
in vacuum. Product yield was 5.43 g (100%), m.p. duced into the sample loop and eluted with a 5 min133–1348C. mobile phase gradient ranging from 0.2% formic
acid to aqueous 56% acetonitrile in 0.2% formic2.3. Acetylation of peptides acid, followed by a 2 min isocratic elution with 80%
ACN in 0.2% formic acid. Nitrogen was used asA three-fold molar excess of N-acetoxysuc- spray gas. Spectra were acquired at the rate of 2 s
cinimide and N-acetoxy-d -succinimide was added per spectrum with an ion count threshold of 1.3
individually to the two equal aliquots of 1 mg/mlpeptide solution in phosphate buffer at pH 7.5, 2.6. Proteolysisrespectively. The reaction was carried out at roomtemperature. After stirring 4–5 h, equal aliquots of Human serotransferrin (5 mg), nuclear extractthe two samples were mixed and purified on a C from cell line U937, human serum or E. coli were18
reversed-phase chromatography column. Collected reduced and alkylated in 1 ml of 0.2 M Tris bufferfractions were then subjected to MALDI–time-of- (pH 8.5) containing 8 M urea and 10 mM DTT.flight (TOF)-MS and electrospray ionization (ESI)- After a 2-h incubation at 378C, iodoacetic acid (vinylMS. pyridine was used for ovalbumin) was added to a
final concentration of 20 mM and incubated in2.4. MALDI–TOF-MS darkness on ice for 2 more hours. Cysteine was then
added to the reaction mixture to a final concentrationMALDI–TOF-MS was performed using a Voyager of 40 mM and the reaction allowed to proceed at
DE-RP BioSpectrometry workstation (PE Biosys- room temperature for 30 min. After dilution with 0.2tems, Framingham, MA, USA). Samples were pre- M Tris buffer to a final urea concentration of 3 M,pared by mixing a 1-ml aliquot with 1 ml of matrix TLCK-treated trypsin (2%, w/w, enzyme to that ofsolution. A 1-ml sample volume was spotted into a protein) was added and incubated for 24 h at 378C.well of the MALDI sample plate and allowed to Digestion was stopped by adding TLCK in slightair-dry before being placed in the mass spectrometer. molar excess to that of trypsin.The matrix for acetylated peptides was a solution of3% TFA, ACN–water (50:50) solution saturated 2.7. Affinity selection of glycopeptides by a two-with a-cyano-4-hydroxycinnamic acid. The matrix dimensional chromatographic methodsolution for glycopeptides was prepared by saturatinga water–ACN–TFA (50:47:3) solution with sinipinic All chromatographic steps were performed usingacid. Peptide quantitation was performed with an INTEGRAL Micro-Analytical Workstation fromMALDI–TOF-MS in the linear, positive ion and PE Biosystems. Tryptic digested human serotransfer-reflector mode by delayed extraction using an ac- rin (0.1 ml) was injected onto a Con A affinitycelerating voltage of 20 kV. Ten spectra were col- column that had been equilibrated with a loadinglected from each sample spot and the peak intensities buffer containing 1 mM CaCl , 1 mM MgCl , 0.2 M2 2
averaged for each spot. A linear equation was NaCl and 0.1 M Tris–HCl (pH 7.5). The Con Adeduced from the ion current intensity ratio of the column was eluted sequentially at 1 ml /min withdeuterium-labeled and the unlabeled acetylated pep- two column volumes of loading buffer and then 0.2tides versus the ratio of the amount of these two M methyl-a-D-mannopyranoside in 0.1 M Tris (pHpeptides. 6.0). Glycopeptides were directed to a 25034.6 mm
Peptide C (PE Biosystems) analytical reversed-18
2.5. Quantification of peptides by LC–ESI-MS phase HPLC column, which had been equilibratedfor 5 min at 1.0 ml /min with 5% ACN containing
An Integral HPLC micro-analytical workstation 0.1% aqueous TFA. The glycopeptides were thenwas linked to the electrospray interface of a Mariner eluted at 1.0 ml /min in a 35 min linear gradient toESI mass spectrometer (PE Biosystems) by an 50% ACN in 0.1% aqueous TFA. Eluted peptidesauxiliary six-port splitter valve. Analyte was intro- were monitored at 220 nm and fractions manually

200 J. Ji et al. / J. Chromatogr. B 745 (2000) 197 –210
collected for MALDI–TOF-MS analysis. A 100-ml 0.2-mm filter. Tryptic digested peptides werevolume of tryptic digested nuclear extract was acetylated with a three-fold molar excess of N-injected into a Bandeiraea simplicifolia (BS-II) acetoxysuccinimide in phosphate buffer at pH 7.5.lectin affinity column. The nonglycopeptides werewashed away and the glycopeptides were transferredto the reversed-phase column. Washing with 20 ml 3. Results and discussionstarting buffer regenerated the BS-II column. Theglycopeptides were separated by a 50 min gradient Recognizing concentration changes in biologicalfrom 0.1% TFA in aqueous 1% ACN to 0.1% TFA systems involving small numbers of species in largein 90% ACN. The glycopeptides were manually numbers of similar, fixed components is a majorcollected and lyophilized before storage. problem. This is particularly important when the
objective is to examine changes in the cellular milieu2.8. Partial sequence of peptide mixture by in response to disease or external chemical stimuli,carboxypeptidase such as drugs. The challenge is exacerbated by the
fact that the components in flux are frequentlyA carboxypeptidase sequencing kit (PE Biosys- unknown. In fact, recognizing that a substance is in
tems) was reconstituted and the reagent separated concentration flux would generally precede identifi-into five different solutions varying 10-fold in con- cation. A strategy is proposed below for both recog-centration. Carboxypeptidase concentration in the nizing and identifying proteins in flux in complexmost concentrated solution was 1 pmol /ml. Lyophil- systems.ized glycopeptides from nuclear extracts were recon-stituted in 5 ml of water. A 0.5-ml sample aliquot 3.1. The internal standard strategy forwas deposited on the MALDI plate at each sample quantification of proteinswell. In total, six deposits of each sample were madeon the MALDI plate. After solvents had evaporated Internal standard quantification is frequently usedfrom the deposited samples, carboxypeptidase solu- to determine the concentration of substances intions (0.5 ml) of varying concentration were de- complex systems. This technique is based on theposited on five of the sample deposits. Carboxy- addition of a known substance, similar to the analytepeptidase digestion of peptides was performed direct- in structure, and determining analyte concentrationly on the MALDI plate. Again the solution deposited by ratio, i.e.:on the plate was allowed to air dry. After water had
ARevaporated from the digesting sample on the MALDI ]]D 5 (1)LRplate, 0.5 ml of matrix solution saturated with a-
cyano-4-hydroxycinnamic acid was added to each where D is the relative difference in concentration, Adried spot. is instrument response to the analyte, R is specific
molar response to the analyte, L is instrument2.9. Immobilized metal affinity chromatography response to the internal standard, and R is specific
molar response to the internal standard. When theImmobilized metal affinity chromatography analyte and internal standard only differ isotopically,
(IMAC) was performed using a copper-saturated 4.6 it may be assumed that a mass spectrometer willmm diameter POROS MC column (PE Biosystems). respond equally to both and. In this case, Eq. (1)A 90-min gradient from 1 to 20 mM imidazole in 20 reduces to D5A /L and relative difference in analytemM sodium phosphate containing 0.5 M sodium and isotopically labeled internal standard concen-chloride, pH 7.0 was used for this study. A 70-min tration may be determined from peak height ratios ingradient from 1% ACN to 95% ACN in 0.1% TFA the mass spectrum.was used to elute peptides from the reversed-phase The problem with this approach to quantificationcolumn. All the buffers and solutions were prepared in proteomics is that the concentration of only ain distilled water, degassed and filtered through a small number of proteins will change in response to
J. Ji et al. / J. Chromatogr. B 745 (2000) 197 –210 201
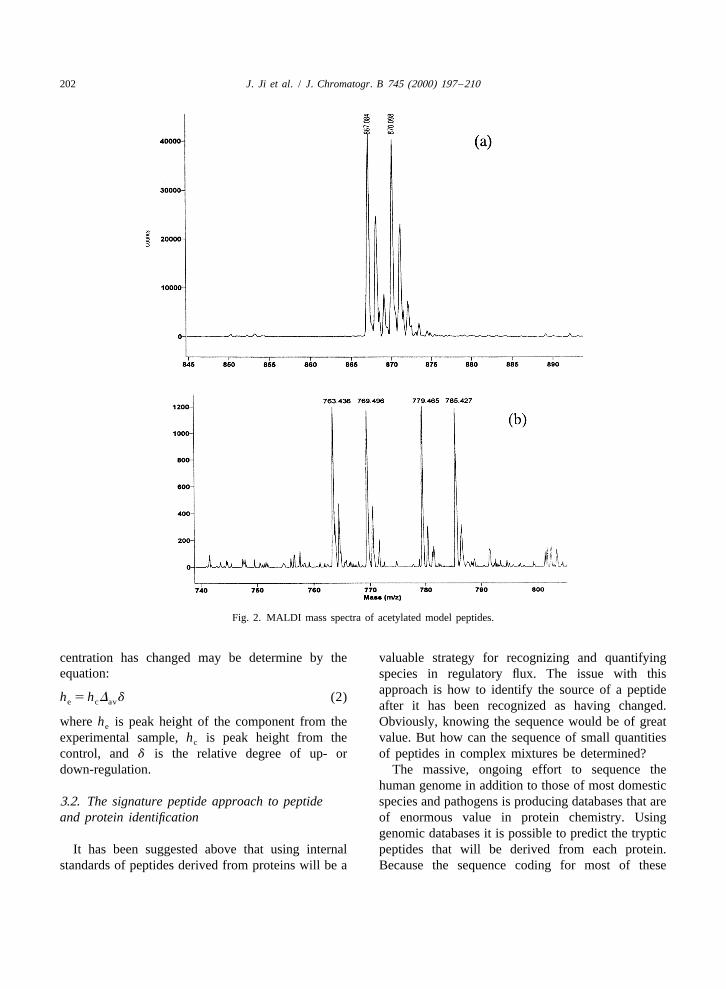
a stimulus and the identity of these proteins is to be a doublet. This is because analyte peptides areseldom known. How does one create internal stan- acetylated at the amino-termini and on e-aminodards for unknowns? One solution is to create groups of lysines with CD -CO– whereas the inter-3
internal standards for all polypeptides in a sample. nal standards are acetylated with the CH -CO–3
Because the objective is to recognize changes in moiety. Arginine residues are not acetylated by thisprotein concentration between control and ex- procedure. Analyte and internal standard peaks ofperimental samples, all the components in the control peptides that contain no lysine will differ by 3 amu.could be used as internal standards for the ex- For each lysine that is added to a peptide, theperimental sample if they were labeled. The issue is difference in mass increases an additional 3 amu.how to label every polypeptide in a sample. Al- MALDI of peptides in the positive ion mode is mostthough metabolic incorporation of labeled amino easily achieved when they have one or more posi-acids has been widely used to label polypeptides, it tively charged groups. When they do not, peptidesis not very reproducible and is objectionable in generally acquire charge from sodium or potassiumhuman subjects. Post-sampling strategies for in- ions in the system. This is the case with peptides thatcorporation of labels would be much more attractive. have neither histidine nor arginine. Subsequent to
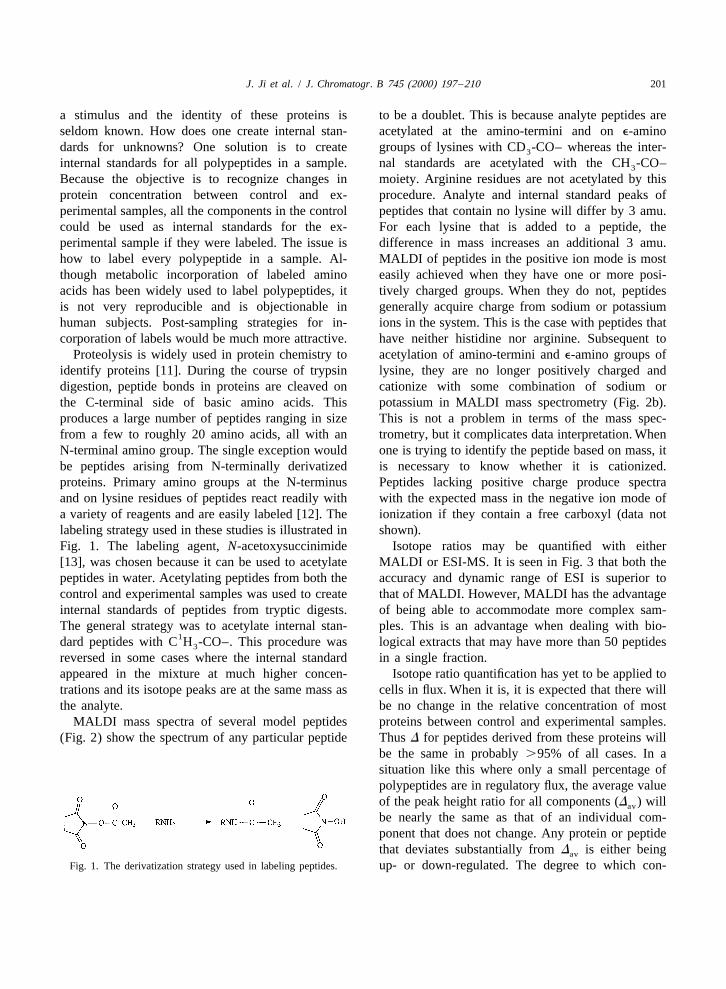
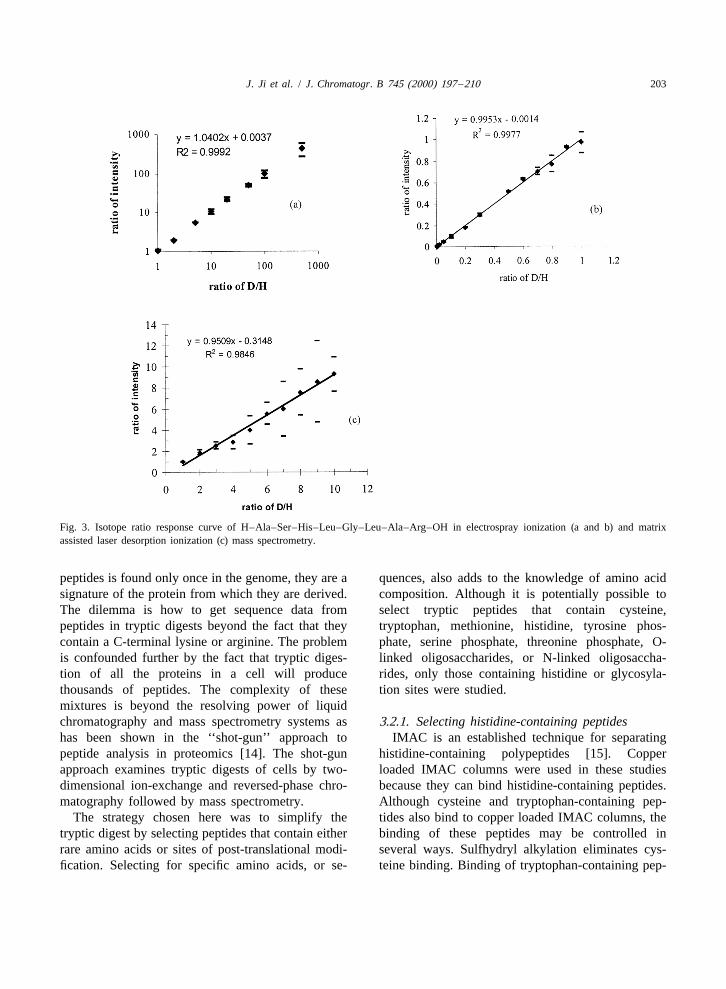
Proteolysis is widely used in protein chemistry to acetylation of amino-termini and e-amino groups ofidentify proteins [11]. During the course of trypsin lysine, they are no longer positively charged anddigestion, peptide bonds in proteins are cleaved on cationize with some combination of sodium orthe C-terminal side of basic amino acids. This potassium in MALDI mass spectrometry (Fig. 2b).produces a large number of peptides ranging in size This is not a problem in terms of the mass spec-from a few to roughly 20 amino acids, all with an trometry, but it complicates data interpretation. WhenN-terminal amino group. The single exception would one is trying to identify the peptide based on mass, itbe peptides arising from N-terminally derivatized is necessary to know whether it is cationized.proteins. Primary amino groups at the N-terminus Peptides lacking positive charge produce spectraand on lysine residues of peptides react readily with with the expected mass in the negative ion mode ofa variety of reagents and are easily labeled [12]. The ionization if they contain a free carboxyl (data notlabeling strategy used in these studies is illustrated in shown).Fig. 1. The labeling agent, N-acetoxysuccinimide Isotope ratios may be quantified with either[13], was chosen because it can be used to acetylate MALDI or ESI-MS. It is seen in Fig. 3 that both thepeptides in water. Acetylating peptides from both the accuracy and dynamic range of ESI is superior tocontrol and experimental samples was used to create that of MALDI. However, MALDI has the advantageinternal standards of peptides from tryptic digests. of being able to accommodate more complex sam-The general strategy was to acetylate internal stan- ples. This is an advantage when dealing with bio-
1dard peptides with C H -CO–. This procedure was logical extracts that may have more than 50 peptides3
reversed in some cases where the internal standard in a single fraction.appeared in the mixture at much higher concen- Isotope ratio quantification has yet to be applied totrations and its isotope peaks are at the same mass as cells in flux. When it is, it is expected that there willthe analyte. be no change in the relative concentration of most
MALDI mass spectra of several model peptides proteins between control and experimental samples.(Fig. 2) show the spectrum of any particular peptide Thus D for peptides derived from these proteins will
be the same in probably .95% of all cases. In asituation like this where only a small percentage ofpolypeptides are in regulatory flux, the average valueof the peak height ratio for all components (D ) willav
be nearly the same as that of an individual com-ponent that does not change. Any protein or peptidethat deviates substantially from D is either beingav
Fig. 1. The derivatization strategy used in labeling peptides. up- or down-regulated. The degree to which con-
202 J. Ji et al. / J. Chromatogr. B 745 (2000) 197 –210
Fig. 2. MALDI mass spectra of acetylated model peptides.
centration has changed may be determine by the valuable strategy for recognizing and quantifyingequation: species in regulatory flux. The issue with this
approach is how to identify the source of a peptideh 5 h D d (2)e c av after it has been recognized as having changed.where h is peak height of the component from the Obviously, knowing the sequence would be of greate
experimental sample, h is peak height from the value. But how can the sequence of small quantitiesc
control, and d is the relative degree of up- or of peptides in complex mixtures be determined?down-regulation. The massive, ongoing effort to sequence the
human genome in addition to those of most domestic3.2. The signature peptide approach to peptide species and pathogens is producing databases that areand protein identification of enormous value in protein chemistry. Using
genomic databases it is possible to predict the trypticIt has been suggested above that using internal peptides that will be derived from each protein.
standards of peptides derived from proteins will be a Because the sequence coding for most of these
J. Ji et al. / J. Chromatogr. B 745 (2000) 197 –210 203
Fig. 3. Isotope ratio response curve of H–Ala–Ser–His–Leu–Gly–Leu–Ala–Arg–OH in electrospray ionization (a and b) and matrixassisted laser desorption ionization (c) mass spectrometry.
peptides is found only once in the genome, they are a quences, also adds to the knowledge of amino acidsignature of the protein from which they are derived. composition. Although it is potentially possible toThe dilemma is how to get sequence data from select tryptic peptides that contain cysteine,peptides in tryptic digests beyond the fact that they tryptophan, methionine, histidine, tyrosine phos-contain a C-terminal lysine or arginine. The problem phate, serine phosphate, threonine phosphate, O-is confounded further by the fact that tryptic diges- linked oligosaccharides, or N-linked oligosaccha-tion of all the proteins in a cell will produce rides, only those containing histidine or glycosyla-thousands of peptides. The complexity of these tion sites were studied.mixtures is beyond the resolving power of liquidchromatography and mass spectrometry systems as 3.2.1. Selecting histidine-containing peptideshas been shown in the ‘‘shot-gun’’ approach to IMAC is an established technique for separatingpeptide analysis in proteomics [14]. The shot-gun histidine-containing polypeptides [15]. Copperapproach examines tryptic digests of cells by two- loaded IMAC columns were used in these studiesdimensional ion-exchange and reversed-phase chro- because they can bind histidine-containing peptides.matography followed by mass spectrometry. Although cysteine and tryptophan-containing pep-
The strategy chosen here was to simplify the tides also bind to copper loaded IMAC columns, thetryptic digest by selecting peptides that contain either binding of these peptides may be controlled inrare amino acids or sites of post-translational modi- several ways. Sulfhydryl alkylation eliminates cys-fication. Selecting for specific amino acids, or se- teine binding. Binding of tryptophan-containing pep-
204 J. Ji et al. / J. Chromatogr. B 745 (2000) 197 –210
Fig. 4. IMAC chromatograms of native and acetylated tryptic peptides from ovalbumin.
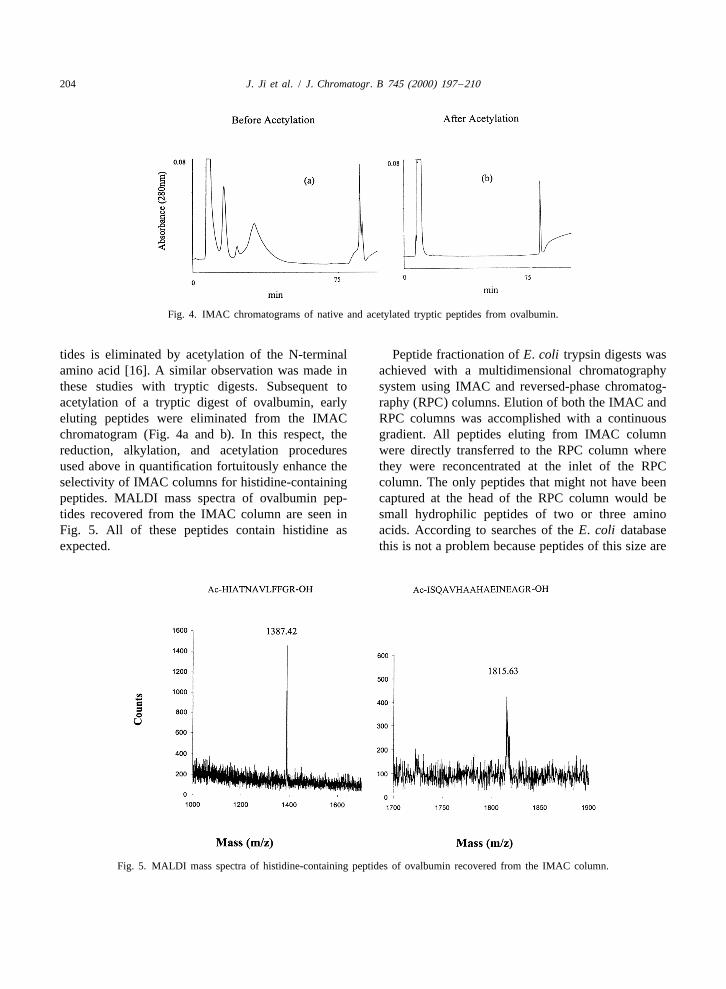
tides is eliminated by acetylation of the N-terminal Peptide fractionation of E. coli trypsin digests wasamino acid [16]. A similar observation was made in achieved with a multidimensional chromatographythese studies with tryptic digests. Subsequent to system using IMAC and reversed-phase chromatog-acetylation of a tryptic digest of ovalbumin, early raphy (RPC) columns. Elution of both the IMAC andeluting peptides were eliminated from the IMAC RPC columns was accomplished with a continuouschromatogram (Fig. 4a and b). In this respect, the gradient. All peptides eluting from IMAC columnreduction, alkylation, and acetylation procedures were directly transferred to the RPC column whereused above in quantification fortuitously enhance the they were reconcentrated at the inlet of the RPCselectivity of IMAC columns for histidine-containing column. The only peptides that might not have beenpeptides. MALDI mass spectra of ovalbumin pep- captured at the head of the RPC column would betides recovered from the IMAC column are seen in small hydrophilic peptides of two or three aminoFig. 5. All of these peptides contain histidine as acids. According to searches of the E. coli databaseexpected. this is not a problem because peptides of this size are
Fig. 5. MALDI mass spectra of histidine-containing peptides of ovalbumin recovered from the IMAC column.
J. Ji et al. / J. Chromatogr. B 745 (2000) 197 –210 205
generally not structurally unique. After sample trans- parent proteins from which these signature peptides4fer, the IMAC column was switched off-line, the were derived is thought to vary 10 , or more [17].
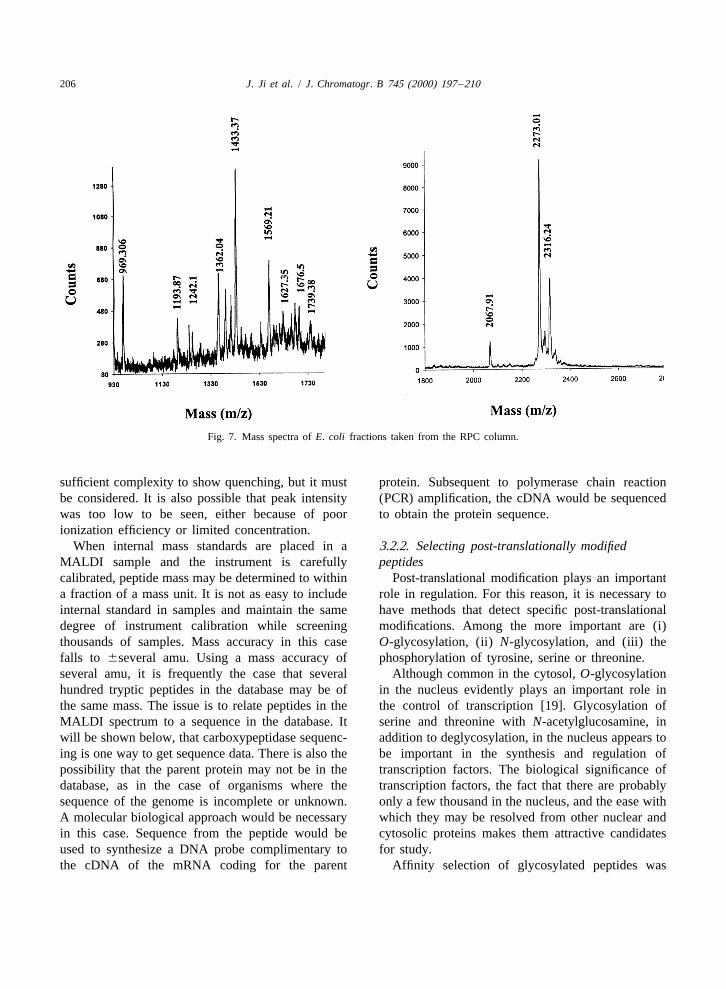
solvent lines of the chromatography instrument Many of the peptides in the reversed-phase chro-purged at 10 ml /min for a few seconds with RPC matogram (Fig. 6) are at too low concentration to besolvent A, and finally the RPC column was gradient seen.eluted at 1 ml /min. Fractions were collected from How can fractions containing 10 or more peptidethe RPC column and spotted onto a MALDI plate. components provide data of analytical value? Fortu-After addition of MALDI matrix and solvent evapo- nately, MALDI-MS can accommodate samples of 50ration, samples were analyzed manually in a MALDI or more peptides. Mass spectra of several representa-mass spectrometer. tive fractions taken from the RPC column are shown
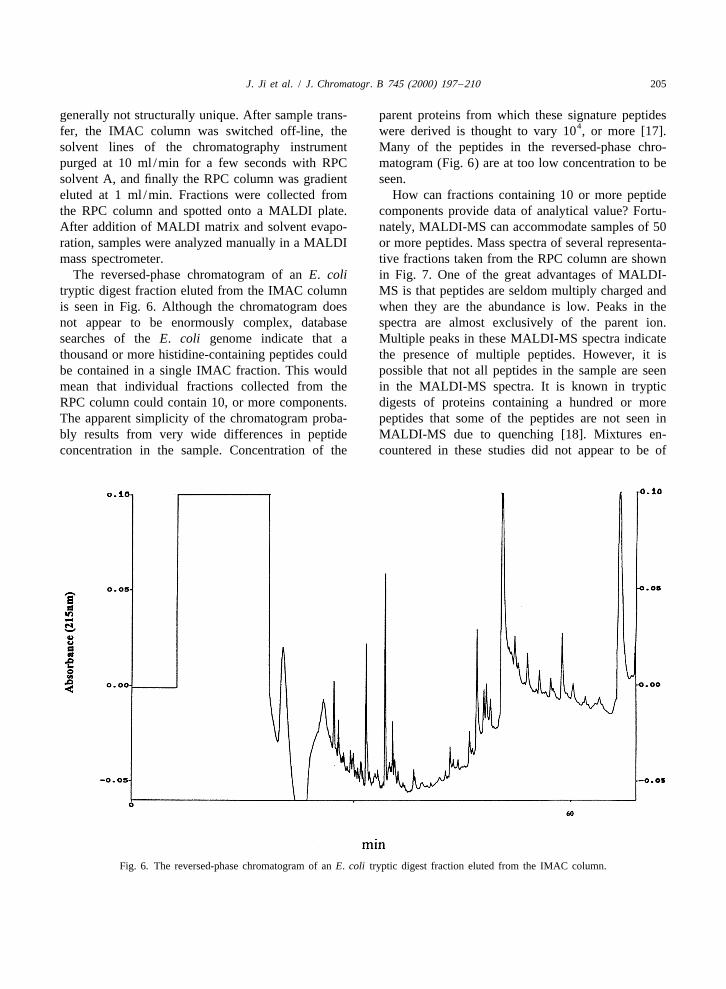
The reversed-phase chromatogram of an E. coli in Fig. 7. One of the great advantages of MALDI-tryptic digest fraction eluted from the IMAC column MS is that peptides are seldom multiply charged andis seen in Fig. 6. Although the chromatogram does when they are the abundance is low. Peaks in thenot appear to be enormously complex, database spectra are almost exclusively of the parent ion.searches of the E. coli genome indicate that a Multiple peaks in these MALDI-MS spectra indicatethousand or more histidine-containing peptides could the presence of multiple peptides. However, it isbe contained in a single IMAC fraction. This would possible that not all peptides in the sample are seenmean that individual fractions collected from the in the MALDI-MS spectra. It is known in trypticRPC column could contain 10, or more components. digests of proteins containing a hundred or moreThe apparent simplicity of the chromatogram proba- peptides that some of the peptides are not seen inbly results from very wide differences in peptide MALDI-MS due to quenching [18]. Mixtures en-concentration in the sample. Concentration of the countered in these studies did not appear to be of
Fig. 6. The reversed-phase chromatogram of an E. coli tryptic digest fraction eluted from the IMAC column.
206 J. Ji et al. / J. Chromatogr. B 745 (2000) 197 –210
Fig. 7. Mass spectra of E. coli fractions taken from the RPC column.
sufficient complexity to show quenching, but it must protein. Subsequent to polymerase chain reactionbe considered. It is also possible that peak intensity (PCR) amplification, the cDNA would be sequencedwas too low to be seen, either because of poor to obtain the protein sequence.ionization efficiency or limited concentration.
When internal mass standards are placed in a 3.2.2. Selecting post-translationally modifiedMALDI sample and the instrument is carefully peptidescalibrated, peptide mass may be determined to within Post-translational modification plays an importanta fraction of a mass unit. It is not as easy to include role in regulation. For this reason, it is necessary tointernal standard in samples and maintain the same have methods that detect specific post-translationaldegree of instrument calibration while screening modifications. Among the more important are (i)thousands of samples. Mass accuracy in this case O-glycosylation, (ii) N-glycosylation, and (iii) thefalls to 6several amu. Using a mass accuracy of phosphorylation of tyrosine, serine or threonine.several amu, it is frequently the case that several Although common in the cytosol, O-glycosylationhundred tryptic peptides in the database may be of in the nucleus evidently plays an important role inthe same mass. The issue is to relate peptides in the the control of transcription [19]. Glycosylation ofMALDI spectrum to a sequence in the database. It serine and threonine with N-acetylglucosamine, inwill be shown below, that carboxypeptidase sequenc- addition to deglycosylation, in the nucleus appears toing is one way to get sequence data. There is also the be important in the synthesis and regulation ofpossibility that the parent protein may not be in the transcription factors. The biological significance ofdatabase, as in the case of organisms where the transcription factors, the fact that there are probablysequence of the genome is incomplete or unknown. only a few thousand in the nucleus, and the ease withA molecular biological approach would be necessary which they may be resolved from other nuclear andin this case. Sequence from the peptide would be cytosolic proteins makes them attractive candidatesused to synthesize a DNA probe complimentary to for study.the cDNA of the mRNA coding for the parent Affinity selection of glycosylated peptides was
J. Ji et al. / J. Chromatogr. B 745 (2000) 197 –210 207
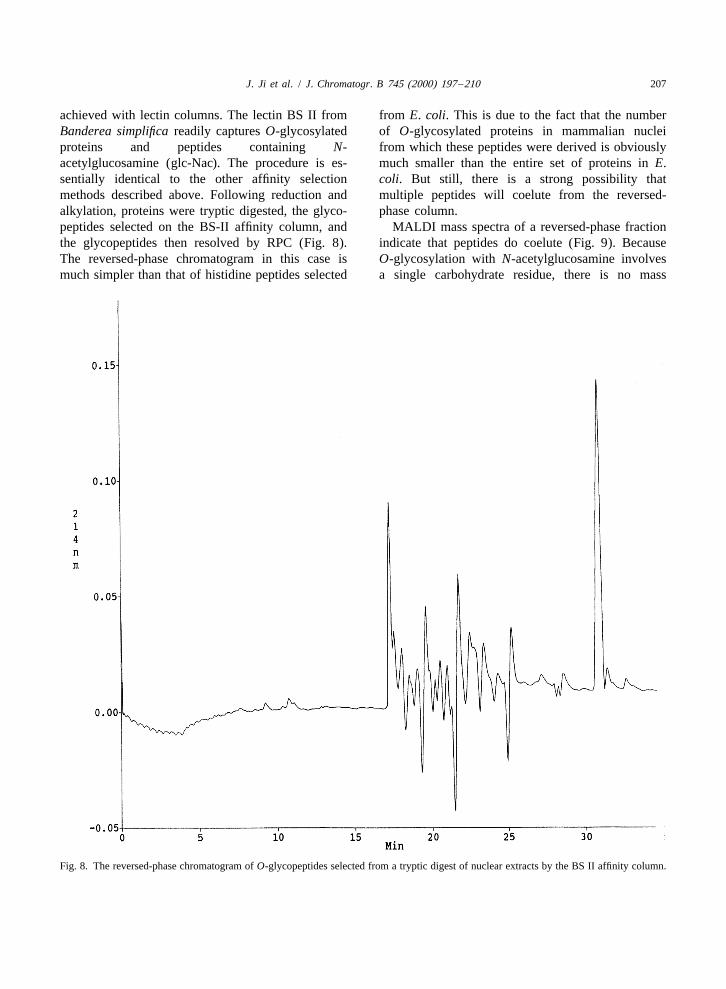
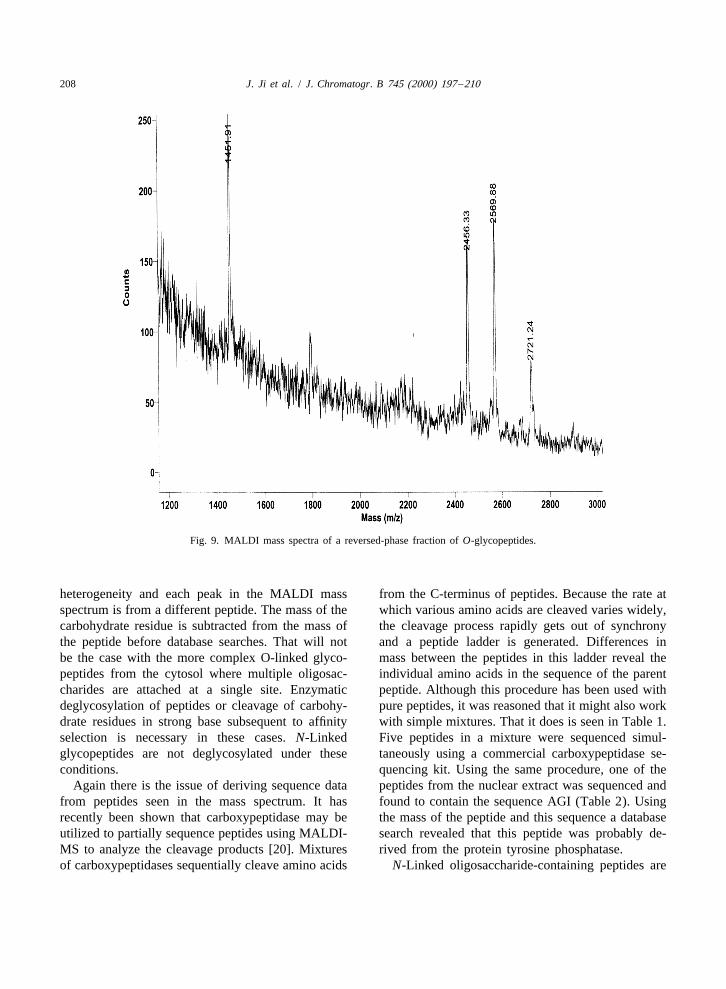
achieved with lectin columns. The lectin BS II from from E. coli. This is due to the fact that the numberBanderea simplifica readily captures O-glycosylated of O-glycosylated proteins in mammalian nucleiproteins and peptides containing N- from which these peptides were derived is obviouslyacetylglucosamine (glc-Nac). The procedure is es- much smaller than the entire set of proteins in E.sentially identical to the other affinity selection coli. But still, there is a strong possibility thatmethods described above. Following reduction and multiple peptides will coelute from the reversed-alkylation, proteins were tryptic digested, the glyco- phase column.peptides selected on the BS-II affinity column, and MALDI mass spectra of a reversed-phase fractionthe glycopeptides then resolved by RPC (Fig. 8). indicate that peptides do coelute (Fig. 9). BecauseThe reversed-phase chromatogram in this case is O-glycosylation with N-acetylglucosamine involvesmuch simpler than that of histidine peptides selected a single carbohydrate residue, there is no mass
Fig. 8. The reversed-phase chromatogram of O-glycopeptides selected from a tryptic digest of nuclear extracts by the BS II affinity column.
208 J. Ji et al. / J. Chromatogr. B 745 (2000) 197 –210
Fig. 9. MALDI mass spectra of a reversed-phase fraction of O-glycopeptides.
heterogeneity and each peak in the MALDI mass from the C-terminus of peptides. Because the rate atspectrum is from a different peptide. The mass of the which various amino acids are cleaved varies widely,carbohydrate residue is subtracted from the mass of the cleavage process rapidly gets out of synchronythe peptide before database searches. That will not and a peptide ladder is generated. Differences inbe the case with the more complex O-linked glyco- mass between the peptides in this ladder reveal thepeptides from the cytosol where multiple oligosac- individual amino acids in the sequence of the parentcharides are attached at a single site. Enzymatic peptide. Although this procedure has been used withdeglycosylation of peptides or cleavage of carbohy- pure peptides, it was reasoned that it might also workdrate residues in strong base subsequent to affinity with simple mixtures. That it does is seen in Table 1.selection is necessary in these cases. N-Linked Five peptides in a mixture were sequenced simul-glycopeptides are not deglycosylated under these taneously using a commercial carboxypeptidase se-conditions. quencing kit. Using the same procedure, one of the
Again there is the issue of deriving sequence data peptides from the nuclear extract was sequenced andfrom peptides seen in the mass spectrum. It has found to contain the sequence AGI (Table 2). Usingrecently been shown that carboxypeptidase may be the mass of the peptide and this sequence a databaseutilized to partially sequence peptides using MALDI- search revealed that this peptide was probably de-MS to analyze the cleavage products [20]. Mixtures rived from the protein tyrosine phosphatase.of carboxypeptidases sequentially cleave amino acids N-Linked oligosaccharide-containing peptides are
J. Ji et al. / J. Chromatogr. B 745 (2000) 197 –210 209
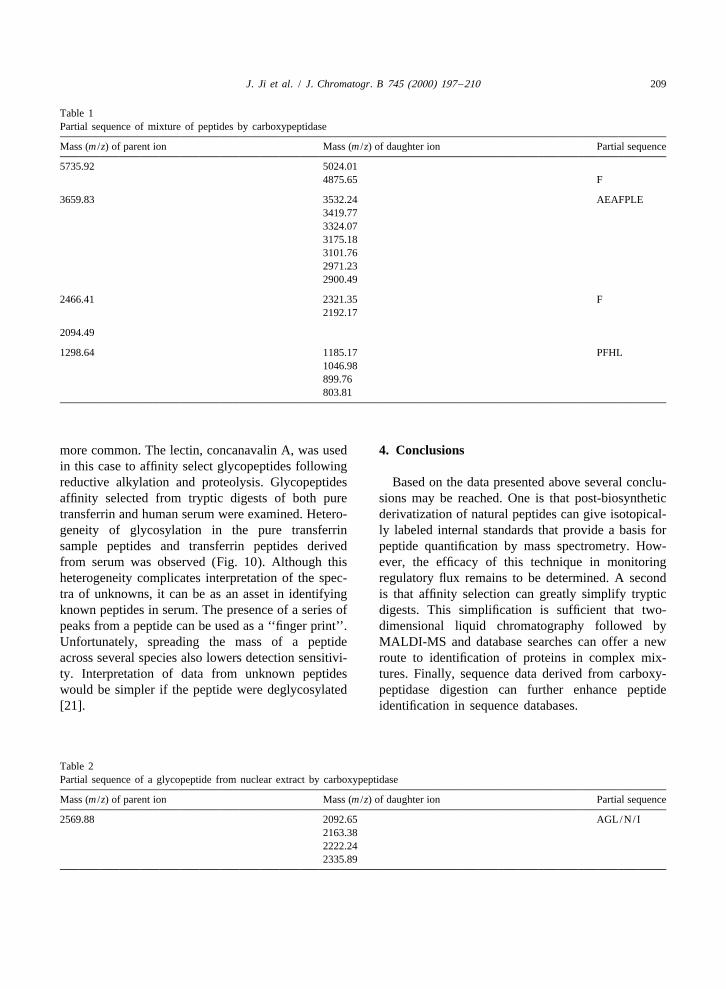
Table 1Partial sequence of mixture of peptides by carboxypeptidase
Mass (m /z) of parent ion Mass (m /z) of daughter ion Partial sequence
5735.92 5024.014875.65 F
3659.83 3532.24 AEAFPLE3419.773324.073175.183101.762971.232900.49
2466.41 2321.35 F2192.17
2094.49
1298.64 1185.17 PFHL1046.98899.76803.81
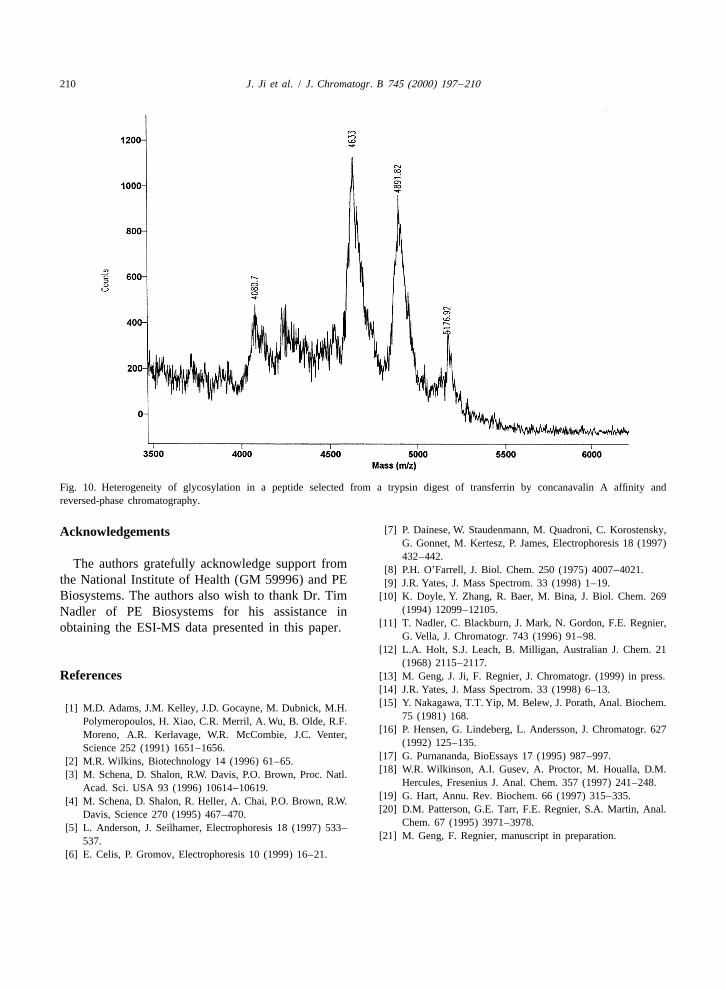
more common. The lectin, concanavalin A, was used 4. Conclusionsin this case to affinity select glycopeptides followingreductive alkylation and proteolysis. Glycopeptides Based on the data presented above several conclu-affinity selected from tryptic digests of both pure sions may be reached. One is that post-biosynthetictransferrin and human serum were examined. Hetero- derivatization of natural peptides can give isotopical-geneity of glycosylation in the pure transferrin ly labeled internal standards that provide a basis forsample peptides and transferrin peptides derived peptide quantification by mass spectrometry. How-from serum was observed (Fig. 10). Although this ever, the efficacy of this technique in monitoringheterogeneity complicates interpretation of the spec- regulatory flux remains to be determined. A secondtra of unknowns, it can be as an asset in identifying is that affinity selection can greatly simplify trypticknown peptides in serum. The presence of a series of digests. This simplification is sufficient that two-peaks from a peptide can be used as a ‘‘finger print’’. dimensional liquid chromatography followed byUnfortunately, spreading the mass of a peptide MALDI-MS and database searches can offer a newacross several species also lowers detection sensitivi- route to identification of proteins in complex mix-ty. Interpretation of data from unknown peptides tures. Finally, sequence data derived from carboxy-would be simpler if the peptide were deglycosylated peptidase digestion can further enhance peptide[21]. identification in sequence databases.
Table 2Partial sequence of a glycopeptide from nuclear extract by carboxypeptidase
Mass (m /z) of parent ion Mass (m /z) of daughter ion Partial sequence
2569.88 2092.65 AGL/N/I2163.382222.242335.89
210 J. Ji et al. / J. Chromatogr. B 745 (2000) 197 –210
Fig. 10. Heterogeneity of glycosylation in a peptide selected from a trypsin digest of transferrin by concanavalin A affinity andreversed-phase chromatography.
[7] P. Dainese, W. Staudenmann, M. Quadroni, C. Korostensky,AcknowledgementsG. Gonnet, M. Kertesz, P. James, Electrophoresis 18 (1997)432–442.
The authors gratefully acknowledge support from [8] P.H. O’Farrell, J. Biol. Chem. 250 (1975) 4007–4021.the National Institute of Health (GM 59996) and PE [9] J.R. Yates, J. Mass Spectrom. 33 (1998) 1–19.Biosystems. The authors also wish to thank Dr. Tim [10] K. Doyle, Y. Zhang, R. Baer, M. Bina, J. Biol. Chem. 269
(1994) 12099–12105.Nadler of PE Biosystems for his assistance in[11] T. Nadler, C. Blackburn, J. Mark, N. Gordon, F.E. Regnier,obtaining the ESI-MS data presented in this paper.
G. Vella, J. Chromatogr. 743 (1996) 91–98.[12] L.A. Holt, S.J. Leach, B. Milligan, Australian J. Chem. 21
(1968) 2115–2117.References [13] M. Geng, J. Ji, F. Regnier, J. Chromatogr. (1999) in press.
[14] J.R. Yates, J. Mass Spectrom. 33 (1998) 6–13.[15] Y. Nakagawa, T.T. Yip, M. Belew, J. Porath, Anal. Biochem.[1] M.D. Adams, J.M. Kelley, J.D. Gocayne, M. Dubnick, M.H.
75 (1981) 168.Polymeropoulos, H. Xiao, C.R. Merril, A. Wu, B. Olde, R.F.[16] P. Hensen, G. Lindeberg, L. Andersson, J. Chromatogr. 627Moreno, A.R. Kerlavage, W.R. McCombie, J.C. Venter,
(1992) 125–135.Science 252 (1991) 1651–1656.[17] G. Purnananda, BioEssays 17 (1995) 987–997.[2] M.R. Wilkins, Biotechnology 14 (1996) 61–65.[18] W.R. Wilkinson, A.I. Gusev, A. Proctor, M. Houalla, D.M.[3] M. Schena, D. Shalon, R.W. Davis, P.O. Brown, Proc. Natl.
Hercules, Fresenius J. Anal. Chem. 357 (1997) 241–248.Acad. Sci. USA 93 (1996) 10614–10619.[19] G. Hart, Annu. Rev. Biochem. 66 (1997) 315–335.[4] M. Schena, D. Shalon, R. Heller, A. Chai, P.O. Brown, R.W.[20] D.M. Patterson, G.E. Tarr, F.E. Regnier, S.A. Martin, Anal.Davis, Science 270 (1995) 467–470.
Chem. 67 (1995) 3971–3978.[5] L. Anderson, J. Seilhamer, Electrophoresis 18 (1997) 533–[21] M. Geng, F. Regnier, manuscript in preparation.537.
[6] E. Celis, P. Gromov, Electrophoresis 10 (1999) 16–21.