Aldlgan, Abdulaziz (2016) Chromatographic analysis ... - CORE

ISSN 1061�9348, Journal of Analytical Chemistry, 2012, Vol. 67, No. 13, pp. 1014–1025. © Pleiades Publishing, Ltd., 2012.Published in Russian in Mass�Spektrometria, 2011, Vol. 8, No. 4, pp. 281–292.
1014
1 INTRODUCTION
Inversion of peptide elution order in reversed�phase liquid chromatography under changing separa�tion parameters, e.g. solvent flow rate, column sizeand gradient profile, has been widely discussed in lit�erature since 1980s [1–3]. Due to the growing interestin utilization of liquid chromatography in proteomicstudies, discussion of this phenomenon still retains theimportance [4–7]. Both the phenomenologicaldescription and the prediction of the inversion phe�nomenon are challenging issues that force theresearchers to employ the same peptide separationconditions for preserving the reproducibility of thechromatographic data. For example, the AccurateMass and Time tags (AMT) method is increasinglyused in proteomics. It is based on generation and uti�lization of databases of accurate masses and retentiontimes of peptides that are protein markers [6–10].These AMT databases allow rapid identification ofproteins based on liquid chromatography/mass spec�trometry (HPLC�MS) analysis without employing thetandem mass spectrometry. In the AMT approach, theparent mass measured with high accuracy and nor�malized peptide retention time are used for unambig�uous peptide identifications. Normalization is usuallyperformed using linear (RTnorm = aRTexp + b) or qua�
1 The article was translated by the authors.
dratic (RTnorm = aR + bRTexp + c) transforms [9–11]. This approach to normalization is highly accuratewhen applied under identical or close separationparameters [9, 11]. However, it does not allow correctconversion of peptide retention times to selected nor�malized time scale if the peptides have changed elu�tion order due to a change in the experimental condi�tions.
Another target approach to fast protein identifica�tion is LC�dependent Selected/Multiple ReactionMonitoring (SRM/MRM) [12]. SRM/MRMmethod implements targeted search through specified“precursor ion product ion” transitions followedby the conclusion on the presence or absence of thepeptide in the analyzed mixture. In the MRM�basedstrategy, three transitions per peptide are typicallydetected, and not more than 100 peptides per elutionpeak can be specifically searched under typicalHPLC�MS conditions [12]. Knowing the retentiontimes allows separating the peptide search over therespective time intervals of the chromatogram and,thus, enhancing the analysis throughput by reducingthe search space or the reliability of the quantitativeassessment as the number of identifications per pro�tein increases. However, the inability to correctly pre�dict changes in the order of peptide elution underchanging separation conditions can lead to the loss of
Texp2
Inversion of Chromatographic Elution Orders of Peptidesand Its Importance for Proteomics1
I. A. Tarasovaa, *, T. Yu. Perlovaa, M. L. Pridatchenkoa, A. A. Goloborod’koa, L. I. Levitskya,V. V. Evreinovb, V. Gurycac, d, C. D. Masselonc, d, A. V. Gorshkovb, and M. V. Gorshkova
a Institute for Energy Problems of Chemical Physics RAS, Leninsky pr. 38, bld. 2, Moscow, 119334 Russia*e�mail: [email protected]
b Semenov’s Institute of Chemical Physics, RAS, ul. Kosygina 4, Moscow, 119991 Russiac CEA, Universite Joseph Fourier, 17 Avenue des Martyrs, Bat. C3, 38054 Grenoble Cedex 9, France
d INSERM, U880, Grenoble, F�38054, FranceReceived August 4, 2011; in final form, October 10, 2011
Abstract—Inversion of the order of peptide elution in reversed�phase liquid chromatography under changingseparation conditions, such as gradient slope has been considered. Using a six�protein proteolytic peptidestandard and available literature data, the occurrence frequency and importance of this phenomenon in pro�teomic studies utilizing methods of shotgun proteomics and accurate mass and time tags have been evaluated.Feasibility of qualitative and quantitative description of peptide elution order inversion has been demon�strated using a model of critical liquid chromatography. Existing approaches to predict peptide separation anddirections of the shifts of chromatographic peaks when the gradient profile changes have been compared.
Keywords: proteomics, mass spectrometry, inversion of chromatographic elution orders of peptides, accuratemass and retention time tags, critical liquid chromatography
DOI: 10.1134/S1061934812130102
ARTICLES
JOURNAL OF ANALYTICAL CHEMISTRY Vol. 67 No. 13 2012
INVERSION OF CHROMATOGRAPHIC ELUTION ORDERS OF PEPTIDES 1015
a peptide tag in the corresponding search time inter�val, as well as a false negative protein identification.
Until recently, the only theory describing thechange in the elution order of peptides when changingthe gradient slope was the empirically derived Linear�Solvent�Strength Theory (LSS) by L.R. Snyder [13].One of the basic equations of the theory postulates alinear relation between the logarithm of the distribu�tion coefficient logKd and the volume fraction of theorganic solvent θ:
(1)
where Kd0 is the distribution coefficient in pure water,and S is the proportionality coefficient. It is assumedthat S is a complex function, which depends on phys�ico�chemical properties of the biomolecule. Forexample, it was shown that it depends on the molecu�lar mass [2], as well as length, charge, hydrophobicity,and amino acid sequence [14]. Snyder’s theory allowsprediction of the inversion of peptide elution orderwhen the gradient slope changes provided that both Sand Kd0 values in Eq. (1) are determined. These valuescan be measured experimentally using the dependenceof the distribution coefficient on the gradient slope foreach peptide, although this approach is not feasible onthe large scale as these coefficients should be deter�mined for hundreds of thousands of peptides in thiscase.
An empirical model for calculation of the S coeffi�cients of tryptic peptides was proposed recently. Freeparameters in the suggested model were obtained byoptimization procedure applied to statistically largedatasets [14, 15]. In particular, the following equationwas proposed for prediction of the signs of the shifts inchromatographic peaks relative to a chosen tag peptidewhen the gradient profile changes [14]:
(2)
in which g0 and g1 are gradient slopes, S and S ' are cal�culated coefficients for a pair of peptides, one of whichchanges its position relative to the tag peptide whenthe gradient changes. The value of Δ in Eq. (2) is achange in the distance between two peaks after the gra�dient slope has changed, and is expressed in percent�age units of the organic eluent in the portion of the sol�vent within which the peptides are eluted:
(3)
in which and are retention times of the tagpeptide, which is used as a reference for determinationof the change in retention of another peptide withretention times of RTg0 and RTg1 in g0 and g1 gradients,respectively. The sign of Δ defines the direction of therelative shift of the pair of peptides. It is important tonote that knowing Δ does not allow conclusion onwhether the inversion of the elution order actuallyoccurs or not, when the peaks are closing to eachother.
Kdlog Kd0log Sθ,–=
Δ 100 g0/g1( ) 1/S 1/S'–( ),log=
Δ g0 RTg0 RTg0'–( ) g1 RTg1 RTg1'–( ),–=
RTg0' RTg1'
Earlier, we proposed a model of separation ofbiomacromolecules—Liquid Chromatography atCritical Conditions for Biomacromolecules (BioLCCC)for the phenomenological description of peptide sepa�ration which is based on statistical physics of macro�molecules [16–18]. The model allows calculation ofthe chromatographic distribution coefficient of a bio�molecule with a known amino acid sequence for theparticular experimental conditions. In BioLCCC, thedistribution coefficient, Kd, which depends on achange in the free energy, ΔG, is determined by thepartition function, Zp, of the biomacromolecule insidethe pore [19]:
Kd = exp(–ΔG) ~ Zp. (4)
Currently, there are two approaches for calculationof the partition function in the BioLCCC model.These approaches are based on different assumptionsabout the flexibility of biomolecules. In the firstapproach, the molecule is represented as a rigid rod,which better describes short molecules, such as pep�tides [20]. In the other approach the model of free�walk flexible chain is used. It can be applied to describelong molecules, such as denatured proteins [16–18,20, 21]. The aim of the present work was experimentalstudy on the inversion of peptide elution order underchanging gradient elution profile, revealing the under�lying mechanism, and the estimation of the scale ofthis phenomenon in proteomic studies. Also, the fea�sibility to predict elution order inversion using differ�ent models was evaluated.
EXPERIMENTAL
Samples
Two commercially available peptide standardswere used a tryptic digest of cytochrome c and atryptic digest of six proteins, containing BSA (Bos tau�rus), α�galactosidase (Escherichia coli), lysozyme(Gallus gallus), alcohol dehydrogenase (Saccharomy�ces cerevisiae), cytochrome c (Bos taurus), and apo�transferrin (Bos taurus). Both standards were pur�chased from Dionex/LCPacking (Amsterdam, TheNetherlands).
Chromatography
Chromatographic separation of peptide mixtureswas performed using Ultimate 3000 gradient HPLCsystem (Dionex, Amsterdam, The Netherlands), cou�pled to a hybrid ion cyclotron resonance LTQ�FTmass spectrometer (ThermoFisher, Bremen, Ger�many). The samples were injected in 200–500 fmol/μL concentrations. Mobile phases werewater/acetonitrile (ACN) mixtures (Merck, Darms�tadt, Germany) with addition of formic acid (VWRInternational, London, England) in the following vol�ume ratios: A—acetonitrile/water/formic acid(2/98/0.1); B—acetonitrile/water/formic acid
1016
JOURNAL OF ANALYTICAL CHEMISTRY Vol. 67 No. 13 2012
TARASOVA et al.
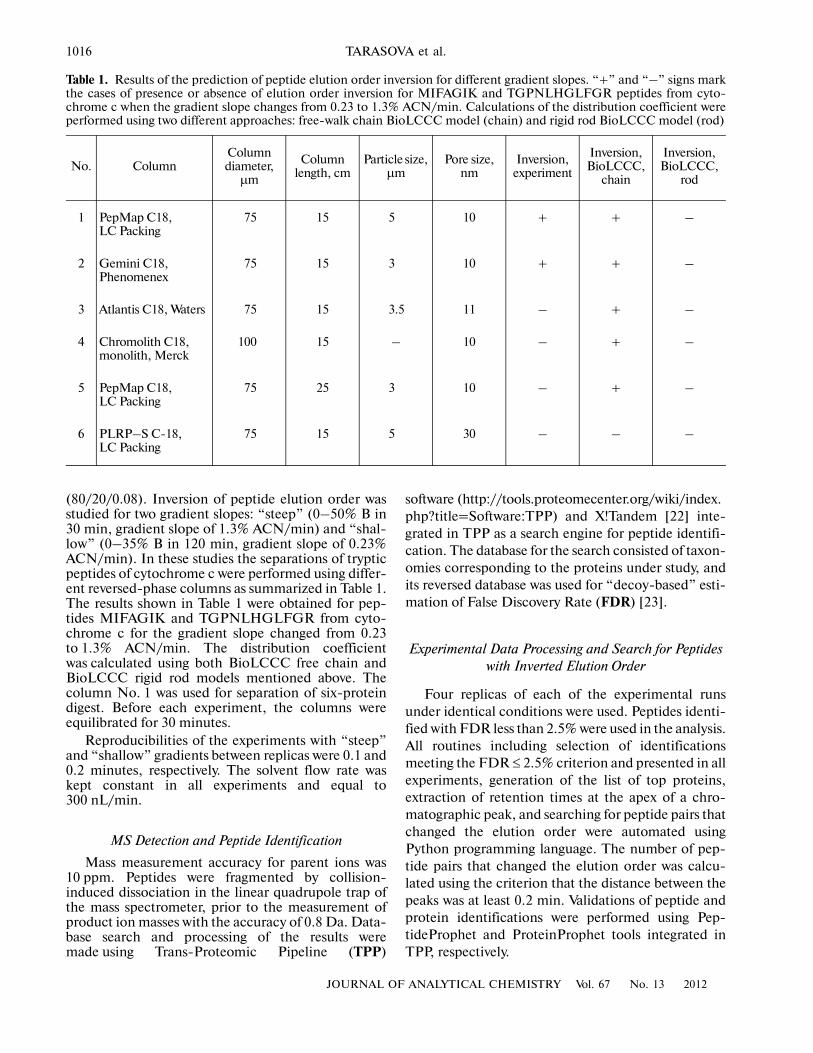
(80/20/0.08). Inversion of peptide elution order wasstudied for two gradient slopes: “steep” (0–50% B in30 min, gradient slope of 1.3% ACN/min) and “shal�low” (0–35% B in 120 min, gradient slope of 0.23%ACN/min). In these studies the separations of trypticpeptides of cytochrome c were performed using differ�ent reversed�phase columns as summarized in Table 1.The results shown in Table 1 were obtained for pep�tides MIFAGIK and TGPNLHGLFGR from cyto�chrome c for the gradient slope changed from 0.23to 1.3% ACN/min. The distribution coefficientwas calculated using both BioLCCC free chain andBioLCCC rigid rod models mentioned above. Thecolumn No. 1 was used for separation of six�proteindigest. Before each experiment, the columns wereequilibrated for 30 minutes.
Reproducibilities of the experiments with “steep”and “shallow” gradients between replicas were 0.1 and0.2 minutes, respectively. The solvent flow rate waskept constant in all experiments and equal to300 nL/min.
MS Detection and Peptide Identification
Mass measurement accuracy for parent ions was10 ppm. Peptides were fragmented by collision�induced dissociation in the linear quadrupole trap ofthe mass spectrometer, prior to the measurement ofproduct ion masses with the accuracy of 0.8 Da. Data�base search and processing of the results weremade using Trans�Proteomic Pipeline (TPP)
software (http://tools.proteomecenter.org/wiki/index.php?title=Software:TPP) and X!Tandem [22] inte�grated in TPP as a search engine for peptide identifi�cation. The database for the search consisted of taxon�omies corresponding to the proteins under study, andits reversed database was used for “decoy�based” esti�mation of False Discovery Rate (FDR) [23].
Experimental Data Processing and Search for Peptides with Inverted Elution Order
Four replicas of each of the experimental runsunder identical conditions were used. Peptides identi�fied with FDR less than 2.5% were used in the analysis.All routines including selection of identificationsmeeting the FDR ≤ 2.5% criterion and presented in allexperiments, generation of the list of top proteins,extraction of retention times at the apex of a chro�matographic peak, and searching for peptide pairs thatchanged the elution order were automated usingPython programming language. The number of pep�tide pairs that changed the elution order was calcu�lated using the criterion that the distance between thepeaks was at least 0.2 min. Validations of peptide andprotein identifications were performed using Pep�tideProphet and ProteinProphet tools integrated inTPP, respectively.
Table 1. Results of the prediction of peptide elution order inversion for different gradient slopes. “+” and “–” signs markthe cases of presence or absence of elution order inversion for MIFAGIK and TGPNLHGLFGR peptides from cyto�chrome c when the gradient slope changes from 0.23 to 1.3% ACN/min. Calculations of the distribution coefficient wereperformed using two different approaches: free�walk chain BioLCCC model (chain) and rigid rod BioLCCC model (rod)
No. ColumnColumn diameter,
µm
Column length, cm
Particle size, µm
Pore size, nm
Inversion, experiment
Inversion, BioLCCC,
chain
Inversion, BioLCCC,
rod
1 PepMap C18, LC Packing
75 15 5 10 + + –
2 Gemini C18, Phenomenex
75 15 3 10 + + –
3 Atlantis C18, Waters 75 15 3.5 11 – + –
4 Chromolith C18, monolith, Merck
100 15 – 10 – + –
5 PepMap C18, LC Packing
75 25 3 10 – + –
6 PLRP–S C�18, LC Packing
75 15 5 30 – – –

JOURNAL OF ANALYTICAL CHEMISTRY Vol. 67 No. 13 2012
INVERSION OF CHROMATOGRAPHIC ELUTION ORDERS OF PEPTIDES 1017
Retention Time Calculation
Retention times for different gradient slopes weretheoretically predicted using the BioLCCCmodel, implemented by the authors in C++ andPython programming languages as an open�sourcelibrary pyBioLCCC (http://www.theorchromo.ru/lib/). The rigid rod model (rpAcnFaRod) [20] with thestandard set of phenomenological parameters (inter�action energies between amino acid residues and thestationary phase) was used in the predictions. Thesephenomenological parameters were previously deter�mined for a reversed�phase Magic AQ C18 20 nm col�umn (Michrom BioResources, Auburn, USA) and awater�acetonitrile mobile phase with addition of iso�propanol and formic acid (pH 3.5) [24]. It should benoted that the properties of Magic AQ C18 phase dif�fer from the commonly used reversed�phase C18: it ischemically modified phase for enhanced retention ofthe hydrophilic substances yet provides similar separa�tion selectivity for the hydrophobic substances [25].When comparing the BioLCCC model to alternativeapproaches for prediction of the direction of peakshifts for different gradients, the absolute retentiontimes calculated by pyBioLCCC were converted torelative shifts as follows: ΔBioLCCC =
– The sign
of ΔBioLCCC was compared to the experimental value,Δexp. The value of Δexp was determined using Eq. (3)[14]:
Δexp = – (4)
Alternatively, the direction of peptide retentiontime shifts and S coefficients of the Snyder’s theory,were calculated using Sequence Specific Slope Reten�tion Calculator (SSSRCalc) (http://hs4.pro�teome.ca/SSRCalc/Slope/). In this approach the the�oretical values of peak shifts for different gradientswere determined using Eq. (2) [14]:
ΔSSSRC = 100log(g0/g1)(1/S – 1/S '), (5)followed by comparison between theoretically pre�dicted and experimentally measured shifts in retentiontimes.
RESULTS AND DISCUSSION
Analysis of Inverting Peptide Pairs
Table 2 shows peptide pairs from 6�protein stan�dard that changed the elution order after the gradientslope was changed. These pairs were determined bythe analysis of 47 unmodified peptides identified withFDR ≤ 2.5%. 19 pairs with inversion were found. Asshown in Table 2, the longer peptide in each of thepairs was eluting first under the “steep” gradient, andvise versa for the “shallow” gradient. One pair of pep�tides with equal sequence lengths was also found.
We also analyzed the literature data for differentgradient slopes [14] and searched for peptides that
g0 RTg0theor RTg0
theor'–( ) g1 RTg1theor RTg1
theor'–( ).
g0 RTg0exp RTg0
exp'–( ) g1 RTg1exp RTg1
exp'–( ).
changed the elution order. The first dataset contained247 peptides, among which 567 pairs with inversionwere found. In these pairs, peptide with largestsequence length was eluting first in the “steep” gradi�ent (with the gradient slope of 0.75% ACN/min) inmost of the cases, as was observed for the 6�proteinstandard. However, there are “exceptions” in whichthe shorter peptides were eluting first in the “steep”gradient, for example:
Yet, the molecular weights of these peptides werenot always higher:
Among the peptide pairs changing the elutionorder there are cases that peptides have the sameamino acid sequence length, as shown below:
In this case, either the lighter or the heavier peptidecan be eluted first in the “steep” gradient. Theseexceptional pairs constituted 4.5% of the total numberof inverted pairs found in the 247�peptide set.
The second analyzed literature dataset contained504 tryptic peptides [14]. When the gradient slope waschanged from 0.75% ACN/min to 0.187% ACN/min,1392 peptide pairs with changed elution order werefound. Among these pairs, 4.0% of “exceptions” werealso found, in which the shorter (or the lighter) pep�tide was eluting first under the “steep” gradient.
The considered experimental data show that in gra�dient chromatography a change in the gradient slope
Peptide Mass, Da Length
Elution time, min, at slope 0.75
(0.187)%ACN/min
HQTVPQNTG�GKNPDPWAK
1975.15 18 20.72 (54.52)
NPSSAGSWNSG�SSGPSTGNR
1693.95 21 21.03 (53.7)
Peptide Mass, Da Length
Elution time, min, at slope 0.75
(0.187)%ACN/min
YQISVNK 850.97 7 21.78 (54.15)
QDGSVDFGR 980.00 9 22.1 (53.47)
Peptide Mass, Da Length
Elution time, min, at slope 0.75
(0.187)%ACN/min
ECCEKPLLEK 1191.42 10 19.8 (48.37)
LGGGGGGDFR 891.94 10 20.27 (47.14)
RHPYFYAPE�LLFFAK
1899.23 15 38.32 (124.65)
DSDWPFCSD�EDWNYK
1906.95 15 38.86 (123.95)

1018
JOURNAL OF ANALYTICAL CHEMISTRY Vol. 67 No. 13 2012
TARASOVA et al.
Table 2. Peptide pairs from 6�protein standard which changed the elution order under the change of gradient slopes from0.23 to 1.3% ACN/min
No. Peptide pairs with inverted elution order Mass, Da
Num�ber of
amino� acid
residues
Gradient, % ACN/min
0.23 1.3
RTexp, min
RTBioLCCC, min
RTexp, min
RTBioLCCC, min
1 HSTVFDNLPNPEDRK 1768.90 15 54.28 31.96 20.03 9.97
DKPDNFQLFQSPHGK 1757.92 15 53.99 41.91 20.26 12.17
2 DQTVIQNTDGNNNEAWAK 2018.08 18 56.57 51.42 20.47 13.44
RHPEYAVSVLLR 1439.68 12 55.30 74.98 20.72 20.94
3 KVPQVSTPTLVEVSR 1639.91 15 58.30 56.61 20.81 15.07
GYLAVAVVK 919.13 9 57.18 55.48 21.32 16.75
4 KTYDSYLGDDYVR 1594.70 13 58.35 51.02 20.86 14.53
GYLAVAVVK 919.13 9 57.18 55.48 21.32 16.75
5 HSTVFDNLPNPEDR 1640.73 14 62.52 42.95 21.71 12.39
TGPNLHGLFGR 1168.32 11 61.31 40.43 21.93 13.77
6 TSDANINWNNLK 1389.49 12 65.98 53.40 22.01 15.58
SISIVGSYVGNR 1251.40 12 63.59 51.33 22.29 14.42
7 TSDANINWNNLK 1389.49 12 65.98 53.40 22.01 15.58
GTDVQAWIR 1045.16 9 62.93 53.06 22.44 17.41
8 TSDANINWNNLK 1389.49 12 65.98 53.40 22.01 15.58
LVVSTQTALA 1002.18 10 63.09 71.46 22.48 19.45
9 TSDANINWNNLK 1389.49 12 65.98 53.40 22.01 15.58
LVNELTEFAK 1163.34 10 65.70 65.82 23.38 18.11
10 TYDSYLGDDYVR 1466.52 12 67.51 52.92 22.88 14.94
LVNELTEFAK 1163.34 10 65.70 65.82 23.38 18.11
11 LPLVGGHEGAGVVVGMGENVK 2019.35 21 70.01 76.90 22.90 17.32
LVNELTEFAK 1163.34 10 65.70 65.82 23.38 18.11
12 VLGIDGGEGKEELFR 1618.81 15 68.81 71.03 22.90 18.06
LVNELTEFAK 1163.34 10 65.70 65.82 23.38 18.11
13 AISNNEADAVTLDGGLVYEAGLKPNNLKPVVAEF�HGTK
3953.42 38 87.26 98.60 25.81 19.77
GEADAMSLDGGYLYIAGK 1831.03 18 86.62 95.77 26.38 21.63
14 AISNNEADAVTLDGGLVYEAGLKPNNLKPVVAEF�HGTK
3953.42 38 87.26 98.60 25.81 19.77
IVSDGNGMNAWVAWR 1675.88 15 85.96 99.75 26.53 24.07
15 SANLMAGHWVAISGAAGGLGSLAVQYAK 2701.10 28 98.66 111.64 28.55 22.77
AIQAAFFYLEPR 1425.65 12 97.48 109.28 28.76 25.66
16 SANLMAGHWVAISGAAGGLGSLAVQYAK 2701.10 28 98.66 111.64 28.55 22.77
TAGWNIPMGLLYSK 1550.84 14 98.37 110.05 29.14 25.04
17 GITWGEETLMEYLENPKK 2138.42 18 99.80 90.26 28.78 20.19
GPTLTEILEGLK 1270.49 12 99.19 86.07 29.04 21.54
18 GITWGEETLMEYLENPKK 2138.42 18 99.80 90.26 28.78 20.19
TAGWNIPMGLLYSK 1550.84 14 98.37 110.05 29.14 25.04
19 EDVIWELLNHAQEHFGK 2065.27 17 101.24 86.51 28.88 20.19
TAGWNIPMGLLYSK 1550.84 14 98.37 110.05 29.14 25.04
Note: Calculation parameters correspond to the experimental conditions used in the study (gradient profile, mobile phase composition, flowrate, column parameters). For the rest of parameters the default values were used, including the dead volume equal to zero.
JOURNAL OF ANALYTICAL CHEMISTRY Vol. 67 No. 13 2012
INVERSION OF CHROMATOGRAPHIC ELUTION ORDERS OF PEPTIDES 1019
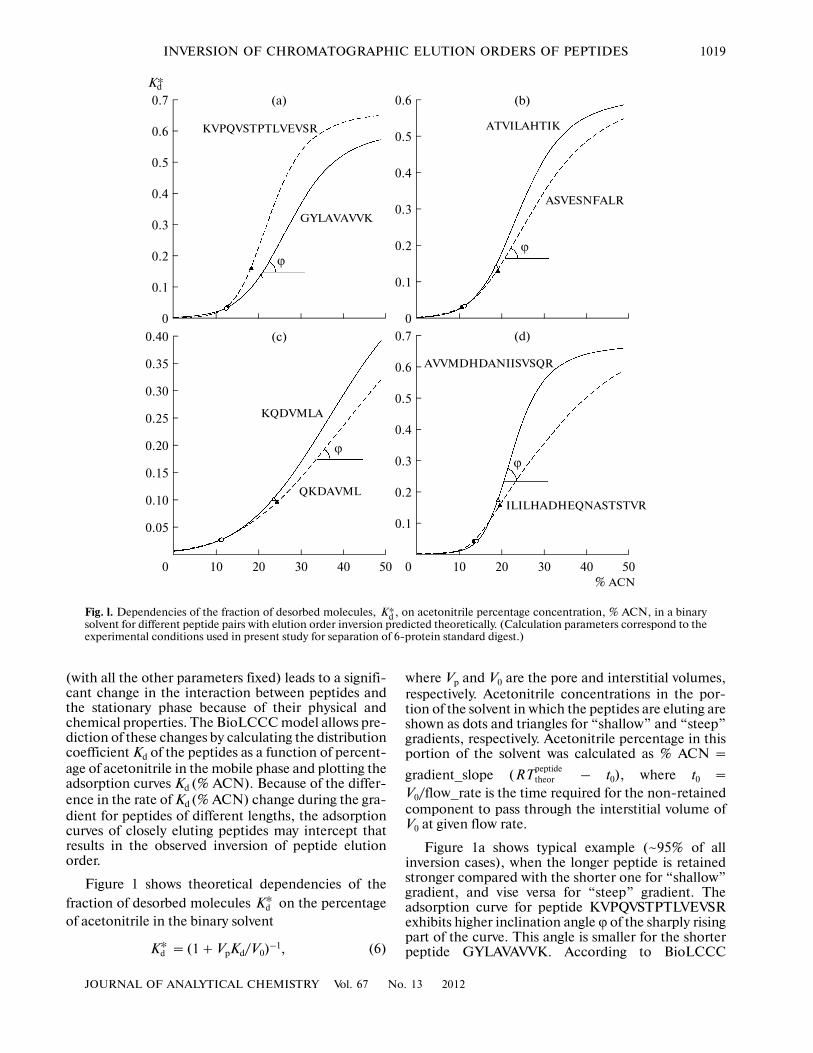
(with all the other parameters fixed) leads to a signifi�cant change in the interaction between peptides andthe stationary phase because of their physical andchemical properties. The BioLCCC model allows pre�diction of these changes by calculating the distributioncoefficient Kd of the peptides as a function of percent�age of acetonitrile in the mobile phase and plotting theadsorption curves Kd (% ACN). Because of the differ�ence in the rate of Kd (% ACN) change during the gra�dient for peptides of different lengths, the adsorptioncurves of closely eluting peptides may intercept thatresults in the observed inversion of peptide elutionorder.
Figure 1 shows theoretical dependencies of thefraction of desorbed molecules on the percentageof acetonitrile in the binary solvent
= (1 + VpKd/V0)–1, (6)
Kd*
Kd*
where Vp and V0 are the pore and interstitial volumes,respectively. Acetonitrile concentrations in the por�tion of the solvent in which the peptides are eluting areshown as dots and triangles for “shallow” and “steep”gradients, respectively. Acetonitrile percentage in thisportion of the solvent was calculated as % ACN =
gradient_slope ( – t0), where t0 =V0/flow_rate is the time required for the non�retainedcomponent to pass through the interstitial volume ofV0 at given flow rate.
Figure 1a shows typical example (~95% of allinversion cases), when the longer peptide is retainedstronger compared with the shorter one for “shallow”gradient, and vise versa for “steep” gradient. Theadsorption curve for peptide KVPQVSTPTLVEVSRexhibits higher inclination angle ϕ of the sharply risingpart of the curve. This angle is smaller for the shorterpeptide GYLAVAVVK. According to BioLCCC
RTtheorpeptide
0.40
0.35
0.30
0.25
0.20
0.15
0.10
0.05
0 50403020
Kd*
10
KQDVMLA
QKDAVML
ϕ
0.7
0.6
0.5
0.4
0.3
0.2
0.1
0
KVPQVSTPTLVEVSR
GYLAVAVVK
ϕ
0.6
0.5
0.4
0.3
0.1
0
ATVILAHTIK
ASVESNFALR
ϕ
0.7
0.6
0.5
0.4
0.3
0.2
0.1
0 5040302010
AVVMDHDANIISVSQR
ILILHADHEQNASTSTVR
ϕ
(c)
(a)
0.2
(b)
(d)
% ACN
Fig. l. Dependencies of the fraction of desorbed molecules, , on acetonitrile percentage concentration, % ACN, in a binarysolvent for different peptide pairs with elution order inversion predicted theoretically. (Calculation parameters correspond to theexperimental conditions used in present study for separation of 6�protein standard digest.)
Kd*

1020
JOURNAL OF ANALYTICAL CHEMISTRY Vol. 67 No. 13 2012
TARASOVA et al.
model the inclination angle ϕ of the adsorption curveis affected not only by peptide length, but also by itsamino acid composition and sequence as shown inFig. 1: Fig. 1b shows dependence of the fraction of
desorbed molecules on acetonitrile concentration
(% ACN) for a pair of peptides having the samesequence lengths but different compositions,ASVESNFALR and ATVILAHTIK; and Fig. 1c dem�onstrates the influence of the sequence on the shape ofthe adsorption curve for the case of two peptides ofthe same composition and length, QKDAVML andKQDVMLA. The example presented in Fig. 1d forpeptide pair ILILHADHEQNASTSTVR/AVVM�DHDANIISVSQR shows further that BioLCCCmodel may predict a number of cases when the longerpeptide is eluting earlier than the shorter peptide in the“shallow” gradient followed by elution order inversionwhen “steep” gradient is applied.
Therefore, the examples shown in Figs. 1c⎯1ddemonstrate that BioLCCC model accounts for inver�sion of elution order for all types of “exceptions” whenthe shorter or the lighter peptide is eluted first in the“steep” gradients. These “exceptions” comprised 4.0to 4.5% of all peptide pairs changing the elution order.
Kd*
The Scale of Inversion Phenomenon in Proteomic Studies
When different experimental datasets obtainedunder different HPLC conditions are compared, thescale of the inversion phenomenon and the subsequentinformation losses have to be estimated. Specifically,the following problems have to be addressed: (1)dependence of the number of inverting peptides on thecomposition and size of the peptide dataset; (2) rangeof the changes in the gradient profiles that leads to anumber of inversions significant enough to affect thecomparison of different chromatography datasets;and, finally; (3) a possibility for evaluation of the num�ber of peptide pairs that change the elution orderdepending on the HPLC conditions using retentiontime prediction.
Table 3 presents the results of analysis of our ownand literature data [14] that address the above prob�lems. It shows that with increasing number of peptidesin the dataset the number of peptide pairs with invert�ing elution order also increases up to 90% of the totalnumber of peptides in the set. It is interesting to notethat for all HPLC conditions used the number of pep�tides involved in inversions when gradient changesexceeded 50% of the total. Consider further thedependence of the number of inverting pairs. Expect�
Table 3. Results of the data processing of different experimental datasets, which demonstrate the dependence of the numberof inverted peptide pairs on the total number of peptides in the dataset and a change in gradient slopes. Results of predictionof peptide elution order inversions and the direction of the corresponding LC peak shifts are presented. Peak shifts werepredicted using both the BioLCCC and SSSRCalc models
SampleNumber
of peptides
Gradient change, % ACN/min
Number of inverted
peptide pairs, experiment*
Fraction of peptides from
the dataset which
changed/ unchanged the elution order,
%
Peak shift, BioLCCC,
matches with the
experiment, %
Peak shift, SSSRCalc,
matches with the
experiment, %
Prediction of the inver�
sion, BioLCCC,
matches with the
experiment, %
6�Protein standard digest, Dionex, USA
47 0.23 1.3 19 53.2/46.8 94.7 88.9 47.4
Literature dataset no. 1, “test peptide mixture”
247 0.375 0.75 151 56.3/43.7 92.7 100.0 13.3
0.187 0.375 269 71.3/28.7 91.1 99.3 11.2
0.187 0.75 567 85.4/14.6 90.7 99.6 23.8
Literature dataset no. 2, Clostridium Thermocellum
504 0.375 0.75 318 54.6/45.4 97.5 99.7 8.2
0.187 0.375 627 81.7/18.3 95.1 97.6 11.3
0.187 0.75 1392 93.1/6.9 94.9 98.4 22.2
* During the processing of the experimental data the number of inverted peptide pairs was counted for peptide pairs which were displaced fromeach other by more than 0.2 min.

JOURNAL OF ANALYTICAL CHEMISTRY Vol. 67 No. 13 2012
INVERSION OF CHROMATOGRAPHIC ELUTION ORDERS OF PEPTIDES 1021
edly, the highest number of these pairs corresponds toa change from the “steepest” to the most “shallow”gradient. However, a transition between two “shallow”gradients, e.g. 0.1875 0.375% ACN/min, resultsin twice larger number of inversions compared withtransition 0.375 0.75 ACN/min. The percentageof acetonitrile in the peptide elution fraction was cal�culated as discussed before: % ACN =
gradient_slope( – t0). The above results provethat even small variations in the gradient slopes resultin significant number of elution order inversions incase of the “shallow” gradients (<0.4% ACN/min).
The error arising when two distinct chromato�graphic datasets are linearly converted to each otherfor standardization purposes was estimated for the lit�erature dataset no. 2 [14] consisting of 504 peptides.Changing the gradient slope from 0.187% ACN/minto 0.75% ACN/min that results in the largest numberof peptide pairs experiencing inversion was consid�ered. To determine the coefficients of the linear con�version, an arbitrary subset of peptides covering thewhole scale of retention times with an approx. 2 mininterval was chosen. The subset consisted of 22 pep�tides for which the correlation between the experi�mental retention times corresponding to 0.187%ACN/min and the 0.75% ACN/min slopes was plot�ted. This correlation was then fitted to a linear func�tion. The coefficients of this linear correlation werefurther used to convert all retention times correspond�ing to “shallow” gradient into timescale of the “steep”gradient. As a result of this conversion, the mean aver�age error in the “steep” gradient was estimated to be0.3 min. However, retention times of 44% of the pep�tides from dataset no. 2 deviated by more than0.3 min, and 19% of all peptides exhibited larger than0.5 min deviation after conversion. Therefore, if oneconsiders identifications with retention time devia�tions from the database time tags within a peak widthas correct identifications, this results in the “loss” ofup to 20% of identifications obtained using AMTapproach due to inversion.
The above analysis has shown that inversion of pep�tide elution order occurs frequently even for the smallvariations in the gradient slopes. This leads to signifi�cant errors when different chromatography data arecompared calling for the evaluation of the scale ofinversion phenomenon for a given range of separationconditions.
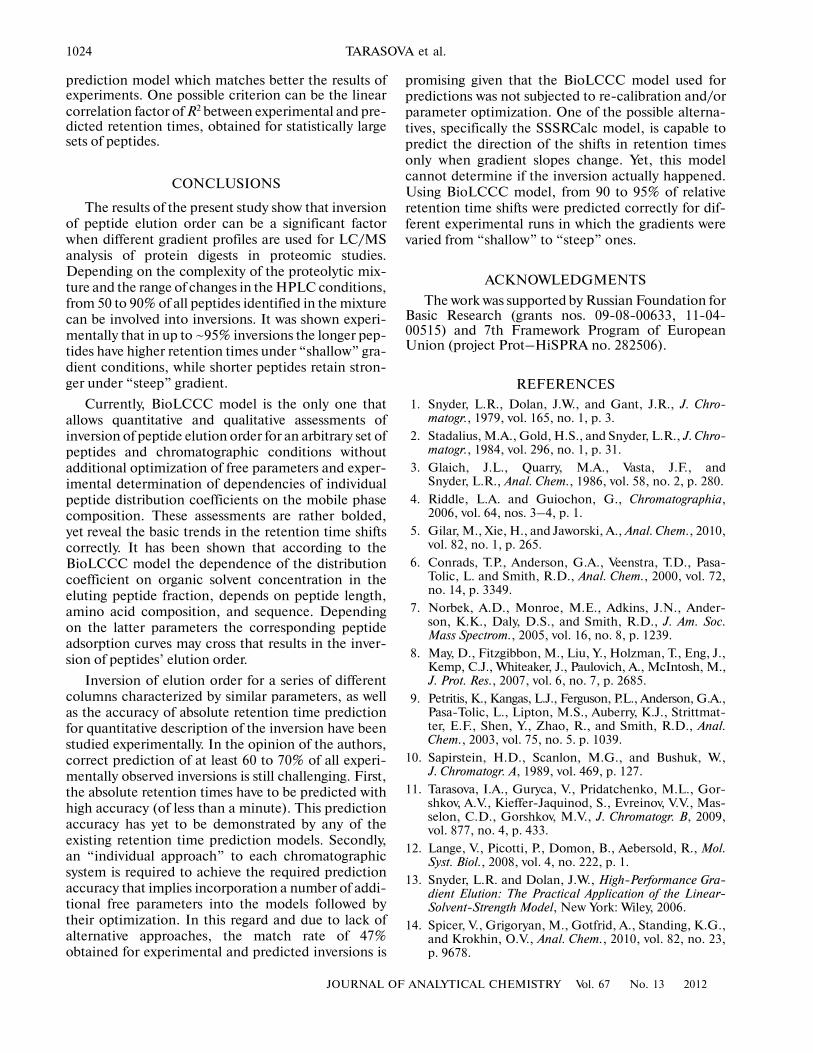
Figure 2 presents the results of prediction of thenumber of inverting peptide pairs and its dependenceon both the number of peptides in the dataset (Fig. 2a)and the change in gradient slope (Fig. 2b). SwedCADannotated database, an open database of collision�induced dissociation mass spectra of tryptic peptides[26], was used to compile the peptide sets for inversionanalysis. The database comprises 15897 differentamino acid sequences, which allowed varying the sizeand composition of peptide sets in a wide range. As
RTtheorpeptide
can be seen from the figures, comparison of predictedand experimental results has shown that BioLCCCmodel overestimates the number of inverting pairs.Yet, the model correctly predicts the observed trends,
18000
16000
14000
10000
8000
6000
4000
2000
0 1000800600400200Npep
(a)
12000
3000
2500
1500
1000
500
0 2.01.51.00.5
Δψ, % ACN/min
(b)
2000
Npairs
Fig. 2. Dependence of the number of inverted peptidepairs, Npairs, on the size of peptide dataset, Npep, and onthe change in gradient slope Δψ. Dotted line denotes thetheoretical evaluations of the rate of the increase in thenumber of peptide pairs with inverted elution orders:(a) datasets of different compositions and sizes under thechange in gradient from 0.187 to 0.75% ACN/min;(b) datasets of fixed sizes (250 peptides) and differed pep�tide compositions, under the change in gradient slope from0.1% ACN/min to “steeper” slopes. �—experimentalpoints, obtained for 6�protein standard digest and litera�ture data (Table 3); �—theoretical estimations of thenumber of inverted peptide pairs for available experimentaldata; and, � and �—experimental points, obtained for lit�erature datasets nos. 1 and 2 (Table 3), respectively. “Out�laying” experimental points correspond to 0.375 0.75% ACN/min change in the gradient slope.

1022
JOURNAL OF ANALYTICAL CHEMISTRY Vol. 67 No. 13 2012
TARASOVA et al.
and the calculation results could be used as an upperestimate of the expected number of elution orderinversions of peptides for given separation conditions.
Prediction of the Chromatographic Peak Shiftsfor Different Separation Conditions
Table 3 (columns 6, 7) shows the percentage ofmatches between predicted direction of the chromato�graphic peak shifts and experimental values for differ�ent gradient slopes. Experimental and predicted (byBioLCCC model) shifts were calculated using Eq. (3).When SSSRCalc model is employed for comparison,the theoretical shift was estimated using Eq. (2), inwhich the slope values S were calculated using on�lineslope calculator (http://hs4.proteome.ca/SSRCalc/Slope/). In these calculations, positive values of theshift indicate that the peaks are closing to eachother or their complete inversion. As seen in Table 3,BioLCCC model correctly predicts the direction ofpeak shift for up to 94% of all observed inversions forboth our own and literature experimental data. Theresults presented show that the accuracy of BioLCCCmodel is comparable to that of SSSRCalc predictions.It should also be noted that BioLCCC model is appli�cable to peptides of any type and thus has less limita�tions compared to SSSRCalc calculator which isdeveloped for tryptic peptides only. Thus, whenS coefficients from experimental data for 6�proteinstandard were calculated using SSSRCalc, the pairwith non�tryptic peptides was excluded (pair no. 8,Table 2).
The Problem of Quantitative Prediction of Inversion of Peptide Elution Order when the Gradient
Slope Changes
Table 3, column 8, shows the results of predictionof peptide elution order inversion by BioLCCC modeland the comparison of predictions with experimentaldata. For experimental data obtained in present study,we were able to correctly predict 47% of inversions.For literature data, this number dropped from 8 to23% depending on the range of the gradient slopechanges. These results were obtained under theassumption that the distance between the invertingpeaks should be more than 0.2 min for both gradientsto call it an inversion. When loosing this requirement,the prediction accuracy for the literature dataincreased. For example, for datasets nos. 1 and 2(Table 3) the highest match rates were observed forassumption about the distances between invertedpeaks exceeding 1 min and were 43.6 and 34.4%,respectively. This fact could indicate that BioLCCCmodel is not able to predict absolute retention timesaccurately enough to achieve higher match rate forelution order inversions observed in experiments.The correlation coefficient R2 between arbitrarysets of experimentally determined and predicted by
BioLCCC retention times varied from 0.87 to 0.93.These values correspond to an absolute error of severalminutes for separation conditions typical for pro�teomic studies, whereas the inversion occurs typicallywithin much smaller time ranges. For example, for theliterature dataset no. 1 the 0.2 min limit for the dis�tance between inverted peaks gives the number ofinverting pairs of 567 (gradient slope was changedfrom 0.187 to 0.75% ACN/min), that reduced to 55when this limit was set to 1 min. No inverting pairswere observed for 6�protein digest when the limit wasset to 0.7 min or higher. Therefore, to better accountfor inversion of peptide elution order, sub�minuteaccuracy of absolute retention time prediction isrequired. Yet, even such a high prediction accuracydoes not warrant prediction of all inversions. The mostaccurate algorithms of peptide retention time predic�tion allow correlation between predicted and experi�mental retention times with R2 of 0.97–0.98. Thisaccuracy corresponds to the error of 1.5% [27] or1 min [28]. However, these algorithms do not predictthe existence of the inversion phenomenon when thegradient profiles change.
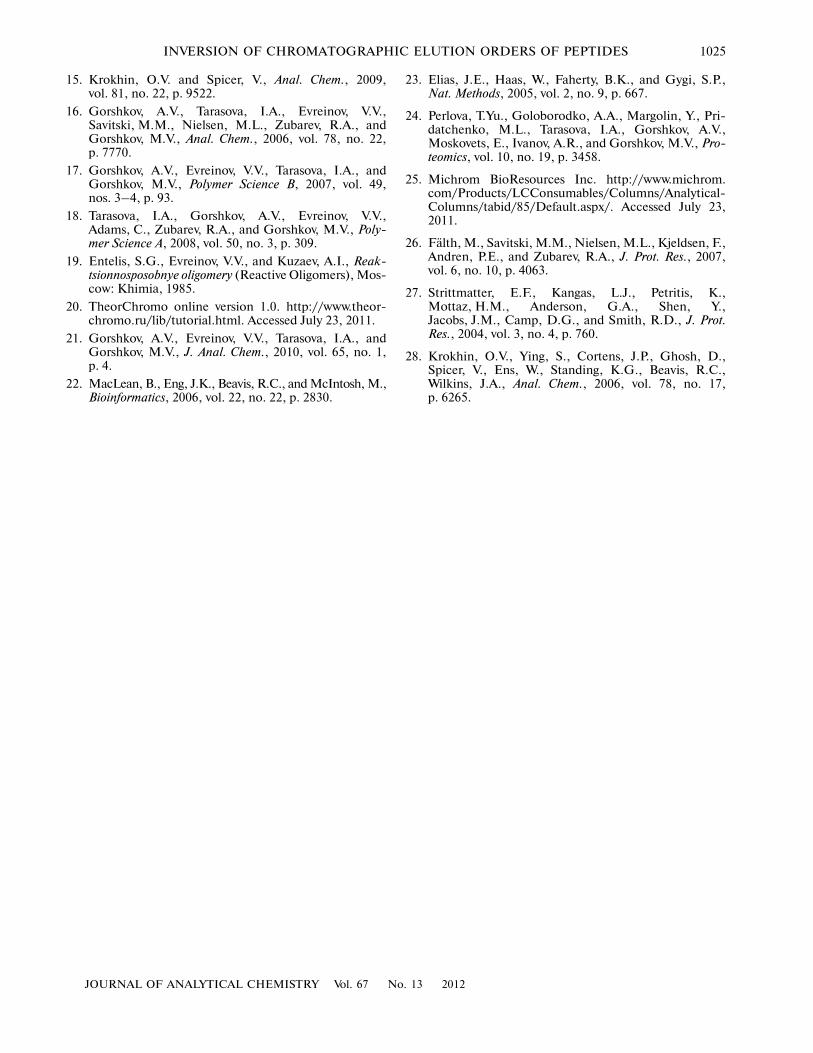
There is another factor affecting the accuracy ofinversion prediction. Figure 3 shows chromatogramsof inverting peptide pair from cytochrome c digest,obtained using six different reversed�phase C18 col�umns. Despite the fact that column properties differ ina narrow range, inversion of elution order under iden�tical changes in gradient slope may not be observed forthe same peptide pair. Specifically, complete inversionwas observed for two columns only, while the peptideswere either co�eluted, or their elution order was notchanged for the other columns. These results werereproduced in a series of control experiments. The lat�ter means that the observed differences in separationare related to the differences in specific column prop�erties. Taking this into account is challanging since theadsorption properties of the columns may depend onthe manufacturer or the stationary phase material (e.g.monolith and silica, as in the above example). Thesolution of this problem is seen in the “individualiza�tion” of each chromatographic system and incorpora�tion of the additional free parameters into the predic�tion model to increase its accuracy. This is followed byoptimization of these free parameters for each chro�matographic system.
BioLCCC theory does not have free, non�phe�nomenological parameters, and retention times arederived from the distribution coefficient calculatedfrom the first principles of statistical physics. As wasdiscussed in the introduction, the theory implementstwo approaches for distribution coefficient calcula�tions: free�walk chain model and rigid rod model.These approaches are based on different assumptionson the flexibility of a biomolecule. The phenomeno�logical parameters (amino acid adsorption energies)are also different and were determined for significantlydifferent separation conditions including: ion�pairing

JOURNAL OF ANALYTICAL CHEMISTRY Vol. 67 No. 13 2012
INVERSION OF CHROMATOGRAPHIC ELUTION ORDERS OF PEPTIDES 1023
reagents (trifluoroacetic acid and formic acid for freechain and rigid rod models, respectively); binary sol�vent compositions; and column types (http://www.theorchromo.ru/help/). This results in signifi�cant deviations between the results of prediction asshown in Table 1. Different models used for calcula�tion of Kd yield sometimes contradicting resultsfor the inversion of elution order of MIFAGIK andTGPNLHGLFGR peptide pair from cytochrome c
digest. The results agree for the column with the poresize of 30 nm only. Not surprisingly, the predictionsmade by these two BioLCCC models for the experi�mental data are matched in about half of all inversions.
The contribution of each of the mentioned factors(model of the molecule flexibility, ion�pairing reagent,column type, etc.) into retention time prediction usingBioLCCC model requires further evaluation. There�fore, it is reasonable to pick the specific BioLCCC
40
1008060
20
0 14012080604020 100
MIFAGIK
TGPNLHGLFGR61.36
40
1008060
200
110100706020 5030 90
MIFAGIK
TGPNLHGLFGR
66.60
403628242016 32
MIFAGIK
TGPNLHGLFGR
26.74
40 80
+
40
1008060
200
110100706020 5030 90
MIFAGIK
TGPNLHGLFGR
63.02
40 80
40
1008060
200
110100706020 5030 90
MIFAGIK
TGPNLHGLFGR
76.68
40 80
40
1008060
200
110100706020 5030 90
MIFAGIK
TGPNLHGLFGR
62.15
40 80
40
1008060
200
100706030 50 90
MIFAGIK
TGPNLHGLFGR
67.35
40 80
67.32
72.91
60.95
66.61
+
383628242016 32
MIFAGIK
TGPNLHGLFGR
27.63
28.14
30262218 34
3836282420 32
MIFAGIK
TGPNLHGLFGR
28.38
28.15
30262218 34
36282420 32
MIFAGIK
TGPNLHGLFGR
29.05
16
+
35251510 30
MIFAGIK
TGPNLHGLFGR
21.86
5 4020
22.08
342618 30
MIFAGIK
TGPNLHGLFGR
26.97
14 3822
27.38
Inte
nsi
ty,
rel.
un
its
Time, min
Co
lum
n 1
0
MIFAGIK
63.02
67.32
Co
lum
n 2
Co
lum
n 3
Co
lum
n 4
Co
lum
n 5
Co
lum
n 6
Gradient 1.3% ACN/minGradient 0.23% ACN/min
Fig. 3. Dependence of the occurrence rate of elution order inversion on chromatographic column parameters. Chromatogramswere obtained for MIFAGIK and TGPNLHGLFGR peptides from cytochrome c protein when the gradient slope was changedfrom 0.23% ACN/min to 1.3% ACN/min.
65.13
1024
JOURNAL OF ANALYTICAL CHEMISTRY Vol. 67 No. 13 2012
TARASOVA et al.
prediction model which matches better the results ofexperiments. One possible criterion can be the linearcorrelation factor of R2 between experimental and pre�dicted retention times, obtained for statistically largesets of peptides.
CONCLUSIONS
The results of the present study show that inversionof peptide elution order can be a significant factorwhen different gradient profiles are used for LC/MSanalysis of protein digests in proteomic studies.Depending on the complexity of the proteolytic mix�ture and the range of changes in the HPLC conditions,from 50 to 90% of all peptides identified in the mixturecan be involved into inversions. It was shown experi�mentally that in up to ~95% inversions the longer pep�tides have higher retention times under “shallow” gra�dient conditions, while shorter peptides retain stron�ger under “steep” gradient.
Currently, BioLCCC model is the only one thatallows quantitative and qualitative assessments ofinversion of peptide elution order for an arbitrary set ofpeptides and chromatographic conditions withoutadditional optimization of free parameters and exper�imental determination of dependencies of individualpeptide distribution coefficients on the mobile phasecomposition. These assessments are rather bolded,yet reveal the basic trends in the retention time shiftscorrectly. It has been shown that according to theBioLCCC model the dependence of the distributioncoefficient on organic solvent concentration in theeluting peptide fraction, depends on peptide length,amino acid composition, and sequence. Dependingon the latter parameters the corresponding peptideadsorption curves may cross that results in the inver�sion of peptides’ elution order.
Inversion of elution order for a series of differentcolumns characterized by similar parameters, as wellas the accuracy of absolute retention time predictionfor quantitative description of the inversion have beenstudied experimentally. In the opinion of the authors,correct prediction of at least 60 to 70% of all experi�mentally observed inversions is still challenging. First,the absolute retention times have to be predicted withhigh accuracy (of less than a minute). This predictionaccuracy has yet to be demonstrated by any of theexisting retention time prediction models. Secondly,an “individual approach” to each chromatographicsystem is required to achieve the required predictionaccuracy that implies incorporation a number of addi�tional free parameters into the models followed bytheir optimization. In this regard and due to lack ofalternative approaches, the match rate of 47%obtained for experimental and predicted inversions is
promising given that the BioLCCC model used forpredictions was not subjected to re�calibration and/orparameter optimization. One of the possible alterna�tives, specifically the SSSRCalc model, is capable topredict the direction of the shifts in retention timesonly when gradient slopes change. Yet, this modelcannot determine if the inversion actually happened.Using BioLCCC model, from 90 to 95% of relativeretention time shifts were predicted correctly for dif�ferent experimental runs in which the gradients werevaried from “shallow” to “steep” ones.
ACKNOWLEDGMENTS
The work was supported by Russian Foundation forBasic Research (grants nos. 09�08�00633, 11�04�00515) and 7th Framework Program of EuropeanUnion (project Prot–HiSPRA no. 282506).
REFERENCES
1. Snyder, L.R., Dolan, J.W., and Gant, J.R., J. Chro�matogr., 1979, vol. 165, no. 1, p. 3.
2. Stadalius, M.A., Gold, H.S., and Snyder, L.R., J. Chro�matogr., 1984, vol. 296, no. 1, p. 31.
3. Glaich, J.L., Quarry, M.A., Vasta, J.F., andSnyder, L.R., Anal. Chem., 1986, vol. 58, no. 2, p. 280.
4. Riddle, L.A. and Guiochon, G., Chromatographia,2006, vol. 64, nos. 3–4, p. 1.
5. Gilar, M., Xie, H., and Jaworski, A., Anal. Chem., 2010,vol. 82, no. 1, p. 265.
6. Conrads, T.P., Anderson, G.A., Veenstra, T.D., Pasa�Tolic, L. and Smith, R.D., Anal. Chem., 2000, vol. 72,no. 14, p. 3349.
7. Norbek, A.D., Monroe, M.E., Adkins, J.N., Ander�son, K.K., Daly, D.S., and Smith, R.D., J. Am. Soc.Mass Spectrom., 2005, vol. 16, no. 8, p. 1239.
8. May, D., Fitzgibbon, M., Liu, Y., Holzman, T., Eng, J.,Kemp, C.J., Whiteaker, J., Paulovich, A., McIntosh, M.,J. Prot. Res., 2007, vol. 6, no. 7, p. 2685.
9. Petritis, K., Kangas, L.J., Ferguson, P.L., Anderson, G.A.,Pasa�Tolic, L., Lipton, M.S., Auberry, K.J., Strittmat�ter, E.F., Shen, Y., Zhao, R., and Smith, R.D., Anal.Chem., 2003, vol. 75, no. 5. p. 1039.
10. Sapirstein, H.D., Scanlon, M.G., and Bushuk, W.,J. Chromatogr. A, 1989, vol. 469, p. 127.
11. Tarasova, I.A., Guryca, V., Pridatchenko, M.L., Gor�shkov, A.V., Kieffer�Jaquinod, S., Evreinov, V.V., Mas�selon, C.D., Gorshkov, M.V., J. Chromatogr. B, 2009,vol. 877, no. 4, p. 433.
12. Lange, V., Picotti, P., Domon, B., Aebersold, R., Mol.Syst. Biol., 2008, vol. 4, no. 222, p. 1.
13. Snyder, L.R. and Dolan, J.W., High�Performance Gra�dient Elution: The Practical Application of the Linear�Solvent�Strength Model, New York: Wiley, 2006.
14. Spicer, V., Grigoryan, M., Gotfrid, A., Standing, K.G.,and Krokhin, O.V., Anal. Chem., 2010, vol. 82, no. 23,p. 9678.
JOURNAL OF ANALYTICAL CHEMISTRY Vol. 67 No. 13 2012
INVERSION OF CHROMATOGRAPHIC ELUTION ORDERS OF PEPTIDES 1025
15. Krokhin, O.V. and Spicer, V., Anal. Chem., 2009,vol. 81, no. 22, p. 9522.
16. Gorshkov, A.V., Tarasova, I.A., Evreinov, V.V.,Savitski, M.M., Nielsen, M.L., Zubarev, R.A., andGorshkov, M.V., Anal. Chem., 2006, vol. 78, no. 22,p. 7770.
17. Gorshkov, A.V., Evreinov, V.V., Tarasova, I.A., andGorshkov, M.V., Polymer Science B, 2007, vol. 49,nos. 3–4, p. 93.
18. Tarasova, I.A., Gorshkov, A.V., Evreinov, V.V.,Adams, C., Zubarev, R.A., and Gorshkov, M.V., Poly�mer Science A, 2008, vol. 50, no. 3, p. 309.
19. Entelis, S.G., Evreinov, V.V., and Kuzaev, A.I., Reak�tsionnosposobnye oligomery (Reactive Oligomers), Mos�cow: Khimia, 1985.
20. TheorChromo online version 1.0. http://www.theor�chromo.ru/lib/tutorial.html. Accessed July 23, 2011.
21. Gorshkov, A.V., Evreinov, V.V., Tarasova, I.A., andGorshkov, M.V., J. Anal. Chem., 2010, vol. 65, no. 1,p. 4.
22. MacLean, B., Eng, J.K., Beavis, R.C., and McIntosh, M.,Bioinformatics, 2006, vol. 22, no. 22, p. 2830.
23. Elias, J.E., Haas, W., Faherty, B.K., and Gygi, S.P.,Nat. Methods, 2005, vol. 2, no. 9, p. 667.
24. Perlova, T.Yu., Goloborodko, A.A., Margolin, Y., Pri�datchenko, M.L., Tarasova, I.A., Gorshkov, A.V.,Moskovets, E., Ivanov, A.R., and Gorshkov, M.V., Pro�teomics, vol. 10, no. 19, p. 3458.
25. Michrom BioResources Inc. http://www.michrom.com/Products/LCConsumables/Columns/Analytical�Columns/tabid/85/Default.aspx/. Accessed July 23,2011.
26. Fälth, M., Savitski, M.M., Nielsen, M.L., Kjeldsen, F.,Andren, P.E., and Zubarev, R.A., J. Prot. Res., 2007,vol. 6, no. 10, p. 4063.
27. Strittmatter, E.F., Kangas, L.J., Petritis, K.,Mottaz, H.M., Anderson, G.A., Shen, Y.,Jacobs, J.M., Camp, D.G., and Smith, R.D., J. Prot.Res., 2004, vol. 3, no. 4, p. 760.
28. Krokhin, O.V., Ying, S., Cortens, J.P., Ghosh, D.,Spicer, V., Ens, W., Standing, K.G., Beavis, R.C.,Wilkins, J.A., Anal. Chem., 2006, vol. 78, no. 17,p. 6265.
Copyright © 2022 FDOKUMEN