B. I Board Orders - Newfoundland Power
579
POWER A FORTIS COMPANY DELIVERED BY HAND June 23,20 15 Board of Commissioners of Public Utilities P.O. Box 21040 1 20 Torbay Road St. John 's, NL AlA 5B2 Attention: G. Cheryl Blundon Director of Corporate Services and Board Secretary Ladies and Gentlemen: Re: Newfoundland Power's 2016 Capital Budget Application A. 2016 Capital Budget Application Newfoundland Power Inc. 55 Kenmount Road P.O. Box 8910 St. John's, NL A 1B 3P6 Business: (709) 737-5600 Facsimile: (709) 737-2974 www .newfoundlandpower.com Enclosed are the ori gi nal and 12 copies ofNewfoundland Power Inc.'s (the " Company") 2016 Capital Budget Application and supporting materials (the "Filing"). The Filing outlines a proposed 2016 Capital Budget totaling $107,028,000. Included in that tot al are 2016 capital expenditures of$19,609,000 previously approved in Order No . P.U. 40(2014) (the "2 015 Capital Order " ). Those previously approved expenditures relate to multi-year projects proposed in the 20 15 Capital Budget Application. The Filing also outlines multi-year projects commencing in 2016 that include proposed 2017 capital expen ditures totali ng $4,957,000. In addition, the Filing seeks approval of a 2014 rate base in the amount of $964,930,000. B. Compliance Matters B. I Board Orders In the 2015 Capital Order, the Board required a progress report on 2015 capital expenditures to be provided with the Filing. In Order No. P.U. 35(2003) (the "2004 Capital Order"), the Board required a 5-year capital plan to be provided with the Filing. In Order No. P.U. 19(2003) (the ''2003 Rate Order "), the Board required that evidence relating to deferred charges and a reconciliation of average rate base to invested capital be filed with capital budget applications. These requirements are specifically addressed in the Filing in the following: 1. 2015 Capital Expenditure Status Report: this meets the requirements of the 2015 Capital Order ; Telephone: (709) 737-5609 Email: ghayes@newfoundlandpower. com Fax : (709) 737-2974
-
Upload
khangminh22 -
Category
Documents
-
view
0 -
download
0
Transcript of B. I Board Orders - Newfoundland Power

NEWFOUNDLAND~
POWER A FORTIS COMPANY
DELIVERED BY HAND
June 23,2015
Board of Commissioners of Public Utilities
P.O. Box 21040 120 Torbay Road St. John 's, NL AlA 5B2
Attention: G. Cheryl Blundon Director of Corporate Services
and Board Secretary
Ladies and Gentlemen:
Re: Newfoundland Power's 2016 Capital Budget Application
A. 2016 Capital Budget Application
Newfoundland Power Inc.
55 Kenmount Road P.O. Box 8910 St. John's, NL A 1 B 3P6 Business: (709) 737-5600 Facsimile: (709) 737-2974 www .newfoundlandpower.com
Enclosed are the original and 12 copies ofNewfoundland Power Inc.'s (the "Company") 2016 Capita l Budget Application and supporting materials (the "Filing").
The Filing outlines a proposed 2016 Capital Budget totaling $107,028,000. Included in that tota l are 2016 capita l expenditures of$19,609,000 previously approved in Order No. P .U. 40(2014) (the "2015 Capital Order"). Those previously approved expenditures relate to multi-year projects proposed in the 20 15 Capital Budget Application. The Filing also outlines multi-year projects commencing in 2016 that include proposed 2017 capital expenditures totaling $4,957,000. In addition, the Filing seeks approval of a 2014 rate base in the amount of $964,930,000.
B. Compliance Matters
B. I Board Orders
In the 2015 Capital Order, the Board required a progress report on 2015 capital expenditures to be provided with the Filing. In Order No. P.U. 35(2003) (the "2004 Capita l Order"), the Board required a 5-year capital plan to be provided with the Fi ling. In Order No. P.U. 19(2003) (the ''2003 Rate Order"), the Board required that evidence relating to deferred charges and a reconciliation of average rate base to invested capital be filed with capital budget applications.
These requirements are specifically addressed in the Filing in the following:
1. 2015 Capital Expenditure Status Report: this meets the requirements of the 2015 Capital Order;
Telephone: (709) 737-5609 Email: ghayes@newfoundlandpower. com Fax: (709) 737-2974

Board of Commissioners of Public Utilities
June 23, 2015 Page 2 of3
2. 2016 Capital Plan: this meets the requirements ofthe 2004 Capital Order; and
3. Rate Base: Additions, Deductions & Allowances: this meets the requirements of the 2003 Rate Order.
B.2 2015 Reporting Commitment
In 2014, as part of its Investigation and Hearing into Supply Issues and Power Outages on the Island Interconnected System, the Board undertook a comprehensive review of the Company's electrical system reliability management practices. Amongst the outcomes of this review were recommendations for the Company made by the Board's consultants, the Liberty Consulting Group, in its December 17, 2014 report (the "Liberty Consulting Report") aimed at improving the Company's electrical distribution system reliability and asset management.
In its February 5, 2015 response to the Liberty Consulting Report, the Company indicated it would assess those recommendations and incorporate the assessment as part of the Company's continuing reporting to the Board commencing with its 2016 Capital Budget Application. The 2015 Distribution Reliability Review included in the Filing provides the Company's initial assessment ofthose recommendations.
B.3 The Guidelines
In the October 2007 Capital Budget Application Guidelines (the "Guidelines"), the Board provided certain directions on how to categorize capital expenditures. Although compliance with the Guidelines necessarily requires the exercise of a degree of judgment, the Filing, in the Company's view, complies with the Guidelines while remaining reasonably consistent and comparable with past filings .
Section 2 of the 2016 Capital Plan provides a breakdown of the overall 20 16 Capital Budget by definition, classification, and materiality segmentation as described in the Guidelines. Pages i through viii of Schedule B to the formal application provide details of these categorizations by project.
C. Filing Details and Circulation
The Filing will be posted on the Company's website (newfoundlandpower.com) in the next few days. Copies of the Filing will be available for review by interested parties at the Company's offices throughout its service territory.
The enclosed material has been provided in binders with appropriate tabbing. For convenience, additional materials such as Responses to Requests for Information will be provided on three-ho le punched paper.
A PDF file of the Filing will be forwarded to the Board in due course.
Telephone: (709) 737-5609 Email: ghayes@newfoundlandpower. com Fax: (709) 737-2974

Board of Commissioners of Public Utilities
June 23 , 2015 Page 3 of3
A copy of the Fi ling has been forwarded directly to Mr. Geoffrey Young, Senior Legal Counsel of Newfoundland and Labrador Hydro and Mr. Thomas Johnson, the Consumer Advocate.
D. Concluding
We trust the foregoing and enclosed are found to be in order.
If you have any questions on the Filing, please contact us at your convenience.
Yours very truly,
~~~'-Senior Counsel
Enclosures
c. Geoffrey Young Newfoundland and Labrador Hydro
Thomas Johnson, QC O'Dea Earle Law Offices
Telephone: (709) 737-5609 Email: ghayes@newfoundlandpower. com Fax: (709) 737-2974

Newfoundland Power Inc. 2016 Capital Budget Application
Filing Contents
Application Application
Schedule A 2016 Capital Budget Summary Schedule B 2016 Capital Projects Summary Schedule C Multi-Year Projects Schedule D Computation of Average Rate Base
2016 Capital Plan 2015 Distribution Reliability Review 2015 Capital Expenditure Status Report
Supporting Materials Generation 1.1 2016 Facility Rehabilitation 1.2 Public Safety Around Dams 1.3 Pierre’s Brook Hydro Plant Refurbishment Substations 2.1 2016 Substation Refurbishment and Modernization 2.2 2016 Additions Due to Load Growth Transmission 3.1 2016 Transmission Line Rebuild Distribution 4.1 Distribution Reliability Initiative 4.2 Feeder Additions for Load Growth 4.3 Vault Refurbishment and Modernization 4.4 2016 Metering Strategy 4.5 St. John’s Main Waterford River Ductbank Replacement 4.6 King’s Bridge Substation Distribution Feeder Refurbishment Transportation 5.1 Vehicle Replacement Criteria Information Systems 6.1 2016 Application Enhancements 6.2 2016 System Upgrades 6.3 2016 Shared Server Infrastructure 6.4 Outage Management System Replacement Telecommunications 7.1 2016 Fibre Optic Cable Builds Deferred Charges 8.1 Rate Base: Additions, Deductions & Allowances

IN THE MATTER OF the Public Utilities Act, (the "Act"); and IN THE MATTER OF capital expenditures and rate base of Newfoundland Power Inc.; and IN THE MATTER OF an application by Newfoundland Power Inc. for an order pursuant to Sections 41 and 78 of the Act: (a) approving a 2016 Capital Budget of $107,028,000; (b) approving certain capital expenditures related to multi-year projects commencing in 2016; and (c) fixing and determining a 2014 rate base of $964,930,000
2016 Capital Budget Application

IN THE MATTER OF the Public Utilities Act, (the "Act"); and IN THE MATTER OF capital expenditures and rate base of Newfoundland Power Inc.; and IN THE MATTER OF an application by Newfoundland Power Inc. for an order pursuant to Sections 41 and 78 of the Act: (a) approving a 2016 Capital Budget of $107,028,000; (b) approving certain capital expenditures related to multi-year projects commencing in 2016; and (c) fixing and determining a 2014 rate base of $964,930,000 TO: The Board of Commissioners of Public Utilities (the "Board") THE APPLICATION OF Newfoundland Power Inc. (“Newfoundland Power”) SAYS THAT: 1. Newfoundland Power is a corporation duly organized and existing under the laws of the
Province of Newfoundland and Labrador, is a public utility within the meaning of the Act, and is subject to the provisions of the Electrical Power Control Act, 1994.
2. Schedule A to this Application is a summary of Newfoundland Power’s 2016 Capital
Budget in the amount of $107,028,000, which includes forecast 2016 capital expenditures previously approved in Order No. P.U. 40(2014), and also includes an estimated amount of $1,500,000 in contributions in aid of construction that the Applicant intends to demand from its customers in 2016. All contributions to be recovered from customers shall be calculated in a manner approved by the Board.
3. Schedule B to this Application provides detailed descriptions of the projects for which
the proposed capital expenditures included in Newfoundland Power’s 2016 Capital Budget are required.
4. Schedule C to this Application is a listing of multi-year projects including:
(a) ongoing projects for which capital expenditures were approved in Order No. P.U. 40(2014); and
(b) projects which will commence as part of the 2016 Capital Budget but will not
be completed in 2016.
5. The proposed expenditures as set out in Schedules A, B and C to this Application are necessary for Newfoundland Power to continue to provide service and facilities which

2
are reasonably safe and adequate and are just and reasonable as required pursuant to Section 37 ofthe Act.
6. ScheduleD to this Application shows Newfoundland Power's actual average rate base for 2014 of$964,930,000.
7. Communication with respect to this Application should be forwarded to the attention of Liam P. O' Brien and Gerard M. Hayes, Counsel to Newfoundland Power.
8. Newfoundland Power requests that the Board make an Order:
(a) pursuant to Section 41 of the Act, approving Newfoundland Power's 2016 Capital Budget in the amount of$107,028,000 as set out in Schedules A and B to the Application;
(b) pursuant to Section 41 ofthe Act, approving Newfoundland Power's purchase and construction in 2017 of improvements and additions to its property in the amount of$4,957,000, as set out in Schedule C to the Application;
(c) pursuant to Section 78 of the Act, fixing and determining Newfoundland Power's average rate base for 2014 in the amount of $964,930,000 as set out in ScheduleD to the Application.
DATED at St. John's, Newfoundland and Labrador, this 23rd day of June, 2015.
NEWFOUNDLAND POWER INC.
~~~:MHayes Counsel to Newfoundland Power Inc. P.O. Box 8910 55 Kenmount Road St. John's, NL AlB 3P6
Telephone: Telecopier:
(709) 737-5609 (709) 737-2974

IN THE MATTER OF the Public Utilities Act, (the "Act"); and
IN THE MATTER OF capital expenditures and rate base of Newfoundland Power Inc.; and
IN THE MATTER OF an application by Newfoundland Power Inc. for an order pursuant to Sections 41 and 78 ofthe Act: (a) approving a 2016 Capital Budget of
$107,028,000; (b) approving certain capital expenditures related
to multi-year projects commencing in 2016; and (c) fixing and determining a 2014 rate base of
$964,930,000
AFFIDAVIT
I, Gary MutTay of St. John's in the Province of Newfoundland and Labrador, make oath and say as
follows:
1. That I am Vice-President, Engineering and Operations ofNewfoundland Power Inc.
2. To the best of my knowledge, information and belief, all matters, facts and things set out in
this Application are true.
SWORN to before me at St. John's
in the Province ofNewfoundland and
Labrador this 23 rd day of June, 2015:
~t~' Gary Murray

Schedule A 2016 Capital Budget Summary NP 2016 CBA
Newfoundland Power Inc. – 2016 Capital Budget Application Page 1 of 4
2016 CAPITAL BUDGET SUMMARY
Asset Class Budget (000s)
1. Generation - Hydro $ 17,357
2. Generation - Thermal 1,738
3. Substations 17,940
4. Transmission 6,067
5. Distribution 45,055
6. General Property 1,840
7. Transportation 3,258
8. Telecommunications 514
9. Information Systems 8,009
10. Unforeseen Allowance 750
11. General Expenses Capitalized 4,500
Total $ 107,028

Schedule A 2016 Capital Budget Summary NP 2016 CBA
Newfoundland Power Inc. – 2016 Capital Budget Application Page 2 of 4
2016 CAPITAL PROJECTS (BY ASSET CLASS)
Capital Projects Budget (000s) Description1 1. Generation – Hydro Facility Rehabilitation $ 1,462 2 Public Safety Around Dams 883 4 Pierre’s Brook Plant Refurbishment 2 15,012 6 Total Generation – Hydro $ 17,357 2. Generation – Thermal Facility Rehabilitation Thermal $ 238 9 Greenhill Gas Turbine Refurbishment 1,500 11
Total Generation – Thermal $ 1,738 3. Substations Substations Refurbishment and Modernization $ 7,871 14 Replacements Due to In-Service Failures 3,771 17
Additions Due to Load Growth 5,868 19 Substation Feeder Termination 430 21
Total Substations $ 17,940
4. Transmission Transmission Line Rebuild3,4 $ 6,067 24
Total Transmission $ 6,067
1 Project descriptions can be found in Schedule B at the page indicated. 2 Includes $13,530,000 in expenditures approved in Schedule B of Order No. P.U. 40 (2014). 3 Includes the rebuild of 57L (Bay Roberts to Harbour Grace substations) which is a multi-year project included
in Schedule C to this Application. 4 Includes $2,318,000 in expenditures approved in Schedule B of Order No. P.U. 40 (2014).

Schedule A 2016 Capital Budget Summary NP 2016 CBA
Newfoundland Power Inc. – 2016 Capital Budget Application Page 3 of 4
2016 CAPITAL PROJECTS (BY ASSET CLASS)
Capital Projects Budget (000s) Description5 5. Distribution Extensions $ 10,439 28 Meters 4,582 30 Services 3,784 33 Street Lighting 2,245 36 Transformers 5,759 39 Reconstruction 4,599 41 Rebuild Distribution Lines 3,694 43 Relocate/Replace Distribution Lines for Third Parties 2,454 46 Trunk Feeders 1,607 48 Feeder Additions for Growth 1,708 50 Distribution Reliability Initiative 1,463 52 Distribution Feeder Automation 565 54 St. John’s Main Underground Refurbishment6 1,950 56 Allowance for Funds Used During Construction 206 58
Total Distribution $ 45,055 6. General Property Tools and Equipment $ 682 61 Additions to Real Property 434 64 Company Buildings Renovations – Duffy Place 7 724 66
Total General Property $ 1,840 7. Transportation Purchase Vehicles and Aerial Devices $ 3,258 69 Total Transportation $ 3,258
5 Project descriptions can be found in Schedule B at the page indicated. 6 This is a multi-year project, with future commitments identified in Schedule C of this Application. 7 Includes $724,000 in expenditures approved in Schedule B of Order No. P.U. 40 (2014).

Schedule A 2016 Capital Budget Summary NP 2016 CBA
Newfoundland Power Inc. – 2016 Capital Budget Application Page 4 of 4
2016 CAPITAL PROJECTS (BY ASSET CLASS)
Capital Projects Budget (000s) Description8 8. Telecommunications Replace/Upgrade Communications Equipment $ 105 73 Fibre Optic Network $ 409 75 Total Telecommunications $ 514 9. Information Systems Application Enhancements $ 1,143 78 System Upgrades9 1,718 80 Personal Computer Infrastructure 465 82 Shared Server Infrastructure 916 85 Network Infrastructure 294 87 SCADA System Replacement10 2,842 89 Geographic Information System Improvements 482 91 Outage Management System Replacement11 149 93 Total Information Systems $ 8,009 10. Unforeseen Allowance Allowance for Unforeseen Items $ 750 96 Total Unforeseen Allowance $ 750
11. General Expenses Capitalized General Expenses Capitalized $ 4,500 98 Total General Expenses Capitalized $ 4,500
8 Project descriptions can be found in Schedule B at the page indicated. 9 Includes $195,000 in expenditures for the Microsoft Enterprise Agreement approved in Schedule B of Order
No. P.U. 40 (2014). 10 Includes $2,842,000 in expenditures approved in Schedule B of Order No. P.U. 40 (2014). 11 This is a multi-year project, with future commitments identified in Schedule C of this Application.

Schedule B 2016 Capital Projects NP 2016 CBA
Newfoundland Power Inc. – 2016 Capital Budget Application
2016 CAPITAL PROJECTS SUMMARY

Schedule B 2016 Capital Projects NP 2016 CBA
Newfoundland Power Inc. – 2016 Capital Budget Application Page i
2016 Capital Project Summary On October 29, 2007, the Board issued Capital Budget Application Guidelines (the “Guidelines”) to provide direction for utility capital budget applications filed pursuant to section 41 of the Public Utilities Act. The Guidelines provide that utilities present their annual capital budget with sufficient detail for the Board and interested parties to understand the nature, scope and justification for individual expenditures and the capital budget overall. Specifically, the Guidelines require each expenditure to be defined, classified, and segmented in the following manner: 1. Definition of the Capital Expenditure
Capital Expenditures are to be defined as clustered, pooled or other. Clustered expenditures are those which would logically be undertaken together. Pooled expenditures are a series of expenditures which are neither inter-dependant nor related but which nonetheless are logically grouped together. Other expenditures are those which do not fit the definition of clustered or pooled.
2. Classification of the Capital Expenditure
Capital Expenditures are to be classified as mandatory, normal capital or justifiable. Mandatory capital expenditures are those a utility is obliged to carry out as the result of legislation, Board Order, safety issues or risk to the environment. Normal capital expenditures are those that are required based upon identified need or on a historical pattern of repair and replacement. Justifiable capital expenditures are those which are justified upon the positive impact the project will have on the utility’s operations.
3. Segmentation of the Capital Expenditure by Materiality
Capital expenditures are to be segmented by their materiality as follows: • Expenditures under $200,000; • Expenditures between $200,000 and $500,000; and • Expenditures over $500,000
This 2016 Capital Project Summary provides a summary of the planned capital expenditures contained in Newfoundland Power’s (the “Company”) 2016 Capital Budget Application by definition (pages ii to iv), classification (pages v to vi), and segmentation by materiality (pages vii to viii) as required by the Guidelines. In addition, each of the project descriptions in Schedule B indicate the definitions, classifications and forecast costs as provided for in the Guidelines.

Schedule B 2016 Capital Projects NP 2016 CBA
Newfoundland Power Inc. – 2016 Capital Budget Application Page ii
Summary of 2016 Capital Projects by Definition
(000’s)
Clustered $23,551 Page Distribution 3,315
Feeder Additions for Growth 1,708 50 Trunk Feeders 1,607 48
Substations 14,169 Additions Due to Load Growth 5,868 19 Substations Refurbishment & Modernization 7,871 14 Substation Feeder Termination 430 21
Transmission 6,067 Transmission Line Rebuild 6,067 24
Pooled $71,304 Page Distribution 39,790
Distribution Reliability Initiative 1,463 52 Extensions 10,439 28 Meters 4,582 30 Rebuild Distribution Lines 3,694 43 Reconstruction 4,599 41 Relocate/Replace Distribution Lines for Third Parties 2,454 46 Services 3,784 33 Street Lighting 2,245 36 Transformers 5,759 39 AFUDC 206 58 Distribution Feeder Automation 565 54
General Property 1,840 Additions to Real Property 434 64 Tools and Equipment 682 61 Company Building Renovations – Duffy Place 724 66
Generation 17,595 Facility Rehabilitation 1,462 2 Facility Rehabilitation Thermal 238 9 PBK Plant Refurbishment 15,012 6 Public Safety Around Dams 883 4
Information Services 4,536 Application Enhancements 1,143 78 Network Infrastructure 294 87 Personal Computer Infrastructure 465 82 Shared Server Infrastructure 916 85 System Upgrades 1,718 80

Schedule B 2016 Capital Projects NP 2016 CBA
Newfoundland Power Inc. – 2016 Capital Budget Application Page iii
Pooled (continued) Page Substations 3,771
Replacement Due to In-Service Failures 3,771 17 Telecommunications 514
Replace/Upgrade Communications Equipment 105 73 Fibre Optic Network 409 75
Transportation 3,258 Purchase Vehicles and Aerial Devices 3,258 69
Other $12,173 Page
Unforeseen Allowance 750 Allowance for Unforeseen Items 750 96
Distribution 1,950 St. John’s Main Underground Refurbishment 1,950 56
General Expenses Capitalized 4,500 General Expenses Capitalized 4,500 98
Generation 1,500 Greenhill Gas Turbine Refurbishment 1,500 11
Information Services 3,473 SCADA System Replacement 2,842 89 Geographic Information System Improvements 482 91 Outage Management System 149 93
Project Clustering Clustered expenditures are those which would logically be undertaken together. Clustered expenditures are either inter-dependent or related. Inter-dependent items are necessarily linked together, as one item necessarily triggers the other. Related items are not necessarily linked to each other, but are nonetheless logically undertaken together. In 2016, the following projects have expenditures which are clustered:
1. The Trunk Feeders Distribution project involving the replacement of distribution plant underbuilt on poles shared with transmission line 30L has aspects which are clustered with the Transmission Line Rebuild project. Transmission line 30L in St. John’s shares pole line infrastructure with distribution lines from King’s Bridge Substation. The replacement of the transmission pole line infrastructure necessitates the replacement of the distribution plant that shares those same structures. These items are inter-dependent, and are therefore clustered.
2. The Substations Refurbishment and Modernization Substations project has aspects which
are clustered with the Additions Due to Load Growth Substations project. In 2016, additional transformer capacity will be added to Grand Falls and King’s Bridge

Schedule B 2016 Capital Projects NP 2016 CBA
Newfoundland Power Inc. – 2016 Capital Budget Application Page iv
substations to accommodate customer load growth. To coincide with the installation of the necessary power transformers the refurbishment and modernization of these substations is also scheduled for 2016. Completing the capacity addition and refurbishment projects in the same year will minimize the customer service interruptions associated with installing a portable substation and improve productivity by combining project planning and execution for both projects. These projects are related, and are therefore clustered.
3. The Trunk Feeders Distribution project has aspects which are clustered with the
Additions Due to Load Growth and Substation Refurbishment and Modernization Substations projects. In 2016, a new 25 MVA 66/12.5 kV transformer will replace an existing 10 MVA transformer at King’s Bridge Substation under the Additions Due to Load Growth Substations project to accommodate an increase in 12.5 kV load. The voltage conversion of KBR distribution feeders from 4.16 kV to 12.5 kV is being undertaken as a least cost way of refurbishing the existing distribution infrastructure. These items are inter-dependent, and are therefore clustered.
4. The Feeder Additions for Growth Distribution project has aspects which are clustered
with the Substation Feeder Termination Substations project. In 2016, a new distribution feeder will be added to Bayview Substation. The new feeder will be constructed under the Feeder Additions for Growth Distribution project and terminated at Bayview Substation under the Substation Feeder Termination Substations projects. These items are inter-dependent, and are therefore clustered.
5. The Feeder Additions for Growth Distribution project has aspects which are clustered
with the Substation Feeder Termination Substations project. In 2016, a new distribution feeder will be added to Pulpit Rock Substation. The new feeder will be constructed under the Feeder Additions for Growth Distribution project and terminated at Pulpit Rock Substation under the Substation Feeder Termination Substations project. These items are inter-dependent, and are therefore clustered.

Schedule B 2016 Capital Projects NP 2016 CBA
Newfoundland Power Inc. – 2016 Capital Budget Application Page v
Summary of 2016 Capital Projects by Classification
(000’s)
Normal Capital $104,520 Page Unforeseen Allowance 750
Allowance for Unforeseen Items 750 96 Distribution 45,055
AFUDC 206 58 Distribution Feeder Automation 565 54 Distribution Reliability Initiative 1,463 52 Extensions 10,439 28 Feeder Additions for Growth 1,708 50 Meters 4,582 30 Rebuild Distribution Lines 3,694 43 Reconstruction 4,599 41 Relocate/Replace Distribution Lines for Third Parties 2,454 46 Services 3,784 33 St. John’s Main Underground Refurbishment 1,950 56 Street Lighting 2,245 36 Transformers 5,759 39 Trunk Feeders 1,607 48
General Expenses Capitalized 4,500 General Expenses Capitalized 4,500 98
General Property 1,840 Additions to Real Property 434 64 Tools and Equipment 682 61 Company Building Renovations – Duffy Place 724 66
Generation 18,212 Facility Rehabilitation 1,462 2 Facility Rehabilitation Thermal 238 9 PBK Plant Refurbishment 15,012 6 Greenhill Gas Turbine Refurbishment 1,500 11
Information Systems 6,384 Network Infrastructure 294 87 Personal Computer Infrastructure 465 82 Shared Server Infrastructure 916 85 System Upgrades 1,718 80 SCADA System Replacement 2,842 89 Outage Management System 149 93
Substations 17,940 Additions Due to Load Growth 5,868 19 Substations Refurbishment & Modernization 7,871 14 Substation Feeder Termination 430 21 Replacement and In-Service Failures 3,771 17

Schedule B 2016 Capital Projects NP 2016 CBA
Newfoundland Power Inc. – 2016 Capital Budget Application Page vi
Normal Capital (continued) Page Telecommunications 514
Replace/Upgrade Communications Equipment 105 73 Fibre Optic Network 409 75
Transmission 6,067 Transmission Line Rebuild 6,067 24
Transportation 3,258 Purchase Vehicles and Aerial Devices 3,258 69
Justifiable $1,625 Page
Information Systems 1,625 Application Enhancements 1,143 78 Geographic Information System Improvements 482 91
Mandatory $883 Page Generation 883 Public Safety Around Dams 883 4

Schedule B 2016 Capital Projects NP 2016 CBA
Newfoundland Power Inc. – 2016 Capital Budget Application Page vii
Summary of 2016 Capital Projects by Materiality
(000’s)
Large – Greater than $500 $103,816 Page Unforeseen Allowance 750
Allowance for Unforeseen Items 750 96 Distribution 44,849
Distribution Reliability Initiative 1,463 52 Extensions 10,439 28 Meters 4,582 30 Rebuild Distribution Lines 3,694 43 Reconstruction 4,599 41 Relocate/Replace Distribution Lines for Third Parties 2,454 46 Services 3,784 33 St. John’s Main Underground Refurbishment 1,950 56 Street Lighting 2,245 36 Transformers 5,759 39 Feeder Additions for Growth 1,708 50 Trunk Feeders 1,607 48 Distribution Feeder Automation 565 54
General Expenses Capitalized 4,500 General Expenses Capitalized 4,500 98
Generation-Property 1,406 Tools and Equipment 682 61 Company Building Renovations – Duffy Place 724 66
Generation 18,857 Facility Rehabilitation 1,462 2 PBK Plant Refurbishment 15,012 6 Public Safety Around Dams 883 4 Greenhill Gas Turbine Refurbishment 1,500 11
Information Systems 6,619 Application Enhancements 1,143 78 Shared Server Infrastructure 916 85 System Upgrades 1,718 80 SCADA System Replacement 2,842 89
Substations 17,510 Additions Due to Load Growth 5,868 19 Replacement Due to In-Service Failures 3,771 17 Substations Refurbishment & Modernization 7,871 14
Transmission 6,067 Transmission Line Rebuild 6,067 24
Transportation 3,258 Purchase Vehicles and Aerial Devices 3,258 69

Schedule B 2016 Capital Projects NP 2016 CBA
Newfoundland Power Inc. – 2016 Capital Budget Application Page viii
Medium – Between $200 and $500 $2,958 Page Distribution 206
AFUDC 206 58 General Property 434
Additions to Real Property 434 64 Generation 238
Thermal Plant Facility Rehabilitation 238 9 Information Systems 1,241
Network Infrastructure 294 87 Personal Computer Infrastructure 465 82 Geographic Information System Improvements 482 91
Substations 430 Substation Feeder Termination 430 21
Telecommunications 409 Fibre Optic Network 409 75
Small – Under $200 $254 Page
Information Systems 149 Outage Management System 149 93
Telecommunications 105 Replace/Upgrade Communications Equipment 105 73

Schedule B 2016 Capital Projects NP 2016 CBA
Newfoundland Power Inc. – 2016 Capital Budget Application Page 1 of 98
GENERATION - HYDRO

Schedule B 2016 Capital Projects – Normal Capital (Identified Need) NP 2016 CBA
Newfoundland Power Inc. – 2016 Capital Budget Application Page 2 of 98
Project Title: Facility Rehabilitation (Pooled) Project Cost: $1,462,000 Project Description This Generation Hydro project is necessary to improve the efficiency and reliability of various hydro plants or to replace plant components due to in-service failures. This project involves the replacement or rehabilitation of deteriorated plant components that have been identified through routine inspections, operating experience and engineering studies. The 2016 project includes the following items:
• Refurbishment of 2 spillways; • Refurbishment of 2 intake structures; and • Equipment replacements due to in-service failures.
The replacement or rehabilitation of deteriorated components at individual plants is not inter-dependent or related. However, all budget items included in this project are similar in nature and justification, and are therefore pooled for consideration as a single capital project. Details on 2016 proposed expenditures are included in 1.1 2016 Facility Rehabilitation. Justification The Company’s 23 hydroelectric plants range in age from 16 to 115 years old. These facilities provide relatively inexpensive energy to the Island Interconnected System. Maintaining these generating facilities reduces the need for additional, more expensive, generation. Replacement and rehabilitation projects are identified during ongoing inspections and maintenance activities. These projects are necessary for the continued operation of generation facilities in a safe, reliable and environmentally compliant manner. The alternative to maintaining these generation facilities would be to retire them. The Company’s hydro generation facilities produce a combined normal annual production of 430.5 GWh. Replacing the energy produced by these facilities by increasing production at Newfoundland and Labrador Hydro’s Holyrood thermal generation facility would require approximately 683,000 barrels of fuel annually. At an oil price of $73.35 per barrel, this translates into approximately $50 million in annual fuel savings.1 All expenditures on individual hydroelectric plants, such as the replacement of dam structures, runners, or forebays, are justified on the basis of maintaining access to hydroelectric generation at a cost that is lower than the cost of replacement energy.
1 The price forecast per barrel of oil used at Holyrood as per letter regarding Rate Stabilization Plan - Fuel Price
Projection dated April 21, 2015.

Schedule B 2016 Capital Projects – Normal Capital (Identified Need) NP 2016 CBA
Newfoundland Power Inc. – 2016 Capital Budget Application Page 3 of 98
Projected Expenditures Table 1 provides a breakdown of the proposed expenditures for 2016 and a projection of expenditures through 2020.
Table 1 Projected Expenditures
(000s)
Cost Category 2016 2017 2018 - 2020 Total
Material $946 - - - Labour – Internal 203 - - - Labour – Contract - - - - Engineering 186 - - - Other 127 - - - Total $1,462 $1,490 $4,577 $7,529
Costing Methodology Table 2 shows the annual expenditures for this project for the most recent five-year period.
Table 2 Expenditure History
(000s)
Year 2011 2012 2013 2014 2015F Total $1,450 $1,616 $1,449 $1,825 $1,586
The budget estimate for this project is based on engineering estimates for the individual budget items and an assessment of historical expenditures for the remainder. To ensure this project is completed at the lowest possible cost consistent with safe and reliable service, all material and contract labour will be obtained through competitive tendering. Future Commitments This is not a multi-year project.

Schedule B 2016 Capital Projects – Mandatory (Identified Need) NP 2016 CBA
Newfoundland Power Inc. – 2016 Capital Budget Application Page 4 of 98
Project Title: Public Safety Around Dams (Pooled) Project Cost: $883,000 Project Description This project is necessary for the Company to address public safety improvements for dams throughout its various hydroelectric developments over the period from 2015 to 2017. Newfoundland Power has over 150 dam structures throughout its 23 hydroelectric facilities. In 2011, the Canadian Dam Association (“CDA”) published their Guidelines for Public Safety Around Dams.2 These guidelines address the risk of accidents or incidents in which a member of the public is exposed to a hazard created by a hydroelectric development. It is estimated that expenditures of approximately $2.0 million are necessary to implement public safety improvements at the Company’s hydroelectric developments over this period. The Company has completed detailed public safety assessments consistent with the Guidelines for Public Safety Around Dams on developments associated with 14 of its 23 hydroelectric plants.3 Included in this 2016 capital project are expenditures associated with the safety improvements identified for 10 hydroelectric plants. Expenditures in 2017 will be based upon detailed public safety assessments for the remaining 9 hydroelectric plants and presented in the Company’s 2017 Capital Budget Application. Details on the proposed expenditures are included in 1.2 Public Safety Around Dams. Justification The Public Safety Around Dams project is justified on the basis of making reasonable effort to eliminate hazards and minimizes risk that have the potential to threaten the health and safety of employees, contractors and the general public. Although the Company’s dam portfolio consists of small dams, it is recognized that all dams pose a risk to public safety, regardless of size or impoundment. Low head and small dams may be equally or more hazardous than high dams as the hazards may not be as apparent and they may not command the same respect as high dams from the general public.
2 These guidelines are in addition to the CDA Dam Safety Guidelines 2007. Copies of these guidelines can be
ordered online from www.cda.ca. 3 In 2015, public safety improvements are being completed at 4 of the 23 hydroelectric plants.

Schedule B 2016 Capital Projects – Mandatory (Identified Need) NP 2016 CBA
Newfoundland Power Inc. – 2016 Capital Budget Application Page 5 of 98
Projected Expenditures Table 1 provides a breakdown of the proposed expenditures for 2016 and a projection of expenditures through 2020.
Table 1 Projected Expenditures
(000s)
Cost Category 2016 2017 2018 - 2020 Total
Material $706 - - - Labour – Internal 45 - - - Labour – Contract - - - - Engineering 106 - - - Other 26 - - - Total $883 $662 $0 $1,545
Costing Methodology The budget estimate for this project is based on an engineering estimate. Future Commitments This is not a multi-year project. Expenditures for projects in future years will be presented in future Capital Budget Applications.

Schedule B 2016 Capital Projects – Normal Capital (Identified Need) NP 2016 CBA
Newfoundland Power Inc. – 2016 Capital Budget Application Page 6 of 98
Project Title: Pierre’s Brook Plant Refurbishment (Pooled, Multi-year) Project Cost: $15,012,000 Project Description This Generation Hydro project is necessary to complete the life extension of the Pierre’s Brook Hydro Plant. The project involves the replacement of the 2,470 metres long woodstave penstock, refurbishment of the surge tank and the refurbishment of the substation, generator, protection and control equipment and switchgear at Pierre’s Brook Hydro Plant. The existing penstock has been in service since 1965, and requires replacement.4 The surge tank was reconstructed in 1991. Inspections completed in 2013 identified deterioration of the surge tank that requires refurbishment when the penstock is replaced. An engineering assessment of the plant has been conducted and the refurbishment of selected assets is proposed for 2016. The project is a multi-year project and will be executed over 2 years, with the engineering design and procurement work for the penstock and site preparation work, including access roads, approved in the 2015 capital order.5 The installation of the replacement penstock and the refurbishment of the surge tank will take place in 2016. Also in 2016, the refurbishment of the substation, generator, protection and control equipment and switchgear will take place during the outage required to replace the penstock.6 Details on the engineering assessment of the Plant and proposed expenditures associated with the refurbishment of the substation, generator, protection and control equipment and switchgear are included in 1.3 Pierre’s Brook Hydro Plant Refurbishment. Justification The Pierre’s Brook Plant, located on the Avalon Peninsula near the community of Witless Bay, was commissioned in 1931 with a capacity of 4.1 MW. The normal annual production at Pierre’s Brook is 24.4 GWh or 5.7% of the total hydroelectric production of Newfoundland Power. Engineering assessments of the woodstave penstock at this facility have revealed that it has reached the end of its useful life and requires replacement. The surge tank has deficiencies that will be addressed during the same plant outage as the penstock replacement. An engineering assessment of the remaining plant assets has identified refurbishment of the substation, generator, protection and control equipment and switchgear is required. This refurbishment work will also coincide with the replacement of the penstock. 4 The plant was commissioned in 1931 and the original penstock was replaced in 1965. 5 The 2015 capital project to replace the woodstave penstock and refurbish the surge tank was approved in Order
No. P.U. 40 (2014). 6 The estimated expenditure associated with the refurbishment of the substation, generator, protection and control
equipment and switchgear was not included in the approval sought in the 2015 Capital Budget Application, although the estimated expenditure was included in the feasibility analysis completed at that time.

Schedule B 2016 Capital Projects – Normal Capital (Identified Need) NP 2016 CBA
Newfoundland Power Inc. – 2016 Capital Budget Application Page 7 of 98
A present worth feasibility analysis of projected capital and operating expenditures for the Pierre’s Brook Plant has determined the levelized cost of energy from the plant over the next 50 years to be 4.87¢ per kWh, which is less than the cost of replacement energy from other sources such as additional Holyrood thermal generation or the estimated marginal cost of production post completion of the Muskrat Falls Project.7 Projected Expenditures Table 1 provides a breakdown of the proposed expenditures for 2015 and 2016, and a projection of expenditures through 2020.
Table 1 Multi-year Projected Expenditures
(000s)
Cost Category 2015 20168 2017 - 2020 Total
Material $546 $14,256 - $14,802 Labour – Internal 12 211 - 223 Labour – Contract - - - - Engineering 112 305 - 417 Other 80 240 - 320 Total $750 $15,012 - $15,762
Costing Methodology The budget for this project is based on an engineering cost estimate. To ensure this project is completed at the lowest possible cost consistent with safe and reliable service, all material and contract labour will be obtained through competitive tendering. Future Commitments This is a multi-year project which will be completed in 2015 and 2016.
7 The avoided cost of No. 6 fuel at the Holyrood Thermal Generating Station is estimated at 11.6¢ per kWh for
2015. This is based upon a 630 kWh/barrel conversion efficiency and oil price forecast from Hydro of $73.35 per barrel for 2015, as per Newfoundland and Labrador Hydro’s letter regarding Rate Stabilization Plan – Fuel Price Projection dated April 21, 2015. The avoided cost of fuel for the Holyrood 100 MW combustion turbine is 29.0 ¢/kWh as per Hydro’s response to Request for Information GT-NP-NLH-006. Also, an estimate of the marginal cost of production post completion of the Muskrat Falls Project is 5.0 ¢/kWh for energy plus $103/kW for demand starting in 2018, as per Hydro’s response to Request for Information CA-NLH-033 (Revision 1, Hydro’s 2013 Generation Rate Application, December 9, 2014). This marginal cost increases into the future.
8 Includes $13,530,000 to replace penstock and refurbish surge tank approved in P.U. 40(2014).

Schedule B 2016 Capital Projects NP 2016 CBA
Newfoundland Power Inc. – 2016 Capital Budget Application Page 8 of 98
GENERATION - THERMAL

Schedule B 2016 Capital Projects – Normal Capital (Historical Pattern) NP 2016 CBA
Newfoundland Power Inc. – 2016 Capital Budget Application Page 9 of 98
Project Title: Facility Rehabilitation Thermal (Pooled) Project Cost: $238,000 Project Description This Generation Thermal project is necessary for the replacement or rehabilitation of deteriorated thermal plant components that are identified through routine inspections, operating experience and engineering studies. The 2016 project consists of the refurbishment or replacement of thermal plant structures and equipment due to damage, deterioration, corrosion and in-service failure. This equipment is critical to the safe and reliable operation of thermal generating facilities and must be replaced in a timely manner. Based upon historical information, $238,000 is estimated to be the cost of refurbishment or replacement of thermal plant structures in 2016. The replacement or rehabilitation of deteriorated components at individual plants is not inter-dependent or related. However, all budget items included in this project are similar in nature and justification, and are therefore pooled for consideration as a single capital project. Justification The Company maintains 41.5 MW of thermal generation consisting of gas turbine and diesel units. These units are generally used to provide emergency generation, both locally and for the Island Interconnected System, and to facilitate scheduled maintenance. Replacement and rehabilitation projects are identified during ongoing inspections and maintenance activities. These projects are necessary for the continued operation of thermal generation facilities in a safe, reliable and environmentally compliant manner.

Schedule B 2016 Capital Projects – Normal Capital (Historical Pattern) NP 2016 CBA
Newfoundland Power Inc. – 2016 Capital Budget Application Page 10 of 98
Projected Expenditures Table 1 provides a breakdown of the proposed expenditures for 2016 and a projection of expenditures through 2020.
Table 1 Projected Expenditures
(000s)
Cost Category 2016 2017 2018 - 2020 Total
Material $152 - - - Labour – Internal 22 - - - Labour – Contract - - - - Engineering 43 - - - Other 21 - - - Total $238 $244 $766 $1,248
Costing Methodology Table 2 shows the annual expenditures for this project for the most recent five-year period.
Table 2 Expenditure History
(000s)
Year 2011 2012 2013 2014 2015F Total $252 $117 $201 $331 $216
The budget requirement for rehabilitation of thermal generating facilities is based on a historical average, and is adjusted for anticipated expenditure requirements for extraordinary items. To ensure this project is completed at the lowest possible cost consistent with safe and reliable service, all material and contract labour will be obtained through competitive tendering. Future Commitments This is not a multi-year project.

Schedule B 2016 Capital Projects – Normal Capital (Identified Need) NP 2016 CBA
Newfoundland Power Inc. – 2016 Capital Budget Application Page 11 of 98
Project Title: Greenhill Gas Turbine Overhaul (Other) Project Cost: $1,500,000 Project Description This Generation Thermal project is necessary to complete an overhaul of the OLYMPUS gas generator used to power the Geenhill Gas Turbine facility at Grand Bank on the Burin Peninsula. The Greenhill Gas Turbine is powered by a Rolls Royce OLYMPUS aero-derivative gas generator packaged by Curtis Wright Corporation. The Rolls Royce OLYMPUS gas generator was last overhauled in 1995. The Geenhill Gas Turbine provides 20 MW of capacity in support of the Island Interconnected System.9 In March 2014, Newfoundland Power engaged engineering expertise to complete an assessment of the OLYMPUS gas generator at Greenhill.10 The borescope inspection identified areas where there is a loss of coating with some corrosion found in the HP compressor and on the stators. The combustion chambers are showing carbon buildup and experiencing corrosion. Blades in the turbine section have lost coating and the leading edges are showing signs of degradation. These signs of wear and extensive coating loss throughout the internal sections of the gas generator are consistent with the amount of time since the last overhaul. Based on the March 2014 inspection results, while the gas generator at Greenhill is serviceable in the immediate term, an overhaul at a certified facility is required.11 The 2016 project consists of the removal from service of the OLYMPUS gas generator, packaging of the unit for shipment, shipping the unit to a certified overall facility, and the completion of the actual overhaul itself. Once completed the unit will be returned to site and reinstalled, tested and commissioned prior to returning it to active service. Justification The Company’s thermal plants are used to support system peaks for very limited periods of time each year, to allow for local system maintenance and to provide backup in the event of localized outages. This project is necessary for the continued operation of the Greenhill Gas Turbine facility in a safe, reliable and environmentally compliant manner.
9 The Greenhill facility has been de-rated from 25 MW to 20 MW as a result of long-term issues with cracks in
the power turbine casing. 10 A borescope inspection of the Rolls Royce OLYMPUS gas generator was completed on March 19th and 20th,
2014 by Alba Power on site at the Greenhill facility. A copy of the borescope inspection report was included as Appendix D to the report titled Thermal Generation Refurbishment, June 2014, filed on June 16, 2014 as part of the application for approval of expenditure supplemental to the Company’s approved 2014 Capital Budget.
11 If the deterioration identified in March 2014 is allowed to continue indefinitely, it could lead to catastrophic failure of the gas generator.

Schedule B 2016 Capital Projects – Normal Capital (Identified Need) NP 2016 CBA
Newfoundland Power Inc. – 2016 Capital Budget Application Page 12 of 98
Projected Expenditures Table 1 provides a breakdown of the proposed expenditures for 2016 and a projection of expenditures through 2020.
Table 1 Projected Expenditures
(000s)
Cost Category 2016 2017 2018 - 2020 Total
Material $1,400 - - - Labour – Internal 10 - - - Labour – Contract - - - - Engineering 40 - - - Other 50 - - - Total $1,500 $0 $0 $1,500
Costing Methodology The budget for this project is based on an engineering cost estimate. To ensure this project is completed at the lowest possible cost consistent with safe and reliable service, the overhaul will be obtained through competitive tendering. Future Commitments This is not a multi-year project.

Schedule B 2016 Capital Projects NP 2016 CBA
Newfoundland Power Inc. – 2016 Capital Budget Application Page 13 of 98
SUBSTATIONS

Schedule B 2016 Capital Projects – Normal Capital (Identified Need) NP 2016 CBA
Newfoundland Power Inc. – 2016 Capital Budget Application Page 14 of 98
Project Title: Substations Refurbishment and Modernization (Clustered) Project Cost: $7,871,000 Project Description This Substations project is a continuation of work started in 2007 as a result of the Substation Strategic Plan. The work included in this project is consistent with that plan. An update to the Substation Strategic Plan is included in 2.1 2016 Substation Refurbishment and Modernization. The Company has 130 substations ranging in age from 13 years to greater than 100 years. This project is necessary for the planned replacement of deteriorated and substandard substation infrastructure, such as bus structures, breakers, potential transformers, protective relaying, support structures, equipment foundations, switches and fencing. Infrastructure to be replaced is identified as a result of inspections, engineering assessments and operating experience. In 2016, this project will refurbish and modernize the following substations:
• Grand Falls Substation12 • King’s Bridge Substation13 • Victoria Substation • Virginia Waters Substation14
In addition to the substations listed above, the 2016 project includes the refurbishment and modernization of Portable Substation P1 along with the upgrading of automation equipment in substations, including the automation of distribution feeder breakers and reclosers.15 The individual requirements for the replacement of substation infrastructure are not inter-dependent. However, they are similar in nature and justification. The expenditures are therefore pooled for consideration as a single capital project.
12 The Grand Falls Substation refurbishment and modernization is clustered with the installation of a new
substation transformer required at Grand Falls which is included in the Additions Due To Load Growth project. 13 The King’s Bridge Substation refurbishment and modernization is clustered with the installation of a spare
substation transformer required at King’s Bridge Substation which is included in the Additions Due To Load Growth project. It is also clustered with the item to refurbish the King’s Bridge Substation distribution system in the Trunk Feeders project.
14 The Virginia Waters Substation refurbishment and modernization is clustered with the installation of a new substation transformer required at Virginia Waters which is included in the Additions Due To Load Growth project.
15 At the end of 2014, approximately 70% of distribution feeder breakers and reclosers located in Company substations were automated through the SCADA system. By the end of 2015, there will be 238 distribution feeders automated representing approximately 80% of all distribution feeders. By the end of 2016 there will be 249 distribution feeders automated representing approximately 84% of all distribution feeders.

Schedule B 2016 Capital Projects – Normal Capital (Identified Need) NP 2016 CBA
Newfoundland Power Inc. – 2016 Capital Budget Application Page 15 of 98
Justification This project is justified based on the need to maintain safe, reliable electrical service and ensure workplace safety by replacing deteriorated or substandard substation infrastructure. Projected Expenditures Table 1 provides a breakdown of the proposed expenditures for 2016 and a projection of expenditures through 2020. Appendix A of 2.1 2016 Substation Refurbishment and Modernization details the work planned for each year.
Table 1 Projected Expenditures
(000s)
Cost Category 2016 2017 2018 - 2020 Total
Material $6,282 - - - Labour – Internal 442 - - - Labour – Contract - - - - Engineering 984 - - - Other 163 - - - Total $7,871 $10,275 $25,500 $43,646
Costing Methodology Table 2 shows the annual expenditures for this project for the most recent five-year period.
Table 2 Expenditure History
(000s)
Year 2011 2012 2013 2014 2015F Total $2,208 $2,279 $3,570 $6,411 $9,811
The budget for this project is based on engineering estimates for the cost of individual budget items. To ensure this project is completed at the lowest possible cost consistent with safe and reliable service, all material and contract labour will be obtained through competitive tendering.

Schedule B 2016 Capital Projects – Normal Capital (Identified Need) NP 2016 CBA
Newfoundland Power Inc. – 2016 Capital Budget Application Page 16 of 98
Future Commitments This is not a multi-year project.

Schedule B 2016 Capital Projects – Normal Capital (Historical Pattern) NP 2016 CBA
Newfoundland Power Inc. – 2016 Capital Budget Application Page 17 of 98
Project Title: Replacements Due to In-Service Failures (Pooled) Project Cost: $3,771,000 Project Description This Substations project is necessary to replace substation equipment that has been retired due to storm damage, lightning strikes, vandalism, electrical or mechanical failure, corrosion damage, technical obsolescence and failure during maintenance testing. Substation equipment that fails in-service requires immediate attention as it is essential to the integrity and reliability of the electrical supply to customers. The individual requirements for substation equipment are not inter-dependent. However, they are similar in nature and justification. The expenditures are therefore pooled for consideration as a single capital project. Justification This project is justified based on the need to maintain safe, reliable electrical service and ensure workplace safety by replacing deteriorated or substandard substation plant and equipment. Projected Expenditures Table 1 provides a breakdown of the proposed expenditures for 2016 and a projection of expenditures through 2020.
Table 1 Projected Expenditures
(000s)
Cost Category 2016 2017 2018 - 2020 Total
Material $2,620 - - - Labour – Internal 761 - - - Labour – Contract - - - - Engineering 295 - - - Other 95 - - - Total $3,771 $3,860 $12,105 $19,736

Schedule B 2016 Capital Projects – Normal Capital (Historical Pattern) NP 2016 CBA
Newfoundland Power Inc. – 2016 Capital Budget Application Page 18 of 98
Costing Methodology Table 2 shows the annual expenditures for this project for the most recent five-year period.
Table 2 Expenditure History
(000s)
Year 2011 2012 2013 2014 2015F Total $2,689 $3,327 $3,485 $4,797 $3,110
The Company has 130 substations. The major equipment items comprising a substation include substation transformers, circuit breakers, reclosers, voltage regulators, potential transformers and battery banks. In total, Newfoundland Power has approximately 190 substation transformers, 400 circuit breakers, 200 reclosers, 360 voltage regulators, 220 potential transformers, 115 battery banks and 2,500 high voltage switches in service. The need to replace equipment is determined on the basis of tests, inspections, in-service and imminent failures and operational history of the equipment. An adequate pool of spare equipment is necessary to enable the Company to quickly respond to in-service failure. The size of the pool is based on past experience and engineering judgement, as well as a consideration of the impact that the loss of a particular apparatus would have on the electrical system. The budget for this project is based on engineering assessment of historical expenditures and inventory requirements. To ensure this project is completed at the lowest possible cost consistent with safe and reliable service, all material and contract labour will be obtained through competitive tendering. Future Commitments This is not a multi-year project.

Schedule B 2016 Capital Projects – Normal Capital (Identified Need) NP 2016 CBA
Newfoundland Power Inc. – 2016 Capital Budget Application Page 19 of 98
Project Title: Additions Due To Load Growth (Clustered) Project Cost: $5,868,000 Project Description This Substations project is necessary to address the growth in customer load in recent years with capacity additions to various substations. The 2016 project includes:
1. The replacement of the existing 66/25 kV 4.0 MVA substation transformer at Doyles Substation with the former 66/25 kV 6.7 MVA Lethbridge Substation transformer to accommodate load growth in the Codroy Valley in western Newfoundland. ($768,000)
2. The installation of a new 66/12.5 kV 50 MVA substation transformer at Grand Falls
Substation to accommodate load growth in the Grand Falls Winsor area. This area includes customers in the community of Badger and surrounding area. This item is clustered with the Grand Falls Substation item in the Substations Refurbishment and Modernization Substations project. ($2,019,000)
3. The installation of a new 66/12.5 kV 25 MVA substation transformer at King’s Bridge
Substation to accommodate load growth on the King’s Bridge 12.5 kV distribution system. This item is clustered with the King’s Bridge Substation item in the Substations Refurbishment and Modernization Substations project and the King’s Bridge Substation item in the Trunk Feeders Distribution project. ($3,081,000)
Details on the proposed expenditures are contained in 2.2 2016 Additions Due to Load Growth. The individual requirements for additions to substations due to load growth included in this project are not inter-dependent. However, they are similar in nature and justification. The expenditures are therefore pooled for consideration as a single capital project. Justification A 20-year load forecast has projected increased electrical demand for the Doyles, Grand Falls, and St. John’s areas. The development and analysis of alternatives has established a recommended expansion plan to meet that demand. The least cost alternative that meets all of the technical criteria requires (i) the installation of an existing 6.7 MVA substation transformers at Doyles Substation to replace the existing 4.0 MVA substation transformer (ii) a new 50 MVA substation transformer at Grand Falls Substation and (iii) a new 25 MVA substation transformer at King’s Bridge Substation.

Schedule B 2016 Capital Projects – Normal Capital (Identified Need) NP 2016 CBA
Newfoundland Power Inc. – 2016 Capital Budget Application Page 20 of 98
The project is justified on the basis of accommodating customer load growth. The proper sizing of equipment is necessary to avoid overloading equipment and to maintain safe, reliable electrical service. Projected Expenditures Table 1 provides a breakdown of the proposed expenditures for 2016 and a projection of expenditures through 2020.
Table 1 Projected Expenditures
(000s)
Cost Category 2016 2017 2018 - 2020 Total
Material $5,285 - - - Labour – Internal 61 - - - Labour – Contract - - - - Engineering 417 - - - Other 105 - - - Total $5,868 $3,300 $18,121 $27,289
Costing Methodology The budget estimate for this project is based on engineering estimates of the cost of individual budget items. To ensure this project is completed at the lowest possible cost consistent with safe and reliable service, all material and contract labour will be obtained through competitive tendering. Future Commitments This is not a multi-year project.

Schedule B 2016 Capital Projects – Normal Capital (Identified Need) NP 2016 CBA
Newfoundland Power Inc. – 2016 Capital Budget Application Page 21 of 98
Project Title: Substation Feeder Termination (Clustered) Project Cost: $430,000 Project Description This Substations project is required to provide substation equipment necessary for the addition of 2 new distribution feeders. The project involves the termination of a new 12.5 kV feeder at Bayview Substation and a new 12.5 kV feeder at Pulpit Rock Substation. The feeder termination at the Bayview Substation is clustered with the Feeder Additions for Growth Distribution project to install a new 12.5 kV feeder at the Bayview Substation (Schedule B, page 50 of 98). The feeder termination at the Pulpit Rock Substation is clustered with the Feeder Additions for Growth Distribution project to install a new 12.5 kV feeder at the Pulpit Rock Substation (Schedule B, page 50 of 98). Justification The project is justified on the basis of accommodating customer load growth and on the obligation to provide safe, least cost reliable service. Actual peak load conditions and customer growth indicate that this project is warranted in order to maintain the reliability of the electrical system. Projected Expenditures Table 1 provides a breakdown of the proposed expenditures for 2016 and a projection of expenditures through 2020.
Table 1 Projected Expenditures
(000s)
Cost Category 2016 2017 2018 - 2020 Total
Material $376 - - - Labour – Internal 8 - - - Labour – Contract - - - - Engineering 38 - - - Other 8 - - - Total $430 $0 $0 $430

Schedule B 2016 Capital Projects – Normal Capital (Identified Need) NP 2016 CBA
Newfoundland Power Inc. – 2016 Capital Budget Application Page 22 of 98
Costing Methodology The budget estimate for this project is based on engineering estimates. To ensure this project is completed at the lowest possible cost consistent with safe and reliable service, all material and contract labour will be obtained through competitive tendering. Future Commitments This is not a multi-year project.

Schedule B 2016 Capital Projects NP 2016 CBA
Newfoundland Power Inc. – 2016 Capital Budget Application Page 23 of 98
TRANSMISSION

Schedule B 2016 Capital Projects – Normal Capital (Identified Need) NP 2016 CBA
Newfoundland Power Inc. – 2016 Capital Budget Application Page 24 of 98
Project Title: Transmission Line Rebuild (Clustered, Multi-year) Project Cost: $6,067,000 Project Description This Transmission project is necessary to replace deteriorated transmission line infrastructure. The 2016 project involves:
1. The rebuilding of the Company’s oldest, most deteriorated transmission lines in accordance with the program outlined in the report 3.1 Transmission Line Rebuild Strategy that was filed with the 2006 Capital Budget Application.
Proposed 2016 transmission line rebuild work will take place on transmission lines 30L, 57L and 400L. Transmission line 30L operates between Ridge Road Substation and King’s Bridge Substation in St. John’s. Transmission line 57L operates between Bay Roberts Substation and Harbour Grace Substation in Conception Bay North. Transmission line 400L operates between Newfoundland & Labrador Hydro’s terminal station at Bottom Brook and Wheeler’s Substation in the Stephenville area.16
Details on the proposed 2016 rebuilds are included in 3.1 2016 Transmission Line Rebuild ($4,166,000).
2. The replacement of poles, crossarms, conductors, insulators and hardware due to
deficiencies identified during inspections and engineering reviews, or due to in-service and imminent failures ($1,901,000).
For 2016, a portion of the Transmission Line Rebuild project proposed for the St. John’s area is clustered with the Trunk Feeders Distribution project. This is because relocation of the under-built trunk feeders is dependent upon the completion of the transmission line rebuilds for transmission line 30L. Transmission line rebuilds and replacements to address identified deficiencies are similar in nature and justification. The expenditures are therefore pooled for consideration as a single capital project. Justification Approximately 30% of the Company’s 103 transmission lines are in excess of 40 years of age. Many of these lines are experiencing pole, crossarm, conductor, insulator and hardware deterioration. Replacement is required to maintain the strength and integrity of these lines.
16 All 3 transmission line rebuild projects are multi-year projects. Details on each multi-year project are provided
in the Future Commitments section on page 26 of 98.

Schedule B 2016 Capital Projects – Normal Capital (Identified Need) NP 2016 CBA
Newfoundland Power Inc. – 2016 Capital Budget Application Page 25 of 98
This project is justified based on the need to replace deteriorated infrastructure in order to ensure the continued provision of safe, reliable electrical service. Projected Expenditures Table 1 provides a breakdown of the proposed expenditures for 2016 and a projection of expenditures through 2020. Appendix A of 3.1 2016 Transmission Line Rebuild details the transmission line rebuilds planned for each year.
Table 1 Projected Expenditures
(000s)
Cost Category 2016 2017 2018 - 2020 Total
Material $2,017 - - - Labour – Internal 389 - - - Labour – Contract 2,902 - - - Engineering 246 - - - Other 513 - - - Total $6,067 $6,139 $21,730 $33,936
Costing Methodology Table 2 shows the annual expenditures for this project for the most recent five-year period. Annual expenditures are a function of the number of lines rebuilt, the distance covered and the construction standard used in the design.
Table 2 Expenditure History
(000s)
Year 2011 2012 2013 2014 2015F Total $3,732 $4,694 $5,081 $4,664 $5,731
The budget estimates for rebuilding and upgrade projects are based on engineering cost estimates. The budget estimates for replacements projects are based on an assessment of historical expenditures. To ensure this project is completed at the lowest possible cost consistent with safe and reliable service, all material and contract labour will be obtained through competitive tendering.

Schedule B 2016 Capital Projects – Normal Capital (Identified Need) NP 2016 CBA
Newfoundland Power Inc. – 2016 Capital Budget Application Page 26 of 98
Future Commitments The rebuilding of transmission lines 30L and 400L are multi-year projects approved in Order No. P.U. 40 (2014). Table 3 details the complete multi-year project expenditure for these multi-year projects.
Table 3 30L and 400L Multi-Year Projected Expenditures
(000s)
Cost Category 201517 201618 Total
Material $743 $826 $1,569 Labour – Internal 238 215 453 Labour – Contract 1,154 1,216 2,370 Engineering 110 120 230 Other 265 268 533 Total $2,510 $2,645 $5,155
The rebuilding of transmission line 57L is a multi-year project. Table 4 details the 2016 and 2017 project expenditures for this multi-year project.
Table 4 57L Multi-Year Projected Expenditures
(000s)
Cost Category 2016 2017 Total
Material $521 $578 $1,099 Labour – Internal 66 74 140 Labour – Contract 721 829 1,550 Engineering 40 44 84 Other 173 192 365 Total $1,521 $1,717 $3,238
17 Approved in Order No. P.U. 40 (2014). 18 Schedule B of Order No. P.U. 40 (2014) approved an expenditure of $2,318,000 for 2016. Engineering work
completed for the 400L rebuild project in advance of the 2015 tender release has identified additional work associated with structures located in bog resulting in a $327,000 increase in the forecast 2016 expenditure.

Schedule B 2016 Capital Projects NP 2016 CBA
Newfoundland Power Inc. – 2016 Capital Budget Application Page 27 of 98
DISTRIBUTION

Schedule B 2016 Capital Projects – Normal Capital (Historical Pattern) NP 2016 CBA
Newfoundland Power Inc. – 2016 Capital Budget Application Page 28 of 98
Project Title: Extensions (Pooled) Project Cost: $10,439,000 Project Description This Distribution project involves the construction of both primary and secondary distribution lines to connect new customers to the electrical distribution system. The project also includes upgrades to the capacity of existing lines to accommodate customers who increase their electrical load. The project includes labour, materials, and other costs to install poles, wires and related hardware. Distribution line extensions and upgrades for new customers and for increased loads are similar in nature and justification. The expenditures are therefore pooled for consideration as a single capital project. Justification This project is justified based on the need to address customers’ new or additional service requirements. Projected Expenditures Table 1 provides a breakdown of the proposed expenditures for 2016 and a projection of expenditures through 2020.
Table 1 Projected Expenditures
(000s)
Cost Category 2016 2017 2018 - 2020 Total
Material $3,258 - - - Labour – Internal 3,070 - - - Labour – Contract 2,458 - - - Engineering 1,317 - - - Other 336 - - - Total $10,439 $10,740 $31,561 $52,740

Schedule B 2016 Capital Projects – Normal Capital (Historical Pattern) NP 2016 CBA
Newfoundland Power Inc. – 2016 Capital Budget Application Page 29 of 98
Costing Methodology Table 2 shows the annual expenditures and unit costs for this project for the most recent five-year period, as well as a projected unit cost for 2016.
Table 2 Expenditure History and Unit Cost Projection
Year 2011 2012 2013 2014 2015F 2016B Total (000s) $ 11,420 $ 11,321 $ 13,434 $ 15,467 $ 11,318 $ 10,439 Adjusted Costs (000s)1,2 $ 12,885 $ 12,385 $ 14,293 $ 14,262 - - New Customers 4,909 5,286 5,280 4,308 3,798 3,831 Unit Costs ($/customer)2 $ 2,625 $ 2,343 $ 2,707 $ 3,311 $ 2,980 $ 2,725
1 An adjustment has been made to the expenditure history to recognize the impact of the sale of 40% of joint use support structures to Bell Aliant in 2011.
2 2015 dollars. The project cost for the connection of new customers is calculated on the basis of historical data.19 Historical annual expenditures over the most recent five-year period, including the current year, are expressed in current-year dollars (“Adjusted Costs”). The Adjusted Costs are divided by the number of new customers in each year to derive the annual extension cost per customer in current-year dollars (“Unit Costs”). The average of these Unit Costs, with unusually high and low data excluded, is inflated by the GDP Deflator for Canada before being multiplied by the forecast number of new customers for the budget year to determine the budget estimate. The forecast number of new customers is derived from economic projections provided by independent agencies. To ensure this project is completed at the lowest possible cost consistent with safe and reliable service, all material and contract labour will be obtained through competitive tendering. Future Commitments This is not a multi-year project.
19 An adjustment has been made to the expenditure history to recognize the impact of the sale of 40% of joint use
support structures to Bell Aliant.

Schedule B 2016 Capital Projects – Normal Capital (Historical Pattern) NP 2016 CBA
Newfoundland Power Inc. – 2016 Capital Budget Application Page 30 of 98
Project Title: Meters (Pooled) Project Cost: $4,582,000 Project Description This Distribution project includes the purchase and installation of meters for new customers and replacement meters for existing customers. Table 1 lists the meter requirement for 2016.
Table 1 2016 Proposed Meter Acquisition
Program Number of Meters Energy Only Domestic Meters 42,597 Other Energy Only and Demand Meters 5,621
The expenditures for individual meters are not inter-dependent. However, because the individual expenditure items are similar in nature and justification, they have been pooled for consideration as a single capital project. The 2013 Capital Budget Application included the 2013 Metering Strategy. For 2016, the Company has completed another review of the meter reading function and has prepared an update to the 2013 strategy. The updated metering strategy can be found in 4.4 2016 Metering Strategy. The 2016 Metering Strategy will:
• Continue with the objectives outlined in the 2013 Metering Strategy with respect to accuracy & timeliness, cost management, worker safety and ratemaking;
• Continue with the transition strategy to comply with changes to Measurement Canada regulations;
• Maintain focus on route optimization in order to achieve productivity improvements and reduced costs through use of AMR meters; and
• Accelerate the installation of AMR meters in order to achieve 100% penetration by the end of 2017.
Justification The purchase of new meters is necessary to accommodate customer growth and to replace deteriorated meters. Revenue metering of electrical service is regulated under the Electricity and Gas Inspection Act (Canada). The additional cost associated with expenditures on AMR meters is justified by both safety and economics. The additional cost associated with accelerating expenditures on AMR meters is justified by a positive net present value of $1.1 million.

Schedule B 2016 Capital Projects – Normal Capital (Historical Pattern) NP 2016 CBA
Newfoundland Power Inc. – 2016 Capital Budget Application Page 31 of 98
Projected Expenditures Table 2 provides a breakdown of the proposed expenditures for 2016 and a projection of expenditures through 2020.
Table 2 Projected Expenditures
(000s)
Cost Category 2016 2017 2018 - 2020 Total
Material $4,124 - - - Labour – Internal 458 - - - Labour – Contract - - - - Engineering - - - - Other - - - - Total $4,582 $4,403 $1,547 $10,532
Costing Methodology Table 3 shows the annual expenditures for the most recent five-year period, as well as a projection for 2016.
Table 3 Expenditure History and Unit Cost Projection
Year 2011 2012 2013 2014 2015F Avg 2016B
Meter Requirements New Connections 4,909 5,286 5,280 4,308 3,798 3,831 GROs/CSOs 13,671 15,257 18,805 20,009 17,631 18,287 Other 8,366 7,130 6,218 8,825 10,673 26,100 Total 26,946 27,673 30,303 33,142 32,102 48,218 Meter Costs Actual (000s) $1,763 $2,557 $3,109 $3,003 $3,400 $4,582 Adjusted1 (000s) $1,923 $2,719 $3,242 $3,071 Unit Costs1 $ 71 $ 98 $ 107 $ 93 $ 106 $ 93 $ 95
1 2015 dollars.

Schedule B 2016 Capital Projects – Normal Capital (Historical Pattern) NP 2016 CBA
Newfoundland Power Inc. – 2016 Capital Budget Application Page 32 of 98
The project cost for meters is calculated on the basis of historical data. Historical annual expenditures over the most recent five-year period, including the current year, are expressed in current year dollars (“Adjusted Meter Costs”). The Adjusted Meter Costs are divided by the total meter requirements in each year to derive the annual meter cost in current-year dollars (“Unit Costs”). The average of the Unit Costs, with unusually high and low data excluded, is inflated by the GDP Deflator for Canada before being multiplied by forecast meter installations. The expected number of meter installations is based on projected new customer connections, projected requirements to meet Industry Canada regulations and other requirements based on historical trends. The quantity of meters for new customers is based on the Company’s forecast growth in the number of customers the Company serves. The quantity for replacement purposes is based on historic data and the transition strategy outlined in the 2013 Metering Strategy to comply with changes to compliance sampling regulations for electricity meters, and the 2016 Metering Strategy plan to accelerate the replacement of non-AMR meters. Sampling and replacement requirements are governed by Compliance Sampling Orders (“CSOs”) and Government Retest Orders (“GROs”) issued in accordance with regulations under the Electricity and Gas Inspection Act (Canada). To ensure this project is completed at the lowest possible cost consistent with safe and reliable service, all material and contract labour will be obtained through competitive tendering. Future Commitments This is not a multi-year project.

Schedule B 2016 Capital Projects – Normal Capital (Historical Pattern) NP 2016 CBA
Newfoundland Power Inc. – 2016 Capital Budget Application Page 33 of 98
Project Title: Services (Pooled) Project Cost: $3,784,000 Project Description This Distribution project involves the installation of service wires to connect new customers to the electrical distribution system. Service wires are low voltage wires that connect the customer’s electrical service equipment to the Company’s transformers. Also included in this project is the replacement of existing service wires due to deterioration, failure or damage, as well as the installation of larger service wires to accommodate customers’ additional load. The proposed expenditures for new and replacement services are similar in nature. The expenditures are therefore pooled for consideration as a single capital project. Justification The new component of this project is justified based on the need to address customers’ new service requirements. The replacement component is justified on the basis of the obligation to provide safe, reliable electrical service. Projected Expenditures Table 1 provides a breakdown of the proposed expenditures for 2016 and a projection of expenditures through 2020.
Table 1 Projected Expenditures
(000s)
Cost Category 2016 2017 2018 - 2020 Total
Material $1,139 - - - Labour – Internal 2,100 - - - Labour – Contract 184 - - - Engineering 317 - - - Other 44 - - - Total $3,784 $3,690 $11,053 $18,527

Schedule B 2016 Capital Projects – Normal Capital (Historical Pattern) NP 2016 CBA
Newfoundland Power Inc. – 2016 Capital Budget Application Page 34 of 98
Costing Methodology Table 2 shows the annual expenditures and unit costs for new services for the most recent five-year period, as well as a projected unit cost for 2016.
Table 2 Expenditure History and Unit Cost Projection
New Services
Year 2011 2012 2013 2014 2015F 2016B Total (000s) $3,887 $3,351 $3,608 $3,300 $2,801 $2,891 Adjusted Costs (000s)1 $4,394 $3,673 $3,844 $3,408 - - New Customers 4,909 5,286 5,280 4,308 3,798 3,831 Unit Costs ($/customer)1 $ 895 $ 695 $ 728 $ 791 $ 737 $ 755
1 2015 dollars. The project cost for the connection of new customers is calculated on the basis of historical data. For new services, historical annual expenditures over the most recent five-year period, including the current year, are converted to current-year dollars (“Adjusted Costs”). The Adjusted Costs are divided by the number of new customers in each year to derive the annual services cost per customer in current-year dollars (“Unit Costs”). The average of the Unit Costs, with unusually high and low data excluded, is inflated by the GDP Deflator for Canada before being multiplied by the forecast number of new customers for the budget year to determine the budget estimate. The forecast number of new customers is derived from economic projections provided by independent agencies. Table 3 shows the annual expenditures for replacement services for the most recent five-year period, as well as a projected cost for 2016.
Table 3 Expenditure History and Average Cost Projection
Replacement Services (000s)
Year 2011 2012 2013 2014 2015F 2016B Total $795 $1,157 $672 $544 $800 $893 Adjusted Costs1 $899 $1,268 $716 $562 - -
1 2015 dollars.

Schedule B 2016 Capital Projects – Normal Capital (Historical Pattern) NP 2016 CBA
Newfoundland Power Inc. – 2016 Capital Budget Application Page 35 of 98
The process of estimating the budget requirement for replacement services is similar to that for new services, except the budget estimate is based on the historical average of the total cost of replacement services, as opposed to a unit cost. To ensure this project is completed at the lowest possible cost consistent with safe and reliable service, all material and contract labour will be obtained through competitive tendering. Future Commitments This is not a multi-year project.

Schedule B 2016 Capital Projects – Normal Capital (Historical Pattern) NP 2016 CBA
Newfoundland Power Inc. – 2016 Capital Budget Application Page 36 of 98
Project Title: Street Lighting (Pooled) Project Cost: $2,245,000 Project Description This Distribution project involves the installation of new street lighting fixtures, the replacement of existing fixtures, and the provision of associated overhead and underground wiring. A street light fixture includes the light head complete with bulb, photocell and starter as well as the pole mounting bracket and other hardware. The project is driven by customer requests and historical levels of lighting fixtures requiring replacement. The proposed expenditures for new and replacement street lights are similar in nature. The expenditures are therefore pooled for consideration as a single capital project. Justification The new component of this project is justified based on the need to address customers’ new street light requirements. The replacement component is justified on the basis of the obligation to provide safe, reliable electrical service. Projected Expenditures Table 1 provides a breakdown of the proposed expenditures for 2016 and a projection of expenditures through 2020.
Table 1 Projected Expenditures
(000s)
Cost Category 2016 2017 2018 - 2020 Total
Material $1,216 - - - Labour – Internal 800 - - - Labour – Contract 173 - - - Engineering 33 - - - Other 23 - - - Total $2,245 $2,200 $6,611 $11,056

Schedule B 2016 Capital Projects – Normal Capital (Historical Pattern) NP 2016 CBA
Newfoundland Power Inc. – 2016 Capital Budget Application Page 37 of 98
Costing Methodology Table 2 shows the annual expenditures and unit costs for new street lights for the most recent five-year period, as well as a projected unit cost for 2016.
Table 2 Expenditure History and Unit Cost Projection
New Street Lights
Year 2011 2012 2013 2014 2015F 2016B Total (000s) $1,461 $1,588 $1,889 $2,265 $1,513 $1,479 Adjusted Costs (000s)1 $1,626 $1,712 $1,989 $1,6582 $1,513 - New Customers 4,909 5,286 5,280 4,308 3,798 3,831 Unit Costs ($/customer)1 $ 331 $ 324 $ 377 $ 385 $ 398 $ 386
1 2015 dollars. 2 Amount adjusted for the timing of a large number of street light poles installed in 2014. The project cost for street lights is calculated on the basis of historical data. For new street lights, historical annual expenditures over the most recent five-year period, including the current year, are expressed in current-year dollars (“Adjusted Costs”). The Adjusted Costs are divided by the number of new customers in each year to derive the annual street light cost per customer in current-year dollars (“Unit Costs”). The average of the Unit Costs, with unusually high and low data excluded, is inflated by the GDP Deflator for Canada before being multiplied by the forecast number of new customers for the budget year to determine the budget estimate. The forecast number of new customers is derived from economic projections provided by independent agencies. Table 3 shows the annual expenditures and unit costs for replacement street lights for the most recent five-year period, as well as a projected cost for 2016.
Table 3 Expenditure History and Average Cost Projection
Replacement Street Lights (000s)
Year 2011 2012 2013 2014 2015F 2016B Total $750 $776 $703 $482 $780 $766 Adjusted Costs1 $833 $837 $741 $495 - -
1 2015 dollars.

Schedule B 2016 Capital Projects – Normal Capital (Historical Pattern) NP 2016 CBA
Newfoundland Power Inc. – 2016 Capital Budget Application Page 38 of 98
The process of estimating the budget requirement for replacement street lights is similar to that for new street lights, except the budget estimate is based on the historical average of the total cost of replacement street lights, as opposed to a unit cost. The estimate is based on historical annual expenditures for the replacement of damaged, deteriorated or failed street lights. To ensure this project is completed at the lowest possible cost consistent with safe and reliable service, all material and contract labour will be obtained through competitive tendering. Future Commitments This is not a multi-year project.

Schedule B 2016 Capital Projects – Normal Capital (Historical Pattern) NP 2016 CBA
Newfoundland Power Inc. – 2016 Capital Budget Application Page 39 of 98
Project Title: Transformers (Pooled) Project Cost: $5,759,000 Project Description This Distribution project includes the cost of purchasing transformers to serve customer growth, and the replacement or refurbishment of units that have deteriorated or failed. Transformer requirements are similar in nature and justification. The expenditures are therefore pooled for consideration as a single capital project. Justification This project is justified on the basis of the obligation to meet customers’ electrical service requirements and the need to replace defective or worn out electrical equipment in order to maintain a safe, reliable electrical system. Projected Expenditures Table 1 provides the breakdown of the proposed expenditures for 2016 and a projection of expenditures through 2020.
Table 1 Projected Expenditures
(000s)
Cost Category 2016 2017 2018 - 2020 Total
Material $5,759 - - - Labour – Internal - - - - Labour – Contract - - - - Engineering - - - - Other - - - - Total $5,759 $5,727 $16,098 $27,584

Schedule B 2016 Capital Projects – Normal Capital (Historical Pattern) NP 2016 CBA
Newfoundland Power Inc. – 2016 Capital Budget Application Page 40 of 98
Costing Methodology Table 2 shows the annual expenditures for the most recent five-year period, as well as an estimate for 2016.
Table 2 Expenditure History and Budget Estimate
(000s)
Year 2011 2012 2013 2014 2015F 2016B Total $7,196 $6,565 $6,710 $7,106 $5,6782 $5,759 Adjusted Costs1 $7,788 $6,872 $ 6,920 $7,227 - -
1 2015 dollars. The process of estimating the budget requirement for transformers is based on a historical average. Historical annual expenditures related to distribution transformers over the most recent five-year period, including the current year, are expressed in current-year dollars (“Adjusted Costs”). The estimate for the budget year is calculated by taking the average of the Adjusted Costs and inflating it using the GDP Deflator for Canada. To ensure this project is completed at the lowest possible cost consistent with safe and reliable service, all material and contract labour will be obtained through competitive tendering. Future Commitments This is not a multi-year project.

Schedule B 2016 Capital Projects – Normal Capital (Historical Pattern) NP 2016 CBA
Newfoundland Power Inc. – 2016 Capital Budget Application Page 41 of 98
Project Title: Reconstruction (Pooled) Project Cost: $4,599,000 Project Description This Distribution project involves the replacement of deteriorated or damaged distribution structures and electrical equipment. This project comprises smaller unplanned projects that are identified during the budget year or recognized during follow-up on operational problems, including power interruptions and customer trouble calls. This project consists of high priority projects that cannot wait to the next budget year. Distribution Reconstruction requirements are similar in nature and justification. The expenditures are therefore pooled for consideration as a single capital project. This project differs from the Rebuild Distribution Lines project, which involves rebuilding sections of lines or the selective replacement of various line components based on preventive maintenance inspections or engineering reviews. Justification This project is justified on the basis of the need to replace defective or deteriorated electrical equipment in order to maintain a safe, reliable electrical system. Projected Expenditures Table 1 provides a breakdown of the proposed expenditures for 2016 and a projection of expenditures through 2020.
Table 1 Projected Expenditures
(000s)
Cost Category 2016 2017 2018 - 2020 Total
Material $1,088 - - - Labour – Internal 1,852 - - - Labour – Contract 1,038 - - - Engineering 465 - - - Other 156 - - - Total $4,599 $4,722 $14,926 $24,247

Schedule B 2016 Capital Projects – Normal Capital (Historical Pattern) NP 2016 CBA
Newfoundland Power Inc. – 2016 Capital Budget Application Page 42 of 98
Costing Methodology Table 2 shows the annual expenditures and costs in current dollars for the most recent five-year period, as well as the projected expenditure for 2016.
Table 2 Expenditure History and Budget Estimate
(000s)
Year 2011 2012 2013 2014 2015F 2016B Total $3,967 $3,463 $4,643 $5,041 $4,163 $4,599 Adjusted Costs1 $4,476 $3,789 $4,940 $5,202 $4,163
1 2015 dollars. The process of estimating the budget requirement for Reconstruction is based on a historical average. Historical annual expenditures related to unplanned repairs to distribution feeders over the most recent five-year period, including the current year, are expressed in current-year dollars (“Adjusted Costs”). The estimate for the budget year is calculated by taking the average of the Adjusted Costs and inflating it using the GDP Deflator for Canada. To ensure this project is completed at the lowest possible cost consistent with safe and reliable service, all material and contract labour will be obtained through competitive tendering. Future Commitments This is not a multi-year project.

Schedule B 2016 Capital Projects – Normal Capital (Historical Pattern) NP 2016 CBA
Newfoundland Power Inc. – 2016 Capital Budget Application Page 43 of 98
Project Title: Rebuild Distribution Lines (Pooled) Project Cost: $3,694,000 Project Description This Distribution project involves the replacement of deteriorated distribution structures and electrical equipment that have been previously identified through the ongoing preventative maintenance program or engineering reviews. Distribution rebuild projects are preventative capital maintenance projects which consist of either the complete rebuilding of deteriorated distribution lines, or the selective replacement of various line components based on preventative maintenance reviews of the power line or engineering reviews. These typically include the replacement of poles, crossarms, conductor, cutouts, surge/lightning arrestors, insulators and transformers. Based on a 7-year inspection cycle for distribution feeders, the work for 2016 will be performed on the following 43 of the Company’s 305 feeders:
ABC-01 GAM-01 GLN-01 PAB-03 SJM-07 SLA-12 BUC-01 GAN-03 HOL-02 PAB-05 SJM-08 SLA-13 BVJ-01 GBS-01 KEN-02 PEP-01 SJM-09 SPR-01 CAT-01 GBS-02 MSY-03 PUL-03 SJM-11 SPR-02 CAT-02 GFS-07 GRH-02 ROB-01 SLA-05 STX-01 CHA-02 GFS-08 NCH-01 SCT-02 SLA-06 SUM-01 CLV-01 GIL-01 NCH-02 SJM-06 SLA-11 WAL-01 COL-02
While the various components of the project are not inter-dependent, they are similar in nature and justification. The expenditures are therefore pooled for consideration as a single capital project. Justification This project is justified on the basis of the need to replace defective or deteriorated electrical equipment in order to maintain a safe, reliable electrical system. The Company has over 9,800 kilometres of distribution lines in service and has an obligation to maintain this plant in good condition to safeguard the public and its employees and to maintain reliable electrical service. The replacement of deteriorated distribution structures and equipment is an important element of this obligation.

Schedule B 2016 Capital Projects – Normal Capital (Historical Pattern) NP 2016 CBA
Newfoundland Power Inc. – 2016 Capital Budget Application Page 44 of 98
Projected Expenditures Table 1 provides a breakdown of the proposed expenditures for 2016 and a projection of expenditures through 2020.
Table 1 Projected Expenditures
(000s)
Cost Category 2016 2017 2018 - 2020 Total
Material $1,552 - - - Labour – Internal 1,699 - - - Labour – Contract 222 - - - Engineering 37 - - - Other 184 - - - Total $3,694 $3,787 $14,176 $21,657 Costing Methodology Table 2 shows the annual expenditures for this project for the most recent five-year period.
Table 2 Expenditure History
(000s)
Year 2011 2012 2013 2014 2015F Actual $2,413 $3,723 $2,958 $4,338 $3,302
Adjusted $2,587 $3,932 $3,071 $4,420 $3,302 1 2015 dollars. Distribution feeders are inspected in accordance with Newfoundland Power’s distribution inspection standards to identify the following:
a) Deficiencies that are a risk to public or employee safety, or that are likely to result in imminent failure of a structure or hardware. This includes primary components such as poles, crossarms and conductor; and
b) Specific line components targeted for replacement based on engineering reviews, including lightning arrestors, CP8080 and 2-piece insulators, current limiting fuses, automatic sleeves, porcelain cutouts and transformers.

Schedule B 2016 Capital Projects – Normal Capital (Historical Pattern) NP 2016 CBA
Newfoundland Power Inc. – 2016 Capital Budget Application Page 45 of 98
The report 4.4 Rebuild Distribution Lines Update included with the 2013 Capital Budget Application described the Company’s current preventative maintenance program, distribution inspection standards and targeted replacement programs. Proposed expenditures under this Distribution project are consistent with that report. Inspections for the lines upon which work is to take place in 2016 are ongoing throughout 2015. Complete inspection data will not be available until late 2015. Therefore the 2016 budget estimate is based on average historical expenditures over the previous 5 years. To ensure this project is completed at the lowest possible cost consistent with safe and reliable service, all material and contract labour will be obtained through competitive tendering. Future Commitments This is not a multi-year project.

Schedule B 2016 Capital Projects – Normal Capital (Historical Pattern) NP 2016 CBA
Newfoundland Power Inc. – 2016 Capital Budget Application Page 46 of 98
Project Title: Relocate/Replace Distribution Lines for Third Parties (Pooled) Project Cost: $2,454,000 Project Description This Distribution project is necessary to accommodate third party requests for the relocation or replacement of distribution lines. The relocation or replacement of distribution lines results from (1) work initiated by municipal, provincial and federal governments, (2) work initiated by other utilities such as Bell Aliant, Eastlink and Rogers Cable, or (3) requests from customers.20 The Company’s response to requests for relocation and replacement of distribution facilities by governments and other utility service providers is governed by the provisions of agreements in place with the requesting parties. Relocation or replacement of facilities by customers may be governed by the Company’s policy respecting contributions in aid of construction. While the individual requirements are not inter-dependent, they are similar in nature and justification, and are therefore pooled for consideration as a single capital project. Justification This project is justified on the basis of the need to respond to legitimate requirements for plant relocations resulting from third party activities. Projected Expenditures Table 1 provides a breakdown of the proposed expenditures for 2016 and a projection of expenditures through 2020.
Table 1 Projected Expenditures
(000s)
Cost Category 2016 2017 2018 - 2020 Total
Material $860 - - - Labour – Internal 784 - - - Labour – Contract 516 - - - Engineering 251 - - - Other 43 - - - Total $2,454 $2,516 $7,927 $12,897
20 Also included is distribution work associated with the installation and relocation of communications cables used
by the Company’s various protection and control systems.

Schedule B 2016 Capital Projects – Normal Capital (Historical Pattern) NP 2016 CBA
Newfoundland Power Inc. – 2016 Capital Budget Application Page 47 of 98
Costing Methodology Table 2 shows the annual expenditures for this project for the most recent five-year period.
Table 2 Expenditure History
(000s) Year 2011 2012 2013 2014 2015F Total $2,863 $2,195 $2,586 $2,077 $2,504 Adjusted Costs1 $3,200 $2,377 $2,732 $2,136 $2,504
1 2015 dollars. The budget estimate is based on historical expenditures. Generally, these expenditures are associated with a number of small projects that are not specifically identified at the time the budget is prepared. Historical annual expenditures related to distribution line relocations and replacements over the most recent five-year period, including the current year, are expressed in current-year dollars (“Adjusted Costs”). The estimate for the budget year is calculated by taking the average of the Adjusted Costs and inflating it using the GDP Deflator for Canada. Estimated contributions from customers and requesting parties associated with this project are included in the estimated contributions in aid of construction referred to in the Application. To ensure this project is completed at the lowest possible cost consistent with safe and reliable service, all material and contract labour will be obtained through competitive tendering. Future Commitments This is not a multi-year project.

Schedule B 2016 Capital Projects – Normal Capital (Identified Need) NP 2016 CBA
Newfoundland Power Inc. – 2016 Capital Budget Application Page 48 of 98
Project Title: Trunk Feeders (Clustered) Project Cost: $1,607,000 Project Description This Distribution project includes:
1. The replacement of distribution plant from pole line infrastructure shared with transmission line 30L. Transmission line 30L is a 66 kV line running between King’s Bridge Substation and Ridge Road Substation in St. John’s. Constructed in 1959, 30L runs alongside New Cove Road, Portugal Cove Road and London Road. The transmission line consists of 87 single-pole structures, all of which have distribution plant sharing the same poles.21 The rebuild of transmission line 30L is planned for completion in 2015 and 2016.22 The distribution plant sharing the poles with transmission line 30L will be replaced at the same time as the pole line infrastructure is replaced on transmission line 30L. ($423,000)
2. The upgrade of the 4.16 kV distribution system from King’s Bridge Substation to 12.5
kV is a least cost way of addressing reliability concerns with the aging distribution infrastructure. Details on the proposed expenditures are included in 4.6 KBR Substation Distribution Feeder Refurbishment. ($611,000)
3. The refurbishment and modernization of 3 vaults in the St. John’s underground
distribution system. These vaults contain high voltage equipment supplying customers utilizing special underground arrangements. Details on the proposed expenditures are included in 4.3 Vault Refurbishment and Modernization. ($573,000)
For 2016, portions of the Trunk Feeders project is clustered with the 2016 Transmission Line Rebuild Transmission project, since the relocation of the under-built distribution feeders is dependent upon the completion of the rebuild of transmission line 30L, and with the Additions Due to Load Growth and Substation Refurbishment and Modernization Substation projects, since the refurbishment of the distribution feeders is dependent upon the completion of necessary substation work.
21 A description of the project to rebuild transmission line 30L can be found in 3.1 2016 Transmission Line
Rebuild. 22 The multiyear project to rebuild transmission line 30L was approved in Order No. P.U. 40 (2014).

Schedule B 2016 Capital Projects – Normal Capital (Identified Need) NP 2016 CBA
Newfoundland Power Inc. – 2016 Capital Budget Application Page 49 of 98
Justification The project is justified based on the obligation to provide safe, least cost reliable service. Inspections of transmission line 30L have identified deterioration due to decay and vehicular damage, splits and checks in the poles, substandard crossarms and other hardware deficiencies. Many of these components are in advanced stages of deterioration and require replacement. As this transmission line supports distribution line infrastructure, it is necessary to relocate and rebuild those distribution lines when the transmission line support structures are replaced. The refurbishment and modernization of the underground vaults and the KBR distribution system will bring this infrastructure into compliance with current standards. Projected Expenditures Table 1 provides the breakdown of the proposed expenditures for 2016 and a projection of expenditures through 2020.
Table 1 Projected Expenditures
(000s)
Cost Category 2016 2017 2018 - 2020 Total
Material $299 - - - Labour – Internal 593 - - - Labour – Contract 330 - - - Engineering 107 - - - Other 278 - - - Total $1,607 $2,641 $8,502 $12,750
Costing Methodology The budget estimate is based on detailed engineering estimates. To ensure this project is completed at the lowest possible cost consistent with safe and reliable service, all material and contract labour will be obtained through competitive tendering. Future Commitments This is not a multi-year project.

Schedule B 2016 Capital Projects – Normal Capital (Identified Need) NP 2016 CBA
Newfoundland Power Inc. – 2016 Capital Budget Application Page 50 of 98
Project Title: Feeder Additions for Growth (Clustered) Project Cost: $1,708,000 Project Description This Distribution project consists of expenditures to address overload conditions and provide additional capacity to address growth in the number of customers and volume of energy deliveries. For 2016, the following proposed expenditures are required:
1. The upgrading of conductor on Pulpit Rock Substation feeder PUL-02 to address overloaded conductor on this distribution feeder. ($521,000)
2. The upgrading of a 1.2 km section of Ridge Road Substation feeder RRD-10 along Portugal Cove Road from single-phase to 3-phase in order to transfer customers from Virginia Water’s Substation feeder VIR-07 to distribution feeder RRD-10. This transfer is necessary to resolve an overloading condition on VIR-07 and provide additional capacity for continued load growth forecast for the St. John’s International Airport area. ($313,000)
3. The construction of a new feeder originating at Pulpit Rock Substation to accommodate growth in customers and load in the White Rose Drive and Hebron Way development area, located north of Stavanger Drive. ($504,000)
4. The construction of a new feeder originating at Bayview Substation to accommodate growth in customers and load in the City of Corner Brook. The power transformers at Humber Substation have reached their rated capacity. Through a series of voltage conversions on distribution feeders HUM-01 and HUM-07, customers and load will be transferred to the new Bayview distribution feeder, thereby offloading the Humber Substation power transformers. ($370,000)
Details on the proposed expenditures are included in 4.2 Feeder Additions for Load Growth. A portion of the Feeder Additions for Growth Distribution project is clustered with the Substation Feeder Terminations Substations project, since the installation of new distribution feeders at Bayview and Pulpit Rock substations is dependent upon the substation work necessary to terminate the new distribution feeders (Schedule B, page 21 of 98). Justification The project is justified based on the obligation to provide safe, least cost reliable service. Actual peak load conditions and customer growth indicate that this project is warranted in order to maintain the electrical system within recommended guidelines.

Schedule B 2016 Capital Projects – Normal Capital (Identified Need) NP 2016 CBA
Newfoundland Power Inc. – 2016 Capital Budget Application Page 51 of 98
Projected Expenditures Table 1 provides the breakdown of the proposed expenditures for 2016 and a projection of expenditures through 2020.
Table 1 Projected Expenditures
(000s)
Cost Category 2016 2017 2018 - 2020 Total
Material $246 - - - Labour – Internal 447 - - - Labour – Contract 569 - - - Engineering 134 - - - Other 312 - - - Total $1,708 $3,016 $6,654 $11,378
Costing Methodology The budget estimate is based on detailed engineering estimates of individual feeder requirements. To ensure this project is completed at the lowest possible cost consistent with safe and reliable service, all material and contract labour will be obtained through competitive tendering. Future Commitments This is not a multi-year project.

Schedule B 2016 Capital Projects – Normal Capital (Identified Need) NP 2016 CBA
Newfoundland Power Inc. – 2016 Capital Budget Application Page 52 of 98
Project Title: Distribution Reliability Initiative (Pooled) Project Cost: $1,463,000 Project Description This Distribution project involves the replacement of deteriorated poles, conductor and hardware to reduce both the frequency and duration of power interruptions to the customers served by specific distribution lines.23 The nature of the upgrading work follows from a detailed assessment of past service problems, knowledge of local environmental conditions (such as salt contamination, wind and ice loading), and engineering knowledge to apply location-specific design and construction standards. In the past, Newfoundland Power identified worst performing feeders on the basis of SAIDI, SAIFI and customer minutes.24 These indices rank reliability performance based on the customer impact of the outages. In 2012, the Canadian Electricity Association began capturing and reporting on 2 additional indices; CIKM and CHIKM. 25 These indices rank reliability performance based on the length of line experiencing outages and tend to be more reflective of asset condition. The Company has incorporated CIKM and CHIKM into its reliability analysis. The 2016 project involves work on feeders GFS-02, HWD-07 and SLA-09. Table 1 shows the number of customers affected and the average unscheduled interruption statistics by feeder for the 5-year period ending December 31, 2014. These statistics exclude planned power interruptions and interruptions due to all causes other than distribution system failure. An analysis of these feeders is contained in report 4.1 Distribution Reliability Initiative.
Table 1 Distribution Interruption Statistics
5-Years to December 31, 2013
Feeder Customers SAIFI SAIDI CHIKM CIKM GFS-02 1,645 2.42 3.01 447.0 364.2
HWD-07 2,580 1.85 2.31 239.2 197.1 SLA-09 960 2.74 6.27 469.7 162.5
Company Average 1.18 1.73 62.4 45.0
23 These feeders are sometimes referred to in the industry as worst performing feeders. 24 System Average Interruption Frequency Index (SAIFI) is calculated by dividing the number of customers that
have experienced an outage by the total number of customers in an area. System Average Interruption Duration Index (SAIDI) is calculated by dividing the number of customer-outage-hours (e.g., a two hour outage affecting 50 customers equals 100 customer-outage-hours) by the total number of customers in an area.
25 Customers Interrupted per Kilometer (CIKM) is calculated by dividing the number of customers that have experienced an outage by the kilometres of line. Customer Hours of Interruption per Kilometer (CHIKM) is calculated by dividing the number of customer-outage-hours by the kilometres of line.

Schedule B 2016 Capital Projects – Normal Capital (Identified Need) NP 2016 CBA
Newfoundland Power Inc. – 2016 Capital Budget Application Page 53 of 98
Justification This project is justified on the basis of the obligation to provide reliable electrical service. Individual feeder projects have been prioritized based on their historic interruption statistics. Customers supplied by these worst performing feeders experience power interruptions more often, or of longer duration, than the Company average, or experience power interruptions caused by the deteriorated condition of the distribution infrastructure. The Distribution Reliability Initiative project has had a positive impact on the reliability performance of the feeders that have been upgraded.26 Projected Expenditures Table 2 provides the breakdown of the proposed expenditures for 2016 and a projection of expenditures through 2020.
Table 2 Projected Expenditures
(000s)
Cost Category 2016 2017 2018 - 2020 Total
Material $281 - - - Labour – Internal 194 - - - Labour – Contract 540 - - - Engineering 126 - - - Other 322 - - - Total $1,463 $1,840 $7,520 $10,823
Costing Methodology The budget estimate is based on detailed engineering estimates of individual feeder requirements. To ensure this project is completed at the lowest possible cost consistent with safe and reliable service, all material and contract labour will be obtained through competitive tendering. Future Commitments This is not a multi-year project.
26 Chart 8 of the 2016 Capital Plan shows a 49% improvement in SAIDI and 48% improvement in SAIFI over the
period from 1999 to 2014.

Schedule B 2016 Capital Projects – Normal Capital (Identified Need) NP 2016 CBA
Newfoundland Power Inc. – 2016 Capital Budget Application Page 54 of 98
Project Title: Distribution Feeder Automation (Pooled) Project Cost: $565,000 Project Description This Distribution project is necessary to increase the level of automation in the Company’s distribution system. The project consists of expenditures to address remote control limitations in the distribution system. Increasing the level of automation in the distribution system will improve the Company’s capability to deal with cold load pickup and improved efficiency of restoration following both local and system wide outages.27 Installing automated reclosers on distribution feeders allows for the isolation of the section of feeder closest to the fault from the remainder of the customers upstream of the fault location. This will isolate the outage to only those customers closest to the fault location reducing the duration of the outage for customers upstream of the fault location. Increasing automation of distribution feeders will involve the addition of new equipment to the distribution system or the replacement of some older generation equipment in service with modern communications capable equipment. The increase in automation will include the addition of technologies such as automated downline reclosers and sectionalizing switches, sensors for voltage and load flow, and fault indicators. In 2016, the following distribution feeders have been identified for a downline automated recloser to be installed:
Avalon Peninsula Burin Peninsula Grand Falls St. John’s DUN-01 MSY-03 GFS-06 HWD-09 WAV-01 GFS-0628 KEN-04
OXP-01 Justification The project is justified based on the obligation to provide safe, least cost reliable service. Installing automated reclosers to sectionalize distribution feeders provides a greater degree of reliability in all operating conditions.
27 Increasing the level of automation in the distribution system is consistent with Recommendation 2.4 of
Liberty’s Report on Island Interconnected System to Interconnection with Muskrat Falls addressing Newfoundland Power.
28 This second location involves a single-phase recloser further downstream from the 1st 3-phase recloser.
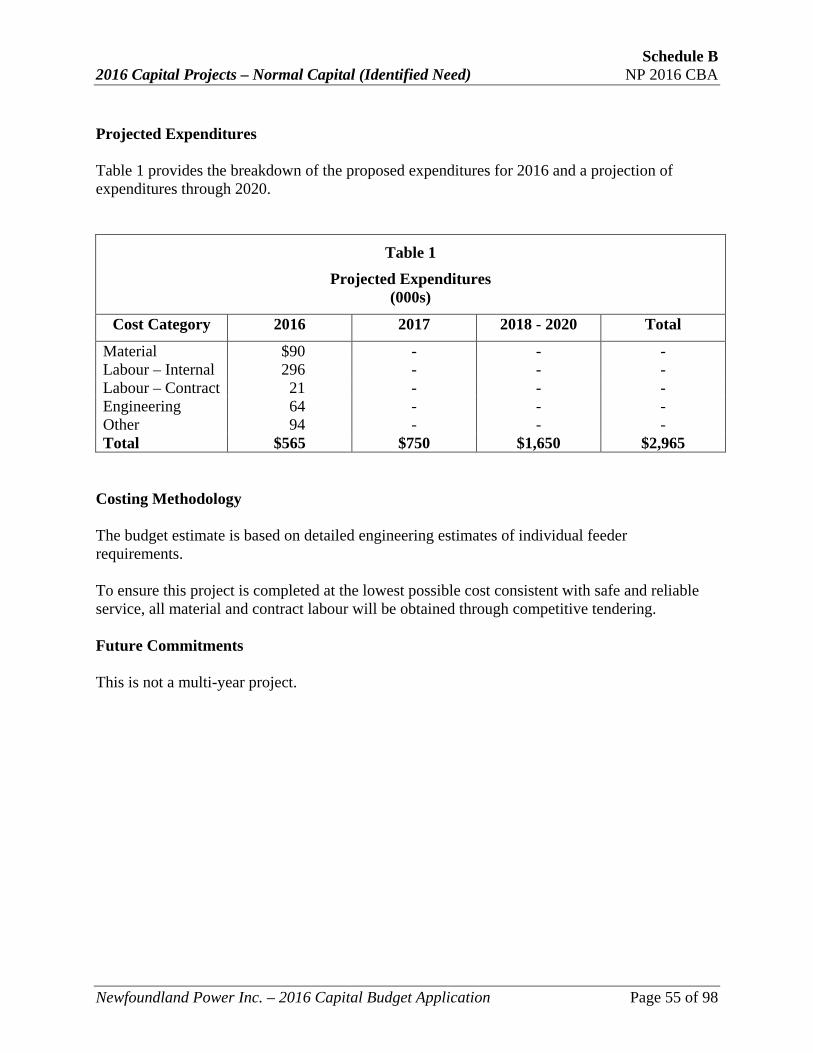
Schedule B 2016 Capital Projects – Normal Capital (Identified Need) NP 2016 CBA
Newfoundland Power Inc. – 2016 Capital Budget Application Page 55 of 98
Projected Expenditures Table 1 provides the breakdown of the proposed expenditures for 2016 and a projection of expenditures through 2020.
Table 1 Projected Expenditures
(000s)
Cost Category 2016 2017 2018 - 2020 Total
Material $90 - - - Labour – Internal 296 - - - Labour – Contract 21 - - - Engineering 64 - - - Other 94 - - - Total $565 $750 $1,650 $2,965
Costing Methodology The budget estimate is based on detailed engineering estimates of individual feeder requirements. To ensure this project is completed at the lowest possible cost consistent with safe and reliable service, all material and contract labour will be obtained through competitive tendering. Future Commitments This is not a multi-year project.

Schedule B 2016 Capital Projects – Normal Capital (Identified Need) NP 2016 CBA
Newfoundland Power Inc. – 2016 Capital Budget Application Page 56 of 98
Project Title: St. John’s Main Underground Refurbishment (Other, Multi-year) Project Cost: $1,950,000 Project Description This Distribution project consists of expenditures to address the refurbishment of underground distribution infrastructure originating from St. John’s Main (“SJM”) substation. The substation is located on Southside Road, just east of the Pitts Memorial Drive overpass. It supplies electricity to the area surrounding St. John’s harbour, including the downtown core of the City of St. John’s. The distribution system supplied from the SJM substation includes both overhead distribution feeders and an underground system that consists of a series of ductbanks, manholes, switches and cables.29 In 2010, the Company completed a planning study on the underground system and has completed a series of upgrade projects in the years since. The underground system supplying the St. John’s downtown core is approximately 40 years old, serving a dense population of large commercial customers. This underground system includes a major ductbank that exits the substation and runs under the Waterford River, containing the main trunks of 9 distribution feeders. The Company has completed an engineering assessment for alternatives to replace the ductbank from SJM Substation to Hutchings Street. Details on the proposed expenditures are included in 4.5 St. John’s Main Waterford River Ductbank Replacement. Justification The project is justified based on the obligation to provide safe, least cost reliable service. The assessment of the underground distribution infrastructure has identified deterioration due to decay and water. These ductbanks are approximately 40 years old and in advanced stages of deterioration. As these ductbanks supply distribution lines serving the St. John’s downtown core and its dense population of large commercial customers, they must be replaced to maintain reliable service going forward.
29 The St. John’s Main Planning Study was included as Attachment A to the report 4.2 Feeder Additions for Load
Growth included in the 2011 Capital Budget Application.

Schedule B 2016 Capital Projects – Normal Capital (Identified Need) NP 2016 CBA
Newfoundland Power Inc. – 2016 Capital Budget Application Page 57 of 98
Projected Expenditures Table 1 provides the breakdown of the proposed expenditures for 2016 and a projection of expenditures through 2020.
Table 1 Projected Expenditures
(000s)
Cost Category 2016 2017 2018 - 2020 Total
Material $1,503 $1,163 - $2,666 Labour – Internal 38 556 - 594 Labour – Contract - 70 - 70 Engineering 338 270 - 608 Other 71 381 - 452 Total $1,950 $2,440 $- $4,390
Costing Methodology The budget estimate is based on a detailed engineering estimate. To ensure this project is completed at the lowest possible cost consistent with safe and reliable service, all material and contract labour will be obtained through competitive tendering. Future Commitments This is a multi-year project to be completed in 2016 and 2017.

Schedule B 2016 Capital Projects – Normal Capital (Historical Pattern) NP 2016 CBA
Newfoundland Power Inc. – 2016 Capital Budget Application Page 58 of 98
Project Title: Allowance for Funds Used During Construction (Pooled) Project Cost: $206,000 Project Description This Distribution project is an allowance for funds used during construction (“AFUDC”) which will be charged on distribution work orders with an estimated expenditure of less than $50,000 and a construction period in excess of three months. Effective January 1, 2008, the Company calculates AFUDC in a manner consistent with Order No. P.U. 32 (2007). This method of calculating AFUDC is the mainstream practice for regulated Canadian utilities. Justification The AFUDC is justified on the same basis as the distribution work orders to which it relates. Projected Expenditures Table 1 provides the breakdown of the proposed expenditures for 2016 and a projection of expenditures through 2020.
Table 1 Projected Expenditures
(000s)
Cost Category 2016 2017 2018 - 2020 Total
Material - - - - Labour – Internal - - - - Labour – Contract - - - - Engineering - - - Other $206 - - - Total $206 $211 $657 $1,074

Schedule B 2016 Capital Projects – Normal Capital (Historical Pattern) NP 2016 CBA
Newfoundland Power Inc. – 2016 Capital Budget Application Page 59 of 98
Costing Methodology Table 2 shows the annual expenditures for the most recent five-year period.
Table 2 Expenditure History and Budget Estimate
(000s) Year 2011 2012 2013 2014 2015F Total $181 $192 $196 $208 $197
The budget estimate for AFUDC is based on an estimated $1.0 million monthly average of distribution work in progress and capital materials upon which the interest rate will be applied. The AFUDC rate is applied each month in accordance with Order No. P.U. 32 (2007). Future Commitments This is not a multi-year project.

Schedule B 2016 Capital Projects NP 2016 CBA
Newfoundland Power Inc. – 2016 Capital Budget Application Page 60 of 98
GENERAL PROPERTY

Schedule B 2016 Capital Projects – Normal Capital (Historical Pattern) NP 2016 CBA
Newfoundland Power Inc. – 2016 Capital Budget Application Page 61 of 98
Project Title: Tools and Equipment (Pooled) Project Cost: $682,000 Project Description This General Property project is necessary to add or replace tools and equipment used in providing safe, reliable electrical service. Users of tools and equipment include line staff, engineering technicians, engineers and electrical and mechanical tradespersons. The majority of these tools are used in normal day to day operations. As well, specialized tools and equipment are required to maintain, repair, diagnose or commission Company assets required to deliver service to customers. Most items within this project involve expenditures of less than $50,000. These items are consolidated into the following categories: 1. Operations Tools and Equipment ($129,000): This is the replacement of tools and equipment
used by line and field technical staff in the day to day operations of the Company. These tools are maintained on a regular basis. However, over time they degrade and wear out, especially hot line equipment which must meet rigorous safety requirements. Where appropriate, such tools will be replaced with battery and hydraulic alternatives to improve working conditions.
2. Engineering Tools and Equipment ($210,000): This item includes engineering test
equipment and tools used by electrical and mechanical maintenance personnel and engineering technicians. Engineering test equipment is required to perform system calibration, commissioning and testing of power system facilities and testing and analysis of associated data communications facilities.
3. Office Furniture ($133,000): This item includes the replacement of office furniture that has
deteriorated. The office furniture utilized by the Company’s employees deteriorates through normal use and must be replaced.
4. Substation Grounding Sticks ($25,000): This item involves the purchase of grounding sticks
for approximately 8 substations. Grounding sticks are required for the safe isolation of equipment to allow for maintenance, testing and troubleshooting. Multiple sets of grounding sticks are required at each substation.30
5. Tools for New Line Truck ($35,000): This item involves the purchase of tools and equipment
to be added to a new line truck after it has been delivered. These tools are required for line staff in the day to day operations of the Company.
30 A set of grounding sticks includes 3 individual grounding sticks, one for each of the 3 phases. Estimated cost
per set is $3,000.

Schedule B 2016 Capital Projects – Normal Capital (Historical Pattern) NP 2016 CBA
Newfoundland Power Inc. – 2016 Capital Budget Application Page 62 of 98
In 2016, the Company will purchase a load cell and associated transformer. This equipment is used with mobile generation when supplying single or 2-phase loads thereby presenting a balanced 3-phase load to the mobile generation. Historically the Company rented this equipment but the more frequent use in recent years makes the purchase of the equipment least cost.31 Individual requirements for the addition or replacement of tools and equipment are not inter-dependent. However, the expenditure requirements are similar in nature and justification. They are therefore pooled for consideration as a single capital project. Justification Suitable tools and equipment in good condition enable staff to perform work in a safe, effective and efficient manner. Additional or replacement tools are purchased to either maintain or improve quality of work and overall operational efficiency. Projected Expenditures Table 1 provides a breakdown of the proposed expenditures for 2016 and a projection of expenditures through 2020.
Table 1 Projected Expenditures
(000s)
Cost Category 2016 2017 2018 - 2020 Total
Material $682 - - - Labour – Internal - - - - Labour – Contract - - - - Engineering - - - - Other - - - - Total $682 $542 $1,752 $2,976
31 Over the 9-year period from 2006 to 2014 the Company has incurred approximately $202,000 in equipment
rental cost associated with the use of a load cell with mobile generation.

Schedule B 2016 Capital Projects – Normal Capital (Historical Pattern) NP 2016 CBA
Newfoundland Power Inc. – 2016 Capital Budget Application Page 63 of 98
Costing Methodology Table 2 shows the annual expenditures for this project for the most recent five-year period.
Table 2 Expenditure History
(000s)
Year 2011 2012 2013 2014 2015F Total $428 $449 $443 $440 $467
The project cost is based on an assessment of historical expenditures for the replacement of tools and equipment that become broken or worn out, and is adjusted for anticipated expenditure requirements for extraordinary items. The budget for this project is calculated on the basis of historical data respecting operations tools and equipment, engineering tools and equipment, and office furniture. The budget for the substation grounding sticks, tools for the new line truck and the load cell is based on an engineering estimate. To ensure consistency from year to year, expenditures related to large unplanned additions are excluded from the historical average calculation. To ensure this project is completed at the lowest possible cost consistent with safe and reliable service, all material and contract labour will be obtained through competitive tendering. Future Commitments This is not a multi-year project.

Schedule B 2016 Capital Projects – Normal Capital (Historical Pattern) NP 2016 CBA
Newfoundland Power Inc. – 2016 Capital Budget Application Page 64 of 98
Project Title: Additions to Real Property (Pooled) Project Cost: $434,000 Project Description This General Property project is necessary to ensure the continued safe operation of Company facilities and workplaces. The Company has in excess of 20 office and other buildings. There is an ongoing requirement to upgrade or replace equipment and facilities at these buildings due to failure or normal deterioration. Past expenditures have included such items as emergency roof replacement and correcting major drainage problems. The 2016 project consists of the upgrading, refurbishment or replacement of equipment and facilities due to organizational changes, damage, deterioration, corrosion and in-service failure. Based upon recent historical information, $334,000 is required for 2016. This project also includes corporate security upgrades to the Company’s security infrastructure, including improvements in surveillance, fencing and lighting of Company facilities. Based upon an engineering estimate, $100,000 is required for corporate security upgrades in 2016. The individual budget items are less than $50,000 each and are not inter-dependent. However, they are similar in nature and are therefore pooled for consideration as a single capital project. Justification This project is necessary to maintain buildings and support facilities and to operate them in a safe and efficient manner. Projected Expenditures Table 1 provides a breakdown of the proposed expenditures for 2016 and a projection of expenditures through 2020.
Table 1 Projected Expenditures
(000s)
Cost Category 2016 2017 2018 - 2020 Total
Material $351 - - - Labour – Internal 23 - - - Labour – Contract - - - - Engineering 42 - - - Other 18 - - - Total $434 $442 $1,169 $2,045

Schedule B 2016 Capital Projects – Normal Capital (Historical Pattern) NP 2016 CBA
Newfoundland Power Inc. – 2016 Capital Budget Application Page 65 of 98
Costing Methodology Table 2 shows the annual expenditures for this project for the most recent five-year period.
Table 2 Expenditure History
(000s)
Year 2011 2012 2013 2014 2015F Total $3111 $300 $4012 $2713 $2854
1 Excludes cost of security camera upgrades ($49,000) and Duffy Place office renovations ($63,000). 2 Excludes cost of parking lot resurfacing ($40,000) and Duffy Place truck bay doors replacement ($47,000). 3 Excludes corporate security upgrades ($96,000). 4 Excludes corporate security upgrades ($100,000). The budget for this project is calculated on the basis of historical data as well as engineering estimates for planned budget items as required. To ensure consistency from year to year, expenditures related to large unplanned additions are excluded from the historical average calculation. To ensure this project is completed at the lowest possible cost consistent with safe and reliable service, all material and contract labour will be obtained through competitive tendering. Future Commitments This is not a multi-year project.

Schedule B 2016 Capital Projects – Normal Capital (Identified Need) NP 2016 CBA
Newfoundland Power Inc. – 2016 Capital Budget Application Page 66 of 98
Project Title: Company Building Renovations – Duffy Place (Pooled, Multi-year) Project Cost: $724,000 Project Description This General Property project includes the renovation of the Company’s Duffy Place facility.32 The renovations are necessary to replace deteriorated building components necessary to ensure the continued safe operation of the facility, workplaces and surrounding property. The Duffy Place facility is now 26 years old and has reached an age where capital improvements are necessary to ensure it continues to provide safe and reliable service to employees and the public. Improvements are required in 2015 and 2016 to replace building components that have reached the end of their useful service life.33 The following items of this project are to be completed in 2016: 1. HVAC Replacement (2015 - $1,000,000, 2016 - $600,000). Replacement of the existing
Heating Ventilation and Air Conditioning (“HVAC”) system with an energy efficient ground source heat pump is planned for 2015 and 2016.
2. Building Interior (2015 - $182,000, 2016 - $124,000). The carpet in the office areas is original to the 1988 building construction and is in poor condition. Window treatment and wall coverings in many areas are also deteriorated. Upgrade of both is planned for 2016.
Details on the proposed expenditures were included in the 2015 Capital Budget Application report 5.1 Company Building Renovations‒Duffy Place Facility. The individual budget items are not inter-dependent. However, they are related from a construction perspective and are therefore pooled for consideration as a single capital project. Justification The project is justified on the age and the deterioration of the existing Company buildings. Justification for individual projects is based upon inspections completed by professional engineers or independent experts. The least cost justification for selecting the ground source
32 The Facility houses approximately 230 employees and the equipment necessary to support operations
throughout St. John’s Region’s service territory. This includes line crews, line inspectors, work dispatchers, regional engineering, meter reading and associated support and management staff. In addition, the Facility houses corporate functions such as stores warehouse, metering, customer service, information services, production center, generation maintenance, transportation and dispatch functions.
33 The 2-year project to renovate of the Duffy Place facility was approved in Order No. P.U. 40 (2014).

Schedule B 2016 Capital Projects – Normal Capital (Identified Need) NP 2016 CBA
Newfoundland Power Inc. – 2016 Capital Budget Application Page 67 of 98
heat pump alternative can be found in Appendix B of the 2015 Capital Budget Application report 5.1 Company Building Renovations‒Duffy Place Facility. Projected Expenditures Table 1 provides a breakdown of the proposed expenditures for 2015 and 2016 for this multi-year project. There are no expenditures projected beyond 2016.
Table 1 Multi-year Projected Expenditures
(000s)
Cost Category 2015 2016 2017 - 2020 Total
Material $1,824 $601 - $2,425 Labour – Internal 10 10 - 20 Labour – Contract - - - - Engineering 112 58 - 170 Other 122 55 - 177 Total $2,068 $724 - $2,792
Costing Methodology The budget estimate for this project is comprised of engineering estimates. To ensure this project is completed at the lowest possible cost consistent with safe and reliable service, all material and contract labour will be obtained through competitive tendering. Future Commitments This is a multi-year project to be completed in 2015 and 2016.

Schedule B 2016 Capital Projects NP 2016 CBA
Newfoundland Power Inc. – 2016 Capital Budget Application Page 68 of 98
TRANSPORTATION

Schedule B 2016 Capital Projects – Normal Capital (Identified Need) NP 2016 CBA
Newfoundland Power Inc. – 2016 Capital Budget Application Page 69 of 98
Project Title: Purchase Vehicles and Aerial Devices (Pooled) Project Cost: $3,258,000 Project Description This Transportation project involves the addition and necessary replacement of heavy fleet, passenger and off-road vehicles. Detailed evaluation of the units to be replaced indicates they have reached the end of their useful lives. Table 1 summarizes the units to be replaced in 2016.
Table 1
2016 Proposed Vehicle Replacements
Category No. of Units Heavy fleet vehicles 8 Passenger vehicles1 22 Off-road vehicles2 8 Total 38
1 The Passenger vehicles category includes the purchase of cars and light duty trucks. 2 The Off-road vehicles category includes snowmobiles, ATVs trailers and specialized mobile equipment. In 2016, there are 8 heavy fleet vehicles that meet the age, mileage and condition parameters which indicate replacement is necessary. In 2016, the Company has identified 22 passenger vehicles for replacement. The Company’s replacement criteria for vehicles is described in 5.1 Vehicle Replacement Criteria. This report also compares these criteria to those used by other Canadian electrical utilities and shows the current approach of the Company is (i) consistent with current Canadian utility practice and (ii) consistent with the least cost delivery of service to customers. The expenditures for individual vehicle replacements are not inter-dependent. However, they are similar in nature and justification. The expenditures are therefore pooled for consideration as a single capital project.

Schedule B 2016 Capital Projects – Normal Capital (Identified Need) NP 2016 CBA
Newfoundland Power Inc. – 2016 Capital Budget Application Page 70 of 98
Justification This project is justified on the basis of the need to replace existing vehicles and aerial devices that have reached the end of their useful service lives. Projected Expenditures Table 2 provides a breakdown of the proposed expenditures for 2016 and a projection of expenditures through 2020.
Table 2 Projected Expenditures
(000s)
Cost Category 2016 2017 2018 - 2020 Total
Material $3,258 - - - Labour – Internal - - - - Labour – Contract - - - - Engineering - - - - Other - - - - Total $3,258 $3,330 $11,869 $18,457
Table 3 shows the expenditures for this project for the most recent five-year period.
Table 3 Expenditure History
(000s)
Year 2011 2012 2013 2014 2015F Total $2,272 $2,514 $3,220 $2,872 $3,094

Schedule B 2016 Capital Projects – Normal Capital (Identified Need) NP 2016 CBA
Newfoundland Power Inc. – 2016 Capital Budget Application Page 71 of 98
Costing Methodology Newfoundland Power individually evaluates all vehicles considered for replacement according to a number of criteria to ensure replacement is the least cost option. Evaluation for replacement is initiated when individual vehicles reach a threshold age or level of usage. Heavy fleet vehicles are considered for replacement at 10 years of age or usage of 250,000 kilometres. For passenger vehicles, the guideline is 5 years of age or 150,000 kilometres. Vehicles reaching the threshold are evaluated on a number of criteria, such as overall condition, maintenance history and immediate repair requirements, to determine whether they have reached the end of their useful service lives. Based on such evaluations, it has been forecast that each unit proposed for replacement will reach the end of its useful life and require replacement in 2016. New vehicles are acquired through competitive tendering to ensure the lowest possible cost consistent with safe, reliable service. Future Commitments This is not a multi-year project.

Schedule B 2016 Capital Projects NP 2016 CBA
Newfoundland Power Inc. – 2016 Capital Budget Application Page 72 of 98
TELECOMMUNICATIONS

Schedule B 2016 Capital Projects – Normal Capital (Historical Pattern) NP 2016 CBA
Newfoundland Power Inc. – 2016 Capital Budget Application Page 73 of 98
Project Title: Replace/Upgrade Communications Equipment (Pooled) Project Cost: $105,000 Project Description This Telecommunications project is necessary to ensure the continued integrity of the Company’s operational voice systems and the remote monitoring and control of field devices. This, in turn, allows the Company to provide acceptable levels of customer service and operational efficiency. The 2016 project involves the replacement and/or upgrade of communications equipment, including radio communication equipment associated with electrical system operations and data communications equipment providing remote monitoring and control capabilities associated with the SCADA system. The Company has mobile radio, portable radio, base station radio and radio console equipment in service providing operational voice communications for field staff. The radio equipment is used for communications between (i) field staff working in multiple crews, (ii) field staff and operations centres, and (iii) field staff and the System Control Centre. Data communications equipment is used to link the monitoring and control technologies on distribution lines, in substations and hydro plants to the SCADA system at the System Control Centre. A variety of different technologies are used to provide these data communications links depending upon local conditions and available service offerings from telecommunications companies. The technologies used include land line communications, fibre optic communications and wireless communications. Over time this voice and data communications equipment fails in service, becomes obsolete or no longer supports the most cost effective service offering from telecommunications companies. As a result the equipment must be upgraded or replaced. The individual budget items are less than $50,000 each and are not inter-dependent. However, they are similar in nature and are therefore pooled for consideration as a single capital project. Justification This project is justified on the basis that reliable operational voice and data communications is necessary to provide reliable least cost service to customers. Projected Expenditures Table 1 provides a breakdown of the proposed expenditures for 2016 and a projection of expenditures through 2020.

Schedule B 2016 Capital Projects – Normal Capital (Historical Pattern) NP 2016 CBA
Newfoundland Power Inc. – 2016 Capital Budget Application Page 74 of 98
Table 1 Projected Expenditures
(000s)
Cost Category 2016 2017 2018 - 2020 Total
Material $65 - - - Labour – Internal 10 - - - Labour – Contract - - - - Engineering 20 - - - Other 10 - - - Total $105 $107 $337 $549
Costing Methodology Table 2 shows the annual expenditures and costs in current dollars for the most recent five-year period.
Table 2 Expenditure History
(000s) Year 2011 2012 2013 2014 2015F Total $88 $100 $82 $97 $123 Adjusted Cost $97 $107 $86 $99 $123
The process of estimating the budget requirement for communications equipment is based on a historical average. Historical annual expenditures related to upgrading and replacing communications equipment over the most recent five-year period, including the current year, expressed in current-year dollars (“Adjusted Costs”). The estimate for the budget year is calculated by taking the average of the Adjusted Costs and inflating it using the GDP Deflator for Canada to determine the budget estimate. To ensure consistency from year to year, expenditures related to planned projects are excluded from the calculation of the historical average. To ensure this project is completed at the lowest possible cost consistent with safe and reliable service, all material and contract labour will be obtained through competitive tendering. Future Commitments This is not a multi-year project.

Schedule B 2016 Capital Projects – Normal Capital (Identified Need) NP 2016 CBA
Newfoundland Power Inc. – 2016 Capital Budget Application Page 75 of 98
Project Title: Fibre Optic Network (Pooled) Project Cost: $409,000 Project Description This Telecommunications project involves the addition of two new fibre optic links in the Company’s St. John’s network and the construction of the first link in the fibre optic network connecting its substations and office in the City of Corner Brook. The Company currently operates more than 36 fibre optic links. These fibre optic links are used for corporate data, substation, voice and SCADA communications, protective relay communications as well as data communications between Newfoundland Power’s and Newfoundland and Labrador Hydro’s control centres.34 In 2016, the Company will install two new fibre cable links from Hardwoods Substation to Kenmount Substation and from Kenmount Substation to the Duffy Place building to expand its St. John’s network. These fibre optic links are required to provide route diversity and to provide additional capacity in the existing network connecting the System Control Centre to the remainder of the corporate network. In 2016, the Company will build a fibre optic cable link between Massey Drive substation and Bayview substation.35 Included in the Company’s 5-year Substation Refurbishment and Modernization project plan, the protection system on the 66 kV transmission lines interconnecting the 4 Corner Brook substations will be upgraded. As part of this protection upgrade, the Company will undertake a program to install fibre optic cables between all 4 substations in the City of Corner Brook. Details on the proposed expenditures are contained in 6.1 2016 Fibre Optic Cable Builds. The individual budget items are similar in nature and are therefore pooled for consideration as a single capital project.
34 The Company’s fibre optic network in St. John’s includes a cable to Newfoundland and Labrador Hydro’s
Energy Management Centre. This fibre cable carries the Inter Control Centre Protocol (“ICCP”) link which is used to exchange real-time power system data between the 2 SCADA systems.
35 This fibre optic link will pass through the Maple Valley office to allow for the connection of corporate and SCADA data traffic to these substations thereby reducing the number of leased circuits used for SCADA communications in Corner Brook.

Schedule B 2016 Capital Projects – Normal Capital (Identified Need) NP 2016 CBA
Newfoundland Power Inc. – 2016 Capital Budget Application Page 76 of 98
Justification Reliable communications equipment is essential to the provision of safe, reliable electrical service. Fibre optic cables are used to provide communications between digital protective relays in selected substations. The communication established between relays monitors the substation equipment at both ends of the associated transmission lines interconnecting the substations, protecting employees and the public from energized failures of transmission line infrastructure. Also, the fibre optic cables provide SCADA communications between the substations and the System Control Centre allowing for the remote monitoring and control of all critical substation equipment. The communications transmitted by the fibre optic cables, for both protection and remote control functionality, are essential for the provision of safe and reliable service to customers. Projected Expenditures Table 1 provides a breakdown of the proposed expenditures for 2016 and a projection of expenditures through 2020.
Table 1 Projected Expenditures
(000s)
Cost Category 2016 2017 2018 - 2020 Total
Material $328 - - - Labour – Internal 14 - - - Labour – Contract - - - - Engineering 51 - - - Other 16 - - - Total $409 $327 $512 $1,248
Costing Methodology The budget for this project is based on an engineering cost estimate. To ensure this project is completed at the lowest possible cost consistent with safe and reliable service, all material and contract labour will be obtained through competitive tendering. Future Commitments This is not a multi-year project.

Schedule B 2016 Capital Projects NP 2016 CBA
Newfoundland Power Inc. – 2016 Capital Budget Application Page 77 of 98
INFORMATION SYSTEMS

Schedule B 2016 Capital Projects – Justifiable (Identified Need) NP 2016 CBA
Newfoundland Power Inc. – 2016 Capital Budget Application Page 78 of 98
Project Title: Application Enhancements (Pooled) Project Cost: $1,143,000 Project Description This Information Systems project is necessary to enhance the functionality of software applications. The Company’s software applications are used to support all aspects of business operations including provision of service to customers, ensuring the effective operation of the electrical system and compliance with regulatory and financial reporting requirements. The application enhancements proposed in 2016 include enhancements to the Company’s payroll system, vehicle inspection management, and Customer Service Internet and energy conservation website enhancements. The application enhancements proposed for 2016 are not inter-dependent. But, they are similar in nature and justification and are therefore pooled for consideration as a single capital project. Details on proposed expenditures are included in 6.1 2016 Application Enhancements. Justification The proposed enhancements included in this project are justified on the basis of improving customer service and operational efficiencies. Cost benefit analyses, where appropriate, are provided in 6.1 2016 Application Enhancements.

Schedule B 2016 Capital Projects – Justifiable (Identified Need) NP 2016 CBA
Newfoundland Power Inc. – 2016 Capital Budget Application Page 79 of 98
Projected Expenditures Table 1 provides a breakdown of the proposed expenditures for 2016 and a projection of expenditures through 2020.
Table 1 Projected Expenditures
(000s)
Cost Category 2016 2017 2018 - 2020 Total
Material $95 - - - Labour – Internal 753 - - - Labour – Contract - - - - Engineering - - - - Other 295 - - - Total $1,143 $1,450 $2,500 $5,093
Costing Methodology Table 2 shows the annual expenditures for this project for the most recent five-year period.
Table 2 Expenditure History
(000s)
Year 2011 2012 2013 2014 2015F Total $1,003 $1,102 $1,473 $1,382 $1,325
The budget for this project is based on cost estimates for the individual budget items. All materials and services for this project will be purchased after examining the competitive bids of prospective suppliers. Where alternative suppliers do not exist, all materials and services will be negotiated with a sole-source supplier to ensure least cost. Future Commitments This is not a multi-year project.

Schedule B 2016 Capital Projects – Normal Capital (Identified Need) NP 2016 CBA
Newfoundland Power Inc. – 2016 Capital Budget Application Page 80 of 98
Project Title: System Upgrades (Pooled) Project Cost: $1,718,000 Project Description This Information Systems project involves necessary upgrades to the computer software underlying the Company’s business applications. Most upgrades are necessary to address known software issues, to facilitate infrastructure upgrades or to maintain vendor support. For 2016, the project includes upgrades to the Company’s business applications including the contact centre technology including the automatic call distribution infrastructure, workforce management application and email management application, and electrical system drawing application. This project also includes the Microsoft Enterprise Agreement. This Agreement covers the purchase of Microsoft software and provides access to the latest versions of each software product purchased under this agreement. Details on the multi-year expenditure associated with the Microsoft Enterprise Agreement are included in Schedule C to this Application. Details on proposed expenditures are included in 6.2 2016 System Upgrades. Justification This project is justified on the basis of maintaining current levels of customer service and operational efficiency supported by the software.

Schedule B 2016 Capital Projects – Normal Capital (Identified Need) NP 2016 CBA
Newfoundland Power Inc. – 2016 Capital Budget Application Page 81 of 98
Projected Expenditures Table 1 provides a breakdown of the proposed expenditures for 2016 and a projection of expenditures through 2020.
Table 1 Projected Expenditures
(000s)
Cost Category 2016 2017 2018 - 2020 Total
Material $626 - - - Labour – Internal 760 - - - Labour – Contract - - - - Engineering - - - - Other 332 - - - Total $1,718 $1,395 $4,600 $7,713
Costing Methodology Table 2 shows the annual expenditures and unit costs for this project for the most recent five-year period.
Table 2 Expenditure History
(000s)
Year 2011 2012 2013 2014 2015F Total $853 $1,363 $1,269 $1,066 $1,125
The budget for this project is based on cost estimates for the individual budget items. All materials and services for this project will be purchased after examining the competitive bids of prospective suppliers. Where alternative suppliers do not exist, all materials and services will be negotiated with a sole-source supplier to ensure least cost. Future Commitments This project includes provision in 2015 for the Microsoft Enterprise Agreement, which was approved as a multi-year project in Order No. P.U. 40 (2014). This is not otherwise a multi-year project.

Schedule B 2016 Capital Projects – Normal Capital (Identified Need) NP 2016 CBA
Newfoundland Power Inc. – 2016 Capital Budget Application Page 82 of 98
Project Title: Personal Computer Infrastructure (Pooled) Project Cost: $465,000 Project Description This Information Systems project is necessary for the replacement or upgrade of personal computers (“PCs”), printers and associated assets that have reached the end of their useful lives. In 2016, a total of 181 PCs will be purchased, consisting of 122 desktop computers and 59 mobile computers. This project also includes the purchase of peripheral equipment such as monitors, mobile devices, and printers to replace existing units that have reached the end of their useful life. The individual PCs and peripheral equipment are not inter-dependent. However, they are similar in nature and justification, and are therefore pooled for consideration as a single capital project. Specifications for replacement PCs and peripheral equipment are reviewed annually to ensure the personal computing infrastructure remains effective. Industry best practices, technology trends, and the Company’s experience are considered when establishing specifications. Newfoundland Power is currently able to achieve an approximate 5-year life cycle for its PCs before they require replacement. Table 1 outlines the PC additions and retirements for 2014 and 2015, as well as the proposed additions and retirements for 2016.
Table 1 PC Additions and Retirements
2014 – 2016B
2014 2015F 2016B Add Retire Total Add Retire Total Add Retire Total Desktop 79 79 453 102 95 460 122 164 418 Mobile 64 64 308 70 70 308 59 17 350 Total 143 143 761 172 165 768 181 181 768

Schedule B 2016 Capital Projects – Normal Capital (Identified Need) NP 2016 CBA
Newfoundland Power Inc. – 2016 Capital Budget Application Page 83 of 98
Justification This project is justified on the basis of the need to replace personal computers and associated equipment that have reached the end of their useful life. Projected Expenditures Table 2 provides a breakdown of the proposed expenditures for 2016 and a projection of expenditures through 2020.
Table 2 Projected Expenditures
(000s)
Cost Category 2016 2017 2018 - 2020 Total
Material $325 - - - Labour – Internal 98 - - - Labour – Contract - - - - Engineering - - - - Other 42 - - - Total $465 $500 $1,500 $2,465
Costing Methodology Table 3 shows the annual expenditures for this project for the most recent five-year period.
Table 3 Expenditure History
(000s)
Year 2011 2012 2013 2014 2015F Total $423 $401 $411 $455 $487
The project cost for this project is calculated on the basis of historical expenditures and on cost estimates for the individual budget items. Historical annual expenditures over the most recent three-year period are considered and an approximate unit cost is determined based on historical average prices and a consideration of pricing trends. These unit costs are then multiplied by the quantity of units (i.e. desktop, mobile, printer, etc.) to be purchased. Quantities are forecast by identifying the number of unit replacements resulting from lifecycle retirements and the number of new units required to accommodate new software applications or work methods. Once the

Schedule B 2016 Capital Projects – Normal Capital (Identified Need) NP 2016 CBA
Newfoundland Power Inc. – 2016 Capital Budget Application Page 84 of 98
unit price estimates and quantities have been determined, the work associated with the procurement and installation of the units is estimated based on experience and historical pricing. To ensure this project is completed at the lowest possible cost consistent with safe and reliable service, all materials and services for this project will be purchased after examining the competitive bids of prospective suppliers. Future Commitments This is not a multi-year project.

Schedule B 2016 Capital Projects – Normal Capital (Identified Need) NP 2016 CBA
Newfoundland Power Inc. – 2016 Capital Budget Application Page 85 of 98
Project Title: Shared Server Infrastructure (Pooled) Project Cost: $916,000 Project Description This Information Systems project includes the procurement, implementation, and management of the hardware and software relating to the operation of shared servers. Shared servers are computers that support applications used by multiple employees. Management of these shared servers, and their components, is critical to ensuring that these applications operate effectively at all times. This project is necessary to maintain current performance of the Company’s shared servers and to provide the additional infrastructure needed to accommodate new and existing applications. This involves the replacement and upgrade of servers, disk storage, as well as security upgrades. For 2016, the project includes the replacement of technology infrastructure that has reached the end of their useful life, expanded video conferencing technology, as well as infrastructure required to ensure the security of customer and corporate information. Projects proposed for 2016 include:
1. The replacement of shared server infrastructure that hosts the Company’s data retention, backup and recovery application;
2. The replacement of shared server infrastructure that hosts the Company’s regional computing requirements (9 area office locations) that has reached the end of useful life;
3. The expansion of shared server infrastructure that is used to provide video-conferencing capabilities to Company locations that currently do not have this capability;
4. The installation of new security management infrastructure including software to protect the Company’s customer-facing internet applications and data from malicious damage and software to further reduce the potential threat from external malware on shared servers and Company personal computers; and
5. The replacement of workgroup printing infrastructure that has reached the end of useful life.
The shared server infrastructure requirements for 2016 are not inter-dependent. However, they are similar in nature and justification, and are therefore pooled for consideration as a single capital project. Details on proposed expenditures are included in 6.3 2016 Shared Server Infrastructure.

Schedule B 2016 Capital Projects – Normal Capital (Identified Need) NP 2016 CBA
Newfoundland Power Inc. – 2016 Capital Budget Application Page 86 of 98
Justification This project is justified on the basis of maintaining current levels of customer service and operational efficiencies that are supported by the Company’s shared server infrastructure. Projected Expenditures Table 1 provides a breakdown of the proposed expenditures for 2016 and a projection of expenditures through 2020.
Table 1 Projected Expenditures
(000s)
Cost Category 2016 2017 2018 - 2020 Total
Material $650 - - - Labour – Internal 196 - - - Labour – Contract - - - - Engineering - - - - Other 70 - - - Total $916 $650 $2,150 $3,716
Costing Methodology Table 2 shows the annual expenditures for this project for the most recent five-year period.
Table 2 Expenditure History
(000s)
Year 2011 2012 2013 2014 2015F Total $941 $687 $941 $832 $970
The budget for this project is based on cost estimates for the individual budget items. All materials and services for this project will be purchased after examining the competitive bids of prospective suppliers. Where alternative suppliers do not exist, all materials and services will be negotiated with a sole-source supplier to ensure least cost. Future Commitments This is not a multi-year project.

Schedule B 2016 Capital Projects – Normal Capital (Identified Need) NP 2016 CBA
Newfoundland Power Inc. – 2016 Capital Budget Application Page 87 of 98
Project Title: Network Infrastructure (Pooled) Project Cost: $294,000 Project Description This Information Systems project involves the addition of network components that provide employees with access to applications and data in order to provide service to customers and to operate efficiently. Network components such as routers and switches interconnect shared servers and personal computers across the Company, enabling the transport of SCADA data, corporate and customer service data. The Company has increased its use of wireless communications technologies in recent years. For 2016, this project includes the purchase and implementation of network equipment that has reached the end of useful life and to increase overall network availability and disaster recovery capabilities. The individual network infrastructure requirements for 2016 are not inter-dependent. However, they are similar in nature and justification, and are therefore pooled for consideration as a single capital project. Justification The reliability and availability of the network infrastructure is critical to enabling the Company to continue to provide least cost, reliable service to customers. This project will replace components of the network equipment that facilitate communication between all of the Company’s shared servers and related applications. These components have reached the end of their useful lives. This project is necessary to ensure the continued integrity of Company and customer data. This, in turn, allows the maintenance of acceptable levels of customer service and operational efficiency.

Schedule B 2016 Capital Projects – Normal Capital (Identified Need) NP 2016 CBA
Newfoundland Power Inc. – 2016 Capital Budget Application Page 88 of 98
Projected Expenditures Table 1 provides a breakdown of the proposed expenditures for 2016 and a projection of expenditures through 2020.
Table 1 Projected Expenditures
(000s)
Cost Category 2016 2017 2018 - 2020 Total
Material $195 - - - Labour – Internal 74 - - - Labour – Contract - - - - Engineering - - - - Other 25 - - - Total $294 $300 $900 $1,494
Costing Methodology Table 2 shows the annual expenditures for this project for the most recent five-year period.
Table 2 Expenditure History
(000s)
Year 2011 2012 2013 2014 2015F Total $158 $429 $218 $345 $328
The budget for this project is based on cost estimates for the individual budget items based on past experiences and pricing. All materials and services for this project will be purchased after examining the competitive bids of prospective suppliers. Where alternative suppliers do not exist, all materials and services will be negotiated with a sole-source supplier to ensure least cost. Future Commitments This is not a multi-year project.

Schedule B 2016 Capital Projects – Normal Capital (Identified Need) NP 2016 CBA
Newfoundland Power Inc. – 2016 Capital Budget Application Page 89 of 98
Project Title: SCADA System Replacement (Other, Multi-year) Project Cost: $2,842,000 Project Description The Supervisory Control and Data Acquisition (“SCADA”) System remotely monitors and controls the electricity system from a central location operated 24 hours a day.36 The replacement of the SCADA System is necessary at this time due to the technical obsolescence of the operating system and server hardware platform on which the SCADA application operates. Also, the existing SCADA application will not be upgraded by the vendor to operate on a supported operating system and server hardware platform. Therefore, the Company must proceed to replace the existing SCADA system. The Company proposes to replace the SCADA system as a multi-year project starting in 2015. The project will be completed in 2 years at an estimated cost of $5.7 million.37 The project will involve the acquisition, installation, configuration, testing and deployment of an upgraded SCADA application to ensure the system continues to support Company operations. This includes the conversion and migration of SCADA components such as databases, operator displays, reporting environment and custom applications to the new platform Details on proposed expenditures are included in the 2015 Capital Budget Application in report 6.4 SCADA System Replacement. Justification This project is justified on the basis that the SCADA system is a critical operational technology necessary to provide reliable least cost service to customers. This project is necessary to ensure the continued integrity of the Company’s remote monitoring and control capabilities. This, in turn, allows the maintenance of acceptable levels of customer service and operational efficiency.
36 The SCADA system remotely monitors and controls 71 substations, 25 hydro generators, 2 gas turbines, 187
distribution feeders and 78 power transformers. In total there are approximately 40,000 individual data points monitored and controlled through the SCADA system.
37 The 2-year project to replace the SCADA system was approved in Order No. P.U. 40 (2014).

Schedule B 2016 Capital Projects – Normal Capital (Identified Need) NP 2016 CBA
Newfoundland Power Inc. – 2016 Capital Budget Application Page 90 of 98
Projected Expenditures Table 1 provides a breakdown of the proposed expenditures for 2015 and 2016 and a projection of expenditures through 2020.
Table 1 Multi-year Projected Expenditures
(000s)
Cost Category 2015 2016 2017 - 2020 Total
Material $2,338 $2,309 - $4,647 Labour – Internal 158 156 - 314 Labour – Contract - - - - Engineering 294 332 - 626 Other 43 45 - 88 Total $2,833 $2,842 - $5,675
Costing Methodology The budget for this project is based on cost estimates for the individual budget items based on an engineering assessment completed by an expert in SCADA system replacement. All materials and services for this project will be purchased after examining the competitive bids of prospective suppliers. Future Commitments This is a multi-year project to be completed in 2015 and 2016.

Schedule B 2016 Capital Projects – Justifiable (Identified Need) NP 2016 CBA
Newfoundland Power Inc. – 2016 Capital Budget Application Page 91 of 98
Project Title: Geographic Information System Improvements (Other) Project Cost: $482,000 Project Description This Information Systems project involves expanding the GIS database to include information about customer location and electrical connectivity.38 Newfoundland Power operates approximately 300 distribution feeders, representing over 9,800 kilometres of distribution lines. It is important that accurate records of the current state of the electrical system be made available to field and technical employees at all times. The Company’s geographical information system (GIS) provides a central database for storage of distribution asset information. This enables information to be updated and available in a more efficient and timely manner, and also reduces the inherent inefficiencies that exist with maintaining multiple systems. Details on proposed expenditures were included in the 2015 Capital Budget Application in report 6.5 Geographic Information System Improvements. Justification This project is justified on the basis that GIS technology is an important tool in improving customer service and overall efficiency in the Company’s field operations. Providing improved functionality to crews in the field, and integrating the GIS with other key systems such as the customer service system, will help improve data management, eliminate redundancies and enhance decision making abilities. The proposed improvements included in this project are justified on the basis of improving customer service and operational efficiencies. Net Present Value analysis for the proposed improvements can be found in Appendix B of the 2015 Capital Budget Application report 6.5 Geographical Information System Improvements.
38 The collection of customer premise information and tying the location into the distribution network was started
in 2015. When completed, the GIS database will include customer locations relative to devices on the distribution network. This information will be used in the future by the replacement outage management system to identify customers impacted by distribution system outages.

Schedule B 2016 Capital Projects – Justifiable (Identified Need) NP 2016 CBA
Newfoundland Power Inc. – 2016 Capital Budget Application Page 92 of 98
Projected Expenditures Table 1 provides a breakdown of the proposed expenditures for 2016 and a projection of expenditures through 2020.
Table 1 Projected Expenditures
(000s)
Cost Category 2016 2017 2018 - 2020 Total
Material $20 - - - Labour – Internal 382 - - - Labour – Contract - - - - Engineering - - - - Other 80 - - - Total $482 $200 - $682
Costing Methodology The budget for this project is based on cost estimates for the individual budget items based on past experiences and pricing. All materials and services for this project will be purchased after examining the competitive bids of prospective suppliers. Future Commitments This is not a multi-year project. Expenditures for projects in future years will be presented in future Capital Budget Applications.

Schedule B 2016 Capital Projects – Normal Capital (Identified Need) NP 2016 CBA
Newfoundland Power Inc. – 2016 Capital Budget Application Page 93 of 98
Project Title: Outage Management System (Other, Multi-year) Project Cost: $149,000 Project Description In 2016, the Company will undertake a multiyear project to replace its existing outage management system (“OMS”) with a commercially available system.39 The OMS replacement will follow the installation of the Company’s replacement SCADA system in 2016. The OMS will be integrated with both the SCADA and GIS systems. This integration will provide improved response capability, including customer response, to major system events. Newfoundland Power operates over 300 distribution feeders, with approximately 9,800 kilometres of distribution lines, serving approximately 260,000 customers. The Company’s OMS was developed internally and has performed as expected since it was created in 2003. It is functionally obsolescent and at the end of its expected service life. Details on proposed expenditures are included in 6.4 Outage Management System Replacement. Justification The replacement OMS is an important tool in improving customer service and overall efficiency in the Company’s field operations. Providing accurate outage data will allow for efficient power restoration and improved customer service. This project is justified on maintaining acceptable levels of customer service.
39 Conclusion 6.4 of Liberty’s Report on Island Interconnected System to Interconnection with Muskrat Falls
addressing Newfoundland Power, December 17, 2014 indicated that Newfoundland Power’s “Outage Management System has served adequately, but the Company is appropriately moving to a commercially provided replacement.”

Schedule B 2016 Capital Projects – Normal Capital (Identified Need) NP 2016 CBA
Newfoundland Power Inc. – 2016 Capital Budget Application Page 94 of 98
Projected Expenditures Table 1 provides a breakdown of the proposed expenditures for 2016 and 2017, and a projection of expenditures through 2020.
Table 1 Projected Expenditures
(000s)
Cost Category 2016 2017 2018 - 2020 Total
Material $15 320 - - Labour – Internal 49 380 - - Labour – Contract - - - - Engineering - - - - Other 85 100 - - Total $149 $800 - $949
Costing Methodology The budget for this project is based on cost estimates for the individual budget items based on past experiences and pricing. All materials and services for this project will be purchased after examining the competitive bids of prospective suppliers. Future Commitments This is a multi-year project to be completed in 2016 and 2017.

Schedule B 2016 Capital Projects NP 2016 CBA
Newfoundland Power Inc. – 2016 Capital Budget Application Page 95 of 98
UNFORESEEN ALLOWANCE

Schedule B 2016 Capital Projects – Normal Capital (Historical Pattern) NP 2016 CBA
Newfoundland Power Inc. – 2016 Capital Budget Application Page 96 of 98
Project Title: Allowance for Unforeseen Items (Other) Project Cost: $750,000 Project Description This Allowance for Unforeseen Items project is necessary to permit unforeseen capital expenditures which have not been budgeted elsewhere. The purpose of the account is to permit the Company to act expeditiously to respond to events affecting the electrical system in advance of seeking specific approval of the Board. Examples of such expenditures are the replacement of facilities and equipment due to major storm damages or equipment failure. While the contingencies for which this budget allowance is intended may be unrelated, it is appropriate that the entire allowance be considered as a single capital budget item. Justification This project provides funds for timely service restoration in accordance with Section B Supplementary Capital Budget Expenditures of the Capital Budget Application Guidelines. Projects for which these funds are intended are justified on the basis of reliability, or on the need to immediately replace deteriorated or damaged equipment. Costing Methodology An allowance of $750,000 for unforeseen capital expenditures has been included in all of Newfoundland Power’s capital budgets in recent years. If the balance in the Allowance for Unforeseen Items is depleted in the year, the Company may be required to file an application for approval of an additional amount in accordance with the Capital Budget Application Guidelines. Future Commitment This is not a multi-year project.

Schedule B 2016 Capital Projects NP 2016 CBA
Newfoundland Power Inc. – 2016 Capital Budget Application Page 97 of 98
GENERAL EXPENSES CAPITALIZED

Schedule B 2016 Capital Projects – Normal Capital (Historical Pattern) NP 2016 CBA
Newfoundland Power Inc. – 2016 Capital Budget Application Page 98 of 98
Project Title: General Expenses Capitalized (Other) Project Cost: $4,500,000 Project Description General Expenses Capitalized (“GEC”) are general expenses of Newfoundland Power that are capitalized due to the fact that they are related, directly or indirectly, to the Company’s capital projects. GEC includes amounts from two sources: direct charges to GEC and amounts allocated from specific operating accounts. Justification Certain of Newfoundland Power’s general expenses are related, either directly or indirectly, to the Company’s capital program. Expenses are charged to GEC in accordance with guidelines approved by the Board in Order No. P.U. 3 (1995-96). Costing Methodology In Order No. P.U. 3 (1995-96), the Board approved guidelines to determine the expenses of the Company to be included in GEC. The budget estimate of GEC is determined in accordance with pre-determined percentage allocations to GEC based on the guidelines approved by the Board. Future Commitment This is not a multi-year project.

Schedule C Multi-Year Projects NP 2016 CBA
Newfoundland Power Inc. – 2016 Capital Budget Application Page 1 of 2
Newfoundland Power Inc.
2016 Capital Budget Multi-Year Projects Approved in Previous Years
Class Project Description CBA/
Board Order Expenditure (000s) 2015 2016 2017 2018 Total
Generation Pierre’s Brook Plant Penstock and Surge Tank 1
2015 CBA P.U. 40 (2014)
Approved $750 $13,530 $14,280
Forecast $750 $13,530 $14,280 Transmission Transmission Line Rebuild2 2015 CBA
P.U. 40 (2014) Approved $2,510 $2,318 $4,828
Forecast $2,510 $2,645 $5,155 General Property
Company Building Renovations Duffy Place Building3
2015 CBA P.U. 40 (2014)
Approved $2,068 $724 $2,792
Forecast $2,068 $724 $2,792 Information Systems
SCADA System Replacement4 2015 CBA P.U. 40 (2014)
Approved $2,833 $2,842 $5,675
Forecast $2,833 $2,842 $5,675 Information Systems
Microsoft Enterprise Agreement5
2015 CBA P.U. 40 (2014)
Approved $195 $195 $195 $585
Forecast $195 $195 $195 $585
1 A detailed project description can be found in the 2015 Capital Budget Application, Schedule B pages 6 and 7, and report 1.2 Pierre’s Brook Hydro Plant. 2 A detailed project description can be found in the 2015 Capital Budget Application, Schedule B pages 25 to 27, and report 3.1 2015 Transmission Line Rebuild. 3 A detailed project description can be found in the 2015 Capital Budget Application, Schedule B pages 69 and 70, and report 5.1 Company Building Renovations – Duffy Place
Facility. 4 A detailed project description can be found in the 2015 Capital Budget Application, Schedule B pages 90 and 91, and report 6.4 SCADA System Replacement. 5 A detailed project description can be found in the 2015 Capital Budget Application, Schedule B pages 81 and 82, and report 6.2 2015 System Upgrades.

Schedule C Multi-Year Projects NP 2016 CBA
Newfoundland Power Inc. – 2016 Capital Budget Application Page 2 of 2
Newfoundland Power Inc. 2016 Capital Budget
Multi-Year Projects Commencing in 2016
Class Project Description CBA/
Board Order Expenditure (000s) 2015 2016 2017 2018 Total
Distribution SJM Waterford River Ductbank Replacement 6
2016 CBA
Budget $1,950 $2,440 $4,390
Transmission Transmission Line Rebuild7 2016 CBA
Budget $1,521 $1,717 $3,238
Information Systems
Outage Management System8 Replacement
2016 CBA
Budget $149 $800 $949
6 A detailed project description can be found in the 2016 Capital Budget Application, Schedule B pages 56 and 57, and report 4.5 St. John’s Main Waterford River Ductbank
Replacement. 7 A detailed project description can be found in the 2016 Capital Budget Application, Schedule B pages 24 to 26, and report 3.1 2016 Transmission Line Rebuild. 8 A detailed project description can be found in the 2016 Capital Budget Application, Schedule B pages 93 and 94, and report 6.4 Outage Management System Replacement.

Schedule D Computation of Average Rate Base NP 2016 CBA
Newfoundland Power Inc. – 2016 Capital Budget Application Page 1 of 1
Newfoundland Power Inc. Computation of Average Rate Base For The Years Ended December 31
($000's)
2014
2013
Net Plant Investment
Plant Investment
1,592,616
1,501,729
Accumulated Amortization
(645,826)
(623,645)
Contributions in Aid of Construction
(33,701)
(31,911)
913,089
846,173 Additions to Rate Base
Deferred Pension Costs
103,939
101,159
Credit Facility Costs1
72
-
Cost Recovery Deferral – Seasonal/TOD Rates
68
95
Cost Recovery Deferral – Hearing Costs
322
644
Cost Recovery Deferral – Regulatory Amortizations
1,107
2,214
Cost Recovery Deferral – 2012 Cost of Capital
588
1,177
Cost Recovery Deferral – 2013 Revenue Shortfall 1,126 2,252
Cost Recovery Deferral – Conservation
4,937
2,085
Customer Finance Programs
1,136
1,363
113,295
110,989
Deductions from Rate Base
Weather Normalization Reserve
1,640
5,058
Other Post-Employment Benefits
32,435
23,515
Customer Security Deposits
660
840
Accrued Pension Obligation
4,635
4,325
Accumulated Deferred Income Taxes
2,529
1,872
Excess Earnings2 49 - Demand Management Incentive Account 446 (272)
42,394
35,338
Year End Rate Base
983,990
921,824 Average Rate Base Before Allowances
952,907
903,849
Rate Base Allowances
Materials and Supplies Allowance3
5,619
5,445
Cash Working Capital Allowance
6,404
6,526 Average Rate Base at Year End
964,930
915,820
1 For 2013, the unamortized credit facility costs are included as a component of the Company’s weighted average cost of capital and
are therefore excluded from the calculation of average rate base. The exclusion of deferred credit facility costs adjusts the 2013 calculation of average rate base filed in Return 3 of Newfoundland Power’s 2013 Annual Report to the Board.
2 This differs from the 2014 average rate base filed in Return 3 of Newfoundland Power’s 2014 Annual Report to the Board. The 2014 rate base calculation in the 2014 Annual Report to the Board omitted to include the excess earnings adjustment.
3 This differs from the materials and supplies allowance included in the 2013 calculation of average rate base as filed in Return 3 of Newfoundland Power’s 2013 Annual Report to the Board. The materials and supplies allowance included in Return 3 of the 2013 Annual Report understated the final materials and supplies costs for 2013.

2016 Capital Plan NP 2016 CBA
2016 Capital Plan
June 2015

2016 Capital Plan NP 2016 CBA
i
Table of Contents
Page 1.0 Introduction ..........................................................................................................................1 2.0 2016 Capital Budget ............................................................................................................2 2.1 2016 Capital Budget Overview ................................................................................2 2.2 The Capital Budget Application Guidelines ............................................................5 3.0 5-Year Outlook ....................................................................................................................8 3.1 Capital Expenditures: 2011-2020 ...........................................................................8 3.2 2016-2020 Capital Expenditures..............................................................................9 3.2.1 Overview ......................................................................................................9 3.2.2 Generation ..................................................................................................11 3.2.3 Transmission ..............................................................................................12 3.2.4 Substations .................................................................................................13 3.2.5 Distribution ................................................................................................16 3.2.6 General Property ........................................................................................19 3.2.7 Transportation ............................................................................................19 3.2.8 Telecommunications ..................................................................................20 3.2.9 Information Systems ..................................................................................20 3.2.10 Unforeseen Allowance ...............................................................................21 3.2.11 General Expenses Capitalized ....................................................................21 3.3 5-Year Plan: Risks ................................................................................................21 Appendix A: 2016-2020 Capital Plan

2016 Capital Plan NP 2016 CBA
1
1.0 Introduction Newfoundland Power’s 2016 Capital Plan provides an overview of the Company’s 2016 Capital Budget together with an outlook for capital expenditure through 2020. Newfoundland Power’s 2016 Capital Budget totals $107,028,000. The Company’s 2016 Capital Budget is part of a series of stable and predictable annual capital budgets which the Board of Commissioners of Public Utilities (the “PUB” or the “Board”) has recognized assists in fostering stable and predictable rates for consumers.1 Newfoundland Power’s annual capital expenditure for the next 5 years is forecast to average approximately $108 million.2 The Company’s annual capital budgets continue to focus principally on (i) plant replacement and (ii) meeting customer and sales growth. Together, expenditures on plant replacement and growth combine to account for 82% of expenditures over the next 5 years. This composition is broadly consistent with Newfoundland Power’s capital budgets over the previous 5 years. The Board has retained the Liberty Consulting Group (“Liberty”) to study and report on Supply Issues and Power Outages on the Island of Newfoundland Interconnected Electrical System following the events of January 2014. In its December 2014 report, Liberty’s assessment was that Newfoundland Power’s overall engineering and customer operations conform to good utility practices.3 The Company has mature reliability management systems and practices. Newfoundland Power expects these practices will evolve over the term of the 5-year 2016 Capital Plan and continue to provide reliable service to customers. Newfoundland Power has achieved significant improvement in its electrical system reliability performance over the past decade. Newfoundland Power has assessed Liberty’s conclusions and recommendations within the context of its existing reliability management framework. The 2015 Distribution Reliability Review included with this application supports the continuation of the Rebuild Distribution Lines and Distribution Reliability Initiative capital programs. In addition, to address the impacts weather conditions are having on the reliability performance of its oldest assets, the Company will fully assess the issue of Distribution asset replacement in 2016. Over the previous 5 year period the Company’s use of technology in operations has expanded to include the use of geographic information system (“GIS”) maps and work dispatch (“CLICK”) to crews using their mobile computers. Annual expenditures in the Information Systems projects have improved the Company’s Internet presence, including the expanded use of social media for communicating with customers during major disturbances on the electricity system. Annual expenditures in the Substations Refurbishment and Modernization project have increased the
1 See Order No. P.U. 36 (2002-2003). 2 The 2016 to 2020 Capital Plans include a number of significant expenditures including the purchase of a new
portable generator, refurbishment of the Greenhill Gas Turbine, replacement penstocks for the Pierre’s Brook, Topsail and Sandy Brook hydro plants, the replacement of the customer service system CSS and an additional 9 power transformers.
3 Executive Summary of Report on Island Interconnected System to Interconnection with Muskrat Falls addressing Newfoundland Power, page ES-1.

2016 Capital Plan NP 2016 CBA
2
amount of automation in the electricity system. Increased automation of substation equipment, particularly transmission line breakers and distribution feeder breakers and reclosers, has improved the electricity system’s capability and flexibility to respond to both major disturbances and local system events. The 2016 Capital Plan continues to expand the use of technology in operations. The Substation Refurbishment and Modernization project continues with the automation of substation based equipment.4 By the end of 2019, the Company intends to automate all distribution feeders through the SCADA system. Through the Distribution Feeder Automation project the Company will further automate existing downline reclosers and increase the number of downline reclosers on distribution feeders. In 2015 and 2016, the Company will replace its 15 year old SCADA system with a new system that will be capable of integrating with geographic information and outage management systems. Following the completion of the SCADA replacement, the Company will replace its Outage Management System (“OMS”) in 2016 and 2017 with a commercial offering that utilizes the SCADA map to identify the location of outages. The combination of substation and feeder automation along with new SCADA and OMS technology will improve customer service delivery during normal operations and at times of major disturbances. 2.0 2016 Capital Budget Newfoundland Power’s 2016 capital budget is $107,028,000. This section of the 2016 Capital Plan provides an overview of the 2016 capital budget by origin (root cause) and asset class. In addition, this section summarizes 2016 capital projects by the various categories set out in the Board’s October 2007 Capital Budget Application Guidelines. 2.1 2016 Capital Budget Overview Newfoundland Power’s 2016 Capital Budget contains 40 projects totalling approximately $107.0 million.
4 By the end of 2015 approximately 80% of distribution feeders will be automated from the System Control
Centre.

2016 Capital Plan NP 2016 CBA
3
Chart 1 shows the 2016 capital budget by origin, or root cause.
Approximately 59% of proposed 2016 capital expenditure is related to the replacement of plant. A further 25% of proposed 2016 capital expenditure is required to meet the Company’s obligation to serve new customers and meet the requirement for increased system capacity. The 8% of proposed 2016 capital expenditure associated with Information Systems includes the project to replace the Company’s SCADA system. The remaining 8% of forecast capital expenditures for 2016 relate to general expenses capitalized, third party requirements and financial carrying costs (allowance for funds used during construction). The allocation of 2016 capital expenditures is broadly consistent with capital budgets for the past 5 years.
59%
25%
8%
1% 4% 2% 1%
Chart 1 2016 Capital Expenditures by Origin
Plant Replacement
Customer/Load Growth
Information Systems
System Additions
General Expenses Capitalized
Third Party Requirement
Financial

2016 Capital Plan NP 2016 CBA
4
Chart 2 shows the 2016 capital budget by asset class.
As in past years, Distribution capital expenditure accounts for the greatest percentage of overall expenditure at $45.1 million, or 42% of the 2016 capital budget. Generation capital expenditure accounts for $19.1 million, or 18% of the 2016 capital budget. Substations capital expenditure accounts for $18.0 million, or 17% of the 2016 capital budget. Information Systems capital expenditure accounts for $8.0 million or 7% of the 2016 capital budget. Transmission capital expenditure accounts for $6.1 million, or 6% of the 2016 capital budget. Together, expenditure for these 5 asset classes comprises 90% of the Company’s 2016 capital budget. Distribution capital expenditure is primarily driven by customer requests for new connections to the electrical system and the rebuilding of aged and deteriorated infrastructure. In 2016, the Distribution Reliability Initiative will address reliability issues associated with 1 rural and 2 urban feeders. Otherwise Distribution capital expenditures in 2016 are expected to be similar to recent years. In 2016, the Company will complete the 2nd year of the project to replace the penstock at the Pierre’s Brook hydro plant. The 2016 expenditure of $15.1 million for the Pierre’s Brook Plant Refurbishment is the single biggest project expenditure in the 2016 capital budget.
18%
17%
6% 42%
2%
3%
0.1% 7%
1% 4%
Chart 2 2016 Capital Expenditures by Asset Class
Generation
Substations
Transmission
Distribution
General Property
Transportation
Telecommunications
Information Systems
Unforeseen Allowance
General Expenses Capitalized

2016 Capital Plan NP 2016 CBA
5
In 2016, the Company plans to install new power transformers at the Grand Falls substation and the King’s Bridge substation in the City of St. John’s. Also in 2016, the Company will install the Lethbridge transformer at Doyles substation in the Codroy Valley.5 These projects are necessary to address growth in customer load in these areas. In 2016, the Company will continue with the rebuilding of 2 transmission lines that were approved as multiyear projects in the 2015 capital budget application, including 1 line in the City of St. John’s and one line in the Stephenville area.6 Transmission line 30L operates between Ridge Road and King’s Bridge substations in the City of St. John’s. Transmission line 400L operates between Newfoundland & Labrador Hydro’s Bottom Brook terminal station and Wheeler’s substation on the Hansen Highway outside of Stephenville. Also, in 2016 the Company will initiate a 2-year project to rebuild transmission line 57L operating between Bay Roberts and Harbor Grace substations in the Conception Bay North area. 2.2 The Capital Budget Application Guidelines On October 29, 2007, the Board issued Policy No. 1900.6, referred to as the Capital Budget Application Guidelines (the “CBA Guidelines”), providing for definition and categorization of capital expenditures for which a public utility requires prior approval of the Board. Newfoundland Power’s 2016 Capital Budget Application complies with the CBA Guidelines. The 2016 Capital Budget Application includes 40 projects, as detailed in Schedule A. Included in Schedule B is a summary of these projects organized by definition, classification, and costing method. The following section provides a summary of each of these views of the 2016 Capital Budget, along with a summary of costs segmented by materiality.
5 This substation transformer destined for Doyles was last in service at Lethbridge substation. The transformer is
planned to be replaced at Lethbridge substation by a new unit in 2015. The project was included in the 2015 Capital Budget Application and approved on Order No. P.U. 40 (2014).
6 These transmission lines are deteriorated and have reached a point where continued maintenance is no longer feasible.

2016 Capital Plan NP 2016 CBA
6
2016 Capital Projects by Definition Table 1 summarizes Newfoundland Power’s proposed 2016 capital projects by definition as set out in the CBA Guidelines.
Table 1 2016 Capital Projects
By Definition
Definition
Number of Projects
Budget (000s)
Pooled 27 $71,304 Clustered7 6 23,551 Other 7 12,173
Total 40 $107,028 There are a total of 33 pooled or clustered projects accounting for 89% of total expenditures. 2016 Capital Projects by Classification Table 2 summarizes Newfoundland Power’s proposed 2016 capital projects by classification as set out in the CBA Guidelines.
Table 2 2016 Capital Projects
By Classification
Classification
Number of Projects
Budget (000s)
Normal 37 $104,520 Mandatory 1 883 Justifiable 2 1,625
Total 40 $107,028 There are 37 normal projects accounting for 98% of total expenditures.
7 Projects that have some items that are defined as Clustered and some other items that are defined as either
Pooled or Other are included as Clustered for the purpose of this table.

2016 Capital Plan NP 2016 CBA
7
2016 Capital Projects Costing Table 3 summarizes Newfoundland Power’s proposed 2016 capital projects by costing method (i.e., identified need vs. historical pattern) as set out in the CBA Guidelines.
Table 3 2016 Capital Projects By Costing Method
Method
Number of Projects
Budget (000s)
Identified Need 24 $58,786 Historical Pattern 16 48,242
Total 40 $107,028 Projects with costing method based on identified need account for 55% of total expenditures, while those based on historical pattern account for 45% of total expenditures. 2016 Capital Projects Materiality Table 4 segments Newfoundland Power’s proposed 2016 capital projects by materiality as set out in the CBA Guidelines.
Table 4 2016 Capital Projects
Segmentation by Materiality
Segment
Number of Projects
Budget (000s)
Under $200,000 2 $254 $200,000 - $500,000 8 2,958 Over $500,000 30 103,816
Total 40 $107,028 There are 30 projects budgeted at over $500,000 accounting for 97% of total expenditures.

2016 Capital Plan NP 2016 CBA
8
3.0 5-Year Outlook Newfoundland Power’s 5-year capital outlook for 2016 through 2020 includes forecast average annual capital expenditure of $107.6 million. Over the 5 year period 2011 through 2015, the average annual capital expenditure is expected to be $89.1 million. The increase in forecast annual capital expenditure reflects inflation and requirements for specific projects related to replacement of deteriorated facilities, meeting customer and load growth, replacing the Company’s SCADA system and a new portable generator. Otherwise annual expenditure through the forecast period is broadly consistent on an inflation adjusted basis with that in the period 2011 through 2015. 3.1 Capital Expenditures: 2011-2020 The Company plans to invest $538 million in plant and equipment during the 2016 through 2020 period. On an annual basis, capital expenditures are expected to average approximately $107.6 million and range from a low of $105.8 million in 2019, to a high of $109.3 million in 2017.8 Chart 3 shows actual capital expenditures for the period 2011 through 2014, and forecast capital expenditures for the period 2015 through 2020.9 For comparison purposes, the annual capital expenditures are also expressed in 2015 dollars to remove the effects of inflation.
Overall planned capital expenditures for the 5-year period from 2016 through 2020 are expected to be greater than those in the 5-year period from 2011 through 2015. Forecast requirements for 8 The Company plans to purchase a new mobile generator at an estimated cost of $9.2 million in 2017 and 2018. 9 The 2014 capital expenditure includes supplemental capital expenditures for the Bell Island Submarine Cable
Replacement and distribution feeder improvements and substation refurbishment application approved by Board Order Nos. P.U. 43 (2013) and P.U. 14 (2014) respectively.
40,000
60,000
80,000
100,000
120,000
2011 2012 2013 2014 2015F 2016F 2017F 2018F 2019F 2020F
Chart 3 Capital Expenditures
2011 to 2020F ($000s)
Actual $ Inflation Adjusted (2015$)

2016 Capital Plan NP 2016 CBA
9
the 5-year period from 2016 through 2020 include additional power transformers due to load growth, replacement of Pierre’s Brook, Topsail and Sandy Brook penstocks, mobile generation, gas turbine refurbishment and the replacement of important information technology such as SCADA, Outage Management and Customer Service systems. The replacement of plant has been, and will continue to be, the largest driver of Newfoundland Power’s capital budget, accounting for 54.5% of total expenditure for the 10-year period from 2011 through 2020. Over the same 10-year period, capital expenditures to meet increased customer connections and electricity sales account for 28.6% of total expenditures. 3.2 2016-2020 Capital Expenditures 3.2.1 Overview Chart 4 shows aggregate forecast capital expenditures by origin for the period 2016 through 2020.
Plant replacement accounts for 58% of all planned expenditures over the 5-year period from 2016 through 2020. This is greater than the average of 51% in the previous 5-year period from 2011 through 2015. Capital expenditure related to customer and load growth accounts for 25% of planned expenditures over the 5-year period from 2016 through 2020. This is less than the average of 33% in the previous 5-year period from 2011 through 2015.
58%
25%
7%
3%
4% 2% 1%
Chart 4 Capital Expenditures
by Origin 2016 to 2020
Plant Replacement
Customer/Load Growth
Information Systems
System Additions
General Expenses Capitalized
Third Party Requirement
Financial

2016 Capital Plan NP 2016 CBA
10
The remaining 17% of total capital expenditures for the 2016 through 2020 period relate to a variety of origins including information systems, system additions, general expenses capitalized, third party requirements and financial costs. Chart 5 shows aggregate forecast capital expenditures for the period 2016 through 2020 by asset class.
The Distribution asset class accounts for 43% of all planned expenditures over the next 5 years, followed by Substations (18%), Generation (13%) and Transmission (8%). The remaining six asset classes account for 18% of total capital expenditures for the 2016 through 2020 period. Overall, planned expenditures for the period 2016 through 2020 are expected to remain relatively stable in all asset classes with the exception of generation and substations which vary annually due to refurbishment and system load growth requirements, and the addition of portable generation over the forecast period. A summary of planned capital expenditures by asset class and by project for 2016 to 2020 is provided in Appendix A.
13%
18%
9% 43%
2%
3% 0.3%
7% 0.7%
4%
Chart 5 Capital Expenditures
by Asset Class 2016 to 2020
Generation
Substations
Transmission
Distribution
General Property
Transportation
Telecommunications
Information Systems
Unforeseen Allowance
General Expenses Capitalized

2016 Capital Plan NP 2016 CBA
11
3.2.2 Generation Generation capital expenditures will average approximately $14.1 million per year from 2016 through 2020, which is greater than the annual average of $7.7 million from 2011 through 2015.10 Generation capital expenditures on the Company’s 23 hydroelectric plants, 3 gas turbines and 2 diesel plants are primarily driven by:
• breakdown capital maintenance; • generation preventive capital maintenance; and • specific capital project initiatives, such as plant refurbishment.
The Company has a preventive maintenance program in place for generation assets. The level of expenditure for capital maintenance, both breakdown and preventive, is expected to be relatively stable over the forecast period and generally consistent with the historical average. Due to the age of the Company’s fleet of generating plants, significant refurbishment will continue to be required over the planning period. Over the next 5 years, the Company plans to continue the practice adopted in recent years of undertaking major plant refurbishment while also identifying opportunities to increase energy production and reduce losses at existing facilities. Specifically, the following major capital projects are planned:
• In 2015 and 2016, the Company is replacing the Pierre’s Brook woodstave penstock, refurbishing the existing surge tank and upgrading the plant controls at an estimated cost of $15.9 million. Work in 2015 will involve upfront engineering as well as necessary work required for the penstock access road. The construction work associated with the penstock replacement, surge tank refurbishment and plant controls upgrade is planned for 2016.
• In 2016, the Company plans to refurbish the Greenhill Olympus gas generator at an
estimated cost of $1.5 million. In 2018 and 2019, the Company plans to refurbish the Greenhill power turbine at an estimated cost of $2.9 million.
• In 2017 and 2018, the Company plans to replace the Topsail woodstave penstock at an
estimated cost of $6.5 million. • In 2017 and 2018, the Company plans to refurbish the generators, turbines and wicket
gates on generators G1 and G3 along with the automation of generator G1 at the 76 year old Tors Cove hydro plant at an estimated total cost of $3.7 million.
10 This increase is attributable to the purchase of a new mobile generator, the refurbishment of the Greenhill gas
turbine, upgrades to the Wesleyville gas turbine, and the replacement of penstocks at Pierre’s Brook, Topsail and Sandy Brook hydro plants.

2016 Capital Plan NP 2016 CBA
12
• In 2017 and 2018, the Company plans to purchase a mobile generator at an estimated cost of $9.2 million. The mobile generator will be used for both emergency generation and to minimize customer outages during planned work.11
• In 2017 and 2019, the Company plans to replace the turbine runners at the Rattling Brook
hydro plant at an estimated cost of $2.4 million. • In 2018, the Company plans to replace the deteriorated runner at the Cape Broyle hydro
plant. The new runner will increase hydro production by 0.9 GWh at an estimated cost of $1.2 million.
• In 2019, the Company plans to replace the final section of woodstave penstock at the
Petty Harbour hydro plant at an estimated cost of $2.9 million. The remaining section of woodstave penstock was replaced in 1999 with a steel penstock.
• In 2020, the Company plans to replace the Sandy Brook woodstave penstock at an
estimated cost of $5.3 million. • In 2020, the Company plans to upgrade the Wesleyville gas turbine facility. The
Company will explore replacement options in advance of the 2020 project. 3.2.3 Transmission Transmission capital expenditures are expected to average $9.1 million annually from 2016 through 2020 compared with $4.9 million annually from 2011 through 2015.12 The Company operates approximately 2,000 km of transmission lines. Transmission capital expenditures are primarily driven by:
• breakdown capital maintenance; • transmission preventive capital maintenance; and • third party requests.
The Company has a maintenance program in place for its transmission assets. The level of expenditure for capital maintenance, both breakdown and preventive, is expected to be relatively stable over the forecast period. In its 2006 Capital Budget Application, the Company submitted its 10-year transmission strategy in the report titled 3.1 Transmission Line Rebuild Strategy. The report outlined the need to completely rebuild certain sections of aging transmission lines that are deteriorated. This proactive approach to managing transmission assets is expected to reduce failures over the long term. An update of the strategic plan is included in the report 3.1 2016 Transmission Line Rebuild included with the 2016 Capital Budget Application.
11 The existing mobile gas turbine will be 44 years old in 2017. 12 The increase in transmission line capital expenditures over the 5-year plan is attributable to the construction of a
new transmission line on the Northeast Avalon Peninsula and the rebuild of the 66 kV transmission system in Central Newfoundland.

2016 Capital Plan NP 2016 CBA
13
In 2018, the Company anticipates that a new transmission line will be required to supply substations in the area from Torbay to Portugal Cove at an estimated cost of approximately $4.1 million over 2 years. In 2011, the Company installed a new 25 MVA transformer in Pulpit Rock substation and in 2019, the Company plans to install a new 25 MVA transformer in Broad Cove substation. Both transformers are required due to customer and load growth in the area. The transmission lines supplying these 2 substations are radial with no contingency for the loss of supply other than mobile generation. The construction of a new transmission line is required to provide redundancy of supply to this growing area. Starting in 2017, and continuing through 2020, the Company plans to rebuild approximately 112 km of 66kV transmission line from Grand Falls to Gander at approximately $16 million based upon the deteriorated condition of the lines. It may be technically feasible to retire the 66 kV transmission systems between Grand Falls and Gander by expanding the existing 138 kV transmission system into substations at Notre Dame Junction and Rattling Brook. In 2016 the Company will undertake a planning study to determine the least cost design for providing reliable service to substations in the Central Newfoundland region. 3.2.4 Substations Substations capital expenditures are expected to average $19.0 million annually from 2016 through 2020, an increase from the average of $16.4 million annually from 2011 through 2015. The increase in expenditure is largely attributable to the requirement for additional system capacity to serve increased customer load and increasing the automation of transmission line breakers and distribution feeder breakers and reclosers. The Company operates 130 substations containing approximately 4,000 pieces of critical electrical equipment. Substation capital expenditures are primarily driven by:
• breakdown capital maintenance; • substation preventive capital maintenance; • Government regulations regarding the elimination of PCBs; and • system load growth.
The Company has a preventive capital maintenance program in place for its substation assets. Preventive maintenance is expected to ensure that the overall reliability of substation assets remains stable. In its 2007 Capital Budget Application, the Company submitted its 10-year substation strategy in a report titled Substation Strategic Plan. The 2007 plan addressed substation refurbishment and modernization work in 80% of the Company’s substations in an orderly way over a multi-year planning horizon. This is consistent with the maintenance of reasonable year to year stability in the Company’s annual capital budgets. Since 2007, work performed as part of the Substation Refurbishment and Modernization capital project has broadly reflected this approach. An update of the strategic plan is included in the report 2.1 2016 Substation Refurbishment and Modernization filed with this 2016 Capital Budget Application. The system events of January 2-8, 2014, particularly the lengthy customer outages and the successive rotating power outages, revealed control limitations on the Company’s transmission

2016 Capital Plan NP 2016 CBA
14
and distribution systems.13 At year-end 2015, SCADA control and monitoring will be implemented on approximately 92% of Newfoundland Power’s transmission lines and approximately 80% of distribution feeders.14 Chart 6 illustrates that this 5-Year Capital Plan includes projects to complete the automation of the remaining distribution feeders by the end of 2019. The 2016 Substation Refurbishment and Modernization project includes the automation of 11 distribution feeders.
The Company forecasts a number of significant substations projects will be required due to system load growth over the planning period. Capital expenditures will be required to increase system capacity, particularly power transformation capacity. Over the 2016 to 2020 forecast period, there is a requirement to install 10 substation transformers to accommodate load growth.15 In 2016, as a result of customer and load growth experienced over the past decade, new power transformers will be required at Grand Falls and Kings Bridge substations.16 Also in 2016, an existing substation transformer will be relocated to Doyles substation. Commencing in 2016 and continuing through 2020, 9 new substation transformers
13 The level of monitoring is dependent on the type of protection and communication equipment installed at the
substation and ranges from monitoring equipment status to the ability to remotely control equipment and configure protection settings.
14 This is an increase from year end 2013 when SCADA control and monitoring had been implemented on approximately 91% of Newfoundland Power’s transmission lines and approximately 60% of distribution feeders.
15 By comparison, in the period 2011 through 2015, Newfoundland Power has purchased 9 new power transformers and relocated 2 power transformers to serve increased customer load. The purchase of new transformers and the relocation of other transformers to serve customer load growth are in addition to the requirement to replace aged or deteriorated equipment.
16 The planning study for the Grand Falls service areas is included in the 2016 Capital Budget Application report 2.2 2016 Additions Due To Load Growth.
0%
20%
40%
60%
80%
100%
2015 2016 2017 2018 2019 2020
Chart 6 Distribution Feeders Automated by Year
2015 - 2020

2016 Capital Plan NP 2016 CBA
15
will be required for the Northeast Avalon Peninsula, Burin Peninsula, Grand Falls and Western Newfoundland areas.17 Chart 7 shows growth in substation transformer capacity along with growth in energy and system peak demand over the past 25 years. Over this period the addition of substation transformer capacity has lagged growth in both energy and demand. This is not unexpected. Energy deliveries tend to grow at a relatively consistent rate while capacity grows in blocks of typically 25 MWs per transformer installation. Over the 5-Year Capital Plan the addition of 11 substation transformers to accommodate load growth will close the gap between growth and transformer capacity.
The Company has met the Government of Canada’s regulatory requirement to remove from service all bushings and instrument transformer equipment containing oil at or above 500 mg/kg by December 31, 2014.18 Equipment with PCB concentrations greater than 50 mg/kg and less than 500 mg/kg must be removed from service by 2025. The 5-year capital plan includes
17 The Company’s annual Capital Budget Applications will include engineering studies detailing the requirements
for additional power transformers in the years in which they are required. 18 Newfoundland Power was granted a permit extending the deadline to remove from service equipment
containing oil at or above 500 mg/kg to December 31, 2014.
0%
5%
10%
15%
20%
25%
30%
35%
40%
45%
50%
1995 1997 1999 2001 2003 2005 2007 2009 2011 2013 2015 2017 2019
Chart 7 Growth vs Transformer Capacity
1995 - 2020
Growth in Purchased and Produced Growth in Native Peak
Growth in Distribution Transformer Capacity

2016 Capital Plan NP 2016 CBA
16
expenditures of approximately $3.7 million to address PCB concentrations greater than 50 mg/kg and less than 500 mg/kg in advance of the 2025 deadline. 3.2.5 Distribution Distribution capital expenditures from 2016 through 2020 are expected to increase to an average of approximately $46.5 million annually, compared to an average of $45.2 million annually from 2011 through 2015. The Company operates approximately 9,500 km of distribution lines serving approximately 259,000 customers. Distribution capital expenditures are primarily driven by:
• new customers; • third party requests; • breakdown capital maintenance; • distribution preventive capital maintenance; • system load growth; and • specific capital project initiatives, such as trunk feeder rebuilds.
The number of new customer connections is forecast to decrease over the planning period when compared to the 2011 to 2015 period. Over the 5-year period from 2016 to 2020, the number of new customer connections is forecast to decrease by 14.7%. Over the same 5-year period capital expenditures associated with new customer connections is forecast to decrease by 6.9%. This decrease in capital expenditures is primarily due to the reduction in the number of forecast new customer connections. The costs to connect new customers to the electricity system are included in several distribution projects including Extensions, Transformers, Services, Meters and Street Lighting. Table 5 shows the forecast number of new customer connections and the total capital expenditures associated with those connections over the next 5 years.
Table 5 New Customer Connections
2016 2017 2018 2019 2020
New Customer Connections 3,831 3,576 3,391 3,319 3,268 Average Cost/Connection $4,847 $5,005 $5,169 $5,291 $5,291 Capital Expenditure (000s) $18,569 $17,898 $17,528 $17,561 $17,291
Over the period 2016 to 2020, the expenditure associated with new customer connections is forecast to be within the range of $17 million to $19 million, or approximately 16% of the annual capital expenditures. Distribution capital expenditure related to system load growth primarily reflects growth in customer electricity requirements. The majority of this growth continues to be located in the St.

2016 Capital Plan NP 2016 CBA
17
John’s metropolitan area. This requires the transfer of customer load or the upgrade of feeders to increase capacity. Expenditures for feeder modifications and additions due to system load growth from 2016 through 2020 are expected to total approximately $11.4 million over the next 5 years.19 Distribution capital expenditures are required to relocate or replace distribution lines to meet third party requests from governments, telecommunications companies and individual customers. In 2016, the expenditures associated with third party requests are estimated at $2.5 million. Over the remainder of the 5-year period, these expenditures are forecast to remain stable and approximate an average of $2.6 million. Capital expenditures associated with the replacement of meters are typically based upon historical expenditures. In 2016, the Company plans to accelerate the replacement of all remaining non-AMR meters with AMR meters by the end of 2017. A detailed description of the Company’s strategy to deal with new regulations and improved efficiency in the metering function can be found in the report 4.4 2016 Meter Strategy. The Company has a preventive capital maintenance program in place for its Distribution assets. However, in-service failures of distribution plant and equipment are unavoidable. In 2016, the Company will fully assess the replacement rate of older Distribution assets to ensure it is sufficient to ensure both (i) continued safe and reliable service and (ii) long-term stability and predictability in capital expenditures. In the 2013 Capital Budget Application, the Company outlined its preventive capital maintenance program for Distribution assets in the report 4.4 Rebuild Distribution Lines Update. The expenditures associated with the preventive capital maintenance program are budgeted in the annual Rebuild Distribution Lines project. The Company plans to perform preventive capital maintenance on approximately 43 distribution feeders per year over the planning period. The Distribution Reconstruction project involves the replacement of deteriorated or damaged distribution structures and electrical equipment. The project is comprised of small unplanned projects and is estimated using the historical average of the most recent 5-year period. The Company ranks its distribution feeders based on reliability performance and completes in-field assessments of those with the poorest performance statistics. Capital upgrades are performed on the worst performing feeders under a project titled Distribution Reliability Initiative.
19 Capital expenditures for the Feeder Additions for Load Growth project for the 5-year period 2011 to 2015 were
approximately $6.8 million.

2016 Capital Plan NP 2016 CBA
18
Chart 8 shows SAIDI, or system average interruption duration index, and SAIFI, or system average interruption frequency index, for the years 1999 through 2014. Chart 8 has been adjusted to remove the effects of severe weather and system events.20
Newfoundland Power considers current levels of service reliability on a system wide basis to be satisfactory. However, the number of wind storms that have an impact on the electricity distribution system increased in 2014. It is unclear whether this is an isolated event.21 In 2014, Newfoundland Power incorporated additional reliability indices, CIKM and CHIKM into its reliability analysis.22 This has resulted in additional distribution feeders being identified for work under the Distribution Reliability Initiative project. In 2016, distribution feeders GFS-02 in Central Newfoundland, HWD-07 and SLA-09 located in St. John’s are included for reliability rebuilds.23 Details on the project expenditure can be found in the report 4.1 Distribution Reliability Initiative. Newfoundland Power has equipment located in duct banks and manholes under Water Street in the St. John’s downtown. The Water Street underground electrical distribution system was 20 Adjustments exclude the 2007 and 2010 Bonavista ice storms, Hurricane Igor in 2010, the December 2011 high
wind event, Tropical Storm Leslie in September 2012, the January 11th 2013 system disturbance and the Central Newfoundland winter storm in November 2013. These exclusions are consistent with the Canadian Electricity Association approved definitions. If these severe weather events were included, 2007 SAIDI and SAIFI would be 5.94 and 2.46, respectively, 2010 SAIDI and SAIFI would be 13.82 and 2.69 respectively, 2011 SAIDI and SAIFI would be 4.03 and 1.95, respectively, 2012 SAIDI and SAIFI would be 5.85 and 2.12 respectively and 2013 SAIDI and SAIFI would be 3.04 and 1.82 respectively .
21 See 2015 Distribution Reliability Review, page 16-18. 22 In 2012 the Canadian Electricity Association began capturing and reporting on 2 additional indices; customer
hours of interruption per kilometer “CHIKM” and customers interrupted per kilometer “CIKM”. 23 It is anticipated that by using indices that consider customer interruptions and circuit length that the worst
performing feeders will be found in urban settings where the Company has issues with older poles and associated infrastructure.
0.00
1.00
2.00
3.00
4.00
5.00
6.00
Chart 8 SAIDI and SAIFI
1999 - 2014
SAIDI SAIFI

2016 Capital Plan NP 2016 CBA
19
installed in the late 1960s and is approaching the end of its service life. A planning study for the St. John’s downtown was included in the Company’s 2011 Capital Budget Application that discussed the aging infrastructure and presented a plan to replace various sections of the underground system over a period of years. Included in the plan was the requirement to replace duct banks under the Waterford River and along Water Street. In 2016 and 2017, the Company plans to replace the duct banks on the Waterford River crossing. In March 2015, the City of St. John’s issued terms of reference documents for engineering consulting services to design the replacement of its water and sewer infrastructure under Water Street from Waldegrave Street to Jobs Cove. The Company’s 5-year plan includes expenditures to allow the replacement of the underground electricity distribution system along Water Street to coincide with the work to be undertaken by the City of St. John’s. The 2016 Capital Plan includes a distribution project titled Distribution Feeder Automation that increases the automation of the Company’s distribution feeders. In 2016, the Company will install 10 additional automated reclosers on distribution feeders. Additional distribution feeder automation will improve the Company’s capability to deal with cold load pickup and improve efficiency of restoration following both local and system wide outages. Downline reclosers on distribution feeders will also improve reliability indices when used to isolate faulted segments from undamaged sections of feeder upstream of the fault.24 3.2.6 General Property The General Property asset class includes capital expenditures for:
• the addition or replacement of tools and equipment utilized by line and engineering staff; • the replacement or addition of office furniture and equipment; • additions to real property necessary to maintain buildings and facilities; • the refurbishment of Company buildings; and • backup electricity generation at Company buildings.
General Property capital expenditures are expected to average $2.4 million annually from 2016 through 2020 which is similar to the average of $2.3 million for the period from 2011 through 2015. General Property capital expenditures involve addressing deterioration associated with Company owned office, service and special purpose buildings throughout its service territory. 3.2.7 Transportation The Transportation asset class includes the heavy truck fleet, passenger and off-road vehicles. The replacement of these vehicles can be influenced by a number of factors including kilometres traveled, vehicle condition, operating experience and maintenance expenditures. Transportation capital expenditures from 2016 through 2020 are expected to increase to an average of approximately $3.7 million annually, compared to an average of $2.8 million annually from 2011 through 2015. The Company operates 71 heavy fleet vehicles which have an
24 Recommendation 2.4 of Liberty’s Report on Island Interconnected System to Interconnection with Muskrat
Falls addressing Newfoundland Power, December 17, 2014, identified the potential for downline reclosers to positively impact reliability indices.

2016 Capital Plan NP 2016 CBA
20
anticipated service life of 10 years. On average, it would be expected that approximately 7 heavy fleet vehicles and 40 passenger vehicles would be replaced annually. The increase in transportation capital expenditures from 2016 through 2020 is principally reflective of inflation and the number of heavy fleet and passenger vehicles expected to meet the replacement parameters over the period. Also, commencing in 2016 and continuing through 2020, the Company plans to increase the heavy fleet from 71 units to 80 units to accommodate the increase in the number of journeyperson powerline technicians resulting from the advancement of apprentices. This will reduce the number of 3 person crews and increase the number of 2 person crews, which, in turn, will improve efficiency. 3.2.8 Telecommunications Capital expenditure in the Telecommunications asset class includes the replacement or upgrading of various communications systems. These systems contribute to customer service, safety, and power system reliability by supporting communications between the Company’s fleet of vehicles, substations, plants and offices. Telecommunications capital expenditures are expected to increase to an average of approximately $359,000 annually from 2016 through 2020, compared to the annual average of $263,000 from 2011 through 2015. The difference is attributable to the cost associated with replacing some rented fibre optic cables in the St. John’s area and the installation of new fibre optic cables in Corner Brook. The Company’s fibre optic cables provide telecommunications for the Company’s remote control and protective relaying technology. 3.2.9 Information Systems The Information Systems asset class capital expenditure includes:
• the replacement of shared server and network infrastructure, personal computers, printers and associated assets;
• upgrades to current software tools, processes, and applications as well as the acquisition of new software licenses; and
• the development of new applications or enhancements to existing applications to support changing business requirements and take advantage of software product improvements.
Information Systems capital expenditures from 2016 through 2020 are expected to increase to an average of approximately $7.2 million annually, compared to an average of $4.7 million annually from 2011 through 2015. The increase is largely driven by the SCADA system replacement and operational technology upgrades for the Company’s Geographic Information System (“GIS”) and Outage Management System (“OMS”).25 Also, commencing in 2019, the Company plans to replace its’ customer service system.
25 A detailed report on the SCADA system replacement is included with the 2015 Capital Budget Application as
6.4 SCADA System Replacement. A report on the improvements being made with the GIS system is included with the 2015 Capital Budget Application as 6.5 Geographic Information System Improvements. A detailed report on the OMS replacement can be found in report 6.4 Outage Management System Replacement included with the 2016 Capital Budget Application.

2016 Capital Plan NP 2016 CBA
21
3.2.10 Unforeseen Allowance The Unforeseen Allowance covers any unforeseen capital expenditures that have not been budgeted elsewhere. The purpose of the account is to permit the Company to act expeditiously to deal with exigent circumstances in advance of seeking approval of the Board. The Unforeseen Allowance constitutes $750,000 in each year’s capital budget from 2016 through 2020. 3.2.11 General Expenses Capitalized General Expenses Capitalized is the allocation of a portion of administrative costs to capital. In accordance with Order No. P.U. 3 (1995-96), the Company uses the incremental cost method of accounting for the purpose of capitalization of general expenses. General Expenses Capitalized of $4.5 million is reflected in each year’s capital budget from 2016 through 2020. 3.3 5-Year Plan: Risks While the Company accepts the Board’s view of the desirable effects of year to year capital expenditure stability, the nature of the utility’s obligation to serve will not, in some circumstances, necessarily facilitate such stability. The Company has identified some risks to such stability in the period 2016 through 2020. Newfoundland Power has an obligation to serve customers in its service territory. Should customer and load growth vary from forecast, so will the capital expenditures that are sensitive to growth. For example, there are a number of power transformers in the Company’s 5-year forecast. Should customer and load growth vary from forecast, the capital expenditure for the required transformers (each in the order of $2-$3 million) may also vary from the current 5-year forecast. The age of the Company’s power transformers presents another potential risk to the stability of the capital forecast. In-service failures of power transformers, like the losses of the Kenmount, Horse Chops, Pierre’s Brook and Salt Pond power transformers will necessitate capital expenditures.26 Newfoundland Power’s gas turbines range in age from 40 years to 46 years. These gas turbines had a significant increase in usage during the 2013/2014 winter season. Condition assessments were completed following the 2013/2014 winter season identifying necessary refurbishment work to be completed prior to the 2014/2015 winter season. A broader review of the Company’s gas turbines is underway in light of potential increased use. The 5-year capital plan has identified refurbishment work on the Greenhill gas turbine system and the future replacement of
26 Replacement of the Horse Chops power transformer was approved as part of the 2009 Capital Budget
Application in Board Order No. P.U. 27 (2008). Replacement of the Pierre’s Brook power transformer was approved in Board Order No. P.U. 3 (2008). Replacement of the Salt Pond power transformer was approved in Board Order No. P.U. 15 (2002-2003). Kenmount power transformer failed in-service in March 2009 and its refurbishment was approved in Board Order No. P.U. 29 (2009).

2016 Capital Plan NP 2016 CBA
22
the Wesleyville gas turbine system. An in-service failure of either gas turbine system will necessitate a change to this plan. New home construction on the Northeast Avalon Peninsula has weakened considerably compared with the previous 5-year period, and is expected to deteriorate over the forecast period. The current forecast for new customer connections indicates a decline throughout the Company’s service territory. The extent of change in new customer connections required over the course of this 5-year capital plan can have a material impact on capital expenditures. The Muskrat Falls development will have an impact upon Newfoundland Power’s capital expenditures. The Company will be involved in supplying construction power to sites within its service territory and potential rerouting of existing transmission and distribution lines to accommodate the Nalcor DC transmission line. There may be other impacts associated with integrating the new DC infeed with the existing power system. This capital plan has not envisioned material capital expenditures resulting from the Muskrat Falls development. The Company has taken steps to reduce the uncertainty regarding replacement of its CSS, which has been in service since 1991.27 These steps have included upgrades of hardware and software components and removal of technology components that posed the highest risk. While the current versions of hardware, software and database should be supported throughout this capital plan period, commencing in 2019, the Company has included a project to replace CSS. Any changes to the availability of support to existing technology platforms could materially impact the capital plan. Capital expenditures can be impacted by major storms or weather events. In 1984 and 1994, the Company was impacted by sleet storms that resulted in widespread damage and service interruption to customers. On March 5th and 6th, 2010, an ice storm in eastern Newfoundland caused widespread power outages on the Bonavista and Avalon Peninsulas. In September 2010, Hurricane Igor caused extensive damage to the Company’s generation and distribution assets. In 2012, Tropical Storm Leslie caused damage to the distribution system. The occurrence and costs of severe storms are not predictable.
27 The CSS originally cost in excess of $10 million.

2016 Capital Plan NP 2016 CBA
Appendix A 2016-2020 Capital Plan

2016 Capital Plan NP 2016 CBA
A-1
Newfoundland Power Inc. 2016-2020 Capital Plan
(000s)
Asset Class 2016 2017 2018 2019 2020 Generation $19,095 $13,781 $14,064 $11,122 $12,466 Substations $17,940 $18,326 $22,987 $19,138 $16,430 Transmission $6,067 $8,039 $9,658 $11,464 $10,195 Distribution $45,055 $51,683 $45,182 $45,817 $44,883 General Property $1,840 $2,026 $2,140 $2,772 $3,131 Transportation $3,258 $3,330 $4,119 $3,834 $3,916 Telecommunications $514 $434 $333 $401 $115 Information Systems $8,009 $6,395 $5,250 $6,050 $10,650 Unforeseen Allowance 750 750 750 750 750 General Expenses Capitalized 4,500 4,500 4,500 4,500 4,500 Total $107,028 $109,264 $108,983 $105,848 $107,036

2016 Capital Plan NP 2016 CBA
A-2
Newfoundland Power Inc. 2016-2020 Capital Plan
(000s)
GENERATION
Project 2016 2017 2018 2019 2020
Facility Rehabilitation – Hydro $1,462 $1,490 $1,512 $1,533 $1,533
Facility Rehabilitation - Thermal $238 $244 $250 $255 $261
Public Safety Around Dams $883 $662 $0 $0 $0
Pierre’s Brook Penstock $15,012 $0 $0 $0 $0
Tors Cove Plant Refurbishment $0 $2,710 $1,035 $0 $0
Rattling Brook Plant Refurbishment $0 $1,165 $0 $1,188 $0
Cape Broyle Plant Refurbishment $0 $10 $1,170 $0 $0
Topsail Plant Upgrades $0 $300 $6,150 $0 $0
Petty Harbour Plant Refurbishment $0 $0 $0 $2,947 $0
Lookout Brook Plant Refurbishment $0 $0 $0 $623 $0
Mobile Plant Refurbishment $0 $0 $0 $3,145 $0
Morris Plant Refurbishment $0 $0 $0 $510 $0
Horsechops Plant Refurbishment $0 $0 $0 $0 $700
Rose Blanche Plant $0 $0 $0 $0 $700
Sandy Brook Upgrades $0 $0 $0 $0 $5,272
Greenhill Plant Upgrades $1,500 $0 $1,997 $921 $0
Purchase Portable Generation $0 $7,200 $1,950 $0 $0
Wesleyville Plant Replacement $0 $0 $0 $0 $4,000
Total Generation $19,095 $13,781 $14,064 $11,122 $12,466

2016 Capital Plan NP 2016 CBA
A-3
Newfoundland Power Inc. 2016-2020 Capital Plan
(000s)
SUBSTATIONS
Project 2016 2017 2018 2019 2020 Substations Refurbishment & Modernization $7,871 $10,275 $9,510 $8,000 $7,990 Replacements Due to In-Service Failure $3,771 $3,860 $3,948 $4,032 $4,125 Additions Due to Load Growth $5,868 $3,300 $8,611 $6,160 $3,350 Substation Feeder Terminations $430 $0 $0 $0 $0 PCB Bushing Phase Out $0 $891 $918 $946 $965 Total – Substations $17,940 $18,326 $22,987 $19,138 $16,430

2016 Capital Plan NP 2016 CBA
A-4
Newfoundland Power Inc. 2016-2020 Capital Plan
(000s)
TRANSMISSION
Project 2016 2017 2018 2019 2020 Rebuild Transmission Lines $4,167 $6,139 $6,204 $7,131 $8,395 Transmission Line Reconstruction $1,900 $1,900 $1,900 $1,800 $1,800 Transmission Line Additions $0 $0 $1,554 $2,533 $0 Total – Transmission $6,067 $8,039 $9,658 $11,464 $10,195

2016 Capital Plan NP 2016 CBA
A-5
Newfoundland Power Inc. 2016-2020 Capital Plan
(000s)
DISTRIBUTION
Project 2016 2017 2018 2019 2020 Extensions $10,439 $10,740 $10,455 $10,497 $10,609 Meters $4,582 $4,403 $522 $515 $510 Services $3,784 $3,690 $3,641 $3,678 $3,734 Street Lighting $2,245 $2,200 $2,179 $2,200 $2,232 Transformers $5,759 $5,727 $5,036 $5,519 $5,543 Reconstruction $4,599 $4,722 $4,848 $4,973 $5,105 Rebuild Distribution Lines $3,694 $3,787 $4,381 $4,723 $5,072
Relocations For Third Parties $2,454 $2,516 $2,579 $2,641 $2,707 Distribution Reliability Initiative $1,463 $1,840 $2,360 $2,480 $2,680
Distribution Feeder Automation $565 $750 $450 $600 $600 Feeder Additions for Load Growth $1,708 $3,016 $3,061 $1,977 $1,616 Trunk Feeders $1,607 $2,641 $2,455 $2,795 $3,252 St. John’s Underground Refurbishment $1,950 $5,440 $3,000 $3,000 $1,000 Allowance for Funds Used During Construction $206 $211 $215 $219 $223 Total – Distribution $45,055 $51,683 $45,182 $45,817 $44,883

2016 Capital Plan NP 2016 CBA
A-6
Newfoundland Power Inc. 2016-2020 Capital Plan
(000s)
GENERAL PROPERTY
Project 2016 2017 2018 2019 2020 Tools and Equipment $682 $542 $622 $595 $535 Additions to Real Property $434 $442 $449 $356 $364 Renovations Company Buildings $724 $867 $1,069 $1,821 $2,232 Standby Generators $0 $175 $0 $0 $0 Total – General Property $1,840 $2,026 $2,140 $2,772 $3,131

2016 Capital Plan NP 2016 CBA
A-7
Newfoundland Power Inc. 2016-2020 Capital Plan
(000s)
TRANSPORTATION
Project 2016 2017 2018 2019 2020 Replace Vehicles and Aerial Devices $2,918 $2,979 $3,039 $3,094 $3,156 Purchase Additional Vehicles and Aerial Devices $340 $351 $1,080 $740 $760
Total – Transportation $3,258 $3,330 $4,119 $3,834 $3,916

2016 Capital Plan NP 2016 CBA
A-8
Newfoundland Power Inc. 2016-2020 Capital Plan
(000s)
TELECOMMUNICATIONS
Project 2016 2017 2018 2019 2020 Replace/Upgrade Communications Equipment $105 $107 $110 $112 $115 Fibre Optic Cable $409 $327 $223 $289 $0 Total – Telecommunications $514 $434 $333 $401 $115

2016 Capital Plan NP 2016 CBA
A-9
Newfoundland Power Inc. 2016-2020 Capital Plan
(000s)
INFORMATION SYSTEMS
Project 2016 2017 2018 2019 2020 Application Enhancements $1,143 $1,450 $1,500 $500 $500 System Upgrades $1,718 $1,395 $1,500 $1,500 $1,600 Personal Computer Infrastructure $465 $500 $500 $500 $500 Shared Server Infrastructure $916 $650 $650 $750 $750 Network Infrastructure $294 $300 $300 $300 $300 SCADA System Replacement $2,842 $1,100 $800 $0 $0 GIS Improvement $482 $200 $0 $0 $0 Outage Management System $149 $800 $0 $0 $0 Customer Service System $0 $0 $0 $2,500 $7,000 Total – Information Systems $8,009 $6,395 $5,250 $6,050 $10,650

2016 Capital Plan NP 2016 CBA
A-10
Newfoundland Power Inc. 2016-2020 Capital Plan
(000s)
UNFORESEEN ALLOWANCE
Project 2016 2017 2018 2019 2020 Allowance for Unforeseen Items $750 $750 $750 $750 $750 Total - Unforeseen Allowance $750 $750 $750 $750 $750

2016 Capital Plan NP 2016 CBA
A-11
Newfoundland Power Inc. 2016-2020 Capital Plan
(000s)
GENERAL EXPENSES CAPITALIZED
Project 2016 2017 2018 2019 2020 General Expenses Capitalized $4,500 $4,500 $4,500 $4,500 $4,500 Total - General Expenses Capitalized $4,500 $4,500 $4,500 $4,500 $4,500

2015 Distribution Reliability Review NP 2016 CBA
2015 Distribution Reliability Review
June 2015
Prepared by:
Ralph Mugford, P. Eng.
Robert Cahill, Eng. L.
A FORTIS COMPAN Y

2015 Distribution Reliability Review NP 2016 CBA
i
Table of Contents
Page
1.0 EXECUTIVE SUMMARY .................................................................................................1 2.0 CURRENT RELIABILITY MANAGEMENT ...................................................................2 2.1 Overview ..................................................................................................................2 2.2 Rebuild Distribution Lines .......................................................................................3 2.3 Distribution Reliability Initiative .............................................................................4 3.0 CURRENT SYSTEM RELIABILITY ................................................................................6 3.1 Newfoundland Power System Reliability ................................................................6 3.2 Canadian Comparison ..............................................................................................9 3.3 Assessment of Current System Reliability ............................................................10 4.0 DISTRIBUTION RELIABILITY OUTLOOK .................................................................12 4.1 Assessing Risks to Distribution Reliability ...........................................................12 4.2 Aging Distribution Infrastructure ..........................................................................14 4.3 The Impact of Weather ..........................................................................................16 4.4 Reliability Outlook.................................................................................................18 5.0 PREDICTIVE ASSET MANAGEMENT .........................................................................19 5.1 Industry Overview .................................................................................................19 5.2 Newfoundland Power’s Plans ................................................................................20 6.0 THE LIBERTY CONSULTING GROUP’S RECOMMENDATIONS ............................21 6.1 The Distribution Reliability Recommendations ....................................................21 6.2 Newfoundland Power Assessment .........................................................................21

2015 Distribution Reliability Review NP 2016 CBA
ii
List of Charts & Tables
Page Charts Chart 1: SAIDI for DRI Feeders ......................................................................................................5 Chart 2: SAIDI ................................................................................................................................. 6 Chart 3: SAIDI (excluding significant events) ................................................................................ 7 Chart 4: SAIFI.................................................................................................................................. 7 Chart 5: SAIFI (excluding significant events) ................................................................................. 8 Chart 6: SAIDI, Newfoundland Power vs. Canadian Average ........................................................ 9 Chart 7: SAIFI, Newfoundland Power vs. Canadian Average ...................................................... 10 Chart 8: Causes of Distribution Outages ....................................................................................... 11 Chart 9: SAIDI, Normal Operations .............................................................................................. 12 Chart 10: SAIDI, Extreme Conditions ........................................................................................... 13 Chart 11: Fragility Curve ............................................................................................................... 15 Chart 12: SAIDI, Winds Greater than 100 km/hr .......................................................................... 18 Tables Table 1: Insulator Contribution to SAIDI ........................................................................................ 3 Table 2: Average Age Distribution Poles ...................................................................................... 14 Table 3: Distribution Poles by Age ................................................................................................ 16 Table 4: Wind Speed in Excess of 100 km/hr ................................................................................ 17

2015 Distribution Reliability Review NP 2016 CBA
1
1.0 EXECUTIVE SUMMARY In 2014, as part of its Investigation and Hearing into Supply Issues and Power Outages on the Island Interconnected System, a comprehensive review of Newfoundland Power’s electrical system reliability management practices was undertaken by the Board. Amongst the outcomes of this review were recommendations for Newfoundland Power made by the Board’s consultants, the Liberty Consulting Group (“Liberty Consulting”) in its December 17, 2014 report (the “Liberty Consulting Report”). Six of Liberty Consulting’s recommendations were aimed at improving the reliability of, or asset management for, Newfoundland Power’s electrical distribution system. In its February 5, 2015 response to the Liberty Consulting Report, Newfoundland Power indicated it would assess these recommendations and incorporate the assessment as part of the Company’s continuing reporting to the Board commencing with its 2016 capital budget application. This report provides Newfoundland Power’s initial assessment of the reliability recommendations contained in the Liberty Consulting Report. This report outlines Newfoundland Power’s current distribution reliability management practices and provides an assessment of current distribution system reliability. Current reliability management practices have yielded distribution system reliability for Newfoundland Power’s customers, which is better than the current Canadian average. In a nutshell, Newfoundland Power’s distribution system reliability is currently adequate. Aging utility assets present a challenge to the electric utility industry generally, including Newfoundland Power. This report explains how diminished resilience of older distribution assets can be expected to present a hazard to future distribution system reliability. While this hazard may not present an immediate risk to the reliability enjoyed by Newfoundland Power’s customers, this report indicates that a full assessment of the risk presented is warranted in the near-term. Newfoundland Power commenced replacement of some key operational technologies which support its electrical system management functions in 2015. This replacement process, parts of which have already been approved by the Board, is expected to continue through 2019. The increased data analysis capabilities which will be provided by this new generation of technologies are expected to provide the Company with potential for further improvement of its distribution asset management capabilities. Newfoundland Power’s initial assessment of the reliability and asset management recommendations contained in the Liberty Consulting Report is found in the last section of this report. This assessment is influenced by current management practices and the distribution system reliability those practices have yielded, the requirement for a more comprehensive assessment of medium to longer-term threats to reliability, and the Company’s ongoing plans for replacement of the key systems that support reliability management.

2015 Distribution Reliability Review NP 2016 CBA
2
2.0 CURRENT RELIABILITY MANAGEMENT 2.1 Overview Newfoundland Power’s distribution reliability will, in significant measure, reflect the general condition of its plant in the field. If the plant is deteriorated or defective, it will be more prone to failure. Maintaining deteriorated plant, particularly in areas subject to severe weather conditions, can result in reduced levels of service reliability for customers. It also requires Newfoundland Power to incur operating costs on a recurring basis. These costs include the cost of reinstating service when failures occur, which is often in severe weather conditions. The combination of reliability and operating efficiency is central to Newfoundland Power’s existing reliability management practices. Newfoundland Power’s existing reliability management practices include a combination of (i) a structured, inspection-based preventative maintenance program for the Company’s distribution system, (ii) ongoing data-based assessment of individual distribution feeder reliability performance, and (iii) effective response to system failure throughout the Company’s service territory.1 Newfoundland Power performs condition assessments on all of its distribution feeders on a seven year cycle. Where conditions are encountered which give rise to a risk of imminent failure of feeder sections or components, repairs are performed as soon as practicable. More substantial repairs typically form part of the Company’s annual Reconstruction capital project.2 Where conditions encountered on inspection indicate replacement of deteriorated distribution structures or electrical equipment is warranted, but not immediately required to ensure continuity of service to customers, repairs are scheduled for the ensuing year as part of the Company’s annual Rebuild Distribution Lines capital project.3 Each year, Newfoundland Power assesses and ranks the reliability performance of its distribution feeders based upon industry standard reliability indices. Where reliability data, together with engineering condition assessment, indicate that material improvement in reliability performance
1 This review will focus on the Company’s preventative maintenance and database reliability programs. It will
not include a review of the structure of the Company’s outage management and emergency response capabilities.
2 The annual Reconstruction capital project is part of the Company’s annual capital budget application. It is meant to ensure that high priority projects which are required to ensure continuity of service to customers are undertaken in a prompt manner.
3 The annual Rebuild Distribution Lines capital project is part of the Company’s annual capital budget application. By scheduling refurbishment of distribution lines, the Company is able to achieve improved economies in overall distribution maintenance.

2015 Distribution Reliability Review NP 2016 CBA
3
of worst performing feeders is warranted, work will be undertaken as part of the Company’s Distribution Reliability Initiative capital project.4 2.2 Rebuild Distribution Lines Newfoundland Power’s Rebuild Distribution Lines capital project is a cornerstone of its overall reliability management practices. It has existed for more than a decade. Currently, inspections are performed by Distribution Planners who assess plant condition according to the Company’s inspection standards. Inspection standards include both (i) specifications for distribution equipment such as poles, guys, crossarms, insulators, conductor, transformers, cut outs and switches, and (ii) condition assessment standards for that equipment. Inspections are conducted on a seven year cycle. Where problems with specific types or brands of distribution equipment become known, the Rebuild Distribution Lines capital project can be used to address an orderly replacement of the equipment.5 One example of this was the defective grout used in the manufacture of the CP 8080 two piece distribution insulator. These insulators were specifically identified for replacement early in the Rebuild Distribution Lines capital project. Table 1 shows the contribution to SAIDI made by distribution insulators over the period 1999-2013.
Table 1 Insulator Contribution to SAIDI
Newfoundland Power 1999-2013 (5-year averages)
1999-2003 2004-2008 2009-2013 0.48 0.23 0.14
Over the period 2009-2013, distribution insulators were responsible for less than 1/3 of the total outage duration experienced by Newfoundland Power customers than they were in the period 1999-2003.
4 The Distribution Reliability Initiative capital project is part of the Company’s capital budget applications.
Work will only be undertaken under the Distribution Reliability Initiative capital project where data analysis and engineering condition assessment indicate material improvement in reliability performance can be achieved. Regardless of whether work is proposed to be performed under the Distribution Reliability Initiative capital project, Newfoundland Power reports its assessment of its worst performing feeders as part of every annual capital budget application.
5 Defective equipment can be identified from a variety of sources including field experience, reliability analysis, other utilities’ experience, or equipment manufacturers.

2015 Distribution Reliability Review NP 2016 CBA
4
Newfoundland Power’s Rebuild Distribution Lines capital project provides a structured basis to ensure the continuing maintenance of distribution plant and equipment in good condition. It also provides convenient means of addressing specific defective equipment types or other plant conditions which reduce reliability as those defects or conditions emerge. 2.3 Distribution Reliability Initiative The Distribution Reliability Initiative capital project targets the replacement of deteriorated poles, conductor, and hardware to improve reliability for customers served by specific distribution feeders. The selection of the specific distribution feeders for consideration under the Distribution Reliability Initiative capital project involves a two stage assessment. First, the reliability performance of all 305 of the Company’s distribution feeders is assessed against 6 industry standard reliability metrics. These include (i) the system average interruption frequency index, or SAIFI6, (ii) the system average interruption duration index, or SAIDI7, (iii) the customers interrupted per kilometer of distribution line, or CIKM8, (iv) the customers hours of interruption per kilometer of distribution line, or CHIKM9, (v) the total number of customer interruptions, or CI, and (vi) total number of customer minutes of interruption. Each of these metrics provides a different perspective on the reliability that customers’ experience. Second, once screening identifies the Company’s worst performing distribution feeders, an engineering assessment is performed on these feeders. This assessment includes an analysis of past service problems, consultation with local field staff, and consideration of possible design and construction alternatives. Where this assessment indicates that reliability improvement can be achieved in a reasonably cost effective manner, then work is proposed for inclusion in the Distribution Reliability Initiative capital project.
6 SAIFI is the total number of customers interrupted divided by the total number of customers served by the
distribution line. 7 SAIDI is the total number of hours of customer interruption divided by the total number of customers served by
the distribution line. 8 CIKM is the total number of customers interrupted divided by the length in kilometers of the distribution line. 9 CHIKM is the total number of hours of customer interruption divided by the length in kilometers of the
distribution line.

2015 Distribution Reliability Review NP 2016 CBA
5
Chart 1 shows the reliability performance in SAIDI of those Newfoundland Power distribution feeders which have been included in the Distribution Reliability Initiative capital project from 1998-2014.
The hours of interruption experienced by customers served by distribution feeders which have been included in the Distribution Reliability Initiative capital project have declined markedly over the period 1998 through 2014. This partly reflects the relatively poorer performance of distribution feeders included in the capital project from 1998 through 2008 when compared to those included since 2009. It also reflects the material improvement in overall reliability achieved over the period through the replacement of old and deteriorated plant and equipment. Most utilities have programs to identify worst performing feeders. A survey conducted by the Canadian Electricity Association Service Continuity Committee indicated that 81% of respondent utilities identified worst performing feeders. Of this group, over 2/3rds used only one method to identify worst performing feeders.10
10 See Worst Performing Feeders, a working group whitepaper prepared by Canadian Electricity Association
Analytics.
02468
101214161820
Hou
rs
Chart 1: SAIDI for DRI Feeders Newfoundland Power
1998-2014

2015 Distribution Reliability Review NP 2016 CBA
6
3.0 CURRENT SYSTEM RELIABILITY 3.1 Newfoundland Power System Reliability Chart 2 shows SAIDI for Newfoundland Power’s customers for the period 1998-2014.
The data reflected in Chart 2 shows that the duration of outages experienced by Newfoundland Power’s customers varies significantly from year to year. The principal causes of this variation are significant weather events (i.e., ice storms and hurricanes) and loss of supply from Newfoundland and Labrador Hydro (“Hydro”). For example, longer customer outages in 2007 were principally related to an ice storm; in 2010, longer customer outages were attributable to a combination of an ice storm and hurricane Igor. For 2013 and 2014, the longer customer outages were substantially attributable to loss of Hydro supply in January of each year. For evaluating electrical system reliability, normalizing data to exclude significant events is useful. This is because electrical systems are typically not engineered or constructed to respond to the extreme weather events. Industry accepted definitions of significant events to be used in such evaluations exist to ensure reasonable data comparability.11
11 The Canadian Electricity Association (“CEA”) defines significant events as “events that exceed reasonable
design and/or operational limits of the electrical power system”.
0
2
4
6
8
10
12
14
16
Hou
rs
Chart 2: SAIDI Newfoundland Power
1998-2014

2015 Distribution Reliability Review NP 2016 CBA
7
Chart 3 shows SAIDI for Newfoundland Power’s customers for the period 1998-2014 excluding significant events.
The data reflected in Chart 3 shows that the duration of customer outages excluding significant events has been reduced over the period 1998-2014. Chart 4 shows SAIFI for Newfoundland Power’s customers for the period 1998-2014.
The data reflected in Chart 4 shows that the frequency of customer outages experienced varies materially from year to year. Significant events, depending upon their nature, can have a range
0
1
2
3
4
5
6
Hou
rs
Chart 3: SAIDI (excl. significant events) Newfoundland Power
1998-2014
012345678
Num
ber
of O
utag
es
Chart 4: SAIFI Newfoundland Power
1998-2014

2015 Distribution Reliability Review NP 2016 CBA
8
of impacts on the frequency of outages to customers. These impacts will not necessarily be consistent with the duration of outages associated with those significant events. For example, ice storms often result in a single outage for a group of customers. Depending on the system damage that requires repair, however, that single outage could be for days in duration. For 2013 and 2014, the increased frequency of customer outages was substantially attributable to loss of Hydro supply in January of each year. These outages materially increased both the frequency and duration of customer outages in those years. Chart 5 shows SAIFI for Newfoundland Power’s customers for the period 1998-2014 excluding significant events.
The data reflected in Chart 5 shows that the frequency of customer outages excluding significant events has been reduced over the period 1998-2014.
0
1
2
3
4
5
Num
ber
of O
utag
es
Chart 5: SAIFI (excl. significant events)
Newfoundland Power 1998-2014

2015 Distribution Reliability Review NP 2016 CBA
9
3.2 Canadian Comparison Chart 6 compares Newfoundland Power’s SAIDI to the Canadian average, excluding significant events, for the period 1998-2014.
The data reflected in Chart 6 shows that Newfoundland Power’s SAIDI has improved relative to the Canadian average since the current reliability program was introduced in 1998. Since 2004, the Company’s SAIDI has consistently been approximately 1/2 the Canadian average.
0123456789
Hou
rs
Chart 6: SAIDI Newfoundland Power vs. Canadian Average
(excl. significant events) 1998-2014
NP
CEA

2015 Distribution Reliability Review NP 2016 CBA
10
Chart 7 compares Newfoundland Power’s SAIFI, excluding significant events, to the Canadian average for the period 1998-2014.
The data reflected in Chart 7 shows that Newfoundland Power’s SAIFI has improved since the current reliability program was introduced in 1998. Since 2004, the Company’s SAIFI has been consistent with the Canadian average. 3.3 Assessment of Current Reliability Management Newfoundland Power’s distribution system reliability has shown general improvement since 1998. Currently, overall electrical system reliability for Newfoundland Power is better than the Canadian average once significant events are excluded. Current Newfoundland Power electrical system reliability appears adequate. Existing levels of Newfoundland Power distribution system reliability are the result of a combination of maintenance and capital refurbishment over a number of years. The Company’s annual Rebuild Distribution Lines and Distribution Reliability Initiative capital projects have made a substantial contribution to the electrical system reliability enjoyed by Newfoundland Power’s customers. Newfoundland Power experiences approximately 3,000 unscheduled distribution related outages each year.12 These outages occur for a variety of reasons and may affect a single customer or thousands of customers. Newfoundland Power assesses the causes of distribution system failures on an ongoing basis. This data-based assessment helps establish effective inspection standards for the Rebuild Distribution Lines capital project. It also plays a role in determining what
12 This excludes significant events as defined by CEA.
0
1
2
3
4
5
Num
ber
of O
utag
es
Chart 7: SAIFI Newfoundland Power vs. Canadian Average
(excl. significant events) 1998-2014
NP
CEA

2015 Distribution Reliability Review NP 2016 CBA
11
distribution feeders, or portions of feeders, are included in the Distribution Reliability Initiative capital project. Chart 8 shows the leading causes of unscheduled distribution outages each year for the period 1998-2014.
In the period 1998 through 2005, the leading causes of distribution system outages included conductor, transformer and insulator failures. During this period, the Rebuild Distribution Lines capital project included inspection standards aimed at improving the failure rate of these specific components.13 Replacing the components which were prone to failure and identified on field inspection was also a significant justification for the feeders included in Distribution Reliability Initiative capital projects over this period.14 The Rebuild Distribution Lines and Distribution Reliability Initiative annual capital projects use a combination of data analysis and field condition assessment to help maintain the condition of distribution systems on an ongoing basis. This combination permits the Company to identify emerging hazards to distribution system reliability and respond to them in a structured, cost effective manner throughout the distribution system via the Rebuild Distribution Lines capital
13 See, for example, 2004 Capital Budget Application, Volume III, Distribution Appendix II, Attachment B:
Distribution Lightning Arrestors, Attachment C: Distribution Insulator Replacement Program and Attachment E: Automatic Sleeve Replacement. These standards were aimed at increased transformer failure (distribution lightning arrestors), insulator failure (distribution insulator replacement program) and conductor failure (automatic sleeve replacement).
14 See, for example, 2004 Capital Budget Application, Volume III, Distribution Appendix III, Attachment A: A Review of Reliability Wesleyville – 02 Feeder.
0
100
200
300
400
500
600
700
800
Num
ber
of O
utag
es
Chart 8 Causes of Distribution Outages
Newfoundland Power 1998-2014
Conductor
Insulators
Cutouts & Switches
Transformers
Poles & Crossarms
Trees

2015 Distribution Reliability Review NP 2016 CBA
12
project. It also helps the Company identify and improve the performance of worst performing feeders via the Distribution Reliability Initiative capital project. For these reasons, Newfoundland Power intends to continue to include the Rebuild Distribution Lines and Distribution Reliability Initiative capital projects as part of its ongoing management of distribution system reliability. 4.0 DISTRIBUTION RELIABILITY OUTLOOK 4.1 Assessing Risks to Distribution Reliability The vast majority of the time pole line infrastructure is subjected to normal loading and weather conditions. During normal operations customer outages are usually caused by the failure of components such as insulators or cutouts, human intervention and animals or trees coming in contact with the pole line. Chart 9 shows SAIDI for Newfoundland Power’s customers for the period 1998-2014 under normal system operations.15
Reliability during normal operations has shown continuous improvement since 1998.
15 Normal operations essentially excludes significant events as defined by the CEA. Chart 9 displays the same
data as Chart 3 on page 7.
0
1
2
3
4
5
6
Hou
rs
Chart 9: SAIDI Normal Operations Newfoundland Power
1998-2014

2015 Distribution Reliability Review NP 2016 CBA
13
When a distribution feeder is subjected to extreme loading due to weather conditions, it can result in failure of part, or all, of the feeder. For Newfoundland Power, extreme loading typically results from a combination of wind and icing conditions or high sustained winds. Failures resulting from extreme loading typically result in sustained customer outages. Chart 10 shows SAIDI for Newfoundland Power’s customers under extreme loading for the period 1998–2014.
Extreme weather conditions have the most profound impact on the reliability experienced by Newfoundland Power’s customers. In 6 of the past 8 years, the Company’s distribution system was exposed to extreme weather conditions such as hurricanes, tropical storms and extreme ice loading once or twice each year. These extreme conditions contributed between 0.52 hours (2014) and 11.23 hours (2010) to annual SAIDI in those 6 years. In total, the contribution to SAIDI in the 6 years was 20.22 hours. These outages occurred in compressed periods, typically of 1 week or less. By comparison, SAIDI under normal operations during the full 8 year period amounted to only 21.46 hours. The total length of customer outages resulting from extreme weather conditions are approximately equal to the total length of customer outages which occur for a full year under normal operating conditions. Because of these disproportionate customer impacts, weather conditions are particularly significant in the assessment of risks to distribution reliability.
0
2
4
6
8
10
12
Hou
rs
Chart 10 : SAIDI Extreme Conditions Newfoundland Power
1998-2014

2015 Distribution Reliability Review NP 2016 CBA
14
4.2 Aging Distribution Infrastructure Like most electric utilities, Newfoundland Power’s distribution infrastructure is aging. Table 2 shows the average age of Newfoundland Power’s distribution poles for the period 2010-2014.
Table 2 Average Age (yrs) Distribution Poles
Newfoundland Power 2010-2014
2010 2011 2012 2013 2014 27.25 27.81 28.33 28.84 29.32
The average age of Newfoundland Power’s distribution poles is gradually increasing. As distribution poles age, their strength gradually diminishes.16 This typically is not an issue during normal operations; however, the diminished strength will reduce the ability of an old distribution pole to withstand extreme conditions. This, in turn, will reduce the full, or part, of a distribution feeders’ capability to withstand extreme conditions. This reduced capability is the result of a combination of diminished component strength over time (i.e., the old pole) and the diminished strength of the overall feeder. The 45 foot class 4 treated wooden distribution poles are a common component of Newfoundland Power distribution feeders. Chart 11 shows a fragility curve indicating the combined impact of wind and age on a loaded 45 foot class 4 treated wooden pole.17
16 Strength will very gradually diminish due to the natural effects of time. Age is not the only criteria in
determining strength. Condition assessment is critical to proper management of aging assets. 17 Salman, Abdullahi M., “Age-Dependent Fragility and Life-Cycle Cost Analysis of Timber and Steel
Distribution Poles Subjected to Hurricanes”, Master’s Thesis, Michigan Technological University, 2014.

2015 Distribution Reliability Review NP 2016 CBA
15
Chart 11 shows that a new fully loaded distribution pole has virtually no probability of failure until winds reach in excess of 160 km/hr. By age 60, the probability of pole failure begins to significantly increase once wind speeds approach 120 km/hr. The reduced resilience of aging distribution poles presents a growing dimension of risk which faces the entire electric utility industry. Reduced resilience of individual distribution feeder components can have extended consequences for reliability. While distribution feeders are engineered and constructed to be robust, components in the system gain support from stiffer or less heavily loaded adjacent components. This is referred to as load sharing. When a distribution feeder experiences stress from extreme weather, the interconnection of components on the feeder will distribute the stress to adjacent components. This can increase feeder resilience. However, when a weakened component on a distribution feeder fails, it can result in cascading failures of other components, including poles which are old and relatively weak. This dynamic tends to reduce feeder resilience and increase the severity of overall physical and customer impacts. Newfoundland Power’s existing design and construction standards for distribution plant and equipment reflect the Company’s operating environment. However, older infrastructure will contribute to more reduced reliability in extreme conditions. Further, the older infrastructure gets, the greater the reliability consequences will be.
0.0
0.2
0.4
0.6
0.8
1.0
1.2
Prob
abili
ty o
f Fai
lure
Wind speed (km/hr)
Chart 11: Fragility Curve 45 ft Southern Yellow Pine
New
60 years old

2015 Distribution Reliability Review NP 2016 CBA
16
Table 3 shows the current age of Newfoundland Power’s distribution poles.
Table 3 Newfoundland Power
Distribution Poles by Age Age Quantity
0 - 10 34,138 10 - 20 31,203 21 - 30 43,886 31 - 40 43,051 41 - 50 36,890 51 - 60 11,752
60+ 9,100 Approximately 10% of Newfoundland Power’s distribution poles are more than 50 years old. Newfoundland Power currently rebuilds approximately 60 kilometers of distribution pole line each year. This is done as a result of maintenance and upgrades. Newfoundland Power has approximately 9,800 kilometers of distribution line in service. The current rate of rebuild implies a replacement cycle (or expected service life) of approximately 163 years. Such a service life expectancy does not appear reasonable. A replacement cycle of approximately 50 years would require Newfoundland Power to replace an additional 136 kilometers of pole line infrastructure annually.18 At current construction costs, this would require an additional annual expenditure of more than $20 million.19 4.3 The Impact of Weather Hurricanes, blizzards and ice have long been risks to distribution reliability for Newfoundland Power. Newfoundland Power’s distribution construction and maintenance standards reflect these risks. Nevertheless, extreme weather events still have the capacity to cause catastrophic damage to the Company’s distribution system. Such events typically result in prolonged customer outages. Weather conditions that are less than extreme can also have a material effect on distribution reliability performance. For Newfoundland Power’s aerial distribution systems, the most significant weather feature from a reliability perspective is wind.
18 The replacement cycle of 50 years is provided for exemplary purposes only. Newfoundland Power currently
depreciates distribution poles based upon a life expectancy of approximately 48 years. 19 Current distribution feeder upgrade costs are approximately $150,000/km. $150,000 x 136 = $20,400,000.

2015 Distribution Reliability Review NP 2016 CBA
17
Table 4 shows the number of days where recorded wind speeds in Newfoundland Power’s service territory exceeded 100 km/hr for the period 2007–2014.
Table 4 Wind Speed in Excess of 100 km/hr (days)
Newfoundland Power 2007-2014
St. John's Bonavista Gander Stephenville Total
2007 2 5 1 2 10 2008 2 14 4 1 21 2009 0 16 0 0 16 2010 0 9 0 4 13 2011 2 19 1 1 23 2012 2 11 0 2 15 2013 4 12 1 3 20 2014 22 20 0 2 44
The data in Table 4 indicates that wind speeds in excess of 100 km/hr occur routinely in Newfoundland Power’s service territory. In 2014, Newfoundland Power experienced an unusually high incidence of winds in excess of 100 km/hr in its service territory. The increased incidence of high winds in 2014 was a significant contributor to the increased duration of outages (i.e., SAIDI) for Newfoundland Power’s customers that year.

2015 Distribution Reliability Review NP 2016 CBA
18
Chart 12 shows the impact on SAIDI of outages where winds exceeded 100 km/hr during the period 2007-2014.
4.4 Reliability Outlook The most pressing issue in Newfoundland Power’s distribution system reliability outlook relates to the aging of the system. As Newfoundland Power’s distribution system ages, the overall strength of the distribution system can be expected to decline. Because the overall aging process is gradual, the decline in system strength can be expected to be gradual. Under normal conditions, the impact of distribution system aging on reliability to customers can likewise be expected to be gradual. Under more extreme weather or abnormal conditions, the impact can be expected to be more profound. This effect can also be expected to gradually worsen. Overall, more damage and consequent customer outages will result from less significant events as aging progresses. The observation that existing levels of distribution system reliability are unlikely to be maintainable at current plant replacement levels is common.20 Increasing the pace of distribution plant replacement carries additional costs. These costs are ultimately borne by Newfoundland Power’s customers in the rates they pay for service. Currently, it is not clear to Newfoundland Power whether increasing distribution plant replacement levels is more likely to be cost effectively done via existing programs such as the Rebuild Distribution Lines and Distribution Reliability Initiative capital programs or via a more specific program or programs which target specific assets such as utility poles. For these 20 See, for example, Economic Benefits of Increasing Electric Grid Resilience to Weather Outages, Executive
Office of the President of the United States, August 2013.
0.00
0.10
0.20
0.30
0.40
0.50
0.60
Hou
rs
Chart 12: SAIDI Winds Greater than 100km/hr Newfoundland Power
2007-2014

2015 Distribution Reliability Review NP 2016 CBA
19
reasons, Newfoundland Power intends to conduct a thorough assessment of the matter (including current best North American utility practice). The results of this assessment will be incorporated in future Newfoundland Power capital budget applications. 5.0 PREDICTIVE ASSET MANAGEMENT 5.1 Industry Overview Historically, distribution system maintenance was reactive. A utility would wait until a problem manifested itself before undertaking repair or replacement of the asset. Recurring problems were subjected to engineering assessment and programs implemented to address them. A combination of an aging workforce and aging utility assets has tended to increase the management and regulatory focus on utility asset management systems. In recent years, the electric utility industry has been moving towards more systematic means of constructing, operating, maintaining, refurbishing and retiring the assets used to provide service to customers. Today it is generally accepted that utility asset management systems should, to the degree practical, be predictive. They should attempt to ensure the maximum service life of existing assets is achieved while avoiding asset failure in service. Achieving the maximum practical service life of existing assets is consistent with delivery of least cost electrical service to customers. Avoidance of asset failure in service is consistent with least cost delivery of reliable electrical service to customers.21 While most electric utilities use an asset management system, there is no particular consistency in overall design, operation or effectiveness of these systems. This lack of uniformity reflects the divergent operating and cost circumstances of electric utilities. An asset management system appropriate to, say, Toronto Hydro, an urban distribution utility serving a city of millions, would not necessarily be appropriate or cost effective for a utility such as Newfoundland Power. Reduced costs of data management, storage and processing have been an enabler of more sophisticated utility asset management systems. The availability of more field data allows more effective assessment of a distribution system’s vulnerabilities. This, in turn, permits more effective prediction of where distribution systems are most likely to experience failure. The increased availability of data has not yet contributed to a consistency in overall design, operation or effectiveness of utility asset management systems. Differing operating circumstances and cost structures will likely continue to contribute to a diversity of systems existing amongst electric utilities. The increased availability of data should, however, permit for general improvement in the effectiveness of virtually all predictive utility asset management systems.
21 Failure of assets in service typically results in more expensive asset replacement when compared to planned
replacement. In addition, failure of assets in service results in reduced reliability for customers.

2015 Distribution Reliability Review NP 2016 CBA
20
5.2 Newfoundland Power’s Plans In 2015, Newfoundland Power commenced replacement of some key operational technologies which support its electrical system management functions. Newfoundland Power is currently replacing its supervisory control and data acquisition (“SCADA”) system and completing a geographic information system (“GIS”) inventory of its assets.22 Advances in SCADA system technology in the 15 years since Newfoundland Power installed its current system have been substantial. The new SCADA system will have significantly increased capability to analyze distribution system operations. More complete GIS data will provide a more reliable basis for more accurate field analysis, including predictive analysis. The SCADA system and more comprehensive GIS data are the cornerstones of Newfoundland Power’s longer term reliability management plans. Starting in 2014 and continuing in 2015, Newfoundland Power has installed fully automated downline feeder reclosers on the distribution system with additional installations planned for 2016. As operational technologies are implement over the next several years the Company will consider the addition of more automated devices on the distribution system, such as downline recloser as a cost effective means of improving distribution reliability to customers. In the 2016 capital budget, Newfoundland Power is proposing to commence acquisition of an outage management system (“OMS”) to replace the Company’s existing system over the 2016-2017 time horizon. The replacement OMS will be integrated with the SCADA system and GIS and provide significantly greater functionality, particularly outage response functionality, over the next 5 years.23 This greater functionality will not, however, be limited in its usefulness to outage response. Because of its increased data analysis capabilities, it will provide options to improve the Company’s current predictive maintenance capabilities. The full extent to which this capability can be cost effectively used to improve the Company’s distribution reliability management is currently uncertain, however, the potential for such improvement is an aspect of Newfoundland Power’s current plans.24
22 The SCADA System Replacement and GIS improvements were approved by the Board as part of
Newfoundland Power’s 2015 Capital Budget Application in Order No. P.U. 40 (2014). 23 The Liberty Consulting Group, Report on Island Interconnected System to Interconnection with Muskrat Falls
addressing Newfoundland Power, December 17, 2014, at page 71 observed “Newfoundland Power expects to replace its existing Outage Management System with a commercial alternative within five years. Modern outage management systems provide more advanced functionality through integrations with SCADA systems and geographic information systems. This functionality includes predictive analysis and automatic grouping of related outage calls, as well as automatic customer outage notifications.”
24 Currently, Newfoundland Power expects to pursue any upgrade of its maintenance capabilities in 2018-2019, following implementation of upgraded outage response capabilities in late 2017.

2015 Distribution Reliability Review NP 2016 CBA
21
6.0 THE LIBERTY CONSULTING GROUP’S RECOMMENDATIONS 6.1 The Distribution Reliability Recommendations In its December 17, 2014 Report on Island Interconnected System to Interconnection with Muskrat Falls addressing Newfoundland Power, the Liberty Consulting Group (“Liberty Consulting”) made 6 recommendations relating to distribution reliability management for the Company. These recommendations were:
1. Increase the emphasis on the Rebuild Distribution Lines capital project in annual capital budgets, with the goal of reducing distribution equipment failures.
2. Perform a structured evaluation of the costs and benefits of instituting a regular annual program for addressing worst performing feeders.
3. Develop a weighted analytical scoring of criteria process to support capital planning; include in this a scoring criterion that relates expected project costs to avoided customer interruptions or minutes.
4. Investigate the installation of downstream feeder reclosers for the purpose of improving distribution SAIFI and SAIDI indices, in addition for reducing cold load pick up difficulties, with priorities given to feeders based on installation costs versus anticipated avoided customer interruptions.
5. Consider conducting “sounding” tests on all older distribution poles (not just those obviously rotted) when inspecting feeders; reconsider chemically treating distribution poles to extend their lives.
6. Unless it can show that fungus and insect infestation does not occur on its wood poles, Newfoundland Power should reconsider the need to treat its transmission poles for fungus and insect infestation, as does Hydro.
6.2 Newfoundland Power Assessment Recommendation 2.1: Increasing the Emphasis on Rebuild Distribution Lines Capital Project The annual Rebuild Distribution Lines capital project is based upon actual field inspections performed on the distribution system on a 7-year cycle. The inspection standards which support the Rebuild Distribution Lines capital project reflect the most current data relating to distribution equipment failure available to Newfoundland Power. Because the inspection standards are adapted to reflect current distribution equipment failure data, this annual capital project has

2015 Distribution Reliability Review NP 2016 CBA
22
proven particularly effective in addressing emerging causes of specific equipment failure in a timely way and improving overall distribution system reliability as a result.25 Based upon this, Newfoundland Power sees no basis for increasing the emphasis on this annual capital project at this time. It is possible that further assessment of the longer term issue of appropriate distribution plant replacement levels referred to in Section 4.4: Reliability Outlook may indicate that a change in emphasis or approach to the Rebuild Distribution Lines capital project is warranted. Recommendation 2.2: Instituting a Regular Annual Program for Worst Performing Feeders Newfoundland Power’s Distribution Reliability Initiative capital project is intended to be an annual program to address the Company’s worst performing feeders. Each year, Newfoundland Power (i) analyzes the performance of, and considers expenditures to address, its worst performing feeders and (ii) proposes appropriate expenditures to address poor performance where the circumstances, in the Company’s view, warrant this. For 4 of the 16 years since the Distribution Reliability Initiative was introduced, expenditures were not made under this capital project because the Company’s analysis of reliability data associated with its worst performing feeders did not, in Newfoundland Power’s view, justify any expenditure. However, in each year, statistical data and engineering analysis relating to the Company’s worst performing feeders was included in the annual capital budget application to the Board. The Distribution Reliability Initiative capital project will continue to be a part of Newfoundland Power’s annual capital budgets. Recommendation 2.3: Analytical Scoring of Reliability Criteria Newfoundland Power’s annual capital budgeting for its electrical distribution system explicitly relies upon (i) a structured program of field inspections and (ii) 6 industry standard reliability metrics relating to customer interruptions. Newfoundland Power’s distribution system reliability has improved significantly over the past 15 years and is currently better than the Canadian average. Newfoundland Power is aware that some other electric utilities use more weighted analytical models to assess electrical distribution system reliability and inform annual expenditure programs. The Company does not currently have the automated information systems that would support such analysis on a cost effective basis. Given Newfoundland Power’s relatively small distribution system (9,800 km of distribution line), it is unlikely that such systems would be cost justified for reliability planning alone.26 Newfoundland Power is upgrading its SCADA and OMS systems over the next few years. In addition, the Company is completing a GIS inventory of its assets. This combination of systems will provide significantly greater predictive analysis capability for Newfoundland Power in 25 See Chart 8 on page 11. 26 By comparison, Hydro One, a Canadian electric utility that relies on such weighted analytical models, has
approximately 120,000 km of distribution line.

2015 Distribution Reliability Review NP 2016 CBA
23
restoring service to customers after an outage. The Company expects that once these systems are operational, they will be able to contribute to reducing outages by improving broader distribution management capabilities. Those improved capabilities might possibly include a more weighted analytical approach to assessing distribution reliability expenditures. Recommendation 2.4: Installation of Downline Feeder Reclosers Newfoundland Power recommenced installation of additional downline feeder reclosers in 2014 and 2015.27 Newfoundland Power’s 2016 Capital Budget includes a Distribution Feeder Automation capital project to add a further 8 downline automated distribution feeder reclosers to the Company’s distribution system. These distribution system additions will permit a greater degree of distribution system reliability in both normal and extreme operating conditions. Newfoundland Power will continue to install downline automated reclosers on its distribution system where conditions indicate reliability improvement will result. Recommendations 3.1 & 3.2: Reconsideration of Approach to Fungal Decay Newfoundland Power has not had significant reliability issues associated with the fungal decay of distribution poles. Newfoundland Power’s inspection and reliability management practices reflect this.28 To determine whether a reconsideration of the Company’s approach to addressing fungal decay in distribution poles is justified, the Company will conduct analysis on distribution poles removed from service to assess the degree, if any, of fungal decay. This analysis will provide the basis for any required change in Newfoundland Power’s current practice.
27 In Order No. P.U. 14 (2014), the Board approved, amongst other things, the installation of 14 downline
automated distribution feeder sectionalizing reclosers in 2014. In Order No. P.U. 40 (2014), the Board approved, amongst other things, the installation of 2 downline automated distribution feeder sectionalizing reclosers in 2015.
28 The issue of whether Newfoundland Power’s distribution pole maintenance practices should include groundline treatments was specifically raised at the Company’s last general rate application by the Consumer Advocate’s expert witness, Jacob Pous. No change in Newfoundland Power’s practices resulted.

2015 Capital Expenditure Status Report NP 2016 CBA
2015 Capital Expenditure Status Report
June 2015

2015 Capital Expenditure Status Report NP 2016 CBA
Newfoundland Power Inc. – 2016 Capital Budget Application
Newfoundland Power Inc.
2015 Capital Expenditure Status Report
Explanatory Note
This report is presented in compliance with the directive of the Board of Commissioners of Public Utilities (the “Board”) contained in paragraph 6 of Order No. P.U. 40 (2014). Page 1 of the 2015 Capital Expenditure Status Report outlines the forecast variances from budget of the capital expenditures approved by the Board. The detailed tables on pages 2 to 13 provide additional detail on capital expenditures in 2015, which were approved in Order No. P.U. 40 (2014). The detailed tables also include information on those capital projects approved for 2012 and 2014 (and approved in Order No. P.U. 26 (2011) and Order No. P.U. 27 (2013)) that were not completed prior to 2015. Variances of more than 10% of approved expenditure and $100,000 or greater are explained in the Notes contained in Appendix A, which immediately follows the blue page at the conclusion of the 2015 Capital Expenditure Status Report. These variance criteria are as outlined in the Capital Budget Application Guidelines.

2015 Capital Expenditure Status Report NP 2016 CBA
Newfoundland Power Inc. – 2016 Capital Budget Application Page 1 of 13
Newfoundland Power Inc.
2015 Capital Budget Variances (000s)
Approved by Order No.
P.U.40 (2014)
Forecast
Variance Generation – Hydro $4,698 $4,698 $ - Generation - Thermal 216 216 - Substations 22,478 22,553 75 Transmission 5,731 5,731 - Distribution 42,473 40,154 ($2,319) General Property 3,224 3,224 - Transportation 2,917 3,094 177 Telecommunications 123 123 - Information Systems 7,501 7,501 - Unforeseen Items 750 750 - General Expenses Capitalized 4,100 5,000 900
Total $94,211 $93,044 ($1,167) Projects carried forward from 2014 $2,079 Projects carried forward from 2012 $175

Page 2 of 13
Total Remainder Total Overall2012 2013 2014 2015 Total 2012 2013 2014 2015 To Date 2015 2015 Total Variance
A B C D E F G H I J K L M N
2015 Projects -$ -$ -$ 94,211$ 94,211$ -$ -$ -$ 23,892$ 23,892$ 69,152$ 93,044$ 93,044 (1,167)$
2014 Projects - - 21,722 - 21,722$ - - 20,268 553 20,821 1,591 2,144$ 22,412 690
2013 Projects - 200 - - 200$ - 144 - - 144 - -$ 144 (56)
2012 Projects 5,000 - - - 5,000$ 2,744$ 213 235 10$ 3,202 166$ 176$ 3,368 (1,632)
Grand Total 5,000$ 200$ 21,722$ 94,211$ 121,133$ 2,744$ 357$ 20,503$ 24,455$ 47,915$ 70,909$ 95,364$ 118,824$ (2,165)$
Column A Approved Capital Budget for 2012Column B Approved Capital Budget for 2013Column C Approved Capital Budget for 2014Column D Approved Capital Budget for 2015Column E Total of Columns A, B, C and DColumn F Actual Capital Expenditures for 2012 Column G Actual Capital Expenditures for 2013Column H Actual Capital Expenditures for 2014Column I Actual Capital Expenditures for 2015Column J Total of Columns F, G, H and IColumn K Forecast for Remainder of 2015Column L Total of Columns I and KColumn M Total of Columns J and KColumn N Column M less Column E
2015 Capital Expenditure Status Report(000s)
Capital Budget Actual Expenditures Forecast

Page 3 of 13
Category: Generation - Hydro
Total Remainder Total OverallProject 2012 2013 2014 2015 Total 2012 2013 2014 2015 To Date 2015 2015 Total Variance Notes*
A B C D E F G H I J K L M N
2015 ProjectsHydro Plants - Facility Rehabilitation -$ -$ -$ 1,586$ 1,586$ -$ -$ -$ 166$ 166$ 1,420$ 1,586$ 1,586$ -$ Public Safety Around Dams - - - 429 429 - - - 21 21 408 429 429 - Pierre's Brook Plant Penstock and Surge Tank - - - 750 750 - - - 68 68 682 750 750 - Tors Cove Plant Refurbishment - - - 1,777 1,777 - - - 154 154 1,623 1,777 1,777 - Seal Cove Plant Refurbishment - - - 156 156 - - - 6 6 150 156 156 -
Total - 2015 Generation Hydro -$ -$ -$ 4,698$ 4,698$ -$ -$ -$ 415$ 415$ 4,283$ 4,698$ 4,698$ -$
2012 ProjectsRattling Brook Fisheries Compensation 5,000$ -$ -$ -$ 5,000$ 2,744$ 213$ 235$ 10$ 3,202$ 166$ 176$ 3,368$ (1,632)$ 1
2014 ProjectsHydro Plants - Facility Rehabilitation -$ - 1,610$ -$ 1,610 -$ - 1,538 10$ 1,548 277$ 287$ 1,825$ 215$ 2Hydro Plant Production Increase - - 1,665 - 1,665 - - 899 19 918 760 779 1,678 13 Hearts Content Plant Refurbishment - 200 5,735 - 5,935 - 144 6,020 258 6,422 7 265 6,429 494
Total - Generation Hydro 5,000$ 200$ 9,010$ 4,698$ 18,908$ 2,744$ 357$ 8,692$ 712$ 12,505$ 5,493$ 6,205$ 17,998$ (910)$
* See Appendix A for notes containing variance explanations.
Column A Approved Capital Budget for 2012Column B Approved Capital Budget for 2013Column C Approved Capital Budget for 2014Column D Approved Capital Budget for 2015Column E Total of Columns A, B, C and DColumn F Actual Capital Expenditures for 2012Column G Actual Capital Expenditures for 2013Column H Actual Capital Expenditures for 2014Column I Actual Capital Expenditures for 2015Column J Total of Columns F, G H and IColumn K Forecast for Remainder of 2015Column L Total of Columns I and K
2015 Capital Expenditure Status Report(000s)
Capital Budget Actual Expenditures Forecast

Page 4 of 13
Category: Generation - Thermal
Total Remainder Total OverallProject 2015 Total 2015 To Date 2015 2015 Total Variance Notes*
A B C D E F G H
2015 ProjectsThermal Plants - Facility Rehabilitation 216$ 216$ 30$ 30$ 186$ 216$ 216$ -$
Total - Generation Thermal 216$ 216$ 30$ 30$ 186$ 216$ 216$ -$
* See Appendix A for notes containing variance explanations.
Column A Approved Capital Budget for 2015Column B Total of Column AColumn C Actual Capital Expenditures for 2015Column D Total of Column CColumn E Forecast for Remainder of 2015Column F Total of Columns C and EColumn G Total of Column FColumn H Column G less Column B
Actual Expenditures Forecast
2015 Capital Expenditure Status Report(000s)
Capital Budget

Page 5 of 13
Category: Substations
Total Remainder Total OverallProject 2014 2015 Total 2014 2015 To Date 2015 2015 Total Variance Notes*
A B C D E F G H I J2015 ProjectsSubstation Refurbishment and Modernization -$ 9,961$ 9,961$ -$ 1,123$ 1,123$ 8,688$ 9,811$ 9,811$ (150)$ Replacements Due to In-Service Failures - 3,110 3,110 - 508 508 2,602 3,110 3,110 - Additions Due to Load Growth - 8,935 8,935 - 872 872 8,288 9,160 9,160 225 Substation Feeder Termination - 472 472 - 90 90 382 472 472 -
-$ 22,478$ 22,478$ -$ 2,593$ 2,593$ 19,960$ 22,553$ 22,553$ 75$
2014 ProjectsAdditions Due to Load Growth 5,250$ -$ 5,250$ 4,385$ 21$ 4,406$ 239$ 260$ 4,645$ (605)$ 3
Total - Substations 5,250 22,478 27,728 4,385 2,614 6,999 20,199 22,813 27,198 (530)
* See Appendix A for notes containing variance explanations.
Column A Approved Capital Budget for 2014Column B Approved Capital Budget for 2015Column C Total of Columns A and B Column D Actual Capital Expenditures for 2014Column E Actual Capital Expenditures for 2015Column F Total of Columns D and EColumn G Forecast for Remainder of 2015Column H Total of Columns E and GColumn I Total of Columns F and GColumn J Column I less Column C
Capital Budget Actual Expenditures Forecast
2015 Capital Expenditure Status Report(000s)

Page 6 of 13
Category: Transmission
Total Remainder Total OverallProject 2014 2015 Total 2014 2015 To Date 2015 2015 Total Variance Notes*
A B C D E F G H I J2015 ProjectsRebuild Transmission Lines -$ 5,731$ 5,731$ -$ 658$ 658$ 5,073$ 5,731$ 5,731$ -$
-$ 5,731$ 5,731$ -$ 658$ 658$ 5,073$ 5,731$ 5,731$ -$
2014 ProjectsRebuild Transmission Lines 5,099$ -$ 5,099$ 4,522$ 40$ 4,562$ 102$ 142$ 4,664$ (435)$
Total - Transmission 5,099 5,731 10,830 4,522 698 5,220 5,175 5,873 10,395 (435)
* See Appendix A for notes containing variance explanations.
Column A Approved Capital Budget for 2014Column B Approved Capital Budget for 2015Column C Total of Columns A and B Column D Actual Capital Expenditures for 2014Column E Actual Capital Expenditures for 2015Column F Total of Columns D and EColumn G Forecast for Remainder of 2015Column H Total of Columns E and GColumn I Total of Columns F and GColumn J Column I less Column C
2015 Capital Expenditure Status Report(000s)
Capital Budget Actual Expenditures Forecast

Page 7 of 13
Category: Distribution
Total Remainder Total OverallProject 2014 2015 Total 2014 2015 To Date 2015 2015 Total Variance Notes*
A B C D E F G H I J2015 ProjectsExtensions -$ 12,314$ 12,314$ -$ 4,860$ 4,860$ 6,458$ 11,318$ 11,318$ (996)$ Meters - 3,146 3,146 - 1,126 1,126 2,274 3,400 3,400 254 Services - 4,101 4,101 - 1,160 1,160 2,441 3,601 3,601 (500) 4Street Lighting - 2,469 2,469 - 776 776 1,517 2,293 2,293 (176) Transformers - 6,778 6,778 - 3,649 3,649 2,029 5,678 5,678 (1,100) 5Reconstruction - 3,964 3,964 - 2,023 2,023 2,140 4,163 4,163 199 Rebuild Distribution Lines - 3,302 3,302 - 1,470 1,470 1,832 3,302 3,302 - Relocate/Rebuild Distribution Lines for Third Parties 2,504 2,504 - 360 360 2,144 2,504 2,504 - Trunk Feeders 991 991 - 342 342 649 991 991 - Feeder Additions for Growth 1,684 1,684 - 164 164 1,520 1,684 1,684 - Distribution Reliability Initiative - 863 863 - 9 9 854 863 863 - Distribution Feeder Automation - 160 160 - 70 70 90 160 160 - Allowance for Funds Used During Construction - 197 197 - 70 70 127 197 197 -
-$ 42,473$ 42,473$ -$ 16,079$ 16,079$ 24,075$ 40,154$ 40,154$ (2,319)$
2014 Projects
Trunk Feeders 1,261$ -$ 1,261$ 1,544$ 174$ 1,718$ 87$ 261$ 1,805$ 544$ 6Feeder Additions for Growth 1,102 - 1,102 1,360 31 1,391 119 150 1,510 408 7
Total - Substations 2,363 42,473 44,836 2,904 16,284 19,188 24,281 40,565 43,469 (1,367)
* See Appendix A for notes containing variance explanations.
Column A Approved Capital Budget for 2014Column B Approved Capital Budget for 2015Column C Total of Columns A and B Column D Actual Capital Expenditures for 2014Column E Actual Capital Expenditures for 2015Column F Total of Columns D and EColumn G Forecast for Remainder of 2015Column H Total of Columns E and GColumn I Total of Columns F and GColumn J Column I less Column C
2015 Capital Expenditure Status Report(000s)
Capital Budget Actual Expenditures Forecast

Page 8 of 13
Category: General Property
Total Remainder Total OverallProject 2015 Total 2015 To Date 2015 2015 Total Variance Notes*
A B C D E F G H
2015 ProjectsTools and Equipment 467$ 467$ 185$ 185$ 282$ 467$ 467$ -$ Additions to Real Property 385 385 66 66 319 385 385 - Standby and Emergency Power - Carbonear Office 304 304 32 32 272 304 304 - Renovations to Company Buildings 2,068 2,068 82 82 1,986 2,068 2,068 -
Total - General Property 3,224$ 3,224$ 365$ 365$ 2,859$ 3,224$ 3,224$ -$
* See Appendix A for notes containing variance explanations.
Column A Approved Capital Budget for 2015Column B Total of Column AColumn C Actual Capital Expenditures for 2015Column D Total of Column CColumn E Forecast for Remainder of 2015Column F Total of Columns C and EColumn G Total of Column FColumn H Column G less Column B
2015 Capital Expenditure Status Report(000s)
Capital Budget Actual Expenditures Forecast

Page 9 of 13
Category: Transportation
Total Remainder Total OverallProject 2015 Total 2015 To Date 2015 2015 Total Variance Notes*
A B C D E F G H
2015 ProjectsPurchase Vehicles and Aerial Devices 2,917$ 2,917$ 389$ 389$ 2,705$ 3,094$ 3,094$ 177$
Total - Transportation 2,917$ 2,917$ 389$ 389$ 2,705$ 3,094$ 3,094$ 177$
* See Appendix A for notes containing variance explanations.
Column A Approved Capital Budget for 2015Column B Total of Column AColumn C Actual Capital Expenditures for 2015Column D Total of Column CColumn E Forecast for Remainder of 2015Column F Total of Columns C and EColumn G Total of Column FColumn H Column G less Column B
Actual Expenditures Forecast
2015 Capital Expenditure Status Report(000s)
Capital Budget

Page 10 of 13
Category: Telecommunications
Total Remainder Total OverallProject 2015 Total 2015 To Date 2015 2015 Total Variance Notes*
A B C D E F G H2015 ProjectsReplace/Upgrade Communications Equipment 123$ 123$ 20$ 20$ 103$ 123$ 123$ -$
Total - Telecommunications 123$ 123$ 20$ 20$ 103$ 123$ 123$ -$
* See Appendix A for notes containing variance explanations.
Column A Approved Capital Budget for 2015Column B Total of Column AColumn C Actual Capital Expenditures for 2015Column D Total of Column CColumn E Forecast for Remainder of 2015Column F Total of Columns C and EColumn G Total of Column FColumn H Column G less Column B
2015 Capital Expenditure Status Report(000s)
ForecastCapital Budget Actual Expenditures

Page 11 of 13
Category: Information Systems
Total Remainder Total OverallProject 2015 Total 2015 To Date 2015 2015 Total Variance Notes*
A B C D E F G H
2015 ProjectsApplication Enhancements 1,325$ 1,325$ 423$ 423$ 902$ 1,325$ 1,325$ -$ System Upgrades 1,125 1,125 270 270 855 1,125 1,125 - Personal Computer Infrastructure 487 487 308 308 179 487 487 - Shared Server Infrastructure 970 970 141 141 829 970 970 - Network Infrastructure 328 328 87 87 241 328 328 - SCADA System Replacement 2,833 2,833 244 244 2,589 2,833 2,833 - Geographic Information System Improvement 433 433 132 132 301 433 433 -
Total - Information Systems 7,501$ 7,501$ 1,605$ 1,605$ 5,896$ 7,501$ 7,501$ -$
* See Appendix A for notes containing variance explanations.
Column A Approved Capital Budget for 2015Column B Total of Column AColumn C Actual Capital Expenditures for 2015Column D Total of Column CColumn E Forecast for Remainder of 2015Column F Total of Columns C and EColumn G Total of Column FColumn H Column G less Column B
2015 Capital Expenditure Status Report(000s)
Capital Budget Actual Expenditures Forecast

Page 12 of 13
Category: Unforeseen Allowance
Total Remainder Total OverallProject 2015 Total 2015 To Date 2015 2015 Total Variance Notes*
A B C D E F G H
2015 ProjectsAllowance for Unforeseen Items 750$ 750$ -$ -$ 750$ 750$ 750$ -$
Total - Unforeseen Items 750$ 750$ -$ -$ 750$ 750$ 750$ -$
* See Appendix A for notes containing variance explanations.
Column A Approved Capital Budget for 2015Column B Total of Column AColumn C Actual Capital Expenditures for 2015Column D Total of Column CColumn E Forecast for Remainder of 2015Column F Total of Columns C and EColumn G Total of Column FColumn H Column G less Column B
Forecast
2015 Capital Expenditure Status Report(000s)
Actual ExpendituresCapital Budget

Page 13 of 13
Category: General Expenses Capitalized
Total Remainder Total OverallProject 2015 Total 2015 To Date 2015 2015 Total Variance Notes*
A B C D E F G H
2015 ProjectsGeneral Expenses Capitalized 4,100$ 4,100$ 1,738$ 1,738$ 3,262$ 5,000$ 5,000$ 900$ 8
Total - General Expenses Capitalized 4,100$ 4,100$ 1,738$ 1,738$ 3,262$ 5,000$ 5,000$ 900$
* See Appendix A for notes containing variance explanations.
`Column A Approved Capital Budget for 2015Column B Total of Column AColumn C Actual Capital Expenditures for 2015Column D Total of Column CColumn E Forecast for Remainder of 2015Column F Total of Columns C and EColumn G Total of Column FColumn H Column G less Column B
2015 Capital Expenditure Status Report(000s)
Capital Budget Actual Expenditures Forecast

NP 2016 CBA 2015 Capital Expenditure Report: Notes Appendix A
Newfoundland Power Inc. – 2016 Capital Budget Application Page 1 of 5
Generation - Hydro
1. Rattling Brook Fisheries Compensation (2012 Project):
Budget: $5,000,000 Actual: $3,367,000 Variance: ($1,633,000) In 2010, the Company received an order from Department of Fisheries and Oceans (“DFO”) stating that, pursuant to section 20 of the Fisheries Act, fish passage must be in place on Rattling Brook to allow downstream migration of salmon kelts and smolts by May 1, 2013 and the upstream migration of grilse and adult salmon by June 2014. The implementation plan as proposed in the 2012 Capital Budget Application involved completing all construction work in 2012. Subsequent to the project being approved, the Company engaged the necessary technical expertise to execute the project. As a result of this technical work, it was determined that the work should take place over a 5-year period from 2012 to 2016. The extended implementation period allows in-stream structures to be adapted to make them more suitable to migrating salmon. The revised implementation plan was submitted to DFO for review, and DFO confirmed its approval.1
2. Facility Rehabilitation (2014 Project):
Budget: $1,610,000 Actual: $1,825,000 Variance: $215,000
The Cape Broyle Spillway project was budgeted at $495,000. However, as a result of poor bedrock conditions experienced during excavation the work did not get completed as planned in 2014 and will result in the actual project expenditure being $150,000 over budget. Approximately $125,000 is required in 2015 to complete the installation of the sluice gate and platform, downstream retaining wall and security fencing bringing the total cost to $645,000.
1 The revised implementation plan meets the requirements and schedule of the original DFO order.

NP 2016 CBA 2015 Capital Expenditure Report: Notes Appendix A
Newfoundland Power Inc. – 2016 Capital Budget Application Page 2 of 5
Substations
3. Additions Due to Load Growth (2014 Project):
Budget: $5,250,000 Actual: $4,645,000 Variance: ($605,000)
The variance resulted from projects that were completed at costs under the budget estimates. Expenditure for major equipment purchases including power transformers, circuit breakers and protection panels were lower than the original budget estimates. Also, installation contract expenditures were lower than the original budget estimates.

NP 2016 CBA 2015 Capital Expenditure Report: Notes Appendix A
Newfoundland Power Inc. – 2016 Capital Budget Application Page 3 of 5
Distribution 4. Services:
Budget: $4,101,000 Forecast: $3,601,000 Variance: ($500,000)
The 2015 Capital Budget Estimate was based on an estimated 4,749 new customer connections. The current estimate is for 3,798 new customer connections, a reduction of approximately 20%. The new service connection cost has been reduced accordingly.
5. Transformers:
Budget: $6,778,000 Forecast: $5,678,000 Variance: ($1,100,000) The 2015 Capital Budget Estimate was based on an estimated 4,749 new customer connections. The current estimate is for 3,798 new customer connections, a reduction of approximately 20%. The quantity of transformers required for new customer connections has been reduced accordingly.
6. Trunk Feeders (2014 Project):
Budget: $1,261,000 Forecast: $1,805,000 Variance: $544,000 The relocation of the underbuilt distribution lines on transmission line 12L was estimated at $397,000. The actual cost was $615,000. The additional cost resulted from a design change to permit voltage conversion (from 4.16 kV to 12.5 kV) on the distribution lines being relocated. Performing the voltage conversion on this section of line now (i) improves system reliability for customers served by these underbuilt distribution lines, and (ii) eliminates the need to replace the line again in the near term for voltage conversion purposes due to planned changes to the distribution system in the east end of St. John’s. Accordingly, the expenditures are consistent with long-term least cost, reliable operation of the electrical system. The cost of the Manhole Cover Replacement project was budgeted at $267,000. The actual expenditure was $474,000. The budget cost was based on an estimate provided by a third party for the replacement of the manhole covers. During project execution it was determined that in many locations the collars and the bedding that supports the collars were a mixture of stacked rocks and broken concrete that were hazardous to vehicular traffic. The collars and bedding had to be replaced along with replacing the covers increasing project expenditures.

NP 2016 CBA 2015 Capital Expenditure Report: Notes Appendix A
Newfoundland Power Inc. – 2016 Capital Budget Application Page 4 of 5
Distribution 7. Feeder Additions for Growth (2014 Project):
Budget: $1,102,000 Forecast: $1,510,000 Variance: $408,000
This variance substantially relates to three feeder upgrades and additions. The CLV-03 feeder upgrade involved re-conductoring a 3.5 km section of overloaded 3 phase line. The original cost estimate was $268,000 and was based upon average construction cost forecasts. The work was performed in the central business district of Clarenville. Work in such environments is typically significantly higher than average cost due to the requirements to reduce business interruption to the extent reasonably possible. The final cost for completing the work was $392,000.
The MMT-01 feeder extension was estimated at $150,000 and will ultimately cost $250,000. The $100,000 increase over budget relates to higher regulator cost than budgeted ($30,000) and detailed design changes which required installation of a number of H-frame structures instead of single pole structures ($70,000).
The third feeder extension was GDL-08. This extension was originally approved in the 2013 Capital Budget. GDL-07 and GDL-08 were additional feeders originating at the Glendale substation in Mount Pearl. Municipal planning requirements delayed, and ultimately increased the cost of the GDL-08 extension by $100,000. This variance is included in the 2014 variances as work on GDL-08 concluded in 2014.

NP 2016 CBA 2015 Capital Expenditure Report: Notes Appendix A
Newfoundland Power Inc. – 2016 Capital Budget Application Page 5 of 5
General Expenses Capital 8. General Expenses Capital:
Budget: $4,100,000 Forecast: $5,000,000 Variance: $900,000 The variance is primarily related to an increase in the allocated portion of pension expense. Pension expenses have increased principally as a result of a lower discount rate being used to determine the Company's accrued obligation under its defined benefit pension plan.

1.1 2016 Facility Rehabilitation NP 201 6 CBA
2016 Facility Rehabilitation
June 2015
Prepared by:
David Ball, P. Eng.
A FORTIS C OMPAN Y

1.1 2016 Facility Rehabilitation NP 2016 CBA
i
Table of Contents
Page
1.0 Introduction ..........................................................................................................................1 2.0 Hydro Dam and Spillway Rehabilitation .............................................................................1 3.0 Generation Equipment Replacements Due to In-Service Failures ......................................7 4.0 Concluding ...........................................................................................................................8

1.1 2016 Facility Rehabilitation NP 2016 CBA
1
1.0 Introduction The 2016 Facility Rehabilitation project is necessary for the replacement or rehabilitation of deteriorated plant components that have been identified through routine inspections, operating experience and engineering studies. The project includes expenditures necessary to improve the efficiency and reliability of various hydro plants or to replace plant due to in-service failures. Newfoundland Power (the “Company”) has 23 hydroelectric plants that provide energy to the Island Interconnected System. Maintaining these generating facilities reduces the need for additional, more expensive, generation. Items involving replacement and rehabilitation work, which are identified during inspections and maintenance activities, are necessary for the continued operation of these generation facilities in a safe, reliable and environmentally compliant manner. The Company’s hydro generation facilities produce a combined normal annual production of 430.5 GWh.1 The alternative to maintaining these facilities is to retire them. The 2016 Facility Rehabilitation project totalling $1,462,000 is comprised of Hydro Dam and Spillway Rehabilitation and Generation Equipment Replacements Due to In-Service Failures. 2.0 Hydro Dam and Spillway Rehabilitation Cost: $923,000 The Company has over 150 dam structures throughout its 23 hydroelectric facilities. Based on the age of structures in the Newfoundland Power system, deterioration of embankment, timber crib and concrete dams is to be expected. Refurbishment is required to ensure integrity of the structures is maintained to an appropriate level of dam safety as per the guidelines established by the Canadian Dam Association.2 The cost of the projects is justified based on the need to restore the structures to an appropriate safety level based on the site design conditions and to allow for future operation of the hydro system in a safe and reliable manner. This item involves the refurbishment of deteriorated components at various dam structures. Specific work to be completed in 2016 includes:
1. Gull Pond Dam and Spillway Refurbishment ($100,000) The Gull Pond Dam and Spillway was originally constructed in 1931 as part of the original Pierre’s Brook hydro development. The last significant upgrade occurred in 1982 which included the encasing of the original concrete dam with earth fill, extension of the gate conduit and addition of a new spillway. This project involves
1 Normal annual production was established as 430.5 GWh in the Normal Production Review, Newfoundland
Power Inc., December 2010. 2 The guidelines established by the Canadian Dam Association (“CDA”) applicable to the Hydro Dam
Rehabilitation projects are CDA Dam Safety Guidelines 2007, Dam Safety Guidelines 2007 Technical Bulletins and Guidelines for Public Safety Around Dams 2011. Copies of these guidelines can be ordered online from www.cda.ca.

1.1 2016 Facility Rehabilitation NP 2016 CBA
2
refurbishment of the riprap, and the existing intake walkway.3 The work is planned to coincide with the replacement of the Pierre’s Brook Penstock in 2016.4 Over time the riprap has migrated down the slope of the dam and the top has become rounded.5 Improvements to the riprap are required to ensure the dam is adequately protected from wave action. The crest will be re-graded to ensure the design dam width is maintained. Employee safety improvements are required on the intake walkway to meet provincial occupational health and safety regulations.6 The walkway railing was constructed without toe boards.7 The coating system on the steel components and the timber decking is in poor condition and requires refurbishment. Riprap improvements will reduce the risk of erosion during a significant inflow event. Railing improvements at the intake walkway will remove employee safety hazards.
Figure 1 – Dam Riprap
Figure 2 – Intake Walkway
3 Riprap is a layer of rock placed on the face of an embankment dam to prevent erosion from currents or waves. 4 Approved as part of the 2015 Capital Budget, Board Order P.U. 40 (2014). An estimate of $100,000 was
included in the feasibility analysis for the refurbishment of the Gull Pond Forebay Dam in 2016, to be justified in the 2016 Facilities Rehabilitation Report.
5 See Figure 1. 6 Railing replacement was not included as part of the 2015 Public Safety Project as there was no increase in risk
reduction above minor measures which were proposed for this structure. 7 See Figure 2.

1.1 2016 Facility Rehabilitation NP 2016 CBA
3
2. Sandy Lake Emergency Spillway ($447,000) The Sandy Lake Emergency Spillway provides a significant portion of the spillway capacity for the Sandy Brook Hydroelectric Development. The structure is approximately 215 m long and 1-2 m high and consists of a timber core to prevent leakage and a riprap surface to prevent erosion.8
Figure 3 – Sandy Lake Emergency Spillway Figure 4 – Timber Core
The spillway core is in poor condition and over time has shifted as it is now misaligned and no longer level.9 It requires replacement to ensure the long term stability of the structure. The riprap has migrated in places and requires refurbishment.10 To facilitate the core replacement, a large portion of the riprap will be removed. When replaced, it will be refurbished as required to maintain adequate erosion protection for the structure.
Figure 5 – Misaligned Core
Figure 6 – Riprap Displacement and Downstream
Erosion 8 See Figures 3 and 4. 9 See Figure 5. 10 See Figure 6. The riprap should be flush with the top of the core.

1.1 2016 Facility Rehabilitation NP 2016 CBA
4
A 15 m central section of the spillway is constructed slightly lower than the remaining 200 m to focus the spill under normal spill conditions. The spill channel immediately downstream of this section is currently experiencing erosion during spill conditions and requires improvements including erosion protection to ensure the long term stability of this section of spillway. 11
3. New Chelsea Intake ($171,000) The New Chelsea Intake provides the transition from Seal Cove Pond to the New Chelsea Penstock. 12 The intake consists of a concrete foundation, trash rack, head gate and a timber building. With the exception of improvements to the head gate in 2004, no major works have been undertaken since the original 1957 construction. This project involves replacement of deteriorated components, operational improvements and safety improvements. When required, access to the trash rack, stoplog slot and de-icing system is gained using a temporary timber platform.13 If left in place, the platform is susceptible to destruction from wave action. A permanent raised platform with proper railing and provision for fall protection is required. This will safely facilitate removal of debris, installation of stoplogs and servicing of the de-icing system. The existing lifting frame is in poor condition and will be removed as it will no longer be required after the refurbishment.
Figure 7 – New Chelsea Intake
Figure 8 – Timber Platform Access
11 See Figure 6 background. 12 See Figure 7. 13 The stoplogs are used to dewater the intake for head gate maintenance and provide a second safety barrier for
penstock inspection. A de-icing system, commonly referred to as a bubbler, is used primarily to agitate the water to prevent ice formation in locations where it presents a problem. The temporary platform shown in Figure 8 would be located on the concrete walls facing the reservoir.
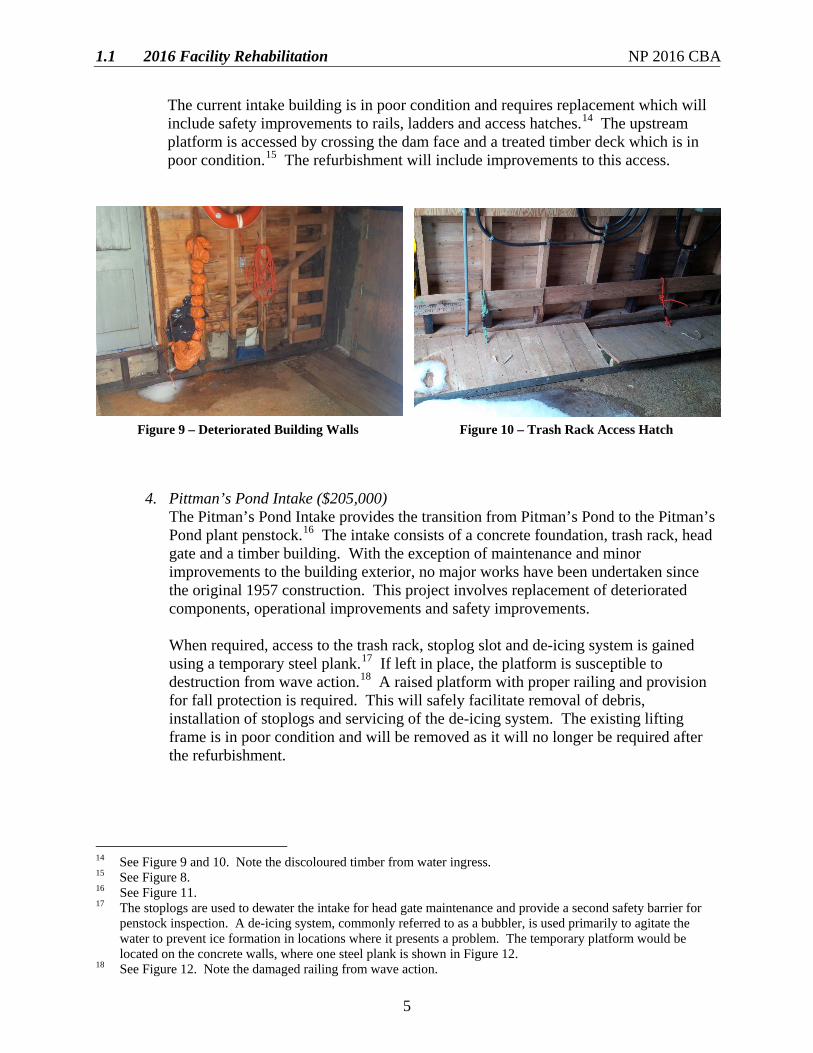
1.1 2016 Facility Rehabilitation NP 2016 CBA
5
The current intake building is in poor condition and requires replacement which will include safety improvements to rails, ladders and access hatches.14 The upstream platform is accessed by crossing the dam face and a treated timber deck which is in poor condition.15 The refurbishment will include improvements to this access.
Figure 9 – Deteriorated Building Walls
Figure 10 – Trash Rack Access Hatch
4. Pittman’s Pond Intake ($205,000) The Pitman’s Pond Intake provides the transition from Pitman’s Pond to the Pitman’s Pond plant penstock.16 The intake consists of a concrete foundation, trash rack, head gate and a timber building. With the exception of maintenance and minor improvements to the building exterior, no major works have been undertaken since the original 1957 construction. This project involves replacement of deteriorated components, operational improvements and safety improvements. When required, access to the trash rack, stoplog slot and de-icing system is gained using a temporary steel plank.17 If left in place, the platform is susceptible to destruction from wave action.18 A raised platform with proper railing and provision for fall protection is required. This will safely facilitate removal of debris, installation of stoplogs and servicing of the de-icing system. The existing lifting frame is in poor condition and will be removed as it will no longer be required after the refurbishment.
14 See Figure 9 and 10. Note the discoloured timber from water ingress. 15 See Figure 8. 16 See Figure 11. 17 The stoplogs are used to dewater the intake for head gate maintenance and provide a second safety barrier for
penstock inspection. A de-icing system, commonly referred to as a bubbler, is used primarily to agitate the water to prevent ice formation in locations where it presents a problem. The temporary platform would be located on the concrete walls, where one steel plank is shown in Figure 12.
18 See Figure 12. Note the damaged railing from wave action.

1.1 2016 Facility Rehabilitation NP 2016 CBA
6
Figure 11 – Pitman’s Pond Intake Figure 12 – Upstream Platform
The current intake building is in fair condition however there is some localized deterioration of the footing as well as safety concerns with the layout. The upstream platform is currently accessed through a reduced size door on the upstream side of the building.19 To facilitate safe egress from the working platform, a standard size door will be installed. In addition, the building is not weather tight as a result of the serrated grating used as an access hatch. During winter, snow blows through the grating and creates slippery conditions inside the intake building.20
Figure 13 – Reduced Size Door Figure 14 – Building Interior A significant portion of the building will require re-construction to facilitate installation of a standard access door, foundation repair and interior safety improvements including rails, ladders and access hatches as well make the building weather tight.
19 See Figure 13. 20 See Figure 14.

1.1 2016 Facility Rehabilitation NP 2016 CBA
7
3.0 Generation Equipment Replacements Due to In-Service Failures Cost: $539,000 Equipment and infrastructure at generating facilities routinely requires upgrading or replacement to extend the life of the asset. This item involves the refurbishment or replacement of structures and equipment due to damage, deterioration, corrosion, technical obsolescence and in-service failure. This equipment is critical to the safe and reliable operation of generating facilities and must be replaced in a timely manner. Equipment replaced under this item includes civil infrastructure, instrumentation, mechanical, electrical, and protection and controls equipment. Replacements under this item are typically due to one of two reasons:
1. Emergency replacements – where components fail and require immediate replacement to return a unit to service; or
2. Observed deficiencies – where components are identified for replacement due to
imminent failure or for safety or environmental reasons. Table 1 shows the expenditures for replacements due to in-service failures since 2011.
Table 1 Expenditures Due to In-Service Failures
(000s)
Year 2011 2012 2013 2014 2015F Total $464 $523 $399 $590 $530
Based upon this recent historical information and engineering judgement, $539,000 is estimated to be required in 2016 for replacement of equipment due to in-service failures or equipment at risk of imminent failure. Generation equipment, buildings, intakes, dams and control structures are critical components in the safe and reliable operation of generating facilities. This item is required to enable the timely refurbishment or replacement of equipment to facilitate the continued operation of generating facilities in a safe and reliable manner.

1.1 2016 Facility Rehabilitation NP 2016 CBA
8
4.0 Concluding This project, for which there is no feasible alternative, is required in order to ensure the continued provision of safe, reliable generating plant operations. A 2016 budget of $1,462,000 for Facility Rehabilitation is recommended as follows:
• $923,000 for Hydro Dam and Spillway Rehabilitation; • $539,000 for Generation Equipment Replacements Due to In-Service Failures.

1.2 Public Safety Around Dams NP 2016 CBA
Public Safety Around Dams
June 2015
Prepared by:
David Ball, P. Eng.
A FORTIS COMPAN Y

1.2 Public Safety Around Dams NP 2016 CBA
i
Table of Contents
Page
1.0 Introduction ..........................................................................................................................1 2.0 2016 Project Description ......................................................................................................1
2.1 Tors Cove and Rocky Pond .....................................................................................2 2.2 Cape Broyle and Horse Chops .................................................................................5 2.3 Mobile and Morris ...................................................................................................8 2.4 New Chelsea and Pitman’s ....................................................................................10 2.5 Victoria ..................................................................................................................12 2.6 Heart’s Content ......................................................................................................14
3.0 2016 Project Cost ...............................................................................................................16

1.2 Public Safety Around Dams NP 2016 CBA
1
1.0 Introduction In the 2015 Capital Budget Application, Newfoundland Power (the “Company”) outlined plans to address public safety deficiencies throughout its various hydroelectric developments over a 3-year period from 2015-2017. It was estimated that expenditures of approximately $2.0 million will be necessary to implement public safety improvements at the Company’s hydroelectric developments over this period. Continuing with year 2 of the 3-year plan, the Company has completed detailed public safety assessments, consistent with the Canadian Dam Association (“CDA”) Guidelines for Public Safety Around Dams (the “Guidelines”) for 10 of the remaining 19 hydroelectric developments to be included in the 2016 Capital Budget.1,2 The 2016 expenditures associated with the public safety improvements identified through the assessments total $883,000. Expenditures in future years will be based upon detailed public safety assessments and presented in the capital budget application for that year. 2.0 2016 Project Description For 2016 the Company has identified 10 hydroelectric developments where public safety projects will take place. Assessments have been completed for Tors Cove, Rocky Pond, Cape Broyle, Horse Chops, Mobile, Morris, New Chelsea, Pitman’s Pond, Victoria and Heart’s Content hydroelectric developments.3 A number of safety hazards were found to exist at dams, intakes and other infrastructure located within the developments reviewed. Based on the level of activity and site particulars, varying levels of treatment have been recommended. Minimum treatment to be implemented involves signage with text viewable from outside of the hazardous area. Additional treatments such as warning buoys, safety booms, railing and fencing are also required. The assessments identified approximately 125 small items requiring attention. Many of these items are related to deficiencies in signage. The types of projects by development are identified in the subsequent sections. The projects to be completed in 2016 include:
(i) Safety booms at 6 sites, (ii) Fencing additions and modifications at 25 sites, (iii) Signage improvements at all sites, and (iv) Audible alarms at tailraces frequented by the public.
1 These guidelines are in addition to the CDA Dam Safety Guidelines 2007. Copies of these guidelines can be
ordered online from www.cda.ca. 2 Year 1 of the program consisted of 4 assessments which were approved in Order No. P.U. 40(2014). 3 Developments to be assessed in Year 2 and 3 were grouped geographically for efficiency in both assessment
and construction. Developments on the Avalon Peninsula were selected to be completed first as they generally see higher levels of public recreational use.

1.2 Public Safety Around Dams NP 2016 CBA
2
2.1 Tors Cove and Rocky Pond The Tors Cove and Rocky Pond developments are located on the Southern Shore of the Avalon Peninsula, approximately 40 km south of the City of St. John’s. The Tors Cove powerhouse is situated near the community of Tors Cove and the Rocky Pond Powerhouse is located 4 km upstream. Water storage is provided at Tors Cove Pond (forebay), Rocky Pond (forebay), Cape Pond and Franks Pond. Franks Canal, Cluneys Canal and the Le Manche Canal move water through the development. Figure 1 shows the locations of the various dams and control structures that form the Tors Cove and Rocky Pond developments.
Tors Cove Plant and Associated Infrastructure The concrete powerhouse is supplied from the intake by a 704 m long woodstave penstock. A 33 m steel surge tank is located along the penstock route. The plant has a short tailrace channel which empties directly into the Atlantic Ocean at Tors Cove. Tors Cove Pond Two main structures are present on Tors Cove Pond, the East Dam and the West Dam. The East Dam is a 10.5 m high earthfill structure with a crest length of approximately 72 m and concrete intake. The spillway is part of the East Dam and is a low concrete gravity structure approximately 1.5 m high with a crest length of 23 m. The West Dam is a 10.5 m high earthfill structure with a crest length of approximately 138 m.
Figure 1 – Tors Cove and Rocky Pond Hydroelectric Development

1.2 Public Safety Around Dams NP 2016 CBA
3
Rocky Pond Plant and Associated Infrastructure The concrete powerhouse is supplied from the intake by a 756 m long steel penstock. The plant has a 105 m long excavated tailrace channel from the powerhouse to Tors Cove Pond. Rocky Pond The primary diversion structure on Rocky Pond is the Rocky Pond Dam which is a 240 m long, 9 m high earthfill structure with a concrete intake. The adjacent spillway is a 34 m long, low concrete gravity structure. Three additional earthfill freeboard dams are located on Rocky Pond and total 240 m in length and vary in height. Long Pond, Le Manche and Cluneys Structures A system of canals, control structures and spillways span the 11.5 km reach between Cape Pond and Rocky Pond. Included is 1 diversion dam, 8 km of canals, 2 control structures and 11 spillways of varying dimensions. Cape Pond The Cape Pond Dam is a 160 m long, 5 m high earthfill dam with a concrete control structure located approximately 100 m from the right abutment. A concrete gravity spillway is located within the dam and is 40 m long, 2.0 m high and has an access walkway. Franks Pond The primary dam structure on Franks Pond is an 80 m long, 3.5 m high earthfill dam with a concrete control structure located approximately 30 m from the right abutment. Five additional earthfill dams and two rockfill/earthfill overflow spillways are also present and range in length from 30 m to 200 m and range in height from 1.5 m to 6.0 m. A 1,700 m long canal moves water from Franks Pond downstream. Required Treatments Fencing is required at the Tors Cove Plant forebay dam and tailrace, Rocky Pond Plant forebay spillway abutment, Long Pond control structure, Cluneys spillway and control structure, Franks Pond control structure, and Cape Pond intake and spillway. Fence and railing improvements are required at Rocky Pond Plant tailrace, the walkway along Cape Pond spillway and Mount Carmel Pond spillway. A boom and marker buoy is required at the Tors Cove intake structure and marker buoys are also required at Tors Cove spillway and the Rocky Pond Plant and Cape Pond intakes. An audible alarm will be installed at Tors Cove Plant to warn the public that the plant is about to start. Signage conforming to the Guidelines is required at all locations.

1.2 Public Safety Around Dams NP 2016 CBA
4
Public safety treatments identified for the Tors Cove and Rocky Pond Development are listed in Table 1.
Table 1 Public Safety Treatments
Tors Cove and Rocky Pond Developments
Site Signage Buoys4 Fencing5 Other6 Tors Cove Plant × × × Tors Cove Pond × × × Rocky Pond Plant × × Rocky Pond × × × Long Pond, Le Manche and Cluneys × × Cape Pond × × × Franks Pond ×
4 Buoys include treatments involving marker buoys and larger booms to restrict access by recreational boaters
and swimmers to hazardous areas. 5 Fencing includes treatments involving new and refurbishment of existing fences, gates and other barriers to
restrict access by pedestrians to hazardous areas. 6 An audible alarm is planned for Tors Cove tailrace.

1.2 Public Safety Around Dams NP 2016 CBA
5
2.2 Cape Broyle and Horse Chops The Cape Broyle and Horse Chops developments are located on the Southern Shore of the Avalon Peninsula, approximately 55 km south of the City of St. John’s. The Cape Broyle powerhouse is situated near the community of Cape Broyle and the Horse Chops powerhouse is located 4 km upstream. Water storage is provided at Cape Broyle Pond (forebay), Horse Chops Pond (forebay), Mount Carmel Pond, Fly Pond, Two Arm Pond and the Blackwoods Ponds structures. Figure 2 shows the locations of the various dams and control structures that form the Cape Broyle and Horse Chops developments.
Cape Broyle Plant and Associated Infrastructure The powerhouse is supplied from the intake by a 470 m long steel penstock. The first 40 m of penstock is buried while the remainder is constructed above ground on concrete cradles. A 60 m inlet of Cape Broyle Harbour serves as a tailrace. Cape Broyle Pond Cape Broyle Pond has several structures. The Forebay Dam is a 122 m long, 12 m high earthfill dam. The adjacent spillway is a 70 m long, 2.0 m high concrete gravity spillway with a sluice gate at the right abutment. The intake dam is a 40 m long, 10.7 m high earthfill dam with an intake located approximately 15 m from the left abutment. Two freeboard dams, both earthfill, are also present on this reservoir, the 45 m long Cape Broyle freeboard dam and the 75 m long Beaver Pond freeboard dam.
Figure 2 – Cape Broyle and Horse Chops Hydroelectric Development

1.2 Public Safety Around Dams NP 2016 CBA
6
Horse Chops Plant and Associated Infrastructure The Horse Chops Plant is fed by a 1,280 m long above ground steel penstock, which in turn is fed from Horse Chops Pond through a 1,700 m long canal, impounded by a 7.6 m high earthfill dam. An 80 m high surge tank is located along the penstock. The plant has a tailrace channel which extends approximately 450 m from the powerhouse to Cape Broyle Pond. Horse Chops Pond Several structures are located on Horse Chops Pond. The West Dam is a 340 m long, 11 m high, earthfill dam. The East Dam is 90 m long and 7.6 m high and is also an earthfill dam. The spillway is a 34 m long, 2.1 m high stop log spillway with an access walkway. Mount Carmel Pond The Mount Carmel Pond Dam is a 460 m long, 12 m high earthfill dam with a concrete control structure located approximately 160 m from the right abutment. The spillway is a 73 m long, 3.3 m high stop log spillway with an access walkway. Fly Pond and Two Arm Pond The Fly Pond Dam is a 180 m long, 4.3 m high earthfill dam. Water flows downstream through the 220 m long Fly Pond Canal. The Two Arm Pond dam is an earthfill dam which is approximately 45 m long and 1.5 m high. Fourth Blackwoods Structures Several structures are present on Fourth Blackwoods Pond. The Fourth Blackwoods Pond diversion dam is a rockfill/earthfill overflow structure which also serves as a spillway. It is approximately 55 m long and 4.6 m high. A 1,500 m long canal extends downstream. Two earthfill freeboard dams are present which are both approximately 45 m long and 2.5 m high. East Blackwoods Structures A cluster of 9 low head earthfill freeboard dams and one rockfill/earthfill spillway is present at East Blackwoods. The structures range from 18 m to 110 m long and 1.2 m to 4.6 m high. Northwest Blackwoods Structures A cluster of structures are located close together in the vicinity of Northwest Blackwoods Pond which includes 3 diversion dams, 2 freeboard dams and a spillway. All are rockfill or earthfill and range in size from 45 m to 180 m long and 2.4 m to 7.6 m high. West Ragged and Rock Pond The West Ragged Dam is a 75 m long rockfill treated timber dam with a 68 m long centrally located spillway. It ranges in height from 0.2 m to 2.0 m. The Rock Pond Dam is an 80 m long, 1.5 m high earthfill dam. Required Treatments Fencing is required along the parking area at Cape Broyle Plant, Horse Chops spillway and along Mount Carmel Pond spillway abutments and outlet. Fence and railing improvements are required at Cape Broyle intake dam, Fourth Blackwoods control structure, Fly Pond Canal, Blackwoods Canal and the walkway along Mount Carmel Pond spillway. A boom and marker

1.2 Public Safety Around Dams NP 2016 CBA
7
buoy is required at the Cape Broyle intake structure and marker buoys are also required at Cape Broyle spillway and Mount Carmel Pond inlet. An audible alarm will be installed at Cape Broyle Plant to warn the public that the plant is about to start. Signage conforming to the Guidelines is required at all locations. Public safety treatments identified for the Cape Broyle and Horse Chops Development are listed in Table 2 below:
Table 2 Public Safety Treatments
Cape Broyle and Horse Chops Developments
Site Signage Buoys7 Fencing8 Other Cape Broyle Plant × × Cape Broyle Pond × × × Horse Chops Plant × Horse Chops Pond × × Mount Carmel Pond × × × Fly and Two Arm Pond × × Fourth Blackwoods Structures × × East Blackwoods Structures × Northwest Blackwoods × West Ragged and Rock Pond ×
7 Buoys include treatments involving marker buoys and larger booms to restrict access by recreational boaters
and swimmers to hazardous areas. 8 Fencing includes treatments involving new and refurbishment of existing fences, gates and other barriers to
restrict access by pedestrians to hazardous areas.

1.2 Public Safety Around Dams NP 2016 CBA
8
2.3 Mobile and Morris The Mobile and Morris developments are located on the Southern Shore of the Avalon Peninsula, approximately 30 km south of the City of St. John’s. The Mobile powerhouse is situated in the community of Mobile and the Morris Powerhouse is located 7 km upstream. Water storage is provided at Mobile First Pond and Mobile Big Pond. Canals extending from both reservoirs move water to the powerhouse intakes. Figure 3 shows the locations of the various dams and control structures that form the Mobile and Morris developments.
Mobile Plant and Associated Infrastructure The Mobile Plant is fed from a small unnamed forebay by a 1,585 m long buried fiberglass and steel penstock, which in turn is fed from Mobile First Pond through a 2,500 m long canal, impounded by a 6 m high earthfill dam. A 61 m high surge tank is located along the penstock. The plant has a 30 m tailrace channel extending to Mobile Bay. Mobile First Pond Spillway The Mobile First Pond Spillway is a 73 m long, 1.5 m high concrete gravity structure with a steel walkway with stop log slots.
Figure 3 – Mobile and Morris Hydroelectric Development

1.2 Public Safety Around Dams NP 2016 CBA
9
Morris Plant and Associated Infrastructure The Morris Plant is fed by a 195 m long buried fiberglass penstock, which in turn is fed from Mobile Big Pond through a 2,100 m long canal, impounded by a 3 m high earthfill dam. The plant has a 100 m tailrace channel extending to Mobile First Pond. Mobile Big Pond The Mobile Big Pond Dam is a 435 m long, 9.5 m high earthfill dam with a concrete control structure located approximately 170 m from the left abutment. The spillway is a 54 m long, low concrete structure with a steel walkway with stop log slots. Required Treatments Fencing is required along the tailrace at Mobile and Morris plants, and along the abutments for Mobile First Pond spillway and the Morris Canal spillway. Fencing is also required at the Mobile Big Pond outlet. The existing fence and railing at Morris Plant intake need to be extended. Railings need improvement at the Mobile intake platform and at Mobile Big Pond inlet. Improvements to the walkway at Mobile First Pond are required. A boom and marker buoy is required at the Mobile Big Pond intake structure and a boom is also required at Mobile forebay. Audible alarms will be installed at Mobile and Morris plants to warn the public that the plants are about to start. Signage conforming to the Guidelines is required at all locations. Public safety treatments identified for the Mobile and Morris Developments are listed in Table 3 below:
Table 3 Public Safety Treatments
Mobile and Morris Developments
Site Signage Buoys9 Fencing10 Other11 Mobile Plant × × × Mobile First Pond × × × Morris Plant × × × Mobile Big Pond × × ×
9 Buoys include treatments involving marker buoys and larger booms to restrict access by recreational boaters
and swimmers to hazardous areas. 10 Fencing includes treatments involving new and refurbishment of existing fences, gates and other barriers to
restrict access by pedestrians to hazardous areas. 11 Audible alarms are planned for Mobile and Morris tailraces.

1.2 Public Safety Around Dams NP 2016 CBA
10
2.4 New Chelsea and Pitman’s
The New Chelsea and Pitman’s developments are located on the east side of Trinity Bay on the Avalon Peninsula. The New Chelsea powerhouse is located near the community of New Chelsea and the Pitman’s Powerhouse is located 3 km upstream. Water storage is provided at Seal Cove Pond (New Chelsea Forebay) and Pitman’s Pond (Pitman’s Pond Forebay). Figure 4 shows the locations of the various dams and control structures that form the New Chelsea and Pitman’s developments.
New Chelsea Plant and Associated Infrastructure New Chelsea Plant is supplied from the intake by a 1,090 m long steel penstock. A 60 m tailrace runs from the plant to the shoreline of Trinity Bay. Seal Cove Pond (New Chelsea Forebay) The structures at Seal Cove Pond consist of the Seal Cove Pond Dam and Spillway. The dam is a 180 m long, 13.7 m high earthfill structure with a concrete intake and timber gatehouse. The spillway is a 36 m long, low concrete gravity structure.
Figure 4 – New Chelsea and Pitman’s Hydroelectric Development

1.2 Public Safety Around Dams NP 2016 CBA
11
Pitman’s Plant and Associated Infrastructure Pitman’s Plant is supplied from the intake by a 400 m long woodstave penstock. A 130 m tailrace runs from the plant to Lance Cove Pond. Pitman’s Pond (Pitman’s Forebay) The structures at Pitman’s Pond consist of the Pitman’s Pond Dam and Spillway. The Pitman’s Pond Dam is a 320 m long, 11.6 m high earthfill structure with a concrete intake and timber gatehouse. The spillway is a 44 m long, low concrete gravity structure. The dam and the spillway are separated by a 2.4 m high concrete retaining wall. West Dyke The West Dyke is a 366 m long, 2.8 m high earthfill dam which serves as a freeboard dyke on Pitman’s Pond. Required Treatments Fencing is required along Seal Cove Pond intake platform and left abutment, Pitman’s Pond intake platform and right abutment, and at Pitman’s Pond tailrace. Existing fence and railing needs to be extended at Lance Cove Pond canal. A boom and marker buoy is required at the Seal Cove Pond intake structure and a marker buoy is also required at Pitman’s Pond forebay. An audible alarm will be installed at New Chelsea Plant to warn the public that the plant is about to start. Signage conforming to the Guidelines is required at all locations. Public safety treatments identified for the New Chelsea and Pitman’s Pond Developments are listed in Table 4.
Table 4 Public Safety Treatments
New Chelsea and Pitman’s Pond Development
Site Signage Buoys12 Fencing13 Other14 New Chelsea Plant × × Seal Cove Pond Dam × × × Pitman’s Plant × × Pitman’s Pond Dam × × × West Dyke ×
12 Buoys include treatments involving marker buoys and larger booms to restrict access by recreational boaters
and swimmers to hazardous areas. 13 Fencing includes treatments involving new and refurbishment of existing fences, gates and other barriers to
restrict access by pedestrians to hazardous areas. 14 An audible alarm is planned for New Chelsea tailrace.

1.2 Public Safety Around Dams NP 2016 CBA
12
2.5 Victoria
The Victoria development is located on the northern part of Conception Bay near the community of Victoria. Water storage is provided at Blue Hill Pond (forebay) and Rocky Pond. Figure 5 shows the locations of the various dams and control structures that form the Victoria development.
Victoria Plant and Associated Infrastructure Victoria Plant is supplied from the intake by a 490 m long, 0.9 m to 1.2 m diameter steel and woodstave penstock. A 45 m long, 3 m wide tailrace extends from the plant. Blue Hill Pond (Forebay) The forebay dam at Blue Hill Pond is approximately 32 m long and constructed primarily of rock fill with a reinforced concrete cap. Incorporated in the structure is a 9.1 m long overflow spillway, a dewatering conduit, trash racks and a steel sluice gate with manual control. A wooden walkway is present across the spillway.
Figure 5 – Victoria Hydroelectric Development

1.2 Public Safety Around Dams NP 2016 CBA
13
Rocky Pond Dam The Rocky Pond Dam is a concrete gravity dam with a maximum height of 8 m and a crest length of approximately 90 m, including an 11 m long spillway crest. The outlet consists of a 2.5 m wide x 1.5 m high gate and stem lift located in the center of the structure. Required Treatments Fencing is required at the Blue Hill Pond dam and at the spillway. Existing fencing at the tailrace needs to be extended. Improvements are required to the fence and railing along Rocky Pond Dam. The footbridge at the outlet structure for Rocky Pond Dam requires replacement. Signage conforming to the Guidelines is required at all locations. Public safety treatments identified for the Victoria Development are listed in Table 5.
Table 5 Public Safety Treatments
Victoria Development
Site Signage Buoys15 Fencing16 Other17 Victoria Plant × × Blue Hill Pond (Forebay) × × Rocky Pond × × ×
15 Buoys include treatments involving marker buoys and larger booms to restrict access by recreational boaters
and swimmers to hazardous areas. 16 Fencing includes treatments involving new and refurbishment of existing fences, gates and other barriers to
restrict access by pedestrians to hazardous areas. 17 Replacement of a short foot bridge is required at Rocky Pond Dam.

1.2 Public Safety Around Dams NP 2016 CBA
14
2.6 Heart’s Content
The Heart’s Content development is located on the east side of Trinity Bay, near the community of Heart’s Content. Water storage is provided at Southern Cove Pond/Rocky Pond (forebay), Seal Cove Pond, Long Pond, and Packs Pond. Figure 6 shows the locations of the various dams and control structures that form the Heart’s Content development.
Heart’s Content Plant and Associated Infrastructure The Heart’s Content Plant is supplied from the intake by a 579 m long, 1.8 m diameter steel penstock. A short tailrace extends into Trinity Bay. Heart’s Content Forebay The forebay dam is a 250 m long earthfill dam with timber core, of which 130 m provides containment of the power canal. A concrete intake constructed in 2014, is located at the end of the canal and is equipped with a head gate, steel trash racks, control equipment, and a wooden gatehouse.
Figure 6 – Heart’s Content Hydroelectric Development

1.2 Public Safety Around Dams NP 2016 CBA
15
Rocky Pond Dam and Spillway Rocky Pond Dam is an earthfill dam that measures 127 m long, with a maximum height of 2.8 m. The 146 m long overflow spillway is of earthfill/rockfill construction. This structure serves as the spillway for the Heart’s Content Forebay. Long Pond The Long Pond Dam consists of a 145 m long, 3 m high earthfill section, a 30 m long earthfill/rockfill overflow spillway and a concrete gate structure with a timber gate and screw stem lift. Seal Cove Pond Seal Cove Pond Dam is approximately 210 m long with a maximum height of 3 m. The dam is of earthfill construction, encasing the original rockfilled timber crib structure. The earthfill/rockfill overflow spillway is approximately 16 m long and 1 m high. Packs Pond The Packs Pond dam consists of two earthfill dam sections; a 46 m long, 2.5 m high dam section and a 125 m long, 3.5 m high section. Required Treatments Fencing is required at the forebay along the intake wing walls, and an extension to the fencing is required around the tailrace. Fencing is also required in proximity of the gate structure at Long Pond dam. Signage conforming to the Guidelines is required at all locations. Public safety treatments identified for the Heart’s Content Development are listed in Table 6.
Table 6 Public Safety Treatments
Heart’s Content Development
Site Signage Buoys18 Fencing19 Other Heart’s Content Plant × × Heart’s Content Forebay × × Rocky Pond Dam and Spillway × Long Pond Dam × × Seal Cove Pond Dam × Packs Pond Dam ×
18 Buoys include treatments involving marker buoys and larger booms to restrict access by recreational boaters
and swimmers to hazardous areas. 19 Fencing includes treatments involving new and refurbishment of existing fences, gates and other barriers to
restrict access by pedestrians to hazardous areas.
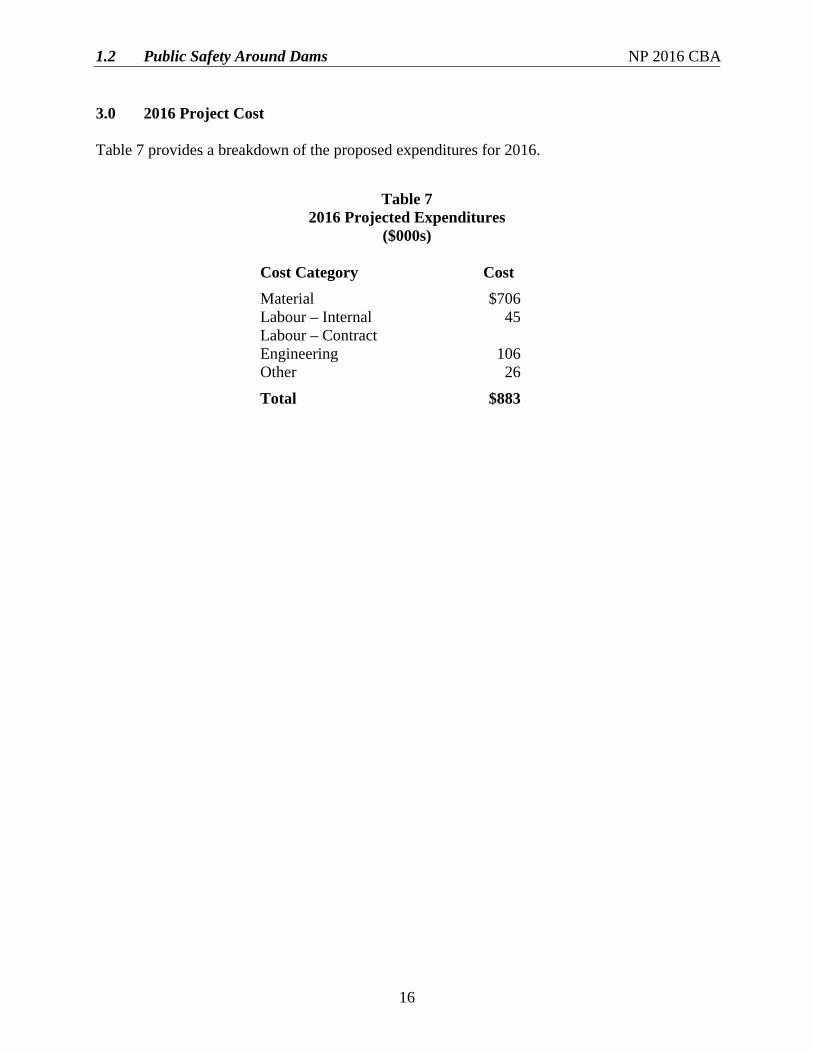
1.2 Public Safety Around Dams NP 2016 CBA
16
3.0 2016 Project Cost Table 7 provides a breakdown of the proposed expenditures for 2016.
Table 7 2016 Projected Expenditures
($000s)
Cost Category Cost Material $706 Labour – Internal 45 Labour – Contract Engineering 106 Other 26
Total $883

1.3 Pierre's Brook Hydro Plant Refurbishment NP 2016 CBA
Pierre's Brook Hydro Plant Refurbishment
June 2015
- .:...:'~! - - -
Prepared by:
Jeremy Decker, P. Eng.
John Pardy, P. Eng.
NEWFOUNDLAND~
POWER A FORTIS COMPAN Y

1.3 Pierre’s Brook Hydro Plant Refurbishment NP 2016 CBA
i
Table of Contents
Page
1.0 Background ..........................................................................................................................1 1.1 General .....................................................................................................................1 1.2 Previous Upgrades ...................................................................................................1 2.0 Engineering Assessment ......................................................................................................2 3.0 2016 Project Description ......................................................................................................2 3.1 Substation .................................................................................................................2 3.2 Protection and Control .............................................................................................3 3.3 Switchgear................................................................................................................4 3.4 AC and DC Systems ................................................................................................4 3.5 Lighting, Heat and Ventilation ................................................................................4 3.6 Powerhouse ..............................................................................................................5 3.7 Governor ..................................................................................................................5 4.0 Project Proposal ...................................................................................................................5 4.1 Cost Breakdown .......................................................................................................5 4.2 Feasibility Analysis ..................................................................................................5 5.0 Conclusion ...........................................................................................................................6 Appendix A: Pierre’s Brook Hydro Plant Engineering Assessment

1.3 Pierre’s Brook Hydro Plant Refurbishment NP 2016 CBA
1
1.0 Background 1.1 General The Pierre’s Brook hydroelectric development (the “Plant”) is located on the Avalon Peninsula, near the community of Witless Bay, approximately 30 km south of the City of St. John’s. The Plant was placed into service in 1931 and contains one General Electric generating unit with a nameplate capacity of 3,200 kW and a rated net head of 80.0 m. It contains a single 5,029 hp vertical Francis turbine manufactured by J.M. Voith.1 The Plant’s normal annual production is approximately 24.4 GWh or 5.7 % of the total hydroelectric production of Newfoundland Power. The Plant has provided 84 years of reliable energy production. The refurbishment and life extension of the Plant includes necessary work on the substation, generator, protection and control equipment and switchgear.2 The estimated levelized cost of energy from the Plant over the next 50 years, including the capital expenditure of $16.6 million over the next 25 years, is 4.87¢ per kWh.3 This report provides a summary of the engineering assessment of the Plant and the refurbishment proposed for 2016. 1.2 Previous Upgrades There have been a number of upgrades to the original plant and equipment since commissioning in 1931. The following is a list of the upgrades that have been completed in the past 25 years:
1989 – Battery bank 1991 – Woodward 505H governor controller 1993 – Pivot valve and controls 1994 – Heat, light and controls upgrade, annunciator, governor additions, station service
transformer and exciter 1995 – Runner and station service transformers 1996 – Generator stator windings 1999 – Air intake louver, PDA system, cooling water controls 2000 – Air compressor and Nexus meter 2003 – Intruder and fire alarm systems, cooling water controls and pulse meter
1 The generator is rated at 4,000 kVA at 80% power factor, which equates to a 3,200 kW load rating. The actual
generator power output was increased as a result of the replacement of the runner in 1995 and stator windings in 1996. The Plant produces 4,100 kW on peak which is confirmed during the annual generation test.
2 This project is associated with the replacement of the penstock which was approved as a multiyear project in Order No. P.U. 40 (2014). A copy of the report describing the penstock replacement project can be found with the 2015 Capital Budget Application at 1.2 Pierre’s Brook Hydro Plant Penstock Replacement and Surge Tank Refurbishment (the “2015 Report”). The feasibility analysis included in the 2015 capital budget report included the estimated cost of this project.
3 The 2015 Report estimated the levelized cost of energy at 4.87¢ per kWh.

1.3 Pierre’s Brook Hydro Plant Refurbishment NP 2016 CBA
2
2004 – Electrical service, brushgear, cooling water solenoids and flow meters 2006 – 25-ton crane hoist, duplex water filter, cooling water controls, rebuild pivot valve,
turbine overhaul, wicket gate bushings, battery bank 2007 – Rotor re-insulation 2008 – PLC based digital governor control system, sync-check relay, voltage regulator
and generator power cable 2008 – Constructed new 66 kV substation and replaced power transformer 2009 – ION meter
2.0 Engineering Assessment A detailed engineering assessment has been completed and has determined that the Plant is in generally good condition.4 Most civil and mechanical systems have been upgraded over the past 25 years and are in good condition, requiring only minor refurbishment. The engineering assessment has determined that the Plant requires the refurbishment of five major electrical systems at this time. The overall building structure is in good condition, including the roof, entrance systems and overhead crane. The only civil work required during the refurbishment are modifications to accommodate the new switchgear and renovations to provide a new control room. The mechanical portion of the governor is original to the Plant but requires only a routine overhaul. The generator stator has been rewound, the rotor reinsulated and the exciter overhauled. The turbine runner, wicket gates and the main valve have been recently overhauled. The battery bank and charger have been replaced. Most existing instrumentation has been upgraded and will be reused. 3.0 2016 Project Description Based on the detailed engineering assessment completed on the Plant the primary systems requiring refurbishment at this time are the low voltage substation, protection and control equipment, switchgear, AC systems, DC systems and heat and ventilation systems. In addition, the powerhouse requires an extension to accommodate the new switchgear and the mechanical governor components require an overhaul. Details on the engineering assessment which has led to the recommendations to replace and refurbish the various components of the primary systems can be found in Appendix A. 3.1 Substation ($109,000) A new 66 kV substation was constructed adjacent to the Plant in 2008 in conjunction with the replacement of the power transformer. It replaced a 33 kV structure located in the old substation attached to the building.5 The remainder of the old substation was left in place and continues to accommodate the low voltage structure and equipment although in a substandard configuration.
4 Appendix A includes the detailed engineering assessment of the Plant. 5 Order P.U. 41 (2009) approved the conversion of transmission line 23L and associated substations at Pierre’s
Brook and Mobile from 33 kV to 66 kV.

1.3 Pierre’s Brook Hydro Plant Refurbishment NP 2016 CBA
3
This structure and equipment will be replaced in the 66 kV substation and the old substation removed. A new low voltage steel structure will be constructed and new power cables from the generator breaker terminated on it. A larger station service transformer bank is required to carry the existing and increased Plant loads. A new T1-D disconnect switch will be installed on the low voltage structure. The step-down transformers for the forebay line will be mounted on an existing pole in front of the Plant. 3.2 Protection and Control ($798,000) The electromechanical generator protection relaying, will be replaced with a digital multifunction protection relay and rotor ground module. It will be located in a new unit control panel and interfaced with an upgraded plant control system. A neutral grounding transformer with secondary resistor will be installed to provide improved ground fault protection of the generator stator windings. A stator insulation testing system with neutral interrupter will be installed to provide a warning that will initiate corrective action when the stator insulation value is reduced and prevent energizing the generator if the insulation level falls below an acceptable value. The generator neutral current transformers will be replaced with higher accuracy units and used to provide the critical sensing for all the generator protection elements. The governor and the balance of plant control will be transferred to an Allan-Bradley ControlLogix® PLC based plant control system. The upgraded PLC will improve the local and remote monitoring and control functionality, provide additional information about the performance of key plant components and facilitate the implementation of a water management system to optimize the use of available water. The new unit control panel containing the upgraded PLC and a computer based operator interface will be located in the new control room. The unit control panel will also house all associated monitoring and control equipment, control switches and meters necessary to operate the Plant locally. The Basler DECS-200 voltage regulator will be replaced with an Allen-Bradley Combination Generator Control Module (“CGCM”).6 A new field breaker will replace the existing 44 year old Westinghouse unit, which is beyond its expected service life. The power cables between the exciter and the rotor will also be replaced. Most of the existing instrumentation in the Plant will be interfaced with the upgraded control system. Also upgraded vibration monitoring, penstock, scroll case and braking air pressure sensing will be provided. The new instrumentation for these measurements will also be interfaced with the upgraded control system. A new network communications panel with a data concentrator and network switch will be installed to replace the existing SCADA Remote Terminal Unit. The improved communications infrastructure will permit remote administration of the PLC and digital relays by engineering and operations staff.
6 In addition to voltage regulation, the CGCM provides synchronizing and metering functionality and is designed
to integrate with ControlLogix programmable controllers.

1.3 Pierre’s Brook Hydro Plant Refurbishment NP 2016 CBA
4
The forebay water level system, which is critical to the implementation of the water management system in the PLC, will be replaced. A fibre optic cable will be installed to replace the existing copper communications cable to transfer water level information from the forebay to the Plant. 3.3 Switchgear ($325,000) The existing 1972 vintage switchgear will be replaced with an arc flash rated assembly, equipped with an arc-flash protection system and containing a new vacuum breaker with closed-door racking capability. The new switchgear enclosure will be physically larger than the existing enclosure due to the recent requirements associated with arc flash standards. The existing current transformers on the 66 kV side of PBK-T1 transformer will be used for the arc-flash relay system. Higher accuracy instrument transformers for improved protection and metering will be supplied with the switchgear. An emergency station service transformer and surge protection will be incorporated into the new switchgear. The power cables between the switchgear and the generator will be rerouted and re-terminated in the new switchgear. New power cables and terminations will be installed between the switchgear and the new low voltage structure in the 66 kV substation. 3.4 AC and DC Systems ($40,000) A 75 kVA, 120/208 volt, 3-phase transformer bank will be installed on the new low voltage structure in the 66 kV substation and will normally supply all Plant loads. A 45 kVA, 120/208 volt, 3-phase transformer will be installed in the new switchgear to supply the essential services panel and facilitate black starting the Plant. A 600 amp switchboard will be installed and connected to the transformer bank in the 66 kV substation. A new 60-circuit, 120/208 volt non-essential services panel will be installed and connected directly to the switchboard. A new 60-circuit, 120/208 volt essential services panel will also be installed. It will be connected to a new automatic transfer switch that will normally supply the panel from the switchboard but will transfer to the emergency station service transformer, located in the switchgear, during a black start. A new 60-circuit DC distribution panel replacing the existing 28-circuit 1980 vintage DC distribution panel will be installed to ensure the availability of replacement breakers and additional capacity. 3.5 Lighting, Heat and Ventilation ($60,000) The existing lights and heaters will be replaced and additional heaters installed in the generator room to reduce condensation on the stator windings when the unit is shut down, maintaining the integrity of the winding insulation. The heat and ventilation control cabinet will be replaced and the new controls integrated with the upgraded control system. A thermostat/humidistat will be installed on the generator floor and will be used by the PLC to control all heat and ventilation equipment. The exhaust fan louvers on the substation side of the building are damaged and will be replaced.

1.3 Pierre’s Brook Hydro Plant Refurbishment NP 2016 CBA
5
3.6 Powerhouse ($135,000) Modifications are required to the powerhouse to accommodate the physically larger arc flash rated switchgear enclosure in the existing switchgear and control room. A new control room will be constructed on the upstream end of the building to provide the necessary space for the new unit control panel, protection and control equipment and to provide for the separation of employees from the energized switchgear. 3.7 Governor ($15,000) The governor was upgraded with a North American Hydro programmable logic controller (“PLC”) based digital governor control in 2008. The mechanical governor components including the power piston, relay valve, accumulator and pumping unit portions of the governor were reused in 2008 and an overhaul of these mechanical items will be completed as part of the refurbishment. 4.0 Project Proposal 4.1 Cost Breakdown The total project cost for the refurbishment of the Plant, excluding cost associated with the penstock replacement and surge tank refurbishment approved in the 2015 capital order, is estimated at $1,482,000. Table 1 below summarizes the cost breakdown.
Table 1 Project Cost
($000s) Cost Category Cost
Material 1,136 Labour - Internal 189 Labour - Contract - Engineering 102 Other 55
Total 1,482 4.2 Feasibility Analysis This project is associated with the penstock replacement and the surge tank refurbishment at an estimated cost of $13,530,000, which was approved as a multiyear project in Order No. P.U. 40 (2014). The economic feasibility analysis for the penstock project included the estimated cost of

1.3 Pierre’s Brook Hydro Plant Refurbishment NP 2016 CBA
6
$1,482,000 for this project, to be justified in the 2016 CBA.7 The estimated levelized cost of energy from the Pierre’s Brook plant over the next 50 years is 4.87¢ per kWh. The summary of capital costs and the calculation of levelized cost of energy are provided in Appendix B of the 2015 Report. The results of the analysis show that the continued operation of the Plant is economical over the long term. Investing in the life extension of the Plant ensures the availability of 24.4 GWh of energy to the Island Interconnected electrical system. The estimated levelized cost of energy from the Plant over the next 50 years, including the capital expenditure of $16.6 million over the next 25 years, is 4.87¢ per kWh. This energy is lower in cost than energy from other sources such as additional Holyrood thermal generation or the estimated marginal cost of production post completion of the Muskrat Falls Project.8 5.0 Conclusion A detailed engineering assessment has been completed on the Pierre’s Brook Hydro Plant and has determined that the Plant is in generally good condition. The primary systems requiring refurbishment at this time for the life extension of the Plant include the low voltage substation, protection and control equipment, switchgear, AC systems, DC systems and lighting, heat and ventilation systems. A new low voltage substation structure, improved PLC based plant control system, upgraded protection and replacement of equipment that has surpassed its reliable service life are required to ensure reliable, efficient operation of the Plant and the provision of energy to the Island Interconnected System. The feasibility analysis included in the 2015 Report verifies the financial viability of completing this project. The 24.4 GWh of energy that will be available from Pierre’s Brook each year will provide affordable energy to the customers of Newfoundland Power for the foreseeable future. The planned schedule for project execution ensures the minimum amount of lost production due to spill. Based upon these considerations, and others outlined in this report and attached engineering assessment, the project is recommended to proceed in 2016.
7 A copy of the report describing the penstock replacement project can be found with the 2015 Capital Budget
Application at 1.2 Pierre’s Brook Hydro Plant. 8 The avoided cost of No. 6 fuel at the Holyrood Thermal Generating Station is estimated at 11.6¢ per kWh for
2015. This is based upon a 630 kWh/barrel conversion efficiency and oil price forecast from Hydro of $73.35 per barrel for 2015 as per Newfoundland and Labrador Hydro letter regarding Rate Stabilization Plan – Fuel Price Projection dated April 21, 2015. The avoided cost of fuel for the Holyrood 100 MW combustion turbine is 29.0 ¢/kWh as per Hydro’s response to Request for Information GT-NP-NLH-006, Revision 1. Also an estimate of the marginal cost of production post completion of the Muskrat Falls Project is 5.0 ¢/kWh for energy plus $103/kW for demand starting in 2018 as per Hydro’s response to Request for Information CA-NLH-033, Revision 1 (Hydro’s 2013 General Rate Application, December 9, 2014). This cost increases into the future.

1.3 Pierre’s Brook Hydro Plant Refurbishment NP 2016 CBA
Appendix A Pierre’s Brook Hydro Plant
Engineering Assessment

1.3 Pierre’s Brook Hydro Plant Refurbishment NP 2016 CBA
A-i
Table of Contents Page
1.0 General ............................................................................................................................ A-1
2.0 Civil................................................................................................................................. A-1
3.0 Substation ........................................................................................................................ A-1
4.0 Governor ......................................................................................................................... A-2
5.0 AC Generator .................................................................................................................. A-2
6.0 Excitation System ........................................................................................................... A-4
7.0 Switchgear....................................................................................................................... A-4
8.0 AC Distribution System .................................................................................................. A-5
9.0 DC System ...................................................................................................................... A-6
10.0 Protective Relaying ......................................................................................................... A-7
11.0 Plant Control ................................................................................................................... A-7
12.0 Instrumentation ............................................................................................................... A-9
13.0 Lighting, Heating and Ventilation .................................................................................. A-9
14.0 Water Level Monitoring and Control ............................................................................. A-9
15.0 Cooling Water ............................................................................................................... A-10
16.0 Turbine .......................................................................................................................... A-10
17.0 Main Inlet Valve ........................................................................................................... A-10
18.0 Air Compressor ............................................................................................................. A-10
19.0 Overhead Crane ............................................................................................................ A-11

1.3 Pierre’s Brook Hydro Plant Refurbishment NP 2016 CBA
A-1
1.0 General The following summarizes the detailed engineering assessment performed on Newfoundland Power’s Pierre’s Brook Hydro Plant (the “Plant”). This report includes a condition assessment of the various components together with recommendations for required refurbishment necessary for life extension of the Plant. 2.0 Civil Structurally, the building is in good condition. The roof was replaced in 1986. The only civil work required during the refurbishment are modifications to accommodate the new arc flash rated switchgear in the existing switchgear and control room, construction of a new control room in the existing storage and battery room on the upstream end of the building and the painting of the interior of the Plant upon completion of the project. 3.0 Substation The original substation, which is attached to the Plant building, contained a 33 kV high voltage structure, power transformer, low voltage bus, station service transformer bank, forebay line stepdown transformers and generator power cable terminations. In 2007, a fault developed within the power transformer necessitating its removal from service.1 In 2008, a new 66 kV substation was constructed adjacent to the Plant replacing the 33 kV structure in the old substation, which did not have adequate clearance to accommodate the new transformer.2 The low voltage structure and equipment were left in the old substation. This substandard wooden structure will be replaced as part of the refurbishment.
1 The power transformer was used to convert the generator’s 6.9 kV output voltage to 33 kV for transmission to
Mobile Substation through transmission line 23L. At the time transmission line 23L was one of only two 33 kV transmission lines in Newfoundland Power’s system. The purchase of a new 66 kV transformer for the Plant and conversion of transmission line 23L to 66 kV, thereby eliminating the 33/66 kV transformer at Mobile Substation was approved in P.U. 41 (2009). This simplified the overall transmission and substation configurations and proactively removed another aged transformer from service.
2 The Plant was connected to the 33 kV transmission system using a portable substation until the new substation was constructed and the transformer energized enabling the Plant to continue production of electricity during the time while the new transformer was being manufactured.
Figure 1 – Low Voltage Substation

1.3 Pierre’s Brook Hydro Plant Refurbishment NP 2016 CBA
A-2
A new, low voltage steel structure will be constructed in the 66 kV substation and new generator power cables terminated on it. The existing overloaded station service transformer bank will be replaced. A larger station service transformer bank, with capacity to carry the increased plant load, and a new T1-D disconnect switch will be installed on the new low voltage structure. The stepdown transformers for the forebay line will be mounted on the existing pole in front of the Plant. The existing substation fencing will be removed permitting direct access to the main entrance of the Plant. 4.0 Governor In 1991, the original Voith W800 hydraulic governor was retrofitted with a Woodward pilot valve, relay valve, pumping unit and 505H control. In 2008, the 505H control unit was replaced with a North American Hydro (“NAH”) programmable logic controller (“PLC”) based digital governor control that provided improved control and feedback capabilities. The power piston, relay valve, accumulator and pumping unit portions of the hydraulic governor were reused and these mechanical items require periodic overhaul. A mechanical overhaul will be completed as part of the refurbishment. The advanced control of governor setpoints provided by the NAH digital governor control facilitates the implementation of a water management system in the new Unit Control PLC, which will be installed as part of the project. This will optimize energy production from the available water, maximizing the energy output of the Plant.3 5.0 AC Generator The AC generator at the Plant was manufactured by General Electric in 1930. The exciter was refurbished in 1994, the stator windings were replaced in 1996 and the rotor poles were reinsulated in 2007. No additional work is required on these items at this time. The generator neutral is solidly connected to ground. This method of grounding does not provide optimum protection for the generator windings as it permits high ground fault currents to flow, which in turn can result in significant winding damage. To minimize the magnitude of fault currents, high impedance grounding will be provided to connect the generator neutral to ground. The high impedance grounding system includes a properly sized resistor to minimize 3 The Plant has a high capacity factor with water typically available for production most of the year making it an
excellent candidate for a PLC based water management system.
Voith Power Piston Pumping Unit
Relay Valve
NAH Control
Figure 2 – Hydraulic Governor with Digital Control

1.3 Pierre’s Brook Hydro Plant Refurbishment NP 2016 CBA
A-3
the transient overvoltage in the event of an arcing ground fault. The grounding transformer will be connected to the station ground bus through a neutral contactor, which will be incorporated into the new grounding system to facilitate testing of the stator insulation as outlined below. The generator is shut down when there is inadequate supply of water available for efficient operation. This usually occurs during late summer and early fall when humidity is high. During these climatic conditions, moisture accumulation on the stator windings compromises the winding insulation. Energizing the generator with moisture present could result in an electrical flashover and permanent winding damage.4 To enable winding insulation testing to be completed, the grounding system must include a neutral contactor to disconnect the stator windings from ground when the generator shuts down. Current sensing is presently provided by three generator neutral current transformers (“CTs”), located in the generator termination cubicle, and seven CTs located in the switchgear. The neutral CTs, which are original to the 1931 installation, and a set of three CTs in the switchgear are dedicated to providing generator differential protection. Another set of three CTs located in the switchgear is used for the remaining protection elements and metering. There is also a single CT in the switchgear that provides sensing for the voltage regulator. The AC generator protection system requires modernization. The generator neutral CTs will be replaced and they will be used in the new protection scheme to provide the critical sensing for all the generator protection elements. The new switchgear will contain three sets of three single-phase CTs. One set will be used for generator differential protection, a second, revenue class set for metering and a third set will provide current sensing for metering and voltage regulation in the new Allen-Bradley Combination Generator Control Module (CGCM).5 The existing generator surge protection capacitor and lightning arresters are connected to the 6,900 volt bus in the switchgear. The three single-phase capacitors were installed in 1986 and the lightning arresters are original to the Plant’s 1931 commissioning. Three new capacitors and MOV type lightning arresters will be installed in the new switchgear to provide improved surge protection.
4 The Company has installed 16 MegAlert® insulation testing systems on generators that have been similarly
refurbished. They continuously monitor the integrity of the insulation while the unit is shut down, ensuring it can be safely re-energized when required. In addition to warning that the insulation value is reduced, the MegAlert® systems will prevent re-energizing of the generator should the insulation value fall below a safe value.
5 The third set can also be used if substation bus or transformer differential protection is implemented in the future.
Figure 3 – Neutral Current Transformers

1.3 Pierre’s Brook Hydro Plant Refurbishment NP 2016 CBA
A-4
6.0 Excitation System The exciter is the original unit supplied with the General Electric generator in 1930. It was refurbished in 1994 and the brushgear was last replaced in 2004. The exciter, commutator, brushgear and the slip rings are in good condition and do not require any work at this time. The voltage regulator is a Basler DECS-200 installed in 2008. It will be replaced with a CGCM module and returned to the spare parts inventory.6 The DECS-200 technology has been incorporated into the Allen-Bradley CGCM, which also provides synchronizing and metering functionality and was designed to integrate with the ControlLogix® PLC. The Westinghouse Type DBF-6 field breaker installed with the switchgear in 1972, is no longer supported by the original manufacturer and is beyond its expected service life. A new field breaker will be installed and the power cables between the exciter and the rotor will also be replaced. 7.0 Switchgear
The switchgear was manufactured by Canadian Westinghouse in 1972. The only upgrades completed since then were the replacement of the surge capacitors, generator power cables and several pieces of control equipment located in the cubicle doors. The remaining equipment, including the emergency station service transformer, generator breaker, potential transformers and current transformers are original. The protective relays, meters, voltage regulator and control switches are incorporated into the switchgear doors, greatly increasing the arc flash exposure for operating personnel. The arc flash hazard associated with this switchgear requires an arc flash boundary of 3.7 metres when performing work in or around the
switchgear. In addition to the additional space required to provide separation of employees from the energized breaker, the physical size of the arc flash rated switchgear is much larger than the
6 Prior to the introduction of the Allen-Bradley CGCM Module, Newfoundland Power used the Basler DECS-200
as its standard replacement voltage regulator and currently has six units in service. Newfoundland Power standardized on the CGCM for all its upgraded generator control systems in 2006.
Figure 4 – Front of Switchgear

1.3 Pierre’s Brook Hydro Plant Refurbishment NP 2016 CBA
A-5
original switchgear. As a result the existing switchgear room will need to be expanded into the existing control room space. The high voltage compartments in the rear of the switchgear are vented at the top of the doors. In the event of an internal fault, the electric arc and hot gases would exit the switchgear directly towards plant personnel. In addition, the location of the vents results in the high voltage connections being accessible from outside the switchgear. This presents concerns regarding safety and approach distances. The existing switchgear will be replaced with an arc flash rated assembly, equipped with an arc-flash protection system and containing a new vacuum breaker with closed-door racking capability. The existing current transformers on the 66 kV side of PBK-T1 transformer will be used for the arc-flash relay system. Higher accuracy instrument transformers for improved protection and metering will be supplied with the switchgear. An emergency station service transformer and surge protection will be incorporated into the design of the new switchgear. The three single-phase surge capacitors will be removed from the existing switchgear and returned to inventory.7 The protective relays, meters, voltage regulator (CGCM) and control switches will be mounted in a new unit control panel located in the new control room. The control room will be separated from the switchgear by an existing brick wall, providing additional employee safety. The power cables between the switchgear and the generator, which were installed in 2008, will be rerouted and re-terminated in the new switchgear. The power cables and terminations between the switchgear and the old 33 kV substation were installed in 1972. New power cables must be installed between the switchgear and the new low voltage structure in the 66 kV substation due to the increased distance. 8.0 AC Distribution System The existing AC service voltage is non-standard, the two paralleled AC panels do not have main breakers, the transfer switch is beyond its life expectancy and the transformer bank in the low voltage substation is overloaded.
7 The single-phase capacitors are a direct replacement for the unit in service at Pitman’s Pond plant and could
also be used at 6 other Company plants.
Figure 5 – High Voltage Components Inside Switchgear

1.3 Pierre’s Brook Hydro Plant Refurbishment NP 2016 CBA
A-6
The AC loads are supplied by a 400 amp, 36-circuit panel and a 100 amp, 32-circuit panel connected in parallel and supplied either from the 30 kVA, 120/240 volt transformer bank in the low voltage substation or the three phase 45 kVA, 120/240 volt, 3-phase transformer in the switchgear. Neither of the two distribution panels are equipped with a main breaker. An automatic transfer switch, supplied with the existing switchgear, transfers the load from the normal 30 kVA supply in the substation to the 45 kVA emergency supply in the switchgear to facilitate black starting the generator. The present metered load demand at the plant is 39 kVA, which exceeds the capacity of the 30 kVA transformer bank. In addition, 3-phase 120/240 volt transformer banks are non-standard and no longer supplied by Newfoundland Power. A 75 kVA, 120/208 volt transformer bank will be installed on the new low voltage structure in the 66 kV substation and will normally supply all the plant load. A 45 kVA, 120/208 volt, 3-phase transformer will be installed in the new switchgear to supply the essential service panel and facilitate black starting the plant. A new 600A switchboard will be installed that will be supplied from the 75 kVA transformer bank. A 60-circuit 120/208V non-essential services panel will be installed and connected to the switchboard. A 60-circuit 120/208V essential services panel will also be installed. It will be connected to a new automatic transfer switch that will normally supply the panel from the switchboard but will transfer to the 45 kVA transformer in the switchgear during a black start. 9.0 DC System The gel-cell battery bank and C-Can temperature compensated battery charger were installed in 2006 and do not need to be replaced. The battery bank and charger will be relocated to facilitate the construction of the control room. The 28-circuit DC distribution panel, was installed in 1980 and circuit breakers are no longer readily available. A new 60-circuit panel will be installed to ensure the availability of replacement circuit breakers and additional capacity.
Figure 6 – AC Panels

1.3 Pierre’s Brook Hydro Plant Refurbishment NP 2016 CBA
A-7
10.0 Protective Relaying The generator electrical protection is provided by electromechanical relays, manufactured primarily by Westinghouse, installed with the switchgear in 1972. The following protective elements are in service:
27 Undervoltage 49 Stator Thermal 51V Voltage Controlled Overcurrent 59 Overvoltage 64 Field Ground 87 Differential
The existing protective relaying lacks six elements of the minimum protection set.8 The electromechanical relays will be replaced with a digital multifunction generator protection relay and rotor ground module, located in the unit control panel. Improved protection reduces stresses on the generator windings due to system disturbances and electrical faults, extending the life of the generator. 11.0 Plant Control The plant is remotely monitored from the System Control Centre. An Allen-Bradley Model SLC 5/04 PLC was installed in 2006 to monitor bearing vibration, oil level and oil temperature, cooling water and protection trips. In addition the SLC 5/04 PLC provided load control and controlled building heat and ventilation. The PLC was upgraded to integrate the digital governor and voltage regulator in 2008 and brush temperature monitoring in 2010. The standardized Newfoundland Power remote control and water management systems, including the setting of machine loads to optimize the use of the water resources, has not been implemented.9 An Allan-Bradley ControlLogix® PLC will be installed to replace the existing system, which will be returned to inventory.10 The upgraded processor will provide processing power that will greatly improve the local and remote monitoring and control functionality and will provide additional information about the performance of key plant components. It will facilitate the implementation of a variety of control modes to ensure efficient operation of the plant and utilization of available water. Standard control, protection and automation functionality will be implemented.
8 The existing generator protection does not include Stator Ground Fault (59N), Volts/Hertz (24), Reverse Power
(32), Loss of Field Fault (40), Stator Unbalance Current / Negative Sequence Fault (46) or Frequency (81) protective elements, which are recommended by the IEEE for these generators.
9 The lack of processing power with the SLC 5/04 PLC prohibited the implementation of the computationally intensive applications such as water management.
10 The Allen-Bradley Model SLC 5/04 PLC is being discontinued by the manufacturer. The unit at Pierre’s Brook Plant contains 12 input/output cards. Two of these have already been discontinued and five more will reach their end of life on June 30, 2015. The system being removed will provide spares for systems that Newfoundland Power has in service at other plants.

1.3 Pierre’s Brook Hydro Plant Refurbishment NP 2016 CBA
A-8
The existing human-machine interface (“HMI”) is provided by an Allan-Bradley PanelView Plus® 1250 installed in 2006. It will be returned to inventory and replaced with an Allan-Bradley PanelView Plus® 1500 Touch. This HMI is compatible with the upgraded control system and will provide enhanced alarm and event indication, plant monitoring and trending, set point management, control functionality and more intuitive user interaction. The existing SCADA Remote Terminal Unit has limited capability to communicate with the ControlLogix® PLC. It will be replaced with a new network communications panel containing a data concentrator and network switch. This will improve communications with the SCADA system and in conjunction with the upgraded processor will enhance remote monitoring and control of plant operations.11 It will provide additional information about the performance of key plant components. Improved communications infrastructure will also permit remote administration of the PLC and digital relays by engineering staff that would normally require a site visit. The new unit control panel, which will be located in the new control room, will contain the processor, associated monitoring and control equipment, control switches and generator protection relays. The following equipment will be located in the panel:
a) Allan Bradley ControlLogix® PLC b) Allan-Bradley PanelView Plus® HMI c) MegAlert® remote LED display and switch board meter d) Emergency stop pushbutton (latching) e) Start pushbutton f) Stop pushbutton g) Alarm reset pushbutton h) Generator breaker control switch (ANSI device No. 52CS) i) Field breaker control switch (ANSI device No. 41CS) j) Speed raise/lower control switch (ANSI device No. 15CS) k) Gate limit control switch (ANSI device No. 65CS) l) Voltage raise/lower control switch (ANSI device No. 70CS) m) Generator lock out relay (ANSI Device No. 86G) and blocking switches n) Three position manual/local/remote control switch (ANSI Device No. 43CS) o) Schweitzer SEL-700G1 relay with SEL-2664 rotor ground module p) Ethernet Switch q) Combination Generator Control Module (CGCM) r) Synchroscope s) Automatic/manual synchronizing control switch (ANSI device No. 25CS) t) Schneider PowerLogic® ION 7550 for revenue metering
11 The implementation of a water management system will introduce new modes of operation for the Plant. The
enhancements will involve the exchange of various setpoints that regulate the operation of the Plant to optimize production.

1.3 Pierre’s Brook Hydro Plant Refurbishment NP 2016 CBA
A-9
12.0 Instrumentation The instrumentation has been upgraded over the past number of years with stator temperature RTD’s added as part of the stator rewind in 1996, partial discharge couplers in 1999, cooling water flow meters in 2004, bearing temperature, oil level and vibration monitoring in 2007, toothgear magnetic speed pickups as part of the governor upgrade in 2008 and brush temperature sensors in 2010. The existing instrumentation, with the exception of the vibration monitor, will be reused and integrated into the upgraded control system. The vibration sensors will be reused but the SKF monitor will be replaced with a Rockwell Automation Entek® system, designed to seamlessly integrate into the Allan-Bradley PLC. Penstock, scroll case and braking air pressure transducers need to be added. The analog gauges on the governor must be replaced with new digital gauges to provide analog signals to the PLC. The Schneider PowerLogic® ION 7550 revenue meter, which was installed in the switchgear in 2009, will be relocated to the new unit control panel. 13.0 Lighting, Heating and Ventilation The lighting and heating systems have not been upgraded since 1972, except for infrared generator heaters and cooling water anti-freeze heaters, installed in 1982. The heating in the generator room was designed for continuous operation of the plant and cannot maintain the temperature at a level to prevent condensation on the windings when the generator is shut down. The existing lights and heaters will be replaced and additional heaters installed in the generator room. The heat and ventilation control cabinet, installed in 1994, will be replaced and the new controls integrated with the upgraded control system. An Omega HX303C thermostat/humidistat will be installed on the generator floor and will be used by the PLC to control all heat and ventilation equipment. Intake and exhaust fans and louvers were installed in 1985. The louvers on the exhaust fan on the substation side of the building are damaged and will be replaced. The ventilation system will be controlled from the new PLC. 14.0 Water Level Monitoring and Control A reliable forebay water level system is critical to the implementation of the Water Management System for the Plant. The water level and trash rack signals are currently transmitted to the plant utilizing pulse width modulated signals over a copper cable. The copper cable is no longer reliable as it has experienced damage due to lightning and ground potential rise and will be replaced with a fibre optic cable. The water level probe and control system will be replaced. The existing water level and trash rack monitoring equipment in the forebay building will be upgraded to technology designed to integrate with the upgraded plant control system. The PLC will use the water level signal to control the Water Management System. High level (spill) and low level alarms will be initiated when specified water levels are reached. The Water Management System will use the water level, inflow, wicket gate position and control mode set

1.3 Pierre’s Brook Hydro Plant Refurbishment NP 2016 CBA
A-10
points to optimize the efficiency of the plant by controlling the load on the unit based upon the following:
Peak Water Level Low Inflow Peak Water Level Efficient Water Level Low Inflow Efficient Water Level Partial Water Level Low Inflow Partial Water Level Shutdown Water Level Low Inflow Shutdown Water Level Level Deadband Start-up Water Level
Peak Gate Position Efficient Gate Position Partial Gate Position Gate Position Deadband Rate of Rise (Bump) Elevation Mode Water Level Elevation Mode Gate Shutdown Level Load Control Mode Voltage Level Load Control Mode Kilowatt Level Load Control Mode Kilowatt Deadband
15.0 Cooling Water The cooling water system was upgraded in 2005 and 2006 in conjunction with the main inlet valve rebuild. The bearing cooling coils, meters and solenoids were replaced and a duplex water strainer was added. The only additional work required is to integrate the cooling water controls into the upgraded control system. 16.0 Turbine The turbine runner was replaced in 1994 and the wicket gate bushings were replaced in 2006. No additional work is required at this time. 17.0 Main Inlet Valve The main inlet valve is a 42-inch Pratt butterfly valve with Rotork actuator. It was installed in 1993 and rebuilt in 2006 with a new valve body and seal. It is in good condition and does not required an overhaul at this time. The control cabinet, which was also installed in 1993, only contains part of the control system. The solenoids are located in a control panel in the control room, which is going to be removed. A new control cabinet will be installed and the controls integrated with the upgraded control system. 18.0 Air Compressor Compressed air is used to operate the generator braking system. The compressor was installed in 2000 and does not require replacement as part of this project. It will be relocated to facilitate the construction of the control room. A digital air pressure transducer will be installed to enable the PLC to monitor the system pressure.

1.3 Pierre’s Brook Hydro Plant Refurbishment NP 2016 CBA
A-11
19.0 Overhead Crane A new 25-ton Munck electric crane and trolley were installed in 2006 and no additional work is required.

2.1 2016 Substation Refurbishment and Modernization
2016 Substation Refurbishment and Modernization
June 2015
Prepared by:
Adam Wong, P. Eng.
J. W. Pardy, P. Eng.
NP 2016 CBA
A FORT IS COMPANY

2.1 2016 Substation Refurbishment and Modernization NP 2016 CBA
i
Table of Contents
Page
1.0 Substation Refurbishment and Modernization Strategy ......................................................1 2.0 Substation Refurbishment and Modernization 2016 Projects ..............................................1 2.1 2016 Substation Projects ..........................................................................................3 2.2 Substation Feeder Automation ..............................................................................13 2.3 Substation Monitoring and Operations ..................................................................13 Appendix A: Substation Refurbishment and Modernization Plan
Five-Year Forecast 2016 to 2020

2.1 2016 Substation Refurbishment and Modernization NP 2016 CBA
1
1.0 Substation Refurbishment and Modernization Strategy Newfoundland Power (the “Company”) has 130 substations located throughout its operating territory. Distribution substations connect the low voltage distribution system to the high voltage transmission system. Transmission substations connect transmission lines of different voltages. Generation substations connect generating plants to the electrical system. Substations are critical to reliability; an unplanned substation outage can affect thousands of customers. The Company’s substation maintenance program and the Substation Refurbishment and Modernization project ensure the delivery of reliable least cost electricity to customers in a safe and environmentally responsible manner. The Substation Refurbishment and Modernization project provides a structured approach for the overall refurbishment and modernization of substations and coordinates major equipment maintenance and replacement activities.1 Where practical the substation plan is coordinated with the maintenance cycle for major substation equipment. Such coordination minimizes customer service interruptions and ensures optimum use of resources. This approach is consistent with the least cost delivery of reliable service. Substation refurbishment and modernization is reviewed annually. When updating the substation refurbishment and modernization plan, assessments are made based upon (i) the condition of the infrastructure and equipment, (ii) the need to upgrade and modernize protection and control systems, and (iii) other relevant work. In 2015, an initiative to accelerate substation feeder automation was incorporated into the Substation Refurbishment and Modernization Project. This initiative was identified to accelerate the automation of distribution feeders ensuring all were fully automated from the System Control Centre by the end of 2019.2 This will enhance the Company’s ability to ensure system reliability. Substation refurbishment and modernization typically requires power transformers to be removed from service. Therefore, the timing of the work is restricted to the availability of a portable substation if customer outages are to be avoided. Due to capacity limitations of portable substations, this often requires the work to be completed in the late spring and summer when substation load is reduced. The current 5-year forecast for the Substation Refurbishment and Modernization Plan is shown in Appendix A. 2.0 Substation Refurbishment and Modernization 2016 Projects The 2016 Substation Refurbishment and Modernization project includes planned refurbishment and modernization of 4 substations and 1 portable substation. This substation work is estimated to cost a total of $6,974,000 which comprises approximately 89% of the total 2016 project cost. 1 The Company’s Substation Refurbishment and Modernization Project is the result of the Substation Strategic
Plan filed with the 2007 Capital Budget Application. 2 By the end of 2016 there will be 249 distribution feeders automated representing approximately 84% of all
distribution feeders. In its Report on Island Interconnected System to Interconnection with Muskrat Falls addressing Newfoundland Power, December 17th, 2014, (the “Liberty Report”), the Board’s consultants’; the Liberty Consulting Group, observed in Conclusion 2.9 that executing the 5-year plan to automate all distribution feeders by 2019 will bring “Newfoundland Power into conformity with good utility practices”.

2.1 2016 Substation Refurbishment and Modernization NP 2016 CBA
2
The remaining project cost includes $732,000 for Substation Feeder Automation to automate 9 distribution feeders and $165,000 associated with Substation Monitoring and Operations upgrades to automate substation communication systems to accommodate increased data requirements. Table 1 identifies the 2016 Substation Refurbishment and Modernization Project expenditures.
Table 1 2016 Substation Refurbishment and Modernization Projects
(000s)
Project Budget Victoria Substation (VIC) Virginia Waters Substation (VIR) King’s Bridge Substation (KBR) Grand Falls 25 kV Substation (GFS) Portable Substation P1 Substation Feeder Automation Substation Monitoring and Operations
$2,113 $2,616
$978 $490 $777 $732 $165
Total $7,871 The location of the 4 substations undergoing refurbishment and modernization projects in 2016 is shown on the map below.
The following pages outline the capital work required for each substation.
2016 Substation Refurbishment and Modernization Projects

2.1 2016 Substation Refurbishment and Modernization NP 2016 CBA
3
2.1 2016 Substation Projects ($6,974,000) Victoria Substation ($2,113,000) Victoria Substation (“VIC”) was built in 1966 as both a generation and distribution substation. One 66 kV to 12.5 kV, 13.3 MVA power transformer (VIC-T1) provides distribution voltage to the 12.5 kV bus structure. There are two 12.5 kV distribution feeders (VIC-01 and VIC-02) directly serving approximately 2,060 customers in the Victoria area. One 12.5 kV to 2.4 kV, 0.6 MVA power transformer (VIC-T2) connects the 500 kVA hydro electric generator to the substation. Engineering assessments determine that the 66 kV and 12.5 kV wood pole structures are in a deteriorated condition and do not have adequate clearances to allow work on the equipment to proceed safely without impacting customer service. This clearance concern was created when additional equipment was required to provide voltage control while limiting the amount of modifications to the existing structure (see Figure 1).
Figure 1: Inadequate Clearances

2.1 2016 Substation Refurbishment and Modernization NP 2016 CBA
4
Presently, the 66 kV wood pole structures are splitting (see Figure 2) and the 12.5 kV crossarms are rotting (see Figure 3). The wood pole structures will be replaced by steel structures. New concrete foundations will be required for the steel structures and associated equipment.
Figure 2: Deteriorated Wood Pole
Figure 3: Deteriorated Cross Arms
The 2 distribution feeders are protected and controlled using hydraulic reclosers that are 28 and 39 years old.3 The hydraulic reclosers are not capable of automation through the SCADA system. New intelligent reclosers will be installed to replace the hydraulic reclosers providing automation for monitoring and control from the System Control Centre through the SCADA System. This will provide a means of automated restoration of service which will improve customer service. With feeder automation, the 2 VIC distribution feeders will be added to the provincial under-frequency load shedding scheme.4 A spill containment foundation will be constructed for transformer VIC-T1 and voltage regulator VIC-VR to protect against environmental damage in the event of an oil spill from the units. The existing VIC-T2 spill containment will be upgraded to current standards (see Figure 4). To provide improved monitoring and protection for the VIC-T1 transformer, 3 current transformers will be installed.
3 The 2 hydraulic reclosers are associated with distribution feeders VIC-01 and VIC-02. 4 The automation of distribution feeders through digital relays or intelligent reclosers allows for remote
monitoring and control through SCADA. Once automated, these feeders can be remotely tagged for employee safety, included in under-frequency load shedding and have their protection setting adjusted remotely to allow for cold load pickup after extended outages.

2.1 2016 Substation Refurbishment and Modernization NP 2016 CBA
5
Figure 4: Existing VIC-T2 Spill Containment
Power transformer VIC-T1 installed in 1974 will be refurbished and upgrades made to the transformers’ auxiliary protection. The existing 40 year old auxiliary protection devices, including temperature gauges and gas detection relays have deteriorated and will be replaced. These auxiliary devices are used to monitor and protect the power transformers and will be replaced to ensure continued protection and safe operation of the power transformer. The VIC-T1 transformer 66 kV air break switch (VIC-T1-A), 40L transmission line air break switch (VIC-40L-A) and feeder hook stick operated switches are all more than 35 years old and will be replaced due to their mechanical condition and in-service age.5 The installation of one 66 kV breaker for transmission line 40L with the associated protective relaying to achieve operational flexibility is required for the 66 kV transmission system and for the protection of transformer VIC-T1. This will be provided by installing microprocessor based digital relays to support remote monitoring and control. A 66 kV bypass air break switch is also required for this radial transmission line.
5 The Company’s strategy for switches is to operate and maintain switches whenever opportunities and substation
work permit, and to replace switches when they are more than 30 years old. Over the life of the switches there is mechanical wear and tear experienced by items such as hinge bushings, Teflon bushing liners and springs used to assist movement. The result is typically misalignment of switch blades and contact surfaces.

2.1 2016 Substation Refurbishment and Modernization NP 2016 CBA
6
A complete communications package including a gateway will be installed to facilitate SCADA system remote control and monitoring of the power system protection equipment. The gateway will integrate the digital devices that monitor and control the transmission lines, distribution feeders and substation transformer into the SCADA system. A small control building will be erected to provide a climate controlled environment for the new microprocessor based digital relays that will be installed for transmission line, transformer and feeder protection and control upgrades. All low voltage equipment will have standard varmint protection installed.6 A grounding study will be completed and the ground grid for the substation will be extended to improve safety for personnel inside the substation.7 Virginia Waters Substation ($2,616,000) Virginia Waters Substation (“VIR”) was built in 1974 as both a transmission and distribution substation. The transmission portion of the substation contains four 66 kV transmission lines.8 Three 66 kV to 12.5 kV, 25 MVA power transformers (VIR-T1, VIR-T2, and VIR-T3) provide distribution voltage to the 12.5 kV bus structure. There are eight 12.5 kV distribution feeders (VIR-01, VIR-02, VIR-03, VIR-04, VIR-05, VIR-06, VIR-07 and VIR-08), serving approximately 7,700 customers in the eastern area of St. John’s. Engineering assessments determine that the 66 kV and 12.5 kV steel structures, foundations, buses, and insulators are all in good condition. Transformers VIR-T1 and VIR-T3 are in good condition. All of the switches on the 66 kV bus structures are in excess of 35 years in service and will be replaced due to their mechanical condition and age.9 This includes 8 side break switches, 1 bus tie switch, and three transformer air break switches (VIR-T1-A, VIR-T2-A, and VIR-T3-A). The transformer air break switches will be replaced with motorized air break switches complete with ground switches.10 The relays for the bus and transformer protection are vintage electromechanical type and are original to the 1974 substation construction (see Figure 5). Electromechanical relays operate by
6 Report 2.1 Substation Strategic Plan included with the 2007 Capital Budget Application verified that these
barriers can be effective in preventing damage to equipment and customer outages caused by small animals and birds. In the Liberty Report. Conclusion 2.10 states that “The use of insulated coverings, guards and insulated leads have been effective in preventing animal-caused damage and outages.”
7 Newfoundland Power designs substation ground grids using the ANSI/IEEE Standard 80-2000 Guide for Safety in AC Substation Grounding. This standard is considered industry best practice for designing substation ground grids.
8 The four 66kV transmission lines are 34L and 58L to Oxen Pond Substation, 59L to Pulpit Rock Substation and 74L to Pepperrell Substation.
9 The Company’s strategy for switches is to operate and maintain switches whenever opportunities and substation work permit, and to replace switches when they are more than 30 years old. Over the life of the switches there is mechanical wear and tear experienced by items such as hinge bushings, Teflon bushing liners and springs used to assist movement. The result is typically misalignment of switch blades and contact surfaces.
10 The motorized air break switches in conjunction with the upgraded protection relays will improve equipment protection.

2.1 2016 Substation Refurbishment and Modernization NP 2016 CBA
7
using torque-producing coils, energized by current and voltage inputs, which open or close contacts based upon mechanically calibrated thresholds. At present, there are 21 electromechanical relays installed in 3 individual protection panels inside the substation control building. These relays, used for the protection of 3 transformers (VIR-T1, VIR-T2 and VIR-T3) and 1 bus structure are approximately 38 years old. Electromechanical relays contain moving parts that can fail as they age, wear, and accumulate dirt and dust. The age of these relays dictate they are to be replaced.11
Figure 5: Existing VIR Control Building
with Electromechanical Relays
11 Report 2.1 Substation Strategic Plan included with the 2007 Capital Budget Application identified that
electromechanical relays contain moving parts that can fail as they age, wear and accumulate dirt and dust. The Liberty Report examined Newfoundland Power’s practice of replacing multiple obsolete electromechanical relays with a single modern microprocessor controlled relay.

2.1 2016 Substation Refurbishment and Modernization NP 2016 CBA
8
The protection and control of substation assets will be modernized by replacing these obsolete devices with microprocessor based digital relays, reducing the total protection relay device count from 21 electromechanical relays to 3 digital relays. The protection upgrade will also involve replacing all of the existing protection panels. This approach minimizes the number of active devices used to provide protection to substation assets, consolidates the control and automation architecture, and reduces ongoing maintenance. A complete communications package including a gateway will be installed to facilitate SCADA system remote control and monitoring of the power system protection equipment. The gateway will integrate the digital devices providing monitoring and control of the transmission lines, distribution feeders and substation transformers into the SCADA system. The existing 38 year old control building at VIR cannot accommodate the new relay and communication panels required to complete the protection upgrades. The building does not meet present requirements.12 A new control building will be constructed adjacent to the existing building. The new building will permit installation of the protection and communications panels with minimum disruption to the existing protection scheme and impact to the integrity of the electrical system during construction. All low voltage equipment will have standard varmint protection installed.13 A grounding study will be completed and the ground grid for the substation will be extended to improve safety for personnel inside the substation.14 King’s Bridge Substation ($978,000) The refurbishment and modernization of King’s Bridge Substation (“KBR”) will be undertaken in 2016 at the same time as the installation of a new power transformer.15 KBR was built in 1948 as both a transmission and distribution substation. The transmission portion of the substation contains three 66 kV transmission lines.16 Two 66 kV to 4.16 kV, 10 MVA power transformers (KBR-T1 and KBR-T2) provide distribution voltage to the 4.16 kV switchgear. There are eight 4.16 kV distribution feeders (KBR-01, KBR-02, KBR-03, KBR-04, KBR-05, KBR-06, KBR-07, and KBR-08) serving approximately 2,266 customers in St. John’s. One 66 kV to 12.5 kV, 25 MVA power transformer (KBR-T3) provides distribution voltage to
12 Overcrowding of the panels inside the building limits access to the rear of the panels where the wiring is
terminated. The existing building is a self-framing steel structure which inhibits the ability to enlarge the footprint as removal of existing exterior walls compromises the building’s structural integrity.
13 Report 2.1 Substation Strategic Plan included with the 2007 Capital Budget Application verified that these barriers can be effective in preventing damage to equipment and customer outages caused by small animals and birds. The Liberty Report’s Conclusion 2.10 states that “The use of insulated coverings, guards and insulated leads have been effective in preventing animal-caused damage and outages.”
14 Newfoundland Power designs substation ground grids using the ANSI/IEEE Standard 80-2000 Guide for Safety in AC Substation Grounding. This standard is considered industry best practice for designing substation ground grids.
15 The Substations project 2016 Additions Due to Load Growth includes the installation of a new 25 MVA 66/12.5 kV substation transformer at KBR.
16 The 66 kV transmission lines are 12L to Memorial, 16L to Pepperrell and 30L to Ridge Road.

2.1 2016 Substation Refurbishment and Modernization NP 2016 CBA
9
the 12.5 kV switchgear. There are four 12.5 kV distribution feeders (KBR-09, KBR-10, KBR-11, and KBR-12) serving approximately 2,849 customers in St. John’s. Engineering assessments determined that the 66 kV steel structure, foundations, buses, and insulators are all in good condition. Transformers KBR-T1, KBR-T2, and KBR-T3 are in good condition. The transformer switches, transmission line 12L switches, and bus tie switches are all in excess of 35 years in service and will be replaced due to their mechanical condition and age.17 This includes 2 bus tie switches, 2 transmission line switches and 2 transformer air break switches (KBR-T2-A and KBR-T3-A). The transformer air break switches will be replaced with motorized air break switches complete with ground switches.18 In 2009, the majority of the electromechanical protection at the KBR was replaced with microprocessor based digital relays.19 The remaining electromechanical relays for the bus and transformer protection are in excess of 35 years old. These relays, used for the protection of the 66 kV bus and KBR-T3 transformer, contain moving parts that can fail as they age, wear, and accumulate dirt and dust. The age of these relays dictate they are to be replaced.20 The transition from electromechanical relays to microprocessor based digital relays at KBR will be complete in 2017 when the two 4.16 kV transformers will be retired from service.21 Grand Falls 25kV Substation ($490,000)22 The refurbishment and modernization of Grand Falls 25 kV Substation (“GFS”) will be undertaken in 2016 at the same time as the replacement of an existing power transformer.23
17 The Company’s strategy for switches is to operate and maintain switches whenever opportunities and substation
work permit, and to replace switches when they are more than 30 years old. Over the life of the switches there is mechanical wear and tear experienced by items such as hinge bushings, Teflon bushing liners and springs used to assist movement. The result is typically misalignment of switch blades and contact surfaces.
18 The motorized air break switches in conjunction with the upgraded protection relays will improve equipment protection.
19 Electromechanical relays operate by using torque-producing coils, energized by current and voltage inputs, which open or close contacts based upon mechanically calibrated thresholds.
20 Report 2.1 Substation Strategic Plan included with the 2007 Capital Budget Application identified that electromechanical relays contain moving parts that can fail as they age, wear and accumulate dirt and dust.
21 The retirement from service of the 4.16 kV infrastructure at KBR will take place following the completion of the 2016 Substations Additions Due to Load Growth project and the 2017 Distribution Trunk Feeders project. The 4.16 kV infrastructure is being retired to accommodate an expansion of the 12.5 kV infrastructure at KBR, including a new 12.5 kV switchgear arrangement including breakers for T4-B and 4 feeder breakers.
22 The “Grand Falls Substation” refers to two physically separate substation yards. On the north side of the Trans-Canada Highway (“TCH”) within the town of Grand Falls – Windsor, there is a substation yard that contains 138 kV, 66 kV and 25 kV infrastructure, which is known as the “Grand Falls 25 kV Substation”. On the south side of the TCH, located directly across the road from the first substation yard and connected via a very short 66 kV transmission line, there is another substation yard that contains 66 kV and 4.16 kV infrastructure, which is known as the “Grand Falls 4.16 kV Substation”. For the purpose of this report any reference to “GFS” will refer to the “Grand Falls 25 kV Substation” only.
23 The Substations project 2016 Additions Due to Load Growth includes the replacement of an existing transformer with a new 50 MVA substation transformer required for GFS.

2.1 2016 Substation Refurbishment and Modernization NP 2016 CBA
10
GFS was built in 1977 as both a transmission and distribution substation. The transmission portion of the substation contains one 66 kV transmission line and two 138 kV transmission lines.24 One 138 kV to 66 kV, 29.7 MVA power transformer (GFS-T1) connects the 138 kV and 66 kV buses. Two 138 kV to 25 kV, 20 MVA power transformers (GFS-T2 and GFS-T3) provide distribution voltage to the 25 kV bus structure. There are five 25 kV distribution feeders (GFS-02, GFS-06, GFS-07, GFS-08, and GFS-10), serving approximately 6,437 customers in Grand Falls. Engineering assessments determined that the 138 kV, 66 kV and 25 kV steel structures, foundations, buses, and insulators are all in good condition. Transformers GFS-T1 and GFS-T2 are in good condition. The transformer and bus tie switches are in excess of 35 years in service and will be replaced due to their mechanical condition and age.25 This includes 1 bus tie switch (GFS-BTS-1) and 3 transformer air break switches (GFS-T1-A, GFS-T2-A, and GFS-T3-A). The transformer air break switches will be replaced with motorized air break switches complete with ground switches.26
Figure 6: Existing GFS Control Building
with Electromechanical Relays
24 The one 66kV transmission line is 101L to Rattling Brook Substation. The 138 kV transmission lines are 130L
to Stoney Brook and 132L to Bishop’s Falls. 25 The Company’s strategy for switches is to operate and maintain switches whenever opportunities and substation
work permit, and to replace switches when they are more than 30 years old. Over the life of the switches there is mechanical wear and tear experienced by items such as hinge bushings, Teflon bushing liners and springs used to assist movement. The result is typically misalignment of switch blades and contact surfaces.
26 The motorized air break switches in conjunction with the upgraded protection relays will improve equipment protection.

2.1 2016 Substation Refurbishment and Modernization NP 2016 CBA
11
In 2012, the majority of the electromechanical protection relays at GFS were replaced with microprocessor based digital relays.27 The remaining relays for the transformer protection are vintage electromechanical type and are in excess of 35 years old (see Figure 6). These relays, used for the protection of the 2 transformers (GFS-T1 and GFS-T2), contain moving parts that can fail as they age, wear, and accumulate dirt and dust. The age of these relays dictate they are to be replaced.28 This will complete the transition from electromechanical relays to microprocessor based digital relays at GFS. Portable Substation P1 ($777,000) Portable substation P1 (see Figure 7) was purchased in 1966. It is used to respond to power transformer failures and for planned transformer maintenance and substation refurbishment and modernization work. P1 can provide backup for 44%, or 84 of the 192 power transformers in service on Newfoundland Power’s system.
Figure 7: Portable Substation P1
27 Electromechanical relays operate by using torque-producing coils, energized by current and voltage inputs,
which open or close contacts based upon mechanically calibrated thresholds. 28 Report 2.1 Substation Strategic Plan included with the 2007 Capital Budget Application identified that
electromechanical relays contain moving parts that can fail as they age, wear and accumulate dirt and dust.

2.1 2016 Substation Refurbishment and Modernization NP 2016 CBA
12
An inspection of the portable substation trailer has indicated that the trailer chassis is in acceptable condition (see Figure 8). Existing corrosion will be removed and a rust inhibiting coating will be applied to the chassis and axles to prevent further deterioration.
Figure 8: Portable Substation P1 Chassis
The P1-T1 transformer 66 kV air break switch (P1-T1-A) is more than 45 years old and will be replaced due to the mechanical condition and in-service age.29 The transformer air break switch will be replaced with a motorized air break switch complete with a high speed ground switch. The 25 kV circuit breaker is more than 40 years old and will be replaced due to in-service age and transportation logistics. Replacing the oil filled circuit breaker on the portable substation P1 with a vacuum circuit breaker will eliminate the risk of oil spills during transportation and will reduce the overall weight of the portable substation. In the event of a failure, it is becoming increasingly difficult to locate the required components for repair since the Company is phasing out oil filled breakers. To provide improved monitoring and protection for the transformer, slip on current transformers will be added to the bushings and utilized when the transformer is in the auto-transformer configuration. The alarm annunciation panel will be replaced. The existing protection relays have been in service for approximately 20 years and this relay type is no longer in service elsewhere in
29 The Company’s strategy for switches is to operate and maintain switches whenever opportunities and substation
work permit, and to replace switches when they are more than 30 years old. Over the life of the switches there is mechanical wear and tear experienced by items such as hinge bushings, Teflon bushing liners and springs used to assist movement. The result is typically misalignment of switch blades and contact surfaces.

2.1 2016 Substation Refurbishment and Modernization NP 2016 CBA
13
Newfoundland Power’s system. They will be replaced with microprocessor based protection relays. A digital metering system for measuring power, voltage and current will be provided. The wiring associated with the protection and control of the portable substation is showing signs of deterioration. Deteriorated wiring, termination and junction boxes will be replaced. Online monitoring of transformer gas and oil analysis will be provided to protect the transformer. This analysis provides an indication of the health of the transformer through the monitoring of specific gases which are known to be created by transformer problems. High voltage linkages connecting the power transformer to the switches are deteriorated and will be replaced. The batteries and charging system are at the end of life and will be replaced. A communication package will be installed on the portable substation to provide remote monitoring and control capability of the unit from the System Control Centre. A fall arrest system will be installed in areas where employees have to work aloft. External lighting will be provided at locations around the trailer to improve visibility for employees during setup and operation of the unit. 2.2 Substation Feeder Automation ($732,000) At the end of 2015, approximately 80% of distribution feeders will be automated at the substation breaker or recloser. Under the current plan, this percentage will increase to 84% by the end of 2016. Automation of distribution feeders at the substation breaker or recloser improves restoration from local and system wide outages. In addition to the opening and closing of the devices under remote control, automation also allows for the adjusting of operational parameters such as automatic reclosing, protection settings and temporary adjustment of trip settings to allow for cold load pickup. In 2016, the Company plans to automate an additional 11 distribution feeders. The refurbishment and modernization of VIC will automate 2 distribution feeders. Nine distribution feeders not associated with either of the 3 remaining substations undergoing refurbishment and modernization in 2016 will be automated.30 These feeders are located in Lockston, Summerville, Frenchman’s Cove, Howley, Riverhead, Berry Head, Grand Beach, and Linton Lake. 2.3 Substation Monitoring and Operations ($165,000) Over the past decade, there has been a substantial increase of computer-based equipment in electrical system control and operations. Periodic upgrades of this equipment are necessary to ensure continued effective electrical system control and operations.
30 The Company plans to automate all distribution feeders by 2019. The plan will be executed through the
refurbishment and modernization of 25 substations with the remaining 43 distribution feeders being automated through this Substation Feeder Automation item. The cost to automate these remaining 43 distribution feeders is estimated at approximately $3.3 million. These projects will be justified in future capital budget applications.

2.1 2016 Substation Refurbishment and Modernization NP 2016 CBA
14
In 2016, upgrades to the communications hubs that connect multiple devices in substations to the SCADA system are planned. Effective management of increased volumes of electrical system data requires the upgrading of the hubs. This requires both hardware and software upgrades. In 2016, the required work will incorporate manufacturers’ upgrades to communications and other computer-based equipment located in Company substations. These upgrades typically increase functionality of the equipment and software and remedy known deficiencies.

2.1 2016 Substation Refurbishment and Modernization NP 2016 CBA
Appendix A Substation Refurbishment and Modernization Plan
Five-Year Forecast 2016 to 2020

2.1 2016 Substation Refurbishment and Modernization NP 2016 CBA
A-1
Substation Refurbishment and Modernization Plan Five-Year Forecast
2016 to 2020 ($000s)
2016 2017 2018 2019 2020
SUB Cost SUB Cost SUB Cost SUB Cost SUB Cost
KBR $ 978 BVS $2,113 BLA $ 733 BCV $1,057 ABC $ 851 GFS $ 490 CAT $2,594 BVA $1,745 HWD $ 510 DUN $ 599 VIC $2,113 CHA $ 500 GBS $1,507 HAR $1,423 HGR $3,120 VIR $2,616 HUM $1,987 HCP $ 535 NCH $1,563 GBY $1,240 P1 $ 777 SPO $2,150 MSY $1,240 PAS $ 483 MOL $1,995
SFA $ 732 SFA $ 761 PEP $ 921 PUL $ 510 SMU $ 185 SMU $ 165 SMU $ 170 SLA $1,211 SUN $ 952
TCV $ 559 WAL $ 396 SFA $ 884 SFA $ 926 SMU $ 175 SMU $ 180
$7,871 $10,275 $9,510 $8,000 $7,990
Note: SUB: Substation - Refer to the Electrical System handbook included with the 2006 Capital Budget Application for three letter substation designations. P1 is the designation for Portable Substation No. 1.

2.2 2016 Additions Due to Load Growth NP 2016 CBA
2016 Additions Due to Load Growth
June 2015
Prepared by:
Brad Tucker, P. Eng.
Lome Henderson, P. Eng.
NEWFOUNDLAND~
POWER A FORTIS COM PANY

2.2 2016 Additions Due to Load Growth NP 2016 CBA
i
Table of Contents
Page 1.0 Introduction ..........................................................................................................................1 2.0 King’s Bridge Substation .....................................................................................................1 3.0 Grand Falls Substation .........................................................................................................2 4.0 Doyles Substation ................................................................................................................2 5.0 Project Cost ..........................................................................................................................3 6.0 Conclusion ...........................................................................................................................3 Attachment A: King’s Bridge 12.5 kV Substation Study Attachment B: Grand Falls 25 kV Substation Study Attachment C: Doyles 25 kV Substation Study

2.2 2016 Additions Due to Load Growth NP 2016 CBA
1
1.0 Introduction As load increases on an electrical system, individual components can become overloaded. The focus of Newfoundland Power’s system planning is to avoid or minimize component overloading through cost effective upgrades to the system. In the case of substation transformers, an engineering study is completed to identify and evaluate technical alternatives in advance of the overloads.1 These technical alternatives are fully examined, cost estimates are prepared, and an analysis is performed to identify the least cost alternative. In general, the alternatives for addressing an overload condition on a substation transformer involve the following:
(i) Transferring the customer load from one substation transformer to another. The other substation transformer may or may not be in the same substation.
(ii) Paralleling substation transformers together. In substations that have more than one transformer, the transformers can be connected in parallel so that they share the load between them.
(iii) Replacing an existing transformer with a transformer of a higher capacity rating. (iv) Installing a new transformer in the substation and transferring customer load from the
overloaded transformer(s) onto the new transformer. Peak load forecasts completed for the 2016 Capital Budget planning cycle have identified 3 substations where transformers are forecast to be overloaded if no capital improvements are undertaken. These include King’s Bridge (“KBR”) Substation, Grand Falls (“GFS”) Substation, and Doyles (“DOY”) Substation. To address these overloads, it is proposed that the transformer capacities at each of these substations be increased. This report provides details on the proposals to address the overloads including the justifications for the 3 items to be included in the 2016 Additions Due to Load Growth project. 2.0 King’s Bridge Substation ($3,081,000) An engineering study has been completed on the distribution system upgrades to meet the electrical demands of the customers supplied by KBR Substation. This study is presented in Attachment A to this report. The study examined the 4 alternatives described in Section 1.0 to determine the least cost option to address the forecast overload condition on the KBR 12.5 kV system. This study determined that only 1 of the 4 alternatives was a viable option to address the overload condition. This alternative is the addition of a new 25 MVA, 66 kV/12.5 kV substation transformer at KBR Substation.
1 A substation transformer converts electricity from transmission level voltages (typically between 66 kV and 138
kV) to distribution level voltages (typically between 4 kV and 25 kV).

2.2 2016 Additions Due to Load Growth NP 2016 CBA
2
There are 2 possible options for adding the new transformer. The least cost alternative involves the replacement of an existing substation transformer KBR-T2 with a new 25 MVA 66 kV/12.5 kV transformer at KBR Substation. 3.0 Grand Falls 25 kV Substation ($2,019,000) An engineering study has been completed on the distribution system upgrades to meet the electrical demands of the customers supplied by GFS 25 kV Substation. This study is presented in Attachment B to this report. The study examined the 4 alternatives described in Section 1.0 to determine the least cost option to address the forecasted overload condition on the GFS 25 kV system. The study determined that 2 of the 4 alternatives were viable options to address the overload condition. Both alternatives were evaluated using economic and sensitivity analyses to determine the least cost alternative to address the overload condition of the GFS 25 kV system over a 20 year load forecast period. The least cost alternative involves installing a new 50 MVA substation transformer to replace an existing 20 MVA substation transformer, GFS-T3, at GFS Substation. 4.0 Doyles Substation ($768,000) An engineering study has been completed on the distribution system upgrades to meet the electrical demands of the customers supplied by DOY Substation. This study is presented in Attachment C to this report. The study examined the 4 alternatives described in Section 1.0 to determine the least cost option to address the forecasted overload condition on the DOY 25 kV system. This study determined that only 1 of the 4 alternatives was a viable option to address the overload condition. This alternative is to replace the existing DOY-T2 transformer with a transformer of a higher capacity rating. There are 2 possible options for replacing the existing transformer. The least cost alternative is to replace the existing 4.0 MVA substation transformer, DOY-T2, at DOY Substation with a spare 6.7 MVA transformer.2
2 The 6.7 MVA transformer to be removed from Lethbridge Substation as approved in Order No. P.U. 40 (2014)
will be relocated to DOY Substation to replace the existing 4.0 MVA DOY-T2 in 2016.

2.2 2016 Additions Due to Load Growth NP 2016 CBA
3
5.0 Project Cost Table 3 shows the total 2016 project capital costs for the project.
Table 3 2016 Project Costs
($000’s)
Cost Category
King’s Bridge Substation
Transformer Addition
Grand Falls Substation
Transformer Replacement
Doyles Substation
Transformer Replacement
Material 2,804 1,858 623 Labour – Internal 27 17 17 Engineering 210 96 111 Other 40 48 17
Total 3,0813 2,0194 768 6.0 Conclusion
The Company has identified existing and forecast substation transformer overloads in the Grand Falls, St. John’s east and Doyles areas. It is recommended that the projects identified be undertaken in 2016 to address the capacity issues in these areas. The recommended projects include:
• The installation of a new 25 MVA transformer and associated switchgear breakers in KBR Substation;
• The replacement of the existing 20 MVA GFS-T3 transformer with a new 50 MVA transformer; and
• The replacement of the existing 4.0 MVA DOY-T2 transformer with a spare 6.7 MVA transformer.
This project is estimated to cost $5,868,000 in 2016.
3 The $3,081,000 excludes costs associated with refurbishment and modernization of the KBR Substation. The
total cost of this project including the costs for refurbishment and modernization of other KBR substation equipment is $4,059,000. These additional costs are included in the 2016 Capital Budget Application project, 2.1 2016 Substation Refurbishment and Modernization.
4 The $2,019,000 excludes costs associated with refurbishment and modernization of other GFS substation equipment. The total cost of this project including costs for refurbishment and modernization of other GFS substation equipment is $2,509,000. These additional costs are included in the 2016 Capital Budget Application project, 2.1 2016 Substation Refurbishment and Modernization.

2.2 2016 Additions Due to Load Growth NP 2016 CBA
Attachment A King’s Bridge 12.5 kV Substation Study

2.2 2016 Additions Due to Load Growth NP 2016 CBA
i
Table of Contents
Page
1.0 Introduction ..........................................................................................................................1 2.0 Description of Existing System ...........................................................................................1 3.0 Load Forecast .......................................................................................................................2 4.0 Development of Alternatives ...............................................................................................3 5.0 Evaluation of Alternatives ...................................................................................................5 6.0 Project Cost ..........................................................................................................................6 7.0 Conclusion and Recommendation .......................................................................................6

2.2 2016 Additions Due to Load Growth NP 2016 CBA
1
1.0 Introduction The purpose of this study is to determine the distribution system alternative that best meets the electrical demands of customers supplied from King’s Bridge (“KBR”) Substation. In the winter of 2016, the 12.5 kV substation transformer at KBR Substation, KBR-T3, is expected to experience a total peak load of 39.3 MVA. The current capacity of KBR-T3 is 25 MVA. As a result, the load forecast indicates that KBR-T3 will be overloaded in 2016. Load growth on KBR-T3 transformer is primarily the result of voltage conversion of 4.16 kV distribution to 12.5 kV.5 The voltage conversion is increasing the load on the 12.5 kV substation transformer and decreasing the load on the 4.16 kV substation transformers. This report identifies the capital project required to avoid the 2016 forecast overload by determining the least cost expansion plan required to meet the existing and future electrical demands of the customers supplied by KBR Substation. 2.0 Description of Existing System KBR Substation is located on King’s Bridge Road in the City of St. John’s (the “City”). It supplies electricity to approximately 5,500 customers in the east end of the City. The majority of the areas served from KBR Substation are older, mature areas of the City including neighbourhoods commonly referred to as Churchill Park, Rennies Mill Road, Quidi Vidi and the Battery. KBR Substation also supplies electricity to the hotels, condominiums and office buildings on the east ends of Water and Duckworth streets. The KBR distribution system was originally built in the early 1950s. The Company has ongoing refurbishment programs to address the aging assets of both the transmission lines supplying the substation and the distribution system supplied from the substation.6 A major component of upgrading the distribution system is the voltage conversion of the existing KBR 4.16 kV distribution system to 12.5 kV. KBR Substation supplies customers through 3 substation transformers. One transformer supplies the distribution system at a voltage of 12.5 kV and has a capacity of 25 MVA. The 2 other transformers supply the distribution system at 4.16 kV. The two 4.16 kV transformers have a combined capacity of 20 MVA, with each transformer having a 10 MVA capacity.
5 The report 4.6 King’s Bridge Substation Distribution Feeder Refurbishment describes the role voltage
conversion has played in the refurbishment and reliability improvement of the KBR distribution system. Operating the KBR distribution system exclusively at 12.5 kV will (i) reduce the number of feeders necessary to serve the 5,500 customers, (ii) reduce the cost associated with refurbishing the 4.16 kV feeders, (iii) improve reliability by replacing old aerial cables, (iv) provide the ability to transfer feeders to adjacent substations and (v) provide additional capacity for future growth.
6 The refurbishment of the Company’s transmission assets are undertaken in the Transmission Line Rebuild capital project. The refurbishment of the Company’s distribution assets are undertaken in the Rebuild Distribution Lines, Trunk Feeders and Distribution Reliability Initiative capital projects.

2.2 2016 Additions Due to Load Growth NP 2016 CBA
2
3.0 Load Forecast The voltage conversion from 4.16 kV to 12.5 kV is increasing the load on the 12.5 kV substation transformer and decreasing the load on the 4.16 kV substation transformers. Table 1 provides the forecast peak load on the 12.5 kV system with and without the effect of the voltage conversion and load transfers to other substations.
Table 1 KBR 12.5 kV Peak Load Forecast
(MVA)
2014 2015 2016 2017 2018
Total without conversion 23.9 23.9 23.9 24.0 24.1 To date conversion from 4.16 kV 5.0 5.0 13.0 17.4 17.5 Total with conversion to 12.5 kV 28.9 28.9 36.8 41.4 41.6 To date load transfers7 -6.0 -6.0 2.5 2.5 2.5 Final Forecast 22.9 22.9 39.3 43.9 44.1
Table 1 shows that the load on the 12.5 kV system prior to voltage conversion is approximately 24 MVA. At current loading, there is approximately 1.0 MVA of spare capacity on the substation transformer supplying the 12.5 kV distribution system.8 Table 1 also shows that with the conversion of the 4.16 kV infrastructure to 12.5 kV, the load on the 12.5 kV system will increase to approximately 39 MVA by 2016. This will exceed the 25 MVA rating of the substation transformer supplying the 12.5 kV distribution system. This overload needs to be addressed in 2016.
7 In 2014, approximately 6.0 MVA of load was transferred from KBR Substation to Stamps Lane Substation to
offload the KBR 12.5 kV substation transformer KBR-T3. In 2016, once additional capacity is installed at KBR, the 2014 load transfer will be reversed, and a transfer of approximately 2.5 MVA will be transferred from Ridge Road Substation to address a forecast substation transformer overload condition there.
8 The nameplate rating of KBR-T3 is 25 MVA. The name plate rating of the transformer is the rating which should not be exceeded under normal operations. When temporary conditions exist, the Company will allow the load on a transformer to exceed its name plate rating in accordance with equipment loading standards.

2.2 2016 Additions Due to Load Growth NP 2016 CBA
3
4.0 Development of Alternatives When addressing forecast substation transformer overloads, there are 4 primary alternatives considered. Transferring load from one substation transformer to another Table 2 provides the capacity available at adjacent substations to transfer load from the KBR distribution system to other substations.
Table 2 Potential Load Transfers
Substation Feeder Tie Points Capacity Available
(MVA)
St. John’s Main Substation (“SJM”) SJM-03 - KBR-10 SJM-04 - KBR-10 0.09
Stamps Lane Substation (“SLA”) SLA-13 – KBR 11 SLA-09 – KBR-1310 5.3
Ridge Road Substation (“RRD”) RRD-02 – KBR-09 RRD-04 – KBR-09 0.0
Pepperell Substation (“PEP”) PEP-01 – KBR-09 PEP-03 – KBR-1211 < 1.0
Table 2 indicates that there is very limited capacity available to transfer load from the KBR 12.5 kV distribution system to adjacent substations’ distribution feeders. Given the limited capacity available to transfer loads, the option to permanently transfer load to adjacent substations is not considered a viable alternative.
9 The reconstruction of the Water Street underground distribution system is to be completed as part of a major
upgrade to the City’s water and sewer infrastructure. Planned reconstruction of the Waterford River crossing by the Company and reconstruction of the City’s downtown underground infrastructure along Water Street from 2016 to 2018 will require multiple temporary load transfers to the KBR distribution system. Additional capacity to transfer load from SJM Substation to KBR Substation, and additional tie points between the 2 substations, are needed to facilitate the reconstruction of the Water Street underground distribution system.
10 KBR-13 is a new 12.5 kV distribution feeder that will be created as a result of the conversion of the 4.16 kV distribution system at KBR Substation.
11 A new tie point for distribution feeder KBR-12 to the 12.5 kV feeder PEP-03 will be created as a result of the conversion of the 4.16 kV distribution system at KBR Substation.

2.2 2016 Additions Due to Load Growth NP 2016 CBA
4
Paralleling substation transformers together Currently there is only one 12.5 kV substation transformer at KBR Substation. Therefore this is not a viable alternative. Replace an existing transformer with a transformer with a higher capacity rating The existing transformer has a 25 MVA capacity rating which is the largest 12.5 kV size used by Newfoundland Power. Buying a larger transformer would require replacing multiple components of the existing 12.5 kV substation equipment that has a capacity limitation of 26 MVA. This option is not considered technically or economically feasible. Install a new transformer in the substation Figure 1 provides an aerial view of KBR Substation.
Figure 1 – Aerial View of KBR

2.2 2016 Additions Due to Load Growth NP 2016 CBA
5
There are two options for installing a new transformer at the KBR Substation.12 These are: Option 1: Replace KBR-T2 with a new 25 MVA 66 kV/12.5 kV substation transformer.
Construct a new switchgear building near the existing 12.5 kV switchgear and control buildings. Construct a 12.5 kV ductbank from the new transformer to the new switchgear.
The estimated cost of this option is $3,081,000. Option 2: Extend the 66 kV bus next to KBR-T3 and install a new 25 MVA 66 kV/12.5 kV
substation transformer adjacent in the area near KBR-T3 and the existing 12.5 kV switchgear. Construct a new switchgear building near the existing 12.5 kV switchgear and control buildings. Construct a 12.5 kV ductbank from the new transformer to the new switchgear.
The estimated cost of this option is $3,281,000. The cost of Option 1 is approximately 10% less than Option 2. 5.0 Evaluation of Alternatives Option 1 takes advantage of the conversion of the 4.16 kV infrastructure which will see all the 4.16 kV load converted to 12.5 kV by 2017. The existing 66 kV/4.16 kV transformer bay currently occupied by transformer KBR-T2 will be reused, thereby reducing the overall project cost. Option 2 makes use of the initial substation design for the expansion of 12.5 kV infrastructure as contemplated in the 1950s. The replacement of the substation transformer KBR-T2 with a new 25 MVA 66 kV/12.5 kV transformer is the preferred arrangement since it is estimated to cost about 10% less than the alternative arrangement. This option is the least cost alternative at a cost of $3,081,000.
12 The option of installing a 50 MVA substation transformer has not been considered due to capacity limits on
12.5 kV distribution switches, breakers and conductors within the substation. The option of installing a 50 MVA substation transformer is only considered when supplying 25 kV distribution systems where standard distribution switches, breakers and conductors within the substation have the capacity to support currents associated with 50 MVA of load.

2.2 2016 Additions Due to Load Growth NP 2016 CBA
6
6.0 Project Cost Table 1 shows the estimated project costs for the chosen alternative.
Table 1 Project Capital Costs
Year Item Cost 2016
The replacement of substation transformer KBR-T2 with a new 25 MVA 66 kV/12.5 kV transformer.
$3,081,000
Total $3,081,000 7.0 Conclusion and Recommendation System upgrades are required to meet the forecast overload at KBR Substation. An engineering study of viable alternatives has determined that the least cost expansion plan for KBR Substation is to replace substation transformer KBR-T2 with a new 25 MVA 66 kV/12.5 kV transformer. The least cost expansion plan includes the following item in the 2016 Capital Budget:
1) The replacement of substation transformer KBR-T2 with a new 25 MVA 66 kV/12.5 kV transformer.
The 2016 project is estimated to cost $3,081,000.

2.2 2016 Additions Due to Load Growth NP 2016 CBA
Attachment B Grand Falls 25 kV Substation Study

2.2 2016 Additions Due to Load Growth NP 2016 CBA
i
Table of Contents
Page
1.0 Introduction ..........................................................................................................................1 2.0 Description of Existing System ...........................................................................................1 3.0 Load Forecast .......................................................................................................................3 4.0 Development of Alternatives ...............................................................................................5 4.1 Alternative 1.............................................................................................................5 4.2 Alternative 2.............................................................................................................6 5.0 Evaluation of Alternatives ...................................................................................................6 5.1 Economic Analysis ..................................................................................................6 5.2 Sensitivity Analysis .................................................................................................7 6.0 Project Cost ..........................................................................................................................8 7.0 Conclusion and Recommendation .......................................................................................8 Appendix A: GFS 25 kV Substation Service Area Map Appendix B: 2014 Substation Load Forecast – Base Case Appendix C: Alternative 1 – 20 Year Substation Load Forecasts Appendix D: Alternative 2 – 20 Year Substation Load Forecasts

2.2 2016 Additions Due to Load Growth NP 2016 CBA
1
1.0 Introduction The purpose of this study is to determine the distribution system alternative that best meets the electrical demands of Grand Falls (“GFS”) Substation.1 In the winter of 2016, the substation transformers at GFS Substation are expected to experience a total peak load of 44.7 MVA. The current parallel capacity of transformers GFS-T2 and GFS-T3 is 39.3 MVA.2 As a result, the load forecast indicates that both GFS-T2 and GFS-T3 will be overloaded in 2016. Load growth on these transformers is primarily the result of commercial development at the Hardy Avenue Industrial Park and residential subdivision development in the Ridgewood, Grenfell Estates, Harmsworth, and Grenfell Heights subdivisions. This report identifies the capital project required to avoid the 2016 forecasted overload by determining the least cost expansion plan required to meet a 20 year load forecast. 2.0 Description of Existing System The GFS 25 kV Substation is located along the TCH, just west of the Mount Peyton Hotel. There are 3 transformers located in the substation: GFS-T1, GFS-T2, and GFS-T3. GFS-T1 is a 29.7 MVA, 138 kV/66 kV system power transformer that is used to convert a transmission level voltage of 138 kV to a transmission voltage of 66 kV. GFS-T2 is a 20 MVA, 138 kV/25 kV distribution power transformer that operates in parallel with GFS-T3, another 20 MVA, 138 kV/25 kV distribution power transformer. The parallel combination of these two transformers is used to convert a transmission level voltage of 138 kV to a distribution level voltage of 25 kV to supply power to customers through 5 distribution feeders. There are a total of 5 distribution feeders originating from the GFS Substation: 1) GFS-02 is a 25 KV feeder serving approximately 1,645 customers. The main trunk portion of this feeder consists of a combination of approximately 0.3 km of 4/0 AASC primary conductor and approximately 1.2 km of 477 ASC primary conductor heading east along Southcott Drive and north east into Grenfell Heights. The main trunk portion then contains a total of approximately 9.0 km of #2 ACSR conductor through Grenfell Heights and north along New Bay Road. GFS-02 can be paralleled with GFS-08 near the intersection of Knight Street and Brown Avenue or GFS-10 on the TCH near Grenfell Heights.
1 The “Grand Falls Substation” refers to two physically separate substation yards. On the north side of the Trans-
Canada Highway (“TCH”) within the town of Grand Falls – Windsor, there is a substation yard that contains 138 kV, 66kV and 25 kV infrastructure, which is known as the “Grand Falls 25 kV Substation”. On the south side of the TCH, located directly across the road from the first substation yard and connected via a very short 66 kV transmission line, there is another substation yard that contains 66 kV and 4.16 kV infrastructure, which is known as the “Grand Falls 4.16 kV Substation”. For the purposes of this report, any reference to “GFS” will refer to the “Grand Falls 25 kV Substation” only.
2 The total substation capacity is not necessarily equal to the sum of the individual transformer nameplate capacities. The electrical characteristics of each transformer, more specifically the transformer’s per unit impedance, determines how load is split between transformers that operate in parallel.

2.2 2016 Additions Due to Load Growth NP 2016 CBA
2
2) GFS-06 is a 25 kV feeder serving approximately 1,775 customers. The main trunk portion of this feeder consists of approximately 1.5 km of 4/0 AASC primary conductor and approximately 12.5 km of #2 ACSR primary conductor heading west along the TCH to supply power to the community of Badger. GFS-06 can be paralleled with GFS-08 near the intersection of Cromer Avenue and Pinsent Drive or GFS-07 near the intersection of King Street and 7th Avenue. 3) GFS-07 is a 25 kV feeder serving approximately 1,390 customers. The main trunk portion of this feeder consists of approximately 1.5 km of a combination of 4/0 AASC and 477 ASC primary conductor heading west along the TCH, approximately 1.1 km of 4/0 AASC conductor heading northeast along Main Street, approximately 1.5 km of a combination of 1/0 AASC, 477 ASC, and 4/0 AASC primary conductors heading north along 7th Avenue, and approximately 2.0 km of a combination of #4 copper and #2 AASC primary conductors heading northwest along Masters Avenue, 13th Avenue, and Whitmore Street. GFS-07 can be paralleled with GFS-06 near the intersection of King Street and 7th Avenue or GFS-08 at various locations. 4) GFS-08 is a 25 kV feeder serving approximately 775 customers. The main trunk portion of this feeder consists of approximately 0.8 km of 477 ASC primary conductor heading north along Sheppard Street and northwest along Harris Avenue and approximately 0.4 km of a combination of 1/0 and 4/0 AASC primary conductor heading northwest along Cormer Avenue and north along Queensway. GFS-08 can be paralleled with GFS-02 near the intersection of Knight Street and Brown Avenue or with GFS-06 near the intersection of Cromer Avenue and Pinsent Drive or with GFS-07 at various locations. 5) GFS-10 is a 25 kV feeder serving approximately 855 customers. The main trunk portion of this feeder consists of approximately 0.7 km of 477 ASC primary conductor heading west along the TCH and approximately 1.5 km of 4/0 AASC primary conductor heading west then south along Goodyear Avenue. GFS-10 can be paralleled with GFS-02 along the TCH near Grenfell Heights. There are currently no other substations nearby to allow for load transferring from GFS feeder.3 A map of the GFS Substation service area is shown in Appendix A.
3 There are no distribution feeders from adjacent substations that can currently be connected to any GFS feeders.
Bishop Falls (“BFS”) Substation is approximately 14 km away so the only option for offloading the Grand Falls 25 kV system would be to build a tie between GFS-02 and BFS-02. This project isn’t reasonable as it would cost approximately $900,000 to delay the purchase of a new transformer for GFS for only a single year. Delaying the purchase of a new transformer for more than 1 year would require a complete rebuild of BFS-02 in order that more load can be transferred between substations.

2.2 2016 Additions Due to Load Growth NP 2016 CBA
3
3.0 Load Forecast From 2005 to 2014, the number of customers served from GFS Substation has increased by 17% from 5,499 to 6,416 customers. In addition, the load on GFS Substation has increased at a levelized rate of 2.6% per year since 2005. These increases are due to commercial and residential development that is occurring throughout the town of Grand Falls – Windsor. The forecast indicates that the load on the 25 kV system will reach 44.7 MVA in 2016. Graph 1 shows the customer growth on GFS Substation between 2005 and 2014.
0
1,000
2,000
3,000
4,000
5,000
6,000
7,000
Num
ber
of C
usto
mer
s
Year
Graph 1 GFS 25 kV System Customer Growth

2.2 2016 Additions Due to Load Growth NP 2016 CBA
4
Graph 2 shows the historical load growth on GFS Substation between 2005 and 2013, as well as the forecasted 2014, 2015, and 2016 loads.
Both GFS-T2 and GFS-T3 transformers are rated for 20 MVA, with a combined parallel capacity of 39.3 MVA. The following is the forecasted peak substation load that is expected for GFS-T2 and GFS-T3 in the winter of 2016.
• GFS-T2 is rated for 20.0 MVA. The peak load on GFS-T2 is forecasted to be 21.9 MVA. • GFS-T3 is rated for 20.0 MVA. The peak load on GFS-T3 is forecasted to be 22.8 MVA.
This study uses a 20 year load forecast for each substation transformer. The base case 20 year substation forecast for GFS-T2 and GFS-T3 is located in Appendix B. High and low load growth forecasts have also been created for each alternative for use in a sensitivity analysis. With the exception of the first year forecast, the sensitivities are based on increasing the load growth by a factor of 50% for the high forecast and decreasing by a factor of 50% for the low forecast.
0.00
10.00
20.00
30.00
40.00
50.00
Peak
Loa
d - M
VA
Year
Graph 2 GFS 25 kV System Load Growth

2.2 2016 Additions Due to Load Growth NP 2016 CBA
5
4.0 Development of Alternatives Two alternatives have been developed to eliminate the forecasted overload conditions using a set of defined technical criteria.4 These alternatives will provide sufficient capacity to meet forecasted loads over the next 20 years. Each alternative contains estimates for all of the costs involved, including new transformers and feeders. The results of a net present value (“NPV”) calculation are provided for each alternative. 4.1 Alternative 1 In 2016, replace the existing 20 MVA, 138/25 kV GFS-T3 transformer with a new 50 MVA, 138/25 kV transformer. This new transformer would operate in parallel with the existing 20 MVA, 138/25 kV GFS-T2 transformer. This would increase the total substation 25 kV transformer capacity from 39.3 MVA to 64.0 MVA.5 The existing GFS-T3 will become a system spare. Table 1 shows the capital costs estimated for Alternative 1.
Table 1 Alternative 1 Capital Costs
Year Item Cost 2016
Purchase and install a new 50 MVA transformer at GFS Substation to replace the existing GFS-T3 and parallel it with the existing GFS-T2.
$2,019,000
Total $2,019,000 The resultant peak load forecasts for GFS-T2 and GFS-T3 under Alternative 1 are shown in Appendix C.
4 The following technical criteria were applied:
• The steady state substation transformer loading should not exceed the nameplate rating. • The minimum steady state feeder voltage should not fall below 116 Volts (on a 120 Volt base). • The feeder normal peak loading should be sufficient to permit cold load pickup.
5 New transformers are being purchased with a per unit impedance of 7% on the transformer base. As a result, the load split between new and existing transformers may not be evenly or proportionately divided so as to use 100% of each individual transformer’s nameplate capacity. Therefore, the substation capacity is not necessarily equal to the arithmetic sum of the paralleled transformers’ capacities.

2.2 2016 Additions Due to Load Growth NP 2016 CBA
6
4.2 Alternative 2 In 2016, add a new 25 MVA, 138/25 kV transformer (GFS-T4) to GFS Substation. The additional transformer would be configured to operate in parallel with the 20 MVA, 138/25 kV GFS-T2 transformer and the 20 MVA, 138/25 kV GFS-T3 transformer. This transformer addition would increase the total substation 25 kV transformer capacity from 39.3 MVA to 60.4 MVA.
Table 2 shows the capital costs estimated for Alternative 2.
Table 2 Alternative 2 Capital Costs
Year Item Cost 2016
Purchase and install a new 25 MVA transformer (GFS-T4) at GFS Substation and parallel it with the existing GFS-T2 and GFS-T3. Expand the 138 kV and 25 kV buses, install a 138 kV air break switch and 25 kV transformer breaker to accommodate the new 25 MVA transformer.
$3,271,000
Total $3,271,000 The resultant peak load forecasts for GFS-T2, GFS-T3, and GFS-T4 under Alternative 2 are shown in Appendix D. 5.0 Evaluation of Alternatives 5.1 Economic Analysis In order to compare the economic impact of the alternatives, a NPV calculation of customer revenue requirement was completed for each alternative. Capital costs from 2016 to 2033 were converted to the customer revenue requirement and the resulting customer revenue requirement was reduced to a NPV using the Company’s weighted average incremental cost of capital.6 Capital costs required beyond the 20 year forecast period that are required to balance the installed transformer capacity across both alternatives are also included in the NPV calculation and are known simply as end effect capital costs.
6 This analysis captures the customer revenue requirement for the life of a new transformer asset.

2.2 2016 Additions Due to Load Growth NP 2016 CBA
7
Table 3 shows the NPV of customer revenue requirement for each alternative under the base case load forecast.
Table 3 Net Present Value Analysis
($000)
Alternative NPV
1 2,164 2 3,793
Alternative 1 has the lowest NPV of customer revenue requirement. As a result, Alternative 1 is recommended as the most appropriate expansion plan. 5.2 Sensitivity Analysis To assess the sensitivity to load forecast variability of each alternative, high and low load growth forecasts were developed. The peak load forecasts for the sensitivity analysis are shown in Appendix C and D for Alternatives 1 and 2 respectively. In general, the low load growth forecast results in delaying the required construction projects. Similarly, with a higher load growth forecast, the timing of the required construction projects is advanced. Using these revised dates, the NPV of the customer revenue requirement was recalculated. Table 4 shows the NPV of customer revenue requirement for each alternative under the high and low load forecasts.
Table 4 Sensitivity Analysis
($000)
Alternative
High Load Forecast
NPV
Low Load Forecast
NPV
1 2,476 1,929 2 4,078 3,516
Under all 3 scenarios, the base case, high and low growth forecasts, Alternative 1 is the least cost. This indicates that Alternative 1 is a suitable alternative under varying load growth

2.2 2016 Additions Due to Load Growth NP 2016 CBA
8
scenarios. As a result, the recommendation to implement Alternative 1 is still appropriate given the results of the sensitivity analysis. 6.0 Project Cost Table 5 shows the estimated project costs for the chosen alternative.
Table 5 Project Capital Costs
Year Item Cost 2016
Purchase and install a new 50 MVA transformer at GFS Substation to replace the existing GFS-T3 and parallel it with the existing GFS-T2.
$2,019,000
Total $2,019,000 7.0 Conclusion and Recommendation A 20 year load forecast has projected the electrical demands for GFS Substation. The development and analysis of distribution system alternatives has established a preferred expansion plan to meet the forecasted needs of the area. The economic analysis performed in section 5.1 of this study indicates that Alternative 1 is the least cost alternative that meets all of the required technical criteria. The sensitivity analysis indicates that Alternative 1 is the least cost alternative under both the high load growth forecast and the low load growth forecast. The sensitivity analysis is performed to ensure that the least cost alternative indicated by the economic analysis is a suitable alternative for varying levels of load growth. As a result, the Alternative 1 expansion plan has been selected as the most appropriate project. The least cost expansion plan includes the following item in the 2016 Capital Budget:
1) The purchase and installation of a new 50 MVA transformer (GFS-T3) at GFS Substation.
The 2016 project is estimated to cost $2,019,000.

2.2 2016 Additions Due to Load Growth NP 2016 CBA
Appendix A GFS 25 kV Substation Service Area Map

2.2 2016 Additions Due to Load Growth NP 2016 CBA
A-1
GFS 25 kV Substation Service Area Map

2.2 2016 Additions Due to Load Growth NP 2016 CBA
Appendix B 2014 Substation Load Forecast – Base Case

2.2 2016 Additions Due to Load Growth NP 2016 CBA
B-1
20 Year Substation Load Forecast – Base Case
Device GFS-T2 GFS-T3 Sec. Voltage (kV) 25.0 25.0
Rating (MVA) 20.0 20.0 2013 Peak (MVA) 20.8 21.6
Year Forecasted Undiversified Peak (MVA) 2014 20.9 21.8 2015 21.1 21.9 2016 21.9 22.8 2017 22.3 23.2 2018 22.5 23.3 2019 22.6 23.5 2020 22.9 23.7 2021 23.1 24.0 2022 23.3 24.2 2023 23.5 24.4 2024 23.8 24.6 2025 24.0 24.9 2026 24.2 25.1 2027 24.5 25.3 2028 24.7 25.6 2029 24.9 25.8 2030 25.2 26.1 2031 25.4 26.3 2032 25.7 26.5 2033 25.9 26.8

2.2 2016 Additions Due to Load Growth NP 2016 CBA
Appendix C Alternative 1
20 Year Substation Load Forecasts

2.2 2016 Additions Due to Load Growth NP 2016 CBA
C-1
Alternative 1 20 Year Substation Load Forecast – Base Case
Device GFS-T2 GFS-T3 GFS-T3 (New)
Sec. Voltage (kV) 25.0 25.0 25.0 Rating (MVA) 20.0 20.0 50.0
2013 Peak (MVA) 20.8 21.6 N/A Year Forecasted Undiversified Peak (MVA) 2014 20.9 21.8 0.0 2015 21.1 21.9 0.0 2016 14.0 0.0 30.7 2017 14.2 0.0 31.2 2018 14.3 0.0 31.5 2019 14.4 0.0 31.7 2020 14.6 0.0 32.0 2021 14.7 0.0 32.3 2022 14.9 0.0 32.6 2023 15.0 0.0 32.9 2024 15.2 0.0 33.2 2025 15.3 0.0 33.6 2026 15.4 0.0 33.9 2027 15.6 0.0 34.2 2028 15.7 0.0 34.5 2029 15.9 0.0 34.9 2030 16.0 0.0 35.2 2031 16.2 0.0 35.5 2032 16.3 0.0 35.9 2033 16.5 0.0 36.2

2.2 2016 Additions Due to Load Growth NP 2016 CBA
C-2
Alternative 1 20 Year Substation Load Forecast – High Growth
Device GFS-T2 GFS-T3 GFS-T3 (New)
Sec. Voltage (kV) 25.0 25.0 25.0 Rating (MVA) 20.0 20.0 50.0
2013 Peak (MVA) 20.8 21.6 N/A Year Forecasted Undiversified Peak (MVA) 2014 20.9 21.8 0.0 2015 21.2 22.0 0.0 2016 14.3 0.0 31.4 2017 14.7 0.0 32.2 2018 14.8 0.0 32.5 2019 15.0 0.0 32.9 2020 15.2 0.0 33.4 2021 15.4 0.0 33.9 2022 15.7 0.0 34.4 2023 15.9 0.0 34.9 2024 16.1 0.0 35.4 2025 16.3 0.0 35.9 2026 16.6 0.0 36.4 2027 16.8 0.0 36.9 2028 17.1 0.0 37.4 2029 17.3 0.0 38.0 2030 17.5 0.0 38.5 2031 17.8 0.0 39.1 2032 18.1 0.0 39.6 2033 18.3 0.0 40.2

2.2 2016 Additions Due to Load Growth NP 2016 CBA
C-3
Alternative 1 20 Year Substation Load Forecast – Low Growth
Device GFS-T2 GFS-T3 GFS-T3 (New)
Sec. Voltage (kV) 25.0 25.0 25.0 Rating (MVA) 20.0 20.0 50.0
2013 Peak (MVA) 20.8 21.6 N/A Year Forecasted Undiversified Peak (MVA) 2014 20.9 21.8 0.0 2015 21.0 21.8 0.0 2016 13.7 0.0 30.0 2017 13.8 0.0 30.3 2018 13.8 0.0 30.4 2019 13.9 0.0 30.5 2020 14.0 0.0 30.6 2021 14.0 0.0 30.8 2022 14.1 0.0 30.9 2023 14.2 0.0 31.1 2024 14.2 0.0 31.2 2025 14.3 0.0 31.4 2026 14.4 0.0 31.5 2027 14.4 0.0 31.7 2028 14.5 0.0 31.8 2029 14.6 0.0 32.0 2030 14.6 0.0 32.1 2031 14.7 0.0 32.3 2032 14.8 0.0 32.4 2033 14.9 0.0 32.6

2.2 2016 Additions Due to Load Growth NP 2016 CBA
Appendix D Alternative 2
20 Year Substation Load Forecasts

2.2 2016 Additions Due to Load Growth NP 2016 CBA
D-1
Alternative 2 20 Year Substation Load Forecast – Base Case
Device GFS-T2 GFS-T3 GFS-T4 (New)
Sec. Voltage (kV) 25.0 25.0 25.0 Rating (MVA) 20.0 20.0 25.0
2013 Peak (MVA) 20.8 21.6 N/A Year Forecasted Undiversified Peak (MVA) 2014 20.9 21.8 0.0 2015 21.1 21.9 0.0 2016 14.2 14.8 15.6 2017 14.5 15.0 15.9 2018 14.6 15.2 16.0 2019 14.7 15.3 16.1 2020 14.9 15.4 16.3 2021 15.0 15.6 16.5 2022 15.1 15.7 16.6 2023 15.3 15.9 16.8 2024 15.4 16.0 16.9 2025 15.6 16.2 17.1 2026 15.7 16.3 17.3 2027 15.9 16.5 17.4 2028 16.0 16.7 17.6 2029 16.2 16.8 17.8 2030 16.3 17.0 17.9 2031 16.5 17.1 18.1 2032 16.6 17.3 18.3 2033 16.8 17.5 18.4

2.2 2016 Additions Due to Load Growth NP 2016 CBA
D-2
Alternative 2 20 Year Substation Load Forecast – High Growth
Device GFS-T2 GFS-T3 GFS-T4 (New)
Sec. Voltage (kV) 25.0 25.0 25.0 Rating (MVA) 20.0 20.0 25.0
2013 Peak (MVA) 20.8 21.6 N/A Year Forecasted Undiversified Peak (MVA) 2014 20.9 21.8 0.0 2015 21.2 22.0 0.0 2016 14.6 15.1 16.0 2017 14.9 15.5 16.4 2018 15.1 15.7 16.6 2019 15.3 15.9 16.8 2020 15.5 16.1 17.0 2021 15.7 16.3 17.3 2022 16.0 16.6 17.5 2023 16.2 16.8 17.8 2024 16.4 17.1 18.0 2025 16.6 17.3 18.3 2026 16.9 17.5 18.5 2027 17.1 17.8 18.8 2028 17.4 18.0 19.1 2029 17.6 18.3 19.3 2030 17.9 18.6 19.6 2031 18.1 18.8 19.9 2032 18.4 19.1 20.2 2033 18.6 19.4 20.5

2.2 2016 Additions Due to Load Growth NP 2016 CBA
D-3
Alternative 2 20 Year Substation Load Forecast – Low Growth
Device GFS-T2 GFS-T3 GFS-T4 (New)
Sec. Voltage (kV) 25.0 25.0 25.0 Rating (MVA) 20.0 20.0 25.0
2013 Peak (MVA) 20.8 21.6 N/A Year Forecasted Undiversified Peak (MVA) 2014 20.9 21.8 0.0 2015 21.0 21.8 0.0 2016 13.9 14.5 15.3 2017 14.0 14.6 15.4 2018 14.1 14.7 15.5 2019 14.2 14.7 15.5 2020 14.2 14.8 15.6 2021 14.3 14.9 15.7 2022 14.4 14.9 15.8 2023 14.4 15.0 15.8 2024 14.5 15.1 15.9 2025 14.6 15.1 16.0 2026 14.6 15.2 16.1 2027 14.7 15.3 16.1 2028 14.8 15.4 16.2 2029 14.8 15.4 16.3 2030 14.9 15.5 16.4 2031 15.0 15.6 16.4 2032 15.1 15.6 16.5 2033 15.1 15.7 16.6

2.2 2016 Additions Due to Load Growth NP 2016 CBA
Attachment C Doyles 25 kV Substation Study

2.2 2016 Additions Due to Load Growth NP 2016 CBA
i
Table of Contents
Page
1.0 Introduction ..........................................................................................................................1 2.0 Description of Existing System ...........................................................................................1 3.0 Load Forecast .......................................................................................................................1 4.0 Development of Alternatives ...............................................................................................3 5.0 Evaluation of Alternatives ...................................................................................................4 6.0 Project Cost ..........................................................................................................................4 7.0 Conclusion and Recommendation .......................................................................................4

2.2 2016 Additions Due to Load Growth NP 2016 CBA
1
1.0 Introduction The purpose of this study is to determine the distribution system alternative that best meets the electrical demands of customers supplied from Doyles (“DOY”) Substation. In the winter of 2016, the substation transformer at DOY Substation, DOY-T2, is expected to experience a total peak load of 4.2 MVA. The current capacity of DOY-T2 is 4.0 MVA. As a result, the load forecast indicates that DOY-T2 will be overloaded in 2016. Load growth on this transformer is primarily the result of the increase in residential development throughout the Doyles, St. Andrew’s, and Codroy Valley areas. As a result, distribution system upgrades are required to meet the electrical demands at DOY Substation. This report identifies the capital project required to avoid the 2016 forecast overload by determining the least cost expansion plan required to meet the existing and future electrical demands of the customers supplied by DOY Substation. 2.0 Description of Existing System DOY Substation is located in the community of Doyles, in western Newfoundland. There are 2 power transformers located in the substation, DOY-T1 and DOY-T2. DOY-T1 is a Newfoundland and Labrador Hydro owned 41.7 MVA transformer that converts 138 kV transmission voltage to 66 kV transmission voltage.1 DOY-T2 is a Newfoundland Power owned 4.0 MVA transformer that converts 66 kV transmission voltage to 25 kV distribution voltage and supplies customers on 1 distribution feeder. The 25 kV feeder DOY-01 serves approximately 1,700 customers. The main trunk portion of this feeder consists of approximately 4.7 km of #2 ACSR primary conductor heading north along the Trans Canada Highway and 5.9 km of #2 ACSR primary conductor that runs north west along Route 406 through the community of Doyles. 3.0 Load Forecast From 2005 to 2014, the number of customers served from DOY Substation has increased by 12% from 1,512 to 1,694 customers. In addition, the load on DOY Substation has increased at a levelized rate of 4.3% per year since 2005. The forecast indicates that the load on this 25 kV system will continue to exceed 4.0 MVA in 2016.
1 In addition to supplying DOY-T2 and Newfoundland Power’s customers on distribution feeder DOY-01,
DOY-T1 supplies the Port aux Basques area through the 66 kV transmission line TL215.

2.2 2016 Additions Due to Load Growth NP 2016 CBA
2
Graph 1 shows the customer growth on DOY Substation between 2005 and 2014.
Graph 2 shows the historical load growth on DOY Substation between 2005 and 2013, as well as the forecasted 2014, 2015 and 2016 loads.
0
250
500
750
1,000
1,250
1,500
1,750
2,000
Num
ber
of C
usto
mer
s
Year
Graph 1 DOY 25 kV System Customer Growth
0.00
1.00
2.00
3.00
4.00
5.00
Peak
Loa
d - M
VA
Year
Graph 2 DOY 25 kV System Load Growth

2.2 2016 Additions Due to Load Growth NP 2016 CBA
3
4.0 Development of Alternatives When addressing forecast substation transformer overloads, there are 4 primary alternatives considered. Transferring load from one substation transformer to another Due to the geographical location, the DOY 25 kV distribution system is islanded with no adjacent distribution substations to provide an economical means to transferring load from DOY-T2.2 Paralleling substation transformers together Currently there is only one 25 kV substation transformer at DOY, therefore this is not a viable alternative. Replace an existing transformer with a transformer with a higher capacity rating There are two options for replace the existing transformer at the DOY Substation. These are: Option 1: Relocation of a spare 6.7 MVA transformer from Lethbridge “LET” Substation
which will be available in 2015 to replace the existing 4.0 MVA DOY-T2 in 2016.3 The installation of this spare transformer would provide adequate capacity to address existing and forecast electrical demands of the customers supplied by DOY Substation. The estimated cost of this alternative is $768,000.
Option 2: The purchase and installation of a new 6.7 MVA, 25 kV transformer to replace the
existing 4.0 MVA, 25 kV transformer would provide adequate capacity to address existing and forecast electrical demands of the customers supplied by DOY Substation. The estimated cost of this alternative is $1,181,440.
The cost of Option 1 is approximately 35% less than Option 2. Install a new transformer in the substation This alternative does not provide an economical means for addressing the forecast load since it would involve the expansion of DOY Substation including both 66kV and 25 kV bus structures.
2 Grand Bay “GBS” Substation located approximately 25 km from DOY Substation is the closest adjacent
substation. Providing load transfer capability to GBS Substation would involve the construction of approximately 7.5 km of new 12.5 kV distribution line from GBS Substation and the voltage conversion of a portion of DOY 25kV distribution system to 12.5 kV.
3 The 6.7 MVA transformer to be removed from Lethbridge Substation as approved in Order No. P.U. 40 (2014).

2.2 2016 Additions Due to Load Growth NP 2016 CBA
4
5.0 Evaluation of Alternatives An engineering study develops technical alternatives to eliminate the forecasted overload conditions of an area using a set of defined technical criteria. These alternatives are evaluated on an economic level to determine the preferred least cost expansion plan to meet the forecasted needs of an area. The least cost expansion plan for DOY Substation is to replace the 4.0 MVA DOY-T2 transformer with a spare 6.7 MVA transformer. Other alternatives including load transfers, purchasing a new replacement transformer or paralleling with the existing DOY-T2 transformer were eliminated as they were not technically viable or had higher cost compared to the alternative of using an available spare transformer. The least cost alternative to address the existing and forecast electrical demands of the customers supplied by DOY Substation is the installation of the spare 6.7 MVA transformer being removed from LET Substation in 2015. 6.0 Project Cost Table 1 shows the estimated project costs for the chosen alternative.
Table 1 Project Capital Costs
Year Item Cost 2016
The replacement of the existing 4.0 MVA DOY-T2 transformer with a spare 6.7 MVA transformer.
$768,000
Total $768,000 7.0 Conclusion and Recommendation System upgrades are required to meet the load growth in the DOY area. An engineering study of viable alternatives has determined that the least cost expansion plan for DOY Substation is to replace the existing 4.0 MVA DOY-T2 transformer with a spare 6.7 MVA transformer. The least cost expansion plan includes the following item in the 2016 Capital Budget:
2) The replacement of the existing 4.0 MVA DOY-T2 transformer with a spare 6.7 MVA transformer.
The 2016 project is estimated to cost $768,000.

3.1 2016 Transmission Line Rebuild NP 2016 CBA
2016 Transmission Line Rebuild
June 2015
Prepared by:
M. R. Murphy, P. Eng.
A FORT IS COM PAN Y

3.1 2016 Transmission Line Rebuild NP 2016 CBA
i
Table of Contents
Page 1.0 Transmission Line Rebuild Strategy ................................................................................... 1 2.0 2016 Transmission Line Rebuild Projects .......................................................................... 1
2.1 Transmission Line 30L ........................................................................................... 2 2.2 Transmission Line 400L/404L ................................................................................ 2 2.3 Transmission Line 57L ........................................................................................... 4
3.0 Concluding .......................................................................................................................... 4 Appendix A: Transmission Line Rebuild Strategy Schedule Appendix B: Maps of Transmission Lines 30L, 400L and 57L Appendix C: Photographs of Transmission Lines 30L, 400L and 57L

3.1 2016 Transmission Line Rebuild NP 2016 CBA
1
1.0 Transmission Line Rebuild Strategy Newfoundland Power’s transmission lines are the bulk transmitter of electricity providing service to customers. The Company’s transmission lines operate at 66 kV or 138 kV and are often located across country, away from road right of ways. In 2006, Newfoundland Power (the “Company”) submitted its Transmission Line Rebuild Strategy outlining a long term plan to rebuild aging transmission lines. This plan laid out the investment in rebuild projects based on physical condition, risk of failure, and potential customer impact in the event of a failure. The Transmission Line Rebuild Strategy is regularly updated to ensure it reflects the latest reliability data, inspection information, and condition assessments. Appendix A contains the updated Transmission Line Rebuild Strategy Schedule. 2.0 2016 Transmission Line Rebuild Projects In 2016, the Company proposes to rebuild sections of 3 transmission lines totalling 21.9 km with an average age of 54 years.1 Appendix B contains maps of each of the lines to be rebuilt. Appendix C contains photographs of the existing lines. The transmission lines sections to be rebuilt in 2016 are included in Table 1.
Table 1 2016 Transmission Line Rebuilds
Transmission Line Distance to be
Rebuilt Year
Constructed 30L 1.4 km 1959
400L/404L 12.0 km 1967 57L 8.5 km 1958
All of these sections of transmission line have deteriorated poles, crossarms, hardware, and conductor. This makes the lines vulnerable to large scale damage when exposed to heavy wind, ice, and snow loading, thus increasing the risk of power outages. Inspections have identified evidence of decaying wood, worn hardware and damage to insulators. Upgrading of these sections of line will improve the overall reliability of the transmission system that serves customers in these areas.
1 This 21.9 km represents approximately 1% of the total 2,000 km of transmission lines owned and maintained by
Newfoundland Power.

3.1 2016 Transmission Line Rebuild NP 2016 CBA
2
2.1 Transmission Line 30L ($590,000 in 2015 and $507,000 in 2016) Transmission line 30L is a 66 kV single pole line running between Ridge Road Substation (“RRD”) and King’s Bridge Road Substation (“KBR”) in St. John’s. The 2.9 km transmission line was originally constructed in 1959 and consists of 87 single pole structures, all of which have under built distribution circuitry. The route taken by the transmission line, as shown by Figure 1 of Appendix B, is through heavy residential areas of the City of St. John’s.2 Recognizing the added complexity associated with access to private property, obtaining permits from municipal authorities and construction in heavy traffic areas, the Company has chosen to complete the rebuild of transmission line 30L over 2 years. Inspections have identified deterioration due to decay, splits and checks in the poles and crossarms. Many of these wooden components are in advanced stages of deterioration and require replacement. The majority of the wooden poles are original vintage and have surpassed their normal life expectancy. Transmission line 30L also contains insulators manufactured by Canadian Ohio Brass. These insulators are identified as deficiencies due to a history of premature failure caused by cement growth. As the cement in these insulators expands, cracks in the porcelain insulator discs occur making the insulators more susceptible to flashovers. Due to the age and condition of the line it is susceptible to damage should it become exposed to severe wind, ice or snow loading. This line was built to weather loading criteria that are less than the standards currently used to construct new lines in this area. The transmission line has reached a point where continued maintenance is no longer feasible and it has to be rebuilt to continue its safe, reliable operation. In Order No. P.U. 40 (2014) the Board approved a multiyear project to rebuild transmission line 30L. In 2015, work is planned to rebuild 1.5 km of 30L at an estimated cost of $590,000. In 2016, the remaining 1.4 km will be rebuilt. Revised estimates for this project indicate the cost of rebuilding this section of line will be slightly less than originally estimated. This work will be completed at an estimated cost of $507,000. 2.2 Transmission Line 400L/404L ($1,920,000 in 2015 and $2,138,000 in 2016) Transmission line 400L is a 66 kV line running between Newfoundland & Labrador Hydro’s (“Hydro”) Bottom Brook Substation (“BBK”) and the Company’s Wheeler’s Substation (“WHE”), located on the Hansen Highway near Stephenville. Transmission line 400L was constructed in 1967. It is 21.9 km in length and comprised of 90 H-Frame structures. Transmission line 404L, constructed in 1968, extends from WHE to the tap with transmission
2 Most of the poles are located adjacent to city streets and are prone to damage by passing snowploughs and other
vehicles. Where practical, new poles will be located behind the curb and sidewalk to mitigate future damage.

3.1 2016 Transmission Line Rebuild NP 2016 CBA
3
line 401L. It is 2.0 km in length and is comprised of 14 single pole structures. For the purposes of this report we will refer to the combination of transmission lines 400L and 404L as simply 400L. Transmission line 400L is 1 of only 2 transmission lines connecting Stephenville and the Port au Port Peninsula to the Island Interconnected System. The Company has approximately 10,000 customers in Stephenville and on the Port au Port Peninsula, including Stephenville International Airport, Sir Thomas Roddick Hospital, and Lower Cove Mine. The other transmission line connecting Stephenville and the Port au Port Peninsula to the Island Interconnected System is Hydro’s transmission line TL209. Transmission line 400L along with Hydro’s Stephenville Gas Turbine are used to supply customer load for unscheduled outages and scheduled maintenance on transmission line TL209.3 Transmission line 400L is limited in its ability to supply the peak load of the Stephenville and the Port au Port Peninsula area as a back-up to TL209 by (i) the capacity of transformer BBK-T2 and (ii) the capacity of the existing conductor.4 Rebuilding 400L and replacing the conductor will address the load carrying capacity of the transmission line conductor.5 Inspections have identified significant deterioration of the transmission line due to decay, splits and checks in the poles, cross braces and crossarms, loss of rock ballast in pole cribs, cracks in insulators and other hardware deficiencies. Many of these components are in advanced stages of deterioration and require replacement. The transmission line has reached a point where continued maintenance is no longer feasible and has to be rebuilt to continue its safe, reliable operation. In Order No. P.U. 40 (2014) the Board approved a multiyear project to rebuild transmission line 400L. In 2015 work is ongoing to rebuild 12 km of 400L at an estimated cost of $1,920,000. In 2016, the remaining 9.9 km of H-Frame (400L) and 2.0 km of single pole line (404L) will be rebuilt.6 Experience gained through planning the 2015 section of the rebuild indicates that cost estimates for this section of line should be increased, due to the wetland area occupied by the line and additional pole cribbing that will be required. The 2016 section will be completed at an estimated cost of $2,138,000.
3 Transmission line 400L is currently able to supply all Newfoundland Power’s customers in the Stephenville and
the Port au Port Peninsula for the months of June, July, August and September without support from transmission line TL209 or the Stephenville Gas Turbine.
4 Transmission line 400L is rated at 50 MVA. The current condition of the conductor, and the presence of splices in the conductor, makes the actual line rating less than 50 MVA.
5 Discussions have taken place with Hydro on the long term benefits of 400L and the Company’s plan to rebuild the transmission line in 2015 and 2016. Hydro acknowledges the requirement for 400L as a backup to TL209 especially following the decommissioning of the Stephenville Gas Turbine at some future date.
6 Figure 2 in Appendix B shows the route taken by 400L and identifies the sections to be completed in 2015 and 2016.

3.1 2016 Transmission Line Rebuild NP 2016 CBA
4
2.3 Transmission Line 57L ($1,521,000 in 2016 and $1,717,000 in 2017) Transmission line 57L is a 66 kV line running between Bay Roberts Substation (“BRB”) and Harbour Grace Substation (“HGR”). The line was originally constructed in 1958, with the exception of an 8 km section extending into Island Cove Substation (“ILC”) which was constructed in 1989. Approximately 17.8 km of original vintage line consisting of 186 two-pole and three-pole H-Frame structures with non-standard 4/0 ACSR conductor, remain in service. Inspections have identified significant deterioration of the line due to decay, splits and checks in the poles and crossarms, cracks in insulators and other hardware deficiencies. Many of these components are in advanced stages of deterioration and require replacement.7 In 1958, transmission line 57L was built using the construction standards of the time, which did not include crossbraces on the H-Frame structures.8 Some of the structure types used on the line has since been identified as failure points when subjected to extreme weather loads and have thus been removed from the Company’s construction standards. The transmission line has reached a point where continued maintenance is no longer feasible and it has to be rebuilt to continue its safe, reliable operation. The rebuilding of transmission line 57 L is a multi-year project. Based on the age, deteriorated condition and weather loadings on this section of line it is recommended that a 8.5 km section be rebuilt in 2016 at an estimated cost of $1,521,000 and the remaining 9.3 km section be rebuilt in 2017 at an estimated cost of $1,717,000.9 3.0 Concluding In 2016, the Company will rebuild sections of 30L, 400L and 57L. Each of these transmission lines has structures experiencing deterioration of the poles, crossarms, hardware, and conductor. Recent inspections and engineering assessment have determined the transmission lines have reached a point where continued maintenance is no longer feasible and they have to be rebuilt to continue providing safe, reliable electrical service. This project is justified based on the need to replace deteriorated transmission line infrastructure in order to ensure the continued provision of safe, reliable electrical service.
7 Figures 35 through 41 of Appendix C show examples of deterioration such as pole top checks, broken
crossarms, vandalism, splits and shell separation. 8 Figure 36 in Appendix C shows an example of a two-pole H-Frame structure without cross bracing. 9 Figure 3 in Appendix B shows the route taken by 57L and identifies the sections to be completed in 2016 and
2017.

3.1 2016 Transmission Line Rebuild NP 2016 CBA
Appendix A Transmission Line Rebuild Strategy Schedule

3.1 2016 Transmission Line Rebuild NP 2016 CBA
A-1
Transmission Line Rebuilds 2016 – 2020
($000s)
Line Year 2016 2017 2018 2019 2020 030L RRD-KBR 1959 507 400L BBK-WHE 1967 2,138 057L BRB-HGR 1958 1,521 1,717 032L OXP-RRD 1959 370 041L CAR-HCT 1958 2,522 102L GAN-RBK 1958 1,530 4,042 2,651 3,611 101L GFS-RBK 1957 2,162 1,865 363L BVJ-SCR 1963 2,615 3,143 302L SPO-LAU 1959 1,641 Total 4,166 6,139 6,204 7,131 8,395

3.1 2016 Transmission Line Rebuild NP 2016 CBA
Appendix B Maps of Transmission Lines
30L, 400L and 57L

3.1 2016 Transmission Line Rebuild NP 2016 CBA
B-1
Figure 1 – Map of 30L Route

3.1 2016 Transmission Line Rebuild NP 2016 CBA
B-2
Figure 2 – Map of 400L Route

3.1 2016 Transmission Line Rebuild NP 2016 CBA
B-3
Figure 3 – Map of 57L Route

3.1 2016 Transmission Line Rebuild NP 2016 CBA
Appendix C Photographs of Transmission Lines
30L, 400L and 57L

3.1 2016 Transmission Line Rebuild NP 2016 CBA
C-1
Transmission Line 30L
Figure 1 – Pole Checking
Figure 2 – 1950’s Vintage Insulators and Hardware

3.1 2016 Transmission Line Rebuild NP 2016 CBA
C-2
Figure 3 – Pole Damage
Figure 4 – Burned Pole

3.1 2016 Transmission Line Rebuild NP 2016 CBA
C-3
Figure 5 – Split Crossarm
Figure 6 – Bolts Provide Temporary Repairs to Damaged Pole

3.1 2016 Transmission Line Rebuild NP 2016 CBA
C-4
Transmission Line 400L
Figure 7 – Pole and Hardware Damage at Guy Wire Attachment
Figure 8 – Pole Shell Separation

3.1 2016 Transmission Line Rebuild NP 2016 CBA
C-5
Figure 9 – Significant Pole Checking Due To Shell Separation
Figure 10 – Crossbrace Damage

3.1 2016 Transmission Line Rebuild NP 2016 CBA
C-6
Figure 11 – Severe Pole Checking Due to Shell Separation
Figure 12 – Split Pole Top and Checking

3.1 2016 Transmission Line Rebuild NP 2016 CBA
C-7
Figure 13 – Repairs to Conductor Due to Phase Contact Damage
Figure 14 – Pole Shell Separation Showing Exposed Inner Wood

3.1 2016 Transmission Line Rebuild NP 2016 CBA
C-8
Figure 15 – Deep Checking Due to Shell Separation
Figure 16 – Pole Shell Separation

3.1 2016 Transmission Line Rebuild NP 2016 CBA
C-9
Figure 17 – Deep Pole Checking
Figure 18 – Exposed Inner Wood

3.1 2016 Transmission Line Rebuild NP 2016 CBA
C-10
Figure 19 – Oxidization and Corrosion of 266.8 ACSR Steel Core
Figure 20 – Oxidization and Corrosion of 266.8 ACSR Conductor

3.1 2016 Transmission Line Rebuild NP 2016 CBA
C-11
Figure 21 – Corroded Conductor in Foreground
Figure 22 – Deteriorated Crossarm

3.1 2016 Transmission Line Rebuild NP 2016 CBA
C-12
Figure 23 – Bolts Keeping Broken Pole Together
Figure 24 – Bolts Keeping Broken Pole Together

3.1 2016 Transmission Line Rebuild NP 2016 CBA
C-13
Figure 25 – Deteriorated Pole Crib
Figure 26 – Deteriorated Pole Crib Timber

3.1 2016 Transmission Line Rebuild NP 2016 CBA
C-14
Figure 27 – Rock Ballast No Longer Contained
Figure 28 – Deteriorated Pole Crib Timber

3.1 2016 Transmission Line Rebuild NP 2016 CBA
C-15
Figure 29 – Bent Structure
Figure 30 – Broken Crossarm

3.1 2016 Transmission Line Rebuild NP 2016 CBA
C-16
Figure 31 – Bolt No Longer Securing Cross Brace
Figure 32 – Broken Crossarm

3.1 2016 Transmission Line Rebuild NP 2016 CBA
C-17
Figure 33 – Cracks in COB Type Insulator
Figure 34 – Cracks in OB Type Insulator

3.1 2016 Transmission Line Rebuild NP 2016 CBA
C-18
Transmission Line 57L
Figure 35 – Severe Check in Pole Top
Figure 36 – Damage Resulting from Rotten Crossarm

3.1 2016 Transmission Line Rebuild NP 2016 CBA
C-19
Figure 37 – Vandalism - Pole Damage
Figure 38 – Woodpecker Hole Damage

3.1 2016 Transmission Line Rebuild NP 2016 CBA
C-20
Figure 39 – Split Crossarm
Figure 40 – Outer Shell Layer Separation

3.1 2016 Transmission Line Rebuild NP 2016 CBA
C-21
Figure 41 – Twisted Structure

4.1 Distribution Reliability Initiative NP 2016 CBA
Distribution Reliability Initiative
June 2015
Prepared by:
Ralph Mugford, P. Eng.
A FO RTIS COM PANY

4.1 Distribution Reliability Initiative NP 2016 CBA
i
Table of Contents
Page
1.0 Introduction ..........................................................................................................................1 2.0 Background ..........................................................................................................................1 3.0 Project Description ...............................................................................................................2 4.0 Project Cost ..........................................................................................................................3 Appendix A: Distribution Reliability Data: Worst Performing Feeders Appendix B: Worst Performing Feeders: Summary of Data Analysis Appendix C: Grand Falls GFS-02 Feeder Study Appendix D: Hardwoods HWD-07 Feeder Study Appendix E: Stamps Lane SLA-09 Feeder Study

4.1 Distribution Reliability Initiative NP 2016 CBA
1
1.0 Introduction The Distribution Reliability Initiative is a capital project focusing on the reconstruction of the worst performing distribution feeders. Customers on these feeders experience more frequent and longer duration outages than the majority of customers. Newfoundland Power manages system reliability through capital investment, maintenance practices and operational deployment. On an ongoing basis, Newfoundland Power examines its actual distribution reliability performance to assess where targeted capital investment is warranted to improve service reliability. The process used by Newfoundland Power to identify which distribution feeders will benefit from targeted capital investment involves (i) calculating reliability performance indices for all feeders, (ii) analysing the reliability data for the worst performing feeders to identify the cause of the poor reliability performance and (iii) where appropriate complete engineering assessments for those feeders where poor reliability performance cannot be directly related to isolated events that have already been addressed. The decision to make capital investment to improve the reliability performance of the worst performing feeders is based upon the engineering assessments completed as part of the process. 2.0 Background Previously Newfoundland Power identified its worst performing feeders exclusively on the basis of System Average Interruption Duration Index (“SAIDI”), System Average Interruption Frequency Index (“SAIFI”) and customer minutes of outage.1 These are the indices most commonly used in Canada and are reflective of the overall system condition.2 SAIDI and SAIFI are used to rank the reliability performance of distribution feeders on the impact outages have on individual customers. However, it is recognised that relying solely on these indices to identify worst performing feeders can lead to overlooking smaller feeders with chronic issues.3 In 2012, the Canadian Electricity Association began reporting on 2 additional indices; Customer Hours of Interruption per Kilometer (“CHIKM”) and Customers Interrupted per Kilometer (“CIKM”).4 CHIKM and CIKM are used to rank the reliability performance of distribution feeders on the length of line exposed to the outage. These indices tend to be more reflective of infrastructure condition and better identify issues associated with shorter feeders. Similar to 1 System Average Interruption Duration Index (SAIDI) is calculated by dividing the number of customer-outage-
hours (e.g., a two hour outage affecting 50 customers equals 100 customer-outage-hours) by the total number of customers in an area. Distribution SAIDI records the average hours of outage related to distribution system failure. System Average Interruption Frequency Index (SAIFI) is calculated by dividing the number of customers that have experienced an outage by the total number of customers in an area. Distribution SAIFI records the average number of outages related to distribution system failure.
2 Over the period 1999 to 2011 Newfoundland Power spent approximately $17.5 million on Distribution Reliability Initiative projects almost exclusively in rural areas of its service territory.
3 Smaller feeders will have fewer customers than larger feeders and as a result outages of similar duration will involve less customer minutes of outage.
4 Customers Interrupted per Kilometer (CIKM) is calculated by dividing the number of customers that have experienced an outage by the kilometres of line. Customer Hours of Interruption per Kilometer (CHIKM) is calculated by dividing the number of customer-outage-hours by the kilometres of line.

4.1 Distribution Reliability Initiative NP 2016 CBA
2
SAIDI and SAIFI, CHIKM and CIKM are used to rank worst performing feeders that require further analysis of reliability data, and where appropriate, complete engineering assessments to determine if targeted capital investment is warranted to improve service reliability. Newfoundland Power has incorporated CIKM and CHIKM into its reliability analysis in this report.5 Appendix A contains the 5-year average distribution reliability data, excluding significant events, for the 15 worst performing feeders based on data for 2010 to 2014, utilizing SAIDI, SAIFI, customer minutes, CIKM and CHIKM. Appendix B contains a summary of the assessment carried out on each of the feeders listed in Appendix A. 3.0 Project Description The examination of the worst performing feeders, as listed in Appendix A and Appendix B, has resulted in Distribution Reliability Initiative work being proposed on 2 St. John’s distribution feeders, HWD-07 and SLA-09 and on 1 Grand Falls distribution feeder GFS-02. A detailed engineering assessment of each distribution feeder is included in Appendix C, Appendix D and Appendix E to this report. Table 1 summarizes the reliability data for each of the 3 distribution feeders and compares those data to Company averages.
Table 1 Distribution Interruption Statistics
5 Years to December 31, 2014
Feeder Customers SAIFI SAIDI CHIKM CIKM GFS-02 1,645 2.42 3.01 447.0 364.2 HWD-07 2,580 1.85 2.31 239.2 197.1 SLA-09 960 2.74 6.27 469.7 162.5
Company Average 833 1.18 1.73 62.4 45.0 Table 1 shows that distribution feeders GFS-02, HWD-07 and SLA-09 are not outliers from the Company average for SAIDI and SAIFI.6 However, it is clear that these 3 distribution feeders
5 Newfoundland Power started using the CIKM and CHIKM in its analysis of worst performing feeders in 2015.
It is anticipated that by using indices that consider customer interruptions and circuit length that the worst performing feeders will be found in urban settings where the Company has older poles and associated infrastructure.
6 The SAIFI for these 3 feeders is between 1.6 to 2.3 times the Company average while SAIDI is between 1.3 and 3.6 times the Company average.

4.1 Distribution Reliability Initiative NP 2016 CBA
3
are outliers from the Company average for CHIKM and CIKM.7 An analysis of the outage data reveals that equipment failure has been the cause of most of the outages experienced. 4.0 Project Cost The estimate to complete all work associated with the 2016 Distribution Reliability Initiative project is $1,463,000. Table 2 provides a detailed breakdown of the total project cost by distribution feeder.
Table 2 Project Cost
Description GFS-02 HWD-07 SLA-09 Total Engineering $34,000 $71,000 $21,000 $126,000 Labour - Contract 70,000 409,000 61,000 540,000 Labour - Internal 110,000 - 84,000 194,000 Material 88,000 53,000 140,000 281,000 Other 62,000 165,000 95,000 322,000
Total $364,000 $698,000 $401,000 $1,463,000
7 The CIKM for these 3 feeders is between 3.6 to 8.1 times the Company average while CHIKM is between 3.8
and 7.5 times the Company average.

4.1 Distribution Reliability Initiative NP 2016 CBA
Appendix A Distribution Reliability Data:
Worst Performing Feeders

4.1 Distribution Reliability Initiative NP 2016 CBA
A-1
Unscheduled Distribution Related Outages Five-Year Average
2010-2014 Sorted By Customer Minutes of Interruption
Feeder
Annual Customer
Interruptions
Annual Customer Minutes
of Interruption
Annual Distribution
SAIFI
Annual Distribution
SAIDI SLA-09 2,682 465,170 2.74 6.27 DLK-03 2,595 457,848 1.96 5.85 KEN-04 6,682 446,954 2.50 2.90 DUN-01 2,326 429,447 2.32 7.20 GLV-02 2,802 413,803 1.87 4.61 KEN-03 4,477 409,310 1.91 2.57 BOT-01 2,737 396,892 1.62 3.92 HWD-08 6,356 387,262 2.38 2.38 DOY-01 2,964 367,440 1.75 3.64 HWD-07 4,928 358,750 1.85 2.31 GBY-03 2,850 357,497 3.73 7.75 SUM-01 3,660 343,901 2.03 3.17 SCR-01 1,491 328,387 1.53 5.65 BCV-02 2,438 308,014 1.56 3.30 MSY-03 3,972 296,515 2.79 3.51
Company Average 958 85,218 1.18 1.73

4.1 Distribution Reliability Initiative NP 2016 CBA
A-2
Unscheduled Distribution Related Outages Five-Year Average
2010-2014 Sorted By Distribution SAIFI
Feeder
Annual Customer
Interruptions
Annual Customer Minutes
of Interruption
Annual Distribution
SAIFI
Annual Distribution
SAIDI KBR-06 778 33,724 3.77 1.89 GBY-03 2,850 357,497 3.73 7.75 KBR-08 95 7,422 3.53 4.43 MOB-01 4,621 191,776 3.04 2.18 CAB-01 3,672 214,596 2.91 2.84 MSY-03 3,972 296,515 2.79 3.51 SLA-09 2,682 465,170 2.74 6.27 GBY-02 2,425 176,319 2.68 3.22 FER-01 1,720 137,049 2.66 3.56 GIL-01 2,649 211,489 2.60 3.49 GBY-01 1,557 161,566 2.50 4.35 WAV-01 3,296 260,702 2.50 3.32 KEN-04 6,682 446,954 2.50 2.90 GFS-02 3,971 292,426 2.42 3.01
HWD-08 6,356 387,262 2.38 2.38 Company Average 958 85,218 1.18 1.73

4.1 Distribution Reliability Initiative NP 2016 CBA
A-3
Unscheduled Distribution Related Outages Five-Year Average
2010-2014 Sorted By Distribution SAIDI
Feeder
Annual Customer
Interruptions
Annual Customer Minutes
of Interruption
Annual Distribution
SAIFI
Annual Distribution
SAIDI GBY-03 2,850 357,497 3.73 7.75 HBS-01 7 2,312 1.39 7.71 SUM-02 783 275,676 1.28 7.57 DUN-01 2,326 429,447 2.32 7.20 SLA-09 2,682 465,170 2.74 6.27 LGL-01 603 131,251 1.70 6.20 DLK-03 2,595 457,948 1.96 5.85 SCR-01 1,491 328,387 1.53 5.65 LGL-02 1,132 205,111 1.80 5.43 ABC-01 1,108 227,209 1.42 4.85 RVH-02 152 43,457 0.97 4.70 GLV-02 2,802 413,803 1.87 4.61 HUM-09 1,176 115,119 2.06 4.50 KBR-08 95 7,422 3.53 4.43 GBY-01 1,557 161,566 2.50 4.35
Company Average 958 85,218 1.18 1.73

4.1 Distribution Reliability Initiative NP 2016 CBA
A-4
Unscheduled Distribution Related Outages Five-Year Average
2010-2014 Sorted By Distribution CHIKM
Feeder Annual Distribution
CHIKM RVH-02 724.3 RRD-09 660.4 SLA-09 469.7 GFS-02 447.0 MOL-09 403.4 MOL-04 330.0 KBR-02 322.6 KBR-10 313.1 KEN-03 283.2 KBR-01 273.3 KEN-04 263.6 HWD-07 239.2 HWD-08 239.1 SJM-13 229.6 SPR-02 218.0
Company Average 62.4

4.1 Distribution Reliability Initiative NP 2016 CBA
A-5
Unscheduled Distribution Related Outages Five-Year Average
2010-2014 Sorted By Distribution CIKM
Feeder Annual Distribution CIKM RRD-09 537.3 GFS-02 364.2 MOL-09 250.0 KEN-04 236.5 HWD-08 235.4 MOL-04 210.1 HWD-07 197.1 KBR-04 189.8 KEN-03 185.9 KBR-10 170.6 MOL-02 164.5 SLA-09 162.5 SLA-02 161.3 RVH-02 152.1 MOL-05 151.9
Company Average 45.0

4.1 Distribution Reliability Initiative NP 2016 CBA
Appendix B Worst Performing Feeders: Summary of Data Analysis

4.1 Distribution Reliability Initiative NP 2016 CBA
B-1
Worst Performing Feeders Summary of Data Analysis
Feeder Comments ABC-01 Reliability statistics were driven by two broken conductor events, one
in 2010, one in 2014, and a faulted lightning arrestor in 2010. There was also a sleet related incident in 2011. No work is required at this time.
BCV-02 Problems were caused by the submarine cable leading to Bell Island. This cable was replaced in 2014.
BOT-01 Reliability statistics in 2010 were poor due to damage caused by a vehicle accident. In 2013 and 2014, trees falling across the line during a wind storm contributed to poor reliability. No work is required at this time.
CAB-01 Reliability was poor in 2012 principally due to 2 separate tree related incidents. A wind storm in 2013 also contributed to poor reliability. No work is required at this time.
DLK-03 Reliability statistics were driven by weather related events in 2011 and 2014, along with several incidents of trees contacting the line in 2013. No work is required at this time.
DOY-01 Overall reliability statistics on this feeder have been impacted by feeder unbalance caused by a number of long single-phase taps. The poor reliability statistics are also driven by weather related events in 2010 and 2012. Work was completed under the 2014 Feeder Additions for Load Growth project to address the single-phase taps issue. No further work is required at this time.
DUN-01 Poor reliability in 2012 was due to vegetation issues. In 2014, high winds and a faulty lightning arrestor also caused problems. A downline automated recloser is being added to the feeder in 2016 as part of the Distribution Feeder Automation project. Otherwise no work is required at this time.
FER-01 Reliability statistics were driven by a broken conductor in 2014. No work is required at this time.
GBY-01
GBY-01 has had good reliability over the years. A lightning related event resulted in poor overall reliability in 2012. In addition a tree contacted the line in late 2013. No work is required at this time.

4.1 Distribution Reliability Initiative NP 2016 CBA
B-2
Worst Performing Feeders Summary of Data Analysis
Feeder Comments
GBY-02 GBY-02 has had good reliability over the years. A wind related event resulted in poor overall reliability in 2012. No work is required at this time.
GBY–03 Reliability statistics were driven by isolated weather related events in each of 2010, 2011 and 2013. A bird caused an outage in 2014. This feeder had significant upgrades as part of the 2011 Rebuild Distribution Lines project. No work is required at this time.
GFS-02 Reliability statistics were driven by storm damage in November 2013. Broken conductor caused a long duration outage in 2014. This feeder is one of the Company’s worst performing from an interruption per kilometer perspective. An engineering assessment has determined this feeder should be included in the 2016 Distribution Reliability Initiative project.
GIL-01
Reliability statistics were driven by a tree related event in October 2010 and blizzard conditions in December 2013. This feeder is one of the Company’s worst performing from an interruption per kilometer perspective. This feeder will continue to be monitored to determine if it should be considered for rebuilding in a future capital budget.
GLV-02 Poor reliability statistics in 2010 were due to problems accessing the line through Terra Nova Park in response to a tree related event. A sleet storm in 2012 impacted reliability as well as a vegetation related incident in 2013. No work is required at this time.
HBS-01 Most issues are wind related. This feeder has only 5 customers. No work is required at this time.
HWD-08 Poor reliability statistics were principally due to wind and problems related to several incidents of broken conductor. This feeder will continue to be monitored to determine if it should be considered for rebuilding in a future capital budget.
HUM-09
Reliability statistics were driven by a tree related event in 2010 and a failed lightning arrestor in 2013. This feeder is one of the Company’s worst performing from an interruption per kilometer perspective. This feeder will continue to be monitored to determine if it should be considered for rebuilding in a future capital budget.

4.1 Distribution Reliability Initiative NP 2016 CBA
B-3
Worst Performing Feeders Summary of Data Analysis
Feeder Comments
HWD-07
Reliability statistics were driven by a failed cut-out in 2010 and issues related to high winds in February 2013 and December 2013. This feeder is one of the Company’s worst performing from an interruption per kilometer perspective. An engineering assessment has determined this feeder should be included in the 2016 Distribution Reliability Initiative project.
KBR-01
This feeder will be eliminated by upgrading the distribution line from 4.16 kV to 12.5 kV and transferring the customers to a new 12.5 kV feeder as part of the 2016 Feeder Additions for Load Growth project.
KBR-02
This feeder will be eliminated by upgrading the distribution line from 4.16 kV to 12.5 kV and transferring the customers to a new 12.5 kV feeder as part of the 2015 Distribution Reliability Initiative project to address poor reliability on KBR-10 feeder.
KBR-04
This feeder will be eliminated by upgrading the distribution line from 4.16 kV to 12.5 kV and transferring the customers to a new 12.5 kV feeder as part of the Feeder Additions for Load Growth project in 2017.
KBR-06 The reliability issues were caused by damage by an outside party and some conductor related issues. No work is required at this time.
KBR-08 There are no customers remaining on this feeder. In 2014 the feeder was upgraded from 4.16 kV to 12.5 kV and the customers transferred to an adjacent 12.5 kV feeder.
KBR-10
Over the period 2009 to 2013 this feeder has had 6 feeder level outages due to equipment failure. The condition of the aerial cable along Kings Bridge Road is of particular concern. The rebuilding of sections of this feeder is included in the 2015 Distribution Reliability Initiative project to address poor reliability.
KEN-03
KEN-03 has had good reliability over the years. A broken insulator in 2012 and issues which occurred with a new pole installation in 2013 led to poor reliability statistics. No work is required at this time.

4.1 Distribution Reliability Initiative NP 2016 CBA
B-4
Worst Performing Feeders Summary of Data Analysis
Feeder Comments KEN-04 KEN-04 has had good reliability over the years. Two events, a pole
hit by a vehicle and a lightning strike resulted in poor overall reliability in 2012. A downline automated recloser is being added to the feeder in 2016 as part of the Distribution Feeder Automation project. Otherwise no work is required at this time.
LGL-01 Problems were all weather related, including damage from wind in 2013 and 2014. No work is required at this time.
LGL-02
Reliability statistics were driven by wind in 2010, salt spray and a broken conductor in 2013. This feeder is one of the Company’s worst performing from an interruption per kilometer perspective. This feeder will continue to be monitored to determine if it should be considered for rebuilding in a future capital budget.
MOB-01
MOB-01 has had good reliability over the years. Broken conductor in 2011 and a broken pole and crossarm as a result of a vehicle accident in 2013 were the prime reasons for the poor reliability statistics experienced in recent years. Approximately 5 kms of the feeder is being upgraded as part of the 2015 Feeder Additions for Growth project. Otherwise no work is required at this time.
MOL-04 MOL-04 has had good reliability over the years. Several weather events resulted in poor overall reliability in 2012. This feeder is one of the Company’s worst performing from an interruption per kilometer perspective. This feeder will continue to be monitored to determine if it should be considered for rebuilding in a future capital budget.
MOL-05
MOL-05 has had good reliability over the years. A broken insulator in 2013 and a broken riser in 2014 caused the poor reliability statistics. No work is required at this time.
MOL-08
Broken conductor in 2010 and a broken insulator in 2012 were the most significant issues on MOL-08. This feeder is one of the Company’s worst performing from an interruption per kilometer perspective. This feeder will continue to be monitored to determine if it should be considered for rebuilding in a future capital budget.

4.1 Distribution Reliability Initiative NP 2016 CBA
B-5
Worst Performing Feeders Summary of Data Analysis
Feeder Comments
MOL-09
Over the period 2009 to 2013 this feeder has had 6 feeder level outages due to equipment failure. The feeder also had multiple outages on long taps due to equipment failure. This feeder is included in the 2015 Distribution Reliability Initiative project to address poor reliability.
MSY-03
Reliability statistics were driven by a broken conductor event in each of 2012 and 2013. A downline automated recloser is being added to the feeder in 2016 as part of the Distribution Feeder Automation project. Otherwise no work is required at this time.
RRD-09 Reliability problems were due to broken conductor in 2011. This feeder is one of the Company’s worst performing from an interruption per kilometer perspective. This feeder will continue to be monitored to determine if it should be considered for rebuilding in a future capital budget.
RVH-02
Reliability problems were due to 2 events; a blizzard and a broken crossarm in 2011. This feeder is one of the Company’s worst performing from an interruption per kilometer perspective. This feeder will continue to be monitored to determine if it should be considered for rebuilding in a future capital budget.
SCR-01 Reliability statistics were driven by a wind related event in November 2011 and a tree contacting the line in 2013. No work is required at this time.
SJM-13 Reliability problems were due a tree contacting the line in 2010. No work is required at this time.
SLA-02 Reliability problems were caused by an underground cable fault and conductor troubles in 2013. No work is required at this time.
SLA-09 Poor overall reliability is due to an underground cable fault in 2011. This feeder is one of the Company’s worst performing from an interruption per kilometer perspective. An engineering assessment has determined this feeder should be included in the 2016 Distribution Reliability Initiative project.

4.1 Distribution Reliability Initiative NP 2016 CBA
B-6
Worst Performing Feeders Summary of Data Analysis
Feeder Comments SPR-02 Poor reliability was caused by tree issues in 2012 and 2013 and a
snow storm in 2013. No work is required at this time.
SUM-01 Three events, one involving salt spray and the others broken conductor, resulted in poor overall reliability in 2012. In 2013 an issue occurred with a broken insulator. No work is required at this time.
SUM-02 Reliability statistics were driven by 2 tree related events in May and December 2011 and a weather event in 2012. There was a broken conductor issue in 2014. No work is required at this time.
WAV-01 Reliability statistics were principally driven by broken conductor and tree issues during high winds. No work required at this stage.

4.1 Distribution Reliability Initiative NP 2016 CBA
Appendix C Grand Falls GFS-02 Feeder Study
June 2015

4.1 Distribution Reliability Initiative NP 2016 CBA
C-i
Table of Contents
Page
1.0 General .............................................................................................................................C-1 2.0 GFS-02 Feeder .................................................................................................................C-1 3.0 Engineering Assessment ..................................................................................................C-2 4.0 Recommendations ............................................................................................................C-3 Appendix C-1: Map Showing Areas Served by GFS-02 Appendix C-2: Photographs of GFS-02 Feeder

4.1 Distribution Reliability Initiative NP 2016 CBA
C-1
1.0 General The Distribution Reliability Initiative is a project that involves the replacement of deteriorated poles, conductor and hardware to reduce both the frequency and duration of power interruptions to the customers served by specific distribution feeders. Distribution feeders are identified for evaluation based on an analysis of reliability statistics over the past 5 years. Once identified, a detailed engineering assessment of the feeder is carried out to determine if any upgrade work is required. The assessment looks at the physical condition of plant, the risk of failure and the potential impact to customers in the event of a failure. The 2015 Distribution Reliability Initiative identified the GFS-02 feeder as one of the worst performing feeders on Newfoundland Powers distribution system. An engineering evaluation of the feeder was carried out in early 2015. This report summarizes the findings of that evaluation and presents a plan to improve reliability on the feeder. 2.0 GFS-02 Feeder The GFS-02 feeder is one of 5 distribution feeders originating from Grand Falls 25 kV Substation (“GFS”). The feeder has ties to 2 other Grand Falls feeders which allows for both permanent and temporary load transfers between these feeders during unplanned or planned outages. GFS-02 feeder also supplies the water treatment plant for the Town of Grand Falls -Windsor. GFS-02 is a 25 kV distribution feeder that was originally constructed in the late 1960’s serving approximately 1,645 customers. The feeder extends from the substation located on the north side of the Trans-Canada Highway (“TCH”) heading east on the TCH until it reaches Grenfell Heights and Grenfell Heights Extension just west of Bishop’s Falls. The feeder also has 3-phase lines extending into the Hardy Avenue industrial area and along New Bay Road to the water treatment facility.1 The main 3-phase trunk portion of GFS-02 runs from the substation to the intersection of Hardy Avenue and Grenfell Heights. The pole line infrastructure on the main trunk is original to the 1960’s construction. This section of the feeder is located at the rear of large properties making year round access difficult from the road. The main trunk is 3.2 kms long with approximately 2.0 kms located at the rear of several large properties. The conductor on this section of line is a mixture of 4/0 Aluminum Alloy Stranded Conductor (“AASC”) and 477 Aluminum Stranded Conductor (“ASC”). There are 3 long 3-phase taps attached to the main trunk serving Hardy Avenue, Grenfell Heights and New Bay Road. The Hardy Avenue tap is approximately 2.8 km long and provides a tie point with distribution feeder GFS-08. This entire section is comprised of 1/0 AASC conductor. The Grenfell Heights tap is approximately 4.0 kms long. This section is comprised of all #2
1 Appendix C-1 includes a map showing the areas served by distribution feeder GFS-02.

4.1 Distribution Reliability Initiative NP 2016 CBA
C-2
ACSR.2 The New Bay Road tap is approximately 15.0 kms long and connects the water supply for the town to the main trunk feeder. This section is comprised of #2 ACSR conductor. There are also various sections of single-phase construction throughout the distribution feeder, most of which are within the first 2.0 kms of the GFS-02 main trunk. 3.0 Engineering Assessment An engineering assessment has identified deteriorated poles and crossarms including decay, splits and checks in the poles as well as deficiencies with 2-piece insulators. The 2-piece insulators have a documented high failure rate due to cement growth and are of particular concern on this heavily loaded urban feeder.3 Also, due to the age and condition, the main trunk of the feeder is susceptible to damage when exposed to severe wind, ice and snow loading.4 In addition to the deterioration there are many un-fused single phase taps on the remote end of the feeder. As a result any faults that occur on these taps will cause upstream protection devices back at the substation to operate thereby disconnecting the entire feeder. In this situation, the operation of the substation based feeder breaker or recloser causes unnecessary disruption to many customers that are upstream of the actual fault. Installing fused cutouts at single-phase tap locations will increase the probability of isolating faults closer to their locations thus keeping the main 3-phase trunk feeder energized and minimizing the overall impact on customers.5 A downline recloser will be installed on this distribution feeder at a location near the intersection of Grenfell Heights and New Bay Road. A majority of the 3-phase line feeds the water supply at the end of New Bay Road. There are 100 customers from this location to the end of the feeder. The probability of outages occurring on this section of the feeder is much higher due to conductor condition, line length and location. The installation of a downline recloser at this location will allow for the isolation of faults while maintaining service to the approximately 1,500 other customers on the feeder thus increasing overall reliability. A large portion of the main trunk is set back deep on customers’ properties. Access to the pole line infrastructure for maintenance and to conduct patrols is very difficult especially during severe weather conditions. Sections of the pole line infrastructure that require replacement will be relocated to the road right-of-way where practical thereby improving access during all weather conditions.
2 Aluminum conductor steel re-enforced (ACSR) has been noted to have poor operating characteristics in a salt
spray environment. Over time, the outer aluminum strands break, leaving the steel core to carry the load. Eventually the steel core breaks causing an outage to customers.
3 Since the 1960’s the term “cement growth” has been used to categorize a problem with premature failure of porcelain insulators. The cement joining the 2 insulating discs grows over time placing stress on the porcelain that fails in tension by cracking.
4 This distribution feeder was built to weather loading criteria that are less than the standard currently used for new construction.
5 The fuses are sized appropriately through a fuse coordination study that minimizes the number of device operations for a single fault by ensuring the protection device closest to the actual fault operates before other devices.

4.1 Distribution Reliability Initiative NP 2016 CBA
C-3
Table 1 summarizes the reliability data for GFS-02 distribution feeder for the most recent 5-year period.
Table 1 GFS-02 Distribution Interruption Statistics
5 Years to December 31, 2014
Customers SAIFI SAIDI CHIKM CIKM GFS-02 1,645 2.42 3.01 447.0 364.2 Company Average 833 1.18 1.73 62.4 45.0
Table 1 shows that distribution feeder GFS-02 is not an outlier from the Company average for SAIDI and SAIFI.6 The feeder is an outlier from the Company average for CHIKM and CIKM.7 An analysis of the outage data reveals that equipment failure has been the cause of most of the outages experienced. Distribution feeder GFS-02 is constructed from some of the oldest poles and related infrastructure in service in the Town of Grand Falls-Windsor. The main trunk of this distribution feeder has reached a point where continued maintenance is no longer feasible and the feeder has to be rebuilt to current construction standards for continued safe and reliable operation. 4.0 Recommendations The GFS-02 feeder is a critical part of the Company’s distribution system in the Town of Grand Falls-Windsor. Over the past 5 years the majority of the reliability issues on this line have been due to equipment failure, aging and substandard infrastructure and heavy loading. To improve the performance and reliability of this feeder, it is recommended to:
• Rebuild 1.8 kms of the main trunk feeder including 54 poles from the beginning of Grenfell Heights west to Crawley Avenue and relocate to the road right-of-way.8
• Install a new 3-phase downstream recloser at intersection of Grenfell Heights and New Bay Road.
• Install new fused cut-outs on 20 single phase taps and coordinate with upstream protection devices.
It is proposed to complete the required work in 2016 at an estimated cost of $364,000.
6 The SAIFI for the GFS-02 feeder is 2.1 times the Company average while SAIDI is 1.7 times the Company
average. 7 ` The CHIKM for the GFS-02 feeder is 7.2 times the Company average while CIKM is 8.1 times the Company
average. 8 The section of feeder to be rebuilt includes 15 structures each with 2-piece insulators and approximately 15
porcelain cutouts. The 2-piece insulators and porcelain cutouts are known to fail in service.

4.1 Distribution Reliability Initiative NP 2016 CBA
Appendix C-1 Map Showing Areas Served by GFS-02

4.1 Distribution Reliability Initiative NP 2016 CBA
1

4.1 Distribution Reliability Initiative NP 2016 CBA
Appendix C-2 Photographs of GFS-02 Feeder

4.1 Distribution Reliability Initiative NP 2016 CBA
1
Figure 1 – GFS-02 Main Trunk 2-Piece Insulators

4.1 Distribution Reliability Initiative NP 2016 CBA
2
Figure 2 – GFS-02 Main Trunk Deteriorated Crossarm

4.1 Distribution Reliability Initiative NP 2016 CBA
3
Figure 3 – GFS-02 Main Trunk Cracked Pole

4.1 Distribution Reliability Initiative NP 2016 CBA
4
Figure 4 – GFS-02 Porcelain Cutouts

4.1 Distribution Reliability Initiative NP 2016 CBA
5
Figure 5 – GFS-02 Porcelain Cutouts

4.1 Distribution Reliability Initiative NP 2016 CBA
Appendix D Hardwoods HWD-07 Feeder Study
June 2015

4.1 Distribution Reliability Initiative NP 2016 CBA
D-i
Table of Contents
Page
1.0 General ............................................................................................................................ D-1 2.0 HWD-07 Feeder .............................................................................................................. D-1 3.0 Engineering Assessment ................................................................................................. D-2 4.0 Recommendations ........................................................................................................... D-3 Appendix D-1: Map Showing Areas Served by HWD-07 Appendix D-2: Photographs of HWD-07 Feeder

4.1 Distribution Reliability Initiative NP 2016 CBA
D-1
1.0 General The Distribution Reliability Initiative is a project that involves the replacement of deteriorated poles, conductor and hardware to reduce both the frequency and duration of power interruptions to the customers served by specific distribution feeders. Distribution feeders are identified for evaluation based on an analysis of reliability statistics over the past 5 years. Once identified, a detailed engineering assessment of the feeder is carried out to determine if any upgrade work is required. The assessment looks at the physical condition of plant, the risk of failure and the potential impact to customers in the event of a failure. The 2015 Distribution Reliability Initiative identified the HWD-07 feeder as one of the worst performing feeders on Newfoundland Power’s distribution system. An engineering evaluation of the feeder was carried out in early 2015. This report summarizes the findings of that evaluation and presents a plan to improve reliability on the feeder. 2.0 HWD-07 Feeder The HWD-07 feeder is one of 8 distribution feeders originating from Hardwoods Substation (“HWD”) and one of three 25 kV feeders supplied from this substation.1 The feeder has ties to 2 other feeders, HWD-09 and CHA-02, which allows for both permanent and temporary load transfers between these feeders during unplanned or planned outages. HWD-07 was constructed in the early 1990’s and currently serves approximately 2,580 customers. The original construction of this feeder included the voltage conversion of adjacent distribution infrastructure formerly assigned to the 12.5 kV HWD-05 distribution feeder.2 The feeder leaves the lower substation yard located on Kenmount Road and extends west along Kenmount Road then across Karwood Drive, Topsail Road, Paradise Road and north on St. Thomas Line. HWD-07 exits the substation overhead with 477 MCM ASC conductors. The first 1.8 km section of the main trunk along Kenmount Road, Karwood Drive and Topsail Road is constructed using 3-phase 477 ASC conductors. The main trunk along Paradise Road is primarily constructed from approximately 3.0 km of non-standard 2/0 ACSR conductors.3 The main trunk along St. Thomas Line is constructed from approximately 3.6 km of 1/0 AASC.4
1 The Company’s 25 kV distribution system in the St. John’s west and Paradise area is comprised of feeders from
the Chamberlains, Hardwoods, and Kenmount substations. 2 Distribution feeder HWD-05 was constructed in the early 1980’s meaning the pole line infrastructure along this
section is approximately 35 years old. 3 Aluminum conductor steel re-inforced (ACSR) has been noted to have poor operating characteristics in a salt
spray environment. Over time, the outer aluminum strands break, leaving the steel core to carry the load. Eventually the steel core breaks causing an outage to customers.
4 Appendix D-1 includes a map showing the areas served by distribution feeder HWD-07.

4.1 Distribution Reliability Initiative NP 2016 CBA
D-2
3.0 Engineering Assessment Inspections have identified significant deterioration due to decay, splits, and checks in the poles and cross-arms, as well as deficiencies with guys, anchors, hardware and insulators on the feeder. Many of the insulators on this line are in excess of 40 years old and are deteriorated. Sections of this feeder have two-piece insulators which have a documented high failure rate related to cement growth.5 Component failure during high winds has been an issue over the past couple of years. Due to the age and condition of the support structures and conductor, they are becoming more susceptible to damage when exposed to severe wind, ice and snow loading.6 The steel core of the existing #2/0 ACSR conductor shows evidence of corrosion. Deterioration of the steel core reduces the strength of the conductor. In addition, there are numerous locations where the existing conductor has been sleeved to extend the distribution line to adjacent structures.7 The physical condition of the overhead conductors, existing customer load and potential for load growth, make it highly likely that there will be further failures experienced. Table 1 summarizes the reliability data for HWD-07 distribution feeder for the most recent 5-year period.
Table 1 HWD-07 Distribution Interruption Statistics
5 Years to December 31, 2014
Customers SAIFI SAIDI CHIKM CIKM HWD-07 2,580 1.85 2.31 239.2 197.1 Company Average 833 1.18 1.73 62.4 45.0
Table 1 shows that distribution feeder HWD-07 is not an outlier from the Company average for SAIDI and SAIFI.8 The feeder is an outlier from the Company average for CHIKM and CIKM.9 An analysis of the outage data reveals that equipment failure has been the cause of most of the outages experienced. The main trunk of this distribution feeder has reached a point where
5 Since the 1960’s the term “cement growth” has been used to categorize a problem with premature failure of
porcelain insulators. The cement joining the 2 insulating discs grows over time placing stress on the porcelain that fails in tension by cracking.
6 Sections of this distribution feeder were built to weather loading criteria that are less than the standard currently used for new construction.
7 The use of compression sleeves to laterally join aerial conductor is not compliant with current design standards as this reduces the structural integrity of the aerial conductor between insulated contact points and represents additional single-points of failure. This is typically done to quickly return the feeder to service after a conductor breaks in service. An example of this is shown in Appendix D-2, Figure 4.
8 The SAIFI for the HWD-07 feeder is 1.6 times the Company average while SAIDI is 1.3 times the Company average.
9 ` The CHIKM for the HWD-07 feeder is 3.8 times the Company average while CIKM is 4.4 times the Company average.

4.1 Distribution Reliability Initiative NP 2016 CBA
D-3
continued maintenance is no longer feasible and the feeder has to be rebuilt to current construction standards for continued safe and reliable operation. 4.0 Recommendations The HWD-07 feeder is a critical part of the Company’s 25 kV distribution system in the St. John’s west and Paradise area. The majority of the reliability issues on this line are due to overloaded conductor and deteriorated pole and crossarm infrastructure along Paradise Road. The deteriorated condition of the pole line infrastructure in this area presents significant risk to system reliability. To improve the performance and reliability of this feeder, it is recommended that:
• The existing 2/0 ACSR conductor be replaced. The 82 spans of standard 3-phase open wire construction will be rebuilt with 477 ASC conductor;
• The pole line along Paradise Road be upgraded including the replacement of 68
overloaded poles and 30 anchors due to conductor replacement,10 and
• All deteriorated crossarms and insulators on the main trunk of HWD-07 feeder along Paradise Road be replaced with 25 kV clamp top insulators and V-brace crossarms.
It is proposed to complete the required work in 2016 at an estimated cost of $698,000.
10 The majority of poles to be replaced have been in service for at least 40 years and are among some of the oldest
poles in service in the 25 kV system.

4.1 Distribution Reliability Initiative NP 2016 CBA
Appendix D-1 Map Showing Areas Served by HWD-07

4.1 Distribution Reliability Initiative NP 2016 CBA
1
Figure 1 – Map of HWD-07
HWD Substation

4.1 Distribution Reliability Initiative NP 2016 CBA
Appendix D-2 Photographs of HWD-07 Feeder

4.1 Distribution Reliability Initiative NP 2016 CBA
1
Figure 1 – Deteriorated Pole with Notable Bend and Obsolete Hardware

4.1 Distribution Reliability Initiative NP 2016 CBA
2
Figure 2 – Deteriorated Distribution Structure with 2-Piece Insulators

4.1 Distribution Reliability Initiative NP 2016 CBA
3
Figure 3 – Deteriorated Pole with Plow Damage

4.1 Distribution Reliability Initiative NP 2016 CBA
4
Figure 4 – Aerial Conductor with Multiple In-line Sleeves

4.1 Distribution Reliability Initiative NP 2016 CBA
5
Figure 5 – Sub-Standard Distribution Hardware

4.1 Distribution Reliability Initiative NP 2016 CBA
Appendix E Stamp’s Lane SLA-09 Feeder Study
June 2015

4.1 Distribution Reliability Initiative NP 2016 CBA
E-i
Table of Contents
Page
1.0 General ............................................................................................................................. E-1 2.0 SLA-09 Feeder ................................................................................................................. E-1 3.0 Engineering Assessment .................................................................................................. E-1 4.0 Recommendations ............................................................................................................ E-3 Appendix E-1: Map Showing Areas Served by SLA-09 Appendix E-2: Photographs of SLA-09 Feeder

4.1 Distribution Reliability Initiative NP 2016 CBA
E-1
1.0 General The Distribution Reliability Initiative is a project that involves the replacement of deteriorated poles, conductor and hardware to reduce both the frequency and duration of power interruptions to the customers served by specific distribution feeders. Distribution feeders are identified for evaluation based on an analysis of reliability statistics over the past 5 years. Once identified, a detailed engineering assessment of the feeder is carried out to determine if any upgrade work is required. The assessment looks at the physical condition of plant, the risk of failure and the potential impact to customers in the event of a failure. The 2015 Distribution Reliability Initiative identified the SLA-09 feeder as one of the worst performing feeders on Newfoundland Power’s distribution system. An engineering evaluation of the feeder was carried out in early 2015. This report summarizes the findings of that evaluation and presents a plan to improve reliability on the feeder. 2.0 SLA-09 Feeder The SLA-09 feeder is one of 11 distribution feeders originating from Stamp’s Lane Substation (“SLA”). The feeder has ties to three other adjacent feeders which allows for both permanent and temporary load transfers between these feeders during unplanned or planned outages. SLA-09 is a 12.5 kV distribution feeder that was originally constructed in the early 1960’s serving approximately 960 customers. The feeder exits the substation located on Stamp’s Lane between Terra Nova Road and Wishingwell Road via underground cable installed through an underground ductbank. The underground ductbank extends from the substation northeast on Wishingwell Road onto Terra Nova Road and then extends east along Freshwater Road where it comes up above ground in front of 197 Freshwater Road, before continuing overhead via bare aerial conductor. The underground cable, originally installed in the 1960’s is a 500 MCM PILC, 3 conductor cable.1 The overhead line serves Winchester Street with laterals onto Liverpool Avenue and Empire Avenue up to Cairo Street. The feeder also services Merrymeeting Road from Linscott Street to Bonaventure Avenue.2 3.0 Engineering Assessment Inspections have identified the major contributing factors to outage duration and frequency to be the deteriorating underground trunk cable from the substation to Freshwater Road, deterioration due to decay, splits and checks in the poles and cross arms, as well as significant deficiencies with insulators, guys, anchors and hardware. The aging underground trunk cable has had multiple failures during its lifetime with numerous splices in the PILC cable along with transitional splices using XLPE cable to make temporary
1 Much of the Company’s PILC (Paper-Insulated, Lead-Covered) cable is at least 40 years old and is no longer a
standard design used for underground distribution infrastructure. 2 Appendix E-1 includes a map showing the areas served by distribution feeder SLA-09.

4.1 Distribution Reliability Initiative NP 2016 CBA
E-2
repairs.3 Over the last 3 year period the underground trunk cable has faulted at 2 different locations resulting in significant service disruption.4 When the faulted cable is out of service the entire distribution feeder must be transferred onto adjacent feeders to minimize outage time while repairs are made to the faulted cable.5 Due to the proximity to the road, damage to the outer layers of the poles from vehicles and snowplows has impacted the structural integrity of the support structures. In addition 2-piece insulators are still in use on the main trunk section of the feeder. The 2-piece insulators have a documented high failure rate related to cement growth and are a particular concern on a heavily loaded urban feeder.6 Due to the age and condition of the support structures they are susceptible to damage when exposed to severe wind, ice and snow loading.7 Table 1 summarizes the reliability data for SLA-09 distribution feeder for the most recent 5-year period.
Table 1 SLA-09 Unscheduled Distribution Interruption Statistics
5 Years to December 31, 2014
Customers SAIFI SAIDI CHIKM CIKM SLA-09 960 2.74 6.27 469.7 162.5 Company Average 833 1.18 1.73 62.4 45.0
Table 1 shows that distribution feeder SLA-09 is an outlier from the Company average for SAIDI and SAIFI.8 It is also an outlier from the Company average for CHIKM and CIKM.9 An analysis of the outage data reveals that equipment failure has been the cause of most of the outages experienced. The main trunk of this distribution feeder has reached a point where
3 Since 2011 there have been a total of 5 full feeder outages on SLA-09 caused by faults on the underground
cable. 4 Initial customer service restoration times for the 5 feeder outages related to SLA-09 cable faults since 2011
have ranged from a minimum of 119 minutes to a maximum of 230 minutes. 5 Depending on the time of year and load levels at the time of a cable fault, transferring the entire SLA-09 feeder
may involve extensive switching of customer load to provide adequate capacity on adjacent feeders to complete the temporary transfer of the customers served by SLA-09 feeder. This tends to add risk to the customers supplied from these feeders since the feeders are loaded to their maximum electrical ratings thereby exposing more customers to potential outages since the adjacent feeders are supplying more customers than normal.
6 Since the 1960’s the term “cement growth” has been used to categorize a problem with premature failure of porcelain insulators. The cement joining the 2 insulating discs grows over time placing stress on the porcelain that fails in tension by cracking.
7 This distribution feeder was built to weather loading criteria that are less than the standard currently used for new construction.
8 The SAIFI for the SLA-09 feeder is 2.3 times the Company average while SAIDI is 3.6 times the Company average.
9 ` The CHIKM for the SLA-09 feeder is 7.5 times the Company average while CIKM is 3.6 times the Company average.

4.1 Distribution Reliability Initiative NP 2016 CBA
E-3
continued maintenance is no longer feasible and the feeder has to be rebuilt to current construction standards for continued safe and reliable operation. 4.0 Recommendations SLA-09 is a vital part of the Company’s distribution system in the centre of the City of St. John’s. The primary contributor to the poor reliability of this feeder is the aging and substandard underground trunk cable and pole line infrastructure. Two piece insulators also are causing reliability issues. To improve the performance and reliability of this feeder, it is recommended that:
• The entire length of underground trunk cable from Stamp’s Lane substation to the termination pole on Freshwater Road (1km) be replaced with tree-retardant crosslinked polyethylene (TR-XLPE) cable;10
• 15 deteriorated poles and hardware along Empire Avenue and Merrymeeting Road be
upgraded to current standards; and
• All remaining 2-piece insulators on the main trunk of SLA-09 feeder be replaced with 34 kV clamp top insulators and V-brace cross arms.
It is proposed to complete the required work in 2016 at an estimated cost of $401,000.
10 The replacement underground cable will be installed in spare ducts in the existing ductbank.

4.1 Distribution Reliability Initiative NP 2016 CBA
Appendix E-1 Map Showing Areas Served by SLA-09

4.1 Distribution Reliability Initiative NP 2016 CBA
1
SLA
Sub
stat
ion

4.1 Distribution Reliability Initiative NP 2016 CBA
Appendix E-2 Photographs of SLA-09 Feeder

4.1 Distribution Reliability Initiative NP 2016 CBA
1
Figure 1 – SLA-09 Faulted Underground Cable

4.1 Distribution Reliability Initiative NP 2016 CBA
2
Figure 2 – Pole Leaning Towards Traffic

4.1 Distribution Reliability Initiative NP 2016 CBA
3
Figure 3 – Loss of Pole Diameter at Base

4.1 Distribution Reliability Initiative NP 2016 CBA
4
Figure 4 – Narrowed Pole Diameter at Base

4.1 Distribution Reliability Initiative NP 2016 CBA
5
Figure 5 – Deteriorated Pole

4.1 Distribution Reliability Initiative NP 2016 CBA
6
Figure 6 – Deteriorated Pole with Notable Bend

4.1 Distribution Reliability Initiative NP 2016 CBA
7
Figure 7 – Pole Leaning Towards Traffic

4.2 Feeder Additions for Load Growth NP 2016 CBA
Feeder Additions for Load Growth
June 2015
Prepared by:
Dean Efford
Robert Cahill, Eng. L.
NEWFOUNDLAND~
POWER A FORTIS COM PAN Y

4.2 Feeder Additions for Load Growth NP 2016 CBA
i
Table of Contents
Page
1.0 Introduction ..........................................................................................................................1 2.0 Overloaded Conductors .......................................................................................................1
2.1 General .....................................................................................................................1 2.2 Alternatives for Overloaded Conductor ...................................................................1 2.3 Overloaded Feeders .................................................................................................2
3.0 BVS-05 New Feeder Construction ......................................................................................4 4.0 Project Cost ..........................................................................................................................5 5.0 Concluding ...........................................................................................................................5 Appendix A: Distribution Planning Guidelines – Conductor Ampacity Ratings Appendix B: Distribution Feeder Diagrams

4.2 Feeder Additions for Load Growth NP 2016 CBA
1
1.0 Introduction As load increases on an electrical system, the components of the system can become overloaded. These overload conditions occur at the substation level, on equipment such as transformers, breakers and reclosers, or on specific sections of the distribution system. When an overload condition has been identified, it can often be mitigated through operating practices such as feeder balancing or load transfers.1 Such practices are low cost solutions and are completed as normal operating procedures. However, in some cases it becomes necessary to complete upgrades to the distribution system to either increase capacity or alter system configuration in order to complete a load transfer. The overload conditions described in this report can each be attributed to commercial and residential customer growth in Newfoundland Power’s (the “Company”) service territory. 2.0 Overloaded Conductors 2.1 General An overloaded section of conductor on a distribution line is at risk of failure. Failures are caused by overheating of the conductor as the customer load exceeds the conductor’s capacity ratings. As a result, the conductor will have excessive sag, which may result in the conductor coming into contact with other conductors or ultimately, the conductor breaking, causing a fault and subsequent power interruption. The Company undertakes analysis of distribution feeders using a distribution feeder computer modelling application to identify sections of feeders that may be overloaded. Overload conditions that are identified using the computer modelling application are followed up with field visits to ensure the accuracy of information.2 2.2 Alternatives for Overloaded Conductor There are several alternatives for dealing with a conductor overload condition. Each alternative may not be applicable to every overload condition. They are dependent on factors such as; available tie points to surrounding feeders, the amount of conductor overload, physical limitations of line construction, or the effect on offloading strategies for surrounding feeders. Alternative #1 – Feeder Balancing In some cases, conductor may be overloaded on only one phase of a 3-phase line. In this situation, it may be possible to remove the overload condition by balancing the downstream loads through load transfers from the highly loaded phase to one of the more lightly loaded phases. In some situations, overload conditions on individual phases can be alleviated by 1 Feeder balancing involves transferring load from one phase to another on a 3-phase distribution feeder in order
to balance the amount of load on each phase. Load transfers involve transferring load from one feeder to another adjacent feeder.
2 Where necessary, load measurements are taken to verify the results of the computer modeling. The analysis uses conductor capacity ratings based on Newfoundland Power’s Distribution Planning Guidelines. These ratings are shown in Appendix A.

4.2 Feeder Additions for Load Growth NP 2016 CBA
2
extending the 3-phase trunk of the feeder. This is only applicable in situations where all 3 phases are not overloaded. Alternative #2 – Load Transfer On a looped system, if a tie point exists downstream of the overload condition, it may be possible to transfer a portion of load to an adjacent feeder. However, consideration must be given to the loading on the adjacent feeder to ensure a new overload condition is not created. Alternative #3 – Upgrade Conductor The overload condition can be eliminated by increasing the conductor size on the overloaded section. This will improve load transfer capabilities for the feeder, and will not add to the total load or cause an overload condition on an adjacent feeder. Alternative #4 – New Feeder In cases where the feeder conductor leaving a substation is overloaded, and none of the above alternatives can be used to resolve the overload condition, then the addition of a new feeder from the substation is required to transfer a portion of load from the overloaded conductor. 2.3 Overloaded Feeders PUL-02 Feeder Upgrade ($521,000) Pulpit Rock (“PUL”) Substation is located on Whiteway Pond Road in the community of Torbay. There are four 12.5 kV distribution feeders terminated at PUL Substation serving approximately 5,500 customers. PUL-02 distribution feeder leaves PUL Substation and extends northward along the Torbay Bypass Road (Route 20) serving approximately 1,750 primarily residential customers in the communities of Flatrock and Pouch Cove. A 3.5 km section of this feeder is overloaded. The overloaded section is from Cameron Place to Marsh Road in the community of Pouch Cove and was evaluated using all 4 available alternatives identified in section 2.2. The conductor on this section is #4 copper and is rated for 153 amps per phase. The balanced 2016 forecasted peak load on each of the phases in this section is 193 amps per phase. The overload condition on PUL-02 can be attributed to residential growth in the community of Pouch Cove. Continued growth is expected as development in this area has increased with the completion of the Torbay Bypass Road. Feeder balancing is not an option for this overload condition due to the fact that the combined forecasted peak currents exceed the total capacity of the 3 phase conductors. There is a tie point to a 2nd distribution feeder from PUL Substation through the PUL-03 feeder, however due to the routing of each feeder, the tie point does not allow for the offloading of the PUL-02 feeder to resolve the overload condition. The tie point only allows for backup of a portion of PUL-02 feeder in the event of an unplanned outage or planned maintenance. There are no other existing tie points that would allow load to be transferred. Therefore, it is recommended that this 3.5 km section be upgraded to #4/0 AASC conductor, which has a rating of 356 amps per phase.3 3 Single line diagram for PUL-02 feeder is included in Appendix B.

4.2 Feeder Additions for Load Growth NP 2016 CBA
3
RRD-10 Feeder Upgrade ($313,000) Virginia Waters (“VIR”) Substation is located on Snows Lane in the east end of St. John’s. There are eight 12.5 kV distribution feeders terminated at VIR Substation serving approximately 7,700 customers. Ridge Road (“RRD”) Substation is located at the corner of Higgins Line and Ridge Road in the east end of St. John’s. There are eight 12.5 kV distribution feeders terminated at RRD Substation serving approximately 4,900 customers. VIR-07 distribution feeder exits VIR Substation and extends westward along Major’s Path serving approximately 825 residential and commercial customers. The main trunk section of this distribution feeder primarily serves 2 large customers; the St. John’s International Airport and the City of St. John’s water treatment facility located at Windsor Lake. VIR-07 is forecasted to overload in 2016. The conductor on the main trunk section of VIR-07 is 477 ASC and is rated for 590 amps per phase. The balanced 2016 forecasted peak loads on each of the phases on this section are 602 amps per phase. This forecasted overloaded condition can be attributed to the ongoing multi-year expansion at St. John’s International Airport. Feeder balancing is not an option for this overload condition due to the fact that the combined forecasted peak currents exceed the total capacity of the 3 phase conductors. There are existing tie points to RRD Substation through RRD-09 feeder and to PUL Substation through PUL-04 feeder. Due to the routing of each feeder, these 2 existing tie points do not allow for the offloading of the VIR-07 feeder to resolve the overload condition without creating an overload condition on both RRD-09 and PUL-04 feeders. The tie point only allows for backup of a portion of VIR-07 feeder in the event of an unplanned outage or planned maintenance. There are no other existing tie points that would allow load to be transferred. RRD-10 distribution feeder leaves Ridge Road substation and travels northward toward the Outer Ring Road serving approximately 670 residential and commercial customers. It is recommended to extend 3 phases of distribution feeder RRD-10 approximately 1.2 km northward along Portugal Cove Road and interconnect with VIR-07 at Airport Road.4 This will provide an adequate permanent load transfer to resolve the overloading condition on VIR-07 and provide additional capacity for continued load growth forecast for this area.5 PUL-05 New Feeder Construction ($504,000) Customers in the area northeast of St. John’s are served from VIR and PUL substations. The main trunk section of distribution feeder VIR-06 leaving VIR Substation is forecasted to overload in 2016. The conductor on the main trunk section of VIR-06 is 477 ASC, which is rated for 590 amps per phase. The balanced 2016 forecasted peak loads on each of the phases on this section are 601 amps per phase.
4 Single line diagram for RRD-10 feeder is included in Appendix B. 5 RRD substation has two 20 MVA transformers operating in parallel for a combined rating of 40 MVA. In
2015, the combined load on both RRD transformers reached 92% of rated capacity. RRD transformers can accommodate the 3 MVA load transfer from VIR-07 with adequate spare capacity to meet future load growth requirements until 2018 when the requirement for additional transformer capacity for the area is forecast.

4.2 Feeder Additions for Load Growth NP 2016 CBA
4
The forecasted overload condition can be attributed to continued commercial growth in the White Rose Drive and Hebron Way development area, located north of Stavanger Drive. Feeder balancing is not an option for this overload condition due to the fact that the combined forecasted peak currents exceed the total capacity of the 3 phase conductors. There is a tie point to another distribution feeder from PUL Substation through the PUL-01 feeder, however due to the routing of each feeder, the tie point does not allow for the sufficient offloading of the VIR-06 feeder to resolve the overload condition without creating an overload condition on PUL-01 feeder. The tie point only allows for backup of a portion of VIR-06 feeder in the event of an unplanned outage or planned maintenance. There are no other existing tie points that would allow load to be transferred. Therefore, the least cost option to correct this overload condition is to construct a new distribution feeder from PUL Substation to Torbay Road. The new PUL-05 distribution feeder will exit the front of PUL Substation and proceed south along the Torbay Bypass Road for approximately 3.9 km and interconnect with VIR-06 feeder at Torbay Road.6 This new distribution feeder will be used to offload portions of VIR-06 and PUL-01 feeders. These permanent load transfers will adequately distribute the existing load on the feeders and provide capacity for continued load growth forecast for this area.7 The PUL-05 new feeder item of the Feeder Additions for Load Growth project is clustered with the Substation Feeder Termination project. 3.0 BVS-05 New Feeder Construction ($370,000) Customers in the northeast area of the City of Corner Brook are served from Humber (“HUM”) and Bayview (“BVS”) Substations. HUM Substation consists of 2 power transformers, HUM-T2 and HUM-T3 that are used to convert a transmission level voltage of 66 kV to a distribution voltage of 4.16 kV and 12.5 kV, respectively. HUM-T2 has a rated capacity of 7.46 MVA that supply customers through four 4.16 kV distribution feeders, while HUM-T3 has a rated capacity of 13.33 MVA that supply customers through two 12.5 kV distribution feeders. In 2015, the load on HUM-T2 reached 8.2 MVA, which equals 110% of rated capacity, while the load on HUM-T3 reached 13.0 MVA, which equals 98% of rated capacity. The load levels seen on both transformers can be attributed to continued load growth in the northeast area of Corner Brook. There are 3 alternatives to address a substation transformer that is approaching or exceeding its design capacity. One alternative is to replace the transformer with a larger unit. A 2nd option is to add an additional transformer to the substation to distribute the existing load over more transformers. The 3rd alternative is to transfer load to an adjacent substation that has available transformer capacity through a distribution feeder. The 3rd alternative is typically the least cost option since it delays the need to purchase an additional substation transformer.
6 Single line diagram for PUL-05 feeder is included in Appendix B. 7 PUL substation has two 25 MVA transformers operating in parallel for a combined rating of 50 MVA. In 2015,
the combined load on both transformers reached 35.8 MVA which is 72% of rated capacity. PUL transformers can accommodate the 3.2 MVA load transfer from VIR-06 with adequate spare capacity to meet future load growth requirements.

4.2 Feeder Additions for Load Growth NP 2016 CBA
5
There are no existing 4.16 kV distribution systems adjacent to the 4.16 kV feeders supplied from HUM-T2 available to permit load transfers. The upgrade and transfer of sections of distribution feeders HUM-01 and HUM-07 to a new Bayview distribution feeder, BVS-05, would transfer approximately 2.5 MVA of load from the overloaded HUM-T2 transformer to BVS-T2.8,9 To complete this load transfer, a voltage conversion must be completed on sections of HUM-01 and HUM-07 feeders, from an operating voltage of 4.16 kV to an operating voltage of 12.5 kV, before these feeder sections can be transferred to the new BVS-05 distribution feeder. The 2016 project involves the construction of approximately 1.0 km of new aerial distribution line for BVS-05 as well as distribution upgrades to complete the voltage conversion of approximately 1.4 km of HUM-01 distribution line and 3.6 km of HUM-07 distribution line from 4.16 kV to 12.5kV. This permanent load transfer is the least cost alternative to correct the overload condition on HUM-T2 and provide capacity for the continued load growth forecast for this area. The new BVS-05 feeder item of the Feeder Additions for Load Growth project is clustered with the Substation Feeder Termination project. 4.0 Project Cost Table 1 shows the estimated 2016 Feeder Additions for Load Growth project costs.
Table 1 2016 Project Costs
Description Cost Estimate PUL-02 Feeder Upgrade $521,000 RRD-10 Feeder Upgrades $313,000 PUL-05 Feeder Addition $504,000 BVS-05 Feeder Addition $370,000
Total $1,708,000 5.0 Concluding The Feeder Additions for Load Growth project for 2016 includes distribution system upgrades to:
• Upgrade 3.5 km section of PUL-02 feeder, • Upgrade 1.2 km section of RRD-10 feeder, • Construct 3.9 km of new PUL-05 distribution feeder, and
8 Single line diagram for BVS-05 feeder is included in Appendix B 9 The rating of BVS-T2 is 15 MVA. In 2015, the load on BVS-T2 reached 8.3 MVA which is 55% of rated
capacity. BVS-T2 can accommodate the 2.5 MVA load transfer from HUM-T2 with adequate spare capacity to meet future load growth requirements.

4.2 Feeder Additions for Load Growth NP 2016 CBA
6
• Construct 1.0 km of new BVS-05 distribution feeder and convert 5.0 km of HUM-01 and HUM-07 distribution feeders,
The estimated cost to complete this work in 2016 is $1,708,000.

4.2 Feeder Additions for Load Growth NP 2016 CBA
Appendix A Distribution Planning Guidelines
Conductor Ampacity Ratings

4.2 Feeder Additions for Load Growth NP 2016 CBA
A-1
Aerial Conductor Capacity Ratings
Size and Type
Continuous Winter Rating1
Continuous Summer Rating2
Planning Ratings3 CLPU Factor4 = 2.0
Sectionalizing Factor5 = 1.33
Amps Amps Amps MVA 4.16 kV 12.5 kV 25.0 kV
1/0 AASC 303 249 228 1.6 4.9 9.8 4/0 AASC 474 390 356 2.6 7.7 15.4 477 ASC 785 646 590 4.2 12.7 25.5 #2 ACSR 224 184 168 1.2 3.6 7.3 2/0 ACSR 353 290 265 1.9 5.7 11.4 266 ACSR 551 454 414 3.0 8.9 17.9 397 ACSR 712 587 535 3.9 11.6 23.1 #4 Copper 203 166 153 1.1 3.3 6.6 1/0 Copper 376 309 283 2.0 6.1 12.2 2/0 Copper 437 359 329 2.4 7.1 14.2
1 The winter rating is based on ambient conditions of 0ºC and 2ft/s wind speed. 2 The summer rating is based on ambient conditions of 25ºC and 2ft/s wind speed. 3 The planning rating is theoretically 75% of the winter conductor ampacity. In practice the actual percentage
will be something less due to (i) the age and physical condition of the conductor, (ii) the number of customers on the feeder, (iii) the ability to transfer load to adjacent feeders and (iv) operational considerations including the geographic layout and the distribution of customers on the feeder.
4 Cold Load Pick Up: Occurs when power is restored after an extended outage. On feeders with electric heat, the load on the feeder can be 2.0 times as high as the normal winter peak load. This is the result of all electric heat coming on at once when power is restored. The duration of CLPU is typically between 20 minutes and 1 hour.
5 Sectionalizing factor: Two-stage sectionalizing is used during CLPU conditions to increase the Planning Rating of aerial conductors. Restoring power to one section of the feeder at a time reduces the overall effect of CLPU. The sectionalizing factor is the fraction of the load that is restored in the first stage multiplied by the CLPU factor. The optimal portion of the total load on a feeder that is restored in the first stage is 0.66, resulting in a sectionalizing factor of 0.66 x 2.0 = 1.33.

4.2 Feeder Additions for Load Growth NP 2016 CBA
Appendix B Distribution Feeder Diagrams

4.2 Feeder Additions for Load Growth NP 2016 CBA
B-1
PUL-02 Distribution Feeder Upgrade

4.2 Feeder Additions for Load Growth NP 2016 CBA
B-2
RRD-10 Distribution Feeder Upgrade

4.2 Feeder Additions for Load Growth NP 2016 CBA
B-3
PUL-05 New Distribution Feeder

4.2 Feeder Additions for Load Growth NP 2016 CBA
B-4
BVS-05 New Distribution Feeder

4.3 Vault Refurbishment and Modernization
Vault Refurbishment and Modernization
June 2015
Prepared by:
Jon O'Reilly Dean Efford
Approved by:
Robert Cahill, Eng. L.
NP 2016 CBA
A FORTIS COMPANY

4.3 Vault Refurbishment and Modernization NP 2016 CBA
i
Table of Contents
Page
1.0 Vault Refurbishment and Modernization Plan ....................................................................1 2.0 2016 Vault Refurbishment and Modernization Projects ......................................................1 2.1 Battery Hotel – KBR-V3 .........................................................................................2 2.2 Newfoundland & Labrador Credit Union – SJM-V9 ..............................................4 2.3 City Hall Annex – SJM-V11 ....................................................................................7 3.0 2016 Project Cost .................................................................................................................9 4.0 Concluding ...........................................................................................................................9

4.3 Vault Refurbishment and Modernization NP 2016 CBA
1
1.0 Vault Refurbishment and Modernization Plan Newfoundland Power (the “Company”) has 19 electrical distribution vaults within the City of St. John’s.1 These vaults are an essential part of the Company’s electrical distribution system and are primarily located inside customer-owned buildings in the Water Street and Duckworth Street areas of St. John’s. These vaults are typically located in the basements of buildings and contain high voltage electrical equipment that converts primary voltages from the existing underground distribution system to secondary voltages. This electricity is then distributed to serve the building occupied by the vault, and in some cases, adjacent buildings in the area. Most of the existing vaults in downtown St. John’s are at least 40 years old and were initially constructed when underground electrical service was established in the buildings in which they are located. Throughout the years, as standards have changed, operational and safety issues associated with these vaults have required the Company to develop new procedures. In most cases, this requires that the electrical equipment in the vaults and associated buildings be de-energized prior to entry. In the 2014 Capital Budget Application, the Company submitted a Vault Refurbishment and Modernization plan (the “Vault Plan”) which identified the need to refurbish and modernize these vaults to comply with the current versions of: (i) the Canadian Standards Association Z462-08 Arc Flash Standard, (ii) the Canadian Electrical Code, (iii) the National Building Code of Canada and (iv) the Company’s operational procedures. The Company has selected 3 vaults to be upgraded in 2016. 2.0 2016 Vault Refurbishment and Modernization Projects For 2016, the Company has identified 3 locations where refurbishment and modernization of existing vaults will take place. The vaults are located at the Battery Hotel on Signal Hill Road; the Newfoundland & Labrador Credit Union (“NLCU”) on Water Street; and the City Hall Annex on George Street.2 At both the Battery Hotel and the City Hall Annex buildings there is adequate space outdoors in the vicinity of the vault to eliminate the vault entirely. This can be achieved by replacing the exposed high voltage equipment in the vault with standard pad mount equipment located outdoors. The NLCU vault on Water Street does not have adequate space outdoors in the vicinity; therefore, the vault will be refurbished.
1 The Canadian Electrical Code (CSA C22.1-12) defines a vault as “an isolated enclosure, either above or below
ground, with fire-resisting walls, ceilings, and floors for the purpose of housing transformers and other electrical equipment”.
2 The vaults are located on customer premises and are essential to the delivery of electricity to the customer and in some cases to customers in the same or adjacent buildings. The Company will work with the affected customers to plan and schedule the work to minimize the impacts on their businesses.

4.3 Vault Refurbishment and Modernization NP 2016 CBA
2
Table 1 identifies the 2016 Vault Refurbishment and Modernization estimated expenditures for 2016.
Table 1 2016 Vault Refurbishment and Modernization
Project Budget
Battery Hotel (KBR-V3) NLCU (SJM-V9) City Hall Annex (SJM-V11)
$246,000 $139,000 $188,000
Total $573,000 2.1 Battery Hotel – KBR-V3 ($246,000) The electrical vault at the Battery Hotel is located within the building’s bottom floor.
Figure 1: Battery Hotel Vault Location
The following is a list of electrical equipment within the vault:
• High voltage power cables, • 7.2 kV to 120/240 volt pole mount distribution transformers, • An additional spare pole mount transformer,
The Battery Hotel

4.3 Vault Refurbishment and Modernization NP 2016 CBA
3
• Pole mount cutouts, and • Insulated secondary conductors.
All of the equipment within the vault is owned by Newfoundland Power.
Figure 2: Battery Hotel Vault Transformers
The 12.5 kV power cable supplies the vault from an underground termination pole located on Murphy’s Row off Signal Hill Road and enters the vault through an underground conduit. The power cables feed three 7.2 kV to 120/240 volt pole mount distribution transformers. The 120/240 volt secondary cable exits the room through a conduit system to the customer’s electrical service. A review of the vault has identified the following:
• Lack of proper spill containment for the pole mount transformers, and • Exposed high voltage electrical equipment that could result in arc flash and electrical
contact. Due to electrical contact and arc flash hazards associated with the exposed high voltage equipment located in the vault, personnel must wear arc flash personal protective equipment and

4.3 Vault Refurbishment and Modernization NP 2016 CBA
4
maintain a minimum approach distance of 30 inches from the exposed high voltage equipment while inside the vault. Since there is adequate outdoor space in the vicinity of the vault, it is feasible to eliminate the vault by installing the electrical equipment outside.3 The work required to complete this is as follows:
• Install a 12.5 kV to 120/240 volt pad mount transformer, and • Install 120/240 volt cables to the customer-owned main disconnect switch in the
building’s electrical room. 2.2 Newfoundland & Labrador Credit Union – SJM-V9 ($139,000) The NLCU vault is located within the building’s bottom floor at 240 Water Street.
Figure 3: Credit Union Vault Location
3 The Battery Hotel property has recently been purchased by Memorial Univerisity. Newfoundland Power will
work with the new property owner to coordinate the removal and replacement of the electrical equipment in the vault with planned changes and upgrades to the electrical service for the property.
Credit Union

4.3 Vault Refurbishment and Modernization NP 2016 CBA
5
The following is a list of electrical equipment within the vault:
• 12.5 kV 3 phase primary underground cable, • High voltage fused disconnect switch, • Spare 12.5 kV 3 phase primary cable, and • Insulated primary cable to the customer-owned transformer in the building’s electrical
room. All of the equipment within the vault is owned by Newfoundland Power.
Figure 4: Credit Union Primary Feed and Disconnect Switch The 12.5 kV power cable supplies the vault from a pad mount switch located on McBrides Hill and enters the vault through an underground conduit. The power cable feeds a 3 phase fused disconnect switch in the vault. Primary cable then leaves the switch and feeds a customer owned dry type transformer in the electrical room. A review of the vault has identified the following:
• Exposed high voltage electrical equipment that could result in arc flash and electrical contact, and
• Lack of an adequate barrier between the vault and the rest of the building.

4.3 Vault Refurbishment and Modernization NP 2016 CBA
6
Figure 5: Credit Union Spare Primary Feed
Due to electrical contact and arc flash hazards associated with the exposed high voltage equipment located in the vault, personnel must wear arc flash personal protective equipment and maintain a minimum approach distance of 30 inches from the exposed high voltage equipment while inside the vault. Since there is insufficient space outdoors in the vicinity of the vault, the vault will be refurbished. The work required to complete this is as follows:
• Install new high voltage enclosed disconnect switch, • Install new disconnect switch in order to terminate spare cable, and • Install new non-combustible barrier to effectively separate the vault from the
remainder of the building.

4.3 Vault Refurbishment and Modernization NP 2016 CBA
7
2.3 City Hall Annex – SJM-V11 ($188,000) The City Hall Annex vault is located within the building’s bottom floor at 3 George Street.
Figure 6: City Hall Annex Vault Location
The following is a list of electrical equipment within the vault:
• High voltage power cable, • Pole mount cutouts, • 7.2 kV to 347/600 volt pole mount distribution transformers, • A spare 7.2 KV to 347/600 volt pole mount transformer, and • Insulated secondary conductors.
All of the equipment within the vault is owned by Newfoundland Power.
City Hall Annex

4.3 Vault Refurbishment and Modernization NP 2016 CBA
8
Figure 7: City Hall Annex Pole Mount Transformers and Cutouts
The 12.5 kV power cable supplies the vault from a manhole located on New Gower Street and enters the vault through an underground conduit. The power cables feed three 7.2 kV to 347/600 volt pole mount distribution transformers. The 347/600 volt secondary cable exits the room through a conduit system to the customer’s electrical service. A review of the vault has identified the following:
• Lack of proper spill containment for the pole mount transformers, • Exposed high voltage electrical equipment that could result in arc flash and electrical
contact, and • Lack of adequate ventilation.
Due to electrical contact and arc flash hazards associated with the exposed high voltage equipment located in the vault, personnel must wear arc flash personal protective equipment and maintain a minimum approach distance of 30 inches from the exposed high voltage equipment while inside the vault. Since there is adequate outdoor space in the vicinity of the vault, it is feasible to eliminate the vault by installing the electrical equipment outside.

4.3 Vault Refurbishment and Modernization NP 2016 CBA
9
The work required to complete this is as follows:
• Install a 12.5 kV to 347/600 volt pad mounted transformer, and • Install 347/600 volt secondary service conductors to the customer-owned main
disconnect switch in the building’s electrical room. 3.0 2016 Project Cost Table 3 is a summary of the 2016 expenditures associated with the Vault Refurbishment and Modernization project.
Table 3 2016 Project Expenditures
Cost Category Expenditure
Material $189,000 Labour - Internal 152,000 Labour - Contract 73,000 Engineering 38,000 Other 121,000
Total $573,000 4.0 Concluding The Vault Refurbishment and Modernization work for 2016 includes the following:
• Replacement and relocation of vault equipment to outdoor location for the Battery Hotel vault,
• Refurbishment and modernization of the Credit Union vault, and • Replacement and relocation of vault equipment to outdoor location for the City Hall
Annex vault. The estimated cost to complete this work in 2016 is $573,000.

4.4 2016 Metering Strategy NP 2016 CBA
2016 Metering Strategy
June 2015
Prepared by:
Byron Chubbs, P. Eng.
NEWFOUNDLAND~
POWER A FORTIS COMPANY

4.4 2016 Metering Strategy NP 2016 CBA
i
Table of Contents
Page
1.0 Introduction ..........................................................................................................................1 2.0 Background ..........................................................................................................................1 2.1 Route Optimization ..................................................................................................1 2.2 Safety Performance ..................................................................................................2 2.3 Operating Costs ........................................................................................................3 2.4 Capital Costs ............................................................................................................3 3.0 Metering Landscape .............................................................................................................4 3.1 AMR Technology ....................................................................................................4 3.2 Ratemaking ..............................................................................................................4 4.0 Accelerated AMR Installations ............................................................................................6 4.1 Economic Analysis – Current Strategy ....................................................................6 4.2 Economic Analysis – Accelerated Strategy .............................................................8 4.3 Comparison of Alternatives .....................................................................................9 5.0 Concluding .........................................................................................................................10 Appendix A: NPV Analysis

4.4 2016 Metering Strategy NP 2016 CBA
1
1.0 Introduction Metering is a core function of Newfoundland Power’s (the “Company’s”) business. The Company provides electrical service to approximately 259,000 customers, the majority of which are supplied through an electricity meter that is read on a monthly basis. Each year, the Company’s capital budget provides for expenditures to purchase and install electrical demand and energy meters. Capital expenditures are driven by connecting new customers to the electrical system, federal regulations governing revenue meters, and improving safety and productivity. The Company periodically reviews and updates its metering strategy to reflect the current state of metering (technology improvements, federal regulations, etc), in an effort to continually improve safety and operational efficiency at least cost to the customer. The purpose of this report is to identify the current and future direction of metering at Newfoundland Power. 2.0 Background The Company last submitted its metering strategy to the Board of Commissioners of Public Utilities (the “Board”) in its 2013 capital budget application. The strategy outlined the following key metering objectives:
• Continue with the objectives outlined in the 2006 Metering Strategy with respect to Accuracy & Timeliness, Cost Management, Worker Safety and Ratemaking.
• Implement the recommended transition strategy to comply with changes to Measurement Canada regulations.
• Proceed with purchasing only Automated Meter Reading (“AMR”) meters for all meter replacements and new installations.
• Maintain its focus on route optimization in order to achieve productivity improvements through AMR and reduce costs.
These metering objectives have helped to achieve improved productivity and safety performance in meter reading since 2013. 2.1 Route Optimization The primary means by which the Company manages the cost of the meter reading function is through Route Optimization. Route Optimization is the process of evaluating meter reading routes and making appropriate changes to ensure optimal efficiency is achieved.1 This
1 One meter reading “route” represents the volume of work that can be completed by one meter reader during a
regular 8 hour day. The number of meters in a route varies depending on factors such as: • the density of meters in the route (urban routes typically have more meters than rural routes) • percent of AMR meters in the route • driving time to and from the route • number of commercial customers in the route (high commercial routes typically have fewer meters than
high residential routes)

4.4 2016 Metering Strategy NP 2016 CBA
2
evaluation requires taking a number of variables into consideration, such as the total reading time and driving time in the route, the total number of meters in the route along with the amount of AMR penetration, the length and location of adjacent routes, etc. For example, a route in a high growth area may become too large to be read in a single day, at which point some meters may be moved to an adjacent route, or some meters in the route may be converted to AMR to reduce the total read time. Another route may take less time to read as more and more meters get replaced with AMR meters. In this case meters may be added from an adjacent route, or in some situations two shorter routes can be merged into one route. Since the beginning of 2013, the Company has reduced the total number of meter reading routes by approximately 20% through the strategy of using route optimization and AMR technology.2 Over that same period of time, the number of metered services has increased by approximately 3%.3 2.2 Safety Performance Safety performance associated with meter reading has continually improved over the last 5 years. An important aspect of this improvement has been the use of AMR meters in locations that pose a safety hazard to meter readers. Such hazards may include unsafe terrain, deteriorated steps or walkways, and dogs. Table 1 shows the number of lost time and medical aid incidents associated with the meter reading group over the past 5 years.
Table 1 Meter Reading Safety Performance
Year 2010 2011 2012 2013 2014 Lost Time Incidents 0 2 2 0 0 Medical Aid Incidents 3 1 0 1 1 Total 3 3 2 1 1
Meter Readers drive approximately 1 million kilometres and take approximately 6 million steps per year to obtain meter readings. The use of AMR technology in general can reduce the total driving time required to read meters, eliminate the need for a meter reader to exit their vehicle, and reduce the total time spent walking on customers’ property, all of which provides an opportunity for safer working conditions and reduced incidents.
2 At the beginning of 2013 the Company had 659 meter reading routes. This was reduced to 522 routes by the end
of 2014, a reduction of 137 routes, or approximately 20%, over the 2 year period. 3 At the beginning of 2013 the Company had approximately 241,000 metered services. This increased to 248,000
metered services by the end of 2014, an increase of approximately 3%.

4.4 2016 Metering Strategy NP 2016 CBA
3
2.3 Operating Costs Operating costs for the Company’s metering function are comprised of labour, vehicle and travel costs, and related administrative costs. Table 2 shows the total operating costs of the Company’s metering function and the cost per customer for the years 2010 through 2014.
Table 2 Expenditure History and Unit Cost Projection
Year 2010 2011 2012 2013 2014 Annual Operating Cost (000s) $3,225 $3,198 $3,132 $2,946 $2,844 Average Number of Customers 241,366 245,294 249,347 253,575 257,249 Operating Cost per Customer $13.36 $13.04 $12.56 $11.62 $11.06 As shown in Table 2, the total operating cost per customer for the Company’s metering function has decreased by approximately 17% since 2010, down from $13.36 in 2010 to $11.06 in 2014. Although labour and fuel costs have increased over this period, the decrease in operating cost per customer is largely attributable to above average customer growth coupled with increased meter reading efficiency through the expanded use of AMR meters. 2.4 Capital Costs Table 3 shows the capital expenditures of the Company’s metering function for 2010 through 2014.
Table 3 Capital Expenditure History 2010 - 2014
Year 2010 2011 2012 2013 2014 Quantity of New or Replacement Meters New Connections 5,300 4,909 5,286 5,280 4,308 GROs/CSOs4 10,284 13,671 15,257 18,805 20,009 Other5 7,494 8,366 7,130 6,218 8,825 Total 23,078 26,946 27,673 30,303 33,142
Meter Costs
Actual (000s) $1,872 $1,763 $2,557 $3,109 $3,003 Adjusted6 (000s) $2,100 $1,923 $2,719 $3,242 $3,071
4 Government Removal Orders (“GROs”) and Compliance Sampling Orders (“CSOs”) are completed in
accordance with Measurement Canada regulations under the Electricity and Gas Inspection Act (Canada). 5 Meter requirements classified as “Other” include AMR meters installed for safety or winter accessibility, route
optimization, or defective or broken meters. 6 Cost in 2015 dollars.

4.4 2016 Metering Strategy NP 2016 CBA
4
Capital expenditures have been driven by purchasing meters to connect new customers to the electrical system, replacing expired meters as a requirement of federal government regulations, replacing defective or broken meters, and installing AMR meters to improve safety and productivity. 3.0 Metering Landscape 3.1 AMR Technology The Company currently uses handheld devices to collect meter readings in the field. The readings are entered manually into the handheld device for non-AMR meters, and are collected via a radio frequency signal for AMR meters. At the end of the shift all readings are downloaded from the handheld device into the Company’s meter reading database for archiving and billing purposes. In 2013, the Company began testing a mobile collector unit for gathering AMR meter readings. This technology uses a vehicle mounted dock and external antenna to increase the range of the handheld device. As a result, AMR meters can be read at a greater distance than had previously been possible with the handheld device alone. In 2015, the Company is undertaking a project to replace all remaining non-AMR meters with AMR meters in its Burin operating area.7 Combined with the new mobile collector technology, this project will increase meter reading efficiency and reduce overall meter reading costs in the area. This project is also allowing the Company to evaluate the new mobile collector technology as it gains further operational experience with the technology in a rural environment. At the beginning of 2015, there were 26 meter reading routes required to read approximately 11,000 meters in Burin area. As of the end of May 2015, approximately 99.5% of meters in the Burin operating area now use AMR technology. Through a combination of route optimization and utilizing mobile collector technology, the number of meter reading routes has been reduced to 4 routes, with an average of 2,840 meters per route.8 3.2 Ratemaking Metering requirements can be significantly influenced by ratemaking requirements. For example, demand management, alternative rates and energy conservation initiatives are typically
7 See report 4.4 Burin AMR Project filed as part of the Company’s 2015 Capital Budget Application. 8 The Burin AMR Project will provide an annual operating savings of approximately $88,000 per year. Meter
reading labour and non-labour costs will reduce by approximately $76,000 annually. Vehicle maintenance and fuel costs will reduce by approximately $12,000 annually.
Figure 1: Handheld meter reading device (left) and mobile collector unit (right)

4.4 2016 Metering Strategy NP 2016 CBA
5
supported with the collection of more detailed energy consumption and demand information than is provided by conventional metering systems. Rate initiatives currently supported by the Company’s metering function include (i) the Curtailable Service Option, which is supported by load recorder type meters that can verify the success of requested curtailments via telephone, (ii) the Company’s metering program for its largest General Service customers (i.e. those with demands of 1,000 kVA and above), which uses load recorder type meters to obtain detailed load information and (iii) load research initiatives. Load research initiatives that are either on-going or recently completed include a Time of Day (“TOD”) Rate Study, a direct load control study, and a mini-split heat pump study. The TOD Rate Study involved collecting usage data from 240 domestic customers and 4 large General Service customers. Analysis of the data collected is on-going. If TOD rates are determined to be a cost-effective rate option, changes will be required in the Company’s metering function.9 The direct load control hot water heater program known as “takeCHARGE SmartPeak”, has approximately 500 residential customers participating in Mount Pearl and Paradise. Two pieces of equipment were installed at each participating home, a meter/controller near the hot water tank, and an AMI10 meter replacing the standard meter on the home. The meters provide two way communications with the tank to shut the heating element off during an event and to turn it back on when the event is over. The AMI outside meter stores data on the energy use of the home while the data provided by the tank meter will verify the demand reduction achieved. SmartPeak is a pilot program designed to reduce electricity use during peak times when demand is very high, usually on very cold winter days. Reduced electricity usage will be accomplished by occasionally powering down the homeowners’ hot water tanks during peak times.11 9 To implement TOD rates to a broad range of customers would require meters to record consumption in intervals
as determined by the rate parameters, a communications infrastructure and changes to the data collection and billing systems. The AMR meters being purchased under the current strategy do not have the capabilities to record consumption in time intervals and as a result are not compatible with TOD rates.
10 AMI or Advanced Metering Infrastructure typically includes meters able to communicate data such as meter readings to a central location. Many of these meters also allow for two way communications from the utility to the customer location.
11 Water heating is the third highest consumer of electricity in Newfoundland homes.
Figure 2: AMI outside meter (left) and 2 hot water tank AMI meters (right)

4.4 2016 Metering Strategy NP 2016 CBA
6
The mini-split heat pump study involves recording the use of approximately 25 residential customers who have mini-split heat pumps. The energy use information will provide better insight into how the technology works during system peak conditions.12 4.0 Accelerated AMR Installations The Company currently uses only AMR meters for all meter replacements and new installations. At the current rate of meter replacement it is expected that the Company will achieve 100% penetration of AMR meters by the end of 2019. Based on current productivity improvements realized through the use of AMR meters, as well as the increased efficiency achieved using the new mobile collector technology, an analysis was completed to determine if accelerating the installation of AMR meters in order to achieve 100% AMR penetration by the end of 2017 is a least cost approach to meter reading. 4.1 Economic Analysis – Current Strategy Table 4 shows the forecast number of new customer connections for 2016 through 2020, an estimate of the number of GROs and CSOs to be completed during each year, as well as an estimate of the number of meter replacements required for safety, accessibility and route optimization consistent with the strategy outlined in the 2013 meter strategy.
Table 4 Meter Replacement Forecast – Current Strategy
2016 2017 2018 2019 2020
Gross New Connections 3,831 3,576 3,391 3,319 3,268 GROs/CSOs 18,287 13,732 14,016 1,629 1,600 Other (AMR, Safety, Access, etc.) 10,673 10,673 11,173 11,173 500 Total 32,791 27,981 28,580 16,121 5,368
Capital Cost (000s)13 $3,115 $2,658 $2,715 $1,531 $510
12 The efficiency and capacity of a mini-split heat pump tends to become less during extreme cold weather. This
may limit any benefit the technology has in reducing system peak demand requirements. 13 The capital cost is the total number of meter replacements multiplied by the unit cost of $95 for the purchase
and installation of an AMR meter.

4.4 2016 Metering Strategy NP 2016 CBA
7
Table 5 provides an estimate of the number of meter reading routes as well as an estimate of the operating cost required each year for meter reading based on the forecast penetration of AMR meters that will be required in each year under the current meter strategy.
Table 5 Required Meter Reading Routes – Current Strategy 14
2016 2017 2018 2019 2020
Metered Services15 252,943 255,111 257,104 259,025 260,889 Total AMRs Installed16 194,747 221,320 246,402 259,025 260,889 AMR Penetration17 77% 87% 96% 100% 100% Required # of Routes 360 279 184 89 87 Total Operating Cost (000s) $2,211 $1,864 $1,516 $1,118 $780
The net present value (“NPV”) of the forecast capital and operating costs to continue with the current metering strategy over the 5 year period between 2016 and 2020 is $16,953,000. See Appendix A for details on the NPV analysis.
14 Numbers shown are values forecast to be achieved by the end of each year. 15 Forecast number of customer connections by year end, minus street and area lighting which are not metered
services. 16 Total AMRs installed is equivalent to the number of AMR meters in service at the end of the previous year plus
the number of new connections, GRO/CSOs and other meters installed in the current year. 17 AMR Penetration is the total AMRs installed divided by the number of metered services.

4.4 2016 Metering Strategy NP 2016 CBA
8
4.2 Economic Analysis – Accelerated Strategy Table 6 shows the forecast number of new customer connections for 2016 through 2020, an estimate of the number of GROs and CSOs to be completed during each year, an estimate of the number of meter replacements required for safety, accessibility and route optimization, as well as the additional meter installations required to achieve 100% penetration of AMR meters by the end of 2017.
Table 6 Meter Replacement Forecast – Accelerated Strategy
2016 2017 2018 2019 2020
Gross New Connections 3,831 3,576 3,391 3,319 3,268 GROs/CSOs18, 19 18,287 13,732 1,600 1,600 1,600 Other (AMR, Safety, Access, etc.)20 26,100 29,037 500 500 500 Total 48,218 46,345 5,491 5,419 5,368
Total Capital Cost (000s)21 $4,581 $4,403 $521 $515 $510
18 The total GRO/CSO meter replacements from 2016 to 2020 in the accelerated strategy is less than the
GRO/CSO replacements required in the current strategy because in the accelerated strategy, GRO/CSO replacements for the years 2018 to 2020 are replaced as ‘Other’ meters in 2016 and 2017.
19 1,600 GRO/CSO replacements in each year from 2018 to 2020 are required for AMR meters that were installed in the period 2008 to 2010 and have reached their 10 year expiry date.
20 500 ‘Other’ meter replacements required in each year from 2018 to 2020 are required for purposes such as replacing damaged or defective meters, or upgrading meter installations.
21 The capital cost is the total number of meter replacements multiplied by the unit cost of $95 for the purchase and installation of an AMR meter.

4.4 2016 Metering Strategy NP 2016 CBA
9
Table 7 provides an estimate of the number of meter reading routes as well as an estimate of the operating cost required each year for meter reading based on the forecast penetration of AMR meters that will be achieved in each year.
Table 7 Required Meter Reading Routes – Accelerated Strategy 22
2016 2017 2018 2019 2020
Metered Services23 252,943 255,111 257,104 259,025 260,889 Total AMRs Installed24 210,174 255,111 257,104 259,025 260,889 AMR Penetration25 83% 100% 100% 100% 100% Required # of Routes 299 85 86 86 87 Total Operating Cost (000s) $2,179 $1,526 $766 $768 $770
The NPV of the forecast capital and operating costs for an accelerated meter installation strategy over the 5 year period between 2016 and 2020 is $15,840,000. See Appendix A for details on the NPV analysis. 4.3 Comparison of Alternatives Table 8 provides a comparison of capital and operating expenditures over the 5 year period between 2016 and 2020 as well as the NPV of each alternative over the same period.
Table 8 Comparison of Alternatives
($000s)
Current Strategy
Accelerated Strategy
Difference
Total Capital 2016-2020 $10,530 $10,530 - Total Operating 2016-2020 $7,489 $6,010 ($1,479) Net Present Value $16,953 $15,840 ($1,113)
22 Numbers shown are values forecast to be achieved by the end of each year. 23 Forecast number of customer connections by year end, minus street and area lighting which are not metered
services. 24 Total AMRs Installed is equivalent to the number of AMR meters in service at the end of the previous year plus
the number of new connections, GRO/CSOs and other meters installed in the current year. 25 AMR penetration is the total AMRs installed divided by the number of metered services.

4.4 2016 Metering Strategy NP 2016 CBA
10
In both alternatives, the total number of AMR meters installed over the 5 year period is the same, and as a result the total capital cost for both alternatives is equal. However, by accelerating the installation of AMR meters, the operating savings achieved through improved meter reading efficiency will be realized earlier, resulting in a reduction of approximately $1,478,623 in operating costs over the 5 year period. 5.0 Concluding The Company periodically reviews and updates its metering strategy to reflect the current state of metering (technology improvements, federal regulations, etc), in an effort to continually improve safety and operational efficiency at least cost to the customer. In 2015, the Company conducted a review that has determined that accelerating the replacement of electrical demand and energy meters provides a reduction in operating costs over the 5 year period from 2016 through 2020. The NPV calculation for both operating and capital costs shows that accelerating the installation of AMR meters is the least cost approach to metering by approximately $1,113,000. As a result, the Company will accelerate the installation of AMR meters in order to achieve 100% penetration by the end of 2017.

4.4 2016 Metering Strategy NP 2016 CBA
Appendix A NPV Analysis

4.4 2016 Metering Strategy NP 2016 CBA
A-1
NPV Analysis – Current Strategy Average Incremental Cost of Capital: 6.85% CCA Rate: 55.00% Present Worth Year: 2016
Year Capital
Expenditure
Capital Revenue
Requirement Operating
Costs Net
Benefit Total
Present Worth 2016 3,115,145 304,137 2,211,251 -2,515,389 -12,158,195 2017 2,715,356 601,350 1,903,607 -2,504,957 -13,939,764 2018 2,833,916 877,537 1,582,150 -2,459,687 -15,325,558 2019 1,631,952 1,024,471 1,191,579 -2,216,050 -16,302,343 2020 554,449 1,043,373 847,870 -1,891,242 -16,952,819 2021 0 999,720 0 -999,720 -16,952,819 2022 0 959,334 0 -959,334 -16,952,819 2023 0 927,355 0 -927,355 -16,952,819 2024 0 899,157 0 -899,157 -16,952,819 2025 0 872,662 0 -872,662 -16,952,819 2026 0 846,933 0 -846,933 -16,952,819 2027 0 821,549 0 -821,549 -16,952,819 2028 0 796,319 0 -796,319 -16,952,819 2029 0 771,160 0 -771,160 -16,952,819 2030 0 746,031 0 -746,031 -16,952,819 2031 0 720,917 0 -720,917 -16,952,819 2032 0 695,810 0 -695,810 -16,952,819 2033 0 670,705 0 -670,705 -16,952,819 2034 0 645,601 0 -645,601 -16,952,819 2035 0 620,499 0 -620,499 -16,952,819 2036 0 595,396 0 -595,396 -16,952,819 2037 0 570,293 0 -570,293 -16,952,819 2038 0 545,191 0 -545,191 -16,952,819 2039 0 520,088 0 -520,088 -16,952,819 2040 0 555,161 0 -555,161 -16,952,819

4.4 2016 Metering Strategy NP 2016 CBA
A-2
NPV Analysis – Accelerated Strategy Average Incremental Cost of Capital: 6.85% CCA Rate: 55.00% Present Worth Year: 2016
Year Capital
Expenditure
Capital Revenue
Requirement Operating
Costs Net
Benefit Present Worth
2016 4,580,710 447,223 2,179,379 -2,626,602 -12,367,433 2017 4,497,452 933,531 1,559,318 -2,492,849 -13,826,786 2018 544,473 991,164 799,228 -1,790,392 -14,526,824 2019 548,573 984,541 818,468 -1,803,009 -15,197,755 2020 554,449 998,191 837,575 -1,835,766 -15,840,333 2021 0 965,886 0 -965,886 -15,840,333 2022 0 930,766 0 -930,766 -15,840,333 2023 0 901,315 0 -901,315 -15,840,333 2024 0 874,415 0 -874,415 -15,840,333 2025 0 848,663 0 -848,663 -15,840,333 2026 0 823,427 0 -823,427 -15,840,333 2027 0 798,424 0 -798,424 -15,840,333 2028 0 773,526 0 -773,526 -15,840,333 2029 0 748,674 0 -748,674 -15,840,333 2030 0 723,844 0 -723,844 -15,840,333 2031 0 699,023 0 -699,023 -15,840,333 2032 0 674,207 0 -674,207 -15,840,333 2033 0 649,392 0 -649,392 -15,840,333 2034 0 624,579 0 -624,579 -15,840,333 2035 0 599,766 0 -599,766 -15,840,333 2036 0 574,953 0 -574,953 -15,840,333 2037 0 550,140 0 -550,140 -15,840,333 2038 0 525,327 0 -525,327 -15,840,333 2039 0 500,514 0 -500,514 -15,840,333 2040 0 564,186 0 -564,186 -15,840,333

4.4 2016 Metering Strategy NP 2016 CBA
A-3
NPV Analysis Major Inputs and Assumptions
Specific assumptions include: Income Tax: Income tax expense reflects a statutory income tax rate of 29%. Operating Costs: Operating costs were assumed to be in 2016 dollars escalated yearly using
the GDP Deflator for Canada. Average Incremental Cost of Capital:
Capital
Structure Return Weighted Cost Debt 55.00% 5.250% 2.89% Common Equity 45.00% 8.800% 3.96% Total 100.00% 6.85% CCA Rates: Class Rate Details 50 55.0% Expenditures related to the use of AMR meters
for the metering of electric service. Escalation Factors: Conference Board of Canada GDP deflator, November 24, 2014.

4.5 SJM Waterford River Ductbank Replacement NP 2016 CBA
St. John's Main Waterford River Ductbank Replacement
June 2015
Prepared by:
Robert Cahill , Eng. L.
NEWFOUNDLAND~
POWER A FORTIS COMPANY

4.5 SJM Waterford River Ductbank Replacement NP 2016 CBA
i
Table of Contents
Page
1.0 Introduction ..........................................................................................................................1 2.0 SJM Ductbank Replacement ................................................................................................1 3.0 Project Schedule ...................................................................................................................3 4.0 Project Cost ..........................................................................................................................3 Appendix A: NDAL Report – Replacement Options for the Waterford River Ductbank

4.5 SJM Waterford River Ductbank Replacement NP 2016 CBA
1
1.0 Introduction The St. John’s Main (“SJM”) Substation is located on Southside Road, just east of the Pitts Memorial Drive overpass. It supplies electricity to the area surrounding St. John’s harbour, including the downtown core of the City of St. John’s. The distribution system supplied from the SJM Substation includes both overhead distribution feeders and an underground system that consists of a series of ductbanks, manholes, switches and cables. The underground system supplying the St. John’s downtown core is approximately 40 years old and has a dense population of large commercial customers. This underground system which exits the substation and runs under the Waterford River includes a major ductbank that contains the main trunks of 9 distribution feeders. 2.0 SJM Ductbank Replacement Newfoundland Power (the “Company”) submitted the SJM Planning Study (the “Study”) with its 2011 Capital Budget Application.1 The purpose of the Study was to develop a 5 year plan to address the deteriorated underground primary infrastructure as well as provide adequate capacity to supply new development in the St. John’s downtown area. The Study identified a project that requires the replacement of the deteriorated ductbank from SJM Substation to Hutchings Street which crosses under the Waterford River.2 This project was originally planned for 2015; however the Company took additional time to complete preliminary engineering work to assess alternatives for replacing the section of the underground system currently routed under the Waterford River.3 The existing Newfoundland Power underground infrastructure from SJM substation to Hutchings Street utilizes paper-insulated lead-covered (“PILC”) cables installed in 100 mm diameter fibre duct banks encased in concrete buried under the Waterford River and the St. John’s Dockyard property. The existing PILC cables and associated duct banks are in excess of 40 years old and are nearing the end of their expected service life. Over the years, the fibre duct material has swollen due to absorbed moisture. The swollen fibre ducts make the removal of existing cable or installation of new cable extremely difficult and, in some cases, impossible.
1 The St. John’s Main Planning Study was included as Attachment A to the report 4.2 Feeder Additions for Load
Growth included in the 2011 Capital Budget Application. 2 Newfoundland Power undertook a similar project in 2008 to replace civil infrastructure, including concrete duct
banks, manholes, and switch pads, along Water Street and Harbour Drive between Hutchings Street and Beck’s Cove. This project was undertaken to coincide with the City of St. John’s Harbour Interceptor Sewer Project and approved in Order No. P.U. 19(2008).
3 The Study also identified a project for 2014 to replace ductbanks along Water Street from Beck’s Cove to Baird’s Cove and Telegram Lane to Prescott Street. This work has been deferred to coordinate with future work planned by the City of St. John’s to replace water and sewer infrastructure along Water Street. All other work identified in the Study has been completed.

4.5 SJM Waterford River Ductbank Replacement NP 2016 CBA
2
The Company engaged Newfoundland Design Associates Limited (“NDAL”) to provide an engineering assessment and cost estimate for alternatives to replace the ductbank from SJM Substation to Hutchings Street including the Waterford River crossing.4 NDAL’s assessment identified and evaluated 4 potential alternatives for the replacement of the section of ductbank located under the Waterford River.5 The assessment concluded that 2 alternatives, (i) underground ductbank installed by sandbag cofferdam and (ii) above ground space truss bridge design with conduit, are both viable least cost alternatives. Detailed engineering design will determine the least cost option that meets all technical and engineering requirements. The Company will tender either one or both alternatives to ensure competitive bidding for the project. Due to logistical and property constraints, the assessment also concluded that there are no viable alternatives for the replacement of the section of ductbank that crosses the St. John’s Dockyard property to Hutchings Street other than a new underground ductbank. The completion of the project involves:
• the installation of civil infrastructure from SJM Substation to Hutchings Street, either by ductbank under the Waterford River or by means of a bridge over the Waterford River, and by underground ductbank across the St. John’s Dockyard property,
• the disconnection and isolation of the high voltage electrical equipment being replaced, and
• the replacement of associated power cables and electrical equipment. Due to electrical loading and project scheduling constraints, this work will be completed over 2 years.6 Scheduling the project over 2 years will allow for de-energizing of the feeder cables in the existing ductbank exiting SJM substation by offloading the SJM distribution feeders to surrounding substations during the summer off-peak loading season. This will allow for the completion of the project without effecting electricity supply to customers.
4 The NDAL report is included as Appendix A. 5 The estimates provided for the alternatives in the NDAL report include civil and structural costs only and do not
include costs associated with the supply and installation of electrical power cables. The electrical costs for each alternative are not materially different and do not impact the assessment of the alternatives.
6 The electrical loading on the underground cables ductbank from SJM Substation to Hutchings Street limits the time of year that the cables can be offloaded to adjacent substations and distribution feeders. Water levels in the Waterford River also limit the times of year that a cofferdam can be used to isolate the work area.

4.5 SJM Waterford River Ductbank Replacement NP 2016 CBA
3
3.0 Project Schedule Table 1 shows the proposed preliminary high level schedule for the project.
Table 1 High-Level Project Schedule
Date Description
March 2016 Complete detailed engineering and tender package.
May 2016 Tender and award installation contract.
May – Sept. 2016 Complete construction of the Waterford River ductbank – Phase I.
May – June 2017 Complete construction of the ductbank from St. John’s Dockyard to Hutchings Street – Phase II.
June – Sept. 2017 Complete installation of the high voltage electrical cable and equipment – Phase III.
4.0 Project Cost The total project cost is estimated at $4,390,000 which includes $1,950,000 in 2016 for the replacement of the existing ductbank under the Waterford River and installation of new underground ductbank within the SJM substation. The remainder of the project, which includes the construction of a new underground ductbank across the St. John’s Dockyard Property to Hutchings Street, and the supply and installation of electrical power cables, will be completed in 2017 at an estimated cost of $2,440,000. The total project costs estimates for 2016 and 2017 include the construction estimates identified in NDAL’s report plus engineering, project management, electrical material and internal labour costs.7
7 Engineering and internal labour costs include detailed engineering design, tendering, project management,
material and internal trade labour for the installation, switching, disconnection and isolation of the high voltage electrical equipment being replaced.

4.5 SJM Waterford River Ductbank Replacement NP 2016 CBA
4
Table 2 provides the project cost breakdown by year for the multi-year project to replace the Waterford River ductbank.
Table 2 Cost Estimate for Waterford River Ductbank Replacement
SJM Substation to Hutchings Street (000s)
Description 2016 2017
Material $1,503 $1,163 Labour - Internal 38 556 Labour - Contract - 70 Engineering 338 270 Other 71 381
Total $1,950 $2,440

4.5 SJM Waterford River Ductbank Replacement NP 2016 CBA
Appendix A NDAL Report
Replacement Options for the Waterford River Ductbank

Newfoundland Power Replacement Options for the Waterford River Duct Bank
St. John’s, NL
March 2015

New foundland Power Replacement Options for the Waterford River Duct Bank St. John’s, NL March 2015
Table of Contents
1.0 GENERAL ...................................................................................................... 1
2.0 EXISTING CONDITIONS ................................................................................. 2
3.0 UNDERGROUND OPTIONS ............................................................................. 3
3.1 Duct Bank Installed by Sandbag Cofferdam ............................................ 3
3.2 Duct Bank Installed by Sheet Pile Cofferdam .......................................... 4
3.3 Trenchless Installation by Pipe Ramming ................................................ 5
3.4 Trenchless Installation by Horizontal Directional Drilling .......................... 5
4.0 ABOVE GROUND OPTIONS ............................................................................. 7
4.1 Space Truss Bridge With Conduit ........................................................... 7
4.2 Aerial Crossing Using Poles/Towers ........................................................ 8
4.3 Existing Viaduct and/or Footbridges ....................................................... 8
5.0 ESTIMATES ................................................................................................. 10
5.1 Duct Bank Installed by Sandbag Cofferdam .......................................... 10
5.2 Duct Bank Installed by Sheet Pile Cofferdam ........................................ 10
5.3 Trenchless Installation of Duct Bank by Pipe Ramming .......................... 10
5.4 Space Truss Bridge With Conduit ......................................................... 10
6.0 APPROVAL PROCESS .................................................................................... 11
7.0 DOCKYARD TO HUTCHINGS STREET DUCT BANK .......................................... 12
8.0 CONCLUSION AND RECOMMENDATION ........................................................ 13

New foundland Power Replacement Options for the Waterford River Duct Bank St. John’s, NL March 2015 LIST OF APPENDICES
Appendix A • Drawing C-1 General Location Plan • Drawing C-2 Duct Bank Installation - Sandbag Cofferdam Option • Drawing C-3 Duct Bank Installation - Sheet Pile Cofferdam Option • Drawing C-4 Duct Bank Installation - Trenchless Pipe Ramming Option • Drawing C-5 Space Truss Bridge with Conduit Option

New foundland Power Replacement Options for the Waterford River Duct Bank St. John’s, NL March 2015 1.0 GENERAL
Newfoundland Powers infrastructure at the St. John’s Main (SJM) substation is located on Southside Road. It supplies electricity to the downtown core of the City of St. John’s, through a series of duct banks, manholes, switches and cables that form the downtown electrical distribution system. There are currently twelve (12) distribution feeders operating at 12.5kV that originate at SJM substation, each of which exits the substation via underground cables. Nine (9) of these feeders pass under the Waterford River in two separate duct banks consisting of 100mm diameter fibre ducts encased in concrete. Each of the nine (9) existing feeders consists of 3-500MCM paper-insulated lead-covered (PILC) cables run in one of the 100mm ducts. These PILC cables and associated duct banks are approximately 40 years old and are nearing the end of their expected service life. Over the years, the fibre duct material has swollen due to absorbed moisture. The swollen fibre ducts make the removal of existing cable or installation of new cable extremely difficult and, in some cases, impossible. The length of the existing duct bank requiring replacement measures approximately 240m in length running underground from the location near SJM substation at Southside Road, beneath the Waterford River, to location where Pitts Memorial Drive passes over Water Street.
With recent load growth in the downtown area in 2012 two distribution feeders in the existing duct bank were replaced with aerial distribution feeders. These new feeders cross the Waterford River overhead west of the Pitts Memorial Drive overpass. Currently, only seven of the nine 500MCM feeder cables are supplying load in the existing duct bank passing under the Waterford River.
This report identifies options for the replacement of the existing duct bank system that currently crosses the Waterford River near the St. John’s Main (SJM) substation. It assesses both underground and above ground options for the crossing, and considers design elements that include addition of future feeders, accessibility to individual cables, operating environment, a minimum cable system service life of 40 years and maintenance requirements. Possible route and installation considerations were also made to ensure power is maintained to existing feeders during the future installation phase.
Newfoundland Design Associates Limited 1

New foundland Power Replacement Options for the Waterford River Duct Bank St. John’s, NL March 2015 2.0 EXISTING CONDITIONS
To assess possible routes for the proposed new component of the electrical distribution system crossing the Waterford River, it was important to gather information pertaining to existing infrastructure in the area. In compiling available information on existing infrastructure, drawing C-1 in Appendix A outlines existing conditions for the area. Drawing C-1 outlines numerous water mains, sanitary and storm sewer mains, electrical/phone duct banks, aerial electrical/phone lines, bridges, buildings, and other infrastructure that that exists in the area.
Choosing the route for the proposed underground or above ground crossing of the Waterford River primarily depends on avoiding conflicts with existing infrastructure. The proposed route would be located east of the existing duct bank crossing, west of the existing 1650mm trunk sanitary sewer crossing, and in a general alignment leading from the substation toward existing electrical vault located at the Dockyard. This route not only avoids possible conflicts with existing infrastructure, but is also the shortest possible distance. There is an existing removable building located at the Dockyard that would need to be relocated. This building appears to be located atop an easement associated with the existing duct bank. It is however, removable and can be relocated accordingly.
Newfoundland Design Associates Limited 2

New foundland Power Replacement Options for the Waterford River Duct Bank St. John’s, NL March 2015 3.0 UNDERGROUND OPTIONS
Underground options assessed include Duct Bank Installed by Sandbag Cofferdam, Duct Bank Installed by Sheet Pile Cofferdam, Trenchless Installation by Pipe Ramming and Trenchless Installation by Horizontal Directional Drilling.
3.1 Duct Bank Installed by Sandbag Cofferdam
A cofferdam is a structure that retains water and/or soil, allowing the enclosed area to be pumped out and excavated in a relatively dry condition. Cofferdams are commonly used for structures built within or beneath water. Open trench options for crossing the Waterford River would involve provision of a cofferdam and dewatering to facilitate installation of a buried duct bank beneath the river bed.
One such option assessed the use of sandbags to create a cofferdam to isolate the work area. In this option the larger type sandbag consisting of woven polypropylene material having approximately one cubic meter volume would be utilised in conjunction with a liner to form a cofferdam. Sandbags would be filled with clean gravel material and positioned to form a cofferdam. The liner would consist of 0.4-0.6 mil polyethylene tarps to further seal the work area. This system works well because the cofferdam can be built to any configuration, and its height can be varied to accommodate variable river depths and extremely irregular river beds. Drawing C-2 in Appendix A illustrates the proposed arrangement, which would see approximately three tiers of sandbags, stacked in formation as to incorporate the polyethylene liner between bags, to form a semi-watertight cofferdam around the work area, which would be pumped dry by means of submersible pumps. There would be seepage expected both through the cofferdam, as well as underneath. This seepage would be controlled by way of submersible pumps, as to maintain a dry work area for excavating the necessary trench.
Trenching operation would be done using an excavator, with material moved from site by way of tandem dump trucks. Once a trench has been excavated, conduit would be placed and a concrete duct bank formed and poured. After the concrete is cured, the duct bank would be backfilled accordingly. The sandbag cofferdam would be removed after backfilling is complete. This method of construction would be conducted in such a manner as to install the duct bank starting on one side of the river extending to its midpoint, then repeating the process from the opposite side of the river to form a connection. To ensure sufficient space is available for the river to flow around the cofferdam, the river banks would be widened accordingly as illustrated by drawing C-2.
The benefits associated with this option involves the relative simplicity of the sandbag cofferdam installation, a relatively lower cost associated with the use of sandbags to form a cofferdam, and the fact that bags can quickly be removed and emptied. Benefits of a buried duct bank beneath the river involves increased security, longevity, and decreased susceptibility to the elements. Potential risks associated with this method involve the dewatering process, as it is difficult to estimate the rate of seepage that will occur through and/or under the cofferdam. Other risks involve the range of river flows that may occur during construction, with possibility of heavy rainfall creating increased river flow that could
Newfoundland Design Associates Limited 3

New foundland Power Replacement Options for the Waterford River Duct Bank St. John’s, NL March 2015
overtop the cofferdam, which could in turn compromise the cofferdam and/or delay construction. These risks can be mitigated by scheduling the work during the drier months of summer, when river flows are at their lowest, while ensuring adequate and additional pumping is available to keep any seepage in check.
3.2 Duct Bank Installed by Sheet Pile Cofferdam
As in the previous discussion of Section 3.1, an alternate cofferdam configuration involves the use of sheet piles to form a cofferdam. Cofferdams formed from sheet piles are supported by walers and internal braces, and cross braces, allowing excavation of materials from within the enclosed area to form a trench. The sheet pile cofferdam would be dismantled after permanent works are completed. Since cofferdams are usually constructed within water, the sheet piles are installed using pre-constructed templates that permit the correct positioning of each sheet pile which are then driven into the ground to form a “box” around the excavation area. The sheet piles are then braced on the inside and the interior is dewatered. This method is primarily used for bridge piers in shallow water, and would be well suited to enclosing an area of trenching associated with crossing the Waterford River with a duct bank.
Drawing C-3 in Appendix A illustrates the proposed arrangement, which would see a number of sheet piles driven into position to form a cofferdam around the work area, which would be pumped dry by means of submersible pumps. Sheet pile cofferdams are relatively watertight when compared to sand bag cofferdams as outlined in prior section 3.1.
Trenching operation would be done using an excavator, with material moved from site by way of tandem dump trucks. Once a trench has been excavated, conduit would be placed and a concrete duct bank formed and poured. After the concrete is cured, the duct bank would be backfilled accordingly. The sheet pile cofferdam would be removed after backfilling is complete. This method of construction would be conducted in such a manner as to install the duct bank starting on one side of the river extending to its midpoint, then repeating the process from the opposite side of the river to form a connection. To ensure sufficient space is available for the river to flow around the cofferdam, the river banks would be widened accordingly as illustrated by drawing C-3.
The benefits associated with this option involve the water tightness of a sheet pile cofferdam compared to a sandbag cofferdam. Benefits of a buried duct bank beneath the river involve increased security, longevity, and decreased susceptibility to the elements. Potential risks associated with this method involves the range of river flows that may occur during construction, with possibility of heavy rainfall creating increased river flow that could overtop the cofferdam, which could in turn compromise the cofferdam and/or delay construction. These risks can be mitigated by ensuring the top of the sheet piles are above the flood plain, as well as scheduling the work during the drier months of summer, when river flows are at their lowest. Other mitigation measures involve ensuring adequate and additional pumping is available. Another risk that may delay construction involves possible presence of deleterious materials in the area such as timber/wood, which adversely affects pile driving operations.
Newfoundland Design Associates Limited 4

New foundland Power Replacement Options for the Waterford River Duct Bank St. John’s, NL March 2015 3.3 Trenchless Installation by Pipe Ramming
Pipe ramming is a trenchless method for installation of steel pipes and casings, which uses a pneumatic hammer to drive the pipe through the ground. Distances of 30 m and diameters of 1500 mm are common, although the method can be used for much longer installations as well as a wide range of diameters. Pipe ramming is useful for locations where conventional trenching needs to be avoided such as installations beneath major highways or railway lines, or in crossing beneath water bodies such as rivers. The majority of installations are horizontal, although the method can be used for vertical installations.
The use of pipe ramming requires excavation of access pits at the desired starting point and endpoint of the pipe or casing that is being installed. In the case of the Waterford River crossing, as illustrated by drawing C-4 of Appendix A, an entry pit would be excavated at the Dockyard side of the crossing, and an exit pit excavated in vicinity of the St. John's Main Substation. The entry pit would require approximately 13mx4m footprint to accommodate pipe ramming equipment. The exit pit would require a 4mx4m footprint. Due to limited space at the locations, sheet piling would be required to facilitate excavation of the access pits, and prevent undermining existing utilities and structures. A 1200mm diameter casing would be installed between these access pits. After a pipe or casing has been installed through pipe ramming, removal of spoils from the pipe or casing is done using augers, compressed air or water jetting. After spoils have been removed, a HDPE pipe would be inserted into the casing and the necessary conduit configuration would be installed and grouted within the HDPE pipe to form an underground duct bank. The casing would need to be installed a minimum of 2m below the river bed, as illustrated by the enclosed drawing C-4 to provide necessary lateral pressure needed for pipe ramming operations.
Benefits to this installation include security and protection associated with buried electrical duct bank. Disadvantages include increased cost associated with having a pipe ramming contractor mobilize to the area from out of Province, as there are currently no local Contractors specializing in pipe ramming technology.
3.4 Trenchless Installation by Horizontal Directional Drilling
Horizontal directional drilling (HDD) is a trenchless method of installing underground pipes and casings using a surface-launched drilling rig and specialized steering tools. The method utilizes an excavated entrance pit at the starting point, and a receiving pit at the endpoint. A pilot hole is drilled along a gradual arc shaped path between the start and endpoints, and a secondary reaming tool enlarges the hole to suit the size of the pipe or casing that will later be pulled back through the bore hole. HDD is used when conventional trenching is not practical, and where ground conditions are primarily solid rock. Pipe or casings that are pulled into the bore can be made of materials such as PVC, polyethylene, polypropylene, ductile iron, and steel. HDD is not practical if there are voids in the rock or incomplete layers of rock. The best material is solid rock or sedimentary material, although other soils can be drilled as long as sufficient depth is provided.
Newfoundland Design Associates Limited 5

New foundland Power Replacement Options for the Waterford River Duct Bank St. John’s, NL March 2015
Discussions with HDD contractors in Alberta and Quebec indicates the use of HDD in crossing the Waterford River would require several small bores of 200mm diameter or less. Larger diameters would not be practical due to radius and length of the arc associated with a larger diameter bore. Since each bore follows a gradual arc in its alignment, discussions indicate a drill rig would need to be set up to enter the ground some 30m from the river, passing some 5-6m beneath the river, and exiting the ground some 30m on the opposite side of the river. Multiple bores would be necessary to house the required number of electrical distribution lines. Considering the limited space available on the side of the river where the substation currently exists, the necessary 30m distance to the exit point would not be practical. Therefore, considering the spatial restrictions, along with the multiple number of bores, HDD would not be practical for crossing the Waterford River. Another disadvantage involves the fact that HDD services are not available locally, and would therefore involve costly mobilization and demobilization efforts just to bring in the equipment. For these reasons, the HDD option for crossing the Waterford River was not assessed any further.
Newfoundland Design Associates Limited 6

New foundland Power Replacement Options for the Waterford River Duct Bank St. John’s, NL March 2015 4.0 ABOVE GROUND OPTIONS
Above ground options assessed include Space Truss Bridge with Conduit, Aerial Crossing Using Poles/Towers and Existing Viaduct and/or Footbridges.
4.1 Space Truss Bridge With Conduit
A space truss bridge could be designed and constructed for reliable conveyance of SJM substation distribution feeders over the Waterford River. Conceptual drawings and details of this potential solution are provided by Drawing C-5 of Appendix A.
The bridge would support twelve (12) separate straight horizontal runs of 100 mm diameter urethane coated galvanized rigid steel electrical conduits. The conduits would be positioned in four rows within the cross section of the space truss and supported at approximately 2 m intervals. On each river bank the concrete bridge abutments would serve the dual function of bridge support, and be formed above ground to create a large cast in place concrete pull box structure. The bridge abutment pull box structures would be equipped with lockable steel double man doors for access. The electrical distribution feeders would be routed to and from the bridge abutment pull boxes on each side of the river by way of underground concrete duct banks. At the elevation of the concrete floor within the bridge abutment pull box structures the concrete encased PVC conduits would terminate. The electrical distribution feeders would continue vertically and transition into the horizontal rigid conduit runs supported within the space truss bridge crossing the river.
With bridge abutment pull box structures positioned on each river bank beyond the existing 100 year flood line, a bridge clear span of just less than 40 m will be required. Locating the abutments beyond this line will reduce flood impacts and position the associated construction earthwork away from the normal water edge to avoid in-stream work. By designing the bridge for a clear span between the abutments the construction of intermediate piers supports and associated in-stream work will not be required.
The floor elevation of the bridge abutment pull box structure is shown higher than the existing surrounding grade with construction of a raised earth berm and concrete stairs being required for access. This is the result of assigning a height of approximately 2.4 m between the underside of the space truss bridge and the top of the existing surrounding grade elevation. This height would limit access to individuals attempting to climb the structure.
The space truss bridge is envisioned to be a rectangular prism form with a constant box shape cross section. It would be constructed using hollow tube structural sections and welded connections. Along its length each face of the prism would have the tube sections arranged to form a Howe truss. This form and construction will combine to provide a robust and economic solution that will convey a rigid steel conduit route within its cross section over the Waterford River. The structure will be designed to resist the gravity and lateral loads including but not limited to icing, wind, earthquake, and construction loads.
Newfoundland Design Associates Limited 7

New foundland Power Replacement Options for the Waterford River Duct Bank St. John’s, NL March 2015
To facilitate galvanizing and shipping the bridge would be fabricated in several lengths. Hot dip galvanizing would follow complete shop fabrication of each length. Once delivered to site the bridge would be assembled to its full length using bolted connections. Rigid electrical conduits could be installed and secured in place prior to lifting the entire bridge assembly into position and anchoring it to the cast in place concrete abutments. The site assembly and final lift into place with a large mobile crane will need to be undertaken from the North side of the river. In order to facilitate this operation, what appears to be an existing temporary building located in part over the existing NL Power easement at the Dockyard will require removal.
There are several benefits to this type of crossing. First, there would be no need for in-stream works, meaning the construction could occur outside of the typical window for in-stream works that Department of Fisheries and Oceans would seek (i.e. June 1-September 30). While the structure would be subject to environmental loading including wind and ice loading, it would be designed to accommodate those loads. Having the cables installed within rigid steel conduits offers protection from the elements and the public. The abutment pull box structures and open framing of the bridge allows access to conduits and facilitates feeder installation. Aesthetically a space frame truss construction using HSS members and with conduits routed within its cross section will present a neat appearance. If there is a need to enhance the aesthetics, then the addition of light weight galvanized metal architectural panels or shapes, with aquatic designs, attached to the sides of the truss is an option
4.2 Aerial Crossing Using Poles/Towers
Options of aerial crossing of the Waterford River using poles/towers was assessed, however it became apparent that space is restricted for the necessary structures and/or guy wires necessary to facilitate an aerial crossing. Therefore, this option was not explored any further.
4.3 Existing Viaduct and/or Footbridges
As part of our assessment we evaluated options of utilizing existing structures in the vicinity to facilitate crossing the Waterford River, namely the Pitts Memorial Drive Viaduct, as well as two small footbridges that exist in the area.
The Pitts Memorial Drive Viaduct is owned by the Department of Transportation and Works. Discussions with the Provinces Chief Bridge Engineer indicated they are opposed to the idea of using the structure to support an electrical distribution system crossing the Waterford River. Their primary concern involved the fact that presence of electrical distribution supported from the bridge structure would complicate any planned rehabilitation works for the structure. Therefore, this option was not explored any further.
Newfoundland Design Associates Limited 8

New foundland Power Replacement Options for the Waterford River Duct Bank St. John’s, NL March 2015
There are two (2) separate footbridges crossing the Waterford River near the St. John's Main Substation. The first is located approximately 50m from Newfoundland Powers St. John's Main Substation and is owned by the Dockyard. Structural review of this footbridge indicated it may not be capable of carrying added loads associated with fixing electrical conduit and cable to the structure. It appears the structures elevation is near the 100 year floodplain elevation, indicating a risk of inundation. The second footbridge, is located approximately 100m from the substation and is owned by the City of St. John's as part of the Grand Concourse. Structural review of this footbridge indicated it may be capable of carrying added loads associated with fixing electrical conduit and cable to the structure. However, after contacting owners of the footbridges indicated there was opposition to using the structures for the purpose of crossing the Waterford River with electrical distribution system. Therefore, this option was not explored any further.
Newfoundland Design Associates Limited 9

New foundland Power Replacement Options for the Waterford River Duct Bank St. John’s, NL March 2015 5.0 ESTIMATES
The following information summarizes cost estimates associated with the options of crossing the Waterford River with a major electrical distribution line. All estimates include a 25% contingency amount. Cost associated with electrical cables supply and installation is not included in the estimates. Estimates do not include HST.
5.1 Duct Bank Installed by Sandbag Cofferdam
Based on the concept of construction presented by drawing C2 in Appendix A, which involves a temporary sand bag cofferdam to facilitate construction of a concrete encased duct bank crossing beneath the Waterford River, with duct banks and pull pits/splicing vaults located on each side of the river as illustrated, estimated construction cost for this option amounts to $1,414,000.
5.2 Duct Bank Installed by Sheet Pile Cofferdam
Based on the concept of construction presented by drawing C3 in Appendix A, which involves a temporary sheet pile cofferdam to facilitate construction of a concrete encased duct bank crossing beneath the Waterford River, with duct banks and pull pits/splicing vaults located on each side of the river as illustrated, estimated cost for this option amounts to $2,474,000.
5.3 Trenchless Installation of Duct Bank by Pipe Ramming
Based on the concept of construction presented by drawing C4 in Appendix A, which involves construction of temporary access pits to facilitate installation of a pipe beneath the Waterford River, to house a concrete encased duct bank, including necessary duct banks and pull pits/splicing vaults located on each side of the river as illustrated, estimated cost for this option amounts to $1,761,000.
5.4 Space Truss Bridge With Conduit
Based on the concept of construction presented by drawing C5 in Appendix A, which involves construction of a space truss bridge with conduit spanning the Waterford River, with abutments on each side of the river, including necessary duct banks and pull pits/splicing vaults located on each side of the river as illustrated, estimated cost for this option amounts to $1,503,000.
Newfoundland Design Associates Limited 10

New foundland Power Replacement Options for the Waterford River Duct Bank St. John’s, NL March 2015 6.0 APPROVAL PROCESS
To outline necessary approval's associated with the proposed crossing of the Waterford River with a major electrical distribution line, preliminary discussions were held with the City of St. John's, the Provincial Department of Environment and Conservation, and Federal Department of Fisheries and Oceans.
Submittal of design drawings for any above ground or underground option selected would require submittal to the City of St. John's, as it would constitute a new development within the City. A development application would need to be sought through Access St. John's, and an application fee paid. The City would review design drawings and offer review comments prior to granting approval. City approval would need to be in place prior to any construction.
Submittal of design drawings to the Department of Environment and Conservation would depend on which option is selected for construction. Works within 15m of a body of water would require a permit. To acquire this permit, an Application to Alter a Body of Water would be submitted to the Water Resources Division, and an application fee paid. Following the Departments review of the design package, comments would be provided should any item require revision. Otherwise a permit would be issued, known as a Permit to Construct. This would need to be in place before any construction occurs.
Submittal to the Department of Fisheries and Oceans (DFO) would be dependant on which option is selected for construction. The options requiring any in-stream works within the Waterford River would require DFO approval. This is typically obtained by compiling a Project Review Form, and submitting the necessary design drawings and site photos to form an application. Following review by DFO, they will issue a letter outlining comments and other particulars associated with in-stream works and/or harmful alteration disruption or destruction (HADD) of fish habitat. Any option requiring work within the river will typically need to be constructed between June 1 and September 30 of any given year.
Newfoundland Design Associates Limited 11

New foundland Power Replacement Options for the Waterford River Duct Bank St. John’s, NL March 2015
7.0 DOCKYARD TO HUTCHINGS STREET DUCT BANK
The section of existing duct bank which crosses the Dockyard to Hutchings Street has also been identified by Newfoundland Power for replacement. These fibre ducts encased in concrete are 40 years old and are nearing the end of their service life. The fibre duct materials are swollen due to absorbed moisture, which makes removal of existing cable and/or installation of new cable extremely difficult. Considering this in conjunction with the presence of new duct banks at Water Street, and proposed new crossing of the Waterford River, replacement of the portion of duct bank between the Dockyard and Hutchings Street would ensure all new distribution system between the St. John's Main Substation and Water Street, it is therefore recommended that this portion of existing duct bank be replaced with new duct bank. Estimated construction cost associated with replacement of this portion of duct bank between the Dockyard and Hutchings Street amounts to $680,000. This estimate includes a 25% contingency amount, and does not include HST.
Newfoundland Design Associates Limited 12

New foundland Power Replacement Options for the Waterford River Duct Bank St. John’s, NL March 2015
8.0 CONCLUSION AND RECOMMENDATION
Of the options assessed, there are two (2) viable least cost options for crossing the Waterford River, namely the option involving duct bank installation by sandbag cofferdam, and the above ground option based on space truss bridge crossing with conduits. It is recommended that detailed design be undertaken for both options, and combined in a common tender to gather competitive bids for each. After tender closing, actual cost of each option would be known, and the least cost option can be chosen.
Newfoundland Design Associates Limited 13

Appendix A Drawings


4.6 KBR Substation Distribution Feeder Refurbishment
King's Bridge Substation Distribution Feeder Refurbishment
June 2015
Prepared by:
Robert Cahill, Eng. L.
NP 2016 CBA
A FO RTIS C OMPANY

4.6 KBR Substation Distribution Feeder Refurbishment NP 2016 CBA
i
Table of Contents
Page
1.0 Introduction ..........................................................................................................................1 2.0 Background ..........................................................................................................................2 3.0 KBR 4.16 kV Distribution System ......................................................................................3 4.0 KBR 12.5 kV Distribution System ......................................................................................5 5.0 King’s Bridge Distribution System Upgrades 2011-2015 ...................................................7 6.0 King’s Bridge Distribution System Upgrades 2016-2017 ...................................................8
6.1 Planned 2016 Work ..................................................................................................9 6.2 Planned 2017 Work ..................................................................................................9
7.0 Project Cost ........................................................................................................................10 8.0 Conclusion .........................................................................................................................10 Appendix A: Existing Feeder Schematic Diagram Appendix B: Reconfigured Feeder Schematic Diagram Appendix C: KBR Distribution System Photographs

4.6 KBR Substation Distribution Feeder Refurbishment NP 2016 CBA
1
1.0 Introduction The King’s Bridge (“KBR”) Substation is located on King’s Bridge Road in the City of St. John’s (the “City”). It supplies electricity to approximately 5,500 customers in the east end area of the City. The majority of the areas served from KBR Substation are older mature areas including neighbourhoods commonly referred to as Churchill Park, Rennies Mill, Quidi Vidi and the Battery. KBR Substation also supplies electricity to the hotels, condominiums and office buildings on the east ends of Water and Duckworth streets. Figure 1 is a map showing the location of KBR Substation.
Figure 1 – Location of KBR Substation
This report outlines the capital expenditures required to address the deteriorated infrastructure which remains on the KBR distribution system. These capital expenditures will increase the capability to transfer load from the KBR distribution system to the surrounding distribution systems supplied from other substations.1 Also, the elimination of the islanded 4.16 kV distribution system will increase the capability to transfer load between 12.5 kV distribution feeders for planned and unplanned outages. The replacement of one of the two existing 4.16 kV substation transformers with a 12.5 kV substation transformer will provide additional capacity at KBR Substation for growth in the east end of the City.
1 Additional capacity to transfer load from KBR Substation to adjacent substations will have a positive impact on
the duration and frequency of both planned and unplanned outages.
KBR SUBSTATION

4.6 KBR Substation Distribution Feeder Refurbishment NP 2016 CBA
2
2.0 Background KBR Substation is supplied by three 66 kV transmission lines, 16L from Pepperrell (“PEP”) Substation, 12L from Memorial (“MUN”) Substation and 30L from Ridge Road (“RRD”) Substation. The Company completed projects to rebuild transmission lines 16L and 12L in 2011 and 2014 respectively. The rebuild of transmission line 30L is being completed in 2015 and 2016. Each of these transmission lines were approximately 60 years old at the time they were being rebuilt. Inspections had identified deterioration due to decay, splits and checks in the poles and crossarms, as well as deficiencies with guys and anchors, hardware, and insulators. Many of these components were in advanced stages of deterioration and required replacement. Each transmission line had reached a point where continued maintenance was no longer feasible and it had to be rebuilt to the current wind and ice loading criteria, to continue safe, reliable operation. Associated with each of these Transmission Line Rebuild projects there were Trunk Feeder projects to rebuild distribution line infrastructure underbuilt on the shared transmission line poles. Much of the distribution line infrastructure sharing these transmission line poles was of the same vintage as the transmission line infrastructure requiring replacement.2 A major component of upgrading the KBR distribution system over this period has been the voltage conversion of the existing 4.16 kV distribution system to 12.5 kV. The KBR distribution system was originally built in the early 1950s and is primarily constructed of overhead distribution feeders with underground trunk cables exiting the substation. The overhead distribution system consists of a mixture of bare conductor and aerial cable.3 The reliability of the aerial cable has become a concern in recent years. For example, the aerial cable running along King’s Bridge Road and Ordinance Street has faulted twice in the past 3 years.4 The age and physical condition of the aerial cable makes it highly likely that there will be further cable faults experienced. Most of the Company’s aerial cable is more than 40 years old and is no longer a standard design for distribution feeders.
The KBR Substation has a total transformer capacity of 45 MVA which supplies 8 distribution feeders that operate at 4.16 kV and 4 distribution feeders that operate at 12.5 kV.5 The distribution feeder upgrades completed since 2011 have involved rebuilding some of the 4.16 kV distribution infrastructure to 12.5 kV standards. Also, some of the 4.16 kV load was converted to 12.5 kV and temporarily transferred to adjacent substations. Continuing with the conversion of the remaining 4.16 kV load to 12.5 kV will require replacement of one of the two existing 4.16 kV substation transformers with a 12.5 kV substation transformer.6 2 Over the same 4-year period from 2011 to 2014, nine of the 12 distribution feeders were included in the Rebuild
Distribution Lines project. 3 Aerial cable is an insulated cable assembled from 3 separate single-phase cables bundled together around a
messenger wire. Aerial cables have wind and ice loading factors much larger than bare aluminum cable requiring larger poles with shorter span length.
4 The replacement of the aerial cable on KBR-10 with bare conductor construction is being addressed in the 2015 Distribution Reliability Initiative project approved in Order No. P.U. 40 (2014).
5 See Existing Feeder Schematic Diagram in Appendix A. 6 The Substations project report 2.2 Additions Due to Load Growth includes a description of the project to install
a new 66 kV/12.5 kV substation transformer to KBR Substation.

4.6 KBR Substation Distribution Feeder Refurbishment NP 2016 CBA
3
3.0 KBR 4.16 kV Distribution System The eight 4.16 kV distribution feeders originating from KBR Substation are supplied by metal clad switchgear breakers and exit the substation via underground cables to steel towers and then transition to aerial cable. Figure 2 is a map showing the location of the 4.16 kV distribution feeders.7
Figure 2 - KBR 4.16 kV Distribution Feeders
Each of the eight 4.16 kV feeders utilizes aerial cable for the main trunk conductor in the vicinity of the substation. These aerial cables are a reliability concern and cannot be worked on while energized and therefore require customer outages in most circumstances for maintenance or new customer connections.8
7 Figure 2 includes all eight 4.16 kV distribution feeders as they were prior to any voltage conversions and
temporary transfers to adjacent 12.5 kV distribution feeders. 8 Due to the number of cable faults, Newfoundland Power’s operating procedures requires that aerial cable not be
worked on directly while energized and shall be isolated and grounded. This includes the installation of poles.

4.6 KBR Substation Distribution Feeder Refurbishment NP 2016 CBA
4
As shown in Figure 3, the KBR 4.16 kV distribution system is islanded with no ability to transfer load to surrounding substations.9 With the increased reliability risk associated with the aging aerial cables on these feeders and the lack of back-up capability from surrounding distribution systems, customers can expect future extended outage durations.10
Figure 3 – Islanded KBR 4.16 kV Distribution System
When substations and the associated distribution systems were constructed during the electrification of Newfoundland prior to 1960, 4.16 kV was considered an economic distribution voltage level. At that time, loads were smaller consisting of mostly lighting, some heating, and small appliances. The capital construction costs associated with 4.16 kV facilities were favoured over more expensive higher voltage systems for the typically smaller loads. However, the nature of electrical loads on Newfoundland Power’s system has changed over the years. This has resulted in increased load on the 4.16 kV distribution systems. These 4.16 kV distribution feeders have approximately 33% of the electrical load handling capability of a 12.5 kV
9 There are no adjacent 4.16 kV substations and all surrounding distribution systems and associated feeders
operate at 12.5 kV. 10 Repair or replacement of aerial cables typically requires extended outages. In the past 10 years there have been
13 aerial cable faults on the KBR feeders. The average outage duration for these 13 outages was 4.22 hours. This is greater than the average outage duration of 1.73 hours experienced on all distribution feeders.

4.6 KBR Substation Distribution Feeder Refurbishment NP 2016 CBA
5
distribution feeder. This serves to increase the number of distribution feeders required to serve an equivalent customer load as compared to a 12.5 kV feeder.11 The rebuilding of the eight 4.16 kV distribution feeders in situ created a number of challenges, while converting sections of feeders to 12.5 kV created a number of opportunities. Taking advantage of the increase in customers and load afforded by operating at a higher voltage level allowed sections of the former 4.16 kV feeders to be added to 12.5 kV feeders. This resulted in the amount of conductor necessary to rebuild these feeders being less than would have been otherwise required. Also, physical space on the shared transmission structures for multiple 4.16 kV feeders would require much larger structures to meet current design standards. Converting sections of 4.16 kV feeders to 12.5 kV reduced the number of feeders that required physical space on the shared transmission structures. Another benefit of converting sections of the 4.16 kV feeders to 12.5 kV was associated with finding space for all 8 distribution feeders in the immediate vicinity of KBR substation along King’s Bridge Road and Empire Avenue. To continue into the future with eight 4.16 kV distribution feeders was difficult and would require the rebuilding of the steel underground cable tower structure west of the substation.12 The KBR 4.16 kV distribution system must be upgraded to 12.5 kV standards to eliminate the islanded 4.16 kV distribution system in the east end of the City. Doing so will eliminate the remaining aerial cables and their associated reliability concerns. The conversion of the 4.16 kV feeders to 12.5 kV will effectively reduce the total number of feeders exiting the substation addressing issues with utility congestion along King’s Bridge Road and Empire Avenue and allowing for the use of standard open wire aerial construction for the 12.5 kV distribution feeders. 4.0 KBR 12.5 kV Distribution System The four 12.5 kV distribution feeders that originate from KBR Substation are supplied via metal clad switchgear breakers and exit the substation via underground cables from the substation and then transition to a combination of aerial cable or bare aerial conductor. Two of the four 12.5 kV feeders transition from underground to bare aerial conductor, while the remaining two feeders transition from underground to aerial cable along King’s Bridge Road. These aerial cables are a reliability concern and cannot be worked energized and therefore require customer outages in most circumstances for maintenance or new customer connections. Figure 4 is a map showing the location of the 12.5 kV distribution feeders.
11 Due to the higher electrical currents associated with a lower distribution voltage, 4.16 kV feeders are typically
limited to approximately 500 customers whereas 12.5 kV feeders are typically limited to approximately 1,500 customers.
12 To continue into the future with eight 4.16 kV distribution feeders exiting KBR Substation would require the continued use of nonstandard aerial cables.

4.6 KBR Substation Distribution Feeder Refurbishment NP 2016 CBA
6
Figure 4 - KBR 12.5 kV Distribution Feeders
Three of the 12.5 kV feeders have tie-points to a 12.5 kV distribution feeder from another substation while the remaining 12.5 kV feeder only has 1 tie point to another KBR 12.5 kV feeder. The lack of tie points to adjacent distribution systems is a concern as it impacts reliability and minimizes operational flexibility for both planned and unplanned work. The existing KBR distribution system has only 3 tie points for 12 feeders serving approximately 5,500 customers. The routing of both the 4.16 kV and the 12.5 kV feeders prevents the existence of more feeder tie points between the existing 12.5 kV KBR feeders. In 2016, the City plans to undertake a 3-year project to replace its water and sewer infrastructure along Water Street. The Company will work with the City to replace its primary and secondary distribution systems along Water Street to avoid future construction along this busy business district. Also in 2016 and 2017, the Company plans to replace the ductbank under the Waterford River. Undertaking these projects requires capacity to transfer load from SJM substation to KBR Substation for the duration of the work. Additional tie points between SJM and KBR distribution feeders will ensure the work proceeds with minimal impact on customers.

4.6 KBR Substation Distribution Feeder Refurbishment NP 2016 CBA
7
5.0 King’s Bridge Distribution System Upgrades 2011-2015 The Company has completed projects to rebuild transmission lines 16L in 2011 and 12L in 2014. The rebuild of transmission line 30L is being completed in 2015 and 2016.13 Each of these transmission lines serving KBR Substation were approximately 60 years old at the time they were being rebuilt. Over the same period the Company has completed upgrades to portions of the KBR distribution system. This work was completed as part of the Trunk Feeders, Rebuild Distribution Lines and Distribution Reliability Initiative projects related to the KBR distribution system and was completed as a least cost means of addressing aging infrastructure issues on the transmission and distribution systems. During the 2013 and 2014 Trunk Feeders projects that addressed underbuilt distribution infrastructure on structures shared with transmission line 12L, work was completed to replace distribution plant alongside Empire Avenue and Rennies Mill Road. Prior to the Trunk Feeders projects the underbuilt portion of 12L contained 6 bundled aerial cables which served as the main trunk conductor for three 4.16 kV KBR distribution feeders. To reduce the scope and complexity of the 12L project, 2 of the 3 feeders were upgraded to 12.5 kV and temporarily transferred to an adjacent 12.5 kV KBR feeder. This allowed for replacement of the 6 bundled 3-phase aerial cables with one bare 3-phase open wire feeder underbuilt on the new structures for 12L.14 During the 2015 Trunk Feeders project that addresses underbuilt distribution infrastructure on structures shared with transmission line 30L, work will be completed to replace distribution plant alongside New Cove Road. This section of line contains 1 underbuilt 4.16 kV KBR distribution feeder. This feeder will be relocated to the new transmission poles and all electrical equipment replaced with 12.5 kV rated equipment. 15 Also, all distribution transformers along this section will be replaced with dual voltage units.16 As part of the work completed on the 4.16 kV feeders during the Rebuild Distribution Lines project in 2012, 2013 and 2014, all distribution equipment was replaced with equipment rated for 12.5 kV. All distribution transformers that were replaced are dual voltage rated. This allows for future voltage upgrades to be completed on existing 4.16 kV distribution systems without replacing distribution transformers.
13 The transmission lines were identified for rebuilds due to deterioration caused by decay, splits and checks in the
poles and crossarms, as well as deficiencies with guys and anchors, hardware, and insulators. Each transmission line had reached a point where continued maintenance was no longer feasible and it had to be rebuilt to the current wind and ice loading criteria, to continue safe, reliable operation.
14 The reduction in trunk feeder conductor associated with the elimination of the 6 bundled aerial cables significantly reduced the wind and ice loading requirements and therefore reduced the number and class of transmission poles required to be installed for the 12L rebuild project.
15 Typical distribution equipment that would be replaced under this project includes insulators, cutouts, lighting arrestors, etc.
16 Since 2004 the Company has purchased dual voltage distribution transformers for the 4.16 kV distribution system for inventory cost control and efficiency purposes.

4.6 KBR Substation Distribution Feeder Refurbishment NP 2016 CBA
8
The 2015 Distribution Reliability Initiative (“DRI”) project identified the aerial cable along King’s Bridge Road as the primary cause of the reliability issues with KBR-10 feeder. To reduce the scope and complexity of the replacement of KBR-10 aerial cable, sections of the 4.16 kV feeders that share common poles with KBR-10 along King’s Bridge Road will be upgraded to 12.5 kV and temporarily transferred to adjacent KBR 12.5 kV feeders. This will allow for replacement of the KBR-10 distribution line along King’s Bridge Road with bare open wire conductor and 55 foot high poles. A major aspect of the distribution system upgrades from 2011 to 2015 has been the voltage conversion of the existing KBR 4.16 kV distribution system to 12.5 kV. The upgrade to a higher voltage allows for the elimination of existing aerial cable and reduces the number of trunk feeders required from KBR Substation to serve the existing customer load. 6.0 King’s Bridge Distribution System Upgrades 2016-2017 Based on the assessment of the KBR distribution system and the work completed to date, the following objectives were set for the upgrade of the remainder of distribution system.
• Eliminate the remaining 40 year old aerial cables, thereby improving reliability. • Eliminate the islanded 4.16 kV distribution system, thereby increasing operational
flexibility. • Eliminate the non-standard distribution termination structure outside the substation on
King’s Bridge Road, thereby avoiding the cost of rebuilding this structure to current design standards for ice and wind loading.
• Provide additional 12.5 kV transfer capacity to offload KBR feeders to surrounding 12.5 kV distribution systems.
• Provide additional capacity for growth on the 12.5 kV distribution system in the east end of the City.
These objectives are best achieved by upgrading the remaining 4.16 kV distribution system to 12.5 kV. The upgrade to 12.5 kV will eliminate the remaining 4.16 kV aerial cables and the non-standard distribution termination structure. It will also provide additional tie points to surrounding 12.5 kV distribution systems from KBR, PEP, SLA, RRD and SJM substations. 17 These additional tie points will allow both permanent and temporary load transfers between these substations during unplanned or planned outages. This will minimize customer outage durations and provide greater operational flexibility to complete planned maintenance activities. Increasing the 12.5 kV capacity of KBR Substation will prepare the Company for additional growth in the east end of Water and Duckworth streets.18
17 See Reconfigured Feeder Schematic Diagram in Appendix B. 18 A number of developments are planned for the east end of Water and Duckworth streets including a 38 unit
residential condominium building on Temperance Street.

4.6 KBR Substation Distribution Feeder Refurbishment NP 2016 CBA
9
6.1 Planned 2016 Work ($611,000) Work planned for 2016 includes addressing the risk presented by the potential failure of the aerial cable for KBR-01 on Empire Avenue East. This requires the upgrade and conversion of distribution feeder KBR-01 from 4.16 kV to 12.5 kV. The completion of this upgrade will facilitate the elimination of 4.16 kV feeders KBR-01 and KBR-07. Also, a new 12.5 kV underground cable from the substation to Empire Avenue East will be installed and become the new trunk of KBR-12 feeder. The existing customer load of KBR-12, KBR-01 and KBR-07 will be permanently transferred to the new KBR-12 trunk feeder on Empire Avenue East.19 A new underground cable will be installed from a new KBR-13 breaker in the substation to the existing KBR-12 dip pole on King’s Bridge Road. This new feeder will be used to permanently transfer 3 existing 4.16 kV distribution feeders which have been upgraded as part of the 2015 Distribution Reliability Initiative Project. A new underground cable will be installed from a new KBR-14 breaker in the substation to the existing KBR-06 termination pole in the substation yard. This work will coordinate with the planned Substation Refurbishment and Modernization project in 2016 and allow for the upgrade and permanent transfer of the remaining three 4.16 kV feeders to 12.5 kV in 2017. 20 Not included in this project but ongoing in 2015 and 2016 is the replacement of distribution plant underbuilt on pole line infrastructure shared with transmission line 30L. Transmission line 30L is a 66 kV line running between King’s Bridge Substation and Ridge Road Substation in St. John’s. Constructed in 1959, 30L runs alongside New Cove Road, Portugal Cove Road and London Road. The transmission line consists of 87 single-pole structures, all of which have distribution plant sharing the same poles.21 The majority of the pole line infrastructure shared with transmission line 30L by the KBR distribution system will be replaced in the 2015 phase of the 2-year Transmission Line Rebuild project. 6.2 Planned 2017 Work ($690,000) Addressing the risk presented by the potential failure of the aerial cable for KBR-03 on Winter Avenue requires the upgrade of KBR-03 feeder from 4.16 kV to 12.5 kV. To facilitate the elimination of the KBR-03 feeder requires KBR-06 to be upgraded to 12.5 kV and the customers on KBR-03, KBR-06 and KBR-04 permanently transferred to the new KBR-14 feeder. This will eliminate the 3 remaining 4.16 kV distribution feeders at KBR Substation thereby eliminating the islanded 4.16 kV system served by KBR Substation.
19 See Reconfigured Feeder Schematic Diagram in Attachment B. 20 The Substations project report 2.2 Additions Due to Load Growth includes a description of the project to install
a new 66 kV/12.5 kV substation transformer to KBR. 21 A description of the project to rebuild transmission line 30L can be found in 3.1 2016 Transmission Line
Rebuild.

4.6 KBR Substation Distribution Feeder Refurbishment NP 2016 CBA
10
7.0 Project Cost The estimated project costs for 2016 and 2017 are shown in Table 2.
Table 2 KBR Distribution System Rehabilitation
Capital Plan
Year Cost 2016 2017
$ 611,000 $ 690,000
This is not a multi-year project. The project costs for 2017 will be presented for approval in the 2017 Capital Budget Application. 8.0 Conclusion In 2011, the Company commenced refurbishing the existing transmission and distribution infrastructure serving KBR Substation. This report describes the plan to complete the refurbishment of the KBR distribution system in 2016 and 2017. This plan addresses the reliability concerns with the deteriorated infrastructure on the existing KBR distribution system by upgrading the remaining 4.16 kV distribution system to 12.5 kV. The existing KBR distribution system comprising eight 4.16 kV feeders and four 12.5 kV feeders will be replaced by a new KBR distribution system comprising six 12.5 kV feeders. The new KBR distribution will have an overall reduction of 6 distribution feeders. Operating the KBR distribution system exclusively at 12.5 kV reduces the number of feeders necessary to serve the 5,500 customers, reduces the cost associated with refurbishing the 4.16 kV feeders, improves reliability by replacing the old non-standard aerial cables, provides the ability to transfer feeders to adjacent substations and provides additional capacity for future growth. The increased 12.5 kV load at KBR Substation will require additional transformer capacity. This will be achieved by installing a new 66 kV/12.5 kV substation transformer at KBR Substation.

4.6 KBR Substation Distribution Feeder Refurbishment NP 2016 CBA
Appendix A Existing Feeder Schematic Diagram

4.6 KBR Substation Distribution Feeder Refurbishment NP 2016 CBA
A-1

4.6 KBR Substation Distribution Feeder Refurbishment NP 2016 CBA
Appendix B Reconfigured Feeder Schematic Diagram

4.6 KBR Substation Distribution Feeder Refurbishment NP 2016 CBA
B-1

4.6 KBR Substation Distribution Feeder Refurbishment NP 2016 CBA
Appendix C KBR Distribution System Photographs

4.6 KBR Substation Distribution Feeder Refurbishment NP 2016 CBA
C-1
Figure 1: KBR-01 Aerial Cable (Empire Avenue)
Figure 2: KBR-01 Non-Standard Transformer Connection
KBR-01 Aerial Cable

4.6 KBR Substation Distribution Feeder Refurbishment NP 2016 CBA
C-2
Figure 3: KBR-01 Damaged Pole
Figure 4: KBR-03 Aerial Cable (Winter Avenue)
KBR-03 Aerial Cable KBR-03 Aerial Cable

4.6 KBR Substation Distribution Feeder Refurbishment NP 2016 CBA
C-3
Figure 5: 4.16kV Steel Tower (King’s Bridge Road)

4.6 KBR Substation Distribution Feeder Refurbishment NP 2016 CBA
C-4
Figure 6: Aerial Cables (King’s Bridge Road)

4.6 KBR Substation Distribution Feeder Refurbishment NP 2016 CBA
C-5
Figure 7: Aerial Cables (King’s Bridge Road)
Figure 8: Aerial Cables (King’s Bridge Road)

4.6 KBR Substation Distribution Feeder Refurbishment NP 2016 CBA
C-6
Figure 9: Aerial Cable Splices (King’s Bridge Road)
Figure 10: Aerial Cable Splices (King’s Bridge Road)
Aerial Cable Splices from Previous Faults

4.6 KBR Substation Distribution Feeder Refurbishment NP 2016 CBA
C-7
Figure 11: KBR-12 Termination Pole (King’s Bridge Road)

4.6 KBR Substation Distribution Feeder Refurbishment NP 2016 CBA
C-8
Figure 12: KBR-10 Termination Pole (King’s Bridge Road)

4.6 KBR Substation Distribution Feeder Refurbishment NP 2016 CBA
C-9
Figure 13: 12L/KBR Distribution Steel Tower (Empire Avenue) Before Rebuild

4.6 KBR Substation Distribution Feeder Refurbishment NP 2016 CBA
C-10
Figure 14: 12L/KBR Distribution (Empire Avenue) After Rebuild

4.6 KBR Substation Distribution Feeder Refurbishment NP 2016 CBA
C-11
Figure 15: 12L/KBR Distribution (Empire Avenue) Before Rebuild
Figure 16: 12L/KBR Distribution (Empire Avenue) After Rebuild

5.1 Vehicle Replacement Criteria NP 2016 CBA
Vehicle Replacement Criteria
June 2015
Prepared by:
Ralph Mugford P. Eng.
NEWFOUNDLAND~
POWER A FORTIS C O M PA N Y

5.1 Vehicle Replacement Criteria NP 2016 CBA
i
Table of Contents
Page
1.0 Executive Summary .............................................................................................................1 2.0 Canadian Utility Survey .......................................................................................................1 2.1 General .....................................................................................................................1 2.2 Age of Replaced Vehicles ........................................................................................2 2.3 Kilometres Driven by Replaced Vehicles ................................................................3 3.0 Newfoundland Power Policy ...............................................................................................3 3.1 Newfoundland Power’s Replacement Criteria .........................................................3 3.2 Criteria Application .................................................................................................4 4.0 Policy Comparison ...............................................................................................................6 4.1 Canada and Newfoundland Power ...........................................................................6 4.2 Atlantic Canada and Newfoundland Power .............................................................8 4.3 Assessment ...............................................................................................................9 Appendix A: Survey of Canadian Utilities Vehicle Replacement Criteria

5.1 Vehicle Replacement Criteria NP 2016 CBA
ii
List of Charts & Tables
Page
Charts
Chart 1: Canadian Survey Results – Vehicle Replacement by Age ...............................................2 Chart 2: Canadian Survey Results – Vehicle Replacement by Kilometres Driven ........................3 Chart 3: Vehicle Replacement by Age – NP Criterion vs. Retirement ...........................................4 Chart 4: Vehicle Replacement by Kilometres Driven – NP Criterion vs. Retirement ...................5 Chart 5: Vehicle Replacement by Age – Canada vs. NP ................................................................6 Chart 6: Vehicle Replacement by Kilometres Driven – Canada vs. NP .........................................7 Chart 7: Vehicle Replacement by Age – Atlantic Canada vs. NP ..................................................8 Chart 8: Vehicle Replacement by Kilometres Driven – Atlantic Canada vs. NP ...........................9 Tables Table 1: Vehicle Replacement Criteria – Newfoundland Power ....................................................3

5.1 Vehicle Replacement Criteria NP 2016 CBA
1
1.0 Executive Summary
In Board Order No. P.U. 40 (2014), the 2015 Capital Budget Order, the Board stated it “sees merit in requiring information in relation to the vehicle replacement criteria of other Canadian utilities. In its next capital budget application where expenditures are proposed in relation to vehicle replacements, Newfoundland Power will be expected to provide information on the vehicle replacement policies for other Canadian utilities.” In its 2016 Capital Budget Application, Newfoundland Power is proposing expenditures in 2016 for vehicle replacements. This report provides the results of a survey of current vehicle replacement policies for Canadian electrical utilities performed by Newfoundland Power. This report also compares vehicle replacement policies for Canadian electrical utilities to the policy of Newfoundland Power. The results of the survey of Canadian electrical utility vehicle replacement policies and the comparisons to the current policy of Newfoundland Power indicate that the current approach of the Company in vehicle replacement is consistent with current Canadian utility practice. Furthermore, the application of this policy is consistent with the least cost delivery of service to customers. 2.0 Canadian Utility Survey
2.1 General Newfoundland Power surveyed 12 Canadian electrical utilities to ascertain their current vehicle replacement policies for 3 classes of utility vehicles. The 3 classes of utility vehicles included passenger vehicles, light duty line vehicles and heavy duty line vehicles. The 12 Canadian electrical utilities surveyed included at least one utility in each Canadian province. To ensure adequate participation, Newfoundland Power agreed to keep the individual utility responses anonymous. A summary of the results of the survey of Canadian electrical utilities is Appendix A to this report. The electrical utilities surveyed included Newfoundland and Labrador Hydro, Nova Scotia Power, Maritime Electric Company, NB Power, Hydro Quebec, Hydro One, Fortis Ontario, Manitoba Hydro, Sask Power, Fortis Alberta, BC Hydro and Fortis BC. For the purposes of analysis, Newfoundland Power grouped survey results by 3 regions: (i) Atlantic Canada, (ii) Central Canada and (iii) Western Canada. Each of the 3 regions contained 4 participants.1
1 The survey participants in the Atlantic region are Newfoundland and Labrador Hydro, Nova Scotia Power,
Maritime Electric Company and NB Power. The survey participants in the Central region are Hydro Quebec, Hydro One, Fortis Ontario and Manitoba Hydro. The survey participants in the Western region are Sask Power, Fortis Alberta, BC Hydro and Fortis BC.

5.1 Vehicle Replacement Criteria NP 2016 CBA
2
The survey of Canadian electrical utilities indicated that all participants use the criteria of vehicle age and kilometres driven in determining when to assess or replace vehicles. Not all utilities used both criteria in assessing all classes of utility vehicles. For example, 5 of the 12 utilities surveyed relied upon age as the primary determinant for replacement of heavy duty line vehicles and did not use kilometres driven as a criterion. Similarly, 2 of the 12 utilities surveyed relied upon kilometres driven as the primary determinant for replacement of light duty line vehicles and did not use age as a criterion. 2.2 Age of Replaced Vehicles Chart 1 shows the Canadian utility survey results by region for the age at which vehicles are replaced for each class of vehicle.
Chart 1 shows significant variations in the age at which utilities determine when to assess or replace vehicles. Generally, vehicles are replaced at a lower age in Atlantic Canada than in Western Canada. This likely reflects differences in utility operating regions. Atlantic Canada is well known for the relatively high exposure to salty environmental conditions which accelerate corrosion. By contrast, Western Canadian climates such as Alberta, have relatively low exposure to such conditions.
0
2
4
6
8
10
12
Passenger Light Duty Heavy duty
Yea
rs
Chart 1 Canadian Survey Results
Vehicle Replacement by Age
Atlantic Region
Central Region
Western Region

5.1 Vehicle Replacement Criteria NP 2016 CBA
3
2.3 Kilometres Driven by Replaced Vehicles Chart 2 shows the Canadian utility survey results by region for the kilometres of usage at which vehicles are replaced for each class of vehicle.
The data reflected in Chart 2 for light duty and heavy duty line vehicles in the Central region reflects the criterion used by a single participant. The remaining 3 participants in the Central region do not use this criterion for line vehicles. Excepting this anomaly, Chart 2 shows relative consistency in the criterion of kilometres driven used by Canadian utilities for each class of vehicle. 3.0 Newfoundland Power Policy
3.1 Newfoundland Power’s Replacement Criteria Table 1 shows Newfoundland Power’s current vehicle replacement criteria.
Table 1 Vehicle Replacement Criteria
Newfoundland Power
Criterion Passenger Light Duty Heavy Duty Age (Years) 5 10 10 Kilometres 150,000 250,000 250,000
0
100
200
300
400
500
Passenger Light Duty Heavy duty
Kilo
met
res
(000
s)
Chart 2 Canadian Survey Results
Vehicle Replacement by Kilometres Driven
Atlantic Region
Central Region
Western Region

5.1 Vehicle Replacement Criteria NP 2016 CBA
4
3.2 Criteria Application Newfoundland Power uses age and kilometres driven thresholds as criteria to initiate a condition evaluation to determine whether a vehicle should be replaced. If the condition evaluation determines the vehicle has remaining useful service life, the vehicle will remain in service. The result of this practice is that vehicles typically remain in service past the point at which they pass the criteria.2 Chart 3 shows a comparison between the age criterion used by Newfoundland Power and the actual age of retirement for each class of vehicle.
Chart 3 shows that, for each class of vehicle, actual retirements occur, on average, later than the age criterion used by the Company to initiate a condition evaluation. For passenger vehicles, condition evaluation occurs at 5 years, but actual retirements occur, on average, 3 years (or 60%) later, at 8 years. Similarly, for heavy duty line vehicles, condition evaluation occurs at 10 years, but actual retirements occur, on average, 2 years (or 20%) later, at 12 years. For light duty line vehicles, actual retirements occur, on average, 0.7 years (or 7%) later, at 10.7 years.
2 The Company reviewed experience for the period 2011 through 2014 to assess the difference between the criteria
used by Newfoundland Power and the actual age and kilometres driven of retired vehicles. Data prior to 2011 was not readily accessible for the purpose of evaluation.
0
2
4
6
8
10
12
14
Passenger Light Duty Heavy duty
Yea
rs
Chart 3 Vehicle Replacement by Age
Newfoundland Power Criterion vs. Retirement
Age Criterion
Age of Retirement

5.1 Vehicle Replacement Criteria NP 2016 CBA
5
Chart 4 shows a comparison between the criterion for kilometres driven used by Newfoundland Power and the actual kilometres driven by retirement for each class of vehicle.
Chart 4 shows that, for each class of vehicle, actual retirements occur, on average, after the kilometres driven exceeds the criterion used by the Company to initiate a condition evaluation. For passenger vehicles, condition evaluation occurs at 150,000 kilometres, but actual retirements occur, on average, at 194,000 kilometres, or 44,000 kilometres (or about 29%) beyond the condition evaluation threshold. For light duty vehicles, condition evaluation occurs at 250,000 kilometres, but actual retirements occur, on average, at 266,000 kilometres, or 16,000 kilometres (or about 6%) beyond the threshold. For heavy duty line vehicles, condition evaluation occurs at 250,000 kilometres, but actual retirements occur, on average, at 275,000 kilometres, or 25,000 kilometres (or 10%) beyond the threshold.
0
50
100
150
200
250
300
Passenger Light Duty Heavy duty
Kilo
met
res
(000
s)
Chart 4 Vehicle Replacement by Kilometres Driven
Newfoundland Power Criterion vs. Retirement
Kilometres Criterion
Actual Kilometres

5.1 Vehicle Replacement Criteria NP 2016 CBA
6
4.0 Policy Comparison
4.1 Canada and Newfoundland Power Chart 5 compares the Canadian utility survey results for the age at which vehicles are assessed or replaced for each class of vehicle to Newfoundland Power’s criterion.
Chart 5 shows that, for passenger vehicles, Newfoundland Power’s criterion for assessment at 5 years is 1.3 years (or about 26%) lower than the Canadian average of 6.3 years. For light duty line vehicles, Newfoundland Power’s criterion for assessment at 10 years is 1.7 years (or about 20%) higher than the Canadian average of 8.3 years. For heavy duty line vehicles, Newfoundland Power’s criterion for assessment at 10 years is marginally (about 4%) lower than the Canadian average of 10.4 years.
0
2
4
6
8
10
12
Passenger Light Duty Heavy duty
Yea
rs
Chart 5 Vehicle Replacement by Age
Criterion Comparison Canada vs. Newfoundland Power
Canada
Newfoundland Power

5.1 Vehicle Replacement Criteria NP 2016 CBA
7
Chart 6 compares the Canadian utility survey results for the kilometres driven at which vehicles are assessed or replaced for each class of vehicle to Newfoundland Power’s criterion.
Chart 6 shows that, for all classes of vehicles, Newfoundland Power’s criterion for assessment by kilometres driven is lower than the Canadian average. These differences range from 4,000 kilometres (or about 2%) for light duty line vehicles to 32,000 kilometres (or about 21%) for passenger vehicles.
0
50
100
150
200
250
300
Passenger Light Duty Heavy duty
Kilo
met
res
(000
s)
Chart 6 Vehicle Replacement by Kilometres Driven
Criterion Comparison Canada vs. Newfoundland Power
Canada
Newfoundland Power

5.1 Vehicle Replacement Criteria NP 2016 CBA
8
4.2 Atlantic Canada and Newfoundland Power Chart 7 compares the Atlantic Canadian regional utility survey results for the age at which vehicles are assessed or replaced for each class of vehicle to Newfoundland Power’s criterion.
Chart 7 shows that, for all classes of vehicles, Newfoundland Power’s criterion for assessment by age is equal to, or higher than, the Atlantic Canadian average. For passenger vehicles, Newfoundland Power’s criterion matches the Atlantic Canadian average. For light duty line vehicles, Newfoundland Power’s criterion is 3.2 years (or about 47%) higher than the Atlantic Canadian average. For heavy duty line vehicles, Newfoundland Power’s criterion is 0.6 years (or about 6%) higher than the Atlantic Canadian average.
0
2
4
6
8
10
12
Passenger Light Duty Heavy duty
Yea
rs
Chart 7 Vehicle Replacement by Age
Criterion Comparison Atlantic Canada vs. Newfoundland Power
Atlantic Region
Newfoundland Power

5.1 Vehicle Replacement Criteria NP 2016 CBA
9
Chart 8 compares the Atlantic Canadian regional utility survey results for the kilometres driven at which vehicles are assessed or replaced for each class of vehicle to Newfoundland Power’s criterion.
Chart 8 shows that, for all classes of vehicles, Newfoundland Power’s criterion for assessment by kilometres driven is less than the Atlantic Canadian average. For passenger vehicles, Newfoundland Power’s criterion is 30,000 kilometres (or 20%) lower than the Atlantic Canadian average. For light duty line vehicles, Newfoundland Power’s criterion is 20,000 kilometres (or about 8%) lower than the Atlantic Canadian average. For heavy duty line vehicles, Newfoundland Power’s criterion is 10,000 kilometres (or 4%) lower than the Atlantic Canadian average. 4.3 Assessment The Canadian electrical utilities survey performed by Newfoundland Power indicated material regional variations in criteria used across the country. These variations would appear to support the proposition that Newfoundland Power, an Atlantic Canadian electric utility, would reasonably use threshold criteria to assess replacement of vehicles, which are lower than the average of Canadian electrical utilities. The age and kilometres driven criteria used by Newfoundland Power to determine when to assess or replace vehicles are broadly consistent with the average of similar criteria used by Canadian electrical utilities surveyed. In the circumstances, this appears reasonable. Newfoundland Power’s criteria are consistent with the average of those used by Atlantic Canadian electrical utilities. This might be expected given the similarity in regional operating and environmental conditions. The consistency in criteria used supports the reasonableness of the criteria used by Newfoundland Power.
0
50
100
150
200
250
300
Passenger Light Duty Heavy duty
Kilo
met
res
(000
s)
Chart 8 Vehicle Replacement by Kilometres Driven
Criterion Comparison Atlantic Canada vs. Newfoundland Power
Atlantic Region
Newfoundland Power

5.1 Vehicle Replacement Criteria NP 2016 CBA
10
Finally, it is clear that the application of the age and kilometres driven thresholds used by Newfoundland Power as criteria to initiate condition evaluations is consistent with the least cost delivery of service to customers. Actual retirements by Newfoundland Power for all classes of vehicles, on average, occur significantly later than the age criteria. Similarly, vehicles, on average, are retired after the vehicles have driven more kilometres than the threshold used to initiate condition evaluation.

5.1 Vehicle Replacement Criteria NP 2016 CBA
Appendix A
Survey of Canadian Utilities Vehicle Replacement Criteria

5.1 Vehicle Replacement Criteria NP 2016 CBA
A-1
Summary of Survey Results Electric Utility Vehicle Replacement Criteria
Canada Passenger Light Duty Heavy Duty
Age Km Age Km Age Km
Utility 1 8 160 10 * 13 *
Utility 2 6 185 8 300 10 400
Utility 3 5 160 10 * 10 *
Utility 4 6 200 11 * 12 *
Utility 5 * 220 * 220 10 *
Utility 6 6 185 6 215 12 350
Utility 7 10 200 10 * 12 *
Utility 8 10 160 * 200 10 200
Utility 9 5 150 6 200 7 200
Utility 10 5 200 8 300 10 300
Utility 11 5 200 5 300 10 250
Utility 12 5 200 5 300 10 300
Newfoundland Power 5 150 10 250 10 250
* Utility does not use this criteria for determining replacements for this class of vehicles.

6.1 2016 Application Enhancements NP 2016 CBA
2016 Application Enhancements
June 2015

6.1 2016 Application Enhancements NP 2016 CBA
i
Table of Contents
Page
1.0 Introduction ..........................................................................................................................1 2.0 Business Support Systems Enhancements ...........................................................................1 2.1 Payroll Process Enhancements ................................................................................2 3.0 Operations and Engineering Systems Enhancements ..........................................................3 3.1 Vehicle Inspection Enhancements ...........................................................................3 4.0 Internet Enhancements .........................................................................................................4 4.1 Customer Service Internet Enhancements ...............................................................5 4.2 Energy Conservation Website Enhancements .........................................................6 5.0 Various Minor Enhancements..............................................................................................7 Appendix A: Net Present Value Analysis

6.1 2016 Application Enhancements NP 2016 CBA
1
1.0 Introduction Newfoundland Power (the “Company”) operates and supports over 60 computer applications. These include third party software products, such as the Microsoft Dynamics Great Plains (“Dynamics GP”) financial system, the Click Software (“Click”) work scheduling and dispatch system, as well as internally developed software, such as the Customer Service System (“CSS”) and the Outage Management System (“OMS”). These applications help employees work more effectively and efficiently in their daily duties. The Company’s computer application enhancements can be considered in 4 broad categories: Business Support Systems, Operations and Engineering Systems, Customer Service Systems and Internet/Intranet Systems. In addition, the Company budgets for minor enhancements to respond to unforeseen requirements encountered during the course of each year. Enhancing these applications, either through vendor supplied functionality or internal software development, enables the Company to meet its obligation to serve to its customers at least cost. The following report describes the application enhancements planned for 2016. 2.0 Business Support Systems Enhancements Business Support System Enhancements include application enhancements necessary to support the Company’s business applications. The information technology in this category includes the human resources application Empower, the Dynamics GP application and various other applications used to manage the financial, human resources and materials management areas of the Company. For 2016, enhancements to the Company’s Dynamic GP Payroll application are proposed. Table 1 summarizes the estimated cost associated with these enhancements.
Table 1 Business Support Systems Enhancements
Project Expenditures ($000s)
Cost Category 2016 Estimate Material - Labour – Internal 98 Labour – Contract - Engineering - Other 25
Total 123

6.1 2016 Application Enhancements NP 2016 CBA
2
2.1 Payroll Process Enhancements ($123,000) Description The purpose of this project is to automate several manual payroll functions. Operating Experience The Company currently pays active employees bi-weekly, and retirees either monthly or semi-monthly, through 62 payroll executions per year.1 Each payroll execution is complex and functionally distinct. The payroll process requires some labor intensive activities by the payroll administrator, assisted with a number of quality control and evaluation responsibilities by other members of the Finance department. With each new negotiated bargaining unit contract and amendments to government legislation, manual processing is required to implement the changes while ensuring the accuracy and completeness of several payroll functions. These manual processes are often complex, requiring significant time and expertise to complete. In 2016, the Company will improve several of these processes by:
(i) Simplifying the process to create an employee’s Record of Employment (“ROE”) by automating the upload process of the ROE information to Service Canada. Currently the necessary data has to be generated on several reports and manually keyed online to Service Canada.
(ii) Automating the reconciliation of employee benefits between what is collected from the employees and what is paid to the vendor. This reconciliation is currently a manual process.
Leveraging vendor-supplied functionality improvements, this project will reduce the manual effort associated with the creation and validation of employee related payroll statements and reports. Justification In 2016, the Company will implement enhancements to automate payroll functions that will reduce the manual effort required to produce the required documentation (i.e. T4’s, Payroll Remittance, Insurances, ROE, etc.). This project has a net present value of approximately $16,900 over an expected application life-cycle of 7 years.2
1 Historically upon retirement new retirees were given the option of receiving their pension payment either
monthly or semi-monthly. 2 The net present value calculation for this project can be found on page A-1 of Appendix A.

6.1 2016 Application Enhancements NP 2016 CBA
3
3.0 Operations and Engineering Systems Enhancements Operations and Engineering Systems Enhancements include application enhancements necessary to support the Company’s engineering and operations functions. The information technology in this category includes various applications used to engineer and maintain Company assets, respond to customer requests and manage work in a safe and environmentally responsible manner. For 2016, the Company propose to expand the use of mobile computing devices by providing additional electronic forms to be used by field staff. Table 2 summarizes the estimated cost associated with this item.
Table 2 Operations and Engineering Enhancements
Project Expenditures ($000s)
Cost Category 2016 Estimate Material 20 Labour – Internal 98 Labour – Contract - Engineering - Other 70
Total 188 3.1 Vehicle Inspection Enhancements ($188,000) Description The purpose of these enhancements is to improve the process for field staff to complete documentation required to meet Occupational Health & Safety and provincial legislative requirements. These enhancements will also improve the method by which field staff report this information. Operating Experience The Company is required by legislation under Sections 187 and 197 of the Highway Traffic Act to complete daily truck inspections and record of duty status for vehicles greater than 4,500 kilograms. The completion of these records is also necessary to fulfill the Company’s obligation and commitment to be compliant with Occupational Health & Safety Advisory Services’ (“OHSAS”) 18001 Safety Management Standard. This OHSAS 18001 standard specifies

6.1 2016 Application Enhancements NP 2016 CBA
4
requirements for an Occupational Health & Safety (“OH&S”) management system to enable an organization to control its OH&S risks and improve its OH&S performance. Prior to 2014, these forms were completed manually and filed in each area office for a minimum of 6 months. This manual process was time consuming and there was no automated method to report on compliance. In 2014, the Company implemented a pilot project to enable crews to complete these forms electronically. During this pilot, the Company processed approximately 22,600 Record of Duty reports, 11,800 daily truck inspections and 1,700 weekly truck inspections electronically. The pilot project indicated that an automated process would provide efficiency gains and also highlighted the difficulty associated with documenting compliance with the legislation. While the pilot project demonstrated the benefits in automating the inspection and record of duty process it also showed effective compliance reporting would require a well-defined database to ensure efficient and complete data collection, verification and reporting. In 2016, the Company will implement an application that will provide a consistent, sustainable process for the electronic capture and reporting of this data. This solution will reduce the manual effort to produce the required documentation and ensures the Company is able to continue to demonstrate regulatory compliance. Justification These enhancements are justified on the basis of ensuring compliance with legislation and the Company’s OHSAS Safety Standard. The Company operates over 75 vehicles which exceed the 4,500 kilogram threshold. These vehicles are operated by approximately 160 qualified employees who are required to complete vehicle inspections. These inspections result in the production of over 30,000 inspection reports and over 58,000 Record of Duty reports annually. Eliminating the need for support staff to assist with the collection of vehicle data to produce the required reports will ensure prompt and effective follow-up with crews on potential non-compliance infractions. This project has a net present value of approximately $25,500 over an expected application life-cycle of 7 years.3 4.0 Internet Enhancements Internet Enhancements include enhancements to the Company’s web-based applications, which provide customers with convenient, self-service options. These options give customers the ability to interact with the Company 24 hours a day. The applications in this category include the Company’s customer service internet website, mobile website and the takeCHARGE website.4
3 The net present value calculation for this project can be found on page A-2 of Appendix A. 4 The takeCHARGE website supports the joint Newfoundland and Labrador Hydro and Newfoundland Power
customer energy conservation initiative.

6.1 2016 Application Enhancements NP 2016 CBA
5
For 2016, the customer service website will be enhanced to improve functionality and access for mobile devices. Table 3 summarizes the estimated cost associated with this item.
Table 3 Internet Enhancements Project Expenditures
($000s)
Cost Category 2016 Estimate
Material 75 Labour – Internal 302 Labour – Contract - Engineering - Other 170
Total 547 4.1 Customer Service Internet Enhancements ($494,000) Description The purpose of these enhancements is to meet the evolving needs of the Company’s customers and ensure that the technology used to develop the website positions the Company for future innovation. The Company has experienced an increase in the number of customers who access the Company’s website through mobile devices. Customers who use mobile devices have different needs than those using a desktop or laptop computer. To meet those needs, the Company is proposing enhancements to the Company’s website for 2016. These enhancements will enable the website to re-organize content to match the characteristics of the device being used to access the website. This will ensure optimal compatibility and provide a consistent user experience, regardless of the type of device being used by the customer. These enhancements also include improved website content management capabilities. This will enable the Company’s staff to update the site with information in a more timely and efficient manner. Operating Experience The use of electronic communications between customers and the Company continues to grow.

6.1 2016 Application Enhancements NP 2016 CBA
6
In 2014, the Company’s website recorded over 2,400,000 site visits, up 147% over 2013.5 Approximately 44% of the visits were made to the website via a smart phone. This is a 218% increase over 2013. According to Company statistics, the number of customers using a mobile device to access information from the Company’s website has increased from approximately 422,000 mobile device visits in 2013, to approximately 1,091,000 mobile device visits in 2014. The Company has experienced exponential growth in customers looking for up-to-date information during outages. In a 7 day period during January 2014, Newfoundland Power managed an unprecedented number of customer inquiries relating to power outages associated with rolling blackouts, Newfoundland and Labrador Hydro equipment failures and severe weather.6 Justification This item is justified primarily on improved customer service. These customer service internet enhancements will enable the Company to respond to customers’ web and mobile needs. These enhancements, which provide customers with better access and interaction with the Company, will result in improved customer communications and customer service. The proposed customer service website enhancements will ensure simpler navigation for customers using mobile devices. The enhancements will also focus on presentation of content that is optimized for viewing on the customer platform of choice, while delivering content with responsive page loading for customers using mobile devices. The enhancements will also ensure simpler management and optimized coding practices, as all content and functionality will be maintained on one website, using a single code stream. In addition, responsive design technology will help future proof website design, enabling the content to function on future web-enabled devices. 4.2 Energy Conservation Website Enhancements ($53,000) Description The purpose of this item is to enhance the Internet based functionality which supports the Company’s energy conservation initiatives under takeCHARGE. In 2016, the takeCHARGE website enhancements are required to support the changes to customer energy conservation programs arising from the 5-Year Energy Conservation Plan: 2015-2019, which is currently being developed. Specific enhancements anticipated include 5 Newfoundland Power maintains 2 separate websites; a website optimized for viewing on a full desktop browser:
www.newfoundlandpower.com and a mobile website with limited functionality and content: www.newfoundlandpower.mobi.
6 During the seven day period of January 2–8, 2014, Newfoundland Power received approximately 950,000 customer visits to www.newfoundlandpower.com.

6.1 2016 Application Enhancements NP 2016 CBA
7
using self-service technology to provide additional residential and commercial customer incentive programs that provide timely customer follow-up as well as continued expansion of mobile functionality. Operating Experience In 2008, Newfoundland and Labrador Hydro and Newfoundland Power launched a joint energy conservation initiative which included the takeCHARGE website. This website is an integral part of the Company’s customer energy conservation communications portfolio. It serves as the primary communication channel to which customers are directed for information regarding customer energy conservation programs, rebate and eligibility details, as well as energy efficiency education and awareness resources. In 2014, 95% of customers chose electronic means of communication with the Company to obtain information on energy conservation and rebate programs. This is consistent with promotion of the takeCHARGE website as the primary resource for customer inquiries and information. In 2014, there were over 186,000 visits to the takeCHARGE website, which was an increase of 144% from 2013. This reflects increased promotion, program changes, and new programs that were launched in the fall of 2014. The proportion of takeCHARGE website visits using mobile devices also increased in 2014 to over 50%. Justification Website enhancements are justified based on the Company’s desire to improve customer service and promote energy efficiency. As customer energy conservation programs and associated incentives and information evolve, it is necessary that website technology is updated to ensure these new programs can be offered to customers. With the ever increasing use of mobile computing devices, and the increased visits to the takeCHARGE website, the need for enhanced customer experience through a mobile web interface is required. These enhancements will expand customers’ access to the energy conservation tools and information which are integral to the Company’s customer energy conservation initiative, through their personal choice of a full or mobile website. This will enhance the customer’s ability to access information on conservation opportunities independent of location, time of day or type of device used, and will support continued efficiency in the Company's response to customer expectations in this area. 5.0 Various Minor Enhancements ($285,000) Description The purpose of this item is to complete enhancements to the Company’s computer applications in response to unforeseen requirements such as legislative and compliance changes, vendor driven changes or employee-identified enhancements designed to improve customer service or operational efficiency.

6.1 2016 Application Enhancements NP 2016 CBA
8
Operating Experience Examples of previous work completed under this budget item include modifications to customer, operations and engineering applications performed in response to severe weather events, employee self-service functionality to improve timesheet entry, and improved customer work request functionality to include new work types.7 Justification Work completed as part of Various Minor Enhancements is justified on the basis of improved customer service, operating efficiencies, or compliance with regulatory and legislative requirements.
7 Improvements include customer outage communication, vehicle tracking, and outage management.

6.1 2016 Application Enhancements NP 2016 CBA
Appendix A Net Present Value Analysis

6.1 2016 Application Enhancements NP 2016 CBA
A-1
YEARNew
SoftwareNew
Hardware Software HardwareResidual
CCA Total Labour Non-Lab Labour Non-LabNet Operating
SavingsIncome
TaxAfter-Tax Cash Flow
A B F G H
0 2016 ($123,000) $0 $61,500 $0 $61,500 $0 $0 $6,000 $0 $6,000 $16,095 ($100,905)1 2017 $0 $0 $61,500 $0 $61,500 $0 $0 $23,575 $0 $23,575 $10,998 $34,5732 2018 $0 $0 $0 $0 $0 $0 $0 $24,164 $0 $24,164 ($7,008) $17,1573 2019 $0 $0 $0 $0 $0 $0 $0 $24,768 $0 $24,768 ($7,183) $17,5864 2020 $0 $0 $0 $0 $0 $0 $0 $25,388 $0 $25,388 ($7,362) $18,0255 2021 $0 $0 $0 $0 $0 $0 $0 $26,022 $0 $26,022 ($7,546) $18,4766 2022 $0 $0 $0 $0 $0 $0 $0 $26,673 $0 $26,673 ($7,735) $18,9387 2023 $0 $0 $0 $0 $0 $0 $0 $0 $27,340 $0 $27,340 ($7,929) $19,411
7 Yr Present Value (See Note I) @ 5.79% $16,904
NOTES:
F is the sum of columns D, and E.
NET PRESENT VALUE ANALYSIS
Capital Additions CCA Tax Deductions
Capital Impacts
I is the present value of column H. Column H is discounted using the weighted after-tax cost of capital.
G is the impact on taxes from the CCA and operating cost deductions. It is equal to column C (total) less column F times the tax rate.H is the after tax cash flow which is the sum of the capital expenditure (columns A + B) plus operating expenditures (column F) plus income tax (column G).
Payroll Enhancements
Operating Cost Impacts
Cost Increases Cost Benefits
C
B is the sum of the computer network hardware additions by year.
D is any software maintenance fees and internal support costs associated with the project. The labour cost estimates are escalated to current year using the GDP Deflator Index. The non-labour costs are escalated by The cost estimate is escalated to current year using Newfoundland Power's Labour Escalation Rates.E is the reduced operating costs. The non-labour cost estimates are escalated to current year using the GDP Deflator Index. The labour costs are escalated by The cost estimate is escalated to current year using Newfoundland Power's Labour Escalation Rates.
C is the Capital Cost Allowance deduction. It was calculated using declining balance depreciation and the 50% rule for capitalizing additions.
A is the sum of the software additions by year.
D E

6.1 2016 Application Enhancements NP 2016 CBA
A-2
YEARNew
SoftwareNew
Hardware Software HardwareResidual
CCA Total Labour Non-Lab Labour Non-LabNet Operating
SavingsIncome
TaxAfter-Tax Cash Flow
A B F G H
0 2016 ($188,000) $0 $94,000 $0 $94,000 $0 $0 $0 $0 $0 $27,260 ($160,740)1 2017 $0 $0 $94,000 $0 $94,000 $0 $0 $37,495 $0 $37,495 $16,387 $53,8812 2018 $0 $0 $0 $0 $0 $0 $0 $38,432 $0 $38,432 ($11,145) $27,2873 2019 $0 $0 $0 $0 $0 $0 $0 $39,393 $0 $39,393 ($11,424) $27,9694 2020 $0 $0 $0 $0 $0 $0 $0 $40,377 $0 $40,377 ($11,709) $28,6685 2021 $0 $0 $0 $0 $0 $0 $0 $41,387 $0 $41,387 ($12,002) $29,3856 2022 $0 $0 $0 $0 $0 $0 $0 $42,422 $0 $42,422 ($12,302) $30,1197 2023 $0 $0 $0 $0 $0 $0 $0 $0 $43,482 $0 $43,482 ($12,610) $30,872
7 Yr Present Value (See Note I) @ 5.79% $25,583
NOTES:
F is the sum of columns D, and E.
I is the present value of column H. Column H is discounted using the weighted after-tax cost of capital.
G is the impact on taxes from the CCA and operating cost deductions. It is equal to column C (total) less column F times the tax rate.H is the after tax cash flow which is the sum of the capital expenditure (columns A + B) plus operating expenditures (column F) plus income tax (column G).
Vehicle Inspection Enhancements
Operating Cost Impacts
Cost Increases Cost Benefits
C
B is the sum of the computer network hardware additions by year.
D is any software maintenance fees and internal support costs associated with the project. The labour cost estimates are escalated to current year using the GDP Deflator Index. The non-labour costs are escalated by The cost estimate is escalated to current year using Newfoundland Power's Labour Escalation Rates.E is the reduced operating costs. The non-labour cost estimates are escalated to current year using the GDP Deflator Index. The labour costs are escalated by The cost estimate is escalated to current year using Newfoundland Power's Labour Escalation Rates.
C is the Capital Cost Allowance deduction. It was calculated using declining balance depreciation and the 50% rule for capitalizing additions.
A is the sum of the software additions by year.
D E
NET PRESENT VALUE ANALYSIS
Capital Additions CCA Tax Deductions
Capital Impacts

6.2 2016 System Upgrades NP 2016 CBA
2016 System Upgrades
June 2015

6.2 2016 System Upgrades NP 2016 CBA
i
Table of Contents
Page
1.0 Introduction ..........................................................................................................................1 2.0 Business Applications Upgrades..........................................................................................1 2.1 Description ...............................................................................................................1 2.1.1 Contact Center Upgrade ...............................................................................2 2.1.2 Workforce Management Upgrade ..............................................................3 2.1.3 eMail Management Replacement ................................................................4 2.1.4 Electrical System Drawing Software Upgrade ............................................4 2.2 Operating Experience ...............................................................................................5 2.3 Justification ..............................................................................................................5 3.0 The Microsoft Enterprise Agreement ..................................................................................5

6.2 2016 System Upgrades NP 2016 CBA
1
1.0 Introduction Newfoundland Power (the “Company”) depends on the effective implementation and on-going operation of its business applications in order to continue to provide least cost service to customers. Over time, these applications need to be upgraded to ensure continued vendor support, to improve software compatibility, or to take advantage of newly developed functionality. This project consists of Business Applications Upgrades and continuation of the Microsoft Enterprise Agreement. 2.0 Business Applications Upgrades ($1,523,000) Business Applications Upgrades involve third party software that supports the Company’s business applications. For 2016, upgrades are proposed for the Company’s Contact Center System, workforce management application, eMail management application, electrical system drawing software and Internet (customer website) technology. Table 1 summarizes the cost associated with these items.
Table 1 Business Applications Upgrades
Project Expenditures ($000s)
Cost Category 2016 Estimate Material 431 Labour – Internal 760 Labour – Contract - Engineering - Other 332
Total 1,523 2.1 Description The upgrades to the Company’s business applications ensure that these applications continue to function in a stable and reliable manner with the appropriate level of vendor support. Each year, the Company’s software applications are reviewed to determine if upgrades are required.

6.2 2016 System Upgrades NP 2016 CBA
2
For 2016, upgrades include: 2.1.1 Contact Center Upgrade ($793,000) Aspect is an enterprise contact center vendor, providing many of the technology components used at the Company’s Customer Contact Center (“CCC”). A central component of the Aspect technology is the Automatic Call Distribution (“ACD”) infrastructure. It has the primary task of accepting and routing all incoming customer calls and connecting all outgoing agent calls to customers. The ACD infrastructure used at the CCC was originally commissioned in 1998. The system consists primarily of server hardware, network terminals and switches, telephone lines and software for call routing, customer self-service applications and computer telephony integrations. The primary purposes of the ACD are to process incoming customer calls by either:
• Connecting the Company’s CCC infrastructure to telecommunications capacity leased from Bell;
• Distributing incoming calls to specific groups of Customer Service Representatives (“CSR”) based on the CSR skill set and the menu option selected by the customer;
• Using automation to satisfy a customer call by means of the self service capabilities of the platform; and
• Reporting and analysis on the types of calls received and how effective the CCC is at handling these calls.
Continual modifications, upgrades and enhancements have ensured the infrastructure has met both customer service and business requirements and has remained operating effectively, processing over 450,000 incoming calls annually. Many hardware components of the ACD infrastructure, including dual-tone multi-frequency signaling cards, digital trunk interface cards, agent monitoring cards, power rectifiers and associated internal servers, are at the end of their useful life. The current version of the ACD operating system is at the end of its life and will no longer be supported by Aspect or Microsoft. This introduces the added security risk associated with no future vendor updates.1 Recently, Aspect has informed Newfoundland Power that there are no longer opportunities for future purchases or additions to the existing ACD platform. Effectively, this means Newfoundland Power can no longer continue to expand the ACD technology, as has been done over the past 17 years. As a result, no additional user licences, hardware modules, telephony cards or software upgrades can be purchased. This limits Newfoundland Power’s ability to respond to evolving customer requirements and business needs with the current ACD infrastructure.
1 In 2013, Aspect confirmed Microsoft released 37 critical patches for the Windows Server software version
currently in use. Without similar patching, the ability to ensure mission critical operations and security compliance is limited.
6.2 2016 System Upgrades NP 2016 CBA
3
The ACD technology continues to require support to provide an acceptable level of service. In recent months, Newfoundland Power has experienced two critical ACD incidents during periods of high customer activity that required immediate trouble shooting and action with the vendor to ensure customers were provided access to Newfoundland Power customer service. Given the age of the infrastructure, the inability to further expand the solution, end of vendor support on critical components, recent critical support incidents, and the criticality of customer service delivery, Newfoundland Power proposes to upgrade its Aspect ACD infrastructure in 2016. 2.1.2 Workforce Management Upgrade ($252,000) Aspect Workforce Management is a critical software application that the Company uses daily to provide essential forecasting, scheduling, tracking, adherence monitoring and seat planning capabilities in the CCC. It helps to balance staffing and cost to ensure an acceptable level of customer service is provided. A primary feature of this software is the use of its historical call tracking database to record key characteristics. This includes number and arrival pattern of customer calls received daily, the length and type of call, seasonal patterns, holiday patterns, and employee break, lunch and shift preferences. These parameters ensure the optimal numbers of agents are available to handle the forecasted call volume for each day. In addition, the software will layer the additional staff required to perform off phone tasks that can be completed between calls or during separate off phone shifts, to guarantee the CCC staffing is optimal for the targeted level of service to customers. This also ensures Newfoundland Power is not over staffing the CCC, resulting in unnecessary costs.2 In addition, the real time monitoring capabilities manage the diverse interaction of customer call arrival, employee availability, schedule adherence, off phone activity and special requests (such as emergency or sick leave, meeting attendance, training) to enable supervisors to ensure the efficient operation of the CCC. The proposed Workforce Management upgrade involves upgrading the Company’s core Workforce Management software and associated components. The Workforce Management software is essential to the provision of least-cost service, while ensuring an acceptable level of customer service is achieved in the CCC. To ensure the software is supported by the vendor and will continue to provide the important functions described, the Company proposes to upgrade the current version of Aspect Workforce Management in 2016. This is necessary as the existing version will no longer be supported by the vendor after 2015.
2 The ability for forecast staffing levels to meet customer call volume is critical to the operation of the CCC.
Understaffing results in poor customer service and issues with employees’ workload. Overstaffing results in unnecessary labour costs being incurred.

6.2 2016 System Upgrades NP 2016 CBA
4
2.1.3 eMail Management Replacement ($331,000) Newfoundland Power’s email management software has been in service since 2009. Over the past 6 years, approximately 5 million emails have been processed by the CCC. In 2014, the CCC received approximately 56,000 incoming customer emails and processed over 1.3 million outgoing customer emails.3 The email management software is integrated with the Company’s Customer Service System, website and Microsoft Exchange. With the help of automated workflows and predefined email templates, the software optimizes response to customer email requests. In addition, a database stores all previous electronic correspondences with each customer, allowing for immediate review of past email communications. Recently, the provider of the email management software informed the Company that support of the email management product has been discontinued. For 2016, Newfoundland Power proposes to replace the existing email management application with contact management software that will ensure customer email continues to be managed effectively and responsively. The new software will also provide a platform that will allow for future growth of multichannel customer communication options.4 2.1.4 Electrical System Drawing Software Upgrade ($147,000) The Company is proposing to upgrade existing AutoCAD Electrical and AutoCAD Vault 2012 applications to the vendor’s currently supported AutoCAD Electrical and AutoDesk Vault releases. The Company manages an electrical system that has thousands of pieces of high voltage equipment and electronic components installed throughout its substations and power plants. This equipment is used to power, protect, monitor and control all aspects of the electrical system. Electrical system drawing software is widely used in the utility industry. These tools ensure a high level of precision and accuracy of drawings documenting the utility’s engineered assets. Each year, the Company executes approximately 30 projects to maintain, expand and improve the electricity system. These projects involve the creation or modification of approximately 500 engineering drawings annually. AutoCAD Electric is used to assist with the management of electrical schematics, wiring diagrams and electric panel layout drawings. The AutoDesk Vault addition automates the
3 Outgoing emails include both direct agent responses to customer enquiries and automated eCorrespondences,
primarily eBills. 4 In Chapter VIII Customer Service and Outage Communications of Liberty’s Report on Island Interconnected
System to Interconnection with Muskrat Falls addressing Newfoundland Power, Liberty recognizes the importance of being responsive to evolving customer communication requirements by adapting the Company’s customer-facing technology as required.

6.2 2016 System Upgrades NP 2016 CBA
5
updating of drawings, including necessary adjustments to related documents like bills of materials, cable schedules, termination schedules and other related drawings. AutoDesk has released 2016 versions of the electrical engineering software. As a result, current installations of 2012 versions will no longer be supported by the vendor. To ensure an acceptable level of vendor support and maintenance to the Company’s electrical system drawing software, the Company proposes to upgrade to the latest supported vendor release of AutoCAD Electric and AutoDesk Vault. 2.2 Operating Experience System upgrades help ensure the reliability and effectiveness of the Company’s business applications and mitigate risks associated with technology related problems. The timing of the upgrades is based on a review of the risks and operational experience of the applications being considered for upgrade. System upgrades are also required to ensure compatibility with upgrades in hardware platforms that occur when shared servers are upgraded. As well, upgrades are often completed in order to take advantage of functional or technical enhancements provided by the vendor in new versions of a software application. 2.3 Justification Investments in Business Applications Upgrades are necessary to replace outdated technology that is no longer supported by vendors. This will enable the Company to take advantage of newly developed capabilities provided in the most recent release of the applications. Unstable and unsupported software applications can negatively impact operating efficiencies and customer service. 3.0 The Microsoft Enterprise Agreement ($195,000) Description This Agreement covers the purchase of Microsoft software and provides access to the latest versions of each software product purchased under this agreement at least-cost. Through the Microsoft Enterprise Agreement, Newfoundland Power achieves overall cost savings. This is a fixed price annual agreement based on the number of eligible employees that utilize Microsoft software on Company assigned personal computers.5 Under this agreement, the Company distributes its purchasing costs for these licenses over three years, as outlined in Schedule C.
5 Personal computers include desktops, laptops, tablets and other mobile computing devices.

6.2 2016 System Upgrades NP 2016 CBA
6
Operating Experience The Company has had the Microsoft Enterprise Agreement in place providing access to the latest versions of business software for over 10 years.6 The terms of the agreements are typically 3 years, with requirements reviewed and adjusted annually. The current agreement expires on May 31, 2018. Justification The Microsoft Enterprise Agreement is the least cost option to ensure access to current Microsoft software products.
6 The agreement covers software applications such as Microsoft Office, Outlook, SharePoint, SQL Server and
other applications used by employees in the completion of their normal duties.

6.3 2016 Shared Server Infrastructure NP 2016 CBA
2016 Shared Server Infrastructure
June 2015

6.3 2016 Shared Server Infrastructure NP 2016 CBA
i
Table of Contents
Page
1.0 Introduction ..........................................................................................................................1 2.0 Description ...........................................................................................................................1 3.0 Operating Experience ...........................................................................................................2 4.0 Justification ..........................................................................................................................3

6.3 2016 Shared Server Infrastructure NP 2016 CBA
1
1.0 Introduction Shared server infrastructure consists of over 100 shared servers that are used for routine operation, testing, and disaster recovery of Newfoundland Power’s (the “Company”) business applications. The Company relies on these shared servers to ensure the efficient operation and support of its customer service, internet, engineering and operations, and business support systems. Each year, an assessment is completed to determine shared server infrastructure requirements. This assessment involves identifying servers and peripherals to be replaced based on age and risk of failure. The assessment also determines new computing requirements for corporate applications and identifies security management equipment necessary for the protection of customer and corporate data. 2.0 Description This project includes the addition, upgrade and replacement of computer hardware components and related technology associated with shared server infrastructure. Table 1 summarizes the cost associated with these items.
Table 1 Shared Server Infrastructure Upgrades
Project Expenditures ($000s)
Cost Category 2016 Estimate Material 650 Labour – Internal 196 Labour – Contract - Engineering - Other 70
Total 916 For 2016, this project includes: 1. The replacement of the server infrastructure that supports the Company’s data retention,
backup and recovery processes. This equipment has reached the end of its useful life. The estimated project cost for this project is $289,000.
2. The replacement of the Company’s server infrastructure for regional offices (10 locations).
Each of these servers are at the end of their useful life, are experiencing a number of component failures and use technology that is no longer supported. The estimated project cost for regional server replacement in infrastructure upgrades is $144,000.

6.3 2016 Shared Server Infrastructure NP 2016 CBA
2
3. The expansion of video conferencing infrastructure to include 9 Company locations where this collaboration service is currently unavailable. This technology reduces employee travel costs and increases overall employee productivity. The estimated cost for this project is $114,000.
4. The installation of new security management infrastructure, including software to protect the
Company’s customer-facing internet applications and data from malicious damage. This will further reduce the potential threat from external malware on shared servers and Company personal computers. The estimated cost for this project is $279,000.
5. The replacement of 14 workgroup multi-function printers purchased between 2007 and 2008.
This equipment has reached the end of its useful life. The estimated cost of the project is $90,000.
3.0 Operating Experience The Shared Server Infrastructure project includes the purchase, implementation and management of the hardware and software related to the operation of shared servers. Shared servers are computers that support applications used by employees and customers. Management of these shared servers, and their components, is critical to ensuring that these applications are available for the Company to operate efficiently and provide service to customers. Factors considered in determining when to upgrade, replace or add server components include: (i) the level of support provided by the vendor; (ii) the current performance of the components; (iii) the ability of the components to meet future growth; (iv) the cost of maintaining and operating the components using internal staff; (v) the cost of replacing or upgrading the components versus operating the current components; (vi) the criticality of the applications running on the shared server components; and (vii) the business or customer impact should the component fail. Gartner Inc. has indicated that computer servers have a useful life of approximately 5 years.1 By making appropriate investments in its shared server infrastructure, Newfoundland Power’s experience is that the average useful life of its corporate servers is about 7 years. In order to ensure high availability of applications, and to minimize the vulnerability of its computer systems to external interference, the Company invests in system availability and proactive security monitoring and protection tools. These tools allow the Company to monitor and respond to problems that could impede the normal operation of applications or damage customer and corporate information.
1 Gartner Inc. is a leading provider of research and analysis on the global Information Technology industry.

6.3 2016 Shared Server Infrastructure NP 2016 CBA
3
4.0 Justification Sharing server infrastructure is essential to maintaining the provision of least cost service to customers. The need to replace, upgrade and modernize information technology infrastructure is fundamentally the same as the need to replace, upgrade and modernize the components of the Company’s electrical system infrastructure as it deteriorates. Instability within the shared server infrastructure has the potential to impact large numbers of employees and customers, and therefore is critical to the Company’s overall operations and to the provision of least cost customer service. Investments in shared server infrastructure are based on evaluating the alternatives of modernizing or replacing technology components and selecting the least-cost alternative.

6.4 Outage Management System Replacement NP 2016 CBA
Outage Management System Replacement
June 2015
Prepared By:
Jack Casey, P. Eng. Chris Wells
NEWFOUNDLAND~
POWER A FORTIS COMPANY

6.4 Outage Management System Replacement NP 2016 CBA
i
Table of Contents
Page
1.0 Introduction ..........................................................................................................................1 2.0 The Existing OMS in Context..............................................................................................1 3.0 The Replacement OMS ........................................................................................................3
3.1 Project Scope ...........................................................................................................3 3.2 Replacement System Functionality ..........................................................................3 3.3 Possible Future Enhancements ................................................................................4
4.0 Project Description ...............................................................................................................5 5.0 Project Cost ..........................................................................................................................6

6.4 Outage Management System Replacement NP 2016 CBA
1
1.0 Introduction Newfoundland Power (the “Company”) operates over 300 distribution feeders with approximately 9,800 kilometres of distribution lines, serving approximately 260,000 customers. The Company uses a combination of technologies to help it efficiently and effectively serve customers throughout its service territory. An outage management system (“OMS”) is a software application used by utilities to assist in coordinating response to electrical system outages. It is a critical component of effective utility response, including customer response, to major system events. Typically, OMSs process information from a variety of operational sources. These include the Supervisory Control and Data Acquisition (“SCADA”) system which monitors and controls the electrical system on a real-time basis; customer service systems that receive information from customers; and websites which permit the digital exchange of information between a utility and its customers. Newfoundland Power’s existing OMS was created in 2003. It is functionally obsolescent and at the end of its expected service life.1 The Company intends to commence a 2-year replacement process for its existing OMS.2 In 2016, the Company will assess the range of OMSs currently commercially available and develop an appropriate specification for the replacement OMS. In 2017, the Company will install the replacement OMS. This OMS replacement will be coordinated with other operational technology replacements which are currently underway. It will follow the installation of the Company’s replacement SCADA system in 2016. The replacement SCADA project is integrated with the Company’s geographic information system (“GIS”) electricity network model. It is envisaged that the replacement OMS will be integrated with both the SCADA and GIS systems. This integration will provide improved response capability, including customer response, to major system events. 2.0 The Existing OMS in Context Newfoundland Power uses its existing OMS to manage reports of power outages and streetlight outages received from customers.3 The OMS performs several key functions, (i) allowing electronic outage forms to be created, processed, dispatched, and closed; (ii) maintaining historical records of outage calls and response times; and (iii) recording interruptions for
1 The average service life of computer software is approximately 10 years. 2 Conclusion 6.4 of The Liberty Consulting Group’s Report on Island Interconnected System to Interconnection
with Muskrat Falls addressing Newfoundland Power, December 17, 2014 indicates that Newfoundland Power’s “Outage Management System has served adequately, but the Company is appropriately moving to a commercially provided replacement.”
3 Customers can report power outages and streetlight outages by calling the Company’s customer service phone number, and more recently by reporting them on the Company’s website.

6.4 Outage Management System Replacement NP 2016 CBA
2
reporting.4 There are approximately 17,000 outage reports, or outage tickets, and 11,000 streetlight reports recorded in the Company’s OMS each year.5 Like most OMSs, the Company’s OMS evolved from a paper form system. The system allows the capture of customer outage information and provides post-response reporting. The Company’s existing OMS was developed internally and has performed as expected since it was created in 2003. Newfoundland Power’s existing OMS contains limited information about the electrical system. This practically requires significant manual engineering judgement to be exercised in a compressed timeframe to assess outage causes and coordinate response. This presents limitations during normal system operations, but these become more apparent during storms and major outage events. For example, following Hurricane Igor in 2010, the Company’s OMS logged approximately 8,500 outage tickets. During January 2-8, 2014, approximately 5,000 outage tickets were logged. The technical limitations of the Company’s existing OMS are most pronounced in response to storms and major outages. Advances in OMS technology over the past decade or so have been substantial. Current commercially available OMSs have substantially greater processing and data management capabilities.6 Commercial OMSs also have improved integration capabilities. Together, these features permit more effective assessment of the state of the electrical system following a system event which interrupts customer service. In addition, currently available OMS technology permits more effective assessment of electrical system vulnerabilities, including the ability to predict where systems have failed. Commercially available OMS technology now permits integration with GIS and SCADA systems to provide greater detail on the status and location of electrical equipment when assessing customer trouble calls. More timely and accurate information is available for both field crews and customers. This has the capability to reduce the length of the outage by improving field response time. It also has the capability to improve customer service by way of making more timely and accurate information available for transmittal to customers. Improved integration capabilities available with current commercial OMS technology permit correlation of customer trouble calls with outage locations to automatically generate estimates of restoration times for many typical causes of outages. In addition, current OMS technology can automatically group related outages to permit more effective response. Commercially available
4 An interruption report is created when there is a power outage to one or multiple customers. Interruption reports
are used to calculate reliability statistics such as system average interruption duration index or SAIDI and system average interruption frequency index or SAIFI.
5 In the 5 year period from 2010 to 2014, a total of 97,874 outage tickets and 58,031 streetlight tickets have been recorded in the Company’s OMS. Outage tickets include customer calls for no power, part power, flickering lights, wire down, tree on line, safety alert, etc.
6 At least part of these advanced capabilities results from reduced cost of data management, storage and processing that has enabled a range of more sophisticated utility management systems, including asset management systems.

6.4 Outage Management System Replacement NP 2016 CBA
3
OMSs can also interface with web sites and social media to improve two way flow of outage information between the utility and its customers.7 3.0 The Replacement OMS 3.1 Project Scope The replacement OMS will integrate with the replacement SCADA and GIS systems which will provide a real-time geographic representation of the status of the electrical system. This will be completed in 2017. The replacement OMS will also provide a platform enabling future enhancements where justified by improvements and efficiency in customer service. For example, the integration of the replacement OMS with Newfoundland Power’s customer service systems, including its website, is a possible future enhancement. Such enhancements are not within the scope of this project. Any future enhancements along these lines will be subject to further Board assessment and approval. 3.2 Replacement System Functionality The OMS will provide real-time outage information to operations personnel and support restoration activities on the distribution network. This will be accomplished by data exchange with the SCADA and GIS systems. The OMS will include a user interface for entering customer and outage information received from outage calls, and when required, creates an outage ticket. To the extent possible, outage information will be automatically generated from inbound customer communications. The OMS will perform outage analysis on all outage reports and trouble calls that are reported via the various outage notification interfaces.8 OMS reporting will also reflect system operations, such as switching orders, and SCADA detected field device operations. Outage analysis will use GIS data to identify the location of each reported outage based on a combination of customer supplied information and real-time input from SCADA on the status of the electrical system. The result of the outage analysis will be available to those responsible for operating the electrical system, dispatching trouble response and interacting with customers. The OMS will be equipped with a central database of distribution outage information. The database will be used for historical analysis and support post-event reporting.
7 Newfoundland Power currently provides customers several options for reporting outages and obtaining outage
restoration information. Customers can call the Customer Contact Centre using the Company’s toll free number and can also use the Report Power Outage function available on the Company’s website.
8 The Company receives reports of outages from its customers through the telephone network and the corporate website.

6.4 Outage Management System Replacement NP 2016 CBA
4
3.3 Possible Future Enhancements The replacement OMS will improve the Company’s outage management capabilities. Future potential OMS enhancements include: The ability to predict outage locations: Predicting outage locations is standard in current OMS technology. The capability to analyse incoming customer information and immediately predict outage cause and location is an advanced capability.
Interfaces with multichannel communication services: Current commercial OMS technology incorporates customer interactions through a variety of multichannel communication services.9 Interfacing with customer communication systems such as interactive voice response and corporate websites are possible with a commercial OMS.10
Interfaces with workforce management: A commercial OMS may also provide the ability to interface with the Company’s workforce management system for scheduling and assigning field crews to outage tickets.
Automatic estimation of restoration times: Prediction of estimated restoration times is a feature available from some commercial OMS vendors. The prediction is based on a number of inputs such as the volume of outage calls, backlogs of outage tickets, the number of available crews and weather conditions. These inputs, along with analysis of historical data for other restoration efforts, allow the enhanced OMS to estimate restoration times. Improved predictive system maintenance: Analysis of outage history to identify chronic issues could help to optimize electrical equipment maintenance.
9 Liberty Consulting Group Report on Island Interconnected System to Interconnection with Muskrat Falls
addressing Newfoundland Power, December 17, 2014 Chapter VIII, indicates the importance of providing multichannel communication options for communicating with customers.
10 Some utilities operating enhanced OMS technology provide near real-time maps of customer outages on their customer facing website.

6.4 Outage Management System Replacement NP 2016 CBA
5
Figure 1 shows a conceptual representation of a fully integrated OMS.
Figure 1 - Fully Integrated Outage Management System11 4.0 Project Description In 2016, the Company will undertake a 2-year project to replace its existing OMS with a commercially available system. The OMS replacement will follow the installation of the Company’s replacement SCADA system in 2016. The Company is also integrating the GIS electricity network model into the SCADA system by the end of 2016. The initial deployment of the replacement OMS will be integrated with the SCADA and GIS systems to provide the Company accurate outage data that will allow for efficient power restoration and improved customer service. Further integration with other operational technologies such as workforce management integration and vehicle tracking, the customer service system and multichannel communication services, and predictive outage capabilities will be possible in the future.12 In 2016, the Company will prepare technical specifications for the replacement OMS and undertake a request for information process to pre-qualify OMS vendors. In 2017, the project will move forward with vendor selection, system configuration, integration with SCADA and GIS systems, testing and commissioning prior to placing the replacement OMS in service.
11 A fully integrated OMS will take several phases of integration to complete. The order of what systems get
integrated first will be evaluated based on the product selected and cost associated with integration. 12 Further enhancements to the OMS will be brought forward for approval in future capital budget applications.

6.4 Outage Management System Replacement NP 2016 CBA
6
5.0 Project Cost Table 1 summarizes the cost estimates associated with this project.
Table 1 2016-2017 Project Cost
($000s) Cost Category 2016 Cost 2017 Cost Material 15 320 Labour – Internal 49 380 Labour – Contract - - Engineering - - Other 85 100
Total 149 800

7.1 2016 Fibre Optic Cable Builds NP 2016 CBA
2016 Fibre Optic Cable Builds
June 2015
Prepared by:
Gerry Walsh, B. Comm.
John Pardy, P. Eng.
NEWFOUNDLAND~
POWER A FORTlS COMPANY

7.1 2016 Fibre Optic Cable Builds NP 2016 CBA
i
Table of Contents
Page
1.0 Background ..........................................................................................................................1 2.0 St. John’s Fibre Network .....................................................................................................2 3.0 Corner Brook Fibre Network ...............................................................................................3 4.0 2016 Project Costs ...............................................................................................................6

7.1 2016 Fibre Optic Cable Builds NP 2016 CBA
1
1.0 Background Newfoundland Power (the “Company”) constructed its first fibre optic cable circuits in 1990. Since then, a network of 36 fibre optic circuits has been established. Of these, 30 are owned by the Company. The remaining 6 circuits are leased from 3rd party telecommunications service providers. These circuits are used for corporate data, substation, voice and Supervisory Control and Data Acquisition (“SCADA”) communications, protective relay communications as well as data communications between Newfoundland Power’s and Newfoundland and Labrador Hydro’s (“Hydro”) control centres. Fibre optic circuits provide high speed communications between substations and reliable real-time communications between substations and control centres. The data carried on the network is used by protection and control systems that monitor and operate transmission lines and high voltage substation buses. The short transmission lines between substations in urban areas require very fast clearing times to protect equipment, employees and the public.1 As a result, Newfoundland Power’s fibre optic networks are practically required in multi-substation urban environments such as in Corner Brook, Gander and St. John’s.2 Fibre optic circuits are also used to provide SCADA communications between substation equipment and the System Control Centre (“SCC”) in St. John’s. In areas where there is no requirement for high speed communications between substations for protection and control purposes, the Company will lease data services from telecommunication service providers where this is the least cost communication alternative available.3 In 2016, the Company will add two new fibre optic links in the St. John’s network. These links will improve the reliability of the network by ensuring an appropriate level of redundancy. In the Corner Brook area, the 1st link in a network to connect the 4 substations in the area will be installed. Once complete, this network will provide high speed fault clearing capability for the Newfoundland Power and Hydro transmission systems serving the Corner Brook area.
1 Any fault, if not detected and isolated quickly could cascade into a system wide disturbance causing widespread
outages for a tightly interconnected system like what is typically found in urban settings with multiple substations. Fast clearing times also require that both ends of a transmission line are tripped simultaneously to ensure quick fault clearing is achieved. As a result a reliable dedicated communications path between relays is critical.
2 Fibre optic cable circuits between substations already exist in Gander and St. John’s. The Northeast Avalon region has by far the most concentrated number of fibre optic cable circuits, accountable for 26 of the existing 36 circuits owned or leased by the Company. The other large urban centres in the Province only have a single substation serving customers.
3 Traditional copper communication cable based solutions require electrical isolation between the electricity system and the telecommunications system. Typically this is achieved by some sort of electrical isolation technology such as teleline isolation, which has to be installed prior to the termination of the copper communications cable. This isolation technology is not required for fibre optic cable circuits as there is no metallic component for the fibre optic cable construction.

7.1 2016 Fibre Optic Cable Builds NP 2016 CBA
2
There is no suitable fibre optic capacity available for rent in either area.4 Therefore, the Company will build the necessary fibre optic cable circuits. 2.0 St. John’s Fibre Network Newfoundland Power operates a fibre optic cable network in St. John’s that connects 15 substations and 4 office buildings in a series of logically ringed networks.5 There is a combination of Company owned and rented cables in the fibre optic cable network. A critical link in the fibre optic cable network in St. John’s is the cables that connect the Kenmount Road building to the SCC. These cables run along Kenmount Road, pass through Kenmount Substation, across Kenmount Hill, along Blackmarsh Road to Topsail Road, terminating at the SCC. There is no spare fibre capacity in these cables and the risk of damage due to ice loading or vehicle accidents is high due to the location of the cables. There is also an issue with physical route diversity along Blackmarsh Road as two cable links share common utility poles. This lack of diversity can effectively eliminate the redundancy designed into the St. John’s fibre network. This project will install 2 new fibre cable links. One will extend from Hardwoods Substation to Kenmount Substation. The second will extend from Kenmount Substation to the Duffy Place operations centre (see Figure 1). The fibre optic cables will permit new routes through Kenmount Terrace and Kelsey Drive which provide the necessary physical diversity for this critical link. Some of the existing network traffic that passes through the Kenmount Hill and Blackmarsh Road cables will be transferred to the Hardwoods to Duffy Place cables. Transferring network traffic to the new cables will relieve current capacity constraints by increasing the number of spare fibres in each existing cable.
4 Suitable fibre optic capacity must be dark fibre. Dark fibre are dedicated strands of fibre optics inside cable
plant owned by telecommunications service providers. Typically telecommunications service providers sell data services sometimes referred to as bandwidth or broadband service using their fibre optic cable networks. The design of protective relaying systems requires direct access to the actual fibre optic strands to transmit signals at speeds which provide high speed fault clearing capability to protect breakers and other high voltage equipment from damage. As a result, direct access to the fibre optic cable plant of the telecommunications service provider is required for Newfoundland Power’s application.
5 The 4 buildings include the SCC, the Duffy Place operations centre, the Kenmount Road head office and Hydro Place. Hydro is included in the fibre optic network as the Inter Control Centre Protocol (“ICCP”) link continuously exchanges real-time power system data between the two companies.

7.1 2016 Fibre Optic Cable Builds NP 2016 CBA
3
Figure 1: St. John’s West Proposed Fibre Optic Network
3.0 Corner Brook Fibre Network Currently, the Company has limited communications capability with the 4 substations in the City of Corner Brook.6 Each substation now has an analog telephone line and a leased 4-wire data circuit for SCADA communications.7 The SCADA communications circuits are consolidated at the Company’s Corner Brook office where they are integrated with other data communications traffic and transported over broadband communications to the SCC in St. John’s. At present, there are no communications between the protective relaying in the Corner Brook substations. As part of the Company’s Substation Refurbishment and Modernization capital project, all transmission line protective relays in the Corner Brook area substations will be upgraded to allow high speed fault clearing. This refurbishment of protective relaying commenced in 2014 at Massey Drive (“MAS”) Substation and is planned to be completed in the remaining 3 Corner Brook area substations over the horizon of the current 5-year capital plan. To implement the protection upgrades, the fibre optic circuits between substations need to be practically established at the same time as the Substation Refurbishment and Modernization projects for the Corner Brook area proceed.
6 There are 4 substations in the City of Corner Brook. Newfoundland Power owns substations at Bayview
(“BVS”), Humber (“HUM”) and Walbournes (“WAL”). The Company also has equipment in Hydro’s Massey Drive terminal station (“MAS”).
7 SCADA communications consists of a 9,600 baud data circuit provided by a 1980s vintage modem. The copper cable plant is protected using teleline isolation equipment, also installed in Company substations during the 1980s.

7.1 2016 Fibre Optic Cable Builds NP 2016 CBA
4
Figure 2 shows a map of this 66 kV transmission line network in the City of Corner Brook and the locations of the 4 substations. To achieve the high speed clearing times over 100% of the transmission line length, the protective relays at each end of the transmission lines will need to be connected to each other by fibre optic cable.
Figure 2: Corner Brook Area Transmission Line Network
To accomplish the protection upgrades, the Company will undertake a program to install fibre optic cables between the 4 Corner Brook area substations commencing in 2016. To further leverage this connectivity, the fibre optic cable will be extended to the Company’s Regional Office on Maple Valley Road. This connectivity will permit extension of both SCADA and corporate data network services to these substations and allow retirement of existing leased copper circuits and associated isolation equipment. Upon completion in 2019, there will be no leased copper circuits in the Corner Brook area substations creating an annual operating cost saving of approximately $4,200.8 The 4 Corner Brook area substations will be interconnected in a fibre optic network designed in a ring topology (see Figure 3). Through the use of multiplexing equipment, each relay will have a redundant optical path around the fibre ring, thereby increasing reliability and interconnecting the protective relays to meet critical clearing time requirements.
8 The net present value of the $4,200 operating cost saving over the 25 year life of the fibre optic cable network is
approximately $67,000.

7.1 2016 Fibre Optic Cable Builds NP 2016 CBA
5
Figure 3: Corner Brook Area Planned Fibre Optic Network
Table 1 summarizes estimated capital expenditures for Corner Brook Fibre Optic Cable projects from 2016 to 2019. The schedule for the fibre optic cable builds is set to coordinate with the transmission line relay upgrades which will be included in future Substation Refurbishment and Modernization projects.
Table 1 Capital Expenditures
Corner Brook Area Fibre Optic Cable ($000s)
Year Cable Link Estimate 2016 Massey Drive – Maple Valley – Bayview $125 2017 Bayview – Humber 82 2019 Humber – Walbournes – Massey Drive 289 Total $496

7.1 2016 Fibre Optic Cable Builds NP 2016 CBA
6
4.0 2016 Project Costs The 2016 project cost estimates for the St. John’s and Corner Brook fibre optic cable network additions are shown in Table 2 below.
Table 2 2016 Project Cost Estimates
Cost Category St. John’s Corner Brook Total
Material $228,000 $100,000 $328,000 Labour – Internal 10,000 4,000 14,000 Labour – Contract - - - Engineering 35,000 16,000 51,000 Other 11,000 5,000 16,000 Total $284,000 $125,000 $409,000
To ensure that the project is completed at the lowest possible cost consistent with safe and reliable service, all material and contract labour will be obtained through competitive tendering. This is not a multi-year project. Projects for future years will be presented for approval in future capital budget applications.

8.1 Rate Base: Additions, Deductions & Allowances NP 2016 CBA
Rate Base: Additions, Deductions & Allowances
June 2015

8.1 Rate Base: Additions, Deductions & Allowances NP 2016 CBA
i
Table of Contents
Page
1.0 Introduction ..........................................................................................................................1 1.1 General .....................................................................................................................1 1.2 Compliance and Related Matters .............................................................................1 2.0 Additions to Rate Base .........................................................................................................2 2.1 Summary ..................................................................................................................2 2.2 Deferred Pension Costs ............................................................................................3 2.3 Credit Facility Costs ................................................................................................4 2.4 Cost Recovery Deferral – Seasonal/Time-of-Day Rates .........................................5 2.5 Cost Recovery Deferral – Hearing Costs .................................................................5 2.6 Cost Recovery Deferral – 2010 Regulatory Amortizations .....................................6
2.7 Cost Recovery Deferral – 2012 Cost of Capital ......................................................7 2.8 Cost Recovery Deferral – 2013 Revenue Shortfall ..................................................7
2.9 Cost Recovery Deferral – Conservation ..................................................................8 2.10 Customer Finance Programs ....................................................................................9 3.0 Deductions from Rate Base .................................................................................................9 3.1 Summary ..................................................................................................................9 3.2 Weather Normalization Reserve ............................................................................10 3.3 Other Post Employment Benefits ...........................................................................11 3.4 Customer Security Deposits ...................................................................................11 3.5 Accrued Pension Obligation ..................................................................................12 3.6 Accumulated Deferred Income Taxes ...................................................................12 3.7 Demand Management Incentive Account ..............................................................13 3.8 Excess Earnings .....................................................................................................14 4.0 Rate Base Allowances........................................................................................................14 4.1 Summary ................................................................................................................14 4.2 Cash Working Capital Allowance .........................................................................15
4.3 Materials and Supplies Allowance .........................................................................15

8.1 Rate Base: Additions, Deductions & Allowances NP 2016 CBA
1
1.0 Introduction 1.1 General In the 2016 Capital Budget Application (the “Application”), Newfoundland Power seeks final approval of its 2014 average rate base. This is consistent with current regulatory practice before the Board. Newfoundland Power’s 2014 average rate base of $964,930,000 is set out in Schedule D to the Application. To meet the cost of service standard, rate base, as calculated in accordance with the Asset Rate Base Method, should reflect what the utility must finance. For investment in utility plant, it is the depreciated value of the plant that must be effectively financed. However, for rate base to fully reflect the financing requirements associated with the provision of regulated service, it must also be adjusted to reflect other costs required to provide service. Conceptually, additions to rate base are costs that have been incurred to provide service but have not yet been recovered through customer rates. Deductions from rate base represent amounts that have been recovered through customer rates in advance of the required utility payment for those costs. Rate base allowances simply reflect the cost associated with maintaining the required working capital and inventories necessary to provide service. Each of these items affect what the utility must finance. In Order No. P.U. 32 (2007), the Board approved Newfoundland Power’s calculation of rate base in accordance with the Asset Rate Base Method. That calculation included the additions to, deductions from, and allowances, in rate base which are more fully described in this report. 1.2 Compliance and Related Matters In Order No. P.U. 19 (2003), the Board, in effect, ordered Newfoundland Power file with its capital budget applications: (i) evidence related to changes in deferred charges, including pension costs, and (ii) a reconciliation of average rate base and average invested capital. Commencing in 2008, Newfoundland Power’s rate base is calculated in accordance with the Asset Rate Base Method. This includes provision for allowances calculated in accordance with accepted regulatory practice. The use of allowances versus average year-end balances results in permanent differences between Newfoundland Power’s average rate base and average invested capital. Accordingly, they are, in effect, the principal reconciling items between the Company’s average rate base and average invested capital. This report provides evidence relating to: (i) changes in deferred charges including pension costs and (ii) the cash working capital allowance and materials and supplies allowance included in rate base. This complies with the requirements of Order No. P.U. 19 (2003).

8.1 Rate Base: Additions, Deductions & Allowances NP 2016 CBA
2
To provide the Board with a comprehensive overview of those items in Newfoundland Power’s rate base other than plant investment, this report reviews all additions, deductions and allowances included in rate base. Four years of data are provided in this report. This includes two historical years, the current year and the following year. The 2015 and 2016 forecast rate base additions and deductions reflect the Company’s most recent forecasts and estimates. In addition, the data presented is year-end data. This is consistent with past evidence submitted in compliance with Order No. P.U. 19 (2003). 2.0 Additions to Rate Base 2.1 Summary Table 1 summarizes Newfoundland Power’s additions to rate base for 2013 and 2014, and the forecast additions for 2015 and 2016.
Table 1 Additions to Rate Base
2013-2016F ($000s)
2013 2014 2015F 2016F Deferred Pension Costs 101,159 103,939 98,520 91,248 Credit Facility Issue Costs - 72 56 40 Cost Recovery Deferral – Seasonal/TOD Rates1 95 68 72 73 Cost Recovery Deferral – Hearing Costs1 644 322 - - Cost Recovery Deferral –Regulatory Amortizations1 2,214 1,107 - - Cost Recovery Deferral – 2012 Cost of Capital1 1,177 588 - - Cost Recovery Deferral – 2013 Revenue Shortfall1 2,252 1,126 - - Cost Recovery Deferral – Conservation2 2,085 4,937 7,854 9,926 Customer Finance Programs 1,363 1,136 1,136 1,136
Total Additions 110,989 113,295 107,638 102,423 Additions to rate base were approximately $113.3 million in 2014. This is approximately $2.3 million more than 2013. The higher additions to rate base through 2014 reflect increases in deferred pension costs and the deferred recovery of annual customer energy conservation program costs.
1 In Order No. P.U. 13 (2013), the Board approved the deferred recovery from 2013 through 2015 of : (i) 2013
Hearing Cost; (ii) 2011/2012 Cost Deferrals; (iii) 2012 Cost of Capital; and (iv) 2013 Revenue Shortfall. These amortizations conclude in 2015.
2 In Order No. P.U. 13 (2013), the Board approved the deferral of annual customer energy conservation program costs and the amortization of annual costs over seven years, commencing in 2013, with recovery through the Rate Stabilization Account.

8.1 Rate Base: Additions, Deductions & Allowances NP 2016 CBA
3
This section outlines the additions to rate base in further detail. 2.2 Deferred Pension Costs Table 2 shows details of changes in Newfoundland Power’s deferred pension costs from 2013 through 2016.
Table 2 Deferred Pension Costs
2013-2016F ($000s)
2013 2014 2015F 2016F Deferred Pension Costs 101,159 103,939 98,520 91,248
The difference between pension plan funding and pension plan expense associated with the Company’s defined benefit pension plan is captured as a deferred pension cost in accordance with Order No. P.U. 17 (1987).3 Table 3 shows details of changes in Newfoundland Power’s deferred pension costs from 2013 through 2016.
Table 3 Deferred Pension Costs
2013-2016F ($000s)
2013 2014 2015F 2016F
Deferred Pension Costs, January 1st 100,113 101,159 103,939 98,520 Pension Plan Funding4 13,791 13,864 9,904 3,531 Pension Plan Expense (12,745) (11,084) (15,323) (10,803)
Deferred Pension Costs, December 31st 101,159 103,939 98,520 91,248
3 Deferred pension costs were approved for inclusion in average rate base in Order No. P.U. 19 (2003). 4 Pension funding for 2013 and 2014 includes special funding payments of $10.7 million. Special funding
payments of $7.0 million are forecast for 2015 based on the Actuarial Valuation dated December 31, 2014. There are no special funding payments forecast for 2016.

8.1 Rate Base: Additions, Deductions & Allowances NP 2016 CBA
4
2.3 Credit Facility Costs In Order P.U. 1 (2005), the Board approved Newfoundland Power’s issue of a $100 million committed revolving term credit facility. On March 27th, 2012, the committed credit facility was renegotiated on similar terms as the previous facility, with a decrease in pricing, and an extension to a five year term maturing in August 2017. Legal and other administration costs of $115,000 resulting from the amendment are being amortized over the life of the agreement beginning in April 2012. In Order No. P.U. 23 (2013), the Board approved Newfoundland Power’s return on rate base for 2013 and 2014, which includes credit facility issue costs. For the 2013 and 2014 test years, the unamortized credit facility costs are included as a component of the Company’s weighted average cost of capital and are therefore reflected in the rate of return on rate base for those years. Consequently, costs reflected in the 2013 and 2014 test years are not included in the calculation of average rate base for 2013 and 2014. In August, 2014, the committed credit facility was renegotiated to extend its maturity date to August 2019. Costs related to this amendment totalled $80,000 and are being amortized over the 5-year life of the agreement, beginning in 2014. As these costs are not reflected in test year costs, they are being included in the calculation of average rate base for 2014, 2015 and 2016. Table 4 shows details of Newfoundland Power’s amortization of deferred credit facility issue costs for 2013 through 2016.
Table 4 Deferred Credit Facility Issue Costs
2013-2016F ($000s)
2013 2014 2015F 2016F Balance, January 1st - - 72 56 Cost - 80 - - Amortization - (8) (16) (16)
Balance, December 31st - 72 56 40

8.1 Rate Base: Additions, Deductions & Allowances NP 2016 CBA
5
2.4 Cost Recovery Deferral – Seasonal/Time-of-Day Rates In Order No. P.U. 8 (2011), the Board approved the Optional Seasonal Rate Revenue and Cost Recovery Account. This account is charged with: (i) the current year revenue impact of making the Domestic Seasonal – Optional Rate available to customers and (ii) the operating costs associated with implementing the Domestic Seasonal – Optional and the Time-of-Day (“TOD”) Rate Study. Newfoundland Power is required to file an application with the Board no later than the 1st day of March each year for the disposition to the Rate Stabilization Account (“RSA”) of any balance in this account. Table 5 shows details of the Optional Seasonal Rate Revenue and Cost Recovery Account for 2013 through 2016.
Table 5 Seasonal/TOD Rates
2013-2016F ($000s)
2013 2014 2015F 2016F Balance, January 1st 93 95 68 72 Additions 95 68 72 73 Reductions (93) (95) (68) (72)
Balance, December 31st 95 68 72 73 The disposition of the December 31, 2014 balance in the Optional Seasonal Rate Revenue and Cost Recovery Account to the RSA as of March 31, 2015, was approved by the Board in Order No. P.U. 10 (2015). 2.5 Cost Recovery Deferral – Hearing Costs In Order No. P.U. 13 (2013), the Board approved the deferred recovery over a three year period, beginning in 2013, of external costs related to the Company’s 2013 General Rate Application. The actual external costs incurred for the 2013 General Rate Application were $965,000. The deferred hearing costs will be fully amortized in 2015.

8.1 Rate Base: Additions, Deductions & Allowances NP 2016 CBA
6
Table 6 shows details of the changes in Newfoundland Power’s deferred hearing costs from 2013 through 2016.
Table 6 Deferred Hearing Costs
2013-2016F ($000s)
2013 2014 2015F 2016F Balance, January 1st - 644 322 - Cost 965 - - - Amortization (321) (322) (322) -
Balance, December 31st 644 322 - - 2.6 Cost Recovery Deferral – 2010 Regulatory Amortizations In Order No. P.U. 30 (2010), the Board approved the deferred recovery in 2011, until a further Order of the Board, of $2.4 million in costs ($1.6 million after-tax) related to the expiry of certain regulatory amortizations in 2010. In Order No. P.U. 22 (2011), the Board approved the deferred recovery in 2012, until a further Order of the Board, of $2.4 million in costs ($1.7 million after-tax) related to the expiry of certain regulatory amortizations in 2010. In Order No. P.U. 13 (2013), the Board approved, with effect from January 1, 2013, the amortization of these deferrals over three years using the straight-line method, commencing in 2013. Table 7 shows the cost recovery deferral and its amortization for 2013 through 2016 related to the expiry of regulatory amortizations in 2010.
Table 7 Cost Recovery Deferral – Regulatory Amortizations
2013-2016F ($000s)
2013 2014 2015F 2016F Balance, January 1st 3,320 2,214 1,107 - Cost - - - - Amortization (1,106) (1,107) (1,107) -
Balance, December 31st 2,214 1,107 - -

8.1 Rate Base: Additions, Deductions & Allowances NP 2016 CBA
7
2.7 Cost Recovery Deferral – 2012 Cost of Capital In Order No. P.U. 17 (2012), the Board approved the deferred recovery of the amount of the difference in revenue for 2012, relating to the determination of Newfoundland Power's 2012 cost of capital of $2.5 million ($1.8 million after-tax). In Order No. P.U. 13 (2013), the Board approved, with effect from January 1, 2013, the amortization of the deferral over three years using the straight-line method, commencing in 2013. Table 8 shows the 2012 cost of capital deferral for 2012, and its amortization for 2013, through 2016.
Table 8 Cost Recovery Deferral – 2012 Cost of Capital
2013-2016F ($000s)
2013 2014 2015F 2016F
Balance, January 1st 1,766 1,177 588 - Cost - - - - Amortization (589) (589) (588) -
Balance, December 31st 1,177 588 - - 2.8 Cost Recovery Deferral – 2013 Revenue Shortfall In Order No. P.U. 13 (2013), the Board approved the proposed amortization over three years, commencing in 2013, of the 2013 revenue shortfall resulting from the implementation of new rates after January 1, 2013.5 In Order No. P.U. 23 (2013), the Board approved the revenue shortfall in the amount of $4.0 million ($2.8 million after-tax).
5 Per Order No. P.U. 13 (2013), amortization will be from the effective date of the new rates (July 1, 2013) to
December 31, 2015, using the straight-line method.

8.1 Rate Base: Additions, Deductions & Allowances NP 2016 CBA
8
Table 9 shows the revenue shortfall for 2013 and its amortization for 2013 through 2016.
Table 9 Cost Recovery Deferral – 2013 Revenue Shortfall
2013-2016F ($000s)
2013 2014 2015F 2016F
Balance, January 1st - 2,252 1,126 - Cost 2,815 - - - Amortization (563) (1,126) (1,126) -
Balance, December 31st 2,252 1,126 - - 2.9 Cost Recovery Deferral – Conservation Table 10 shows details of forecast amortization of the deferred cost recovery related to conservation for 2013 through 2016.
Table 10 Cost Recovery Deferral – Conservation
2013-2016F ($000s)
2013 2014 2015F 2016F Balance, January 1st 227 2,085 4,937 7,854 Cost 2,085 3,150 3,665 3,344 Amortization (227) (298) (748) (1,272)
Balance, December 31st 2,085 4,937 7,854 9,926 In Order No. P.U. 13 (2009), the Board approved the deferred recovery of certain forecast 2009 conservation costs. These costs totalled $948,000 on an after-tax basis in 2009. In Order No. P.U. 43 (2010), the Board approved the after-tax recovery of 2009 deferred conservation costs evenly over a four year period beginning in 2010. The deferral will be fully amortized in 2013. In Order No. P.U. 13 (2013), the Board approved the deferral of annual customer energy conservation program costs and the amortization of annual costs over seven years, beginning in 2014, with recovery through the RSA.

8.1 Rate Base: Additions, Deductions & Allowances NP 2016 CBA
9
2.10 Customer Finance Programs Customer finance programs are loans provided to customers for the purchase and installation of products and services related to conservation programs and contributions in aid of construction (“CIAC”). Table 11 shows details of changes to balances related to customer finance programs for 2013 through 2016.
Table 11 Customer Finance Programs
2013-2016F ($000s)
2013 2014 2015F 2016F
Balance, January 1st 1,446 1,363 1,136 1,136 Change (83) (227) - -
Balance, December 31st 1,363 1,136 1,136 1,136 3.0 Deductions from Rate Base 3.1 Summary Table 12 summarizes Newfoundland Power’s deductions from rate base for 2013 and 2014, and the Company’s forecasts for 2015 and 2016.
Table 12 Deductions from Rate Base
2013-2016F ($000s)
2013 2014 2015F 2016F
Weather Normalization Reserve 5,058 1,640 (457) - Other Post Employment Benefits (“OPEBs”) 23,515 32,435 39,298 46,013 Customer Security Deposits 840 660 700 700 Accrued Pension Obligation 4,325 4,635 4,996 5,375 Accumulated Deferred Income Taxes 1,872 2,529 1,405 1,289 Demand Management Incentive Account (272) 446 293 - Excess Earnings - 49 49 49
Total Deductions 35,338 42,394 46,284 53,426

8.1 Rate Base: Additions, Deductions & Allowances NP 2016 CBA
10
Deductions from rate base were approximately $42.4 million in 2014. Newfoundland Power’s deductions from rate base in 2014 have increased approximately $7.0 million from 2013. The reduction in rate base primarily reflects the amortization of the OPEB regulatory asset6 and amortization of the employee future benefits regulatory asset7 related to OPEBs. This section outlines the deductions from rate base in further detail. 3.2 Weather Normalization Reserve In Order No. P.U. 1 (1974), the Board approved that rate base be adjusted for the balance in the Weather Normalization Reserve. In Order No. P.U. 13 (2013), the Board approved the disposition of the annual balance in the Weather Normalization Reserve Account through the RSA. The Board also approved, with effect from January 1, 2013, the amortization over three years, commencing in 2013, of the 2011 year-end balance in the Weather Normalization Reserve Account of $5.0 million. Table 13 shows details of changes in the balance of the Weather Normalization Reserve from 2013 through 2016.
Table 13 Weather Normalization Reserve
2013-2016F ($000s)
2013 2014 2015F 2016F
Balance, January 1st 4,803 5,058 1,640 (457) Operation of the reserve 1,712 (33) (457) - Transfers to the RSA 216 (1,712) 33 457 Amortization (1,673) (1,673) (1,673) -
Balance, December 31st 5,058 1,640 (457) - The disposition of the December 31, 2014 balance in the Weather Normalization Reserve Account to the RSA as of March 31, 2015, was approved by the Board in Order No. P.U. 11 (2015).
6 In Order No. PU. 31 (2010), the Board approved, beginning in 2011, the adoption of the accrual method of
accounting for OPEBs and related income tax. In addition, the Board approved a 15-year straight line amortization of a transitional balance starting in 2011.
7 In Order No. PU. 11 (2012), the Board approved the opening balances for regulatory assets and liabilities associated with employee future benefits to be recognized for regulatory purposes under U.S. GAAP as of January 1, 2012.

8.1 Rate Base: Additions, Deductions & Allowances NP 2016 CBA
11
3.3 Other Post Employment Benefits Newfoundland Power’s other post employment benefits (“OPEBs”) are comprised of retirement allowances for retiring employees as well as health, medical and life insurance for retirees and their dependents. In Order No. P.U. 31 (2010), the Board approved, beginning in 2011, the adoption of the accrual method of accounting for OPEBs and related income tax. In addition, the Board approved a 15-year straight line amortization of a transitional balance starting in 2011. In Order No. P.U. 11 (2012), the Board approved the opening balances for regulatory assets and liabilities associated with employee future benefits to be recognized for regulatory purposes under U.S. GAAP as of January 1, 2012. Table 14 shows details of the changes related to the net OPEBs liability from 2013 through 2016.
Table 14 Other Post Employment Benefits
2013-2016F ($000)
2013 2014 2015F 2016F Regulatory Asset 73,105 52,808 48,554 44,353 OPEB Liability 96,620 85,243 87,852 90,366
Net OPEBs Liability 23,515 32,435 39,298 46,013 3.4 Customer Security Deposits Customer security deposits are provided by customers in accordance with the Schedule of Rates, Rules and Regulations. Table 15 shows details on the changes in customer security deposits from 2013 through 2016.
Table 15 Customer Security Deposits
2013-2016F ($000)
2013 2014 2015F 2016F Balance, January 1st 851 840 660 700 Change (11) (180) 40 -
Balance, December 31st 840 660 700 700

8.1 Rate Base: Additions, Deductions & Allowances NP 2016 CBA
12
3.5 Accrued Pension Obligation Accrued pension obligation is the cumulative costs of Newfoundland Power’s unfunded pension plans net of associated benefit payments. Table 16 shows details of changes related to accrued pension obligation for 2013 through 2016.
Table 16 Accrued Pension Obligation
2013-2016F ($000)
2013 2014 2015F 2016F Balance, January 1st 4,020 4,325 4,635 4,996 Change 305 310 361 379
Balance, December 31st 4,325 4,635 4,996 5,375 3.6 Accumulated Deferred Income Taxes Accumulated deferred income taxes result from timing differences related to the payment of income taxes and the recognition of income taxes for financial reporting and regulatory purposes. Currently, Newfoundland Power recognizes deferred income taxes with respect to timing differences related to plant investment,8 pension costs9 and other employee future benefit costs.10
8 In Order Nos. P.U. 20 (1978), P.U. 21 (1980) and P.U. 17 (1987), the Board approved the Company’s use of
Tax Accrual Accounting to recognize deferred income tax liabilities associated with plant investment. 9 In Order No. P.U. 32 (2007), the Board approved the use of Tax Accrual Accounting to recognize deferred
income taxes related to timing differences between pension funding and pension expense. 10 In Order No. P.U. 31 (2010), the Board approved the use of Tax Accrual Accounting to recognize deferred
income taxes related to timing differences between other employee future benefits recognized for tax purposes (cash payments) and other employee future benefit expense recognized for accounting purposes (accrual basis).

8.1 Rate Base: Additions, Deductions & Allowances NP 2016 CBA
13
Table 17 shows details of changes in the accumulated deferred income taxes from 2013 through 2016.
Table 17 Accumulated Deferred Income Taxes
2013-2016F ($000)
2013 2014 2015F 2016F Balance, January 1st 2,504 1,872 2,529 1,406 Change (632) 656 (1,123) (116)
Balance, December 31st 1,872 2,529 1,406 1,290 3.7 Demand Management Incentive Account In Order No. P.U. 32 (2007), the Board approved the Demand Management Incentive Account (the “DMI Account”) to replace the Purchase Power Unit Cost Variance Reserve. Table 18 shows details of the DMI Account from 2013 through 2016.
Table 18 DMI Account 2013-2016F
($000)
2013 2014 2015F 2016F Balance, January 1st 558 (272) 446 293 Transfers to the RSA (558) 272 (446) (293) Operation of DMI (272) 446 293 -
Balance, December 31st (272) 446 293 - In Order No. P.U. 8 (2015), the Board approved a credit transfer to the RSA at March 31, 2015, of $627,503, equal to the balance in the DMI account for 2014, and related income tax effects.

8.1 Rate Base: Additions, Deductions & Allowances NP 2016 CBA
14
3.8 Excess Earnings In Order No. P.U. 23 (2013), the Board approved the definition of the Excess Earnings Account. In 2013, Newfoundland Power’s regulated earnings exceeded the upper limit of allowed regulated earnings by $49,000.11 Table 19 shows details of the Excess Earnings Account from 2013 through 2016.
Table 19 Excess Earnings Account
2013-2016F ($000)
2013 2014 2015F 2016F Balance, January 1st - 49 49 49 Change - - - -
Balance, December 31st - 49 49 49 4.0 Rate Base Allowances 4.1 Summary The cash working capital allowance, together with the materials and supplies allowance, form the total allowances that are included in the Company’s rate base. This represents the average amount of investor-supplied working capital necessary to provide service.
11 The allowed regulated earnings are based on a return on rate base of 7.92% plus 18 basis points approved in
Order No. P.U. 23 (2013).

8.1 Rate Base: Additions, Deductions & Allowances NP 2016 CBA
15
4.2 Cash Working Capital Allowance The cash working capital allowance recognizes that a utility must finance the cost of its operations until it collects the revenues to recover those costs. Table 20 shows details on changes in the cash working capital allowance from 2013 through 2016.
Table 20 Rate Base Allowances
Cash Working Capital Allowance12 2013-2016F
($000)
2013 2014 2015F 2016F Gross Operating Costs 467,036 482,094 488,063 495,840 Income Taxes (1,999) 11,044 13,762 11,025 Municipal Taxes Paid 15,625 16,771 15,659 14,753 Non-Regulated Expenses 11,364 (1,989) (2,203) (2,312) Total Operating Expenses 492,026 507,920 515,281 519,305 Cash Working Capital Factor 1.73% 1.69% 1.69% 1.69% 8,512 8,584 8,708 8,776 HST Adjustment (1,986) (2,180) (2,180) (2,180) Cash Working Capital Allowance 6,526 6,404 6,528 6,596
4.3 Materials and Supplies Allowance Including a materials and supplies allowance in rate base provides a utility a means to reasonably recover the cost of financing its inventories that are not related to the expansion of the electrical system.13
12 The cash working capital allowance for 2013 through 2016 is calculated based on the method used to calculate
the 2013/2014 Test Year average rate base approved by the Board in Order No. P.U. 13 (2013). 13 Financing costs for inventory related to the expansion of the electrical system are recovered through the use of
an allowance for funds used during construction and are capitalized upon project completion.

8.1 Rate Base: Additions, Deductions & Allowances NP 2016 CBA
16
Table 21 shows details on changes in the materials and supplies allowance from 2013 through 2016.
Table 21 Rate Base Allowances
Materials and Supplies Allowance 2013-2016F
($000)
2013 2014 2015F 2016F Average Materials and Supplies 7,029 7,253 7,623 7,850 Expansion Factor14 22.53% 22.53% 22.53% 22.53% Expansion 1,584 1,634 1,717 1,769
Materials and Supplies Allowance 5,445 5,619 5,905 6,081
14 The expansion factor is based on a review of actual inventories used for expansion projects. The calculation of
the 2013 through 2016 rate base, including a materials and supplies allowance based upon an expansion factor of 22.53%, was approved by the Board in Order No. P.U. 13 (2013).