Tables of spectral-line intensities: part 1: arranged by elements
Upload
independentCategory
view
2download
0
Combined Statistical Analyses of Peptide Intensities and Peptide
Occurrences Improves Identification of Significant Peptides from
MS-Based Proteomics Data
Bobbie-Jo M. Webb-Robertson,* Lee Ann McCue, Katrina M. Waters, Melissa M. Matzke,Jon M. Jacobs, Thomas O. Metz, Susan M. Varnum, and Joel G. Pounds
Pacific Northwest National Laboratory, P.O. Box 999, Richland, Washington 99352, United States
Received May 25, 2010
Liquid chromatography-mass spectrometry-based (LC-MS) proteomics uses peak intensities ofproteolytic peptides to infer the differential abundance of peptides/proteins. However, substantial run-to-run variability in intensities and observations (presence/absence) of peptides makes data analysisquite challenging. The missing observations in LC-MS proteomics data are difficult to address withtraditional imputation-based approaches because the mechanisms by which data are missing areunknown a priori. Data can be missing due to random mechanisms such as experimental error ornonrandom mechanisms such as a true biological effect. We present a statistical approach that uses atest of independence known as a G-test to test the null hypothesis of independence between the numberof missing values across experimental groups. We pair the G-test results, evaluating independence ofmissing data (IMD) with an analysis of variance (ANOVA) that uses only means and variances computedfrom the observed data. Each peptide is therefore represented by two statistical confidence metrics,one for qualitative differential observation and one for quantitative differential intensity. We use threeLC-MS data sets to demonstrate the robustness and sensitivity of the IMD-ANOVA approach.
Keywords: Missing data • peak intensity comparison • quantitative statistical analysis • qualitativestatistical analysis • imputation
IntroductionMeasuring quantitative and qualitative changes in the global
profile of proteins by high-resolution mass spectrometrycoupled with liquid chromatography (LC-MS) is key to suchfields as biomarker discovery and systems biology. An LC-MSglobal protein profile is based on whole-cell protein extractionsand the identification of enzymatically cleaved peptides, forwhich peptide abundances are estimated from the extractedion-chromatographic intensities,1-4 allowing a quantitativemeasure of each peptide. This ability to make quantitativemeasurements means that one can associate changes in theglobal profile of proteins with factor-based changes in theunderlying biological system. Here, factors are the categoricalseparations, or groups (e.g., time, exposure, treatment, disease),of individual samples, defined in controlled experiments tomeasure a biological effect. Thus, the output from LC-MSexperiments can generally be defined as a set of measurementsover J peptides, across N samples separated into K groups,where groups may represent a single or combination of factors.Similar to microarrays, this experimental design allows statisti-cal analyses to identify peptides and subsequently proteins thatchange based on the “treatment” group.
There are obvious analysis parallels between transcriptomicsand proteomics data since the goal of both approaches is tomeasure whole cell complements of biomolecules (RNA and
protein, respectively) up to the limitations of the technologies.Conceptually, after feature extraction and quantification fromthe raw data, both technologies result in similar data repre-sentations, i.e., a matrix where the columns represent distinctsamples (microarray hybridizations or MS runs), and the rowsare associated with the entity measured, which is usually probesor peptides.5 Downstream statistical analysis methods havebeen designed and validated for microarray data, and many ofthese methods have been used extensively in the analysis ofLC-MS and LC-MS/MS proteomics data.1,5,6 However, asnoted by Li and Roxas,7 fundamental differences between thesetwo types of data challenge the appropriateness of statisticalmethods designed for microarray analysis when applied toproteomics data.
One of the key differences between transcriptomics andproteomics data is the fraction and underlying reason formissing values in the data matrix. The missing values inmicroarray data are typically minimal with modern technolo-gies and are generally due to issues such as printing artifacts,scratches, and other processing issues; thus, data are missingat random. Standard imputation approaches such as K-nearestneighbors (KNN) work relatively well8 for random missing data,and advances in imputation methods such as clustering ofmicroarray data9,10 continue to improve downstream analyses.With proteomic technologies the data can be missing fornumerous diverse reasons. For example, a peptide observedin one sample may not be observed in other samples due to* Corresponding author. E-mail: [email protected].
5748 Journal of Proteome Research 2010, 9, 5748–5756 10.1021/pr1005247 2010 American Chemical SocietyPublished on Web 09/10/2010

post-translational modification, sequence variation, alternativesplicing, or incomplete enzymatic cleavage; all of these biologi-cal and experimental variables hinder software-based peptideidentification.11-14 Alternatively, the peptide abundance maysimply be near or below the limits of detection of the platform;low abundance peptides are more difficult to consistentlyidentify. Moreover, a peptide may not be observed simplybecause it is not present; i.e., the parent protein is notexpressed in a defined experimental groupsthese peptides areof particular importance because their differential expressionis associated with a biological effect. In effect, a priori it isunknown if a specific peptide is missing in an individualanalysis at random or due to some systematic, biological effect(censored). Proteins that are significantly different due to thepresence/absence (qualitatively significant) between experi-mental groups are of special interest in many proteomicsanalyses because they have the potential to be used as clinicalbiomarkers.
In proteomics analyses, the missing data are often imputedusing simple approaches, and then differential peptide orprotein abundances are identified by univariate statistical testssuch as a t test or analysis of variance (ANOVA).1,6,15 However,imputation of the missing values changes both the mean andvariance structures of the data, and therefore imputation mayinvalidate the results of these common statistical tests. Ad-ditionally, proteomics data sets are often filtered prior toanalysis by some minimum level of occurrence, which isgenerally based on arbitrary user rules; e.g., the peptide isobserved in at least 50% of the samples within an experimentalgroup or across all runs.16,17 These occurrence filters aid in theremoval of peptides with inadequate data but may inadvert-ently remove peptides associated with proteins that havequalitative differences. An alternate to these simple filters basedon counts in specific groups is model-based filtering.15 A pro-tein-specific additive model-based filter selects, for each pro-tein, the subset of all identified peptides that maximize theprotein-level group differences, i.e., produces optimal informa-tion content. Only those in the optimal set are retained forfurther analyses. If the protein does not have a collection ofpeptides that produce an identifiable model, then none of thepeptides from the parent protein are retained for furtheranalysis. In many cases, this approach produces biases in thedata similar to the ANOVA filter because if there are notadequate data to estimate more than one group mean thenthe model will not be identifiable for the protein.
The present work describes an approach for the analysis ofproteomics data at the peptide level that combines a statisticaltest of peptide intensities with a statistical test for the inde-pendence of missing data (IMD) from an experimental group.Our focus herein is to develop a statistically robust approachto identify a data matrix of peptides that contain significancerelated to experimental conditions. These peptide lists maythen be interpreted at the peptide level or provide robustpeptide data for processing at the protein level. Specifically,we employ a standard ANOVA, or nonparametric equivalent,when adequate data are present to estimate the peptide meanand variance for the observed intensity values. To assess theindependence of missing data from an experimental group, weuse a modified �2 test of independence called a G-test, whichis best suited to data sets with a small number of samples orwith many missing values, a common characteristic of pro-teomics data. The combination of these two methods, calledIMD-ANOVA, therefore quantifies significance using both
peptide intensity and peptide occurrence, therefore capturingboth quantitative and qualitative differences, respectively. Apeptide may be significant by only one or both tests.
We demonstrate the robustness of the IMD-ANOVA ap-proach on two experimental LC-MS data sets. Analyses of thesedata sets by a traditional ANOVA-after-imputation approachresulted in large numbers of significant peptides due to a biasintroduced by imputation of the missing data, when either limitof detection (LOD) or K-nearest neighbor (KNN) methods wereused for imputation. IMD-ANOVA did not introduce this bias,yielding a more statistically robust result for these data sets.Lastly, we applied the IMD-ANOVA approach to a proteomicsdata set from a cell culture/virus infection experiment, wherethe presence of viral proteins was known a priori to demon-strate that the G-test can more accurately identify peptidesassociated with proteins with differential occurrence thanmodel-based approaches that depend on group averages.
Material and Methods
LC-MS Data Sets. Three LC-MS data sets from independentMS proteomics experiments were used to compare the G-teststatistical procedure to traditional approaches for statisticalanalysis of proteomics data sets. The first experimental dataset is associated with a study designed to detect microbialrespiratory infections of mice by analyzing bronchial alveolarlavage fluid (BALF). The second data set is associated with anexperiment designed to detect changes in protein profilescorrelated with smoking status, by analyzing human plasmasamples. The third data set is associated with a time-seriesexperiment of influenza infection of Calu-3 epithelial cells; thisdata set has the lowest level of run-to-run variability, as wellas known qualitative differences (presence/absence of influenzaproteins).
All BALF and plasma samples were analyzed using an LTQ-Orbitrap mass spectrometer (Thermo Electron Corp., Waltham,MA) with nanoelectrospray ionization. All Calu-3 samples wereanalyzed using an Exactive mass spectrometer (Thermo Elec-tron Corp.). Spectra were collected at 400-2000 m/z with aresolution of 100k and analyzed using the accurate mass andelution time (AMT) tag approach.18 Features from the LC-MSanalyses were matched to AMT tags to identify peptides, usingan initial tolerance of (6 ppm for mass and 0.025% for the LCnormalized elution time (NET). The mass deisotoping processwas performed using Decon2LS,19 and the matching processwas performed using VIPER.20 BALF and plasma peptideabundance data were further processed to remove peptidesidentified with low confidence, using a uniqueness filter of aSLiC21 score of 0.5 and a DelSLiC of 0.2.21 Calu-3 peptideabundance data were processed using a SLiC score of 0.35.
Mouse BALF Data Set (BALF). Young male mice (C57/BL)were subjected to aerosol exposure to one of three organisms:virulent strains of Francisella novicida (FTN) or Pseudomonasaeruginosa (PA) or an avirulent strain of F. novicida (MGLA)containing a mutation in the transcriptional regulator genemglA. The C57/BL mice were exposed to one of the abovepathogens and sacrificed at one of three time points, 0, 4, or24 h. The BALF of four mice was analyzed for each exposureand time point with no technical replicates; additional experi-mental detail is available.22,23 For the purposes of this study,the samples from postinfection time points (4 and 24 h) werecombined into single groups of size 8 for each pathogen.Proteomic analysis as described above returned 3272 peptideswhich were identified at least once with appropriate confidence
Statistical Analyses of Peptide Intensities and Occurrences research articles
Journal of Proteome Research • Vol. 9, No. 11, 2010 5749

thresholds. Thus, each sample consisted of 3272 peptides, eachwith either a measured abundance or a missing value. Eachsample data set was log 10 transformed and normalized usingmedian absolute deviation (MAD) scaling. The final, combineddata set thus consisted of a matrix representing 3272 peptides,with values in four total groups (Control, FTN, PA, and MGLA)with 12, 8, 8, and 8 samples each, respectively.
Human Plasma Data Set (Plasma). Plasma samples of 27representative individuals from a cohort of 500 tobacco smok-ers or nonsmokers were selected for proteomics. The con-founding factors of age, body mass index (obesity), and genderwere also captured but ignored herein to demonstrate thestatistical approach on a data set with large within- andbetween-group variability and with larger sample numbers(g10) than we had with the mouse infection study (BALF). Atotal of 6459 peptides were identified with statistical confidencein at least one of 71 data sets (27 plasma samples each with 2or 3 technical replicates each). The data were log 10 trans-formed and normalized using a MAD scaling factor, and thepeptide intensities from the technical replicates were averagedto provide peptide intensities representative of each plasmasample. The final data set thus consisted of a matrix of 6459peptides, with values for 27 samples separated into two groups(smokers and nonsmokers), with 13 and 14 samples each,respectively.
Calu-3 Cell Line/Viral Data Set (VN1203). Calu-3 cells, ahuman lung adenocarcinoma cell line, were exposed to avianinfluenza virus A/Vietnam/1203/2004 (H5N1) (VN1203). Cellmonolayers were inoculated with VN1203 for 50 min at 37 °C,and sham-infected controls were inoculated with medium only.Following inoculation, monolayers were rinsed and incubatedfor times 0, 3, 7, 12, 18, and 24 h. Samples were run withtriplicate technical replicates and returned 25 747 and 288 totalpeptides identified at least once with appropriate confidencethresholds against either the Calu-3 cell or viral proteins,respectively. For the purpose of this study, we focus on theviral peptides because they have known differential occurrencebetween the sham and infected groups. To ensure we have adata set of differential occurrence, we used the 7 h and latertime points for comparative purposes as the 0 and 3 h infectedcells generally have expression of the viral proteins below limit-of-detection. Peptides with one occurrence were filtered out;the data were log 10 transformed and normalized using a MADscaling factor; and the peptide intensities from technicalreplicates were averaged to provide peptide intensities repre-sentative of each sample. The final data set thus consisted ofa matrix representing 255 peptides, with values for 23 samplesseparated into two groups (no exposure and influenza exposed)of 11 and 12 samples each, respectively. This data set was usedas a benchmark with known qualitative differences sinceinfluenza proteins should not be identified in the sham-infectedsamples.
G-Test Statistical Procedure. A �2 test of independence is astatistical test to compare the relationship between two factorsassociated with the data.24 For the missing data problem inproteomics, these two factors are: (1) the K experimental groupsand (2) the two missing data states (observed or absent). Thenull hypothesis is that the number of missing observations isindependent of the groups (e.g., smokers vs nonsmokers). Thenumber of times each peptide is observed and absent acrossthe samples associated with group k can be defined as countsCOk and CAk, respectively. On the basis of the total number ofpeptides observed (O) and absent (A) from a sample, the
expected number in each group by random chance can becomputed as EOk ) (mOnk)/N and EAk ) (mAnk)/N, where N isthe total number of samples from which mO and mA are thenumber observed and absent, respectively (mO + mA ) N); nk
is the number of samples associated with group k; and K isthe total number of groups. Given the counts of observed andabsent peptides and the expected values, the �2 test statisticcan be computed as
The statistical significance is then derived from a �2 distributionwith (K - 1) degrees of freedom. If the measured counts andexpected values are similar, then the �2 test statistic will besmall and result in a large p-value; if they are not similar, thenthe p-value will be small, indicating that the missing data arenot dispersed as would be expected by random chance.
The �2 test of independence assumes that there are anadequate number of observations for a normal approximationof the underlying multinomial distribution. A general rule ofthumb for this assumption is that most expected values usedin the test (EOk and EAk) should be greater than five.24 Withproteomics data, expected values of less than 5 are highly likely,especially for studies with small sample numbers, eitherglobally or within an experimental group. In addition, for trulycensored peptides, the observed values will be near zero andconsequently result in small expected values. A modifiedversion of the �2 test of independence, called a G-test, can beused where these conditions for the �2 test of independenceare not met. The G-test statistic is computed as
The sum is taken over all nonzero counts, and the statisticalsignificance is still derived from a �2 distribution with (K - 1)degrees of freedom. Since the censored peptides of interest willhave a large amount of missing data, the G-test is generallythe most appropriate and for simplicity is used exclusively inthis study.
A comparison of the G-test to ANOVA under simulatedscenarios of missing data is given in the Supporting Informa-tion. The approach for simulating the data and the results ofthe simulation are presented in the Supporting Informationmethods and associated Figures S1-S3. The results demon-strate that ANOVA-based analyses in the presence of missingdata do not identify censored peptides as significant beyondwhat is expected by chance, a key motivating factor of theG-test approach. The G-test was implemented and evaluatedin MatLab (version 7.10.0.499, R2010a, The Mathworks Inc.,Natwick, MA). The basic MatLab implementation code forcomputing the G-value and associated significance value isgiven in Figure S4 (Supporting Information).
Statistical Occurrence Filtering. An occurrence filter istypically applied to proteomics data to remove peptide obser-vations for which the data are inadequate for statistical analysis.For example, if a peptide is observed only one time across aseries of samples, it is evident that there is not enough data toinfer a differential abundance via statistics, regardless ofwhether the observation is accurate. Common occurrence
�2 ) ∑k
[(COk - EOk)2
EOk+
(CAk - EAk)2
EAk] (1)
G ) 2 ∑k
[COk ln(COk
EOk) + CAk ln(CAk
EAk)] (2)
research articles Webb-Robertson et al.
5750 Journal of Proteome Research • Vol. 9, No. 11, 2010

filters are based on a minimum number of measured intensityvalues for a peptide within a treatment group.6,16 Since twoobserved intensity values are the minimum needed to computea SD, this is the minimum occurrence filter that can theoreti-cally be applied. However, in practice, ANOVA must have twogroups to compare, so at least two observed intensity valuesin each of the two distinct groups is the minimum numbernecessary if one is to use ANOVA.16 This “ANOVA-filter” can,however, eliminate peptides with a large number of observa-tions in a single group, i.e., peptides with a qualitative differ-ence. Thus, we describe a “G-test filter” that is based on thetheoretical number of observations of a peptide that any singlegroup must have to be significant in the absence of observa-tions in any of the remaining groups. The minimum numberof peptides that must be present within a single group can besolved by a simple integer programming problem for eachgroup k
This equation can be solved very quickly by setting tk ) 1 andincrementally increasing by 1 until the G-value results in ap-value of less than 0.05 based on the �2 distribution. Underspecific scenarios of large numbers of very small groups, tk maybe undefined, meaning that at tk ) nk the significant value isstill not less than 0.05. In this case, tk is set to be equal to nk.A standard 0.05 threshold is used in this study, but a user canset any threshold desired to eliminate peptides based on theneeds of the study; for example, a corrected p-value thresholdfor multiple comparisons would be called for in some studies.We combine an ANOVA-filter (at least two observations in twodistinct groups) and this G-filter to analyze our real proteomicsdata sets (described above). The identification of the G-testfiltering values was implemented and evaluated (Version7.10.0.499, R2010a, The Mathworks Inc., Natwick, MA). BasicMatLab implementation code for identification of the numberof peptides required for G-filtering is given in Figure S5(Supporting Information).
Results and Discussion
ANOVA is based on a comparison of variance betweentreatment groups to variance within treatment groups. Inparticular, the ratio of the between to within group variance isused to compute the test statistic, which is estimated by anF-distribution.24 This ratio becomes larger as the quantitativedifferences become more extreme, and the p-value computedfrom the F-distribution becomes small. However, if adequatedata are not available to compute these estimates of variance,as is the case with peptides exhibiting a qualitative (occurrence)difference between groups, the test statistic (F) is undeter-mined, and no statistical assessment of the data is possible.
Thus, ANOVA-based analyses in the presence of missing datacannot identify these censored peptides simply due to a lackof adequate data to estimate a group mean (see Figures S1 andS2, Supporting Information). We first demonstrate how theG-test filter can be combined with the ANOVA-filter (GA-filter)to retain the most complete peptide data. Since the peptidedata are the first step to protein-level inferences, the identifica-tion of the appropriate set of peptides for analysis is essential.Subsequently, we demonstrate how the GA-filter affects proteinidentification in comparison to model-based filtering. Lastly,we compare the G-test directly to ANOVA on imputed data.
Statistical Occurrence Filtering on Peptide Data Sets. Realproteomics data are generated by a mass spectrometer on arun-by-run basis, which yields a set of observed and missingvalues for a given peptide across runs (which may be samplesor technical replicates of samples), as discussed above. It isnot uncommon in an experiment for a peptide to be observedin so few runs that the data are inadequate for statisticalanalysis, and keeping those peptide observations in the dataset provides no benefit. Not filtering these rarely observedpeptides affects downstream analyses, such as false discoveryrate corrections that rely on the number of comparisonsmade.25 The GA-filtered peptide list is the result of using acombination of a standard threshold-filter, i.e., our “ANOVA-filter”, as well as our proposed G-filter (see Methods, eq 3).Basic MatLab code to implement the GA-filter is given in FigureS6 (Supporting Information). The ANOVA-filter used here is athreshold of two (at least two values in each of two distinctgroups), although any level can be specified (three is a commonthreshold).
By applying both an ANOVA- and G-filter to the experimentalBALF and Plasma data sets, no peptides with only one or twoobservations passed either filter, and peptides with three (total)measured intensities did not pass the ANOVA-filter, althoughthese may have passed the G-filter (if all three observationswere within the same group). This combined filter reduced theexperimental BALF and Plasma data sets to ∼53.5% and ∼79.2%of their original data size, respectively. We also examined themodel-based filter presented by Karpievitch et al.,15 to deter-mine if censored peptides would be retained in the context ofthe global protein model. Figure 1 gives the exact numbers ofpeptides retained by each filter and their overlap.
For the BALF data set, there were 1347 peptides retained inthe data set when using the ANOVA-filter. An additional 386peptides were retained by the G-filter, of which 345 (∼85.4%)are significant by a G-test at a p-value of less than 0.05 and
minimize: tk
subject to:COk ) tk
CAk ) nk - tk
∀j*k
COj ) 0
∀j*k
CAj ) nk
G ) 2 ∑k
[COk ln(COk
EOk) + CAk ln(CAk
EAk)]
�2(G, K - 1) < 0.050 < tk e nk
tk integer
(3)
Figure 1. Number of peptides retained by peptide occurrencefiltering and the overlap and uniqueness of the ANOVA, G-test,and model-based occurrence filters. Only the G-test filter retainspeptides that occur predominantly in a single treatment group.
Statistical Analyses of Peptide Intensities and Occurrences research articles
Journal of Proteome Research • Vol. 9, No. 11, 2010 5751
198 at a false discovery rate (FDR) corrected p-value of 0.05using a standard Benjamini-Hochberg correction.25 An ex-ample of one of these peptides is one for which 11 measuredintensity values were observed: one measurement in each ofthe first three groups and eight in the last group (FTN). Sincethere were not at least two groups with two measured intensityvalues, this peptide was deemed as having inadequate data bythe ANOVA-filter. However, given its observation pattern, onemight infer that this peptide is censored, present in the FTNgroup, and missing from the otherssan inference that wasstrongly supported by a p-value of less than 1 × 10⁻⁵ by theG-test. The model-based filtering retained fewer peptides (929total) than either the ANOVA- or G-filter, and these largelyoverlap with the peptides retained by one of the other filters.The 29 peptides uniquely retained by the model-based filteringwere all peptides with intensity values present in all fourgroups, but with too few values in each group to be retainedby a standard peptide-level ANOVA-filter or a G-test filter. ThePlasma data set returned similar results (Figure 1B); a largenumber of peptides (512 total) were retained by only theG-filter, and the 103 peptides uniquely retained by the model-based filter were those with low numbers of observations(exactly three observations dispersed between the two groups).
Our combination of the G-test filter and ANOVA-filter (GA-Filter) provides a methodology to filter peptides that have toolittle data for downstream statistical analyses, while retainingpeptides with the potential to be either quantitatively orqualitatively different across groups. Although these occurrencefilters could potentially be combined with any other filters ofinterest (including a model-based filter), our results suggest thatthe GA-filter retains the most complete data set to moveforward into the protein inference and quantitation steps.
Influence of Statistical Occurrence Filtering on Protein-Level Analysis. The primary goal of this study is the identifica-tion of an appropriate set of peptides from proteomics data tocarry forward to downstream analyses, most notably theidentification of significant protein-level differences betweenexperimental groups. Although we do not address the chal-lenging problem of inference of significant proteins in thisstudy, it is instructive to examine at the protein level the effectof the filters described above.
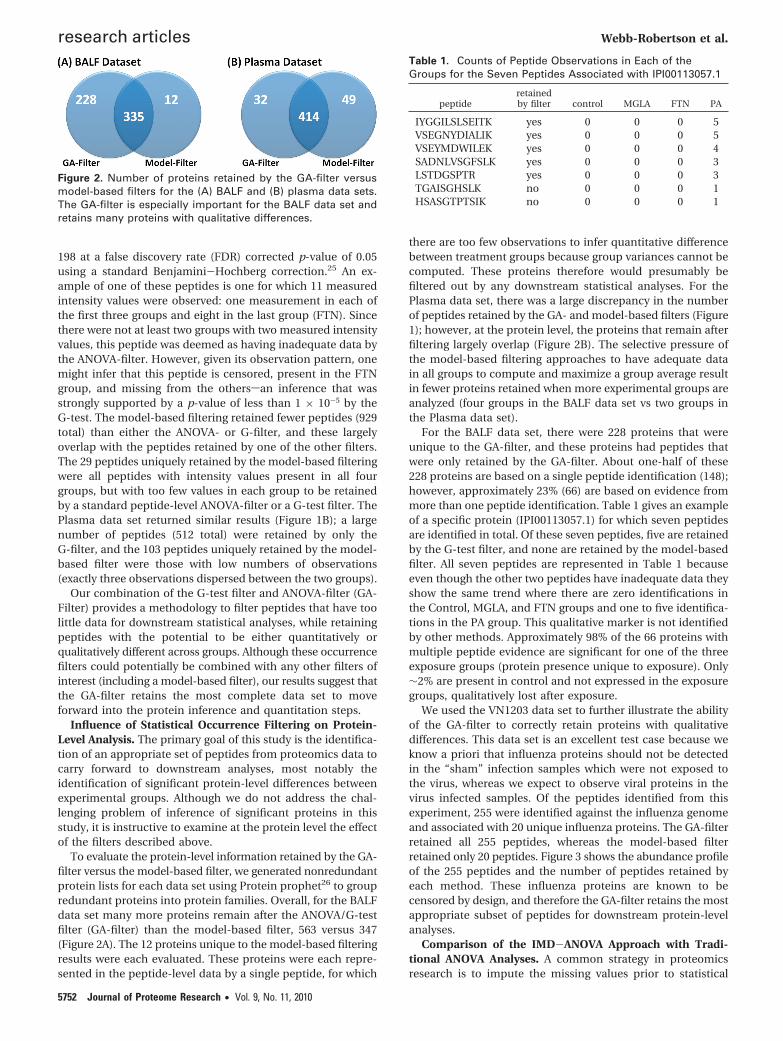
To evaluate the protein-level information retained by the GA-filter versus the model-based filter, we generated nonredundantprotein lists for each data set using Protein prophet26 to groupredundant proteins into protein families. Overall, for the BALFdata set many more proteins remain after the ANOVA/G-testfilter (GA-filter) than the model-based filter, 563 versus 347(Figure 2A). The 12 proteins unique to the model-based filteringresults were each evaluated. These proteins were each repre-sented in the peptide-level data by a single peptide, for which
there are too few observations to infer quantitative differencebetween treatment groups because group variances cannot becomputed. These proteins therefore would presumably befiltered out by any downstream statistical analyses. For thePlasma data set, there was a large discrepancy in the numberof peptides retained by the GA- and model-based filters (Figure1); however, at the protein level, the proteins that remain afterfiltering largely overlap (Figure 2B). The selective pressure ofthe model-based filtering approaches to have adequate datain all groups to compute and maximize a group average resultin fewer proteins retained when more experimental groups areanalyzed (four groups in the BALF data set vs two groups inthe Plasma data set).
For the BALF data set, there were 228 proteins that wereunique to the GA-filter, and these proteins had peptides thatwere only retained by the GA-filter. About one-half of these228 proteins are based on a single peptide identification (148);however, approximately 23% (66) are based on evidence frommore than one peptide identification. Table 1 gives an exampleof a specific protein (IPI00113057.1) for which seven peptidesare identified in total. Of these seven peptides, five are retainedby the G-test filter, and none are retained by the model-basedfilter. All seven peptides are represented in Table 1 becauseeven though the other two peptides have inadequate data theyshow the same trend where there are zero identifications inthe Control, MGLA, and FTN groups and one to five identifica-tions in the PA group. This qualitative marker is not identifiedby other methods. Approximately 98% of the 66 proteins withmultiple peptide evidence are significant for one of the threeexposure groups (protein presence unique to exposure). Only∼2% are present in control and not expressed in the exposuregroups, qualitatively lost after exposure.
We used the VN1203 data set to further illustrate the abilityof the GA-filter to correctly retain proteins with qualitativedifferences. This data set is an excellent test case because weknow a priori that influenza proteins should not be detectedin the “sham” infection samples which were not exposed tothe virus, whereas we expect to observe viral proteins in thevirus infected samples. Of the peptides identified from thisexperiment, 255 were identified against the influenza genomeand associated with 20 unique influenza proteins. The GA-filterretained all 255 peptides, whereas the model-based filterretained only 20 peptides. Figure 3 shows the abundance profileof the 255 peptides and the number of peptides retained byeach method. These influenza proteins are known to becensored by design, and therefore the GA-filter retains the mostappropriate subset of peptides for downstream protein-levelanalyses.
Comparison of the IMD-ANOVA Approach with Tradi-tional ANOVA Analyses. A common strategy in proteomicsresearch is to impute the missing values prior to statistical
Figure 2. Number of proteins retained by the GA-filter versusmodel-based filters for the (A) BALF and (B) plasma data sets.The GA-filter is especially important for the BALF data set andretains many proteins with qualitative differences.
Table 1. Counts of Peptide Observations in Each of theGroups for the Seven Peptides Associated with IPI00113057.1
peptideretainedby filter control MGLA FTN PA
IYGGILSLSEITK yes 0 0 0 5VSEGNYDIALIK yes 0 0 0 5VSEYMDWILEK yes 0 0 0 4SADNLVSGFSLK yes 0 0 0 3LSTDGSPTR yes 0 0 0 3TGAISGHSLK no 0 0 0 1HSASGTPTSIK no 0 0 0 1
research articles Webb-Robertson et al.
5752 Journal of Proteome Research • Vol. 9, No. 11, 2010

analysis. A simple approach to impute missing peptide intensityvalues is to insert, for each given peptide with missing values,a simple constant defined as 1/2 of the minimum observedabundance of that peptide.6 This quasi-LOD imputation as-sumes that the missing values are due to analytical sensitivity.More advanced approaches, such as K-nearest neighbors (KNN)or singular value decomposition (SVD), assume a correlativestructure in the data, so that peptides with similar intensitypatterns can be used to infer the intensities of the missingpeptide values. More recent model-based methods performmore advanced imputation15 based on the distribution of theobserved data, but at the caveat of requiring preimputationfiltering that removes many peptides that are significant to theG-test as shown in Figure 1. Therefore, the model-basedimputation approach is not compared.
IMD-ANOVA combines ANOVA to identify quantitativedifferences in the presence of missing data with the G-test toexamine the missing data structure for qualitative differences.In particular, if adequate observations and intensity data arepresent for a peptide, then variance estimates can be attainedfor the observed intensity values, and a standard t test orANOVA-based analysis can be performed; otherwise, the p-value for ANOVA is 1. For missing data, the central question ofimportance is whether the missing peptides are associated witha particular experimental group; thus, if a peptide is observedin all samples, the p-value for the G-test would be 1, and thenull hypothesis that the data are missing at random is notrejected. The larger the p-value, the more likely the data aresimply missing in a random manner with respect to theexperimental groups. The combination of these two methods,called IMD-ANOVA, therefore quantifies significance usingboth peptide occurrence and peptide intensity and is per-formed without imputation. A peptide may be significant byonly one or both tests. For example, suppose a peptide isobserved in samples that represent three experimental treat-ment groups and that the peptide is measured with high
frequency in the first two groups but is missing (i.e., censored)from the third group. This peptide would have a significantqualitative difference by the G-test. If there is a quantitativedifference between the measured intensity values in the firsttwo groups, then it would also be significant by ANOVA andtherefore would have a significant result for both ANOVA andG-test. If there was no quantitative difference between themeasured values in the first two groups, then it would besignificant by the G-test only.
Because we have shown that occurrence filtering of the datausing a GA-filter eliminates peptides with inadequate data forstatistical analysis, we use the filtered BALF and Plasma datasets (Figure 1) to compare analysis approaches. Specifically,we analyzed the peptide intensities to determine differencesidentified as significant for differential abundance by ourIMD-ANOVA approach and compared them with results fromANOVA with the missing data imputed by LOD or KNN-1. KNNwith more neighbors (2, 3, and 4) was also evaluated (data notshown) but correlated highly with KNN-1, and thus only resultsusing KNN-1 are presented.
The BALF and Plasma data sets consisted of 1733 and 5117peptides, respectively, after the GA-filter (Figure 1). UsingIMD-ANOVA and a standard Benjamini-Hochberg25 FDRcorrection for multiple comparisons, the BALF and Plasma datasets return 541 and 127 peptides, respectively, that are signifi-cant by either ANOVA or G-test (Figure 4) at a q-value of 0.05.As seen in Figure 4, the same peptides are generally notcaptured by both statistical tests. The significant peptidesidentified using the IMD-ANOVA approach were comparedto those identified by ANOVA after LOD or KNN-1 imputation(Figure 5). A large number of peptides identified as significantby the G-test were not identified by ANOVA when the missingdata were imputed.
Figure 5 shows that there are many peptides identified assignificant using only specific approaches, especially after
Figure 3. Overall graphical representation of the VN1203 data set.The top graphic shows that the 255 identified viral peptides arenearly all absent from the sham group (black) but have varyingabundance values in the virus group. On the bottom is a bargraph that shows the number of peptides retained by the model-based filter versus the GA-filter of the 20 viral proteins identifiedby proteomics. Only 9 of these 20 proteins with known qualitativedifferences are retained by the model-based filter, and those areonly represented by a small fraction of the total identifiedpeptides.
Figure 4. Overlap and uniqueness between the peptides identifiedas significant at an FDR corrected p-value of 0.05 by ANOVA andG-test. The G-test for missing data identifies significant numbersof peptides as having a treatment-related difference in occurrence.
Figure 5. Overlap and uniqueness between the peptides identifiedas significant at a FDR corrected p-value of 0.05 by IMD-ANOVA,ANOVA LOD, and ANOVA KNN-1.
Statistical Analyses of Peptide Intensities and Occurrences research articles
Journal of Proteome Research • Vol. 9, No. 11, 2010 5753

imputation when ANOVA or G-test does not find them signifi-cant prior to imputation. For example, the large number ofpeptides unique to the ANOVA (KNN-1) illustrates a commonproblem for KNN imputation: when peptide observations arefew, the chance of false positive significance is increasedbecause one is imputing using intensities of a peptide whichdoes exhibit significant differential abundance, even thoughthere are not adequate data in the raw form to make such aninference. To demonstrate issues with imputation, we selectedseveral peptides for individual evaluation. The first example(ESTLHLVLR) shown in Figure 6 is a peptide significant byANOVA which becomes nonsignificant after imputation, andthe second example (DLLFRDDTK) displays the reverse trend(Figure 7), which is much more common.
For the peptide shown in Figure 6, the G-test returns ap-value of 0.405; that is, there was no group for which the data
were missing at a greater frequency than expected by randomchance. In fact, the peptides are observed in g62.5% of thesamples within each group. This peptide also had sufficientdata for ANOVA analysis, and the box plot in Figure 6A showsa clear separation of the PA group from the FTN and controlgroups, resulting in a p-value of 0.016 from ANOVA. Imputingthe missing values for this peptide with an LOD constant(Figure 6B) significantly changed the variance structure of thedata, especially for the PA group which became skewed by thelow intensity “outliers” that were introduced by imputation.This LOD imputation caused a nonsignificant result (p-value∼0.45 from ANOVA). The KNN-1 imputation was also prob-lematic (Figure 6C) because the nearest neighbor peptide hadsome very low intensities, which affected the variance of thispeptide (ESTLHLVLR) in a manner similar to the LOD imputa-tion, resulting in a p-value of ∼0.47 from ANOVA.
Figure 6. Comparison of the boxplots and abundance values for (A)/(D) the raw data, (B)/(E) LOD imputed data, and (C)/(F) KNN-1imputed data for peptide ESTLHLVLR. Peptide ESTLHVLR is significant when analyzed by ANOVA when ignoring missing data (A) butbecomes nonsignificant after LOD or KNN-1 imputation due to variance introduced by the imputation method, (B) and (C), respectively.
Figure 7. Comparison of the boxplots and abundance values for (A)/(D) the raw data, (B)/(E) LOD imputed data, and (C)/(F) KNN-1imputed data for peptide DLLFRDDTK. Peptide DLLFRDDTK is not significant when analyzed by ANOVA when ignoring missing data(A) but becomes significant after LOD or KNN-1 imputation due to variance introduced by imputation, (B) and (C), respectively.
research articles Webb-Robertson et al.
5754 Journal of Proteome Research • Vol. 9, No. 11, 2010

Similar to the peptide data shown in Figure 6, the peptidein Figure 7 had observed intensity values in at least 75% ofsamples across groups. Again, given the large number ofobserved values in all groups, this peptide was not significantby G-test (p-value of 0.326). Evaluation of the raw data (Figure7A, D) showed that except for a few low intensities in thecontrol group the peptide intensities are similar across groups,and ANOVA appropriately returned a p-value of 0.134. How-ever, when the missing values were imputed by LOD, the meanof the control group was significantly reduced, becomingstatistically smaller than the FTN group mean (p-value of 0.045),but this significance was merely an artifact because the FTNgroup happened to be the one group with no missing observa-tions and thus no imputed values. A similar artifactual signifi-cance is returned from KNN-1 because the imputed intensitieswere not similar to the observed intensities. This exampleillustrates the danger of imputing missing values and creatingfalse positive significant peptides when the data clearly dem-onstrate otherwise.
These examples demonstrate that the LOD and KNN-1imputed values may introduce variance structures that causefalse positive and false negative results using ANOVA with theimputed values. To be precise, the largest issue with imputationis that it can alter the means and SDs of a peptide’s intensityvalues, either creating artificial significance or masking truesignificance. Examination of the subset of peptides significantby IMD-ANOVA but not ANOVA with imputation showed thatthese are largely peptides present in only one or two groupsand absent from the others, demonstrating that the IMD-ANOVA procedure performed as expected, successfully iden-tifying censored peptides.
Conclusions
IMD-ANOVA integrates a statistical test across means(ANOVA) with a statistical test of missing data (G-test) to yieldmore accurate and sensitive results over common approacheswhen analyzing measured peptide intensity values acrossdefined treatment groups. The G-test is especially useful sincethe results are not affected by other data processing procedures,such as normalization. The G-test is based only on the numberof peptide observations and does not consider peptide intensi-ties. The IMD-ANOVA approach was compared to ANOVA(LOD) and ANOVA (KNN-1) to demonstrate that the variancestructure of the data can be adversely affected by the imputedpeptide intensities and that imputation ultimately createsbiases that change the significance of a large number ofpeptides. It is not surprising that imputation methods havebeen difficult to validate in proteomics, and very little has beenpublished in this area, particularly since truth is rarely known.Even when data are missing from microarrays at random, theresults can be affected by imputation.9,10,27 As noted byTroyanskaya et al., regarding microarray analyses, “estimateddata should be flagged where possible, and its significance onthe discovery of biological results should be assessed to avoiddrawing unwarranted conclusions”.8 Since the amount ofmissing data in proteomics is much larger than its transcrip-tomic counterpart (and not at random in many cases), theproteomics community should be very cautious of methodsto impute missing data.
The primary benefit of IMD-ANOVA is that it offers anapproach to analyze a proteomics data set in the presence ofmissing data without further biasing the statistical conclusions.As observed in Figure 3, the GA-filtering approach retained
proteins with qualitative differences that are not evaluated inmodel-based methods. Future work should determine the bestapproach to the identification of statistically significant proteinsbased on various levels of peptide evidence, such as G-test.Lastly, ANOVA is available through any statistical package, andthe G-test is very easy to implement based on eq 2 using simplecounts of observed and absent intensity values for a peptide.Code to generate the G-value and G-filter and to implementthe GA-filter is provided in Figures S4-S6 (Supporting Infor-mation). Although the method is demonstrated at the peptidelevel, the same methods for statistical analysis would beapplicable at the protein level.
Acknowledgment. This work was supported in partby the National Institutes of Health under grant 1R011GM-084892 (BJWR) from the National Institute of GeneralMedical Sciences, from the National Institute of Environ-mental Health Sciences under grant U54 016015 (JGP), fromthe National Institute of Allergy and Infectious Diseaseunder contract number HHSN272200800060C (KMW), andthrough the Environmental Biomarkers Initiative underLaboratory Directed Research and Development. PacificNorthwest National Laboratory (PNNL) is a multiprogramlaboratory operated by Battelle for the U.S. Department ofEnergy under Contract DE-AC05-76RL01830. The proteomicsdata presented were processed by the Instrument Develop-ment Laboratory at the Environmental Molecular SciencesLaboratory (EMSL). EMSL is a national scientific user facilitysupported by the DOE. We thank Thomas Taverner andYuliya Karpievitch from the Biological Separations and MassSpectrometry group at PNNL for providing the model-basedfiltering routine and assistance with its application.
Supporting Information Available: Seven supportingdocumentation files are available. The first is the supportingdocumentation on the simulation and evaluation of data setsto evaluate the capability of the G-test to identify qualitativedata types. Six supporting figures are provided for moredetailed descriptions of (1) the distribution fit for the simulateddata, (2) the sensitivity and specificity of the G-test on thesimulated data, (3) the sensitivity and specificity comparing theG-test to ANOVA and Kruskal-Wallis on the simulated datasets, (4) MatLab code to compute the G-value in eq 2, (5)MatLab code to compute the G-filter in eq 3, and (6) MatLabcode to implement the GA-filter. This material is available freeof charge via the Internet at http://pubs.acs.org.
References(1) Brusniak, M. Y.; Bodenmiller, B.; Campbell, D.; Cooke, K.; Eddes,
J.; Garbutt, A.; Lau, H.; Letarte, S.; Mueller, L. N.; Sharma, V.; Vitek,O.; Zhang, N.; Aebersold, R.; Watts, J. D. Corra: Computationalframework and tools for LC-MS discovery and targeted massspectrometry-based proteomics. BMC Bioinf. 2008, 9, 542.
(2) Kiebel, G. R.; Auberry, K. J.; Jaitly, N.; Clark, D. A.; Monroe, M. E.;Peterson, E. S.; Tolic, N.; Anderson, G. A.; Smith, R. D. PRISM: adata management system for high-throughput proteomics. Pro-teomics 2006, 6 (6), 1783–90.
(3) Wang, G.; Wu, W. W.; Zeng, W.; Chou, C. L.; Shen, R. F. Label-freeprotein quantification using LC-coupled ion trap or FT massspectrometry: Reproducibility, linearity, and application withcomplex proteomes. J. Proteome Res. 2006, 5 (5), 1214–23.
(4) Zhu, Z.; Boobis, A. R.; Edwards, R. J. Identification of estrogen-responsive proteins in MCF-7 human breast cancer cells usinglabel-free quantitative proteomics. Proteomics 2008, 8 (10), 1987–2005.
(5) Pavelka, N.; Fournier, M. L.; Swanson, S. K.; Pelizzola, M.; Ricciardi-Castagnoli, P.; Florens, L.; Washburn, M. P. Statistical similarities
Statistical Analyses of Peptide Intensities and Occurrences research articles
Journal of Proteome Research • Vol. 9, No. 11, 2010 5755

between transcriptomics and quantitative shotgun proteomicsdata. Mol. Cell. Proteomics 2008, 7 (4), 631–44.
(6) Polpitiya, A. D.; Qian, W. J.; Jaitly, N.; Petyuk, V. A.; Adkins, J. N.;Camp, D. G., 2nd; Anderson, G. A.; Smith, R. D. DAnTE: a statisticaltool for quantitative analysis of -omics data. Bioinformatics 2008,24 (13), 1556–8.
(7) Li, Q.; Roxas, B. A. An assessment of false discovery rates andstatistical significance in label-free quantitative proteomics withcombined filters. BMC Bioinf. 2009, 10, 43.
(8) Troyanskaya, O.; Cantor, M.; Sherlock, G.; Brown, P.; Hastie,T.; Tibshirani, R.; Botstein, D.; Altman, R. B. Missing valueestimation methods for DNA microarrays. Bioinformatics 2001,17 (6), 520–5.
(9) Aittokallio, T. Dealing with missing values in large-scale studies:microarray data imputation and beyond. Briefings Bioinf. 2010,11 (2), 253–64.
(10) Celton, M.; Malpertuy, A.; Lelandais, G.; de Brevern, A. G.Comparative analysis of missing value imputation methods toimprove clustering and interpretation of microarray experiments.BMC Genomics 2010, 11, 15.
(11) Bafna, V.; Edwards, N. SCOPE: a probabilistic model for scoringtandem mass spectra against a peptide database. Bioinformatics2001, 17 (1), S13–21.
(12) Cannon, W. R.; Jarman, K. H.; Webb-Robertson, B. J.; Baxter, D. J.;Oehmen, C. S.; Jarman, K. D.; Heredia-Langner, A.; Auberry, K. J.;Anderson, G. A. Comparison of probability and likelihood modelsfor peptide identification from tandem mass spectrometry data.J. Proteome Res. 2005, 4 (5), 1687–98.
(13) Eng, K.; McCormack, A. L.; Yates, J. R., III. An approach to correlatetandem mass spectral data of peptides with amino acid sequencesin a protein database. J. Am. Soc. Mass Spectrom. 1999, 5, 976–989.
(14) Zhang, N.; Aebersold, R.; Schwikowski, B. ProbID: a probabilisticalgorithm to identify peptides through sequence database search-ing using tandem mass spectral data. Proteomics 2002, 2 (10),1406–12.
(15) Karpievitch, Y.; Stanley, J.; Taverner, T.; Huang, J.; Adkins, J. N.;Ansong, C.; Heffron, F.; Metz, T. O.; Qian, W. J.; Yoon, H.; Smith,R. D.; Dabney, A. R. A statistical framework for protein quantitationin bottom-up MS-based proteomics. Bioinformatics 2009, 25 (16),2028–34.
(16) Daly, D. S.; Anderson, K. K.; Panisko, E. A.; Purvine, S. O.; Fang,R.; Monroe, M. E.; Baker, S. E. Mixed-effects statistical model forcomparative LC-MS proteomics studies. J. Proteome Res. 2008, 7(3), 1209–17.
(17) Metz, T. O.; Qian, W. J.; Jacobs, J. M.; Gritsenko, M. A.; Moore, R. J.;Polpitiya, A. D.; Monroe, M. E.; Camp, D. G., II; Mueller, P. W.; Smith,R. D. Application of proteomics in the discovery of candidate proteinbiomarkers in a diabetes autoantibody standardization programsample subset. J. Proteome Res. 2008, 7 (2), 698–707.
(18) Smith, R. D.; Anderson, G. A.; Lipton, M. S.; Pasa-Tolic, L.; Shen,Y.; Conrads, T. P.; Veenstra, T. D.; Udseth, H. R. An accurate masstag strategy for quantitative and high-throughput proteomemeasurements. Proteomics 2002, 2 (5), 513–23.
(19) Jaitly, N.; Mayampurath, A.; Littlefield, K.; Adkins, J. N.; Anderson,G. A.; Smith, R. D. Decon2LS: An open-source software packagefor automated processing and visualization of high resolution massspectrometry data. BMC Bioinf. 2009, 10, 87.
(20) Monroe, M. E.; Tolic, N.; Jaitly, N.; Shaw, J. L.; Adkins, J. N.; Smith,R. D. VIPER: an advanced software package to support high-throughput LC-MS peptide identification. Bioinformatics 2007,2315, 2021–3.
(21) Anderson, K. K.; Monroe, M. E.; Daly, D. S. Estimating probabilitiesof peptide database identifications to LC-FTICR-MS observations.Proteome Sci. 2006, 4, 1.
(22) Beagley, N.; Stratton, K. G.; Webb-Robertson, B. J. VIBE 2.0: visualintegration for bayesian evaluation. Bioinformatics 2010, 26 (2),280–2.
(23) Webb-Robertson, B. J.; McCue, L. A.; Beagley, N.; McDermott, J. E.;Wunschel, D. S.; Varnum, S. M.; Hu, J. Z.; Isern, N. G.; Buchko,G. W.; McAteer, K.; Pounds, J. G.; Skerrett, S. J.; Liggitt, D.; Frevert,C. W. A Bayesian integration model of high-throughput proteomicsand metabolomics data for improved early detection of microbialinfections. Pac. Symp. Biocomput. 2009, 451–63.
(24) Ott, R. L.; Longnecker, M. An Introduction to Statistical Methodsand Data Analysis, 6th ed.; Brooks/Cole: Belmont, 2010.
(25) Hochberg, Y.; Benjamini, Y. More powerful procedures for multiplesignificance testing. Stat. Med. 1990, 9 (7), 811–8.
(26) Nesvizhskii, A. I.; Keller, A.; Kolker, E.; Aebersold, R. A statisticalmodel for identifying proteins by tandem mass spectrometry. Anal.Chem. 2003, 75 (17), 4646–58.
(27) Hu, J.; Li, H.; Waterman, M. S.; Zhou, X. J. Integrative missing valueestimation for microarray data. BMC Bioinf. 2006, 7, 449.
PR1005247
research articles Webb-Robertson et al.
5756 Journal of Proteome Research • Vol. 9, No. 11, 2010
Copyright © 2022 FDOKUMEN


![Noninvasive Molecular Imaging of MYC mRNA Expression in Human Breast Cancer Xenografts with a [ 99m Tc]Peptide−Peptide Nucleic Acid−Peptide Chimera](https://static.fdokumen.com/doc/165x107/63214cddbc33ec48b20e4a4a/noninvasive-molecular-imaging-of-myc-mrna-expression-in-human-breast-cancer-xenografts.jpg)


![Multiple Occurrences of Dark-bellied Brant (Branta [bernicla] bernicla) in North America](https://static.fdokumen.com/doc/165x107/6325b502584e51a9ab0bb660/multiple-occurrences-of-dark-bellied-brant-branta-bernicla-bernicla-in-north.jpg)