Self-Assembly of Short Peptide Derivatives
194
Self-Assembly of Short Peptide Derivatives Dissertation Presented in Partial Fulfillment of the Requirements for the Degree Doctor of Philosophy in the Graduate School of The Ohio State University By Tao Lin Graduate Program in Chemistry The Ohio State University 2021 Dissertation Committee Professor Jonathan R. Parquette, Advisor Professor Jovica D. Badjic Professor Psaras L. McGrier Professor Dale Hoyt
-
Upload
khangminh22 -
Category
Documents
-
view
1 -
download
0
Transcript of Self-Assembly of Short Peptide Derivatives

1
Self-Assembly of Short Peptide Derivatives
Dissertation
Presented in Partial Fulfillment of the Requirements for the Degree Doctor of Philosophy
in the Graduate School of The Ohio State University
By
Tao Lin
Graduate Program in Chemistry
The Ohio State University
2021
Dissertation Committee
Professor Jonathan R. Parquette, Advisor
Professor Jovica D. Badjic
Professor Psaras L. McGrier
Professor Dale Hoyt

2
Copyrighted by
Tao Lin
2021

ii
Abstract
The self-assembly of simple peptides and peptide derivatives are powerful method
in developing new nanomaterials for tissue engineering, targeted drug delivery,
optoelectronics, etc. Many of the self-assembly system comprise only one component and
designing and controlling multicomponent self-assembly is challenging since not only
force balance between individual components but also noncovalent interactions between
different component should be included in the study. Here, we investigated self-assembly
consist of peptide and protein and multicomponent self-assembly of different peptides.
We synthesized a series of peptide derivatives AAC1-7 which contained amino
acids with different charges and antioxidative moieties. The self-assembly of the peptide
derivatives were investigated. Among the all the AACs, AAC2 displayed low cytotoxicity
and the co-assembly of AAC2 and human insulin was studied. Further studies revealed that
AAC2 itself had promising effect on controlling glucose homeostasis in vitro. Animal
studies in type 1 diabetic mice revealed that AAC2 maintained glucose homeostasis as
insulin without increasing adiposity. AAC2 also increased brain mass and anxiety-related
behaviors in type 1 diabetic mice. Overall, AAC2 induced glucose uptake via a distinct
mechanism that activated LepR/PKCς/GLUT1 axis and it could provide a novel strategy
to treat diabetes and prevent complications of nervous and insulin-resistant tissues.

iii
We also investigated multicomponent assembly of two oppositely charged
peptides. Positively charged peptide Fmoc-KK-BA (AAC7) and negatively charged
peptide Fmoc-EK-MC (AAC4’) were able to individually self-assemble into nanotubes and
nanofibers respectively. The self-assembly of both peptides were concentration dependent.
As pre-assembled AAC7 and AAC4’ were combined, electrostatic interactions between
positively charge AAC7 nanotubes and negatively charged AAC4’ nanofibers led to
wrapping of nanofibers on the surface of nanotubes. In contrast, when AAC7 and AAC4’
were combined in monomeric form, the co-assembly of the peptides resulted in nanofibers
with width of 13 nm, which were distinctive compare to the mixture of pre-assembled
peptides.

iv
Dedication
This document is dedicated to my parents Yongshuang Lin and Dajuan Yang, and
to my family and friends.

v
Acknowledgments
I would like to thank my advisor Dr. Jon R. Parquette for his guidance and support.
He is always patient and keen to help me out with my research. He would also encourage
me to explore new field in chemistry and I learned a lot in the past five years working with
him.
I would also like to thank all group members in Parquette lab for making the
working environment enjoyable and fun. I would like to express my sincere thanks to Dr.
Cassidy Creemer for helping me in the lab and inspiring me in the past five years. I want
to thank Dr. Yuan Sun, Dr. Mengmeng Liu and Dr. Aileen Shieh for teaching me lab skills
and giving me advise on my lab work when I started working in Parquette group. I also
want to thank Alessandro Brunetti for his help in the lab.
I would like to thank our collaborators Dr. Ouliana Ziouzenkova and Dr. Aejin Lee
in Ohio State University for teaching me knowledge in the field of human nutrition. I want
to also express my appreciation to Dr. Noel Paul for his support and help to me when I was
a graduate teaching assistant.
I would like to specifically thank my parents Yongshuang Lin and Dajuan Yang,
for always encouraging me to pursue my goals and supporting me in my life.

vi
Vita
2015................................................................B.S. Biochemistry, Department of Chemistry
and Biochemistry, The Ohio State University
2015 to present ..............................................Graduate Teaching Assistant, Department of
Chemistry and Biochemistry, The Ohio State
University
Publications
Petrov, B.; Aldoori, A.; James, C.; Yang, K.; Perez Algorta, G.; Lee, A.; Zhang, L.;
Lin, T.; Al Awadhi, R.; Parquette, J. R.; Samogyi, A.; Arnold, L. E.; Fristad, M. A.;
Gracious, B.; Ziouzenkova, O., Bipolar disorder in youth is associated with increased
levels of vitamin D-binding protein. Transl. Psychiatry 2018, 8: 61.

vii
Lee, A.; Sun, Y.; Lin, T.; Song, N.-J.; Mason, M. L.; Leung, J. H.; Kowdley, D.;
Wall, J.; Brunetti, A.; Fitzgerald, J.; Baer, L. A.; Stanford, K. I.; Ortega-Anaya, J.;
Gomes-Dias, L.; Needleman, B.; Noria, S.; Weil, Z.; Blakeslee, J. J.; Jiménez-Flores,
R.; Parquette, J. R.; Ziouzenkova, O., Amino acid-based compound activates atypical
PKC and leptin receptor pathways to improve glycemia and anxiety like behavior in
diabetic mice. Biomaterials 2020, 239, 119839.
Fields of Study
Major Field: Chemistry

viii
Table of Contents
Abstract ............................................................................................................................... ii
Dedication .......................................................................................................................... iv
Acknowledgments............................................................................................................... v
Vita ..................................................................................................................................... vi
List of Schemes ................................................................................................................... x
List of Figures .................................................................................................................... xi
List of Abbriviations ......................................................................................................... xx
Chapter 1 Peptide Self-assembly in Aqueous Medium ...................................................... 1
1.1 Introduction ............................................................................................................... 1
1.2 Significance of Water ............................................................................................... 2
1.3 Non-Covalent Interactions of Self-assembly in Water ............................................. 2
1.4 Assemblies of Peptides and Peptide Derivatives in Water ....................................... 6
1.5 References ............................................................................................................... 29
Chapter 2 Self-assembled Anti-diabetic Amino Acid Compound .................................... 36
2.1 Introduction ............................................................................................................. 36

ix
2.2 Results and Discussion ........................................................................................... 44
2.3 Experimental Section .............................................................................................. 66
2.4 References ............................................................................................................... 87
Chapter 3 Co-assembly of Two Oppositely Charged Peptides ......................................... 93
3.1 Introduction ............................................................................................................. 93
3.2 Results and Discussion ......................................................................................... 101
3.3 Experimental Section ............................................................................................ 129
3.4 References ............................................................................................................. 135
Bibliography ................................................................................................................... 138
Appendix A: NMR spectrum .......................................................................................... 154

x
List of Schemes
Scheme 1.1 Structures of Fmoc-dipeptide 1-7. ................................................................. 25
Scheme 2.1 Chemical structures and features of AAC1-7. .............................................. 45
Scheme 2.2 Synthesis of benzyl succinic acid. ................................................................. 67
Scheme 2.3 Synthesis of DAC. ......................................................................................... 67
Scheme 2.4 Synthesis of AAC1. ....................................................................................... 68
Scheme 2.5 Synthesis of AAC2. ....................................................................................... 69
Scheme 2.6 Synthesis of AAC3. ....................................................................................... 70
Scheme 2.7 Synthesis of AAC4. ....................................................................................... 71
Scheme 2.8 Synthesis of AAC5. ....................................................................................... 72
Scheme 2.9 Synthesis of AAC6. ....................................................................................... 73
Scheme 2.10 Synthesis of AAC7. ..................................................................................... 74
Scheme 3.1 Synthesis of MC .......................................................................................... 130
Scheme 3.2 Synthesis of AAC7 ...................................................................................... 131
Scheme 3.3 Synthesis of AAC4’ .................................................................................... 132
xi
List of Figures
Figure 1.1 Self-assembled structures in nature. .................................................................. 2
Figure 1.2 Two typical π - π interaction: parallel-displaced and T-shaped. ....................... 5
Figure 1.3 Three components of van der Waals forces. Copyright 2017 Elsevier Inc.40 ... 5
Figure 1.4 Tubular structures formed from self-assembly of cyclic peptide. Copyright 1996
American Chemical Society.54 ............................................................................................ 8
Figure 1.5 Hierarchical assembly to hollow macrotubes. Copyright 2004 WILEY‐VCH
Verlag GmbH & Co. KGaA, Weinheim.58 ......................................................................... 9
Figure 1.6 Dipeptide NH2-Phe-Phe-COOH and its self-assembled nanotubes. Copyright
2003, American Association for the Advancement of Science.62 ..................................... 11
Figure 1.7 Tripeptide sequences; hydrogels and nanostructures formed by DVFF and DFFV.
Copyright 2012, The Royal Society of Chemistry.70 ........................................................ 12
Figure 1.8 Self-assemblies of FEFEFKFK at pH 2.8, 4 and 10. Copyright 2013, The Royal
Society of Chemistry.78 ..................................................................................................... 15
Figure 1.9 A. Chemical structure of the peptide amphiphile. B. Molecular model of the
PA. C. self-assembly of PA molecules into a cylindrical micelle. Copyright 2001, The
American Association for the Advancement of Science.84 ............................................... 18
Figure 1.10 A. Chemical structures of peptide amphiphile KLAK PA and pegylated
amphiphile PEG PA. Cryo-TEM of KLAK PA alone (B). KLAK with PEG (D) shows a

xii
significant difference in average length. Conventional TEM images show fiber formation
for both KLAK alone (C) and KLAK PA with PEG PA (E). Copyright 2012 American
Chemical Society.90........................................................................................................... 21
Figure 1.11 (a) The peptide amphiphile used for the polarization-sensitive polymerization
experiments. (b) The polymerization that occurs upon illumination of a diacetylene. (c)
Dependent on the polarization direction of the light (the arrows), one or the other
orientation of the fibers will polymerize. The darkness of the lines depicts their degree of
polymerization. A black line is fully polymerized, and light gray is nonpolymerized.
Copyright 2009 American Chemical Society.95................................................................ 23
Figure 1.12 Example of aromatic peptide derivatives. Copyright 2014 The Royal Society
of Chemistry.17 .................................................................................................................. 24
Figure 1.13 TEM images and actual samples of Fmoc-FG, Fmoc-GG and Fmoc-GF.
Copyright 2011 American Chemical Society.104 .............................................................. 26
Figure 1.14 TEM of evolution of structures with time for dipeptide in the presence of GdL
(14.42 mg/mL): (a) immediately after GdL addition; (b) 40 min, (c) 80 min, (d) 120 min,
(e) 160 min, (f) 200 min, (g) 240 min, (h) 280 min, and (i) 400 min after GdL addition. In
all cases, the scale bar represents 200 nm. Copyright 2009 American Chemical Society.109
........................................................................................................................................... 28
Figure 2.1 Two different insulin-releasing nanoparticles. Copyright 2014, Nature
Publishing Group, a division of Macmillan Publishers Limited.27 ................................... 39
Figure 2.2 A) Schematic of the enzyme-based glucose-responsive nanovesicle. B) The
chemical structure of the pH-sensitive polymer PEG-poly(Ser-Ketal), which can be

xiii
hydrolyzed into water-soluble PEG-polyserine. Copyright 2014 American Chemical
Society.29 ........................................................................................................................... 41
Figure 2.3 Schematic representation of insulin secretion mechanism. Copyright 2015 The
Canadian Society of Clinical Chemists.38 ......................................................................... 43
Figure 2.4 TEM images of (a) AAC1, (b) AAC2, (c) AAC3, (d) AAC4, (e) AAC5, (f)
AAC6, (g) AAC7 in PBS (pH 7.4, 1 day) at 20 mM. ....................................................... 47
Figure 2.5 (a) Cytotoxicity of 6 h-treatment without or with AAC1-3 (0.5, 100, and 500
µM) was measured in 3T3-L1 preadipocytes using lactate dehydrogenase (LDH) activity
assay. Cytotoxicity of (b) 3T3-L1 preadipocytes and (c) human brain endothelial cells
treated with different concentrations of AAC2 or left untreated for up to 72 h. (d)
Cytotoxicity of 3T3-L1 preadipocytes treated with AAC compounds (0.1 μM) or left
untreated for 24 h. (e) Reactive oxygen species concentration was measured in 3T3-L1
preadipocytes stimulated with H2O2 for 4 h (200 μM) and treated with and without AAC
(0.1μM) for 24 h. .............................................................................................................. 49
Figure 2.6 (a) TEM image of the self-assembled structure of AAC2 in PBS. (b) UV-Vis
spectra of AAC2 in TFE and PBS. (c) Co-plot of UV-Vis and CD spectra of AAC2 in PBS.
(d) FT-IR spectrum of AAC2. (e) Thioflavin T binding assay (Excitation: 440 nm and
Emission: 482 nm) of AAC2 in PBS (1 mM, aged for 24 h). (f) Plot of fluorescence
intensity of Nile Red at 656 nm (Ex = 550 nm) versus the concentration (mM) of AAC2 in
PBS. .................................................................................................................................. 51
Figure 2.7 a) Titration of AAC2 (0.1 mM in PBS, pH 7.4) with hINS at different
concentrations. b) TEM image of AAC2-hINS complex. c) Change in frequencies and

xiv
dissipations vs. time for hINS (10µg/mL) and AAC2 nanofiber (0.1µM) on active gold
surface. Insulin were introduced at t=500s. d) Values of thickness of AAC2 nanofiber and
hINS on the active gold surface in real time were calculated to unveil molecular interaction
between AAC2 nanofiber and insulin. .............................................................................. 53
Figure 2.8 (a) Dose-dependent FD-glucose uptake in SVF cells stimulated with AAC2 and
AAC6. (b) FD-glucose uptake in non-treated (Veh) SVF cells or stimulated with AAC2,
or hINS for 80min. (c) Glucose uptake in non-treated (Veh) 3T3-L1 adipocytes or
stimulated with hINS, mLep or AAC2. (d) FD-glucose uptake in human brain endothelial
cells (hBEC) treated with vehicle (Veh; PBS) or hINS, human leptin (hLep), or AAC2 in
the presence and absence of GLUT1 inhibitor. (e) FD-glucose uptake in mouse 3T3-L1
preadipocytes treated with vehicle (Veh;PBS) or hINS, mouse leptin (mLep), or AAC2 in
the presence and absence of GLUT1 inhibitor. ................................................................ 55
Figure 2.9 (a) Dose-dependence FD-glucose uptake stimulated by AAC2 in 3T3-L1
preadipocytes after 100 min of incubation. (b) FD-glucose uptake in non-stimulated (Veh)
or stimulated with AAC2 or hINS in 3T3-L1 cells for 80 min. Prior to stimulation cells
were incubated with Veh, heat-inactivated immunoglobulin (data not shown), or anti-InsR
antibody for 40 min. (c) FD-glucose uptake (% vs. Veh) in presence of AAC2 with and
without PI3K inhibitor or pan-Akt inhibitor in 3T3-L1 preadipocytes. (d) Glucose uptake
in 3T3-L1 preadipocytes mediated by AAC2 with or without inhibitors for various
pathways implicated in glucose uptake............................................................................. 57
Figure 2.10 (a) FD-glucose uptake (% compared to Veh) in presence of AAC2 or
recombinant mouse leptin protein in 3T3-L1 preadipocytes incubated with inactivated

xv
antibodies or poly clonal anti-LepR antibodies. (b) FD-glucose uptake (% compared to
Veh) in presence of AAC2 or recombinant mouse leptin protein in SVF cells isolated from
subcutaneous fat of Leprdb mouse. .................................................................................... 58
Figure 2.11 (a) Expression of phosphorylated and non-phosphorylated proteins measured
in 3T3-L1 preadipocytes treated with leptin, insulin and AAC2 for 5 or 15minutes using
Western blot. (b) FD-glucose uptake (% compared to Control) in presence in the absence
(Veh) of AAC2 inhuman visceral SVF cells with and without ZIP inhibitor. ................. 59
Figure 2.12 Binding affinity between recombinant mouse leptin receptor protein (LepR)
and leptin (a) or binding affinity between LepR and AAC2 (b); Blue line shows frequency
and orange line shows dissipation. (c) Thickness of LepR-leptin film or LepR-AAC2 film.
........................................................................................................................................... 60
Figure 2.13 (a) GTT in Leprdb mice treated without (Veh) or with AAC2. (b) Food intake
in Leprdb mice treated without (Veh)or withAAC2. (c) Weight gain in Leprdb mice treated
without (Veh) or with AAC2. (d) Insulin levels in plasma of Leprdb mice. (e) GTT in Lepob
mice treated without (Veh) or with AAC2. (f) Food intake in Lepob mice treated without
(Veh) or withAAC2. (g) Weight gain in Lepob mice treated without (Veh) or with AAC2.
(h) Insulin levels in plasma of Lepob mice. ....................................................................... 61
Figure 2.14 (a) Baseline fasting glucose levels prior to treatment in Ins2Akita mice. (b)
Mouse insulin levels measured in same Ins2Akita mice at the end of the study. (c) Food and
(d) water consumption measured in same Ins2Akita mice 7 weeks after treatment.
Respiratory exchange ratio (RER) measured in same Ins2Akita mice during the (e) dark and
(f) light period. (g)GTT in same Ins2Akita mice 3weeks after beginning of treatment. ..... 63

xvi
Figure 2.15 (a) Body weight in Ins2Aktia mice. (b) Percent body fat in Ins2Aktia mice. (c)
Percent lean body mass in Ins2Aktia mice. ......................................................................... 64
Figure 2.16 (a) Brain mass in Ins2Aktia mice. (b) Total movement distance, (c) Amount of
activity in the periphery of the arena and (d) number of rears were conducted using open
field test. (e) Latency time and (f) number of errors measured in the training period. (g)
Hole escape time at day6 (Q3 in same experiment). ........................................................ 65
Figure 3.1 Proposed supramolecular models for a) the gelators Pyr-YL and (Fmoc-YL);
b) the surfactants Fmoc-S and Pyr-S; c) orthogonal PyrYL/Fmoc-S and (Fmoc-YL/Pyr-S);
d) cooperative Pyr-YL/Fmoc-YL and Pyr-S/Fmoc-S; and e) disruptive Pyr-YL/Pyr-S and
(Fmoc-YL/FmocS). Copyright 2014 American Chemical Society.20 ............................... 96
Figure 3.2 a) Structures of gelators 1 (top) and 2 (bottom); b) Hydrolysis of GdL to
gluconic acid. Copyright 2013 Nature Publishing Group, a division of Macmillan
Publishers Limited.22......................................................................................................... 97
Figure 3.3 Proposed mechanism of the twisted ribbons, belts and fibrils formation by the
peptides EFFFFE, and EFFFFK, EFFFFE/KFFFFK mixture, and KFFFFK. Copyright
2015 American Chemical Society.26 ............................................................................... 100
Figure 3.4 Structures of AAC7 and AAC4’.................................................................... 102
Figure 3.5 TEM images of AAC7 in HPLC grade water after a) 1 day and b) 1 week. The
sample were prepared at 5 mM and diluted to 1 mM for microscopic studies. .............. 103
Figure 3.6TEM images of AAC4’ in HPLC grade water after a) 1 day and b) c) 1 week.
The sample were prepared at 5 mM and diluted to 1mM for microscopic studies. ........ 104

xvii
Figure 3.7 Deconvoluted FT-IR spectra of a) AAC7 and b) AAC4’. The samples were
prepared in D2O (5 mM) and set for 1 week. Then the samples were lyophilized for 2 days
to remove solvent and redissolved in D2O (5 mM) for measurement. c) Calculated
percentage of secondary structures of AAC7 and AAC4’. ............................................. 105
Figure 3.8 CD spectra of a) AAC7 and b) AAC4’; UV-Vis spectra of c) AAC7 and d)
AAC4’. AAC7 and AAC4’ were self-assembled in HPLC grade water (5 mM) for a week.
Monomeric samples were prepared by dissolving AAC7 and AAC4’ in TFE (5 mM). The
spectroscopic experiments were performed at 5 mM in a 0.1 mm quartz cuvette. Co-plot of
CD and UV-Vis spectra of e) AAC7 and f) AAC4’. ...................................................... 108
Figure 3.9 TEM images of AAC7 self-assembled in HPLC grade H2O at a)1 mM and b)
0.5 mM; TEM images of AAC4’ self-assembled in HPLC grade H2O for 5 days at c) 1 mM
and d) 0.5 mM. ................................................................................................................ 110
Figure 3.10 CD spectra of a) AAC7 and b) AAC4’ and UV-Vis spectra of c) AAC7 and d)
AAC4’ at 5 mM, 1 mM, 0.5 mM in HPLC grade water and 5 mM in TFE. .................. 112
Figure 3.11 Zeta potentials of AAC4’ and AAC7 at 1 mM in HPLC grade water. ....... 113
Figure 3.12 a) Co-plot of CD and UV-Vis spectra and b) TEM image of AAC7:AAC4’
(1:1) mixture. AAC7 and AAC4’ were pre-assembled in HPLC grade water at 5 mM for 1
week and then combined in 1:1 ratio by volume. The mixture was set at room temperature
for 3 days and diluted to 1 mM for spectroscopic and microscopic studies. .................. 114
Figure 3.13 a) CD spectra and b) UV-vis spectra of pre-assembled AAC7:AAC4’ (2:1) and
(5:1) mixtures. TEM image of c) pre-assembled AAC7:AAC4’ (2:1) mixture and d) pre-
assembled AAC7:AAC4’ (5:1) mixture. AAC7 and AAC4’ were self-assembled in HPLC

xviii
grade water (5 mM) separately for 1 week, then the samples were made by combining
AAC7 and AAC4’ in different ratios by volume. ........................................................... 116
Figure 3.14 Co-plot of theoretical (dash line) and experimental (solid line) CD spectra of
AAC7:AAC4’ at 1:1, 2:1 and 5:1 ratio. Theoretical CD spectra were obtained from simple
ratiomatic combination of data from AAC7 and AAC4’. ............................................... 118
Figure 3.15 Deconvoluted FT-IR spectra of pre-assembled AAC7:AAC4’ mixtures at ratio
of a) 1:1, b) 2:1 and c) 5:1. d) Co-plot of FT-IR spectra of pre-assembled AAC7:AAC4’
mixtures, AAC7 and AAC4’. AAC7 and AAC4’ were prepared in D2O (5mM) and set for
1 week. Then the samples were combined in different ratios, set at room temperature for 3
days and then lyophilized for 2 days to remove solvent. The dried samples were redissolved
in D2O for measurement. e) Calculated percentage of secondary structures in pre-
assembled AAC7:AAC4’ mixtures................................................................................. 120
Figure 3.16 Normalized fluorescence spectra of AAC4’ and pre-assembled AAC7:AAC4’
mixtures in 1:1, 2:1 and 5:1 ratios. All samples were diluted from 5 mM to 1 mM.
Fluorescence spectra were measured using 3 mM quartz cuvette. The samples were excited
at 350 nm......................................................................................................................... 122
Figure 3.17 TEM images of co-assembled AAC7:AAC4’ at ratios of a) 1:1; b) 2:1; c) 5:1.
The samples were prepared at 5 mM and diluted to 1 mM for microscopic studies. ..... 123
Figure 3.18 a) CD spectra and b) UV-Vis spectra of co-assembled AAC7:AAC4 at 1:1, 2:1
and 5:1 ratios. The samples were prepared at 5 mM in HPLC grade water with 10% TFE
and diluted to 1 mM for spectroscopic and microscopic studies. ................................... 124

xix
Figure 3.19 Deconvoluted FT-IR spectra of co-assembled AAC7:AAC4’ mixtures at ratio
of a) 1:1, b) 2:1 and c) 5:1. AAC7 and AAC4’ were first dissolved in TFE (5 mM),
combined in different ratios and lyophilized. The dried mixtures were dissolved in D2O
with 10% TFE (5mM) and set for 1 week and then lyophilized for 2 days to remove solvent.
The samples were redissolved in D2O for measurement d) Co-plot of FT-IR spectra of co-
assembled AAC7:AAC4’ mixtures, AAC7 and AAC4’................................................. 126
Figure 3.20 Normalized fluorescence spectra of AAC4’ and co-assembly of AAC7:AAC4’
in 1:1, 2:1 and 5:1 ratios. All samples were diluted from 5 mM to 1 mM. Fluorescence
spectra were measured using 3 mM quartz cuvette. The samples were excited at 350 nm.
......................................................................................................................................... 127
Figure 3.21 Proposed AAC7:AAC4’ self-assembly. a) AAC7 and AAC4’ are pre-
assembled in water to yield distinct nanostructures. Pre-assembled AAC7 and AAC4’ form
the complex showed on the right via electrostatic attraction. b) AAC7 and AAC4’ are
combined in monomeric form. The co-assembled nanofibers comprise segments of AAC4’
and AAC7. ...................................................................................................................... 128

xx
List of Abbriviations
A alanine
α alpha
Å Angstrom
R arginine
KATP ATP-sensitive potassium channel
β beta
CNS central nervous system
CD circular dichoism
Con A concanavalin A
J coupling constant in Hz (NMR)
CMC critical micelle concentration
C cysteine
°C degrees Celsius
D dextrorotary
DLS dynamic light scattering
DMF dimethylformamide
GPCR G protein-coupled receptor
GLP glucagon-like peptide

xxi
GdL glucono-δ-lactone
GTT glucose tolerance test
GLUT glucose transporter
E glutamic acid
G glycine
HPLC high performance liquid chromatography
hBEC human brain endothelial cells
hINS human insulin
IR infrared
InsR insulin receptor
I isoleucine
K lysine
L liter (s); levorotatory; leucine
pH -log[H+]
mTOR mammalian target of rapamycin
μ micro
m milli; meter(s); multiplet (NMR)
M moles per liter
NMR nuclear magnetic resonance
1D one dimensional
ppm parts per million
PA peptide amphiphile

xxii
F phenylalanine
PBA phenylboronic acid
π pi
PEG polyethylene glycol
AKT protein kinase B
PKC protein kinase C
RER respiratory exchange ratio
S serine
STAT signal transducer and activator of transcription protein
SVF stromal vascular fraction preadipocytes
ThT thioflavin T
3D three dimensional
TEM transmission electron microscopy
TES triethylsilane
TFA trifluoroacetic acid
TFE trifluoroethanol
t triplet (NMR)
2D two dimensional
T1D type 1 diabetes
T2D type 2 diabetes
Y tyrosine
UV ultraviolet

xxiii
V valine
Vis visible
λ wavelength

1
Chapter 1 Peptide Self-assembly in Aqueous Medium
1.1 Introduction
Molecular self-assembly is a spontaneous and reversible process which disordered
molecular units form organized structures as a result of non-covalent interactions, such as
hydrogen-bonding, hydrophobic interaction, van der Waals forces, π - π interaction and
electrostatic attraction/repulsion. Self-assembly is ubiquitous in nature (Figure 1.1) and it plays a
vital role in life. Many structures in physiological system form through self-assembly process,
such as phospholipid lipid bilayer structure of cell membrane, double helix of DNA and formation
of protein structures. Self-assembly not only plays a significant role in biological system, it also
inspires scientists to design dynamic and functional nanomaterials. In fact, self-assembly has been
extensively studied in recent decades and self-assembled materials have been applied in different
fields including tissue engineering1-4, targeted drug delivery5-7, optoelectronics8-10, etc. The
progress and achievement on the field allow scientists to have profound understanding on
mechanisms of molecular self-assembly11-16 and design molecules that yield predictable
morphology and desired functions.17, 18

2
Figure 1.1 Self-assembled structures in nature.
1.2 Significance of Water
Water is a unique solvent for self-assembly.19 All biological processes take place in water
and nature uses water as a medium to achieve complex, adaptable and robust structures.20 The
unique properties of water are, on certain level, attributed to its ability to form weak hydrogen
bonding which allows biomolecules to reorient in specific configurations and form distinct three
dimensional structures.21 The specific interactions between biological subunits in water has
enlightened researchers to design new supramolecular systems in aqueous condition and aqueous
supramolecular polymers could be beneficial since they have high biocompatibility. Furthermore,
water, as a solvent, is economical, highly accessible and it has minimal ecological impact.19
1.3 Non-Covalent Interactions of Self-assembly in Water
Hydrophobic Effect
The hydrophobic effect is one of the fundamental driving forces of self-assembly in
aqueous solvent. The hydrophobic effect is generally considered to have entropic origin. When

3
hydrophobic molecules are introduced to aqueous environment, water molecules will initially form
static clusters around the hydrophobic group and lose mobility.21, 22 The initial accommodation of
hydrophobic molecules in water is entropically unfavorable. Thus, the hydrophobic molecules will
aggregate, and water molecules will be released to regain faster dynamics and entropy will
increase.23 Furthermore, compensation of enthalpy can also affect hydrophobic effect. If a large
hydrophobic group is introduced to aqueous medium, multiple hydrogen bonds in the solvent will
be broken.24 To compensate the enthalpic cost, hydrophobic molecules aggregate in order to
minimize the interfacial area with water molecules. In this case, both entropy and enthalpy have
impacts on the hydrophobic effect. It is considered by some researchers that the hydrophobic
effect is the major driving force for self-assembly processes and plays a vital role in life. The self-
assembly of phospholipids is an excellent example. Phospholipid molecules consist of hydrophilic
head and hydrophobic tail.25 Driven by hydrophobic effects, the non-polar tails of phospholipids
aggregate together to avoid contact with aqueous environment and eventually bilayer structure is
formed, which is the basis of cell and other organelles formation. Amphiphilic molecules like
phospholipids can form nanoscale vesicles and micelles, which are now widely applied in drug
delivery systems and other biomedical uses.26-28
Hydrogen Bonding
Hydrogen bonding is particularly important for self-assembly of peptides since hydrogen
bonds form between peptide amide bonds. The selective and highly directional nature of hydrogen
bonds can induce peptides assemble into distinctive 1-dimensional (1-D), 2-D and 3-D

4
nanostructures.11 Hydrogen bonding is considered a rather strong intermolecular force and the
strength of hydrogen bonds mostly lie between 4 and 10 kJ mol-1 (5–10 kT) per bond at 298 K. 29
Hydrogen bonds exist between electronegative atoms with free electron lone pairs (e.g., oxygen
and nitrogen) and hydrogen atoms covalently bound to similarly electronegative atoms.30
Hydrogen bonding is the major driving force for DNA and protein assembly. Secondary structures
of proteins like α-helices and β-sheets are formed from special arrangements of hydrogen bonds
and many of these secondary structures play important roles in disease development. For example,
water-assisted hydrogen bonding is believed to a key to protein fibrillation process, which is
considered as a critical element for Alzheimer disease.31
π - π Interaction
π - π interaction is the non-covalent, attractive interaction between two aromatic
molecules.32 The interaction originates from the attraction between the pi orbitals of an aromatic
molecule and the pi orbitals or electropositive atoms of another aromatic molecule. The two most
stable forms of π - π interaction are parallel-displaced and T-shaped conformation (Figure 1.2).33
π - π interaction is commonly seen in biological systems and it play an important role in life, one
example is that it maintains structural stability of proteins due to preferential binding enthalpy.34
Studies also showed that π - π interaction is vital for molecular recognition35 and it is widely used
in drug design.36 In recent years, the impact of π - π interaction on self-assembly process are also
well-studied.37-39

5
Figure 1.2 Two typical π - π interaction: parallel-displaced and T-shaped.
Van der Waals Forces
Van der Waals forces comprise Keesom forces, Debye forces, and London (dispersion)
forces.40 (Figure 1.3) They originate from dipole or induced dipole interactions. Van der Waals
forces are generally weak (~5kJ mol-1)29 and they have very little influence on self-assembly in
most cases, though van der Waal forces can still affect the self-assembly of molecules with
aliphatic chains, especially within monolayered and multilayered films.41
Figure 1.3 Three components of van der Waals forces. Copyright 2017 Elsevier Inc.40
Electrostatic Forces
Electrostatic interaction between two charged moieties is also an important factor for self-
assembly. It can be either repulsive as the molecular subunits have the same charge, or attractive
as the molecular subunits have opposite charges. Electrostatic attraction is much stronger than

6
other intermolecular forces in organic solvent, with strength of approximately 500 kJ mol-1 and
range up to 50 nm.29, 42 However, electrostatic attraction is greatly weakened in water due to the
high polarity. Therefore, electrostatic interactions are considered to affect self-assembly in
combination with other molecular interactions.43
1.4 Assemblies of Peptides and Peptide Derivatives in Water
Nowadays, fabricating natural building blocks like peptides, phospholipids,
oligonucleotides and oligosaccharides has been a novel path to develop new materials.44 Among
materials employed for self-assembly studies, peptides have drawn great attention due to their
advantages. Peptides have relatively simple structures and they are stable both physically and
chemically.45 There are 20 L-amino acids in nature and the side chains of amino acids are versatile
in size, hydrophobicity and charge, which diversifies synthetic sequences and self-assembled
morphologies. Furthermore, it is feasible to synthesize peptides in large scale, which guarantees
accessibility of the materials. Also, peptides are highly biocompatible and biodegradable45 and
such features enable applications in medical treatments and pharmaceutical industries.
Since early 1990s, peptidic supramolecular materials have been studied in depth, and a
great number of self-assembled architectures formed from peptides has been developed, such as
spheres, fibers, tubes, tapes, extended sheets, etc.45-47 The design of self-assembled peptides can
come from either adapting biological structures like elastins,48 collagens,49 α-helices and β-
sheets,50 or synthesizing novel structures like cyclic peptides or peptide derivatives functionalized
with aliphatic groups and/or aromatic groups.

7
Cyclic Peptides
The self-assembly of cyclic peptides are formed by stacking of peptide subunits (Figure
1.4). The flat, ring-shaped peptides can assemble to hydrogen-bonded hollow tubular structure
with side chains perpendicularly pointing outward.51, 52 Pioneer work of cyclic peptide assemblies
was carried out by Ghadiri and his co-workers in Scripps Research Institute.51-55 In their earliest
work,51 they synthesized a novel cyclic octapeptide cyclo[(D-Ala-Glu-D-Ala-Gln)2. They
hypothesized that the alternation of L- and D-amino acids enabled cyclic peptide to adopt a low-
energy, flat conformation. The peptide subunits were able to assemble into nanotubes with internal
diameters between 7-8 Å under acidic conditions. FT-IR and electron diffraction studies revealed
that the peptides formed anti-parallel β-sheet structures. Based on preliminary studies, Ghadiri and
his co-workers demonstrated that the internal diameter of the peptide nanotubes can be controlled
by adjusting the size of the cyclic peptide.52 By increasing the number of residue from 8 to 12,
they obtained nanotubes with uniform internal diameters of ~13 Å. The research team also
proposed that the formation of the nanotubes was attributed to the cooperative nature of the
assembly process which hydrogen-bonding motif and hydrophobic interactions were
simultaneously involved.54

8
Figure 1.4 Tubular structures formed from self-assembly of cyclic peptide. Copyright 1996
American Chemical Society.54
Applications of the cyclic peptides have also been studied by the same group as they
designed a cyclic octapeptide cyclo[-(Trp-o-Leu)3Gln-D-Leu-].56 It was hypothesized that
decoration of hydrophobic residues on the peptide allowed formation of transmembrane channels
to form in lipid bilayer of cell membrane, which could be a potential vehicle for drug delivery and
gene therapy. They also discovered that formation of hollow tubular structures from cyclic
peptides in bacterial cell membrane could increase membrane permeability, collapse
transmembrane ion potentials, and cause rapid cell death, which could potentially be a new class
of antibacterial agent.57

9
Figure 1.5 Hierarchical assembly to hollow macrotubes. Copyright 2004 WILEY‐VCH Verlag
GmbH & Co. KGaA, Weinheim.58
Zhao and Dory reported a cyclic peptide (Figure 1.5) that formed hexagonal hollow tubes
with diameters in the range of micrometers and length reaching several millimeters.58 Molecular
dynamic studies suggested that individual cyclic peptides stacked up and formed nanotubes, which
further organized into larger hollow tubes which were later observed by SEM. In recent years,
Perrier and Jolliffe synthesized a series of cyclic octapeptides with alternating L and D chirality.
The peptides were conjugated with hydroxyethyl acrylate, acrylic acid and poly(2-ethyl-2-
oxazoline).59, 60 The peptides all self-assembled into nanotubes which were either pH-responsive
or thermo-responsive and the assembly was investigated in detail using different techniques, such

10
as dynamic light scattering (DLS), TEM, and small angle neutron scattering. The authors also
introduced a new series of cyclic peptide conjugates with hydrophobic or hydrophilic polymer
chains.61 By varying the molecular weight of the side chains, they discovered the correlation
between the lipophilicity of the peptide and the proton transfer activity of the transmembrane
channel formed by the peptide conjugates.
Linear Peptides
Besides self-assemblies from cyclic peptide, a large number of linear peptides were
synthesized and shown to be able to self-assemble into various nanostructures. In 2003, Gazit and
his co-worker reported the self-assembly of a short dipeptide NH2-Phe-Phe-COOH (FF) into
nanotubes (Figure 1.6), which could reduce ionic silver and generated long, discrete silver
nanowires.62 In following years, self-assembly of FF was investigated in detail by the same
research group.63-65 Several other groups have explored the properties of FF as well. Park and co-
workers reported that FF can self-assemble into nanotubes and nanowires with high stability
against thermal, chemical and proteolytic attacks.66 Görbitz demonstrated that the X-ray powder
diffraction pattern of FF nanotubes is was identical to the single crystal structure.67 As a minimalist
building block, FF motif has been popular in the field of nanomedicine since binding drug
molecules and/or imaging agents that FF dipeptide can help improve the delivery of some
hydrophobic or unstable molecules to the cells.68

11
Figure 1.6 Dipeptide NH2-Phe-Phe-COOH and its self-assembled nanotubes. Copyright 2003,
American Association for the Advancement of Science.62
Aside from the FF dipeptide motif discovered by Gazit’s group, Ventura and co-workers
investigated the properties of dipeptides NH2-Ile-Phe-COOH (IF) and NH2-Val-Phe-COOH (VF).
The research team found that dipeptide IF could self-assemble into fibrillar networks and become
a transparent, thermoreversible hydrogel. While dipeptide VF was not able to form any
supramolecular structures, even though it only differed from IF by one methyl group. The research
team proposed that slight changes of hydrophobicity could affect the self-assembly process and
assembly of IF could be similar to Aβ42 peptide.69
Hartley’s group discovered the importance of chirality for self-assembly. The group found
that changing the chirality of the first N-terminal amino acid from VFF and FFV, which were not
able to self-assemble at physiological pH, to DVFF and DFFV can result in distinct self-assemblies

12
(Figure 1.7).70 The group also investigated DLFF and its epimer LFF. Similar behaviors to
tripeptides reported in the previous publication were observed. Only DLFF can self-assemble into
long fibers and form hydrogels, while LFF generated heterogenous self-assemblies and failed to
form self-supporting gels.71 In a later publication, the authors demonstrated that subtle changes in
chirality on each amino acid along the tripeptide FFV can affect the conformation and behavior of
self-assembly. Particularly, the two enantiomers DFFV and FDFDV showed high viability and
proliferation of mammalian cells in vitro, whereas they were not cytotoxic in solution.72
Figure 1.7 Tripeptide sequences; hydrogels and nanostructures formed by DVFF and DFFV.
Copyright 2012, The Royal Society of Chemistry.70
Verma and co-workers reported the self-assembly of tetrapeptide PWWP, which was
derived from the antimicrobial peptide indolicidin sequence. The peptide formed vesicles and
addition of KCl could disrupt the structures.73 Miller and co-workers introduced an ionic-
complementary tetrapeptide FEFK. The research group investigated the self-assembly of FEFK
resulting from reverse hydrolysis triggered by protease thermolysin. The main product of this
system was an octapeptide, which was thermodynamically favored and its concentration depended
on the initial concentration of FEFK.74

13
Hamley and co-workers investigated the self-assembly of pentapeptide KLVFF, which was
a fragment derived from amyloid peptide. Experimental results revealed that self-assembly of
KLVFF was influenced by aromatic interactions between phenylalanine units on the peptide and
KLVFF formed -sheet amyloid fibrils in diluted aqueous solution. In phosphate-buffered saline
solution, KLVFF gelated and the gelation was believed to result from electrostatic charge
screening on the peptide, which allowed -sheet amyloid fibrils to aggregate in to a gel network.75
Based on the KLVFF motif, Hamley and co-workers introduced a new peptide AAKLVFF by
extending the pentapeptide with two alanines at the N-terminus. Self-assembly into twisted
nanoribbons in water was observed. Further studies showed that AAKLVFF did not form well-
defined -sheet structure in diluted aqueous solution but in dried film. It was also observed that
well-defined fibrils can be generated from assembling small subunits of AAKLVFF in films dried
from diluted solution. Such phenomenon may allow AAKLVFF to be a good candidate to study
amyloid fibrillization.76 The research group also synthesized octapeptide YYKLVFFC using the
KLVFF motif. The octapeptide was design with multiple residues to investigate how aromatic
interactions and electrostatic interactions affect the self-assembly of the peptide. Also, addition of
two tyrosines introduced pH-induced phenol-phenolate transition and pH effect on self-assembly
of YYKLVFFC was observed that YYKLVFFC self-assembled into long nanofibers at pH 4.7 and
transformed into twisted short nanofibrils at pH 11.77
Saiani and co-workers investigated the self-assembly of four ionic-complementary
octapeptides: AEAEAKAK, AEAKAEAK, FEFEFKFK and FEFKFEFK. Alanine-based peptides
formed α-helices and phenylalanine-based peptides adopted -sheet conformation. Self-assembly
was not observed for AEAKAEAK. AEAEAKAK was found to form fibers with diameter of ~6

14
nm but gelation for AEAEAKAK was not observed even at concentration up to 100 mg mL-1.
FEFEFKFK and FEFKFEFK were found to self-assembled and form hydrogels at concentration
of 8 mg mL-1. Morphologies of both peptides were similar and both hydrogels contained a
homogeneous dense network of semi-flexible fibers.50 Saiani et al. later reported self-assembly
studies of octapeptide FEFEFKFK in detail. The gelation process of FEFEFKFK was investigated
as a function of media pH. At low (<6) and high (>8) pHs, FEFEFKFK formed fibers with distinct
morphologies (Figure 1.8) and hydrogels had different mechanical properties. When pH was in the
range of 6-8, only large bundles of fibers were observed.78

15
Figure 1.8 Self-assemblies of FEFEFKFK at pH 2.8, 4 and 10. Copyright 2013, The Royal
Society of Chemistry.78
Hartgerink and co-workers designed a series of multidomain peptides which had ABA
motifs. Domain B was composed of alternating hydrophilic (glutamine) and hydrophobic (leucine)
amino acids, which enabled peptides to form extended -sheets. Domain A contained a segment
of positively charged lysines at pH 7 and electrostatic repulsions of domain A can work against
self-assembly driven by domain B. The force balances between A and B were studied and it is
noteworthy that the length of nanofibers formed from peptide K2(QL)6K2 can be controlled by

16
changing electrostatic strength of solvent media.79 Based on the same motif, the authors introduced
three other multidomain peptides K2(SL)6K2, E2(SL)6E2 and K2(QL)6K2, which were able to form
hydrogels. The authors also demonstrated that the nanofibers form by peptides with lysine domains
can cross-link using lysyl oxidase or plasma amine oxidase. The mechanical strength of the
hydrogel increased after cross-linking and it is considered that this method may have great
potential in biomaterial applications.80
Aliphatic Peptide Derivatives
Although self-assembly of peptides can generate various nanomaterials, modifying
peptides with different functional groups can enrich the variety of nanomaterials and lead to new
applications. One of the most successful strategies is attaching hydrophobic functional groups on
peptides and making them peptide amphiphiles. Aliphatic peptides are one of the representatives
that are essentially composed of hydrophobic alkyl or lipid chains and hydrophilic peptide
segments. Early studies of aliphatic peptide amphiphiles were focused on their bioactivities. Tirrell
and co-workers introduced a dialkyl peptide amphiphile and its cell membrane mimicry behaviors
were studied.81 In later publications, the authors also synthesized peptide amphiphiles with
collagen-model head groups and dialkyl chain tails and investigations of self-assembly showed
that the peptide amphiphile adopted triple-helical structures.82, 83
Stupp’s lab have successfully designed a series of aliphatic peptide amphiphiles. In 2001,
Stupp and co-workers reported the self-assembly of an aliphatic peptide amphiphile. The peptide
amphiphile assembled into long nanofibers by pH induction (Figure 1.9). The nanofibers were able
to form hydrogels, which could mimic extracellular matrix. The nanofibers could also reversibly

17
cross-link by formation/reduction of intermolecular disulfide bonds. Additionally, hydroxyapatite
mineralized along the long axis of the cross-linked nanofibers and such alignment was also
observed in bone structure.84 This pioneering discovery showed the potential of aliphatic peptide
amphiphiles in biomedical applications and it has drawn researchers’ attention to the field of
aliphatic peptide study.

18
Figure 1.9 A. Chemical structure of the peptide amphiphile. B. Molecular model of the PA. C.
self-assembly of PA molecules into a cylindrical micelle. Copyright 2001, The American
Association for the Advancement of Science.84
Since the ground-breaking publication in 2001, Stupp’s group has consecutively reported
studies of multiple aliphatic peptide amphiphiles. The design of the peptide amphiphiles often
consist of a long aliphatic tail, followed by a peptide sequence with high tendency to form -sheet
and charged residues to enhance solubility in water. Occasionally, the hydrophilic end of the
amphiphile molecule is coupled with a spacer to allow more flexibility to combine with bioactive
molecules.12 The research group have extensively studied the factors that affect self-assembly of

19
aliphatic amphiphiles. Twelve peptide amphiphile derivatives were synthesized to form
nanofibers. The researchers discovered that peptide sequence and aliphatic tail length can influence
morphology and surface chemistry of self-assembly.85 In following studies, the research group
demonstrated that modification of aliphatic tail and peptide sequence affected -sheet character of
nanofiber assembly and bioactivity of nanofibers could be controlled by modifying peptide
amphiphiles.86 Formation of flat nanobelts had also been reported. Peptide amphiphile C16O-
VEVE formed nanobelts with monodispersed width of 150 nm. Interestingly, increasing the pH
resulted in transformation from flat, smooth nanobelts to grooved nanobelts, which was caused by
change in electrostatic interactions between the peptide segments. Also, in diluted solution, the
nanobelt was unraveled to twisted nanofibers.87
Stupp’s group have also broadly studied applications of aliphatic peptide amphiphiles in
the biomedical field. The authors reported a new peptide amphiphile that was able to rapidly induce
differentiate progenitor cells into neurons without astrocytes development, by encapsulation with
three-dimensional nanofiber network formed by self-assembly of peptide amphiphiles with cell
suspension in media.88 The research group also demonstrated that nanofibers generated from
peptide amphiphile (KLAKLAK)(2) can induce breast cancer cell death by membrane disruption
and the process was divergent from caspase-independent and Bax/Bak-independent mechanisms.
The self-assembled (KLAKLAK)(2) showed higher selectivity on inducing cell death in
transformed breast epithelial cells than in untransformed cells, which indicated that peptide
amphiphiles with rational design could form nanofibers that effectively target cancer cells.89 In a
more recent publication, the authors introduced a peptide amphiphile with additional polyethylene
glycol (PEG) chain. The peptide amphiphile self-assembled into nanofibers (Figure 1.10) and

20
pegylation of peptide amphiphile significantly increased the stability of nanofibers against protease
trypsin activity. Using an orthotopic mouse xenograft model of breast cancer, administration of
pegylated peptide amphiphile nanofiber showed promising reduction of tumor cell proliferation
and overall tumor growth, indicating that the pegylated peptide amphiphile had high potential in
cancer treatment.90

21
Figure 1.10 A. Chemical structures of peptide amphiphile KLAK PA and pegylated amphiphile
PEG PA. Cryo-TEM of KLAK PA alone (B). KLAK with PEG (D) shows a significant
difference in average length. Conventional TEM images show fiber formation for both KLAK
alone (C) and KLAK PA with PEG PA (E). Copyright 2012 American Chemical Society.90
Hamley’s group have reported studies on aliphatic peptide amphiphiles as well. In 2010,
the group demonstrated the self-assembly of a commercially available peptide amphiphile C16-
KTTKS, which is also known as Matrixyl. The peptide amphiphile can stimulate collagen
production on skin and hence it is widely used in anti-aging skincare products.91 C16-KTTKS

22
formed macroscale fibrillar structures, which were based on nanotapes with widths ranging from
10 to 100 nm. SAXS results indicated that the peptide amphiphiles formed bilayer structures.
Understanding the self-assembly of this peptide amphiphile could help in developing next
generation collagen-stimulating peptide amphiphiles.92 In later publication, Hamley and co-
workers investigated the self-assembly behaviors of C16-KTTKS (TFA salt) in water at different
temperature. Proton NMR and SAXS results showed that C16-KTTKS reversibly transformed from
nanotapes to micelles as temperature increased and such behaviors were not found in preliminary
studies for aliphatic peptide amphiphiles.93 The same research group also reported that the self-
assembly of C16-KTTKS was controlled by pH. At pH 4, C16-KTTKS formed twisted nanofibers
and at pH 3 flat ribbons were observed. As pH dropped to 2, only micelles were seen. Surprisingly,
the self-assembly transformed into ribbons again when pH was increased to 7. The pH-responsive
behaviors of C16-KTTKS may also shed some light on biomedical application of this peptide
amphiphile.94
Van Hest and co-workers design a fiber-forming peptide amphiphile with peptide sequence
GANPNAAG and hydrophobic tail with diacetylene moiety attaching on N-terminus. The group
discovered that if nonaligned nanofibers were irradiated with polarized light, polymerization only
happened to the fibers that were parallel to the polarized direction (Figure 1.11). The fibers were
aligned magnetically and selectively polymerized using polarization holography.95 The same
group synthesized three peptide amphiphiles with hydrophobic tails containing diacetylene in
different positions. Experimental results indicated that the position of diacetylene on the aliphatic
chain affected the stability of self-assembly and chromatic properties.96

23
Figure 1.11 (a) The peptide amphiphile used for the polarization-sensitive polymerization
experiments. (b) The polymerization that occurs upon illumination of a diacetylene. (c)
Dependent on the polarization direction of the light (the arrows), one or the other orientation of
the fibers will polymerize. The darkness of the lines depicts their degree of polymerization. A
black line is fully polymerized, and light gray is nonpolymerized. Copyright 2009 American
Chemical Society.95
Aromatic Peptide Derivatives
Besides utilization of aliphatic groups in peptide derivative design, aromatic groups can
also be employed since π - π interaction is a major driving force for self-assembly. In general,
aromatic peptide derivatives consist of a short peptide sequence and an aromatic moiety which is
often capped on the N-terminus (Figure 1.12). Fluorene, naphthalene, pyrene, azobenzene and

24
phenyl derivatives are some of the most common aromatic moieties used in aromatic peptide
derivative design. A linker segment is sometimes added between the aromatic group and the N-
terminus of the peptide. The C-terminus of the peptide derivative can also be functionalized.17
Much work has been carried out on aromatic peptide derivatives and it is no doubt that aromatic
peptide derivatives are now a significant subset of peptide self-assembly.
Figure 1.12 Example of aromatic peptide derivatives. Copyright 2014 The Royal Society of
Chemistry.17
Pioneering work was reported by Vegners and co-workers in 1995. Dipeptide derivative
Fmoc-LD was synthesized and thermoresponsive behavior of Fmoc-LD hydrogel was observed.
The hydrogel was used as a carrier to incorporate with non-antigenic antiviral drugs and injected
into rabbits, which successfully induced antibody production without additional adjuvant.97 In
2003, Xu and co-workers synthesized a series of Fmoc-dipeptides 1-7 (Scheme 1). Gelation was
observed in all peptides and hydrogels 1, 3 and 4 converted to suspensions in respond to ligand-
receptor interaction.98 Based on ligand-receptor interactions, Xu’s group later reported a novel
strategy to enhance mechanical strength of hydrogels self-assembled from small molecules.
Vancomycin was chosen as the receptor and added to a hydrogel formed from ligand peptide
pyrene-DADA. The storage modulus of the hydrogel of pyrene-DADA increased by 106-fold after

25
addition of the receptor. Spectroscopic and microscopic experiments revealed that molecular
recognition between vancomycin and pyrene-DADA and dimerization of vancomycin led to the
conspicuous increase in elacity.99 The same research group also demonstrated utilization of
kinase/phosphatase switch to regulate self-assembly of nanostructures and formation of hydrogels.
Naphthalene-based hydrogelator Nap−FFGEY was synthesized. Phosphorylation of tyrosine
residue on the peptide derivative by kinase resulted in a gel−sol phase transition and
dephosphorylation by phosphatase regenerated the hydrogel. Subcutaneous injections to mice
indicated that the phase transition also occurs in vivo.100
Scheme 1.1 Structures of Fmoc-dipeptide 1-7. Copyright 2003 American Chemical Society.98
Ulijn’s group have also developed a series of aromatic peptide derivatives since mid-2000s.
The group investigated the self-assembly of dipeptide derivative Fmoc-FF. A model of anti-
parallel -sheets connected by π-π interactions of Fmoc groups and phenyl groups was proposed.
Spectroscopic experiment results were consistent with the author’s explanation.101 The research
group reported the study of mechanosensitivity of hydrogel formed from Fmoc-FF in later
publication. Particularly, the group demonstrated that using different homogenization techniques
during gelation process can significantly influence the mechanical properties and self-assembly of

26
the hydrogel.102 The research group also synthesized three new peptide derivatives Fmoc-FG,
Fmoc-GG and Fmoc-GF, and the self-assembly of these peptides were investigated and compared
with Fmoc-FF, which was well-studied in preliminary publications. It was observed that all three
Fmoc-dipeptides were able to self-assemble into nanostructures, which indicated that the major
driving force of self-assembly was π-π interactions between Fmoc groups combining with
hydrogen bonding on the peptide segments. However, the morphologies of the nanostructures were
different (Figure 1.13). This observation showed that replacement of phenylalanine by glycine
affected the flexibility103 of the dipeptide and further changed the conformation of the self-
assembly.104 Ulijn’s group have reported studies on enzyme-assisted self-assembly of aromatic
peptide derivatives as well.105-108 Enzyme-assisted self-assembly shows a novel way to control
self-assembly at a nanoscale level. The reversibility and biocompatibility of the process also
provides a new platform for biomedical and electronic material research.
Figure 1.13 TEM images and actual samples of Fmoc-FG, Fmoc-GG and Fmoc-GF. Copyright
2011 American Chemical Society.104

27
The Adams group has reported self-assembly of various aromatic peptide derivatives as
well. In 2010, the research group synthesized peptide derivative bromonaphthalene-AV and its
self-assembly process was pH-responsive. Hydrolysis of glucono-δ-lactone (GdL) to gluconic acid
was employed to adjust the pH of the peptide solution. Furthermore, this method allowed kinetic
control of the self-assembly and the process could be observed. Microscopic and spectroscopic
experiments revealed that self-assembly process began as the peptide derivative was protonated
(Figure 1.14). Protonation of the carboxylate on the C-terminus of the peptide segment reduced
electrostatic repulsions and then led to self-assembly.109 The research group also investigated how
structural modifications could influence self-assembly and gelation of naphthalene-dipeptides by
varying both the substitution on naphthalene and amino acids on the peptide segment.110 In
addition, the research group also demonstrated the studies of salt-induced hydrogelation with
naphthalene-dipeptide derivatives and they discovered that addition of divalent cation such as Ca2+
at high pH resulted in self-assembly of nanofibers and gelation.111, 112

28
Figure 1.14 TEM of evolution of structures with time for dipeptide in the presence of GdL (14.42
mg/mL): (a) immediately after GdL addition; (b) 40 min, (c) 80 min, (d) 120 min, (e) 160 min,
(f) 200 min, (g) 240 min, (h) 280 min, and (i) 400 min after GdL addition. In all cases, the scale
bar represents 200 nm. Copyright 2009 American Chemical Society.109

29
1.5 References
1. Kalai Selvan, N.; Shanmugarajan, T. S.; Uppuluri, V. N. V. A., Hydrogel based
scaffolding polymeric biomaterials: Approaches towards skin tissue regeneration. J. Drug Deliv.
Sci. Technol. 2020, 55, 101456.
2. Hirst, A. R.; Escuder, B.; Miravet, J. F.; Smith, D. K., High-Tech Applications of Self-
Assembling Supramolecular Nanostructured Gel-Phase Materials: From Regenerative Medicine
to Electronic Devices. Angew. Chem. Int. Ed. 2008, 47 (42), 8002-8018.
3. Holmes, T. C.; de Lacalle, S.; Su, X.; Liu, G.; Rich, A.; Zhang, S., Extensive neurite
outgrowth and active synapse formation on self-assembling peptide scaffolds. Proc. Natl. Acad.
Sci. U.S.A. 2000, 97 (12), 6728.
4. Woolfson, D. N.; Ryadnov, M. G., Peptide-based fibrous biomaterials: some things old,
new and borrowed. Curr. Opin. Chem. Biol. 2006, 10 (6), 559-567.
5. Dreiss, C. A., Hydrogel design strategies for drug delivery. Curr. Opin. Colloid Interface
Sci. 2020, 48, 1-17.
6. Rösler, A.; Vandermeulen, G. W. M.; Klok, H.-A., Advanced drug delivery devices via
self-assembly of amphiphilic block copolymers. Adv. Drug Del. Rev. 2001, 53 (1), 95-108.
7. Du, J.-Z.; Du, X.-J.; Mao, C.-Q.; Wang, J., Tailor-Made Dual pH-Sensitive Polymer–
Doxorubicin Nanoparticles for Efficient Anticancer Drug Delivery. J. Am. Chem. Soc. 2011, 133
(44), 17560-17563.
8. Zhao, Y. S.; Fu, H.; Peng, A.; Ma, Y.; Liao, Q.; Yao, J., Construction and
optoelectronic properties of organic one-dimensional nanostructures. Acc. Chem. Res. 2010, 43
(3), 409-18.
9. Murugavelu, M.; Imran, P. K. M.; Sankaran, K. R.; Nagarajan, S., Self-assembly and
photophysical properties of a minuscule tailed perylene bisimide. Mater. Sci. Semicond. Process.
2013, 16 (2), 461-466.
10. Maity, N.; Ghosh, R.; Nandi, A. K., Optoelectronic Properties of Self-Assembled
Nanostructures of Polymer Functionalized Polythiophene and Graphene. Langmuir 2018, 34
(26), 7585-7597.
11. Wang, J.; Liu, K.; Xing, R.; Yan, X., Peptide self-assembly: thermodynamics and
kinetics. Chem. Soc. Rev. 2016, 45 (20), 5589-5604.
12. Hendricks, M. P.; Sato, K.; Palmer, L. C.; Stupp, S. I., Supramolecular Assembly of
Peptide Amphiphiles. Acc. Chem. Res. 2017, 50 (10), 2440-2448.
13. Fu, I. W.; Markegard, C. B.; Nguyen, H. D., Solvent Effects on Kinetic Mechanisms of
Self-Assembly by Peptide Amphiphiles via Molecular Dynamics Simulations. Langmuir 2015,
31 (1), 315-324.
14. Zaldivar, G.; Conda-Sheridan, M.; Tagliazucchi, M., Twisting of Charged Nanoribbons
to Helicoids Driven by Electrostatics. J. Phys. Chem. B 2020, 124 (15), 3221-3227.
15. Roy, S.; Javid, N.; Frederix, P. W.; Lamprou, D. A.; Urquhart, A. J.; Hunt, N. T.;
Halling, P. J.; Ulijn, R. V., Dramatic specific-ion effect in supramolecular hydrogels. Chemistry
2012, 18 (37), 11723-31.
16. Zhang, M.; Grossman, D.; Danino, D.; Sharon, E., Shape and fluctuations of frustrated
self-assembled nano ribbons. Nat. Commun. 2019, 10 (1), 3565.

30
17. Fleming, S.; Ulijn, R. V., Design of nanostructures based on aromatic peptide
amphiphiles. Chem. Soc. Rev. 2014, 43 (23), 8150-77.
18. Zhao, X.; Zhang, S., Molecular designer self-assembling peptides. Chem. Soc. Rev. 2006,
35 (11), 1105-1110.
19. Oshovsky, G. V.; Reinhoudt, D. N.; Verboom, W., Supramolecular Chemistry in Water.
Angew. Chem. Int. Ed. 2007, 46 (14), 2366-2393.
20. Krieg, E.; Bastings, M. M. C.; Besenius, P.; Rybtchinski, B., Supramolecular Polymers
in Aqueous Media. Chem. Rev. 2016, 116 (4), 2414-2477.
21. Ball, P., Water as an Active Constituent in Cell Biology. Chem. Rev. 2008, 108 (1), 74-
108.
22. Grdadolnik, J.; Merzel, F.; Avbelj, F., Origin of hydrophobicity and enhanced water
hydrogen bond strength near purely hydrophobic solutes. Proc. Natl. Acad. Sci. U.S.A. 2017, 114
(2), 322-327.
23. Southall, N. T.; Dill, K. A.; Haymet, A. D. J., A View of the Hydrophobic Effect. J.
Phys. Chem. B 2002, 106 (3), 521-533.
24. Chandler, D., Interfaces and the driving force of hydrophobic assembly. (1476-4687
(Electronic)).
25. Sánchez-Iglesias, A.; Grzelczak, M.; Altantzis, T.; Goris, B.; Pérez-Juste, J.; Bals, S.;
Van Tendeloo, G.; Donaldson, S. H.; Chmelka, B. F.; Israelachvili, J. N.; Liz-Marzán, L. M.,
Hydrophobic Interactions Modulate Self-Assembly of Nanoparticles. ACS Nano 2012, 6 (12),
11059-11065.
26. Singh, R. P.; Gangadharappa, H. V.; Mruthunjaya, K., Phospholipids: Unique carriers
for drug delivery systems. J. Drug Deliv. Sci. Technol. 2017, 39, 166-179.
27. Dilek, K.; Aysen, T., Micelles As Delivery System for Cancer Treatment. Curr. Pharm.
Des. 2017, 23 (35), 5230-5241.
28. Elezaby, R. S.; Gad, H. A.; Metwally, A. A.; Geneidi, A. S.; Awad, G. A., Self-
assembled amphiphilic core-shell nanocarriers in line with the modern strategies for brain
delivery. Journal of Controlled Release 2017, 261, 43-61.
29. Israelachvili, J. N., 8 - Special Interactions: Hydrogen-Bonding and Hydrophobic and
Hydrophilic Interactions. In Intermolecular and Surface Forces (Third Edition), Israelachvili, J.
N., Ed. Academic Press: San Diego, 2011; pp 151-167.
30. Murray, T. J.; Zimmerman, S. C., New triply hydrogen bonded complexes with highly
variable stabilities. J. Am. Chem. Soc. 1992, 114 (10), 4010-4011.
31. Krone, M. G.; Hua, L.; Soto, P.; Zhou, R.; Berne, B. J.; Shea, J.-E., Role of Water in
Mediating the Assembly of Alzheimer Amyloid-β Aβ16−22 Protofilaments. J. Am. Chem. Soc.
2008, 130 (33), 11066-11072.
32. Martinez, C. R.; Iverson, B. L., Rethinking the term “pi-stacking”. Chem. Sci. 2012, 3
(7), 2191-2201.
33. Sinnokrot, M. O.; Valeev, E. F.; Sherrill, C. D., Estimates of the Ab Initio Limit for π−π
Interactions: The Benzene Dimer. J. Am. Chem. Soc. 2002, 124 (36), 10887-10893.
34. McGaughey, G. B.; Gagne, M.; Rappe, A. K., pi-Stacking interactions. Alive and well in
proteins. J. Biol. Chem. 1998, 273 (25), 15458-63.
35. Hunter, C. A.; Sanders, J. K. M., The nature of .pi.-.pi. interactions. J. Am. Chem. Soc.
1990, 112 (14), 5525-5534.

31
36. Babine, R. E.; Bender, S. L., Molecular Recognition of Protein−Ligand Complexes:
Applications to Drug Design. Chem. Rev. 1997, 97 (5), 1359-1472.
37. Gazit, E., Self Assembly of Short Aromatic Peptides into Amyloid Fibrils and Related
Nanostructures. Prion 2007, 1 (1), 32-35.
38. Ma, M.; Kuang, Y.; Gao, Y.; Zhang, Y.; Gao, P.; Xu, B., Aromatic−Aromatic
Interactions Induce the Self-Assembly of Pentapeptidic Derivatives in Water To Form
Nanofibers and Supramolecular Hydrogels. J. Am. Chem. Soc. 2010, 132 (8), 2719-2728.
39. Shi, J.; Gao, Y.; Yang, Z.; Xu, B., Exceptionally small supramolecular hydrogelators
based on aromatic-aromatic interactions. Beilstein J. Org. Chem. 2011, 7, 167-72.
40. Hadjittofis, E.; Das, S. C.; Zhang, G. G. Z.; Heng, J. Y. Y., Chapter 8 - Interfacial
Phenomena. In Developing Solid Oral Dosage Forms (Second Edition), Qiu, Y.; Chen, Y.;
Zhang, G. G. Z.; Yu, L.; Mantri, R. V., Eds. Academic Press: Boston, 2017; pp 225-252.
41. Dhotel, A.; Chen, Z.; Delbreilh, L.; Youssef, B.; Saiter, J.-M.; Tan, L., Molecular
motions in functional self-assembled nanostructures. Int. J. Mol. Sci. 2013, 14 (2), 2303-2333.
42. Israelachvili, J. N.; Mitchell, D. J.; Ninham, B. W., Theory of self-assembly of
hydrocarbon amphiphiles into micelles and bilayers. J. Chem. Soc., Faraday Trans. 2 1976, 72
(0), 1525-1568.
43. Rehm, T. H.; Schmuck, C., Ion-pair induced self-assembly in aqueous solvents. Chem.
Soc. Rev. 2010, 39 (10), 3597-3611.
44. Whitesides, G. M.; Mathias, J. P.; Seto, C. T., Molecular self-assembly and
nanochemistry: a chemical strategy for the synthesis of nanostructures. Science 1991, 254
(5036), 1312.
45. Mandal, D.; Nasrolahi Shirazi, A.; Parang, K., Self-assembly of peptides to
nanostructures. Org. Biomol. Chem. 2014, 12 (22), 3544-61.
46. Lee, S.; Trinh, T. H. T.; Yoo, M.; Shin, J.; Lee, H.; Kim, J.; Hwang, E.; Lim, Y.-B.;
Ryou, C., Self-Assembling Peptides and Their Application in the Treatment of Diseases. Int. J.
Mol. Sci. 2019, 20 (23), 5850.
47. Habibi, N.; Kamaly, N.; Memic, A.; Shafiee, H., Self-assembled peptide-based
nanostructures: Smart nanomaterials toward targeted drug delivery. Nano today 2016, 11 (1), 41-
60.
48. MacEwan, S. R.; Chilkoti, A., Elastin-like polypeptides: biomedical applications of
tunable biopolymers. (0006-3525 (Print)).
49. Fallas, J. A.; O'Leary, L. E. R.; Hartgerink, J. D., Synthetic collagen mimics: self-
assembly of homotrimers, heterotrimers and higher order structures. Chem. Soc. Rev. 2010, 39
(9), 3510-3527.
50. Saiani, A.; Mohammed, A.; Frielinghaus, H.; Collins, R.; Hodson, N.; Kielty, C. M.;
Sherratt, M. J.; Miller, A. F., Self-assembly and gelation properties of α-helix versus β-sheet
forming peptides. Soft Matter 2009, 5 (1), 193-202.
51. Ghadiri, M. R.; Granja, J. R.; Milligan, R. A.; McRee, D. E.; Khazanovich, N., Self-
assembling organic nanotubes based on a cyclic peptide architecture. Nature 1993, 366 (6453),
324-327.
52. Khazanovich, N.; Granja, J. R.; McRee, D. E.; Milligan, R. A.; Ghadiri, M. R.,
Nanoscale Tubular Ensembles with Specified Internal Diameters. Design of a Self-Assembled
Nanotube with a 13-.ANG. Pore. J. Am. Chem. Soc. 1994, 116 (13), 6011-6012.

32
53. Clark, T. D.; Buriak, J. M.; Kobayashi, K.; Isler, M. P.; McRee, D. E.; Ghadiri, M. R.,
Cylindrical β-Sheet Peptide Assemblies. J. Am. Chem. Soc. 1998, 120 (35), 8949-8962.
54. Hartgerink, J. D.; Granja, J. R.; Milligan, R. A.; Ghadiri, M. R., Self-Assembling
Peptide Nanotubes. J. Am. Chem. Soc. 1996, 118 (1), 43-50.
55. Kobayashi, K.; Granja, J. R.; Ghadiri, M. R., β-Sheet Peptide Architecture: Measuring
the Relative Stability of Parallel vs. Antiparallel β-Sheets. Angew. Chem. Int. Ed. 1995, 34 (1),
95-98.
56. Ghadiri, M. R.; Granja, J. R.; Buehler, L. K., Artificial transmembrane ion channels from
self-assembling peptide nanotubes. Nature 1994, 369 (6478), 301-304.
57. Fernandez-Lopez, S.; Kim, H.-S.; Choi, E. C.; Delgado, M.; Granja, J. R.; Khasanov,
A.; Kraehenbuehl, K.; Long, G.; Weinberger, D. A.; Wilcoxen, K. M.; Ghadiri, M. R.,
Antibacterial agents based on the cyclic d,l-α-peptide architecture. Nature 2001, 412 (6845),
452-455.
58. Leclair, S.; Baillargeon, P.; Skouta, R.; Gauthier, D.; Zhao, Y.; Dory, Y. L.,
Micrometer-Sized Hexagonal Tubes Self-Assembled by a Cyclic Peptide in a Liquid Crystal.
Angew. Chem. Int. Ed. 2004, 43 (3), 349-353.
59. Chapman, R.; Warr, G. G.; Perrier, S.; Jolliffe, K. A., Water-Soluble and pH-
Responsive Polymeric Nanotubes from Cyclic Peptide Templates. Chem. Eur. J. 2013, 19 (6),
1955-1961.
60. Chapman, R.; Bouten, P. J. M.; Hoogenboom, R.; Jolliffe, K. A.; Perrier, S.,
Thermoresponsive cyclic peptide – poly(2-ethyl-2-oxazoline) conjugate nanotubes. Chem.
Commun. 2013, 49 (58), 6522-6524.
61. Danial, M.; Tran, C. M. N.; Jolliffe, K. A.; Perrier, S., Thermal Gating in Lipid
Membranes Using Thermoresponsive Cyclic Peptide–Polymer Conjugates. J. Am. Chem. Soc.
2014, 136 (22), 8018-8026.
62. Reches, M.; Gazit, E., Casting Metal Nanowires Within Discrete Self-Assembled Peptide
Nanotubes. Science 2003, 300 (5619), 625.
63. Tamamis, P.; Adler-Abramovich, L.; Reches, M.; Marshall, K.; Sikorski, P.; Serpell,
L.; Gazit, E.; Archontis, G., Self-assembly of phenylalanine oligopeptides: insights from
experiments and simulations. Biophys. J. 2009, 96 (12), 5020-5029.
64. Reches, M.; Gazit, E. Designed aromatic homo-dipeptides: formation of ordered
nanostructures and potential nanotechnological applications Phys. Biol. [Online], 2006, p. S10-9.
PubMed.
65. Adler-Abramovich, L.; Reches, M.; Sedman, V. L.; Allen, S.; Tendler, S. J. B.; Gazit,
E., Thermal and Chemical Stability of Diphenylalanine Peptide Nanotubes: Implications for
Nanotechnological Applications. Langmuir 2006, 22 (3), 1313-1320.
66. Ryu, J.; Park, C. B., High stability of self-assembled peptide nanowires against thermal,
chemical, and proteolytic attacks. Biotechnol. Bioeng. 2010, 105 (2), 221-230.
67. Görbitz, C. H., The structure of nanotubes formed by diphenylalanine, the core
recognition motif of Alzheimer's β-amyloid polypeptide. Chem. Commun. 2006, (22), 2332-
2334.
68. Marchesan, S.; Vargiu, A. V.; Styan, K. E., The Phe-Phe Motif for Peptide Self-
Assembly in Nanomedicine. Molecules 2015, 20 (11), 19775-19788.

33
69. de Groot, N. S.; Parella, T.; Aviles, F. X.; Vendrell, J.; Ventura, S., Ile-Phe Dipeptide
Self-Assembly: Clues to Amyloid Formation. Biophys. J. 2007, 92 (5), 1732-1741.
70. Marchesan, S.; Easton, C. D.; Kushkaki, F.; Waddington, L.; Hartley, P. G., Tripeptide
self-assembled hydrogels: unexpected twists of chirality. Chem. Commun. 2012, 48 (16), 2195-
2197.
71. Marchesan, S.; Waddington, L.; Easton, C. D.; Winkler, D. A.; Goodall, L.; Forsythe,
J.; Hartley, P. G., Unzipping the role of chirality in nanoscale self-assembly of tripeptide
hydrogels. Nanoscale 2012, 4 (21), 6752-6760.
72. Marchesan, S.; Easton, C. D.; Styan, K. E.; Waddington, L. J.; Kushkaki, F.; Goodall,
L.; McLean, K. M.; Forsythe, J. S.; Hartley, P. G., Chirality effects at each amino acid position
on tripeptide self-assembly into hydrogel biomaterials. Nanoscale 2014, 6 (10), 5172-5180.
73. Ghosh, S.; Singh, S. K.; Verma, S., Self-assembly and potassium ion triggered disruption
of peptide-based soft structures. Chem. Commun. 2007, (22), 2296-2298.
74. Guilbaud, J.-B.; Vey, E.; Boothroyd, S.; Smith, A. M.; Ulijn, R. V.; Saiani, A.; Miller,
A. F., Enzymatic Catalyzed Synthesis and Triggered Gelation of Ionic Peptides. Langmuir 2010,
26 (13), 11297-11303.
75. Krysmann, M. J.; Castelletto, V.; Kelarakis, A.; Hamley, I. W.; Hule, R. A.; Pochan,
D. J., Self-Assembly and Hydrogelation of an Amyloid Peptide Fragment. Biochemistry 2008, 47
(16), 4597-4605.
76. Castelletto, V.; Hamley, I. W.; Harris, P. J. F., Self-assembly in aqueous solution of a
modified amyloid beta peptide fragment. Biophys. Chem. 2008, 138 (1), 29-35.
77. Hamley, I. W.; Castelletto, V.; Moulton, C.; Myatt, D.; Siligardi, G.; Oliveira, C. L.
P.; Pedersen, J. S.; Abutbul, I.; Danino, D., Self-Assembly of a Modified Amyloid Peptide
Fragment: pH-Responsiveness and Nematic Phase Formation. Macromol. Biosci. 2010, 10 (1),
40-48.
78. Boothroyd, S.; Miller, A. F.; Saiani, A., From fibres to networks using self-assembling
peptides. Faraday Discuss. 2013, 166 (0), 195-207.
79. Dong, H.; Paramonov, S. E.; Aulisa, L.; Bakota, E. L.; Hartgerink, J. D., Self-Assembly
of Multidomain Peptides: Balancing Molecular Frustration Controls Conformation and
Nanostructure. J. Am. Chem. Soc. 2007, 129 (41), 12468-12472.
80. Bakota, E. L.; Aulisa, L.; Galler, K. M.; Hartgerink, J. D., Enzymatic Cross-Linking of a
Nanofibrous Peptide Hydrogel. Biomacromolecules 2011, 12 (1), 82-87.
81. Berndt, P.; Fields, G. B.; Tirrell, M., Synthetic lipidation of peptides and amino acids:
monolayer structure and properties. J. Am. Chem. Soc. 1995, 117 (37), 9515-9522.
82. Yu, Y.-C.; Berndt, P.; Tirrell, M.; Fields, G. B., Self-Assembling Amphiphiles for
Construction of Protein Molecular Architecture. J. Am. Chem. Soc. 1996, 118 (50), 12515-
12520.
83. Yu, Y.-C.; Roontga, V.; Daragan, V. A.; Mayo, K. H.; Tirrell, M.; Fields, G. B.,
Structure and Dynamics of Peptide−Amphiphiles Incorporating Triple-Helical Proteinlike
Molecular Architecture. Biochemistry 1999, 38 (5), 1659-1668.
84. Hartgerink, J. D.; Beniash, E.; Stupp, S. I., Self-Assembly and Mineralization of Peptide-
Amphiphile Nanofibers. Science 2001, 294 (5547), 1684.

34
85. Hartgerink, J. D.; Beniash, E.; Stupp, S. I., Peptide-amphiphile nanofibers: A versatile
scaffold for the preparation of self-assembling materials. Proc. Natl. Acad. Sci. U.S.A. 2002, 99
(8), 5133.
86. Pashuck, E. T.; Cui, H.; Stupp, S. I., Tuning Supramolecular Rigidity of Peptide Fibers
through Molecular Structure. J. Am. Chem. Soc. 2010, 132 (17), 6041-6046.
87. Cui, H.; Muraoka, T.; Cheetham, A. G.; Stupp, S. I., Self-Assembly of Giant Peptide
Nanobelts. Nano Lett. 2009, 9 (3), 945-951.
88. Silva, G. A.; Czeisler, C.; Niece, K. L.; Beniash, E.; Harrington, D. A.; Kessler, J. A.;
Stupp, S. I., Selective Differentiation of Neural Progenitor Cells by High-Epitope Density
Nanofibers. Science 2004, 303 (5662), 1352.
89. Standley, S. M.; Toft, D. J.; Cheng, H.; Soukasene, S.; Chen, J.; Raja, S. M.; Band,
V.; Band, H.; Cryns, V. L.; Stupp, S. I., Induction of cancer cell death by self-assembling
nanostructures incorporating a cytotoxic peptide. Cancer Res. 2010, 70 (8), 3020-3026.
90. Toft, D. J.; Moyer, T. J.; Standley, S. M.; Ruff, Y.; Ugolkov, A.; Stupp, S. I.; Cryns,
V. L., Coassembled Cytotoxic and Pegylated Peptide Amphiphiles Form Filamentous
Nanostructures with Potent Antitumor Activity in Models of Breast Cancer. ACS Nano 2012, 6
(9), 7956-7965.
91. Katayama, K.; Armendariz-Borunda J Fau - Raghow, R.; Raghow R Fau - Kang, A. H.;
Kang Ah Fau - Seyer, J. M.; Seyer, J. M., A pentapeptide from type I procollagen promotes
extracellular matrix production. (0021-9258 (Print)).
92. Castelletto, V.; Hamley, I. W.; Perez, J.; Abezgauz, L.; Danino, D., Fibrillar
superstructure from extended nanotapes formed by a collagen-stimulating peptide. Chem.
Commun. 2010, 46 (48), 9185-9187.
93. Miravet, J. F.; Escuder, B.; Segarra-Maset, M. D.; Tena-Solsona, M.; Hamley, I. W.;
Dehsorkhi, A.; Castelletto, V., Self-assembly of a peptide amphiphile: transition from nanotape
fibrils to micelles. Soft Matter 2013, 9 (13), 3558-3564.
94. Dehsorkhi, A.; Castelletto, V.; Hamley, I. W.; Adamcik, J.; Mezzenga, R., The effect of
pH on the self-assembly of a collagen derived peptide amphiphile. Soft Matter 2013, 9 (26),
6033-6036.
95. van den Heuvel, M.; Prenen, A. M.; Gielen, J. C.; Christianen, P. C. M.; Broer, D. J.;
Löwik, D. W. P. M.; van Hest, J. C. M., Patterns of Diacetylene-Containing Peptide Amphiphiles
Using Polarization Holography. J. Am. Chem. Soc. 2009, 131 (41), 15014-15017.
96. van den Heuvel, M.; Löwik, D. W. P. M.; van Hest, J. C. M., Effect of the Diacetylene
Position on the Chromatic Properties of Polydiacetylenes from Self-Assembled Peptide
Amphiphiles. Biomacromolecules 2010, 11 (6), 1676-1683.
97. Vegners, R.; Shestakova, I.; Kalvinsh, I.; Ezzell, R. M.; Janmey, P. A., Use of a gel-
forming dipeptide derivative as a carrier for antigen presentation. J. Pept. Sci. 1995, 1 (6), 371-
378.
98. Zhang, Y.; Gu, H.; Yang, Z.; Xu, B., Supramolecular Hydrogels Respond to
Ligand−Receptor Interaction. J. Am. Chem. Soc. 2003, 125 (45), 13680-13681.
99. Zhang, Y.; Yang, Z.; Yuan, F.; Gu, H.; Gao, P.; Xu, B., Molecular Recognition
Remolds the Self-Assembly of Hydrogelators and Increases the Elasticity of the Hydrogel by
106-Fold. J. Am. Chem. Soc. 2004, 126 (46), 15028-15029.

35
100. Yang, Z.; Liang, G.; Wang, L.; Xu, B., Using a Kinase/Phosphatase Switch to Regulate
a Supramolecular Hydrogel and Forming the Supramolecular Hydrogel in Vivo. J. Am. Chem.
Soc. 2006, 128 (9), 3038-3043.
101. Smith, A. M.; Williams, R. J.; Tang, C.; Coppo, P.; Collins, R. F.; Turner, M. L.;
Saiani, A.; Ulijn, R. V., Fmoc-Diphenylalanine Self Assembles to a Hydrogel via a Novel
Architecture Based on π–π Interlocked β-Sheets. Adv. Mater. 2008, 20 (1), 37-41.
102. Helen, W.; de Leonardis, P.; Ulijn, R. V.; Gough, J.; Tirelli, N., Mechanosensitive
peptide gelation: mode of agitation controls mechanical properties and nano-scale morphology.
Soft Matter 2011, 7 (5), 1732-1740.
103. Tang, C.; Smith, A. M.; Collins, R. F.; Ulijn, R. V.; Saiani, A., Fmoc-Diphenylalanine
Self-Assembly Mechanism Induces Apparent pKa Shifts. Langmuir 2009, 25 (16), 9447-9453.
104. Tang, C.; Ulijn, R. V.; Saiani, A., Effect of Glycine Substitution on Fmoc–
Diphenylalanine Self-Assembly and Gelation Properties. Langmuir 2011, 27 (23), 14438-14449.
105. Xu, H.; Das, A. K.; Horie, M.; Shaik, M. S.; Smith, A. M.; Luo, Y.; Lu, X.; Collins,
R.; Liem, S. Y.; Song, A.; Popelier, P. L. A.; Turner, M. L.; Xiao, P.; Kinloch, I. A.; Ulijn, R.
V., An investigation of the conductivity of peptide nanotube networks prepared by enzyme-
triggered self-assembly. Nanoscale 2010, 2 (6), 960-966.
106. Williams, R. J.; Smith, A. M.; Collins, R.; Hodson, N.; Das, A. K.; Ulijn, R. V.,
Enzyme-assisted self-assembly under thermodynamic control. Nat. Nanotechnol. 2009, 4 (1), 19-
24.
107. Hughes, M.; Xu, H.; Frederix, P. W. J. M.; Smith, A. M.; Hunt, N. T.; Tuttle, T.;
Kinloch, I. A.; Ulijn, R. V., Biocatalytic self-assembly of 2D peptide-based nanostructures. Soft
Matter 2011, 7 (21), 10032-10038.
108. Roy, S.; Javid, N.; Sefcik, J.; Halling, P. J.; Ulijn, R. V., Salt-Induced Control of
Supramolecular Order in Biocatalytic Hydrogelation. Langmuir 2012, 28 (48), 16664-16670.
109. Chen, L.; Morris, K.; Laybourn, A.; Elias, D.; Hicks, M. R.; Rodger, A.; Serpell, L.;
Adams, D. J., Self-Assembly Mechanism for a Naphthalene−Dipeptide Leading to
Hydrogelation. Langmuir 2010, 26 (7), 5232-5242.
110. Chen, L.; Revel, S.; Morris, K.; C. Serpell, L.; Adams, D. J., Effect of Molecular
Structure on the Properties of Naphthalene−Dipeptide Hydrogelators. Langmuir 2010, 26 (16),
13466-13471.
111. Chen, L.; Pont, G.; Morris, K.; Lotze, G.; Squires, A.; Serpell, L. C.; Adams, D. J.,
Salt-induced hydrogelation of functionalised-dipeptides at high pH. Chem. Commun. 2011, 47
(44), 12071-12073.
112. Chen, L.; McDonald, T. O.; Adams, D. J., Salt-induced hydrogels from functionalised-
dipeptides. RSC Adv. 2013, 3 (23), 8714-8720.

36
Chapter 2 Self-assembled Anti-diabetic Amino Acid Compound
(Adapted from “Amino acid-based compound activates atypical PKC and leptin receptor
pathways to improve glycemia and anxiety like behavior in diabetic mice.”
Biomaterials, 239, 119839. https://doi.org/10.1016/j.biomaterials.2020.119839. Cell and
animal studies were performed by Dr. Ouliana Ziouzenkova and Dr. Aejin Lee)
2.1 Introduction
Glucose is a major energy substrate in biological systems and regulation of glucose
homeostasis is critical for life. Insulin is one of the most well-known hormones that
regulates glucose metabolism. In skeletal muscle, liver and adipose tissues, insulin converts
glucose either into glycogen via glycogenesis or lipids via lipogenesis.1 Moreover, insulin
can regulate the major glucose transporter (GLUT4) in peripheral tissues, which supplies
70% of post prandial glucose to muscle tissues and 10% to adipose tissues.2 Impairment
in insulin signaling pathways such as deficient insulin production, misfolding of insulin
and insulin resistance can result in diabetes mellitus.2, 3
In type 1 diabetic (T1D) individuals, insulin has been used as the primary treatment
to maintain glucose homeostasis for a century.4 Insulin also acts as an anabolic hormone
and it supports growth in young individuals and other anabolic processes in all age groups.2,
4 Alternatively to insulin, leptin is used in diabetic treatment as well. Unlike insulin, leptin
is a catabolic hormone and regulates glucose homeostasis in peripheral tissues via

37
activating GLUT4 catabolically.5, 6 In T1D individuals, leptin production is often
diminished and treatment with leptin can control glucose homeostasis via peripheral GLU4
activation, compensating for insulin deficiency in T1D individuals.7-9 In addition, leptin
treatment is also effective in leptin-deficient Lepob mice with insulin resistance and
lipodystrophic mice and patients.10, 11 Whilst, in type 2 diabetes (T2D), commonly
accompanied by obesity, leptin resistance is often developed and it limits application of
leptin treatment under this situation.
Apart from peripheral tissues, neural tissues also utilize glucose as primary energy
substrate, which consume up to 20% of daily glucose used in biological systems.12
Regulation of glucose homeostasis in neural tissues is different from that in peripheral
tissues: insulin-insensitive glucose transporters GLUT1 and GLUT3 are highly expressed
in brain tissues, whereas insulin-regulated GLUT4 is abundant in peripheral tissues.13-15
Since GLUT1 is the major glucose transporter in neural tissues, deficiency of GLUT1 can
lead to irreversible neural tissue damage.16, 17 In diabetic individuals, GLUT1 is often
deactivated by decreased leptin production,7 impaired GLUT1 amino acid metabolism18
and/or irregular phosphorylation of protein kinase C (PKC), which is related to GLUT1
translocation in cells.19 Because regulation of glucose homeostasis does not completely
depend on insulin in neural tissues, interruption of insulin signaling pathway in neural
tissues does not impair their functions.20 Moreover, insulin treatment for diabetic patients
results in reciprocal glucose uptake in peripheral tissues and could lead to hypoglycemic
episodes and energy deprivation states in neurons.4, 21

38
In the past few decades, different therapeutics and materials have been developed
for diabetic treatment, most of which act on the canonic insulin signaling pathway. In
1970s, synthesis of human insulin using recombinant DNA technology was developed and
later commercialized in 1980s.4 Since then, a series of insulin analogs were synthesized
and have been used commercially.4 There are two major types of insulin analogs: fast-
acting and basal. Fast-acting insulin analogs can act within 15 minutes after meals to lower
blood sugar level.22 On the contrary, basal insulin analogs are long-acting and peakless in
physiological systems.23
Insulin treatment is mostly administrated by periodic manual injection or electronic
insulin pump. Whereas difficulty in controlling insulin doses during injection and
biofouling in insulin pumps are two of the major shortcomings in traditional insulin
treatment.24 To overcome these problems, glucose responsive nanomedicines were
developed. The design of glucose-responsive nanomedicines are based on the function of
-cells in pancreas and it can release insulin in response to hyperglycemic condition in
blood.24 To achieve the glucose-sensing system, insulin nanocarriers consist of various
molecules25 were engineered with different glucose-responsive triggers.26 Three types of
glucose-responsive triggers are most commonly used: glucose oxidase, glucose-binding
proteins and glucose-binding small molecules.27 To release insulin, the nanocarriers are
designed to disassemble by either swelling or degrading (Figure 2.1).27

39
Figure 2.1 Two different insulin-releasing nanoparticles. Copyright 2014, Nature
Publishing Group, a division of Macmillan Publishers Limited.27
Glucose oxidase is capable of oxidizing glucose into gluconic acid in physiological
environment. pH-responsive polymers are used with glucose oxidase to build glucose-
sensing platforms for insulin release. For example, Zhen’s group designed a nanoparticle
loaded with insulin, glucose oxide and catalase (Figure 2.2).28 Addition of catalase can
convert H2O2, a byproduct from glucose oxidation, to O2 and further promote glucose
oxidation. The nanovesicle was bilayered and comprised amphipilic polymer PEG–
poly(Ser-Ketal), which contained an acid-sensitive ketal end. The polymer bilayer shell
was stable under physiological pH and prevented loss of encapsulated insulin at low blood
sugar level. As glucose levels increased in the system, glucose molecules entered the
nanovesicle by passive diffusion and glucose oxidase catalyzed the oxidation from glucose
to gluconic acid. Increased concentration of gluconic acid triggered the hydrolysis of the

40
ketal group on PEG–poly(Ser-Ketal) and converted it into hydrophilic PEG-polyserine.
The nanovesicle disassembled and eventually released insulin into the system.28 Zhen and
co-workers also developed a novel glucose-responsive insulin delivery device using a
painless microneedle-array patch, which contained nanovesicles loaded with insulin and
glucose oxidase.29 The nanovesicle consisted of hypoxia-sensitive hyaluronic acid
conjugated with 2-nitroimidazole. As glucose got oxidized under hyperglycemic
conditions, the local microenvironment became hypoxic and the 2-nitroimidazole on the
polymer was reduced to a more hydrophilic 2-aminoimidazole, causing the nanovesicle to
dissociate and releasing insulin. The patch showed high efficacy on glucose homeostasis
regulation in chemically induced T1D mice and provided faster response to
hyperglycemia.29

41
Figure 2.2 A) Schematic of the enzyme-based glucose-responsive nanovesicle. B) The
chemical structure of the pH-sensitive polymer PEG-poly(Ser-Ketal), which can be
hydrolyzed into water-soluble PEG-polyserine. Copyright 2014 American Chemical
Society.29
Glucose-binding protein is commonly used as a glucose-responsive trigger.
Concanavalin A (Con A) is a lectin protein extracted from plants. Con A protein can bind
with glucose-specific carbohydrates and it can act as crosslinker between polymers bearing
glucose moieties.30 Under hyperglycemic conditions, Con A can bind with free glucose
molecules and the nanostructure formed by the polymers can swell or disassemble to
release insulin.30 In 2001, Park and co-workers introduced a glucose-sensitive hydrogel
that comprised insulin, glucose-containing polymers and PEGylated Con A. As glucose
concentration increased, the insulin release rate was enhanced.31 Anzai and co-workers

42
have design a series of glucose-sensitive layer-by-layer films using various polymers and
Con A to achieve controlled insulin release in physiological environment.32-35 For example,
glucose-sensitive microcapsules were prepared by layer-by-layer deposition of Con A and
glycogen on calcium carbonate particles loaded with fluorescein-labeled insulin.35 Insulin
was released slowly in the absence of sugar and the releasing rate was accelerated as sugar
concentration increased, which was caused by added sugars replacing glycogen in the
binding site of Con A and consequently enhancing permeability of the capsule layers.35
Small molecules like phenylboronic acid (PBA) represent a chemical approach to
glucose-responsive insulin delivery systems.27 PBA is designed to mimic glucose-binding
proteins, which can bind with glucose-containing polymers and form glucose-responsive
nanostructures. Matsumoto and co-workers introduced a hydrogel that consisted of PBA-
containing polymers. Under hyperglycemic condition, the gel was able to release insulin.36
As glucose reacted with PBA, the gel underwent dehydration and formed a skin layer on
the surface of gel to prevent further release of insulin, which prevented hypoglycemia from
over-release of insulin.36 In later publication, Matsumoto and co-workers developed a PBA
derivative to improve binding specificity to glucose under physiological pH.37
Apart from the insulin delivery nanomedicines mentioned above, medications
called insulin secretagogues for improving insulin secretion are also widely used
specifically on T2D patients. Insulin secretion is initiated by increase of glucose in the
pancreatic beta cell, followed by glycolysis and production of ATP to inhibit the ATP-
sensitive potassium channel (KATP). As KATP shut down, potassium ions build up in
cytoplasm and cell membrane will undergo depolarization. The process will open the

43
voltage-gated calcium channel and lead to the influx of calcium ions, and further stimulate
the release of insulin into the blood (Figure 2.3)38, 39. In diabetic individuals, glucose uptake
of cell is impaired and ATP generation is insufficient in cytoplasm to inhibit KATP and
further trigger insulin secretion. To address this problem, KATP inhibitors are introduced.
Sulfonylurea drugs are one of the most used KATP inhibitors for diabetic management and
generations of sulfonylurea treatment have been developed over decades.40 Glucagon-like
peptide 1 (GLP1) and its synthetic analogs are also well-studied for diabetic treatment.41,
42 GLP1 is a blood glucose-lowering hormone that binds to G protein-coupled receptors
(GPCRs) located on pancreatic β-cells and causes stimulation of insulin gene transcription,
insulin biosynthesis, and insulin secretion.43
Figure 2.3 Schematic representation of insulin secretion mechanism. Copyright 2015 The
Canadian Society of Clinical Chemists.38

44
The diabetic treatments mentioned above are all targeted on the canonic insulin
signaling pathway, which regulates insulin sensitive GLUT4 in peripheral tissues.
However, glucose homeostasis regulated by GLUT1 in peripheral and neural tissues in
diabetic individuals is neglected in this case. As a matter of fact, many treatments that
optimize systemic glucose control are not able to prevent neurodegeneration that
contributes to the development of retinopathies, neuropathies and central nervous system
(CNS) damage in diabetic patients44, 45 and cognitive impairments occur in all age groups.46
Therefore, searching for compounds that can regulate glucose homeostasis via alternative
pathways to work in combination with insulin treatment is significant for diabetic
management. It was reported that some natural di-and polypeptides could have glycemic
properties,47-49 even though proteolytic degradation could limit the efficacy of the peptides.
Likewise, plant extracts like coumarin derivatives demonstrate antidiabetic activity,
although high dosage is required.50 Despite preliminary discoveries, the antidiabetic
properties of compounds consist of both peptides and coumarins are still unknown.
Herein, we demonstrate the syntheses of a series of peptide derivatives that can
self-assemble into various nanostructures. We also investigate the antidiabetic efficacy of
the prototype peptide, which rescues mice models associated with T1D and T2D and
attenuates cognitive deficits.
2.2 Results and Discussion
It was reported that lysine and coumarin derivatives can induce glucose response,51,
52 hence we utilized 7-(diethylamino)coumarin-3-carboxylic acid (DAC) to incorporate

45
with Fmoc-dilysine peptide as the prototype. In addition, to understand the role of charged
amino acid side chain and aromatic moiety play in antidiabetic efficacy, we synthesized
and tested a series of Fmoc-peptide derivatives (Scheme 2.1) termed amino acid compound
(AAC). The influence of charge on amino acid residue was explored by testing positively
charged AAC1-3, AAC5-7 and negatively charged AAC4. The impact of coumarin moiety
was investigated by comparing DAC-coupled dipeptides AAC2, AAC4 and AAC5 with
peptides containing benzyl succinate (AAC1) and benzyl amide (AAC3 and AAC7). A
dipeptide without aromatic moiety on the second lysine side chain AAC6 was also tested.
Scheme 2.1 Chemical structures and features of AAC1-7.
AAC1-7 were dissolved in phosphate-buffered saline (PBS, pH 7.4) solution at 20
mM for 1 day. Afterwards, the self-assembly of the peptide derivatives was investigated

46
by transmission electron microscopy (TEM). AAC1 formed several micrometer-long flat
nanoribbons with width of ~22 nm (Figure 2.4 a). AAC2 self-assembled into twisted
nanofibers with width of ~16 nm (Figure 2.4 b). AAC3 formed twisted nanoribbons with
widest width of 23 nm and narrowest width of 13 nm (Figure 2.4 c). AAC4 and AAC5 both
self-assembled into nanofibrils with width of 9 nm and 10 nm respectively (Figure 2.4 c,
d). AAC6 only formed amorphous aggregation (Figure 2.4 e) and AAC7 yielded coiled
nanoribbons with width of ~60 nm, some of which started wrapping into tubular structures
with diameter ranging from 60 to 70 nm (Figure 2.4 g).

47
Figure 2.4 TEM images of (a) AAC1, (b) AAC2, (c) AAC3, (d) AAC4, (e) AAC5, (f)
AAC6, (g) AAC7 in PBS (pH 7.4, 1 day) at 20 mM.
Short (6 h) and long-term (24 h) toxicity of AAC compounds on murine 3T3-L1
fibroblasts were investigated. Short-term experiments show that AAC3 was significantly

48
more cytotoxic compared to the other peptide derivatives, therefore it was excluded for
further experiments (Figure 2.5 a). AAC1 and AAC4-7 showed low but significant
cytotoxicity after 24 h (Figure 2.5 d), whereas cytotoxicity of AAC2 was unexpectedly low
that the cell viability of AAC2-treated cells was identical to control (Figure 2.5 d). Due to
the low cytotoxicity of AAC2, the effects of treating fibroblasts and human brain
endothelial cells with higher concentration of AAC2 were investigated for prolonged
period (Figure 2.5 b, c). After 24 h, the cell viability of AAC2-treated cells was still similar
to the control. Based on the preliminary experimental results, we suggested that AAC2 has
low cytotoxicity in both peripheral and braincells. Since the peptides were functionalized
with potential antioxidants such as coumarin, antioxidant properties of AAC1-7 were tested
under oxidative stress conditions induced by hydrogen peroxide (Figure 2.5 e). Only AAC6
showed reductive activity among all the AAC compounds. However, AAC6 had higher
cytotoxicity compare to AAC2. Thus, in following glycemic studies in vitro, both AAC2
and AAC6 will be tested.

49
Figure 2.5 (a) Cytotoxicity of 6 h-treatment without or with AAC1-3 (0.5, 100, and 500
µM) was measured in 3T3-L1 preadipocytes using lactate dehydrogenase (LDH) activity
assay. Cytotoxicity of (b) 3T3-L1 preadipocytes and (c) human brain endothelial cells
treated with different concentrations of AAC2 or left untreated for up to 72 h. (d)
Cytotoxicity of 3T3-L1 preadipocytes treated with AAC compounds (0.1 μM) or left
untreated for 24 h. (e) Reactive oxygen species concentration was measured in 3T3-L1
preadipocytes stimulated with H2O2 for 4 h (200 μM) and treated with and without AAC
(0.1μM) for 24 h.

50
Additionally, AAC2 was further studied due to its low cytotoxicity. The self-
assembly of AAC2 in PBS at pH 7.4 was investigated. After aging for 1 day at room
temperature, AAC2 was investigated by TEM. AAC2 self-assembled into twisted
nanofibers with widest width of 16 nm and narrowest width of 10 nm. According to the
results observed from TEM, each twisted nanofiber results from intertwining of
protofilaments with diameter of approximately 4 nm. (Figure 2.6 a). UV-Vis spectroscopy
(Figure 2.6 b) revealed that changing the solvent form trifluoroethanol (TFE) to PBS
resulted in decrease of intensity and blue-shift of λmax from 430 nm to 397 nm, indicating
that H-type aggregation was present with the DAC coumarin on AAC2.53 Circular
dichroism (CD) spectroscopy (Figure 2.6 c) exhibited exitonic couplet with zero-crossing
at ~415 nm, indicating M-type helical packing of DAC coumarin was present in the self-
assembled structure.53 Deconvolution of Fourier-transform Infrared (FT-IR) spectrum
(Figure 2.6 d) showed intense absorption at 1610 and 1635 cm-1 in the amide I region,
which is characteristic of -sheet structure. Minor absorption at 1650 cm-1 indicated that
there was small percentage of α-helix present in self-assembly.54, 55 Thioflavin T (ThT)
binding assay was also tested.56 Enhanced fluorescence intensity of ThT solution was
observed as more AAC2 samples were added (Figure 2.6 e), which indicates that AAC2
formed amyloid fibrils.57, 58

51
Figure 2.6 (a) TEM image of the self-assembled structure of AAC2 in PBS. (b) UV-Vis
spectra of AAC2 in TFE and PBS. (c) Co-plot of UV-Vis and CD spectra of AAC2 in
PBS. (d) FT-IR spectrum of AAC2. (e) Thioflavin T binding assay (Excitation: 440 nm
and Emission: 482 nm) of AAC2 in PBS (1 mM, aged for 24 h). (f) Plot of fluorescence
intensity of Nile Red at 656 nm (Ex = 550 nm) versus the concentration (mM) of AAC2
in PBS.

52
Since lysine side chain has pKa of 10.5,59 AAC2 should be positively charge under
physiological condition (pH 7.4). Insulin, with isoelectric point at pH 5.3,60 is negatively
charged at pH 7.4. Hence, the oppositely charged AAC2 and hINS should be able to bind
together via electrostatic attraction. Preliminary researches showed that incorporating
insulin with self-assembled nanostructures could prolong circulation life and control the
release of insulin in response to blood glucose change.25, 61 Therefore, human insulin
(hINS) was combined with self-assembled AAC2 and investigated. AAC2 was diluted
from 20 mM to 0.1 mM and titrated with hINS solution at different concentrations in 1:1
ratio by volume. Zeta potentials of AAC2-hINS mixtures were measured (Figure 2.7 a).
Titration result indicated that as concentration of hINS increased, zeta potential of AAC2-
insulin mixture dropped from 15 mV to -20 mV. Decreased zeta potential indicated that
the interface between self-assembly of AAC2 and solvent became more negative, meaning
negatively charged hINS molecules were bound to AAC2 nanofibers.
TEM was utilized to observe AAC2-hINS complex. To visualize insulin, gold
nanoparticle (GNP) functionalized with HS-PEG-COOH was coupled with amine tail of
hINS molecule.62 TEM image revealed that hINS bound to the surface of AAC2 (Figure
2.7 b). Quartz crystal microbalance with dissipation (QCM-D) binding assay was also
employed to investigate AAC2-hINS complex. The progressive decrease in frequency
signal (Figure 2.7 c) and increased thickness of AAC2 film after hINS addition (Figure 2.7
d) indicated that hINS was able to bind to AAC2 assembly.

53
Figure 2.7 a) Titration of AAC2 (0.1 mM in PBS, pH 7.4) with hINS at different
concentrations. b) TEM image of AAC2-hINS complex. c) Change in frequencies and
dissipations vs. time for hINS (10µg/mL) and AAC2 nanofiber (0.1µM) on active gold
surface. Insulin were introduced at t=500s. d) Values of thickness of AAC2 nanofiber
and hINS on the active gold surface in real time were calculated to unveil molecular
interaction between AAC2 nanofiber and insulin.
Critical micelle concentration (CMC) was measured using solvochromatic dye Nile
Red and the concentration was 84 µM (Figure 2.6 f). The CMC of AAC2 in PBS was 840
times higher than the concentration used for experiments in vitro. Thus, we considered that
AAC2 remained in monomeric form in this study. Based on preliminary experiment results,

54
AAC2 and AAC6 was chosen for glycemic studies in vitro due to their low cytotoxicity
and antioxidant activity respectively. The anti-diabetic efficacy of AAC2 and AAC6 was
first tested on the relevant primary human stromal vascular fraction preadipocytes (SVF),
which were isolated from visceral (omental) fat from obese patients served as an example
as peripheral tissue.63, 64 Administration of AAC2 showed a dose-dependent increase in
glucose uptake in SVF preadipocytes, whereas AAC6 reduced glucose uptake (Figure 2.8
a). Therefore, due to the efficacy of anti-diabetic activity and low cytotoxicity, AAC2 was
selected for further investigation.
The glucose uptake of AAC2 and human insulin (hINS) was compared using SVF
isolated from six patients. Treatment with AAC2 resulted in glucose uptake in all patients,
while hINS was effective on only 50% of the patients (Figure 2.8 b). Glycemic properties
of AAC2 in human brain endothelial cells (hBEC) were also investigated and AAC2 was
compared with hINS and leptin (hLep). Since hBEC cells primarily utilize glucose
transporter 1 (GLUT1) to facilitate glucose transport across the cell membrane,16 GLUT1
inhibitor was used to suppress glucose uptake of the cells. AAC2 and leptin induced
glucose uptake (Figure 2.8 c) and cells incubated with GLU1 inhibitor was not responsive
to AAC2 and leptin (Figure 2.7 d). hINS did not have any effect on hBEC cells (Figure 2.8
d). Mouse 3T3-L1 preadipocytes, which use glucose transporter 4 (GLUT4) as major
transporter and GLUT1 as minor transporter,65 was also tested. AAC2, leptin and hINS all
induced glucose uptake in mouse 3T3-L1 preadipocytes. Incubation of GLUT1 inhibitor
suppressed glucose uptake of cells administrated with AAC2 and leptin but not with hINS
(Figure 2.8e). Interestingly, AAC2 can induce glucose uptake in differentiated 3T3-L1

55
adipocytes. However, 3T3-L1 adipocytes were responsive to leptin and hINS (Figure 2.8
e), which was in concord with the insulin and leptin resistance observed in adipocytes. To
summarize, AAC2 and leptin induce glucose uptake using different glucose transporter
compare to insulin and AAC2 influenced glucose uptake in both peripheral adipocytes and
in endothelial cells of nervous tissue.
Figure 2.8 (a) Dose-dependent FD-glucose uptake in SVF cells stimulated with AAC2
and AAC6. (b) FD-glucose uptake in non-treated (Veh) SVF cells or stimulated with
AAC2, or hINS for 80min. (c) Glucose uptake in non-treated (Veh) 3T3-L1 adipocytes or
stimulated with hINS, mLep or AAC2. (d) FD-glucose uptake in human brain endothelial
cells (hBEC) treated with vehicle (Veh; PBS) or hINS, human leptin (hLep), or AAC2 in
the presence and absence of GLUT1 inhibitor. (e) FD-glucose uptake in mouse 3T3-L1
preadipocytes treated with vehicle (Veh;PBS) or hINS, mouse leptin (mLep), or AAC2 in
the presence and absence of GLUT1 inhibitor.
The mechanism of AAC2-mediated glucose uptake was investigated using 3T3-L1
preadipocytes. AAC2 increased glucose uptake in a concentration-dependent manner
(Figure 2.9 a). Both AAC2 and hINS induced glucose uptake in 3T3-L1 preadipocytes

56
(Figure 2.9 b). However. incubation of 3T3-L1 preadipocytes with anti-insulin receptor
(InsR) antibodies only interfered the glucose uptake stimulated by insulin (Figure 2.9 b).
To obtain profound understanding of the initial observation, AKT and PI3K pathways,
which mediate downstream effects of activated InsR in 3T3-L1 preadipocytes, were
investigated.66 Inhibition of AKT and PI3K pathways did not suppress glucose uptake in
3T3-L1 preadipocytes (Figure 2.9 c), which indicated that AAC2 induced glucose uptake
via different pathways. AMPK, MAPK, PPARα, EGFR and FGFR pathways were also
ruled out since inhibition of these pathways did not prevent glucose uptake in the cells
treated with AAC2 (Figure 2.9 d).

57
Figure 2.9 (a) Dose-dependence FD-glucose uptake stimulated by AAC2 in 3T3-L1
preadipocytes after 100 min of incubation. (b) FD-glucose uptake in non-stimulated
(Veh) or stimulated with AAC2 or hINS in 3T3-L1 cells for 80 min. Prior to stimulation
cells were incubated with Veh, heat-inactivated immunoglobulin (data not shown), or
anti-InsR antibody for 40 min. (c) FD-glucose uptake (% vs. Veh) in presence of AAC2
with and without PI3K inhibitor or pan-Akt inhibitor in 3T3-L1 preadipocytes. (d)
Glucose uptake in 3T3-L1 preadipocytes mediated by AAC2 with or without inhibitors
for various pathways implicated in glucose uptake.
Since glucose uptake in peripheral tissues can be regulated by leptin-leptin receptor
(LepR) pathway,67 glucose uptake mediated by AAC2 and leptin were compared in 3T3-
L1 preadipocytes. The cells were first incubated with inactivated or intact antibodies
against LepR, then treated with AAC2 or leptin. Inhibition of LepR suppressed glucose
uptake in 3T3-L1 preadipocytes, indicating that AAC2 and leptin mediate glucose uptake
via LepR (Figure 2.10 a). To consolidate this observation, glucose uptake mediated by

58
AAC2 and leptin were also measured in cells with genetically dysfunctional LepR (Figure
2.10 b). AAC2 and leptin were not able to induce glucose uptake in these cells, which
further confirmed that AAC2 and leptin regulate glucose homeostasis via LepR.
Figure 2.10 (a) FD-glucose uptake (% compared to Veh) in presence of AAC2 or
recombinant mouse leptin protein in 3T3-L1 preadipocytes incubated with inactivated
antibodies or poly clonal anti-LepR antibodies. (b) FD-glucose uptake (% compared to
Veh) in presence of AAC2 or recombinant mouse leptin protein in SVF cells isolated
from subcutaneous fat of Leprdb mouse.
The effects of AAC2, leptin and insulin on major signaling pathways in 3T3-L1
preadipocytes were examined to further understand the mechanism of glucose uptake
regulation mediated by AAC2. Expression of phosphorylated and non-phosphorylated
proteins in different pathways were investigated (Figure 2.11 a). Western blot results
showed that insulin treatment led to strong activation of AKT and weak activation of
mTOR, STAT3, STAT5, and ERK after 15 min treatment. Leptin treatment only activated
mTOR after 15 min. AAC2 only had weak effect on AKT, mTOR, STAT3 and STAT5,
but it activated ERK and PKCς. It was reported that PKCς can regulate glucose uptake in
response to mechanical stretch in muscle cells.68 Therefore, PKCς pathway activity was
investigated in AAC2-treated 3T3-L1 preadipocytes. ZIP inhibitor was used to suppress

59
PKCς activity in cells and it was observed that inhibition of PKCς interfered AAC2-
mediated glucose uptake in the cells (Figure 2.10 b), indicating that AAC2 regulated
glucose uptake via PKCς in a different manner compare to leptin.
Figure 2.11 (a) Expression of phosphorylated and non-phosphorylated proteins measured
in 3T3-L1 preadipocytes treated with leptin, insulin and AAC2 for 5 or 15minutes using
Western blot. (b) FD-glucose uptake (% compared to Control) in presence in the absence
(Veh) of AAC2 inhuman visceral SVF cells with and without ZIP inhibitor.
Preliminary experiment results indicated that AAC2 can regulate glucose uptake
via LepR. Thus, interaction between AAC2 and LepR was investigated and compared with
leptin-LepR interaction utilizing a quartz crystal microbalance. Binding of LepR on the
active gold surface increased the dissipation and decreased the frequencies. Binding of
leptin with LepR resulted in further increased the dissipation and decreased the frequencies
(Figure 2.12 a), which indicated a thin film of leptin was formed on the active gold surface.
On the contrary, addition of AAC2 resulted in decreased dissipation and increased
frequencies (Figure 2.12 b), meaning that LepR was dissociated from the active gold

60
surface. The decrease in LepR film thickness after addition of AAC2 also validated the
deduction (Figure 2.12 c). The quartz crystal microbalance showed that AAC2 had strong
interaction with LepR and it was distinctive compare to that of leptin-LepR.
Figure 2.12 Binding affinity between recombinant mouse leptin receptor protein (LepR)
and leptin (a) or binding affinity between LepR and AAC2 (b); Blue line shows
frequency and orange line shows dissipation. (c) Thickness of LepR-leptin film or LepR-
AAC2 film.
The effects of AAC2 in vivo were examined on LepR deficient Leprdb mice. The
mice were administrated with AAC2 for one month. Glucose tolerance test (GTT) showed
that glucose uptake in Leprdb mice was impaired by AAC2 (Figure 2.13 a). Food intake,
weight gain and insulin level were not affected by AAC2 either (Figure 2.13 b, c, d). On
the contrary, AAC2 treatment on leptin deficient Lepob mice resulted in improved glucose
uptake (Figure 2.13 e). Even though the food intake of AAC2-treated deficient Lepob mice
was decreased compare to the control group (Figure 2.13 f), the weight gain of AAC2-
treated deficient Lepob mice was significantly lower than the control group (Figure 2.13 g).
The experiment results indicated that AAC2 can regulate glucose homeostasis in vivo. The
process did not require leptin but LepR must be present. The result was also in agreement

61
with binding studies results of AAC2 and LepR. AAC2 mediates glycemic effect in vivo
via LepR, while it did not fully function like leptin.
Figure 2.13 (a) GTT in Leprdb mice treated without (Veh) or with AAC2. (b) Food intake
in Leprdb mice treated without (Veh)or withAAC2. (c) Weight gain in Leprdb mice treated
without (Veh) or with AAC2. (d) Insulin levels in plasma of Leprdb mice. (e) GTT in
Lepob mice treated without (Veh) or with AAC2. (f) Food intake in Lepob mice treated
without (Veh) or withAAC2. (g) Weight gain in Lepob mice treated without (Veh) or with
AAC2. (h) Insulin levels in plasma of Lepob mice.
AAC2 was also tested on type 1diabetic (T1D) Ins2Aktia mice. The mice were
administrated with AAC2 or insulin every 48 h for 4 weeks. Before treatment, all three
groups of mice had severe hyperglycemia (Figure 2.14 a). After 4-week treatment, the
insulin level in control group and AAC2-treated group were similar and significantly lower

62
than the insulin-treated group (Figure 2.13 b). Interestingly, food intake and water
consumption of AAC2-treated mice were higher than insulin-treated mice and control
group (Figure 2.14 c, d). These phenomena were in agreement with preliminary studies
which showed regulation of food intake and water consumption were related to the
activation of LepR in hypothalamus.69, 70 All three groups showed a respiratory exchange
ratio (RER) higher than 0.8 during active dark and light day cycles (Figure 2.14 e, f),
indicating that glucose was the predominant energy substrate. GTT results demonstrated
that the control group was severely glucose tolerant. Whereas AAC2- and insulin-treated
groups showed improved glucose uptake (Figure 2.14 g). Overall, AAC2 exhibited high
efficacy similar to hINS in glucose homeostasis regulation in genetic mouse model of T1D.

63
Figure 2.14 (a) Baseline fasting glucose levels prior to treatment in Ins2Akita mice. (b)
Mouse insulin levels measured in same Ins2Akita mice at the end of the study. (c) Food
and (d) water consumption measured in same Ins2Akita mice 7 weeks after treatment.
Respiratory exchange ratio (RER) measured in same Ins2Akita mice during the (e) dark
and (f) light period. (g)GTT in same Ins2Akita mice 3weeks after beginning of treatment.
Both AAC2 and hINS regulated glucose uptake in Ins2Aktia mice. However, they
had different effects on body composition of the mice. All three groups of mice had similar
weight at the end of the studies (Figure 2.15 a), but the body fat proportion in insulin-

64
treated mice was 172% higher than the AAC2-treated mice and the control group (Figure
2.15 b), which contradicted the observation of decreased food consumption in insulin-
treated mice (Figure 2.15 c). The paradoxical phenomenon could be explained by the
lipogenesis activity induced by insulin.3, 4 In addition, AAC2-treated mice had similar body
composition of fat and lean mass to the control group (Figure 2.15 c).
Figure 2.15 (a) Body weight in Ins2Aktia mice. (b) Percent body fat in Ins2Aktia mice. (c)
Percent lean body mass in Ins2Aktia mice.
The brain mass of AAC2-treated mice was significantly higher than the control
group (2.16 a). To understand whether the behaviors and the cognitive performance were
related to the changes in brain mass, behavioral open field tests were performed on the
Ins2Aktia mice. 71 Distance traveled in the light compartment and amount of time in
periphery were much shorter in AAC2-treated mice (Figure 2.16 b, c) compare to the
control group. AAC2-treated mice showed reduced number of rears (Figure 2.16 d),
indicating low anxiety level. Barnes maze test was used to estimate the cognitive
performance of the mice.72 AAC2-treated group show significantly shorter latency period
(27 s) compare to the control group (63 s). The latency period of insulin-treated group was

65
35.9 s, which was not statistically significant (Figure 2.16 e). The errors made by the mice
during a 5-day training period in the test were measured. All three groups made similar
amount of errors by the end of the training period (Figure 2.16 f). At day 6, a probe test
was run to assess the acquisition and retention of the spatial reference memory in the mice
and all group show similar responses. To summarize, the cognitive performance was
moderately improved by AAC2 or hINS treatment in Ins2Aktia mice.
Figure 2.16 (a) Brain mass in Ins2Aktia mice. (b) Total movement distance, (c) Amount of
activity in the periphery of the arena and (d) number of rears were conducted using open
field test. (e) Latency time and (f) number of errors measured in the training period. (g)
Hole escape time at day6 (Q3 in same experiment).

66
Conclusion
A series of peptide derivatives AAC1-7 which contained amino acids with different
charges and antioxidative moieties, were synthesized and investigated. Among the all the
AACs, AAC2 showed promising effect on controlling glucose homeostasis in 3T3-L1
preadipocytes and human brain endothelial cells by activating GLUT1. Furthermore,
AAC2 activated LepR and PKCς to increase glucose uptake in vitro. Animal studies
revealed that AAC2 did not induce glucose uptake in leptin receptor deficient Leprdb mice,
whereas in leptin deficient Lepob mice. In type 1 diabetic Ins2Akita mice, AAC2 maintained
glucose homeostasis as insulin without increasing adiposity. AAC2 also increased brain
mass and anxiety-related behaviors in Ins2Akita mice. Overall, AAC2 induced glucose
uptake via a distinct mechanism that activated LepR/PKCς/GLUT1 axis and it could
provide a novel strategy to treat diabetes and prevent complications of nervous and insulin-
resistant tissues.
2.3 Experimental Section
Syntheses of Starting Materials
Benzyl alcohol (12.67 g, 126.7 mmol) and succinic anhydride (10.0 g, 92.4 mmol) were
added to dichloromethane and DMAP (2.26 g, 18.5 mmol) was later added. The mixture
was reacted at room temperature for 12 hours and the crude product was extracted by
adding saturated Na2CO3 aqueous solution. The aqueous layer of the mixture was collected,
and the pH was adjusted to 2. Afterwards, the solution was extracted by dichloromethane.

67
The organic layer was collected and dried with Na2SO4. The solvent was then removed
under vacuum and the product was yield as a white solid without further purification (16.53
g, 86%).73
Scheme 2.2 Synthesis of benzyl succinic acid.
4-Diethylaminosalicylaldehyde (3.86 g, 20 mmol), diethylmalonate (6.40 g, 40 mmol) and
piperidine (2 mL) were combined in absolute ethanol (60 mL) and stirred for 6 h at reflux.
Then 10% NaOH (60mL) aqueous solution was added to the mixture and the solution was
heated at reflux for 15 minutes. The reaction mixture was cooled down to room temperature
and the pH of the mixture was adjusted to 2 with concentrated hydrochloric acid to obtain
an orange precipitate. The crude product was filtered, washed with cold water and
recrystallized into orange crystal in absolute ethanol (4.17g, 80%).74
Scheme 2.3 Synthesis of DAC.
General Peptide Preparation
The peptide is synthesized using a solid phase peptide coupling protocol on Rink
amide resin (0.8 g/mmol). All amino acids were coupled using Fmoc-protected amino
acids, DIC and HOBt, which were combined in DMF and reacted for 2 h. The Fmoc group
was removed using 20% piperidine in DMF and the Mtt group was deprotected using

68
TFA/TES/DCM (2:1:97). Boc, tBu and Pbf groups were removed using TFA/TES/H2O
(94:5:1) at the final cleaving step. Benzyl succinic acid, DAC and benzoic acid were
coupled on the deprotected lysine side chain using HOBt, HBTU and DIPEA to yield
AAC1-7 respectively. The final peptides were cleaved with TFA/TES/H2O (94:5:1). After
cleavage from the solid support, all AAC peptides were purified by high performance
liquid chromatography. AAC structures were validated using 1HNMR and13CNMR and
mass spectroscopy.
Scheme 2.4 Synthesis of AAC1.
AAC1 1H NMR (700 MHz, DMSO-d6) δ 7.90 (2H, d, J=7.5 Hz), 7.82 (1H, t, J=5.5 Hz),
7.80 (1H, d, J=8.0 Hz), 7.73 (1H, d, J=7.5 Hz), 7.71(1H, d, J=7.5 Hz), 7.64 (2H, bs),
7.51(1H, d, J=8.1 Hz), 7.42(2H, t, J=7.4 Hz), 7.28-7.39 (8H, m), 7.02 (1H,s), 5.07 (2H,s),
4.29 (2H, m), 4.23 (1H, t, J=7.07 Hz), 4.18 (1H, m), 4.00 (1H, m), 2.99 (2H, m), 2.76 (2H,
m), 2.55 (2H, t, J=6.9 Hz), 2.36 (2H, t, J=6.9 Hz), 1.64 (2H, m), 1.52 (4H, m), 1.21-1.39

69
(6H, m); 13C NMR (176 MHz, DMSO-d6) δ 173.98, 172.73, 172.04, 170.85, 156.45,
144.37, 144.19, 141.20, 136.70, 128.86, 128,40, 128.26, 128.12, 127.56, 127.54, 125.76,
125.71, 120.61, 120.60, 66.08, 65.83, 54.89, 52.58, 47.14, 39.19, 38.92, 32.31, 31.71,
30.27, 29.52, 29.31, 27.03, 23.11, 22.80; ESI-MS for C38H47N5O7 [M+H]+ calculated
686.3548; found 686.3567.
Scheme 2.5 Synthesis of AAC2.
AAC2 1H NMR (700 MHz, DMSO-d6) δ 8.63 (1H, s), 7.87 (2H, d, J=7.5 Hz), 7.85 (1H,
d, J=8.0 Hz), 7.77 (3H, bs), 7.73 (1H, d, J=7.5 Hz), 7.70 (1H, d, J=7.4 Hz), 7.65 (1H, d,
J=9.0 Hz), 7.52 (1H, d, J=8.1 Hz), 7.41 (2H, t, J=7.2 Hz), 7.33 (2H, t, J=7.4 Hz), 7.04 (s,
1H), 6.79 (1H, dd, J=9.0, 2.2 Hz), 6.58 (1H, d, J=2.0 Hz), 4.29 (2H, m), 4.21 (2H, m), 4.01
(1H, m), 3.46 (4H, m), 3.27 (2H, m), 2.77 (2H, m), 1.67 (2H, m), 1.48-1.59 (6H, m), 1.33
(4H, m),1.13 (6H, t, J=7.0 Hz); 13C NMR (176MHz, DMSO-d6) δ 174.03, 172.08, 162.56,

70
162.25, 157.65, 156.45, 152.84, 144.39, 144.18, 141.18, 131.98, 127.54, 127.52, 125.76,
125.70, 120.55, 110.56, 109.90, 108.11, 96.28, 66.07, 54.94, 52.56, 47.14, 44.78, 39.28,
39.15, 32.31, 31.70, 29.35, 27.02, 23.20, 22.80, 12.74; ESI-MS for C41H50N6O7 [M+H]+
calculated 739.3814; found 739.3818.
Scheme 2.6 Synthesis of AAC3.
AAC3 1H NMR (700 MHz, DMSO-d6) δ 8.48 (1H, t, J=5.5 Hz), 8.01 (1H, d, J=8.1 Hz),
7.99 (1H, d, J=8.1 Hz), 7.94 (1H, d, J=8.0 Hz), 7.91 (2H, d, J=7.6 Hz), 7.84 (2H, d, J=7.14
Hz), 7.72 (1H, d, J=7.3 Hz), 7.71(1H, d, J=7.0 Hz), 7.68 (2H, bs), 7.63 (2H, bs), 7.51 (1H,
t, J=7.4 Hz ), 7.50 (1H, d, J=8.1Hz), 7.44 (2H, t, J=7.9 Hz), 7.42 (2H, t, J=7.5 Hz), 7.33
(2H, t, J=7.5 Hz), 7.20-7.25 (5H, m), 7.18 (1H, t, J=6.8 Hz), 7.05 (1H, s), 4.54 (1H, m),
4.30 (1H, m), 4.23 (3H, m), 4.16 (1H, m), 3.98 (1H, m), 3.25 (2H, m), 3.05 (1H, m), 2.68-

71
2.83 (5H, m), 1.70 (1H, m), 1.44-1.63 (12H, m), 1.23-1.33 (6H, m); 13C NMR (176MHz,
DMSO-d6) δ 173.85, 172.30, 171.80, 171.09, 166.65, 156.48, 144.29, 144.26, 141.20,
138.05, 135.09, 131.51, 129.63, 128.70, 128.50, 128.14, 127.60, 127.54, 126.72, 125.77,
125.73, 120.65, 120.61, 66.06, 54.78, 54.22, 52.89, 52.65, 47.12, 39.19, 37.80, 32.38,
31.98, 31.71, 29.40, 27.10, 23.27, 22.98, 22.55; ESI-MS for C49H62N8O7 [M+H]+
calculated 875.4814; found 875.4814.
Scheme 2.7 Synthesis of AAC4.
AAC4 1H NMR (700 MHz, DMSO-d6) δ 8.64 (1H, s), 8.62(1H, t, J=5.7 Hz), 7.88 (2H, d,
J=7.5 Hz), 7.83 (1H, d, J=8.0 Hz), 7.73 (1H, d, J=7.5 Hz), 7.71 (1H, d, J=7.5 Hz), 7.67
(1H, d, J=9.0 Hz), 7.57 (1H, d, J=8.1 Hz), 7.41 (2H, t, J=7.4 Hz), 7.37 (1H, s), 7.33 (2H,
d, J=7.4 Hz), 7.02 (1H, s), 6.79 (1H, dd, J=9.0, 2.2 Hz), 6.60 (1H, d, J=2.1 Hz), 4.26 (2H,
m), 4.19 (2H, m), 4.02 (1H, m), 3.46 (5H, m), 3.26 (2H, m), 2.27 (2H, t, J=7.9 Hz), 1.92

72
(1H, m), 1.76 (1H, m), 1.68 (1H, m), 1.56 (1H, m), 1.50 (2H, m), 1.31 (2H, m), 1.14 (6H,
t, J=7.0 Hz); 13C NMR (176MHz, DMSO-d6) δ 174.43, 173.90, 171.65, 162.53, 162.24,
157.65, 156.39, 152.84, 148.10, 144.38, 144.20, 141.16, 132.00, 128.09, 127.55, 125.79,
125.76, 120.55, 110.57, 109.95, 108.13, 96.32, 66.15, 54.44, 52.58, 47.11, 44.78, 39.25,
32.25, 30.70, 29.35, 27.75, 23.18, 12.78; ESI-MS for C40H45N5O9 [M+23]+ calculated
762.3109; found 762.3107.
Scheme 2.8 Synthesis of AAC5.
AAC5 1H NMR (700 MHz, DMSO-d6) δ 8.64 (1H, s), 7.89 (2H, t, J=7.6 Hz), 7.83 (1H, d,
J=8.0 Hz), 7.73 (1H, d, J=7.5 Hz), 7.70 (1H, d, J=7.5 Hz), 7.67 (1H, d, J=9.1 Hz), 7.57
(1H, d, J=8.2 Hz), 7.52 (1H, t, J=5.5 Hz), 7.41 (2H, t, J=7.4 Hz), 7.32 (2H, t, J=7.4 Hz),
7.04 (1H, s), 6.80 (1H, dd, J=9.0, 2.3 Hz), 6.59 (1H, d, J=2.2 Hz), 4.29 (2H, m), 4.22 (2H,

73
m), 4.04 (1H, m), 3.48 (4H, m), 3.37 (2H, m), 3.10 (2H, m), 1.67-1.72 (2H, m), 1.44-1.60
(6H, m), 1.26-1.35 (2H, m), 1.14 (6H, t, J=7.1 Hz); 13C NMR (176MHz, DMSO-d6) δ
173.90, 171.80, 162.56, 157.66, 157.13, 156.40, 152.87, 144.38, 144.15, 141.18, 132.01,
128.10, 127.55, 125.70, 120.57, 110.60, 109.98, 108.12, 96.30, 66.12, 54.76, 52.54, 47.13,
44.79, 40.91, 39.29, 32.35, 29.54, 29.36, 25.56, 23.13, 12.77; C41H50N8O7 [M+H]+
calculated 767.3875; found 767.3865.
Scheme 2.9 Synthesis of AAC6.
AAC6 1H NMR (700 MHz, DMSO-d6) δ 7.91 (2H, d, J=7.4 Hz), 7.72 (2H, d, J=6.4 Hz),
7.50 (1H, d, J=8.0 Hz), 7.43 (2H,t, J=7.5 Hz), 7.38 (1H, s), 7.34 (2H, t, J=7.4 Hz), 7.04
(1H,s), 4.14-4.32 (4H, m), 4.00 (1H, m), 2.75 (4H, m), 1.65 (2H, m), 1.49-1.59 (6H, m),
1.31 (4H, m); 13C NMR (176MHz, DMSO-d6) δ 173.81, 172.19, 156.47, 144.31, 144.25,
141.20, 128.14, 127.55, 125.77, 125.75, 120.64, 120.61, 66.07, 54.87, 52.42, 47.13, 39.17,
32.02, 31.67, 27.12, 27.06, 22.89, 22.65; ESI-MS for C27H37N5O4 [M+H]+ calculated
496.2918; found 496.2922.

74
Scheme 2.10 Synthesis of AAC7.
AAC7 1H NMR (700 MHz, DMSO-d6) δ 8.42 (1H, t, J=5.9 Hz), 7.90 (2H, d, J=7.1Hz),
7.82 (2H, d, J=7.4 Hz), 7.73 (1H, d, J=7.4 Hz), 7.71 (1H, d, J=7.6 Hz), 7.52 (2H, d, J=7.8
Hz), 7.50 (1H, d, J=7.3 Hz), 7.40-7.46 (5H, m), 7.38 (1H, s), 7.33 (2H, t, J=7.4Hz), 7.03
(1H, s), 4.28 (2H, m), 4.22 (2H, m), 4.00 (1H, m), 3.23 (2H, m), 2.76 (2H, m), 1.62-1.72
(2H, m), 1.47-1.59 (7H, m), 1.27-1.37 (5H,m); 13C NMR (176MHz, DMSO-d6) δ 173.98,
172.04, 166.55, 156.45, 144.38, 144.20, 141.20, 135.15, 131.46, 128.88, 128.12, 127.57,
125.76, 125.72, 120.62, 120.60, 120.51, 66.08, 54.89, 52.63, 47.14, 40.50, 39.24, 32.43,
31.75, 29.37, 27.11, 23.24, 22.79; ESI-MS for C34H41N5O5 [M+H]+ calculated 600.3180;
found 600.3189.
Circular Dichroism (CD) Spectroscopy Measurement.
CD spectra were recorded on a Jasco CD J-815 spectrometer under nitrogen atmosphere.
Experiments were performed in a quartz cell with a 1 mm path length over the range of

75
190-600 nm. Samples were prepared as 20mM solution in PBS after 1-day incubation at
room temperature, and subsequently diluted to 1mM before the measurement.
Thioflavin T (ThT) Assay
ThT stock solution was prepared (8mg in 10mL PBS, pH 7.4). The stock solution was
diluted 50x to yield the working solution. An aliquot (10µL) of AAC2 was added to 0.2mL
of working solution each time and fluorescence intensity was measured in a 3mm quartz
cuvette. (Excitation: 440 nm, slit width:1.5; Emission: 482 nm, slit width: 3).56
Fourier Transform Infrared (FT-IR) Spectroscopy Measurement
FT-IR spectra were collected on a Shimadzu FTIR spectrometer at ambient temperature.
Spectra were recorded between 1700 and 1600 cm-1 at a resolution of 4 cm-1, and a total
of 128 scans were averaged. Samples for FT-IR were first dissolved in PBS (20mM) and
freeze-dried to remove water. The sample was re-dissolved in D2O for FT-IR measurement.
Spectra were analyzed in a transmission cell having CaF2 windows and a 0.025 μm path
length. After subtracting the solvent spectrum from the sample spectrum, the amide I band
(1600-1700 cm-1) of each spectrum was analyzed using peak fit with Gaussian method on
Origin.
Transmission Electron Microscopy Measurement
AAC1-AAC7 were dissolved in PBS to form 20mM solution and left to self-assemble for
12h. After gelation, the solution was diluted to1mM and 30 μL diluted samples were loaded
on the formvar/carbon-covered copper grid and stained with uranyl acetate (2 wt% in
distilled water) for 30s and the grids were dried with filter paper. The nanostructures of the
AAC1-AAC7 were observed by TEM.
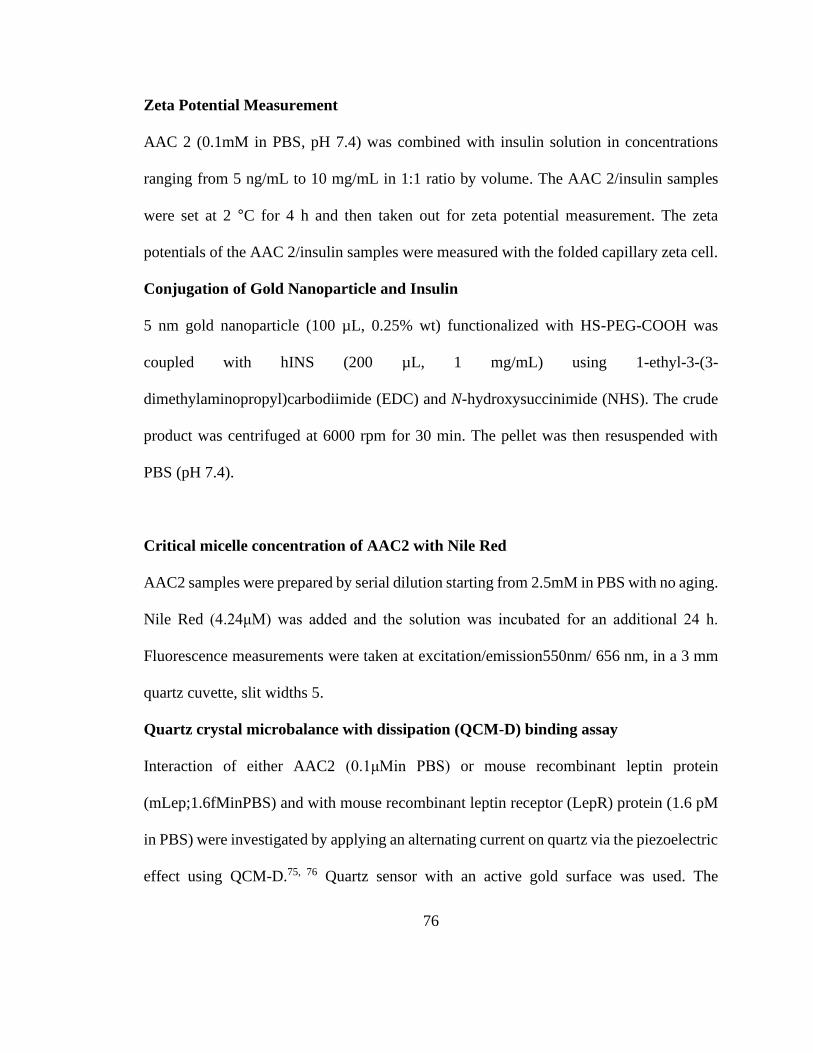
76
Zeta Potential Measurement
AAC 2 (0.1mM in PBS, pH 7.4) was combined with insulin solution in concentrations
ranging from 5 ng/mL to 10 mg/mL in 1:1 ratio by volume. The AAC 2/insulin samples
were set at 2 °C for 4 h and then taken out for zeta potential measurement. The zeta
potentials of the AAC 2/insulin samples were measured with the folded capillary zeta cell.
Conjugation of Gold Nanoparticle and Insulin
5 nm gold nanoparticle (100 µL, 0.25% wt) functionalized with HS-PEG-COOH was
coupled with hINS (200 µL, 1 mg/mL) using 1-ethyl-3-(3-
dimethylaminopropyl)carbodiimide (EDC) and N-hydroxysuccinimide (NHS). The crude
product was centrifuged at 6000 rpm for 30 min. The pellet was then resuspended with
PBS (pH 7.4).
Critical micelle concentration of AAC2 with Nile Red
AAC2 samples were prepared by serial dilution starting from 2.5mM in PBS with no aging.
Nile Red (4.24μM) was added and the solution was incubated for an additional 24 h.
Fluorescence measurements were taken at excitation/emission550nm/ 656 nm, in a 3 mm
quartz cuvette, slit widths 5.
Quartz crystal microbalance with dissipation (QCM-D) binding assay
Interaction of either AAC2 (0.1μMin PBS) or mouse recombinant leptin protein
(mLep;1.6fMinPBS) and with mouse recombinant leptin receptor (LepR) protein (1.6 pM
in PBS) were investigated by applying an alternating current on quartz via the piezoelectric
effect using QCM-D.75, 76 Quartz sensor with an active gold surface was used. The

77
interaction of each component layer, measured as difference in frequency (ΔF) and
dissipation (ΔD) values of the odd overtones was modeled using Voight Voinova equations
for homogenous viscoelastic layers.77, 78
Cytotoxicity test (WST-1 assay)
3T3-L1 preadipocytes were seeded into 48-well plates (5 × 10⁴ per well). Then, after 24 h,
cells were treated with 0.1μM AAC for 24h in DMEM containing 10% calf serum. After
incubation, 10 μl of WST-1 solution was added directly into themedia (1:10ratio) and
incubated for 3 h. After incubation, absorbance was measured at 450 nm using Synergy H1
Hybrid Multi-Mode Microplate Reader. Similar experiments were performed using
different concentrations of AAC2 for 24 and 72 h in 3T3-L1 preadipocytes and hBEC
cultures.
Detection of reactive oxygen species (ROS)
ROS species production were detected using fluorescent CellROX Green Reagent
according to manufacturer's instructions. 3T3-L1 preadipocyte cells were seeded into 48-
well plates (5 × 10⁴ per well) and treated with 200 μM H2O2 for 4 h to induce cellular ROS
production. After oxidative stress induction, these cells were treated with AACs (0.1μM
each) and incubated for additional 24 h. Then, 5 μM CellROX Green Reagent was used to
stain live cell ROS accumulation by measuring absorption/emission maxima at 485/520
nm using fluorescence microscope. Quantification of ROS positive area was analyzed by
ImageJ software (version1.8.0_112).

78
Glucose uptake assay
General protocol. Glucose uptake was measured using fluorescent2-deoxy-2-[(7-nitro-
2,1,3-benzoxadiazol-4yl)amino]-D-glucose) (2-NBDG or FD glucose). For all experiments
we used monolayer of cells. Cells were washed with PBS to remove residual glucose.
Starvation conditions were induced in the DMEM medium, which does not contain glucose
phenol red, and L-glutamine (200μL/well) for 40min otherwise described. The FD-
working solution (0.29 mM) was prepared in the glucose-free medium. After treatment,
cells were incubated with the FD-working solution containing reagents at 37°C for 80 min
otherwise described. Cells were washed with PBS twice. Then, the fluorescence of cells
was measured in cells containing 100μL of PBS per well at an excitation/emission
wavelength of 485/535 nm using Synergy H1 Hybrid Multi-Mode Microplate Reader. The
specifics of experimental conditions for each cell type are described below. Human SVF
were obtained from each donor and seeded at ~80% confluence on a flat-96 well plate in
the 100 μL/well of PGM-2 Preadipocyte Growth Medium-2 Bullet Kit.
After3days,glucoseuptake was measured in confluent cells.The starved cells were
stimulated with vehicle (Veh; PBS), AAC2 (1, 3, 10, 30, and 100 nM for Figure 2.7 a; 0.03
μM for Figure 2.7 b) or AAC6 (1, 3, 10, 30, and 100 nM for Figure 2.7 a), or human insulin
(hINS, 1.7 μM) that were added into 100μL of FD-working solution per well.
Experiment with PKCς inhibitor
Human visceral SVF cells were incubated with the ZIP inhibitor of acatalytic domain of
PKCς, which also exists as constitutively active form, i.e. protein kinase Mς [56] (1 μM)

79
or diluted in water or in glucose-free medium for 40 min. Then cells were incubated with
Veh or AAC2(0.1μM) inFD-working solution for 80min.
Experiments with GLUT 1inhibitor
hBEC were split and seeded onto a 96-wellplate (2×10⁴/0.1mL/well) coated with 0.1%
gelatin solution. After ~24h, cells formed monolayer, then glucose uptake was performed.
Cells were treated with vehicle (Veh; PBS) or human insulin (hINS; 1.7 μM) or human
leptin (hLep; 62.5 nM,) or AAC2 (0.1 μM) which were diluted in same glucose free DMEM
(200 μL/well) for 40 min. Then, GLUT1 inhibitor ((BAY-876; 10 nM diluted in DMSO)
or DMSO were added in 100 μL of FD-working solution per well and incubated for 50 min
at 37 °C. 3T3-L1 preadipocytes were seeded in a 96 well plate at a density of 4 × 10³ in
100 μL of culture medium per well and grow for 24 h prior to measurement of glucose
uptake. Cells were pre-incubated with GLUT1 inhibitor (BAY-876;10nM diluted in
DMSO) or DMSO diluted in DMEM not containing glucose phenol red, and L-glutamine
(200μL/well) fo r40min. Then, Vehor AAC2 (0.1μM) or human insulin (hINS;1.7μM) or
mouse leptin (mLep;12.5nM) were treated to cells with FD working solution for 80min.
Experiment with diverse AAC2 doses
3T3-L1cells were starved with glucose-free DMEM for 50 min. Then cells were treated
with FD-glucose solution containing vehicle or AAC2 (10, 100, and 300 nM) for 100min.
Experiment with anti-insulin receptor (InsR) antibody. 3T3-L1 cells were treated with heat-
inactivated immunoglobulin or anti-InsR antibody (2.96 pM) in glucose-free DMEM. After

80
40 min incubation, cells were stimulated with Vehor AAC2 (0.1μM) or human insulin
(hINS;1.7μM) diluted in the FD-working solution for 80min. Experiment with PI3K and
Akt inhibitors. 3T3-L1 cells were stimulated with FD-working solution containing AAC2
(0.1 μM), PI3K inhibitor (Wortmannin,0.1μM), pan-Aktinhibitor (GSK690693, 0.1 μM),
or no reagents (Veh control) for 80min.
Experiment with anti-leptin receptor (LepR) antibody
3T3-L1 cells were treated with heat-inactivated immunoglobulin or anti-LepR antibody
(3.2 pM) in the glucose-free DMEM (200μL/well). After 40 min incubation, cells were
stimulated with Veh or AAC2 (0.1μM) or mouse leptin (mLep;1.6fMinPBS) in the FD-
working solution for 80 min. Similar experiment was performed using wild type
subcutaneous SVF cells. Subcutaneous mouse Leprdb SVF cells were seeded in a flat 96-
well plate and grown in high glucose DMEM containing 10% FBS and 1% Penicillin-
Streptomycin (10,000 U/mL) for 1 week. Cells were stimulated with FD working solution
containing Veh or AAC2 (0.1 μM), or mouse leptin (mLep; 12.5nM) for 80min.
Western blot
Treated 3T3-L1 cells lysed using RIPA buffer, containing Halt™ Protease and Phosphatase
Inhibitor Cocktail (100X). Antibodies were purchased from Cell Signaling Technology:
protein kinase B (PKB, alias: AKT, 4691S), phosphorylated (p-)p-AKT (9271S), signal
transducer and activator of transcription 5 (STAT5, 94205S), p-STAT5 (4322S), STAT3

81
(9139S), the extracellular-signal-regulated kinase (ERK, 4696S), and p-ERK, (4370S). β-
Actin was purchased from Sigma-Aldrich (A5441).
Protein concentrations measurement
Protein concentrations were measured using Pierce BCA protein assay.
Enzyme-linked immunosorbent assay (ELISA)
The level of mouse insulin was measured in mouse plasma by ELISA following the
manufacturer's instruction. The absorbance at 450 and 590nm were measured using
SynergyH1 Hybrid Multi-Mode Microplate Reader.
Glucose tolerance test (GTT)
GTT test wasperformedforallstudiesusing4–5hfastedmiceafter 3-week treatment period.
Mice were i.p. injected with 10 % glucose solution (w/v;0.56M, diluted in distilled water
and sterilized,10μL/gBW). Glucose levels in tail-tip blood were measured using
glucometer during GTT experiments and weekly monitoring of glucose status.
Body composition measurement
Mouse body composition was measured with Echo MRI™-100H Body Composition
Analyzer for Live Small Animals 4 weeks after treatment.

82
Comprehensive Lab animal monitoring system (CLAMS)
Metabolic parameters were measured by indirect calorimetry at an ambient temperature
(22 °C) with 12 h light/dark cycles 7 weeks after treatment. Animals were fed the same
diet and water provided ad libitum and consumption was measured. Mice were placed
individually and metabolic parameters were measured for 24h.
Open field test
The open filed test was performed at the Behavioral Core facility at OSU in blinded fashion
using encoded groups of mice 5 weeks after treatment. Each animal is placed in a
polypropylene open-field arena (36 cm×36 cm) with two rows of infrared sensors mounted
on the sides to detect and distinguish between horizontal movements and vertical
movements (Open Field Photo beam Activity System).The arenas are contained in boxes
that are light- and sound-attenuating. Activity counts are defined as interruptions in the
infrared light sources by the animal (i.e., beam breaks). Total activity, amount of activity
in the center versus the periphery of th earena, and number of rears is analyzed.
Barnes maze test
Barnes maze was performed as described.72 The Barnes maze, (122 cm diameter) with 18
escape holes (9.5 cm) placed every 20° around the perimeter was surrounded with a 60 cm
high white polycarbonate barrier to prevent escape. The blind escape holes were blocked
by black panels, and the target escape hole was visually the same as the blind holes, but
contained a black escape box (38.7×12.1×14.2cm).Distinct visual cues (black 2

83
dimensional geometric shapes, 20–25 cm) on the upper edge were attached to of the
surround at the 4 compass points and present visual cues distal to the maze. Testing
consisted of 5 days of acquisition training followed by a single probe trial 24 h after the
last training trial. Each acquisition day consisted of one session/animal, 3 trials per session,
with an inter-trialintervalof5min. For acquisition training, all mice were allowed to
acclimate for 30 min before the start of testing. Each trial consisted of carefully placing the
mouse in the center of the maze from the opaque plastic beaker. The mouse was allowed
to search for the escape box for 120s, then it was guided to it. Olfactory cues were
eliminated by cleaning with 70% ethanol after testing of each mouse, and each day the
maze was rotated 90°counterclockwise, with the escape box location and location of visual
cues remaining constant throughout testing. All behavior on coded mice were recorded and
scored using The Observer software (XT8.0; Noldus). For training trials, latency to escape
and number of errors were recorded. An error was defined as an investigation of a blind
escape hole where the entire head of the mouse broke the plane of the edge of the escape
hole. For the probe trial, latency to escape hole, number of errors, and time in quadrant of
escape hole (% in path Q3) were measured.
Statistical analysis
All data were analyzed using SPSS23. All data are shown as mean ± standard error (SEM).
Number of samples for each assay is indicated in Figure legends. Group comparisons were
assessed using Student's independent or paired t-test(two-sided) or one-way analysis of
variance (ANOVA) for normally distributed samples. Mann-Whitney Utestor Kruskal-

84
Wallis test were used as nonparametric tests. P < 0.05 was considered statistically
significant.
Cells models
Human visceral stromal vascular fraction (SVF) cells Institutional review board–approved
informed consent was obtained for the patients' medical records. Human visceral fat tissues
(VF) were obtained from the greater omentum during endoscopic repair of hernias and/or
bariatric surgeries (laparoscopic banding and gastric bypass) from overnight fasted in
patients. Stromal vascular fraction cells (SVF) were isolated from VF using type1
collagenase.79 Isolated cells were cultured in PGM-2 Preadipocyte Growth Medium-2
Bullet Kit (supplemented withPT-9502). The medium was changed every 3 days prior to
measurement of glucose uptake.
Human brain endothelial cells (hBEC) Human BEC were grown with DMEM: F12
(ATCC, 30–2006) supplemented with 10% FBS and endothelial cell growth supplement.
Mouse subcutaneous SVF cells SVF cells were isolated from subcutaneous fat isolated
from Lepr deficient mice (Homozygous for Leprdb; 12-week old) or wild type male
(C56BL6/J) using type 1 collagenase following manufacture's instruction. The
subcutaneous SVF cells were seeded in a flat 96-well plate in 100 μL/well of high glucose
DMEM supplemented with 10% FBS and 1% Penicillin-Streptomycin (10,000U/mL).
Medium was changed every 48h.
Mouse 3T3-L1 cells Mouse 3T3-L1 fibroblast (preadipocyte) cells line were purchased
from ATCC (CL-173). The 3T3-L1 preadipocytes were maintained in high glucose DMEM

85
containing10 % newborn calf serum and 1% Penicillin-Streptomycin (10,000 U/mL).
Medium was changed every 48 h. Differentiation was initiated with medium containing
10% FBS, 1.7 μM bovine, 1 μM dexamethasone, 0.5 mM 3-isobutyl-1-methyl xanthine.
Medium was replaced every 48 h with DMEM containing 10% FBS, 10μg/mL insulin, and
continued for 6 days.
Animal study models
Animal studies were approved by the Institutional Animal Care and Use Committee of The
Ohio State University (OSU). All mice were purchased from The Jackson Laboratory and
were fed a regular chow diet (Teklad LM-485mouse/rat diet, irradiated) under 12 h:12 h
light: dark cycle. Fasting glucose and body weight were monitored weekly. Mice were
sacrificed by isoflurane inhalation followed by cardiac puncture.
LepR deficient mice (Leprdb) The 5-week old male leptin receptor deficient mice
(Homozygous for Leprdb) were randomly assigned to a control group treated with 10 μL
PBS/g body weight (BW) or AAC2 treatment (0.1 nmol/g BW). Six mice per group were
used for this study. Non-fasted mice were injected subcutaneously into the scapular region
every other day for 4weeks.
Leptin deficient mice (Lepob) The 5-week old male leptin deficient mice (Homozygous for
Lepob) were randomized and treated as Leprdb mice (n=5pergroup).
Wild type mice The aged male wild type mice (37–38 week old) were fed a high fat die
t(45% kcal from fat) to induce glucose tolerance. Mice were injected (i.p.) every other days
with 10μL PBS/gBW, (n=5), AAC2 (0.1nmol/gBW, n=5) for 4 weeks.

86
Monogenic model for phenotypes associated with T1D The 5 or 6-week old male C57BL/6-
Ins2Akita/J were injected intraperitoneally (i.p.) every other days with 10 μL PBS/g BW,
AAC2 (0.2 nmol/g BW), or hINS (1.7 nmol/g BW). Five mice per group were used for this
study.

87
2.4 References
1. Qaid, M. M.; Abdelrahman, M. M., Role of insulin and other related hormones in
energy metabolism—A review. Cogent Food & Agriculture 2016, 2 (1), 1267691.
2. Kahn, C. R., The Gordon Wilson Lecture. Lessons about the control of glucose
homeostasis and the pathogenesis of diabetes from knockout mice. Trans. Am. Clin.
Climatol. Assoc. 2003, 114, 125-148.
3. Dionne, D. A.; Skovsø, S.; Templeman, N. M.; Clee, S. M.; Johnson, J. D.,
Caloric Restriction Paradoxically Increases Adiposity in Mice With Genetically Reduced
Insulin. Endocrinology 2016, 157 (7), 2724-2734.
4. Zaykov, A. N.; Mayer, J. P.; DiMarchi, R. D., Pursuit of a perfect insulin. Nat.
Rev. Drug Discov. 2016, 15 (6), 425-439.
5. Berti, L.; Gammeltoft, S., Leptin stimulates glucose uptake in C2C12 muscle cells
by activation of ERK2. Mol. Cell. Endocrinol. 1999, 157 (1), 121-130.
6. Ravussin, Y.; Leibel, Rudolph L.; Ferrante, Anthony W., A Missing Link in
Body Weight Homeostasis: The Catabolic Signal of the Overfed State. Cell Metab. 2014,
20 (4), 565-572.
7. Azar, S. T.; Zalloua, P. A.; Zantout, M. S.; Shahine, C. H.; Salti, I., Leptin
levels in patients with Type 1 diabetes receiving intensive insulin therapy compared with
those in patients receiving conventional insulin therapy. J. Endocrinol. Invest. 2002, 25
(8), 724-726.
8. Perry, R. J.; Zhang, X.-M.; Zhang, D.; Kumashiro, N.; Camporez, J.-P. G.;
Cline, G. W.; Rothman, D. L.; Shulman, G. I., Leptin reverses diabetes by suppression of
the hypothalamic-pituitary-adrenal axis. Nat. Med. 2014, 20 (7), 759-763.
9. Yu, X.; Park, B.-H.; Wang, M.-Y.; Wang, Z. V.; Unger, R. H., Making insulin-
deficient type 1 diabetic rodents thrive without insulin. Proc. Natl. Acad. Sci. U.S.A.
2008, 105 (37), 14070.
10. Shimomura, I.; Hammer, R. E.; Ikemoto, S.; Brown, M. S.; Goldstein, J. L.,
Leptin reverses insulin resistance and diabetes mellitus in mice with congenital
lipodystrophy. Nature 1999, 401 (6748), 73-76.
11. Ebihara, K.; Kusakabe, T.; Hirata, M.; Masuzaki, H.; Miyanaga, F.;
Kobayashi, N.; Tanaka, T.; Chusho, H.; Miyazawa, T.; Hayashi, T.; Hosoda, K.;
Ogawa, Y.; DePaoli, A. M.; Fukushima, M.; Nakao, K., Efficacy and Safety of Leptin-
Replacement Therapy and Possible Mechanisms of Leptin Actions in Patients with
Generalized Lipodystrophy. J. Clin. Endocrinol. Metab. 2007, 92 (2), 532-541.
12. Watson, G. S.; Craft, S., Modulation of memory by insulin and glucose:
neuropsychological observations in Alzheimer's disease. Eur. J. Pharmacol. 2004, 490
(1), 97-113.
13. Camandola, S.; Mattson, M. P., Brain metabolism in health, aging,
and neurodegeneration. The EMBO Journal 2017, 36 (11), 1474-1492.
14. McClain, D. A.; Hazel, M.; Parker, G.; Cooksey, R. C., Adipocytes with
increased hexosamine flux exhibit insulin resistance, increased glucose uptake, and

88
increased synthesis and storage of lipid. American Journal of Physiology-Endocrinology
and Metabolism 2005, 288 (5), E973-E979.
15. Morgello, S.; Uson, R. R.; Schwartz, E. J.; Haber, R. S., The human blood-brain
barrier glucose transporter (GLUT1) is a glucose transporter of gray matter astrocytes.
Glia 1995, 14 (1), 43-54.
16. Virgintino, D.; Robertson, D.; Monaghan, P.; Errede, M.; Bertossi, M.;
Ambrosi, G.; Roncali, L., Glucose transporter GLUT1 in human brain microvessels
revealed by ultrastructural immunocytochemistry. J. Submicrosc. Cytol. Pathol. 1997, 29
(3), 365-370.
17. De Vivo, D. C.; Trifiletti, R. R.; Jacobson, R. I.; Ronen, G. M.; Behmand, R.
A.; Harik, S. I., Defective Glucose Transport across the Blood-Brain Barrier as a Cause
of Persistent Hypoglycorrhachia, Seizures, and Developmental Delay. N. Engl. J. Med.
1991, 325 (10), 703-709.
18. Mathew, A. V.; Jaiswal, M.; Ang, L.; Michailidis, G.; Pennathur, S.; Pop-
Busui, R., Impaired Amino Acid and TCA Metabolism and Cardiovascular Autonomic
Neuropathy Progression in Type 1 Diabetes. Diabetes 2019, 68 (10), 2035.
19. Lee, Eunice E.; Ma, J.; Sacharidou, A.; Mi, W.; Salato, Valerie K.; Nguyen,
N.; Jiang, Y.; Pascual, Juan M.; North, Paula E.; Shaul, Philip W.; Mettlen, M.; Wang,
Richard C., A Protein Kinase C Phosphorylation Motif in GLUT1 Affects Glucose
Transport and is Mutated in GLUT1 Deficiency Syndrome. Mol. Cell 2015, 58 (5), 845-
853.
20. Schubert, M.; Gautam, D.; Surjo, D.; Ueki, K.; Baudler, S.; Schubert, D.;
Kondo, T.; Alber, J.; Galldiks, N.; Küstermann, E.; Arndt, S.; Jacobs, A. H.; Krone,
W.; Ronald Kahn, C.; Brüning, J. C., Role for neuronal insulin resistance in
neurodegenerative diseases. Proc. Natl. Acad. Sci. U.S.A. 2004, 101 (9), 3100-3105.
21. Boersma, G. J.; Johansson, E.; Pereira, M. J.; Heurling, K.; Skrtic, S.; Lau, J.;
Katsogiannos, P.; Panagiotou, G.; Lubberink, M.; Kullberg, J.; Ahlström, H.; Eriksson,
J. W., Altered Glucose Uptake in Muscle, Visceral Adipose Tissue, and Brain Predict
Whole-Body Insulin Resistance and may Contribute to the Development of Type 2
Diabetes: A Combined PET/MR Study. Horm. Metab. Res. 2018, 50 (8), 627-639.
22. Haahr, H.; Heise, T., Fast-Acting Insulin Aspart: A Review of its
Pharmacokinetic and Pharmacodynamic Properties and the Clinical Consequences. Clin.
Pharmacokinet. 2020, 59 (2), 155-172.
23. Zinman, B., Newer insulin analogs: advances in basal insulin replacement.
Diabetes, Obesity and Metabolism 2013, 15 (s1), 6-10.
24. Chen, Z.; Wang, Z.; Gu, Z., Bioinspired and Biomimetic Nanomedicines. Acc.
Chem. Res. 2019, 52 (5), 1255-1264.
25. Mo, R.; Jiang, T.; Di, J.; Tai, W.; Gu, Z., Emerging micro- and nanotechnology
based synthetic approaches for insulin delivery. Chem. Soc. Rev. 2014, 43 (10), 3595-
3629.
26. Wu, Q.; Wang, L.; Yu, H.; Wang, J.; Chen, Z., Organization of Glucose-
Responsive Systems and Their Properties. Chem. Rev. 2011, 111 (12), 7855-7875.

89
27. Veiseh, O.; Tang, B. C.; Whitehead, K. A.; Anderson, D. G.; Langer, R.,
Managing diabetes with nanomedicine: challenges and opportunities. Nat. Rev. Drug
Discov. 2015, 14 (1), 45-57.
28. Tai, W.; Mo, R.; Di, J.; Subramanian, V.; Gu, X.; Gu, Z., Bio-Inspired
Synthetic Nanovesicles for Glucose-Responsive Release of Insulin. Biomacromolecules
2014, 15 (10), 3495-3502.
29. Yu, J.; Zhang, Y.; Ye, Y.; DiSanto, R.; Sun, W.; Ranson, D.; Ligler, F. S.;
Buse, J. B.; Gu, Z., Microneedle-array patches loaded with hypoxia-sensitive vesicles
provide fast glucose-responsive insulin delivery. Proc. Natl. Acad. Sci. U.S.A. 2015, 112
(27), 8260.
30. Guan, Y.; Zhang, Y., Nanostructured Hydrogels for Diabetic Management.
Biomedical Nanomaterials 2016, 387-419.
31. Kim, J. J.; Park, K., Modulated insulin delivery from glucose-sensitive hydrogel
dosage forms. Journal of Controlled Release 2001, 77 (1), 39-47.
32. Anzai, J.-i.; Kobayashi, Y., Construction of Multilayer Thin Films of Enzymes by
Means of Sugar−Lectin Interactions. Langmuir 2000, 16 (6), 2851-2856.
33. Sato, K.; Imoto, Y.; Sugama, J.; Seki, S.; Inoue, H.; Odagiri, T.; Hoshi, T.;
Anzai, J.-i., Sugar-Induced Disintegration of Layer-by-Layer Assemblies Composed of
Concanavalin A and Glycogen. Langmuir 2005, 21 (2), 797-799.
34. Sato, K.; Kodama, D.; Anzai, J.-i., Sugar-Sensitive Thin Films Composed of
Concanavalin A and Sugar-Bearing Polymers. Anal. Sci. 2005, 21 (11), 1375-1378.
35. Sato, K.; Kodama, D.; Endo, Y.; Anzai, J.-I., Preparation of Insulin-Containing
Microcapsules by a Layer-by-Layer Deposition of Concanavalin A and Glycogen. J.
Nanosci. Nanotechnol. 2009, 9 (1), 386-390.
36. Matsumoto, A.; Ishii, T.; Nishida, J.; Matsumoto, H.; Kataoka, K.; Miyahara,
Y., A Synthetic Approach Toward a Self-Regulated Insulin Delivery System. Angew.
Chem. Int. Ed. 2012, 51 (9), 2124-2128.
37. Matsumoto, A.; Yoshida, R.; Kataoka, K., Glucose-Responsive Polymer Gel
Bearing Phenylborate Derivative as a Glucose-Sensing Moiety Operating at the
Physiological pH. Biomacromolecules 2004, 5 (3), 1038-1045.
38. Bonfanti, D. H.; Alcazar, L. P.; Arakaki, P. A.; Martins, L. T.; Agustini, B. C.;
de Moraes Rego, F. G.; Frigeri, H. R., ATP-dependent potassium channels and type 2
diabetes mellitus. Clin. Biochem. 2015, 48 (7), 476-482.
39. Henquin, J. C., Triggering and amplifying pathways of regulation of insulin
secretion by glucose. Diabetes 2000, 49 (11), 1751.
40. Thulé, P. M.; Umpierrez, G., Sulfonylureas: A New Look at Old Therapy. Curr.
Diab. Rep. 2014, 14 (4), 473.
41. Lee, Y.-S.; Jun, H.-S., Anti-diabetic actions of glucagon-like peptide-1 on
pancreatic beta-cells. Metabolism 2014, 63 (1), 9-19.
42. Leech, C. A.; Dzhura, I.; Chepurny, O. G.; Kang, G.; Schwede, F.; Genieser,
H.-G.; Holz, G. G., Molecular physiology of glucagon-like peptide-1 insulin
secretagogue action in pancreatic β cells. Prog. Biophys. Mol. Biol. 2011, 107 (2), 236-
247.

90
43. Holz, G. G.; Chepurny, O. G., Glucagon-like peptide-1 synthetic analogs: new
therapeutic agents for use in the treatment of diabetes mellitus. Curr. Med. Chem. 2003,
10 (22), 2471-2483.
44. Kodl, C. T.; Seaquist, E. R., Cognitive dysfunction and diabetes mellitus. Endocr.
Rev. 2008, 29 (4), 494-511.
45. Arnold, S. E.; Arvanitakis, Z.; Macauley-Rambach, S. L.; Koenig, A. M.;
Wang, H.-Y.; Ahima, R. S.; Craft, S.; Gandy, S.; Buettner, C.; Stoeckel, L. E.;
Holtzman, D. M.; Nathan, D. M., Brain insulin resistance in type 2 diabetes and
Alzheimer disease: concepts and conundrums. Nat. Rev. Neurol. 2018, 14 (3), 168-181.
46. Biessels, G. J.; Despa, F., Cognitive decline and dementia in diabetes mellitus:
mechanisms and clinical implications. Nat. Rev. Endocrinol. 2018, 14 (10), 591-604.
47. Nishitani, S.; Takehana, K.; Fujitani, S.; Sonaka, I., Branched-chain amino acids
improve glucose metabolism in rats with liver cirrhosis. American Journal of Physiology
- Gastrointestinal and Liver Physiology 2005, 288 (6 51-6), G1292-G1300.
48. Ayabe, T.; Mizushige, T.; Ota, W.; Kawabata, F.; Hayamizu, K.; Han, L.;
Tsuji, T.; Kanamoto, R.; Ohinata, K., A novel Alaska pollack-derived peptide, which
increases glucose uptake in skeletal muscle cells, lowers the blood glucose level in
diabetic mice. Food and Function 2015, 6 (8), 2749-2757.
49. Cripps, M. J.; Hanna, K.; Lavilla, C.; Sayers, S. R.; Caton, P. W.; Sims, C.;
De Girolamo, L.; Sale, C.; Turner, M. D., Carnosine scavenging of glucolipotoxic free
radicals enhances insulin secretion and glucose uptake. Sci. Rep. 2017, 7 (1), 13313.
50. Marles, R. J.; Farnsworth, N. R., Antidiabetic plants and their active constituents.
Phytomedicine 1995, 2 (2), 137-189.
51. Kalogeropoulou, D.; LaFave L Fau - Schweim, K.; Schweim K Fau - Gannon,
M. C.; Gannon Mc Fau - Nuttall, F. Q.; Nuttall, F. Q., Lysine ingestion markedly
attenuates the glucose response to ingested glucose without a change in insulin response.
(1938-3207 (Electronic)).
52. Konstantina, C. F.; Dimitra, J. H.-L.; Konstantinos, E. L.; Demetrios, N. N.,
Natural and Synthetic Coumarin Derivatives with Anti-Inflammatory / Antioxidant
Activities. Curr. Pharm. Des. 2004, 10 (30), 3813-3833.
53. Kim, S. H.; Sun, Y.; Kaplan, J. A.; Grinstaff, M. W.; Parquette, J. R., Photo-
crosslinking of a self-assembled coumarin-dipeptide hydrogel. New J. Chem. 2015, 39
(5), 3225-3228.
54. Miyazawa, T.; Blout, E. R., The Infrared Spectra of Polypeptides in Various
Conformations: Amide I and II Bands1. J. Am. Chem. Soc. 1961, 83 (3), 712-719.
55. Kong, J.; Yu, S., Fourier Transform Infrared Spectroscopic Analysis of Protein
Secondary Structures. Acta Biochimica et Biophysica Sinica 2007, 39 (8), 549-559.
56. Nilsson, M. R., Techniques to study amyloid fibril formation in vitro. Methods
2004, 34 (1), 151-160.
57. Voropai, E. S.; Samtsov, M. P.; Kaplevskii, K. N.; Maskevich, A. A.; Stepuro,
V. I.; Povarova, O. I.; Kuznetsova, I. M.; Turoverov, K. K.; Fink, A. L.; Uverskii, V.
N., Spectral Properties of Thioflavin T and Its Complexes with Amyloid Fibrils. J. Appl.
Spectrosc. 2003, 70 (6), 868-874.

91
58. Khurana, R.; Coleman, C.; Ionescu-Zanetti, C.; Carter, S. A.; Krishna, V.;
Grover, R. K.; Roy, R.; Singh, S., Mechanism of thioflavin T binding to amyloid fibrils.
J. Struct. Biol. 2005, 151 (3), 229-238.
59. Pace, C. N.; Grimsley, G. R.; Scholtz, J. M., Protein ionizable groups: pK values
and their contribution to protein stability and solubility. J. Biol. Chem. 2009, 284 (20),
13285-13289.
60. Farías, R. N.; López Viñals, A. E.; Posse, E.; Morero, R. D., Relationship
between isoelectric point of native and chemically modified insulin and liposomal fusion.
The Biochemical journal 1989, 264 (1), 285-287.
61. Sharma, G.; Sharma, A. R.; Nam, J.; Priya, G.; Doss, C.; Lee, S.; Chakraborty,
C., Nanoparticle based insulin delivery system: the next generation efficient therapy for
Type 1 diabetes. J Nanobiotechnol 2015, 13, 74-87.
62. Shilo, M.; Berenstein, P.; Dreifuss, T.; Nash, Y.; Goldsmith, G.; Kazimirsky,
G.; Motiei, M.; Frenkel, D.; Brodie, C.; Popovtzer, R., Insulin-coated gold
nanoparticles as a new concept for personalized and adjustable glucose regulation.
Nanoscale 2015, 7 (48), 20489-20496.
63. Kahn, B. B., Adipose Tissue, Inter-Organ Communication, and the Path to Type 2
Diabetes: The 2016 Banting Medal for Scientific Achievement Lecture. Diabetes 2019,
68 (1), 3.
64. Caputo, T.; Gilardi, F.; Desvergne, B., From chronic overnutrition to
metaflammation and insulin resistance: adipose tissue and liver contributions. FEBS Lett.
2017, 591 (19), 3061-3088.
65. Priyanka, A.; Shyni, G. L.; Anupama, N.; Raj, P. S.; Anusree, S. S.; Raghu, K.
G., Development of insulin resistance through sprouting of inflammatory markers during
hypoxia in 3T3-L1 adipocytes and amelioration with curcumin. Eur. J. Pharmacol. 2017,
812, 73-81.
66. Taniguchi, C. M.; Emanuelli, B.; Kahn, C. R., Critical nodes in signalling
pathways: insights into insulin action. Nat. Rev. Mol. Cell Biol. 2006, 7 (2), 85-96.
67. Wauman, J.; Zabeau, L.; Tavernier, J., The Leptin Receptor Complex: Heavier
Than Expected? Front. Endocrinol. (Lausanne) 2017, 8 (30).
68. Saito, T.; Okada, S.; Shimoda, Y.; Tagaya, Y.; Osaki, A.; Yamada, E.;
Shibusawa, R.; Nakajima, Y.; Ozawa, A.; Satoh, T.; Mori, M.; Yamada, M., APPL1
promotes glucose uptake in response to mechanical stretch via the PKCζ-non-muscle
myosin IIa pathway in C2C12 myotubes. Cell. Signal. 2016, 28 (11), 1694-1702.
69. Friedman, J. M.; Mantzoros, C. S., 20 years of leptin: From the discovery of the
leptin gene to leptin in our therapeutic armamentarium. Metabolism 2015, 64 (1), 1-4.
70. Brown, J. A.; Wright, A.; Bugescu, R.; Christensen, L.; Olson, D. P.;
Leinninger, G. M., Distinct Subsets of Lateral Hypothalamic Neurotensin Neurons are
Activated by Leptin or Dehydration. Sci. Rep. 2019, 9 (1), 1873.
71. Caliskan, H.; Akat, F.; Tatar, Y.; Zaloglu, N.; Dursun, A. D.; Bastug, M.;
Ficicilar, H., Effects of exercise training on anxiety in diabetic rats. Behav. Brain Res.
2019, 376, 112084.

92
72. Walton, J. C.; Chen, Z.; Weil, Z. M.; Pyter, L. M.; Travers, J. B.; Nelson, R. J.,
Photoperiod-mediated impairment of long-term potention and learning and memory in
male white-footed mice. Neuroscience 2011, 175, 127-132.
73. Sun, Y.; Kaplan, J. A.; Shieh, A.; Sun, H. L.; Croce, C. M.; Grinstaff, M. W.;
Parquette, J. R., Self-assembly of a 5-fluorouracil-dipeptide hydrogel. Chem. Commun.
2016, 52 (30), 5254-5257.
74. Kaur, A.; Haghighatbin, M. A.; Hogan, C. F.; New, E. J., A FRET-based
ratiometric redox probe for detecting oxidative stress by confocal microscopy, FLIM and
flow cytometry. Chem. Commun. 2015, 51 (52), 10510-10513.
75. Ward, M. D.; Buttry, D. A., In situ interfacial mass detection with piezoelectric
transducers. Science 1990, 249 (4972), 1000-1007.
76. Hedegaard, S. F.; Cárdenas, M.; Barker, R.; Jorgensen, L.; Van De Weert, M.,
Lipidation Effect on Surface Adsorption and Associated Fibrillation of the Model Protein
Insulin. Langmuir 2016, 32 (28), 7241-7249.
77. Voinova, M. V.; Rodahl, M.; Jonson, M.; Kasemo, B., Viscoelastic acoustic
response of layered polymer films at fluid-solid interfaces: Continuum mechanics
approach. Phys. Scr. 1999, 59 (5), 391-396.
78. Reviakine, I.; Johannsmann, D.; Richter, R. P., Hearing what you cannot see and
visualizing what you hear: Interpreting quartz crystal microbalance data from solvated
interfaces. Anal. Chem. 2011, 83 (23), 8838-8848.
79. Yasmeen, R.; Reichert, B.; Deiuliis, J.; Yang, F.; Lynch, A.; Meyers, J.;
Sharlach, M.; Shin, S.; Volz, K. S.; Green, K. B.; Lee, K.; Alder, H.; Duester, G.;
Zechner, R.; Rajagopalan, S.; Ziouzenkova, O., Autocrine function of aldehyde
dehydrogenase 1 as a determinant of diet- and sex-specific differences in visceral
adiposity. Diabetes 2013, 62 (1), 124-136.

93
Chapter 3 Co-assembly of Two Oppositely Charged Peptides
3.1 Introduction
Self-assembly of short peptides is a well-studied field in supramolecular chemistry.
Assembly of peptides has been applied in drug delivery,1-4 nanomedicine,5-7, catalysis8-10
and many other subjects. Despite the simplicity of the building blocks, assemblies from
peptides may result in diverse nanostructures.11-13 Although peptide self-assembly has been
extensively studied and a great number of the research focus on single component
assemblies, multicomponent self-assembly still draw a lot of attention. Co-assembly of two
or more peptide building blocks could result in structures with higher structural complexity
and chemical diversity.14 Noncovalent interactions make these co-assembly systems much
easier to achieve compared to covalently bonded co-assemblies, which may require
complicated syntheses and purification steps. Furthermore, interplaying the ratio between
the components in co-assembly system could lead to changes in morphology, chemical and
mechanical properties. These unique features of multicomponent self-assembly are not
often found in single-component self-assembly. Hence, co-assembly of two or more
building blocks has attracted a lot of researchers and the study of this field is well-
developed over decades.
The motif of multicomponent self-assembly can generally be categorized as self-
sorted and co-assembled. Self-sorted assembly is the organization of distinctive structures

94
based on self-recognition of the building blocks in multicomponent system.15 It can be
narcissistic,16 meaning that the two building blocks form homo-structures separately and
there are no interactions between the homo-structures.15 Self-sorted assembly can also be
social when homo-structures formed by two or more building blocks associate together and
generate new hetero-structures.15-17 Co-assembled structures occur when two or more
different building blocks assemble into one nanostructure. There are several types of
molecular arrangement in co-assembled structure as described by Gazit, et al.:14
cooperative, random and disruptive co-assembly. In cooperative co-assembly, two building
blocks interact with each other and arrange in an alternating pattern.14 Random co-
assembly shows little to no order in the organization of different building blocks.14, 18 In
disruptive co-assembly, one building block can act as a stopper for the self-assembly of the
other building block.14
In order to promote co-assembly and social self-sorted assembly, many strategies
have been developed. Aromatic interaction is commonly used to achieve this goal. Nilsson
and co-workers utilized complementary π-π interactions between phenyl group on Fmoc-
Phe and fluorinated phenyl group on Fmoc-F5-Phe to obtain co-assembled nanofibrils.19
The aromatic side chains of the peptides had complementary quadrupole electronics, which
allowed Fmoc-Phe and Fmoc-F5-Phe to readily co-assemble into nanofibrils by face-to-
face quadrupole stacking interactions. In contrast, neither Fmoc-Phe and Fmoc-F5-Phe
were able to self-assemble individually. Additionally, Fmoc-Phe could also co-assemble
with mono-fluorinated Fmoc-Phe derivatives to yield nanofibrils. Collectively, the results

95
confirmed that the co-assembly was driven by π-π effects arising from the fluorination of
the benzyl side chain.19
Ulijn and co-workers explored the assembly and coassembly of serine surfactants
and tyrosine-leucine hydrogelators.20 Tyrosine-leucine and serine segments were
functionalized with pyrene and Fmoc to yield Py-YL, Py-S, Fmoc-YL and Fmoc-S
accordingly. All 4 peptide derivatives were able to self-assemble individually.
Hydrogelators Fmoc-YL and Py-YL self-assembled via aromatic and -sheet type H-
bonding interactions, while surfactants Fmoc-S and Py-S assembly was governed by
aromatic stacking and hydrophobic or hydrophilic interactions. Three different modes of
co-assembly were discovered when different peptides were combined (Figure 3.1).
Spectroscopic and microscopic experiments revealed that when individual building blocks
were sufficiently different in structure (Py-YL/Fmoc-S and Fmoc-YL/Py-S), orthogonal
assembly occurred. If the peptides were structurally similar (Py-YL/Fmoc-YL and Py-S/
Fmoc-S), cooperative co-assembly would be dominant. Moreover, disruptive co-assembly
would take place if the peptides had same aromatic moieties but different interactions on
the peptide segments. Overall, this work provided new insights in multicomponent
assembly design based on structural differences between individual components.20

96
Figure 3.1 Proposed supramolecular models for a) the gelators Pyr-YL and (Fmoc-YL);
b) the surfactants Fmoc-S and Pyr-S; c) orthogonal PyrYL/Fmoc-S and (Fmoc-YL/Pyr-
S); d) cooperative Pyr-YL/Fmoc-YL and Pyr-S/Fmoc-S; and e) disruptive Pyr-YL/Pyr-S
and (Fmoc-YL/FmocS). Copyright 2014 American Chemical Society.20
Enantiomeric interaction is also utilized in tuning multicomponent assembly.
Schneider and co-workers introduced two -hairpin peptides
VKVKVKVKVDPLPTKVKVKVKV-NH2 (MAX1) and
VKVKVKVKVLPDPTKVKVKVKV-NH2 (DMAX1), which possessed different chirality
on the proline moiety. CD spectra revealed that the hydrogel containing MAX1 and
DMAX1in 1:1 ration was racemic. In addition, co-assembled hydrogel had 4-fold higher

97
rigidity compare to enantiomerically pure hydrogels. The enhancement of mechanical
properties of co-assembled hydrogel resulted from hydrophobic interactions between
enantiomers which are not present in enantiomerically pure fibrils.21
External stimuli are also used in multicomponent assembly. Adams and co-workers
design two peptides present below (Figure 3.2 a).22 As the pH in the solution dropped from
10.5 to just below the apparent pKa of the terminal carboxylic acid, the peptides self-
assembled in self-sorted fashion. The author discovered that the pKa of the peptide was
determined by its hydrophobicity, indicating that the pH at which the peptide started to
self-assemble was predictable and controllable. The author also introduced slow hydrolysis
of glucono-d-lactone (GdL) to gluconic acid (Figure 3.2 b) in order to trigger self-sorted
assembly in situ.22 In a later publication, Adams and co-workers employed electrochemical
stimulation to trigger pH drop in the same two-component solution and induce self-sorted
assembly.23
Figure 3.2 a) Structures of gelators 1 (top) and 2 (bottom); b) Hydrolysis of GdL to
gluconic acid. Copyright 2013 Nature Publishing Group, a division of Macmillan
Publishers Limited.22
Electrostatic interactions between different building blocks in multicomponent
system can also result in change of self-assembly. In 2003, Stupp and co-workers

98
introduced a series of peptide amphiphiles with opposite charges at neutral pH.24 The
oppositely charged peptides were able to co-assembled to nanofibers via electrostatic
attraction and it was suggested that the co-assembled nanofibers could be potentially used
in biomedical fields.24 Lynn and co-workers synthesized two oppositely charged peptides
Ac-KLVFFAL-NH2 and Ac-(pY)LVFFAL-NH2 with different N-terminal residue lysine
and phosphotyrosine respectively.25 Both peptides formed nanotubes with charged inner
and outer surface when they self-assembled individually. Co-assembly of Ac-KLVFFAL-
NH2 and Ac-(pY)LVFFAL-NH2 yielded nanotubes comprising a bilayer of cross -sheets
with negative external and positive internal solvent exposed surfaces. Cross-seeding
peptide solutions with a preassembled peptide nanotube seed generated nanotubes with
different leaflet architecture. Furthermore, the asymmetry across the peptide bilayer and
along the lateral axis of the nanotube membranes could be controlled, which enabled
further construction of functional mesoscale assemblies.25
Cui and co-workers designed three peptides EFFFFE, KFFFFK, and EFFFFK to
elucidate -sheet stacking controlled by electrostatic interactions (Figure 3.3) .26 Individual
self-assembly of EFFFFE and KFFFFK showed multilayer twisted ribbon and fibrils
respectively. The twisting degree between the ribbon and the fibril resulted from different
scales of electrostatic repulsion on peptide termini. For both the homogeneous self-
assembly of EFFFFK and the heterogeneous assembly of EFFFFE/KFFFFK mixture,
twisting of -sheets were not present due to electrostatic attractions of the oppositely
charged groups on peptide termini. The lateral aromatic interaction between phenyl groups
offset the elastic penalty and led to multilayer stacking of -sheets. When EFFFFE or

99
KFFFFK co-assembled with EFFFFK, the charge was imbalanced. The flat nanobelt would
tend to twist or dissociate to grooved belts. Overall, the morphology of the co-assembled
structure could be controlled by manipulating the charge balance, which provided new
insight in precise morphological control on new materials.26

100
Figure 3.3 Proposed mechanism of the twisted ribbons, belts and fibrils formation by the
peptides EFFFFE, and EFFFFK, EFFFFE/KFFFFK mixture, and KFFFFK. Copyright
2015 American Chemical Society.26
In this study, we explored the self-assembly of two oppositely charged dipeptides
individually as well as when mixing in different ratios. We expected that electrostatic
attractions between the oppositely charged peptides would be able to alter the self-
assembly pattern when the peptides were combined. Nowadays, multicomponent self-
assembly has been widely used in material science and biomedical materials. Therefore,

101
the success of this study could provide a new insight of multicomponent self-assembly
study and potentially be applied in new material or medical fields.
3.2 Results and Discussion
Preliminary studies showed that electrostatic interactions can significantly
influence multicomponent assembly.25, 26 Hence, two oppositely charged peptides were
synthesized in this work. In chapter 2, a series of dipeptides named amino acid compound
(AAC) were synthesized and the self-assembly of the peptides were investigated.27 Inspired
by the design of AACs, N-(fluorenyl)-9-methoxycarbonyl (Fmoc) group was selected to
appended to the N-terminus of both dipeptides since Fmoc group can induce self-assembly
by aromatic stacking.20 Benzoic acid (BA) was selected to be appended to the second lysine
side chain of Fmoc-dislysine backbone since π-π interactions between BA moieties can
also enhance self-assembly. Positively charged dipeptide Fmoc-KK-BA was yield, which
was reported as AAC7 in chapter 2. 7-methoxycoumarin-3-carboxylic acid (MC) were
selected to append to lysine side chains of the peptide since π-π interactions between
aromatic moieties is a strong driving force of self-assembly and the inherent fluorescence
of MC enables monitoring self-assembly states by fluorescence spectroscopy or confocal
microscopy.28 Glutamic acid was utilized in order to obtain a negatively charged peptide
Fmoc-EK-MC. Since Fmoc-EK-MC has similar structure with AAC4 (Fmoc-EK-DAC)
reported in chapter 2, Fmoc-EK-MC will be addressed as AAC4’ in the following
discussion.

102
Figure 3.4 Structures of AAC7 and AAC4’.
AAC7 was dissolved in HPLC grade water at a concentration of 5 mM. The self-
assembly of AAC7 was the investigated by transmission electron microscope (TEM). After
24 h of aging at room temperature, twisted nanoribbons of 10 ± 1 nm and 20 ± 3 nm wide
were observed as majority. Meanwhile, wider coiled nanobelts of 40 ± 5 nm merging from
two 20 nm-wide nanoribbons were also found (Figure 3.5 a). After 5 days, TEM images
showed nanotubes with diameters ranging from 60 to 100 nm and length of a few
micrometers (Figure 3.5 b).

103
Figure 3.5 TEM images of AAC7 in HPLC grade water after a) 1 day and b) 1 week. The
sample were prepared at 5 mM and diluted to 1 mM for microscopic studies.
Dissolving AAC4’ in pure water at 5 mM resulted in opaque white solution. TEM
image of AAC4’ aged for 1 day only showed formation of very few nanofibers (Figure 3.6
a). However, as AAC4’ aged in HPLC grade water over a week, the solution became more
transparent and a large number of nanofibers with width of 10.5 ± 1.5 nm and length of
several micrometers were observed by TEM (Figure 3.6 b, c).

104
Figure 3.6TEM images of AAC4’ in HPLC grade water after a) 1 day and b) c) 1 week.
The sample were prepared at 5 mM and diluted to 1mM for microscopic studies.
The assembly behaviors of AAC7 and AAC4’ were further investigated by Fourier
transform infrared (FT-IR) spectroscopy. The samples were self-assembled in D2O for 1
week, lyophilized for 2 days to remove solvent and redissolved in D2O for FT-IR
measurement. After deconvolution, wavenumbers of 1628 was observed from the spectrum
of AAC7 (Figure 3.7 a), which are characteristic of β-sheet secondary structures.29 A minor
peak at 1648 cm-1 on the spectrum indicated that α-helix was also present in the assembly.29
Calculation of secondary structures indicated that self-assembly of AAC7 comprised
87.3% -sheet and 12.7% α-helix (Figure 3.7 c). On the other hand, FT-IR spectrum of
AAC4’ (Figure 3.7 b) displayed a strong peak at 1635 cm-1 and a weaker peak at 1653 cm-
1, which indicated both β-sheet and α-helix structures correspondingly.29 Calculation
showed that AAC4’ consisted of 74.8% β-sheet and 25.2% α-helix (Figure 3.7 c).

105
Figure 3.7 Deconvoluted FT-IR spectra of a) AAC7 and b) AAC4’. The samples were
prepared in D2O (5 mM) and set for 1 week. Then the samples were lyophilized for 2
days to remove solvent and redissolved in D2O (5 mM) for measurement. c) Calculated
percentage of secondary structures of AAC7 and AAC4’.
TEM studies revealed that neither AAC7 nor AAC4’ formed any self-assembled
structures in trifluoroethanol (TFE) at 5mM. Thus, it was considered that AAC7 and
AAC4’ were in monomeric state in TFE and UV-Vis and CD spectra of both peptides in
TFE (5mM) and HPLC grade water (5mM) were then compared. UV-Vis spectroscopy
showed that AAC7 in TFE displayed abosoption maxima at 262 and 297 nm (Figure 3.8
c), which corresponded to π-π* and n-π* transition of Fmoc and benzyl amidyl groups on
the peptide.30 Changing the solvent from TFE to water resulted in reduced intensity and
red-shifted peaks from 262 and 297 nm to 264 and 300 nm respectively (Figure 3.8 c),
indicating that J-type aggregation was present in AAC7 assembly. CD spectrum of AAC7

106
in water exhibited excitonic couplet with zero crossing at 267 nm (Figure 3.8 e). On the
contrary, a flat line was observed in TFE, which further confirmed that AAC7 was in
monomeric state in TFE (Figure 3.8 a). Provided that excitonic couplet was not observed
in TFE, the excitonic couplet of AAC7 in water should originate from distinct orientations
between the Fmoc groups. The electric transition moment of the excitation band at 264 nm
for Fmoc group runs approximately along the long axis of the functional group.30 The
positive couplet indicated that Fmoc group on AAC7 stacked in P-type helical fashion. .
UV-Vis spectrum of AAC4’ in TFE showed absorption maxima at 258, 300 nm
(Figure 3.8 d), which corresponded to π-π* and n-π* transition of Fmoc group.30 Another
peak at 350 nm was also observed (Figure 3.8 d), which was related to MC moiety on the
peptide. As the solvent switched to water, the intensity of absorbance reduced significantly.
The peaks at 258, 300 and 350 nm red-shifted to 260, 304 and 352 nm respectively (Figure
3.8d). Also, the peak at 350 nm displayed shoulder peak at 370 nm (Figure 3.8 d). Overall,
the red-shifted absorption indicated J-type aggregation of Fmoc and MC group in AAC4’
assembly. Emergence of shoulder peak at 350 nm also confirmed that coupling between
MC groups were present in the assembly.31 CD spectra of AAC4’ in water (5mM) and in
TFE (5mM) were also investigated. AAC4’ in TFE displayed a flat line (Figure 3.8 b). The
CD spectrum of AAC4’ in water showed a positive Cotton effect in the range of 260-390
nm, which originated from π-π* transition of MC moieties on the peptide (Figure 3.10 f).
A negative excitonic coupling with zero crossing at 254 nm and absorption maximum at
260 nm was also observed (Figure 3.10 f), which arised from π-π* transition of electric

107
transition moment that runs along the long axis of Fmoc group. The negative couplet
indicated that Fmoc groups stacked in a M-type helical fashion in AAC4’ assembly.

108
Figure 3.8 CD spectra of a) AAC7 and b) AAC4’; UV-Vis spectra of c) AAC7 and d)
AAC4’. AAC7 and AAC4’ were self-assembled in HPLC grade water (5 mM) for a
week. Monomeric samples were prepared by dissolving AAC7 and AAC4’ in TFE (5
mM). The spectroscopic experiments were performed at 5 mM in a 0.1 mm quartz
cuvette. Co-plot of CD and UV-Vis spectra of e) AAC7 and f) AAC4’.

109
Further experiments revealed that the assemblies of AAC7 and AAC4’ were both
concentration dependent. TEM images of AAC7 self-assembled at 1 mM (Figure 3.9 a)
and 0.5 mM (Figure 3.9 b) for 5 days exhibited coexistence of nanotubes ranging from 60
to 100 nm, coiled nanobelts of 40 ± 5 nm and twisted nanoribbons of 20 ± 3 nm and 10 ±
1 nm, which were also observed at early stage of self-assembly at 5 mM (Figure 3.5 a).
When AAC4’ was dissolved in water at 1 mM, micrometer-long nanofibers with width of
13 ± 2 nm were still observed (Figure 3.9 c). However, spherical structures with diameters
ranging from 30-70 nm emerged at 0.5 mM (Figure 3.9 d).

110
Figure 3.9 TEM images of AAC7 self-assembled in HPLC grade H2O at a)1 mM and b)
0.5 mM; TEM images of AAC4’ self-assembled in HPLC grade H2O for 5 days at c) 1
mM and d) 0.5 mM.
UV-Vis spectra of AAC7 at 5 mM, 1 mM, 0.5 mM in water and 5mM in TFE were
shown in Figure 3.10 c. Comparing with AAC7 in TFE (5mM), AAC7 samples self-
assembled at 1 mM and 0.5 mM in water both displayed similar red-shifts of absorption
maxima like 5 mM sample in water. The peaks shifted from 262 and 297 nm to 264 and

111
300 nm respectively (Figure 3.10 c), indicating that J-type aggregation between the
aromatic moieties were also present in 1 mM and 0.5 mM AAC7 assemblies. CD spectra
of AAC7 at 5 mM, 1 mM, 0.5 mM in water and 5 mM in TFE were also compared. At 5
mM in water, strong excitonic couplet was observed in the range of 240-350 nm. Whereas
the intensity of the couplet decreased drastically in 1 mM and 0.5 mM assemblies (Figure
3.10 a), indicating that the interaction between Fmoc groups were declined in the
assemblies at 1mM and 0.5 mM. .
In the model developed by Aggeli, et al.,32-34 twisted -sheets could merge laterally
into various structures by stacking. The stacking number of -sheets depends on the
concentration of the peptide and the interactions among the side chains on the peptides.35
If the twisted -sheet grows laterally, it has to untwist itself to obtain close packing and
this process could cause shifting and intensity change of the -sheet absorbance peaks on
CD spectrum,36 which was shown in Figure 3.10 a. When the energy of lateral growth is
high enough to compensate the entropy loss of untwisting -sheets and electrostatic
repulsions, wider, coiled nanobelts and then nanotubes will occur. Based on CD
spectroscopy results, it is believed that the formation of nanotubes is driven by the π-π
interactions between Fmoc groups on AAC7 because the excitonic couplet at ~300 nm
occurs as concentration of AAC7 increases, indicating chiral arrangement between the
aromatic moieties and the energies of aromatic interaction are enough to overcome entropy
loss.

112
Figure 3.10 CD spectra of a) AAC7 and b) AAC4’ and UV-Vis spectra of c) AAC7 and
d) AAC4’ at 5 mM, 1 mM, 0.5 mM in HPLC grade water and 5 mM in TFE.
As AAC4’ was diluted from 5 mM to 1 mM, the intensity of excitonic couplets on
CD spectrum and the UV-Vis absorbance increased overall (Figure 3.10 b). Such
phenomenon could be due to the relatively low solubility of AAC4’ in water. At 5 mM,
small aggregates were observed in solution, which could lead to decreased absorbance on
CD spectrum. The CD spectrum of AAC4’ at 0.5 mM was unexpectedly different. The
excitonic couplets observed in higher concentrations intensively decreased at 0.5 mM. The

113
decline of excitonic couplet could be explained by the morphological change from
nanofibers to spheres with various sizes. At 0.5 mM, AAC4’ self-assembled in a different
pattern such that the chiral arrangement of MC moieties was not present anymore. The
disappearance of shoulder peak at 370 nm on UV-Vis spectrum also indicated stacking of
MC was depleted.
AAC4' AAC7
-40
-30
-20
-10
0
10
20
30
ze
ta p
ote
nti
als
(m
V)
Figure 3.11 Zeta potentials of AAC4’ and AAC7 at 1 mM in HPLC grade water.
Zeta potential measurements revealed that AAC7 had zeta potential of 22 mV and
AAC4’ had zeta potential of -35 mV at 1mM in HPLC grade water (Figure 3.11). Due to
the opposite charges on the self-assemblies of AAC7 and AAC4’, electrostatic interactions
could lead to combination of the two components and potentially morphological changes.
Hence, pre-assemblies of AAC7 and AAC4’ at 5 mM in HPLC grade water were combined
in a 1:1 ratio by volume and the mixed sample was investigated first.

114
Figure 3.12 a) Co-plot of CD and UV-Vis spectra and b) TEM image of AAC7:AAC4’
(1:1) mixture. AAC7 and AAC4’ were pre-assembled in HPLC grade water at 5 mM for
1 week and then combined in 1:1 ratio by volume. The mixture was set at room
temperature for 3 days and diluted to 1 mM for spectroscopic and microscopic studies.
TEM image of the AAC7:AAC4’ (1:1) mixture showed that both nanotubes of
AAC7 and nanofibers of AAC4’ were present (Figure 3.12 b). Nanotubes with distinct
morphology compare to AAC7 were observed (Figure 3.12 b). The new nanotube assembly
could originate from lateral association of AAC7 nanoribbons that were unwrapped from
nanotubes, and AAC4’ nanofibers via electrostatic attraction. Such lateral self-assembly
mechanism was reported by Frisch et al.37.UV-Vis spectrum (Figure 3.12 a) exhibited that
the absorbance peaks at 264 and 300 nm were identical to AAC7 and AAC4’ spectra
measured above (Figure 3.10 c, d). The absorbance of MC at 350 nm was lower and the
peak shape was even broader compared to AAC4’ at 5 mM (Figure 3.10 c), which resulted
from stronger interactions between the electric dipoles along the long axis on MC
moieties.31 The CD spectrum was significantly different from preliminary results. The

115
overall intensity of CD spectrum of the AAC7:AAC4’ (1:1) mixture at 5 mM decreased
drastically and it could result from the relatively low solubility of the AAC7:AAC4’ (1:1)
mixture since positively charged AAC7 could form an ion pair with negative charged
AAC4’ thus generating aggregates in solution. However, a weak positive excitonic couplet
in 320-375 nm with zero crossing at 330 nm was still observed, which was related to chiral
packing of MCs on the peptides. A positive peak at 300 nm and a negative at 265 nm were
also observed and they could be corresponding to aromatic rings such as Fmoc and
benzylamidyl groups on AAC7 and AAC4’.

116
Figure 3.13 a) CD spectra and b) UV-vis spectra of pre-assembled AAC7:AAC4’ (2:1)
and (5:1) mixtures. TEM image of c) pre-assembled AAC7:AAC4’ (2:1) mixture and d)
pre-assembled AAC7:AAC4’ (5:1) mixture. AAC7 and AAC4’ were self-assembled in
HPLC grade water (5 mM) separately for 1 week, then the samples were made by
combining AAC7 and AAC4’ in different ratios by volume.
At 1:1 ratio, the large amount of AAC4’ nanofibers made finding the nanotubes
difficult. Hence, we decide to lower the ratio of AAC4’ in the following studies.
AAC7:AAC4’ pre-assembled mixtures at 2:1 and 5:1 were investigated. TEM images of

117
both 2:1 and 5:1 mixtures showed free nanofibers and nanotubes laminated with nanofibers
(Figure 3.13 c, d). UV-Vis spectra of 2:1 and 5:1 both exhibited peaks at 264 and 300 nm.
Broaden peak with low intensity at 350 nm were observed in both samples. The absorbance
at 200, 264 and 300 nm of the 5:1 sample was higher than the 2:1 sample. On the contrary,
the absorbance at 350 nm was lower in 5:1 sample compared to the 2:1 sample. The
variation of UV-Vis absorbance intensities at distinct wavelengths resulted from different
percentages of AAC7 and AAC4’ in the samples.
The CD spectrum of 2:1 sample showed strong negative peaks at 215 and 270 nm
and weak positive peak at 307 nm and broad positive peak in 340-380 nm. In the 5:1
sample, negative peaks at 214 and 267 nm and positive peaks at 307 nm and in 340-380
nm were observed. The CD signals of 2:1 and 5:1 samples were stronger compare to 1:1
sample, which could due to less aggregation in the mixtures since AAC7 was in excess and
less ion pairs were present in the samples. The negative peaks at ~215 nm and positive
peaks at ~195 nm, which corresponded to π-π* and n-π* transition on amide respectively,
indicated that -sheets structures were present.36 Cotton effects shown in 260-310 nm
demonstrated chiral arrangement of Fmoc groups. The excitonic couplets corresponding to
MC in both samples were strongly diminished compare to AAC4’. Experimental CD
spectra of pre-assembled AAC7:AAC4’ mixtures were also compared with theoretical
spectra calculated from simple ratiometric combination of data from the parent peptides
(Figure 3.14). If there was no interaction between pre-assembled AAC7 and AAC4’
structures, the expected CD spectra should be identical to the sum of the spectra of two
parent peptides, which is shown in dash line in figure 3.14 a. However, the spectra obtained

118
from the mixtures were dramatically different in magnitude and key signature peaks.38, 39
All in all, the drastic difference between experimental CD spectra and theoretical CD
spectra suggested that electrostatic interaction between assembled AAC7 and AAC4’ were
present.
200 300 400 500 600
-200000
-150000
-100000
-50000
0
50000
100000
Mo
lar
Ellip
ticit
y [q]
Wavelength (nm)
1 to 1
2 to 1
5 to 1
1 to 1 (cal.)
2 to 1 (cal.)
5 to 1 (cal.)
Figure 3.14 Co-plot of theoretical (dash line) and experimental (solid line) CD spectra of
AAC7:AAC4’ at 1:1, 2:1 and 5:1 ratio. Theoretical CD spectra were obtained from
simple ratiomatic combination of data from AAC7 and AAC4’.
FT-IR spectra of 1:1, 2:1 and 5:1 pre-assembled mixtures of AAC7 and AAC4’
were taken and compared. Experimental results showed that all pre-assembled mixtures of
AAC7 and AAC4’ had -sheet and α-helix in the assemblies (Figure 3.15 a-c), which were

119
also observed in spectra of AAC7 and AAC4’ (Figure 3.15 d). Interestingly, the percentage
of -sheet decreased as the molar ratio of AAC7:AAC4’ increased (Figure 3.15 e),
indicating that the pre-assembled structures of AAC7 and AAC4’ remained even after
combining.

120
Figure 3.15 Deconvoluted FT-IR spectra of pre-assembled AAC7:AAC4’ mixtures at
ratio of a) 1:1, b) 2:1 and c) 5:1. d) Co-plot of FT-IR spectra of pre-assembled
AAC7:AAC4’ mixtures, AAC7 and AAC4’. AAC7 and AAC4’ were prepared in D2O
(5mM) and set for 1 week. Then the samples were combined in different ratios, set at
room temperature for 3 days and then lyophilized for 2 days to remove solvent. The dried
samples were redissolved in D2O for measurement. e) Calculated percentage of
secondary structures in pre-assembled AAC7:AAC4’ mixtures.

121
To further investigate whether deviation between experimental and theoretical CD
spectra was related to the interaction between pre-assembled AAC7 and AAC4’,
fluorescence spectroscopy was used. Since the excitonic couplet generated from MC
stacking changed drastically in experimental CD spectra that the intensity of the peaks were
significantly lower compare to calculated CD spectra, the fluorescence activity of
AAC7:AAC4’ mixtures were investigated and compared with AAC4’. Fluorescence
measurements showed that AAC4’ in water had λmax of emission at 411 nm (Figure 3.16).
However, λmax of emission for the 1:1 mixture red-shifted to 420 nm (Figure 3.16). For 2:1
and 5:1 mixtures, λmax of emission both blue-shifted to 407 nm (Figure 3.16). The shifting
of λmax on the emission spectra of AAC7:AAC4’ mixtures indicated that the supramolecular
interaction between MC moieties on the peptides were different from AAC4’ assembly.40
If pre-assembled AAC7 and AAC4’ were self-sorted in the mixture, the emission spectra
should be identical to fluorescence spectrum of AAC4’. Whereas the fluorescence spectra
were different for pre-assembled AAC7/AAC4’ mixtures, indicating that there was
interactions between AAC7 and AAC4’ and that affected the electronic levels involved in
MC emission.

122
350 400 450 500 550 600
0.0
0.2
0.4
0.6
0.8
1.0
No
rma
lized
In
ten
sit
y
Wavelength (nm)
1 to 1
2 to 1
5 to 1
AAC4' only
Figure 3.16 Normalized fluorescence spectra of AAC4’ and pre-assembled
AAC7:AAC4’ mixtures in 1:1, 2:1 and 5:1 ratios. All samples were diluted from 5 mM to
1 mM. Fluorescence spectra were measured using 3 mM quartz cuvette. The samples
were excited at 350 nm.
AAC7 and AAC4’ were also combined as monomers at different ratios and then
co-assembled in water in order to compare with pre-assembled mixture of AAC7 and
AAC4’. To ensure the peptides were mixed in molecular level and to remove any pre-
assembled structure, AAC7 and AAC4’ were first dissolved in TFE separately and then
mixed in desired molar ratio and followed by lyophilization. Afterwards, the lyophilized
sample was dissolved in water with 10% TFE at 5 mM due to the low solubility of the
sample. TEM was used to investigate the assembly of the co-assembled samples.

123
Surprisingly, nanofibers with width of 13 ± 2 nm and length of micrometers were observed
in co-assembled samples in ratios of 1:1, 2:1 and 5:1(Figure 3.17 a-c).
Figure 3.17 TEM images of co-assembled AAC7:AAC4’ at ratios of a) 1:1; b) 2:1; c) 5:1.
The samples were prepared at 5 mM and diluted to 1 mM for microscopic studies.
UV-Vis spectra of 1:1, 2:1 and 5:1 mixtures (Figure 3.18 b) all exhibited absorption
peaks at 265 and 300 nm, which corresponded to π-π* and n-π* transition of Fmoc and
benzyl amidyl groups. The peak intensity increased as the molar ratio of AAC7 was higher,
indicating that absorbance change in these wavelengths were related to concentration of
AAC7 in the mixture. A weak peak was observed in 310-380 nm, which was related to MC
group on AAC4’. From the inset of figure 3.17 b, a broad peak with λ max at 350 nm and
shoulder peak at 370 nm were observed in the 1:1 ratio of AAC7 and AAC4’, indicating
chiral interaction between MC groups. The absorbance at 350 nm increased and the
shoulder peak intensity was lower for the 2:1 sample. The drop of shoulder peak intensity
showed that intermolecular interactions between MC groups were weaker due to lower
molar ratio of AAC4’ in 2:1 sample. Absorbance in 310-380 nm was even lower in 5:1

124
sample, but the shoulder peak did not change, indicating the interaction between MC in 5:1
ratio was similar to that in the 2:1 sample.
CD spectroscopy revealed distinctive spectra of co-assembled AAC7:AAC4’
samples (Figure 3.18 a) compare with pre-assembled AAC7:AAC4’ mixture. The positive
Cotton effect was much weaker in the spectra of all co-assembled samples. Signature
negative peaks at ~215 and ~265 nm were not seen in all CD spectra, indicating that
supramolecular motif observed in AAC7 were not present. The observation from these CD
spectra was in agreement with the TEM results because wide nanotube structures were not
seen (Figure 3.17 a-c). Positive excitonic couplets were observed in the range of 310-390
nm, which indicated that P-type helical stacking between MC moieties was present.
Figure 3.18 a) CD spectra and b) UV-Vis spectra of co-assembled AAC7:AAC4 at 1:1,
2:1 and 5:1 ratios. The samples were prepared at 5 mM in HPLC grade water with 10%
TFE and diluted to 1 mM for spectroscopic and microscopic studies.
FT-IR spectroscopy was utilized to investigate the secondary structures of co-
assembled samples of AAC7 and AAC4’. In the spectrum of 1:1 sample, only -sheet with

125
wavenumber at 1616 and 1636 cm-1 was shown (Figure 3.19 a). For 2:1 sample, -sheet
structure was also observed with peaks at 1622, 1628 and 1634 cm-1. Whereas a large peak
at 1644 cm-1 emerged on the spectrum, indicating that random coil was present in the
assembly (Figure 3.19 b). For 5:1 sample, not only -sheet peaks at 1622 and 1633 cm-1
and random coil peak at 1644 cm-1 were observed, a peak at 1650 cm-1 revealed that α-
helix was also present in 5:1 co-assembly of AAC7 and AAC4’. The distinct FT-IR spectra
of AAC7:AAC4’ co-assembly suggested that the supramolecular arrangement of the
peptides was different from both AAC7 and AAC4’ (Figure 3.19 d).

126
Figure 3.19 Deconvoluted FT-IR spectra of co-assembled AAC7:AAC4’ mixtures at ratio
of a) 1:1, b) 2:1 and c) 5:1. AAC7 and AAC4’ were first dissolved in TFE (5 mM),
combined in different ratios and lyophilized. The dried mixtures were dissolved in D2O
with 10% TFE (5mM) and set for 1 week and then lyophilized for 2 days to remove
solvent. The samples were redissolved in D2O for measurement d) Co-plot of FT-IR
spectra of co-assembled AAC7:AAC4’ mixtures, AAC7 and AAC4’.
Fluorescence measurement was performed on co-assembled samples of AAC7 and
AAC4’ (Figure 3.20). Fluorescence spectra of 1:1, 2:1 and 5:1 samples exhibited λmax of

127
emission at 411 nm, which was identical to AAC4’. The same λmax of emission of co-
assembled samples and AAC4’ indicated that the supramolecular interactions between MC
moieties in these co-assembled samples were similar.
350 400 450 500 550 600
0.0
0.2
0.4
0.6
0.8
1.0
No
rma
lized
In
ten
sit
y
Wavelength (nm)
1 to 1
2 to 1
5 to 1
AAC4' only
Figure 3.20 Normalized fluorescence spectra of AAC4’ and co-assembly of
AAC7:AAC4’ in 1:1, 2:1 and 5:1 ratios. All samples were diluted from 5 mM to 1 mM.
Fluorescence spectra were measured using 3 mM quartz cuvette. The samples were
excited at 350 nm.
The preliminary results showed that when AAC7 and AAC4’ were mixed in
monomeric form, the self-assembly would be very different from the mixture of pre-
assembled peptides. The absence of signature -sheet peaks on CD spectra indicated that
the motif of AAC7:AAC4’ co-assembly was not similar to AAC7 itself. The positive cotton
effect in 310-390 nm on the CD spectra exhibited that the supramolecular interaction

128
between MC groups in the co-assembly of AAC7 and AAC4’ resembled the stacking motif
in AAC4’. Identical λmax of fluorescence emission for MC also agreed with observation
from CD spectroscopy. Hence, it is possible that the co-assembled nanofibers comprise
AAC4’ segments (Figure 3.21), which has same assembly pattern to AAC4’ nanofibers
and AAC7 segments that have completely different supramolecular arrangement compare
to AAC7 nanotubes.
Figure 3.21 Proposed AAC7:AAC4’ self-assembly. a) AAC7 and AAC4’ are pre-
assembled in water to yield distinct nanostructures. Pre-assembled AAC7 and AAC4’
form the complex showed on the right via electrostatic attraction. b) AAC7 and AAC4’
are combined in monomeric form. The co-assembled nanofibers comprise segments of
AAC4’ and AAC7.

129
Conclusion
In summary, positively charged peptide AAC7 and negatively charged peptide
AAC4’ were able to self-assemble into nanotubes and nanofibers respectively.
Spectroscopic and microscopic studies revealed that the morphology of AAC7 and AAC4’
assemblies were concentration dependent. As pre-assembled AAC7 and AAC4’ were
combined at ratio of 1:1, 2:1 and 5:1, nanotubes with distinct morphology compare to
AAC7 were observed. On the contrary, when AAC7 and AAC4’ were combined in
monomeric form at 1:1, 2:1 and 5:1 ratio, nanofibers were observed in all samples. The
morphology of co-assembled peptides was distinctive compare to the mixture of pre-
assembled peptides. Spectroscopic and microscopic results further proved that co-assembly
motif of AAC7 and AAC4’ were different from pre-assembled mixture of AAC7 and
AAC4’. Overall, this study provided a new insight on multicomponent self-assembly and
further exploration on the motifs of self-assemblies in this study could be helpful in
designing functional multicomponent self-assembled materials.
3.3 Experimental Section
Synthesis of MC
2-Hydroxy-4-methoxybenzaldehyde (3.04 g, 20 mmol), diethylmalonate (6.40 g, 40 mmol)
and piperidine (2 mL) were combined in absolute ethanol (60 mL) and stirred for 6 h at
reflux. Then 10% NaOH (60mL) aqueous solution was added to the mixture and the
solution was heated at reflux for 15 minutes. The reaction mixture was cooled down to

130
room temperature and the pH of the mixture was adjusted to 2 with concentrated
hydrochloric acid to obtain an light yellow precipitate. The crude product was filtered,
washed with cold water and recrystallized into white crystal in absolute ethanol (2.77g,
63%).
Scheme 3.1 Synthesis of MC
General Peptide Preparation
The peptide is synthesized using a solid phase peptide coupling protocol on Rink amide
resin (0.8 g/mmol). All amino acids were coupled using Fmoc-protected amino acids, DIC
and HOBt, which were combined in DMF and reacted for 2 h. The Fmoc group was
removed using 20% piperidine in DMF and the Mtt group was deprotected using
TFA/TES/DCM (2:1:97). Boc and tBu groups were removed using TFA/TES/H2O (94:5:1)
at the final cleaving step. MC and benzoic acid were coupled on the deprotected lysine side
chain using HOBt, HBTU and DIPEA to yield AAC4’ and AAC7 respectively. The final
peptides were cleaved with TFA/TES/H2O (94:5:1). After cleavage from the solid support,
all AAC peptides were purified by high performance liquid chromatography. AAC
structures were validated using 1HNMR and13CNMR and mass spectroscopy.

131
Scheme 3.2 Synthesis of AAC7
AAC7 1H NMR (700 MHz, DMSO-d6) δ 8.42 (1H, t, J=5.9 Hz), 7.90 (2H, d, J=7.1Hz),
7.82 (2H, d, J=7.4 Hz), 7.73 (1H, d, J=7.4 Hz), 7.71 (1H, d, J=7.6 Hz), 7.52 (2H, d, J=7.8
Hz), 7.50 (1H, d, J=7.3 Hz), 7.40-7.46 (5H, m), 7.38 (1H, s), 7.33 (2H, t, J=7.4Hz), 7.03
(1H, s), 4.28 (2H, m), 4.22 (2H, m), 4.00 (1H, m), 3.23 (2H, m), 2.76 (2H, m), 1.62-1.72
(2H, m), 1.47-1.59 (7H, m), 1.27-1.37 (5H,m); 13C NMR (176MHz, DMSO-d6) δ 173.98,
172.04, 166.55, 156.45, 144.38, 144.20, 141.20, 135.15, 131.46, 128.88, 128.12, 127.57,
125.76, 125.72, 120.62, 120.60, 120.51, 66.08, 54.89, 52.63, 47.14, 40.50, 39.24, 32.43,
31.75, 29.37, 27.11, 23.24, 22.79; ESI-MS for C34H41N5O5 [M+H]+ calculated 600.3180;
found 600.3189.

132
Scheme 3.3 Synthesis of AAC4’
AAC4’ 1H NMR (700 MHz, DMSO-d6) δ 8.94 (1H, s), 8.77 (1H, t, J=5.6 Hz), 8.03 (2H,
d, J=8.7 Hz), 8.02 (2H, d, J=6.7 Hz), 7.98 (1H, d, J=8.1 Hz), 7.87 (1H, d, J=7.5 Hz), 7.85
(1H, d, J=7.5 Hz), 7.70 (1H, d, J=8.1 Hz), 7.55 (2H, t, J=7.38 Hz), 7.50 (1H, s), 7.46 (2H,
t, J=7.4 Hz), 7.24 (1H, d, J=2.2 Hz), 7.18 (2H, dd, J= 8.7, 2.4 Hz), 7.16 (1H, s), 4.40 (2H,
d, J=7.2 Hz), 4.34 (2H, m), 4.18 (1H, m), 4.03 (3H, s), 3.42 (2H, m), 2.41 (2H, t, J=7.92),
2.05 (1H, m), 1.90 (1H, m), 1.82 (1H, m), 1.61-1.73 (3H, m), 1.46 (2H, m); 13C NMR
(176MHz, DMSO-d6) δ 171.66, 164.82, 161.76, 161.35, 156.59, 156.39, 148.16, 144.37,
144.19, 141.16, 131.97, 128.09, 127.55, 125.79, 125.76, 120.55, 115.39, 114.09, 112.61,
100.73, 66.16, 56.71, 54.45, 52.58, 47.10, 39.41, 32.22, 30.71, 29.20, 27.75, 23.15; ESI-
MS for C37H38N4O10 [M+23]+ calculated 721.2480; found 721.2487.

133
Circular Dichroism (CD) Spectroscopy Measurement.
CD spectra were recorded on a Jasco CD J-815 spectrometer under nitrogen atmosphere.
Experiments were performed in a quartz cell with a 1 mm path length at 1mM and 0.5mM
and with a 0.1mm path length at 5mM over the range of 190-600 nm. Samples were
prepared as 5mM solution in H2O after 1-week incubation at room temperature, and
subsequently diluted before the measurement.
Fourier Transform Infrared (FT-IR) Spectroscopy Measurement
FT-IR spectra were collected on a Shimadzu FTIR spectrometer at ambient temperature.
Spectra were recorded between 1700 and 1600 cm-1 at a resolution of 4 cm-1, and a total of
128 scans were averaged. Samples for FT-IR were first dissolved in D2O (5mM) and
freeze-dried to remove water. Spectra were analyzed in a transmission cell having CaF2
windows and a 0.025 μm path length. After subtracting the solvent spectrum from the
sample spectrum, the amide I band (1600-1700 cm-1) of each spectrum was analyzed using
peak fit with Gaussian method on Origin. The contribution of each peak to the amide I
band were quantified by the integrated areas of respective peaks.
Transmission Electron Microscopy Measurement
AAC4’ and AAC7 were dissolved in Millipore water to form 5mM solution and left to self-
assemble for 1 week. Afterwards, the sample was diluted to1mM and 30 μL diluted samples
were loaded on the formvar/carbon-covered copper grid and stained with uranyl acetate (2
wt% in distilled water) for 50 s and the grids were dried with filter paper. Then
nanostructures of the AAC4’ and AAC7 were observed by TEM.

134
Zeta Potential Measurement
Zeta potential measurements were performed on AAC7 and AAC4’. The peptides were
prepared as 5mM solution in H2O and aged for 1 week before diluted to 1mM for zeta
potential measurement on Malvern Zetasizer Nano ZS.

135
3.4 References
1. Webber, M. J.; Newcomb, C. J.; Bitton, R.; Stupp, S. I., Switching of self-
assembly in a peptide nanostructure with a specific enzyme. Soft Matter 2011, 7 (20),
9665-9672.
2. Cheetham, A. G.; Zhang, P.; Lin, Y.-a.; Lock, L. L.; Cui, H., Supramolecular
Nanostructures Formed by Anticancer Drug Assembly. J. Am. Chem. Soc. 2013, 135 (8),
2907-2910.
3. Kim, S. H.; Kaplan, J. A.; Sun, Y.; Shieh, A.; Sun, H.-L.; Croce, C. M.;
Grinstaff, M. W.; Parquette, J. R., The Self-Assembly of Anticancer Camptothecin–
Dipeptide Nanotubes: A Minimalistic and High Drug Loading Approach to Increased
Efficacy. Chem. Eur. J. 2015, 21 (1), 101-105.
4. Sun, Y.; Shieh, A.; Kim, S. H.; King, S.; Kim, A.; Sun, H.-L.; Croce, C. M.;
Parquette, J. R., The self-assembly of a camptothecin-lysine nanotube. Bioorg. Med.
Chem. Lett. 2016, 26 (12), 2834-2838.
5. Webber, M. J.; Matson, J. B.; Tamboli, V. K.; Stupp, S. I., Controlled release of
dexamethasone from peptide nanofiber gels to modulate inflammatory response.
Biomaterials 2012, 33 (28), 6823-6832.
6. Tysseling-Mattiace, V. M.; Sahni, V.; Niece, K. L.; Birch, D.; Czeisler, C.;
Fehlings, M. G.; Stupp, S. I.; Kessler, J. A., Self-Assembling Nanofibers Inhibit Glial
Scar Formation and Promote Axon Elongation after Spinal Cord Injury. J. Neurosci.
2008, 28 (14), 3814.
7. Shah, R. N.; Shah, N. A.; Del Rosario Lim, M. M.; Hsieh, C.; Nuber, G.;
Stupp, S. I., Supramolecular design of self-assembling nanofibers for cartilage
regeneration. Proc. Natl. Acad. Sci. U.S.A. 2010, 107 (8), 3293.
8. Lee, K. S.; Parquette, J. R., A self-assembled nanotube for the direct aldol
reaction in water. Chem. Commun. 2015, 51 (86), 15653-15656.
9. Guler, M. O.; Stupp, S. I., A Self-Assembled Nanofiber Catalyst for Ester
Hydrolysis. J. Am. Chem. Soc. 2007, 129 (40), 12082-12083.
10. Makhlynets, O. V.; Gosavi, P. M.; Korendovych, I. V., Short Self-Assembling
Peptides Are Able to Bind to Copper and Activate Oxygen. Angew. Chem. Int. Ed. 2016,
55 (31), 9017-9020.
11. Mandal, D.; Nasrolahi Shirazi, A.; Parang, K., Self-assembly of peptides to
nanostructures. Org. Biomol. Chem. 2014, 12 (22), 3544-61.
12. Habibi, N.; Kamaly, N.; Memic, A.; Shafiee, H., Self-assembled peptide-based
nanostructures: Smart nanomaterials toward targeted drug delivery. Nano today 2016, 11
(1), 41-60.
13. Hendricks, M. P.; Sato, K.; Palmer, L. C.; Stupp, S. I., Supramolecular
Assembly of Peptide Amphiphiles. Acc. Chem. Res. 2017, 50 (10), 2440-2448.
14. Makam, P.; Gazit, E., Minimalistic peptide supramolecular co-assembly:
expanding the conformational space for nanotechnology. Chem. Soc. Rev. 2018, 47 (10),
3406-3420.

136
15. Safont-Sempere, M. M.; Fernández, G.; Würthner, F., Self-Sorting Phenomena in
Complex Supramolecular Systems. Chem. Rev. 2011, 111 (9), 5784-5814.
16. Tsai, Y.-T.; Raffy, G.; Liu, H.-F.; Peng, B.-J.; Tseng, K.-P.; Hirsch, L.; Del
Guerzo, A.; Bassani, D. M.; Wong, K.-T., Incorporation of narcissistic self-sorting
supramolecular interactions for the spontaneous fabrication of multiple-color solid-state
materials for OLED applications. Mater. Chem. Front. 2020, 4 (3), 845-850.
17. He, Z.; Jiang, W.; Schalley, C. A., Integrative self-sorting: a versatile strategy for
the construction of complex supramolecular architecture. Chem. Soc. Rev. 2015, 44 (3),
779-789.
18. Colquhoun, C.; Draper, E. R.; Eden, E. G. B.; Cattoz, B. N.; Morris, K. L.;
Chen, L.; McDonald, T. O.; Terry, A. E.; Griffiths, P. C.; Serpell, L. C.; Adams, D. J.,
The effect of self-sorting and co-assembly on the mechanical properties of low molecular
weight hydrogels. Nanoscale 2014, 6 (22), 13719-13725.
19. Ryan, D. M.; Doran, T. M.; Nilsson, B. L., Complementary π–π Interactions
Induce Multicomponent Coassembly into Functional Fibrils. Langmuir 2011, 27 (17),
11145-11156.
20. Fleming, S.; Debnath, S.; Frederix, P. W. J. M.; Hunt, N. T.; Ulijn, R. V.,
Insights into the Coassembly of Hydrogelators and Surfactants Based on Aromatic
Peptide Amphiphiles. Biomacromolecules 2014, 15 (4), 1171-1184.
21. Nagy, K. J.; Giano, M. C.; Jin, A.; Pochan, D. J.; Schneider, J. P., Enhanced
Mechanical Rigidity of Hydrogels Formed from Enantiomeric Peptide Assemblies. J.
Am. Chem. Soc. 2011, 133 (38), 14975-14977.
22. Morris, K. L.; Chen, L.; Raeburn, J.; Sellick, O. R.; Cotanda, P.; Paul, A.;
Griffiths, P. C.; King, S. M.; O’Reilly, R. K.; Serpell, L. C.; Adams, D. J., Chemically
programmed self-sorting of gelator networks. Nat. Commun. 2013, 4 (1), 1480.
23. Raeburn, J.; Alston, B.; Kroeger, J.; McDonald, T. O.; Howse, J. R.; Cameron,
P. J.; Adams, D. J., Electrochemically-triggered spatially and temporally resolved multi-
component gels. Materials Horizons 2014, 1 (2), 241-246.
24. Niece, K. L.; Hartgerink, J. D.; Donners, J. J. J. M.; Stupp, S. I., Self-Assembly
Combining Two Bioactive Peptide-Amphiphile Molecules into Nanofibers by
Electrostatic Attraction. J. Am. Chem. Soc. 2003, 125 (24), 7146-7147.
25. Li, S.; Mehta, A. K.; Sidorov, A. N.; Orlando, T. M.; Jiang, Z.; Anthony, N.
R.; Lynn, D. G., Design of Asymmetric Peptide Bilayer Membranes. J. Am. Chem. Soc.
2016, 138 (10), 3579-3586.
26. Hu, Y.; Lin, R.; Zhang, P.; Fern, J.; Cheetham, A. G.; Patel, K.; Schulman, R.;
Kan, C.; Cui, H., Electrostatic-Driven Lamination and Untwisting of β-Sheet Assemblies.
ACS Nano 2016, 10 (1), 880-888.
27. Lee, A.; Sun, Y.; Lin, T.; Song, N.-J.; Mason, M. L.; Leung, J. H.; Kowdley,
D.; Wall, J.; Brunetti, A.; Fitzgerald, J.; Baer, L. A.; Stanford, K. I.; Ortega-Anaya, J.;
Gomes-Dias, L.; Needleman, B.; Noria, S.; Weil, Z.; Blakeslee, J. J.; Jiménez-Flores,
R.; Parquette, J. R.; Ziouzenkova, O., Amino acid-based compound activates atypical
PKC and leptin receptor pathways to improve glycemia and anxiety like behavior in
diabetic mice. Biomaterials 2020, 239, 119839.

137
28. Wu, L.; Huang, C.; Emery, B. P.; Sedgwick, A. C.; Bull, S. D.; He, X.-P.;
Tian, H.; Yoon, J.; Sessler, J. L.; James, T. D., Förster resonance energy transfer
(FRET)-based small-molecule sensors and imaging agents. Chem. Soc. Rev. 2020, 49
(15), 5110-5139.
29. Kong, J.; Yu, S., Fourier Transform Infrared Spectroscopic Analysis of Protein
Secondary Structures. Acta Biochimica et Biophysica Sinica 2007, 39 (8), 549-559.
30. Zou, Y.; Razmkhah, K.; Chmel, N. P.; Hamley, I. W.; Rodger, A.,
Spectroscopic signatures of an Fmoc–tetrapeptide, Fmoc and fluorene. RSC Adv. 2013, 3
(27), 10854-10858.
31. Berova, N.; Bari, L. D.; Pescitelli, G., Application of electronic circular
dichroism in configurational and conformational analysis of organic compounds. Chem.
Soc. Rev. 2007, 36 (6), 914-931.
32. Aggeli, A.; Nyrkova, I. A.; Bell, M.; Harding, R.; Carrick, L.; McLeish, T. C.
B.; Semenov, A. N.; Boden, N., Hierarchical self-assembly of chiral rod-like molecules
as a model for peptide β-sheet tapes, ribbons, fibrils, and fibers. Proc. Natl. Acad. Sci.
U.S.A. 2001, 98 (21), 11857.
33. Aggeli, A.; Bell, M.; Boden, N.; N. Keen, J.; C. B. McLeish, T.; Nyrkova, I.;
Radford, S. E.; Semenov, A., Engineering of peptide β-sheet nanotapes. J. Mater. Chem.
1997, 7 (7), 1135-1145.
34. Nyrkova, I. A.; Semenov, A. N.; Aggeli, A.; Boden, N., Fibril stability in
solutions of twisted -sheet peptides: a new kind of micellization in chiral systems. The
European Physical Journal B - Condensed Matter and Complex Systems 2000, 17 (3),
481-497.
35. Cui, H.; Muraoka, T.; Cheetham, A. G.; Stupp, S. I., Self-Assembly of Giant
Peptide Nanobelts. Nano Lett. 2009, 9 (3), 945-951.
36. Sreerama, N.; Woody, R. W., Computation and Analysis of Protein Circular
Dichroism Spectra. In Methods Enzymol., Academic Press: 2004; Vol. 383, pp 318-351.
37. Frisch, H.; Unsleber, J. P.; Lüdeker, D.; Peterlechner, M.; Brunklaus, G.;
Waller, M.; Besenius, P., pH-Switchable Ampholytic Supramolecular Copolymers.
Angew. Chem. Int. Ed. 2013, 52 (38), 10097-10101.
38. Sahoo, J. K.; VandenBerg, M. A.; Ruiz Bello, E. E.; Nazareth, C. D.; Webber,
M. J., Electrostatic-driven self-sorting and nanostructure speciation in self-assembling
tetrapeptides. Nanoscale 2019, 11 (35), 16534-16543.
39. Onogi, S.; Shigemitsu, H.; Yoshii, T.; Tanida, T.; Ikeda, M.; Kubota, R.;
Hamachi, I., In situ real-time imaging of self-sorted supramolecular nanofibres. Nat.
Chem. 2016, 8 (8), 743-752.
40. Adelizzi, B.; Aloi, A.; Markvoort, A. J.; Ten Eikelder, H. M. M.; Voets, I. K.;
Palmans, A. R. A.; Meijer, E. W., Supramolecular Block Copolymers under
Thermodynamic Control. J. Am. Chem. Soc. 2018, 140 (23), 7168-7175.

138
Bibliography
1. Kalai Selvan, N.; Shanmugarajan, T. S.; Uppuluri, V. N. V. A., Hydrogel based
scaffolding polymeric biomaterials: Approaches towards skin tissue regeneration. J. Drug
Deliv. Sci. Technol. 2020, 55, 101456.
2. Hirst, A. R.; Escuder, B.; Miravet, J. F.; Smith, D. K., High-Tech Applications
of Self-Assembling Supramolecular Nanostructured Gel-Phase Materials: From
Regenerative Medicine to Electronic Devices. Angew. Chem. Int. Ed. 2008, 47 (42),
8002-8018.
3. Holmes, T. C.; de Lacalle, S.; Su, X.; Liu, G.; Rich, A.; Zhang, S., Extensive
neurite outgrowth and active synapse formation on self-assembling peptide scaffolds.
Proc. Natl. Acad. Sci. U.S.A. 2000, 97 (12), 6728.
4. Woolfson, D. N.; Ryadnov, M. G., Peptide-based fibrous biomaterials: some
things old, new and borrowed. Curr. Opin. Chem. Biol. 2006, 10 (6), 559-567.
5. Dreiss, C. A., Hydrogel design strategies for drug delivery. Curr. Opin. Colloid
Interface Sci. 2020, 48, 1-17.
6. Rösler, A.; Vandermeulen, G. W. M.; Klok, H.-A., Advanced drug delivery
devices via self-assembly of amphiphilic block copolymers. Adv. Drug Del. Rev. 2001,
53 (1), 95-108.
7. Du, J.-Z.; Du, X.-J.; Mao, C.-Q.; Wang, J., Tailor-Made Dual pH-Sensitive
Polymer–Doxorubicin Nanoparticles for Efficient Anticancer Drug Delivery. J. Am.
Chem. Soc. 2011, 133 (44), 17560-17563.
8. Zhao, Y. S.; Fu, H.; Peng, A.; Ma, Y.; Liao, Q.; Yao, J., Construction and
optoelectronic properties of organic one-dimensional nanostructures. Acc. Chem. Res.
2010, 43 (3), 409-18.
9. Murugavelu, M.; Imran, P. K. M.; Sankaran, K. R.; Nagarajan, S., Self-assembly
and photophysical properties of a minuscule tailed perylene bisimide. Mater. Sci.
Semicond. Process. 2013, 16 (2), 461-466.
10. Maity, N.; Ghosh, R.; Nandi, A. K., Optoelectronic Properties of Self-Assembled
Nanostructures of Polymer Functionalized Polythiophene and Graphene. Langmuir 2018,
34 (26), 7585-7597.
11. Wang, J.; Liu, K.; Xing, R.; Yan, X., Peptide self-assembly: thermodynamics
and kinetics. Chem. Soc. Rev. 2016, 45 (20), 5589-5604.
12. Hendricks, M. P.; Sato, K.; Palmer, L. C.; Stupp, S. I., Supramolecular
Assembly of Peptide Amphiphiles. Acc. Chem. Res. 2017, 50 (10), 2440-2448.
13. Fu, I. W.; Markegard, C. B.; Nguyen, H. D., Solvent Effects on Kinetic
Mechanisms of Self-Assembly by Peptide Amphiphiles via Molecular Dynamics
Simulations. Langmuir 2015, 31 (1), 315-324.

139
14. Zaldivar, G.; Conda-Sheridan, M.; Tagliazucchi, M., Twisting of Charged
Nanoribbons to Helicoids Driven by Electrostatics. J. Phys. Chem. B 2020, 124 (15),
3221-3227.
15. Roy, S.; Javid, N.; Frederix, P. W.; Lamprou, D. A.; Urquhart, A. J.; Hunt, N.
T.; Halling, P. J.; Ulijn, R. V., Dramatic specific-ion effect in supramolecular hydrogels.
Chemistry 2012, 18 (37), 11723-31.
16. Zhang, M.; Grossman, D.; Danino, D.; Sharon, E., Shape and fluctuations of
frustrated self-assembled nano ribbons. Nat. Commun. 2019, 10 (1), 3565.
17. Fleming, S.; Ulijn, R. V., Design of nanostructures based on aromatic peptide
amphiphiles. Chem. Soc. Rev. 2014, 43 (23), 8150-77.
18. Zhao, X.; Zhang, S., Molecular designer self-assembling peptides. Chem. Soc.
Rev. 2006, 35 (11), 1105-1110.
19. Oshovsky, G. V.; Reinhoudt, D. N.; Verboom, W., Supramolecular Chemistry in
Water. Angew. Chem. Int. Ed. 2007, 46 (14), 2366-2393.
20. Krieg, E.; Bastings, M. M. C.; Besenius, P.; Rybtchinski, B., Supramolecular
Polymers in Aqueous Media. Chem. Rev. 2016, 116 (4), 2414-2477.
21. Ball, P., Water as an Active Constituent in Cell Biology. Chem. Rev. 2008, 108
(1), 74-108.
22. Grdadolnik, J.; Merzel, F.; Avbelj, F., Origin of hydrophobicity and enhanced
water hydrogen bond strength near purely hydrophobic solutes. Proc. Natl. Acad. Sci.
U.S.A. 2017, 114 (2), 322-327.
23. Southall, N. T.; Dill, K. A.; Haymet, A. D. J., A View of the Hydrophobic Effect.
J. Phys. Chem. B 2002, 106 (3), 521-533.
24. Chandler, D., Interfaces and the driving force of hydrophobic assembly. (1476-
4687 (Electronic)).
25. Sánchez-Iglesias, A.; Grzelczak, M.; Altantzis, T.; Goris, B.; Pérez-Juste, J.;
Bals, S.; Van Tendeloo, G.; Donaldson, S. H.; Chmelka, B. F.; Israelachvili, J. N.; Liz-
Marzán, L. M., Hydrophobic Interactions Modulate Self-Assembly of Nanoparticles. ACS
Nano 2012, 6 (12), 11059-11065.
26. Singh, R. P.; Gangadharappa, H. V.; Mruthunjaya, K., Phospholipids: Unique
carriers for drug delivery systems. J. Drug Deliv. Sci. Technol. 2017, 39, 166-179.
27. Dilek, K.; Aysen, T., Micelles As Delivery System for Cancer Treatment. Curr.
Pharm. Des. 2017, 23 (35), 5230-5241.
28. Elezaby, R. S.; Gad, H. A.; Metwally, A. A.; Geneidi, A. S.; Awad, G. A., Self-
assembled amphiphilic core-shell nanocarriers in line with the modern strategies for brain
delivery. Journal of Controlled Release 2017, 261, 43-61.
29. Israelachvili, J. N., 8 - Special Interactions: Hydrogen-Bonding and Hydrophobic
and Hydrophilic Interactions. In Intermolecular and Surface Forces (Third Edition),
Israelachvili, J. N., Ed. Academic Press: San Diego, 2011; pp 151-167.
30. Murray, T. J.; Zimmerman, S. C., New triply hydrogen bonded complexes with
highly variable stabilities. J. Am. Chem. Soc. 1992, 114 (10), 4010-4011.
31. Krone, M. G.; Hua, L.; Soto, P.; Zhou, R.; Berne, B. J.; Shea, J.-E., Role of
Water in Mediating the Assembly of Alzheimer Amyloid-β Aβ16−22 Protofilaments. J.
Am. Chem. Soc. 2008, 130 (33), 11066-11072.

140
32. Martinez, C. R.; Iverson, B. L., Rethinking the term “pi-stacking”. Chem. Sci.
2012, 3 (7), 2191-2201.
33. Sinnokrot, M. O.; Valeev, E. F.; Sherrill, C. D., Estimates of the Ab Initio Limit
for π−π Interactions: The Benzene Dimer. J. Am. Chem. Soc. 2002, 124 (36), 10887-
10893.
34. McGaughey, G. B.; Gagne, M.; Rappe, A. K., pi-Stacking interactions. Alive and
well in proteins. J. Biol. Chem. 1998, 273 (25), 15458-63.
35. Hunter, C. A.; Sanders, J. K. M., The nature of .pi.-.pi. interactions. J. Am. Chem.
Soc. 1990, 112 (14), 5525-5534.
36. Babine, R. E.; Bender, S. L., Molecular Recognition of Protein−Ligand
Complexes: Applications to Drug Design. Chem. Rev. 1997, 97 (5), 1359-1472.
37. Gazit, E., Self Assembly of Short Aromatic Peptides into Amyloid Fibrils and
Related Nanostructures. Prion 2007, 1 (1), 32-35.
38. Ma, M.; Kuang, Y.; Gao, Y.; Zhang, Y.; Gao, P.; Xu, B., Aromatic−Aromatic
Interactions Induce the Self-Assembly of Pentapeptidic Derivatives in Water To Form
Nanofibers and Supramolecular Hydrogels. J. Am. Chem. Soc. 2010, 132 (8), 2719-2728.
39. Shi, J.; Gao, Y.; Yang, Z.; Xu, B., Exceptionally small supramolecular
hydrogelators based on aromatic-aromatic interactions. Beilstein J. Org. Chem. 2011, 7,
167-72.
40. Hadjittofis, E.; Das, S. C.; Zhang, G. G. Z.; Heng, J. Y. Y., Chapter 8 -
Interfacial Phenomena. In Developing Solid Oral Dosage Forms (Second Edition), Qiu,
Y.; Chen, Y.; Zhang, G. G. Z.; Yu, L.; Mantri, R. V., Eds. Academic Press: Boston,
2017; pp 225-252.
41. Dhotel, A.; Chen, Z.; Delbreilh, L.; Youssef, B.; Saiter, J.-M.; Tan, L.,
Molecular motions in functional self-assembled nanostructures. Int. J. Mol. Sci. 2013, 14
(2), 2303-2333.
42. Israelachvili, J. N.; Mitchell, D. J.; Ninham, B. W., Theory of self-assembly of
hydrocarbon amphiphiles into micelles and bilayers. J. Chem. Soc., Faraday Trans. 2
1976, 72 (0), 1525-1568.
43. Rehm, T. H.; Schmuck, C., Ion-pair induced self-assembly in aqueous solvents.
Chem. Soc. Rev. 2010, 39 (10), 3597-3611.
44. Whitesides, G. M.; Mathias, J. P.; Seto, C. T., Molecular self-assembly and
nanochemistry: a chemical strategy for the synthesis of nanostructures. Science 1991, 254
(5036), 1312.
45. Mandal, D.; Nasrolahi Shirazi, A.; Parang, K., Self-assembly of peptides to
nanostructures. Org. Biomol. Chem. 2014, 12 (22), 3544-61.
46. Lee, S.; Trinh, T. H. T.; Yoo, M.; Shin, J.; Lee, H.; Kim, J.; Hwang, E.; Lim,
Y.-B.; Ryou, C., Self-Assembling Peptides and Their Application in the Treatment of
Diseases. Int. J. Mol. Sci. 2019, 20 (23), 5850.
47. Habibi, N.; Kamaly, N.; Memic, A.; Shafiee, H., Self-assembled peptide-based
nanostructures: Smart nanomaterials toward targeted drug delivery. Nano today 2016, 11
(1), 41-60.
48. MacEwan, S. R.; Chilkoti, A., Elastin-like polypeptides: biomedical applications
of tunable biopolymers. (0006-3525 (Print)).
141
49. Fallas, J. A.; O'Leary, L. E. R.; Hartgerink, J. D., Synthetic collagen mimics:
self-assembly of homotrimers, heterotrimers and higher order structures. Chem. Soc. Rev.
2010, 39 (9), 3510-3527.
50. Saiani, A.; Mohammed, A.; Frielinghaus, H.; Collins, R.; Hodson, N.; Kielty,
C. M.; Sherratt, M. J.; Miller, A. F., Self-assembly and gelation properties of α-helix
versus β-sheet forming peptides. Soft Matter 2009, 5 (1), 193-202.
51. Ghadiri, M. R.; Granja, J. R.; Milligan, R. A.; McRee, D. E.; Khazanovich, N.,
Self-assembling organic nanotubes based on a cyclic peptide architecture. Nature 1993,
366 (6453), 324-327.
52. Khazanovich, N.; Granja, J. R.; McRee, D. E.; Milligan, R. A.; Ghadiri, M. R.,
Nanoscale Tubular Ensembles with Specified Internal Diameters. Design of a Self-
Assembled Nanotube with a 13-.ANG. Pore. J. Am. Chem. Soc. 1994, 116 (13), 6011-
6012.
53. Clark, T. D.; Buriak, J. M.; Kobayashi, K.; Isler, M. P.; McRee, D. E.; Ghadiri,
M. R., Cylindrical β-Sheet Peptide Assemblies. J. Am. Chem. Soc. 1998, 120 (35), 8949-
8962.
54. Hartgerink, J. D.; Granja, J. R.; Milligan, R. A.; Ghadiri, M. R., Self-Assembling
Peptide Nanotubes. J. Am. Chem. Soc. 1996, 118 (1), 43-50.
55. Kobayashi, K.; Granja, J. R.; Ghadiri, M. R., β-Sheet Peptide Architecture:
Measuring the Relative Stability of Parallel vs. Antiparallel β-Sheets. Angew. Chem. Int.
Ed. 1995, 34 (1), 95-98.
56. Ghadiri, M. R.; Granja, J. R.; Buehler, L. K., Artificial transmembrane ion
channels from self-assembling peptide nanotubes. Nature 1994, 369 (6478), 301-304.
57. Fernandez-Lopez, S.; Kim, H.-S.; Choi, E. C.; Delgado, M.; Granja, J. R.;
Khasanov, A.; Kraehenbuehl, K.; Long, G.; Weinberger, D. A.; Wilcoxen, K. M.;
Ghadiri, M. R., Antibacterial agents based on the cyclic d,l-α-peptide architecture. Nature
2001, 412 (6845), 452-455.
58. Leclair, S.; Baillargeon, P.; Skouta, R.; Gauthier, D.; Zhao, Y.; Dory, Y. L.,
Micrometer-Sized Hexagonal Tubes Self-Assembled by a Cyclic Peptide in a Liquid
Crystal. Angew. Chem. Int. Ed. 2004, 43 (3), 349-353.
59. Chapman, R.; Warr, G. G.; Perrier, S.; Jolliffe, K. A., Water-Soluble and pH-
Responsive Polymeric Nanotubes from Cyclic Peptide Templates. Chem. Eur. J. 2013, 19
(6), 1955-1961.
60. Chapman, R.; Bouten, P. J. M.; Hoogenboom, R.; Jolliffe, K. A.; Perrier, S.,
Thermoresponsive cyclic peptide – poly(2-ethyl-2-oxazoline) conjugate nanotubes.
Chem. Commun. 2013, 49 (58), 6522-6524.
61. Danial, M.; Tran, C. M. N.; Jolliffe, K. A.; Perrier, S., Thermal Gating in Lipid
Membranes Using Thermoresponsive Cyclic Peptide–Polymer Conjugates. J. Am. Chem.
Soc. 2014, 136 (22), 8018-8026.
62. Reches, M.; Gazit, E., Casting Metal Nanowires Within Discrete Self-Assembled
Peptide Nanotubes. Science 2003, 300 (5619), 625.
63. Tamamis, P.; Adler-Abramovich, L.; Reches, M.; Marshall, K.; Sikorski, P.;
Serpell, L.; Gazit, E.; Archontis, G., Self-assembly of phenylalanine oligopeptides:
insights from experiments and simulations. Biophys. J. 2009, 96 (12), 5020-5029.

142
64. Reches, M.; Gazit, E. Designed aromatic homo-dipeptides: formation of ordered
nanostructures and potential nanotechnological applications Phys. Biol. [Online], 2006, p.
S10-9. PubMed.
65. Adler-Abramovich, L.; Reches, M.; Sedman, V. L.; Allen, S.; Tendler, S. J. B.;
Gazit, E., Thermal and Chemical Stability of Diphenylalanine Peptide Nanotubes:
Implications for Nanotechnological Applications. Langmuir 2006, 22 (3), 1313-1320.
66. Ryu, J.; Park, C. B., High stability of self-assembled peptide nanowires against
thermal, chemical, and proteolytic attacks. Biotechnol. Bioeng. 2010, 105 (2), 221-230.
67. Görbitz, C. H., The structure of nanotubes formed by diphenylalanine, the core
recognition motif of Alzheimer's β-amyloid polypeptide. Chem. Commun. 2006, (22),
2332-2334.
68. Marchesan, S.; Vargiu, A. V.; Styan, K. E., The Phe-Phe Motif for Peptide Self-
Assembly in Nanomedicine. Molecules 2015, 20 (11), 19775-19788.
69. de Groot, N. S.; Parella, T.; Aviles, F. X.; Vendrell, J.; Ventura, S., Ile-Phe
Dipeptide Self-Assembly: Clues to Amyloid Formation. Biophys. J. 2007, 92 (5), 1732-
1741.
70. Marchesan, S.; Easton, C. D.; Kushkaki, F.; Waddington, L.; Hartley, P. G.,
Tripeptide self-assembled hydrogels: unexpected twists of chirality. Chem. Commun.
2012, 48 (16), 2195-2197.
71. Marchesan, S.; Waddington, L.; Easton, C. D.; Winkler, D. A.; Goodall, L.;
Forsythe, J.; Hartley, P. G., Unzipping the role of chirality in nanoscale self-assembly of
tripeptide hydrogels. Nanoscale 2012, 4 (21), 6752-6760.
72. Marchesan, S.; Easton, C. D.; Styan, K. E.; Waddington, L. J.; Kushkaki, F.;
Goodall, L.; McLean, K. M.; Forsythe, J. S.; Hartley, P. G., Chirality effects at each
amino acid position on tripeptide self-assembly into hydrogel biomaterials. Nanoscale
2014, 6 (10), 5172-5180.
73. Ghosh, S.; Singh, S. K.; Verma, S., Self-assembly and potassium ion triggered
disruption of peptide-based soft structures. Chem. Commun. 2007, (22), 2296-2298.
74. Guilbaud, J.-B.; Vey, E.; Boothroyd, S.; Smith, A. M.; Ulijn, R. V.; Saiani, A.;
Miller, A. F., Enzymatic Catalyzed Synthesis and Triggered Gelation of Ionic Peptides.
Langmuir 2010, 26 (13), 11297-11303.
75. Krysmann, M. J.; Castelletto, V.; Kelarakis, A.; Hamley, I. W.; Hule, R. A.;
Pochan, D. J., Self-Assembly and Hydrogelation of an Amyloid Peptide Fragment.
Biochemistry 2008, 47 (16), 4597-4605.
76. Castelletto, V.; Hamley, I. W.; Harris, P. J. F., Self-assembly in aqueous solution
of a modified amyloid beta peptide fragment. Biophys. Chem. 2008, 138 (1), 29-35.
77. Hamley, I. W.; Castelletto, V.; Moulton, C.; Myatt, D.; Siligardi, G.; Oliveira,
C. L. P.; Pedersen, J. S.; Abutbul, I.; Danino, D., Self-Assembly of a Modified Amyloid
Peptide Fragment: pH-Responsiveness and Nematic Phase Formation. Macromol. Biosci.
2010, 10 (1), 40-48.
78. Boothroyd, S.; Miller, A. F.; Saiani, A., From fibres to networks using self-
assembling peptides. Faraday Discuss. 2013, 166 (0), 195-207.

143
79. Dong, H.; Paramonov, S. E.; Aulisa, L.; Bakota, E. L.; Hartgerink, J. D., Self-
Assembly of Multidomain Peptides: Balancing Molecular Frustration Controls
Conformation and Nanostructure. J. Am. Chem. Soc. 2007, 129 (41), 12468-12472.
80. Bakota, E. L.; Aulisa, L.; Galler, K. M.; Hartgerink, J. D., Enzymatic Cross-
Linking of a Nanofibrous Peptide Hydrogel. Biomacromolecules 2011, 12 (1), 82-87.
81. Berndt, P.; Fields, G. B.; Tirrell, M., Synthetic lipidation of peptides and amino
acids: monolayer structure and properties. J. Am. Chem. Soc. 1995, 117 (37), 9515-9522.
82. Yu, Y.-C.; Berndt, P.; Tirrell, M.; Fields, G. B., Self-Assembling Amphiphiles
for Construction of Protein Molecular Architecture. J. Am. Chem. Soc. 1996, 118 (50),
12515-12520.
83. Yu, Y.-C.; Roontga, V.; Daragan, V. A.; Mayo, K. H.; Tirrell, M.; Fields, G.
B., Structure and Dynamics of Peptide−Amphiphiles Incorporating Triple-Helical
Proteinlike Molecular Architecture. Biochemistry 1999, 38 (5), 1659-1668.
84. Hartgerink, J. D.; Beniash, E.; Stupp, S. I., Self-Assembly and Mineralization of
Peptide-Amphiphile Nanofibers. Science 2001, 294 (5547), 1684.
85. Hartgerink, J. D.; Beniash, E.; Stupp, S. I., Peptide-amphiphile nanofibers: A
versatile scaffold for the preparation of self-assembling materials. Proc. Natl. Acad. Sci.
U.S.A. 2002, 99 (8), 5133.
86. Pashuck, E. T.; Cui, H.; Stupp, S. I., Tuning Supramolecular Rigidity of Peptide
Fibers through Molecular Structure. J. Am. Chem. Soc. 2010, 132 (17), 6041-6046.
87. Cui, H.; Muraoka, T.; Cheetham, A. G.; Stupp, S. I., Self-Assembly of Giant
Peptide Nanobelts. Nano Lett. 2009, 9 (3), 945-951.
88. Silva, G. A.; Czeisler, C.; Niece, K. L.; Beniash, E.; Harrington, D. A.;
Kessler, J. A.; Stupp, S. I., Selective Differentiation of Neural Progenitor Cells by High-
Epitope Density Nanofibers. Science 2004, 303 (5662), 1352.
89. Standley, S. M.; Toft, D. J.; Cheng, H.; Soukasene, S.; Chen, J.; Raja, S. M.;
Band, V.; Band, H.; Cryns, V. L.; Stupp, S. I., Induction of cancer cell death by self-
assembling nanostructures incorporating a cytotoxic peptide. Cancer Res. 2010, 70 (8),
3020-3026.
90. Toft, D. J.; Moyer, T. J.; Standley, S. M.; Ruff, Y.; Ugolkov, A.; Stupp, S. I.;
Cryns, V. L., Coassembled Cytotoxic and Pegylated Peptide Amphiphiles Form
Filamentous Nanostructures with Potent Antitumor Activity in Models of Breast Cancer.
ACS Nano 2012, 6 (9), 7956-7965.
91. Katayama, K.; Armendariz-Borunda J Fau - Raghow, R.; Raghow R Fau - Kang,
A. H.; Kang Ah Fau - Seyer, J. M.; Seyer, J. M., A pentapeptide from type I procollagen
promotes extracellular matrix production. (0021-9258 (Print)).
92. Castelletto, V.; Hamley, I. W.; Perez, J.; Abezgauz, L.; Danino, D., Fibrillar
superstructure from extended nanotapes formed by a collagen-stimulating peptide. Chem.
Commun. 2010, 46 (48), 9185-9187.
93. Miravet, J. F.; Escuder, B.; Segarra-Maset, M. D.; Tena-Solsona, M.; Hamley,
I. W.; Dehsorkhi, A.; Castelletto, V., Self-assembly of a peptide amphiphile: transition
from nanotape fibrils to micelles. Soft Matter 2013, 9 (13), 3558-3564.

144
94. Dehsorkhi, A.; Castelletto, V.; Hamley, I. W.; Adamcik, J.; Mezzenga, R., The
effect of pH on the self-assembly of a collagen derived peptide amphiphile. Soft Matter
2013, 9 (26), 6033-6036.
95. van den Heuvel, M.; Prenen, A. M.; Gielen, J. C.; Christianen, P. C. M.; Broer,
D. J.; Löwik, D. W. P. M.; van Hest, J. C. M., Patterns of Diacetylene-Containing
Peptide Amphiphiles Using Polarization Holography. J. Am. Chem. Soc. 2009, 131 (41),
15014-15017.
96. van den Heuvel, M.; Löwik, D. W. P. M.; van Hest, J. C. M., Effect of the
Diacetylene Position on the Chromatic Properties of Polydiacetylenes from Self-
Assembled Peptide Amphiphiles. Biomacromolecules 2010, 11 (6), 1676-1683.
97. Vegners, R.; Shestakova, I.; Kalvinsh, I.; Ezzell, R. M.; Janmey, P. A., Use of a
gel-forming dipeptide derivative as a carrier for antigen presentation. J. Pept. Sci. 1995, 1
(6), 371-378.
98. Zhang, Y.; Gu, H.; Yang, Z.; Xu, B., Supramolecular Hydrogels Respond to
Ligand−Receptor Interaction. J. Am. Chem. Soc. 2003, 125 (45), 13680-13681.
99. Zhang, Y.; Yang, Z.; Yuan, F.; Gu, H.; Gao, P.; Xu, B., Molecular Recognition
Remolds the Self-Assembly of Hydrogelators and Increases the Elasticity of the
Hydrogel by 106-Fold. J. Am. Chem. Soc. 2004, 126 (46), 15028-15029.
100. Yang, Z.; Liang, G.; Wang, L.; Xu, B., Using a Kinase/Phosphatase Switch to
Regulate a Supramolecular Hydrogel and Forming the Supramolecular Hydrogel in Vivo.
J. Am. Chem. Soc. 2006, 128 (9), 3038-3043.
101. Smith, A. M.; Williams, R. J.; Tang, C.; Coppo, P.; Collins, R. F.; Turner, M.
L.; Saiani, A.; Ulijn, R. V., Fmoc-Diphenylalanine Self Assembles to a Hydrogel via a
Novel Architecture Based on π–π Interlocked β-Sheets. Adv. Mater. 2008, 20 (1), 37-41.
102. Helen, W.; de Leonardis, P.; Ulijn, R. V.; Gough, J.; Tirelli, N.,
Mechanosensitive peptide gelation: mode of agitation controls mechanical properties and
nano-scale morphology. Soft Matter 2011, 7 (5), 1732-1740.
103. Tang, C.; Smith, A. M.; Collins, R. F.; Ulijn, R. V.; Saiani, A., Fmoc-
Diphenylalanine Self-Assembly Mechanism Induces Apparent pKa Shifts. Langmuir
2009, 25 (16), 9447-9453.
104. Tang, C.; Ulijn, R. V.; Saiani, A., Effect of Glycine Substitution on Fmoc–
Diphenylalanine Self-Assembly and Gelation Properties. Langmuir 2011, 27 (23), 14438-
14449.
105. Xu, H.; Das, A. K.; Horie, M.; Shaik, M. S.; Smith, A. M.; Luo, Y.; Lu, X.;
Collins, R.; Liem, S. Y.; Song, A.; Popelier, P. L. A.; Turner, M. L.; Xiao, P.;
Kinloch, I. A.; Ulijn, R. V., An investigation of the conductivity of peptide nanotube
networks prepared by enzyme-triggered self-assembly. Nanoscale 2010, 2 (6), 960-966.
106. Williams, R. J.; Smith, A. M.; Collins, R.; Hodson, N.; Das, A. K.; Ulijn, R. V.,
Enzyme-assisted self-assembly under thermodynamic control. Nat. Nanotechnol. 2009, 4
(1), 19-24.
107. Hughes, M.; Xu, H.; Frederix, P. W. J. M.; Smith, A. M.; Hunt, N. T.; Tuttle,
T.; Kinloch, I. A.; Ulijn, R. V., Biocatalytic self-assembly of 2D peptide-based
nanostructures. Soft Matter 2011, 7 (21), 10032-10038.

145
108. Roy, S.; Javid, N.; Sefcik, J.; Halling, P. J.; Ulijn, R. V., Salt-Induced Control of
Supramolecular Order in Biocatalytic Hydrogelation. Langmuir 2012, 28 (48), 16664-
16670.
109. Chen, L.; Morris, K.; Laybourn, A.; Elias, D.; Hicks, M. R.; Rodger, A.;
Serpell, L.; Adams, D. J., Self-Assembly Mechanism for a Naphthalene−Dipeptide
Leading to Hydrogelation. Langmuir 2010, 26 (7), 5232-5242.
110. Chen, L.; Revel, S.; Morris, K.; C. Serpell, L.; Adams, D. J., Effect of
Molecular Structure on the Properties of Naphthalene−Dipeptide Hydrogelators.
Langmuir 2010, 26 (16), 13466-13471.
111. Chen, L.; Pont, G.; Morris, K.; Lotze, G.; Squires, A.; Serpell, L. C.; Adams,
D. J., Salt-induced hydrogelation of functionalised-dipeptides at high pH. Chem.
Commun. 2011, 47 (44), 12071-12073.
112. Chen, L.; McDonald, T. O.; Adams, D. J., Salt-induced hydrogels from
functionalised-dipeptides. RSC Adv. 2013, 3 (23), 8714-8720.
113. Qaid, M. M.; Abdelrahman, M. M., Role of insulin and other related hormones in
energy metabolism—A review. Cogent Food & Agriculture 2016, 2 (1), 1267691.
114. Kahn, C. R., The Gordon Wilson Lecture. Lessons about the control of glucose
homeostasis and the pathogenesis of diabetes from knockout mice. Trans. Am. Clin.
Climatol. Assoc. 2003, 114, 125-148.
115. Dionne, D. A.; Skovsø, S.; Templeman, N. M.; Clee, S. M.; Johnson, J. D.,
Caloric Restriction Paradoxically Increases Adiposity in Mice With Genetically Reduced
Insulin. Endocrinology 2016, 157 (7), 2724-2734.
116. Zaykov, A. N.; Mayer, J. P.; DiMarchi, R. D., Pursuit of a perfect insulin. Nat.
Rev. Drug Discov. 2016, 15 (6), 425-439.
117. Berti, L.; Gammeltoft, S., Leptin stimulates glucose uptake in C2C12 muscle cells
by activation of ERK2. Mol. Cell. Endocrinol. 1999, 157 (1), 121-130.
118. Ravussin, Y.; Leibel, Rudolph L.; Ferrante, Anthony W., A Missing Link in
Body Weight Homeostasis: The Catabolic Signal of the Overfed State. Cell Metab. 2014,
20 (4), 565-572.
119. Azar, S. T.; Zalloua, P. A.; Zantout, M. S.; Shahine, C. H.; Salti, I., Leptin
levels in patients with Type 1 diabetes receiving intensive insulin therapy compared with
those in patients receiving conventional insulin therapy. J. Endocrinol. Invest. 2002, 25
(8), 724-726.
120. Perry, R. J.; Zhang, X.-M.; Zhang, D.; Kumashiro, N.; Camporez, J.-P. G.;
Cline, G. W.; Rothman, D. L.; Shulman, G. I., Leptin reverses diabetes by suppression of
the hypothalamic-pituitary-adrenal axis. Nat. Med. 2014, 20 (7), 759-763.
121. Yu, X.; Park, B.-H.; Wang, M.-Y.; Wang, Z. V.; Unger, R. H., Making insulin-
deficient type 1 diabetic rodents thrive without insulin. Proc. Natl. Acad. Sci. U.S.A.
2008, 105 (37), 14070.
122. Shimomura, I.; Hammer, R. E.; Ikemoto, S.; Brown, M. S.; Goldstein, J. L.,
Leptin reverses insulin resistance and diabetes mellitus in mice with congenital
lipodystrophy. Nature 1999, 401 (6748), 73-76.
123. Ebihara, K.; Kusakabe, T.; Hirata, M.; Masuzaki, H.; Miyanaga, F.;
Kobayashi, N.; Tanaka, T.; Chusho, H.; Miyazawa, T.; Hayashi, T.; Hosoda, K.;

146
Ogawa, Y.; DePaoli, A. M.; Fukushima, M.; Nakao, K., Efficacy and Safety of Leptin-
Replacement Therapy and Possible Mechanisms of Leptin Actions in Patients with
Generalized Lipodystrophy. J. Clin. Endocrinol. Metab. 2007, 92 (2), 532-541.
124. Watson, G. S.; Craft, S., Modulation of memory by insulin and glucose:
neuropsychological observations in Alzheimer's disease. Eur. J. Pharmacol. 2004, 490
(1), 97-113.
125. Camandola, S.; Mattson, M. P., Brain metabolism in health, aging,
and neurodegeneration. The EMBO Journal 2017, 36 (11), 1474-1492.
126. McClain, D. A.; Hazel, M.; Parker, G.; Cooksey, R. C., Adipocytes with
increased hexosamine flux exhibit insulin resistance, increased glucose uptake, and
increased synthesis and storage of lipid. American Journal of Physiology-Endocrinology
and Metabolism 2005, 288 (5), E973-E979.
127. Morgello, S.; Uson, R. R.; Schwartz, E. J.; Haber, R. S., The human blood-brain
barrier glucose transporter (GLUT1) is a glucose transporter of gray matter astrocytes.
Glia 1995, 14 (1), 43-54.
128. Virgintino, D.; Robertson, D.; Monaghan, P.; Errede, M.; Bertossi, M.;
Ambrosi, G.; Roncali, L., Glucose transporter GLUT1 in human brain microvessels
revealed by ultrastructural immunocytochemistry. J. Submicrosc. Cytol. Pathol. 1997, 29
(3), 365-370.
129. De Vivo, D. C.; Trifiletti, R. R.; Jacobson, R. I.; Ronen, G. M.; Behmand, R.
A.; Harik, S. I., Defective Glucose Transport across the Blood-Brain Barrier as a Cause
of Persistent Hypoglycorrhachia, Seizures, and Developmental Delay. N. Engl. J. Med.
1991, 325 (10), 703-709.
130. Mathew, A. V.; Jaiswal, M.; Ang, L.; Michailidis, G.; Pennathur, S.; Pop-
Busui, R., Impaired Amino Acid and TCA Metabolism and Cardiovascular Autonomic
Neuropathy Progression in Type 1 Diabetes. Diabetes 2019, 68 (10), 2035.
131. Lee, Eunice E.; Ma, J.; Sacharidou, A.; Mi, W.; Salato, Valerie K.; Nguyen,
N.; Jiang, Y.; Pascual, Juan M.; North, Paula E.; Shaul, Philip W.; Mettlen, M.; Wang,
Richard C., A Protein Kinase C Phosphorylation Motif in GLUT1 Affects Glucose
Transport and is Mutated in GLUT1 Deficiency Syndrome. Mol. Cell 2015, 58 (5), 845-
853.
132. Schubert, M.; Gautam, D.; Surjo, D.; Ueki, K.; Baudler, S.; Schubert, D.;
Kondo, T.; Alber, J.; Galldiks, N.; Küstermann, E.; Arndt, S.; Jacobs, A. H.; Krone,
W.; Ronald Kahn, C.; Brüning, J. C., Role for neuronal insulin resistance in
neurodegenerative diseases. Proc. Natl. Acad. Sci. U.S.A. 2004, 101 (9), 3100-3105.
133. Boersma, G. J.; Johansson, E.; Pereira, M. J.; Heurling, K.; Skrtic, S.; Lau, J.;
Katsogiannos, P.; Panagiotou, G.; Lubberink, M.; Kullberg, J.; Ahlström, H.; Eriksson,
J. W., Altered Glucose Uptake in Muscle, Visceral Adipose Tissue, and Brain Predict
Whole-Body Insulin Resistance and may Contribute to the Development of Type 2
Diabetes: A Combined PET/MR Study. Horm. Metab. Res. 2018, 50 (8), 627-639.
134. Haahr, H.; Heise, T., Fast-Acting Insulin Aspart: A Review of its
Pharmacokinetic and Pharmacodynamic Properties and the Clinical Consequences. Clin.
Pharmacokinet. 2020, 59 (2), 155-172.

147
135. Zinman, B., Newer insulin analogs: advances in basal insulin replacement.
Diabetes, Obesity and Metabolism 2013, 15 (s1), 6-10.
136. Chen, Z.; Wang, Z.; Gu, Z., Bioinspired and Biomimetic Nanomedicines. Acc.
Chem. Res. 2019, 52 (5), 1255-1264.
137. Mo, R.; Jiang, T.; Di, J.; Tai, W.; Gu, Z., Emerging micro- and nanotechnology
based synthetic approaches for insulin delivery. Chem. Soc. Rev. 2014, 43 (10), 3595-
3629.
138. Wu, Q.; Wang, L.; Yu, H.; Wang, J.; Chen, Z., Organization of Glucose-
Responsive Systems and Their Properties. Chem. Rev. 2011, 111 (12), 7855-7875.
139. Veiseh, O.; Tang, B. C.; Whitehead, K. A.; Anderson, D. G.; Langer, R.,
Managing diabetes with nanomedicine: challenges and opportunities. Nat. Rev. Drug
Discov. 2015, 14 (1), 45-57.
140. Tai, W.; Mo, R.; Di, J.; Subramanian, V.; Gu, X.; Gu, Z., Bio-Inspired
Synthetic Nanovesicles for Glucose-Responsive Release of Insulin. Biomacromolecules
2014, 15 (10), 3495-3502.
141. Yu, J.; Zhang, Y.; Ye, Y.; DiSanto, R.; Sun, W.; Ranson, D.; Ligler, F. S.;
Buse, J. B.; Gu, Z., Microneedle-array patches loaded with hypoxia-sensitive vesicles
provide fast glucose-responsive insulin delivery. Proc. Natl. Acad. Sci. U.S.A. 2015, 112
(27), 8260.
142. Guan, Y.; Zhang, Y., Nanostructured Hydrogels for Diabetic Management.
Biomedical Nanomaterials 2016, 387-419.
143. Kim, J. J.; Park, K., Modulated insulin delivery from glucose-sensitive hydrogel
dosage forms. Journal of Controlled Release 2001, 77 (1), 39-47.
144. Anzai, J.-i.; Kobayashi, Y., Construction of Multilayer Thin Films of Enzymes by
Means of Sugar−Lectin Interactions. Langmuir 2000, 16 (6), 2851-2856.
145. Sato, K.; Imoto, Y.; Sugama, J.; Seki, S.; Inoue, H.; Odagiri, T.; Hoshi, T.;
Anzai, J.-i., Sugar-Induced Disintegration of Layer-by-Layer Assemblies Composed of
Concanavalin A and Glycogen. Langmuir 2005, 21 (2), 797-799.
146. Sato, K.; Kodama, D.; Anzai, J.-i., Sugar-Sensitive Thin Films Composed of
Concanavalin A and Sugar-Bearing Polymers. Anal. Sci. 2005, 21 (11), 1375-1378.
147. Sato, K.; Kodama, D.; Endo, Y.; Anzai, J.-I., Preparation of Insulin-Containing
Microcapsules by a Layer-by-Layer Deposition of Concanavalin A and Glycogen. J.
Nanosci. Nanotechnol. 2009, 9 (1), 386-390.
148. Matsumoto, A.; Ishii, T.; Nishida, J.; Matsumoto, H.; Kataoka, K.; Miyahara,
Y., A Synthetic Approach Toward a Self-Regulated Insulin Delivery System. Angew.
Chem. Int. Ed. 2012, 51 (9), 2124-2128.
149. Matsumoto, A.; Yoshida, R.; Kataoka, K., Glucose-Responsive Polymer Gel
Bearing Phenylborate Derivative as a Glucose-Sensing Moiety Operating at the
Physiological pH. Biomacromolecules 2004, 5 (3), 1038-1045.
150. Bonfanti, D. H.; Alcazar, L. P.; Arakaki, P. A.; Martins, L. T.; Agustini, B. C.;
de Moraes Rego, F. G.; Frigeri, H. R., ATP-dependent potassium channels and type 2
diabetes mellitus. Clin. Biochem. 2015, 48 (7), 476-482.
151. Henquin, J. C., Triggering and amplifying pathways of regulation of insulin
secretion by glucose. Diabetes 2000, 49 (11), 1751.

148
152. Thulé, P. M.; Umpierrez, G., Sulfonylureas: A New Look at Old Therapy. Curr.
Diab. Rep. 2014, 14 (4), 473.
153. Lee, Y.-S.; Jun, H.-S., Anti-diabetic actions of glucagon-like peptide-1 on
pancreatic beta-cells. Metabolism 2014, 63 (1), 9-19.
154. Leech, C. A.; Dzhura, I.; Chepurny, O. G.; Kang, G.; Schwede, F.; Genieser,
H.-G.; Holz, G. G., Molecular physiology of glucagon-like peptide-1 insulin
secretagogue action in pancreatic β cells. Prog. Biophys. Mol. Biol. 2011, 107 (2), 236-
247.
155. Holz, G. G.; Chepurny, O. G., Glucagon-like peptide-1 synthetic analogs: new
therapeutic agents for use in the treatment of diabetes mellitus. Curr. Med. Chem. 2003,
10 (22), 2471-2483.
156. Kodl, C. T.; Seaquist, E. R., Cognitive dysfunction and diabetes mellitus. Endocr.
Rev. 2008, 29 (4), 494-511.
157. Arnold, S. E.; Arvanitakis, Z.; Macauley-Rambach, S. L.; Koenig, A. M.;
Wang, H.-Y.; Ahima, R. S.; Craft, S.; Gandy, S.; Buettner, C.; Stoeckel, L. E.;
Holtzman, D. M.; Nathan, D. M., Brain insulin resistance in type 2 diabetes and
Alzheimer disease: concepts and conundrums. Nat. Rev. Neurol. 2018, 14 (3), 168-181.
158. Biessels, G. J.; Despa, F., Cognitive decline and dementia in diabetes mellitus:
mechanisms and clinical implications. Nat. Rev. Endocrinol. 2018, 14 (10), 591-604.
159. Nishitani, S.; Takehana, K.; Fujitani, S.; Sonaka, I., Branched-chain amino acids
improve glucose metabolism in rats with liver cirrhosis. American Journal of Physiology
- Gastrointestinal and Liver Physiology 2005, 288 (6 51-6), G1292-G1300.
160. Ayabe, T.; Mizushige, T.; Ota, W.; Kawabata, F.; Hayamizu, K.; Han, L.;
Tsuji, T.; Kanamoto, R.; Ohinata, K., A novel Alaska pollack-derived peptide, which
increases glucose uptake in skeletal muscle cells, lowers the blood glucose level in
diabetic mice. Food and Function 2015, 6 (8), 2749-2757.
161. Cripps, M. J.; Hanna, K.; Lavilla, C.; Sayers, S. R.; Caton, P. W.; Sims, C.;
De Girolamo, L.; Sale, C.; Turner, M. D., Carnosine scavenging of glucolipotoxic free
radicals enhances insulin secretion and glucose uptake. Sci. Rep. 2017, 7 (1), 13313.
162. Marles, R. J.; Farnsworth, N. R., Antidiabetic plants and their active constituents.
Phytomedicine 1995, 2 (2), 137-189.
163. Kalogeropoulou, D.; LaFave L Fau - Schweim, K.; Schweim K Fau - Gannon,
M. C.; Gannon Mc Fau - Nuttall, F. Q.; Nuttall, F. Q., Lysine ingestion markedly
attenuates the glucose response to ingested glucose without a change in insulin response.
(1938-3207 (Electronic)).
164. Konstantina, C. F.; Dimitra, J. H.-L.; Konstantinos, E. L.; Demetrios, N. N.,
Natural and Synthetic Coumarin Derivatives with Anti-Inflammatory / Antioxidant
Activities. Curr. Pharm. Des. 2004, 10 (30), 3813-3833.
165. Kim, S. H.; Sun, Y.; Kaplan, J. A.; Grinstaff, M. W.; Parquette, J. R., Photo-
crosslinking of a self-assembled coumarin-dipeptide hydrogel. New J. Chem. 2015, 39
(5), 3225-3228.
166. Miyazawa, T.; Blout, E. R., The Infrared Spectra of Polypeptides in Various
Conformations: Amide I and II Bands1. J. Am. Chem. Soc. 1961, 83 (3), 712-719.

149
167. Kong, J.; Yu, S., Fourier Transform Infrared Spectroscopic Analysis of Protein
Secondary Structures. Acta Biochimica et Biophysica Sinica 2007, 39 (8), 549-559.
168. Nilsson, M. R., Techniques to study amyloid fibril formation in vitro. Methods
2004, 34 (1), 151-160.
169. Voropai, E. S.; Samtsov, M. P.; Kaplevskii, K. N.; Maskevich, A. A.; Stepuro,
V. I.; Povarova, O. I.; Kuznetsova, I. M.; Turoverov, K. K.; Fink, A. L.; Uverskii, V.
N., Spectral Properties of Thioflavin T and Its Complexes with Amyloid Fibrils. J. Appl.
Spectrosc. 2003, 70 (6), 868-874.
170. Khurana, R.; Coleman, C.; Ionescu-Zanetti, C.; Carter, S. A.; Krishna, V.;
Grover, R. K.; Roy, R.; Singh, S., Mechanism of thioflavin T binding to amyloid fibrils.
J. Struct. Biol. 2005, 151 (3), 229-238.
171. Pace, C. N.; Grimsley, G. R.; Scholtz, J. M., Protein ionizable groups: pK values
and their contribution to protein stability and solubility. J. Biol. Chem. 2009, 284 (20),
13285-13289.
172. Farías, R. N.; López Viñals, A. E.; Posse, E.; Morero, R. D., Relationship
between isoelectric point of native and chemically modified insulin and liposomal fusion.
The Biochemical journal 1989, 264 (1), 285-287.
173. Sharma, G.; Sharma, A. R.; Nam, J.; Priya, G.; Doss, C.; Lee, S.; Chakraborty,
C., Nanoparticle based insulin delivery system: the next generation efficient therapy for
Type 1 diabetes. J Nanobiotechnol 2015, 13, 74-87.
174. Shilo, M.; Berenstein, P.; Dreifuss, T.; Nash, Y.; Goldsmith, G.; Kazimirsky,
G.; Motiei, M.; Frenkel, D.; Brodie, C.; Popovtzer, R., Insulin-coated gold
nanoparticles as a new concept for personalized and adjustable glucose regulation.
Nanoscale 2015, 7 (48), 20489-20496.
175. Kahn, B. B., Adipose Tissue, Inter-Organ Communication, and the Path to Type 2
Diabetes: The 2016 Banting Medal for Scientific Achievement Lecture. Diabetes 2019,
68 (1), 3.
176. Caputo, T.; Gilardi, F.; Desvergne, B., From chronic overnutrition to
metaflammation and insulin resistance: adipose tissue and liver contributions. FEBS Lett.
2017, 591 (19), 3061-3088.
177. Priyanka, A.; Shyni, G. L.; Anupama, N.; Raj, P. S.; Anusree, S. S.; Raghu, K.
G., Development of insulin resistance through sprouting of inflammatory markers during
hypoxia in 3T3-L1 adipocytes and amelioration with curcumin. Eur. J. Pharmacol. 2017,
812, 73-81.
178. Taniguchi, C. M.; Emanuelli, B.; Kahn, C. R., Critical nodes in signalling
pathways: insights into insulin action. Nat. Rev. Mol. Cell Biol. 2006, 7 (2), 85-96.
179. Wauman, J.; Zabeau, L.; Tavernier, J., The Leptin Receptor Complex: Heavier
Than Expected? Front. Endocrinol. (Lausanne) 2017, 8 (30).
180. Saito, T.; Okada, S.; Shimoda, Y.; Tagaya, Y.; Osaki, A.; Yamada, E.;
Shibusawa, R.; Nakajima, Y.; Ozawa, A.; Satoh, T.; Mori, M.; Yamada, M., APPL1
promotes glucose uptake in response to mechanical stretch via the PKCζ-non-muscle
myosin IIa pathway in C2C12 myotubes. Cell. Signal. 2016, 28 (11), 1694-1702.
181. Friedman, J. M.; Mantzoros, C. S., 20 years of leptin: From the discovery of the
leptin gene to leptin in our therapeutic armamentarium. Metabolism 2015, 64 (1), 1-4.

150
182. Brown, J. A.; Wright, A.; Bugescu, R.; Christensen, L.; Olson, D. P.;
Leinninger, G. M., Distinct Subsets of Lateral Hypothalamic Neurotensin Neurons are
Activated by Leptin or Dehydration. Sci. Rep. 2019, 9 (1), 1873.
183. Caliskan, H.; Akat, F.; Tatar, Y.; Zaloglu, N.; Dursun, A. D.; Bastug, M.;
Ficicilar, H., Effects of exercise training on anxiety in diabetic rats. Behav. Brain Res.
2019, 376, 112084.
184. Walton, J. C.; Chen, Z.; Weil, Z. M.; Pyter, L. M.; Travers, J. B.; Nelson, R. J.,
Photoperiod-mediated impairment of long-term potention and learning and memory in
male white-footed mice. Neuroscience 2011, 175, 127-132.
185. Sun, Y.; Kaplan, J. A.; Shieh, A.; Sun, H. L.; Croce, C. M.; Grinstaff, M. W.;
Parquette, J. R., Self-assembly of a 5-fluorouracil-dipeptide hydrogel. Chem. Commun.
2016, 52 (30), 5254-5257.
186. Kaur, A.; Haghighatbin, M. A.; Hogan, C. F.; New, E. J., A FRET-based
ratiometric redox probe for detecting oxidative stress by confocal microscopy, FLIM and
flow cytometry. Chem. Commun. 2015, 51 (52), 10510-10513.
187. Ward, M. D.; Buttry, D. A., In situ interfacial mass detection with piezoelectric
transducers. Science 1990, 249 (4972), 1000-1007.
188. Hedegaard, S. F.; Cárdenas, M.; Barker, R.; Jorgensen, L.; Van De Weert, M.,
Lipidation Effect on Surface Adsorption and Associated Fibrillation of the Model Protein
Insulin. Langmuir 2016, 32 (28), 7241-7249.
189. Voinova, M. V.; Rodahl, M.; Jonson, M.; Kasemo, B., Viscoelastic acoustic
response of layered polymer films at fluid-solid interfaces: Continuum mechanics
approach. Phys. Scr. 1999, 59 (5), 391-396.
190. Reviakine, I.; Johannsmann, D.; Richter, R. P., Hearing what you cannot see and
visualizing what you hear: Interpreting quartz crystal microbalance data from solvated
interfaces. Anal. Chem. 2011, 83 (23), 8838-8848.
191. Yasmeen, R.; Reichert, B.; Deiuliis, J.; Yang, F.; Lynch, A.; Meyers, J.;
Sharlach, M.; Shin, S.; Volz, K. S.; Green, K. B.; Lee, K.; Alder, H.; Duester, G.;
Zechner, R.; Rajagopalan, S.; Ziouzenkova, O., Autocrine function of aldehyde
dehydrogenase 1 as a determinant of diet- and sex-specific differences in visceral
adiposity. Diabetes 2013, 62 (1), 124-136.
192. Webber, M. J.; Newcomb, C. J.; Bitton, R.; Stupp, S. I., Switching of self-
assembly in a peptide nanostructure with a specific enzyme. Soft Matter 2011, 7 (20),
9665-9672.
193. Cheetham, A. G.; Zhang, P.; Lin, Y.-a.; Lock, L. L.; Cui, H., Supramolecular
Nanostructures Formed by Anticancer Drug Assembly. J. Am. Chem. Soc. 2013, 135 (8),
2907-2910.
194. Kim, S. H.; Kaplan, J. A.; Sun, Y.; Shieh, A.; Sun, H.-L.; Croce, C. M.;
Grinstaff, M. W.; Parquette, J. R., The Self-Assembly of Anticancer Camptothecin–
Dipeptide Nanotubes: A Minimalistic and High Drug Loading Approach to Increased
Efficacy. Chem. Eur. J. 2015, 21 (1), 101-105.
195. Sun, Y.; Shieh, A.; Kim, S. H.; King, S.; Kim, A.; Sun, H.-L.; Croce, C. M.;
Parquette, J. R., The self-assembly of a camptothecin-lysine nanotube. Bioorg. Med.
Chem. Lett. 2016, 26 (12), 2834-2838.

151
196. Webber, M. J.; Matson, J. B.; Tamboli, V. K.; Stupp, S. I., Controlled release of
dexamethasone from peptide nanofiber gels to modulate inflammatory response.
Biomaterials 2012, 33 (28), 6823-6832.
197. Tysseling-Mattiace, V. M.; Sahni, V.; Niece, K. L.; Birch, D.; Czeisler, C.;
Fehlings, M. G.; Stupp, S. I.; Kessler, J. A., Self-Assembling Nanofibers Inhibit Glial
Scar Formation and Promote Axon Elongation after Spinal Cord Injury. J. Neurosci.
2008, 28 (14), 3814.
198. Shah, R. N.; Shah, N. A.; Del Rosario Lim, M. M.; Hsieh, C.; Nuber, G.;
Stupp, S. I., Supramolecular design of self-assembling nanofibers for cartilage
regeneration. Proc. Natl. Acad. Sci. U.S.A. 2010, 107 (8), 3293.
199. Lee, K. S.; Parquette, J. R., A self-assembled nanotube for the direct aldol
reaction in water. Chem. Commun. 2015, 51 (86), 15653-15656.
200. Guler, M. O.; Stupp, S. I., A Self-Assembled Nanofiber Catalyst for Ester
Hydrolysis. J. Am. Chem. Soc. 2007, 129 (40), 12082-12083.
201. Makhlynets, O. V.; Gosavi, P. M.; Korendovych, I. V., Short Self-Assembling
Peptides Are Able to Bind to Copper and Activate Oxygen. Angew. Chem. Int. Ed. 2016,
55 (31), 9017-9020.
202. Makam, P.; Gazit, E., Minimalistic peptide supramolecular co-assembly:
expanding the conformational space for nanotechnology. Chem. Soc. Rev. 2018, 47 (10),
3406-3420.
203. Safont-Sempere, M. M.; Fernández, G.; Würthner, F., Self-Sorting Phenomena in
Complex Supramolecular Systems. Chem. Rev. 2011, 111 (9), 5784-5814.
204. Tsai, Y.-T.; Raffy, G.; Liu, H.-F.; Peng, B.-J.; Tseng, K.-P.; Hirsch, L.; Del
Guerzo, A.; Bassani, D. M.; Wong, K.-T., Incorporation of narcissistic self-sorting
supramolecular interactions for the spontaneous fabrication of multiple-color solid-state
materials for OLED applications. Mater. Chem. Front. 2020, 4 (3), 845-850.
205. He, Z.; Jiang, W.; Schalley, C. A., Integrative self-sorting: a versatile strategy for
the construction of complex supramolecular architecture. Chem. Soc. Rev. 2015, 44 (3),
779-789.
206. Colquhoun, C.; Draper, E. R.; Eden, E. G. B.; Cattoz, B. N.; Morris, K. L.;
Chen, L.; McDonald, T. O.; Terry, A. E.; Griffiths, P. C.; Serpell, L. C.; Adams, D. J.,
The effect of self-sorting and co-assembly on the mechanical properties of low molecular
weight hydrogels. Nanoscale 2014, 6 (22), 13719-13725.
207. Ryan, D. M.; Doran, T. M.; Nilsson, B. L., Complementary π–π Interactions
Induce Multicomponent Coassembly into Functional Fibrils. Langmuir 2011, 27 (17),
11145-11156.
208. Fleming, S.; Debnath, S.; Frederix, P. W. J. M.; Hunt, N. T.; Ulijn, R. V.,
Insights into the Coassembly of Hydrogelators and Surfactants Based on Aromatic
Peptide Amphiphiles. Biomacromolecules 2014, 15 (4), 1171-1184.
209. Nagy, K. J.; Giano, M. C.; Jin, A.; Pochan, D. J.; Schneider, J. P., Enhanced
Mechanical Rigidity of Hydrogels Formed from Enantiomeric Peptide Assemblies. J.
Am. Chem. Soc. 2011, 133 (38), 14975-14977.

152
210. Morris, K. L.; Chen, L.; Raeburn, J.; Sellick, O. R.; Cotanda, P.; Paul, A.;
Griffiths, P. C.; King, S. M.; O’Reilly, R. K.; Serpell, L. C.; Adams, D. J., Chemically
programmed self-sorting of gelator networks. Nat. Commun. 2013, 4 (1), 1480.
211. Raeburn, J.; Alston, B.; Kroeger, J.; McDonald, T. O.; Howse, J. R.; Cameron,
P. J.; Adams, D. J., Electrochemically-triggered spatially and temporally resolved multi-
component gels. Materials Horizons 2014, 1 (2), 241-246.
212. Niece, K. L.; Hartgerink, J. D.; Donners, J. J. J. M.; Stupp, S. I., Self-Assembly
Combining Two Bioactive Peptide-Amphiphile Molecules into Nanofibers by
Electrostatic Attraction. J. Am. Chem. Soc. 2003, 125 (24), 7146-7147.
213. Li, S.; Mehta, A. K.; Sidorov, A. N.; Orlando, T. M.; Jiang, Z.; Anthony, N.
R.; Lynn, D. G., Design of Asymmetric Peptide Bilayer Membranes. J. Am. Chem. Soc.
2016, 138 (10), 3579-3586.
214. Hu, Y.; Lin, R.; Zhang, P.; Fern, J.; Cheetham, A. G.; Patel, K.; Schulman, R.;
Kan, C.; Cui, H., Electrostatic-Driven Lamination and Untwisting of β-Sheet Assemblies.
ACS Nano 2016, 10 (1), 880-888.
215. Lee, A.; Sun, Y.; Lin, T.; Song, N.-J.; Mason, M. L.; Leung, J. H.; Kowdley,
D.; Wall, J.; Brunetti, A.; Fitzgerald, J.; Baer, L. A.; Stanford, K. I.; Ortega-Anaya, J.;
Gomes-Dias, L.; Needleman, B.; Noria, S.; Weil, Z.; Blakeslee, J. J.; Jiménez-Flores,
R.; Parquette, J. R.; Ziouzenkova, O., Amino acid-based compound activates atypical
PKC and leptin receptor pathways to improve glycemia and anxiety like behavior in
diabetic mice. Biomaterials 2020, 239, 119839.
216. Wu, L.; Huang, C.; Emery, B. P.; Sedgwick, A. C.; Bull, S. D.; He, X.-P.;
Tian, H.; Yoon, J.; Sessler, J. L.; James, T. D., Förster resonance energy transfer
(FRET)-based small-molecule sensors and imaging agents. Chem. Soc. Rev. 2020, 49
(15), 5110-5139.
217. Zou, Y.; Razmkhah, K.; Chmel, N. P.; Hamley, I. W.; Rodger, A.,
Spectroscopic signatures of an Fmoc–tetrapeptide, Fmoc and fluorene. RSC Adv. 2013, 3
(27), 10854-10858.
218. Sreerama, N.; Woody, R. W., Computation and Analysis of Protein Circular
Dichroism Spectra. In Methods Enzymol., Academic Press: 2004; Vol. 383, pp 318-351.
219. Berova, N.; Bari, L. D.; Pescitelli, G., Application of electronic circular
dichroism in configurational and conformational analysis of organic compounds. Chem.
Soc. Rev. 2007, 36 (6), 914-931.
220. Aggeli, A.; Nyrkova, I. A.; Bell, M.; Harding, R.; Carrick, L.; McLeish, T. C.
B.; Semenov, A. N.; Boden, N., Hierarchical self-assembly of chiral rod-like molecules
as a model for peptide β-sheet tapes, ribbons, fibrils, and fibers. Proc. Natl. Acad. Sci.
U.S.A. 2001, 98 (21), 11857.
221. Aggeli, A.; Bell, M.; Boden, N.; N. Keen, J.; C. B. McLeish, T.; Nyrkova, I.;
Radford, S. E.; Semenov, A., Engineering of peptide β-sheet nanotapes. J. Mater. Chem.
1997, 7 (7), 1135-1145.
222. Nyrkova, I. A.; Semenov, A. N.; Aggeli, A.; Boden, N., Fibril stability in
solutions of twisted -sheet peptides: a new kind of micellization in chiral systems. The
European Physical Journal B - Condensed Matter and Complex Systems 2000, 17 (3),
481-497.

153
223. Sahoo, J. K.; VandenBerg, M. A.; Ruiz Bello, E. E.; Nazareth, C. D.; Webber,
M. J., Electrostatic-driven self-sorting and nanostructure speciation in self-assembling
tetrapeptides. Nanoscale 2019, 11 (35), 16534-16543.
224. Onogi, S.; Shigemitsu, H.; Yoshii, T.; Tanida, T.; Ikeda, M.; Kubota, R.;
Hamachi, I., In situ real-time imaging of self-sorted supramolecular nanofibres. Nat.
Chem. 2016, 8 (8), 743-752.
225. Adelizzi, B.; Aloi, A.; Markvoort, A. J.; Ten Eikelder, H. M. M.; Voets, I. K.;
Palmans, A. R. A.; Meijer, E. W., Supramolecular Block Copolymers under
Thermodynamic Control. J. Am. Chem. Soc. 2018, 140 (23), 7168-7175.

154
Appendix A: NMR spectrum

155

156

157

158

159

160

161

162

163

164

165

166

167

168

169

170