Genome assembly forensics: finding the elusive mis-assembly
13
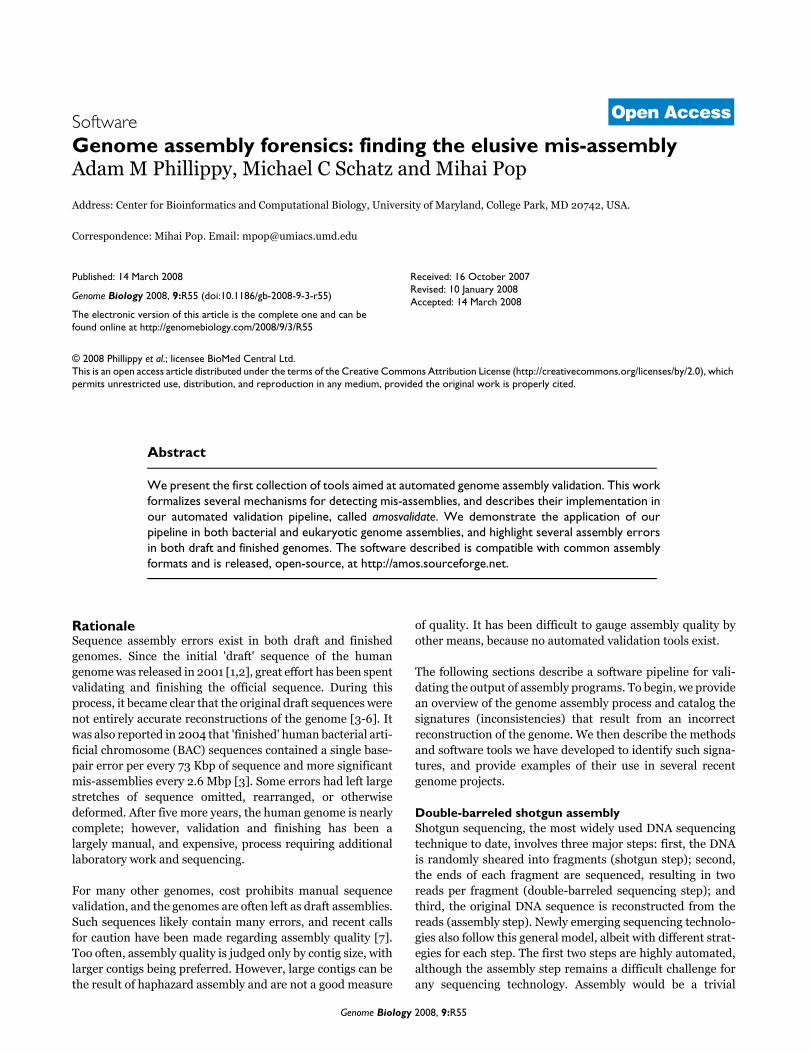
Genome Biology 2008, 9:R55 Open Access 2008 Phillippy et al. Volume 9, Issue 3, Article R55 Software Genome assembly forensics: finding the elusive mis-assembly Adam M Phillippy, Michael C Schatz and Mihai Pop Address: Center for Bioinformatics and Computational Biology, University of Maryland, College Park, MD 20742, USA. Correspondence: Mihai Pop. Email: [email protected] © 2008 Phillippy et al.; licensee BioMed Central Ltd. This is an open access article distributed under the terms of the Creative Commons Attribution License (http://creativecommons.org/licenses/by/2.0), which permits unrestricted use, distribution, and reproduction in any medium, provided the original work is properly cited. Detecting genome mis-assembly <p>A collection of software tools is combined for the first time in an automated pipeline for detecting large-scale genome assembly errors and for validating genome assemblies.</p> Abstract We present the first collection of tools aimed at automated genome assembly validation. This work formalizes several mechanisms for detecting mis-assemblies, and describes their implementation in our automated validation pipeline, called amosvalidate. We demonstrate the application of our pipeline in both bacterial and eukaryotic genome assemblies, and highlight several assembly errors in both draft and finished genomes. The software described is compatible with common assembly formats and is released, open-source, at http://amos.sourceforge.net. Rationale Sequence assembly errors exist in both draft and finished genomes. Since the initial 'draft' sequence of the human genome was released in 2001 [1,2], great effort has been spent validating and finishing the official sequence. During this process, it became clear that the original draft sequences were not entirely accurate reconstructions of the genome [3-6]. It was also reported in 2004 that 'finished' human bacterial arti- ficial chromosome (BAC) sequences contained a single base- pair error per every 73 Kbp of sequence and more significant mis-assemblies every 2.6 Mbp [3]. Some errors had left large stretches of sequence omitted, rearranged, or otherwise deformed. After five more years, the human genome is nearly complete; however, validation and finishing has been a largely manual, and expensive, process requiring additional laboratory work and sequencing. For many other genomes, cost prohibits manual sequence validation, and the genomes are often left as draft assemblies. Such sequences likely contain many errors, and recent calls for caution have been made regarding assembly quality [7]. Too often, assembly quality is judged only by contig size, with larger contigs being preferred. However, large contigs can be the result of haphazard assembly and are not a good measure of quality. It has been difficult to gauge assembly quality by other means, because no automated validation tools exist. The following sections describe a software pipeline for vali- dating the output of assembly programs. To begin, we provide an overview of the genome assembly process and catalog the signatures (inconsistencies) that result from an incorrect reconstruction of the genome. We then describe the methods and software tools we have developed to identify such signa- tures, and provide examples of their use in several recent genome projects. Double-barreled shotgun assembly Shotgun sequencing, the most widely used DNA sequencing technique to date, involves three major steps: first, the DNA is randomly sheared into fragments (shotgun step); second, the ends of each fragment are sequenced, resulting in two reads per fragment (double-barreled sequencing step); and third, the original DNA sequence is reconstructed from the reads (assembly step). Newly emerging sequencing technolo- gies also follow this general model, albeit with different strat- egies for each step. The first two steps are highly automated, although the assembly step remains a difficult challenge for any sequencing technology. Assembly would be a trivial Published: 14 March 2008 Genome Biology 2008, 9:R55 (doi:10.1186/gb-2008-9-3-r55) Received: 16 October 2007 Revised: 10 January 2008 Accepted: 14 March 2008 The electronic version of this article is the complete one and can be found online at http://genomebiology.com/2008/9/3/R55
-
Upload
independent -
Category
Documents
-
view
5 -
download
0
Transcript of Genome assembly forensics: finding the elusive mis-assembly
Open Access2008Phillippyet al.Volume 9, Issue 3, Article R55SoftwareGenome assembly forensics: finding the elusive mis-assemblyAdam M Phillippy, Michael C Schatz and Mihai Pop
Address: Center for Bioinformatics and Computational Biology, University of Maryland, College Park, MD 20742, USA.
Correspondence: Mihai Pop. Email: [email protected]
© 2008 Phillippy et al.; licensee BioMed Central Ltd. This is an open access article distributed under the terms of the Creative Commons Attribution License (http://creativecommons.org/licenses/by/2.0), which permits unrestricted use, distribution, and reproduction in any medium, provided the original work is properly cited.Detecting genome mis-assembly<p>A collection of software tools is combined for the first time in an automated pipeline for detecting large-scale genome assembly errors and for validating genome assemblies.</p>
Abstract
We present the first collection of tools aimed at automated genome assembly validation. This workformalizes several mechanisms for detecting mis-assemblies, and describes their implementation inour automated validation pipeline, called amosvalidate. We demonstrate the application of ourpipeline in both bacterial and eukaryotic genome assemblies, and highlight several assembly errorsin both draft and finished genomes. The software described is compatible with common assemblyformats and is released, open-source, at http://amos.sourceforge.net.
RationaleSequence assembly errors exist in both draft and finishedgenomes. Since the initial 'draft' sequence of the humangenome was released in 2001 [1,2], great effort has been spentvalidating and finishing the official sequence. During thisprocess, it became clear that the original draft sequences werenot entirely accurate reconstructions of the genome [3-6]. Itwas also reported in 2004 that 'finished' human bacterial arti-ficial chromosome (BAC) sequences contained a single base-pair error per every 73 Kbp of sequence and more significantmis-assemblies every 2.6 Mbp [3]. Some errors had left largestretches of sequence omitted, rearranged, or otherwisedeformed. After five more years, the human genome is nearlycomplete; however, validation and finishing has been alargely manual, and expensive, process requiring additionallaboratory work and sequencing.
For many other genomes, cost prohibits manual sequencevalidation, and the genomes are often left as draft assemblies.Such sequences likely contain many errors, and recent callsfor caution have been made regarding assembly quality [7].Too often, assembly quality is judged only by contig size, withlarger contigs being preferred. However, large contigs can bethe result of haphazard assembly and are not a good measure
of quality. It has been difficult to gauge assembly quality byother means, because no automated validation tools exist.
The following sections describe a software pipeline for vali-dating the output of assembly programs. To begin, we providean overview of the genome assembly process and catalog thesignatures (inconsistencies) that result from an incorrectreconstruction of the genome. We then describe the methodsand software tools we have developed to identify such signa-tures, and provide examples of their use in several recentgenome projects.
Double-barreled shotgun assemblyShotgun sequencing, the most widely used DNA sequencingtechnique to date, involves three major steps: first, the DNAis randomly sheared into fragments (shotgun step); second,the ends of each fragment are sequenced, resulting in tworeads per fragment (double-barreled sequencing step); andthird, the original DNA sequence is reconstructed from thereads (assembly step). Newly emerging sequencing technolo-gies also follow this general model, albeit with different strat-egies for each step. The first two steps are highly automated,although the assembly step remains a difficult challenge forany sequencing technology. Assembly would be a trivial
Published: 14 March 2008
Genome Biology 2008, 9:R55 (doi:10.1186/gb-2008-9-3-r55)
Received: 16 October 2007Revised: 10 January 2008Accepted: 14 March 2008
The electronic version of this article is the complete one and can be found online at http://genomebiology.com/2008/9/3/R55
Genome Biology 2008, 9:R55

http://genomebiology.com/2008/9/3/R55 Genome Biology 2008, Volume 9, Issue 3, Article R55 Phillippy et al. R55.2
process if each read had a unique placement; however, all butthe simplest organisms contain duplicated sequences(repeats) throughout their genome. These repeats confuse theassembly process, since reads originating from distinct copiesof the repeat appear identical to the assembler. Additionally,for near-identical repeats, it is difficult to differentiatesequencing error from the polymorphism between repeatcopies. This may cause an assembler to incorrectly placerepetitive reads, resulting in mis-assembly. The pairing ofreads sequenced from opposite ends of a same DNA fragment(mate-pairs, or paired ends) helps to disambiguate readplacements within and around repeats, as show in Figure 1awhere ambiguous placements can be resolved by reads whosemates are anchored in unique sequence.
In a correct assembly, the layout of the reads, and implicitly,the layout of the original DNA fragments, must be consistentwith the characteristics of the shotgun sequencing processused to generate the data. In general, a correct assembly mustsatisfy the following constraints. First, the sequences of over-lapping reads must agree; exceptions are sequencing errors,polyploid organisms, and the assembly of mixed samplessuch as non-clonal or out-bred organisms. Second, the dis-tance between mated reads must be consistent with the size ofthe fragments generated from the random shearing process;exceptions are chimeric DNA fragments. Third, mated readsmust be oriented towards each other, that is, they must comefrom opposite strands of the sequenced DNA; exceptions arechimeric DNA fragments, and alternative pairing methods(for example, transposon libraries). Fourth, the placement ofreads throughout the assembly must be consistent with a ran-dom shearing process, represented mathematically as a Pois-
son process [8]; exceptions are cloning or sequencing biases.Fifth, all reads provided to the assembler must be consistentwith the resulting assembly, that is, every read must perfectlymatch at least one location in the reconstructed genome;exceptions are sequencing errors, incomplete trimming of thesequencing vector, and the presence of contaminants.
All five of these constraints are subject to some degree of inac-curacy, as indicated by the exceptions indicated above. A sin-gle violation is, therefore, not usually conclusive of mis-assembly. Instead, multiple, coinciding constraint violationsneed to be observed in order to infer the presence of an errorin assembly. The following section describes the primarytypes of mis-assemblies and the pattern of constraint viola-tions they exhibit.
Mis-assembly signaturesThe majority of mis-assemblies fall into two generalized cate-gories: repeat collapse and expansion; and sequence rear-rangement and inversion. Each type has distinct mechanismsfor mis-assembly and results in different signatures. The firsttype of mis-assembly results from incorrectly gauging thenumber of repeat copies in a genome and including too few ortoo many copies. Differences in copy numbers of certainrepeats are known to cause phenotypic differences betweenorganisms (for example, Huntington's disease [9]); therefore,a correct assembly of such regions is essential. The secondtype of mis-assembly results from shuffling the order of mul-tiple repeat copies, thereby rearranging the unique sequencein between. This type of mis-assembly, if uncaught, could bemisinterpreted as a biological rearrangement event. There isa chance such false conclusions have already been drawn dueto mis-assembled genomes, and, therefore, the mechanismsand signatures of these mis-assemblies need to be examinedin more detail.
In both collapse and rearrangement events, reads may beplaced in the wrong copy of a repeat. Small differencesbetween repeat copies, often single nucleotide polymor-phisms (SNPs) caused by mutations that arose in the differentcopies independently, are useful indicators of collapsed orotherwise mis-assembled repeats. While disagreements dueto sequencing errors tend to occur at random, the differencescaused by mis-assemblies can be identified by their correlatedlocation across multiple reads (Figure 1b). Some correlatedSNPs may also occur due to heterogeneous sequencing sam-ples or sequence-specific lab errors, and, therefore, correlatedSNPs by themselves are not always sufficient evidence of mis-assembly.
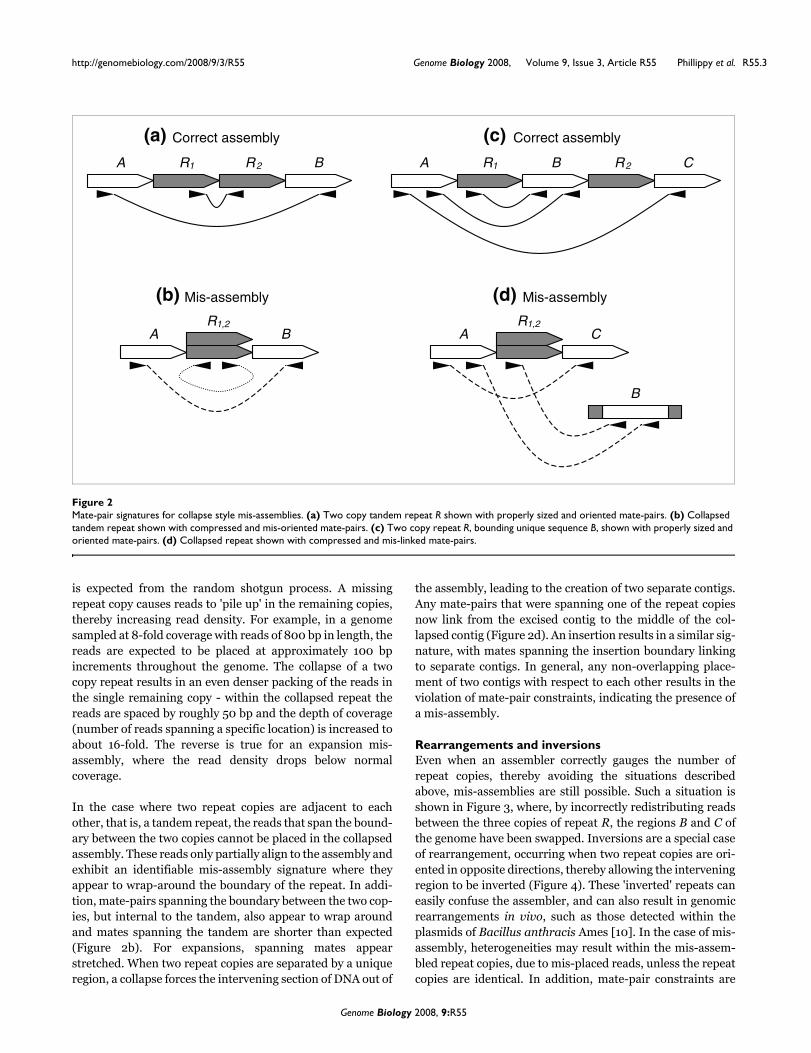
Repeat collapse and expansionIn the case of a repeat collapse, the assembler incorrectlyjoins reads originating from distinct repeat copies into a sin-gle unit (Figure 2). The opposite occurs in an expansion,where extra copies of a repeat are included in the assembly.These often result in a greater (or lesser) density of reads than
Misplaced reads caused by the two copy repeat R and leading to (a) unsatisfied mate-pairs and (b) correlated SNPsFigure 1Misplaced reads caused by the two copy repeat R and leading to (a) unsatisfied mate-pairs and (b) correlated SNPs. Unique sequence is shown in white and repetitive sequence in gray. Example mate-pairs are drawn as connected arrow heads. Properly oriented mates point towards each other, and properly sized pairs are connected with a solid line. All mates can be satisfied and the correlated SNP removed if the bottom two reads in R1 are moved to R2.
R1 R2
AGAGCTAGCAGAGCTAGCAGATCTCGCAGATCTCGC
(a)
(b)
Genome Biology 2008, 9:R55
http://genomebiology.com/2008/9/3/R55 Genome Biology 2008, Volume 9, Issue 3, Article R55 Phillippy et al. R55.3
is expected from the random shotgun process. A missingrepeat copy causes reads to 'pile up' in the remaining copies,thereby increasing read density. For example, in a genomesampled at 8-fold coverage with reads of 800 bp in length, thereads are expected to be placed at approximately 100 bpincrements throughout the genome. The collapse of a twocopy repeat results in an even denser packing of the reads inthe single remaining copy - within the collapsed repeat thereads are spaced by roughly 50 bp and the depth of coverage(number of reads spanning a specific location) is increased toabout 16-fold. The reverse is true for an expansion mis-assembly, where the read density drops below normalcoverage.
In the case where two repeat copies are adjacent to eachother, that is, a tandem repeat, the reads that span the bound-ary between the two copies cannot be placed in the collapsedassembly. These reads only partially align to the assembly andexhibit an identifiable mis-assembly signature where theyappear to wrap-around the boundary of the repeat. In addi-tion, mate-pairs spanning the boundary between the two cop-ies, but internal to the tandem, also appear to wrap aroundand mates spanning the tandem are shorter than expected(Figure 2b). For expansions, spanning mates appearstretched. When two repeat copies are separated by a uniqueregion, a collapse forces the intervening section of DNA out of
the assembly, leading to the creation of two separate contigs.Any mate-pairs that were spanning one of the repeat copiesnow link from the excised contig to the middle of the col-lapsed contig (Figure 2d). An insertion results in a similar sig-nature, with mates spanning the insertion boundary linkingto separate contigs. In general, any non-overlapping place-ment of two contigs with respect to each other results in theviolation of mate-pair constraints, indicating the presence ofa mis-assembly.
Rearrangements and inversionsEven when an assembler correctly gauges the number ofrepeat copies, thereby avoiding the situations describedabove, mis-assemblies are still possible. Such a situation isshown in Figure 3, where, by incorrectly redistributing readsbetween the three copies of repeat R, the regions B and C ofthe genome have been swapped. Inversions are a special caseof rearrangement, occurring when two repeat copies are ori-ented in opposite directions, thereby allowing the interveningregion to be inverted (Figure 4). These 'inverted' repeats caneasily confuse the assembler, and can also result in genomicrearrangements in vivo, such as those detected within theplasmids of Bacillus anthracis Ames [10]. In the case of mis-assembly, heterogeneities may result within the mis-assem-bled repeat copies, due to mis-placed reads, unless the repeatcopies are identical. In addition, mate-pair constraints are
Mate-pair signatures for collapse style mis-assembliesFigure 2Mate-pair signatures for collapse style mis-assemblies. (a) Two copy tandem repeat R shown with properly sized and oriented mate-pairs. (b) Collapsed tandem repeat shown with compressed and mis-oriented mate-pairs. (c) Two copy repeat R, bounding unique sequence B, shown with properly sized and oriented mate-pairs. (d) Collapsed repeat shown with compressed and mis-linked mate-pairs.
(a) Correct assembly (c) Correct assembly
BA R1 R2
(b) Mis-assembly
R1,2A B
CA R1 R2
(d) Mis-assembly
AR1,2
B
C
B
Genome Biology 2008, 9:R55

http://genomebiology.com/2008/9/3/R55 Genome Biology 2008, Volume 9, Issue 3, Article R55 Phillippy et al. R55.4
violated for any mate-pairs spanning the repeat unit. If therepeat is not spanned by mate-pairs, this class of mis-assem-bly is harder to detect, and it is sometimes possible to mis-assemble the genome without violating a single mate-pairconstraint. While a random placement of the reads amongrepeat copies would result in violations, assembly programsoften place the reads such that the constraints are satisfied,thereby obscuring the mis-assembly.
Prior workGene Myers' original formulation of the assembly problemstated that an assembly of a genome must match (in terms of
the Kolmogorov-Smirnoff test statistic) the statistical charac-teristics of the process used to generate the data [11]. To ourknowledge, this is the first formulation of the assembly prob-lem that explicitly takes into account the presence of repeatsin genomes. Furthermore, this formulation provides atheoretical framework for developing assembly validationtools. A simple version of this approach, the arrival-rate sta-tistic (A-statistic), is used within Celera Assembler to identifycollapsed repeats [12].
The validation of genome assemblies was originally donemanually, in conjunction with genome finishing efforts aimedat generating the complete sequence of organisms. Validationsoftware was generally provided as an add-on to assemblyeditors like Consed [13], Staden package [14], or TIGR Editor(in-house software used at The Institute for GenomicResearch). New interest in developing tools for assessing thequality of assemblies was spurred by the race to finish thehuman genome, in particular by the competition between thepublicly led effort [1] and the private challenger CeleraGenomics [2]. The ensuing controversy and flurry of paperscomparing the two assemblies underscored the absence ofobjective and reliable tools for assembly validation. Eventu-ally, the human assemblies were verified through compari-sons to a collection of independently generated data such asfinished BAC clones [15], gene content [16,17], and (at a lowerresolution) genomic physical maps [1,2,18].
Such comparative validation methods have limited applica-bility. First, they rely on the availability of a 'gold standard'provided by independently generated and often manuallycurated data. Second, these methods can only detect mis-assemblies covered by the sparse curated data. A more gen-eral approach utilizes just the assembly data themselves, suchas the constraints imposed by the mate-pairs, whose place-ment within the assembly must be consistent with the charac-teristics of the shotgun process. For example, a visual displayof mate-pairs, the clone-middle-plot, was used to comparethe two different assemblies of the human genome [19], andthe popular assembly viewer/editor Consed [13] includes themeans to explore the placement of paired reads along thegenome as a tool for identifying mis-assemblies. Our ownassembly viewer, Hawkeye [20], presents the assembly as atiling of paired reads, and provides several visualizationoptions aimed at highlighting possible assembly problems.An integrated analysis of mate-pairs is built into the qualitycontrol module of the Arachne assembler [21,22]. TheArachne approach detects clusters of unsatisfied mate-pairsand low quality bases to estimate the probability of mis-assembly for each region of the assembly. In addition, twostandalone programs are available for mate-pair basedevaluations: BACCardI [23] allows the user to visualize theplacement of mate-pairs along the genome and highlightsthose mate-pairs that are incorrectly placed with respect toeach other, and TAMPA [24] uses a computational geometry
Mate-pair signatures for rearrangement style mis-assembliesFigure 3Mate-pair signatures for rearrangement style mis-assemblies. (a) Three copy repeat R, with interspersed unique sequences B and C, shown with properly sized and oriented mates. (b) Mis-assembled repeat shown with mis-oriented and expanded mate-pairs. The mis-assembly is caused by co-assembled reads from different repeat copies, illustrated by the stacked repeat blocks.
Mate-pair signatures for inversion style mis-assembliesFigure 4Mate-pair signatures for inversion style mis-assemblies. (a) Two copy, inverted repeat R, bounding unique sequence B, shown with properly sized and oriented mate-pairs. (b) Mis-assembled repeat shown with mis-oriented mate-pairs.
(a) Correct assemblyCA R1 R2B R3
(b) Mis-assembly
BCR1,2 R1,3 R2,3
DA
D
(a) Correct assembly
CA R2 R1
(b) Mis-assembly
B'
R1 R2BA C
Genome Biology 2008, 9:R55
http://genomebiology.com/2008/9/3/R55 Genome Biology 2008, Volume 9, Issue 3, Article R55 Phillippy et al. R55.5
algorithm to identify clusters of mis-mated reads that arecharacteristic of a mis-assembly.
Despite its many benefits, mate-pair based validation mayproduce many false positives due to the inherent inaccuracyin the experimental protocols. For example, in a correctassembly many mate-pairs would be characterized as incor-rect, specifically those representing the tails of the mate-pairsize distribution. This problem can be alleviated using statis-tical hypothesis testing, an approach used by the compres-sion-expansion (CE) statistic [25]. In short, for every positionin the genome, the CE statistic represents the deviation - innumber of standard errors - of the observed mean mate-pairsize from the mean size of the shotgun library (the statisticalZ-test). A CE value near 0 indicates the local distribution ofsizes is in agreement with the global distribution, while large(for example, greater than 3) negative (positive) values indi-cate the presence of a compression (expansion) in the assem-bly. This statistic is less sensitive to the variance of mate-pairsizes, and, therefore, much more sensitive in identifying trueerrors.
An alternative approach to mis-assembly detection and reso-lution is taken by DNPTrapper [26]. This tool focuses on theheterogeneities between co-assembled reads to detect col-lapsed repeats, and provides an interface for manually sepa-rating the individual copies, using the Defined NucleotidePosition framework of Tammi et al. [27]. Another sequencebased approach introduced by Kim et al. [28] examines thedistribution of sequences within all reads to identify repeti-tive, and therefore difficult to assemble, regions.
Despite their utility, none of the tools described above takeinto account more than one measure of assembly correctness.The Methods section describes amosvalidate, the first inte-grated pipeline for assembly validation that combines multi-ple observations and validation techniques to moreaccurately detect mis-assemblies. This comprehensiveapproach increases the sensitivity and specificity of mis-assembly detection, and focuses validation on the most prob-able mis-assemblies. Regions identified as mis-assembled areoutput in AMOS message format, thereby enabling the inte-gration with other validation pipelines, as well as manualinspection with the Hawkeye assembly visualization tool.
MethodsViolations of the five basic rules described in the Rationale aremost commonly caused not by mis-assemblies, but by statis-tical variation or errors in the underlying data provided to theassembler. The high-throughput biochemical processes usedto sequence genomes are error-prone, leading to non-randomcoverage across the genome, sequencing errors, and mis-paired reads. Furthermore, experimental measurements (forexample, mate-pair sizes) are inherently noisy. Separatingsuch experimental artifacts from errors introduced by mis-
assemblies is one of the main requirements of a robust valida-tion pipeline. To reduce the effect of these errors on the anal-ysis, multiple sources of evidence must be combined toincrease the specificity of mis-assembly detection. In addi-tion, certain types of mis-assembly can only be detected byspecific methods, while the sequencing strategy employedmay restrict the types of information that can be used for val-idation (for example, many emerging sequencing technolo-gies do not yet generate mate-pair information). In theremainder of this section we describe our approach forassembly validation based on several measures of assemblyconsistency. We will describe the types of mis-assembliesdetected by each of the measures and conclude with examplesof how these measures are integrated to reveal potentialassembly errors.
Mate-pair validationThe mate-pair validation component of the pipeline sepa-rately identifies the four types of mis-mated reads: mates tooclose to each other; mates too far from each other; mates withthe same orientation; and mates pointing away from eachother. Reads with mates not present in the assembly or whosemates are present in a different contig are also reported. Inorder to reduce the impact of noise in the underlying data,multiple mate-pair violations must co-occur at a specific loca-tion in the assembly before reporting the presence of an error.In addition, the CE statistic described in the Rationale aids inthe identification of clusters of compressed or expandedmate-pairs.
The actual size of shotgun libraries is sometimes mis-esti-mated by sequencing centers; therefore, a mechanism to re-estimate the library parameters on the basis of mate-pairsthat are co-assembled within a contig is required. Reads thatoccur too close to the end of a contig may bias the distributionin favor of short mate-pairs (the mate-pairs at the upper endof the distribution would fall beyond the end of the contigand, therefore, not contribute to the calculations) and arethus ignored. Specifically, we ignore every read that is closerthan μ + 3σ from the end of the contig when re-estimating theparameters of a library with mean μ and standard deviation σ.It is often necessary to iterate this process a few times untilconvergence. The size of a library is re-estimated only if thesize of a sufficient number of mate-pairs can be estimated andonly if either the mean or the standard deviation change sig-nificantly from the original estimate.
In addition to mate-pair violations, regions of inadequatedepth of coverage are identified, as well as regions that are notspanned by any valid mate-pair (that is, 0X fragment cover-age). The latter may represent situations where non-adjacentregions of the genome were co-assembled across a repeat.When computing fragment coverage we exclude from consid-eration the paired reads sequenced from each fragment. Thisis necessary in order to make the distinction between readand fragment coverage at a specific location. By our
Genome Biology 2008, 9:R55

http://genomebiology.com/2008/9/3/R55 Genome Biology 2008, Volume 9, Issue 3, Article R55 Phillippy et al. R55.6
definition, the read coverage cannot drop below one within acontig, but the fragment coverage can be as low as zero, indi-cating the absence of long-range support for this region of thecontig. At the typical depths of read coverage used in sequenc-ing, each location in the genome is generally well covered bymate-pairs.
Repeat analysisMost mis-assemblies are caused by repeats; therefore, under-standing the repeat structure of a genome can aid in the vali-dation of its assembly. Some repeats can be found by aligningthe assembled contigs against each other and identifyingduplicated regions. Tools like Vmatch [29] and TandemRepeat Finder [30] can be used for the de novo identificationof repetitive regions in the assembly, which can then be exam-ined for correctness. This approach, however, is not appropri-ate for all types of mis-assemblies. For example, the completecollapse of a two copy tandem repeat into a single copy cannotbe detected by comparative means.
For validation purposes we are not simply interested in iden-tifying the location of all repeats, rather we are trying to iden-tify those repeats that have been assembled incorrectly, inparticular those repeats that cannot be easily identifiedthrough comparative analysis. Specifically, we try to identifyregions of the genome that are over-represented in the set ofreads, yet appear unique when examining the consensussequence generated by the assembler. We achieve this bycomparing the frequencies of k-mers (k-length words) com-puted within the set of reads (KR) with those computed solelyon the basis of the consensus sequence (KC). KR is the fre-quency of all k-mers inside the clear range of all reads; and KC
is the frequency of all k-mers across the consensus sequenceof the assembled contigs. The forward and reverse comple-ments of each k-mer are combined into a single frequency.The normalized k-mer frequency, K* = KR/KC, is computedfor each k-mer in the consensus, where a deviation from theexpected K* (in a correctly assembled region, K* shouldapproximately equal the average depth of coverage c) revealsthose repeats likely to be mis-assembled. For example, KR
measured across a two copy repeat is 2c regardless of whetherthe assembly is correct or not. If the repeat is correctly assem-bled into two distinct copies, KC = 2, and, therefore, K* = c. Ifinstead the repeat is collapsed, then KC = 1 and K* = 2c, indi-cating the presence of a mis-assembly. This approach is par-ticularly powerful when used in conjunction with thetechnique described below for identifying dense clusters ofSNPs because the two methods are complementary. SNPbased detection will find collapsed, heterogeneous repeats,while K* will reveal collapsed, identical repeats.
Coverage analysisAs described in the introduction, the collapse of a repeatresults in an increase in the depth of coverage. This character-istic signature can, therefore, be used to detect the presenceof mis-assemblies. For short repeats with low copy number
(for example, two-copy repeats), this effect cannot be distin-guished from the variation in coverage caused by the random-ness of the shotgun sequencing process, limiting theapplicability of this method to repeats that occur in many cop-ies throughout the genome, or to relatively long stretches ofrepetitive DNA (sustained deviations from the average depthof coverage are unlikely to occur by chance). The significanceof observing a certain level of over-representation, given theparameters of the shotgun process, can be calculated throughstatistical means (see the A-statistic used by Celera Assembler[12]).
Identification of micro-heterogeneitiesUnder the assumption of a random distribution of sequencingerrors, and an independent random sampling of the genomeduring the shotgun process, it is unlikely that any two over-lapping reads have sequencing errors at the same consensusposition. While there are several examples of sequence-dependent sequencing errors that invalidate our assumptionof independence between errors occurring in different reads(for example, hard-stops caused by the formation of DNAhair-pin structures, or long homopolymer regions character-ized by frequent polymerase slippage), these assumptions aretrue for the vast majority of sequencing errors. Also, the fol-lowing discussion assumes the genome being sequenced rep-resents a single clonal organism. The assembly of non-clonalbacterial populations or heterozygous eukaryotes is charac-terized by frequent heterogeneities between co-assembledreads. Such situations are often known a priori and the vali-dation pipeline can be adjusted accordingly.
As described in the introduction, mis-assemblies often resultin the presence of micro-heterogeneities (SNPs) that are cor-related across multiple overlapping reads. Identifying suchpolymorphisms can, therefore, indicate potential errors in theassembly. To identify mis-assembly induced SNPs, and dis-tinguish them from simple sequencing errors, we take advan-tage of the base quality values provided by the sequencingsoftware. The phred quality values [31], for example, repre-sent the log-probability of error at every base in the sequence.Under the assumption of independence of errors acrossreads, we can sum these values to estimate the probability ofobserving multiple correlated errors at a specific location inthe assembly, and mark as polymorphism those locationswhere this probability exceeds a specific threshold. For exam-ple, the probability of error for two reads reporting the samebase, each with a quality value of 20, is equivalent to the prob-ability of error for a single base with a quality value of 40(P(error) = 1/10,000). This is, in essence, the same approachused by genome assembly software in assigning quality valuesfor the consensus sequence [32]. For each heterogeneouscolumn of the multi-alignment, reads are grouped into 'alle-les' by which nucleotide they report. The quality values foreach read in an allele are summed, and if two or more alleleshave a quality value of 40 or greater (by default), the differ-ence is marked as a SNP. For a concrete example, if two reads
Genome Biology 2008, 9:R55
http://genomebiology.com/2008/9/3/R55 Genome Biology 2008, Volume 9, Issue 3, Article R55 Phillippy et al. R55.7
report a C each with quality 25, and three reads report a Geach with quality 20, the qualities of the alleles are 50 and 60,respectively, and the difference is marked as a C/G SNP. If,however, the quality of either allele is below 40, the differenceis not marked as a SNP. In addition, our software evaluatesthe proximity of SNPs to further increase the confidence inour predictions; clusters of SNPs that occur within a smallrange in the assembly are likely indicative of a mis-assembly.By default we mark regions containing at least 2 high qualitySNPs occurring within a 500 bp window.
Note that this technique for mis-assembly detection can alsobe applied in heterogeneous genomes, for example, by identi-fying regions with a significantly higher SNP density than thebackground rate. In such genomes, however, we expect muchhigher false-positive rates due to localized regions of hetero-geneity, requiring this method to be combined with other val-idation measures.
Read breakpoint analysisThe reads provided to an assembler must be consistent withthe resulting assembly. Thus, examining how the un-assem-bled reads (also called singletons, or shrapnel) disagree withthe assembly can reveal potential mis-assemblies. To com-pare un-assembled reads to a consensus we use the nucmercomponent of the MUMmer package [33,34], and allow frag-mented alignments to the consensus. For instance, a mappingthat aligns the first half of a read to a different region than thesecond half, but at 100% identity, is preferable to a mappingthat aligns the read contiguously at 80% identity. The frag-mented, high identity alignment is more likely because theread sequence should be nearly identical to the consensussequence, modulo sequencing errors. From among all align-ments of a read to the genome we choose the placement thatmaximizes the sum of len(Ai) * idy(Ai) over all alignment seg-ments Ai, where len(Ai) and idy(Ai) are the length and percentidentity of the ith segment of alignment A, and len(Ai) isadjusted where necessary to avoid scoring the overlapbetween adjacent segments twice. This scoring function esti-mates the number of non-redundant bases matching the con-sensus, and the MUMmer utility delta-filter computes anoptimal alignment using this function and a modified versionof the Longest Increasing Subsequence (LIS) algorithm [35].Most mappings consist of a single alignment that covers theentire read, while the fragmented mappings indicate eitherincorrect trimming of the read or the presence of a mis-assembly.
For fragmented alignments, the locations where the align-ment breaks - boundaries of alignment fragments that do notcoincide with the ends of the read - are called 'breakpoints'.Under the assumption that all reads map perfectly to theassembly, breakpoints indicate the presence of errors, eitherin the assembly, or in the reads themselves (for example,incomplete trimming, or chimeric fragments). Breakpointssupported by a single read are rarely cause for concern, and
can often be explained by errors in the reads themselves.However, multiple reads that share a common breakpointoften indicate assembly problems. These multiply supportedbreakpoints are identified, after the alignment processdescribed in the previous section, by sorting the boundaries offragmented alignments by their location in the consensus,and reporting those that occur in multiple reads. In addition,for each read we store a vector of coordinates encoding allbreakpoints in the alignment of the read to the genome. Thisvector allows us to determine not only if two reads share com-mon breakpoints, but also if they have similar mappings tothe consensus. For each breakpoint, we then examine thecluster of reads with similar alignment signatures to charac-terize different classes of mis-assemblies in much the sameway mate-pairs are used to characterize collapse, inversion,and so on. But while mate-pair and coverage methods canonly bound a mis-assembly to a certain region, breakpointscan identify the precise position in the consensus at which theerror occurs.
Integration of validation signaturesOur validation pipeline, amosvalidate, executes the analysesdescribed above to tag regions that appear mis-assembled.Independently, each analysis method may report many false-positives that reflect violations of the data constraints, butthat do not necessarily represent mis-assemblies or incorrectconsensus sequence. A common example is clusters of over-lapping stretched or compressed mate-pairs caused by a widevariance in fragment sizes rather than mis-assembly. By com-bining multiple mis-assembly signatures we increase the like-lihood that the tagged regions identify true errors in theassembly. For example, a region with a largely negative CEvalue is more likely to indicate the presence of a collapsedrepeat if an unusually high density of correlated SNPs is alsopresent. This particular combination is especially strong,since mate-pair and sequence data are independent sources.
Since some types of signatures do not necessarily tag the exactlocation of a mis-assembly, combining mis-assembly signa-tures requires considering not only overlapping signatures,but also those that occur in close proximity. To combine mis-assembly signatures, the pipeline identifies regions in theassembly where multiple signatures co-occur within a smallwindow (2 Kbp by default). If multiple signatures of at leasttwo different evidence types occur within this window, theregion is flagged as 'suspicious'. Each such region is reportedalong with detailed information about the individual signa-tures, and forms the initial focus for subsequent validationand correction efforts. For manual analysis, these regions,along with the individual mis-assembly features, can beviewed alongside the assembly data in the AMOS assemblyviewer, Hawkeye.
Implementation detailsThe validation modules of amosvalidate are implemented inC++ and included as part of the AMOS assembly package
Genome Biology 2008, 9:R55
http://genomebiology.com/2008/9/3/R55 Genome Biology 2008, Volume 9, Issue 3, Article R55 Phillippy et al. R55.8
[36]. AMOS is a modular, open-source framework for genomeassembly research and development, which provides integra-tion between software modules through a centralized datastore and a well defined API. This framework allows develop-ers to focus on a particular area of interest, for example, scaf-folding, without needing to develop a complete assemblyinfrastructure. Furthermore, AMOS can import data fromcommon assembly programs and formats - ACE, NCBIAssembly/Trace Archives [37], Arachne [38,39], CeleraAssembler [12], PCAP [40], Phrap [41], Phusion [42] andNewbler [43], allowing for the integration of AMOS modulesinto existing assembly pipelines.
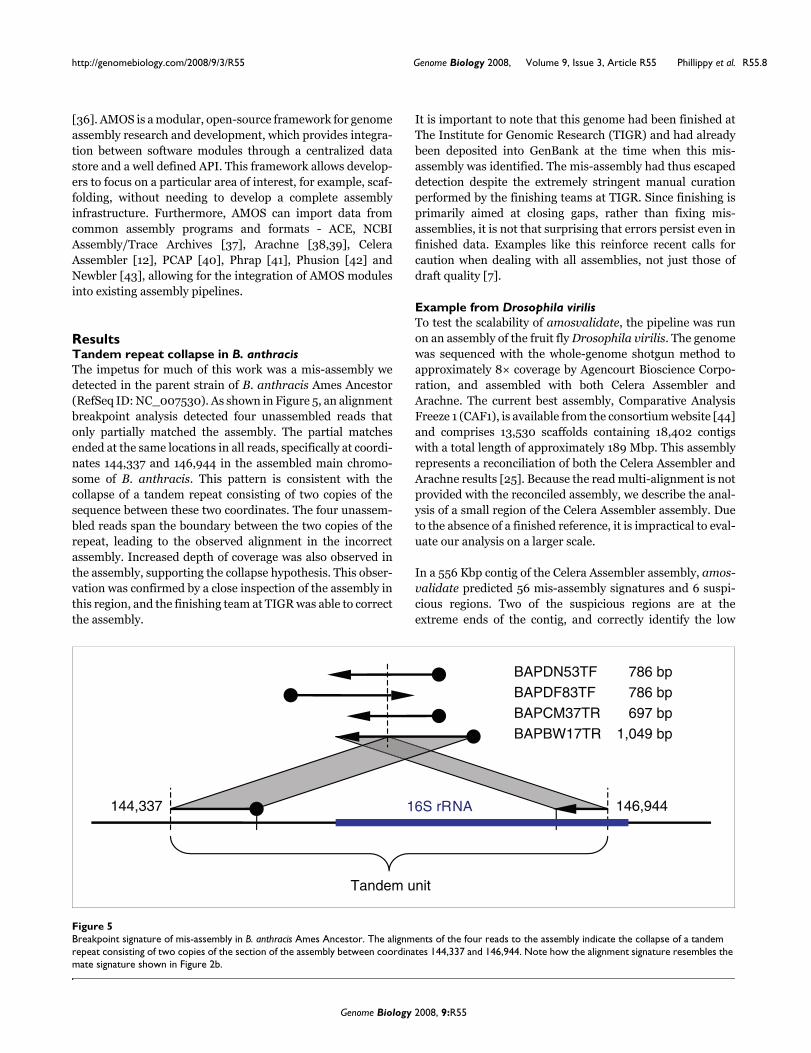
ResultsTandem repeat collapse in B. anthracisThe impetus for much of this work was a mis-assembly wedetected in the parent strain of B. anthracis Ames Ancestor(RefSeq ID: NC_007530). As shown in Figure 5, an alignmentbreakpoint analysis detected four unassembled reads thatonly partially matched the assembly. The partial matchesended at the same locations in all reads, specifically at coordi-nates 144,337 and 146,944 in the assembled main chromo-some of B. anthracis. This pattern is consistent with thecollapse of a tandem repeat consisting of two copies of thesequence between these two coordinates. The four unassem-bled reads span the boundary between the two copies of therepeat, leading to the observed alignment in the incorrectassembly. Increased depth of coverage was also observed inthe assembly, supporting the collapse hypothesis. This obser-vation was confirmed by a close inspection of the assembly inthis region, and the finishing team at TIGR was able to correctthe assembly.
It is important to note that this genome had been finished atThe Institute for Genomic Research (TIGR) and had alreadybeen deposited into GenBank at the time when this mis-assembly was identified. The mis-assembly had thus escapeddetection despite the extremely stringent manual curationperformed by the finishing teams at TIGR. Since finishing isprimarily aimed at closing gaps, rather than fixing mis-assemblies, it is not that surprising that errors persist even infinished data. Examples like this reinforce recent calls forcaution when dealing with all assemblies, not just those ofdraft quality [7].
Example from Drosophila virilisTo test the scalability of amosvalidate, the pipeline was runon an assembly of the fruit fly Drosophila virilis. The genomewas sequenced with the whole-genome shotgun method toapproximately 8× coverage by Agencourt Bioscience Corpo-ration, and assembled with both Celera Assembler andArachne. The current best assembly, Comparative AnalysisFreeze 1 (CAF1), is available from the consortium website [44]and comprises 13,530 scaffolds containing 18,402 contigswith a total length of approximately 189 Mbp. This assemblyrepresents a reconciliation of both the Celera Assembler andArachne results [25]. Because the read multi-alignment is notprovided with the reconciled assembly, we describe the anal-ysis of a small region of the Celera Assembler assembly. Dueto the absence of a finished reference, it is impractical to eval-uate our analysis on a larger scale.
In a 556 Kbp contig of the Celera Assembler assembly, amos-validate predicted 56 mis-assembly signatures and 6 suspi-cious regions. Two of the suspicious regions are at theextreme ends of the contig, and correctly identify the low
Breakpoint signature of mis-assembly in B. anthracis Ames AncestorFigure 5Breakpoint signature of mis-assembly in B. anthracis Ames Ancestor. The alignments of the four reads to the assembly indicate the collapse of a tandem repeat consisting of two copies of the section of the assembly between coordinates 144,337 and 146,944. Note how the alignment signature resembles the mate signature shown in Figure 2b.
786 bpBAPDN53TF786 bpBAPDF83TF697 bpBAPCM37TR
1,049 bpBAPBW17TR
144,337 146,94416S rRNA
Tandem unit
Genome Biology 2008, 9:R55
http://genomebiology.com/2008/9/3/R55 Genome Biology 2008, Volume 9, Issue 3, Article R55 Phillippy et al. R55.9
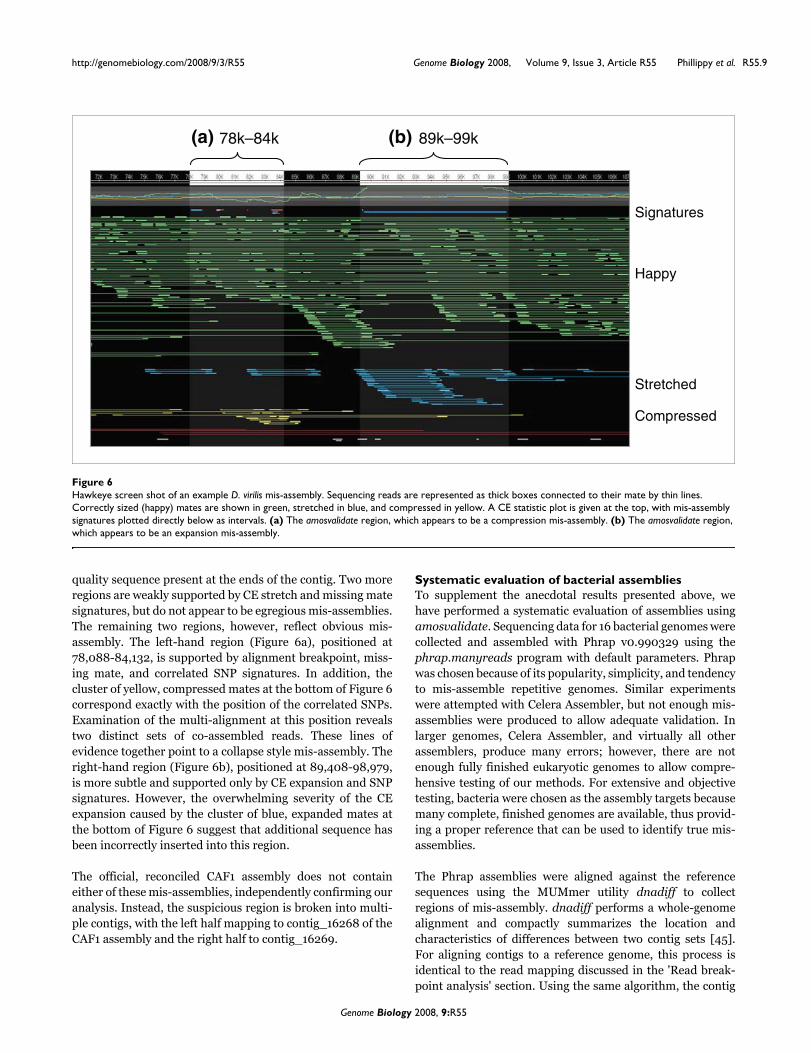
quality sequence present at the ends of the contig. Two moreregions are weakly supported by CE stretch and missing matesignatures, but do not appear to be egregious mis-assemblies.The remaining two regions, however, reflect obvious mis-assembly. The left-hand region (Figure 6a), positioned at78,088-84,132, is supported by alignment breakpoint, miss-ing mate, and correlated SNP signatures. In addition, thecluster of yellow, compressed mates at the bottom of Figure 6correspond exactly with the position of the correlated SNPs.Examination of the multi-alignment at this position revealstwo distinct sets of co-assembled reads. These lines ofevidence together point to a collapse style mis-assembly. Theright-hand region (Figure 6b), positioned at 89,408-98,979,is more subtle and supported only by CE expansion and SNPsignatures. However, the overwhelming severity of the CEexpansion caused by the cluster of blue, expanded mates atthe bottom of Figure 6 suggest that additional sequence hasbeen incorrectly inserted into this region.
The official, reconciled CAF1 assembly does not containeither of these mis-assemblies, independently confirming ouranalysis. Instead, the suspicious region is broken into multi-ple contigs, with the left half mapping to contig_16268 of theCAF1 assembly and the right half to contig_16269.
Systematic evaluation of bacterial assembliesTo supplement the anecdotal results presented above, wehave performed a systematic evaluation of assemblies usingamosvalidate. Sequencing data for 16 bacterial genomes werecollected and assembled with Phrap v0.990329 using thephrap.manyreads program with default parameters. Phrapwas chosen because of its popularity, simplicity, and tendencyto mis-assemble repetitive genomes. Similar experimentswere attempted with Celera Assembler, but not enough mis-assemblies were produced to allow adequate validation. Inlarger genomes, Celera Assembler, and virtually all otherassemblers, produce many errors; however, there are notenough fully finished eukaryotic genomes to allow compre-hensive testing of our methods. For extensive and objectivetesting, bacteria were chosen as the assembly targets becausemany complete, finished genomes are available, thus provid-ing a proper reference that can be used to identify true mis-assemblies.
The Phrap assemblies were aligned against the referencesequences using the MUMmer utility dnadiff to collectregions of mis-assembly. dnadiff performs a whole-genomealignment and compactly summarizes the location andcharacteristics of differences between two contig sets [45].For aligning contigs to a reference genome, this process isidentical to the read mapping discussed in the 'Read break-point analysis' section. Using the same algorithm, the contig
Hawkeye screen shot of an example D. virilis mis-assemblyFigure 6Hawkeye screen shot of an example D. virilis mis-assembly. Sequencing reads are represented as thick boxes connected to their mate by thin lines. Correctly sized (happy) mates are shown in green, stretched in blue, and compressed in yellow. A CE statistic plot is given at the top, with mis-assembly signatures plotted directly below as intervals. (a) The amosvalidate region, which appears to be a compression mis-assembly. (b) The amosvalidate region, which appears to be an expansion mis-assembly.
(a) (b)
Signatures
Happy
Stretched
Compressed
78k–84k 89k–99k
Genome Biology 2008, 9:R55
http://genomebiology.com/2008/9/3/R55 Genome Biology 2008, Volume 9, Issue 3, Article R55 Phillippy et al. R55.10
set is mapped to the reference genome using nucmer, and theoptimal mapping for each contig is identified. The alignmentinformation is then parsed, and all alignment breakpoints areidentified. By default, nucmer creates a contiguous alignmentas long as the average nucleotide identity is greater than 70%for a 200 bp window; therefore, any stretch of greater thanapproximately 60 mis-matches will force the alignment tobreak. After alignment, the breakpoints are classified asinsertions, deletions, rearrangements, or inversions based ontheir surrounding context. For example, a breakpointbetween a forward-strand and negative-strand alignment onthe same contig is classified as an inversion. For the Phrapcontigs, only alignment differences that produced a break-point were considered as mis-assemblies. Small differencessuch as consensus SNPs, short indels (less than approxi-mately 60 bp), and breakpoints occurring within the first 10bp of a contig were ignored. All contigs less than 5,000 bpwere also ignored because of their generally low quality.
amosvalidate was then run on all 16 Phrap assemblies todetermine if the mis-assembled regions were correctly identi-fied by our methods. Additional data file 1 lists the NCBI Tax-onomy and RefSeq identifiers for the 16 reference genomes.
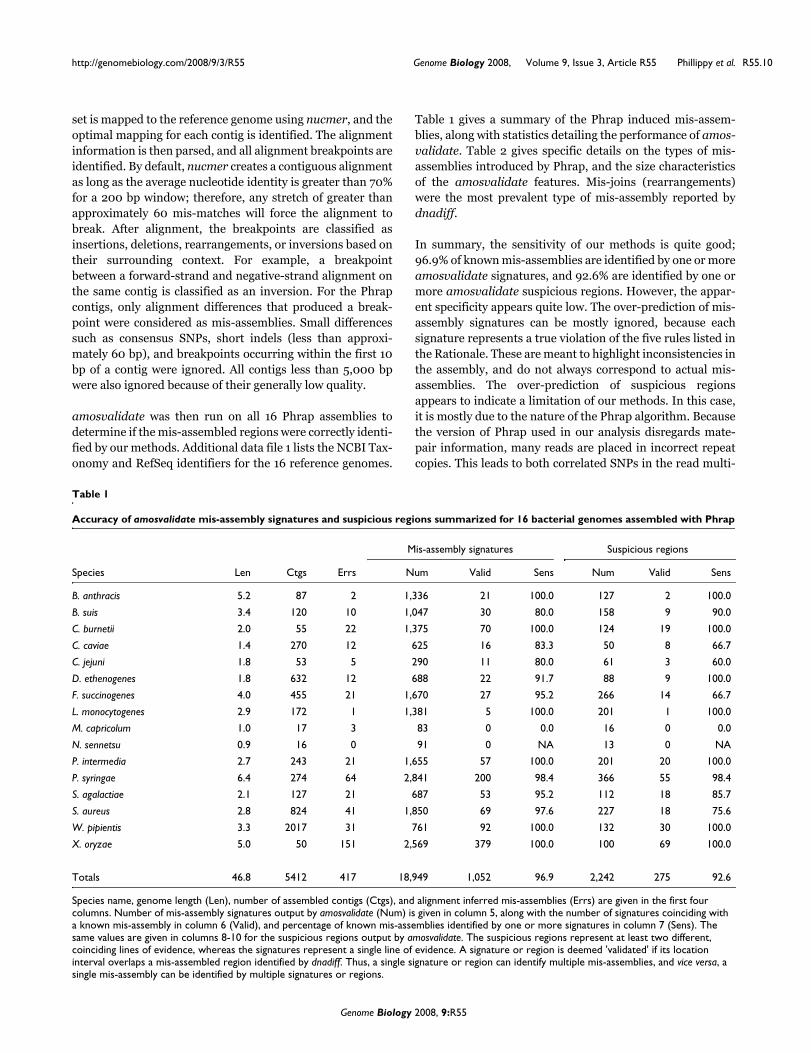
Table 1 gives a summary of the Phrap induced mis-assem-blies, along with statistics detailing the performance of amos-validate. Table 2 gives specific details on the types of mis-assemblies introduced by Phrap, and the size characteristicsof the amosvalidate features. Mis-joins (rearrangements)were the most prevalent type of mis-assembly reported bydnadiff.
In summary, the sensitivity of our methods is quite good;96.9% of known mis-assemblies are identified by one or moreamosvalidate signatures, and 92.6% are identified by one ormore amosvalidate suspicious regions. However, the appar-ent specificity appears quite low. The over-prediction of mis-assembly signatures can be mostly ignored, because eachsignature represents a true violation of the five rules listed inthe Rationale. These are meant to highlight inconsistencies inthe assembly, and do not always correspond to actual mis-assemblies. The over-prediction of suspicious regionsappears to indicate a limitation of our methods. In this case,it is mostly due to the nature of the Phrap algorithm. Becausethe version of Phrap used in our analysis disregards mate-pair information, many reads are placed in incorrect repeatcopies. This leads to both correlated SNPs in the read multi-
Table 1
Accuracy of amosvalidate mis-assembly signatures and suspicious regions summarized for 16 bacterial genomes assembled with Phrap
Mis-assembly signatures Suspicious regions
Species Len Ctgs Errs Num Valid Sens Num Valid Sens
B. anthracis 5.2 87 2 1,336 21 100.0 127 2 100.0
B. suis 3.4 120 10 1,047 30 80.0 158 9 90.0
C. burnetii 2.0 55 22 1,375 70 100.0 124 19 100.0
C. caviae 1.4 270 12 625 16 83.3 50 8 66.7
C. jejuni 1.8 53 5 290 11 80.0 61 3 60.0
D. ethenogenes 1.8 632 12 688 22 91.7 88 9 100.0
F. succinogenes 4.0 455 21 1,670 27 95.2 266 14 66.7
L. monocytogenes 2.9 172 1 1,381 5 100.0 201 1 100.0
M. capricolum 1.0 17 3 83 0 0.0 16 0 0.0
N. sennetsu 0.9 16 0 91 0 NA 13 0 NA
P. intermedia 2.7 243 21 1,655 57 100.0 201 20 100.0
P. syringae 6.4 274 64 2,841 200 98.4 366 55 98.4
S. agalactiae 2.1 127 21 687 53 95.2 112 18 85.7
S. aureus 2.8 824 41 1,850 69 97.6 227 18 75.6
W. pipientis 3.3 2017 31 761 92 100.0 132 30 100.0
X. oryzae 5.0 50 151 2,569 379 100.0 100 69 100.0
Totals 46.8 5412 417 18,949 1,052 96.9 2,242 275 92.6
Species name, genome length (Len), number of assembled contigs (Ctgs), and alignment inferred mis-assemblies (Errs) are given in the first four columns. Number of mis-assembly signatures output by amosvalidate (Num) is given in column 5, along with the number of signatures coinciding with a known mis-assembly in column 6 (Valid), and percentage of known mis-assemblies identified by one or more signatures in column 7 (Sens). The same values are given in columns 8-10 for the suspicious regions output by amosvalidate. The suspicious regions represent at least two different, coinciding lines of evidence, whereas the signatures represent a single line of evidence. A signature or region is deemed 'validated' if its location interval overlaps a mis-assembled region identified by dnadiff. Thus, a single signature or region can identify multiple mis-assemblies, and vice versa, a single mis-assembly can be identified by multiple signatures or regions.
Genome Biology 2008, 9:R55

http://genomebiology.com/2008/9/3/R55 Genome Biology 2008, Volume 9, Issue 3, Article R55 Phillippy et al. R55.11
alignment and unsatisfied mate-pairs. In some cases, mis-placing repetitive reads is benign and the resulting consensussequence is correct. However, amosvalidate identifies theSNPs and unsatisfied mates as a signature of mis-assemblyand reports the region as suspicious. We argue that this is thecorrect behavior, and for the false-positives we manuallyinvestigated, this was indeed the case. This is also the reasonfor such a large fraction of some assemblies being marked assuspicious (as high as 50% in some cases; Table 2). Accepta-ble specificity of our method is evidenced by the previous D.virilis example, where analysis of the 556 Kbp Celera Assem-bler contig revealed 6 suspicious regions that covered only 4%of the total sequence.
As would be expected, the wide variance of mis-assembliesfound in the Phrap assemblies roughly correlates withgenome repeat content, with no mis-assemblies being foundin the small, non-repetitive assembly of Neorickettsia sen-netsu, and 151 being found in the complex assembly of Xan-thomonas oryzae, which contains many highly repetitiveinsertion sequence elements. The quality of these two assem-blies is clearly reflected in the percentage of the genomemarked as suspicious (3.5% and 55.1%, respectively). Alsointeresting are the three mis-assemblies identified in theMycoplasma capricolum assembly, none of which were iden-tified by our methods. Manual inspection of the referencealignment shows tandem repeat expansions of lengths 42,
240, and 654 bp. However, the assembly appears sound atthese points with no fluctuation in CE statistic, good cover-age, and few unsatisfied mates. Closure teams generallyspend extra effort to properly handle repetitive regions, but ifthese repeats went unidentified during the closure process, itis possible that the reference sequence was mis-assembled.Unfortunately, the original assembly is not available for thisgenome, and only experimental validation could confirm theexact length and copy number of these repeats.
DiscussionDue to the high cost of genome finishing, an increasingnumber of genomes, both prokaryotic and eukaryotic, aresequenced to only a draft level. Efforts at providing qualitystandards for draft genomes (for example, the comparative-grade standard [46]) have not yet addressed the issue oflarge-scale mis-assemblies, leading to the likely possibilitythat such mis-assemblies are present in the data deposited (atan ever increasing rate) in public databases. In addition, wehave shown that mis-assemblies can persist even in 'finished'genomes. This situation is particularly troubling as scientistsmove away from the 'gene by gene' paradigm and attempt tounderstand the global organization of genomes. Without aclear understanding of the errors present in the data, suchstudies may draw incorrect conclusions. The validation toolsdescribed in this paper provide a first step towards a robust
Table 2
Details on the types of mis-assemblies and feature characteristics for the results presented in Table 1
Mis-assembly types Mis-assembly signatures Suspicious regions
Species Len Ins Del Join Inv Num aLen %Len Num aLen %Len
B. anthracis 5.2 0 0 2 0 1,336 831 21.5 127 5,546 13.6
B. suis 3.4 0 0 7 3 1,047 1,354 42.2 158 7,575 35.6
C. burnetii 2.0 0 0 13 9 1,375 1,106 74.3 124 11,455 69.4
C. caviae 1.4 0 0 11 1 625 320 14.1 50 3,896 13.7
C. jejuni 1.8 1 0 3 1 290 613 10.0 61 1,981 6.8
D. ethenogenes 1.8 0 0 8 4 688 691 26.5 88 4,116 20.2
F. succinogenes 4.0 0 1 19 1 1,670 1,387 57.5 266 7,396 48.8
L. monocytogenes 2.9 0 0 1 0 1,381 873 42.1 201 5,254 36.9
M. capricolum 1.0 3 0 0 0 83 835 6.8 16 3,005 4.7
N. sennetsu 0.9 0 0 0 0 91 512 5.4 13 2,328 3.5
P. intermedia 2.7 0 0 19 2 1,655 727 44.5 201 6,263 46.5
P. syringae 6.4 0 1 43 20 2,841 782 34.4 366 5,725 32.4
S. agalactiae 2.1 0 0 16 5 687 793 25.6 112 4,082 21.5
S. aureus 2.8 1 0 34 6 1,850 740 49.0 227 5,582 45.4
W. pipientis 3.3 0 0 17 14 761 1,206 28.1 132 6,395 25.8
X. oryzae 5.0 1 0 74 76 2,569 1,551 79.0 100 27,771 55.1
Totals 46.8 6 2 267 142 18,949 895 35.1 2242 6773 30.0
Phrap mis-assemblies are grouped into tandem insertion (Ins), tandem collapse (Del), mis-join (Join), and inversion (Inv) events in columns 3-6. Columns 7-9 give the total count (Num), average length (aLen), and total length as a percentage of genome (%Len) for the amosvalidate mis-assembly signatures. Columns 10-12 give the same information, but for amosvalidate suspicious regions.
Genome Biology 2008, 9:R55
http://genomebiology.com/2008/9/3/R55 Genome Biology 2008, Volume 9, Issue 3, Article R55 Phillippy et al. R55.12
set of measures of assembly quality that go beyond the simplebase-level measures commonly used. In future work, we willexplore methods for converting mis-assembly features into anew type of assembly quality score representing the probabil-ity of mis-assembly at any location. The tools presented here,combined with tools designed to correct assemblies, willultimately lead to automated finishing protocols that coulddramatically improve the quality of draft-level assemblies.
In addition, we would like to stress the fact that the large-scale validation of assemblies cannot proceed without theavailability of detailed information on the placement of indi-vidual reads within an assembly. Even if the raw reads areprovided in the NCBI Trace Archive (as is the case for mostcurrent sequencing projects), mapping these reads to theassemblies deposited in public databases is a laborious, anderror-prone process. Thus, we encourage the sequencingcenters to release the details of their assemblies by submittingthe complete assembly information to the NCBI AssemblyArchive [37]. This community resource not only enables theapplication of high-throughput validation techniques, butalso provides scientists with an interface for the manualinspection of assemblies.
AbbreviationsBAC, bacterial artificial chromosome; CAF1, ComparativeAnalysis Freeze 1; CE statistic, compression-expansion statis-tic; SNP, single nucleotide polymorphism.
Authors' contributionsAMP, MCS, and MP contributed to all portions of this work.
Additional data filesThe following additional data are available. Additional datafile 1 contains a table listing the NCBI Taxonomy and RefSeqidentifiers for the 16 genomes described in the Resultssection.Additional data file 1NCBI Taxonomy and RefSeq identifiers for the 16 genomes described in the Results sectionNCBI Taxonomy and RefSeq identifiers for the 16 genomes described in the Results section.Click here for file
AcknowledgementsThe authors would like to thank Steven Salzberg for his support and guid-ance; Aleksey Zimin for providing the D. virilis assembly; Arthur Delcher andMichael Roberts for their many helpful discussions; and the anonymousreviewers for their helpful suggestions. This work was supported in part bygrants R01-LM06845 and R01-LM007938 from the NIH, and grant HU001-06-1-0015 from the Uniformed Services University of the Health Sciencesadministered by the Henry Jackson Foundation.
References1. Lander ES, Linton LM, Birren B, Nusbaum C, Zody MC, Baldwin J,
Devon K, Dewar K, Doyle M, FitzHugh W, Funke R, Gage D, HarrisK, Heaford A, Howland J, Kann L, Lehoczky J, LeVine R, McEwan P,McKernan K, Meldrim J, Mesirov JP, Miranda C, Morris W, Naylor J,Raymond C, Rosetti M, Santos R, Sheridan A, Sougnez C, et al.: Initialsequencing and analysis of the human genome. Nature 2001,409:860-921.
2. Venter JC, Adams MD, Myers EW, Li PW, Mural RJ, Sutton GG, SmithHO, Yandell M, Evans CA, Holt RA, Gocayne JD, Amanatides P,Ballew RM, Huson DH, Wortman JR, Zhang Q, Kodira CD, ZhengXH, Chen L, Skupski M, Subramanian G, Thomas PD, Zhang J, GaborMiklos GL, Nelson C, Broder S, Clark AG, Nadeau J, McKusick VA,Zinder N, et al.: The sequence of the human genome. Science2001, 291:1304-1351.
3. Schmutz J, Wheeler J, Grimwood J, Dickson M, Yang J, Caoile C,Bajorek E, Black S, Chan YM, Denys M, Escobar J, Flowers D, Fotop-ulos D, Garcia C, Gomez M, Gonzales E, Haydu L, Lopez F, RamirezL, Retterer J, Rodriguez A, Rogers S, Salazar A, Tsai M, Myers RM:Quality assessment of the human genome sequence. Nature2004, 429:365-368.
4. She X, Jiang Z, Clark RA, Liu G, Cheng Z, Tuzun E, Church DM, Sut-ton G, Halpern AL, Eichler EE: Shotgun sequence assembly andrecent segmental duplications within the human genome.Nature 2004, 431:927-930.
5. Cheung J, Estivill X, Khaja R, MacDonald JR, Lau K, Tsui LC, SchererSW: Genome-wide detection of segmental duplications andpotential assembly errors in the human genome sequence.Genome Biol 2003, 4:R25.
6. Stein LD: Human genome: end of the beginning. Nature 2004,431:915-916.
7. Salzberg SL, Yorke JA: Beware of mis-assembled genomes. Bio-informatics 2005, 21:4320-4321.
8. Lander ES, Waterman MS: Genomic mapping by fingerprintingrandom clones: a mathematical analysis. Genomics 1988,2:231-239.
9. Sutherland GR, Richards RI: Simple tandem DNA repeats andhuman genetic disease. Proc Natl Acad Sci USA 1995,92:3636-3641.
10. Read TD, Salzberg SL, Pop M, Shumway M, Umayam L, Jiang L, Holt-zapple E, Busch JD, Smith KL, Schupp JM, Solomon D, Keim P, FraserCM: Comparative genome sequencing for discovery of novelpolymorphisms in Bacillus anthracis. Science 2002,296:2028-2033.
11. Myers EW: Toward simplifying and accurately formulatingfragment assembly. J Comput Biol 1995, 2:275-290.
12. Myers EW, Sutton GG, Delcher AL, Dew IM, Fasulo DP, Flanigan MJ,Kravitz SA, Mobarry CM, Reinert KH, Remington KA, Anson EL,Bolanos RA, Chou HH, Jordan CM, Halpern AL, Lonardi S, BeasleyEM, Brandon RC, Chen L, Dunn PJ, Lai Z, Liang Y, Nusskern DR, ZhanM, Zhang Q, Zheng X, Rubin GM, Adams MD, Venter JC: A whole-genome assembly of Drosophila. Science 2000, 287:2196-2204.
13. Gordon D, Abajian C, Green P: Consed: a graphical tool forsequence finishing. Genome Res 1998, 8:195-202.
14. Staden R, Beal KF, Bonfield JK: The Staden package, 1998. Meth-ods Mol Biol 2000, 132:115-130.
15. Semple CA, Morris SW, Porteous DJ, Evans KL: Computationalcomparison of human genomic sequence assemblies for aregion of chromosome 4. Genome Res 2002, 12:424-429.
16. Li S, Liao J, Cutler G, Hoey T, Hogenesch JB, Cooke MP, Schultz PG,Ling XB: Comparative analysis of human genome assembliesreveals genome-level differences. Genomics 2002, 80:138-139.
17. Hogenesch JB, Ching KA, Batalov S, Su AI, Walker JR, Zhou Y, KaySA, Schultz PG, Cooke MP: A comparison of the Celera andEnsembl predicted gene sets reveals little overlap in novelgenes. Cell 2001, 106:413-415.
18. Istrail S, Sutton GG, Florea L, Halpern AL, Mobarry CM, Lippert R,Walenz B, Shatkay H, Dew I, Miller JR, Flanigan MJ, Edwards NJ,Bolanos R, Fasulo D, Halldorsson BV, Hannenhalli S, Turner R,Yooseph S, Lu F, Nusskern DR, Shue BC, Zheng XH, Zhong F,Delcher AL, Huson DH, Kravitz SA, Mouchard L, Reinert K, Reming-ton KA, Clark AG, et al.: Whole-genome shotgun assembly andcomparison of human genome assemblies. Proc Natl Acad SciUSA 2004, 101:1916-1921.
19. Huson DH, Halpern AL, Lai Z, Myers EW, Reinert K, Sutton GG:Comparing assemblies using fragments and mate-pairs. InProceedings of the Algorithms in Bioinformatics: First InternationalWorkshop, WABI 2001: 28-31 August 2001; Aarhus, Denmark. Volume2149. Edited by Gascuel O, Moret BME. Berlin/Heidelberg: Springer-Verlag; 2001:294-306. [Lecture Notes in Computer Science]
20. Schatz MC, Phillippy AM, Shneiderman B, Salzberg SL: Hawkeye: aninteractive visual analytics tool for genome assemblies.Genome Biol 2007, 8:R34.
21. Lindblad-Toh K, Wade CM, Mikkelsen TS, Karlsson EK, Jaffe DB,Kamal M, Clamp M, Chang JL, Kulbokas EJ 3rd, Zody MC, Mauceli E,Xie X, Breen M, Wayne RK, Ostrander EA, Ponting CP, Galibert F,
Genome Biology 2008, 9:R55
http://www.ncbi.nlm.nih.gov/entrez/query.fcgi?cmd=Retrieve&db=PubMed&dopt=Abstract&list_uids=3294162
http://www.ncbi.nlm.nih.gov/entrez/query.fcgi?cmd=Retrieve&db=PubMed&dopt=Abstract&list_uids=3294162
http://www.ncbi.nlm.nih.gov/entrez/query.fcgi?cmd=Retrieve&db=PubMed&dopt=Abstract&list_uids=7731957
http://www.ncbi.nlm.nih.gov/entrez/query.fcgi?cmd=Retrieve&db=PubMed&dopt=Abstract&list_uids=7731957
http://www.ncbi.nlm.nih.gov/entrez/query.fcgi?cmd=Retrieve&db=PubMed&dopt=Abstract&list_uids=7497129
http://www.ncbi.nlm.nih.gov/entrez/query.fcgi?cmd=Retrieve&db=PubMed&dopt=Abstract&list_uids=7497129
http://www.ncbi.nlm.nih.gov/entrez/query.fcgi?cmd=Retrieve&db=PubMed&dopt=Abstract&list_uids=9521923
http://genomebiology.com/2008/9/3/R55 Genome Biology 2008, Volume 9, Issue 3, Article R55 Phillippy et al. R55.13
Smith DR, DeJong PJ, Kirkness E, Alvarez P, Biagi T, Brockman W,Butler J, Chin CW, Cook A, Cuff J, Daly MJ, DeCaprio D, Gnerre S,et al.: Genome sequence, comparative analysis and haplotypestructure of the domestic dog. Nature 2005, 438:803-819.
22. Mikkelsen TS, Wakefield MJ, Aken B, Amemiya CT, Chang JL, Duke S,Garber M, Gentles AJ, Goodstadt L, Heger A, Jurka J, Kamal M,Mauceli E, Searle SM, Sharpe T, Baker ML, Batzer MA, Benos PV,Belov K, Clamp M, Cook A, Cuff J, Das R, Davidow L, Deakin JE, Faz-zari MJ, Glass JL, Grabherr M, Greally JM, Gu W, et al.: Genome ofthe marsupial Monodelphis domestica reveals innovation innon-coding sequences. Nature 2007, 447:167-177.
23. Bartels D, Kespohl S, Albaum S, Druke T, Goesmann A, Herold J, Kai-ser O, Puhler A, Pfeiffer F, Raddatz G, Stoye J, Meyer F, Schuster SC:BACCardI - a tool for the validation of genomic assemblies,assisting genome finishing and intergenome comparison. Bio-informatics 2005, 21:853-859.
24. Dew IM, Walenz B, Sutton G: A tool for analyzing mate pairs inassemblies (TAMPA). J Comput Biol 2005, 12:497-513.
25. Zimin AV, Smith DR, Sutton G, Yorke JA: Assemblyreconciliation. Bioinformatics 2008, 24:42-45.
26. Arner E, Tammi MT, Tran AN, Kindlund E, Andersson B: DNPTrap-per: an assembly editing tool for finishing and analysis ofcomplex repeat regions. BMC Bioinformatics 2006, 7:155.
27. Tammi MT, Arner E, Britton T, Andersson B: Separation of nearlyidentical repeats in shotgun assemblies using defined nucle-otide positions, DNPs. Bioinformatics 2002, 18:379-388.
28. Kim S, Liao L, Tomb JF: A probabilistic approach to sequenceassembly validation. In Proceedings of the ACM SIGKDD Workshopon Data Mining in Bioinformatics (BIOKDD'01): 26 August 2001; San Fran-cisco. Edited by Zaki MJ, Toivonen H, Wang JT. New York: ACM;2001:38-43.
29. Kurtz S: A time and space efficient algorithm for the substringmatching problem. Technical Report. Universität Hamburg, Zen-trum für Bioinformatik; 2003.
30. Benson G: Tandem repeats finder: a program to analyze DNAsequences. Nucleic Acids Res 1999, 27:573-580.
31. Ewing B, Green P: Base-calling of automated sequencer tracesusing phred. II. Error probabilities. Genome Res 1998,8:186-194.
32. Churchill GA, Waterman MS: The accuracy of DNA sequences:estimating sequence quality. Genomics 1992, 14:89-98.
33. Kurtz S, Phillippy A, Delcher AL, Smoot M, Shumway M, AntonescuC, Salzberg SL: Versatile and open software for comparinglarge genomes. Genome Biol 2004, 5:R12.
34. Delcher AL, Phillippy A, Carlton J, Salzberg SL: Fast algorithms forlarge-scale genome alignment and comparison. Nucleic AcidsRes 2002, 30:2478-2483.
35. Gusfield D: Algorithms on Strings, Trees, and Sequences: Computer Sci-ence and Computational Biology New York: Cambridge UniversityPress; 1997.
36. AMOS: A Modular Open-Source Assembler [http://amos.sourceforge.net]
37. Salzberg SL, Church D, DiCuccio M, Yaschenko E, Ostell J: Thegenome Assembly Archive: a new public resource. PLoS Biol2004, 2:E285.
38. Batzoglou S, Jaffe DB, Stanley K, Butler J, Gnerre S, Mauceli E, BergerB, Mesirov JP, Lander ES: ARACHNE: a whole-genome shotgunassembler. Genome Res 2002, 12:177-189.
39. Jaffe DB, Butler J, Gnerre S, Mauceli E, Lindblad-Toh K, Mesirov JP,Zody MC, Lander ES: Whole-genome sequence assembly formammalian genomes: Arachne 2. Genome Res 2003, 13:91-96.
40. Huang X, Wang J, Aluru S, Yang SP, Hillier L: PCAP: A whole-genome assembly program. Genome Res 2003, 13:2164-2170.
41. PHRAP documentation: ALGORITHMS [http://bozeman.mbt.washington.edu/phrap.docs/phrap.html]
42. Mullikin JC, Ning Z: The phusion assembler. Genome Res 2003,13:81-90.
43. Margulies M, Egholm M, Altman WE, Attiya S, Bader JS, Bemben LA,Berka J, Braverman MS, Chen YJ, Chen Z, Dewell SB, Du L, Fierro JM,Gomes XV, Godwin BC, He W, Helgesen S, Ho CH, Irzyk GP, JandoSC, Alenquer ML, Jarvie TP, Jirage KB, Kim JB, Knight JR, Lanza JR,Leamon JH, Lefkowitz SM, Lei M, Li J, et al.: Genome sequencing inmicrofabricated high-density picolitre reactors. Nature 2005,437:376-380.
44. Assembly Alignment Annotation of 12 related Drosophilaspecies [http://rana.lbl.gov/drosophila/virilis.html]
45. The MUMmer Homepage [http://mummer.sourceforge.net]
46. Blakesley RW, Hansen NF, Mullikin JC, Thomas PJ, McDowell JC,Maskeri B, Young AC, Benjamin B, Brooks SY, Coleman BI, Gupta J,Ho SL, Karlins EM, Maduro QL, Stantripop S, Tsurgeon C, Vogt JL,Walker MA, Masiello CA, Guan X, Bouffard GG, Green ED: Anintermediate grade of finished genomic sequence suitablefor comparative analyses. Genome Res 2004, 14:2235-2244.
Genome Biology 2008, 9:R55
http://www.ncbi.nlm.nih.gov/entrez/query.fcgi?cmd=Retrieve&db=PubMed&dopt=Abstract&list_uids=9862982
http://www.ncbi.nlm.nih.gov/entrez/query.fcgi?cmd=Retrieve&db=PubMed&dopt=Abstract&list_uids=9862982
http://www.ncbi.nlm.nih.gov/entrez/query.fcgi?cmd=Retrieve&db=PubMed&dopt=Abstract&list_uids=9521922
http://www.ncbi.nlm.nih.gov/entrez/query.fcgi?cmd=Retrieve&db=PubMed&dopt=Abstract&list_uids=9521922
http://www.ncbi.nlm.nih.gov/entrez/query.fcgi?cmd=Retrieve&db=PubMed&dopt=Abstract&list_uids=1358801