Peptide-Based Immunotherapeutics and Vaccines 2017
130
Journal of Immunology Research Peptide-Based Immunotherapeutics and Vaccines 2017 Lead Guest Editor: Pedro A. Reche Guest Editors: Darren R. Flower, Masha Fridkis‑Hareli, and Yoshihiko Hoshino
-
Upload
khangminh22 -
Category
Documents
-
view
1 -
download
0
Transcript of Peptide-Based Immunotherapeutics and Vaccines 2017

Journal of Immunology Research
Peptide-Based Immunotherapeutics and Vaccines 2017
Lead Guest Editor: Pedro A. RecheGuest Editors: Darren R. Flower, Masha Fridkis‑Hareli, and Yoshihiko Hoshino

Peptide-Based Immunotherapeuticsand Vaccines 2017

Journal of Immunology Research
Peptide-Based Immunotherapeuticsand Vaccines 2017
Lead Guest Editor: Pedro A. RecheGuest Editors: Darren R. Flower, Masha Fridkis-Hareli,and Yoshihiko Hoshino

Copyright © 2018 Hindawi. All rights reserved.
This is a special issue published in “Journal of Immunology Research.” All articles are open access articles distributed under the CreativeCommons Attribution License, which permits unrestricted use, distribution, and reproduction in any medium, provided the originalwork is properly cited.

Editorial Board
B. D. Akanmori, CongoJagadeesh Bayry, FranceKurt Blaser, SwitzerlandEduardo F. Borba, BrazilFederico Bussolino, ItalyNitya G. Chakraborty, USACinzia Ciccacci, ItalyRobert B. Clark, USAMario Clerici, ItalyNathalie Cools, BelgiumM. Victoria Delpino, ArgentinaNejat K. Egilmez, USAEyad Elkord, UKSteven E. Finkelstein, USAMaria Cristina Gagliardi, ItalyLuca Gattinoni, USAAlvaro González, SpainTheresa Hautz, AustriaMartin Holland, UK
Douglas C. Hooper, USAEung-Jun Im, USAHidetoshi Inoko, JapanJuraj Ivanyi, UKRavirajsinh N. Jadeja, USAPeirong Jiao, ChinaTaro Kawai, JapanAlexandre Keller, BrazilHiroshi Kiyono, JapanBogdan Kolarz, PolandHerbert K. Lyerly, USAMahboobeh Mahdavinia, USAGiulia Marchetti, ItalyEiji Matsuura, JapanChikao Morimoto, JapanHiroshi Nakajima, JapanPaola Nistico, ItalyEnrique Ortega, MexicoPatrice Petit, France
Isabella Quinti, ItalyEirini Rigopoulou, GreeceIlaria Roato, ItalyLuigina Romani, ItalyAurelia Rughetti, ItalyFrancesca Santilli, ItalyTakami Sato, USASenthamil R. Selvan, USANaohiro Seo, JapanBenoit Stijlemans, BelgiumJacek Tabarkiewicz, PolandMizue Terai, USABan-Hock Toh, AustraliaJoseph F. Urban, USAPaulina Wlasiuk, PolandBaohui Xu, USAXiao-Feng Yang, USAQiang Zhang, USA

Contents
Peptide-Based Immunotherapeutics and Vaccines 2017Pedro Reche , Darren R. Flower , Masha Fridkis-Hareli , and Yoshihiko HoshinoEditorial (2 pages), Article ID 4568239, Volume 2018 (2018)
Longitudinal Evaluation of Humoral Immunity and Bacterial and Clinical Parameters RevealsThatAntigen-Specific Antibodies Suppress Inflammatory Responses in Active Tuberculosis PatientsMamiko Niki, Takashi Yoshiyama, Yuji Miyamoto, Masao Okumura, Makoto Niki, Ken-ichi Oinuma,Yukihiro Kaneko, Sohkichi Matsumoto, Yuka Sasaki, Hideo Ogata, Hajime Goto, Shoji Kudoh,and Yoshihiko HoshinoResearch Article (11 pages), Article ID 4928757, Volume 2018 (2018)
Immune Response and Partial Protection against Heterologous Foot-and-Mouth Disease Virus Inducedby Dendrimer Peptides in CattleI. Soria , V. Quattrocchi, C. Langellotti, M. Pérez-Filgueira , J. Pega, V. Gnazzo, S. Romera, J. Schammas,D. Bucafusco, S. Di Giacomo, Beatriz G. de la Torre, D. Andreu , F. Sobrino , E. Blanco ,and P. ZamoranoResearch Article (12 pages), Article ID 3497401, Volume 2018 (2018)
Immature Dendritic Cell Therapy Confers Durable Immune Modulation in an Antigen-Dependent andAntigen-Independent Manner in Nonobese Diabetic MiceJeannette Lo, Chang-Qing Xia , Ruihua Peng, and Michael J. Clare-SalzlerResearch Article (13 pages), Article ID 5463879, Volume 2018 (2018)
Frequency of Interferon-Resistance Conferring Substitutions in Amino Acid Positions 70 and 91 ofCore Protein of the Russian HCV 1b Isolates Analyzed in the T-Cell Epitopic ContextV. S. Kichatova , K. K. Kyuregyan , N. V. Soboleva, A. A. Karlsen, O. V. Isaeva, M. G. Isaguliants,and M. I. MikhailovResearch Article (13 pages), Article ID 7685371, Volume 2018 (2018)
Fundamentals and Methods for T- and B-Cell Epitope PredictionJose L. Sanchez-Trincado, Marta Gomez-Perosanz, and Pedro A. RecheReview Article (14 pages), Article ID 2680160, Volume 2017 (2018)
Computer-Aided Design of an Epitope-Based Vaccine against Epstein-Barr VirusJulio Alonso-Padilla, Esther M. Lafuente, and Pedro A. RecheResearch Article (15 pages), Article ID 9363750, Volume 2017 (2018)
Vaccinomics Approach for Designing Potential Peptide Vaccine by Targeting Shigella spp. SerineProtease Autotransporter Subfamily Protein SigAArafat Rahman Oany, Tahmina Pervin, Mamun Mia, Motaher Hossain, Mohammad Shahnaij,Shahin Mahmud, and K. M. Kaderi KibriaResearch Article (14 pages), Article ID 6412353, Volume 2017 (2018)

Fusion to Flaviviral Leader Peptide Targets HIV-1 Reverse Transcriptase for Secretion and Reduces ItsEnzymatic Activity and Ability to Induce Oxidative Stress but Has No Major Effects on ItsImmunogenic Performance in DNA-Immunized MiceAnastasia Latanova, Stefan Petkov, Yulia Kuzmenko, Athina Kilpeläinen, Alexander Ivanov, Olga Smirnova,Olga Krotova, Sergey Korolev, Jorma Hinkula, Vadim Karpov, Maria Isaguliants,and Elizaveta StarodubovaResearch Article (16 pages), Article ID 7407136, Volume 2017 (2018)
The Immune Epitope Database: How Data Are Entered and RetrievedWard Fleri, Kerrie Vaughan, Nima Salimi, Randi Vita, Bjoern Peters, and Alessandro SetteReview Article (13 pages), Article ID 5974574, Volume 2017 (2018)

EditorialPeptide-Based Immunotherapeutics and Vaccines 2017
Pedro Reche ,1 Darren R. Flower ,2 Masha Fridkis-Hareli ,3 and Yoshihiko Hoshino 4
1Department of Immunology & O2, Facultad de Medicina, Universidad Complutense, 28040 Madrid, Spain2School of Life and Health Sciences, Aston University, Birmingham B4 7ET, UK3ATR, LLC, Worcester, MA 01606, USA4Department of Mycobacteriology, National Institute of Infectious Diseases, Higashi-Murayama, Tokyo 189-0002, Japan
Correspondence should be addressed to Pedro Reche; [email protected]
Received 4 February 2018; Accepted 4 February 2018; Published 15 July 2018
Copyright © 2018 Pedro Reche et al. This is an open access article distributed under the Creative Commons Attribution License,which permits unrestricted use, distribution, and reproduction in any medium, provided the original work is properly cited.
The increasing understanding of the immune system and thecritical role of antigenic epitopes in eliciting robust immuneresponses has led to the development of peptide vaccines.Peptide-based vaccines or—more technical—epitope ensem-ble vaccines represent an alternative approach to the discov-ery of disease-specific prophylactic and therapeutic vaccines,distinct from other vaccine moieties, such as attenuated orkilled whole pathogen vaccines, subunit or toxoid vaccines,and carbohydrate-based vaccines. Epitopes represent the rel-evant part of the antigen recognized by T and/or B cells,mediating adaptive immunity. Consequently, the majorpotential of epitope vaccine ensembles is that of inducingdesirable T and B cell-mediated immune responses. The riskof causing pathogenic or off-target responses with epitopevaccines is thus much lower than with convectional vaccinesand can, on that basis, be regarded as safer. Epitope ensemblevaccines are also very versatile and can be formulated as syn-thetic peptides or encoded as DNA and RNA formulations.Currently, there are many epitope vaccines under develop-ment, spanning a wide range of diseases, including chronicviral infections and therapeutic anticancer vaccines, but asyet none are available. The case for epitope ensemble vac-cines is nonetheless compelling, and the research communityremains certain it is only time that separates us from a viableand deployable vaccine.
Developing a successful peptide-based vaccine involvesidentifying disease-specific epitopes inducing protectiveimmunity and tackling a number of steps, such as determin-ing appropriate means of epitope delivery and overcomingthe intrinsically low immunogenicity of isolated epitopes.
Following the success of previous special issues on peptide-based vaccines and immunotherapeutics, we present a newedition of the special issue in which we have incorporatedseven original articles and two reviews, addressing variousaspects of peptide-based vaccine design.
The reviews in the issue deal with epitope databases andepitope prediction. Peptide databases with information onT and B cell epitopes and peptide binding to MHCmoleculesare important tools for analyzing immune responses, bench-marking predictive methods, generating new ones, anddeveloping peptide-based immunotherapeutics [1]. Cur-rently, there are a number of online resources providing thistype of information [2] but the Immune Epitope Database(IEDB) is the largest and most comprehensive epitope data-base. Thus, in this issue, we are pleased to feature a reviewby W. Fleri et al., in which the authors describe how the dataare entered and retrieved from IEDB. B and T cell epitopescan be predicted from the relevant antigens with the help ofbioinformatics tools. In this issue, J. L. Sanchez-Trincado etal. analyzed aspects of antigen recognition by T and B cellsthat are relevant for epitope prediction and provided a sys-tematic and inclusive review of available tools, paying partic-ular attention to their foundations. In the review, the authorsalso provide arguments on why B cell epitope prediction isless accurate and practical than T cell prediction and intro-duce solutions to solve some of the problems associated withepitope-vaccine design.
The original articles in this special issue include twopapers focusing on computational vaccine design. In one,A. R. Oany et al. proposed a peptide vaccine candidate for
HindawiJournal of Immunology ResearchVolume 2018, Article ID 4568239, 2 pageshttps://doi.org/10.1155/2018/4568239

shigellosis consisting of four predicted cytotoxic T cell (CTL)epitopes from the SigA antigen, which is known to be highlyimmunogenic. These four candidates are conserved amongShigella species and provide wide population coverage. Inaddition, the authors identified that MHC II molecules couldalso present two of the CTL epitopes and thus stimulate Thelper responses. In the other, J. Alonso-Padilla et al. haveexpanded on an emerging strategy that relies on the use ofexperimentally defined T-cell epitopes [3] and formulated aprophylactic epitope vaccine against EBV infection thatincludes both T and B cell epitopes. The T cell componentconsists of experimentally defined CD8 and CD4 T cell epi-topes from various EBV antigens that are conserved andcan be presented by a large number of human MHC mole-cules, while the B cell component includes experimental Bcell epitopes mapping on the ectodomain of EBV envelopeproteins and exhibiting a high degree of flexibility and sol-vent accessibility.
The experimental articles in the issue range widely. Wehave a work byM. Niki et al.which aims to identify appropri-ate antigens for tuberculosis (TB) vaccines. The study is anextension of a previous work in which the authors did across-sectional assay in TB patients [4]. Here, the authorsused a different cohort and did a longitudinal assay, findingimmunoglobulin responses to antigens that correlated to sev-eral clinical parameters. These results provide insights intothe development of a novel TB vaccine inducing protectivehumoral immunity.
Dendritic cell- (DC) and peptide-based immunother-apies often go hand in hand. In this issue, J. Lo et al. investi-gate on whether DCs unpulsed or pulsed with antigenicdominant determinants (DD), subdominant determinants(SD), and ignored determinants (ID) could prevent type 1diabetes (T1D) in a mouse model. The authors found thatdiabetes was significantly delayed by DCs pulsed with SDor ID peptides. Moreover, they also found that Tregs fromDC-treated mice proliferated more actively and showedenhanced immunosuppressive activities. Overall, this studydemonstrates that DC therapy leads to long-lasting immuno-modulatory effects in an antigen-dependent manner, provid-ing support for DC-guided peptide-based interventions forautoimmune diabetes.
Toxicity is a handicap for vaccine design and, here, A.Latanova et al. present a work addressing this issue. In thestudy, the authors fused a flaviviral leader peptide to reversetranscriptase (RT), a crucial target of immunotherapy againstdrug-resistant HIV-1. This fusion allowed RT secretion andreduced its toxicity and ability to induce oxidative stress, withno major effects on its immunogenicity. Subsequently, theauthors proposed the use of leader peptides to increase safetyof RT-based DNA vaccines. Genetic diversity of pathogensremain also a substantial obstacle for vaccine design. V. S.Kichatova et al. addressed this subject for human hepatitisC virus (HCV). These authors characterized the occurrenceof IFN resistance-conferring mutations in HCV isolates cir-culating in the Russian Federation, identifying that thespread of viral variants was linked to mutations on HCV-specific CTL epitopes in association with the immunogeneticbackground of HCV-infected individuals. These results are
useful in identifying those individuals in need of IFN-freetreatments and for developing epitope-based vaccines thatcircumvent viral immune escape.
Finally, we include a work by I. Soria et al. showing thatcombining viral-specific B and T cell epitopes onto appropri-ated structures can increase immunogenicity and enhanceprotection. These authors work with foot-and-mouth diseasevirus (FMDV), which has a high morbidity in cloven-hoofedanimals, like cattle and swine. In cattle, there are knownFMDV-specific B and T cell epitopes that could be used forsafer and more effective vaccines. However, immunizationwith linear synthetic peptides encompassing the epitopeshas failed to induce protection in cattle. In contrast, in thestudy, the authors immunized cattle with a dendrimeric pep-tide structures consisting of 4 copies of a peptide encompass-ing a B cell epitope linked through thioether bonds to a singlecopy of a CD4 T cell epitope. As a result, I. Soria et al.obtained that these dendrimeric peptides elicited humoraland cellular immune responses that conferred partial protec-tion against heterologous virus challenge.
In conclusion, the articles included in this special issueexamined relevant aspects of peptide-based vaccines, andwe trust that readers shall find them both interesting andmotivating.
Pedro RecheDarren R. Flower
Masha Fridkis-HareliYoshihiko Hoshino
References
[1] D. R. Flower, “Databases and data mining for computationalvaccinology,” Current Opinion in Drug Discovery & Develop-ment, vol. 6, no. 3, pp. 396–400, 2003.
[2] Y. He and Z. Xiang, “Databases and in silico tools for vaccinedesign,” Methods in Molecular Biology, vol. 993, pp. 115–127,2013.
[3] Q. M. Sheikh, D. Gatherer, P. A. Reche, and D. R. Flower,“Towards the knowledge-based design of universal influenzaepitope ensemble vaccines,” Bioinformatics, vol. 32, no. 21,pp. 3233–3239, 2016, Epub 2016 Jul 10.
[4] M. Niki, M. Suzukawa, S. Akashi et al., “Evaluation of humoralimmunity to Mycobacterium tuberculosis-specific antigens forcorrelation with clinical status and effective vaccine develop-ment,” Journal of Immunology Research, vol. 2015, Article ID527395, 13 pages, 2015.
2 Journal of Immunology Research
Research ArticleLongitudinal Evaluation of Humoral Immunity and Bacterial andClinical Parameters Reveals That Antigen-Specific AntibodiesSuppress Inflammatory Responses in Active Tuberculosis Patients
Mamiko Niki,1 Takashi Yoshiyama,2 Yuji Miyamoto,3 Masao Okumura,2 Makoto Niki,1
Ken-ichi Oinuma,1 Yukihiro Kaneko,1 Sohkichi Matsumoto,4 Yuka Sasaki,2 Hideo Ogata,2
Hajime Goto,2 Shoji Kudoh,2 and Yoshihiko Hoshino 3
1Department of Bacteriology, Osaka City University Graduate School of Medicine, Abeno, Osaka 545-8585, Japan2Division of Respiratory Medicine, Fukujuji Hospital, Japan Anti-Tuberculosis Association, Matsuyama, Kiyose,Tokyo 204-8522, Japan3Department of Mycobacteriology, Leprosy Research Center, National Institute of Infectious Diseases, Aoba, Higashi-Murayama,Tokyo 189-0002, Japan4Department of Bacteriology, Niigata University Graduate School of Medicine, Niigata 951-8510, Japan
Correspondence should be addressed to Yoshihiko Hoshino; [email protected]
Received 19 May 2017; Revised 6 November 2017; Accepted 31 December 2017; Published 4 July 2018
Academic Editor: Senthamil R. Selvan
Copyright © 2018 Mamiko Niki et al. This is an open access article distributed under the Creative Commons Attribution License,which permits unrestricted use, distribution, and reproduction in any medium, provided the original work is properly cited.
A novel tuberculosis vaccine to replace BCG has long been desired. However, recent vaccine trials focused on cell-mediatedimmunity have failed to produce promising results. It is worth noting that most commercially available successful vaccines relyon humoral immunity. To establish a basic understanding of humoral immunity against tuberculosis, we analyzed and evaluatedlongitudinal levels and avidity of immunoglobulin to various tuberculosis antigens compared with bacterial and clinicalparameters during treatment. We found that levels of IgG antibodies against HrpA and HBHA prior to treatment exhibited apositive correlation with bacterial burden. Analysis of changes in CRP during treatment revealed an association with high levelsof specific IgG and IgA antibodies against mycobacterial antigens. Levels of CRP prior to treatment were negatively associatedwith IgG avidity to CFP-10 and MDP1 and IgA avidity to HrpA, while IgA avidity to MDP1 and Acr exhibited a negativecorrelation with CRP levels after 60 days of treatment. These results may provide insight for the development of a noveltuberculosis (TB) vaccine candidate to induce protective humoral immunity against tuberculosis.
1. Introduction
Tuberculosis remains one of the most prevalent infectiousdiseases worldwide and is caused by Mycobacterium tuber-culosis (Mtb). There were 1.4 million tuberculosis (TB)deaths and 10.4 million new TB cases in 2015. Approxi-mately, one-third of the world’s population is latentlyinfected with Mtb, which represents a huge reservoir offuture disease progression and transmission. Mtb is trans-mitted through the air from a person with active TB to ahealthy individual. In addition, Mtb has no environmental
or animal reservoirs and is believed to have coevolved withhumans [1]. Therefore, an effective Mtb vaccine to preventinfection is the best strategy to eradicate tuberculosis.
The BCG vaccine has been the only available way tocombat tuberculosis long before the development of anti-biotics [2]. Although the BCG vaccine is effective for theprevention of children’s disseminated tuberculosis, it haslimited protective capacity on the development of adultpulmonary tuberculosis caused by the reactivation of per-sistent Mtb. With increasing numbers of cases involvingHIV- and TB-coinfected people and multidrug-resistant
HindawiJournal of Immunology ResearchVolume 2018, Article ID 4928757, 11 pageshttps://doi.org/10.1155/2018/4928757

TB, the development of a more effective vaccination strategyis sorely needed.
As Mtb is an intracellular pathogen, the activation of cell-mediated immunity (CMI) characterized by IFN-γ-producingCD4+ T cells is regarded as crucial for TB immunity [3].Research on vaccines that induce CMI has dominated muchof the conventional development effort, since antibody-mediated immunity has been considered to play little rolein the outcome of Mtb infection [4]. To date, several candi-date vaccines targeting the induction of CMI have reachedclinical trials. One of these new vaccines, namely, MVA85A,is an attenuated vaccinia virus expressing Mtb antigenAg85A, which induces high levels of antigen-specific CD4+
and CD8+ T cells in a murine model [5]. Although MVA85Aachieved successful results in mouse models and phase Ihuman clinical trials, the final outcome of the trial was foundto exhibit no detectable improvement of protection againstTB [6, 7]. Recently, a first-in-human phase I trial was con-ducted to investigate AERAS-422, a recombinant BCG over-expressing Mtb antigens and mutant perfringolysin derivedfrom Clostridium perfringens [8]. However, high-doseAERAS-422 vaccination was found to elicit reactivation ofthe varicella-zoster virus (VZV), possibly due to negative regu-lation of immune control of latent VZV induced by the elevatedIFN-γ production [9]. It is obvious that the conventionalapproach to targeting CMI against TB is insufficient.
In contrast to the research on CMI, many of the studieson humoral immune responses against Mtb antigens focusedlargely on their use in the diagnosis of TB, since some of thestudies indicated that the serum antibody levels against Mtbantigens correlate with the degree of bacterial load [10, 11].However, accumulating experimental evidence suggests thathumoral immunity can modulate the immune response tointracellular pathogens [12–16]. In addition, studies on vac-cines with protective efficacy based on antibody-mediatedimmunity against some of these pathogens have beenreported [17–21]. Therefore, humoral immunity has beenconsistently highlighted as an important component of pro-tective immune responses to Mtb [22]. As several reportshave revealed a potential role of specific antibodies in hostdefense against Mtb [23–26], vaccination that induces Mtb-specific antibodies in the airway mucosa could be an effectivestrategy for protection against primary infection prior to Mtbentry into the lung.
In addition to the quantity of antibodies, the avidity ofantibodies seems to be an important contributing factor tothe protective capacity of vaccines. Antibody avidity is thefunctional affinity of multivalent antibody to bind multiva-lent antigens. It can be used to determine the net antigenbinding force of a heterogeneous population of antibodiesand has been used as a marker of B cell maturation duringviral and bacterial infection [27–30]. In many infectiousdiseases including TB, elevated antibody avidity is observedin patients with chronic or severe conditions [31]. Althoughhigh-avidity antibodies are found to be crucial for the pro-tection conferred by vaccines against many pathogens[32–35], there has been little investigation into the role ofantibody avidity of anti-Mtb antibodies in protectionagainst TB.
We previously demonstrated that serum levels of Mtbantigen-specific IgA, not IgG, correlated with clinical statusesof TB patients, suggesting that specific IgA antibodies couldplay a role in protection from disease [36]. In this study, weobserved a relationship between clinical parameters relatedto TB severity and a change in antibody levels and antibodyavidity to Mtb antigens, both before and after treatment.
2. Subjects and Methods
2.1. Participants. Patients of Fukujuji Hospital, Tokyo, Japan,were consecutively enrolled, after giving written informedconsent, from April 2010 to March 2013. A total of 205patients were recruited for this study. Patients were diag-nosed as active-phase tuberculosis by clinical symptoms,chest X-ray images, and bacterial cultures. When blood sam-ples both before and after treatment were available, they wereincluded in the analysis. A total of thirty-three patients (age;55.6± 16.4 yrs, male: 66.7%) were analyzed (Table 1). Allpatients took Japanese standard medications for tuberculosis(RFP+ INH+EB(SM)+PZA for 2 months and RFP+ INHfor an additional 4 months) [37]. No patients dropped outof the treatment during the clinical course, and no patientswere relapsed by the time of the analysis. There were nodeceased patients during this analysis. The following infor-mation was obtained from all patients at the time ofenrollment: history of prior TB disease, work history inany healthcare setting or recent exposure to a patient withactive TB, and other TB risk factors, such as havingimmunodeficiency disorders or taking immunosuppressivedrugs. We used the same inclusion/exclusion criteria as ina previous study [36]. Information on previous medicalhistory and clinical signs and symptoms were also collectedas previously described [36]. “Smear at entry” (entry =pointof diagnosis before treatment) indicates the number ofacid-fast bacilli inspected in the sputum smear taken at entry.The severity was subdivided as 0 (no acid-fast bacilli (AFB)on smear), ± (1-2 AFB per 300 fields), 1+ (1–9 AFB per 100fields), 2+ (more than 10 AFB per 100 fields), and 3+ (morethan 10 AFB per field). Several routine laboratory tests,including serum concentration of “C-reactive protein(CRP) at entry” and “CRP after 60 days” of treatment, weresimultaneously performed. Blood sample collection wasperformed before treatment and after treatment for theanalysis of immunoglobulin levels and avidity. The researchprotocol was approved by the Institutional Review Boardsof Osaka City University Graduate School of Medicine,Osaka, Japan, and Fukujuji Hospital, Tokyo, Japan, andby the Research Ethics Committee of the National Instituteof Infectious Disease, Tokyo, Japan.
2.2. Measurement of Serum Antibody Levels. Concentrationsof IgG and IgA antibodies against Mtb were determined byELISA using recombinant proteins as previously describedwith slight modification [36]. Ninety-six well microplates(Sumilon Type H, LMS, Tokyo, Japan) were coated with eachrecombinant antigen in bicarbonate buffer, pH9.6 overnightat 4°C. The plates were blocked with phosphate bufferedsaline (PBS) containing 0.05% Tween 20 and 5% skim milk
2 Journal of Immunology Research

for 12 hr at 4°C and washed four times with PBS containing0.05% Tween 20. Human serum samples diluted 1 : 200 inPBS containing 0.05% Tween 20 and 0.5% skim milk werethen added in duplicate (IgG) or triplicate (IgA) to theantigen-coated wells and incubated for 12hr at 4°C. Afterwashing the wells, HRP-conjugated anti-human IgG or IgAantibodies were added at a 1 : 2000 or 1 : 1000 dilution,respectively. Following one-hour incubation at 37°C, theplates were washed four times before 100μl of SureBluereserve TMB was added to each well. The reactions werestopped after 10min by adding 50μl of 0.1M HCl, andabsorbance was measured at 450 nm using a Multiskan Spec-trophotometer (Thermo Fisher Scientific, Yokohama, Japan).
The results of the IgG-ELISA were expressed as absorbanceat 450 nm, whereas results of the IgA-ELISA were expressedas ELISA-Index, S/(B+3SD), where S is the average OD valueof the triplicate test samples and B+3SD [38] corresponds tothe average OD value of the triplicate negative controls (B)plus three times the standard deviation (SD).
2.3. Avidity ELISA.Antibody avidity is a measure of the over-all accumulated strength of the interaction between multipleantigenic epitopes and a multivalent antibody. For the mea-surement of the avidity of antibody, an incubation step with7M urea for 15min after the serum incubation to elute thelow-avidity antibodies was added to the ELISA assay proce-dure described above. Avidity indexes were obtained by cal-culating the ratio of the antibody levels measured by ELISAwith and without urea treatment.
2.4. Reagents andRecombinant Protein Preparation. pET-21b,pET-22b, Luria-Bertani (LB) medium, and carbenicillin werefrom Sigma (St. Louis, MO, USA); isopropyl-1-thio-beta-D-galactopyranoside and Ni-NTA agarose were from Qiagen(Gaithersburg, MD, USA); skim milk was from Morinaga(Tokyo, Japan); horseradish peroxidase-conjugated anti-human IgG or IgA antibodies were from Dako (Carpinteria,CA, USA); SureBlue reserve TMB microwell peroxidasesubstrate was from KPL (Gaithersburg, MD, USA). Expres-sion and purification procedures for recombinant mycobac-terial antigens (ESAT-6, CFP-10, MDP1, Ag85A, Acr,HBHA, and HrpA [Acr2]) were described previously [36].
2.5. Statistical Analysis. Spearman’s rank correlation coeffi-cient was used to determine the correlation betweenELISA values and the severity of clinical status values.All analyses were performed using online statistics cal-culators (http://www.socscistatistics.com/tests/Default.aspx,http://vassarstats.net/index.html, http://molpath.charite.de/cutoff/index.jsp). The threshold of significance was set atp < 0 05.
3. Results
3.1. Results of Clinical Parameters before and afterTuberculosis Treatment. We collected bacterial and clinicalparameters as severity of smear at entry, CRP levels (mg/dl)at entry, and CRP levels (mg/dl) after 60 days of treatment(Table 1). We also measured levels of humoral immunityas IgG level, IgG avidity index, IgA level, and IgA avidityindex (Supplemental Table 1).
3.2. Measurement and Comparison of Serum IgG Levels andIgG Avidity to Various Mtb Antigens before and afterTreatment. We evaluated whether TB treatment affectsserum antibody levels and antibody avidity indices for vari-ous Mtb antigens. A previous study showed that the levelsof IgG against certain antigens decreased after the initiationof treatment [36], although it was also reported that the anti-body response is heterogeneous and varies by individual, typeof antigen, severity of the disease, and bacterial load [39, 40].In our study, we observed a significant decrease in IgG levelsagainst Acr and HrpA and in IgG avidity levels against
Table 1: Individual patient characteristics. Severity of smear atentry was subdivided as 0 (no acid-fast bacilli (AFB) on smear), ±(1-2 AFB per 300 fields), 1+ (1–9 AFB per 100 fields), 2+ (morethan 10 AFB per 100 fields), and 3+ (more than 10 AFB per fields).
ID Age SexSmear atentry
CRP at entry(mg/dl)
CRP after 60days (mg/dl)
1 83 M 1 3.68 0
2 63 F 3 2.39 0.39
3 61 F 2 10.4 3.55
4 64 M 2 0.17 0
5 36 F 2 4.93 1.14
6 43 M 3 0.6 0.18
7 66 M 3 12.79 13.09
8 33 F 2 0.02 0.02
9 56 M 2 0.04 0.05
10 63 M 3 10.45 8.7
11 71 M 3 0.69 0
12 71 M 3 11.31 3.91
13 68 M 3 5.12 5.27
14 69 F 2 2.4 0.17
15 57 M 3 7.36 2.99
16 54 M 3 16.52 1.15
17 83 M 2 2.71 1.28
18 32 M 2 0.11 0.11
19 47 M 3 11.47 4.67
20 46 M 2 0.44 0.06
21 64 M 2 0.85 1.59
22 51 M 2 1.78 0.2
23 68 M 3 1.9 0.83
24 78 F 3 4.2 1.73
25 76 F 2 2.87 1.76
26 38 F 3 0.56 0.5
27 27 F 1 4.73 0.27
28 34 F 2 1.43 0.01
29 54 M 2 6.12 2.8
30 62 F 3 18.63 6.52
31 59 M 2 6.12 7.92
32 27 M 3 4.04 1.66
33 31 M 1 1.76 0.05
3Journal of Immunology Research

MDP1 and Ag85A, during treatment (Supplemental Figure1A–1B). On the other hand, neither IgA levels nor IgA avid-ity indices showed significant differences when comparedbefore and after treatment (Supplemental Figure 2A–2B).Correlations between the change of serum antibody levelsand antibody avidity levels during treatment were alsoanalyzed. We found a statistically significant positive cor-relation between serum IgG levels and IgG avidity levelsagainst CFP-10 and MDP1 before treatment (Figure 1(a)).Conversely, analysis of the relationship between serum IgAlevels and IgA avidity against CFP-10 and MDP1 showeda negative correlation before treatment (Figure 1(b)). Aftertreatment, only serum IgG level and avidity level againstCFP-10 showed a positive correlation (Figure 2(a)), whereasalmost all IgA tested was found to have a negative correlationbetween their antibody levels and the avidity levels(Figure 2(b)).
3.3. Analysis of the Relationship between Bacterial Load andSerum Mtb Antigen-Specific Antibody. To investigatewhether the bacterial load affected the quantity or avidity ofMtb antigen-specific antibody, we compared the antibody
levels and their avidity levels with “smear at entry” value.We found that HBHA- and HrpA-IgG levels before treat-ment showed a positive relationship with “smear at entry”(Figure 3(a)). We also observed that patients with high“smear at entry” scores gained high serum IgG levels andavidity levels against these antigens after treatment(Figure 3(b)). Meanwhile, neither the IgA levels nor IgAavidity levels were found to be associated with “smear atentry” values (data not shown).
3.4. Analysis of the Relationship between Serum CRP Leveland Serum Mtb Antigen-Specific Antibody. To observe theassociation between antibody responses and the progressionof disease, the antibody levels as well as avidity levels werecompared to the serum CRP levels. We found that CFP-10and MDP1 IgG avidity before treatment showed a reverseassociation with serum CRP levels at entry (Figure 4(a)).It was also found that HrpA-IgA level before treatmentshowed a negative correlation with CRP before treatment,and MDP1- and Acr-IgA avidity after treatment alsoshowed a negative correlation with CRP after 60 days oftreatment (Figure 4(b)).
0 1 2 3 0 1 2 3
CFP-10 MDP1
IgG level (OD450) IgG level (OD450)
r = 0.46
p = 0.005
r = 0.56
p = 0.0005
0
0.2
0.4
0.6
0.8
1
1.2
IgG
avid
ity in
dex
0
0.1
0.2
0.3
0.4
0.5
0.6
0.7
0.8
0.9
IgG
avid
ity in
dex
(a)
0 2 4 6 0 5 10IgA level (EI) IgA level (EI)
r = −0.48
p = 0.005
r = −0.61
p = 0.0002
CFP-10 MDP1
0
0.2
0.4
0.6
0.8
1
1.2
IgA
avi
dity
inde
x
0
0.2
0.4
0.6
0.8
1
1.2
1.4
IgA
avi
dity
inde
x
(b)
Figure 1: (a) Correlation between IgG levels and IgG avidity index against CFP-10 and MDP1 before treatment. (b) Correlation between IgAlevels and IgA avidity index against CFP-10 and MDP1 before treatment.
4 Journal of Immunology Research
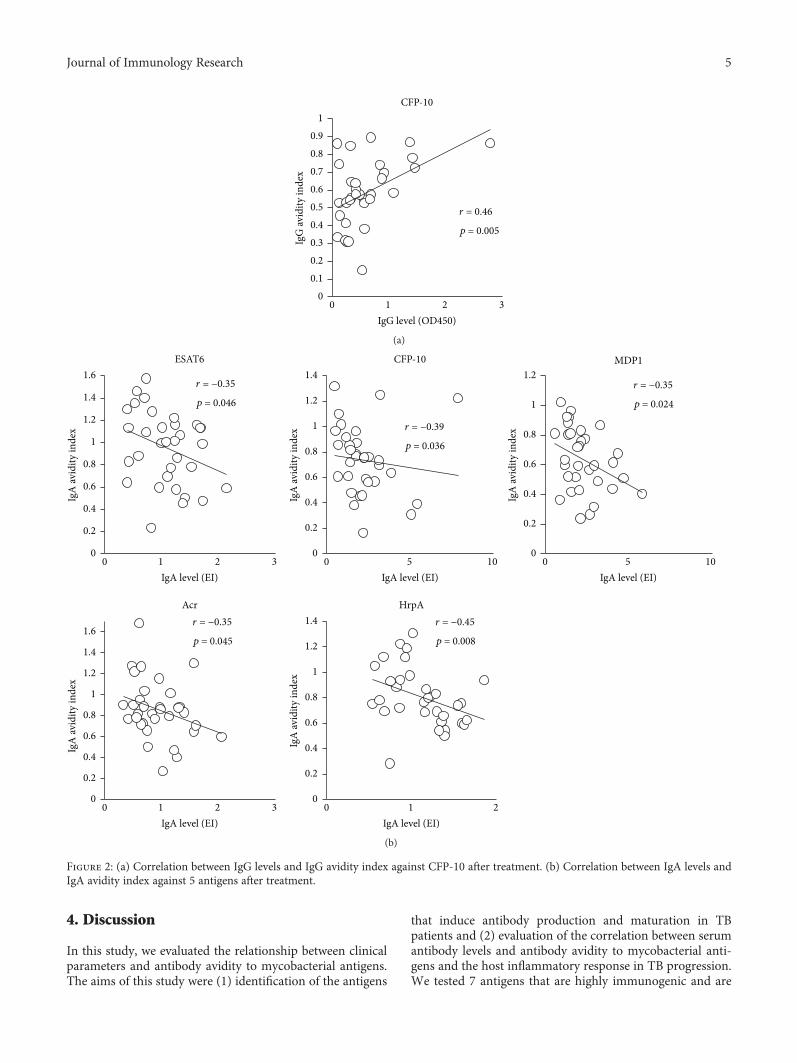
4. Discussion
In this study, we evaluated the relationship between clinicalparameters and antibody avidity to mycobacterial antigens.The aims of this study were (1) identification of the antigens
that induce antibody production and maturation in TBpatients and (2) evaluation of the correlation between serumantibody levels and antibody avidity to mycobacterial anti-gens and the host inflammatory response in TB progression.We tested 7 antigens that are highly immunogenic and are
0 1 2 3IgG level (OD450)
r = 0.46
p = 0.005
CFP-10
00.10.20.30.40.50.60.70.80.9
1
IgG
avid
ity in
dex
(a)
0 1 2 3
ESAT6 CFP-10
0 5 10 0 5 10
MDP1
0 1 2 3 0 1 2
Acr HrpA
IgA level (EI) IgA level (EI) IgA level (EI)
IgA level (EI) IgA level (EI)
r = −0.35
p = 0.046
r = −0.39
p = 0.036
r = −0.35
p = 0.024
r = −0.35
p = 0.045
r = −0.45
p = 0.008
0
0.2
0.4
0.6
0.8
1
1.2
1.4
1.6
IgA
avid
ity in
dex
0
0.2
0.4
0.6
0.8
1
1.2
1.4
IgA
avid
ity in
dex
0
0.2
0.4
0.6
0.8
1
1.2
IgA
avid
ity in
dex
0
0.2
0.4
0.6
0.8
1
1.2
1.4
1.6
IgA
avid
ity in
dex
0
0.2
0.4
0.6
0.8
1
1.2
1.4
IgA
avid
ity in
dex
(b)
Figure 2: (a) Correlation between IgG levels and IgG avidity index against CFP-10 after treatment. (b) Correlation between IgA levels andIgA avidity index against 5 antigens after treatment.
5Journal of Immunology Research

reported to be vaccine-candidate antigens. Acr is known tobe a member of the dormancy regulon-encoded antigens.HrpA, also known as Acr2, is a member of the α-crystallinfamily in mycobacteria, which shares 30% homology withAcr, and is strongly upregulated following infection of mac-rophages [41]. Both antigens have been found to contributeto prolonged Mtb infection and disease progression. Ag85Ais involved in mycobacterial cell wall assembly [42] and isprimarily expressed during the early stages of infection,during which Mtb cells replicate rapidly and require syn-thesis of cell wall components. MDP1 is a mycobacterialhistone-binding protein [43], which is reported to bestrongly highly expressed during latent Mtb infection [44].HBHA is a heparin-binding hemagglutinin protein and amycobacterial surface-expressed adhesin, which is reportedto be involved in extrapulmonary dissemination of Mtb[45] by enhancing adherence and phagocytosis of mononu-clear phagocytes [46].
In this study, we found a significant decrease in IgG levelsagainst Acr and HrpA and IgG avidity to MDP1 and Ag85Aduring treatment. In our previous study, we showed that
MDP1 and Ag85A are expressed in Mtb cells inside tubercu-lous granuloma lesions in an asymptomatic subject andinduced production of specific antibodies in latent TBpatients[44]. In contrast to IgG responses, we did not find any signifi-cant differences in IgA antibody levels and IgA avidity toMtbantigens when compared before and after treatment.
We found that IgG avidity to CFP-10 and MDP1 beforetreatment exhibited a negative association with serum CRPlevels at entry. As IgG avidity is generally higher in chroni-cally infected patients than patients with acute infection,IgG avidity to these antigens may reflect the duration ofMtb infection. Additionally, we observed that levels of IgGantibodies against HBHA andHrpA exhibited a positive rela-tionship with “smear at entry,” and IgG avidity elevation dur-ing treatment was observed in patients with high IgG levelsagainst these antigens before treatment. These findings indi-cate that patients with high bacterial burden produced higherlevels of IgG against HBHA and HrpA. In agreement withour findings, several studies have indicated that serum IgGantibody levels against Mtb antigens correlate with the bacte-rial burden in active TB patients [10, 47, 48]. On the other
HBHA
Smear at entry 1+ and 2+ 3+
Smear at entry 1+ and 2+ 3+
HrpA
⁎
⁎
Before treatment
0
0.5
1
1.5
2
IgG
leve
l (O
D45
0 nm
)
0
0.2
0.4
0.6
0.8
1
1.2
1.4
1.6
IgG
leve
l (O
D45
0 nm
)
(a)
Smear at entry 1+ and +2 3+ 1+ and +2 3+
HrpA HrpA
⁎
⁎
⁎⁎⁎
Smear at entry 1+ and +2 3+ 1+ and +2 3+
HBHA HBHA After treatment
0
0.5
1
1.5
2
IgG
leve
l (O
D45
0 nm
)0
0.2
0.4
0.6
0.8
1
1.2
IgG
avid
ity in
dex
0
0.2
0.4
0.6
0.8
1
1.2
1.4
IgG
leve
l (O
D45
0 nm
)
0
0.2
0.4
0.6
0.8
1
1.2
1.4
1.6
IgG
avid
ity in
dex
(b)
Figure 3: (a) Levels of serum IgG against HBHA and HrpA before treatment in smear at entry subgrouped between 1+ and 2+ and 3+.Vertical lines: mean values and ∗p < 0 05. (b) Serum IgG levels and avidity indices against HBHA and HrpA after treatment in smear atentry subgrouped between 1+ and 2+ and 3+. Vertical lines: mean values and ∗∗p < 0 01, ∗p < 0 05.
6 Journal of Immunology Research
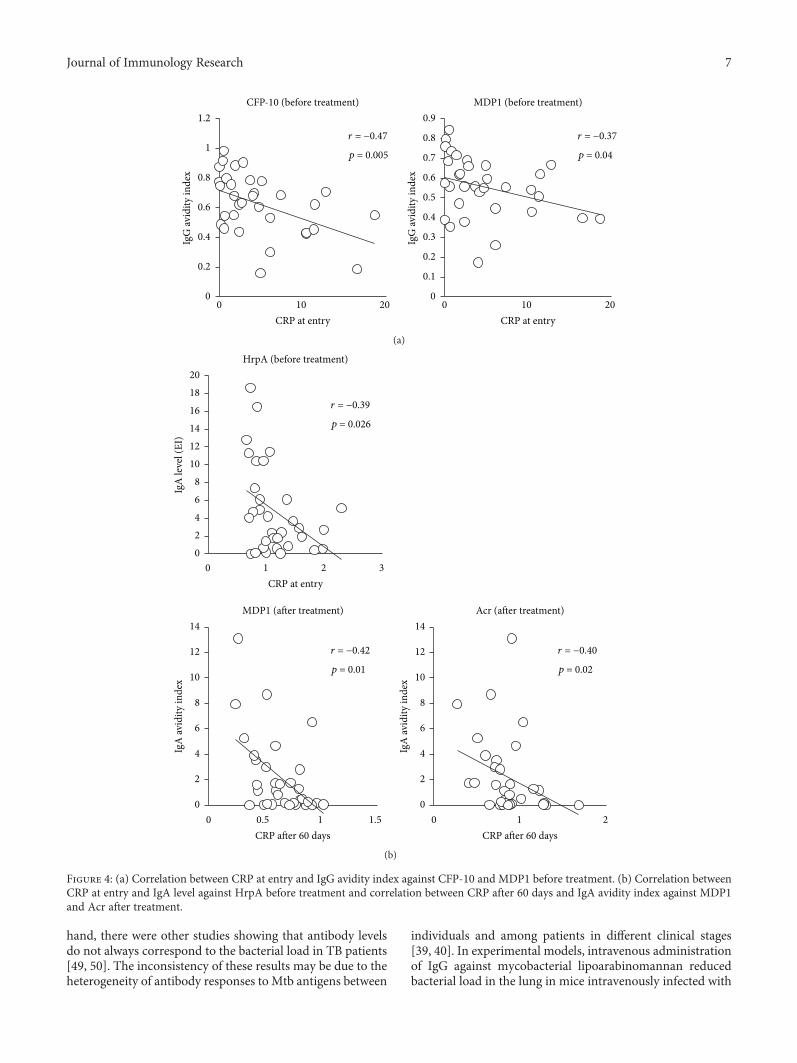
hand, there were other studies showing that antibody levelsdo not always correspond to the bacterial load in TB patients[49, 50]. The inconsistency of these results may be due to theheterogeneity of antibody responses to Mtb antigens between
individuals and among patients in different clinical stages[39, 40]. In experimental models, intravenous administrationof IgG against mycobacterial lipoarabinomannan reducedbacterial load in the lung in mice intravenously infected with
0 10 20 0 10 20CRP at entry CRP at entry
r = −0.47
p = 0.005
r = −0.37
p = 0.04
CFP-10 (before treatment) MDP1 (before treatment)
0
0.2
0.4
0.6
0.8
1
1.2
IgG
avid
ity in
dex
0
0.1
0.2
0.3
0.4
0.5
0.6
0.7
0.8
0.9
IgG
avid
ity in
dex
(a)
0 1 2 3
HrpA (before treatment)
0 0.5 1 1.5
MDP1 (after treatment)
0 1 2
Acr (after treatment)
CRP at entry
CRP after 60 days CRP after 60 days
r = −0.39
p = 0.026
r = −0.42
p = 0.01
r = −0.40
p = 0.02
02468
101214161820
IgA
leve
l (EI
)
0
2
4
6
8
10
12
14
IgA
avid
ity in
dex
0
2
4
6
8
10
12
14
IgA
avid
ity in
dex
(b)
Figure 4: (a) Correlation between CRP at entry and IgG avidity index against CFP-10 and MDP1 before treatment. (b) Correlation betweenCRP at entry and IgA level against HrpA before treatment and correlation between CRP after 60 days and IgA avidity index against MDP1and Acr after treatment.
7Journal of Immunology Research

Mtb [25]. Another study using a mouse TB model revealedthat intranasal administration of antigen 85B-HBHA fusionprotein as a booster following BCG vaccination showed a sig-nificant reduction in bacterial load [51]. On the other hand,Mtb-reactive monoclonal antibodies increased uptake ofMtb cells by human lung epithelial cells [52]. These data sug-gest that the protective function of IgG may depend on theability of the target antigen to induce sufficient IgG produc-tion. In addition, a recent study demonstrated that mosthumans with active TB exhibited lower serum IgG avidityto the Mtb cell surface [53]. Although these published datasuggest a protective role for IgG in TB, further studies areneeded for the identification of protective Mtb antigen epi-topes and the induction of mature B cells that producehigh-avidity antibodies crucial for the development of aneffective vaccine.
As IgA in its secretory form is the main effector moleculeof the mucosal immune system and serves as the first line ofdefense against pathogen invasion initiated at mucosal sur-faces, we also investigated the role of IgA in TB progression[54]. We found that bacterial load did not affect serum IgAlevels or IgA avidity to Mtb antigens. On the other hand,patients with elevated IgA levels against HrpA at the initialvisit were found to exhibit lower CRP levels at entry. Theseresults suggest that early induction of high levels of specificantibodies and avidity may suppress the inflammatoryresponse. We have now confirmed that high levels of HrpAwere significantly associated with lower serum CRP levels atentry in two different settings, namely, the current longitudi-nal study, as well as a previous cross-sectional study [36].Moreover, we demonstrated that induction of antibody avid-ity to mycobacterial antigens may be associated with lowerserum CRP levels, a marker of lower inflammatory status.Consistent with our results, several reports in both animaland human models showed that IgA provides early protec-tion against Mtb infection. In mice, IgA-deficiency leads toincreased susceptibility to intranasal BCG infection [55].Another study revealed that mouse IgAmonoclonal antibodyagainst the Mtb antigen Acr reduced early pulmonary Mtbinfection in mice [56]. It was also reported that passiveadministration of purified secretory IgA from human colos-trum reduced the pneumonic area in a murine infectionmodel [24]. These findings indicate that IgA may play a piv-otal role in the host’s early defense against Mtb invasion inthe respiratory tract.
Despite the great efforts that have been made to develop anovel vaccine that can effectively induce CMI to eliminateintracellular Mtb bacilli, these vaccine candidates have failedto induce better protection than BCG. As recent studiesextensively demonstrated that mucosal immune responsesare important in protecting the host from Mtb infection[57, 58], vaccine strategies that attempt to enhance mucosalimmunity should be included in future TB vaccine develop-ment efforts. While the results of the present study suggesta possible role of specific antibodies in TB protection, andthus the benefit of potential inclusion of some of the investi-gated antigens in the development of a future vaccine candi-date, the results are still not fully conclusive at this point,highlighting the need for further research in this area.
5. Conclusion
To our knowledge, this is the first human study to investigatethe relationship between the kinetics of humoral antibody tovarious Mtb antigens and the clinical disease status duringthe treatment. The correlation between humoral immunityand bacterial and clinical parameters was analyzed for thefirst time. Antigen-specific IgA suppresses inflammatoryresponses in active tuberculosis patients. The data in thisstudy support the inclusion of strategies that elicit humoralimmunity when developing vaccines against tuberculosis.
Conflicts of Interest
The authors declare that they have no conflict of interests.
Authors’ Contributions
Mamiko Niki, Yuji Miyamoto, and Yoshihiko Hoshino per-formed the laboratory experiments. Takashi Yoshiyama,Masao Okumura, Makoto Niki, Ken-ichi Oinuma, andSohkichi Matsumoto contributed to the experimental systemand statistical analysis. Mamiko Niki, Takashi Yoshiyama,and Yoshihiko Hoshino contributed to the planning and pro-posal of the work. Takashi Yoshiyama, Yukihiro Kaneko,Hideo Ogata, Hajime Goto, Shoji Kudoh, and YoshihikoHoshino coordinated the work.
Acknowledgments
This work was supported in part by a Grant-in-Aid forResearch on Emerging and Reemerging Infectious Diseasesfrom the Ministry of Health, Labour, and Welfare ofJapan for Yoshihiko Hoshino (JP18fk0108075) and by aGrant-in-Aid for Scientific Research from the JapanSociety for the Promotion of Science for Mamiko Niki andYoshihiko Hoshino.
Supplementary Materials
Supplementary 1. Supplemental Figure 1: (A) IgG responsesto Mtb antigens. Levels of serum IgG against 7 antigens(ESAT-6, CFP-10, MDP1, Ag85A, Acr, HBHA, and HrpA)before treatment (labeled as “before”) and after treatment(labeled as “after”) were analyzed by ELISA. Data shownare the average of triplicate experiments. Vertical lines: meanvalues. (B) IgG avidity index to Mtb antigens. Levels of serumIgG avidity index against 7 antigens (ESAT-6, CFP-10,MDP1, Ag85A, Acr, HBHA, and HrpA) before treatment(labeled as “before”) and after treatment (labeled as “after”)were analyzed by Urea ELISA. Data shown are the aver-age of triplicate experiments. Vertical lines: mean values,∗∗p < 0 01 and ∗p < 0 05. Supplemental Figure 2: (A) IgAresponses to Mtb antigens. Levels of serum IgA against 7antigens (ESAT-6, CFP-10, MDP1, Ag85A, Acr, HBHA,and HrpA) before treatment (labeled as “before”) and aftertreatment (labeled as “after”) were analyzed by ELISA. Datashown are the average of triplicate experiments. Verticallines: mean values. (B) IgA avidity index to Mtb antigens.Levels of serum IgA avidity index against 7 antigens (ESAT-6,
8 Journal of Immunology Research

CFP-10, MDP1, Ag85A, Acr, HBHA, and HrpA) beforetreatment (labeled as “before”) and after treatment (labeledas “after”) were analyzed by Urea ELISA. Data shown arethe average of triplicate experiments. Vertical lines:mean values.
Supplementary 2. Supplemental Table 1: antibody responsesin individuals.
References
[1] A.-L. Bañuls, A. Sanou, N. T. Van Anh, and S. Godreuil,“Mycobacterium tuberculosis: ecology and evolution of ahuman bacterium,” Journal of Medical Microbiology, vol. 64,no. 11, pp. 1261–1269, 2015.
[2] T. H. M. Ottenhoff and S. H. E. Kaufmann, “Vaccines againsttuberculosis: where are we and where do we need to go?,” PLoSPathogens, vol. 8, no. 5, article e1002607, 2012.
[3] A. M. Cooper, “Cell-mediated immune responses in tubercu-losis,” Annual Review of Immunology, vol. 27, no. 1, pp. 393–422, 2009.
[4] R. A. Seder and A. V. S. Hill, “Vaccines against intracellularinfections requiring cellular immunity,” Nature, vol. 406,no. 6797, pp. 793–798, 2000.
[5] N. P. Goonetilleke, H. McShane, C. M. Hannan, R. J.Anderson, R. H. Brookes, and A. V. S. Hill, “Enhancedimmunogenicity and protective efficacy against Mycobacte-rium tuberculosis of bacille Calmette-Guérin vaccine usingmucosal administration and boosting with a recombinantmodified vaccinia virus Ankara,” Journal of Immunology,vol. 171, no. 3, pp. 1602–1609, 2003.
[6] H. McShane, A. A. Pathan, C. R. Sander et al., “Recombinantmodified vaccinia virus Ankara expressing antigen 85A boostsBCG-primed and naturally acquired antimycobacterialimmunity in humans,” Nature Medicine, vol. 10, no. 11,pp. 1240–1244, 2004.
[7] M. D. Tameris, M. Hatherill, B. S. Landry et al., “Safety andefficacy of MVA85A, a new tuberculosis vaccine, in infantspreviously vaccinated with BCG: a randomised, placebo-controlled phase 2b trial,” The Lancet, vol. 381, no. 9871,pp. 1021–1028, 2013.
[8] R. Sun, Y. A. W. Skeiky, A. Izzo et al., “Novel recombinantBCG expressing perfringolysin O and the over-expression ofkey immunodominant antigens; pre-clinical characterization,safety and protection against challenge with Mycobacteriumtuberculosis,” Vaccine, vol. 27, no. 33, pp. 4412–4423, 2009.
[9] D. F. Hoft, A. Blazevic, A. Selimovic et al., “Safety and immu-nogenicity of the recombinant BCG vaccine AERAS-422 inhealthy BCG-naïve adults: a randomized, active-controlled,first-in-human phase 1 trial,” eBioMedicine, vol. 7, pp. 278–286, 2016.
[10] J. M. Achkar, E. Jenny-Avital, X. Yu et al., “Antibodies againstimmunodominant antigens of Mycobacterium tuberculosis insubjects with suspected tuberculosis in the United States com-pared by HIV status,” Clinical and Vaccine Immunology,vol. 17, no. 3, pp. 384–392, 2010.
[11] K. R. Steingart, N. Dendukuri, M. Henry et al., “Performanceof purified antigens for serodiagnosis of pulmonary tuberculo-sis: a meta-analysis,” Clinical and Vaccine Immunology,vol. 16, no. 2, pp. 260–276, 2009.
[12] S. J. Culkin, T. Rhinehart-Jones, and K. L. Elkins, “A novel rolefor B cells in early protective immunity to an intracellular
pathogen, Francisella tularensis strain LVS,” Journal of Immu-nology, vol. 158, pp. 3277–3284, 1997.
[13] J. Langhorne, C. Cross, E. Seixas, C. Li, and T. von der Weid,“A role for B cells in the development of T cell helper functionin a malaria infection in mice,” Proceedings of the NationalAcademy of Sciences of the United States of America, vol. 95,no. 4, pp. 1730–1734, 1998.
[14] P. Mastroeni, C. Simmons, R. Fowler, C. E. Hormaeche, andG. Dougan, “Igh-6−/− (B-cell-deficient) mice fail to mountsolid acquired resistance to oral challenge with virulent Salmo-nella enterica serovar typhimurium and show impaired Th1T-cell responses to Salmonella antigens,” Infection andImmunity, vol. 68, no. 1, pp. 46–53, 2000.
[15] A. Casadevall, “Antibody-mediated immunity against intracel-lular pathogens: two-dimensional thinking comes full circle,”Infection and Immunity, vol. 71, no. 8, pp. 4225–4228, 2003.
[16] L. Kozakiewicz, J. Phuah, J. Flynn, and J. Chan, “The role of Bcells and humoral immunity in Mycobacterium tuberculosisinfection,” Advances in Experimental Medicine and Biology,vol. 783, pp. 225–250, 2013.
[17] R. Wahid, S. J. Zafar, M. A. McArthur, M. F. Pasetti, M. M.Levine, andM. B. Sztein, “Live oral Salmonella enterica serovarTyphi vaccines Ty21a and CVD 909 induce opsonophagocyticfunctional antibodies in humans that cross-react with S.Paratyphi A and S. Paratyphi B,” Clinical and VaccineImmunology, vol. 21, no. 3, pp. 427–434, 2014.
[18] F. Bowe, E. C. Lavelle, E. A. McNeela et al., “Mucosal vaccina-tion against serogroup B meningococci: induction of bacteri-cidal antibodies and cellular immunity following intranasalimmunization with NadA of Neisseria meningitidis andmutants of Escherichia coli heat-labile enterotoxin,” Infectionand Immunity, vol. 72, no. 7, pp. 4052–4060, 2004.
[19] S. A. Khan, C. Waugh, G. Rawlinson et al., “Vaccination ofkoalas (Phascolarctos cinereus) with a recombinant chlamydialmajor outer membrane protein adjuvanted with poly I:C, ahost defense peptide and polyphosphazine, elicits strongand long lasting cellular and humoral immune responses,”Vaccine, vol. 32, no. 44, pp. 5781–5786, 2014.
[20] M. Mizutani, M. Iyori, A. M. Blagborough et al., “Baculovirus-vectored multistage Plasmodium vivax vaccine induces bothprotective and transmission-blocking immunities againsttransgenic rodent malaria parasites,” Infection and Immunity,vol. 82, no. 10, pp. 4348–4357, 2014.
[21] D. B. Rawool, C. Bitsaktsis, Y. Li et al., “Utilization of Fcreceptors as a mucosal vaccine strategy against an intracellularbacterium, Francisella tularensis,” Journal of Immunology,vol. 180, no. 8, pp. 5548–5557, 2008.
[22] J. M. Achkar and A. Casadevall, “Antibody-mediated immu-nity against tuberculosis: implications for vaccine develop-ment,” Cell Host & Microbe, vol. 13, no. 3, pp. 250–262, 2013.
[23] N. Olivares, B. Marquina, D. Mata-Espinoza et al., “Theprotective effect of immunoglobulin in murine tuberculosis isdependent on IgG glycosylation,” Pathogens and Disease,vol. 69, no. 3, pp. 176–183, 2013.
[24] N. Alvarez, O. Otero, F. Camacho et al., “Passive administra-tion of purified secretory IgA from human colostrum inducesprotection against Mycobacterium tuberculosis in a murinemodel of progressive pulmonary infection,” BMC Immunol-ogy, vol. 14, article S3, Supplement 1, 2013.
[25] B. Hamasur,M.Haile, A. Pawlowski, U. Schroder, G. Kallenius,and S. B. Svenson, “A mycobacterial lipoarabinomannanspecific monoclonal antibody and its F(ab′)2 fragment prolong
9Journal of Immunology Research

survival of mice infected with Mycobacterium tuberculosis,”Clinical & Experimental Immunology, vol. 138, no. 1,pp. 30–38, 2004.
[26] P. B. Kang, A. K. Azad, J. B. Torrelles et al., “The human mac-rophage mannose receptor directsMycobacterium tuberculosislipoarabinomannan-mediated phagosome biogenesis,” TheJournal of Experimental Medicine, vol. 202, no. 7, pp. 987–999, 2005.
[27] M. Baccard-Longere, F. Freymuth, D. Cointe, J. M. Seigneurin,and L. Grangeot-Keros, “Multicenter evaluation of a rapid andconvenient method for determination of cytomegalovirusimmunoglobulin G avidity,” Clinical and Diagnostic Labora-tory Immunology, vol. 8, no. 2, pp. 429–431, 2001.
[28] K. N. Ward, D. J. Turner, X. C. Parada, and A. D. Thiruchel-vam, “Use of immunoglobulin G antibody avidity for differen-tiation of primary human herpesvirus 6 and 7 infections,”Journal of Clinical Microbiology, vol. 39, no. 3, pp. 959–963,2001.
[29] W. R. Usinger and A. H. Lucas, “Avidity as a determinant ofthe protective efficacy of human antibodies to pneumococcalcapsular polysaccharides,” Infection and Immunity, vol. 67,no. 5, pp. 2366–2370, 1999.
[30] M. M. Alam, M. Arifuzzaman, S. M. Ahmad et al., “Study ofavidity of antigen-specific antibody as a means of understand-ing development of long-term immunological memory afterVibrio cholerae O1 infection,” Clinical and Vaccine Immunol-ogy, vol. 20, no. 1, pp. 17–23, 2013.
[31] L. M. Arias-Bouda, S. Kuijper, A. Van der Werf, L. N. Nguyen,H. M. Jansen, and A. H. Kolk, “Changes in avidity and level ofimmunoglobulin G antibodies to Mycobacterium tuberculosisin sera of patients undergoing treatment for pulmonarytuberculosis,” Clinical and Diagnostic Laboratory Immunol-ogy, vol. 10, no. 4, pp. 702–709, 2003.
[32] M. Boxus, L. Lockman, M. Fochesato, C. Lorin, F. Thomas,and S. L. Giannini, “Antibody avidity measurements in recip-ients of Cervarix® vaccine following a two-dose schedule or athree-dose schedule,” Vaccine, vol. 32, no. 26, pp. 3232–3236,2014.
[33] C. A. Siegrist, M. Pihlgren, C. Tougne et al., “Co-administra-tion of CpG oligonucleotides enhances the late affinity matura-tion process of human anti-hepatitis B vaccine response,”Vaccine, vol. 23, no. 5, pp. 615–622, 2004.
[34] C. L. Vermont, H. H. van Dijken, C. J. van Limpt, R. de Groot,L. van Alphen, and G. P. van Den Dobbelsteen, “Antibodyavidity and immunoglobulin G isotype distribution followingimmunization with a monovalent meningococcal B outermembrane vesicle vaccine,” Infection and Immunity, vol. 70,no. 2, pp. 584–590, 2002.
[35] Y. Schlesinger, D. M. Granoff, T. V. Murphy et al., “Avidityand bactericidal activity of antibody elicited by differentHaemophilus influenzae type b conjugate vaccines,” JAMA,vol. 267, no. 11, pp. 1489–1494, 1992.
[36] M. Niki, M. Suzukawa, S. Akashi et al., “Evaluation of humoralimmunity to Mycobacterium tuberculosis-specific antigens forcorrelation with clinical status and effective vaccine develop-ment,” Journal of Immunology Research, vol. 2015, Article ID527395, 13 pages, 2015.
[37] K. Sasaki, “Molecular cytogenetic analysis of cancer of thedigestive system and its clinical application,” Nihon NaikaGakkai Zasshi, vol. 91, pp. 94–99, 2002.
[38] M. Legesse, G. Ameni, G. Medhin et al., “IgA response toESAT-6/CFP-10 and Rv2031 antigens varies in patients with
culture-confirmed pulmonary tuberculosis, healthy Mycobac-terium tuberculosis–infected and non-infected individuals ina tuberculosis endemic setting, Ethiopia,” ScandinavianJournal of Immunology, vol. 78, no. 3, pp. 266–274, 2013.
[39] K. Lyashchenko, R. Colangeli, M. Houde, H. Al Jahdali,D. Menzies, and M. L. Gennaro, “Heterogeneous antibodyresponses in tuberculosis,” Infection and Immunity, vol. 66,no. 8, pp. 3936–3940, 1998.
[40] U. Demkow, M. Filewska, D. Michalowska-Mitczuk et al.,“Heterogeneity of antibody response to myobacterial antigensin different clinical manifestations of pulmonary tuberculosis,”Journal of Physiology and Pharmacology, vol. 58, Supplement5, pp. 117–127, 2007.
[41] G. R. Stewart, S. M. Newton, K. A. Wilkinson et al., “Thestress-responsive chaperone α-crystallin 2 is required for path-ogenesis ofMycobacterium tuberculosis,”Molecular Microbiol-ogy, vol. 55, no. 4, pp. 1127–1137, 2005.
[42] J. T. Belisle, V. D. Vissa, T. Sievert, K. Takayama, P. J. Brennan,and G. S. Besra, “Role of the major antigen of Mycobacteriumtuberculosis in cell wall biogenesis,” Science, vol. 276, no. 5317,pp. 1420–1422, 1997.
[43] M. Furugen, S. Matsumoto, T. Matsuo, M. Matsumoto, andT. Yamada, “Identification of the mycobacterial DNA-binding protein 1 region which suppresses transcriptionin vitro,” Microbial Pathogenesis, vol. 30, no. 3, pp. 129–138,2001.
[44] M. Osada-Oka, Y. Tateishi, Y. Hirayama et al., “Antigen85A and mycobacterial DNA-binding protein 1 are targetsof immunoglobulin G in individuals with past tuberculosis,”Microbiology and Immunology, vol. 57, no. 1, pp. 30–37,2013.
[45] K. Pethe, S. Alonso, F. Biet et al., “The heparin-binding hae-magglutinin of M. tuberculosis is required for extrapulmon-ary dissemination,” Nature, vol. 412, no. 6843, pp. 190–194,2001.
[46] S. L. Mueller-Ortiz, A. R. Wanger, and S. J. Norris, “Mycobac-terial protein HbhA binds human complement componentC3,” Infection and Immunity, vol. 69, no. 12, pp. 7501–7511,2001.
[47] S. Kunnath-Velayudhan, A. L. Davidow, H. Y. Wang et al.,“Proteome-scale antibody responses and outcome ofMycobac-terium tuberculosis infection in nonhuman primates and intuberculosis patients,” The Journal of Infectious Diseases,vol. 206, no. 5, pp. 697–705, 2012.
[48] Y. G. Hur, A. Kim, Y. A. Kang et al., “Evaluation of antigen-specific immunoglobulin g responses in pulmonary tuberculo-sis patients and contacts,” Journal of Clinical Microbiology,vol. 53, no. 3, pp. 904–909, 2015.
[49] Y. Fujita, T. Doi, K. Sato, and I. Yano, “Diverse humoralimmune responses and changes in IgG antibody levels againstmycobacterial lipid antigens in active tuberculosis,”Microbiol-ogy, vol. 151, no. 6, pp. 2065–2074, 2005.
[50] X. Li, H. Xu, S. Jiang et al., “TB-SA antibody test for diagnosisand monitoring treatment outcome of sputum smear negativepulmonary tuberculosis patients,” The Southeast Asian Journalof Tropical Medicine and Public Health, vol. 42, no. 5,pp. 1147–1153, 2011.
[51] E. Stylianou, G. R. Diogo, I. Pepponi et al., “Mucosal deliveryof antigen-coated nanoparticles to lungs confers protectiveimmunity against tuberculosis infection in mice,” EuropeanJournal of Immunology, vol. 44, no. 2, pp. 440–449, 2014.
10 Journal of Immunology Research

[52] N. Zimmermann, V. Thormann, B. Hu et al., “Human isotype‐dependent inhibitory antibody responses against Mycobacte-rium tuberculosis,” EMBO Molecular Medicine, vol. 8, no. 11,pp. 1325–1339, 2016.
[53] C. C. Perley, M. Frahm, E. M. Click et al., “The human anti-body response to the surface of Mycobacterium tuberculosis,”PLoS One, vol. 9, no. 6, article e98938, 2014.
[54] M. E. Lamm, “Interaction of antigens and antibodies atmucosal surfaces,” Annual Review of Microbiology, vol. 51,no. 1, pp. 311–340, 1997.
[55] A. Rodriguez, A. Tjarnlund, J. Ivanji et al., “Role of IgA in thedefense against respiratory infections: IgA deficient miceexhibited increased susceptibility to intranasal infection withMycobacterium bovis BCG,” Vaccine, vol. 23, no. 20,pp. 2565–2572, 2005.
[56] A. Williams, R. Reljic, I. Naylor et al., “Passive protection withimmunoglobulin A antibodies against tuberculous early infec-tion of the lungs,” Immunology, vol. 111, no. 3, pp. 328–333,2004.
[57] D. Kaushal, T. W. Foreman, U. S. Gautam et al., “Mucosal vac-cination with attenuated Mycobacterium tuberculosis inducesstrong central memory responses and protects against tuber-culosis,” Nature Communications, vol. 6, no. 1, p. 8533, 2015.
[58] M. Ahmed, H. Jiao, R. Domingo-Gonzalez et al., “Rationalizeddesign of a mucosal vaccine protects against Mycobacteriumtuberculosis challenge in mice,” Journal of Leukocyte Biology,vol. 101, no. 6, pp. 1373–1381, 2017.
11Journal of Immunology Research
Research ArticleImmune Response and Partial Protection against HeterologousFoot-and-Mouth Disease Virus Induced by DendrimerPeptides in Cattle
I. Soria ,1,2 V. Quattrocchi,1 C. Langellotti,1,2M. Pérez-Filgueira ,1,2 J. Pega,1,2 V. Gnazzo,2
S. Romera,1,2 J. Schammas,1 D. Bucafusco,1,2 S. Di Giacomo,1 Beatriz G. de la Torre,3
D. Andreu ,3 F. Sobrino ,4 E. Blanco ,5 and P. Zamorano 1,2,6
1Instituto de Virología, Centro de Investigaciones en Ciencias Veterinarias, Instituto Nacional de Tecnología Agropecuaria (INTA)-Castelar, Buenos Aires, Argentina2Consejo Nacional de Investigaciones Científicas y Técnicas (CONICET), Buenos Aires, Argentina3Departament de Ciencies Experimentals i de la Salut, Universitat Pompeu Fabra, 08003 Barcelona, Spain4Centro de Biología Molecular Severo Ochoa (CSIC-UAM), 28049 Madrid, Spain5Centro de Investigación en Sanidad Animal (CISA-INIA), Valdeolmos, 28130 Madrid, Spain6Universidad del Salvador, Buenos Aires, Argentina
Correspondence should be addressed to I. Soria; [email protected], F. Sobrino; [email protected],and P. Zamorano; [email protected]
Received 15 May 2017; Revised 8 November 2017; Accepted 29 November 2017; Published 18 April 2018
Academic Editor: Pedro A. Reche
Copyright © 2018 I. Soria et al. This is an open access article distributed under the Creative Commons Attribution License, whichpermits unrestricted use, distribution, and reproduction in any medium, provided the original work is properly cited.
Synthetic peptides mimicking protective B- and T-cell epitopes are good candidates for safer, more effective FMD vaccines.Nevertheless, previous studies of immunization with linear peptides showed that they failed to induce solid protection in cattle.Dendrimeric peptides displaying two or four copies of a peptide corresponding to the B-cell epitope VP1 [136–154] of type OFMDV (O/UKG/11/2001) linked through thioether bonds to a single copy of the T-cell epitope 3A [21–35] (termed B2Tand B4T, resp.) afforded protection in vaccinated pigs. In this work, we show that dendrimeric peptides B2T and B4T canelicit specific humoral responses in cattle and confer partial protection against the challenge with a heterologous type O virus(O1/Campos/Bra/58). This protective response correlated with the induction of specific T-cells as well as with an anamnesticantibody response upon virus challenge, as shown by the detection of virus-specific antibody-secreting cells (ASC) in lymphoidtissues distal from the inoculation point.
1. Background
The foot-and-mouth-disease virus (FMDV) causes a highlycontagious disease with high morbidity in cloven-hoofed ani-mals, including cattle and swine. FMDV can be controlled bythe use of a chemically inactivated whole-virus vaccine; how-ever, some disadvantages are associated with the use of
inactivated vaccine. For example, the vaccine providesshort-term protection, resulting in the need for revaccination[1], and there is a risk of the infectious virus being releasedduring vaccine production. Therefore, a number of countrieswith large livestock industries have abandoned vaccination.However, this policy leaves livestock herds prone to suddenoutbreaks of FMD, with dramatic effects on livestock
HindawiJournal of Immunology ResearchVolume 2018, Article ID 3497401, 12 pageshttps://doi.org/10.1155/2018/3497401

economy and animal welfare, as seen in the United Kingdomin 2001 [2, 3] and in turn has led to intensive research onalternative vaccination strategies.
The FMD viral particle consists of a positive-strand RNAgenome, a single open reading frame (ORF) which encodesfour capsid proteins, VP1, VP2, VP3, and VP4, and elevendifferent mature nonstructural proteins (NSP).
The B-cell binding site located in the G-H loop (aroundresidues 140–160) of FMDV VP1 protein has been identifiedas a predominant epitope that elicits neutralizing antibodiesagainst this virus in natural hosts and animal models [4, 5].A T-cell epitope, located at residues 21 to 35 of FMDV NSP3A, efficiently stimulates lymphocytes from pigs infectedwith a type C virus [6].
The current inactivated FMD vaccines only promoteserological protection against a given FMDV serotype, donot confer interserotype protection, and may not, in somecases, confer intraserotype protection given the antigenicvariation existing within some serotypes [7]. Additionally,these vaccines present other shortcomings, such as possibleincomplete inactivation of virus, need for biosafety level 4(BSL-4 OIE) laboratories, and requirement for a cold chainto preserve virus stability. On the other hand, the vaccinevirus must be purified enough as not to induce detectableantibodies against viral NSP to allow a distinction betweenvaccinated and infected animals [8].
Peptide vaccines are an attractive alternative strategythat relies on the usage of short peptide fragments to engi-neer the induction of highly targeted immune responses,consequently avoiding allergenic and/or reactogenicsequences [9]. Various synthetic peptide or recombinantprotein vaccines based on the FMDV VP1 G-H loop havebeen shown effective in pigs [10–12], but they have shownlimited efficacy in cattle [13–15], pointing to the limitationsof these vaccines in eliciting broad protective responsesin different hosts. Synthetic peptides are particularlyattractive FMDV vaccine candidates as they are highlypure, defined, stable, and safe, and due to their modularapproach, they can incorporate different B- and T-cellpeptides [9, 16].
Multiple antigenic peptides (MAPs) are dendrimeric(branched) macromolecules built from a lysine core fromwhich a defined number of epitopes radiate [17, 18]. An effec-tive peptide vaccine needs a B-cell epitope to elicit a high neu-tralizing antibody response and a T-cell epitope to provideadequate cooperation between T-cells and B-lymphocytes.
The dendrimeric peptide design improves the effective-ness of viral antigenic site presentation to the immunesystem. Recent studies indicate that vaccination with dendri-meric peptides based on the amino acid sequence of 3A (T-cell epitope) and VP1 GH loop (B-cell epitope) from the typeO FMDV O/UKG/11/2001, and branched by means ofthioether or maleimide conjugation chemistries, elicits animmune response that achieved protection in up to 100% ofthe vaccinated pigs [16]. Likewise, we recently reported thatsimilar dendrimeric peptides, based on the amino acidsequences from the type O FMDV O1/Campos/Bra/58,including a VP4 sequence as T-cell epitope, can protect cattleagainst homologous challenge [19].
The aim of this study was to investigate whether dendri-meric peptides elicited protection against heterologousviruses, a relevant issue for efficient vaccine design. To thisend, the immune response elicited in cattle by dendrimerscontaining amino acid sequences of 3A and VP1 GH loopfrom type O FMDV O/UKG/11/2001, B2T and B4T, andthe protection they afforded against the heterologous typeO virus O1/Campos/Bra/58, was analyzed.
Our results indicate that B2T and B4T elicited specifichumoral responses in cattle and conferred partial protectionagainst the challenge with a heterologous virus O1/Campos/Bra/58. This protective response correlated with the induc-tion of FMDV-specific T-cells as well as with an anamnesticantibody response upon virus challenge, as shown by thedetection of virus-specific ASC in lymphoid tissues distalfrom the inoculation point.
2. Material and Methods
2.1. Peptides. The dendrimeric peptides reproduced the B-cell(PVTNVRGDLQVLAQKAART, residues 136–154 of VP1)and T-cell (AAIEFFEGMVHDSIK, residues 21–35 of 3A)epitopes of FMDV O-UKG 11/01 (Figure 1). As detailed in[19], B2T and B4T constructions were assembled by conjuga-tion of a T-epitope N terminally elongated with Lys residuesproviding 2 or 4 levels of branching and functionalized withchloroacetyl units and an N-acetylated B epitope with a C-terminal Cys whose thiol group reacts with the chloroacetylgroup to give a thioether link. Additional details on the syn-thesis are available in previously published works [11, 20].The final products were purified to near homogeneity byHPLC and characterized by mass spectrometry.
2.2. Virus. FMDV O1/Campos/Bra/58 was kindly providedby Biogenesis Bagó SA as binary ethylene-imine (BEI) inacti-vated (iFMDV). Purified virus was obtained by a sucrosedensity gradient centrifugation method [21] and was usedfor ELISA and lymphoproliferation assay. For challengingand virus neutralization assays, infective FMDV O1/Cam-pos/Bra/58 (kindly donated by the Argentine NationalService of Animal Health) was used in BSL-4 OIE laborato-ries and boxes at INTA. The sequence corresponding to theB-cell epitope of VP1 from FMDVO1/Campos/Bra/58 (140–158) comprises the amino acid residues AVPNVRGDLQV-LAQKVART. The amino acids that differ between strainsO1/Campos/Bra/58 and O/UKG/11/2001 are those corre-sponding to positions 140, 142, and 156 (indicated with theitalic and bold formats).
A virus stock derived from FMDV isolated O/UKG/11/2001 (The Pirbright Institute, UK) by two amplifications inswine kidney cells was used in the virus neutralization assays.
2.3. Animals, Vaccines, Immunization, Infection, andSampling of Cattle. Ten Hereford calves serologically nega-tive for FMDV, approximately 6 months old, were used inthe experiment. Groups of four animals were inoculatedtwice (days 0 and 18), by subcutaneous injection in the frontleft quarter, with 2mg of B2T or B4T peptide in 2ml of awater-in-oil single emulsion. The adjuvant included was the
2 Journal of Immunology Research

same contained in commercial vaccines. At 38 days post-vaccination (dpv), the animals were challenged by nasalinstillation with 1ml (0.5ml for each nostril) of 10000 of50% bovine infective doses (BID50) of infective FMDV O1/Campos/Bra/58 (determined by titration on cattle tongue)[22–26]. This method is intended to mimic a natural FMDVinfection [27]. Control unvaccinated bovines (n = 2) werechallenged at the same time, and the same procedure wasfollowed. All animals were monitored for 7 days for theemergence of FMD clinical signs and then were euthanized.The clinical score was determined by the number of feet pre-senting FMD lesions (with score one for each foot withlesions typical of FMDV) plus the presence of vesicles inthe snout (score one) and/or mouth (score one), 6 being themaximum score.
Seven days postchallenge (dpc), all animals were checkedfor FMDV-induced lesions on the feet and tongue. Bovineswith the absence of FMDV-induced lesions at the feet wereconsidered as protected to podal generalization (PPG), while,animals with a delay in the onset of symptoms were consid-ered partially protected (PP). At 7 dpc, different lymphoidorgans were obtained postmortem from each animal: man-dibular lymph nodes (ML), medial retropharyngeal lymphnodes (MRL), and tracheobronchial lymph nodes (TBL).All lymphoid organs were collected aseptically and placedin ice-cold wash buffer (RPMI 1640, 10mM HEPES,100U/ml penicillin G sodium, 100μg/ml streptomycin,and 20μg/ml gentamicin) until processing.
Another five calves were immunized by subcutaneousinjection with a single dose of commercial FMDV vaccine(water-in-oil single emulsion containing FMDV strains AArg 2000, A Arg 2001, A24 Cruzeiro, and O1 Campos). This
vaccine has been approved by the Argentine AnimalHealth Service (SENASA) with more than 80% of expectedpercentage of protection against all vaccine strains [28].Experiments were performed according to the INTA ethicsmanual Guide for the Use and Care of Experimental Animals.The protocol was approved by the Institutional Animal Careand Use Committee (CICUAE INTA CICVyA) (PermitNumber: 14/2011).
2.4. Measurement of Anti-Dendrimer and Anti-FMDVAntibodies. For the estimation of the immune response elic-ited by the dendrimers, we followed the methods of Soriaet al. [19]. An indirect ELISA was used for anti-dendrimerantibodymeasurement. MaxiSorp 96-well plates (Nunc) werecoated with B4T peptide (30μg/ml), the plates were washedand blockedwithPBST-OVA1%, anddilutions of serumsam-ples were added. After incubation, the plates were washed andhorseradish peroxidase- (HRP-) labeled goat anti-bovine IgGantibody (KPL,USA)was added.Afterwashing, ortho-pheny-lenediamine- (OPD-) H2O2 was added as HRP substrate.
FMDV-specific antibodies were detected by means of anindirect ELISA, as described by Quattrocchi et al. [29].Briefly, Immulon II 96-well ELISA plates were coated with2.6μg/ml FMDV O1/Campos/Bra/58 and processed asdescribed above.
The antiviral ELISA detailed above was modified in orderto detect FMDV-specific IgG1 and IgG2 (in sera) and IgG1and IgA (in nasal swabs) antibodies. After incubation withsamples, a mouse anti-bovine IgG1, IgG2, or IgAmonoclonalantibody was added (kindly provided by Dr. S. Srikumaran,University of Nebraska, USA). Lastly, a (HRP)-labeled goatanti-mouse IgG antibody was added after wash. OPD was
Lys-Lys-Lys-
Peptide General structure
B4T
B2T
B epitope
B epitope
B epitope
B epitope
B epitope
B epitope
Lys-Lys-Lys-
T epitope
T epitope
Lys
Lys
In both cases, epitope B = acetyl-PVTNVRGDLQVLAQKAARTC and epitope T = AAIEFFEGMVHDSIK (bothin C-terminal carboxamide form). The C-terminal Cys side chain thiol is linked to Lys via a 3-maleimidopropionic
acid unit OO
=( )N
O
Figure 1: Dendrimeric peptides used in this study.
3Journal of Immunology Research

used as HRP substrate. Absorbance was recorded at 492 nm(A492) in a microplate photometer (Multiskan FC, Thermo).The cut-off was established as the mean A492 of the negativesera (from all unvaccinated animals) plus two standard devi-ations (SD). Antibody titres were calculated for IgG1 andIgG2 as log10 of the last reciprocal dilution above cut-off.IgA levels were expressed as the ratio between the ODA492 of the nasal swabs from 22dpv to 0 dpv. Positive con-trol sera were included in every plate.
2.5. Neutralizing Index. The neutralizing index (NI) of serum(variable virus and fixed serum) from cattle immunized withB2T, B4T, or conventional vaccine, at 38 dpv (upon 2 doses ofpeptide), was measured. A 1/16 serum dilution was incubatedwith 10-fold dilutions of infective FMDV (1000 to 1 of 50%tissue culture infective dose—TCID50), and the infectivevirus recovered was determined by a TCID50 assay. The NIof a serum was calculated as the ratio between the titres ofthe virus in the presence of vaccinated animal serum and inthe presence of a negative serum. The results were expressedas log10 of NI.
2.6. Neutralizing Antibody Titres. Serum samples were exam-ined for anti-FMDV neutralizing antibodies (fixed virus andvariable serum) as described before [29]. Briefly, serialdilutions (from 1/4 to 1/512) of inactivated sera were incu-bated for 1 h at 37°C with 100 TCID50 of infective FMDVO/UKG/11/2001 or O1/Campos/Bra/58. Then virus-serummixtures were seed on BHK-21 monolayers. After 40min at37°C, fresh MEM-D/2% fetal calf serum was added to themonolayers and incubated at 37°C, under 5% CO2. Cyto-pathic effects were observed after 48 h. Titres of virus neutral-izing antibodies (VNT) were expressed as log10 of thereciprocal of the serum dilution, which neutralizes 50% of100 TCID50 FMDV.
2.7. Lymphoproliferation Assay. Peripheral blood mononu-clear cells (PBMC) were obtained from cattle as described[30]. To this end, 100μl of 2.5× 10⁶ cells/ml suspension wereadded to 96-well plate containing (i) 5μg/ml iFMDV; (ii)50μg/ml of B2T, B4T, or T peptides; and (iii) 5μg/ml conca-navalin A (Sigma-Aldrich, St. Louis, MO) and the cells wereincubated at 37°C in 5% CO2 atmosphere for 4 days. Duringthe last 18 h of culture, 1μCi [3H]-thymidine (sp. act. 20Ci(740Gbq)/mMol; PerkinElmer) was added to each well. Cellswere collected using a semiautomatic harvester (Skatron),and the incorporation of radioactivity into the DNA wasmeasured by liquid scintillation counting with a counter unit(Wallac 1414, PerkinElmer) that was controlled by the Win-Spectral software system. Results were expressed as stimula-tion index (SI). The SI was calculated as the cpm ofantigen-specific proliferation/cpm of cell basal proliferation(in the absence of antigen).
2.8. Interferon-Gamma Detection. PBMC were cultured witheither 50μg/ml of B2T, B4T, or T peptides or with 5μg/mliFMDV for 72h. Supernatants were analyzed using ELISAas described previously [30]. Briefly, plates were coated witha mAb against interferon-gamma (IFN-γ) (kindly donatedby Dr. L. Babiuk). Samples and recombinant IFN-γ standard
(Serotec, UK) were added, and IFN was detected using rabbitpolyclonal anti-IFN-γ antibodies. After incubation, biotinyl-ated goat anti-rabbit IgG antibody was added and then HRP-conjugated streptavidin (KPL, USA) was added. The plateswere washed, incubated with (OPD)-H2O2, and read at492 nm. The IFN-γ concentration was calculated from inter-polation of data in the standard curve.
2.9. ELISPOT Assay for FMDV-Specific ASC. Mononuclearcell (MNC) suspensions were obtained from lymphoidtissues as previously described [31]. A FMDV-ASC ELISPOTassay was developed for this study. Ninety-six-well nitrocel-lulose plates (Millipore, MA) were coated overnight with2.4μg/well inactivated purified FMDV O1/Campos/Bra/58and blocked with 4% skim milk for 1 h at room temperature(RT). MNC were seeded in FMDV-coated plates in 2-folddilutions (2.5× 10⁵ and 1.25× 10⁵ cells per well) in triplicate,and wells were incubated overnight at 37°C with 5% CO2.After 5 washes with phosphate-buffered saline (PBS), mouseanti-bovine IgG1 or IgG2 monoclonal antibodies (BD-Sero-tec, Oxford, UK) were added (1 : 500 dilution) and incubatedfor 1 h at RT. Reactions were revealed with anti-mouse IgG(HRP)-labeled conjugate (KPL, UK) for 1 h at RT, followedby the addition of TrueBlue peroxidase substrate (KPL,UK). IgM and IgA ASC were detected with HRP-labeledsheep anti-bovine IgM and IgA sera (Bethyl), diluted1 : 5.000, and revealed as described above. Spots correspond-ing to ASC were visualized and counted manually under astereomicroscope. Spots from control wells were subtractedfrom experimental wells, and results were expressed, unlessotherwise indicated, as the mean number of ASC per1× 106 cells for triplicate wells.
2.10. Statistical Analysis. The InfoStat program was used.One-way analysis of variance (ANOVA) and posttests wereused to compare data between three or more groups.
3. Results
3.1. B2T and B4T Induce Anti-Peptide and FMDV-SpecificAntibodies in Cattle. At 38 dpv, all animals inoculated witheither B2T or B4T constructs developed specific and pro-nounced anti-peptide (Figure 2(a)) as well as anti-FMDVtotal IgG (Figure 2(b)) and IgG1 responses (Figure 2(c)).
At 38 dpv, high anti-FMDV IgG titres were detected in allanimals with an average titre of 3.4± 0.4 and 3.3± 0.3 in B2Tand B4T groups, respectively (Figure 2(b)). However, someanimals showed a significant increase in IgG titre only afterthe second peptide dose (168, 164, and 166), while the otherswere able to achieve high IgG titres since the first immuniza-tion. Lastly, the results showed that the anti-FMDV IgG1 wasthe predominant isotype in all vaccinated animals given thatthere was a minor difference between total IgG and IgG1,and low levels of specific FMDV IgG2 were detected inB2T and B4T groups with average antibody titres of 1.1± 0.3and 1.9± 0.7, respectively (data not shown).
3.2. FMDV-Specific Mucosal Immunity. Animals from theB4T group exhibited high levels of anti-FMDV IgG1 in nasalsecretions at 22 dpv, with the exception of bovine 166;
4 Journal of Immunology Research

however, at this time, animals from the B2T group did notpresent high anti-FMDV IgG1 titres (Figure 2(d)). WhenIgA was measured in nasal secretions, animals 44 and 170in the B2T group and 36 in the B4T group showed positiveanti-FMDV IgA levels, indicating that these peptide con-structs were able to induce not only systemic but also localmucosal immunity.
3.3. Analysis of the Neutralizing Capacity of the Sera. TheVNT against the homologous virus O/UKG/11/2001 weredetermined at 32 dpv, and average values of 1.2± 0.3 and1.3± 0.3 were found in the B2T and B4T groups, respectively(Table 1). Although the VNT against the heterologous type Ovirus (O1/Campos/Bra/58) was in the limit of the detectionthreshold, a log10 neutralization index with values of
1.3± 0.5 and 1.8± 0.7 could be determined for sera from ani-mals of the B2T and B4T groups, respectively (Table 1). Asexpected, no NI values were found in the preimmune sera(T = 0). The log10 NI of sera from 4 bovines vaccinatedwith commercial vaccine was 2.0± 0.3 (data not shown).
3.4. Specific Cellular Immune Response and IFN-γ Release inVaccinated Animals. Before challenge, at 32 dpv, specificin vitro lymphoproliferations were conducted using differentstimuli. Significant values of proliferation (SI ≥ 2) to the pep-tide used for immunization (B2T or B4T) were found in 2 outof 4 animals of the B2T group and in 3 out of 4 animals of theB4T group (Table 2(a)). Responses to dendrimers not usedfor immunization were similar to those achieved with theimmunizing peptide while the number of animals that
6.0
B2TB4T
5.55.04.54.03.53.02.52.01.51.00.50.0
0 18Days postvaccination
22
Sera
�훼-p
eptid
eIg
G ti
ter (
log 1
0)
32 38 0 18 22 32 38
(a)
B2T group B4T group
5.0
44168169170
36164166431
4.54.03.53.02.52.01.51.00.50.0
Days postvaccination
Sera
�훼-F
MD
VIg
G ti
tre lo
g(di
l−1)
0 18 22 32 38 0 18 22 32 38
(b)
6.05.55.04.54.03.53.02.52.01.51.00.50.0
Days postvaccination
Sera
�훼-F
MD
VIg
G ti
tre lo
g(di
l−1)
0 18 22 32 38 0 18 22 32 38
B2T group B4T group44168169170
36164166431
(c)
3.0 7.0
6.0
5.0
4.0
3.0
2.0
1.0
2.5
2.0
1.5
1.0
0.5
0.0B2T B4T B2T B4T
Nas
al �훼
-FM
DV
IgG
1 tit
re lo
g(di
l−1)
Nas
al �훼
-FM
DV
IgA
(OD
492n
mdp
v/O
D49
2nm
0dpv
)
(d)
Figure 2: Antibody detection by ELISA in vaccinated cattle. Animals were immunized on days 0 and 18 (arrow) with B2T or B4T vaccine. (a)Kinetics of anti-peptide serum antibodies. Bars represent the mean IgG titres from bovines in each group (gray, B2T; black, B4T) throughoutthe experiment (error marks, SD). (b, c) Kinetics of total IgG and IgG1 anti-FMDV O1/Campos/Bra/58 serum antibodies. Titres werecalculated as log10 of the last reciprocal dilution above cut-off. Data points represent the IgG titre (b) or IgG1 titre (c) from each animalrepresented by different shapes (right legend) throughout the experiment. (d) FMDV-specific mucosal IgG1 and IgA responses. Nasalswabs were collected at 22 dpv. Each point represents the nasal IgG1 anti-FMDV antibody titres (log10) (black) or IgA (gray) anti-FMDVO1/Campos/Bra/58 antibody level of each animal. The cut-off was established as the mean value of mock-vaccinated animals plus twicethe SD value (dotted line).
5Journal of Immunology Research
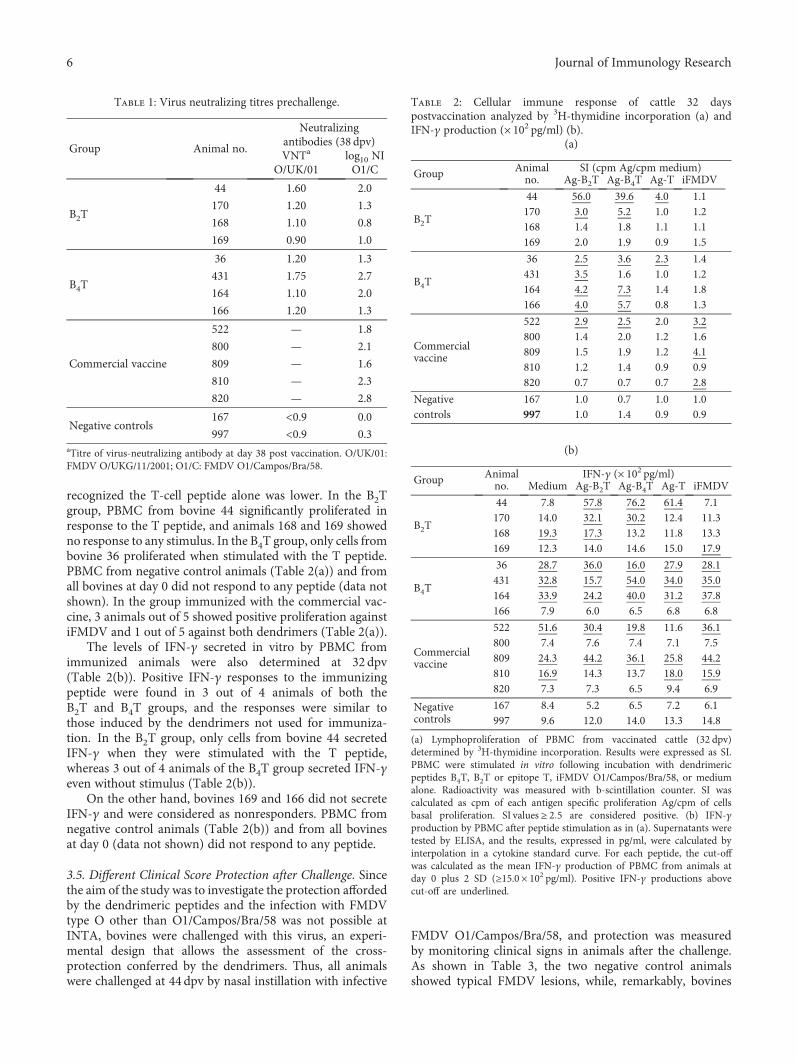
recognized the T-cell peptide alone was lower. In the B2Tgroup, PBMC from bovine 44 significantly proliferated inresponse to the T peptide, and animals 168 and 169 showedno response to any stimulus. In the B4T group, only cells frombovine 36 proliferated when stimulated with the T peptide.PBMC from negative control animals (Table 2(a)) and fromall bovines at day 0 did not respond to any peptide (data notshown). In the group immunized with the commercial vac-cine, 3 animals out of 5 showed positive proliferation againstiFMDV and 1 out of 5 against both dendrimers (Table 2(a)).
The levels of IFN-γ secreted in vitro by PBMC fromimmunized animals were also determined at 32 dpv(Table 2(b)). Positive IFN-γ responses to the immunizingpeptide were found in 3 out of 4 animals of both theB2T and B4T groups, and the responses were similar tothose induced by the dendrimers not used for immuniza-tion. In the B2T group, only cells from bovine 44 secretedIFN-γ when they were stimulated with the T peptide,whereas 3 out of 4 animals of the B4T group secreted IFN-γeven without stimulus (Table 2(b)).
On the other hand, bovines 169 and 166 did not secreteIFN-γ and were considered as nonresponders. PBMC fromnegative control animals (Table 2(b)) and from all bovinesat day 0 (data not shown) did not respond to any peptide.
3.5. Different Clinical Score Protection after Challenge. Sincethe aim of the study was to investigate the protection affordedby the dendrimeric peptides and the infection with FMDVtype O other than O1/Campos/Bra/58 was not possible atINTA, bovines were challenged with this virus, an experi-mental design that allows the assessment of the cross-protection conferred by the dendrimers. Thus, all animalswere challenged at 44 dpv by nasal instillation with infective
FMDV O1/Campos/Bra/58, and protection was measuredby monitoring clinical signs in animals after the challenge.As shown in Table 3, the two negative control animalsshowed typical FMDV lesions, while, remarkably, bovines
Table 1: Virus neutralizing titres prechallenge.
Group Animal no.
Neutralizingantibodies (38 dpv)VNTa
O/UK/01log10 NIO1/C
B2T
44 1.60 2.0
170 1.20 1.3
168 1.10 0.8
169 0.90 1.0
B4T
36 1.20 1.3
431 1.75 2.7
164 1.10 2.0
166 1.20 1.3
Commercial vaccine
522 — 1.8
800 — 2.1
809 — 1.6
810 — 2.3
820 — 2.8
Negative controls167 <0.9 0.0
997 <0.9 0.3aTitre of virus-neutralizing antibody at day 38 post vaccination. O/UK/01:FMDV O/UKG/11/2001; O1/C: FMDV O1/Campos/Bra/58.
Table 2: Cellular immune response of cattle 32 dayspostvaccination analyzed by 3H-thymidine incorporation (a) andIFN-γ production (× 102 pg/ml) (b).
(a)
Group Animalno.
SI (cpm Ag/cpm medium)Ag-B2T Ag-B4T Ag-T iFMDV
B2T
44 56.0 39.6 4.0 1.1170 3.0 5.2 1.0 1.2168 1.4 1.8 1.1 1.1169 2.0 1.9 0.9 1.5
B4T
36 2.5 3.6 2.3 1.4431 3.5 1.6 1.0 1.2164 4.2 7.3 1.4 1.8166 4.0 5.7 0.8 1.3
Commercialvaccine
522 2.9 2.5 2.0 3.2800 1.4 2.0 1.2 1.6809 1.5 1.9 1.2 4.1810 1.2 1.4 0.9 0.9820 0.7 0.7 0.7 2.8
Negative 167 1.0 0.7 1.0 1.0controls 997 1.0 1.4 0.9 0.9
(b)
Group Animalno.
IFN-γ (× 102 pg/ml)Medium Ag-B2T Ag-B4T Ag-T iFMDV
B2T
44 7.8 57.8 76.2 61.4 7.1170 14.0 32.1 30.2 12.4 11.3168 19.3 17.3 13.2 11.8 13.3169 12.3 14.0 14.6 15.0 17.9
B4T
36 28.7 36.0 16.0 27.9 28.1431 32.8 15.7 54.0 34.0 35.0164 33.9 24.2 40.0 31.2 37.8166 7.9 6.0 6.5 6.8 6.8
Commercialvaccine
522 51.6 30.4 19.8 11.6 36.1800 7.4 7.6 7.4 7.1 7.5809 24.3 44.2 36.1 25.8 44.2810 16.9 14.3 13.7 18.0 15.9820 7.3 7.3 6.5 9.4 6.9
Negativecontrols
167 8.4 5.2 6.5 7.2 6.1997 9.6 12.0 14.0 13.3 14.8
(a) Lymphoproliferation of PBMC from vaccinated cattle (32 dpv)determined by 3H-thymidine incorporation. Results were expressed as SI.PBMC were stimulated in vitro following incubation with dendrimericpeptides B4T, B2T or epitope T, iFMDV O1/Campos/Bra/58, or mediumalone. Radioactivity was measured with b-scintillation counter. SI wascalculated as cpm of each antigen specific proliferation Ag/cpm of cellsbasal proliferation. SI values ≥ 2 5 are considered positive. (b) IFN-γproduction by PBMC after peptide stimulation as in (a). Supernatants weretested by ELISA, and the results, expressed in pg/ml, were calculated byinterpolation in a cytokine standard curve. For each peptide, the cut-offwas calculated as the mean IFN-γ production of PBMC from animals atday 0 plus 2 SD (≥15.0 × 10² pg/ml). Positive IFN-γ productions abovecut-off are underlined.
6 Journal of Immunology Research

44 (from the B2T group) and 36 (from the B4T group) did notshow any lesions on their feet along the 7 days of clinicalobservation and were considered as PPG, albeit they showeda single vesicle in the tongue at 7 dpc. In addition, animals170 (from the B2T group) and 431 (from the B4T group)showed a delay in the onset of symptoms (PP) during thenormal course of disease, and the lesions in the feet appearedon 7dpc, while those in the mock-vaccinated animalsappeared on 3 or 4 dpc. Bovines 168, 169, 164, and 166 werenonprotected (NP); they presented vesicle in the tongue,mouth, and feet. At 7 dpc, all animals showed lesions in theirmouth or tongue (Table 3).
3.6. Mucosal Adaptive Antibody Responses in Peptide-Vaccinated Cattle after Nasal Infection. Animals were eutha-nized at 7 dpc, and the FMDV-specific mucosal immuneresponses were studied along the respiratory tract by meansof a FMDV-ASC ELISPOT assay (FMDV-ASC ELISPOT).The results showed three profiles of responses (Figure 3(a))according to the degree of protection (PPG, PP, or NP)observed in the animals. In general, PPG and PP bovinesshowed a very low number of ASC in mandibular lymphnodes (ML) and medial retropharyngeal lymph nodes(MRL), with the exception of bovine 431. Tracheobronchiallymph nodes (TBL) of animals 44 and 170 from the B2Tgroup (PPG and PP, resp.) and animals 36 and 431 fromthe B4T group (PPG and PP, resp.) did not show secretorycells producing FMDV-specific antibodies (Figures 3(a) and3(b)). When ASC from peptide-immunized NP animals werestudied, IgM and IgG1 were the dominant isotypes of anti-body detected in ML; high amounts of IgA ASC (>200 ASC/106 cells) were detected in animal 168. However, the other NPbovines (169, 164, and 166) presented a low number of IgAASC (<50 ASC/106 cells). On the other hand, IgG2 ASC weredetectable in ML at this time with values 10- to 80-fold lowerthan the IgG1 value. Finally, in vaccinated NP animals, highamounts of IgM and IgG1 ASC were detected in MRL(excluding bovine 164). Finally, animals 168, 169, and 166presented a high level of total ASC in ML and MRL(Figure 3(b)). NP vaccinated (168,169, 164, and 166) and
mock-vaccinated animals (167 and 997) also showedresponses in TBL at the lower respiratory tract. IgM andIgG1 antibodies against FMDV were the isotypes secreted.
Animal 166, which showed delayed humoral responseagainst virus, presented the highest number of IgG1 ASC(>2× 10³ ASC/106 cells) in ML and MRL. Concordantly,bovine 166 was the only animal that showed high numbersof IgM and IgG1 ASC in TBL.
In mock-vaccinated animals (167 and 997), ML andMRLwere the most stimulated secondary lymphoid organs at7 dpc, IgM was the dominant isotype among the FMDV-ASC developed in these organs. In animal 167, IgG1 wasthe next isotype with regard to the detection level, with levels10- to 30-fold lower than those detected in the ML of NP vac-cinated bovines. When the total FMDV-ASC was calculated,PPG and PP animals presented very low numbers of ASC incomparison with NP vaccinated animals (Figure 3(b)).
3.7. IFN-γ Secretion by Mononuclear Cells (3 Days Post-FMDV Challenge). In order to determine thememory immu-nity induced in vaccinated animals after the challenge withthe live virus, the level of IFN-γ secreted in vitro by mononu-clear cells of those animals was measured (Figure 4). At 3 dpc,PPG animals (44 and 36) presented IFN-γ levels between 8and 9.5×10³ pg/ml in the supernatant of PBMC stimulatedwith iFMDV, B2T, or B4T peptides. On the other hand, PPanimals (170 and 431) showed high levels of IFN-γ even with-out stimuli as also observed in PPG animal 36. Significant dif-ferences were found in ASC, ML, and MRL of PPG and PPanimals compared to NP-vaccinated cattles. Surprisingly,bovine 169 presented high levels of IFN-γ.
4. Discussion
Synthetic peptides corresponding to the protective B- and T-cell epitopes can be considered good candidates for FMDvaccines as, among other advantages, they are safe andsupport a rational design and their production and character-ization are simple. The development of successful peptidevaccines has been limited for a number of reasons, including
Table 3: Clinical scores of vaccinated cattle after challenge.
Group Animal no.Clinical score (dpc)a
Protectionb2 dpc 3 dpc 4 dpc 7 dpc
B2T
44 0 0 0 2 PPG
170 0 0 0 5 PP
168 0 0 5 6 NP
169 0 0 3 6 NP
B4T
36 0 0 0 2 PPG
431 0 0 0 5 PP
164 0 0 3 5 NP
166 0 5 6 6 NP
Negative controls167 0 0 4 6 NP
997 0 4 4 6 NPaClinical score was established after the challenge and was determined by the number of feet presenting FMD lesions plus the presence of vesicles in the snoutand/or mouth, 6 being the maximum score. bAnimals with no lesions on the feet were PPG. Animals with a delay in the onset of symptoms of disease were PP,and animals with lesions on their feet before 7 dpc were considered NP.
7Journal of Immunology Research
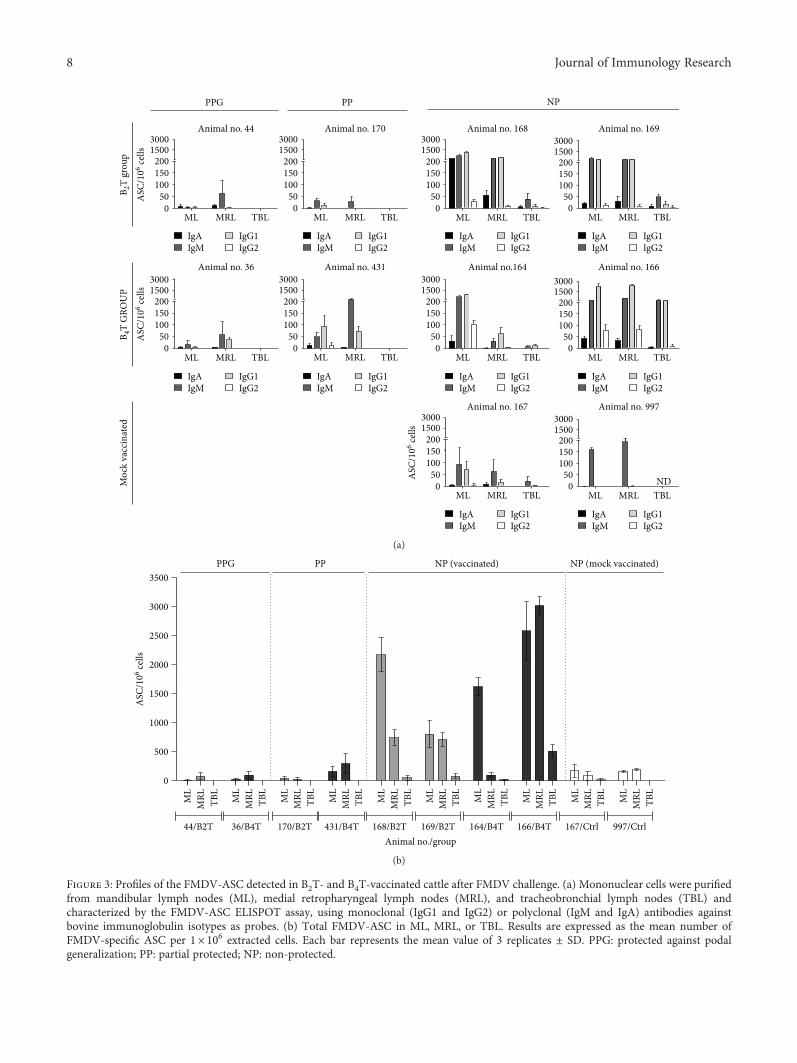
Moc
k va
ccin
ated
B 2T
grou
pB 4
T G
ROU
PAnimal no. 44
ML MRL TBL0
50100150200
15003000
Animal no. 170
ML MRL TBL0
50100150200
15003000
Animal no. 168
ML MRL TBL0
50100150200
15003000
Animal no. 169
ML MRL TBL0
50100150200
15003000
IgAIgM
IgG1IgG2
IgAIgM
IgG1IgG2
IgAIgM
IgG1IgG2
IgAIgM
IgG1IgG2
IgAIgM
IgG1IgG2
IgAIgM
IgG1IgG2
IgAIgM
IgG1IgG2
IgAIgM
IgG1IgG2
IgAIgM
IgG1IgG2
IgAIgM
IgG1IgG2
Animal no. 36
ML MRL TBL0
50100150200
15003000
ASC
/106 ce
lls
ASC
/106 ce
lls
ASC
/106 ce
lls
Animal no. 431
ML MRL TBL0
50100150200
15003000
Animal no.164
ML MRL TBL0
50100150200
15003000
Animal no. 166
ML MRL TBL0
50100150200
15003000
Animal no. 167
ML MRL TBL0
50100150200
15003000
Animal no. 997
ML MRL TBL0
50100150200
15003000
ND
PPG PP NP
(a)
ML
MRL TB
L
ML
MRL TB
L
ML
MRL TB
L
ML
MRL TB
L
ML
MRL TB
L
ML
MRL TB
L
ML
MRL TB
L
ML
MRL TB
L
ML
MRL TB
L
ML
MRL TB
L
0
500
1000
1500
2000
2500
3000
3500
44/B2T 167/Ctrl 997/Ctrl
PPG PP NP (vaccinated) NP (mock vaccinated)
Animal no./group
ASC
/106 ce
lls
36/B4T 170/B2T 431/B4T 168/B2T 169/B2T 164/B4T 166/B4T
(b)
Figure 3: Profiles of the FMDV-ASC detected in B2T- and B4T-vaccinated cattle after FMDV challenge. (a) Mononuclear cells were purifiedfrom mandibular lymph nodes (ML), medial retropharyngeal lymph nodes (MRL), and tracheobronchial lymph nodes (TBL) andcharacterized by the FMDV-ASC ELISPOT assay, using monoclonal (IgG1 and IgG2) or polyclonal (IgM and IgA) antibodies againstbovine immunoglobulin isotypes as probes. (b) Total FMDV-ASC in ML, MRL, or TBL. Results are expressed as the mean number ofFMDV-specific ASC per 1× 10⁶ extracted cells. Each bar represents the mean value of 3 replicates ± SD. PPG: protected against podalgeneralization; PP: partial protected; NP: non-protected.
8 Journal of Immunology Research

those associated with “in vivo” stability, poor immunogenic-ity of linear peptides, and lack of adequate T-cell activationdue to MHC polymorphism of the host species [32, 33].Previous results in pigs vaccinated with B2T or B4T dendri-meric peptides allow concluding that multiple presentationof the B-cell epitope is advantageous over a simple juxtaposi-tion of the epitopes for the induction of humoral and cellularimmune responses [34]. Recently, Blanco et al. [16] reportedthat 100% of pigs vaccinated with B2T dendrimeric peptidesbearing type O FMDV O/UKG/11/2001 sequences of a B-(VP1 136–154) and a T-cell epitope (3A 21–35) were pro-tected after the challenge with homologous FMDV. In thisreport, we have explored the immunogenicity of B2T andB4T dendrimers in cattle and showed that they can elicitcross-reactive immune responses against a heterologous typeO strain, FMDV O1/Campos/Bra/58, including partialprotection to challenge.
In our experiment, specific antibody responses to viruswere observed in all cattle receiving peptide vaccines;however, even when neutralizing antibodies against FMDVO/UKG/11/2001 were detected, their levels were lower thanthose found in pigs immunized with the same peptides.
The amino acid sequence of the B-cell epitope VP1(136–154) between FMDV O/UKG/11/2001 and O1/Cam-pos/Bra/58, the virus used for cattle challenge, differs in 3amino acids. Nevertheless, Wang et al. [10] reported thatpigs vaccinated with a peptide containing a consensus typeO VP1 sequence (residues 129–169) from 75 historic andprevalent isolates (including O1/Campos/Bra/58 andO/UKG/11/2001) and a promiscuous artificial Th site, devel-oped humoral immunity against FMDVO1/Campos/Bra/58.Indeed, the neutralizing activity against FMDV O1/Campos/Bra/58 was detected in our peptide-immunized cattle, albeitthe magnitudes of the responses were lower than thoseelicited against FMDV O/UKG/11/2001. B2T and B4Tpeptides induce neutralizing antibodies against FMDV O/
UKG 11 at low levels, but they do not neutralize FMDVO1 Campos (100 DITC50).
Despite the presence of anti-peptide and anti-FMDVantibodies in sera, they may not have the affinity necessaryto effectively neutralize the virus, and only 25% of the B2T-or B4T-vaccinated animals were PPG after the challenge withFMDV O1/Campos/Bra/58. It is possible that when usinganother adjuvant or other amounts of peptides in the vaccine,the immune response could increase in cattle, achieving thematuration of the antibodies affinity for the viral neutraliza-tion of FMDV O1/Campos/Bra/58.
The isotype of antibodies elicited in cattle by the twodendrimers differs from those induced in swine [16]. Pigsvaccinated with B2T showed a trend towards increased levelsof specific IgG1 and IgG2 relative to pigs vaccinated withB4T. In contrast, here B2T- or B4T-vaccinated bovines elicitlevels of IgG1 higher than those of IgG2. These changes seemto reflect marked differences in how the immune systems ofswine and cattle recognize and process the dendrimericimmunogens. In any case, it is noteworthy that the samenomenclature for subclasses among different species oftenleads to the misleading belief that these subclasses are homol-ogous and have the same functions.
Animal-to-animal variation is found in the protectiveresponses evoked by peptide vaccines, including thoseagainst FMDV [13, 35], which has been associated with theMHC-restricted recognition of T-cell epitopes included intheir composition. On the other hand, the different immuneresponses against peptide might be indicative of marked dif-ferences in the recognition of T epitopes between cattle andswine. The T-cell peptide 3A (21–35) was well studied in pigs[6] but not in cattle, and our results support that T epitope3A (21–35) is not recognized by the majority of bovines.
Our findings suggest that in some instances, animalsshowing the highest immunological parameters measuredagainst peptides and iFMDV were better protected against
44 170 168 169 36 431 164 166 167 9970
2000
4000
6000
8000
10000
MediumAg‐FMDV
Ag‐B2TAg‐B4T
B2T group B4T group Mock vaccinated
NPPPPPGPPPPG NP
ND
Animal no./group
IFN
-�훾 (p
g/m
l)
Figure 4: IFN-γ production by PBMC from peptide-vaccinated bovines after challenge. PBMC were purified at 3 dpc and cultured in thepresence of peptide or inactivated virus. The supernatants were tested by a sandwich ELISA. Results are expressed in pg/ml byinterpolation in a cytokine standard curve. Each bar represents the mean value of 2 replicates of supernatants ± SD. PPG: protectedagainst podal generalization; PP: partial protected; NP: nonprotected.
9Journal of Immunology Research

viral challenge. Bovines 44 (B2T) and 36 (B4T) elicited highlevels of antibodies against virus (although animal 36 showedlevels of neutralizing antibodies of 1.2) and developed highlevels of IgA specific against virus in nasal secretions as wellas a positive lymphoproliferative response not only againstdendrimeric peptides but also against the epitope T 3A(21–40). All these positive parameters in bovines 44 and 36correlated with a protective immune response. Indeed, thesewere the only two PPG animals. On the other hand, anddespite at the time of challenge the level of antibodies (mea-sured by ELISA) being similarly high for all cattle, animalsthat showed modest humoral response initially (at 18 or22 dpv) failed to be protected against viral challenge, whichmay be due to the lack of antibody maturation. Nonpro-tected animals 168 (B2T) and 164 (B4T) showed antibodyresponses against iFMDV only after receiving a second doseof vaccine, and their viral neutralization titres were lowerthan 1.2 (VNT positive for FMDV ≥ 1 2 [27]). These resultssuggest that although neutralizing antibodies are importantin protecting against viral challenge, other factors could alsofavor protection.
Cattle are highly susceptible to FMDV, and the virus usu-ally gains entry through the respiratory tract of these animals[36]. Moreover, FMDV replicates in tissues of the upperrespiratory system [37, 38], the soft palate and pharynx beingpreferential sites of FMDV replication and persistence inruminants. A feature of the mucosal system in ruminants isthe prominence of IgG1 relative to IgA in nasal secretions.
The study of antibody responses in local lymphoid tissuesindicates that the systemic FMD vaccination of cattle withdendrimeric peptides can effectively promote the presenceof anti-FMDV ASC in lymphoid tissues associated with therespiratory tract. In addition, the detection of both FMDVO1/Campos/Bra/58-specific ASC and antibodies followingvaccination shows that these peptides, encompassing FMDVO/UKG/11/2001 sequences, were able to induce a cross-reactive ASC response.
In peptide-vaccinated unprotected animals, viral chal-lenge by nasal instillation triggered an antibody responsecompatible with a local anamnestic recall upon contactwith replicating FMDV, suggesting that peptide vaccina-tion might induce the circulation of virus-specific B-lym-phocytes, including memory B-cells that differentiate intoASC soon after contact with the infective virus. Thus,NP animals showed a strong stimulation of FMDV-specificB-lymphocytes to locally produce antibodies all along therespiratory tract, including in the tracheobronchial lymphnodes (TBL) with frequencies of ASC much higher thanthose in mock-vaccinated infected animals. In the NPanimals, ASC were detected in all studied organs, and theisotype of the antibodies (mainly IgM and IgG1) revealedthat even when B2T and B4T peptides elicited specificmemory B-cells, the response failed to stop the advance ofthe challenge virus. Conversely, in peptide-vaccinated PPGand PP animals, no FMDV-ASC were detected in TBL possi-bly because the virus did not reach that area. Thus, in animals44 and 36 (PPG) and 170 and 431 (PP), cells producingantibodies against FMDV were not found in TBL, and ingeneral the total number of ASC induced was low.
It has been proposed that structural features lend FMDVcapsids towards stimulating B-cells in a T-independent man-ner [39, 40] and acute cytopathic viral infections can result inthe accelerated induction of antibody in a T-independentmanner [41, 42], providing a rapid means of stopping thesystemic spread of the virus [43]. In the absence of CD4+T-cells, cattle can produce class-switched antibody rapidlyin response to the FMDV challenge [40], and a rapid induc-tion of FMDV-specific plasma cells has been also reported inlocal lymphoid tissue following live-virus exposure, which,again, is consistent with a T-independent response [21]. Inthis report, at 7 dpc, limited amounts of IgM and IgG1 ASCwere detected in ML, MRL, and TBL of one of the negativecontrol animals (167), and only IgM was found in the other(997), a result that is consistent with a primary responseagainst FMDV. A greater increase in the number of ASC ofisotypes IgA, IgM, IgG1, and IgG2 was found by Monso et al.[20] at 6 dpc in ML, TBL, and MRL; this discrepancy may berelated with the difference in the viral dose and inoculationroute employed by these authors (107 TCID50, aerosol) com-pared with those of our study (104 BID50, nasal instillation).
Overall, our results support that immunization in cattlewith dendrimeric peptides B2T and B4T can elicit humoraland cellular immune responses and confer partial protectionagainst a heterologous virus challenge that is associated withthe induction of solid T-cell responses as well as of an anam-nestic antibody response. Experiments are in progress toaddress whether modifications such as the replacement ofthe T-cell peptide by one widely recognized by cattle canresult in an improvement of the protective response elicitedby these dendrimeric peptides.
Additional Points
Highlights.Dendrimeric peptides containing T andB epitopeswere designed as vaccine candidates against FMDV for cattle.Dendrimeric peptides evoke in immunized cattle heterolo-gous cellular and humoral immune responses. Tetravalentand bivalent presentation of B-cell epitopes linked to the Tepitope conferred partial heterologous protection in cattle.
Conflicts of Interest
The authors declare that there is no conflict of interestregarding the publication of this article.
Acknowledgments
The authors thankN. Fondevilla for his invaluable work in theBSL-4 OIE facilities at the CICVyA-INTA and J. Leiva, C.Fioroni, D. Franco, and L. Vagnoni for their help in animalhandling. The authors also thank E. Rivarola for his adminis-trative assistance and E. Smitsaard (Biogenesis Bagó) for pro-viding the inactivated FMDV. Work at INTA was supportedby the National Institute of Agricultural Technology (Grantno. PNSA 1115052) and an INTA-INIA (Spain) cooperationagreement. Work at UPF and CBMSO was supported byMINECO, Spain (Grant no. AGL2014-52395-C2).
10 Journal of Immunology Research

References
[1] S. Barteling and J. Vreeswijk, “Developments in foot-and-mouth disease vaccines,” Vaccines, vol. 9, no. 2, pp. 75–88,1991.
[2] C. J. Laurence, “Animal welfare consequences in England andWales of the 2001 epidemic of foot and mouth disease,” RevueScientifique et Technique, vol. 21, no. 3, pp. 863–868, 2002.
[3] D. K. Thompson, P. Muriel, D. Russell et al., “Economic costsof the foot and mouth disease outbreak in the United Kingdomin 2001,” Revue Scientifique et Technique, vol. 21, no. 3,pp. 675–687, 2002.
[4] J. L. Bittle, R. A. Houghten, H. Alexander et al., “Protectionagainst foot-and-mouth disease by immunization with achemically synthesized peptide predicted from the viral nucle-otide sequence,” Nature, vol. 298, no. 5869, pp. 30–33, 1982.
[5] R. DiMarchi, G. Brooke, C. Gale, V. Cracknell, T. Doel, andN. Mowat, “Protection of cattle against foot-and-mouth dis-ease by a synthetic peptide,” Science, vol. 232, no. 4750,pp. 639–641, 1986.
[6] E. Blanco, M. Garcia-Briones, A. Sanz-Parra et al., “Identifica-tion of T-cell epitopes in nonstructural proteins of foot-and-mouth disease virus,” Journal of Virology, vol. 75, no. 7,pp. 3164–3174, 2001.
[7] T. R. Doel, “Natural and vaccine-induced immunity to footand mouth disease: the prospects for improved vaccines,”Revue Scientifique et Technique, vol. 15, no. 3, pp. 883–911,1996.
[8] Y. Cao, D. Li, Y. Fu et al., “Rational design and efficacy of amulti-epitope recombinant protein vaccine against foot-and-mouth disease virus serotype a in pigs,” Antiviral Research,vol. 140, pp. 133–141, 2017.
[9] W. Li, M. D. Joshi, S. Singhania, K. H. Ramsey, and A. K.Murthy, “Peptide vaccine: progress and challenges,” Vaccines,vol. 2, no. 4, pp. 515–536, 2014.
[10] C. Y. Wang, T. Y. Chang, A. M. Walfield et al., “Effective syn-thetic peptide vaccine for foot-and-mouth disease in swine,”Vaccines, vol. 20, no. 19-20, pp. 2603–2610, 2002.
[11] C. Cubillos, B. G. de la Torre, A. Jakab et al., “Enhanced muco-sal immunoglobulin A response and solid protection againstfoot-and-mouth disease virus challenge induced by a noveldendrimeric peptide,” Journal of Virology, vol. 82, no. 14,pp. 7223–7230, 2008.
[12] J. J. Shao, C. K. Wong, T. Lin et al., “Promising multiple-epitope recombinant vaccine against foot-and-mouth diseasevirus type O in swine,” Clinical and Vaccine Immunology,vol. 18, no. 1, pp. 143–149, 2011.
[13] O. Taboga, C. Tami, E. Carrillo et al., “A large-scale evaluationof peptide vaccines against foot-and-mouth disease: lack ofsolid protection in cattle and isolation of escape mutants,”Journal of Virology, vol. 71, no. 4, pp. 2606–2614, 1997.
[14] L. L. Rodriguez, J. Barrera, E. Kramer, J. Lubroth, F. Brown,and W. T. Golde, “A synthetic peptide containing the consen-sus sequence of the G-H loop region of foot-and-mouthdisease virus type-O VP1 and a promiscuous T-helper epitopeinduces peptide-specific antibodies but fails to protect cattleagainst viral challenge,” Vaccine, vol. 21, no. 25-26,pp. 3751–3756, 2003.
[15] Z. Zhang, L. Pan, Y. Ding et al., “Efficacy of synthetic peptidecandidate vaccines against serotype-A foot-and-mouth diseasevirus in cattle,” Applied Microbiology and Biotechnology,vol. 99, no. 3, pp. 1389–1398, 2015.
[16] E. Blanco, B. Guerra, B. G. de la Torre et al., “Full protection ofswine against foot-and-mouth disease by a bivalent B-cellepitope dendrimer peptide,” Antiviral Research, vol. 129,pp. 74–80, 2016.
[17] J. P. Tam, Y. A. Lu, and J. L. Yang, “Antimicrobial dendrimericpeptides,” European Journal of Biochemistry, vol. 269, no. 3,pp. 923–932, 2002, 11846794.
[18] P. M. H. Heegaard, U. Boas, and N. S. Sorensen, “Dendrimersfor vaccine and immunostimulatory uses. A review,” Bioconju-gate Chemistry, vol. 21, no. 3, pp. 405–418, 2010.
[19] I. Soria, V. Quattrocchi, C. Langellotti et al., “Dendrimericpeptides can confer protection against foot-and-mouth diseasevirus in cattle,” PLoS One, vol. 12, no. 9, article e0185184, 2017.
[20] M. Monso, B. G. de la Torre, E. Blanco, N. Moreno, andD. Andreu, “Influence of conjugation chemistry and B epitopeorientation on the immune response of branched peptide anti-gens,” Bioconjugate Chemistry, vol. 24, no. 4, pp. 578–585,2013.
[21] J. Pega, D. Bucafusco, S. Di Giacomo et al., “Early adaptiveimmune responses in the respiratory tract of foot-and-mouthdisease virus-infected cattle,” Journal of Virology, vol. 87,no. 5, pp. 2489–2495, 2013.
[22] E. Maradei, J. La Torre, B. Robiolo et al., “Updating of the cor-relation between lpELISA titers and protection from viruschallenge for the assessment of the potency of polyvalent aph-tovirus vaccines in Argentina,” Vaccine, vol. 26, no. 51,pp. 6577–6586, 2008.
[23] K. Orsel and A. Bouma, “The effect of foot-and-mouth disease(FMD) vaccination on virus transmission and the significancefor the field,” The Canadian Veterinary Journal, vol. 50, no. 10,pp. 1059–1063, 2009.
[24] K. Orsel, M. C. M. de Jong, A. Bouma, J. A. Stegeman, andA. Dekker, “Foot and mouth disease virus transmission amongvaccinated pigs after exposure to virus shedding pigs,”Vaccine,vol. 25, no. 34, pp. 6381–6391, 2007.
[25] K. Orsel, A. Dekker, A. Bouma, J. A. Stegeman, and M. C. M.de Jong, “Vaccination against foot and mouth disease reducesvirus transmission in groups of calves,”Vaccine, vol. 23, no. 41,pp. 4887–4894, 2005.
[26] N. Fondevila, D. Compaired, E. Maradei, and S. Duffy, “Vali-dation of a real time RT-PCR assay to detect foot-and-mouthdisease virus and assessment of its performance in acute infec-tion,” Revista Argentina de Microbiología, vol. 46, no. 3,pp. 188–195, 2014.
[27] R. F. Sellers, A. I. Donaldson, K. A. J. Herniman, and J. Paeker,“Foot-and-mouth virus,” The Lancet, vol. 297, no. 7711,p. 1238, 1971.
[28] OIE, “Foot and Mouth Disease,” Manual of Diagnostic Testsand Vaccines for terrestrial Animals, pp. 1–29, 2009, http://www.oie.int/fileadmin/Home/eng/Health_standards/tahm/2.01.08_FMD.pdf.
[29] V. Quattrocchi, J. S. Pappalardo, C. Langellotti, E. Smitsaart,N. Fondevila, and P. Zamorano, “Early protection againstfoot-and-mouth disease virus in cattle using an inactivatedvaccine formulated with Montanide ESSAI IMS D 12802VG PR adjuvant,” Vaccine, vol. 32, no. 19, pp. 2167–2172,2014.
[30] V. Quattrocchi, I. Soria, C. A. Langellotti et al., “A DNAvaccine formulated with chemical adjuvant provides partialprotection against bovine herpes virus infection in cattle,”Frontiers in Immunology, vol. 8, p. 37, 2017.
11Journal of Immunology Research
[31] J. M. Pacheco, J. Arzt, and L. L. Rodriguez, “Early events in thepathogenesis of foot-and-mouth disease in cattle aftercontrolled aerosol exposure,” Veterinary Journal, vol. 183,no. 1, pp. 46–53, 2010.
[32] C. Leclerc, “New approaches in vaccine development,” Com-parative Immunology, Microbiology and Infectious Diseases,vol. 26, no. 5-6, pp. 329–341, 2003.
[33] D. Rowlands, “Foot-and-mouth disease virus peptide vac-cines,” in Foot-and- mouth disease: current perspectives,pp. 335–354, Horizon Bioscience, Norfolk, UK, 2004.
[34] E. Blanco, C. Cubillos, N. Moreno et al., “B epitope multiplicityand B/T epitope orientation influence immunogenicity offoot-and-mouth disease peptide vaccines,” Clinical andDevelopmental Immunology, vol. 2013, Article ID 475960,9 pages, 2013.
[35] T. Collen, “Foot-and-mouth disease (aphthovirus): viral T cellepitopes,” in Cell Mediated Immunity in Ruminants, B. M.Goddeeris and W. I. Morrison, Eds., CRC Press Inc., BocaRaton, FL, USA, 1994.
[36] S. Alexandersen and N. Mowat, “Foot-and-mouth disease:host range and pathogenesis,” Current Topics in Microbiologyand Immunology, vol. 288, pp. 9–42, 2005.
[37] J. W. McVicar and P. Sutmoller, “Growth of foot-and-mouthdisease virus in the upper respiratory tract of non-immunized,vaccinated, and recovered cattle after intranasal inoculation,”Journal of Hygiene, vol. 76, no. 3, pp. 467–481, 1976.
[38] Z. Zhang and S. Alexandersen, “Quantitative analysis offoot-and-mouth disease virus RNA loads in bovine tissues:implications for the site of viral persistence,” The Journalof General Virology, vol. 85, no. 9, pp. 2567–2575, 2004.
[39] B. V. Carr, E. A. Lefevre, M. A. Windsor et al., “CD4+ T-cellresponses to foot-and-mouth disease virus in vaccinated cat-tle,” Journal of General Virology, vol. 94, Part 1, pp. 97–107,2013.
[40] N. Juleff, M. Windsor, E. A. Lefevre et al., “Foot-and-mouthdisease virus can induce a specific and rapid CD4+ T-cell-independent neutralizing and isotype class-switched antibodyresponse in naive cattle,” Journal of Virology, vol. 83, no. 8,pp. 3626–3636, 2009.
[41] T. Fehr, M. F. Bachmann, H. Bluethmann, H. Kikutani,H. Hengartner, and R. M. Zinkernagel, “T-independent activa-tion of B cells by vesicular stomatitis virus: no evidence for theneed of a second signal,” Cellular Immunology, vol. 168, no. 2,pp. 184–192, 1996.
[42] B. O. Lee, J. Rangel-Moreno, J. E. Moyron-Quiroz et al., “CD4T cell-independent antibody response promotes resolution ofprimary influenza infection and helps to prevent reinfection,”Journal of Immunology, vol. 175, no. 9, pp. 5827–5838, 2005.
[43] M. F. Bachmann and R. M. Zinkernagel, “Neutralizing antivi-ral B cell responses,” Annual Review of Immunology, vol. 15,no. 1, pp. 235–270, 1997.
12 Journal of Immunology Research

Research ArticleImmature Dendritic Cell Therapy Confers Durable ImmuneModulation in an Antigen-Dependent and Antigen-IndependentManner in Nonobese Diabetic Mice
Jeannette Lo, Chang-Qing Xia , Ruihua Peng, and Michael J. Clare-Salzler
Department of Pathology, Immunology and Laboratory Medicine, Center for Immunology and Transplantation,University of Florida, Gainesville, FL 32610, USA
Correspondence should be addressed to Michael J. Clare-Salzler; [email protected]
Received 17 July 2017; Revised 19 October 2017; Accepted 27 November 2017; Published 14 February 2018
Academic Editor: Yoshihiko Hoshino
Copyright © 2018 Jeannette Lo et al. This is an open access article distributed under the Creative Commons Attribution License,which permits unrestricted use, distribution, and reproduction in any medium, provided the original work is properly cited.
Dendritic cell (DC) immunotherapy has been effective for prevention of type 1 diabetes (T1D) in NOD mice but fails to protect ifinitiated after active autoimmunity. As autoreactivity expands inter- and intramolecularly during disease progression, weinvestigated whether DCs unpulsed or pulsed with β cell antigenic dominant determinants (DD), subdominant determinants(SD), and ignored determinants (ID) could prevent T1D in mice with advanced insulitis. We found that diabetes wassignificantly delayed by DC therapy. Of interest, DCs pulsed with SD or ID appeared to provide better protection. Tlymphocytes from DC-treated mice acquired spontaneous proliferating capability during in vitro culture, which could be largelyeliminated by IL-2 neutralizing antibodies. This trend maintained even 29 weeks after discontinuing DC therapy and appearedantigen-independent. Furthermore, CD4+Foxp3+ T regulatory cells (Tregs) from DC-treated mice proliferated more activelyin vitro compared to the controls, and Tregs from DC-treated mice showed significantly enhanced immunosuppressive activitiesin contrast to those from the controls. Our study demonstrates that DC therapy leads to long-lasting immunomodulatory effectsin an antigen-dependent and antigen-independent manner and provides evidence for peptide-based intervention during aclinically relevant window to guide DC-based immunotherapy for autoimmune diabetes.
1. Introduction
Type 1 diabetes (T1D) is an autoimmune disorder resultingfrom the loss of self-tolerance to pancreatic islet β cell auto-antigens. Efforts to redirect the immune response toward tol-erance through peptide or whole autoantigen-based therapyhave been shown to be effective in autoimmune mousemodels, but have met with considerable setbacks in humanstudies [1–8]. Difficulties in translating the appropriate toler-izing antigen dose combined with the risk of activating orenhancing autoimmunity have delayed the development ofantigen-specific therapy for tolerance induction into theclinical setting. Furthermore, it is uncertain whether thedelivery of antigen to an already impaired immune system[9–11] is able to correct the autoimmunity.
Dendritic cell therapy provides an alternative way ofdelivering antigen by using ex vivo-generated cells engineered
to control the direction of the immune response toward a pre-loaded autoantigenic peptides of interest. We and others havedemonstrated that peptide-pulsed immature dendritic cell(DC) therapy prevents T1D in NOD mice, the autoimmunediabetes mouse model, when applied during the early stagesof autoimmunity [12, 13]. Interestingly, protection fromunpulsed DC therapy has also been reported [14–18], chal-lenging the need for antigen. Whether these protective DCspick up autoantigen in vivo or exert antigen-independentinfluences to the immune repertoire is unknown asmost stud-ies using DC therapy have only assessed antigen-specificchanges. The global effect that DC therapy may have on non-target immune cell populations has not been fully elucidated.Moreover, the requirement for early intervention wouldpreclude most patients from its benefits as over 80% of T1Dsubjects lack familial evidence and do not seek treatmentuntil symptomatic when autoimmunity is well-developed,
HindawiJournal of Immunology ResearchVolume 2018, Article ID 5463879, 13 pageshttps://doi.org/10.1155/2018/5463879

thereby missing the critical window for early intervention.Thus, an approach that can be initiated within a wider win-dow of time will be more reliable for T1D intervention, anda better understanding of both antigen-dependent andantigen-independent effects of DC therapy will assist in pre-dicting the clinical outcome of DC therapy.
In T1D, T cell reactivity is initially limited to a few auto-antigen determinants. However, as disease progresses, auto-reactivity gradually expands intra- and intermolecularly toadditional determinants and antigens, chronically recruitingnaïve cells into the autoreactive pool and possibly leavingan altered immune repertoire with time, providing an expla-nation for why we observe the fall in efficacy of Ag-basedtherapies as the rise in autoimmunity expands [19–24]. Thisepitope spreading gives rise to an array of determinants thathave distinct immunogenic properties and possibly uniqueroles in autoimmune pathogenicity. Regions within thewhole antigen that T cells intrinsically recognize and respondto due to preferential antigen processing and presentation byantigen-presenting cells are known as dominant determi-nants (DD), while subdominant (SD) and ignored (ID)determinants are regions that are minimally unprocessedand unseen and fail to impact the naïve T cell repertoire. Asautoreactivity expands to multiple determinants with time,it is expected that fewer T cells remain naïve to DD as theybecome recruited into a preprogrammed autoreactiveresponse when challenged with a DD. In contrast, even in alate-stage disease, the naïve T cell pool should continue toremain nonreactive to SD or ID as they have had a minimaleffect on the naïve T cell pool [25, 26]. Thus, DD-reactive Tcells are progressively drained from the naïve pool, whileuncommitted naïve T cells remain available to be potentiallyprimed into regulatory function by SD and ID even atlater stages of autoimmunity. Olcott et al. first examinedthis theory by treating NOD mice with a panel of controland T1D-specific autoantigen peptides during late-stageautoimmunity. They showed that only ID, but not targetdeterminants (DD), could protect these mice from diabetesand that the ability of ID to prime Th2 responses did notattenuate with time [26].
In the present study, we hypothesized that through DC-guided presentation of SD or ID, we could better controlthe direction of the immune response to autoantigen chal-lenge and quench established DD autoreactivity through reg-ulatory T cell-biased bystander suppression. We investigatedhow various determinant peptides presented through imma-ture DC therapy affected disease outcome when DC therapywas administered to NOD mice with active autoimmunity.In addition, we demonstrated antigen-independent effectsof DC therapy and characterized changes in the overallimmune response. The findings in this study will contributeto our current understanding on the role of antigen in DC-based therapies and guide the development of DC-basedT1D immunotherapy.
2. Materials and Methods
2.1. Animals. Female NOD/ShiLtj (NOD), C57BL/6J (B6),and Balb/c mice were purchased from The Jackson
Laboratory or Animal Care Services at the University ofFlorida. Bone marrow donor mice were 5–8 weeks ofage. Up to five mice were housed together in micro isola-tor cages in a specific-pathogen-free (SPF) facility withaccess to food and water ad libitum. Mice were allowedto acclimate to the housing facility for one week prior tothe initiation of any studies. Development of diabeteswas monitored through twice weekly urine glucose testingusing urine glucose test strips (Clinistix, Bayer). Upondetection of glucosuria, a small amount of blood was col-lected by pricking the tail vein and testing blood glucoseusing the Accuchek OneTouch glucose meter. A mousewith 2 consecutive daily readings of blood glucose greaterthan 250mg/dl was considered to be diabetic. Mice wereeuthanized by CO2 asphyxiation. All mouse experimentswere performed in accordance with the University of FloridaInstitutional Animal Care and Use Committee.
2.2. Bone Marrow-Derived Dendritic Cells: Culture andIsolation. The femur and tibia were removed from mice andcleaned of muscle and connective tissue. The ends of thebones were cut, and bone marrow (BM) cells were flushedout with media using a 25–5/8 gauge needle attached to asyringe. Red blood cells were removed from bone marrowcells using ammonium chloride potassium (ACK) lysis bufferfor 2 minutes at room temperature, then washed free of lysisbuffer using PBS. BM-derived DCs were cultured in RPMI1640 (Cellgro) supplemented with 10% fetal calf serum(FCS) (Invitrogen Life Sciences), 1x penicillin/streptomy-cin/neomycin (Gibco), and 10mM HEPES buffer (Gibco) ata concentration of 106 cells/mL in flat-bottom 6-well cultureplates (Corning). 500U/mL GM-CSF (R&D Systems) and1000U/mL IL-4 (BD Pharmingen) were added to BM cul-tures to promote differentiation into DC. On day 2 or 3, halfof the media was replaced with fresh media and cytokines.On day 5 or 6, cells were removed from the bottoms of wellswith gentle pipetting and a cell scraper. DCs were purifiedusing CD11c+positive selection magnetic beads (MiltenyiBiotec) and confirmed by flow cytometry to exceed 90%purity. Baseline expression of MHCII, CD80, and CD86compared to DC stimulated for 24h with TNF-α (semima-ture) or LPS (mature) was assessed by flow cytometry tocharacterize maturation state (Supplemental Figure 1).
2.3. Dendritic Cell Therapy. Dendritic cells for injection werederived from the bone marrow precursor cells of nondiabetic4-–8-week-old female NOD mice. 100,000 DCs were sus-pended in 100μl of sterile PBS for subcutaneous injectioninto the area of the hind footpads at 50μl per footpad. Threeweekly injections of PBS or peptide-pulsed or peptide-unpulsed DC (105 cells/mouse) were given to female NODmice beginning at 9 weeks of age. Mice in short-term treat-ment studies were treated with one DC injection per weekfor three weeks, while mice in long-term treatment studiesreceived the short-term treatment followed by boosters everyother week. Boosters contained either 200 ng of correspond-ing peptide in PBS vehicle, or peptide-pulsed DC as receivedpreviously. Mice were monitored for normal locomotor
2 Journal of Immunology Research

activity following footpad injections to ensure no disruptionof accessibility to food and drink.
2.4. Flow Cytometry. Cells were prepared into single-cellsuspensions in FACS buffer (1x PBS/1% FCS) and blockedin Fc Block CD16/32 (2.4G2). Antibody used to identify den-dritic cells was CD11c (HL3). Antibodies used to characterizeDC maturation were I-Ab [25-9-17], I-Ad (39-10-8, crossreacts with NOD I-Ag7), CD80 (16-10A1), and CD86(GL1). Antibodies used to characterize T cells were CD3(145-2C11), CD4 (RM4-5), and CD8a (53-6.7). Antibodiesused to characterize B cells were B220 (RA3-6B2) andCD19 (1D3). We also used CD25 (PC61) and Foxp3 (FJK-16s) to assess regulatory T cell population, CD11b (M1/70)to assess macrophages, CD44 (IM7) and CD62 (MEL-14)to assess memory T cells, CD138 (281-2) for plasma cells,and CD80 (1610-A1) and CD35 (8C12) for memory B cells.Cells that were further examined for intracellular markerswere fixed using Cytofix/CytoPerm reagent (eBioscience)for 15 minutes at room temperature, then washed in Perm/Wash (eBioscience). All subsequent steps were performedin Perm/Wash to maintain membrane permeability. Cellswere analyzed by flow cytometer (FACS Calibur, BD Phar-mingen). Live cells were gated from dead cells on the basisof forward/side scatter or with 7AAD (amino-antimycin D)labeling. Isotype controls include mouse IgG3κ, rat IgG2a,hamster IgG1κ, and hamster IgG1λ. All antibodies werepurchased from BD Pharmingen or eBiosciences. FACSCalibur equipment (BD Biosciences) was used to collectflow cytometry data, and results were analyzed usingFCS Express (De Novo).
2.5. Peptides. Peptides were purchased from Peptides Inter-national (Louisville, KY) and Bio-Synthesis Inc. (Lewisville,TX) and determined to be >90% purity by HPLC analysis.All peptides are tested to be endotoxin-free. Lyophilizedpeptides were dissolved in RPMI media at 1mg/mL, thensterile filtered using a syringe apparatus (Gibco). Onceresuspended in media, peptides were stored at 4°C as aworking solution for up to 2 months. Lyophilizedpeptides were stored at −20°C indefinitely. Dominantdeterminants (DD) used were insulin β9-23 (SHLVEA-LYLVCGERG), and subdominant determinant (SD) usedwas GAD6578-97 (KPCNCPKGDVNYAFLHATDL). Ignoreddeterminant (ID) used was GAD65260-279 (PEVKEKGMAALPRLIAFTSE).
2.6. Dendritic Cell Peptide Pulsing. DCs were pulsed with3μM of peptide in cRPMI for 1-2 h in a humidified incubator37°C with 5% CO2. Cells were washed 3 times and resus-pended in PBS at 106 cells/mL for injection.
2.7. Proliferation Assay. Suspensions of spleen cells were inserum-free HL-1 media (Biowhittaker Cambrex) with theaddition of penicillin/streptomycin/neomycin (Gibco) andL-glutamine (Gibco) in triplicate with a selected peptide(25μM). Cells were cultured at 1× 10⁶ cells/well in round-bottom 96-well plates at 37°C. At 72 h of culture, 1μCu 3H-thymidine (Amersham Biosciences) in 50μl of media wasadded per well and allowed to incorporate for 12–16 h. Cells
were harvested and washed using an automated cell harvester(Perkin Elmer), and radioactivity was analyzed using a liquidscintillation counter. cpm outliers identified by Grubbs testwere removed from analysis.
In assessment of in vitro spontaneous proliferation ofTregs following DC therapy, CFSE-labeled spleen cellsfrom female NOD mice from different groups were cul-tured in serum-free HL-1 media without stimulation andallowed to proliferate for 72–84 h. Cells were subject tosurface staining for CD4 and subsequent intracellularstaining for Foxp3 and analyzed for proliferating Foxp3+cells on gated CD4+ T cells.
For assessment of whether IL-2, IL-7, or IL-15 wasresponsible for the in vitro spontaneous T cell proliferationof spleen cells from DC-treated mice, spleen cells were cul-tured at 1× 10⁶ cells/well in round-bottom 96-well plates at37°C in serum-free HL-1 media without stimulation in thepresence of isotype IgG antibody, or neutralizing anti-IL-2antibody, anti-IL-7 antibody, or anti-IL-15 antibody for84 h. Thereafter, 1μCu 3H-thymidine (Amersham Biosci-ences) in 50μl of media was added per well and allowed toincorporate for 12–16h. Cells were harvested and washedusing an automated cell harvester (Perkin Elmer), and radio-activity was analyzed using a liquid scintillation counter.
For evaluating homeostatic proliferation in normal andautoimmune mouse models, NOD, B6 mice were treatedwith 3 weekly subcutaneous injections of DC (105/injec-tion) or PBS beginning at 9 weeks of age, and Balb/c miceat the same age were treated with 3 weekly intravenousinjections of DC or PBS. Spleen cells were prepared 2weeks following final injection to assess 3H-thymidineproliferation in the HL-1 media in the absence ofin vitro stimulation.
2.8. Suppressor Assay. Spleen cells were prepared andsuspended in MACS buffer. CD4+ cells were enrichedthrough depletion of unwanted cells using the CD4+CD25+Regulatory Cell Isolation Kit (Miltenyi Biotec). Next, CD25+ cells were positively selected from the preenriched fractionfollowing the instruction from the manufacturer (Miltenyi).Suppressor CD4+CD25+ cells were cultured with CD4+CD25+ depleted cells (105) at 0 : 1, 1 : 2, and 1 : 4 ratios ina round-bottom 96-well plate. Cells were cultured inserum-free HL-1 media with anti-CD3e (0.05μg/200μl well).At 72h of culture, 1μCu 3H-thymidine (Amersham Biosci-ences) in 50μl of media was added per well and allowed toincorporate for 12–16 h. Cells were harvested and washedusing an automated cell harvester (Perkin Elmer), andradioactivity was analyzed using a liquid scintillation coun-ter. The suppression rate = (proliferation (cpm) withoutCD4+CD25+ T cells−proliferation (cpm) with CD4+CD25+ T cells)/proliferation (cpm) without CD4+CD25+ T cells.
2.9. ELISA for Global Suppression Analysis. Eight-week-oldfemale NOD mice received PBS, unpulsed, or peptide-pulsed DC injections as described previously, once weeklyfor three consecutive weeks. One week following the lastinjection, mice were immunized in the footpad with100μg/mouse of Keyhole limpet hemocyanin (KLH)
3Journal of Immunology Research
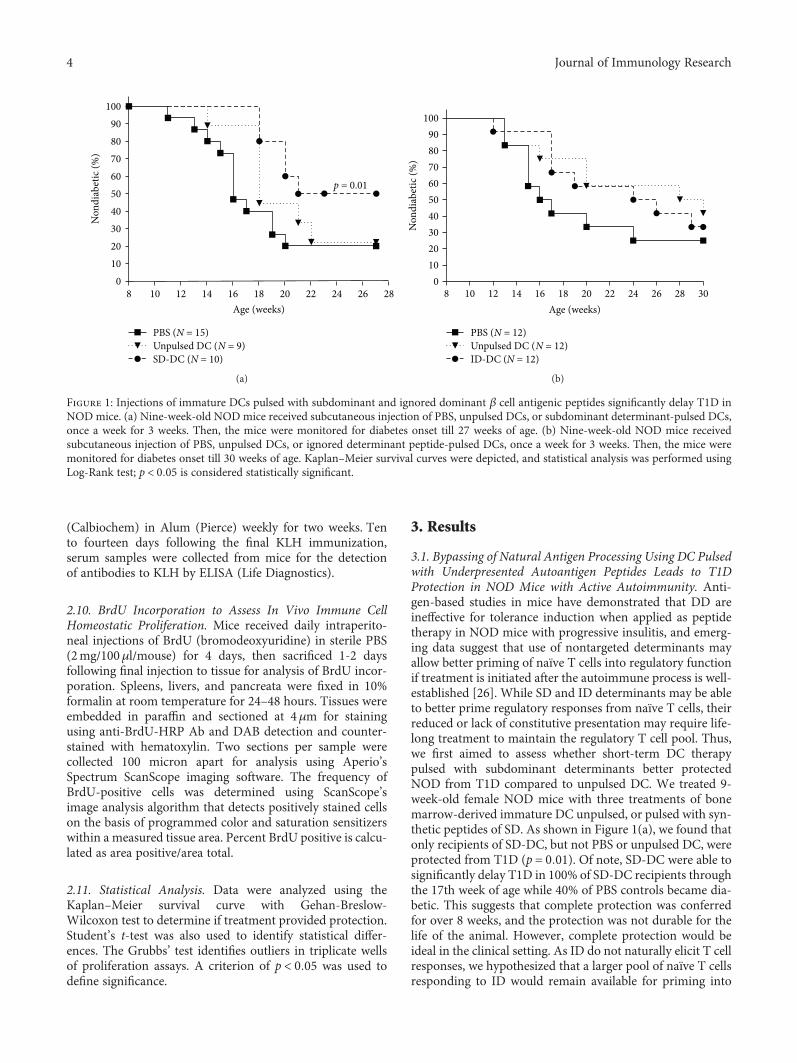
(Calbiochem) in Alum (Pierce) weekly for two weeks. Tento fourteen days following the final KLH immunization,serum samples were collected from mice for the detectionof antibodies to KLH by ELISA (Life Diagnostics).
2.10. BrdU Incorporation to Assess In Vivo Immune CellHomeostatic Proliferation. Mice received daily intraperito-neal injections of BrdU (bromodeoxyuridine) in sterile PBS(2mg/100μl/mouse) for 4 days, then sacrificed 1-2 daysfollowing final injection to tissue for analysis of BrdU incor-poration. Spleens, livers, and pancreata were fixed in 10%formalin at room temperature for 24–48 hours. Tissues wereembedded in paraffin and sectioned at 4μm for stainingusing anti-BrdU-HRP Ab and DAB detection and counter-stained with hematoxylin. Two sections per sample werecollected 100 micron apart for analysis using Aperio’sSpectrum ScanScope imaging software. The frequency ofBrdU-positive cells was determined using ScanScope’simage analysis algorithm that detects positively stained cellson the basis of programmed color and saturation sensitizerswithin a measured tissue area. Percent BrdU positive is calcu-lated as area positive/area total.
2.11. Statistical Analysis. Data were analyzed using theKaplan–Meier survival curve with Gehan-Breslow-Wilcoxon test to determine if treatment provided protection.Student’s t-test was also used to identify statistical differ-ences. The Grubbs’ test identifies outliers in triplicate wellsof proliferation assays. A criterion of p < 0 05 was used todefine significance.
3. Results
3.1. Bypassing of Natural Antigen Processing Using DC Pulsedwith Underpresented Autoantigen Peptides Leads to T1DProtection in NOD Mice with Active Autoimmunity. Anti-gen-based studies in mice have demonstrated that DD areineffective for tolerance induction when applied as peptidetherapy in NOD mice with progressive insulitis, and emerg-ing data suggest that use of nontargeted determinants mayallow better priming of naïve T cells into regulatory functionif treatment is initiated after the autoimmune process is well-established [26]. While SD and ID determinants may be ableto better prime regulatory responses from naïve T cells, theirreduced or lack of constitutive presentation may require life-long treatment to maintain the regulatory T cell pool. Thus,we first aimed to assess whether short-term DC therapypulsed with subdominant determinants better protectedNOD from T1D compared to unpulsed DC. We treated 9-week-old female NOD mice with three treatments of bonemarrow-derived immature DC unpulsed, or pulsed with syn-thetic peptides of SD. As shown in Figure 1(a), we found thatonly recipients of SD-DC, but not PBS or unpulsed DC, wereprotected from T1D (p = 0 01). Of note, SD-DC were able tosignificantly delay T1D in 100% of SD-DC recipients throughthe 17th week of age while 40% of PBS controls became dia-betic. This suggests that complete protection was conferredfor over 8 weeks, and the protection was not durable for thelife of the animal. However, complete protection would beideal in the clinical setting. As ID do not naturally elicit T cellresponses, we hypothesized that a larger pool of naïve T cellsresponding to ID would remain available for priming into
282624222018Age (weeks)
PBS (N = 15)Unpulsed DC (N = 9)SD-DC (N = 10)
p = 0.01
Non
diab
etic
(%)
1614121080
102030405060708090
100
(a)
Age (weeks)
Non
diab
etic
(%)
0102030405060708090
100
30282624222018161412108
PBS (N = 12)Unpulsed DC (N = 12)ID-DC (N = 12)
(b)
Figure 1: Injections of immature DCs pulsed with subdominant and ignored dominant β cell antigenic peptides significantly delay T1D inNOD mice. (a) Nine-week-old NOD mice received subcutaneous injection of PBS, unpulsed DCs, or subdominant determinant-pulsed DCs,once a week for 3 weeks. Then, the mice were monitored for diabetes onset till 27 weeks of age. (b) Nine-week-old NOD mice receivedsubcutaneous injection of PBS, unpulsed DCs, or ignored determinant peptide-pulsed DCs, once a week for 3 weeks. Then, the mice weremonitored for diabetes onset till 30 weeks of age. Kaplan–Meier survival curves were depicted, and statistical analysis was performed usingLog-Rank test; p < 0 05 is considered statistically significant.
4 Journal of Immunology Research

tolerance compared to SD. This advantage in available naïveT cell pool size may translate into better protection. There-fore, we performed another study using ID-pulsed DC in9-week-old NOD mice with active autoimmunity. Weadministered three weekly injections of PBS, unpulsed, orID-pulsed DC to mice and observed them for the develop-ment of T1D. Surprisingly, we found that ID-DC treat-ment was not able to significantly protect mice fromT1D though we did observe an initial delay in T1Ddevelopment (Figure 1(b)).
3.2. Repetitive Administration of DC Pulsed with ID or SDProlongs T1D Protection. To assess whether the lack of con-stitutive presentation of the ID accounted for the loss, werefined this study to include repetitive injections that allowedfor consistent presentation of the normally unpresenteddeterminants. Since cell procurement in the clinical settingis both costly and labor-intensive, we wanted to first elucidatewhether peptide-only boosters following short-term peptide-pulsed DC could maintain the protection. Because the fate ofpeptide therapy in the absence of a DC carrier is unknown, ina separate group of mice, we also followed the initial short-term priming treatment with peptide-pulsed DC boosters asproof of principle to account for any peptide competitionthat may occur in vivo. Boosters were given every other weekuntil the end of the study. We found that peptide-onlyboosters could not continue protection (data not shown).However, as shown in Figure 2, repetitive SD (p = 0 01) orID-pulsed DC treatment was protective (p = 0 03) in contrastto PBS control group. No protection was observed in micereceiving repetitive PBS or DD-pulsed DC treatment.
3.3. T1D-Specific Peptide-Pulsed DC Therapy Does Not AlterImmune Response to Non-T1D Antigen Challenge in Termsof Development of Antigen-Specific Antibodies. Because weobserved an initial delay in development of T1D in all
mice receiving DC therapy, we were uncertain whetherthe apparent DC-induced protection against T1D wasactually due to an overall dampening of the immuneresponse. We sought to evaluate whether DC therapy con-ferred specific protection against T1D, or whether theobserved protection was an artifact of global immunosup-pression that renders mice tolerant to all immunechallenges. We tested this by evaluating the ability ofDC-treated mice to respond to a non-T1D-specific antigenchallenge. We administered either PBS, unpulsed, or ID-pulsed DC therapy as described previously, then immu-nized the mice with keyhole limpet hemocyanin (KLH),a protein commonly used to examine and elicit immuneresponses. Two weeks following KLH immunization, wecollected sera from the treated mice to detect if an anti-body response was mounted against KLH. As shown inFigure 3, there was no difference in the ability of DC-treated mice to generate an antibody response to KLHchallenge as compared to PBS-treated mice (p > 0 05), sug-gesting that normal immune processes were intact and theprotection previously observed can be attributed to T1D-specific protection.
3.4. Homeostatic Lymphocyte Proliferation Is Observedfollowing DC Therapy: Immediate and Sustained Effects. Inour studies, we observed that antigen pulsing with SD or IDdeterminants improved disease outcome. However, micereceiving unpulsed DC also seemed to exhibit a delay inT1D development though they did not achieve significantprotection. Since protection from unpulsed DC therapy hasbeen reported in early intervention studies, we wanted toassess how DC therapy affected the immune response as awhole including antigen-independent responses. The spleenis a major site of immune cell interactions and antigenprocessing, with active processes that contribute to theoverall immune status [27, 28]. Thus, we sought to examine
100
Age (weeks)
PBSr (N = 14)Unpulsed-r (N = 10)SD-DCr (N = 10) ⁎p = 0.03
DD-DCr (N = 10)ID-DCr (N = 10) ⁎⁎p = 0.04
Non
diab
etic
(%)
8 10 12 14 16 18 20 22 24 26 28 30
908070605040302010
0
⁎
⁎⁎
Figure 2: DC therapy-induced T1D protection can be maintained by ignored or subdominant determinant antigenic peptide boosters. Nine-week-old NODmice received three weekly injections of PBS, unpulsed DCs, or DCs pulsed with DD, SD, or ID peptides. Thereafter, the micereceived the corresponding treatment every other week until the study ended. Diabetes onset was monitored once a week. P values representdifference compared between PBS and treatment groups.
5Journal of Immunology Research

cellular responses in this immune cell-rich environment. Toevaluate the spleen cell response following DC therapy, wecultured spleen cells with and without autoantigen peptidestimulation for 86 hours, then observed for proliferationusing 3H-thymidine incorporation. We found that even inthe absence of in vitro peptide stimulation, spleen cells iso-lated from all DC-treated mice had 3–14-fold increase in pro-liferation compared to PBS-treated mice (Figure 4). Thiseffect of spontaneous proliferation was enhanced in micereceiving antigen-pulsed DC but did not increase with recallpeptide challenge suggesting that the response was noteliciting a pathogenic reactivity to the immunizing peptide.The proliferation was seen as soon as just 2 weeks follow-ing the last DC treatment at 14-week age (Figure 4(a)) andcontinued into 40 weeks of age, 29 weeks after the cessa-tion of treatment (Figure 4(b)).
3.5. Homeostatic Proliferation Occurs in Healthy andAutoimmune Mouse Strains following DC Therapy. Homeo-static proliferation has been linked to immunodeficiencywhich promotes a compensatory expansion of “immuno-logical space” [29]. Because NOD mice have been shownto have abnormalities in the immune function of manycell types including differences in DC phenotype and func-tion [30–34], we evaluated whether this homeostatic pro-liferation was a true effect of DC therapy or only an effectassociated with immunotherapy in an animal afflicted withaberrant immune cell subsets. We administered DC therapyto the autoimmune NODmouse model as well as the healthycontrol mouse models C57BL/6J and Balb/c and evaluatedspleen cell proliferation. As depicted in Figure 4(c), spleencell homeostatic proliferation following DC treatmentoccurred in both NOD and nonautoimmune-prone mousemodels, suggesting that DC therapy uniquely resulted in areprogramming of immune cell homeostasis. Additionally,this pattern was independent of route of administration, asBalb/c mice were treated with intravenous DC injectionswhile NOD and B6 mice were given subcutaneous injections.
3.6. Homeostatic Proliferation Is Driven by Interleukin-2.Ourexperiments comparing NOD mice to healthy controlC57BL/6J and Balb/c mice revealed that spontaneous prolif-eration following DC treatment is not attributed to lympho-penia possibly happening in NOD mice. Flow cytometricphenotyping of the proliferating cells did not provideevidence for CD4+CD44hiCD62lo memory T cell nor CD80+CD35+ memory B cell expansion (data not shown).Another mechanism driving the expansion may be solublecytokines that contribute to proliferation or maintenance ofhomeostasis. Studies have shown that IL-2 and IL-15 canactivate NK, T, and B cells, induce their proliferation and sur-vival, and stimulate cytokine production [35, 36]. IL-7, arelated cytokine sharing the common gamma chain, has beenshown to have a role in T cell development, homeostaticproliferation, and survival [35, 37, 38]. Thus, we performedproliferation assays in the presence of cytokine neutralizingantibodies to assess whether proliferation could be abated.We found that neutralization of IL-7 or IL-15 had a minoreffect on cell proliferation, while culture with IL-2 neutraliz-ing antibody significantly reduced the expansion of spleencells of DC-treated mice by 45%, twice the effect observedfrom cells of PBS-treated mice (Figure 5).
3.7. DC Therapy Results in Sustained Expansion of RegulatoryT Cells with Enhanced Immunosuppressive Function. Ourwork has shown that DC therapy protects mice fromT1D and induces noninflammatory homeostatic prolifera-tion of CD4+ T cells. Evidence from the literature sug-gests that a possible mechanism for protection from DCtherapy is the induction of regulatory T cells. Thus, wesought to examine whether Tregs are being induced andwhether they are part of the proliferating cell population.Following unpulsed and antigen-pulsed DC therapy, welooked for changes in regulatory T cell frequency andfunction by evaluating the proportion of CD4+Foxp3+cells in DC-treated and control mice and examining theirability to suppress proliferation of effector cells. As shownin Figure 6(a), we found that there was an over 2-foldincrease in the frequency of CD4+Foxp3+ T cells in micereceiving unpulsed DC and an over 4-fold increase in fre-quency of CD4+Foxp3+ T cells in mice receiving ID DC,demonstrating that DC therapy resulted in sustainedexpansion of regulatory T cells and that the effect wasparticularly enhanced in mice receiving ID-pulsed DC.This homeostatic expansion of Tregs was independentof in vitro peptide stimulation, as the pattern wasobserved in both stimulated (data not shown) and unsti-mulated cell cultures.
We also examined whether there were functional dif-ferences in regulatory T cells following DC therapy. Weperformed a suppressor cell function assay by coculturingCD4+CD25+-depleted spleen cells with CD4+CD25+-puri-fied cells at ratios of 0 : 1, 1 : 2, and 1 : 4 in the presence ofanti-CD3. As seen in Figure 6(b), regulatory T cells from bothunpulsed and peptide-pulsed DC-treated mice demonstratedgreater suppressive function in a dose-dependent manner,with the effect enhanced in the peptide-pulsed DC group.The enhanced suppression was found to be nearly 2-3-fold
PBS0
10Ant
i-KLH
IgG
(uni
ts/m
L)
20
30
40
50
60
70
Unpulsed DC ID-pulsed DC
Figure 3: Antibody response following KLH immunization incontrol and DC-treated mice. NOD mice were treated with 3weekly injections of either PBS or unpulsed DCs or ID-pulsedDCs (N = 3/group). Two weeks following DC therapy, mice wereimmunized with 2 weekly injections of KLH. Serum antibodylevels were assessed 14 days following final KLH immunization.The levels of anti-KLH antibodies of each group are shown asmean± SD.
6 Journal of Immunology Research
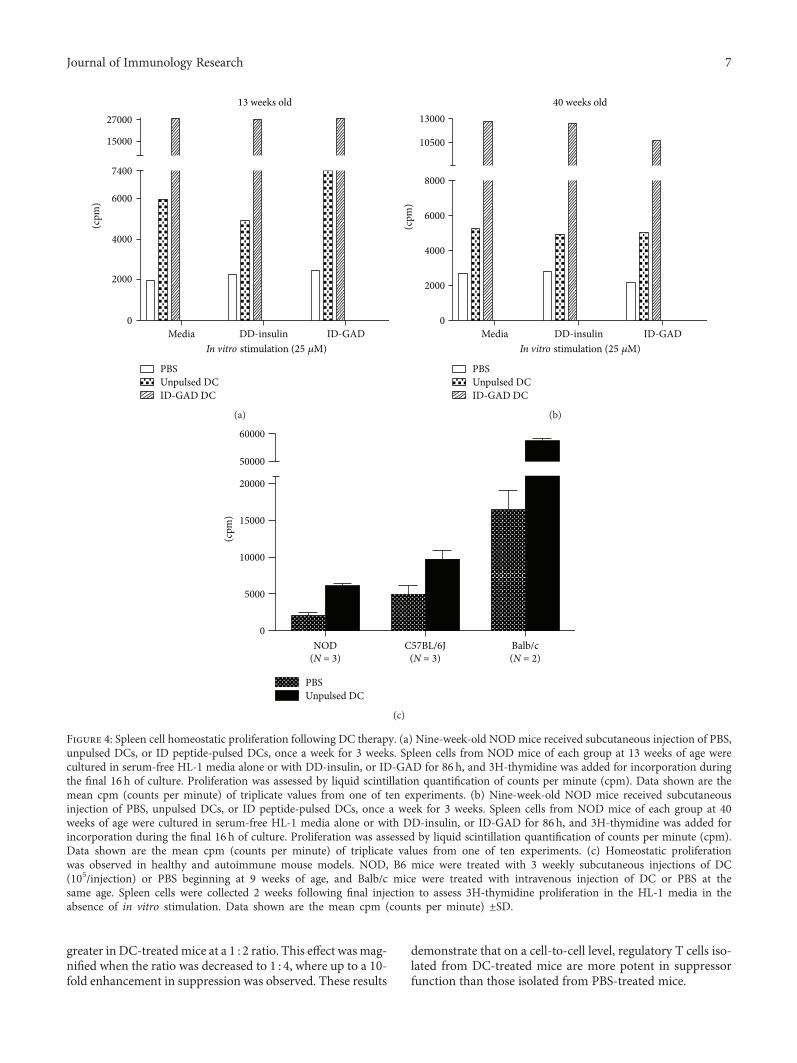
greater in DC-treatedmice at a 1 : 2 ratio. This effect wasmag-nified when the ratio was decreased to 1 : 4, where up to a 10-fold enhancement in suppression was observed. These results
demonstrate that on a cell-to-cell level, regulatory T cells iso-lated from DC-treated mice are more potent in suppressorfunction than those isolated from PBS-treated mice.
ID-GADDD-insulinIn vitro stimulation (25 �휇M)
Media
(cpm
)
0
2000
4000
6000
7400
15000
2700013 weeks old
ID-GAD DCUnpulsed DCPBS
(a)(c
pm)
ID-GADDD-insulinIn vitro stimulation (25 �휇M)
Media0
2000
4000
6000
8000
10500
1300040 weeks old
ID-GAD DCUnpulsed DCPBS
(b)
NOD(N = 3)
PBSUnpulsed DC
(cpm
)
0
5000
10000
15000
20000
50000
60000
C57BL/6J(N = 3)
Balb/c(N = 2)
(c)
Figure 4: Spleen cell homeostatic proliferation following DC therapy. (a) Nine-week-old NODmice received subcutaneous injection of PBS,unpulsed DCs, or ID peptide-pulsed DCs, once a week for 3 weeks. Spleen cells from NOD mice of each group at 13 weeks of age werecultured in serum-free HL-1 media alone or with DD-insulin, or ID-GAD for 86 h, and 3H-thymidine was added for incorporation duringthe final 16 h of culture. Proliferation was assessed by liquid scintillation quantification of counts per minute (cpm). Data shown are themean cpm (counts per minute) of triplicate values from one of ten experiments. (b) Nine-week-old NOD mice received subcutaneousinjection of PBS, unpulsed DCs, or ID peptide-pulsed DCs, once a week for 3 weeks. Spleen cells from NOD mice of each group at 40weeks of age were cultured in serum-free HL-1 media alone or with DD-insulin, or ID-GAD for 86 h, and 3H-thymidine was added forincorporation during the final 16 h of culture. Proliferation was assessed by liquid scintillation quantification of counts per minute (cpm).Data shown are the mean cpm (counts per minute) of triplicate values from one of ten experiments. (c) Homeostatic proliferationwas observed in healthy and autoimmune mouse models. NOD, B6 mice were treated with 3 weekly subcutaneous injections of DC(105/injection) or PBS beginning at 9 weeks of age, and Balb/c mice were treated with intravenous injection of DC or PBS at thesame age. Spleen cells were collected 2 weeks following final injection to assess 3H-thymidine proliferation in the HL-1 media in theabsence of in vitro stimulation. Data shown are the mean cpm (counts per minute) ±SD.
7Journal of Immunology Research
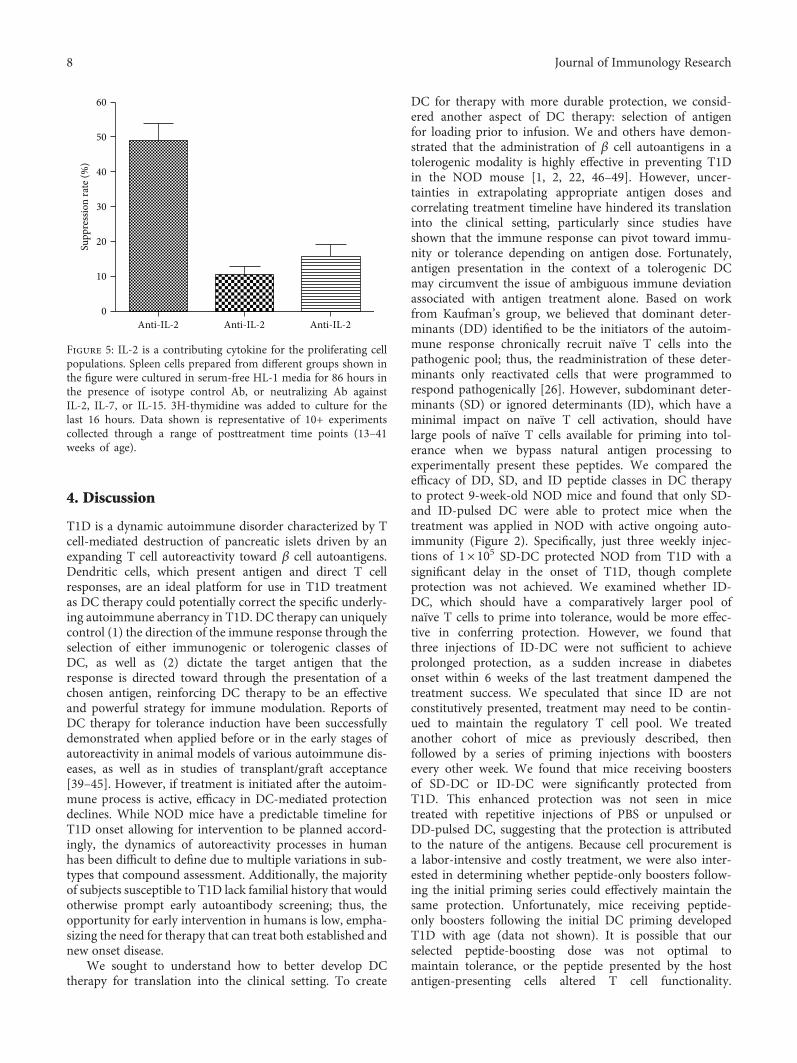
4. Discussion
T1D is a dynamic autoimmune disorder characterized by Tcell-mediated destruction of pancreatic islets driven by anexpanding T cell autoreactivity toward β cell autoantigens.Dendritic cells, which present antigen and direct T cellresponses, are an ideal platform for use in T1D treatmentas DC therapy could potentially correct the specific underly-ing autoimmune aberrancy in T1D. DC therapy can uniquelycontrol (1) the direction of the immune response through theselection of either immunogenic or tolerogenic classes ofDC, as well as (2) dictate the target antigen that theresponse is directed toward through the presentation of achosen antigen, reinforcing DC therapy to be an effectiveand powerful strategy for immune modulation. Reports ofDC therapy for tolerance induction have been successfullydemonstrated when applied before or in the early stages ofautoreactivity in animal models of various autoimmune dis-eases, as well as in studies of transplant/graft acceptance[39–45]. However, if treatment is initiated after the autoim-mune process is active, efficacy in DC-mediated protectiondeclines. While NOD mice have a predictable timeline forT1D onset allowing for intervention to be planned accord-ingly, the dynamics of autoreactivity processes in humanhas been difficult to define due to multiple variations in sub-types that compound assessment. Additionally, the majorityof subjects susceptible to T1D lack familial history that wouldotherwise prompt early autoantibody screening; thus, theopportunity for early intervention in humans is low, empha-sizing the need for therapy that can treat both established andnew onset disease.
We sought to understand how to better develop DCtherapy for translation into the clinical setting. To create
DC for therapy with more durable protection, we consid-ered another aspect of DC therapy: selection of antigenfor loading prior to infusion. We and others have demon-strated that the administration of β cell autoantigens in atolerogenic modality is highly effective in preventing T1Din the NOD mouse [1, 2, 22, 46–49]. However, uncer-tainties in extrapolating appropriate antigen doses andcorrelating treatment timeline have hindered its translationinto the clinical setting, particularly since studies haveshown that the immune response can pivot toward immu-nity or tolerance depending on antigen dose. Fortunately,antigen presentation in the context of a tolerogenic DCmay circumvent the issue of ambiguous immune deviationassociated with antigen treatment alone. Based on workfrom Kaufman’s group, we believed that dominant deter-minants (DD) identified to be the initiators of the autoim-mune response chronically recruit naïve T cells into thepathogenic pool; thus, the readministration of these deter-minants only reactivated cells that were programmed torespond pathogenically [26]. However, subdominant deter-minants (SD) or ignored determinants (ID), which have aminimal impact on naïve T cell activation, should havelarge pools of naïve T cells available for priming into tol-erance when we bypass natural antigen processing toexperimentally present these peptides. We compared theefficacy of DD, SD, and ID peptide classes in DC therapyto protect 9-week-old NOD mice and found that only SD-and ID-pulsed DC were able to protect mice when thetreatment was applied in NOD with active ongoing auto-immunity (Figure 2). Specifically, just three weekly injec-tions of 1× 10⁵ SD-DC protected NOD from T1D with asignificant delay in the onset of T1D, though completeprotection was not achieved. We examined whether ID-DC, which should have a comparatively larger pool ofnaïve T cells to prime into tolerance, would be more effec-tive in conferring protection. However, we found thatthree injections of ID-DC were not sufficient to achieveprolonged protection, as a sudden increase in diabetesonset within 6 weeks of the last treatment dampened thetreatment success. We speculated that since ID are notconstitutively presented, treatment may need to be contin-ued to maintain the regulatory T cell pool. We treatedanother cohort of mice as previously described, thenfollowed by a series of priming injections with boostersevery other week. We found that mice receiving boostersof SD-DC or ID-DC were significantly protected fromT1D. This enhanced protection was not seen in micetreated with repetitive injections of PBS or unpulsed orDD-pulsed DC, suggesting that the protection is attributedto the nature of the antigens. Because cell procurement isa labor-intensive and costly treatment, we were also inter-ested in determining whether peptide-only boosters follow-ing the initial priming series could effectively maintain thesame protection. Unfortunately, mice receiving peptide-only boosters following the initial DC priming developedT1D with age (data not shown). It is possible that ourselected peptide-boosting dose was not optimal tomaintain tolerance, or the peptide presented by the hostantigen-presenting cells altered T cell functionality.
Anti-IL-20
10
20
30
40
50
60
Supp
ress
ion
rate
(%)
Anti-IL-2 Anti-IL-2
Figure 5: IL-2 is a contributing cytokine for the proliferating cellpopulations. Spleen cells prepared from different groups shown inthe figure were cultured in serum-free HL-1 media for 86 hours inthe presence of isotype control Ab, or neutralizing Ab againstIL-2, IL-7, or IL-15. 3H-thymidine was added to culture for thelast 16 hours. Data shown is representative of 10+ experimentscollected through a range of posttreatment time points (13–41weeks of age).
8 Journal of Immunology Research

Alternatively, this finding stresses the importance of therole of DC in therapy. Administration of peptide aloneto a host with an existing aberrant immune system maybe futile. Likewise, it is unknown what happens to peptidewithout using DC as an antigen carrier because peptidecompetition in vivo could render the injected peptide irrel-evant. Overall, our findings indicate that antigen presenta-tion, and particularly the class of determinant, plays animportant role in DC-based immune modulation.
Consistent with this finding, we observed that antigen-DC-treated mice had a greater number of pancreatic isletscompared to unpulsed-DC-treated mice (data not shown).We failed to observe β regeneration in all groups. Thus, it ispossible that the islet preservation we observed was achievedthrough the induction of regulatory T cells that wasenhanced with antigen-pulsed DC treatment, but this
treatment was not enough to completely quench the inflam-mation generated from the pathogenic T cells.
To exclude the possibility that the observed protectionfrom T1D was due to global immunosuppression, we exam-ined whether NOD mice could generate a normal immuneresponse to a non-T1D-related antigen challenge followingtreatment with DC therapy. We immunized PBS, unpulsedDC, and ID-DC-treated mice with KLH and examined theirserum antibody responses. All DC-treated mice were ableto mount antibody responses to KLH in a manner compara-ble to PBS controls, suggesting that normal immuneresponses were intact and the previously observed protectioncould be attributed to diabetes-specific protection.
Much of the current knowledge on how DC therapyaffects immune responses has been delineated from studieswith a focus on antigen-specific immune modulation, as we
PBS Unpulsed DC ID-DC0
10
20
30
40
50Unpulsed DC ID-DCPBS
Prol
ifera
ting
Treg
sin
tota
l Tre
gs (%
)
CFSE
Foxp
3
(a)
1 : 2 1 : 40
20
40
60
80
100
Treg/Te� ratio
Unpulsed DCID-DC
PBS
Supp
ress
ion
(%)
(b)
Figure 6: Assessment of Treg spontaneous proliferation and function induced by DC therapy. (a) Assessment of in vitro spontaneousproliferation of Tregs following DC therapy. CFSE-labeled spleen cells from female NOD mice from different groups were cultured inserum-free media without stimulation and allowed to proliferate for 72–84 h. Cells stained with CD4 and Foxp and analyzed by flowcytometry. The proliferating Foxp3+ cells were analyzed by gating on total CD4+ cells. Data shown is representative of 3 experimentsfrom mice aging from 13–41weeks old. (b) For suppressor T cell assay. Female 9-week-old NOD mice were treated with 3 weeklyinjections of DC, then Treg function was assessed at 13 weeks of age. CD4+CD25+ Tregs were purified and cocultured with CD4+CD25+T cell-depleted spleen cells at ratios of 0 : 1, 1 : 2, and 1 : 4 and stimulated with anti-CD3 antibodies (0.05 μg/ml). Proliferation was assessedby 3H-thymidine incorporation. The suppression rate = (proliferation (cpm) without CD4+CD25+ T cells− proliferation (cpm) with CD4+CD25+ T cells)/proliferation (cpm) without CD4+CD25+ T cells.
9Journal of Immunology Research

have shown that antigen-based DC therapy-mediated protec-tion is limited to the suppression of autoreactive processesspecific to T1D. However, whether DC therapy results inantigen-nonspecific immune changes has not been wellinvestigated. Recent evidence suggests that β cell antigens inT1D immunotherapy might not be necessary for therapy-induced protection [50]. The spleen is a major site of immunecell interactions and antigen processing, with active processesthat contribute to the overall immune status [27, 28]. Thus,we sought to examine the spleen cell response in the absenceand presence of T1D peptide stimulation. To our surprise, wefound robust in vitro homeostatic proliferation of spleen cellsisolated from DC-treated mice (unpulsed or antigen-pulsed),but not PBS-treated mice. The resulting changes are not anti-gen specific as we find this reprogrammed spleen cellresponses in the absence of antigen stimulation. Furthermore,this effect was immediate and sustained, as the proliferationcould be observed as early as just two weeks following only2 DC injections, and was durable even 29 weeks after treat-ment had ended. Further characterization of these cellsrevealed that the proliferation was predominantly attributedto B and T lymphocytes (data not shown). In addition, byscreening T cell proliferation-related cytokines in this DCtherapy-induced spontaneous proliferation of lymphocytes,IL-2 was found to be the responsible cytokine while IL-7and IL-15 played a minor role.
Because NOD mice have a defect in DC phenotype andfunction, we evaluated whether this homeostatic prolifera-tion was a true effect of DC therapy or an only effect associ-ated with therapy using DC with an aberrant phenotype.We treated the nonautoimmune-prone mouse strains Balb/c and C57BL/6J mice with PBS or DC and observed a similarenhancement in homeostatic proliferation in mice receivingDC therapy, confirming that the effect is a true immuneresponse to DC therapy.
To determine whether homeostatic proliferationoccurred in vivo, we treated mice with BrdU and collectedspleens to detect for BrdU incorporation. We were not ableto detect a difference in percentage of proliferating cellsbetween mice treated with PBS compared to DC-treated mice(data not shown). We also sought to determine whether theprotection observed resulted from increased beta cell regen-eration. We examined pancreata and found no differencesin BrdU incorporation.
In T1D, the lack of an adequate regulatory responseallows autoreactive T cells to become pathogenic, therebyinvading and destroying the pancreatic islet cells. Multiplestudies have demonstrated that DC therapy can confer pro-tection against autoimmunity through the induction of regu-latory T cells that inhibit the pathogenic T cell inflammation[44, 51–64]. Thus, we evaluated the effect of DC therapyon the regulatory T cells. Consistent with our earlier find-ing of homeostatic CD4+ T cell expansion, we found thatDC therapy resulted in a durable 2-3-fold increase in thefrequency of proliferating CD4+Foxp3+ regulatory T cellswhen cultured in vitro, and this effect was further enhancedusing ID-DC. DC therapy also enhanced the immunosup-pressive function of Tregs, as CD4+CD25+ regulatory cellsfrom DC-treated mice more potently suppress anti-CD3
antibody-stimulated proliferation of CD4+CD25-depletedresponder cells compared to Tregs from PBS controls. Theseresults suggest that DC (esp. antigen-pulsed) therapy primesgeneration of more immunosuppressive Tregs. Again, theaddition of antigen to DC therapy leads to even greaterenhanced suppressive function. Of interest, these findingswere observed in both nondiabetic and delayed diabetic miceemphasizing the correlation to DC treatment. While weobserved an increase in both frequency and function of Tregswith DC treatment in vitro, we did not observe a correlationin protection from T1D in vivo. A potential explanation wasproposed by work from Diane Mathis’s group, whichdemonstrates that while defects in NOD Tregs contributeto T1D, it may be an effect of overresponsive effector T cellsto self-antigen that truly drive the immunopathology [65].Thus, the loss of tolerance may be related not to impairedfunction or decreased frequency of NOD Tregs, but rathera decline in the ability of NOD T cell effectors to respondto fully competent Tregs. However, our studies of Treg func-tion examine PBS-treated Tregs versus DC-treated Tregsagainst NOD effectors, which in concept should be simi-larly impaired, so our observation of functional differencesbetween the treatment groups can be attributed to a truevariation between PBS- and DC-treated Tregs. Alterna-tively, it is possible that the improvement was not suffi-cient to pivot the balance in favor of regulation in thepresence of a potent inflammatory effector T cell responsethat has been shown to grow with age [65]. This may besupported by our observation of increased islet survivalin antigen-pulsed-DC-treated mice, but not unpulsed-DC-treated mice that have similar levels of lymphocyteinfiltrate (data not shown), as the undefined lymphocytepopulation may potentially be an influx of both patho-genic and regulatory T cells. The influence of regulatoryT cells to preserve existing islets must surpass the destruc-tion by pathogenic T cells to maintain physiologically rel-evant numbers of functional islets for metabolic control ofinsulin. Nonetheless, the later stages of advanced autoimmu-nity immediately prior to T1D onset may simply not be ame-nable to a one-armed intervention; Tregs alone may not besufficient to rescue β cell death and the requirement forcombinatorial strategies to treat both autoimmunity andregenerate β cell mass may become necessary. To assess theT1D-protective regulatory T cells, an alternative approachto be considered is to use adoptive T cell transfer to examinewhether the DC-treatment-induced regulatory T cells aremore potent in protecting NOD mice from T1D or protect-ing NOD-Rag−/− mice from diabetes induced by cotrans-ferred diabetogenic T cells, compared to regulatory T cellsfrom PBS-treated mice.
Collectively, our study demonstrates that DC therapyresults in antigen-dependent and antigen-independenteffects on immune modulation [66]. We find that theselection of autoantigen peptide for therapies aimed toprime naïve T cells has a critical impact on the efficacyof protection against dynamic autoimmune diseases. Con-stitutively, underpresented autoantigen determinants maybe more effective in tolerance induction when used in late-stage intervention. This fundamental principle of altering
10 Journal of Immunology Research
native determinant presentation to accommodate a changingT cell repertoire can be extended to the design of treatmentfor any dynamic autoantigen-based diseases. We also dem-onstrate that immature DC therapy augments the immuneresponse in an antigen-independent manner resulting inhomeostatic expansion of functionally enhanced Tregs.Overall, these findings demonstrate the durable potencyof DC therapy in the modulation of antigen-specific andantigen-nonspecific immune responses and provide animportant step toward translation into the clinic as otherpeptide-based therapies for T1D have been limited toearly intervention.
Disclosure
This paper represents part of the doctoral dissertation ofJeannette Lo.
Conflicts of Interest
The authors declare that there is no conflict of interestregarding the publication of this paper.
Authors’ Contributions
Jeannette Lo performed the experiments and wrote themanuscript; Chang-Qing Xia performed part of the exper-iments and wrote the manuscript; Ruihua Peng performedsome of the experiments; Michael J. Clare-Salzler super-vised the study and edited the manuscript; Jeannette Loand Chang-Qing Xia share first authorship.
Acknowledgments
This work was supported by NIH/NIDDK/NIAID R21/R33to Michael J. Clare-Salzler and partially supported byNIH1R21DK08026-01A2 to Chang-Qing Xia.
Supplementary Materials
Figure 1: characterization of DC phenotype. DCs were differ-entiated in the presence of GM-CSF and IL-4 for 5-6 days(immature iDC), and baseline expression of MHCII, CD80,and CD86 was assessed by flow cytometry compared withDC stimulated with TNFα (semimature smDC) or LPS(mature mDC) for 24 h. (Supplementary Materials)
References
[1] J. Tian, M. A. Atkinson, M. Clare-Salzler et al., “Nasal admin-istration of glutamate decarboxylase (GAD65) peptidesinduces Th2 responses and prevents murine insulin-dependent diabetes,” The Journal of Experimental Medicine,vol. 183, no. 4, pp. 1561–1567, 1996.
[2] D. Daniel and D. R. Wegmann, “Protection of nonobesediabetic mice from diabetes by intranasal or subcutaneousadministration of insulin peptide B-(9-23),” Proceedings ofthe National Academy of Sciences of the United States ofAmerica, vol. 93, no. 2, pp. 956–960, 1996.
[3] D. Elias, T. Reshef, O. S. Birk, R. van der Zee, M. D.Walker, and I. R. Cohen, “Vaccination against autoimmunemouse diabetes with a T-cell epitope of the human 65-kDaheat shock protein,” Proceedings of the National Academy ofSciences of the United States of America, vol. 88, no. 8,pp. 3088–3091, 1991.
[4] J. M. Barker, K. K. McFann, and T. Orban, “Effect of oral insu-lin on insulin autoantibody levels in the diabetes preventiontrial type 1 oral insulin study,” Diabetologia, vol. 50, no. 8,pp. 1603–1606, 2007.
[5] P. Pozzilli, “The DPT-1 trial: a negative result with lessons forfuture type 1 diabetes prevention,” Diabetes/MetabolismResearch and Reviews, vol. 18, no. 4, pp. 257–259, 2002.
[6] J. Ludvigsson, “Therapy with GAD in diabetes,” Diabetes/Metabolism Research and Reviews, vol. 25, no. 4, pp. 307–315, 2009.
[7] C. D. Agardh, K. F. Lynch, M. Palmer, K. Link, andA. Lernmark, “GAD65 vaccination: 5 years of follow-up in arandomised dose-escalating study in adult-onset autoimmunediabetes,” Diabetologia, vol. 52, no. 7, pp. 1363–1368, 2009.
[8] I. Raz, A. Avron, M. Tamir et al., “Treatment of new-onset type 1 diabetes with peptide DiaPep277® is safeand associated with preserved beta-cell function: extensionof a randomized, double-blind, phase II trial,” Diabetes/Metabolism Research and Reviews, vol. 23, no. 4,pp. 292–298, 2007.
[9] M. Feili-Hariri and P. A. Morel, “Phenotypic and functionalcharacteristics of BM-derived DC from NOD and non-diabetes-prone strains,” Clinical Immunology, vol. 98, no. 1,pp. 133–142, 2001.
[10] X. Chen, L. H. C. Makala, Y. Jin et al., “Type 1 diabetes patientshave significantly lower frequency of plasmacytoid dendriticcells in the peripheral blood,” Clinical Immunology, vol. 129,no. 3, pp. 413–418, 2008.
[11] A. C. Vasquez, M. Feili-Hariri, R. J. Tan, and P. A. Morel,“Qualitative and quantitative abnormalities in splenic den-dritic cell populations in NODmice,” Clinical and Experimen-tal Immunology, vol. 135, no. 2, pp. 209–218, 2004.
[12] P. Chaturvedi, B. Agrawal, M. Zechel, E. Lee-Chan, andB. Singh, “A self MHC class II β-chain peptide prevents diabe-tes in nonobese diabetic mice,” The Journal of Immunology,vol. 164, no. 12, pp. 6610–6620, 2000.
[13] J. Lo, R. H. Peng, T. Barker, C. Q. Xia, and M. J. Clare-Salzler,“Peptide-pulsed immature dendritic cells reduce response to βcell target antigens and protect NOD recipients from type Idiabetes,” Annals of the New York Academy of Sciences,vol. 1079, no. 1, pp. 153–156, 2006.
[14] M. A. Ruffner and P. D. Robbins, “Dendritic cells transducedto express interleukin 4 reduce diabetes onset in both normo-glycemic and prediabetic nonobese diabetic mice,” PLoS One,vol. 5, no. 7, article e11848, 2010.
[15] R. J. Creusot, P. Chang, D. G. Healey, I. Y. Tcherepanova, C. A.Nicolette, and C. G. Fathman, “A short pulse of IL-4 deliveredby DCs electroporated with modified mRNA can both preventand treat autoimmune diabetes in NOD mice,” MolecularTherapy, vol. 18, no. 12, pp. 2112–2120, 2010.
[16] E. van Etten, O. Dardenne, C. Gysemans, L. Overbergh, andC. Mathieu, “1,25-Dihydroxyvitamin D3 alters the profile ofbone marrow-derived dendritic cells of NOD mice,” Annalsof the New York Academy of Sciences, vol. 1037, no. 1,pp. 186–192, 2004.
11Journal of Immunology Research

[17] J. Machen, J. Harnaha, R. Lakomy, A. Styche, M. Trucco, andN. Giannoukakis, “Antisense oligonucleotides down-regulating costimulation confer diabetes-preventive propertiesto nonobese diabetic mouse dendritic cells,” The Journal ofImmunology, vol. 173, no. 7, pp. 4331–4341, 2004.
[18] J. Morin, B. Faideau, M. C. Gagnerault, F. Lepault, C. Boitard,and S. Boudaly, “Passive transfer of flt-3L-derived dendriticcells delays diabetes development in NOD mice and associ-ates with early production of interleukin (IL)-4 and IL-10 inthe spleen of recipient mice,” Clinical and ExperimentalImmunology, vol. 134, no. 3, pp. 388–395, 2003.
[19] J. Tian, A. P. Olcott, and D. L. Kaufman, “Antigen-basedimmunotherapy drives the precocious development of auto-immunity,” The Journal of Immunology, vol. 169, no. 11,pp. 6564–6569, 2002.
[20] J. Tian, A. P. Olcott, L. R. Hanssen, D. Zekzer, B. Middleton,and D. L. Kaufman, “Infectious Th1 and Th2 autoimmunityin diabetes-prone mice,” Immunological Reviews, vol. 164,no. 1, pp. 119–127, 1998.
[21] P. V. Lehmann, E. E. Sercarz, T. Forsthuber, C. M. Dayan, andG. Gammon, “Determinant spreading and the dynamics of theautoimmune T-cell repertoire,” Immunology Today, vol. 14,no. 5, pp. 203–208, 1993.
[22] R. Tisch, X. D. Yang, S. M. Singer, R. S. Liblau, L. Fugger, andH. O.McDevitt, “Immune response to glutamic acid decarbox-ylase correlates with insulitis in non-obese diabetic mice,”Nature, vol. 366, no. 6450, pp. 72–75, 1993.
[23] J. Tian, S. Gregori, L. Adorini, and D. L. Kaufman, “The fre-quency of high avidity T cells determines the hierarchy ofdeterminant spreading,” The Journal of Immunology,vol. 166, no. 12, pp. 7144–7150, 2001.
[24] D. L. Kaufman, M. Clare-Salzler, J. Tian et al., “Spontaneousloss of T-cell tolerance to glutamic acid decarboxylase inmurine insulin-dependent diabetes,” Nature, vol. 366,no. 6450, pp. 69–72, 1993.
[25] J. Tian and D. L. Kaufman, “Attenuation of inducible Th2immunity with autoimmune disease progression,” TheJournal of Immunology, vol. 161, no. 10, pp. 5399–5403,1998.
[26] A. P. Olcott, J. Tian, V. Walker et al., “Antigen-based therapiesusing ignored determinants of β cell antigens can more effec-tively inhibit late-stage autoimmune disease in diabetes-prone mice,” The Journal of Immunology, vol. 175, no. 3,pp. 1991–1999, 2005.
[27] A. Cadili and C. de Gara, “Complications of splenectomy,” TheAmerican Journal of Medicine, vol. 121, no. 5, pp. 371–375,2008.
[28] S. N. Mueller and R. Ahmed, “Lymphoid stroma in the initia-tion and control of immune responses,” ImmunologicalReviews, vol. 224, no. 1, pp. 284–294, 2008.
[29] C. King, A. Ilic, K. Koelsch, and N. Sarvetnick, “Homeostaticexpansion of T cells during immune insufficiency generatesautoimmunity,” Cell, vol. 117, no. 2, pp. 265–277, 2004.
[30] D. V. Baev, S. Caielli, F. Ronchi et al., “Impaired SLAM-SLAMhomotypic interaction between invariant NKT cells and den-dritic cells affects differentiation of IL-4/IL-10-secretingNKT2 cells in nonobese diabetic mice,” The Journal of Immu-nology, vol. 181, no. 2, pp. 869–877, 2008.
[31] K. Takahashi, J. Satoh, and Y. Oka, “Lowered expressions ofthe NF-κB family members in dendritic cells from NOD miceare associated with a reduced expression of GATA-2,” Annals
of the New York Academy of Sciences, vol. 1150, no. 1, pp. 59-60, 2008.
[32] J. Morin, A. Chimenes, C. Boitard, R. Berthier, and S. Boudaly,“Granulocyte-dendritic cell unbalance in the non-obese dia-betic mice,” Cellular Immunology, vol. 223, no. 1, pp. 13–25,2003.
[33] R. Peng, K. Bathjat, Y. Li, and M. J. Clare-Salzler, “Defectivematuration of myeloid dendritic cell (DC) in NOD mice iscontrolled by IDD10/17/18,” Annals of the New York Academyof Sciences, vol. 1005, no. 1, pp. 184–186, 2003.
[34] S. Boudaly, J. Morin, R. Berthier, P. Marche, and C. Boitard,“Altered dendritic cells (DC) might be responsible for regula-tory T cell imbalance and autoimmunity in nonobese diabetic(NOD) mice,” European Cytokine Network, vol. 13, no. 1,pp. 29–37, 2002.
[35] K. Schuster, J. Gadiot, R. Andreesen, A. Mackensen, T. F.Gajewski, and C. Blank, “Homeostatic proliferation of naïveCD8+ T cells depends on CD62L/L-selectin-mediated homingto peripheral LN,” European Journal of Immunology, vol. 39,no. 11, pp. 2981–2990, 2009.
[36] J. Suffner, K. Hochweller, M. C. Kuhnle et al., “Dendritic cellssupport homeostatic expansion of Foxp3+ regulatory T cells inFoxp3.LuciDTR mice,” The Journal of Immunology, vol. 184,no. 4, pp. 1810–1820, 2010.
[37] S. R. Jacobs, R. D. Michalek, and J. C. Rathmell, “IL-7 isessential for homeostatic control of T cell metabolismin vivo,” The Journal of Immunology, vol. 184, no. 7,pp. 3461–3469, 2010.
[38] O. Boyman, S. Letourneau, C. Krieg, and J. Sprent, “Homeo-static proliferation and survival of naïve and memory T cells,”European Journal of Immunology, vol. 39, no. 8, pp. 2088–2094, 2009.
[39] A. Ali, M. Garrovillo, M. X. Jin, M. A. Hardy, and S. F. Oluwole,“Major histocompatibility complex class I peptide-pulsedhost dendritic cells induce antigen-specific acquired thymictolerance to islet cells,” Transplantation, vol. 69, no. 2, pp. 221–226, 2000.
[40] M. Garrovillo, A. Ali, H. A. Depaz et al., “Induction of trans-plant tolerance with immunodominant allopeptide-pulsedhost lymphoid and myeloid dendritic cells,” American Journalof Transplantation, vol. 1, no. 2, pp. 129–137, 2001.
[41] F. Fu, Y. Li, S. Qian et al., “Costimulatory molecule-deficient dendritic cell progenitors (MHC class II+,CD80dim, CD86-) prolong cardiac allograft survival in non-immunosuppressed recipients,” Transplantation, vol. 62,no. 5, pp. 659–665, 1996.
[42] M. B. Lutz, R. M. Suri, M. Niimi et al., “Immature dendriticcells generated with low doses of GM-CSF in the absence ofIL-4 are maturation resistant and prolong allograft survivalin vivo,” European Journal of Immunology, vol. 30, no. 7,pp. 1813–1822, 2000.
[43] M. J. Clare-Salzler, J. Brooks, A. Chai, K. Van Herle, andC. Anderson, “Prevention of diabetes in nonobese diabeticmice by dendritic cell transfer,” The Journal of Clinical Investi-gation, vol. 90, no. 3, pp. 741–748, 1992.
[44] M. Feili-Hariri, X. Dong, S. M. Alber, S. C. Watkins, R. D.Salter, and P. A. Morel, “Immunotherapy of NOD mice withbone marrow-derived dendritic cells,” Diabetes, vol. 48,no. 12, pp. 2300–2308, 1999.
[45] M. Feili-Hariri, D. H. Falkner, A. Gambotto et al., “Dendriticcells transduced to express interleukin-4 prevent diabetes in
12 Journal of Immunology Research

nonobese diabetic mice with advanced insulitis,”Human GeneTherapy, vol. 14, no. 1, pp. 13–23, 2003.
[46] J. Tian, M. Clare-Salzler, A. Herschenfeld et al., “Modulatingautoimmune responses to GAD inhibits disease progressionand prolongs islet graft survival in diabetes–prone mice,”Nature Medicine, vol. 2, no. 12, pp. 1348–1353, 1996.
[47] A. Muir, A. Peck, M. Clare-Salzler et al., “Insulin immuniza-tion of nonobese diabetic mice induces a protective insulitischaracterized by diminished intraislet interferon-gamma tran-scription,” The Journal of Clinical Investigation, vol. 95, no. 2,pp. 628–634, 1995.
[48] D. Elias and I. R. Cohen, “Peptide therapy for diabetes in NODmice,” The Lancet, vol. 343, no. 8899, pp. 704–706, 1994.
[49] J. F. Elliott, H. Y. Qin, S. Bhatti et al., “Immunization with thelarger isoform of mouse glutamic acid decarboxylase (GAD67)prevents autoimmune diabetes in NOD mice,” Diabetes,vol. 43, no. 12, pp. 1494–1499, 1994.
[50] C. Engman, Y. Wen, W. S. Meng, R. Bottino, M. Trucco, andN. Giannoukakis, “Generation of antigen-specific Foxp3 + reg-ulatory T-cells in vivo following administration of diabetes-reversing tolerogenic microspheres does not require provisionof antigen in the formulation,” Clinical Immunology, vol. 160,no. 1, pp. 103–123, 2015.
[51] B. Ahrens, C. Gruber, R. D. Rha et al., “BCG priming ofdendritic cells enhances T regulatory and Th1 functionand suppresses allergen-induced Th2 function in vitro andin vivo,” International Archives of Allergy and Immunology,vol. 150, no. 3, pp. 210–220, 2009.
[52] A. W. Thomson, H. R. Turnquist, A. F. Zahorchak, andG. Raimondi, “Tolerogenic dendritic cell-regulatory T-cellinteraction and the promotion of transplant tolerance,” Trans-plantation, vol. 87, Supplement 9, pp. S86–S90, 2009.
[53] M. Feili-Hariri, D. H. Falkner, and P. A. Morel, “RegulatoryTh2 response induced following adoptive transfer of dendriticcells in prediabetic NOD mice,” European Journal of Immu-nology, vol. 32, no. 7, pp. 2021–2030, 2002.
[54] K. V. Tarbell, S. Yamazaki, K. Olson, P. Toy, and R. M.Steinman, “CD25+ CD4+ T cells, expanded with dendritic cellspresenting a single autoantigenic peptide, suppress autoim-mune diabetes,” The Journal of Experimental Medicine,vol. 199, no. 11, pp. 1467–1477, 2004.
[55] S. Yamazaki, K. Inaba, K. V. Tarbell, and R. M. Steinman,“Dendritic cells expand antigen-specific Foxp3+CD25+CD4+
regulatory T cells including suppressors of alloreactivity,”Immunological Reviews, vol. 212, no. 1, pp. 314–329, 2006.
[56] S. Yamazaki, T. Iyoda, K. Tarbell et al., “Direct expansion offunctional CD25+ CD4+ regulatory T cells by antigen-processing dendritic cells,” The Journal of ExperimentalMedicine, vol. 198, no. 2, pp. 235–247, 2003.
[57] S. Yamazaki, M. Patel, A. Harper et al., “Effective expansionof alloantigen-specific Foxp3+ CD25+ CD4+ regulatory Tcells by dendritic cells during the mixed leukocyte reaction,”Proceedings of the National Academy of Sciences of theUnited States of America, vol. 103, no. 8, pp. 2758–2763,2006.
[58] S. Gregori, M. Battaglia, andM. G. Roncarolo, “Re-establishingimmune tolerance in type 1 diabetes via regulatory T cells,”Novartis Foundation Symposium, vol. 292, pp. 174–183,2008, discussion 183-176, 202-173.
[59] K. Mahnke, E. Schmitt, L. Bonifaz, A. H. Enk, and H. Jonuleit,“Immature, but not inactive: the tolerogenic function of
immature dendritic cells,” Immunology and Cell Biology,vol. 80, no. 5, pp. 477–483, 2002.
[60] S. Adams, D. W. O’Neill, and N. Bhardwaj, “Recent advancesin dendritic cell biology,” Journal of Clinical Immunology,vol. 25, no. 2, pp. 87–98, 2005.
[61] H. Jonuleit, E. Schmitt, K. Steinbrink, and A. H. Enk, “Den-dritic cells as a tool to induce anergic and regulatory T cells,”Trends in Immunology, vol. 22, no. 7, pp. 394–400, 2001.
[62] H. Jonuleit, E. Schmitt, G. Schuler, J. Knop, and A. H. Enk,“Induction of interleukin 10–producing, nonproliferatingCD4+ T cells with regulatory properties by repetitive stimula-tion with allogeneic immature human dendritic cells,” TheJournal of Experimental Medicine, vol. 192, no. 9, pp. 1213–1222, 2000.
[63] K. Steinbrink, M. Wolfl, H. Jonuleit, J. Knop, and A. H. Enk,“Induction of tolerance by IL-10-treated dendritic cells,” TheJournal of Immunology, vol. 159, no. 10, pp. 4772–4780, 1997.
[64] V. Kronin, L. Wu, S. Gong, M. C. Nussenzweig, andK. Shortman, “DEC-205 as a marker of dendritic cells withregulatory effects on CD8 T cell responses,” InternationalImmunology, vol. 12, no. 5, pp. 731–735, 2000.
[65] A. M. D'Alise, V. Auyeung, M. Feuerer et al., “The defect inT-cell regulation in NOD mice is an effect on the T-celleffectors,” Proceedings of the National Academy of Sciencesof the United States of America, vol. 105, no. 50,pp. 19857–19862, 2008.
[66] J. Lo, Dendritic Cell Therapy for Type 1 Diabetes: Role ofAntigen-Presentation in Immune Modulation (DoctoralDisseration), University of Florida, Gainesville, FL, USA,2009.
13Journal of Immunology Research

Research ArticleFrequency of Interferon-Resistance Conferring Substitutions inAmino Acid Positions 70 and 91 of Core Protein of the RussianHCV 1b Isolates Analyzed in the T-Cell Epitopic Context
V. S. Kichatova ,1,2,3 K. K. Kyuregyan ,1,2,3 N. V. Soboleva,1 A. A. Karlsen,1,2,3,4
O. V. Isaeva,2,3 M. G. Isaguliants,1,4,5 and M. I. Mikhailov2,3
1Chumakov Federal Scientific Center for Research and Development of Immune-and-Biological Products of Russian Academy ofSciences, Moscow 108819, Russia2Russian Medical Academy of Continuous Professional Education, Moscow 125993, Russia3Mechnikov Research Institute for Vaccines and Sera, Moscow 105064, Russia4NF Gamaleja Research Center of Epidemiology and Microbiology, Moscow 123098, Russia5Riga Stradins University, Riga LV-1007, Latvia
Correspondence should be addressed to V. S. Kichatova; [email protected] K. K. Kyuregyan; [email protected]
Received 29 August 2017; Accepted 29 November 2017; Published 7 February 2018
Academic Editor: Pedro A. Reche
Copyright © 2018 V. S. Kichatova et al. This is an open access article distributed under the Creative Commons AttributionLicense, which permits unrestricted use, distribution, and reproduction in any medium, provided the original work isproperly cited.
Amino acid substitutions R70Q/H and L91M in HCV subtype 1b core protein can affect the response to interferon and areassociated with the development of hepatocellular carcinoma. We found that the rate of R70Q/H in HCV 1b from Russiawas 31.2%, similar to that in HCV strains from Asia (34.0%), higher than that in the European (18.0%, p = 0 0010), butlower than that in the US HCV 1b strains (62.8%, p < 0 0001). Substitution L91M was found in 80.4% of the RussianHCV 1b isolates, higher than in Asian isolates (43.8%, p < 0 0001). Thus, a significant proportion of Russian HCV 1bisolates carry the unfavorable R70Q/H and/or L91M substitution. In silico analysis of the epitopic structure of theregions of substitutions revealed that both harbor clusters of T-cell epitopes. Peptides encompassing these regions werepredicted to bind to a panel of HLA class I molecules, with substitutions impairing peptide recognition by HLA Imolecules of the alleles prevalent in Russia. This indicates that HCV 1b with R70Q/H and L91M substitutions may haveevolved as the immune escape variants. Impairment of T-cell recognition may play a part in the negative effect of thesesubstitutions on the response to IFN treatment.
1. Introduction
Approximately 177.5 million people worldwide areinfected with the hepatitis C virus (HCV). In 60–80%of cases, infection results in the chronic liver disease; 10to 25% progress to cirrhosis and hepatocellular carcinoma(HCC) [1–4], the second most common cause of cancerdeath worldwide after the lung cancer [5]. HCV infectionis associated with at least half of the HCC cases [6]. In
patients with hepatitis C, treatment with the direct-acting antivirals (DAAs) of the second generation resultsin the sustained virological response (SVR) in 98-99%cases. Unfortunately, due to the high cost and limited avail-ability of DAAs, clinical practice in low- to moderate-income countries still relies on the pegylated interferon andribavirin (PEG-IFN/RBV) therapy.
Infections with HCV genotype 1 that still predominate(in 48% of HCV-infected people), specifically HCV 1b
HindawiJournal of Immunology ResearchVolume 2018, Article ID 7685371, 13 pageshttps://doi.org/10.1155/2018/7685371

(in 23% of HCV-infected people [4]), have been repeatedlyassociated with poor prognosis [7–11]. In chronic hepatitisC, infection with HCV 1b increases the rate of progressionto fibrosis and cirrhosis and the risk of HCC developmentcompared to infections with other HCV genotypes [8–12].HCV genotype 1 infection is also an important prognos-tic factor of poor SVR to PEG-IFN/RBV treatment, withthe response rate for genotypes 2 and 3 reaching 80%,and for genotype 1, only 35 to 45% [13–15], being loweror tending to be lower for HCV 1b carriers (37% ofpatients with subtype 1b and 45% of those with subtype1a [16]). Several studies and meta-analyses have con-cluded that eradication of HCV with antiviral therapyreduces the risk of HCC in patients with chronic hepati-tis C, but the risk is not eliminated [17]. Wide spread ofHCV 1b, high rate of progression to chronic hepatitis C,poor response to PEG-IFN/RBV therapy still actual inpoor to modest healthcare settings, and the increasedrisks of HCC development prompt continuation of thestudies on the mechanisms of HCV 1b resistance tointerferon treatment.
Akuta et al. were the first to report that amino acidsubstitutions in positions 70 and 91 of the HCV 1b coreprotein associate with virological response to PEG-IFN/RBV treatment. They found that change of arginine toglutamine or histidine in amino acid (aa) position 70(R70Q and R70H or R70Q/H) and/or methionine in aaposition 91 (L91M) was present in 100% of nonresponderswho tested positive for HCV RNA at the end of 48 weeks ofPEG-IFN/RBV treatment, but in only 42% of responders[18]. The significance of R70Q for HCV 1b (and also forsubtype 5a) was confirmed in a series of later studies (see[19] for a review). R70Q was recorded as a predictivemarker for the resistance to PEG-IFN/RBV also in theprolonged treatment regimens (72 weeks) and in the tripletherapy with PEG-IFN/RBV and second-generation DAA[19–21]. A series of studies determined the frequency ofthese mutations in different population groups [22–24].All, including the very recent ones, concluded that thenature of amino acid residues in aa position 70 of HCVcore can help to distinguish patients who can still benefitfrom the affordable IFN-based therapy from those whomust be treated with DAAs to prevent the evolutiontowards the end-stage liver disease [25]. The clinicalsignificance of substitutions in aa position 91 of HCV 1bis less well defined [19] and for other HCV genotypes eitherunclear [19] or not demonstrated [26–29]. Interestingly,clinical and experimental studies demonstrated theinvolvement of both of these mutations in hepatocellularcarcinogenesis [30, 31]. Amino acid substitution R70Q/Happeared to be associated with cirrhosis and developmentof HCC even in PEG-IFN/RBV-treated patients achievingSVR [17, 22, 32–38]. Altogether, this motivates the needto characterize polymorphisms in HCV 1b core proteinand identify patients carrying “carcinogenic” HCV 1b var-iants staying at a high risk of developing HCC even afterthe successful treatment.
The prevalence of HCV core polymorphisms R70Q/Hand/or L91M in the territory of the Russian Federation
was not characterized despite high incidence of HCVinfections [39], the predominance of HCV 1 genotype,specifically of HCV 1b subtype (up to 50% [40–42]), andwide use of standard interferon therapy. In this study,we filled this gap and described the spread in the RussianFederation of HCV 1b strains with R70Q/H and/or L91Msubstitutions in comparison to their spread in the othergeographical regions and evaluated the effect of thesesubstitutions on the recognition of these regions by theimmune system of the patients.
2. Materials and Methods
2.1. Samples. The analysis included 313 sequences encodingHCV core amplified from the serum samples of patientswith chronic hepatitis C collected during 2007–2014 indifferent regions of the Russian Federation: Moscowand the Moscow region (n = 238), Rostov/Rostov-on-Don(n = 12), Tuva/Kyzyl (n = 12), Khabarovsk (n = 36), Sverd-lovsk/Yekaterinburg (n = 4), and Sakha/Yakutsk (n = 11).Age and gender were known for 117 individuals; 34 werefemales and 83 were males (the female to male ratio was1 : 2.4). Mean age was 40± 14 years. All serum samplesincluded into the database were from the general popula-tion with the exception of those from Moscow/Moscowregion represented by the subgroup of the general popula-tion without known risk factors (n = 49) and intravenousdrug users (IDUs; n = 45). Written informed consent wasobtained from each patient.
2.2. HCV Genotyping and Sequencing. HCV genotype andsubtype were determined by the phylogenetic analysis ofHCV core coding region; and for HCV 2k/1b recombinants,also of the NS5b region. Nucleic acid extraction was per-formed using QIAamp Viral RNA Mini Kit (QIAGEN, Hil-den, Germany), or MagNA Pure Compact Nucleic AcidIsolation Kit I (Roche Applied Science, Mannheim, Ger-many), or Sileks MagNA kit (Sileks, Moscow, Russia).Reverse transcription and amplification was performed withTranscriptor First Strand cDNA Synthesis Kit and Fast StartHigh Fidelity PCR System (Roche Applied Science). HCVcore coding region (nucleotide positions 273–1315 accordingto HCV 1a reference strain H77, GenBank accession numberAF011753) was subjected to nested PCR with the followingprimers: outer forward 5′-GCT AGC CGA GTA GTG TTGGG-3′; outer reverse 5′-ACC AGT TCA TCATCA TATYCC-3′; inner forward 5′-GAA AGG CCT TGT GGT ACTGC-3′; and inner reverse 5′-TTC ATC ATA TTC CATGCCA-3′. The first and the second steps of PCR were asfollows: 5min at 94°C, then 35 cycles of 45 sec at 94°C,45 sec at 55°C, 90 sec at 72°C, and final elongation for7min at 72°C. PCR products of 1043 nt length were cutand extracted from agarose gel using QIAquick GelExtraction kit (QIAGEN). Sequencing was performed onan automated sequencer 3130 Genetic Analyzer (ABI,Foster City, USA) using Big Dye Terminator v.3.1 CycleSequencing Kit according to the manufacturer’s protocol.The genotype was established by comparison sequences
2 Journal of Immunology Research

with GenBank reference sequences representative for allHCV genotypes.
2.3. HCV Sequence Database. Database of 313 HCVsequences was supplemented with 94 sequences from Gen-Bank geographically attributed to St. Petersburg (n = 42:AY070167–AY070169, AY070174.1, AY070178–AY070211,AY070214, AY070215, AY587844, and AY587845);Novosibirsk (n = 47: DQ001223–DQ001264, DQ001267–DQ001270, AH014196.2, and AH014197.2); and Moscow(n = 5: AF176573, KM054515, KM054516, KT983617, andX71407). The complete database consisted of 407 sequencesof the “Russian” HCV core of subtypes: 1a (n = 29), 1b(n = 189), 3a (n = 171), and recombinant 2k/1b (n = 18)(Table 1). Group of comparison consisted of 2210 HCVcore sequences from the Los Alamos database (LANL;https://hcv.lanl.gov/content/index) distributed as follows:Asia (n = 374), USA (n = 1343), and Europe (n = 497)(Table 1). Samples of the Russian patients infected withHCV1b formed a separate set divided into the subsetsdepending on the region of sample collection (Table 2).The geographical distribution of these subsets is illus-trated by Supplementary Figure S1.
2.4. In Silico Analysis of HCV Core Sequences. Alignment ofthe nucleotide and predicted amino acid sequences ofHCV were performed using MEGA 7.0.18. Prevalence ofsubstitutions in amino acid positions 70 and 91 was calcu-lated using Microsoft Office Excel. Phylogenetic analysis ofHCV1b core sequences (Supplementary Figure S2) wasdone using a Bayesian likelihood-based algorithm imple-mented in Beast version 1.8.4 [43]. The SRD06 substitu-tion model was used with a relaxed lognormal clock.Analysis was run over 700 million generations and treeswere sampled every 70,000 generations, resulting in70,000 trees. Trees were annotated with TreeAnnotatorv.1.8.3 using a burn-in of 1000 trees and visualized withFigTree v.1.4.2 (Andrew Rambaut; http://tree.bio.ed.ac.uk/software/figtree/). Search for T-cell epitopes in HCV coresequences was performed through EIDB database (http://www.iedb.org) [44]. Epitope sequences were aligned withHCV core aa sequences using MEGA software.
2.5. Prediction of Presentation of HCV Core-Derived Peptidesby HLA Class I and II Molecules. Amino acid sequences ofHCV core of 189 HCV 1b were used to build the consensussequence of “Russian” HCV 1b core (sequence in GenBankdeposition). Consensus sequence was divided into nineamino acid- (aa-) long peptides with mandatory presenceof aa residues 70 or 91. Prediction of presentation of resultingHCV core-derived peptides by human leukocyte antigenclass I molecules (HLA class I) was done on EPITOPE VAC-CINE OPTIMIZATION server (http://bio.med.ucm.es/episopt.html) using EPISPOT tool (http://bio.med.ucm.es/episopt.html; [45]). Analysis was carried for a selection ofHLA I alleles prevalent in the Russian population basedon the most representative dataset [46] and other datadeposited in the Allele Frequency Net Database (http://www.allelefrequencies.net/pop6001c.asp?pop_id=3322; [47]).
Presentation by HLA class II molecules was evaluatedusing the NetMHCIIpan 3.1 program (http://www.cbs.dtu.dk/services/NetMHCIIpan-3.1) [48–50] for the region start-ing with 20-mer peptide with the C-terminal aa 70 and end-ing with the 20-mer peptide with the N-terminal aa 91.Analysis was done for the following: 275 HLA class IIalleles DRB1∗1101–DRB1∗1195, DRB1∗1301–DRB1∗1399,and DRB1∗1501–DRB1∗1549; and combination of alphaand beta chains DQA1∗0101, DQA1∗0102, DQA1∗0301,DQA1∗0501 with DQB1∗0201, DQB1∗0301, DQB1∗0501,DQB1∗0602, DQB1∗0603, DQB1∗0604, DQB1∗0605,DQB1∗0606, DQB1∗0607, and DQB1∗0608, selected basedon the published data on the frequency of HLA class IIalleles in the Russian Federation [46, 47, 51]. Strong bind-ing was characterized by binding level< 2%; weak binding,2 to 10%; no binding, >10%.
2.6. Statistical Analysis. Data analysis was performed usingthe http://Graphpad.com/. Statistical significance was eval-uated by Fisher’s exact test using parametric model, two-tailed p value< 0.05 was considered statistically significant.
3. Results
3.1. Characteristics of the Set of HCV 1b Sequences Used in theStudy. The analysis included 313 sequences encoding HCVcore amplified from the serum samples of patients withchronic hepatitis C collected during 2007–2014 from thegeneral population in different regions of the RussianFederation, supplemented with 94 sequences from the Gen-Bank (n = 407; Table 1). Sequence set included 189 HCV 1bsequences derived from the territory of the Russian Federa-tion, 140 obtained here, and 49 sequences from the Gen-Bank. We performed their phylodynamic analysis withthe focus on 140 HCV 1b isolates (Supplementary FigureS2). The analysis illustrated a long history of HCV 1bevolution on the Russian territory, with current strainshaving an average time of separation from the “foreign”strains of approximately 15± 5 years, the oldest strainsseparating 60± 15 years ago (Supplementary Figure S2).No clusters were revealed, indicating that sequences werenot related. HCV 1b sequences with R70Q/H and/orL91M substitutions did not form any clusters either,being distributed evenly throughout the phylogenetic tree(Supplementary Figure S2). This demonstrates that theselected sequences are geographically genuine, adequatelyreproduce the diversity of HCV 1b in the territory ofthe Russian Federation, and are, therefore, suitable forthe analysis of frequency of occurrence of amino acidsubstitutions in positions 70 and 91 in the territory of theRussian Federation.
3.2. Frequency of Substitutions in aa Positions 70 and 91 ofHCV 1b from the Russian Federation Compared to OtherGeographical Regions. Substitution R70Q was found in27.0% and R70H in 4.2% of the Russian HCV 1b isolates,which was similar to their frequencies in the isolates fromAsia and in all countries taken together (p > 0 05), but signif-icantly higher than the frequency of R70Q and of R70H in
3Journal of Immunology Research

Europe (17.7%, p = 0 0179; and 0.3%, p = 0 0021, resp.;Table 1). Substitution L91M was found in 80.4% of HCV1b isolates from Russia, likewise to Europe and worldwide,but more often than in the strains from Asia (43.8%,p < 0 0001; Table 1). Substitution R70Q was significantlymore prevalent compared to substitution R70H in all geo-graphical regions including Russia. Frequency of occur-rence of substitutions in positions 70 and 91 in HCVgenotypes 1a and 3a was low (Table 1). Geographicaldistribution of amino acid variants in positions 70 and 91for HCV subtypes 1a and 3a was similar, except for com-paratively more frequent occurrence of R70Q in HCV 3astrains from Asia (significantly more than in the RussianHCV subtype 3a strains; 9.8% versus 2.9%, p = 0 0204;Table 1). All available core sequences of the recombinantHCV 2k/1b (18 from Russia and 4 from Europe) had nosubstitutions in either position 70 or 91 (data not shown).
3.3. Pattern of Substitutions in aa Positions 70 and 91 in HCV1b Strains in the Russian Federation. HCV 1b variants withsubstitutions R70Q/H and L91M were evenly distributed inall eight regions of the Russian Federation assessed(Table 2). Differences were observed only between Moscow(R70Q/H, 40.4%; L91M, 79.8%) and Novosibirsk subcohorts(R70Q/H, 20.7%, p = 0 0049; L91M, 75.5%, p = 0 0094). Sub-stitution R70Q dominated over substitution R70H in allstudied cohorts (data not shown). Prevalence of R70Q/Hand L91M mutations were similar in males and females(р = 0 8286 and p = 0 439 for aa positions 70 and 91,
resp.). Comparison of subcohorts with a known year ofsample collection demonstrated the accumulation ofR70Q/H substitution over time: they were found in19.6% of samples collected before 2005 and in 39.1% in sam-ples collected in 2011–2014 (p = 0 038; Table 2). An increasein the frequency of occurrence of the substitution wasobserved only for position 70 but not for 91 (Figure 1).
Analysis of the Moscow cohort demonstrated similarfrequency of R70Q/H and L91M mutations among thegeneral population and the intravenous drug users (IDUs)(R70Q/H: 38.7% versus 42.2%, p = 0 8341; L91M: 81.6%versus 77.7%, p = 0 7979; Table 2). Difference betweenthese two population groups was observed only in aa res-idue in position 75: R75H/Q occurred in the general pop-ulation more frequently than in IDUs (52.6% and 46.6%,resp.; p = 0 0423). Substitutions at aa position 75 wererepeatedly detected in the earlier studies [52, 53], but theirclinical significance is yet unclear.
3.4. Epitopic Analysis of the Region of HCV Core ContainingAmino Acid Residues 70 and 91. Amino acid sequences ofHCV core of 189 HCV 1b were used to build the consensussequence of the “Russian” HCV 1b core, an “average” HCVsequence largely free from the patient-specific adaptations[54]. Epitopic analysis of the consensus HCV core usingImmune Epitope Database and Analysis resource (http://www.iedb.org) identified 183 CD4+ and CD8+ Т cellepitopes, with 14 (7.7%) encompassing aa 70 and 29(15.8%) encompassing aa 91, respectively. Totally, 23.5%
Table 1: Frequency of occurrence of substitutions at amino acid positions 70 and 91 of the nucleocapsid (core) protein of HCV genotypes 1a,1b, and 3a in different population groups (in %).
HCV genotype SubstitutionsGeographical variation in % of sequences variants in HCV of different genotypes
Russia Europe Asia USA Total
1a
nn samples n = 29 n = 149 n = 27 n = 1087 n = 1292Q70 3.4 0.7 0 1.7 1.5
H70 0 0 0 0.1 0.1
M91 0 0 0 0 0
Both∗ 0 0 0 0 0
None∗∗ 96.6 99.3 100 98.2 98.4
1b
nn samples n = 189 n = 316 n = 224 n = 218 n = 947Q70 27.0 17.7 31.3 59.6 32.4
H70 4.2 0.3 2.7 3.2 2.3
M91 80.4 85.8 43.8 86.2 74.9
Both∗ 27.5 15.5 16.1 54.6 27.0
None∗∗ 15.9 11.7 38.4 5.5 17.4
3a
nn samples n = 171 n = 28 n = 123 n = 38 n = 360Q70 2.9 7.1 9.8 0 5.3
H70 0 0 0 0 0
M91 0.6 0 0 0 0.3
Both∗ 0 0 0 0 0
None∗∗ 96.5 92.9 90.2 100 94.4∗Substitutions in both aa 70 and 91; ∗∗no substitutions.
4 Journal of Immunology Research

Table2:Occurrenceof
substitution
sin
aminoacid
position
s70
and91
ofthenu
cleocapsid
(core)
proteinof
HCV1b
inthesamples
collected
from
thegeneralp
opulationof
theRussian
Federation
during
theroutinebloodtests.
Num
ber
ofcoho
rt
Federal
Districtof
Russia
City
Dateof
collectionof
samples
Num
berof
HCV
1bsequ
ences
Mutations
foun
din
aapo
sition
70,n
(%)
Mutations
foun
din
aapo
sition
91,n
(%)
Mutations
foun
din
aapo
sition
s70
and91,n
(%)
Witho
utmutations
inaa
position
s70
and91,n
(%)
1Central
Moscow
2008
51(20.0)
4(80.0)
1(20.0)
1(20.0)
2009
61(16.7)
5(83.3)
0(0)
0(0)
2011
1710
(58.9)
15(88.2)
9(53.0)
1(5.9)
2014
217(33.3)
16(76.2)
6(28.6)
4(19.0)
2008–2014
4919
(38.7)
40(81.6)
17(34.7)
7(14.2)
2014
45∗
19(42.2)
35(77.7)
16(35.6)
7(15.6)
2008–2014
94∗∗
38(40.4)
75(79.8)
33(35.1)
14(14.9)
2Northwest
Saint
Petersburg
Before2001
184(22.2)
15(83.3)
3(16.7)
2(11.1)
3Southern
Rostov-on
-Don
2008
80(0)
8(100)
0(0)
0(0)
4Ural
Yekaterinbu
rg2008
31(33.3)
3(100)
1(33.3)
0(0)
5Siberian
Novosibirsk
Before2005
296(20.8)
22(75.9)
6(20.7)
7(23.8)
6Kyzyl
2008
61(16.7)
4(66.7)
0(0)
1(16.7)
7FarEastern
Yakutsk
2008
71(14.3)
6(85.7)
1(14.3)
1(14.3)
8Khabarovsk
2009
248(33.3)
19(79.2)
8(33.3)
5(20.8)
∗Intravenou
sdrug
users(IDUs);∗
∗allsam
ples
includ
ingID
Us.
5Journal of Immunology Research
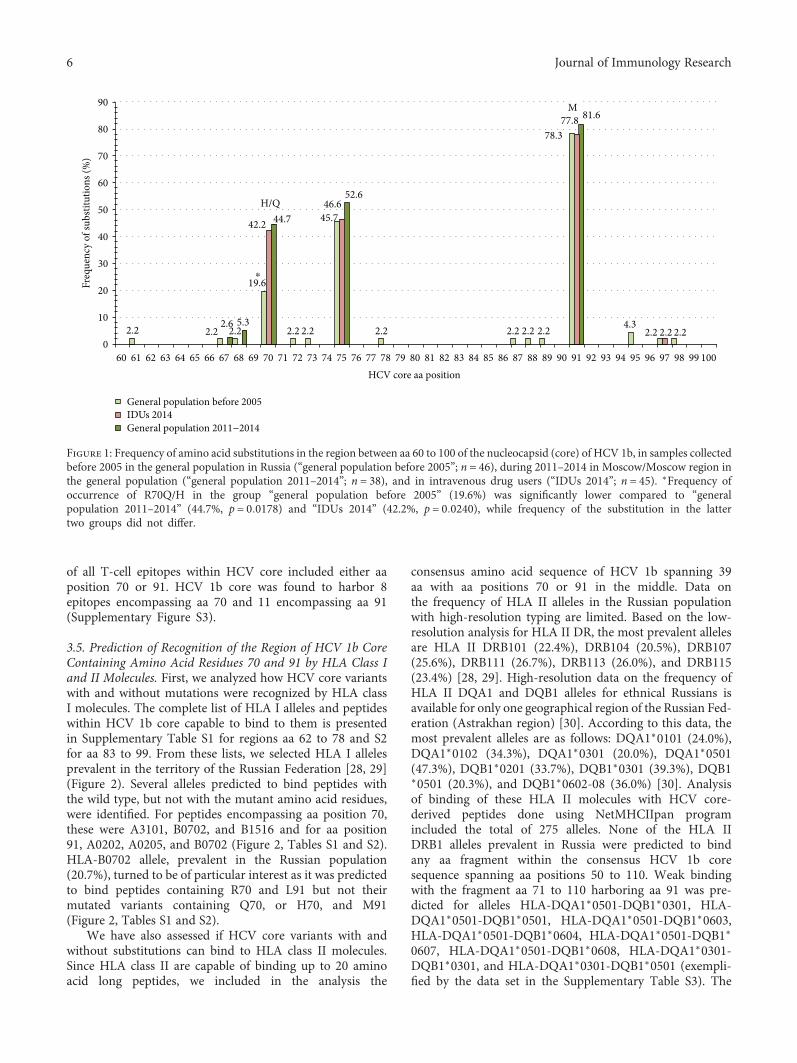
of all T-cell epitopes within HCV core included either aaposition 70 or 91. HCV 1b core was found to harbor 8epitopes encompassing aa 70 and 11 encompassing aa 91(Supplementary Figure S3).
3.5. Prediction of Recognition of the Region of HCV 1b CoreContaining Amino Acid Residues 70 and 91 by HLA Class Iand II Molecules. First, we analyzed how HCV core variantswith and without mutations were recognized by HLA classI molecules. The complete list of HLA I alleles and peptideswithin HCV 1b core capable to bind to them is presentedin Supplementary Table S1 for regions aa 62 to 78 and S2for aa 83 to 99. From these lists, we selected HLA I allelesprevalent in the territory of the Russian Federation [28, 29](Figure 2). Several alleles predicted to bind peptides withthe wild type, but not with the mutant amino acid residues,were identified. For peptides encompassing aa position 70,these were A3101, B0702, and B1516 and for aa position91, A0202, A0205, and B0702 (Figure 2, Tables S1 and S2).HLA-B0702 allele, prevalent in the Russian population(20.7%), turned to be of particular interest as it was predictedto bind peptides containing R70 and L91 but not theirmutated variants containing Q70, or H70, and M91(Figure 2, Tables S1 and S2).
We have also assessed if HCV core variants with andwithout substitutions can bind to HLA class II molecules.Since HLA class II are capable of binding up to 20 aminoacid long peptides, we included in the analysis the
consensus amino acid sequence of HCV 1b spanning 39aa with aa positions 70 or 91 in the middle. Data onthe frequency of HLA II alleles in the Russian populationwith high-resolution typing are limited. Based on the low-resolution analysis for HLA II DR, the most prevalent allelesare HLA II DRB101 (22.4%), DRB104 (20.5%), DRB107(25.6%), DRB111 (26.7%), DRB113 (26.0%), and DRB115(23.4%) [28, 29]. High-resolution data on the frequency ofHLA II DQA1 and DQB1 alleles for ethnical Russians isavailable for only one geographical region of the Russian Fed-eration (Astrakhan region) [30]. According to this data, themost prevalent alleles are as follows: DQA1∗0101 (24.0%),DQA1∗0102 (34.3%), DQA1∗0301 (20.0%), DQA1∗0501(47.3%), DQB1∗0201 (33.7%), DQB1∗0301 (39.3%), DQB1∗0501 (20.3%), and DQB1∗0602-08 (36.0%) [30]. Analysisof binding of these HLA II molecules with HCV core-derived peptides done using NetMHCIIpan programincluded the total of 275 alleles. None of the HLA IIDRB1 alleles prevalent in Russia were predicted to bindany aa fragment within the consensus HCV 1b coresequence spanning aa positions 50 to 110. Weak bindingwith the fragment aa 71 to 110 harboring aa 91 was pre-dicted for alleles HLA-DQA1∗0501-DQB1∗0301, HLA-DQA1∗0501-DQB1∗0501, HLA-DQA1∗0501-DQB1∗0603,HLA-DQA1∗0501-DQB1∗0604, HLA-DQA1∗0501-DQB1∗
0607, HLA-DQA1∗0501-DQB1∗0608, HLA-DQA1∗0301-DQB1∗0301, and HLA-DQA1∗0301-DQB1∗0501 (exempli-fied by the data set in the Supplementary Table S3). The
90
General population before 2005
General population 2011−2014IDUs 2014
80
70
60
50
40
30
Freq
uenc
y of
subs
titut
ions
(%)
20
10
060 61 62
2.2 2.2 2.2 2.2 2.2 2.2 2.2 2.2 2.2 2.2 2.2 2.24.32.6 5.3
19.6
42.2 44.7 45.746.6
52.6
78.377.8 81.6
M
H/Q
⁎
63 64 65 66 67 68 69 70 71 72 73 74 75 76 77 78 79HCV core aa position
80 81 82 83 84 85 86 87 88 89 90 91 92 93 94 95 96 97 98 99 100
Figure 1: Frequency of amino acid substitutions in the region between aa 60 to 100 of the nucleocapsid (core) of HCV 1b, in samples collectedbefore 2005 in the general population in Russia (“general population before 2005”; n = 46), during 2011–2014 in Moscow/Moscow region inthe general population (“general population 2011–2014”; n = 38), and in intravenous drug users (“IDUs 2014”; n = 45). ∗Frequency ofoccurrence of R70Q/H in the group “general population before 2005” (19.6%) was significantly lower compared to “generalpopulation 2011–2014” (44.7%, p = 0 0178) and “IDUs 2014” (42.2%, p = 0 0240), while frequency of the substitution in the lattertwo groups did not differ.
6 Journal of Immunology Research

binding was not affected by the nature of amino acid residuein position 91. No binding was predicted for the peptidesspanning aa 50 to 90 harboring aa 70 (data not shown).
4. Discussion
The presence of substitutions R to Q/H in aa position 70 ofthe nucleocapsid (core) of HCV 1b can help distinguishpatients who can still benefit from the affordable IFN-basedtherapy from those who do not respond and are at anincreased risk of HCC development [17, 22, 25, 32–38].There are also indications of the clinical significance of L toM substitution in aa position 91 of HCV 1b, although lesswell defined [18, 19]. Here, we for the first time analyzedthe frequency of occurrence of R70Q/H and L91M
substitutions in a set of 189 sequences of HCV 1b isolatesderived from the territory of the Russian Federation. Phylo-genetic analysis has shown that these sequences formed noclusters, and it evolved as a result of continuous viral circula-tion in the territory of the former Soviet Union, which indi-cates that they adequately represent the diversity of RussianHCV 1b isolates. We found that 31.4% of the Russian HCV1b isolates harbor R70Q/H, that is, almost one-third of indi-viduals infected with HCV 1b in the Russian Federation carryviral isolates that are potentially resistant to the standardPEG-IFN/RBV therapy and confer an increased risk ofHCC development. Comparative analysis of HCV 1b corevariant distribution demonstrated a higher prevalence ofunfavorable R70Q/H variants in the Russian Federationcompared to the neighboring European countries. USA was
PredictedHLA l allele
A0201 ⁎
⁎
⁎
⁎
⁎ ⁎
⁎ ⁎
⁎ ⁎
⁎ ⁎ ⁎
⁎
⁎
⁎
⁎
⁎
⁎ ⁎
⁎
⁎
⁎
⁎
⁎
⁎
⁎ ⁎
⁎ ⁎
⁎ ⁎⁎ ⁎ ⁎
⁎ ⁎⁎ ⁎ ⁎
⁎
⁎
⁎
⁎ ⁎ ⁎
⁎ ⁎
⁎ ⁎
⁎ ⁎
⁎
⁎ ⁎
⁎
⁎⁎
⁎
A0202A02 50,0
A0205A0209A2402 A24 20,3
A29 3,2A31 3,9B07 20,7B08 12,6
B15 11,4
B27 8,8
B35 20,6B39 4,6B44 18,0
B51 9,6
B53 0,3B54 No dataB55 1,9
B57 5,1
A2902A3101B0702B0801B1508B1513B1516B2801B2702B2703B2704B2705B2706B3501B3909B4402B5101B5102B5103B5301B5401B5502B5701B2702
Prevalence based on lowresolution HLA l typing
Epitopes within HCV core encompassing regionsof subsitutes
aa position 70 aa position 91
HLA l type Prevalence, %R70 Q70 H70 L91 M91
Figure 2: Prediction of binding of peptides encompassing aa 70 and 91 of nucleocapsid (core) protein of HCV 1b to HLA I alleles prevalent inthe Russian population. Binding prediction was done using EPISPOT tool (http://bio.med.ucm.es/episopt.html [45]). Allele frequency data isbased on the data obtained from Allele Frequency Net Database [46, 47]. Predicted binding is depicted by an asterisk. HLA class I moleculesbinding only to the peptides containing wild-type amino acid residues R70 and/or L91 are shaded green; only variants with Q70, or H70, and/or M91 mutations, red; binding regardless of the nature of amino acid residues in positions 70 and/or 91, blue.
7Journal of Immunology Research
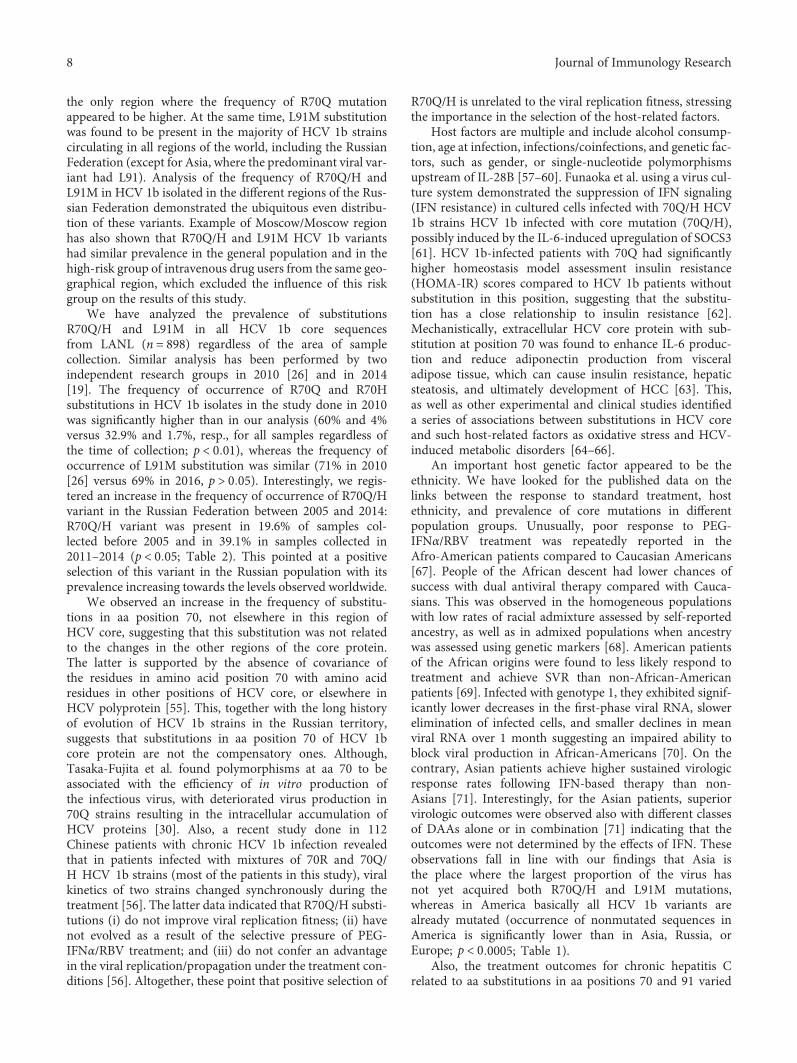
the only region where the frequency of R70Q mutationappeared to be higher. At the same time, L91M substitutionwas found to be present in the majority of HCV 1b strainscirculating in all regions of the world, including the RussianFederation (except for Asia, where the predominant viral var-iant had L91). Analysis of the frequency of R70Q/H andL91M in HCV 1b isolated in the different regions of the Rus-sian Federation demonstrated the ubiquitous even distribu-tion of these variants. Example of Moscow/Moscow regionhas also shown that R70Q/H and L91M HCV 1b variantshad similar prevalence in the general population and in thehigh-risk group of intravenous drug users from the same geo-graphical region, which excluded the influence of this riskgroup on the results of this study.
We have analyzed the prevalence of substitutionsR70Q/H and L91M in all HCV 1b core sequencesfrom LANL (n = 898) regardless of the area of samplecollection. Similar analysis has been performed by twoindependent research groups in 2010 [26] and in 2014[19]. The frequency of occurrence of R70Q and R70Hsubstitutions in HCV 1b isolates in the study done in 2010was significantly higher than in our analysis (60% and 4%versus 32.9% and 1.7%, resp., for all samples regardless ofthe time of collection; p < 0 01), whereas the frequency ofoccurrence of L91M substitution was similar (71% in 2010[26] versus 69% in 2016, p > 0 05). Interestingly, we regis-tered an increase in the frequency of occurrence of R70Q/Hvariant in the Russian Federation between 2005 and 2014:R70Q/H variant was present in 19.6% of samples col-lected before 2005 and in 39.1% in samples collected in2011–2014 (p < 0 05; Table 2). This pointed at a positiveselection of this variant in the Russian population with itsprevalence increasing towards the levels observed worldwide.
We observed an increase in the frequency of substitu-tions in aa position 70, not elsewhere in this region ofHCV core, suggesting that this substitution was not relatedto the changes in the other regions of the core protein.The latter is supported by the absence of covariance ofthe residues in amino acid position 70 with amino acidresidues in other positions of HCV core, or elsewhere inHCV polyprotein [55]. This, together with the long historyof evolution of HCV 1b strains in the Russian territory,suggests that substitutions in aa position 70 of HCV 1bcore protein are not the compensatory ones. Although,Tasaka-Fujita et al. found polymorphisms at aa 70 to beassociated with the efficiency of in vitro production ofthe infectious virus, with deteriorated virus production in70Q strains resulting in the intracellular accumulation ofHCV proteins [30]. Also, a recent study done in 112Chinese patients with chronic HCV 1b infection revealedthat in patients infected with mixtures of 70R and 70Q/H HCV 1b strains (most of the patients in this study), viralkinetics of two strains changed synchronously during thetreatment [56]. The latter data indicated that R70Q/H substi-tutions (i) do not improve viral replication fitness; (ii) havenot evolved as a result of the selective pressure of PEG-IFNα/RBV treatment; and (iii) do not confer an advantagein the viral replication/propagation under the treatment con-ditions [56]. Altogether, these point that positive selection of
R70Q/H is unrelated to the viral replication fitness, stressingthe importance in the selection of the host-related factors.
Host factors are multiple and include alcohol consump-tion, age at infection, infections/coinfections, and genetic fac-tors, such as gender, or single-nucleotide polymorphismsupstream of IL-28B [57–60]. Funaoka et al. using a virus cul-ture system demonstrated the suppression of IFN signaling(IFN resistance) in cultured cells infected with 70Q/H HCV1b strains HCV 1b infected with core mutation (70Q/H),possibly induced by the IL-6-induced upregulation of SOCS3[61]. HCV 1b-infected patients with 70Q had significantlyhigher homeostasis model assessment insulin resistance(HOMA-IR) scores compared to HCV 1b patients withoutsubstitution in this position, suggesting that the substitu-tion has a close relationship to insulin resistance [62].Mechanistically, extracellular HCV core protein with sub-stitution at position 70 was found to enhance IL-6 produc-tion and reduce adiponectin production from visceraladipose tissue, which can cause insulin resistance, hepaticsteatosis, and ultimately development of HCC [63]. This,as well as other experimental and clinical studies identifieda series of associations between substitutions in HCV coreand such host-related factors as oxidative stress and HCV-induced metabolic disorders [64–66].
An important host genetic factor appeared to be theethnicity. We have looked for the published data on thelinks between the response to standard treatment, hostethnicity, and prevalence of core mutations in differentpopulation groups. Unusually, poor response to PEG-IFNα/RBV treatment was repeatedly reported in theAfro-American patients compared to Caucasian Americans[67]. People of the African descent had lower chances ofsuccess with dual antiviral therapy compared with Cauca-sians. This was observed in the homogeneous populationswith low rates of racial admixture assessed by self-reportedancestry, as well as in admixed populations when ancestrywas assessed using genetic markers [68]. American patientsof the African origins were found to less likely respond totreatment and achieve SVR than non-African-Americanpatients [69]. Infected with genotype 1, they exhibited signif-icantly lower decreases in the first-phase viral RNA, slowerelimination of infected cells, and smaller declines in meanviral RNA over 1 month suggesting an impaired ability toblock viral production in African-Americans [70]. On thecontrary, Asian patients achieve higher sustained virologicresponse rates following IFN-based therapy than non-Asians [71]. Interestingly, for the Asian patients, superiorvirologic outcomes were observed also with different classesof DAAs alone or in combination [71] indicating that theoutcomes were not determined by the effects of IFN. Theseobservations fall in line with our findings that Asia isthe place where the largest proportion of the virus hasnot yet acquired both R70Q/H and L91M mutations,whereas in America basically all HCV 1b variants arealready mutated (occurrence of nonmutated sequences inAmerica is significantly lower than in Asia, Russia, orEurope; p < 0 0005; Table 1).
Also, the treatment outcomes for chronic hepatitis Crelated to aa substitutions in aa positions 70 and 91 varied
8 Journal of Immunology Research
with ethnicity. The first studies demonstrating the impor-tance of R70Q/H and L91M substitutions in the core proteinwere carried in patients infected with HCV 1b in Japan (18).However, they were not reproduced in all Japanese studies.Enomoto et al. identified the role in treatment response onlyof the amino acid substitutions in HCV NS5a, but not in thecore protein [72]. A study of HCV 1b-infected Caucasianpatients in Spain demonstrated a significant association withPEG-IFN/RBV treatment outcome with substitutions R62G,R70Q, and N110T [28]; in Saudi patients, with substitutionsR70Q and A75; in Azerbaijani patients from Iran, withsubstitutions K43R, R70Q, L91M, and S106 [23]. Studies ofthe Caucasian patients infected with HCV 1b in Sweden,and in Caucasians infected with HCV 1b in the United Statesdemonstrated significant association of PEG-IFN/RBV treat-ment outcome with substitutions in aa position 70, but not inother aa positions including 91 [26, 27]. Interestingly, despitethe unusually poor response to PEG-IFNα/RBV treatmentin the Afro-American patients compared to CaucasianAmericans, their isolates did not differ in the frequencyof occurrence of amino residues in position 70 [27]. Also,the association of differential viral responses with polymor-phisms in core aa position 70 demonstrated in the NorthAmerican patients was weaker than in the Japanese studies[27]. On top of it, in the study of the correlates of PEG-IFNα/RBV treatment response in the Chinese patients withchronic HCV 1b infection, 70Q/H HCV 1b strains exhibitedthe same virological response as the 70R strains [56].Analysis of these studies demonstrated that the role of aminoacid substitutions in positions other than 70 is discrepant,while substitutions in the position 70 predict poor IFNtreatment response in patients of some, but not all ethnicitiesand nationalities.
While analyzing a broad scope of viral and host factorslinking substitutions in aa positions 70 and 91 of HCV corewith treatment response, these studies left out the issue ofthe adaptive immune response, and possible viral evolu-tion under the pressure of the immune system of thehost. Immune database analysis done here demonstratedthat R70Q/H and L91M substitutions are localized inthe T-cell epitopic clusters and may interfere with theimmune recognition of host cells infected with mutantvirions, which would affect the spontaneous and alsoIFN therapy-driven immune clearance. Immune recogni-tion in populations of different ethnicity varies; differentethnic groups have distinct and characteristic HLA allelefrequencies, resulting in the differential immune recognitionof the epitope-carrying regions depending on the haplotypeof the host, which would differentially drive viral immuneescape. In this context, the increasing prevalence of mutantHCV variants can be explained by an escape from the domi-nant types of immune pressure in a certain population, inrelation to the regionally prevalent HLA types. Such HLAallele-specific mutation patterns were earlier described forHIV-1 [73].
The assumption that HLA allele specific immune pres-sure would result in the regionally variable patterns ofimmune escape mutations falls in line with uneven geograph-ical distribution of HCV 1b R70Q/H and L91M variants
(Table 1). Furthermore, in silico analysis carried here sug-gests that at least some of HLA I alleles prevalent in theRussian Federation, such as A02 and B07, are able to bind70R and 91L peptides but cannot bind peptides withR70Q/H or L91M substitutions. At the same time, therole of HLA class II binding, hence of the T-helper cell orantibody response in immune selection, was predicted asnegligible. Due to insufficiency of the high-resolution HLAtyping data for the Russian Federation, our predictions ofHLA I and HLA II binding with HCV core peptides weredone on the low-resolution level. Even with these limitations,our data points at the involvement of HLA I- (but not HLAII-) specific alleles in the differential immune recognition ofHCV 1b variants with substitutions in aa positions 70 and91, with the possibility for immune escape of the variants thathave acquired R70Q/H and/or L91M. A very recent compar-ative analysis of the variation and selection in HCV genomedemonstrated positive selection of HCV variants associatedwith HLA class I-driven CTL response (but not CD4+ T-cell response or RNA structure) [74]. Increasing frequencyof occurrence of HCV 1b variants bearing R70Q/H andL91M may result from such positive selection. Interestingly,a study conducted in one particular region of the RussianFederation among patients of the Russian ethnicity foundthat HLA I haplotypes A02/B07 and A03/B07 are associatedwith the higher rates of spontaneous HCV elimination andprotection against the development of chronic infection[51]. Carriage of A(∗)02 was also found to predict SVR in astudy done in the Caucasian American patients [75]. Inpatients with chronic hepatitis C, HLA I allele B07 wasrelated to the resistance to active chronic liver diseaseindicating its association with recognition and clearanceof HCV-infected hepatocytes [51]. These findings supportthe clinical significance of our observations, requesting fur-ther confirmatory studies with high-resolution genotypingof the population.
5. Conclusions
This is the first study characterizing the frequency ofoccurrence of IFN resistance-conferring mutations inhuman hepatitis C virus isolates circulating in the terri-tory of the Russian Federation, and the first one, in whichthe spread of viral variants with substitutions in aa posi-tions 70 and 91 may be associated with the positive selec-tion under the pressure of immune response. Spread ofR70Q/H and L91M HCV 1b variants may result froman immune escape from the CTL response. The immuno-genetic background of HCV-infected individuals (racialvariations in viral-specific immunity) would then deter-mine both the differences in geographical distribution ofcertain viral variants and ethnical differences in theirresponse to treatment. The choice of treatment strategyfor patients with HCV is increasingly based on the per-sonalized approach. It takes into account many viral andhost factors. Screening of HCV 1b-infected patients forunfavorable mutations in the core region could be a use-ful tool to identify the individuals in need of IFN-freetreatment regimens employing DAA. In the future, after
9Journal of Immunology Research

complete implementation of IFN-free regimens, analysisof polymorphisms at position 70 of HCV 1b core willremain relevant to identify patients at higher risk ofHCC development who require immediate treatment.
Conflicts of Interest
The authors declare that there is no conflict of interestregarding the publication of this paper.
Authors’ Contributions
V. S. Kichatova and K. K. Kyuregyan contributed equally tothis work.
Acknowledgments
This study was supported by the grant of the Russian ScienceFoundation (Project ID 15-15-30039). Mobility and trainingof the researchers was supported by the grants of the SwedishInstitute (TP 09272/2013 and PI 19806/2016).
Supplementary Materials
Supplementary 1. Figure S1: geographical origins of samplesof hepatitis C patients infected with HCV 1b from theRussian Federation used in the analysis of frequency of sub-stitutions in HCV core amino acid positions 70 and 91. Dataon the sample set is presented in Table 2.
Supplementary 2. Figure S2: phylogenetic tree for the com-plete HCV core sequences covering nucleotide positions342–915 according to HCV 1a reference strain H77 (Gen-Bank accession number NC004102) built using a Bayesianlikelihood-based algorithm; detailed overview of the treefragments (А; В). Sequences of the Russian origins are under-lined. Sequences with wild type aa in positions 70 and 91(R70, L91) are colored green; with mutated R70Q/H, orange;with M91L substitution, blue; with substitutions in both 70and 91(R70Q/H, M91L), red.
Supplementary 3. Figure S3: T-cell epitopes in the consensusamino acid sequence of nucleocapsid (core) of HCV 1bencompassing amino acids 70 (A) and 91 (B) localized usingImmune Epitope Database and Analysis resource (http://www.iedb.org).
Supplementary 4. Table S1: presentation by HLA I alleles of9-mer peptide variants derived from the region between aa62 and 78 of the nucleocapsid (core) of HCV 1b encompass-ing aa 70, predicted using EPISPOT tool (http://bio.med.ucm.es/episopt.html; EPISPOT [25]). Nine amino acid long pep-tides were chosen based on the consensus amino acidsequence of nucleocapsid (core) protein of HCV 1b variantsisolated in the Russian Federation. Upper row: position ofamino acids in HCV core; % (n = 189), frequency of occur-rence of the respective variant in a set of 189 HCV 1bsequences; potential epitopes, selection of potential CTL-epitopes localized within the peptide seqeunce; PPC, popula-tion protection coverage (PPC) calculated as the proportionof the population that can potentially mount an immune
response to the peptide computed using known frequencesof the HLA I alleles that can present the peptide; HLA classI binding profile lists HLA class I molecules predicted topresent the peptide. NF, not found.
Supplementary 5. Table S2: presentation by HLA I alleles of9-mer peptide variants derived from the region between aa83 and 99 of the nucleocapsid (core) ofHCV1b encompassingaa 91, predicted using EPISPOT tool (http://bio.med.ucm.es/episopt.html; EPISPOT [45]). Nine amino acid long peptideswere chosen based on the consensus amino acid sequence ofnucleocapsid (core) protein of HCV 1b variants isolated inthe Russian Federation. Upper row: position of amino acidsin HCV core; % (n = 189), percentage of respective variant ina set of 189 HCV 1b sequences; PPC, population protectioncoverage (PPC) calculated as the proportion of the popula-tion that can potentially mount an immune response to thepeptide computed using known frequences of the HLA Ialleles that can present the epitope; HLA I binding profilelists HLA I molecules predicted to present the epitope. NF,not found.
Supplementary 6. Table S3: NetMHCIIpan 3.1 engine [48]predicts only weak binding of HCV 1b core peptides encom-passing amino acid residue 91 to a limited number of humanHLA class II molecules. Peptide predicted to be recognized isboxed in green and aa position 91 in red. Strong binding ischaracterized by binding level< 2%; weak binding, 2 to10%; no binding, >10%.
References
[1] T. J. Liang, B. Rehermann, L. B. Seeff, and J. H. Hoofnagle,“Pathogenesis, natural history, treatment, and prevention ofhepatitis C,” Annals of Internal Medicine, vol. 132, no. 4,pp. 296–305, 2000.
[2] C. W. Shepard, L. Finelli, and M. J. Alter, “Global epidemiol-ogy of hepatitis C virus infection,” The Lancet Infectious Dis-eases, vol. 5, no. 9, pp. 558–567, 2005.
[3] J. Thompson Coon, G. Rogers, P. Hewson et al., “Surveillanceof cirrhosis for hepatocellular carcinoma: systematic reviewand economic analysis,” Health Technology Assessment,vol. 11, no. 34, pp. 1–206, 2007.
[4] A. Petruzziello, S. Marigliano, G. Loquercio, A. Cozzolino, andC. Cacciapuoti, “Global epidemiology of hepatitis C virusinfection: an up-date of the distribution and circulation of hep-atitis C virus genotypes,” World Journal of Gastroenterology,vol. 22, no. 34, pp. 7824–7840, 2016.
[5] International Agency for Research on Cancer, World CancerReport 2014, World Health Organization, Geneva, 2014.
[6] G. L. Armstrong, A. Wasley, E. P. Simard, G. M. McQuillan,W. L. Kuhnert, and M. J. Alter, “The prevalence of hepatitis Cvirus infection in theUnited States, 1999 through 2002,”Annalsof Internal Medicine, vol. 144, no. 10, pp. 705–714, 2006.
[7] P. Amoroso, M. Rapicetta, M. E. Tosti et al., “Correlationbetween virus genotype and chronicity rate in acute hepatitisC,” Journal of Hepatology, vol. 28, no. 6, pp. 939–944, 1998,9672167.
[8] C. Bréchot, “Hepatitis C virus: molecular biology andgenetic variability,” Digestive Diseases and Sciences, vol. 41,Supplement 12, pp. 6S–21S, 1996.
10 Journal of Immunology Research

[9] T. Poynard, P. Bedossa, P. Opolon, and The OBSVIRC,METAVIR, CLINIVIR, and DOSVIRC Groups, “Natural his-tory of liver fibrosis progression in patients with chronic hep-atitis C,” The Lancet, vol. 349, no. 9055, pp. 825–832, 1997.
[10] B. Le Guen, G. Squadrito, B. Nalpas, P. Berthelot, S. Pol, andC. Brechot, “Hepatitis C virus genome complexity correlateswith response to interferon therapy: a study in French patientswith chronic hepatitis C,” Hepatology, vol. 25, no. 5, pp. 1250–1254, 1997.
[11] J. B. Nousbaum, S. Pol, B. Nalpas et al., “Hepatitis C virus type1b (II) infection in France and Italy,” Annals of Internal Med-icine, vol. 122, no. 3, pp. 161–168, 1995.
[12] S. Raimondi, S. Bruno, M. U. Mondelli, and P. Maisonneuve,“Hepatitis C virus genotype 1b as a risk factor for hepatocellu-lar carcinoma development: a meta-analysis,” Journal of Hepa-tology, vol. 50, no. 6, pp. 1142–1154, 2009.
[13] M. W. Fried, M. L. Shiffman, K. R. Reddy et al., “Peginterferonalfa-2a plus ribavirin for chronic hepatitis C virus infection,”The New England Journal of Medicine, vol. 347, no. 13,pp. 975–982, 2002.
[14] S. J. Hadziyannis, H. Sette Jr., T. R. Morgan et al., “Peginter-feron-α2a and ribavirin combination therapy in chronic hepa-titis C: a randomized study of treatment duration and ribavirindose,” Annals of Internal Medicine, vol. 140, no. 5, pp. 346–355, 2004.
[15] M. P. Manns, J. G. McHutchison, S. C. Gordon et al., “Pegin-terferon alfa-2b plus ribavirin compared with interferon alfa-2b plus ribavirin for initial treatment of chronic hepatitis C:a randomised trial,” The Lancet, vol. 358, no. 9286, pp. 958–965, 2001.
[16] A. Andriulli, F. Morisco, A. M. Ippolito et al., “HCV genotype1 subtypes (1a and 1b): similarities and differences in clinicalfeatures and therapeutic outcome,” Hepatology International,vol. 9, no. 1, pp. 52–57, 2015.
[17] R. H. Westbrook and G. Dusheiko, “Natural history of hepati-tis C,” Journal of Hepatology, vol. 61, no. 1, pp. S58–S68, 2014.
[18] N. Akuta, F. Suzuki, H. Sezaki et al., “Association of aminoacid substitution pattern in core protein of hepatitis C virusgenotype 1b high viral load and non-virological response tointerferon-ribavirin combination therapy,” Intervirology,vol. 48, no. 6, pp. 372–380, 2005.
[19] A. El-Shamy and H. Hotta, “Impact of hepatitis C virus hetero-geneity on interferon sensitivity: an overview,” World Journalof Gastroenterology, vol. 20, no. 24, pp. 7555–7569, 2014.
[20] N. Akuta, F. Suzuki, M. Hirakawa et al., “Amino acid substitu-tion in hepatitis C virus core region and genetic variation nearthe interleukin 28B gene predict viral response to telaprevirwith peginterferon and ribavirin,” Hepatology, vol. 52, no. 2,pp. 421–429, 2010.
[21] N. Akuta, F. Suzuki, Y. Seko et al., “Determinants of response totriple therapy of telaprevir, peginterferon, and ribavirin in pre-vious non-responders infected with HCV genotype 1,” Journalof Medical Virology, vol. 84, no. 7, pp. 1097–1105, 2012.
[22] N. Akuta, F. Suzuki, Y. Kawamura et al., “Amino acid substitu-tions in the hepatitis C virus core region are the important pre-dictor of hepatocarcinogenesis,” Hepatology, vol. 46, no. 5,pp. 1357–1364, 2007.
[23] T. Okanoue, Y. Itoh, H. Hashimoto et al., “Predictive values ofamino acid sequences of the core and NS5A regions in antivi-ral therapy for hepatitis C: a Japanese multi-center study,”Journal of Gastroenterology, vol. 44, no. 9, pp. 952–963, 2009.
[24] R. C. Jaspe, Y. F. Sulbarán, M. Z. Sulbarán, C. L. Loureiro, H. R.Rangel, and F. H. Pujol, “Prevalence of amino acid mutationsin hepatitis C virus core and NS5B regions among Venezuelanviral isolates and comparison with worldwide isolates,” Virol-ogy Journal, vol. 9, no. 1, p. 214, 2012.
[25] C. Sultana, G. Oprişan, M. D. Teleman et al., “Impact of hep-atitis C virus core mutations on the response to interferon-based treatment in chronic hepatitis C,”World Journal of Gas-troenterology, vol. 22, no. 37, pp. 8406–8413, 2016.
[26] E. Alestig, B. Arnholm, A. Eilard et al., “Core mutations, IL28Bpolymorphisms and response to peginterferon/ribavirin treat-ment in Swedish patients with hepatitis C virus genotype 1infection,” BMC Infectious Diseases, vol. 11, no. 1, article 124,2011.
[27] M. J. Donlin, N. A. Cannon, E. Yao et al., “Pretreatmentsequence diversity differences in the full-length hepatitis Cvirus open reading frame correlate with early response to ther-apy,” Journal of Virology, vol. 81, no. 15, pp. 8211–8224, 2007.
[28] F. A. Di Lello, J. A. Mira, K. Neukam et al., “Core amino acidvariation at position 110 is associated with sustained virologi-cal response in Caucasian patients with chronic hepatitis Cvirus 1b infection,” Archives of Virology, vol. 159, no. 12,pp. 3345–3351, 2014.
[29] F. S. Alhamlan, M. N. Al-Ahdal, N. Z. Khalaf et al., “HepatitisC virus genotype 1: how genetic variability of the core proteinaffects the response to pegylated-interferon and ribavirin ther-apy,” Journal of Medical Virology, vol. 86, no. 2, pp. 224–234,2014.
[30] M. Tasaka-Fujita, N. Sugiyama, W. Kang et al., “Amino acidpolymorphisms in hepatitis C virus core affect infectious virusproduction and major histocompatibility complex class I mol-ecule expression,” Scientific Reports, vol. 5, article 13994, 2015.
[31] A. El-Shamy, M. Pendleton, F. J. Eng, E. H. Doyle, A. Bashir,and A. D. Branch, “Impact of HCV core gene quasispecieson hepatocellular carcinoma risk among HALT-C trialpatients,” Scientific Reports, vol. 6, article 27025, 2016.
[32] N. Akuta, F. Suzuki, Y. Seko et al., “Complicated relationshipsof amino acid substitution in hepatitis C virus core region andIL28B genotype influencing hepatocarcinogenesis,” Hepatol-ogy, vol. 56, no. 6, pp. 2134–2141, 2012.
[33] S. Nakamoto, F. Imazeki, K. Fukai et al., “Association betweenmutations in the core region of hepatitis C virus genotype 1and hepatocellular carcinoma development,” Journal of Hepa-tology, vol. 52, no. 1, pp. 72–78, 2010.
[34] N. Akuta, F. Suzuki, M. Hirakawa et al., “Amino acid substitu-tions in hepatitis C virus core region predict hepatocarcino-genesis following eradication of HCV RNA by antiviraltherapy,” Journal of Medical Virology, vol. 83, no. 6,pp. 1016–1022, 2011.
[35] Y. Seko, N. Akuta, F. Suzuki et al., “Amino acid substitutions inthe hepatitis C virus core region and lipid metabolism are asso-ciated with hepatocarcinogenesis in nonresponders to inter-feron plus ribavirin combination therapy,” Intervirology,vol. 56, no. 1, pp. 13–21, 2013.
[36] A. El-Shamy, M. Shindo, I. Shoji, L. Deng, T. Okuno, andH. Hotta, “Polymorphisms of the core, NS3, and NS5A pro-teins of hepatitis C virus genotype 1b associate with develop-ment of hepatocellular carcinoma,” Hepatology, vol. 58,no. 2, pp. 555–563, 2013.
[37] N. Akuta, F. Suzuki, M. Kobayashi et al., “Impact of mutationsat amino acid 70 in hepatitis C virus (HCV) genotype 1b coreregion on hepatocarcinogenesis following eradication of HCV
11Journal of Immunology Research
RNA,” Journal of Clinical Microbiology, vol. 53, no. 9,pp. 3039–3041, 2015.
[38] S. Kobayashi, T. Takeda, M. Enomoto et al., “Development ofhepatocellular carcinoma in patients with chronic hepatitis Cwho had a sustained virological response to interferon therapy:a multicenter, retrospective cohort study of 1124 patients,”Liver International, vol. 27, no. 2, pp. 186–191, 2007.
[39] H. Bailey, A. Turkova, and C. Thorne, “Syphilis, hepatitis Cand HIV in Eastern Europe,” Current Opinion in InfectiousDiseases, vol. 30, no. 1, pp. 93–100, 2017.
[40] A. V. Shustov, G. V. Kochneva, G. F. Sivolobova et al., “Molec-ular epidemiology of the hepatitis C virus in Western Siberia,”Journal of Medical Virology, vol. 77, no. 3, pp. 382–389, 2005.
[41] S. N. Kuzin, E. I. Samokhvalov, E. E. Zabotina et al., “Hepatitisvirus genotype structure in patients with chronic hepatitis C,”Zhurnal Mikrobiologii, Epidemiologii, i Immunobiologii, no. 3,pp. 33–38, 2011.
[42] V. Kartashev, M. Döring, L. Nieto et al., “New findings in HCVgenotype distribution in selected West European, Russian andIsraeli regions,” Journal of Clinical Virology, vol. 81, pp. 82–89,2016.
[43] A. J. Drummond and A. Rambaut, “BEAST: Bayesian evolu-tionary analysis by sampling trees,” BMC Evolutionary Biology,vol. 7, no. 1, p. 214, 2007.
[44] R. Vita, J. A. Overton, J. A. Greenbaum et al., “The immuneepitope database (IEDB) 3.0,” Nucleic Acids Research, vol. 43,no. D1, pp. D405–D412, 2014.
[45] M. Molero-Abraham, E. M. Lafuente, D. R. Flower, and P. A.Reche, “Selection of conserved epitopes from hepatitis C virusfor pan-populational stimulation of T-cell responses,” Clinicaland Developmental Immunology, vol. 2013, Article ID 601943,10 pages, 2013.
[46] L. Lebedeva, A. Chumak, T. Pukhlikova, S. Pavlenko,V. Zinkin, and O. Mayorova, “The features of histocompatibil-ity antigens polymorphism of cord blood samples in MoscowBlood Bank,” Bulletin of Hematology, vol. 11, no. 2, pp. 20-21, 2015.
[47] F. F. González-Galarza, L. Y. C. Takeshita, E. J. M. Santoset al., “Allele frequency net 2015 update: new features forHLA epitopes, KIR and disease and HLA adverse drug reac-tion associations,” Nucleic Acid Research, vol. 43, no. D1,pp. D784–D788, 2015.
[48] M. Andreatta, E. Karosiene, M. Rasmussen, A. Stryhn, S. Buus,and M. Nielsen, “Accurate pan-specific prediction of peptide-MHC class II binding affinity with improved binding coreidentification,” Immunogenetics, vol. 67, no. 11-12, pp. 641–650, 2015.
[49] I. Hoof, B. Peters, J. Sidney et al., “NetMHCpan, a method forMHC class I binding prediction beyond humans,” Immunoge-netics, vol. 61, no. 1, pp. 1–13, 2009.
[50] M. Nielsen and M. Andreatta, “NetMHCpan-3.0; improvedprediction of binding to MHC class I molecules integratinginformation from multiple receptor and peptide length data-sets,” Genome Medicine, vol. 8, p. 33, 2016.
[51] A. K. Akhmineeva, HLA Phenotype and Clinical Course ofChronic Viral Hepatitis, [Ph.D. thesis], Astrakhan State Medi-cal Academy, Astrakhan, 2008.
[52] A. Utama, N. P. Tania, R. Dhenni et al., “Genotype diversity ofhepatitis C virus (HCV) in HCV-associated liver diseasepatients in Indonesia,” Liver International, vol. 30, no. 8,pp. 1152–1160, 2010.
[53] I. Brahim, S. Ezzikouri, E. M. Mtairag et al., “Amino acid sub-stitutions in the hepatitis C virus core region of genotype 1b inMoroccan patients,” Infection, Genetics and Evolution, vol. 14,pp. 102–104, 2013.
[54] S. C. Ray, L. Fanning, X. H. Wang, D. M. Netski, E. Kenny-Walsh, and D. L. Thomas, “Divergent and convergent evolu-tion after a common-source outbreak of hepatitis C virus,”Journal of Experimental Medicine, vol. 201, no. 11, pp. 1753–1759, 2005.
[55] R. Aurora, M. J. Donlin, N. A. Cannon, and J. E. Tavis,“Genome-wide hepatitis C virus amino acid covariance net-works can predict response to antiviral therapy in humans,”The Journal of Clinical Investigation, vol. 119, no. 1, pp. 225–236, 2008.
[56] Z. Hu, Y. Liu, L. Qiu et al., “Kinetic response of wild andmutant core codon 70 strains of HCV genotype 1b to pegy-lated interferon-α and ribavirin therapy,” Virology Journal,vol. 12, no. 1, p. 220, 2015.
[57] K. R. Reddy, J. H. Hoofnagle, M. J. Tong et al., “Racial differ-ences in responses to therapy with interferon in chronic hepa-titis C,” Hepatology, vol. 30, no. 3, pp. 787–793, 1999.
[58] M. Isaguliants and N. Ozeretskovskaya, “Host background fac-tors contributing to hepatitis C virus clearance,” Current Phar-maceutical Biotechnology, vol. 4, no. 3, pp. 185–193, 2003.
[59] Y. Tanaka, N. Nishida, M. Sugiyama et al., “Genome-wideassociation of IL28B with response to pegylated interferon-αand ribavirin therapy for chronic hepatitis C,”Nature Genetics,vol. 41, no. 10, pp. 1105–1109, 2009.
[60] C. Fabris, E. Falleti, A. Cussigh et al., “IL-28B rs12979860 C/Tallele distribution in patients with liver cirrhosis: role in thecourse of chronic viral hepatitis and the development ofHCC,” Journal of Hepatology, vol. 54, no. 4, pp. 716–722, 2011.
[61] Y. Funaoka, N. Sakamoto, G. Suda et al., “Analysis of inter-feron signaling by infectious hepatitis C virus clones with sub-stitutions of core amino acids 70 and 91,” Journal of Virology,vol. 85, no. 12, pp. 5986–5994, 2011.
[62] N. Akuta, F. Suzuki, M. Hirakawa et al., “Amino acid substitu-tions in the hepatitis C virus core region of genotype 1b are theimportant predictor of severe insulin resistance in patientswithout cirrhosis and diabetes mellitus,” Journal of MedicalVirology, vol. 81, no. 6, pp. 1032–1039, 2009.
[63] S. Uraki, M. Tameda, K. Sugimoto et al., “Substitution inamino acid 70 of hepatitis C virus core protein changes the adi-pokine profile via toll-like receptor 2/4 signaling,” PLoS One,vol. 10, no. 6, article e0131346, 2015.
[64] Y. Tachi, Y. Katano, T. Honda et al., “Impact of amino acidsubstitutions in the hepatitis C virus genotype 1b core regionon liver steatosis and hepatic oxidative stress in patients withchronic hepatitis C,” Liver International, vol. 30, no. 4,pp. 554–559, 2010.
[65] Y. Sumida, K. Kanemasa, T. Hara et al., “Impact of amino acidsubstitutions in hepatitis C virus genotype 1b core region onliver steatosis and glucose tolerance in non-cirrhotic patientswithout overt diabetes,” Journal of Gastroenterology and Hepa-tology, vol. 26, no. 5, pp. 836–842, 2011.
[66] A. V. Ivanov, V. T. Valuev-Elliston, D. A. Tyurina et al., “Oxi-dative stress, a trigger of hepatitis C and B virus-induced livercarcinogenesis,” Oncotarget, vol. 8, no. 3, pp. 3895–3932, 2017.
[67] M. J. Donlin, N. A. Cannon, R. Aurora et al., “Contributionof genome-wide HCV genetic differences to outcome ofinterferon-based therapy in Caucasian American and
12 Journal of Immunology Research

African American patients,” PLoS One, vol. 5, no. 2, articlee9032, 2010.
[68] L. N. Cavalcante, K. Abe-Sandes, A. L. D. Angelo et al., “IL28Bpolymorphisms are markers of therapy response and are influ-enced by genetic ancestry in chronic hepatitis C patients froman admixed population,” Liver International, vol. 32, no. 3,pp. 476–486, 2012.
[69] U. Navaneethan, N. Kemmer, and G. W. Neff, “Review: pre-dicting the probable outcome of treatment in HCV patients,”Therapeutic Advances in Gastroenterology, vol. 2, no. 5,pp. 287–302, 2009.
[70] J. E. Layden-Almer, R. M. Ribeiro, T.Wiley, A. S. Perelson, andT. J. Layden, “Viral dynamics and response differences inHCV-infected African American and white patients treatedwith IFN and ribavirin,” Hepatology, vol. 37, no. 6, pp. 1343–1350, 2003.
[71] J. H. Kao, S. H. Ahn, R. N. Chien et al., “Urgency to treatpatients with chronic hepatitis C in Asia,” Journal of Gastroen-terology and Hepatology, vol. 32, no. 5, pp. 966–974, 2017.
[72] N. Enomoto, I. Sakuma, Y. Asahina et al., “Comparison of full-length sequences of interferon-sensitive and resistant hepatitisC virus 1b. Sensitivity to interferon is conferred by amino acidsubstitutions in the NS5A region,” The Journal of ClinicalInvestigation, vol. 96, no. 1, pp. 224–230, 1995.
[73] M. Ragonnet-Cronin, S. Aris-Brosou, I. Joanisse et al.,“Adaptive evolution of HIV at HLA epitopes is associatedwith ethnicity in Canada,” PLoS One, vol. 7, no. 5, articlee36933, 2012.
[74] J. Á. Patiño-Galindo and F. González-Candelas, “Comparativeanalysis of variation and selection in the HCV genome,” Infec-tion, Genetics and Evolution, vol. 49, pp. 104–110, 2017.
[75] S. L. Rhodes, H. Erlich, K. A. Im et al., “Associationsbetween the human MHC and sustained virologic responsein the treatment of chronic hepatitis C virus infection,”Genes & Immunity, vol. 9, no. 4, pp. 328–333, 2008.
13Journal of Immunology Research

Review ArticleFundamentals and Methods for T- and B-Cell Epitope Prediction
Jose L. Sanchez-Trincado, Marta Gomez-Perosanz, and Pedro A. Reche
Laboratory of Immunomedicine, Faculty of Medicine, Complutense University of Madrid, Ave Complutense S/N,28040 Madrid, Spain
Correspondence should be addressed to Pedro A. Reche; [email protected]
Received 27 July 2017; Revised 22 November 2017; Accepted 27 November 2017; Published 28 December 2017
Academic Editor: Senthami R. Selvan
Copyright © 2017 Jose L. Sanchez-Trincado et al. This is an open access article distributed under the Creative CommonsAttribution License, which permits unrestricted use, distribution, and reproduction in any medium, provided the original workis properly cited.
Adaptive immunity is mediated by T- and B-cells, which are immune cells capable of developing pathogen-specific memory thatconfers immunological protection. Memory and effector functions of B- and T-cells are predicated on the recognition throughspecialized receptors of specific targets (antigens) in pathogens. More specifically, B- and T-cells recognize portions within theircognate antigens known as epitopes. There is great interest in identifying epitopes in antigens for a number of practical reasons,including understanding disease etiology, immune monitoring, developing diagnosis assays, and designing epitope-basedvaccines. Epitope identification is costly and time-consuming as it requires experimental screening of large arrays of potentialepitope candidates. Fortunately, researchers have developed in silico prediction methods that dramatically reduce the burdenassociated with epitope mapping by decreasing the list of potential epitope candidates for experimental testing. Here, we analyzeaspects of antigen recognition by T- and B-cells that are relevant for epitope prediction. Subsequently, we provide a systematicand inclusive review of the most relevant B- and T-cell epitope prediction methods and tools, paying particular attention totheir foundations.
1. Introduction
The immune system is typically divided into two categories,innate and adaptive. Innate immunity involves nonspecificdefense mechanisms that act immediately or within hoursafter a microbe appearance in the body. All multicellularbeings exhibit some kind of innate immunity. In contrast,adaptive immunity is only present in vertebrates and it ishighly specific. In fact, the adaptive immune system is ableto recognize and destroy invading pathogens individually.Moreover, the adaptive immune system remembers the path-ogens that fights, acquiring a pathogen-specific long-lastingprotective memory that enables stronger attacks each timethe pathogen is reencountered [1]. Nonetheless, innate andadaptive immune mechanisms work together and adaptiveimmunity elicitation is contingent on prior activation ofinnate immune responses [1].
Adaptive immunity is articulated by lymphocytes, morespecifically by B- and T-cells, which are responsible for the
humoral and cell-mediated immunity. B- and T-cells donot recognize pathogens as a whole, but molecular compo-nents known as antigens. These antigens are recognized byspecific receptors present in the cell surface of B- and T-cells. Antigen recognition by these receptors is required toactivate B- and T-cells but not enough, as second activationsignals stemming from the activation of the innate immunesystem are also needed. The specificity of the recognition isdetermined by genetic recombination events that occur dur-ing lymphocyte development, which lead to generatingmillions of different variants of lymphocytes in terms of theantigen-recognizing receptors [1]. Antigen recognition byB- and T-cells differ greatly.
B-cells recognize solvent-exposed antigens throughantigen receptors, named as B-cell receptors (BCR), consist-ing of membrane-bound immunoglobulins, as shown inFigure 1. Upon activation, B-cells differentiate and secretesoluble forms of the immunoglobulins, also known asantibodies, which mediate humoral adaptive immunity.
HindawiJournal of Immunology ResearchVolume 2017, Article ID 2680160, 14 pageshttps://doi.org/10.1155/2017/2680160

Antibodies released by B-cells can have different functionsthat are triggered upon binding their cognate antigens. Thesefunctions include neutralizing toxins and pathogens andlabeling them for destruction [1].
A B-cell epitope is the antigen portion binding to theimmunoglobulin or antibody. These epitopes recognized byB-cells may constitute any exposed solvent region in the anti-gen and can be of different chemical nature. However, mostantigens are proteins and those are the subjects for epitopeprediction methods.
On the other hand, T-cells present on their surface aspecific receptor known as T-cell receptor (TCR) that enablesthe recognition of antigens when they are displayed on thesurface of antigen-presenting cells (APCs) bound to majorhistocompatibility complex (MHC) molecules. T-cell epi-topes are presented by class I (MHC I) and II (MHC II)MHC molecules that are recognized by two distinct subsetsof T-cells, CD8 and CD4 T-cells, respectively (Figure 2).Subsequently, there are CD8 and CD4 T-cell epitopes. CD8T-cells become cytotoxic T lymphocytes (CTL) following TCD8 epitope recognition. Meanwhile, primed CD4 T-cellsbecome helper (Th) or regulatory (Treg) T-cells [1]. Th cellsamplify the immune response, and there are three mainsubclasses: Th1 (cell-mediated immunity against intracellu-lar pathogens), Th2 (antibody-mediated immunity), andTh17 (inflammatory response and defense against extracellu-lar bacteria) [2].
Identifying epitopes in antigens is of great interest for anumber of practical reasons, including understanding diseaseetiology, immune monitoring, developing diagnosis assays,and designing epitope-based vaccines. B-cell epitopes canbe identified by different methods including solving the 3Dstructure of antigen-antibody complexes, peptide libraryscreening of antibody binding or performing functionalassays in which the antigen is mutated and the interactionantibody-antigen is evaluated [3, 4]. On the other hand,
experimental determination of T-cell epitopes is carried outusing MHCmultimers and lymphoproliferation or ELISPOTassays, among others [5, 6]. Traditional epitope identificationhas depended entirely upon experimental techniques, beingcostly and time-consuming. Thereby, scientists have devel-oped and implemented epitope prediction methods thatfacilitate epitope identification and decrease the experimentalload associated with it. Here, we will first analyze aspects ofantigen recognition by T- and B-cells that are relevant for abetter understanding of the topic of epitope prediction.Subsequently, we will provide a systematic and inclusivereview of the most important prediction methods and tools,paying particular attention to their foundations and poten-tials. We will also discuss epitope prediction limitations andways to overcome them. We will start with T-cell epitopes.
2. T-Cell Epitope Prediction
T-cell epitope prediction aims to identify the shortestpeptides within an antigen that are able to stimulate eitherCD4 or CD8 T-cells [7]. This capacity to stimulate T-cellsis called immunogenicity, and it is confirmed in assaysrequiring synthetic peptides derived from antigens [5, 6].There are many distinct peptides within antigens and T-cellprediction methods aim to identify those that are immuno-genic. T-cell epitope immunogenicity is contingent on threebasic steps: (i) antigen processing, (ii) peptide binding toMHC molecules, and (iii) recognition by a cognate TCR. Ofthese three events, MHC-peptide binding is the most selec-tive one at determining T-cell epitopes [8, 9]. Therefore,prediction of peptide-MHC binding is the main basis toanticipate T-cell epitopes and we will review it next.
2.1. Prediction of Peptide-MHC Binding.MHC I and MHC IImolecules have similar 3D-structures with bound peptidessitting in a groove delineated by two α-helices overlying a
B-cell
Fc region
Fab region
Antigen
BCR Immunoglobulin
Light chain
Heavy chain
Antigen binding site Epitope
(a)
Antigen
Antibody
(b)
Figure 1: B-cell epitope recognition. B-cell epitopes are solvent-exposed portions of the antigen that bind to secreted and cell-boundimmunoglobulins. (a) B-cell receptors encompass cell-bound immunoglobulins, consisting of two heavy chains and two light chains. Thedifferent chains and regions are annotated. (b) Molecular representation of the interaction between an antibody and the antigen.Antibodies are secreted immunoglobulins of known specificity.
2 Journal of Immunology Research

floor comprised of eight antiparallel β-strands. However,there are also key differences between MHC I and II bind-ing grooves that we must highlight for they conditionpeptide-binding predictions (Figure 3). The peptide-binding cleft of MHC I molecules is closed as it is madeby a single α chain. As a result, MHC I molecules can onlybind short peptides ranging from 9 to 11 amino acids,whose N- and C-terminal ends remain pinned to con-served residues of the MHC I molecule through a networkof hydrogen bonds [10, 11]. The MHC I peptide-bindinggroove also contains deep binding pockets with tight phys-icochemical preferences that facilitate binding predictions.There is a complication however. Peptides that have differ-ent sizes and bind to the same MHC I molecule often usealternative binding pockets [12]. Therefore, methods pre-dicting peptide-MHC I binding require a fixed peptidelength. However, since most MHC I peptide ligands have9 residues, it is generally preferable to predict peptides withthat size. In contrast, the peptide-binding groove of MHCII molecules is open, allowing the N- and C-terminal endsof a peptide to extend beyond the binding groove [10, 11].As a result, MHC II-bound peptides vary widely in length(9–22 residues), although only a core of nine residues (pep-tide-binding core) sits into the MHC II binding groove.Therefore, peptide-MHC II binding prediction methodsoften target to identify these peptide-binding cores. MHCII molecule binding pockets are also shallower and lessdemanding than those of MHC I molecules. As a conse-quence, peptide-binding prediction to MHC II moleculesis less accurate than that of MHC I molecules.
Given the relevance of the problem, there are numerousmethods to predict peptide-MHC binding. The most relevantwith free online use are collected on Table 1. They can bedivided in two main categories: data-driven and structure-based methods. Structure-based approaches generally rely
on modeling the peptide-MHC structure followed by evalua-tion of the interaction through methods such as moleculardynamic simulations [8, 13]. Structure-based methods havethe great advantage of not needing experimental data. How-ever, they are seldom used as they are computationally inten-sive and exhibit lower predictive performance than data-driven methods [14].
Data-driven methods for peptide-MHC binding predic-tion are based on peptide sequences that are known to bindto MHC molecules. These peptide sequences are generallyavailable in specialized epitope databases such as IEDB[15], EPIMHC [16], Antijen [17, 18]. Both MHC I and IIbinding peptides contain frequently occurring amino acidsat particular peptide positions, known as anchor residues.Thereby, prediction of peptide-MHC binding was firstapproached using sequence motif (SM) reflecting amino acidpreferences of MHC molecules at anchor positions [19].However, it was soon shown that nonanchor residues alsocontribute to the capacity of a peptide to bind to a givenMHCmolecule [20, 21]. Subsequently, researchers developedmotif matrices (MM), which could evaluate the contributionof each and all peptide positions to the binding with theMHC molecule [22–25]. The most sophisticated form ofmotif matrices consists of profiles [24–26] that are similarto those used for detecting sequence homology [27]. Wewould like to remark that motif matrices are often mistakenwith quantitative affinity matrices (QAMs) since both pro-duce peptide scores. However, MMs are derived without tak-ing in consideration values of binding affinities and,therefore, resulting peptide scores are not suited to addressbinding affinity. In contrast, QAMs are trained on peptidesand corresponding binding affinities, and aim to predictbinding affinity. The first method based on QAMs was devel-oped by Parker et al. [28] (Table 1). Subsequently, variousapproaches were developed to obtain QAMs from peptide
CD4 T-cell
APC
CD4
T-cell receptor
MHC I
Peptide
1
�훽2
�훼1
�훼2
C�훼
V�훼
C�훽
V�훽
�훽1
(a)
APC
CD8 T-cell
CD8
MHC I
T-cell receptor
Peptide
�훼1
�훽2 m
�훼3
�훼2
C�훼
V�훼
C�훽
V�훽
(b)
Figure 2: T-cell epitope recognition. T-cell epitopes are peptides derived from antigens and recognized by the T-cell receptor (TCR) whenbound to MHC molecules displayed on the cell surface of APCs. (a) CD4 T-cells express the CD4 coreceptor, which binds to MHC II, andrecognize peptides presented by MHC II molecules. (b) CD8 T-cells express the CD8 coreceptor, which binds to MHC I, and recognizepeptides presented by MHC I molecules.
3Journal of Immunology Research
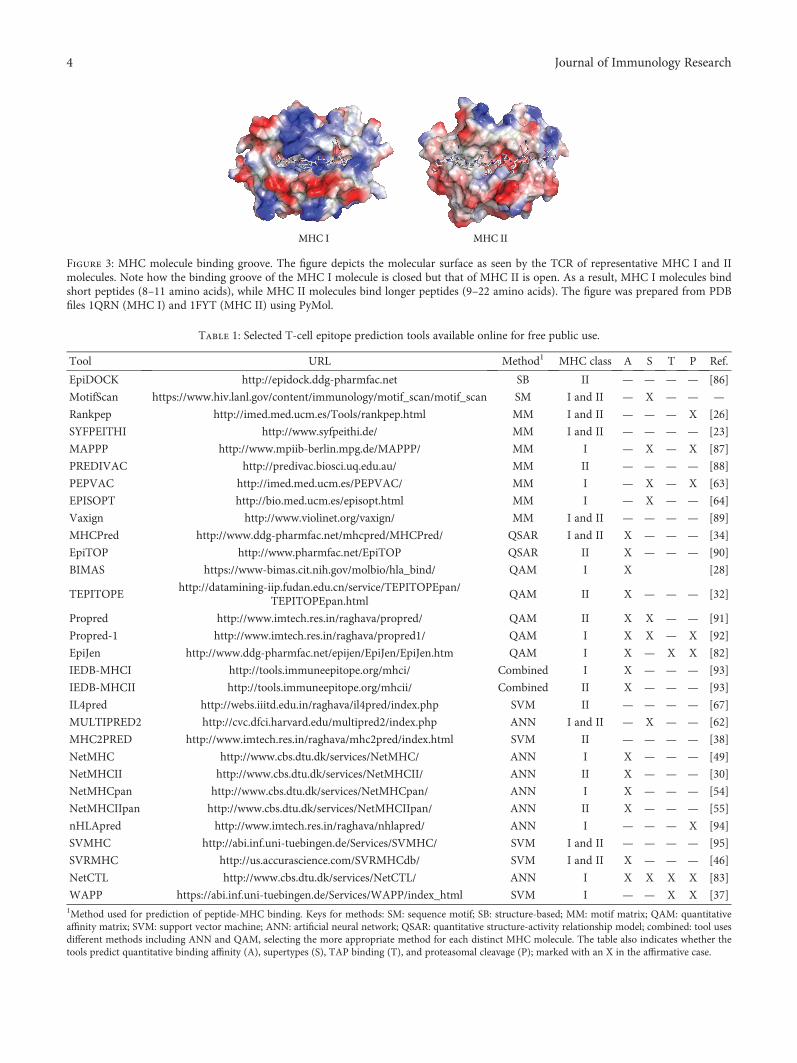
MHC I MHC II
Figure 3: MHC molecule binding groove. The figure depicts the molecular surface as seen by the TCR of representative MHC I and IImolecules. Note how the binding groove of the MHC I molecule is closed but that of MHC II is open. As a result, MHC I molecules bindshort peptides (8–11 amino acids), while MHC II molecules bind longer peptides (9–22 amino acids). The figure was prepared from PDBfiles 1QRN (MHC I) and 1FYT (MHC II) using PyMol.
Table 1: Selected T-cell epitope prediction tools available online for free public use.
Tool URL Method1 MHC class A S T P Ref.
EpiDOCK http://epidock.ddg-pharmfac.net SB II — — — — [86]
MotifScan https://www.hiv.lanl.gov/content/immunology/motif_scan/motif_scan SM I and II — X — — —
Rankpep http://imed.med.ucm.es/Tools/rankpep.html MM I and II — — — X [26]
SYFPEITHI http://www.syfpeithi.de/ MM I and II — — — — [23]
MAPPP http://www.mpiib-berlin.mpg.de/MAPPP/ MM I — X — X [87]
PREDIVAC http://predivac.biosci.uq.edu.au/ MM II — — — — [88]
PEPVAC http://imed.med.ucm.es/PEPVAC/ MM I — X — X [63]
EPISOPT http://bio.med.ucm.es/episopt.html MM I — X — — [64]
Vaxign http://www.violinet.org/vaxign/ MM I and II — — — — [89]
MHCPred http://www.ddg-pharmfac.net/mhcpred/MHCPred/ QSAR I and II X — — — [34]
EpiTOP http://www.pharmfac.net/EpiTOP QSAR II X — — — [90]
BIMAS https://www-bimas.cit.nih.gov/molbio/hla_bind/ QAM I X [28]
TEPITOPEhttp://datamining-iip.fudan.edu.cn/service/TEPITOPEpan/
TEPITOPEpan.htmlQAM II X — — — [32]
Propred http://www.imtech.res.in/raghava/propred/ QAM II X X — — [91]
Propred-1 http://www.imtech.res.in/raghava/propred1/ QAM I X X — X [92]
EpiJen http://www.ddg-pharmfac.net/epijen/EpiJen/EpiJen.htm QAM I X — X X [82]
IEDB-MHCI http://tools.immuneepitope.org/mhci/ Combined I X — — — [93]
IEDB-MHCII http://tools.immuneepitope.org/mhcii/ Combined II X — — — [93]
IL4pred http://webs.iiitd.edu.in/raghava/il4pred/index.php SVM II — — — — [67]
MULTIPRED2 http://cvc.dfci.harvard.edu/multipred2/index.php ANN I and II — X — — [62]
MHC2PRED http://www.imtech.res.in/raghava/mhc2pred/index.html SVM II — — — — [38]
NetMHC http://www.cbs.dtu.dk/services/NetMHC/ ANN I X — — — [49]
NetMHCII http://www.cbs.dtu.dk/services/NetMHCII/ ANN II X — — — [30]
NetMHCpan http://www.cbs.dtu.dk/services/NetMHCpan/ ANN I X — — — [54]
NetMHCIIpan http://www.cbs.dtu.dk/services/NetMHCIIpan/ ANN II X — — — [55]
nHLApred http://www.imtech.res.in/raghava/nhlapred/ ANN I — — — X [94]
SVMHC http://abi.inf.uni-tuebingen.de/Services/SVMHC/ SVM I and II — — — — [95]
SVRMHC http://us.accurascience.com/SVRMHCdb/ SVM I and II X — — — [46]
NetCTL http://www.cbs.dtu.dk/services/NetCTL/ ANN I X X X X [83]
WAPP https://abi.inf.uni-tuebingen.de/Services/WAPP/index_html SVM I — — X X [37]1Method used for prediction of peptide-MHC binding. Keys for methods: SM: sequence motif; SB: structure-based; MM: motif matrix; QAM: quantitativeaffinity matrix; SVM: support vector machine; ANN: artificial neural network; QSAR: quantitative structure-activity relationship model; combined: tool usesdifferent methods including ANN and QAM, selecting the more appropriate method for each distinct MHC molecule. The table also indicates whether thetools predict quantitative binding affinity (A), supertypes (S), TAP binding (T), and proteasomal cleavage (P); marked with an X in the affirmative case.
4 Journal of Immunology Research
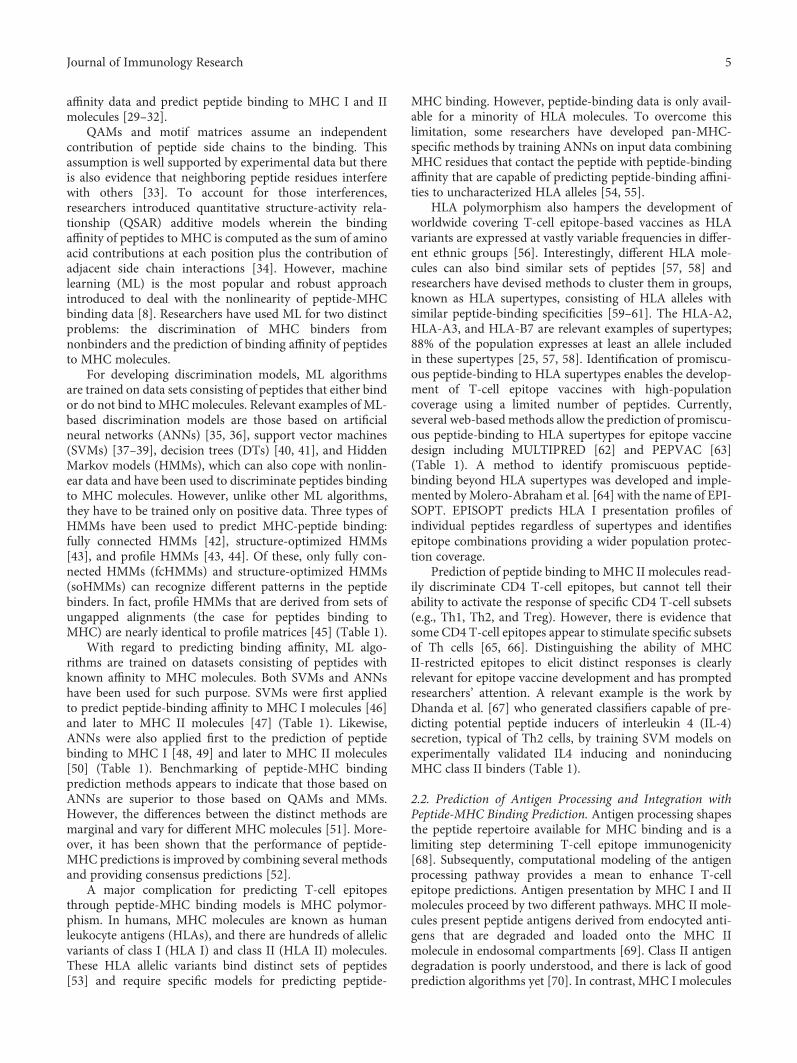
affinity data and predict peptide binding to MHC I and IImolecules [29–32].
QAMs and motif matrices assume an independentcontribution of peptide side chains to the binding. Thisassumption is well supported by experimental data but thereis also evidence that neighboring peptide residues interferewith others [33]. To account for those interferences,researchers introduced quantitative structure-activity rela-tionship (QSAR) additive models wherein the bindingaffinity of peptides to MHC is computed as the sum of aminoacid contributions at each position plus the contribution ofadjacent side chain interactions [34]. However, machinelearning (ML) is the most popular and robust approachintroduced to deal with the nonlinearity of peptide-MHCbinding data [8]. Researchers have used ML for two distinctproblems: the discrimination of MHC binders fromnonbinders and the prediction of binding affinity of peptidesto MHC molecules.
For developing discrimination models, ML algorithmsare trained on data sets consisting of peptides that either bindor do not bind to MHCmolecules. Relevant examples of ML-based discrimination models are those based on artificialneural networks (ANNs) [35, 36], support vector machines(SVMs) [37–39], decision trees (DTs) [40, 41], and HiddenMarkov models (HMMs), which can also cope with nonlin-ear data and have been used to discriminate peptides bindingto MHC molecules. However, unlike other ML algorithms,they have to be trained only on positive data. Three types ofHMMs have been used to predict MHC-peptide binding:fully connected HMMs [42], structure-optimized HMMs[43], and profile HMMs [43, 44]. Of these, only fully con-nected HMMs (fcHMMs) and structure-optimized HMMs(soHMMs) can recognize different patterns in the peptidebinders. In fact, profile HMMs that are derived from sets ofungapped alignments (the case for peptides binding toMHC) are nearly identical to profile matrices [45] (Table 1).
With regard to predicting binding affinity, ML algo-rithms are trained on datasets consisting of peptides withknown affinity to MHC molecules. Both SVMs and ANNshave been used for such purpose. SVMs were first appliedto predict peptide-binding affinity to MHC I molecules [46]and later to MHC II molecules [47] (Table 1). Likewise,ANNs were also applied first to the prediction of peptidebinding to MHC I [48, 49] and later to MHC II molecules[50] (Table 1). Benchmarking of peptide-MHC bindingprediction methods appears to indicate that those based onANNs are superior to those based on QAMs and MMs.However, the differences between the distinct methods aremarginal and vary for different MHC molecules [51]. More-over, it has been shown that the performance of peptide-MHC predictions is improved by combining several methodsand providing consensus predictions [52].
A major complication for predicting T-cell epitopesthrough peptide-MHC binding models is MHC polymor-phism. In humans, MHC molecules are known as humanleukocyte antigens (HLAs), and there are hundreds of allelicvariants of class I (HLA I) and class II (HLA II) molecules.These HLA allelic variants bind distinct sets of peptides[53] and require specific models for predicting peptide-
MHC binding. However, peptide-binding data is only avail-able for a minority of HLA molecules. To overcome thislimitation, some researchers have developed pan-MHC-specific methods by training ANNs on input data combiningMHC residues that contact the peptide with peptide-bindingaffinity that are capable of predicting peptide-binding affini-ties to uncharacterized HLA alleles [54, 55].
HLA polymorphism also hampers the development ofworldwide covering T-cell epitope-based vaccines as HLAvariants are expressed at vastly variable frequencies in differ-ent ethnic groups [56]. Interestingly, different HLA mole-cules can also bind similar sets of peptides [57, 58] andresearchers have devised methods to cluster them in groups,known as HLA supertypes, consisting of HLA alleles withsimilar peptide-binding specificities [59–61]. The HLA-A2,HLA-A3, and HLA-B7 are relevant examples of supertypes;88% of the population expresses at least an allele includedin these supertypes [25, 57, 58]. Identification of promiscu-ous peptide-binding to HLA supertypes enables the develop-ment of T-cell epitope vaccines with high-populationcoverage using a limited number of peptides. Currently,several web-based methods allow the prediction of promiscu-ous peptide-binding to HLA supertypes for epitope vaccinedesign including MULTIPRED [62] and PEPVAC [63](Table 1). A method to identify promiscuous peptide-binding beyond HLA supertypes was developed and imple-mented byMolero-Abraham et al. [64] with the name of EPI-SOPT. EPISOPT predicts HLA I presentation profiles ofindividual peptides regardless of supertypes and identifiesepitope combinations providing a wider population protec-tion coverage.
Prediction of peptide binding to MHC II molecules read-ily discriminate CD4 T-cell epitopes, but cannot tell theirability to activate the response of specific CD4 T-cell subsets(e.g., Th1, Th2, and Treg). However, there is evidence thatsome CD4 T-cell epitopes appear to stimulate specific subsetsof Th cells [65, 66]. Distinguishing the ability of MHCII-restricted epitopes to elicit distinct responses is clearlyrelevant for epitope vaccine development and has promptedresearchers’ attention. A relevant example is the work byDhanda et al. [67] who generated classifiers capable of pre-dicting potential peptide inducers of interleukin 4 (IL-4)secretion, typical of Th2 cells, by training SVM models onexperimentally validated IL4 inducing and noninducingMHC class II binders (Table 1).
2.2. Prediction of Antigen Processing and Integration withPeptide-MHC Binding Prediction. Antigen processing shapesthe peptide repertoire available for MHC binding and is alimiting step determining T-cell epitope immunogenicity[68]. Subsequently, computational modeling of the antigenprocessing pathway provides a mean to enhance T-cellepitope predictions. Antigen presentation by MHC I and IImolecules proceed by two different pathways. MHC II mole-cules present peptide antigens derived from endocyted anti-gens that are degraded and loaded onto the MHC IImolecule in endosomal compartments [69]. Class II antigendegradation is poorly understood, and there is lack of goodprediction algorithms yet [70]. In contrast, MHC I molecules
5Journal of Immunology Research

present peptides derived mainly from antigens degraded inthe cytosol. The resulting peptide antigens are then trans-ported to the endoplasmic reticulum by TAP where theyare loaded onto nascent MHC I molecules [69] (Figure 4).Prior to loading, peptides often undergo trimming byERAAP N-terminal amino peptidases [71].
Proteasomal cleavage and peptide-binding to TAP havebeen studied in detail and there are computational methodsthat predict both processes. Proteasomal cleavage predictionmodels have been derived from peptide fragments generatedin vitro by human constitutive proteasomes [72, 73] andfrom sets of MHC I-restricted ligands mapped onto theirsource proteins [74–76]. On the other hand, TAP bindingprediction methods have been developed by trainingdifferent algorithms on peptides of known affinity to TAP[77–80]. Combination of proteasomal cleavage and peptide-binding to TAP with peptide-MHC binding predictionsincreases T-cell epitope predictive rate in comparison to justpeptide-binding to MHC I [37, 77, 81–83]. Subsequently,researchers have developed resources to predict CD8 T-cellepitopes through multistep approaches integrating proteaso-mal cleavage, TAP transport, and peptide-binding to MHCmolecules [26, 37, 82–85] (Table 1).
3. Prediction of B-Cell Epitopes
B-cell epitope prediction aims to facilitate B-cell epitopeidentification with the practical purpose of replacing the anti-gen for antibody production or for carrying structure-function studies. Any solvent-exposed region in the antigencan be subject of recognition by antibodies. Nonetheless,B-cell epitopes can be divided in two main groups: linearand conformational (Figure 5). Linear B-cell epitopes consistof sequential residues, peptides, whereas conformationalB-cell epitopes consist of patches of solvent-exposed atomsfrom residues that are not necessarily sequential (Figure 5).Therefore, linear and conformational B-cell epitopes are alsoknown as continuous and discontinuous B-cell epitopes,respectively. Antibodies recognizing linear B-cell epitopescan recognize denatured antigens, while denaturing the anti-gen results in loss of recognition for conformational B-cellepitopes. Most B-cell epitopes (approximately a 90%) areconformational and, in fact, only a minority of native anti-gens contains linear B-cell epitopes [3]. We will review both,prediction of linear and conformational B-cell epitopes.
3.1. Prediction of Linear B-Cell Epitopes. Linear B-cell epi-topes consist of peptides which can readily be used to replaceantigens for immunizations and antibody production. There-fore, despite being a minority, prediction of linear B-cell epi-topes have received major attention. Linear B-cell epitopesare predicted from the primary sequence of antigens usingsequence-based methods. Early computational methods forthe prediction of B-cell epitopes were based on simple aminoacid propensity scales depicting physicochemical features ofB-cellepitopes. For example, Hopp and Wood applied resi-due hydrophilicity calculations for B-cell epitope prediction[96, 97] on the assumption that hydrophilic regions are pre-dominantly located on the protein surface and are potentially
antigenic. We know now, however, that protein surfaces con-tain roughly the same number of hydrophilic and hydropho-bic residues [98]. Other amino acid propensity scalesintroduced for B-cell epitope prediction are based on flexibil-ity [99], surface accessibility [100], and β-turn propensity[101]. Current available bioinformatics tools to predict linearB-cell epitopes using propensity scales include PREDITOP[102] and PEOPLE [103] (Table 2). PREDITOP [102] usesa multiparametric algorithm based on hydrophilicity, acces-sibility, flexibility, and secondary structure properties of theamino acids. PEOPLE [103] uses the same parameters andin addition includes the assessment of β-turns. A relatedmethod to predict B-cell epitopes was introduced by Kolas-kar and Tongaonkar [104], consisting on a simple antigenic-ity scale derived from physicochemical properties andfrequencies of amino acids in experimentally determined B-cell epitopes. This index is perhaps the most popular anti-genic scale for B-cell epitope prediction, and it is actuallyimplemented by GCG [105] and EMBOSS [106] packages.Comparative evaluations of propensity scales carried out ina dataset of 85 linear B-cell epitopes showed that most pro-pensity scales predicted between 50 and 70% of B-cell epi-topes, with the β-turn scale reaching the best values [101,107]. It has also been shown that combining the differentscales does not appear to improve predictions [102, 108].Moreover, Blythe and Flower [109] demonstrated thatsingle-scale amino acid propensity scales are not reliable topredict epitope location.
The poor performance of amino acid scales for the pre-diction of linear B-cell epitopes prompted the introductionof machine learning- (ML-) based methods (Table 2). Thesemethods are developed by training ML algorithms to distin-guish experimental B-cell epitopes from non-B-cell epitopes.Prior to training, B-cell epitopes are translated into featurevectors capturing selected properties, such as those given bydifferent propensity scales. Relevant examples of B-cell epi-tope prediction methods based on ML include BepiPred[110], ABCpred [111], LBtope [112], BCPREDS [113], andSVMtrip [114]. Datasets, training features, and algorithmsused for developing these methods differ. BepiPred is basedon random forests trained on B-cell epitopes obtained from3D-structures of antigen-antibody complexes [110]. BothBCPREDS [113] and SVMtrip [114] are based on supportvector machines (SVM) but while BCPREDS was trainedusing various string kernels that eliminate the need forrepresenting the sequence into length-fixed feature vectors,SMVtrip was trained on length-fixed tripeptide composi-tion vectors. ABCpred and LBtope methods consist on arti-ficial neural networks (ANNs) trained on similar positivedata, B-cell epitopes, but differ on negative data, non-B-cell epitopes. Negative data used for training ABCpred con-sisted on random peptides while negative data used forLBtope was based on experimentally validated non-B-cellepitopes form IEDB [15]. In general, B-cell epitope predic-tion methods employing ML-algorithm are reported tooutperform those based on amino acid propensity scales.Nevertheless, some authors have reported that ML algo-rithms show little improvement over single-scale-basedmethods [115].
6 Journal of Immunology Research

Protein
Proteasome
APC
TAP
Golgi
T-cell epitope
ERAAP
T-cell
Secretory vesicle
Endoplasmatic reticulum
Peptides
MHC binding peptide
Figure 4: Class I antigen processing. The figure depicts the major steps involved in antigen presentation by MHC I molecules. Proteins aredegraded by the proteasome and peptide fragments transported to the endoplasmic reticulum (ER) by TAP where they are loaded ontonascent MHC I molecules. TAP transports peptides ranging from 8 to 16 amino acids. Long peptides cannot bind MHC I molecules butoften become suitable for binding after N-terminal trimming by ERAAP.
Antigen
Antigen denatured
Continuous residues linear epitope
Discontinuous residues conformational epitope
(a) (b)
19 20 21 22 23
Epitope
Antigen
Epitope
32
504720
Antibody Antibody
Figure 5: Linear and conformational B-cell epitopes. Linear B-cell epitopes (a) are composed of sequential/continuous residues, whileconformational B-cell epitopes (b) contain scattered/discontinuous residues along the sequence.
7Journal of Immunology Research
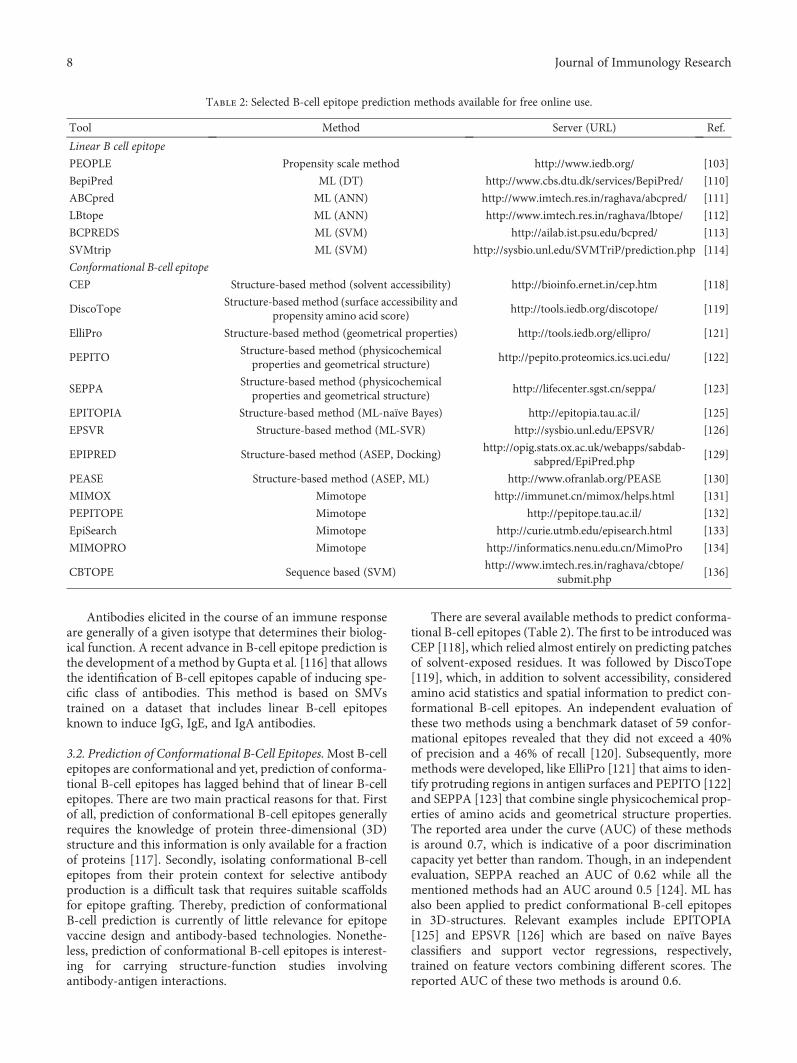
Antibodies elicited in the course of an immune responseare generally of a given isotype that determines their biolog-ical function. A recent advance in B-cell epitope prediction isthe development of a method by Gupta et al. [116] that allowsthe identification of B-cell epitopes capable of inducing spe-cific class of antibodies. This method is based on SMVstrained on a dataset that includes linear B-cell epitopesknown to induce IgG, IgE, and IgA antibodies.
3.2. Prediction of Conformational B-Cell Epitopes.Most B-cellepitopes are conformational and yet, prediction of conforma-tional B-cell epitopes has lagged behind that of linear B-cellepitopes. There are two main practical reasons for that. Firstof all, prediction of conformational B-cell epitopes generallyrequires the knowledge of protein three-dimensional (3D)structure and this information is only available for a fractionof proteins [117]. Secondly, isolating conformational B-cellepitopes from their protein context for selective antibodyproduction is a difficult task that requires suitable scaffoldsfor epitope grafting. Thereby, prediction of conformationalB-cell prediction is currently of little relevance for epitopevaccine design and antibody-based technologies. Nonethe-less, prediction of conformational B-cell epitopes is interest-ing for carrying structure-function studies involvingantibody-antigen interactions.
There are several available methods to predict conforma-tional B-cell epitopes (Table 2). The first to be introduced wasCEP [118], which relied almost entirely on predicting patchesof solvent-exposed residues. It was followed by DiscoTope[119], which, in addition to solvent accessibility, consideredamino acid statistics and spatial information to predict con-formational B-cell epitopes. An independent evaluation ofthese two methods using a benchmark dataset of 59 confor-mational epitopes revealed that they did not exceed a 40%of precision and a 46% of recall [120]. Subsequently, moremethods were developed, like ElliPro [121] that aims to iden-tify protruding regions in antigen surfaces and PEPITO [122]and SEPPA [123] that combine single physicochemical prop-erties of amino acids and geometrical structure properties.The reported area under the curve (AUC) of these methodsis around 0.7, which is indicative of a poor discriminationcapacity yet better than random. Though, in an independentevaluation, SEPPA reached an AUC of 0.62 while all thementioned methods had an AUC around 0.5 [124]. ML hasalso been applied to predict conformational B-cell epitopesin 3D-structures. Relevant examples include EPITOPIA[125] and EPSVR [126] which are based on naïve Bayesclassifiers and support vector regressions, respectively,trained on feature vectors combining different scores. Thereported AUC of these two methods is around 0.6.
Table 2: Selected B-cell epitope prediction methods available for free online use.
Tool Method Server (URL) Ref.
Linear B cell epitope
PEOPLE Propensity scale method http://www.iedb.org/ [103]
BepiPred ML (DT) http://www.cbs.dtu.dk/services/BepiPred/ [110]
ABCpred ML (ANN) http://www.imtech.res.in/raghava/abcpred/ [111]
LBtope ML (ANN) http://www.imtech.res.in/raghava/lbtope/ [112]
BCPREDS ML (SVM) http://ailab.ist.psu.edu/bcpred/ [113]
SVMtrip ML (SVM) http://sysbio.unl.edu/SVMTriP/prediction.php [114]
Conformational B-cell epitope
CEP Structure-based method (solvent accessibility) http://bioinfo.ernet.in/cep.htm [118]
DiscoTopeStructure-based method (surface accessibility and
propensity amino acid score)http://tools.iedb.org/discotope/ [119]
ElliPro Structure-based method (geometrical properties) http://tools.iedb.org/ellipro/ [121]
PEPITOStructure-based method (physicochemicalproperties and geometrical structure)
http://pepito.proteomics.ics.uci.edu/ [122]
SEPPAStructure-based method (physicochemicalproperties and geometrical structure)
http://lifecenter.sgst.cn/seppa/ [123]
EPITOPIA Structure-based method (ML-naïve Bayes) http://epitopia.tau.ac.il/ [125]
EPSVR Structure-based method (ML-SVR) http://sysbio.unl.edu/EPSVR/ [126]
EPIPRED Structure-based method (ASEP, Docking)http://opig.stats.ox.ac.uk/webapps/sabdab-
sabpred/EpiPred.php[129]
PEASE Structure-based method (ASEP, ML) http://www.ofranlab.org/PEASE [130]
MIMOX Mimotope http://immunet.cn/mimox/helps.html [131]
PEPITOPE Mimotope http://pepitope.tau.ac.il/ [132]
EpiSearch Mimotope http://curie.utmb.edu/episearch.html [133]
MIMOPRO Mimotope http://informatics.nenu.edu.cn/MimoPro [134]
CBTOPE Sequence based (SVM)http://www.imtech.res.in/raghava/cbtope/
submit.php[136]
8 Journal of Immunology Research
The above methods for conformational B-cell epitopeprediction identify generic antigenic regions regardless ofantibodies, which are ignored [127]. However, there are alsomethods for antibody-specific epitope prediction. Thisapproach was pioneered by Soga et al. [128] who definedan antibody-specific epitope propensity (ASEP) index afteranalyzing the interfaces of antigen-antibody 3D-structures.Using this index, they developed a novel method forpredicting epitope residues in individual antibodies thatworked by narrowing down candidate epitope residues pre-dicted by conventional methods. More recently, Krawczyket al. [129] developed EpiPred, a method that uses adocking-like approach to match up antibody and antigenstructures, thus identifying epitope regions on the antigen.A similar approach is used by PEASE [130], adding that thismethod utilizes the sequence of the antibody and the3D-structure of the antigen. Briefly, for each pair of antibodysequence and antigen structure, PEASE uses a machinelearning model trained on properties from 120 antibody-antigen complexes to identify pair combination of residuesfrom complementarity-determining regions (CDRs) of theantibody and the antigen that are likely to interact.
Another approach to identify conformational B-cell epi-topes in a protein with a known 3D-structure is throughmimotope-based methods. Mimotopes are peptides selectedfrom randomized peptide libraries for their ability to bindto an antibody raised against a native antigen. Mimotope-based methods require to input antibody affinity-selectedpeptides and the 3D-structure of the selected antigen.Examples of bioinformatics tools for conformational B-cellepitope prediction using mimotopes include MIMOX [131],PEPITOPE [132], EPISEARCH [133], MIMOPRO [134],and PEPMAPPER [135] (Table 2).
As remarked before, methods for conformational B-cellepitope prediction generally require the 3D-structure of theantigen. Exceptionally, however, Ansari and Raghava [136]developed a method (CBTOPE) for the identification of con-formational B-cell epitope from the primary sequence of theantigen. CBTOPE is based on SVM and trained on physico-chemical and sequence-derived features of conformationalB-cell epitopes. CBTOPE reported accuracy was 86.6% incrossvalidation experiments.
4. Concluding Remarks
Currently, T-cell epitope prediction is more advanced andreliable than that of B-cell prediction. However, while it ispossible to confirm experimentally the predicted binding toMHC molecules of most peptides predicted, only ~10% ofthose are shown to be immunogenic (able to elicit a T-cellresponse) [68]. Such a low T-cell epitope discovery rate isdue to the fact that we do not have adequate models forpredicting antigen processing yet [68]. The economic toll oflow T-cell epitope discovery rate can be overcome, at leastin part, by prioritizing protein antigens for epitope prediction[137–139]. For T-cell epitope vaccine development,researchers can also resort to experimentally known T-cellepitopes, available in epitope databases, selecting throughimmunoinformatics those that provide maximum
population protection coverage [64, 140, 141]. In any case,T-cell epitope prediction remains an integral part of T-cellepitope mapping approaches. In contrast, B-cell epitopeprediction utility is currently much more limited. There areseveral reasons to that. First of all, prediction of B-cellepitopes is still unreliable for both linear and conformationalB-cell epitopes. Secondly, linear B-cell epitopes do usuallyelicit antibodies that do not crossreact with native antigens.Third, the great majority of B-cell epitopes are conforma-tional and yet predicting conformational epitopes have fewapplications, as they cannot be isolated from their proteincontext. Under this scenario, the key is not only to improvecurrent methods for B-cell epitope prediction but also todevelop novel approaches and platforms for epitope graftingonto suitable scaffolds capable of replacing the native antigen.
To conclude, we wish to make two final remarks that arerelevant for epitope vaccine design. First of all, it is thatepitope prediction methods can provide potential epitopesfrom any given protein query but not all the antigens areequally relevant for vaccine development. Therefore,researchers have also developed tools to identify vaccine can-didate antigens [142, 143], those likely to induce protectiveimmunity, which can then be targeted for epitope predictionand epitope vaccine design. Second, it should be borne inmind that epitope peptides exhibit little immunogenicityand need to be used in combination with adjuvants, whichincrease immunogenicity by inducing strong innate immuneresponses that enable adaptive immunity [144–146]. Conse-quently, the discovery of new adjuvants is particularly rele-vant for epitope-based vaccines [146] and to that end,Nagpal et al. [147] developed a pioneered method that canpredict the immunomodulatory activity of RNA sequences.
Conflicts of Interest
The authors declare that they have no conflicts of interest.
Authors’ Contributions
Jose L. Sanchez-Trincado and Marta Gomez-Perosanz con-tributed equally to this work.
Acknowledgments
The authors wish to thank Inmunotek, SL and the SpanishDepartment of Science at MINECO for supporting theImmunomedicine group research through Grants SAF2006:07879, SAF2009:08301, and BIO2014:54164-R to Pedro A.Reche. The authors also wish to thank Dr. Esther M. Lafuentefor critical reading and corrections.
References
[1] W. E. Paul, Fundamental Immunology, Lippincott Williams& Wilkins, 2012.
[2] B. Sun and Y. Zhang, “Overview of orchestration of CD4+ Tcell subsets in immune responses,” Advances in ExperimentalMedicine and Biology, vol. 841, pp. 1–13, 2014.
[3] M. H. Van Regenmortel, “What is a B-cell epitope?,”Methodsin Molecular Biology, vol. 524, pp. 3–20, 2009.
9Journal of Immunology Research
[4] J. Ponomarenko and M. Van Regenmortel, “B-cell epitopeprediction,” in Structural Bioinformatics, pp. 849–879, JohnWiley & Sons, Inc, 2009.
[5] T. A. Ahmad, A. E. Eweida, and L. H. El-Sayed, “T-cell epi-tope mapping for the design of powerful vaccines,” VaccineReports, vol. 6, pp. 13–22, 2016.
[6] L. Malherbe, “T-cell epitope mapping,” Annals of Allergy,Asthma & Immunology, vol. 103, no. 1, pp. 76–79, 2009.
[7] R. K. Ahmed and M. J. Maeurer, “T-cell epitope mapping,”Methods in Molecular Biology, vol. 524, pp. 427–438, 2009.
[8] E. M. Lafuente and P. A. Reche, “Prediction of MHC-peptidebinding: a systematic and comprehensive overview,” CurrentPharmaceutical Design, vol. 15, no. 28, pp. 3209–3220, 2009.
[9] P. E. Jensen, “Recent advances in antigen processing andpresentation,” Nature Immunology, vol. 8, no. 10, pp. 1041–1048, 2007.
[10] L. J. Stern and D. C. Wiley, “Antigenic peptide binding byclass I and class II histocompatibility proteins,” Structure,vol. 2, no. 4, pp. 245–251, 1994.
[11] D. R. Madden, “The three-dimensional structure of peptide-MHC complexes,” Annual Review of Immunology, vol. 13,no. 1, pp. 587–622, 1995.
[12] D. R. Madden, D. N. Garboczi, and D. C. Wiley, “The anti-genic identity of peptide-MHC complexes: a comparison ofthe conformations of five viral peptides presented by HLA-A2,” Cell, vol. 75, no. 4, pp. 693–708, 1993.
[13] D. V. Desai and U. Kulkarni-Kale, “T-cell epitope predictionmethods: an overview,” Methods in Molecular Biology,vol. 1184, pp. 333–364, 2014.
[14] A. Patronov and I. Doytchinova, “T-cell epitope vaccinedesign by immunoinformatics,” Open Biology, vol. 3, no. 1,article 120139, 2013.
[15] R. Vita, J. A. Overton, J. A. Greenbaum et al., “The immuneepitope database (IEDB) 3.0,” Nucleic Acids Research,vol. 43, D1, pp. D405–D412, 2015.
[16] M. Molero-Abraham, E. M. Lafuente, and P. Reche, “Cus-tomized predictions of peptide-MHC binding and T-cell epi-topes using EPIMHC,” Methods in Molecular Biology,vol. 1184, pp. 319–332, 2014.
[17] C. P. Toseland, D. J. Clayton, H. McSparron et al., “AntiJen: aquantitative immunology database integrating functional,thermodynamic, kinetic, biophysical, and cellular data,”Immunome Research, vol. 1, no. 1, p. 4, 2005.
[18] S. P. Singh and B. N. Mishra, “Major histocompatibility com-plex linked databases and prediction tools for designing vac-cines,”Human Immunology, vol. 77, no. 3, pp. 295–306, 2016.
[19] J. D'Amaro, J. G. A. Houbiers, J. W. Drijfhout et al., “A com-puter program for predicting possible cytotoxic T lympho-cyte epitopes based on HLA class I peptide-binding motifs,”Human Immunology, vol. 43, no. 1, pp. 13–18, 1995.
[20] M. Bouvier and D. Wiley, “Importance of peptide amino andcarboxyl termini to the stability of MHC class I molecules,”Science, vol. 265, no. 5170, pp. 398–402, 1994.
[21] J. Ruppert, J. Sidney, E. Celis, R. T. Kubo, H. M. Grey, andA. Sette, “Prominent role of secondary anchor residues inpeptide binding to HLA-A2.1 molecules,” Cell, vol. 74,no. 5, pp. 929–937, 1993.
[22] M. Nielsen, C. Lundegaard, P. Worning et al., “Improved pre-diction of MHC class I and class II epitopes using a novelGibbs sampling approach,” Bioinformatics, vol. 20, no. 9,pp. 1388–1397, 2004.
[23] H. G. Rammensee, J. Bachmann, N. P. N. Emmerich, O. A.Bachor, and S. Stevanovic, “SYFPEITHI: database for MHCligands and peptide motifs,” Immunogenetics, vol. 50,no. 3-4, pp. 213–219, 1999.
[24] P. A. Reche, J. P. Glutting, and E. L. Reinherz, “Prediction ofMHC class I binding peptides using profile motifs,” HumanImmunology, vol. 63, no. 9, pp. 701–709, 2002.
[25] P. A. Reche and E. L. Reinherz, “Definition of MHC super-types through clustering of MHC peptide-binding reper-toires,” Methods in Molecular Biology, vol. 409, pp. 163–173, 2007.
[26] P. A. Reche, J. P. Glutting, H. Zhang, and E. L. Reinherz,“Enhancement to the RANKPEP resource for the predictionof peptide binding to MHC molecules using profiles,” Immu-nogenetics, vol. 56, no. 6, pp. 405–419, 2004.
[27] M. Gribskov and S. Veretnik, “Identification of sequence pat-tern with profile analysis,” Methods in Enzymology, vol. 266,pp. 198–212, 1996.
[28] K. C. Parker, M. A. Bednarek, and J. E. Coligan, “Scheme forranking potential HLA-A2 binding peptides based on inde-pendent binding of individual peptide side-chains,” The Jour-nal of Immunology, vol. 152, no. 1, pp. 163–175, 1994.
[29] H. H. Bui, J. Sidney, B. Peters et al., “Automated generationand evaluation of specific MHC binding predictive tools:ARB matrix applications,” Immunogenetics, vol. 57, no. 5,pp. 304–314, 2005.
[30] M. Nielsen, C. Lundegaard, and O. Lund, “Prediction ofMHC class II binding affinity using SMM-align, a novel stabi-lization matrix alignment method,” BMC Bioinformatics,vol. 8, no. 1, p. 238, 2007.
[31] B. Peters and A. Sette, “Generating quantitative modelsdescribing the sequence specificity of biological processeswith the stabilized matrix method,” BMC Bioinformatics,vol. 6, no. 1, p. 132, 2005.
[32] T. Sturniolo, E. Bono, J. Ding et al., “Generation of tissue-specific and promiscuous HLA ligand databases using DNAmicroarrays and virtual HLA class II matrices,” Nature Bio-technology, vol. 17, no. 6, pp. 555–561, 1999.
[33] B. Peters, W. Tong, J. Sidney, A. Sette, and Z. Weng, “Exam-ining the independent binding assumption for binding ofpeptide epitopes to MHC-I molecules,” Bioinformatics,vol. 19, no. 14, pp. 1765–1772, 2003.
[34] P. Guan, I. A. Doytchinova, C. Zygouri, and D. R. Flower,“MHCPred: a server for quantitative prediction of peptide–MHC binding,” Nucleic Acids Research, vol. 31, no. 13,pp. 3621–3624, 2003.
[35] M. Milik, D. Sauer, A. P. Brunmark et al., “Application of anartificial neural network to predict specific class I MHC bind-ing peptide sequences,” Nature Biotechnology, vol. 16, no. 8,pp. 753–756, 1998.
[36] V. Brusic, G. Rudy, G. Honeyman, J. Hammer, andL. Harrison, “Prediction of MHC class II-binding peptidesusing an evolutionary algorithm and artificial neural net-work,” Bioinformatics, vol. 14, no. 2, pp. 121–130, 1998.
[37] P. Donnes and O. Kohlbacher, “Integrated modeling of themajor events in the MHC class I antigen processing path-way,” Protein Science, vol. 14, no. 8, pp. 2132–2140, 2005.
[38] M. Bhasin and G. P. S. Raghava, “SVM based method forpredicting HLA-DRB1∗0401 binding peptides in an anti-gen sequence,” Bioinformatics, vol. 20, no. 3, pp. 421–423, 2004.
10 Journal of Immunology Research

[39] L. Jacob and J. P. Vert, “Efficient peptide-MHC-I bindingprediction for alleles with few known binders,” Bioinformat-ics, vol. 24, no. 3, pp. 358–366, 2008.
[40] S. Zhu, K. Udaka, J. Sidney, A. Sette, K. F. Aoki-Kinoshita,and H. Mamitsuka, “Improving MHC binding peptide pre-diction by incorporating binding data of auxiliary MHCmolecules,” Bioinformatics, vol. 22, no. 13, pp. 1648–1655, 2006.
[41] C. J. Savoie, N. Kamikawaji, T. Sasazuki, and S. Kuhara, “Useof BONSAI decision trees for the identification of potentialMHC class I peptide epitope motifs,” Pacific Symposium onBiocomputing, vol. 4, pp. 182–189, 1999.
[42] H. Mamitsuka, “Predicting peptides that bind to MHC mole-cules using supervised learning of hidden Markov models,”Proteins, vol. 33, no. 4, pp. 460–474, 1998.
[43] C. Zhang, M. G. Bickis, F. X. Wu, and A. J. Kusalik, “Opti-mally-connected hidden Markov models for predictingMHC-binding peptides,” Journal of Bioinformatics and Com-putational Biology, vol. 04, no. 05, pp. 959–980, 2006.
[44] M. Lacerda, K. Scheffler, and C. Seoighe, “Epitope discoverywith phylogenetic hidden Markov models,” MolecularBiology and Evolution, vol. 27, no. 5, pp. 1212–1220, 2010.
[45] R. Durbin, S. Eddy, A. Krogh, and G. Mitchison, BiologicalSequence Analysis: Probabilistic Models of Proteins andNucleic Acids, Cambridge University Press, Cambridge, 1998.
[46] W. Liu, X. Meng, Q. Xu, D. R. Flower, and T. Li, “Quantita-tive prediction of mouse class I MHC peptide binding affinityusing support vector machine regression (SVR) models,”BMC Bioinformatics, vol. 7, no. 1, p. 182, 2006.
[47] D. R. Jandrlic, “SVM and SVR-based MHC-binding predic-tion using a mathematical presentation of peptidesequences,” Computational Biology and Chemistry, vol. 65,pp. 117–127, 2016.
[48] S. Buus, S. L. Lauemoller, P. Worning et al., “Sensitive quan-titative predictions of peptide-MHC binding by a ‘query bycommittee’ artificial neural network approach,” TissueAntigens, vol. 62, no. 5, pp. 378–384, 2003.
[49] M. Nielsen, C. Lundegaard, P. Worning et al., “Reliableprediction of T-cell epitopes using neural networks withnovel sequence representations,” Protein Science, vol. 12,no. 5, pp. 1007–1017, 2003.
[50] M. Nielsen and O. Lund, “NN-align. An artificial neuralnetwork-based alignment algorithm for MHC class II peptidebinding prediction,” BMC Bioinformatics, vol. 10, no. 1,p. 296, 2009.
[51] K. Yu, N. Petrovsky, C. Schonbach, J. Y. Koh, and V. Brusic,“Methods for prediction of peptide binding to MHCmolecules: a comparative study,” Molecular Medicine, vol. 8,no. 3, pp. 137–148, 2002.
[52] P. Wang, J. Sidney, C. Dow, B. Mothe, A. Sette, and B. Peters,“A systematic assessment of MHC class II peptide bindingpredictions and evaluation of a consensus approach,” PLoSComputational Biology, vol. 4, no. 4, article e1000048, 2008.
[53] P. A. Reche and E. L. Reinherz, “Sequence variability analysisof human class I and class II MHC molecules: functional andstructural correlates of amino acid polymorphisms,” Journalof Molecular Biology, vol. 331, no. 3, pp. 623–641, 2003.
[54] M. Nielsen, C. Lundegaard, T. Blicher et al., “NetMHCpan, amethod for quantitative predictions of peptide binding to anyHLA-A and -B locus protein of known sequence,” PLoS One,vol. 2, no. 8, article e796, 2007.
[55] M. Nielsen, C. Lundegaard, T. Blicher et al., “Quantitativepredictions of peptide binding to any HLA-DR molecule ofknown sequence: NetMHCIIpan,” PLoS ComputationalBiology, vol. 4, no. 7, article e1000107, 2008.
[56] P. I. Terasaki, “A brief history of HLA,” ImmunologicResearch, vol. 38, no. 1-3, pp. 139–148, 2007.
[57] A. Sette and J. Sidney, “HLA supertypes and supermotifs: afunctional perspective on HLA polymorphism,” CurrentOpinion in Immunology, vol. 10, no. 4, pp. 478–482, 1998.
[58] A. Sette and J. Sidney, “Nine major HLA class I supertypesaccount for the vast preponderance of HLA-A and -Bpolymorphism,” Immunogenetics, vol. 50, no. 3-4, pp. 201–212, 1999.
[59] I. A. Doytchinova and D. R. Flower, “In silico identification ofsupertypes for class II MHCs,” The Journal of Immunology,vol. 174, no. 11, pp. 7085–7095, 2005.
[60] J. Greenbaum, J. Sidney, J. Chung, C. Brander, B. Peters, andA. Sette, “Functional classification of class II humanleukocyte antigen (HLA) molecules reveals seven differentsupertypes and a surprising degree of repertoire sharingacross supertypes,” Immunogenetics, vol. 63, no. 6, pp. 325–335, 2011.
[61] O. Lund, M. Nielsen, C. Kesmir et al., “Definition of super-types for HLAmolecules using clustering of specificity matri-ces,” Immunogenetics, vol. 55, no. 12, pp. 797–810, 2004.
[62] G. L. Zhang, D. S. DeLuca, D. B. Keskin et al., “MULTI-PRED2: a computational system for large-scale identificationof peptides predicted to bind to HLA supertypes and alleles,”Journal of Immunological Methods, vol. 374, no. 1-2,pp. 53–61, 2011.
[63] P. A. Reche and E. L. Reinherz, “PEPVAC: a web server formulti-epitope vaccine development based on the predictionof supertypic MHC ligands,” Nucleic Acids Research, vol. 33,Supplement 2, pp. W138–W142, 2005.
[64] M. Molero-Abraham, E. M. Lafuente, D. R. Flower, and P. A.Reche, “Selection of conserved epitopes from hepatitis Cvirus for pan-populational stimulation of T-cell responses,”Clinical and Developmental Immunology, vol. 2013, ArticleID 601943, 10 pages, 2013.
[65] S. L. Constant and K. Bottomly, “Induction of Th1 and Th2CD4+ T cell responses: the alternative approaches,” AnnualReview of Immunology, vol. 15, no. 1, pp. 297–322, 1997.
[66] E. M. Janssen, A. J. M. van Oosterhout, A. J. M. L. van Rensen,W. van Eden, F. P. Nijkamp, and M. H. M. Wauben, “Modu-lation of Th2 responses by peptide analogues in a murinemodel of allergic asthma: amelioration or deterioration ofthe disease process depends on the Th1 or Th2 skewing char-acteristics of the therapeutic peptide,” The Journal of Immu-nology, vol. 164, no. 2, pp. 580–588, 2000.
[67] S. K. Dhanda, S. Gupta, P. Vir, and G. P. Raghava, “Predictionof IL4 inducing peptides,” Clinical and Developmental Immu-nology, vol. 2013, Article ID 263952, 9 pages, 2013.
[68] W. Zhong, P. A. Reche, C. C. Lai, B. Reinhold, and E. L. Rein-herz, “Genome-wide characterization of a viral cytotoxic Tlymphocyte epitope repertoire,” The Journal of BiologicalChemistry, vol. 278, no. 46, pp. 45135–45144, 2003.
[69] J. S. Blum, P. A. Wearsch, and P. Cresswell, “Pathways ofantigen processing,” Annual Review of Immunology, vol. 31,no. 1, pp. 443–473, 2013.
[70] E. Hoze, L. Tsaban, Y. Maman, and Y. Louzoun, “Predictorfor the effect of amino acid composition on CD4 + T cell
11Journal of Immunology Research

epitopes preprocessing,” Journal of Immunological Methods,vol. 391, no. 1-2, pp. 163–173, 2013.
[71] G. E. Hammer, F. Gonzalez, M. Champsaur, D. Cado, andN. Shastri, “The aminopeptidase ERAAP shapes the peptiderepertoire displayed by major histocompatibility complexclass I molecules,” Nature Immunology, vol. 7, no. 1,pp. 103–112, 2006.
[72] A. K. Nussbaum, C. Kuttler, K. P. Hadeler, H. G. Rammensee,and H. Schild, “PAProC: a prediction algorithm for proteaso-mal cleavages available on the WWW,” Immunogenetics,vol. 53, no. 2, pp. 87–94, 2001.
[73] H. G. Holzhutter, C. Frommel, and P. M. Kloetzel, “A the-oretical approach towards the identification of cleavage-determining amino acid motifs of the 20s proteasome,”Journal of Molecular Biology, vol. 286, no. 4, pp. 1251–1265, 1999.
[74] M. Nielsen, C. Lundegaard, O. Lund, and C. Kesmir, “Therole of the proteasome in generating cytotoxic T-cell epi-topes: insights obtained from improved predictions of pro-teasomal cleavage,” Immunogenetics, vol. 57, no. 1-2,pp. 33–41, 2005.
[75] C. M. Diez-Rivero, E. M. Lafuente, and P. A. Reche, “Compu-tational analysis and modeling of cleavage by the immuno-proteasome and the constitutive proteasome,” BMCBioinformatics, vol. 11, no. 1, p. 479, 2010.
[76] M. Bhasin and G. P. S. Raghava, “Pcleavage: an SVMbased method for prediction of constitutive proteasomeand immunoproteasome cleavage sites in antigenicsequences,” Nucleic Acids Research, vol. 33, Supplement 1,pp. W202–W207, 2005.
[77] M. Bhasin and G. P. Raghava, “Analysis and prediction ofaffinity of TAP binding peptides using cascade SVM,” ProteinScience, vol. 13, no. 3, pp. 596–607, 2004.
[78] C. M. Diez-Rivero, B. Chenlo, P. Zuluaga, and P. A. Reche,“Quantitative modeling of peptide binding to TAP using sup-port vector machine,” Proteins, vol. 78, no. 1, pp. 63–72, 2010.
[79] S. Daniel, V. Brusic, S. Caillat-Zucman et al., “Relation-ship between peptide selectivities of human transportersassociated with antigen processing and HLA class I mole-cules,” The Journal of Immunology, vol. 161, no. 2,pp. 617–624, 1998.
[80] V. Brusic, P. van Endert, J. Zeleznikow, S. Daniel, J. Hammer,and N. Petrovsky, “A neural network model approach to thestudy of human TAP transporter,” In Silico Biology, vol. 1,no. 2, pp. 109–121, 1999.
[81] S. Tenzer, B. Peters, S. Bulik et al., “Modeling the MHC class Ipathway by combining predictions of proteasomal cleavage,TAP transport and MHC class I binding,” Cellular andMolecular Life Sciences, vol. 62, no. 9, pp. 1025–1037, 2005.
[82] I. A. Doytchinova, P. Guan, and D. R. Flower, “EpiJen: aserver for multistep T cell epitope prediction,” BMC Bioinfor-matics, vol. 7, no. 1, p. 131, 2006.
[83] M. V. Larsen, C. Lundegaard, K. Lamberth et al., “Anintegrative approach to CTL epitope prediction: a com-bined algorithm integrating MHC class I binding, TAPtransport efficiency, and proteasomal cleavage predic-tions,” European Journal of Immunology, vol. 35, no. 8,pp. 2295–2303, 2005.
[84] B. Schubert, H. P. Brachvogel, C. Jurges, and O. Kohlbacher,“EpiToolKit—a web-based workbench for vaccine design,”Bioinformatics, vol. 31, no. 13, pp. 2211–2213, 2015.
[85] B. Schubert, M.Walzer, H. P. Brachvogel, A. Szolek, C. Mohr,and O. Kohlbacher, “FRED 2: an immunoinformatics frame-work for Python,” Bioinformatics, vol. 32, no. 13, pp. 2044–2046, 2016.
[86] M. Atanasova, A. Patronov, I. Dimitrov, D. R. Flower, andI. Doytchinova, “EpiDOCK: a molecular docking-based toolfor MHC class II binding prediction,” Protein Engineering,Design and Selection, vol. 26, no. 10, pp. 631–634, 2013.
[87] J. Hakenberg, A. K. Nussbaum, H. Schild et al., “MAPPP:MHC class I antigenic peptide processing prediction,”Applied Bioinformatics, vol. 2, no. 3, pp. 155–158, 2003.
[88] P. Oyarzun, J. J. Ellis, M. Boden, and B. Kobe, “PREDIVAC:CD4+ T-cell epitope prediction for vaccine design that covers95% of HLA class II DR protein diversity,” BMC Bioinformat-ics, vol. 14, no. 1, p. 52, 2013.
[89] Y. He, Z. Xiang, and H. L. T. Mobley, “Vaxign: the firstweb-based vaccine design program for reverse vaccinologyand applications for vaccine development,” Journal ofBiomedicine and Biotechnology, vol. 2010, Article ID297505, 15 pages, 2010.
[90] I. Dimitrov, P. Garnev, D. R. Flower, and I. Doytchinova,“EpiTOP—a proteochemometric tool for MHC class II bind-ing prediction,” Bioinformatics, vol. 26, no. 16, pp. 2066–2068, 2010.
[91] H. Singh and G. P. S. Raghava, “ProPred: prediction ofHLA-DR binding sites,” Bioinformatics, vol. 17, no. 12,pp. 1236-1237, 2001.
[92] H. Singh and G. P. Raghava, “ProPred1: prediction of pro-miscuous MHC class-I binding sites,” Bioinformatics,vol. 19, no. 8, pp. 1009–1014, 2003.
[93] Q. Zhang, P. Wang, Y. Kim et al., “Immune epitope databaseanalysis resource (IEDB-AR),” Nucleic Acids Research,vol. 36, Web Server issue, pp. W513–W518, 2008.
[94] M. Bhasin and G. P. S. Raghava, “A hybrid approach forpredicting promiscuous MHC class I restricted T cell epi-topes,” Journal of Biosciences, vol. 32, no. 1, pp. 31–42, 2007.
[95] P. Donnes and A. Elofsson, “Prediction of MHC class I bind-ing peptides, using SVMHC,” BMC Bioinformatics, vol. 3,no. 1, p. 25, 2002.
[96] T. P. Hopp and K. R. Woods, “Prediction of protein antigenicdeterminants from amino acid sequences,” Proceedings of theNational Academy of Sciences of the United States of America,vol. 78, no. 6, pp. 3824–3828, 1981.
[97] T. P. Hopp and K. R. Woods, “A computer program for pre-dicting protein antigenic determinants,”Molecular Immunol-ogy, vol. 20, no. 4, pp. 483–489, 1983.
[98] L. Lins, A. Thomas, and R. Brasseur, “Analysis of accessiblesurface of residues in proteins,” Protein Science, vol. 12,no. 7, pp. 1406–1417, 2003.
[99] P. A. Karplus and G. E. Schulz, “Prediction of chain flexibilityin proteins: a tool for the selection of peptide antigen,”Natur-wissenschaften, vol. 72, no. 4, pp. 212-213, 1985.
[100] E. A. Emini, J. V. Hughes, D. S. Perlow, and J. Boger, “Induc-tion of hepatitis A virus-neutralizing antibody by a virus-specific synthetic peptide,” Journal of Virology, vol. 55,no. 3, pp. 836–839, 1985.
[101] J. L. Pellequer, E. Westhof, and M. H. V. Van Regenmortel,“Correlation between the location of antigenic sites and theprediction of turns in proteins,” Immunology Letters,vol. 36, no. 1, pp. 83–99, 1993.
12 Journal of Immunology Research

[102] J. L. Pellequer and E. Westhof, “PREDITOP: a program forantigenicity prediction,” Journal of Molecular Graphics,vol. 11, no. 3, pp. 204–210, 1993, 191–2.
[103] A. J. P. Alix, “Predictive estimation of protein linear epitopesby using the program PEOPLE,” Vaccine, vol. 18, no. 3-4,pp. 311–314, 1999.
[104] A. S. Kolaskar and P. C. Tongaonkar, “A semi-empiricalmethod for prediction of antigenic determinants on proteinantigens,” FEBS Letters, vol. 276, no. 1-2, pp. 172–174, 1990.
[105] D. D. Womble, “GCG: the Wisconsin package of sequenceanalysis programs,” Methods in Molecular Biology, vol. 132,pp. 3–22, 2000.
[106] P. Rice, I. Longden, and A. Bleasby, “EMBOSS: the Europeanmolecular biology open software suite,” Trends in Genetics,vol. 16, no. 6, pp. 276-277, 2000.
[107] J. L. Pellequer, E. Westhof, and M. H. V. Van Regenmortel,“Predicting location of continuous epitopes in proteins fromtheir primary structures,” Methods in Enzymology, vol. 203,pp. 176–201, 1991.
[108] M. Odorico and J. L. Pellequer, “BEPITOPE: predictingthe location of continuous epitopes and patterns in pro-teins,” Journal of Molecular Recognition, vol. 16, no. 1,pp. 20–22, 2003.
[109] M. J. Blythe and D. R. Flower, “Benchmarking B cell epitopeprediction: underperformance of existing methods,” ProteinScience, vol. 14, no. 1, pp. 246–248, 2005.
[110] M. C. Jespersen, B. Peters, M. Nielsen, and P. Marcatili,“BepiPred-2.0: improving sequence-based B-cell epitope pre-diction using conformational epitopes,” Nucleic AcidsResearch, vol. 45, Web Server issue, pp. W24–W29, 2017.
[111] S. Saha and G. P. S. Raghava, “Prediction of continuous B-cellepitopes in an antigen using recurrent neural network,” Pro-teins, vol. 65, no. 1, pp. 40–48, 2006.
[112] H. Singh, H. R. Ansari, and G. P. S. Raghava, “Improvedmethod for linear B-cell epitope prediction using antigen’sprimary sequence,” PLoS One, vol. 8, no. 5, articlee62216, 2013.
[113] Y. El-Manzalawy, D. Dobbs, and V. Honavar, “Predicting lin-ear B-cell epitopes using string kernels,” Journal of MolecularRecognition, vol. 21, no. 4, pp. 243–255, 2008.
[114] B. Yao, L. Zhang, S. Liang, and C. Zhang, “SVMTriP: amethod to predict antigenic epitopes using support vectormachine to integrate tri-peptide similarity and propensity,”PLoS One, vol. 7, no. 9, article e45152, 2012.
[115] J. A. Greenbaum, P. H. Andersen, M. Blythe et al., “Towards aconsensus on datasets and evaluation metrics for developingB-cell epitope prediction tools,” Journal of Molecular Recog-nition, vol. 20, no. 2, pp. 75–82, 2007.
[116] S. Gupta, H. R. Ansari, A. Gautam, Open Source DrugDiscovery Consortium, and G. P. Raghava, “Identificationof B-cell epitopes in an antigen for inducing specific class ofantibodies,” Biology Direct, vol. 8, no. 1, p. 27, 2013.
[117] M. Levitt, “Nature of the protein universe,” Proceedings of theNational Academy of Sciences of the United States of America,vol. 106, no. 27, pp. 11079–11084, 2009.
[118] U. Kulkarni-Kale, S. Bhosle, and A. S. Kolaskar, “CEP: a con-formational epitope prediction server,” Nucleic AcidsResearch, vol. 33, Web Server issue, pp. W168–W171, 2005.
[119] P. Haste Andersen, M. Nielsen, and O. Lund, “Predictionof residues in discontinuous B-cell epitopes using protein
3D structures,” Protein Science, vol. 15, no. 11, pp. 2558–2567, 2006.
[120] J. V. Ponomarenko and P. E. Bourne, “Antibody-proteininteractions: benchmark datasets and prediction tools evalu-ation,” BMC Structural Biology, vol. 7, no. 1, p. 64, 2007.
[121] J. Ponomarenko, H. H. Bui, W. Li et al., “ElliPro: a newstructure-based tool for the prediction of antibody epitopes,”BMC Bioinformatics, vol. 9, no. 1, p. 514, 2008.
[122] M. J. Sweredoski and P. Baldi, “PEPITO: improved discontin-uous B-cell epitope prediction using multiple distance thresh-olds and half sphere exposure,” Bioinformatics, vol. 24,no. 12, pp. 1459-1460, 2008.
[123] J. Sun, D. Wu, T. Xu et al., “SEPPA: a computational serverfor spatial epitope prediction of protein antigens,” NucleicAcids Research, vol. 37, no. suppl_2, Web Server issue,pp. W612–W616, 2009.
[124] X. Xu, J. Sun, Q. Liu et al., “Evaluation of spatial epitope com-putational tools based on experimentally-confirmed datasetfor protein antigens,” Chinese Science Bulletin, vol. 55,no. 20, pp. 2169–2174, 2010.
[125] N. D. Rubinstein, I. Mayrose, E. Martz, and T. Pupko, “Epito-pia: a web-server for predicting B-cell epitopes,” BMC Bioin-formatics, vol. 10, no. 1, p. 287, 2009.
[126] S. Liang, D. Zheng, D. M. Standley, B. Yao, M. Zacharias, andC. Zhang, “EPSVR and EPMeta: prediction of antigenic epi-topes using support vector regression and multiple serverresults,” BMC Bioinformatics, vol. 11, no. 1, p. 381, 2010.
[127] I. Sela-Culang, Y. Ofran, and B. Peters, “Antibody specificepitope prediction— emergence of a new paradigm,” CurrentOpinion in Virology, vol. 11, pp. 98–102, 2015.
[128] S. Soga, D. Kuroda, H. Shirai, M. Kobori, and N. Hirayama,“Use of amino acid composition to predict epitope residuesof individual antibodies,” Protein Engineering, Design andSelection, vol. 23, no. 6, pp. 441–448, 2010.
[129] K. Krawczyk, X. Liu, T. Baker, J. Shi, and C. M. Deane,“Improving B-cell epitope prediction and its application toglobal antibody-antigen docking,” Bioinformatics, vol. 30,no. 16, pp. 2288–2294, 2014.
[130] I. Sela-Culang, S. Ashkenazi, B. Peters, and Y. Ofran, “PEASE:predicting B-cell epitopes utilizing antibody sequence,” Bio-informatics, vol. 31, no. 8, pp. 1313–1315, 2015.
[131] J. Huang, A. Gutteridge, W. Honda, and M. Kanehisa,“MIMOX: a web tool for phage display based epitope map-ping,” BMC Bioinformatics, vol. 7, no. 1, p. 451, 2006.
[132] I. Mayrose, O. Penn, E. Erez et al., “Pepitope: epitope map-ping from affinity-selected peptides,” Bioinformatics, vol. 23,no. 23, pp. 3244–3246, 2007.
[133] S. S. Negi and W. Braun, “Automated detection of conforma-tional epitopes using phage display peptide sequences,”Bioinformatics and Biology Insights, vol. 3, pp. 71–81, 2009.
[134] W. Chen, P. Sun, Y. Lu, W. W. Guo, Y. Huang, and Z. Ma,“MimoPro: a more efficient web-based tool for epitope pre-diction using phage display libraries,” BMC Bioinformatics,vol. 12, no. 1, p. 199, 2011.
[135] W. Chen, W. W. Guo, Y. Huang, and Z. Ma, “PepMapper:a collaborative web tool for mapping epitopes fromaffinity-selected peptides,” PLoS One, vol. 7, no. 5, articlee37869, 2012.
[136] H. Ansari and G. P. S. Raghava, “Identification of conforma-tional B-cell epitopes in an antigen from its primarysequence,” Immunome Research, vol. 6, no. 1, p. 6, 2010.
13Journal of Immunology Research

[137] C. M. Diez-Rivero and P. A. Reche, “CD8 T cell epitopedistribution in viruses reveals patterns of protein biosynthe-sis,” PLoS One, vol. 7, no. 8, article e43674, 2012.
[138] D. R. Flower, I. K. Macdonald, K. Ramakrishnan, M. N.Davies, and I. A. Doytchinova, “Computer aided selectionof candidate vaccine antigens,” Immunome Research, vol. 6,Supplement 2, p. S1, 2010.
[139] M. Molero-Abraham, J. P. Glutting, D. R. Flower, E. M.Lafuente, and P. A. Reche, “EPIPOX: immunoinformaticcharacterization of the shared T-cell epitome betweenvariola virus and related pathogenic orthopoxviruses,”Journal of Immunology Research, vol. 2015, Article ID738020, 11 pages, 2015.
[140] P. A. Reche, D. B. Keskin, R. E. Hussey, P. Ancuta,D. Gabuzda, and E. L. Reinherz, “Elicitation from virus-naive individuals of cytotoxic T lymphocytes directed againstconserved HIV-1 epitopes,” Medical Immunology, vol. 5,no. 1, p. 1, 2006.
[141] Q. M. Sheikh, D. Gatherer, P. A. Reche, and D. R. Flower,“Towards the knowledge-based design of universal influenzaepitope ensemble vaccines,” Bioinformatics, vol. 32, no. 21,pp. 3233–3239, 2016.
[142] S. J. Goodswen, P. J. Kennedy, and J. T. Ellis, “Vacceed: ahigh-throughput in silico vaccine candidate discovery pipe-line for eukaryotic pathogens based on reverse vaccinol-ogy,” Bioinformatics, vol. 30, no. 16, pp. 2381–2383, 2014.
[143] M. Rizwan, A. Naz, J. Ahmad et al., “VacSol: a high through-put in silico pipeline to predict potential therapeutic targets inprokaryotic pathogens using subtractive reverse vaccinol-ogy,” BMC Bioinformatics, vol. 18, no. 1, p. 106, 2017.
[144] H. Yang and D. S. Kim, “Peptide immunotherapy in vaccinedevelopment: from epitope to adjuvant,” Advances in ProteinChemistry and Structural Biology, vol. 99, pp. 1–14, 2015.
[145] A. Di Pasquale, S. Preiss, F. Tavares Da Silva, and N. Garcon,“Vaccine adjuvants: from 1920 to 2015 and beyond,” Vac-cines, vol. 3, no. 2, pp. 320–343, 2015.
[146] F. Azmi, A. A. Ahmad Fuaad, M. Skwarczynski, and I. Toth,“Recent progress in adjuvant discovery for peptide-basedsubunit vaccines,” Human Vaccines & Immunotherapeutics,vol. 10, no. 3, pp. 778–796, 2014.
[147] G. Nagpal, K. Chaudhary, S. K. Dhanda, and G. P. S. Raghava,“Computational prediction of the immunomodulatorypotential of RNA sequences,” Methods in Molecular Biology,vol. 1632, pp. 75–90, 2017.
14 Journal of Immunology Research
Research ArticleComputer-Aided Design of an Epitope-Based Vaccine againstEpstein-Barr Virus
Julio Alonso-Padilla,1 Esther M. Lafuente,2 and Pedro A. Reche2
1Barcelona Institute for Global Health (ISGlobal), Centre for Research in International Health (CRESIB), Hospital Clinic-Universityof Barcelona, Barcelona, Spain2Laboratory of Immunomedicine, Faculty of Medicine, University Complutense of Madrid, Ave Complutense S/N,28040 Madrid, Spain
Correspondence should be addressed to Pedro A. Reche; [email protected]
Received 19 May 2017; Revised 7 August 2017; Accepted 20 August 2017; Published 28 September 2017
Academic Editor: Peirong Jiao
Copyright © 2017 Julio Alonso-Padilla et al. This is an open access article distributed under the Creative Commons AttributionLicense, which permits unrestricted use, distribution, and reproduction in any medium, provided the original work isproperly cited.
Epstein-Barr virus is a very common human virus that infects 90% of human adults. EBV replicates in epithelial and B cells andcauses infectious mononucleosis. EBV infection is also linked to various cancers, including Burkitt’s lymphoma andnasopharyngeal carcinomas, and autoimmune diseases such as multiple sclerosis. Currently, there are no effective drugs orvaccines to treat or prevent EBV infection. Herein, we applied a computer-aided strategy to design a prophylactic epitopevaccine ensemble from experimentally defined T and B cell epitopes. Such strategy relies on identifying conserved epitopes inconjunction with predictions of HLA presentation for T cell epitope selection and calculations of accessibility and flexibility forB cell epitope selection. The T cell component includes 14 CD8 T cell epitopes from early antigens and 4 CD4 T cell epitopes,targeted during the course of a natural infection and providing a population protection coverage of over 95% and 81.8%,respectively. The B cell component consists of 3 experimentally defined B cell epitopes from gp350 plus 4 predicted B cellepitopes from other EBV envelope glycoproteins, all mapping in flexible and solvent accessible regions. We discuss the rationalefor the formulation and possible deployment of this epitope vaccine ensemble.
1. Introduction
Epstein-Barr virus (EBV), or human herpesvirus 4, is a largeenveloped virus that belongs to the family herpesviruses γ. Ithas a size of 120–180nm and a double-stranded linear DNAgenome (~171Kb long), encoding ~90 genes [1]. The genomeis enclosed within a nucleocapsid protein which is in turnsurrounded by a lipid envelope that contains the viral surfaceproteins essential for infection [2]. According to its expres-sion, EBV genes are divided into immediate early (expressedvery early during lytic infection, coding for transcriptionfactors), early (interfere with the host metabolism and DNAsynthesis), and late genes (including structural and nonstruc-tural glycoproteins). There are two major subtypes of EBV(type 1 and type 2), which mainly differ in their nuclearantigen-3 gene (EBNA-3). Both types are detected all overthe world, yet type 1 is dominant in most populations [3].
EBV is present in over 90% of the adult world popula-tion [4]. Most people become infected with EBV duringchildhood and develop little or no symptoms. However,if the infection occurs later in life, it can cause infectiousmononucleosis (IM) in about 30–50% of the cases [5].Viral transmission is primarily through saliva; hence, thenickname of kiss disease for IM. The virus can infectand replicate in epithelial and B cells. Infection of epithe-lial cells of the oropharynx has a relevant role in EBVexpansion during primary infection [2]. However, B cellsare the main targets of the virus. They are fundamentalto establish an EBV infection—X-linked agammaglobulin-emic patients are not infected by the virus [6]—and canpass the virus to epithelial cells by direct contact [7].Moreover, it is in memory B cells that the virus persistsas a long-term latent infection [8]. Tropism of EBV forB lymphocytes is mediated by cell surface molecules
HindawiJournal of Immunology ResearchVolume 2017, Article ID 9363750, 15 pageshttps://doi.org/10.1155/2017/9363750

CD21 (i.e., complement receptor 2 (CR2)) and HLA-II thatserve as receptors of the viral envelope glycoproteins gp350and gp42, respectively [9]. Infection of B cells by EBV doesnot usually release viral progeny. Instead, the virus activatesthe cell cycle driving the expansion of latently infected B cells,inducing its own proliferation, thus getting persistentlyestablished in the lymphoid system [7, 8]. Latency is notpermanent though, as EBV can periodically switch betweenlatent and lytic states. Reactivation from latency is triggeredby environmental stimuli and the process is tightly controlledby the immune system [10].
Immunity against EBV has been studied extensively[10, 11]. Natural killer (NK) cells play an important role inthe innate immune response, delaying or preventing theEBV transformation of B cells through the production ofinterferon gamma (IFN-γ) [12]. Subsequently, the viruselicits strong adaptive immune responses, primarily medi-ated by cytotoxic CD8 T cells. CD8 T cell responses eliminateviral-infected cells upon recognition of EBV peptide antigensbound to MHC I molecules in the surface of target cells.Cytotoxic CD8 T cell response against EBV infection is sodramatic that, in IM patients, up to 50% of CD8 T cellsrecognize EBV-specific CD8 T cell epitopes, most derivedfrom immediate early or early antigens [13, 14]. In contrast,CD4 T cell responses against the virus are less dramatic andfocused [13]. CD4 T cells recognize peptide antigens boundto MHC II molecules and commit into different phenotypesof cytokine-producing T helper cells (Th) that control theimmune response. Most EBV-specific CD4 T cells produceIFN-γ and tumor necrosis factor alpha (TNF-α), with asmaller number producing IL-2 which is the usual andexpected Th1 antiviral response [15]. Regarding the humoralimmune response, EBV infection triggers a potent reactionagainst various viral antigens. The acute primary infectionis associated with the induction of IgM antibodies againstthe virus capsid antigen (VCA), which switches to an IgGisotype. IgG anti-VCA antibodies are not neutralizing andremain for life. Neutralizing IgG antibodies targeting viralmajor glycoprotein gp350 arise only after the resolution ofthe primary infection [16]. Other antibodies targeting non-neutralizing antigens (e.g., viral proteins located intracellu-larly) also appear sometime after the resolution of theprimary infection [16, 17].
The immune system is capable of controlling EBVprimary infection and reactivation phases, forcing the virusto stay latent inmemory B cells. Such a control likely has a tollin the immune system. In fact, after extended periods oflatency andbeing facilitated by its potent growth transformingcapability, EBV appears to promote an increasing number ofhuman cancers. Frequent cancers linked to EBV includeseveral B cell malignancies, such as Burkitt’s lymphoma (BL)and Hodgkin’s lymphoma (HL), and epithelial cell malignan-cies, notably nasopharyngeal carcinoma (NPC) [18]. Further-more, EBV infection has been implicated with autoimmunityand it is clearly a risk factor for developing multiple sclerosisand to a lesser systemic lupus erythematosus [19].
Currently, no medicine can cure EBV infection and thereis no prophylactic or therapeutic vaccine against it. Clearly, aprophylactic vaccine against EBV will have a major impact in
public health as it will prevent both EBV infection and relateddiseases [20]. In this study, we explored a reverse-vaccinology approach to design a prophylactic vaccineagainst EBV based on CD8 and CD4 T cell epitopes and Bcell epitopes. For designing the T cell epitope vaccine compo-nent, we relied on combining legacy experimentation withbioinformatics analysis aimed to identify conserved andhighly promiscuous T cell epitopes [21–23]. Given the sizeand complexity of EBV, we also introduced expressioncriteria to reduce the number of T cell epitopes and focuson those from early antigens with acknowledged function atthe initial steps of primary infection [23, 24]. As for the B cellcomponent, we included highly conserved experimentallydetermined B cell epitopes from EBV gp350 protein aswell as potential B cell epitopes predicted in flexiblesolvent-exposed regions of other envelope proteins impor-tant for infection like gp42, gB, and gL. We are confidentthat our epitope vaccine ensemble poses a basis for devel-oping a powerful and effective vaccine against EBV.Moreover, we trust that the approach and methods intro-duced in this work ought to become a paradigm of generaluse in reverse vaccinology.
2. Materials and Methods
2.1. Collection of EBV-Specific Epitopes. We retrieved experi-mentally defined EBV-specific T and B epitope sequencesfrom the EPIMHC [25] and IEDB [26]. As inclusion criteria,we considered positive assays (excluding low-positiveresponses) and epitopes being linked to the course of anatural infection in humans for T cell epitopes and anyhuman disease for B cell epitopes. We discarded duplicatepeptides and when available, we also retrieved the MHCrestriction elements of T cell epitopes. For B cell epitopes,we considered all unique sequences that were not includedas part of longer peptides. In total, we obtained 247 uniqueB cell epitopes and 109 unique T cell epitopes (88 CD8 T cellepitopes and 21 CD4 T cell epitopes). These epitopes areavailable as supplementary data in Additional File S1available online at https://doi.org/10.1155/2017/9363750,including Tables S1A, S1B, and S1C for CD8, CD4, and B cellepitopes, respectively. Perl scripts used to identify unique Band T cell epitopes from IEDB search outputs can beobtained from the corresponding author.
2.2. Generation of Clusters and Multiple Sequence Alignmentsof EBV Protein Sequences.We used CD-HIT [27] with defaultsettings to generate clusters from 13,899 EBV proteinsequences that included 89 translated coding DNAsequences (CDS) from a reference genome virus (accession:NC_007605). The protein sequences were downloadedfollowing the links in the NCBI taxonomy database (TAXID: 10376) [28]. We processed CD-HIT clusters with refer-ence EBV proteins, removed identical sequences, and subse-quently generated multiple sequence alignments (MSA)using MUSCLE [29]. As a result, we obtained 85 referencedMSA of EBV proteins that were used for further analysis.Software for clustering the sequences will be provided bythe corresponding author upon written request.
2 Journal of Immunology Research

2.3. Generation of EBV-Reference Proteome with VariableSites Masked and Identification of Conserved Epitopes. Wegenerated EBV-reference sequences with variable sitesmasked upon sequence variability analyses on the referencedMSA of EBV proteins. Briefly, we calculated the sequencevariability in the MSA of EBV proteins using the Shannonentropy [30], H, as a variability metric [21, 24, 31]. Shannonentropy per site in a MSA is given by
H = −〠M
i=1Pilog2Pi, 1
where Pi is the fraction of residues of amino acid type i andM is equal to 20, the number of amino acid types. H rangesfrom 0 (total conservation, only one amino acid type is pres-ent at that position) to 4.322 (all 20 amino acids are equallyrepresented in that position). We considered gaps as no data.To generate reference EBV consensus sequences, we assignedthe computed variability, H, to the EBV-reference proteinsincluded in the MSA and subsequently masked all positionswith a variability, H, greater than 0.5 [32, 33]. We used thisreference sequence to discard epitope sequences that didnot match entirely with it. Hence, the epitopes that we con-sidered conserved did not have a single residue with H> 0.5.
2.4. Prediction of Peptide HLA Presentation Profiles andComputation of Population Protection Coverage. T cells onlyrecognize peptides when presented in the cell surface ofantigen-presenting cells bound to HLA molecules (MHCmolecules in humans). Therefore, we anticipated HLA pre-sentation profiles of peptides by predicting peptide-HLAbinding. For CD8 T cell epitopes, we predicted peptide bind-ing using 55 HLA I-specific motif profiles [34–36]. A top 2%rank percentile was used to consider binding to the relevantHLA I molecule. For CD4 T cell epitopes, we predictedpeptide binding to 15 reference HLA-DR molecules [37]using the IEDB binding tool [38]. We used a 5% percentilerank cutoff to consider that binding had occurred. Thepopulation protection coverage (PPC) of a set of epitopes isthe proportion of the population that could elicit an immuneresponse against any of them and can be computed by know-ing the gene frequencies of the HLA I alleles that can presentthe epitopes [21]. For HLA I-restricted T cell epitopes, weused EPISOPT to compute epitope PPC [39]. EPISOPT usesHLA I allele frequencies for 5 distinct ethnic groups in theUSA population (Caucasian, Hispanic, Black, Asian, andNorth American natives) [40] and can identify combinationsof epitopes reaching a determined PPC in each of the popu-lation groups. We aimed to identify epitope combinationsreaching a PPC of 95% in the 5 ethnic groups. For HLA II-restricted epitopes, we used IEDB PPC tool [41] to computePPC for the world population using the epitope-HLA IIpresentation profiles predicted previously. We identifiedcombinations of CD4 T cell epitopes reaching a maximumPPC by introducing into the IEDB PPC tool differentcombinations of epitopes with their corresponding HLA IIbinding profiles.
2.5. B Cell Epitope Prediction and Calculation of Flexibilityand Solvent Accessibility. We considered flexible proteinfragments identified in available 3D structures of the relevantantigens with relative solvent accessibility≥ 50% as potentialB cell epitopes. As residue flexibility values, we used normal-ized B factors, ZB (2):
ZB =B − μB∂B
, 2
where B is the residue B factor from the relevant PDB, μB is themean of theCα residue of B factors, and ∂B is the standard devi-ation of Cα B factors. Flexible regions, potential B cell epitopes,consisted of 9 consecutive residues or more with flexibilityequal or greater than the computed ∂B (1.0). For each selectedprotein fragment, we obtained a flexibility score consisting ofthe average flexibility of the fragment residues and a solventaccessibility value consisting of the average relative solventaccessibility (RSA) of the residues. We obtained residue RSAsfrom the relevant PDB coordinates using NACCESS [42]. Sol-vent accessibility values and flexibility scores were computed inthe same manner for experimental B cell epitopes.
2.6. Blast Searches, Protein Annotation, and AnalysisProcedures. We mapped epitopes onto three-dimensional(3D) structures and retrieved UniProtKB [43] entries uponBLAST searches [44] against the PDB and Swissprot databasesat NCBI (http://blast.ncbi.nlm.nih.gov/Blast.cgi). We also car-ried out BLAST searches with conserved epitope sequences asquery against human proteins and human microbiome pro-teins to detect epitope identity to human or human micro-biome proteins. These BLAST searches were carried outlocally with standalone programs using an expectation value(−e) of 10,000. Human microbiome protein sequences forBLAST searches were obtained from the NIH Human Micro-biome Project [45] at NCBI (https://www.ncbi.nlm.nih.gov/bioproject/43021). As human protein sequences, we used allhuman proteins available in the nonredundant (NR) collectionat NCBI. We used PyMOL Molecular Graphics System,Version 1.8 Schrödinger, to visualize B cell epitopes on 3Dstructures. We identified function, subcellular localization,and temporal expression of selected EBV proteins (develop-mental stage) from UniProtKB [43].
3. Results
3.1. Reference EBV Proteome with Variable Residues Masked.Epitope-based vaccines can force the immune system torecognize conserved antigen regions. Therefore, a key stepin our approach to epitope vaccine design is to carry outsequence variability analyses enabling the selection ofconserved epitopes. To that end, we clustered all availableEBV protein sequences around a reference EBV proteome(NC_007605), obtaining 85 protein clusters with EBV refer-ence proteins on them (details in Materials and Methods).Upon aligning the sequences in the clusters, we subjectedthem to sequence variability analyses using the Shannonentropy,H, as variability metric. As a result, we identified thatonly 960 residue sites of the 42,998 evaluated hadH≥ 0.5 andgenerated reference consensus EBV sequences with those
3Journal of Immunology Research
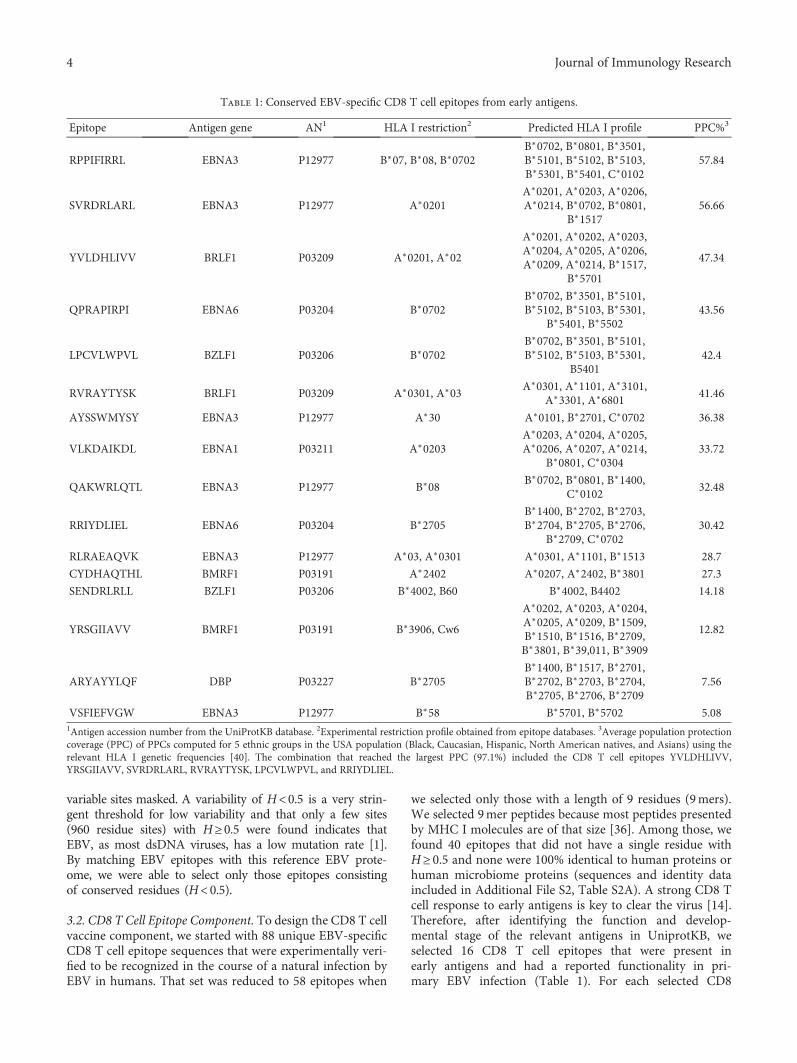
variable sites masked. A variability of H<0.5 is a very strin-gent threshold for low variability and that only a few sites(960 residue sites) with H≥0.5 were found indicates thatEBV, as most dsDNA viruses, has a low mutation rate [1].By matching EBV epitopes with this reference EBV prote-ome, we were able to select only those epitopes consistingof conserved residues (H<0.5).
3.2. CD8 T Cell Epitope Component. To design the CD8 T cellvaccine component, we started with 88 unique EBV-specificCD8 T cell epitope sequences that were experimentally veri-fied to be recognized in the course of a natural infection byEBV in humans. That set was reduced to 58 epitopes when
we selected only those with a length of 9 residues (9mers).We selected 9mer peptides because most peptides presentedby MHC I molecules are of that size [36]. Among those, wefound 40 epitopes that did not have a single residue withH≥ 0.5 and none were 100% identical to human proteins orhuman microbiome proteins (sequences and identity dataincluded in Additional File S2, Table S2A). A strong CD8 Tcell response to early antigens is key to clear the virus [14].Therefore, after identifying the function and develop-mental stage of the relevant antigens in UniprotKB, weselected 16 CD8 T cell epitopes that were present inearly antigens and had a reported functionality in pri-mary EBV infection (Table 1). For each selected CD8
Table 1: Conserved EBV-specific CD8 T cell epitopes from early antigens.
Epitope Antigen gene AN1 HLA I restriction2 Predicted HLA I profile PPC%3
RPPIFIRRL EBNA3 P12977 B∗07, B∗08, B∗0702B∗0702, B∗0801, B∗3501,B∗5101, B∗5102, B∗5103,B∗5301, B∗5401, C∗0102
57.84
SVRDRLARL EBNA3 P12977 A∗0201A∗0201, A∗0203, A∗0206,A∗0214, B∗0702, B∗0801,
B∗151756.66
YVLDHLIVV BRLF1 P03209 A∗0201, A∗02
A∗0201, A∗0202, A∗0203,A∗0204, A∗0205, A∗0206,A∗0209, A∗0214, B∗1517,
B∗5701
47.34
QPRAPIRPI EBNA6 P03204 B∗0702B∗0702, B∗3501, B∗5101,B∗5102, B∗5103, B∗5301,
B∗5401, B∗550243.56
LPCVLWPVL BZLF1 P03206 B∗0702B∗0702, B∗3501, B∗5101,B∗5102, B∗5103, B∗5301,
B540142.4
RVRAYTYSK BRLF1 P03209 A∗0301, A∗03A∗0301, A∗1101, A∗3101,
A∗3301, A∗680141.46
AYSSWMYSY EBNA3 P12977 A∗30 A∗0101, B∗2701, C∗0702 36.38
VLKDAIKDL EBNA1 P03211 A∗0203A∗0203, A∗0204, A∗0205,A∗0206, A∗0207, A∗0214,
B∗0801, C∗030433.72
QAKWRLQTL EBNA3 P12977 B∗08B∗0702, B∗0801, B∗1400,
C∗010232.48
RRIYDLIEL EBNA6 P03204 B∗2705B∗1400, B∗2702, B∗2703,B∗2704, B∗2705, B∗2706,
B∗2709, C∗070230.42
RLRAEAQVK EBNA3 P12977 A∗03, A∗0301 A∗0301, A∗1101, B∗1513 28.7
CYDHAQTHL BMRF1 P03191 A∗2402 A∗0207, A∗2402, B∗3801 27.3
SENDRLRLL BZLF1 P03206 B∗4002, B60 B∗4002, B4402 14.18
YRSGIIAVV BMRF1 P03191 B∗3906, Cw6
A∗0202, A∗0203, A∗0204,A∗0205, A∗0209, B∗1509,B∗1510, B∗1516, B∗2709,B∗3801, B∗39,011, B∗3909
12.82
ARYAYYLQF DBP P03227 B∗2705B∗1400, B∗1517, B∗2701,B∗2702, B∗2703, B∗2704,B∗2705, B∗2706, B∗2709
7.56
VSFIEFVGW EBNA3 P12977 B∗58 B∗5701, B∗5702 5.081Antigen accession number from the UniProtKB database. 2Experimental restriction profile obtained from epitope databases. 3Average population protectioncoverage (PPC) of PPCs computed for 5 ethnic groups in the USA population (Black, Caucasian, Hispanic, North American natives, and Asians) using therelevant HLA I genetic frequencies [40]. The combination that reached the largest PPC (97.1%) included the CD8 T cell epitopes YVLDHLIVV,YRSGIIAVV, SVRDRLARL, RVRAYTYSK, LPCVLWPVL, and RRIYDLIEL.
4 Journal of Immunology Research
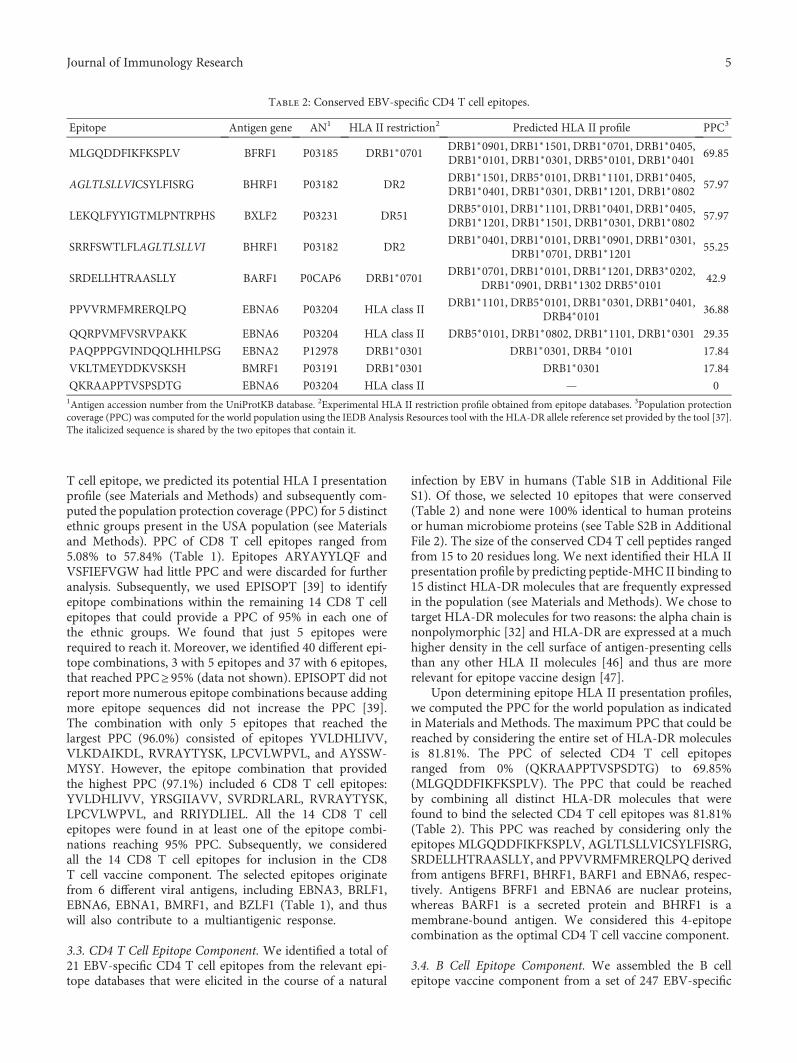
T cell epitope, we predicted its potential HLA I presentationprofile (see Materials and Methods) and subsequently com-puted the population protection coverage (PPC) for 5 distinctethnic groups present in the USA population (see Materialsand Methods). PPC of CD8 T cell epitopes ranged from5.08% to 57.84% (Table 1). Epitopes ARYAYYLQF andVSFIEFVGW had little PPC and were discarded for furtheranalysis. Subsequently, we used EPISOPT [39] to identifyepitope combinations within the remaining 14 CD8 T cellepitopes that could provide a PPC of 95% in each one ofthe ethnic groups. We found that just 5 epitopes wererequired to reach it. Moreover, we identified 40 different epi-tope combinations, 3 with 5 epitopes and 37 with 6 epitopes,that reached PPC≥ 95% (data not shown). EPISOPT did notreport more numerous epitope combinations because addingmore epitope sequences did not increase the PPC [39].The combination with only 5 epitopes that reached thelargest PPC (96.0%) consisted of epitopes YVLDHLIVV,VLKDAIKDL, RVRAYTYSK, LPCVLWPVL, and AYSSW-MYSY. However, the epitope combination that providedthe highest PPC (97.1%) included 6 CD8 T cell epitopes:YVLDHLIVV, YRSGIIAVV, SVRDRLARL, RVRAYTYSK,LPCVLWPVL, and RRIYDLIEL. All the 14 CD8 T cellepitopes were found in at least one of the epitope combi-nations reaching 95% PPC. Subsequently, we consideredall the 14 CD8 T cell epitopes for inclusion in the CD8T cell vaccine component. The selected epitopes originatefrom 6 different viral antigens, including EBNA3, BRLF1,EBNA6, EBNA1, BMRF1, and BZLF1 (Table 1), and thuswill also contribute to a multiantigenic response.
3.3. CD4 T Cell Epitope Component. We identified a total of21 EBV-specific CD4 T cell epitopes from the relevant epi-tope databases that were elicited in the course of a natural
infection by EBV in humans (Table S1B in Additional FileS1). Of those, we selected 10 epitopes that were conserved(Table 2) and none were 100% identical to human proteinsor human microbiome proteins (see Table S2B in AdditionalFile 2). The size of the conserved CD4 T cell peptides rangedfrom 15 to 20 residues long. We next identified their HLA IIpresentation profile by predicting peptide-MHC II binding to15 distinct HLA-DR molecules that are frequently expressedin the population (see Materials and Methods). We chose totarget HLA-DR molecules for two reasons: the alpha chain isnonpolymorphic [32] and HLA-DR are expressed at a muchhigher density in the cell surface of antigen-presenting cellsthan any other HLA II molecules [46] and thus are morerelevant for epitope vaccine design [47].
Upon determining epitope HLA II presentation profiles,we computed the PPC for the world population as indicatedin Materials and Methods. The maximum PPC that could bereached by considering the entire set of HLA-DR moleculesis 81.81%. The PPC of selected CD4 T cell epitopesranged from 0% (QKRAAPPTVSPSDTG) to 69.85%(MLGQDDFIKFKSPLV). The PPC that could be reachedby combining all distinct HLA-DR molecules that werefound to bind the selected CD4 T cell epitopes was 81.81%(Table 2). This PPC was reached by considering only theepitopes MLGQDDFIKFKSPLV, AGLTLSLLVICSYLFISRG,SRDELLHTRAASLLY, and PPVVRMFMRERQLPQ derivedfrom antigens BFRF1, BHRF1, BARF1 and EBNA6, respec-tively. Antigens BFRF1 and EBNA6 are nuclear proteins,whereas BARF1 is a secreted protein and BHRF1 is amembrane-bound antigen. We considered this 4-epitopecombination as the optimal CD4 T cell vaccine component.
3.4. B Cell Epitope Component. We assembled the B cellepitope vaccine component from a set of 247 EBV-specific
Table 2: Conserved EBV-specific CD4 T cell epitopes.
Epitope Antigen gene AN1 HLA II restriction2 Predicted HLA II profile PPC3
MLGQDDFIKFKSPLV BFRF1 P03185 DRB1∗0701DRB1∗0901, DRB1∗1501, DRB1∗0701, DRB1∗0405,DRB1∗0101, DRB1∗0301, DRB5∗0101, DRB1∗0401
69.85
AGLTLSLLVICSYLFISRG BHRF1 P03182 DR2DRB1∗1501, DRB5∗0101, DRB1∗1101, DRB1∗0405,DRB1∗0401, DRB1∗0301, DRB1∗1201, DRB1∗0802
57.97
LEKQLFYYIGTMLPNTRPHS BXLF2 P03231 DR51DRB5∗0101, DRB1∗1101, DRB1∗0401, DRB1∗0405,DRB1∗1201, DRB1∗1501, DRB1∗0301, DRB1∗0802
57.97
SRRFSWTLFLAGLTLSLLVI BHRF1 P03182 DR2DRB1∗0401, DRB1∗0101, DRB1∗0901, DRB1∗0301,
DRB1∗0701, DRB1∗120155.25
SRDELLHTRAASLLY BARF1 P0CAP6 DRB1∗0701DRB1∗0701, DRB1∗0101, DRB1∗1201, DRB3∗0202,
DRB1∗0901, DRB1∗1302 DRB5∗010142.9
PPVVRMFMRERQLPQ EBNA6 P03204 HLA class IIDRB1∗1101, DRB5∗0101, DRB1∗0301, DRB1∗0401,
DRB4∗010136.88
QQRPVMFVSRVPAKK EBNA6 P03204 HLA class II DRB5∗0101, DRB1∗0802, DRB1∗1101, DRB1∗0301 29.35
PAQPPPGVINDQQLHHLPSG EBNA2 P12978 DRB1∗0301 DRB1∗0301, DRB4 ∗0101 17.84
VKLTMEYDDKVSKSH BMRF1 P03191 DRB1∗0301 DRB1∗0301 17.84
QKRAAPPTVSPSDTG EBNA6 P03204 HLA class II — 01Antigen accession number from the UniProtKB database. 2Experimental HLA II restriction profile obtained from epitope databases. 3Population protectioncoverage (PPC) was computed for the world population using the IEDB Analysis Resources tool with the HLA-DR allele reference set provided by the tool [37].The italicized sequence is shared by the two epitopes that contain it.
5Journal of Immunology Research

unique linear B cell epitope sequences ranging from 4 to 38amino acids (Table S1C in Additional File S1). From those,we discarded B cell epitopes shorter than 9 residues and kept117 that were conserved with no single residue with H> 0.5(details in Materials and Methods). Moreover, none of these117 B cell epitopes were identical to human proteins or tohuman microbiome proteins (data provided in AdditionalFile S2, Table S2C). We analyzed the subcellular location ofselected antigens to identify those that are expressed in theviral surface, accessible for antibody recognition. We foundthat the vast majority of the selected epitopes originated fromviral intracellular antigens and therefore have no interest forB cell epitope vaccine design. We only found 9 B cell epitopesthat were present in viral envelope glycoproteins: 7 from themajor surface antigen gp350, the main viral determinantmediating viral attachment to B cells [48] and 2 from the enve-lope glycoprotein B (gB), key for the fusion of viral and hostcell membranes during viral entry [49] (Table 3). However,only the 7 gp350 B cell epitopes mapped on the protein ecto-domain and were further considered for theB cell epitope vac-cine component. The 2 gB epitopes, QKRAAQRAAGPSVASand VSGFISFFKNPFGGM, mapped onto the inner andtransmembrane regions, respectively (Table 3).
Flexible and accessible linear B cell epitopes are oftencross-reactive with antibodies against native antigens andare thereby of prime interest for epitope vaccine design[50]. Therefore, to further analyze the suitability for vaccinedesign of the 7 remaining gp350 B cell epitopes, we deviseda system to quantify the flexibility and solvent accessibilityof B cell epitopes from the known 3D structures. Briefly, weused normalized B factors and relative residue solventaccessibility computed from the relevant PDBs as measuresof flexibility and accessibility (details in Materials andMethods). Following these criteria, we discarded the gp350B cell epitope PSTSSKLRPRWTFTSPPVTT, for it mappedonto a region of the gp350 without a 3D structure andwe could not readily evaluate its flexibility and accessibil-ity. Of the 6 gp350 B cell epitopes that mapped onto theavailable gp350 3D structure (PDB: 2H6O), only 3 ofthem, SKAPESTTTSPTLNTTGFA, YVFYSGNGPKASGG
DYCIQS, and QNPVYLIPETVPYIKWDN, had flexibilityand solvent accessibility values supporting that they werereadily accessible for antibody recognition (Table 3). Infact, visual inspection of epitopes SVKTEMLGNEID andQVSLESVDVYFQDVFGTMWC in the gp350 3D struc-ture revealed that they were buried and thus not accessiblefor antibody recognition, while B cell epitope TNTTDITYVGD though accessible (60%) was located in a rigidregion of the protein (Figure S1 in Additional File S3). Theseepitopes will likely induce antibodies that will be unable torecognize native antigens and were discarded from the B cellvaccine component.
Following the hypothesis that highly flexible proteinregions are suitable B cell epitopes for epitope vaccine design,we identified inner antigenic regions in the gp350 B cellepitopes SKAPESTTTSPTLNTTGFA, YVFYSGNGPKASGGDYCIQS, and QNPVYLIPETVPYIKWDN (APESTTTSPTLNTTGFA, GNGPKASGGD, and ETVPYIKWDN, resp.),encompassing only residues with a high degree of flexibility(≥1.0) and solvent accessibility greater than 50% (Table 3).Visual inspection of the gp350 B cell epitopes in the 3D struc-ture clearly showed that the selected core fragments werelocated in highly flexibly and accessible regions of thestructure while some parts of the remaining epitope wereburied or semiburied (Figure 1). Therefore, we regarded theantigenic core regions (APESTTTSPTLNTTGFA, GNGPKASGGD, and ETVPYIKWDN) identified in the gp350 B cellepitopes as the experimental B cell component of the EBVepitope vaccine ensemble.
As all experimental B cell epitopes suitable for epitopevaccine design were in gp350, we sought to identify potentialB cell epitopes from the 3D structures of EBV envelope pro-teins gp42 (PDB: 3FD4), gB (PDB: 3FVC) and the heterodi-mer conformed by gH and gL (PDB: 5T1D). These proteinshave been described to participate in the viral attachmentand/or fusion to the host cell membrane required for viralentry [49, 51, 52]. We considered as potential B cell epitopes,antigen fragments in the relevant 3D structures consistingof 9 or more consecutive residues with flexibility≥ 1.0 andan average accessibility≥ 50% (details in Materials and
Table 3: Experimentally defined conserved EBV-specific B cell epitopes.
Epitope Antigen (gene) AN1 Epitope location PDB hit2 Flexibility3 Access.4
SKAPESTTTSPTLNTTGFA gp350 (BLLF1) P03200 Ectodomain 2H6O [422–440] 2.486 (2.672) 59.2 (63.4)
YVFYSGNGPKASGGDYCIQS gp350 (BLLF1) P03200 Ectodomain 2H6O [282–301] 1.102 (2.004) 31.7 (51.2)
QNPVYLIPETVPYIKWDN gp350 (BLLF1) P03200 Ectodomain 2H6O [147–164] 0.618 (1.191) 62.4 (77.5)
SVKTEMLGNEID gp350 (BLLF1) P03200 Ectodomain 2H6O [197–208] −0.347 19.8
QVSLESVDVYFQDVFGTMWC gp350 (BLLF1) P03200 Ectodomain 2H6O [122–141] −0.575 17.5
TNTTDITYVGD gp350 (BLLF1) P03200 Ectodomain 2H6O [317–327] 0.121 60.1
PSTSSKLRPRWTFTSPPVTT gp350 (BLLF1) P03200 Ectodomain No N/A N/A
QKRAAQRAAGPSVAS gpB (BALF4) P03188 Inner domain No N/A N/A
VSGFISFFKNPFGGM gpB (BALF4) P03188 Transmembrane No N/A N/A1Accession number from UniProtKB database. 2Epitope hit with corresponding PDBs (in bracket sequence hit). Values of 3
flexibility (arbitrary units) and4solvent accessibility (%) were calculated as explained in Materials and Methods. N/A: not applicable; gp: glycoprotein. We show the italicized regions in Bcell epitopes consisting of 9 or more consecutive residues with flexibility ≥ 1 and we show in brackets the corresponding flexibility and accessibility values ofthese regions.
6 Journal of Immunology Research
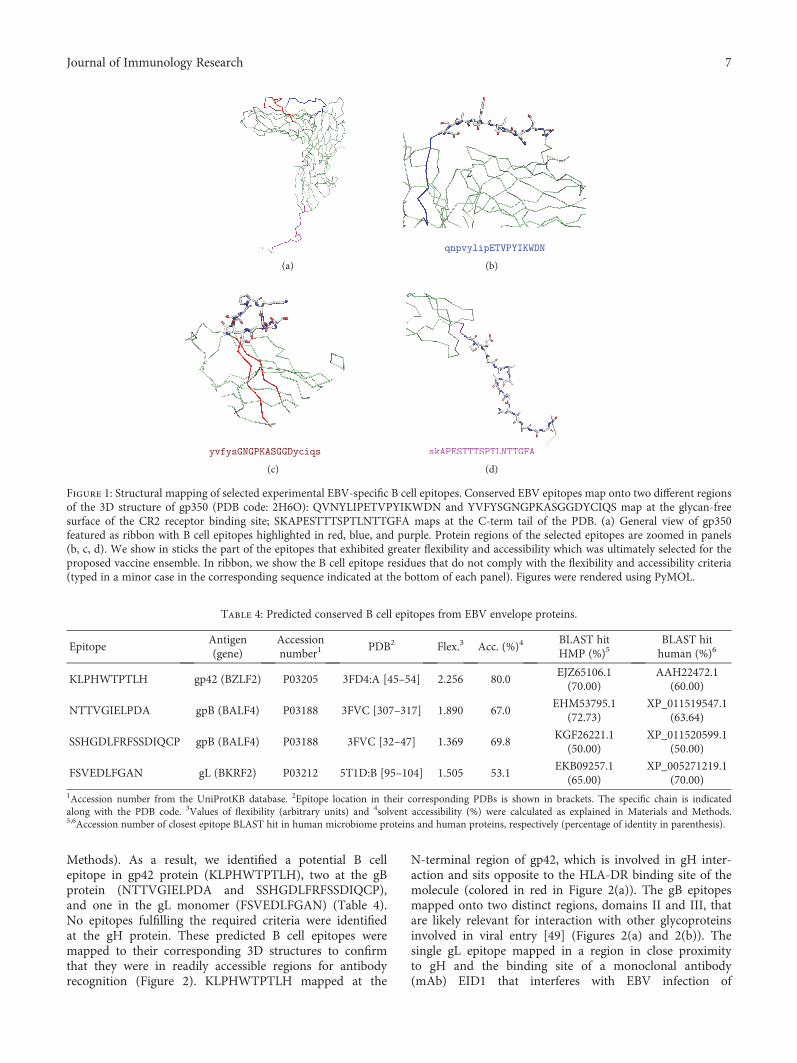
Methods). As a result, we identified a potential B cellepitope in gp42 protein (KLPHWTPTLH), two at the gBprotein (NTTVGIELPDA and SSHGDLFRFSSDIQCP),and one in the gL monomer (FSVEDLFGAN) (Table 4).No epitopes fulfilling the required criteria were identifiedat the gH protein. These predicted B cell epitopes weremapped to their corresponding 3D structures to confirmthat they were in readily accessible regions for antibodyrecognition (Figure 2). KLPHWTPTLH mapped at the
N-terminal region of gp42, which is involved in gH inter-action and sits opposite to the HLA-DR binding site of themolecule (colored in red in Figure 2(a)). The gB epitopesmapped onto two distinct regions, domains II and III, thatare likely relevant for interaction with other glycoproteinsinvolved in viral entry [49] (Figures 2(a) and 2(b)). Thesingle gL epitope mapped in a region in close proximityto gH and the binding site of a monoclonal antibody(mAb) EID1 that interferes with EBV infection of
Table 4: Predicted conserved B cell epitopes from EBV envelope proteins.
EpitopeAntigen(gene)
Accessionnumber1
PDB2 Flex.3 Acc. (%)4BLAST hitHMP (%)5
BLAST hithuman (%)6
KLPHWTPTLH gp42 (BZLF2) P03205 3FD4:A [45–54] 2.256 80.0EJZ65106.1(70.00)
AAH22472.1(60.00)
NTTVGIELPDA gpB (BALF4) P03188 3FVC [307–317] 1.890 67.0EHM53795.1
(72.73)XP_011519547.1
(63.64)
SSHGDLFRFSSDIQCP gpB (BALF4) P03188 3FVC [32–47] 1.369 69.8KGF26221.1
(50.00)XP_011520599.1
(50.00)
FSVEDLFGAN gL (BKRF2) P03212 5T1D:B [95–104] 1.505 53.1EKB09257.1
(65.00)XP_005271219.1
(70.00)1Accession number from the UniProtKB database. 2Epitope location in their corresponding PDBs is shown in brackets. The specific chain is indicatedalong with the PDB code. 3Values of flexibility (arbitrary units) and 4solvent accessibility (%) were calculated as explained in Materials and Methods.5,6Accession number of closest epitope BLAST hit in human microbiome proteins and human proteins, respectively (percentage of identity in parenthesis).
(a) (b)
(c) (d)
Figure 1: Structural mapping of selected experimental EBV-specific B cell epitopes. Conserved EBV epitopes map onto two different regionsof the 3D structure of gp350 (PDB code: 2H6O): QVNYLIPETVPYIKWDN and YVFYSGNGPKASGGDYCIQS map at the glycan-freesurface of the CR2 receptor binding site; SKAPESTTTSPTLNTTGFA maps at the C-term tail of the PDB. (a) General view of gp350featured as ribbon with B cell epitopes highlighted in red, blue, and purple. Protein regions of the selected epitopes are zoomed in panels(b, c, d). We show in sticks the part of the epitopes that exhibited greater flexibility and accessibility which was ultimately selected for theproposed vaccine ensemble. In ribbon, we show the B cell epitope residues that do not comply with the flexibility and accessibility criteria(typed in a minor case in the corresponding sequence indicated at the bottom of each panel). Figures were rendered using PyMOL.
7Journal of Immunology Research

epithelial cells [52] (Figure 2(d)). We also verified thatnone of the predicted B cell epitopes were identical tohuman proteins or human microbiome proteins (Table 4).
4. Discussion
Over 90% of human adults are infected with EBV. Mostinfections occur in childhood and are asymptomatic orcourse with nonspecific symptoms. Nonetheless, EBV is theprimary cause of IM when infection occurs in early adult-hood. Furthermore, the viral infection is associated withautoimmunity and a number of lymphocyte and epithelialcell malignancies [18, 19]. Despite its wide impact, there isno treatment available, hence the growing interest in findinga prophylactic and/or therapeutic EBV vaccine.
The target population for an EBV prophylactic vaccine inthe developed world would be 10- or 11-year-old children,before they are susceptible to most severe IM symptomatol-ogies. It is acknowledged that by precluding the initial viralinfection, the risks of developing EBV-associated autoim-mune and cancer disorders would also be reduced [53]. Insub-Saharan Africa and southern China, where Burkitt’slymphoma and nasopharyngeal carcinoma are major publichealth problems and children are infected by EBV earlier inlife, the vaccine target would be much younger infants.
EBV-naïve transplant recipients susceptible to sufferposttransplant lymphoproliferative disorders (PTLD) wouldalso benefit from a prophylactic vaccine [54].
Currently, the most advanced EBV vaccine clinicallytested consists of a gp350 subunit that was administered withAS04 adjuvant to virus-naïve young adults [55]. The gp350subunit vaccination strategy follows the approach success-fully used in other viral infections, that is, induction ofneutralizing antibodies (nAbs) against the most abundantglycoprotein on the virus, which also represents the maintarget of naturally occurring nAbs [16]. In this regards, amicroneutralization assay based on an EBV expressinggreen-fluorescent protein has been very recently developedto provide measurement of humoral EBV vaccine responsesin large clinical trials [56]. Another EBV vaccine trial wasdesigned to control the expansion of EBV-infected B cells,based on the generation of CD8 T cell immunity to EBNAs[57]. Specifically, the vaccine consisted of a single EBNA3Aepitope restricted by HLA-B08 administered as a peptidealong with tetanus toxoid as adjuvant [57].
A major outcome of the Sokal et al. [55] clinical trial wasthat immunization with gp350 did not protect from new viralinfections [55]. Therefore, it has been suggested that a pro-phylactic vaccine against EBV should elicit B cell responsesalso against all 5 major viral envelope proteins involved in
(a) (b)
(c) (d)
Figure 2: Structural mapping of predicted B cell epitopes in EBV envelope proteins. (a) KLPHWTPTLH in EBV gp42 3D structure(PDB: 3FD4 chain A); epitope shown as sticks and gp42 region interaction with HLA-DR is shown in red. (b) NTTVGIELPDA and (c)SSHGDLFRFSSDIQCP at EBV gB 3D structure (PDB: 3FVC) map, respectively, in its domain II and domain III; epitopes shown as sticks.(d) FSVEDLFGAN at gL 3D structure (PDB: 5T1D chain B) in its domain I (colored in blue); gH is colored in pale green. In (b, c, d), thecorresponding whole structure is shown minimized at the bottom left of each panel; the magnified epitope mapping region is circled inthem. In (a, b, c), the protein backbone is featured as pale green ribbon. Figures were rendered using PyMOL.
8 Journal of Immunology Research

host-cell attachment and entry, including gp42, gH, gL,BMRF2 (gp350), and gB [58]. Among these, at least thefirst four are known to elicit neutralizing antibodies [59].The induction of cytotoxic T cell responses against earlyviral antigens has been as well suggested in order todestroy recently infected B cells [14, 53, 59]. Attachingto these premises, we used a computer-assisted strategyto design a prophylactic epitope vaccine ensemble againstEBV infection.
The strategy that we followed to design the EBV vaccinerelied on combining legacy experimentation consisting ofexperimentally defined epitopes with immunoinformaticspredictions. This strategy was first conceived to assembleCD8 T cell epitope vaccines [21, 39] and latter extended toinclude CD4 T cell epitope vaccines [22]. The main advan-tage of this approach is that of saving time and resources asit mainly relies on experimentally validated epitopes, not onpredicted epitopes, using immunoinformatics to identifythose that are more suitable for epitope vaccine design. It isworth noting that epitope prediction is not a precise scienceand epitope prediction methods only facilitate epitopediscovery by providing candidates that need to be validatedexperimentally. Therefore, our strategy ought to gain widen-ing acceptance as a vaccine design tool whenever ampleexperimental epitope data is readily available. Key criteriafor epitope inclusion/selection are conservation and bindingto multiple MHC molecules for maximum population pro-tection coverage. Here, we also added that the source ofCD8 T cell epitopes had to be from early EBV antigens withdefined function in the primary infection process. Moreover,we checked that peptides were nonself and did not have exactmatches with human proteins or human microbiome pro-teins and extended the approach to B cell epitopes. To thatend, we devised a system to select from experimentallydefined B cell epitopes those that were conserved, nonselfand located on the ectodomains of viral envelope antigensand consisted of highly flexible and solvent-accessible resi-dues (Figure 3). Note that we are not discriminating B cellepitopes from non-B cell epitopes in primary sequences. Infact, solvent accessibility or flexibility alone cannot discrimi-nate B cell epitopes from non-B cell epitopes in primarysequences [60]. Instead, we are selecting known B cellmapping in the antigen surface that isolated from the anti-gen context can elicit antibodies cross-reacting with thenative antigens and hence are worth for epitope vaccinedesign [61].
The composition of the epitope vaccine ensembledesigned in this study includes 14 CD8 T cell epitopes, 4CD4 T cell epitopes, and 7 B cell epitopes (Table 5). Noneof these epitopes matched exactly to human proteins orhuman microbiome proteins. This result is somewhatpredictable for we focused mostly on epitopes that have beenverified experimentally and it should be expected that theimmune system selected nonself targets for recognition.Nonetheless, a few of the selected epitopes have a high iden-tity with human microbiome proteins (around 88.9%,Table 5). Whether this high identity to human microbiomeproteins could be a source of trouble is arguable: detectionof epitope identity to self-proteins required using BLAST
with expectation values of 10000, epitope matches may notbe available for recognition, and epitope recognition can bedisrupted by single amino acid changes.
According to some authors, the ideal EBV CD8 T cell epi-tope component should include antigens EBNA2, EBNA-LP,and BHRF1, which are abundant at the very initial stage of Bcell infection [14]. Our epitope vaccine ensemble does notinclude CD8 T cell epitopes from these three antigens. How-ever, it includes CD8 T cell epitopes from other EBV earlyantigens, such as EBNA1, EBNA3, EBNA6, BMRF1, BRLF1,and BZLF1 (Tables 1 and 5). Although a 95% PPC wasreached with just 5 CD8 T cell epitopes, the key importanceof a broad multiantigenic cytotoxic response prompted usto incorporate 14 CD8 T cell epitopes. For the CD4 T cellcomponent, our proposed vaccine ensemble includes 4 epi-topes reaching the maximum PPC possible of 81.8% pro-vided by the reference set of HLA II molecules targeted forbinding predictions [37]. The PPC of the CD4 T cell compo-nent is likely an underestimation. HLA II molecules are verypromiscuous [62] and the selected epitopes will surely bindand be presented by other HLA II molecules not includedin the selected reference set [37].
For the B cell epitope vaccine component, we included 7B cell epitopes consisting of 3 experimental B cell epitopesfrom gp350 plus 4 other predicted B cell epitopes fromEBV envelope proteins gp42, gB, and gL, all of them contin-uous and with high flexibility and solvent accessibility. Wefocused on linear B cell epitopes because they can be deliv-ered isolated from their antigen context to induce selectivehumoral responses. We sought to predict B cell epitopes ongp42, gB, and gL that can be used to elicit antibodies that
Experimental B cell epitope selection
Unique B cell epitopes from IEDB247
Conserved, non-self & length ≥ 9117
From env antigens9
In ectodomain7
Flex-access3
Figure 3: Strategy for experimentalBcell epitope selection.Overviewof the approachdevised to select invariant experimental EBV-specificB cell epitopes for the B cell component of an epitope-based vaccineagainst EBV. The approach comprises 5 steps: (1) selection ofunique epitopes from databases; (2) sequence variability filteringand testing for self-peptides; (3) selection of epitopes from viralenvelope antigens; (4) progression of epitopes located to envelopeprotein ectodomains; (5) final output of epitopes that fulfill theflexibility and accessibility criteria established in the text. None ofthe epitopes that we selected were identical to human proteins orproteins from the humanmicrobiome.
9Journal of Immunology Research
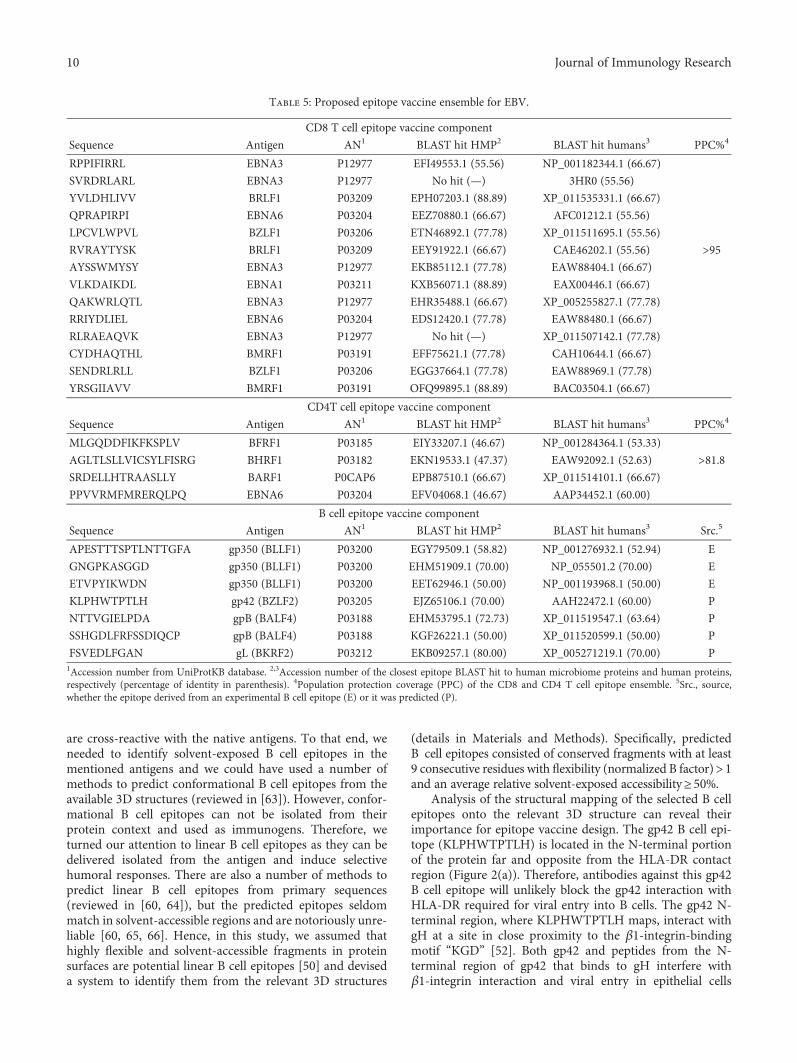
are cross-reactive with the native antigens. To that end, weneeded to identify solvent-exposed B cell epitopes in thementioned antigens and we could have used a number ofmethods to predict conformational B cell epitopes from theavailable 3D structures (reviewed in [63]). However, confor-mational B cell epitopes can not be isolated from theirprotein context and used as immunogens. Therefore, weturned our attention to linear B cell epitopes as they can bedelivered isolated from the antigen and induce selectivehumoral responses. There are also a number of methods topredict linear B cell epitopes from primary sequences(reviewed in [60, 64]), but the predicted epitopes seldommatch in solvent-accessible regions and are notoriously unre-liable [60, 65, 66]. Hence, in this study, we assumed thathighly flexible and solvent-accessible fragments in proteinsurfaces are potential linear B cell epitopes [50] and deviseda system to identify them from the relevant 3D structures
(details in Materials and Methods). Specifically, predictedB cell epitopes consisted of conserved fragments with at least9 consecutive residues with flexibility (normalized B factor)>1and an average relative solvent-exposed accessibility≥50%.
Analysis of the structural mapping of the selected B cellepitopes onto the relevant 3D structure can reveal theirimportance for epitope vaccine design. The gp42 B cell epi-tope (KLPHWTPTLH) is located in the N-terminal portionof the protein far and opposite from the HLA-DR contactregion (Figure 2(a)). Therefore, antibodies against this gp42B cell epitope will unlikely block the gp42 interaction withHLA-DR required for viral entry into B cells. The gp42 N-terminal region, where KLPHWTPTLH maps, interact withgH at a site in close proximity to the β1-integrin-bindingmotif “KGD” [52]. Both gp42 and peptides from the N-terminal region of gp42 that binds to gH interfere withβ1-integrin interaction and viral entry in epithelial cells
Table 5: Proposed epitope vaccine ensemble for EBV.
CD8 T cell epitope vaccine component
Sequence Antigen AN1 BLAST hit HMP2 BLAST hit humans3 PPC%4
RPPIFIRRL EBNA3 P12977 EFI49553.1 (55.56) NP_001182344.1 (66.67)
SVRDRLARL EBNA3 P12977 No hit (—) 3HR0 (55.56)
YVLDHLIVV BRLF1 P03209 EPH07203.1 (88.89) XP_011535331.1 (66.67)
QPRAPIRPI EBNA6 P03204 EEZ70880.1 (66.67) AFC01212.1 (55.56)
LPCVLWPVL BZLF1 P03206 ETN46892.1 (77.78) XP_011511695.1 (55.56)
RVRAYTYSK BRLF1 P03209 EEY91922.1 (66.67) CAE46202.1 (55.56) >95AYSSWMYSY EBNA3 P12977 EKB85112.1 (77.78) EAW88404.1 (66.67)
VLKDAIKDL EBNA1 P03211 KXB56071.1 (88.89) EAX00446.1 (66.67)
QAKWRLQTL EBNA3 P12977 EHR35488.1 (66.67) XP_005255827.1 (77.78)
RRIYDLIEL EBNA6 P03204 EDS12420.1 (77.78) EAW88480.1 (66.67)
RLRAEAQVK EBNA3 P12977 No hit (—) XP_011507142.1 (77.78)
CYDHAQTHL BMRF1 P03191 EFF75621.1 (77.78) CAH10644.1 (66.67)
SENDRLRLL BZLF1 P03206 EGG37664.1 (77.78) EAW88969.1 (77.78)
YRSGIIAVV BMRF1 P03191 OFQ99895.1 (88.89) BAC03504.1 (66.67)
CD4T cell epitope vaccine component
Sequence Antigen AN1 BLAST hit HMP2 BLAST hit humans3 PPC%4
MLGQDDFIKFKSPLV BFRF1 P03185 EIY33207.1 (46.67) NP_001284364.1 (53.33)
AGLTLSLLVICSYLFISRG BHRF1 P03182 EKN19533.1 (47.37) EAW92092.1 (52.63) >81.8SRDELLHTRAASLLY BARF1 P0CAP6 EPB87510.1 (66.67) XP_011514101.1 (66.67)
PPVVRMFMRERQLPQ EBNA6 P03204 EFV04068.1 (46.67) AAP34452.1 (60.00)
B cell epitope vaccine component
Sequence Antigen AN1 BLAST hit HMP2 BLAST hit humans3 Src.5
APESTTTSPTLNTTGFA gp350 (BLLF1) P03200 EGY79509.1 (58.82) NP_001276932.1 (52.94) E
GNGPKASGGD gp350 (BLLF1) P03200 EHM51909.1 (70.00) NP_055501.2 (70.00) E
ETVPYIKWDN gp350 (BLLF1) P03200 EET62946.1 (50.00) NP_001193968.1 (50.00) E
KLPHWTPTLH gp42 (BZLF2) P03205 EJZ65106.1 (70.00) AAH22472.1 (60.00) P
NTTVGIELPDA gpB (BALF4) P03188 EHM53795.1 (72.73) XP_011519547.1 (63.64) P
SSHGDLFRFSSDIQCP gpB (BALF4) P03188 KGF26221.1 (50.00) XP_011520599.1 (50.00) P
FSVEDLFGAN gL (BKRF2) P03212 EKB09257.1 (80.00) XP_005271219.1 (70.00) P1Accession number from UniProtKB database. 2,3Accession number of the closest epitope BLAST hit to human microbiome proteins and human proteins,respectively (percentage of identity in parenthesis). 4Population protection coverage (PPC) of the CD8 and CD4 T cell epitope ensemble. 5Src., source,whether the epitope derived from an experimental B cell epitope (E) or it was predicted (P).
10 Journal of Immunology Research
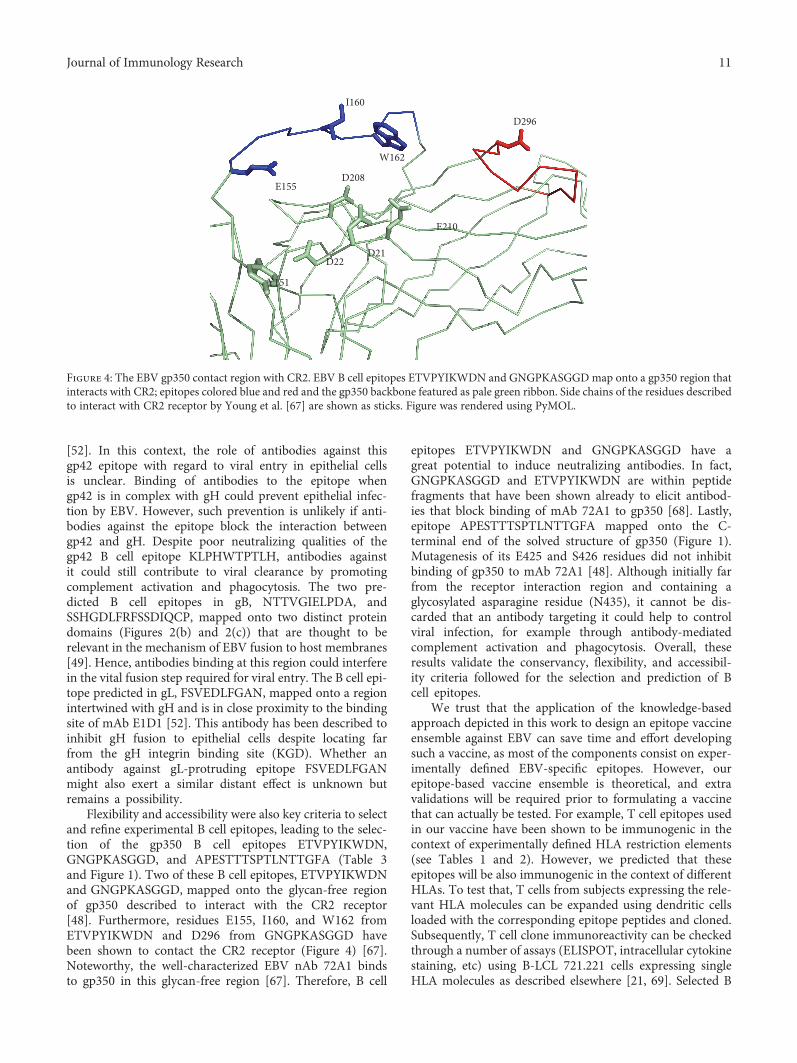
[52]. In this context, the role of antibodies against thisgp42 epitope with regard to viral entry in epithelial cellsis unclear. Binding of antibodies to the epitope whengp42 is in complex with gH could prevent epithelial infec-tion by EBV. However, such prevention is unlikely if anti-bodies against the epitope block the interaction betweengp42 and gH. Despite poor neutralizing qualities of thegp42 B cell epitope KLPHWTPTLH, antibodies againstit could still contribute to viral clearance by promotingcomplement activation and phagocytosis. The two pre-dicted B cell epitopes in gB, NTTVGIELPDA, andSSHGDLFRFSSDIQCP, mapped onto two distinct proteindomains (Figures 2(b) and 2(c)) that are thought to berelevant in the mechanism of EBV fusion to host membranes[49]. Hence, antibodies binding at this region could interferein the vital fusion step required for viral entry. The B cell epi-tope predicted in gL, FSVEDLFGAN, mapped onto a regionintertwined with gH and is in close proximity to the bindingsite of mAb E1D1 [52]. This antibody has been described toinhibit gH fusion to epithelial cells despite locating farfrom the gH integrin binding site (KGD). Whether anantibody against gL-protruding epitope FSVEDLFGANmight also exert a similar distant effect is unknown butremains a possibility.
Flexibility and accessibility were also key criteria to selectand refine experimental B cell epitopes, leading to the selec-tion of the gp350 B cell epitopes ETVPYIKWDN,GNGPKASGGD, and APESTTTSPTLNTTGFA (Table 3and Figure 1). Two of these B cell epitopes, ETVPYIKWDNand GNGPKASGGD, mapped onto the glycan-free regionof gp350 described to interact with the CR2 receptor[48]. Furthermore, residues E155, I160, and W162 fromETVPYIKWDN and D296 from GNGPKASGGD havebeen shown to contact the CR2 receptor (Figure 4) [67].Noteworthy, the well-characterized EBV nAb 72A1 bindsto gp350 in this glycan-free region [67]. Therefore, B cell
epitopes ETVPYIKWDN and GNGPKASGGD have agreat potential to induce neutralizing antibodies. In fact,GNGPKASGGD and ETVPYIKWDN are within peptidefragments that have been shown already to elicit antibod-ies that block binding of mAb 72A1 to gp350 [68]. Lastly,epitope APESTTTSPTLNTTGFA mapped onto the C-terminal end of the solved structure of gp350 (Figure 1).Mutagenesis of its E425 and S426 residues did not inhibitbinding of gp350 to mAb 72A1 [48]. Although initially farfrom the receptor interaction region and containing aglycosylated asparagine residue (N435), it cannot be dis-carded that an antibody targeting it could help to controlviral infection, for example through antibody-mediatedcomplement activation and phagocytosis. Overall, theseresults validate the conservancy, flexibility, and accessibil-ity criteria followed for the selection and prediction of Bcell epitopes.
We trust that the application of the knowledge-basedapproach depicted in this work to design an epitope vaccineensemble against EBV can save time and effort developingsuch a vaccine, as most of the components consist on exper-imentally defined EBV-specific epitopes. However, ourepitope-based vaccine ensemble is theoretical, and extravalidations will be required prior to formulating a vaccinethat can actually be tested. For example, T cell epitopes usedin our vaccine have been shown to be immunogenic in thecontext of experimentally defined HLA restriction elements(see Tables 1 and 2). However, we predicted that theseepitopes will be also immunogenic in the context of differentHLAs. To test that, T cells from subjects expressing the rele-vant HLA molecules can be expanded using dendritic cellsloaded with the corresponding epitope peptides and cloned.Subsequently, T cell clone immunoreactivity can be checkedthrough a number of assays (ELISPOT, intracellular cytokinestaining, etc) using B-LCL 721.221 cells expressing singleHLA molecules as described elsewhere [21, 69]. Selected B
D296
I160
E155D208
W162
Y151
D22D21
E210
Figure 4: The EBV gp350 contact region with CR2. EBV B cell epitopes ETVPYIKWDN and GNGPKASGGDmap onto a gp350 region thatinteracts with CR2; epitopes colored blue and red and the gp350 backbone featured as pale green ribbon. Side chains of the residues describedto interact with CR2 receptor by Young et al. [67] are shown as sticks. Figure was rendered using PyMOL.
11Journal of Immunology Research
cell epitopes should also be subjected to extra validations, inparticular to test whether they elicit antibodies cross-reacting with native antigens. To that end, sera from immu-nized mice with B cell epitope peptides could be used tocheck whether they recognize native antigens in ELISAassays and/or interfere with EBV infection of epithelial andB cells as described elsewhere [68]. Once the individualcomponents of the epitope vaccine ensemble had passedexperimental validation, it will still remain to elucidate howto formulate such a vaccine for delivering the epitopes.
There are several choices to formulate epitope vaccinesranging from peptide-based formulations to genetic formula-tions. Regardless of the choice, CD4 T cell epitopes need to bephysically linked with the other selected epitopes, particu-larly B cell epitopes, to elicit productive Th cells [70]. Apeptide-based vaccine has already been tested for the deliveryof an EBV CD8 T cell epitope fused with tetanus toxoid toincrease immunogenicity and elicit Th responses [57]. Simi-larly, a polymeric epitope concatemer in the form of a“string-of-beads” could be chemically synthesized or formu-lated as a genetic construct [71]. In either cases, the order ofthe epitopes and the presence of cleavage sites between themare crucial features to address [71]. Concatenating epitopescan result in toxic products and tools to predict toxicity canalso be used to optimize epitope concatemers [72]. Toxicityof epitope vaccine formulations should nevertheless bechecked in cellular assays prior to carrying out any immu-nization studies. In general, poor immunogenicity is animportant issue with peptide-based formulations [22]. Arecent development in vaccine formulation that increasesthe immunogenicity of the epitope-peptide componentsconsists in the use of nanoparticles of diverse nature[73]. For example, Kuai et al. [74] used high-densitylipoprotein-mimicking nanodiscs coupled with peptides tostimulate potent tumor-specific CD8 T cell responses thatinhibited tumor growth in a murine model of colon carci-noma. Nanoparticles have also been used to deliver geneticconstructs, particularly RNA constructs. RNA-based vac-cine formulations offer lower safety concerns and enhancedimmunogenicity with regard to those based on DNA, andinherent RNA instability can be overcame using nanoparti-cles for delivery [75].
Ideally, the B cell response should only be focused onB cell epitopes. To that end, a solution would be formulat-ing the epitope vaccine as liposomal or virosome-like par-ticles, where the selected T cell epitopes, either alone orconcatenated, ought to be placed encapsulated inside theparticle and the B cell epitopes displayed linked in theouter part of the particle [76, 77]. These liposomal vaccineformulations are also more immunogenic than those consist-ing of genetic or synthetic peptide-based constructs [76, 77].Moreover, immunogenicity can be further enhanced by theinclusion of appropriated adjuvants [78].
Epitope vaccine formulations, as any vaccine candidate,should be evaluated in preclinical animal models prior toclinical testing in humans. However, in the case of EBV, thisstands as a major drawback as there is a lack of appropriateanimal models that recapitulate EBV infection and itsimmune control [79]. Thus, EBV vaccine immunogenicity
and protection capabilities have to be assessed in clinicalstudies. Although this is very informative and may acceleratethe developmental process, it also carries high associatedcosts early in the discovery path and involves enrollment ofparticipants, which is not at the reach of many researchgroups. The clinical status of the target population to testEBV prophylactic vaccine candidates should also be consid-ered. For instance, the phase II study by Sokal et al. [55],the most advanced of any EBV vaccine tested so far [54],involved a total of 181 EBV-seronegative, healthy, young vol-unteers between 16 and 25 years of age that were random-ized in a double-blind fashion to receive either placebo ora recombinant EBV subunit glycoprotein 350.
5. Conclusions and Limitations
EBV infection is associated with a number of humandiseases, including cancer and autoimmunity. Currently, itis unclear why some individuals with apparently properresponses to EBV develop associated diseases while othersdo not, but surely genetic and environmental factors,including life style and past pathogen encounters, play arole [80–82]. In any case, a prophylactic EBV vaccine willbe beneficial in preventing EBV-associated diseases [53, 59].We herein provide an epitope ensemble that would serve todevelop an epitope-based prophylactic vaccine against EBVinfection, eliciting both adaptive cellular and humoral immu-nity. The T cell component consists of highly conservedexperimental EBV-specific epitopes capable of eliciting cellu-lar responses in virtually the whole population. The B cellcomponent consists of conserved experimental and predictedB cell epitopes from EBV envelope proteins gp350, gp42, gB,and gL. These epitopes were selected from the relevant 3Dstructures applying a novel structure-based reverse vaccinol-ogy approach that includes calculation of flexibility andsolvent accessibility values. As a result, we identified B cellepitopes that could elicit antibodies interfering with EBVentry in epithelial and B cells. Whether our epitope vaccineensemble has also any therapeutic value is arguable but,clearly, it is harder to combat EBV once it has established alatent infection.
This study has limitations that may handicap its transla-tion into an EBV vaccine. Appropriate antigen processing is akey limiting factor in the immunogenicity of T cell epitopes[83]. Therefore, we selected experimental T cell epitopes thatwere shown to be processed and presented in the course of anatural infection with EBV and assumed that T cell epitopeimmunogenicity will be then only determined by their bind-ing to MHC molecules. This assumption has not beenthoroughly tested and it is very sensitive to possible errorsin the databases where we collected the data. In the same line,population coverage estimates for the T cell component needto be tested as they are inferred from peptide binding predic-tions to MHC molecules. Nonetheless, the reliability ofpeptide-MHC binding predictions has been widely proved[84]. With regard to the B cell component, we deliberatelyfailed to include conformational epitopes as they cannot beisolated from their context and solely focused on linear B cellepitopes. Whether these B cell epitopes are able to elicit
12 Journal of Immunology Research
antibodies recognizing the native protein conformationsneeds to be tested.
Abbreviations
MHC: Major histocompatibility complexHLA: Human leukocyte antigensgp: GlycoproteinnAb: Neutralizing antibody.
Conflicts of Interest
Julio Alonso-Padilla is a postdoctoral researcher at ISGlobalsupported by the Juan de la Cierva Program (MINECO,Spain) and a visiting scientist at the Laboratory of Immuno-medicine, Faculty of Medicine, UCM, led by Pedro A. Reche.ISGlobal is a member of the CERCA Programme, Generalitatde Catalunya. The authors declare that they have no conflictof interests.
Acknowledgments
The authors wish to thank Inmunotek S.L. and the SpanishDepartment of Science at MINECO for supporting theresearch of the Immunomedicine Group through GrantsSAF2006:07879, SAF2009:08301, and BIO2014:54164-R toPedro A. Reche. Julio Alonso-Padilla acknowledges thesupport provided by Joaquim Gascón, director of theISGlobal Chagas Disease Program.
References
[1] Z. Lin, X. Wang, M. J. Strong et al., “Whole-genome sequenc-ing of the Akata and Mutu Epstein-Barr virus strains,” Journalof Virology, vol. 87, no. 2, pp. 1172–1182, 2013.
[2] K. Sathiyamoorthy, J. Jiang, Y. X. Hu et al., “Assembly andarchitecture of the EBV B cell entry triggering complex,” PLoSPathogens, vol. 10, no. 8, article e1004309, 2014.
[3] M. Neves, J. Marinho-Dias, J. Ribeiro, and H. Sousa, “Epstein-Barr virus strains and variations: geographic or disease-specificvariants?,” Journal of Medical Virology, vol. 89, no. 3, pp. 373–387, 2017.
[4] L. S. Young and A. B. Rickinson, “Epstein-Barr virus: 40 yearson,” Nature Reviews Cancer, vol. 4, no. 10, pp. 757–768, 2004.
[5] E. K. Vetsika and M. Callan, “Infectious mononucleosis andEpstein-Barr virus,” Expert Reviews in Molecular Medicine,vol. 6, no. 23, pp. 1–16, 2004.
[6] G. C. Faulkner, S. R. Burrows, R. Khanna, D. J. Moss, A. G.Bird, and D. H. Crawford, “X-linked agammaglobulinemiapatients are not infected with Epstein-Barr virus: implicationsfor the biology of the virus,” Journal of Virology, vol. 73, no. 2,pp. 1555–1564, 1999.
[7] C. D. Shannon-Lowe, B. Neuhierl, G. Baldwin, A. B. Rickinson,and H. J. Delecluse, “Resting B cells as a transfer vehicle forEpstein-Barr virus infection of epithelial cells,” Proceedings ofthe National Academy of Sciences of the United States ofAmerica, vol. 103, no. 18, pp. 7065–7070, 2006.
[8] B. Kempkes and E. S. Robertson, “Epstein-Barr virus latency:current and future perspectives,” Current Opinion in Virology,vol. 14, pp. 138–144, 2015.
[9] M. M. Mullen, K. M. Haan, R. Longnecker, and T. S. Jardetzky,“Structure of the Epstein-Barr virus gp42 protein bound to theMHC class II receptor HLA-DR1,”Molecular Cell, vol. 9, no. 2,pp. 375–385, 2002.
[10] G. S. Taylor, H. M. Long, J. M. Brooks, A. B. Rickinson,and A. D. Hislop, “The immunology of Epstein-Barr virus-induced disease,” Annual Review of Immunology, vol. 33,pp. 787–821, 2015.
[11] D. A. Thorley-Lawson, “Epstein-Barr virus: exploiting theimmune system,” Nature Reviews Immunology, vol. 1, no. 1,pp. 75–82, 2001.
[12] T. Strowig, F. Brilot, F. Arrey et al., “Tonsilar NK cells restrictB cell transformation by the Epstein-Barr virus via IFN-gamma,” PLoS Pathogens, vol. 4, no. 2, article e27, 2008.
[13] A. D. Hislop, G. S. Taylor, D. Sauce, and A. B. Rickinson,“Cellular responses to viral infection in humans: lessons fromEpstein-Barr virus,” Annual Review of Immunology, vol. 25,pp. 587–617, 2007.
[14] J. M. Brooks, H. M. Long, R. J. Tierney et al., “Early Tcell recognition of B cells following Epstein-Barr virusinfection: identifying potential targets for prophylactic vac-cination,” PLoS Pathogens, vol. 12, no. 4, article e1005549,2016.
[15] E. Amyes, C. Hatton, D. Montamat-Sicotte et al., “Characteri-zation of the CD4+ T cell response to Epstein-Barr virus duringprimary and persistent infection,” The Journal of ExperimentalMedicine, vol. 198, no. 6, pp. 903–911, 2003.
[16] W. Bu, G. M. Hayes, H. Liu et al., “Kinetics of Epstein-Barrvirus (EBV) neutralizing and virus-specific antibodies afterprimary infection with EBV,” Clinical and Vaccine Immunol-ogy, vol. 23, no. 4, pp. 363–369, 2016.
[17] M. De Paschale and P. Clerici, “Serological diagnosis ofEpstein-Barr virus infection: problems and solutions,” WorldJournal of Virology, vol. 1, no. 1, pp. 31–43, 2012.
[18] M. P. Thompson and R. Kurzrock, “Epstein-Barr virusand cancer,” Clinical Cancer Research, vol. 10, no. 3,pp. 803–821, 2004.
[19] A. Ascherio and K. L. Munger, “EBV and autoimmunity,”Current Topics in Microbiology and Immunology, vol. 390,Part 1, pp. 365–385, 2015.
[20] J. I. Cohen, “Epstein-Barr virus vaccines,” Clinical & Transla-tional Immunology, vol. 4, no. 1, article e32, 2015.
[21] P. A. Reche, D. B. Keskin, R. E. Hussey, P. Ancuta, D. Gabuzda,and E. L. Reinherz, “Elicitation from virus-naive individuals ofcytotoxic T lymphocytes directed against conserved HIV-1epitopes,” Medical Immunology, vol. 5, p. 1, 2006.
[22] Q. M. Sheikh, D. Gatherer, P. A. Reche, and D. R. Flower,“Towards the knowledge-based design of universal influenzaepitope ensemble vaccines,” Bioinformatics, vol. 32, no. 21,pp. 3233–3239, 2016.
[23] M. Molero-Abraham, J. P. Glutting, D. R. Flower, E. M.Lafuente, and P. A. Reche, “EPIPOX: immunoinformaticcharacterization of the shared T-cell epitome between vari-ola virus and related pathogenic Orthopoxviruses,” Journalof Immunology Research, vol. 2015, Article ID 738020,11 pages, 2015.
[24] C. M. Diez-Rivero and P. A. Reche, “CD8 T cell epitope distri-bution in viruses reveals patterns of protein biosynthesis,”PLoS One, vol. 7, no. 8, article e43674, 2012.
[25] P. A. Reche, H. Zhang, J. P. Glutting, and E. L. Reinherz,“EPIMHC: a curated database of MHC-binding peptides for
13Journal of Immunology Research

customized computational vaccinology,” Bioinformatics,vol. 21, no. 9, pp. 2140-2141, 2005.
[26] Q. Zhang, P. Wang, Y. Kim et al., “Immune epitope data-base analysis resource (IEDB-AR),” Nucleic Acids Research,vol. 36, Web Server issue, pp. W513–W518, 2008.
[27] W. Li and A. Godzik, “Cd-hit: a fast program for clusteringand comparing large sets of protein or nucleotide sequences,”Bioinformatics, vol. 22, no. 13, pp. 1658-1659, 2006.
[28] S. Federhen, “Type material in the NCBI taxonomy database,”Nucleic Acids Research, vol. 43, Database issue, pp. D1086–D1098, 2015.
[29] R. C. Edgar, “MUSCLE: multiple sequence alignment withhigh accuracy and high throughput,” Nucleic Acids Research,vol. 32, no. 5, pp. 1792–1797, 2004.
[30] C. E. Shannon, “The mathematical theory of communication,”The Bell System Technical Journal, vol. 27, pp. 379–423, 1948,623-656.
[31] M. Garcia-Boronat, C. M. Diez-Rivero, E. L. Reinherz, andP. A. Reche, “PVS: a web server for protein sequencevariability analysis tuned to facilitate conserved epitope dis-covery,” Nucleic Acids Research, vol. 36, Web Server issue,pp. W35–W41, 2008.
[32] P. A. Reche and E. L. Reinherz, “Sequence variability analysisof human class I and class II MHC molecules: functional andstructural correlates of amino acid polymorphisms,” Journalof Molecular Biology, vol. 331, no. 3, pp. 623–641, 2003.
[33] J. J. Stewart, C. Y. Lee, S. Ibrahim et al., “A Shannon entropyanalysis of immunoglobulin and T cell receptor,” MolecularImmunology, vol. 34, pp. 1067–1082, 1997.
[34] P. A. Reche, J.-P. Glutting, and E. L. Reinherz, “Enhancementto the RANKPEP resource for the prediction of peptide bind-ing to MHC molecules using profiles,” Immunogenetics,vol. 56, pp. 405–419, 2004.
[35] P. A. Reche, J. P. Glutting, and E. L. Reinherz, “Prediction ofMHC class I binding peptides using profile motifs,” HumanImmunology, vol. 63, no. 9, pp. 701–709, 2002.
[36] P. A. Reche and E. L. Reinherz, “Prediction of peptide-MHCbinding using profiles,” Methods in Molecular Biology,vol. 409, pp. 185–200, 2007.
[37] J. Greenbaum, J. Sidney, J. Chung, C. Brander, B. Peters, and A.Sette, “Functional classification of class II human leukocyteantigen (HLA) molecules reveals seven different supertypesand a surprising degree of repertoire sharing across super-types,” Immunogenetics, vol. 63, no. 6, pp. 325–335, 2011.
[38] P. Wang, J. Sidney, Y. Kim et al., “Peptide binding predictionsfor HLA DR, DP and DQ molecules,” BMC Bioinformatics,vol. 11, p. 568, 2010.
[39] M. Molero-Abraham, E. M. Lafuente, D. R. Flower, and P. A.Reche, “Selection of conserved epitopes from hepatitis C virusfor pan-populational stimulation of T-cell responses,” Clini-cal & Developmental Immunology, vol. 2013, Article ID601943, 10 pages, 2013.
[40] K. Cao, J. Hollenbach, X. Shi, W. Shi, M. Chopek, andM. A. Fernandez-Vina, “Analysis of the frequencies ofHLA-A, B, and C alleles and haplotypes in the five majorethnic groups of the United States reveals high levels ofdiversity in these loci and contrasting distribution patternsin these populations,” Human Immunology, vol. 62, no. 9,pp. 1009–1030, 2001.
[41] H. H. Bui, J. Sidney, K. Dinh, S. Southwood, M. J. Newman,and A. Sette, “Predicting population coverage of T-cell
epitope-based diagnostics and vaccines,” BMC Bioinformatics,vol. 7, p. 153, 2006.
[42] S. J. Hubbard and J. M. Thornton, NACCESS, ComputerProgram, Department of Biochemistry and Molecular Biology,University College London, London, England, UK, 1993.
[43] M. Magrane, “UniProt Knowledgebase: a hub of integratedprotein data,” Database: The Journal of Biological Databasesand Curation, vol. 2011, article bar009, 2011.
[44] S. F. Altschul, T. L. Madden, A. A. Schaffer et al., “GappedBLAST and PSI-BLAST: a new generation of protein databasesearch programs,” Nucleic Acids Research, vol. 25, no. 17,pp. 3389–3402, 1997.
[45] J. Peterson, S. Garges, M. Giovanni et al., “The NIH HumanMicrobiome Project,” Genome Research, vol. 19, no. 12,pp. 2317–2323, 2009.
[46] L. H. Glimcher and C. J. Kara, “Sequences and factors: a guideto MHC class-II transcription,” Annual Review of Immunol-ogy, vol. 10, pp. 13–49, 1992.
[47] L. J. Stern and J. M. Calvo-Calle, “HLA-DR: molecular insightsand vaccine design,” Current Pharmaceutical Design, vol. 15,no. 28, pp. 3249–3261, 2009.
[48] G. Szakonyi, M. G. Klein, J. P. Hannan et al., “Structure of theEpstein-Barr virus major envelope glycoprotein,” NatureStructural & Molecular Biology, vol. 13, no. 11, pp. 996–1001,2006.
[49] M. Backovic, R. Longnecker, and T. S. Jardetzky, “Structure ofa trimeric variant of the Epstein-Barr virus glycoprotein B,”Proceedings of the National Academy of Sciences of the UnitedStates of America, vol. 106, no. 8, pp. 2880–2885, 2009.
[50] E. Westhof, D. Altschuh, D. Moras et al., “Correlationbetween segmental mobility and the location of antigenicdeterminants in proteins,” Nature, vol. 311, no. 5982,pp. 123–126, 1984.
[51] A. N. Kirschner, J. Sorem, R. Longnecker, and T. S. Jardetzky,“Structure of Epstein-Barr virus glycoprotein 42 suggests amechanism for triggering receptor-activated virus entry,”Structure, vol. 17, no. 2, pp. 223–233, 2009.
[52] K. Sathiyamoorthy, Y. X. Hu, B. S. Mohl, J. Chen, R.Longnecker, and T. S. Jardetzky, “Structural basis forEpstein-Barr virus host cell tropism mediated by gp42 andgHgL entry glycoproteins,” Nature Communications, vol. 7,article 13557, 2016.
[53] C. Smith and R. Khanna, “The development of prophylacticand therapeutic EBV vaccines,” Current Topics in Microbiol-ogy and Immunology, vol. 391, pp. 455–473, 2015.
[54] H. H. Balfour Jr., “Progress, prospects, and problems inEpstein-Barr virus vaccine development,” Current Opinion inVirology, vol. 6, pp. 1–5, 2014.
[55] E. M. Sokal, K. Hoppenbrouwers, C. Vandermeulen et al.,“Recombinant gp350 vaccine for infectious mononucleosis: aphase 2, randomized, double-blind, placebo-controlled trialto evaluate the safety, immunogenicity, and efficacy of anEpstein-Barr virus vaccine in healthy young adults,” TheJournal of Infectious Diseases, vol. 196, no. 12, pp. 1749–1753, 2007.
[56] R. Lin, D. Heeke, H. Liu et al., “Development of a robust,higher throughput green fluorescent protein (GFP)-basedEpstein-Barr virus (EBV) micro-neutralization assay,” Journalof Virological Methods, vol. 247, pp. 15–21, 2017.
[57] S. L. Elliott, A. Suhrbier, J. J. Miles et al., “Phase I trial of aCD8+ T-cell peptide epitope-based vaccine for infectious
14 Journal of Immunology Research

mononucleosis,” Journal of Virology, vol. 82, no. 3, pp. 1448–1457, 2008.
[58] L. M. Hutt-Fletcher, “EBV glycoproteins: where are we now?,”Future Virology, vol. 10, no. 10, pp. 1155–1162, 2015.
[59] V. Dasari, K. H. Bhatt, C. Smith, and R. Khanna, “Designing aneffective vaccine to prevent Epstein-Barr virus-associateddiseases: challenges and opportunities,” Expert Review ofVaccines, vol. 16, no. 4, pp. 377–390, 2017.
[60] J. Ponomarenko andM. Van Regenmortel, “B-cell epitope pre-diction,” in Structural Bioinformatics, pp. 849–879, JohnWiley& Sons, Hoboken, NJ, USA, 2009.
[61] M. H. Van Regenmortel, “What is a B-cell epitope?,” Methodsin Molecular Biology, vol. 524, pp. 3–20, 2009.
[62] P. A. Reche and E. L. Reinherz, “Definition of MHC supertypesthrough clustering of MHC peptide-binding repertoires,”Methods in Molecular Biology, vol. 409, pp. 163–173, 2007.
[63] P. Sun, H. Ju, Z. Liu et al., “Bioinformatics resources andtools for conformational B-cell epitope prediction,” Compu-tational and Mathematical Methods in Medicine, vol. 2013,Article ID 943636, 11 pages, 2013.
[64] L. Potocnakova, M. Bhide, and L. B. Pulzova, “An introductionto B-cell epitope mapping and in silico epitope prediction,”Journal of Immunology Research, vol. 2016, Article ID6760830, 11 pages, 2016.
[65] M. J. Blythe and D. R. Flower, “Benchmarking B cell epitopeprediction: underperformance of existing methods,” ProteinScience, vol. 14, no. 1, pp. 246–248, 2005.
[66] J. Gao and L. Kurgan, “Computational prediction of B cell epi-topes from antigen sequences,” Methods in Molecular Biology,vol. 1184, pp. 197–215, 2014.
[67] K. A. Young, A. P. Herbert, P. N. Barlow, V. M. Holers,and J. P. Hannan, “Molecular basis of the interaction betweencomplement receptor type 2 (CR2/CD21) and Epstein-Barrvirus glycoprotein gp350,” Journal of Virology, vol. 82,no. 22, pp. 11217–11227, 2008.
[68] J. E. Tanner, M. Coincon, V. Leblond et al., “Peptides designedto spatially depict the Epstein-Barr virus major virion glyco-protein gp350 neutralization epitope elicit antibodies thatblock virus-neutralizing antibody 72A1 interaction with thenative gp350 molecule,” Journal of Virology, vol. 89, no. 9,pp. 4932–4941, 2015.
[69] V. Litwin, J. Gumperz, P. Parham, J. H. Phillips, and L. L.Lanier, “Specificity of HLA class I antigen recognition byhuman NK clones: evidence for clonal heterogeneity, protec-tion by self and non-self alleles, and influence of the target celltype,” The Journal of Experimental Medicine, vol. 178, no. 4,pp. 1321–1336, 1993.
[70] R. Arnon and T. Ben-Yedidia, “Old and new vaccineapproaches,” International Immunopharmacology, vol. 3,no. 8, pp. 1195–1204, 2003.
[71] J. L. Whitton, N. Sheng, M. B. Oldstone, and T. A. McKee, “A“string-of-beads” vaccine, comprising linked minigenes, con-fers protection from lethal-dose virus challenge,” Journal ofVirology, vol. 67, no. 1, pp. 348–352, 1993.
[72] S. Gupta, P. Kapoor, K. Chaudhary, A. Gautam, R. Kumar, andG. P. Raghava, “In silico approach for predicting toxicity ofpeptides and proteins,” PLoS One, vol. 8, no. 9, articlee73957, 2013.
[73] E. M. Varypataki, N. Benne, J. Bouwstra, W. Jiskoot, andF. Ossendorp, “Efficient eradication of established tumors inmice with cationic liposome-based synthetic long-peptide
vaccines,” Cancer Immunology Research, vol. 5, no. 3,pp. 222–233, 2017.
[74] R. Kuai, L. J. Ochyl, K. S. Bahjat, A. Schwendeman, and J. J.Moon, “Designer vaccine nanodiscs for personalized cancerimmunotherapy,” Nature Materials, vol. 16, no. 4, pp. 489–496, 2017.
[75] M. Brazzoli, D. Magini, A. Bonci et al., “Induction of broad-based immunity and protective efficacy by self-amplifyingmRNA vaccines encoding influenza virus hemagglutinin,”Journal of Virology, vol. 90, no. 1, pp. 332–344, 2015.
[76] R. A. Schwendener, “Liposomes as vaccine delivery systems: areview of the recent advances,” Therapeutic Advances inVaccines, vol. 2, no. 6, pp. 159–182, 2014.
[77] D. Felnerova, J. F. Viret, R. Gluck, and C. Moser, “Liposomesand virosomes as delivery systems for antigens, nucleic acidsand drugs,” Current Opinion in Biotechnology, vol. 15, no. 6,pp. 518–529, 2004.
[78] Y. Perrie, D. Kirby, V. W. Bramwell, and A. R. Mohammed,“Recent developments in particulate-based vaccines,” RecentPatents on Drug Delivery & Formulation, vol. 1, no. 2,pp. 117–129, 2007.
[79] C. Gujer, B. Chatterjee, V. Landtwing, A. Raykova, D.McHugh, and C. Munz, “Animal models of Epstein Barrvirus infection,” Current Opinion in Virology, vol. 13,pp. 6–10, 2015.
[80] C. Calcagno, R. Puzone, Y. E. Pearson et al., “Computersimulations of heterologous immunity: highlights of an inter-disciplinary cooperation,” Autoimmunity, vol. 44, no. 4,pp. 304–314, 2011.
[81] Proceedings of the IARC working group on the evaluationof carcinogenic risks to humans. Epstein-Barr virus andKaposi’s sarcoma herpesvirus/human herpesvirus 8. Lyon,France, 17-24 June 1997,” IARC Monographs on the Evalua-tion of Carcinogenic Risks to Humans, vol. 70, pp. 1–492, 1997.
[82] A. W. Lee, W. Foo, O. Mang et al., “Changing epidemiology ofnasopharyngeal carcinoma in Hong Kong over a 20-yearperiod (1980-99): an encouraging reduction in both incidenceand mortality,” International Journal of Cancer, vol. 103, no. 5,pp. 680–685, 2003.
[83] W. Zhong, P. A. Reche, C. C. Lai, B. Reinhold, and E. L.Reinherz, “Genome-wide characterization of a viral cytotoxicT lymphocyte epitope repertoire,” The Journal of BiologicalChemistry, vol. 278, no. 46, pp. 45135–45144, 2003.
[84] E. M. Lafuente and P. A. Reche, “Prediction of MHC-peptide binding: a systematic and comprehensive overview,”Current Pharmaceutical Design, vol. 15, no. 28, pp. 3209–3220, 2009.
15Journal of Immunology Research

Research ArticleVaccinomics Approach for Designing PotentialPeptide Vaccine by Targeting Shigella spp. SerineProtease Autotransporter Subfamily Protein SigA
Arafat Rahman Oany,1 Tahmina Pervin,2 Mamun Mia,1 Motaher Hossain,3
Mohammad Shahnaij,4 Shahin Mahmud,1 and K. M. Kaderi Kibria1
1Department of Biotechnology and Genetic Engineering, Faculty of Life Science, Mawlana Bhashani Science and TechnologyUniversity, Tangail, Bangladesh2Biotechnology and Genetic Engineering Discipline, Life Science School, Khulna University, Khulna, Bangladesh3Department of Biochemistry and Molecular Biology, University of Dhaka, Dhaka, Bangladesh4Enteric and Food Microbiology Laboratory, International Centre for Diarrhoeal Disease Research Bangladesh (icddr,b),Dhaka, Bangladesh
Correspondence should be addressed to K. M. Kaderi Kibria; [email protected]
Received 18 March 2017; Revised 28 June 2017; Accepted 24 July 2017; Published 7 September 2017
Academic Editor: Pedro A. Reche
Copyright © 2017 Arafat Rahman Oany et al. This is an open access article distributed under the Creative Commons AttributionLicense, which permits unrestricted use, distribution, and reproduction in anymedium, provided the original work is properly cited.
Shigellosis, a bacillary dysentery, is closely associated with diarrhoea in human and causes infection of 165 million peopleworldwide per year. Casein-degrading serine protease autotransporter of enterobacteriaceae (SPATE) subfamily protein SigA, anouter membrane protein, exerts both cytopathic and enterotoxic effects especially cytopathic to human epithelial cell type-2(HEp-2) and is shown to be highly immunogenic. In the present study, we have tried to impose the vaccinomics approach fordesigning a common peptide vaccine candidate against the immunogenic SigA of Shigella spp. At first, 44 SigA proteins fromdifferent variants of S. flexneri, S. dysenteriae, S. boydii, and S. sonnei were assessed to find the most antigenic protein. Weretrieved 12 peptides based on the highest score for human leukocyte antigen (HLA) supertypes analysed by NetCTL. Initially,these peptides were assessed for the affinity with MHC class I and class II alleles, and four potential core epitopesVTARAGLGY, FHTVTVNTL, HTTWTLTGY, and IELAGTLTL were selected. From these, FHTVTVNTL and IELAGTLTLpeptides were shown to have 100% conservancy. Finally, IELAGTLTL was shown to have the highest population coverage(83.86%) among the whole world population. In vivo study of the proposed epitope might contribute to the development offunctional and unique widespread vaccine, which might be an operative alleyway to thwart dysentery from the world.
1. Background
Shigella is a Gram-negative, facultative anaerobic, nonmotile,nonspore forming, and rod-shaped true bacteria closelyrelated to Salmonella and Escherichia coli. The resultinginfection by this organism called shigellosis, also known asbacillary dysentery or Marlow syndrome, is most typicallyassociated with diarrhoea and other gastrointestinal symp-toms in humans. This pathogen is usually found in water thatis contaminated with human feces within the setting of poorhygiene among kids of underneath 5 years old and is trans-mitted via the fecal-oral route. The infection will occur even
if there is just a bodily function of only ten to one hundredmicroorganisms [1]. In each year, 165 million cases of Shi-gella infection are accounted worldwide, of that, 163 milliontake place in developing countries and ultimately result inmillions of death [2]. Bangladesh has got the top rates of shig-ellosis according to the recent Global Enteric MulticenterStudy (GEMS) in Asia. The output of this study has revealedthat the Shigella is the third leading reason behind diarrhoeain children [3, 4].
Shigella species are usually classified into four serogroups:S. dysenteriae (12 serotypes), S. flexneri (6 serotypes), S. boy-dii (18 serotypes), and S. sonnei (one serotype) based on the
HindawiJournal of Immunology ResearchVolume 2017, Article ID 6412353, 14 pageshttps://doi.org/10.1155/2017/6412353
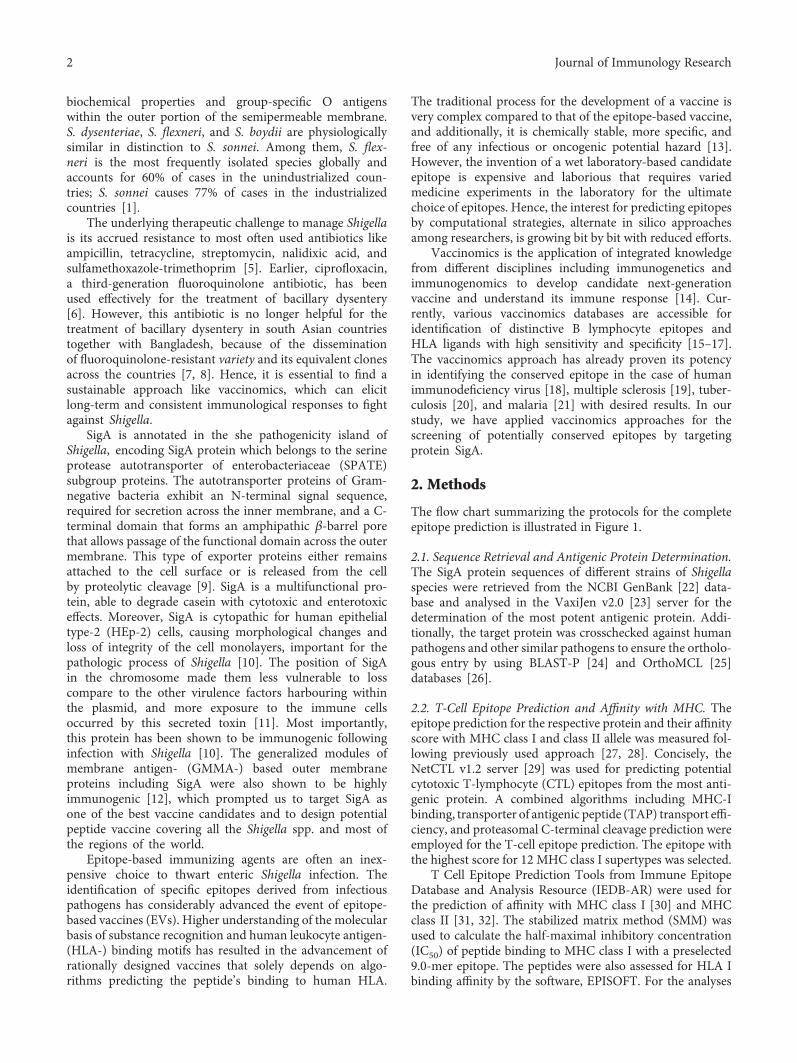
biochemical properties and group-specific O antigenswithin the outer portion of the semipermeable membrane.S. dysenteriae, S. flexneri, and S. boydii are physiologicallysimilar in distinction to S. sonnei. Among them, S. flex-neri is the most frequently isolated species globally andaccounts for 60% of cases in the unindustrialized coun-tries; S. sonnei causes 77% of cases in the industrializedcountries [1].
The underlying therapeutic challenge to manage Shigellais its accrued resistance to most often used antibiotics likeampicillin, tetracycline, streptomycin, nalidixic acid, andsulfamethoxazole-trimethoprim [5]. Earlier, ciprofloxacin,a third-generation fluoroquinolone antibiotic, has beenused effectively for the treatment of bacillary dysentery[6]. However, this antibiotic is no longer helpful for thetreatment of bacillary dysentery in south Asian countriestogether with Bangladesh, because of the disseminationof fluoroquinolone-resistant variety and its equivalent clonesacross the countries [7, 8]. Hence, it is essential to find asustainable approach like vaccinomics, which can elicitlong-term and consistent immunological responses to fightagainst Shigella.
SigA is annotated in the she pathogenicity island ofShigella, encoding SigA protein which belongs to the serineprotease autotransporter of enterobacteriaceae (SPATE)subgroup proteins. The autotransporter proteins of Gram-negative bacteria exhibit an N-terminal signal sequence,required for secretion across the inner membrane, and a C-terminal domain that forms an amphipathic β-barrel porethat allows passage of the functional domain across the outermembrane. This type of exporter proteins either remainsattached to the cell surface or is released from the cellby proteolytic cleavage [9]. SigA is a multifunctional pro-tein, able to degrade casein with cytotoxic and enterotoxiceffects. Moreover, SigA is cytopathic for human epithelialtype-2 (HEp-2) cells, causing morphological changes andloss of integrity of the cell monolayers, important for thepathologic process of Shigella [10]. The position of SigAin the chromosome made them less vulnerable to losscompare to the other virulence factors harbouring withinthe plasmid, and more exposure to the immune cellsoccurred by this secreted toxin [11]. Most importantly,this protein has been shown to be immunogenic followinginfection with Shigella [10]. The generalized modules ofmembrane antigen- (GMMA-) based outer membraneproteins including SigA were also shown to be highlyimmunogenic [12], which prompted us to target SigA asone of the best vaccine candidates and to design potentialpeptide vaccine covering all the Shigella spp. and most ofthe regions of the world.
Epitope-based immunizing agents are often an inex-pensive choice to thwart enteric Shigella infection. Theidentification of specific epitopes derived from infectiouspathogens has considerably advanced the event of epitope-based vaccines (EVs). Higher understanding of the molecularbasis of substance recognition and human leukocyte antigen-(HLA-) binding motifs has resulted in the advancement ofrationally designed vaccines that solely depends on algo-rithms predicting the peptide’s binding to human HLA.
The traditional process for the development of a vaccine isvery complex compared to that of the epitope-based vaccine,and additionally, it is chemically stable, more specific, andfree of any infectious or oncogenic potential hazard [13].However, the invention of a wet laboratory-based candidateepitope is expensive and laborious that requires variedmedicine experiments in the laboratory for the ultimatechoice of epitopes. Hence, the interest for predicting epitopesby computational strategies, alternate in silico approachesamong researchers, is growing bit by bit with reduced efforts.
Vaccinomics is the application of integrated knowledgefrom different disciplines including immunogenetics andimmunogenomics to develop candidate next-generationvaccine and understand its immune response [14]. Cur-rently, various vaccinomics databases are accessible foridentification of distinctive B lymphocyte epitopes andHLA ligands with high sensitivity and specificity [15–17].The vaccinomics approach has already proven its potencyin identifying the conserved epitope in the case of humanimmunodeficiency virus [18], multiple sclerosis [19], tuber-culosis [20], and malaria [21] with desired results. In ourstudy, we have applied vaccinomics approaches for thescreening of potentially conserved epitopes by targetingprotein SigA.
2. Methods
The flow chart summarizing the protocols for the completeepitope prediction is illustrated in Figure 1.
2.1. Sequence Retrieval and Antigenic Protein Determination.The SigA protein sequences of different strains of Shigellaspecies were retrieved from the NCBI GenBank [22] data-base and analysed in the VaxiJen v2.0 [23] server for thedetermination of the most potent antigenic protein. Addi-tionally, the target protein was crosschecked against humanpathogens and other similar pathogens to ensure the ortholo-gous entry by using BLAST-P [24] and OrthoMCL [25]databases [26].
2.2. T-Cell Epitope Prediction and Affinity with MHC. Theepitope prediction for the respective protein and their affinityscore with MHC class I and class II allele was measured fol-lowing previously used approach [27, 28]. Concisely, theNetCTL v1.2 server [29] was used for predicting potentialcytotoxic T-lymphocyte (CTL) epitopes from the most anti-genic protein. A combined algorithms including MHC-Ibinding, transporter of antigenic peptide (TAP) transport effi-ciency, and proteasomal C-terminal cleavage prediction wereemployed for the T-cell epitope prediction. The epitope withthe highest score for 12 MHC class I supertypes was selected.
T Cell Epitope Prediction Tools from Immune EpitopeDatabase and Analysis Resource (IEDB-AR) were used forthe prediction of affinity with MHC class I [30] and MHCclass II [31, 32]. The stabilized matrix method (SMM) wasused to calculate the half-maximal inhibitory concentration(IC50) of peptide binding to MHC class I with a preselected9.0-mer epitope. The peptides were also assessed for HLA Ibinding affinity by the software, EPISOFT. For the analyses
2 Journal of Immunology Research
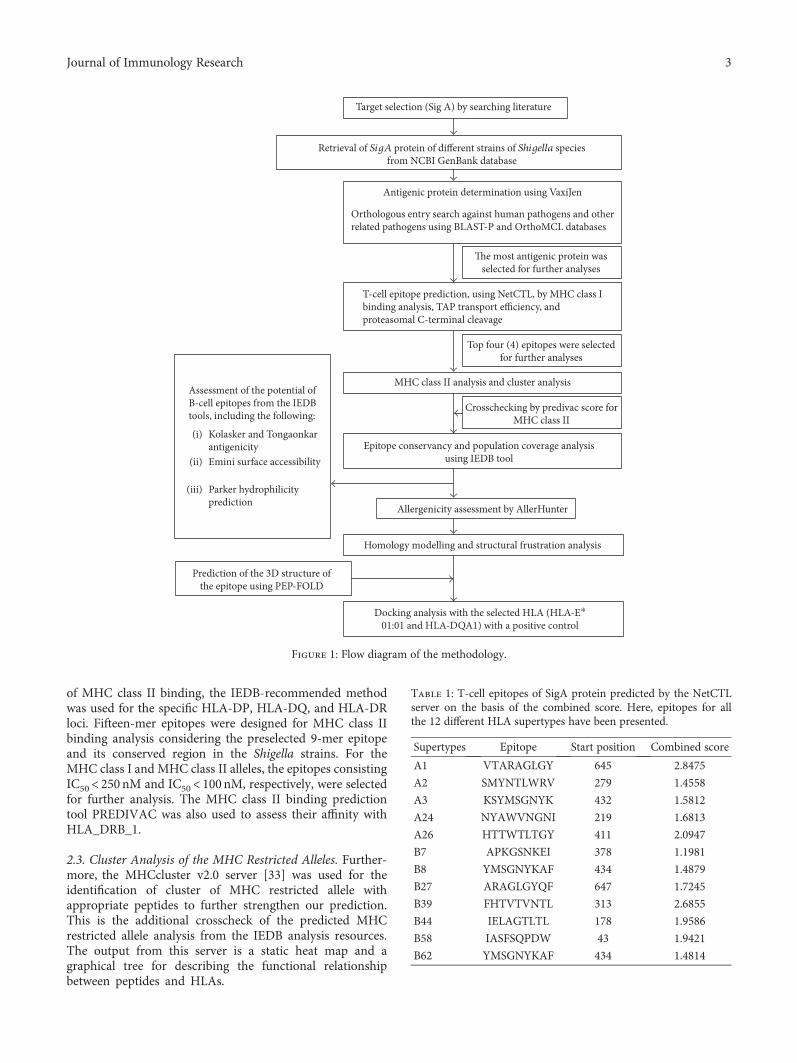
of MHC class II binding, the IEDB-recommended methodwas used for the specific HLA-DP, HLA-DQ, and HLA-DRloci. Fifteen-mer epitopes were designed for MHC class IIbinding analysis considering the preselected 9-mer epitopeand its conserved region in the Shigella strains. For theMHC class I and MHC class II alleles, the epitopes consistingIC50< 250 nM and IC50< 100nM, respectively, were selectedfor further analysis. The MHC class II binding predictiontool PREDIVAC was also used to assess their affinity withHLA_DRB_1.
2.3. Cluster Analysis of the MHC Restricted Alleles. Further-more, the MHCcluster v2.0 server [33] was used for theidentification of cluster of MHC restricted allele withappropriate peptides to further strengthen our prediction.This is the additional crosscheck of the predicted MHCrestricted allele analysis from the IEDB analysis resources.The output from this server is a static heat map and agraphical tree for describing the functional relationshipbetween peptides and HLAs.
Table 1: T-cell epitopes of SigA protein predicted by the NetCTLserver on the basis of the combined score. Here, epitopes for allthe 12 different HLA supertypes have been presented.
Supertypes Epitope Start position Combined score
A1 VTARAGLGY 645 2.8475
A2 SMYNTLWRV 279 1.4558
A3 KSYMSGNYK 432 1.5812
A24 NYAWVNGNI 219 1.6813
A26 HTTWTLTGY 411 2.0947
B7 APKGSNKEI 378 1.1981
B8 YMSGNYKAF 434 1.4879
B27 ARAGLGYQF 647 1.7245
B39 FHTVTVNTL 313 2.6855
B44 IELAGTLTL 178 1.9586
B58 IASFSQPDW 43 1.9421
B62 YMSGNYKAF 434 1.4814
Target selection (Sig A) by searching literature
Retrieval of SigA protein of different strains of Shigella speciesfrom NCBI GenBank database
Antigenic protein determination using VaxiJen
Orthologous entry search against human pathogens and otherrelated pathogens using BLAST-P and OrthoMCL databases
The most antigenic protein wasselected for further analyses
T-cell epitope prediction, using NetCTL, by MHC class Ibinding analysis, TAP transport efficiency, andproteasomal C-terminal cleavage
Top four (4) epitopes were selectedfor further analyses
MHC class II analysis and cluster analysis
Crosschecking by predivac score forMHC class II
Epitope conservancy and population coverage analysisusing IEDB tool
Allergenicity assessment by AllerHunter
Homology modelling and structural frustration analysis
Docking analysis with the selected HLA (HLA-E⁎
01:01 and HLA-DQA1) with a positive control
Prediction of the 3D structure ofthe epitope using PEP-FOLD
Assessment of the potential ofB-cell epitopes from the IEDBtools, including the following:
Kolasker and Tongaonkarantigenicity
(i)
Emini surface accessibility(ii)
Parker hydrophilicityprediction
(iii)
Figure 1: Flow diagram of the methodology.
3Journal of Immunology Research

2.4. Epitope Conservancy and Population Coverage Analyses.Epitope conservancy of the candidate epitopes was exam-ined using a web-based epitope conservancy tool availablein IEDB analysis resource [34]. The conservancy level of
each potential epitope was calculated by considering iden-tities in all SigA protein sequences of different strainsretrieved from the database. Multiple sequence alignment(MSA) was employed to understand the positions of the
Table 2: Epitopes for CD8+ T-cell along with their interacting MHC class I alleles with affinity< 250 nM.
Epitope Interacting MHC-I allele (IC50) on the nM scale
VTARAGLGY HLA-A∗29:02 (40.62), HLA-A∗01:01 (224.16), HLA-A∗30:02 (168.45), HLA-B∗15:02 (81.70), HLA-C∗03:03 (103.66)
FHTVTVNTLHLA-B∗39:01 (9.02), HLA-B∗38:01 (62.10), HLA-B∗15:02 (21.84), HLA-C∗03:03 (5.48), HLA-C∗08:02 (211.91),
HLA-C∗14:02 (92.18), HLA-C∗12:03 (78.92)
HTTWTLTGYHLA-A∗26:01 (162.41), HLA-A∗25:01 (219.32), HLA-B∗15:02 (153.54), HLA-C∗14:02 (122.92), HLA-C∗12:03 (33.90),
HLA-C∗03:03 (144.75)
IELAGTLTL HLA-E∗01:01 (152.83), HLA-B∗40:01 (35.47), HLA-B∗15:02 (55.75), HLA-C∗03:03 (29.28), HLA-C∗12:03 (109.70)
IASFSQPDWHLA-B∗58:01 (9.34), HLA-B∗57:01 (42.06), HLA-B∗53:01 (61.22), HLA-C∗03:03 (2.35), HLA-C∗08:02 (187.57),
HLA-C∗15:02 (164.60), HLA-C∗12:03 (11.95), HLA-C∗14:02 (248.10)ARAGLGYQF HLA-C∗12:03, HLA-C∗03:03 (53.53), HLA-B∗15:02 (107.95), HLA-B∗27:05 (97.18)NYAWVNGNI HLA-A∗68:02 (188.19), HLA-C∗14:02 (21.26), HLA-C∗03:03 (220.60), HLA-C∗12:03 (60.56)
KSYMSGNYKHLA-C∗15:02 (6.94), HLA-A∗30:01 (9.18), HLA-A∗11:01 (11.28), HLA-A∗03:01 (20.22), HLA-A∗31:01 (54.63),
HLA-C∗14:02 (40.80), HLA-C∗03:03 (61.75), HLA-C∗12:03 (31.71)
YMSGNYKAFHLA-B∗15:01 (61.09), HLA-B∗35:01 (124.62), HLA-C∗14:02 (17.24), HLA-B∗15:02 (61.69), HLA-C∗03:03 (13.14),
HLA-C∗12:03 (151.43)
SMYNTLWRV HLA-A∗02:01 (6.70), HLA-A∗02:06 (13.79), HLA-C∗14:02 (105.59), HLA-C∗12:03 (30.21)
APKGSNKEI HLA-B∗07:02 (199.48), HLA-C∗12:03 (7.82), HLA-C∗03:03 (37.81)
HLA-B15:01HLA-B15:02HLA-A26:01HLA-A25:01HLA-A30:02HLA-A29:02HLA-A01:01HLA-B57:01HLA-B58:01HLA-B53:01HLA-B35:01HLA-B07:02HLA-C08:02HLA-C15:02HLA-C03:03HLA-C12:03HLA-C06:06HLA-C07:01HLA-C14:02HLA-A02:01HLA-A02:06HLA-A68:02HLA-B39:01HLA-B38:01HLA-B40:01HLA-B27:05HLA-A11:01HLA-A03:01HLA-A31:01
HLA
-A30
:01
HLA
-A31
:01
HLA
-A03
:01
HLA
-A11
:01
HLA
-B27
:05
HLA
-B40
:01
HLA
-B38
:01
HLA
-B39
:01
HLA
-A68
:02
HLA
-A02
:06
HLA
-A02
:01
HLA
-C14
:02
HLA
-C07
:01
HLA
-C06
:02
HLA
-C12
:03
HLA
-C03
:03
HLA
-C15
:02
HLA
-C08
:02
HLA
-B07
:02
HLA
-B35
:01
HLA
-B53
:01
HLA
-B58
:01
HLA
-B57
:01
HLA
-A01
:01
HLA
-A29
:02
HLA
-A30
:02
HLA
-A25
:01
HLA
-A26
:01
HLA
-B15
:02
HLA
-B15
:01
Color key
0 10.4Value
(a)
Color key
0 10.4Value
DRB1 :0101
DRB1 :0901
DRB1 :0701
DRB1 :0401
DRB1 :1302
DRB4 :0101
DRB3 :0101
DRB1 :0301
DRB1 :0802
DRB1 :0803
DRB1 :1501
DRB1 :1101
DRB1 :1402
DRB5 :0101
DRB
5 :0
101
DRB
1 :1
402
DRB
1 :1
101
DRB
1 :1
501
DRB
1 :0
803
DRB
1 :0
802
DRB
1 :0
301
DRB
3 :0
101
DRB
4 :0
101
DRB
1 :1
302
DRB
1 :0
401
DRB
1 :0
701
DRB
1 :0
901
DRB
1 :0
101
(b)
Figure 2: Cluster analysis of the HLA alleles for both MHC molecules through heat map representation. (a) Representing the cluster of theMHC-I. (b) Representing the cluster of MHC-II molecules. Epitopes are clustered on the basis of interaction with HLA and shown as redcolour indicating strong interaction with appropriate annotation. Yellow zone indicates the weaker interaction. Here, all the availablealleles are shown only.
4 Journal of Immunology Research

epitopes within the sequences. As SPATE family is verymuch specific for the enterobacteria, specifically, E. coliand Shigella, we also include two E. coli sequences(gi|693049347| and gi|699401135|) along with those of fourspecies of Shigella for MSA construction. The Jalview(http://www.jalview.org/) tool was used for this analysis.The conservancy of the selected peptides was also substan-tiated by the Protein Variability Software (PVS) [35]. Pop-ulation coverage for the epitope was assessed by the IEDB
population coverage calculation tool [36]. The combinedscore for MHC classes I and II was assessed for theanalysis of the population coverage.
2.5. Homology Modelling and Structural Frustration Analysis.A homology model of the conserved region was obtained byMODELLER v9 [37], and the predicted model was assessedby the PROCHECK [38, 39] server. For the disorder predic-tion among the amino acid sequences, DISOPRED v3 [40]
Table 3: The potential CD4+ T-cell epitopes along with their interacting MHC class II alleles with affinity (IC50)< 100 nM and respectivepredivac scores.
Epitope Interacting MHC-II allele (IC50) on the nM scaleNumberof alleles
Predivac score(binding core)
VTARAGLGYQFDLFAHLA-DRB1∗04:01, HLA-DRB1∗09:01, HLA-DRB1∗04:05, HLA-DRB3∗01:01,
HLA-DQA1∗05:01 568.76
(LGYQFDLFA)
NSGFHTVTVNTLDAT
HLA-DRB1∗01:01 (53), HLA-DRB1∗01:21 (17.87), HLA-DRB1∗01:17 (77.94),HLA-DRB1∗01:16 (98.93), HLA-DRB1∗01:13 (61.53), HLA-DRB1∗01:29 (83.08),HLA-DRB1∗01:24 (62.89), HLA-DRB1∗01:10 (28.18), HLA-DRB1∗01:11 (45.39),HLA-DRB1∗01:19 (39.99), HLA-DRB1∗01:12 (39.99), HLA-DRB1∗01:31 (39.99),HLA-DRB1∗01:32 (39.99), HLA-DRB1∗01:08 (39.99), HLA-DRB1∗01:05 (39.99),HLA-DRB1∗01:07 (39.99), HLA-DRB1∗01:27 (39.99), HLA-DRB1∗01:25 (39.99),HLA-DRB1∗01:22 (39.99), HLA-DRB1∗01:28 (39.99), HLA-DRB1∗01:14 (47.44),HLA-DRB1∗01:09 (37.12), HLA-DRB1∗01:15 (71.58), HLA-DRB1∗01:18 (44.25),HLA-DRB1∗01:06 (35.78), HLA-DRB1∗01:26 (38.4), HLA-DRB1∗01:20 (41.15),HLA-DRB1∗01:23 (48.69), HLA-DRB1∗01:04 (48.54), HLA-DRB1∗07:06 (65.25),
HLA-DRB1∗07:05 (65.06), HLA-DRB5∗02:05 (46.61)
3271.56
(FHTVTVNTL)
KAIELAGTLTLTGTP
HLA-DRB1∗01:01 (82), HLA-DRB1∗01:21 (23.85), HLA-DRB1∗01:17 (98.16),HLA-DRB1∗01:24 (58.9), HLA-DRB1∗01:10 (29.05), HLA-DRB1∗01:11 (49.8),HLA-DRB1∗01:19 (44.72), HLA-DRB1∗01:12 (44.72), HLA-DRB1∗01:31 (44.72),HLA-DRB1∗01:32 (44.72), HLA-DRB1∗01:08 (44.72), HLA-DRB1∗01:05 (44.72),HLA-DRB1∗01:07 (44.72), HLA-DRB1∗01:27 (44.72), HLA-DRB1∗01:25 (44.72),HLA-DRB1∗01:22 (44.72), HLA-DRB1∗01:28 (44.72), HLA-DRB1∗01:03 (91.98),HLA-DRB1∗01:14 (54.39), HLA-DRB1∗01:09 (31.87), HLA-DRB1∗01:15 (59.62),HLA-DRB1∗01:18 (40.48), HLA-DRB1∗01:06 (14.26), HLA-DRB1∗01:26 (18.43),HLA-DRB1∗01:20 (17.57), HLA-DRB1∗01:23 (24.27), HLA-DRB1∗01:04 (18.63),
HLA-DRB1∗01:01 (82), HLA-DRB5∗02:05 (70.95)
2971.70
(IELAGTLTL)
NNQIASFSQPDWESR 055.02
(FSQPDWESR)
VTARAGLGYQFDLFA 068.76
(LGYQFDLFA)
AQNYAWVNGNIKSDK HLA-DRB5∗01:01 (62), HLA-DRB5∗02:04 (93.07), HLA-DRB5∗02:05 (24.55) 378.78
(YAWVNGNIK)
AAKSYMSGNYKAFLT
HLA-DRB1∗08:05 (65.65), HLA-DRB1∗12:03 (94.66), HLA-DRB1∗01:09 (57.66),HLA-DRB1∗01:10 (98.95), HLA-DRB1∗01:19 (99.23), HLA-DRB1∗01:12 (99.23),HLA-DRB1∗01:31 (99.23), HLA-DRB1∗01:32 (99.23), HLA-DRB1∗01:08 (99.23),HLA-DRB1∗01:05 (99.23), HLA-DRB1∗01:07 (99.23), HLA-DRB1∗01:27 (99.23),HLA-DRB1∗01:25 (99.23), HLA-DRB1∗01:22 (99.23), HLA-DRB1∗01:28 (99.23),HLA-DRB1∗01:21 (73.89), HLA-DRB1∗01:06 (52.24), HLA-DRB1∗01:23 (86.01),HLA-DRB1∗01:04 (87.14), HLA-DRB1∗01:26 (83.15), HLA-DRB1∗01:20 (85.84),HLA-DRB5∗02:05 (12.01), HLA-DRB5∗02:02 (67.2), HLA-DRB5∗02:04 (62.02)
2460.30
(KSYMSGNYK)
SYMSGNYKAFLTEVNHLA-DRB1∗01:21 (56.34), HLA-DRB1∗01:09 (89.52), HLA-DRB1∗01:10 (81.52),HLA-DRB1∗01:26 (98.98), HLA-DRB1∗01:06 (88.25), HLA-DRB1∗04:05 (38),
HLA-DRB5∗02:05 (41.74)7
69.98(YKAFLTEVN)
ASMYNTLWRVNGQSA
HLA-DRB1∗08:05 (35.19), HLA-DRB1∗13:01 (49.45), HLA-DRB1∗12:05 (52.01),HLA-DRB1∗12:02 (60.35), HLA-DRB1∗12:03 (50.74), HLA-DRB1∗01:23 (62.08),HLA-DRB1∗01:26 (66.37), HLA-DRB1∗01:20 (74.19), HLA-DRB1∗01:06 (73.79),
HLA-DRB5∗02:05 (44.37), HLA-DRB1∗11:01 (70)
1182.45
(LWRVNGQSA)
5Journal of Immunology Research

was used. The protein frustratometer server [41] wasemployed for the detection of the stability and energy differ-ences of the 3D structure of the protein.
2.6. Molecular Docking Analysis and HLA Allele Interaction.Docking studies were also performed using the best possibleepitope following the strategy used in previous studies[27, 28]. AutoDock Vina [42] was used for the dockinganalysis. In our study, we have selected the HLA-E∗01:01molecule as a candidate for MHC class I and the HLA-DQA1 as a candidate for MHC class II for docking analysisbecause they are the available hits in the Protein Data Bank(PDB) database. The PDB structure 2ESV, human cytomeg-alovirus complexes with T-cell receptors, VMAPRTLILpeptide, and 3PL6—structure of autoimmune TCRHy.1B11 in complex with HLA-DQ1—were retrieved fromthe Research Collaboratory for Structural Bioinformatics(RCSB) protein database [43]. Then, the structures weresimplified by using PyMOL (the PyMOLMolecular GraphicsSystem, Version 1.5.0.4, Schrödinger, LLC) for the finaldocking purpose.
The PEP-FOLD server [44] was used for the conversionof the 3D structure of the epitope “IELAGTLTL” for MHCI and the epitope “KAIELAGTLTLTGTP” for the MHC IImolecule in order to analyse the interaction with HLA alleles.
Finally, molecular docking was performed at the center ofX: 77.8087, Y: −3.2264, and Z: −9.5769 and the dimensions(angstrom) of X: 31.4432, Y: 29.9517, and Z: 19.0455 forthe MHC I molecules. For the MHC II molecules, dockingwas performed at the center of X: 38.5584, Y: 46.6132, andZ: −36.4392 and the dimensions (angstrom) of X: 34.8104,Y: 40.4401, and Z: 37.3366. Additionally, we have per-formed a control docking with the experimentally knownpeptide—MHC-bound complex. The PDB structure 2ESV,human cytomegalovirus complexes with T-cell receptors,and VMAPRTLIL peptide were used for this purpose. Thegridline was used at the center of X: 77.3404, Y: −3.5159,and Z: −9.5829.
2.7. Allergenicity Investigation and B-Cell Epitope Prediction.The AllerHunter server [45] was used to predict the
allergenicity of our proposed epitope for further securingthe prediction, and the support vector machine (SVM)algorithm was used for the prediction within the server[46]. The predicted T-cell epitope (15-mer) was screenedby IEDB-AR using a number of web-based tools for thesuitability as the B-cell epitope [47–49].
3. Results
3.1. Analysis of the Retrieved Sequences andTheir Antigenicity.A total of 44 SigA proteins from different variants of S. flex-neri, S. dysenteriae, S. boydii, and S. sonneiwere retrieved fromthe GenBank database (Table S1 in Supplementary Materialavailable online at https://doi.org/10.1155/2017/6412353).Thereafter, analyses with the VaxiJen v2.0 server showed theprotein with the accession number of gi|745767180| to havethe highest antigenicity of 0.6699 (Table S1). This highlyantigenic protein was further analysed to detect the highlyimmunogenic epitope. No significant entry was found in theorthologous entry search of our targeted protein.
3.2. T-Cell Epitope Identification. The NetCTLv1.2 serveridentified the T-cell epitopes, where the epitope predictionwas confined to 12 MHC class I supertypes. Based on thecombined score, the top twelve epitopes (Table 1) were listedfor further analysis.
3.3. MHC Restriction and Cluster Analysis. IEDB analysisresource predicted both MHC class I and MHC class IIrestricted allele on the basis of the IC50 value. All the pre-dicted epitopes in Table 1 were assessed for the MHC inter-action analysis. Epitopes for the MHC class I alleles arepresented in Table 2. The peptide IELAGTLTLT was pre-dicted to have the highest number of MHC class I binding.This peptide was predicted to have the binding affinity withfive MHC class I alleles including HLA-E∗01:01, HLA-B∗40:01, HLA-B∗15:02, HLA-C∗03:03, and HLA-C∗12:03.Furthermore, the interacted alleles were reassessed by clus-ter analysis and are shown in Figure 2(a), as a heat map,and in Figure S1A, as a dynamic tree. The peptides werereassessed by the EPISOPT software for the HLA I binding,
Table 4: Conservancy analysis of all the epitopes with appropriate length.
Epitope Conservancy Length Epitope Conservancy Length
VTARAGLGY 84.09% 9 VTARAGLGYQFDLFA 84.09% 15
SMYNTLWRV 100% 9 ASMYNTLWRVNGQSA 100% 15
KSYMSGNYK 97.73% 9 AAKSYMSGNYKAFLT 97.73% 15
NYAWVNGNI 100% 9 AQNYAWVNGNIKSDK 97.73% 15
HTTWTLTGY 97.73% 9 No prediction Undetected 15
APKGSNKEI 100% 9 No prediction Undetected 15
YMSGNYKAF 97.73% 9 SYMSGNYKAFLTEVN 97.73% 15
ARAGLGYQF 84.09% 9 VTARAGLGYQFDLFA 84.09% 15
FHTVTVNTL 100% 9 NSGFHTVTVNTLDAT 100% 15
IELAGTLTL 100% 9 KAIELAGTLTLTGTP 100% 15
IASFSQPDW 97.73% 9 NNQIASFSQPDWESR 97.73% 15
YMSGNYKAF 97.73% 9 SYMSGNYKAFLTEVN 97.73% 15
6 Journal of Immunology Research

and IELAGTLTL was found to have affinity with six HLA Ialleles (Table S3). From this analysis, we selected top fourpeptides VTARAGLGY, FHTVTVNTL, HTTWTLTGY,and IELAGTLTL depending on the affinity with mostMHC class I.
Epitopes for the MHC class II alleles are presented inTable 3. Depending on the IC50 values as well as on thenumber of MHC class II alleles, three 15-mer peptide candi-dates were selected. The peptides NSGFHTVTVNTLDAT,KAIELAGTLTLTGTP, and AAKSYMSGNYKAFLT werepredicted to have high affinity with MHC-II allele, whichcan interact with 32, 29, and 24MHC class II alleles. The datahas been validated by another software PREDIVAC. The pre-divac scores of the two core peptides FHTVTVNTL andIELAGTLTL have been shown to be promising for theirbinding to HLA_DRB_1 (Table 3). Accumulating bothMHC class I allele- and MHC class II allele-based analyses,we showed FHTVTVNTL and IELAGTLTL peptides to havethe best score to be a vaccine potential.
3.4. Conservancy Analysis and Position of the Epitopes. Con-servancy of all the proposed epitopes was assessed by theIEDB conservancy analysis tool and is summarized inTable 4. FHTVTVNTL, IELAGTLTL, NYAWVNGNI, andSMYNTLWRV were shown to have 100% conserved regionsacross all the SigA proteins. The position of all the predictedepitopes is shown in a multiple sequence alignment of SigAproteins in Figure 3. Here, we used only our desiredsequences for the proper annotation. So, from the most
potential candidates, only two, that is, FHTVTVNTL andIELAGTLTL, were found to be fully conserved. The top fourepitopes were shown within the protein in Figure 4. Theconservancy of both of these peptides were crosscheckedby PVS software, and it was found that they were locatedin the conserved region of the SigA protein (Figure S5).
gi|647302223| YK S
600 610 740 750 780
NNQ IA S F SQPDW ES R A I E LAGTL T TGTPTGTPTGTPTGTPTGTPTGTPTGTP
L Q NY WVNGN I K A S
840 870 880
MYNTLWRV ENSENSENSENSENSENSENS
G FHTVTVNTLG FHTVTVNTLG FHTVTVNTLG FHTVTVNTLG FHTVTVNTLG FHTVTVNTLG FHTVTVNTL
FHTVTVNTL
SMYNTLWRVSMYNTLWRVSMYNTLWRVSMYNTLWRVSMYNTLWRVSMYNTLWRVSMYNTLWRV
AAAAAA
AQ NY WVNGN I KAQ NY WVNGN I KAQ NY WVNGN I KAQ NY WVNGN I KAQ NY WVNGN I KAQ NY WVNGN I KA
NY WVNGN IA
I E LAGTL TLI E LAGTL TLI E LAGTL TLI E LAGTL TLI E LAGTL TLI E LAGTL TLI E LAGTL TL
KES R AKES R AKES R AKES R AKES R AKES R AK
IA S F SQPDWIA S F SQPDWIA S F SQPDWIA S F SQPDWIA S F SQPDWIA S F SQPDWIA S F SQPDW
YKSNNQYK SNNQYK SNNQYK SNNQYK SNNQYK SNNQ
gi|446956855|gi|844758686|gi|446956853|gi|446956854|gi|693049347|gi|699401135|
Conservation
gi|647302223|
940
T APKGSN KE I F Q E HTTWTL TGYKVA E NTAS S GAA K S YMS GNYKAF L VTARAGLGYQF DVTARAGLGYQF DVTARAGLGYQF DVTARAGLGYQF DVTARAGLGYQF DVTARAGLGYQF DVTARAGLGYQFVTARAGLGY
ARAGLGYQF
D
K S YMS GNYKAF LK S YMS GNYKAF LK S YMS GNYKAF LK S YMS GNYKAF LK S YMS GNYKAF LK S YMS GNYKAFK S YMS GNYK
YMSGNYKAF
L
QE HTTWTL TGYKVA E NTAS S GAAQE HTTWTL TGYKVA E NTAS S GAAQE HTTWTL TGYKVA E NTAS S GAAQE HTTWTL TGYKVA E NTAS S GAAQE HTTWTL TGYKVA E NTAS S GAAQE HTTWTL TGY
HTTWTL TGYKVA E NTAS S GAA
T APKGSN KE I FT APKGSN KE I FT APKGSN KE I FT APKGSN KE I FT APKGSN KE I FT APKGSN
Conservation
KE IAPKGSN KE I
F
970 980 990 1000 1210
gi|446956855|gi|844758686|gi|446956853|gi|446956854|gi|693049347|gi|699401135|
Figure 3: MSA-based location identification of the different epitopes within the SPATE proteins of Shigella and their homologue in E. coli. Inthis figure, gi|647302223|, gi|446956855|, gi|844758686|, and gi|446956853| represent the S. flexneri, S. sonnei, S. boydii, and S. dysenteriae,respectively. E. coli represented by gi|693049347| and gi|699401135|.
Figure 4: The three-dimensional model of SPATE subfamilyprotein SigA with the proposed epitopes VTARAGLGY(magenta), FHTVTVNTL (yellow), HTTWTLTGY (green), andIELAGTLTL (red). The superficial localities of the epitopesindicate their surface accessibility.
7Journal of Immunology Research

The epitopes are precisely positioned on the surface of theprotein indicating that they would be accessible to theimmune system, especially by B-cells.
3.5. Model Validation Structural Frustration Analysis.MODELLER modelled the three-dimensional structure ofthe targeted protein through the best multiple template-based modelling approach. The validation of the modelwas measured by the PROCHECK server through theRamachandran plot and is depicted in Figure S2, where88.8% amino acid residues were found within the favouredregion. Furthermore, the predicted model was also assessedfor the frustration analysis and is depicted in Figure 5. TheDISOPRED server likewise assessed the disorder of the
protein sequences in order to get an understanding aboutthe disorder among the targeted sequences, which is shownin Figure S3.
3.6. Population Coverage Analysis. IEDB analysis resourcepredicted both MHC class I- and MHC class II-basedcoverage of the selected epitopes for the world popula-tion to assess the feasibility of being a potential vaccinecandidate. The combined prediction was also assessed.The epitope “IELAGTLTLT” has the highest populationcoverage of 83.86% for the whole world population(shown graphically in Figure 6); however, another potentialepitope “FHTVTVNTL” was shown to have 50.61% popula-tion coverage (Table S2).
(a) (b)
Figure 5: The configurational frustration index of the predicted model of the SigA. (a) This analysis detects the stability and energydifferences of the 3D structure of the protein. Colours are in accordance with their frustration index. The red colour regions are highlyfrustrated and the green colour regions are not frustrated. The frustrated residues are able to change their identity and also displace thelocation in any favourable conditions. (b) The locations of our proposed epitopes are described by different colours. The epitopesHTTWTLTGY (cyan) and IELAGTLTL (blue) are well outside of the frustrated regions and securing their stability. On the other hand,the epitopes VTARAGLGY (yellow) and FHTVTVNTL (orange) are in the frustrated regions and unable to secure their stability.
Cumulative percent of population coverage
World—Class I and II coverage
Perc
ent o
f ind
ivid
uals
Cou
mul
ativ
e per
cent
of p
opul
atio
n co
vera
ge
656055504540353025201510
50
10090PC90
80706050403020100
0 1 2 3 4 5 6 7Number of epitope hits/HLA combinations recognized
Figure 6: Population coverage analysis for the top predicted epitope based on the HLA interaction. Here, the whole world populations areassessed for the proposed epitope. The combined prediction for both of the MHC has been shown. Here, the number 1 bar for all theanalyses represents out-predicted epitope. Notes: in the graphs, the line (-o-) represents the cumulative percentage of population coverageof the epitopes; the bars represent the population coverage for each epitope.
8 Journal of Immunology Research
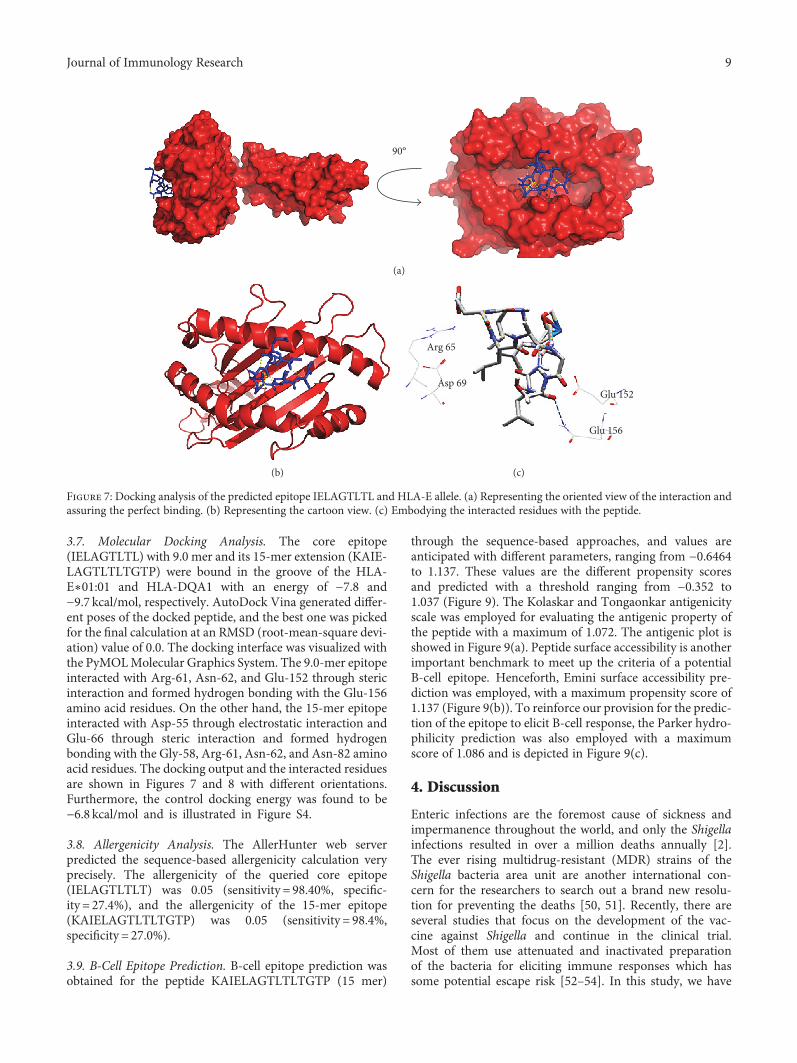
3.7. Molecular Docking Analysis. The core epitope(IELAGTLTL) with 9.0 mer and its 15-mer extension (KAIE-LAGTLTLTGTP) were bound in the groove of the HLA-E∗01:01 and HLA-DQA1 with an energy of −7.8 and−9.7 kcal/mol, respectively. AutoDock Vina generated differ-ent poses of the docked peptide, and the best one was pickedfor the final calculation at an RMSD (root-mean-square devi-ation) value of 0.0. The docking interface was visualized withthe PyMOLMolecular Graphics System. The 9.0-mer epitopeinteracted with Arg-61, Asn-62, and Glu-152 through stericinteraction and formed hydrogen bonding with the Glu-156amino acid residues. On the other hand, the 15-mer epitopeinteracted with Asp-55 through electrostatic interaction andGlu-66 through steric interaction and formed hydrogenbonding with the Gly-58, Arg-61, Asn-62, and Asn-82 aminoacid residues. The docking output and the interacted residuesare shown in Figures 7 and 8 with different orientations.Furthermore, the control docking energy was found to be−6.8 kcal/mol and is illustrated in Figure S4.
3.8. Allergenicity Analysis. The AllerHunter web serverpredicted the sequence-based allergenicity calculation veryprecisely. The allergenicity of the queried core epitope(IELAGTLTLT) was 0.05 (sensitivity = 98.40%, specific-ity = 27.4%), and the allergenicity of the 15-mer epitope(KAIELAGTLTLTGTP) was 0.05 (sensitivity = 98.4%,specificity = 27.0%).
3.9. B-Cell Epitope Prediction. B-cell epitope prediction wasobtained for the peptide KAIELAGTLTLTGTP (15 mer)
through the sequence-based approaches, and values areanticipated with different parameters, ranging from −0.6464to 1.137. These values are the different propensity scoresand predicted with a threshold ranging from −0.352 to1.037 (Figure 9). The Kolaskar and Tongaonkar antigenicityscale was employed for evaluating the antigenic property ofthe peptide with a maximum of 1.072. The antigenic plot isshowed in Figure 9(a). Peptide surface accessibility is anotherimportant benchmark to meet up the criteria of a potentialB-cell epitope. Henceforth, Emini surface accessibility pre-diction was employed, with a maximum propensity score of1.137 (Figure 9(b)). To reinforce our provision for the predic-tion of the epitope to elicit B-cell response, the Parker hydro-philicity prediction was also employed with a maximumscore of 1.086 and is depicted in Figure 9(c).
4. Discussion
Enteric infections are the foremost cause of sickness andimpermanence throughout the world, and only the Shigellainfections resulted in over a million deaths annually [2].The ever rising multidrug-resistant (MDR) strains of theShigella bacteria area unit are another international con-cern for the researchers to search out a brand new resolu-tion for preventing the deaths [50, 51]. Recently, there areseveral studies that focus on the development of the vac-cine against Shigella and continue in the clinical trial.Most of them use attenuated and inactivated preparationof the bacteria for eliciting immune responses which hassome potential escape risk [52–54]. In this study, we have
90°
(a)
(b)
Arg 65
Asp 69Glu 152
Glu 156
(c)
Figure 7: Docking analysis of the predicted epitope IELAGTLTL and HLA-E allele. (a) Representing the oriented view of the interaction andassuring the perfect binding. (b) Representing the cartoon view. (c) Embodying the interacted residues with the peptide.
9Journal of Immunology Research
tried to find out alternatives to treat this global burdenthrough vaccinomics approaches and targeting the immu-nogenic and toxic protein SigA. The sequences of differentstrains of Shigella showed that there is a little island ofconserved sequence throughout the species [55], and wehave focused on that target for designing the vaccinecandidate. The orthologous entry search of our targetedprotein revealed no significant similarity with humanpathogens and other closely related pathogens. These resultsfurther strengthen our prediction through confirming nocross immunity.
In recent time, most of the vaccines are grounded on B-cell immunity; vaccines based on a T-cell epitope have beeninvigorated lately. This is often as a result of body substanceresponse from memory B-cells which may be overawed basi-cally by matter drift as time goes on, whereas cell-mediatedimmunity repeatedly delivers long-run immunity [56, 57].
As a consequence, a T-lymphocyte epitope elicits a robustand distinctive immune response through the cytotoxiclymphocyte- (CTL-) mediated pathway and impedes thespreading of the infectious agents by the CTL through recog-nizing and killing the infected cells or by secreting specificcytokines [58].
The epitopes VTARAGLGY, FHTVTVNTL, HTTWTLTGY, and IELAGTLTL are primarily selected for thedesigning of vaccine from the initial analysis depending onthe affinity with MHC class I and additionally confirmedtheir presence along with those of the ancestral homologuein E. coli (Figure 2). Finally, through substantiation withdifferent parameters, the core epitopes IELAGTLTL andFHTVTVNTL (in 15.0-mer form, KAIELAGTLTLTGTPand NSGFHTVTVNTLDAT, resp.) were found to be themost potential and highly interacting HLA candidates forMHC class II molecule. Furthermore, we have used
90°
(a)
(b)
Glu 66 B
Asn 82 B
Asp 55 A
Gly 58 A
Arg 61 AAsn 62 A
(c)
Figure 8: Docking analysis of the predicted epitope KAIELAGTLTLTGTP and HLA-DQA1 allele. (a) Representing the oriented view of theinteraction and assuring the perfect binding. (b) Representing the cartoon view. (c) Embodying the interacted residues with the peptide.
10 Journal of Immunology Research
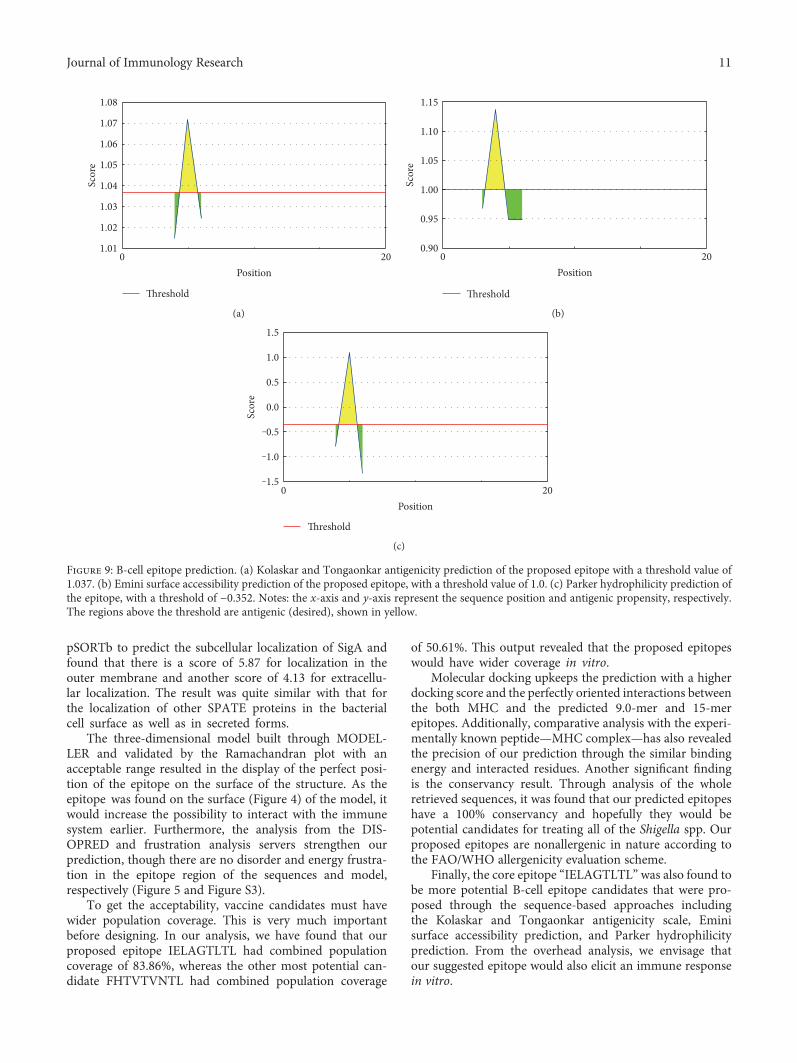
pSORTb to predict the subcellular localization of SigA andfound that there is a score of 5.87 for localization in theouter membrane and another score of 4.13 for extracellu-lar localization. The result was quite similar with that forthe localization of other SPATE proteins in the bacterialcell surface as well as in secreted forms.
The three-dimensional model built through MODEL-LER and validated by the Ramachandran plot with anacceptable range resulted in the display of the perfect posi-tion of the epitope on the surface of the structure. As theepitope was found on the surface (Figure 4) of the model, itwould increase the possibility to interact with the immunesystem earlier. Furthermore, the analysis from the DIS-OPRED and frustration analysis servers strengthen ourprediction, though there are no disorder and energy frustra-tion in the epitope region of the sequences and model,respectively (Figure 5 and Figure S3).
To get the acceptability, vaccine candidates must havewider population coverage. This is very much importantbefore designing. In our analysis, we have found that ourproposed epitope IELAGTLTL had combined populationcoverage of 83.86%, whereas the other most potential can-didate FHTVTVNTL had combined population coverage
of 50.61%. This output revealed that the proposed epitopeswould have wider coverage in vitro.
Molecular docking upkeeps the prediction with a higherdocking score and the perfectly oriented interactions betweenthe both MHC and the predicted 9.0-mer and 15-merepitopes. Additionally, comparative analysis with the experi-mentally known peptide—MHC complex—has also revealedthe precision of our prediction through the similar bindingenergy and interacted residues. Another significant findingis the conservancy result. Through analysis of the wholeretrieved sequences, it was found that our predicted epitopeshave a 100% conservancy and hopefully they would bepotential candidates for treating all of the Shigella spp. Ourproposed epitopes are nonallergenic in nature according tothe FAO/WHO allergenicity evaluation scheme.
Finally, the core epitope “IELAGTLTL” was also found tobe more potential B-cell epitope candidates that were pro-posed through the sequence-based approaches includingthe Kolaskar and Tongaonkar antigenicity scale, Eminisurface accessibility prediction, and Parker hydrophilicityprediction. From the overhead analysis, we envisage thatour suggested epitope would also elicit an immune responsein vitro.
Threshold
1.08
1.07
1.06
1.05
1.04
1.03
1.02
1.01200
Position
Scor
e
(a)
20
Threshold
1.15
1.10
1.05
1.00
0.95
0.900
Position
Scor
e
(b)
20
Threshold
1.5
1.0
0.5
0.0
‒1.0
‒1.5
‒0.5
0Position
Scor
e
(c)
Figure 9: B-cell epitope prediction. (a) Kolaskar and Tongaonkar antigenicity prediction of the proposed epitope with a threshold value of1.037. (b) Emini surface accessibility prediction of the proposed epitope, with a threshold value of 1.0. (c) Parker hydrophilicity prediction ofthe epitope, with a threshold of −0.352. Notes: the x-axis and y-axis represent the sequence position and antigenic propensity, respectively.The regions above the threshold are antigenic (desired), shown in yellow.
11Journal of Immunology Research
5. Conclusion
The improved knowledge about antigen recognition atmolecular level led us to the development of rationallydesigned peptide vaccines. The idea of peptide vaccines isbased on detecting and chemical synthesis of immunodomi-nant B-cell and T-cell epitopes capable of evoking specificimmune responses. In this study, we used different compu-tational tools to identify potential epitope targets againstShigella which will help to decrease the cost and time ofwet lab experiments more successfully. Our bioinformaticanalyses speculate that the selected part of the outer mem-brane and highly immunogenic protein, SigA, is a potentialcandidate for a peptide vaccine. It might also contribute tothe reduction in the SigA-mediated pathogenicity to the host.However, further wet lab validation is necessary to confirmthe efficiency of our identified peptide sequence as an epitopevaccine against Shigella.
Abbreviations
SPATE: Serine protease autotransporter of enterobacteriaHEp-2: Human epithelial cell type-2MHC-I: Major histocompatibility complex class IMHC-II: Major histocompatibility complex class IIMSA: Multiple sequence alignmentGMMA: Generalized modules of membrane antigensCTL: Cytotoxic T-lymphocyteTAP: Transporter of antigenic peptideSMM: Stabilized matrix methodHLA: Human leukocyte antigen.
Additional Points
Availability of Data and Materials. Information about thedata and their availability is intricately described in Methods.
Ethical Approval
As samples from human or animals had not been used in thisstudy, ethical clearance is not applicable.
Consent
Patient consent is not applicable.
Conflicts of Interest
No potential competing interest was reported by the authors.
Authors’ Contributions
Arafat Rahman Oany conceived, designed, and guided thestudy; drafted the manuscript; and analysed the data.Tahmina Pervin, Mamun Mia, and Motaher Hossain carriedout themolecular genetic studies, participated in the sequencealignment, and drafted themanuscript. Mohammad Shahnaijhelped in the design of the study. Shahin Mahmud helped indrafting the manuscript. K. M. Kaderi Kibria participated inthe design and coordination, performed critical revision,
and helped in drafting the manuscript. All authors read andapproved the final manuscript.
References
[1] T. L. Hale and G. T. Keusch, “Shigella,” in Medical Microbiol-ogy, S. Baron, Ed., University of Texas Medical Branch atGalveston, Galveston (TX), USA, 1996, Chapter 22.
[2] K. L. Kotloff, J. P.Winickoff, B. Ivanoff et al., “Global burden ofShigella infections: implications for vaccine development andimplementation of control strategies,” Bulletin of the WorldHealth Organization, vol. 77, no. 8, p. 651, 1999.
[3] L. von Seidlein, D. R. Kim, M. Ali et al., “A multicentrestudy of Shigella diarrhoea in six Asian countries: diseaseburden, clinical manifestations, and microbiology,” PLoSMed-icine, vol. 3, no. 9, article e353, 2006.
[4] K. L. Kotloff, J. P. Nataro, W. C. Blackwelder et al., “Burdenand aetiology of diarrhoeal disease in infants and young chil-dren in developing countries (the Global Enteric MulticenterStudy, GEMS): a prospective, case-control study,” Lancet,vol. 382, no. 9888, p. 209, 2003.
[5] S. Dutta, K. Rajendran, S. Roy et al., “Shifting serotypes, plas-mid profile analysis and antimicrobial resistance pattern ofshigellae strains isolated from Kolkata, India during 1995-2000,” Epidemiology and Infection, vol. 129, no. 2, p. 235, 2002.
[6] M. A. Salam, U. Dhar, W. A. Khan, and M. L. Bennish, “Ran-domised comparison of ciprofloxacin suspension and pivme-cillinam for childhood shigellosis,” Lancet, vol. 352, no. 9127,p. 522, 1998.
[7] K. A. Talukder, B. K. Khajanchi, M. A. Islam et al., “Geneticrelatedness of ciprofloxacin-resistant Shigella dysenteriae type1 strains isolated in south Asia,” The Journal of AntimicrobialChemotherapy, vol. 54, no. 4, p. 730, 2004.
[8] K. A. Talukder, B. K. Khajanchi, M. A. Islam et al., “Fluoro-quinolone resistance linked to both gyrA and parC mutationsin the quinolone resistance-determining region of Shigella dys-enteriae type 1,” Current Microbiology, vol. 52, no. 2, p. 108,2006.
[9] I. R. Henderson, F. Navarro-Garcia, and J. P. Nataro, “Thegreat escape: structure and function of the autotransporterproteins,” Trends in Microbiology, vol. 6, no. 9, p. 370, 1998.
[10] K. Al-Hasani, F. Navarro-Garcia, J. Huerta, H. Sakellaris, andB. Adler, “The immunogenic SigA enterotoxin of Shigella flex-neri 2a binds to HEp-2 cells and induces fodrin redistributionin intoxicated epithelial cells,” PLoS One, vol. 4, no. 12, articlee8223, 2009.
[11] K. Al-Hasani, I. R. Henderson, H. Sakellaris et al., “The sigAgene which is borne on the shepathogenicity island of Shigellaflexneri 2a encodes an exported cytopathic protease involvedin intestinal fluid accumulation,” Infection and Immunity,vol. 68, no. 5, p. 2457, 2000.
[12] F. Berlanda Scorza, A. M. Colucci, L. Maggiore et al., “Highyield production process for Shigella outer membrane parti-cles,” PLoS One, vol. 7, no. 6, article e35616, 2012.
[13] A. Sette, M. Newman, B. Livingston et al., “Optimizing vaccinedesign for cellular processing, MHC binding and TCR recog-nition,” Tissue Antigens, vol. 59, no. 6, p. 443, 2002.
[14] G. A. Poland, I. G. Ovsyannikova, and R. M. Jacobson, “Appli-cation of pharmacogenomics to vaccines,” Pharmacogenomics,vol. 10, no. 5, p. 837, 2009.
12 Journal of Immunology Research

[15] S. P. Singh and B. N. Mishra, “Major histocompatibility com-plex linked databases and prediction tools for designing vac-cines,” Human Immunology, vol. 77, no. 3, p. 295, 2016.
[16] V. Brusic, G. Rudy, and L. C. Harrison, “MHCPEP, a databaseof MHC-binding peptides: update 1997,” Nucleic AcidsResearch, vol. 26, no. 1, p. 368, 1998.
[17] H. Rammensee, J. Bachmann, N. P. Emmerich, O. A. Bachor,and S. Stevanovic, “SYFPEITHI: database for MHC ligandsand peptide motifs,” Immunogenetics, vol. 50, no. 3-4, p. 213,1999.
[18] C. C. Wilson, D. McKinney, M. Anders et al., “Development ofa DNA vaccine designed to induce cytotoxic T lymphocyteresponses to multiple conserved epitopes in HIV-1,” Journalof Immunology, vol. 171, no. 10, p. 5611, 2003.
[19] D. N. Bourdette, E. Edmonds, C. Smith et al., “A highly immu-nogenic trivalent T cell receptor peptide vaccine for multiplesclerosis,” Multiple Sclerosis, vol. 11, no. 5, p. 552, 2005.
[20] H. L. Robinson and R. R. Amara, “T cell vaccines formicrobial infections,” Nature Medicine, vol. 11, article S25,Supplement 4, 2005.
[21] J. A. Lopez, C. Weilenman, R. Audran et al., “A syntheticmalaria vaccine elicits a potent CD8+ and CD4+ T lymphocyteimmune response in humans. Implications for vaccinationstrategies,” European Journal of Immunology, vol. 31, no. 7,p. 1989, 2001.
[22] D. A. Benson, K. Clark, I. Karsch-Mizrachi, D. J. Lipman,J. Ostell, and E. W. Sayers, “GenBank,” Nucleic Acids Research,vol. 43, article D30, Database issue, 2008.
[23] I. A. Doytchinova and D. R. Flower, “VaxiJen: a server forprediction of protective antigens, tumour antigens and subunitvaccines,” BMC Bioinformatics, vol. 8, p. 4, 2007.
[24] S. F. Altschul, W. Gish, W. Miller, E. W. Myers, and D. J.Lipman, “Basic local alignment search tool,” Journal of Molec-ular Biology, vol. 215, no. 3, p. 403, 1990.
[25] F. Chen, A. J. Mackey, C. J. Stoeckert Jr., and D. S. Roos,“OrthoMCL-DB: querying a comprehensive multi-speciescollection of ortholog groups,” Nucleic Acids Research,vol. 34, article D363, Database issue, 2006.
[26] S. P. Singh, K. Roopendra, and B. N. Mishra, “Genome-wideprediction of vaccine candidates for Leishmania major: anintegrated approach,” Journal of Tropical Medicine, vol. 2015,Article ID 709216, 14 pages, 2015.
[27] A. R. Oany, A. A. Emran, and T. P. Jyoti, “Design of anepitope-based peptide vaccine against spike protein of humancoronavirus: an in silico approach,” Drug Design, Developmentand Therapy, vol. 8, p. 1139, 2014.
[28] A. R. Oany, T. Sharmin, A. S. Chowdhury, T. P. Jyoti, andM. A. Hasan, “Highly conserved regions in Ebola virusRNA dependent RNA polymerase may be act as a universalnovel peptide vaccine target: a computational approach,” InSilico Pharmacol, vol. 3, no. 1, p. 7, 2015.
[29] M. V. Larsen, C. Lundegaard, K. Lamberth, S. Buus, O. Lund,and M. Nielsen, “Large-scale validation of methods for cyto-toxic T-lymphocyte epitope prediction,” BMC Bioinformatics,vol. 8, p. 424, 2007.
[30] S. Buus, S. L. Lauemoller, P. Worning et al., “Sensitive quanti-tative predictions of peptide-MHC binding by a ‘Query byCommittee’ artificial neural network approach,” Tissue Anti-gens, vol. 62, no. 5, p. 378, 2003.
[31] P. Wang, J. Sidney, C. Dow, B. Mothe, A. Sette, and B.Peters, “A systematic assessment of MHC class II peptide
binding predictions and evaluation of a consensus approach,”PLoS Computational Biology, vol. 4, no. 4, article e1000048,2008.
[32] P. Wang, J. Sidney, Y. Kim et al., “Peptide binding predictionsfor HLA DR, DP and DQ molecules,” BMC Bioinformatics,vol. 11, p. 568, 2010.
[33] M. Thomsen, C. Lundegaard, S. Buus, O. Lund, and M.Nielsen, “MHCcluster, a method for functional clustering ofMHC molecules,” Immunogenetics, vol. 65, no. 9, p. 655, 2013.
[34] H. H. Bui, J. Sidney, W. Li, N. Fusseder, and A. Sette, “Devel-opment of an epitope conservancy analysis tool to facilitatethe design of epitope-based diagnostics and vaccines,” BMCBioinformatics, vol. 8, p. 361, 2007.
[35] M. Garcia-Boronat, C. M. Diez-Rivero, E. L. Reinherz, andP. A. Reche, “PVS: a web server for protein sequence variabilityanalysis tuned to facilitate conserved epitope discovery,”Nucleic Acids Research, vol. 36, article W35, Web Server issue,2008.
[36] H. H. Bui, J. Sidney, K. Dinh, S. Southwood, M. J. Newman,and A. Sette, “Predicting population coverage of T-cellepitope-based diagnostics and vaccines,” BMC Bioinformatics,vol. 7, p. 153, 2006.
[37] A. Sali, L. Potterton, F. Yuan, H. van Vlijmen, and M. Karplus,“Evaluation of comparative protein modeling by MODEL-LER,” Proteins, vol. 23, no. 3, p. 318, 1995.
[38] R. A. Laskowski, J. A. Rullmannn, M. W. MacArthur, R.Kaptein, and J. M. Thornton, “AQUA and PROCHECK-NMR: programs for checking the quality of protein structuressolved by NMR,” Journal of Biomolecular NMR, vol. 8, no. 4,p. 477, 1996.
[39] K. Arnold, L. Bordoli, J. Kopp, and T. Schwede, “The SWISS-MODEL workspace: a web-based environment for proteinstructure homology modelling,” Bioinformatics, vol. 22, no. 2,p. 195, 2006.
[40] J. J. Ward, L. J. McGuffin, K. Bryson, B. F. Buxton, and D. T.Jones, “The DISOPRED server for the prediction of proteindisorder,” Bioinformatics, vol. 20, no. 13, p. 2138, 2004.
[41] M. Jenik, R. G. Parra, L. G. Radusky, A. Turjanski, P. G.Wolynes, and D. U. Ferreiro, “Protein frustratometer: a toolto localize energetic frustration in protein molecules,”Nucleic Acids Research, vol. 40, article W348, Web Serverissue, 2012.
[42] O. Trott and A. J. Olson, “AutoDock Vina: improving thespeed and accuracy of docking with a new scoring function,efficient optimization, and multithreading,” Journal of Compu-tational Chemistry, vol. 31, no. 2, p. 455, 2010.
[43] H. M. Berman, J. Westbrook, Z. Feng et al., “The Protein DataBank,” Nucleic Acids Research, vol. 28, no. 1, p. 235, 2000.
[44] P. Thevenet, Y. Shen, J. Maupetit, F. Guyon, P. Derreumaux,and P. Tuffery, “PEP-FOLD: an updated de novo structureprediction server for both linear and disulfide bonded cyclicpeptides,” Nucleic Acids Research, vol. 40, article W288, WebServer issue, 2012.
[45] H. C. Muh, J. C. Tong, and M. T. Tammi, “AllerHunter: aSVM-pairwise system for assessment of allergenicity and aller-gic cross-reactivity in proteins,” PLoS One, vol. 4, no. 6, articlee5861, 2009.
[46] L. Liao and W. S. Noble, “Combining pairwise sequencesimilarity and support vector machines for detecting remoteprotein evolutionary and structural relationships,” Journal ofComputational Biology, vol. 10, no. 6, p. 857, 2003.
13Journal of Immunology Research
[47] A. S. Kolaskar and P. C. Tongaonkar, “A semi-empiricalmethod for prediction of antigenic determinants on proteinantigens,” FEBS Letters, vol. 276, no. 1-2, p. 172, 1990.
[48] E. A. Emini, J. V. Hughes, D. S. Perlow, and J. Boger,“Induction of hepatitis A virus-neutralizing antibody by avirus-specific synthetic peptide,” Journal of Virology, vol. 55,no. 3, p. 836, 1985.
[49] J. M. Parker, D. Guo, and R. S. Hodges, “New hydrophilicityscale derived from high-performance liquid chromatographypeptide retention data: correlation of predicted surface resi-dues with antigenicity and X-ray-derived accessible sites,”Biochemistry, vol. 25, no. 19, p. 5425, 1986.
[50] D. A. Rowe-Magnus and D. Mazel, “The role of integrons inantibiotic resistance gene capture,” International Journal ofMedical Microbiology, vol. 292, no. 2, p. 115, 2002.
[51] K. Goh, D. Chua, B. Beck, M. L. McKee, and A. A. Bhagwat,“Arginine-dependent acid-resistance pathway in Shigella boy-dii,” Archives of Microbiology, vol. 193, no. 3, p. 179, 2011.
[52] R. Walker, “New possibilities for the development of a com-bined vaccine against ETEC and Shigella,” BMJ Global Health,vol. 1, no. 2, article A11, Supplement 2, 2017.
[53] M. S. Riddle, R. W. Kaminski, C. Di Paolo et al., “Safety andimmunogenicity of a candidate bioconjugate vaccine againstShigella flexneri 2a administered to healthy adults: a single-blind, randomized phase I study,” Clinical and Vaccine Immu-nology, vol. 23, no. 12, p. 908, 2016.
[54] M. S. Riddle, R. W. Kaminski, C. Williams et al., “Safety andimmunogenicity of an intranasal Shigella flexneri 2a invaplex50 vaccine,” Vaccine, vol. 29, no. 40, p. 7009, 2011.
[55] Q. Jin, Z. Yuan, J. Xu et al., “Genome sequence of Shigellaflexneri 2a: insights into pathogenicity through comparisonwith genomes of Escherichia coli K12 and O157,” NucleicAcids Research, vol. 30, no. 20, p. 4432, 2002.
[56] R. Bacchetta, S. Gregori, and M. G. Roncarolo, “CD4+ regula-tory T cells: mechanisms of induction and effector function,”Autoimmunity Reviews, vol. 4, no. 8, p. 491, 2005.
[57] J. U. Igietseme, F. O. Eko, Q. He, and C. M. Black, “Antibodyregulation of T-cell immunity: implications for vaccinestrategies against intracellular pathogens,” Expert Review ofVaccines, vol. 3, no. 1, p. 23, 2004.
[58] B. Shrestha and M. S. Diamond, “Role of CD8+ T cells incontrol of West Nile virus infection,” Journal of Virology,vol. 78, no. 15, p. 8312, 2004.
14 Journal of Immunology Research

Research ArticleFusion to Flaviviral Leader Peptide Targets HIV-1 ReverseTranscriptase for Secretion andReduces Its Enzymatic Activity andAbility to Induce Oxidative Stress but Has NoMajor Effects on ItsImmunogenic Performance in DNA-ImmunizedMice
Anastasia Latanova,1,2,3 Stefan Petkov,3 Yulia Kuzmenko,1 Athina Kilpeläinen,3
Alexander Ivanov,1 Olga Smirnova,1 Olga Krotova,1,2 Sergey Korolev,4 Jorma Hinkula,5
Vadim Karpov,1 Maria Isaguliants,2,6,7 and Elizaveta Starodubova1,3,7
1Engelhardt Institute of Molecular Biology, Russian Academy of Sciences, Moscow, Russia2Gamaleja Research Center of Epidemiology and Microbiology, Moscow, Russia3Department of Microbiology, Tumor and Cell Biology, Karolinska Institutet, Stockholm, Sweden4Chemistry Department, Belozersky Research Institute of Physico-Chemical Biology of Lomonosov Moscow State University,Moscow, Russia5Linköping University, Linköping, Sweden6Riga Stradins University, Riga, Latvia7M.P. Chumakov Institute of Poliomyelitis and Viral Encephalities, Russian Academy of Sciences, Moscow, Russia
Correspondence should be addressed to Anastasia Latanova; [email protected]
Received 28 December 2016; Accepted 13 April 2017; Published 22 June 2017
Academic Editor: Masha Fridkis-Hareli
Copyright © 2017 Anastasia Latanova et al. This is an open access article distributed under the Creative Commons AttributionLicense, which permits unrestricted use, distribution, and reproduction in any medium, provided the original work isproperly cited.
Reverse transcriptase (RT) is a key enzyme in viral replication and susceptibility to ART and a crucial target of immunotherapyagainst drug-resistant HIV-1. RT induces oxidative stress which undermines the attempts to make it immunogenic. Wehypothesized that artificial secretion may reduce the stress and make RT more immunogenic. Inactivated multidrug-resistantRT (RT1.14opt-in) was N-terminally fused to the signal providing secretion of NS1 protein of TBEV (Ld) generating optimizedinactivated Ld-carrying enzyme RT1.14oil. Promotion of secretion prohibited proteasomal degradation increasing the half-lifeand content of RT1.14oil in cells and cell culture medium, drastically reduced the residual polymerase activity, anddownmodulated oxidative stress. BALB/c mice were DNA-immunized with RT1.14opt-in or parental RT1.14oil by intradermalinjections with electroporation. Fluorospot and ELISA tests revealed that RT1.14opt-in and RT1.14oil induced IFN-γ/IL-2,RT1.14opt-in induced granzyme B, and RT1.14oil induced perforin production. Perforin secretion correlated with coproductionof IFN-γ and IL-2 (R = 0 97). Both DNA immunogens induced strong anti-RT antibody response. Ld peptide was notimmunogenic. Thus, Ld-driven secretion inferred little change to RT performance in DNA immunization. Positive outcome wasthe abrogation of polymerase activity increasing safety of RT-based DNA vaccines. Identification of the molecular determinantsof low cellular immunogenicity of RT requires further studies.
1. Introduction
Starting from the first DNA immunization in 1991, multiplegene-based HIV vaccines have undergone preclinical and
clinical trials [1–3]. Several of them that initially aimed toinduce strong T cell responses failed to do so indicating anecessity to optimize both genes and their combinations.Several preclinical and clinical studies employed HIV pol
HindawiJournal of Immunology ResearchVolume 2017, Article ID 7407136, 16 pageshttps://doi.org/10.1155/2017/7407136

gene, full-length or in fragments [4–6]. Plasmids encodingsome of the pol gene products, as protease and integrase, wereshown to be immunogenic in both preclinical and clinical tri-als [7–10]. At the same time, numerous trials showed animpaired immunogenicity of HIV-1 reverse transcriptase(RT) [11–13]. A recent study by Garrod et al. compared theperformance in C57BL/6 mice of DNA vaccines encodingsingle HIV antigens in combination with HIV gag- andpol-based DNA immunogens. The efficacy of vaccinationwas tested by challenge with a chimeric EcoHIV virus thatcan infect mice [14]. At 60 days, there was significantly lowerfrequency of induced antigen-specific CD8(+) T cells in thespleens of pCMVgag-pol-vaccinated mice compared withmice immunized with single pCMVgag. Furthermore, whileshort-term viral control of EcoHIV was similar for gag- andgag-pol DNA-vaccinated mice, only gag DNA-vaccinatedones were able to control EcoHIV two months postvaccina-tion, indicating that inclusion of the HIV pol gene mayreduce the durable control over viral replication [14].
HIV enzymes encoded by pol gene, including RT, are cru-cial if aiming at immunotherapeutic vaccination whichwould prevent drug resistance in HIV infection [15]. Potentimmunogenic performance of all three HIV enzymes is a pre-requisite of the efficacy of such immunotherapy. We andothers performed series of studies aimed to improve theimmunogenicity of RT, a key enzyme determining HIV-1resistance to antiretroviral therapy, but with a limited success[12, 13, 16–18]. Lately, we found that cells expressing HIV-1RT produce reactive oxygen species (ROS) and express highlevels of phase II detoxifying enzymes that interfere with theimmune response against this enzyme [19, 20]. Oxidativestress is induced by awide panel of RTvariants, drug-resistant,expressed from viral and expression-optimized genes, enzy-matically active and inactive [19] indicating that the ability toinduce oxidative stress and oxidative stress response is a prop-erty of a domain (domains) within the protein rather than theconsequence of its enzymatic activity. We hypothesized thatcellular immunogenicity of HIV RT in DNA immunizationmay be increased by decreasing the levels of this stress-inducing protein in the expressing cells.
We tested if this is the case by artificially promoting RTexport. For this, we provided a multidrug-resistant variantof HIV-1 RT (RT1.14) [16], complemented for safety sake,with mutations inhibiting polymerase and RNase H activity,with a leader signal peptide (Ld) of the nonstructural protein1 of tick-borne encephalitis virus (NS1 of TBEV). NS1 issynthesized as a monomer and dimerizes after the posttrans-lational modification; it is also expressed on the cell surfaceand is secreted as a hexamer [21–23]. Ld peptide is responsi-ble for the presentation of NS1 on the cellular surface andfurther secretion [24–26]. We characterized the propertiesof Ld-RT1.14 chimera such as the half-life, route of degrada-tion, efficacy of secretion, capacity to induce oxidative stress,and oxidative stress response and, finally, studied its perfor-mance in DNA immunization in a mouse model. Retargetingof RT to ER with subsequent secretion resulted in an increasein the RT expression levels due to protein stabilization andalso, interestingly, in the nearly complete inhibition of theresidual polymerase activity retained in the inactivated RT.
Secretion led to a mild reduction of oxidative stress, but nosignificant enhancement of the cellular immune responsein the experimental DNA immunization. Immune responseto RT remained tinted towards the production of RT-specificantibodies, typical to M2 polarization of macrophagesand Th2 polarization of T-cells in the settings of oxidativestress [27–29].
2. Materials and Methods
2.1. Plasmids. Expression-optimized gene encoding reversetranscriptase derived from the patient infected withmultidrug-resistant HIV-1 clade B isolate (RT1.14, [18]) withmutations D185N, D186N, and E478Q abrogating polymer-ase and RNase H activities was cloned into pVax1 vector(Invitrogen, USA) generating pVaxRT1.14opt-in which wasdescribed by us earlier [19]. Sequence encoding RT1.14opt-in was used as a backbone to design a chimeric gene encod-ing RT1.14 with the N-terminal insertion of the leadersequence of NS1 protein of TBE. The latter was cloned fromplasmid pLdNS1 carrying the gene of NS1 protein ofWesternEuropean subtype of TBE [24]. The cloned fragment encoded25 amino acids of a leader sequence ofNS1 and theN-terminalmethionine for an effective initiation of translation. Thisfragment including 78 nucleotide b.p. was amplified withKAPA HiFi Hot Start DNA polymerase (Kapa Biosystems,USA) and Ld-NheI-F (5′-ATA-CGC-AAG-CTA-GCA-ATA-TGA-GAA-ACC-CTA-CAA-TG-3′) and Ld-BamHI-R (5′-TCT-AAC-AGG-ATC-CCG-CCC-CCA-CTC-CAA-GGG-3′) primers (Syntol, Russia), containing restrictionsites NheI and BamHI, respectively. Resulting PCR productwas cloned at the 5′-terminus of RT1.14 gene using NheIand BamHI restriction sites. Fusion of NS1 Ld- andRТ1.14opt-in-encoding fragments formed one open-readingframe encoding optimized inactivated leader-fused RT1.14,dubbed RT1.14oil, within the plasmid pVaxRT1.14oil. Nucle-otide sequence of the cloned fragment was confirmed bysequencing. For immunization, plasmids were purified usingPlasmid Endofree kits (Qiagen, Germany) as described bythe manufacturer.
2.2. Expression of Homo- and Heterodimers of ReverseTranscriptase in E. coli. For expression in E. coli genes ofactive and inactivated RT, HIV-1 HXB2 and RT1.14 werecloned into a two-cistron vector pET-2c. Proteins wereexpressed inE. coli andpurifiedby ion exchange chromatogra-phy as homodimers using the protocol described earlier [30].Wild-type p66/p51 heterodimeric HIV-1 RT was expressedin M-15 [pREP4] E.coli strain transformed with the plasmidp6HRT [31] and purified as previously described [32].
2.3. RT Polymerase Activity Assay. The RT assays using acti-vated DNA were performed as follows: the standard reactionmixture (20μl) contained 0,75μg of activated DNA, 0,02–0,05μg RT, 3μM dATP, 30μM of dCTP, dGTP, and dTTP,1μCi [a-32P]dATP in a Tris-HCl buffer (50mM, pH 7,5)containing also 10mM MgCl2, and 0,2M KCl. The reactionmixtures were incubated for 12 minutes at 37°C and appliedonto Whatman 3MM filters with a 0,5M EDTA solution to
2 Journal of Immunology Research
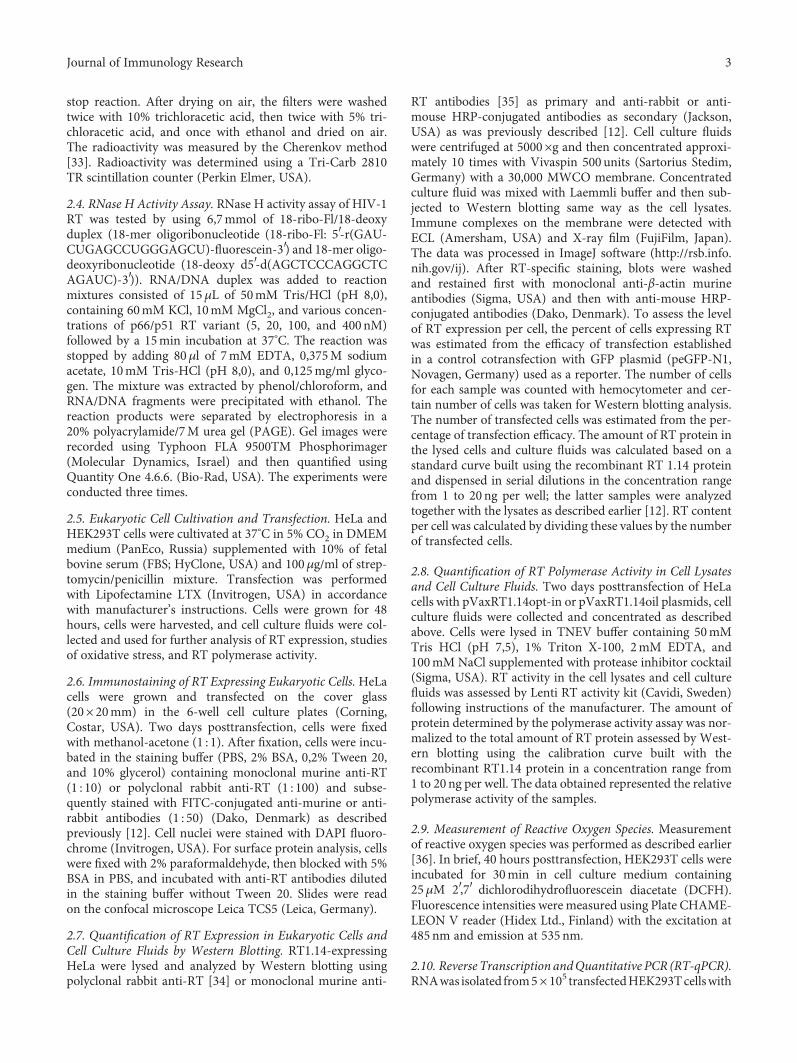
stop reaction. After drying on air, the filters were washedtwice with 10% trichloracetic acid, then twice with 5% tri-chloracetic acid, and once with ethanol and dried on air.The radioactivity was measured by the Cherenkov method[33]. Radioactivity was determined using a Tri-Carb 2810TR scintillation counter (Perkin Elmer, USA).
2.4. RNase H Activity Assay. RNase H activity assay of HIV-1RT was tested by using 6,7mmol of 18-ribo-Fl/18-deoxyduplex (18-mer oligoribonucleotide (18-ribo-Fl: 5′-r(GAU-CUGAGCCUGGGAGCU)-fluorescein-3′) and 18-mer oligo-deoxyribonucleotide (18-deoxy d5′-d(AGCTCCCAGGCTCAGAUC)-3′)). RNA/DNA duplex was added to reactionmixtures consisted of 15μL of 50mM Tris/HCl (pH 8,0),containing 60mM KCl, 10mM MgCl2, and various concen-trations of p66/p51 RT variant (5, 20, 100, and 400nM)followed by a 15min incubation at 37°C. The reaction wasstopped by adding 80μl of 7mM EDTA, 0,375M sodiumacetate, 10mM Tris-HCl (pH 8,0), and 0,125mg/ml glyco-gen. The mixture was extracted by phenol/chloroform, andRNA/DNA fragments were precipitated with ethanol. Thereaction products were separated by electrophoresis in a20% polyacrylamide/7M urea gel (PAGE). Gel images wererecorded using Typhoon FLA 9500TM Phosphorimager(Molecular Dynamics, Israel) and then quantified usingQuantity One 4.6.6. (Bio-Rad, USA). The experiments wereconducted three times.
2.5. Eukaryotic Cell Cultivation and Transfection. HeLa andHEK293T cells were cultivated at 37°C in 5% CO2 in DMEMmedium (PanEco, Russia) supplemented with 10% of fetalbovine serum (FBS; HyClone, USA) and 100μg/ml of strep-tomycin/penicillin mixture. Transfection was performedwith Lipofectamine LTX (Invitrogen, USA) in accordancewith manufacturer’s instructions. Cells were grown for 48hours, cells were harvested, and cell culture fluids were col-lected and used for further analysis of RT expression, studiesof oxidative stress, and RT polymerase activity.
2.6. Immunostaining of RT Expressing Eukaryotic Cells. HeLacells were grown and transfected on the cover glass(20× 20mm) in the 6-well cell culture plates (Corning,Costar, USA). Two days posttransfection, cells were fixedwith methanol-acetone (1 : 1). After fixation, cells were incu-bated in the staining buffer (PBS, 2% BSA, 0,2% Tween 20,and 10% glycerol) containing monoclonal murine anti-RT(1 : 10) or polyclonal rabbit anti-RT (1 : 100) and subse-quently stained with FITC-conjugated anti-murine or anti-rabbit antibodies (1 : 50) (Dako, Denmark) as describedpreviously [12]. Cell nuclei were stained with DAPI fluoro-chrome (Invitrogen, USA). For surface protein analysis, cellswere fixed with 2% paraformaldehyde, then blocked with 5%BSA in PBS, and incubated with anti-RT antibodies dilutedin the staining buffer without Tween 20. Slides were readon the confocal microscope Leica TCS5 (Leica, Germany).
2.7. Quantification of RT Expression in Eukaryotic Cells andCell Culture Fluids by Western Blotting. RT1.14-expressingHeLa were lysed and analyzed by Western blotting usingpolyclonal rabbit anti-RT [34] or monoclonal murine anti-
RT antibodies [35] as primary and anti-rabbit or anti-mouse HRP-conjugated antibodies as secondary (Jackson,USA) as was previously described [12]. Cell culture fluidswere centrifuged at 5000×g and then concentrated approxi-mately 10 times with Vivaspin 500 units (Sartorius Stedim,Germany) with a 30,000 MWCO membrane. Concentratedculture fluid was mixed with Laemmli buffer and then sub-jected to Western blotting same way as the cell lysates.Immune complexes on the membrane were detected withECL (Amersham, USA) and X-ray film (FujiFilm, Japan).The data was processed in ImageJ software (http://rsb.info.nih.gov/ij). After RT-specific staining, blots were washedand restained first with monoclonal anti-β-actin murineantibodies (Sigma, USA) and then with anti-mouse HRP-conjugated antibodies (Dako, Denmark). To assess the levelof RT expression per cell, the percent of cells expressing RTwas estimated from the efficacy of transfection establishedin a control cotransfection with GFP plasmid (peGFP-N1,Novagen, Germany) used as a reporter. The number of cellsfor each sample was counted with hemocytometer and cer-tain number of cells was taken for Western blotting analysis.The number of transfected cells was estimated from the per-centage of transfection efficacy. The amount of RT protein inthe lysed cells and culture fluids was calculated based on astandard curve built using the recombinant RT 1.14 proteinand dispensed in serial dilutions in the concentration rangefrom 1 to 20 ng per well; the latter samples were analyzedtogether with the lysates as described earlier [12]. RT contentper cell was calculated by dividing these values by the numberof transfected cells.
2.8. Quantification of RT Polymerase Activity in Cell Lysatesand Cell Culture Fluids. Two days posttransfection of HeLacells with pVaxRT1.14opt-in or pVaxRT1.14oil plasmids, cellculture fluids were collected and concentrated as describedabove. Cells were lysed in TNEV buffer containing 50mMTris HCl (pH 7,5), 1% Triton X-100, 2mM EDTA, and100mM NaCl supplemented with protease inhibitor cocktail(Sigma, USA). RT activity in the cell lysates and cell culturefluids was assessed by Lenti RT activity kit (Cavidi, Sweden)following instructions of the manufacturer. The amount ofprotein determined by the polymerase activity assay was nor-malized to the total amount of RT protein assessed by West-ern blotting using the calibration curve built with therecombinant RT1.14 protein in a concentration range from1 to 20 ng per well. The data obtained represented the relativepolymerase activity of the samples.
2.9. Measurement of Reactive Oxygen Species. Measurementof reactive oxygen species was performed as described earlier[36]. In brief, 40 hours posttransfection, HEK293T cells wereincubated for 30min in cell culture medium containing25μM 2′,7′ dichlorodihydrofluorescein diacetate (DCFH).Fluorescence intensities were measured using Plate CHAME-LEON V reader (Hidex Ltd., Finland) with the excitation at485 nm and emission at 535 nm.
2.10. Reverse Transcription andQuantitative PCR (RT-qPCR).RNAwas isolated from5× 105 transfectedHEK293Tcellswith
3Journal of Immunology Research
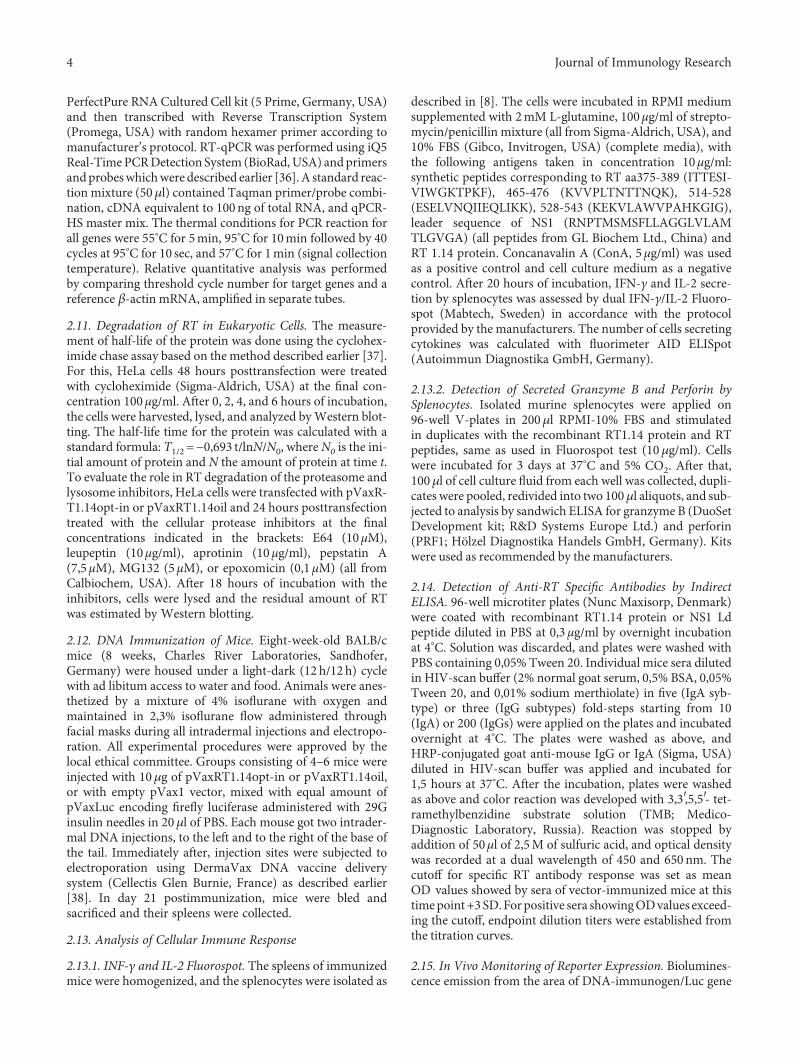
PerfectPure RNA Cultured Cell kit (5 Prime, Germany, USA)and then transcribed with Reverse Transcription System(Promega, USA) with random hexamer primer according tomanufacturer’s protocol. RT-qPCR was performed using iQ5Real-TimePCRDetection System (BioRad,USA) andprimersandprobeswhichwere described earlier [36].A standard reac-tion mixture (50μl) contained Taqman primer/probe combi-nation, cDNA equivalent to 100ng of total RNA, and qPCR-HS master mix. The thermal conditions for PCR reaction forall genes were 55°C for 5min, 95°C for 10min followed by 40cycles at 95°C for 10 sec, and 57°C for 1min (signal collectiontemperature). Relative quantitative analysis was performedby comparing threshold cycle number for target genes and areference β-actin mRNA, amplified in separate tubes.
2.11. Degradation of RT in Eukaryotic Cells. The measure-ment of half-life of the protein was done using the cyclohex-imide chase assay based on the method described earlier [37].For this, HeLa cells 48 hours posttransfection were treatedwith cycloheximide (Sigma-Aldrich, USA) at the final con-centration 100 μg/ml. After 0, 2, 4, and 6 hours of incubation,the cells were harvested, lysed, and analyzed byWestern blot-ting. The half-life time for the protein was calculated with astandard formula: Т1/2 =−0,693 t/lnN/N0, where N0 is the ini-tial amount of protein and N the amount of protein at time t.To evaluate the role in RT degradation of the proteasome andlysosome inhibitors, HeLa cells were transfected with pVaxR-T1.14opt-in or pVaxRT1.14oil and 24 hours posttransfectiontreated with the cellular protease inhibitors at the finalconcentrations indicated in the brackets: E64 (10μM),leupeptin (10μg/ml), aprotinin (10 μg/ml), pepstatin A(7,5μM), MG132 (5 μM), or epoxomicin (0,1 μM) (all fromCalbiochem, USA). After 18 hours of incubation with theinhibitors, cells were lysed and the residual amount of RTwas estimated by Western blotting.
2.12. DNA Immunization of Mice. Eight-week-old BALB/cmice (8 weeks, Charles River Laboratories, Sandhofer,Germany) were housed under a light-dark (12 h/12 h) cyclewith ad libitum access to water and food. Animals were anes-thetized by a mixture of 4% isoflurane with oxygen andmaintained in 2,3% isoflurane flow administered throughfacial masks during all intradermal injections and electropo-ration. All experimental procedures were approved by thelocal ethical committee. Groups consisting of 4–6 mice wereinjected with 10μg of pVaxRT1.14opt-in or pVaxRT1.14oil,or with empty pVax1 vector, mixed with equal amount ofpVaxLuc encoding firefly luciferase administered with 29Ginsulin needles in 20μl of PBS. Each mouse got two intrader-mal DNA injections, to the left and to the right of the base ofthe tail. Immediately after, injection sites were subjected toelectroporation using DermaVax DNA vaccine deliverysystem (Cellectis Glen Burnie, France) as described earlier[38]. In day 21 postimmunization, mice were bled andsacrificed and their spleens were collected.
2.13. Analysis of Cellular Immune Response
2.13.1. INF-γ and IL-2 Fluorospot. The spleens of immunizedmice were homogenized, and the splenocytes were isolated as
described in [8]. The cells were incubated in RPMI mediumsupplemented with 2mM L-glutamine, 100μg/ml of strepto-mycin/penicillin mixture (all from Sigma-Aldrich, USA), and10% FBS (Gibco, Invitrogen, USA) (complete media), withthe following antigens taken in concentration 10μg/ml:synthetic peptides corresponding to RT aa375-389 (ITTESI-VIWGKTPKF), 465-476 (KVVPLTNTTNQK), 514-528(ESELVNQIIEQLIKK), 528-543 (KEKVLAWVPAHKGIG),leader sequence of NS1 (RNPTMSMSFLLAGGLVLAMTLGVGA) (all peptides from GL Biochem Ltd., China) andRT 1.14 protein. Concanavalin A (ConA, 5 μg/ml) was usedas a positive control and cell culture medium as a negativecontrol. After 20 hours of incubation, IFN-γ and IL-2 secre-tion by splenocytes was assessed by dual IFN-γ/IL-2 Fluoro-spot (Mabtech, Sweden) in accordance with the protocolprovided by the manufacturers. The number of cells secretingcytokines was calculated with fluorimeter AID ELISpot(Autoimmun Diagnostika GmbH, Germany).
2.13.2. Detection of Secreted Granzyme B and Perforin bySplenocytes. Isolated murine splenocytes were applied on96-well V-plates in 200μl RPMI-10% FBS and stimulatedin duplicates with the recombinant RT1.14 protein and RTpeptides, same as used in Fluorospot test (10μg/ml). Cellswere incubated for 3 days at 37°C and 5% CO2. After that,100μl of cell culture fluid from each well was collected, dupli-cates were pooled, redivided into two 100μl aliquots, and sub-jected to analysis by sandwich ELISA for granzyme B (DuoSetDevelopment kit; R&D Systems Europe Ltd.) and perforin(PRF1; Hölzel Diagnostika Handels GmbH, Germany). Kitswere used as recommended by the manufacturers.
2.14. Detection of Anti-RT Specific Antibodies by IndirectELISA. 96-well microtiter plates (Nunc Maxisorp, Denmark)were coated with recombinant RT1.14 protein or NS1 Ldpeptide diluted in PBS at 0,3 μg/ml by overnight incubationat 4°C. Solution was discarded, and plates were washed withPBS containing 0,05% Tween 20. Individual mice sera dilutedin HIV-scan buffer (2% normal goat serum, 0,5% BSA, 0,05%Tween 20, and 0,01% sodium merthiolate) in five (IgA syb-type) or three (IgG subtypes) fold-steps starting from 10(IgA) or 200 (IgGs) were applied on the plates and incubatedovernight at 4°C. The plates were washed as above, andHRP-conjugated goat anti-mouse IgG or IgA (Sigma, USA)diluted in HIV-scan buffer was applied and incubated for1,5 hours at 37°C. After the incubation, plates were washedas above and color reaction was developed with 3,3′,5,5′- tet-ramethylbenzidine substrate solution (TMB; Medico-Diagnostic Laboratory, Russia). Reaction was stopped byaddition of 50μl of 2,5M of sulfuric acid, and optical densitywas recorded at a dual wavelength of 450 and 650 nm. Thecutoff for specific RT antibody response was set as meanOD values showed by sera of vector-immunized mice at thistimepoint +3SD.Forpositive sera showingODvalues exceed-ing the cutoff, endpoint dilution titers were established fromthe titration curves.
2.15. In Vivo Monitoring of Reporter Expression. Biolumines-cence emission from the area of DNA-immunogen/Luc gene
4 Journal of Immunology Research

injection was analyzed days 1, 3, 9, 15, and 22 postimmuniza-tion. To estimate luciferase expression in vivo, mice wereintraperitoneally injected with the solution of D-luciferin(Perkin Elmer, USA) in PBS in 15mg/ml at a dose of 100 μlfor 10 g of body weight and left for 5 minutes. In vivo imagingof bioluminescence was performed with a highly sensitiveCCD camera, mounted in a light-tight chamber (SpectrumCT, Perkin Elmer, USA). Anesthesia was induced by 4% iso-flurane and maintained by 2,3% isoflurane throughout theimaging procedure. Camera exposure time was automaticallydetermined by the system and varied between 1 and 60 sdepending on the intensity of the bioluminescent signal.Regions of interest were localized around the injections sitesand were quantified as the total luminescence flux in pho-tons/s. CT/BLI data were processed using the Living Image®software version 4.1 (Perkin Elmer, USA) to generate valuesof total photon flux and mean photon flux (photons/sq cm)from the injected area.
2.16. Statistics. Statistical evaluations were done using STA-TISTICA AXA 10.0 (StatSoft Inc., OK, USA). Nonparametricstatistics was chosen as appropriate for sample sizes <100entries. Continuous but not normally distributed variables,such as the average radiance in photons/s/cm2/Sr, antibodytiters, or the number of cytokine-producing SFCs, cytokinelevels in pg/ml, were compared in groups by the nonpara-metric Kruskal-Wallis and pairwise by Mann–Whitney Utest. Correlations were run using the Spearman rank ordertest. p values <0.05 were considered significant.
3. Results
3.1. Design and Expression of the Inactivated MultidrugResistant RT Fused to the Leader Peptide of TBEV NS1(RT1.14oil). The secretable RT chimera was designed basedon the plasmid pVaxRT1.14opt-in [19] which encodes aninactivated multidrug-resistant RT variant (RT1.14opt-in).Original RT1.14 amino acid sequence originated from HIV-1 clade B isolate from patient with multiple drug resistance[18] modified by mutations introducing two D/N substitu-tions in the polymerase YMDD motif, and one E/Q substitu-tion in the RNase H DEDD motif, shown earlier to inhibitrespective enzymatic activities [39–42]. Inactivation of thepolymerase and RNase H moieties of RT was confirmed inin vitro assays done on the “classical” RT derived fromHIV-1 HXB2 strain and its analogue inactivated by D185N,D186N, and E478Q mutations, represented, for adequatecharacteristics of the enzymatic activity, by p51/p66 hetero-dimers (Supplementary Figure S1 available online at https://doi.org/10.1155/2017/7407136). Introduction of D185Nand D186N mutations completely abrogated the polymeraseactivity of the enzyme (Figure S1A). We have also assessedthe RNase H activity of the active and inactivated RTs (FigureS1B, C). The wild-type RT demonstrated significant activityin a broad range of enzyme concentrations tested (FigureS1B, C). The efficacy of hydrolysis of the 18-mer RNA/DNA hybrid duplex strongly depended on the enzyme con-centration (Figure S1B, C). On the contrary, RT inactivatedwith mutation E478Q in the RNase H moiety was practically
inactive even at high enzyme concentrations; the efficiencyof hydrolysis was reduced by over 90% compared to thewild-type enzyme. These results confirmed the adequacy ofinactivation strategy used to generate the inactivated drug-resistant HIV RT.
Todesign the secreted formof inactivatedRT1.14,we useda specialized signal of theheterologous viral protein, namely ofthe nonstructural protein 1 of tick-borne encephalitis virus(TBEV NS1) [24] (Figure 1). The leader signal of TBEV NS1(Ld) consisting of the last 25 amino acid residues of TBEVenvelope protein (glycoprotein) E is responsible for thetransport to ER and secretion of the downstream NS1 pro-tein [25, 26]. DNA sequence encoding LdNS1-RT1.14opt-in chimera was generated by PCR and cloned into pVax1vector yielding a plasmid dubbed pVaxRT1.14oil (Figure 1).
We have then compared the expression profiles of theparental inactivated RT1.14 and of Ld-RT1.14 chimera. Forthis, we transfected HeLa cells with pVaxRT1.14opt-in andpVaxRT1.14oil plasmids; 48 hours posttransfection, celllysates and cell culture fluids were collected and analyzed byWestern blotting. Lysates of cells fromboth transfections con-tainedproteinswithmolecularmassof 66 kDa coincidingwiththe expectedmolecularmass of RT1.14 [43] (Figure 2(a)). Theamount of the 66 kDa product detected in the lysates of cellstransfected with pVaxRT1.14oil was approximately 1,4 timeshigher than in the lysates of cells transfected with the parentalRT1.14opt-in gene (Figure 2(a)). Both lysates contained also aprotein with the molecular mass of 51 kDa corresponding thepolymerase subunit of HIV-1 RT [44]. Besides, lysates of cellstransfectedwith pVaxRT 1.14oil contained products of highermolecular mass (over 170 kDa) that were specifically stainedwith anti-RT antibodies; suggestively, the aggregates formedas a result of RT overexpression. RT1.14opt-in was found inthe cellular fraction and, interestingly, in equal amounts, inthe cell culture fluid from the expressing cells (Table 1). Ld-RT1.14 chimera encoded bypVaxRT1.14oilwas preferentially(>70%) found in the cell culture fluid (Table 1).
3.2. Enzymatic Activity of RT in the Expressing Cells and inthe Culture Fluids. Next, we analyzed the lysates of cellstransfected with RT1.14opt-in and RT1.14oil genes for thepolymerase activity of RT by an ELISA-based test (Cavidi,Sweden). We also collected, concentrated, and subjectedto the HIV RT activity test samples of the cell culturefluids. RT protein content in these probes was estimatedby Western blotting.
A residual RT polymerase activity was detected in allprobes, but not in the probes from nontransfected HeLa cells.We evaluated the specific RT activity per 105 of HeLa cellstransfected with RT1.14opt-in and with RT1.14oil codingplasmids. Lysates of 105 cells expressing RT1.14opt-in hadRT activity corresponding to 9,8 pg of the active protein, thatis, retained 0,00012% activity (9,8 pg of the active form in thetotal 8,3μg of the enzyme by Western blotting; Table 1).Lysates of 105 cells expressing RT1.14oil retained 0,00005%of the activity (5,7 pg of the active form in the total 11,3μgof the enzyme; Table 1). At the same time, cell culture fluidsof RT1.14opt-in expressing cells retained 0,00053% of theactivity (74,4 pg out of 14μg), which is four times more than
5Journal of Immunology Research

the specific activity in the cells (Table 1). The latter pointedthat RT1.14opt-in is secreted in the active form even withoutthe signal peptide. On contrary, cell culture fluids ofRT1.14oil-expressing cells contained only 0,000014% of theactive enzyme (4,9 pg per 34,6μg), that is, 3,5 times less thanthe lysates of RT1.14oil-expressing cells (Table 1). Thus,RT1.14oil was effectively secreted, but almost exclusively inthe inactive form.
3.3. RT Localization in the Expressing Eukaryotic Cells. Intra-cellular localization of RT variants was investigated by theimmunofluorescence microscopy. HeLa cells were trans-fected with pVaxRT1.14opt-in and pVaxRT1.14oil plasmidsand subsequently stained with anti-RT and then FITC-conjugated secondary antibodies. RT1.14opt-in was distrib-uted in cell cytoplasm homogeneously (Figure 3(a)),whereas the distribution of RT1.14oil was more granular(Figure 3(b)). Besides, cultures of the cells transfected withpVaxRT1.14oil plasmid were characterized by the presenceof granules specifically stained with anti-RT antibodies that
were localized inside and outside the cells and on the cellsurface (Figure 3(b), indicated by arrows). To confirm thecell surface localization of the protein, transfected cells werefixed with 2% paraformaldehyde with subsequent staining inthe absence of detergent. Surface of the cells transfected withthe initial plasmid pVaxRT1.14opt-in was not specificallystained (Figure 3(c)), whereas the surface of pVaxR-T1.14oil-transfected cells was specifically stained with anti-RT antibodies (Figure 3(d)). To localize RT in relation toER, HeLa cells were treated with TRITC-conjugated anti-bodies to an ER marker calreticulin, and FITC and TRITCsignals were overlaid (Figures 3(e) and 3(f)). In the case ofRT1.14oil, RT-specific signal was partially colocalized withER marker and partially with the secretory vesicles, whereasRT1.14opt-in had a more prominent colocalization with ER.
3.4. RT Protein Degradation. Next, we estimated the speed ofdegradation of RT1.14oil in HeLa cells and investigated thecontribution of cellular proteases into its proteolysis. To esti-mate the half-life of the protein, cells transiently expressing
1 26 380 1 561Ld
NS1 NS1
D185ND186N E478Q
D185ND186N E478Q
M
1
M
586
RT1.14opt-in
LdNS1 RT1.14oil
MRNPTMSMSFLLAGGLVLAMTLGVGA
Figure 1: Schematic representation of chimeric drug-resistant HIV-1 reverse transcriptase carrying the N-terminal insertion of the N-terminal signal peptide of NS1 protein of TBEV (RT1.14oil). Rectangular boxes stand for polypeptide chains of NS1 with leader signalpeptide (white) and RT1.14opt-in sequence (gray) with amino acid substitutions in polymerase (D185N, D186N) and RNase H signaturemotives (E478Q) leading to inactivation of respective enzymatic activities in the resultant RT1.14oil polyprotein. Amino acid positions inthe polypeptide chain are designated with numbers.
1
250130100
70
55
2 3kDa
p66
p51
Anti-RT
Anti-actin
(a)
17055
2 3kDa
Anti-RT
(b)
Figure 2: Expression of HIV-1 RT1.14 fused to the N-terminal signal peptide of NS1 protein of TBEV in HeLa cells resolved by SDS-PAGE.(a) Western blotting of the lysates of HeLa cells transfected with pVax1 (1), pVaxRT1.14opt-in (2), and pVaxRT1.14oil (3) plasmids; upperpanel, membranes stained with anti-RT; lower panel, with anti-β-actin antibodies for signal normalization. (b)Western blotting of the culturefluids of cells transfected with pVax1 (1), pVaxRT1.14opt-in (2), and pVaxRT1.14oil (3). Blots were stained with the specific polyclonal anti-RT antibodies as described in the experimental section “Materials andMethods.” To control equal loading of the samples of cell lysates on thegel, membranes were for the second time stained with anti-β-actin antibodies. Positions of the molecular mass markers are given to the left.
6 Journal of Immunology Research

RT1.14oil, or RT1.14opt-in, were after two days treated withcycloheximide and lysed 0, 2, 4, and 6 hours after the on-startof the treatment. The amount of RT1.14opt-in and RT1.14oilin the probes was detected by Western blotting (Figure 4(a)).The half-life of RT1.14opt-in was estimated as 2 and ofRT1.14oil as more than 8 hours (approximately 15 hours)which characterizes it as a long-living protein (Figure 4(b)).
For a detailed study of RT proteolysis, on the next dayafter the transfection, cells were treated with the inhibitorsof proteasomal and lysosomal proteolysis. The role ofproteasome in degradation was assessed using reversible(MG132) and irreversible (epoxomicin) proteasomal inhib-itors. Lysosomal proteolysis was blocked with the inhibitorsof cysteine (E64, leupeptin), serine (aprotinin, leupeptin),and acid proteases (pepstatin A). Cells were incubated withthe inhibitors for 18 hours and lysed, and RT content wasestimated by Western blotting in comparison with the con-tent in the untreated samples (Figure 5(a)). Treatment withMG132 increased RT1.14opt-in content 2,5, and withepoxomicin, 3 times compared to untreated samples;lysosomal inhibitors had no effect. None of the inhibitorshad any effect on the intracellular level of RT1.14oil(Figures 5(b) and 5(c)).
3.5. Induction of Oxidative Stress and Oxidative StressResponse in RT1.14-Expressing Cells. Next, we have evaluatedthe level of oxidative stress induced by RT1.14opt-in andRT1.14oil in HEK293T cells transiently transfected with theirgenes. Oxidative stress was measured by the formation ofreactive oxygen species (ROS) visualized in the presenceof fluorogenic 2, 7′-dichlorofluorescein. The presence ofboth RT variants in cells led to the formation of ROS(Figure 6(a)). Interestingly, secretion resulted in a weakbut significant decrease in the levels of ROS production(15%; p = 0 013; F test; Figure 6(a)). Next, we have studiedthe induction of oxidative stress response, namely, theinduction of expression of phase II detoxifying enzymes,heme oxygenase 1 (HO1), and NAD(P)H-oxygenase 1(Nqo1). Level of transcription of their genes was evaluatedby RT-PCR. Expression of RT variants led to an increasein the levels of expression of both detoxifying enzymes(Figure 6(b)). Cells expressing RT1.14oil demonstrated anincrease in the expression of Nqo1 (p < 0 05; F test;Figure 6(b)) and a tendency to the increased induction ofHO1 (p = 0 07; F test; Figure 6(b)).
3.6. RT1.14 Performance in DNA-Immunized Mice. BALB/cmice were injected with pVaxRT1.14opt-in, pVaxRT1.14oil,or pVax1 plasmids intradermally with subsequent electropo-ration. On day 22, mice were sacrificed; blood and spleenswere collected. Splenocytes were isolated and tested for theability to proliferate after in vitro stimulation with RT-derived antigens. Immune response was evaluated as the pro-duction of IFN-γ and IL-2 by Fluorospot and perforin andgranzyme B by sandwich ELISA. RT1.14opt-in- andRT1.14oil-immunized mice demonstrated similar levels ofcellular response against the recombinant RT1.14 protein(Figure 7(a)). Immunization with DNA encoding RT1.14opt-in and RT1.14oil induced a weak IFN-γ and IL-2response against a CD4+ T cell epitope of RT localized at aa528-543 [45], which tended to be stronger in mice DNAimmunized with RT1.14oil (Figure 7(b), p < 0 1). Peptidesrepresenting other known epitopes of RT induced no specificIFN-γ or IL-2 production (data not shown). Interestingly,splenocytes of mice DNA immunized with RT1.14oilresponded to stimulation with these peptides by a strong pro-duction of perforin (Figure 7(c)). Levels of perforin secretionsignificantly correlated to the levels of RT-specific pro-duction IFN-γ and IL-2 (Figure 7(e); R values >0,8;p < 0 0005). On contrary, mice DNA immunized withRT1.14opt-in responded to stimulation with RT-derivedpeptides by a high-level production of granzyme B whichwas not correlated to either IFN-γ or IL-2 levels(Figure 7(d), data not shown). IFN-γ/IL-2 responseshave also been tested in splenocytes stimulated with apeptide encoding a leader sequence of NS1 (NS1 leaderpeptide). No specific cytokine secretion was detected(data not shown).
Murine sera collected at the endpoint of the experimentwere analyzed for anti-RT antibodies by indirect ELISA. Nosignificant difference was detected in antibody titers reachedin both groups of RT-immunized mice. Titers of IgG andIgG1 exceeded 50,000 in both groups, IgG2a reached 15,000in RT1.14opt-in and 6000 in RT1.14oil-immunized miceand IgA 5000 in RT1.14opt-in and 6000 in RT1.14oil-immu-nized mice, respectively (Figure 8). Ratio of IgG2a/IgG1 wasequal to 0,15 in both groups of mice indicating a Th2 type ofimmune response [46]. TBEV NS1 Ld peptide induced nospecific antibodies (data not shown).
3.7. Effector Immune Response to RT and Its In VivoEvaluation. We have earlier shown that diminishment of
Table 1: Expression, secretion, and residual enzymatic activity of inactivated forms of HIV reverse transcriptase RT1.14opt-in and RT1.14oilin transiently transfected HeLa cells. RT content was determined by Western blotting using protein calibration curves with signalquantification by ImageJ (dubbed WB, in μg/105 cells) and by quantification of enzymatic activity against standard RT preparation usingLenti RT activity test (Cavidi, Sweden) (dubbed EA, in pg/105 cells). RT content in cell lysates is dubbed “in cells” and in cell culture fluids“secreted.” Specific activity was measured as a ratio of protein content evaluated using the enzymatic activity assay to RT contentdetermined by Western blotting.
RT variantRT content by WB, μg/105 cells RT content by EA, pg/105 cells
Specific RT activity(EA/WB), μU
In cells Secreted Total In cells Secreted Total In cells Secreted
RT1.14opt-in 8,30 14,00 22,30 9,80 74,40 85,00 1,18 5,30
RT1.14oil 11,30 34,60 46,00 5,70 4,90 11,00 0,51 0,14
7Journal of Immunology Research

RT1.14opt-in
(a)
RT1.14oil
(b)
RT1.14opt-in
(c)
RT1.14oil
(d)
RT1.14opt-in
(e)
RT1.14oil
(f)
Figure 3: Cellular localization of RT without signal of secretion (RT1.14opt-in) and with a signal peptide (RT1.14oil) in HeLa cells. HeLa cellswere transfected with the plasmids pVaxRT1.14opt-in (a, c, e) and pVaxRT1.14oil (b, d, f), grown on slides for 48 hours, fixed withmethanol : acetone (1 : 1 v/v) (a, b, e, f) or 2% paraformaldehyde (c, d), and stained first with polyclonal anti-RT and with secondaryFITC-conjugated anti-rabbit antibodies. For localization of RT in relation to ER, HeLa cells were treated with TRITC-conjugatedantibodies to an ER marker calreticulin (e, f), and the overlay of FITC and TRITC signals is shown.
8 Journal of Immunology Research

bioluminescence induced by the expression of reporter genecoinjected with DNA immunogen correlates with the induc-tion of polyfunctional cellular responses against the immu-nogen [8, 47] specifically with IFN-γ/Il-2 responses of CD4T cells [8]. To monitor this effect, mice were coinjected withRT gene variants and a reporter gene encoding firefly lucifer-ase (Luc) and assessed for the levels of bioluminescence ondays 1, 3, 6, 9, 15, and 22 postimmunization. We haveobserved a significant diminishment of in vivo luminescenceafter day 9 in all immunized mice, independently of theenzyme form (Figure 9).
4. Discussion
Multiple efforts made by us, and by others, to enhance theimmunogenicity of HIV-1 RT had limited success [12–14,16–18]. Recently, we discovered that both the wild-typeand drug-resistant RT variants induce oxidative stress inthe expressing cells [19]. Oxidative stress has a dual impacton the development of immune response, and low to moder-ate levels of stress may be stimulating, whereas excessivestress affects both the innate and adaptive immune response[48–51]. High levels of oxidative stress detected in the RT-expressing cells during DNA immunization may suppressthe development of specific immune response. We hypothe-sized that this effect can be neutralized or minimized by anearly export of RT from the expressing cells. To test this,we supplemented RT with the leader signal peptide of NS1protein of TBEV, responsible for cotranslational transloca-tion of the carrier proteins into ER with subsequent secre-tion [25, 26]. As the backbone for this chimera, we chosethe most immunogenic RT variant of the ones we havetested so far, RT of HIV-1 clade B strain with multiple muta-tions of drug resistance (RT1.14) [18] encoded by theexpression optimized gene. RT1.14 was devoid of the enzy-matic activities by two D/N mutations in YMDD, and one
E/Q mutation in DEDD motives was shown to inhibit thepolymerase and RNase H activities, respectively [39–42].We have proven that these mutations successfully abrogateboth activities of the model RT of HIV-1 HXB2 strain.A chimera of the inactivated multidrug-resistant RT withthe leader peptide Ld of NS1 dubbed “Optimized Inacti-vated with Leader sequence” RT1.14, or RT1.14oil, wasthus created.
Fusion of the leader peptide sequence changed localiza-tion of the chimera. The distribution of RT1.14oil was moregranular in comparison to RT1.14opt-in. Also, in the caseof RT1.14oil, RT-specific signal was partially colocalized withthe ER marker and in part with the secretory vesicles, unlikethe parental RT1.14opt-in which had a more prominent ERcolocalization. RT1.14oil was detected in the cells and asgranules on the cell surface and in the intercellular space.As expected, RT1.14oil was detected also in the cell culturefluids with three times more protein there than in the cells.Altogether, this demonstrated the success of our strategy ofRT export. Leader peptide of TBEV NS1 can function as anefficient signal for targeting the heterologous proteins intothe secretory pathway. Detection of RT1.14oil both in thecells (cell lysates) and in the cell culture fluids was anexpected finding. We have also made an unexpected findingof RT1.14opt-in not only inside the cells (in cell lysates) butalso in the cell culture fluids. One of the explanations couldbe the leakage from apoptotic cells dying due to oxidativestress. However, we have not observed an abnormal/exces-sive cell death of the RT-expressing cells neither in this norin the earlier studies [19]. The actual RT export/secretionmechanism requires further elucidation.
Relocalization of RT1.14oil drastically changed its pro-cessing. Firstly, its half-life increased from 2 to >8 hours.While RT1.14opt-in was mainly degraded by proteasome,RT1.14oil was insensitive to most of the cellular proteasestested. Thus, retargeting of RT1.14oil into the secretory
Time after inhibition of translation
0 2 4 6
0 2 4 6
Hours
Anti-actin
Anti-actin
Anti-RT1.14opt-in
Anti-RT.14oil
(a)
100908070605040302010
000 1 2 3 4 5 6
Time (hours)
The r
emai
ning
pro
tein
(%)
RT1.14opt-inRT1.14oil
⁎
⁎
⁎
(b)
Figure 4: The kinetics of degradation of RT1.14opt-in and RT1.14oil in HeLa cells after blocking of translation with cycloheximide. (a)Western blotting of HeLa cells transfected with pVaxRT1.14opt-in and pVaxRT1.14oil plasmids 0, 2, 4, and 6 hours after cycloheximidetreatment. The blots were stained with polyclonal anti-RT antibodies. To control equal loading of the samples on the gel, membranes wererestained with anti-β-actin antibodies. (b) Diagram of protein degradation speed. 100% is according to initial amount of the protein. Thegraph is plotted in accordance with the results of 3 independent experiments, ±SD. ∗p < 0 05 (Mann–Whitney test).
9Journal of Immunology Research

pathway led to its “escape” from both proteasomal andlysosomal processing which resulted in accumulation of theprotein inside and outside of the cells.
By measuring the polymerase activity in the lysates andcell culture fluids of the expressing cells, we found that intro-duction of the mutations in YMDD motif expected [42, 52]and confirmed here to completely abrogate the polymeraseactivity of the wild-type HIV-1 RT could not completelyinactivate the multidrug-resistant enzyme. Both RT1.14opt-in and RT1.14oil preparations had a residual activity on thelevel of 0,0005% to 0,00005% of the activity of the equivalentamount of RT of HXB2 strain. Secretion of RT increasedthe biosafety, as we have observed that RT1.14oil was
significantly less active than the parental RT1.14 both inthe cells and when secreted in the cell culture medium.Onepossible explanation is in theRT-inducedoxidative stress.Earlier, a phenomenon was described of the superoxideradical-mediated inactivation of an enzyme (myeloperoxi-dase) secreted by neutrophils [53]. Secreted RT1.14oil canundergo a likewise inactivation. Inactivation can also be dueto the protein agglomeration following the accumulation ofhigh amounts of undegradable RT1.14oil protein. Weobserved granular staining in the cytoplasm of RT1.14oil-expressing cells, and proteins of high molecular mass werespecifically stained with anti-RT antibodies in Westernblotting of cell lysates, the latter indicating formation of
No
inhi
bito
r
MG
132
Epox
omic
in
E 64
Leup
eptin
Apro
tinin
Peps
tatin
A
Anti-RT1.14opt-in
Anti-RT1.14oil
Anti-actin
Anti-actin
(a)
RT1.14opt-in RT1.14oil0
1
2
3
4
No inhibitorMG 132Epoxomicin
Rela
tive p
rote
in co
nten
t
⁎
⁎
(b)
RT1.14opt-in RT1.14oil0
1
2
3
4
No inhibitorE64Leupeptin
AprotininPepstatin
Rela
tive
prot
ein
cont
ent
(c)
Figure 5: RT accumulation in HeLa cells treated with inhibitors of proteasomal and lysosomal proteolysis. Western blotting of HeLa cellstransfected with pVaxRT1.14opt-in and pVaxRT1.14oil after 18-hour incubation with MG132 (5 μМ), epoxomicin (0,1 μМ), E64 (10 μМ),leupeptin (10 μg/ml), aprotinin (10 μg/ml), and pepstatin А (7,5 μМ) or without inhibitors. The blots were stained with monoclonal anti-RT antibodies. To control equal loading of the samples on the gel, the membranes were stripped and restained with anti-β-actinantibodies (a). Relative content of RТ1.14opt-in and RТ1.14oil in the samples treated with proteasomal inhibitors (b). Relative content ofRТ1.14opt-in and RТ1.14oil in the samples treated with lysosomal inhibitors; no difference in response to lysosomal inhibitors betweenRT1.14opt-in- and RT1.14oil-expressing cells was detected (all p values > 0,05) (c). In (b) and (c), protein content in the untreatedsamples is taken for 1. Graphs in (b) and (c) represent the results of three independent experiments, +SD. ∗p < 0 05 (Mann–Whitney test).
10 Journal of Immunology Research

cross-linked protein agglomerates, similar to the observationsmade for the near-infrared reporter proteins [54]. The latteroften results in the loss of enzymatic activity (protein func-tion(s)) [55, 56]. Signal peptide-targeted secretion helped todiminish the residual polymerase activity andmadeRT1.14oilmore attractive as the potential DNA vaccine component.
Artificial secretion resulted in a decrease of the capacityof RT to induce oxidative stress with 15% decrease in the pro-duction of ROS compared to the parental enzyme. This canbe explained by the induction of the ARE-dependent mecha-nisms of oxidative stress response involving the enhancedexpression of phase II detoxifying enzymes, specificallyNAD(P)H-oxygenase 1. We have further inquired whethera decrease in the level of oxidative stress induced byRT1.14oil would improve its immunogenicity when deliv-ered as DNA. We detected no significant enhancement ofRT-specific immune response to RT1.14oil compared toRT1.14opt-in. Both genes induced a similar loss in theexpression of luciferase reporter from the sites of immuniza-tion indicating that an immune response induced by RT-14opt-in and by RT1.14oil genes had a similar capacity forin vivo clearance of RT-expressing cells. The only differencewas observed in the profile of the secreted effector molecules.Mice DNA immunized with RT1.14oil responded by thesecretion of perforin, in which the latter correlated to thelevels of RT-specific dual secretion of IFN-γ/IL-2. In contrast,mice DNA immunized with RT1.14opt-in responded by theRT-specific secretion of granzyme B not correlated to theproduction of either IFN-γ or IL-2. Thus, the enhancementof secretion due to signal peptide tag led to no major changesin the profile of anti-RT cellular immune response with theexception of a shift from the secretion of granzyme B in
response to RT1.14opt-in, in favor of perforin in the responseto RT1.14oil.
The addition of secretion signal is expected to pro-mote antibody formation. Targeting for secretion of themembrane-bound glycoprotein of viral haematopoietic septi-caemia virus resulted in the enhancement of IgM response inthe rainbow trout [57]. DNA immunizationwith the cytoplas-mic protein cathepsin B fused to the signal peptide of TPAinduced a twofold increase in the level of specific IgG [58].However, here, secretion of RT1.14 caused no enhancementof either IgG or IgA responses. Similar observations weremade earlier for the rabies glycoprotein that was originallyexposed on the cell surface and elicited strong antibodyresponse even prior to artificial secretion; addition of a secre-tion signal gave no boost to the specific antibody response[59]. Apparently, even comparatively low amounts of extra-cellular immunogen (as in case of RT1.14opt-in) are capableof eliciting high antibody production. Further increase in theamounts of extracellular protein due to artificial secretion donot promote further enhancement of humoral responses. Ofnote, signal sequence of TBEVNS1 appeared to be nonimmu-nogenic on either cellular or antibody levels, the latter favor-ing its inclusion into the heterologous protein immunogensas a noninterfering transport moiety.
Both the parental and the signal peptide-tagged RTs weresecreted. Enhancement of secretion due to signal peptide taginduced only moderate decrease in the oxidative stress.Hereby, we could extend our statement on the capacity ofRTs to induce oxidative stress: it is induced by a wide panelof RT variants, wild-type and drug-resistant, expressed fromviral and from the expression-optimized genes [19], prefera-bly secreted as well as preferably intracellular, both
pVax1 RT1.14opt-in RT1.14oil0
2
4
6
8
10
12Re
lativ
e RO
S le
vel
⁎
(a)
pVax1 RT1.14opt-in RT1.14oil0
4
8
12
16
Nqo1HO1
Rela
tive m
RNA
leve
l
⁎
(b)
Figure 6: Induction of oxidative stress and oxidative stress response in cells expressing multidrug-resistant inactivated reverse transcriptaseRT1.14opt-in and its derivative RT1.14oil carrying a signal peptide. Induction of the oxidative stress was detected as the production of ROS(a) and increase in the levels of mRNA of the phase II detoxification enzymes Nqo1 and HO1 (b). Levels of ROS were normalized to those inHEK293T cells transfected with the empty vector pVax1. Levels of mRNA for Nqo1 and HO-1 were normalized to levels of mRNA for actinand then represented as fold difference to the effect of empty vector pVax1. Data represent the results of two independent experiments, eachdone in triplicate, +SD. Results are compared using F test (Statistica AXA 10), ∗p < 0 05.
11Journal of Immunology Research
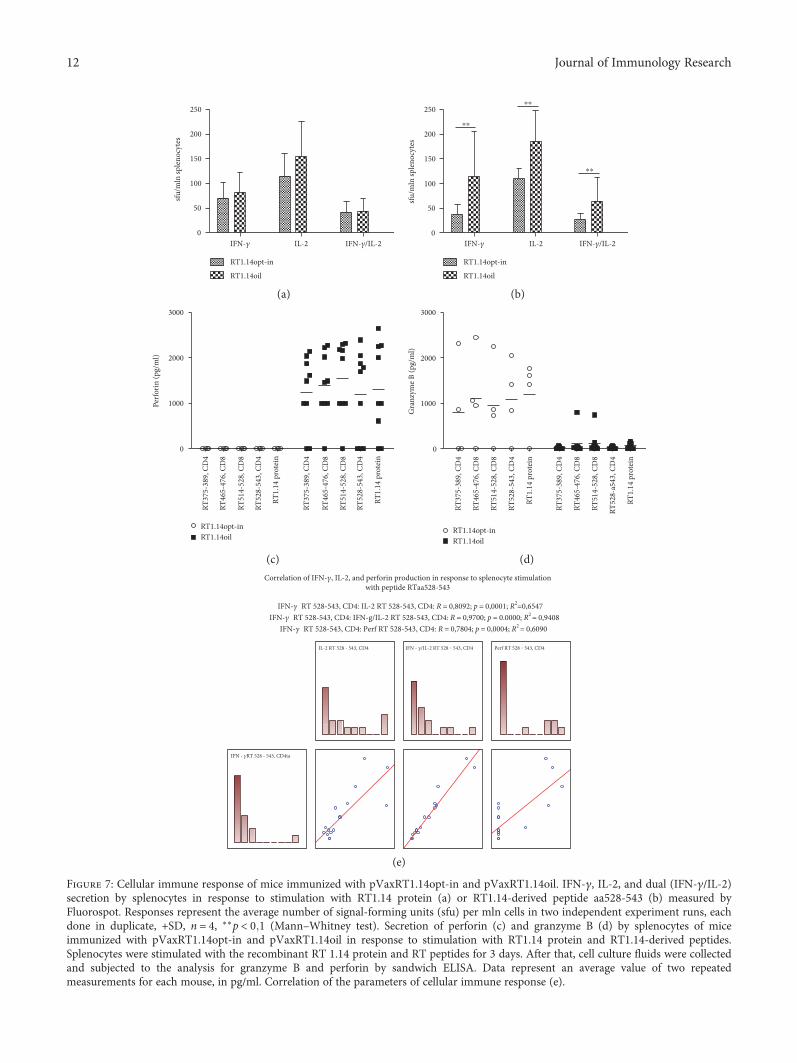
0
50
100
150
200
250
IFN-�훾 IL-2 IFN-�훾/IL-2
RT1.14opt-in
RT1.14oil
sfu/
mln
sple
nocy
tes
(a)
0
50
100
150
200
250
IFN-�훾 IL-2 IFN-�훾/IL-2
⁎⁎
⁎⁎
⁎⁎
sfu/
mln
sple
nocy
tes
RT1.14opt-in
RT1.14oil
(b)
0
1000
2000
3000
RT37
5-38
9, C
D4
RT46
5-47
6, C
D8
RT51
4-52
8, C
D8
RT52
8-54
3, C
D4
RT1.
14 p
rote
in
RT37
5-38
9, C
D4
RT46
5-47
6, C
D8
RT51
4-52
8, C
D8
RT52
8-54
3, C
D4
RT1.
14 p
rote
in
RT1.14opt-inRT1.14oil
Perfo
rin (p
g/m
l)
(c)
0
1000
2000
3000
RT37
5-38
9, C
D4
RT46
5-47
6, C
D8
RT51
4-52
8, C
D8
RT52
8-54
3, C
D4
RT1.
14 p
rote
in
RT37
5-38
9, C
D4
RT46
5-47
6, C
D8
RT51
4-52
8, C
D8
RT52
8-a5
43, C
D4
RT1.
14 p
rote
in
RT1.14opt-inRT1.14oil
Gra
nzym
e B (p
g/m
l)
(d)
Correlation of IFN-�훾, IL-2, and perforin production in response to splenocyte stimulationwith peptide RTaa528-543
IFN-�훾 RT 528-543, CD4: IL-2 RT 528-543, CD4: R = 0,8092; p = 0,0001; R2=0,6547IFN-�훾 RT 528-543, CD4: IFN-g/IL-2 RT 528-543, CD4: R = 0,9700; p = 0.0000; R2 = 0,9408
IFN-�훾 RT 528-543, CD4: Perf RT 528-543, CD4: R = 0,7804; p = 0,0004; R2 = 0,6090
IL-2 RT 528 - 543, CD4 Perf RT 528 ‒ 543, CD4
IFN - �훾RT 528 - 543, CD4ta
IFN - �훾/IL-2 RT 528 ‒ 543, CD4
(e)
Figure 7: Cellular immune response of mice immunized with pVaxRT1.14opt-in and pVaxRT1.14oil. IFN-γ, IL-2, and dual (IFN-γ/IL-2)secretion by splenocytes in response to stimulation with RT1.14 protein (a) or RT1.14-derived peptide aa528-543 (b) measured byFluorospot. Responses represent the average number of signal-forming units (sfu) per mln cells in two independent experiment runs, eachdone in duplicate, +SD, n = 4, ∗∗p < 0 1 (Mann–Whitney test). Secretion of perforin (c) and granzyme B (d) by splenocytes of miceimmunized with pVaxRT1.14opt-in and pVaxRT1.14oil in response to stimulation with RT1.14 protein and RT1.14-derived peptides.Splenocytes were stimulated with the recombinant RT 1.14 protein and RT peptides for 3 days. After that, cell culture fluids were collectedand subjected to the analysis for granzyme B and perforin by sandwich ELISA. Data represent an average value of two repeatedmeasurements for each mouse, in pg/ml. Correlation of the parameters of cellular immune response (e).
12 Journal of Immunology Research
enzymatically active and inactive. Altogether, this indicatesthat the propensity to induce oxidative stress and to modu-late the immune response towards the antibody type is aproperty of the protein not linked to its enzymatic activitieswhich can be modified and even abrogated.
We tentatively allocated this property to the RNase Hdomain of HIV-1 RT. RNases are necessary for the mainte-nance of cellular homeostasis, they participate in the degra-dation of ribosomes/cleavage of tRNA; RNases are involvedin the recycling of phosphate during processes involving celldeath and, hence, in the control of apoptosis [60]. Cleavage oftRNA by RNases is a conserved aspect of the response to oxi-dative stress [61, 62]. A secreted ribonuclease angiogeninselectively cleaves tRNA in eukaryotic cells; treatment of cellswith this recombinant RNase or cell transfection with prod-ucts of angiogenin activity (tRNA fragments) inhibits proteinsynthesis and induces apoptosis [62]. Overexpression ofanother RNase, RNase T2 family Rny1p, also caused apopto-sis in yeast cells, whereas the deletion of its gene inhibited theapoptosis, specifically apoptosis in response to stress [63]. Aproapoptotic activity of HIV-1 RNAse H was recentlydescribed [62]. Interestingly, Rny1p induced apoptosis inde-pendently of the catalytic activity through (yet unknown)interactions with the downstream components of the cata-bolic cell cascades [63, 64]. These observations indicate thatoxidative stress induced by HIV RT expression may be linkedto the properties of the RNase H moiety of the enzyme, notnecessarily its activity. As Rny1p, inactive HIV-1 RNase H
may retain the capacity to interact with the cellular proteinsinducing oxidative stress and apoptotic cell death. By artifi-cial secretion of HIV RT, we made it more stable and failedto reduce its content and, hence, the content of RNase Hinside the cells, which in its turn did not allow us to signifi-cantly improve RT immunogenicity. Indirect confirmationof this concept lies in the experiments by Hallengard et al.who succeeded in raising strong immune response againstRT after truncation of a part of RNase H domain [17]. Fur-thermore, we believe that the secretion that we found to becharacteristic to this enzyme may play a role in the develop-ment of oxidative stress and oxidative stress response. Twoother HIV proteins known to induce oxidative stress whichcontributes to HIV pathogenicity, namely, Tat and Vpr, arealso secreted [65, 66]. Entry into the intercellular space turnsTat, Vpr, and possibly also RT into the signal molecules capa-ble of affecting neighboring, also uninfected, cells. The actualmechanism(s) of the secretion of untagged RT and the inputof this process into the induction of oxidative stress andmodulation of immune response deserve a separate study.
Conflicts of Interest
The authors have no conflicts of interest to disclose.
Authors’ Contributions
Maria Isaguliants and Elizaveta Starodubova shared lastcoauthorship.
RT1.
14oi
l
RT1.
14oi
l
RT1.
14op
t-in
RT1.
14op
t-in
RT1.
14oi
l
RT1.
14op
t-in
RT1.
14op
t-in
RT1.
14oi
l
100
101
102
103
104
105
IgGIgG1
IgG2aIgA
ELIS
A e
ndpo
int t
iter
Figure 8: RT-specific IgGs and IgA induced in sera of miceimmunized with pVaxRT1.14opt-in and pVaxRT1.14oil plasmids.Endpoint titers of RT-specific total IgG, IgG subtypes (IgG1,IgG2a), and IgA antibodies detected in the sera of BALB/c miceimmunized with the genes encoding RT1.14opt-in and RT1.14oilplasmids. Data represent a mean + SD for the endpoint titer ofantibodies against recombinant RT1.14 protein for four mice pergroup in two independent immunization runs. Cutoffs were setagainst the control mice immunized with empty vector pVax1 (see“Materials and Methods”). Groups demonstrate no significantdifference in either IgG, or IgG1, or IgG2a, or IgA levels (p > 0 05).
1 3 6 9 15 22104
105
106
107
108
109
pVaxRT1.14opt-inpVaxRT1.14oilpVax1
Days post gene coinjection
Biol
umin
esce
nce (
p/se
c/cm
2 /sr)
⁎
⁎
Figure 9: Kinetics of in vivo bioluminescence from the sites ofcoadministration of RT genes and luciferase reporter genes. Invivo monitoring of luciferase activity on days 1, 3, 6, 9, 15, 22 afterthe administration of plasmids encoding RT1.14opt-in andRT1.14oil, or empty vector pVax1, each mixed with pVaxLucencoding firefly luciferase (1 : 1 w/w). One curve representsbioluminescent emission from eight mice with two immunizationsites in each, assessed in two independent immunization runs.∗p < 0 05 (Mann–Whitney test).
13Journal of Immunology Research

Acknowledgments
This study was supported by the Russian Foundation of BasicResearch, Grant no. 14-04-01817; immunization of mice andstudies of anti-RT immune response were supported by theRussian Science Foundation, Grant no. 15-15-30039. Interac-tion of the partners and in-learning of the methods wassupported by the EU Twinning Project VACTRAIN no.692293 and the Swedish Institute PI Project no. 19806_2016.
References
[1] X. Jin, C. Morgan, X. Yu et al., “Multiple factors affect immu-nogenicity of DNA plasmid HIV vaccines in human clinicaltrials,” Vaccine, vol. 33, no. 20, pp. 2347–2353, 2015.
[2] P. J. Munseri, A. Kroidl, C. Nilsson et al., “Priming with a sim-plified intradermal HIV-1 DNA vaccine regimen followed byboosting with recombinant HIV-1 MVA vaccine is safe andimmunogenic: a phase IIa randomized clinical trial,” PLoSOne, vol. 10, no. 4, article e0119629, 2015.
[3] Y. Chen, S. Wang, and S. Lu, “DNA immunization for HIVvaccine development,” Vaccine, vol. 2, no. 1, pp. 138–159,2014.
[4] T. Ahmed, N. J. Borthwick, J. Gilmour, P. Hayes, L. Dorrell,and T. Hanke, “Control of HIV-1 replication in vitro byvaccine-induced human CD8(+) T cells through conservedsubdominant pol epitopes,” Vaccine, vol. 34, no. 9, pp. 1215–1224, 2016.
[5] N. Borthwick, T. Ahmed, B. Ondondo et al., “Vaccine-elicitedhuman T cells recognizing conserved protein regions inhibitHIV-1,”Molecular Therapyy, vol. 22, no. 2, pp. 464–475, 2014.
[6] A. Joachim, C. Nilsson, S. Aboud et al., “Potent functionalantibody responses elicited by HIV-I DNA priming and boost-ing with heterologous HIV-1 recombinant MVA in healthyTanzanian adults,” PloS One, vol. 10, no. 4, article e0118486,2015.
[7] D. Hallengard, B. K. Haller, S. Petersson et al., “Increasedexpression and immunogenicity of HIV-1 protease followinginactivation of the enzymatic activity,” Vaccine, vol. 29, no. 4,pp. 839–848, 2011.
[8] O. Krotova, E. Starodubova, S. Petkov et al., “Consensus HIV-1 FSU-A integrase gene variants electroporated into miceinduce polyfunctional antigen-specific CD4+ and CD8+ Tcells,” PloS One, vol. 8, no. 5, article e62720, 2013.
[9] M. L. Knudsen, A. Mbewe-Mvula, M. Rosario et al., “Superiorinduction of T cell responses to conserved HIV-1 regions byelectroporated alphavirus replicon DNA compared to thatwith conventional plasmid DNA vaccine,” Journal of Virology,vol. 86, no. 8, pp. 4082–4090, 2012.
[10] A. Boberg, D. Sjostrand, E. Rollman, J. Hinkula, B. Zuber, andB. Wahren, “Immunological cross-reactivity against a drugmutated HIV-1 protease epitope after DNA multi-CTL epi-tope construct immunization,” Vaccine, vol. 24, no. 21,pp. 4527–4530, 2006.
[11] E. Rollman, A. Brave, A. Boberg et al., “The rationale behind avaccine based on multiple HIV antigens,” Microbes and Infec-tion, vol. 7, no. 14, pp. 1414–1423, 2005.
[12] E. S. Starodubova, A. Boberg, M. Litvina et al., “HIV-1 reversetranscriptase artificially targeted for proteasomal degradationinduces a mixed Th1/Th2-type immune response,” Vaccine,vol. 26, no. 40, pp. 5170–5176, 2008.
[13] E. Starodubova, A. Boberg, A. Ivanov et al., “Potent cross-reactive immune response against the wild-type and drug-resistant forms of HIV reverse transcriptase after the chimericgene immunization,” Vaccine, vol. 28, no. 8, pp. 1975–1986,2010.
[14] T. J. Garrod, T. Gargett, W. Yu et al., “Loss of long termprotection with the inclusion of HIV pol to a DNA vaccineencoding gag,” Virus Research, vol. 192, pp. 25–33, 2014.
[15] A. Boberg and M. Isaguliants, “Vaccination against drug resis-tance in HIV infection,” Expert Review of Vaccines, vol. 7,no. 1, pp. 131–145, 2008.
[16] M. G. Isaguliants, S. V. Belikov, E. S. Starodubova et al., “Muta-tions conferring drug resistance affect eukaryotic expression ofHIV type 1 reverse transcriptase,” AIDS Research and HumanRetroviruses, vol. 20, no. 2, pp. 191–201, 2004.
[17] D. Hallengard, B. Wahren, and A. Brave, “A truncatedplasmid-encoded HIV-1 reverse transcriptase displays strongimmunogenicity,” Viral Immunology, vol. 26, no. 2, pp. 163–166, 2013.
[18] M. G. Isaguliants, B. Zuber, A. Boberg et al., “Reversetranscriptase-based DNA vaccines against drug-resistantHIV-1 tested in a mouse model,” Vaccine, vol. 22, no. 13-14,pp. 1810–1819, 2004.
[19] M. Isaguliants,O. Smirnova,A.V. Ivanovet al.,“Oxidative stressinducedbyHIV-1 reverse transcriptasemodulates the enzyme’sperformance in gene immunization,” Human Vaccines &Immunotherapeutics, vol. 9, no. 10, pp. 2111–2119, 2013.
[20] A. V. Ivanov, V. T. Valuev-Elliston, O. N. Ivanova et al., “Oxi-dative stress during HIV infection: mechanisms and conse-quences,” Oxidative Medicine and Cellular Longevity,vol. 2016, p. 8910396, 2016.
[21] G. Winkler, V. B. Randolph, G. R. Cleaves, T. E. Ryan, and V.Stollar, “Evidence that the mature form of the flavivirus non-structural protein NS1 is a dimer,” Virology, vol. 162, no. 1,pp. 187–196, 1988.
[22] J. M. Lee, A. J. Crooks, and J. R. Stephenson, “The synthesisand maturation of a non-structural extracellular antigen fromtick-borne encephalitis virus and its relationship to the intra-cellular NS1 protein,” The Journal of General Virology,vol. 70, Part 2, pp. 335–343, 1989.
[23] M. Flamand, F. Megret, M. Mathieu, J. Lepault, F. A. Rey, andV. Deubel, “Dengue virus type 1 nonstructural glycoproteinNS1 is secreted from mammalian cells as a soluble hexamerin a glycosylation-dependent fashion,” Journal of Virology,vol. 73, no. 7, pp. 6104–6110, 1999.
[24] S. E. S. Kuzmenko Y. V., A. S. Shevtsova, G. G. Karganova, A.V. Timofeev, and V. L. Karpov, “Protectivity of gene-basedconstructions carrying a gene of NS 1 protein of tick-borneencephalitis virus,” BioDrugs, vol. 1-2, no. 33-34, pp. 7–9,2009.
[25] W. F. Fan and P. W. Mason, “Membrane association andsecretion of the Japanese encephalitis virus NS1 protein fromcells expressing NS1 cDNA,” Virology, vol. 177, no. 2,pp. 470–476, 1990.
[26] B. Falgout, R. Chanock, and C. J. Lai, “Proper processing ofdengue virus nonstructural glycoprotein NS1 requires the N-terminal hydrophobic signal sequence and the downstreamnonstructural protein NS2a,” Journal of Virology, vol. 63,no. 5, pp. 1852–1860, 1989.
[27] M. R. King, A. S. Ismail, L. S. Davis, and D. R. Karp, “Oxidativestress promotes polarization of human T cell differentiation
14 Journal of Immunology Research

toward a T helper 2 phenotype,” Journal of Immunology,vol. 176, no. 5, pp. 2765–2772, 2006.
[28] E. N. Wardle, Guide to Signal Pathways in Immune Cells,Humana Press, New York, 2009.
[29] M. Rath, I. Muller, P. Kropf, E. I. Closs, and M. Munder,“Metabolism via arginase or nitric oxide synthase: twocompeting arginine pathways in macrophages,” Frontiers inImmunology, vol. 5, p. 532, 2014.
[30] A. V. Ivanov, A. N. Korovina, V. L. Tunitskaya et al., “Develop-ment of the system ensuring a high-level expression of hepatitisC virus nonstructural NS5B and NS5A proteins,” ProteinExpression and Purification, vol. 48, no. 1, pp. 14–23, 2006.
[31] S. F. Le Grice and F. Gruninger-Leitch, “Rapid purification ofhomodimer and heterodimer HIV-1 reverse transcriptase bymetal chelate affinity chromatography,” European Journal ofBiochemistry/FEBS, vol. 187, no. 2, pp. 307–314, 1990.
[32] R. S. Fletcher, G. Holleschak, E. Nagy et al., “Single-step puri-fication of recombinant wild-type and mutant HIV-1 reversetranscriptase,” Protein Expression and Purification, vol. 7,no. 1, pp. 27–32, 1996.
[33] K. Rengan, “Cerenkov counting technique for beta particles:advantages and limitations,” Journal of Chemical Education,vol. 60, no. 8, pp. 682–684, 1983.
[34] M. G. Isaguliants, K. Pokrovskaya, V. I. Kashuba et al.,“Eukaryotic expression of enzymatically active human immu-nodeficiency virus type 1 reverse transcriptase,” FEBS Letters,vol. 447, no. 2-3, pp. 232–236, 1999.
[35] A. S. Rytting, L. Akerblom, J. Albert et al., “Monoclonal anti-bodies to native HIV type 1 reverse transcriptase and theirinteraction with enzymes from different subtypes,” AIDSResearch and Human Retroviruses, vol. 16, no. 13, pp. 1281–1294, 2000.
[36] A. V. Ivanov, O. A. Smirnova, O. N. Ivanova, O. V. Masalova,S. N. Kochetkov, and M. G. Isaguliants, “Hepatitis C virus pro-teins activate NRF2/ARE pathway by distinct ROS-dependentand independent mechanisms in HUH7 cells,” PloS One,vol. 6, no. 9, article e24957, 2011.
[37] P. Zhou, “Determining protein half-lives,”Methods in Molecu-lar Biology, vol. 284, pp. 67–77, 2004.
[38] A. K. Roos, F. Eriksson, D. C. Walters, P. Pisa, and A. D. King,“Optimization of skin electroporation in mice to increasetolerability of DNA vaccine delivery to patients,” MolecularTherapy, vol. 17, no. 9, pp. 1637–1642, 2009.
[39] J. K. Wakefield, S. A. Jablonski, and C. D. Morrow, “In vitroenzymatic activity of human immunodeficiency virus type 1reverse transcriptase mutants in the highly conserved YMDDamino acid motif correlates with the infectious potential ofthe proviral genome,” Journal of Virology, vol. 66, no. 11,pp. 6806–6812, 1992.
[40] G. L. Beilhartz and M. Gotte, “HIV-1 ribonuclease H: struc-ture, catalytic mechanism and inhibitors,” Virus, vol. 2, no. 4,pp. 900–926, 2010.
[41] K. R. Young, J. M. Smith, and T. M. Ross, “Characterization ofa DNA vaccine expressing a human immunodeficiency virus-like particle,” Virology, vol. 327, no. 2, pp. 262–272, 2004.
[42] J. M. Smith, R. R. Amara, H. M. McClure et al., “MultiproteinHIV type 1 clade B DNA/MVA vaccine: construction, safety,and immunogenicity in macaques,” AIDS Research andHuman Retroviruses, vol. 20, no. 6, pp. 654–665, 2004.
[43] L. A. Kohlstaedt, J. Wang, J. M. Friedman, P. A. Rice, and T. A.Steitz, “Crystal structure at 3.5 a resolution of HIV-1 reverse
transcriptase complexed with an inhibitor,” Science, vol. 256,no. 5065, pp. 1783–1790, 1992.
[44] Z. Hostomska, D. A. Matthews, J. F. Davies 2nd, B. R. Nodes,and Z. Hostomsky, “Proteolytic release and crystallization ofthe RNase H domain of human immunodeficiency virus type1 reverse transcriptase,” The Journal of Biological Chemistry,vol. 266, no. 22, pp. 14697–14702, 1991.
[45] G. Haas, R. David, R. Frank et al., “Identification of a majorhuman immunodeficiency virus-1 reverse transcriptase epi-tope recognized by mouse CD4+ T lymphocytes,” EuropeanJournal of Immunology, vol. 21, no. 6, pp. 1371–1377, 1991.
[46] C. M. Snapper and W. E. Paul, “Interferon-gamma and B cellstimulatory factor-1 reciprocally regulate Ig isotype produc-tion,” Science, vol. 236, no. 4804, pp. 944–947, 1987.
[47] E. Starodubova, O. Krotova, D. Hallengard et al., “Cellularimmunogenicity of novel gene immunogens in mice moni-tored by in vivo imaging,” Molecular Imaging, vol. 11, no. 6,pp. 471–486, 2012.
[48] S. Sutti, A. Jindal, I. Locatelli et al., “Adaptive immuneresponses triggered by oxidative stress contribute to hepaticinflammation in NASH,” Hepatology, vol. 59, no. 3, pp. 886–897, 2014.
[49] M. Los, W. Droge, K. Stricker, P. A. Baeuerle, and K. Schulze-Osthoff, “Hydrogen peroxide as a potent activator of Tlymphocyte functions,” European Journal of Immunology,vol. 25, no. 1, pp. 159–165, 1995.
[50] A. Csillag, I. Boldogh, K. Pazmandi et al., “Pollen-induced oxi-dative stress influences both innate and adaptive immuneresponses via altering dendritic cell functions,” Journal ofImmunology, vol. 184, no. 5, pp. 2377–2385, 2010.
[51] A. Larbi, F. Cabreiro, H. Zelba et al., “Reduced oxygen tensionresults in reduced human T cell proliferation and increasedintracellular oxidative damage and susceptibility to apoptosisupon activation,” Free Radical Biology & Medicine, vol. 48,no. 1, pp. 26–34, 2010.
[52] D. M. Lowe, V. Parmar, S. D. Kemp, and B. A. Larder, “Muta-tional analysis of two conserved sequence motifs in HIV-1reverse transcriptase,” FEBS Letters, vol. 282, no. 2, pp. 231–234, 1991.
[53] C. C. King, M. M. Jefferson, and E. L. Thomas, “Secretion andinactivation of myeloperoxidase by isolated neutrophils,”Journal of Leukocyte Biology, vol. 61, no. 3, pp. 293–302, 1997.
[54] L. M. Costantini, M. Baloban, M. L. Markwardt et al., “Apalette of fluorescent proteins optimized for diverse cellularenvironments,” Nature Communications, vol. 6, p. 7670, 2015.
[55] J. Tyedmers, A. Mogk, and B. Bukau, “Cellular strategies forcontrolling protein aggregation,” Nature Reviews. MolecularCell Biology, vol. 11, no. 11, pp. 777–788, 2010.
[56] A. Ganesan, A. Siekierska, J. Beerten et al., “Structural hotspots for the solubility of globular proteins,” Nature Commu-nications, vol. 7, p. 10816, 2016.
[57] A. Martinez-Lopez, P. Garcia-Valtanen, M. Ortega-VillaizanMdel et al., “Increasing versatility of the DNA vaccinesthrough modification of the subcellular location of plasmid-encoded antigen expression in the in vivo transfected cells,”PloS One, vol. 8, no. 10, article e77426, 2013.
[58] R. Jayaraj, D. Piedrafita, T. Spithill, and P. Smooker, “Evalua-tion of the immune responses induced by four targeted DNAvaccines encoding the juvenile liver fluke antigen, cathepsinB in a mouse model,” Genetic Vaccines and Therapy, vol. 10,no. 1, p. 7, 2012.
15Journal of Immunology Research

[59] M. Kaur, A. Rai, and R. Bhatnagar, “Rabies DNA vaccine: noimpact of MHC class I and class II targeting sequences onimmune response and protection against lethal challenge,”Vaccine, vol. 27, no. 15, pp. 2128–2137, 2009.
[60] G. C. MacIntosh, RNase T2 Family: Enzymatic Properties,Functional Diversity, and Evolution of Ancient Ribonucleases,vol. 26, Springer-Verlag, Berlin Heidelberg, 2011.
[61] D. M. Thompson, C. Lu, P. J. Green, and R. Parker, “tRNAcleavage is a conserved response to oxidative stress in eukary-otes,” RNA, vol. 14, no. 10, pp. 2095–2103, 2008.
[62] S. Yamasaki, P. Ivanov, G. F. Hu, and P. Anderson, “Angio-genin cleaves tRNA and promotes stress-induced translationalrepression,” The Journal of Cell Biology, vol. 185, no. 1, pp. 35–42, 2009.
[63] Y. B. Ouyang, S. G. Carriedo, and R. G. Giffard, “Effect of Bcl-x(L) overexpression on reactive oxygen species, intracellularcalcium, and mitochondrial membrane potential followinginjury in astrocytes,” Free Radical Biology & Medicine,vol. 33, no. 4, pp. 544–551, 2002.
[64] L. B. Ray, “RNases signal stress,” Science Signaling, vol. 2,no. 66, p. ec134, 2009.
[65] K. M. Porter and R. L. Sutliff, “HIV-1, reactive oxygen species,and vascular complications,” Free Radical Biology & Medicine,vol. 53, no. 1, pp. 143–159, 2012.
[66] M. R. N. Adriano Ferrucci and B. Wigdahl, “Human immuno-deficiency virus viral protein R as an extracellular protein inneuropathogenesis,” Advances in Virus Research, A. J. S. KarlMaramorosch and F. A. Murphy, Eds., vol. 81, pp. 165–199,2011.
16 Journal of Immunology Research

Review ArticleThe Immune Epitope Database: How Data AreEntered and Retrieved
Ward Fleri, Kerrie Vaughan, Nima Salimi, Randi Vita, Bjoern Peters, and Alessandro Sette
Division of Vaccine Discovery, La Jolla Institute for Allergy and Immunology, 9420 Athena Circle, La Jolla, CA 92037, USA
Correspondence should be addressed to Ward Fleri; [email protected]
Received 28 February 2017; Accepted 26 April 2017; Published 29 May 2017
Academic Editor: Pedro A. Reche
Copyright © 2017 Ward Fleri et al. This is an open access article distributed under the Creative Commons Attribution License,which permits unrestricted use, distribution, and reproduction in any medium, provided the original work is properly cited.
Easy access to a vast collection of experimental data on immune epitopes can greatly facilitate the development of therapeutics andvaccines. The Immune Epitope Database and Analysis Resource (IEDB) was developed to provide such a resource as a free serviceto the biomedical research community. The IEDB contains epitope and assay information related to infectious diseases,autoimmune diseases, allergic diseases, and transplant/alloantigens for humans, nonhuman primates, mice, and any otherspecies studied. It contains T cell, B cell, MHC binding, and MHC ligand elution experiments. Its data are curated primarilyfrom the published literature and also include direct submissions from researchers involved in epitope discovery. This articledescribes the process of capturing data from these sources and how the information is organized in the IEDB data. Differentapproaches for querying the data are then presented, using the home page search interface and the various specialized searchinterfaces. Specific examples covering diverse applications of interest are given to highlight the power and functionality of the IEDB.
1. A High-Level Overview of the IEDB
The Immune Epitope Database (IEDB) is a free onlineresource that catalogs and makes accessible to the scientificcommunity epitope-related data derived from allergic dis-eases, infectious diseases, apart from HIV which is capturedseparately in the Los Alamos HIV database [1], autoimmunediseases, and diseases associated with transplantation andalloantigens. The IEDB [2] contains both T cell and B cellepitopes, as well as MHC ligand data. The epitopes arederived from humans, nonhuman primates, mice, and allother studied hosts.
The curation of scientific literature started in 2004,requiring the curation of past and current relevant epitopeliterature in available peer-reviewed journals [3, 4]. As theIEDB evolved, it has been necessary to change how biologicalconcepts are captured in order to maximize accuracy. Inaddition, automated validation is continuously added.Consequently, there is a significant ongoing “recuration”effort of revising existing entries to improve data qualityand consistency. The IEDB is now current with the publishedliterature, and targeted PubMed queries are run biweekly,
with the goal of making the data available in the IEDB withineight weeks of publication.
As of November 2016, the IEDB data were derived fromover 18,000 papers. In addition, the IEDB contains nearly300 submissions (corresponding to approximately 20% ofthe total data) from several NIH-funded large-scale epitopediscovery programs and from researchers that directlyapproach the IEDB to deposit their data, including negativedata, which might typically appear in supplemental tablesor might not be published at all. Slightly more than half ofthe references in the IEDB relate to infectious diseases andabout a quarter relate to autoimmune diseases. The remain-der includes allergy, transplant, and other categories. Becausethe data in the IEDB reside in the public domain, researcherscan freely access, analyze, and publish works using these data.
When initially designing the IEDB, we realized thatdifferent researchers had different views on what should beincluded in an epitope database, based largely on their areaof research. While each scientist’s specific interests andepitope definitions might vary, ultimately every epitope isdefined by an experiment or specific assay. To provide ageneral yet accurate epitope database, we utilized an assay-
HindawiJournal of Immunology ResearchVolume 2017, Article ID 5974574, 13 pageshttps://doi.org/10.1155/2017/5974574
centric design, capturing the experiments (assays) that char-acterize and define each epitope. This required translation ofthe data typically described in the methods and resultssections of a scientific paper into a generic data structure inwhich epitope data are entered and stored in a format thatallows users to query for the characteristics of these epitopes.
The IEDB website has undergone two major revisionssince its introduction in early 2006, each improving itsfeatures and usability [2, 5]. The current IEDB 3.0, deployedin February 2015, incorporated feedback from immunolo-gists and bioinformaticians, collected at user workshops, helpdesk requests, and user observation sessions, to make search-ing the database more intuitive and to deliver results in amore useful format. The home page prominently featuresthe query interface, which contains the fields that addressover 80% of the typical queries. The query concept is similarto a travel website where users specify basic information andcan then filter or refine the results with additional fields. Inthe following sections, we will present a detailed account ofthe IEDB query and reporting and also provide severalspecific examples.
2. Which Data Are Included in the IEDB?
The IEDB does not capture predicted/inferred data orreviews. All data come from empirically derived assaysreflecting the interaction of an adaptive immune receptorwith an epitope. There are four categories of assays—T cell,B cell (including soluble antibodies), MHC binding, andMHC ligand elution.
Data are captured in accordance with clearly establishedcriteria [5]. Linear peptides cannot exceed 50 amino acidsin length and must be tested as either an immunogen or anantigen. We capture discontinuous epitopes where they showthat specific residues are important for antibody recognitionof an antigen, usually through mutation, or from crystalstructures of B cell receptor and peptide. The database alsoincludes nonpeptidic epitopes. These include carbohydrates,lipids, chemicals, metals, and drugs. In addition, for all datathere is a minimal set of information required. For linearpeptides, the amino acid sequence must be specified, andfor discontinuous epitopes, the amino acid and their respec-tive position must be specified (e.g., G104, G106, L107, andW231). In all cases, it must be possible to determine whetherthe outcome was positive or negative. In the case of T and Bcell assays, a host (e.g., human or mouse) must be specified.
Because the IEDB is fundamentally a database of experi-ments, each paper or reference to be included must describeat least one epitope, and each epitope must be described inone or more experiments. Up to 400 data fields are used tocapture all the details of these experiments. Simplifying thecuration process and ensuring accuracy and consistency islargely addressed by the use of external resources and ontol-ogies [6].
The goal of the IEDB is to allow a global query of all datafrom the scientific literature and direct submission. Individ-ual epitopes can be tested in multiple references, in morethan one host and under different conditions. If an epitopehas been studied in multiple publications, users can gather
all the cumulative data from the IEDB and draw their ownconclusions regarding its utility for their application. Thesame epitope might be tested in different assay types ormay be repeatedly tested in the same experimental setup bydifferent groups. In some cases, the assay may be positiveand in others negative and the user can examine theexperimental details captured therein to critically evaluatethe available information.
3. How Are the Data Structured?
As stated above, each IEDB record must be associated with aclearly defined molecular structure. In addition, for peptidicepitopes, the author must provide a sequence and identifyits protein source and organism source. While some authorsspecify a GenBank or UniProt identifier for each protein,most provide a protein name or abbreviation. Since proteinnomenclature is highly variable and a search for proteinnames in GenBank can yield a large number of results, theprotein source assigned to a given peptide by the IEDB musthave a 100% BLAST match [7] with that sequence and mustcorrespond to the protein that the author indicated.
Each peptidic epitope is also derived from an organismspecies, and authors may further specify a particular strain.The IEDB uses the NCBI taxonomy (https://www.ncbi.nlm.nih.gov/taxonomy) to formalize the organism assignment.The extensive taxonomy tree has been modified to onlyinclude species found in the IEDB and subsequently embed-ded in an organism finder, augmented with synonyms andauto-complete features to facilitate queries.
The curation of nonpeptidic structures within the IEDBconforms with the Chemical Entities of Biological Interest(ChEBI) database in the UK (https://www.ebi.ac.uk/chebi/)[8]. For this, a ChEBI curator with specific chemistry exper-tise assists in describing each chemical structure capturedin the database. In the case of nonpeptidic epitopes, theChEBI curator reads the paper, draws the structure, depositsit into the ChEBI database, and provides the ChEBI identi-fier, which is then used to curate all associated assays withthat structure [9].
To describe the immunization processes, the NCBItaxonomy tree is again used to specify the host organismwhose T cells or antibodies are being studied in experiment.The immunization process describes how the host becameinitially exposed or sensitized. For example, a mouse wasinjected with a protein, a human was given a vaccine, or ahuman contracted a specific disease. The Disease Ontology(DO) [10] is used to provide a standardized list of diseasenames and identifiers, which enables linkage of the IEDBdata to other databases using the same identifiers. The useof external ontologies like DO provides useful information,such as definitions, synonyms, and relationships that theIEDB can leverage to enhance its information content.
The Ontology of Biomedical Investigation (OBI) [11],which gives a hierarchical tree structure of all assay typesfound in the literature, is used to capture the details of theexperiment accurately and as completely as possible. Thehierarchical tree structure allows users to search at manylevels, for example, on all T cell assays, or specifically
2 Journal of Immunology Research

cytokine assays, or only IL-2 assays. As we encounter newassay types, we request OBI to add new terms to the ontology,which can then be used by our curators and end users.
MHC restriction is an important parameter related to Tcell assays, as well as MHC binding and ligand elution assays.Because no MHC allele ontology existed, the IEDB createdthe MHC Restriction Ontology (MRO). MRO models theprotein complex of the MHC as being composed of twodifferent protein chains that are each encoded by differentloci that come together to form a complex [12]. Users cansearch by locus, protein chain, or the whole MHC complex.In addition, haplotype information is included for mice.
4. The Curation Process
The literature curation process starts with the execution of acomplex keyword query of PubMed to retrieve potentiallyrelevant papers. An automated classifier [13–15] thenassesses the likelihood that a paper contains relevant infor-mation and assigns each paper retrieved to a disease category.Curatability is then reviewed by a staff immunologist, andpapers are assigned to the curation team. Individual papersare read, assessed for meeting strict inclusion criteria (http://curationwiki.iedb.org/wiki/index.php/IEDB_Inclusion_Criteria), and then entered into the database. About 30% ofthe papers do not meet the inclusion criteria and are markedtherefore as uncuratable. Although the abstract may containthe requisite keywords, the actual article commonly mightomit sequence information or might not actually be aboutepitopes. Articles about NK epitopes, epitope tags, superanti-gens, and antigen processing are also excluded.
Curators use a specialized internal application called a“finder” to assign a GenBank (https://www.ncbi.nlm.nih.gov/genbank/) or UniProt (http://www.uniprot.org/) identi-fier to each epitope based on 100% sequence identity. Findersare incorporated into the curation system and the externalproduction system to facilitate input selections and the useof controlled vocabulary. They organize various queryparameters, such as molecules and organisms, in a hierarchi-cal tree fashion. As an example, the hemagglutinin proteinfrom influenza A virus has more than 300 different GenBankentries that capture differences in the epitope sequencesencountered in the literature, but these are presented by thefinder as a single hemagglutinin entry.
To avoid sorting through this many possible sequences ofhemagglutinin when performing a query, the protein sourcedata are organized using a UniProt reference proteome.UniProt provides a list of all the proteins for a given speciesthat is used to group all the proteins used as epitope sources.Therefore, only the UniProt hemagglutinin is displayed inthe finder (Figure 1). Stars (∗∗) are used to indicate the qual-ity and completeness of the associated reference proteome forthat organism. Within the finder application, a questionmark icon provides a link that elaborates on the star gradingsystem. UniProt also provides information on the processingof proteins into functional fragments. The IEDB search inter-face embeds these UniProt annotations to enable searches onprocessed fragments or on full-length proteins. Users canalso query all influenza virus proteins by selecting a higher
node in the finder tree. Similar finders with hierarchical treesare used throughout the query interface.
All curated papers undergo peer review to determine ifthe captured data are accurate. If necessary, authors arecontacted for clarifications on the paper’s content. New dataare promotedon the IEDBwebsiteweekly, representing 15–20new papers per week.
The papers themselves can differ greatly, given the varietyof journals, authors, and diseases, making data consistency achallenge. To address these differences, a number of qualitycontrol measures have been implemented. Formal curationguidelines have been developed over the years as we encoun-ter new concepts and techniques in the literature (http://curationwiki.iedb.org/wiki/index.php/Curation_Manual2.0)[16]. We also refer to immunological experts as needed,especially when modifications of how data are captured areproposed or new assays or immunological content isencountered. To assist and streamline the curation process,a web-based curation system has been developed with built-in validation logic. For example, when a curator inputs acertain value in the data field, input for other data fields areconstrained to certain allowable values.
5. Direct Submission Processes
As mentioned above, the IEDB is populated with data fromdirect submissions in addition to literature curation. Directsubmissions account for about 20% of the epitope records.The primary source of submissions has been the NIAID-funded large-scale T cell and antibody epitope discoverycontracts and grants for infectious diseases, such as denguevirus, influenza virus, arenavirus, tuberculosis, and commonallergens, although other researchers have deposited theirepitopes as well.
There are three ways to submit data to the IEDB. The firstis a wizard system that walks the submitter through astep-by-step process to enter data. This is ideal for newsubmitters who need to become familiar with the datafields and for those with only a few epitopes and assays.The second method utilizes Excel files that work as tem-plates for different types of assays. This method accommo-dates larger data submissions and is the most commonlyused. The third method uses XML files, which offer thegreatest flexibility, but also require expertise in the use ofXML and familiarity with the IEDB data structure. Oneof the IEDB curators specializes in assisting researchersin submitting data.
Just as all curated published literature has a PubMed IDthat is captured in the IEDB, all data submissions areassigned a submission ID that can be used in publicationsand later referenced. The submissions are reviewed bycurators to ensure completeness and accuracy, and the datavalidation rules are executed as done for data curated fromliterature. The data are not made publicly available until theauthor requests it, usually at the time that a correspondingmanuscript is published. If a data submission is associatedwith a publication curated by the IEDB, the submission IDis linked to the PubMed ID.
3Journal of Immunology Research
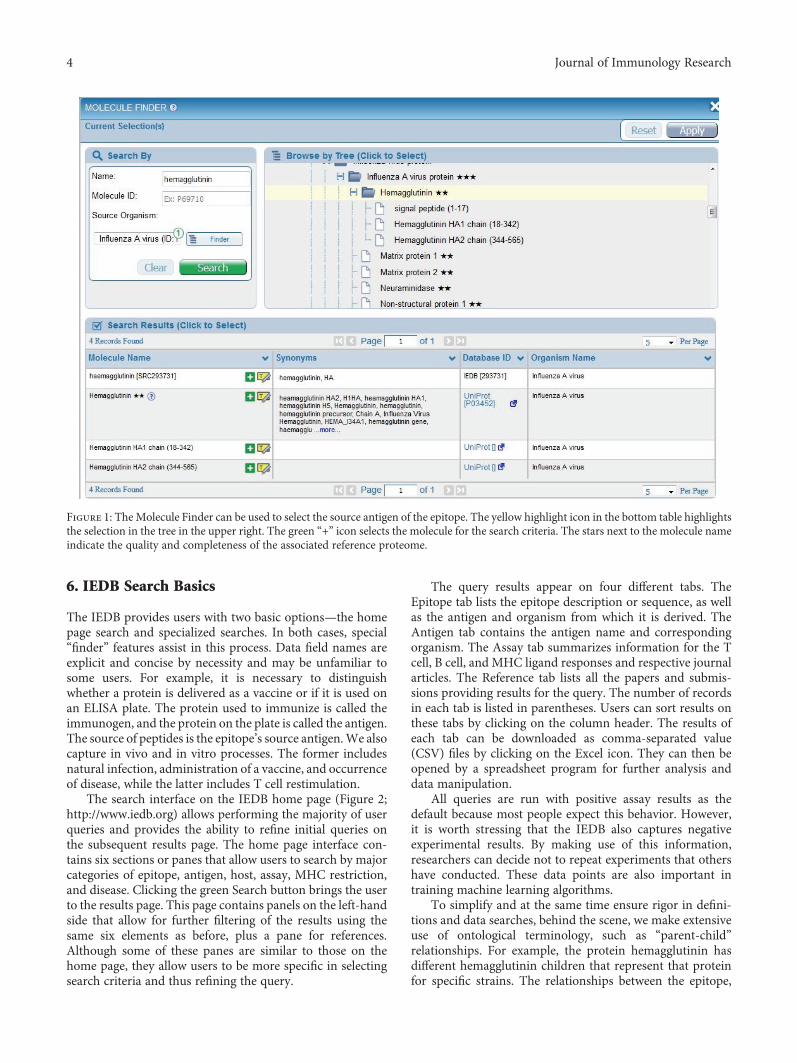
6. IEDB Search Basics
The IEDB provides users with two basic options—the homepage search and specialized searches. In both cases, special“finder” features assist in this process. Data field names areexplicit and concise by necessity and may be unfamiliar tosome users. For example, it is necessary to distinguishwhether a protein is delivered as a vaccine or if it is used onan ELISA plate. The protein used to immunize is called theimmunogen, and the protein on the plate is called the antigen.The source of peptides is the epitope’s source antigen.We alsocapture in vivo and in vitro processes. The former includesnatural infection, administration of a vaccine, and occurrenceof disease, while the latter includes T cell restimulation.
The search interface on the IEDB home page (Figure 2;http://www.iedb.org) allows performing the majority of userqueries and provides the ability to refine initial queries onthe subsequent results page. The home page interface con-tains six sections or panes that allow users to search by majorcategories of epitope, antigen, host, assay, MHC restriction,and disease. Clicking the green Search button brings the userto the results page. This page contains panels on the left-handside that allow for further filtering of the results using thesame six elements as before, plus a pane for references.Although some of these panes are similar to those on thehome page, they allow users to be more specific in selectingsearch criteria and thus refining the query.
The query results appear on four different tabs. TheEpitope tab lists the epitope description or sequence, as wellas the antigen and organism from which it is derived. TheAntigen tab contains the antigen name and correspondingorganism. The Assay tab summarizes information for the Tcell, B cell, and MHC ligand responses and respective journalarticles. The Reference tab lists all the papers and submis-sions providing results for the query. The number of recordsin each tab is listed in parentheses. Users can sort results onthese tabs by clicking on the column header. The results ofeach tab can be downloaded as comma-separated value(CSV) files by clicking on the Excel icon. They can then beopened by a spreadsheet program for further analysis anddata manipulation.
All queries are run with positive assay results as thedefault because most people expect this behavior. However,it is worth stressing that the IEDB also captures negativeexperimental results. By making use of this information,researchers can decide not to repeat experiments that othershave conducted. These data points are also important intraining machine learning algorithms.
To simplify and at the same time ensure rigor in defini-tions and data searches, behind the scene, we make extensiveuse of ontological terminology, such as “parent-child”relationships. For example, the protein hemagglutinin hasdifferent hemagglutinin children that represent that proteinfor specific strains. The relationships between the epitope,
Figure 1: The Molecule Finder can be used to select the source antigen of the epitope. The yellow highlight icon in the bottom table highlightsthe selection in the tree in the upper right. The green “+” icon selects the molecule for the search criteria. The stars next to the molecule nameindicate the quality and completeness of the associated reference proteome.
4 Journal of Immunology Research

the protein from which it is derived, and the organism that isthe source of the protein are all captured. Further descriptionof the terms and nomenclature can be found on the DataField Descriptions page (http://curationwiki.iedb.org/wiki/index.php/Data_Field_Descriptions) and in the IEDB Cura-tion Manual (http://curationwiki.iedb.org/wiki/index.php/Curation_Manual2.0).
7. Easy Options to Narrow Search Results
As a user moves the mouse over each search pane on theresults page, it expands to reveal free-text fields and finderbuttons. In the Epitope pane, by default the radio buttonfor “Any Epitopes” is selected, but users can restrict theirsearch to linear, discontinuous, or nonpeptidic epitopes. Byexpanding this pane, users can specify a sequence for a linearepitope. They can also select whether they want an exactmatch to the sequence, find it as a substring in another epi-tope, or find epitopes that are homologous to it at 70%,80%, or 90% sequence identity. A specific finder enables theselection of a nonpeptidic structure.
The Antigen pane has two fields, Organism and AntigenName, which permit users to search for pathogen, allergen,or self-antigen from which the epitope was derived. Forautoimmune diseases, these would be human proteins, and
for allergens, these would include sources such as grass,pollen, or dust mites. The text fields are auto-completeenabled, so as the user starts typing, possible values willbe listed below to help speed the input process. Synonymsare included, so typing HCV, for example, will produceHepatitis C virus as an option.
The Assay pane by default selects all assay types that havepositive measurements. The search can be refined by dese-lecting these options and by specifying assay types with theauto-complete text fields or finders for the three major assaytypes—T cell, B cell, and MHC ligand (binding and elution).
The MHC Restriction pane enables queries for therestrictions captured for a given epitope in a given T cell,MHC binding, or elution assay. Users can constrain thesearch at a high level to class I, class II, or nonclassical broadcategories. They can also specify one or more alleles using theauto-complete text field or the finder.
The Host pane lets users define the host in which theepitope was described. The Host pane on the home page hasselections for Any, Humans, Mice, Non-human Primates,and a text field for specifying other curated host species. Onthe results page, the Host pane replaces the Other CommonHosts with a Specific Host option with an accompanyingauto-complete field and finder. This allows the specificationof transgenic mice or particular mouse strains.
Figure 2: The IEDB home page features a search interface in the center of the page.
5Journal of Immunology Research

The Disease pane enables searching for data based onthe clinical status of the host as detailed in the patient his-tory or for a known animal model disease, such as exper-imental allergic encephalomyelitis (EAE) for multiplesclerosis. As such, it makes searching for autoimmuneand allergens easier since antigens in these disease catego-ries are not necessarily pathogenomonic, as they are withinfectious disease antigens. Users can specify diseases withthe auto-complete text field or the associated finder.Finally, the Reference pane can be used to limit searchesto journal articles or submissions, if desired, or by author,title, year, or PubMed ID. In general, users can also spec-ify author, reference titles, and year.
8. Using the Antigen, Organism, MHC Allele,Assay, and Disease Finders
As described above, finders provide standardization andhierarchical organization of the data in the IEDB and helpthe users formulate search criteria at different levels of gran-ularity. The tree structure graphically displays parent-childrelationships of the data. Finders exist for antigens, nonpep-tidic molecules, organisms, MHC alleles, assays, and disease.
The Epitope pane contains a finder for nonproteinchemical entities, including metal allergens, such as nickel;drug compounds, such as penicillin; and glycolipids, suchas lipopolysaccharides. The Antigen pane also containsan antigen finder for specifying the molecular source ofthe epitope (in most cases a protein). For example, a userinterested in hemagglutinin for influenza A virus can type“HA” in the Name field and select “influenza A” using theauto-complete feature in the Source Organism text fieldand then click Search to generate a list of potential hemag-glutinin hits.
As mentioned above, the organism finder is used tospecify the source of the epitope or the assay immunogenor antigen. To do this, users can open the finder and type“HCV” in the Name text field in the upper left corner andclick the Search button on the finder. This generates a listof related terms below. Users can then click on the green“+” icon to make a choice, which then appears at the top ofthe finder in Current Selections at top. Alternatively, a usercan click on the yellow highlight icon, which will highlightthe selected organism in the tree structure in the center(Figure 3). This highlight feature enables the user to visualizethe taxonomic relationships and allows the user to select astrain, species, genus, or family. In either case, the user mustclick the green Apply button to complete the organism spec-ification for that query. The organism finder can be accessedby the Antigen pane.
The Assay pane contains the assay finder that is used tofind specific assay types within the broader category of B cell,T cell, or MHC ligand. Users can search by name, method, or“measurement of.” In this way, users can specify assaymethods such as ELISA, ELISPOT, ICS, or X-ray crystallog-raphy or can alternatively specify all assays that measureinterferon gamma (IFNγ).
The allele finder in the Allele pane is used to specify theMHC restriction defined in the assay. As of January 2017,
the IEDBMHC tree contains alleles from 16 different species,including primarily human, nonhuman primates, and mice.Users can type in the name of their alleles of interest in theName text field or use the pull-down menus for Organismor Class and then click the Search button to generate a listof possible alleles. As with the other finders, users can selectfrom the list or highlight an allele to expand the allele tree.The use of the finder is especially convenient since the allelenotation can change over time.
The host finder on the Host pane allows users to selectadditional host species that are not available from the Hostpane on the home page. This might include specific mousestrains, such as transgenicmouse specieswith complex names.
As discussed above, the disease finder within the Diseasepane lets the user specify a disease, which is helpful whensearching for autoimmune diseases or allergens. For example,a search for “asthma” using the Disease Name text field findstwo types of asthma, allergic asthma and nonallergic/occupa-tional asthma. Again, it should be emphasized that this fielddoes not search for epitope data based on disease categorybut rather by the clinical state of the subject or animal model.
9. Specialized Search Options
While the home page search interface can accommodate thevast majority of common searches, more intricate or compleximmunological queries may need one of the specializedsearch interfaces. The specialized searches can be accessedfrom the home page under the Specialized Searches pull-down menu. The first four items in the list, Epitope Details,T Cell Assay Details, B Cell Assay Details, and MHC AssayDetails, allow the user to access every field in the database,greatly expanding the search options.
The first Specialized Search in the menu is EpitopeDetails. This page has a similar layout to the Results page inthe home page search interface. It has the same four resultstabs, but the filter selections on the left are different andcan be expanded to reveal numerous fields that were notpreviously available. The Epitope Reference Details sectioncontains fields for epitope name and start/stop positions ina reference protein. The Epitope Related Object sectionincludes fields intended to capture entities that bear somerelationship to the epitope—analog, mimotope, and neoepi-tope. Analogs are synthetic constructs of peptide sequencesor chemical compounds that share some structural featuresin common with another sequence or compound. They areoften used to determine the role of specific amino acids inthe binding or immunogenicity of an epitope. The source ofan analog is always artificial. Mimotopes are functionalmimics of natural molecular structures which bear little orno sequence homology to their biological counterparts. Can-cer neoepitopes are defined herein as any epitope comprisingamino acids that are not encoded in the germ line genomebut that arise due to somatic (nonsynonomous) mutations,excluding somatic rearrangements of TCR and Ig genes.The IEDB will curate both immunogenic neoepitopes andputative epitopes tested for recognition that were not foundto be immunogenic. Users can search by author, keywordsin abstracts, journal name, MeSH terms, year, and more.
6 Journal of Immunology Research

The T Cell, B Cell, and MHC assay details pages all havethe same capabilities described above plus two others—Hostand Assay. The Host pane contains fields related to how thehost acquired immune reactivity, such as being immunizedor by natural infection. Users can also specify the immuno-gen (e.g., epitope, protein, or organism) and the host disease,among many other criteria. In the Assay pane, in addition toselecting assay type, users can specify effector cells, antibodyisotypes, monoclonal or polyclonal response, and the assayantigen (e.g., epitope, protein, or organism).
The Host pane also has data fields for the first and secondin vivo processes. An in vivo process indicates how the hostacquired immune reactivity, such as by immunization ornatural exposure. A host can also encounter an immunogenmore than once, which is why two in vivo processes areavailable. For example, a mouse can be immunized with apeptide and then later challenged with an organism and thecells taken from the organism and assayed in vitro. That sce-nario is captured with two in vivo processes, the first for theimmunization of the mouse and the second for the challenge.There are also fields to capture in vitro process because oftenthere is a restimulation performed in vitro prior to the assay.
To specify in vivo processes, the Host pane contains amultiselect pull-down menu with a variety of choices thatcan be categorized into groups related to administration,occurrence, exposure, transplant/transfusion, no immuni-zation, and unknown. Definitions for all the choices areprovided in the IEDB Curation Manual. The 1st Immunogensection has fields to extend the criteria of the 1st In VivoProcess. Users can indicate the relationship of the immuno-gen to the epitope. For example, should the immunogen bethe epitope itself, the source antigen of the epitope, or havea taxonomic relationship to the epitope, such as an epitopethat is reported from strain A, but the immunogen used isfrom strain B. These fields are mirrored in the antigen andassay fields as well.
The final specialized search is the Identifier Search, whichis divided into two sections. The top section has query fieldsfor internal IEDB identifiers for Epitope ID, Reference ID,Submission ID, and Assay ID. All curated articles and sub-mission are given a Reference ID. In addition, data submis-sions are given a Submission ID that researchers can use intheir publications. When the paper is published and curated,a link in the database is created between the paper and
Figure 3: The Organism Finder can be used to select the search criteria for the epitope source organism. A similar finder is available forselecting the host organism.
7Journal of Immunology Research
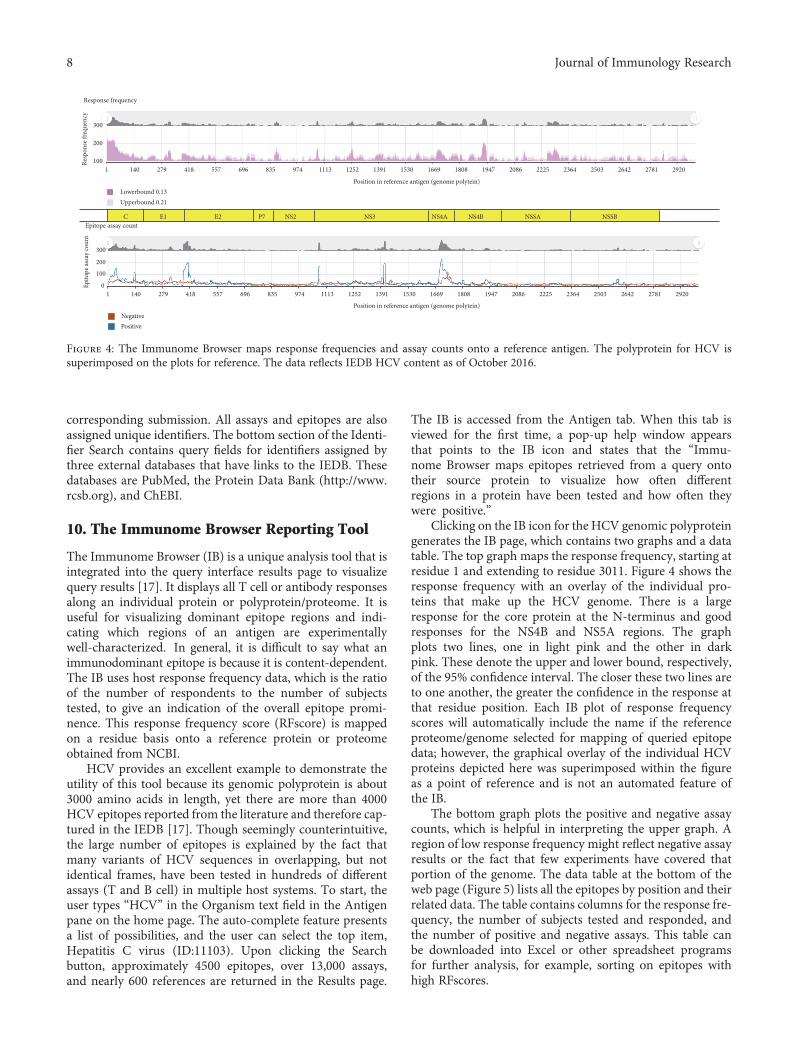
corresponding submission. All assays and epitopes are alsoassigned unique identifiers. The bottom section of the Identi-fier Search contains query fields for identifiers assigned bythree external databases that have links to the IEDB. Thesedatabases are PubMed, the Protein Data Bank (http://www.rcsb.org), and ChEBI.
10. The Immunome Browser Reporting Tool
The Immunome Browser (IB) is a unique analysis tool that isintegrated into the query interface results page to visualizequery results [17]. It displays all T cell or antibody responsesalong an individual protein or polyprotein/proteome. It isuseful for visualizing dominant epitope regions and indi-cating which regions of an antigen are experimentallywell-characterized. In general, it is difficult to say what animmunodominant epitope is because it is content-dependent.The IB uses host response frequency data, which is the ratioof the number of respondents to the number of subjectstested, to give an indication of the overall epitope promi-nence. This response frequency score (RFscore) is mappedon a residue basis onto a reference protein or proteomeobtained from NCBI.
HCV provides an excellent example to demonstrate theutility of this tool because its genomic polyprotein is about3000 amino acids in length, yet there are more than 4000HCV epitopes reported from the literature and therefore cap-tured in the IEDB [17]. Though seemingly counterintuitive,the large number of epitopes is explained by the fact thatmany variants of HCV sequences in overlapping, but notidentical frames, have been tested in hundreds of differentassays (T and B cell) in multiple host systems. To start, theuser types “HCV” in the Organism text field in the Antigenpane on the home page. The auto-complete feature presentsa list of possibilities, and the user can select the top item,Hepatitis C virus (ID:11103). Upon clicking the Searchbutton, approximately 4500 epitopes, over 13,000 assays,and nearly 600 references are returned in the Results page.
The IB is accessed from the Antigen tab. When this tab isviewed for the first time, a pop-up help window appearsthat points to the IB icon and states that the “Immu-nome Browser maps epitopes retrieved from a query ontotheir source protein to visualize how often differentregions in a protein have been tested and how often theywere positive.”
Clicking on the IB icon for the HCV genomic polyproteingenerates the IB page, which contains two graphs and a datatable. The top graph maps the response frequency, starting atresidue 1 and extending to residue 3011. Figure 4 shows theresponse frequency with an overlay of the individual pro-teins that make up the HCV genome. There is a largeresponse for the core protein at the N-terminus and goodresponses for the NS4B and NS5A regions. The graphplots two lines, one in light pink and the other in darkpink. These denote the upper and lower bound, respectively,of the 95% confidence interval. The closer these two lines areto one another, the greater the confidence in the response atthat residue position. Each IB plot of response frequencyscores will automatically include the name if the referenceproteome/genome selected for mapping of queried epitopedata; however, the graphical overlay of the individual HCVproteins depicted here was superimposed within the figureas a point of reference and is not an automated feature ofthe IB.
The bottom graph plots the positive and negative assaycounts, which is helpful in interpreting the upper graph. Aregion of low response frequency might reflect negative assayresults or the fact that few experiments have covered thatportion of the genome. The data table at the bottom of theweb page (Figure 5) lists all the epitopes by position and theirrelated data. The table contains columns for the response fre-quency, the number of subjects tested and responded, andthe number of positive and negative assays. This table canbe downloaded into Excel or other spreadsheet programsfor further analysis, for example, sorting on epitopes withhigh RFscores.
C E1 E2 P7 NS2 NS3 NS4A NS4B NSSA NSSB
1 140 279 418 557 696 835 974 1113 1252 1391 1530 1669 1808 1947 2086 2225 2364 2503 2642 2781 2920
Epito
pe as
say
coun
tRe
spon
se fr
eque
ncy
Epitope assay count
Response frequency
Upperbound 0.21Lowerbound 0.13
NegativePositive
1401 279 418 557 696 835 974 1113
Position in reference antigen (genome polytein)
Position in reference antigen (genome polytein)
1252 1391 1530 1669 1808 1947 2086 2225 2364 2503 2642 2781 2920
100
200
300
0
100
200
300
Figure 4: The Immunome Browser maps response frequencies and assay counts onto a reference antigen. The polyprotein for HCV issuperimposed on the plots for reference. The data reflects IEDB HCV content as of October 2016.
8 Journal of Immunology Research
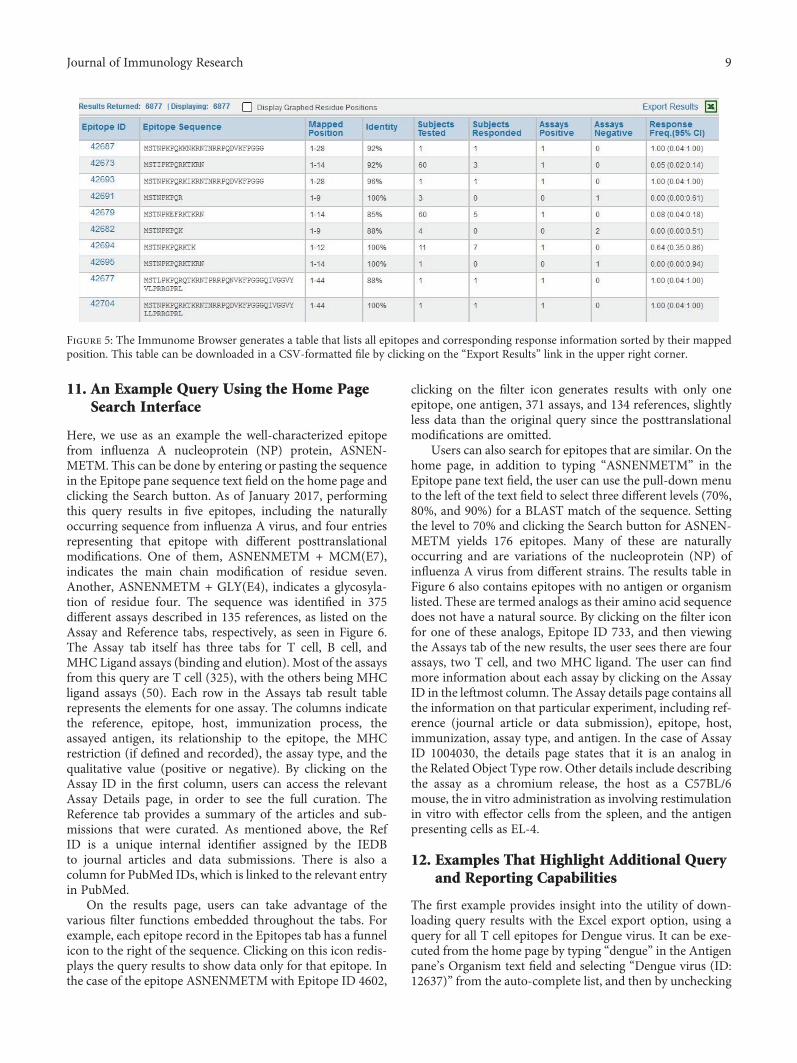
11. An Example Query Using the Home PageSearch Interface
Here, we use as an example the well-characterized epitopefrom influenza A nucleoprotein (NP) protein, ASNEN-METM. This can be done by entering or pasting the sequencein the Epitope pane sequence text field on the home page andclicking the Search button. As of January 2017, performingthis query results in five epitopes, including the naturallyoccurring sequence from influenza A virus, and four entriesrepresenting that epitope with different posttranslationalmodifications. One of them, ASNENMETM + MCM(E7),indicates the main chain modification of residue seven.Another, ASNENMETM + GLY(E4), indicates a glycosyla-tion of residue four. The sequence was identified in 375different assays described in 135 references, as listed on theAssay and Reference tabs, respectively, as seen in Figure 6.The Assay tab itself has three tabs for T cell, B cell, andMHC Ligand assays (binding and elution). Most of the assaysfrom this query are T cell (325), with the others being MHCligand assays (50). Each row in the Assays tab result tablerepresents the elements for one assay. The columns indicatethe reference, epitope, host, immunization process, theassayed antigen, its relationship to the epitope, the MHCrestriction (if defined and recorded), the assay type, and thequalitative value (positive or negative). By clicking on theAssay ID in the first column, users can access the relevantAssay Details page, in order to see the full curation. TheReference tab provides a summary of the articles and sub-missions that were curated. As mentioned above, the RefID is a unique internal identifier assigned by the IEDBto journal articles and data submissions. There is also acolumn for PubMed IDs, which is linked to the relevant entryin PubMed.
On the results page, users can take advantage of thevarious filter functions embedded throughout the tabs. Forexample, each epitope record in the Epitopes tab has a funnelicon to the right of the sequence. Clicking on this icon redis-plays the query results to show data only for that epitope. Inthe case of the epitope ASNENMETM with Epitope ID 4602,
clicking on the filter icon generates results with only oneepitope, one antigen, 371 assays, and 134 references, slightlyless data than the original query since the posttranslationalmodifications are omitted.
Users can also search for epitopes that are similar. On thehome page, in addition to typing “ASNENMETM” in theEpitope pane text field, the user can use the pull-down menuto the left of the text field to select three different levels (70%,80%, and 90%) for a BLAST match of the sequence. Settingthe level to 70% and clicking the Search button for ASNEN-METM yields 176 epitopes. Many of these are naturallyoccurring and are variations of the nucleoprotein (NP) ofinfluenza A virus from different strains. The results table inFigure 6 also contains epitopes with no antigen or organismlisted. These are termed analogs as their amino acid sequencedoes not have a natural source. By clicking on the filter iconfor one of these analogs, Epitope ID 733, and then viewingthe Assays tab of the new results, the user sees there are fourassays, two T cell, and two MHC ligand. The user can findmore information about each assay by clicking on the AssayID in the leftmost column. The Assay details page contains allthe information on that particular experiment, including ref-erence (journal article or data submission), epitope, host,immunization, assay type, and antigen. In the case of AssayID 1004030, the details page states that it is an analog inthe Related Object Type row. Other details include describingthe assay as a chromium release, the host as a C57BL/6mouse, the in vitro administration as involving restimulationin vitro with effector cells from the spleen, and the antigenpresenting cells as EL-4.
12. Examples That Highlight Additional Queryand Reporting Capabilities
The first example provides insight into the utility of down-loading query results with the Excel export option, using aquery for all T cell epitopes for Dengue virus. It can be exe-cuted from the home page by typing “dengue” in the Antigenpane’s Organism text field and selecting “Dengue virus (ID:12637)” from the auto-complete list, and then by unchecking
Figure 5: The Immunome Browser generates a table that lists all epitopes and corresponding response information sorted by their mappedposition. This table can be downloaded in a CSV-formatted file by clicking on the “Export Results” link in the upper right corner.
9Journal of Immunology Research
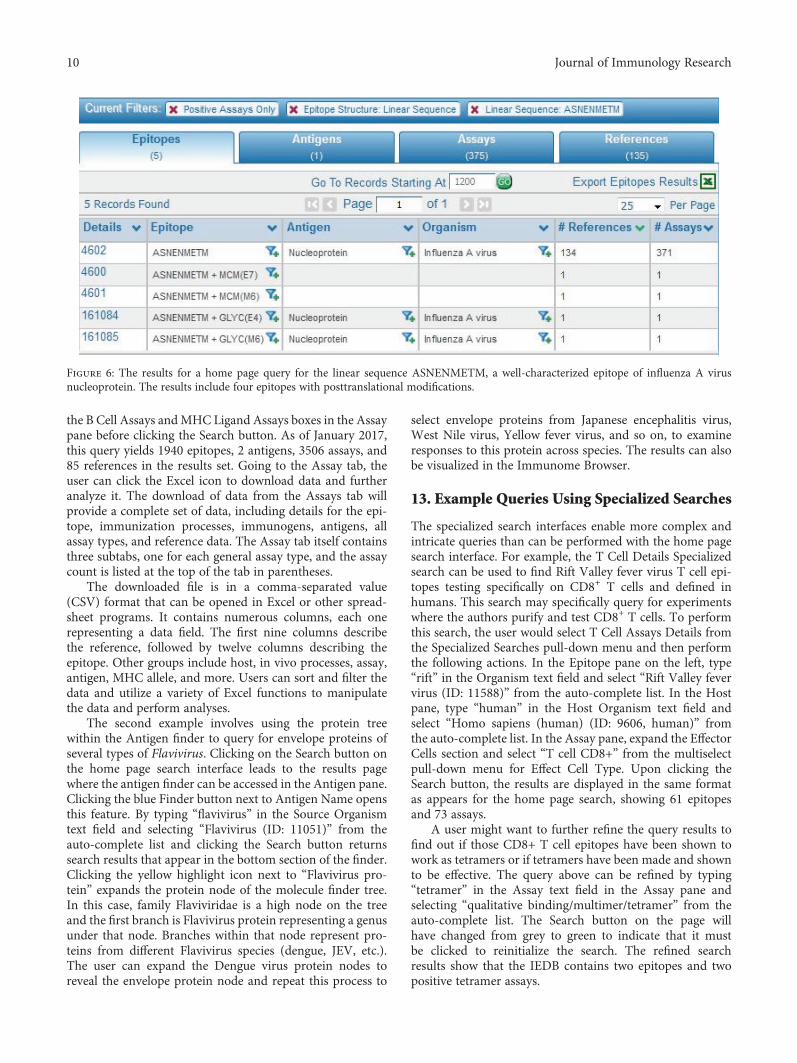
the B Cell Assays andMHC Ligand Assays boxes in the Assaypane before clicking the Search button. As of January 2017,this query yields 1940 epitopes, 2 antigens, 3506 assays, and85 references in the results set. Going to the Assay tab, theuser can click the Excel icon to download data and furtheranalyze it. The download of data from the Assays tab willprovide a complete set of data, including details for the epi-tope, immunization processes, immunogens, antigens, allassay types, and reference data. The Assay tab itself containsthree subtabs, one for each general assay type, and the assaycount is listed at the top of the tab in parentheses.
The downloaded file is in a comma-separated value(CSV) format that can be opened in Excel or other spread-sheet programs. It contains numerous columns, each onerepresenting a data field. The first nine columns describethe reference, followed by twelve columns describing theepitope. Other groups include host, in vivo processes, assay,antigen, MHC allele, and more. Users can sort and filter thedata and utilize a variety of Excel functions to manipulatethe data and perform analyses.
The second example involves using the protein treewithin the Antigen finder to query for envelope proteins ofseveral types of Flavivirus. Clicking on the Search button onthe home page search interface leads to the results pagewhere the antigen finder can be accessed in the Antigen pane.Clicking the blue Finder button next to Antigen Name opensthis feature. By typing “flavivirus” in the Source Organismtext field and selecting “Flavivirus (ID: 11051)” from theauto-complete list and clicking the Search button returnssearch results that appear in the bottom section of the finder.Clicking the yellow highlight icon next to “Flavivirus pro-tein” expands the protein node of the molecule finder tree.In this case, family Flaviviridae is a high node on the treeand the first branch is Flavivirus protein representing a genusunder that node. Branches within that node represent pro-teins from different Flavivirus species (dengue, JEV, etc.).The user can expand the Dengue virus protein nodes toreveal the envelope protein node and repeat this process to
select envelope proteins from Japanese encephalitis virus,West Nile virus, Yellow fever virus, and so on, to examineresponses to this protein across species. The results can alsobe visualized in the Immunome Browser.
13. Example Queries Using Specialized Searches
The specialized search interfaces enable more complex andintricate queries than can be performed with the home pagesearch interface. For example, the T Cell Details Specializedsearch can be used to find Rift Valley fever virus T cell epi-topes testing specifically on CD8+ T cells and defined inhumans. This search may specifically query for experimentswhere the authors purify and test CD8+ T cells. To performthis search, the user would select T Cell Assays Details fromthe Specialized Searches pull-down menu and then performthe following actions. In the Epitope pane on the left, type“rift” in the Organism text field and select “Rift Valley fevervirus (ID: 11588)” from the auto-complete list. In the Hostpane, type “human” in the Host Organism text field andselect “Homo sapiens (human) (ID: 9606, human)” fromthe auto-complete list. In the Assay pane, expand the EffectorCells section and select “T cell CD8+” from the multiselectpull-down menu for Effect Cell Type. Upon clicking theSearch button, the results are displayed in the same formatas appears for the home page search, showing 61 epitopesand 73 assays.
A user might want to further refine the query results tofind out if those CD8+ T cell epitopes have been shown towork as tetramers or if tetramers have been made and shownto be effective. The query above can be refined by typing“tetramer” in the Assay text field in the Assay pane andselecting “qualitative binding/multimer/tetramer” from theauto-complete list. The Search button on the page willhave changed from grey to green to indicate that it mustbe clicked to reinitialize the search. The refined searchresults show that the IEDB contains two epitopes and twopositive tetramer assays.
Figure 6: The results for a home page query for the linear sequence ASNENMETM, a well-characterized epitope of influenza A virusnucleoprotein. The results include four epitopes with posttranslational modifications.
10 Journal of Immunology Research

The second specialized search example uses the B CellDetails search to find Influenza A virus epitopes recognizedby neutralizing human monoclonal antibodies. Starting withthe B Cell Details search page, the user would specify organ-ism as Influenza A in the Epitope pane and host organism ashuman in the Host pane. For the specialized searches, thequalitative assay is not set to positive by default, so it wouldbe necessary to select “positive” in the pull-down menu inthe Assay pane for Qualitative Measurement. Next, the userwould perform the following actions: in the same pane, type“neutralization” in the Assay text field and select “neutra-lization|biological activity” from the auto-complete list. Tospecify monoclonal antibodies, expand the Assayed Anti-body section on the Assay pane and select “Monoclonal”from the drop-down multiselect list under Antibody Purifi-cation Status. Other choices in this menu include polyclonaland display library. Clicking the Search button reveals 66epitopes and 575 B cell assays.
14. Example Queries for DENV MonoclonalAntibodies, Influenza Tetramer Assays, andRSV Protective Antibodies
The next query example is what monoclonal antibodies havebeen described for Dengue virus, which requires the B cellassay specialized search. Here, the user would perform thefollowing actions: in the Assay pane, expand “Assay Anti-body,” open the menu for Antibody Purification Status, andcheck “monoclonal.” “Display Library (monoclonal)” canalso be selected if desired. In the Epitope pane, type “dengue”in the Organism text box and click on “Dengue virus (ID:12637),” and then click the Search button to generate a listof all monoclonal antibodies for Dengue. To further explorethe results, users can go to the Assay tab and download theresults in an Excel-readable file. Once in Excel, users caneasily sort and filter data. For example, users can filter onthe Assay/Assay Group column for neutralization assaysand further filter on the 1st in vivo Process column forOccurrence of Natural Infection. In addition, information isavailable on isotype and other assay variables. If users areinterested in 3-dimensional structures, they can open theAssay finder in the Assay pane and click on “3D structure.”If users are interested in a particular PDB ID, they can searchfor it by expanding the 3D Structure of Complex in the Assaypane and enter the PDB ID in the corresponding text field.
Other example queries for tetramers are used in thecontext of Influenza A virus and associated MHC alleles.To specify an assay type, the user will need to access an assayfinder. Starting on the home page, the user immediatelyclicks the Search button to get to the Results page. In theOrganism text field in the Antigen pane, the user would type“influenza” and the auto-complete function will list “Influ-enza A virus (ID: 11320).” Next, the user would performthe following actions: select this value and then deselect BCell Assays and MHC Ligand Assays in the Assay pane. Inthat same pane, type “tetramer” in the T Cell Assays textfield. From the auto-complete-generated list, select “qualita-tive binding|multimer/tetramer” assay and click the Search
button. This will produce a list of over 400 epitopes. The usercan view the alleles on the Assays tab in the MHC Restrictioncolumn, which is sortable. Users can also download theresults of the Assay tab and find the allele information intheMHC/Allele Name column in one of the far right columnsin the spreadsheet. There is also a column for Effector Cells/Cell Type that can be sorted and filtered.
The final infectious disease query example involvesfinding protective antibody epitopes for respiratory syncytialvirus (RSV). This search involves targeting a specific type ofassay for a pathogen of interest. Thus, from the home page,the user clicks the Search button to get to the filters on theResults page. In the Antigen pane, typing “RSV” will generatean auto-complete list with numerous related individual spe-cies choices. Thus, in order to select a high node includingall RSVs, the user can instead open the finder and type“rsv” in the organism name text box. Once done, the usercan click on the yellow highlight icon in one of the rows toopen up the organism tree to reveal bovine RSV, humanRSV, and other related organisms under the Orthopneumo-virus node. From here, the user can select this higher nodeand click Apply. The user next specifies the assay type inthe finder in the Assay pane by typing “challenge” in thename field and clicking Search to get a list of challenge assays.By clicking on the highlight icon in one of the finder searchresult rows, the assay tree is opened to reveal the hierarchicalstructure. Next, the user would perform the followingactions: select the “challenge” node, click Apply, and thenclick Search on the Results page to reveal at least 17 epitopesin the context of an in vivo challenge assay where, inmost instances, an animal model was challenged with livevirus to demonstrate whether or not an epitope could elicitprotective immunity.
15. Example Queries for Human DiabetesEpitopes
The first query seeks to specifically identify all human dataavailable for type 1 diabetes (T1D), including what antigenshave been mapped for T cell epitopes, and how many thera-peutic epitopes have been identified. The query can beperformed with the home page search by clicking Search toget to the Results page and then perform the followingactions: in the Disease pane, type “diabetes” in the SpecificDisease text field and select “diabetes mellitus” from theauto-complete list. In the Host pane, select the “human”radio button and in the Assay pane, uncheck B Cell Assaysand MHC Ligand Assays, and click the Search button. Theresults of the search show over 450 epitopes. The Antigenstab displays the antigens in descending order of the numberof epitopes. In this case, Gluctamate decarboxylase 2 (GAD),one of the predominant antigens for type 1 diabetes, appearsat the top of the list.
Next, to find the subset of these data that is associatedwith treatments or decreased disease, the user can refine theinitial search by adding the criteria of T cell assays relatedto treatment. In the T Cell Assay text field, type “treatment”and select “decreased disease in vivo assay (reduction ofdisease after treatment)” and click the Search button. As of
11Journal of Immunology Research

January 2017, this search revealed two epitopes found to betherapeutic in humans with T1D. The final example querybuilds on the previous one, asking if there are immunodo-minant regions defined for insulin in humans with T1D.Perform the query as above for humans, T1D and T cellresponses. Then, on the antigen tab, click the ImmunomeBrowser icon next to insulin. This will display the responsefrequency of all assays mapped onto a reference antigen forinsulin. From this, the user can visualize the immunologicalhot spots.
16. Conclusions
The IEDB provides biomedical researchers interested in thedevelopment of vaccines and therapeutics a unique resourcefor epitopes related to a wide variety of infectious diseases,allergens, autoimmunediseases, and alloantigens. Thedatabasecontent of peptidic, conformational, and nonpeptidic epitopesand their associated T cell, B cell, MHC binding, and MHCligand elution assays is kept currentwith the scientific literatureand includes data depositions from the research community.All data in the IEDBare experimentally derived, and it containsboth positive andnegative data, an important consideration forexperiment design and for those interested in developingmachine learning algorithms for predicting epitopes.
The IEDB has certain constraints and limitations. TheIEDB does not curate HIV or cancer references, as these dataare not within the programmatic scope of the NIAID. How-ever, exceptions for the inclusion of HIV and cancer epitopesare made if they are reported alongside other epitopes. Simi-larly, any epitope reported in the context of a cancer resultingfrom viral infection (e.g., human papilloma virus and humanT-lymphotropic virus) are included. The database is also lim-ited by the information provided in each paper by theauthors. For example, the type of disease (disease state) iscaptured in accordance with the patient histories providedby the author. The IEDB primarily describes disease statesusing the Disease Ontology (DO), which uses formal nomen-clature and synonyms. The progress of the disease (diseasestage) is described using a searchable list of terms, such asacute, chronic, and post.
There are several user interfaces that researchers can useto query the database. The home page search interfacefeatures six query criteria used in most searches. Searchresults can be further refined with additional filters, similarto the search paradigm used on most travel websites andmany shopping websites. The results page includes fourseparate tabs that list epitopes, antigens, assays, and refer-ences (journal articles and data submissions). A visualizationof the results mapped on to a reference proteome called theImmunome Browser can be accessed from the Antigen tab.Users can also access all the fields in the data schema withthe specialized search interfaces. These interfaces enabledatabase queries that would not be possible via the homepage interface. All results can be downloaded as a CSV filefor further processing in a spreadsheet application. Examplesare presented to illustrate the features of the home page andspecialized search interfaces for a variety of applications,including infectious and autoimmune diseases.
Conflicts of Interest
The authors declare that there is no conflict of interestregarding the publication of this article.
Acknowledgments
This work was supported by the National Institute of Allergyand InfectiousDiseases (Contract no. HHSN272201200010C).
References
[1] K. Yusim, B. T. Korber, C. Brander, B. F. Haynes, R. Koup, J. P.Moore, B. D. Walker, and D. I. Watkins, Eds., HIV MolecularImmunology 2009, Los Alamos National Laboratory, Theo-retical Biology and Biophysics, Los Alamos, New Mexico,2009, LA-UR 09-05941, http://www.hiv.lanl.gov/content/immunology/pdf/2009/immuno2009.pdf.
[2] R. Vita, J. A. Overton, J. A. Greenbaum et al., “The immuneepitope database (IEDB) 3.0,” Nucleic Acids Research, vol. 43,no. D1, pp. D405–D412, 2015.
[3] R. Vita, K. Vaughan, L. Zarebski et al., “Curation of complex,context-dependent immunological data,” BMC Bioinformatics,vol. 7, no. 1, p. 341, 2006.
[4] Z. Lu and L. Hirschman, “Biocuration workflows and textmining: overview of the BioCreative 2012 workshop track II,”Database: The Journal of Biological Databases and Curation,vol. 2012, p. bas043, 2012.
[5] R. Vita, L. Zarebski, J. A. Greenbaum et al., “The immuneepitope database 2.0,”Nucleic Acids Research, vol. 38, Databaseissue, p. D854, 2010.
[6] B. Smith, W. Ceusters, B. Klagges et al., “Relations in biomed-ical ontologies,” Genome Biology, vol. 6, no. 5, p. R46, 2005.
[7] T. Madden, “The BLAST sequence analysis tool. 2013Mar 15,”in The NCBI Handbook [Internet]. 2nd edition, J. McEntyreand J. Ostell, Eds., National Center for Biotechnology Infor-mation (US), Bethesda (MD), 2013, Available from: http://www.ncbi.nlm.nih.gov/books/NBK153387/.
[8] P. de Matos, A. Dekker, M. Ennis et al., “ChEBI: a chemistryontology and database,” Journal of Cheminformatics, vol. 2,Supplement 1, p. P6, 2010.
[9] R. Vita, B. Peters, Z. Josephs et al., “A model for collaborativecuration, the IEDB and ChEBI curation of non-peptidicepitopes,” Immunome Research, vol. 7, no. 1, pp. 1–8, 2011.
[10] W. A. Kibbe, C. Arze, V. Felix et al., “Disease Ontology 2015update: an expanded and updated database of human diseasesfor linking biomedical knowledge through disease data,”Nucleic Acids Research, vol. 43, Database issue, pp. D1071–D1078, 2015.
[11] A. Bandrowski, R. Brinkman, M. Brochhausen et al., “Theontology for biomedical investigations,” PloS One, vol. 11,no. 4, article e0154556, 2016.
[12] R. Vita, J. A. Overton, E. Seymour et al., “An ontology formajor histocompatibility restriction,” Journal of BiomedicalSemantics, vol. 7, no. 1, p. 1, 2016, eCollection 2016.
[13] X. T. Wee, Y. Koh, and C. W. Yap, “Automated systems toidentify relevant documents in product risk management,”BMC Medical Informatics and Decision Making, vol. 12,no. 1, p. 13, 2012.
12 Journal of Immunology Research

[14] P. Wang, A. A. Morgan, Q. Zhang, A. Sette, and B. Peters,“Automating document classification for the immune epitopedatabase,” BMC Bioinformatics, vol. 8, no. 1, p. 269, 2007.
[15] E. Seymour, R. Damle, A. Sette, and B. Peters, “Cost sensitivehierarchical document classification to triage PubMedabstracts for manual curation,” BMC Bioinformatics, vol. 12,no. 1, p. 482, 2011.
[16] R. Vita, B. Peters, and A. Sette, “The curation guidelines of theimmune epitope database and analysis resource,” Cytometry.Part a, vol. 73, no. 11, pp. 1066–1070, 2008.
[17] Y. Kim, K. Vaughan, J. Greenbaum, B. Peters, M. Law, andA. Sette, “A meta-analysis of the existing knowledge ofimmunoreactivity against hepatitis C virus (HCV),” PloS One,vol. 7, no. 5, article e38028, 2012.
13Journal of Immunology Research