american university of beirut vaccines and essential oil in ...
143
AMERICAN UNIVERSITY OF BEIRUT VACCINES AND ESSENTIAL OIL IN RESPECTIVE PROTECTION AND TREATMENT OF CHICKEN AND RABBIT AILMENTS by HUSSEIN MOUFID HALAWI A thesis submitted in partial fulfillment of the requirements for the degree of Master of Science to the Department of Animal Sciences of the Faculty of Agricultural and Food Sciences at the American University of Beirut Beirut, Lebanon March 2005
-
Upload
khangminh22 -
Category
Documents
-
view
3 -
download
0
Transcript of american university of beirut vaccines and essential oil in ...

AMERICAN UNIVERSITY OF BEIRUT
VACCINES AND ESSENTIAL OIL IN RESPECTIVE PROTECTION AND TREATMENT OF CHICKEN AND
RABBIT AILMENTS
by HUSSEIN MOUFID HALAWI
A thesis submitted in partial fulfillment of the requirements
for the degree of Master of Science to the Department of Animal Sciences
of the Faculty of Agricultural and Food Sciences at the American University of Beirut
Beirut, Lebanon March 2005

AMERICAN UNIVERSITY OF BEIRUT
VACCINES AND ESSENTIAL OIL IN RESPECTIVE PROTECTION AND TREATMENT OF CHICKEN AND
RABBIT AILMENTS
by HUSSEIN MOUFID HALAWI
Approved by: ______________________________________________________________________ Dr. Elie Barbour, Professor Advisor Animal Sciences ______________________________________________________________________ Dr. Shady Hamadeh, Professor Member of Committee Animal Sciences ______________________________________________________________________ Dr. Salma Talhouk, Associate Professor Member of Committee Plant Sciences Date of thesis defense: March 8, 2005
AMERICAN UNIVERSITY OF BEIRUT
THESIS RELEASE FORM I, Hussein Moufid Halawi authorize the American University of Beirut to supply copies of my thesis to
libraries or individuals upon request. do not authorize the American University of Beirut to supply copies of my thesis
to libraries or individuals for a period of two years starting with the date of the thesis defense.
Signature
Date

v
ACKNOWLEDGEMENTS
I would like to express my recognition and deepest thanks to my advisor Dr. Elie Barbour for his valuable contribution to this work, encouragement, patience in reviewing and editing the thesis, attention, devotion and special guidance.
I continue to be indebted to Dr. Shady Hamadeh for his great statistical and
editorial contribution to this work. My gratitude to Dr. Salma Talhouk for her valuable suggestions concerning my thesis. Special thanks to our dean, Dr. Nuhad Daghir, for his continuous support throughout my years of studies at AUB.
Special thanks are expressed to Mrs. Nesta Sagherian for her excellent
technical assistance; to Miss Lina Jaber for her help and moral support; to Tharwat Haddad, Rabia koubayssi and Haifa Hamzeh for their cooperation and patience.
My recognition and gratitude to all my graduate colleagues in the animal
science lab. To AREC’02 class. To my family and friends.
vi
AN ABSTRACT OF THE THESIS OF
Hussein Moufid Halawi for Master of Science Major: Poultry Science Title: Vaccines and Essential Oil in Respective Protection and Treatment of Chicken
and Rabbit Ailments.
The first study determined the anti-inflammatory effect induced by Origanum
ehrenbergii essential oil on Staphylococcus aureus skin infection in rabbits. Experimental rabbits were divided into two groups with 5 rabbits per group. Group 1 was challenged with 0.1 ml Staphylococcus aureus intradermally and treated twice topically with 1 % Origanum ehrenbergii essential oil diluted in 40 % DMSO/water. Group 2 received the same challenge as Group 1 but without any treatment. After 24 hours, the mean weight of the ear lesion in the non-treated rabbits was larger than the mean weight of the ear lesion in the treated rabbits (2.72g, 1.24g respectively, p<0.05).
In the second study, serological profiling for disease diagnosis and for vaccine
evaluation was conducted for the first time in Lebanon on free-range poultry farms situated in Jezzine area. The humoral immune responses in the chicken sera showed disease exposure to IBV, NDV, EDS, Mg and IBDV. The immune response of chicken towards an inactivated trivalent vaccine was serologically determined by testing paired serum samples from the vaccinated farms. According to the ELISA system, no significant difference in humoral antibody level was observed after 21 days of vaccination. Furthermore, the immune responses to the trivalent vaccine were both qualitatively and quantitatively assessed by reacting the protective polypeptides in the pooled farm sera with the antigens of the trivalent vaccine by Western Immunoblotting. The qualitative immune response was observed in the appearance of new antibodies to the F protein (60KDa) in NDV, and the appearance of new antibodies to the membrane glycoprotein GP36 in IBV. In addition, there were more quantitative levels of antibodies to the large (L) protein (248 KDa) and the matrix (M) protein (40 KDa) in NDV and to the nucleocapsid protein (51 KDa) and the membrane glycoprotein GP28 (28 KDa) in the case of IBV three weeks after vaccination compared to levels at the time of vaccination (P<0.05).
Key words: Staphylococcus aureus, Origanum ehrenbergii, free-range poultry, serological profiling, ELISA, Western Immunoblotting.

vii
CONTENTS
Page ACKNOWLEDGEMENTS...................................................................... v ABSTRACT...................................................................................................... vi LIST OF ILLUSTRATIONS ................................................................... xi LIST OF TABLES......................................................................................... xiii LIST OF ABBREVIATIONS.................................................................. xv Chapter I. INTRODUCTION.................................................................................. 1 II. REVIEW OF LITERATURE ........................................................... 4 A. Experiment 1: Anti-Inflammatory Effect of Origanum ehrenbergii against Staphylococcus aureus Skin Infection in Rabbits ................................................................................................ 4 1. Staphylococcus aureus............................................................ 4 a. Introduction .............................................................. 4 b. Pathogenesis of Staphylococcus aureus Infections .................................................................. 4 c. Invasion by Staphylococci ........................................ 5 2. Origanum Species and Their Essential Oils ........................... 6 a. Introduction .............................................................. 6 b. Morphology of the Origanum Species...................... 7 c. Storage conditions for Origanum Species ................ 7 d. Classification of Essential Oils................................. 8 e. Chemical Composition of Essential Oils.................. 8 f. Characteristics of Oregano ....................................... 10 3. Essential Oils and Immunity................................................... 12 B. Experiment 2: Serological Profiling and Molecular Detection of Protective Polypeptides in Sentinel Free-Range Layers ................ 17 1. Surveillance and Epidemiology .............................................. 17
viii
a. Introduction .............................................................. 17 b. Disease Surveys........................................................ 19 c. Measure of Disease................................................... 20 d. Seroprevalence versus Clinical Prevalence .............. 21 e. Diagnostic Tests ....................................................... 22 f. Sensitivity and Specificity ........................................ 22 2. Free-Range Poultry Production .............................................. 23 a. Introduction .............................................................. 23 b. Feeding ..................................................................... 23 c. Health and Medication.............................................. 24 d. Housing..................................................................... 25 e. Behavioral Considerations........................................ 25 f. Lighting .................................................................... 26 g. Fencing ..................................................................... 26 h. Animal Health........................................................... 27 i. Feather Pecking and Cannibalism ............................ 28 j. Egg Drop Syndrome (EDS)...................................... 30 k. Infectious Bronchitis Virus....................................... 32 l. Newcastle Disease Virus .......................................... 38 III. MATERIALS AND METHODS .................................................... 47 A. Experiment 1: Anti-Inflammatory Effect of Origanum ehrenbergii against Staphylococcus aureus Skin Infection in Rabbits ................................................................................................ 47 1. Preparation of Staphylococcus aureus Inoculum.................... 47 2. Standard Curve Preparation .................................................... 47 3. Optimization of In Vitro Analysis of Antimicrobial Activity of Essential Oil ......................................................... 48 a. Antimicrobial Activity of Essential Oil from Origanum Ehrenbergii Harvest of Three Different Locations................................................... 48 b. Impact of DMSO Level on Antimicrobial Activity of Dispersed Essential Oil in Aqueous Medium..................................................................... 50 c. Optimized Antimicrobial Activity of Essential Oil and DMSO Dilution against Different Staphylococcus aureus Densities.............................. 51 4. Disinfection and Preparation of Animal Rooms..................... 51 5. Antimicrobial Effect of Origanum ehrenbergii Essential Oil on Rabbits Challenged Intradermally with Staphylococcus aureus............................................................ 52 a. Experiment 1............................................................. 52 b. Experiment 2............................................................. 52 c. Experiment 3............................................................. 54 6. Statistical Analysis.................................................................. 56

ix
B. Experiment 2: Serological Profiling and Molecular Detection of Viral Protective Polypeptides by Sera of Sentinel Free- Range Layers ...................................................................................... 57 1. Serological Profiling On Sentinel Free-Range Chicken Layers Uncovering Prevalent Pathogen Exposure.................. 57 a. Farm Surveillance and History ................................. 57 b. Serum Collection ...................................................... 60 c. Serology for Disease Diagnosis................................ 60 d. Serology for Vaccine Evaluation.............................. 66 e. Statistical Analysis ................................................... 67 2. Separation and Identification of the Protective Polypeptides of IBV and NDV ............................................... 67 a. Separation of the Virus-Aqueous Portion from Oil Emulsion Vaccine............................................... 67 b. Sodium Dodecyl Sulfate- Polyacrylamide Gel Electrophoresis (SDS-PAGE) for Detecting Protein Bands Present In the Viral Vaccine Antigens.................................................................... 68 c. Western Immunoblotting for Detection of Specific Antibodies to Vaccine Antigens of IBV and NDV................................................................... 70 d. Western Immunoblotting for Reacting Antigens of ND Clone Vaccine with NDV Sera...................... 72 e. Western Immunoblotting for Reacting Antigens of IB H120 & IB 4-91 Vaccines with IBV Sera....... 73 f. Quantitating the Antibodies Reacting to Protective Polypeptides ............................................ 74 IV. RESULTS AND DISCUSSION...................................................... 75 A. Experiment 1: Anti-Inflammatory Effect of Origanum ehrenbergii Essential Oil against Staphylococcus aureus Skin Infection in Rabbits............................................................................... 75 1. Antimicrobial Activity of Essential Oil from Origanum ehrenbergii Harvest of Three Different Locations ................. 75 2. Impact of DMSO Level on Antimicrobial Activity of Dispersed Essential Oil in Aqueous Medium......................... 76 3. Optimized Antimicrobial Activity of Essential Oil and DMSO Dilution against Different Staphylococcus aureus Densities.................................................................................. 77 4. Experiment 1........................................................................... 78 5. Experiment 2........................................................................... 81 6. Experiment 3........................................................................... 82 B. Experiment 2: Serological Profiling and Molecular Detection of Viral Protective Polypeptides by Sera of Sentinel Free-Range Layers.................................................................................................... 84
x
1. Serology for Disease Diagnosis.............................................. 84 2. Serology for Vaccine Evaluation............................................ 86 3. Vaccine Failure ....................................................................... 88 4. Quantitative Immune Responses to Polypeptides................... 90 V. CONCLUSIONS AND RECOMMENDATIONS................. 106 A. Experiment 1: Anti-inflammatory Effect of Origanum ehrenbergii Essential Oil against Staphylococcus aureus Skin Infection in Rabbits .................................................................................................. 106 B. Experiment 2: Serological Profiling and Molecular Detection of Viral Protective Polypeptides by Sera of Sentinel Free-Range Layers.................................................................................................... 107 BIBLIOGRAPHY.......................................................................................... 109

xi
ILLUSTRATIONS
Figure Page 1. Logarithmic standard curve of Staphylococcus aureus ...................................... 49 2. Effect of Origanum ehrenbergii essential oil on skin inflammation induced by Staphylococcus aureus................................................................................... 80 3. Banding patterns and molecular weight (KDa) of each detected polypeptide band after reacting the antigens of a trivalent vaccine (NDV+IBV+EDS) with serum samples collected from two farms before and after vaccination with the same trivalent vaccine ........................................ 91 4. Banding patterns and molecular weight (KDa) of each detected polypeptide band after reacting the antigens of the trivalent vaccine (NDV+IBV+EDS) with positive sera and negative control sera as revealed by Western Immunoblotting ................................................................ 93 5. Banding patterns and molecular weight (KDa) of each detected polypeptide band of the antigens of ND clone 30 live vaccine. Bands are seen on a nitrocellulose membrane after being transferred from SDS-PAGE and stained with a Ponceau stain ........................................................................ 95 6. Banding patterns and molecular weight (KDa) of each detected polypeptide band after reacting the antigens of ND clone 30 live vaccine with positive NDV and negative NDV sera as revealed by Western Immunoblotting .................................................................................... 96 7. Banding patterns and molecular weight (KDa) of each detected polypeptide band after reacting the antigens of ND clone 30 live vaccine with pooled serum samples from farms given a trivalent vaccine (NDV+IBV+EDS) as revealed by Western Immunoblotting................ 97 8. Banding pattern and molecular weight (KDa) of each detected polypeptide band after reacting the antigens of two lives vaccines, IB H120 and IB 4-91, with positive IBV-Mass strain sera and negative IBV sera as revealed by Western Immunoblotting..................................................... 99 9. Banding pattern of each detected polypeptide band after reacting the antigens of two live vaccines, IB H120 and IB 4-91, with positive IBV-Ark strain sera and negative IBV sera as revealed by Western Immunoblotting .................................................................................................. 100

xii
10. Banding pattern of each detected polypeptide band after reacting the antigens of two live vaccines, IB H120 and IB 4-91, with pooled serum samples of Farm 1 given a trivalent vaccine (NDV+IBV+EDS) as revealed by Western Immunoblotting ................................................................ 101 11. Banding pattern of each detected polypeptide band after reacting the antigens of two live vaccines, IB H120 and IB 4-91, with pooled serum samples of Farm 2 given a trivalent vaccine (NDV+IBV+EDS) as revealed by Western Immunoblotting ................................................................ 103

xiii
TABLES
Table Page 1. Experimental design of rabbits challenged with Staphylococcus aureus and treated with essential oil................................................................... 53 2. Experimental design of rabbits challenged intradermally with Staphylococcus aureus and treated with essential oil......................................... 54 3. Experimental design of rabbits challenged with the Staphylococcus aureus (Stock E) and treated with essential oil .............................................................. 55 4. Data Collection from sentinel farms that were surveyed before vaccination for exposure to IBV, NDV, EDS, MG, IBDV, and ALV................................... 58 5. Data collection from farms 21 days after vaccination with a trivalent killed vaccine against IBV, NDV, and EDS................................................................. 59 6. The effect of different harvest-locations of Origanum ehrenbergii essential oil on Staphylococcus aureus ............................................................................. 75 7. In-vitro analysis of Origanum ehrenbergii essential oil dispersed in different percentages of DMSO in water, and their effect on inhibiting Staphylococcus aureus growth ........................................................................... 77 8. In-vitro Analysis of Origanum ehrenbergii essential oil dispersed in different percentages of DMSO in water, and their effect on inhibiting Staphylococcus aureus growth ........................................................................... 77 9. The effect of Origanum ehrenbergii essential oil on different Staphylococcus aureus counts ............................................................................ 78 10. Mean diameter of inflammation zone measured on the rabbit ears challenged with Staphylococcus aureus and treated with Origanum ehrenbergii essential oil over a period of three days.......................................... 79 11. Effect of Origanum ehrenbergii essential oil on the weight and bacterial count of lesions in rabbit ears challenged with Staphylococcus aureus ............. 83 12. Outbreak mean titers from the different regions in Jezzine area for six viruses 85 13. Vaccine titers before and after 21 days of vaccination with a trivalent killed vaccine against IBV, NDV, and EDS....................................................... 87

xiv
14. Mean optical densities of humoral antibody response induced by a killed trivalent vaccine against the 248 KDa polypeptide of NDV present in the same trivalent vaccine antigens .................................................................... 92 15. Mean optical densities of humoral antibody response induced by a killed trivalent vaccine against different polypeptides present in ND clone 30 vaccine ................................................................................................. 98 16. Mean optical densities of humoral antibody response induced by a killed trivalent vaccine against different polypeptides present in IB H120 and IB 4-91 vaccines ................................................................................................. 102 17. Mean optical densities of humoral antibody response induced by a killed trivalent vaccine against different polypeptides present in IB H120 and IB 4-91 vaccines ................................................................................................. 104

xv
ABBREVIATIONS
% Percent
/ Per
µl Micro liter
Ab Antibody
Ag Antigen
AGID Agar Gel Immunodiffusion Test
ALV Avian Leukosis Virus
ANOVA Analysis of Variance
Ark Arkansas
AUB American University of Beirut
BaCl2 Barium Chloride
C Celsius
CFT Complement Fixation Test
CFU Coliform Forming Unit
Conn Connecticut
Cm Centimeters
CTL Cytotoxic T Lymphocytes
DMSO Dimethyl Sulfoxide
DNA Deoxyribonucleoside Triphosphate
EDS Egg Drop Syndrome
ELISA Enzyme-Linked Immunosorbant Assay
et al. Et allii (and others)
xvi
EDTA Ethylene-Diamine-Tetraacetic Acid
FAO Food and Agriculture Organization of the United Nations
G Gram (s)
HA Hemagglutination
HCl Hydrochloric Acid
MSA Mannitol Salt Agar
MWs Molecular weights
nm Nanometer
N Normality
NDV Newcastle Disease Virus
SDS-PAGE Sodium Dodecyl Polyacrylamide Gel Electrophoresis
VN Virus Neutralization
V Volts
UKROFS UK Register of Organic Food Standards
TTBS Tween-Tris-Buffer Saline
TPB Tryptose Phosphate Broth
TEMED Tetra-Methyl-Ethylene Diamine
TBS Tris-Buffer Saline
S protein Spike protein
SEM Standard Error of Means
SA Soil Association
rpm Rounds per minute
° Degree
RBC Red Blood Cell

xvii
pH Hydrogen Potential
O.D. Optical Density
NCM Nitrocellulose Membrane
NaCl Sodium Chloride
HI Hemagglutination-Inhibition
MOSS Monitoring and Surveillance System
M Molarity
mm Millimeter
ml Milliliter
MG Mycoplasma gallisepticum
Mass Massachusetts
ma Milliamperes
KDa Kilodalton (s)
IBV Infectious Bronchitis Virus
IBDV Infectious Bursal Disease Virus
HR Heptad Repeat
hr Hour
H-V-R Hypervariable region

To My Beloved Parents

1
CHAPTER I
INTRODUCTION
Staphylococci are gram-positive spherical bacteria that occur in microscopic
clusters resembling grapes. Almost all strains of Staphylococcus aureus produce the
enzyme coagulase, hence this bacteria is considered a potential pathogen (Todar 2004).
Staphylococcal skin infection restricts the host response to inflammation
characterized by elevated temperature at the site, swelling, the accumulation of pus, and
necrosis of tissue. In an aim to evaluate the susceptibility of staphylococcal isolates to
oregano essential oil, Nostro et al. (2004) showed that oregano essential oil is primarily
characterized by its phenol constituents, carvacrol and thymol and by there two
precursor monoterpene hydrocarbons, γ-terpinene and p-cymene. However, no
antimicrobial activity was reported for γ-terpinene and p-cymene probably due to the
absence of the phenolic hydroxyl group in these hydrocarbon monoterpenes (Dorman
and Deans 2000). The most beneficial effect that essential oils have on immune
modulation is their ability to inhibit the multitude of inflammatory processes that
contribute to almost every immune response in illness and disease (Alexander 2001).
In the first study, Staphylococcus aureus bacteria were injected intradermally
into the skin of the rabbit ears. Then topical treatments of Origanum ehrenbergii
essential oil were administered on the inflammation areas. The purpose of the first study
was to assess the anti-inflammatory effect induced by Origanum ehrenbergii essential
oil on Staphylococcus aureus skin infection in rabbits.
The outgrowing poultry production in the last two decades has forced some
small poultry producers to shift their production into free-range/organic chickens, in

2
addition to the fact that the natural/organic market has largely grown in the last decade
(Neufeld 2002). Free-range/organic chickens, also known as “all natural”, contain
neither preservatives nor artificial ingredients and are being raised in a friendly
environment.
According to Darre (2003), free-range poultry production increased from 1.9 %
in the year 1985 to 15.5 % in the year 1999, as compared to cage poultry production that
has dropped from 96.1 % in the year 1985 to 80.1 % in the year 1999.
In organic standards, vaccination is the only mean of prevention; where as
hormones, growth promoters and prophylactic use of antibiotics are prohibited. The
prevention of disease is accomplished by improving the welfare of the animal. Usually,
free-range pullets are vaccinated in their rearing stage, specifically against Newcastle
Disease Virus, Infectious Bronchitis Virus, and Marek’s Disease and in some occasions
Infectious Laryngotracheitis.
Surveillance for animal diseases has been widely used by epidemiologists and
other animal health experts to aid in monitoring and controlling health-related measures
in animal populations (Salman et al. 2003). Disease surveillance is the device that
provides information for scheduling eradication programs and disease control. The data
obtained for a monitoring and surveillance system (MOSS) should be used to assess the
health status of an animal population and to trigger action. A vital requirement for
evaluating a MOSS is by using a transparent, objective, and systemic approach.
Integrated quality assurance mechanisms and precise objectives will facilitate in
evaluating a well-documented MOSS (Salman et al. 2003).
Many disease surveys require the application of laboratory diagnostic tests to
analyze specimens collected from the animal. An example is the use of laboratory tests
such as Complement Fixation Tests (CFTs), ELISAs, or Agar Gel Immunodiffusion
3
Tests (AGIDs) to evaluate the presence of antigens and antibodies in the blood. Few
laboratory tests are ideal, even though most tests give inaccurate results only
occasionally. When using laboratory examinations in a disease survey, it is advisable to
understand the accuracy of the test, and the errors that might occur (Cameron 1999).
In the second study, a disease surveillance study for the first time in Lebanon
was conducted on a group of free-range poultry farms after which serological profiling
was conducted to determine the disease outbreaks. Another serological profiling was
conducted to the same farms after 3 weeks of vaccination with an inactivated trivalent
vaccine in order to assess the immunological responses of the birds to the vaccine.
Furthermore, the immune responses to the trivalent vaccine were both quantitatively
and qualitatively assessed by Western Immunoblotting, thus reacting the pooled farm
sera with the antigens of the trivalent vaccine and antigens of the live vaccine strains
including ND clone 30, IB H120 and IB 4-91.

4
CHAPTER II
LITERATURE REVIEW
A. Experiment 1: Anti-Inflammatory Effect of Origanum ehrenbergii against Staphylococcus aureus Skin Infection in Rabbits
1. Staphylococcus aureus
a. Introduction
Staphylococci are gram-positive spherical bacteria that occur in microscopic
clusters resembling grapes. Rosenberch (1884) described two pigmented colony types
of staphylococci and named them as Staphylococcus aureus and Staphylococcus albus
that later became known as Staphylococcus epidermitis. Bergey’s manual (Bergan and
Kocur 1986) describes more than 20 species of Staphylococcus, however,
Staphylococcus aureus and Staphylococcus epidermitis are the most likely to interact
with animals. Staphylococcus aureus is hemolytic on blood agar and forms a yellow
colony on rich medium. Most strains of Staphylococcus aureus produce the enzyme
coagulase, hence this bacteria is considered a potential pathogen (Todar 2004).
b. Pathogenesis of Staphylococcus aureus Infections
The ability of Staphylococcus aureus to avoid the host immune system
response and cause pathogenesis is due to an extensive range of virulence factors
including two lipases, exotoxins, enterotoxins, four hemolysins, and several proteases
(Somerville et al. 2002). The production of several virulence factors is regulated by the
accessory gene regulatory (agr) operon (Morfeldt et al. 1988; Peng et al. 1988) and
several other globular regulatory loci.
There is a common pathway by which both gram-positive and gram-negative
5
bacteria induce the production of different inflammatory mediators, such as factors of
the coagulation, complement, and contact systems, which act simultaneously with
cytokines forming a complex inflammatory network (Bone 1993; Glauser et al. 1991).
The contact system through their enzymatic factors release bradykinin (BK) that
induces vasodilatation (Mattsson et al. 2001). The coagulation of plasma is a well-
established phenomenon for the majority of Staphylococcus aureus pathogenic strains
(Blair 1939; Bayliss and Hall 1965).
Staphylococcal skin infection restricts the host response to inflammation
characterized by elevated temperature at the site, swelling, the accumulation of pus, and
necrosis of tissue. Around the inflamed area, a fibrin clot may form, walling off the
bacteria and leukocytes as a characteristic pus-filled boil or abscess. More serious
infections of the skin may occur, such as furuncles or impetigo (Todar 2004).
c. Invasion by Staphylococci
Staphylococci invasion of host tissues involves the production of a large range
of extracellular proteins. A major membrane-damaging toxin produced by
Staphylococcus aureus is α-hemolysin that binds to the membrane of susceptible cells
forming a pore through which cellular contents leak. Another important membrane-
damaging toxin is leukocidin whereby almost 90 % of Staphylococcus aureus strains
isolated from dermatonecrotic lesions express this toxin, hence suggesting the
importance of leukocidin in necrotizing skin infection (Todar 2004).
An important extracellular protein that plays a role in Staphylococci invasion is
coagulase that is a traditional marker for identifying Staphylococcus aureus in
microbiology laboratories. Coagulase will lead to the conversion of fibrinogen to fibrin;
hence Staphylococcus aureus might possibly form localized clotting to protect itself

6
from phagocytic and immune defenses of the host (Todar 2004).
2. Origanum Species and Their Essential Oils a. Introduction
The genus Origanum (Labiatae family) is characterized by a large
morphological and chemical diversity: forty-nine taxa divided into ten sections belong
to this genus, most of them having a local distribution around the Mediterranean. In
particular, three taxa are restricted to Morocco and south of Spain, two occur in Algeria
and Tunisia, three are endemic to Cyrenaica, nine are restricted to Greece, south Balkan
and Asia Minor (six are local Greek endemics), 21 are found in Turkey, Cyprus, Syria
and Lebanon (21 are local Turkish endemics), and eight are locally distributed in Israel,
Jordan and Sinai Peninsula. The essential oils of the members of the Origanum genus
vary in respect to the total amount produced by plants (ranging from traces to 8ml/ 100
g of dry weight) as well as in their qualitative composition. Origanum essential oils are
characterized by a number of main components, which are implicated in the various
plant odors. A wide chemical diversity is found even within a single Origanum species,
like the widely used O. vulgare. The pattern of variation of quantitative and qualitative
essential oils in the latter species follows its geographical distribution or depends on the
time of plant collecting (Padulosi 1997).
The Origanum species are sub-shrubs or perennial herbs with seven stems,
ascending or erect, subsessile or petiolate leaves and flowers in verticillasters
aggregated in dense or loose spike which are arranged in a peniculate or corymbiform
inflorescence. Origanum plants are widely used all over the world as very popular
spice, under the vermicular name “oregano”. They are of great economic importance,
which is not only related to their use as a spice. In fact, as recent studies have pointed

7
out, oregano is used traditionally in many other ways as their essential oils have anti-
microbial, cytotoxic, and anti-oxidant activity (Lagouri et al. 1993; Sivropoulou et al.
1996).
The highest yields correspond to plants growing at low altitudes, in
Mediterranean ecosystems, as is common for the whole family of Labiatae (Kokkini et
al. 1989). It should be noted that these values are the highest essential oil yields
reported for any oregano plant.
A number of studies have shown that variation within a single Origanum
species may occur in its morphological and chemical features. Furthermore, it has been
found that the pattern of variation of a single species follows its geographical
distribution or it depends on the season of plant collecting. Quantitative and qualitative
essential oil analyses have shown that the major constituents are carvacrol and/or
thymol, accompanied by p-cymene and γ-terpinene (Vokou et al. 1993).
b. Morphology of the Origanum Species
The morphological variation within the genus results in the distinction of 10
sections consisting of 42 species or 49 taxa (species, subspecies and varieties) (Ietswaart
1980; Carlstrm 1984; Danin 1990; Danin and Künne 1996). Following Ietswaart’s
classification (1980), Origanum ehrenbergii under section Prolaticorolla was endemic to
Lebanon. Section Prolaticorolla comprises 3 species endemic to eastern or western parts
of the Mediterranean. These species are characterized by dense spikes and tubular
calyces becoming turbinate in fruiting.
c. Storage Conditions of Origanum Species
There is little information on the conditions in which the genetic resources of

8
Origanum are being preserved. Most institutions hold seed collections and only a few
maintain field collections. Seed collection of Origanum does not need particular
conservation methods: seeds are preserved in the same controlled conditions used for
any other orthodox-seeded plant, thus being maintained in short-, medium-, or long term
storage rooms. As for most aromatic plants, also for Origanum, long-term storage (-18
C) is a good conservation method, which ensures the safe seed conservation for at least
a period of eight years (Montezuma-De-Carvalho et al. 1984).
d. Classification of Essential Oils
The essential oils of Origanum members vary in respect of the total amount
produced per plant as well as in their qualitative composition. Based on their essential
oil content, the different taxa of the genus can be distinguished as 3 main groups:
• Essential oil “poor” taxa with an essential oil content of less than 0.5%
(ml/100g dry weight), e.g. the Greece endemic O. calcaratum (Karousou 1995);
• Taxa with an essential oil content between 0.5 and 2%, e.g. the Cretan
endemic taxon O. microphyllum known as Cretan marjoram (Karousou 1995);
• Essential oils “rich” taxa with an essential oil content of more than 2%, as
for example the two most well commercially known “oregano” plants, O. vulgare
subsp. hirtum (Greek oregano) and O. onites (Turkish oregano) (Kokkini et al. 1991;
Vokou et al. 1993).
e. Chemical Composition of Essential Oils
With reference to their essential oil composition, Origanum taxa may be
characterized by the dominant occurrence of the following compounds:
• Linalool, terpinen-4-ol, and sabinene hydrate like the essential oil of

9
O.majorana (Fisher et al. 1987);
• The phenolic compounds, carvacrol and/or thymol, like the essential oils of
O. vulgare subsp. hirtum (Kokkini and Vokou 1989; Kokkini et al. 1991; Vokou et al.
1993) and O. onites (Vokou et al. 1988; Ruberto et al. 1993);
• Sesquiterpenes like the essential oil of O. vulgare subsp. vulgare (Lawrence
1984).
A study done by Alma et al. (2003) on the chemical composition of essential
oil of Origanum syriacum showed that the phenolic compounds are relatively high.
Among those phenolic compounds was carvacrol constituting 26.97 % of the essential
oil. Baser et al. (2003) reported that Origanum syriacum grown in Turkey contained
carvacrol (64.1 %) and p-cymene (12.3 %) as major components. Fleisher and Fleisher
(1991) reported that while essential oil from Origanum syriacum originating from Israel
contained thymol (59.87 %) and carvacrol (80.17 %) as a major component, the
essential oil from the same plant originating in Egypt contained only carvacrol as the
major constituent (76.7 %). These sources of variation are possibly due to growing
conditions, harvesting time and geographical origin.
In an aim to evaluate the susceptibility of staphylococcal isolates to oregano
essential oil, Nostro et al. (2004) showed that oregano essential oil is primarily
characterized by its phenol constituents, carvacrol and thymol and by there two
precursor monoterpene hydrocarbons, γ-terpinene and p-cymene. However, no
antimicrobial activity was reported for γ-terpinene and p-cymene probably due to the
absence of the phenolic hydroxyl group in these hydrocarbon monoterpenes (Dorman
and Deans 2000).

10
f. Characteristics of Oregano
• Utilization as a spice
Records on the use of oregano date back thousands of years: the famous
“hyssop”, mentioned in the Bible, is believed to be an Origanum syriacum L. plant
(Hepper 1987). Today, oregano plant parts are commonly used in the food industry as a
spice. Inspite of its long European history, oregano was only introduced into America at
the beginning of this century, and afterwards to other parts of the world. Today oregano
can be considered one of the most important spices both in Mediterranean countries
(Carmo et al. 1989; Baser et al. 1992, 1993; Vokou et al. 1988, 1993) and elsewhere
(International Organization for Standardization 1985). The overall market of oregano is
about 350-500 tons in France, 600 tons in Germany, 500 tons in the UK and 150 tons in
the Netherlands (Maftei 1992).
The popularity of oregano is increasingly growing as a result of scientific
developments achieved in the area of its cultivation and utilization. More and more new
interesting varieties are being produced, thus contributing to broadening the horizon of
its actual application.
• Antibacterial and antifungal activity
The antibacterial and fungicidal activity of oregano has been reported in many
works; its oil has a bactericidal effect against Erwinia amylovora (Scortichini and Rossi
1989 1993) and many other microorganisms such as Bacillus subtilis, Escherichia coli,
Hafnia alvei, Micrococcus luteus, Proteus vulgaris, Staphylococcus aureus and
Streptococcus faecalis (Biondi et al. 1993). Research findings also report inhibiting
effects on the growth of some plant and animal pathogens, as well as organisms causing
food spoilage (Deans and Svoboda 1990; Deans et al. 1992; Izzo et al. 1995). On
honeybee pathogens, the bactericidal and fungicidal effects of oregano extracts are
11
reported for Bacillus larvae (causing American foulbrood), Ascosphaera apis (causing
chalkbrood) and Bacillus alvei (a secondary pathogen involved in European foulbrood).
These findings, confirmed by Calderone et al. (1994), highlight the important role that
oregano can also play in the management of honeybee diseases.
Essential oils present in oregano are active against the growth of fungi
Aspergillus niger, Aspergillus flavus and Aspergillus ochraceus, as well as against the
bacteria Campylobacter jejuni and Clostridium sporogenes (Paster et al. 1990, 1995;
Shaaya et al. 1991) and Clostridium botulinim (Ismaiel 1988). The same property was
found against Phytophthora citrophthora, Phoma tracheiphita and Pseudomonas
syringae (Arras 1988). With regard of this latter activity, the high carvacrol content of
oregano was found to play a major role. Origanum syriacum was found to be effective
in controlling a number of pathogens such as Fusarium oxysporum, Macrophomina
phasealina, Botrytis cinerea and Exserohilum turcicium (Setosphaeria tucica) (Shimoni
et al. 1993), whereas O. compactum is active against spore germination, mycelial
elongation and sporulation of Aspergillus niger, Penicillium italicum and Zygonhynchus
sp. (Tantaoui-Elaraki et al. 1993).
The antibacterial/fungicidal activity of oregano oil is used today in a number of
practical applications. An interesting example is provided by the following case: an
aerosol formulation of its extracts (containing 0.4% mixture of essential oils) was
sprayed into three enclosed areas (school hall, analytical laboratory and library) and a
drastic reduction of the microorganisms present in the air was registered (a drop of 74-
93%) (Panizzi and Pinzuti 1989).
• Antiviral activity
Ethanolic extracts of O. vulgare proved to be active against ECH09 Hill virus,
in culture of monkey kidney cells, by inducing the formation of a substance with

12
interferon-like activity (Skwarek et al. 1994).
• Nematicidal activity
In this area, interacting and promising results have been recorded with leaf
extract of O. vulgare. The toxicity of the preparation was dependent on concentration
and duration of treatment (Ramraj et al. 1991). Abd-Elgawad and Omer (1995) made
similar findings. The main compounds involved in these activities are p-cymene,
terpinen-4-ol and carvone.
• Anti-oxidant activity
The anti-oxidant activity of natural sources, including Origanum species, has
been investigated (Dorofeev et al. 1989; Nguyen et al. 1991; Sawabe and Okamota
1994; Takacsova et al. 1995). Lagouri et al., (1993) have demonstrated the anti-oxidant
activity of O. vulgare subsp.hirtum (Greek oregano), O. onites (Turkish oregano),
Coridothymus capitatus (Spanish oregano) and Satureja thymbra. Results of these
findings indicate that the anti-oxidant effect may be related to the presence of carvacrol
and thymol in the essential oils. Other chemical compounds such as terpenoids may be
responsible for the anti-oxidant activity; this is the case of glucosides (Nakatani and
Kikuzaki 1987) or flavonoids (Vekiari et al. 1993), both extracted from the leaves of
oregano. Five phenolic acids with anti-oxidant properties were isolated by Kikuzaki and
Nakatani (1989), their activity being greater than the one shown by alpha-tocopherol.
3. Essential Oils and Immunity
The most beneficial effect that essential oils have on immune modulation is
their ability to inhibit the multitude of inflammatory processes that contribute to almost
every immune response in illness and disease (Alexander 2001).
The inflammatory process involves a series of events that can be elicited by

13
numerous stimuli such as infectious agents, ischaemia, antigen-antibody interactions,
and thermal and other physical injuries. Inflammatory responses occur in three distinct
phases, each apparently mediated by different mechanisms:
• An acute transient phase, characterized by local vasodilatation and increased
capillary permeability;
• A delayed, subacute phase, most prominently characterized by infiltration of
leucocytes and phagocytic cells; and
• A chronic, proliferative phase, in which tissue degeneration and fibrosis
occur (Alexander 2001).
One of the chief functions of the immune system is to respond to pathogenic or
inflammatory agents, which activate cytokines, which scavenge for the antigens. The
cytokines are a group of diverse proteins produced by lymphocytes and related cells that
have a number of discrete roles in regulation of the immune system, as well as
hematopoiesis (blood cell formation). Cytokines include interferons, colony stimulating
factors like granulocytes and monocytes, and the interleukins (IL), and tumour necrosis
factor (TNF) (Alexander 2001).
Responses to inflammation also trigger the expression of eicosanoids
(leukotrienes, prostaglandins, thromboxane) and platelet-activating factor (PAF). The
eicosanoids play a prominent role in inflammation, are extremely prevalent, and have
been detected in almost every tissue and body fluid. Because virtually every cell can
form eicosanoids, it is not unreasonable to suspect that each pharmacological effect may
reflect a physiological and pathophysiological function (Alexander 2001).
Many essential oils owe their anti-inflammatory effects to blockade of
eicosanoids. For example, cardamom essential oil reduces the synthesis of eicosanoid
mediators of inflammation, also exhibiting analgesic activity (Al-Zuhair 1996).

14
Histamine, a hormone/chemical transmitter is involved in local immune
responses, regulating stomach acid production and in allergic reactions as a mediator of
immediate hypersensitivity. Histamine is often the chief catalyst in an inflammatory
process. The histaminergic (binding and liberating histamine) system is thought to
function in the regulation of arousal, body temperature, and vascular dynamics.
Histamine might be a central neurotransmitter due to the fact that histamines and anti-
histamines active in the periphery have been known to produce significant effects on
animal behavior. Thus, essential oil acting in a histaminergic capacity has central as
well as peripheral activity (Schwartz 1994).
Inflammation caused by hypersensitivity to allergens and upon cellular injury
results from a chemical cascade facilitated by histamine activation, by affecting
inflammatory mediators of the immune system, which stimulate inflammation. The
mast cell is the predominant storage site for histamine; the concentration of histamine
outside the brain is particularly high in tissues that contain large numbers of mast cells,
such as the mucosa of the bronchial tree, the intestinal mucosa and skin. The actions of
histamine on bronchial and smooth muscle and blood vessels account in part for the
symptoms of the allergic responses that are caused by mast cell activation. Mast cells
(which are leukocytes) contain metachromatic granules that store a variety of
inflammatory mediators. These include:
• Histamine and serotonin
• Proteolytic enzymes that can destroy tissue or cleave complement
components.
• Heparin or chondroitin sulfate which are anticoagulants.
• Chemotactic factors, such as eosinophil chemotactic factor of anaphylaxis
(an important regulator of eosinophil function) and neutrophil chemotactic factor.

15
Normally, mast cells are not found in circulation.
Allergies are abnormal immune system reactions to things that are typically
harmless to most people. Substances that cause allergic reactions, such as certain foods,
dust, plant pollen, or medicines are known as allergens. In an attempt to protect the
body, the immune system produces IgE antibodies to that allergen. Those antibodies
then cause certain cells in the body to release chemicals into the bloodstream, one of
which is histamine. The histamine then acts on a person's eyes, nose, throat, lungs, skin,
or gastrointestinal tract and causes the symptoms of the allergic reaction. Future
exposure to that same allergen will trigger this antibody response again.
Though histamine is a mediator of the inflammatory process, agents that
antagonize (block) their releases are useful only for the treatment of vascular events in
the early transient phase of inflammation (like burns). There are many essential oils that
block the actions of histamine that should respond well to hypersensitivity reactions or
other cellular injury, including lavender (LisBalchin & Bart 1999), peppermint (Taylor
1983), rosemary (Aqel 1991), blue chamomile (Miller 1996), clary sage (Moretti 1997),
curcuma leaf (Chandra & Gupta 1972), black cumin (El Tahir 1993), croton (Coelho-
de-Souza 1997), carum capticum (Boskabady & Shaikhi 2000), origanum compactum
(Van Den Broucke & Lemli 1982), Todalia asiatica (Kavimani 1996), Alpinia speciosa
and A. japonica (Morita 1996) and eugonol-containing essential oils (Hume 1983). One
of the greatest benefits of using essential oils as anti-inflammatory agents is that many
essential oils exert multiple anti-inflammatory effects related to inflammatory mediators
like histamine, kinin, and prostaglandin by inhibiting their synthesis (Kavimani 1996),
as well as inhibit platelet-activating factor (PAF) (Murayama & Kumaroo 1986) and
thromboxane production (Saeed and Gilani 1994).
Eugenol, a common and often the most effective constituent of many essential
16
oils has been shown to be a histamine antagonist, a kinin antagonist (Sharma 1997) and
inhibits PAF (Saeed & Gilani 1994; Janssens 1990). The results of Kim and Cho (1997)
suggest that eugonol possesses antianaphylactic properties by preventing mast-cell
degranulation. The effect of eugenol on vascular resistance was examined by Hume
(1983). The results showed it depressed vasoconstrictor responses in response to
exogenous histamine.
Histamine antagonists are most useful in dermatology to treat pruritis due to
urticaria, atopic dermatitis, contact dermatitis, psoriasis, and many other clinical
conditions facilitated by histamine activation. Lavender essential oil applied topically
potentially inhibited allergic responses to sensitized skin by inhibiting histamine release
from mast cells, which indicated that mast-cell mediated immediate-type allergic
reactions were inhibited (Kim and Cho 1997).
The degranulation of mast cells liberates many other inflammatory mediators
other than histamine, including prostaglandins, leukotrienes, thromboxane, platelet-
activating factor and kinins. Many essential oils inhibit the synthesis of these
inflammatory mediators. Prostaglandins are found in almost every tissue and body fluid,
and are important factors in the occurrence of inflammation. Prostaglandins are released
whenever cells are damaged and they appear in inflammatory exudates (Alexander
2001).
Inflammatory process also involves reactive oxygen species started by
leukocyte activation. Grabmann (2000) investigated two common essential oils used to
treat irritations and infections of the respiratory tract. They found that eucalyptus and
myrtle attenuated leukocyte activation by scavenging hydroxyl radicals, indirectly
produced by leukocyte degranulation, thereby interfering with inflammatory processes
by acting as antioxidants. It has been shown by many researches that essential oils
17
possess antioxidant properties in various physiological processes, including rosemary,
oregano, geranium, lemongrass, nutmeg and thyme (Deans 1993; Zheng 1993;
Aeschbach 1994).
B. Experiment 2: Serological Profiling and Molecular Detection of Protective Polypeptides in Sentinel Free-Range Layers
1. Surveillance and Epidemiology
a. Introduction
Surveillance for animal diseases has been widely used by epidemiologists and
other animal health experts to aid in monitoring and controlling health-related measures
in animal populations (Salman et al. 2003).
The two terms monitoring and surveillance are often used interchangeably in
animal health programs. Animal disease surveillance involves examining an animal
population carefully to determine if a particular disease enters that population.
Monitoring of animal diseases identifies a disease to establish changes in prevalence
and find out the direction and rate of disease spread. The World Organization for
Animal Health, OIE defines these terms as follows:
• Surveillance: “surveillance means the continuous investigation of a given
population to detect the occurrence of disease for control purposes, which may involve
testing of a part of the population”.
• Monitoring: “monitoring constitutes on-going programs directed at the
detection of changes in the prevalence of disease in a given population and in its
environment” (Cameron 1999).
According to Cameron (1999), there are 2 types of surveillances, namely the
active surveillance and the passive surveillance.

18
• Active surveillance: Unlike passive reporting system, active surveillance
differs by using surveys of a relatively small, representative sample of the population.
Advantages of active surveillance are better quality of information collected, the
information estimated the true situation in the whole population, and it is usually
quicker and inexpensive to collect as compared to passive methods.
• Passive surveillance: in spite of their disadvantages such as under reporting,
cost and non-representative reports, passive reporting systems are an essential source of
disease information. Almost all countries are following the passive disease reporting
systems; with relatively few exceptional countries following the active surveillance.
This is probably because appropriate techniques were previously lacking, and the
veterinary staff was unqualified in the necessary skills.
Disease surveillance is the device that provides information for scheduling
eradication programs and disease control. The data obtained for a monitoring and
surveillance system (MOSS) should be used to assess the health status of an animal
population and to trigger action. Documentation is a precondition for evaluating the
value of the monitoring and surveillance system. All standards on procedures and
methods should be recognized in detail. Documentation includes the following steps:
• Sampling
• Processing the samples
• Recording the data
• Laboratory analysis
• Statistical analysis (Salman et al. 2003).
The monitoring and surveillance system designer must characterize the type of
information that the system will gather, and should also describe the proposed uses of
the data before the system is in process. An ideal MOSS for an animal disease should
19
gather data on the agent, the host and the environment (Hueston 1993). The data
collected should consist of the following:
• The number of incidences of the disease
• The animal species affected
• The population at risk
• The type of production system in which the incidences were found
• The geographical location of the incidences
• Whether there is laboratory conformation of the disease
• The type of test used for conformation (Hueston 1993).
A vital requirement for evaluating a MOSS is by using a transparent, objective,
and systemic approach. Integrated quality assurance mechanisms and precise objectives
will facilitate in evaluating a well-documented MOSS (Salman et al. 2003).
Understanding the distribution of the disease is an efficient way to control the
disease spread. For this purpose, the following steps should be considered:
• Both intensive and non-intensive animal industries must be located
• The level of disease in different areas, and
• The pattern of animal movements between different areas (Cameron 1999).
b. Disease Surveys
In order to create complete reporting (and precise measures of disease
frequency), a passive disease reporting system requires information about every single
case of the main diseases present in the country. Hence, each animal must be examined
regularly. Such kinds of data collection are recognized as census, where all members of
the population are checked (Cameron 1999).
Surveys are capable to collect information rapidly and inexpensively because

20
as an alternative of requiring a census, where the whole population is examined (by
unqualified owners), only a small percentage (a sample) of the population is examined
(by qualified veterinary staff) (Cameron 1999).
The sample usually constitutes of a small group of animals that have been
chosen from their population. So a survey examines a small group (a sample) selected
from the population. Nevertheless, the problem with surveys is that they accurately
identify the disease status of the sample; but little is known about the rest of the
population that was not examined. Hence, we can only assume the disease status of the
population. So inference is the mechanism by which we can estimate the similarity in
disease status between the sample and the population (Cameron 1999). In order to
exclude the possibility of the inference from being wrong, the sample and the
population have to be almost the same with respect to the unit of interest so we can have
a representative sample. If not, then the estimate is considered as biased that is caused
by systemic error.
Choosing a representative sample is a difficult task in any animal disease
survey. To select a representative sample, it is a must to ensure that each animal in the
population has an equal probability of being selected in the sample, regardless of its
location, size, owner or any other characteristic. Sampling techniques of this kind are
recognized as random sampling. Hence random sampling is a reliable technique in
selecting a representative sample (Cameron 1999).
c. Measure of Disease
For an effective control of disease, the distribution of the disease must be
understood in terms of quantity, location, and the animals affected. Disease surveys are
based on considering the number of infected and uninfected animals. Prevalence and

21
incidence rate are the two main measures of disease used for active surveillance
(Cameron 1999).
Prevalence: “prevalence (sometimes called point prevalence) is a measure of
the number of animals with the disease of interest at a specific time, as a proportion of
the total number of animals in the population” (Cameron 1999).
Incidence Rate: “incidence rate (specifically true incidence or incidence
density rate) is a measure of the average speed at which the disease is spreading.
Incidence rate is the total number of new cases of disease divided by the total time that
each animal in the population was at risk of getting the disease” (Cameron 1999).
In many occasions, prevalence surveys are sufficient to identify the level of
disease present in a population; at times incidence rate surveys might replace the
prevalence surveys. In addition, both survey types can be implemented together when
laboratory tests fail to differentiate among naturally acquired and vaccine antibodies
(Cameron 1999).
d. Seroprevalence versus Clinical Prevalence
Prevalence surveys can determine any aspect of disease, clinical symptoms of
disease, indication of subclinical disease, or proof that the animal was infected earlier,
but has now recovered. In each situation, the duration of the disease varies. Clinical
disease usually lasts for a relatively short duration. Subclinical disease comes before
clinical disease in a longer time. Evidence of earlier exposure to a disease, in the form
of antibodies, persists for a much longer period of time after the disease (Cameron
1999).
When conducting surveys on rare diseases having a low prevalence, a large
number of animals should be evaluated to find a significant number carrying the

22
disease. Diseases of high prevalence require less animals to be examined, thus the
survey will be less expensive and faster. This is why seroprevalence surveys (“surveys
to estimate the prevalence of animals with high levels of antibodies indicating previous
exposure to the disease or previous vaccination”) are frequently used in animal disease
control programs. It is usually more practical to measure the level of disease through a
seroprevalence survey rather than a clinical prevalence survey since it requires a smaller
sample size. One advantage of clinical prevalence is that only clinical examination of
animals is required, while laboratory examinations are not needed. This may be faster
and cheaper, but laboratory examinations aid in developing more reliable diagnosis
(Cameron 1999).
e. Diagnostic Tests
Many disease surveys require the application of laboratory diagnostic tests to
analyze specimens collected from the animal. An example is the use of laboratory tests
such as Complement Fixation Tests (CFTs), ELISAs, or Agar Gel Immunodiffusion
Tests (AGIDs) to evaluate the presence of antigens and antibodies in the blood. Few
laboratory tests are ideal, even though most tests give inaccurate results only
occasionally. When using laboratory examinations in a disease survey, it is advisable to
understand the accuracy of the test, and the errors that might occur (Cameron 1999).
f. Sensitivity and Specificity
The reliability of a test is assessed by two measures, sensitivity and
specificity. “The sensitivity of a test measures the proportion of truly diseased animals
that the test correctly identifies as diseased. The specificity measures the proportion of
non-diseased animals that the test correctly identifies as non-diseased” (Cameron 1999).
23
2. Free-Range Poultry Production
a. Introduction
The outgrowing poultry production in the last two decades has forced some
small poultry producers to shift their production into free-range/organic chickens, in
addition to the fact that the natural/organic market has largely grown in the last decade
(Neufeld 2002).
Free-range/organic chickens, also known as “all natural”, contain neither
preservatives nor artificial ingredients and are being raised in a friendly environment.
According to Darre (2003), free-range poultry production increased from 1.9 %
in the year 1985 to 15.5 % in the year 1999, as compared to cage poultry production that
has dropped from 96.1 % in the year 1985 to 80.1 % in the year 1999.
Many important issues must be considered while designing and managing free-
range/organic poultry systems, these include:
• Breed origin, suitability and rearing of stock
• Behavior, housing and welfare
• Sources and types of feedstuffs that must provide suitable rations with
acceptable costs
• Animal health and treatment, specifically towards coccidiosis, cannibalism,
and other infectious diseases
• Stocking densities, manure handling and the access to range
• Market demands
• Financial returns and cost of poultry enterprises (Lampkin 1997).
b. Feeding
Diet is still a point of controversy between free-range and organic standards,

24
where free-range standards do not concentrate on the feed type and quality. While
organic standards suggest that 100 % of the diet to be organic with some allowance for
non-organic components. The UKROFS (UK Register of Organic Food Standards)
(1996) standards state that a minimum of 50 % of the diet to be fully organic, while the
rest comes from sources that are converting to organic production. The EU draft
regulation is proposing additional rules that restrict the use of non-organic materials to
20 % while increasing the fully organic materials to 60 %. Furthermore, the EU draft
regulation suggests that the holdings should produce their own animal feed where a
special approval is needed to buy in feeds.
c. Health and Medication
In organic standards, vaccination is the only mean of prevention; where as
hormones, growth promoters and prophylactic use of antibiotics are prohibited. The
prevention of disease is accomplished by improving the welfare of the animal.
However, the UKROFS (1996) gave some exceptions towards the use of anthelmintics,
specifically the use of coccidiostats accompanied by managerial practices to minimize
the problems.
The EU free-range and barn regulations and the RSPCA (The RSPCA welfare
standards for laying hens and chickens) (1995) have no restrictions on vaccination,
growth promoters, hormones or the use of medications.
At present, no organic pullet-rearing activity is being held to provide layers for
organic egg production, except for small enterprises. According to the Soil Association
(SA) standards (1996), layers might be accepted from conventional sources up to the
age of 16 weeks where they will be subjected to a six weeks conversion period. This
type of management is widely used especially for large-scale producers that would be
25
minimizing their cost of production.
Usually, free-range pullets are vaccinated in their rearing stage, specifically
against Newcastle Disease Virus, Infectious Bronchitis Virus, and Marek’s Disease and
in some occasions Infectious Laryngotracheitis. However, it is recommended that the
producers do not buy vaccinated birds if they do not have the infection on their unit
(Lampkin 1997).
d. Housing
Organic/free-range poultry producers have two approaches for housing
systems; static housing systems, where chickens have access to outside areas covered
with vegetation, and mobile systems that allow houses to be moved for better utilization
of vegetation when resources are limited (Lampkin 1997).
The UKROFS standards (1996) insist on the necessity that birds must have
easy access to the outside areas; if such conditions are not fulfilled, then the free-range
farms will not be accredited. Organic standards aim to minimize stress by providing an
optimum environment for the birds in which they can practice their normal behavior
patterns. Minimizing stress on the birds will reflect positively on the production
capacity and the health of the flock. Most free-range farms are designed in a way to
account for the behavioral needs of the birds especially during night times when the
farms are closed to prevent the entry of predators.
e. Behavioral Considerations
Chickens are known for their strong pecking order, where birds have the ability
to distinguish each other by their head forms. Hence excessive numbers of birds are
threatened by serious pecking problems that will result in a socially unstable group

26
leading to the formation of subgroups within the flock (Keppler et al. 1996).
Attractive nests are necessary in reducing the number of mislaid and ground
eggs, consequently, this will facilitate the time needed for egg collection and will reduce
the number of dirty eggs. Nests are usually placed away from the light in a quit area of
the barn but not far from the other facilities (Bauer et al. 1994). Nests having an
enclosed framework seem to be preferred especially when located undercover in the
wild (Appleby 1984). Comfort behavior of free-range hens is associated with sand and
sun-bathing to maintain proper hygiene and an effective control of ectoparasites
(Lampkin 1997).
f. Lighting
According to the organic standards, natural lighting should be available
knowing that direct sunlight causes problems associated with cannibalism and feather
pecking. Such problems can be avoided by placing extended roofs facing the windows
or by covering the windows with white paint (Lampkin 1997).
Artificial lighting is allowed to reach a maximum of 16 hours of lighting per
day, whereby the lighting should be provided in the morning instead of the evening.
This will allow the majority of the birds to lay their eggs early in the morning before
leaving the barn thus reducing the chances of obtaining dirty eggs (Lampkin 1997).
g. Fencing
Fencing is not a must in free-range farms since birds do not usually wonder far
away from their premises and they are shut up at night. However, fencing is
recommended to protect both the flock and the vegetation if predators are present. Two
kinds of fencing are implemented; the most effective is the electric netting that are

27
connected to batteries and the permanent non-electric fence that is usually 2 meters high
with a portion that is buried to prevent digging by foxes (Lampkin 1997).
h. Animal Health
Most of the organic producers surveyed reported very few or no health
problems, emphasizing the need for good management and meticulous care with respect
to hygiene and cleanliness, including disinfections between batches. However, there
currently appear to be some health problems in organic poultry production for which
specific solutions in the spirit of the organic standards have not been found. For other
health issues, such as virus diseases, it is assumed that satisfactory solutions can be
achieved with prevention through management and/or permitted methods of
treatment/vaccination. Day-old chicks and pullets purchased from conventional
hatcheries and rearers will be routinely vaccinated against a number of diseases in any
case. In practice, few (if any) organic producers used vaccines once the birds had
arrived on the holding (Lampkin 1997).
Mainstream poultry units have generated the concept of "in house" biosecurity,
where disease challenge is met by vaccination for viral infections and environmental
controls (air quality etc.) for bacterial problems. Organic animal health standards restrict
the use of prophylactic medicines. This, and the consequences of being free-range,
means that organic systems are potentially at a greater risk from some diseases.
However, low stocking rates and access to outdoor environments reduce the potential
for other diseases associated with dense populations, high levels of inputs, enclosed
environments and restricted movement. Organic systems can avail themselves of the
advantages of vaccinations based on risk assessment and the lessons that have been
learned from good basic hygiene and health management practices in conventional

28
systems (Hovri et al. 2001).
A survey of small-scale organic producers in the UK revealed that producers
do not generally perceive a problem with the health of their flocks (Roderick et al.
1996; Roderick and Hovi 1999). Other studies, in particular those described by Permin
and Nansen (1996) and Permin et al (1999), suggest that organic poultry are subject to a
range of diseases, including internal parasites picked up whilst ranging. Lampkin (1997)
identifies coccidiosis, feather pecking and cannibalism, and external parasites as
significant potential problems in organic and other free-range systems. Swarbrick
(1986) identified a range of diseases and welfare problems in free-range systems in
southern England. In Canada, Herenda and Jakel (1994) recorded significantly higher
levels of disease related condemnation rates in "vegetarian" (also referred to as organic)
as compared to other free-range and "standard" systems.
Contamination from exotic birds is also a possibility. Infections of virulent
forms of Newcastle disease have been associated with birds purchased as pets. Free-
range chickens are at a greater risk than intensively managed birds, as they are likely to
be in close contact with wild and migratory birds that carry the disease (Alexander and
Gough 1986).
i. Feather Pecking and Cannibalism
Feather pecking and cannibalism currently appear to be a big problem for
larger-scale organic egg producers. Cannibalism is a problem in many conventional
free-range systems, sometimes, but not always associated with feather pecking which is
only one of several pre-disposing factors (along with group size and light intensity)
(Lampkin 1997).
Feather pecking alone might not necessarily represent a serious problem, even
29
though it leads to a partial loss of feathers and can represent a visual problem. However,
feather pecking often is followed by cannibalism, where hens inflict injuries mainly to
the cloacal region of other hens, which can lead to further health problems because of
infection and also has negative impacts on production. Producers therefore try to reduce
feather pecking in the first instance in order to avoid the problem of cannibalism
(Lampkin 1997).
A variety of factors have been suggested as causes for feather pecking
including exposure to sunlight, insufficient protein supply, excessive egg sizes,
excessive group size, stress and boredom. In addition, attention should also be focused
on breeds. A tendency to engage in feather pecking is partly inherited and it appears that
most modern lines of hybrids selected under intensive conditions have similar problems
when housed in free-range systems (Bauer and Keppler 1996).
Cannibalism can also be related to parasite problems and infections in the
ovaries and cloacal region of the layers. Birds already infected might draw the attention
of other hens, and the wounds resulting from cannibalism can be the cause of further
infection. It is clear that a wide range of factors are potentially involved, and that
producers need to pay attention to all of these if they are to avoid cannibalism problems
in free-range systems without the use of beak clipping. In summary they should pay
attention to the rearing of pullets, enriched housing systems, offering a variety of feed
sources (including scratch feed) in a balanced ration, equal distribution of light
(including daylight) and regular checks of climate and general health of the flock (Bauer
and Keppler 1996).
Permin and Nansen (1996) view the incidence of cannibalism, with the risk of
secondary Escherichia coli infection, as a growing problem on organic farms. Keeling
et al. 1988 observed an outbreak of cannibalism in a free-range flock that occurred
30
primarily in the last 8 weeks of lay. Cannibalism and pecking have also been observed
in other free-range flocks in England. An extensive postal survey of "alternative"
poultry systems in the UK and showed that over 55% of respondents reported feather
pecking in laying flocks (Swarbrick 1986).
Flock size and density factors were also observed in research on laying hens in
percheries, which showed that mild feather pecking increases with age, flock size and
stocking density. However, although rare, aggressive pecking was most common in
small flocks of low stocking density. This was related to birds attempting to form social
hierarchies, whereas large flocks at high density appear to adopt non-social, non-
aggressive behavioral strategies (Nicol et al. 1999).
j. Egg Drop Syndrome (EDS)
Egg drop syndrome causes decreased egg production (Van Eck el. 1976). It is
caused by a duck adenovirus belonging to the genus Atadenovirus. The EDS virus is
nonenvelopped, hemagglutinating, DNA virus, 74-80 nm in diameter, which replicates
in the nucleus of host cells (Jordan 1990).
The infected birds lay soft-shelled or shell-less, discoloured and miss-shapened
eggs. EDS virus may cause 40-50% decrease in egg production. If the disease is due to
reactivation of latent virus, the fall usually occurs when production is between 50% and
peak level. In acute cases there may be mild depression, however general appearance,
feed and water intake of the affected bird remain normal (Yamaguchi et al. 1980). EDS
virus spreads both vertically through the embryonated eggs (Adair et al. 1979) and
horizontally. The horizontal transmission of the disease in the flock is usually faster.
The virus can survive in the litter of an infected poultry house for many weeks. Both
domestic and wild ducks may act as a carrier and play a vital role in the transmission of
31
disease (McFerran 1999).
The EDS virus agglutinated avian erythrocytes but not mammalian
erythrocytes, due to the presence of hemagglutinin molecule on its surface (Baxendale
et al. 1980; Jordan 1990). It was also observed that EDS virus mediated HA did not
show elution on 24 hours post incubation. This property might be due to the lack of
neuraminidase molecules on the surface of EDS virus (Spalatin et al. 1970).
The incidence of the disease has declined as the classical form has largely been
eliminated from primary breeder flocks. Organic and free-range flocks may be at a
greater risk than conventional ones, as there is likely to be more contact with wild-fowl
and geese or duck carriers. EDS has been encountered in organic flocks in Denmark,
and is considered a risk (Permin and Nansen 1996). Swarbrick (1986) recorded EDS in
three out of 16 free-range farms, and of these at least one was infected from wild ducks.
Christensen and Stanislawek (1994) reported high levels of antibodies to EDS 76 in a
free-range flock that had contact with ducks on a farm dam and was supplied with
untreated drinking water from the dam.
Spread of EDS may occur through three possible routes. Classical EDS may be
introduced by means of a vaccine that has been grown in duck eggs and spread by
vertical transmission via the egg. An endemic form may also spread laterally, from bird
to bird, through a flock. A sporadic form can spread to chickens via direct contact with
ducks, geese or infected wild birds, or indirectly through contaminated water. The virus
can also be transmitted via humans, needles and egg trays (Lampkin 1997).
The lateral spread of the disease can be slow. The virus has been shown to take
11 weeks to spread through a battery laying house, while affecting 4% of eggs produced
(Cook and Darbyshire 1980). Birds with antibodies slow the spread of the virus. Chicks
hatched from eggs of infected hens possess maternal antibodies that confer a passive
32
immunity to challenge for approximately the first 4 weeks of life (Darbyshire and Peters
1980).
k. Infectious Bronchitis Virus
• Introduction
IBV is the cause of highly contagious respiratory disease that produces high
morbidity in all ages of chickens and high mortality in chicks less than 6 weeks old
(Case et al. 1983). IBV can cause losses to the poultry producer due to poor feed
conversion, condemnations, and mortality, especially when the birds are co-infected
with other pathogens (Andrade et al. 1983; Perrotta et al. 1988).
• Morphology of IBV
IBV particles tend to be circular, although some pleomorphism of the stained
virus is observed. The virus particle has characteristic club-shaped projections
uniformly distributed on its surface. According to McIntosh et al. (1967), these are
approximately 20 nm long and 10 nm wide at their outer edge, with a narrow base. They
are spaced loosely around the particle in contrast to the closely spaced, rod-shaped
projections on paramyxoviruses. In a study of 12 strains of IBV, Harkness and
Bracewell (1974) found differences in the morphology of the projections.
Berry et al. (1964) reported the size of IBV to be 80-120 nm in diameter
including projections. Cunningham (1966) found the sedimentation constant of IBV to
be 344S, from which he estimated the diameter of the particle to be 80-100 nm.
However, McIntosh et al. (1967) reported the size variation from 120 to 200 nm.
Cunningham (1966) reported the specific gravity of IBV to be 1.24 in cesium chloride
and 1.19 in sucrose.
33
• Chemical composition of IBV
IBV is a member of the Coronaviridae family. The nucleic acid of IBV is a
single-stranded RNA (Cunningham 1966), this positive RNA genome codes for three
structural proteins: nucleocapsid (N) protein, membrane (M) protein, and spike (S)
protein. The molecular weights (MWs) of the three proteins are approximately 50, 23-
35, and 180 KDa, respectively (Cavanagh 1981). The surface of the particle contains an
essential lipid. Purified virions contain approximately 4% by weight of RNA.
Sixteen polypeptides with molecular weights ranging from 15 to 135 KDa were
observed by polyacrylamide gel electrophoresis of disrupted purified IBV on 7.5%
acrylamide gels (Alexander and Collins 1977). Stern and Kennedy (1980) analyzed
extracted nucleic acid from IBV-infected chicken embryo infected kidney cells. They
found six RNA species designated A-F, the latter having the same electrophoretic
mobility as purified viral genome.
The S protein of IBV is posttranslationally cleaved into S1 and S2 subunits
with molecular weights of 90 and 84 KDa, respectively (Stern & Sefton 1982). The S2
subunit anchors the spike in the membrane, whereas the S1 subunit forms the globular
head of the spike protein. The S1 subunit encodes amino acids involved in the induction
of neutralizing, serotype specific, and hemagglutination-inhibition antibodies (Collison
et al. 2001).
It has been shown that the epitopes that induce virus-neutralizing (VN)
antibody and determine the IBV serotype are associated with the S1 fraction (Cavanagh
& Davis 1986). Chickens inoculated with purified S1 fraction, and mice inoculated with
a recombinant vaccinia virus containing S1 gene, produced IBV VN Abs (Tomley et al.
1987). Also, a majority of VN monoclonal antibodies produced against IBV have been
shown to react with S1 protein and not with M or N proteins (Karaca et al. 1992).

34
Two clusters of amino acid substitutions (between positions 56 to 69 and 117
to 133) were observed in the S1 protein sequences of several Mass serotype isolates.
These were designated hypervariable regions 1 and 2 (HVR-1 and HVR-2), respectively
(Cavanagh et al. 1988). This led to the proposal that most VN epitopes were located in
the first and the third quarters of the S1 protein (Jia et al. 1996).
• Replication of IBV
Becker et al. (1967) studied the morphogenesis of IBV in infected
embryonated eggs. The virus appears to develop in the cytoplasm by a process of
budding into cisternae or vesicles, incorporating intracytoplasmic cellular membrane
material into its outer coat. The club-shaped projections observed on the virus particle
in negatively stained preparations were not observed on the surface of the virus in tissue
sections of infected chorioallantoic membrane (CAM). The complete virus particle has a
double outer shell surrounding a core of amorphous material.
• Biological properties of IBV
Untreated IBV in allantoic fluid does not agglutinate avian erythrocytes.
Bingham et al. (1975) found the hemagglutinin of the Connecticut strain to be
detectable after sucrose gradient purification. The Massachusetts strain required an
additional incubation with the enzyme phospholipase C after the purification step to
reveal hemagglutination activity. Alexander and Chettle (1977) produced a satisfactory
hemagglutination antigen by concentrating the virus, followed by treatment with
phospholipase C type I at a final concentration of 1 unit/ml for 2 hr at 37 C.
• Strain classification of IBV
Prior to 1956 avian IB was considered to be caused by a single antigenic type
of virus as exemplified by the pathogenic Massachusetts strain and the Beaudette,
nonpathogenic, embryo lethal strain. However, since that time a number of isolates have
35
been identified from outbreaks of IB in chickens that are different antigenically from the
original Massachusetts type (Cunningham 1966).
More than 20 serologically distinguishable IBV strains have been identified
worldwide (Gelb et al. 1981). The majority of IBV field isolates in the United States
belong to serotypes Massachusetts (Mass), Arkansas (Ark), and Connecticut (Conn)
(Hopkins 1974). Vaccination with one serotype most often results partial or no
immunity to heterologous types (Andrade et al. 1983; Gelb et al. 1981; Gelb et al.
1983; Hofstad 1981; Johnson & Marquardt 1975; Marquardt et al. 1982). This is
important, since the Ark-99 strain has been isolated numerous times on the Delmarva
Peninsula, where common vaccination regimens often don’t include this serotype (Gelb
et al. 1981; Gelb et al. 1983). Furthermore, although eyedrops, course spray, and
intratracheal instillation are all effective methods of vaccination (Andrade et al. 1983),
both Mass and JMK serotypes of IBV have been isolated from vaccinated flocks (Gelb
et al. 1981; Perrotta et al. 1988).
Since IBV immunity is serotype specific, vaccine failures are often associated
with the emergence of antigenic variants that differ from the vaccine viruses. Therefore,
a thorough understanding of the serotype-specific epitopes on the S protein is required
for developing strategies to improve currently used vaccines (Jia et al. 1996).
• Natural and experimental hosts of IBV
The chicken is the only natural host for IBV. All ages are susceptible, but the
disease is most severe in baby chicks were it causes some mortality. Following aerosol
exposure of chicken to IBV there is rapid multiplication of the virus in the respiratory
tract. Virus can be isolated from the trachea and lungs at 24 hr through the 8th day. Virus
also multiplies in nonrespiratory tissues such as the kidney and bursa where it may
persist longer than in the lung and trachea (Hofstad 1984).

36
• Transmission of IBV
IBV spreads rapidly among chickens in a flock. Susceptible birds placed in a
room with infected chickens usually develop symptoms within 48 hr. It is assumed that
the virus spreads among flocks where farms are close and in the direction of the
prevailing wind (Hofstad 1984).
• Immunity to IBV
Chickens recovered from the natural disease are resistant to intratracheal
inoculations with the homologous strains as soon as symptoms have subsided. It
requires about 3 wk for chickens to reach a high level of antibodies following exposure
to IBV. Flocks that have experienced the outbreak have some degree of immunity, and
antibodies can be demonstrated for at least one year (Hofstad 1984). However,
observations by Van Rockel et al. (1950) have suggested that immunity may decline
sufficiently for reinfection to occur in some flocks following exposure to the virus.
Plurality of strains has complicated immunity studies with IBV.
Eggs laid by recovered hens will carry antibodies later absorbed by the hatched
chick. The passive antibody levels are highest soon after hatching and decline steadily
to negligible levels by the forth week. Passive antibodies serve to reduce the severity of
the disease but do not prevent respiratory infection following exposure to the virus
(Hofstad 1984).
Immunity to IBV has most often been assessed using traditional serological
assays such as HI and VN tests (Alexander et al. 1976; Garcia & Bankowski 1981;
Hatcher et al. 1983; King & Hopkins 1983; Lukert 1966). However, the ELISA is now
being used on a more frequent basis to measure IBV Abs (Case et al. 1983; Garcia &
Bankowski 1981; Marquart et al. 1981). The use of an ELISA offers a number of
advantages compared with traditional serological assays, including increased sensitivity

37
(Garcia & Bankowaski 1981; Marquart et al. 1981), ease of automation (Snyder et al.
1983; Snyder et al. 1984), and the fact that the antibody levels to a number of different
viruses and/or strains can be measured simultaneously (Snyder et al. 1984). These
factors all support the idea that ELISA is a promising tool for serological studies,
especially for use in evaluating the efficacy of vaccination regimens and in monitoring
the immune status of birds in a flock (Perrotta et al. 1988).
A number of authors have reported success in using the IBV-ELISA to
measure the antibody levels following vaccination with IBV (Case et al. 1983; Garcia &
Bankowski 1981; Snyder et al. 1983). However, although ELISA is extremely sensitive,
it is not serotype-specific with regard to IBV antibody detection (Perrotta et al. 1988).
Although HI and VN can detect type- as well as group- specific Abs to IBV
strains, they, like ELISA, are of little epidemiological value because of the confusion
associated with cross reacting antibodies (King & Hopkins 1983). If a reliable type-
specific ELISA could be developed, it would greatly assist diagnosticians and
epidemiologists in the establishment of serotype causation of IBV field outbreaks
(Perrotta et al. 1988).
In addition, lack of serotype specificity combined with great sensitivity make
the ELISA ideally suited for monitoring the pressure of IBV in specific pathogen free
(SPF) flocks. Furthermore, the IBV-ELISA could be used as a screening test to monitor
for IBV outbreaks among previously vaccinated or infected flocks. In this case, once an
increase in anti-IBV antibody titer is detected, a more specific assay could be utilized to
identify the serotype responsible for the increase (Perrotta et al. 1988).
• Isolation of IBV
Isolation of IBV is most frequently accomplished by inoculating 10- or 11-day-
old embryonating chicken eggs via the allantoic sac with a broth suspension of exudates

38
collected by swabbing the trachea of several birds in the acute stage of the disease.
Penicillin and streptomycin (10,000 units and 10 mg respectively per ml) are usually
used to control bacterial contamination. However, filtration through the 0.65, 0.45, and
0.3 µm Millipore filters can also be used to eliminate bacteria from the broth suspension
(Hofstad 1984).
• Serology for IBV
Diagnosis of avian IB by serologic methods is based on demonstration of an
ascending serum antibody level. The first sample of blood is collected during initial
stages of the disease and the second is taken in 2 or 3 weeks. Both samples of serum are
tested for neutralizing antibodies against IBV. Demonstration of a negative or low
antibody titer in the serum collected early and a higher titer after recovery constitutes a
diagnosis of IBV. The plurality of strains may necessitate using strains of IBV other
than the Massachusetts type, the most frequently encountered (Hofstad 1984).
The primary aim of IBV diagnostic techniques is to determine the serotype of
the virus. Serotype is defined as a grouping of viruses that are serologically related.
Classically, strains of IBV have been placed into serologically related groups on the
basis of their reactivity with known serotype-specific antiserum in virus neutralization
tests (Collison et al. 2001).
l. Newcastle Disease Virus
• Introduction
Five clinical forms or pathotypes of Newcastle disease (ND)-Doyle’s, Beach’s,
Beaudette’s, Hitchner’s, and avirulent enteric- are caused by ND viruses that are
morphologically and antigenically similar.
Doyle’s form, first recognized in 1926 (Doyle 1927), is an acute lethal

39
infection of all ages of chickens. Hemorrhagic lesions of the digestive tract, which lead
to description of this form of the disease as VVND (viscerotropic velogenic Newcastle
disease), are a prominent pathologic feature.
Beach’s form, described in 1942 (Beach 1942) is an acute and frequently lethal
infection of chickens of all ages characterized by lesions in the respiratory tract and
nervous system. Hemorrhages are conspicuously absent from the digestive tract. It was
initially called nervous respiratory disease or pneumoencephalitis and is also caused by
certain velogenic strains. This pathotype is frequently termed “neurotropic Newcastle”.
Beaudette’s form, recognized a few years later (Beaudette and Black 1946), is
an acute respiratory and sometimes lethal nervous infection of young chickens. In older
birds mortality is rare. Mesogenic viruses cause this pathotype of ND. Some of these
strains are used as viable vaccines.
Hitchner’s form (Hitchner and Johnson 1948) is a mild or unapparent
respiratory infection of chickens caused by lentogenic strains. Mortality is rare in birds
of any age. Several lentogenic strains are widely used as vaccines.
The asymptomatic enteric form of infection (Lancaster 1981) is caused by
lentogenic strains that result in no clinical signs or pathology and is detectable only by
virus isolation from the gut or feces and by presence of specific antibodies.
High mortality of 50-100% among adult birds has characterized Doyle’s form
of the disease in many countries where flocks have been devastated and market
operations upset. Severe direct and indirect losses occurred from VVND viruses in
southern California in 1971-72 (Walker at al. 1973). Less lethal forms of Beach and
Beaudette have also been the source of major economic losses. Crippling, impaired
growth and poor feed use often occur among surviving birds. Greatest loss among
layers frequently results from reduced production and impairment of eggshell and

40
albumin quality. Reduction of fertility and hatchability of eggs has also been reported,
and additional losses have come from restrictions on export of eggs (both hatching and
table), chicks, breeding and other stock, and dressed poultry (Beard and Hanson 1984).
• Classification and molecular nature of the ND virus
NDV is a paramyxovirus. This genus, according to the classification presented
by Mathews (1979), includes the parainfluenza viruses of mammals 1-5, mumps virus,
and the avian paramyxoviruses (PMVs), of which there are at least 7 serotypes, NDV
being serotype PMV-1. PMVs contain a single strand of RNA within protein arranged
in a helical symmetry. This nucleocapsid is contained within a lipoprotein envelope
(Beard and Hanson 1984).
The virus is enveloped and contains a negative –sense, single stranded RNA
genome that codes for six proteins including an RNA-dependent RNA polymerase (L),
fusion (F) protein, hemagglutinin-neuraminidase (HN) protein, matrix (M) protein,
phosphoprotein (P), and nucleoprotein (NP) (Kapczynski and Tumpey 2003).
The HN and F proteins are glycosylated and form two projections on the
lipoprotein envelope of the virion. Studies with monoclonal antibodies to these proteins
have demonstrated neutralization to NDV in vitro and in vivo by preventing virus
attachment and cell fusion activity. The M protein is located in the inner surface of the
envelope and provides structural integrity for the virion. The NP, P, and L proteins are
associated with genomic RNA to form the nucleocapsid. The role of antibodies to NP/P
and M proteins in protection against NDV infection is unclear (Reynolds and Maraqa
2000).
• Morphology of the ND virus
The virion or mature NDV unit, which varies in size from 120 to 300 nm but is
usually about 180 nm, consists of an envelope and an internal component. The ether-
41
sensitive and osmotically deformable envelope has a pattern of projection or spikes (80
Å long) and contains the antigenic components that stimulate the host to produce
hemagglutinin inhibiting and virus neutralizing antibodies (Rott 1964).
The internal component (nucleocapsid), also known as the G antigen or
nucleoprotein (NP) soluble antigen, consists of a long and much coiled tube of a
diameter of 180 Å. The protein structural units of the tube are arranged in a helix around
the central hollow axis; within them and determining the entire configuration is the
RNA. The oligonucleotide fingerprinting of NDV strains (McMillan and Hanson 1982)
has allowed precise determination of sameness or differences among isolates.
Two glycoproteins of the envelope and seven other polypeptides have been
identified by investigators and compared among other avian paramyxoviruses
(Alexander and Collins 1981). The two glycoproteins are the HN (containing
hemagglutinin and neuraminidase) and the F (responsible for cell-fusing activity and
polykarocytes). The HN and F polypeptides are derived from precursors, HN0 and F0,
by proteolytic cleavage. Susceptibility of these precursors to cleavage by enzymes
determines ability of the virus to spread in the host and organ tropism. Therefore, it now
appears that cleavage of these surface glycoproteins is a requirement for pathogenicity
(Nagai et al. 1979).
The HN protein has three functions: it recognizes sialic acid –containing
receptors on cell surfaces, it promotes the fusion activity of the F protein, allowing the
virus to penetrate the cell surface, and it acts as a neuraminidase (sialidase), removing
sialic acid from progeny virus particles to prevent virus self-agglutination. Many studies
show that only hemotypic HN and F can induce fusion suggesting that there is a specific
interaction between HN and F, involving both the stalk and globular head regions of
HN. The multifunctional HN molecule makes it an attractive target for structure-based
42
drug design for diseases caused by paramyxoviruses (Zaitsev et al. 2004).
Unlike many viral F proteins, paramyxovirus F proteins do not require the acid
pH of endosome for the activation of fusion activity; thus, other mechanisms for F
protein activation must be invoked. Because of this acid pH independence, infected cells
expressing both HN and the F proteins can fuse with adjacent cells to form multinuclear
cells or syncytia, a process that is assumed to be similar to virus cell fusion (Gravel and
Morison 2003).
For paramyxoviruses, fusion of the viral and host cell membranes occurs at the
cell surface, in contrast to the influenza virus, which undergoes endocytosis where the
lower endosomal pH triggers a dramatic structural change in the influenza virus
hemagglutinin. In the case of paramyxoviruses, binding of HN to sialic acid receptors
must trigger the fusion protein into its fusogenic state through an association between
HN and F (Zaitsev 2004).
The NDV F protein is synthesized as a precursor, Fo that must be
proteolytically cleaved to activate F protein fusion activity. Cleavage at amino acid 117
produces disulfides-linked F2 and F1 polypeptides derived from the amino-terminal and
carboxyl-terminal domains of F0, respectively. The F1 polypeptide has one acid perhaps
two-fusion peptides. Upon initiation of fusion, fusion peptides are thought to insert into
target membranes, docking the protein to these membranes. Paramyxovirus F1
polypeptides have 2 heptad repeat (HR) regions, one (HR1) located just carboxyl-
terminal to the more amino-terminal fusion peptide and the other adjacent to the
transmembrane domain (HR2). Studies of peptides with sequences of these HR
domains, characterization of mutations within the domains, and results of similar studies
of human immunodeficiency virus and influenza virus have led to hypothesis that F
proteins are synthesized and transported to cell surfaces in a metastable conformation in

43
which the HR domains are not associated and the fusion peptides are masked. Upon
fusion activation, F proteins are thought to undergo a series of conformational changes
that result in the insertion of fusion peptides into target membranes and the interaction
of the HR1 and HR2 domains to form a very stable complex. The formation of this
complex is thought to pull target and attack membranes in close proximity, allowing
subsequent fusion events (Gravel and Morison 2003).
The HN protein binds to sialic acid-containing molecules found on cell
surfaces and has demonstrated neuraminidase activity. The F and HN transmembrane
glycoproteins are the principle antigens that elicit a protective immune response.
Monoclonal antibodies directed against these glycoproteins neutralize NDV by
inhibiting cell fusion and attachment (Kapczynski and Tumpey 2003).
Because of evidence which suggested an interaction between HN and F
protein, we have explored their association during NDV infection since there have been
no reports of such an interaction in naturally infected cells. We were able to
demonstrate an interaction between the HN and F protein in NDV-infected cells by
using coimmunoprecipitation and chemical cross-linking. To stabilize the potential
association of HN and F proteins on infected cell plasma membranes, use of the
chemical cross-linker DTSSP was investigated. DTSSP is a membrane-impermeable
cross-linker; therefore, incubation of intact cells with this cross-linker will link only
proteins expressed on the cell surface. We report that a complex between HN and F
protein could be immunoprecipitated with antisera against either protein, and this
complex could be stabilized by chemical cross-linking. Precipitation of this complex
was not dependent on cleavage of Fo (uncleaved fusion protein) into F1 and F2 (cleaved
form of fusion protein), the complex did not dissociate immediately after HN protein
attachment to uninfected cells, and it was not dependent on attachment of the HN

44
protein to its receptors (Stone-Hulslander and Morison 1997).
In most paramyxovirus systems, F protein cleavage is not sufficient to activate
these conformational changes in the F protein; rather, coexpression of the attachment
protein is also required. The HN protein provides more than an attachment or
membrane-docking function, since mutants with mutations in the HN protein can retain
attachment activity but are defective in fusion promotion. It has been proposed that the
attachment of the HN protein to its receptor serves to activate the F protein, but the
nature of this activation is poorly understood. The HN protein and the F protein must be
from the same virus, with a few exceptions, indicating that virus-specific interactions
between HN and F proteins are required for fusion directed by the F protein. Indeed, an
interaction has been shown in several systems. It seems likely that this interaction is
somehow linked to F protein activation (Gravel and Morison 2003).
Passive administration of anti-serum against intact NDV, or the surface
glycoproteins HN/F, provided protection to susceptible chicken against NDV challenge.
However, no report has been published on the protective role of the other NDV
polypeptides (Reynolds and Maraqa 2000). In studies with simian virus 5 (SV5),
Randall et al. (1988) found that in vitro neutralization was provided by antibodies
directed against the surface HN glycoprotein, but neutralization was not achieved when
antisera against the internal protein NP, P, or M were used. Furthermore, similar
findings have been reported for IBV. Immunizing birds with purified nucleocapsid and
membrane proteins of the IBV did not protect them against virulent challenge despite
high antibody titers, whereas birds immunized with the surface S1 glycoprotein were
protected (Reynolds and Maraqa 2000).
• Replication of NDV
Replication of NDV has been studied in cell culture systems. After the virion

45
adsorbs to the cell, the virion envelope fuses with the cell membrane, enabling extrusion
of the nucleocapsid into the cell. The RNA-dependent RNA polymerase synthesizes
RNA complementary to that of the viral nucleocapsid (Huang et al. 1971), which then
acts as messenger RNA. Virus production occurring in the cytoplasm reaches its
maximum in 5-8 hours. During the 3-4 hours noninfectious period, NDV-specific
antigen can be demonstrated by compliment fixation and by use of fluorescent antibody.
First to be detected is the NP in the cytoplasm near the nucleus (Rott 1964). Then the
hemagglutinating antigen and neuraminidase can be found throughout the cytoplasm.
Both the HN and F polypeptides are synthesized in rough endoplasmic reticulum
(Schwalbe and Hightower 1982).
NDV interferes with multiplication and pathologic expression of certain other
viruses and in turn is interfered with by certain viruses such as infectious bronchitis
virus (Raggi et al. 1963). Mixed infections in chickens can result in aborted disease and
immunologically reduced response (Hanson et al. 1956). In cell cultures, interference
induced by other viruses on multiplication of NDV has been used in development of
procedures to detect noncytopathic viruses (Beard 1967). Conditions under which NDV
induces formation of interferon in many host systems have been extensively studied
(Baron 1964). NDV is frequently used as an elicitor of interferon, being quite resistant
to its effects (Lomniczi 1973).
• NDV- strain classification
A strain of NDV is a culture that has been recovered from a chicken or other
animal by inoculation of a suitable laboratory host system such as embryonated chicken
eggs or cell cultures (Beard and Hanson 1984).
Among the strains that are almost avirulent (lentogenic) are B1, F, and LaSota,
which have been extensively used as vaccines. Ulster and V4, more recently isolated,
46
are heat-stable lentogens that replicate in the intestinal mucosa. Among the strains of
highest virulence (velogenic) are Milano, Herts, and GB, which have been used as
challenge strains. Ca-1083 and Largo are VVND isolates that are frequently used in
laboratories with adequate biosafety provisions to test efficacy of vaccines in challenge
trials. From some virulent and milder strains, sublines can be isolated that are
differentiable from the parent culture on the basis of plaque morphology (Granoff
1964).
• Immunity to NDV
All NDV strains are capable of provoking antibody response in chickens,
rabbits, and other species into which they are introduced. Antigens that induce the virus-
neutralization (VN) antibody, which is apparently also the hemagglutination-inhibition
(HI) antibody, are associated with virus envelope (Beard and Hanson 1984).
47
CHAPTER III
MATERIALS AND METHODS
A. Experiment 1: Anti-Inflammatory Effect of Origanum ehrenbergii Essential Oil against Staphylococcus aureus Skin Infection in Rabbits
1. Preparation of Staphylococcus aureus Inoculum
The Staphylococcus aureus strain was provided by the bacteriology lab of the
American University Hospital (AUH), Beirut, Lebanon and grown in a nutrient broth at
37°C for 3-4 hours until reaching to the log phase. A volume of 0.1 ml of
Staphylococcus aureus was struck for isolation on Mannitol Salt Agar (HiMedia
Laboratories, Limited, Mumbai, India) and incubated at 37°C for 24 hours. The
incubated MSA was scraped aseptically using a sterile loop and the inoculum was
suspended in 5 ml sterile Triptose Phosphate Broth (TPB) tube, and then inoculated for
5 hours at 37ºC. After 5 hours, the percent transmittance of the original bacterial culture
was 21.75. From the Staphylococcus aureus logarithmic standard curve equation (y = -
46.507x + 410.889) the inoculum count was deduced as 2.33x 10⁸ CFU/ml (according
to Microsoft Excel 2000 program).
2. Standard Curve Preparation
For the Staphylococcus aureus bacterium, and with the use of a metal loop,
sterilized over a flame, a colony was taken from the MSA and placed in TPB. The
inocula were incubated for four to five hours, time that is needed for the bacteria to
reach the log phase in bacterial growth curves. The turbidity of the inocula was
compared to Mc Ferland Turbidity Standard, which consists of 0.5 ml of 1 % BaCl2 and
99.5 ml of 1 % Sulfuric Acid (0.36 N). This BaCl2 suspension matches with a

48
Staphylococcus aureus culture that contains approximately 1 to 4 x 10⁶ CFU/ml.
Serial dilutions from 101 to 108 were made by adding 0.5 ml of each inoculum
to 4.5 ml sterile saline. In parallel, percent transmittance for each dilution was read
using Spectronic 20 D+ spectrophotometer at a wavelength of 540 nm. The aim was to
end up with a standard curve of bacterial count (CFU/ml) versus percent transmittance.
However, transmittance reached to a plateau for almost all the dilutions, thus, failed to
obtain a linear slope.
Serial dilutions were made from 1:2 to 1:64 in which percent transmittance of
the bacterial dilutions could be read but the colonies were too many to count. So serial
dilutions from 1:2 to 1:1,048,576 were performed and percent transmittance was
recorded for each bacterial dilution. Levels of the bacteria were calculated as follows:
bacterial count (CFU/ml) = number of colonies formed x the dilution factor x 10 (since
0.1 ml of the corresponding dilution was plated). The number of colonies considered
corresponds to the plate with a count ranging from 30 to 300 colonies. For
Staphylococcus aureus, a standard curve of the logarithm of colonies’ count versus
percent transmittance was plotted (Figure 1).
3. Optimization of In Vitro Analysis of Antimicrobial Activity of Essential Oil
a. Antimicrobial Activity of Essential Oil from Origanum Ehrenbergii Harvest of Three Different Locations
Three sources of Origanum ehrenbergii essential oil were from three different
locations in Lebanon. The essential oils from the three different locations were tested
for their inhibitory effect against Staphylococcus aureus by using the Kirby Bauer Test
(Bauer et al. 1966).

49
0
10
20
30
40
50
60
70
80
90
100
6.6 6.8 7 7.2 7.4 7.6 7.8
Log2 count
% T
rans
mitt
ance
% Transmittance Linear (% Transmittance)
Staphylococcus aureusy = -46.507x + 410.889
R2 = 0.9751
Fig. 1. Logarithmic standard curve of Staphylococcus aureus X-axis = log2 of the bacterial count and Y-axis = percent transmittance.
Two different essential oil dilutions were tested for each location,
• 1/100 = 10 µl oil + 2 µl DMSO + 980 µl BHI
• 1/200 = 10 µl oil + 4 µl DMSO + 1960 µl BHI
From the Staphylococcus aureus logarithmic standard curve equation (y = -
46.507x + 410.889) the inoculum count in the major seed stock of Staphylococcus
aureus was deduced as 8.013 x 10⁸ CFU/ml (according to Microsoft Excel 2000
program). For preparation of 100,000 CFU/ml, 1.3 µl of the stock containing S. aureus
were reconstituted in 10 ml of sterile saline.
A volume of 0.1 ml of the culture was seeded on 6 Muller Hinton (MH) Agar

50
(Mast group Ltd, Merseyside, U.K.) plates, using sterile L-glass rod. A volume of 20 µl
of either 1/100 or 1/200 essential oil dilution was loaded on each blank sterile disk of
6.5 mm diameter (Mast group Ltd, Merseyside, U.K.). The diameter of the area of
inhibition around the disk was measured in cm, after the Muller-Hinton Agar cultures
were incubated for 24 hours at 37°C.
b. Impact of DMSO Level on Antimicrobial Activity of Dispersed Essential Oil in Aqueous Medium
From the Staphylococcus aureus logarithmic standard curve equation (y = -
46.507x + 410.889) the inoculum count in the major seed stock of Staphylococcus
aureus culture was deduced as 2.3 x 10⁸ CFU/ml. For preparation of 1,000,000 CFU/ml,
43.48 µl of the stock containing S. aureus were suspended in 10 ml sterile saline.
The essential oil dilution used at variable levels of DMSO in water was 1/100
dilution. The different prepared dilutions of DMSO ranging from 1 to 5% with the
constant essential oil level were each loaded on blank sterile disks at a volume of 20
µl/disk and spread on Muller Hinton Agar plates that were already subjected to 0.1 ml-
spread of Staphylococcus aureus culture standardized at a suspension of 106 CFU/ml.
The same procedure was repeated again but with different levels of DMSO
ranging from 5 to 40%. From the Staphylococcus aureus logarithmic standard curve
equation (y = -46.507x + 410.889) the inoculum count in the major seed stock of
Staphylococcus aureus culture was deduced as 2.33 x 10⁸ CFU/ml. For preparation of
1,000,000 CFU/ml, 42.9 µl of the stock containing S. aureus were suspended in 10 ml
sterile saline.

51
c. Optimized Antimicrobial Activity of Essential Oil and DMSO Dilution against Different Staphylococcus aureus Densities
After determining the best location that resulted in Origanum ehrenbergii with
essential oil containing the highest antimicrobial activity and the proper DMSO level
(40%), different dilutions of Staphylococcus aureus were included in this following test.
From the Staphylococcus aureus logarithmic standard curve equation (y = -
46.507x + 410.889) the inoculum count in the major seed stock of Staphylococcus
aureus culture was deduced as 5.47 x 10⁷ CFU/ml. For preparation of 1,000 CFU/ml,
0.6 µl of the stock containing S. aureus were suspended in 33.3 ml sterile saline. For
preparation of 10,000 CFU/ml, 1.828 µl of the stock containing S. aureus were
suspended in 10 ml sterile saline. For preparation of 100,000 CFU/ml, 18.28 µl of the
stock containing S. aureus were suspended in 10 ml sterile saline. For preparation of
1,000,000 CFU/ml, 182.8 µl of the stock containing S. aureus were suspended in 10 ml
sterile saline.
The different levels of Staphylococcus aureus (103, 104, 105, and 106 CFU/ml)
were spread individually, using 0.1 ml inocula, on Muller Hinton Agar plates. Blank
disks loaded each with 20 µl of 1/100 essential oil in 40% DMSO in water were
overlaid the surface of the Muller Hinton Agar plates that were previously seeded with
different levels of Staphylococcus aureus.
4. Disinfection and Preparation of the Animal Rooms
Walls and floors of four animal rooms were cleaned, flushed with water and
disinfected by soaking overnight with 10% sodium hypochlorite. Samples for bacterial
count were collected from the walls and the floor of each room by rubbing a 25-cm2
area with sterile swabs previously soaked in Tryptose Phosphate Broth (Mast Group
52
Ltd, Merseyside, U.K). Each swab was struck for seeding onto Nutrient Agar and
McConkey Agar plates (Mast Group Ltd, Merseyside, U.K) and the plates were then
incubated for 24 hours at 37 oC. Disinfection was repeated until no colony forming units
were observed on both agar plates. Wood shavings were then spread over the floor of
each room to a depth of around 5 cm. Each animal room was supplemented with two
feeders of 60 cm length, one waterer of 35 cm diameter and one height-adjustable 250-
Watts infrared lamp.
5. Antimicrobial Effect of Origanum ehrenbergii Essential Oil on Rabbits Challenged Intradermally with Staphylococcus aureus
a. Experiment 1
On April 29 2004, twenty-one experimental rabbits were distributed equally in
4 groups. The objective of this experiment was to challenge intradermally the right ears
of the rabbits with Staphylococcus aureus followed by topical treatment with essential
oil for a period of three days. Each group was placed in a separate room; the
experimental design is presented in Table 1.
On April 30, May 1 and May 2 2004 (three consecutive days after the
challenge), the diameter of the inflammation area was measured on the left control ear
and the right ear (challenged ear) of each rabbit, twice a day.
b. Experiment 2
On May 10 2004, another approach was conducted with the same experimental
design; however, this time the aim was to assess the difference in bacterial counts
between the essential oil treated and the non-treated rabbit ears that have been
challenged with Staphylococcus aureus.
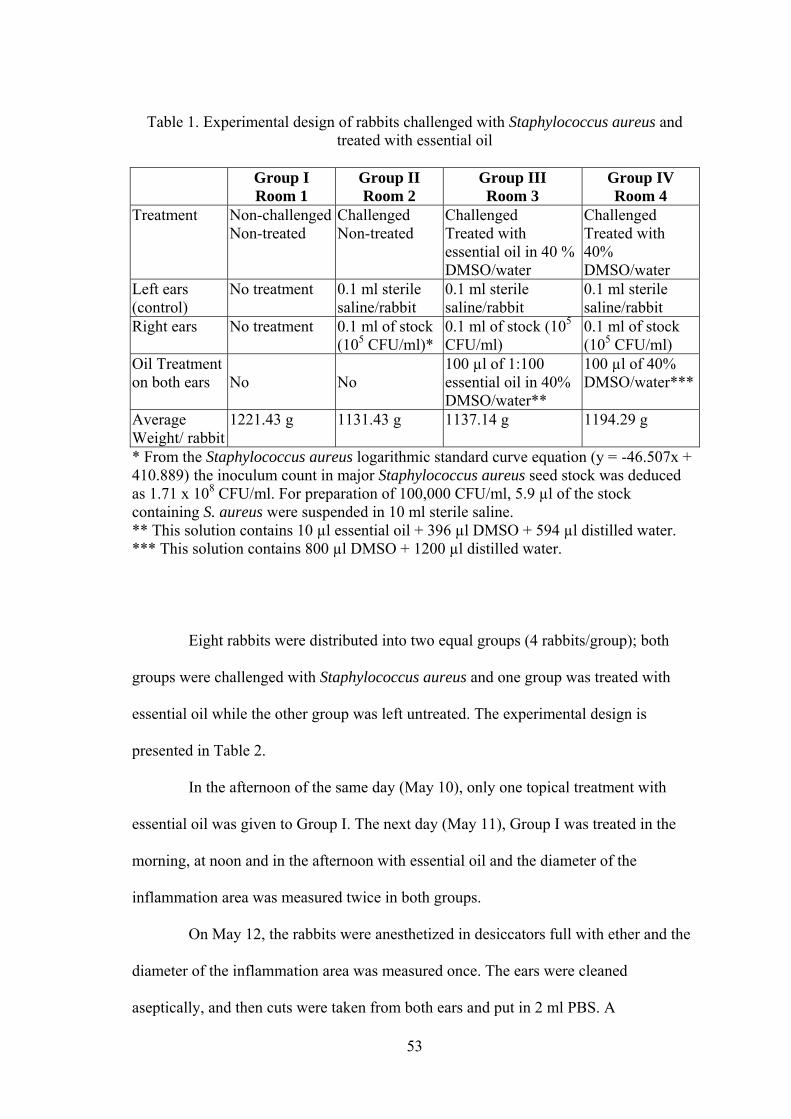
53
Table 1. Experimental design of rabbits challenged with Staphylococcus aureus and treated with essential oil
Group I
Room 1 Group II Room 2
Group III Room 3
Group IV Room 4
Treatment Non-challengedNon-treated
Challenged Non-treated
Challenged Treated with essential oil in 40 % DMSO/water
Challenged Treated with 40% DMSO/water
Left ears (control)
No treatment 0.1 ml sterile saline/rabbit
0.1 ml sterile saline/rabbit
0.1 ml sterile saline/rabbit
Right ears No treatment 0.1 ml of stock (105 CFU/ml)*
0.1 ml of stock (105 CFU/ml)
0.1 ml of stock (105 CFU/ml)
Oil Treatment on both ears
No
No
100 µl of 1:100 essential oil in 40% DMSO/water**
100 µl of 40% DMSO/water***
Average Weight/ rabbit
1221.43 g 1131.43 g 1137.14 g 1194.29 g
* From the Staphylococcus aureus logarithmic standard curve equation (y = -46.507x + 410.889) the inoculum count in major Staphylococcus aureus seed stock was deduced as 1.71 x 10⁸ CFU/ml. For preparation of 100,000 CFU/ml, 5.9 µl of the stock containing S. aureus were suspended in 10 ml sterile saline. ** This solution contains 10 µl essential oil + 396 µl DMSO + 594 µl distilled water. *** This solution contains 800 µl DMSO + 1200 µl distilled water.
Eight rabbits were distributed into two equal groups (4 rabbits/group); both
groups were challenged with Staphylococcus aureus and one group was treated with
essential oil while the other group was left untreated. The experimental design is
presented in Table 2.
In the afternoon of the same day (May 10), only one topical treatment with
essential oil was given to Group I. The next day (May 11), Group I was treated in the
morning, at noon and in the afternoon with essential oil and the diameter of the
inflammation area was measured twice in both groups.
On May 12, the rabbits were anesthetized in desiccators full with ether and the
diameter of the inflammation area was measured once. The ears were cleaned
aseptically, and then cuts were taken from both ears and put in 2 ml PBS. A

54
homogenate of the cut ear was ground with a tissue grinder and then serial dilutions
were made to tubes each containing 4.5 ml PBS to end up with dilutions of 1:1,
1:10,and 1:100. Finally, 0.1 ml of each dilution was streaked on MSA plates with a
sterile L-glass rod and incubated for 48 hours at 37ºC to get the bacterial count.
Table 2. Experimental design of rabbits challenged intradermally with Staphylococcus
aureus and treated with essential oil
Group I, Room 2 Group II, Room 3
Treatment Challenged Treated with essential oil
Challenged Non-treated
Left ears (control) 0.1 ml sterile saline/rabbit 0.1 ml sterile saline/rabbit
Right ears 0.1 ml of stock (105 CFU/ml)*
0.1 ml of stock (105 CFU/ml)
Oil Treatment 100 µl of 1:100 essential oil in 40% DMSO/water**
Average Weight/ rabbit 1625 g 1730 g * From the Staphylococcus aureus logarithmic standard curve equation (y = -46.507x + 410.889) the inoculum count in the major seed stock of Staphylococcus aureus was deduced as 1.02 x 10⁸ CFU/ml. For preparation of 100,000 CFU/ml, 9.8 µl of the stock containing S. aureus were suspended in 10 ml sterile saline. ** This solution contains 10 µl essential oil + 396 µl DMSO + 594 µl distilled water.
c. Experiment 3
In the previous experiments, the inflammation resulting from Staphylococcus
aureus challenge was weak and it was not lasting more than three days. Hence, an in
vivo passage helping in increasing the virulence of S. aureus was followed as detailed
below (Peters and Paterson 2003). Ten rabbits were divided into two equal groups and
challenged intradermally in the ear with the passaged S. aureus, and then one group was
treated with essential oil (Table 3). The objective of this experiment was to assess the

55
difference in the weight of the ear lesion and the bacterial count between the treated and
non-treated rabbits that were challenged with Staphylococcus aureus (Stock E).
Table 3. Experimental design of rabbits challenged with the Staphylococcus aureus
(Stock E) and treated with essential oil
Group I, Room 2 Group II, Room 3 Treatment Challenged
Treated with essential oil Challenged Non-treated
Left ears (control) 0.1 ml sterile saline/rabbit 0.1 ml sterile saline/rabbit Right ears 0.1 ml of stock E
equivalent to 3.45x10⁷ CFU/ml0.1 ml of stock E equivalent to 3.45 x10⁷ CFU/ml
Oil Treatment 100 µl of 1:100 essential oil in 40% DMSO/water*
No
Average Weight/ rabbit 1755 g 1690 g * This solution contains 10 µl essential oil + 396 µl DMSO + 594 µl distilled water.
Preparation of Staphylococcus aureus Challenge (Stock E)
• The Staphylococcus aureus strain was provided by the bacteriology lab of
the American University Hospital (AUH), Beirut, Lebanon and grown in a nutrient
broth (3-4 hours until reaching to the log phase).
• A 0.1 ml volume of Staphylococcus aureus was streaked for seeding on
Mannitol Salt Agar (HiMedia Laboratories, Limited, Mumbai, India) and incubated at
37°C for 24 hours (day 1).
• The incubated MSA was scraped aseptically using a sterile loop and
suspended in 1 ml sterile saline (Stock A), and then injected in one rabbit in its right ear
with 2 sites (0.1 ml/site) of Stock A (day 2). After 24 hours of injection, the rabbit was
anesthetized in desiccators full with ether; the ears were cut, homogenized in 2 ml
sterile saline to obtain Stock B (day 3).

56
• The passage was repeated for another two times to end up with Stock D.
• Seed the homogenate (Stock D) on 5 plates of MSA; incubate for 24 hours at
37ºC (day 5).
• Scrape all cells with a sterile scalpel and reconstitute in 2 ml saline
aseptically to obtain Stock E (day 6).
• From the Staphylococcus aureus logarithmic standard curve equation (y = -
46.507x + 410.889) the inoculum count of stock E was deduced as 3.45 x 10⁸ CFU/ml.
In the noon and the afternoon of the same day, two topical treatments with
essential oil were given to Group I. The next day, the rabbits were anesthetized in
desiccators full with ether, the ears were cleaned aseptically then an equal area of the
inflamed tissue of the ears were cut and put in empty sterile plates of known weight.
The plates were weighed after the cuts were put in them. After that, each cut was put in
2 ml PBS and weighed again. The PBS solution was ground with a tissue grinder, and
then counting was done by dilution of the PBS up to 10-6 on MSA, using a 1:10 dilution
factor (Cork and Halliwel 2002). Finally, 0.1 ml of each dilution was streaked on MSA
plates with a sterile L-glass rod and incubated for 48 hours at 37ºC to get the bacterial
count per gram of the ear weight.
6. Statistical Analysis
Analysis of variance of the rabbits’ ear weights and bacterial counts were
carried out by the One Way Analysis of Variance (ANOVA-1) using the MSTAT
software (MSTATC 1991). Means were then separated by Duncan’s Multiple Range
Test (α = 0.05).
57
B. Experiment 2: Serological Profiling and Molecular Detection of Viral Protective Polypeptides by Sera of Sentinel Free-Range Layers
1. Serological Profiling On Sentinel Free-Range Chicken Layers Uncovering
Prevalent Pathogen Exposure a. Farm Surveillance and History
Serological profiling is a technology that is followed in many countries of the
world to detect exposure of unvaccinated sentinel birds to field strains of devastating
diseases. A representative sample consisting of 10 out of 35 free-range chicken layer
farms in Jezzine area were included in this study.
The 10 farms were in the following districts of Jezzine area:
• 2 farms from the north.
• 2 farms from the south.
• 2 farms from the west.
• 2 farms from the east.
• 2 farms from the mid-region.
On August 5, 8, and 12, screening of the ten representative farms was done.
From each of the selected farms, ten blood samples were drawn randomly from ten
individual chickens (5% of the total number of birds per farm). Serum was extracted
from the blood samples and serological analyses were conducted using the ELISA
method and Hemagglutination-Inhibition (HI) for an indirect assessment of exposure to
pathogens of economical reproductive diseases (IBV, NDV, EDS, and MG) and to other
immunosuppressive and neoplastic pathogens namely, IBDV and ALV. Data from each
of the chosen farms was recorded (Table 4).
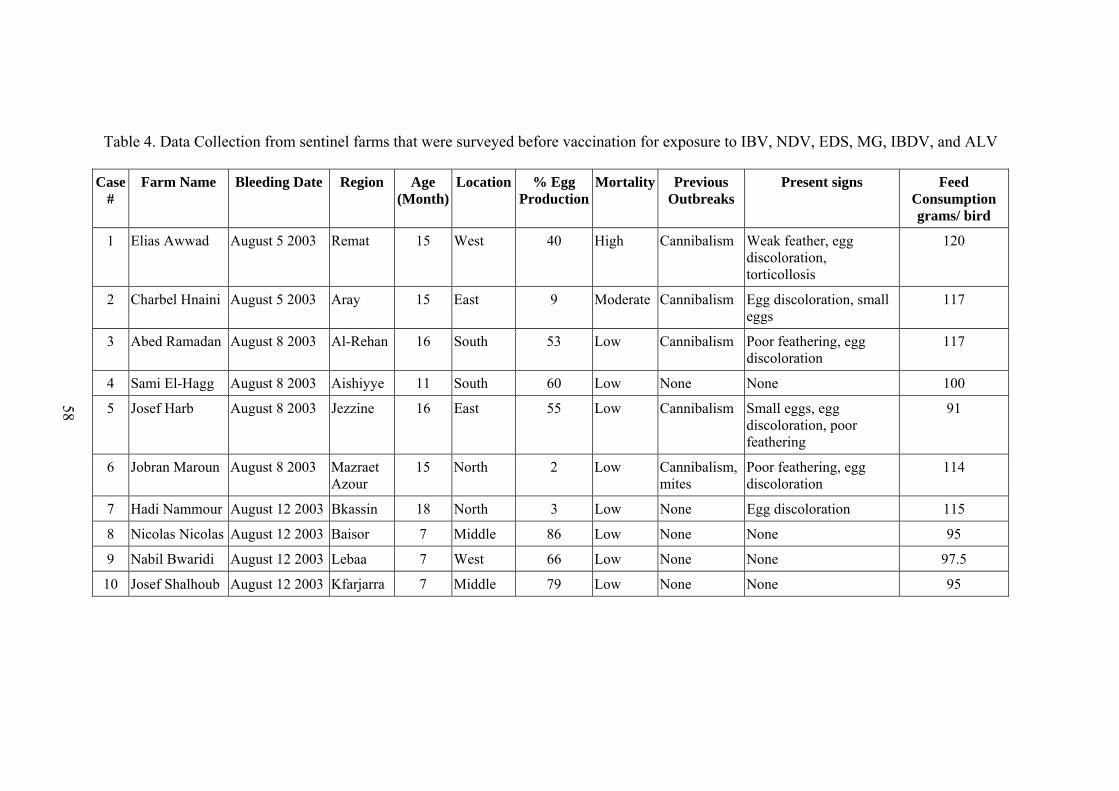
Table 4. Data Collection from sentinel farms that were surveyed before vaccination for exposure to IBV, NDV, EDS, MG, IBDV, and ALV Case
# Farm Name Bleeding Date Region Age
(Month)Location % Egg
ProductionMortality Previous
Outbreaks Present signs Feed
Consumption grams/ bird
1 Elias Awwad August 5 2003 Remat 15 West 40 High Cannibalism Weak feather, egg discoloration, torticollosis
120
2 Charbel Hnaini August 5 2003 Aray 15 East 9 Moderate Cannibalism Egg discoloration, small eggs
117
3 Abed Ramadan August 8 2003 Al-Rehan 16 South 53 Low Cannibalism Poor feathering, egg discoloration
117
4 Sami El-Hagg August 8 2003 Aishiyye 11 South 60 Low None None 100
5 Josef Harb August 8 2003 Jezzine 16 East 55 Low Cannibalism Small eggs, egg discoloration, poor feathering
91
6 Jobran Maroun August 8 2003 Mazraet Azour
15 North 2 Low Cannibalism, mites
Poor feathering, egg discoloration
114
7 Hadi Nammour August 12 2003 Bkassin 18 North 3 Low None Egg discoloration 115
8 Nicolas Nicolas August 12 2003 Baisor 7 Middle 86 Low None None 95
9 Nabil Bwaridi August 12 2003 Lebaa 7 West 66 Low None None 97.5
10 Josef Shalhoub August 12 2003 Kfarjarra 7 Middle 79 Low None None 95
58
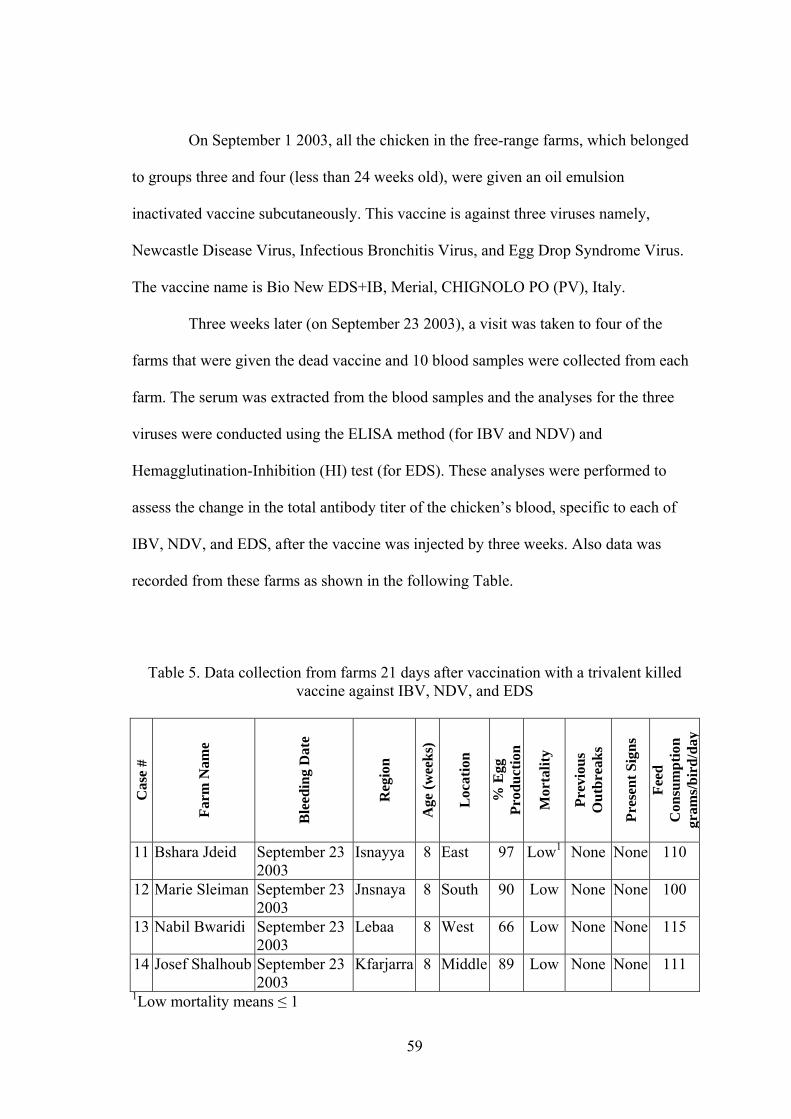
59
On September 1 2003, all the chicken in the free-range farms, which belonged
to groups three and four (less than 24 weeks old), were given an oil emulsion
inactivated vaccine subcutaneously. This vaccine is against three viruses namely,
Newcastle Disease Virus, Infectious Bronchitis Virus, and Egg Drop Syndrome Virus.
The vaccine name is Bio New EDS+IB, Merial, CHIGNOLO PO (PV), Italy.
Three weeks later (on September 23 2003), a visit was taken to four of the
farms that were given the dead vaccine and 10 blood samples were collected from each
farm. The serum was extracted from the blood samples and the analyses for the three
viruses were conducted using the ELISA method (for IBV and NDV) and
Hemagglutination-Inhibition (HI) test (for EDS). These analyses were performed to
assess the change in the total antibody titer of the chicken’s blood, specific to each of
IBV, NDV, and EDS, after the vaccine was injected by three weeks. Also data was
recorded from these farms as shown in the following Table.
Table 5. Data collection from farms 21 days after vaccination with a trivalent killed
vaccine against IBV, NDV, and EDS
Cas
e #
Farm
Nam
e
Ble
edin
g D
ate
Reg
ion
Age
(wee
ks)
Loc
atio
n
% E
gg
Prod
uctio
n
Mor
talit
y
Prev
ious
O
utbr
eaks
Pres
ent S
igns
Feed
C
onsu
mpt
ion
gram
s/bi
rd/d
ay
11 Bshara Jdeid September 23 2003
Isnayya 8 East 97 Low1 None None 110
12 Marie Sleiman September 23 2003
Jnsnaya 8 South 90 Low None None 100
13 Nabil Bwaridi September 23 2003
Lebaa 8 West 66 Low None None 115
14 Josef Shalhoub September 23 2003
Kfarjarra 8 Middle 89 Low None None 111
1Low mortality means ≤ 1

60
b. Serum Collection
Ten individual blood samples were collected from the brachial vein of
individual birds on each farm, containing a flock size of 200 free-range layers. The
samples were centrifuged at 720 xg (International Equipment Company, Needham
Heights, Mass., USA) for 10 minutes and the sera were collected and kept frozen at -
20ºC for later serological analysis.
c. Serology for Disease Diagnosis
• Hemagglutination-Inhibition (HI) for screening of chicken exposure to EDS
The Hemagglutination-inhibition (HI) test was used to detect the antibody titers
in sera specific to Egg Drop Syndrome (EDS) virus (Thayer and Beard 1998). The EDS
virus used in this test had a 4 HA strength; the antigen was prepared by Charles River
SPAFAS Laboratory products, Connecticut, USA; the chicken RBC suspension was set
at 0.5%.
The Hemagglutination-Inhibition (HI) test is a quantitative test; it measures the
level of antibodies in chicken serum that are specific to the hemagglutinin protein
present in the virus. In the HI test, the adsorption or agglutination between
hemagglutinin protein of the antigen and chicken red blood cells (RBC) is inhibited by
the binding between hemagglutinin of the antigen and its specific antibody present in
serum, thus allowing the RBCs used as an indicator in the test to settle down. The HI
test consists of many steps:
Reagent preparation
- Preparation of Saline
8.5 g NaCl were dissolved in 1000 ml distilled water (0.85% saline
solution).
61
- Preparation of 25 % RBC suspension
A syringe of 10 ml capacity and a needle of 20-gauge size were used
to draw whole blood from a commercial chicken layer. Four ml of Alsever’s
solution were put in the syringe before drawing about 2-3 ml of the blood from
the brachial vein. This solution is an anticoagulant (2 % dextrose, 0.8 %
sodium citrate, 0.44 % sodium chloride and 0.05 % citric acid; pH = 6.1). The
blood was then put in centrifuge tubes and spun for about ten minutes at 405 xg
using centrifugation (Eppendorf AG 22331, Hamburg, Germany). After the
first spinning, the supernatant (plasma + buffy coat) was discarded. The saline
was added to the RBC at equal volume, mixed gently, centrifuged, and the
supernatant was discarded again. This washing was repeated for another two
times. At the end of the third washing, saline was added to the RBC resulting
in a 25 % RBC stock suspension, which was kept in the refrigerator for not
more than 4 days (the volume of the saline in the 25 % RBC suspension was
three times that of the packed erythrocytes).
- The 0.5 % RBC suspension was prepared from the 25 % stock just
before each test.
- Antigens preparation:
A four Hemagglutinating (HA) units of the Egg Drop Syndrome virus
was prepared by performing HA test (Fenner et al. 1987) using serial dilutions
of the antigen stock with a dilution factor of ½, and with RBC suspension of
0.5 %.
HI Test Procedure
- Twenty five µl of saline were delivered per well of a microtitration
plate (96 wells, U bottoms) using 12 tip multichannel pipette (Digital

62
Multichannel, Finnpipette, Helsinki, Finland).
- Twenty five µl of the chicken serum per well were put in column
number one.
- Dilution of the serum was performed from column 1 to column 12,
using the same multichannel pipette, with a carried volume of 25 µl from one
well to the other. The last 25 µl were then discarded (the dilution factor is 1:2).
- Twenty five µl of the 4 HA antigen for Egg Drop Syndrome was
added in each well and the plates were rotated gently in a circular manner for
about one minute, then incubated at 37ºC for about 30 minutes.
- Fifty µl of 0.5 % RBC suspension were then added to each well.
The plates were also shaken in a circular way for about one minute.
- The plates were left at room temperature for 45 minutes.
- The antibody titer of each serum sample was read, using a special
microplate reading mirror (Titertek, Microtitration equipment, Flow
Laboratories); the titer is defined as the highest dilution of the serum that had
enough antibodies to inhibit the agglutination between the agglutinin antigen of
the virus and the receptors of agglutinin on the RBC.
• ELISA for screening of chicken exposure to IBV, NDV, MG, ALV, and
IBDV
Commercial ELISA systems designed by ProFLOCK® Synbiotic Corporation,
San Diego, USA, were made to quantitate the relative levels of antibodies in chicken
serum that are specific to IBV, NDV, MG, ALV, and IBDV.
ELISA for IBV
The ProFLOCK® IBV ELISA Kit, San Diego, USA, is a rapid serologic test for
the detection of IBV antibody in chicken serum samples (Indirect ELISA). It was
63
developed primarily to aid in the detection of pre and post-vaccination IBV antibody
levels in chickens, and for studying the indirect effect to field exposure in chickens by
serological profiling.
The assay is designed to measure IBV antibody bound to IBV antigen coated
plates. The principle of the test is as follows: Serum obtained from chickens exposed to
IBV antigens contains specific anti-IBV antibodies. Serum, diluted in Dilution Buffer,
is added to an IBV antigen coated plate. Specific IBV antibody in the serum forms an
antibody-antigen complex with the IBV antigen bound to the plate. After washing the
plate, an affinity purified goat anti-chicken IgG (H+L) peroxidase conjugate is added to
each well. The antibody-antigen complex remaining from the previous step binds with
the conjugate. After a brief incubation period, the unbound conjugate is removed by a
second wash step. Substrate, which contains a chromagen (ABTS), is added to each
well. Chromagen color change (from clear to green-blue) occurs in the presence of
peroxidase enzyme. The relative intensity of color developed in 15 minutes (compared
to controls) is directly proportional to the level of IBV antibody in the serum. After the
substrate was incubated, Stop Solution is added to each well to terminate the reaction
and the plate is read using an ELISA plate reader at 405-410 nm.
Sample Collection
Blood samples were collected from poultry farms in Jezzine; serum was
extracted from the blood samples and stored (4ºC for up to four days or at -20ºC for
longer periods). This is needed to provide reliable test results.
Sample Dilution Procedure
Dilute serum samples using Dilution Buffer in a clean, uncoated 96 well
microtiter plate. This plate has 12 columns labeled with Arabic numbers, and 8 rows
labeled alphabetically from A to H.
64
Preparation of the Serum Dilution Plate
- Add 300µl Dilution Buffer to each well of an uncoated 96 well
microtiter plate. This plate is referred to as the serum dilution plate.
- Add 6µl unknown serum per well (producing a 1:50 dilution). Start
with well A4 and end with well H9 (moving left to right, row by row of wells).
It is worth noting that wells A1, A3, and H11 are reserved for positive control
serum, while wells A2, H10, and H12 are reserved for the negative control
serum.
Preparation of IBV positive control
An IBV Positive Control Serum has been provided with this kit. Dilute the
appropriate volume of IBV Positive Control Serum with Dilution Buffer (1:50) in a
tube, mix well. 150µl of diluted IBV Positive Control are needed per ELISA plate.
Preparation of Conjugate Solution
The horseradish peroxidase conjugated anti-chicken IgG (H+L) is supplied in
HRP stabilizer. Dilute 100µl stock conjugate in 10ml Dilution Buffer, mix well. This
10ml preparation will supply sufficient conjugate for one 96 well ELISA plate.
Preparation of Wash Solution
Dilute 20ml concentrated Wash Solution in 380ml distilled water (1:20), mix
well. This 400ml preparation is needed for one 96 well ELISA plate.
Preparation of Substrate Solution
The Substrate Solution is ready to use.
Preparation of Stop Solution
Dilute 2.5ml concentrated Stop Solution in 10ml distilled water (1:5), mix well.
This 12.5ml preparation is needed for one 96 well ELISA plate.
ELISA Test Procedure
65
Preparing the Test Plate
- Remove an IBV antigen coated test plate from the protective bag
and label according to dilution plate identification.
- Add 50µl Dilution Buffer to all wells on the test plate.
- Add 50µl diluted IBV Positive Control Serum to wells A1, A3 and
H11.
- Add 50µl diluted IBV Negative Control Serum to wells A2, H10
and H12.
- Using a 12 channel pipette transfer 50µl/well of each of the diluted
serum samples from the dilution plate to the corresponding wells of the IBV
coated test plate.
- Incubate plate for 30 minutes at room temperature.
Wash Procedure
- Tap out liquid from each well into an appropriate vessel containing
bleach or other decontamination agent.
- Using a 12 channel pipette, fill each well with 300µl wash solution.
Allow soaking in wells for three minutes, and then discarding contents. Repeat
wash procedure two more times.
Addition of Anti-Chicken IgG Peroxidase Conjugate, Substrate and Stop
Solution
- Using a 12-channel pipette, dispense 100µl diluted conjugate into
each assay well.
- Incubate for 30 minutes at room temperature.
- WASH as in steps a and b.
- Add 100µl Substrate Solution into each test well.

66
- Incubate 15 minutes at room temperature.
- Add 100µl diluted Stop Solution to each test well.
- Allow bubbles to dissipate before reading the plate.
- Read the plate using an ELISA plate reader set at 405 nm.
The ELISA plate reader determined the optical density (O.D.) of the serum
samples, and then those values were introduced to a software program (SYNBIOTICS
corporation). This program converts the optical densities into titers based on installed
regression equation correlating the O.D. values to titers.
ELISA for NDV, MG, and IBDV has the same procedure as that to IBV.
However, each kit is coated with the antigen specific to the virus, and each has a
different installed regression equation in the used software.
ELISA for ALV differs from the previous ones. The difference is that there is
no need for the dilution plate; hence the serum samples are put directly in the wells of
the ALV ELISA kit. It is worth noting that the ALV is a direct ELISA and not indirect,
like the previous ones, thus detecting the presence of the Retrovirus in the serum. More
specifically, the wells are coated with antibodies specific to capture the protein (p27)
present on the ALV.
d. Serology for Vaccine Evaluation
• HI for convalescent evaluation of EDS titers
Serum samples collected three weeks after administering the trivalent vaccine
and those collected at vaccination were again assessed for their antibody response to the
EDS antigens by the HI test. The HI test procedure was conducted as mentioned earlier
under Materials and Methods.
• ELISA for convalescent evaluation of IBV and NDV titers

67
Serum samples collected three weeks after administering the trivalent vaccine
and those collected at vaccination were assessed also for their antibody level specific to
IBV and NDV antigens by the indirect ELISA method. The ELISA test procedures used
are the same as the ones used earlier for IBV and NDV, respectively.
e. Statistical Analysis
Analysis of variance of outbreak titers (among regions) was carried out using
SPSS version 10. The experimental layout was Complete Randomized Design. Means
were then separated by Duncan’s Multiple Range test (α = 0.05).
Analysis of variance of vaccine titers (at vaccination and 3 weeks after
vaccination) was carried out by the One Way Analysis of Variance (ANOVA-1) using
the SPSS version 10.
2. Separation and Identification of the Protective Polypeptides of IBV and NDV
a. Separation of the Virus-Aqueous Portion from Oil Emulsion Vaccine
• A volume of 20 ml of the trivalent oil emulsion vaccine (NDV+IBV+EDS)
is added over 20 ml of acetone.
• Vortex (Vortex Mixer, Industries Inc. Bohem, N.Y., USA) for 1 minute.
• Centrifuge at a speed of 15557 xg for 15 minutes.
• Remove all the above liquid layers and keep the pellets in the tube bottom.
• Add 1 ml saline over the pellets to reconstitute.
• Vortex for 1 minute.
• Centrifuge at a speed of 15557 xg for 15 minutes.
• The reconstituted volume was distributed over 3 Eppendorf tubes.
• Centrifuge at a speed of 3645 xg for 15 minutes.

68
• Remove the upper turbid layer and discard it.
• Collect the lower clear layer that contains the antigens (virus stock).
• The samples (virus stock) were pooled and collected in one tube.
b. Sodium Dodecyl Sulfate- Polyacrylamide Gel Electrophoresis (SDS-PAGE) for Detecting Protein Bands Present In the Viral Vaccine Antigens
• Preparation of 12% separating gel
- An amount of 3.35 ml of distilled water is mixed with 2.5 ml of
1.5M Tris-HCl, 100µl of 10% sodium dodecyl sulfate (SDS), 4 ml of
acrylamide/Bis, 50µl of 10% ammonium persulfate and 5µl of TEMED
(N,N,N,N’-Tetra-Methyl Ethylene Diamine) (BioRad Lab. 2000 Alfred
NobelDr., Hercules, CA, USA).
- The 12% separating gel was added using a pipette in between the
assembled glass plate sandwiches of the Mini-PROTEAN II Electrophoresis
cell (BioRad Lab. 2000 Alfred Nobel Dr., Hercules, CA, USA) that can run
two gels at the same time. Distilled water is added at the end to straighten the
gel surface. The gel is allowed to polymerize for one hour then the water is
removed from above by using filter paper.
• Preparation of 4% stacking gel
- A volume of 6.1 ml of distilled water is mixed with 2.5 ml of 0.5M
Tris-HCl, 100µl of 10% SDS, 1.33 ml of acrylamide/Bis, 50µl of ammonium
persulfate and 10µl of TEMED. Stacking gel is added in the area above the
separating gel after placing a comb in the gel sandwich. The stacking gel is
allowed to polymerize for one hour. The gel is ready, after removing the comb,
for sample loading and electrophoresis.
69
• Protein Assay
- Six dilutions of Bovine Serum Albumin in saline were made for the
preparation of a standard curve. The dilutions were 0.5, 1, 1.5, 2, 2.5 and 3
mg/ml. An individual volume of 5µl of standards or samples were pipetted in a
clean, dry microtiter plate into a well containing 25µl of reagent A and 20µl of
reagent B (BioRad Lab. 2000 Alfred Nobel Dr., Hercules, CA, USA). The
plate is then placed in a microplate reader and mixed for 5 seconds and
absorbance is read after 15 minutes using a wavelength of 640 nm. A standard
curve equation was established allowing the determination of the protein
concentration in the viral stock namely, a concentration of 1.8 mg/ml was
obtained using the Excel program (Microsoft 1997).
• Gel Electrophoresis
- All the samples were diluted 1:2 in the SDS reducing sample buffer
(25µl of β-mercaptoethanol and 475µl of stock sample buffer that was prepared
by mixing 4.8 ml of distilled water, 1.2 ml of 0.5M Tris-HCl, 1 ml glycerol, 2
ml of 10% SDS and 0.5 ml of 0.1% Bromophenol blue). They were heated at
95 oC for 5 minutes and 20µl of each of the reduced samples and 5µl of a broad
range molecular weight marker (BioRad Lab. 2000 Alfred Nobel Dr., Hercules,
CA, USA) ranging from 6.5 to 200 KDa were loaded on the stacking gels
leaving a free lane in between.
- After the running buffer was added (the running buffer contains an
amount of 15 grams of Tris base dissolved with 72 grams of glycine and 5
grams of SDS in 1 L of distilled water, the pH of the buffer was adjusted to 8.3
using 6 N HCl), the gel was run at 200 V and 120 mA for about 45 minutes or
until all the marker bands are separated. Gels were kept at 4 oC in distilled
70
water or in transfer buffer to be used later on in Western Immunoblotting.
- In case you don’t want to progress to Western Immunoblotting, the
gel could be stained with 0.1% Coomassie blue {an amount of 0.5 grams of
Coomassie Blue R-250 powder (Bio-Rad Lab. 2000 Alfred Noble Dr.
Hercules, CA, USA) was mixed with 200 ml of methanol (E. Merck,
Darmstadt, Germany) and 50 ml of glacial acetic acid (Mallinckrodt Chemical
Works, St. Louis, MO, USA) in 250 ml distilled water} with continuous
shaking and then distained with a distainer solution (an amount of 400 ml of
methanol and 100 ml of glacial acetic acid was mixed with 500 ml of distilled
water) to remove the background (Barbour et al. 1989).
c. Western Immunoblotting for Detection of Specific Antibodies to Vaccine Antigens of IBV and NDV
The serum samples from each of two farms, before and after vaccination, were
pooled separately. From each farm, 100 µl of each of ten individual serum samples were
added to 1ml glycerol to form a total volume of 2 ml, hence a ratio of 1:1.
Nitrocellulose membrane (NCM), two pieces of blotting filter and two scotch-
brite scouring pads were soaked in transfer buffer (an amount of 6.06 grams of Tris-
base and 28.8 grams of glycine were added to 400 ml of methanol and made to 2000 ml
with distilled water, no acid or base was added and the pH was 8.4, the solution was
stored at 4ºC), before sandwiching, for 30 minutes. The gel and the NCM were
sandwiched between the two pieces of prewetted blotting filter, which were sandwiched
between two prewetted scotch-brite scouring pads. The sandwich was placed in a
hinged holder and immersed in transfer buffer contained in the transblot cell (BioRad
Lab. 2000 Alfred Nobel Dr., Hercules, CA, USA). The electrophoretic transfer time was

71
one hour at 100 V and 25 mA.
The NCM containing the peptides transferred from SDS-PAGE gel were
immersed in Ponceau stain {an amount of 0.5 grams of Ponceau S Stain (Sigma, St.
Louis, MO, USA) was mixed with 7.5 grams of trichloroacetic acid and 7.5 grams of
sulfosalicylic acid in 250 ml distilled water} for 5 minutes with continuous shaking at
60 rpm. The NCM was then rinsed with distilled water for 2-3 times to resolve the
transferred polypeptides. The molecular weight marker was cut and preserved at 4 oC in
distilled water. The NCM were immersed in Tris-Buffer Saline (TBS) for 10 minutes
shake at 60 rpm (TBS was prepared by dissolving 19.38g of Tris-base and 233.8g of
NaCl in 4 liters of distilled water, pH was then adjusted to 7.5 using 6N HCl). Blocking
of the active sites was done by immersing the NCM in 5% gelatin-TBS for one hour at
37oC in a water bath with continuous shaking. The NCM was washed twice with TTBS
(TTBS was prepared by mixing one liter of TBS with 0.5 ml of Tween-20) for 5
minutes shake per each wash.
SPAFAS IBV Mass, IBV Ark, NDV positive control sera and negative control
sera (Charles River SPAFAS Laboratory products, USA) were diluted with 1% gelatin
in Tris-Tween-Buffer Saline (TTBS) to 1:100. On the other hand, pooled serum samples
from each of the two farms, before and after vaccination, were also diluted with 1%
gelatin-TTBS to 1:100. The NCM lanes were cut carefully, so that each lane containing
peptides of IBV and NDV will be reacted separately with specific positive control sera,
negative control sera, and pooled sera collected before and after vaccination to allow
judgment on the presence of specific antibodies to protective antigens of IBV and NDV.
These reactions take place after incubating the cut NCM lanes containing the antigens
with their specific control and pooled sera for two hours at 37oC in a water bath with
continuous shaking. Unbound antibodies were removed by washing the NCM twice
72
with TTBS for 5 minutes shake per wash. A conjugate of anti-chicken IgG (H+L)
chains made in goats and labeled with peroxidase enzyme (Sigma, St. Louis, USA) was
diluted to 1:1000 in 1% gelatin-TTBS and was added to the NCM and incubated at 37oC
in a water bath with continuous shaking for 30 minutes.
The NCM were washed twice with TTBS for a 5 minutes shake per wash.
NCM were further washed twice in TBS for 5 minutes shake per wash then dried over a
filter paper. A 3,3’-Diaminobenzidine (DAB) Peroxidase Substrate Solution (Sigma, St.
Louis, USA) was added to the NCM for 30 minutes at 37oC in a water bath with
continuous shaking to obtain bands of brown color. NCM were then rinsed with
distilled water 2-3 times and dried over a filter paper then photographed with GelDoc
2000 System (BioRad Lab. 2000 Alfred Nobel Dr., Hercules, CA, USA).
d. Western Immunoblotting for Reacting Antigens of ND Clone Vaccine with NDV Sera
For further molecular detection of antibody response to ND polypeptides, an
ND clone vaccine (Nobilis R , product of Intervet International B.V., Boxmeer- Holland)
was prepared for reaction against the NDV positive and negative antisera and the farm
serum samples.
This vaccine was suspended in 2 ml distilled water then distributed over
aliquots and stored in the freezer. The Protein Assay using Bio-Rad reagents determined
the protein concentration. The protein level in the ND clone sample was 36.8 mg/ml.
The same procedure of SDS-PAGE followed by Western Immunoblotting was
conducted on the ND clone vaccine where the samples were diluted 1:2 in the SDS
reducing sample buffer.
After blocking the active sites on the NCM, the NCM lanes containing the

73
NDV peptides were cut and reacted separately with the NDV positive and negative
control sera and the pooled serum samples (before and after vaccination). However, the
molecular weight standards included in this test were the Kaleidoscope Prestained
Standards (BioRad Lab. 2000 Alfred Nobel Dr., Hercules, CA, USA) ranging from 6.5
to 200 KDa.
e. Western Immunoblotting for Reacting Antigens of IB H120 & IB 4-91 Vaccines with IBV Sera
Both IB H120 and IB 4-91 (Nobilis R , product of Intervet International B.V.,
Boxmeer- Holland) were further used to detect the antibody response to IBV by reacting
these two vaccines with the IBV positive and negative control sera and the pooled farm
serum samples.
Both vaccines were suspended each in 2 ml distilled water then distributed over
aliquots and stored in the freezer. The Protein Assay using Bio-Rad reagents determined
the protein concentration. The protein levels were 20.35 and 20.1 mg/ml for IB H120
and IB 4-91 respectively.
The same procedure of SDS-PAGE followed by Western Immunoblotting was
conducted on both vaccines where the samples were diluted 1:2 in the SDS reducing
sample buffer.
After blocking the active sites on the NCM, the NCM lanes containing the IBV
peptides were cut and reacted separately with the IBV positive and negative control sera
and the pooled serum samples (before and after vaccination). The molecular weight
standards included in this test were the Kaleidoscope Prestained Standards (BioRad
Lab. 2000 Alfred Nobel Dr., Hercules, CA, USA) ranging from 6.5 to 200 KDa.

74
f. Quantitating the Antibodies Reacting to Protective Polypeptides
The antibodies specific to IBV and NDV formed as bands on the NCM were
quantitatively measured by reading the optical densities of the bands formed, before and
after vaccination, using a computerized program known as Quantity One 1-D Analysis
Software (BioRad Lab. 2000 Alfred Nobel Dr., Hercules, CA, USA).
The procedure works by selecting a random area equivalent to 5 mm2 of a
specific polypeptide and then dragging this same area to the other polypeptide that
needs to be compared. The program will measure the optical density with respect to the
chosen area (OD/mm2) and will calculate the mean optical density (OD). In order for us
to obtain statistical analysis of the quantitative immune responses to each polypeptide,
three random areas were selected from each polypeptide formed after reacting pooled
sera (N=10) of layers from farms before vaccination and were compared to other equal
and random three areas of the same polypeptide of farms after vaccination.
The One Way Analysis of Variance (ANOVA-1) using the SPSS version 10
carried out analysis of variance of the quantitative immune responses (before and after
vaccination).
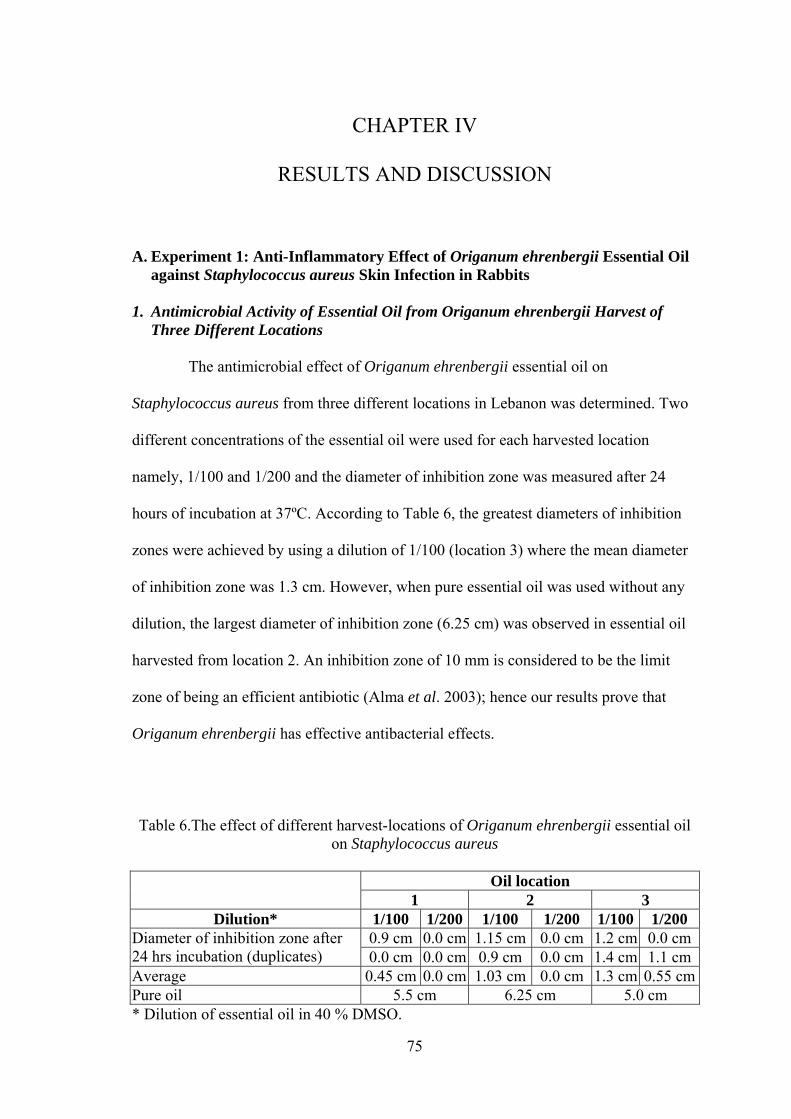
75
CHAPTER IV
RESULTS AND DISCUSSION
A. Experiment 1: Anti-Inflammatory Effect of Origanum ehrenbergii Essential Oil against Staphylococcus aureus Skin Infection in Rabbits
1. Antimicrobial Activity of Essential Oil from Origanum ehrenbergii Harvest of
Three Different Locations The antimicrobial effect of Origanum ehrenbergii essential oil on
Staphylococcus aureus from three different locations in Lebanon was determined. Two
different concentrations of the essential oil were used for each harvested location
namely, 1/100 and 1/200 and the diameter of inhibition zone was measured after 24
hours of incubation at 37ºC. According to Table 6, the greatest diameters of inhibition
zones were achieved by using a dilution of 1/100 (location 3) where the mean diameter
of inhibition zone was 1.3 cm. However, when pure essential oil was used without any
dilution, the largest diameter of inhibition zone (6.25 cm) was observed in essential oil
harvested from location 2. An inhibition zone of 10 mm is considered to be the limit
zone of being an efficient antibiotic (Alma et al. 2003); hence our results prove that
Origanum ehrenbergii has effective antibacterial effects.
Table 6.The effect of different harvest-locations of Origanum ehrenbergii essential oil
on Staphylococcus aureus
Oil location 1 2 3
Dilution* 1/100 1/200 1/100 1/200 1/100 1/200 0.9 cm 0.0 cm 1.15 cm 0.0 cm 1.2 cm 0.0 cmDiameter of inhibition zone after
24 hrs incubation (duplicates) 0.0 cm 0.0 cm 0.9 cm 0.0 cm 1.4 cm 1.1 cmAverage 0.45 cm 0.0 cm 1.03 cm 0.0 cm 1.3 cm 0.55 cmPure oil 5.5 cm 6.25 cm 5.0 cm * Dilution of essential oil in 40 % DMSO.

76
Since our interest in this study is to assess the effect of essential oil
incorporated with DMSO and water (40 %), then we selected oil harvested from
location 3 with a dilution of 1/100.
2. Impact of DMSO Level on Antimicrobial Activity of Dispersed Essential Oil in Aqueous Medium
In order to determine the optimum level of DMSO that must be incorporated
with the essential oil, several levels of DMSO dilutions were to be tested. Table 7 shows
the DMSO levels ranging from 1 to 5 % while the essential oil concentration was
constant at 1 %. The greatest diameters of inhibition zones (average = 0.6 cm) after 24
hours incubation at 37ºC were achieved by using a dilution of 1/100 essential oil in 5 %
DMSO in water. Table 8 shows the DMSO levels ranging from 5 to 40 % while the
essential oil concentration was constant at 1 %. The greatest diameters of inhibition
zones (average = 0.95 cm) after 24 hours incubation at 37ºC were achieved by using a
dilution of 1/100 essential oil in 40 % DMSO in water.
In a study conducted by Nakamura et al. (1999), they tested the activity of
Ocinum gratissimum essential oil in inhibiting Staphylococcus aureus in vitro. They
incorporated the essential oil with DMSO at two levels (24 and 48 %) and the results
showed better antimicrobial activity for the essential oil diluted in 48 % DMSO by
forming a diameter of inhibition zone of 21 mm. Our results are almost in agreement
with those of Nakamura et al. (1999) with a slight difference in DMSO levels and a
variation in inhibition zones probably because of the difference in species between the
two essential oils, and possibly due to difference in Staphylococcus aureus strains used
in both studies.

77
Table 7. In-vitro analysis of Origanum ehrenbergii essential oil dispersed in different percentages of DMSO in water, and their effect on inhibiting Staphylococcus aureus
growth
DMSO level Components 1% 2% 3% 4% 5%
Essential Oil* 1µl 1µl 1µl 1µl 1µl DMSO 1µl 2µl 3µl 4µl 5µl D.W. 98µl 97µl 96µl 95µl 94µl
0.8 cm 0.8 cm 0.8 cm 0.8 cm 0.8 cm Diameter of inhibition zone after 24 hours incubation (duplicates) 0.0 cm 0.0 cm 0.0 cm 0.0 cm 0.4 cmAverage 0.4 cm 0.4 cm 0.4 cm 0.4 cm 0.6 cm* The essential oil used here is from location 3 which previously gave the best results among the three locations by the Kirby-Bauer method (Table 6).
Table 8. In-vitro Analysis of Origanum ehrenbergii essential oil dispersed in different percentages of DMSO in water, and their effect on inhibiting Staphylococcus aureus
growth
DMSO level Components 5% 10% 20% 30% 40%
Essential Oil* 5µl 5µl 5µl 5µl 5µl DMSO 25µl 50µl 99µl 149µl 198µl D.W. 470µl 445µl 396µl 346µl 297µl
0.9 cm 0.8 cm 0.9 cm 0.9 cm 0.9 cm Diameter of inhibition zone after 24 hours incubation (duplicates) 0.9 cm 0.8 cm 0.9 cm 0.0 cm 1.0 cm Average 0.9 cm 0.8 cm 0.9 cm 0.45 cm 0.95 cmPure Oil 3.7 cm * The essential oil used here is from location 3 which previously gave the best results among the three locations (Table 6).
3. Optimized Antimicrobial Activity of Essential Oil and DMSO Dilution against Different Staphylococcus aureus Densities
After determining the best essential oil location among the three available
sources along with the optimum concentration of essential oil and DMSO levels,
different dilutions of Staphylococcus aureus were to be tested to determine the

78
appropriate inoculum count (CFU/ml). For this purpose, different dilutions of
Staphylococcus aureus ranging from 103 to 106 CFU/ml were tested in vitro. Table 9
shows that the greatest diameter of inhibition zone (after 24 hours of incubation at 37ºC)
that was achieved by the essential oil (used in 1/100 dilution in 40% DMSO in water)
against Staphylococcus aureus standardized at 105 CFU/ml (mean diameter = 1.03 cm).
In a study conducted by Baydar et al. (2004) to evaluate the antibacterial activity of
essential oils, the inoculum counts of Staphylococcus aureus used in vitro were 106
CFU/ml. However, our in vitro results showed that the inoculum count of 105 CFU/ml
gave larger diameters of inhibition zones than the inoculum count of 106 CFU/ml.
All the necessary in vitro analysis was conducted after determining the best oil
location (location 3), optimum concentrations of essential oil (1 %) and DMSO levels
(40 %), and the appropriate bacterial inoculum counts (105 CFU/ml). Hence, in vivo
analysis will follow the in vitro analysis to evaluate the effect of essential oil treatment
on intradermal Staphylococcus aureus challenge in rabbits.
Table 9. The Effect of Origanum ehrenbergii Essential Oil on Different
Staphylococcus aureus Counts
Inoculum count (CFU/ml) 103 104 105 106
0.7 cm 0.9 cm 1.2 cm 0.8 cm 0.0 cm 1.0 cm 0.8 cm 0.9 cm
Diameter of inhibition zone after 24 hours incubation (triplicates)
0.0 cm 0.8 cm 1.1 cm 0.9 cm Average 0.23 cm 0.9 cm 1.03 cm 0.87 cm
4. Experiment 1
In the first experiment, rabbits were challenged with 105 CFU/ml
Staphylococcus aureus intradermally, and then each group was treated differently. The
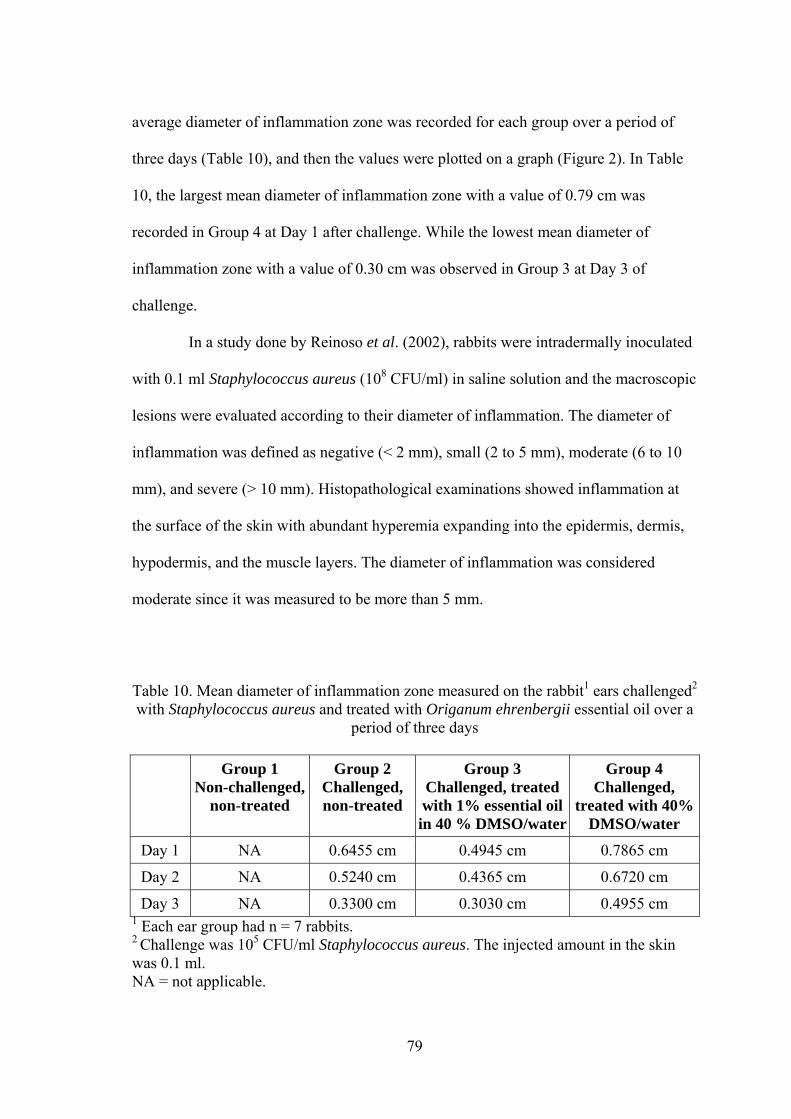
79
average diameter of inflammation zone was recorded for each group over a period of
three days (Table 10), and then the values were plotted on a graph (Figure 2). In Table
10, the largest mean diameter of inflammation zone with a value of 0.79 cm was
recorded in Group 4 at Day 1 after challenge. While the lowest mean diameter of
inflammation zone with a value of 0.30 cm was observed in Group 3 at Day 3 of
challenge.
In a study done by Reinoso et al. (2002), rabbits were intradermally inoculated
with 0.1 ml Staphylococcus aureus (108 CFU/ml) in saline solution and the macroscopic
lesions were evaluated according to their diameter of inflammation. The diameter of
inflammation was defined as negative (< 2 mm), small (2 to 5 mm), moderate (6 to 10
mm), and severe (> 10 mm). Histopathological examinations showed inflammation at
the surface of the skin with abundant hyperemia expanding into the epidermis, dermis,
hypodermis, and the muscle layers. The diameter of inflammation was considered
moderate since it was measured to be more than 5 mm.
Table 10. Mean diameter of inflammation zone measured on the rabbit1 ears challenged2 with Staphylococcus aureus and treated with Origanum ehrenbergii essential oil over a
period of three days
Group 1 Non-challenged,
non-treated
Group 2 Challenged, non-treated
Group 3 Challenged, treated with 1% essential oil in 40 % DMSO/water
Group 4 Challenged,
treated with 40% DMSO/water
Day 1 NA 0.6455 cm 0.4945 cm 0.7865 cm
Day 2 NA 0.5240 cm 0.4365 cm 0.6720 cm
Day 3 NA 0.3300 cm 0.3030 cm 0.4955 cm 1 Each ear group had n = 7 rabbits. 2 Challenge was 105 CFU/ml Staphylococcus aureus. The injected amount in the skin was 0.1 ml. NA = not applicable.

80
0
0.1
0.2
0.3
0.4
0.5
0.6
0.7
0.8
0.9
Group 2 Group 3 Group 4
Treatment
Dia
met
er o
f inf
lam
mat
ion
zone
in c
ms
One day after challenge Two days after challenge Three days after challenge
Fig. 2. Effect of Origanum ehrenbergii essential oil on skin inflammation induced by Staphylococcus aureus
In comparison to our study, inflammation at Day 3 after treatment with
essential oil (Group 3) is considered to be small (3 mm) since it falls within the range of
2 to 5 mm. According to Easmon and Adlam (1983), there might be a possible
relationship between dermatonecrosis and α-hemolysin that is produced in high
quantities by Staphylococcus aureus causing severe skin lesions in rabbits. Hence, this
minimal skin inflammation three days after challenge in the non-treated group (Group
2) might be interpreted by the low levels of α-hemolysin production.
In Figure 2, the diameter of inflammation zone decreased by time in all three
groups. However, the diameter of inflammation zone in the rabbits treated with 1 %
essential oil in 40 % DMSO/water (Group 3) gave the lowest values compared to those
treated with 40 % DMSO/water (Group 4) and the non-treated challenged rabbits

81
(Group 2), especially on the first day of challenge. This suggests that the Origanum
ehrenbergii essential oil had an anti-inflammatory effect against the Staphylococcus
aureus infection. Nevertheless, on the third day of infection, both rabbits treated with
the essential oil and those non-treated were having approximately the same
inflammation zone. Thus, we conclude that the challenge with Staphylococcus aureus
was weak. In this experiment, it is worth noticing that rabbits treated with 40 %
DMSO/water had the highest diameter of inflammation zone compared to those treated
with essential oil or to non-treated challenged rabbits. This suggests that DMSO was
increasing the inflammation when it was administered alone. However, when
incorporated with the essential oil, DMSO gave better results.
5. Experiment 2
In experiment two, two groups of rabbits (each group had 4 rabbits) were
challenged intradermally with Staphylococcus aureus (105 CFU/ml), one group was
treated with essential oil over a period of one day as opposed to three days in the
previous experiment. The other group was left untreated as a positive control. After one
day of treatment, a homogenate of each cut ear was taken and serial dilutions of 1:1,
1:10, and 1:100 were made in tubes containing PBS. These dilutions were streaked on
MSA plates and incubated for 48 hours as mentioned in Materials and Methods to
obtain the bacterial count. After 48 hours of incubation, no bacterial growth was
obtained on any of the MSA plates. Since neither the treated group nor the non-treated
group showed any bacterial growth, then the intradermal Staphylococcus aureus
challenge was not strong enough to persist under the skin for 24 hours. It is worth
noting that the same bacterial stock (105 CFU/ml) of Staphylococcus aureus showed
inhibition to treatment done in vitro (Table 9).

82
6. Experiment 3
Since both of the previous experiments showed these failures, a different
approach had to be attempted. When the bacteria cultured in vitro are transformed to in
vivo conditions, the virulence factors in the bacteria are not rapidly reactivated to
overcome the innate immune defenses of the host. So the virulence of the bacteria can
be enhanced and restored by passing the bacteria through animals (Vahidy et al 1996).
In a study conducted by Peters and Peterson (2002), two in vivo passages were required
to restore the induction of cell-mediated immunity to passenger antigens and maximum
virulence to these antigens. Hence in vivo passages helping in increasing the virulence
of Staphylococcus aureus were followed in Experiment 3.
In Experiment 3, two groups of rabbits were challenged intradermally with
Staphylococcus aureus that has been subjected to 3 in vivo passages to increase its
virulence. One group was treated with 1 % essential oil in 40 % DMSO and the other
group was left untreated as mentioned in Materials and Methods. Results showed that
there was a significant difference in the mean weight of the ear lesion between the
rabbits treated with the essential oil having a mean weight of 1.24 g as compared to
those left untreated having a mean weight of 2.72 g (P<0.05). This suggests that the
essential oil played a role in reducing the inflammatory response (Table 11).
Usually, an inflammatory response is induced by infection with Staphylococcus
aureus and it is associated with swelling and redness, and then the polymorphonuclear
leukocytes will follow by attracting and accumulating. In case the infection continues
and spreads deeper, it will reach the subcutaneous tissue forming an abscess. This
abscess leads to painful swelling that is known as boil (Todar 2004). In our case, the
application of the essential oil might have played a role in diminishing the abscess and
decreasing the accumulation of white blood cells. Thus a reduction in the mean weight
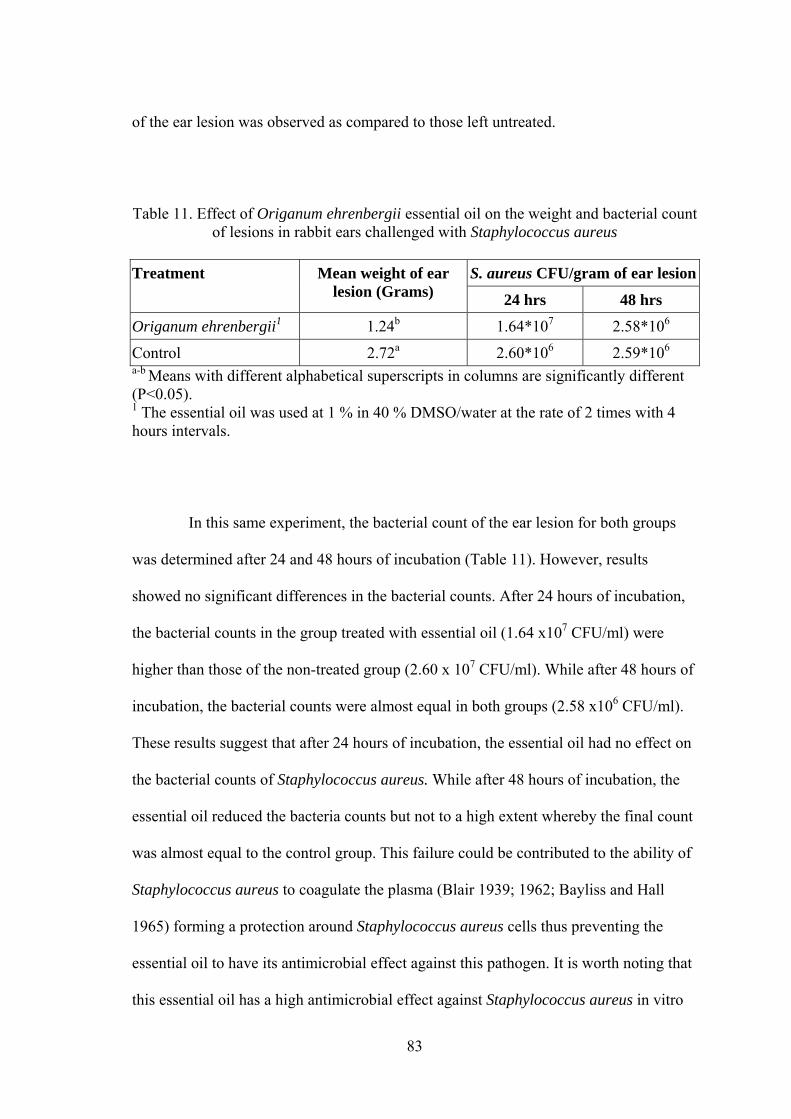
83
of the ear lesion was observed as compared to those left untreated.
Table 11. Effect of Origanum ehrenbergii essential oil on the weight and bacterial count
of lesions in rabbit ears challenged with Staphylococcus aureus
S. aureus CFU/gram of ear lesionTreatment Mean weight of ear lesion (Grams) 24 hrs 48 hrs
Origanum ehrenbergii1 1.24b 1.64*107 2.58*106
Control 2.72a 2.60*106 2.59*106 a-b Means with different alphabetical superscripts in columns are significantly different (P<0.05). 1 The essential oil was used at 1 % in 40 % DMSO/water at the rate of 2 times with 4 hours intervals.
In this same experiment, the bacterial count of the ear lesion for both groups
was determined after 24 and 48 hours of incubation (Table 11). However, results
showed no significant differences in the bacterial counts. After 24 hours of incubation,
the bacterial counts in the group treated with essential oil (1.64 x10⁷ CFU/ml) were
higher than those of the non-treated group (2.60 x 10⁷ CFU/ml). While after 48 hours of
incubation, the bacterial counts were almost equal in both groups (2.58 x10⁶ CFU/ml).
These results suggest that after 24 hours of incubation, the essential oil had no effect on
the bacterial counts of Staphylococcus aureus. While after 48 hours of incubation, the
essential oil reduced the bacteria counts but not to a high extent whereby the final count
was almost equal to the control group. This failure could be contributed to the ability of
Staphylococcus aureus to coagulate the plasma (Blair 1939; 1962; Bayliss and Hall
1965) forming a protection around Staphylococcus aureus cells thus preventing the
essential oil to have its antimicrobial effect against this pathogen. It is worth noting that
this essential oil has a high antimicrobial effect against Staphylococcus aureus in vitro

84
as mentioned earlier and this failure to clear the infection in the rabbit is most likely due
to the inability of essential oil to reach to the Staphylococcus aureus cells in skin.
B. Experiment 2: Serological Profiling and Molecular Detection of Viral Protective Polypeptides by Sera of Sentinel Free-Range Layers
1. Serology for Disease Diagnosis
Serological profiling was used in evaluating the outbreak titers of free-range
chicken layers. Table 12 represents the immune responses to Infectious Bronchitis Virus
(IBV), Newcastle Disease Virus (NDV), Avian Leukosis Virus (ALV), Mycoplasma
gallisepticum (MG), and Infectious Bursal Disease Virus (IBDV) using the Enzyme-
Linked Immunosorbant Assay. While the immune response to Egg Drop Syndrome
(EDS) is represented in Table 12 using the Hemagglutination-Inhibition (HI) test. The
immune responses in Table 12 are categorized according to the different regions in
Jezzine area. Each region; namely the north, south, east, west, and the central region of
Jezzine is represented by two farms. Nine serum samples were randomly collected from
each farm for analysis of the above six diseases. Previous workers depended on
serological profiling to uncover exposure of poultry to specific disease antigens (Cooper
et al. 1989; Gast and Beard 1990; Keck et al. 1993; McBride et al. 1991; Schelling et
al. 1999; Wunderwald and Hoop 2002).
The ELISA titers specific to IBV showed significant differences in humoral
antibody levels between the different regions in Jezzine. The highest relative titers for
IBV were observed in the south and the east followed by the north, and the lowest
relative titers were observed in the west and the central region of Jezzine.
The ELISA titers specific to NDV also showed significant differences in
humoral antibody levels between the different regions in Jezzine. The highest relative

85
titers for NDV were observed in the south and the central region followed by the north
and the west, and the lowest relative titers were observed in the eastern region of
Jezzine.
Table 12. Outbreak mean titers from the different regions in Jezzine area for six
different viruses
Means
Farm Regions
No. of Farms
Samples/ Farm
IBV
NDV
EDS
ALV
MG
IBDV
North 2 9 9988.11ab 8668.83ab 568.89a 201.78 1689.50b 12559.50b
South 2 9 11986.67a 11851.50b 3242.67c 111.78 2567.50bc 12579.39b
East 2 9 11831.94a 4605.67a 839.11a 518.56 724.00a 11404.72a
West 2 9 7799.17b 7754.44ab 1123.56ab 803.44 2036.17bc 12361.89b
Central 2 9 7707.33b 12128.22b 2076.44b 355.56 2807.89c 12437.72b
a-b-c Means with different alphabetical superscripts in columns are significantly different (P<0.05). No significance was observed in the column of ALV (P>0.05).
The ELISA titers specific to ALV showed no significant differences in
humoral antibody levels between the different regions of Jezzine. In addition, the mean
titer values among the different regions are relatively low with respect to the titer values
of the other diseases.
The ELISA titers specific to MG showed significant differences in humoral
antibody levels between the different regions in Jezzine. The highest relative titers for
MG were observed in the central region followed by both the south and the west after
which came the north while the eastern region gave the lowest relative titers for MG.
The ELISA titers specific to IBDV showed a slightly significant difference in
humoral antibody level between the north, south, west, and central regions of Jezzine as

86
compared to the eastern region which gave a relatively lower titer for IBDV.
The Hemagglutination-Inhibition (HI) test used for evaluating the outbreak
titers for EDS showed significant differences in humoral antibody levels between the
different regions in Jezzine. The highest relative titers for EDS were observed in the
south followed by the central region, then the west and finally both the north and the
east with lowest relative titers for EDS.
Among the six viruses that were serologically evaluated for their immune
response with respect to the different regions, the south region seemed in many
instances to have the highest titers to most etiologic agents studied (Table 12). Farms
situated in the southern area of Jezzine are geographically closer to the southern borders
of Lebanon; hence they are most likely subjected to aerosol-transmitted viruses coming
from the poultry farms in Israel. Future investigations should emphasize the search for
transboundary diseases to help in formulating regional projects for control of the spread
of such identified diseases (FAO 1997).
2. Serology for Vaccine Evaluation
Serological profiling was used in evaluating a trivalent oil emulsion vaccine
against three viruses, namely NDV, IBV, and EDS. The humoral antibody response for
the three viruses (IBV, NDV, and EDS) was measured before the trivalent vaccine was
administered and 21 days after vaccination. Previous literature suggests that the immune
response to killed vaccines will show its significance after 21 days of the
administration. Hence paired serum samples are recommended for serological profiling
whereby the first sampling occurs at the time of vaccination (acute) and the
convalescent sampling 3 weeks later (Gillingham 2003). Table 13 represents the
immune response to IBV and NDV using the ELISA, while the immune response to

87
EDS is represented in the same table using the HI test. The immune responses to each
virus were measured twice, before and after vaccination (Table 13). Two farms were
included, each farm containing 9 samples to be analyzed.
Table 13. Vaccine titers before and after 21 days of vaccination with a trivalent killed
vaccine against IBV, NDV, and EDS
Means Vaccination Status
No. of Farms Samples/ Farm
IBV NDV EDS
Before 2 9 9366.17 12902.28 1877.33
After 3 weeks 2 9 11378.33 13508.11 1848.89
SEM 600.90 929.54 290.74 No significance was observed in the columns of IBV, NDV, and EDS (P>0.05).
The ELISA titer specific to IBV showed no significant difference in humoral
antibody level before and after vaccination, although there was an increase in the titer
after vaccination. In the case of NDV, there was a slight increase in the titer after
vaccination but there was no significant difference among the values.
The HI test specific to EDS showed no significant difference in humoral
antibody level before and after vaccination where there was a small difference in the
titer values before and after vaccination.
The immune responses of farms before and after vaccination with a trivalent
inactivated vaccine were evaluated (Table 13). With respect to IBV, no significant
differences in the titer values were observed; however, there was a 21.5% increase in
titer. This increase in titer value after vaccination shows that the birds responded to the
vaccine by acquiring more immunity levels. Similarly, with respect to NDV, the birds
responded to the vaccine by a slight increase of 4.7% in titer. Nevertheless, this increase

88
in titer was not considered to be significant. In the case of EDS, a slight decrease of
1.5% in titer was observed after vaccination; still, this decrease was not considered to be
significant.
It is worth noting that although there was no significant difference in the
humoral antibody level after 3 weeks of vaccination, the farms showed an increase of 10
% in egg production and an increase of 13 % in feed consumption. This is an indication
that the vaccine has enhanced the immunity and the health of the birds that reflected in a
positive manner on their egg production and their feed consumption.
3. Vaccine Failure
According to Butcher and Miles (1993), a failure in vaccination occurs when
inadequate antibody titers are developed after vaccination and/or the chickens are
exposed to field disease outbreaks. A failure in vaccination is most probably due to the
vaccine. However, additional factors may play a role in causing a vaccine failure such
as:
• High level of maternal antibodies present in young birds that may block the
vaccine virus receptors thus preventing them from attaching to the receptor cells and
multiplying in them. This process will lead to a decrease in immune response to the
vaccine.
• Wide variation in immunological responses among individual birds as a
result of stress. Stress usually appears when the bird is subjected to environmental
extremes, parasitism, and inadequate nutrition, in addition to other diseases.
• Mechanical failure resulting from improper storage, handling, and
administration of the vaccine. To avoid such failure, the manufacturer’s
recommendations should be followed carefully.

89
• Different strains or serotypes present in the vaccine may be different than
those required to stimulate protective immunity.
• Missed birds in different areas of the poultry house due to poor vaccine
distribution particularly while administering live vaccines by the spray or water route.
The live vaccine may be transmitted from vaccinated to unvaccinated birds, but this
may result in delayed immunity at the level of the flock. As for killed vaccines, birds
that are missed will get no protection since killed vaccines are not transmitted among
birds.
• Birds may already have acquired the disease that the vaccine aims to protect
against. In such situations, the birds will be diseased since antibody production requires
time to reach protective levels.
• Immunosuppressed birds as a result of infection with Marek’s disease,
IBDV, or due to high levels of mycotoxins in the diet.
• Poor quality vaccines that might be contaminated or contain low titer levels.
Nevertheless, vaccine failure resulting from problems with the vaccine is rare due to the
quality control on the vaccine manufacturing industries.
In our study, there was obviously an insignificant seroconversion after three
weeks of vaccination as shown by ELISA and HI (Table 13). This could be due to
several factors that are discussed earlier. One of these factors is the immunosuppression
caused by IBDV since serological profiling for indicating the outbreak titers revealed
high titers for IBDV (Table 12). Another possible reason for vaccine failure could be
that the strains present in the vaccine might be different than those used in the coated
ELISA plates. This was evident when the antigens of the trivalent vaccine reacted only
with the positive Mass sera and showed no reaction with the Ark positive sera (Figure
4). Also birds might already have acquired the disease before being vaccinated; this was

90
evident by the serological profiling to uncover the disease outbreak for NDV, IBV, and
EDS that showed high titers before vaccination (Table 12). A wide variation in
immunological responses might also be a possible explanation for a vaccine failure.
This wide variation is caused by stress that the birds are subjected to. In our case, the
birds were probably subjected to stress caused by environmental extremes since the
free-range farms are situated on high elevations where the temperature fluctuates
between day and night. In addition, the farms are not tightly constructed to prevent wind
from entering the barn and thus causing stress.
4. Quantitative Immune Responses to Polypeptides
The immune responses to the trivalent vaccine were assessed by Western
Immunoblotting (Figure 3). After reacting the vaccine antigens with each of two pooled
serum samples of the farms (before and after vaccination), the formed bands of sera
after vaccination had a higher optical density than the bands formed by the sera
collected of farms before vaccination. Furthermore, additional bands were observed
from sera of farm flocks after vaccination (60 KDa). This suggests that the vaccine
enhanced the development of acquired immunity in the birds with new antibodies that
have specificity to certain antigens that were not initially present. In Figure 3, the
antigens of NDV showed high competitiveness to antigens of IBV and EDS in the
trivalent vaccine due to the fact that antibodies developed in the vaccinated birds were
mainly against NDV antigens namely, the 248 and 60 KDa. The NDV antigens could be
highly immunogenic or the antigens of NDV might be present in higher quantities
compared to IBV and EDS in the trivalent vaccine. This lead to an immune response
specific to two proteins that are present in the NDV, namely to the 248 and the 60 KDa
proteins. It is reported before that the 248 KDa protein is the large (L) protein that is a

91
subunit of the paramyxovirus RNA polymerase complex (Takimoto et al. 2000).
According to Lamb et al. (1976), the paramyxovirus L protein is the least abundant
among the structural proteins having a molecular weight of more than 200 KDa. This
large L protein is responsible for most of the enzymatic activities involved in
transcription and viral replication. All the catalytic steps of RNA synthesis, capping and
methylation are executed by the paramyxovirus L proteins (Wagner and Rose 1996).
Fig. 3. Banding patterns and molecular weight (KDa) of each detected polypeptide band after reacting the antigens of a trivalent vaccine (NDV+IBV+EDS) with serum samples collected from two farms before and after vaccination with the same trivalent vaccine. Lane 1 = molecular weight markers (KDa), lane 2 = pooled serum from Farm 1 before vaccination, lane 3 = pooled serum from Farm 1 three weeks after vaccination, lane 4 = pooled serum from Farm 2 before vaccination, lane 5 = pooled serum from Farm 2 three weeks after vaccination. The 248 and the 60 KDa bands represent the large L protein and the fusion F protein, respectively, those are present in NDV.
As for the protein with the molecular weight of 60 KDa, it is reported to be the
fusion (F) protein. The fusion between the virion envelope and the cellular plasma
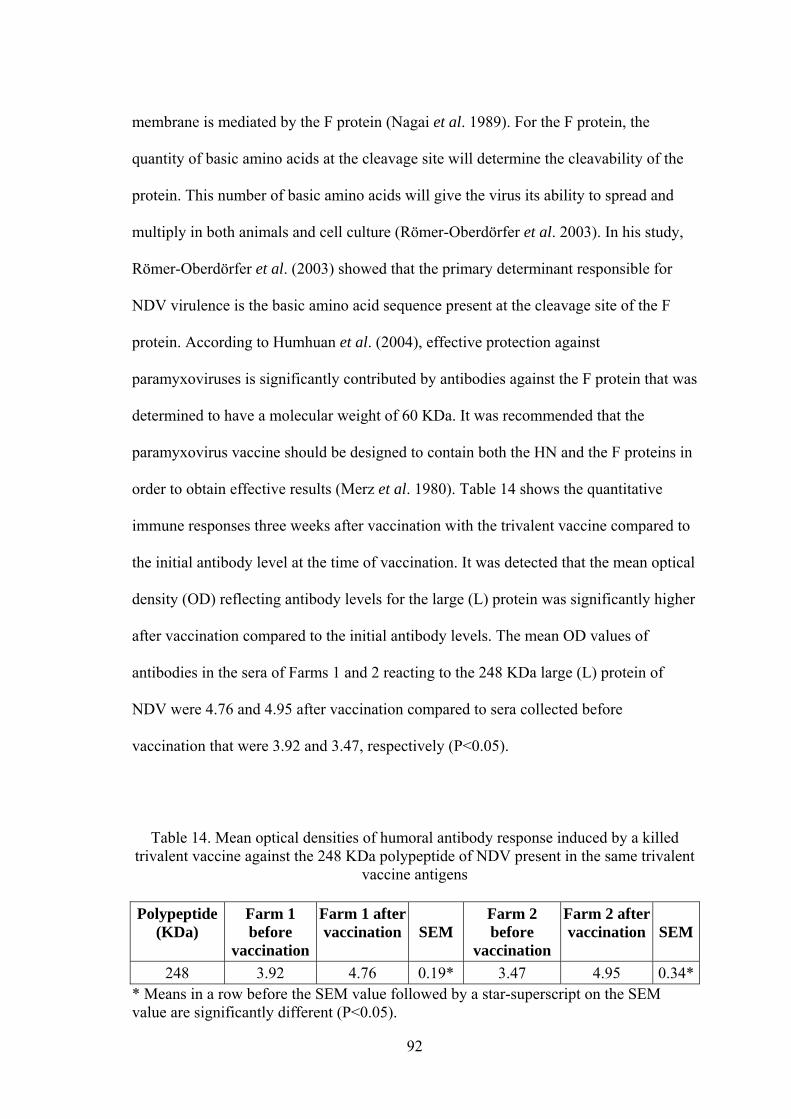
92
membrane is mediated by the F protein (Nagai et al. 1989). For the F protein, the
quantity of basic amino acids at the cleavage site will determine the cleavability of the
protein. This number of basic amino acids will give the virus its ability to spread and
multiply in both animals and cell culture (Römer-Oberdörfer et al. 2003). In his study,
Römer-Oberdörfer et al. (2003) showed that the primary determinant responsible for
NDV virulence is the basic amino acid sequence present at the cleavage site of the F
protein. According to Humhuan et al. (2004), effective protection against
paramyxoviruses is significantly contributed by antibodies against the F protein that was
determined to have a molecular weight of 60 KDa. It was recommended that the
paramyxovirus vaccine should be designed to contain both the HN and the F proteins in
order to obtain effective results (Merz et al. 1980). Table 14 shows the quantitative
immune responses three weeks after vaccination with the trivalent vaccine compared to
the initial antibody level at the time of vaccination. It was detected that the mean optical
density (OD) reflecting antibody levels for the large (L) protein was significantly higher
after vaccination compared to the initial antibody levels. The mean OD values of
antibodies in the sera of Farms 1 and 2 reacting to the 248 KDa large (L) protein of
NDV were 4.76 and 4.95 after vaccination compared to sera collected before
vaccination that were 3.92 and 3.47, respectively (P<0.05).
Table 14. Mean optical densities of humoral antibody response induced by a killed
trivalent vaccine against the 248 KDa polypeptide of NDV present in the same trivalent vaccine antigens
Polypeptide
(KDa) Farm 1 before
vaccination
Farm 1 after vaccination
SEM
Farm 2 before
vaccination
Farm 2 after vaccination
SEM
248 3.92 4.76 0.19* 3.47 4.95 0.34** Means in a row before the SEM value followed by a star-superscript on the SEM value are significantly different (P<0.05).
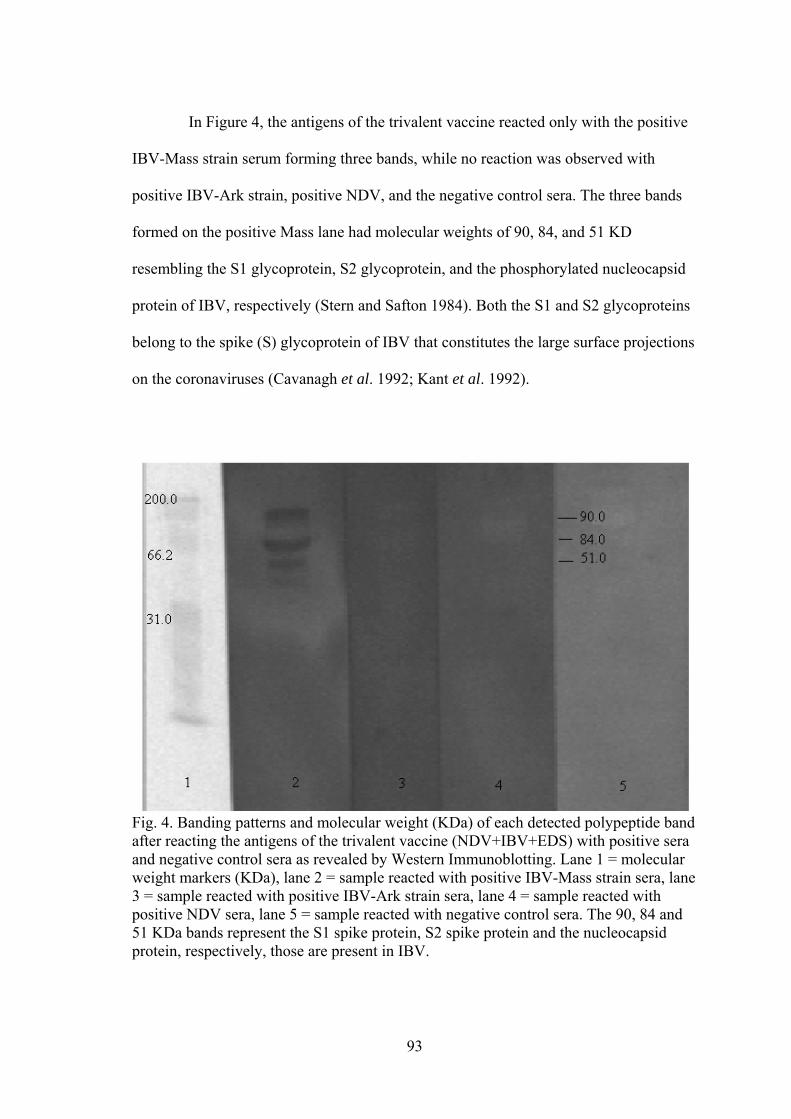
93
In Figure 4, the antigens of the trivalent vaccine reacted only with the positive
IBV-Mass strain serum forming three bands, while no reaction was observed with
positive IBV-Ark strain, positive NDV, and the negative control sera. The three bands
formed on the positive Mass lane had molecular weights of 90, 84, and 51 KD
resembling the S1 glycoprotein, S2 glycoprotein, and the phosphorylated nucleocapsid
protein of IBV, respectively (Stern and Safton 1984). Both the S1 and S2 glycoproteins
belong to the spike (S) glycoprotein of IBV that constitutes the large surface projections
on the coronaviruses (Cavanagh et al. 1992; Kant et al. 1992).
Fig. 4. Banding patterns and molecular weight (KDa) of each detected polypeptide band after reacting the antigens of the trivalent vaccine (NDV+IBV+EDS) with positive sera and negative control sera as revealed by Western Immunoblotting. Lane 1 = molecular weight markers (KDa), lane 2 = sample reacted with positive IBV-Mass strain sera, lane 3 = sample reacted with positive IBV-Ark strain sera, lane 4 = sample reacted with positive NDV sera, lane 5 = sample reacted with negative control sera. The 90, 84 and 51 KDa bands represent the S1 spike protein, S2 spike protein and the nucleocapsid protein, respectively, those are present in IBV.
94
These glycoproteins are responsible for the binding of the virions to the host
cell surface leading to cell fusion and then infection (Holmes et al. 1981). However, the
S1 glycoprotein has been identified to be the main inducer of protective immune
responses since it induces hemagglutination-inhibition (HI) and virus neutralization
(VN) antibodies (Cavanagh et al. 1984; Kock et al. 1990; Mockett et al. 1984). As for
the nucleocapsid protein that is associated with genomic RNA, this protein plays an
essential role in the replication and the structure of IBV (Stern and Sefton 1982; Seo et
al. 1997). During replication, large quantities of nucleocapsid proteins are produced. In
addition, among the various IBV strains, the nucleocapsid protein has a highly
conserved amino acid sequence (Siddel et al. 1983; Williams et al. 1992; Seo et al.
1997). Sneed et al. (1989) showed that in addition to the protective immunity present in
the spike protein, still the nucleocapsid protein is highly immunogenic in terms of
cytotoxic T lymphocytes (CTL) and antibody levels. This suggests that in order to
obtain effective vaccine strategies against IBV, both the spike protein and the
nucleocapsid protein should be incorporated together especially since the S1
glycoprotein is known for its continuous antigenic diversity.
Figure 5 shows the banding patterns of detected polypeptides present in the ND
clone 30 live vaccines. Three proteins were found to correlate in their molecular weight
to proteins present in NDV. These proteins had molecular weights of 248, 60, and 40
KDa representing the large L protein, the fusion F protein, and the matrix M protein
(Elango 1989) present in NDV, respectively. The functions of the L protein and the F
protein were mentioned earlier. However, the matrix M protein is believed to coordinate
the budding process of virus particles after being assembled at the plasma membrane.
This coordination done by the M protein involves interactions with the nucleocapsid,
the plasma membrane, and the cytoplasm of the viral glycoprotein (Peeples 1991;

95
Peeples et al. 1992). In addition, the M protein has been proved to play a role in
inhibiting the host RNA transcription and its protein synthesis and thus inducing
cytopathologic changes (Dunigan et al. 1986; McGowan et al. 1982). In this regard, it is
worth noting that NDV is known to have the highest cytopathic effect among the
different paramyxoviruses (Hightower and Bratt 1974), probably due to the
characteristic provided by the M protein in inhibiting the host protein synthesis.
Fig. 5. Banding patterns and molecular weight (KDa) of each detected polypeptide band of the antigens of ND clone 30 live vaccine. Bands are seen on a nitrocellulose membrane after being transferred from SDS-PAGE and stained with a Ponceau stain. Lanes 1 to 4 are replicates of the same polypeptides of ND clone 30, lane 5 = molecular weight markers (KDa). The 248, 60 and 40 KDa bands represent the large L protein, fusion F protein and the matrix M protein, respectively, those are present in NDV.
In Figure 6, the antigens of the ND clone 30 live vaccine were reacted with the
positive and negative NDV sera. Two bands with molecular weights of 60 and 40 KDa
representing the F protein and the M protein reacted with the positive NDV sera while

96
no reaction was observed on the negative NDV sera. In Figure 5, the ND clone 30 live
vaccine showed three antigens belonging to NDV. Nevertheless, after reacting the
antigens of the live vaccine with the positive NDV sera (Figure 6), only the F protein
and the M protein were observed while the L protein was undetected. From these
results, we may suspect that the positive NDV sera are specific to two main proteins in
NDV, namely the F protein and the M protein.
Fig. 6. Banding patterns and molecular weight (KDa) of each detected polypeptide band after reacting the antigens of ND clone 30 live vaccine with positive NDV and negative NDV sera as revealed by Western Immunoblotting. Lane 1 = antigens of ND clone 30 vaccine reacted with negative NDV sera, lane 2 = antigens of ND clone 30 reacted with positive NDV sera, lanes 3 and 4 are duplicates of lanes 1 and 2, respectively, lane 5 = molecular weight markers (KDa). The 60 and 40 KDa bands represent the fusion F protein and the matrix M protein, respectively, those are present in NDV.
In Figure 7, the antigens of the ND clone 30 live vaccine were reacted with the
pooled serum samples from farms before and after three weeks of being administered

97
the trivalent vaccine. Sera from both farms before being vaccinated reacted with the F
protein and the M protein with molecular weights of 60 and 40 KDa, respectively.
Three weeks after vaccination, sera from both farms reacted to the same proteins but
their reaction to the M protein was more obvious. Table 15 shows the quantitative
immune response against both the F protein (60 KDa) and the M protein (40 KDa). The
mean OD values of antibodies in the sera of Farm 1 and Farm 2 reacting to the F protein
were 4.74 and 4.73 after vaccination compared to sera collected before vaccination that
were 4.66 and 5.55, respectively.
Fig. 7. Banding patterns and molecular weight (KDa) of each detected polypeptide band after reacting the antigens of ND clone 30 live vaccine with pooled serum samples from farms given a trivalent vaccine (NDV+IBV+EDS) as revealed by Western Immunoblotting. Lane 1 = antigens of ND clone 30 vaccine reacted with serum samples from Farm 2 three weeks after vaccination, lane 2 = antigens of ND clone 30 vaccine reacted with serum samples from Farm 2 before vaccination, lane 3 = antigens of ND clone 30 vaccine reacted with serum samples from Farm 1 three weeks after vaccination, lane 4 = antigens of ND clone 30 vaccine reacted with serum samples from Farm 1 before vaccination, lane 5 = molecular weight markers (KDa). The 60 and 40 KDa bands represent the fusion F protein and the matrix M protein, respectively, those are present in NDV.

98
Table 15. Mean optical densities of humoral antibody response induced by a killed trivalent vaccine against different polypeptides present in ND clone 30 vaccine
Polypeptide
(KDa) Farm 1 before
vaccination
Farm 1 after vaccination
SEM
Farm 2 before
vaccination
Farm 2 after vaccination
SEM
40 3.71 3.85 0.06 3.46 4.23 0.20*60 4.66 4.74 0.05 5.55 4.73 0.20
* Means in a row before the SEM value followed by a star-superscript on the SEM value are significantly different (P<0.05).
For the M protein, the mean OD values of antibodies in the sera of Farm 1 and
Farm 2 were 3.85 and 4.23 after vaccination compared to sera collected before
vaccination that were 3.71 and 3.46, respectively. However, for the F protein, no
significant change in quantitative immune response was observed three weeks after the
vaccination with the trivalent vaccine as compared to the initial antibody level specific
to the F protein at the time of vaccination (Table 15). The following data suggest that
the trivalent vaccine has boosted the immunity of the birds with antibodies specific to
the M protein present in NDV. No significant quantitative change was observed for the
F protein probably because they initially had high quantitative levels (mean OD = 5.55)
before being vaccinated.
Figure 8 shows the antigens of two IBV live vaccines, IB H120 and IB 4-91,
after being reacted with positive IBV-Mass strain sera and negative IBV sera. It is
interesting to notice that although the two vaccines contain different strains of IBV;
however, both of them had the same banding patterns on the positive Mass lane. This
suggests that the two vaccines contain similar polypeptides, but they may differ in their
epitopes. The polypeptides of either IB H120 or IB 4-91 that reacted with the positive
IBV-Mass strain sera had molecular weights of 155, 90, 51, 36, and 28 KDa
99
corresponding to the S protein, S1 glycoprotein, nucleocapsid protein, and the two
membrane proteins GP36 and GP 28, respectively. The role of the Spike protein, S1
protein, and the nucleocapsid protein has already been mentioned. As for GP36 and
GP28, these heterogeneous membrane proteins have the same 23 KDa core polypeptide
but they only differ in the type and number of asparagine-linked oligosaccharides (Stern
and Sefton 1982). These membrane glycoproteins protrude slightly outside the virions
interacting with the inner viral membrane through the nucleocapsid and the nucleate
assembly (Sturman et al. 1980). Thus the IBV membrane glycoproteins might play a
role in spanning the virion envelope.
Fig. 8. Banding pattern and molecular weight (KDa) of each detected polypeptide band after reacting the antigens of two lives vaccines, IB H120 and IB 4-91, with positive IBV-Mass strain sera and negative IBV sera as revealed by Western Immunoblotting. Lane 1 = antigens of IB 4-91 vaccine reacted with negative IBV sera, lane 2 = antigens of IB H120 vaccine reacted with negative IBV sera, lane 3 = antigens of IB 4-91 vaccine reacted with positive IBV-Mass strain sera, lane 4 = antigens of IB H120 vaccine reacted with positive IBV-Mass strain sera, lane 5 = molecular weight markers (KDa). The 155, 90, 51, 36 and 28 KDa bands represent the spike S protein, S1 spike protein, nucleocapsid protein, glycoprotein 36 and glycoprotein 28, respectively, those are present in IBV.

100
Figure 9 shows the antigens of two IBV live vaccines, IB H120 and IB 4-91,
after being reacted with positive IBV-Ark strain sera and negative IBV sera. Almost the
same results were obtained as compared to those in Figure 8. This suggests that both
antibodies specific to IBV-Mass strain and IBV-Ark strains react to the similar
polypeptides present in both IBV vaccines, namely the IB H120 and IB 4-91.
Fig. 9. Banding pattern of each detected polypeptide band after reacting the antigens of two live vaccines, IB H120 and IB 4-91, with positive IBV-Ark strain sera and negative IBV sera as revealed by Western Immunoblotting. Lane 1 = antigens of IB 4-91 vaccine reacted with negative IBV sera, lane 2 = antigens of IB H120 vaccine reacted with negative IBV sera, lane 3 = antigens of IB 4-91 vaccine reacted with positive IBV-Ark strain sera, lane 4 = antigens of IB H120 vaccine reacted with positive IBV-Ark strain sera, lane 5 = molecular weight markers (KDa). The 155, 90, 51, 36 and 28 KDa bands represent the spike S protein, S1 spike protein, nucleocapsid protein, glycoprotein 36 and glycoprotein 28, respectively, those are present in IBV.
In Figure 10, the antigens of both IB H120 and IB 4-91 live vaccines were
reacted with the pooled serum samples from Farm 1 before and after three weeks of

101
being administered the trivalent vaccine. The banding pattern of sera from Farm1 before
and after vaccination was the same. In addition, Farm 1 reacted to the same
polypeptides present in both vaccines; namely, the 155 KDa spike protein, the 90 KDa
S1 protein, the 51 KDa nucleocapsid protein, and the two membrane proteins GP36 and
GP28. The quantitative immune response of the antibodies in sera of Farm 1 showed
significant values only for the nucleocapsid protein (51 KDa) after reacting the sera
with the antigens of IB H120 (Table 16).
Fig. 10. Banding pattern of each detected polypeptide band after reacting the antigens of two live vaccines, IB H120 and IB 4-91, with pooled serum samples of Farm 1 given a trivalent vaccine (NDV+IBV+EDS) as revealed by Western Immunoblotting. Lane 1 = antigens of IB 4-91 vaccine reacted with serum samples of Farm 1 three weeks after vaccination, lane 2 = antigens of IB H120 vaccine reacted with serum samples of Farm 1 three weeks after vaccination, lane 3 = antigens of IB 4-91 vaccine reacted with serum samples of Farm 1 before vaccination, lane 4 = antigens of IB H120 vaccine reacted with serum samples of Farm 1 before vaccination, lane 5 = molecular weight markers (KDa). The 155, 90, 51, 36 and 28 KDa bands represent the spike S protein, S1 spike protein, nucleocapsid protein, glycoprotein 36 and glycoprotein 28, respectively, those are present in IBV.

102
Table 16. Mean optical densities of humoral antibody response induced by a killed trivalent vaccine against different polypeptides present in IB H120 and IB 4-91 vaccines
Polypeptide (KDa)
Farm 1 reacted with IB
H120 before vaccination
Farm 1 reacted with IB
H120 after vaccination
SEM
Farm 1 reacted
with IB 4-91 before
vaccination
Farm 1 reacted
with IB 4-91 after
vaccination
SEM
28 4.57 4.35 0.06 4.59 4.21 0.09* 36 4.27 4.32 0.02 4.34 4.04 0.07* 51 4.22 4.45 0.06* 4.40 3.88 0.12* 90 4.46 4.56 0.08 4.45 4.03 0.11* 155 4.11 4.12 0.04 4.23 3.92 0.08*
* Means in a row before the SEM value followed by a star-superscript on the SEM value are significantly different (P<0.05).
The mean OD values of antibodies reacting to the 51 KDa nucleocapsid protein
of IBV was 4.45 when the sera was collected after vaccination compared to sera
collected before vaccination (4.22) (P<0.05). However, the antibodies in the sera from
Farm 1 that reacted with the antigens of IB 4-91 showed an unexpected significant
decrease in mean OD values when collected after vaccination in comparison to that
before vaccination (Table 16).
In Figure 11, the antigens of both IB H120 and IB 4-91 live vaccines were
reacted with the pooled serum samples from Farm 2 before and after three weeks of
being administered the trivalent vaccine. Before vaccination, the pooled serum samples
from Farm 2 reacted to two polypeptides present in both IB H120 and IB 4-91, namely
the nucleocapsid protein and the membrane glycoprotein GP28 with molecular weights
of 51 and 28 KDa, respectively. Three weeks after vaccination, the pooled serum
samples from Farm 2 reacted to the same two proteins, while an additional protein with
a molecular weight of 36 KDa was recognized by new acquired antibodies, representing
the membrane glycoprotein GP36.

103
Fig. 11. Banding pattern of each detected polypeptide band after reacting the antigens of two live vaccines, IB H120 and IB 4-91, with pooled serum samples of Farm 2 given a trivalent vaccine (NDV+IBV+EDS) as revealed by Western Immunoblotting. Lane 1 = antigens of IB 4-91 vaccine reacted with serum samples of Farm 2 three weeks after vaccination, lane 2 = antigens of IB H120 vaccine reacted with serum samples of Farm 2 three weeks after vaccination, lane 3 = antigens of IB 4-91 vaccine reacted with serum samples of Farm 2 before vaccination, lane 4 = antigens of IB H120 vaccine reacted with serum samples of Farm 2 before vaccination, lane 5 = molecular weight markers (KDa). The 51, 36 and 28 KDa bands represent the nucleocapsid, glycoprotein 36 and glycoprotein 28 proteins, respectively, those are present in IBV.
The quantitative immune response of the antibodies in the sera of Farm 2
showed significant increase to the membrane glycoprotein GP28 with a molecular
weight of 28 KDa, when the sera was collected 3 weeks post vaccination and when
reacted to the antigens of both IB H120 and IB 4-91 (Table 17). The mean OD values of
antibodies in sera reacting to the 28 KDa membrane glycoprotein of IBV was 3.21 and
3.12 in the sera collected after vaccination compared to sera collected before
vaccination namely, 2.81 and 2.84 for IB H120 and IB 4-91, respectively (P<0.05). As
for the nucleocapsid protein, the quantitative immune response of the antibodies in the

104
sera of Farm 2 showed no significant values knowing that the mean OD values
increased from 3.11 and 3.25 before vaccination to 3.76 and 3.78 after vaccination,
when reacting the sera to IB H120 and IB 4-91, respectively (Table 17). These results
suggest that the trivalent vaccine has boosted the immunity levels to the membrane
glycoprotein GP28; also the trivalent vaccine enhanced the immune system by forming
antibodies against an additional protein, namely the membrane glycoprotein GP36.
Table 17. Mean optical densities of humoral antibody response induced by a killed
trivalent vaccine against different polypeptides present in IB H120 and IB 4-91 vaccines
Polypeptide (KDa)
Farm 2 reacted with
IB H120 before
vaccination
Farm 2 reacted with
IB H120 after
vaccination
SEM
Farm 2 reacted with
IB 4-91 before
vaccination
Farm 2 reacted with
IB 4-91 after
vaccination
SEM
28 2.81 3.21 0.09* 2.84 3.12 0.07* 51 3.11 3.76 0.19 3.25 3.78 0.17
* Means in a row before the SEM value followed by a star-superscript on the SEM value are significantly different (P<0.05).
On the other hand, the Western-immunoblotting experiments did reveal in
many instances, an induction of quantitative increase in antibodies specific to more
polypeptides of the viruses after 3 weeks of the vaccination compared to those present at
the vaccination time. This could be summarized in appearance of new antibodies to the
F protein (60 KDa) in the case of NDV, and the appearance of new antibodies to the
membrane glycoprotein GP36 (36 KDa) in the case of IBV three weeks after
vaccination compared to at vaccination time. In addition, there were more quantitative
levels of antibodies to the large (L) protein (248 KDa) and the matrix (M) protein (40
KDa) in NDV and to the nucleocapsid protein (51 KDa) and the membrane glycoprotein

105
GP28 (28 KDa) in the case of IBV three weeks after vaccination compared to levels at
the time of vaccination. These positive results on induction of better immunity to
protective antigens could cause a better field protection to the IBV and NDV viruses.
Future investigations should correlate such improvements in antibody induction specific
to certain polypeptides to protection against controlled challenge by NDV and IBV in
free-range poultry.

106
CHAPTER V
CONCLUSIONS AND RECOMMENDATIONS
Two experiments were conducted in this study; the first was to assess the anti-
inflammatory effect of Origanum ehrenbergii essential oil on skin lesions of rabbits
challenged intradermally with Staphylococcus aureus. The second experiment was
conducted on free-range poultry farms in which serological profiling was followed in
order to determine the disease outbreaks and to evaluate the birds’ humoral immune
responses 3 weeks after being administered an inactivated trivalent vaccine.
Furthermore, the immune responses to the trivalent vaccine were both quantitatively
and qualitatively assessed by reacting the pooled farm sera with antigens of the trivalent
vaccine and antigens of different live vaccine strains by Western Immunoblotting.
A. Experiment 1: Anti-inflammatory Effect of Origanum ehrenbergii Essential Oil against Staphylococcus aureus Skin Infection in Rabbits
Based on the results and discussions (Chapter IV), the following conclusions
and recommendations can be made:
• In vitro analysis of 1 % Origanum ehrenbergii essential oil diluted in 40 %
DMSO/water showed an inhibition zone of 10.3 mm when tested against
Staphylococcus aureus (105 CFU/ml).
• Intradermal challenge with Staphylococcus aureus (105 CFU/ml) was not
strong enough to persist under the skin for more than 3 days.
• Two in vivo passages of Staphylococcus aureus in the rabbit ears were able
to increase its pathogenicity.
• Topical treatment with Origanum ehrenbergii essential oil was able to

107
reduce the mean weight of the ear lesions in rabbits while it failed in reducing the
bacterial counts in the ear lesions.
• Our data shows that the Origanum ehrenbergii essential oil has an
antibacterial effect when tested in vitro, but in vivo treatments with Origanum
ehrenbergii essential oil on ear lesions challenged with Staphylococcus aureus failed to
show antibacterial effects. This suggests that the essential oil was not reaching the site
of infection probably due to the coagulation of plasma formed by Staphylococcus
aureus. Further studies should be made on the antibacterial effect of Origanum
ehrenbergii essential oil on in vivo Staphylococcus aureus challenge.
B. Experiment 2: Serological Profiling and Molecular Detection of Viral Protective Polypeptides by Sera of Sentinel Free-Range Layers
Based on the results and discussions (Chapter IV), the following conclusions
and recommendations can be made:
• Serological profiling for disease diagnosis showed high outbreak titers for
IBV, NDV, EDS, MG and IBDV.
• Serological profiling for vaccine evaluation failed to show significant
changes in humoral immune responses for IBV, NDV and EDS. Reasons for this failure
could be attributed to the immunosupression caused by IBDV or the difference in
strains between the antigens present in the vaccine and the antigens coating the ELISA
plates. This suggests that serological profiling for vaccine evaluation using the ELISA
system is not as accurate as the molecular detection of serum antibodies specific to
protective polypeptides of viruses.
• Although the ELISA system showed no significant differences in humoral
immune responses after 3 weeks of vaccination, reacting the pooled serum samples of

108
the farms with the antigens of different vaccine strains showed an improvement in both
quantitative and qualitative immune response at 3 weeks post vaccination in comparison
to that before the vaccination.
• Future investigations should correlate such improvements in antibody
induction specific to certain polypeptides to protection against controlled challenge by
NDV and IBV in free-range poultry.
109
BIBLIOGRAPHY
Abd-Elgawad, M.M. and E.A. Omer. “Effect of essential oils of some medicinal plants on phytonematodes.” Anz. Schaedlingskd. 68(1995): 82-84.
Adair, B.M., J.B. McFerran, T.J. Connor, M.S. McNulty and McKillop. “Biological and physical properties of a virus (strain-127) associated with the egg drop syndrome.” Avian Pathology 8(1979): 249-264.
Aeschbach, R. “Probing the power of common scents.” Fd. Chem. Toxicol. 32(1994): 31-36.
Alexander, D. J. and R.E. Gough. “Isolations of avian influenza virus from birds in Great Britain.” Veterinary Record 118(1986): 537-538.
Alexander, D.J. and M.S. Collins. “Effect of pH on the growth and cytopathogenicity of avian infectious bronchitis virus in chick kidney cells.” Arch. Virol. 67(1981): 309-323.
Alexander, D.J. and M.S. Collins. “The purification and polypeptide composition of avian infectious bronchitis virus.” Microbios. 18(1977): 87-98.
Alexander, D.J. and N.J. Chettle. “Procedures for the haemagglutination and haemagglutination inhibition tests for Avian Infectious Bronchitis.” Avian Pathology 6(1977): 9-17.
Alexander, D.J., C.D. Bracewell and R.E. Gough. “Preliminary evaluation of HA and HI tests for avian IBV.” Avian Pathology 5(1976): 125-134.
Alexander, M. “Aromatherapy and immunity: How the use of essential oil aids immune potential.” The International Journal of Aromatherapy 11(2001): 1-6.
Alma, M.H., A. Mavi, A. Yildirim, M. Digrak and T. Hirata. “Screening chemical composition and in vitro antioxidant activities of the essential oils from Origanum syriacum L. growing in Turkey.” Biol. Pharm. Bull. 26(2003): 1725-1729.
Al-Zuhair, H. “Phamacological studies of cardamom oil in animals.” Pharmacol. Res. 34(1996): 79-82.
Andrade, L.F., P. Villegas and O.J. Fletcher. “Vaccination of day-old broilers against infectious bronchitis virus: effect of vaccine strain and route of administration.” Avian Diseases 27(1983): 178-187.
Appleby, M.C. “Factors influencing floor laying by domestic hens: a review.” World Poultry Science Journal 40(1984): 241-249.

110
Aqel, M.B. “Relaxant effect of the volatile oil of Rosmarinus officinalis on tracheal smooth muscle.” J. Ethnopharmacol. 35(1991): 57-62.
Arras, G. 1988. “Antimicrobial activity of various essential oils against some citrus fruit disease agents.” Citriculture 2(1988): 787-793.
Barbour E. K., J. A. Newman, J. Sasipreeyajan, A. C. Caputa, and M. A. Muneer. “Identification of the antigenic components of the virulent Mycoplasma gallisepticum in chickens: Their role in differentiation from the vaccine strain (F)”. Vet. Immunol Immunopathol. 21(1989): 197-206.
Barbour, E.K., J.A. Newman, V. Sivanandan, D.A. Halvorson and J. Sasipreeyajan. “Protection and immunity in commercial chicken layers administered Mycoplasma gallisepticum liposomal bacteria.” Avian Diseases 31(1987): 723-729.
Baron, S. “NDV: an evolving pathogen.” Avian Pathol. 30(2001):5-11.
Baser, K.H.C., M. Kurkcuoglu, B. Demicri and T. Özel. “Origanum glandulosum Desf. grown wild in Algeria: essential oil composition and glycosidic bound volatiles.” Flavour and Fragrance J. 18(2003): 89-99.
Baser, K.H.C., T. Ozek, G. Tumen and E. Sezik. . “Composition of the essential oil of Origanum sipyleum of Turkish origin.” J. Essential Oil Res. 4(1992): 139-142.
Baser, K.H.C., T. Ozek, M. Kurkcuoglu and G. Tumen. “Composition of the essential oils of Turkish Origanum species with commercial importance.” J. Essential Oil Res. 5(1993): 619-623.
Bauer, M. and C. Keppler. “Federpicken - die krux der legehennenhaltung.” Bioland 5(1996): 15-17.
Bauer, T., D.W. Flِsch and B. Hrِning. “Den Geflügelstall optimal gestalten.” Bioland 4(1994): 11-13.
Baxendale, W., D. Lutticken, R. Hein and I. McPherson. “The results of field trials conducted with an inactivated vaccine against the egg drop syndrome 76 (EDS-76)”. Avian Pathology 9(1980): 77-91.
Baydar, H., O. Sağdiς, G. Őzkan and T. Karadoğan. “Antimicrobial activity and composition of essential oils from Origanum, Thymbra and Satureja species with commercial importance in Turkey.” Food Control 15(2004): 169-172.
Bayliss, B.G. and E.R. Hall. “Plasma coagulation by organisms other than Staphylococcus aureus.” Journal of Bacteriology 89(1965): 100-105.
Beach, J.R. “Proceedings- annual meeting of the United States Livestock Sanitary Association.” Proc. Annu. Meet. US Livest. Sanit. Assoc. 49(1946): 49-58.
111
Beard, C.W. and R.P. Hanson. “Newcastle Disease.” Diseases of Poultry 8th ed. Iowa State University, Ames, Iowa, USA (1984): 452-470.
Beard, L.W. “Ammonia.” Avian Diseases 11(1967): 399-406.
Beaudette, F.R. and J.J. Black. “Proceedings- annual meeting of the United States Livestock Sanitary Association.” Proc. Annu. Meet. US Livest. Sanit. Assoc 49(1946): 49-58.
Becker, W.B., K. McIntosh, J. H. Dees and R.M. Channock. “Morphogenesis of Avian Infectious Bronchitis Virus and a Related Human Virus (Strain 229E).” J. Virol. 1(1967): 1019-1027.
Bergan, T., and M. Kocur. “Genus Stomatococcus” In P. H. A. Sneath, N. S. Mair, M. E. Sharpe, and J. G. Holt (ed.), Bergey's manual of systematic bacteriology. Williams & Wilkins, Baltimore, Md. 2(1986): 1013-1035.
Berry, D.M., J.G. Cruickshank, H.P. Chu and R.J.H. “Identification of the Murine Coronavirus MP1 Cleavage Site Recognized by Papain-Like Proteinase 2.” Virology 23(1964): 403-407.
Bingham, R.W., M.H. Madge and D.A.J. Tyrrel. “Haemagglutination by avian infectious bronchitis virus-a coronavirus.” J. Gen. Virol 28(1975): 381-390.
Biondi, D., P. Cianci, C. Geraci, G. Ruberto and M. Piattelli. 1993. “Antimicrobial activity and chemical composition of essential oils from Sicilian aromatic plants.” Flavour Fragrance J. 8(1993): 331-337.
Blair, J.E. “The pathogenic staphylococci.” Bacteriol. Rev. 3(1939): 97-146.
Blair, J.E. “What is staphylococcus?” Bacteriol. Rev. 26(1962): 375-381.
Bone, R.C. “How gram-positive organisms cause sepsis.” J. Crit. Care 8(1993): 51-59.
Boskabady, M.H. and J. Shaiki. “Inhibitory effect of Carum copticum on histamine (H1) receptors of isolated guinea pig tracheal chains.” J. Ethnopharmacol. 69(2000): 217-227.
Butcher, G.D. and R.D. Miles. “Vaccination failures: Factors to consider”. Poultry Digest. (March 1993): 22-26.
Calderone, N.W., H. Shimanuki and G. Allen-Wardell. “An in vitro evaluation of botanical compounds for the control of the honeybee pathogens Bacillus larvae and Ascosphaera apis, and the secondary invader B. alvei.” J. Essential Oil Res. 6 (1994): 279-287.
Cameron, A.R. “A practical manual and software package for active surveillance of livestock diseases in developing countries.” Australian Center for International Agricultural Research (ACIAR) 54(1999): 5-60.

112
Capua, I., and S. Marangon. “The avian influenza epidemic in Italy 1999-2000.” Avian pathology 29(2000): 289-294.
Carlstrmِ, A. “New species of Alyssum, Consolida, Origanum and Umbilicus from the SE Aegean Sea.” Willdenowia 14(1984): 15-26.
Carmo, M.M., S. Froze and F. Venancio. “The chemical composition of Portuguese Origanum vulgare oils.” J. Essential Oil Res. 1(1989): 69-71.
Case, J.T., A.A. Ardam, D.C. Bolton and B.J. Reynolds. “Optimization of parameters for detecting antibodies against infectious bronchitis virus using an Enzyme-Linked Immunosorbant Assay: temporal response to vaccination and challenge with live virus.” Avian Diseases 27(1983): 196-210.
Cavanagh, D. “Structural polypeptides of coronavirus IBV.” J. Gen. Virol. 53(1981): 93-103.
Cavanagh, D. and P.G. Davis. “Coronavirus IBV: removal of spike glycopeptide S1 by urea abolished infectivity but not attachment to cells.” J. Gen. Virol 67(1986): 1443-1448.
Cavanagh, D., J.H. Darbyshire, P. Davis and R.W. Peters. “Induction of humoral neutralizing and hemagglutination-inhibiting antibody by the spike protein of avian infectious bronchitis virus.” Avian Pathology 13(1984): 573-583.
Cavanagh, D., P.G. Davis and A.P.A. Mockett. “Amino acids within hypervariable region 1 of avian coronavirus IBV (Massachusetts serotype) spike glycoprotein are associated with neutralizing epitopes.” Virus Res. 11(1988): 141-150.
Cavanagh, D., P.J. Davis, J.K.A. Cook, D. Li, A. Kant and G. Kock. “Location of the amino acid differences in the S1 spike glycoprotein subunit of closely related serotypes of infectious bronchitis virus.” Avian Pathology 21(1992): 33-43.
Chandra, D. and S.S. Gupta. “Anti-inflammatory and antiarthritic activity of volatile oil of Curcuma longa (Haldi).” Ind. J. Med. Res. 60(1972): 138-142.
Christensen, J.P., J.M.N. Skov, K.H. Hinz and M. Bisgaard. “Salmonella enterica serovar Gallinarum biovar gallinarum in layers-epidemiological investigations of a recent outbreak in Denmark.” Avian Pathology 23(1994): 489-501.
Christensen, N. H. and W.L. Stanislawek. “EDS 76 HI antibodies in a flock of free-range layers.” New Zealand Veterinary Journal 42(1994): 70-72.
Coelho-de-Souza, A.N. “Effects of the essential oil of Croton zehntneri and its constituent estragole on intestinal smooth muscle.” Phytother. Res. 11(1997): 299-304.

113
Collison, S.A., M.W. Jackwood and D.A. Hilt. “Molecular characterization of IBV isolates foreign to the United States and comparison with United States isolates.” Avian Diseases 45(2001): 492-499.
Cook, J. K. A. and J.H. Darbyshire. “Epidemiological studies with egg drop syndrome-1976 (EDS-76) virus.” Avian Pathology 9(1980): 437-443.
Cooper, G.L., R.A. Nicholas and C.D. Bracewell 1989. “Serological and bacteriological investigations of chickens from flocks naturally infected with Salmonella enteridis”. Veterinary Record 125(1989): 567-572.
Cunningham, C.H. “Effect of EDT on utilization of dietary zinc by GF swine.” Proc. 13th World’s Poult. Congr. (1966): 416-418.
Danin, A. “Two new species of Origanum (Labiatae) from Jordan.” Willdenowia 19(1990): 401-404.
Danin, A. and I. Künne. “Origanum jordanicum (Labiatae), a new species from Jordan, and notes on the other species of Origanum sect. Campanulaticalyx.” Willdenowia 25(1996): 601-611.
Darbyshire, J. H. and R.W. Peters. “Studies on EDS-76 virus infection in laying chickens.” Avian Pathology 9(1980): 277-290.
Dare, J. “Disease risks associated with raising free-range poultry.” Poultry Perspectives 5(2003): 1-5.
Deans, S.G. “Promotional effects of plant volatile oils on the polyunsaturated fatty acid status during ageing.” Age. 16(1993): 71-74.
Deans, S.G. and K.P. Svoboda. “Biochemical and physiological studies on aromatic plants grown in Scotland.” Acta Hort. 306(1990): 453-457.
Deans, S.G., K.P. Svoboda, M. Gundidza and E.Y. Brechany. “Essential oil profiles of several temperate and tropical aromatic plants: their antimicrobial and antioxidant activities.” Acta Hort. 306(1992): 229-232.
Dorman, H.J.D. and S.G. Deans. “Antimicrobial agents from plants: antibacterial activity plant volatile oils.” J. Appl. Microbiol. 88(2000): 308-316.
Dorofeev, A.N., T.P. Khort, I.F. Rusina, Khmel’nitskii and V. Yu. “Search for antioxidants of plant origin and prospects of their use.” Sbornik Nauchnykh 109(1989): 42-53.
Doyle, T.M. “A hitherto unrecorded disease of fowls due to a filter passing virus.” J. Comp. Pathol. Ther 40(1927): 144-169.
Dunigan, D.D., S. Baird and J. Lucas-Lenard. “Lack of correlation between the accumulation of plus-strand leader RNA and the inhibition of protein and RNA

114
synthesis in vesicular stomatitis virus-infected mouse L cells. Virology 150(1986): 231-246.
Easmon, C. and C. Adlam. “Staphylococci and staphylococcal infections.” Academic Press, New York, USA. (1983): 80-86.
El Tahir, K.E.H. “The respiratory effects of the volatile oil of the black seed (Nigella sativa) in guinea pigs: elucidation of the mechanism(s) of action.” Gen. Pharm. 24(1993): 1115-1122.
Elango, N. “Complete nucleotide sequences of the matrix protein mRNA of mumps virus.” Virology 168(1989): 426-428.
FAO. “Developing national emergency prevention systems for transboundary animal diseases”. FAO animal production and health paper #137 (1997): 45-51.
Fenner, F., P. Bachman, E. Gibbs, F. Murphy, M. Studdent and D. White. “Laboratory diagnosis of viral diseases. In: Veterinary Virology.” Academic Press, Inc., San Diego, Calif. (1987): 237-264.
Fischer, N., S. Nitz and F. Drawert. “Original flavor compounds and the essential oil composition of marjoram (Majorana hortensis Moench).” Flavor Fragrance J. 2(1987): 55-61.
Fleisher, A. and Z. Fleisher. “The essential oil of Origanum syriacum L. var. sinaicum (Boiss.) letswaart.” J. Essent. Oil. Res. 3(1991): 121-123.
Garcia, Z. and R.A. Bankowski. “Comparison of a tissue-culture virus-neutralization test and the Enzyme-Linked Immunosorbant Assay for measurement of antibodies to infectious bronchitis.” Avian Diseases 25(1981): 121-130.
Gast, R.K. and C.W. Beard. “Serological detection of experimental Salmonella enteridis infections in laying hens”. Avian Diseases 34(1990): 721-728.
Gelb, J., B.E. Perkins, J.K. Rosenberger and P.H. Allen. “Serologic and cross-protection studies with several IBV isolates from Delmarva-reared broiler chickens.” Avian Diseases 25(1981): 655-666.
Gelb, J., J.H. Leary and J.K. Rosenberger. “Prevalence of Arkansas-type IBV in Delmarva Peninsula chickens.” Avian Diseases 27(1983): 667-678.
Gillingham, S. “Infectious bronchitis virus”. Canadian Poultry Consultants Ltd. (2003).
Glauser, M.P., G. Zanetti, J.D. Baumgartner and J. Cohen. “Septic shock: pathogenesis.” Lancet 388(1991): 732-736.
Grabmann, J. “Antioxidant properties of essential oils.” Arzneim. Forsch. 50(2000): 135-139.
115
Granoff, A. “NDV: an evolving pathogen.” In R.P. Hanson (ed.) Univ. Wisconsin Press, Madison (1964): 107-118.
Gravel, K.A. and T.G. Morison. “Interacting domains of the HN and F proteins of NDV.” Journal of Virology 77(2003): 11040-11049.
Hanson, L.E., F.H. White and J.O. Alberts. “Development and epidemiological applications of a bacteriophage typing system for typing Pasteurella multocida.” Am. J. Vet. Res. 17(1956): 294-298.
Harkness, J.W., C.D. Bracewell. “Identification of Mycoplasma felis and Mycoplasma gateae by an immunobinding assay.” Res. Vet. Sci. 16(1974): 128-131.
Hatcher, J.A., J.K. Skeeler, P.J. Blore and J.D. Story. “Comparison of the Hemagglutination-Inhibition test with the constant virus diluting serum microneutralization test for detecting antibodies to avian IBV.” Avian Diseases 27(1983): 1157-1161.
Hepper, F.N. “Planting a Bible Garden.” HMSO, London, UK (1987): 16-22.
Herenda, D. and O. Jakel. “Poultry abattoir survey of carcass condemnation for standard, vegetarian, and free range chickens.” Canadian Veterinary Journal 35(1994): 293-296.
Hightower, L.E. and M.A. Bratt. “Protein synthesis in Newcastle disease virus-infected chicken embryo cells”. J. Virol. 13(1974): 788-800.
Hitchner, S.B. and E.P. Johnson. “A virus of low virulence for immunizing fowls against Newcastle disease (avian pneumoencephalitis).“ Vet. Med. 43(1948): 525-530.
Hofstad, M.S. “Avian infectious bronchitis.” Diseases of Poultry 8th ed. Iowa state University, Iowa, Ames, Iowa, USA (1984): 429-443.
Hofstad, M.S. “Cross-immunity in chickens using seven isolates of avian IBV.” Avian Diseases 18(1974): 131-138.
Holmes, K.V., E.W. Doller and L.S. Sturman. “Tunicamycin resistant glycosylation of a coronavirus glycoprotein: demonstration of a novel type of viral glycoprotein.” Virology 115(1981): 334-344.
Hopkins, S.R. “Serological comparison of strains of IBV using plaque-purified isolants.” Avian Diseases 18(1974): 231-239.
Huang, A.S., D. Baltimore and M.A. Brott. “Location of the Transcription Defect in Group I Temperature-Sensitive Mutants of Vesicular Stomatitis Virus.” J. Virol. 7(1971): 389-394.
116
Hueston, W.D. “Assessment of national systems for the surveillance and monitoring of animal health.” Rev. sci. tech. Off. int. Epiz. 12(1993): 1187-1196.
Hume, W.R. “Effect of eugenol on constriction response in blood vessels of the rabbit ear.” J. Dent. Res. 62(1983): 1013-1015.
Humhuan, A., S. Prakongpan, P. Poomvises, R.A. Maas, D.J.A. Crommelin, G.F.A. Kersten and W. Jiskoot. “Virosome and ISCOM vaccines against Newcastle disease: preparation, characterization and immunogenicity”. European Journal of Pharmaceutical Sciences 22(2004): 459-468.
Ietswaart, J.H. “A taxonomic revision of the genus Origanum (Labiatae).” PhD in Greece.” Biosciences 3(1989): 5-12.
International Organization for Standardization. “Dried oregano (Origanum vulgare Linnaeus) - Whole or ground leaves Specification.” International Standard,ISO 7925 (1985).
Ismaiel, A.A. “The inhibition of Clostridium botulinum growth and toxin production by essential oils of spices.” Diss. Abstr. Int. 48(1988): 2834-2839.
Izzo, A.A., G. Carlo, D. Biscardi, R. Fusco, N. Mascolo, F. Borrelli and F. Capasso. “Antimicrobial, Cytotoxic, and Antiviral Activities of Salvia fructicosa Essential Oil.” J. Agric. Food Chem. 44(1996): 1202-1205.
Janisko, L.J. “Serological profiling: swine pathogens.” Proceedings of the North Carolina healthy Hogs Seminar, College of Veterinary Medicine, North Carolina State University (1994): 22-27.
Janssens, J. “Nutme oil: identification and quantification of its most active constituents as inhibitors of platelet aggregation.” J. Ethnopharmacol. 29(1990): 179-188.
Jia, W., X. Wang, C.R. Panish and J.A. Naqi. “Analysis of the serotype-specific epitopes of avian IBV strain Ark99 and Mass41.” Journal of Virology 70(1996): 7255-7259.
Johnson, D.C., M. David and S. Goldsmith. “Epizootiological investigations of an outbreak of pullorum disease in an integrated broiler operation.” Avian Diseases 36(1992): 770-775.
Johnson, R.B. and W.W. Marquandt. “The neutralizing characteristics of strains of IBV as measured by the constant-virus variable-serum method in chicken tracheal cultures.” Avian Diseases 19(1975): 82-90.
Jordan, F.T.W. “Poultry Diseases”. Bialliere Tindall, London (1990): 188-191.
Kant, A., G. Kock, D.J. van Roozelaar, J.G. Kusters, F.A.J. Poelwijk and A.M. van der Zeijst. “Location of antigenic sites defined by neutralizing monoclonal
117
antibodies on the S1 avian infectious bronchitis virus glycopolypeptide.” Journal of General Virology 73(1992): 591-596.
Kapczynski, D.R. and T.M. Tumpey. “Development of a virosome vaccine for Newcastle disease virus.” Avian Diseases 47(2003): 578-587.
Karaca, K., S. Naqi and J. Gelb. “Production and characterization of monoclonal antibodies to three IBV serotypes.” Avian Diseases 39(1992): 903-915.
Karousou, R. “Taxonomic studies on the Cretan Labiatae: Distribution, morphology and essential oils.” PhD Thesis, University of Thessaloniki, Thessaloniki (1995):12-15.
Kavimani, S. “Anti-inflammatory activity of the volatile oil of Toddalia asiatica.” Ind. J. Pharmaceut. Sci. 58(1996): 67-70.
Keck L.D., J.K. Skeeles, and R.W. McNew. “Antibody detection in matched chicken sera and egg yolk samples by commercial enzyme-linked Immunosorbant assay kits for Newcastle disease virus, infectious bronchitis virus, infectious bursal disease virus, and avian reovirus”. Avian Diseases 37(1993): 825-828.
Keeling, L. J., B.O. Hughes and P. Dun. “Performance of free-range laying hens in a polythene house and their behavior on range.” Farm Building Progress 94(1988): 21-28.
Kelly, P.G., D. Chitauro, C. Rohde, J. Rukwava, A. Majok, F. Davelaar and P.R. Mason. “Disease and management of backyard flocks in Chitungwiza, Zimbabwe.” Avian Diseases 36(1994): 626-629.
Keppler, C., U. Blِter-Schnurrenberger and D.W. Flِsch. “Chickens: Activity and Social Relationships.” Paper presented at the 11th IFOAM conference, Copenhagen (August 1996): 32-36.
Kikuzaki, H. and N. Nakatani. “Structure of a new antioxidative phenolic acid from oregano (Origanum vulgare L.).” Agric. and Biol. Chem. 53(1989): 519-524.
Kim, H.M. and S.H. Cho. “Lavender oil inhibits immediate type allergic reaction in mice and rats.” J. Pharm. Pharmacol. 51(1997): 221-226.
King, D.J. and S.R. Hopkins. “Evaluation of the Hemagglutination-Inhibition test for measuring the response of chickens to avian IBV vaccination.” Avian Diseases 27(1983): 100-112.
Kock, G., L. Hartog, A. Kant and D.J. van Roozelaar. “Antigenic domains on the peplomer protein of avian infectious bronchitis virus: correlation with biological functions.” Journal of General Virology 71(1990): 1929-1935.
Kokkini, S. and D. Vokou. “Carvacrol-rich plants in Greece.” Flavor Fragrance J. 4(1989): 1-7.
118
Kokkini, S., D. Vokou and R. Karousou. “Essential oil yield of Lamiaceae plants in Greece.” Biosciences 3(1989): 5-12.
Kokkini, S., D. Vokou and R. Karousou. “Morphological and chemical variation of Origanum vulgare L. in Greece.” Bot. Chron. 10(1991): 337-346.
Lagouri, V., G. Blekas, M. Tsimidou, S. Kokkini and D. Boskou. “Composition and antioxidant activity of essential oils from oregano plants grown wild in Greece.” Z. Lebensm. Unters. Forsch 197(1993): 20-23.
Lamb, R.A., B.W.J. Mahy and P.W. Choppin. “The synthesis of Sendai virus polypeptides in infected cells”. Virology 69(1976): 116-131.
Lampkin, N. “Organic poultry production.” Welsh Institute of Rural Studies, University of Wales, Aberystwyth (1997): 55-58.
Lancaster, J.E. “Newcastle disease-pathogenesis and diagnosis.” World’s Poult. Sci. J. 37(1981): 26-33.
Lawrence, B.M. 1984. “The botanical and chemical aspects of oregano.” Perfumer and Flavorist 9(1984): 41-51.
LisBalchin, M. and S. Bart. “Studies on the mode of action of the essential oil of lavender (Lavandula angustifolia P. Miller).” Phytother. Res. 13(1999): 540-542.
Lomniczi, B. “Studies on interferon production and interferon sensitivity of different strains of Newcastle disease virus.” J. Gen. Virol. 21(1973): 305-313.
Lukert, P.D. “A plaque reduction method for the detection of neutralizing antibodies for IBV.” Avian Diseases 10(1966): 305-313.
Maftei, M. “Dry culinary herbs: an overview of selected western European markets.” Plantes aromatiques et medicinales (N. Verlet, ed.). C.F.P.P.A. de Nyons Pub. 3rd Int. Symp. on Aromatic and Medicinal Plants, Nyons, France (1992): 249-287.
Marquardt, W.W., S.K. Kadavil and D.B. Snyder. “Comparison of ciliary activity and virus recovery from tracheas of chickens and humoral immunity after inoculation with serotypes of avian IBV.” Avian Diseases 26(1982): 828-834.
Marquart, W.W., D.B. Snyder and B.A. Schlotthober. “Detection and quantification of antibodies of IBV by the Enzyme-Linked Immunosorbant Assay.” Avian Diseases 25(1981): 713-722.
Mathews, R.E.F. “Classification and nomenclature of viruses.” Third Report of the International Committee on Taxonomy of Viruses (1979): 216-218.

119
Mattsson, E., H. Herwald, H. Cramer, K. Persson, U. Sjobring and L. Bjorck. “Staphylococcus aureus induces release of bradykinin in human plasma.” Infection and Immunity 69(2001): 3877-3882.
McBride, M.D., D.W. Hird, T.E. Carpenter, K.P. Snipes, C. Danaye-Elmi, and W.W. Utterback. Health survey of backyard poultry and other avian species located within one mile of commercial Californian meat-turkey flocks. Avian Diseases 35(1991): 403-407.
McFerran, J.B.H. “Newcastle Disease Virus.” Diseases of poultry 9th ed., Iowa State Univ. Press, Ames, Iowa, U.S.A. (1999): 573-582.
McGowan, J.J., S.U. Emerson and R.R. Wagner. “The plus-strand leader RNA of VSV inhibits DNA-dependent transcription of adenovirus and SV40 genes in a soluble whole cell extract”. Cell 28(1982): 325-333.
McIntosh, K., J.H. Dees, W.B. Becker, A.Z. Kapikian and R.M Chanock.” Proc. Natl. Acad. Sci. 57(1967): 933-940.
McMillan, B.C. and R.P. Hanson. “Differentiation of exotic strains of Newcastle disease virus by oligonucleotide fingerprinting.” Avian Diseases 26(1982): 332-339.
Merz D.C., A. Scheid, P.W. Choppin. “Importance of antibodies to the fusion glycoprotein of paramyxoviruses in the prevention of spread of infection”. J. Exp. Med. 151(1980): 275-288.
Miller, T.M. “Effect of some components of the essential oil of chamomile, Chamomilla recutita, on histamine release from rat mast cells.” Planta. Med. 62(1996): 60-61.
Mockett, A.P.A., D. Cavanagh and T.D.K. Brown. “Monoclonal antibodies to the S1 spike and membrane proteins of avian infectious bronchitis coronavirus strain Massachusetts M41.” Journal of General Virology 65(1984): 2281-2286.
Montezuma-De-Carvalho, J., J. Paiva, M. Pimenta and M. Celestina. “Effect of cold storage on seed viability of aromatic plants from the Portuguese flora.” Proceedings of Eucarpia International Symposium on Conservation of Genetic Resources of Aromatic and Medicinal Plants, Oeiras, Portugal (1984): 111-116.
Moretti, M.D. “A study on anti-inflammatory and peripheral analgesic action of Salvia sclaria oil and its main components.” J. Essent. Oil Res. 9(1997): 199-204.
Morfeldt, E., L. Janzon, S. Arvidson and S. Lofdahl. “Cloning of a chromosomal locus (exp) which regulates the expression of several exoprotein genes in Staphylococcus aureus.” Mol. Gen. Genet. 211(1988): 435-440.
120
Morita, M. “Structures and spasmolytic activities of derivatives from sesquiterpenes of Alpinia speciosa and Alpinia japonica.” Chem. Pharm. Bull. 44(1996): 1603-1606.
Murayama, M. and K.K. Kumaroo. “Inhibition of ex vivo aggregation of human platelets induced by decompression during reduced barometric pressure.” Thrombosis Res. 42(1986): 511-516.
Nagai, Y., K.Shimokata, T. yoshida, M. Hamaguchi, M. Linuma, K. Maeno, T. Matsumoto, H. Klenk and R. Rott. J. Gen. Virol. 45(1979): 263-272.
Nagai, Y., M. Hamaguchi, and T. Toyoda. “Molecular biology of Newcastle disease virus”. Prog. Vet. Microbiol. Immunol. 5(1989): 16-64.
Nakamura, C.V., T. Ueda-Nakamura, E. Bando, A.F.N. Melo, D.A.G. Cortez and B.P.D. Filho. “Antibacterial activity of Ocimum gratissimum L. essential oil.” Mem Inst OswaldoCruz 94(1999): 675-678.
Nakatani, N. and H. Kikuzaki. “A new antioxidative glucoside isolated from oregano (Origanum vulgare L.).” Agric. and Biol. Chem. 51(1987): 2727-2732.
Neufeld, L. “Consumer preferences for organic/free-range chicken.” Department of Agricultural Economics, Kansas State University (2002): 9-13.
Nguyen, U., G. Frakman and D.A. Evans. “Process for extracting antioxidants from Labiatae herbs.” United States Patent, US 5 017 397 (1991): 85-92.
Nicol, C. J., N.G. Gregory, T.G. Knowles, I.D. Parkman and L.J. Wilkins. “Differential effects of increased stocking density, mediated by increased flock size, on feather pecking and aggression in laying hens.” Applied Animal Behavior Science 65(1999): 137-152.
Nostro, A., A.R. Blanco, M.A. Cannatelli, V. Enea, G. Flamini, I. Morelli, A.S. Roccaro and V. Alonzo. “Susceptibility of methicillin-resistant staphylococci to oregano essential oil, carvacrol and thymol.” FEMS Microbiology Letters 230(2004): 191-195.
Padulosi, S., “Oregano.” International Plant Genetic Resources Institute (1997): 122-130.
Panizzi, L. and M. Pinzauti. “The use of propolis in atmospheric disinfection.” Demetra 13(1989): 11-13.
Paster, N., B.J. Juven, E. Shaaya, M. Menasherov, R. Nitzan, H. Weisslowicz and U. Ravid. “Inhibitory effect of oregano and thyme essential oils on moulds and foodborne bacteria.” Letters in Appl. Microbiol. 11(1990): 33-37.

121
Paster, N., M. Menasherov, U. Ravid and B. Juven. “Antifungal activity of oregano and thyme essential oils applied as fumigants against fungi attacking stored grain.” J. Food Protection 58(1995): 81-85.
Peeples, M.E. “Paramyxovirus M proteins: pulling in all together and taking it on the road.” In D.W. Kingsbury, The paramyxoviruses. Plenum Publishing Corporation, New York. (1991): 427-465.
Peeples, M.E., C. Wang, K.C. Gupta and N. Coleman. “Nuclear entry and nucleolar localization of the Newcastle disease virus (NDV) matrix protein occur early in infection and do not require other NDV proteins.” Journal of Virology 66(1992): 3263-3269.
Peng, H.L., R.P. Novick, B. Kreiswirth, J. Kornblum and P. Schlievert. “Cloning characterization, and sequencing of an accessory gene regulator (agr) in Staphylococcus aureus.” J. Bacteriol. 170(1988): 4365-4372.
Permin, A. and P. Nansen. “Parasitological problems in organic poultry production.” Danish Institute of Animal Science, Tjele, Denmark 729(1996): 91-96.
Permin, A., M. Bisgaard, F. Frandsen, M. Pearman, J. Kold and P. Nansen. “Prevalence of gastrointestinal helminths in different poultry production systems.” British Poultry Science 40(1999): 439-443.
Perrotta, C., C. Furtek, R. A. Wilson, B.S Cowen and R.J. Eckronde. “A standardized Enzyme-Linked Immunosorbant Assay for infectious bronchitis virus: comparison with Hemagglutination-Inhibition and Virus-Neutralization assays for measuring protective antibody levels in chickens.” Avian Diseases 32(1988): 451-460.
Peters, C. and Y. Paterson. “Enhancing the immunogenicity of bioengineered Listeria monocytogenes by passing through live animal hosts”. Vaccine 21(2003): 1187-1194.
Raggi, L.G., G.G. Lee and V. Sohrab-Haghighat. “Infectious bronchitis virus interference with growth of Newcastle disease virus.” Avian Diseases 7(1963): 106-122.
Rahaley, R.S., S.M. Dennis and M.S. Smeltzer. “Comparison of the enzyme-linked Immunosorbant assay and complement fixation test for detecting Brucella ovis antibodies in sheep.” Vet. Rec. 113(1983): 470-476.
Ramraj, P., K. Alagumalai and C.S.S. Hepziba. “Effect of leaf extract of Origanum vulgare (Fam. Lamiaceae) on the hatching of eggs of Meloidogyne incognita.” Indian J. Nematology 21(1991): 56-157.
Randall, R.E., D.F. Young and J.A Southern. “Immunization with solid matrix-antibody-antigen complexes containing surface and internal virus structural
122
proteins protects mice from infection with the paramyxovirus, simian virus 5.” J. Gen. Virol 69(1988): 2517-2526.
Reinoso, E., G. Magnano, J. Giraudo, A. Calzolari and C. Bogni. “Bovine and rabbit models for the study of a Staphylococcus aureus avirulent mutant strain, RC122.” The Canadian Journal of Veterinary Research 66(2002): 285-288.
Reynolds, D.L. and A.D. Maraqa. “Protective immunity against Newcastle disease: the role of antibodies specific to Newcastle disease virus polypeptides.” Avian Diseases 44(2000): 138-144.
Roderick, S. and M. Hovi. “Animal Health and Welfare in Organic Livestock Systems: Identification of Constraints and Priorities.” A report to the Ministry of Agriculture, Fisheries and Food, University of Reading (1999): 6-9.
Roderick, S., N. Short and M. Hovi. “Organic Livestock Production.” Animal Health and Welfare Research Priorities. Technical Report - VEERU, University of Reading (1996): 29-33.
Römer-Oberdörfer, A., O. Werner, J. Veits, T. Mebatsion and T.C. Mettenleiter. “Contribution of the length of the HN protein and the sequence of the F protein cleavage site to Newcastle disease virus pathogenicity”. Journal of General Virology 84(2003): 3121-3129.
Rosenbach, F.J. “Microorganismen bei den Wund-Infections-Krankheiten des Meshed.” J.F. Bergmann, Wiesbaden, (1884): 1-122.
Rott, R. “NDV: an evolving pathogen.” Avian Paramyxoviruses, In R.P. Hanson (ed.) Univ. Wisconsin Press, Madison (1964): 133-146.
RSPCA. “Freedom Food: The RSPCA welfare standards for laying hens and chickens.” RSPCA, Horsham (1995): 55-62.
Ruberto, G., D. Biondi, R. Mel and M. Piattelli. “Volatile flavor components of Sicilian Origanum onites L.” Flavor Fragrance J. 8(1993): 197-200.
SA. “Standards for organic food and farming.” Soil Association Organic Marketing Co. Ltd., Bristol (1996): 16-29.
Saeed, S.H. and A.H. Gilani. “Antithrombotic activity of clove oil.” J. Pak. Med. Assoc. 44(1994): 112-115.
Salman, M.D., K.D.C. Stärk and C. Zepeda. “Quality assurance applied to animal disease surveillance systems.” Rev. sci. tech. Off. int. Epiz. 22(2003): 689-696.
Sawabe, A. and T. Okamoto. “Natural phenolics as antioxidants and hypotensive materials.” Bulletin of the Institute for Comprehensive Agricultural Sciences, Kinki University 2(1994): 1-11.

123
Schelling, E., B. Thür., C. Griot and L. Audigé. “Epidemiological study of Newcastle disease in backyard poultry and wild bird populations in Switzerland”. Avian Pathyology 28(1999): 263-272.
Schwalbe, J.C. and L.E. Hightower. “Maturation of the envelope glycoproteins of Newcastle disease virus on cellular membranes.” J. Virol. 41(1982): 947-957.
Schwartz, J.C. “Histamine in bloom.” Eds. Bloom, F.E. and Kupter, P.J. Psychopharmacology: the fourth generation of progress. Raven, New York (1994): 14-17.
Scortichini, M. and M.P. Rossi. “In vitro activity of some essential oils toward Erwinia amylovora.” Acta Phytopathologica et Entomologica Hungarica 24(1989): 423-431.
Scortichini, M. and M.P. Rossi. “In vitro behaviour of Erwinia amylovora towards some natural products showing bactericidal activity.” Acta Hort. 338(1993): 191-198.
Seo, S.H., L. Wang, R. Smith and E.W. Collisson. “The carboxyl-terminal 120-residue polypeptide of infectious bronchitis virus nucleocapsid induces cytotoxic T lymphocytes and protects chickens from acute infection.” Journal of Virology 71(1997): 7889-7894.
Shaaya, E., U. Ravid, N. Paster, B. Juven, U. Zisman and V. Pissarev. “Fumigant toxicity of essential oils against four major stored- product insects.” J. Chem. Ecol.17(1991): 499-504.
Sharma, J.N. “Effects of eugenol and ginger oil on adjuvant arthritis and kallikreins in rats.” Asia Pac J. Pharmacol. 12(1997): 9-14.
Shimoni, M., R. Reuveni and U. Ravid. “Growth inhibition of plant pathogenic fungi by essential oils.” Hassadeh 74(1993): 306-308.
Siddell, S.G., H. Wege and V. Ter Meulen. “The biology of coronaviruses”. Journal of General Virology 64(1983): 761-776.
Sivropoulou, A., E. Papanicolaou, C. Nikolaou, S. Kokkini, T. Lanaras and M. Arsenakis. “Antimicrobial and cytotoxic activities of Origanum essential oils.” J. Agric. Food Chem. 44(1996): 1202-1205.
Skwarek, T., Z. Tynecka, K. Glowniak and E. Lutostanska. “Plant inducers of interferons.” Herba Polonica 40(1994): 42-49.
Sneed, L., G. Butcher, L. Wang, R. Parr and E.W. Collisson. “Comparisons of the structural proteins of avian bronchitis virus as determined by western blot analysis. Viral Immunol. 2(1989): 221-227.

124
Snyder, D.B., W.W. Marquart and S.K. Kadavil. “Ciliary activity: a criterion for associating resistance to IBV infection with Enzyme-Linked Immunosorbant Assay antibody titer.” Avian Diseases 27(1983): 485-490.
Snyder, D.B., W.W. Marquart, E.T. Malinson, P.K. Savage and D.C. Allen. “Rapid serological profiling by Enzyme-Linked Immunosorbant Assay III. Simultaneous measurements of antibody titers to infectious bronchitis, infectious bursal disease and Newcastle disease viruses in a single serum dilution.” Avian Diseases 28(1984): 12-24.
Somerville, G.A., S.B. Beres, J.R. Fitzgerald, F.R. Deleo, R.L. Cole, J.S. Hoff and J.M. Musser. “In vitro serial passage of Staphylococcus aureus: Changes in physiology, virulence factor production, and agr nucleotide sequence.” Journal of Bacteriology 184(2002): 1430-1437.
Spalatin, J., R.P. Hanson and P.D. Beard. “The hemagglutination-elution pattern as a marker in characterizing Newcastle disease virus.” Avian Diseases 14(1970): 542-549.
Stern, D.F. and B.M. Safton. “Coronavirus multiplication; locations of genes for virion proteins on the avian infectious bronchitis virus genome”. Journal of Virology 50(1984): 22-29.
Stern, D.F. and B.M. Sefton. “Coronavirus proteins: biogenesis of avian coronavirus bronchitis virus.” J. Virol. 44(1982): 794-803.
Stern, D.F. and S.I.T. Kennedy. “Coronavirus multiplication strategy. II. Mapping the avian infectious bronchitis virus intracellular RNA species to the genome.” J. Virol. 34(1980): 665-674.
Stone-Hulslander, J. and T.G. Morison. “Detection of an interaction between the HN and F proteins in NDV-infected cells.” Journal of Virology 71(1997): 6287-6295.
Swarbrick, O. “Clinical problems in 'free range' layers.” Veterinary Record 118(1986): 13, 363.
Takacsova, M., A. Pribela and M. Faktorova. 1995. “Study of the antioxidative effects of thyme, sage, juniper and oregano.” Nahrung 39(1995): 241-243.
Takimoto, T., T. Bousse and A. Portner. “Molecular cloning and expression of human parainfluenza virus type 1 L gene”. Virus Research 70(2000): 45-53.
Tantaoui-Elaraki, A., F. Ferhout and A. Errifi. “Inhibition of the fungal asexual reproduction stages by three Moroccan essential oils.” J. Essential Oil Res. 5(1993): 535-545.
Taylor, B.A. “Inhibitory effect of peppermint oil on gastrointestinal smooth muscle.” Gut 24(1983): 992-996.

125
Thayer, S.G. and C.W. Beard. “Serological procedures. In: A laboratory manual for the isolation and identification of avian pathogenesis.” 4th ed., The American Association of Avian Pathologists (1998): 25-28.
Todar, K. “Staphylococcus.” Todar’s online textbook of bacteriology, University of Wisconsin-Madison, Department of Bacteriology (2004): 5-12.
Tomley, F.M, A.P.A. Mockett, M.E.G. Boursnell, M.M. Binns, J.K.A. Cook, T.D.J. Brown and G.L. Smith. “Expression of the IBV spike protein by recombinant vaccinia virus and induction of neutralizing antibodies in vaccinated mice.” J. Gen. Virol 68(1987): 2291-2298.
UKROFS. “UKROFS standards for organic food production.” UK Register of Organic Food Standards, MAFF, London (1996): 5-15.
Vahidy, R., M. Waseem and S.M. Khalid. “A comparative study of unpassaged and animal passaged cultures of Listeria monocytogenes in rabbits”. Ann Acad Med Singapore 25(1996): 139-553.
Van Den Broucke, C.O. and J.A. Lemli. “Antispasmodic activity of Origanum compactum.” Planta Med. 45(1982): 188-190.
Van Eck, J.H.H., R.F.G. Davlaar, T.A.W. van den Heuvelplasman, N. Vankol, B. Kouwenhoxen and F.H.M. Guldie. “Dropped egg production, soft shelled and shell-less eggs associated with appearance of precipitins to adenovirus in flocks of laying fowl.” Avian Pathology 5(1976): 261-272.
Van Rockel, H., K.L. Bullis, M.K. Clarke, O.M. Olesuik and F.G. Sperling. “Commercial storage of fruits and vegetables.” Mass. Agric. Exp. Stn. Bull. 460(1950): 1-47.
Vekiari, S.A., V. Oreopoulou, C. Tzia and C.D. Thomopoulos. “Oregano flavonoids as lipid antioxidants.” J. Am. Oil Chemists Soc. 70(1993): 483-487.
Vokou, D., S. Kokkini and J.M. Bessiere. “Geographic variation of Greek Oregano (Origanum vulgare ssp. hirtum) essential oils.” Biochem. Syst. Ecol. 21(1993): 287-295.
Vokou, D., S. Kokkini and J.M. Bessiere. “Origanum onites (Lamiaceae) in vulgare (Fam. Lamiaceae) on the hatching of eggs of Meloidogyne incognita.” Indian J. Nematology 21(1991): 56-157.
Wagner, R.R. and J.K. Rose. “Rhabdoviridae: the viruses and their replication”. In: Fields B.N., Knipe D.M., and Howley P.M. (Eds.), Fields Virology. Lappincott-Raven, Philadelphia, PA, (1996): 1121-1135.
Walker, J.W., B.R. Heron and M.A. Mixson. “Exotic Newcastle disease eradication programme in the United States.” Avian Diseases 17(1973): 486-503.
126
Williams, A.K., L. Wang, L.W. Sneed and E.W. Collisson. “Comparative analysis of the nucleocapsid genes of several strains of infectious bronchitis virus and other coronaviruses.” Virus Res. 25(1992): 213-222.
Wilsmore, A.J., B.C. Wilsmore, G.J.R. Dagnall, K.A. Izzard, R.M. Woodland, M. Dawson and C. Venables. “Clinical and immunological responses of ewes following vaccination with an experimental formalin-inactivated Chlamydia psittaci (ovis) vaccine and subsequent challenge with the live organism during pregnancy.” Br. Vet. J. 146(1990): 341-348.
Wunderwald, C., and R.K. Hoop. “Serological monitoring of 40 Swiss fancy breed poultry flocks”. Avian Pathology 31(2002): 157-162.
Yamaguchi, S., T. Imada and H. Kawamura. “Outbreaks of egg drop syndrome virus in Japan and its etiological agent.” Avian Diseases 25(1980): 628-640.
Zaitsev, V., M. von Itzstein, D. Groves, M. Kiefel, T. Takimoto, A. Potrner and G. Taylor. “Second sialic acid binding site in Newcastle disease virus Hemagglutinin-Neuraminidase: implications for fusion.” Journal of Virology 78(2004): 3733-3741.
Zanella, A., P. Dall’Ara and P.A. Martino. “Avian influenza epidemic in Italy due to Serovar H7N1.” Avian Diseases 45(2001): 257-261.
Zheng, G. “Potential anticarcinogenic natural products isolated from lemongrass oil and galanga root oil.” J. Agric. Fd. Chem. 41(1993): 152-156.