Influenza Vaccines for Older Adults - CDC Presentation
65
National Center for Immunization & Respiratory Diseases Influenza Vaccines for Older Adults Lisa Grohskopf Vaccine Policy Unit Epidemiology and Prevention Branch Influe nza Division, NCIRD, CDC Advisory Committee on Immunization Practices (ACIP) 12 January 2022
-
Upload
khangminh22 -
Category
Documents
-
view
0 -
download
0
Transcript of Influenza Vaccines for Older Adults - CDC Presentation

National Center for Immunization & Respiratory Diseases
Influenza Vaccines for Older Adults
Lisa GrohskopfVaccine Policy UnitEpidemiology and Prevention BranchInfluenza Division, NCIRD, CDC
Advisory Committee on Immunization Practices (ACIP)12 January 2022

AcknowledgementsInfluenza DivisionElif AlyanakNoreen AlabiLenee BlantonLynnette BrammerAlicia BuddJessie ChungVivien DuganJill FerdinandsBrendan FlanneryAlicia FryKrista KnissManish PatelMelissa RolfesTim Uyeki
Immunization Safety OfficeKaren BroderFrank DestefanoAnamika DuaPenina HaberTom Shimabukuro
Immunization Services DivisionSam GraitcerAndrew KrogerAmy Parker FiebelkornJeanne Santoli

Overview
Burden of influenza among older adults (ages 65 years and older).
Influenza vaccine efficacy/effectiveness among older adults.
Challenges in comparing influenza vaccines.
Systematic review—overview of retrieved literature.
3

Burden of Influenza Among Older Adults

Surgeon General’s Recommendation for Influenza Immunization—United States, 1960Burney LE, Public Health Reports, October 1960, Vol. 75(10), page 944.
5

Cumulative Influenza Hospitalizations per 100,000 Population by MMWR Week—FluSurv-NET, 2016-17 through 2019-20 Seasons
2017-18
2018-19
2016-17Source:CDC,FluSurv-NET(FluView Interactive)
2019-20
6
≥65 years
≥65 years
≥65 years
≥65 years
200 240
350500

Cumulative Influenza Hospitalizations per 100,000 Population by MMWR Week—FluSurv-NET
Ages ≥65yrs, H3N2- vs H1N1pdm09-predominant seasons
Source: CDC FluSurv-NET (FluView Interactive) 7
2017-18: H3N2, B/Yamagata
2014-15: H3N2, B/Yamagata2016-17: H3N2, B/Yamagata
2019-20: H1N1pdm09, B/Victoria
2013-14: H1N1pdm092015-16: H1N1pdm09, mixed B
2018-19: early H1N1pdm09, late H3N2

Influenza Vaccine Efficacy/Effectiveness Among Older Adults

Influenza Vaccine Effectiveness is Generally Lower Among Older Adults than Younger Age Groups
Season Predominant viruse(s) Overall VE, %(all ages, viruses,
and vaccine types)
≥65 yrs(all viruses and vaccine types)
2019-20 H1N1pdm09, B/Victoria 39 (32, 44) 39 (9, 59)
2018-19 early H1N1pdm09, late H3N2 29 (21, 35) 12 (-31, 40)
2017-18 H3N2, B/Yamagata 38 (31, 43) 17 (-14, 39)
2016-17 H3N2, B/Yamagata 40 (32, 46) 20 (-11, 43)
2015-16 H1N1pdm09, mixed B 48 (43 55) 42 (6, 64)
2014-15 H3N2, B/Yamagata 19 (10, 27) 32 (3, 52)
2013-14 H1N1pdm09 52 (44, 59) 50 (16, 71)
2012-13 H3N2 49 (43, 55) 26 (-10, 50)
2011-12 H3N2, mixed B 47 (36, 56) 43 (-18, 72)Source: CDC, U.S. Flu VE Network, https://www.cdc.gov/flu/vaccines-work/past-seasons-estimates.html 9

Influenza Vaccines by Age Indication—United States, 2021–22 Influenza Season
Vaccine type 0 through 6mos
6 through 23 mos
2 through 17 yrs
18 through 49 yrs
50 through 64 yrs
≥65 yrs
IIV4s Standard-dose, unadjuvantedinactivated(IIV4)
Afluria QuadrivalentFluarix QuadrivalentFluLaval QuadrivalentFluzone Quadrivalent
Cell culture-based inactivated (ccIIV4)
Flucelvax Quadrivalent
Adjuvanted inactivated (aIIV4)
Fluad Quadrivalent
High-dose inactivated (HD-IIV4)
Fluzone High-Dose Quadrivalent
RIV4 Recombinant(RIV4)
Flublok Quadrivalent
LAIV4 Live attenuated(LAIV4)
FluMist Quadrivalent
IIV4=quadrivalent inactivated influenza vaccine, RIV4=quadrivalent recombinant influenza vaccine, LAIV4=quadrivalent live attenuated influenza vaccine, mos=months, yrs=years
Egg-based Not egg-basedNot approved for age group 10

High-dose Inactivated Influenza Vaccine: HD-IIV3 (Fluzone High-Dose) and HD-IIV4 (Fluzone High-Dose Quadrivalent)
11
HD-IIV3 approved in 2009; replaced with HD-IIV4 in 2020-21 .
Contains four times the quantity of hemagglutinin per vaccine virus compared with standard-dose inactivated vaccines (60 µg vs. 15 µg).
HD-IIV3 demonstrated superior efficacy to standard-dose Fluzone in a randomized trial conducted among 32,000 participants ages ≥65 years over 2011-12 and 2012-13 seasons.
HD-IIV4 demonstrated noninferior immunogenicity to HD-IIV3 for the three viruses common to both vaccines, and superior immunogenicity to the additional influenza B viruses not present in the trivalent comparators.

MF59-Adjuvanted Inactivated Influenza Vaccine: aIIV3 (Fluad) and aIIV4 (Fluad Quadrivalent)
12
aIIV3 approved in the US in 2016; in use in Europe as early as 1997.
aIIV4 approved in 2020; quadrivalent is available as of 2020-21.
Contains the lipid-in water adjuvant, MF59.
Quadrivalent (aIIV4) demonstrated favorable safety compared with Tdap in a randomized trial of 6,740 persons ages ≥65 years over two seasons (Northern hemisphere 2016-17 and Southern Hemisphere 2017).
• Primary efficacy endpoints were not met (88% of viruses from culture-confirmed influenza cases in the aIIV4 arm were antigenically mismatched).
• Efficacy higher against illness defined by higher fever.

Recombinant Influenza Vaccine: RIV3 (Flublok) and RIV4 (Flublok Quadrivalent)
13
RIV3 approved in 2013; RIV4 approved in 2017.
Only RIV4 available since 2018-19.
Contains 45 µg/virus recombinant hemagglutinin (no viruses or eggs used).
RIV4 demonstrated efficacy relative to SD-IIV4 in a randomized study conducted among ~8600 persons ages ≥50 years over one season (2014-15).

ACIP Recommendations Concerning Influenza Vaccines for Older Adults
Provide descriptive summary of efficacy and effectiveness data.
• There are studies supporting relative benefits for each; number, size, and designs vary.
• Comparisons among these three vaccines against lab-confirmed outcomes are limited.
• Most accumulated evidence focuses on HD-IIV3 and aIIV3 (which are now exclusively available as quadrivalent formulations).
No preference is expressed for any one vaccine over another; any IIV or RIV is appropriate.
Vaccination should not be delayed to find a specific vaccine when an appropriate one is available.
14

Challenges in Comparing Influenza Vaccines

Influenza Vaccine Efficacy and Effectiveness (VE) Vary
Viral factors:– Circulating virus types and subtypes– Constant mutations and varying degree of match each season– Neither of these can be predicted ahead of the season
Host factors:– Age/immunosenesence– Chronic medical conditions– Past influenza illnesses/exposures– Previous vaccination history
16

Izurieta et al analyses of CMS data– 12-13 million people aged ≥65 years each season.– Analyses comparing multiple vaccine types.– VE against influenza-associated hospital encounters (inpatient stays
and ER visits), defined by ICD influenza codes.
Relative VE (rVE) of Influenza Vaccines Compared to One Another Varie
17
Relative VE compared with egg-based SD-IIV4Vaccine 2017-18 2018-19 2019-20HD-IIV3 9.0 (7.2, 10.6) 4.9 (1.7, 8.1) 6.8 (3.3, 10.1)aIIV3 3.9 (1.4, 6.3) 7.7 (3.9, 11.4) 8.2 (4.2, 12.0)RIV4 - - 13.3 (7.4, 18.9)ccIIV4 11.0 (7.9, 14.0) 0.8 (-4.6, 5.9) 2.8 (-2.8, 8.2)
Izurieta et al: JID 2019;220:1955-1964JID 2020;222:278-287CID 2021;73(11):e4251-e4259

Considerations when Reviewing Literature Data from one/a few seasons might not generalize to all/most seasons. Ideally, preference for data from high-quality, randomized studies
conducted over as many seasons as possible. Common study designs are associated with tradeoffs:
18
• More feasible to conduct over successive seasons using similar methods
Observational Studies
• More subject to biasLesser quality data• Vaccines of interest constrained by uptake
• Less subject to biasHigher quality data• Vaccines of interest not constrained by uptake
Randomized studies
• Less feasible to conduct over successive seasons (and very affected by degree of match in selected seasons)

Considerations when Reviewing Literature If observational data are also to be considered,
– More variability in study designs.– Differences in outcome definitions and analytic methods.
Some tradeoffs with main observational designs:
19
• Often lab-confirmed outcomes(more specific)
Case-control studies
• Often smaller sample sizes/event counts (e.g., hundreds to thousands)
• Potentially very large sample sizes (e .g., tens of thousands to millions)
Retrospective Cohort Studies
• Often diagnostic code-defined outcomes (less specific; potential for misclassification and bias)

Considerations Regarding Relative VE
21
100% VE
VEstandard
VEnew
Relative VE = 𝑉𝑉𝑉𝑉 𝑛𝑛𝑛𝑛𝑛𝑛 − 𝑉𝑉𝑉𝑉 𝑠𝑠𝑠𝑠𝑠𝑠𝑛𝑛𝑠𝑠𝑠𝑠𝑠𝑠𝑠𝑠
1− 𝑉𝑉𝑉𝑉 𝑠𝑠𝑠𝑠𝑠𝑠𝑛𝑛𝑠𝑠𝑠𝑠𝑠𝑠𝑠𝑠∗ 100%
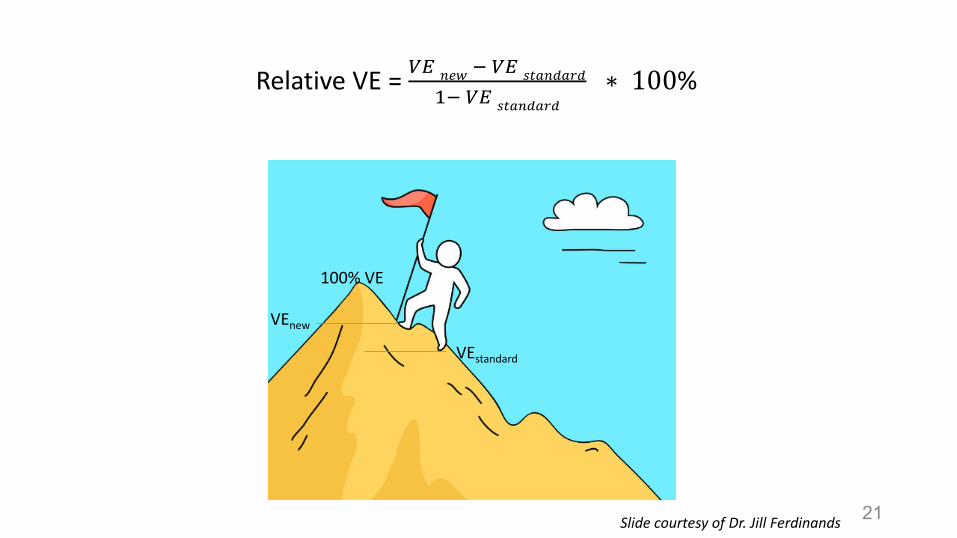
Slide courtesy of Dr. Jill Ferdinands
0.2
0.4
0.75
0.4
0.6
0.95
00.10.20.30.40.50.60.70.80.9
1
Scenario 1 Scenario 2 Scenario 3
Standard vaccine New vaccine
22Slide courtesy of Dr. Jill Ferdinands

Standard vaccine VE Relative VE New vaccine VE Absolute difference
20% 10% 28% 8%
20% 20% 36% 16%
20% 30% 44% 24%
30% 10% 37% 7%
30% 20% 44% 14%
30% 30% 51% 21%
40% 10% 46% 6%
40% 20% 52% 12%
40% 30% 58% 18%
23
Example: New vaccine VE for Ranges of Standard Vaccine VE and Relative V

Considerations for Relative VE When Baseline VE Varies
• The higher the effectiveness of the standard (comparator) vaccine, the higher the relative VE, for the same increase in absolute VE (i.e., the size of the relative VE depends on where you’re starting from)
• Difficult to compare relative VE from different seasons when VE of comparator vaccine varies by season
24Slide courtesy of Dr. Jill Ferdinands

Systematic Review of Influenza Vaccines for Older AdultsOverview of Retrieved Literature

Review Team: Elif AlyanakLenee BlantonJessie ChungJill FerdinandsLisa GrohskopfRachel Holstein
Research Librarian: Joanna Taliano
Consultant: Rebecca Morgan
26

Whether the relative benefits and harms of HD-IIV, aIIV, and RIV, as compared with one another and with other influenza vaccines, favor the use of any one or more of these vaccines over other age-appropriate influenza vaccines for persons ≥65 years of age.
Question
27

Population: Adults aged ≥65 years Interventions: Trivalent/quadrivalent high dose IIV, adjuvanted IIV, or RIV (U.S.-licensed, or
similar in formulation/manufacture to U.S.-licensed)Comparators: Other trivalent or quadrivalent influenza vaccine (U.S.-licensed, or similar in
formulation/manufacture to U.S.-licensed) Non-influenza control vaccine Placebo No vaccine
PICO—Population, Interventions, Comparators
28

Primary Outcomes: Efficacy/Effectiveness (all viral types and subtypes)
– Influenza illness– Influenza-associated outpatient/emergency visits– Influenza-associated hospitalizations– Influenza-associated deaths
Safety– Any solicited systemic adverse event (grade ≥3)– Any solicited injection site adverse event (grade ≥3)– Any serious adverse event (SAE)– Guillain-Barre syndrome
PICO—Outcomes
29

PRISMA Diagram
30

Randomized StudiesEfficacy Outcomes

Comparison Illnesses(all types/subtypes)
Medical visits(all types/subtypes)
Hospitalizations(all types/subtypes)
Deaths(all types/subtypes)
HD-IIV vs Standard-Dose Inactivated Comparator Vaccines (SD-IIV3 or SD-IIV4)HD-IIV3 vs SD-IIV3 2 2 (1 cluster randomized)HD-IIV3 vs SD-IIV4 1aIIV vs Standard-Dose Inactivated Comparator Vaccines (SD-IIV3 or SD-IIV4)aIIV3 vs SD-IIV3 2RIV vs Standard-Dose Inactivated Comparator Vaccines (SD-IIV3 or SD-IIV4)RIV3 vs SD-IIV3 1 1 (cluster randomized)RIV4 vs SD-IIV4 1HD-IIV, aIIV, and RIV vs one another
HD-IIV3 vs aIIV3 1HD-IIV3 vs RIV4 1aIIV3 vs RIV4 1HD-IIV, aIIV, and RIV vs no vaccine, placebo, or non-influenza control vaccine aIIV4 vs Tdap 1
Randomized Studies Overview—Number of Studies by Efficacy Outcome

Influenza Illness— Individually-Randomized Studies—Lab-confirmed OutcomesNumber of Studies (y-axis) and Total Participants (boxes) by Season (x-axis)
0
1
2
2006
-07
2007
-08
2008
-09
2009
-10
2010
-11
2011
-12
2012
-13
2013
-14
2014
-15
2015
-16
2016
-17
2017
-18
HD-IIV vs SD-IIV
0
1
2
2006
-07
2007
-08
2008
-09
2009
-10
2010
-11
2011
-12
2012
-13
2013
-14
2014
-15
2015
-16
2016
-17
2017
-18
aIIV vs SD-IIV2009-10: N= 762010-11: N=6,961
0
1
2
2006
-07
2007
-08
2008
-09
2009
-10
2010
-11
2011
-12
2012
-13
2013
-14
2014
-15
2015
-16
2016
-17
2017
-18
RIV vs SD-IIV2006-07: N= 8692014-15: N=8,604
0
1
2
2006
-07
2007
-08
2008
-09
2009
-10
2010
-11
2011
-12
2012
-13
2013
-14
2014
-15
2015
-16
2016
-17
2017
-18
HD-IIV vs aIIV
0
1
220
06-0
720
07-0
820
08-0
920
09-1
020
10-1
120
11-1
220
12-1
320
13-1
420
14-1
520
15-1
620
16-1
720
17-1
8
HD-IIV vs RIV
0
1
2
2006
-07
2007
-08
2008
-09
2009
-10
2010
-11
2011
-12
2012
-13
2013
-14
2014
-15
2015
-16
2016
-17
2017
-18
aIIV vs RIV2017-18: N=602017-18:N=592017-18:N=59
2009-10: N= 9,1582011-12: N=14,4972012-13: N=17,486

Influenza Illness— Individually-Randomized Studies
Paper / Year Season(s) Comparison N Outcome(s) Relative VE (95% CI)DiazGranados 2013
2009-10 HD-IIV3 vs SD-IIV3
9,158 Protocol-defined ILI, PCR-or culture-confirmed
2009-10: 12.6 (-140.5, 65.8)*
DiazGranados 2014
2011-12 and 2012-13
HD-IIV3 vs SD-IIV3
31,989 PCR-or culture-confirmed ILI due to any viral type or subtype
Protocol-defined ILI (primary)†
Modified CDC-defined ILI†
2011-12: 45.31 (6.95, 68.60)2012-13: 20.74 (4.43, 34.33)
Both seasons: 24.2 (9.7, 36.5)Both seasons: 20.6 (-4.6, 39.9)
34
HD-IIV vs. SD-IIV
* 2009 pandemic season--no cases were due to antigenically matched viruses.† Protocol defined ILI: respiratory illness with sore throat, cough, sputum production, wheezing, or difficulty breathing, concurrent
with one or more of the following: temperature >37.2°C, chills, tiredness, headaches, or myalgia. Modified CDC ILI: respiratory illness with cough or sore throat, concurrent with a temperature above 37.2°C.

Influenza Illness— Individually-Randomized Studies
35
Paper / Year Season(s) Comparison N Outcome(s) Relative VE (95% CI)Song 2013 2009-10 aIIV3 vs SD-
IIV376 ILI associated with influenza
confirmed by virologic testing)*No lab-confirmed influenza observed during follow-up.Denominators by group not provided.
Frey 2014 2010-11 aIIV3 vs SD-IIV3
6,961 ILI (symptom-defined; no lab confirmation)†
9 (-16, 29)
aIIV vs. SD-IIV
* Fever ≥ 38°C with accompanying respiratory symptoms (cough, sore throat, or coryza).† Temperature ≥37.2°C or feverishness and at least two of the following: headache, myalgia, cough, or sore throat.

Influenza Illness— Individually-Randomized Studies
36
Paper / Year Season(s) Comparison N Outcome(s) VE (95% CI)Beran 2020 NH 2016-17
SH 2017aIIV4 vs Tdap 6,740 PCR-confirmed ILI, due to any
viral type or subtype
Protocol-defined ILI (primary)* 19.8 (-5.3, 38.9)Modified CDC-defined ILI* 32.1 (10.2, 48.7)
aIIV vs. Tdap
* Protocol-defined ILI : at least one respiratory symptom (sore throat, cough, sputum production, wheezing, or difficulty breathing) concurrently with at least one systemic symptom (temperature >37.2°C, chills, tiredness, headache, or myalgia).Modified CDC-defined ILI: fever (temperature >37.2°C) with cough or sore throat.

Influenza Illness— Individually-Randomized Studies
37
Paper / Year Season(s) Comparison N Outcome(s) Relative VE (95% CI)Keitel 2009 2006-07 RIV3 vs SD-IIV3 869 ILI* associated culture-
confirmed influenzaNot calculated
RIV3: 1/436 (0.2%)SD-IIV3: 2/433 (0.5%)
Dunkle 2017 2014-15 RIV4 vs SD-IIV4 8,604 ILI† associated with PCR-confirmed influenza—
Ages ≥50 yearsAges ≥65 years
30 (10, 47)17 (-20, 43)
RIV vs. SD-IIV
* Participants asked to present for illness evaluation if they recorded an influenza symptoms score of 2 or greater on the Flu Symptoms Card (based on presence of fever, cough, sore throat, and runny nose/stuffy nose, muscle or joint aches, headache, chills/sweats, and tiredness/malaise), or if they sought medical care for their acute illness.
† At least one symptom in both the respiratory and systemic illness categories, regardless of severity.
* Ages 50 years and older.

Paper / Year Season(s) Outcome Vaccine Instances of PCR-positive ILI/N (%)
Belongia 2020* 2017-18 PCR-confirmed influenza associated with respiratory illness†
HD-IIV3aIIV3RIV4
1/29 (3.3%)3/29 (10%)4/30 (13.3%)
38
Influenza Illness — Individually-Randomized Studies
HD-IIV, aIIV, and RIV
* Ages 65 through 74.† Any two of the following seven symptoms: cough, fever/chills, stuffy/runny nose, headache, body aches/muscle aches, sore throat,
shortness of breath, or fatigue

Influenza-associated Hospitalizations— Individually- and Cluster-Randomized Studies—Number of Studies (y-axis) and Total Participants (boxes) by Season (x-axis)
0
1
2
2006
-07
2007
-08
2008
-09
2009
-10
2010
-11
2011
-12
2012
-13
2013
-14
2014
-15
2015
-16
2016
-17
2017
-18
2018
-19
HD-IIV vs SD-IIV
0
1
2
2006
-07
2007
-08
2008
-09
2009
-10
2010
-11
2011
-12
2012
-13
2013
-14
2014
-15
2015
-16
2016
-17
2017
-18
HD-IIV vs SD-IIV
0
1
2
2006
-07
2007
-08
2008
-09
2009
-10
2010
-11
2011
-12
2012
-13
2013
-14
2014
-15
2015
-16
2016
-17
2017
-18
aIIV vs SD-IIV
2016-17:N=50,0122013-14:N=38,225
2011-12: N=14,4972012-13: N=17,4862016-17-2018-19: N= 5,260
Individually-randomized studies
Cluster-randomized studies

Influenza -associated Hospitalizations —Individually-Randomized Studies
Paper / Year Season(s) Comparison N Outcome(s) Rate Ratio (95% CI)DiazGranados 2015a
2011-12 and 2012-13
HD-IIV3 vs SD-IIV3 31,989 Serious adverse events (SAEs) from DiazGranados 2014, adjudicated as possibly related to influenza
Influenza events 0.67 (0.19, 2.36)Pneumonia events 0.60 (0.45, 0.81)Asthma/Bronchial events 0.99 (0.72, 1.36)Other respiratory events 0.66 (0.42, 1.04)
Vardeny 2021 2016-17, 2017-18, and 2018-19
HD-IIV3 vs SD-IIV4 5,260(median age 66-67 yrs, IQR 58-74)
Hospitalizations adjudicated as: Primarily due to influenza
Primarily due to pneumonia
RR not calculatedHD-IIV3 10/2630 (0.4%)SD-IIV4 8/2630 (0.3%)
p=0.63HD-IIV3 47/2630 (0.2%)SD-IIV4 41/2630 (0.2%)
p=0.56
40
HD-IIV vs SD-IIV

41
aIIV vs SD-IIVPaper / Year Season(s) Comparison N Outcome(s) RR (95% CI)
McConeghy 2020 2016-17 aIIV3 vs SD-IIV3 50,012 Pneumonia and influenza-coded hospitalizations
RR: 0.80 (0.66, 0.98)
Influenza -associated Hospitalizations — Cluster-Randomized Studies
HD-IIV vs SD-IIV
Paper / Year Season(s) Comparison N Outcome(s) RR (95% CI)Gravenstein 2017 2013-14 HD-IIV3 vs SD-
IIV338,225 Pneumonia and influenza-
coded hospitalizationsRR: 0.79 (0.27, 0.95)

Data available comparing HD-IIV and RIV vs SD-IIVs against laboratory-confirmed outcomes.
Limited comparison of aIIV vs SD-IIV against laboratory-confirmed influenza outcomes.
Comparisons of HD-IIV, aIIV, and RIV with one another limited to one small study, as an exploratory endpoint.
Within each vaccine comparison, limited number of seasons represented. Limited data on efficacy against severe influenza outcomes (e.g.,
hospitalization due to influenza);.• No data on laboratory-confirmed hospitalizations. • Estimates from individually randomized studies does not come from
primary analyses.
Randomized Studies—Efficacy Outcomes: Summary

Randomized StudiesSafety Outcomes

Randomized Studies Overview—Number of Studies by Safety OutcomeComparison Any injection site AE
grade ≥3Any solicited systemic AE
grade ≥3Any SAE Guillain Barre syndrome
HD-IIV vs Standard-Dose Inactivated Comparator Vaccines
HD-IIV3 vs SD-IIV3 2 2 6 1
HD-IIV3 vs SD-IIV4 1 1 2 1
aIIV vs Standard-Dose Inactivated Comparator VaccinesaIIV3 vs SD-IIV3 3 3 7 1
aIIV3 vs SD-IIV4 1 1 1RIV vs Standard-Dose Inactivated Comparator VaccinesRIV3 vs SD-IIV3 1 1 3
RIV4 vs SD-IIV4 1 1 2HD-IIV, aIIV, and RIV vs one anotherHD-IIV3 vs aIIV3 2 2 2 1
HD-IIV3 vs RIV4 2 2 2
aIIV3 vs RIV4 1 1 1
HD-IIV, aIIV, and RIV vs no vaccine, placebo, or non-influenza control vaccine
aIIV4 vs Tdap 1
44

Any SAE—Individually Randomized StudiesHD-IIV vs SD-IIV
Paper / Year Season(s) Comparison N Events/n (%)HD-IIV
Events/n (%)SD-IIV
DiazGranados 2013 2009-10 HD-IIV3 vs SD-IIV3 9158 408/6108 (6.7) 197/3050 (6.5)DiazGranados 2014 2011-12 and
2012-13HD-IIV3 vs SD-IIV3 31,983 1323/15990 (8.3) 1442/15993 (9.0)
Falsey 2009 2006-07 HD-IIV3 vs SD-IIV3 3,781 159/2541 (6.3) 93/1240 (7.5)Keitel 2006 2001-02 HD-IIV3 vs SD-IIV3 101 3/50 (6.0) 3/51 (5.9)Nace 2015 2011-12 and
2012-13HD-IIV3 vs SD-IIV3 187 5/89 (5.6) 6/98 (6.1)
Tsang 2014 2007-08 HD-IIV3 vs SD-IIV3 639 16/320 (5.0) 21/319 (6.6)
Cowling 2020 2017-18 HD-IIV3 vs SD-IV4 1,018 10/510 (2.0%) 13/508 (2.6%)
Vardeny 2021 2016-17, 2017-18, and 2018-19
HD-IIV3 vs SD-IV4 5,210 2/2606 (0.08%) 4/2604 (0.2%)
45

Paper / Year Season(s) Comparison N Events/n (%)aIIV
Events/n (%)SD-IIV
De Bruijn 2007 2004-05 aIIV3 vs SD-IIV3 259 1/130 (0.7%) 0/129 (0%)De Donato 1999 1993-94
1994-951995-96
aIIV3 vs SD-IIV3 211* 5/248 (2.0%) 6/233 (2.6%)
Della Cioppa 2012 2008-09 aIIV3 vs SD-IIV3 91 0/47 (0%) 1/44 (2.3%)Frey 2014 2010-11 aIIV3 vs SD-IIV3 7,082 248/3545 (7.0%) 247/3537 (7.0%)Li 2008 2005-06 aIIV3 vs SD-IIV3 589 1/391 (0.2%) 0/198 (0%)Scheifele 2013 2011-12 aIIV3 vs SD-IIV3 608 15/301 (5.0%) 13/307 (4.2%)Sindoni 2009 2002-03 aIIV3 vs SD-IIV3 195 0/96 (0%) 0/99 (0%)
Cowling 2020 2017-18 aIIV3 vs SD-IIV4 1016 11/508 (2.1%) 13/508 (2.6%)
46
Any SAE—Individually Randomized StudiesaIIV vs SD-IIV
* Individuals (total 211) could be enrolled for more than one season and are counted separately for each season.

Paper / Year Season(s) Comparison N Events/n (%)RIV
Events/n (%)SD-IIV
Izikson 2015* 2012-13 RIV3 vs SD-IIV3 2,627 5/1314 (0.4%) 10/1313 (0.8%)
Keitel 2010 2006-2007 RIV3 vs SD-IIV3 869 36/436 (8.3%) 34/433 (7.9%)
Treanor 2006 Not noted RIV3 vs SD-IIV3 199 1/100 (1.0%) 1/99 (1.0%)
Cowling 2020 2017-18 RIV4 vs SD-IIV4 843 4/335 (1.2%) 13/508 (2.6%)
Dunkle 2017* 2014-15 RIV4 vs SD-IIV4 8,672 145/4328 (3.4%) 132/4344 (3.0%)
47
Any SAE—Individually Randomized StudiesRIV vs SD-IIV
* Ages 50 years and older.

Paper / Year Season(s) Comparison N Events/n (%)aIIV
Events/n (%)RIV
Cowling 2020 2017-18 aIIV3 vs RIV4 843 11/508 (2.2%) 4/335 (1.2%)
48
Any SAE—Individually Randomized Studies
aIIV3 vs RIV4
Paper / Year Season(s) Comparison N Events/n (%)HD-IIV
Events/n (%)RIV
Cowling 2020 2017-18 HD-IIV3 vs RIV4 845 10/510 (2.0%) 4/335 (1.2%)
Shinde 2020 2018-19 HD-IIV3 vs RIV4 304 6/153 (3.9%) 3/151 (2.0%)
HD-IIV3 vs RIV4
Paper / Year Published
Season(s) Comparison N Events/n (%)HD-IIV
Events/n (%)aIIV
Cowling 2020 2017-18 HD-IIV3 vs aIIV3 1018 10/510 (2.0%) 11/508 (2.2%)Schmader 2021 2017-18,
2018-19HD-IIV3 vs aIIV3 757 3/377 (0.8%) 9/378 (0.3%)
HD-IIV3 vs aIIV3

In general, no major imbalances in rates of SAEs For solicited adverse events, reporting across symptom categories i
Randomized Studies—Safety Outcomes: Summary

Observational Studies

Overview—Number of Observational Studies by OutcomeComparison Illnesses Outpatient/
ER visitsHospitalizations Inpatient/
Outpatient*Inpatient/
ER*Deaths GBS
HD-IIV, aIIV, and RIV vs Standard-Dose Inactivated Comparator VaccinesHD-IIV3 vs SD-IIV3 4 4 4 1
HD-IIV3 vs SD-IIV4 1 3 4
HD-IIV3 vs SD-IIV unspecified 1 3 1 1 1
aIIV3 vs SD-IIV3 4 2 3 1
aIIV3 vs SD-IIV4 2 3 2 5
aIIV3 vs SD-IIV unspecified 2
RIV3 vs SD-IIV3 1
RIV4 vs SD-IIV4 1
HD-IIV, aIIV, and RIV vs one anotherHD-IIV3 vs aIIV3 3 4 2 6
HD-IIV3 vs RIV4 1 1
aIIV3 vs RIV4 1 1
* Composite outcome

Outpatient-attended Illness— Observational Studies--Number of Studies by SeasonCohort studies (predominantly code -based outcome definitions)
Comparison 1998-99
2010-11
2011-12
2012-13
2013-14
2014-15
2015-16
2016-17
2017-18
2018-19
HD-IIV vs SD-IIV 2 1 1 1
aIIV vs SD-IIV 1 2
RIV vs SD-IIV
HD-IIV vs aIIV 2 1
HD-IIV vs RIV
aIIV vs RIV
Case-control studies (predominantly lab -confirmed outcome definitions)Comparison 1998-
992010-
112011-
122012-
132013-
142014-
152015-
162016-
172017-
182018-
19HD-IIV vs SD-IIV 1 1 1 1
aIIV vs SD-IIV 1
RIV vs SD-IIV
Arrows denote studies spanning multiple seasons

Hospitalizations— Observational Studies--Number of Studies by Season
Cohort studies (predominantly code -based outcome definitions)Comparison 2006-
072007-
082008-
092010-
112011-
122012-
132013-
142014-
152015-
162016-
172017-
182018-
192019-
20HD-IIV vs SD-IIV
1 2 3 3 3 2 1 2 1 1
aIIV vs SD-IIV 1 1 1 1 1 2 1 1 1
RIV vs SD-IIV 1
HD-IIV vs aIIV
HD-IIV vs RIV
aIIV vs RIV
Case-control studies (predominantly lab -confirmed outcome definitions)Comparison 2006-
072007-
082008-
092010-
112011-
122012-
132013-
142014-
152015-
162016-
172017-
182018-
192019-
20HD-IIV vs SD-IIV
1 1
aIIV vs SD-IIV
RIV vs SD-IIV

Hospitalizations— Observational Studies--Number of Studies by Season
Cohort studies (predominantly code -based outcome definitions)Comparison 2006-
072007-
082008-
092010-
112011-
122012-
132013-
142014-
152015-
162016-
172017-
182018-
192019-
20HD-IIV vs SD-IIV
1 2 3 3 3 2 1 2 1 1
aIIV vs SD-IIV 1 1 1 1 1 1 1 1 2 1 1 1
RIV vs SD-IIV 1
HD-IIV vs aIIV
HD-IIV vs RIV
aIIV vs RIV
Case-control studies (predominantly lab -confirmed outcome definitions)Comparison 2006-
072007-
082008-
092010-
112011-
122012-
132013-
142014-
152015-
162016-
172017-
182018-
192019-
20HD-IIV vs SD-IIV
1 1
aIIV vs SD-IIV
RIV vs SD-IIV
Arrows denote studies spanning multiple seasons

Paper / Year Season(s) Design Comparison N Outcome definition Relative VEBalasubramani 2020*
2015-16 through2018-19
TNCC HD-IIV3 vs SD-IIV 2,993 PCR-confirmed 18 (0, 33)
Izurieta 2015 2012-13 Retrospective cohort
HD-IIV3 vs SD-IIV3† 2,545,275 CPT for rapid test and Rx for oseltamivir
21.9 (15, 28.7)
Izurieta 2019 2017-18 Retrospective cohort
HD-IIV3 vs SD-IIV3† 9,482,899 CPT for rapid test and Rx for oseltamivir
-4.3 (-7.4, -1.3)
Izurieta 2019 2017-18 Retrospective cohort
HD-IIV3 vs SD-IIV4† 10,310,998 CPT for rapid test and Rx for oseltamivir
0.7 (-1.5, 2.9)
Shay 2017 2012-132013-14
Retrospective cohort
HD-IIV3 vs SD-IIV3 6,108,412 CPT for rapid test and Rx for oseltamivir
15.3 (9.7, 20.6)
Young-Xu 2018 2015-16 Retrospective cohort
HD-IIV3 vs SD-IIV3 230,741 ICD P&I codes 14 (-8, 32)
56
Outpatient -attended illnesses —Observational StudiesHD-IIVs vs SD-IIVs
* Influenza A only.†Comparison is vs egg-based SD-IIV P&I=pneumonia and influenza
TNCC=test-negative case control

57DRAFT—do not circulate
Outpatient -attended illnesses —Observational StudiesaIIVs vs SD-IIVs
Paper / Year Season(s) Design Comparison N Outcome definition Relative VEIob 2005 1998-99 Prospective cohort aIIV3 vs SD-IIV3* 2,966 Symptomatic definition 34 (18, 47)
Izurieta 2019 2017-18 Retrospective cohort aIIV3 vs SD-IIV3* 2,461,681 ICD influenza codes -11.9 (-15.9, -8.1)
Izurieta 2019 2017-18 Retrospective cohort aIIV3 vs SD-IIV4* 3,289,780 ICD influenza codes -6.6 (-9.7, -3.5)
Pelton 2020 2017-18 Retrospective cohort aIIV3 vs SD-IIV3* 340,804 CPT for rapid test and Rx for oseltamivir
25 (17, 32.2)
Pelton 2020 2017-18 Retrospective cohort aIIV3 vs SD-IIV4* 446,600 CPT for rapid test and Rx for oseltamivir
36.3 (31, 41.2)
Van Buynder 2013 2011-12 TNCC aIIV3 vs SD-IIV3 227 PCR-confirmed 63 (4, 86)
*Comparison is vs egg-based SD-IIV

Paper / Year Season(s) Design Comparison N Outcome(s) rVE (95% CI)Izurieta 2019 2017-18 Retrospective cohort HD-IIV3 vs aIIV3 9,955,054 CPT for rapid test
and Rx for oseltamivir
6.8 (4.6, 8.9)
Pelton 2020 2017-18 Retrospective cohort HD-IIV3 vs aIIV3 1,504,168 CPT for rapid test and Rx for oseltamivir
-19.9 (-28.2, -12.1)
Pelton 2021 2018-19 Retrospective cohort HD-IIV3 vs aIIV3 2,234,094 ICD influenza codes -7.1 (-11.5, 2.9)
58
Outpatient -attended illnesses —Observational StudiesHD-IIVs vs aIIVs

Paper / Year Season(s) Design Comparison N Outcome definition
rVE (95% CI)
Doyle 2021 2015-16, 2016-17
TNCC HD-IIV3 vs SD-IIV 1107 PCR-confirmed 27 (-1, 48)
Izurieta 2019 2017-18 Retrospective cohort HD-IIV3 vs SD-IIV3* 9,482,899 ICD influenza codes 12 (9.2, 14.8)
Izurieta 2019 2017-18 Retrospective cohort HD-IIV3 vs SD-IIV4* 10,310,998 ICD influenza codes 10 (7.8, 12.3)
Izurieta 2020 2018-19 Retrospective cohort HD-IIV3 vs SD-IIV4* 9,450,592 ICD influenza codes 5.2 (1.0, 9.3)
Izurieta 2021 2019-20 Retrospective cohort HD-IIV3 vs SD-IIV4* 8,757,884 ICD influenza codes 6.9, (2.3. 11.4)
Lu 2019 2012-132013-142014-152015-162016-172017-18
Retrospective cohort HD-IIV3 vs SD-IIV 19,922,120 ICD influenza codes 27.4 (20.2, 33.9)9.6 (-1.2, 19.3)9.6 (5.2, 13.9)5.9 (-6.3, 16.8)
10.6 (1.9, 18.5)8.2 (-0.1, 15.9)
Richardson 2015 2010-11 Retrospective cohort HD-IIV3 vs SD-IIV3 165,255 ICD P&I codes ≥65 yrs: 2 (-40, 32)≥85 yrs: 48 (8, 71)
Young-Xu 2018 2015-16 Retrospective cohort HD-IIV3 vs SD-IIV3 2,410,208 ICD P&I codes 25 (2, 43)
Young-Xu 2019 2010-11--2014-15
Retrospective cohort HD-IIV3 vs SD-IIV3 1,728,562 ICD P&I codes 14 (6. 22)
59
Hospitalizations —Observational StudiesHD-IIVs vs SD-IIVs
*Comparison is vs egg-based SD-IIV P&I=pneumonia and influenza

Paper / Year Season(s) Design Comparison N Outcome definition rVE (95% CI)Cocchio 2020 2011-12—
2016-17Retrospective cohort aIIV3 vs SD-IIV 479,397 ICD selected P&I codes 33 (25, 41)
Izurieta 2019 2017-18 Retrospective cohort aIIV3 vs SD-IIV3* 2,411,681 ICD influenza codes 4.7 (0.9, 8.3)
Izurieta 2019 2017-18 Retrospective cohort aIIV3 vs SD-IIV4* 3,289,780 ICD influenza codes 2.5 (-0.8, 5.8)Izurieta 2020 2018-19 Retrospective cohort aIIV3 vs SD-IIV4* 2,645,932 ICD influenza codes 6.5 (1.5, 11.3)Izurieta 2021 2019-20 Retrospective cohort aIIV3 vs SD-IIV4* 4,149,964 ICD influenza codes 6.8 (1.4, 11.9)
Mannino 2012 2006-07—2008-09
Retrospective cohort aIIV3 vs SD-IIV3 107,988 ICD P&I codes 25 (2, 43)
Robison 2018 2016-17 Retrospective cohort aIIV3 vs SD-IIV 47,424 PCR-confirmed 30.7 (8,48)
60
Hospitalizations —Observational StudiesaIIVs vs SD-IIVs
Paper / Year Season(s) Design Comparison N Outcome definition rVE (95% CI)
Izurieta 2020 2019-20 Retrospective cohort RIV3 vs SD-IIV4* 2,192,884 ICD influenza codes 16.8 (9, 23.8)
RIVs vs SD-IIVs
*Comparison is vs egg-based SD-IIV P&I=pneumonia and influenza

Paper / Year Season(s) Design Comparison N Outcome definition rVE (95% CI)Izurieta 2019a 2017-18 Retrospective cohort HD-IIV3 vs aIIV3 9,955,054 ICD influenza codes 7.7 (5.1, 10.2)
Izurieta 2020 2018-19 Retrospective cohort HD-IIV3 vs aIIV3 10,005,844 ICD influenza codes -1.4 (-5.4, 2.4)
Izurieta 2021 2019-20 Retrospective cohort HD-IIV3 vs aIIV3 9,738,946 ICD influenza codes 0.1 (-4.1, 4.2)
Van Aalst 20202016-17—2017-18
Retrospective cohort HD-IIV3 vs aIIV3 2,124,713 ICD respiratory codes 12 (3.3, 20)
61
Hospitalizations —Observational StudiesHD-IIVs vs aIIVs
Paper / Year Season(s) Design Comparison N Outcome definition rVE (95% CI)
Izurieta 2020 2019-20 Retrospective cohort HD-IIV3 vs RIV4 7,781,866 ICD influenza codes -11.8 (-21.1, -3.2)
HD-IIVs vs RIVs
Paper / Year Season(s) Design Comparison N Outcome definition rVE (95% CI)Izurieta 2020 2019-20 Retrospective cohort aIIV3 vs RIV4 2,173,946 ICD influenza codes -12 (-21.8, -2.8)
aIIVs vs RIVs

Compared with randomized studies,• More influenza seasons represented; • More studies which address serious influenza illness outcomes
(hospitalizations).• Limitations
• Data quality/risk of bias.• Majority of studies use diagnostic code-based outcome
definitions (indirect evidence).• These limitations can be characterized through risk of bias
assessment and GRADE.
Description of Observational Studies: Summary
62

Relatively fewer studies of RIV (particularly among the observational studies).
Few to no data for some outcomes of interest for some vaccina comparisons• E.g., no data for influenza-related deaths for either aIIVor RIV.
Most data from studies of HD-IIV and aIIVis for the trivalent versions of these vaccines, which are no longer in use, been replaced with quadrivalent formulations
Potential for missing studies/papers.
Limitations
63

Addition of any further data. Discussion of GRADE (to include randomized and observational
studies) and Evidence to Recommendations Framework at February ACIP meeting.
Next Steps
64

Thank you!