Motor Vehicles, Air Pollution, and PublicHealth - CDC stacks
Upload
khangminh22Category
view
1download
0
C ON T E N T S
PageInfluenza prevalence in the United States -_-_-__- ___ 3251Current world prevalence of communicable diseases -____-_-_-______3253Current State mortality statistics - ___-_-_-__-_________3258Court decision relating to public hcalth -___-_- __-_-_____-________ 3264Public health engineering abstracts -_-___-_____- _________ 3264Deaths during week ended November 24, 1928:
Dcath claims reported by insurance companies - ___-_-_-________ 3269Deaths in certain large cities of the United States - ___-_-____-_3270
PREVALENCE OF DISEASEUnited States:
Current weekly State rePorts-Reports for weeks ended November 24, 1928, and November 26,1927 - 3272
Summary of monthlv reports from States -_-_ -_-____3274Reciprocal notifications, October, 1928 -_-__-_-_-__3276Plague-infected ground squirrel in California -__-_-_-_ -_-_ 3276Influenza in Los Angeles, Calif -_- _-__- _3276Patients in inistitutions for the feeble-minded, April to June, 1928-- 3276General current summary and weekly reports from cities - 3278
City reports for week ended November 17, 1928 - 3278Summary of weekly reports from cities, October 14 to November
17, 1928-Rates-Coinparison with 1927 - 3286Foreign and insular:
Canada-Quebec Province-Communicable diseases-#i-Week endedNovember 17, 1928 - _------------ 3289
China-Inner Mongolia-Plague - 3289Manchuria-Communicable diseases, year 1927-28-_-______ 3290
Denmark-Communicable diseases--September, 1928 -3291Federated Malay States-Vital statistics, 1927 -_-_ __3291Great Britain-Scotland-Vital statistics-July-September, 1928 - 3291Jamaica-Communicable diseases-Six weeks ended November 10,
1928 - 3292New Zealand-Vital statistics-Comparative-Year ended March 31,
1928 and 1927 - 3292Tunisia-Tunis-Vital statistics, 1927 -3293Cholera. plague, smallpox, typhus fever, and yellow fever-
Cholera -_ 3294Plague --------------------------------- 3297
Plague rats on vessels ---- 3302Smalpox -3303Typhus fever - 3309Yellow fever -3312
Il

PUBLICHEALTH REPORTSVOL. 43 DECEMBER 7, 1928 NO. 49
INFLUENZA -PREVALENCE IN THE UNITED STATES
Reports from California have indicated an unusual prevalence ofinfluenza in that State since the middle of October. The first casesoccurred in the region around San Francisco Bay (see Public HealthReports Nov. 16, 1928, p. 3020). Later reports indicate that theepidemic has passed its peak in San Francisco, but has spread toother parts of the State.Reports of cases of influenza are incomplete, as many cases are not
reported. Sometimes a larger percentage of the cases are reportedwhen the disease is present in epidemic form than are reported whenonly a. few cases exist, but the numbers of reported cases in a com-inunity at different times give a rough index of the relative prevalenceof the disease.The following table gives the numbers of cases of influenza reported
weekly by the State of California, since October 1, 1928, comparedwith reports for the corresponding period of the years 1927 and 1926.
Corresponding II Correspondingweek week
Week ended- 1928 _Week ended- 1928
1927 1926 1927 1928
Oct.6,1928-27 23 18 Nov. 3,1928-2,389 18 12Oct. 13,1928 -34 19 15 Nov. 10, 1928 -2,59614 21Oct. 20, 1928 -_-_-_-__ 158 15 10 Nov. 17, 1928-__-____-___3,192 1117Oet. 27, 1928 -_--___-- 1,392 16 21 Nov. 24,1928 -4,__ _ _ 4,843 2118
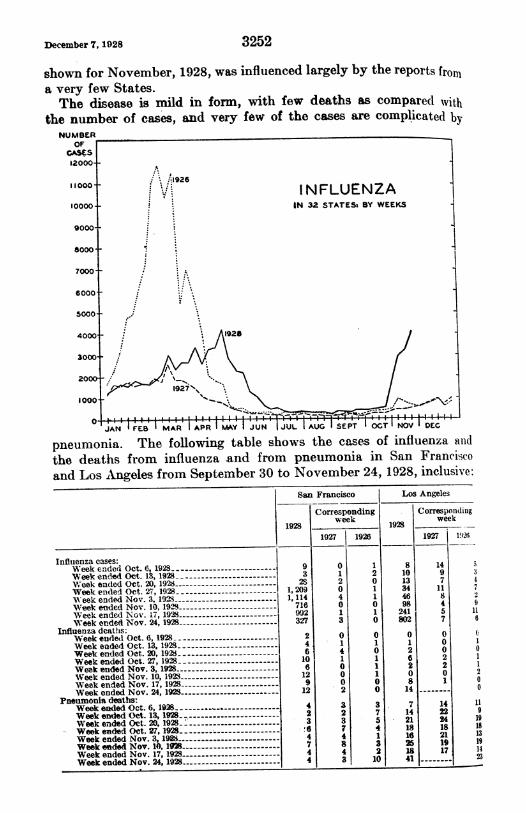
Reports of influenza from most parts of the United States do notshow more than the usual seasonal increase in the number of cases,btut the table on page 3272 shows that Oregon reported 250 cases forthe week ended November 24, 1928, and 17 cases for the correspond-ing w-eek in 1927. Montana reported 421 cases for the week thisyear and did not report any cases one year ago. South Carolina,Georgia, and Alabama have 2,107 cases of influenza in the table thisyear, as compared with 734 last year.The accompanying graph gives a comparison of the reports of cases
of influenza from 32 States for the years 1926, 1927, and 1928. Itshould be noted that during the first two of these years the incidenceof influenza during the fall month, was very low, and that the increase
21314°-28 X (3251)
December 7, 1928 3252
shown for November, 1928, was influenced largely by the reports from
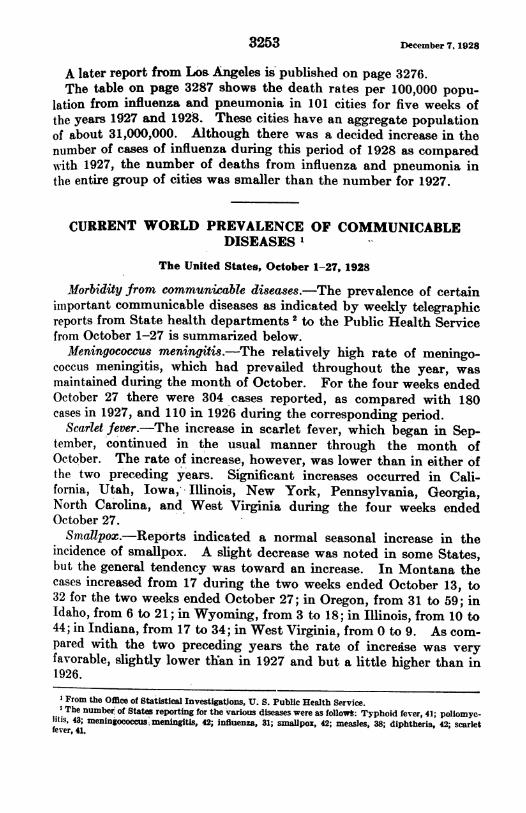
a very few States.The disease is mild in form, with few deaths as compared with
the number of cases, and very few of the cases are complicated byNUMBEROF.
CAS I
JAN 1 F' MAR APRMYI JUN I JUL I AUG I SEPT I OT I NOV IDEC
pneuimonia. The following table shows the cases of influenza aiidthe deaths from influenza and from pneumonia in San Francisco
and Los Angeles from September 30 to November 24, 1928, inclusive:
Influenza cases:Week ended Oct. 6, 1928--Week ended Oct. 13, 1928-1Week ended Oct. 20, 1928-Week ended Oct. 27, 1928-
eek ended Nov. 3, 192--Week ended Nov. 10, 1928Week- ended Nov. 17, 192--Week ended Niov. 24, 1928-
Influenza deaths:Week ended Oct. 6, 1928-Week ended Oct. 13, 1928-
Week ended Oct. 20, 1928-Week ended Oct. 27, 1928-Week ended Nov. 3, 1928-
Week ended Nov. 10, 1928-Week ended Nov. 17, 1928-Week ended Nov. 24, 1928
Pneuimonia deaths:Week ended Oct. 6, 1928
Week ended Oct. 13, 1928Week ended Oct. 20, 1928 _-_-_-_-______ -_Week ended Oct. 27, 1928-Week ended Nov. 3, 1928-Week ended Nov. 10, -_____----__-___
Week ended Nov. 17, 1928 -_-____-_-_ -_-Week ended Nov. 24, 1928-
191
1,
1,
San Francisco Los Angeles
Corresponding Corresponding
28week 192S
week
1927 1926 1927 1r2t6
9 0 1 8 143 1 2 10 9 328 2 0 13 7 4
20 0 1 34 11 7114 4 1 46 8716 0 0 98 4992 1 1 241 5327 3 0 802 7
2 0 0 0 0
4 1 1 1 0
6 4 0 2 0
10 1 1 6 26 0 1 2 212 0 1 0 0
9 0 0 8 112 2 0 14
4 3 3 7 14
2 2 7 14 223 3 5 21 24
-'6 7 4 18 184 4 1 16 217 8 3 25 194 4 2 18 174 3 10 41
L
11200
9141813191423
December 7, 1928
A later report from Los Angeles is published on page 3276.The table on page 3287 shows the death rates per 100,000 popu-
lation from influenza and pneumonia in 101 cities for five weeks ofthe years 1927 and 1928. These cities have an aggregate populationof about 31,000,000. Although there was a decided increase in thenumber of cases of influenza during this period of 1928 as comparedwith 1927, the number of deaths from influenza and pneumonia inthe entire group of cities was smaller than the number for 1927.
CURRENT WORLD PREVALENCE OF COMMUNICABLEDISEASES l
The United States, October 1-27, 1928
Mforbidityfrom communicable diseases.-The prevalence of certainimportant communicable diseases as indicated by weekly telegraphicreports from State health departments 2 to the Public Health Servicefrom October 1-27 is summarized below.
Meningococcus meningitis.-The relatively high rate of meningo-coccus meningitis, which had prevailed throughout the year, wasmaintained during the month of October. For the four weeks endedOctober 27 there were 304 cases reported, as compared with 180cases in 1927, and 110 in 1926 during the corresponding period.
Scarlet fever.-The increase in scarlet fever, which began in Sep-tember, continued in the usual manner through the month ofOctober. The rate of increase, however, was lower than in either ofthe two preceding years. Significant increases occurred in Cali-fornia, Utah, Iowa,' Illinois, New York, Pennsylvania, Georgia,North Carolina, and West Virginia during the four weeks endedOctober 27.Smallpox.-Reports indicated a normal seasonal increase in the
incidence of smallpox. A slight decrease was noted in some States,but the general tendency was toward an increase. In Montana thecases increased from 17 during the two weeks ended October 13, to32 for the two weeks ended October 27; in Oregon, from 31 to 59; inIdaho, from 6 to 21; in Wyoming, from 3 to 18; in Illinois, from 10 to44; in Indiana, from 17 to 34; in West Virginia, from 0 to 9. As com-pared with the two preceding years the rate of incredse was veryfavorable, slightly lower th'an in 1927 and but a little higher than in1926.
I From the Office of Statistical Investigations, U. S. Public Health Service.2 The number of States reporting for the various diseases were as followt: Typhoid fever, 41; poliomyc.
litis, 43; meningococcuS. meningitis, 42; influenza, 31; smallpox, 42; measles, 38; diphtheria, 42; scarletfever, 41.
3253

December 71 1928
Measles.-The usual seasonal increase in. the prevalence of measlesbegan in October and will no doubt continue through the fall andwinter months. The rate of increase followed that of the correspond.ing period in 1927 very closely, but was much lower than in 1926.
Diphtheria.-The diphtheria rate, although experiencing the usualseaso.nal rise, was considerably below the rate for either of the twopreceding years for the month of October. An increase in the numberof cases was reported from practically all sections of the country.
Influenza.-In California, there were 1,392 cases of influenza re-ported during the week ended October 27. Slight increases occulrredin a few other States, but no unusual prevalence was noted else-where. Reports indicated that the disease was still slightly moreprevalent during the current year than in either 1927 or 1926.
Typhoidfever.-A gradual decline in the number of cases of typhoidfever continued; and for the two weeks ended October 27 there were1,159 cases reported-approximately 600 less than occurred duringthe preceding two weeks. The decline in prevalence was somewhatgeneral, but the most significant decreases occurred in the SouthernStates. A lower rate was indicated than during either of the twopreceding years.
Poliomyelitis.-The incidence of poliomyelitis declined rapidlyduring the month of October. The cases reported for the four weeksended October 27 totaled 592, as against 1,105 for the preceding4-week period. While the disease was considerably less prevalenitduring the current year, the rate was almost twice as high as thatrecorded in 1926. At no time was the high incidence of 1927 reachedduring the pe-riod under consideration.
Mortalityfrom all cauaes.-The mortality from all causes in 67 largecities rose sharply during the first three weeks of October, but droppedduring the fourth week to a lower rate (11.1) than was recorded ineither 1927 or 1926 for the corresponding period; the rate for 1927was 12.1 and for 1926 it was 12.2. Only for two previLous weeks ofthe current year had the mortality rate been as much below the cor-responding week of 1927 as it was during-the week ended October 27.A slight increase over the preceding week occurred during the weekended November 3, but the rate of 11.7 was still slightly lower than forthe same week in either of the two preceding years.
FOREIGN COUNTRIES1
The general prevalence of certain epidemic diseases in most foreigncountries during August and September is summarized below.
Yellow fever.-From 1908 until this year the city of Rio de Janeirohas been practically free from yellow fever. The few cases which
1 Data from the Monthly Epfdemiological Report of the Health Section of the League of Nations' Secre-tawiat, Sept. 15 and Oct. 15, 1928, supplemented by information published in the Public Health Reports.
"KA

3255 December 7, 1928
have been reported during that period were in most instances errorsin diagnosis or imported cases from sections of the country whereyellow fever was endemic.The disease reappeared during the second quarter of 1928. The
first suspected case was an artilleryman from the Campinho Barracks,near the city, who became sick on May 12 and died May 16; hisdeath certificate, however, showed a different diagnosis.A typical case of yellow fever was found among the civilian popula-
tion on May 31, and cases continued to appear in various parts of thecity. From, the beginning of the outbreak up to October 4 therewere 119 cases reported, 66 of which had terminated fatally.2Dengue.-The outbreak of dengue, which occurred in Athens and
Piraeus in August and September, is probably the most severe out-break of the disease on record. A census of persons affected by denguegave 239,000 cases up to September 4 in the town of Athens alone.It was officially estimated that 90 per cent of the population of Athensand Piraeus had been ill with the disease. Dengue is usually a milddisease which normally is not notifiable, and its presence in Mediter-ranean countries in 1927 had attracted little attention. Early inAugust it became apparent that the prevailing type of the diseasewas more severe. In Athens there were 413 deaths reported for themonth of August and 218 for the first 20 days of September. InPiraeus there were 176 deaths in August; statistics for Septemberhad not been received. A number of cases of dengue were reportedin various other countries, but there was no epidemic outside ofGreece.Plague.-Plague was, as usual, at its lowest ebb in most countries
during August and September. There were, however, some impor-tant exceptions to the general low incidence of plague. In southernIndia the disease usually begins to spread in August, and in theCentral Province, where the disease was most prevalent, 533 caseswere reported during the two weeks ended August 25, as comparedwith 59 for the preceding two weeks. There were 358 cases in theBombay Presidency and 103 in Mysore during these two weeks, ascompared with 183 and 55 cases, respectively, during the first twoweeks in August.The Health Service of Argentina, South America, reported on Sep-
tember 24, five cases of pneumonic plague in one center in the Prov-ince of Santiago del Estero, and on October 9 it was stated that 11deaths suspected to be from pneumonic plague had occurred duringthe month of September in a single area at Carapujio, in the sameProvince. Plague still continued to increase in Lagos, Nigeria, whereit had been unusually prevaleT1t since early in the year.
3 A report of the yellow fever epidemic at Rio de Janeiro was published in Public Health Reports forNovember 23, 98, "pp. 3079-3063.
December 7, 1928
The North Manchuria Plague Prevention Service stated that therewere 160 cases of bubonic plague at Tungliao, in Inner Mongolia,during the week ended September 15. The outbreak continued, andduring the two weeks ended September 29, 117 cases were reported.Control stations were organized and the Russo-Mongolian frontier,which had been closed, was reopened.Two cases of plague were reported in August in inland localities on
the island of Hawaii.Cholera.-Reports from India showed about the same incidence of
cholera in July as during the corresponding month of the precedingyear, but an average well above that of recent years was maintainedthroughout the month of August. The 7,548 deaths reported duringthe week ended August 11 was the highest weekly total recordedsince 1924; of these deaths 2,000 occurred in the Madras Presidency.A considerable decrease was noted during the latter part of August.There was a serious outbreak in the Central India Agency, whichreached its maximum in the middle of July. The incidence increasedslowly during July and August in the Central Province.A case of laboratory infection was reported at,Osaka on October 4.
Twenty-three cases of cholera were reported during July and Augustin various localities in the Philippine Islands.
Typhus fever.-An increase of typhus fever occurred in the Unionof Socialist Soviet Republics from February to March; in general,however, the disease has been much less prevalent in 1927 and 1928than in previous years. The disease was more prevalent in theeastern governments, but there were a few important exceptions inthe central and western countries, where some of the governmentswere considered as having an incidence of typhus fever above theaverage.In Lithuania, typhus fever was more prevalent during the first
seven months of the year than during the corresponding period ofthe three preceding years. An increase was reported in Bulgaria,up to September, over the precedn year. During the second halfof May an outbreak of typhus began among the Chinese populationof the Kwantung Territory; there were 1,775 cases reported up to
July 1, 1928. The incidence decreased after the middle of July.On the other hand, in Rumania, 425 cases were reported from Janu-
ary 1 to August 23, 1928, compared with 2,753 for the same periodin 1927. The incidence was lower in Poland during the first two
months of 1928 than in any previous year; 1,900 cases and 129 deathswere reported up to July.
SmLdlpoxc.-The incidence of smallpox in England and Wales,which, during the first quarter of 1928, was lower than during thecorresponding period of the previous year, differed little durin thesecond and third quarters of the current year from its level in 1927.
3256

December 7, 1928
During the first quarter of 1928 there were 4,711 cases reported.Fifty-five deaths were attributed to smallpox during the first half of1928, giving a reported case fatality rate of 6.3 per 1,000 cases, ascompared with 36 deaths and a fatality rate of 3.6 per 1,000 duringthe first half of 1927.The number of cases of smallpox has increased in Canada during
the last two years; 2,117 cases were reported during the first half of1928. Only three of these cases terminated fatally. There hasbeen a marked decrease of alastrim in Jamaica during the last twoyears; 43 cases were reported during the first six months of 1928.
Diphtheria and scarlet fever.-The incidence of diphtheria andscarlet fever was higher in practically all of the European countriesduring the year ended June 30, 1928, than in the preceding years.While in some countries the increase was moderate, in others it wasvery considerable. In Scotland the number of deaths from diph-theria was twice as high as during any of the three preceding years.In Hungary and in Czechoslovakia the number trebled in the courseof three years. The increase of scarlet fever was not as universal asthat of diphtheria; but in Germany the number of cases reportedduring the year ended June 30, 1928, was about three times as highas that reported during the year ended June 30, 1927.- In the King-dom of the Serbs, Croats, and Slovenes the number of cases of scarletfever nearly trebled during the past year.The case fatality rate of diphtheria showed a tendency to increase
during the last year in several countries, noticeable in the Nether-lands, Germany, Austria, and Czechoslovakia. It decreased, on theother hand, in Poland, Rumania, and Bulgaria. The case fatalityrate of scarlet fever decreased in most countries, being much lowerthan that of diphtheria in central and eastern Europe, as well as inJapan and New Zealand. In eastern Europe, on the contrary, itapproaches that of diphtheria.Mortality from diphtheria was considerably higher than that
caused by scarlet fever in all European towns except those of easternEuirope. A large excess of scarlet fever over diphtheria occurred inLjeningrad, Moscow, and Warsaw. In Egypt mortality from diph-theria has been particularly high, while the incidence of scarlet feverhas been almost negligible.
Typhoid and paratyphoid fevers.-Typhoid fever was less prevalentup to the middle of September in practically all European countries.The only exceptions were France and England and Wales.In England there was an increase in the prevalence of paratyphoid
fever in London and neighboring localities. The paratyphoid out-break began very suddenly during the last of July, but was of shortduration, having almost subsided by September 15:
3257
December 7, 1928
D?Je1entery.-The Micidene of dysentery in Europe began, as usuej,to increase in August, but was lower in most countries than in pre-vious years. The disease is usually more prevalent in Poland thanin other countries of central Europe, but this year its incidence therewas much lower than in any previous year. The number of casesreported in August in Rumania, the Kingdom of the Serbs, Croats,and Slovenes, Hungary, and Germany was about the same as in 1027There has been a considerable decrease in the incidence of dysen-
tery in Europe. In the Union of Socialist Soviet Republics, where thedisease is more prevalent than in the remainder of Europe, the numberof cases decreased from 271,000 in 1924 to 135,000 in 1927. InMorocco the number of cases reported during the summer months ofthe current year was considerably in exces of those reported for thesame period in the preceding year. In Japan, where dysentery isfairly widespread, the incidence up to August differed little from thatof last year, but was higher than in the six preceding years. Theseasonal maximum incidence of dysentery varies in different parts ofthe country. In Japan, Europe, and the Philippine Islands it occulrsin August; on the other hand, in Java, dysentery -is usually moreprevalent in January and February.
Relapsing fever.-The decrease of relapsing fever in Europeancountries continues, and the disease has become extremely rare. Inthe Union of Socialist Soviet Republics, where -the disease is mostprevalent, the number of cases reported during the first quarter of1928 was considerably less than during the corresponding period of1927. Minor outbreaks of relapsing fever were reported in WestAfrica, Nigeria, and the Gold Coast Colony.
CURRENT STATE MORTALITY STATISTICS
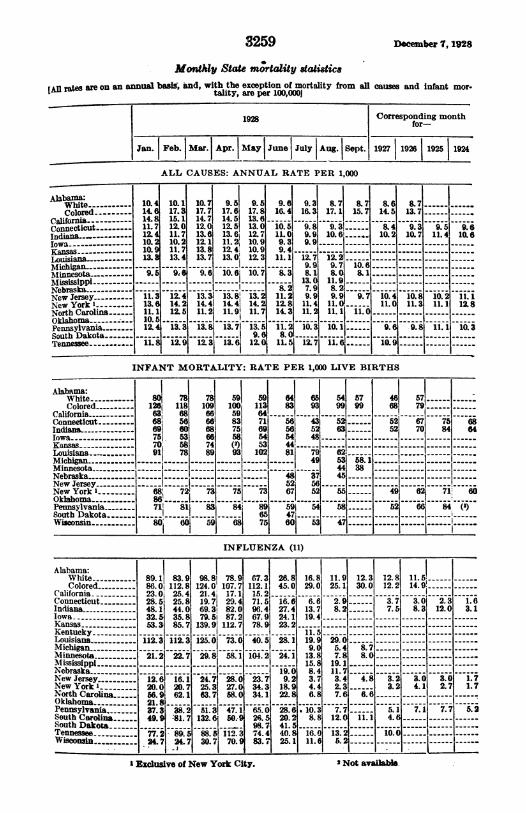
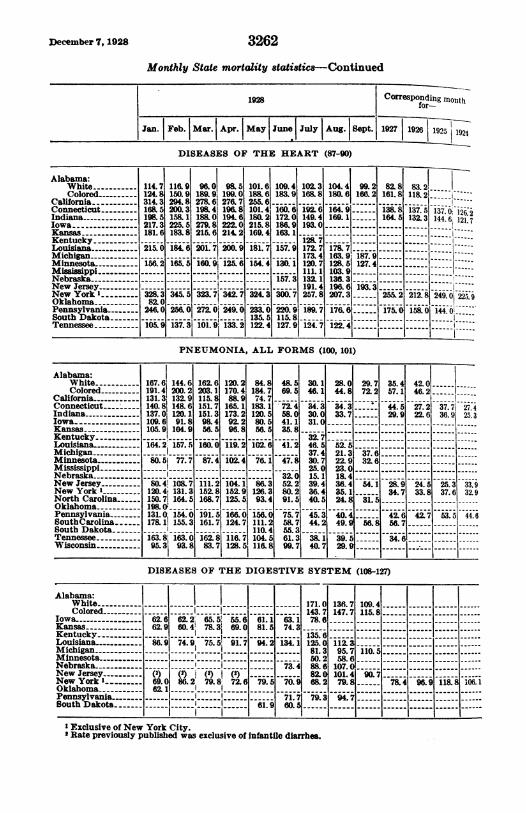
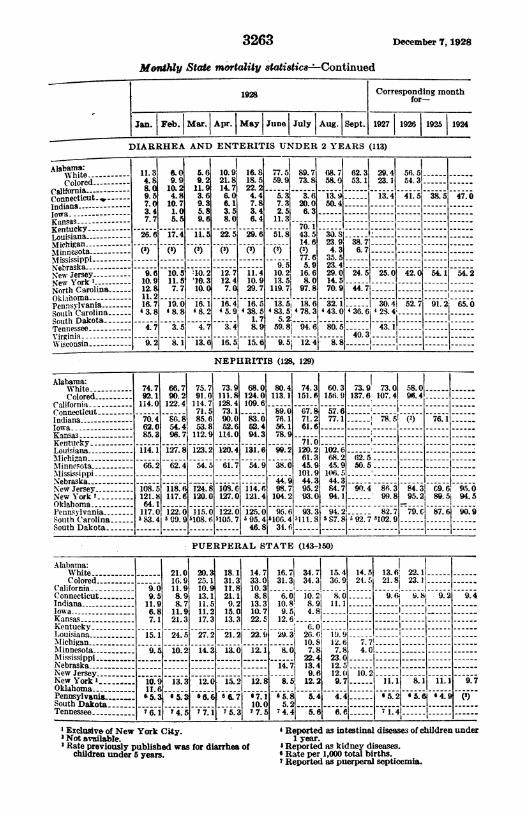
For the information of public-health officials and others interested,the data in the following tables have been compiled from the monthlymortality reports of State healt.h departments for the latest monthfor which published records are available. Statistics of most com-municable diseases are not included, since they are available in othertabulations in the Public Health Reports. Statistics of deaths fromother causes are limited for the most part to t.hose causes whichappear in the State reports. In the case of States which publishdetailed mortality reports each month, the record of only the prin-cipal. groups of causes and certain important specific causes havebeen -used.For purposes of comparison, the mortality records for a few pre-
ceding years are given, the rates being for' the month correspondingto the last month for which the 1928 rate is available.These tabulations will be enlarged as the current data on mortality
from additional States become available.
3258
3259
Monthly State mortality statisics
Dceember 7, 1928
[All rates are on an annualt basis; and, with the exception of mortality from all causes and infant mor-tality, are per 100,0001
1928 Corresponding monthfor-
Ja.Feb. Mar Apr. May j'Junej July Aug. Sept. 1927 1926 1925 1924
ALL CAUSES: ANNUAL RATE PER 1,000
Wie-------10.4 10.1 10.7 9.5 9.5 9.6 9.3 8.71 8.7 8.6 8.7-------colored------ 14.6 17.3 17.7 17.6 17.8 10.4 16.3 17.1i 15.7 14.5 13.7-------
California-------14.8 15.1 14.7 14.5 13.6 ---Connecticut----- 11.7 12.0 12.0 12.5 13.0 10.5 9.8 9.3!-8.--&4 9.3 9.5 9.6Indiana.--~~~- 12.4 11.7 13.8 13.6 12.7 11.0 9.9 10.6-----10.2 10.7 11.4 10.6
Iowa---------10.2 10.2 12.1 11:. 10.9 9.31 9.9 ---------------------
Kansas --------10.9 11.7 13.8 12.4 10.9 9.4!--------.--- --------- -----.---Loisiana-.------13. 813.4 13.7 130' 12.3 11.1I12.7 12.2---- ------------
Mihgn-------I------ ------ ------ 9.9 9.7 10.6--------------Mississippi -----------------------------13.0 11.93--- ------ ------
Nebraska------------------------ 8.2 7.9 8.2 ---- I------- ------
NewJTersey------11.3 12.4 13.3! 13.81 13.2 112 9.9 9.9 9.7 10.41 10.8 10.2 11.1NewYorkI------13.6 14.2 14.41 14.4 14.2 12.8 11.4 11.0-----11.01 11.3 11.1 12.8North Carolina .---- 11. 1 12.5 11.2' 11.9 11. 7 14.3 11.2 11. 1 11.0 ------ ------
Oklahoma ------- 10.5 -----------Pennsylvania-----12. 13.3 13.8 13.7 135 11.2 10.3 10.1----9.61 9.8 11.1 10.3Tennessee-1----12.9 12.3 13.6 12.0 11.51 12.7 11.6[.------. 10.9.----------
INFANT MORTALITY: RATE PER 1,000 LIVE BIRTHS
Alabama:59 64 6 557 8Colored---126--1 118~ 109 100- 113 9999" 68 79.--- ---
California------- 638 68I 66 59 64------------------- ------
Conneeticut------6856 6683 71 5843 52--- 52167 75 68
Indiana..-- - --
69 60 68 75 69 56 5 2 52-- --70 84 64Iowa---------- 75 53 68 58
5448 --- --------- ------
Kansas-70------- 58 74 (2) 53 44-Louisiana..-.-------91 78 89 93 102 811 "7-91--- 62-Michigan --- - - - --- - -- -- -- - -- 49 53j 58.1.-- - - - - -- -
M in eso a --- --- -- --- --- --- ----- 44138 -- ----I -
Nebraska---------------------------- - - 4-81-- 37! 451 -------I--- ------
New Jersey - - - ---52i 56 --INew York68'-72'-73-75 73 67~ 52 5Sf---- 9 6 V 6
Oklahoma.---- - 86' .---- I- ..--- - -- -
Pennsylvania----- 711 811 83 84, 89 59j 54 58 --- 52 66 84 (2)South Dakota---------------- -- j
65 47'-.. ..--------------------Wioo sn _-- - -- -- 01 5 _0 --- -Wisconsin- 80 60! 59 68 75 60~~~~~---34- --I---
INFLUENZA (11)
Alabama:White------- 89.1 83.9 98.8' 78.9 67.3 28.8 16.8 11.9 12.3 12.8 11. 5--- ---Colored------86.0 112.8 124:0' 107:7 112:1 45.0 29.0 25.1 30.0 12.2 14:9:::
California-------23.0Oi 25.4 21.41 17.1 15.2 ---- ---------
Connecticut------28.51 25.8 19.7 29.4 71.5 16.6 6.6 2.9----3.7 3.0 2.3 1.6Indiana --------48.11 44.0 69.31 82.0 96.4 27.4 13.7 8.2----7.5 8.3 12.0 3.1Iowa ---------32.51 35.8 79.5 87.2 67.9 24.1 19.4 ---------------------Kansas --------53.3 85.7 139.9 112.7 78. 23.2 --------------------------Louisiana-------112.3 112.3 125.0 73.0 40.5 28.1 19.91 29.0 --- ------ -------Michigan----------------------------9.01 5.4 8.7 --------------Mlinnesota -------21.2 22.7 29.8 68.1 104.2 24.1 13.81 7.8 8.0----------------
isispi---------------------------15.8 19.1 ------ -------N rak- .---- ---- --- ----- 19. 0 8.4 11.7.--- ------ ------
NewJersey------12.6 16.1 24.7 28.0 23.7 9.2 3.7 3.4 4.8 3.2 3.0 3.0 1.7NewYorkI------20.0 20.7 25.3 27.0 34.3 18.9 4.4 2.3----3.2 4.1 2.7 1.7North Carolina----56.9 62.1 63.7 58.0 34.1 22.8 6.8 7.6 6.6 --------------Oklahomaa-------21.8 ---- ------ ------ --------- ------------
Pennsylvania-----37.3 38.2 51.3 47.1 65.0 28.6. 10.3 7.7----5.1 7.1 7.7 5.2iSouth Carolina----49.9 81.7 132.6 50. 26. 20.2 8.8 12.0 11.1 4.6----------Tennessee- 77.2 89. 88. 5j ~~112. 74. 40.8 16.0 13.2 ----10.0 ---_ ------
Wicosi ------- -24.7, 247 30.7 70. 83.7 25.1 11.6 5.2 ---- ------- ------
I Exclusive of New York City. 2 Not &Vaib".

December 7, 1928 3260
Monthly State mortalitj statistics-Continued
19
Jan. Feb. Mar. Apr. May June July Aug.
TUBERCULOSIS, ALL FORMS (31-37)Alabama:
WhiteColored-
Califormia-Connecticut-IndianaIowa ---------Kans _-________
Kentucky-Louisiana-Michigan-Minnesota-Mississippi-Nebraska-New Jersey-New York _North CarolinaOklahomaPennsylvaniaSouth CarolinaSouth DakotaTennesseeVirginiaWisconsin-
58.1136.9135.263.567.832.029.5
106.9
51.5
6i5.66.74.159.764.372.f
121.1
41i
53.9179.1139.275.167.432.1
52.8
95.5
64. 7
70.882.187.8
I------
78.5
I------150.9
-63.1
57.5 48.5162.2 184.0134.6 153.883.9 77.688.2 76.238.8 36.649.4 49.1
106.9 107.1
60. 1 55.C
78.9 83.1
82. 5 88.86.6 88.
78.4 81.187.2 86.1
140.7 159.1
56.2 63.(
43.5
160.9
143.4
71.581.945.6
43.6
107.5l
64.0
86.382.593.8
97:997.9
61.9
104.9,i-
52.1182.6
73.9
80.635.639.8
47.8
35.487.282.9106.4
f8.680.1
57. C
129.1
60.1
50.5
172.7
68.6d57.538.31
73.893.062.843. 778.220.168.473.265.7
69.087.8
l------l
134.1------
52.2
37.8
168.8
55i.458.9
I-------96.060.854.982.928.476.171.181.8
1159.666.3
l112.566.152.2
50.7128.1
59.150.1
66.9
77.9
53.5
45.,146.
62.
60.175.
69.1
.-
41.2 .--- ---1 177.9 -------
5 74.8 59.3 78.41 79.1 60.1 79.9
o 85.3 71.0 87.4 73.7 79.1 94.1
67.6 72. 70.2
4- ------ ------------
--
-
-ii 710 8.
7 9 i 9.
CANCER, ALL FORMS (43-49)
Alabama:White _lColored-
California --Connecticut-- -IIndianaIowaKansas
Kentucky-_-Louisiana ._--MichiganMinnesotaMississippiNebraskaNew JerseyNew YorkOklahomaPennsylvaniaSouth CarolinaSouth DakotaTennesseeWisconsin
46.81 36.01 44.9 49.2 44.9141.2' 39.5 48.8, 36.81 51.4I
129.51 148.1 129.2 145.81 148.31113.8, 106.6 105.8' 102.51 84.699.3' 87.6f 117.11 105.31 90.8103 88 91.2 121. 2 104. 21 114.095.-6 107. 104.61 96.8 93.go59.81 62.0_ 56.2, 69.9 71.21l ------ I-- ------- --
112.0' 94.8 115.11 93.0 108.1
I-----
-
99.2 102.41 107.91 104. 4i 120. 5127.5 121.2 128.61 122:.0 121.858.7 I95. 5 102. 95. 41 102. 01 95.530.3 39.2 51.2 34.61 50.5
I 173.658.8, 51. 31 53.21 67.61 47.594.9i 95.91 113.2i 106.7 98.1
Alabama:White---- 12.8 6.0Colored 14.51 14.1
California 23. 3 19. 6Connecticut -
IndianaIowa 15.5' 24.4Kansas------------- 24.41 17 1
Kentucky-------. -
Louisia 5. 12.3Michigan __Minnesota 19.9| 19. 4Mississippi ._------Nebraska-lNew Jersey INew York 1_--_- l27.6 27.2Oklahoma 12.6-Pennsylvania 21. 7 23. 5South Carolina 12.6 13.5South DakotaTennessee
Exclusive of New York City.
59.4146.3
113.81 04. 3110.298.8
61.8
I---6-.--110.0
105.4117.2
91.839.281.273.4
l------
49.148.8
99.287.1115.9
54.470.692.1
107.139.487.C97.3123.5
199.446.3I%70.(
111.(
DIABETES (57)
9.8 8.018.5 9.525.1 25.921.9 19.6
19.91 25.628.91 23.2
19.3, 15.0
27121.01-----------:-
27.41 26.3
27.8 25.311.4j 3.3
7.71 7.2 4.27291 6.8 10.5
21. 4 lk------. 18.l- 20.4
19.4j 12.5 15.0|18. 6; 21. 9!
---
85'i 8.1l 971------ ------l M 9
25. Ij 15. 2 13. 4
l---- -- 15.61 16. 716.9
----- ---146 1&
28.6, 26j 18.5
23.2 19.96 18.6
13.41 is.oL_ __
1-----,----1 6.1
52.762.5
147.599.8
I------
I------
1------I------
10di.4126. 6
45.5I-----
45.844.8 ------1---74.8 59.31 78.4106.7 9.61 102.5
------ -- -
1.1 97.3j 105o. 4119.8 129.0 127.390.2 9441 95.7-------I------
52.1146.3
l------1------Il------l
I-------I
|103.9!110.4
101.911----- -
I------
41.1I------4
I--
15.215.0
I------
I------
I------
I------
I------
I------
I-_----118.112.5
I----
.
62.447.5
55.4109.7
75.5
87.5
105.150.
82.
99.E123.5
99.434.1
1455.il104.]1
9.15.3
16.814.5
I------
I------1 13.316.212.57.213.419.424. C
120.05.1
10.5 12-2.8.2 &1-.
22.5 20.3 29.1
152 16.5 16.3.6~
.
..--
--21.4
7.11 __-I *1.---
-
. . . .
,.-.1- - ---Z..'

3261 December 7, 1928
Monthly State mortality statistics-Continued
1928 Corresponding monthfor-
Jn Feb. Mar. Apr.]May June July Aug. Sept.1927 1926 1925 11924
DISEASES OF THE NERVOUS SYSTEM AND OF THE ORGANS OF SPECIAL SENSE (70-86)
Alabama:White-Colored------
california ------ 138i.-3 1492Iowa ----- 125. 145 V1KatnszAs-------146.9' 145.4Kentucky 96.L-ouisians-------96.6 102.0OMichigan - ------ ---- --
Minnes0ta -,Nebraska - il2. i20.-9N,ew Jersey------112.51 120.9New York I - 159I. 1 160. 8Oklahoma- 114. 51------Pennsylvasnia .South Dakota-
14-7153.2173.2
101.4
126.3,17-6.1
------ 75.01 69. 4! 72. 4118.7 133.2 132.2 1
132.7 141. 1' -- ------ -----------------
145.81142. 6! 125. 3'12 -4l---------!---'--171. 7 146. 3j 115.4 --
------ ------ l 82.11110. 4 91.81 89.8, 102.6; 103.31 ------ l-
- 118.53 103.41 126.4._76. 6 82. 7' -----102. 8' 94. 5 97.0 ---- -
139.5 132. 51 110.8 98.6 98.3 95.8 113.3' 117.4 115.91 113.3172.7 159.9, 145.7 128.4 120.6 124.51 12.8, 163.21 157.6
---I--- -- -- ,----- --- ---
918.7 76:0 _ -------I
CEREBRAL HEMORRHAGE, APOPLEXY (74)
Alabama:White-Colored----
California-Indiana-Iowa-Kansas-Kentuicky-_ ___Louisiana--Michigau-Minnesota-Mississippi-Nebraska _-----New Jersey-New York-Oklahoma-PennsylvaniaSouth Dakota
42.358.195.4121.597.0114.2
65. 8
47.284.0104.7122.3108.3104.3
67.1lo, -
---- I------I
------1------1____---- ------!121. 0 131.863.6 ------
10a. l101 O
----------
57.5 48.5 56.187.1 85. 75.2102. 3 94.5 100.5(2) 134.1 107.5111.5 102.2 105.7141.8 131.9 106.5
74.9 75. 57.4I-----
97.2
101.(-13& 2
1- - - ---
l------l
88.2
53. 5
DISEASES OF THE CIRCULATORY SYSTEM (87-96)
Alabama:White ---
Colored-- ---_California _____Iowa----KansasKentucky-L,ouisiana-Michigan-Minnesota - _-Nebraska-New Jersey-_-_New York I---------Oklahoma _- -
Pennsylvania--.South CarolinaSouth Dakota-
371.1 341.4242.0 253.0213. 7 210.6
227.0 196.8
272.7 2.4375.0 399.790.8-
220. 5 27.8. 2.
319.2310.8250.9
215.6
281.6369.1
277.9
318.6249.0236.7
213.4
306. 6387.7
263. 7
1 114.9184 6
1290.0238.1 211.5 226.9197.0 192.3-
-------!---- 143.0193.2 168.5 186.6
------------- 197.5
-- I- --- ---
------ 176.3; 151.4286.0 231.2! 209.2379.4 342.5! 301.6
1- - --- - - - - - - -l-----
1 247.51 209.1341.1 279.4 305.1152.2 136.5 ------
117.7 106. 5 ------ ------188. 5 185. 3 ----------
-----I- ------
---- ------ ------ ------1---------- ------
1191.4------ ------ -----191.4-
188.8 222.1 _
145.3 156i.0152.2 1
213.2 215.9 198.01 196.4276.5 298. 2! 245. 5
196.94274. 11 283.3 273.0-----
lEiclusive of New York City. 'Not
42.9 40. E58.5 48.9
91. 6 90 1
_--
49.2 45.1M. 51 75.2
--.
95.4~ 90.892.71 91.791.51
-1l 48.063.61 75.5
|------j 83.9
80.4 67'.7-i5:
73. f
87.8& 78.738.0'--
35. 7 42. 775. 2080. 4
93.8'------I------I--------
61.6177.2 87.559.3 59.059.2-75. 3170. 3 1i72.0
192.:
1----- --I--- ---76.81
_--_--
--- -- --_--
.-- -_--
130. 124 {_---
93. 8
65. 277.1
.I.--- __
188.6 184.
I------1------
292. 3 267.7.------ .1------ I--- ---
l------I------
I
1------1------l------l------
--------
I Exclusive of New York City. 2 Not available.
December 7, 1928 3262
Monthly State mortality statistics-Continued
1928
Jan. Feb. IMar. Apr. |May Juneo July Aug.
DISEASES OF THE HEART (87-90)
Alabama:WhiteColored-
Califormia-ConnecticutIndianaIowaKansas ------KentuckyLouisiana------MichiganMinnesota-
Je prwNebraska-_-New JerseyNew YorkOklahomaPennsylvaniaSouth DakotaTennessee
114.2124.1E314.1
198.2217.1181.
1662l.I------215.
328.382.0246.0
105.9
11&69150.9294.8200.3158.1225.5183.8
165. 5
96.0 98.2
189.9, 199.27 61 276.7198.41 19.E188.01 194.6279.81 222.6216.61 214.
201.79 200.
160. 9j 125.6
_____ ------I------345. 5 323. 7; 342. 7
256.-272.0' 249.0
i-[3310i I1. 133I 2
PNEUMONIA, ALL FORMS (100, 101)
Alabama:WhiteColored
California-ConnecticutIndianaIowaKansas
KentuckyLouisianaMichiganMinnesotaMississippi-NebraskaNew Jersey-New YorkI--North Carolina-OklahomaPennsylvania-SouthCarolinaSouth Dakota-Tennessee-Wisconsin--
167.6 144.6191.41 200.2131.3 132.9140.81 148.6137.0j 120.1109.6 91.8105.9 104.9
164.2 157.51------ -_____1
!_80.51 77.7
80.4! 108.7
120.4t 131.3150.71 164.5198.0l_-----131. 0 154. 0178.11 15:.3
163.8 163.095.3 93.8
DISEASES OF THE DIGESTIVE SYSTEM (108-127)
Alabama:WhiteColored
Iowa _KansasKentuckyLouisianaMichiganMinnesotaNebraskaNew Jersey ._New York I _-__OklahomaPennsylvaniaBouth Dakota
62.6
62.9
86.9
69.6c62. 1
6 2.2 65.8 5 .6f60.4 78.3 69.0
1---9------ - -I1 - --9-.- -
8674.92:5.5I 91.7
(2) (2) (1()
86.21 79.8j 72.6
.I.
--
I-----
161.181.S1
I------
I------
I------
-- 6I.-
171.0143.7
63.1 78.674.3-
135.6134.1 125.6
---- 81.
50.2
73.4 88.682.6
70.9 68.2
71.7 79.BO.- _---
136.7147.7
95.758.6107.0101.479.8
94.7
109.4115.8
I------
I------
I-----110.5
I------I------I------
1 Exclusive of New York City.I Rate previously published was exclusive of infantile diarrhea.
82.8161.8
138.89164. 5
a----2175. 0
101.6188.6255.6101.418.2215.8169.4
-18i1.-7
324. 3
135.2122.4
109.4183.9
160.
172.0186.9163.1______
157.9
130.1
157.3
300. 7
116.8127.9
99.2166.2
187.9127.4
193.3
102.3168.8
------I
149.4193.0
---- --I12& 7172.717&34120.7111.1132.1191.4257.8
189.7
7
104.4180.6
164.9169.1
163.9128.5
10l3.9136.3
196.6207.3
12.4
183. 21-
----- ------1------
----8-~~~- -- -~
137. 5 137.0 16.132.3 144.6: 121.7
18.0 i44. 2.
------ ------1------
162.6203.1115.8151.7151.398.456..5
160.0
87.4
111.2152.1168.7
191.2161.7
83.7
120.2170.48&89
165. 1173.292.2
I 96.82
119.21l------l102.41l------l104.1,
152.9125.5
160.0
124.7
116.7128.5
84.8184.774.7
183. 1120.580.556.5
102.61
1- iff.i-I1------
'l93.4126.3111.2110.4104. 511&8
48.5 30.169.5 46.1
72.4 34.358.0 30.041.1 31.35.8
------ 32.7
41. 2 46. 5------ 37.4
47. 30.7- 25.032.0 15.152.2 39.480.2 36.491.5 40.5
75.7 45.358.7 44.255.3.------
61.3 3& 199.7 40.7
42.0 .46.2.
27.2 37.7 27.422.6 36.9 2s. 3
24.5 25.31 33.933.8 37.6 32.9
28.0 29.744.8 72.2
34.3-------.33. 7
52.5.21.3 37.622.9 32.623.0.18.4.36.4 64.135.1.24. 31.5
40.4.---49. 56.8
39.529..
35.457.1
44.529.9
28.934.7
34.6
--;d-. .5 44.6
------I
------I
------I------I
I--
------I
------I
------I
------I
______l
------I
------I
------I
-I--------I
------I
------I
------I
------I
I------I------
I------
I------
I------
^ ^
U ppAa l_ _ _ _ _ __----------I- ----I------I------ ------I------I----
I f |-
II------------I------~~~~~~~~~~~~~~
December 7, 1928
M(mthy State mortality statistic8---Continued
-----I1
1928 Corresponding monthfor-
|Jan. Feb. Mar. Apr. May June July Aug. Sept. 1927 1926 1925 1924
DIARRHEA AND ENTERITIS UNDER 2 YEARS (113)
Alabams:White-Colored-
CalIfornia -_Connecticut- ,-Indiana-Iowa-Kansas-Kentucky-Louisiana-Michigan-Minnesota-Mississippi-Nebraska-New Jersey-New York INorth CarolinaOklahoma-Pe.insylvania-South CarolinaSouth Dakota-Tenressee-Virginia-WVisconsin-
11.34.8&O9.57.3.47.7
26. 6
9.610.912.811.216.743.8
4.27
9.2
&019.910.4.810.71.t5.
17.4
10.,511.'57. 7
19.0
3.5
8.1
15.69.211.93.69.35.89.6
I----
11.51(1)
10.310.0I16.1
4 8.2
4.7
13.6
10.91 16.821. 8! 18.114.7 22.26.0 4.46.1 7.83.5 3.48.0 6.422.5 29.f(2) (3)
12.7 11.412.4 10.87.0 29.I
16.4: 16.14 5. g 4 38.3.4 8.
16.Si5. t
7.51 89.7 68.7 62.31 29.41 56.5 .. .59.9 73.8 5& 0 53. 11 23. 1 54. 3------ ------
5.3 3.6 13.9 -__ 13.41 41. 5 38 5 47. 07.3 20.0 50.4 ------- ------ ---- ------2.5 6.311.3 -- ------!------1 - -- ---
70.1 151.8 43.5 30.1 ------ ----------8------1------
------ 14. 6 23.9 38. 7!------ ------ ------ ------
(3) (3) 4.3 6.7- - ------ ----- --------- 77. 6 35. 5 ------ ------ ------1------------
9.5 5.9 23.4 ------ ------ ------ ------ ------10.2 16.6 29.0 24. 5 25.0 42. 0 54. 1 54. 213.5 8. 0 14.5 ------ ---- --- -------- ---
119.7 97.81 70.91 4.7- |-- - - ---
I--- -------I--
13.5; 18.6 32.1- 30.41 52.71 91.2' 65.04 83.I4 78. 3 4 43.0 4 36.6 4 23. 4; -------
5. ------I59.81 94. 6 80. 5---- 43.1--40.3---
l 9 5t 12. 4j- 8.81------ ------ ------ -
NEPURITIS (128, 129)
Alabama:White-Colored-
California -----------Connecticut-_-Indiana-Iowa ----------Kansas ---Kentucly ----Loisiana-'Michigan _-_-_--Mlinnesota - --- -Ilississippi ----------
Nebraska-New Jersey-New York I---------1Oklahoma-Peninsylvania-South C'arolinaSouth Dakota
74.7 66.792.1 90.2114.0 122.4
70.41 80.862.0 54.485.3 96.7
114.1 127.8I---- I---
66.2 62.4I------ ----
108.5 118. R121.8 117.64.1--
117.01 122.,1
i------------
75.7191.0z
711.
85.653.81
112.9123.21
l------l
54.51
M24.8120.0
5108. 6,
73.9111.8128.473.190.052.6
1114.01120.41------
61.7
1108.0127.0
1 i22.o5105. 7I------
68.0 80.4 74.3124. 113.1 151.f
109.6 ------ ------
----- 89.0 67.883.0 76.1 71.252.4 56.1 61.694.3 78.9-
71.0131.fi6 99.2 120.2
61.354.9 38.0 45.9
------1------ 101.9------i44.9 44.3114.6 98.7 95.2121.4 104.2 93.0
125.0 95.6 93.395.45106C4 l111 S46.8 34. i-
10. 3 73.9 73.0 58.0151. 9 137.6 107.4 96.4
57.6- .77.1- 78.5(2) -
68. 2 62. 54.5.9 50.516.5-44.3-84.7 90.4 86.31 84.31' 9.6 95.094.1 -- 99.8 95.2 89.5j 94.5
94 -82.7 79. C 87. 90.957*8 5 92.7 a102.9 --
4-PUERPERAL STATE (143-1S5)
Alabama:White --Colored-
California-Connecticut .Indiana ----
KansasKentucky .Louisianalichigan-innesota -
Mlis-sissippi .-_Nebraska ---- .New Jersey .New YorkOklahoma .Pennsylvania-_-South DakotaTennessee --
9.09.111.86.E7.1
15.1
9._
10.8'5.1
6.1
21.016.911.98.98.711.9
__21.324.5
10.2I- ___.
'------13.3
--.3-37 4. 5
20.31 18.125.11 31.110.9 I1.E13.11 21.111.51 9.2
11.21 15.C17.3 13.127.2 21.2
14.3[ 13.C2---
1------ ------
12.0 15w.
*8.6t '6.2
7-7.1 I---7t7.1i 7 5.3I
14.733.010.38.813.310.722.5
22.ii-v-
- iZ i
12.8
7.110.07 7.1
16. . 34.7 15.4 14.51 13.6' 22.131.71 34.31 36.9 21.5 21.81 23. 1
6.01 10.21 8.0 ----- 9.6 i4.811 9.210.88 8.9 11.1 - _9. 5; 4. Si12.! ----------- ------ ------ ------
-_ -------------
29.3. 26. , 19.9 ------1so.s 12.6 ,77!8.0 7.8' 7.81 4.0!
22.4 23. l __14.7 13.4 12.5
9.61 12. 0X 10.51)---- 1-8.51 12.2 9.7 ------ 11.1 8. 11.1
'5.8 5.4 4-4 '5.2t 5.6j 4.8
7441 5.61 6.6- 1-.4
3263
9.4
_---_---
-----
_---
_--
'Exclusive of New York City. I Reported as intestinal diseases of children under'Not available. 1 year.3 Rate previously published was for diarrhea of ' Reported as kidney diseases.
children under 5 years. 6 Rate per 1,000 total births.7 Reported as puerperal septicemia.
I--
.
December?7,1928 3264
Monthly State mortality statistics-Continued
Corrsponding month1928 ~~~~~~~~~~~~for-n
Jan. Feb. Mar. Apr. May June July Aug. Sept. 1927 192611925 4
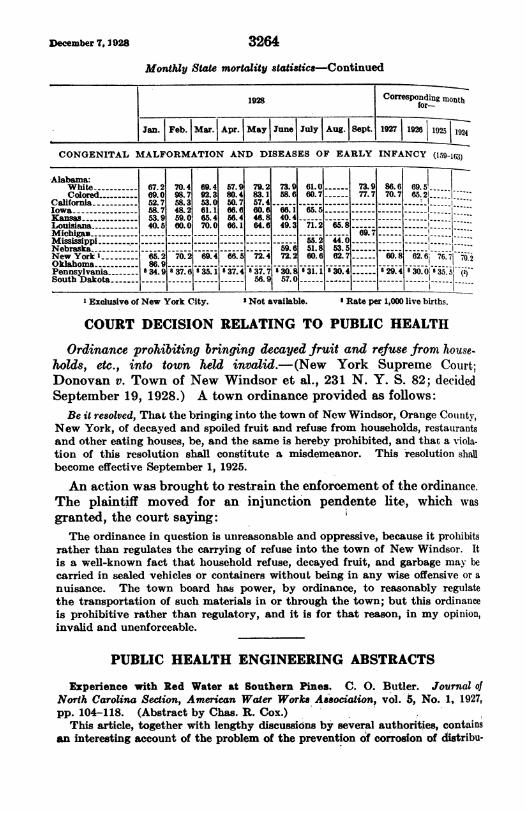
CONGENITAL MALFORMATION AND DISEASES OF EARLY INFANCY (15g-163)
Whiwte 67.2 70.4 69.4 57.9 79.2 73. 61,.0 73.91 86.6 69T
Colored- 69.0 98.7 92.3 80.4 83.1 58. 60.7- 77.7 70.7 65.21California- 52.7 58.3 53.0 50.71 57.4-Iowa 58.7 48.2 61.1 66.6 60. 66.1 65.5 1Kansas ------- 39 5. 65.4 56.4 46.8 40.4 -------I--- ------
Louisianaa--------- 40.5 60.0 70.0 661 64.6 49.3 71.2 65.8Michigaa -----------------------------------69.7 .-------
Mississippi--- 55.2 44.0 .--Neb 59.6 51.8 53.5 -
NewYorkX - 65.2 70.2' 69.4 6.25 72.4 72.2 60.6 62.7- 60.8 62.61.2Oklahoma- - 86.9- 701Pennsylvania- 834.9 8 37.6 8 35. 1 37 4 8 37.7 '-30.8 '31.1 '30.4-829.4 30 3551--South Dakota -56.9 57.0 _N: 57:0 ----|-
X Exclusive of New York City. 2 Not available. 8 Rate per 1,000 live births.
COURT DECISION RELATING TO PUBLIC HEALTH
Ordinance prohibiting bringing decayed fruit and refuse from house-holds, etc., into town held invalid.-(New York Supreme Court;Donovan v. Town of New Windsor et al., 231 N. Y. S. 82; decidedSeptember 19, 1928.) A town ordinance provided as follows:
Be it resolved, That the bringing into the town of New Windsor, Orange County,New York, of decayed and spoiled fruit and refuse from households, restaurantsand other eating houses, be, and the same is hereby prohibited, and that a viola-tion of this resolution shall constitute a misdemeanor. This resolution shallbecome effective September 1, 1925.
An action was brought to restrain the enforcement of the ordinance.The plaintiff moved for an injunction pendente lite, which wasgranted, the court saying:
The ordinance in question is unireasonable and oppressive, because it prohibitsrather than regulates the carrying of refuse into the town of New Windsor. Itis a well-known fact that household refuse, decayed fruit, and garbage may becarried in sealed vehicles or containers without being in any wise offensive or anuisance. The town board has power, by ordinance, to reasonably regulatethe transportation of such materials in or through the town; but this ordinanceis prohibitive rather than regulatory, and it is for that reason, in my opinion,invalid and unenforceable.
PUBLIC HEALTH ENGINEERING ABSTRACTS
Experience with Red Water at Southern Pines. C. 0. Butler. Journal ofNorth Carolina Section, American Water Workls Association, vol. 5, No. 1, 1927,pp. 104-118. (Abstract by Chas. R. Cox.)
This article, together with lengthy discussions by several authorities, containsan interesting account of the problem of the prevention of corrosion of distribu-

3265 December 7, 1928
tion systems. The raw water used at Southern Pines coagulates best at pH5.2 to 5.4. Such treatment of the water naturally produced a highly corrosivefiltered water. The difficulty was temporarily solved by the use of soda ash insufficient quantities to produce a pH of 6.6 to 7.0. Red-water trouble developedagain, however, and finally lime treatment was instigated, using the so-called"marble" test to determine the pH at which the CO2 would be neutralized bythe lime, which was found to be about 8.4 to 8.6. Lime treatment based uponthis procedure produced a noticeable coating on the inside of service pipes andprevented further red-water trouble.One of the discussions of this paper outlined experiments made at the plant to
determine the best treatment. These experiments included aftertreatmentwith lime, soda ash, and caustic soda, coagulation with sodium aluminate andalulll, coagulation with lime and iron sulphate, aftertreatment with sodiumsilicate, pretreatment with calcium chloride and aftertreatment with sodiumsilicate, and aftertreatment with sodium silicate and lime. It was concludedthat sodium silicate and lime was the best combination of chemicals to be used.These laboratory tests were made with the corrosion of iron filings and thus theywere made under conditions quite different from those in distribution systems.Another reviewer of the paper emphasized the importance of considering the
problem from the standpoint of plant conditions, and advocated the use of the"imarble" test to determine the quantity of lime to be used in aftertreatment.Dissolved Iron and Manganese in Stored Water at Kernersville. XV. H. Weir.
Journal of North Carolina Section, American Water Works Association, vol. 5, No. 1,1927, pp. 119-126. (Abstract by Chas. R. Cox.)This valuable conitribution to the limited literature of manganese and iron
removal reviews unusual problems developed at Kernersville, N. C., when anew filtration plant designed to treat a typical turbid water of a flowing streamwas placed in operation to treat the same water after storage in a shallow reser-voir containing large quantities of organic matter. Storage of this water ledto a marked chanige in i-ts quality, leading to the solution of manganese and ironfrom mineral deposits at the site and to a large increase in the color of the water.Experiments conducted at the plant indicate that aeration of the water failedto precipitate the iron and manganese, probably due to the large organic content.
Prechlorination of the water, .however, led to the precipitation of the iron andmanganese, but the organic color remained unchanged. Addition of lime to theraw water produced excellent flocculationi of the iron and manganese, but nochange in the organic color. Subsequent coagulation with alum, however, re-sulted in a reduction of the color. Experiments were duplicated on a plant scaleby the addition of lime to the raw water entering the mixing basin. The doseof lime was determined by the maintenancec of a faintly caustic reaction tophelolphthalein. The forination of the ironi hydroxide was extremely rapid,allowing the alunm solution to be added about half way down the mixing chamber.The alum dose was adjusted to maintain the optimum pH for color coagulation.The sedimentation of the floc, however, was slow so that the settled water wasiore turbid than desirable, thus requiring frequent washing of the filters and the.
use of large volumes of wash water.The above situation indicates the great desirability of thoroughly studying the
quality of a raw water to be treated before the final plans for water-purificationplanits are completed, in order that the plant may be.provided with the necessaryauxiliary equipment, and for special treatment when such is necessary.Succinchlorimide Proposed as a Chemical Agent for the Preparation of Potable
Water. C. B. Wood. Military Surgeon, vol. 63, No. 4, October, 1928, pp.493-506. (Abstract by C. T. Butterfield.)

December 7, 1928 3266
A brief historical sketch is given in this article of methods used to renderpotable water in large and small quantities. Unpublished data are presentedshowing that "halazone" is quite satisfactory, and "nuklorene" entirely unsuit.able for use as a bactericidal agent in water.A chlorine containing organic compound to be used by the Army for preparing
potable water in the field must be: (1) A solid at ordinary temperatures anidpressures; (2) capable of prompt reaction in water with bactericidal action;(3) stable over periods of years rather than weeks or months, and (4) nontoxicto the human body.The qualifications of a number of compounds to meet these conditiolis are
given and discussed. The method of preparation of succinichloriniide an(dexperimental evidence to show that it has the four required qualifications arethen presented.
Chemical Engineering Applied in New St. Louis Water Plant. C. WV. C,i1o.Chemical and Metallurgical Engineering, April, 1928, p. 230-i. Abstract byRudolph E. Thompson in Water and Water Engineering, vol. 30, No. 355, Juiv20, 1928, p. 341.
In this article details are given of the new Howard Bond purification plant onthe Missouri River. The river water will be pumped into two primary Dorrclarifiers providing a detention period of 2 hours and 10 miinutes at the ratedcapacity of 55 m. g. d., thence flowing to an S-shaped mixing conduit, miiilk oflime being added at the inlet and iron sulfate at the outlet. From the mixilngconduit the water will be introduced tangentially at the top of circular mixingtanks 65 feet in diameter, flowing through secondary Dorr clarifiers of the samesize as the primary ones inito coagulation basins. The settled water will herecarbonated with flue -gas from the boiler house, treated with alum in a secon(dmixing chamber and settled in secondary coagulation basins. From the latterthe water will pass to 20 rapid sand filters, and the effluent will finally be treatedwith chlorine.
Final Report on Double Coagulation Studies at Cincinnati. Clarence Bahlilnantand E. B. Evans. Seventh Annual Report of Ohio Conference on Water Puirifi-cation, October, 1927, pp. 60-63. (Abstract by J. K. Hoskins.)
This is a final summary report of double coagulation studies first discussedin the Sixth Annual Report of the Conference. The summarized data of opera-tion are presented in the form of tables whiclh are briefly discussed under hcad-ings of (a) general comparison of single and double coagulation, (b) additionalsafeguards in plant operation, (c) will double coagulation permit temporaryelimination of the chlorination process? (d) effect of primary coagulation uxponsecondary chemical doses, (e) effect upon filter runs and waste water used and(f) costs. The experiments were conducted using alum as a coagulant. Theconclusions as drawn by the authors are:"The process of double coagulation is of great value at times of high turbidity
and pollution in the raw water. Plant operation becomes more responsive tocontrol, and additional safeguards are introduced. Combined with excess limetreatment, a means is afforded of eliminating phenol tastes without any deprecia-tion in the bacterial quality of the water. The process gives promise of beingof assistance when diatoms seriously interfere with filter operation. For atleast 60 per cent of the time this plant can function with single coagulationsatisfactorily as in the past. The use of the double process is advisable onlyunder unusual loads. The additional cost then will be but $6,500 per annum,equivalent to 36 cents per million gallons. This is but slightly more than thepresent cost of chlorination."

3267 December 7, 1928
Effcts of Water on Teeth in Europe. Frederick S. McKay. Water WorksEngineering, vol. 81, No. 15, July 18, 1928, pp. 1037-38 and 1051-52. (Abstractby Arthur P. Miller.)This is a continuation of the discussion of this subject by this author. Other
articles have appeared in Water Works Engineering for January 15, June 1, July1, and August 1, 1926.References to literature bearing on mottled teeth in Italy are cited and the
author then presents evidence collected by himself personally during a trip toItaly in August, 1927, which points to a relationship between the mottled teethof the inhabitants of the area about Naples and some deleterious chemical in thedrinking-water supply of those inhabitants. The author states that "not oneindividual who had used water from these wells [Note.: the wells discussed arethose suspected of containing deleterious chemicals] during.,the enamel-growingperiod had escaped the enamel defect." The evidence as presented is veryinteresting and without further knowledge of some other factor certainly pointstoward the water supply.
Chlorination Method Used to Destroy Alga Growths. L. B. Mangun.Water Works Engineering, vol. 81, No. 15, July 18, 1928, p. 1076. (Abstract byArthur P. Miller.)At Kansas City, Kans., efforts to destroy Tetrastrum, an algi, in one of the
reservoirs with copper sulphate was not successful. Chlorination was then triedwith such success that plans to cover the reservoir at an expense of $146,000were laid aside.Within the reservoir near one of the walls there is a well terminating one of the
pipes leading from the reservoir to the pumps. Due to the arrangements of sluicegates in this well, it was possible by the proper manipulation of the gates to obtainreasonable rotation of the water in the reservoir. The incoming water carriedthe chlorine, and this rotation gave good mixing. It should be noted that thiswas not an effort to chlorinate the incoming water but to chlorinate the water inthe reservoir.Chlorination was done at night about three times a week during the summer.
A dose of 1 p. p. m. showed a residual at 6 a. m. of 0.2 p. p. m. at the peripheryand 0.02 p. p. m. in the center. By 9 a. m. all traces of chlorine had disappeared.After starting this work no further complaints were received by those gettingwater from this reservoir.Innovations Increase Output of Filters. Caleb M. Saville. Water Works
Engineering, vol. 81, No. 12, June 6, 1928, pp. 779-780 and 857. (Abstract byR. C. Beckett.)Hartford is adding two 54-acre slow sand filters to the eight present filters
each about one-half acre in extent. Rates of filtration vary from three to fivemillion gallons per acre per day although rates as high as 7.5 million gallons havebeen maintained. Color is reduced one-third.Development of a boxless type of ejector used in sand pile enables one man
with a fire hose to do work formerly done by six men. Additional Nichols sandseparators operated in parallel from the ejector at lower pressures resulted inless loss of sand and more sand handled in less time. Time of washing filterswas cut from three to two days. Percentage of wash water used for the yearwas one-eighth of 1 per cent of the total effluent.Experiences With Crenothrix in Ground Water Supplies. K. W. Brown.
Municipal News and Water Works, vol. 75, No. 2, August, 1928, pp. 93-94.(Abstract by J. L. Robertson.)This article discusses methods for combating Crenothrix growth by the applica-
tion of chemicals. It is pointed out that the possibilities of success are greater213141- 28~2
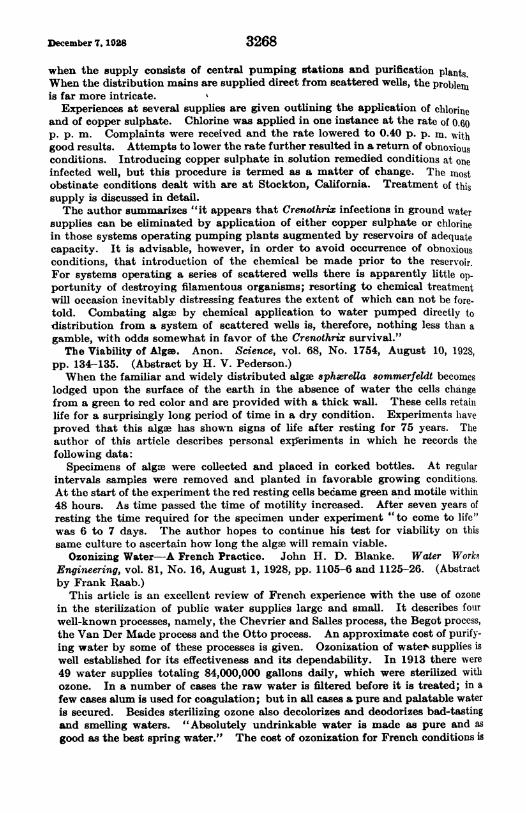
December 7, 1028 3268
when the supply consists of central pumping ftations and purification plants.When the distribution mains are supplied direct from scattered wells, the problemis far more intricate. %
Experiences at several supplies are given outlining the application of chlorineand of copper sulphate. Chlorine was applied in one instance at the rate of 0.60p. p. m. Complaints were received and the rate lowered to 0.40 p. p. m. withgood results. Attempts to lower the rate further resulted in a return of obnoxiousconditions. Introducing copper sulphate in. solution remedied conditions at oneinfected well, but this procedure is termed as a matter of change. The mostobstinate conditions dealt with are at Stockton, California. Treatment of thissupply is discussed in detail.The author summarizes "it appears that Crenothrix infections in ground water
supplies can be eliminated by application of either copper sulphate or chlorinein those systems operating pumping plants augmented by reservoirs of adequatecapacity. It is advisable, however, in order to avoid occurrence of obnoxiousconditions, that introduction of the chemical be made prior to the reservoir.For systems operating a series of scattered wells there is apparently little op-portunity of destroying filamentous organisms; resorting to chemical treatmentwill occasion inevitably distressing features the extent of which can not be fore-told. Combating algie by chemical application to water pumped directly todistribution from a system of scattered wells is, therefore, nothing less than agamble, with odds somewhat in favor of the Crenothrix survival."The Viability of Alge. Anon. Science, vol. 68, No. 1754, August 10, 1928,
pp. 134-135. (Abstract by H. V. Pederson.)When the familiar and widely distributed alg2e sphaereUa sommerfeldt becomes
lodged upon the surface of the earth in the absence of water the cells changefrom a green to red color and are provided with a thick wall. These cells retainilife for a surprisingly long period of time in a dry condition. Experiments haveproved that this algae has shown signs of life after resting for 75 years. Theauthor of this article describes personal experiments in which he records thefollowing data:
Specimens of algme were collected and placed in corked bottles. At regularintervals samples were removed and planted in favorable growing conditions.At the start of the experiment the red resting cells became green and motile within48 hours. As time passed the time of motility increased. After seven years ofresting the time required for the specimen under experiment "to come to life"was 6 to 7 days. The author hopes to cont,inue his test for viability on thissame culture to ascertain how long the algae will remain viable.
Ozonizing Water-A French Practice. John H. D. Blanke. Water WorksEnginteering, vol. 81, No. 16, August 1, 1928, pp. 1105-6 and 1125-26. (Abstractby Frank Raab.)
This article is an excellent review of French experience with the use of ozonein the sterilization of public water supplies large and small. It describes foulrwell-known processes, namely, the Chevrier and Salles process, the Begot process,the Van Der Made process and the Otto process. An approximate cost of purify-ing water by some of these processes is given. Ozonization of water, supplies iswell established for its effectiveness and its dependability. In 1913 there were49 water supplies totaling 84,000,000 gallons daily, which were sterilized withozone. In a number of cases the raw water is filtered before it is treated; in a
few cases alum is used for coagulation; but in all cases a pure and palatable wateris secured. Besides sterilizing ozone also decolorizes and deodorizes bad-tastingand smelling waters. "Absolutely undrinkable water is made as pure and as
good as the best spring water." The cost of ozonization for French conditions is

3269 December 7, 1928
from one-half to two centimes per cubic meter. Calculating five francs to $1,this means a cost of about $3.75 to $15 per million gallons.The article also gives the results and observations of the first workers with
ozone, as well as the physical and chemical properties of it. (Abstracter's note:Small filter plants which experience great troubles with tastes and odors resultingfrom algae might well consider the ozonization of their water supply.)Water Supply. Carl Gross. Illinois Health News, vol. 14, No. 5, May, 1928,
pp. 154-156. (Abstract by H. M. Freeburn.)Inspections indicate that less than one-tenth of 2,000 wells inspected at tourist
camps, farms, and schools are located and permanently constructed so as to bepollution proof at all times. Water in many school wells is contaminated byfilth deposited on poorly constructed well tops. This article advocates properlocation and protection of wells at rural schools to serve as models for the repairof defective farm wells and gives graphical diagrams to show results of inspectionsand bacteriological analyses of 68 school wells in one county. Three of the wellswere within 15 feet of chemical toilets. It is stated that wells should never beless than 50 feet from toilets, sewers, and cesspools.
Wells with wooden tops or manholes are not eligible to receive safe water sealsbecause such wood construction necessitates more frequent repairs, gives tem.porary appearance, and may permit contamination of the -well. Of the 68 wellsinspected, 27 apparently were substantial and permanent and justified an awardof a safe water seal.
Bacteriological analyses of water from 50 wells indicated only two bad andeight doubtful. Most of the supplies inspected were either driven or drilled wells.
Chlorine Absorption of Water. H. Wette. Arch. f. Hyg. 1928, 99 : 143-57.Abstract by Arthur P. Miller in Bulletin of Hygiene, vol. 3, No. 8, August, 1928,p. 665.A measurement of chlorine absorption is useful in providing a better criterion
of the presence of certain albuminoid bodies than by the oxygen absorbed test(as measured by the Kubel-Tiemann process) and in giving an indication of theamount of chlorine needed in the disinfecting process of water purification.
Various methods of testing for chlorine absorption, the results of which testsdepend somewhat on the method, arc discussed. Test samples of boiled tapwater to which urea was added were subjected to the following three methods ofobtaining chlorine absorption: Froboese method-large excess of reagent andheating; Bruns method-addition of 1-2 p. p. m. of chlorine, reaction in coldfollowed by titration of excess; Olszewski method-testing for slight excess withbenzidine.
It was concluded that albuminoid substances like urea, carbohydrates repre-sented by sugar, and fats represented by olive oil, do not affect the dose requiredfor chlorination. Other experiments indicated that a high bicarbonate contentand pH value favor high chlorine absorption.
DEATHS DURING WEEK ENDED NOVEMBER 24, 1928Summary of information received by telegraph from industrial insurance companies
for the week ended,November 24, 1928, and corresponding week of 1927. (Fromthe Weekly Health Index, November 28, 1928, issued by the Bureau of the Census,Department of Commerce)
Week ended CorrespondingNov. 24, 1928 week, 1927
Policies in force --------------------------- 72, 242, 758 69, 519, 120Number of death claims -_____ ----------- 14, 333 11, 263Death claims per 1,000 policies in force, annualrate_----- ----------- ----------- 10. 4 8 4
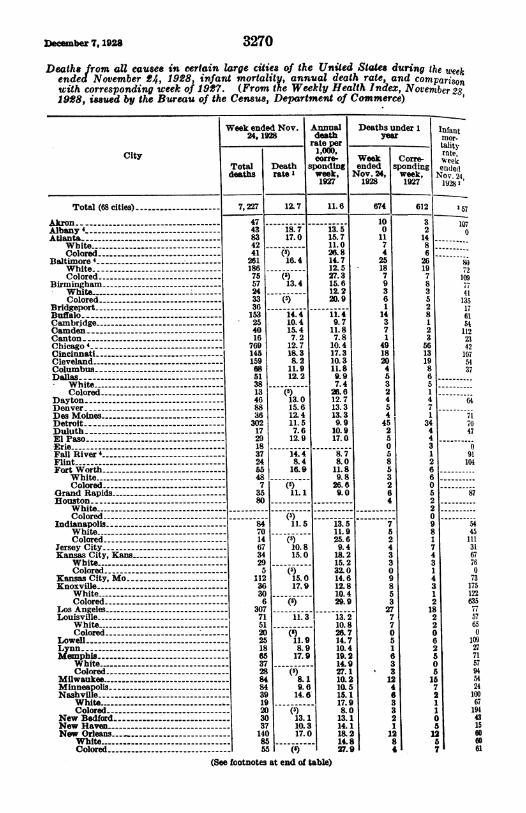
December 7,1928 3270
Deaths from all causes in certain large cities of the United State. during the ueekended November 24, 1928, infant mortality, annual death rate, and comparis0owith corresponding week of 1927. (From the Weekly Health Index, November 28
1928, issued by the Bureau of the Census, Department of Commerce)
City
Total (68 cities) -_,-
Akron -_------____-Albany 4------------------------------Atlanta -_ -
White-Colored-
Baltimore 4______________-_____________White ----------------------Colored.
Birmingham .White --Colored.-----.
Bridgeport - -
Buffalo -_----__-Cambridge -
Camden--Canton -_Chicago 4'-----------------------------Cincinnati - _-Cleveland - _--Columbus - _-Dallas -_---------
White-Colored----------
Dayton-Denver-Des Moines ---_-__---Detroit-Duluth -_---El Paso - _-Erie-Fall River 4'-_____________________-__-Flint-Fort Worth ._
White - ------Colored-
Grand Rapids _--_----Houston - -
White - -----Colored -_--
Indianapolis-White - ---------Colored - -
Jersey City -
Kansas City, Kans -
White-Colored -
Kansas City, Mo .Knoxville -_-
White .Colored -
Los Angeles-Louisville-
White --
Colored _- -
Lowell-Lynn-Memphis----------
White ---Colored __
Milwaukee .Minneapolis -
Nashville.White - ----------Colored-
New Bedford __-------_-_.-New Haven -New Orlea -
White __Colored -_-
Week ended Nov. Annual24, 1928 death
rate per1,000,1core-
Total Death sponding 4deth rte I week, N
7,227 12.7 11.6
47 -
43 18.7 13.583 17.0 15.742 11.0
.-- 41 (9 26.8
._- 261 16.4 14.7186 _-- ___- 12.575 (') 27.357 13.4 15.624 ------ 12.233 (1) 20.936153 14.4 11.425 10.4 9.740 15.4 11.816 7.2 7.8
769 12.7 10.4145 18.3 17.3159 8.2 10.368 11.9 11.851 12.2 9.938 ---------- 7.413 (5) 26.646 13.0 12.788 15.6 13.336 12.4 13.3
. __ 302 11.5 9.9
._-- 17 7.6 10.929 12.9 17.018-37 14.4 8.724 8.4 8.055 16.9 11.848-- 9.87 (5) 26.635
11.9.0
80
84 11.5 13.5do 11. 914 (5) 25.667 10.8 9.434 15.0 18.229 15.25 (5) 32.0
112 15.0 14.636 17.9 12.830 -- 10.46 (5) 29.9
30771 11.3 13.251 -- 10. 8
. - 20 (5) 26.725 11.9 14.718 8.9 10.465 17.9 19.237-- 14.928 (5) 27.184 8.1 10.284 9.6 10 5
*------ 39 14.6 15.119 -- 17.920 (5) 8.030 13.1 13.137 10.3 14.1140 17.0 18. 285 -- 14.8
------ 55 (1) 27.9(See footnotes at end of table)
Deaths un4year
Week (ended sprov. 24,1928
674
100117425187936114371
4918204632464452505863264
762433098532777051633124633211284
ler 1 Infantmor-tality
Corre- rate,
onding ende("week, Nov 241927 1928 2
612 3 573214.8.6.26197835281235613198651471
34443I2660622098174314312
182
2CE
I6
11
I
1070
72109774113517615411223421075437
64
717047
091104
4511167
,78L73175L122
775765
3109227571D57594654724210.0L 671194O41
5 152 60)5 607 61

3271 December 7, 1928
Deaths from all causes in certain large cities of the United States during the weekended November 24, 1928, infant mortality, annual death rate, and comparisonwith corresponding week of 1927-Continued.
Week ended Nov. Annual Deaths under 1 Infant24,1928 death year mor-rate per tality
City ~~~~~~~1,000, rate,City corre- Week Corre- weekTotal Death sponding ended sponding endeddeaths rate week, Nov. 24, week, Nov. 24,
1927 1928 1927 1928
,New York - -1,408 12.2 11.1 129 108 52Bronx Borough --209 11. 5 8.4 13 7 x 39Brooklyn Borough --466 10.6 10.0 41 44 41Manhattan Borough --563 16.8 15.0 ,65 46 77Queens Borough --135 8.3 9.0 10 10 41Richmond Borough --35 12.1 7.5 0 1 0Newark, N. J - -104 11.5 8. 7 16 10 83Oakland - -73 13.9 12.3 5 3 54
Oklahoma City - -40 --- 2 5Omnaha - -54 12.7 9.3 2 2 23Platerson - -34 12.3 9.8 2 4 35Philadelphia - -512 13.0 10.5 45 59 61Pittsburgh _-- - 179 13.9 14.8 22 22 74Portland, Oreg - -77 --- 3 3 33Providence ___-- ___--- 51 9.3 12.3 6 8 52Rtichmond - -57 15.3 12. 5 4 2 55White - -42 12.3 3 1 63
Colored - -15 (5) 13.1 1 1 39Rochester - -79 12 6 10.3 2 6 16St.ILouis - -231 14.2 12.9 28 9 95SiPaul 63 --- 1 5 10Salt Lake City 4 - -46 17.4 9. 2 5 7 81SaniAntonio - -61 14.6 12.8 9 6SanDiego - -40 17.5 17.2 1 1 19SanFrancisco - -190 17.0 12.2 7 7 44Schenectady - -15 8.4 6.7 1 2 31Seattle - -78 10.6 6.3 3 1 32Somerville - -19 9.7 4.6 1 0 28Spokane - -34 16.3 17.7 0 4 0Springfield, Mass - -19 6.6 10.6 2 3 33Syracuse - - 51 13.4 10.6 2 3 24Tacoma - -23 10.9 13.1 1 1 26Toledo - -75 12. 5 12.1 12 7 116Trenton - -28 10.5 14.5 5 1 86IUtica - -40 20.1 14.6 2 1 47Washington, D. C --121 11.5 11.8 10 6 58White --------- 69 -- 10.6 3 3 25(olored - ----------------- 52 (5) 15.3 7 3 129Waterbury - -14 --- 1 1 25Wilmington, Del - -33 13.4 12.8 2 4 49Worcester - -43 11. 4 13. 3 2 5 24Yonkers - -19 8.2 10.5 2 1 45Youngstown - -45 13.5 7. 7 4 2 53
Annual rate per 1,000 population.2 D)eaths under 1 year per 1,000 births. Cities left blank are not in the registration area for births.3 Data for 69 cities.Deaths for week ended Friday, Not-. 23, 1928.In the cities for which deaths are shown by color the colored population in 1920 constituted the follow-ing percentages of the total population: Atlanta, 31; Baltimore, 15; Birmingham, 39; Dallas, 15; For Worth,14; Hiouston, 25; IndianapolLs, 11; Kansas City, Kans 14; Knoxville, 15; Louisville, 17; Memphis, 38;Nashville, 30; New Orleans, 26; Richmond, 32; and Washington, D. C., 25.
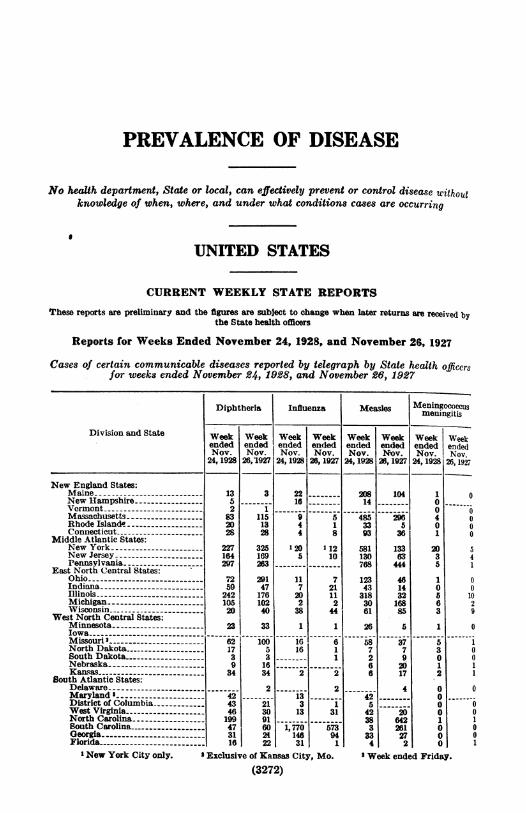
PREVALENCE OF DISEASE
No health department, State or local, can effectively prevent or control disease withoutknowledge of when, where, and under what conditions cases are occurring
UNITED STATES
CURRENT WEEKLY STATE REPORTS
These reports are preliminary and the figures are subject to change when later returns are received bythe State health offloors
Reports for Weeks Ended November 24, 1928, and November 26, 1927
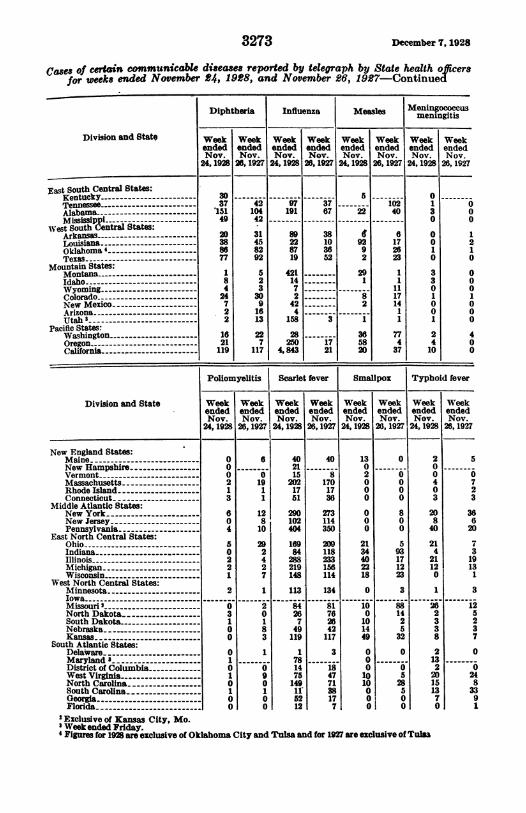
Cases of certain communicable diseases reported by telegraph by State health officersfor weeks ended November 24, 1928, and November 26, 1927
Diphtheria Influenza
Division and State Week Week Week Week
ended ended ended endedNov. Nov. Nov. Nov.
24,1928 26,1927 24, 1928 26, 1927
New England States:Maine -13 3 22New Hampshire 5 16
Vermont -2 1Massachusetts 83 115 9 5Rhode Island 20 13 4 1Connecticut 28 28 4 8
Middle Atlantic States:New York 227 325 l 20 112New Jersey 164 169 5 10Pennsylvania 297 B63
East North Central States:Ohio 72 291 11 7Indiana -9 47 7 21Illinois -242 176 20 11Michigan -105 102 2 2Wisconsin -20 40 38 44
West North Central States:Minnesota- 23 33 1 1IowaMissouri -62 -100 16 6North Dakota 17 5 16 1South Dakota 3 3 1
Nebraska -9 16Kansas ---------------------- 34 342 2
South Atlantic States:Delaware 2 2Maryland 42 13District of Columbia 43 213 1West Virginia 48 30 13 31North Carolina 199 91South Carolina 47 60 1, 770 573Georgia -31 24 146 94Florida 16 22 31 1
New York City only. 2 Exclusive of Kansas City, Mo.
Measles Meningooo,meningit
Week Week Week Wended ended ended ernNov. N;ov. Nov. N
24, 1928 26, 1927 24, 1928 26,
208 104 114- 0
485 296 433 5 0
93 36 1
581 133 20
130 63 3768 444 5
123 46 143 14 0318 32 530 168 661 85 3
26 5 1
58 37 5
7 7 32 9 06 20 16 17 2
4 0
42 05 042 20 0
38 642 13 261 0
33 27 0
4 2 02 Week ended Friday.
Scusis
Ieekded.ov.1927
(3272)
0
000
4001
001029
0
---- -i1
0
0
1
.
1001
3273 December 7,1928
Cases of cein communicable diseases reported by telegraph by State health officersfor weeks ended November 24, 1998, and November 26, 1927-Continued
Diphtheria Influenza Measles Meningococusmeningitis
Division and State Week Week Week Week Week Week Week Weekended ended ended ended ended ended ended endedNov. Nov. Nov. Nov. Nov. Nov. Nov. Nov.24,1928 28, 1927 24, 1928 26,1927 24,1928 20, 1927 24, 1928 26, 1927
East South Central States:Kentucky -30 ---- 5 0Tennessee -37 42 97 37 -- 102 1 0Alabama -151 104 191 67 22 40 3 0Mississippi -49 42 -----0 0
West South Central States:Arkansas -20 31 89 38 9 6 0 1Louisiana -38 45 22 10 92 17 0 2Oklahoma 4 -86 82 87 36 9 28 1 1Texas -77 92 19 52 2 23 0 0
Mountain States:Montana - 1 5 421 29 1 3 0Idaho -8 2 14 1 1 3 0Wyoming - 4 3 7 --- 11 0 0Colorado -24 30 2 8 17 1 1New Mexico -7 9 42 2 14 0 0Arizona -2 16 4 --- 1 0 0Utah ' 2 13 158 3 1 1 1 0
Pacific States'Washington -16 22 28 36 77 2 4Oregon -21 7 250 17 58 4 4 0California - 119 117 4,843 21 20 37 10 0
Poliomyelitis Scarlet fever SmaUlpox Typhoid fever
Division and State Week Week Week Week Week Week Week Weekended ended ended ended ended ended ended endedNov. Nov. Nov. Nov. Nov. Nov. Nov. Nov.24,1928 2B,1927 24,1928 26,1927 24,1928 20, 1927 24,1928 28, 1927
New England States:Maine-0 6 40 40 13 0 2 5New Hampshire-0 21 0 0.----.Vermont -0 0 15 8 2 0 0 0Massachusetts -2 19 202 170 0 0 4 7Rhode Island - 1 1 17 17 0 0 0 2Connecticut -3 1 51 36 0 0 3 3
Middle Atlantic States:New York -6 12 290 273 0 8 20 36New Jersey -0 8 102 114 0 0 8 6Pennsylvania -4 101 404 350 0 0 40 20
East North Central States:Ohio - --------------------- 5 29 169 209 21 5 21 7Indiana -------- 0 2 84 118 34 93 4 3Illinois -2 4 288 233 40 17 21 19Michigan -2 2 219 156 22 12 12 13Wisconsin -1 7 148 114 18 23 0 1
West North Central States:Minnesota -2 1 113 134 0 3 1 3Iowa--- -------- ------
Missouri 2 84 81 10 88 26
North Dakota ---- 3 0 20 76 0 14 2South Dakota -1 1 7 26 10 2 3Nebraska ---------- 0 8 49 42 14 5 3Kansas -0----------- O 3 119 117 49 32 8
South Atlantic States:Delaware ------------------ 0 1 1 3 0 0 2Maryland ------------ 1 78 0 13District of Columbia- 0-- 14 18 0 0 2West Virginia ------- 1 9 75 47 10 5 20North Carolina -0 0 149 71 10 28 15South Carolina -1---------- I 1 38 0 5 13Georgia -0 0 52 17 0 0 7Florida-0 0--------------- O 127 01 0 0
2 Exclusive of Kansa City, Mo.3 Week ended Friday.4 Figur for 1928 are exclusive of Oklahoma City and Tulsa and for 1927 are exclusive of Tuls
125237
0
2483391

Deember 7, 1928 3274
Ca8es of certain communicable diseases reported by telegraph by State health officersfor weeks ended November 24, 1928, and November 26, 1927-Continued
Division and State
East South Central States:Kentucky .-TennesseeAlabama - -
Mississippi .West South Central States:
ArkansassLouisiana .Oklahoma 4Texas ---------------------
Mountain States:Montana .Idaho ---------Wyoming _ColoradoNew Mexico _ArizonaUtah3
Pacific States:WashingtonOregon _- _- _Ca lifornia ----------------------
Poliomyelitis Scarlet fever SmallpoxI
WeekendedNov.
24, 1928
0000
0010
1000100
406
WeekendedNov.26,1927
------i-
00
2
3
2
2
2
0
20
2
9
2617
WeekendedNov.24,1928
83345421
17274535
24102424220105031178
WeekendedNov.
B26,1927
WeekendedNov.
24, 1928
850 320 830 0
10 218 4325 1066 21
12 1417 1233 552 19 00 62 1
39 529 41
155 15
WeekendedNov.
26, 1927
197
283613
5981080030
35205
3 Week ended Friday.4 Figures for 1928 are exclusive of Oklahoma City and Tulsa and for 1927 are exclusive of Tulsa.
SUMMARY OF MONTHLY REPORTS FROM STATESThe following summary of monthly State reports Is published weekly and covers only those States from
which reports are received during the current week:
Menin-
SgMcjni- Diph- Influ- Ma- Mea- Pelag- Polio- cariet 6mall Ty-stte ceun theria enza laria sles ra mye Scaerle Smll Ty-i
g eitns litis f v r Pox fever
,September, 1928
Delaware -1 3 1 6 0 3
October, 1928
Alabama - _ 2 447 230 1,382 29 29 14 176 5 132California - 13 434 4,25S 13 88 3 22 707 101 78Georgia -_---- 0 170 337 953 20 24 0 104 3 96Idaho - 4 11 --- 7 16 83 34 10Illinois - 23 676 61 18 340 4 18 829 65 156Iowa - 1 75 --- 4 4 266 34 16Mississippi --- 233 2,113 10,461 134 683 3 149 2 105Missouri -14 231 23 48 43 1 313 26 91North Carolina_ 0 957 --- 85 4 658 17 148Oklahoma - 8 _6 353 104 582 18 19 2 162 25 222Oregon-5 66 80 66 13 145 99 16Rhode Island 0O 71 5 64 4 54 0 5South Carolina 0 653 2,309 3,935 22 38 6 78 4 180Wisconsin - 18 100 127 0 230 -2 376 35 18
'Exclusive of Oklahoma City and Tulsa.
Typhoid fever
Week Weekended endedNov. IN;o*24, 1928 26,1927
83217
207238
3002611
535
18435
14124314
208111602
537
12%

December 7,1928
Se&Aemer, 198
Delawale: CasesOphthalmia neonatorum 1
Whooping cough -7
Octo&er, 19t8ActinomY(oeis:
California- 1
Illinoisinthrax:
California- 1MIississippi 2Rhode Island 1
Chicken pox:Alabama -25California--------------------- 699Georgia- 1I(laho --------------- 16Illinois ---------- 793Iowa --167Mississippi -- 226Aissouri -152North Carolina 161Oklahoma -17Oregon -115Rhode Island 8South Carolina- 34Wisconsin 87
Coccidoidal granuloma:California 4
Conjuinctivitis:Georgia- 2
Dengue:Alabama -10Georgia -12Mississippi 198Oklahoma I 1South Carolina 102
Dysentery:California (amebic)California (bacillary)- 5Geora --23Illinois -28Mississippi (amebic)- 36Mississippi (bacillary) 350Oklahoma I -17Oregon __----_--_-----1
German measles:California - -- ----- 49Illinois 17North Carolina - ---- 6Wisconsin --------------- 14
Hookworm disease:Georgia 7
Nissippi _---- 286
Oklahomal-------------------------------- 1
South Carolina 82Impetigo contagiosa:
Oregon -15
Jaundice:Califonia- -_ I
Lead poisoning:Illinois- 7
Leprosy:California _-___----------------------- 1-I
XEIclusive of Oklahoma City and Tulsa.
Lethargic encephalitis: CasesCalifomia 6
IdahoIllinois 4Oregon 1
Wisconsin 1
Mumps:Alabama --------- 17Califrnia 79*Georgia 15Idaho 1
Illinois- 160Iowa-NMIssssPP ----------------------------- 173Mississippi-1 73
Missouri 37Oklahoma 2Oregon : _ 23Rhode Island I
South Carolina -14Wisconsin -119
AMilk sickness:Illinois
Ophthalmia neonatorum:Illlinois- 53Mississippi __---- 7Missouri 1
North Carolina -1
RhodleIsland- 2South Carolina 13
Paratyphoid fever:California -2
G3orgia -5
Idaho -3
Illinois-1South Carolina- 4
Puerperal fever:Illinois -___ 13Mfississippi- 41
Rabies in animals:California -65Illinois- 3Mississippi- 5Oregon -1
Rhode Island 14South Carolina- 7
Rabies in man:GeorgiaIowa __-- _ 1
Scabics:Oregon 43
Septic sore throat:Georgia 42Illinois-10Iowa- 1Missouri 13North Carolina -11Oklahoma I -14Oregon 6
Tetanus:California -4
Georgia -1
Illinois -5
Missouri -1
Oklahoma 1- 2South Caroina -1
Wisconsin a
3275
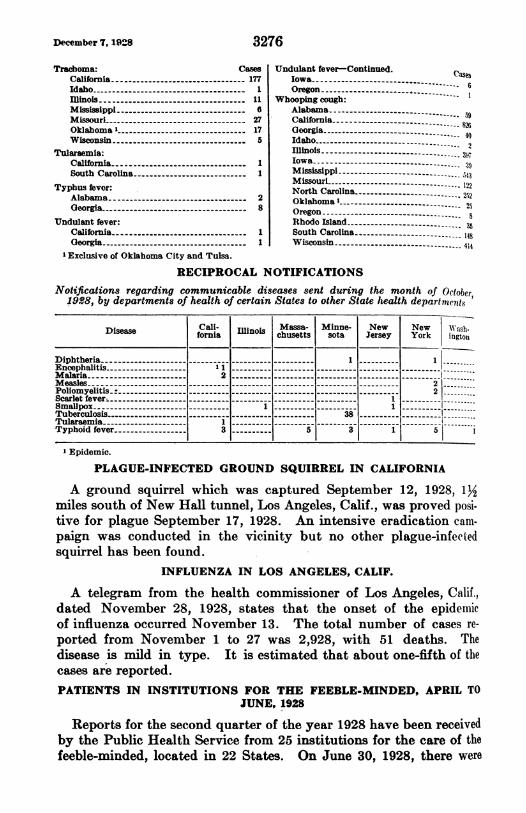
December 7, 1928
Trachoma: CasesCalifornia 177
Idaho -1
Illinois-11Mississippi- 6Missouri -27Oklahoma -17Wisconsin- 5
Tularaemia:California-1South Carolina- 1
Typhus fever:Alabama- 2Georgia- 8
Undulant fever:California -------
Georgia.IExclusive of Oklahoma City and Tulsa.
1
1
Undulant fever-Continued. caeIowa -------------------- ---Oregon --------------------------- I
Whooping cough:
Alabama------------------------------ 59California 8Georgia -- 0
Idaho ---------------------------------Illinois --------------------------------- 39Iowa --------------------------- 39MississippiMissouri ------------------------------- 122
North Carolina-25-------------------- 2
Oklahoma I---------------------------- 25
Oregon ----------------- 8
Rhodo Island ------------ 35
South Carolina -148Wisconsin ------------------ 414
RECIPROCAL NOTIFICATIONSNotifications regarding communicable diseases sent during the month of October,
1928, by departments of health of certain States to other State health departmnC,ts'Disease Cali- Illinois Massa- Minne- New New Wash-fornia chusetts sota Jersey York ington
Diphtheria ---- 1 1Encephalitis -11 --Malaria- 2-Measles ------Poliomyelitis ------ 2Scarlet fever ----- 1Smallpox- 1 -1-1-Tuberculosis - --- 38---------Tularaemia -1Typhoid fever- 3-5 3 1 5 1
XEpidemic.
PLAGUE-INFECTED GROUND SQUIRREL IN CALIFORNIA
A ground squirrel which was captured September 12, 1928, 1Y2miles south of New Hall tunnel, Los Angeles, Calif., was proved posi-tive for plague September 17, 1928. An intensive eradication cam-paign was conducted in the vicinity but no other plague-infectedsquirrel has been found.
INFLUENZA IN LOS ANGELES, CALIF.
A telegram from the health commissioner of Los Angeles, Calif.,dated November 28, 1928, states that the onset of the epidemicof influenza occurred November 13. The total number of cases re-ported from November 1 to 27 was 2,928, with 51 deaths. Thedisease is mild in type. It is estimated that about one-fifth of thecases are reported.PATIENTS IN INSTITUTIONS FOR THE FEEBLE-MINDED, APRIL TO
JUNE, 1928
Reports for the second quarter of the year 1928 have been receivedby the Public Health Service from 25 institutions for the care of thefeeble-minded, located in 22 States. On June 30, 1928, there were
3276

3277 Decealer 7, 1928
29,815 patients in these imstitutions, including those on temporaryleave. The first admissions were as follows:
Male Female Total
~~~~~~~~~~~~173106279Apnl------- ----------------------------------------------- 16711728May-___ _. 187 117 284JuM ---------------------------- 145 99 244
Total 485 807
Of the first admissions 60.1 per cent were males and 39.9 werefemales, the ratio being 151 males per 100 females. On June 30,1928, there were 15,716 male patients and 14,099 .female patients,giving a ratio of 111 males per 100 females.During the three months 218 patients were discharged, 107 males
and 111 females. Two hundred and fifty-four patients died, thedeath rate being for males, 38.1 per 1,000; for females, 30.8; and forpersons, 34.7 per 1,000. These death rates are on an annual basiscomputed on the estimated population of the institutions as of themiddle of May, 1928.Data showing the numbers of patients on temporary leave are
available for 23 institutions for the first six months of the year 1928.During the first quarter of the year there was a small decrease in
the number of patients absent on temporary leave, but during thesecond quarter the number on leave increased 18.8 per cent, althoughduring these three months the total number on the books increasedonly 1.4 per cent, and the number in the institutions decreasedslightly.The following table shows the numbers of patients in the institu-
tions and on temporary leave at the end of each month from Januaryto June, 1928, and the percentage of the total patients who were onleave.
Jan. 31, Feb. 29, Mar. 31, Apr. 30, May 31, June 30,1928 1928 192 928 1928 1928
Patients in institutions:Male - ----------------------- 12,438 12,605 12, 69 12,769 12,802 12,588Female - 11,720 11,770 11, 824 11,8 11,839 11,683Total --------- 24,167 24,375 24,523 24,615 24,641 24,271
Patients on temporary leave:Male ------------------ 1,993 1,958 1,923 1,957 2,015 2,303Female. -1,596 1,497 1,496 1,525 1,561 1,760
Total - _- --------------------- 3,499 3,455 3,419 3,482 3,576 4,063
Total patients on books:Male- - _ 14,431 14,563 14,622 14,726 14,817 14,891Female - _- _---------------------- 13,235 13,267 13,320 13,371 13, 400 13,443
TotalW - ____--- ---------- - 27,606 27,830 27,942 28,097 28,217 28,334
Per cent of total patients on temporaryleave:Male - __ 13.8 13.4 13.2 1 4 13.8 15.5Female - 11.4 11.3 11.2 11.4 1L8 13.1
Total1 2.6 12._------12 114 112 12.4 12.7 14.3

December 7,1928 3278
GENERAL CURRENT SUMMARY AND WEEKLY REPORTS FROMCITIES
The 97 cities reporting cases used in the following table are. sit,.ated in all parts of the country and have an estimated aggregatepopulation of more than 31,450,000. The estimated population of
the 91 cities reporting deaths is more than 30,750,000. The esti-
mated expectancy is based on the experience of the last nine Y,ars,excluding epidemics.
Weeks ended November 17, 1928, and November 19, 1927
Caset reportedDiptheria:
43 States ----97 cities-
Measles:42States ----------------------------------------------97 cities-
Poliomyelitis:44 States -------------------------------------------
Scarlet fever:42 States -_ ----------------------------------------------97 cities-
Smallpox:43 States-97 cities-
Typhoid fever:43 States -----------------------------------------------------97 cities-
Deaths reportedInfluenza and pneumonia:
91 cities - ---------------------------------------------------Smallpox:
91 cities-Chicago, Ill-
1928
I I-
2,563953
2,59156868
3,2511,01538921
40261
686
00
Esti-1927 iliate(d
expect.aney
3,058 .1, 351 1,3072,652 -----
735 ----
300 .
3,581- -
1,040 1.0)2
484111 ;39
486089
701
1
City reports for week ended November 17, 1928
The "estimated expectancy" given for diphtheria, poliomyelitis, scarlet fevcr, smallpox, and typhoidfever is the result of an attempt to ascertain from previous occurrence the number of cases of the disexseunder consideration that may be expected to occur during a certain week in the absence of epidemies. Itis based on reports to the Public Health Service during the past nine years. It is in most instances themedian number of cases reported in the corresponding weeks of the preceeding years. When the relbortsInclude several epidemics or when for other reasons the median is unsatisfactory, the epidemic 1)(Tiodsare excluded and the estimated expectancy is the mean number of cases reported for the week (duiringnonepidemic years.
If the reports have not been received for the full nine years, data are used for as many years as possible,but no year earlier than 1919 is Included. In obtaining the estimated expectancy, the figures are smoothedwhen necessary to avoid abrupt deviation from the usual trend. For some of the diseases given in thetable the available data were not sufficient to make it practicable to compute the estimated expectancy.
Diphtheria InfluenzaPouainChick- Mea- mumps, Pneui-
Division, State, and July 1, ecnpmox Caesti saesCse s deathscity 1926,red
esti-' Caes Cases Deathsre
re- re-estimated pote mated re prted eported portedpr portedexpect- portedpotd ore
ancy
NEW ENGLANDMaine:
Portland-Now Hampshire:
Concord-Manchester -------
I Estimated, July 1, 1925.
76,400
122,54884, 000
2
0
0
2
0
4
0
0
5
0
0
0
000
16
0
0
0
0 2

December 7, 1928
city reports for week ended November 17, 1928-Continued
Division, State, andcity
NEW ENGLAND-Iotd.Vermont:Barre-
Massachusetts:Boston-Fall River-Springfield-Wo'rcester-
Rhode Island:Pawtuleket-Providence-
Conniecticut:Bridgeport-hlartford-New Haven-
iiIPDLE ATLINTIC
New York:Buffalo-New York-RochesterSyracuse-
New Jersey:Camden-Newark-Trenton-
Pennsylvania:Philadelphia-Pittsburgh---
Reading-
EAST NORTH CENTRAL
Ohio:Cincinnati-ClevelandColumbus .Toledo
Ijndiana:Fort WayneIndianapolis-South BendTerre Haute-
Illinois:Clhicago .Springfield -_
MIichigan:DetroitFlint -- -------Grand Rapids
Wisconsin:Kenosha .MilwaukeeRacineSuperior
PopulationJuly 1,1926,
estimated
I 10, 0(s787, 000131,000145,000193,000
71,000275,000
(2)164,000182,000
544,0005,924,000321,000185,000
131,000459,000134,000
Z 008, 000637,000114,000
411,000960,000285,000295,000
99, 900367,00081, 70071,900
3,048,00064,700
1, 242,044136,000156,000
52, 700517,00069,400
139,671WEST NORTH CENTRAL
MIinnesota:Duluth -113,000Minneapolis- 434,000St. Paul - _ - 248,000
Iowa:Davenport----_ 1 52,469Des Moines -- 146,000Sioux City --- 78,000Waterloo- 36,900
'Estimated, July 1, 1925.
Chick-en pox,camere-
ported
0
3531711
20O
21314
321622610
13521
1066013
1411322115
34530
1451
168138
10166361
12171104
00169
Diph
Cases,esti-nated[pect-ancy
Lth
0
48547
111
1083
2117697
10145
82384
19631616
51433
S93
80125
234a0
13419
2630
eria
Dasesre-
ported
0
155122
120
770
1014461
8392
46191
819881
5701
1451
4830
1421
0101
0202
InfluenzaMea-sles,
Cass Deaths:re- re- re-
ported ported ported
0
1000
00
200
16
030
000
0301
0000
181
200
0000
2'No estimate made.
000
0000
0
2000
01
100
0800
121
610
2201
0000
60
411
0000
011
fi--
O---O---O---
0
1101342
23
601
288132
110
9620
- 01290
30
0
330
610
1
48100
0
200
0
0
0
1
3 Special census.
3279
I
d
Pneu-rionia,Leathsre-
ported
0
7100
08
125
1413787
3110
46272
10755
1'1110
491
3141
0500
2166
I--------
I--------
I--------
.---
lumps,casesre-
ported
4
00413
10
012
I1
052
1 0331550
1700
0100,
1100
0
0
16
00
2246
l~
e:
N
I
1.
]
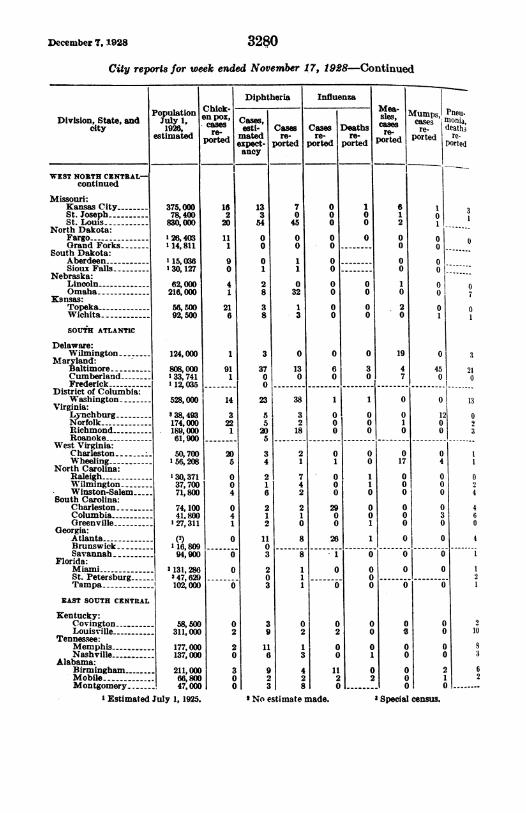
December , 1928 3280
City reports for week ended November 17, 1928-Continued
PDivision, State, and
citye
WEST NORTH CENTRAL-continued
Missouri:Kansas City-St. Joseph-St. Louis-
North Dakota:FargoGrand Forks-
South Dakota:AberdeenSioux Falls-
Nebraska:LincolnOmaha
Kansas:TopekaWichita
SOUTR ATLANTIC
Delaware:Wilmington-
Maryland:Baltimore .Cumberland-Frederick-
District of Columbia:Washington .
Virginia:Lynchburg-NorfolkRichmond-Roanoke-
West Virginia:Charleston - --Wheeling ,
North Carolina:Raleigh ,WilmingtonWinston-Salem
South Carolina:Charleston .Columbia .Greenville
Georgia:AtlantaBrunswickSavannah .
Florida:MiamiSt. PetersburgTampa
EAST SOUTH CENTRAL
Kentucky:Covington ,Louisville
Tennessee:MemphisNashville ._
Alabama:BirminghamMobile --
Montgomery --
'opulationJuly 1,1926,
stimated
375,00078,400830,0001 26,403114,811
115,036130, 127
62,000216,000
56,50092, 500
124,000
806,000133,741112,035
528,000
3 38,493174,000189,00061,900
50,70056, 208
130,37137,70071,800
74, 10041. 800
127,311
(2)16,80994, 900
3 131,2863 47,629102,000
56,500311,000
177,000137,000
211,00066, 80047,000
Cel. 4
p
!hick-,pos,msesre-orted
16
220
11
90
41
216
1
91
1
20
4
1
20
0
0
0
0
0102
210
>1310t10
1 Estimated July 1, 1925.
I
Diphtheria
Cases,esti-natedipect-ancy
P
13354
00
0128
38
3
3700.
23
5
6
205
34
216
212
1103
2* 0
3
39116923
Wasesre-orted
704500
11
3232113
0
130
38
3218
21
742
210
8
8
Influenza
C1asesre-
4orted
0
0
0
0
0-
0-0-
0
0
0
0
0
60
1
0
0
0
0
1
0
0
0
29
0
0
26
0
0
2
0
0
11
2
0
2 No estimate made.
p
1S aumpse PneqUn.n;re-
ported
...di
Pieathsre-Drted
oathsreorted
0
0
0
--------I
0
0
0
0
30
0
0
01--------1
1
1
0
0
0
1
1
0
0
0
0
0
1
02
--- ---
Mea-sles,casesre-
ported
612
00
00
10
20
19
47
0
010
I--------.
017
000
000
0
0
0
0
0
000
OO
1 3
oo00
o
ol o
1 1
O 3
45 21o o
4 13
o
o
o 1
o 4O 1
O i0. 2
o 2o 1
O 4
O 1
2 6
O 1
O 2O 1U
O 8O 3
2 61 20-.
SSpecial census.
:F I
.

3281 December 7, 1928
MiLy reports for week ended November 17, 192g-Continued
Pouaio Chtek-Divtsio, State, and |oulyaion an pox,
city 1928 rae-estimated r-
WEST SOUTH CENTRAL
A,rkanlsasFort Smith- 1 31,643 2Little Rock-75,900 0
Louisiana:New Orleans - 419,000 1Shreveport-59,500 0
Oklahoma:TulsL -133,000 6
Texas:Dalls- 203,000 0Fort Worth- 159,000 7Galveston- 49,100 0hfouston- 1164,954 0San Antonio- 205,000 0
MOUNTAIN
Monitana:Billings- 117,971 10(Ireat Fals-- 1 29, 883 47Helena -- 1 12,037 5Missoula -- 1 12,668 0
Idaho:Boise -- 1 23,042 2
Colorado:Denver -- 285,000 47Pueblo -- 43, 00 9
New Mexico:Albuquerque -- 21,000 0
Utah:Salt Lake City 133,000 123
Nevada:1'eno -- 12,665 0
PACIFIC
Wasshington:Seattle------------- (2) 29Spokane -109,000 61Tacoma -106,000
Oregon:Pcrtland - 1_ 282,383 21
California:Los Angeles-(2) 25Sacramento-73,400 7San Francisc- 567,000 6
Division, State,and city
NEW ENGLAND
Maine:Portland__
New Hampshire:Concord .Manchester
Vermont:Barre --
Scarlet feverI
Cases,esti- Casesmated re-expect- portedancy
Diphtheria Influenza
Mes ~~Pneu-Cases,~ ~ ~~1ea Mumps, monia,
esti- Cases Cases Deaths cases re- re-mated re- re- re- re ported portedexpect- ported ported p ortedportedancy
24
132
6'17518S
I
101
3
5
O
63
,41151320
23
81
17
27201
126
0000
0
270
1
0
0
33
11
2524
Smallpox
Tuber-Cases, Ccasessiesti- Cases | Deaths deathW-mated re- re- re-expoct- ported: ported portedancyl
00
60
00000
0
9
0
I00
0
38
00
4
241
9599
50
0003
0000
0
20
0
4
0
0
829
1110
0000000
13130050
0
20
114
13
Typhoid fever
Cases,esti- Cases Deatlmated 1 1e- re-expect- ported1 porteancy
hS
~d
1003
00000
04000
2310
120
204I7193
Whoop-ing
cough,casesre-
ported
2
0
0
0
--
122
3020
01110
40
2
42
I--------
I--------
I--------
7
18614
Deaths,all
causes
16
1017
8
2 0 0 0 0 100 °
2 6 0 0 10 : :2 00 0 0 0 0 00 0 0 0 0 1 0 01 Estimated, July 1, 1925. 3No estimate made.
I, j | , , , Z
5
I
0

December 7, 1928 3282
City reports for week ended November 17, 1928-Continued
Scarlet
Division, State, Case,and city esti-
matedexpect-ancy
NEW ENGLAND-continued
Massachusetts:Boston 53Fall River 3Springfield 6
orcester 10Rhode Island:
Pawtucket --- 0
Providence 8Connecticut:
Bridgeport 7Hartford 5New Haven 6
MIDDLE ATLANTIC
New York:Buffalo 21New York 111
Rochester 6Syracuse 10
New Jersey:Camden- 4Newark 16Trenton- 3
Pennsylvania:Philadelphia 70Pittsburgh 39Reading- 2
EAST NORTHCENTRAL
Ohio:Cincinnati 13Cleveland 29Columbus 10Toledo 13
Indiana:Fort Wayne_ 2Indianapolis- 13South Bend 4Terre Haute- 4
Illinois:Chicago 102Spring1leld-- 3
Michigan:Detroit 72Flint 11Grand Rapids 9
Wisconsin:Kenosha 1
Mllwaukee-- 18Racine 4Superior- 2
WEST NORTHCENTRAL
Minnesota:Duluth- 7Minneapolis 44St. Paul 19
Iowa:Davenport _ 0Des Moines_ 10Sioux City 3Waterloo _ 2
Missouri:Kansas City 12St. Josejph 4St. us-t 34
l Nonrident.
fever
Casesre-
porteda3
Ie
395
5
10
013
35
4
15981
6
1280
37413
1913128
6190
2
8711
106155
27422
Smallpox Typhoid fevermvb~~~~~
aes,esti-aatedpect-ancy
0
0
0
0
0
0
0
0
0
00
0
0
0
0
0
00
0
0
0
0
0
31
0
10
10
1
0
1
0
1
11 0
0
13 1
0 0
30 1
20 1
0 0
8 0
,CIasesre-orted
I
Vp
0
0
0
0
0
0
0
0
0
0
0
0
0
01 1
0
0
0
0
0
1
0
0
0
0
0
4
0
1
0
0
000
0
0
0
0
1
0
0
0
0
0
0
)eathsre-orted
0
0
0
0
0
0
0
0
0
0
0
0
0
0
0
0
0
0
0
0
0
0
0
0
0
0
0
0
0
culosisdeaths
re-pde
1440
0
0
331
68030
270
360
0
7
1296
010
0
54
2612
0
60
0
0 0
0 1
30 0
0 9
CasesIesti-matedexpectancy
2
10
0
0
0
1
0
1
1
18
1
0
110
50
0
1
2
0
0
0
0
350
0
0
0
0
0
0
0
0
0
0
0
2
0
3
Casesre-
ported
5
0
20
0
0
0
0
0
0
170
0
1
1
0
0
20
i011
0
02
02
2
0
0
0
0
0
0
0
0
1
0
4
Deathsre-
ported
00
0
0
0
0
0
0
0
1
3
0
0
0
0
1
0
1
1
c
c
c
C
c
c
aths,all,U-,es
De
ea
ing)Ugh,Ilasesre-orted
16
11
6
4
8
2
21
41
17
71
LI
6
3,
11
wCl
pIIIII0
229292740
1772
3735
23
1391,342
9348
2S10928
51615;719
1361S29583
32111
1117
68913
3072435
-iio103
2494
-31
7521
212
II560
6
20
80
'5I11.3.314
4
C
LILI2S
onxr.l . .I
IIII
II
-------

December 7,1928
City reports for week ended November 17, 1928-Continued
scarlet fevi
DivisiOn, State, Case,and city eti- Casmated re
porlancy
WEST NORTH CEN-TRAL-Continued
North Dakota:Fargo- 3Grand Forks 1
South Dakota:Aberdeen 0Sioux Falls 3
Nebraska:Lincoln 2Omaha- 6
Kansas:Topeka- 3Wichita- 6
SOUTH ATLANTIC
Delaware:Wilmington- 5
MIaryland:Baltimore 19Cumberland_ 1Frederick 1
District of Colum-bia:Washington - 16
Virginia:Lynchburg 0Norfolk- 3Richmond 9Roanoke 3 -- --
West Virginia:Charleston 2Wheeling 2
North Carolina:Raleigh- 2Wilmington - 1Winston-Salem 2
South Carolina:Charleston - 1Columbia_ 0Greenville 1
Georgia:Atlanta- 6Brunswick - 0Savannah-_ 1
Florida:Miami - 0St. Petersburg 0Tampa - 0
FAST SOUTH CEN-TRAL
Kentucky:Covington 1Louisville 6
Tennessee:Memphis 6Nashville 4
Alabama:Birmingham-_ 4Mobile - 0MIontgomery- 0
WEST SOUTHCENTRAL
Arkansas:Fort Smith-- 1Little Rock 3
Louisiana:New Orleans 6Shreveport 2
21314° 28-3
Dr Smallpox Typhoid feverTuber- _ Whoop-
Cam,s eth l'n ~,~g Deaths,elstis ase Deth cough, alles esti- 'Ca89 Deaths deaths Cesti-t Cases Deaths cghases hs
- mated re- re- matez re- re- re- causesatd agt- ported ported ported expect- ported ported ported
ancy ac
2a
0
0
1
32
0
9
5
0
233
4
0
1
1
5
0
30
19
i510
218
181
812
0
17
131
00
00
0
0
1
0
0
010
0
0
1
0
0
0
0
1
0
0
0
0
0
0
0
0
0
0
0
0
0
0
0
0
0
0
0
0
0
01
0
0
0
0
0
0
0
0
0
00
0
0
0
0
1
0
0
0
0
0
0
0
0
0
0
0
0
0
O
OO
0
0
3
0
0
2
131
8
011
0
0
1
1
0
20
1
3
2
1
0
3
2
22
4
0
o0
u
0
00
1
40
0
2
0
0
0
1
0
1
0
0
0
0
0
0
0
0
0
0
0
0
0
2
2
1
0
0
O
1 114 22 1
00
0.0
1
1
0
0
0
2
10
1
1
0
0
0
0
0
0
0
1
0
1
0
1
0
0
0
0
0
0
1
0
0
0
2
0
°10
0
0
0
20
OO0
0.O
51
20
01
5
4
534
1
0
0
1
70
0
03
0
0
4
4
3
2
0
1
0
0
01
0
0
2
10
1450
1328
28
22915
159
4
44
2016
111830
24149
77
37
25620
1894
7052
6021
16925
0
3
0
1
9
0
0
0
0
0
0
8283
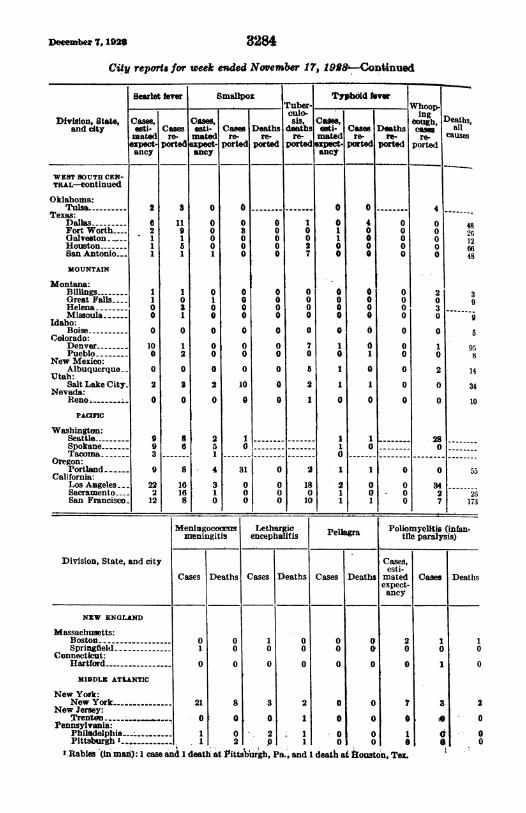
December 7, 1928 3284
City reports for week ended November iT, 19&-Continued
-~~~__ _ _ T ber- __ __ _ __ __ _Scarlet fevr Smallpox lyphd feveTuber- |Whoopculo- ingDivision, State, Cases, Caes, sis, Ce oough, Deaths,
and city eti' Cases eti- Cae Deaths deaths esti- Cas Deaths case allmated re- mated re- re- re- mated re- re- re- causespect- ported pect- ported ported ported epect- ported ported portedancy SDcy ancy
WEST SOUTH CEN-TRAL-Continued
Oklahoma:Tulsa- 2 a 0 O- 0 0 -------- 4
'rexas:Dallas-6 11 0 0 0 1 0 4 0 0 48Fort Worth- 2 9 O 3 0 0 1 0 0 0 26Galveston 1 1 0 0 0 0 1 0 0 0 12Houston- 5 0 0 0 2 0 0 0 0 66San Antonio.. 1 1 1 0 0 7 0 0 0 0 48MOUNTAIN
Montana:Billings -- 1 0 0 0 0 0 2 3Great Falls- 1 0 1 0 0 0 0 0 0 0 9Helena-- 0 a 0 0 0 0 0 0 0 3Missoula 0 1 0 0 0 0 0 0OIdaho:Boise-- 0 0 0 0 0 0 0 0 0 0OColorado:Denver- 10 1 0 0 0 7 1 0 0 1 9,Pueblo -- 0 2 0 0 0 0 0 1 0 0 8New Mexico:Albuquerque-. 0 0 0 0 0 5 1 0 0 2 14Utah:Salt Lake City 2 3 2 10 0 2 1 1 0 0 34Nevada:Reno- ..E 0 0 0 0 0 1 0 0 0 0 10
PACIFC
Washington:Seattle - _ 9 a 2 1- 1 1 28Spokane- 9 6 5 0-0 0-Tacoma ---- 3 1--- ------ -~------- -----------------Oregon:Portland 9 8 4 31 0 2 1 1 0 0 55
California:Los Angeles 22 16 3 0 0 18 2 0 0 34Sacramento- 2 16 1 0 0 0 1 0 0 2 26San Francisco 12 8 0 0 0 10 1 1 0 7 173
Menlugococem Lethargic Poliomyelitis (infan-meningitis encephalitis elartile paralysis)
Division, State, and city Cases,e'sti-Cases Deaths Cases Deaths Cases Deaths mated Cases Deaths
expect-
NEW ENGLAND
Massachusetts:Boston -0 0 1 0 0 0 2 1 1Springfield -1 0 0 0 0 ah 0 0 0
Connecticut:Hartford -0 0 0 0 0 0 0 1 0
MIDDLE ATLANTIC
New York:New York -__ 21 8 3 2 0 0 7 3 2
New Jersey:Trenton- 0 0 0 1 0 0 04 0
Pennsylvania:Philadelphia - _ 1 0 2 1 0 0 1i 0
Pittsburgh I - 1 2 ID 1 0 0 * 0t Rabies (in mail): 1 case and 1 death at pittsb'urgb, Pa., and 1 death at kouston, Tex.
I
I

3285 December 7, 1928
City reports for week ended November 17, 1988-Conitinued
Menio s LAtharic Pella Poliomyelitis (infan-men gitis encephaitis gra tile paralysis)
Division, State, and city Casa.,esti-Cases Deaths Cases Deaths Cases Deaths mated Cases Deathsexpect-ancy
EAST NORTH CENTRAL
Ohio:Cleveland -2 0 1 0 0 0 0 0 O
Illinois:Chicago -6 4 1 1 1 1 1 1 0
Michigan:Detroit -3 3 1 1 0 0 0 0 0
Wisconsin:Milwaukee -3 2 0 0 0 0 0 0 O
WEST NORTH CENTRAL
Minnesota:Duluth -0 0 0 1 0 0 0 0 OMinneapolis-0 0 0 0 ' 7 0 0 1 1
Iowa:Des Moines -0 _ 0 0 0 0 0 0 1 0
Missouri:Kansas City -2 0 0 1 0 0 0 0 OSt. Louis -2 0 1 0 0 0 0 1 0
North Dakota:Grand Forks -_ 0 0 1 O 0 0 O O O
Nebraska:Omaha -0 1 0 0 0 0 0 0 0
SOUTH ATLANTIC
Maryland:Baltimore -0 0 0 1 1 0 0 0 0
North Carolina:Winston-Salem --_ 0 0 0 0 0 1 0 0 0
South Carolina:Charleston -0 0 0 0 2 1 0 0 0Columbia 0 0 0 0 0 1 0 0 0
Georgia:Atlanta-0 1 .0 0 5 3 0 0 0Savannah ' _ _ 0 0 0 0 1 2 0 0 0
EAST SOUTH CENTRAL
Tenne&sse:Memphis -0 _ 0 0 0 1 0 0 0 0
Alabama:Birmingham -__---_ 0 0 0 0 1 1 0 0 0Mobile-0 0 0 0 0 1 0 0 0
WEST SOUTH CENTRAL 1
Louisiana:New Orleans - 0 0 0 0 1 2 1 0 0Shreveport-0 0 0 0 0 1 0 0 0
PACIFIC
Washington:Seattle - 2 0 0 0 0 0 1 1 0
Oregon:Portland - _-- --- 0 0 0 0 0 0 1 1 0
California:Los Angeles __-_-_O-0 0 1 1 0 0 1 0 0
1Rables (in man): 1 case and 1 death at Pittsburgh, Pa., and 1 death at Houston, Tex.' Delayed reports.'Typhus fever: 2 cases at Savannah, Ga.
ThS following table gives the rates per 100,000 population for 101cities for the 5-week period ended November 17, 1928, comparedwith those for a like period ended November 19, 1927. The popula-
I

December 7,1928
tion figures used in computing the rates are approximate estimates asof July 1, 1928 and 1927, respectively, authoritative figures for manyof the cities not being available. The 101 Cities reporting cases hadestimated aggregate populations of approximately 31,657,000 in 1928and 31,050,000 in 1927. The 95 cities reporting deaths had nearly30,961,000 estimated population in 1928 and nearly 30,370,000 in1927. The number of cities included in each group and the esti-mated aggregate populations are shown in a separate table below.
SummaTy of weekly reports from cities, October 14 to November 17, 1928-Annualrates er 100,000 population compared with 7rates for the corresponding period cf1927
DIPHTHIERIA CASE PtATES
Week ended-
Oct. Oct. Oct. Oct. Nov. Nov. Nov. Nov. Nov. Nov.20, 22, 27, 29, 3, 5, 10, 12, 17, 19,1928 1927 1928 1927 1928 1927 1928 19 1928 19
101 cities - '2125 170 131 195 140 213 ' 153 4215 a158 223
New England -145 123 158 135 90 114. 122 160 1.59 163M,ddle Atlantic -84 142 98 190 110 225 109 204 134 233East North Central- 2133 199 154 232 169 261 169 253 166 251Wqst North Central.-_ 127 129 158 139 -144 194 210 160 197 152South Atlantic -235 193 179 191 226 184 ' 243 189 -6 199 216East South Central-190 167 155 259 170 152 180 211 100 238West South Central- 196 265 172 294 220 318 272 294 240 343Mountain -62 152 27 99 71 99 71 278 239 206Pacific - 72 219 66 151 64 141 79 '224 '100 222
MEASLES CASE RATES
101 cities -2 39 64 52 70 6 77 8 73 4 96 '94 124
New Englnd-179 186 244 191 338 242 402 342 382 391Middle A4antic - 19 64 25 72 33 72 42 124 69 93East North Central:-2, 24 21 41 18 39 29 57 27 86 54West North Central- 76 22 49 34 68 14 43 16 62 22South Atlantic- 32 45 63 106 46 132 |8 56 135 6 87 281E,t South Central- 10 51 0 203 10 233 5 76 15 147West South Central - 0 37 8 21 8 21 8 12 12 70Mountain - 71 72 124 63 80 9 177 18 203 72Paeific -41 50 43 91 15 78 43 4 76 7 54 212
SCARLET FEVER CASE RATES
101 cities-. o 117 f 114 145 125 148 3164 4150 '169 177
New England - 152 151 117 212 131 200 175 205 193 249Middle Atlantic - 69 73 57 97 69 110 95 110 l 108 152East North Central- 2 137 127 151 166 172 173 233 177 245 201West North Central- 138 137 214 247 197 164 253 186' 224 232South Atlantic - 114 161 107 168 116 19 l 143 182 a 101 155East South Central- 130 147 120 137 140 167 160 152 249 112Wet South Central- 72 79 76 124 136 149 176 110 196 103Mountain - __---- l 88 278 62 143 62 179 88 152 97 233Pacific -____- 1651 136 179 97 148 141 169 4'117 7 146 154
'The flgures given in this table are rates per 100,000 population, ammnu basi, and not the number ofcases reported. Populations used t,re estimated as of July 1, 1928, and.1927, respectively.
2 South Bend, Ind., not included.Brunswick, Ga., not included.
4 Seattle, Wash., and Spokane, Wash., not included.& Frederick, Md., Roanoke, Va., Brunswick, Ga., and Tacona, Wash., not bwludeiL' Frederick, Md., Roanoke, Va., and Brunswick, Ga., not included.Tacoma, W-ash., not included.

3287 December.7,1928
Sumnlary of weekly reports from cities, October 14 to November 17, 1928-Annualrates per 100,000 population compared with rates for the corresponding period of1927-Continued
SMALLPOX CASE RATES
Week ended-
Oct. Oct. Oct. Oct. 'Nov. Nov. Nov. Nov. Nov. Nov.20, 22, 27, 29, I3, 5, 10, 12, 17, 19,19 1927 19228 1927 12 12 11928 1927 1928 1927
io0 cities -23 7 2 7 1 18 24 | 16 ' 3 19
New England-0 0 2 9 0 0 0 0 0 0Middle Atlantic - 0 0 0 0 0 0 0 0 .0 0East North Central- 2 3 0 3 O 0 6 7 4 4 6west North Central-2 42 2 51 2 58 6 156 2 160£outh Atlantic - 0 7 0 0 2 14 3 5 6 2 9East South Central-0 55 5 0 0 0 5 5west South Central----- O 4 O 4 4 4 4 O 4Mountain -62 72 0 45 0 36 9 27 88 27Pacific -10 21 15 16 5 18 15 4 3 73 29
TYPHOID FEVER CASE RATES
cities --------- -2 18 20| 18 17 13 19 9 | 15 10 15
New England- 7 16 16 19 7 16 9 16 16 23Middle Atlantic-- 23 15 18 12 11 20 7 15 10 14East North Central -- 7 16 10 13 5 7 5 9 6 7West North Central- 10 22 14 16 18 24 4 28 14 20South Atlantic-------- 40 32 40 22 32 31 3 16 20 11 25East South Central-30 30 50 46 35 35 30 5 10 15West South Central- 8 29 24 37 20 58 40 33 20 29Mountain 53 81 27 27 18 36 27 9 18 18Pacific 13 16 13 16 5 5 3 4 7 7 5 13
INFLUENZA DEATH RATES
95 cities- 2 10 9 10 8 1 iol 9 213 8 15 9
New England -2 5 5 0 2 5 5 21 9 5Middle Atlantic -7 7 8 4 5 8 12 91 9 7East North Central- 7 5 5 5 10 9l 9 5 10 2West North Central-8 12 8 6 8 10 2 21 6 10Soutli Atlantic ----------1 11 11 13 11 11 1 7 11 A 7 16 11 14 1 20East South Central-31 27 5 43 21 16 26 16 16 21West South Central_- 21 13 12 17 25 25 37 17 33 34Mountain -62 18I 44 27 18 18 27 18 53 36Pacific ---- 27 14 54 10 27 7 41 0 769 3
PNEUMONIA DEATH RATES
95 cities -21021 77 86 91 86 89 391 104 102 112
New England - 126 86 74 65 90 63 80 95 57 102Middle Atlantic - 124 75 92 92 83 87 105 113 124 119East North Central- 2 87 66 79 82 79 93 77 89 82 96West North Central- 51 64 41 68 71 62 65 75 73 81South Atlantic - 109 70 110 87 93 115 3 74 117 6 125 157East South Central- 94 133 131 117 131 117 146 144 162 154West South Central-_-_-- 74 85 82 187 119 89 90 127 70 140Mountain - 62 143 124 143 97 117 97 143 115 99Pacific---------------------- 98 100 98 97 88 100l 125 100 7 102 -76
2 South Bend, Ind., not included.3 Brunswick, Ga., not included.4 Seattle, Wash., and Spokane, Wash., not included.3 Frederick, Md., Roanoke, Va., Brunswick, Ga., and Tacoma, Wash., not included.6 Frederick, Md., Roanoke, Va., and Brunswick, Ga., not included.' Tacoma, Wash., not included.

DecmberT,I 3288
Nusii of cieis included in summary of weekly reprts, and aggregate Populationof c e fof esac group, approximatd as of July 1, 1928 asd 1927, respecdively
Aggregate population Aggregate PopulationNumber Number or cities reporting of cities reporting
Group of cities of Citie of cities cases deaths________________cities reporting re¶orti. .__r
2928 19. 192 1927
Total ---- 101 95 31,657,000 31,050,300 30,960,700 30, 369, 5o0
Now England -- 12 12 2,274,400 2,a42,70D 2,274,400 242,7ooMidd Atlante c. 4 10 732,400 A 4,700 10,732,400 10, 594, 700Eawt North Central _----16 16 7,991,400 7,820,700 7,991,400 7, 820,700West NorthjCentral --12 10 2,683,560 2,634,500 2, 566,400 2,518,r,500South Atlantic --21 21 2,981,900 2,8W0,700 2,981,900 2,890,700East South Central - 7 6 1, 04 300 1,028,300 1,000,100 980,700West South Central- -------- 8 7 1,307,000 1,260,700 1,274,100 1,227,800Mountai - - 9 9 591, 100 581,600 591,100 si, 600Pacific - -6 4 2,046,400 1,996,400 1,548,900 1, 512, loo

FOREIGN AND INSULAR
CANADA
Quebec Province-Communicable diseases- Week ended November 17,1928.-The Bureau of Health of the Province of Quebec reportscases of certain communicable diseases for the week"ended November17, 1928, as follows:
Disease Case Disease Cass
Chickenpox - -131 Scarlet fever-148Diphtheria-- 70 Smallpox ---------------------- -49German measles-- 6 Tuberculosis-34Influenza -- 16 Typhoid fever -14Measles -________ ----__ 20 Whooping cough- 21Mumps ___--__-------1 39
CHINA
Inner Mongolia-Plague.-According to a report issued by theNorth Manchurian Plague Prevention Service, October 22, 1928, theplague epidemic in the Tungliao district has practically been stampedout. All localities, including Chien Chia Tien, report a clean bill ofhealth, only an occasional case appearing in outlying districts.The little village of Chien Chia Tien, with its 1,800 inhabitants, has
borne the brunt of the attack and lost over one-fifth of its inhabitants.The second center was Chang Yu, while the cases in other cities weremostly among refugees from Chien Chia Tien.The number of victims of the epidemic has been, roughly, as follows:
Cases CasesChien Chia Tien -340 Cheng Chiatun (railway junction)- 2Tungliao and adjoining Mongol settlements- 40 Pa Mien Cheng-,1
Ta Lin-12 Other placs - 20San Lin -22Chang Yu (not on railway but consisting of5 Total ---------------- 487Mongol settlements) -50
Out of 15 post-mortems performed at Chien Chia Tien only 2showed complications in the lungs. A second experiment with Pulexirritans was successful, the guinea pig dying 19 days after inoculationand showing signs of subacute plague.During the epidemic strict isolation and rat and flea destruction by
sulphur fumigation were practiced. The antiplague organization atTungliao and Chien Chia Tien is to be maintained during the winter,
(3289)

December 7, 1928
watching for any possible development and making preparations forthe establishment of a permanent hospital and laboratory at Tungliaounder the auspices of the Manchurian Plague Prevention Serviceearly next year.Manchuria-Commutabi di..a.es, yaw19728.-According to
the annual report of the North Manchurian Plague Prevention Serv-ice, for the year ended September 3U, 1928, the first cases of plaguein the Tung Liao district occurred in August. During that monthsuspicious deaths were reported in the district, which had recentlybeen opened up for cultivation mainly by the building of the Ssuping-kai-Cheng Chia Tien-Taonan (Ssu-Tao) and Ssupingkai-Cheng ChiaTien-Tungliao Railways, which branch off at Ssupingkai from theSouth Manchurian Trunk Line, and also the completion of the250-mile track between Tungliao in the north and Tahusan in thesouth (on the Peking-Mukden Line). This easy access by rail hasalso introduced attendant dangers of plague from the endemic centersof Outer Mongolia.-On receipt of telegraphic inquiries regarding 20 suspicious deaths at
Tungliao early in August, Dr. Wu Lien Teh, director and cbief medicalofficer of the North Manchurian Plague Prevention Se-rvice, made apersonal investigation. Local doctors had seen some patients com-plaining of fever, headache, unconsciousness, and sometimes diarrhea,and dying within two or three days after the first appearance of thesymptoms.During the first wek of September a request for medical help came
from the authorities of the Ssu-Tao Railway, as some suspicious deathshad occurred at Chien Chia hlen, a village 23 miles east of the railwayterminus at Tungliao. A medical officer visited the village, and thecases were bacteriologically confirned as plague.
Precautions in the way of isolating the sick, quarantining the village,rat destruction, rigid control of passenger traffic from the affecteddistrict, and systematic vaccination of the inhabitants with antiplagetevaccine were observed.From Urga information was also received of an outbreak of human
plague, and the Mongoli.n and Russian Medical Departmentsrequested medical aid. Vaccine and serum were sent by raiwayand airplane.
There were no outbreaks of cholera in Ma ieria during the year.Several outbreaks of iuenza have been reported, as a rule of mildform. Smalpox continues to be endemic, but is rarely faal angChinese. Scarlet fever has not been epidemic for several years.There have been, however, ea unusually large nuaber of cses oftyphus fever, 100 eaes being eeived at the lospitel in Dairen i1dnumerous cases being reported during the spring #Iog the rou" to
3290

3291 December 7, 102
Ilarbin. Typhoid fever and dysentery were present, particularlythe latter, which seems to be particularly virulent among Japaneseresidents. DENMARK
Communicable diseases-September, 1928.-During the month ofSeptember, 1928, communicable diseases were reported in Denmarkas follows:
Disease Oases Diseae Cases
Broncho-pneflWUD -907 Paratyphoid fever- - 10CerebrosPiinal meniDptis--4 Pneumonia--_ 195
Chicken pox -19 Poliomyelitis ----------------25Diphtheria and croup --, 393 Puerperal fever- 18
ErysipelS--201 Scarlet fever -- 203Influeeza_ __ _ _ _,_- , 2,366 Tetanus- _ 3Jaundice 108 Tuberculosis, pulmonary-. . . . 243Lethargic encephalitis --__-_ 4 Typhoid fever- 14Measls ---------- 394 Undulant fever-29mumps ---- 292 Whooping-eough- _ 1,447
FEDERATED MALAY STATES
Vital statistic, 1927.-According to the annual report of theMedical Department of the Federated Malay States, the populationof the States, estimated June 30, 1927, was 1,504,832. The fol-lowing table shows a comparison of the deaths, births, and infantmortality for the yeaxs 1926 and 1927:
Death Birth Infantrate per rate per Deaths mortal-
Year Deaths 1,000 Births 1,000 under 1 ity ratepopula- popula- yewr per 1,000tion Yon births
1927---- 48,323 32.11 48,013 31. 9si,752 203.111926 -38,445 29.22 39,834 30.28-- 193.75
Of the total deaths there were 20,736, or 42.91 per cent, attributedto fevers, most of them probably resulting from malaria. Dysenteryand diarrhea accounted for 7.15 per cent of the total deaths, pulmo-nary tuberculosis for 4.16 per cent, pneumonia for 6.66 per cent, andconvulsions for 11.08 per cent.
GREAT BRITAIN
Scotland-Vital statistics-July-September, 1928.-The RegistrarGeneral of Scotland has published statistics for the third quarter of1928, which show that the birth rate for Scotland for that quarterwas 19.1 per 1,000 population, the death rate 11.0 per 1,000, and thedeath rate of infants under 1 year of age was 69 per 1,000 births.

December 7, 1928 3292
The following items are taken from the quarterly returns of births,deaths, and marriages registered in Scotland during the quarter endedSeptember 30, 1928:Population, estimated -4, 18 700Births - 23,441Marriages -9,233Deaths (total) -13,457Deaths under 1 year -1,610Deaths from-
Bronchitis - - 503Broncho-pneumonia --- 378Canoer - 1,682Cerebrospinal meningitis --38Diabetes - 111Diarrhea and enteritis (under 2years)- 236
Diphtberia - -72Dysentery - 2Heart disease - 1,814Influenza:
Sole cause -19With other causes - 63
Deaths from-Continued.Lethargic encephalitisMalariaMeaslesNephritis (acute)Nephritis (chronic)Paratyphoid feverPneumoniaPoliomyelitisPuarperal septicemiaScarlet fever -
SyphilisTetanus.Tuberculosis (pulmonary)Tuberculosis (all ther forms)Typhoid feverWhooping cough .
JAMAICA
Communicable diseaes-Six weeks ended November 10, 1928.-Duringthe six weeks from September 30 to November 10, 1928, cases ofcertain communicable diseases were reported from Kingston, Jamaica,and from the Island of Jamaica outside of Kingston, as follows:
Other OtheDisese Kingston loca ties Disease Kingston localittes
Cerebrospinal meningitis --5 Paratyphoid fever-1--Chicken ox -5 12 Puerperal fever-- 4Diphthena - - 1 Tuberculosis (pulmonary) 76 IIIDysentery-- 38 Typhoid fever 43 140Lethargic encephalitis-1
NEW ZEALAND
Vital statistics-Comparative-Years ended March 31, 1928, and1927.-According to the annual report of the director general ofhealth of New Zealand, for the year ended March 31, 1928, the meanpopulation of the Dominion was estimated as 1,374,439. The fol-lowing table shows the vital statistics for the years ended March 31,1928 and 1927, respectively:
23365473552
483134023242
740331
201

DeceMnber 7,12
The most outstanding feature of the report is the extremely lowinfant mnorital rate. The per eent of illegitimate births still continued high.
Tunis-ftait stat%'sfE48, 1927.-The following items are taken froma resum6 of the demographic and sanitary statistics of the munici-pality of Tunis which appeared in the D6p6che Tuntsienne of October4, 1928.The population im 1926 was said to be 185,996. Deaths from all
causes were 4,853 in 1927, 4,447 in 1926, and 5,765 in 1925. Thedeath rates among the French population were 16.4 per 1,000 in 1927and 14.5 in 1926. Among the; Moslems the death rates were 34 per1,000 in 1927, and 31 in 1926.The deaths of thildren u-nder 10 years of age were said to equal
one-third of the births in the French and Italia'a population, andone-half of the births in the Arab and Jewish population.Smallpox was responsible for 540 deaths in 1925 and only 10
deaths in 1927. Scarlet fever caused 103 deaths in 1927. Tuber-culosis was- said to cause onseventh of the deaths in Tunisia andone-sixth of the deaths among the Moslems.
3248
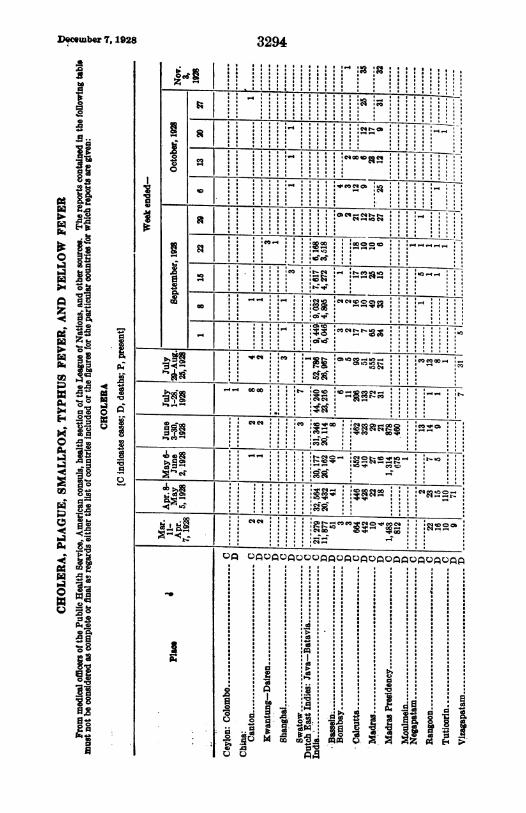
Dwcwuber 7, 1928 3294
o~~~~~~~~~~~~~~~~~~~~~~~c
0~~~~~~~~~~~~~0C
Sl~~~~~~~~~~~~~~~~~~~~~~~~~oC-'_X,04I
|3 ]02 | | } | ,, ,::.~~~~~~~1 43 - .>" a. ,,¢-
o~~~~~~t
;t l | 0 | 0 , '- ; 'li ,"N¢Sm .rs,c ,, |''
1.0
:;mes Me i I Uleol-".e|n)n , -
0~~~
K ID A |29 | ' 9 " @' , ' @'' i¢' P ',jwat)00.:CD to
23 e,], e 5 , A. . ' ", - ..r< .< *- 'R0S i0414 0 fi a S 2 i i 4 || |
~~~~~~~~~~~~~~~~~~~~ ~~~~~~~~~~~~~~~~~~~,,o
~~~~~'~~~~~~~~~C A*.M
4 ',',,~~~~~~~~~~~~~~~~~~~~~-, -4C4
14 ~~~~~~~~~~~ 14 4.
2~~~~~~~~~~ I~~~~~~~~2
-,~~~~~~~~~~~~~~~~~~~~~~~~~~~~~~-1
.=W,~ ~ ~ -4-a43~~~e g'
r.)~~~~~~~~~~~~~~~~4 .14 -oCC)
00. O
0.8~~~~~~~~~~~~~~~Aa 8-3-~~~~ 8 'V~~C,mOX A

Deeember 7, 1928
O0D
..
~. * *
.O *~.4 .P
.
0
Iz.
.E6;IDEl0
6.T; W
m
a . .. .as
. . 4. . , . .
.:.
. . ~. .. . P .
.4 . .
,10, ,
3295
_
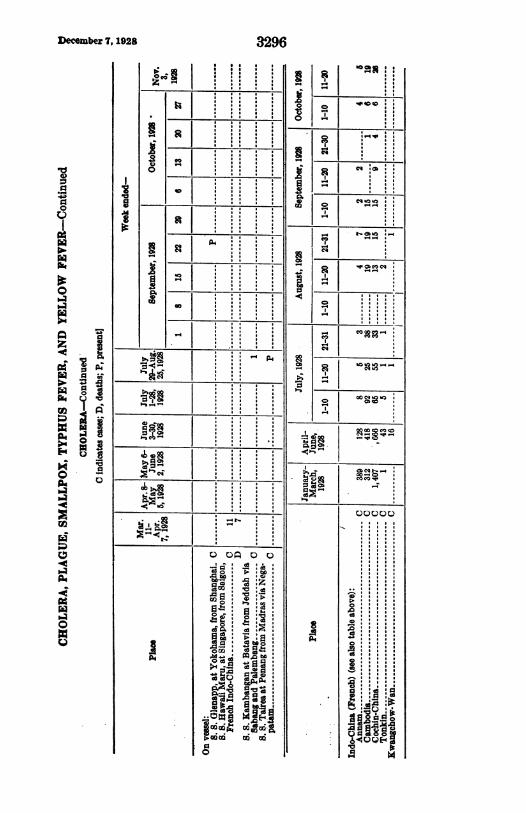
December 7, 1928
so
0)
0
1;
0
04
0
al
I
0A~
= 0
a
0
Ir
a
.0I
|
|
@
3296
Meq
. ai
to
0
Iten
W:sGO¢
N-
1
I I
I II I
I I
II
II@
: :
II&I
'. N
cb4H
-0
IC,
se a
.0
to~
8=
aS
ooe . .Hz . .
. .
. .
. .
. .
. .
. .
. .
. .
. .
. .
. .
. .. et .
.
.
.. *
. .
.
" :o::.
.
.
.
.
.ewuoo *_ . .
.
.
.
..
bo.4 :.:
. . .
.. .
.. ..
. . . ..
.
Ct22_
axew><aa
OQOO¢XOCEt
RSo:COt
C)OC)C)C). . .. . .
. .
. . .. . . .
. . .
. . .. .
.. . .
.. . .. . .
.. . .. . .. . .
. . . .
. . . ... . . ._s . . .ZD | |>o .....^ ....._ . . . . .
< .....ED_ . . . ......>.....;N ..... . . .o.....VX | . ......Z.....8 : : :zo ....._.....
. . ._ . . . .
= .....c3 | * . * .t . , a
<a | 8|}
ob >..SRco Cagx 1..4 so
ti S.- asM",.I".14x-4
tz

8297
ifz
_ '4~~~~~~~~~~~~~~~~~C
o ~~ ~ ~ ~ ~ ~
I IS,,,
.: 1
..:: .- . . . . : : : :
D.eembiea , ,1923
1~~~~~~~~~~~~~~~~~~~~~~~~~~~~o-Go
0b b, ,
I41
III.1
II49
OtoO
14r&s 0
I-4
0
-4
Q.)A o)A
0,:ID :
00
:~
0
0
0
04
I10'Po9I.r-
t42
: 0. : : :: 1. : : :
0 -
U:$.93
..(4
OQ I
co
L; as;3mCsS.34
05ci
904
I

Deceiber 7,1928 3298
iaco
. . . . . . __.. . ,
~~~~~~~ ,ci~~~~~~~~~~~~~~~~~~~~~~c
. . . . . . . . .~ ~ ~ ~ ~ ~ ~ ~~~~~~c~ .
0000
I
0p00p0p0p0 0p0p 00Q
!E-
20
II
0
000
ther-3: 0:w
>b to0 m
;i S 0
13-0.0AQ
0 0
Ca
co
co
to
0
..S4
Do.
N
0Q
U1
co
A
iU4
2.
IIa I I
Iv
IIIII,Ia.II,
-1-2-
1--
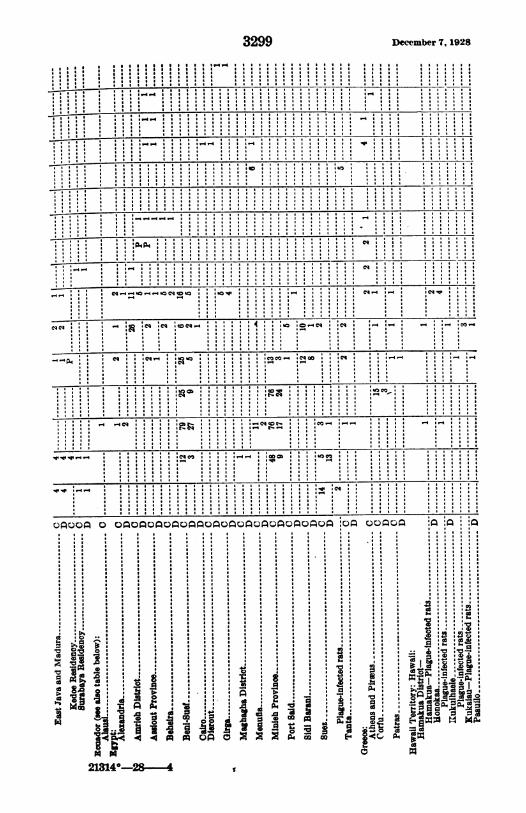
3299
0i
December 7,1928
-28 1-
0 up
g :
I. :I I
I..
m
218140-
. .
.
.E.
. .a
I
'la
lopopor-
I

December 7, 1928 330()
I ~~~~~
0 b .. .. .. .
;J : : 4 .: ::::::
I ci_ ,.,,,.'
0
19 M~~~..4.... ..
oiI 0 "aI .'+"',
hi
hi ; I ''''a:
S toIt _
>:1 a vt |6-6 c4qo"
0 _____N____ |_.____0 _____* ___t
pS 2.aI ~~~~~~lwC
2I-^ ~ ~ Oo.
hi :: :_0.
hi..0 ! 'e : :: :::0 ...
3
Ii
I
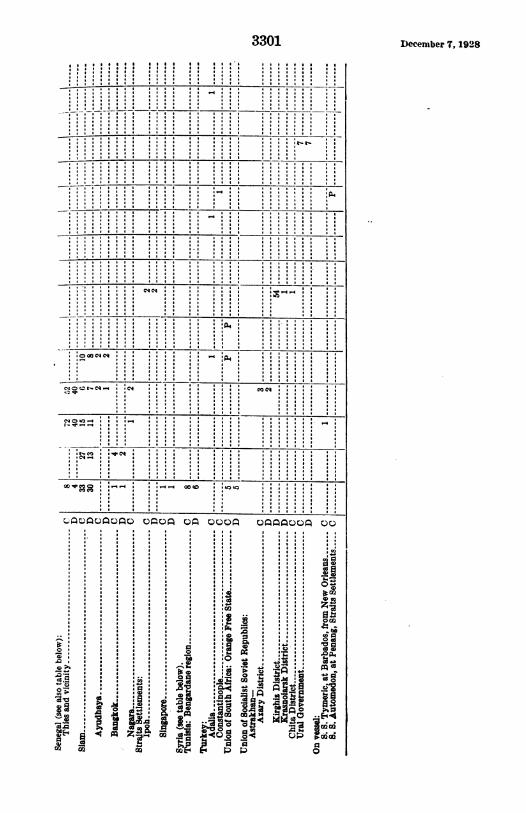
3301
*
4* *44*4*
444*44~~~~*~~ 4C4 4 44 . 4 . 4 , -
C*,ocq ....,.,,
8 0QI I .1
Aol
aM
I^: :0.
C3.90
a
la .:
:A
-C3ot a
: 11E
cs I
a
Qg:up
.1::I..aA. .
4W
4'
44o.
0
.0.0.o .10
33<;)
0
December 7, 1928
0)nA00O 00
444 ,, ,
, , ,, ,* . -4. 00
..,~ .
bi * .O .4@
0|| F0.|.. jef
. .I
I. . . .
tao

Dccember 7, 1928
*)
V
03"
00
0
I'
p
4
pq
it4
4
0
z
ajI
*_
0 BV e44 .ad I
3302....: : : : : :: : : 1
. . .. .'.. .
. . . ..0 . . . . . . .4. . . . . . ..... *
| @ *.s * * @
3,w Sq --4
. . I a.
. . . . .
i. -4-
.1 4W 01 061co.Y
-.a4..
I0
0
V4
, . . . .
i4
: : :,I -
:.. aI
. .
m la
4..
i wz -
'0
S vPm _'o to
0
4 .
46
I0
a
Xal
0
10
gP.
0.
;I
co
a .SIR= : :C-4 :.Obcb :
'.414: : 110: 11: : : 4
8s;;;;
&;
-
.
t- to 40 -4 #I t- 2.- so C43 Illv 1-4 -4 so Os to C4 C4 Co (M clAco I t- AO : a 10 C* 1-4 P" I I a
: . . : : :I I I
a
SR SR MD C-4 ; ao;s 2- co CD. scl: -4 -4 -4 '"oclo 4
--i iq s co : 1; qo : : : : : : . .
-1-.
.1 : : : : : : : 0 t t . . .
6 I , --swo ;Rr.- ; :
C3 >b g1 -1 : : : :p b I

3303 December 7, 1928
N3 . . ... . .. ...,,4p0 P > 4 - ' -S a9 : :: : : ::* ::-:4 :::
C- : : : ::%?!Mt- :: :::-4
0000~~~ ~00 0A0 "oO OOQOOOtOQOOOOOQ 00000
. ... . * ............
H ia . . . . * * . . . .he ~~ ~ ~~~C' ::: : : : : : ::::
8" 'e ! ! !are $ -- .0an.4 -o osS Ro * . . . . .*co * *4
P.e_ ~ r
.4 0 0

December 7, 1928
c:300
p4
OPO PPU
0|
.
.0
.
.0 ..0.
3304
0
N
0
1.4N
FI~i0t04
04.4
wo00
a
p4::
;3
4.

........... .. .
eq C4-4 -4 cx ao oo co
:.cc% uz t- clCO
C% co vo -cl W:, 'q
C% :cqw ac t- C4 t, Cm -4
a, C, co .0 C% co W. C%C"
C'4 -w eq t. t- C% to (mv
co 1-4 :-4 m -4 C03 :40 14 co m co -t .4 ob as co-4
C03 C4 -4 --4 :VCqMC'* C*
C4 cri -4 cq C45 :40 eq -'o cq mCIO CIO 10
:-4 Cov -44m 10 C43 CD W. lw -4 t. CO a
Cb C#3 cq W. C4 o' ac -w ao t- cx -w U:, cx C% -4 :.41-4:-q -4 -4 C4 -1 coC4
so C4 -4 eq -w ob qo C% -0 -c 00.0-n t;m eq --. m 04 gt oo CZ qDww 1- -w co coa m Ul.) C#3
a'a
go C40 C4 :00 00 co co C4 .0 t- :-4 co -4 C. 1-4 -4 4m t- 59 40 :00CO
C43 m
t- c. C'4 w.x co C4CD ao :00 1-4 co co 05 02 W-f
C4
C4 co cq t- lw t- C* C4 co -w t- 'r Cm 40 cq ao cq 6m co :t-mr-n :c%-4-1 CIO C13 Il- CO10 qD
3305 December 7, 1928
: : : : : : : 1. 1. i : :I I a I I I a I I I
: .1 :6 6 I
1. :I I I
oAr.) opo
I: :I
: : : : 10 : : :I a I I I a
: 1. : : : : : :IIIIIIII
E-4ag
ID
zo 00
aI
:A :: W. :
e I I
:N :I I
: "C :: oz :
.0 I19 is.2 of :CIA A-4El b 40 -0 .6&m
0N
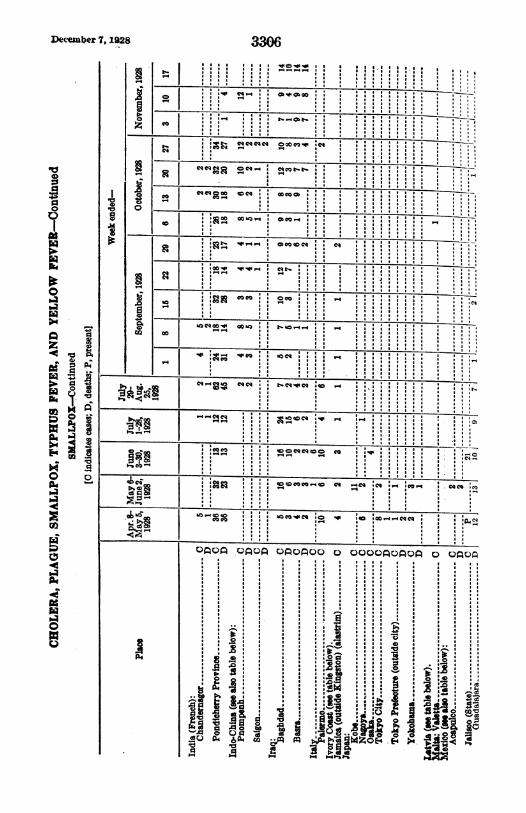
Deemmber 7,1928 3306
~~;f~~~~ C4e4a. C4
co .,.ta -'',
o~~~~~~~~~~~~~c
I ~ 1.o
3 _________________
f~~~~~~~~~~~~t eq aoI ,,9 tHo,co
Z co
ba C3sP9)3
o~~~~~~~~~~~~c
0. p. pop
4 '.4 .
0.. ,i-~. c~i

December 7, 1928
,~ ... .. ............
...~~ ... . . _..,..
..U ..
...r44 c...
...Co . ....a... . .. ......Cs. .. ...*"a ...*..z4,.... ... ...v o | | | @ | s 8 . ~~~0.. ..
3307
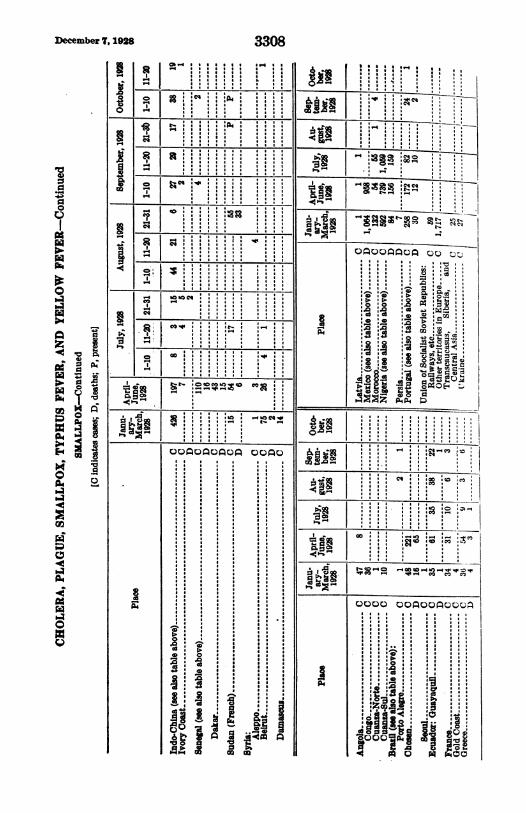
December 7, 1928 3308
o4 to ha....C0o C) g x
0~~~~~0
o o C:?: ::
I _ ...0-....-..........c...c
'.:
,. ........ am
0,~~~~~~~~~...............
z :: : :
S...... .S.' : :t :
P0, ::::: :
I.' : : : :
4 _6 4&0C
^ @ X . ~I ,

3309
III
I . .- . :: :
Iaw
m
December 7, 1928
-- 1
C CI-4- _ _ _ _
I
I
ug~~~~~~~- :ac C08- ''---- -'4
C*e A,_ _ a C-G _ e::N'__.'
Ys : : ::: :: :::::~~~~~~~~~~~~~C' c__ _ _ _ _ _ _ _ _ _ _ONVADNOn VAAUA
. . . . . .
. . . . ..
. . . . . .
. . . . . .
. . . . .
. . . . . .
. . . . ..
. . . . ..
. . . . ..
. . . . ..
. . . . ..
. . . . ..
. . . . ..
. . . . ..
. . . . ..
. . . . ..
. . . . ..
. . . . ..
. . . . ..
. . . . ..
. . . . ..
. . . . ..
. . . . ..
. . . . ..
. . . . ..
. . . . ..
. . . . ..
. . . . ..
. . . . ..
. . . . ..
. . . . ... * * . o
' ! ! ' li. . . . s s
i ° }m J- Pg .q {q V C
(4ra01*mbim;D0Al;mP
. . . . I ' l l s $ - s...a 1-
CD 1. .1 : :-4 : : : : : : : : It Is : : .1 : :: : : : : : : 1. : : 1,:: : I. I. : : : I:
f I I a I 4
I .- : : :. ..
r-.l;;
; --4
i III :
; ; :
-4 -4 -: : ::
.

December 7, 1928
3I
-Wauk
'I
9;:
A
ax
0
**
;ga
3310
H~~~~~~Ii
0m:
asOn OnoOOO oO ooD An c^n0s''| | @ * * * * | * * z
| ~ ~ ~ | | | | | t
V
0
-4O
0
0
0
1
g
.4
h
p4
o
hi
00a

3311
C4 _ _ o - _ _ _ _ _ _
* ,,,,*.,*,* .---~~~~~~~~~~~~~~~~C%c
C4~:t-*
:1
q 0q
8g
~~j~~ j~to~:a:~-AC 3
ID. 4 t q
o~~~~~~~cU2 *~~~~~2as'
-P4 4E4o~
'cq 4 c 40
C- o 4 -o C- - - t~~~OD C
4bC eq- 4 =-C)
000~C
0 0
December T, 1928
I I
I
V C% P41-.-4 a t- = t-xm-4
" t- go
114 ftz.
I
: 1. : 11 :I

December 7, 1928 3312
CIO
-___
Cs L:~~~~:
~ ~ O
as
0
000
I0
- - . . . - . I 9 I I a-ICDO : .1 I : : : : : : : : I I I I I,- .
..4 - I : : : : : : I I I : : : : : : :
: : : : : : : 0 a I I I I
I
.M8
I5:0.0a.O.-avM
IO
...4
0u
I94M;0-rAPk
.r-064QW;M0z14
ciw;0-wr&M;D0ow>-4E--4
oi0owQQ0.xM
Da;D0itQPk
4IV00Q00Q
cSV
I.
AV
as
1-4
C4
m C%
C4 C% C% C% C4
C4
8
t
..4MIt-
Copyright © 2022 FDOKUMEN