
Statistical approach for the characterization of NO 2 concentrations in Beirut
11
Air Qual Atmos Health (2009) 2:57–67 DOI 10.1007/s11869-009-0034-2 ORIGINAL PAPER Statistical approach for the characterization of NO 2 concentrations in Beirut Charbel Afif · Alain L. Dutot · Corinne Jambert · Maher Abboud · Jocelyne Adjizian-Gérard · Wehbeh Farah · Pascal E. Perros · Toufic Rizk Received: 26 June 2008 / Accepted: 18 February 2009 / Published online: 18 March 2009 © The Author(s) 2009. This article is published with open access at Springerlink.com Abstract Measurement of ambient NO 2 concentra- tions using diffusion tube samplers is widespread in many countries. Results from a program of measuring ground-level concentration of NO 2 at 20 urban sites within the city of Beirut are presented. In addition, two curbside sites were implemented at different heights. Two-week sampling period measurements were per- formed over 41 periods for all sites. A study of the sites’ behaviors was conducted using principal compo- nent analysis and agglomerative hierarchical clustering. Firstly, results indicate that urban sites are equivalent, and one global class is identified. Any further mon- itoring of the nitrogen dioxide concentration can be conducted by decreasing the number of urban sites. Secondly, nitrogen dioxide concentration levels present a seasonal variation, as expected. Maximum average concentration of 178 μgm −3 was observed during C. Afif (B ) · A. L. Dutot · P. E. Perros · C. Jambert Laboratoire Interuniversitaire des Systèmes Atmosphériques (LISA), UMR 7583, Université Paris VII et XII, Créteil, France e-mail: charbel.afi[email protected] M. Abboud · W. Farah · T. Rizk Faculté des sciences, Université Saint-Joseph, Beirut, Lebanon J. Adjizian-Gérard Faculté des lettres, Université Saint-Joseph, Beirut, Lebanon Present Address: C. Jambert Laboratoire d’Aérologie (LA) UMR 5560, Université Paul Sabatier OMP, Toulouse, France winter (December 2005) and a minimum concentration of 17 μgm −3 was observed during summer (May 2006). The annual average concentration measured in 2005 is 67 μgm −3 , while the recommended value from the World Health Organization is 40 μgm −3 . Keywords Passive sampler · Triethanolamine · Beirut · Principal component analysis · Agglomerative hierarchical clustering · Nitrogen dioxide Introduction Nitrogen dioxide (NO 2 ) is a pollutant of the urban atmosphere. It is a primary pollutant (emitted from less than 1% to more than 30% of nitrogen oxides emitted from combustion processes) and a secondary one formed from other pollutants (i.e., ozone and nitrogen monoxide) (Finlayson-Pitts and Pitts 2000). Outdoor concentrations of NO 2 can vary widely, and rapidly, ranging from a few micrograms per cubic me- ter to peaks of several hundreds of micrograms per cubic meter during particular episodes of high pollu- tion. Personal exposure to NO 2 has effects on lung function, especially on children, the elderly, and asth- matics. Consequently, there is recommendation by the World Health Organization (WHO) aiming to pro- vide a basis for protecting public health from adverse effects of air pollution. Therefore, air quality and, especially, NO 2 is monitored in almost all countries worldwide.
Transcript of Statistical approach for the characterization of NO 2 concentrations in Beirut
Air Qual Atmos Health (2009) 2:57–67DOI 10.1007/s11869-009-0034-2
ORIGINAL PAPER
Statistical approach for the characterization of NO2concentrations in Beirut
Charbel Afif · Alain L. Dutot · Corinne Jambert ·Maher Abboud · Jocelyne Adjizian-Gérard ·Wehbeh Farah · Pascal E. Perros · Toufic Rizk
Received: 26 June 2008 / Accepted: 18 February 2009 / Published online: 18 March 2009© The Author(s) 2009. This article is published with open access at Springerlink.com
Abstract Measurement of ambient NO2 concentra-tions using diffusion tube samplers is widespread inmany countries. Results from a program of measuringground-level concentration of NO2 at 20 urban siteswithin the city of Beirut are presented. In addition, twocurbside sites were implemented at different heights.Two-week sampling period measurements were per-formed over 41 periods for all sites. A study of thesites’ behaviors was conducted using principal compo-nent analysis and agglomerative hierarchical clustering.Firstly, results indicate that urban sites are equivalent,and one global class is identified. Any further mon-itoring of the nitrogen dioxide concentration can beconducted by decreasing the number of urban sites.Secondly, nitrogen dioxide concentration levels presenta seasonal variation, as expected. Maximum averageconcentration of 178 μg m−3 was observed during
C. Afif (B) · A. L. Dutot · P. E. Perros · C. JambertLaboratoire Interuniversitaire des SystèmesAtmosphériques (LISA), UMR 7583,Université Paris VII et XII, Créteil, Francee-mail: [email protected]
M. Abboud · W. Farah · T. RizkFaculté des sciences, Université Saint-Joseph,Beirut, Lebanon
J. Adjizian-GérardFaculté des lettres, Université Saint-Joseph,Beirut, Lebanon
Present Address:C. JambertLaboratoire d’Aérologie (LA) UMR 5560,Université Paul Sabatier OMP, Toulouse, France
winter (December 2005) and a minimum concentrationof 17 μg m−3 was observed during summer (May 2006).The annual average concentration measured in 2005is 67 μg m−3, while the recommended value from theWorld Health Organization is 40 μg m−3.
Keywords Passive sampler · Triethanolamine ·Beirut · Principal component analysis ·Agglomerative hierarchical clustering ·Nitrogen dioxide
Introduction
Nitrogen dioxide (NO2) is a pollutant of the urbanatmosphere. It is a primary pollutant (emitted fromless than 1% to more than 30% of nitrogen oxidesemitted from combustion processes) and a secondaryone formed from other pollutants (i.e., ozone andnitrogen monoxide) (Finlayson-Pitts and Pitts 2000).Outdoor concentrations of NO2 can vary widely, andrapidly, ranging from a few micrograms per cubic me-ter to peaks of several hundreds of micrograms percubic meter during particular episodes of high pollu-tion. Personal exposure to NO2 has effects on lungfunction, especially on children, the elderly, and asth-matics. Consequently, there is recommendation by theWorld Health Organization (WHO) aiming to pro-vide a basis for protecting public health from adverseeffects of air pollution. Therefore, air quality and,especially, NO2 is monitored in almost all countriesworldwide.

58 Air Qual Atmos Health (2009) 2:57–67
Diffusion samplers have originally been developedfor monitoring pollution at work place atmospheres(Palmes et al. 1976). Being a low-cost, convenientway of mapping spatial distributions and investigatinglong-term trends of NO2, these passive diffusion tubes(PDT) are widely used for ambient air monitoring aswell (Campbell et al. 1994; Ferm and Svanberg 1998;Gair and Penkett 1995). Since the uptake rate is quitelow, this method requires long exposure periods (1 to4 weeks). Thus, it is not possible to measure short-term concentrations, such as hourly averages of NO2,or peaks of pollutants, since the concentration is av-eraged over the entire time of exposure. In order tocharacterize daily cycles and short-term peaks of pol-lutants, one should use a method with high frequencymeasurements like online analyzers. On the other hand,this method is extremely useful to assess long-termconcentration trends (e.g., yearly).
The PDT are devices capable of taking samples ofgas or vapor pollutants from the atmosphere, withoutinvolving active air movement through them. The fix-ation rate is controlled by physical processes, whichcan be diffusion through a static air layer or per-meation through a membrane (Brown et al. 1984).The average atmospheric concentration is calculated byFick’s first law, using the exposure period (Palmes andLindenboom 1979). Several passive samplers have beendeveloped since Palmes and Gunnison published theprinciples of passive sampling in 1973 (Palmes andGunnison 1973).
Concentrations of atmospheric pollutants, especiallyNO2, are extremely variable in space and time, de-pending on meteorological and topographical condi-tions and on the spatial distribution of the emissionsources. The consequences of a high level of pollutionwill depend on the population density at the monitor-ing point and the nature of the ecosystems present.Consequently, air quality sampling sites are chosenrelying on criteria given by specialized organizations(e.g., Environmental Protection Agency (EPA) for theUSA, Agence De l’Environnement et de la Maîtrise del’Energie (ADEME) for France, etc.)
In the present work, a study on air quality by dif-fusion samplers over Beirut is presented. It concernsthe spatial and temporal variations of nitrogen diox-ide concentrations over this city, and is focused onthe identification of the different areas with similarvariation towards nitrogen dioxide. A passive samplingnetwork of NO2 covering the whole city was set up incooperation with the municipality of Beirut. This is thefirst spatial study in the country since a similar moni-toring network for NO2 has never been established inLebanon.
Experimental section
Principle of passive diffusion sampling
All passive samplers operate on the principle of dif-fusion of gases from the atmosphere along a samplerof defined dimensions onto an adsorbing or absorbing(a solid base impregnated with a chemical reagent)medium. The gas molecules are transferred from theambient air into the sampling device by molecular dif-fusion, which is a function of temperature and pressure(Delgado-Saborit and Esteve-Cano 2006). Ordinarydiffusion is defined as a transfer of matter from oneregion to another due to a concentration gradient. Forconstant temperature and pressure conditions, and alaminar fluidic flux, the one-way flux (a single axis) of amolecule from milieu 1 through milieu 2 is covered byFick’s first diffusion law (Eq. 1) (Delgado-Saborit andEsteve-Cano 2006):
F1,2 = −D1,2dC1,2
dx, (1)
where F1,2 is the one-way flux of a molecule of interestfrom milieu 1 through milieu 2 (molec. cm−2 s−1), D1,2
is the molecular diffusion coefficient of the moleculeinto milieu 2 (cm−2 s−1), dC
dx is the linear concentra-tion gradient along the diffusion path, and C1,2 is thegaseous concentration of the compound (molec. cm−3).
Passive samplers (which correspond to milieu 2)have a null concentration regarding the monitored pol-lutant. Thus, the flux is directly proportional to gaseousconcentration in milieu 1 (air), with a constant samplingrate, until milieu 2 is saturated.
Types of passive diffusion samplers
Several samplers have been developed since the orig-inal “Palmes-tube” (Palmes et al. 1976), in particular,tube-type and badge-type samplers. The length L andthe cross-sectional area A of the sampler control thetheoretical uptake rate. The tube-type samplers areusually hollow and cylindrical. Examples of samplingmedia with passive sampler configurations used for fieldapplications for NO2 are summarized in Table 1.
The most commonly used sink for NO2 is tri-ethanolamine (TEA), where the gas is converted intonitrite ions. The reaction-product of TEA has beensubjected to several investigations (Aoyama andYashiro 1983; Gold 1977; Haue-Pedersen et al. 1994;Levaggi et al. 1972; Palmes et al. 1976). Results lead tothe identification of TEA N-oxide as a reaction product

Air Qual Atmos Health (2009) 2:57–67 59
Tab
le1
Som
epa
ssiv
esa
mpl
ers
used
for
NO
2m
easu
rem
ent
Sam
pler
type
Dim
ensi
ons
Inle
tC
olle
ctio
nN
O2
upta
keC
omm
ent
Ref
eren
ceL
(cm
)×
A(c
m2)
med
ium
(m3
h−1)
Pal
mes
-typ
edi
ffus
ion
tube
7.1
×0.
95O
pen
TE
A7.
17×
10−5
aP
rote
ctiv
eco
ver
Pal
mes
etal
.(19
76)
reco
mm
ende
dfo
rou
tdoo
rsa
mpl
ing
Fer
mba
dge
1.0
×3.
14St
eelg
rid
+K
I/N
aAsO
21.
74×
10−3
aF
erm
(199
1)T
eflon
mem
bran
eN
aI/N
aOH
CSP
SSba
dge
8.0
×17
.35
PT
FE
mem
bran
eC
HE
MIX
TM
1.2
×10
−2a
Pro
tect
ive
cove
rT
ang
etal
.(20
01)
for
outd
oor
sam
plin
gK
roch
mal
badg
e1.
0×
4.91
Pol
ypro
pyle
nem
embr
ane
TE
A2.
72×
10−3
aK
roch
mal
and
Kal
ina
(199
7)R
adie
llotu
be6.
0×
0.72
Cyl
indr
ical
synt
hesi
zed
TE
A4.
68×
10−4
Pro
tect
ive
cove
rR
adie
llo(2
006)
mic
ro-p
orou
spo
lyet
hyle
nefo
rou
tdoo
rsa
mpl
ing
aR
ates
calc
ulat
edby
Tan
get
al.(
2001
)
with the 1:1 conversion of NO2 to nitrite ions (Glasiuset al. 1999; Palmes and Johnson 1987).
Effects of different parameters on nitrogendioxide sampling
Effects of meteorological factors Different studieswere carried out to evaluate the influence of meteo-rological factors [temperature, relative humidity (RH),and wind velocity] on the sampling rate of NO2. Thegreatest effect is observed for the wind velocity with asignificant increase of sampling rate (Bush et al. 2001;Campbell et al. 1994; Plaisance et al. 2004). This effect,expressed in terms of reduction in diffusion length, is47% for air velocities close to 2 m s−1 (Plaisance et al.2004) and can be limited by a physical protection of thetube. Temperature and RH induce weak deviations onthe sampling rate in comparison with the one generatedby wind velocity. However, Moschandreas et al. (1990)reported that low temperatures in the range of −22°Cto 10°C resulted in the underestimation of nitrogendioxide concentration because of possible anomalousbehavior of the TEA below its freezing point of 21°C.In addition, correction functions should be appliedunder particular conditions (T>30°C and RH>80%)(Plaisance et al. 2004). Radiello proposes correctionof the sampling rate even for ambient temperature(Radiello 2006).
Effects of fluctuations of NO2 concentration in ambientair Plaisance (2004) conducted a study to estimate theerrors of the Palmes tube induced by concentrationvariations in ambient air. Results indicate that thereis a slight influence or no effect of concentration vari-ations on the sample measurement by Palmes tube.Although fast fluctuations of high amplitude can inducea temporal overestimation of the tube, its contributionto the estimation of mean concentration remains weakover the 14-day sampling time. The errors induced byunsteady ambient concentration appear to be of minorimportance (1.6% for an overall 14-day sampling time)in comparison with those caused by the meteorologicalfactors.
Effects of within-tube chemical reaction and NO2
photolysis The effect of trace species such as HONO,peroxyacetyl nitrate (PAN), O3, and other nitrogencompounds has been investigated by Atkins et al.(1986). They concluded through a campaign conductedin Great Britain that no interference is caused by thepresence of PAN or nitrous acid (HONO), althoughthey can both provide nitrite, in a complex with TEA.

60 Air Qual Atmos Health (2009) 2:57–67
A similar conclusion was reached by Gair et al. (1991).However, Hisham and Grosjean (1990) noted that PANis a “severe interferent” to quantification of NO2 by aTEA diffusion tube. The latter study was conductedin California, where ambient PAN levels are consid-erably higher than those in the UK (Heal and Cape1997). Hedley et al. (1994) also reported a significantoverestimation (up to twofold) of NOz compounds bypassive diffusion samplers in their comparative trials.They attributed it to chemical interferences from PAN,other nitrogen containing species, and oxidation of NOby O3 at the adsorbent.
In an urban environment close to emission sources,NO is the predominant specie in NOx. Due to chemicalreaction with O3, NO is measured as NO2 and cangive rise to errors of up to 30% for curbside locations(Heal et al. 1999) and greater when the NO2/NOx ratioreaches 0.5 at the monitoring site located relatively farfrom the source (Heal et al. 2000). In rural locations,NO is present in small concentrations relative to NO2
and considerably lower than O3. The diffusion tubeswill measure total NOx effectively with small errorsupon NO2 concentration (Heal et al. 2000).
On the other hand, NO2 is photolyzed during the daywith a photolysis frequency (JNO2) that varies greatlythroughout a PDT exposure time. In fact, modelingshows that generation of net excess NO2 is not partic-ularly sensitive to the condition of zero NO2 photolysiswithin the tube (Heal and Cape 1997). The averageresidence time of NO2 for diffusion along the tubeis 2.8 min (Cao and Hewitt 1991). Chemical reactionbetween ambient concentrations of NO and O3 togenerate NO2 occurs on a similar timescale, whereasphotolytic lifetime of NO2 exceeds 17 min for JNO2 =1.10−3 s−1 (Heal and Cape 1997). This mismatch intimescales leads to net generation of NO2, and conse-quently, NO2 might be overestimated.
Effects of exposure time When using TEA as ab-sorbent for NO2 passive sampling, the nitrogen dioxideis converted to nitrite after reaction with TEA. Thereis, however, a lack of specificity of TEA towards NO2
since it is also sensitive to sulfur dioxide (SO2). In anenvironment with high concentrations of SO2, TEA isacidified, and consequently, the sampling efficiency isreduced. There are various reports that NO2 diffusiontubes coated with TEA and exposed for 1 month givelower NO2 concentrations than averaged NO2 concen-trations from successive samples exposed for 1- or 2-week periods (Bush et al. 2001; Ferm and Svanberg1998; Heal and Cape 1997). A 2-week exposure is, thus,a compromise between sufficient sampling and low SO2
interaction.
Measuring campaign
Area of study Beirut, a 32-km2 city, is located at33°52′10′′ N 35°30′40′′ E, on the eastern coast of theMediterranean Sea. The north and west sides of the cityare opened to the sea while the east side is surroundedby Mount Lebanon. The city population density isabout 20,167 inhabitants per square kilometer. Themain source of NO2 is high traffic density, the industrialactivity being little developed in the surroundings of thecity. The number of registered vehicles in Lebanon isgreater than one million, with an average age for thevehicle fleet of more than 10 years (El-Zein et al. 2007).The number of cars circulating in Beirut is not known,although a study was launched by the government butno results are published.
Description of passive sampler employed Measure-ments of NO2 were made with Radiello passive sam-plers (provided by Fondazione Salvatore Maugeri).The Radiello sampler is made of a cylindrical collectioncartridge. It is housed coaxially inside a cylindricalopaque diffusive body, which minimizes the sensitivityof the system to wind speed, turbulence, and sunlight.These components are screwed onto a supporting plate.
The Radiello device is a passive sampler based ona radial diffusion. Consequently, there is a greater dif-fusion area than for the axial ones, which thereforefacilitates the reaction between NO2 and the collectioncartridge.
The Radiello passive sampler for measuring nitrogendioxide is based on the principle that NO2 diffusesacross the diffusive body toward the absorbed TEA onthe inner cartridge. The NO2 is chemiadsorbed in theTEA as nitrite, and is then extracted. Special care wastaken at all times when handling the passive samplers.Except during sampling, all samplers were kept in anairtight bag. Prepared samplers were transported to andfrom the field on ice, in airtight containers. After expo-sure, the sampler’s cartridges were transferred to plastictubes in the refrigerator until preparation for analysis.The uncertainty reported by Radiello regarding thesetubes is 11.9% at 2σ (Radiello 2006).
Technical analysis The derivatization proceedsthrough reaction with sulfanilamide (SA)/N(-(1-naphtyl)ethylendiamine) dihydrochloride (NED) inthe laboratory. The nitrite ion reacts with SA and formsa diazonium compound. The coupling of the diazoniumcompound with NED forms a purple azodye, whichis measured with a Vis-spectrophotometer (Delgado-Saborit and Esteve-Cano 2006; Radiello 2006).

Air Qual Atmos Health (2009) 2:57–67 61
For extraction, 5 ml of ultrapure water is poured intothe plastic tube containing the cartridge. The solutionis stirred vigorously for 5 min to allow the nitrite todissolve in the water. After stirring, the cartridgesare removed from the solution. Sampler extractsare analyzed immediately. For derivatization, 0.5 mlof the nitrite solution is mixed with 5 ml of SA58.10−3 mol L−1 and stirred for 5 min. One milliliterof NED 39.10−4 mol L−1 is then added and the wholeis stirred again. The NO2 captured is then determinedcolorimetrically as nitrite by means of a Nicolet 300spectrophotometer at 537 nm. The measurement preci-sion within the laboratory analysis and the temperaturevariation is less than 5% (Radiello 2006).
Periods and sampling sites Since concentrations ofatmospheric pollutants are extremely variable in spaceand time, measuring the quality of ambient air shouldbe performed under normalized conditions. Numerousair-quality monitoring programmes in rural areas oc-curred in the 1970s, in particular when scientists dis-covered the problem of long-distance pollution and itsharmful effects on the different ecosystems [e.g., theEuropean Monitoring and Evaluation Program, the in-ternational programme run by the World Meteorologi-cal Organization (WMO): WMO—Global AtmosphereWatch)].
Therefore, the implementation of our sampling sitesrelied on the criteria of the ADEME (2002). Twotypes of sampling stations were selected: traffic sitesand urban sites. Two traffic sampling sites (S1 and S2)were selected to verify that urban levels of NO2 arealways lower than the traffic ones and no occasionalsource existed near the sampler. The general objec-tive of traffic sites is to supply data on the concentra-tions measured in areas that are representative of themaximum level of exposure to which the populationlocated near a road network is likely to be exposed.The site should be under the direct influence of thelinear source without any obstacles. It is recommendedto avoid obstacles such as hedgerows or walls thatmight disturb measurements. This type of site shouldbe located either near a roadway with an Annual DailyTraffic Average (ADTA) (in both directions) greaterthan 10,000 vehicles per day or a canyon-type roadwaywith a risk of pollution accumulation. The samplermust be located at most 5 m from the road side. Therecommended height is between 1.5 and 3 m above theground (Agence De l’Environnement et de la Maîtrisede l’Energie 2002; Vardoulakis et al. 2003). In thisstudy, S1 is implemented at 3 m, but S2 at 5.5 m abovethe ground for logistic reasons.
For the urban sites, 20 locations (S3–S22) were se-lected to monitor the population’s average exposureto the phenomena of atmospheric pollution in urbancenters. Minimal distance from the site to the nearestroad depends on the ADTA and varies from 10 m (forADTA less than 1,000 vehicles/day) to over 200 m forADTA greater than 70,000 vehicles/day. Samplers werelocated at about 3 m above the ground for these sites.
The measurement campaign was carried out fromDecember 2004 till June 2006 over the 22 sites. Figure 1shows the location of the experimental sites withinBeirut. Two-week sampling periods were adopted forboth types of site. The results presented in this paperwere thus obtained from 41 periods of measurementsresulting in 902 determinations of NO2 concentrations.
Passive samplers were, at first, designed to assessthe quality of indoor air. In assessing the quality ofair outdoors, it is advisable to protect them with arain/wind shelter. Even in the absence of rain, theshelter is required to minimize dust contamination andto limit the effects of advection on the diffusive sam-plers (Roadman et al. 2003). For this study, shelterssupplied by the manufacturer were fixed by means ofa cable tie. In addition to that, SO2 was measured bymeans of badges with 4-week sampling periods. Sulfurdioxide concentrations varied within the range of 4 to20 μg m−3 all along the campaign. Since the samplingperiod for the NO2 is 2 weeks, the acidification causedby the sulfur dioxide might be limited. Nevertheless,no study was found to propose a correction factor forthe reduction of sampling efficiency caused by SO2.Temperature corrective factor was applied to the sam-pling rate based on in situ temperature measurements.Since the diffusive body is opaque, the NO2 photolysis
Fig. 1 Map of the different sites in Beirut. S1 and S2 are curbsidesites. S3 to S22 are urban sites

62 Air Qual Atmos Health (2009) 2:57–67
Fig. 2 Correlation circle of the PCA analysis of the data classifiedby site (Si). F1 and F2 represent 70% of the total variability of theresults
is eliminated. Unfortunately, some influencing factorson nitrogen dioxide sampling (like titration reaction ofNO by O3 or RH) stand and can be neither correctednor controlled.
Method of data analysis
A statistical approach is used to control and validatethe implementation of measurement sites. The statis-tical approach consisted of data analysis by principalcomponent analysis (PCA) and agglomerative hierar-chical clustering (AHC). Statistical methods such asPCA and AHC have been used in many studies aimedat the management of water monitoring networks(Kannel et al. 2007; Mendiguchia et al. 2004; Shresthaand Kazama 2007; Singh et al. 2004, 2005) and airquality management (Gramsch et al. 2006; Pires et al.2008a,b). The study of Gramsch et al. (2006) deter-mined the seasonal trends and spatial distribution ofPM10 and O3 for Santiago de Chile, concluding thatthe city had four large sectors with dissimilar air pol-lution variations, whereas the study conducted by Pireset al. (2008a) classified SO2 sites in six groups and PM10
sites in two groups of dissimilar variation in OportoMetropolitan Area.
Principal component analysis
Exploratory PCA is a well known data display methodin multivariate analysis (Lavine 2000); therefore, only
a summary of the method is described below. ThePCA is a widely used technique in meteorology andclimatology. It reduces the size of large datasets whileminimizing any loss of information, with the aim ofbetter understanding and interpreting the structure ofthe data.
A typical dataset constituting the original matrix canbe viewed as n observations measured for N variables.To simplify the interpretation process, one should se-lect m variables (m < N), which express all informationcontained in the matrix. This can be done by creatingnew variables that are different from the original onesbut constructed from combinations of them. The sim-plicity of the PCA technique lies in this restriction tolinear functions of the original variables.
Linear functions of the N variables can thus beobtained. The number of these linear functions is equalto N. The variance of each linear function can be calcu-lated. The first principal component (PC) is the linearfunction that explains the maximum possible variance.The second PC is a linear function with a maximum pos-sible variance but which is not correlated with the firstPC, and so on. The objective of PCA is to find a smallnumber, m, of linear functions of a set of N variablesthat successively accounts for the maximum amount ofvariation in the original variables. The eigenvector isthe set of coefficients contained in each PC and to whichcorresponds a score. The eigenvalue corresponds to thevariance of each PC and is therefore a measure of itsimportance in explained variation.
One can compute eigenvalues and eigenvectors ofeither a covariance, a correlation, or a cross-productmatrix of the observations recorded for N variables. Ifthe N initial variables correspond to different samplingsites, this may correspond to a spatial analysis becausethe eigenvectors have a component for each site andrepresent an orthogonal spatial pattern (Molteni et al.1983). PCAs can also be used in other contexts, like atemporal one (Richman 1986).
Commonly, scores are displayed in a two-dimensional PC space facilitating an analysis ofthe data structure, and this can be assisted by PCcoefficients plots. These single plots provide guidancefor the recognition of important variables on a PC.Biplots consisting of an overlay of the criteria variables,represented as vectors, over the PC scores plot providean effective method for studying the object–object,variable–variable, and object–variable relationships.
Generally, if the first factor takes into account alarge part of the information, it describes somethingobvious; the other factors can, however, bring to lightinteresting phenomena hidden in the data matrix. If weare more interested in the joint variability of the PCs

Air Qual Atmos Health (2009) 2:57–67 63
Fig. 3 Dendrogramspresenting the results of theAHC analysis for the dataclassified by site (Si). a Thefour classes: C1 to C4. b Thedifferent sites within eachclass. The dotted linerepresents the truncationlevel
than in their individual variability, we can rotate themwithin their subspace and replace them with m-derivedvariables (rotated components). Wilks (2006) presentsa summary of the multitude of techniques that can beused for rotations in a PCA applied to atmosphericsciences. In the analysis presented below, the rotationmethod was not applied.
Cluster analysis
AHC analysis is a well-established methodology to dis-criminate different climate regimes (Fovell and Fovell1993). The aim of hierarchical clustering is to identify
subsets of objects, i.e., clusters, having similar charac-teristics from within the whole sample (Wilks 2006).
The hierarchical approach starts with all objects be-ing independent elements. The two most similar ele-ments are then combined into one new element. Thesimilarity between two elements can be defined as thedistance between these two elements. The “Euclideandistance” method is probably the most commonly cho-sen type of distance. It corresponds to the geometricdistance in a multidimensional space. The distancesbetween the new formed element and the remainingelements are then calculated. The two closest elementsare again searched for and grouped; the new distancesare calculated. This combination step reduces the num-
64 Air Qual Atmos Health (2009) 2:57–67
ber of elements by one, and it is repeated until only oneelement remains.
The similarity between clusters consisting of morethan one object is often referred to as the clustermethod. In accordance with Kalkstein et al. (1987),Ward’s cluster method (Ward 1963) was appliedbecause this method is more accurate than others(Lu et al. 2006; Mangiameli et al. 1996) and producesstable and compact clusters (Flemming et al. 2005).Ward’s method defines the distance between two clus-ters as the sum of squared distances.
The cluster merging procedure can be shown graphi-cally as a dendrogram, displaying the hierarchical nest-ing of the clusters and their distances for merging. ThePCA and AHC in this study were carried out by usingXLSTAT 2007 software from AddinSoft.
Results and discussion
PCA and AHC described earlier were used (1) toidentify sites of similar variation towards NO2 and (2)to analyze the temporal variability of NO2 concen-tration over the city. The biweekly measurements for18 months at 22 different sampling sites lead to n =41 observations (averaged concentrations) for N = 22variables (sampling sites). The inertia matrix is basedon a cross-product matrix of the PCA coefficients.AHC describes the nearness between objects (i.e., siteconcentrations). A dissimilarity matrix was built us-ing the autoscaled data. The elements of this matrixare the Euclidean distances of one object from therest. To obtain clusters, the Ward method was used.In each step, this agglomerative method considers theheterogeneity or deviance (the sum of the square of thedistance of an object from the centroid of the cluster)of every possible cluster that can be created by linkingtwo existing clusters.
Spatial variability of the data
PCA was used to analyze correlations between thevariables of the sites using observations. Figure 2 rep-resents the correlation circle, showing a projection ofthe initial variables in the factor space. The PCs 1and 2 are plotted as axes F1 and F2. The calculatedeigenvalues reflect the quality of the projection fromthe N-dimensional initial table to a lower number ofdimensions. They show that if we represent the datawith only the axis F1, we are still able to see 64% ofthe total variability of the data. The variables S1 toS22 are all far from the center of the circle. Conse-quently, if the variables are close to each other, they
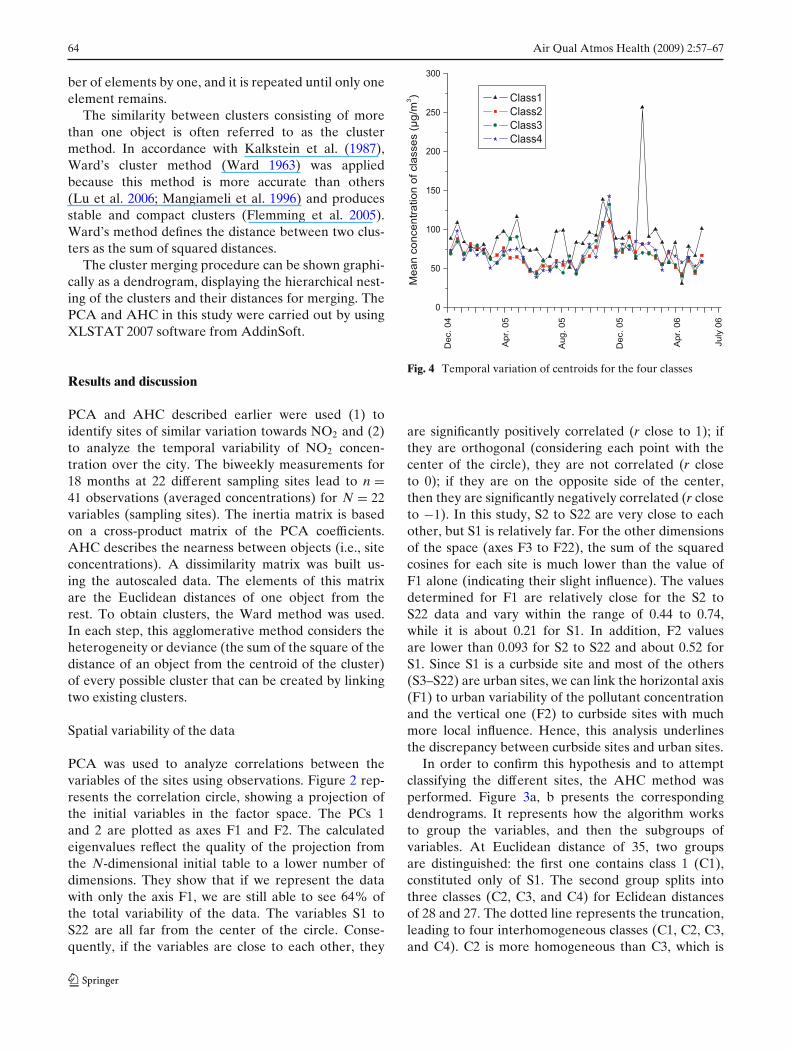
Fig. 4 Temporal variation of centroids for the four classes
are significantly positively correlated (r close to 1); ifthey are orthogonal (considering each point with thecenter of the circle), they are not correlated (r closeto 0); if they are on the opposite side of the center,then they are significantly negatively correlated (r closeto −1). In this study, S2 to S22 are very close to eachother, but S1 is relatively far. For the other dimensionsof the space (axes F3 to F22), the sum of the squaredcosines for each site is much lower than the value ofF1 alone (indicating their slight influence). The valuesdetermined for F1 are relatively close for the S2 toS22 data and vary within the range of 0.44 to 0.74,while it is about 0.21 for S1. In addition, F2 valuesare lower than 0.093 for S2 to S22 and about 0.52 forS1. Since S1 is a curbside site and most of the others(S3–S22) are urban sites, we can link the horizontal axis(F1) to urban variability of the pollutant concentrationand the vertical one (F2) to curbside sites with muchmore local influence. Hence, this analysis underlinesthe discrepancy between curbside sites and urban sites.
In order to confirm this hypothesis and to attemptclassifying the different sites, the AHC method wasperformed. Figure 3a, b presents the correspondingdendrograms. It represents how the algorithm worksto group the variables, and then the subgroups ofvariables. At Euclidean distance of 35, two groupsare distinguished: the first one contains class 1 (C1),constituted only of S1. The second group splits intothree classes (C2, C3, and C4) for Eclidean distancesof 28 and 27. The dotted line represents the truncation,leading to four interhomogeneous classes (C1, C2, C3,and C4). C2 is more homogeneous than C3, which is

Air Qual Atmos Health (2009) 2:57–67 65
Fig. 5 Temporal variation of mean NO2 concentration for the 41periods of observation in urban sites from 2 December 2004 to29 June 2006 in Beirut. Vertical bars: standard deviation for eachperiod
more homogeneous than C4. This higher homogeneityis indicated by the lower value of within-class variance(7,392 for C2, 7,858 for C3, and 8,255 for C4). Aninteresting case is that of S2, the second curbside site,which is classified within class C4. This classificationis due to the different height of the sampler on thissite (5.5 m from the ground compared to 3 m for S1).Since S2 is higher in height, NO2 is more dispersedat 5.5 m than it is at 3 m of height. Consequently,the measured concentrations at 5.5 m are less andtend to be compared in our case to concentrationsof urban sites. This result is in accordance with therecommendation of Agence De l’Environnement et dela Maîtrise de l’Energie (2002) and Vardoulakis et al.(2003). Therefore, traffic sites should be implementedbetween 1.5 and 3 m of height, otherwise they will notgive the desired quality of measurements.
Since no difference could be highlighted within thesecond group (C2, C3, and C4), we studied the temporalvariation of the mean concentration of the four classestrying to find the difference between them. Figure 4
presents the temporal variation of the mean concen-tration of the four classes. Class 1 presents not only athreefold peak in early 2006, but also relatively higherconcentrations of NO2 all over the period. This can beexplained by the nearness of the sampling to the sourcesince S1 is a curbside site. Classes 2, 3, and 4 showweak differences in their temporal variation and a lotof intersections through time.
These results lead to the conclusion that classes C2,C3, and C4 are quite equivalent and can be consideredas one global class. Consequently, we suggest minimiz-ing the number of urban samplers for future monitoringof urban NO2 in Beirut.
Temporal characterization of the NO2 pollution
The temporal variation (mean and standard deviation)for all of the 20 urban sites is presented in Fig. 5. NO2
concentrations during the whole period of observationranged from a minimum value of 17 μg m−3 in May 2006at the site S10 to a maximum value of 178 μg m−3 in De-cember 2005 at the site S6, with an urban backgroundaverage of 66 μg m−3. The annual average concentra-tion for the 20 urban sites for 2005 is 67 μg m−3, whilethe level recommended by the WHO is 40 μg m−3. Thestandard deviation of these measurements ranges from6.6 to 20.8 μg m−3. Local authorities should make aneffort to improve the air quality of the city.
The period of measurement between 2 December2004 and 29 June 2006 was divided into groups cor-responding to the four seasons. Table 2 shows thestatistical analyses of the data by season for these sitesover the whole period of measurements. In general, thepollutant concentration is higher during winter than theone during summer. This can be linked to meteorologi-cal conditions initiating the formation of a lower inver-sion layer during winter than in summer in addition tothe usage of central-heating burners in winter (Salibaet al. 2006), and to the lower photochemical activity,leading to lower photolysis of NO2. In summer, the sinkof NO2 due to its reaction with OH to produce HNO3 ismore efficient than in winter, where OH concentrationsare lower.
Table 2 Statistical analysesof the data classified byseason
Season Mean S.D. Min Max
Winter 2005 71.7 9.3 34.6 110.3Spring 2005 71.1 9 35.5 102.7Summer 2005 51.1 7.9 17.8 96.1Autumn 2005 82.4 8.3 24.5 177.9Winter 2006 75.4 10.4 43.7 130.3Spring 2006 54.9 7.9 16.5 90.9

66 Air Qual Atmos Health (2009) 2:57–67
Conclusion
A nitrogen dioxide network is established for the firsttime in Lebanon, since no air quality network waspresent in the country or in Beirut. The main NOxemission source is traffic. Concentrations of nitrogendioxide are greater than WHO guidelines, indicatingthat an effort has to be made to ameliorate air qualityin Beirut. Aimed at the identification of city areaswith similar pollution variations, two statistical meth-ods, PCA and AHC, were applied. Main results showthat the 20 urban monitoring sites of the establishednetwork can be classified into one quite homogeneousgroup, presenting lower concentrations in summer thanthe ones observed in winter. To complete this, a de-tailed temporal variation would be of great interest.This could be achieved with the use of online analyzers.This possibility will characterize short-term peaks of ni-trogen dioxide, which cannot be done with passive sam-plers. Furthermore, curbside site S1 showed a differentbehavior from urban sites. However, it is recommendedto implement curbside sites at appropriate height (be-tween 1.5 and 3 m) since dispersion plays an importantrole in controlling concentration (i.e., curbside site S2).The results and data presented in this study could playan important role in the development of a strategy tocontrol the pollution in the city and, consequently, theregion.
Acknowledgements Funding for this study was obtained fromthe University Research Board at Saint Joseph University,CEDRE (Coopération pour l’Evaluation et le Développement dela Recherche) program and the Municipality of Beirut. We wouldlike to thank AIRPARIF (France), Ile-de-France regional coun-cil, and the department of geography at Saint Joseph University.
Open Access This article is distributed under the terms of theCreative Commons Attribution Noncommercial License whichpermits any noncommercial use, distribution, and reproductionin any medium, provided the original author(s) and source arecredited.
References
Agence De l’Environnement et de la Maîtrise de l’Energie(2002). Classification and criteria for setting up air-qualitymonitoring stations. Agence De l’Environnement et de laMaîtrise de l’Energie, Paris, pp 64
Aoyama T, Yashiro T (1983) Analytical study of low-concentration gases. Investigation of the reaction by trap-ping nitrogen dioxide in air using the triethanolaminemethod. J Chromatogr 265:69–78
Atkins CHF, Sandalls J, Law DV, Hough AM, Stevenson K(1986) The measurement of nitrogen dioxide in the outdoorenvironment using passive diffusion tube samplers. AERE-R12133, Harwell Laboratory
Brown RH, Harvey RP, Prunell CJ, Saunders KJ (1984) A dif-fusive sampler evaluation protocol. Am Ind Hyg Assoc J45:67–75
Bush T, Smith S, Stevenson K, Moorcroft S (2001) Validationof nitrogen dioxide diffusion tube methodology in the UK.Atmos Environ 35:289–296
Campbell GW, Stedman JR, Stevenson K (1994) A survey ofnitrogen dioxide concentrations in the United Kingdom us-ing diffusion tubes, July-December 1991. Atmos Environ28:477–486
Cao X-L, Hewitt CN (1991) Application of passive samplersto the monitoring of low concentration organic vapours inindoor and ambient air: a review. Environ Technol 12:1056–1062
Delgado-Saborit JM, Esteve-Cano V (2006) Field study of diffu-sion collection rate coefficients of a NO2 passive sampler in amediterranean coastal area. Environ Monit Assess 120:327–345
El-Zein A, Nuwayhid I, El-Fadel M, Mroueh S (2007) Did a banon diesel-fuel reduce emergency respiratory admissions forchildren? Sci Total environ 384:134–140
Ferm M (1991) A sensitive diffusional sampler. IVL ReportL91-172. Swedish Environmental Research Institute,Göteborg
Ferm M, Svanberg PA (1998) Cost-efficient techniques for urbanand background measurements of SO2 and NO2. AtmosEnviron 32:1377–1381
Ferm M, Rodhe H (1997) Measurements of air concentrationsof SO2, NO2 and NH3 at rural and remote sites in Asia. JAtmos Chem 27:17–29
Flemming J, Stern R, Yamartino RJ (2005) A new air qualityregime classification scheme for O3, NO2, SO2 and PM10observations sites. Atmos Environ 39:6121–6129
Fovell RG, Fovell MC (1993) Climate zones of the contermi-nous United States defined using cluster analysis. J Clim 6:2103–2135
Gair AJ, Penkett SA, Oyola P (1991) Development of a simplepassive technique for the determination of nitrogen dioxidein remote continental locations. Atmos Environ 25A:1927–1939
Gair AJ, Penkett SA (1995) The effects of wind speed and turbu-lence on the performance of diffusion tube samplers. AtmosEnviron 29:2529–2533
Glasius M, Carlsen FM, Hansen TS, Lohse C (1999) Measure-ments of nitrogen dioxide on Funen using diffusion tubes.Atmos Environ 33:1177–1185
Gold A (1977) Stoechiometry of nitrogen dioxide determinationin triethanolamine trapping solution. Anal Chem 49:1448–1450
Gramsch E, Cereceda-Balic F, Oyola P, Baer D (2006) Exami-nation of pollution trends in Santiago de Chile with clusteranalysis of PM10 and ozone data. Atmos Environ 40:5464–5475
Haue-Pedersen U, Hanse CL, Knudsen KU, Skov H, Lohse C(1994) Measurments of NO2 by passive sampling. In:Angeletti G, Restelli G (eds) Physico-chemical behavior ofatmospheric pollutants, proceedings of the 6th Europeansymposium, Varese 1993. Report EUR 15609/1. EuropeanCommision, Luxembourg
Heal MR, Cape JN (1997) A numerical evaluation of chemicalinterferences in the measurement of nitrogen dioxide bypassive diffusion samplers. Atmos Environ 31:1911–1923
Heal MR, O’Donoghue MA, Cape JN (1999) Overestimation ofurban nitrogen dioxide by passive diffusion tubes: a com-parative exposure and model study. Atmos Environ 33:513–524

Air Qual Atmos Health (2009) 2:57–67 67
Heal MR, Kirby C, Cape JN (2000) Systematic biases in mea-surement of urban nitrogen dioxide using passive diffusionsamplers. Environ Monit Assess 62:39–54
Hedley KJ, Shepson PB, Barrie LA, Bottenheim JW, MactavishDC, Anlauf KG, Mackay GI (1994) An evaluation of inte-grating techniques for measuring atmospheric nitrogen diox-ide. Int J Environ Anal Chem 54:167–181
Hisham MWM, Grosjean D (1990) Sampling of atmosphericnitrogen dioxide using triethanolamine-interference fromperoxyacetyl nitrate (PAN). Atmos Environ 24:2523–2525
Kalkstein LS, Tan G, Skindlov JA (1987) An evaluation of threeclustering procedures for use in synoptic climatological clas-sification. J Clim Appl Meteorol 26:717–730
Kannel PR, Lee S, Kanel SR, Khan SP (2007) Chemometricapplication in classification and assessment of monitoringlocations of an urban river system. Anal Chim Acta 582:390–399
Krochmal D, Kalina A (1997) A method of nitrogen dioxide andsulfur dioxide determination in ambient air by use of passivesamplers and ion chromatography. Atmos Environ 31:3473–3479
Lavine BK (2000) Clustering and classification of analytical data.Encyclopedia of analytical chemistry: instrumentation andapplications. Wiley, New York, pp 9689–9710
Levaggi DA, Siu W, Feldstein M, Kothny EL (1972) Quanti-tative separation of nitric oxide from nitrogen dioxide atatmospheric concentration ranges. Environ Sci Technol6:250–252
Lu HC, Changb CL, Hsieha JC (2006) Classification of PM10distributions in Taiwan. Atmos Environ 42:1452–1463
Mangiameli P, Chen SK, West D (1996) A comparison of SOMof neural network and hierarchical methods. Eur J Oper Res93:402–417
Mendiguchia C, Moreno C, Galindo-Riano MD, Garcia-VargasM (2004) Using chemometric tools to assess anthropogeniceffects in river water: a case study: Guadalquivir River(Spain). Anal Chim Acta 515:143–149
Molteni E, Bonelli E, Bacci E (1983) Precipitation over NorthernItaly: a description by means of principal component analy-sis. J Clim Appl Meteor 22:1738–1752
Moschandreas DJ, Relwani SM, Taylor KC, Mulik JD (1990) Alaboratory evaluation of a nitrogen dioxide personal sam-pling device. Atmos Environ 24A:2807–2811
Palmes ED, Gunnison AF (1973) Personal monitoring device forgaseous contaminants. Am Ind Hyg Assoc J 34:78–81
Palmes ED, Gunnison AF, DiMattio J, Tomaczyk C (1976) Per-sonal sampler for nitrogen dioxide. Am Ind Hyg Assoc J37:570–577
Palmes ED, Lindenboom RH (1979) Ohm’s law, Fick’s law, anddiffusion samplers for gases. Anal Chem 51:2400–2401
Palmes ED, Johnson ER (1987) Explanation of pressure effectson a nitrogen dioxide (NO2) sampler. Am Ind Hyg Assoc J48:73–76
Pires JCM, Sousa SIV, Pereira MC, Alvim-Ferraz MCM, MartinsFG (2008a). Management of air quality monitoring using
principal component and cluster analysis-Part I: SO2 andPM10. Atmos Environ 42:1249–1260
Pires JCM, Sousa SIV, Pereira MC, Alvim-Ferraz MCM, MartinsFG (2008b) Management of air quality monitoring usingprincipal component and cluster analysis-Part II: CO, NO2and O3. Atmos Environ 42:1261–1274
Finlayson-Pitts BJ, Pitts JN Jr (2000) Chemistry of the upper andlower atmosphere. Academic, London
Plaisance H (2004) Response of a Palmes tube at variousfluctuations of concentration in ambient air. Atmos Environ38:6115–6120
Plaisance H, Piechocki-Minguy A, Garcia-Fouque S, Galloo JC(2004) Influence of meteorological factors on the NO2 mea-surements by passive diffusion tube. Atmos Environ 38:573–580
Radiello M (2006) Fondazione Salvatore Maugeri - IRCCS.http://www.radiello.it/english/download_en.htm
Richman MB (1986) Rotation of principal components (reviewarticle). J Climatol 6:293–335
Roadman MJ, Scudlark JR, Meisinger JJ, Ullman WJ (2003)Validation of ogawa passive samplers for the determinationof gaseous ammonia concentrations in agricultural settings.Atmos Environ 37:2317–2325
Saliba NA, Moussa S, Salame H, El-Fadel M (2006) Variationof selected air quality indicators over the city of Beirut,Lebanon: assessment of emission sources. Atmos Environ40:3263–3268
Shrestha S, Kazama F (2007) Assessment of surface water qual-ity using multivariate statistical techniques: a case studyof the Fuji river basin, Japan. Environ Model Softw 22:464–475
Singh KP, Malik A, Mohan D, Sinha S (2004) Multivariatestatistical techniques for the evaluation of spatial and tem-poral variations in water quality of Gomti River (India)—acase study. Water Res 38:3980–3992
Singh KP, Malik A, Sinha S (2005) Water quality assessment andapportionment of pollution sources of Gomti river (India)using multivariate statistical techniques-a case study. AnalChim Acta 538:355–374
Tang H, Lau T, Brassard B, Cool W (1999) A new all-seasonpassive sampling system for monitoring NO2 in air. FieldAnal Chem Technol 3:338–345
Tang YS, Cape JN, Sutton MA (2001) Development andtypes of passive samplers for monitoring atmospheric NO2and NH3 concentrations. In: Proceedings of the inter-national symposium on passive sampling of gaseous airpollutants in ecological effects research. Sci World 1:513–529
Vardoulakis S, Fischer BEA, Pericleous K, Gonzalez-Flesca N(2003) Modelling air quality in street canyons: a review.Atmos Environ 37:155–182
Ward JH (1963) Hierarchical grouping to optimize and objectivefunction. J Am Stat Assoc 58:236–244
Wilks DS (2006) Statistical methods in the atmospheric sciences,2nd edn. Academic, London