statistical abstract
102
STATISTICAL ABSTRACT STATISTICAL ABSTRACT 2010 VOL 1 DECEMBER 2010 MINISTRY OF LANDS, HOUSING AND URBAN DEVELOPMENT VOL 1 DECEMBER 2010 Ministry of Lands, Housing and Urban Development P. O. Box 7096, Kampala - Uganda Tel: +256-414-259 944/ 414-373 511 Fax: +256-414-230 891 Website: http//www.mlhud.go.ug THIS STATISTICAL ABSTRACT, LAND TRANSFER FORMS, LAND AMENDMENT ACT 2010 & EXTRACTS FROM THE GAZETTE ARE NOW AVAILABLE AT www. mlhud.go.ug for downloading free of charge
-
Upload
khangminh22 -
Category
Documents
-
view
1 -
download
0
Transcript of statistical abstract

STATISTICAL
ABSTRACT
STA
TIS
TIC
AL
AB
ST
RA
CT
201
0
VO
L 1
D
EC
EM
BE
R 2
010
MINISTRY OF LANDS, HOUSING AND URBAN DEVELOPMENT
VOL 1
DECEMBER 2010
Ministry of Lands, Housing and Urban Development
P. O. Box 7096, Kampala - Uganda
Tel: +256-414-259 944/ 414-373 511
Fax: +256-414-230 891Website: http//www.mlhud.go.ug
THIS STATISTICAL ABSTRACT,LAND TRANSFER FORMS,
LAND AMENDMENT ACT 2010 &
EXTRACTS FROM THE GAZETTEARE NOW AVAILABLE AT
www. mlhud.go.ug
for downloading free of charge
STATISTICAL
ABSTRACT
VOL 1
DECEMBER 2010
Kampala; Ministry of Lands, Housing and Urban Development

i
MAP OF THE REPUBLIC OF UGANDA
ii
FOREWORD
There is a growing need in Uganda for statistics related to the Lands, Housing and Urban
Development sector. This need arises out of the current position whereby the available statistics
are not only limited, inaccurate but are also not timely. My Ministry working with the Uganda
Bureau of Statistics is striving to address this problem. It is not debatable that quality statistical
information plays a key role in achieving better sector development results. Such statistical
information is required to identify development issues; inform policy design and facilitate planning,
implementation, monitoring and measurement of the impact of development interventions. This
sector Statistical Abstract, therefore, will be handy in filling the gap of providing statistics to users.
This abstract has therefore been compiled by MLHUD to provide summary and detailed statistics
on the transactions, trends, current status of its various indicators. The data was collected from
Primary and Secondary sources, which included published reports, administrative records and
UBOS household surveys and Census reports.
This abstract forms a basis for documenting baseline statistics to monitor progress of participation
in development activities under the MLHUD sector.
The Ministry therefore urges its stakeholders and sector statistics users to put to use this very
important and vital information. The Ministry looks forward to receiving feedback on this
publication, in order to ensure an even improved production of quality and timely official statistics
in the future.
Gabindadde - Musoke
PERMANENT SECRETARY
iii
ACKNOWLEDGEMENTS
The development of this 2010 MLHUD Statistical Abstract was crosscutting amongst stakeholders
whose dedication and participation has contributed to its successful accomplishment. It involved a
large number of individuals and sector partner organizations.
Special thanks go to the MLHUD Sector Committee Members under the direction of the
Commissioner Planning and Quality Assurance Department and his staff who played a leading
role in the review of the Abstract and offered all the necessary guidance to have a well thought out
and informative Abstract.
A vote of thanks is extended to the Heads of Departments, Directors, Ministry Staff and other key
stakeholders for the dedication and support they have provided during this entire process of
formulating the statistical abstract.
A vote of thanks also goes to the Uganda Bureau of Statistics which, in partnership with the
Department For International Development, has among other things played a vital role in the
coordination, funding and offering of technical guidance throughout the entire process of compiling
the data and publishing the Statistical Abstract.
Lastly, special thanks go to the Government of Uganda, Research bodies and private agencies
whose research and Statistical information has contributed to the formulation of a comprehensive
and detailed Statistical Abstract for the Ministry of Lands, Housing and Urban Development
Sector.
iv
HOW TO READ THE STATISTICS
A GUIDE ON UTILIZING THE ABSTRACT
The statistics used in this abstract were obtained from primary sources and secondary data from
censuses, surveys and administrative records. The statistics are presented in a simple way so that
they are easy to understand and interpret. This Abstract therefore is a quick reference document
depicting the land use, land tenure, housing and urban development statistics in Uganda.
Explanation of words and symbols used is therefore given as follows:
Proportion Is the ratio which indicates the relation in
magnitude of a part to a whole
Percentage Expressing a number as a fraction of 100.
Percentages are used to express how
large/small one quantity is, relative to another
quantity
Rate Is a ration showing relative change of an event
in a specified time frame
“-” Missing Data

v
ACRONYMS AND ABBREVIATIONS
ALCs - Area Land Committees CPQAD - Commissioner, Planning and Quality Assurance Department CSO - Civil Society Organization DFID - Department For International Development DLBs - District Land Boards GIS - Geographical Information System HHs - Households HoDs - Heads of Departments ICT - Information Communication Technology IDPs - Internally Displaced Persons LCs - Local Councils LGs - Local Governments LIS - Land Information System LO - Land Officers LTRP - Land Tenure Reform Project MC - Municipal Council MLHUD - Ministry of Lands, Housing and Urban Development NGOs - Non-Government Organizations NLP - National Land Policy NPA - National Planning Authority NSDS - National Service Delivery Survey PQAD - Planning and Quality Assurance Department PRDP - Peace, Recovery and Development Plan SAP - Slum Aid Project SD - Systematic Demarcation Sq. Kms - Square Kilometers TC - Town Council UBOS - Uganda Bureau of Statistics UNDP - United Nations Development Programme USAID - United States of Agency for International Development VIP - Ventilated Improved Pit latrine

vi
EXECUTIVE SUMMARY
The Statistical Abstract is the first edition of the Ministry of Lands, Housing and Urban Development. The abstract gives a statistical summary of the transactions within the Ministry. The publication is divided into three major chapters which are followed by a glossary of definitions from all chapters and it ends with a set of appendices. Land as per 2005
Area of Uganda was 241,550.7 sq. km. Land was 199,807.4 sq. km. Open water and swamps cover around 41.743 sq. km
Transactions on land A) Mailo land
Special tittles issued increased from 457 in 2007/2008 to 871 in 2009/2010. Number of substitute tittles dropped slightly from 157 in 2007/2008 to 151 in 2009/2010. Number of tittles transferred increased from 15,284 in 2007/2008 to 18,764 in 2009/2010. Number of mortgages registered increased from 5,304 in 2007/2008 to 14,561 in
2009/2010. Number of caveats lodged decreased from 4,821 in 2007/2008 to 1,589 in 2009/2010. Number of certificates issued increased from 6,600 in 2007/2008 to 11,545 in 2009/2010. Number of titles entered in computer data bank increased from 55,466 in 2007/2008 to
171,068 in 2009/2010. B) Lease hold
Caveats registered reduced from 803 in 2007/2008 to 517 in 2009/2010. Lease tittles issued decreased from 7,300 in 2007/2008 to in 5,230 in 2009/2010. Number of mortgages registered increased from 2,453 in 2007/2008 to 3,766 in 2009/2010. Special certificate of tittles issued reduced from 183 in 2007/2008 to 162 in 2009/2010. Number of people who applied for lease extension dropped from 708 in 2007/2008 to 464 in
2009/2010. Substitute titles increased from 36 in 2007/2008 to 103 in 2009/2010.
C) Land offices
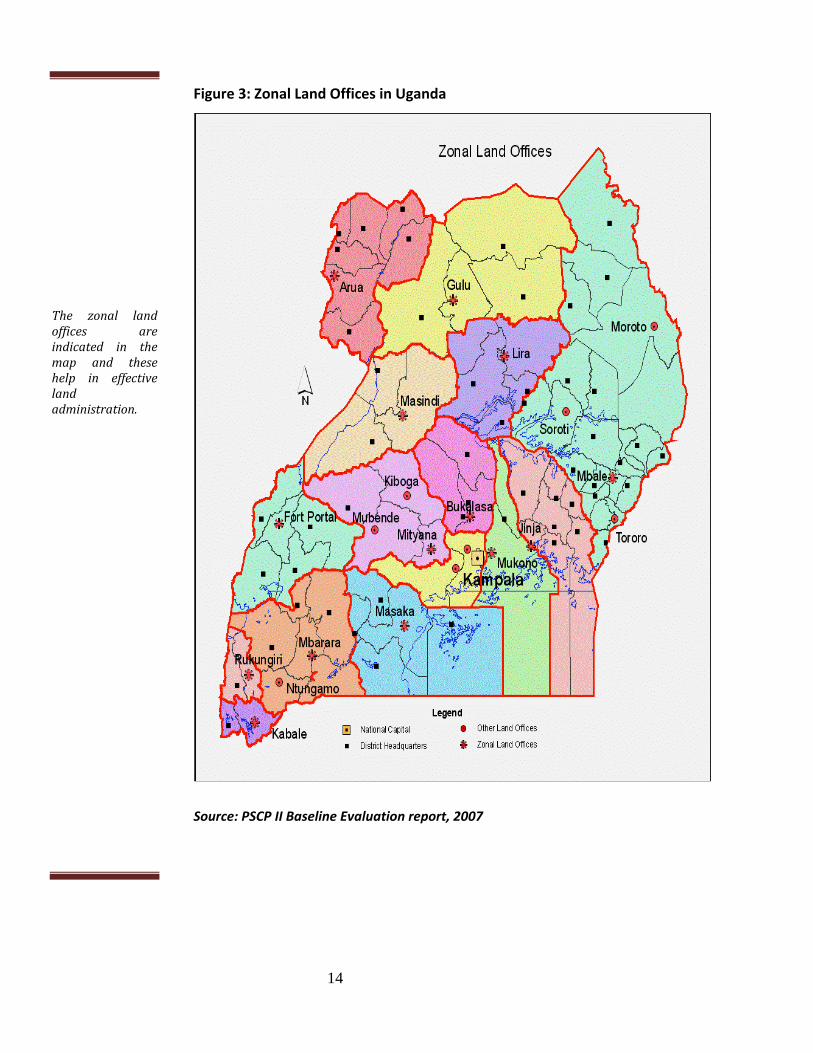
The headquarters are at the Ministry of Lands, Housing and Urban Development. There are 21 regional land offices located in different parts of the country. These are
located in Masindi, Arua, Gulu, Lira, Soroti, Moroto, Mbale, Tororo, Jinja, Mukono, Bukalasa, Mityana, Masaka, Fort Portal, Mbarara, Rukungiri, Kampala, Wakiso, Kibaale, Mpigi and Kabale districts.
D) Land tenure system in Uganda comprises the following by percentage
Customary 68.6% Freehold 18.6% Mailo 9.2% Leasehold 3.6%
vii
E) Forged land titles seized from the public by the Ministry increased from 8 in 2007 to 63 in 2009 and decreased to 55 in 2010.
F) Physical planning status in Uganda
The number of Town Boards was 165 as per June 2010. The number of gazetted Town Councils was 165 as per June 2010. The number of Municipal councils was 22 as per June 2010. One city as per June 2010. 89 Urban Councils had both the structure and detailed plan. 3 had only the detailed plan. 6 had only the structure plan. 13 did not have both the structure and the detailed plan.
G) Current housing status
On average 600 housing units are constructed countrywide every day. Approximately 47% of urban households live in tenements, 31% in detached dwellings,
18% in semi-detached units and 4% in other unspecified housing types. Nationally, 71% of housing stock is constructed in temporary materials, 11% in semi-
permanent and 18% used permanent materials. 60% of the dwelling units are roofed with iron sheets with 58% in rural areas and 85% in
urban areas as per 2008.
viii
TABLE OF CONTENTS MAP OF THE REPUBLIC OF UGANDA ................................................................................................................................................. I
FOREWORD ............................................................................................................................................................................................ II
ACKNOWLEDGEMENTS ....................................................................................................................................................................... III
HOW TO READ THE STATISTICS ....................................................................................................................................................... IV
ACRONYMS AND ABBREVIATIONS ................................................................................................................................................... V
EXECUTIVE SUMMARY ....................................................................................................................................................................... VI
TABLE OF CONTENTS ...................................................................................................................................................................... VIII
LIST OF TABLES .................................................................................................................................................................................. IX
LIST OF FIGURES .................................................................................................................................................................................. X
LAND STATISTICS ............................................................................................................................................................................... 11
1.1 NATIONAL LAND COVER STATISTICS ................................................................................................................................ 11 1.2 LAND TENURE SYSTEMS AND LAND OWNERSHIP IN UGANDA BY STATISTICS ........................................................ 12 1.3 SYSTEMATIC DEMARCATION, SURVEY AND REGISTRATION OF LAND RIGHTS IN UGANDA ................................. 35
URBAN STATISTICS ............................................................................................................................................................................ 36
PHYSICAL PLANNING STATISTICS ................................................................................................................................................ 41
HOUSING STATISTICS: ....................................................................................................................................................................... 46
HOUSING CONDITIONS ................................................................................................................................................................... 46 CURRENT HOUSING STOCK .......................................................................................................................................................... 47
APPENDIX A.......................................................................................................................................................................................... 60
GLOSSARY ........................................................................................................................................................................................... 60 HOUSING AND URBAN DEVELOPMENT CONCEPTS AND DEFINITIONS ............................................................................ 60 LAND CONCEPTS AND DEFINITIONS ....................................................................................................................................... 63 PHYSICAL PLANNING CONCEPTS AND DEFINITIONS ........................................................................................................... 65
APPENDIX B.......................................................................................................................................................................................... 66
META DATA SHEET ............................................................................................................................................................................... 66
APPENDIX C.......................................................................................................................................................................................... 73
STATISTICS PRODUCTION SCHEDULE ........................................................................................................................................ 73
APPENDIX D.......................................................................................................................................................................................... 82
MAPPING AND SURVEYS ................................................................................................................................................................ 82
APPENDIX E .......................................................................................................................................................................................... 84
2009 MID-YEAR PROJECTED POPULATION FOR TOWN COUNCILS ............................................................................................................ 84
APPENDIX F .......................................................................................................................................................................................... 87
KEY PLAYERS IN THE LANDS, HOUSING AND URBAN DEVELOPMENT SECTOR............................................................................................. 87
APPENDIX G ......................................................................................................................................................................................... 89
INFRASTRUCTURE AND BASIC URBAN SERVICES ..................................................................................................................... 89
APPENDIX H.......................................................................................................................................................................................... 90
THE DISTRICTS, NUMBER OF TOWN BOARDS AND THEIR NAMES ................................................................................................................ 90
APPENDIX I ........................................................................................................................................................................................... 95
LIST OF DISTRICTS, MUNICIPALITIES AND TOWN COUNCILS ...................................................................................................................... 95
APPENDIX J ........................................................................................................................................................................................ 100
LIST OF MLHUD SECTOR STATISTICS COMMITTEE MEMBERS ............................................................................................................... 100
ix
LIST OF TABLES Table 1: National land cover statistics (sq. Kms) .......................................................................................... 11 Table 2: Distribution of titles by tenure and region ....................................................................................... 16 Table 3: Trends of registration by tenure as per May 2001 for Mailo and Lease titles ................................. 18 Table 4: Recorded rates of title transactions by region ................................................................................ 18 Table 5: Transactions carried out by the Mailo registries ............................................................................ 19 Table 6: Showing computerization status of mailo land ................................................................................ 21 Table 7: Showing transactions on Leasehold. .............................................................................................. 24 Table 8: Land Tenure of Plots by Residence and Region (%) ...................................................................... 28 Table 9: Estimation of the number of people based on the number of households per district .................... 29 Table 10: Comparative levels of registration by selected districts as per may 2001 .................................... 31 Table 11: Complaints lodged by the public ................................................................................................... 31 Table 12: Showing the Offices/Departments complained about ................................................................... 31 Table 13: Showing the different complaints reported by the public .............................................................. 32 Table 14: Forged titles captured from the public by the Ministry .................................................................. 33 Table 15:Table showing land valuation statistics .......................................................................................... 34 Table 16: Bulowooza I and II villages Iganga district .................................................................................... 35 Table 17: Mandhigandere Village Iganga District ......................................................................................... 35 Table 18: Showing urban and total population growth rates in Uganda. ...................................................... 37 Table 19: Trends in Urban Population in Uganda, 1980 – 2002 ................................................................... 38 Table 20: Population Growth in 15 Towns 1991 – 2002 .............................................................................. 39 Table 21: Showing Gazette Urban Councils in Uganda ............................................................................... 41 Table 22:Gazetted urban councils in Uganda ............................................................................................... 42 Table 23:Basic Indicators of Settlements in Uganda (% of Total Dwellings), 2005/06 ................................. 47 Table 24:distribution of households by cooking fuel and residence (%) ....................................................... 48 Table 25:Table showing Distribution of Households by Type of Construction Materialsand Residence (%) 48 Table 26: Literacy Rates for Population Aged 10 Years and Above ............................................................ 49 Table 27: National level solid waste disposal methods ................................................................................ 49 Table 28:Distribution of Households by Type of Materials for the Dwelling Structure and Residence ......... 50 Table 29: Percentage distribution of Dwelling Units by Permanency and Residence, 1991 and 2002 ...... 51 Table 30:Region distribution of housing units by state of permanency ........................................................ 52 Table 31: Percent Distribution of Housing Units by Type and Residence .................................................... 53 Table 32:Percent distribution of housing units by region .............................................................................. 54 Table 33:Percent distribution of housing units by state of permanency ....................................................... 54 Table 34:Percent Distribution of Dwelling Units by the type and by state of permanency ............................ 55 Table 35:Occupancy tenure by Residence and Region (%) ......................................................................... 56 Table 36: Distribution of Households by Type of Sanitary Facilities and Residence (%) ............................. 58 Table 37: Distribution of Households by Factors Limiting Construction of Toilet Facilities (%) .................... 59

x
LIST OF FIGURES
Figure 1: A pie chart showing percentage Land use in 2005 ........................................................................ 12 Figure 2: Tenure systems in Uganda ............................................................................................................ 13 Figure 3: Zonal Land Offices in Uganda ....................................................................................................... 14 Figure 4: Trends in title registration for Mailo/Freehold and Leasehold for different regions. ....................... 15 Figure 5: Presence of cadastral maps on the topographic map sheets. ....................................................... 17 Figure 6: Court orders on Mailo land ............................................................................................................ 19 Figure 7: Trends of Special and Substitute mailo titles issued ..................................................................... 20 Figure 8: A bar graph showing the trend of Mailo titles transferred. ............................................................. 21 Figure 9: Showing the level of computerization of Mailo land titles .............................................................. 22 Figure 10: Figure showing Mortagages registered and released of Mailo .................................................... 22 Figure 11: Figure showing caveats lodged and removed of Mailo ............................................................... 23 Figure 12: Showing certificate of Mailo land titles issued ............................................................................. 23 Figure 13: Registered court orders on leased land ....................................................................................... 24 Figure 14: A line graph showing a trend of leasehold titles transfers ........................................................... 25 Figure 15: Showing the lease and free hold titles issues .............................................................................. 26 Figure 16: Trends of Special and Substitute leasehold titles ........................................................................ 26 Figure 17: Mortgages registered and released from 2006 to 2010 on lease hold. ....................................... 27 Figure 18: Registered and withdrawn caveats on leaseholds ..................................................................... 27 Figure 19: Graph showing complaints made to MLHUD .............................................................................. 32 Figure 20: Graph showing total and urban population .................................................................................. 38 Figure 21: Urbanisation Trends in Uganda ................................................................................................... 39 Figure 22: Distribution of Households by Occupancy Tenure (%) ................................................................ 47 Figure 23: Occupancy Status by Residence and Sector .............................................................................. 56
11
LAND STATISTICS
1.1 NATIONAL LAND COVER STATISTICS
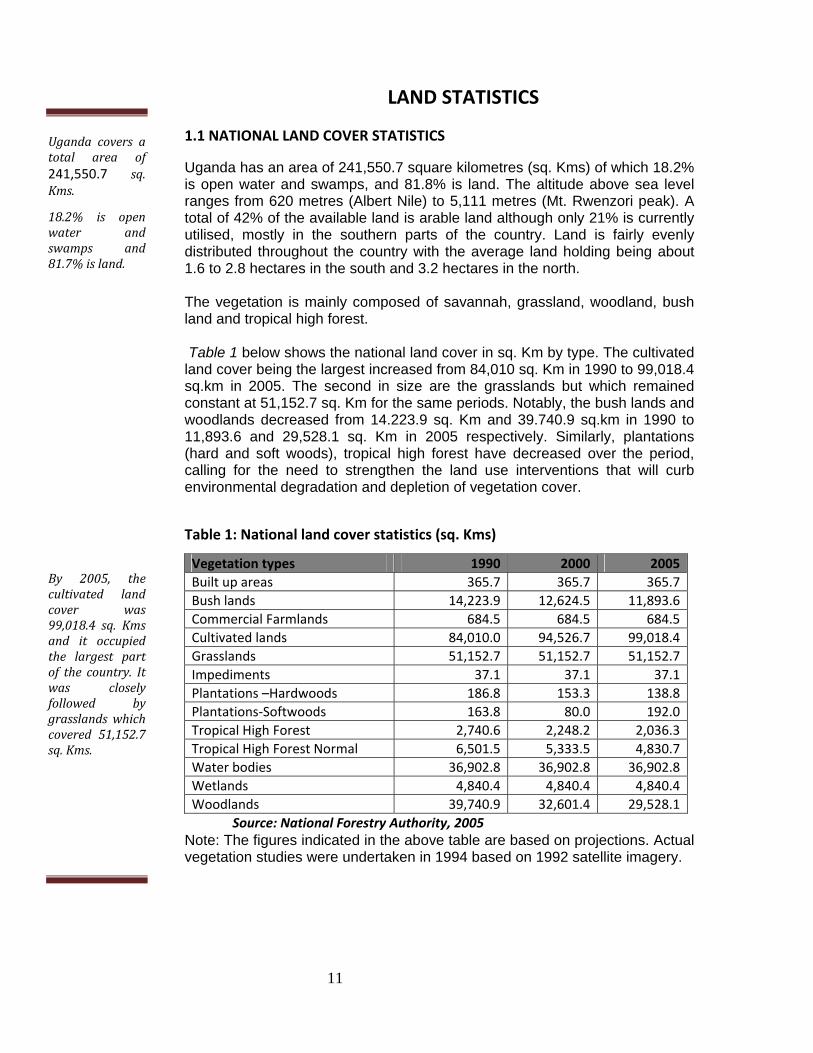
Uganda has an area of 241,550.7 square kilometres (sq. Kms) of which 18.2% is open water and swamps, and 81.8% is land. The altitude above sea level ranges from 620 metres (Albert Nile) to 5,111 metres (Mt. Rwenzori peak). A total of 42% of the available land is arable land although only 21% is currently utilised, mostly in the southern parts of the country. Land is fairly evenly distributed throughout the country with the average land holding being about 1.6 to 2.8 hectares in the south and 3.2 hectares in the north. The vegetation is mainly composed of savannah, grassland, woodland, bush land and tropical high forest. Table 1 below shows the national land cover in sq. Km by type. The cultivated land cover being the largest increased from 84,010 sq. Km in 1990 to 99,018.4 sq.km in 2005. The second in size are the grasslands but which remained constant at 51,152.7 sq. Km for the same periods. Notably, the bush lands and woodlands decreased from 14.223.9 sq. Km and 39.740.9 sq.km in 1990 to 11,893.6 and 29,528.1 sq. Km in 2005 respectively. Similarly, plantations (hard and soft woods), tropical high forest have decreased over the period, calling for the need to strengthen the land use interventions that will curb environmental degradation and depletion of vegetation cover.
Table 1: National land cover statistics (sq. Kms)
Vegetation types 1990 2000 2005
Built up areas 365.7 365.7 365.7
Bush lands 14,223.9 12,624.5 11,893.6
Commercial Farmlands 684.5 684.5 684.5
Cultivated lands 84,010.0 94,526.7 99,018.4
Grasslands 51,152.7 51,152.7 51,152.7
Impediments 37.1 37.1 37.1
Plantations –Hardwoods 186.8 153.3 138.8
Plantations‐Softwoods 163.8 80.0 192.0
Tropical High Forest 2,740.6 2,248.2 2,036.3
Tropical High Forest Normal 6,501.5 5,333.5 4,830.7
Water bodies 36,902.8 36,902.8 36,902.8
Wetlands 4,840.4 4,840.4 4,840.4
Woodlands 39,740.9 32,601.4 29,528.1
Source: National Forestry Authority, 2005 Note: The figures indicated in the above table are based on projections. Actual vegetation studies were undertaken in 1994 based on 1992 satellite imagery.
Uganda covers atotal area of241,550.7 sq.Kms.
18.2% is openwater andswamps and81.7%island.
By 2005, thecultivated landcover was99,018.4 sq. Kmsand it occupiedthe largest partof the country. Itwas closelyfollowed bygrasslandswhichcovered 51,152.7sq.Kms.

12
Figure 1: A pie chart showing percentage Land use in 2005
1.2 LAND TENURE SYSTEMS AND LAND OWNERSHIP IN UGANDA BY STATISTICS
Land in Uganda belongs to the citizens, and is vested in them in accordance with the 1995 Constitution (Article 273) and the Land Act 1998 Cap. 2004. Land tenure is the mode of holding rights in land and specifies how property rights to land are allocated. These rules define how access is granted to rights of use, control and transfer land, as well as associated responsibilities and obligations. In short land tenure systems govern who uses what land resources; for how long; and under what conditions. There are four different types of Land Tenure Systems in Uganda:
- Customary - Freehold - Mailo; and - Leasehold.
The pie chartclearly indicatesthat the greatestproportion of thecountry area wasoccupied bycultivated landswhich covered40.98%.
The four majortenure systems inUganda include:Customary,Freehold, MailoandLeasehold.

13
Figure 2: Tenure systems in Uganda
Source: PSCP II Baseline Evaluation report, 2007 The map above shows that the Central and parts of Mid-western region mostly have Mailo tenure system; south western has native freehold; leaseholds are scattered around the entire country and mostly in urban settings; while customary tenure is more common in the Northern, North East and West Nile regions of the country. To ease the land administration, the country has been grouped into zones with each one having a Regional Land Office for decentralized land administration services to be taken nearer to the people.
In themap shown,Mailo land tenuresystem covers thecentral and partsoftheMid‐Westernregion.
Native freeholdlandtenuresystemcovers the southwesternregion.
Customary landtenure covers theNorthern, NorthEastern and theWest Nile regionsofthecountry.
14
Figure 3: Zonal Land Offices in Uganda
Source: PSCP II Baseline Evaluation report, 2007
The zonal landoffices areindicated in themap and thesehelp in effectivelandadministration.
15
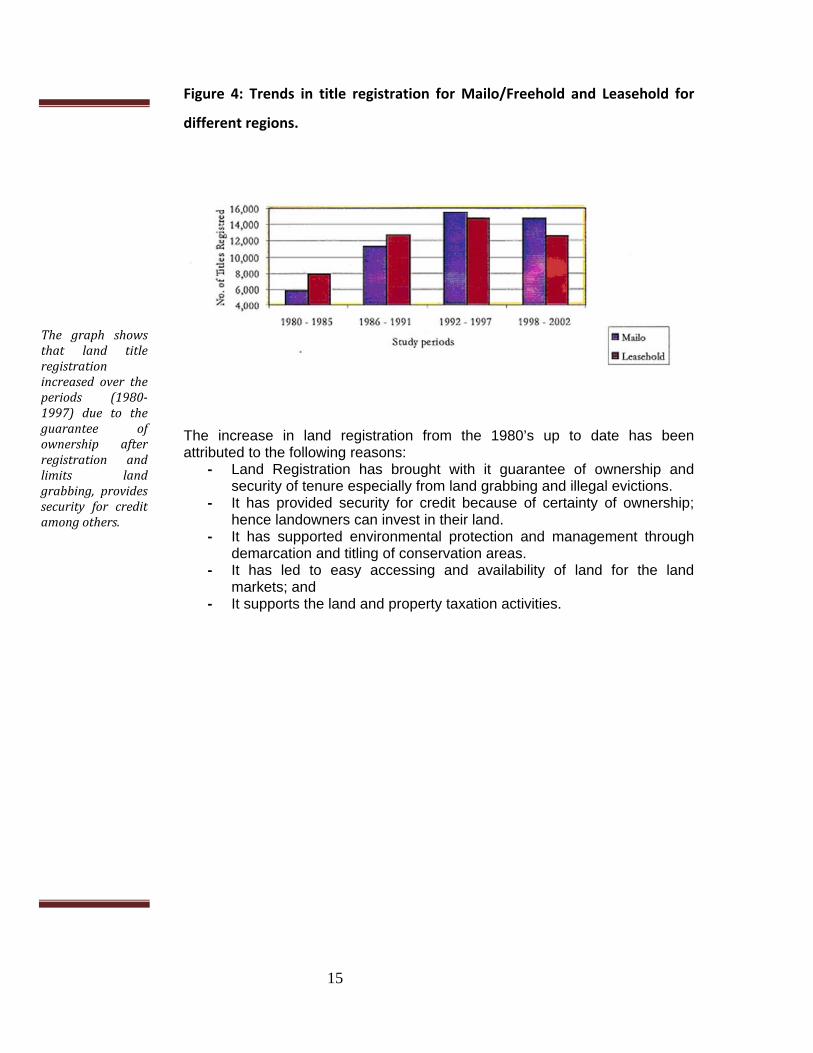
Figure 4: Trends in title registration for Mailo/Freehold and Leasehold for
different regions.
The increase in land registration from the 1980’s up to date has been attributed to the following reasons:
- Land Registration has brought with it guarantee of ownership and security of tenure especially from land grabbing and illegal evictions.
- It has provided security for credit because of certainty of ownership; hence landowners can invest in their land.
- It has supported environmental protection and management through demarcation and titling of conservation areas.
- It has led to easy accessing and availability of land for the land markets; and
- It supports the land and property taxation activities.
The graph showsthat land titleregistrationincreased over theperiods (1980‐1997) due to theguarantee ofownership afterregistration andlimits landgrabbing, providessecurity for creditamongothers.

16
Table 2: Distribution of titles by tenure and region
Mailo/freehold Leasehold
Region Number % Number %
Central 45,470 98.04 23,624 50
Western 816 1.75 10,888 23
Eastern 87 0.19 8,338 18
Northern 5 0.01 3,897 8
Totals 46,378 100 46,747 100
Source: May 2010 Facts and figures for MLHUD sector.
Central region has nearly all the land registered in comparison to other regions. The Northern region on the other hand has not had most of its land registered because of its reliance on the customary system. This fact is further evidenced by the map showing the presence of Cadastral sheets that have been fully covered for the central region and yet some areas in the Northern region have none.
Centralregionhasthe greatestpercentage ofregistered titles of98.04% and 50%in Mailo andLeaseholdrespectively.
The region withthe leastpercentage wasthe Northernregionwith0.01%and 8%respectively.

17
Figure 5: Presence of cadastral maps on the topographic map sheets.
Source: PSCP II Baseline Evaluation report, 2007
Partsof the centralregion havesurveyed land ascompared to theother parts of thecountry.

18
Table 3: Trends of registration by tenure as per May 2001 for Mailo and
Lease titles
Registration Date of title For current owner
Total
Mailo leasehold No %
No % No %
1980‐1985 5,676 12 7,691 17 13,367 14
1986‐1991 11,061 24 12,352 26 23,413 25
1992‐1997 15,094 33 14,358 31 29,452 32
1998‐2002 14,398 31 12,277 26 26,675 29
Total 46,227 100 46,6678 100 92,907 100
Source: PSCP II Baseline Evaluation Report, May 2007
Table 4: Recorded rates of title transactions by region
Registration period Total
1980‐1985
1986‐1991
1992‐1997
1998‐2002
No. No. No. No.
Region
Central
9,023 15,972 19,878 17,110 61,983
Western
196 478 653 797 2124
Eastern
70 113 202 311 696
Northern 16 30 40 94 180
Total transactions 9,305 16,593 20,773 18,312 64,983
Totals titles 13,367 23,413 29,452 26,675 92,907
Source: PSCP II Baseline Evaluation Report, May 2007
The trend ofregistration bytenure in bothMailo andLeasehold landincreasedbetween 1980and1997.
Registration ofboth Mailo andLeasehold landdeclined between1998and2002.
The centralregion had thegreatest numberof titleregistration andthe northernregion had theleast.
In all the regionsgiven, there wasgenerally anincrease in thetrend over theyears.

19
Table 5: Transactions carried out by the Mailo registries
Item 2007/08 2008/09 2009/10 Total
Special Certificates of title issued 457 604 871 1,932
Substitute Certificates of title
issued
157 124 151 432
Area Land amendments upon the
Register
26 143 62 231
Amendment to the Register made 69 129 76 274
Transfers registered 15,284 18,611 18,764 52,659
Letters of Administration registered 639 777 969 2,385
Mortgages registered 5,304 6,959 14,561 26,824
Mortgages released 599 458 1,593 2,650
Caveats registered 4,821 4,545 1,589 10,955
Caveats withdrawn 300 286 1,155 1,741
Court orders registered 40 88 57 185
Correction of errors 0n land titles 1 9 35 45
Duplicate Certificates of land titles
issued
6,600 6,572 11,545 24,717
Source: Administrative records, MLHUD 2010
Figure 6: Court orders on Mailo land
There was anincrease in landtransactions onMailoland.
Court ordersregistered underMailo land tenuresystem increasedbetween FY2007/08 and2008/09 and thendeclined for thenextperiod.
20
The major categories of court orders registered include :Vesting orders, Cancellation of titles, issue of special certificate of title, withdrawal of caveats and warrants of attachments and sale. Figure 6 shows that the court orders registered on mailo land transactions significantily increased during the FY 2008/2009,and reduced in FY 2009/2010. The reduction from FY2008/09-FY 2009/10 may be attributed to the fact that there is a growing desire to settle disputes using alternate dispute resolution mechanisms other than courts because of the hustles, time and expenses it takes to access justice. Some of the dispute resolution mechanisms include the Ministry’s dispute resolution desk, office of Resident District Commissioners and the clan systems.
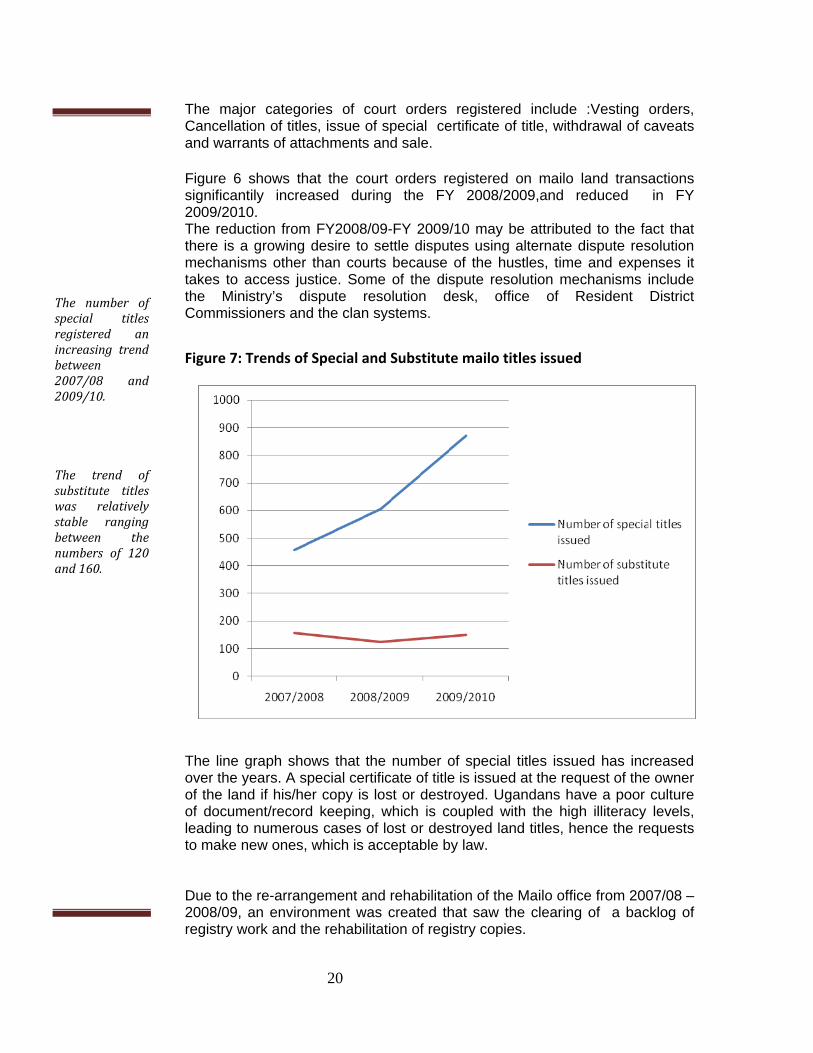
Figure 7: Trends of Special and Substitute mailo titles issued
The line graph shows that the number of special titles issued has increased over the years. A special certificate of title is issued at the request of the owner of the land if his/her copy is lost or destroyed. Ugandans have a poor culture of document/record keeping, which is coupled with the high illiteracy levels, leading to numerous cases of lost or destroyed land titles, hence the requests to make new ones, which is acceptable by law. Due to the re-arrangement and rehabilitation of the Mailo office from 2007/08 – 2008/09, an environment was created that saw the clearing of a backlog of registry work and the rehabilitation of registry copies.
The number ofspecial titlesregistered anincreasing trendbetween2007/08 and2009/10.
The trend ofsubstitute titleswas relativelystable rangingbetween thenumbers of 120and160.
21
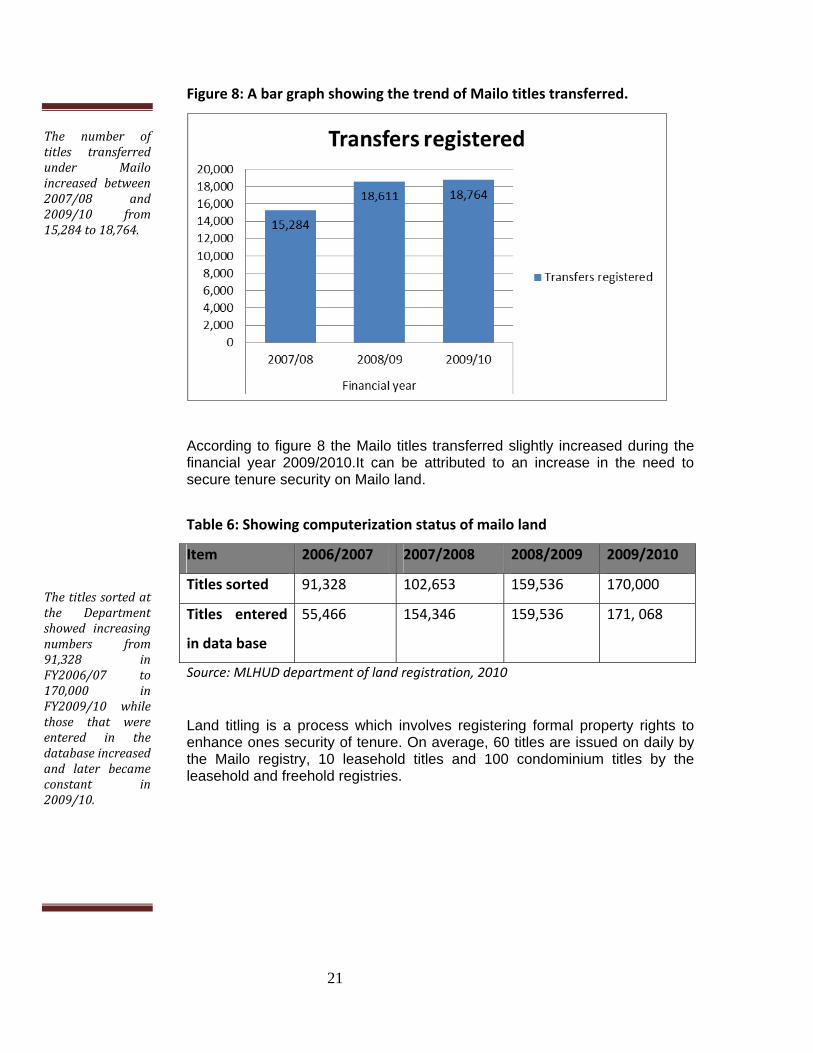
Figure 8: A bar graph showing the trend of Mailo titles transferred.
According to figure 8 the Mailo titles transferred slightly increased during the financial year 2009/2010.It can be attributed to an increase in the need to secure tenure security on Mailo land.
Table 6: Showing computerization status of mailo land
Item 2006/2007 2007/2008 2008/2009 2009/2010
Titles sorted 91,328 102,653 159,536 170,000
Titles entered
in data base
55,466 154,346 159,536 171, 068
Source: MLHUD department of land registration, 2010
Land titling is a process which involves registering formal property rights to enhance ones security of tenure. On average, 60 titles are issued on daily by the Mailo registry, 10 leasehold titles and 100 condominium titles by the leasehold and freehold registries.
The number oftitles transferredunder Mailoincreased between2007/08 and2009/10 from15,284to18,764.
Thetitlessortedatthe Departmentshowed increasingnumbers from91,328 inFY2006/07 to170,000 inFY2009/10 whilethose that wereentered in thedatabaseincreasedand later becameconstant in2009/10.

22
Figure 9: Showing the level of computerization of Mailo land titles
Figure 9 shows that between 2006 and 2010 the number of Mailo titles sorted and entered in the database went on increasing. This implies that the office of titles has progressed with regards to moving away from a manual based system to using ICT to computerize the register. It also shows that the environment for the establishment of the LIS is underway and steadily progressing.
Figure 10: Figure showing Mortagages registered and released of Mailo
According to the figure 10 &17, there was an increase in registration of mortgages due to land titles being used as collateral. Banks become comfortable with the laws on security of tenure by titling.
The graphclearly showsthat bothvariableshadanincreasingtrend.
The number ofmortgagesreleased wasgreatly lowerthanthenumberof mortgagesregistered.
Both variablesexperienced anincreasingtrend.
23
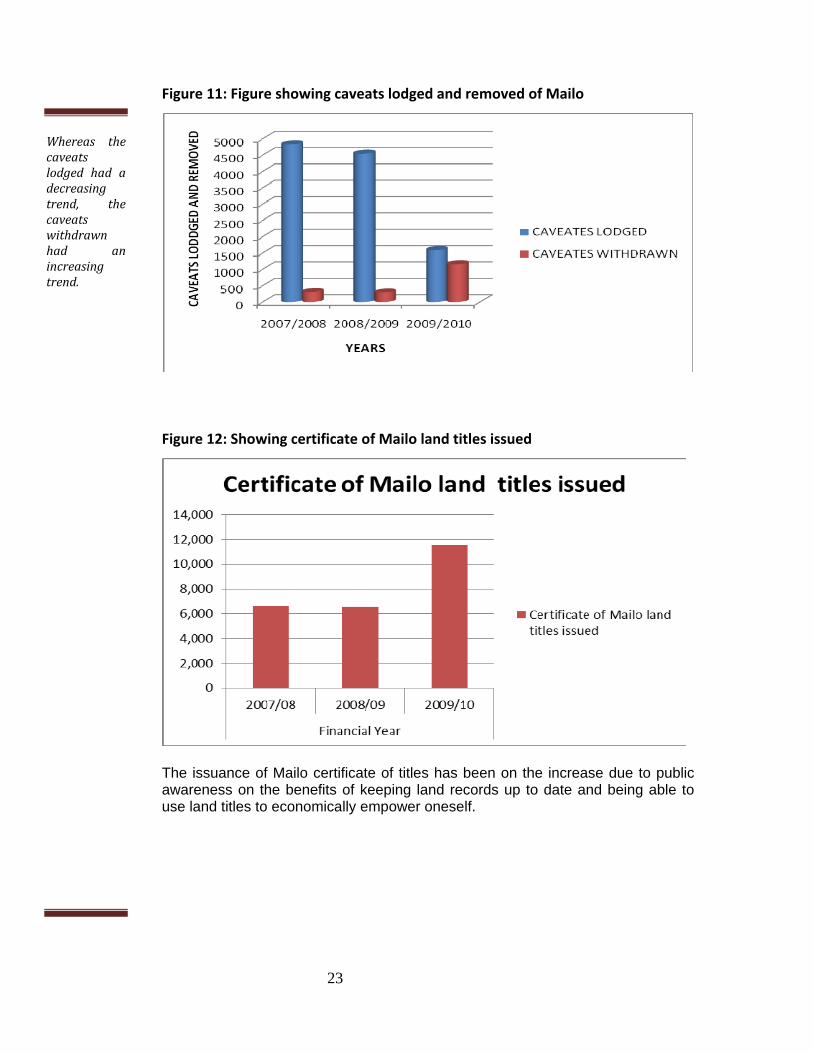
Figure 11: Figure showing caveats lodged and removed of Mailo
Figure 12: Showing certificate of Mailo land titles issued
The issuance of Mailo certificate of titles has been on the increase due to public awareness on the benefits of keeping land records up to date and being able to use land titles to economically empower oneself.
Whereas thecaveatslodged had adecreasingtrend, thecaveatswithdrawnhad anincreasingtrend.
24
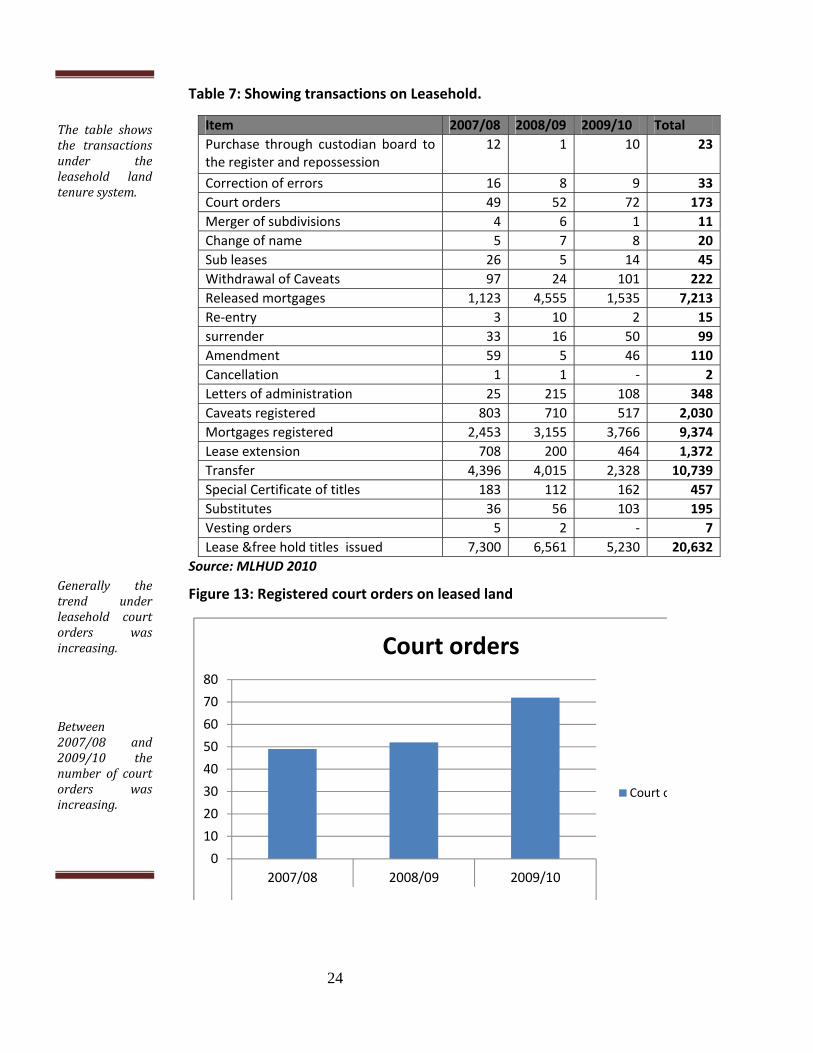
Table 7: Showing transactions on Leasehold.
Source: MLHUD 2010 Figure 13: Registered court orders on leased land
0
10
20
30
40
50
60
70
80
2007/08 2008/09 2009/10
l
Court orders
Court o
Item 2007/08 2008/09 2009/10 Total
Purchase through custodian board to the register and repossession
12 1 10 23
Correction of errors 16 8 9 33
Court orders 49 52 72 173
Merger of subdivisions 4 6 1 11
Change of name 5 7 8 20
Sub leases 26 5 14 45
Withdrawal of Caveats 97 24 101 222
Released mortgages 1,123 4,555 1,535 7,213
Re‐entry 3 10 2 15
surrender 33 16 50 99
Amendment 59 5 46 110
Cancellation 1 1 ‐ 2
Letters of administration 25 215 108 348
Caveats registered 803 710 517 2,030
Mortgages registered 2,453 3,155 3,766 9,374
Lease extension 708 200 464 1,372
Transfer 4,396 4,015 2,328 10,739
Special Certificate of titles 183 112 162 457
Substitutes 36 56 103 195
Vesting orders 5 2 ‐ 7
Lease &free hold titles issued 7,300 6,561 5,230 20,632
The table showsthe transactionsunder theleasehold landtenuresystem.
Generally thetrend underleasehold courtorders wasincreasing.
Between2007/08 and2009/10 thenumber of courtorders wasincreasing.

25
According to figure 13 the number of court orders registered on leased land by the Office of Titles increased between 2007 and 2010 by 46.9%. the relative increase was mainly due to scarcity of land, fraudulent practices associated with the departed Asian custodian board properties and conflict in land allocation between different Controlling Authorities.
Figure 14: A line graph showing a trend of leasehold titles transfers
According to figure 14, there was a significant decrease in leasehold transfer of titles from FY 2007/2008 to 2009/2010. Most DLBs’ tenure expired and there was a significant delay in their re-appointment hence they could not provide consent to transfer most titles that were there in the initial period
There was adecrease between2007/08 and2009/10.Therefore, thetrend wasgenerallydecreasing overthefinancialyears.

26
Figure 15: Showing the lease and free hold titles issues
The trend of titles is decreasing from 2007/08 to 2009/10. The District Land Boards had expired and there was a delay of their re-appointment.
Figure 16: Trends of Special and Substitute leasehold titles
There was adecreasebetween2007/08 and2009/10ofleaseand free holdtitlesissued.
Whereas thetrend ofsubstitutes wasincreasingbetween2007/08 and2009/10, thatofspecial titlesfirst decreasedbetween2007/08 and2008/‐09 thenincreasedbetween2008/09 and2009/10.

27
Figure 17: Mortgages registered and released from 2006 to 2010 on lease
hold.
The number of mortgages registered is on the rise because of the trust which financial institutions have gained in using land titles after due diligence searches are conducted.
Figure 18: Registered and withdrawn caveats on leaseholds
Mortgagesreleasedincreased innumberbetween2007/08 and2008/09 andthen declined inthe following FY2009/10.
Both Caveatsregistered andwithdrawn hada decreasingtrend as shownby figure 18 butthe number ofcaveatsregistered wasgreater than thenumber ofcaveatswithdrawn.

28
According to figure 18, the numbers of caveats registered were more than the number of caveats withdrawn on leaseholds.
The numbers of caveats registered are more than the number of caveats withdrawn. This can be attributed to the consciousness and need to protect the land rights of certain categories of people who may feel threatened in case of a new transaction being registered. In addition, registration of caveats may also be due to actions of financial institutions.
The land market and disputes have also contributed to placement of warnings or notes of caution on certificates of title. Third parties such as spouses, ex-spouses, government institutions, CSOs and Courts of law with some stake in the land have had their caveats registered by the Land Office.
Table 8: Land Tenure of Plots by Residence and Region (%)
RegionCentral
Land Tenure Urban Rural Excl. K'la Central East North West TotalCustomary 37.3 70.2 2.6 2.5 8.0 92.0 4.0 68.6Freehold 0.7 0.3 2.0 0.0 8.6 5.5 6.5 18.6Mailo 8.4 8.8 5.8 5.8 0.6 0.4 4.0 9.2Leasehold 9.6 0.7 0.1 7.0 2.0 2.1 3.1 3.6Total 100
Residence
Source: 2002 Uganda Population and Housing Census Analytical Report
Table 8 gives the distribution of households in owner occupied dwellings by land tenure arrangement. More than two thirds (68.6%) of the households were on customary land, 18.6% were on freehold land, 9.2% were on Mailo land and 3.6% were on leasehold land.
Table 8 showsthat37.3%oftheurbanpopulations wereon customaryland and 70.2%of the customarylandwas inruralareas.
In the centralregion (excludingKampala), 2.6%of the populationwas oncustomaryland.

29
Table 9: Estimation of the number of people based on the number of households per district
NO DISTRICT 2007 POP 2007 NO HHS SIZE OF HHs
Regional LIS OFFICE
LAND TENURE TYPE
TOTAL POP TOTAL NO HHS
1 ADJUMAN ARUA KOBOKO NYADRI MOYO NEBBI YUMBE
273,200 471,400 172,800 350,000 279,500 491,800 365,400
42,90086,700 27,100 66,700 55,900 101,700 61,800
6.35.4 6.4 5.2 5.0 4.8 5.9
ARUA
Freehold, Leasehold Customary
2,403,100 442,800
2 BUSHENYI NTUNGAMO
798,200 412,200
156,00082,900
5.15.0
BUSHENYI Native Freehold
1,210,400 238,900
3 AMURU GULU KITGUM PADER
200,900 340,900 340,900 411,800
44,20066,600 67,500 83,100
4.55.1 5.0 5.0
GULU Freehold, Leasehold, customary
1,210,400 238,900
4 BUGIRI IGANGA NAMUTUMBA
511,500 630,000 188,300
102,600142,100 37,900
5.05.1 5.0
IGANGA Freehold, leasehold customary
1,329,900 264,600
5 JINJA KALIRO KAMULI MAYUGE
433,300 179,700 639,100 380,100
93,00033,900 124,500 74,900
4.65.3 5.1 5.1
JINJA Freehold, leasehold customary
1,632,200 327,200
6 KABALE KANUNGU KISORO RUKUNGIRI
472,300 179,700 639,100 380,100
93,90033,900 124,500 74,900
4.84.7 4.5 4.9
KABALE Native freehold
1,224,100 257,100
7 BUNDIBUGYO KABAROLE KAMWENGE KASESE KYENJOJO
265,200 380,300 292,000 616,400 446,100
57,00081,900 63,300 116,500 95,100
4.74.6 4.6 5.3 4.7
KABAROLE Native freehold
2,000,000 413,800
8 KAMPALA 1,406,600 362,200 3.9 KAMPALA Mailo 1,406,600 362,200
9 AMOLATOR APAC DOKOLO LIRA OYAM
109,700 486,500 152,500 601,300 315,700
22,400102,200 30,400 126,700 65,600
4.94.8 5.0 4.7 4.8
LIRA Freehold,leasehold customary
1,6665,700 347,300
10 LUWELO NAKASEKE NAKASONGOLA
381,300 159,200 138,700
84,90035,500 27,900
4.54.5 5.0
LUWERO Mailo 679,200 148,300
11 KALANGALA LYANTONDE MASAKA RAKAI SEMBABULE
47,000 71,700 797,400 435,600 195,600
17,20015,800 183,000 99,300 42,700
2.74.5 4.4 4.4 4.6
MASAKA Mailo 1,547,300 358,000
12 BULISA HOIMA
70,700 427,700
14,00087,400
5.14.9
MASINDI Freehold,Leasehold
1,004,900 202,800

30
NO DISTRICT 2007 POP 2007 NO HHS SIZE OF HHs
Regional LIS OFFICE
LAND TENURE TYPE
TOTAL POP TOTAL NO HHS
MASINDI 506,800 101,400 5.0 Customary
13 BUDUDA BUKWA KAPCHORWA MANAFWA MBALE SIRONKO
146,400 58,800 172,100 305,100 376,500 316,000
33,20011,700 35,700 67,700 86,400 75,200
4.45.0 4.8 4.5 4.4 4.2
MBALE Freehold,Leasehold Customary
1,374,900 303,900
14 IBANDA ISINGIRO KIRUHURA MBARARA
222,200 359,400 249,000 405,600
45,70076,700 47,400 85,400
4.94.7 5.3 4.7
MBARARA Native freehold
1,236,200 255,200
15 KIBAALE KIBOGA MITYANA MUBENDE
517,400 277,400 283,400 499,500
108,40062,000 65,400 111,800
4.84.5 4.3 4.5
MITYANA Mailo 1,577,700 347,600
16 AMURIA KABERAMAIDO KATAKWI KUMI SOROTI
264,400 158,900 142,300 326,000 468,000
57,10031,400 30,900 64,300 89,200
4.65.1 4.6 5.1 5.2
SOROTI Freehold,Leasehold Customary
1,359,600 272,900
17 KAYUNGA MUKONO
320,000 892,600
67,400210,900
4.74.2
MUKONO Freehold,leasehold customary, Mailo
1,359,600 278,300
18 ABIM KAABONG KOTIDO MOROTO NAKAPIRIPIRIT
53,300 279,400 166,500 248,700 203,600
9,500 49,900 29,700 47,900 36,100
5.65.6 5.6 5.2 5.6
MOROTO Freehold, leasehold customary, Mailo
951,500 173,100
19 BUDAKA BUKEDEA BUSIA BUTALEJA PALLISA TORORO
153,600 148,200 254,300 183,300 449,000 423,000
30,00031,200 54,100 37,200 85,900 89,600
5.14.8 4.7 4.9 5.2 4.7
TORORO Freehold,leasehold, customary
1,611,400 328,000
20 MPIGI WAKISO
430,000 1,096,000
93,500263,300
4.64.2
WAKISO Mailo 1,526,000 356,800
TOTAL 28,247,300
5,946,200 5,946,200 5,946,200
Source; PSCPII Final report preliminary system design and architecture, 2007

31
Table 10: Comparative levels of registration by selected districts as per may
2001
Top 5 districts with highest Number of titles
Bottom 5 districts with least Number of titles
District Titles District Titles
Kampala 40,008 Kaberamaido 11
Mukono 12,587 Pader 5
Masaka 8,654 Nakapiripirit /Kyenjojo (each )4
Mbarara 4,704 Yumbe 3
Wakiso 4,273 Mayuge 2
Source: PSCP II Baseline Evaluation Report, May, 2007
Complaints on Ministry services by the public are made via a dedicated land line.
The complaints provide an opportunity to correct immediate problems clients
face. Complaints and complaint trends inform the Ministry on how to do its job
better by alerting Management to problems that need prompt attention and
correction. The complaints captured data from November 2008 up to November
2010. An analysis of the data captured is provided below:
Table 11: Complaints lodged by the public
Gender Complaints (%)
Male 71
Female 29
Source: Office of the spokesperson, MLHUD, 2010
Table 12: Showing the Offices/Departments complained about
Office/Department Complaints (%)
Department of land registration (Office of titles) 43
Private surveyors and unidentified land agents 18
Land Administration Department 16
Surveys and Mapping Department 16
Others (families, clans, Police, RDCs, spouses) 7
Source: Office of the spokesperson, MLHUD, 2010

32
Table 13: Showing the different complaints reported by the public
Item Complaints (%)
Reporting acts of fraud and forgeries 35
Reporting delayed registration of transactions, missing white
pages, unavailability of land forms and unauthorized removal of
caveats
33
Reporting rudeness of Ministry staff and soliciting of un official
fees
10
Reporting untraceable brokers and land agents 9
Reporting lack of assistance due to expired district land boards 8
Others (misleading procedures, succession issues, lack of Police
intervention etc.)
5
Source: Office of the spokesperson, MLHUD, 2010
Figure 19: Graph showing complaints made to MLHUD

33
Table 14: Forged titles captured from the public by the Ministry
Year 2007 2008 2009 2010
Forged titles 8 46 63 55
Source: MLHUD Administrative records, 2010
The ministry has detected forgeries in the following areas: signatures of registered proprietors and the land management institutions, letters of administration, court orders, release of mortgages, false affidavits, even by advocates, advocates witnessing signatures of deceased proprietors and forged extensions. Because of use of a manual system of registration, some of these forgeries and frauds pass the litmus tests and thereby erode the integrity of the register. Some however are done with the connivance and assistance of some ministry staff.
- Forged certificates of titles Certificates of title are issued in duplicate. The office of titles observed that fraudsters had penetrated the system and were tempering with the original certificate of title. This was being abused through certified photo copies. In order to protect the public and to preserve the register, the office of titles put a stop on issuing certified copies of the original certificate of titles and of instruments, except for evidential purposes required in courts of law. A person seeking to know the status of the register is required to do a physical search, which is then followed by a statement of search signed by the registrar of titles.
- Impersonation This has been noted to be committed mainly against estates of persons in the diaspora. However, there are also incidents on estates of people who are “absentee landlords.” Normally, the fraud is effected by the fraudster applying for a special certificate of title, and then multiple transfers are done to beat the principle of bonafide third party for value.
- Forged Gazettes In order for the Gazette to go through without being detected by the public, fraudsters have had the Gazettes forged.
- Forged court documents Incidents here are impersonation and acquiring letters of administration, seemingly using the right procedure, but by an impostor. There are incidents of letters of administration granted to estates of living people. At other times, it is the forged certified copy of the letters of administration.
- Forged releases of mortgages The ministry has had incidents where certificates of titles have been stolen from the banks’ strong rooms and forged releases of mortgages presented for registration.
Thenumberofforged titleshas beenincreasingover theyearsfrom 8 in2007 to 63 in2009andthendecreased to55in2010.
34
- Unscrupulous Advocates, Money Lenders and some Banks More often than not, titles which have been abused by these vices are handled by particular advocates, and end up with particular money lenders and or banks. These so called mortgagors plead innocence and protection of the bonafide principle. Other types include:
- Forged Deed plans, bearing wrong signatures of either departed or serving officers.
- Forged signatures of genuine land owners some of whom have passed away.
- Forged Valuation assessments.
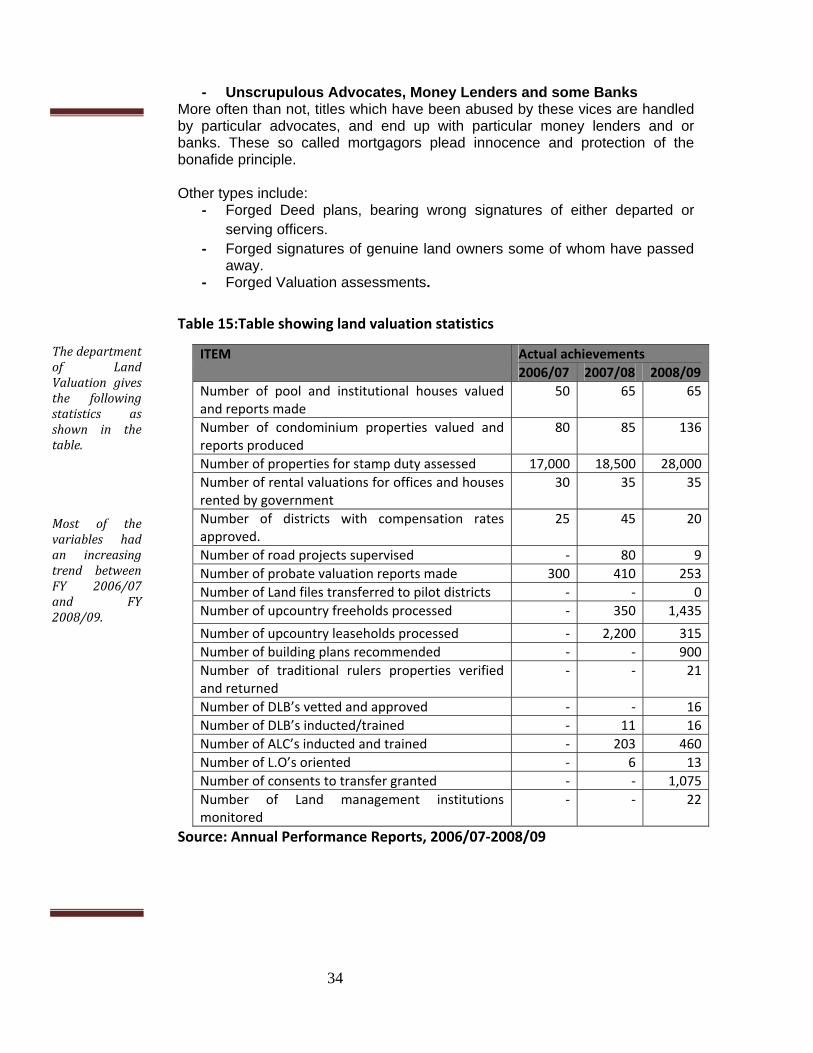
Table 15:Table showing land valuation statistics
Source: Annual Performance Reports, 2006/07‐2008/09
ITEM Actual achievements
2006/07 2007/08 2008/09
Number of pool and institutional houses valued and reports made
50 65 65
Number of condominium properties valued and reports produced
80 85 136
Number of properties for stamp duty assessed 17,000 18,500 28,000
Number of rental valuations for offices and houses rented by government
30 35 35
Number of districts with compensation rates approved.
25 45 20
Number of road projects supervised ‐ 80 9
Number of probate valuation reports made 300 410 253
Number of Land files transferred to pilot districts ‐ ‐ 0
Number of upcountry freeholds processed ‐ 350 1,435
Number of upcountry leaseholds processed ‐ 2,200 315
Number of building plans recommended ‐ ‐ 900
Number of traditional rulers properties verified and returned
‐ ‐ 21
Number of DLB’s vetted and approved ‐ ‐ 16
Number of DLB’s inducted/trained ‐ 11 16
Number of ALC’s inducted and trained ‐ 203 460
Number of L.O’s oriented ‐ 6 13
Number of consents to transfer granted ‐ ‐ 1,075
Number of Land management institutions monitored
‐ ‐ 22
Thedepartmentof LandValuation givesthe followingstatistics asshown in thetable.
Most of thevariables hadan increasingtrend betweenFY 2006/07and FY2008/09.

35
1.3 SYSTEMATIC DEMARCATION, SURVEY AND REGISTRATION OF LAND
RIGHTS IN UGANDA
SD is a process by which land rights of people living in a given area are identified, ascertained, established, and marked in an orderly and uniform way. SD encourages mass ascertainment of land rights. Phase one covered the parishes of Rukarango in Ntungamo District, Kabigi in Masaka District and Aminit, in Soroti District; while the second phase covers the parishes of Bulowooza, in Iganga District; Bumbobi and Bumasikye in Mbale District, Kasingo in Kibaale District, Kinawataka in Kampala District, Rupa in Karamoja District and Gayaza in Wakiso District.
Table 16: Bulowooza I and II villages Iganga district
Source: LTRP, MLHUD 2010
Table 17: Mandhigandere Village Iganga District Source: LTRP, MLHUD 2010
2,444 Parcels were surveyed and plotted for Rukarango parish in Ntungamo district and given to land owners.
In Bulowooza, Bulamagi sub-county in Iganga district, 785 parcels were surveyed, titled and given to land owners.
In Bumbobi parish, Mbale district a total of 1,250 parcels have been surveyed and the application forms for issuance of freehold titles have been applied for conversion from customary tenure to grant freehold.
In Kibaale mobilization, training and sensitization were done. 200 Area Adjudication Team members of Bwanswa Sub County were trained. Detailed SD of Kasingo parish, Bwanswa Sub County started in early January 2009. More than 301 parcels have been adjudicated, demarcated and surveyed.
S/No Classification Number owning land % of persons owning land
1 females 41 14
2 Co‐owned 08 03
3 males 242 82
4 Institutions/families 05 01
total 296 100
S/No item Number owning land % of persons owning land
1 females 77 15
2 Co‐owned 29 06
3 males 384 76
4 Institutions/families 14 03
Total 504 100

36
URBAN STATISTICS
Urbanization is when large numbers of people become permanently
concentrated in relatively small areas, forming cities or towns. A country is
considered to be urbanized when over 50% of its population lives in urban
areas.
The number of people in urban areas is currently 4.5 million. Kampala is the
largest urban center with a population of 1.68 million (2008). Town Council
population projections indicate high growth in medium urban centers in the
western, eastern and northern regions. The urban population is expected to
increase from 3.7% in 2012 to 7.8% in 2022 and to a peak of 25% in 2037 in
line with national growth rates, i.e. population of urban areas on course to
double every 20 years. Urban population increases between 4-5% a year
leading to projected urban population of 7 million in 2020.
Table 16 shows an increasing trend in Uganda’s urban population growth
rates from 1970 to 2004.
The urbanpopulation hasbeen growingovertheyears.
Theurbancentrepopulationprojections are3.7%, 7.8% and25% in 2012,2022 and 2037respectively.

37
Table 18: Showing urban and total population growth rates in Uganda.
Year TOTAL COUNTRY POPULATION POPULATION IN URBAN
1970 9,277,700 738,500
1971 9,568,900 769,340
1972 9,857,900 800,460
1973 10,149,000 831,240
1974 10,450,000 864,240
1975 10,766,000 897,870
1976 11,099,000 935,610
1977 11,448,000 975,390
1978 11,813,000 1,017,100
1979 12,190,000 1,061,700
1980 12,578,000 1,106,800
1981 12,974,000 1,170,200
1982 13,382,000 1,236,500
1983 13,810,000 1,307,900
1984 14,271,000 1,382,900
1985 14,772,000 1,465,300
1986 15,316,000 1,556,100
1987 15,899,000 1,655,100
1988 16,511,000 1,760,100
1989 17,135,000 1,869,400
1990 17,758,000 1,981,800
1991 18,380,000 2,069,600
1992 19,003,000 2,156,800
1993 19,628,000 2,247,400
1994 20,257,000 2,337,700
1995 20,892,000 2,431,900
1996 21,533,000 2,523,700
1997 22,183,000 2,615,400
1998 22,853,000 2,712,700
1999 23,558,000 2,815,200
2000 24,309,000 2,924,300
2001 25,111,000 3,040,900
2002 25,965,000 3,165,100
2003 26,869,000 3,296,900
2004 27,821,000 3,435,800
Source: World Bank Africa Database CD‐ROM (2006)
38
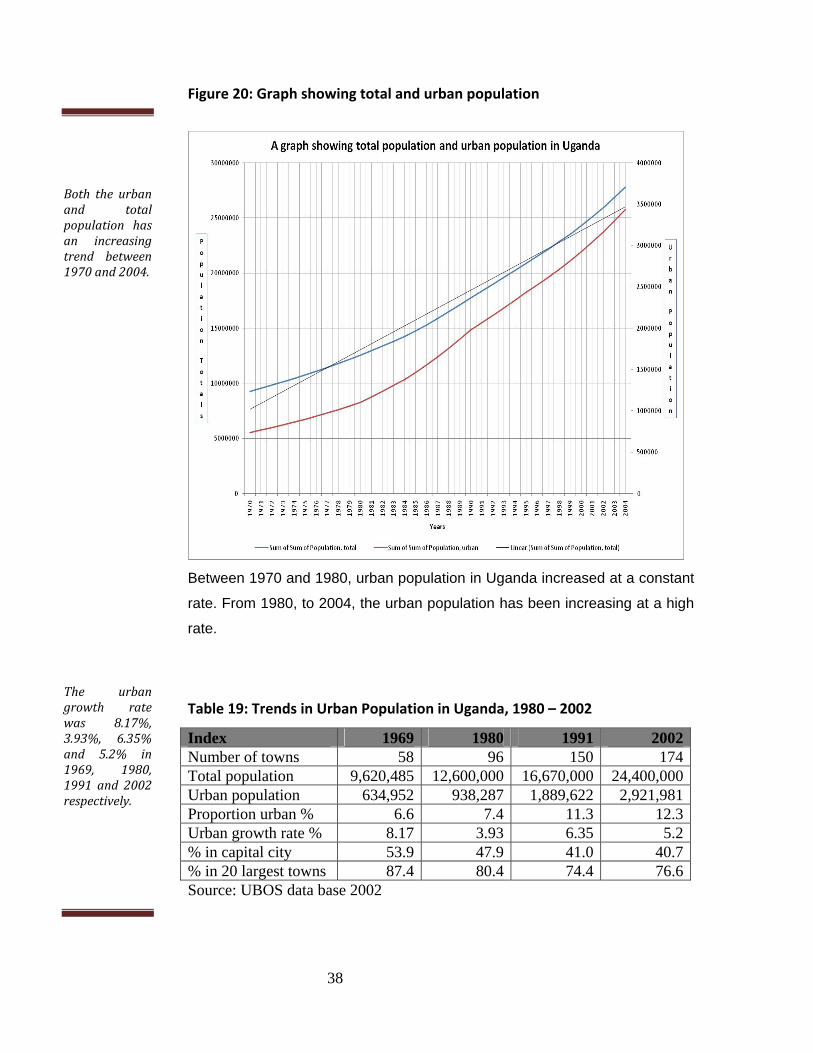
Figure 20: Graph showing total and urban population
Between 1970 and 1980, urban population in Uganda increased at a constant
rate. From 1980, to 2004, the urban population has been increasing at a high
rate.
Table 19: Trends in Urban Population in Uganda, 1980 – 2002
Index 1969 1980 1991 2002Number of towns 58 96 150 174Total population 9,620,485 12,600,000 16,670,000 24,400,000Urban population 634,952 938,287 1,889,622 2,921,981Proportion urban % 6.6 7.4 11.3 12.3Urban growth rate % 8.17 3.93 6.35 5.2% in capital city 53.9 47.9 41.0 40.7% in 20 largest towns 87.4 80.4 74.4 76.6Source: UBOS data base 2002
Both the urbanand totalpopulation hasan increasingtrend between1970and2004.
The urbangrowth ratewas 8.17%,3.93%, 6.35%and 5.2% in1969, 1980,1991 and 2002respectively.
39
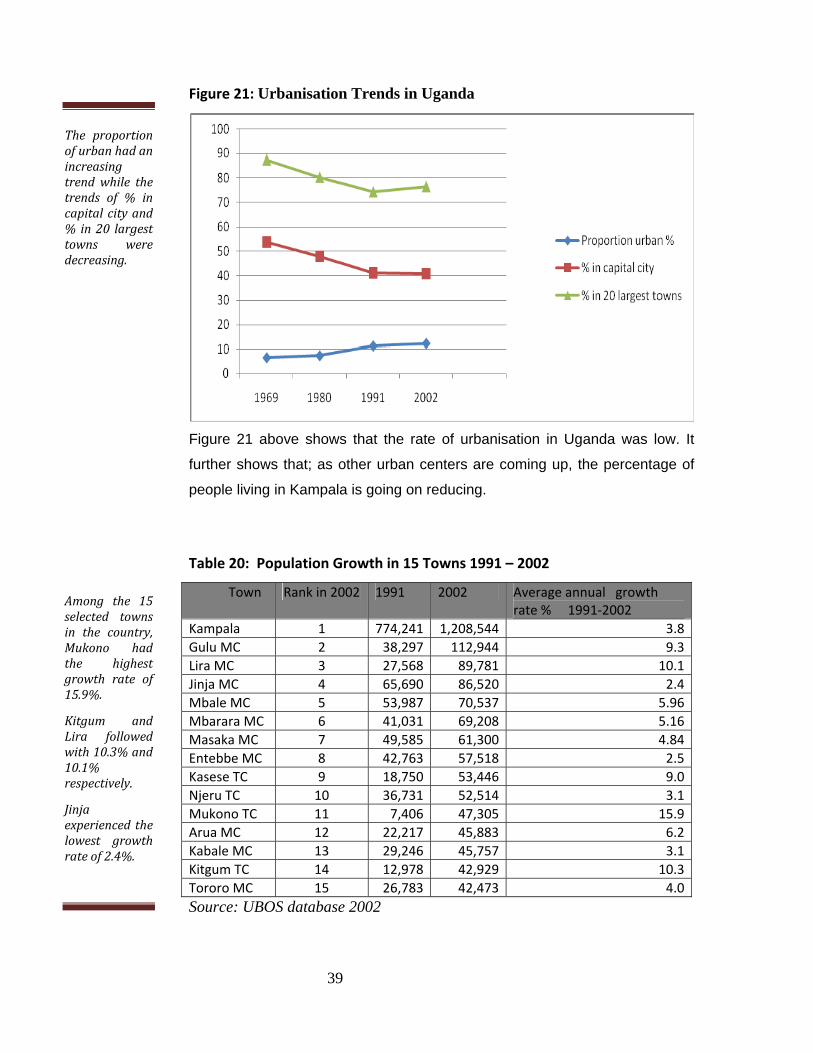
Figure 21: Urbanisation Trends in Uganda
Figure 21 above shows that the rate of urbanisation in Uganda was low. It
further shows that; as other urban centers are coming up, the percentage of
people living in Kampala is going on reducing.
Table 20: Population Growth in 15 Towns 1991 – 2002
Town Rank in 2002 1991 2002 Average annual growth rate % 1991‐2002
Kampala 1 774,241 1,208,544 3.8
Gulu MC 2 38,297 112,944 9.3
Lira MC 3 27,568 89,781 10.1
Jinja MC 4 65,690 86,520 2.4
Mbale MC 5 53,987 70,537 5.96
Mbarara MC 6 41,031 69,208 5.16
Masaka MC 7 49,585 61,300 4.84
Entebbe MC 8 42,763 57,518 2.5
Kasese TC 9 18,750 53,446 9.0
Njeru TC 10 36,731 52,514 3.1
Mukono TC 11 7,406 47,305 15.9
Arua MC 12 22,217 45,883 6.2
Kabale MC 13 29,246 45,757 3.1
Kitgum TC 14 12,978 42,929 10.3
Tororo MC 15 26,783 42,473 4.0
Source: UBOS database 2002
The proportionofurbanhadanincreasingtrendwhile thetrends of % incapitalcityand% in20 largesttowns weredecreasing.
Among the 15selected townsin the country,Mukono hadthe highestgrowth rate of15.9%.
Kitgum andLira followedwith10.3%and10.1%respectively.
Jinjaexperienced thelowest growthrateof2.4%.

40
The population growth rate in the 15 selected major towns in Uganda has been very high between 1991 and2002 ranging between an average rate of 2.4% per year to 15.9% per year. Mukono town council experienced the highest rate followed by Kitgum town council with a rate of 10.3%. Jinja experienced the lowest rate of 2.4% followed by Entebbe municipality.

41
PHYSICAL PLANNING STATISTICS
The table below gives the current statistics on Gazetted Urban Councils in
Uganda, followed by the detailed information, which gives the specific urban
councils and their status:
Table 21: Showing Gazette Urban Councils in Uganda
DESCRIPTION OF STATUS QUANTITY
1. Both structure and detailed plans available 89
2. Only structure plan available but no detailed plans 06
3. Detailed plan available but no structure plan 03
4. Both structure and detailed plans not available 13
Source: Department of Physical Planning, MLHUD as at 30th June 2010.
The urbancouncils withboth detailedand structureplans are 89while thosewithout boththe structureand detailedplansare13.

42
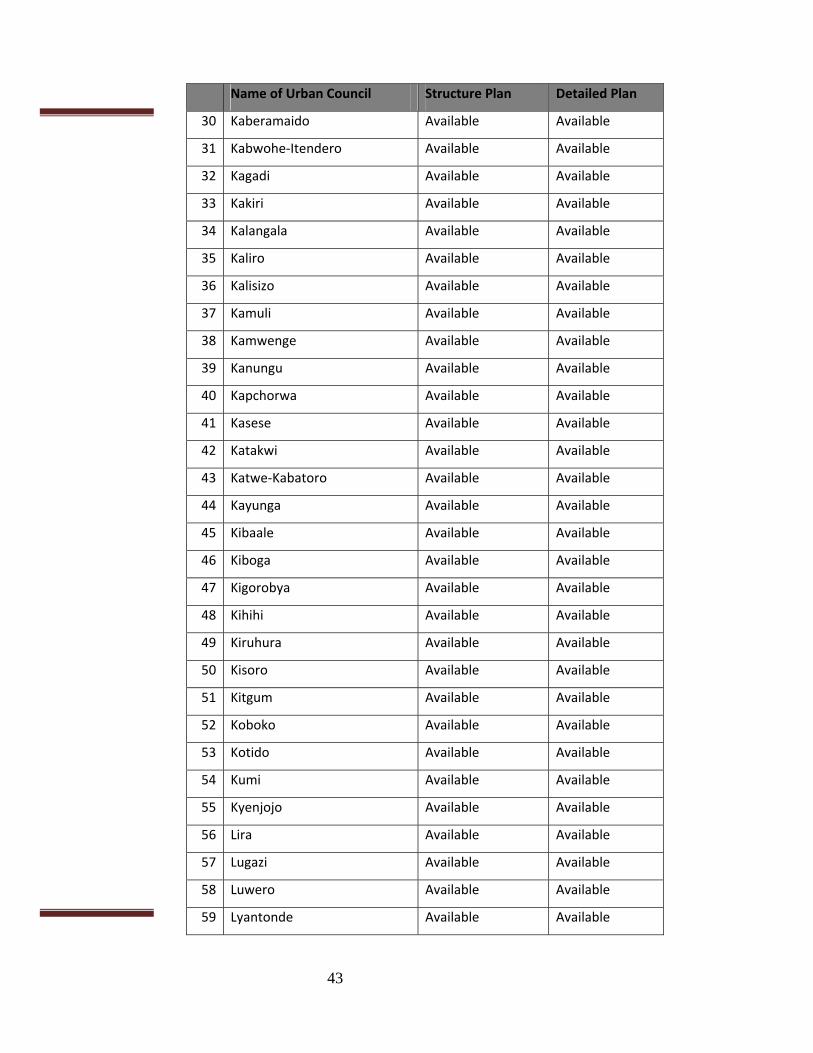
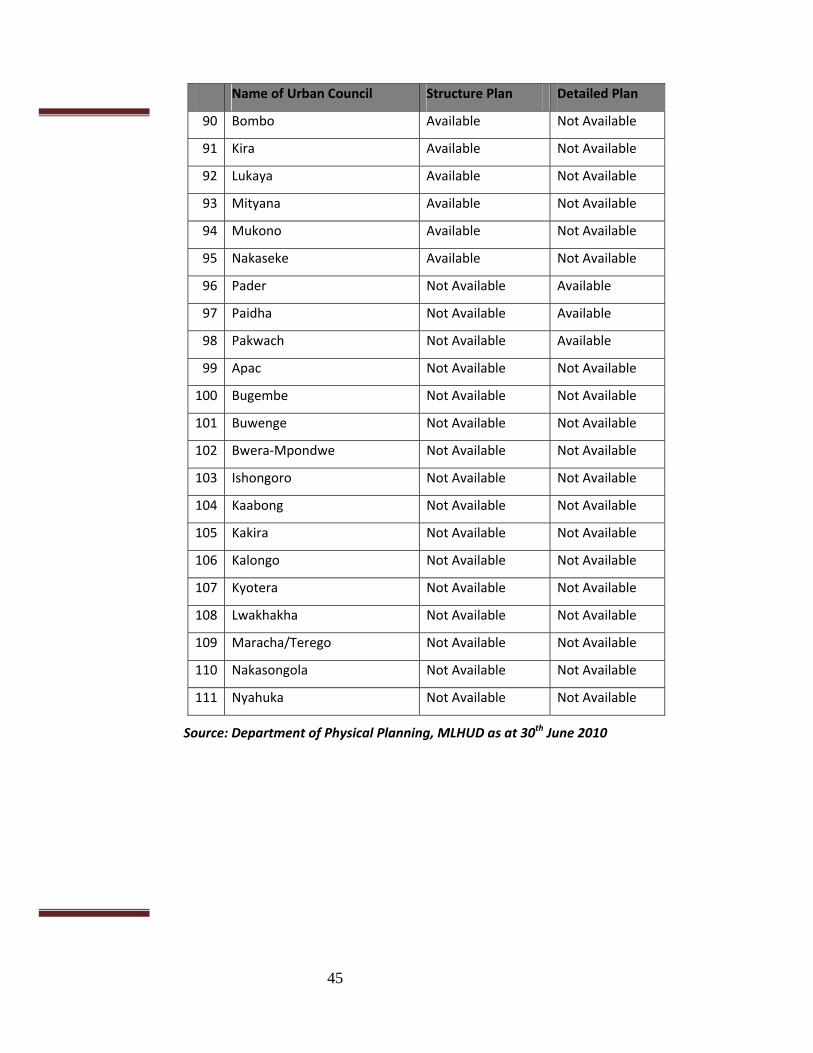
Table 22:Gazetted urban councils in Uganda
Name of Urban Council Structure Plan Detailed Plan
1 Abim Available Available
2 Adjumani Available Available
3 Amolator Available Available
4 Amuria Available Available
5 Amuru Available Available
6 Arua Available Available
7 Budaka Available Available
8 Bududa Available Available
9 Bugiri Available Available
10 Bukedea Available Available
11 Bukwo Available Available
12 Buliisa Available Available
13 Bundibugyo Available Available
14 Busembatya Available Available
15 Busia Available Available
16 Busolwe Available Available
17 Butaleja Available Available
18 Dokolo Available Available
19 Entebbe Available Available
20 Fort Portal Available Available
21 Gulu Available Available
22 Hima Available Available
23 Hoima Available Available
24 Ibanda Available Available
25 Iganga Available Available
26 Ishaka‐Bushenyi Available Available
27 Isingiro Available Available
28 Jinja Available Available
29 Kabale Available Available
43
Name of Urban Council Structure Plan Detailed Plan
30 Kaberamaido Available Available
31 Kabwohe‐Itendero Available Available
32 Kagadi Available Available
33 Kakiri Available Available
34 Kalangala Available Available
35 Kaliro Available Available
36 Kalisizo Available Available
37 Kamuli Available Available
38 Kamwenge Available Available
39 Kanungu Available Available
40 Kapchorwa Available Available
41 Kasese Available Available
42 Katakwi Available Available
43 Katwe‐Kabatoro Available Available
44 Kayunga Available Available
45 Kibaale Available Available
46 Kiboga Available Available
47 Kigorobya Available Available
48 Kihihi Available Available
49 Kiruhura Available Available
50 Kisoro Available Available
51 Kitgum Available Available
52 Koboko Available Available
53 Kotido Available Available
54 Kumi Available Available
55 Kyenjojo Available Available
56 Lira Available Available
57 Lugazi Available Available
58 Luwero Available Available
59 Lyantonde Available Available

44
Name of Urban Council Structure Plan Detailed Plan
60 Malaba Available Available
61 Manafwa Available Available
62 Masaka Available Available
63 Masindi Available Available
64 Mayuge Available Available
65 Mbale Available Available
66 Mbarara Available Available
67 Moroto Available Available
68 Moyo Available Available
69 Mpigi Available Available
70 Mubende Available Available
71 Nagongera Available Available
72 Nakapiripirit Available Available
73 Namutumba Available Available
74 Nansana Available Available
75 Nebbi Available Available
76 Njeru Available Available
77 Nkokonjeru Available Available
78 Ntungamo Available Available
79 Oyam Available Available
80 Pallisa Available Available
81 Rakai Available Available
82 Rukungiri Available Available
83 Sembabule Available Available
84 Sironko Available Available
85 Soroti Available Available
86 Tororo Available Available
87 Wakiso Available Available
88 Wobulenzi Available Available
89 Yumbe Available Available
45
Name of Urban Council Structure Plan Detailed Plan
90 Bombo Available Not Available
91 Kira Available Not Available
92 Lukaya Available Not Available
93 Mityana Available Not Available
94 Mukono Available Not Available
95 Nakaseke Available Not Available
96 Pader Not Available Available
97 Paidha Not Available Available
98 Pakwach Not Available Available
99 Apac Not Available Not Available
100 Bugembe Not Available Not Available
101 Buwenge Not Available Not Available
102 Bwera‐Mpondwe Not Available Not Available
103 Ishongoro Not Available Not Available
104 Kaabong Not Available Not Available
105 Kakira Not Available Not Available
106 Kalongo Not Available Not Available
107 Kyotera Not Available Not Available
108 Lwakhakha Not Available Not Available
109 Maracha/Terego Not Available Not Available
110 Nakasongola Not Available Not Available
111 Nyahuka Not Available Not Available
Source: Department of Physical Planning, MLHUD as at 30th June 2010

46
HOUSING STATISTICS:
HOUSING CONDITIONS Housing conditions are of significant importance in the understanding of the
sanitation and health status of the households. Poor housing conditions are
associated with pests and diseases that are a menace to the health of the
household members. Inadequate sanitation and hygiene arising out of poor
housing and sanitary facilities is a major cause of poor health and poverty. Also
the condition of the house is an indicator of the welfare status of its occupants.
The Shelter Sector Situation Analysis report (William, et al 2009:16) defines
density in terms of people per room, rather than people per hectare. It cites
UN-HABITAT recommendations of a maximum of two persons per room of 12
feet x 12 feet (3.5m x 3.5m).
69.7% of all urban households in Uganda live in over-crowded housing, with an
average household size of 4.2 persons living in dwellings with an average unit
size (rooms) of 1.6, yielding an occupancy density of 2.6.
The 2008 NSDS analyzed types of housing focusing mainly on the materials
used for roof, wall and floor in rural and urban households of Uganda. The
types of power/fuel used for lighting, cooking and ironing were also analyzed.
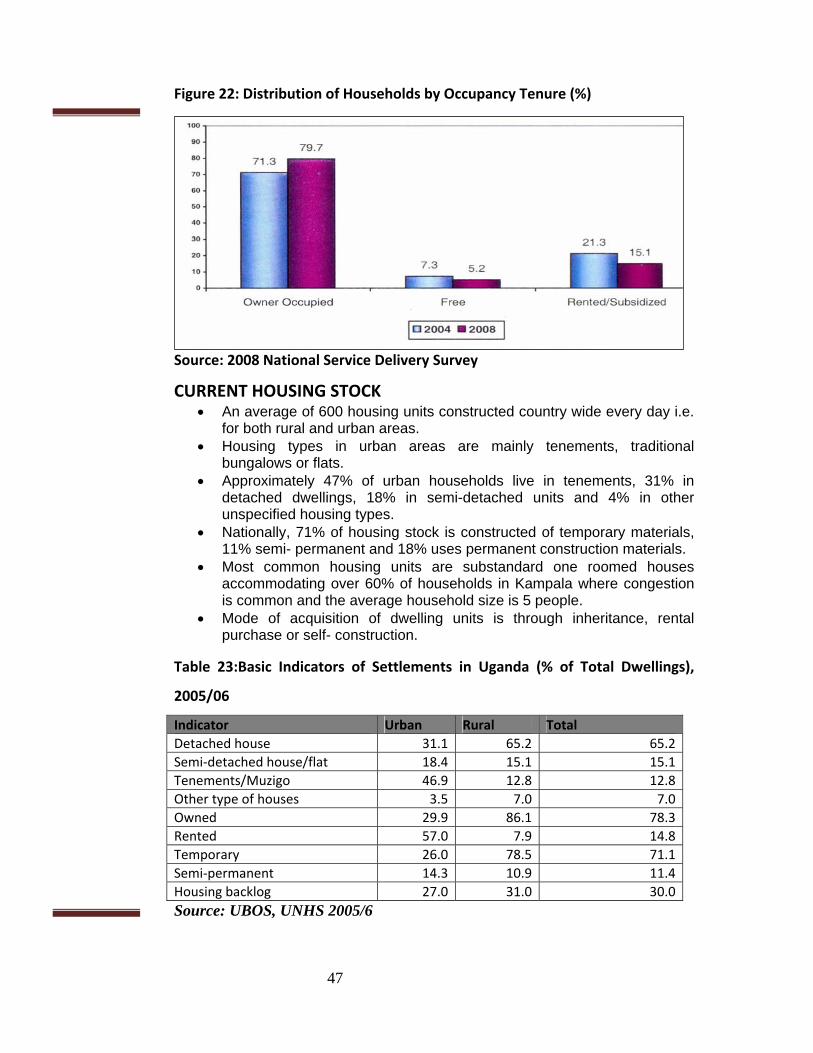
Figure 22 presents the percentage distribution of households by occupancy
and residence. Owner occupied was still the most common form of housing
occupancy tenure. The proportion of owner occupied households increased
from 71% in 2004 to 80% in 2008, whereas the proportion of households
staying in rented and free houses reduced slightly.
47
Figure 22: Distribution of Households by Occupancy Tenure (%)
Source: 2008 National Service Delivery Survey
CURRENT HOUSING STOCK An average of 600 housing units constructed country wide every day i.e.
for both rural and urban areas. Housing types in urban areas are mainly tenements, traditional
bungalows or flats. Approximately 47% of urban households live in tenements, 31% in
detached dwellings, 18% in semi-detached units and 4% in other unspecified housing types.
Nationally, 71% of housing stock is constructed of temporary materials, 11% semi- permanent and 18% uses permanent construction materials.
Most common housing units are substandard one roomed houses accommodating over 60% of households in Kampala where congestion is common and the average household size is 5 people.
Mode of acquisition of dwelling units is through inheritance, rental purchase or self- construction.
Table 23:Basic Indicators of Settlements in Uganda (% of Total Dwellings),
2005/06
Indicator Urban Rural Total
Detached house 31.1 65.2 65.2
Semi‐detached house/flat 18.4 15.1 15.1
Tenements/Muzigo 46.9 12.8 12.8
Other type of houses 3.5 7.0 7.0
Owned 29.9 86.1 78.3
Rented 57.0 7.9 14.8
Temporary 26.0 78.5 71.1
Semi‐permanent 14.3 10.9 11.4
Housing backlog 27.0 31.0 30.0
Source: UBOS, UNHS 2005/6
48
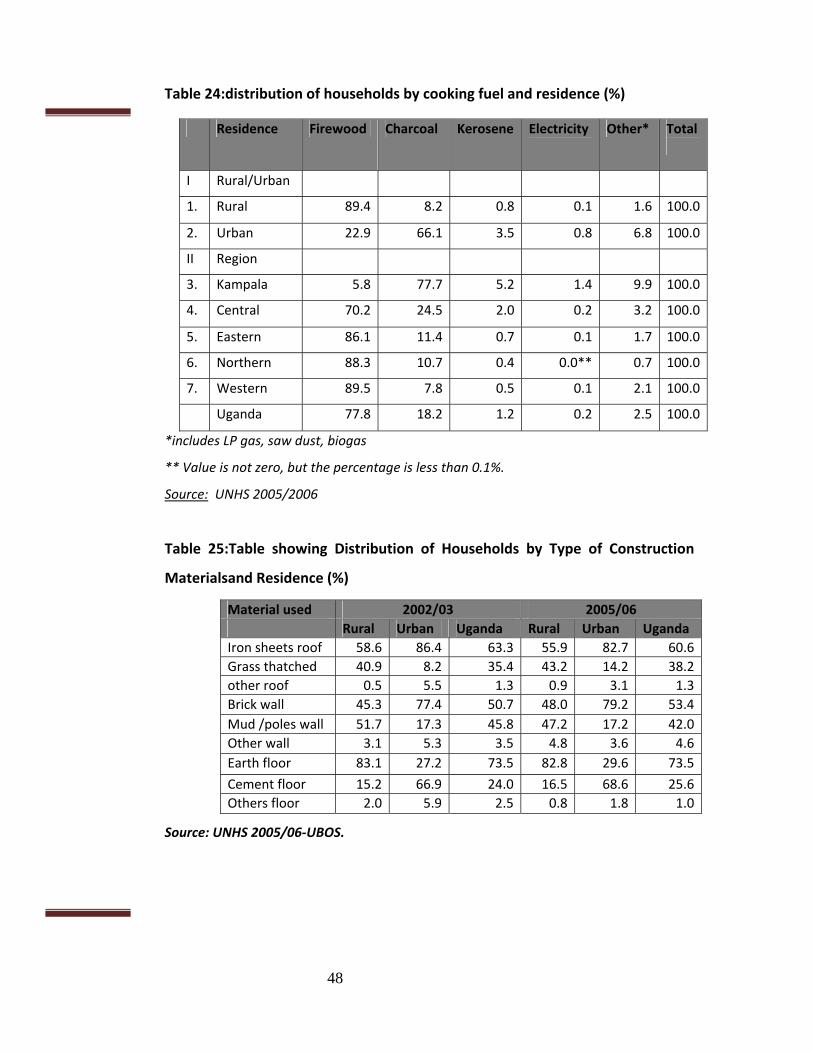
Table 24:distribution of households by cooking fuel and residence (%)
*includes LP gas, saw dust, biogas
** Value is not zero, but the percentage is less than 0.1%.
Source: UNHS 2005/2006
Table 25:Table showing Distribution of Households by Type of Construction
Materialsand Residence (%)
Source: UNHS 2005/06‐UBOS.
Residence Firewood Charcoal Kerosene Electricity
Other* Total
I Rural/Urban
1. Rural 89.4 8.2 0.8 0.1 1.6 100.0
2. Urban 22.9 66.1 3.5 0.8 6.8 100.0
II Region
3. Kampala 5.8 77.7 5.2 1.4 9.9 100.0
4. Central 70.2 24.5 2.0 0.2 3.2 100.0
5. Eastern 86.1 11.4 0.7 0.1 1.7 100.0
6. Northern 88.3 10.7 0.4 0.0** 0.7 100.0
7. Western 89.5 7.8 0.5 0.1 2.1 100.0
Uganda 77.8 18.2 1.2 0.2 2.5 100.0
Material used 2002/03 2005/06
Rural Urban Uganda Rural Urban Uganda
Iron sheets roof 58.6 86.4 63.3 55.9 82.7 60.6
Grass thatched 40.9 8.2 35.4 43.2 14.2 38.2
other roof 0.5 5.5 1.3 0.9 3.1 1.3
Brick wall 45.3 77.4 50.7 48.0 79.2 53.4
Mud /poles wall 51.7 17.3 45.8 47.2 17.2 42.0
Other wall 3.1 5.3 3.5 4.8 3.6 4.6
Earth floor 83.1 27.2 73.5 82.8 29.6 73.5
Cement floor 15.2 66.9 24.0 16.5 68.6 25.6
Others floor 2.0 5.9 2.5 0.8 1.8 1.0

49
Table 26: Literacy Rates for Population Aged 10 Years and Above
Location 1999/00 2002/03 2005/06
Male Female Total Male Female Total Male Female Total
Uganda 74 57 65 77 63 70 76 63 69
Urban 92 82 86 90 84 87 89 83 86
Rural 72 54 62 74 60 67 74 58 66
Source: UNHS 2005/06, Uganda Bureau of Statistics
Table 27: National level solid waste disposal methods
Ranking
Method of Waste Disposal
Urban (%) Rural (%)
Uganda (%)
1. Garden 12.1 44.7 40.2
2. Heap 20.4 24.3 23.8
3. Pit 27.6 21.8 22.6
4. Burning 13.0 7.4 8.2
5. Skip Bin 2.9 0.7 4.3
6. Other 1.0 1.0 1.0
Source: Urban Housing Profile Sector Report (June 2010)
Construction Materials for Dwelling Units The Construction materials of a dwelling not only indicate the durability and permanency of a Dwelling Unit but also serve as a proxy measure of the socio-economic status of the household. Some construction materials also pose a health risk to the occupants since they serve as a good breeding ground and habitat for pests.
Housing by Type of Material
Roofing Materials Over 60% of the dwelling structures are roofed with iron sheets. The percentage of households reporting their dwelling structures to be roofed with iron sheets varies from 58% in the rural areas to 85% in the urban areas in 2008 as compared to 51 and 80% respectively in 2004. Wall Materials Concrete, cement blocks, stones, burnt/stabilized bricks are classified as permanent wall materials, while un-burnt bricks (bonded with cement or mud), wood and mud and pole are considered as temporary materials. Floor Materials Floor materials mainly used in Uganda include concrete, brick, stone, cement screed, rammed earth and wood. Concrete, brick, stone, cement screed are permanent floor materials while rammed earth and wood are considered temporary materials.

50
Table 28:Distribution of Households by Type of Materials for the Dwelling
Structure and Residence
2004 2008Housing Characteristics Rural Urban Total Rural Urban TotalRoof materialThatched 47.7 18.1 37.8 41.3 12.6 36.2 Iron sheets 51.2 79.0 60.4 58.1 84.6 62.8 Other 1.1 2.9 1.8 0.6 2.8 1.0 Total 100.0 100.0 100.0 100.0 100.0 100.0 Wall materialThatched 2.5 0.7 1.9 0.8 0.1 0.7 Mud and poles 55.0 19.4 43.2 47.7 11.5 41.3 Unburnt bricks 17.1 13.5 15.9 18.7 9.4 17.1 Burnt bricks with mud 8.3 8.7 8.5 9.0 5.1 8.3 Burnt bricks with cement 15.1 52.0 27.4 21.6 69.7 30.1 Other 2.0 5.7 3.1 2.2 4.2 2.5 Total 100.0 100.0 100.0 100.0 100.0 100.0 Floor materialEarth 41.3 16.6 33.1 49.8 15.6 43.7 Earth and cow dung 44.0 16.9 34.9 32.6 8.6 28.4 Cement screed 12.4 55.3 26.7 16.2 72.1 26.1 Other 2.3 11.2 5.3 1.4 3.7 1.8 Total 100.0 100.0 100.0 100.0 100.0 100.0
Source: 2002 Uganda Population and Housing Census Analytical Report
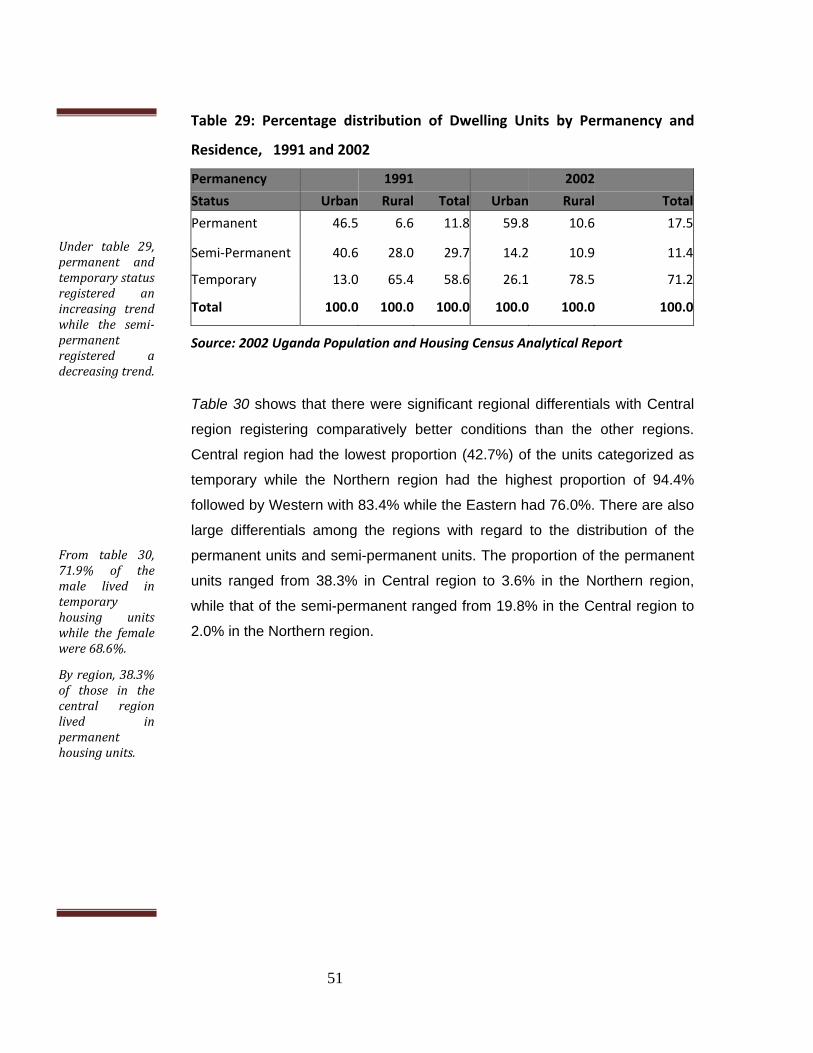
State of Permanency Permanent dwelling units are those built with construction materials (for wall, roof and floor) that can maintain their stability for more than fifteen (15) years. The temporary dwelling units are those that are built with materials that cannot maintain their stability for more than three (3) years, and the semi-permanent are those that are built with a combination of permanent and temporary materials.
Table 29 reveals that the majority of the households live in temporary housing units. A comparative analysis of the distribution of housing units between 1991 and 2002 indicated significant improvements in permanency status of the dwellings. The proportion of the permanent dwellings in the urban areas rose from 46.5% in 1991 to 59.8% in 2002, compared to the rural areas which registered a modest increase from 6.6% to 10.6%. The overall proportion of the permanent units increased from 11.8% to 17.5%.
Under roofmaterials, ironsheets had anincreasing trendwhile thatchedhadadecreasingtrend.
Under wallmaterials, burntbricks withcement had anincreasing trendwhile thatchedand mud poleshadadecreasingtrend.
This all showsthat Uganda ismoving towardsdevelopment.
51
Table 29: Percentage distribution of Dwelling Units by Permanency and
Residence, 1991 and 2002
Permanency 1991 2002
Status Urban Rural Total Urban Rural Total
Permanent 46.5 6.6 11.8 59.8 10.6 17.5
Semi‐Permanent 40.6 28.0 29.7 14.2 10.9 11.4
Temporary 13.0 65.4 58.6 26.1 78.5 71.2
Total 100.0 100.0 100.0 100.0 100.0 100.0
Source: 2002 Uganda Population and Housing Census Analytical Report
Table 30 shows that there were significant regional differentials with Central
region registering comparatively better conditions than the other regions.
Central region had the lowest proportion (42.7%) of the units categorized as
temporary while the Northern region had the highest proportion of 94.4%
followed by Western with 83.4% while the Eastern had 76.0%. There are also
large differentials among the regions with regard to the distribution of the
permanent units and semi-permanent units. The proportion of the permanent
units ranged from 38.3% in Central region to 3.6% in the Northern region,
while that of the semi-permanent ranged from 19.8% in the Central region to
2.0% in the Northern region.
Under table 29,permanent andtemporarystatusregistered anincreasing trendwhile the semi‐permanentregistered adecreasingtrend.
From table 30,71.9% of themale lived intemporaryhousing unitswhile the femalewere68.6%.
Byregion,38.3%of those in thecentral regionlived inpermanenthousingunits.

52
Table 30:Region distribution of housing units by state of permanency
Source: 2002 Uganda Population and Housing Census Analytical Report
Type of Housing Unit
A Housing Unit was defined as a structure intended for habitation by a single
household. It may in reality be housing two or more households as is the case
of a flat shared by several households.
Table 31 shows that the majority of the households 65.2% live in detached
housing units. About 31.1% in urban areas were living in detached housing
units compared to 70.7% in rural areas. Only 14.7% of the households were
staying in semidetached dwelling units and 12.8% were staying in tenements.
The semi-detached units constituted 16.8% in the urban areas compared to
14.3% in the rural areas.
Characteristics Temporary Semi‐permanent Permanent Total
Sex
Male 71.9 11.3 16.8 100.0
Female 68.6 11.6 19.8 100.0
Region
Central 42.7 18.9 38.3 100.0
Central excl 51.1 19.8 29.1 100.0
Eastern 76.0 12.6 11.3 100.0
Northern 94.4 2.0 3.6 100.0
Western 83.4 7.9 8.7 100.0
Uganda 71.2 11.4 17.5 100.0

53
Table 31: Percent Distribution of Housing Units by Type and Residence
Type of Housing Unit 1991 2002Urban Rural Total Urban Rural Total
Detached House 26.0 52.3 48.9 31.1 70.7 65.2 Semi Detached House 14.2 6.6 7.6 16.8 14.3 14.7 Flat 2.3 0.2 0.4 1.6 0.2 0.4 Tenements 43.3 2.8 8.1 46.9 7.2 12.8 Servants Quarters 4.8 0.6 1.1 - - - Huts 7.8 37.1 33.3 - - - Others 1.6 0.5 0.6 3.5 7.5 7.0 TOTAL 100.0 100.0 100.0 100.0 100.0 100.0
Source: 2002 Uganda Population and Housing Census Analytical Report
In the urban areas, nearly half of the households 46.9% live in tenements,
which are normally found in the informal settlements. The majority of the
tenements are constructed in response to the need of the low income
earners. Flats constituted a very small proportion of the housing units both in
urban and rural areas. It should be noted that flats have several advantages
as they optimize on the use of limited land, reduce the unit cost of of flats
from 2.3% to 1.6% in the urban areas is most likely attributed ·to the service
provision and enhance security. Nevertheless they require substantial initial
capital outlay which many individual households do not have.
Housing Units by Region Table 32 shows that detached houses were the majority in all regions with the
Western region having the highest proportion 78.7% while Central had the
least 56.1%. The tenements were more prevalent in Central region 27.6%
while in the rest of the regions, they accounted for less than 8% of the
Housing Units. This is partly attributed to the influence of Kampala City and
other urban areas on the region. The Northern Region had a high proportion
of Housing Units in the residual category of 'Others'. These were most likely
referring to the huts that were not classified among the Housing Unit options.
Table 31 showsthat65.2%ofthehousing unitswere indetachedhouses, 14.7% insemi‐detachedhouses, 0.4% inflats, 12.8% intenements and7%wereinotheroptions.
Most of thehousing units inthe centralregion were indetached housesand this appliedalsotoallregionsasshownintable32.
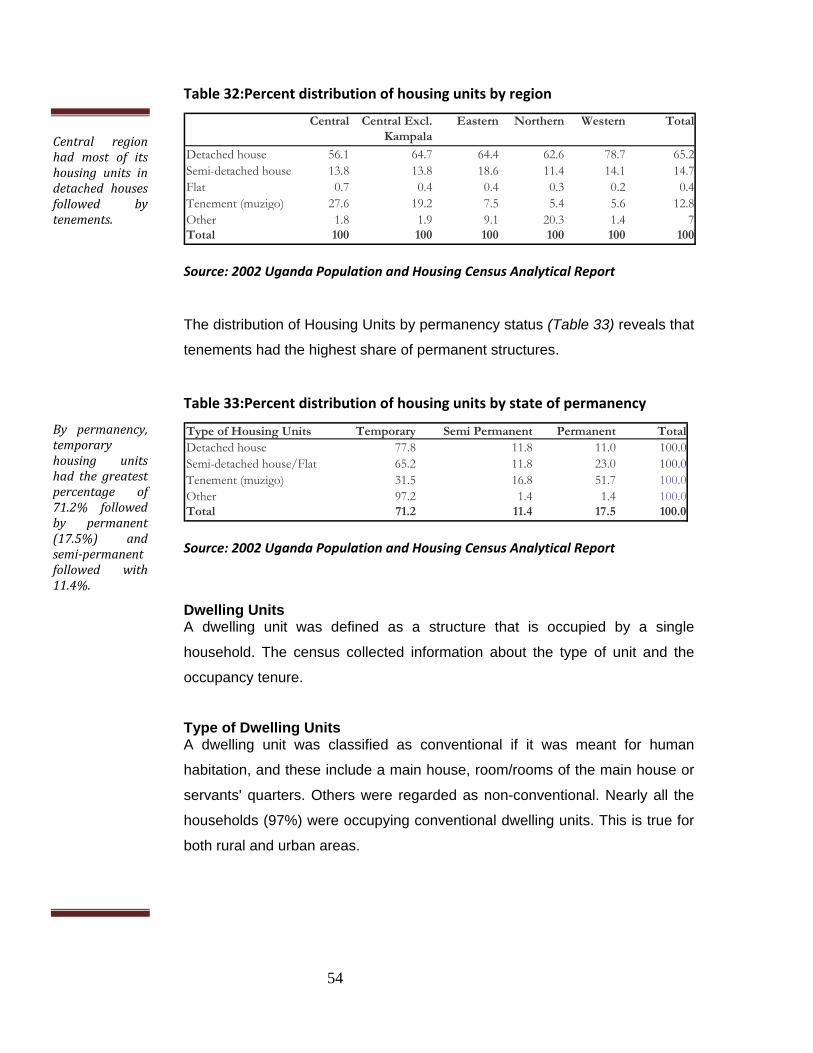
54
Table 32:Percent distribution of housing units by region
Central Central Excl. Kampala
Eastern Northern Western Total
Detached house 56.1 64.7 64.4 62.6 78.7 65.2Semi-detached house 13.8 13.8 18.6 11.4 14.1 14.7Flat 0.7 0.4 0.4 0.3 0.2 0.4Tenement (muzigo) 27.6 19.2 7.5 5.4 5.6 12.8Other 1.8 1.9 9.1 20.3 1.4 7Total 100 100 100 100 100 100
Source: 2002 Uganda Population and Housing Census Analytical Report
The distribution of Housing Units by permanency status (Table 33) reveals that
tenements had the highest share of permanent structures.
Table 33:Percent distribution of housing units by state of permanency
Type of Housing Units Temporary Semi Permanent Permanent Total Detached house 77.8 11.8 11.0 100.0 Semi-detached house/Flat 65.2 11.8 23.0 100.0 Tenement (muzigo) 31.5 16.8 51.7 100.0 Other 97.2 1.4 1.4 100.0 Total 71.2 11.4 17.5 100.0
Source: 2002 Uganda Population and Housing Census Analytical Report
Dwelling Units A dwelling unit was defined as a structure that is occupied by a single
household. The census collected information about the type of unit and the
occupancy tenure.
Type of Dwelling Units A dwelling unit was classified as conventional if it was meant for human
habitation, and these include a main house, room/rooms of the main house or
servants' quarters. Others were regarded as non-conventional. Nearly all the
households (97%) were occupying conventional dwelling units. This is true for
both rural and urban areas.
Central regionhad most of itshousing units indetached housesfollowed bytenements.
By permanency,temporaryhousing unitshad the greatestpercentage of71.2% followedby permanent(17.5%) andsemi‐permanentfollowed with11.4%.

55
The majority of the households (70%) were living in a 'Main House'
dwelling unit compared to 27% who were occupying a room (rooms) of the
units. Other dwelling types constituted very insignificant proportions (3%).
An analysis of the distribution by residence reflects that the nearly two
thirds of the households in the urban areas were living in a Room (62%)
compared to 21% in the rural areas. On the other hand three out of every
four households in the rural areas were living in Main House units. This
could be attributed to the ownership status particularly in the· rural areas
where the majority of the households are owner occupied. Only 32% of the
households in the urban areas lived in main house units.
Table 34 shows that 78.5% of the main houses are temporary, while the
semi-permanent units constitute equal units of one out of every 10. Among
the ‘Room’ dwelling units, more than half are temporary while one out of
three room type dwellings are built in permanent materials. The high
proportion of permanent structures among the Servant's Quarters arises
because they are usually attached to permanent structures.
Table 34:Percent Distribution of Dwelling Units by the type and by state
of permanency
Type of Dwelling Unit Temporary Semi Permanent Permanent Total Main house 78.5 10.9 10.5 100Room or rooms 52.4 13 34.6 100Servants quarters 30.3 15.9 53.8 100Unconventional Dwellings 88.9 3.8 7.3 100Total 71.2 11.4 17.5 100
Source: 2002 Uganda Population and Housing Census Analytical Report
Occupancy Tenure of Dwelling Units Occupancy tenure refers to the arrangements under which the household
resides in a dwelling. The arrangements include renting, owner occupancy
and dwelling supplied free. Ownership of a dwelling unit represents security
of tenure of a household.
Underunconventionaldwellings, 88.9%were temporary,7.3% werepermanent andthe rest (3.8%)were semi‐permanent.
Under mainhouses, thegreatestpercentage wasunder thetemporarystate.
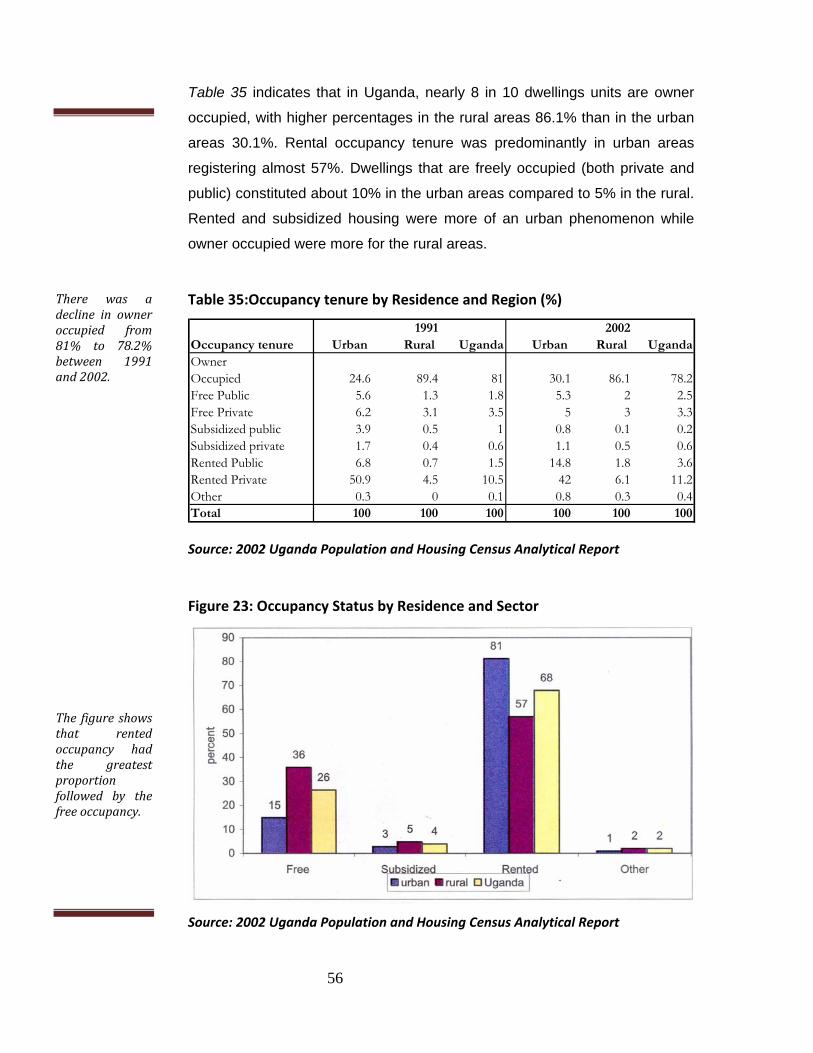
56
Table 35 indicates that in Uganda, nearly 8 in 10 dwellings units are owner
occupied, with higher percentages in the rural areas 86.1% than in the urban
areas 30.1%. Rental occupancy tenure was predominantly in urban areas
registering almost 57%. Dwellings that are freely occupied (both private and
public) constituted about 10% in the urban areas compared to 5% in the rural.
Rented and subsidized housing were more of an urban phenomenon while
owner occupied were more for the rural areas.
Table 35:Occupancy tenure by Residence and Region (%)
1991 2002Occupancy tenure Urban Rural Uganda Urban Rural UgandaOwner Occupied 24.6 89.4 81 30.1 86.1 78.2Free Public 5.6 1.3 1.8 5.3 2 2.5Free Private 6.2 3.1 3.5 5 3 3.3Subsidized public 3.9 0.5 1 0.8 0.1 0.2Subsidized private 1.7 0.4 0.6 1.1 0.5 0.6Rented Public 6.8 0.7 1.5 14.8 1.8 3.6Rented Private 50.9 4.5 10.5 42 6.1 11.2Other 0.3 0 0.1 0.8 0.3 0.4Total 100 100 100 100 100 100
Source: 2002 Uganda Population and Housing Census Analytical Report
Figure 23: Occupancy Status by Residence and Sector
Source: 2002 Uganda Population and Housing Census Analytical Report
There was adecline in owneroccupied from81% to 78.2%between 1991and2002.
The figure showsthat rentedoccupancy hadthe greatestproportionfollowed by thefreeoccupancy.
57
Sanitation Facilities Information was sought on selected household sanitary facilities and hygienic
practices. The focus was on kitchen availability, garbage disposal and
availability and use of bathroom facilities. Table 36 presents the percentage
distribution of households by type of sanitary facility and residence.
Kitchens Slightly over thirty percent of the households (33%) lacked kitchens. Where
kitchens existed, 57% of the households reported that they were located
outside the dwelling place.
Garbage Disposal Pits and gardens were the most common methods for garbage disposal in
both rural and urban areas. Forty one (41%) of rural household was disposing
garbage in gardens, while 34% of the urban residents were disposing in pits.
Another important method of garbage disposal was the bush with 18% of the
households reporting using it.
Bathrooms In terms of bathrooms for the households, the analysis shows variations by
residence and sub-region. In the rural areas, makeshift bathrooms were
common (34%), while in the urban areas, outside built bathrooms were
common (64%). In the rural areas, 35% of the households did not have any
form of bathroom while only 9% of urban dwellers had none.
Toilet Facilities Most of the urban households (56%) were using shared covered pit latrines
compared to 21% in rural households. The biggest proportion of households in
rural areas (50%) had private covered pit latrines. Overall, 12% of the
households had no toilet facility. Considering the sub regions, 88% of the
households in the North East did not have a toilet facility as compared to less
than one percent of Kampala residents.
The greatestproportion hasoutside builtkitchen (57%),5.4% were inbuilt while 33%hadnokitchen.
35.6% usedgardens fortheirgarbagedisposalwhile 33.8%usedpits.
34.4% hadoutside builtbathrooms while30.5% had nobathrooms.
44.9% of thehouseholds hadcovered pitlatrines while4.7% used othermeans.
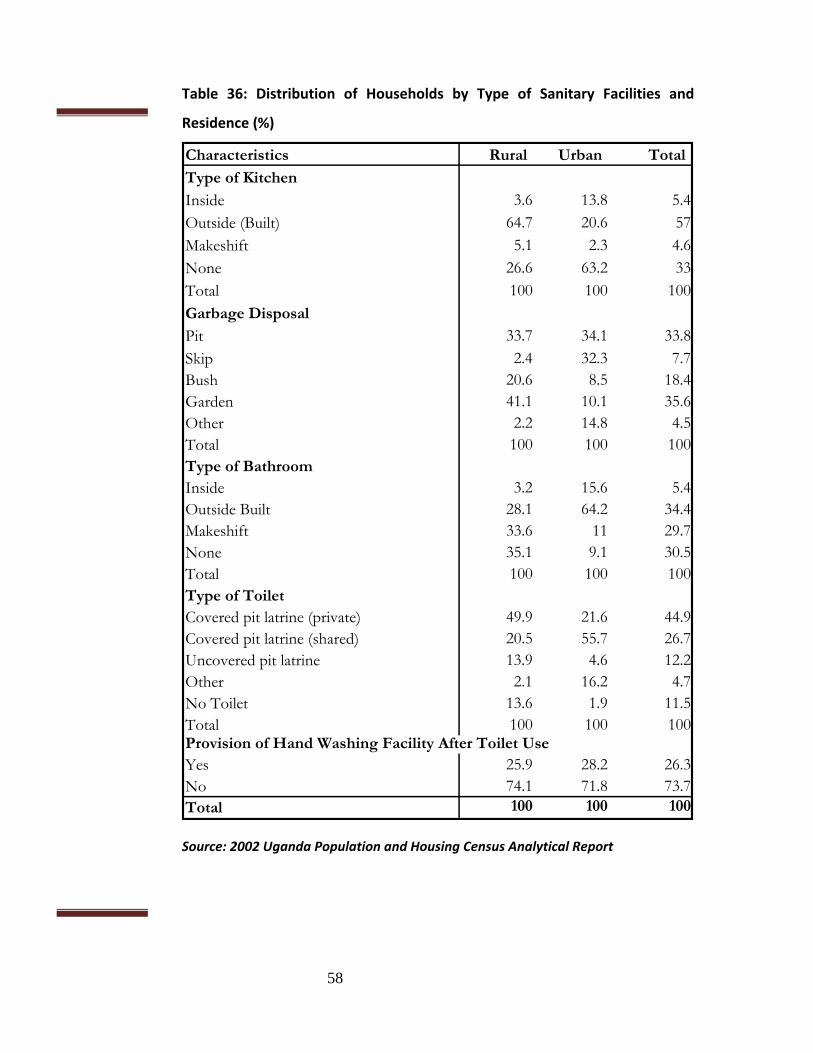
58
Table 36: Distribution of Households by Type of Sanitary Facilities and
Residence (%)
Characteristics Rural Urban Total
Type of Kitchen
Inside 3.6 13.8 5.4Outside (Built) 64.7 20.6 57Makeshift 5.1 2.3 4.6None 26.6 63.2 33Total 100 100 100Garbage Disposal
Pit 33.7 34.1 33.8Skip 2.4 32.3 7.7Bush 20.6 8.5 18.4Garden 41.1 10.1 35.6Other 2.2 14.8 4.5Total 100 100 100Type of Bathroom Inside 3.2 15.6 5.4Outside Built 28.1 64.2 34.4Makeshift 33.6 11 29.7None 35.1 9.1 30.5Total 100 100 100Type of Toilet Covered pit latrine (private) 49.9 21.6 44.9Covered pit latrine (shared) 20.5 55.7 26.7Uncovered pit latrine 13.9 4.6 12.2Other 2.1 16.2 4.7No Toilet 13.6 1.9 11.5Total 100 100 100Provision of Hand Washing Facility After Toilet Use Yes 25.9 28.2 26.3No 74.1 71.8 73.7Total 100 100 100
Source: 2002 Uganda Population and Housing Census Analytical Report
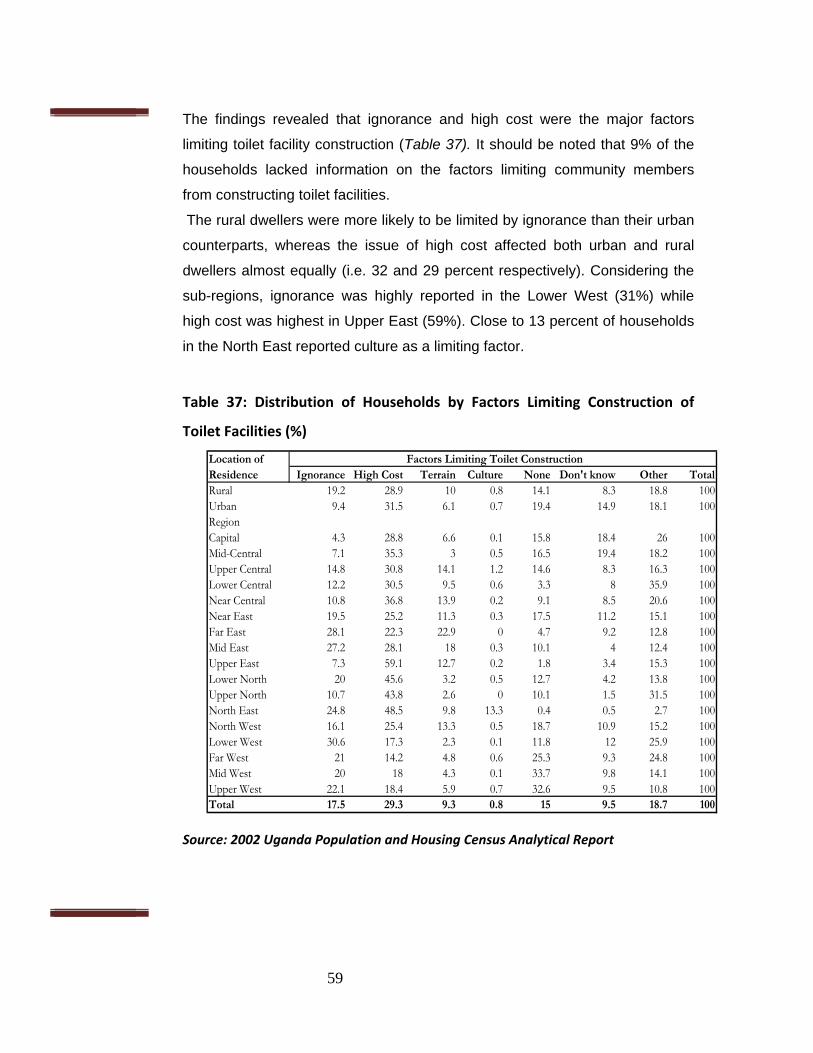
59
The findings revealed that ignorance and high cost were the major factors
limiting toilet facility construction (Table 37). It should be noted that 9% of the
households lacked information on the factors limiting community members
from constructing toilet facilities.
The rural dwellers were more likely to be limited by ignorance than their urban
counterparts, whereas the issue of high cost affected both urban and rural
dwellers almost equally (i.e. 32 and 29 percent respectively). Considering the
sub-regions, ignorance was highly reported in the Lower West (31%) while
high cost was highest in Upper East (59%). Close to 13 percent of households
in the North East reported culture as a limiting factor.
Table 37: Distribution of Households by Factors Limiting Construction of
Toilet Facilities (%)
Location of Factors Limiting Toilet ConstructionResidence Ignorance High Cost Terrain Culture None Don't know Other TotalRural 19.2 28.9 10 0.8 14.1 8.3 18.8 100Urban 9.4 31.5 6.1 0.7 19.4 14.9 18.1 100Region Capital 4.3 28.8 6.6 0.1 15.8 18.4 26 100Mid-Central 7.1 35.3 3 0.5 16.5 19.4 18.2 100Upper Central 14.8 30.8 14.1 1.2 14.6 8.3 16.3 100Lower Central 12.2 30.5 9.5 0.6 3.3 8 35.9 100Near Central 10.8 36.8 13.9 0.2 9.1 8.5 20.6 100Near East 19.5 25.2 11.3 0.3 17.5 11.2 15.1 100Far East 28.1 22.3 22.9 0 4.7 9.2 12.8 100Mid East 27.2 28.1 18 0.3 10.1 4 12.4 100Upper East 7.3 59.1 12.7 0.2 1.8 3.4 15.3 100Lower North 20 45.6 3.2 0.5 12.7 4.2 13.8 100Upper North 10.7 43.8 2.6 0 10.1 1.5 31.5 100North East 24.8 48.5 9.8 13.3 0.4 0.5 2.7 100North West 16.1 25.4 13.3 0.5 18.7 10.9 15.2 100Lower West 30.6 17.3 2.3 0.1 11.8 12 25.9 100Far West 21 14.2 4.8 0.6 25.3 9.3 24.8 100Mid West 20 18 4.3 0.1 33.7 9.8 14.1 100Upper West 22.1 18.4 5.9 0.7 32.6 9.5 10.8 100Total 17.5 29.3 9.3 0.8 15 9.5 18.7 100
Source: 2002 Uganda Population and Housing Census Analytical Report
60
APPENDIX A Glossary
HOUSING AND URBAN DEVELOPMENT CONCEPTS AND DEFINITIONS
Urban Area This refers to a gazetted city, municipality or town council. Tenement A low‐rent dwelling unit, located in a slum of informal settlement, often ageing and in Substandard condition poorly maintained and overcrowded; it is commonly referred to as "Muzigo". Tenant (under Housing) An occupant of a dwelling unit with the owner's assent, who pays rent to the owner of the Unit in return for the right to occupy the dwelling unit. Temporary Dwelling Units Dwelling units built with non‐durable wall floor and roof materials that can maintain stability for no more than 3 years. They require regular replacement. All housing units thatched with untreated natural fibers are classified as temporary irrespective of wall and floor materials. Building Any independent, free‐standing structure comprising one or more rooms or other spaces covered by a roof and usually enclosed within external walls or dividing walls which extend from the foundations to the roof. A building may consist of a roof with supports only, that is, without constructed walls. In some cases, a roofless structure consisting of a space enclosed by walls may be considered a building. It may be used as living quarters or for industrial purposes exclusively, or it may be partially used for both purposes. Buildings used entirely or primarily for agricultural purposes such as warehouses, stores, stables, barns, office building, etc. are classified as non‐residential buildings. House A house is a structure/building designed for residential or non‐residential purposes or both and may be occupied or not. Housing Unit A separate and independent place of abode, intended for habitation by one household, or one not intended for habitation but occupied as living quarters by a household at the time of enumeration.

61
Dwelling Unit A constructed unit or building comprising one or more rooms or other spaces, covered by a roof and usually enclosed within external walls or dividing walls, which extend from the foundation to the roof.
Permanent Dwelling Units These are built with durable materials (wall, floor and roof) that can maintain their stability for at least 15 years.
Semi‐permanent Dwelling Units Semi‐permanent dwelling units are those built with construction materials (for roof, floor and wall) using a combination of permanent and temporary materials. They usually have a life span of between 3‐ 15 years.
Temporary Dwelling Unit Temporary dwelling units are those built with construction materials (for roof, floor and wall) that cannot maintain their stability for more than 3years. Residential building A building for which the major part (more than 50% of its gross floor area) is built for dwelling purposes, i.e. for habitation of households. Non Residential building A building where more than 50% of floor space area is not intended for dwelling but for other purposes such as commercial or industrial or for provision of services i.e. factories, office building, government buildings, garages, warehouses, barns etc. It also covers buildings for persons living in institutions, such as hospital building, prisons, military establishments and so forth.
Condominium Property A multi‐family dwelling in which each unit is individually owned but the land and common areas and facilities are owned and maintained by all owners on a pro‐rated share basis. Shack A small rough hut or shabby old house. Room A space in a housing unit or other living quarters enclosed by walls reaching from the floor to the ceiling or roof covering, or at least to a height of 2 meters, of a size large enough to hold a bed for an adult, that is at least 4 square meters. Passage ways, verandahs, lobbies, bath‐rooms, and toilet rooms are not expected to be counted as rooms, even if they meet the criteria. Kitchen A room or space in a dwelling, set apart for storage of food and various operations involved in preparation and service of meals and cleaning of dishes and cooking utensils.

62
Toilet An installation for the disposal of human excreta
Flush toilet An installation connected with piped water, arranged for humans to discharge their wastes and from which wastes are flushed by water.
Ventilated Improved Latrine A latrine with a pipe inserted to get rid of foul smells and flies.
Pit Latrine A toilet made by digging a ground hole for deposit of excreta. Tenure The right, terms or mode of holding or occupying property, whether owner‐occupied, rental or co‐ownership. Rent The charge for use of land, buildings or other real property, payable by a tenant to a landlord at regular intervals, usually monthly. Institutions Any set of premises in a structure designed to house groups (usually large) of persons who are bound by either a common public objective or a common personal interest. In this type of living quarters, persons of the same sex frequently share dormitories. Hospitals, barracks, boarding schools, convents, prisons etc. fall within this category. Camps A set of premises originally intended for accommodation of persons with common activities or interests, e.g. military camps, refugee camps and camps established for the housing of workers in mining, agriculture, public works or other types of enterprises. Slum A predominantly residential area characterized by high population densities, deteriorated buildings, littered streets, unsanitary and hazardous conditions and economic distress. UN‐HABITAT gives the operational definition of a slum as an area that combines to various extents the following characteristics.
- Inadequate access to safe water. - Inadequate access to sanitation and other infrastructure. - Insecure residential status. - Poor structural quality of housing. - Overcrowding.
Uganda defines a slum as being a place with one or more of the following attributes.

63
1. An area that attracts a high density of low income earners and or unemployed persons, with low levels of literacy.
2. An area with high rates / levels of noise, crime, drug abuse, immorality, alcoholism and high HIV/AIDS prevalence.
3. An area where houses are in environmentally fragile lands like wetlands.
Divested pool & institutional houses These refer to the sale or liquidation of public houses to individuals and the private sector. Building plan A Building design Proto‐type plan It is a building design intended to be reproduced and to be adapted to various site conditions. The estimated housing need This is the housing stock that is required to accommodate all the households. The housing occupancy density/occupancy ratio) It is the average number of households occupying a single housing unit. The housing backlog It is the shortfall of housing arising from homelessness and sharing among the current stock and is the difference between the housing need and the existing stock. Upgrading need It refers to improving the quality of the existing stock in the rural and urban areas. New construction is to meet housing loss, homelessness, new households formed, reduction in household size and population increase.
LAND CONCEPTS AND DEFINITIONS
Land title This is a document in certificate form issued by the Office of Titles which is a proof of ownership for particular parcel of land by the person(s) registered as the owner. Government land It is land vested in or acquired by governments in accordance with the 1995 constitution or acquired by government abroad. Government land includes all land lawfully held, occupied and or used by governments and its agencies for purposes of carrying out the core function of government. Private land Land owned privately by an individual or a private company.
64
Land transaction This refers to any dealing in land for example transfer, mortgage. Land Registration It is the process of identifying, adjudicating and registering land and subsequently registering transactions on that land. Leasehold land This refers to the holding of land under the contract for a specific period of time and usually for a consideration which can be a premium or a yearly rent to be paid by the lessee. Freehold System of owning land in perpetuity and is subject to conditions, restrictions and limitations. Bonafide occupant This is person who before coming into the force of the constitution had occupied and utilized or developed any land unchallenged by the registered owner for 12 years or had been settled on land by the government. Lawful occupant This means a person occupying land by virtue of the repealed Busuulu and Envujjo law of 1928, Toro landlord and tenant law of 1937, and Ankole landlord and tenant law of1937, or a person who entered the land with the consent of the registered owner and includes a purchaser or a person who had occupied land as a customary tenant but whose tenancy was not disclosed to the registered owner at the time of acquiring the leasehold certificate of titles. Mailo land Tenure Holding of registered land in perpetuity. Leasehold land This is the holding of land under a contract for a specific period of time and usually for a consideration which can be premium and yearly rent to be paid by the lessee to the lessor. Freehold land This is a system of ownership of land forever and ever which may include conditions, restrictions/limitations. Customary land Ownership of land according to customs and norms of a specific area and applicable to a specific description of land

65
PHYSICAL PLANNING CONCEPTS AND DEFINITIONS
Urban area: This is an area with an increased density of human‐created structures in comparison to the areas surrounding it. Structure plan: This is a framework that can be used to guide the development or redevelopment of a particular area Gazetted Means published in the official gazette by either a statutory instrument or a legal notice issued by the responsible Minister.

66
APPENDIX B Meta Data Sheet
Indicator Definition and Standard Classifications
Scope and Coverage Sources of data Compilation Practices
Computation Method
Accessibility and availability of data
Accounting conventions
Comments and limitations
Land Statistics Number of land transactions conducted
These are the total number of land titles sorted, scanned & produced.
District level Individuals, firms & institutions
Information on land transactions is manually extracted from land registry records of individuals, firms & institutions from the districts and submitted to the Ministry, where analysis is done to derive the indicator.
Summation of all land titles from districts in Uganda
Ministry website www.mlhud.go.ug Ministerial Policy
Statement Budget Frame work
paper Baseline survey
reports MLHUD Annual
reports MLHUD Annual
Statistical Abstract MLHUD Monitoring
and Evaluation reports
Presidential
Manifesto Implementation reports
Periodicity of production: Annually
Lack of a computerized system to generate land registries.
Number of land certificates issued
These are certificates / actual titles processed & issued for:· Mailo land: land that
was provided by the British colonial government to the royal families and
District level
Individuals, firms & institutions
Information on land certificates issued is manually extracted from land registry records of individuals, firms & institutions from the districts and
Summation of certificates / actual titles processed & issued by land category
Ministry website www.mlhud.go.ug Ministerial Policy
Statement Budget Frame work
Periodicity of production: Annually
Lack of a computerized system to generate land registries.

67
Indicator Definition and Standard Classifications
Scope and Coverage Sources of data Compilation Practices
Computation Method
Accessibility and availability of data
Accounting conventions
Comments and limitations
other nobles in units of square miles.
Leasehold land: system of owning land on contract.
Freehold: system of owning land in perpetuity and is set up by agreement between the Kingdoms and the central Government
Customary land: system of owning land communally.
submitted to the Ministry, where analysis is done to derive the indicator.
paper Baseline survey
reports MLHUD Annual
reports MLHUD Annual
Statistical Abstract MLHUD Monitoring
and Evaluation reports
Presidential
Manifesto Implementation reports
Number of parcels of land owned by Government
This refers to Government land which is surveyed & titled, surveyed & not titled, not surveyed and not titled and infrastructure on private land.
National level Uganda Land Commission & Inspectorate Ministry of Lands, Housing & Urban Development (MLHUD)
Information on parcels of land owned by Government is obtained from the Government land inventory which is regularly updated and maintained by the Ministry.
Total number of parcels of land owned by the government
Ministry website www.mlhud.go.ug Budget Frame work
paper Baseline survey
reports MLHUD Annual
reports MLHUD Annual
Statistical Abstract MLHUD Monitoring
and Evaluation reports
Presidential
Manifesto Implementation reports
Periodicity of production: Annually
Lack of a computerized system to generate land registries.

68
Indicator Definition and Standard Classifications
Scope and Coverage Sources of data Compilation Practices
Computation Method
Accessibility and availability of data
Accounting conventions
Comments and limitations
Housing Statistics
Number of people supported to own houses.
These are persons that have owned homes as a result of a direct and deliberate government intervention e.g. Government HD policy of 1995, SU initiatives, LCH programs etc.
National level Housing Finance Bank, Mortgage Department MLHUD
Data is collected through Inspections and tours conducted by the Ministry and analyzed to derive the indicator. Information is also obtained from the housing project records, DH records for housing programs, PDC records and the Housing Finance Bank, Mortgage Department
Summation of the persons supported to own houses
Ministry website www.mlhud.go.ug Budget Frame work
paper MLHUD Annual
projection reports MLHUD Annual
Statistical Abstract MLHUD Monitoring
and Evaluation reports
Periodicity of production: Annually
Incomplete data Records are not regularly updated
Number of people living in permanent housing
This is the proportion of the national population whose housing units are built with durable BM that can maintain their stability for 15 years and above.
National level MLHUD UBOS
Data is collected through specific housing surveys conducted by the Ministry. The data is centrally captured and analyzed to derive the indicator. Information is also extracted from housing records at the Ministry and the UNHS – Reports at UBOS.
Summation of the persons living in permanent housing
Ministry website www.mlhud.go.ug MLHUD Annual
reports Housing Indicators
Status report MLHUD Annual
Statistical Abstract
Periodicity of production: Annually Periodicity of production: Annually
Projections and estimates are frequently applied.

69
Indicator Definition and Standard Classifications
Scope and Coverage Sources of data Compilation Practices
Computation Method
Accessibility and availability of data
Accounting conventions
Comments and limitations
National Housing Stock
This refers to the total number of housing units in the country.
National level MLHUD Data is collected through specific housing surveys conducted by the Ministry. The data is centrally captured and analyzed to derive the indicator. Information is also extracted from housing records at the Ministry and the UNHS – Reports at UBOS.
Summation of housing units in the country
Ministry website www.mlhud.go.ug Housing Indicators
Status report MLHUD Annual
Statistical Abstract
Periodicity of production: Annually
Projections and estimates are frequently applied.
Housing compliance
This refers to the housing units built according to required standards in the Country.
National level Covers urban areas
Local Governments
Information on housing compliance is derived from Local Government records submitted to the Ministry.
Summation of housing units in the country
Local Governments Annual reports
Periodicity of production: Annually
The scope and coverage of the data is limited to urban areas.
House rent : Income ratio
This is the ratio of average annual rent of a dwelling unit to the average annual household income of renters in the country.
National level Covers urban areas
MLHUD Local Government planning units
Information on housing compliance is derived from Local Government records submitted to the Ministry. Specific Housing baseline studies are also undertaken by the Ministry to determine the house rent: income ratio in the country.
Average annual rent of a dwelling unit divided by the average annual household income of renters
Housing Indicators Status report
Periodicity of production: Annually
Specific housing studies are recommended to determine the accuracy of the indicator.

70
Indicator Definition and Standard Classifications
Scope and Coverage Sources of data Compilation Practices
Computation Method
Accessibility and availability of data
Accounting conventions
Comments and limitations
Number of Houses with basic utilities.
This is the number of households that are connected to piped water, electricity & telephone in the country.
National level MOLHUD Utility Companies i.e. NWSC, UMEME etc.
Data is obtained through specific housing surveys undertaken by the Ministry; the data is centrally captured and analyzed at the centre to derive the indicator. Information on basic utilities is also obtained from utility body records attained from the respective utility companies.
Summation of households connected to piped water, electricity & telephone
Housing Indicators Status report
MLHUD Annual
reports MLHUD Annual
Statistical Abstract
Periodicity of production: Annually
Floor area per person
This is the average usable living space per person in a household.
National level MLHUD Data is obtained through specific housing surveys undertaken by the Ministry; the data is centrally captured and analyzed at the centre to derive the indicator.
Average floor area in Sq meters per person
Housing Indicators Status report
MLHUD Annual
Statistical Abstract
Periodicity of production: Annually
UN recommends 2 persons per standard room of 12m2.
Physical Planning & Urban Development Statistics
Number of planned urban centres
These are planned areas with an increased density of human-created structures in comparison to the areas surrounding them.
District level Local Government
Information on planned urban areas is obtained from National survey reports and records from Local Governments.
Summation of urban centres planned in the country
Ministry website www.mlhud.go.ug Field inspection
reports MLHUD Annual
reports MLHUD Annual
Statistical Abstract Budget Frame work
Periodicity of production: Annually
Conflicting data sets produced at the central government and local governments on the current road network
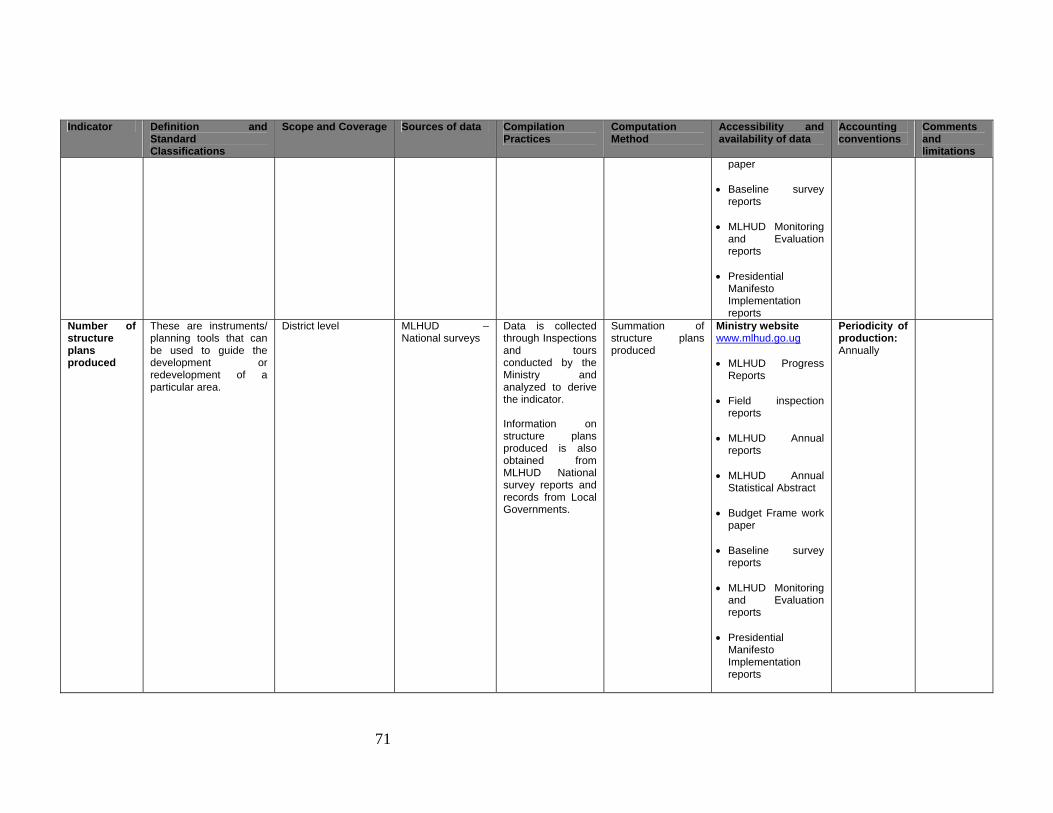
71
Indicator Definition and Standard Classifications
Scope and Coverage Sources of data Compilation Practices
Computation Method
Accessibility and availability of data
Accounting conventions
Comments and limitations
paper Baseline survey
reports MLHUD Monitoring
and Evaluation reports
Presidential
Manifesto Implementation reports
Number of structure plans produced
These are instruments/ planning tools that can be used to guide the development or redevelopment of a particular area.
District level MLHUD – National surveys
Data is collected through Inspections and tours conducted by the Ministry and analyzed to derive the indicator. Information on structure plans produced is also obtained from MLHUD National survey reports and records from Local Governments.
Summation of structure plans produced
Ministry website www.mlhud.go.ug MLHUD Progress
Reports Field inspection
reports MLHUD Annual
reports MLHUD Annual
Statistical Abstract Budget Frame work
paper Baseline survey
reports MLHUD Monitoring
and Evaluation reports
Presidential
Manifesto Implementation reports
Periodicity of production: Annually
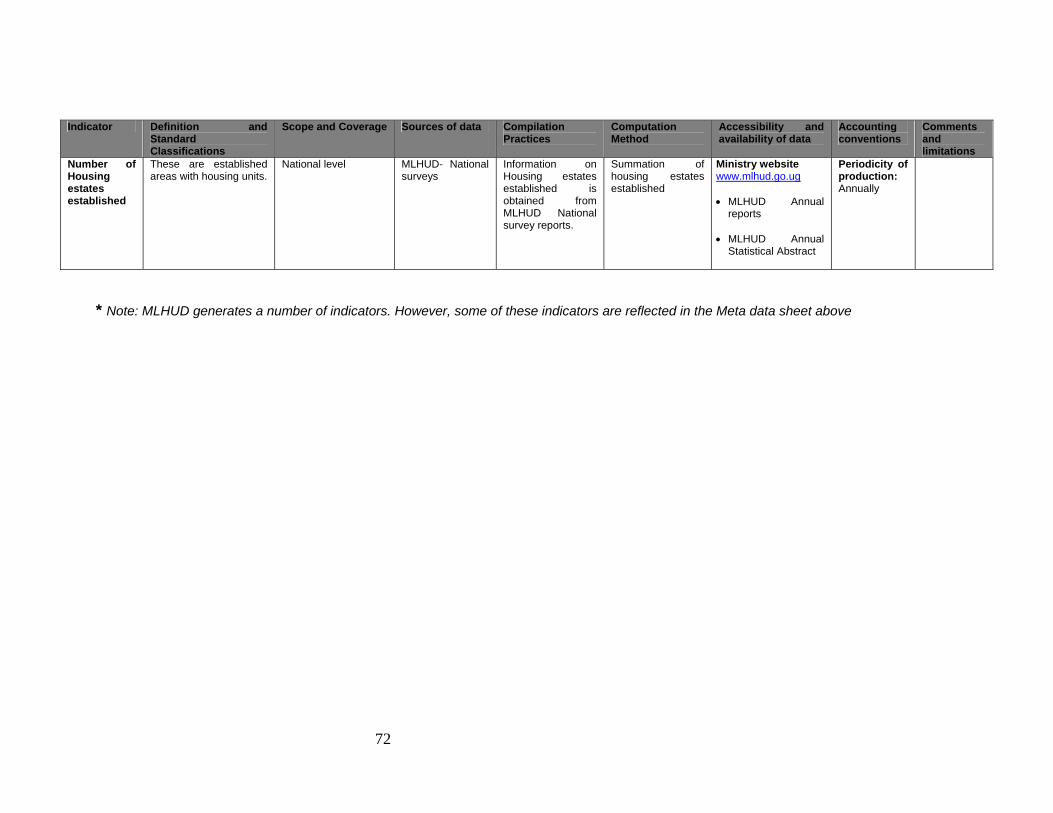
72
Indicator Definition and Standard Classifications
Scope and Coverage Sources of data Compilation Practices
Computation Method
Accessibility and availability of data
Accounting conventions
Comments and limitations
Number of Housing estates established
These are established areas with housing units.
National level MLHUD- National surveys
Information on Housing estates established is obtained from MLHUD National survey reports.
Summation of housing estates established
Ministry website www.mlhud.go.ug MLHUD Annual
reports MLHUD Annual
Statistical Abstract
Periodicity of production: Annually
* Note: MLHUD generates a number of indicators. However, some of these indicators are reflected in the Meta data sheet above
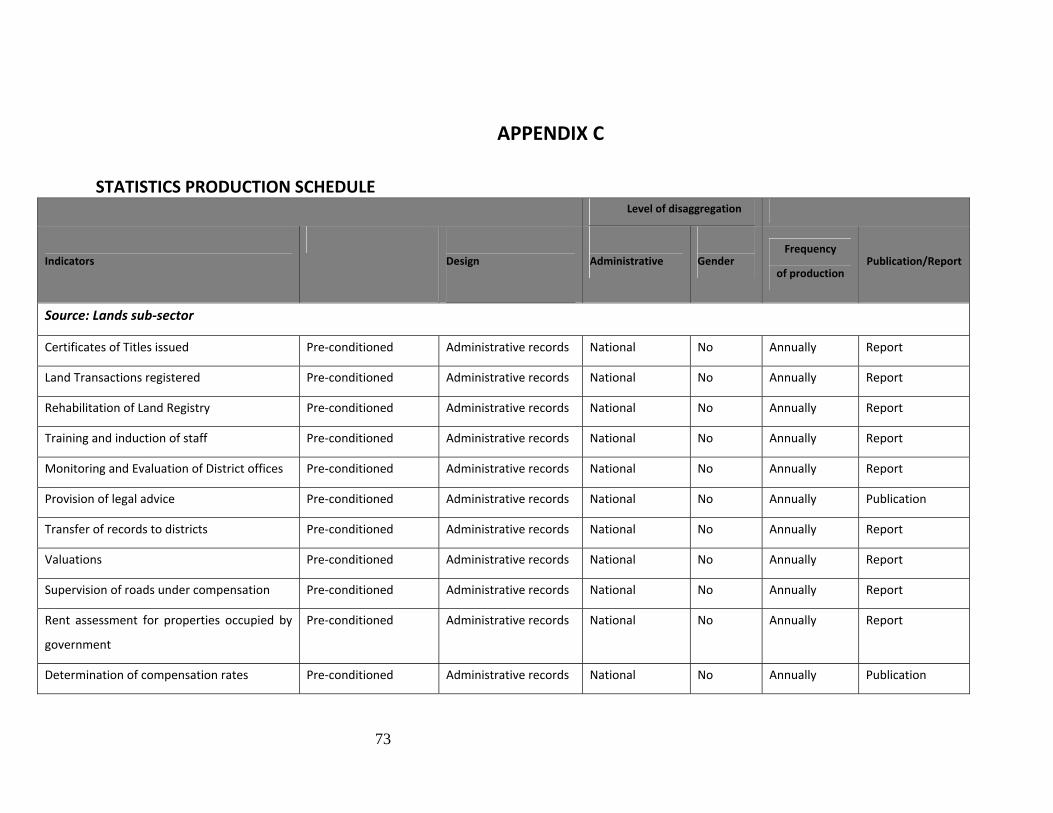
73
APPENDIX C
STATISTICS PRODUCTION SCHEDULE Level of disaggregation
Indicators
Design
Administrative
Gender Frequency
of production Publication/Report
Source: Lands sub‐sector
Certificates of Titles issued Pre‐conditioned Administrative records National No Annually Report
Land Transactions registered Pre‐conditioned Administrative records National No Annually Report
Rehabilitation of Land Registry Pre‐conditioned Administrative records National No Annually Report
Training and induction of staff Pre‐conditioned Administrative records National No Annually Report
Monitoring and Evaluation of District offices Pre‐conditioned Administrative records National No Annually Report
Provision of legal advice Pre‐conditioned Administrative records National No Annually Publication
Transfer of records to districts Pre‐conditioned Administrative records National No Annually Report
Valuations Pre‐conditioned Administrative records National No Annually Report
Supervision of roads under compensation Pre‐conditioned Administrative records National No Annually Report
Rent assessment for properties occupied by
government
Pre‐conditioned Administrative records National No Annually Report
Determination of compensation rates Pre‐conditioned Administrative records National No Annually Publication
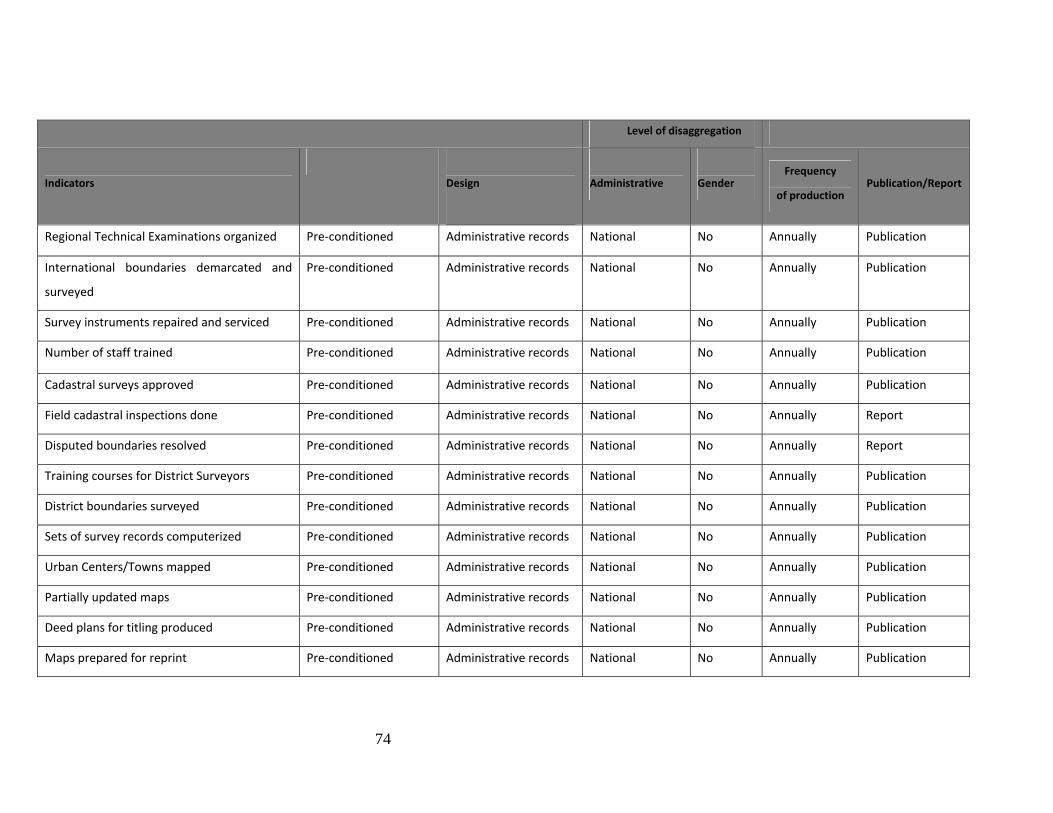
74
Level of disaggregation
Indicators
Design
Administrative
Gender Frequency
of production Publication/Report
Regional Technical Examinations organized Pre‐conditioned Administrative records National No Annually Publication
International boundaries demarcated and
surveyed
Pre‐conditioned Administrative records National No Annually Publication
Survey instruments repaired and serviced Pre‐conditioned Administrative records National No Annually Publication
Number of staff trained Pre‐conditioned Administrative records National No Annually Publication
Cadastral surveys approved Pre‐conditioned Administrative records National No Annually Publication
Field cadastral inspections done Pre‐conditioned Administrative records National No Annually Report
Disputed boundaries resolved Pre‐conditioned Administrative records National No Annually Report
Training courses for District Surveyors Pre‐conditioned Administrative records National No Annually Publication
District boundaries surveyed Pre‐conditioned Administrative records National No Annually Publication
Sets of survey records computerized Pre‐conditioned Administrative records National No Annually Publication
Urban Centers/Towns mapped Pre‐conditioned Administrative records National No Annually Publication
Partially updated maps Pre‐conditioned Administrative records National No Annually Publication
Deed plans for titling produced Pre‐conditioned Administrative records National No Annually Publication
Maps prepared for reprint Pre‐conditioned Administrative records National No Annually Publication

75
Level of disaggregation
Indicators
Design
Administrative
Gender Frequency
of production Publication/Report
Land Boards vetted and approved Pre‐conditioned Administrative records National No Annually Publication
District Land Boards inducted/trained Pre‐conditioned Administrative records National No Annually Publication
Land Management institutions monitored
and evaluated Pre‐conditioned
Administrative records National No Annually Publication
Source: Housing sub‐sector
Divested pool & Institutional houses Pre‐conditioned Administrative records National No Annual Publication
Inventory of Government Estates Pre‐conditioned Administrative records National No Annual Publication
Production of Pro‐type plans & construction
of demonstration houses
Pre‐conditioned Administrative records National No Annual Publication
Condominium properties Pre‐conditioned Administrative records National No Annual Publication
Implementation of the National Action Plan
on Secure Tenure
Pre‐conditioned Administrative records National No Annual Report
Inventory of building materials Pre‐conditioned Administrative records National No Annual Report
Housing database Pre‐conditioned Administrative records National No Annual Report
Public Servants Housing Loan Scheme Pre‐conditioned Administrative records National No Annual Report

76
Level of disaggregation
Indicators
Design
Administrative
Gender Frequency
of production Publication/Report
Infrastructural Improvement of Estates in
Kampala
Pre‐conditioned Administrative records National No Annual Report
Public awareness on Earthquake disaster
mitigation
Pre‐conditioned Administrative records National No Annual Report
Construction of demonstration units with
earthquake resistant technology
Pre‐conditioned Administrative records National No Annual Report
Monitor Housing Projects adopted under the
NSP
Pre‐conditioned Administrative records National No Annual Report
Source: Urban Development sub‐sector
Implementation of national policies, laws,
standards, regulations & guidelines
Pre‐conditioned Administrative records National
No Annual
Statistical Report
Management of national physical planning
and urban development information system
Pre‐conditioned Administrative records National No Annual
Publication
Field Inspection Pre‐conditioned Administrative records National No Annual Report
Mentoring LG Land use
compliance/enforcement staff
Pre‐conditioned Administrative records National No Annual Report
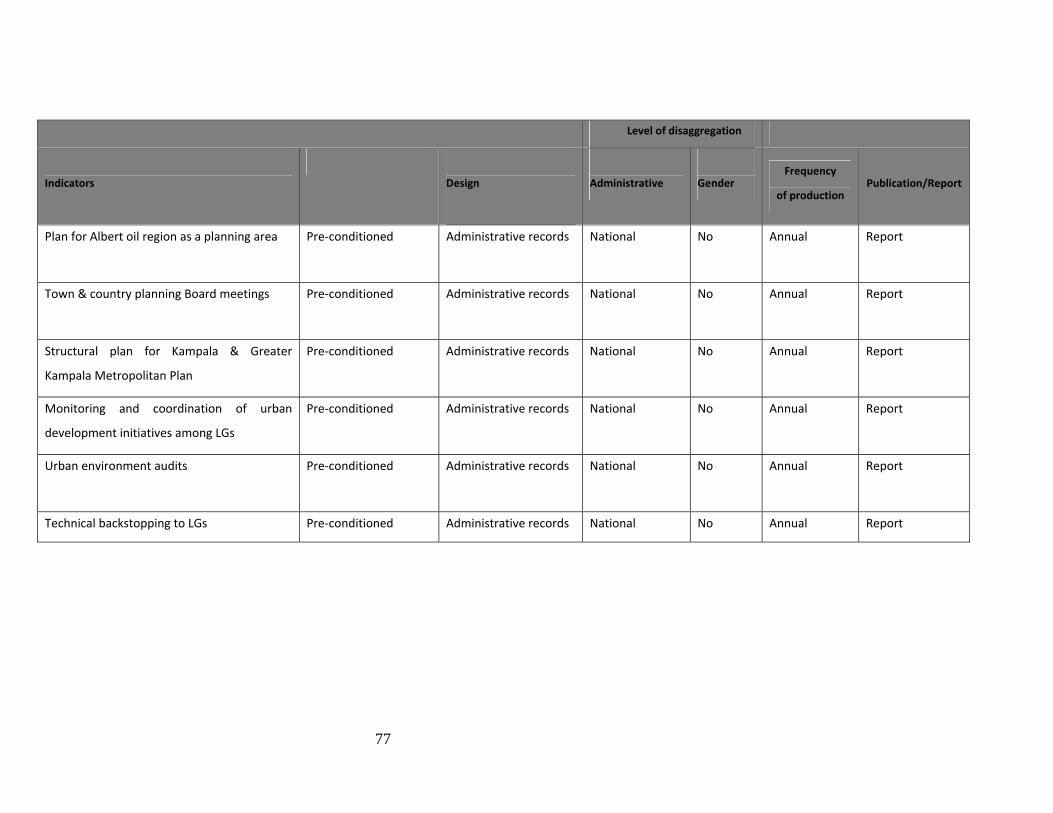
77
Level of disaggregation
Indicators
Design
Administrative
Gender Frequency
of production Publication/Report
Plan for Albert oil region as a planning area Pre‐conditioned Administrative records National No Annual
Report
Town & country planning Board meetings Pre‐conditioned Administrative records National No Annual
Report
Structural plan for Kampala & Greater
Kampala Metropolitan Plan
Pre‐conditioned Administrative records National No Annual
Report
Monitoring and coordination of urban
development initiatives among LGs
Pre‐conditioned Administrative records National No Annual
Report
Urban environment audits Pre‐conditioned Administrative records National No Annual
Report
Technical backstopping to LGs Pre‐conditioned Administrative records National No Annual Report
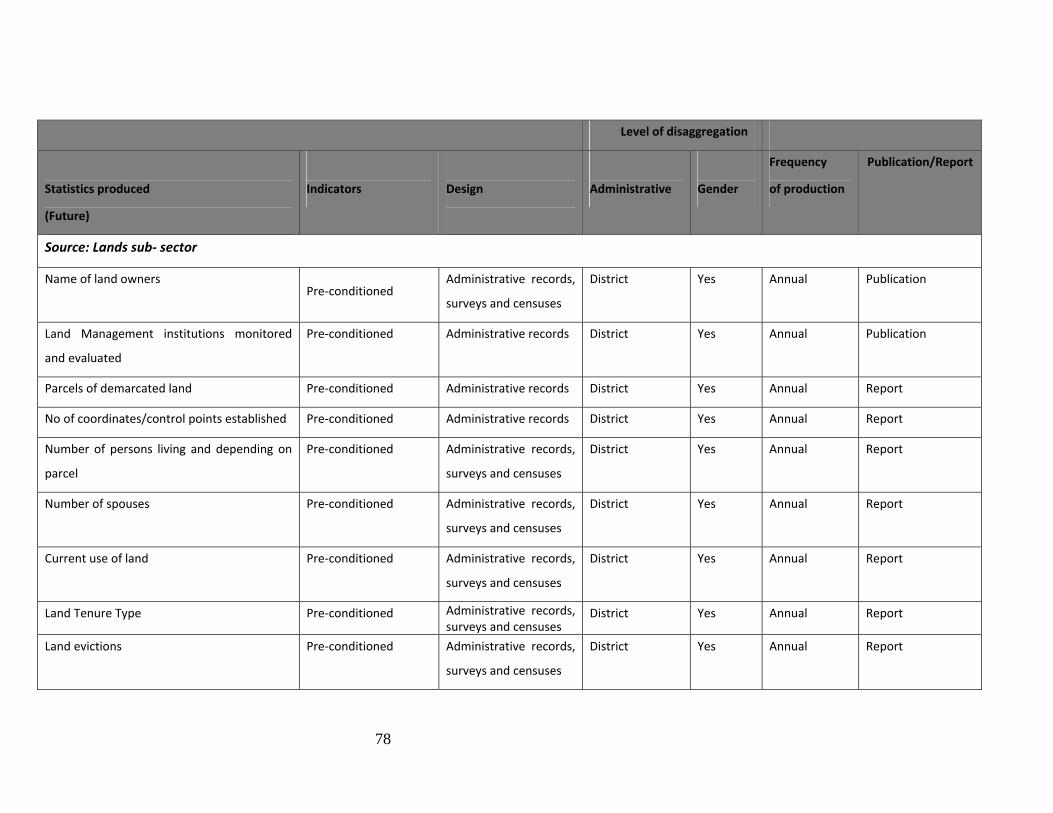
78
Level of disaggregation
Statistics produced
(Future)
Indicators
Design
Administrative
Gender
Frequency
of production
Publication/Report
Source: Lands sub‐ sector
Name of land owners Pre‐conditioned
Administrative records,
surveys and censuses
District Yes Annual Publication
Land Management institutions monitored
and evaluated
Pre‐conditioned Administrative records District Yes Annual Publication
Parcels of demarcated land Pre‐conditioned Administrative records District Yes Annual Report
No of coordinates/control points established Pre‐conditioned Administrative records District Yes Annual Report
Number of persons living and depending on
parcel
Pre‐conditioned Administrative records,
surveys and censuses
District Yes Annual Report
Number of spouses Pre‐conditioned Administrative records,
surveys and censuses
District Yes Annual Report
Current use of land Pre‐conditioned Administrative records,
surveys and censuses
District Yes Annual Report
Land Tenure Type Pre‐conditioned Administrative records, surveys and censuses
District Yes Annual Report
Land evictions Pre‐conditioned Administrative records,
surveys and censuses
District Yes Annual Report

79
Level of disaggregation
Statistics produced
(Future)
Indicators
Design
Administrative
Gender
Frequency
of production
Publication/Report
Source: Housing Sub sector
Preferred housing types.
Pre‐conditioned surveys and censuses National Yes Annual Report
Housing Market segmentation Pre‐conditioned surveys and censuses National No Annual Report
List of other real estate providers Pre‐conditioned Administrative records National No Annual Report
Available mortgage financing in the market Pre‐conditioned Administrative records,
surveys and censuses
National No Annual Report
Sale values at a given point in time.
Pre‐conditioned Administrative records,
surveys and censuses
National No Annual Report
Source: Urban Development sub‐sector
Population
- Population growth
- Population density
- Migration
- Population composition
Pre‐conditioned Administrative records,
surveys and censuses
National Yes Annual Publication
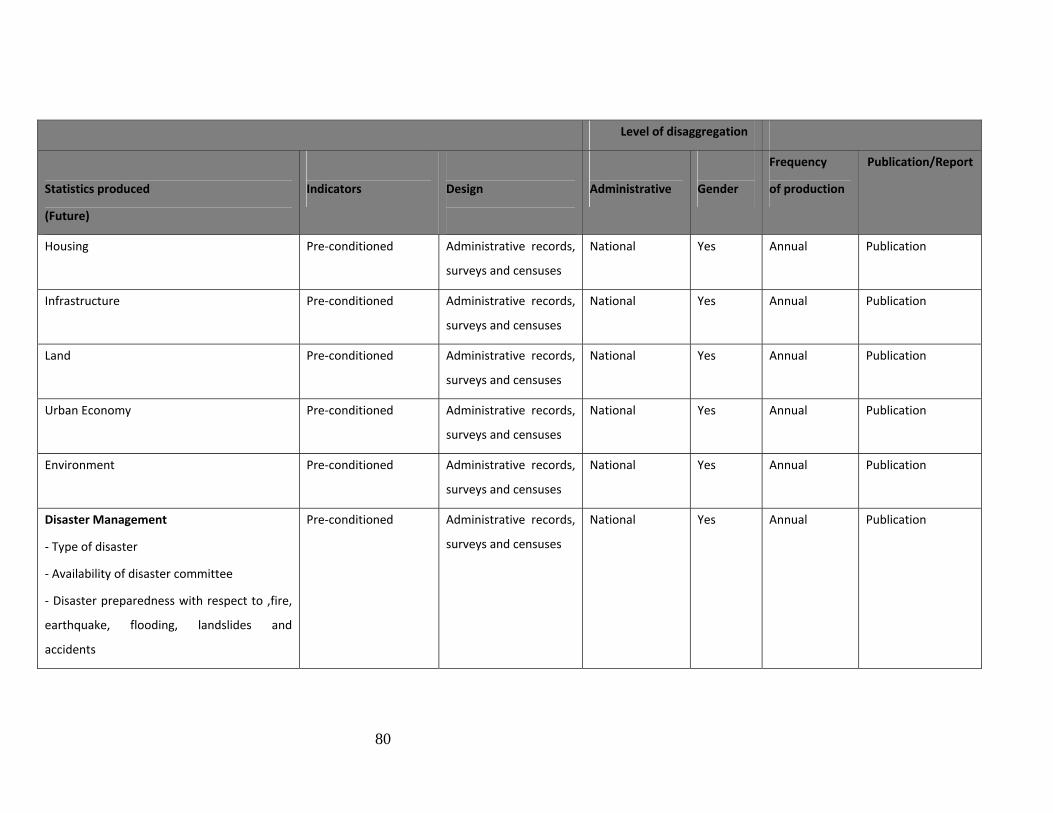
80
Level of disaggregation
Statistics produced
(Future)
Indicators
Design
Administrative
Gender
Frequency
of production
Publication/Report
Housing Pre‐conditioned Administrative records,
surveys and censuses
National Yes Annual Publication
Infrastructure Pre‐conditioned Administrative records,
surveys and censuses
National Yes Annual Publication
Land Pre‐conditioned Administrative records,
surveys and censuses
National Yes Annual Publication
Urban Economy Pre‐conditioned Administrative records,
surveys and censuses
National Yes Annual Publication
Environment Pre‐conditioned Administrative records,
surveys and censuses
National Yes Annual Publication
Disaster Management
‐ Type of disaster
‐ Availability of disaster committee
‐ Disaster preparedness with respect to ,fire,
earthquake, flooding, landslides and
accidents
Pre‐conditioned Administrative records,
surveys and censuses
National Yes Annual Publication
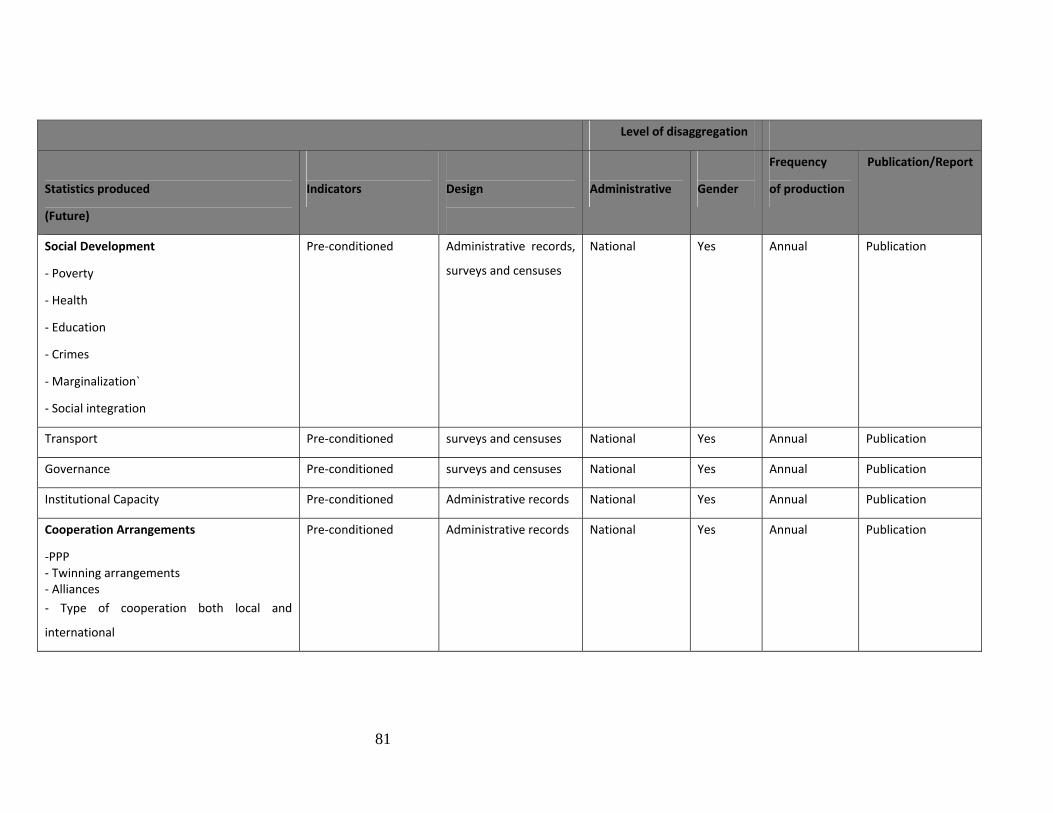
81
Level of disaggregation
Statistics produced
(Future)
Indicators
Design
Administrative
Gender
Frequency
of production
Publication/Report
Social Development
‐ Poverty
‐ Health
‐ Education
‐ Crimes
‐ Marginalization`
‐ Social integration
Pre‐conditioned Administrative records,
surveys and censuses
National Yes Annual Publication
Transport Pre‐conditioned surveys and censuses National Yes Annual Publication
Governance Pre‐conditioned surveys and censuses National Yes Annual Publication
Institutional Capacity Pre‐conditioned Administrative records National Yes Annual Publication
Cooperation Arrangements
‐PPP ‐ Twinning arrangements ‐ Alliances
‐ Type of cooperation both local and
international
Pre‐conditioned Administrative records National Yes Annual Publication

82
APPENDIX D MAPPING AND SURVEYS CADASTRAL MAPS PER DISTRICT LAND OFFICE:
No DLO SCALE CARTRIDGE TOTAL PER DLO
1:50,000 1:10,000 1:2,500
1 Masaka 14 94 13 124 245
2 Mukono 9 5 19 91 124
3 Jinja 5 13 70 6 94
4 Mbarara 9 56 85 47 197
5 Wakiso 12 32 162 123 329
6 Kampala 1 0 44 0 45
7 Mityana 4 15 17 42 78
8 Luwero 6 20 22 46 94
9 Nakasongola/Nakaseke 5 77 6 82 170
10 Kamuli 9 23 44 23 99
11 Kayunga 4 12 1 31 48
12 Mubende 6 96 23 124 249
13 Rakai 4 72 10 54 140
14 Pallisa 2 29 43 15 89
15 Manafwa 3 33 104 21 161
16 Mpigi 7 30 8 80 125
17 Tororo 4 43 125 19 191
18 Sironko 1 19 64 10 94
19 Mbale 2 23 108 17 150
20 Malaba 1 4 6 0 11
21 Busia 2 11 37 0 50
22 Kiruhura 6 120 38 56 220
23 Ssembabule 4 95 2 62 163
24 Isingiro 5 99 19 62 185
25 Apac 17 231 94 40 382
26 West Nile 23 138 133 11 305
27 Ibanda 4 47 47 24 122
28 Bushenyi 7 79 143 55 284
29 Ntungamo 13 85 141 22 261
30 Kyenjojo 5 37 14 95 151
31 Kibaale 10 71 5 115 201
32 Bundibugyo 4 29 19 9 61
33 Bugiri 3 23 39 0 65
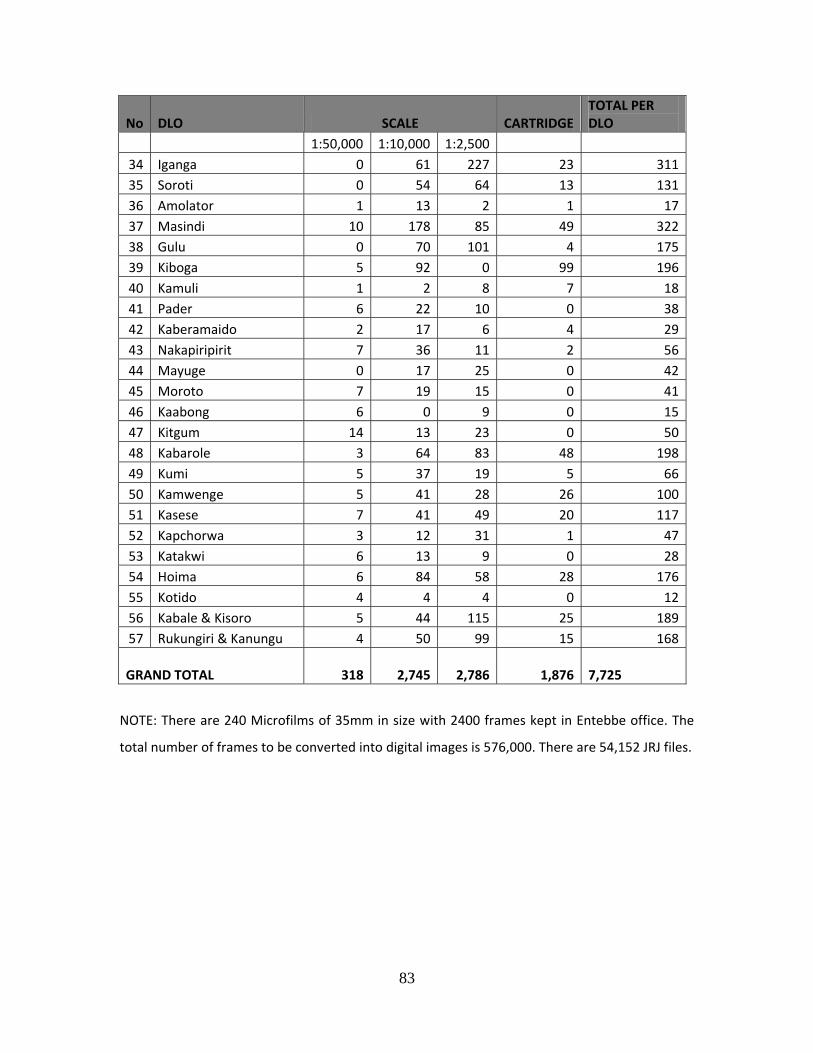
83
No DLO SCALE CARTRIDGE TOTAL PER DLO
1:50,000 1:10,000 1:2,500
34 Iganga 0 61 227 23 311
35 Soroti 0 54 64 13 131
36 Amolator 1 13 2 1 17
37 Masindi 10 178 85 49 322
38 Gulu 0 70 101 4 175
39 Kiboga 5 92 0 99 196
40 Kamuli 1 2 8 7 18
41 Pader 6 22 10 0 38
42 Kaberamaido 2 17 6 4 29
43 Nakapiripirit 7 36 11 2 56
44 Mayuge 0 17 25 0 42
45 Moroto 7 19 15 0 41
46 Kaabong 6 0 9 0 15
47 Kitgum 14 13 23 0 50
48 Kabarole 3 64 83 48 198
49 Kumi 5 37 19 5 66
50 Kamwenge 5 41 28 26 100
51 Kasese 7 41 49 20 117
52 Kapchorwa 3 12 31 1 47
53 Katakwi 6 13 9 0 28
54 Hoima 6 84 58 28 176
55 Kotido 4 4 4 0 12
56 Kabale & Kisoro 5 44 115 25 189
57 Rukungiri & Kanungu 4 50 99 15 168
GRAND TOTAL 318 2,745 2,786 1,876 7,725
NOTE: There are 240 Microfilms of 35mm in size with 2400 frames kept in Entebbe office. The
total number of frames to be converted into digital images is 576,000. There are 54,152 JRJ files.

84
APPENDIX E 2009 Mid‐Year Projected Population for Town Councils District Urban Council 2009 Mid-Year Projected Population
Central
Kalangala Kalangala TC 4,600
Kampala Kampala City 1,533,600
Kayunga Kayunga TC 22,700
Kiboga Kiboga TC 16,000
Luwero Bombo TC 19,900
Luwero TC 28,000
Wobulenzi TC 22,400
Lyantonde Lyantonde TC 8,600
Masaka Lukaya TC 15,000
Masaka MC 72,300
Mityana Mityana TC 38,000
Mpigi Mpigi TC 37,600
Mubende Mubende TC 20,600
Mukono Mukono TC 55,700
Lugazi TC 33,500
Njeru TC 61,300
Nkokonjeru TC 13,300
Nakaseke Nakaseke TC 2,000
Nakasongola Nakasongola TC 7,500
Rakai Rakai TC 6,700
Kalisizo TC 31,400
Kyotera TC 8,600
Ssembabule Sembabule TC 4,500
Wakiso Wakiso TC 19,400
Entebbe MC 73,100
Kakiri TC 5,600
Kira TC 164,700
Nansana TC 82,400
Eastern
Amuria Amuria TC 4,600
Budaka Budaka TC 20,400
Bududa Bududa TC 3,800
Bugiri Bugiri TC 23,500
Bukedea Bukedea TC 33,500
Bukwo Bukwo TC 4,400
Busia Busia TC 44,300
Butaleja Butaleja TC 5,300
Busolwe TC 7,900
Iganga Iganga TC 49,800
Busembatya TC 14,600
Jinja Jinja MC 84,700
Bugembe TC 31,300
Buwenge TC 17,200
Kakira TC 8,100
Kaberamaido Kaberamaido TC 3,200
Kaliro Kaliro TC 12,700
Kamuli Kamuli TC 14,200
Kapchorwa Kapchorwa TC 11,700
Katakwi Katakwi TC 7,700
Kumi Kumi TC 11,900

85
Manafwa Manafwa TC 14,800
LwakhakhaTC 10,000
Mayuge Mayuge TC 11,100
Mbale Mbale MC 86,200
Namutumba Namutumba TC 10,000
Pallisa Pallisa TC 30,000
Sironko Sironko TC 13,300
Soroti Soroti MC 59,200
Tororo Tororo MC 41,300
Malaba TC 9,000
Nagongera TC 11,200 Northern Abim Abim TC 15,700
Adjumani Adjumani TC 30,700
Amolator Amolatar TC 14,000
Amuru Amuru TC -
Apac Apac TC 12,900
Arua Arua MC 55,800
Dokolo Dokolo TC 16,900
Gulu Gulu MC 146,600
Kaabong Kaabong TC 20,900
Kitgum Kitgum TC 55,400
Koboko Koboko TC 45,700
Kotido Kotido TC 20,300
Lira Lira MC 102,200
Moroto Moroto MC 11,000
Moyo Moyo TC 20,500
Nakapiripirit Nakapiripirit TC 2,400
Nebbi Nebbi TC 27,500
Paidha TC 29,100
Pakwach TC 21,300
Oyam Oyam TC 13,600
Pader Pader TC 12,200
Kalongo TC 13,700
Terego/Maracha Nyadri TC 7,100
Yumbe Yumbe TC 26,500
Western
Buliisa Buliisa TC 26,800
Bundibugyo Bundibugyo TC 19,500
Nyahuka TC -
Bushenyi Ishaka-Bushenyi TC 25,800
Kabwohe-Itendero TC 17,700
Hoima Hoima TC 38,700
Kigorobya TC 5,200
Ibanda Ibanda TC 27,100
Kakinga TC 20,800
Isingiro Isingiro TC 20,700
Kabale Kabale MC 43,900
Kabalore Fort Portal MC 45,600
Kamwenge Kamwenge TC 15,700
Kanungu Kanungu TC 14,900
Kihiihi TC 18,500
Kasese Kasese TC 69,200
Bwera – Mpondwe TC 15,500
Hima TC 27,600

86
Katwe Kabatoro TC 7,400
Kibaale Kibaale TC 6,800
Kagadi TC 19,500
Kiruhura Kiruhuura TC 13,100
Kisoro Kisoro TC 12,600
Kyenjojo Kyenjojo TC 19,400
Masindi Masindi TC 40,800
Mbarara Mbarara MC 80,300
Ntungamo Ntungamo TC 15,700
Rukungiri Rukungiri TC 14,000
Total 4,524,700 Source: Uganda Bureau of Statistics
87
APPENDIX F Key Players in the Lands, Housing and Urban Development sector Ministry of Lands, Housing and Urban Development
Land use Management Planned and adequate housing
Ministry of Works and Transport
Promotes standards in the construction industry
Plans, develops and maintains efficient transport infrastructure.
Local authorities i.e. Kampala City Council Plays an indirect role through development control.
Non-Governmental Organizations Active in community development and slum upgrading
NGOs include WFP,ACF-USA, Red cross, AMREF,CPAR
Activities identified by NGOs are water/sanitation (36%) distribution (23%)
nutrition (9%) and school construction (9%)
Community and traditional actors in urban land delivery Improve water supply, drainage systems, roads and Housing microfinance for
households
Uganda Land Alliance Address the needs of the poor with regard to access to land, protection of land rights and inclusive policy reform Uganda Women’s Land Access Trust
Mobilization of capital through community savings
Partnerships with financial intermediaries using credit guarantees to finance
housing development.
Improve policy changes on tenure security housing
Promotes affordable housing in an organized environment
Builds capacity for urban poor.
UWLAT target is to build about 200 homes in Jinja district.
88
Housing Finance Bank of Uganda Assists in buying a finished house
Lends funds necessary to complete a house
Approved mortgage of 15-20% annually.
80 housing units
Invests in estates to serve as models
Real estate developers and agents To develop real estates
International Organizations
UN Habitat
Transforming settlements for the urban poor in Uganda
USAID
Supports voluntary return of IDPs to their homes Increases access to information
UNDP
Improving overall conditions of the people living in slums
Slum Aid Project (SAP)
Generate and disseminate information on Uganda’s slums
Good Earth Trust
Environmentally sustainable and socially responsive, building construction projects for housing.
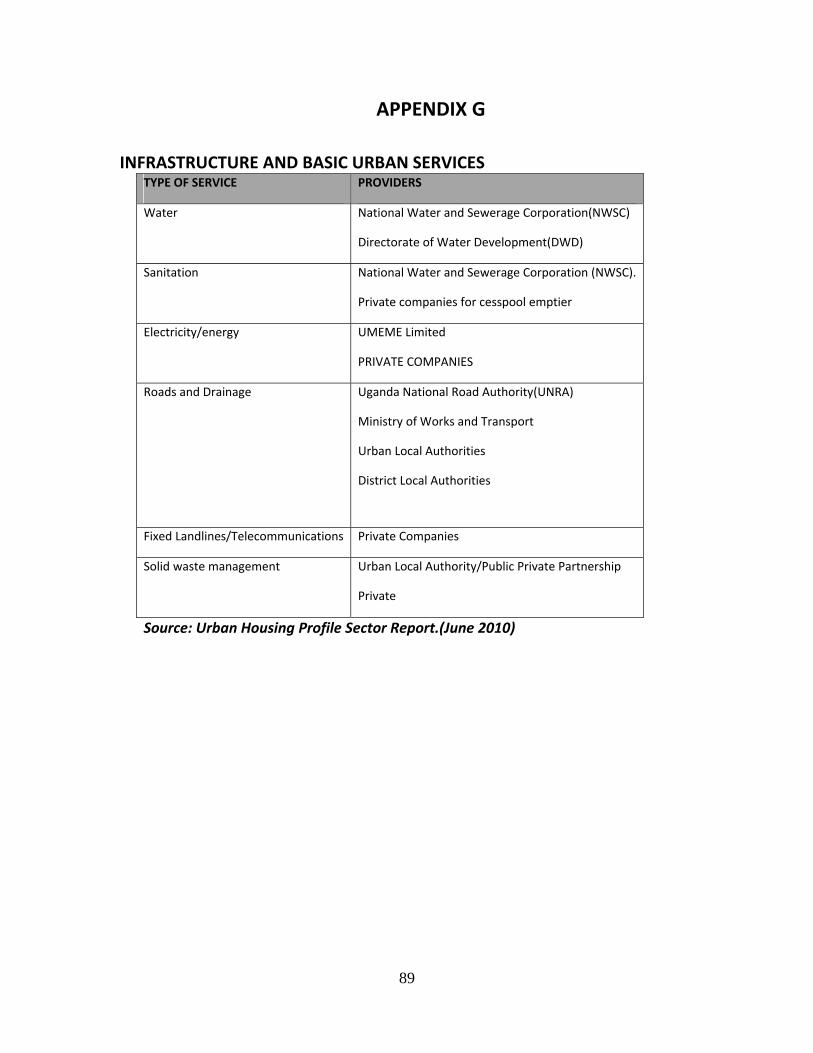
89
APPENDIX G
INFRASTRUCTURE AND BASIC URBAN SERVICES TYPE OF SERVICE PROVIDERS
Water National Water and Sewerage Corporation(NWSC)
Directorate of Water Development(DWD)
Sanitation National Water and Sewerage Corporation (NWSC).
Private companies for cesspool emptier
Electricity/energy UMEME Limited
PRIVATE COMPANIES
Roads and Drainage Uganda National Road Authority(UNRA)
Ministry of Works and Transport
Urban Local Authorities
District Local Authorities
Fixed Landlines/Telecommunications Private Companies
Solid waste management Urban Local Authority/Public Private Partnership
Private
Source: Urban Housing Profile Sector Report.(June 2010)
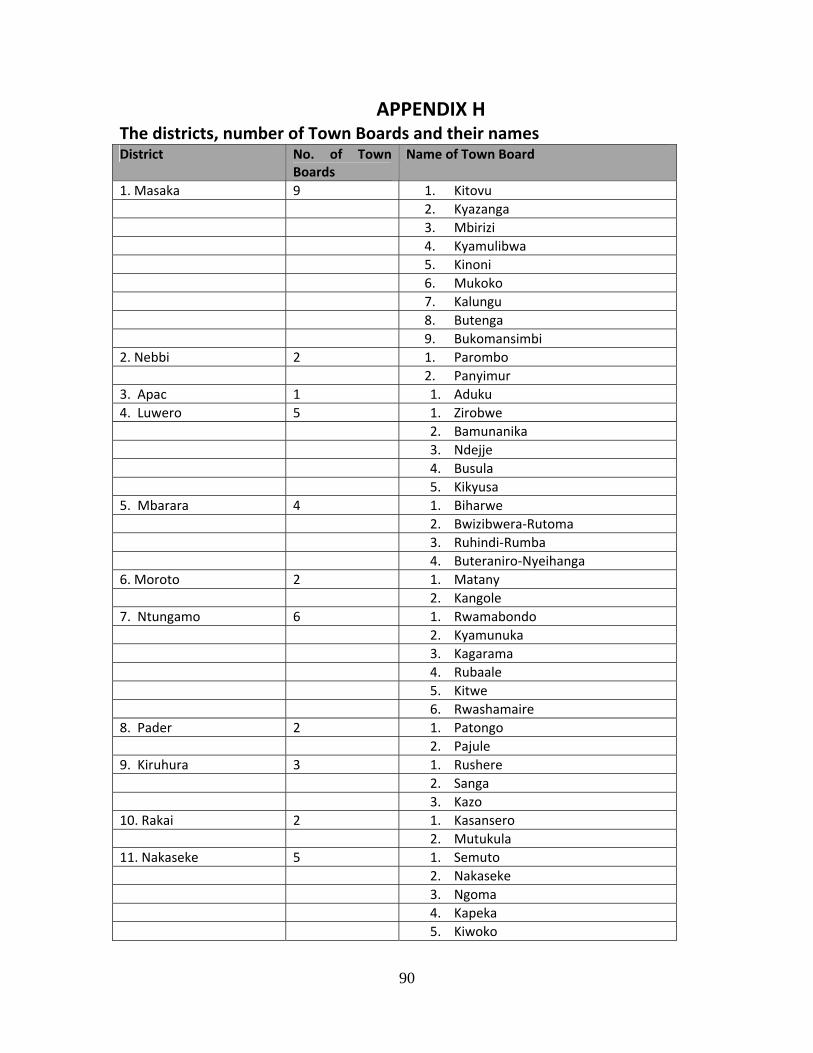
90
APPENDIX H The districts, number of Town Boards and their names District No. of Town
Boards Name of Town Board
1. Masaka 9 1. Kitovu
2. Kyazanga
3. Mbirizi
4. Kyamulibwa
5. Kinoni
6. Mukoko
7. Kalungu
8. Butenga
9. Bukomansimbi
2. Nebbi 2 1. Parombo
2. Panyimur
3. Apac 1 1. Aduku
4. Luwero 5 1. Zirobwe
2. Bamunanika
3. Ndejje
4. Busula
5. Kikyusa
5. Mbarara 4 1. Biharwe
2. Bwizibwera‐Rutoma
3. Ruhindi‐Rumba
4. Buteraniro‐Nyeihanga
6. Moroto 2 1. Matany
2. Kangole
7. Ntungamo 6 1. Rwamabondo
2. Kyamunuka
3. Kagarama
4. Rubaale
5. Kitwe
6. Rwashamaire
8. Pader 2 1. Patongo
2. Pajule
9. Kiruhura 3 1. Rushere
2. Sanga
3. Kazo
10. Rakai 2 1. Kasansero
2. Mutukula
11. Nakaseke 5 1. Semuto
2. Nakaseke
3. Ngoma
4. Kapeka
5. Kiwoko

91
District No. of Town Boards
Name of Town Board
12. Iganga 4 1. Idudi
2. Bulanga
3. Kiyunga
4. Namungwale
13. Kaliro 3 1. Bulumba
2. Nawaikoke
3. Namwiwa
14. Mukono 4 1. Katosi
2. Nakifuma
3. Bwikwe
4. Kasawo
15. Tororo 2 1. Magodesi / Molo
2. Meirkit
16. Oyam 2 1. Kamdini
2. Loro
17. Sironko 4 1. Budadiri
2. Muyembe
3. Buyaga
4. Bulegeni
18. Bushenyi 18 1. Masheruka
2. Kitagata
3. Bugongi
4. Shuuka
5. Rwentuha
6. Kizinda
7. Kashenyi
8. Butare
9. Kyabugimbi
10. Mitoomo
11. Kashenshero 12. Mutara
13. Kabira 14. Ndekye/Nyakashura 15. Katerera 16. Karungu 17. Kashenyi‐Akajani 18. Yakashaka 19. Manafwa 12 1. Magale
2. Butiru
3. Bumbo
4. Tsakhana
5. Bukhaweka
6. Masaka
7. Buwangani

92
District No. of Town Boards
Name of Town Board
8. Bugobero
9. Busambatsa
10. Luuwa 11. Ikaali 12. Bututu 20. Bundibugyo 1 1. Karugutu
21. Kisoro 2 1. Bunagana
2. Rubuguli
22.Masindi 6 1. Bweyale
2. Karuma
3. Kabango
4. Kyatiri
5. Buliima
6. Kigumba
23. Mbale 3 1. Busui
2. Nawuyo
3. Nakaloke
24. Soroti 2 1. Serere
2. Tubur
25. Mayuge 1 1. Magamaga
26. Adjumani 1 1. Pakele
27. Kabale 3 1. Katuna
2. Mulore
3. Muhanga
28. Pallisa 5 1. Kadama
2. Kakoro
3. Kibuku
4. Tirinyi
5. Kabwangasi
29. Arua 2 1. Ovisoni
2. Rhino Camp
30. Isingiro 4 1. Kaberebere
2. Kikagati
3. Endizi
4. Kabuyanda
31. Ibanda 2 1. Rushango
2. Igorora
32. Wakiso 2 1. Kyengera
2. Mattuga
33. Bugiri 6 1. Buwuni
2. Namayembe
3. Busoowa
4. Nankoma
5. Muterere

93
District No. of Town Boards
Name of Town Board
6. Namayingo
34. Butaleja 1 1. Nabiganda
35. Kabarole 5 1. Rwimi
2. Rubona
3. Kibiito
4. Nyakigumba
5. Karago
36. Mityana 2 1. Busunju
2. Kakindu
37. Mpigi 5 1. Buwama
2. Kamengo
3. Kibibi
4. Bulo
5. Kayabwe
38. Kayunga 3 1. Kitwe – Nakyessa
2. Kangulumira
3. Busaana
39. Rukungiri 4 1. Buyanja
2. Kebisoni
3. Rwerere
4. Bukurungu
40. Amuria 6 1. Orungo
2. Wera
3. Asamuk
4. Akore Acowa
5. Kapele byong
6. Obalanga
41. Amuru 6 1. Atiak
2. Bibia
3. Anaka
4. Koch Goma
5. Alero
6. Pabbo
42. Bududa 9 1. Nangako
2. Kikholo
3. Bunamubi
4. Bubiita
5. Kuushu
6. Luukhonje
7. Iki‐Iki
8. Kaderuna
9. Kamonkoli
43. Bukwo 1 1. Suam
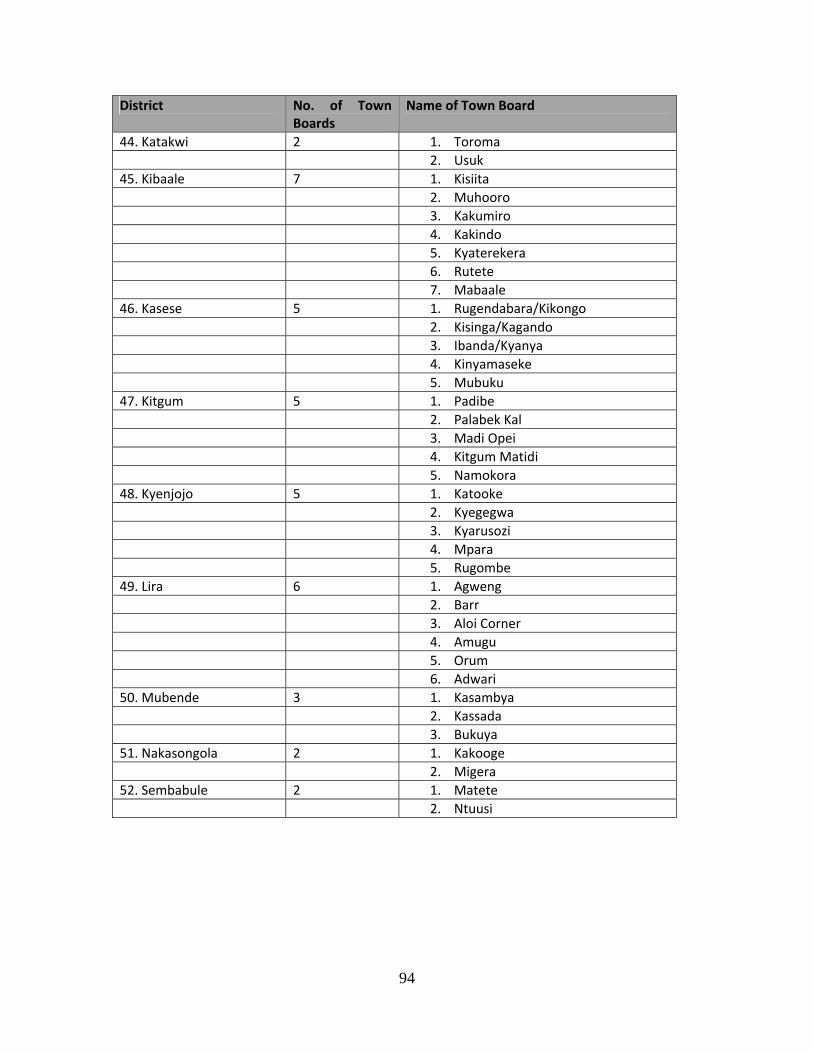
94
District No. of Town Boards
Name of Town Board
44. Katakwi 2 1. Toroma
2. Usuk
45. Kibaale 7 1. Kisiita
2. Muhooro
3. Kakumiro
4. Kakindo
5. Kyaterekera
6. Rutete
7. Mabaale
46. Kasese 5 1. Rugendabara/Kikongo
2. Kisinga/Kagando
3. Ibanda/Kyanya
4. Kinyamaseke
5. Mubuku
47. Kitgum 5 1. Padibe
2. Palabek Kal
3. Madi Opei
4. Kitgum Matidi
5. Namokora
48. Kyenjojo 5 1. Katooke
2. Kyegegwa
3. Kyarusozi
4. Mpara
5. Rugombe
49. Lira 6 1. Agweng
2. Barr
3. Aloi Corner
4. Amugu
5. Orum
6. Adwari
50. Mubende 3 1. Kasambya
2. Kassada
3. Bukuya
51. Nakasongola 2 1. Kakooge
2. Migera
52. Sembabule 2 1. Matete
2. Ntuusi
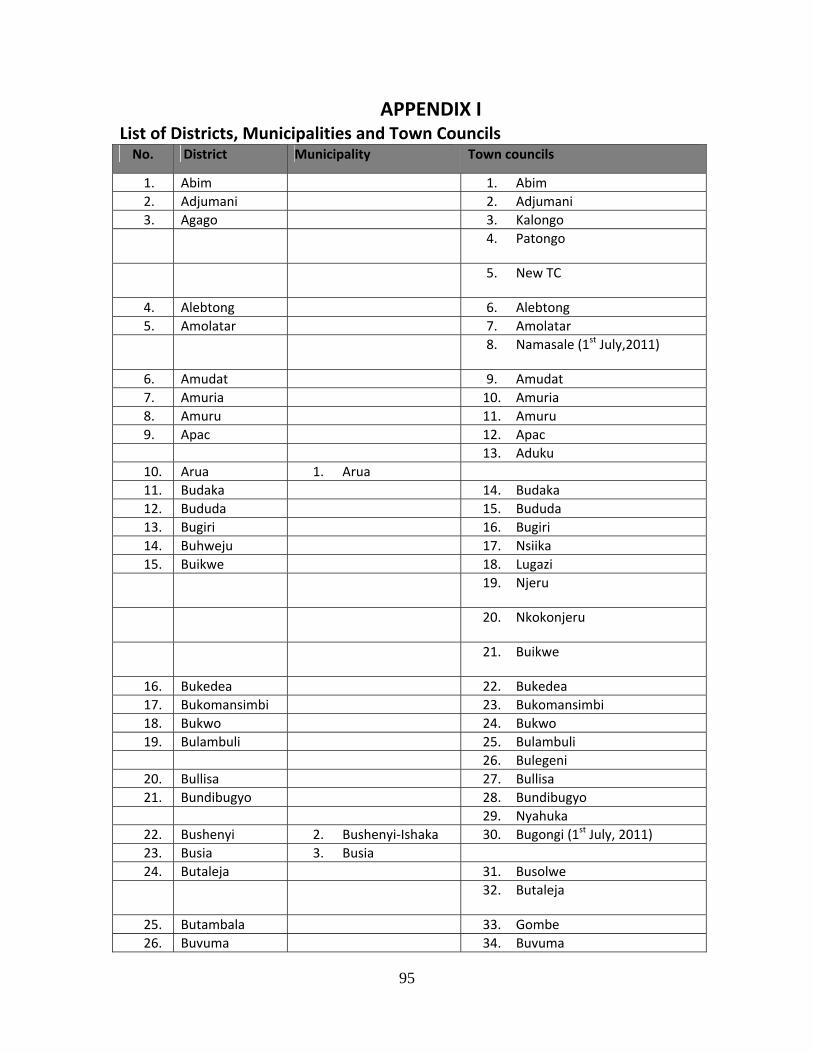
95
APPENDIX I List of Districts, Municipalities and Town Councils No. District Municipality Town councils
1. Abim 1. Abim
2. Adjumani 2. Adjumani
3. Agago 3. Kalongo
4. Patongo
5. New TC
4. Alebtong 6. Alebtong
5. Amolatar 7. Amolatar
8. Namasale (1st July,2011)
6. Amudat 9. Amudat
7. Amuria 10. Amuria
8. Amuru 11. Amuru
9. Apac 12. Apac
13. Aduku
10. Arua 1. Arua
11. Budaka 14. Budaka
12. Bududa 15. Bududa
13. Bugiri 16. Bugiri
14. Buhweju 17. Nsiika
15. Buikwe 18. Lugazi
19. Njeru
20. Nkokonjeru
21. Buikwe
16. Bukedea 22. Bukedea
17. Bukomansimbi 23. Bukomansimbi
18. Bukwo 24. Bukwo
19. Bulambuli 25. Bulambuli
26. Bulegeni
20. Bullisa 27. Bullisa
21. Bundibugyo 28. Bundibugyo
29. Nyahuka
22. Bushenyi 2. Bushenyi‐Ishaka 30. Bugongi (1st July, 2011)
23. Busia 3. Busia
24. Butaleja 31. Busolwe
32. Butaleja
25. Butambala 33. Gombe
26. Buvuma 34. Buvuma

96
No. District Municipality Town councils
27. Buyende 35. Buyende
28. Dokolo 36. Dokolo
29. Gomba 37. Kanoni
30. Gulu 4. Gulu
31. Hoima 5. Hoima 38. Kigorobya
32. Ibanda 39. Ibanda
40. Ishongoro
41. Rushango
42. Igorora (1st July, 2011)
33. Iganga 6. Iganga 43. Busembatya
34. Isingiro 44. Isingiro
45. Kabarebere
46. Kabuyanda
35. Jinja 7. Jinja 47. Bugembe
48. Buwenge
49. Kakira
36. Kaabong 50. Kaabong
37. Kabale 8. Kabale 51. Hamurwa
52. Muhanga (1st July, 2011)
53. Katuna (1st July, 2011)
38. Kabarole 9. Fort Portal 54. Kibiito
55. Rwimi
56. Kijura
57. Rubona (1st July, 2011)
58. Kiko (1st July, 2011)
39. Kaberamaido 59. Kaberamaido
40. Kalangala 60. Kalangala
41. Kaliro 61. Kaliro
42. Kalungu 62. Lukaya
63. Kalungu
43. Kampala*
44. Kamuli 64. Kamuli
45. Kamwenge 65. Kamwenge
46. Kanungu 66. Kanungu
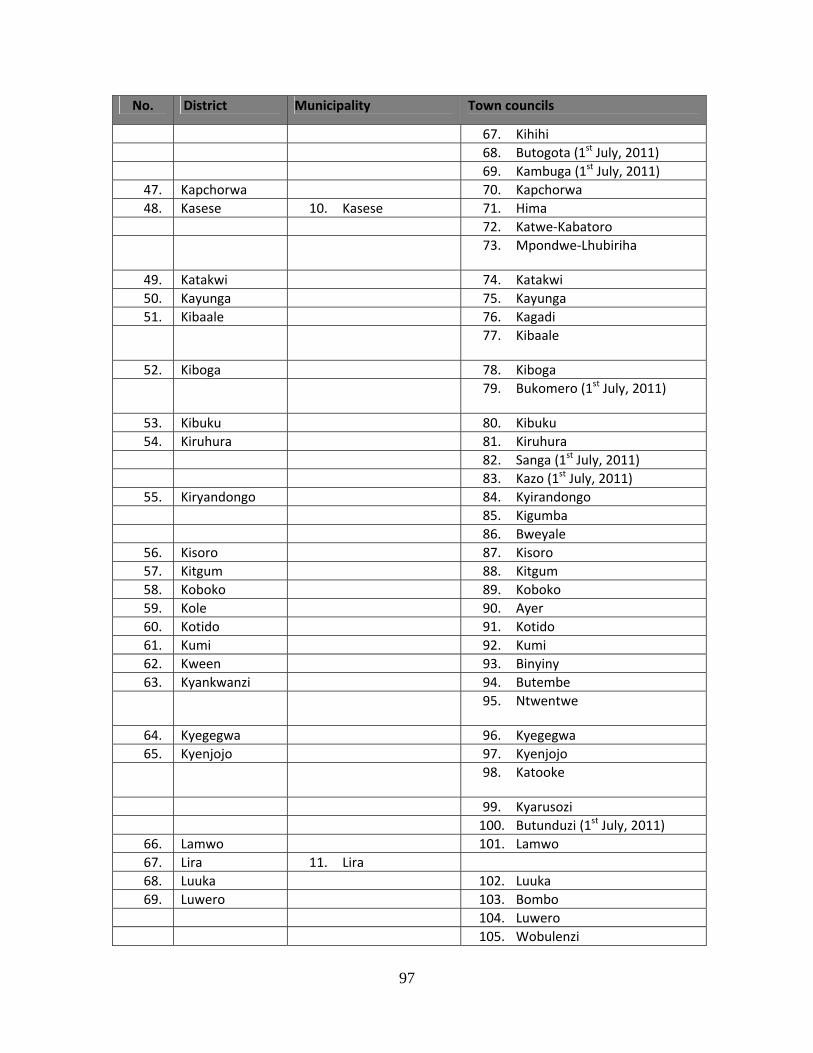
97
No. District Municipality Town councils
67. Kihihi
68. Butogota (1st July, 2011)
69. Kambuga (1st July, 2011)
47. Kapchorwa 70. Kapchorwa
48. Kasese 10. Kasese 71. Hima
72. Katwe‐Kabatoro
73. Mpondwe‐Lhubiriha
49. Katakwi 74. Katakwi
50. Kayunga 75. Kayunga
51. Kibaale 76. Kagadi
77. Kibaale
52. Kiboga 78. Kiboga
79. Bukomero (1st July, 2011)
53. Kibuku 80. Kibuku
54. Kiruhura 81. Kiruhura
82. Sanga (1st July, 2011)
83. Kazo (1st July, 2011)
55. Kiryandongo 84. Kyirandongo
85. Kigumba
86. Bweyale
56. Kisoro 87. Kisoro
57. Kitgum 88. Kitgum
58. Koboko 89. Koboko
59. Kole 90. Ayer
60. Kotido 91. Kotido
61. Kumi 92. Kumi
62. Kween 93. Binyiny
63. Kyankwanzi 94. Butembe
95. Ntwentwe
64. Kyegegwa 96. Kyegegwa
65. Kyenjojo 97. Kyenjojo
98. Katooke
99. Kyarusozi
100. Butunduzi (1st July, 2011)
66. Lamwo 101. Lamwo
67. Lira 11. Lira
68. Luuka 102. Luuka
69. Luwero 103. Bombo
104. Luwero
105. Wobulenzi
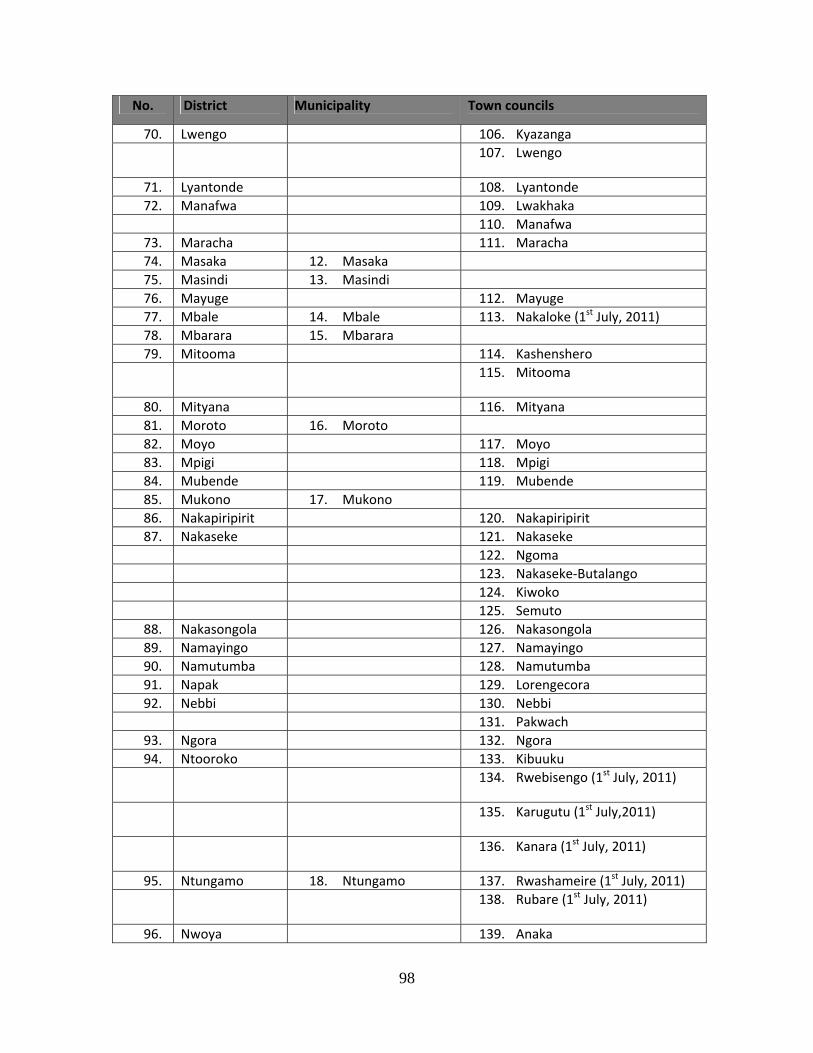
98
No. District Municipality Town councils
70. Lwengo 106. Kyazanga
107. Lwengo
71. Lyantonde 108. Lyantonde
72. Manafwa 109. Lwakhaka
110. Manafwa
73. Maracha 111. Maracha
74. Masaka 12. Masaka
75. Masindi 13. Masindi
76. Mayuge 112. Mayuge
77. Mbale 14. Mbale 113. Nakaloke (1st July, 2011)
78. Mbarara 15. Mbarara
79. Mitooma 114. Kashenshero
115. Mitooma
80. Mityana 116. Mityana
81. Moroto 16. Moroto
82. Moyo 117. Moyo
83. Mpigi 118. Mpigi
84. Mubende 119. Mubende
85. Mukono 17. Mukono
86. Nakapiripirit 120. Nakapiripirit
87. Nakaseke 121. Nakaseke
122. Ngoma
123. Nakaseke‐Butalango
124. Kiwoko
125. Semuto
88. Nakasongola 126. Nakasongola
89. Namayingo 127. Namayingo
90. Namutumba 128. Namutumba
91. Napak 129. Lorengecora
92. Nebbi 130. Nebbi
131. Pakwach
93. Ngora 132. Ngora
94. Ntooroko 133. Kibuuku
134. Rwebisengo (1st July, 2011)
135. Karugutu (1st July,2011)
136. Kanara (1st July, 2011)
95. Ntungamo 18. Ntungamo 137. Rwashameire (1st July, 2011)
138. Rubare (1st July, 2011)
96. Nwoya 139. Anaka

99
No. District Municipality Town councils
97. Otuke 140. Otuke
98. Oyam 141. Oyam
99. Pader 142. Pader
100. Pallisa 143. Pallisa
101. Rakai 144. Kalisizo
145. Kyotera
146. Rakai
102. Rubirizi 147. Katerera
148. Rubirizi
103. Rukungiri 19. Rukungiri
104. Sembabule 149. Sembabule
150. Mateete (1st July, 2011)
105. Serere 151. Serere
152. Kasilo (1st July, 2011)
106. Sheema 153. Kabwohe‐Itendero
154. Kibingo
107. Sironko 155. Budadiri
156. Sironko
108. Soroti 20. Soroti
109. Tororo 21. Tororo 157. Malaba
158. Nagongera
110. Wakiso 22. Entebbe 159. Kakiri
160. Kira
161. Nansana
162. Wakiso
111. Yumbe 163. Yumbe
112. Zombo 164. Paidha
165. Zombo
Kampala* = City Districts = 112 Municipalities = 22 Town councils = 165
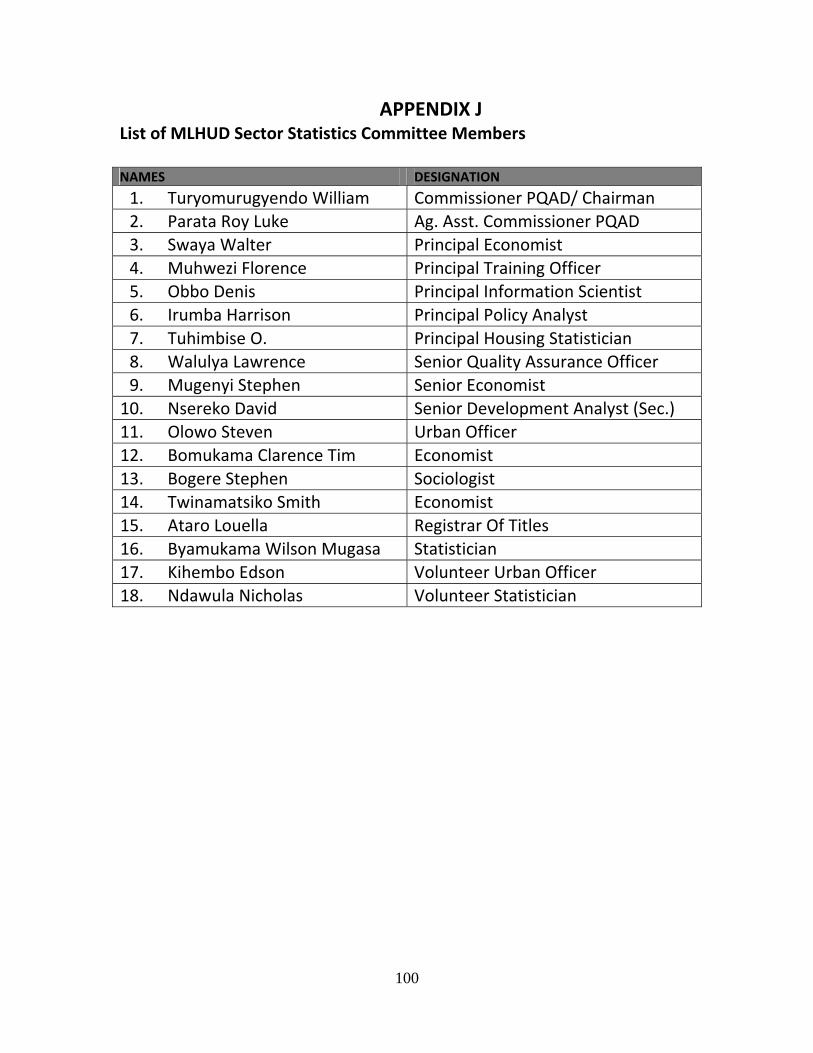
100
APPENDIX J List of MLHUD Sector Statistics Committee Members NAMES DESIGNATION
1. Turyomurugyendo William Commissioner PQAD/ Chairman
2. Parata Roy Luke Ag. Asst. Commissioner PQAD
3. Swaya Walter Principal Economist
4. Muhwezi Florence Principal Training Officer
5. Obbo Denis Principal Information Scientist
6. Irumba Harrison Principal Policy Analyst
7. Tuhimbise O. Principal Housing Statistician
8. Walulya Lawrence Senior Quality Assurance Officer
9. Mugenyi Stephen Senior Economist
10. Nsereko David Senior Development Analyst (Sec.)
11. Olowo Steven Urban Officer
12. Bomukama Clarence Tim Economist
13. Bogere Stephen Sociologist
14. Twinamatsiko Smith Economist
15. Ataro Louella Registrar Of Titles
16. Byamukama Wilson Mugasa Statistician
17. Kihembo Edson Volunteer Urban Officer
18. Ndawula Nicholas Volunteer Statistician