m \^€\ T ftw n STATISTICAL ABSTRACT OF MAHARASHTRA ...
718
m \^€\ T ftw n STATISTICAL ABSTRACT OF MAHARASHTRA STATE 1 9 8 6 - 8 7
-
Upload
khangminh22 -
Category
Documents
-
view
0 -
download
0
Transcript of m \^€\ T ftw n STATISTICAL ABSTRACT OF MAHARASHTRA ...
m \ ^ € \ T f t w n
STATISTICAL ABSTRACTOF
MAHARASHTRA STATE
1 9 8 6 - 8 7
■5ns;5n-W €tt-« OiRECTOflATE O F ECO N O M ICS & STATtSD CS. BOMBAY
STATISTICAL ABSTRACTOF
S!AHARASHTRA STATE
1 9 8 6 - 8 7
3TS$ gr 5TT?R, ^
DIRECTORATE OF ECONOMICS AND STATISTICS g o v e r n m e n t OF MAHARASHTRA
BOMBAY
UBRAT/ r ^ 'ir ” '-"at:on cenfr .Nar . , ' . ' u -rioouF
. . . . ■ . . f io n .17-B, ’rn Mjig,N e w D t lb i 'J i« - 0 i6 I * 7 / 'DOC, N o ................J ^ ” « / . i . . . / J
.........................
I sR?m5T irr ih n f t ^ im < ft a rm irt?*ft
H w i^ ^ fWTT VrSTTtT 3 0 ^ 3 T ^ ^ m iTTfe^cftH «ITf^«MI 3TV 3TTt. ^ SWTfPTTfT
*T5TTT«5 TT^JTTfftw «n f«w n m m ffltf i n v h n > ? * n ^ ? rw ?ft m
^ t m r 3Tr?ft a n | . ^ ^3^j?sss( Tn^t ^ a w m ^ ^*t?5«t
^ m cT 3H^'V 3TT|.
^ 3 ^ 7 H i f e r ^ *T^ f k ? ^ iThvt TTJ?T ^fW ^TT ^TTOtcT ^'^o-qll
fW T ? ft^ H T T m s m w ^ i n i t t q v f e aNmng??
« f ^ a r? ^ 3Tr^ 3tt| cT. m ^gft^uT s n r r ^ ct ^ tt q ^ ^ r r s t in arvTcft^s
rT??iTf®Ti ^ i r n n j t tn ^ w h m ajspRftH a r w % ^ptrN? ^ m ? r a n ^ .
V m % 5 m i m * T $ T ^ T T W ^ JT^rmr ^ «pr?Jt stt itH t
n m ^ n VT»tm r sn^yr a n ^ .
'^ ‘ JT^TTTW TT51T n ?m fTt^ H H T T f^ ^ 3 T r f^ 3T«ni?T ^
?ftS'JTf=irhTT I H » IKH ^ ^ 5 > f^ 3T?ft 3 m n 3TT .
IITTTH ^Ti ?TTH»T> ^^TTf^F tit^ T 3TTfrt ^rTC f^TTfiTTTcSt ^TRft ^ v m f ^ 9
rrffft 3 T R m eft snrr?Tfn5!TT *n 3t cT » w i tfrs1 fn i^T
m a r r u r d 3 n | .
P R E F A C E
T h e Statistical A b stract for the year 1986-87 (b oth in M arathi and in E nglish ) is the tw en ty -secon d in th e series. It g ives data o n so c io eco n o m ic characteristics o f the State m ostly for the year 1986-87.
2 . F rom the issue o f 1982-83 and 1983-84 (com b in ed ) the form o f th is p u b lica tion is som e w hat m od ified b y tak in g in to accou n t th e recom m en d ation s o f the Central^Statistical O rgan isation , N e w D elh i for preparation o f S tate S ta tistica l A b stracts. F or facilita tin g reference to th e tab les in the previous issu e o f sim ilar p u b lica tio n i. e. 1 9 8 4 -8 5 an d 1985-86 (com bined), th e serial num bers o f the tab les as g iven in the prev iou s issue is a lso g iven in the brack et a fter the serial num bers o f the tab les in th e present p u b lica tio n .
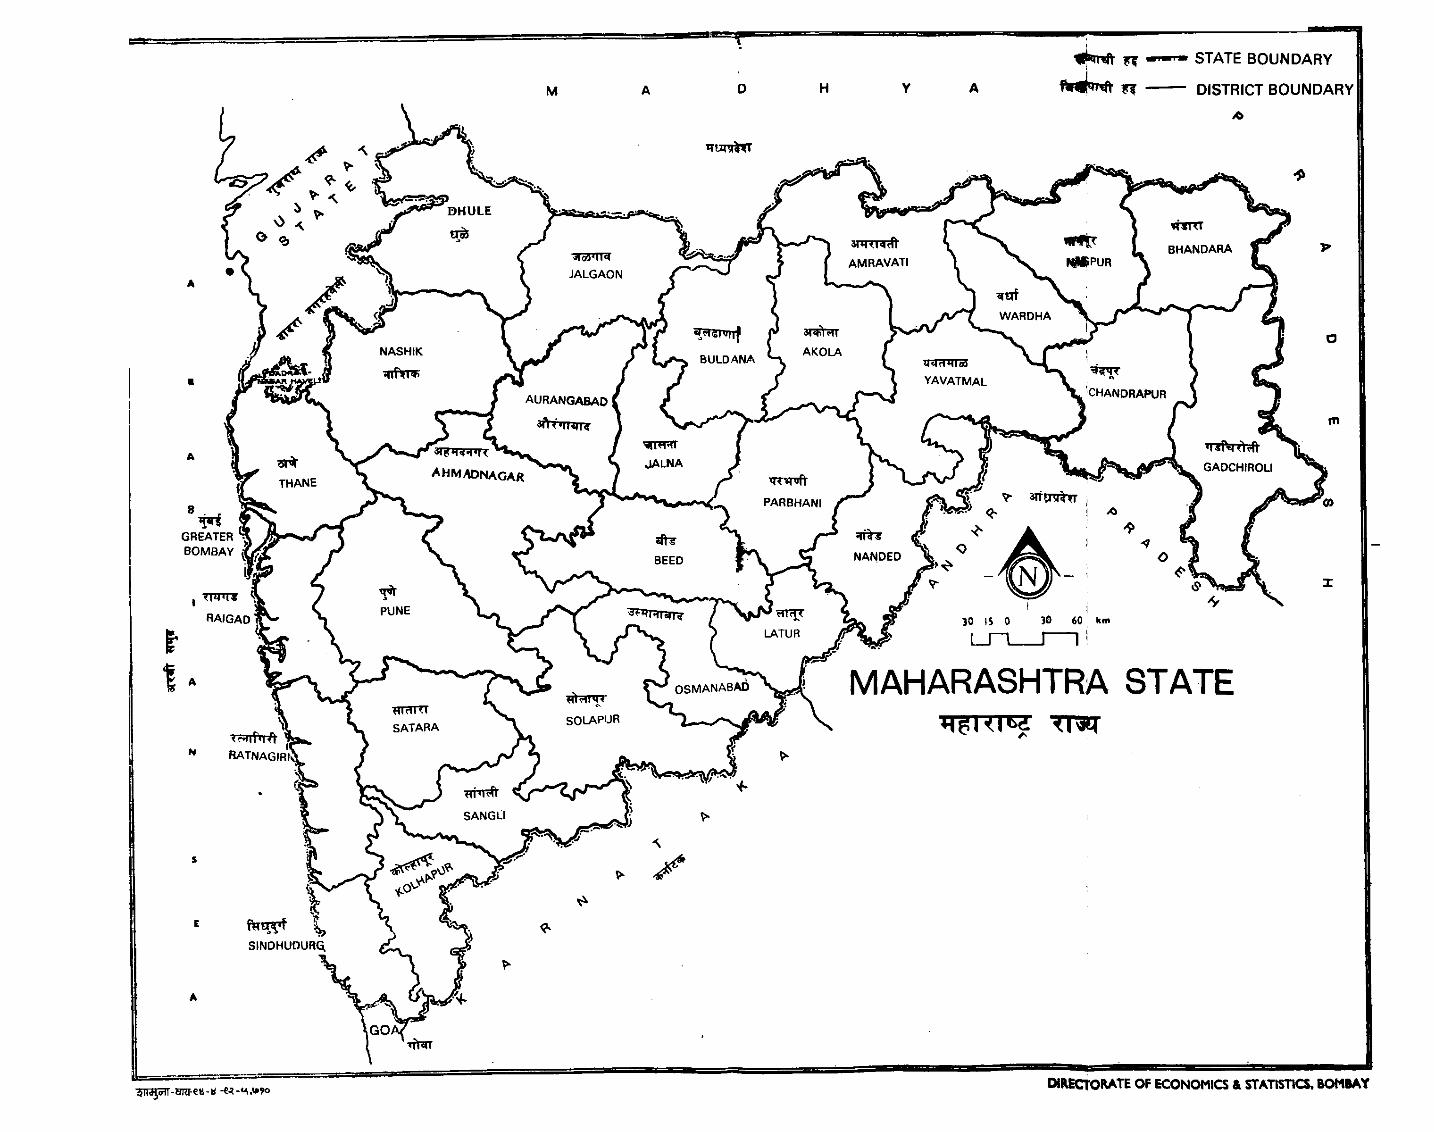
3 . A m ap o f M aharashtra S tate and charts have a lso been in clu d ed in th is issu e .
4 . It is h op ed that th is pu b lication w ill b e fou n d useful as a reference b o o k by th ose interested in so c io econ om ic studies o f M aharashtra and i ^ d istr icts ,
5 . I am th an k fu l to the different departm ents and offices o f th e State G overn m en t, G overnm ent o f Ind ia , L oca l B od ies and other o rg a n isa tio n s for their co -op eration in supp ly ing requisite data fo r in c lu sio n in th is p u b lica tion .
A . K . K A G A L K A R ,
B om b ay 1 D irector o f E con om ics an dD a te d M arch , 1 9 9 U S ta tistics , B om bay.
T I W ’fN ^T T T
STATISTICAL ABSTRACT OF MAHARASHTRA STATE1986.87
?rwT
Table No. (1) (2 )
T«5^.PageNo.(3 )
Subject
(2 )
(i) f TF^rraqr {it) s r m n fe
( m ) 3Tr%g( i v ) 5 f«?#TnT * r f r r r ^ ( w r r ^ v r f ^ , »n’ OTT
(t;) mrmT%(v /) 5r??Rn:
.1* (1 -0 1-2 ( 1 7 )
1-3 (1 -7 )
1 .3 A ( ^ )
1-4 (1 -2 )
1-5 (1 -01*6 (1 -3 )
1*6 A ( 1 4 )
1*7 ( 1 5 )
1-8 (21)
1-9M O
( 2 0
( - )
M l ( - )
1 1 2
M 3
1 .1 4
M 5
M 6
M 7
M 8
( - )( - )( - )(1 -6 )
( - )( - )(2 -2 )
1 -1 9 (2 -3 )
1-20 (2-4)
1-21 ( 2 5 )
1 . w aq>3 a t r o W T :
'a n w a T O ar « y * « w i
3(!J1JF?3 3>r?re!IT
s r w f h r ‘i r w x
in% 5 "T w r
%«'srt% r i tT O ^ g r t anfhRTT . .
9J^/5T ?T ? T f ^ . .
gi^ < i^O, jfF T ^ ’(T m H t 3TTfir im f K
^ KlTilTtft^ ^^TcTl ^ « T r ,w -T ^m r ^ jt
^T»T ^ T o n r ST ^ ^ ^ 5 ^ . .^ T T : ^rt*f a[r?Tin=EiHt st tttt-
^ r f r .
jrmrT^>Fw n.
T T ^ ^ r r 555V
3r7^r=?=T iT R ft^T ?rr5R ^% srm w
3 T ^ r^ fT 5rmrTr-oiiT ^ r r e r r ^ 5P im
f w c 9 1 ^ ®pTurnn% «*r^-miT im -5R rrr
X TT iT T ^ TTcft s i P R m r r ^ s p n n rR t^S E T ^ g W ^ R ( f ^ ^ i r , jsnrm).
3fta^f»n? ^ ^roirr=d% (w r fW ^ _
s r f w ^ ^ 5 ^ ^ ^rr i^ fW ^ rrrT ^ TTori^in% sr f tm r
Njtl>ra^ JTTffTR
(XV)(xvii)(xix)
1
72 5
43
46474849 54 56 58 60
78
7980 81 828384
8 6
89
94
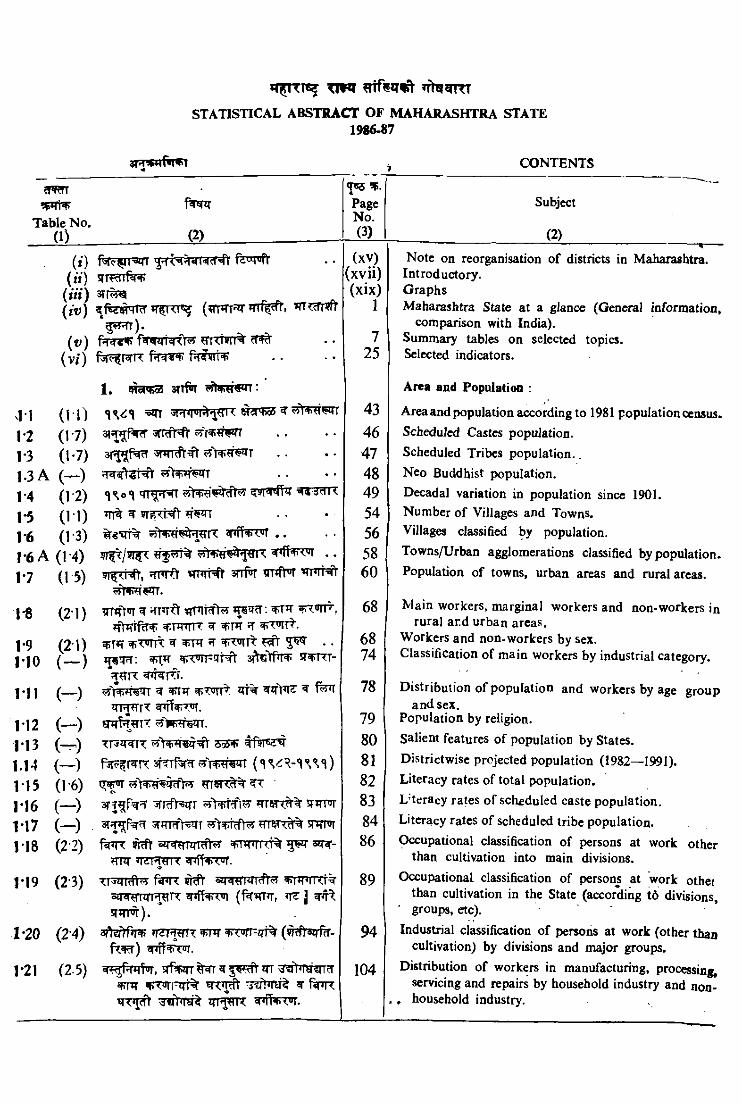
Note on reorganisation of districts in Maharashtra. Introductory.GraphsMaharashtra State at a glance (General informatioo»
comparison with India).Summary tables on selected topics.Selected indicators.
Area and Population :
Area and population according to 1981 population census. Scheduled Castes population.Scheduled Tribes population..Neo Buddhist population.Decadal variation in population since 1901.Number of Villages and Towns.Villages classified by population.Towns/Urban agglomerations classified by population. Population of towns, urban areas and rural areas.
68 Main workers, marginal workers and non-workers in rural and urban areas.
68 Workers and non-workers by sex.7 4 Classification of main workers by industrial category.
Distribution of population and workers by age group and sex.
Population by religion.Salient features of population by States.Districtwise projected population (1982—1991).Literacy rates of total population.Literacy rates of schfduled caste population.Literacy rates of scheduled tribe population.Occupational classification of persons at work other
than cultivation into main divisions.Occupational classification of persons at work othei
than cultivation in the State (according td divisions' groups, etc).Industrial classification of persons at work (other than
cultivation) by divisions and major groups.Distribution of workers in manufacturing, processing
servicing and repairs by household industry and non-, household industry.
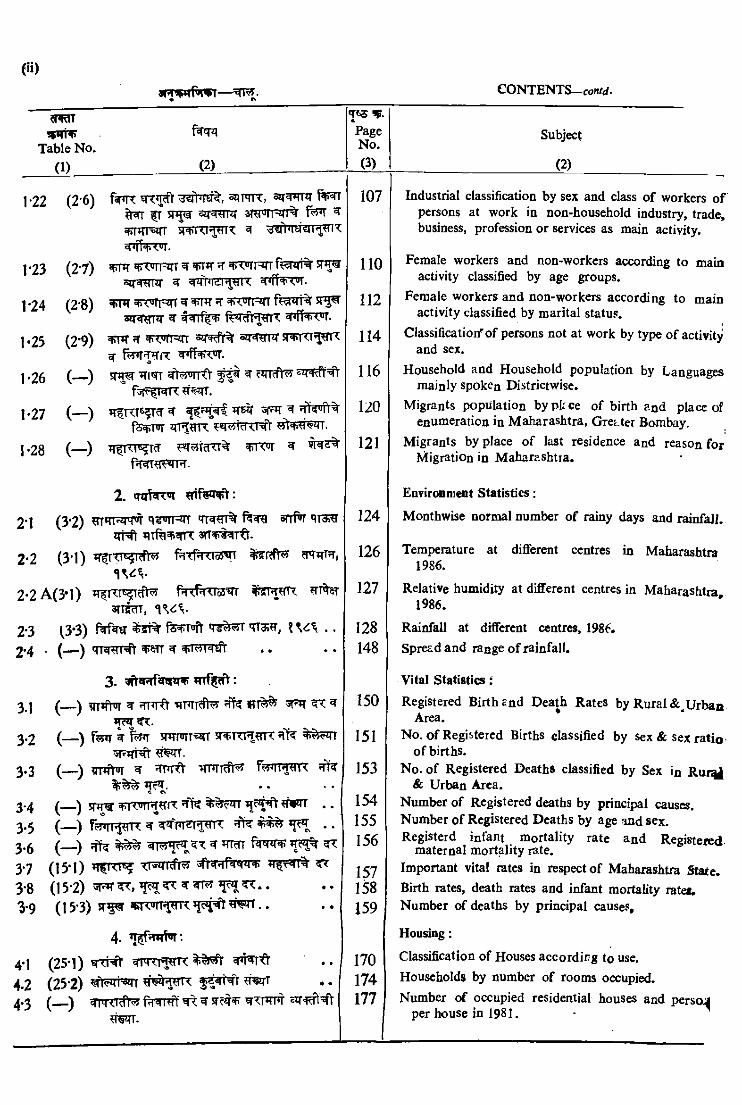
Table No. (1) (2)
«PageNo.(3)
1-22 (2-6)
1*23 (2-7)
1-24 (2-8)
1-25 (2*9)
1-26 ( - )
1*27 ( - )
i-28 ( - )
s q m r , 35^ it ^ f t 5 T ^ o g ^ w r 3T^pn^r% ^
w i x r s p r x ^ ^ E s fh R R rr^ x
^ # P T ^ .
^ iFT’T T ^r ^ Jprir ^n?iri=qT f?^^Tr% s r ^ >^aRTT ^ «(ifMld'l'i+nT ^ i f N r ”T.
^ ^rt'JTrzn ^ ^ ^ s r ^3 IT W T ^ ^«nfT^5nT w i f f r w .
^TTK »T ^f^JTRTr ®T^^fr% snfrT T ^rr^^ f k i r ^ i T w ^ f h r ^ .
s r w ■ I’TT ^ ?sT rfr^ e w f t ^
i T ^ T ^ ^ r ^ ^ ^ fW t%
q ^ i « S T^ ^ 5 i tc m % ^rro ir ^
2 . qirf^T^i
2*1
2*2
(3*2) q ^» T F n 'Tr^^n% a n f^z rh ^ s r r v ^ T f t .
(3*1) *T?rTT^?Rft^ ^ T i ^ m W ^srsft^ r cTTittjt,
n < :v2 * 2 A ( 3 M ) H^TTTi^cft^ U i U T T a '^ ? tt^ s t
3TTffm,
2*3 3*3) r ir^u $jrt^ fe+'T«ft ss?^^ . .2*4 . ( — ) q r ^ m ^ ^
3. grhROmv :
3.1 ( — ) ^ ' f \ m ^ ^ V T ^*T?*T
3 -2 ( ___) f?5»T ^ J P T p ir r^ %%rirT
3 . 3 ( — .) vm W ^ - i r m T ^ r«*iM^riX*Tc^. • •< e\
3 . 4 (— ) 5 m ^ ^rrrnpT^ffT ^ * •
3 . 5 ( — fa sn ^ m r ^ ^ *1^ . .
3.5 (__) ^ ^ ^X ^ 5TRTT ^
3*7 (15*0 *TgT<Tg TnaTTEfr tt
3*8 (15-2)3*9 (15-3) !Tf?r .
4 . *T^«nrH t
4*1 (25*1)4.2 (25*2) ^hw ® n , .4-3 ( — ) ^ ^ w t w f t
9 w r .
107
1 1 0
1 1 2
114
116
1 2 0
121
124
126
127
128 148
150
151
153
154155156
157158159
170174177
Subject
(2)
Industrial classification by sex and class of workers of persons at work in non-household industry, trade, business, profession or services as main activity.
Female workers and non-workers according to main activity classified by age groups.
Female workers and non-workers according to main activity classified by marital statu?.
Classificatioif of persons not at work by type of activity and sex.
Household and Household population by Languages mainly spoken Districtwise.
Migrants population bypkce of birth and place of enumeration in Maharashtra, Grei.ter Bombay.
Migrants by place of last residence and reason for Migration in Mahan-.shtra.
Enviroiimait Statistics:
Monthwise normal number of rainy days and rainfaj/.
Temperature at different centres in Maharashtra 1986.
Relative humidity at different centres in Maharashtra 1986.
Rainfall at different centres, 1986.Spread and range o f rainfall.
Vital Statistics:
Registered Birth and Death Rates by Rural &^Urban Area.
No. o f Registered Births classified by sex & sex ratio of births.
No. of Registered Deaths classified by Sex in R ur^ & Urban Area.
Number of Registered deaths by principal causes.Number of Registered Deaths by age and sex.Registerd infant mortality rate and Registered
maternal mortality rate.Important vita! rates in respect of Maharashtra State.Birth rates, death rates and infant mortality rate*.Number of deaths by principal causes.
Housing:
Classification of Houses according to use.Households by number of rooms occupied.Number of occupied residential houses and persoJ
per house in 1981.
^JTt^Table No.
( 1) (2)
PageNo.(3)
4-4 ( ~ ) ■ rc ^ ’n=5JTr
Subject
(2)
4*5 (—•) TrTv e rr ^nrr^R^rrT ?r^irr.. .4-6 (—) ^
5. fkim:
5.1 (— ) T^TKrpTR m?zra-TgrRi 9TFrr.
5*2 (— ) sr^^JTTsi^’TR^TR m m .
5-3 (— ) ?rrsKt . .5-4 (—) f sfTF- TT f?r T= l- ?T r5*5 (—) f^T«ff5-6 (—) f^rr^FT qr =5JTT
^ m .5 • 7 (— ) f ^ a r r ^ ^ T f ^ m5*8 ( — ) 5rtqrt^
5*9 (14*1) ?f sTT f^pff . .5* 10 (14-2) 'TTRfr f^rsff ?f ?TT5.11 (1 4 3) srrsrto ^ ^riosMt^
fsRTFRM' I TWTWR ?T^T.5.12 (14‘4) 5n«if ^
fsfrawszn TrTEznTRgTc ?fwr.5.13 (14-5)5-14 (14 6) SRTRH R ftreFT5.15 (14*7) f# =nr ^
S r^ 5TWT, ?TT 5nif%f^w?f srrfoT fw^rhf)’ w rr .
5.16 (14*8) sfNitPi sTftrem!3rr»TT, 5T^ 5TFRTT T gTlS-
5.17 (14*9) 3tTw %^, '<?if?i%-<j-*T arT irir lfTTffNl^raqr 3r%rr ^-^sqr ^i(r^T^^3^§n$?c=qT fepcEfM
6. fTT ?rq^:
6 -H (— ) TTFT?J?T STf ri ftq-cr-Pilfe'% ’ErSTT.
6*2 ( — )6.3 (24*1) ^ fTTTf?RTo5 .6.4 (2 4 '2 ) .6.5 (2 4-3) 5 ^ g fq^Tcmf^ irt% wrmwR ^ y cqr..
6 .6 (24’4) iTT^ 5^ fwqrqTrT ^jf^rcV.
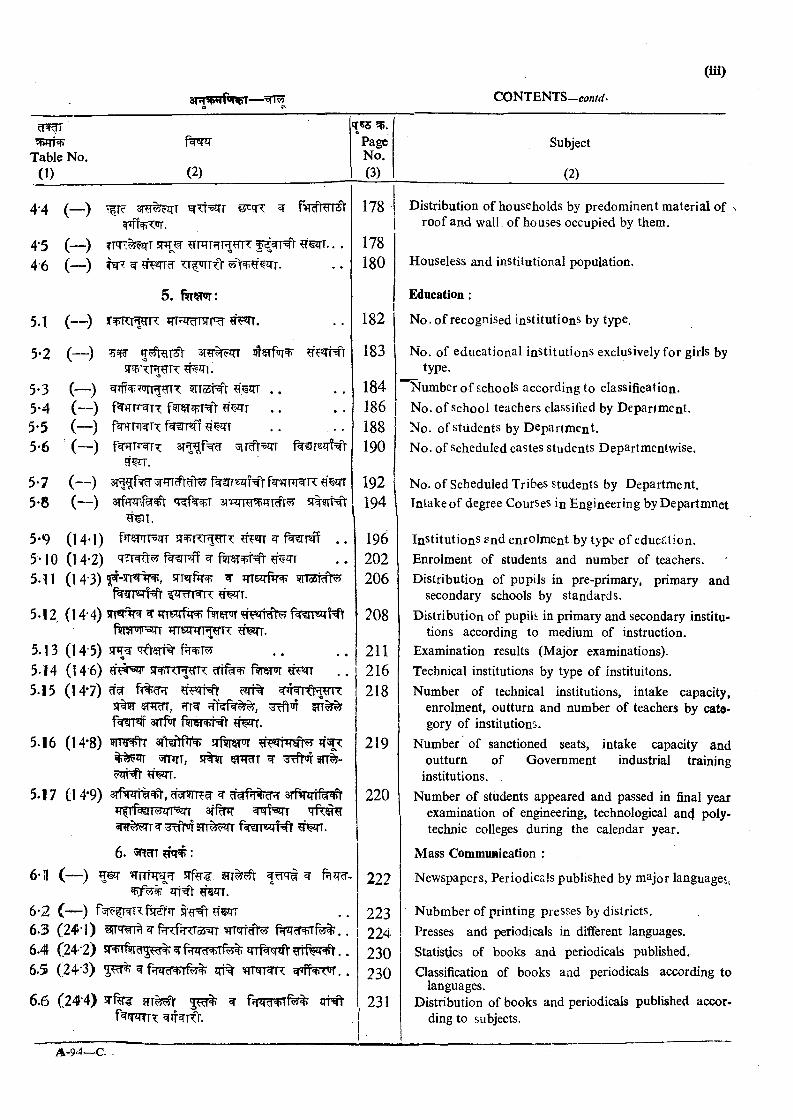
178
178180
182
183
184 186 188 190
192194
196202206
208
211216218
219
220
222
223224 230230
231
Distribution of households by predominent material of n roof and wall of ho uses occupied by them.
Houseless and institutional population.
Education;
No. of recognised institutions by type.
No. of educational institutions exclusively for girls by type.
Number o f schools according to classification.No. of School teachers classified by Department.No. of students by Department.No. of Scheduled castes students Departmentwise.
No. of Scheduled Tribes students by Department.Intake of degree Courses in Engineering by Departmnet
Institutions and enrolment by t>pe of education.Enrolment of students and number of teachers.Distribution of pupils in pre-primary, primary and
secondary schools by standards.Distribution of pupih in primary and secondary institu
tions according to medium of instruction.Examination results (Major examinations).Technical institutions by type of instituitons.Number of technical institutions, intake capacity,
enrolment, outturn and number of teachers by category of institutions.
Number of sanctioned seats, intake capacity and outturn of Government industrial training
institutions. ,Number of students appeared and passed in final year
examination of engineering, technological and polytechnic colleges during the calendar year.
Mass CommuHication :
Newspapers, Periodicals published by major languages^
Nubmber of printing presses by districts.Presses and periodicals in dilferent languages.Statis^cs of books and periodicals published.Classification of books and periodicals according to
languages.Distribution of books and periodicals published accor
ding to subjects.
A -94—C.
c l^
Table No. (1) (2)
PageNo.(3)
Subject
(2)
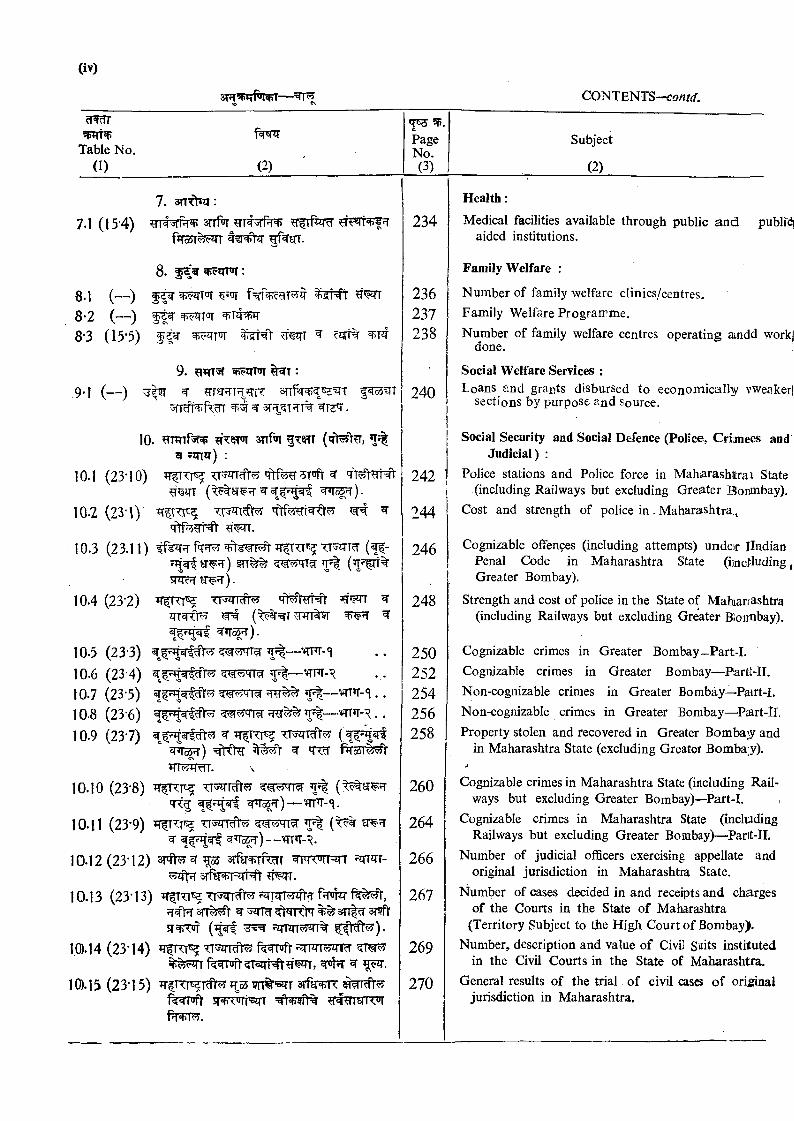
7.
7.1 (15'4) snf iTt e i ^ i t ? r ^ gf^gr.
8 .
8-1 (— )8*2 (—)8*3 (15*5) tf«strT ^ cijt%
9. :,9-1 (—) |5T rsr TTi r'
3TJTT?TT% .
10. 3nf^ gT^T n?|g 5tn*r) :
10.1 (23*10) ^
\0.2 (2 3 i)‘ ^ ^<ftfegt^
10.3 (23.11) (f^-frr^ (’T%t%
10.4 (23-2) ’TfTTT TT^wt^ TlWNIr ^^ (^=^T ^
1Q.5 (23’3)10.6 (23 4)10.7 (23*5) ’f l — ..10.8 (23-6) • •10.9 (23-7) ^
" ^^ra^r) ^
10.10 (23‘8) TT T t ^WTT (^sr^JT'TT 5pTo5jr)“—^^-*1.
lO.H (23’9) TT^T^
10.12 (2312) srft^^ ^ sr% f%r ^m^=?n ^^n-3Ttei=irM'T ? iw .
10.13 (23-13) TTTTl f q'jqr T fjTok?T3r>r sn^ l" ^ ssnl^ ^5T'ti' 'j? ’ zrrzn^^% ) .
IQ.H (23-14) TT|rp^f^WTWt^TSzrMt^^, -opT ^
10). 15 (2 3* 15) R r^T^ ?r 3 nt's rT stFsrtr5Rr t*5q7 ■'il'n n T Rn TR
f?T^.
234
236237238
240
242
244
246
248
250252254256258
260
264
266
267
269
270
Health :
Medical facilities available through public and aided institutions.
pubird]
Family Welfare ;
Number of family welfare clinics/centres.Family Welfare Programme.Number of family welfare centres operating aindd workj
done.
Social Welfare Services :Loans and grants disbursed to econom ical^ vweaker!
sections by purpose and source.
Social Security and Social Defence (Police, Crianees and Judicial) :
Police stations and Police force in Maharashttrai State (including Railways but excluding Greater Bonmbay).
Cost and strength of police in - Maharashtra.,
Cognizable offences (including attempts) undeir Jlndian Penal Code in Maharashtra State (ijncfluding, Greater Bombay).
Strength and cost of police in the State of Mahiarrashtra (including Railways but excluding Greater Bioiinbay),
Cognizable crimes in Greater Bombay~Part-I.Cognizable crimes in Greater Bombay—Partt-II.Non-cognizable crimes in Greater Bombay—Pairt-I.Non-cognizable crimes in Greater Bombay—Part-ll,Property stolen and recovered in Greater Bombajy and
in Maharashtra State (excluding Greater Bomba;y).
Cognizable crimes in Maharashtra State (including Railways but excluding Greater Bombay)—Part-I. i
Cognizable crimes in Maharashtra State (incluiding Railways but excluding Greater Bombay)—Parit-II.
Number of judicial officers exercising appellate and original jurisdiction in Maharashtra State.
Number of cases decided in and receipts and charges of the Courts in the State of Maharashtra
(Territory Subject to the High Court of Bombay).Number^ description and value of Civil Saits instituted
in the Civil Courts in the State of Maharashtra.General results of the trial of civil case of original
jurisdiction in Maharashtra.
FTT Page SubjectTable No. No.
(1) (2) (3) (2)
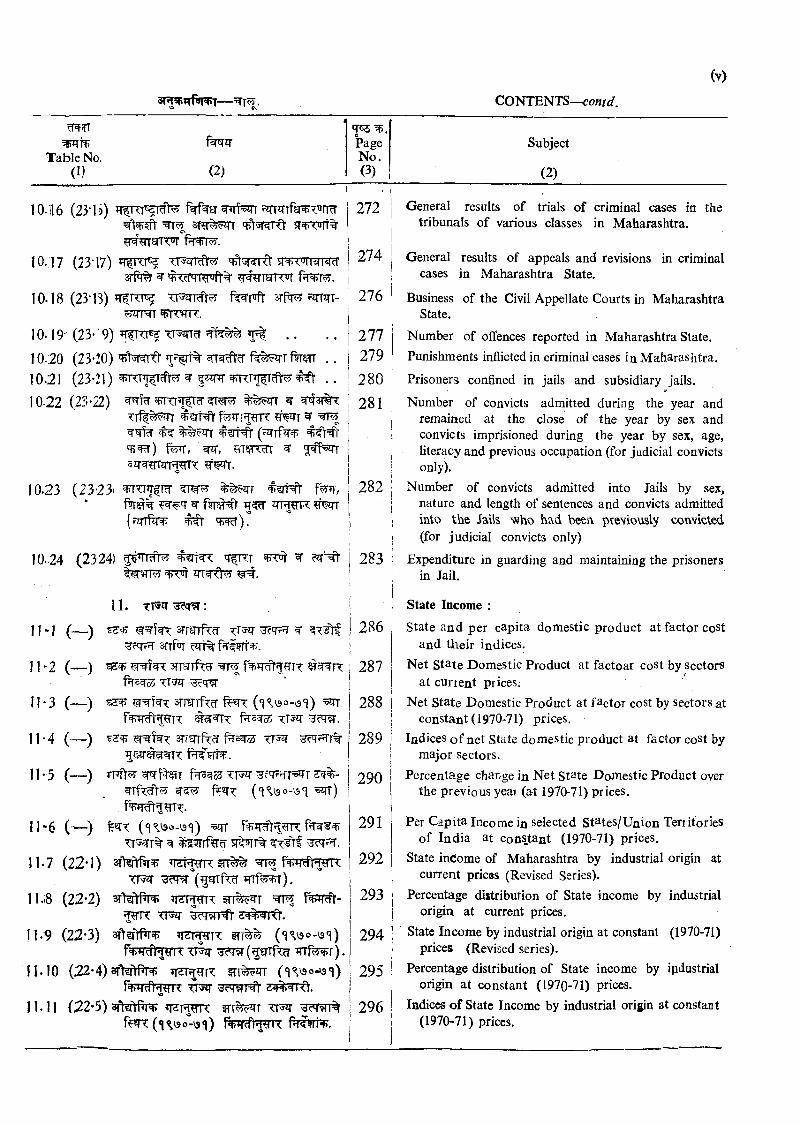
IO.1I6 (2313) f^^!T3Ri%^ 5RTw%
10.17 (2317) ^TfRl^ JT^TTTORcT^ ’ '<'d^wfv% twtstrw f?Nrr .
10.18 (23*13) ^ixps5 f^T’Jft srpT ?irnTT-wiTNT v rw x .
10.19' (23-' 9) ipt . .10.;20 (23-20) '’ ^ f t . .10-21 (23-21) ^ . .10.22 (23-22) ^
#?rt^ f^’Ti TK ^ %eJTT (?qTfir
T)^) f ^ , >?T, ^ ^=3insJT iETTqT T
10.23 (23*23'^ fw ^y TTWR
10..24 (2324) #?rt^ 'T tt w ^^WT?5 ^7^
11. -^rsEr^q^:
I j - 1 ( — ) m w fW T 3 T [m fr^ ^
^cq^ sTTf’JT11 . 2 (— ) w ^h T srmjfTW ^
n - 3 (— ) ^=^kT srrsrrf^^ f m (‘}'^\so-\3‘i) =5iT
11-4 (— ) sTrsrrft: ^??n%
11*5 (— ) ttw ctr?''TT=5 T ? # -
11-6 ( ’— ) ('i^^o-^'l) ITTTT T% :^ff?To 5R r%
1 1-7 (2 2 *1) sfW ^r^ Tdi^ K ?TT^ f^nTcff rmxTTW ^ 3 ^ (gmfT^ iTTf^T).
H.i8 (2 2 *2) s fW n ^ wfOTT irr^^T F^?rr^-X f ^ 5 c w f t 2#mx)r.
11.'9 (22*3) ir TfETR §rr%« (nv9°-^'i)fs*)'*fdl^^K ^m?r (gSTTfW ^ f ^ f ) .
I f . 10 (2 2 -4 )3 rM te fTT JTTtecftW T TR5T ??T?rr 3 ^ ) ^ .va
11.11 (22*5) sfNfrr np trt 3?r?rr%ff«n: (n^so“-\s< ) f%vcfkmx
272
274
276
2 77279
280
281
282
283
286
287
288
289
290
291
292
293
294
295
296
General results of trials of criminal cases in the tribunals of various classes in Maharashtra.
General results of appeals and revisions in criminal cases in Maharashtra State.
Business of the Civil Appellate Courts in Maharashtra State.
Number of offences reported in Maharashtra State.Punishments inflicted in criminal cases in Maharashtra.
Prisoners confined in jails and subsidiary jails.i*
Number of convicts admitted during the year andremained at the close of the year by sex andconvicts imprisioned during the year by sex, age, literacy and previous occupation (for judicial convicts only).
Number of convicts admitted into Jails by sex,nature and length of sentences and convicts admittedinto the Jails who had been previously convicted (for judicial convicts only)
Expenditure in guarding and maintaining the prisoners in Jail.
State Income :
State and per capita domestic product at factor cost and their indices.
Net State Domestic Product at factoar cost by sectors/
at cunent prices;Net State Domestic Product at factor cost by sectors at
constant (1970-71) prices.Indices o f net State domestic product at factor cost by
major sectors.Percentage change in Net State Domestic Product over
the previous yeai (a-t 1970-71) prices.
Per Capita Income in selected States/Union Territories of India at cons.tant (1970-71) prices.
State income of Maharashtra by industrial origin at current prices (Revised Series).
Percentage distribution of State income by industrial origin at current prices.
State Income by industrial origin at constant (1970-71) prices (Revised series).
Percentage distribution of State income by industrial origin at constant (1970-71) prices.
Indices of State Income by industrial origin at constant (1970-71) prices.
(Vi)
Tabic No, (1)
f^JT
(2)
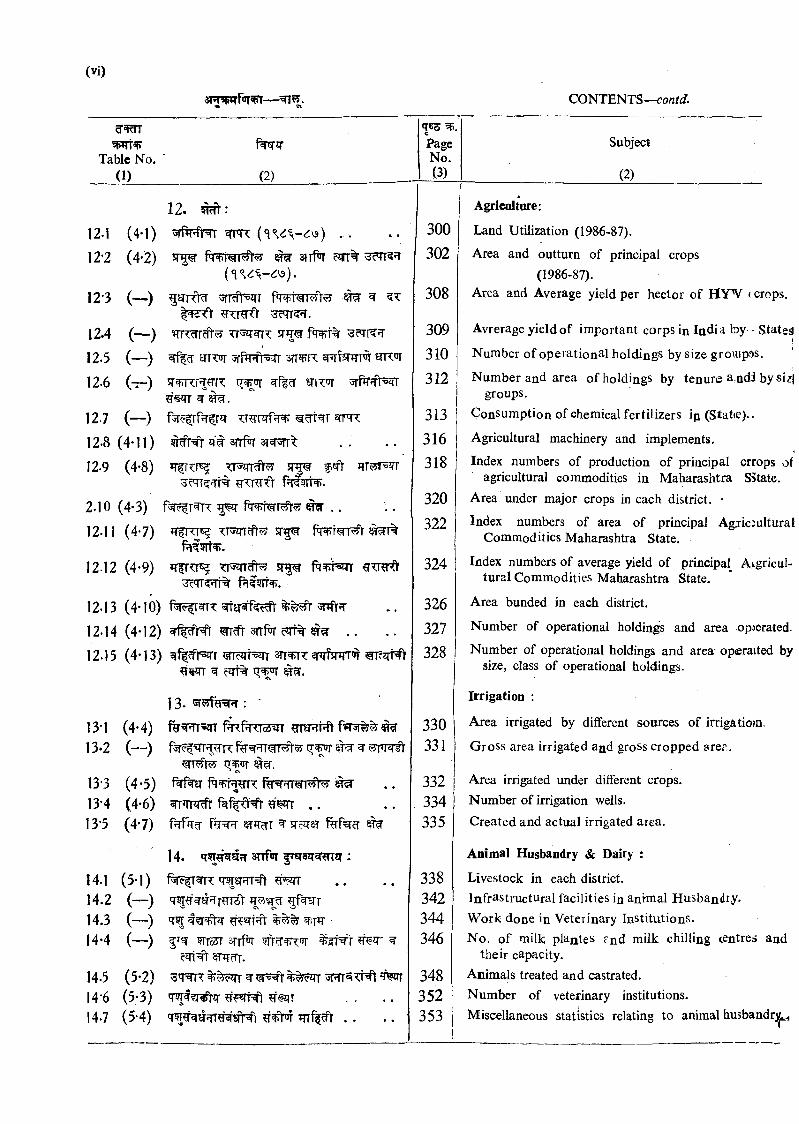
1 2 . ^ :
12.1 (4-1) ^ . *12‘2 (4*‘2) 5!^ frWr^^y ^ cqrr% 3?rr3?J
12*3 (—) ^ r ^ 2TT ^^rcrart
12.4 (— ) TT^^R 5Tw fq r% ?ri fr
12.5 (—) ^Mt=5irr ^fsnrm12-6 (-:-) sr nTrJj TR: ^r^or srrw
127 (— ) f5r?|rf?T r Tmnrf r12-8 (4-11) q# srrPiT BT rr
12.9 (4-8) ^jxJ^ TRTTcf)' srpf fcft ^ r^ m
2.10 (4-3) fsf^T^R ^ .
12.11 (4-7) fwf?§T^ ^r%
1212 (4-9) sr^ fq > Tr'TT? Tt% f srwrsF.
12.13 (4-10)12-14 (4-12) snfw ?JTt% . .12.15 (4-13) 3n-5FTT T ifjrTnw mztr^
m m ^ ciTT%
13. :
13*1 (4*4) ffRfTOS T ?rrsRFft ^13‘2 (— ) ^ ^ ?rmf)-
13-3 (4*5) ^13*4 (4-6) . ,13-5 (4-7) f rfFT ^ 5Tcirs7 ^
14. 'T?THg?j?T sTTfq: |»«i5zi ?n?r:14.1 (5-1) 'TW8rJTT= TOT14.2 (—) T5j !T?rr T?5t gf srr14.3 (—) <TW14.4 (— ) i^sr W T srrfor wr^^'JT ^
m ^ j .14.5 (5-2)I4'6 (5-3) T rl r q- f ssrNI14*7 (5-4) Tnf|?flr . .
7E5PageNo.(3)
Subject
(2)
300
302
308
309
310
312
313
316
318
320
322
324
326
327
328
330331
332334335
338342344346
348352353
Agrlcalture;
Land Utilization (1986-87).
Area and outturn of principal crops (1986-87).
Area and Average yield per hector of HY’V (crops.
Avrerage yield of important corps in India by • StatesI
Number o f o p e r a t io n a l h o ld in g s by s iz e groiupDS,
Number and area of holdings by tenure a,ndi by sizj groups.
Consumption of chemical fertilizers ip (State)..
Agricultural machinery and implements.
Index numbers of production of principal crrops of agricultural commodities in Maharashtra S5tate.
Area under major crops in each district. *
Index numbers of area of principal Ag;ric:ulturat Commodities Maharashtra State.
Index numbers of average yield of principal Avgricul- tural Commodities Maharashtra State.
Area bunded in each district.
Number of operational holdings and area opjerated.
Number of operational holdings and area operaited by size, class of operational holdings.
Irrigation :
Area irrigated by different sources of irrigatiom,
Gross area irrigated and gross cropped area.
Area irrigated under different crops.Number of irrigation wells.Created and actual irrigated area.
Animal Husbandry & Dairy :
Livestock in each district.Infrastructural facilities in anrmal Husbandry.W ork done in Veterinary Institutions.No. of milk plantes ?nd milk chilling centres and
their capacity.Animals treated and castrated.Number of veterinary institutions.Miscellaneous statistics relating to animal husbandr^p,
dMiiixr^vi—♦ CN
(vii)CONTENTS—con/t/.
d'td'l
Table No. (1) (2)
7 ^PageNo.(3)
Subject
(2)
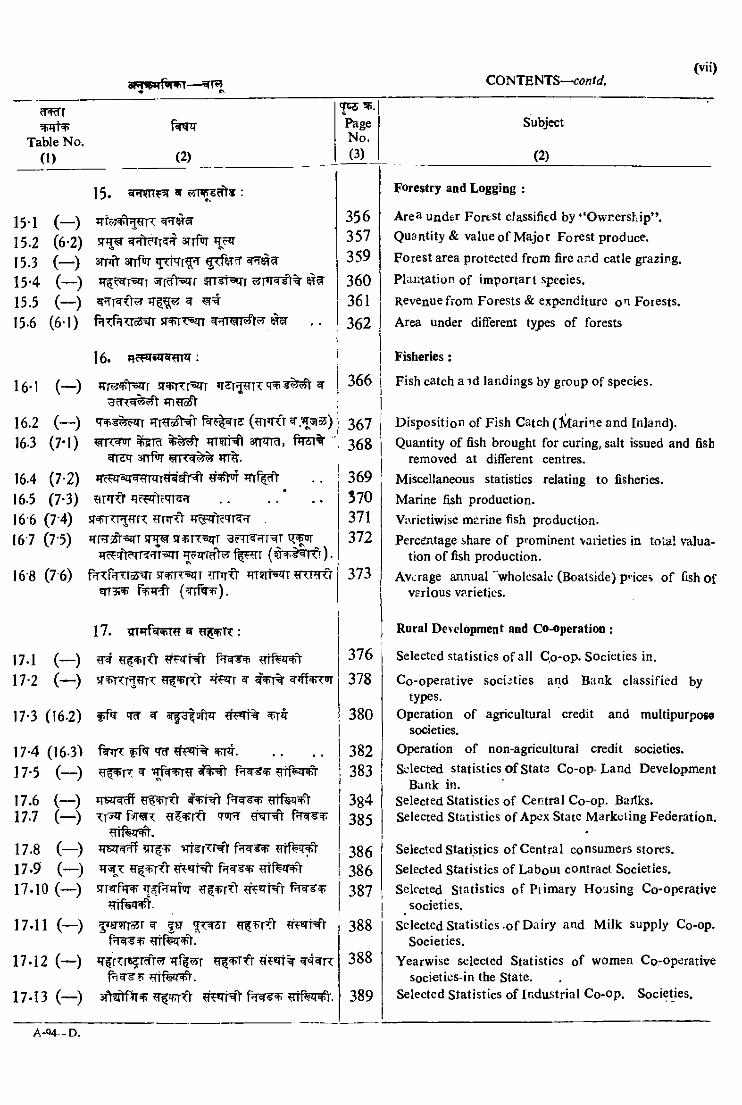
15. ^ : Forestry and Logging :
151 ( - )15.2 (6-2)15.3 ( - ) 15-4 ( - )15.5 ( - )15.6 (6-1)
sriT «fHtcMT?5T 3TTf®rss Cvamft anfq- *p:rTr^
3Tr >aTf fTTTt T
5RTrT5q7 ^
356357359
360361
362
Are^ under FortSt classified by “Ownership” . Quantity & value o f Major Forest produce. Forest area protected from fire and catle grazing. Plantation of importari species.Revenue from Forests & expenditure o'! Forests. Area under different types of forests
I6» ;
16*1 ( — ) s r ^ r ’szn ^JTl ToSV
( — q^^$!r?qT iTT’ToS I ^ (^Tl’R 't
(7 * 1 ) i n ^ r r ^ s n m ^ , i ^ %^ 3 tT sirPrr i n ^ .
iT c ^ i r a i m n n ^ i w ^ i r r f ^ l '
^iT^rd
sr^T T ^fffT H r i r ^ * t^ > c ‘7 t ^ .
16.2I63
16.4 (7-2)16.5 (7-3) 16 6 (7-4) 16 7 (7-5) STW s r ^ R ^ T
JTc^T^Tf^^TT^ f ^ r ( ^ M ^ n f r ) .
16'8 (7'6) f?n:r?TW^ ir^R^T msTTsqr yxm tt
17. ^ :
17.1 (— ) ^ TF-iTi17*2 (— ) *T^r ^
17*3 (16-2) frfq- q^ ^
17-4 (I6-3> *TfT ^ .........................17*5 (— ) ^ T T ^
17.6 (— )17-7 (— ) 0?^rTt m r ^
^ i f e r ^ 'l .17.8 (— ) f?T^^ ?rrf ?717.9' (— ) ^Tsrj ^ ^ T X t ?R5THt OTf ir 't17-10 (— ) STTSTF JT r TTTW
17.11 (— ) ^^Kmoir ^ |sr ?T rKt
17-12 (— ) *r?r^r5?r^m ?rr?^r ^r^^fl-g'?sn% q t f e r ^ .
17-13 (— ) ?T jfTT>
A -Q 4-D .
Fisheries:i
366 I Fish catch a id landings by group of species.
367368
369 570371372
373
376
378
380
382383
3 8 4
385
386386387
388
388
389
Disposition of Fish Catch (M arine and Inland).Quantity of fish brought for curing, salt issued and fish
removed at different centres.Miscellaneous statistics relating to fisheries.Marine fish production.Varietiwise marine fish production.Percentage share of p«-ominent vaneties in total v'alua-
tion of fish production.Avcirage annual'’wholesale (Boalside) p’ ices o f fish of
various varieties.
Rural Development and Co-operation :
Selected statistics of all C,o-op. Societies in.
Co-operative societies and Bank classified by types.
Operation of agricultural credit and multipurpoM societies.
Operation of non-agricultural credit societies.Selected statistics o f State Co-op Land Development
Bank in.Selected Statistics of Central Co-op. Baitks.Selected Statistics of Apex State Marketing Federation.
Selected Statistics o f Central consumers stores.Selected Statistics of Laboui contract Societies.Selected Statistics o f Piimary Housing Co-operative
societies.Selected Statistics-of Dairy and Milk supply Co-op.
Societies.Yearwise selected Statistics of women Co-operative
soci«ties-in the State.Selected Statistics of Industrial Co-op. Societies,
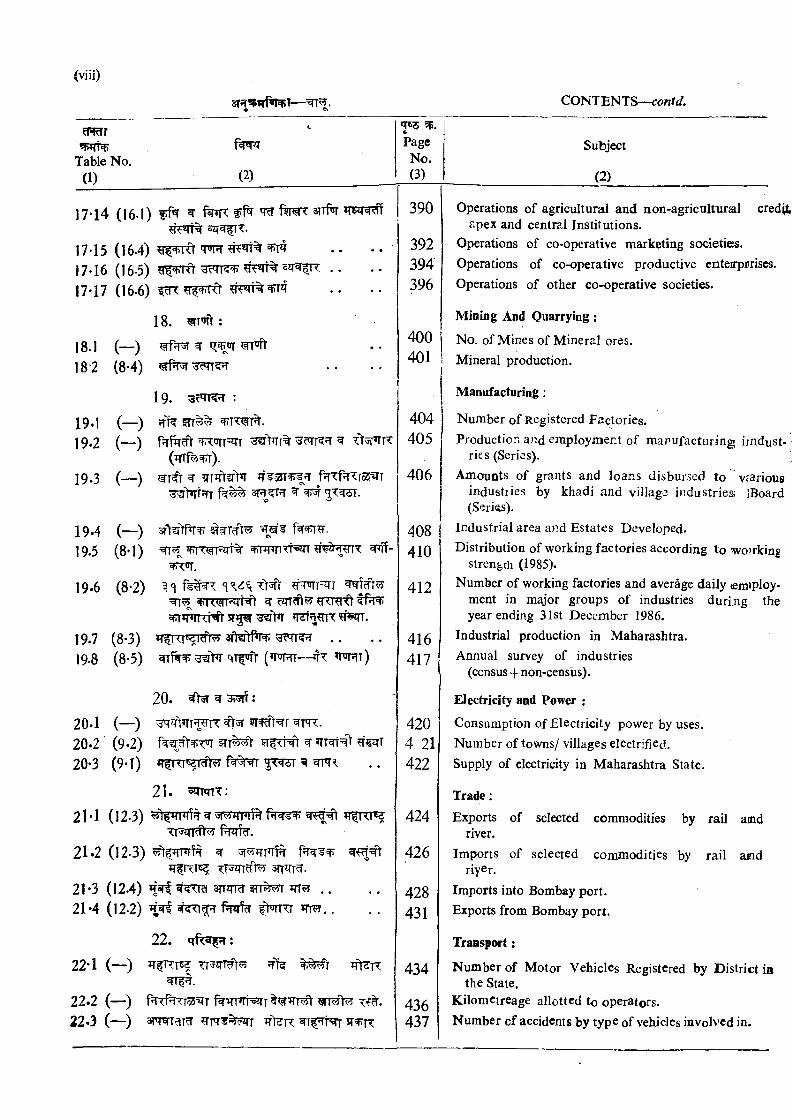
Table No. (1) (2)
17-14 (16.1) ^
17-15 (16-4) ^17*16 (16-5) .♦17*17 (16.6)
18. :
18.1 (—)182 (8-4)
1 9. :
19*1 (—)19.2 (— ) f;rf% T ^qi=^T ^>Tr% ^
(jTTf^ l).29.3 (__) ^ Trr Ttift fvT^f^^rs^T
^>rtJTT 3r ^t ? ^ 5"?:^.
19.419.5
( - )(8 -1 )
19-6 (8 -2)
19.719.8
aa-Tffra w gs ftwH.cs
^OT.?T T=qT
yKVsTl ^t^ ^ cqr?f1 ^ ’ET'd t f ^ ^*r*rRT^ 5T5
(8*3) ’TfRT ?Rf]r sftiftte . .(8 -5) ^>T'HTf»flr (»m T--^T » to t)
20. *hT ^ ^ :
20.1 (— ) wt=^T ^ m .20.2 (9*2) §tt ^ w >TT =20*3 (9-1) ^
2 1 .
21*1 (12.3) ^
21*2 (12.3) ^
21*3 (12.4) Wirf srrqTcT 5H% i?T5? . .21*4 (12-2) f k ^ f JHTT *n^..
2 2 . q f r ^ :
22-1 (— ) ^ T ^ n
22.2 (— ) f TfTTToS T i%^»rr5^r22*3 (-—) sTTTarcT st r
'T«5cPage
No.(3)
Subject
(2)
390
392394396
400401
404405
406
408410
412
416417
420 4 21 422
424
426
428431
434
436437
credit'Operations of agricultural and non-agricultural apex and central Institutions.
Operations of co-operative marketing societies.Operations of co-operative productive enteirprrises.Operations of other co-operative societies.
Mining And Quarrying:
No, of Mines of Mineral ores.Mineral production.
Manufacturing :
Number of R egistered Factories.Production and employment of manufacturing imdust-
ries (Series).Amounts of grants and loans disbursed to v<arious
industiies by khadi and village industries ]Board (Series).
Industrial area and Estates Developed.Distribution of working factories according to wo>rkin^
strength (1985).Number of working factories and average daily temiploy-
ment in major groups of industries duri;ng the year ending 31st December 1986.
Industrial production in Maharashtra.Annual survey of industries
(census+non-census).
Electricity and Power ;
Consumption of Electricity power by uses.Number of towns/ villages electrified.Supply of electricity in Maharashtra State.
Trade;
Exports of selected commodities by rail amd river.
Imports of selected commodities by rail asid riyer.
Imports into Bombay port.Exports from Bombay port.
Transport:
Number of Motor Vehicles Registered by District in the State.
Kilomeireage allotted to operators.Number of accidents by type of vehicles invoK'Cd in.
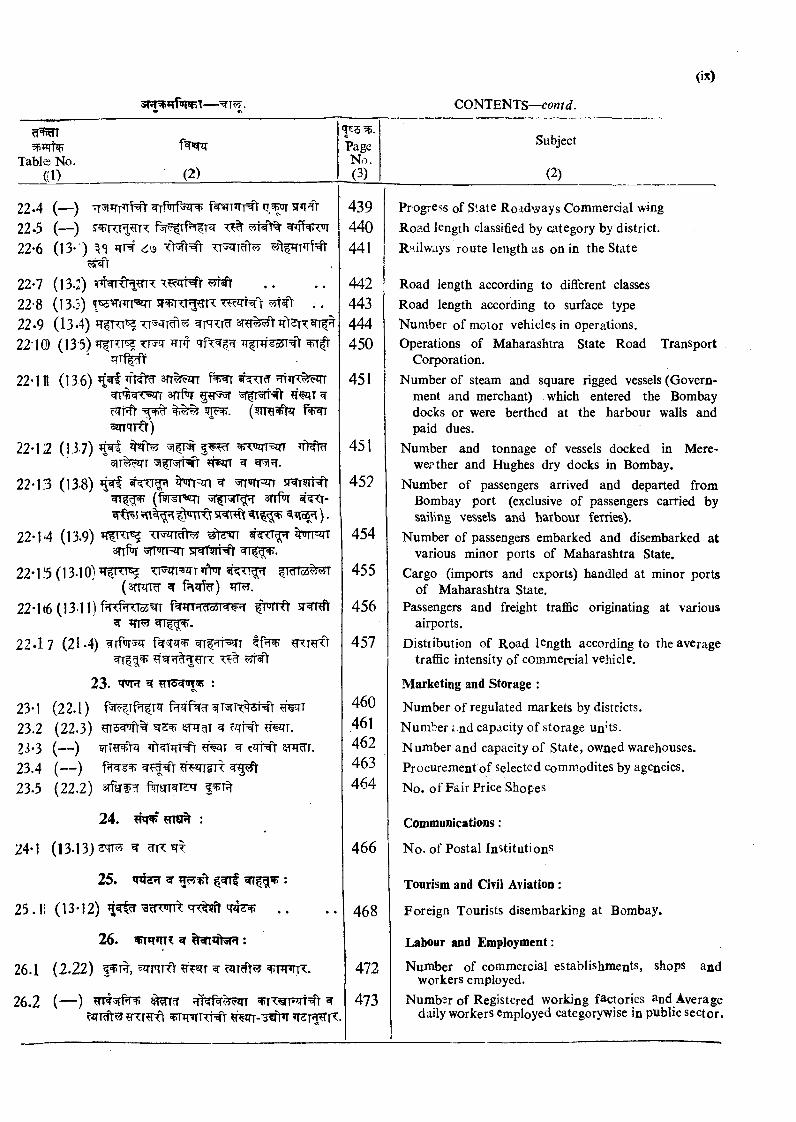
Table No. ((1) (2)
cPageNo.
^(3)
Subject
(2)
22.4 (—) tr^22.5 (—)22*6 (13-) ?rr# ■<M=
22-7 (13.2) ^22-8 (13.5) . .22 «9 (134) ^%TT\ sr r 't2 2 1 0 (135) ^RT'^ TT#
22-111 (136) 3Tr f?inm'^^Tszn anfw sTfrsrt- ^r^r ^
(^iTRl^sqr'TRlr)
22-12 (157) PWreJTT?r«rr ^ ^?r.
22-13 (138) srpnt m srgrr rHt^ s ( T ^ (f^r^m i n|Krg;?T sni^ stt -
22-14 (13.9) ’T kt 'C fw i^ ^rp^nsnfw TpJTPzn sj^ iT ^
22* 1 !5 (13-10) TT5irT=5irT TcTTss(3n?TTcr ^
22-1(6 (13.11) f KfjRTosm fWH-^oSi^w tm f t 5twt^
22.17 (21.4) rf’JT r r rNiTT t f ^ cRTrft
23 . ^ ?TT3^^ :
(22 .1) f5Te|Tf f T5f f^Tm ^ T(22 .3) ^5^% cqHt ^ T .(— ) ?TTg^q ^ T ^ c rHt TTTT.(— ) ^^rrsTT
23-123.223-323.423.5 (22.2) 3rfsrf ftrsTRTjq
24. :
24-1 (13.13) ^
25. 2T ‘
25.11 (13*12) " a ^ T c n n ^ . .
26. gr :
26.1 (2 .2 2 ) I^R, ^NR> ^ cqr?ft ^ m iT .
26.2 (— ) ^?2TKft ? R T ^ T TTTTtM- ^ T ^ T ’C.
439440441
442443444450
451
451
452
454
455
456
457
460461462463464
466
468
472
473
Progress of State Roadways Commercial wingRoad length classified by category by district.Railways route length as on in the State
Road length according to different classesRoad length according to surface typeNumber of motor vehicles in operations.Operations of Maharashtra State Road Transport
Corporation.Number of steam and square rigged vessels (Govern
ment and merchant) which entered the Bombay docks or were berthed at the harbour walls and paid dues.
Number and tonnage of vessels docked in Mere- we?ther and Hughes dry docks in Bombay.
Number of passengers arrived and departed from Bombay port (exclusive of passengers carried by sailing vessels and harboMi ferries).
Number of passengers embarked and disembarked at various minor ports of Maharashtra State.
Cargo (imports and exports) handled at minor ports of Maharashtra State.
Passengers and freight trafiBc originating at various airports.
Distribution of Roa.d length according to the average traflfic intensity of commercial vehicle.
Marketing and Storage :
Number of regulated markets by districts.Number i.nd capacity of storage unHs.Number and capacity of State, owned warehouses.Procurement of selected commodites by agcncies.No. of Fair Price Shopes
Communications:
No. of Postal In ‘'titutioflS
Tourism and Civil Aviation :
Foreign Tourists disembarking at Bombay.
Labour and Employment;
Number of commercial establishments, shops and workers employed.
Number of Registered working factories and Average daily workers employed categorywise in public sector.
cTOT
Table No. (1) (2)
755«PageNo.(3)
Subject
(2)
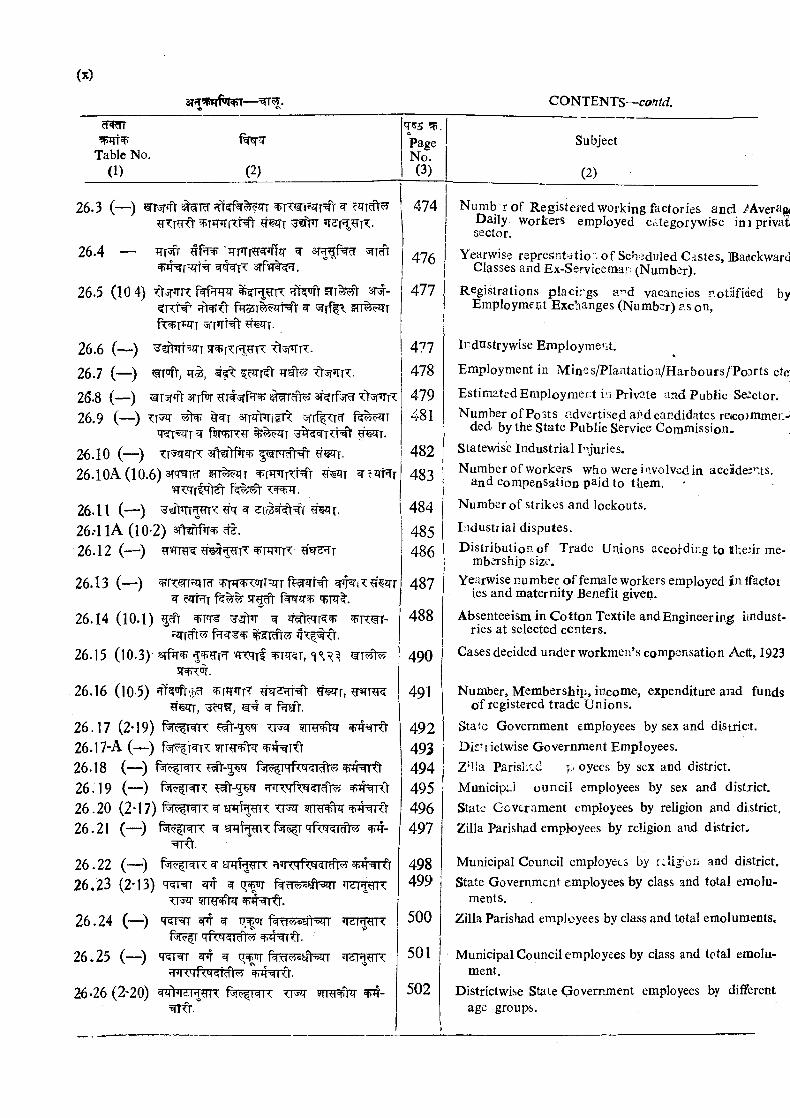
26.3 (— ) TWifJTT=fr ^TTr Rt
26.4 — ‘5TT r ffzr ^iT r-2rT%
26.5 (10 4) Tt JTR ;fW t ? r r ^ sr#-?R t# ^ ITT TfC^T’ JTT *r’Tt= t ?f?2JTr.
26.6 (— ) Ttsi- rrc.
26.7 (— ) T t^R .
2^.8 (—) ^Rjft 3TrPiT rt rPr af rf r Tt ’TfT26.9 (— ) ^ 3TTir>riSf -rflTT f^e^r
'KT T ^ f^TT^r % q-T ^ T -2-6.10 (—) 3ft?ftf»r ^m-26.10A (10.6) sTTETi
26.11 (— ) ^ >TT5T?rT’< 'T ^ ^ r .26 .'llA (10*2)26.12 (— )
26.13 (— ) mw=JTT ^ 1 T^ sT5^
26.14 (10.1) ^ ^R^r-
26.15 (1 0 .3 )^ to wrqif ^Rc{r,
26.16 (10-5) ’FPs rr,c«T , =# ^ f?T!jV.
26.17 (2*19) f^^N'K ^ - 5^ Ti^ wraWr 26.17-A (—)26.18 (— ) r^f^NK r '<rfiMfwid1^26.19 (— )26.20 (2-17) sm f^ x WRT^^nhr^26.21 (— ) f%e|Ni< ^ ?7Tqf^T
26.22 (— ) w^rO'26.23 (2*13) ^ ^
26.24 (— ) 'KT= ^ ^ ITSTWR
26.25 (— ) ^ ^ w m m x
26*26 (2 ’20) ^>RIH^K f V !=IIT TT^
474
476
477
477
478
479481
482
483
484
485486
487
488
490
491
4 92493494 I495496497
498499
500
501
502
Numb r of Registered working factories an d /AvevSif^ Daily Workers employed categorywise iniprivatj sector.
Yearwise represntatio . o f Scheduled Castes, Badckward Classes and Ex-Servicemaii (Number).
Registrations placirgs a^d vacancies r.otiifiaed Employme^t Exchanges (Number) as on,
by!
Indnstrywise Employment.
Employment in IVIines/Plantation/Harbours/'PoDrts etc|
Estimated Eniploymer.t in Private and Public Se^ctor.Number of Posts advertise.d and candidates reicojmmen-s
ded by the State Public Service Commission.Statewise Industrial I'ljuries.Number of workers who were iavolved in acciidesnts.
and Compensation paid to them.Number of strikes and lockouts.
Industrial disputes.Distribution of Trade Unions accotdir.g to theiir me
mbership size.Yearwise number o f female workers employed in Ifactor
ies and maternity Benefit given.
Absenteeism in Cotton Textile and Engineering imdust- ries at selected centers.
Cases decided under workmen’s compensation Actt, 1923
Number, Membership, income, expenditure and funds o f registered trade Unions.
State Government employees by sex and district.Dis^i ictwise Government Employees.Z ’Ma ParisliJicI p oyees by sex and district.MunicipJ ouncil employees by sex and distTict.State Government employees by religion and district,Zilla Parishad employees by religion and district.
Municipal Council employees by i.lig ’oii and district.State Government employees by class and total emolu
ments.Zilla Parishad employees by class and total emoluments.
Municipal Council employees by class and total emolument.
Districtwise State Government employees by different age groups.
♦
cT?^
Table No.Cl) (2)
*^6PageNo.(3)
Subject
(2)
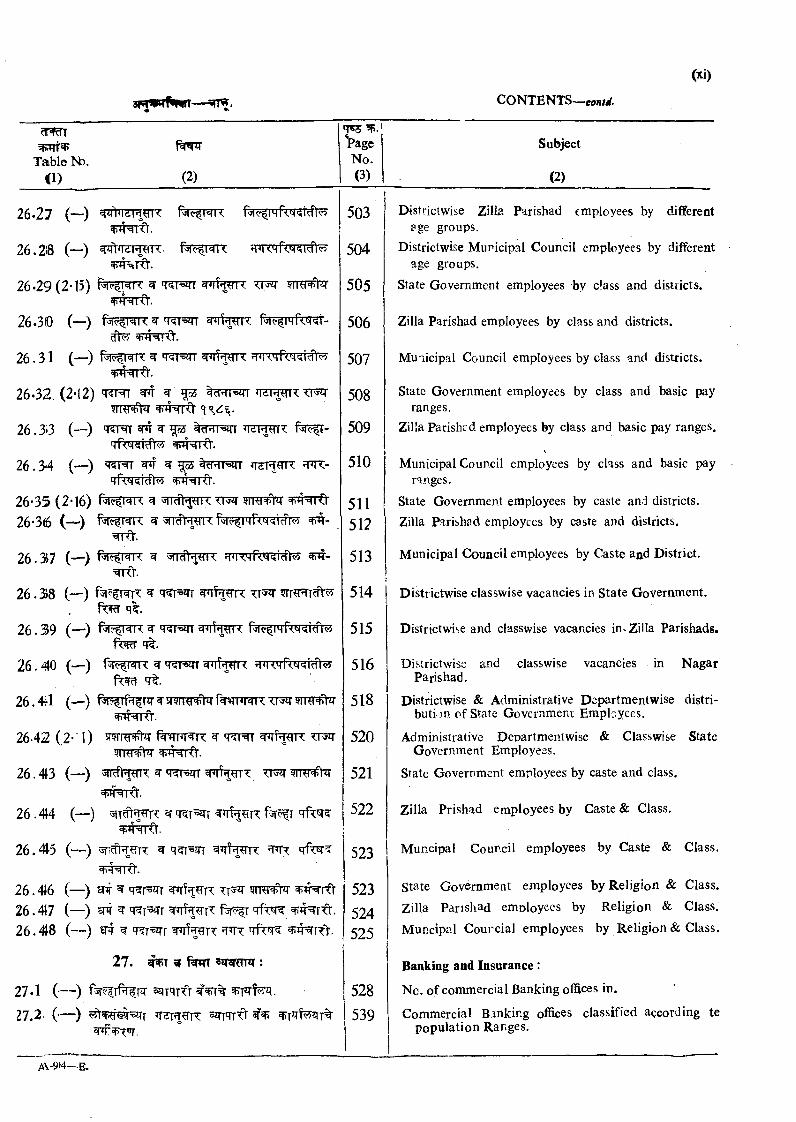
26.27 (—) r^T ?TTsnNitt.
26.218 (—) ^>^T^TT.
26*29 (2-15) ^ q rs rr t j w ^ tr t^^nhrtt.
26.3(0 (—) 'RTSJTT 5rn%TTT f^r^frrf^-TiNT'Ct.
26 .31 (—) f r rwR ^ q rsqr rrnrrfT^r^i^^nNrCt.
26.32. {2*12) 'T?r ^ ^wsett jish^it ? m r ^ +4^i<l'
26. 3i3 (—) 'Tsrr ^ ^ ^
26 .34 (—) ^ ^ t o ' i^ i q-jTT rrr ?fiR-^tr^Nrfr.
26-35 (2*16) r '<*fr=n-< st ?rra^ ^nhrtt26-36 (—') r^^=rr< ^
26.37 (-^) r <=irT 5n#jaTT
26.38 (—) qT=3?Trq^.
26.39 (—) 'KTsqr
2 6 .4 0 (—) f i i<=i'K' ^ fnRqfccr^T^
26.4^1 (—) r^MRI<TT^ £fng^>«y4^'<)'.
26.42 (2 -1 ) ^ fferr TT5q-5mr#5T qnhrrtt.
26.4^3 (—) 5fRT)WT 5T q^rsirr^nhrrt.
26.44 (—) q T T I ^22
26.45 (—) q =3iTT qfT 523+H-MI'0'.
26. 4J6 (—) snr qT=3iTT ^ r Rt 52326.417 (—) ^ q T=5 f * T q f ^ 52426.48 (—) spT q?T=5trr qfr’T 525
503
504
505
506
507
508
509
510
511512
513
514
515
516
518
520
521
21. ^ 3 i r ^ s r :
27.1 (— ) fsr^irf^^rq-sqrqTft qrr%
27.2- (— ) ^qi#€^T »T2:mRwqrT”r.
528
539
Districlwise Zilla Parishad employees by different age groups.
Districlwise Municipal Council employees by different age groups.
State Government employees by class and disiiicts.
Zilla Parishad employees by class and districts.
Municipal Council employees by class and districts.
State Government employees by class and basic pay ranges,
Zilla Parished employees by class and basic pay ranges.
Municipal Council employees by class and basic pay ranges.
State Government employees by caste and districts.Zilla Parishad employees by caste and districts.
Municipal Council employees by Caste and District.
Districtwise classwise vacancies in State Government.
Districtwise and classwise vacancies in Zilla Parishads.
Districtwise and classwise vacancies in Nagar Parishad.
Districtwise & Administrative Departmentwise distribution of State Government Employees.
Administrative Departmentwise & Classwise State Government Employees.
State Government employees by caste and class.
Zilla Prishad employees by Caste & Class.
Muncipal Council employees by Caste & Class.
State Government employees by Religion & Class.Zilla Parishad emoloyees by Religion & Class.Muncipal Courcial employees by Religion & Class.
Banking and Insurance:
No. of commercial Banking offices in.
Commercial Banking offices classified according te population Ranges.
A-9»4—E.
CONTENTS—
Table No. (1)
f cr?T
(2)
f 5 j *Page No. (3)
Subject
(2)
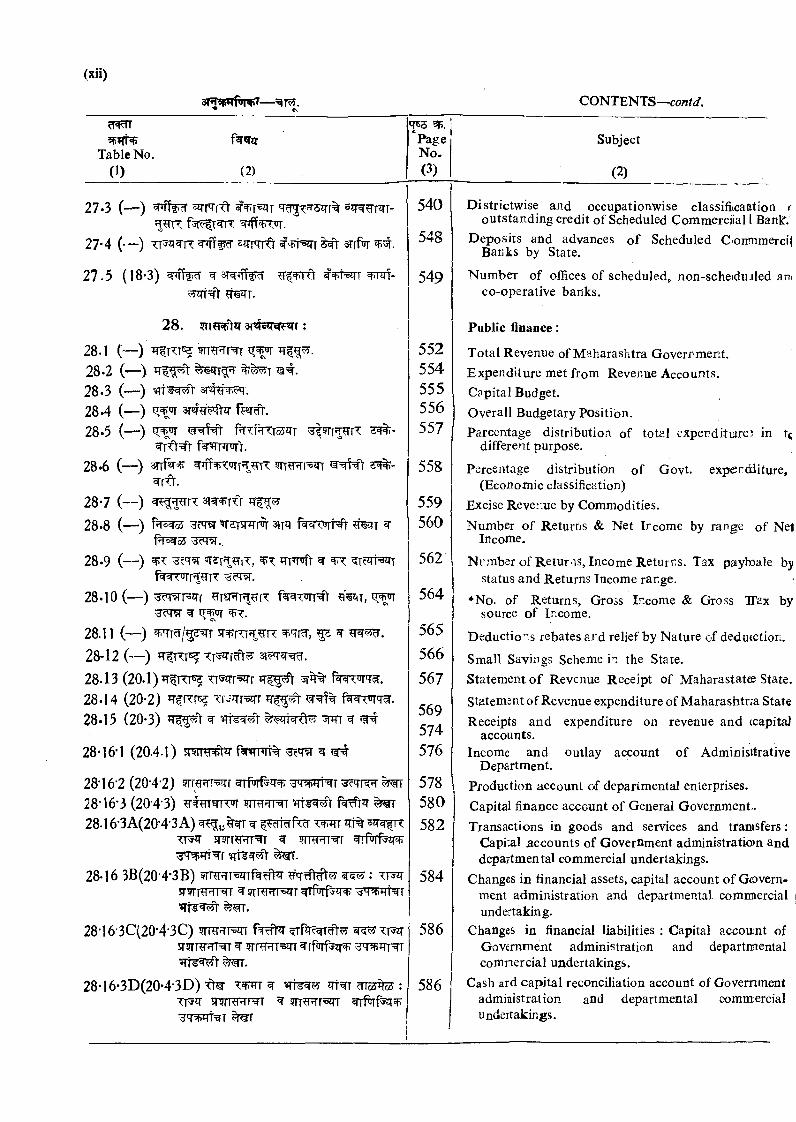
27.3 (—) ^rTrft frr=5tiT 'T ?:?T5irr%
27-4 (—) TT q n: s rr'TRt rrfor
27.5 (18*3) m m .
2 8 . JjTifnFtii 3T«To ?R f :
28.1 (—) TT TTT ' T T= T 28*2 (*—>28.3 (—)28.4 (—) 3T«T?fe4Vir ffsr^.28.5 (—) f?TTFT'?:T5S?TT s # -
rTt= 'v28.6 (—) 3rrf WT rsjrr
28*7 (—)28*8 (—) ^qr ^
f^^oS oR'TvT..28.9 (—) tTT^ T =3JIt
28.10 (—) J Tvrr q-j TTSrTT?rTTT ' T,^ ^T.
28.11 (—) 5r rrr?5, R '71 , ^ ^28-12 (— ) 3j?'T = .
28.13 (20.1)28.14 (20-2 ) = f%28.15 (20-3) w ^
28-16*1 (20.4.1) srm^tr ^
28*16'2 (20-4-2) rr psirr ^?qw^r ^'rr^ ^28*16'3 (20-4-3) ^ m rrroT ^28.16-3A(20‘4-3 A) wrr
sRTF nrr' r ^ wr^nrr^r ^rlwf^ir^
28-16 3B(20-4‘3B) 5Tm?TTwrf ri rqrft^ : • rjq- $rwmHT ^ 5TTWWT ^Tforf^q’ ^3 iTT= r
<5rr.
28‘16-3C(20-4-3C) TO rrs n tv5r?TT T5rr ^ ^rmi^sq-T^rfarf^q-^
28-16-3D(20'4-3D) fm :srwHTwr ^ i?rT?Rr=5qT
■3’q’5pTrt= r
540
548
549
552554555556557
558
559560
562
564
565
566
567
569574576
578580
582
584
586
Districtwise and occupationwise classifi(caUtion c outstanding credit of Scheduled Commerciial 1 Banlf.
Deposits and advances o f Scheduled C<onmmerci Banks by State.
Number of offices of scheduled, non-schedu-iled an| co-operative banks.
Public finance;
Total Revenue of Maharashtra Goverr ment.Expenditure met from Revenue Accounts,Capital Budget.Overall Budgetary Position.Parcentage distribution of total expendituire3 in t<i
different purpose.
Percentage distribution of Govt, expendditure, (Economic classification)
Excise Rever.ue by Commodities.Number of Returns & Net Ircome by range of Net
Income.
Nrmber of Returns, Income Returr,s. Tax payl»ale by status and Returns Income range,
*No. of Returns, Gross Income & Gross TTax by source of Income.
Deductions rebates and relief by Nature of dedwction.
Small Savings Scheme in the State.Statement o f Revenue Receipt of Maharastates State.Statementof Revenue expenditure of Maharashtna StateReceipts and expenditure on revenue and (capital
accounts.Income and outlay account of Administtrative
Department.Production account of departmental enterprises.Capital finance account of General Government..Transactions in goods and services and tranisfers :
Capi'al .accounts of Government administratio)n and departmental commercial undertakings.
Changes in financial assets, capital account of Government administration and departmental comnaercial i undertaking.
Changes in financial liabilities : Capital accouint of Government administration and departmental comnercial undertakings.
Cash ard c a p ita l reco n c ilia tio n acco u n t of Government adm in istration and d ep artm en ta l com m ercia l U ndertakings.
CONTENTS--con/^f.
Table >o. (1)
^ 2T
(2)
T O .PageNo.(3)
29. anfJT
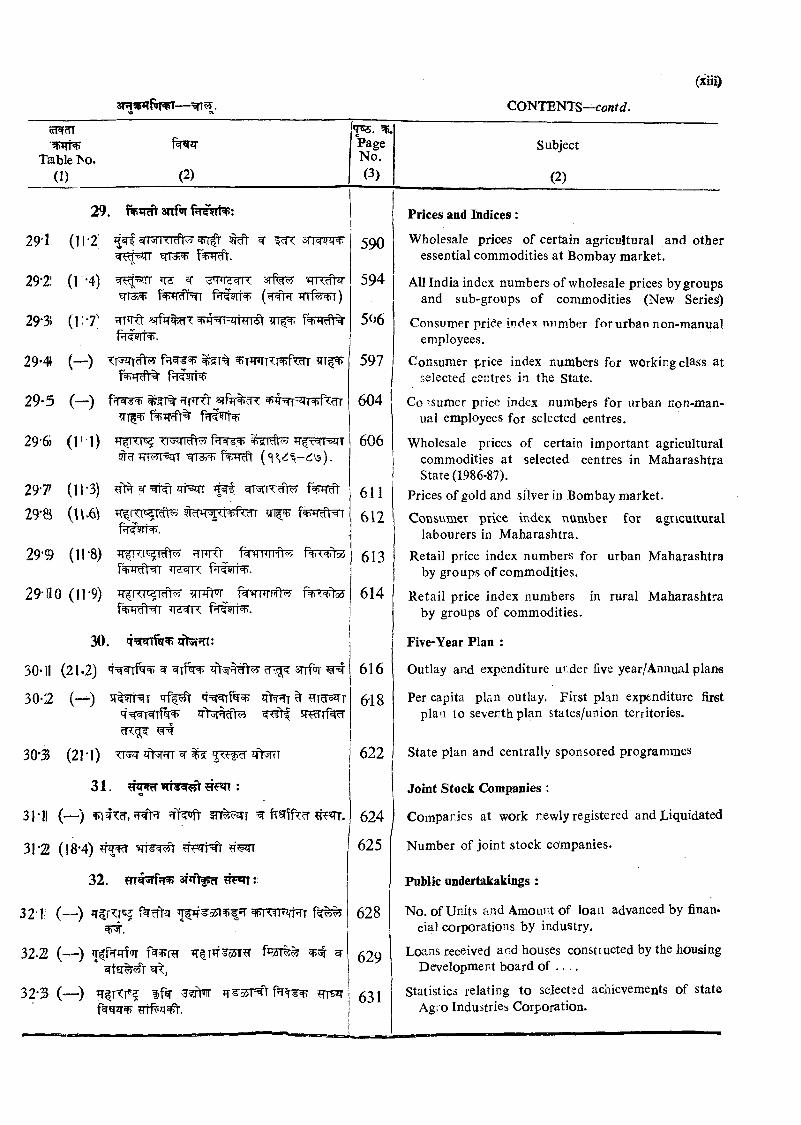
29 I (II‘2! ^ q- ^ 3T
29*2! (1'4) ^ 'T'ii'd=ri < sr fe wrWr
29‘3) (117 ■ ^T rft ^nhr^qwret fNrTRft%
29 .4 (—) ?TT^
2 9 .5 (—) f? r^ ^ ^?T%?rm'V
29*6 ( 111) iT^r^ TTWT^Trr =5jTT ( ' I ) •
29 7 (!l'3 ) ?f1% ^ qt55TT ^
29*B (U '6 fWcTl- i
29*9 ( 11*8) fW rnrfl^ f+i^tcd
29-ilO ( i r 9 ) ^TffTF^T^ N r ? :^f^TRfNr f rf ^TT.
30. q’ rftr
30-11 (21.2) ^ srrfoT ^
30*2 (— ) 'tT^^ q = ^ t o it> ^ t ^
w ^
30*3 (211) w r zr sFTT ^ ^ 57^ jft rrT
31. TiRcr ?r?«n :
311j (— ) i TcT,?T 't?T ? r f ^ iT^JTT ^ fTsrffT ?r 2n-.
31-2 (18*4) Hwr
32. 3 f r f^ eFETT:
32'li (— ) f^cftq ^#^55I^¥^^FTXTRfhTT
32.2 (— ) ’T nrtrfoT irtT^^ssT ^
32-33 (— ) if^ ^?r>f
590
59 4
506
597
604
606
611
61 2
613
614
616
618
622
624
625
628
629
Subject
(2)
Prices and Indices:
Wholesale prices of certain agricultural and other essential commodities at Bombay market.
All India index numbers of wholesale prices by groups and sub-groups of commodities (New Series!)
Consumer priCe index number for urban non-manual employees.
Consumer price index numbers for working class at selected centres in the State.
Consumer price index numbers for urban non-manual employees for selected centres.
Wholesale prices of certain important agricultural commodities at selected centres in Maharashtra State (1986-87).
Prices of gold and silver in Bombay market.
Coivs\iiner price index number for agricultural labourers in Maharashtra.
Retail price index numbers for urban Maharashtra by groups of commodities.
Retail price index numbers in rural Maharashtra by groups of commodities.
Five-Year Plan :
Outlay and expenditure ur.der five year/Annua.1 plarts
Per capita plan outlay. First plan expenditure first plan to seventh plan states/union territories.
State plan and centrally sponsored program m es
Joint Stock Companies :
Companies at work newly registered and J^iquidated
Number of joint stock companies.
Public undertakakings :
No. of Units and Amount of loan advanced by finan. cial corporations by industry.
Loans received a ad houses constiucted by the housing Development board of . . . .
Statistics relating to selected achievements of state Agio Industries Corporation.
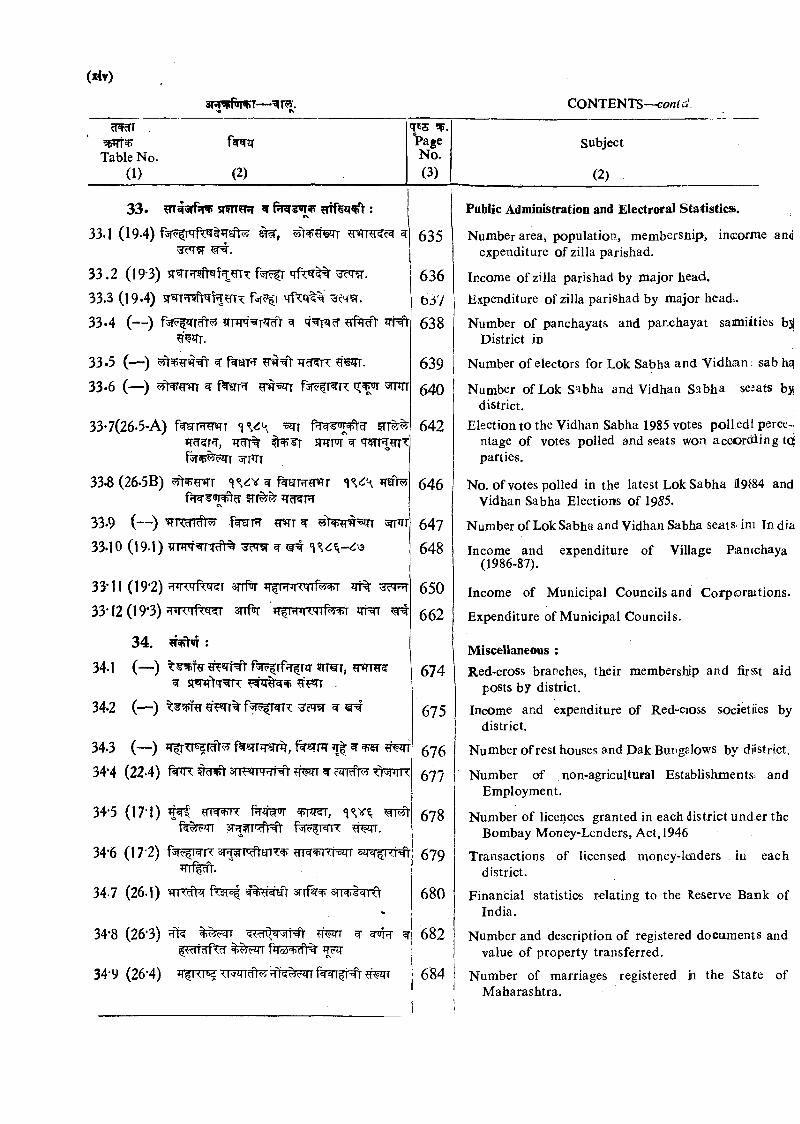
Table No. (1)
farrq-
(2)
PageNo.(3)
Subject
(2)
33. smr f r :c\
33.1 (19-4) m , \ 5 3 5'TvT w^.
33.2 (19-3) q fr '^ 'T?r.33.3 (19«4) fvjic r 'TfTq % ^chvi.
33*4 (—) rfMV?T2TT.
3 3 .5 (— ) ^ f s r ^ TT^T
33-6 (—) f arr f^ r^TT srpn
33*7(26-5-A) <\%6\tN7 r swm'^ q-^^T
rr’Tr33^ (26*5B) w f rsT?mr
5TT JTcTnr€N
33.9 (— ) ?PTr ^ 55t r?rt=5?TT srr iT
33*10 (19-1) ?r?r ^
33*11 (19*2) JTJRTf T snfw qi%33’12 (19‘3) sTwrfrq srrfnr 4■H KTP • i zri ^
34. :
34.1 (—) 9rrarr, smtT=5TR .
34.2 (— ) t^^^=F^T% f5r?|R R ?TW ^ ^
34.3 (-—) f^«rrTTsrr , f^«rnr ^ ^ ^f^qr
34‘4 (22*4) fVr< srrPTFrrNt rwr Tt nrR
34*5 (17i) «T=r+i'<?T?T5rr<fHY -HWi.
34*6 (17-2) f^r^rT sr^p^gnTy ^N^Th rTTT%ft.
34.7 (26.1) w r ^ f%5| srife
34*8 (26’3) w
34-9 (26-4)
636
(d37638
639
640
642
646
647648
650
662
674
675
676677
678
679
680
682
684
Public Administration and Electroral Statistics.
Number area, population, membership, incorme an(i expenditure of zilla parisliad.
Income of zilla parishad by major head.Expenditure of zilla parishad by major head..
Number of panchayats and panchayat sajmiities bjj District in
Number of electors for Lok Sabha and Vidham sab hq
Number of Lok S'^bha and Vidhan Sabha seaats b)| district.
Election to the Vidhan Sabha 1985 votes poll edl percentage of votes polled and seats won accordling td parties.
No. of votes polled in the latest Lok Sabha 119 84 and Vidhan Sabha Elections of 1955.
Number of Lok Sabha and Vidhan Sabha seats ini In dia
Income and expenditure of Village Pan(chaya (1986-87).
Income of Municipal Councils and Corporaitions-
Expenditure of Municipal Councils.
Miscellaneous :Red-cross branches, their membership and firsst aid
posts by district.Income and expenditure of Red-cioss societiies by
district.
Number o f rest h o u ses and D a k B u fg e lo w s by diistrict.
Number of non-agricultural Establishments; and Employment.
Number of licences granted in each district und er the Bombay Money-Lenders, Act, 1946
Transactions of licensed money-lmders in each district.
Financial statistics relating to the Reserve Bank of India.
Number and description of registered documents and value of property transferred.
Number of marriages registered ii the State of Maharashtra.
SerialNo.(V (2)
Item
(2)
3TT^^ GRAPHS
1 O Percentage of population according to age group
2 NiCMH State Income
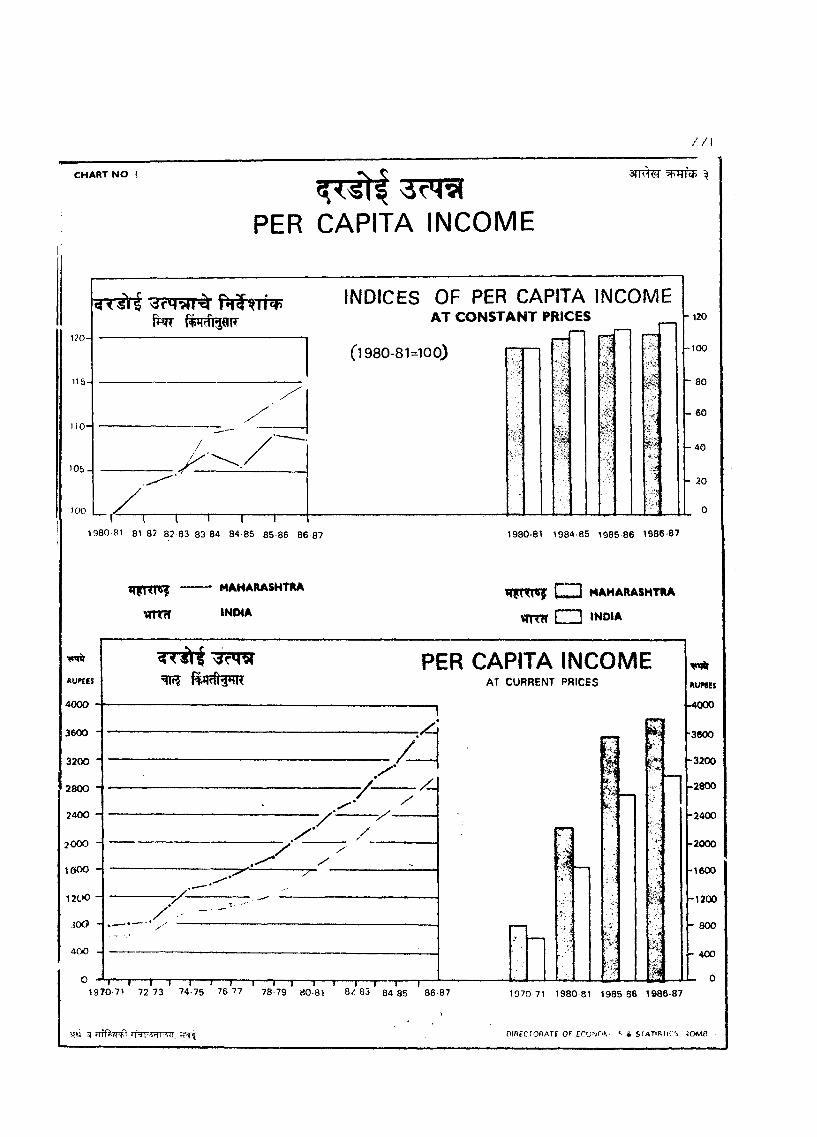
3 K<iri Per Capita Income
4. 3Tr -yT Foodgrains Production
5 NdrMKHI Index number of Agricultural Production
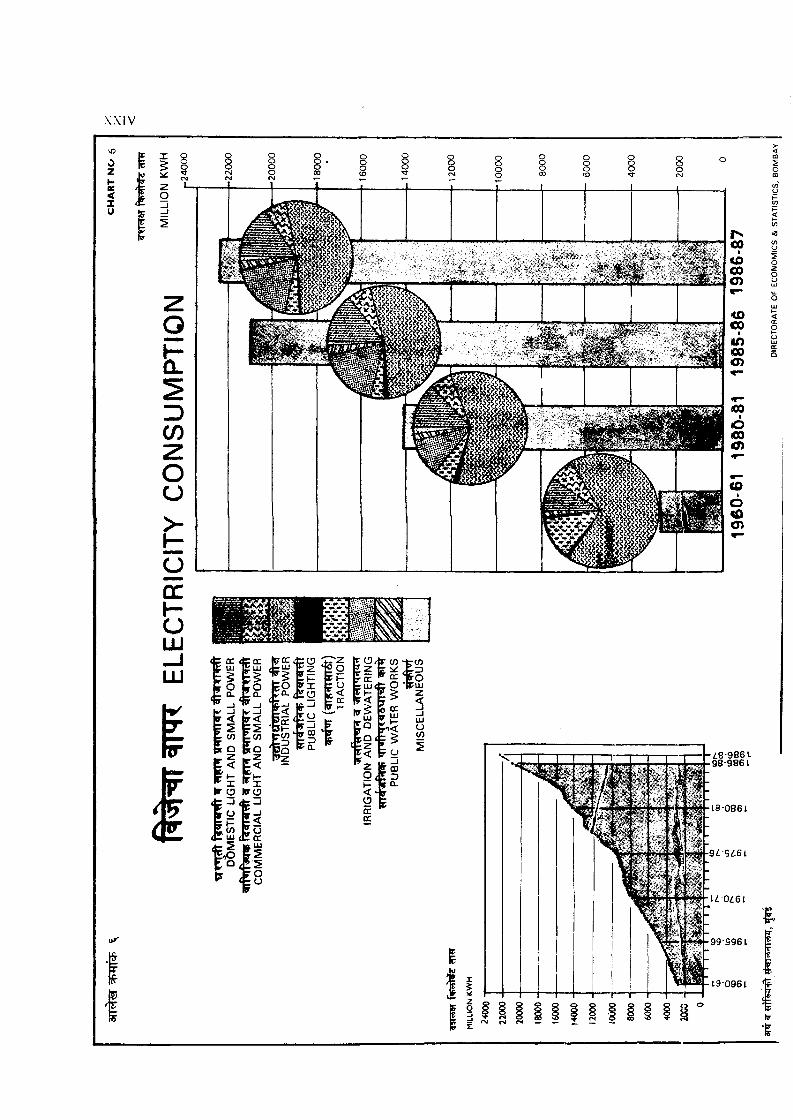
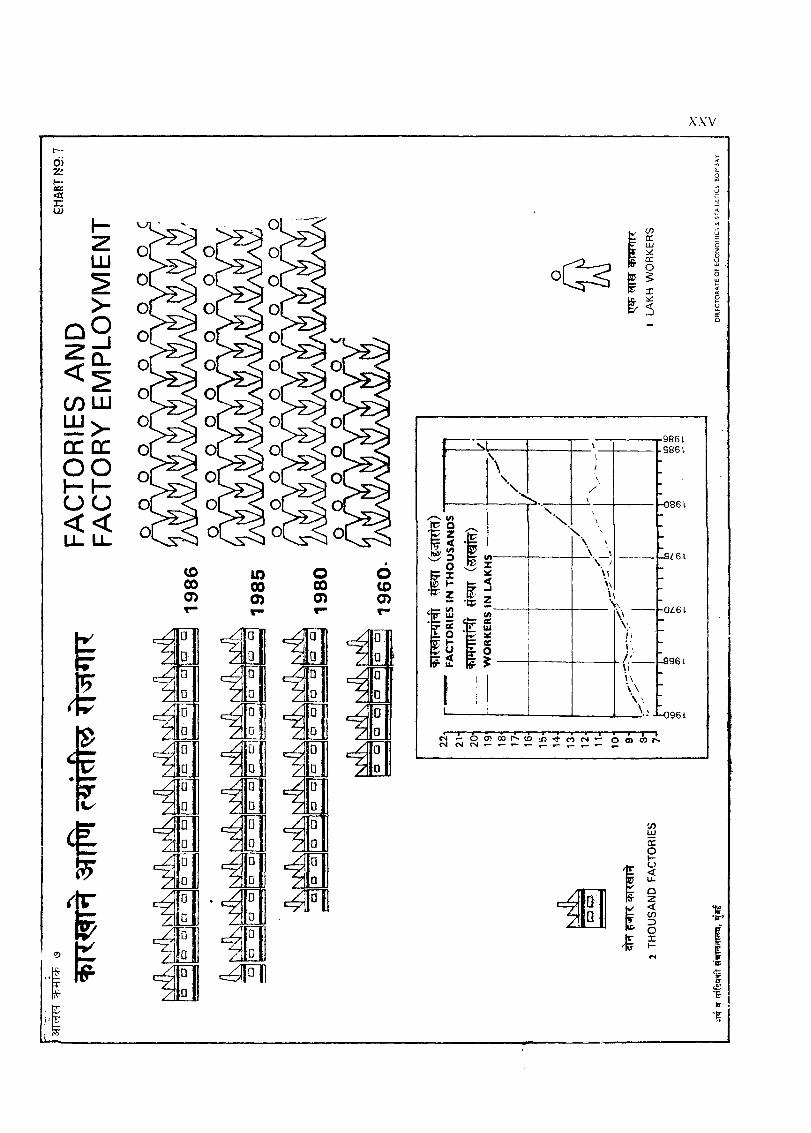
6 Electricity consumption7 srrfw T^rirn: Factories and factory employment
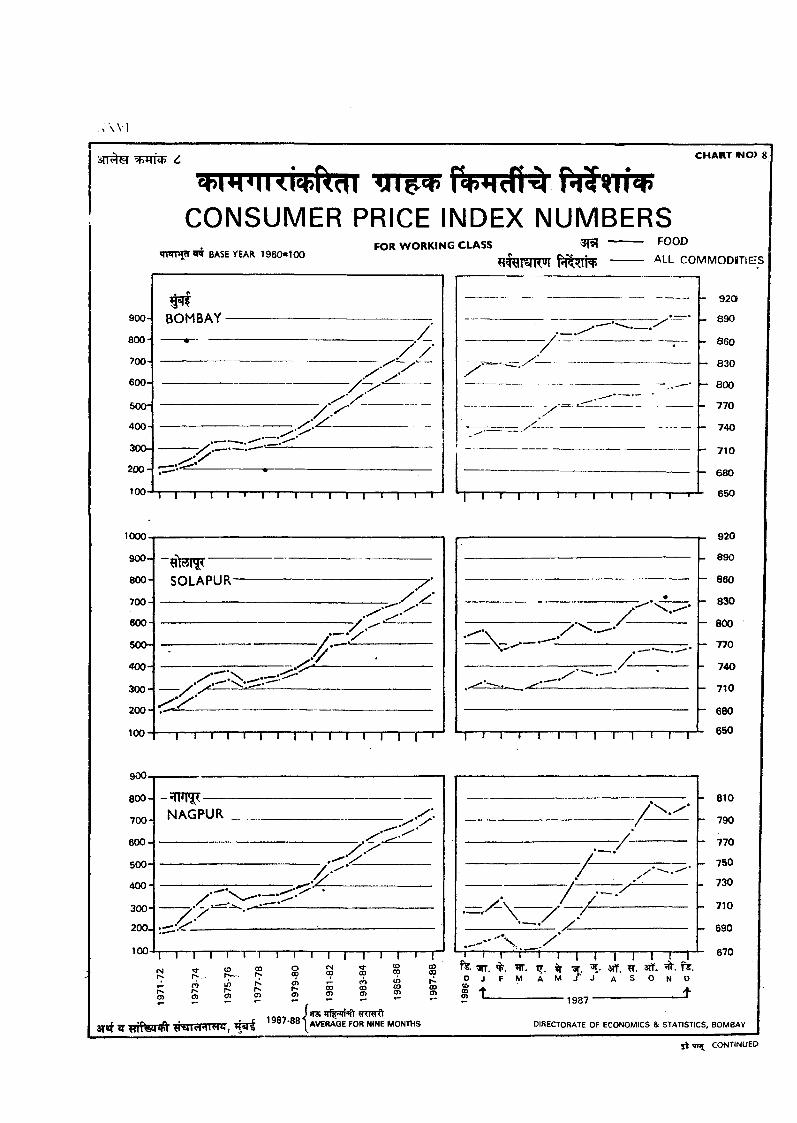
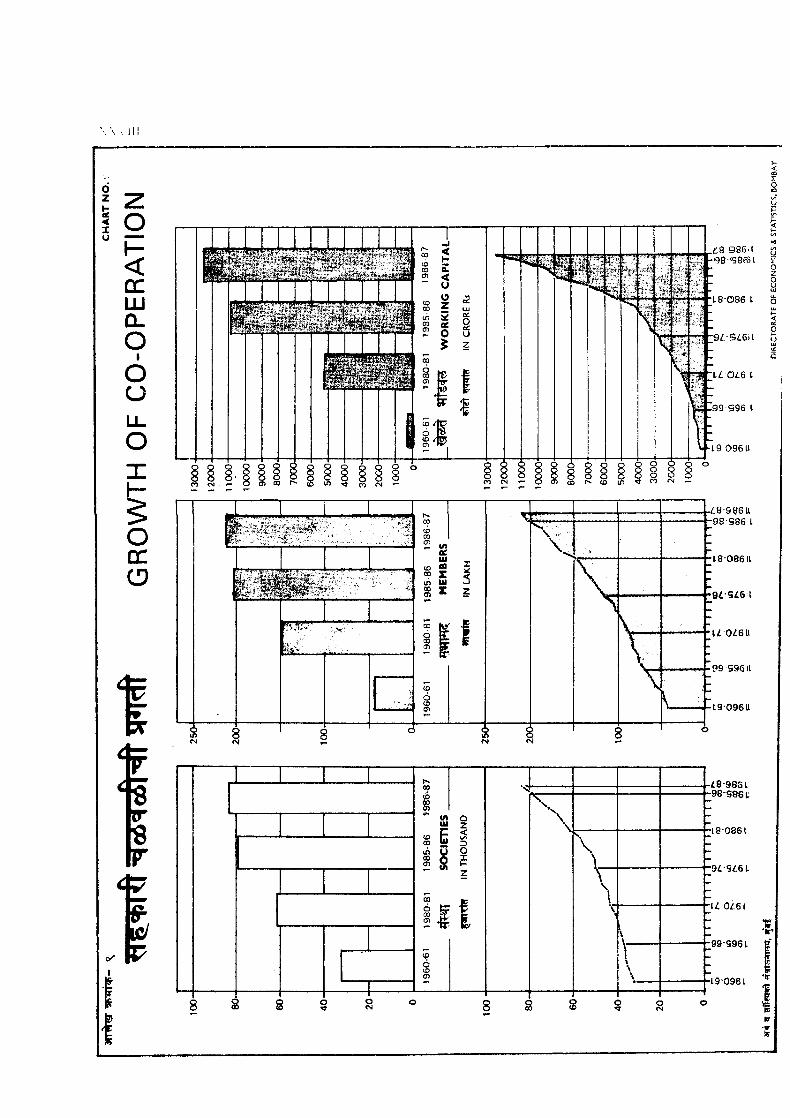
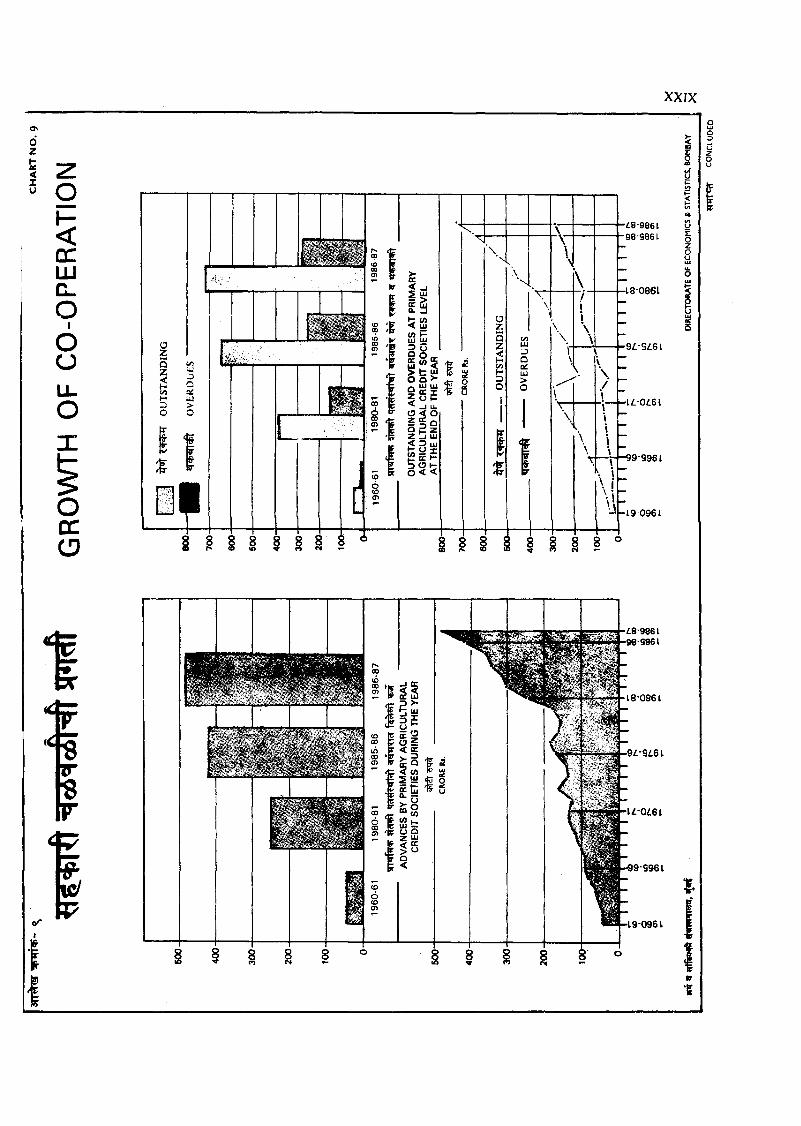
Consumer price index numbers for working class9 SPFft Growth of co-operation
f Te rNt 3 ^ w t ^ ^77^^ s n ^ 3Tt| .Ifote,—The data for the newly created districts wherever available, is reported separately in this issue.
fw^rNrr ^r^Tcft^ «*ciw'i aj §tt s r i^ :—
(*\) f W T ^ ’TT^ ‘'TT3T»T .” 31% S otfRT STT 3Tr|.
(^ ) ctf^55^T w M t , sfltmwR ^ ^rvsMt ITT f^r^Wlr ^ “ srr^yqr” |^ ?i%r^ ^ 3 T 1 ^ 3TT
( ^ 5 = f r ^ T , ^ ?TT f^elTRt 5*Tt^r ^ | ?T%3R=^ ^%6R ^ fsr TR? 3TTiT W R 'TT R 3TT# srTf^.
srr^rtsTRl' ^rsirr sr^r imr ^ qr ? r^ w rc r 3rr|.
Note on reorganisation of Districts in Maharashtra
The folltwing changes have been effected on account of reorganisation of the districts and change in name of diistricts :—
(1) Tie name of Kulaba district is changed to “ Raigad ” district with effect from 1st May 1981,(2)JTyo new districts “ Sindhudurg ” and “ Jalna ” have been created, with effect from 1st May 1981, by
Tcorgaming then existing districts of Ratnagiri, Kolhapur, Aurangabad and Parbhani.
(3) Tyo new districts, “ Latur ’’ and “ Gadchiroli ” have been created, respectively with effect from 16th 'ATUgustl982 and 26th August 1982, by reorganising then existing districts of Osmanabad, Solapur, Beed and Clhandrvpur.
Tihe dati for the newly created districts if readily available, is reported separately in this issue.A - 9 4 - . F.

Cxvii)
STTHflf^
" ” 1 5r^mJTm T tr^Ff^^rmr ^ 3Tt|. srftrs
| 3 I r c^ii^s T R ^ rr^ wsfjt % ^?rr5iT?cr ^ anfq^ ^m1Nq*r 'm#>rfjT^^>5 srr^iqrrf)-^3^5^ sfift sTffw FT ^ftq^r=zrHt ^ f'fd '^ r ^5f € ^ ^ m?T ^^ftsFTT^rT^r, fjT 't^^Tr^K rr ^Tr^qrrsTT ^ a r r f^ ^ 7 -^ r st ' trt qFrr irrsirr
qrir=J 3tt ^ sTR^a'3T^ c ?T5js
5 ^ T ^ tt^ . cT%= ^FTrrf^ ^3nf%^ crf=53Tr sn^^Rt^sqr ?Trf %-
c Tr C7F ^Tcft^ ?TT^ ST ^Tr ^Tm ^>f^.
INTRODUCTORY
0,1, This is the Twentyfirst issue of the Statistical Abstract of Maharashtra State which is being published since its formation in 1960. The purpose of publishing this Abstract is to present background statistical material on as many socio-economic characteristics of the State as is possible so that the Abstract may prove useful not only as a reference book but also for research, planning or, further socio-economi c studies about the State. The information is to the extent feasible, is presented districtwise for interd tr ic t comparison. Some social and economic statistics are presented over a series of years to study changes in these fields.
><nTTT m 3rfsn5t9T
3tt|. ^rrflcft3T?r^c^ TTlffcft %3qYcT stT^^ 3Tt|. rirn'-
^q jfcfs^TT Trrfe^rj5 ^rr WT 3rr|.
f ^ i r sffV s rfe s p ^ 3T5E?Tfjft^ ^ 3T?«Trjft atrcrqr
r?%?q'r ^ r sffar^'TiT 3TT555 't. irr^ -^r ^'tsr^^rr^
snrnf^T TiUcft •(^ T - TTfrTfs T r srrf%^7 1 ^ ) f^T ^ r^ fw ?TT^ rtfer iTt iffer=^rf% 3tirra ' sr rf?r?r §rr^?^T ^r^t.
0.2. The present issue relates to the year 1986-87 and the detailed data are published for the year 1986-87 wherever such data were available. Wherever data for 1986-87 were not available, the data for the latest available year are given. Also, yearly series up to the year 1986-87 are presented. The. statistical data presented in this Abstract are initially compiled by various departments of the State Government, Government of India, I*ocal Bodies, etc. These departments usually prepare and release provisional figures for recent years. These provisional figures are in the process of finalisation and ultimately when they are finalised, they are slightly different from the provisional figures released earlier. For this reason, the data published in the other publications of this Directorate, viz., “ Hand-book of Basic Statistics of Maharashtra State ” Economic Survey of Maharashtra ’* or the earlier issue of the Statistical Abstract may not exactly tally with those published in this Abstract.
o . ^ . ^ irrffd^ 3tt| . 'Tff srrTrxJrrf *T2ft JTr%ft srr|. fFFqt
TFirrTfsi irfq-3T ^ %qrcT s rr^
srr^. sTc^ ^rr^^pfht ^rrf^ ^ r ^ sT r^ r i^<33Tcjjt 3Tt| I 3{T% 3Tr|..
^#^/^r55T ^ 3fr^i^r^ sr^’zrr rr TT c^rr^
3(t| . irr3tt| 3rr|-
o ,V. JTS^f?^?qT^rWr^3TrfW Tt^JTR-f ^ z r ^ JTr%^irst
^rcri^ ^ ^ ^ < \ o o fcfr >fTrcrTTrr ■c q-N?TT%ft 3rr%
wrrcm^l^f ^ 3rr|. ^ ^ <>srVf^r^ srrfq- xt^ g srrf^ 5Fnfe%-
^^TfR 3Tf|. X J ^3?T?r55r 3Tt| .
MAHARASHTRA AT A GLANCE
0.3. This table is divided into two parts. In the first part, some general particulars about the State are given. In the second part, the important indicators under various heads, such as population, agriculture, etc. are presented alongwith the corresponding figures relating to the country. In some cases where the period to which,the figures concerning Maharashtra and India, respectively relate, is not identical, the data for latest available year for India is shown and comparison of Maharashtra with India is made with reference to this period. The statement also gives percentage share of Maharashtra with the figures relating to the country.
0.4. The information regarding factories and employ* ment shown against item 5.1 is inclusive of defence factories, ^oad length per 100 Sq. km. of area shown against item 9.2 is quoted from the information supplied by the Ministry of Transport and Shipping. The estimates of State Income and National Income given against item No. 10 are according to revised series. For India, estimate of National income and N«t National Domestic Ppoduct, is shown.
^iffdl 3tt| . 5Trf^^ p m m ^ 'TT= ^ rf=«TT stt3TT|.
f^?rt«F
o . ^ . 3irf^^ snf T % M?ir^ rr st^t^ srr^f?rf9it ^ sTcT
3TT% 3n-|. TT5 f ^ w ( ^ .*TTT, sfNrE^^T) 3T?ft 3T?Tf^^ ^ + ’ <s^T »T%c^TT cJTT rf — \%6^ =sqT ^ > T ^OZTT^ sn^T 3TT|.
® -V9. ^ 3 5 yrfer^hr Hif cil ct^ 3tt|w.2TT cfWTcT f f t f R R m f^€t 3Tt|. 9lfe#hT
gw^rrsJTT^ i%w=^ ^ ’Tt ifrsRT^qr^ ^ »rr^ 3tt#5?tt m fer^ ?ft T=2Tr ft
3tt| ctpt riw% siT|cr.5#sfT Trtq^T=?rr ^c^rmt q-r^ ?rW%cR rrsETr Rt r w.*f1'*>Ha < ^f?^ 3n|?r.
SUMMARY TABLES
0.5. Summary tables of some im portart 1 topicsvi have been presented here. The data are pregsented^’ in the form of series for 1960-61 and thereaifteer at an interval of five years till the year reference.
SELECTED INDICATORS
0.6. Districtwise selected economic a rd ; social indicators mainly frr the years 1986-87 have been presented in this issue. Base population is„ iin all cases, taken to be the estimated populatiorn for 1986-87 except where the particular popullation estimate such as workers, urban population et(C.,, was not avaiJable for the year. In such cases 19711-1981 population characteristic was used.
*0.7. Statistical tables on various subjects airei presented thereafter. Districtwise data are depiicteed in these tables. The tables are grouped under vairious subjects and are arranged as per recommemdaitions made by the Central Statistical Organisation. The presentation of subjects is slightly different fromi that in earlier State Statistical Abstracts and hencie 1 table numbers are also changed. With a view to facilittating reference to tables in earlier Abstract, old table mumibers are given in brackets after new table numbers*
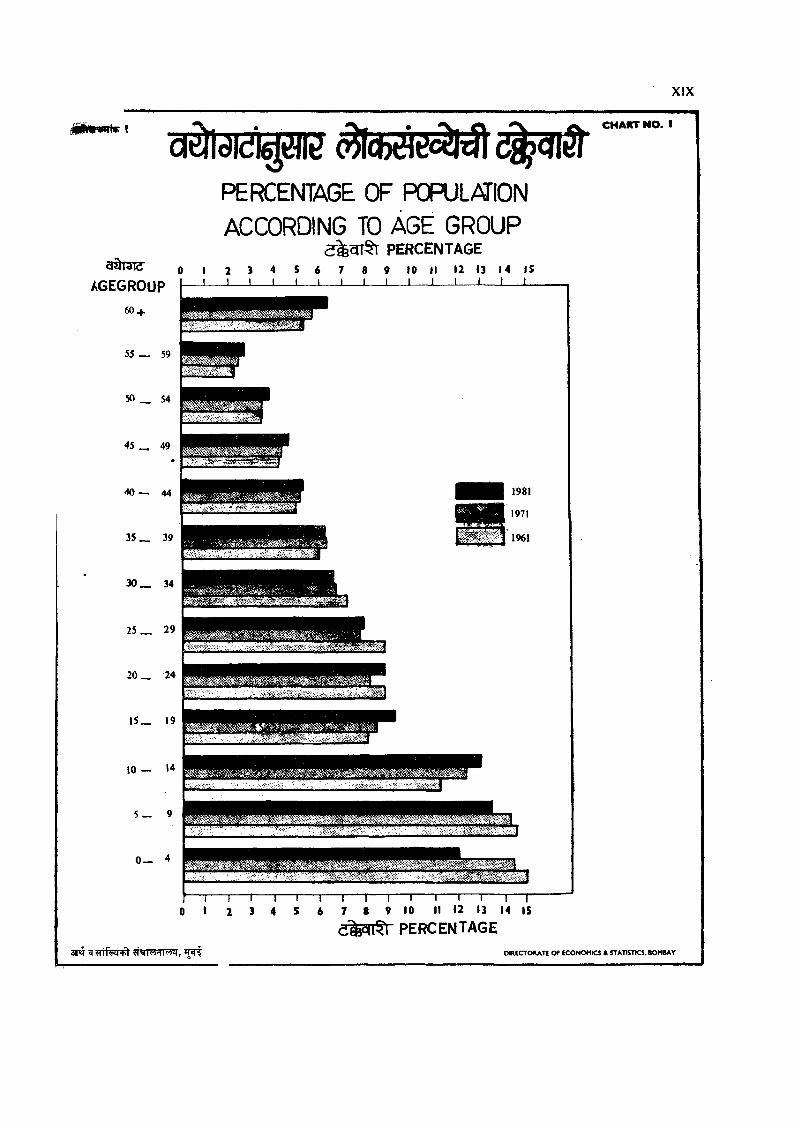
PERCENTAGE OF PCFULATION ACCORDING TO AGE GROUP
a ’ a r tr percentag e0 1 2 3 4 S t 7 < » 10 II 12 13 14 IS
/6EGR0UP ' ' ' ' ' ' ' ‘ I ' l l I I60 +
55 — 59
50 _ 54
45 _ 49
CHAHT NO. I
40 ~ 44
35 _ 39
30 _ 34
25 _ _ 29
20 _ 24
I 5 _ 19
10 — 14
5 — 9
0— 4
,S'
"i— I— I— I— I— I— I— I— \— I— I— I— I— I— r 0 1 2 3 4 5 6 7 8 9 10 II 12 13 14 15
e^Ecn^r pe r c e n t a g e
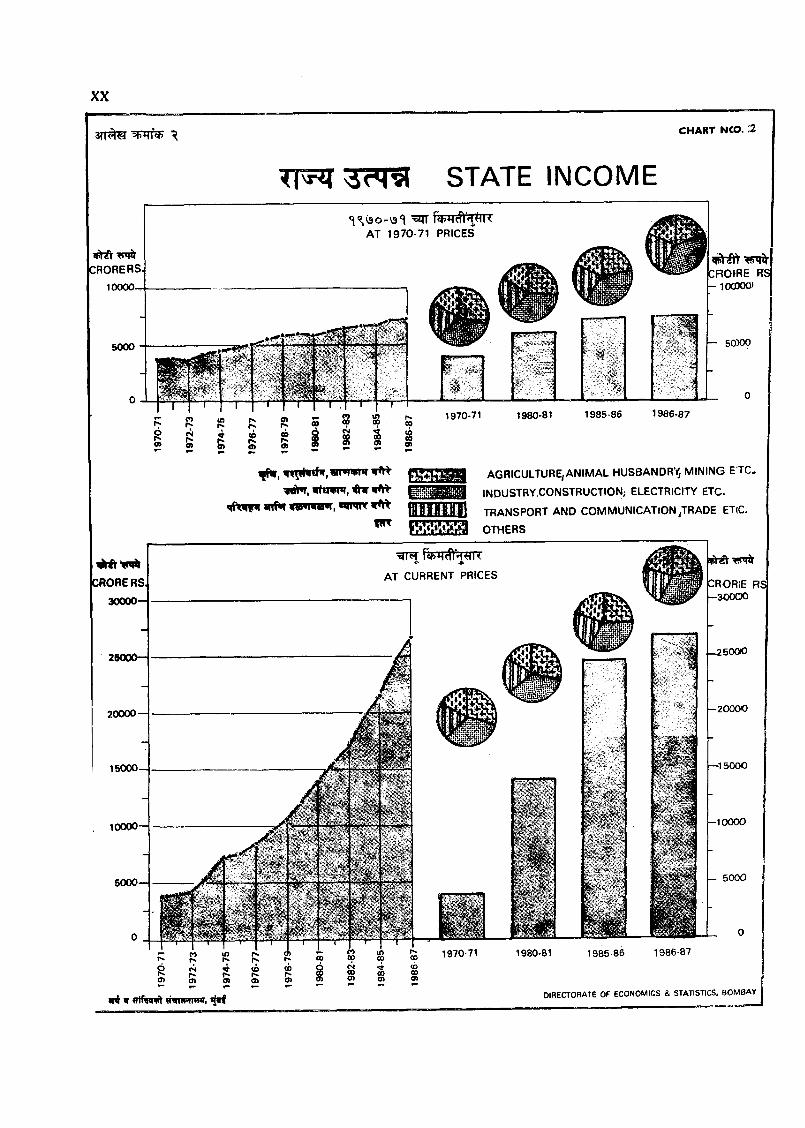
CHART NCO. :2
STATE INCOME
AT 1970-71 PRICES
CHORE RS
10000
5000
1970-71
. C ;
■y ;
^ J k
1980-81 1985-86 1986-87
CROfRE RS 1OC0OO)
— 50XX)
iwplwifw,«r"miT itowm, ^
wnmt wA W?
l i i i i fMi i
AGRICULTURE,ANIMAL HUSBANDRY MINING ETC.
INDUSTRY,CONSTRUCTION; ELECTRICITY ETC.
t r a n s p o r t AND COMMUNICATION JRADE ET(C.
OTHERS
CRORiE RS h-300CX)
—25000
-2 0 0 0 0
—15000
—10000
_ 5000
ipI 9 Fffmntt Hffiwnwf, ijif
1985-86 1986-87
/ / t
CHART NO 3
PER CAPITA INCOME
^ r i r i ^ 3 ? q m ^ i^ S T h F
12 0 -
115-
no-
lOb-
100 __
INDICES OF PER CAPITA INCOMEAT CONSTANT PRICES
0980-81=100)
\------ (------ 1-------(------- 1—1980 81 81 82 82 83 83 84 84-85 85 86 86-87
r 120
-100
*- 80
~ 60
- 40
- 20
0
1980-81 1984-85 1985 86 1986-87
iwtir
RUPEES
4000 '
3600 1
3200 -
2800 1
2400 -
2000
leoo -
12t*0 -
30O -
400 -
o
Vf1T?T
H A H A R A S H T ftA
IN D IA
W r r S f M A H A R A S H T R A
W H c m ‘NOIA
PER CAPITA INCOMEAT CURRENT PRICES
/ I-------------------/ —
/
-y '-
I r I I I T I I I r I T~ I I r1970-71 72 73 74-75 76 77 78 79 «0 81 8 83 84-85 86-87
n
Rums-4000
3600
“ 3200
-2800
-2400
-2000
-1600
p-1200
- 800
- 400
1970 71 1980-81 1985-86 1986-87
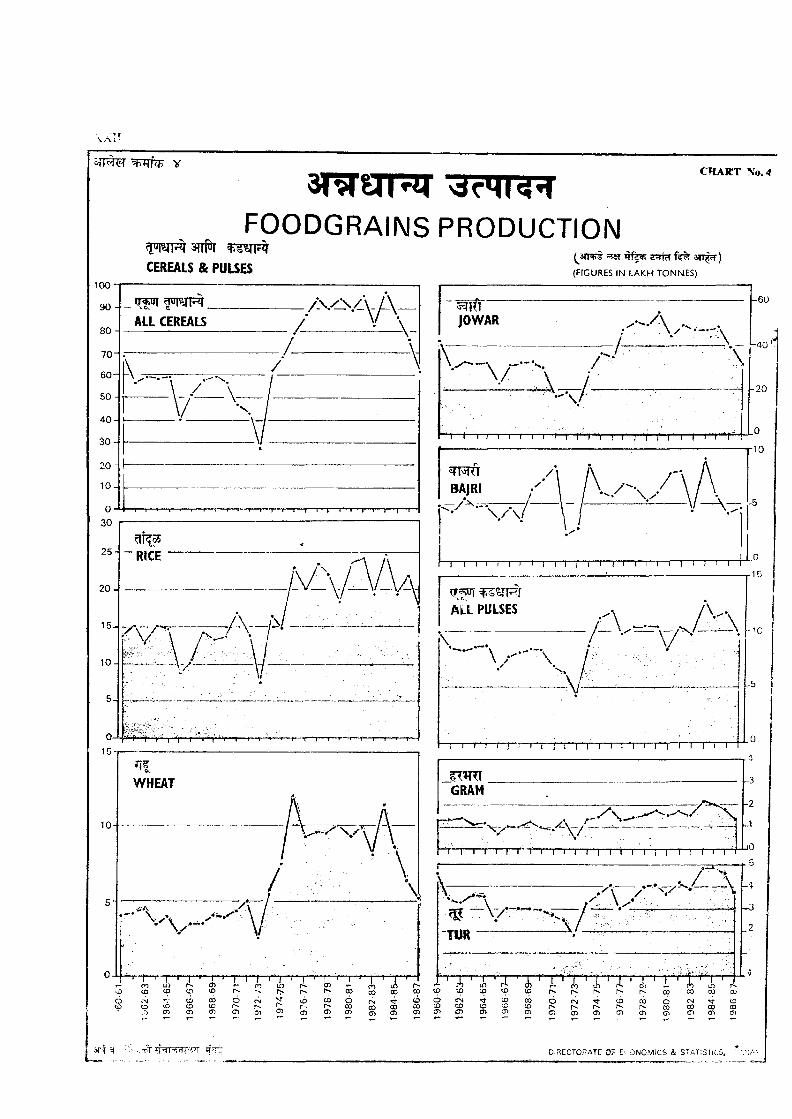
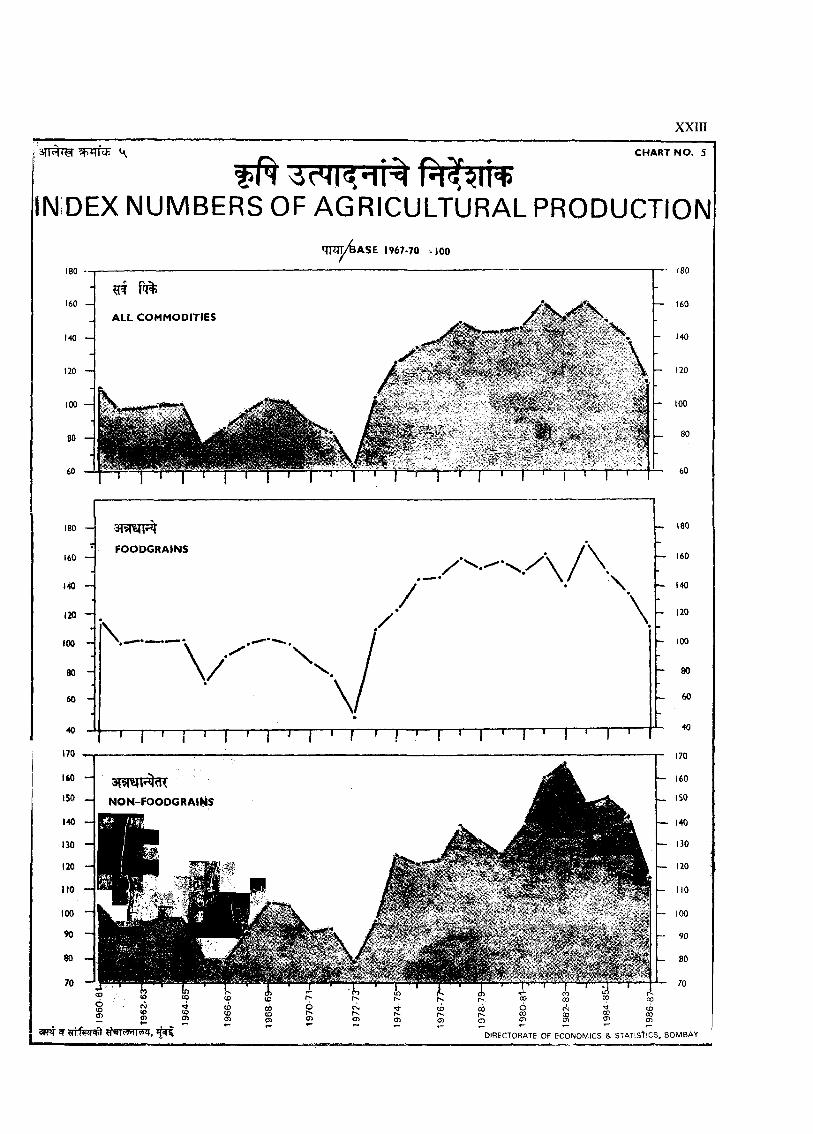
CHART NO. 5
in:d e x n u m b e r s o f a g r ic u l t u r a l p r o d u c t io n
Tr
5J
/!.8-9861.98-9861
99-S961
19-0961
0)-ILH"(££.
x:Ufh - Z LU
> • q O
2 al
(O0 0O)
U)0 0O)
f f
€
o0 0G)
■€1
-z:
1
1
o(OO)
rI
: s c
\
\\
\ /
9861LS861
W \\
_ V ■\\
\Njl \ . i f \i V\w\"\
\
HD861
SLGl
■016 L
■S961
- -»-0961
*- OCTsoor^coirj '^cocM -•— I " I..no o> 00 r.
/ q :0
inwCEOH-O<
QZ<CO3oX
1S■tr’
I•IF
3TT^ C
w r t t N ^CONSUMER PRICE INDEX NUMBERS
CHART INO> 8
qwnjsrw base year 1960»iooFOR WORKING CLASS
900-
800-
700-
600
500“
400-
300-
200 -
100
BOMBAY
/ V
___
1 I I j—j , I I I , I j I , j— ,— p
1000
900-
800-
700-
600-
500-
400-
300-
200
100
etc5T^SOLAPUR
T \ I I I I I I I— f I I | — I I "T
900.
800-
700-
600-
500-
400-
300-
200-
100
-----NAGPUR
/
1— T T 1— r
ifl r;05 01
T—i I rs s
T—T—r—r'§> §
1987-881«I3> tncnrxtAVERAGE FOR NINE MONTHS
FOOD
ALL COMMODITIES
T I I I I I I I I I r
- 920
- 890
- 860
- 830
- 800
- 770
- 740
- 710
680
650
920
830
800
770
740
710
680
650
- /
-J---- 1 I ■ J .2 fi«- -aiT. *ir. Tf. ir % 3ff. W. 3if. f t . O J F M A M j ' ‘ J a S O N O
__________f
- 810
~ 790
- 770
- 750
- 730
- 710
- 690
670
1937
D IRECTORATE OF ECON O M ICS & STATISTICS, BOM BAY
CONTINUED
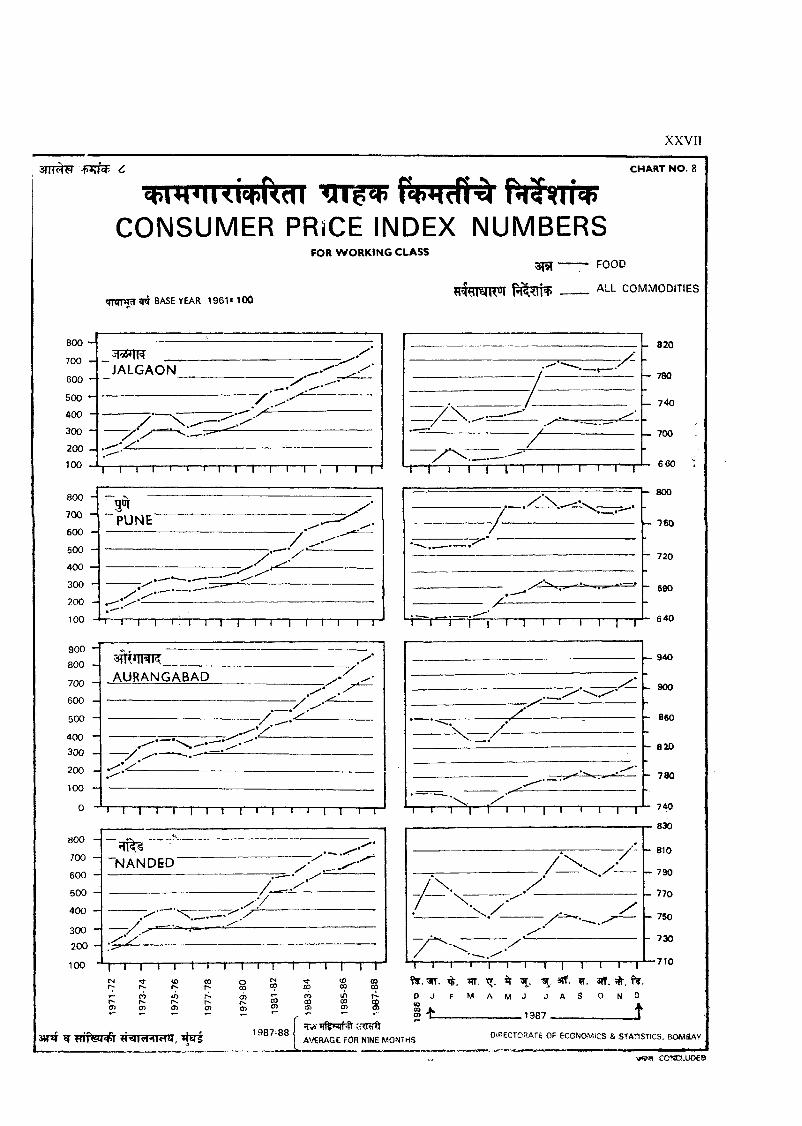
CHART NO. 8
CONSUMER PRiCE INDEX NUMBERSFOR WORKING CLASS
«nqTflTH BASE YEAR 1961M 00
FOOD
ALL COMMODITIES
800
700
600
500
400
300
200100
800
700
600
500
400
300
200
100
__JALGAON
T— !—I— I— I— r-T—T— I— I— I— r “ ,—I— I—r
T— I— I— r T—I— I— \—\— I— I—I—I— r
900
800 -
700 -
600 -
500 -
400 -
300 -
200 -
100 -
0
AURANGABAD
T—T—I— I—T T—I— r-T -1 — r -T 1— r—r
800 -1
700
600 H
500
400
300
200 -
100
"NANDED
• /
r - T T— I— t—1— I— T T —!-----1 1 " T -l— T T
CO 40
1987^88
1— I— i— I— i— r n — m — m — i— r
- 820
~ 780
- 740
— 700
6 60
T— r = i — - r 1—1— r
- SCO
r- 760
720
~ 680
640
X —
~ 940
~ 900
- 860
- 820
- 780
-'wtrA V ER A G E FOR NINE M O N iH S
1— I— I— I— I— I— I— j— I— \— I— rV([. XT. i r -sr. aiT. w. arf. f t .
D J f M A M J J A S O N D
S t ^ ____ 1987 _________________t
D IRECTORATE OF ECONOM ICS & STATtSTtCS. BOM fiAY
w«5M CO T«XU D 60
i i
<c cU Ja .
OI
OoL L
O
oc c .
( D
15 “
f .
V
< p
I
t
Im ^ m m m
V..*
I
oo f;
£8-986.1-98-<98fiU
L 8-086 I
^Z.-Sil6)l t3
IL 0L6 I
99-S96 I
19-0'9611
-•-19 0961
5T
j r
r
£
£8-986198-9861
9-9961
19-0961

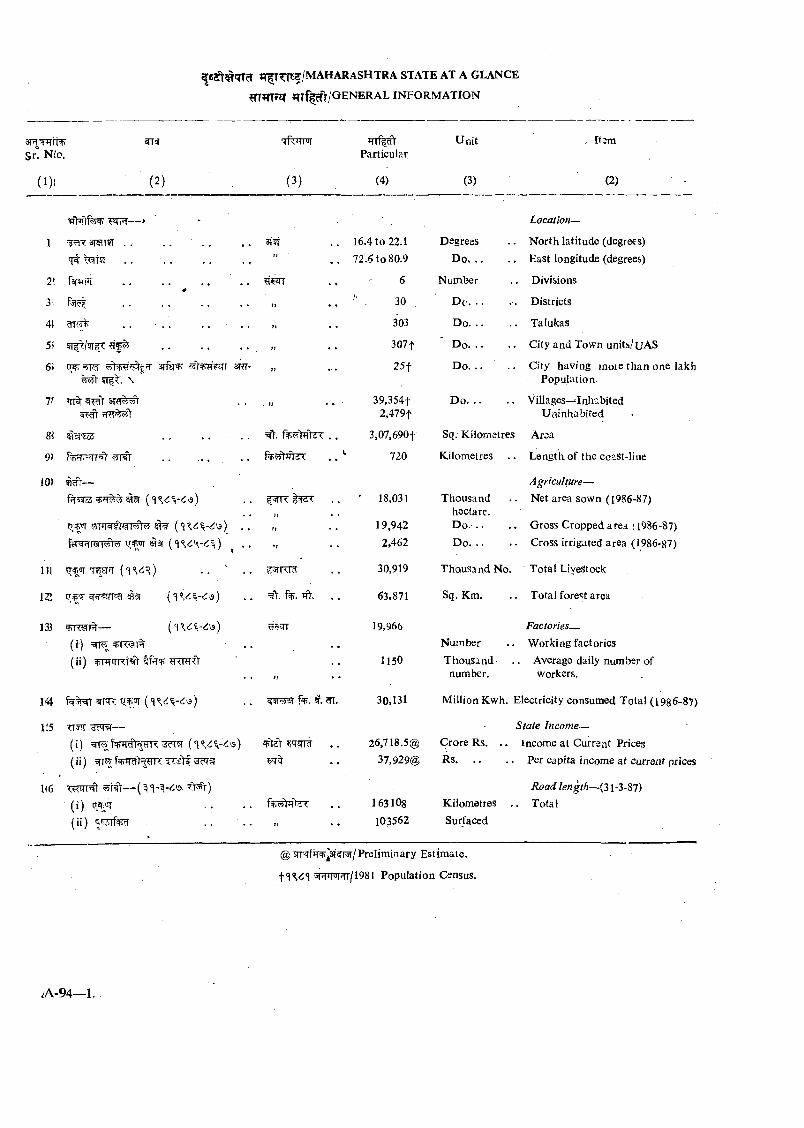
; t ^ t t i k ? / m a h a r a s h t r a s t a t e a t a g l a n c e
m m r z r ? T T % r> /g e n e ra l i n f o r m a t i o n
Sn Nfo.crflTTpiT
ParticularU nit
(1)1 (2) (3) (4) (3) (2)
ftpt— > Location—
1 3r§Tt9T . . . . ' . . 3i?i 16.4 to 22.1 Degrees . N orth latitude (degrees)
'i t ^T5I . . . . . . . , 1) 72.6 to 80.9 D o. . . . . East longitude (degrees)
2’, iM ; . . . . . ’ . . 6 Number .. Divisions
3. . . ................................ >i ♦« '■ . 30 . Dc-. . . . Districts
41 . . ■ . . . . ■ . . » ♦. 303 Do. . . . Talukas
5i » 307f ' D o. . . . City and Town units/UAS
6> arfsr^ srt- » 2 5 t Do. . . . City having inoie than one lakh5J^ 'N.. Population.
ir . 1 1 • ♦ ■ 39,354t D o. . . . Villages— Inhabited2,479t Uninhabited
8i . . . . . . 3,07,690f Sq.-Kilometres Area
9) 5TF . . . . . fe?5)7ft2^ . . '* 720 Kilometres . Le ngt h of t he coaSt-li ne
10) — Agriculture— ■
' 18,031 Thousand . Net area sown (1986-87)i r • • hectare.
t’ 'T 5irTirafr T5?V5? ^ . . 11 • ♦ 19,942 Do. . . . Gross Cropped area ; 1986-8?)
1/ . . 2,462 D o. .. . Cross irrigated area (1986-87)
111 tT or rr?7arrr . . ■ .. 30,919 Thousand No. Total LiyeStock
12 (T ar fEF. I?V. . . 63.871 Sq. Km, . Total forest area
13 ^rrwr^— 19,966 Factories—
( f ) =grrw^R^i% . . • • Number . W orking factories
(ii) ^ r r iT T ^ 1150 Thousand . . Average daily number of>.* ♦ • number. workers.
144 WIM f . t ? f 5 (<1 ) ??rvysii f r . ?rr. 30.131 Million Kwh. Electricity consumed Total ( 1936-87)
its TT^ ^cMvl— State Income—
(i) =^fqpfr?t5 |?rR ^5f fm m 26,718.5® Crore Rs. . . Income at Current Prices
(ii) 37,929® Rs. . . . . Per capita income at Current prices
1(6 Road length—(31-3-87)
( i) qa ir 163108 Kilometres . . Total
(ii) • • • • 103562 Surfaced
@5rT«rriT^|3r?r3r/Preliminary Estimate.
3FmJrr/1981 Population Csnsus.
A-94—1.
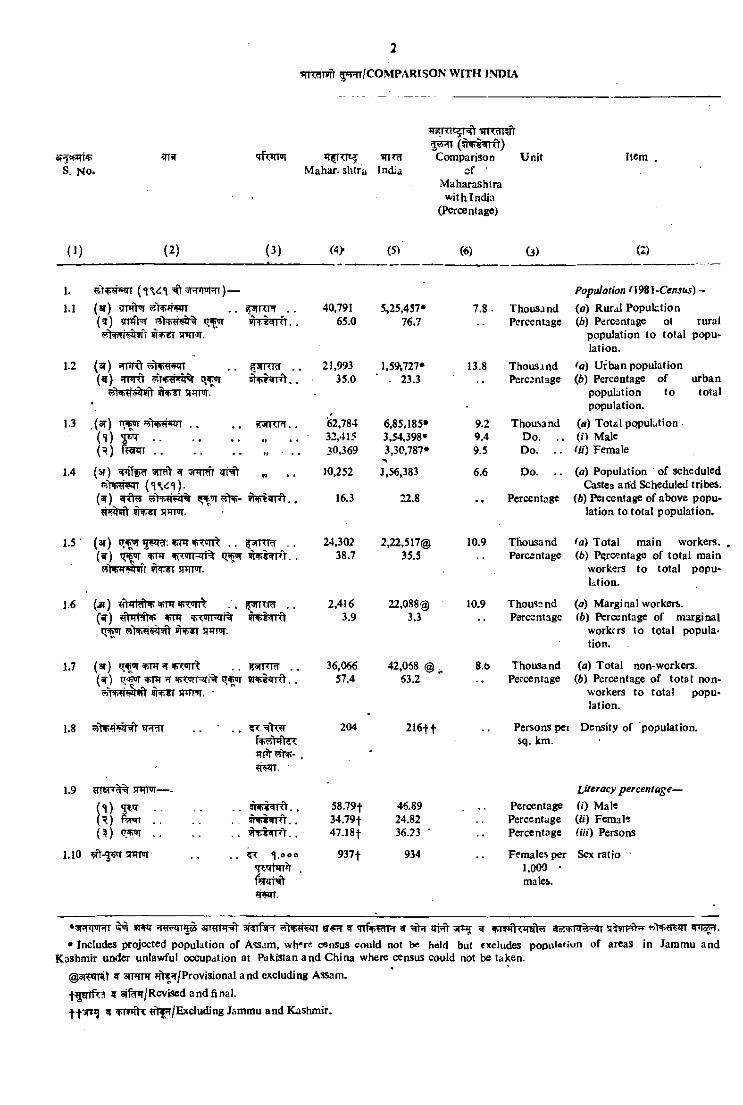
irnm wt ^srt/c o m p a r i s o n w i t h in d ia
Mahar- shira India
*rsrnt^T^ tTTWi5ft <l)
Comparison of ■
M aharashtra w ithlndiii
(Percentage)
U nit Item
(J ) (2) (3) «> (51 (6) (3) (2)
1. Population n981-C ew w )—
1.1 (ar) m h r 3>fr*rwT (5 ) amVr t r ^
sr»fT'*r.
^ilKH . . «I4.5«<KT. .
40,79165.0
5>25,457»76.7
7 .8 . ThousandPercentage
(fl) Rural Population (6) Percentage ol rural
population to to ta l popu> latioD.
1.2 (3i) ^FRt . . gSTRFd . . 21,993 l,59v727* 13.8 Thousand fa) U rban population(^ ) hmkI um i
SUTTW.35.0 . 23.3 * • Pcrcsntage (b) Percentage o f urban
population to total population.
1.3 r^ T . . K-»IKI<1. . '62,784 6,85,185» 9.2 Thoasand (a) Total pQpulution( I ) ................................( ^ ) ................................
32,415 3,54,398* 9.4 Do. . . (j) Maleft • • • 30,369 3,30,787* 9.5 Do. . . tii) Female
1.4 (a?) «( 5lHt 5=5>RTWT
VI • • 10,252 1,56,383 6.6 D o. . . (a) Population of scheduled Castes and Scheduled tribes.
(w) ?rr*fi-i N ^ a TTor.
16.3 22.8 Percentage (b) Peicentage of above population to total population.
1.5- (3T) trfiST Vnr . . 24.302 2,22,517® 10.9 Thousand fa) Total m ain workers.{4) v«6«r «t.w qsrn s tW ’ rifr ihrTT smw.
38.7 35.5 Percentage (b) Percentage of to tal main workers to to tal population.
1.6 { a ) v n r . . I5»ii\in . . 2,416 22,088@ 10.9 ThouSn nd (a) M arginal workers.(4 ) ^H+«i !PPTT a ’Tpir.
3.9 3.3 Percentage (6) Percentage of marginal workers to total population.
1.7 (3t) i/^oi *miT v r m t 36,066 42,068 @ . 8.b Thousand (a) T otal non-workers.(4 ) - f ‘h<'Jir-Ki^ sffW ^Uft sN-tt $nrm. •
57.4 63.2 Percentage (b) Percentage of to tal non- workers to to tal population.
1.8
1.9 H* I'J1— -
(M ................................(^ ) f e r n ................................
jrPT ^t?p-.
9i4.5«<iO..
204
58.79f34.79f
2 1 6 tt
46.8924.82
Persons pei sq. km.
PercentagePercentage
Density of population.
Literacy percentage—U) Male (») Female
( ^ ................................ 47.] 8 f 36.?3 • •• Percentage (Hi) Persons
1.10 ^ t - 5 ^ STRT'ff ^ <1,000
fyrrhit
937f 934 Females per 1.000 • males.
Sex ratio '
*rwT.
*5RTmr ^ sm m r^ s m f r r ^ ^ ^ 4o;T.R ^~qi• Includes projected population of Assam, wh'rc census could not b« hdd but excludes poDul«»«wn of areas in Jammu and
Kashmir under unlawful occupation at Pokistan and China where census could not be taken.@3TPrRt ^ srmnT ?ft«5T/Provisional and excluding Assam.
» 3if^/Revised and final.9 7I9h)< ift^/Excluding Jammu and Kashmir.
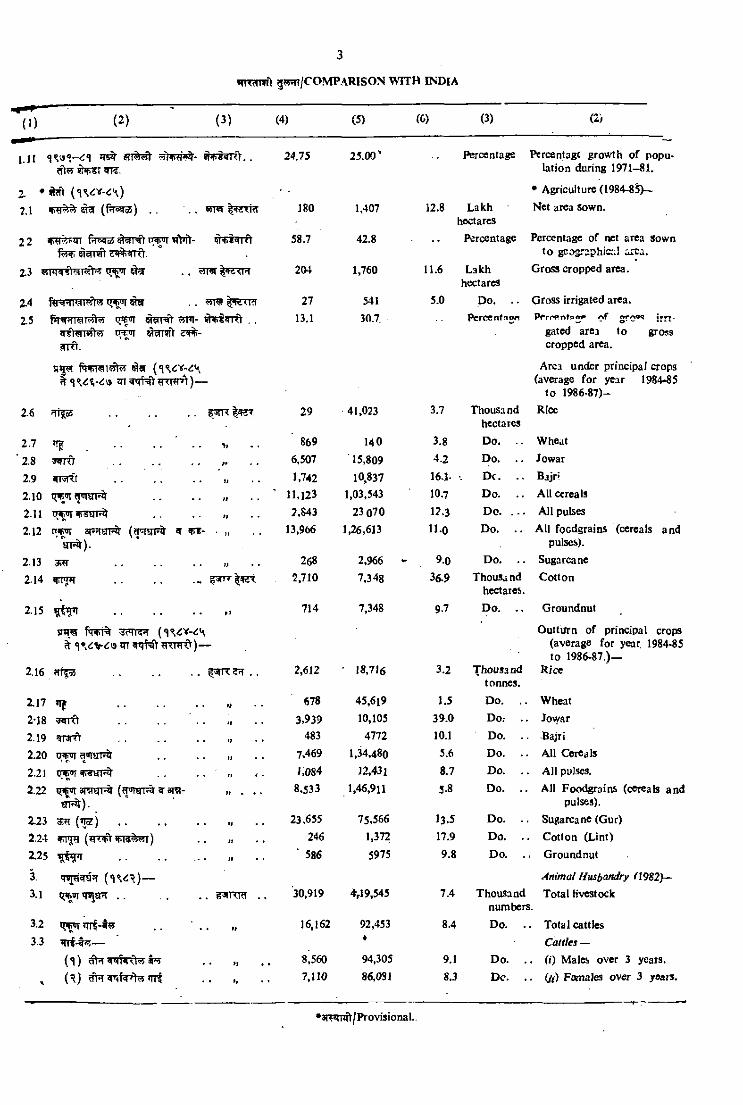
•rromft g«sn/CO M PA RISON W ITH c s d ia
24.75 Percentage T^rcentagt grow th o f popu* lation during 1971-81.
• Agriculture (1984-85)—
?.l e^ r^ m (f^ T 5 ^ ) . . . . WFT 180 1,407 12.8 Lakhhectares
Net area sown.
22IVi i HSTSft CT%TTTt.
58.7 42.8 .. Percentage Pcr<»ntage of net area Sown to gcosr^phic:.! area.
i3 2(M 1,760 11.6 Lakhhectares
Gross cropped area.
27 541 5.0 p o . . . Gross irrigated area.
2.5 f>T TOT ?t «nai ”l ftl l- VPFCTT , . 13.1 30.7, Percenfno« PPrrPntnw rtf ifH-
?fTTt-
mspTNtHTmrt)—
2.6
2.7
2.82.9 ^T5RT
2.102.11 ^5UI'^2.12 r t ^ ff
a i ^ ) .2.13 ................................2-14 ^ .............................. -
2.15 .......................................... .
SXW ^f'TR’T
2.16 . .
Z17 Jif 2*18 WTTl2.19 *ST*rft2.20 i3[^a»iraT?^
2.212.22 araqi^i (w«raT% ^ sra-
« n ^ ) .2.23 ^ (w j2-24 vre^m)Z25
3.1 C^UI tfB UrT . .
3.2 i vi irr^~5te . .3.3 »TTf4^—
(*1)
, (^ ) cftHVifar%5int
S TXIW
gated area to gross cropped area.
Area under principal crop« (average for year 1984-85
to 1986-87)-
29 41,023 3.7 Thousandhectares
Rice
869 140 3.8 Do. . . Wheat
6.507 15,809 4.2 D o. . . Jowar
1,742 10,837 16.1- •- D c. . . Bjjri
11,123 1,03,543 10.7 Do. . . All cereals
2,843 23 070 12.3 D o. . . . All pulses
13,966 1,26,613 11.0 D o. . . All focdgrains (cereals and pulses).
268 2,966 - 9.0 D o. . . Sugarcane
2,710 7,348 36.9 Thousandhectares.
C otton
714 7,348 9.7 D o. . . Groundnut
2,612 • J8.7J6 3.2 Thousandtonnes.
O utti/rn of principal crops (average for year. 1984-85 to 1986-87.)—
Rice
678 45,6l9 1.5 D o. . . Wheat
3,939 10,105 39.0 Do.- . . Jovyar483 4772 10.1 Do. . . Bajri
7,469 1,34,480 5.6 Do. . . All Cereals
1.084 13,431 8.7 Do. . . All pulses.
8,533 1,46,911 5-8 Do. . . All Foodgrains (cereals and pulses).
23.655 75,566 J3.5 Do. . . Sugarcane (Gur)
246 1,372 17.9 Do. . . C otton (Lint)
■ 586 5975 9.8 D o. . . G roundnut
Animal Husbandry <19B2)^30,919 4,19,545 7.4 Thousand
numbers.Total livestock
16.162 92,453»
8.4 Do. . . Total cattles Cattles —
8^560 94,305 9.1 D o. . . (i) Males over 3 ycais.
7,110 86,CWI 8.3 D c. . . (ft) FamaJes over 3 yeais.
>3TWnft/Provisional..
(1) (2) (3) (4) (5) (6) (3) (2)
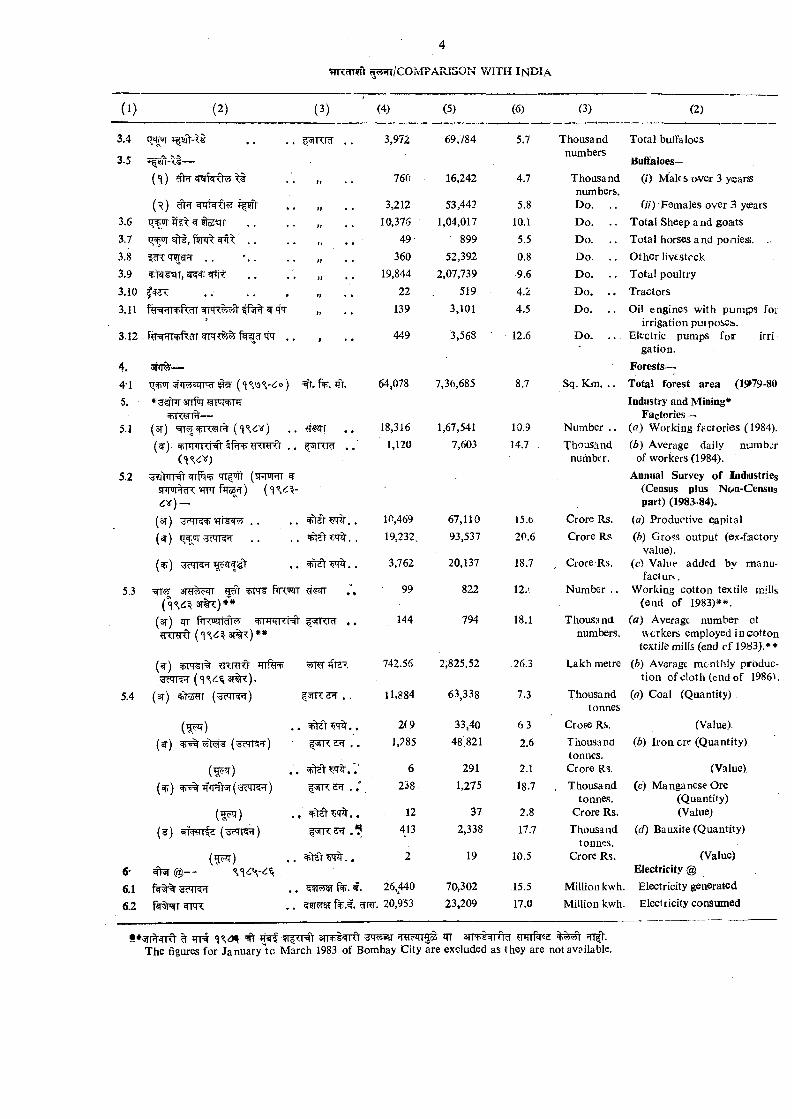
3.4 3,972 69,784 5.7 Thousand Total buffaloesnumbers
3.5 — Bulfaloes—
tf • • 760 16,242 4.7 Thousand (0 Malf s over 3 ysarsnumbers.
(^ ) St • * 3,212 53,442 5.8 Do. . . 07) Females over 3 years3.6 <^’11 ^ 5te^r tj . . 10,376 1,04,017 10.1 Do. . . Total Sheep and goaits
3.7 ^ 5 fipr^ . IJ • • 49- 899 5.5 Do. . . Total horses and poniesj. .3.8 ft • • 360 52,392 0.8 Do. . . O ther livestock
3,9 tt ♦ • 19,844 2,07,739 9.6 Do. Total poultry
3.10 f tt • ♦ 22 519 4.2 D o. . . Tractors
3.11 tt • • 139 3,101 4.5 Do. . . Oil engines with pum ps forirrigation pui poses.
3.12 . fa- ?TT<=t)f aT ^ • . # • • 449 3,568 12.6 D o. . . Electric pumps fo r irri' gation.
4. Forests—
4-1 cjw^iTRf ( ‘ V<i 0 ) <T. %. jfr. 64,078 7,36,685 8.7 Sq. Km. . . Total forest area (1979-80
5. snf'H' Industry and Mining*^TTwr^— Factories—
5.1 (aj) Mk'i+R^ri^ ^TWf . . 18,316 1,67,541 10.9 Number . . («) W orking factories (1984).
(^ ) ^^TTFTRl sHt*" y <l<i^ . . fsiRra- . . 1,120 7,603 14.7 Thousand {b) Average daily num ber( ^ 6 ^ ) number. of workers (1984).
5,2 qT l^ (SJIUMI ^ Annual Survey o f IndwstrlesST’F I ^ ^ f TBS r) (Census plus Nc*n-Censusi - i ) - part) (1983-84).
(3t) yc4K+ . . 10,469 67,110 15.6 Crore Rs. (a) Productive capital
{^) +id\ - ^ . . 19,232. 93,537 20.6 Crore Rs (6) Gross output (ex-factoryvalue).
( ^ ) vicMKn , . 3,762 20,137 18.7 , Crore Rs. (c) Value added by m anufacture..
5.3 f iR w ^fwr . , 99 822 12.'^ Number .. Working cotton textile mills(end of 1983)**.
(3t) ifT fJiwtdV^ ^ T w rN t 144 794 18.1 Thousand (0 ) Average number otnumbers. workers employed in cotton
textile mills (end c f 1983).**
{^) ?RRifr ^nPy ' wi<=i fltaT 742.56 2,825.52 26.3 Lakh metre {b) Average m onthly produc'TTT'T ( «iV^3T%T). tion of cloth (end of 1986^.
5.4 (sr) (xi<^KH) 37T, . 11,884 63,338 7.3 Thousand id) Coal (Quantity)tonnes
=t dV 'T%, , 2(9 33,40 63 Cror^e Rs. (Value).
=ti-o ('dcHl'i'l) ^'J)K . . I,?85 48,821 2.6 Thousand ib) Iro n ere (Quantity)tonnes.
4^d1 . 6 291 2.1 Crore Rs. (Value),
( ^ ) jfTR^(g?TT^) 238 1,275 18.7 , Thousand (c) Manganese Oretonnes. (Quantity)
( ^ ) , ^id l^ i'F r.. 12 37 2.8 Crore Rs. (Value)
(¥ ) miwrfH: (-dc^i^) ^v,|K2^ 413 2,338 17.7 Thousand id) Bauxite (Quantity)tonnes.
) 2 19 10.5 Crore Rs. (Value)6- ^ @— Electricity @
6.1 ?5 T ^ % . 4'. 26,440 70,302 .15.5 Million kwh. Electricity generated
6.2 fq%^Tc(m< cT5r?rer fr.^ . ^RT. 20,953 23,209 17.0 Million kwh. Electricity consumed
•♦srr ' Rif ^ irrt ^ ^ ;r?iFrTfs m amFlwr^ nrr fa:The figures for January "to M arch 1983 of Bombay City are excluded as they are not available.
55RT/g O M PA R ISO N W IT H IN D IA
(1) (2) (3) (4) (5) (6) (3) (2)
6.3 3t) 7?fhTm>ferr
isr) m. . <rW5T f%. . ?IT.
11,134 66,718
7.
7.1
7.2
7.3.
7.4
7.5
8.
8.1
8.25
8.3i
8.41
9.
9,11
■ « ) .
?Nwa 3nP*T :—
shrn rH t^ (M»rr# h w
(S ffFcT sqTTRt)"
. . wrr ,
^ ^ snrrir
#FTT% #55%
't>'
qfVt^ 3npil <4o6'JWci'»l—
. . f TRRT
. r 7?
9 .2
9.31
(sr) M iT P M ^ (^ H T r# fWhfriT
(f) rnrf TT ^ ?HR 77ftr. Jft. ^ STRM ( =1 *TT#
5Rnmr w rH t (M ^
10. *TT5FlT;»cq {\%6\-6^)
10.1 (3T) ^f^nr^pTR
(n)
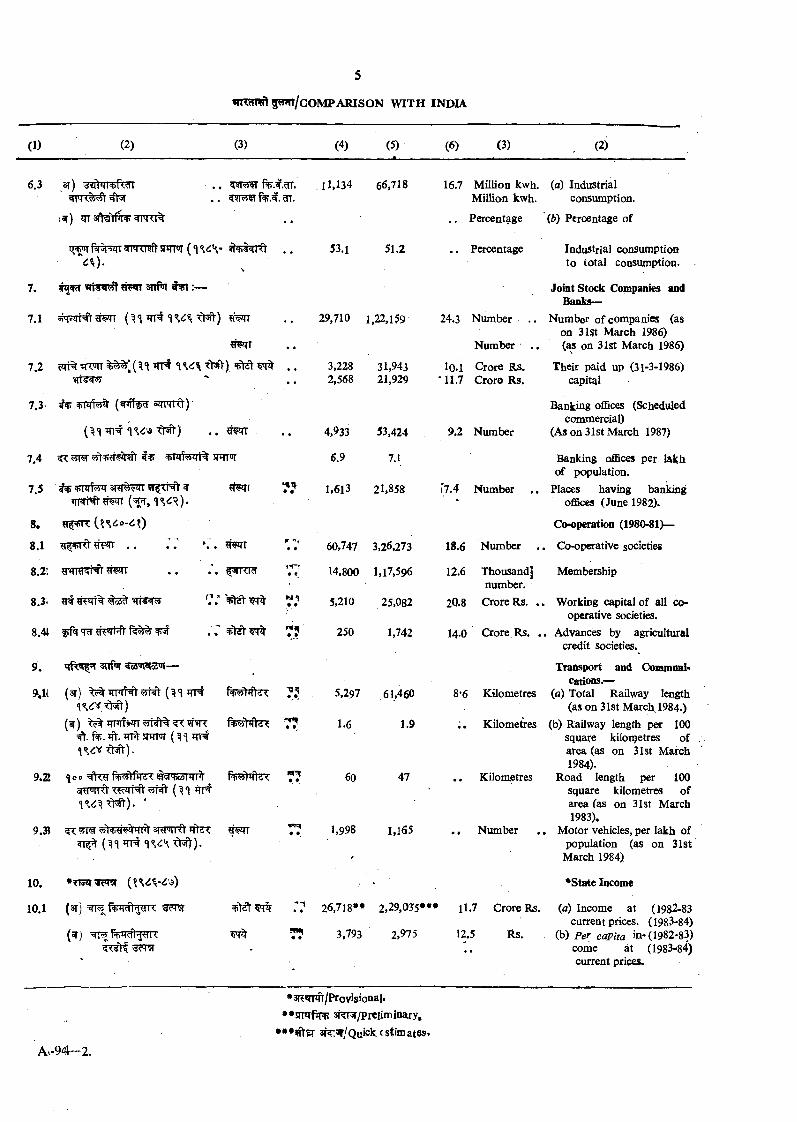
53.1 51.2
29,710 1,22,159
3,228 31,9432,568 21,929
4,933 53,424
6.9 7.1
60,747 3,26,273
14,800 1, 17,596
5.210 25,082
250 1,742
60 47
16.7 M illion kwh. M illion kwh.
. . Percentage
. . Percentage
24.3 Number
N umber
iQ.l Crore Rs. ‘ 11.7 C rore Rs.
9.2 Number
1,613 21,858 F7.4 Number
18.6 Number
12.6 Thousand] number.
2O.8 Crore Rs.
14.0 Crore, Rs.
5,297 61,460 8*6 Kilometres
1.6 1.9 Kilometres
Kilometres
1,998 I ,i6 5 . , Number
26,718** 2,29,035*** i 1.7 Crore Rs.
3.793 2,975 12.5 Rs.
(a) Industrial consumption.
(b) Percentage of
Industrial consumption to total consumption.
Joint Stock Companies and Banks—
N um ber o f companies (as on 31st M arch 1986){as on 31st M arch 1986)
Their paid up (31-3-1986) capital
Banking offices (Scheduled commercial)
(As on 31st March 1987)
Banking offices per lakh of population.
Places having banking offices (June 1982).
Cooperation (1980-81)—
, Co-operative societies
Membership
Working capital of all cooperative societies.
. Advances by agriculttiral credit societies.
Transport and CommoBi- Cations.—
(a) Total Railway length (as on 31st M arch 1984.)
(b) RaUway length per 100 square kilor^etres of area (as on 31st M arch 1984).
Road length per 100 square kilometres of area (as on 31st March 1983).
, M otor vehicles, per lakh of population (as on 31st
March 1984)
*State locome
(a) Income at (1982-83 current prices. (19&3-84)
(b) Per capita in -(1982-83) come at (1983-84) current prices.
A^-94—2.
• 3R®rpft /Provisional*3T^/Prciiminary,
•**fftET ar^^/Quicktstlmates.

f v m ?s u m m a r y t a b l e s o n s e l e c t e d t o p i c s
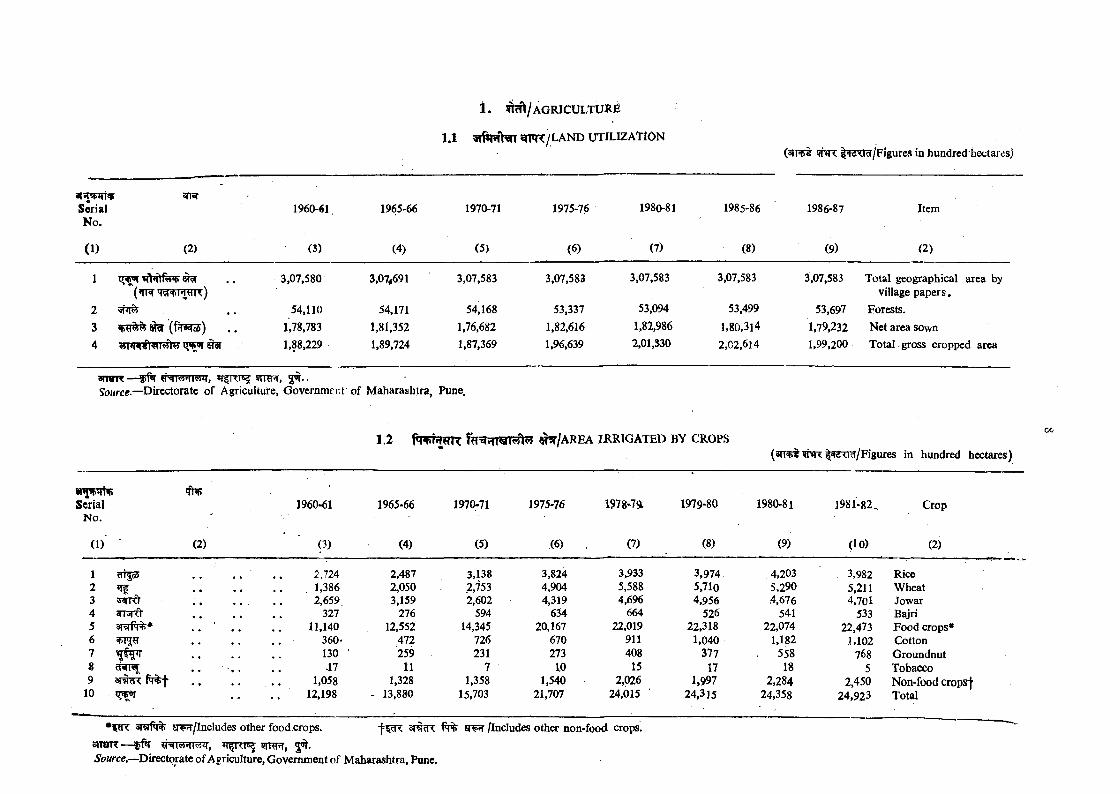
1.1 gmnC/LAND UTILIZATION(sTRit 9nR l^srlRr/Figufes in hundred hectares)
Serial 1960-61 1965-66 1970-71 1975-76 1980-81 1985-86 1986-87 ItemN o.
(1) (2) (3) (4) (5) (6) (7) (8) (9) (2)
1 3,07,580 3,07^691 3,07,583 3,07,583 3,07,583 3,07,583 3,07,583 Total geographical area by( rrsr village papers.
2 . . 54,110 54,171 54,168 53,337 53,094 53,499 53,697 Forests.
3 m (fn*^o5) 1,78,783 1,81,352 1,76,682 1,82,616 1,82,986 1,80,3]4 1,79,232 Net area sown4 1,88,229 1,89,724 1,87,369 1,96,639 2,01,330 2,02,614 1,99,200 Total -gross cropped area
a m n r— sPv 4 ^RT5? . 3^-<Source.—Directorate of Agriculture, Government of M aharashtra, Pune.
1 .2 # ^ / a r e a i iu e iig a t e d b y c r o p s
(aiFFt Wtin: I^CTRr/Figures in hundred hectares)
Serial 1960-61 1965-66 1970^71 1975-76 1978-7a 1979-80 1980-81 1981-82. CropN o.
(1)' (2) (3) (4) (5) (6) (7) (8) (9) (lO) (2)
1 flljaJ 2,724 2,487 3,138 3,824 3,933 3,974. 4,203 3,982 Rice2 ^ • # • * • . 1,386 2,050 2,753 4,904 5,588 5.710 5,290 5,211 Wheat3 2,659 3,159 2,602 4,319 4,696 4,956 4,676 4,701 Jowar4 5 7 ^ • « • • * 327 276 594 634 664 526 54-1 533 Bajri5 3Tvrf7%* • * « • « 11,140 12,552 14,345 20,167 22,019 22,318 22,074 22,473 Food crops*6 « • « • • 360* 472 726 670 911 1,040 1,182 .1,102 Cotton7 130 259 231 273 408 377 558 768 G roundnut8 ♦ • ’ ♦ * • -17 11 7 10 15 17 18 5 Tobacco9 fq%-j- « • • • • 1,058 1,328 1,358 1,540 2,026 1,997 2,284 2,450 Non-food crops-J
10 « • • 12,198 - 13,880 15,703 21,707 24,015 24,315 24,358 24,923 Total
s»TsrR~#r iffra?, jq.Source,—^Directorate of Agriculture, Government of Maharashtra, Pune.
/Includes other non-food crops.
1. ^ /A G R IC U L T U R E
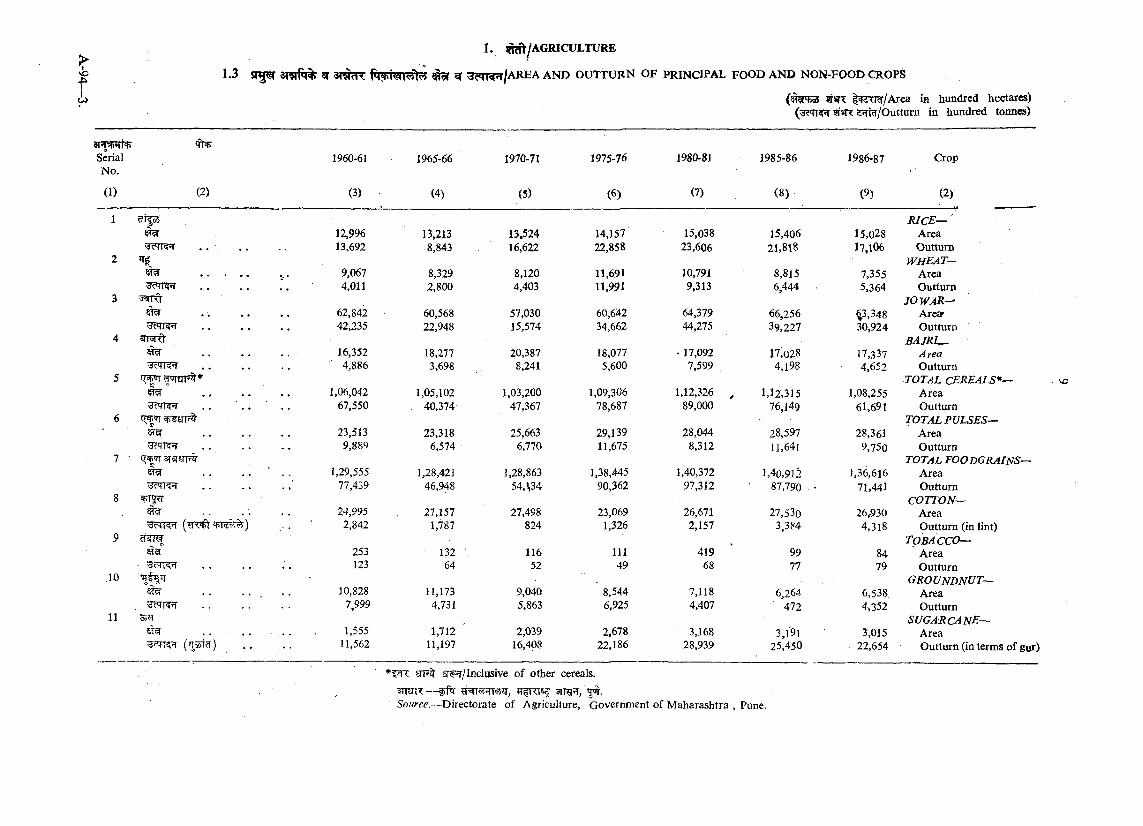
1.3 5T5^ 3T5rft|% ^ 3 T ^ ^ ^ ^ t ^ |AREA AND O UTTURN OF PRINCIPAL FOOD AND NON-FOOD CROPS
( ^ 'E 3 w«n: |^3TTcr/Area in hundred hectares) 5T«R s^Tf^/Outtum in hundred tonnes)
'Tt^
(2)
1960-61
(3)
1965-66
(4)
1970-71
(5)
1975-76
(6)
1980-81
(7)
1985-86
(8)
1986-87
(9)
Crop
(2)
SerialNo.
(1)
1 JiJCE—12,996 13,213 13,524 14,157 15,038 15,406 15,028 Area13,692 8,843 16,622 22,858 23,606 21,818 17,106 Outturn
2 W HEAT-. . . . . 9,067 8,329 8,120 11,691 10,791 8,815 7,355 Area
'3c'TT?*T . . . . . . 4,011 2,800 4,403 11,991 9,313 6,444 - 5,364 Outturn3 JO WAR—
62,842 60,568 57,030 60,642 64,379 66,256 <^3,348 Area*42,235 22,948 15,574 34,662 44,275 39,227 30,924 Outturn
4 sfNO B A jR I^m . . . . 16,352 18,277 20,387 18,077 - 17,092 17;028 17,337 A rea
. . . . ■ 4,886 3,698 8,241 5,600 7,599 4,198 4,652 Outturn5 TOTAL c e r e a l s *—
Iw " . . . . . 1,06,042 1,05,102 1,03,200 1,09,306 1,12,326 ^ 1,12,315 1,08,255 Area67,550 , 40,374 47,367 78,687 89,000 76,149 61,691 Outturn
6 ^grn% TOTAL PULSES—23,513 23,318 25,663 29,139 28,044 28,597 28,361 Area
.............................. 9,889 6,574 6,770 11,675 8,312 11,641 9,750 Outturn7 • TOTAL FOODGRAINS—
^ . . . . ■ . 1,29,555 1,28,421 1,28,863 1,38,445 1,40,372 3,40,912 1,36,616 Area.............................. 77,439 46,948 54,1,34 90,362 97,312 87.790 - 71,441 Outturn
8 COTTON—24,995 ' 27,157 27,498 23,069 26,671 27,530 26,930 Area
2,842 1,787 824 1,326 2,157 3,384 4,318 Outturn (in lint)9 d-sil-y TOBACCO—
253 132 ■, 116 111 419 99 84 Area123 64 52 49 68 77 79 Outturn
.10 GROUNDNUT—. . • . . . 10,828 11,173 9,040 8,544 7,118 6,264 6,538 Area
7,999 4,731 5,863 6,925 4,407 472 4,352 Outturn11 s u g a r c a n e —
. . . . ,' . . 1,555 1,712 ' 2,039 2,678 3,168 3,l'9i 3,015 Area(’'1^^ ) . . . 11,562 11,197 16,408 22,186 28,939 25,450 22,654 O utturn (in terms of gut)
STF sr^fr/Indusive of other cereals.
’R RTW 511 , 3W.Source.—Directorate of Agriculture, Government of M aharashtra , Pune.
^/Year
SerialN o .
(1) (2)
‘TfOTFT
(3)
1951
V4)
1956
(5)
1961
(6)
1966
(7).
1972 1978
(8) (5)
1982
(10)
1987
(11)
Unit
(3)
Item
(2)
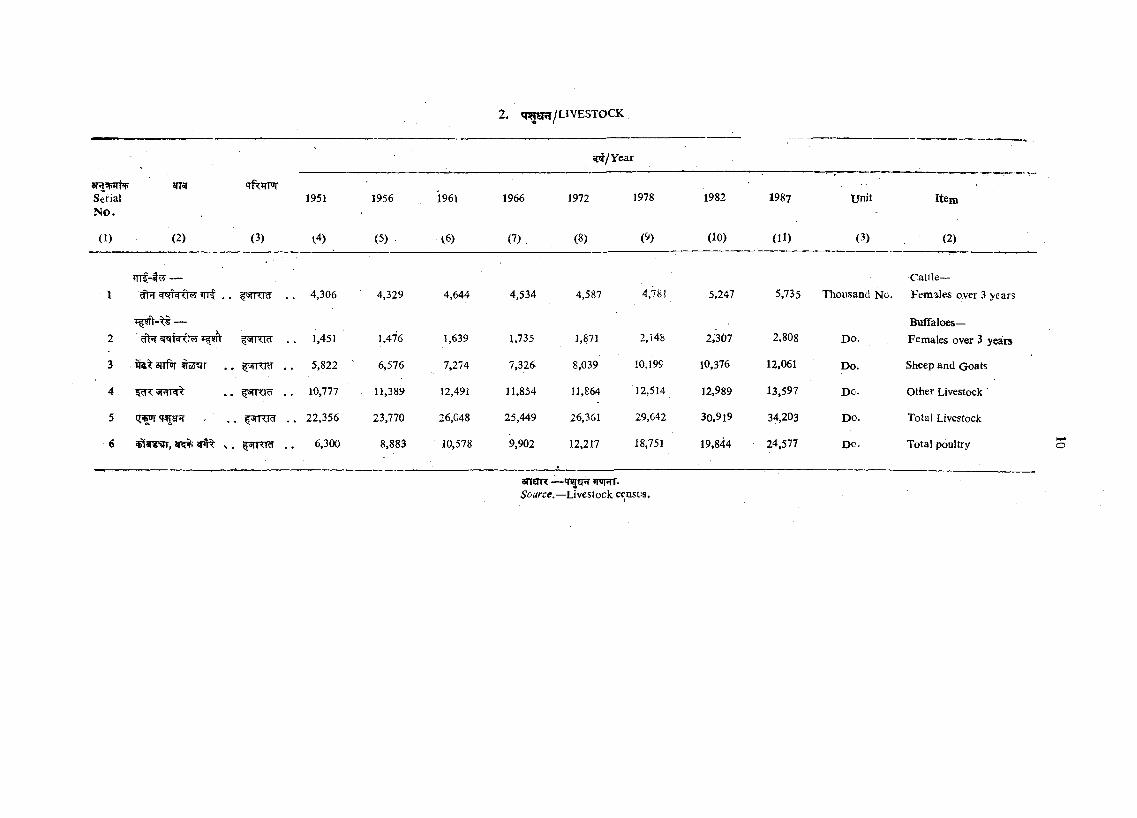
1 ^SfRIcT 4,306 4,329 4,644 4,534 4,587 4,781 5,247 5,735 Thousand No.Catile—
Females over 3 years
2—
1,451 1,476 1,639 1,735 1,871 2,148 2,307 2,808 DO.Buffaloes—Females over 3 years
3 airftir . . 5,822 ■ 6,576 ■7,274 7,326 8,039 10.199 10,376 12,061 Do. Sheep and Goats
4 10,777 11,389 12,491 11,854 11,864 12,514 12.989 13,597 DC Other Livestock '
5 ^ilRRT , . 22,356 23,770 26,048 25,449 26,361 29,642 30,919 34,203 Do. Total Livestock
6 5R% V . fSTKIcT . . 6,300 8,883 10,578 9,902 12,217 18,751 19,844 24,577 Do. Total poultry o
SnSTTT — »r®pTT-Source.—Livestock census.
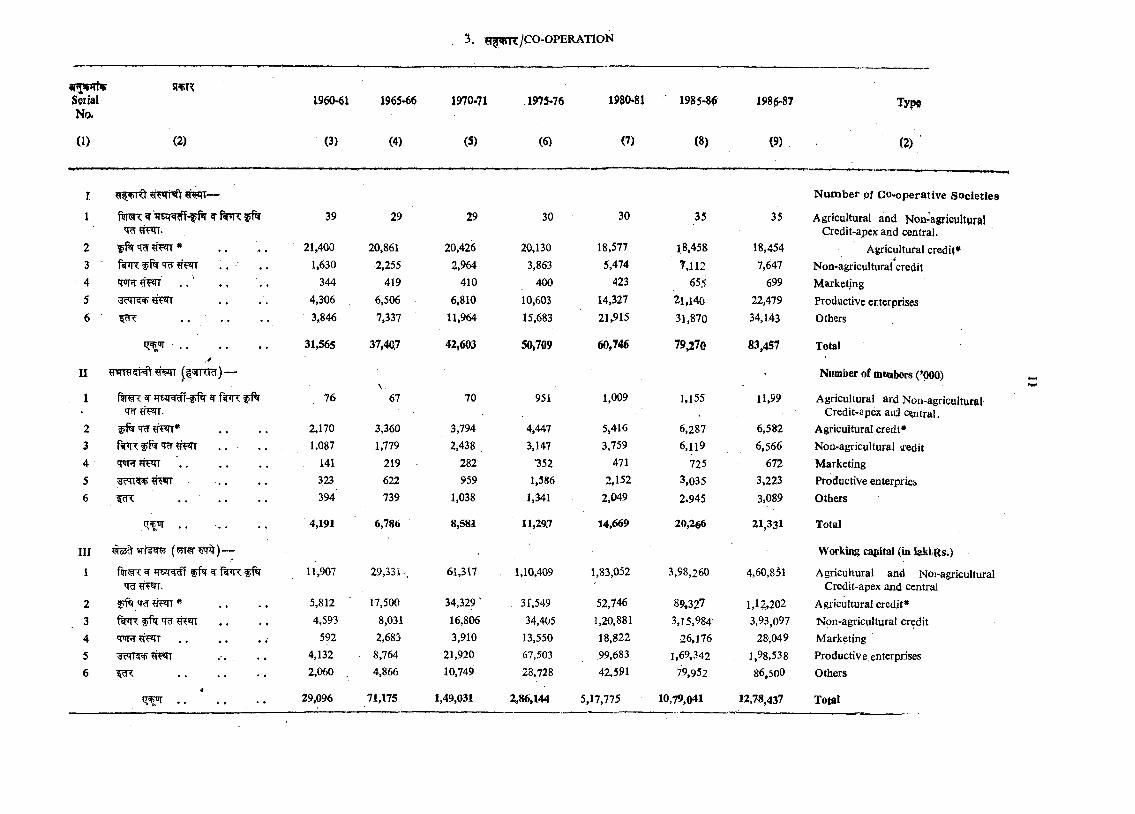
H^l^yCO-OPERATION
SeiialNo.
1960-61 1965-66 1970-71 1975-76 1930-81 ■ 1985-80 1986-87 Type
(1) (2) (3) (4) (5) (6) (7) (8) (9) ( 2 ) '
I N u m b e r pf G o-operative S oc ie ties
1 Psig \ ^ Pt W r^ R 39 29 29 30 30 35 35 Agricultural and N on^gricultw al Credit-apex and central.
2 f f t <T 55Wr * 21,400 20,861 20,426 20,130 18,577 1.8,458 18,454 Agricultural credit*3 f f t TW ?T5«TT . . ' , . 1,630 2,255 2,964 3,863 5,474 7,112 7,647
■4Non-agricultural credit
4 »<<jn ?i5«rr . . . , 344 419 410 400 423 655 699 Marketing5 3 ? rr^ 9 H T 4,306 6,506 6,810 10,603 14.327 21,140 22,479 Productive erterprises6 3,846 7,337 11,964 15,683 21,915 31,870 34,143 Others
q; '>T . . 31,565 37,4017 42,603 50,709 60,746 79^70 83,457 Total
II
1
(I'JtKId) —
ftrax ^ iTEqWcff-ffft W 76\
67 70 951 1,009 1,155 11,99
Number of mmbers (’000)
Agricultural and Non-agricultural
2 f f t w 2,170 3.360 3,794 4,447 5,416 6,287 6,582Credit-apex aiijj oyitral.
Agricultural credt*3 r f t q:w . . . . . 1.087 1,779 2,438 . 3,147 3,759 6,119 6,566 Non-agricultural sredit4 <T<IW ................................. 141 219 • 282 '352 471 725 672 Marketing5 ^Ti!PF«w r 323 622 959 1,586 2,152 3,035 3,223 Productive enterpries6 ’ . . . . 394 739 1,038 1,341 2,049 2.945 3,089 Others
4,191 6,786 8,581 ll,2ft7 14,669 20,266 21,331 Total
III
1 ^ f f t ^ fsj’R fKft 11,907 29,321 . 61,317 1,10,409 1,83,052 3,98,260 4,60,851
Working capital (Ui iaklRs.)
Agricultural and Noi-agricultural
2 ^ f t 'T c T # ^ * 5,812 17,500 34,329' 31,549 52,746 89.327 1,12,202Credit-apex and central
Agricultural credit*3 fijiic f f t . . . 4,593 8,031 16,806 34,405 1,20,881 3,15,984 3,93,097 Non-agricultural credit4 .............................. .. 592 2,683 3,910 13,550 18,822 26,176 28,049 Marketing
5 4,132 . 8,764 21,920 67,503 .99,683 1,69,342 . 1,98,538 Productive, enterprises6 A . . . . . . 2,060 . 4,866 10,749 28,728 42,591 79.952 86,500 Others
■*29,096 71,175 1,49,031 2,86,144 5,17,775 10,79,041 12,78,437 Total
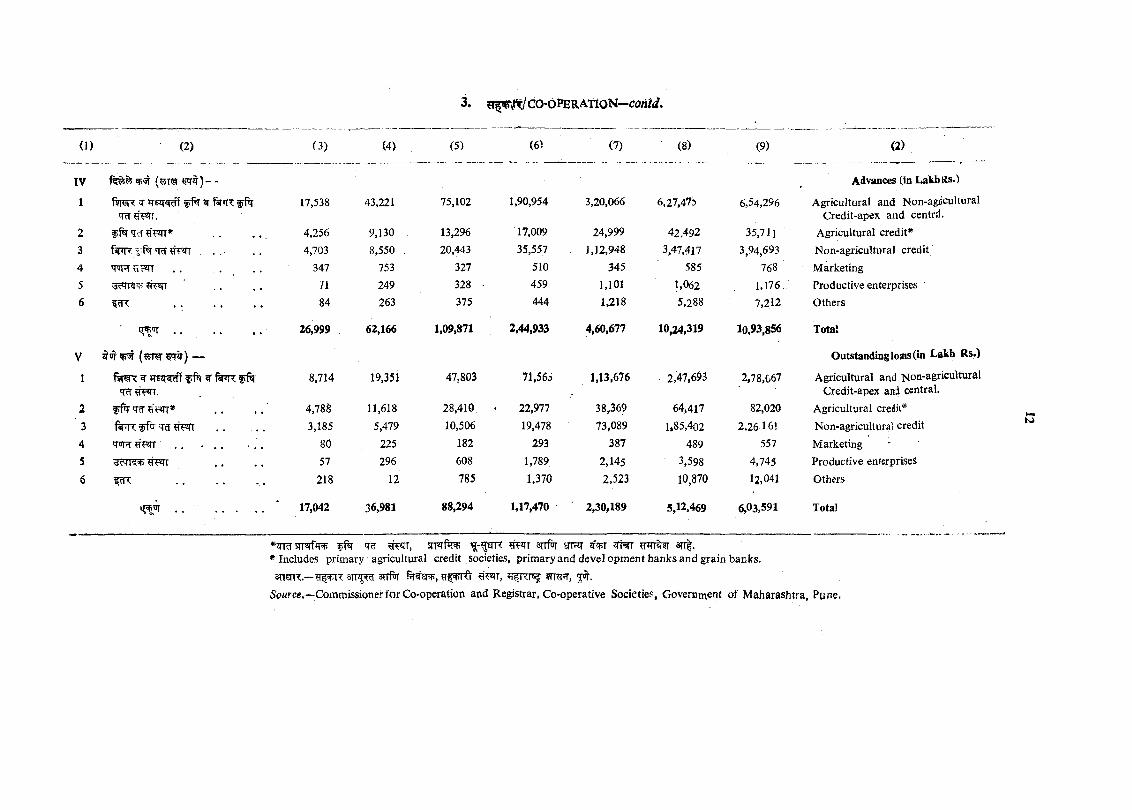
3. ?T5*P‘ilft/C0 -0 ?ERATi0 N—
(1) (2) (3)
IV
1
23456
TcT FTT, ^ 'Tr
'nnTvf'?!n
17,538
4,256
4,703
347/I84
(4)
43,221
9,130
8,550753
249263
(5)
75,102
13,29620,443
327328 375
(6) (7) (8)
1,90,954
17,009
35,557
510459
444
3,20,066 6,27,47i>
24,999
1,12,948
3451,1011,218
42,4923,47.417
585
1,062
5,288
(9)
6,54,296
35,711
3,94,693768
1,176.7,212
(2)
Advances (in LakbRs.)
Agricultural and Non-agiicultural Credit-apex and centrrf.
Agricultural credit*
Non-agricultural creditMarketingProductive enterprises Others
26,999 62,166 1,09,871 2,44,933 4,60,677 10,24,319 10,93.856 Total
V (wiifTFT^) — Outstanding loais (in Lakh Rs.)
1qcT ?f?«rr.
8,714 19,351 47,803 71,56i 1,13.676 . 2,47,693 2,78,067 Agricultural and Non-agricultural Credit-apex ani central.
2 # r qcT Sim * 4,788 11,618 28,410 • 22,977 38,369 64^417 82,020 Agricultural credit*
3 ik W< f fq 3,185 5,479 10,506 19,478 73,089 1.85,402 2.26161 Non-agricultural credit
4 80 225 182 293 387 489 557 Marketing5 57 296 608 1,789 2,145 3,598 4,743 Productive enterprises
6 218 12 785 1,370 2,523 10,870 12,041 Others
. . . . • . . 17,042 36,981 88,:^94 1,17,470 2,30,189 5,12,469 6,03,591 Total
<TrT y W , Sirfui irt=?IT 3n|.
ansn .— 3TT^ arrftiT ifn^, jot,S(?Mrce.~Commissioner for Co-operation and Registrar, Co-operative Societies, Government of M aharashtra, Pune.
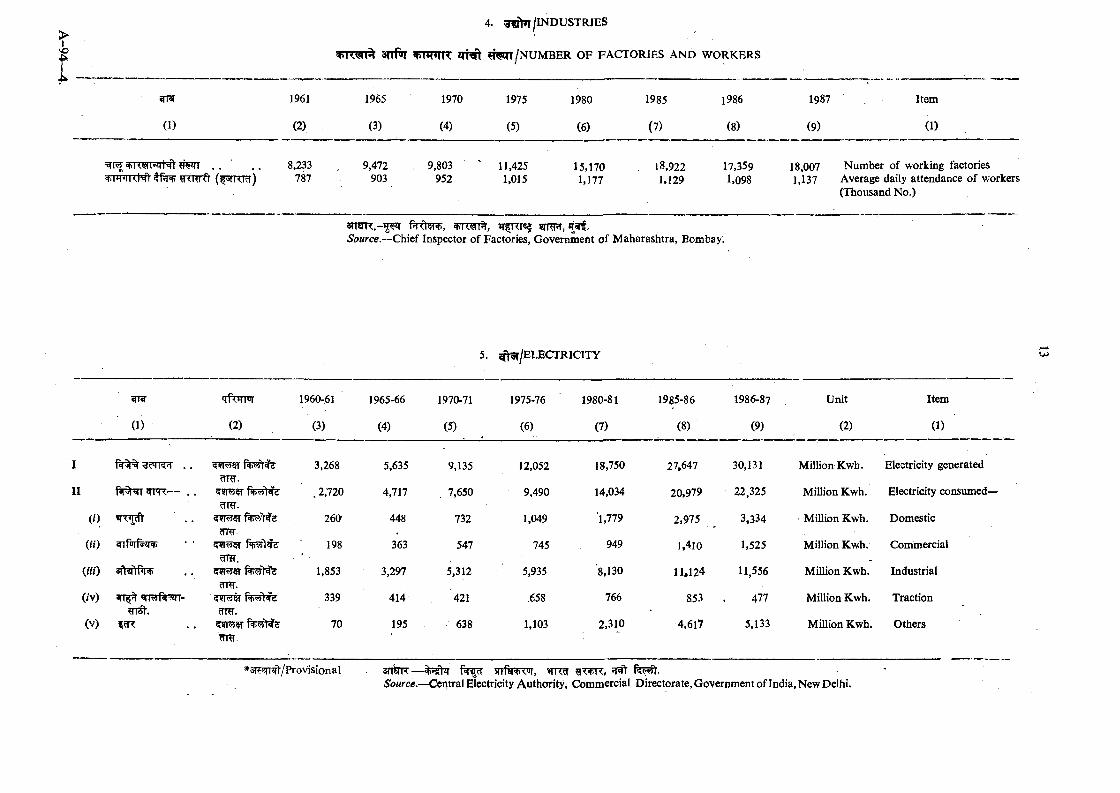
VO 3 n f^ v m R ?t / n u m b e r o f f a c t o r i e s a n d w o r k e r s
(1)
1961
(2)
1965
(3)
1970
(4)
1975
(5)
1980
(6)
1985
(7)
1986
(8)
1987
(9)
Item
(1)
?,233787
9,472 9,803 ' 11,425 15,170 18,922 17,359 18,007 Number of working factories903 952 1,015 1,177 1.129 1.098 1,137 Average daily attendance of workers
(Thousand No.)
aniJTT.-^ TTRTSf 911 , <T5jt.Source.—Chief Inspector of Factories, Government of M aharashtra, Bombay'.
5. ^g r/E L E C IR IC IT Y
9[T«r
(1)
4'fwr«i
(2)
1960-61
(3)
1965-66
(4)
1970-71
(5)
1975-76
(6)
1980-81
(7)
1985-86
(8)
1986-87
(9)
Unit
(2)
Item
(1)
I <i'«I«5T Pbwlqii 3,268 5,635 9,135 12,052 18,750 27,647 30,131 Million Kwh. Electricity generated^mr.
11 ,2,720 4,717 . 7,650 9,490 14,034 20,979 22,325 Million Kwh. Electricity consumed—cTRT.
26a 448 732 1,049 '1,779 2.975 3,334 Million Kwh, Domestic?rre’.
(ii) 198 363 547 745 949 1,410 1,525 Million Kwh. Commercialditf.
(«/) afhftfw 1,853 3,297 5,312 5,935 '8,130 11.124 11,556 Million Kwh. IndustrialcTRT.
(/V) fsfiwWfa 339 414 421 658 766 853 477 Million Kwh. Tractiondl«.
(V) 70 195 638 1,103 2,310 4,617 3,133 Million Kwh. Others
*3T^?n^/ProVisional 3?T^— srrfk rcq, wror ^Source.—Central Electricity Authority, Commercial Directorate, Government oflndia. New Delhi.
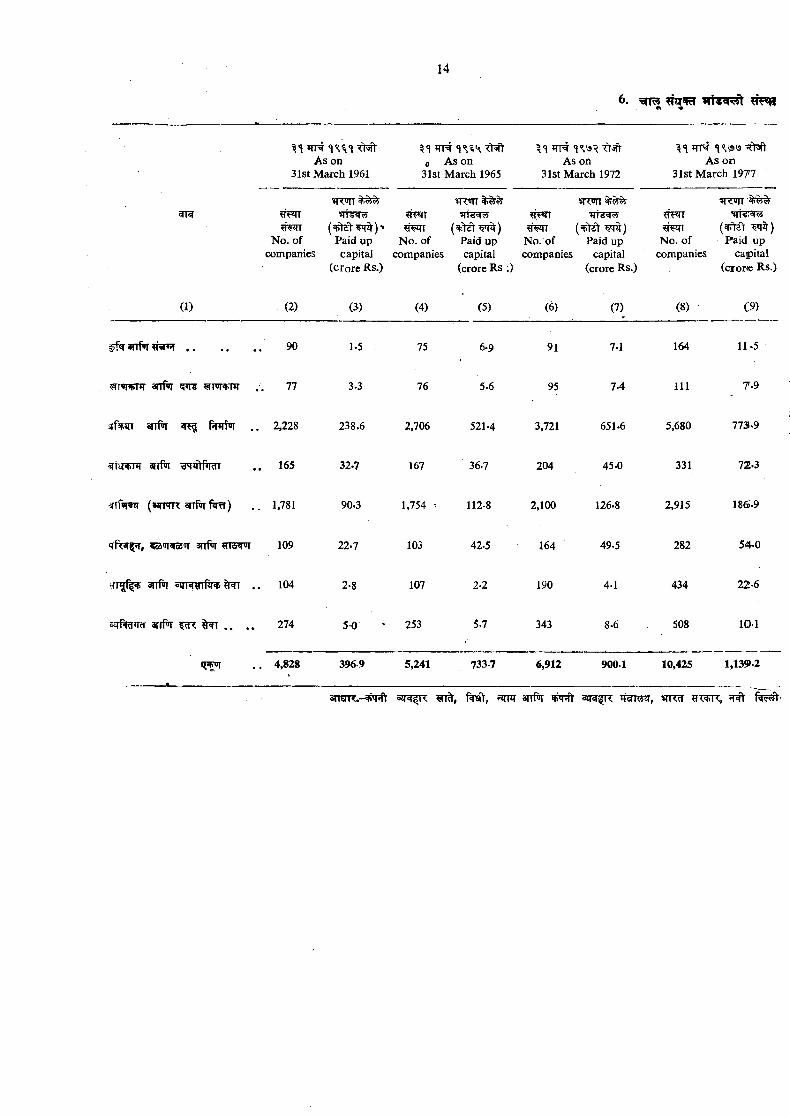
6. xTT??
^As on
31st M arch 1961
?rwT»TtgW
Paid up
?Rsn ?rw
No. of companies
?TF1T
N o. ofcapital companies
(crore Rs.)
<1e As on
31st March 1965
^ <®II
(%W¥I%) Paid up capital
(crorc Rs ;)
As on 31st M arch 1972
^<“11irf¥^
No. of Paid up companies capital
(crore Rs.)
I' VSVSAs on
31st M arch 1977
?R«TT
No. of companies
1RTOT■ssrter
Paid up capital
(cror<e Rs.)
(1) (2) (3) (4) (5) (6) (7) (8) C9)
ff«r arrfw 90 1.5 , 75 6.9 91 7.1 164 11-5
yrervnr 3rrf'»T 77 3.3 76 5.6 95 7.4 111 7.9
s f w arrfw frnrf^ . . 2,228 238.6 2,706 521-4 3,721 651-6 5,680 773-9
arrfu gqqtfiicn 165 32-7 167 36-7 204 45-0 331 72-3
iffr*nRr (s^TTR 3TTp»r f ^ ) . . 1,781 90.3 2.100 126. 2,915 186-9
‘jfT3r5?r, 55aoi«Rs<ir anfir ^ t t s ^ 109 22.7 103 42-5 164 49-5 282 54-0
arrR ^ . . 104 2-8 107 2-2 190 4-1 434 22-6
53Tftcrrcr afrfw 5^ ^ . . 274 5 0 253 5-7 343 8-6 508 10-1
. . 4,828 396 9 5,241 733-7 6,912 9001 10,425 1,139-2
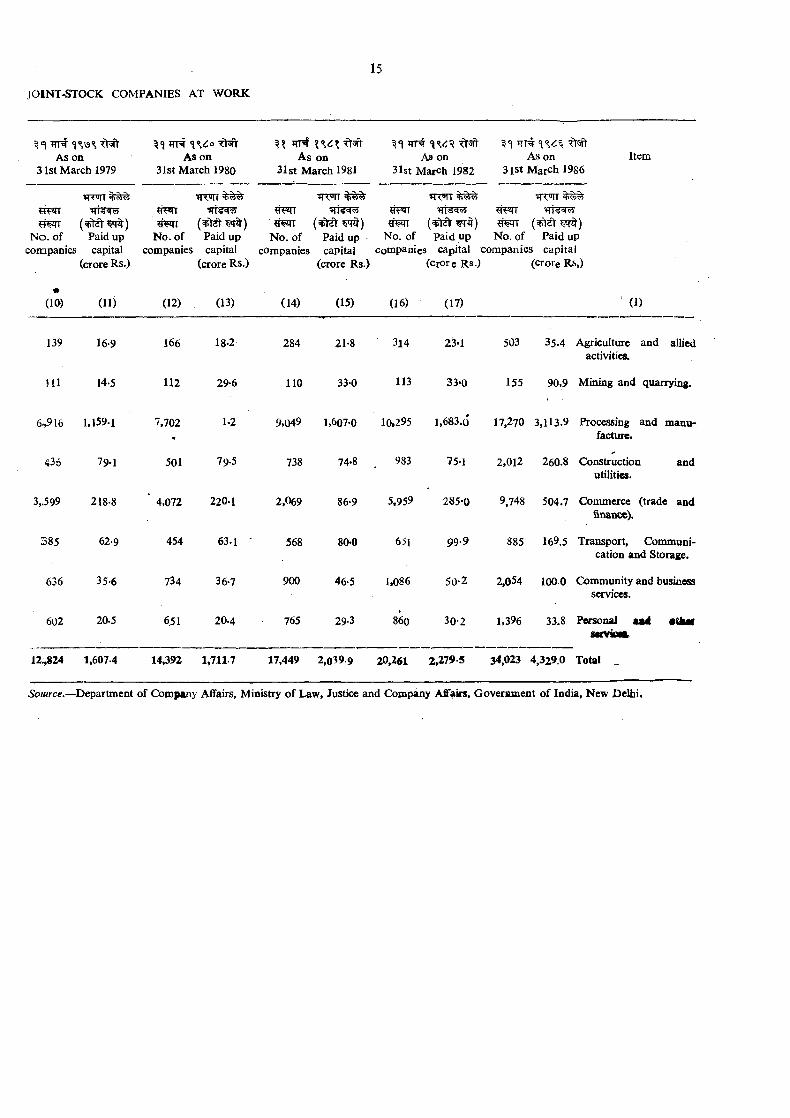
JOINT-STOCK COMPANffiS AT WORK
As on 31st March 1979
As on 31st March 1980
As on 31st March 1981
As on 31st M arch 1982
As on Item 3 is t M arch 1986
^<«il
^ i r )N o. of Paid up
companies capital (crore Rs.)
(+ld) 'T%) No. of Paid up
companies capital (crore it^s.)
N o. of companies
Paid up capital
(crore Rs.)
TTOTT ^ <*J||
No. of Paid up No. of Paid up companies capital companies capital
(Crore Rs.) (crore Rs,)
•m (11) (12) (13) (14) (15) (16) (17) (1)
139 16-9 166 18-2 284 21-8 314 23-1 503 35.4 Agriculture and allied activities.
111 14-5 112 29-6 110 33-0 113 33-0 1.55 90,9 Mining and quarrying.
6.,916 1,159.1 7,702 1-2 9,049 1.607-0 10.295 1,683.0 17,270 3,113.9 Processing and manufacture.
436 79-1 501 79.5 738 74-8 983 75-1 2,012 260.8 Construction and utilities.
3„599 218-8 ‘ 4,072 220-1 2,069 86-9 5,959 285-0 9,748 504.7 Commerce (trade and finance).
385 62-9 454 63-1 ; 568 80-0 651 99.9 885 169.5 Transport, Communication and Storage.
636 35-6 734 36-7 900 46-5 1,086 50-2 2,054 100 0 Community and business services.
602 20-5 651 20.4 765 29-3 860 30-2 1,396 33.8 Personal ami a en n m .
12.,824 1,6074 14,392 1,711 7 17,449 2,039.9 20,261 2,279-5 34,023 4,329.0 Total _
Somrce.—^Department of Company Affairs, Ministry of Law, Justice and Company Affairs, Government of India, New Delhi.
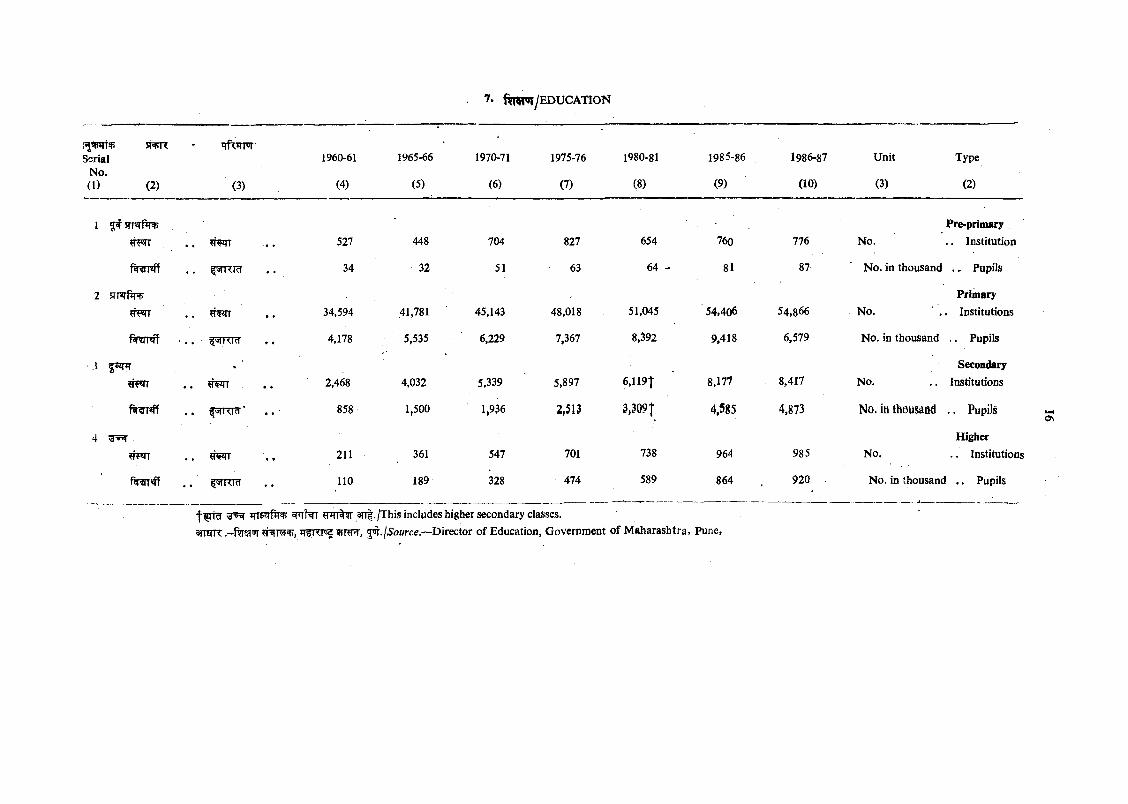
SerialNo.(0
s r ^
(2)
trfxiTFr
(3)
1960-61
(4)
1965-66
(5)
1970-71
(6)
1975-76
(7)
1980-81
(8)
1985-86
(9)
1986-87
(10)
Unit
(3)
Type
(2)
1
f nraff
2 srnirfii
%TT«ff
fiRrr«ff
4
?rwT
fSTRTW
fSTRTW
527
34
34,594
4,178
2,468
858
211
110
448
32
.41,781
5,535
4,032
1,500
361
189
704
51
45,143
6,229
5,339
1,936
547
328
827
63
48,018
7,367
5,897
2,513
701
474
654
64 -
51,045
8,392
6,119t
3,309|
738
589
760
81
54,406
9,418
8,177
4,585
964
864
776
87
54,866
6,579
8,417
4,873
985
920
Pre-primaryNo. . . Institution
No. in thousand . . Pupils
No.
No. in thousand
No.
No. in thousdfld .
No.
No. in thousand
Primary
, Institutions
. . Pupils
SecondaryInstitutions
Higher
. Institutions
, . Pupils
t f r r a anl./This includes higher secondary classes.arraK .-f tra ’ir jSource,—D kector of Education, Government of M aharashtra, Pune,
,A-94—5.
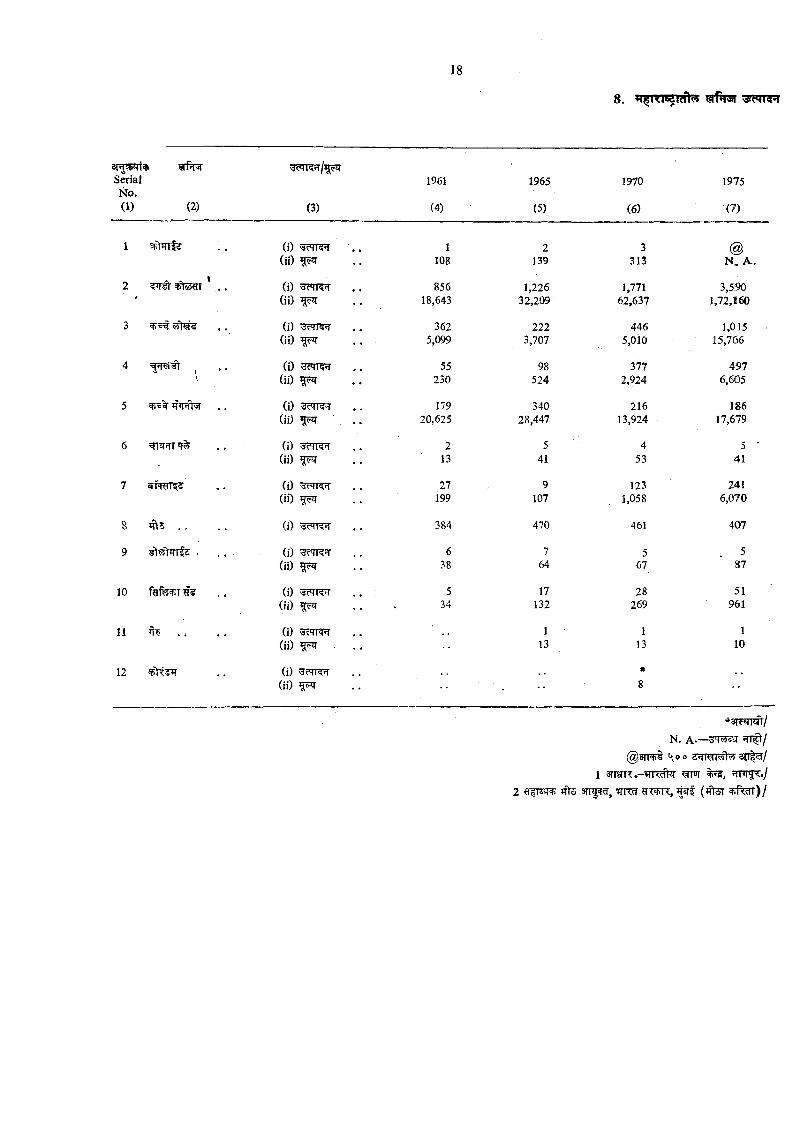
SerialN o.(1) (2) (3)
1961
(4)
1965
(5)
1970
(6)
1975
(7)
1 (i) y^KH 1 2 3(ii) ^ 108 139 313 N . A .
2 'ftiaitiT . . (i) 'dc iK’i 856 1,226 1,771 3,590(ii) ^ 18,643 32,209 62,637 1,72,160
3 w')<s> « , . (i) 'vScMRrj 362 222 446 1,015(ii) . . 5,099 3,707 5,010 15,766
4 (i) 55 98 377 497(ii) ^ 230 524 2,924 6,605
5 . . (i) 119 340 216 186(ii) ^ 20,625 28,447 13,924 17,679
6 = JTfrr ^ . . (i) ^'TRff 2 5 4 5 '.(ii) 13 41 53 41
7 qFRrnsr (i) 27 9 123 241(li) 199 107 1,058 6,070
8 5^5 , . (i> 384 470 461 407
9 i l ^ W f s . . . (i) ^cTRrl 6 7 5 5(ii) ^ 38 64 67 87
10 ^ (i) 5 17 28 51(ii) 34 132 269 961
11 »T . ; (i) 1 1 1(ii) 13 13 10
12 (i) y?TT5nT *(ii) 8
N. A. — fflft/ @3TRrt \oo Sm^T#^3n|^/
1 ^ %??, ffPi^./2 ¥t5 srr^^* ^ <=+>IT, (*ft3T ^iferr)/
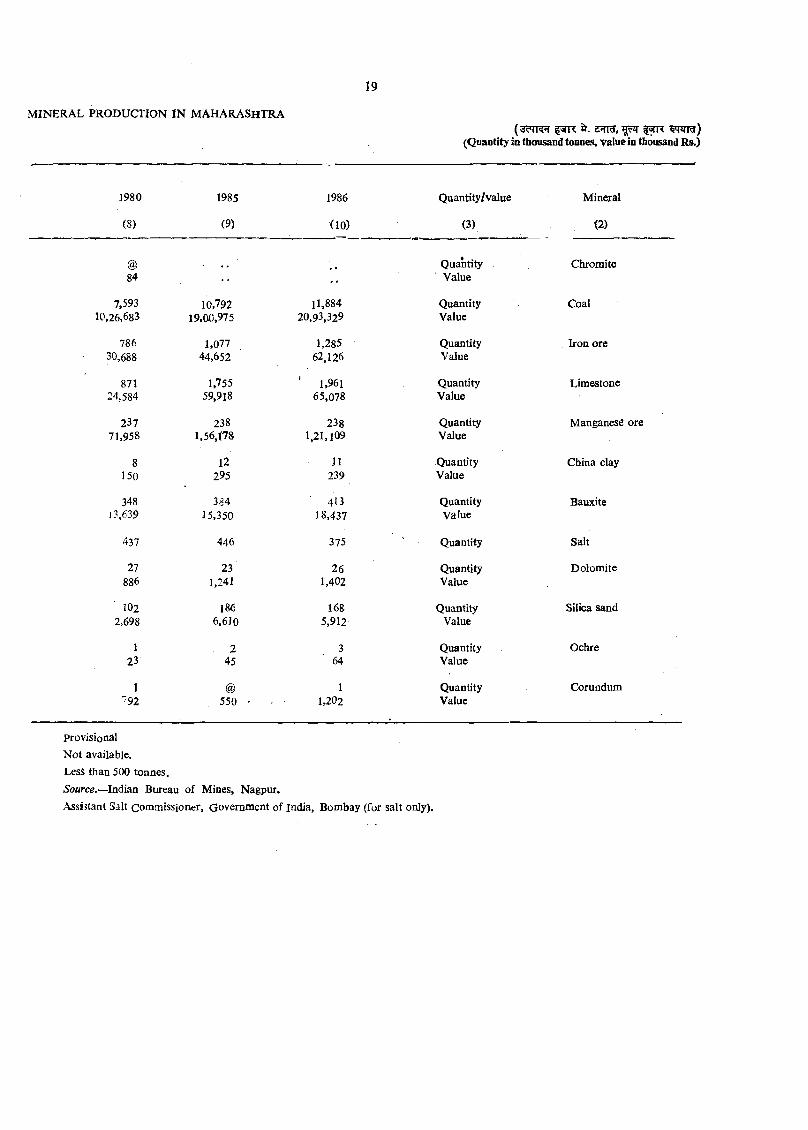
M INERAL PRODUCTION IN MAHARASHTRA
1980
(8)
1985
(9)
Jr. ^ fssTTT wn?r) (Quantity in thousand tonnes, value in thousand Rs.)
1986
(10)
Quantity/value
(3)
Mineral
<2)
@ • • Quantity Chromite84 •• •• Value
7.593 10,792 11.884 Quantity Coal10,26,683 19.00,975 20,93,329 Value
786 1.077 1,285 Quantity Iron ore30,688 44,652 62,126 Value
871 1,755 ' 1,961 Quantity Limestone24.584 59,918 65,078 Value
237 238 238 Quantity Manganese ore71,958 1.56,178 1,21,109 Value
8 12 11 Quantity China clay150 295 239 Value
348 384 413 Quantity Bauxite13,639 15,350 18,437 Value
437 446 375 Quantity Salt
27 23 26 Quantity Dolomite886 1,241 1,402 Value
102 186 168 Quantity Silica sand2.698 6,610 5,912 Value
1 . 2 3 Quantity Ochre23 45 64 Value
1 @ 1 Quantity Corundum"92 550 - 1,202 Value
provisional
N ot available.Less than 500 tonnes.Source.—^Indian Bureau of Mines, Nagpur.Assistant Salt commissioner. Government of India, Bombay (for salt only).
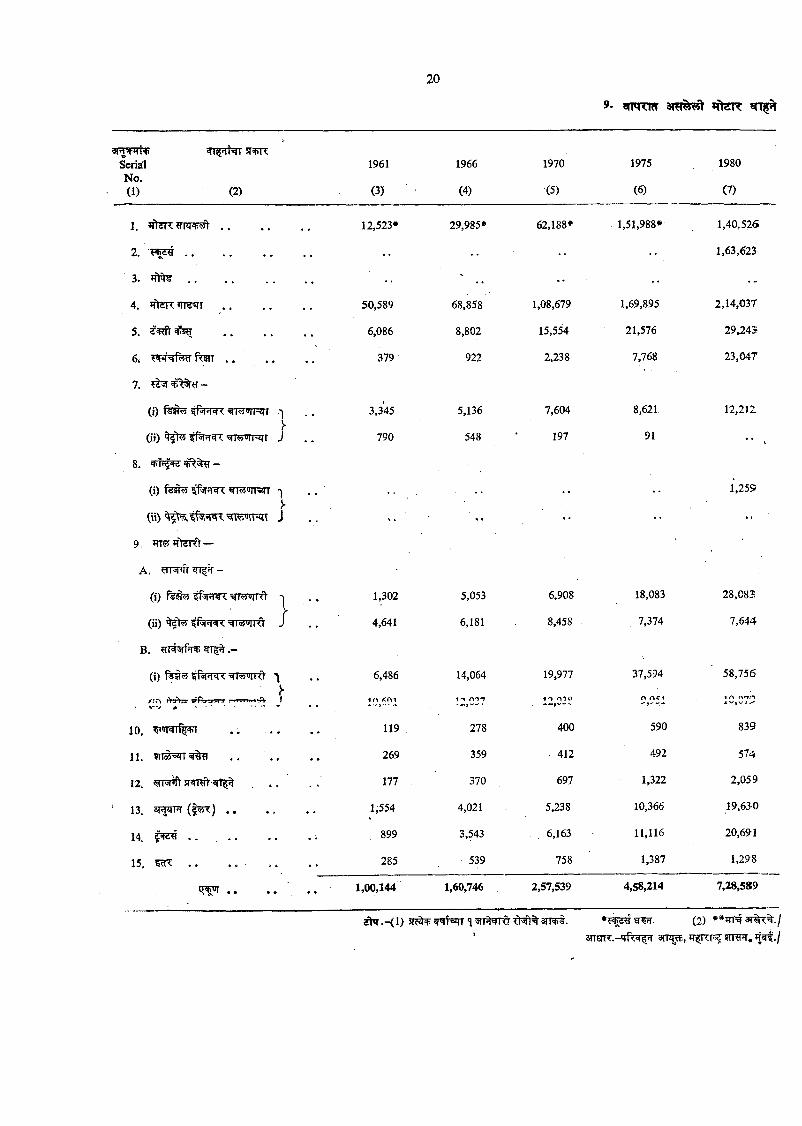
9- g rq re
arvpm?SerialNo.(1)
STTR
(2)
1, JutdK
2. ..
3. . .
1961
(3)
1966
(4)
1970
(5)
1975
(6)
12.523* 29,985» 62,188* 1,51,988*
1980
(7)
1,40,526
1,63,623
4. *Tt!nT»TR5lT 50,589 68,858 1,08,679 1,69,895 2,14,037
5. 2 ^ ^ ................................. 6,086 8,802 15,554 21,576 29,243;
6i frsfT . , . , 379- 922 2,238 7,768 23,047
7, -
(i) ^7 ®rF2JT *j , .I
3,345 5,136 7,604 8,621, 12,212
(if) 'eiiw'Jii- r J 790 548 197 91 •• ,
8.
(i) ■=II«'J|MI “) ,.I.. 1,255
riii) J “ ' •• ••
9, ^TT5y fl^Rt —
A.
(i) f¥?fo5 wMWRt i .» 1,302 5,053 6,908 18,083 28,083
(ii) ' r<iJiIRi' J 4,641 6,181 8,458 7,374 7,644
B. ?TR3lfr-RJ . -
(i) •qf<!iyilO *1 . .y
/;;\ i\a ;x gPj'-ja-T ,-i i-im ■ A I• '.•V * •............. •■ '• -
6,486 14,064 19,977 37,594 58,756
1 n ^oi i > rk'jy A-5 0 f» f>C1 i r% /\rrr\
10 ^ ’oiwrf^+i . . , 119 278 400 590 839
11. ir#=gT9%H 269 359 . 412 492 574
12, . . . ; , 177 370 697 1,322 2,059
13, 3mPT ( »!4<.) . . . . 1,554 4,021 5,238 10,366 19,630
H !'!«« . . . . . . • • 899 3,543 6,163 11,116 20,691
15. . . 285 539 758 1,387 1,298
................................. • • 1,00,144 1,60,746 2,57,539 4,58,214 7,28,589
fft’T.'Ki) *} vjii tO sn^ . (2)3TTOTT.-'rfT 3rnp, TTfRFf5n^,^./
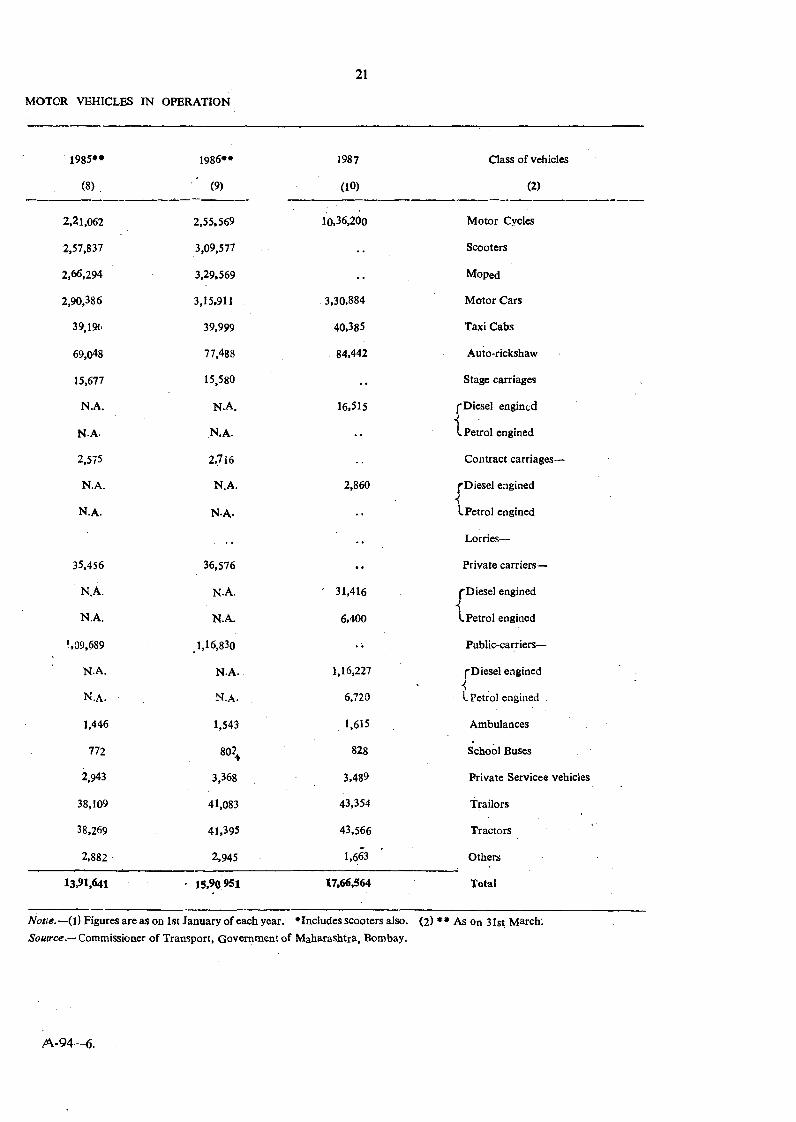
1985»*
(8)
2,21,062
2,57,837
2,66,294
2,90,386
39,19li
69,048
15,677
N.A.
N.A.
2,575
N.A.
n .a .
35,456
N.A.
N.A.
09,689
N.A.
N .a .
1,446
772
2,943
38,109
38,269
2,882
13.91,641
1986**
(9)
2.55.569
3,09,577
3.29.569
3,15,911
39,999
77,488
15,580
N.A.
N .a .
2,716
N.A.
N.A.
36,576
N.A.
N.A.
1,16,830
N.A.
N .a .
1,543
80?
3,368
41,083
41,395
2,945
15,90 951
1987
(10)
10,36,200
3,30.884
40,385
84.442
16,515
2,860
31,416
6,400
1.16,227
6,720
1,615
828
3,489
43,354
43,566
1,663
17,66,564
Class o f vehicles
(2)
M otor Q ycIcs
Scooters
Moped
M otor Cars
Taxi Cabs
Auto-rickshaw
Stage carriages
^Diesel engined
L Petrol engined
Contract carriages—
^Diesel engined
1Petrol engined
Lorries—
Private carriers—
f Diesel engined
L Petrol engined
Public-carriers—
f Diesel engined
L Petrol engined .
Ambulances
School Buses
Private Service® vehicles
Trailors
Tractors
Others
Total
Notte.— {i) Figures are as on 1st January of each year. *Includes scooters also. (2) ** As on 3Ist March'. Souirce.— Conimissioner of Transport, Government of M aharashtra, Bombay.
A-94—6.
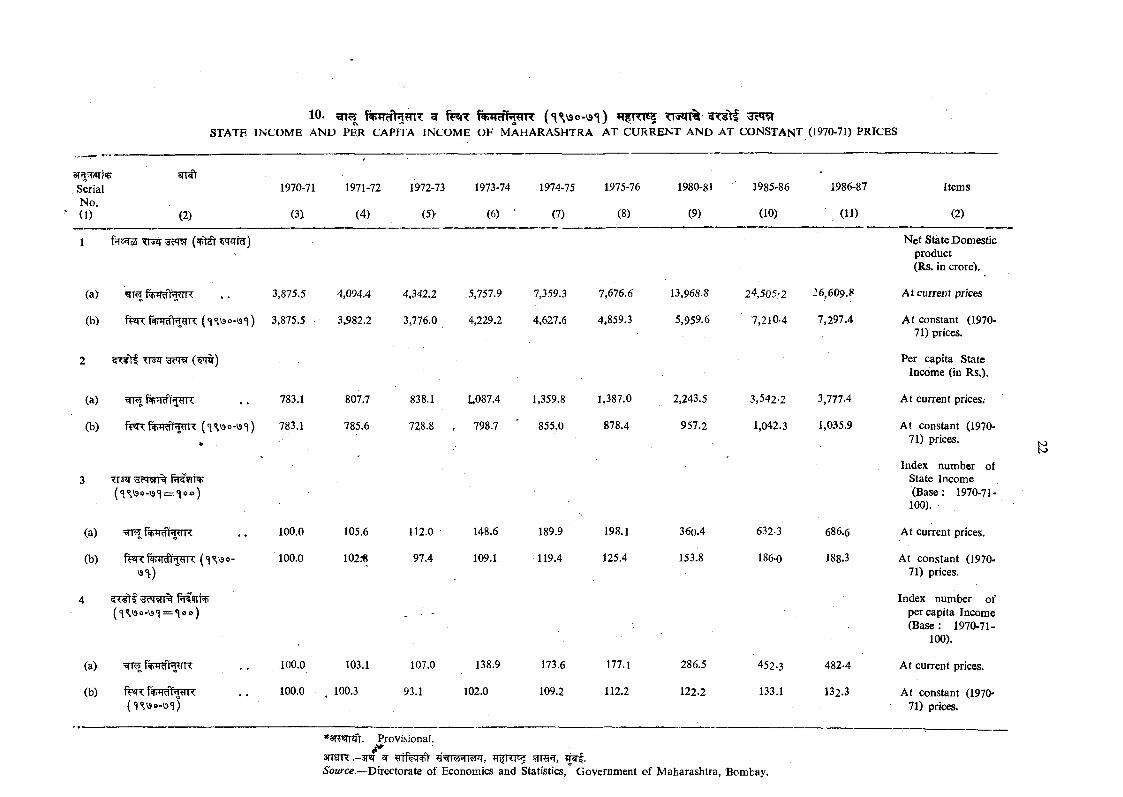
10. ^5? g foHrfiWflTC («\< V9o-V3<l) TT5qT% TO tfSTATE INCOM E AND PER CAPITA INCOME OF MAHARASHTRA AT CURRENT AND AT CONSTANT (1970-71) PRICES
SerialNo.(1) (2)
1970-71
(3)
1971-72
(4)
1972-73
(5)'
1973-74
(6) ■
1974-75
(7)
1975-76
(8)
1980-81
(9)
1985-86
(10)
1986-87
(11)
Items
(2)
1
(a)
(b)
(a)' 3,875.5
(b)
(a)
(b)
3,875.5
( ^ )
(a)
(b)
3 tTsq(< < \3o-\3«l = <lox>)
fFR (t^vso-
(<j< V9o-\9<}=<loo)
TTRflr gR
783.1
100.0
100.0
100.0
100.0
4,094.4
3,982.2
807.7
785.6
105.6
102:«
103.1
100.3
4,342.2
3,776.0
838.1
728.8
112.0
97.4
107.0
93.1
5,151.9
4,229.2
1,087.4
798.7
148.6
109.1
138.9
102.0
7,359.3
4,627.6
1,359.8
855.0
189.9
119.4
173.6
109.2
1,616.6
4,859.3
1,387.0
878.4
198.1
125.4
177.1
112.2
13,968.8
5,959.6
2,243.5
957.2
360.4
153.8
286.5
122.2
24,505.-2 26,609.8
7,210-4 7,297.4
3,542-2
1,042.3
632-3
186-0
452-3
133.1
3,777-4
1,035.9
686.6
188.3
482.4
132.3
Provisional.
3TTEIR .-3T«r ^ !!TRT .Source,—Directorate of Economics and Statistics, Government of M aharashtra, Bombay.
N et State Domestic product (Rs. in crore).
A t current prices
A t constant (1970- 71) prices.
Per capita State Income (in Rs.).
A t current prices.
At constant (1970- 71) prices.
Index number of State Income (Base : 1970-71-
100). -
A t current prices.
At constant (1970- 71) prices.
Index number of per capita Income (B ase : 1970-71-
100).
At current prices.
At constant (1970* 71) prices.
NJK>
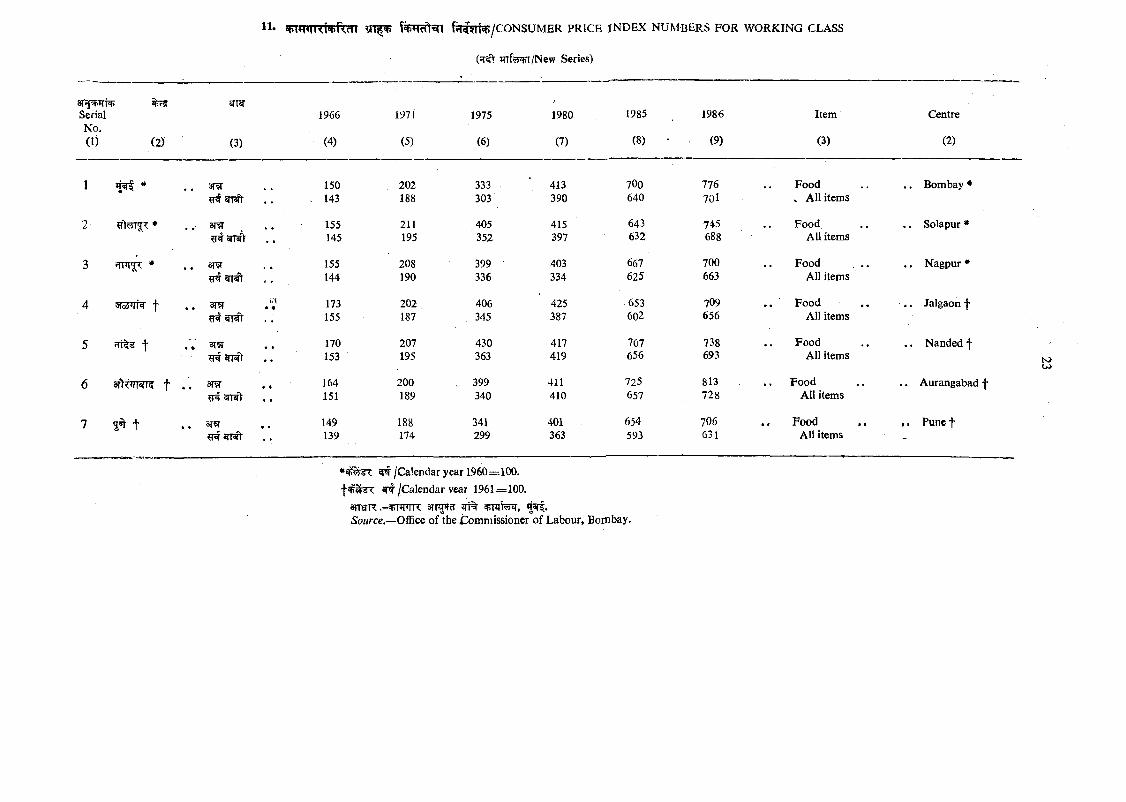
SerialNo.(I) (2)
11* frrfT O /C O N SU M E R PRICE IN DEX NUMBERS FOR W ORKING CLASS
rrrF?y^/New Series)
(3)
1966 1971 1975 1980 1985 1986
(4) (5) (6) (7) (8) • (9)
150 202 333 413 700 776143 188 303 390 640 70l
155 211 405 415 643 745145 195 352 397 632 688
155 208 399 403 667 700144 190 336 334 625 663
173 202 , 406 425 653 709155 187 . '345 387 602 656
170 207 430 417 707 738153 195 363 419 656 693
164 200 . 399 411 725 813151 189 340 410 657 728
149 188 341 401 654 706139 174 299 363 593 631
Item
(3)
Centre
(2)
1 *
2 * . 31
3 * . . 3T
4 . . 3TW
5 t .V 3T5T
6 f
7 5 t?T«f «)i«n
^ /Calendar year 1960=100.^ /C a le n d a r vear 1961=100.
ansTR .-+W ’IR 3TT ?T Jrt% 4 ^ .Source.—Office of the iZ^ommissioner of Labour, Bombay.
Food» All items
Food All items
Food All items
Food All items
Food All items
Food All items
Food All items
. . Bombay *
. . Solapur *
. . N agpu r•
■.. Jalgaon f
. . Nanded f
. . Aurangabad f
• ■ Pune t
U)

Districtwise Selected Indicators—1986-87.
A-94— 7.
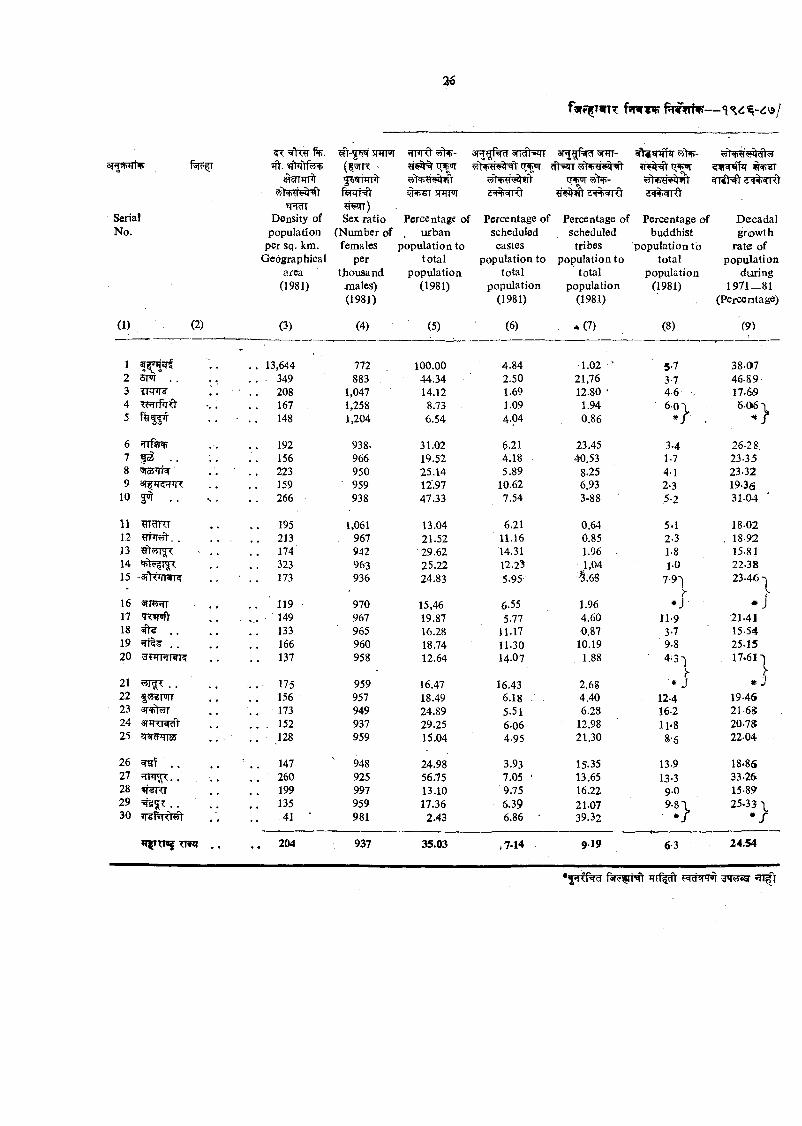
farf^TwR fsnr¥»pfwrfv—
f%. 'Y-sre'T iTJTFn' JTHRt 3T^ [f 3FTT-sT ^TrpiT ift. i^ m x > ( < 7 ^ I
#^TgT 5WFT in k 'l l0'mdi
Serial Density of Sex ratio Percentage of Percentage of Percentage of Percentage of D ecadalNo. population (Num ber of urban scheduled scheduled buddhist grow th
per sq, km. females population to castes tribes population t o ra te ofGeographical per to ta l population to population to total population
area tjiousand population total total population during(1981) juales) (1981) population population (1981) 1971—81
(1981) (1981) (1981) (Percentage)
(1) (2) (3) (4) (5) (6) *(7) (8) (9)
1 . . 13,644 772 100.00 4.84 •1.02 ^ 5-7 38-072 ST T . . . . . 349 883 44.34 2.50 21,76 3-7 46.893 TT^rr ^ . . . 208 1,047 14.12 1.69 12.80 ' 4.6 . 17.694 Tcfrrfirft' •.; 167 1,258 8.73 . 1.09 1.94 6 - 0 \ '6.06 X5 • . . 148 1,204 6.54 4.04 0.86 .
6 ffTftr^ 192 938. 31.02 ^.21 23.45 3.4 26-28.7 f S . . . . 156 966 19.52 4.18 40.53 1-7 23-358 sra’Twr • . . 223 950 25.14 5.89 8.25 41 23-329 ST JR TIT 159 ■ 959 12.97 10.62 6.93 2-3 19-36
10 yii . . 266 938 47.33 7.54 3-88 5-2 31.04 '
11 195 1,061 13.04 6.21 Q.64 5.1 18-0212 ?rr*Mt.. . . . 213 . 967 21.52 11.16 0.85 2.3 . 18-9213 ?r>57r^ . . . . . 174' 942 • 29.62 14.31 1.96 1-8 15.8114 . . 323 963 25.22 12.23 1,04 1-0 22.3815 -«rWnwK ■ . . 173 936 24.83 5.95' ■' .68 7-9'|
V23-46
16 s r m r . . . . . 119 - 970 15,46 6.55 1.96r r
• J17 'RW'ifV ' 149 967 19.87 5.77 4.60 11.9 21.4118 ^ . . . . 133 965 16.28 11.17 0.87 3-7 15-5419 fitt^ , . 166 960 18.74 11.30 10.19 9.8 25.1520 ^FTRRTR . . 137 958 12.64 14.07 1.88 • 4:3 ^
»17.61'!
21 ?5jgT . . . . .. . 175 959 16.47 16.43 2.68>■
* J • J22 |5ygr>3TT . . 156 957 18.49 6.18 4.40 12-4 19-4623 a r^ t^ . . 173 949 24.89 5.51 6.28 16.2 . 21-6824 STJKRcfV . . . 152 937 29.25 6.06 12.98 11-8 20.7825 .. ,128 959 15.04 4.95 21.30 S'6 22-04
26 sraf . . . . ■ . . 147 ' 948 24.98 3.93 15.35 13.9 18-8627 , . . . . 260 925 56.75 7.05 • 13.65 13-3 33-26-28 WJcr . . 199 997 13.10 9.75 16.22 9-0 15-8929 ^ 5 ? : . . . . 135 959 17.36 6.39 21.07 9.8 \ 25-33 \30 . . 41 ' 981 2.43 6.86 • 39.32 • / • /
*T5I'<I«5 7T«T . . . . 204 937 35.03 ,7-14 919 6 3 24.54
rrf ft tqctsj '*! wsg" nijTt
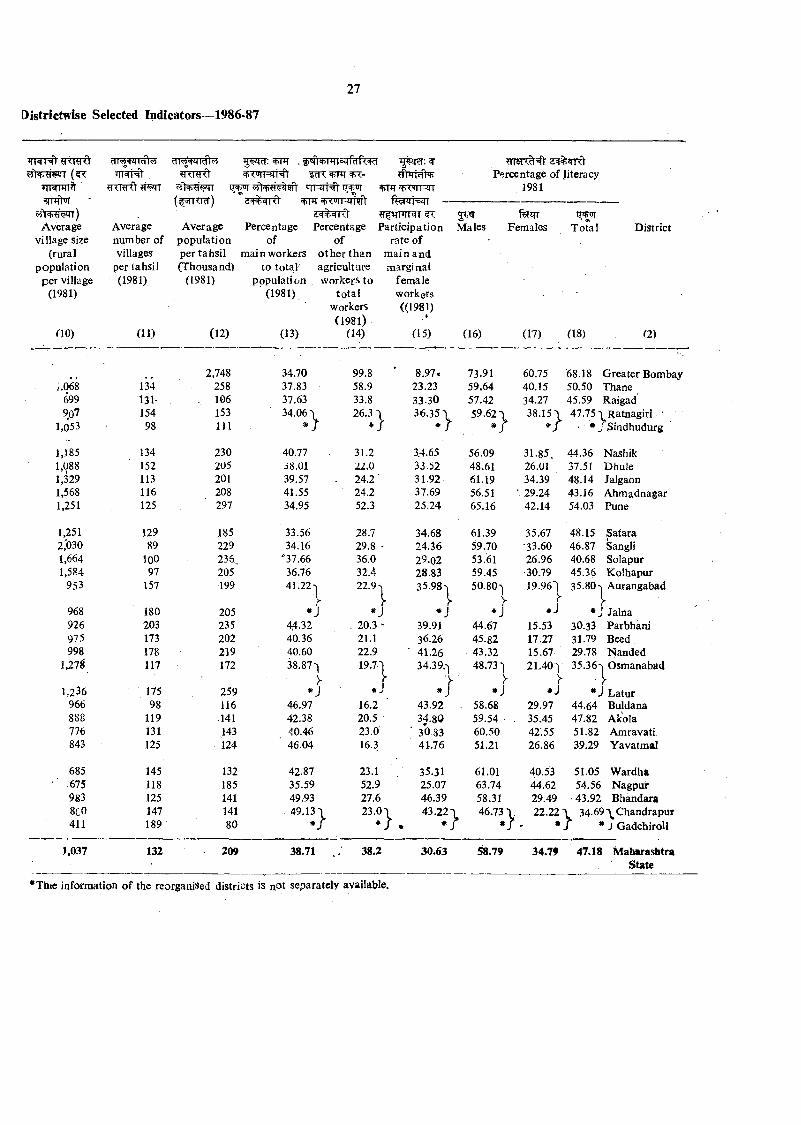
»lTTnTT%wfN'
Average village size
(rural population
per village (1981)
CIO)
;.0686999o7
1,053
1,1851,0881,3291,5681.251
1.251 2,'030 1,654 1,584
953
968926975998
Average number of villages
per tahsil (1981)
(11)
( vjtKid)
F?Tjrr?rN
I'd
. IH fd Rtd
”TRTHt^^n?rrnTTO>
fhrMN)^FT iWRlT
Peircentage of literacy 1981
134131-15498
134152113116125
12989
loo97
157
180203173178
Average population per tahsil (Thousand)
(1981)
(12)
Percentageof
m ain workers to tota.1
population , (1981)
(13)
Percentagebf
o th e r th an agriculture workers to
to ta l workers (1981)
(14)
2,748 34.70 99.8258 37.83 58.9106 37.63 33.8153 34.06^, 26.3 ■111 * r
230 40.77 31.2205 38.01 22.0201 39.57 24.2208 41.55 24.2297 34.95 52.3
185 33.56 28.7229 34.16 29.8236„ "37.66 36.0205 36.76 32.4199 41.22 'I 22.9
205 *yj
235 44.32 20.3202 40.36 21.1219 40.60 22.9
Participation rate of
m ain and naarginal
female workers ((1981)
(15)
2^Males
f^qrFemales T otal District
(16) (17) (18) (2)
8.97*23.23 33.30
3.4.6533.5231.9237.6925.24
34.6824.3629.0228.8335.98-
73.9159.6457.4259.62
60.75 68.18 Greater Bombay40.15 50.50 Thane34.27 45.59 Raigad3 8 .1 5 4 7 .7 5 iR a tn ag irl ’
• * JjSindhudurg12-> 38.15'»
39.9136.2641.26
56.0948.61 61.19 56.51 65.16
61.3959.7053.61 59.45 SO.SO'i
>
44.6745.8243.32
31.85. 44.3626.01 37.5134.39 48.1429.24 43.1642.14 54.03
NashikDhuleJalgaonAhmadnagarPune
35.67 -33.60 26.96 30.79 19.961
I'*J
15.5317.2715.67
48.15 Satara 46.87 Sangli 40.68 Solapur 45.36 Kolhapur 3 5.80 Aurangabad
*J Jalna 3O.33 Parbhani 31.79 Seed 29.78 Nanded
1,278' 117 172 38.87'| 19.7'1 34.39.'! 48.73'1 21.40'] 35.36'| Osmanabad>
1,236 175 259 *J # J * * J Latur966 98 116 46.97 16.2 43.92 . 58.68 29.97 44.64 Buldana888 119 .141 42.38 20.5 3480 59.54 . 35.45 47.82 Akola776 131 143 40.46 23.0 ■ 30.83 60.50 42.55 51.82 Amravati843 125 124 ' 46.04 16.3 41.76 51.21 26.86 39.29 Yavatmal
685 145 132 42.87 23.1 35.31 61.01 40.53 51.05 W ardha.675 118 185 35.59 52.9 25.07 63.74 44.62 54.56 Nagpur983 125 141 49.93 27.6 46.39 58.31 29.49 43.92 Bhandara8c0 147 141 49.13'! 23.0 \ 43.221 46.73 V 22.22 "I 34.69'^C handrapur411 189 80 * / * / * / • J * J GadchiroU
>,037 132 209 38.71 38.2 30.63
*Th(C information of the reorganised districts is not separately available.
58.79 34.79 47.18 M aharashtraState
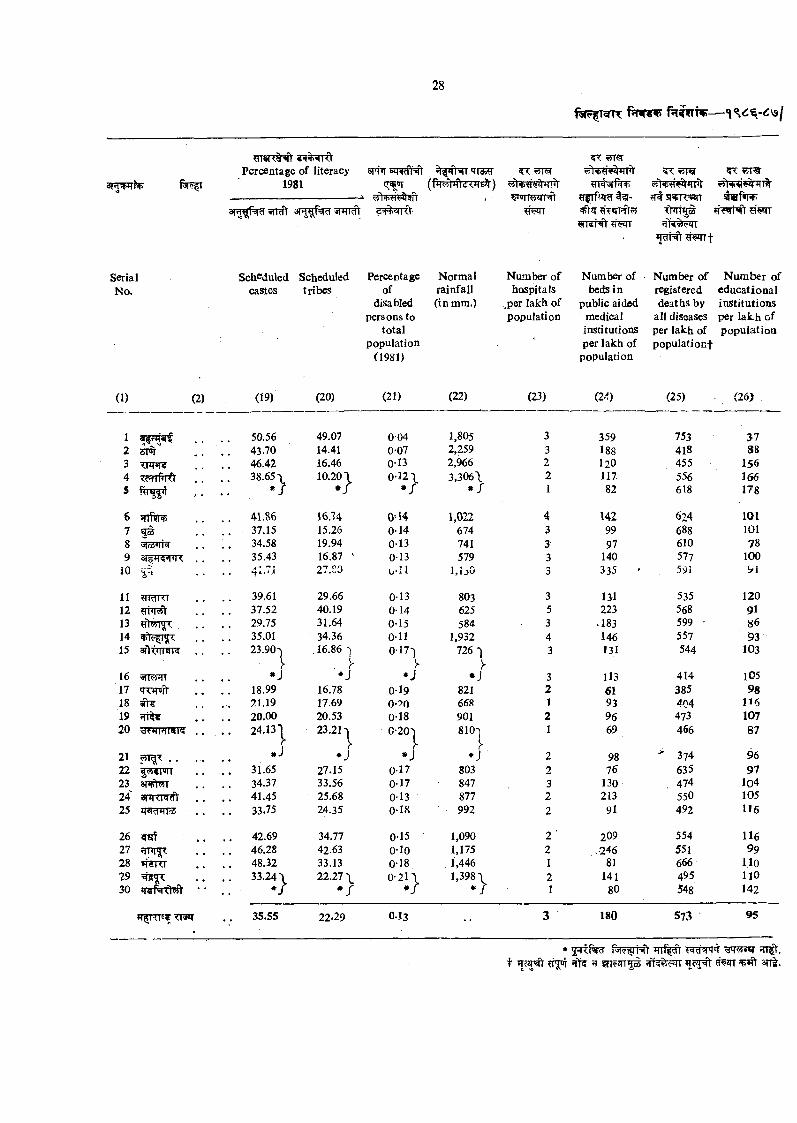
i5f%5rrdPercentage of literacy 5T »4W
3i;m f4. f ^ 1981___________ —i , ■ gfrfizRf tir- wf*nfT
3FTfl[f^ sTTcft snrra^ T>TT5S^TThft'^rw
Serial Scheduled Scheduled Percentage N orm al Number of Number of Number of N um ber ofNo. castes tribes of rainfall hospitals beds in registered educational
disabled (in mm.) ,^per lakh of public aided deaths by institutionspersons to population medical all diseases per lak h of
to tal institutions per lakh of populationpopulation per lakh of popu la tion t
(1981) population
(1) (2) (19) (20) (21) (22) (23) (2- ) (25) (26)
1 50.56 49.07 0-04 1,805 3 359 753 372 ST r . . 43.70 14.41 007 2,259 3 188 418 883 XPFTS . . 46.42 16.46 0-13 2,966 2 l20 455 1564 . . 38.65 X 10.20 \ 0-121 3 ,3 0 6 \ 2 117 556 166s . . , * J • / * / 1 82 618 178
6 jnftsr^ . . 41 .S6 16.74 0 4 4 1,022 i 142 624 1017 f S . . 37.15 15.26 0-14 674 3 99 688 1018 -Jioinri 34.58 19.94 0-13 741 3 97 610 789 si^tRVTX . . 35.43 16.87 ' 013 579 3 140 577 100
10 . . 41.7.1 27.S0 0-11 IjiiO 3 335 ' 591 >1
11 «Fdr<r 39.61 29.66 013 803 3 131 535 12012 37.52 40.19 0-14 625 5 223 568 9113 29.75 31.64 0-15 584 3 .183 599 ' 8614 35.01 34.36 0-11 1,932 4 146 557 9315 sftTHTWK 23.90-) 16.86 -] 0-17-) 726 1 3 131 544 103
, 516 s r i^ i * J *J *J • J 3 113 414 10517 qrw V 18.99 16.78 0-19 821 2 61 385 9818 21.19 17.69 0-70 668 I 93 404 11619 ^ . . 20.00 20.53 0-18 901 2 96 473 10720 . . . . 24.13T 23.21 ■» 0-201
y810-1
A1 69 466 87
21 jn |T . . * JV
* j>
*J 2 98 ■" 374 9622 ^^nw r . . . ! 31.65 27.15 0-17 803 2 76 635 9723 . . 34.37 33.56 0-17 847 3 130 474 10424 an rxm t . . 41.45 25.68 0-13 877 2 213 550 10525 ilfldMra . . 33.75 24.35 0-18 992 2 91 492 116
26 ^ . . . . 42.69 34.77 0-15 1,090 2 ■ 209 554 11627 . . 46.28 42.63 o-io 1,175 2 .246 551 9928 t q ^ r 48.32 33.13 0-18 . 1,446 1 81 666 11029 =sf5^ . . 33.241 22.27 0 - 2 l \ 1 ,3 9 8 \ 2 141 495 11030 * / • / * / 1 80 548 142
35.55 22-29 013 •• 3 180 573 95
t ffik ?J iTT mgs frlR ?qT »i?q 3{nff 3tt .
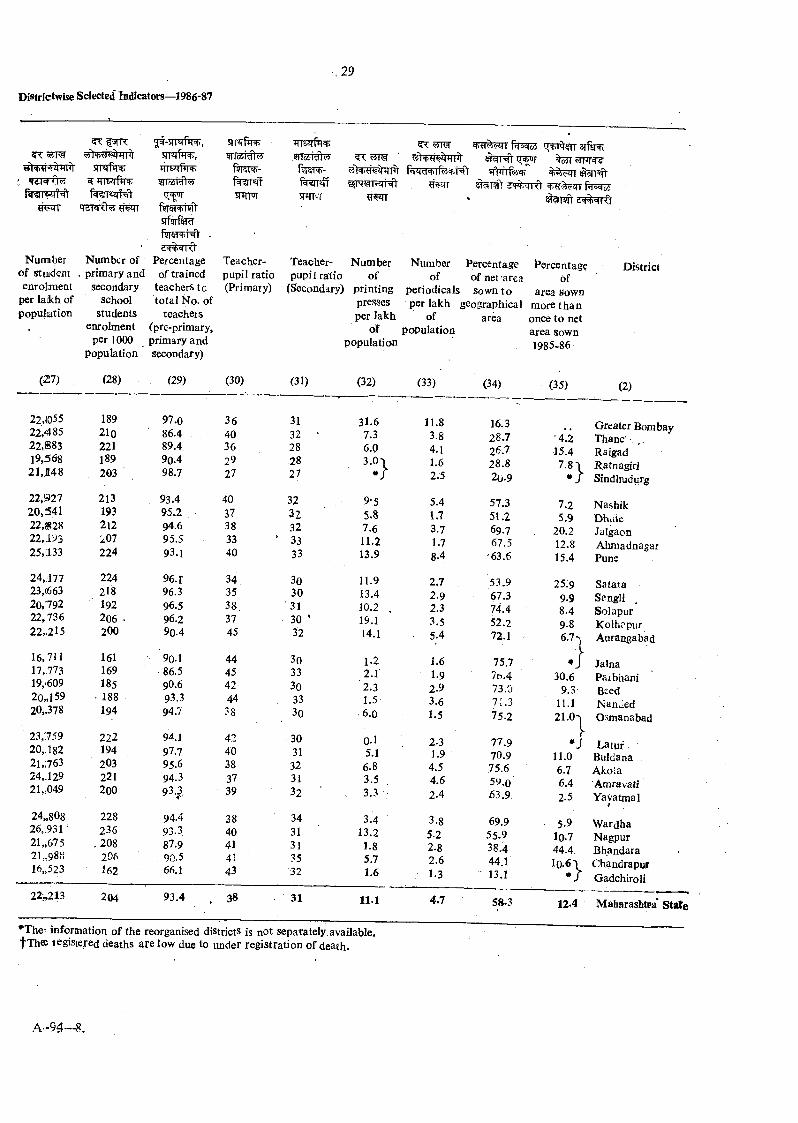
N um ber o f St in d en t
e n r o lm e a t p e r la ik h o f p o p u la t i o n
(27)
22,(055 22,485 22,883 19,568 21,1148
22,92720,34122,»2822,1S>325,133
24,17723,(663 20,792 22,736 22„2l5
16,71117,77319,(60920„15920..378
23,75920.. 182 21,763 24,.129 21,i049
24„808 26„931' 21„675 2L,988 16„523
22;,213
sTFrfir
Number of primary and
secoiidary school
students enrolment
per 1000 population
(28)
18921o221189203
213193 212 207 224
224218192206200
161 169 185
■ 188194
222194203221200
228 236
, 208 206 162
ft-STPrfW,
siTTsraW
sr%fecT-
Percentage of trained
teachers tc to ta l No. of
teacheis (pre-primary, primary and Secondary)
(29)
SRFT
Teacher- pupil ratio (Primary)
^ arfEi
frf^ds
(30)
204
97.086.489.490.4 987
93.495.294.695.593.1
96.r96.396.596.2 9o-4
90.186.590.693.394.7
94.197.795.694.393, .
94.493.3 87.9
. 90-566.1
364036 29 27
40373833 40
3435 38,37 45
4445 42 4438
42 40383739
3840414143
93.4 38
Teacher- Number pup ilra tio of
(Secondary) printing presses per lakh
ofpopulation
(31)
3132 28 28 27
32323233 33
303031 3032
3033 3033 30
3031323132
34 31313532
31
(32)
31.67.3 6.0
3-«>
9 . 5
5.87.6 11.213.9
11.9 13.4 J0.2 .19.114.1
1.22.1
‘2.31.5 6.0
0.15.16.83.53.3
3.4 13.21.8571.6
11 1
Numberof
periodicals per lakh {
ofpopulation
(33)
11.83.84.1 1.6 2:5
5.41.73.7178.4
272.92.33.55.4
1.61.92.9 3.61.5
2.31.94.54.62.4
3.85.22.82.6 1-3
4.7
Percentage Percentage Districtof net -area ofSow n to area Sown
;eographical more th anarea once to net
area sown1985-86
(34) (35) (2)
16.3 Greater Bombay2 8 7 ■4.2 Thane’26.7 15.4 Raigad28.8 7.8 \ Ratnagiri20.9 * / Sindhudurg
57.3 7.2 Nashik5U2 5.9 Dhuie69.7 20.2 Jalgaon67.5 12.8 Alunadnagar
'63.6 15.4 Pune
53.9 25:9 Satata67.3 9.9 Sangli74.4 8.4 Solapur52.2 9.8 Kolhapur72.1 6.7-. Aurangabad
757 Jalna7o.4 30.6 Parbhani73.0 9.3 Beed71.3 11.1 Nanded75.2 21.0 'i Osmanabad
77.9 •J L atuf70.9 11.0 Buldana .
75.6 6 7 Akoia59.0 6.4 Amravati£3.9 2.5 Yavatmal
69.9 5.9 W ardha55.9 10.7 Nagpur38.4 44.4 Bh.andara44.1 1 0 . . 6 \ Chandrapuf13.1 Gadchiroli
58-3 12>4 Mabarashtpa* State
*The; information of the reorganised districts is not separately available. f T h e tegistered deaths are low due to under registration of death.
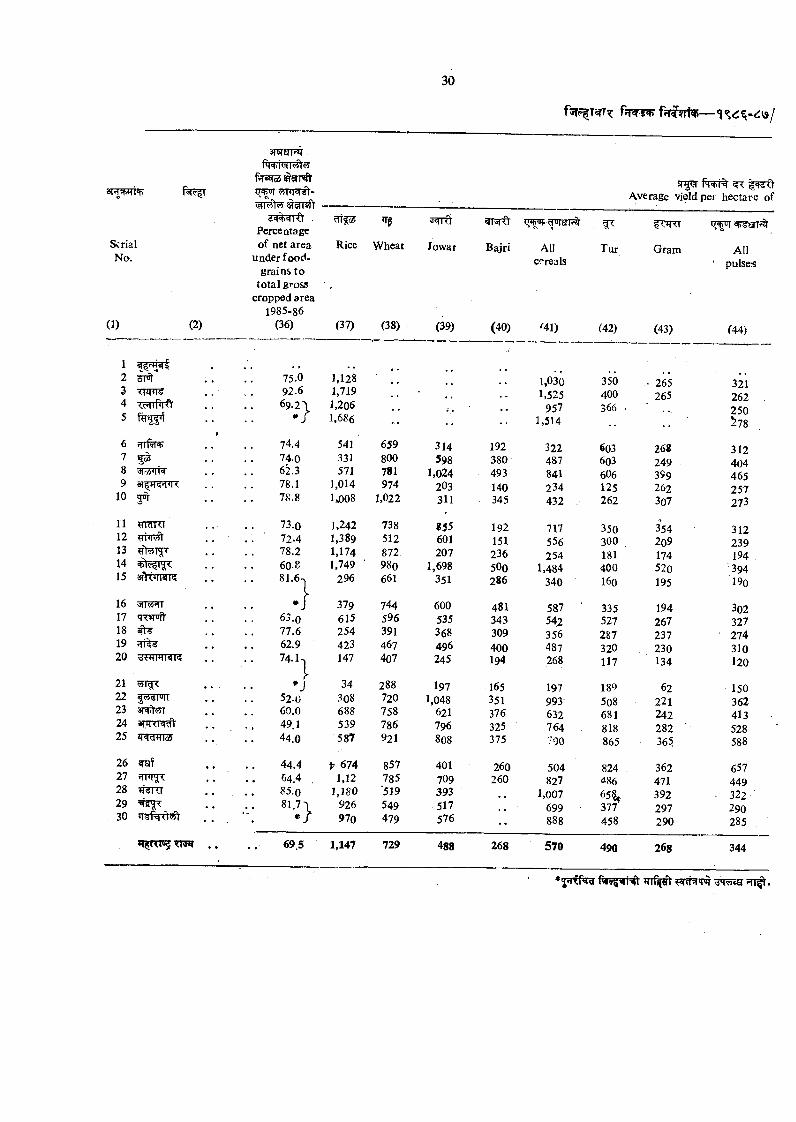
3RW^
3T?rsn ’TPw+MH'l y
SerialNo.
(1) (2)
Percentage of net area
under f ood- g ra in s to
to ta l gross cropped area
1985-86 (36)
Rice
(37)
Wheat
(38)
Jowar
(39)
Bajri
(40)
Allcereals
^41)
Tur
(42)
Gram
(43)
^ s rT ’%
All ' pulses
(44)
12 sm 75.0 1,128
. •• ••1,030 350 265 321
3 T IW . . 92.6 1,719 • 1,525 400 265 2624 icHrpTff . . 69.2 \ 1.206 957 366 . 2505 • / 1,686 ... 1,514 ^78
6 ?iiri(l'*> 74.4 541 659 314 192 322 603 268 3127 f<3 74.0 331 800 598 380 487 603 249 4048 'SHOTT , . 62.3 571 781 1,024 493 841 606 399 4659 3 ? ^ ir? ^ 78.1 1,014 974 203 140 234 125 262 257
10 5^ 78.8 1.008 1,022 311 345 432 262 307 273
11 yidKI . . 73.0 1,242 738 855 192 717 350 354 31212 . . ■ 72.4 1,389 512 601 151 556 300 2o9 23913 78.2 1.174 872 207 236 254 181 174 194 ,14 60.8 1,749 ' 980 1,698 5O0 1,484 400 520 39415 3n <i(«tl<< 81.6^ 296 661 351 286 340 160 195 190
16 ^ra?n • I 379 744 600 481 587 335 194 30217 63.0 615 596 535 343 542 527 267 32718 ^ 77.6 254 391 368 309 356 287 237 27419 62.9 423 467 496 400 487 320 230 31020 74.K 147 407 245 194 268 117 134 120
21r
*J 34 288 197 165 197 189 62 15022 |»ar«i[ 52.0 308 720 1,048 351 993 508 221 36223 3 ■i > ^ 60.0 688 758 621 376 632 681 242 41324 aiTRR^ 49.1 539 786 796 325 764 . 818 282 52825 44.0 587 921 8O8 375 790 865 365 588
26 ?rai 44.4 P 674 857 401 260 504 824 362 65727 fTR ^ 64.4 1,12 785 709 260 827 486 471 44928 »j^i<r 85.0 1,180 '519 393 ■ 1,007 65^
377392 - 3 2 2 '
29 81.7'1 926 549 517 699 297 29030 . . • / 970 479 576 •• 888 458 290 285
69 5 1,147 729 488 268 570 490 268 344
*5H<f%g fwvprHt rrf at ^3^sr ?rt^.
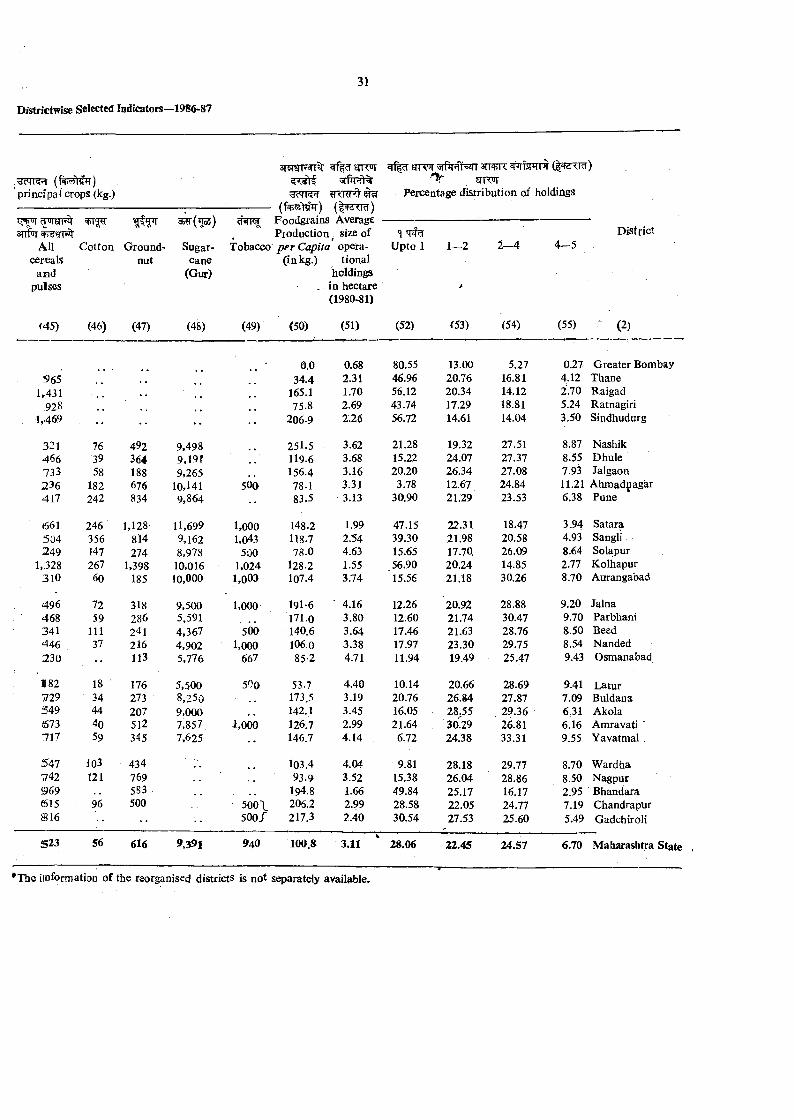
principal crops (kg.)
3T?raTf2n% ^^£rR°T
3?qK?r ?R’RTfl’^
r%T arrir ^rMINrr s rr^arm
Percentage distribution of holdings
Foodgrains Average ■Production size of D istrict
All Cotton Ground Sugar- Tobacco p e r Capita opera- Upto 1 1—2 2 4 4—5cereals nut Cane (in kg.) tional
and (Gur) holdingspulses . in hectare >
(1980.81)
(45) (46) (47) (48) (49) (50) (51) (52) f53) (54) (55) ' (2)
0.0 0.68 80.55 13.00 5.27 0.27 G reater Bom565 34.4 2.31 46.96 20.76 16.81 4.12 Thane
1„431 165.1 1.70 56.12 20.34 14.12 2.70 Raigad'928 75.8 2.69 43.74 17.29 18.81 5.24 Ratnagiri
, 1,469 .. • . •• 206-9 2.26 56.72 14.61 14.04 3.50 Sindhudurg
321 76 492 9,498 251.5 3.62 21.28 19.32 27.51 8.87 Nashik466 39 364 9,19f . . 119.6 3.68 15.22 24.07 27.37 8.55 Dhule733 58 188 9,265 156.4 3.16 20.20 26.34 27.08 7.93 Jalgaon236 182 676 10,141 560 78.1 3.31 3.78 12.67 24.84 11.21 Ahmadnagar417 242 834 9,864 83.5 3.13 30.90 21.29 23.53 6.38 Pune
661 246 1,128 11,699 1,000 148.2 1.99 47.15 22.31 18.47 3.94 Satara504 356 814 9,162 1,043 118.7 2.54 39.30 21.98 20.58 4.93 Sangli249 147 274 8,978 500 78.0 4.63 15.65 17.70 26.09 8.64 Solapur
1,328 267 1,398 10,016 1,024 128.2 1.55 56.90 20.24 14.85 2.77 Kolhapur310 60 185 10,000 i,ooa 107.4 3.74 15.56 21.18 30.26 8.70 Aurangabad
496 72 318 9,500 1,000 191-6 ■ 4.16 12.26 20.92 28.88 9.20 Jalna468 59 286 5,591 171.0 3.80 12.60 21.74 30.47 9.70 Parbhani341 111 241 4,367 500 140.6 3.64 17.46 21.63 28.76 8.50 Beed446 37 216 4,902 1,000 106.0 3.38 17.97 23.30 29.75 8.54 Nanded230 •• 113 5,776 667 85-2 4.71 11.94 19.49 25.47 9.43 Osmanabad
1182 18 176 5,500 500 53.7 4.40 10.14 20.66 28.69 9.41 Latur729 34 273 8,250 173.5 3.19 20.76 26.84 27.87 7.09 Buldana549 44 207 9,000 142.1 3.45 16.05 2 8 /5 29.36 631 Akola673 4o 512 7,857, i,000 126.7 2.99 21.64 , 30C29 26.81 6.16 Amravati ’717 59 345 7.625 •• 146.7 4.14 6.72 24.38 33.31 9.55 Yavatmal .
547 103 434 .. 103.4 4.04 9.81 28.18 29.77 8.70 W ardha742 121 769 93.9 3.52 15.38 26.04 28.86 8.50 Nagpur969 583 194.8 1.66 49.84 25.17 16.17 2.95 Bhandara615 96 500 5001 206.2 2.99 28.58 22.05 24.77 7.19 Chandrapur816 500/ 217.3 2.40 30.54 27.53 25.60 5.49 Gadchiroli
523 56 6 U 9,391 940 100.8 3.11 ‘ 28.06 22.45 24.57 6.70 M aharashtra
*The iinformation of the reorganised districts is not separately available.
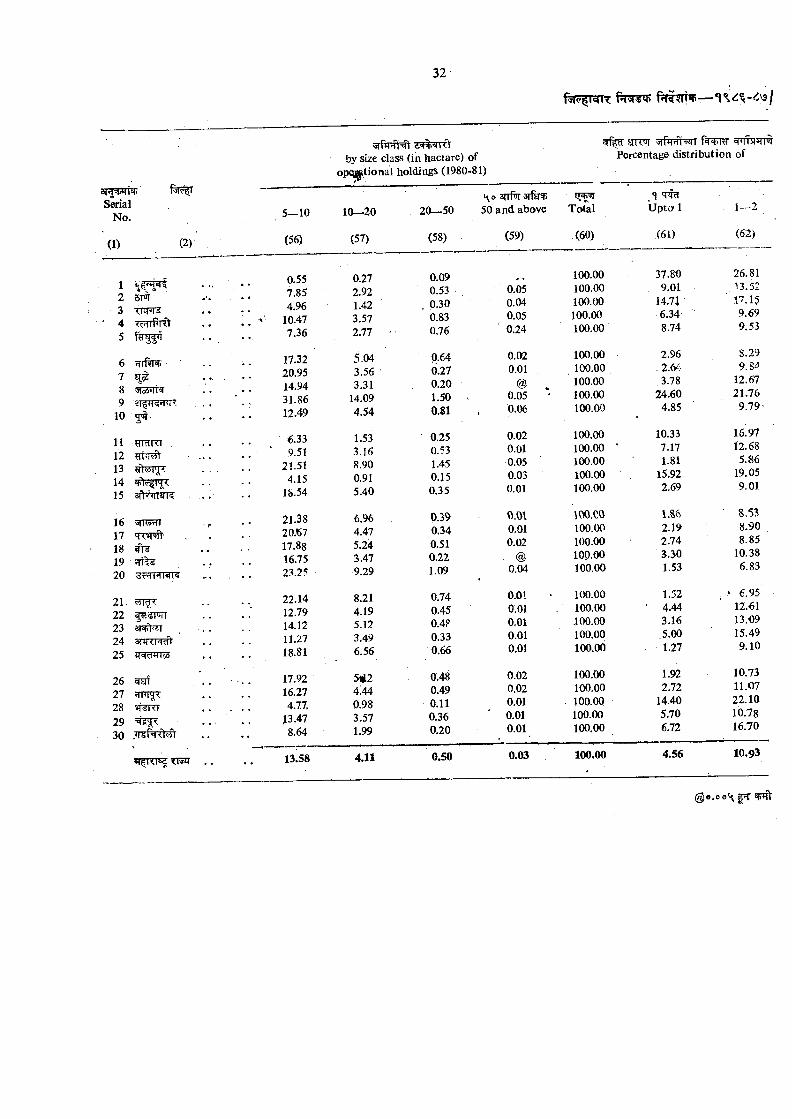
ai^W^Si^al
No.
(1) (2)
5mTR^tc*C)r
910 5<jT
11 m RT .12 ?TT’T^131415
16 'sn^ f17 «TW>lt-1819 ?Tt^
21.22 I STWT23 3T^t^24 ariRRtft25 JfWnoS
26 wsrf27 ?TFI^2829 ^30
TT5ZI
by size class {in hactare) oftrrCT 'JiPM'fl'OMl q'*i7x+ii
Percentage distribution ofopeggitional holdings (1980-81)
\ o srrPT srfjTfi ^ MAld
5—10 10—20 2 0 -5 0 50 and above Total U p to l . 1— 2
(56) (57) (58) (59) (60) (61) (62)
0.55 0.27 0.09 100.00 37.80 26.81
7.85 2.92 0.53 0.05 100.00 9.01 ,13.52
4.96 1.42 , 0.30 0.04 100.00 14.7i 17.15
10.47 3.57 0.83 0.05 100.00 6.34 9.69
7.36 2.77 ' 0.76 ' 0.24 100.00 8.74 9.53
17.32 5.04 0.64 0.02 100.00 2.96 S. 29
20.95 3.56 0.27 0.01 100.00 2.64 9.8'^
14.94 3.31 0.20 @ * 100.00 3.78 12.67
31.86 14.09 1.50 0.05 ‘ 100.00 24.60 21.76
12.49 4.54 0.81 0.06 100.00 4.85 9.79
6.33 1.53 0.25 0.02 100.00 10.33 16’97
9.51 3.16 0.53 0.01 100.00 * 7.17 12.68
21.51 8.90 1.45 0.05 100.00 1.81 5.U
4.15 0.91 0.15 0.03 100.00 15.92 19.05
18.54 5.40 0.35 0.01 100.00 2.69 9.01
21.38 6.% 0.39 0.0\ lOO.CO l.SC> 8.53
20.«7 4.47 0.34 0.01 100.00 2.19 8.-90
17.88 5.24 0.51 0.02 100.00 2.74 8.85
16.75 3.47 0.22 @ 100.00 3.30 10.38
23.25 ■ 9.29 1.09 0.04 100.00 1.53 6.83
22.14 8.21 0.74 O.Ol 100.00 1.52 , ,• 6.95
12.79 4.19 0.45 0.01 100.00 4.44 12.'61
14.12 5.12 0.4P 0.01 JOO.OO 3.16 13.09
11.27 3.49 0.33 0.01 100.00 ,5.00 15.49
18.81 6.56 0.66 0.01 100.00 1.27 9.10
17.92 542 0.48 0.02 100.00 1.92 10.73
16.27 4 M 0.49 0.02 100.00 2.72 11,07
4.77, 0.98 0.11 0.01 . 100.00 14.40 22.10
J3.47 3.57 0.36 ' 0.01 100.00 5.70 10.78
8.64 1.99 0.20 0.01 100.00 6.72 16.70
13.58 4.11 0.50 0.03 100.00 4.56 10.93
e.oo'^
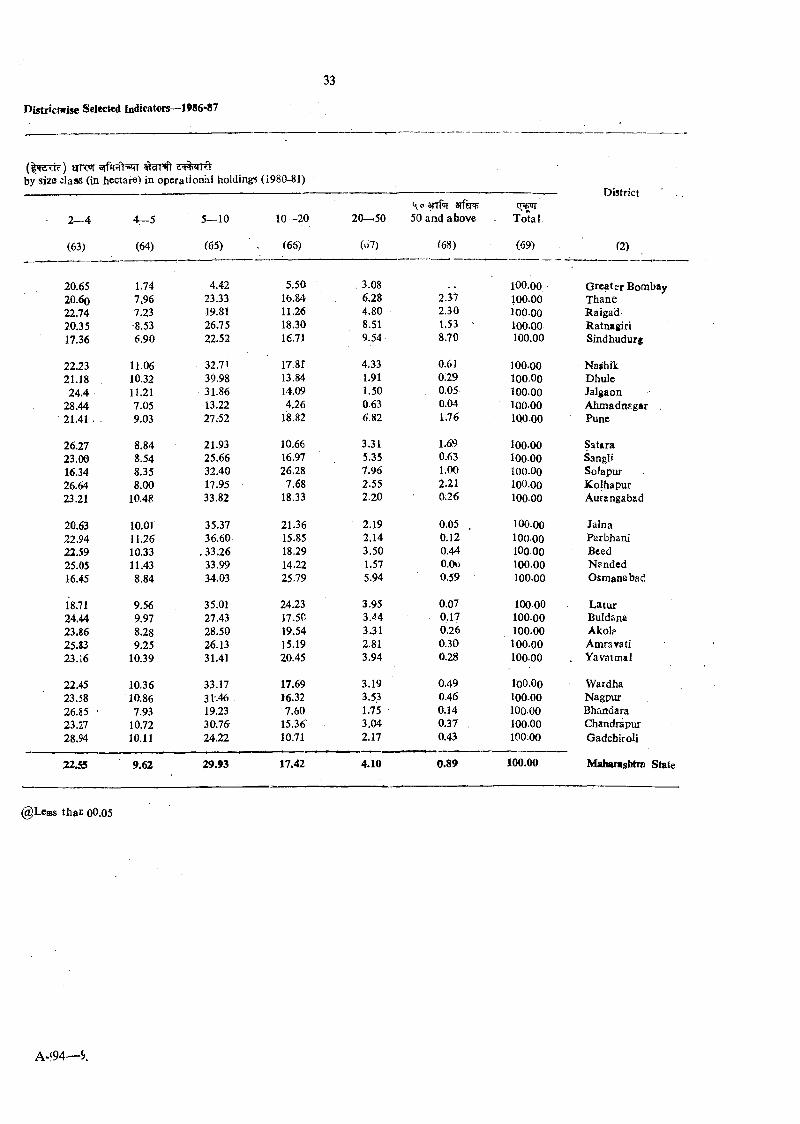
(IWBW) STRwrby size class (in hectat«) in operational holdings (1980-81)
District\o3rrfoT srfcRi
2—4
(63)
4— 5
(64)
5— 10
(65)
10—20
(65)
20—50
(v57)
50 and above
(68)
Total
(69) (2)
20.65 1.74 4.42 5.50 , 3.08 100.00 G reater Bombay20.60 7,96 23.33 16.84 6.28 2.37 100.00 Thane22.74 7.23 19.81 11.26 4.80 2.30 ioo.oo Raiga'd20.35 8.53 26.75 18.30 8.51 1.53 - 100.00 Ratnagiri17.36 6.90 22.52 16.71 9.54 8.70 100.00 Sindhudurg
22.23 11.06 32.71 17.81 4.33 0.61 100.00 Nashik21.18 10.32 39.98 13.84 1.91 o;29 100.00 Dhule24.4 11.21 31.86 14.09 1.50 . 0.05 10000 Jalgaon
28.44 7.05 13.22 4.26 0.63 0.04 100.00 Ahmadnsgar ,21.41 . 9.03 27.52 18.82 6.82 1.76 100 00 Pune
26.27 8.84 21.93 10.66 3.31 1.69 10000 Satiira23.00 8.54 25.66 16.97 5.35 0.63 100-00 Sanglf16.34 8.35 32.40 26,28 7.96 1.00 100.00 Solapur26.64 8.00 17.95 7.68 2.55 2.21 100.00 Kolhapur23.21 10.48 33.82 18.33 2.20 0.26 100-00 Aurangabad
20.63 10.01 35.37 21.36 2.19 0.05 . 100.00 Jain a22.94 11.26 36.60 15.85 2.14 0.12 100 00 Parbhani22.59 10.33 .33.26 18.29 3.50 0.44 lOOOO Bced25.05 11.43 33.99 14.22 1.57 0.06 100.00 Nanded16.45 8.84 34.03 25.79 5.94 0.59 100.00 Osraanabad
18J1 9.56 35.01 24.23 3.95 0.07 100 00 Latur24.44 9.97 27.43 17.50 3.44 0.17 100-00 Buldana23.86 8.28 28.50 19.54 3.31 0.26 100.00 Akole25.83 9.25 26.13 15.19 2.81 0.30 100.00 Amrayati23.16 10.39 31.41 20.45 3.94 0.28 10000 Yavaimal
22.45 10.36 33.17 17.69 3.19 0.49 loo.oo Wardha23.58 10.86 31.46 16.32 3.53 0.46 100.00 Nagpur26.85 ■ 7.93 19.23 7.60 1.75 0.14 10000 Bhandara23.27 10.72 30.76 15.36' 3.04 0.37 100-00 Chandrapur28.94 10.11 24.22 10.71 2.17 0.43 100;00 Gadcbiroli
2 2 ^ 9.62 29.93 17.42 4.10 0.89 100.00 M atnnisbtra State
(^Lesss th a t 00.05
A -‘94— S.
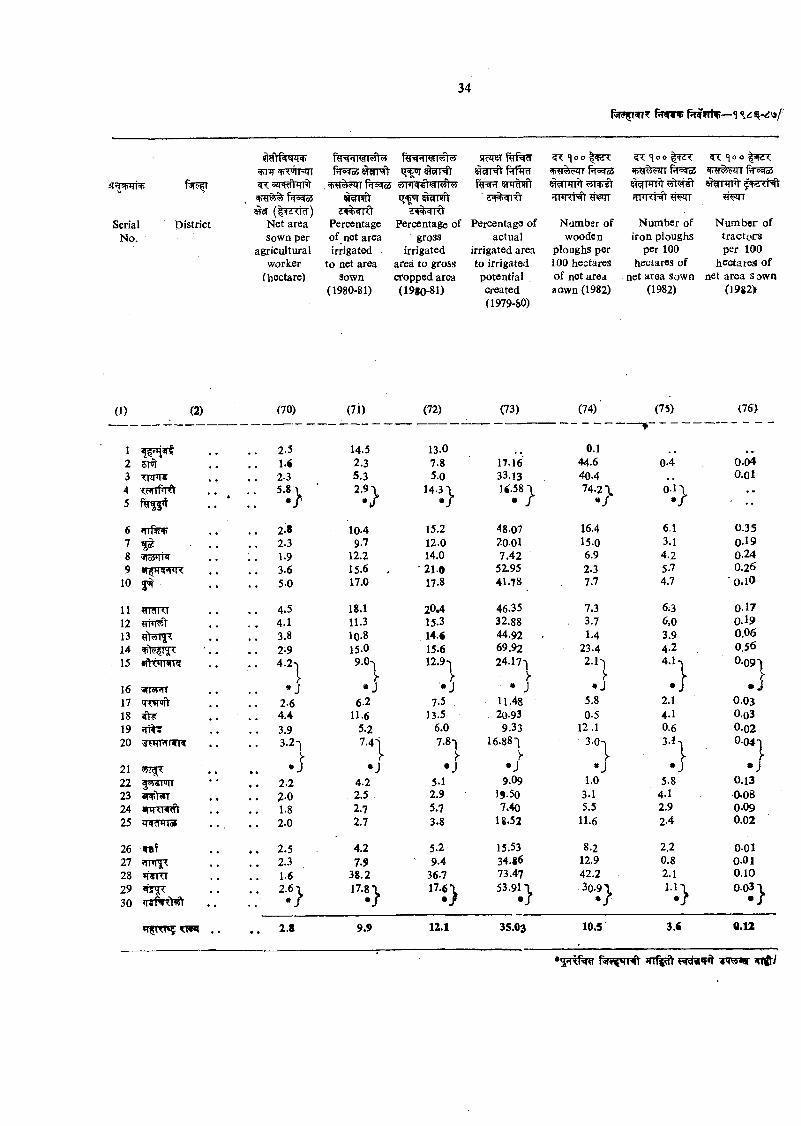
S?JT5Tf%i ^ < l o o | ^ ^'|oo|WJT ?T'}oo|aRnt;^nr iWRTT f ofSJ WT C[ |®r WT PioqoJ 't)y5"?‘ i fH««la4 Vy iFTT fWo^^ oM*wVn% . ( ®*ic6 5TR%5ft sraTRT ?5T rit 5i? i*ii rtl'ifis) ywnrr^aRl%% f «C64 WWT J^TlfT TTW f ?TWr HHRI- ?tWT^ (l^sTRr) CT%m<t ir#WRt
Net area Percentage Percentage of Percentage of Number of N um ber of N um ber of Sown per of net area gross actual wooden iron ploughs trac to rs
agricultural irrigated irrigated irrigated area ploughs per per 100 per 100worker to net area area to gross to irrigated 100 hectares hectares of hectares of
(hectare) sown w oppedarea po ten tia l, of net area net area sown net area sow n(1980-81) (19*0-81) created sown (1982) (1982) (1982>
(1979-bO)
SerialNo.
District
0 ) (2) (70)
12 5T^3 xm*\i45
6 irrfti#.7 W- ■ ••89
10 j®r . .
11 w n r i12 yiM<At1314 iSL15 «AOiT*!K
16 3fTW5TT17 qTFToft181920 SnFFPTfWR
2122 5 sr»rr2324 *nrw t25
262728 n n u2930
*rf[nT«5 TW*i . .
2.31.62-35.8
. }
2.82.3 1.9 3.6 5 0
4.5 4.13.82.9
2.64.43.9 3.2^
2-22-01.82.0
2.5 2.31.6
2.8
(71) (72) (73) (74) (75) (76)— f -
14.5 13.0 0.1 • »2.3 7.8 17.16' 44.6 0-4 0.045.3 5.0 33.13 40.4 o .o i2.9 X 14.3 \ U.58 \ 74.2 \ 0.1 \ , .
• / • / * / * / ...
10-4 15.2 48.07 16.4 6.1 0.359.7 12.0 20.01 15.0 3.1 0.19
12.2 14.0 7.42 6.9 4.2 0.2415.6 , '2 1 .0 52.95 2.3 5.7 0.2617.0 17.8 41.78 7.7 4.7 O.lO
18.1 20.4 46.35 7.3 6.3 0.1711.3 15.3 32.88 . 3.7 6,0 0.1910.8 14.« 44.92 > 1.4 3.9 0.0615.0 15.6 69.92 23.4 4.2 0.56
9.0^ 12.9-| 24.17^1 4 .1 , 0-091
• J • J • 1 • J6.2 7.5 11.48 5.8 2.1 0.03
11.6 13.5 . 20-93 0.5 4.1 0.035.2 6.0 9.33 12.1 0.6 0-02
’ • n7.8-1
)-16.88'^
n3 . 0.04"
• j • J • J • j4.2 5.1 9.09 1.0 5.8 0.13
, 2.5 2.9 19.50 3.1 4.1 0.082.7 5.7 7.40 5.5 2.9 0.092.7 3.8 1§.52 11.6 2.4 0.02
4.2 5.2 15.53 8.2 2.2 0 0 17.9 9.4 34.86 12.9 0.8 0.01
38.2 36.7 73.47 42.2 2.1 0.1017.81 17.6 \ 53.91 \ 30.9 \ i . n 0 0 3 \
• / • / • / • / • / • /
9.9 12.1 35.03 10.5 3.6 Q.12
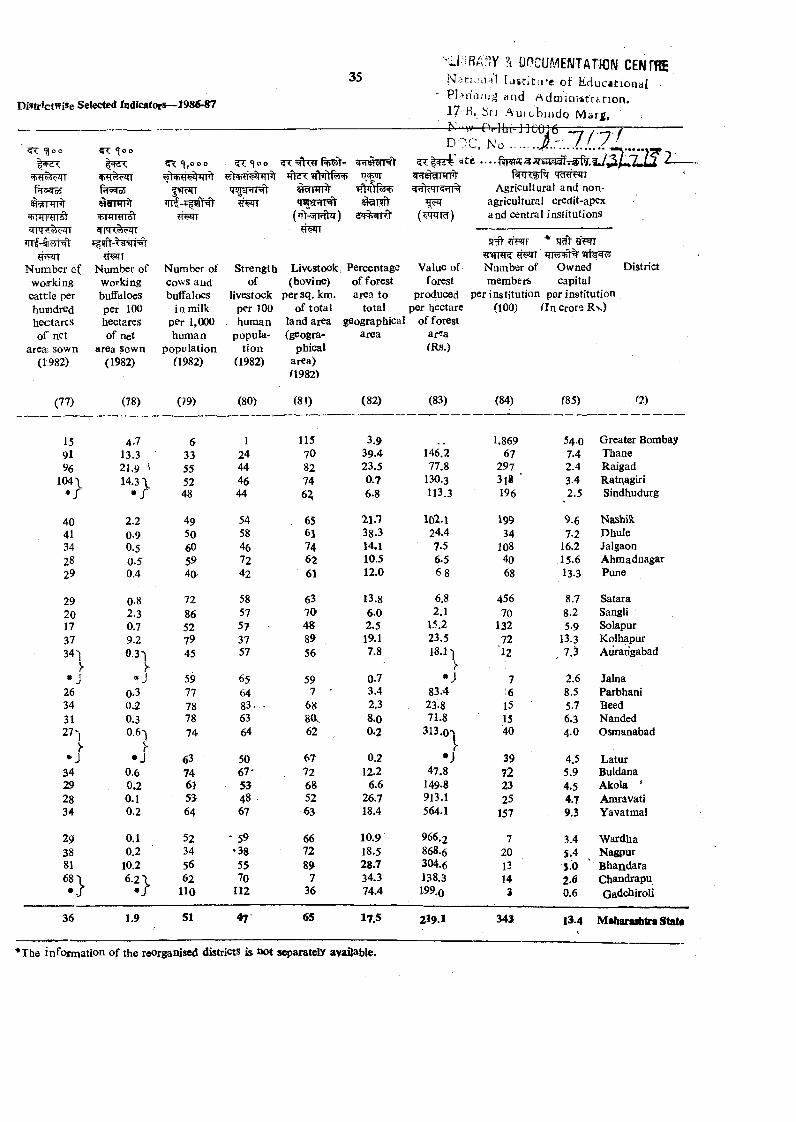
*5T *|oo
f TooS
srrTT^^
?i mCUMENTAWN CENTONaCi.snal I i i sJ i tu ' e o f Educa t io na l PUna/n<j and Adm iniitrcrion,17 B, Srj Autobi i idQ Mar^ ,
— N' W Or 1 hi-J 3 0 ^ 6 ^ i -y j -------------
N um ber cC Number ofwoirking workingcattle per buffaloeshumdred per 100hectares hectareso f net of net
area: sown area Sown(1982) (1982)
(77) (78)
15 4.791 13.396 21.9 '
104 \ 14.3 \* / * /
40 2.241 0-934 0.528 0.529 0.4
29 0.820 2.317 0,737 9.234'j 0.3
1-*J
26 0.334 0.231 0.327-1 0.6')
J-•J •J
34 0.629 0.228 0.134 0.2
29 0.138 0.281 10.268 \ 6.2 \• / • /
36 1.9
‘j,ooo
N um ber ot cows a a d buffaloes
in milk per 1,000 hum an
population fl982)
(?9>
63355 5248
4950 60 59 4a
728652 79 45
597778 78 74
63 74 6J5364
523456 62
llQ
*ft?TiTWEprHt wr*n%
WE^rNt
?t¥TT
N o ...... . ^ . r . . ......1^ - ^ tt . . . . 2_
Agricultural and non- agricultural crcdit-apex and central institutions(wtrt)
Strengthof
livestock per 100
, hum an popula
tion (1982)
(80)
Livtstock, Percentage(bovine)
per sq. km.of to tal
land area (geogra
phical area) 0982)
(8!)
of forest area to
total geographical
area
(82)
Value of forest
produced per hectare
of forest ar^a (Rs.)
(83)
124444644
54 58 46 72
, 42
58575?3757
656483.6364
5067*534867
‘ 59 •3855 70
112
1157082746^
65 61 74 62 61
6370488956
597
6880^62
67 7268 52 63
66 72 89
736
3.939.423.5 0.7 6.8
21.738.314.110.5 12.0
13.8 6.02.519.17.8
0.73.42.38.00.2
0.212.2
6.626.718.4
10.918.528.734.374.4
146.2 77.8
130.3113.3
102.124.47.56.56-8
6.82.1
15.223.5 18.1')
83.423.871.8
313.0
• J47.8
149.8913.1564.1
966.2 868.6 304.6138.3 199.0
?TF?THTRT 9Wr ’HlS'tw
N umber of Owned members capital
per institution per Institution (100) (InC ror^R s.)
District
(84) (85) (7)
1,869 540 Greater Bombay67 7.4 Thane
297 2.4 Raigad3l8 ■ 3.4 Ratqagiri196 2.5 Sindhudurg
199 9.6 Nashik34 7.2 Dhule
108 16.2 Jalgaon40 15.6 Ahmadnagar68 13.3 Pune
456 8.7 Satara70 8.2 Sangli
132 5.9 Solapur72 13.3 Kolhapur12 , 7.3 Aurarigabiad
7 2.6 Jalna6 8.5 Parbhani
15 5.7 Beed15 6.3 Nanded40 4.0 Osmanabad
39 4.5 Latur72 5.9 Buldana23 4.5 Akola '25 4.7 Amravati
157 9,3 Yavatmal
7 3.4 W ardha20 S.4 Nagpur13 5.0 B handara14 2.6 Chandrapu3 0.6 Gadchiroli
51 4? 65 17.5 219.1 343 13.4 Mabaraahtra State
The inform ation of the reorganised districts is not scparatdy avaflable.
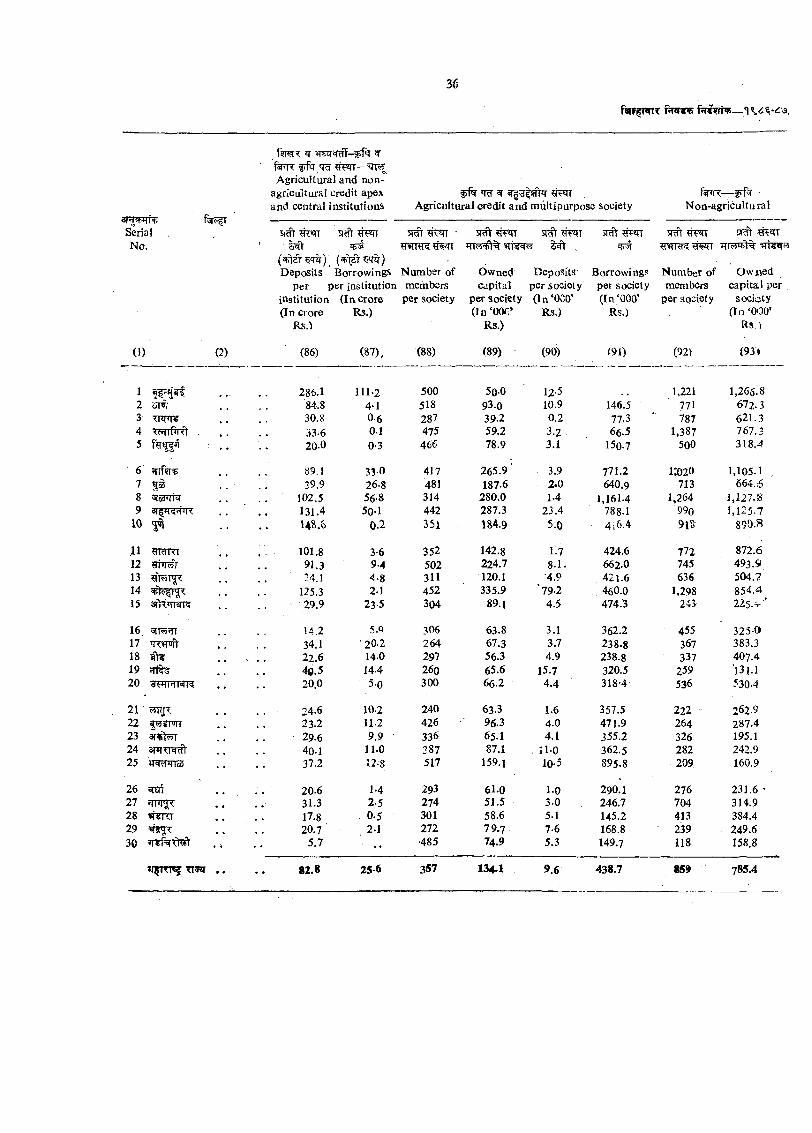
F;r«np»»
ar^TrN)SerialNc.
^ 5TE3T^-l>fw 5T fTPr Tcf ?iwr—
Agricultural and non- agricultural credit apex and central institutions Agricultural credit and multipurpose society
5 ^ sp^ ^k«rw 5=ft ,
Deposits Borrowings Number of Owned Deposits Borrowingsper per institution members capital per society per society
institution (In cro re per society per society ( I n ‘000’ ( I n ‘000’(In ciore Rs.) (In ‘000* Rs.) Rs.)
Rs.> Rs.)
N on-agricultural
N um ber of members
per society
O w ned capital per
society (In ‘COO’
R s .)
0 ) (2) (86) (87), (88) (89) (90) (9\) (92) (93))
1 286.1 I I M 500 5oO 12-5 1,221 1,266-82 84.8 4-1 518 93.0 10.9 146.5 771 672.33 30.8 0-6 287 39.2 0.2 77.3 787 621.34 . 33.6 0.1 475 59.2 3.2 66.5 1,387 767.35 20-0 0-3 466 78.9 3.1 150.7 500 318,4
6 85.1 33-0 417 265.9 ' 3.9 771.2 i;o20 1,105.17 . , ' 39.9 26.8 481 187.6 2.0 640.9 713 664.68 102.5 56-8 3J4 280.0 1-4 1,161.4 1,264 1,127.'S9 Sf TRVT lX 131.4 50-1 442 287.3 23.4 788.1 990 1, 125.7
10 ^ i4%.e> 0.2 351 184.9 5.0 4i6.4 9 IS 890.«
n ^IdKi 101.8 3-6 352 142.8 1:7 424.6 772 872.612 ?riwr 91.3 9.4 502 224.7 8.1. 662.0 745 493.913 g'T^T^ 34.1 4-8 311 120.1 •4.9 421.6 636 504.714 125.3 21 452 335.9 “79.2 460.0 1,298 854.415 3ft . . 29.9 23-5 304 89.1 4.5 474.3 243 225. v ’
16 5tTw?n 14.2 5.Q 306 63.8 3.1 362.2 455 325-017 <n^oft 34.1 ' 20-2 264 67.3 3.7 238.8 367 383.318 g 'k 22.6 140 297 56.3 4.9 238.8 337 407.419 40.5 14.4 260 65.6 15.7 320.5 259 131.120 W TFTRTR' •• 20.0 5-0 300 66.2 4.4 318-4 536 530.4
21 24.6 102 240 63.3 1.6 357.5 222 262.922 ^fTWr ,. 23.2 11.2 426 96.3 4.0 471.9 264 287.423 anfter . . 29.6 9.9 336 65.1 4.1 355.2 326 195.124 snr^TRcfr 4o-i 11.0 387 87.1 H O 362.5 282 242.925 ZRtFITcS . 37.2 12;S 517 159.1 lo o 895.8 209 160.9
26 ^ 20.6 1-4 293 61.0 1-0 290.1 276 231.6 •27 ,, 31.3 2.5 274 51.5 3.0 246.7 704 314.928 17.8 0.5 301 58.6 5.1 145.2 413 384.429 20.7 2-1 272 79.7 7.6 168.8 239 . 249.630 5.7 ■ •• •485 74.9 5.3 149.7 118 158.8
•• 82.8 2 5 6 357 134.1 9.6 438.7 859 785.4
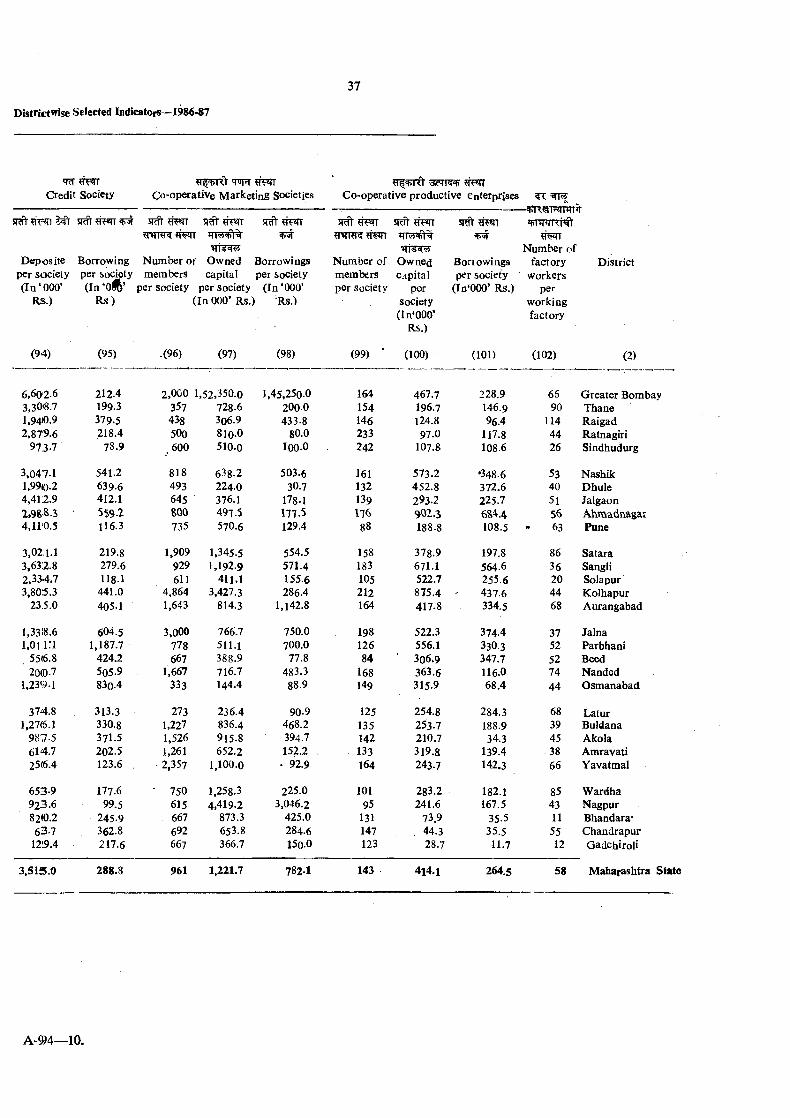
«TcT ?TFrr Credit Society
'T'pTCo-operative M arketing Societies
sRTlr 5i?fr ?TFn
Deposite per society ( I n ‘000’
Rs.)
(94)
6,602-63,3018.71,94<0.92.879.6
97.3.7
3.047.1 1,99(0.2 4,412.9 2,988.5 4,11(0.5
3.021.1 3,632.82.334.7 3,80.‘5.3
23.5.0
1,33!8.6i.onri
55(6.8200.7
1.239.1
374.81.276.1
987.5 614.7 256.4
653-9923.6 82<0.263-7
12!9.4
3,515.0
Borrowing Number of Owned Borrowings per society members capital per society( l n ‘o i^ ’ per society per society ( I n ‘000’
R s ) (In 000’ Rs.) Rs.)
(95)
212-4199.3 379.5218.4
78.9
5412639-6412.1559.2116.3
219.8 279.6 118.1
441.0405.1
604.5 1,187.7
4242505.9830.4
313.3330.8371.5202.5123.6
177.6 99.5
245.9362.8217.6
288.8
.(96) (97) (98)
2,000 1,52,350.0357 438 500
. 600
818493645800735
1,909929611
4,8641,643
3,000778667
1,667333
2731,2271,5261,2612,357
750615667692667
728.6306.9 810.0510.0
638.2224.0376.1497.5570.6
1,345.51,192.9
411.13.427.3
814.3
766.7511.1388.9716.7144.4
236.4836.4915.8652.2
1,100.0
1.258.3 4,419.2
873.3653.8 366.7
961 1,221.7
1,45,250.0200.0433.8
80.0100.0
503.630.7
178.1 m . 5129.4
554.5571.4155.6286.4
1,142.8
750.0700.077.8
483.388.9
90.9468.2394.7 . 1522
• 92.9
225.0 3,046.2
425.0 284.6150.0
782-1
— QT^qriTn
Number ofNumber of Owned B ono wings factory Districtmembers capital per society workersper Society per (Tq‘000’ R s.) per
society working( ln ‘000’ factory
Rs.)
(99) ' (100) (101) (102) (2)
164 467.7 228.9 66 G reater Bombay154 196.7 146.9 90 Thane146 124.8 96.4 114 Raigad233 97.0 117.8 44 Ratnagiri242 107.8 108.6 26 Sindhudurg
161 573.2 »348-6 53 Nashik132 452.8 372.6 40 Dhule139 293.2 225.7 51 Jalgaon176 902.3 684.4 56 Ahmadnagar88 188.8 108.5 - 63 Pune
158 378.9 197.8 86 Satara183 671.1 564-6 36 Sangli105 522.7 255.6 20 Solapur212 875.4 437.6 44 Kolhapur164 417.8 334.5 68 Aurangabad
198 522.3 374.4 37 Jalna126 556.1 330-3 52 Parbhani84 3o6.9 347.7 52 Beed
168 363.6 116.0 74 Nanded149 315.9 68.4 44 Osmanabad
125 254.8 284.3 68 Latur135 253.7 188.9 39 Buldana142 210.7 34.3 45 Akola133 319.8 139.4 38 Amravati164 243.7 142.3 66 Yavatmal
101 283.2 182.1 85 W ardha95 241.6 167.5 43 Nagpur
131 73.9 35.5 11 Bhandara*147 . 44.3 35.5 55 Chandrapur123 28.7 11.7 12 Gadchiroli
143 414.1 264.5 58 M aharashtra State
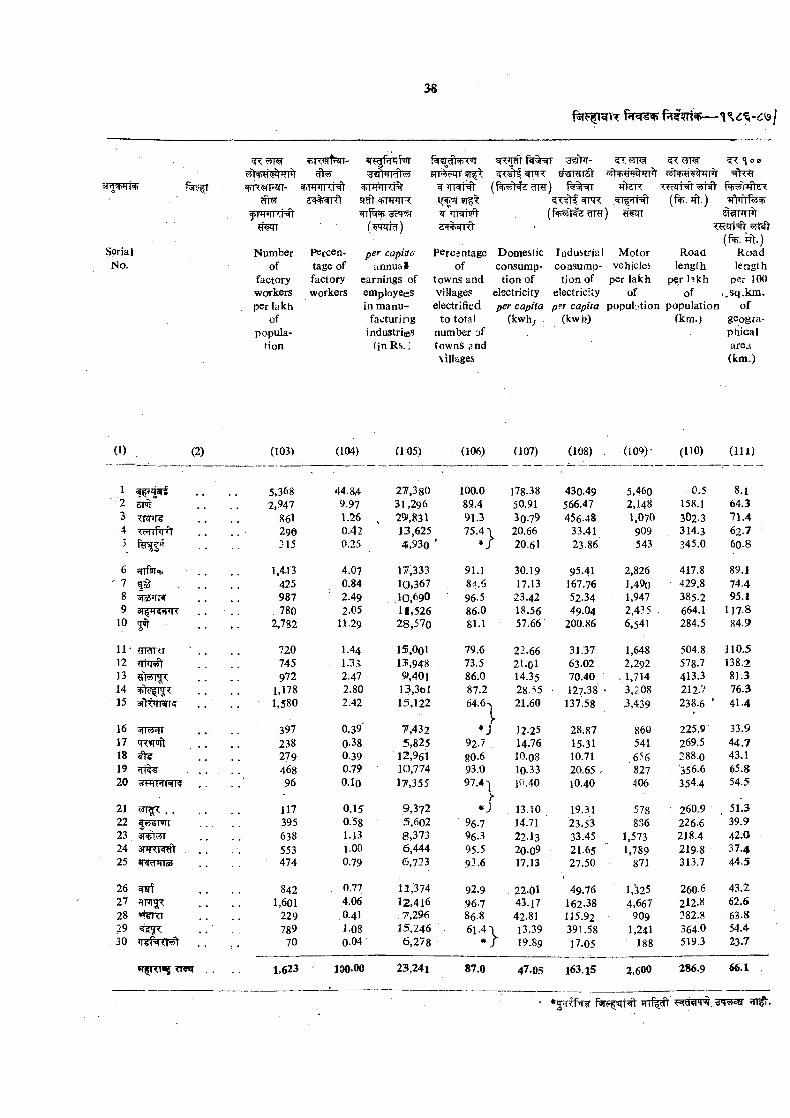
3TT V iW h^- SRgf^f’nrv?t^^H#RFr fft^ ^^>l|rf|W
q w tNS ?T^yra- <1 00
<t.|«= -Fi|T- =r ’TtwHt ( (+W)i?d Wdl<?i d4^^rO 5!rff I'+ul (ftr. Tft.)
^ ^nw )' (f^W gfT w ) ?fwi? iw (w rh r) d4H>s| 10 . h"I
(f%. fft.)Serial Number percen per capiito percentage Domestic Induitriai M otor Road R oad
No. of tage of an n u a l of consump consump vehicle'; length leogthfactory factory earnings of towns and tion of tion of per lakh per lakh per 100workers workers ;mpIoyeeS villages electricity electricity of of ,,sq .km .per lakh in m anu- electrified per capita p?r capita population population o f
of facturi ng to total (kwh; (kwh) (km.) geograpopula industries number of phical
tion (in R s .: towns and area\illages (km.)
(1) (2) (103) (104) (105) (106) (107) (108) (109)- (110) ( I l l )
1 5.368 44.84 2?,3s0 100.0 178.38 430.49 5,460 . 0.5 8.1•2 SM 2,947 9.97 31,296 89.4 50.91 566.47 2,148 158.1 64.33 TTERT 86l 1.26 , 29>,?!3l 91.3 30.79 456.48 1.070 302.3 71.44 290 0.42 13,625 75.4-'1 20.66 33.41 909 314.3 62.73 %^l>t 315 0.25 4,930 1 20.61 23.86 543 345.0 60.8
6 jnfsTct. 1,4.13 4.07 17,333 91.1 30.19 95.41 2,826 417.8 89.1' 7 425 0.84 10,367 84.6 17.13 167.76 l,49o 429.8 74.4
8 5fo5in4 987 ‘ 2.49 .10,690 96.5 23.42 52.34 1,947 385.2 95.19 780 2.05 11,526 86.0 18.56 49.04 2,435 . 664.1 117.8
10 5^ 2,782 11.29 28,570 81.1 57.66 200.86 6,541 284.5 84.9
11' yiclKT 720 1.44 155,001 79.6 22.66 31.37 1,648 504.8 110.512 745 1.33 13,948 73.5 21.01 63.02 2,292 578.7 138.213 972 2.47 9,401 86.0 14.35 70.40 , 1,714 413.3 81.314 1,178 2.80 13,361 87.2 28.55 • 127.38 ■ 3,208 212.7 76.315 1,580 2.42 15,122 64.6-j 21.60 137.58 3,439 238.6 * 41.4
16 . . 397 0.39' 7,432 • J 1 12.25 28.87 860 225.9 33.917 238 0-38 5,825 92.7 14.76 15.31 541 269.5 44.718 279 0.39 12,961 80.6 10.08 10.71 6-6 288.0 43.119 468 0.79 10,774 93.0 10.33 20.65 . 827 356.6 65.8120 TF*fFTraK 96 O.lo 17,355 97.4']1 10.40 10.40 406 354.4 54.5
21 . . 117 0.15 9,372 #JY1 13.10 19.31 578 • 260.9 51.3
22 55JSTWT 395 0.58 5,602 96.7 14.71 23.53 836 226.6 39.9.23 638 1.13 g,373 96.3 22.13 33.45 1,573 218.4 42.024 STRTR^ 553 1.00 6,444 95.5 20-09 21.65 1,789 219.8 37.425 474 0.79 6,723 93.6 17.13 27.50 871 313.7 44-5
26 842 0.77 12,374 92.9 . 22.01 49.76 1,^25 260.6 43.227 fTR^ 1,601 4.06 12,416 96.7 43.17 162.38 4,667 212.8 62.628 'M^Kf 229 .0.41 7,296 86.8 42.81 115.92 909 282.8 63.829 789 J.08 15,246 61.4 \ 13.39 39!.58 1.241 364.0 54.430 70 0.04 6,278 # / 19.8,9 17.05 188 519.3 23.7
» T ^ « 5 rw i . , i,623 100.00 23,241- 87.0 47.05 163.15 2,600 286.9 66.1
fw s ^ H t in% ft 5FRmT^/3'T^
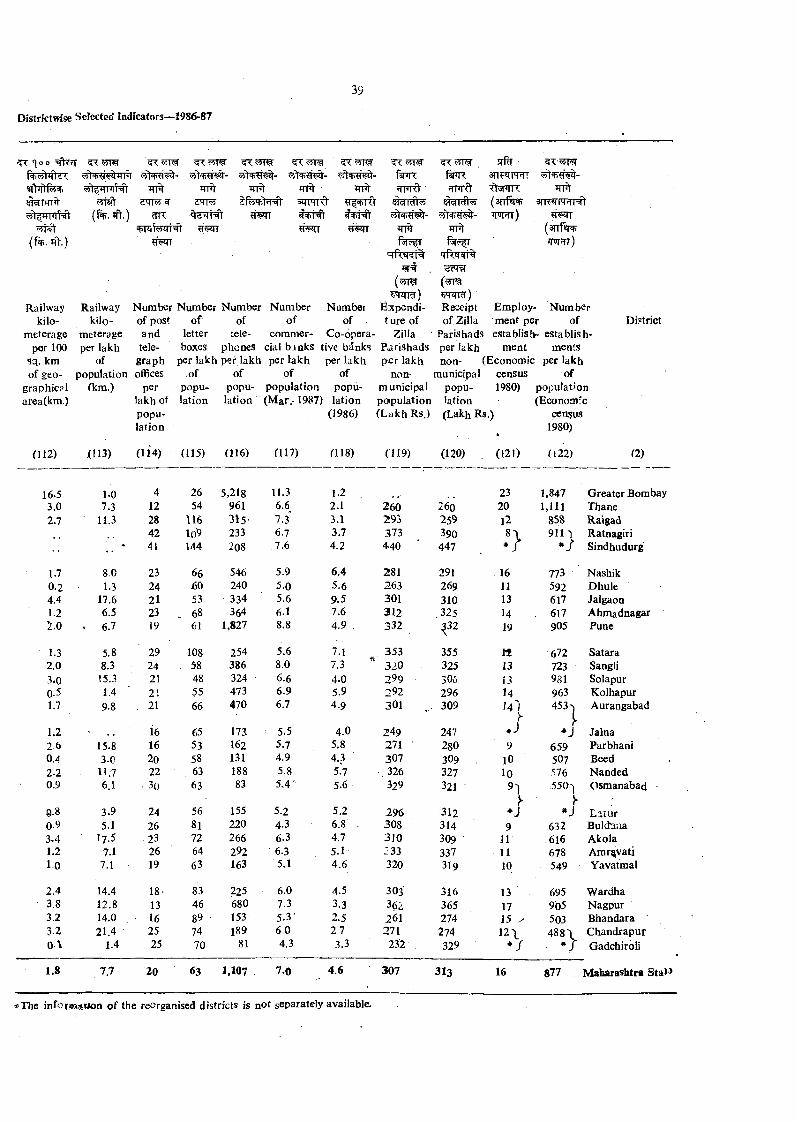
arr Hoc fk?T ^ <Wr<3F 5R: wK=if M<.11 - 3TI?«II4H!
?TFt r iTFf TTFt *TFRt2 11
w t t )(a n fw
(% . jfl".) mriT)
Railway Railway Number Number Number Number Number Espendi- Receipt Employ - Numberkilo- kilo- of post of of of of t ure of of Zilla ment per of Di.'trict
meterage mcterage and letter tele commer Co-opera- Zilla Parishads establish- establishper 100 per lakh tele boxes phones cial b inks tive bJnks ParjshadS per lakh ment ments
sq. km of graph per lakh per lakh per lakh per lakh per lakh non- (Economic pec lakhof geo population offices of of of of non municipal census of
graphical fkm.) per popu popu population popu municipal popu 1980) populationarea(km.) lakh ot lation lation (M ar.-1987) lation potpulation lation (Economic
popu (1986) (L akhR s.) (Lakh Rs.) censuslation 4 1980)
(112) XH3) (114) (115) (116) (117) (118) C1I9) (120) . (121) (122) (2)
16.5 1.0 4 26 5,218 11.3 1.2 23 1,847 Greater Bombay3.0 7.3 12 54 961 6.6 2.1 260 260 20 1,111 Thane2.7 11.3 28 116 315- 7.3 3.1 293 259 12 858 Raigad
42 10^ 233 6.7 3,7 373 390 911'! Ratnagiri41 144 208 7.6 4.2 440 447 * / Sindhudurg
1.7 8.0 23 66 546 5.9 6.4 281 291 16 773 Nashik0.2 1.3 24 .60 240 5.0 .5.6 263 269 11 592 Dhule4.4 17.6 21 53 334 5.6 9.5 301 310 13 617 Jalgaon1.2 6.5 23 . 68 364 6.1 7.6 312 .325 14 617 Ahmadnagar5.0 . 6.7 19 61 1,827 8.8 4.9 . 332 ^32 19 905 Pune
1.3 5.8 29 108 254 5.6 353 355 I t 672 Satara2.0 8.3 24 58 386 8.0 7.3 320 325 13 723 Sangli3.0 15.3 21 48 324 6.6 4.0 299 305 13 981 Solapur0-5 1.4 21 55 473 6.9 5.9 292 296 14 963 Kolhapur1.7 9.8 21 66 470 6.7 4.9 301 309 J4 I 453-j Aurangabad
1.2 16 65 173 5.5 4.0 249 247r
*J Jalna2 6 15.8 16 53 162 5.7 5.8 271 280 9 659 Parbhani0.4 3.0 20 58 131 4.9 4.3 ' 307 3O9 10 507 Beed2-2 11.7 22 63 188 5.8 5.7 326 327 10 576 Nanded0.9 6.1 ■ 30 63 83 5-4' 5.6 329 321 91I
550-ji
Osmanabad
0.8 3.9 24 56 155 5.2 5.2 296 312r
* jr
* j L auir0.9 5.1 26 81 220 4.3 6.8 . 308 314 9 632 Buld^na3-4 17.5 23 72 266 6.3 4.7 3J0 309 11 .616 Akola1.2 7.1 26 64 292 6.3 5.1 :33 337 11 678 Amr^vati1.0 7.1 19 63 163 5.1 4.6 320 319 10 549 Yavatmal
2.4 14.4 18. 83 225 6.0 4.5 303 316 13 695 W ardha3.8 12.8 13 46 680 7.3 3.3 362 365 17 905 Nagpur3.2 14.0 16 89 153 5.3- 2.5 261 274 15 X- 503 Bhandara '3.2 21.4 25 74 189 6.0 2,7 271 274 1 2 \ 488 \ C handrapurOA 1.4 25 70 81 4.3 3.3 232 329 * > Gadchiroli
1.8 7.7 20 63 1,107 7.0 4.6 307 313 16 877 M aharashtra Stal*
*The info|i®aiaion o f the reorganised districts is not separately available.

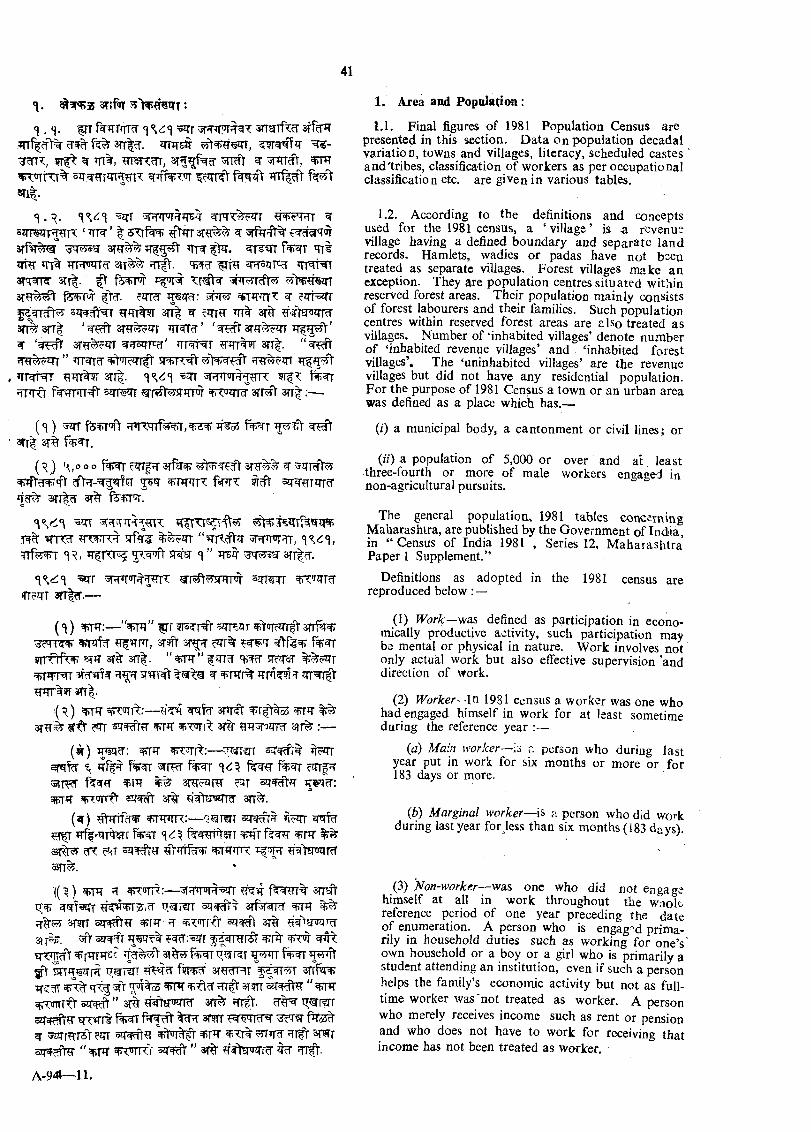
^ ^ r srrerTfTcf 3t% jt
3tt| ^ . tTTTTst =^5-
^ otK t% ^?ff^7:tir f ^ j f t m % f t«Tl|.
=5qr ^ j p F F r w ^ ^t^FT?rT ^s z n w ^ x ‘ TTR' 1 3 T r f ^ ^ftrrr ^ ^ ^ l i rsrf^fT^'’ ^ 5 ^ ? r sr^iiri? t o f ^ T 'ttI^rm in%3TM=frcf 3(7^. ^ fi+T^r
fjfiTiTr y iW ^ * T ^ T ^ c lt's^Tr^fTT%9r ^ c q r^ a r^
3fft? 3tt| ‘ 3T^%?Jrr s f fT ^ r^ar ‘ HF^ ^TRT^r ?T?rr%9r 3 rr |.?T?i%e^ ” +1<jrcATi st rtcN^
3 rr |. ^sH’T 'TT^grr^»T fr f^ w rrM ^ s q r ^ ^ rtf t^ sT frr^ ^ ' i q r ^ s r r ^ 3tt| ;—
( <1 ) ^ TT Tf3^ f% T3Tr| 3T% r^^T.
( :^) t^, o o o cqTf^T srfg '^ ^rrcfV^^ F J f t^ t f t 5^<T f ^ X 53T^?TTqT^4 c!% asrrl^ 3T^ f ^ i T .
<\< ::' =5?nw r x ^ ? IW T ^ 5 d w %%?JTT
T r f^ m ^R , 5r#sr ^ ” j t s ^ ^3W3?t 3 r r |^ .
=5trr g - i ^ w i T u r s q r w«n?srT 3rr|?r.—
( ^ ) 'PT T:— ” ■^r 9rs^rsflr ^ tq c^ rrfr s r r f e ?ii5?rFT, sr^Fr s r ^ f% ^
^ r r f t f ^ ssrtT sr^ s n | . “ ^ ” stc t^ ^■^^zTrw i r r ^ ^ ? r r n ^ ^ ir rs r r^OT%?T 31T|.
{ ^ ) JjrrJT ^ i TT^ : — arrrfr ^ r f r ^3T^r'% 5 fft fTT s J T ^ ? r O T s r^ sit% :—
( ^ ) 5 R ^ f^ :— w m r S J T ^ ^ ^^ f w ^srr^
W>m 3TH?3Rr c5T s q ^ > JiW im j p w f r 3{% ?}3rYaWRr srr^ .
(s r) ?TtTTif^^ ^ r w x : — Q^i^rr s j w r ? it^qr
a r ^ ^ ?-<T s q ^ ^ ^ 'Y ir r f^ ^PTirn: ^>?>8riKiT?rsn^.
((^ w ^ ^ r w r : — ^ w rt= 5 ^ T 3n-?jtq ;^ ^^?=3irr sq^d^T srf^RRr
sT9rr s q ^ ^ ^[JT JT ^ x m - ^ 3 ^ ? ^ ^317w;. ^ sq^cft =f<r
^ i r i T O f ^ ^jg-iiiT f ? i ^ ' 3 T ^? iT s r r f w^ "t ^ ^ 3^wr “ ^ iT
^rcoTTT^ 5?t^ ” 3(% ?f^EnJ?TRf 3 1 # fTr|t. s q " ^ ^ ? n :m t f e r f ^ ^ r f t s rm ^ ' t^t f^os^^ ^ r ^ r s t ?qr ^ i f r W3 i T ^ ^ " s q * ^ " ^ ^f^rsnnrr^ w
1. Area and Population;
1.1. Final figures of 1981 Population Census are presented in this section. Data on population decadal variation, towns and villages, literacy, scheduled castes and'tribes, classification of workers as per occupational classification etc. are given in various tables.
1.2, According to the definitions and concepts used for the 1981 census, a ‘ village’ is a revenue village having a defined boundary and separate land records. Hamlets, wadies or padas have not bsen treated as separate villages. Forest villages make an exception. They are population centres situated within reserved forest areas. Their population mainly consists of forest labourers and their families. Such population centres within reserved forest areas are also treated as villages. Number of ‘inhabited villages’ denote number of ‘inhabited revenue villages’ and ‘inhabited forest villages’. The ‘uninhabited villages’ are the revenue villages but did not have any residential population. For the purpose of 1981 Census a town or an urban area was defined as a place which has.—
(0 a municipal body, a cantonment or civil lines; or
(i7) a population of 5,000 or over and at least three-fourth or more of male workers engaged in non-agricultural pursuits.
The general population, 1981 tables concerning Maharashtra, are published by the Government of India, in “ Census of India 1981 , Series 12, Maharashtra Paper 1 Supplement.”
Definitions as adopted in the 1981 census are reproduced below :—
(1) Work~wa.s defined as participation in economically productive activity, such participation may be mental or physical in nature. Work involves not only actual work but also effective supervision ’and direction of work.
, (2) W orker-ln 1981 census a worker was one who had engaged himself in work for at least sometime during the reference year :—
(a) Main worker—is r. person who during last year put in work for six months or more or for 183 days or more.
(b) Marginal worker—is> a person who did work during last year for Jess than six months (183 days).
(3) Non-worker—was one who did not engage himself at all in work throughout the wnolt reference period of one year preceding the date of enumeration. A person who is engag 'd primarily in household duties such as working for one’s' own household or a boy or a girl who is primarily a student attending an institution, even if such a person helps the family’s economic activity but not as fulltime worker was'not treated as worker. A person who merely receives income such as rent or pension and who does not have to work for receiving that income has not been treated as worker.
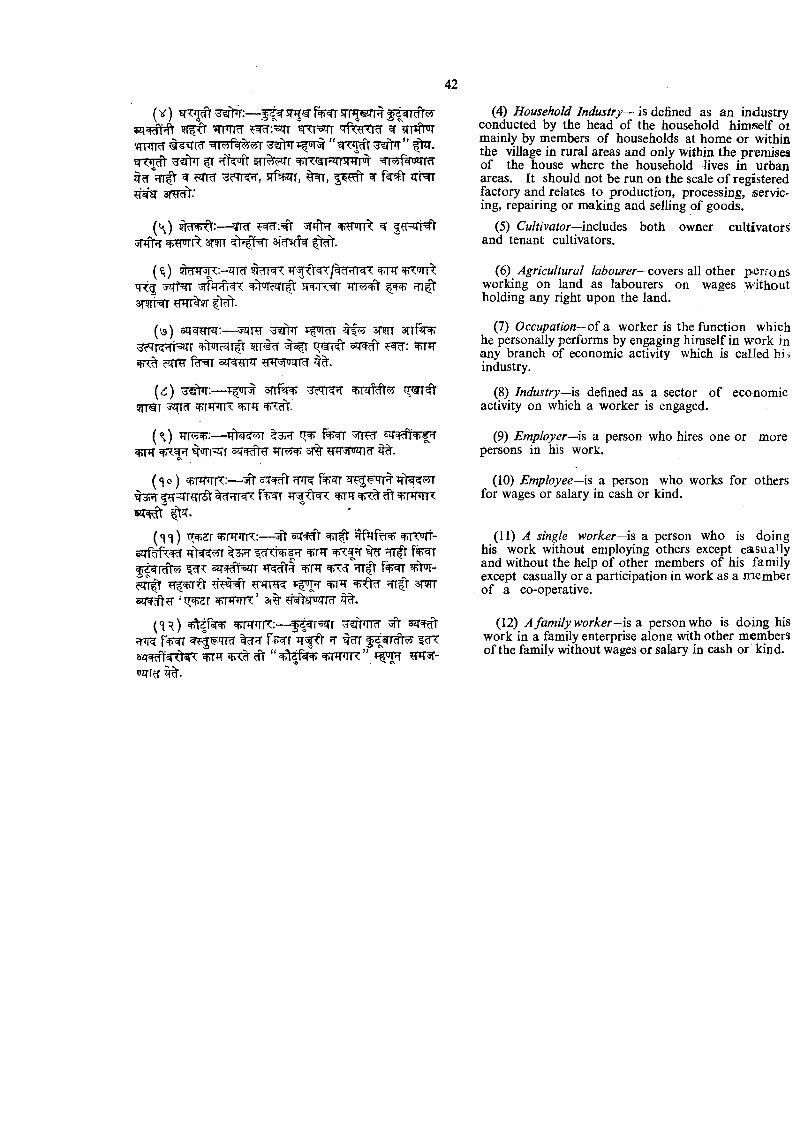
( y )^ = s i r r ^ '¥ P f to r
^?ffrT ^ ^ffcpjff in^^JTr ^ ^ f n w n T r j r =^r<?5f^ra t^ " ? r r f t ^ ^ ? r r ^ , s r ^ r , ^ i n ^?f^sr 3 r?a^:
(K ) t e r f t : — TRT ^^Tirr^ ^ |< n r N ^5t# t srwr 3{^3Tf^
qT 5 rffpftsp!: 3FpiRqT|t s r ^ n w ? r r ^ ? n j ts n r N r rRT%?T
(\3) s q w m : — ^?f r ^ ^ srWT 3rrf«R)^T ^JT T sqr ^rt»JT^T|t q[n:% c^rnr s t w f t M ^roirra’
(<i:) 3rrf%^ ^7?n^?r91WT ^ r ’TTK ^T^T
( ^ ) ^T T ^:— T f)W ^ 3Ti^ oe
O T t^TFTr ssr^Fdl^ ? r i w si%
( o ) ^I'H’ liT.'— a^'fdV ’i ’'('< ^ ^ ^ 'T p T +il«(c;c>i(#3FT i ^ r ^ r r ^ %cnnT^ ^ srrrnnx
(<\T ) rrsfiZ[ ^ m r C : — ^ tf^ lfrR ) + lT ‘Jrt-stT ^ ^ ^3vT ^d"<i^'f?r ^TT^
w ^ 5 2 T # f ^ 5f?T^'Vr^ f % ^ ^ -^qrfr ?n fr s msT^cft’B' ^TFprn:’ 3i% ^gT jq rcT
{ \ r ) ^ m r c : — ^f^r=5ZTr ^ g r n w ^^ f ^ r T T fft ?T t ^ ra ^ ^ l T T d ^ ^ J T ^ ^ ^W JIK ”
(4) Household Industry— is defined as an industry conducted by the head of the household himself oi mainly by members of households at home or within the village in rural areas and only within the premises of the house where the household lives in urban areas. It should not be run on the scale of registered factory and relates to production, processing, servicing, repairing or making and selling of goods.
(5) Cultivator—mcXwdQS both and tenant cultivators.
owner cultivators
(6) Agricultural covers all other perronsworking on land as labourers on wages wdthout holding any right upon the land.
(7) Occupation—oi a worker is the function which he personally performs by engaging himself in work in any branch of economic activity which is called hii industry.
(8) Industry—IS defined as a sector of economic activity on which a worker is engaged.
(9) Employer—is a person who hires one or more persons in his worK.
(10) Employee—IS a person who works for others for wages or salary in cash or kind.
(11) A single worker—is a person who is doing his work without employing others except casuaMy and without the help of other members of his family except casually or a participation in work as a member of a co-operative.
(12) Afamily worker-is a. person who is do-ing his work in a family enterprise alona with other members of the family without wages or salary in cash or kind.
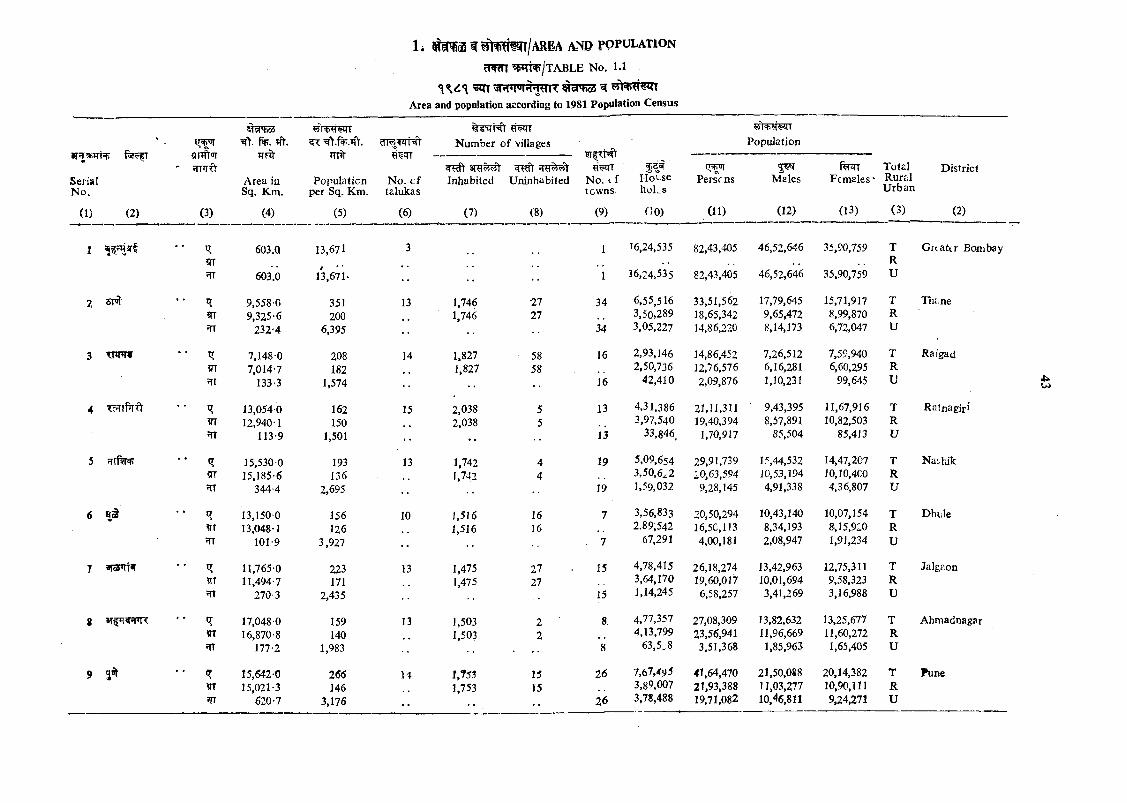
Iw l l^ a W W lW W l/A R E A AND POPULATION
■'Wi^/TABLE No. 1.1
: 95nio5 ^
SerialN o.
(1) (2)
i r ^ flmt'iT
' ^TFT
(3)
ST TicS ft>. »ft. irnr
Area in Sq. Km.
(4)
N o. c f talukas
(6)
Number o f villages
HoLsehoL s
CIO)
Population
Total D istrictRuralU rban
(3) (2)
Mi*l
Populaticn per Sq. Km.
(5)
Inhabited
(7)
Uninhabited
(8)
¥iWT N o. t f towns,
(9)
Persf ns
(11)
Males
(12)
Fem ales'
(13)
1 w i ^, .
603 .Q 13,671 3 1 T6,24,535 82,43,405 46,52,646 35,90,759 T Greater BombayR
?TT 603.0 13,671- •• 1 16,24,535 82,43,405 46,52,646 35,90,759 U
2 q 9,558 0 351 13 1,746 •27 34 6,55,516 33,51,562 17,79,645 15,71,917 T Tlir.ne!TT 9,325-6 200 1,746 27 3,50,289 18,65,342 9,65,472 8,99,870 R?n 232-4 6,395 34 3,05,227 14.86,220 8,14,173 6,72,047 U
3 7,148-0 208 14 1,827 58 16 2,93,146 14,86,452 7,26,512 7,59,940 T Raigad?fT 7,014-7 182 1,827 58 2,50,736 12,76,576 6,16,281 6,60,295 R
133-3 1,574 16 42,410 2,09,876 1,10,231 99,645 U
4 TcJTlf^ft 13,054-0 162 15 2.038 5 13 4,31,386 21,11,311 9,43,395 11,67,916 T Rafnagiri?rr 12,940-1 150 2,038 5 3,97,540 19,40,394 8,57,891 10,82,503 R?TT 113-9 1,501 • • 13 33.846 1,70,917 85,504 85,413 U
5 fT lf^ 15,530-0 193 13 1,742 4 19 5,09,654 29,91,739 15,44,532 14,47,207 T Nai>hikv[j 15,185-6 136 1,742 4 3,50.6^2 20,63,594 10,53,194 10,IO,4CO R
344-4 2,695 19 1,59,032 9,28,145 4.91,338 4.36,807 U
6 13,150-0 156 10 1,516 16 7 3,56,833 20,50,294 10,43,140 10,07,154 T Dhiile13,048-1 126 1,516 16 2.89.542 16,50,113 8.34,193 8,15,910 R
?TT 101-9 3,927 . 7 67,291 4,00,181 2,08,947 1,91,234 U
7 11,765-0 223 13 1,475 27 15 4,78.415 26,18,274 13,42,963 12,75,311 T Jalgaon?IT 11,494-7 171 1,475 27 3,64,170 19,60,017 10,01,694 9,58,323 RHT 270 3 2,435 15 1,14,245 6,58,257 3,41,269 3,16,988 U
S 17,048-0 159 13 1,503 2 8 4,77,357 27,08,309 13,82,632 13,25,677 T AhmadnagarilT 16,870-8 140 1,503 2 4,13,799 23,56,941 11,96,669 11,60,272 R:n 177-2 1,983 8 63,5.8 3.51,368 1,85,963 1,65,405 U
9 <? 15,642-0 266 14 J,?5S 15 26 7,67,495 41,64,470 21,50,088 20,14,382 T Pune15,021-3 146 1,753 15 3,89,007 21,93,388 11,03,277 10,90,111 R
m 620-7 3,176 •• 26 3,78,488 19,71,082 10.46,811 9,24,271 U
4U)
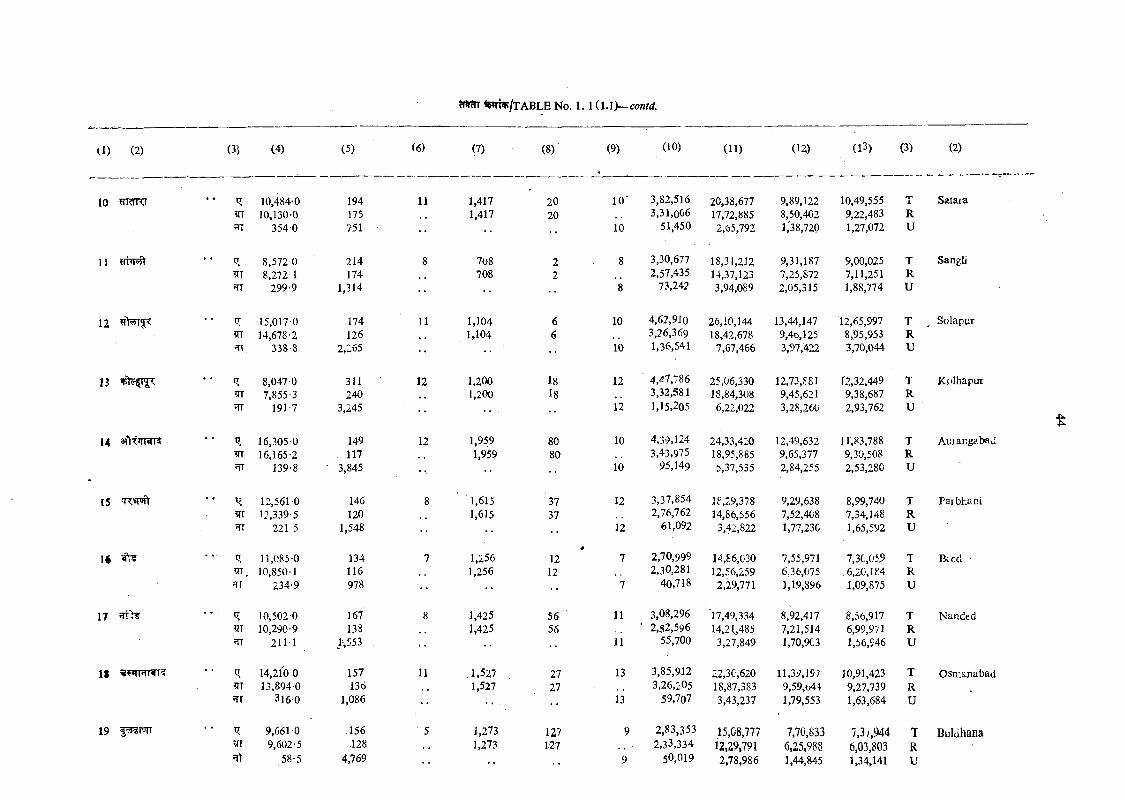
(1) (2) 0 ) (4) (5) (6) (7) (8) (9) (10) (11) (12) (13) (3) (2)
10 ♦• tr 10,484-0 194 11 1,417 20 10 3,82,516 20,38,677 9,89,122 10,49,555 n r1 Satarain 10,130-0 175 1,417 20 3,31,066 17,72,885 8,50,402 9,22,483 Rar 3540 751 •• -- 10 51,450 2,65,792 1,38,720 1,27,072 U
11 IT 8,572 0 214 8 708 2 8 3,30,677 18,31,212 9,31,187 9,00,025 T Sanglim 8,272-1 174 708 2 2,57,435 14,37,123 7,25,872 7,11,251 RfTT 299-9 1,314 •• -- 8 73,242 3,94,089 2,05,315 1,88,774 U
12 • • 15,017 0 174 11 1,104 6 10 4,62,910 26,10,144 13,44,147 12,65,997 T Solapur14,678-2 126 1,104 6 3,26,369 18,42,678 9,46,125 8,95,953 R
338-8 2,265 •• •• 10 1,36,541 7,67,466 3,97,422 3,70,044 U
13 •• tr 8,047 0 311 12 1,200 l8 12 4,47,786 25,06,330 12,73,SS1 12,32,449 T Kolhapurm 7,855-3 240 1,200 18 3,32,581 18,84,308 9,45,621 9,38,687 R
191-7 3,245 •• 12 1,15,205 6,22,022 3,28,260 2,93,762 U
14 •• IX 16,305 0 149 12 1,959 80 10 4,39,124 24,33,420 12,49,632 ir,83,788 T Auiangaba<i¥T 16,165-2 117 1,959 80 3,43.975 18,95,885 9,65,377 9,30,508 RtT 139-8 ' 3,845 10 95,149 5,37,535 2,84,255 2,53,280 U
15 croT»ft •• tr 12,561 0 146 8 " 1,615 37 12 3,37,854 18,29,378 9,29,638 8,99,740 T Parbhani?TT 12,339-5 120 1,615 37 2,76,762 14,86,556 7,52,408 7,34,148 R5TT 221-5 1,548 12 61,092 3,42,822 1,77,230 1,65,592 U
\$ . .. ^ 11,085-0 134 7 1,256-4
12 7 2,70,999 14,86,030 7,55,971 7,30,05:9 T Bccd10,850-1 116 1,256 12 2,30,281 12,56,259 6,36,075 6,20,184 R
m 234-9 978 •• •• 7 40,718 2,29,771 1,19,896 1,09,875 U
17 ?TT . . 10,502-0 167 8 1,425 56 11 3,08,296 17,49,334 8,92,417 8,56,917 T Nanded10,290-9 138 1,425 56 ‘ 2,52,596 14,21,485 7,21,514 6,99,971 R
21M 1 ,553 , 11 55,700 3,27,849 1,70,9C3 1,56,946 U
IS VFTPTisrr • • ^ 14,210 0 157 11 .1,527 27 13 3,85,912 22,3C,620 10,91,423 T OsmanabadIT 13,894-0 136 1,527 27 3,26,205 18,87,383 9,59,644 9,27,739 R
316-0 1,086 -- 13 59,7o7 3,43,237 1,79,553 1,63,684 U
19 • ' 9,661-0 156 5 1,273 127 9 2,83,353 15,08,777 7,3/,944 T BuldhanaTT 9,602-5 .128 1,273 127 2,33,334 12,29,791 6,25,988 6,03,803 R
H) 58-5 4,769 9 50,019 2,78,986 1,44,845 1,34,141 V
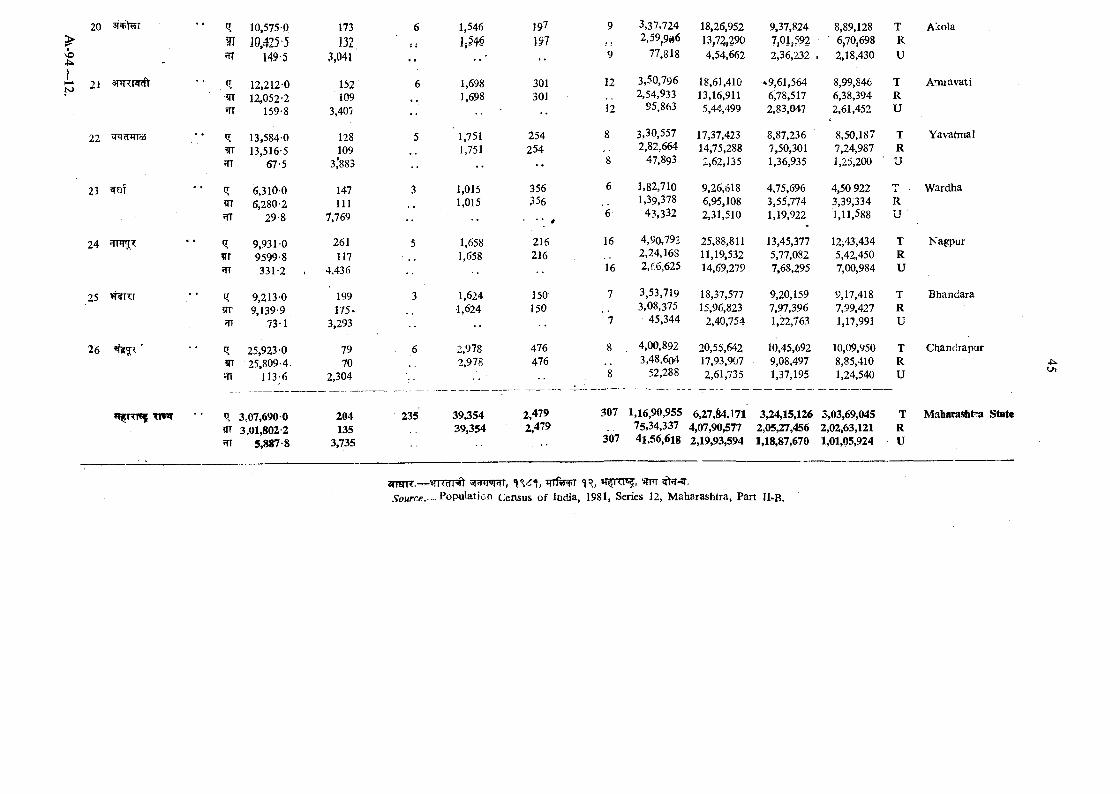
VO4:
K>
20 3Tf;t55r 10,575 0 173 6 1,546 197 9 3,37,724 18,26,952 9,37,824 8,89,128 T Akola10,425-5 132 1*546 197 2.59^9#6 .13,72,290 7,01,592' 6,70,698 R
- fTT 149-5 3,041 •• 9 77,818 4,54,662 2,36,232 . 2,18,430 U
21 3nTTI?Rff 12,2120 152 6 1,698 301 12 3,50,796 18,61,410 *9,61,564 8,99,846 T Amravatim 12,052-2 109 1,698 301 2,54,933 13,16,911 6,78,517 6,38,394 Rm 159-8 3,407 •• •• 12 95,863 5,44,499 2,83,047 2,61,452 U
22 ^^ cTTTT55 ' * »? 13,584-0 128 5 1,751 254 8 3,30,557 17,37,423 8,87,236 8,50,187 T Yavatmal13,516-5 109 1,751 254 2,82,664 14,75,288 7,50,301 7,24,987 R
m 67-5 3’883 •• . 8 47,893 2,62,135 1,36,935 1,25,200 U
23 ^Klf 6,310-0 147 3 1,015 356 6 1,82,710 9,26,618 4,75,696 4,50 922 T Wardha6,280-2 111 1,015 356 1,39,378 6,95,108 3,55,774 3,39,334 R
m 29-8 7,769 * * 6 43,332 2,31,510 1,19,922 1,11,588 U
24 9,931-0 261 5 1,658 216 16 4,90,79s 25,88,811 13,45,377 12,43,434 T Kagpurm 9599-8 117 1,658 216 2,24,168 11,19,532 5,77,082 5,42,450 R5H 331-2 4,436 16 2,66,625 14,69,279 7,68,295 7,00,984 U
25 >t¥T f 9,213-0 199 3 1,624 150 7 3,53,719 18,37,577 9,20,159 9,17,418 T Bhandarairr 9,139-9 175. 1,624 150 3,08,375 15,96,823 7,97,396 7,99,427 R
73-1 3,293 ’ 7 45,344 2,40,754 1,22,763 1,17,991 U
26 25,923-0 79 6 2,978 476 8 4,00,892 20,55,642 10,45,692 10,09,950 T Chandrapur?n 25,809-4. 70 2,978 476 3,48,6o4 17,93,907 9,08,497 8,85,410 R
113-6 2,304 8 52,288 2,61,735 1,37,195 1,24,540 U
*»5rn«f 'I 3,07,690-0 204 235 39,354 2,479 307 1,16,90,955 6 ,27 ,H l71 3,24,15,126 3,03,69,045 T Mabarash^*a3,01,802 2 135 39,354 2,479 75,34,337 4,07,90,577 2,05,27,456 2,02,63,121 R
5,887-8 3,735 307 41,56,618 2,19,93,594 1,18,87,670 1,01,05,924 U
anarrf.—wrmr wrftm m.y<7M/'c<?. - Population Census of India, 1981, Series 12, Maharashtra, Part II-B.
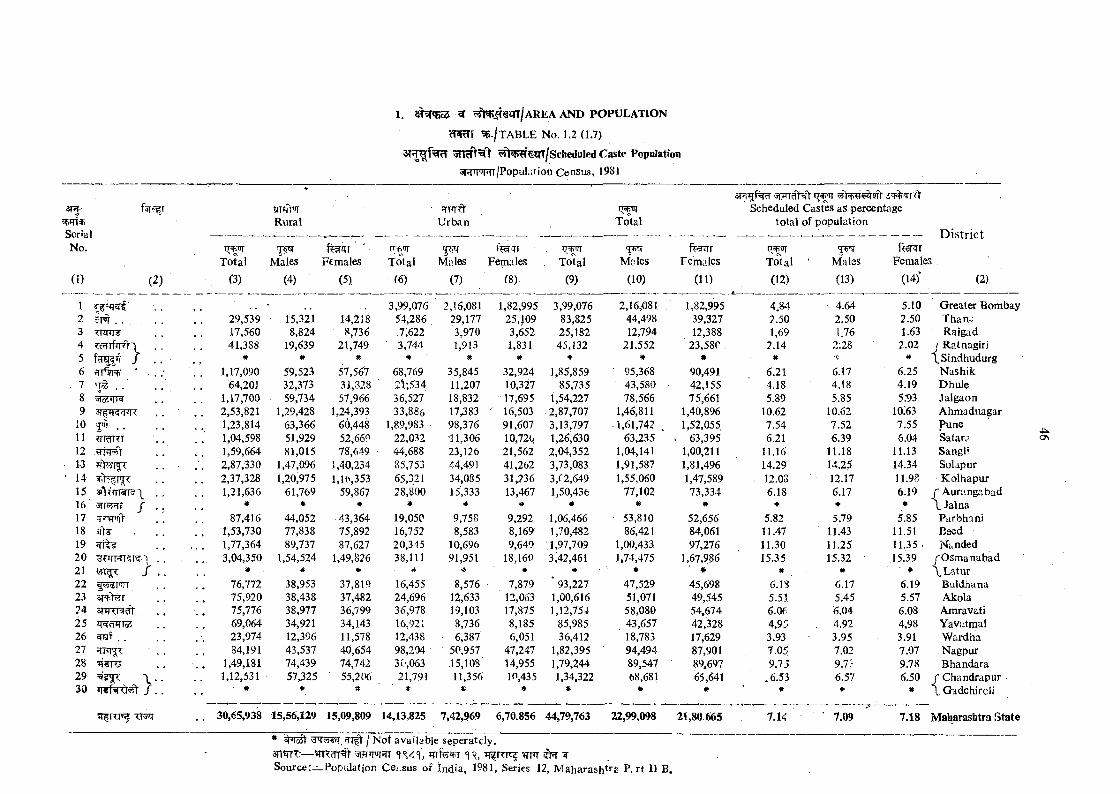
3T3'
SerialNo.
(1) (2)
12 cp jr. . .345 j67 'ra . .8 foETT9
10 . .11 ?rraT?:T1213141516' f1718192021 J2223242526 . .27282930
1. ^ q » 5 5 ^ ^y^ irsm /A R E A a n d p o p u l a t i o n
¥T ^r ?P./TABLE No. 1.2 (1.7)
^ ^ ^ m /S c b e d u le d Caste PopulationsnTTTJFrr/Popuhuion C ensus, 1981
?jT4V'JTRural
iT5p,irTotal
(3)
29,53917,56041,388
*1,17,090
64,2011,17,7002,53,8211,23,8141,04,5981,59,6642,87,3302,37,3281,21,636
*87,416
1,53,7301,77,3643,04,350
*76,772 75,920 75,776 69,064 23,974 84,191
1,49,181 1,12,531
■ #
Males
(4)
l ^ rFemales
(5)
rr 'JTT otal
(6)
U rban
3 ^Males
(7)
, 15,321 8,824
19,639 *
59,52332,37359,734
1,29,42863,36651,92981,015
1,47,0961,20,975
61,769*
44,05277,83889,737
1,54,524#
38,95338.438 38,977 34,921 12,396 43,53774.439 51^225
*
14,2188,736
21,749#
57,56731,32857,966
1,24,39360,44852,66978,649
1,40,234l,l^,353
59,867*
43,36475,89287,627
1,49,826*
37,819 37,482 36,799 34,143 11,578 40,654 74,742
■ 55,206
3,99,076 54,286 7,622
■ 3,7'M *
68,7692l',53436,52733,886
1,89,98322,03244,68885,75365,32128,800
*19,05016,75220,34538,111
*16,45524,69636,97816,92112,43898,2043(',06321,79!
Femjles
f8)
2,16,08129,1773,970I,913
#35,845II,207 18,832 17,383 98,376 -11,306 23,126 44,49! 34,085 15,333
«9,7588,583
10,69691,951
8,576 12,633 19,103 8,736 6,387
' 50,957 ,15,108' 11,356
*
Tolal
(9)
1,82,99525,)093,6521,831
#32,92410,32717,69516,50391,6071'0,72{)21,56241,26231,23613,467
*9,2928,1699,649
18,160*
7,87912,06317,8758,1856,051
47,24714,95510,435
3,99,07683,82525,18245,132
*1,85,859
85,7351,54,227
.2,87,7073,13,7971,26,6302,04,3523,73,0833,f2,6491,50,436
*1,06,4661,70,4821,97,7093;42,461
*‘ 93,227 1,00,616 1,12,754
85,985 36,412
1,82,395 1,79,244 1,34,322
Total
Moles
(10)
2,16,08144,49812,794
21,552#
95,36843,58078,566
1,46,811-1,61,742
63,2351,04,1411,91,5871,55,060
77,102#
53,81086,421
1,00,4331,74,475
*47,52951,07158,08043,65718,78394,49489,54768,681
Females
(11)
Scheduled Castes aS percentage to tal of population
1,82,99539.327 12,388
23,580*
90,49142,15575,661
1,40,8961,52,055
63,3951,00,2111,81,4961,47,58973,334
*52,656 84,061 97,276
1,67,986 ■ * 45,698 49,545 54,67442.328 17,629 87,901 89,697 65,641
#
Total(12)
4.842.50 1,69
2.14*
6.214.18 5.89
10.627.546.21
11.1614.29 12.086.18
*5.8211.4711.30 15.35
*6.185.51 6.06 4,95 3.93 7.05 9.75
.6.53
3 ^Males
(13)
4.642.501.76
2;28■I6 .n4.185.85
10.627.526.39
11.1814.2512.176.17 * .5.79
11.4311.25 15.32
*6.17 5.45 6.04 4.92 3.95 7.02 9.7? 6.57*
RvTTTFemales
(14)’
District
(2)
30,65,938 15,56,129 15,09,809 14,13,825 7,42,969 6,70.856 44,79,763 22,99,098 21,80 665 7.14 7.09
5.10 Greater Bombay2.50 Thatt- 1.63 Raigad
2.02 I Ratnagiri* “Is indhudurg
6.25 N ashik4.19 Dhule 5.'93 Jalgaon
10.63 Ahmadnagar 7.55 Pune 6.04 "Satara
11.13 Sangli14.34 Solapur11.98 K olhapur6.19 f Aurangabad* \ J a ln a
5.85 Parbhani11.51 Beed11.35 . Handed 15.39 jO S m anabad
* \L a tu r6.19 Buld.^ana 5.57 Akola 6.08 Amravati4.98 Yavatmal3.91 W ardha 7.07 . Nagpur9.78 Bhandara6.50 f Chandrapur
* 1 Gadchircli
7.18 M aharashtra State
* I N ot available seperately.sfimT:— vrr^?iT^ 5rrr^5TT ^S o u rc e P o p u la t io n Cej.sus of India, 1981, Series 12, M aharash^rs P, r t II B.
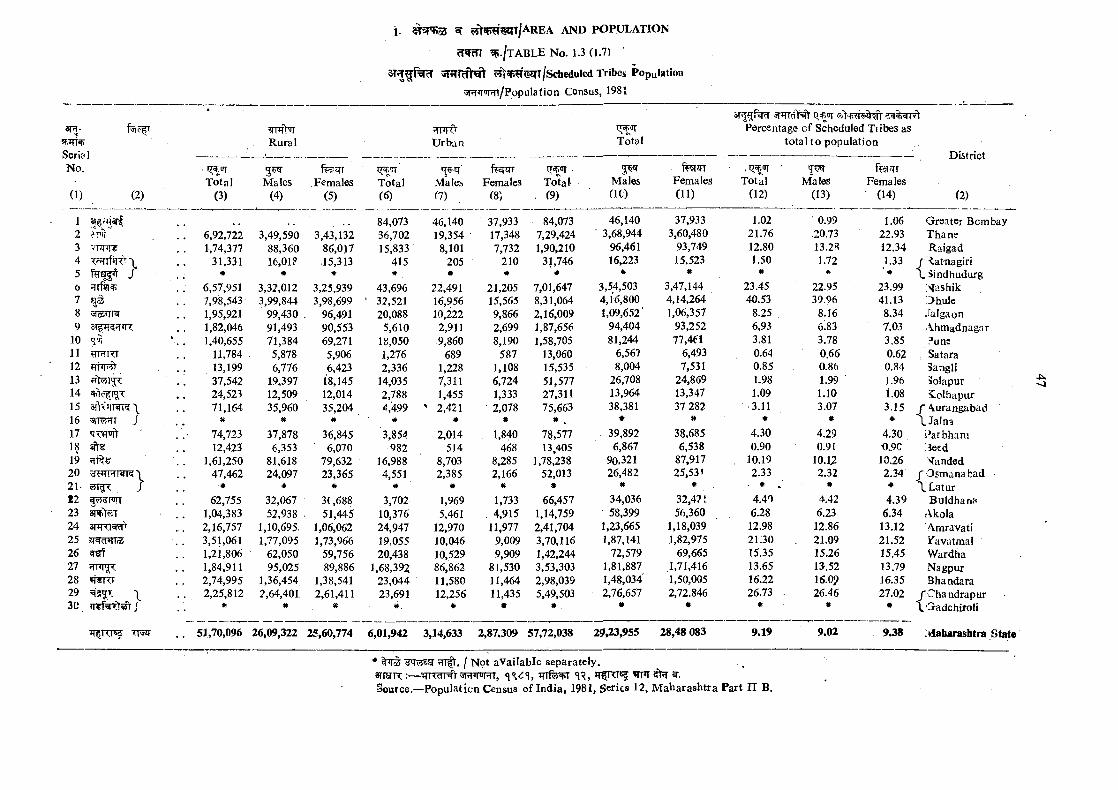
SerialNo.
0 ) (2)
1 ,2 ?Vl'’
VTW?
ftra J
a s8 GfcOTF9 3T?7r5^iR
10 <3;7i11 ?TFiRr12 ?Tt>F7t131415 3iV<J|RR\16 5^T^r f17 qT^Dit18 ^19 ^ s -20 RiTFTT*21- 2223 ar^tsT24 spErawff25 .ZTWiTIfiS26 ^srf27 ? r n ^28 tftSRT29 Mzr^r ^30
JT^Rrsf TTW
}
?rwt'TRural
■l .OTTotal
(3)
6,92,7221,74,377
31,331*
6,57,9517,98,5431,95,9211,82,0461,40,655
11,78413,19937,54224,52371,164
*74,72312,423
1,61,25047,462
*62,755
1,04,3832,16,7573,51,061l,2i,8061,84,9112,74,9952,25,812
5 ^Males
(4)
3,49,59088,36016,01?
*3,32,0123,99,844
99,43091,49371,3845,8786,776
19,39712,50935,960
*37,8786,353
81,61824,097
*32,06752,938
1,10,695.1,77,095
62,05095,025
1,36,4542,64,401
*
ciffrr p./t a b l e n o . i .3 (t.7)
^>f>?r^T/ScheduIed Tribes Population
5nFT<iRT/Populafion Census, 1981
fezrrFemales
(5)
3,43,13286,01715,313
*3,25,9393,98,699
96,49190,55369,2715,9066,423
18,14512,01435,204
«36,8456,070
79.63223,365
*3( ,688 51,445
1,06,062 1,73,966
59,756 89,886
1,38,541 2,61,411
VTi4[fVU rban Total
Percentage of Scheduled Tribes as total to population
District
(2)
tr^trrTotal(6)
Males<7)
fejTTFemales
f8)
-Total.(9)
Males(1C)
feliTTFemales(11)
Total(12)
Males(13)
Females(14)
84,073 46,140 37,933 84,073 46,140 37,933 1.02 ' 0.99 1.06 Greater Bombay36,702 19,354 17,348 7,29,424 3,68,944 3,60,480 21.76 20.73 22.93 Tha ne15,833 8,101 7,732 1,90,210 96,461 93,749 12.80 13.28 12.34 Raigad
415 205 210 31,746 16,223 15,523 1.50 1.72 1.33 / iat-nagiri# « * ’ * * * « * ' * L Sindhudorg
43,696 22,491 21,205 7,01,647 3,54,503 3,47,144 23.45 22.95 23.99 Nashik32,521 16,956 15,565 8,31,064 4,16,800 4,14,264 40.53 39.96 41.13 .'3hule20,088 10,222 9,866 2,16,009 1,09,652’ 1,06,357 . 8.25 , 8.16 8.34 Jalgaon
5,610 2,911 2,699 1,87,656 94,404 93,252 6,93 6.83 7.03 Ahmadnagar18,050 .9,860 8,190 1,58,705 81,244 77,4f'l 3.81 3.78 3.85 ?unc1,276 689 587 13,060 6,567 6,493 0.64 0.66 0.62 Satara2,336 1,228 1,108 15,535 8,004 7,531 0.85 0.86 0.84 5angli
14,035 7,311 6,724 51,577 26,708 24,869 1.98 1.99 1.96 Solapur2,788 1,455 1,333 27,311 13,964 13,347 1.09 1.10 1.08 Solhapur4,499 ' 2,421 2,078 75,663 38,381 37 282 3.11 3.07 3.15 / Aurangabad
# * # * , * « * # * \ Jalna3,854 2,014 1,840 78,577 39,892 38,685 4.30 4.29 4.30 I’arbhani
982 514 468 13,405 6,867 6,538 0.90 0.91 0.9C ;}eed16,988 8,703 8,285 1,78,238 90.321 87.917 . 10.19 10.12 10.26 >Ianded4,551 2,385 2,166 52,013 26,482 25,53.1 2.33 2.32 2.34 jO sm a n a b a d
* * » • * * * * # \L a tu r3,702 1,969 1,733 66,457 34,036 32,4? I 4.40 4.42 4.39 Buldbaoa
10,376 5,461 . 4,915 1,14,759 ■ 58,399 56,360 6.28 6.23 6.34 iVkola24,947 12,970 11,977 2,41,704 1,23,665 1,18,039 12.98 12.86 13.12 Amravati19,055 10,046 9,009 3,70,116 1,87,141 1,82,975 21.30 21.09 21.52 Yavutmal20,438 10,529 9,909 1,42,244 72,579 69,665 15.35 15.26 15.45 Wardha,68,392 86,862 81,530 3,53,303 1,81,887 1,71,416 13.65 13.52 13.79 Nagpur23,044 11,580 11,464 2,98,039 1,48,034' 1,50,005 16.22 16.0? 16.35 Bhandara23,691 12,256 11,435 5,49,503 2,76,657 2,72.846 26.73 26.46 27.02 /C h an d rap u r
*. * • * , « • # * ’ • 1 '3adchiroli
,01,942 3,14,633 2,87.309 57,72,038 29,23,955 28,48 083 9.19 9.02 9.38 ] Maharashtra State
4^<1
* frr|t. I Not availab le separately.sriH R :— w ^rrsft s r w t t , ^ g-.Source.—Population Census of Ind ia , 1981, Series 12, M aharash tra Part I I B.
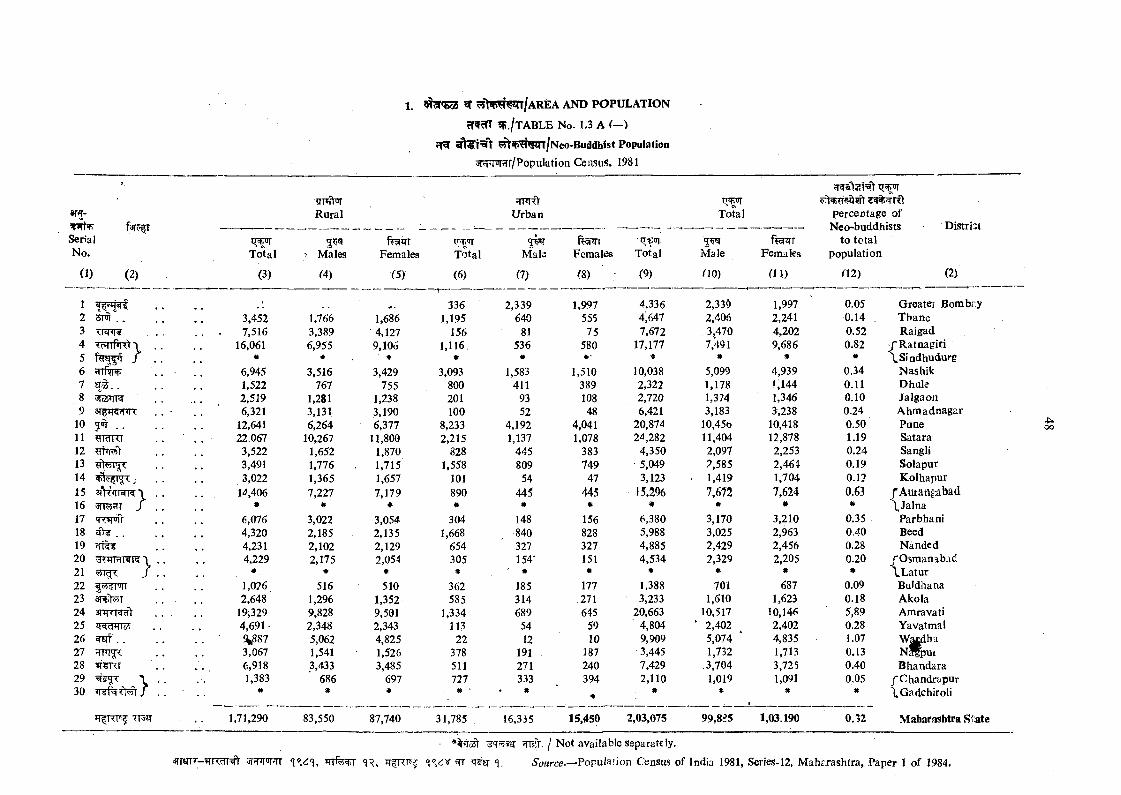
SerialNo.
r»l<r T
0}1 (2)
12 5ri| ..345 /6 ^nfvr^789
10 5 ^ . .11 TrTRT12131415 \16 J1718 ^ . .19 »TT^20 'd T'Hl’liolK 121 ^1^^ J2223 awtwT24 aTTTTR ’V2526 «(af..27 qnr^-2829 \30
1. ^ ^ ' t ^ ^ / A R E A AND POPULATION
cTWm ?5. /t ABLE No. 1.3 A (—)
^ ^ ^ > H ^ /N eo -B u d d b is t Population
3FFTJRr/Population Census, 1981
IT ^To'tal
(3)
3,452 . 7,516 16,061
*6,9451.522 2,519 6,321
12,64122.067
3.522 3,491 3,022
1^,406*
6,0764,3204,2314,229
*1,0262,648
1^,3294,691548873,0676,9181,383
Rural
5 ^Males
(4)
1,7663,3896,955
#3,516
7671,2813,1316,264
10,2671,6521,7761,3657,227
*3,0222,1852,1022,175
*516
1,2969,8282,3485,0621,5413,433
686
Femalea
15)
1,6864,1279,106
*3,429
7551,2383,1906,377
11,8001,8701,7151,6577il79
*3.054 2,135 2,1292.054
*510
1,3529,5012,3434,8251,5263,485
697*
Total
(6)
3361,195
1561,116.
*3,093
800201100
8,2332,215
8281,558
101890#
304 1,668
654305 #
362585
1,334113
22378511727
?rnrdU rban
Mala
O)
1,71,290 83,550 87,740 31,785
2,339,640
81536
*1,583
4119352
4,1921,137
445809
54445*
148840327154-
*185314689
5412
191271333
«
16,335
Total percentage ofNeo-buddhists Distrivl
to to ta l population
<\2) (2)
Females
(8)
Total
(9)
Male
n o )
Females
a i )
1,997 4,336 2,330 1,997 0.05 Greater Bombr.y555 4,647 2,406 2,241 0.14 . Thane75 7,672 3,470 4,202 0.52 Raigad
580 17,177 7,491 9,686 0.82 /R a tn a g ir i*' # * « * \S ln d h u d u rg
1,510 10,038 5,099 4,939 0.34 N ashik389 2,322 1,178 1,144 0.11 Dhule108 2,720 1,374 1,346 0.10 Jalgaon48 6,421 3,183 3,238 0.24 A hm adnagar
4,041 20,874 10,456 10,418 0.50 Pune1,078 2^,282 11,404 12,878 1.19 Satara
383 4,350 2,097 2,253 0.24 Sangli749 ■ 5,049 2,585 2,464 0.19 Solapur
47 3,123 1,419 1,704 0.12 K olhapur445 15,296 7,672 7,624 0.63 /A u ta n g a b a d
* * » * * \J a ln a156 6,380 3,170 3,210 0.35 Parbhani828 5,988 3,025 2,963 0.40 Beed327 4,885 2,429 2,456 0.28 Nanded151 4,534 2,329 2,205 0.20 /O sm anabac’;* • * * # \L a tu r
111 1,388 701 687 0.09 Buidhana271 • 3,233 1,610 1,623 0.18 Akola645 20,663 10,517 10,146 5,89 Amravati
59 ' 4,804 ’ 2,402 2,402 0.28 Yavatmal10 9,909 5,074 ' 4,835 1.07 W atdha
187 3,445 1,732 1,713 0.13 N * p u r240 7,429 .3,704 3,725 0.40 Bhandara394 2,110 1,019 1,091 0.05 /C hand riipu r
# * * * * \G ad ch iro li
15,450 2,03,075 99,8^5 1,03,190 0.32 Maharashtra S tate
45QO
■ / Not available separately.
m '73sr Source.—'^opula>ion Census of India 1981, Series-12, M aharashtra, Paper 1 of 1984.
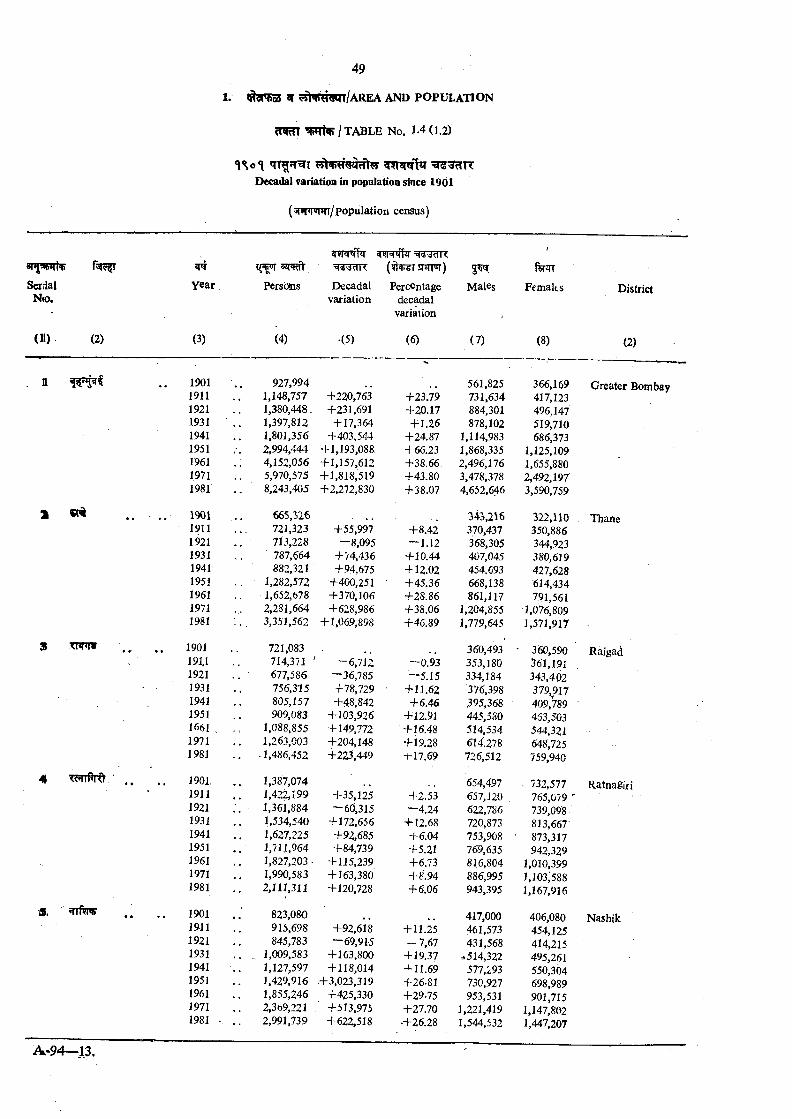
1. < 5n>53 2T ^m m ilA R E A AND POPULATION
I TABLE No. J.4 (1.2)
Decadal variation in population since 1901
(5 l* fw it/population census)
arfaPTRT
SeriialN(0.
(II) (2)
Y ear
(3)
5 i r ^ (^iwfsrFrFr) 3 ^
n
3 Tnm
4 TynPi O
A
190119111921193119411951.196119711981
190119111921193119411951196119711981
190119X11921193119411951166119711981
1901.19111921193119411951196119711981
190119111921193119411951196119711981
Persians
(4)
Decadal Percentagevariation decadal
variation
(5) (6)
927,994 1,148,757 1,380,448. 1,397,812 1,801,356 2,994,444 4,152,056 5,970,575 8,243,405
665,326721,323713,228787,664882,321
1,282,5721,652,6782,281,6643,351,562
721.083 714,371 677,586 756,315 805,157909.083
1,088,855 1,263,003
J ,486,452
1,387,074 1,422,199 1,361,884 1,534,540 1,627,225 J ,711,964 1,827,203 -1.990.583 2,111,311
823,080915,698845,783
1.009.583 1,127,597 1,429,916 1,855,246 2,369,221 2,991,739
+220,763 +231,691
+ 17,364 +403,544
+1,193,088 +1,157,612 + 1,818,519 +2,272,830
+55,997-8 ,0 9 5
+74,436+94,675
+400,251+370,106+628,986
+1,069,898
— 6,7U —36,785 +78,729 +48,842
+ 103,926 + 149,772 +204,148 +223,449
+35,125 — 60,315
+172,656 +92,685 +84,739
+115,239 + 163,380 +120,728
+92,618 —69,915
+163,800 +118,014
+3,023,319 +425,330 +513,975 +622,518
+23.79+20.17+1.26
+24.87+66.23+38.66+43.80+38.07
+8.42 — 1.12
+10.44 + 12.02 +45.36 +28.86 +38.06 +46.89
—0.93—5.15
+11.62+6.46
+12.91+16.48+19.28+17.69
+2.53—4.24
+12.68+6.04+5.21+6.73+8.94+6.06
+11.25 — 7,67
+ 19.37 + 11.69 +26.81 +29-75 +27.70
-+26.28
Males
(7)
561,825731.634 8H 301 878,102
1,114,9831,868,3352,496,1763,478,3784,652,646
343,216370,437368,305407,045454.693668,138861,117
1,204,8551,779,645
360,493353,180334,184376,398,395,368445,580514,534614.278726,512
654,497657,120622,786720,873753,908769.635 816,804 886,995 943,395
417,000461,573431,568
^514,322577,293730,927953,531
1,221,4191,544,532
Females
(8)
366,169417,123496,147519,710686,373
1,125,1091,655,8802,492,1973,590,759
322.110350,886344,923380,619427,628614,434791,561
1,076,8091,571,917
360,590561,191343,402379,917409,789463,503544,321648,725759,940
732,577765.079 ' 739,098 813,667 873,317 942,329
1,010,3991,103;5881,167,916
406.080 454,125 414,215 495,261 550,304 698,989 901,715
1,147,8021,447,207
District
(2)
Greater Bombay
Thane
Raigad
Ratnagiri
Nashik
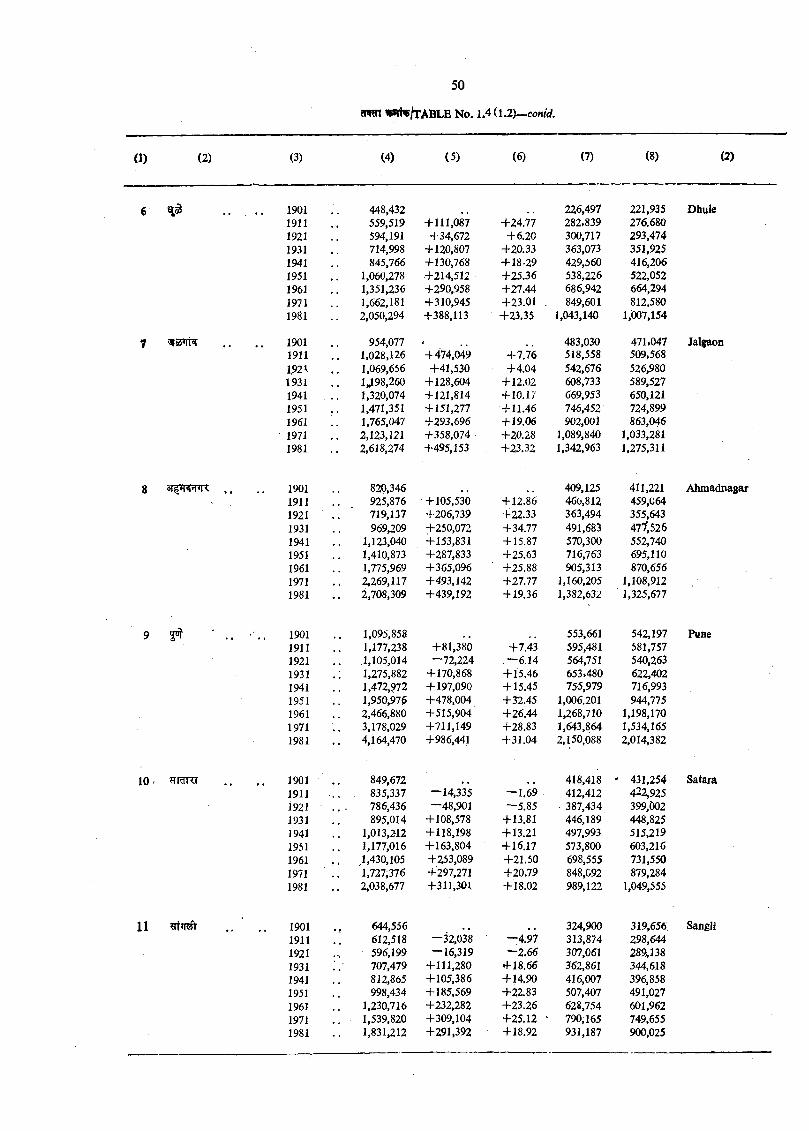
(4) (5) (6) (7) (8) C
448,432 226,497 221,935 Dhule559,519 + 111,087 +24.77 282,839 276.680594,191 +34,672 +6.20 300,717 293,474714,998 + 120,807 +20.33 363,073 351,925845,766 +130,768 +18-29 429,560 416,206
1.060,278 +214,512 +25.36 538,226 522,0521,351,236 +290,958 +27.44 686,942 664,2941,662,181 +310,945 +23.01 . 849,601 812.5802,050,294 +388,113 +23.35 1,043,140 1,007,154
954,077 483,030 471.047 Jalgaon1,028,126 +474,049 +7.76 518,558 509,5681,069,656 +41,530 +4.04 542,676 526,9801,198,260 +128,604 +12.02 608,733 589,5271,320,074 +121,814 + 10.17 669,953 650,1211,471,351 +151,277 +11.46 746,452 724,8991,765,047 +293,696 +19.06 902,001 863,0462,123,121 +358,074 ■ +20.28 1,089,840 1,033,2812,618,274 +495,153 +23.32 1,342,963 1,275,311
190119111921193119411951196119711981
19011911192\193119411951196119711981
8 1901 820,346 409,125 411,221 Ahmadnagar1911 925,876 +105,530 + 12.86 466,812 459,0641921 . ■ 719,137 +206,739 +22.33 363,494 355,6431931 969,209 +250,072 +34.77 491,683 47^,5261941 1,123,040 +153,831 + 15.87 570,300 552,7401951 1,410,873 +287,833 +25.63 716,763 695,1101961 1,775,969 +365,096 +25.88 905,313 870,6561971 2,269,117 +493,142 +21.11 1,160,205 1,108,9121981 2,708,309 +439,192 +19.36 1,382,632 ' 1,325,677
1901 1,095,858 553,661 542,1971911 1,177,238 +81,380 +7.43 595,481 581,7571921 . J , 105,014 —72,224 —6.14 564,751 540,2631931 ; 1,275,882 +170,868 +15.46 653,480 622,4021941 1,472,972 + 197,090 + 15.45 75-5,979 716,9931951 1,950,976 +478,004 +32.45 1,006.201 944,7751961 2,466,880 +515,904 +26.44 1,268,710 1,198,1701971 3,178,029 +711,149 +28.83 1,643,864 1,534,1651981 4,164,470 +986,441 +31.04 2,150,088 2,014,382
Puae
10 - ^ rim r 1901 849,672 418,418 ' 431,2541911 835,337 -1 4 ,335 - 1 .6 9 412,412 422,9251921 786,436 -48 ,901 —5.85 387,434 399,0021931 895,014 +108,578 +13.81 446,189 448,8251941 1,013,212 +118,198 +13.21 497,993 515,2191951 1,177,016 +163,804 + 16.17 573,800 603,2161961 . ,1,430,105 +253,089 +21.50 698,555 731,5501971 1,727,376 +297,271 +20.79 848,092 879,2841981 2,038,677 +311,301 +18.02 989,122 1,049,555
Satam
1901 644,556 324,900 319,656 Sangli1911 612,518 —32,038 ■ —4.97 313,874 298,6441921 596,199 — 16,319 —2.66 307,061 289J381931 707,479 +111,280 +18.66 362,861 344,6181941 812,865 +105,386 +14.90 416,007 396,8581951 998,434 +185,569 +22.83 507,407 491,0271961 1,230,716 +232,282 +23.26 628,754 601,9621971 1,539,820 +309,104 +25.12 ^ 790,165 749,6551981 1,831,212 +291,392 +18.92 931,187 900,025
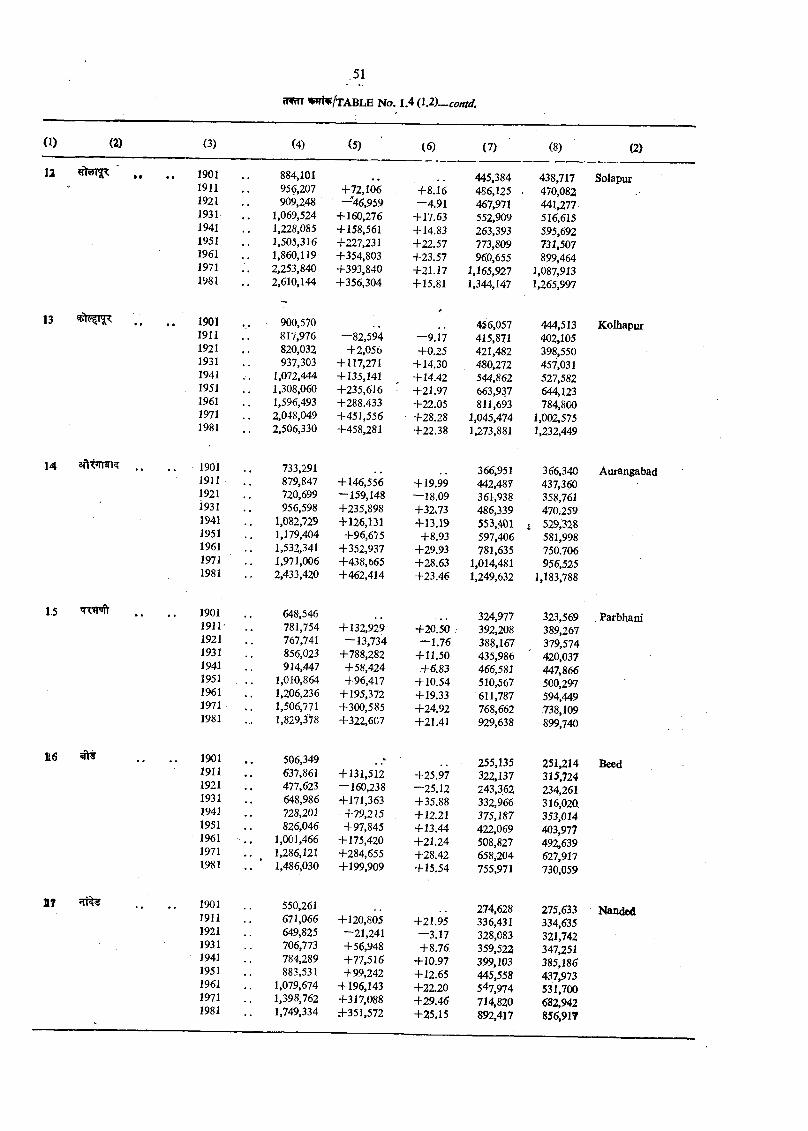
(1) (2) (3)
12 ' . .
(4) (5) (6) (7) (8) (2)
1901 884,101 445,384 438,717 Solapur1911 956,207 +72,106 +8.16 486,125 470,0821921 909,248 —46,959 —4.91 467,971 441,2771931 1,069,524 +160,276 + 17.63 552,909 516,6151941 1,228,085 +158,561 + 14.83 263,393 595,6921951 1,505,316 +227,231 +22.57 773,809 731,5071961 1,860,119 +354,803 +23.57 960,655 899,4641971 2,253,840 +393,840 +21.17 1,165,927 1,087,9131981 2,610,144 +356,304 + 15.81 1,344,147 1,265,997
13
1 4 3ftT^TRT5[
1901 . . 900,570>
456,057 444,5131911 817,976 -8 2 ,5 9 4 -9 .1 7 415,871 402,1051921 820,032 +2,056 +0.25 421,482 398,5501931 937,303 +117,271 +14.30 480,272 457,0311941 1,072,444 + 135,141 + 14.42 544,862 527,5821951 1,308,060 +235,616 - +21.97 663,937 644,1231961 1,596,493 +288.433 +22.05 811,693 784,8001971 2,048,049 +451,556 +28.28 1,045,474 1,002,5751981 2,506,330 +458,281 +22.38 1,273,881 1,232,449
1901 733,291 366,951 366,3401911 879,847 + 146,556 +19.99 442,487 437,3601921 720,699 — 159,148 —18.09 361,938 358,761i931 956,598 +235,898 +32v73 486,339 470.2591941 1,082,729 +126,131 +13.19 553,401 . 529,3281951 1,179,404 +96,675 +8.93 597,406 581,9981961 1,532,341 +352,937 +29.93 781,635 750.7061971 1,971,006 +438,665 +28.63 1,014,481 956,5251981 2,433,420 +462,414 +23.46 1,249,632 1,183,788
Kolhapur
Aurangabad
1,5 190119111921193119411951196119711981
648,546 324,977 323,569781,754 + 132,929 +20.50 . 392,208 389,267767,741 — 13,734 —1.76 388,167 379,574856,023 +788,282 + 11.50 435,986 420,037914,447 +58,424 +6.83 466,581 447,866
1,010,864 +96,417 +10.54 510,567 500,2971,206,236 +195,372 + 19.33 611,787 594,4491,506,771 +300,585 +24.92 768,662 738,1091,829,378 +322,607 +21.41 929,638 899,740
Parbhani
190119111921193119411951196119711981
506,349 255,135 251,214637,861 + 131,512 +25.97 322,137 315.724477,623 —160,238 —25.12 243,362 234,261648,986 +171,363 +35.88 332,966 316,02Q728,201 4-79,215 +12.21 375,187 353,014826,046 +97,845 + 13.44 422,069 403,977
1,001,466 +175,420 +21.24 508,827 492,6391,286,121 +284,655 +28.42 658,204 627,9171,486,030 +199,909 + 15.54 755,971 730,059
Seed
190119111921193119411951196119711981
550,261 274,628 275,633671,066 +120,805 +21.95 336,431 334,635649,825 —21,241 —3.17 328,083 321,742706,773 +56,948 +8.76 359,522 347,251784,289 +77,516 +10.97 399,103 385,186883,531 +99,242 +12.65 445,558 437,973
1,079,674 +196,143 +22.20 547,974 531,7001,398,762 +317,088 +29.46 714,820 682,9421,749,334 +351,572 +25.15 892,417 856,917
Nanded
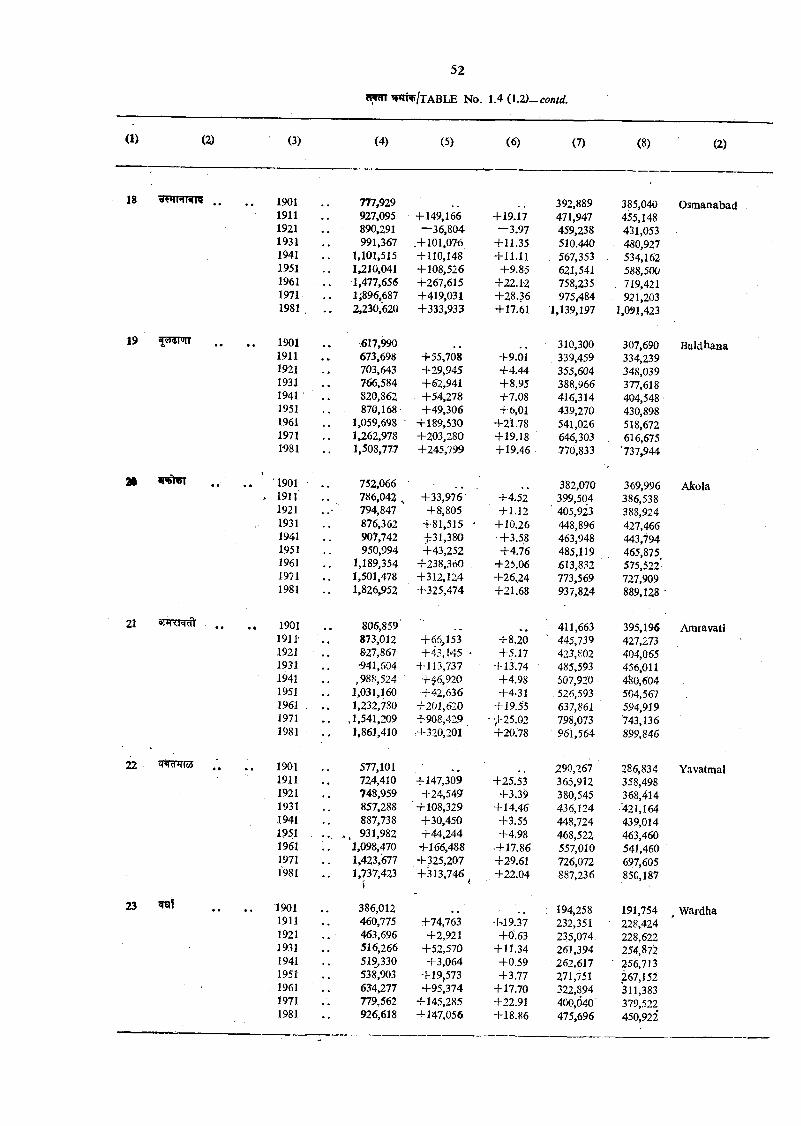
(1) (2)
18
19
21
(3) (4) (5) (6) (7) (8)
1901 777,929 392,889 385,0401911 927,095 + 149,166 +19.17 471,947 455,1481921 890,291 —36,804 —3.97 459,238 431,0531931 991,367 .+ 101,07^ + 11.35 510.440 480,9271941 1,101,515 +110,148 + 11.11 567,353 534,1621951 1,210,041 +108,526 +9.85 621,541 588,5001961 1,477,656 +267,615 +22.12 758,235 719,4211971 . 1^896,687 +419,031 +28.36 975,484 921,2031981 . . 2,230,‘620 +333,933 +17.61 1,139,197 1,091,423
1901 ^617,990 310,300 307,6901911 673,698 +55,708 +9.01 339,459 334,2391921 703,643 +29,945 +4.44 355,604 348,0391931 766,584 +62,941 +8.95 388,966 377,6181941 820,862 +54,278 +7.08 416,314 404,5481951 870,168' +49,306 +6,01 439,270 430,8981961 1,059,698 ' + 189,530 +21.78 541,026 518,6721971 1,262,978 +203,280 + 19.18 646,303 616,6751981 1,508,777 +245,799 + 19.46 770,833 '737,944
1901 752,066 382,070 369,9961911 786,042 , +33,976 +4.52 399,504 386,5381921 794,847 +8,805 +1.12 ' 405,9i3 388,9241931 876,362 +81,515 - + 10.26 448,896 427,4661941 907,742 +31,380 +3.58 463,948 443,7941951 950,994 +43,252 +4.76 485,119 465,8751961 1,189,354 +238,360 +25.06 .613,832 575,522*J971 1,501,478 +312,124 +26,24 773,569 727,9091981 1,826,952 +325,474 +21.68 937,824 889,128
(2)
Osmanabad
B uldhaaa
Akola
21 3T»RR?ft 1901 806,859 411,663 395,1961911- 873,012 +66,153 +8.20 445,739 427,2731921 827,867 +43,145 * +5.17 423,802 404,06519?1 -941,504 + 113,737 ■ +13.74 • 485,593 456,0111941 ,988,524 +^6,920 +4.98 507,920 4^0,6041951 1,031,160 +42,636 +4.31 . 526,593 504,5671961 . l,2 3 2 ,n 0 +201,620 + 19.55 637,861 594,9191971 . . ,1,541,209 +908,429 • -1-25.02 798,073 '743,1361981 1,861,410 +320,201 +20.'78 961,564 899,846
Amravati
23
1901 577,101 . • 290,267 286,8341911 724,410 + 147,309 +25.53 365,912 358,4981921 748,959 +24,549 +3.39 380,545 368,4141931 857,288 ' +108,329 +14.46 436,124 •‘421,1641941 , . . 887,738 +30,450 +3.55 448,724 439,0141951 ... , . 931,982 +44,244 +4.98 468,522 463,4601961 1,098,470 +166,488 +17.86 557,010 541,4601971 1,423,677 +325,207 +29.61 726,072 697,6051981 . . 1,737,423 +313,746 , +22.04 887,236 850,187
1901 386,012 : 194,258 191,7541911 460,775 +74,763 +19.37 232,351 228,4241921 463,696 . +2,921 + 0 ‘.63 235,074. 228,6221931 516,266 +52,570 +11.34 261,394 254,8/21941 519,330 +3,064 +0.59 262,617 - 256,7131951 538,903 +19,573 +3.77 271,751 267,1521961 634,277 +95,374 + 17.70 322,894 311,3831971 779,562 + 145,285 +22.91 400,040 379,5221981 926,618 + 147,056 +18.86 475,696 450,922
Yavatmal
Wardha
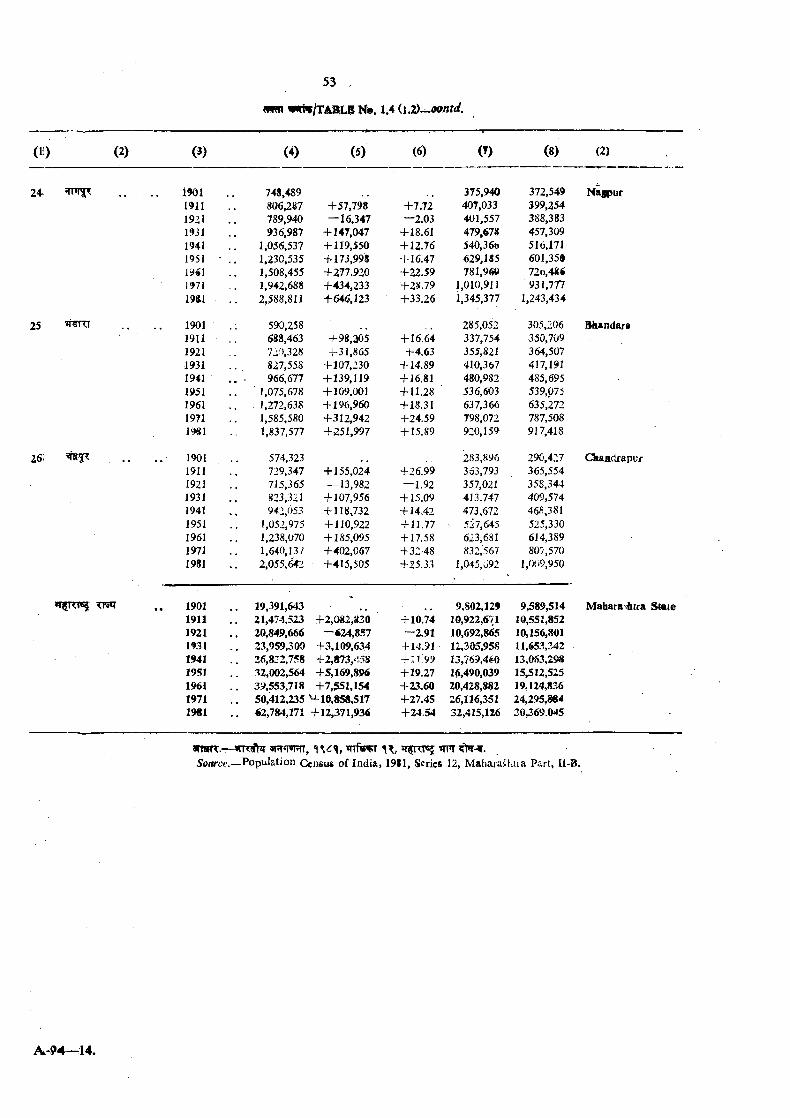
mm H*, 1.4 i\.2i^oontd.
(1 ) (2) (3) (4) (5) (6) (8) (2)
24
25
26;
1901191119211931194119511951197119&1
190119111921193119411951196119711981
190119111921193119411951196119711981
748,489806^87789,940936,987
1,055,5371,230,5351,508,4551,942,6882,588,811
590,258 688,463 720,328 827,558 966,677
1,075,678 1,272,638 1,585,580 1,837,-577
574,323729,347715,365823,321942,053
1,052,9751,238,0701,640,13/2,055,^2
+57,798 — 16.347
+ 147,047 + 119,550 +173,99* +277.920 +434,233 +646,123
+98,305 +31,865
+ 107,230 +139,119 +109,001 +196,960 +312,942 +251,997
+ 155,024 — 13,982
+107,956 + 118,732 + 110,922 +185,095 +402,067 +415,505
+7.72—2.03
+18.61+12.76+16.47+22.59+2S.79+33.26
+ 16.64 +4,63
+ 14.89 + 16.81 + 11.28 +18.31 +24.59 + 15.89
+26.99 —1.92
+ 15.09 + 14,42 + 11.77 + 17.58 +32-48 +25.33
375,940 407,033 401,557 479,678 540,36b 629,185 781,9se
1,010,911 1,345,377
285,052337,754355,821410,367480,982536,603637,366798,072920,159
283,896 363,793 357,021 4 J 3.747 473,672 5i7,645 623,681 832,567
1,045,092
372,549 399,254 388,383 457,309 516,171 601,359 720,48 « 931,777
1,243,434
305,206350,709364.507 417,191 485,695 539,075 635,272787.508 917,418
290,427365,554358,344409,574468,381525,330614,389807,570
1,009,950
Nagpur
Bhandara
CkajBdrapuf
1901 . 19,391,643 * , 9,802,129 9,589,5141911 . 21,474,523 +2,082,830 +10.74 10,922,671 10,551,8521921 . 20,849,666 —«4,857 —2.91 10,692,865 10,156,801193! . 23,959,300 +3,109,634 + 14.91 12,305,958 11,653,3421941 . 26,8J2,758 +2,873,^‘,53 + n .9 9 13,769,460 13,063,2981951 32,002,564 +5,169,896 +19.27 16,490,039 15,512,5251961 . 39,553,718 +7,551,154 +23.60 20,428,882 19,124,8361971 . 50,412,235 M-10,858,517 +27.45 26,116,351 24,295,8641981 . 62,784,171 +12,371,936 +24.54 32,415,126 30369.0J5
Maharasiitra Stoie
Soaroe.—Population Census of India, 1911, Scries 12, M ahaiaihiia Part, Il-B.
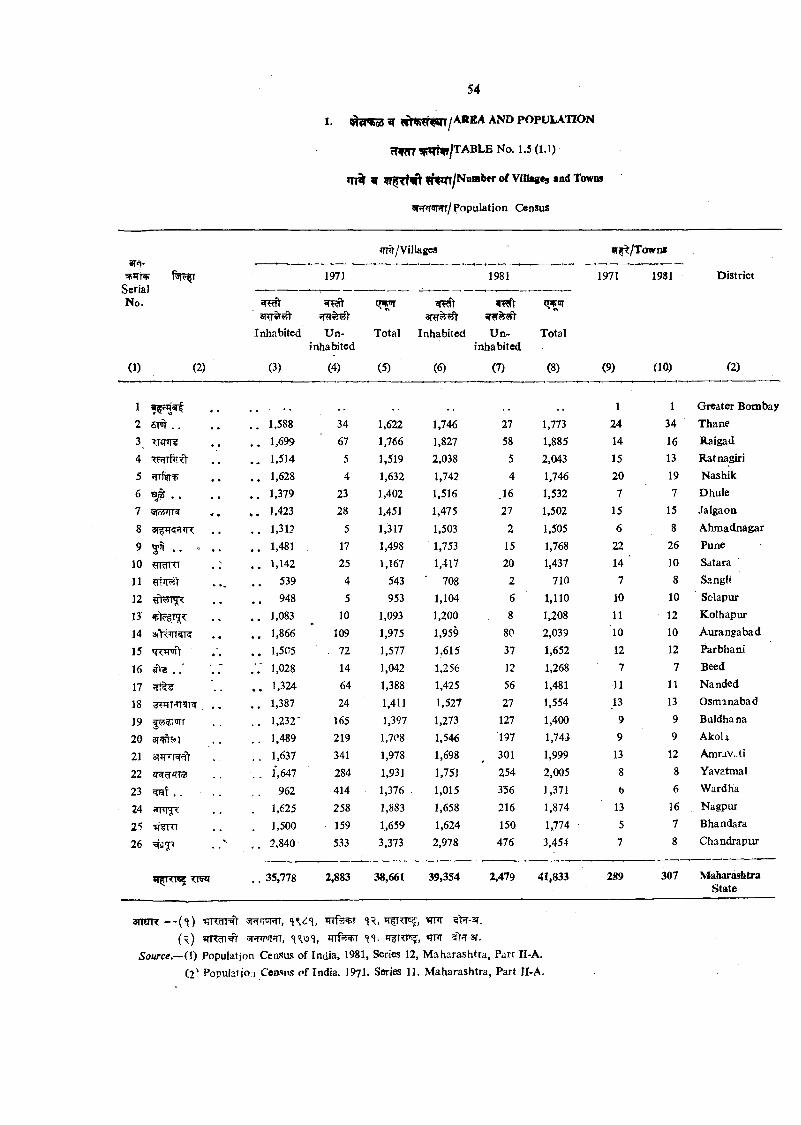
I. 5T AND POPULATION
frWT iJJITfv/TABLE No, 1.5 ( l .I)
*TT% ^ fPpn/Nuaber of Vlfliqtes and Towns
W nP rr/P opu la tion Census
m^/Villages sr^^/Town*ar i-
SerialNo.
(1) (2)
1971 1981 1971 1981 D istrict
Inhabited U n inhabited
Total Inhabited U n inhabited
Total
(3) (4) (5) (6) (7) (8) (9) (10) (2)
1 1 Greater Bombay
. . 1,588 34 1,622 1,746 27 1,773 24 34 Thane
. . 1,699 67 1,766 1,827 58 1,885 14 16 Raigad
. . 1,514 5 1,519 2,038 5 2,043 15 13 Ratnagiri
. . 1,628 4 1,632 1,742 4 1,746 20 19 N ashik
1,379 23 1,402 1,516 .16 1,532 7 7 Dhule
. . 1,423 28 1,451 1,475 27 1,502 15 15 Jalgaon
. . 1,31? 5 1,317 1,503 2 1,505 6 8 A hm adnagar
. . 1,481 17 1,498 1,753 15 1,768 22 26 Pune
. . 1,142 25 1,167 1,417 20 1,437 14 ’ 10 Satara
. . 539 4 543 ' 708 2 710 7 8 Sangli
. . 948 5 953 1,104 6 1,110 10 10 Sclapur
. . 1,083 10 1,093 1,200 8 1,208 11 12 K olhapur
, , 1,866 109 1,975 1,959 80 2,039 10 10 A urangabad
. . 1,505 . 72 1,577 1,615 37 1,652 12 12 Parbhani
.V 1,028 14 1,042 1,256 12 1,268 7 7 Beed
. . 1,324 64 1,388 1,425 56 1,481 11 11 Nanded
. . 1,387 24 1,411 1,527 27 1,554 .13 13 Osmanabad
. . 1,232' 165 1,397 1,273 127 1,400 9 9 Buldha na
. . 1,489 219 1,708 1,546 197 1,743 9 9 AkoU
. . 1,637 341 1,978 1,698 301 1,999 13 12 Amrav.-ti
. . 1,647 284 1,931 1,75J 254 2,005 8 8 Yavatmal
. . 962 414 1,376 . 1,015 336 1,371 b 6 Ward ha
. 1,625 258 1,883 1,658 216 1,874 13 16 Nagpur
. 1,500 159 1,659 1,624 150 1,774 5 7 Bhandara
2,840 533 3,373 2,978 476 3,454 7 8 C handrapur
. . 35,778 2,883 38,661 39,354 2,479 41,833 289 307 MaharashtraState
1SFT . .Tfinr? ■ FrrfiTft
# . .SToI^^
8 3T ^^>R9 5 1 . . ,
10 TRTITT
11 5ETtir«Y12
1314 3»V??TTsrr5r15 TWifV
16 ^ . r17 f r t^1819 p s ^ ’iTr
20 3T^?»i
21 «[TFRrfy2223 . .
24 fTFij?:
25 vfsRT26 =sjsi77
TT^
snOTT — ('}) SFTrroi TT, <1 , WT(^ ) «TRm^ 5R W n, ?TTff?¥7 'iS. WFT af.
Source.~(i) Population Census of India, 1981, Series 12, M aharashtra, Part II-A,
(2 ' Populatio 1 Cea-Mis of India. 19jl, Series 11, M aharashtra, Part II-A.
1 . s r r f ^
AREA AND POPULATION
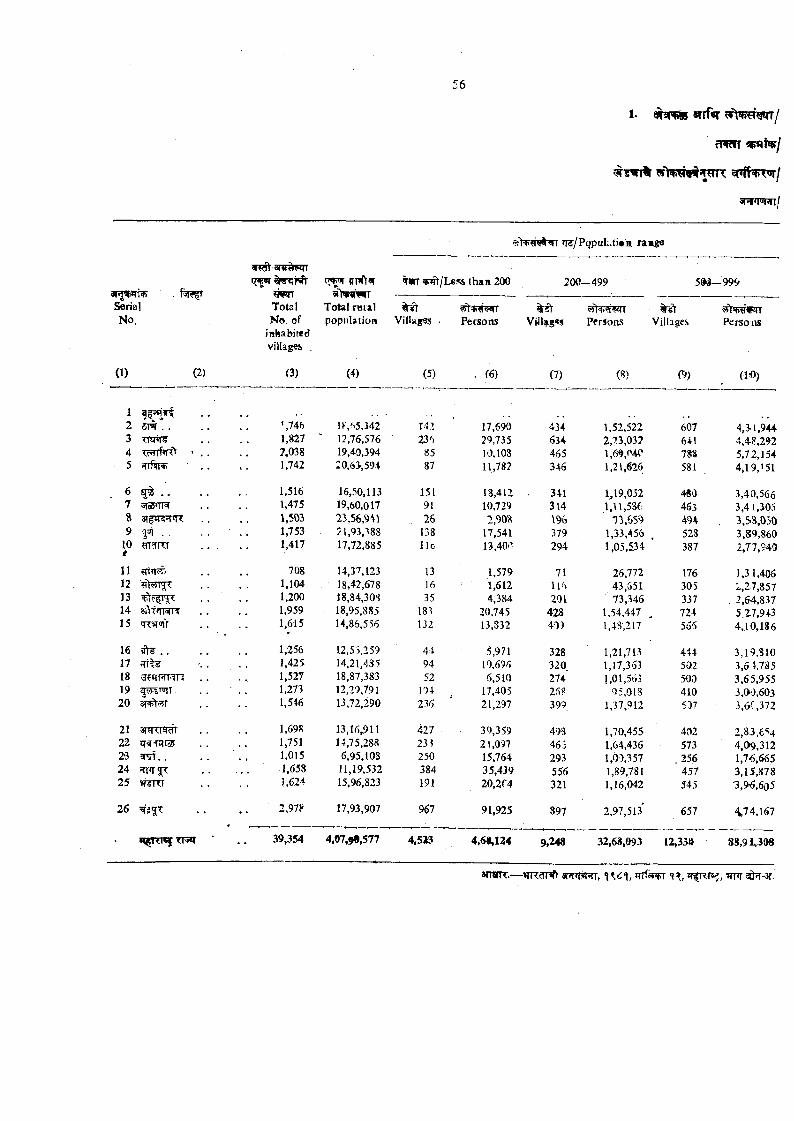
1- wrf«r
c T ^
w 1w w «T^TR ^^fhrroT /
spT^Rin/
3T^*TT . r>l $T Serial No.
(1) (2)
9WTTotal No of
inhabited villages .
(3)
flnfr«T SlWPIT
Total ra ta l popiibtioB
(4)
^ /P o p a k ti* f t ramge
^ ?Mft/Less than 200 200--499 59d--999
Villages ■
(5)
vaug«s
(7)
vfhF^WTPersons
(8)
%stVillages
f9)
v tW w rrPersons
(10)
Persons
. (6)
12 m . . \746 lF,f.5,342 142 17,690 434 1,52,522 607 4,31,9443 'cmtr^ 1,827 ' ] 2.76,576 23') 29,735 634 2,23,03? 641 4,48,2924 f?nrf<rft > , . ?,038 19,40.394 85 10,108 465 1,69,040 m 5,72,1545 iTTfilT 1,742 :0,63,594 87 11,78? 346 1,21,626 581 4,19,151
. 6 . . 1,516 16,50.113 151 18,412 341 1,19,052 480 3,40,5667 vjiosm^ 1,475 19,60,017 91 10,729 314 l ,l l ,5 8 t 463 3,4l,30oS 3t JT5 *TT . . 1,503 2i , s s ,m 26 2 , m 1% 73,659 494 . 3,S8,0509 |q . . 1,753 51,93,388 138 17,541 379 1,33,456 528 3,89,860
10 rr Tirr i1,417 17,72,885 Ho 13,40<' 294 1,05,534 387 2,77,940
11 ?riiTw 708 14,37,123 13 1,579 71 26,772 176 1,31,40612 1,104 18,42,678 16 1,612 43,651 305 1,27,35713 1,200 18,84,30S 35 4,384 201 73,346 337 . 2,64,83714 1,959 18,95,885 183 20,745 428 1,54,447 724 5.Z7.94315 T ^ 'n r 1,615 14,86,556 132 13,832 40) l,48;217 566 4,10,186
16 . . 1.-256 12,55,259 44 5,971 328 1,21,713 4M 3,19,81017 1,425 14,21,485 94 10,696 320. 1,17,363 502 3,6 178518 ^ ff fp rr^ . . 1,527 18,87,383 52 6,510 274 1,01,563 500 3,65,95519 l^niTT 1,273 12,29,791 194 17,405 268 95,013 410 3.0‘0,60320 apFt r 1,546 13,72,290 236 21,297 399 1,37,912 5.D7 ■ 3,5f,372
21 a m iW 1,695! 13,16,911 427 . 39,359 498 1,70,455 402 2,83.6‘:422 1J51 14,75,288 23 ? 21,09? 465 1,64,436 573 4,09,31223 wgf. . 1,015 6,95,108 250 15,764 293 1,00,357 . 256 1,7€,66524 sfr'ir^ 1,658 11,19,532 384 35,439 556 1,89,781 457 3,15,87825 ?iranj 1,624 15,96,823 191 20,2f4 321 1,16,042 545 3,96,6o5
26 2,97>* 17,93,907 967 91,925 897 2,97,513 657 474,167
»?i5ra«f TT^ •• 39,354 4 ,0 7 ,5 7 7 4,523 4,6#,124 9,248 32,68,093 12,330 88,91,398
3 T W R .— T JR c T T ^ « W R T , n < ^ 1 ; J f fR P s ^ , m>T 3 !^ -3 r .
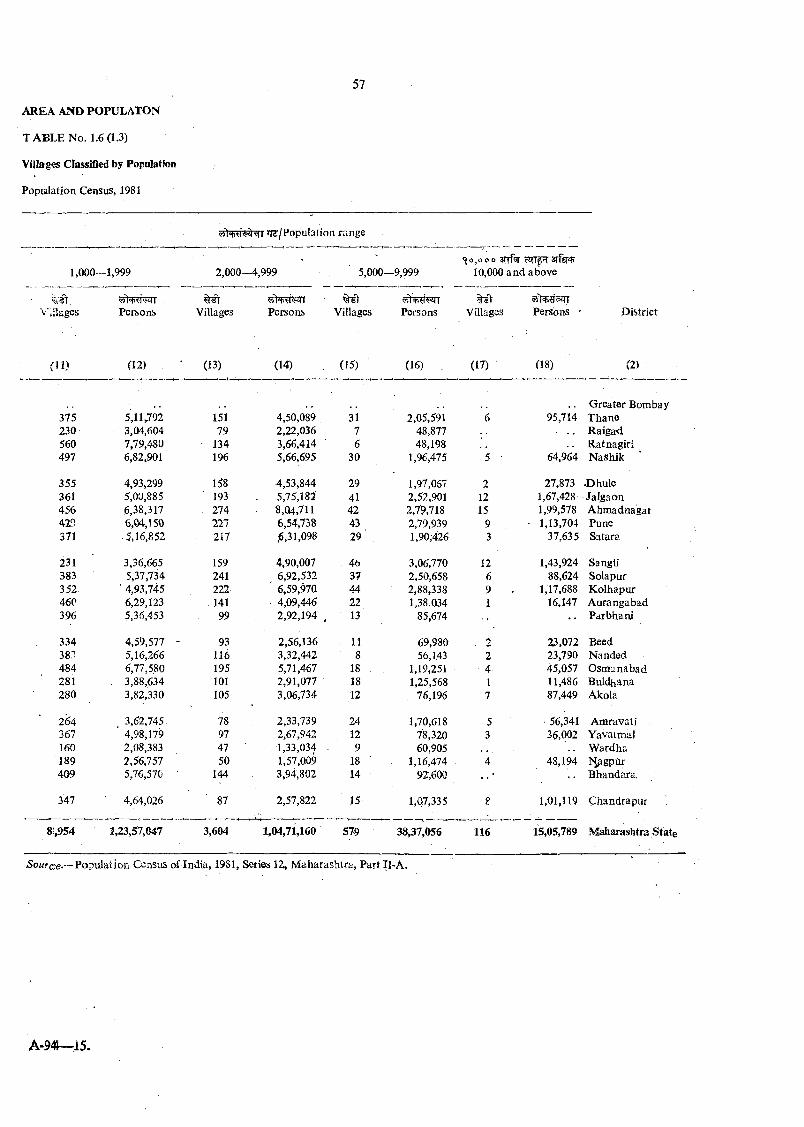
AREA AND POPULATON
T A B L E No. 1.6 (1.3)
Villa ges Classified by Population
Popialation Census, 1981
^ iR :/P o p u la ti on range
«(o,o00 anfor1,000 -1,999 2,000 4,999 5,000--9,999 10,000 and above
Villages Persons Villages Persons Villages Pei'S onS Villages Persoas • District
(11) (12) (13) (14) (15) ' (16) , (17) ■ (18) (2)
Greater Bombay375 5 ,1 1 3 2 151 4,50,089 31 2,05,591 6 95,714 Thane230 3,04,604 79 2,22,036 7 48,877 Raiga<i560 7,79,480 • 134 3,66,414 6 48,198 Ratnagiri497 6,82,901 196 5,66,695 30 1,96,475 5 ■ 64,964 N ashik
355 4,93,299 158 4,53,844 29 1,97,067 2 27,873 •Dhule361 5,00,885 193 - 5,75,182 41 2,52,901 12 1,67,428 • Jalgaon456 6,38,317 . 274 8,04,711 42 2,7'9,718 15 1,99,578 Ahmadaagar429 6,04,150 227 6,54,738 43 2,79,939 9 ■ 1,13,704 Pune371 • 5.16,852 217 ,6,31,098 29 1,90,-426 3 37,635 Satara
231 3,36,665 159 4,90,007 45 3,06,770 12 1,43,924 Sangli383 5,37,734 241 6,92,532 37 2,50,658 6 88,624 Solapur352. ' 4,93,745 222 6,59,970 .44 2,88,338 9 ‘ . 1,17,688 Kolhapur460 6,29,123 141 4,09,446 22 1,38.034 1 16,147 Aurangabad396 5,36,453 99 2,92,194 13 85,674 •• Parbhani
334 4,59,577 - 93 2,56,136 . 11 69,980 , 1 23,072 Beed383 5,16,266 116 3,32,442 8 56,143 2 23,790 Nanded484 6,77,580 195 5,71,467 18 1,19,251 4 45,057 Osmanabad281 . 3,88,634 101 2,91,077 18 1,25,568 I 11,486 Buldhana280 3,82,330 105 3,06,734 12 76,196 7 87,449 ATcoIa
264 , 3,62,745 78 2,33,739 24 1,70,618 5 ■ 56,341 Amravati367 ” 4,98,179 97 2,67,942 12 78,320 3 36,002 Yavatmal160 2,08,383 47 1,33,034 9 60,905 W ardha189 2,56,757 50 1,57,009 18 ' 1,16,474 4 43,194 l^ g p ilr409 5,76,570 144 3,94,802 14 92,600 Bhandara,
347 4,64,026 87 2,57,822 15 1,07,335 1,01,119 Chandrapur
8),954 1,23,^7,047 3,604 1,04,71,160 579 38,37,056 116 15,05,789 Maharashtra State
iSoH?ce.-~Population Census of India, 1981, Series 12, M aharashtra, Part Il-A .
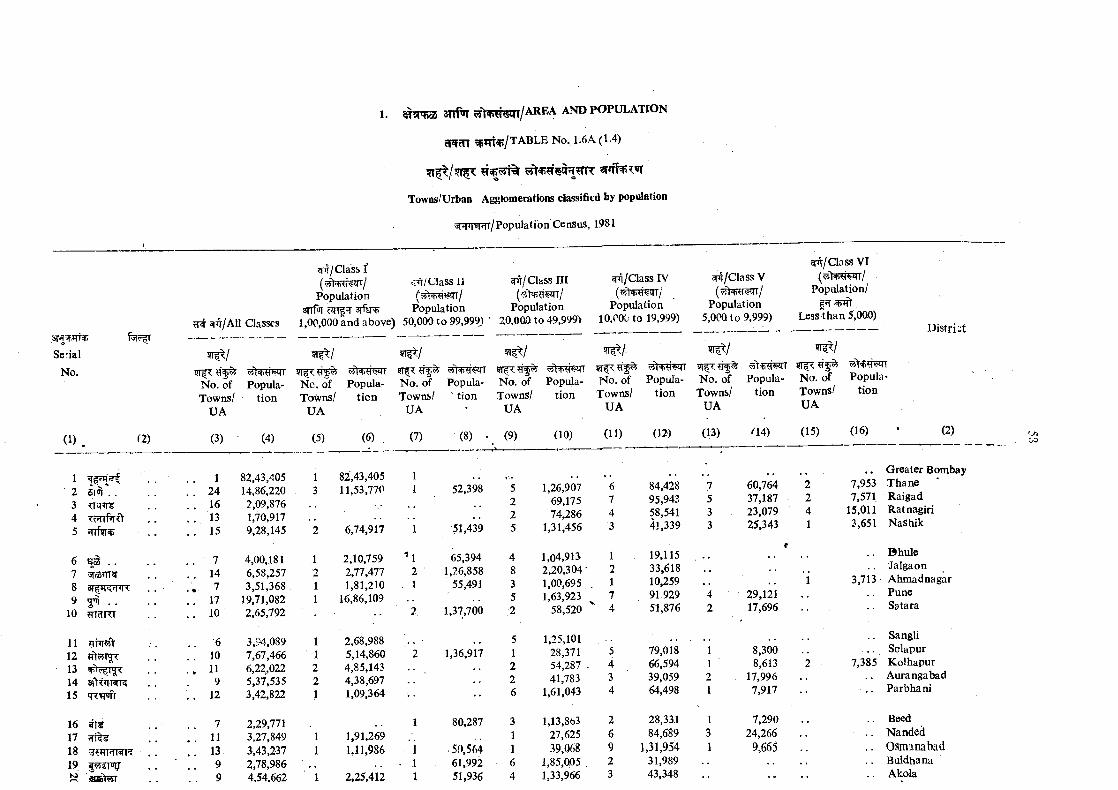
Se-ial
No.
(1) (2)
12 SIOT . .34 Tf?TTpTd5 ffrf^r^
6 ^ . ,7 3fo4<IN
9 jni . ,10 ^rram
1112 Rt^T^1314 BTt^qrar?15 q r^ V
1617 f r i^18 19
HSffRCT
1. STTf'iT AND POPULATION
cRcn 'jpmap/TABLE No. 1.6A (1.4)
Towiis/Urban AggSomerations cl^sified by population
51WT?rr/Population Census, 1981
W^/AII Classes
^tt/C lass Ir-nfr/Class IJ ^ i/C lass III
Populationsnf^ c lTf?T srfgnp Population Population
1,00,000 and above) 50,000 to 99,999) ' 20.0QQ to 49,999>
^ /C la s s IV
Population 10,000 to 19,999)
^ /C la s s V
Population 5,000 to 9,999)
cr/C lass VI
Population/ |?T ,
Less th a n 5,000)D istri-t
5T1 / ?T^/ 51^/ ^ / - ^ •
pS ^N o .S f Popula- No. of Popula- No. of Popula- No. of Popula- No. of Popula- No. of Popula- No. of Popul.^Towns/ tion Towns/ tion Towns/ tion Towns/ tion Towns/ tion Towns/ tion Towns/ tion
U A U A UA ’ UA UA UA UA
(3) (4) (5) (6) (7) (8) (9) (10) (11) (12) (13) ^ 4 ) (15) (16) (2)oo
1241613
82,43,40514,86,2202,09,876
82,43,40511,53,770 52,398 1,26,907
69,17574,286
15 9,28,145 2 6,74,917 1 51,439 5 1,31,456
7 4,00,181 1 2,10,759 -1 65,394 4 1,04,91314 6,58,257 2 2,77,477 2 ■ 1,26,858 8 2,20,3047 3,51,368 1 1,81,210 . 1 55,491 3 1,00,695
17 19,71,082 1 16,86,109 5 1,63,92310 2,65,792 2 1,37,700 2 58,520
6 3,94,089 1 2,68,988 .. 5 1,25,10110 7,67,466 ' 1 5,14,860 2 1,36,917 1 28,37111 6,22,022 2 4,85,143 2 54,2879 5,37,535 2 4,38,697 2 41,783
12 3,42,822 1 1,09,364 •• 6 1,61,043
7 2,29,771 1 80,287 3 l,13,8b311 3.27,849 1 1,91,269 1 27,62513. 3,43,237 1 1,11,986 1 • 50,564 1 39,0689 2,78,986 • 1 61,992 6 1,85,0059 4.54.662 1 2,25.412 1 51,936 4 1,33,966
6 84,428 7 60,764 2 7,9537 95,943 5 37,187 2 7,5714 58,541 3 . 23,079 4 15,0113 41,339 3 25,343 1 3,651
19,11533,61810,25991,92951,876
79,01866,59439,05964,498
28,33184,689
1,31,95431,98943,348
29,12117,696
8,3008,613
17,9967,917
7,29024,266
9,665
3,713
7,385
Greater BombayThaneRaigadRatnagiriN ashik
BhuleJalgaonAhmadnagarPuneSgtara
SangliSclapurKolhapurAurangabadParbhani
BeedNandedOsmanabadBuldhanaAkola
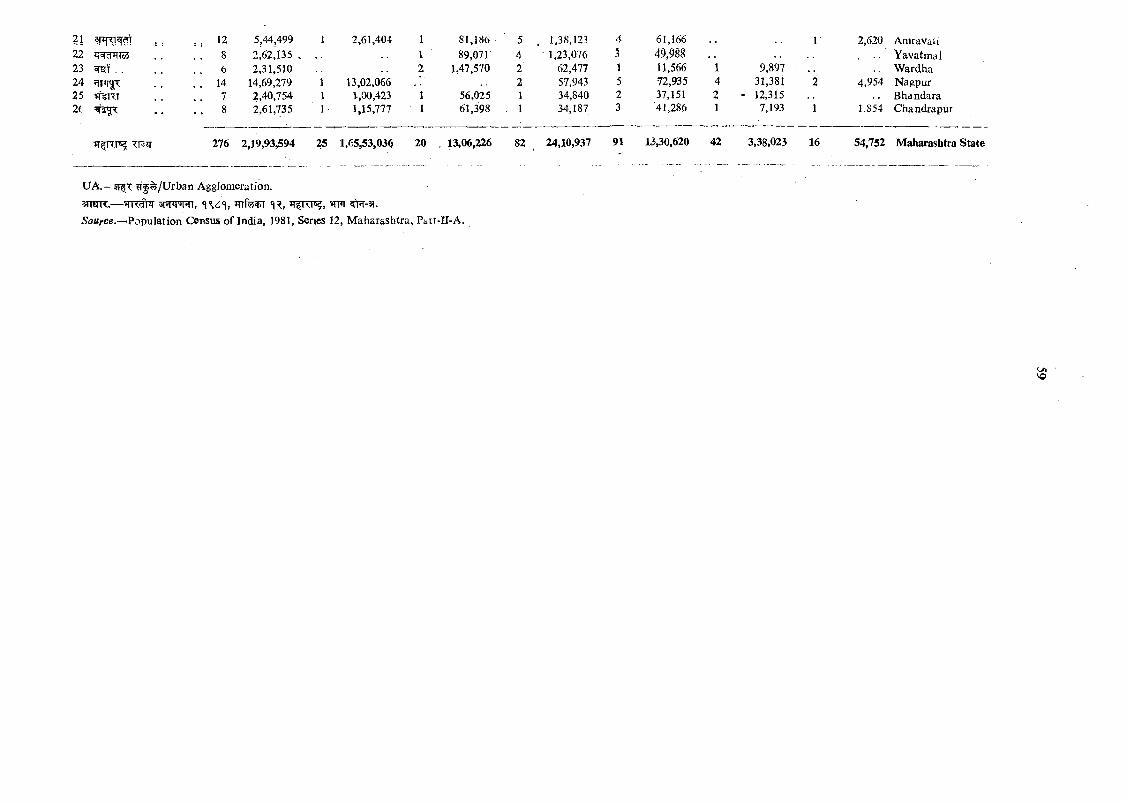
21 , 2223 .2425 9T^T 2i =^2^
iT^RT^ ■?;F3ir
1? 5,44,499 18 2,62,135 .6 2,31,510
14 14,69,279 17 2,40,754 18 2,61,735 1
2,61,404
13,02,066 1.,00,423 1,15,777
276 2,19,93,594 25 1,65,53,036
1 81,186 5 1,38,123 4 61,166 1 2,620 AmravaU1 89,071 4 • 1,23,076 3 49,988 Yavatmal2 1,47,570 2 62,477 1 11,566 1 9,897 W ardha
2 57,943 5 72,935 4 31,381 2 4,954 Nagpur1 56,025 1 34,840 2 37,151 2 • 12,315 B handara1 61,398 . 1 34,187 3 41,286 1 7,193 1 1.854 Chandrapur
20 , 13,06,226 82 24,10,937 91 13,30,620 42 3,38,023 16 54,752 M aharashtra State
UA.— JETf /U rb an Agglomeration.
3TraR.— ^5fffwn, '}%<''!, ^5o«rce.—Population Census of India, 1981, Series 12, M aharashtra, Pt.tt-11-A.
VO
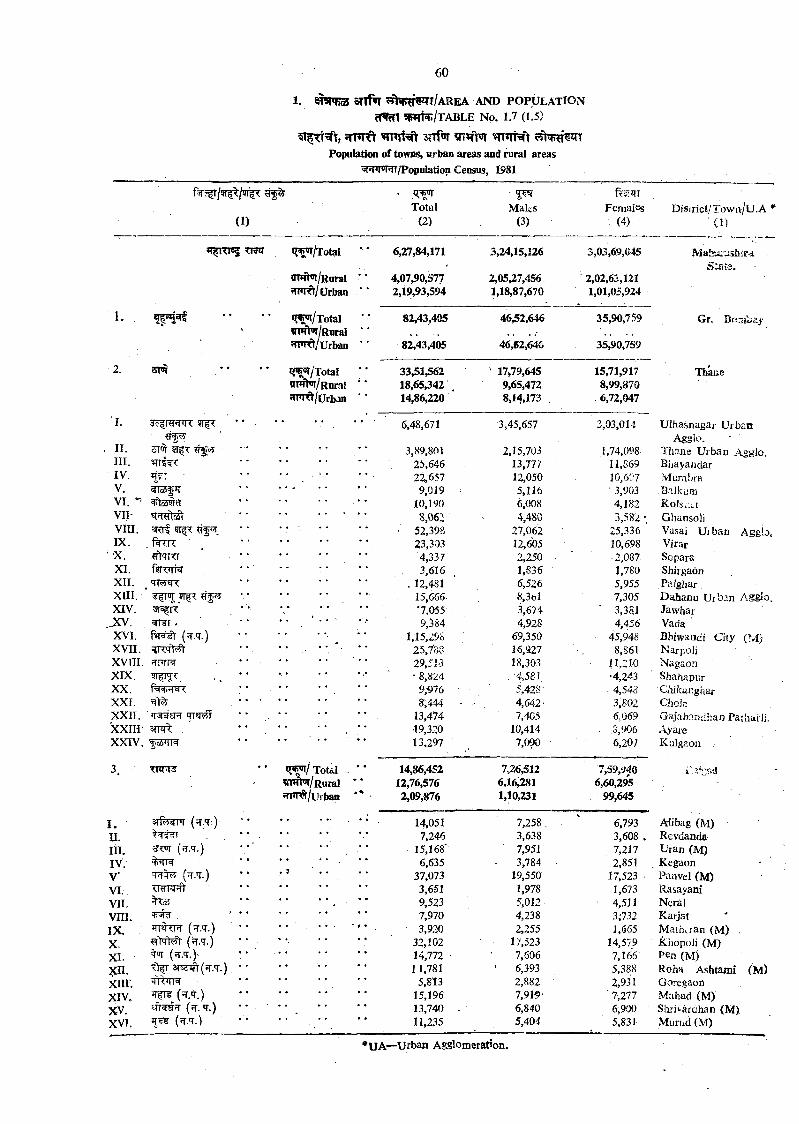
1. STTfw ?^N ?r^T /A R E A AND POPULATIONc f ^ m m H lT A B L E No. 1.7 (1.5)
511^^% snf'^rPopulation of towns, urban areas and rural areas
'Ji -t /Population Census, 1981
(1)Total
(2)
• 5 ^ M aks
(3)Females
(4) ■Disirict/Tow n/U .A *
(1)
*?^/Totai •• 6,27,84,171 3,24,15,126 3,03,69,045 MaharashiT-a. Stnia.
UN*l«i/Rural • 4,07,90,577 2,05,27,456- 2,02,63,121?n»Rt/Urban 2,19,93,594 1,18,87,670 1,01,05,924
1. «?^/T otal • • 82,43,405 46,52,646 35,90,759 Gr.’ ?nw>T/Rural • • • .
Hr<I^VUrban 82,43,405 46,62,646 35,90,759
2. sm *?^/T otal *• 33,51,562 17»79,645 15,71,917 Thaiie5W>r/Rara{ • • 18,65,342 \ 9,65,472 8,99,870ni^iO/UrbM 14,86,220^ 8,14,173 . . 6,72,047
J. . . . . ■ 6,48,671 3,45,657 3,03,014 Ulhasnagar UrbanAgglo.
II. sm 9I|T • 3,89,801 2,15,703 1,74,098. Thane U rban Agglo.III. • 25,646 13,777 11,869 BiiayandarIV. JT5:T ■ • • - 22,657 12,050 10,607 MurabraV. .................. • 9,019 5,116 • 3,903 BalkufiiVI. V • 10,190 6,008 4,182 KoisiiUVII- • S,062 4,480 3,582 •. GhansoliVIII. ^ 4il < • • ■ 52,398 27,062 25,336 Vasai U rban A ggb,IX. fcTTn ' , • • 23,303 12,605 10,698 Virar
' 'X. fft<TRT • • 4,337 2,250 ■ 2,087- SoparaXI. • • . 3,616 .1,836 ■ 1,780 ShirgaonXII. , TMetT • • . 12,481 6,526 5,955 . P aighar.XIII. 5' r'>T • • 15,666 8,3ol 7,305 Dahanu Urban Aggio.XIV. . * • • • '7,055 3,674 ■ 3,381 Jawhar
^ V . 9,584 4,928 4,456 VadaXVI. • • 1,15,298 69,350 45,948 Bhiwandi City (VI)XVII. * * 25,rss 16,927 ■. 8,861 Narpoiix v n i . • * 29,533 18,303 11,210 KagaonXIX. •. •• • 8,824 , -4,581 •4,243 ShahapurXX. * ♦ 9,976 5,428 - 4,548 CiiikangharXXL . • * ' • • 8,444 • 4,642' 3,802 ChoicXXII. TT3RSFT 5T«T# • • 13,474 7,405 6.069 Gajabnndhan Patharli,x x iH - . •19,320 10,414 - .3,906 AyareXXIV. o6Jl\=i * * 13,297 7,090 6,207 ICulgaon
3. TTITTS ^ ^ 1 Totai •• 14,86,452 7,26,512 7,59,940^ n ^ /R « ra l ♦ • 12,76,576 6,16,281 6,60,295*nn’ /Urban 2,09,«76 1,10,231 99,645
I . srfergw (JT.'T:) •• . 14,051 7,258, 6,793 Aiibag (M)n . • • . • • 7,246 3,638 3,608 . RevdandaIII. • * 15,168' 7,951 7,217 Uran (M)IV. * * • • 6,635 . 3,784 2,851 . KegaonV* • • 37,073 19,550 17,523 . Panvel (M)VI. WNWl • * • • 3,651 1,978 1,673 RasayaniVII.
« • 9,523 5,012 4,511 NeralVIII. , ’ * * • ♦ 7,970 4,238 3,732 KarjatIX. 3,92Q 2,255 1,665 MatiK-ran (M ) ,x . * • 32,102 17,523 14,579 J Cihopoii (M)XI. : 'iT (JT.T.y • * * • 14,772 7,606 7,166 p en (M)x n . " V 3T^(q-.tT.) • • • • 11,781 * 6,393 5,388 Rohu Ashtami (M )x ii r . • * 5,813 2,882 ■ 2,931 Gc»regaonXIV. ^^1^ (^T,7.) • • 15,196 7,919- ■ 7,277 Mahad (M)XV. {^. 7.) • * 13,740 . 6,840 6,900 Shrivarahan (M).XVT, 11.235 5,404 5,831 Murud (M)
*UA—U rban Agglomeration.
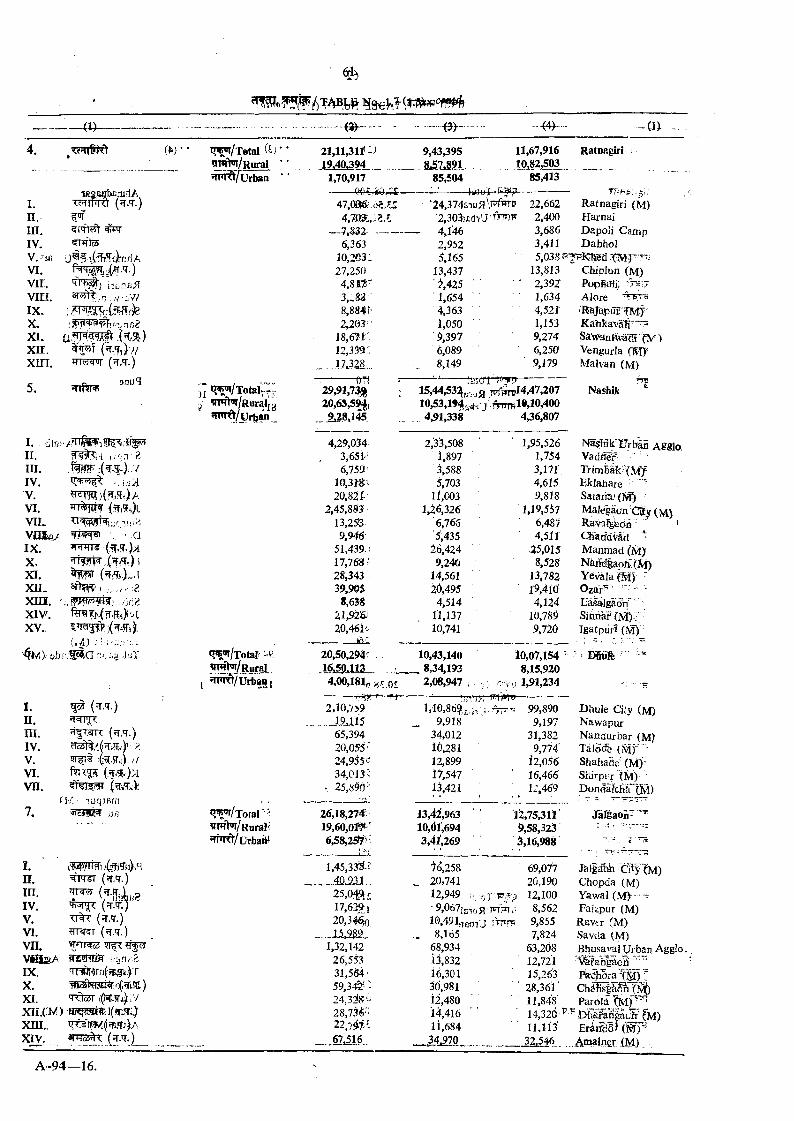
- 0 ^ m - - i^ y - ~ i 4 y - - d >
4. TrT^fCt
I. . dl3?II.III.IV.V.VI. y i L y m f i jIX .X.XI.xn.xni.X IV.XV.
' Iv5> &b
■ / IW ^ A i/:.n .2
V -i^>i
’TT^jirr im - ^ i
„ :;- .a(%%)a
:- .-.id?
UA) ;.!^;.cr>r;,i
<i5?ynwi =5np7¥T (?r.q'.)
(^r.T.) TT%T (^.T.)
(fr.q-.)
f*edi(i^r iiinjr:. 'Tr3fe[Tn(,;i#i)T
XIIX'I^)xin.. joy. 3W5jv < (fr.<T.)_
n .in.IV.V.VI.vn.V flisAIX.X.XI.
q ^ /X e ta lg m H /Rural?n ^ /U rb « n
21,1M11(-^ 19.40.394__
1,70,917
9,43,3958 4 7 ^ 1
85,504
11,67,91610.82,503
85,413
Ratnagiri
tB2eohcrartA(JT.'T.)
-------Q<l4rtor^£---------- --------•24,374&iu; j\ t PTP1. 47,Qafi>.(>c/j: 22,662 Ratnagiri (M)
II. 4,7{&;.c.i •2,303iJE:d-i'J'TTTT)F 2,400 Harnaim . --------- -----4,146 3,686 Dapoli CampIV. <?T 't55 6,363 2,952 3,411 DabholY.^m 10,203: 5,165 5,038'^ jrK lted:<I«pT^;VI. 27,250 13,437 13,813 Chiplun (M)vir. 4,81^^ ' ^,425 ■ ' ■ 2,392 PopBjflij ■'7 77vm. . ,Y !iV// 1,654 1,634 Alore T%T57=IX. 8 ,8m - 4,363 4,521X. 2,203- 1,050 1,153 Ka?iR3Vair~r5XI., 18 ,6n 9,397 9,274 Sjrv^ntw-iatli'fV >xir. 12,3m . 6,089 6,250 Vengurla (M)^xin. JTtW (JT.'T.) J7,328... 8,149 9,179 Malvan (M)
5. 300*1)ij «»*ft«l/Rur^l|g
' - ..... 0T1 *■■29,91 ,7^ 20,65,59^(
---- ikiol15,44,53^,;^,,^ Tt^pn44,47,207 10,53,194,-jfTTTTpl«»10.400
Nashik
5n«T^/Uit?an_ ^9 ,28 .145 4,91,338 4,36,807
^^iT o tS iV ^>T^/R ural
4,29,0341 2,'33,508 ■ 1,95,526 Urbao AggJo,, 3 ,65 t‘ 1,897 1,754 Vadiier' '
6,759' 3,588 3,171 Trimhak'XM f10,3^8^^ 5,703
ll,C034,615 Ekiahare '
20,8:tt 9,818 Safana.i2,45,883 1,26,326 1,19,557 M al^acn 'C % (}4)
13,25i3 6,766 6.481 Rava?igiadri ■ " '9,946 ■5,435 4,511 Oiaifdvaci
51,439 ; 26,424 35,015 Maiunad (M)17,7681 9,240 8,528 NW dgaotf(M )28,343 14,561 13,782 Y m la 'ilM)' "39,905 20,495 1-9,410 O zkr^'
8,6M 4,514 4,124 Lasalga®Zl,92'& 11,137 10,789 Situiaf (M);: '20,461'-
lA-;10,741 9,710 Igatpuri (M);
20,50,294c 10,43,1408,34,193
10,07,154 ' 8,15,920
EHhi'fb ^
4,00,181^ ijf.of 2,08,947
I. (=T.7.) 2,10,759n. _____ JM I5 ..ni. ^ T str: (^.'t.) 65,394IV. 20,055'V. 24,955^^VI. 34,013 cvn. * 25,890^
fl/. TuqiBj'n7. 'iimosr ii?3 ‘i'PVxoral' ■ 26,18,274
n*r>T/Ruraf 19,60,01^'*<Hr<VUrbattf 6,58,25?? '
o vp 1,91,234i n w ------------------ ------ ?7T',’T7t
99,8909.918 9,197
34,012 31,38210,281 9,774'12,899 12,05617,547 ' 16,46613,421 12,469
1,45,33^?,.,„4Q J3J_„
2 5 ,0 ^ £17,62^12 0 ,3 ^0
1,32,142 26,553 31,564' 59,34^' - 24,3iJ^'- 28,7^^'" 2 2 ; / i f i
13,42,96310,()i;6943,41,269
li,75,311<>,58,3235,16,988
Dhule Ciiy (M) Nawapur Nandurbar (M) Talorfe; (My " Shahade' (M)'-Shirpi:r {M) D onaafchF'p^)
Xafgaon^"^
7^,25820,74112,949 ;; . . . j 'r 'y p■ 9»067[£.,ti£ TPT>rr- JM91gert7'J iVt?tp 8,165
68,934 i3,832 1^301 30,981 i2,480 14,416 li,684 34,970
69,077 J & lg ^ n@^'avi) 20,190 Chopda (M)12,100 Yawal (M)-- -
8,562 Faizpur (M)9,855 Raver (M)7,824 Savda (M)
63,208 Bh^sa val Urban Agglo,12,721 VSrahlScfi ' "15,263 Piaaiora t® )'C28,361’ C M is g S S li t^11,84814,320'^'^iMi&fafigacfr' fM)11,11'3' EriiFdBl (Wy-'
32.546 ......... Amaine^r (M)
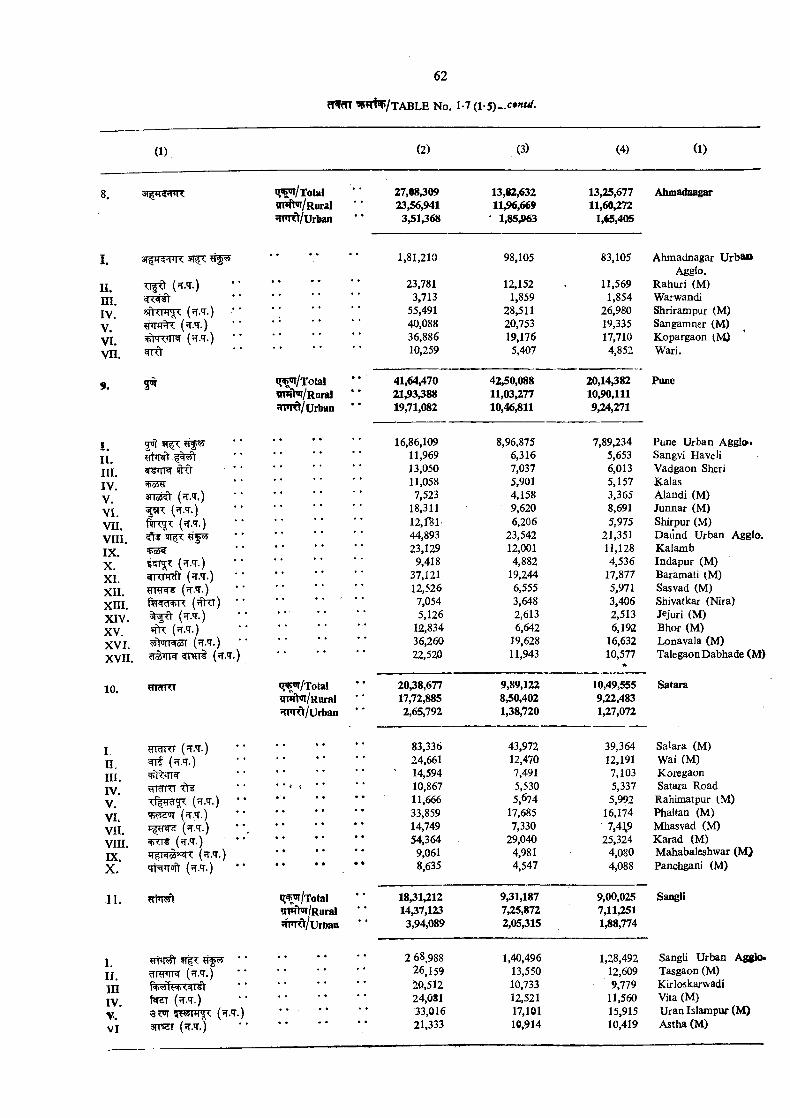
(1) (2) (3) (4) (1)
8. Total 27,§8,309 13,82,632 13,25,677 Ahmadoagar^n»ft«r/Rural • • 23,56,941 11,96,669 11,60,272»rmf^/Urban 3,51,368 • 1,85,963 1,€5,405
I. 1,81,210 98,105 83,105 Ahmadnagar U rbanAgglo.
II. 23,781 12,152 11,569 Rahuri (M)m . ct<<sr • • • * • • 3,713 1,859 1,854 Warwandi
IV.• • • • 55,491 28,511 26,980 Shrirampur (M)
V. ( T.'T.) • * * * 40,088 20,753 19,335 Sangamner (M)
VI. {VT-T.) * • * • 36,886 19,176 17,710 Kopargaon (M)
v n . c«Rt 10,259 5,407 4,852 Wari.
9 . <?^/T otal • • 41,64,470 42,50,088 20,14,382 PuneflT*f^>r/RiiraI « • 214>3,388 11,03,277 104>0,111•4l«Rt/Urban • • 19,71,082 10,46,811 9,24,271
I. •FT 16,86,109 8,96,875 7,89,234 Pune Urban Agglo*
II.♦ • • • • * 11,969 6,316 5,653 Sangvi Haveli
III. ^iT l^ ^ • • • • * • • • • 13,050 7,037 6,013 Vadgaon Sheri
IV * • • • 11,058 5,901 5,157 Kalas
V. 7,523 4,158 3,365 Alandi (M)
VI.• • 18,311 9,620 8,691 Junnar (M)
v n . (fr.7.) • * • ♦ 12,1^1- 6,206 5,975 Shirpur (M)VIII.
• • • • 44,893 23,542 21,351 Daund Urban Agglo.
IX. ^34 • • • • ♦ • 23,129 12,001 11,128 Kalamb
X. (JT.'T.) • • 9,418 4,882 4,536 Indapur (M)
XI. (JT.T.) • • • * 37,121 19,244 17,877 Baramati (M)
XII. (?T.T.) • • • • • * 12,526 6,555 5,971 Sasvad (M)x n i. • * • * • • 7,054 3,648 3,406 Sbivatkar (Nira)
XIV. %i;fr (^.7.) • • • * 5,126 2,613 2,513 Jejuri (M)
XV. ^ (JT.'T.) • • • ♦ ... 12,834 6,642 6,192 Bhor (M)
X VI. ^>1R3T {^.T.) • * • * • • 36,260 19,628 16,632 Lpnavala (M)
XVII. daJ'll'l 5nrT3’ (^•'T.) « * • • 22,520 11,943 10,577*
TalegaonDabhade (M>
10. t?^ /T o ta I •• 20,38,677 9,89,122 10,49,555 Satara^ITRH/Rural . . 17,72,885 8,50,402 9,22,483JTPrd/Urban 2,65,792 1,38,720 1,27,072
I, TRTr<T ( T.T.) 83,336 43,972 39,364 Sataxa (M)
II. ^ (^1.7.) . • • * 24,661 12,470 12,191 Wai (M)
III.. . * • ' 14,594 7,491 7,103 Koregaon
IV. 9TciTTT • • f • • • • 10,867 5,530 5,337 Satara Road
V. (JT.'T.) • • • • • • 11,666 5,674 5,992 Rahimatpur 1.M)
VI. 'firtS'jr • * 33,859 17,685 16,174 Phaltan (M)
vn. (fr.'T.) 14,749 7,330 7,41,9 Mhasvad (1 ^VIII. 4>IT? (?T.'T.) • • 54,364 29,040 25,324 Karad (M)
IX. (JT.T.) . . • • 9,061 4^981 4,080 Mahabaleshwar (M>
X . (?T.'T.) 8,635 4,547 4,088 Panchgani (M)
11. q^«r/xotai 18,31,212 9,31,187 9,00,025 Sangli/Rural * • 14,37,123 7,25,872 7,11,251
ffR ^/u rban 3,94,089 2,05,315 1,88,774
I . ?TFT^ 9T^ 2 68,988 1,40,496 1,28,492 Sangli Urban Agglo*II. ?TRTTn ( T.'T.) • * 26 159 13,550 12,609 Tasgaon (M)
in • • • • 20,512 10,733 9,779 Kirloskarwadi
IV. (JT.'T.) • • • • 24,081 12,521 11,560 Vita (M)
V .* • • ♦ * • 33,016 17,101 15,915 Uran Islampur (M )
VI arrer ( jt.t .) 21,333 10,914 10,419 Astha (M)
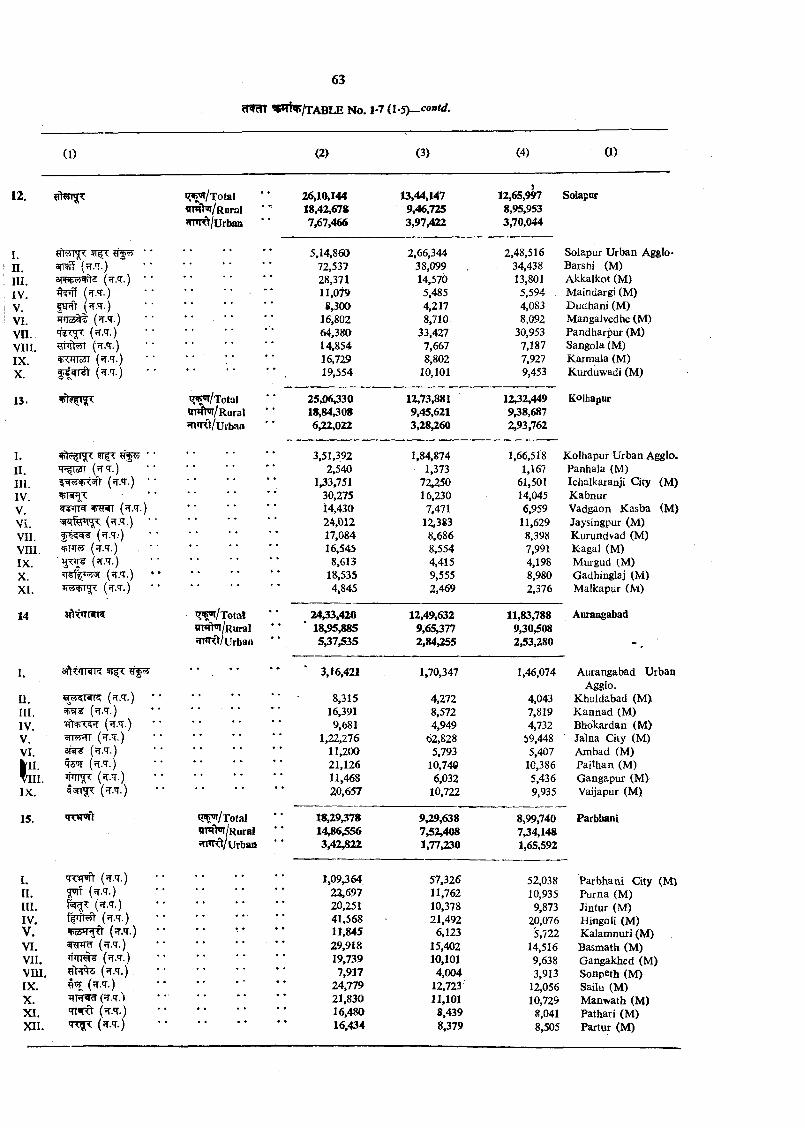
I.II.III.IV.V.VI.v n .v n i.IX.x .
13.
I.II. HI.IV.V.Vi.v n .v iu .IX.x .XI.
(1)
grot (JT.'T.) aiW vtW (JT.'T.)
(JT.'T.)(tt.'t.)(?r.'T.)(V.'T.)
TTaTlXsRnrr
(JT.'T.)
(2) (3) (4) (1)
<?^/T otal^n^N/Rural’fmrd/Urban
26,10,14418,42,6787,67,466
13,44,1479,46,7253,97,422
12,65,9978,95,9533,70,044
5,14,86072.53728,37111,0:^
8,30016,80264,38014,85416,72919,554
2,66,34438,09914,570
5,4854,2178,710
33,4277,6678,802
10,101
2,48,51634,43813,801
5,5944,0838,092
30,9537,1877,9279,453
Solapur
Solapur Urban Agglo* Barsfii (M)Akkalkot (M) Maindargi (M) Dudhani (M) Mangalvedhe (M) Pandharpur (M) Sangola (M)Karniala (M) Kurduwadi (M)
<?^/TotaI linftflT/Rural ’n*T^/Urba5
25J)6,33018,84,3086,22,022
12,73,8819,45,6213,28,260
12,32,4499,38,6872,93,762
Kolhapur
3,51,392 1,84,874 1,66,518 Kolhapur Urban Agglo.2,540 1,373 1,16? Panhala (M)
1,33,751 72,250 61,501 Ichalkaranji City (M)30,275 16,230 14,045 Kabnur14,430 7,471 6,959 Vadgaon Kasba (M)24,012 12.383 11,629 Jaysingpur (M)17.084 8,686 8,398 Kurundvad (M)16,545 8,554 7,991 Ragal (M)
8,613 4.415 4,198 Mmgud (M)18,535 9,555 8,980 Gadhinglaj (M)4.845 2,469 2,376 Malkapur (M)
14 aftvrreR «?^/T o ta t 24,33,420 12,49,632 11,83,788 Aurangabad' 18,95,885 9,65,377 9,30,508
•11*10/Urban 5,37,535 2,84,255 2,53,280
1. 3iK m'NT< .. ' 3,16,421 1,70,347 1,46,074 Aurangabad UrbanAgglo.
U. (jr.tT.) *' .. 8,315 4,272 4,043 Khuldabad (M )ni. • • • * * • 16,391 8,572 7,819 K annad (M)IV. ♦ • • • • • 9,681 4,949 4,732 Bhokardan (M>V. 'a1l«'tT « * * • • ♦ 1,22,276 62,828 59,448 Jalna City (M)VI. 11,200 5,793 5,407 Ambad (M)|n . t s ’JT 21,126 10,740 10,386 Paithan (M)vni. • • • • • ♦ 11,468 6,032 5,436 Gangapur (M>IX. (^r.T.) 20,657 10,722 9,935 Vaijapur (M)
15. ^ ^ /T o ta l 18,29,378 9,29,638 8,99,740 ParbhaniiTW>»r/Rural 14,86,556 7,52,408 7,34,148'n^lTl/Urban ' ' 3,42322 1,77,230 1,65,592
I. (iT.'T.) 1,09,364. 57,326 52,038 Parbhani City (M)n. • • • • • ♦ 22,697 11,762 10,935 Purna (M)in. ( T.cr.) • • ♦ • ♦ ♦ 20,251 10,378 9,873 Jintur (M)IV. (?T.T.) • « • * ♦ ♦ 41,568 21,492 20,076 Hingoli (M)V . +q4 R<1 (h.T.) 11,845 6,123 5,722 Kalamnuri (M)VI. 29,918 15,402 14,516 Basmath (M)v n . 19,739 10,101 9,638 Gangakhed (M)VUI.
• • • • • • 7,917 4,004 3,913 Sonpeth (M)IX. 24,779 12,723 12,056 Sailu (M)X.
• • ♦ 21,830 11,101 10,729 Manwath (M)XI. 'TT«r€t ( T.'T.) 16,480 8,439 8,041 Pathari (M)XII. 16,434 8,379 8,505 Partur (M)
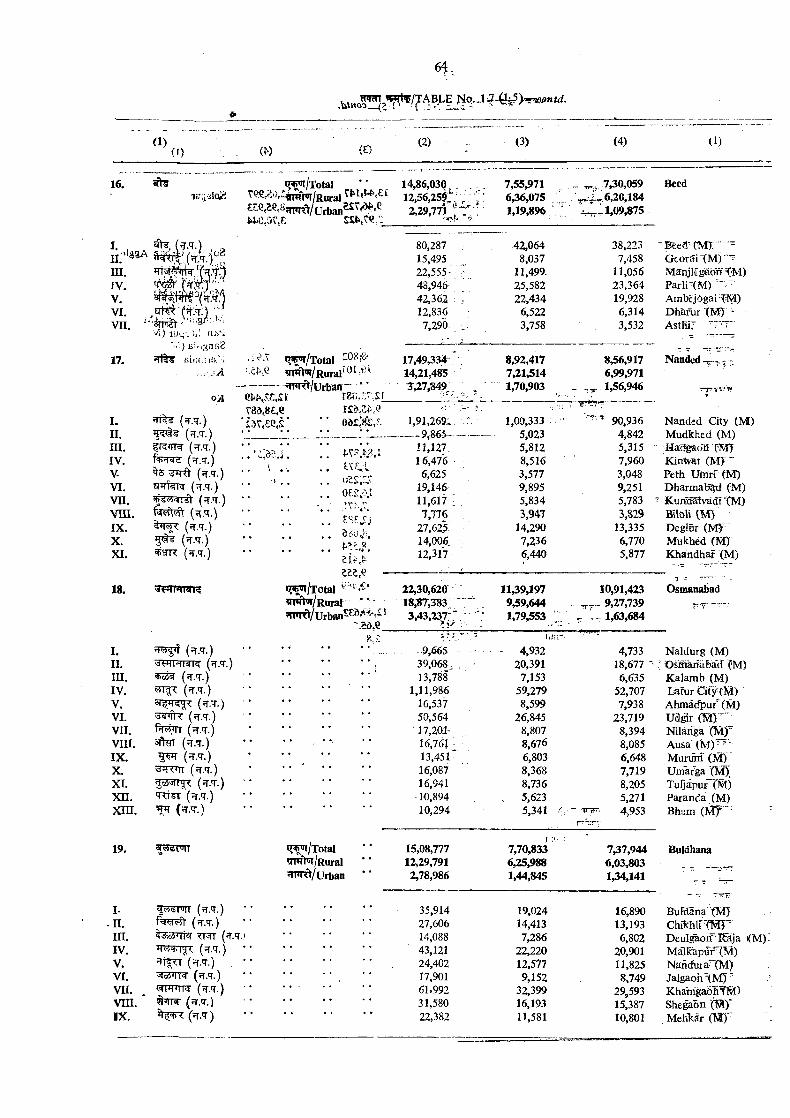
16. eftsK':jdoJ?.
i?^ /T o ta l * *
t^M,ovx £si‘,r<?.c_
14,86,0301 2 .5 6 ,2 5 ^ - , ; ;
7,55,971636,0751,19,896
7,30,059^ 6 ,2 0 ,1 8 4
1,09,875
Beed
ij-UaaA
III.
V.VI. (#;«T.v:^VII. ' ■ ^
'4) i'.iq-..5i:' ■T) £i-:=aaR8
17. Hi '8 sijvi';ixj'i
I.II. m.IV.V-VI.vn.v n i .IX.X.XI.
18.
I.n.m.IV.V.VI.vn.v r a .IX.
oil
(fT.q-.) (?T.’T.) (?r.'T.)
^5 (q-.7.)
(^.^.)
^tJR (?T.q.)
q ^ /T o ta l mjft’Ji/Rural* ^
----------- nnv^U rban ' * ’Q3 { ,s:c,£t ra:,^r:S:Lr3d,8£,ei5 ’r,£Q ,r ’ * OdSXi'/-
80,287. , 42,064 38,223 -B€ea‘ ( M r ''' '~15,495 8,037 7,458 G eorSi^M )'—22,555-':“ 11,499. 11,056 ManjlC p b n '^ M )48,945- 25,582 23,364 Parli-(M) ■42,362 : i 22,434 19,928 Ambejogai-tM)12,836 6,522 6,314 Dh&fur (MT *7,290 3,758 3,532 AstHi; " 7 ”
17,49,334 ’ 8,92,417 8,56,917 Nandcd-^r-; i; --14,21,485 7,21,514 6,99,9713^,27,8®;. , 1,70,903 „ 1,56,946
>
'c 'M I. i . . tKr..!
ut;:,zs 0£^A‘
Siio,/.;.
th\p- lZl<i -
q ^ /T o ta l ^TRt^/Raral • • ?n»rd/ Urban^^^'*^'^^
8.,'t
1,91,269- :. 1,00,333 '• 90,936 Nandcd City (M )-----9 ^ .5------- - — 5,023 4,842 Mudkhed (M)
11,127. 5,812 5,315 Ha'c^diS CM]F16,476 8,516 7,960 KinWat (M ) “
6,625 3,577 3,048 Peth U m n (M)19,146- 9,895 9,251 Dharmatf$a (M)11,617 : . 5,834 5,783 K um iavadTtM )7,776 3,947 3,829 Biloli m )
27,625.' - 14,290 13,335 Deglnr14,006 7,236 6,770 Mukhed (M)12,317: 6,440 5,877 Khandhaf (M)
22,30,620 1139,197 10,91,423 Osmanabad18,^,383;:" " 9,59,644 9,27,739 V'Y
3,43,237;: 1,79,553 ^ 1,63,684
I. {JT.T.) . . 9,665 4,932 4,733 Naldurg (M)II. • • • • ♦ ♦ 39,068. , • 20,391 18,677 Dsmariiibiacr (M)HI. +o6«J (^T.T.) • • • * * » ^ 13,788 7,153 6,635 Kalamb (M)IV. • • • 1,11,986 59,279 52,707 Lafur City (M)V. {n.q.) ‘ • ♦ • ♦« • • 16,537 8,599 7,938 Ahmacfpur"(M)VI. ♦ • ♦• • • 50,564 26,845 23,719 U a^ r (M I '"v n . (jt.'T.) « • ♦• • • 17,201- 8,807 8,394 Nilanga Cf^)”v n i. 3j1^I (rr.T.) • * . *•. • * 16,761 - 8,676 8,085 Ausa' (M) '''IX . • * * • • • 13,45l‘ 6,803 6,648 Murxmi (M)X. (JT.T.) ♦ • • • ♦ • 16,087 ■ 8,368 7,719 Unfafga "(MXXI. 5o3'i)!'^< ( vt.'T.) 16,941 8,736 8,205 Tu^apurTM )x n . M<i i (Fr.'T.) • ♦ ♦ • • • 10,894 - 5,623 5,271 Paranda (M)x in . * • • • • • 10,294 5,341 ^ - Tnrr 4^953 Bhum
19. ti^f/Total 15,08,777 7,70,833 737,944^n*fV /Rural 12,29,791 6,25,988 6,03,803HIM<)/Urban *' 2,78,986 1,44,845 134,141
Buldhana
f^siu ii (fr.'T.)(q-.7.)
^ 3 ^ TT rr (^.7,
( .'T.) ,5ra<TM (q-.7.) ^rmr^ (?r.7.) 9PTR (ar.T.)
(^r.T)
35,914 19,024 16,890 B ufdanafM J27,606 14,413 13,193 Chikhh"TW "14,088 7,286 6,802 D e u l^ o if K ija <M)43,121 22,220 20,901 Mallcapuf" (M)24,402 12,577 11,825 Naiiduian^M)17,901 9,152 8,749 Ja lgaon^M )'61,992 32,399 29,593 KhamgadftTl^)31,580 16,193 15,387 Shegaon (M )'22,382 11,581 10,801 MeHkar (J'3)
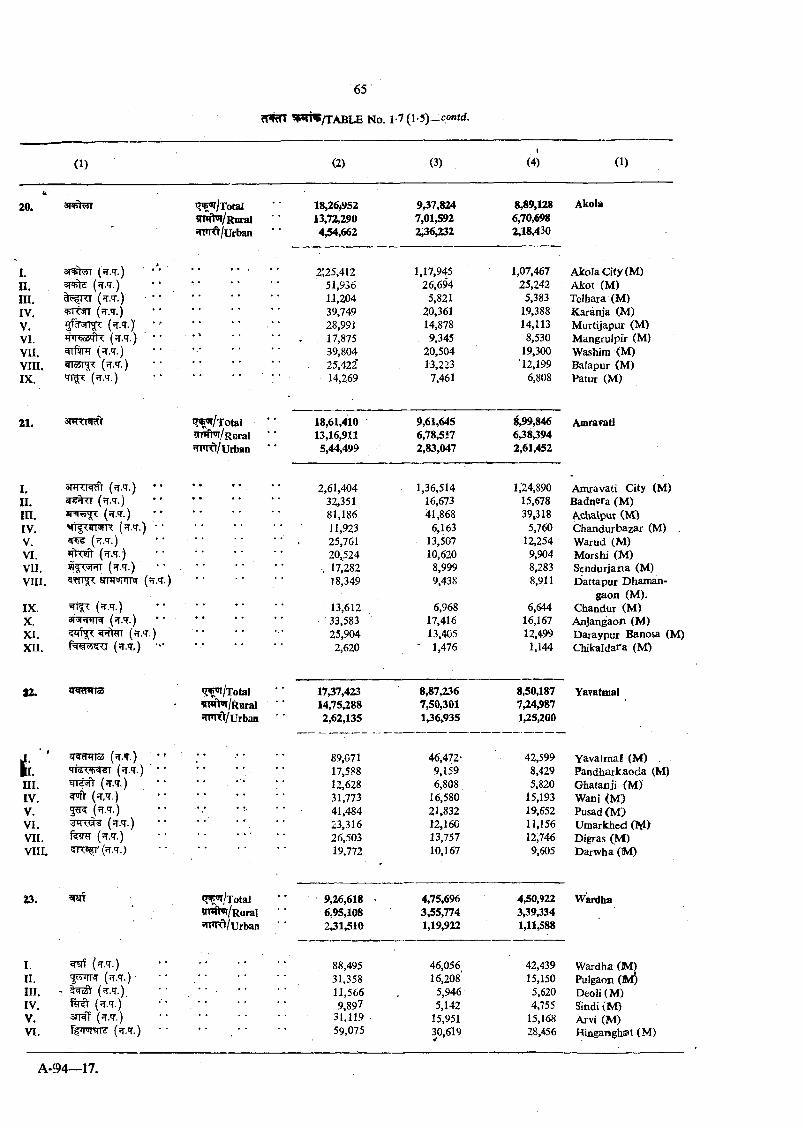
q ^ /X o ta l^IWH/Ruralsnnft/urban
18,26,95213,72,2904,54,662
9,37,8247,01,5922,36,232
8,89,1286,70,6982,18,430
Akola
I. sr^fr^II. sRTts (?i.q.)III. ( ’T'T )IV. (jr.T.)V. • 'VI. thr^osqh: ( t.t.)VII.Vin.IX. 'TTf ( •'T )
2’,25,412 1,17,945 1,07,467 Akola City (M)51,936 26,694 25,242 Akot (M)1J,204 5,821 5,383 Telhara (M)39,749 20,361 19,388 Karanja (M)28,991 14,878 14,113 Murtijapur (M)17,875 9,345 8,530 M angrulpir (M)39,804 20,504 19,300 Washim (M)25,422’ 13,223 12,199 Balapur (M)14,269 7,461 6,808 Patur (M)
21. ^ ^ l Toi&l^n»fh»r/Rurai^rmft/Urban
18,61,41013,16,9315,44,499
9,61,6456,78,5172,83,047
8,99,8466,38,3942,61,452
Amravati
I. snTTRcft ( .<T.) • • 2,61,404 1,36,514 1,'24,890 Amravati City (M)II. (jr.T.) 32,351 16,673 15,678 Badnera (M )m . (rj’.'T.) • • 81,186 41,868 39»318 Actva-lpur (NOIV. >fTf<«|RT< (51.7.) • • 11,923 6,163 5,760 C handurbazar (M)V. (JT.'T.) • • 25,761 13,507 12,254 Warud (M )VI. * ftr# (51.7.) . . 20^524 10,620 9,904 Morshi (M )v u . (^.7.) » • • • , 17,282 8,999 8,283 Sendurjana (M)VIII. srnT' TfiM (Tf.q’.) 18,349 9,438 8,911 D attapur Dhaman-
(fr.'T.)gaon (M).
IX. • • • • 13,612 6,968 6,644 Chandur (M )X. 3T3R rR (•T.'T.) - 33,583 17,416 16,167 Anjangaoc (M)XI. ( T.'T.) * • 25,904 13,405 12,499 Daraypur Banosa (M)XII. (^.7.) •“ « • • • 2,620 - 1,476 1,144 Chikaldara (M)
S2. ^J^/X otal 17,37,423 8,87,236 8,50,187 Yavatmal• «W>T/Rural 14,75,288 7,50,301 7,24,987 *
*nTRt/Urban 2,62,135 1,36,935 1,25,200
. . 89,071 46,472- 42,599 Yavafmal (M ) .Si. (^.7.) •• 17,588 9,159 8,429 Pandhark.aoda (M)ra. Mld-i-n (^.7.) • » • • « • 12,628 6,808 5,820 Ghatanji (M )IV. ^ (fT,7.) • . • • 31,773 16,580 15,193 Wani (M )V. 2 ^ (?r.7.) • V . • • 41,484 21,832 19,652 Pusad (M )VI. (^.7.) * « • * • • 23,316 12,160 11,156 Um arkhed (M>VII. Hiify (^.7.) . . • * ' 26,503 13,757 12,746 Digras (MC)VIII. 5R^(?T.7.) 19,772 10,167 9,605 Darwha (M )
23. ?raf *?^/TotaI 9,26,618 4,75,696 430,922 Wardha?n?f>r/RuraI • * 6,95,108 3,55,774 3,39,334^'Tm^/Urban 2,31,510 1,19,922 1,11,588
I. ^ (5T.7.) ................................ 88,495 46,056 42,439 Wardha (M JII. (rT.7.) 31,358 16,208' 15,150 Pulgaon (M )III. - (^.7.) ‘ • • 11,566 5,946 5,620 D eoIi(M )IV. fy-il (?r.7.) • • 9,897 5,142 4,755 Sindi(M )V. STRT (^.7.) • * 31,119 15,951 15,168 Arvi (M )VI. (?r.7.) • • • • • • 59,075 30,619 28,456 Hinganghs»t (M )
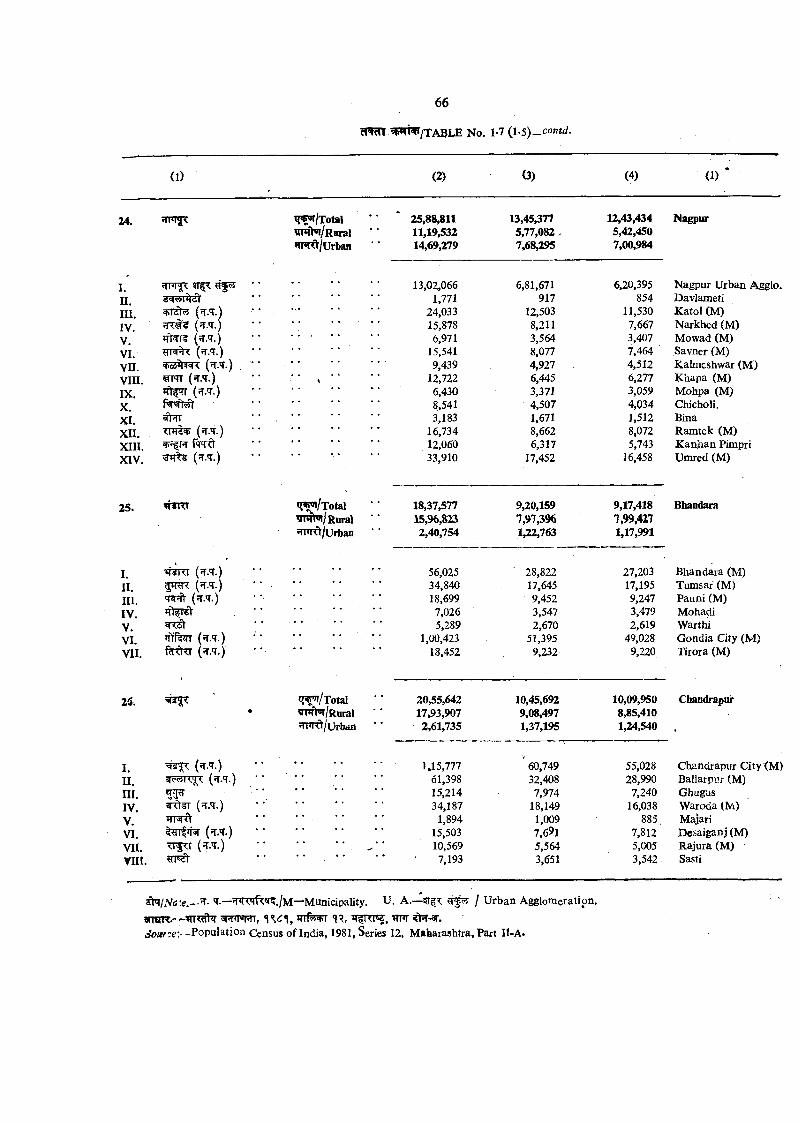
(1) (2) (3) (4) (1) *
24. JTFTJT ^ ^ /T o ta l 25,88,811 13,45,377 12,43,434 Nagpur^iwt^/Raral ' ’ 11,19,532 5,77,082 . 5,42,450HWO/Urban 14,69,279 7,68,295 7,00,984
I... 13,02,066 6,81,671 6,20,395 Nagpur Urban Agglo.
n. 1,771 917 854 Davlametim. ^RTSt (fT.<T.) ... 24,033 12,503 11,530 K ato l(M )IV.
. . 15,878 8,211 7,667 Narkhed (M)V. 6,971 3,564 3,407 Mowad (M)VI. (?r.'T.) 15,541 8,077 7,464 Savner (M)vn. 9,439 4,927 4,512 Kalmeshwar (M )VIII. ^TT (^.7.) 12,722 6,445 6,277 K hapa (M)IX. (-f.T.) . . 6,430 3,371 3,059 M ohpa (M)X. 8,541 4,507 4,034 Chicholi,XI. • • 3,183 1,671 1,512 BinaXII.
• « • ♦ . • 16,734 8,662 8,072 Ramtek (M)XIII. r?T Prrfr • . ♦ . . • 12,060 6,317 5,743 Kan,han PimpriXIV. 33,910 17,452 16,458 Umred (M)
25. q ^ /T o ta l 18,37,577 9,20,159 9,17,418 Bhandara^w 'n /R ural 15,%,823 7,97,3% 7,99,417»ll*ll<t/Urban 2,40,754 1,22,763 1,17,991
I.. . 56,025 28,822 27,203 B handara (M)
11.• • • • • • 34,840 17,645 17,195 Tumsar (M)
III.• . * . • • 18,699 9,452 9,247 Pauni (M)
IV. 7,026 3,547 3,479 MohadiV. • • • • * • 5,289 2,670 2,619 WartWVI. ifffen (^.7.) • • • • • • 1,00,423 51,395 49,028 Gondia City (M )VII. 18,452 9,232 9,220 Tirora (M)
25. q ^ /T o ta i 20,55,642 10,45,692 10,09,950 Cbacdrapur• ym>r/Rural 17,93,907 9,08,497 8,85,410
HrH'ft/Urban * ’ 2,61,735 1,37,195 1,24,540 •
I. (jr.7.) I J 5,777 * 60,749 55,028 C handrapur City <M)n .
• • • • • • 61,398 32,408 28,990 Ballarpi’r (M)III. • • • * • • 15,214 7,974 7,240 GbugusIV. • * • • • • 34,187 18,149 16,038 Waroda (M)V.
. . . • 1,894 1,009 885. MajariVI. (^r.7.) • • • • • • 15,503 7,691 7,812 Desaiganj (M)vu. 10,569 5,564 5,005 Rajura (M)VIII. 7,193 3,651 3,542 Sasti
‘I — TJn?Tft<SR./M—Municipality. U. A. — / U rban Agglomeration,^ m r w , « iV I, q^r<i4, ^ - s r .
Soitf:e\—Population Census of India, 1981, Series 12, M aharashtra, Part II-A*
TABLE No 18
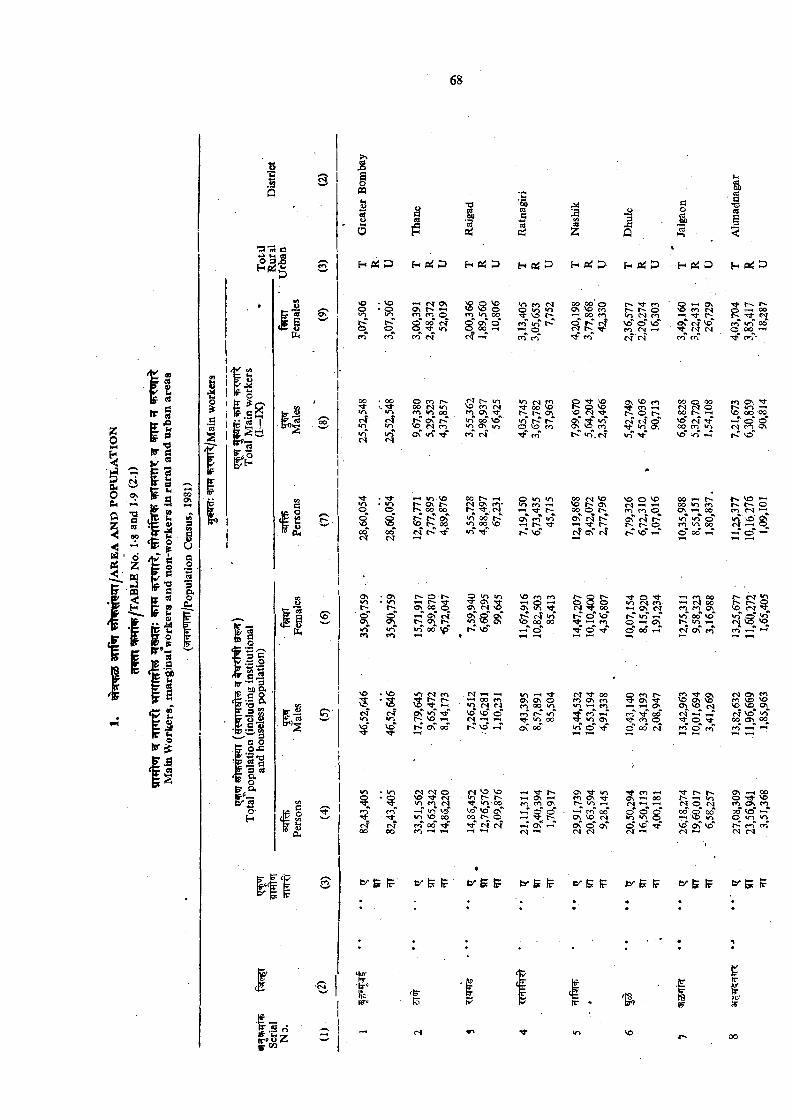
I
03I t
sEl|Xi
W ^
8 |P h
(o '
l>:
ic-1. 3 o
pq
•2
g
O
«
&
o
s
o
s
;;! s? 2ON » -if n fO O
8 » "f<) M
O ro p~ 00 t s «r> m *n oo
o T r ^ v<3 «M r<)o C
> -i <0 VO O s r ^00 00
f : S« S T t
\D Q VOXO V5 O m >n 00
§“ 0 ^ 0 00 - Ic f ~ ?
M r ^ «o VOCO o \<rT 00” VO~ >0 «o r n r i
« o foQ >0 <0
CfT < o “R .
c n c n
^ fs ) 5tJ ■>i- 00 'O Os
f< r
ON ' o \ < n r ~
« n
£ :: S J iON 0 0 O
oo r^ '-I o <0 «oCN( 0 \ trt m
. < s --V«o 00 oT rn'<0 w VO »-, 1-4 -.t•n y f v d '
Q iO VO re , r< i0\ *1 o '- '
VO 0 \ r t0 \ c sl 0 \
10 00 vp t^ \cT »-< »
c f• o
* ri • w i
*n CO 1— 100IN
COfS
o \ TJ-*' VO vo" 0VO c s y-i
1—1o C 00 VO
T f-d 500
<N £J O VO M < 0 r n r j r-T (n \0 <0 VO 00 rf% 00 ■rf
*-1 »~t
n VO VO«r>■<t «o 00 vo" VO* as 00 o
iN >n VO 00 00-H* o*
<0 ^0 \ 0 \ oCO 00 vn r n vN
00On 00
m CO ov
H p .
2? fiS oo s V o CO >-1 00 CO
CO
H P H eJ D
vO CS ■<»•
< 0 . M
00 rv j VOVo Os0 0 O C ' o C
tSf Os <SI
<N
r<f rt- 00 CO ON CO«0 « COr f c<^ »~r
<o On <0 0 “ r f
c\ Tj- inCO Osin — I
CO 00* o ^ VO t s on" 0 “ o T(N fN
^ COo<0 CN CO Vo" o ' VO* CO <N <-<r l ' r i
ON VO fO ^ 23 ^S ’Tf ^
>n
VO O VO <N « -i ’ - I CO CO O
Br ^ v o
o«r> fN CO--» ON <sr O ^c T 00 t-T
1—I >-( Os
O 00 tN
^ CO •—ION <-< 00
0 0 0 an <n o o ' vo" r f(NT >-'
CS
0 0 o 00
S P ? S
00 •-<00 wo CO O s > -i 00
— < CO 00CN 00
CO fO o ^<0 00 vo"
in * -ic ? o T CO
CO T t ON^ S5 Os VO tsM
O ^ TJ-CO“ 0 “ CO
^ '-' mO Cn|2 - SVO O s' vo“
>-H
H P K
T to >-^ 00 p: Tt Mco " w n 00 O 0 0 ’- '
c ^ ‘
CO O S ' 3'
( o » 3 ^
M ^ ^tC \£>
VO »-t r ~ t ~ ' o co^ c s «n vO' n *-< o
o ' *-*
JQt~~ t~~ O VO 0 1 ^
M vS VO CO
<S CO m V ® VO VO VO Os M VO* V J 00 o>^ 00 CO » -r «
ON ^ 00 O ra - VO rn O n COys vo“ i-rO < 0 <n
B ^& t? b^fefF fc 'S I?
' E(c
I
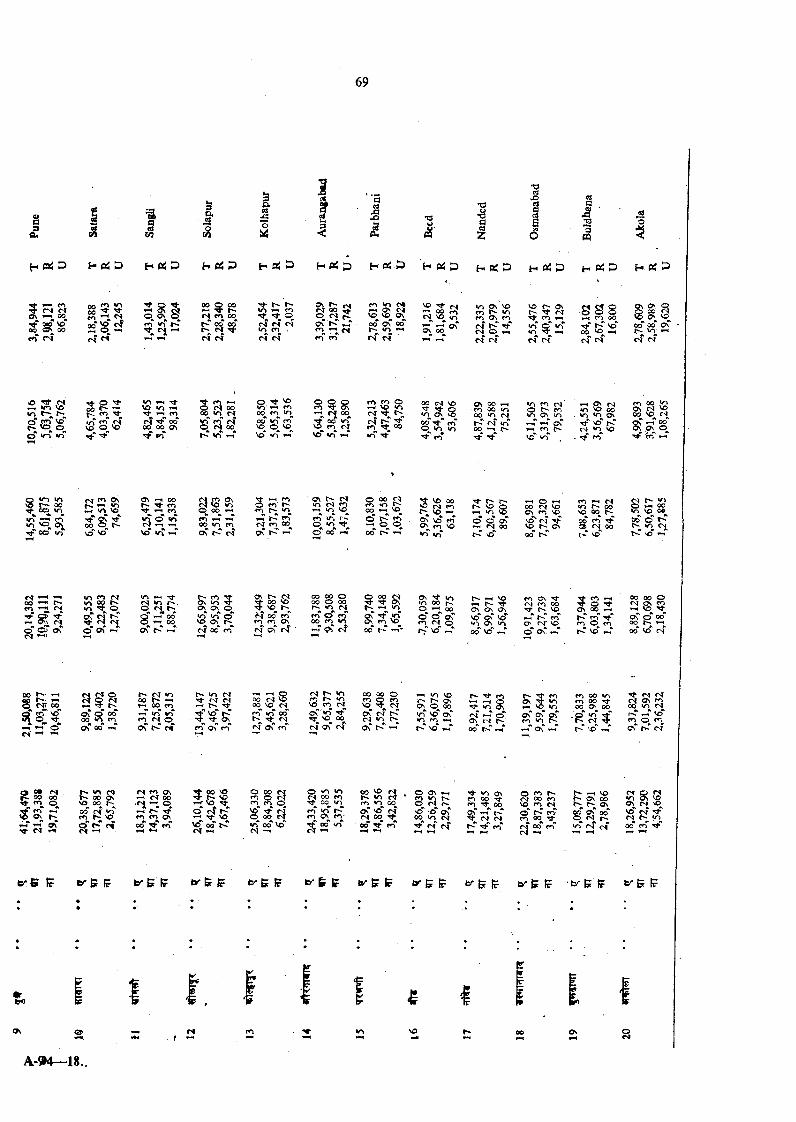
a
£%§CO
M
3
I : §
I I
43esa .C[
s3n
H O i t J H r t D h i d S P H r t p H O S D H P i D n O i i t ) H » ! J 2
, fNi nON « » ■ ■' qop VD 00 00 «n r s
oo 2 S
S o s ?cT
p T t
fo r *
00 5 ?2c5 fO 00r~
00n
M
rj- o r^ (Ni m >o c>4• o i- ic ^ r » o o U — ic ?\< s r
o r j ^ V0'£>0\_^ r ? <s r ? oC ,-T oo oC oo*tri m ■ ro >— f>< r-- V I »-ir l (S tn c»r c s ' t s
i£ ;3:<-< 00t s \D M-;*-< »-< oC0\ 00
m ov VOCO >o fO 0 \ m
fs r f
VO r:- o\ r - ■'4- r 4
C< m■o' o ' vT
tN rT
S S 8»-l CO 00
<s
Os ov qo CO c i05 ov VO 00“ 00“ cTVV
>0 <S « «r-> VO «no "< 2 ? '®'£3 O , 0 V-> «o
s 2:00 t ; s<0 ''f •o 55 5:jVO o VO
V~> •—i TfVO iri —( Tf — r»CS00 00 ON
«n
00 v> r<rn d r } 00 «o
O Tt VO «o »-i00 m ® ^ ^ »-i M 00
ocT vT VO ro n VO* «o“ »~r
cn ro O « VO w> CNl •>!l-
e£tn 00
00 M VO Q«n OS ®
rj-“ f»T O in «r>
OS 00 ^ m 00 <o 00 <0 «NI r f irT 00 *-i
^ rn cs o fo»0 Os 10
VO <0
-< Os •o ^ 00 «0 «0 O ' Tf so r-T CNl <0 VO n-* ro
00 VO f'l8 f s §■<*■’' frT ^
a tr~t irt 05 r — 00Tj- 00^
S ^ «o VC> o^- f o o i n
>/% VO^ S > ‘VO VO .
Os 00 r> 'i - tnTj CO >0 O >iO ts —c VO v\ -T
C^vo O 00 >-i
mO cn r~ro
rrT(\j m 00oT -<“
Ov M ir> «S f»5 w >0 vc f*? >/? r * ®« *'1 c T 00 «
o 00 <NCO -o00 «-1 V©
o o00
S vo 00
VO >-i^ 'O fDO ro VO «r> <o*
i>
c ? o oT «N 00
r - ■o’'
»—< 0 CO <N| £;?00 VO «o 00 p 000 \o VO 00 >0 VO 0^so" <s 00 ro 0VO00
r< ON 0 ^ nso''
00 N-r-T so
CN
o o > Os<N|
^ <NTo " o T - T
V I »-i -<a- r j «o r^. o <N8“ T1 00“
I—I 00 Os“ r-T
m 3 :Os IT) ■<3-Os o s o <0 >o O VO os c-J 00 rn
00 00 o00 O 00
*o r jro 0 “ ro00 c< «o-T oC rf
Os '!f ,>0O rn vo oo' ^ ' »-s*
Os '!*■ loJO 00 t-. c ^ 00 0 “ q oTcn O'! O
vo"
t^ —I VOTt-Os Os Os Vo“ Os- VO*" VT OS >0 0 0' vcT t-T
I—I r<O ' fsr VO o * os“
T* r<i —IO r f
Os 00 T-HK rf"f<s O ro r'T Vo" ^
00 00 oS ? S2•—4 VD ^
ON O 00“ 00 1 ;00'' VD CS
00 J>* ^ l> fN( ir>
*-• •nfO OcC c<f
r>- lo fNtTf ^Tj*
o> m
r ? t^ <0<n VO VO CO fSos“'»0
sO 00fN oC <N
00 00 Oro Q m VO ^ tSf Os" r f01 <o Os‘ C'* «-<“
»-< «o VOOs
o ^ q 00 irT VO Os* •n fo '—I f'.* vo"
fO<o<0
ro 00 «n CO op T t 00 O ^ 00 o ' v-T Tj-''
^r-*' ' S r-T
rj- M C'J tS 0 \ ro 00 m « s t '? r-T V^ ro o po oT r*-" <>f
3 0* ( s «r» r«|fC 00 00 00 OsT t rn o _ VO 00^^ ^ "-T 00 r f 'o 'V© Os |~^ cn
« l -H
M CO OS»“ • <sr 00
CO CO 0 \ 00 CO
o 00 r i n? OCO CO OO 00 r j * rf 00 vo" rq <-1
O u->fS 00 CO Tf 00 ir> CO VO CO
o s' vo" r i 00
00 ^ fo“
0fD
Os»o ro
wo00 O n
t:pCO00
r -CO
1— 1ON
VO00 10 VO
0 CM ro 00 VO CO Os 0 C^I soso*'00
swo
oCr i
0CO 00 co''
o ' h00“r^
vo“yo
r f CO*' r j 00* CO** WO fN c f 00 CO*-< CT »—( •-S
t r S ^ t r B B b^SGF 1=^51? b - f c t
t ,
iere&
'P
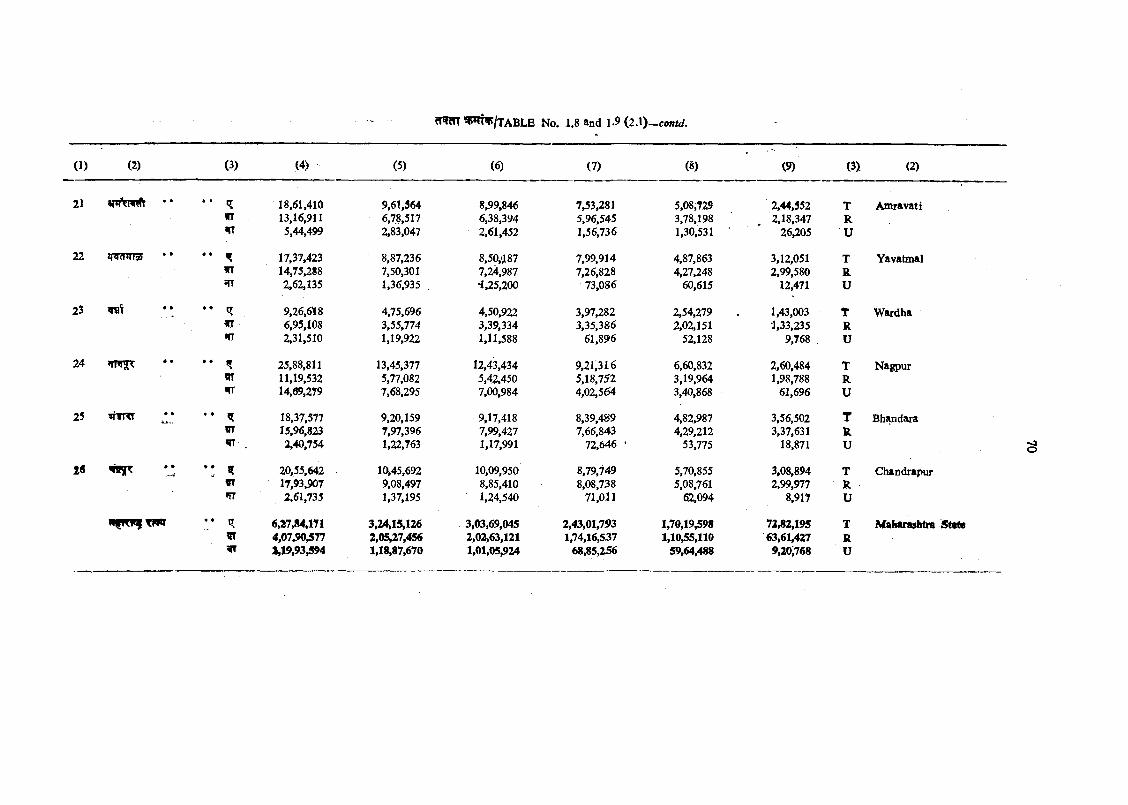
(1) (2) (3) (4) (5) (6) (7) (8) C9) (3) (2)
21 a p te iA * • • • cr 18,61,410 9,61,564 8,99,846 7,53,281 5,08,729 2,44,552 T AmravatiIT 13,16,911 6,78,517 6,38,394 5,96,545 3,78,198 2,18,347 RWT 5,44,499 2,83,047 2,61,452 1,56,736 1,30,531 26,205 U
22 • • ^ 17,37,423 8,87,236 8,50,iJ[87 7,99,914 4,87,863 3,12,051 T YavatmalWT 14,75,288 7,50,301 7,24,987 7,26,828 4,27,248 2,99,580 RfTT ^,62,135 1,36,935 . •1,25,200 73,086 60,615 12,471 U
23 • • ^ 9,26,648 4,75,696 4,50,922 3,97,282 2,54,279 1,43,003 t Wardham 6,95,108 3,55,774 3,39,334 3,35,386 2,02,151 ■1,33,235 R»TT 2,31,510 1,19,922 1,11,588 61,89>6 52,128 9,768 U
24 •* ^ 25,88,811 13,45,377 12,43,434 9,21,316 6,60,832 2,60,484 T Nagpurm 11,19,532 5,77,082 5,42,450 5,18,752 3,19,964 1,98,788 Rwr 14,69,279 7,68,295 7,00,984 4,02,564 3,40,868 61,696 U
25 ^¥pcr • • 18,37,577 9,20,159 9,17,418 8,39,489 4,82,987 3,56,502 T Bhandarain 15,96,823 7,97,396 7,99,427 7,66,843 4,29,212 3,37,631 R*fT . 3,40,754 1,22,763 1,17,991 72,646 • 53,775 18,871 U
20,55,642 10,45,692 10,09,950 8,79,749 5,70,855 3,08,894 T ChandrapurIT 17,93,907 9,08,497 8,85,410 8,08,738 5,08,761 2,99,977 Rm 2,61,735 1,37,195 1,24,540 71,011 62,094 8,917 U
•• 6,27M 471 3,24,15,126 3,03,69,045 2,43,01,793 1,70,19,598 72,82,195 T MaharasMra StateAT 4,07W 7 7 2 .05^ ,456 2,02,63,121 1,74,16,537 1,10,55,110 63,61,427 RWf 1,19,93,594 1,18,87,670 1,01,05,924 68,85,256 59,64,488 9^0,768 U
o
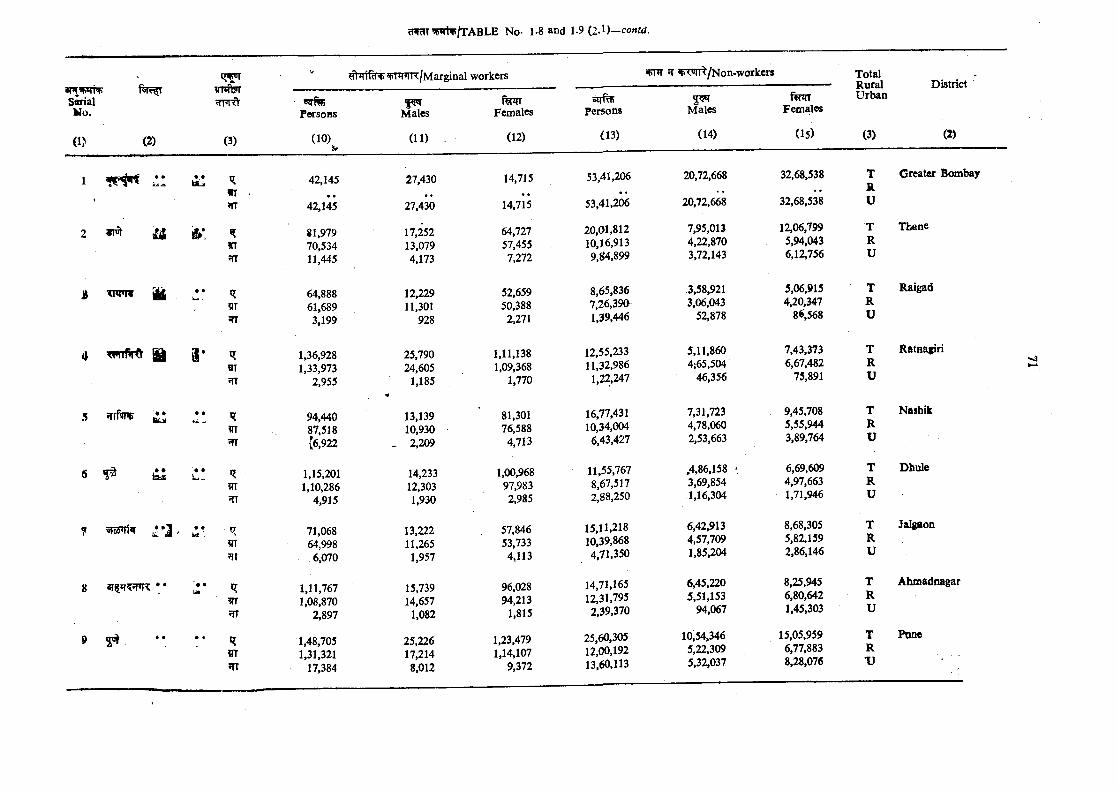
frr*nnr/Marginal workers ^ ?T ‘Kvtll/Non-workers TotalRural Districtl'ST<r5i
S ^ a lNo.
■ «iRhPWSOHS Males Females
scrf^Persons
WMales Females
U rban
(1) (2) (3) (10)i0
(11) (12) (13) (14) (15) (3) (2)
1 • •ksLii
IT .>rr
42.145
42.145
27.430
27.430
14.715
14.715
53.41.206
53.41.206
20.72.668
20.72.668
32.68.538
32.68.538
TRU
Greater Bombay
2 a’fT?rr
81,97970,53411,445
17,25213,0794,173
64,72757,4557,272
20,01,81210,16,9139,84,899
7,95,0134,22,8703,72,143
12,06,7995,94,0436,12,756
TRU
Tbane
» xnm t mUi • •13T5TT
64,88861,6893,199
12,22911,301
928
52,65950,388
2,271
8,65,8367,26,390-1,39,446
3,58,9213,06,043
52,878
5,06,9154,20,347
8^,568
TRU
Raigad
I - 1,36,9281,33,973
2,955
25,790 . 24,605
1,185
1,11,1381,09,368
1,770
12,55.23311,32,986
1,22,247
5,11,8604;65,504
46,356
7,43,3736,67,482
75,891
T Rataagiri4 q I
WT
RU
5 • •kM.
irr5fT
94,44087,518[6,922
13,139 10,930
_ 2,209
81,30176,588
4,713
16,77,43110,34,004
6,43,427
7,31,7234,78,0602,53,663
9.45.7085,55,9443,89,764
TRU
Nashik
6 £ i'• • <?
m?n
1,15,2011,10,286
4,915
14,23312,3031,930
1,00,96897,9832,985
11,55,7678,67,5172,88,250
,4,86,1583.69,8541,16.304
6,69,6094,97,6631,71,946
TRU
Dhule
7 5ra*Jiir ^ * J , # •in q
?nrfrr
71,06864,998
6,070
13,22211,265
1,957
57,84653,733
4,113
15,11,21810,39,8684,71,350
6,42,9134,57,7091,85,204
8,68,3055,82,1592,86,146
TRU
Jalgaon
8 ar§xT??nr • • '♦ •idat .
=arfTT
1,11,7671,08,870
2,897
15,73914,657
1,082
96,02894,213
1,815
14,71.16512,31,7952,39,370
6,45,2205,51,153
94,067
8,25,9456,80,6421,45,303
TRu
Ahmadnagar
9 2 ^• * «?
iJT!jr
1,48,7051,31,321
17,384
25,22617,2148,012
1,23,4791,14,107
9,372
25,60,30512.00,19213,60,113
10.54,3465,22,3095,32,037
15,05,9596,77,8838,28,076
TRTJ
Pone
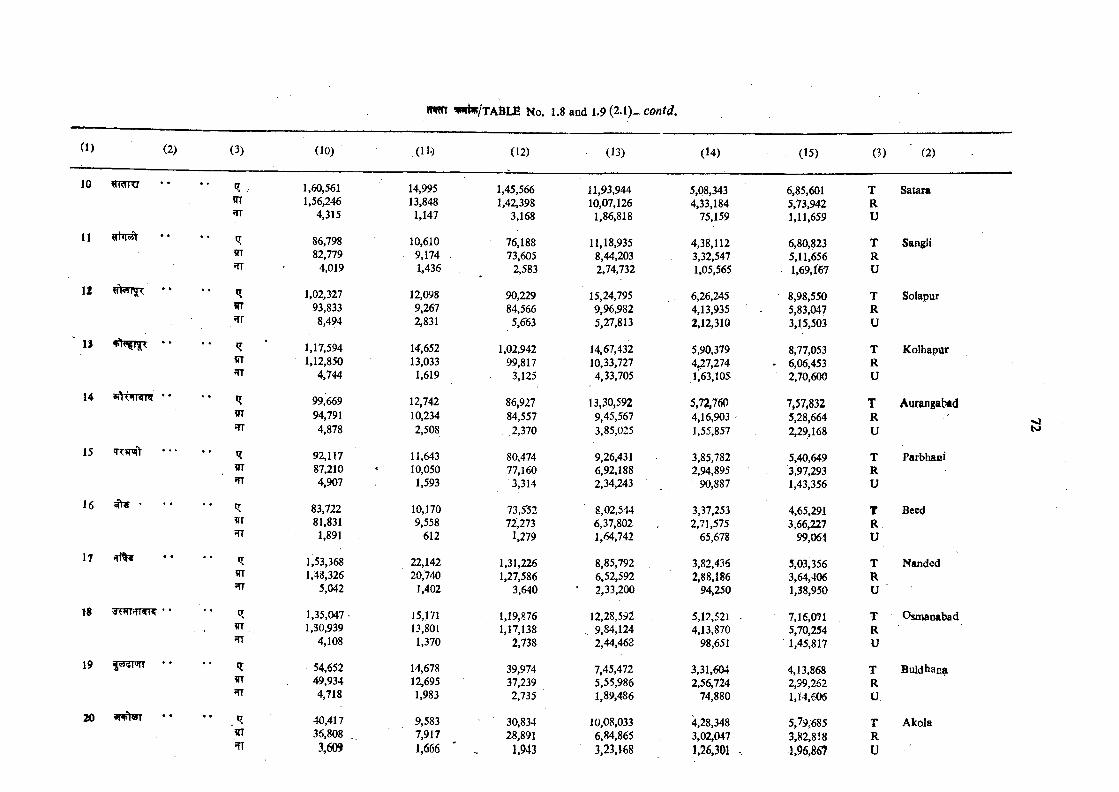
fwm ^w k/X A fiLE No. 1.8 and 1.9(2.1)-CO«f</.
Cl) <2) (3) (10) (11.) (12) (13) (14) (15) 0 )
10 fl’RTRI ^ , 1,60,561 14,995 1,45,566 11,93,944 5,08,343 6,85,601 T1,56,246 13,848 1,42,398 10,07,126 4,33,184 5,73,942 R
5TT 4,315 1,147 3,168 1,86,818 75,159 1,11,659 U
11 II 86,798 10,610 76,188 11,18,935 4.38,112 6,80,823 T82,779 9,174 73,605 8,44,203 3,32,547 5,11,656 R
4,019 1,436 2,583 2.74,732 1,05,565 1,69,I&7 U
12 • * 1,02,327 12,098 90,229 15,24,795 6,26,245 8,98,550 TilT 93,833 9,267 84,566 9,96,982 4,13,935 5,83,047 R?rr 8,494 2,831 5,663 5,27,813 2,12,310 3,15,503 U
IS q 1,17,594 14,652 1,02,942 14,67,432 5,90,379 8,77,053 T1JT 1,12,850 13,033 99,817 10,33,727 4^7,274 . 6,06,453 R
4,744 1,619 3,125 4,33,705 r,63,105 2,70,600 U
14 Sil'inRre • * •• I? 99,669 12,742 86,927 13,30,592 5,72,760 7,57,832 TVI 94,791 10,234 84,557 9,45,567 4,16,903 5,28,664 Rqr 4,878 2,508 2,370 3,85,025 1,55,857 2,29,168 U
15 TTKWV * • ‘ 92,117 11,643 80,474 9,26,431 3,85,782 5,40,649 T87,210 10,050 77,160 6,92,188 2,94,895 3,97,293 R4,907 1,593 3,314 2,34,243 90,887 1,43,356 U
16 83,722 10,170 73,552 8,02,544 3,37,253 4,65,291 T»T 81,831 9,558 72,273 6,37,802 2,71,575 3.66,227 R
1,891 612 1,279 1,64,742 65,678 99,064 U
17 tr 1,53,368 22,142 1,31,226 8,85,792 3,82,436 5,03,356 T?TT 1,48,326 20,740 1,27,586 6,52,592 2,88,186 3,64,406 R5TT 5,042 1,402 3,640 ' 2,33,200 94,250 1,38,950 U
18 1,35,047 • 15,171 1,19,876 12,28,592 5,12,521 . 7,16,071 TV[J 1,30,939 13,801 1,17,138 . 9,84,124 4,13,870 5,70,254 Rm 4,108 1,370 2,738 2,44,468 98,651 1,45,817 U
19 fefSPTT 54,652 14,678 39,974 7,45,472 3,31,604 4,13,868 T49,934 12,695 37,239 5,55,986 2,56,724 2,59,262 R
frr 4,718 1,983 2,735 1,89,486 74,880 1,14,606 0
20 •• II 40,417 9,583 30,834 10,08,033 4,28,348 5,79;685 TITT 36,808 7,917 28,891 6,84,865 3,02,047 3,82,818 R
3,609 1,666 1,943 3,23,168 1,26,301 1,96,867 u
Satara
Sangli
Solapur
Kolhapur
Auraogabad
Parbhani
Beed
Nanded
Osmanabad
Buldhaca
Akola
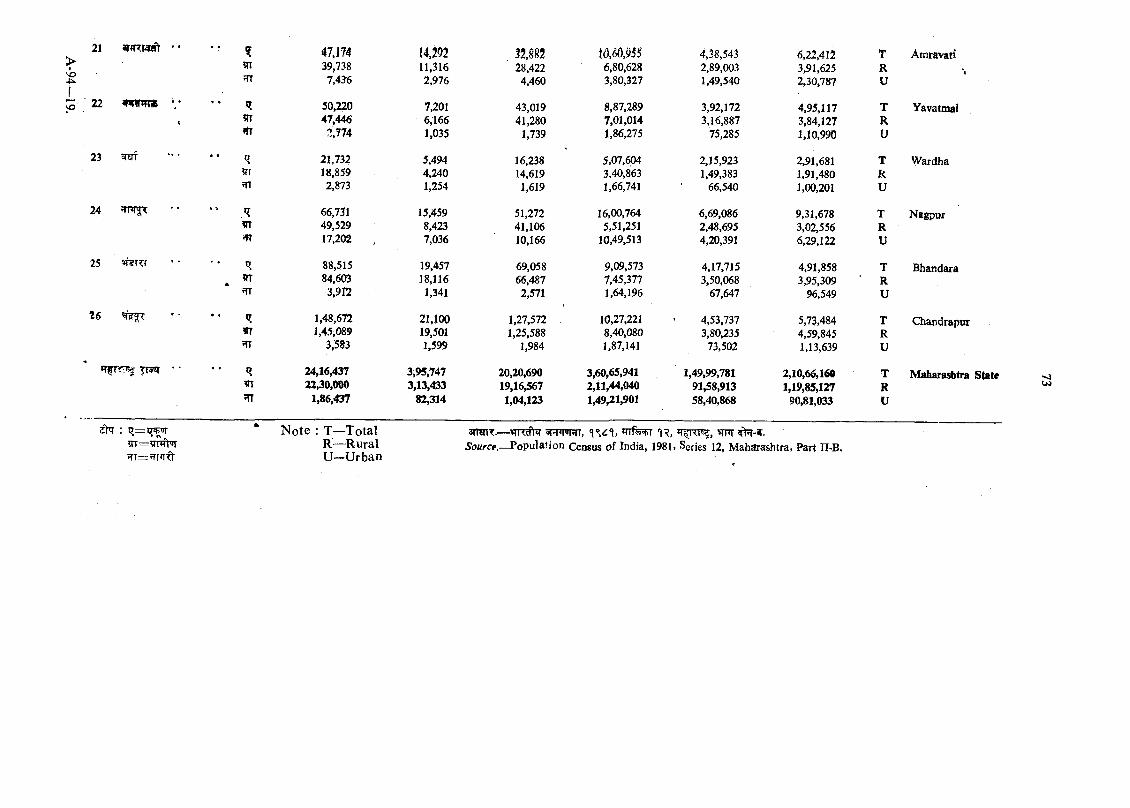
21 • • “ ? 47,m 14,i n 32,§e2 4,38,543 6,22,412 T Amravad39,738 11,316 28,422 6,80,628 2,89,003 3,91,625 R
ffT 7,436 2,976 4,460 3,80,327 1,49,540 2,30,787 V
22 m n ro s • / 50,220 7,201 43,019 8,87,289 3,92,172 4,95,117 T YavatmalfT 47,44€ 6,166 41,280 7,01,014 3,16,887 3,84,127 R
2,774 1,035 1,739 1,86,275 75,285 1,10,990 U
23 ^ «? 21,732 5,494 16,238 5,07,604 2,15,923 2,91,681 T Wardha?rr 18,859 4,240 14,619 3,40,863 1,49,383 1,91,480 R?n 2,873 1,254 1,619 1,66,741 66,540 1,00,201 U
24 'Trn^T *'' *? 66,731 15,459 51,272 16,00,764 6,69,086 9,31,678 T Nagpur?TT 49,529 8,423 41,106 5,51,251 2,48,695 3,02,556 Rm 17,202 7,036 10,166 10,49,513 4,20,391 6,29,122 U
25 88,515 19,457 69,058 9,09,573 4,17,715 4,91,858 T BhandaraA 84,603 18,116 66,487 7,45,377 3,50,068 3,95,309 R
3,912 1,341 2,571 1,64,196 67,647 96,549 U
26 =^g-^ «? 1,48,672 21,100 1,27,572 , 10,27,221 4,53,737 5,73,484 T Chandrapurm 1,45,089 19,501 1,25,588 8,40,080 3,80,235 4,59,845 Rm 3,583 1,599 1,984 1,87,141 73,502 1,13,639 U
24,16,437 3,95,747 20,20,690 3,60,65,941 1,49,99,781 2,10,66,168 T Maharashtra State22,30,000 3,13,433 19,16,567 2,i l , 44,040 91,58,913 1,19,85,127 R
517 1,86,437 82,314 1,04,123 1,49,21,901 58,40,868 90,81,033 U
•vlu>
q-T=5Trirft
Note : T—Total R —Rural U -U rban
m n x .— wRcft^ 5FnpjRT, *T^Rns , ^ ^ - s r .5o«rcp.—Population Census o f India, 1981, Series 12, Maharashtra, Part II-B.
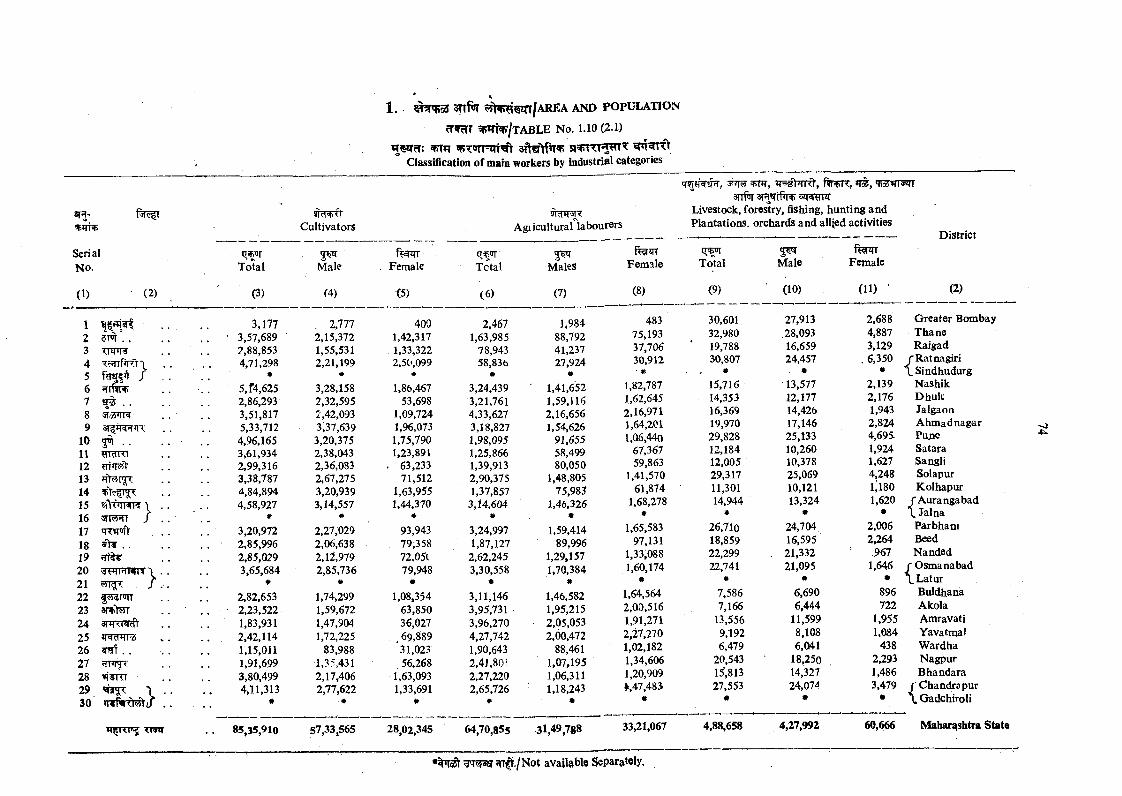
«TH-
SerialNO.
( 0 (2)
12 5M . .
3 TTW?4 ?;fjfTRRV\5 /67 ^ • •8 3[3iTTTW9 3I iT5?TJR
10 5^ • •1112131415 sfttiriTR \16 /1718 ^ . .192021 WTiJi /22232425 tfwmuz26 . .2728 Ti¥m29 ^ \30 irv fv d ^ j" .
U^TTT TTHT
1 . la^TCoS 3TTfnr 55t> T ’5m /A R EA AND POPULATION
5Tfcrr 3 P ^ /tA B L E No. l . io (2 .1)
^ w fT ; ^ *fJT'>TT=in^ 3ihr>fn«PClassification of main workers by industrial categories
q^'orTotal
(3)
3,177 3,57,689 ?,88,853 4,71,298
•5,f4,6252,86,2933,51,8175,33,7124,96,1653,61,9342,99,3163,38,7874,84,8944,58,927
*3,20,9722,85,9962,85,0293,65,684
#2,82,6532,23,5221,83,9312,42,1141,15,0111,91,6993,80,4994,11,313
•
9TcTf)TtCultivators
5^^Male
f4)
2,7772,15,3721,55,5312,21,199
*3,28,1582,32,5952,42,0933,37,6393,20,3752,38,0432,36,0832,67,2753,20,9393,14,557
«2,27,0292,06,6382,15,9792,85,736
*1,74,2991,59,6721,47,9041,72,225
83,9881,35,4312,17,4062,77,622
*
Female
(5)
4001,42,3171,33,3222,50,099
#1,86,467
53,6981,09,7241,96,0731,75,7901,23,891
63,23371,512
1,63,9551,44,370
•93,94379,35872,05179,948
*1,08,354
63,85036,027
.69,88931,02356,268
1,63,0931,33,691
*
srcnr^TAgiicultural labourers
Total
(6)
2,4671,63,985
78,94358,836
•3,24,4393,21,7614,33,6273,18,8271,98,0951,25,8661,39,9132,90,3751,37,857
3,14,604*
3,24,9971,87,127
2,62,2453,30,558
*3,11,1463,95,7313,96,2704,27,7421,90,6432,41,80!2,27,2202,65,726
5 ^Males
(7)
1,98488,79241,23727,924
•1,41,6521,59,1162,16,6561,54,626
91,65558,49980,050
1,48,80575,983
1,46,326•
1,59,41489,996
1,29,1571,70,384
*1,46,5821,95,2152,05,0532,00,472
88,4611,07,1951,06,3111,18,243
•
Livestock, forestry, fishing, hunting and Plantations, orchards and allied activities
District
85,35,910 57,33,565 28,02,345 64,70,855 3l,49,7g8
ftgiTT 5 ^Female Total Male Female
(8) (9) (10) (11) (2)
483 30,601 27,913 2,688 G reater Bwnbay75,193 32,980 28,093 4,887 Thane37,706 ' 19,788 16,659 3,129 Raigad30,912 30,807 24,457 . 6,350 rR atnagiri' # * • • \ Sindhudurg
1,82,787 15,716 13,577 2,139 N ashik1,62,645 14,353 12,177 2,176 Dhulc2,16,971 16,369 14,426 1,943 Jalgaon1,64,201 19,970 17,146 2,824 A hmad nagar1,06,440 29,828 25,133 4,695 Pujje
67,367 12,184 10,260 1,924 Satara59,863 12,005 10,378 1,627 Sangli
1,41,570 29,317 25,069 4,248 Solapur61,874 11,301 10,121 i;i80 Kolhapur
; 1,68,278 14,944 13,324 1,620 r A urangabad* * • • L Jalna
1,65,583 26,710 24,704 2,006 Parbhani97,131 18,859 16,595 2,264 Beed
1,33,088 22,299 21,332 ^67 Nanded1,60,174 22,741 21,095 1,646 rO sm anabad
• * • « L Latur1,64,564 7,586 6,690 896 Buldhana2,00,516 7,166 6,444 722 Akola1,91,271 13,556 11,599 1,955 Amravati2,27,270 9,192 8,108 1,084 Yavatmal1,02,182 6,479 6,041 438 W ardha
; 1,34,606 20,543 18,250 2,293 Nagpur1,20,909 1^,813 14,327 1,486 Bhandara^,47,483 27,553 24,074 3,479 f Chandrapur
* * « • \ Gadchiroli
33,21,067 4,88,658 4,27,992 60,666 Maharashtra State
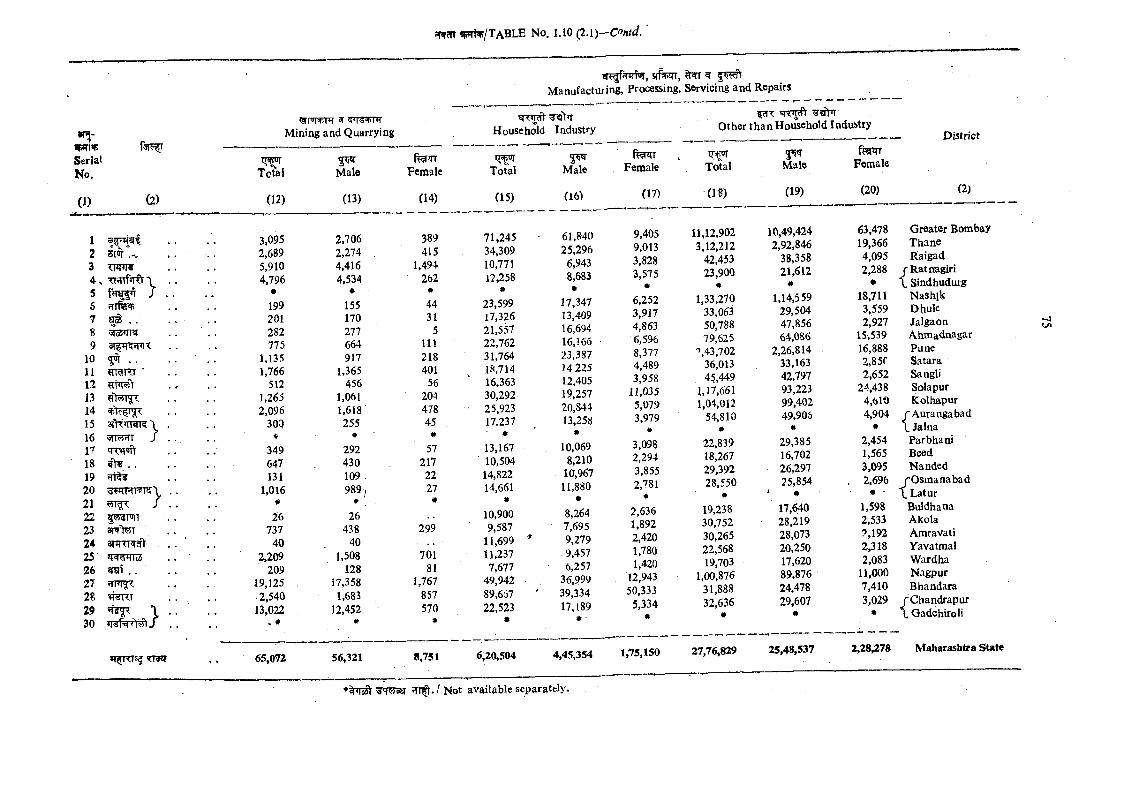
SerialN o .
(I) (2)
12 5Tor3 W IT4» TcJnf»rft\5 J67 • •89
10 5^ . .1112131415161718 9 ^ . .
192021222324 SnTTRfft252627282930
/
zr^^nrfor, ^ ^M anufacturing, Processing, Servicing and Repairs
^ r» iw r ^Mining and Quarrying
WTTRTt Household Industry
To^al
(12)
65,072
Male
(13)
3,095 2,7062,689 2,2745,910 4,4164,796 4,534
• «199 155201 170282 277775 664
1,135 9171,766 1,365
512 4561,265 1,0612,096 1,618
30Q 255« #
349 292647 430131 109 .
1,016 989/* #26 26
737 43840 40
2,209 1,508209 128
19,125 , 17,358• 2,540 1,68313,022 12,452
' • #
56,321
Female
(14)
389415
1,494262
#44 31
5111218401
56 204 47845
«57
21722-27
«
299
70181
1,767857570
8,751
Total
(15)
71,24534,30910,77112,258
*23,59917,32621,55722,76231,76418,71416,36330,29225,92317.237
*13,16710,50414,82214,661
*10,9009,587
11,69911.237 7,677
49,94289,66722,523
#
6,20,504
Male
(16)
61,84025.296
6,9438,683•
17,347 13,409 16,694 16,166 23,387 .14 225 12,40519.257 20,84413.258
*10,069
8,21010,967
11,880•
8,2647,6959,279
.9,4576,257
36,99939,33417,189
#
9,4059,0133,8283,575
•6,2523,9174,8636,5968,3774,4893,958
11,0355,0793,979
*3,0982,2943,8552,781
#2,6361,8922.420 1,7801.420
12,943 50,333
5,334
Other th an Household Industry
f ^ rFemale
(17)
tr mTotal
(18)
4,45,354 1,75,150
11,12,9023,12,212
42,45323,900
m1,33,270
33,06350,78879,'625
'►,43,70236,01345,449
1,17,6611,04,012
54,810*
22,83918,26729,39228,550
*19,23830,75230,26522,56819,703
1,00,87631,88832,636
«
27,76,829
Male
(19)
10,49,4242,92,846
38,35821,612
w1,14,559
29,50447,85664,086
2,26,81433,16342,79793,22399,40249,903
•29,385 16,702 26,297 25,854
■' * 17,640 28,219 28,073 20,250 17,620 89,876 24,478 29,607
*
Fenaale
(20)
District
(2)
25,48,537
63,478 Greater Bombay 19,366 T hane4.095 Raigad 2,288 j'Ratrra.giri
• 1 Sindhudurg18,711 N ashlk3,559 Dhule2,927 Jalgaon
15,539 Ahmadnagar16,888 Pune2,85f Satara2,652 Sangli
24,438 Solapur4,610 Kolhapur4,904 r Aurangabad
• 1 Jalna2,454 Parbhani1,565 Beed3.095 Nanded 2,696 jO sm an ab ad
• \L a t u rI,598 Buldhana2,533 Akola?,192 Amravati2,318 Yavatmal2,083 W ardha
II,000 Nagpur7,410 Bhandara3,029 /C hand rapu r
• \ Gadchiroli
2,28,278 Maharashtra State
C/l
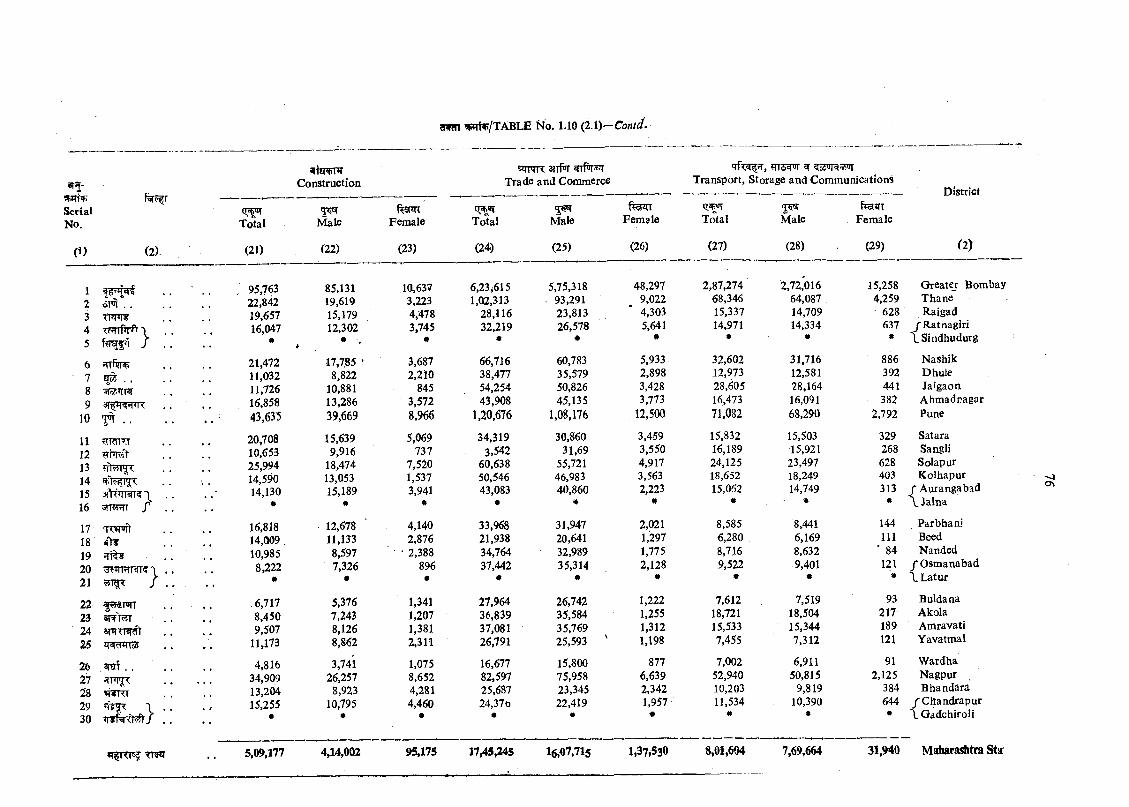
«T5-
SerialNo.
(i) (2).
Total
(21)
^tsnFRConstruction
5 ^Male
f22)
?PRn ?wiv/TABLE i^o. 1.10 ( l.\) '-C o n td ^
Female
(23)
csmn: sfrftr wrf>r7JT Trade and Commerce
Total
(24)
5 ^Male
(25)
f TETTFemale
(26)
<Tfc^;r, HTsy iT Transport, Storage and Communication^
Tcrtal
(27)
Male
(28)
Female
(29)
District
(2)
12 6m . .34 T r 5 n ^ \5 J
5TT%3p
95,76322,84219,65716,047
•
21,472
85,13119,61915,17912,302
•
17,785
10,6373.2234,4783,745
•
3,687
6,23,6151,02,313
28,11632,219
•
66,716
5,75,318 ■ 93,291
23,813 26,578
*
60,7837 ^o5 . , 11,032 8,822 2,210 38,477 35,5798 11,726 10,881 845 54,254 50,826
9 16,858 13,286 3,572 43,908 45,135
10 . . 43,635 39,669 8,966 1,20,676 1,08,176
11 yidiTT 20,708 15,639 5,069 34,319 30,860
12 5ETniV/t 10,653 9,916 737 3.542 31,6913 25,994 18,474 7,520 60,638 55,72114 14,590 13,053 1,537 50,546 46,983
15 \ . . 14,130 15,189 3,941 43,083 40,860
16 f . . • * * «. *
17 16,818 12,678 4,140 33,968 31,947
18 14,009 . 11,133 2,876 21,938 20,641
19 10,985 8,597 ' 2,388 34,764 32,98920 8,222 7,326 896 37,442 35,31421 / . • • • • • «
22 .6,717 5,376 1,341 27,964 26,74223 3nFJ?5T 8,450 7,243 1,207 36,839 35,58424 arUTT^ 9,507 8,126 1,381 37,081 35,76925 M4fl to5 11,173 8,862 2,311 26,791 25,593
26 ^ . . . 4,816 3,741 1,075 16,677 15,80027 34,909 26,257 8,652 82,597 75,95828 13,204 8,923 4,281 25,687 23,34529 15,255 10,795 4,460 24,370 22,41930 ••
• • # « *
5,09,177 444,002 95,175 17,45,245 16,07.715
48,297 2,87,274 2,72,016 15,258 G reatej Bombay9,022 68,346 64,087 4,259 T hane4,303 15,337 14,709 • 628 Raigad5,641 14,971 14,334 637 /R a tn a g ir i
# ■ * * « \ Sindhudurg
5,933. 32,602 31,716 886 Nashik2,898 12,973 12,581 392 Dhule3,428 28,605 28,164 441 JaJgaon3,773 16,473 16,091 382 Ahmadnagar
12,500 71,082 68,290 2,792 Pune
3,459 15,832 15,503 329 Satara3,550 16,189 15,921 268 Sangli4,917 24,125 23,497 628 Solapur3,563 18,652 18,249 403 K olhapur2,223 15,062 14,749 313 /A u ra n g a b a d
« « * « \ Jalna
2,021 8,585 8,441 144 , Parbbanj1,297 6,280 , 6,169 M l Seed1,775 8,716 8,632 ' 84 Nanded2,128 9,522 9,401 121 /O sm a n a b a d
# • * * \ Latur
1,222 7,612 7,519 93 Buldana1,255 18,721 18,504 217 Akola1,312 15,533 15,344 189 Amravati1,198 7,455 7,312 121 Y avatm al
877 7,002 6,911 91 W ardha6,639 52,940 50,815 2,125 Nagpur2,342 10,203 9,819 384 B handara1,957- 11,534 10,390 644 /C h a n d ra p u r
1,37i530 8,01,604 7,69,664
* \ Qadchiroli
^ 4o \
31,940 Maharashtra Sta
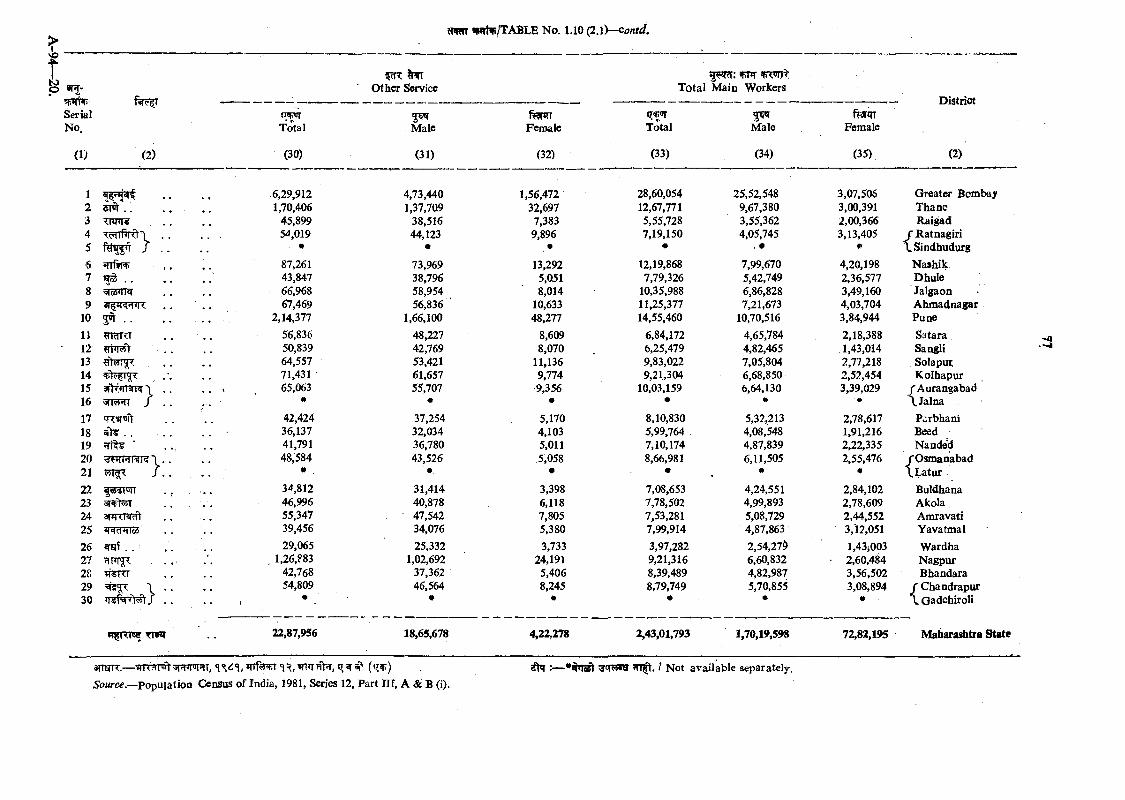
VO4^
O »R>
SerialNo.
(1) (2)
O ther Service T o ta l M ain WorkersDistrict
(2)
Total
(30)
Male
(31)
Female
(32)
Total
(33)
3 ^Male
(34)
Female
(35)
1 6,29,912 4,73,440 1,56,472 28,60,054 25,52,548 3,07,506 G reater Bombay2 5 r» t. . . . . 1,70,406 1,37,709 32,697 12,67,771 9,67,380 3,00,391 Thane3 ■ TIPI¥ . . 45,899 38,516 7,383 5,55,728 3,55,362 2,00,366 R aigad4 . . 54,019 44,123 9,896 7,19,150 4,05,745 3,13,405 / Ratnagiri5 f ^ r J . . * • * • . • « \S in d h u d u rg
6 ? n 1 ^ . . 87,261 73,969 13,292 12,19,868 7,99,670 4,20,198 N ashik7 ^ .............................. 43,847 38,796 5,051 7,79,326 5,42,749 2,36,577 Dhule8 'JlS TFf 66,968 58,954 8,014 10,35,988 6,86,828 3,49,160 Jalgaon9 < . . 67,469 56,836 10,633 11,25,377 7,21,673 4,03,704 A hm adnagar
10 . . 2,14,377 1,66,100 48,277 14,55,460 10,70,516 3,84,944 Pune
11 ?>ldr<T 56,836 48,227 8,609 6,84,172 4,65,784 2,18,388 Satara12 50,839 42,769 8,070 6,25,479 4,82,465 1,43,014 Sangli13 . . 64,557 53,421 11,136 9,83,022 7,05,804 2,77,218 , Sola put.14 71,431 61,657 9,774 9,21,304 6,68,850 2,52,454 K olhapur15 3 f l t» r r ^ \ . . 65,063 55,707 9,356 10,03,159 6,64,130 3,39,029 /A u ran g ab ad16 yjwHi / . . # • • « # # \ j a l n a17 cR tirV 42,424 37,254 5,170 8,10,830 5,32,213 2,78,617 Parbhani18 . 36,137 32,034 4,103 5,99,764 4,08,548 1,91,216 Beed19 ?rr^^ ' . . , 41,791 36,780 5,011 7,10,174 4,87,839 2,22,335 Nanded20 ;?^irR P?R T.. 48,584 43,526 5,058 8,66,981 6,11,505 2,55,476 /O sm anabad21 S . . • m. • • # • \L a tu r
22 , . . . 34,812 31,414 3,398 7,08,653 4,24,551 2,84,102 Buldhana23 3r#55T . . . . 46,996 40,878 6,118 7,78,502 4,99,893 2,78,609 Akola24 55,347 47,542 7,805 7,53,281 5,08,729 2,44,552 Amravati25 ^«id^(a5 39,456 34,076 5,380 7,99,914 4,87,863 3,12,051 Yavatmal26 29,065 25,332 3,733 3,97,282 2,54,27^ l,43i003 W ardha27 . . , 1,26,?83 1,02,692 24,19) 9,21,316 6,60,832 - 2,60,484 N agpur28 w n 42,768 37,362 5,406 8,39,489 4,82,987 3,56,502 Bhandara29 \ . . 54,809 46,564 8,245 8,79,749 5,70,855 3,08,894 r C handrapur30 . . * * • • » * \ Oadchiroli
22,87,956 18,65,678 4,22,278 2,43,01,793 1,70,19,598 72,82,195 Maharashtra State
-a
W|( l X. ’■M V%.t - I I I i; « M \5o«rce.—Population Census of India, 1981, Series 12, Part HI, A & B (i).
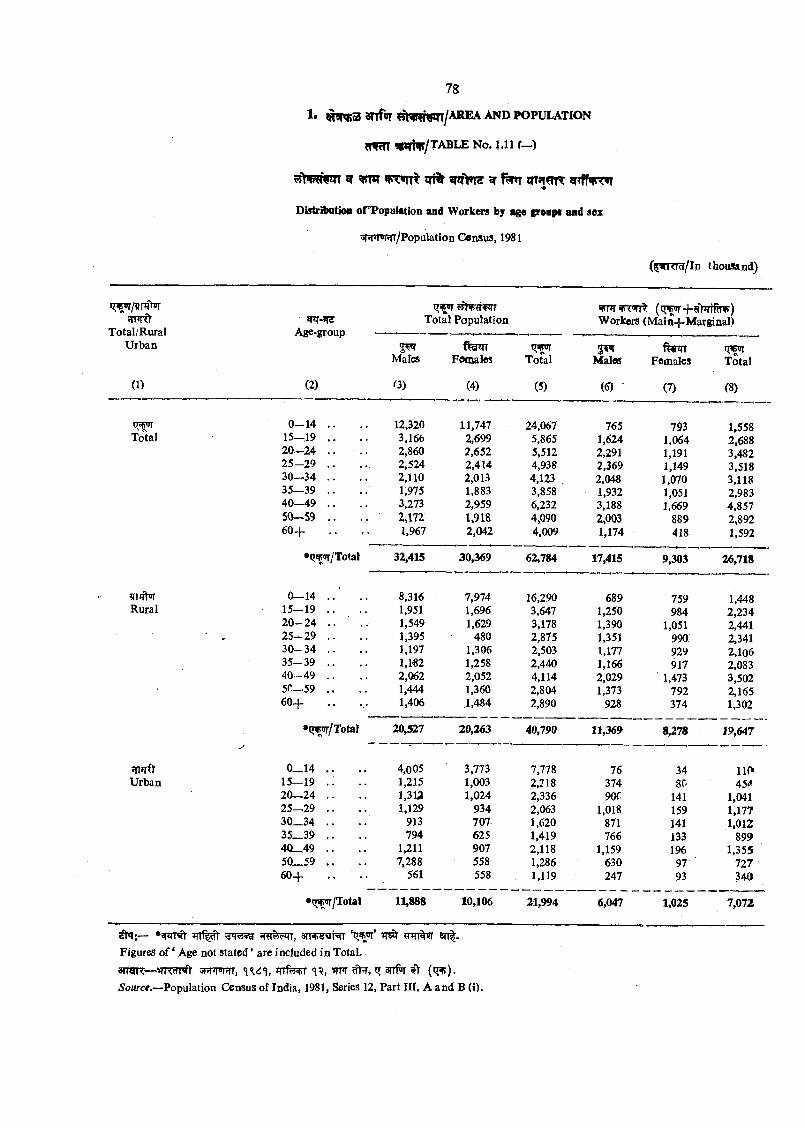
1. ^ 3 anfwr a r e a and p o p u la tio n
^ ^j^/TA B hE No. 1.11 f~)
^ tW F T t ^ trf^lf 3f 9T^?T1T 5 r # S 7 ^
DistrRnitioii o f Topulation and W o rk m by i^e creopi and sex
3RWTT/Population Census, 1981
(^W R m /ln thousand)
!THF<> Total/Rural
U rban
(1)
?PT-»r3Age-group
(2)
Total Population Workers (M ain-|-M arginal)
Males
(3)
Fomales
(4)
Total
(5)
5 ^Males
fNr nFemales
(7)
uripqTotal
(8)
0—14 .. 12,320 11,747 24,067 765 793 1,558Total 15—19 . . 3,166 2,699 5,865 1,624 1,064 2,688
20—24 . . . . 2,860 2,652 5,512 2,291 1,191 3,4822 5 -2 9 . . . . 2,524 2,414 4,938 2,369 1,149 3,51830—34 .. 2,110 2,013 4,123 2,048 1,070 3,11835—39 .. 1,975 1,883 3,858 1,932 1,051 2,98340—49 .. 3,273 2,959 6,232 3,188 1,669 4,85750-59 .. 2 ,m 1,918 4,090 2,003 889 2,8926 0 + 1,967 2,042 4,009 1,174 418 1,592
* t» ^ /T o ta l 32,415 30,369 62,784 17,415 9,303 26,718
?TTffh>T 0 -1 4 . . . . 8,316 7,974 16,290 689 759 1,448Rural 15—19 .. 1,951 1,696 3,647 1,250 984 2,234
2 0 -2 4 .. 1,549 1,629 3,178 1,390 1,051 2,4412 5 -2 9 .. 1,395 480 2,875 1,351 990. 2,3413 0 -3 4 .. 1,197 1,306 2,503 1,177 929 2,10635-39 .. .. 1,1-82 1,258 2,440 1,166 917 2,08340 -4 9 .. 2,062 2,052 4,114 2,029 1,473 3,5025n—59 .. 1,444 1,360 2,804 1,373 792 2,1656 0 + 1,406 .1,484 2,890 928 374 1,302
♦ q ^ /T o ta l“
20,527 20,263 40,790 11,369 8,278 19,647
0_14 . . 4,005 3,773 7,778 76 34U rban 1 5 -1 9 .. 1,215 1,003 2,218 374 8C 454
2 0 -2 4 .. i,3 ia 1,024 2,336 90T 141 1,04125—29 .. 1,129 934 2,063 1,018 159 1,17730—34 .. 913 707 1,620 871 141 1,01235_39 .. 794 625 1,419 766 133 8994Q_49 .. .. 1,211 907 2,118 1,159 196 1,35550_59 . . 7,288 558 1,286 630 97 72760-f- . . . . 561 558 1,119 247 93 340
• v r ^ jlo tA l 11,888 10,106 21,994 6,047 1,025 7,072
•sw H t ?TT%ft 53 553 S T T ^ H t 'q ^ V ^ W%7T 3 n |.Figures o f ' Age not stated ’ arc included in Total.
3TOR—wu3r-«n sRW^fT, # r , 3nf<*i a!V (^?>).5o«ree.—-Population Census of India, 1981, Series 12, Part III, A and B (i).
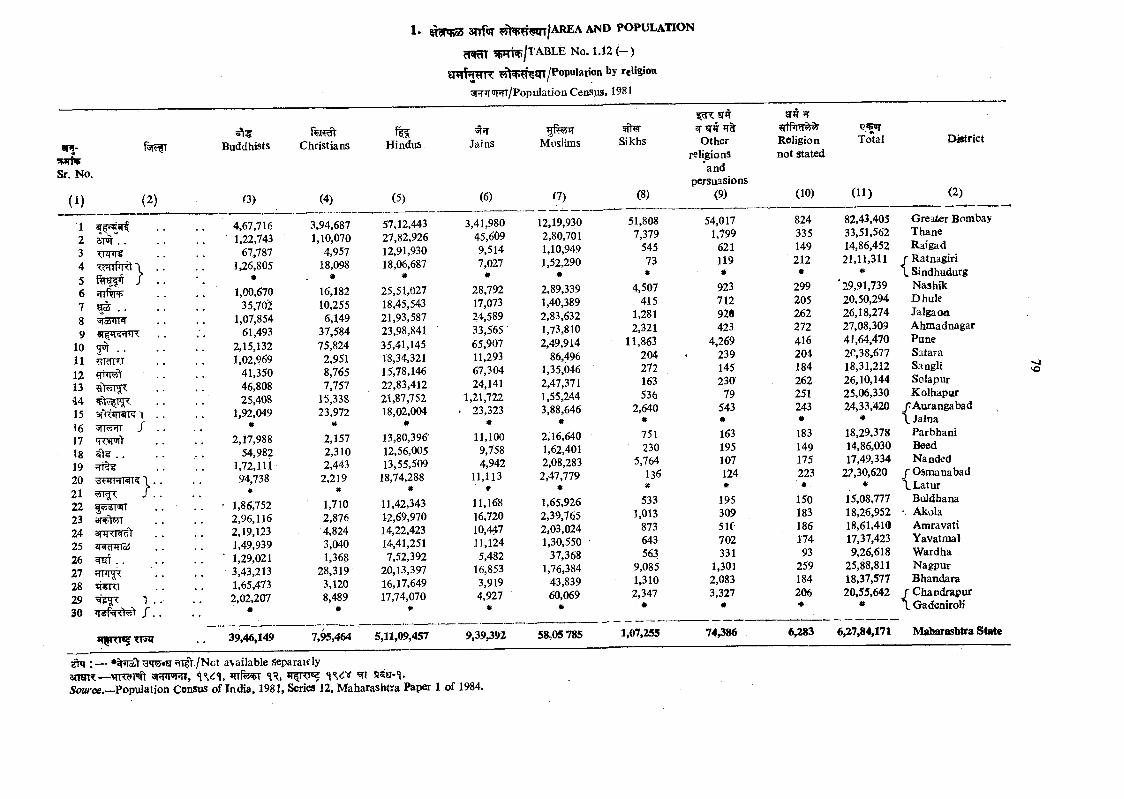
1 . anfoT ^yt^fTtsm/AREA a n d p o p u l a t i o n
^ ^prn^/TA BLE N o. l . J 2 ( - )
« 5 ^^m /P o P « > atio n by religion
enr-m HSr. No.
( i ) (2)
12 5T®t . .345 /67 ^ . .89
10 5^ • •111213441516 /171819 ?TT^20 ^^5TraT5[ \21 J2223 si«h1 r24 sn rrra^2526 TOT . .2728 M4\<\29 130 f
Buddhists
G)
39,46,149
Christians
(4)
Hindus
(5)
^rrJainS
(6)
Muslims
(7)
4,67,716 3,94,687 57,12,443 3,41,980 12,19,9301,22,743 1,10,070 27,82,926 45,609 2,80,701
61,1%1 4,957 12,91,930 9,514 1,10,9491,26,805 18,098 18,06,687 7,027 1,52,290
• * # •
1,00,670 16,182 25,51,027 28,792 2,89,33935,70'2 10,255 18,45,543 17,073 1,40,389
1,07,854 6,149 21,93,587 24,589 2,83,63261,493 37,584 23,98,841 33,565 1,73,810
2,15,132 75,824 35,41,145 65,907 2,49,9141,02,969 2,951 18,34,321 11,293 86,496
41,350 8,765 15,78,146 67,304 1,35,04646,808 7,757 22,83,412 24,141 2,47,37125,408 15,338 21,87,752 1,21,722 1,55,244
1,92,049 23,972 18,02,004 . 23,323 3,88,646* « • * *
2,17,988 2,157 13,80,396' 11,100 2,16,64054,982 2,310 12,56,005 9,758 1,62,401
1,72,111 2,443 13,55,509 4,942 2,08,28394,738 2,219 18,74,288 11,113 2,47,779
* * * * *
1,86,752 1,710 11,42,343 11,168 1,65,9262,96,116 2,876 12,69,970 16,720 2,39,7652,19,123 4,824 14,22,423 10,447 2,03,0241,49,939 3,040 14,41,251 11,124 1,30,5501,29,021 1,368 7,52,392 5,482 37,3683,43,213 28,319 20,13,397 16,853 1,76,3841,65,473 3,120 16,17,649 3,919 43,8392,02,207 8,489 17,74,070 4,927 60,069
7,95,464 5,11,09,457 9,39,392
^ ; — • i im t ^qR?«sr ^r^^./Nct available separatelyansiK— s mwi ? , <\R, S5'a-‘i.Sowcc.—Population ConSus of India, 1981, Series 12, M aharashtra Paper 1 of 1984.
58,05 785
Sikhs Otherreligions
*andpersuasions
Religion not stated
Total District
(8) (9) (10) (11) (2)
51,808 54,017 824 82,43,405 Greater Bombay7,379 1,799 335 33,51,562 Thane
545 621 149 14,86,452 Raigad73 119 212 21,11,311 f Ratnagiri* * • # 1. Sindhudurg
4,507 923 299 ‘29,91.739 Nashik415 712 205 20,50,294 Dhule
1,281 92e 262 26,18,274 Jalgaon2,321 423 272 27,08,309 A hm adoagar
11,863 4,269 416 41,64,470 Pune204 239 204 2f‘,38,677 Satara272 145 184 18,31,212 Sangli163 230 262 26,10,144 Solapur536 79 251 25,06,330 K olhapur
2,640 543 243 24,33,420 f Aurangabad* • • « \ Jaina751 163 183 18,29,378 Parbhani230 195 149 14,86,030 Beed
5,764 107 175 17,49,334 Nanded136 124 223 22,30,620 J Osmanabad* # ■ # , * \L a t u r
533 195 150 15,08,777 Buldhana1,013 309 183 18,26,952 Akola
873 51C 186 18,61,410 Amravati643 702 174 17,37,423 Yavatmal563 331 93 9,26,618 W ardha
9,085 1,301 259 25,88,811 N agpur1,310 2,083 184 18,37,577 B handara2,347 3,327 206 20,55.642 f Chandrapur- • • * • \ GadcniroH
1,07,255 74,386 6,283 6,27,84,171 Maharashtra State
'O
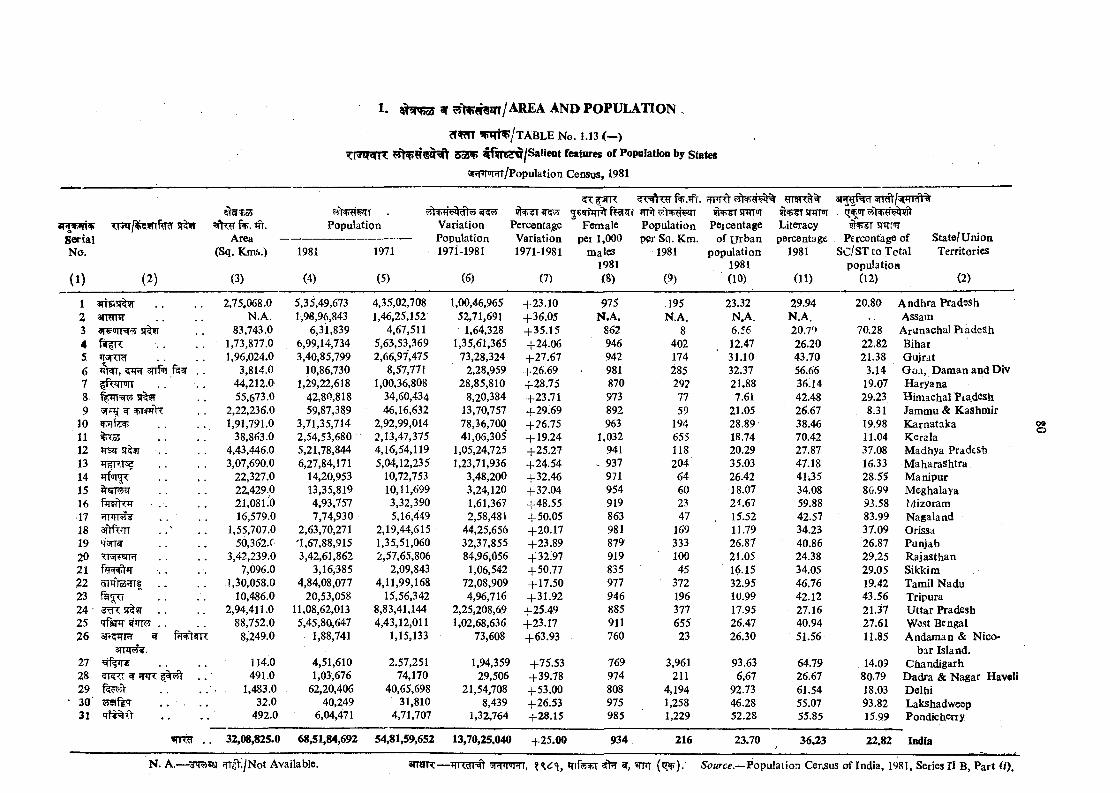
1. ? 5nJo5 ar ^>^ff«m/AREA a n d p o p u l a t io n
? T ^ ^ m ^ /T A B L E No. 1.13 (—)
553WJ ^ W ^ /S a l ie n t features of Population by States
^T jw rr/Population Census, 1981
3TVE1VTVSerialNo.
(1 )
51^
(2 )
=arVr f%.Area
(Sq. Kms.)
(3)
Population
1981
(4)
1971
(5)
'VariationPopulation1971-1981
(6)
9Nt3T 4«>v-5 Percentage
Variation 1971-1981
(7)
Female pei 1,000
males 1981 (8)
Population per Sq. Km.
1981
(9)
wsTsmrcr Peicentage
of u rb a n population
1981 (10)
9Tesn^%^Ni^snTMLiteracypercentage
1981
(11)
3(»i^Pcid 3rrat/^jprnft%
snrriT Percentage of
SC/ST to Tctal population
(12)
State/U nion Territories
(2)
1 3TTSi5I . . . . 2,75,068.0 5,35,49,673 4,35,02,708 1,00,46,965 +23.10 975 .195 23.32 29.94 20.802 amnrr . . . . N.A. 1,98,96,843 1,46,25,152 52,71,691 +36.05 N .A. N.A. N.A, N.A.3 3T?<irr ?; s r ^ . . 83,743.0 6,31,839 4,67,511 1,64,328 +35.15 862 8 6.56 20.79 70.284 . . . . 1,73,877.0 6,99,14,734 5,63,53,369 1,35,61,365 +24.06 946 402 12.47 26.20 22.825 »I5mcT . . . . 1,96,024.0 3,40,85,799 2,66,97,475 73,28,324 +27.67 942 174 ’ 31.10 43.70 21.386 3nf®l . . 3,814.0 10,86,730 8,57,771 2,28,959 +26.69 981 285 32.37 56.66 3.147 ffrilWT . . . . 44,212.0 1,29,22,618 1,00,36,808 28,85,810 +28.75 870 292 21.88 36.14 19.078. 5f%5T . . 55,673.0 42,80,818 34,60,434 8,20,384 +23.71 973 77 7.61 42.48 29.239 . . 2,22,236.0 59,87,389 46,16,632 13,70,757 +29.69 892 59 21.05 26.67 8.31
10 . . . . 1,91,791.0 3,71,35,714 2,92,99,014 78,36,700 +26.75 963 194 28.89 38.46 19.9811 . . . . 38,863.0 2,54,53,680 2,13,47,375 41,06,305 +19.24 1,032 655 18.74 70.42 11.0412 . . . . 4,43,446,0 5,21,78,844 4,16,54,119 1,05,24,725 +25.27 941 118 20.29 27.87 37.0813 . . . . 3,07,690.0 6,27,84,171 5,04,12,235 1,23,71,936 +24.54 937 204 35.03 47.18 16.3314 . . . . 22,327.0 14,20,953 10,72,753 3,48,200 +32.46 971 64 26.42 41.35 28.5515 . . . . 22,429.0 13,35,819 10,11,699 3,24,120 +32.04 954 60 18.07 34.08 80.9916 riTSfrw . . . . 21,081.0 4,93,757 3,.32,390 1,61,367 +48.55 919 23 24.67 59.88 93.58-17 . . . . 16,579.0 7,74,930 5,16,449 2,58,481 +50.05 863 47 . 15.52 42.57 83.99IS a ftfw . . ' . . 1,55,707.0 2,63,70,271 2,19,44,615 44,25,656 +20.17 981 169 11.79 34.23 37.0919 . . . . 50,362.0 '1,67,88,915 1,35,51,060 32,37,855 +23.89 879' 333 26.87 40.86 26.8720 TTvPFW . . . . 3,42,239.0 3,42,61,862 2,57,65,806 84,96,056 +32197 919 100 21.05 24.38 29.2521 . . 7,096.0 3,16,385 2,09,843 1,06,542 +50.77 835 45 16.15 34.05 29.05,22 ......................... 1,30,058.0 4,84,08,077 4,11,99,168 , 72,08,909 +17.50 977 372 32.95 46.76 19.4223 " . . . . 10,486.0 20,53,058 15,56,342 4,96,716 + 31.92 946 196 10.99 42.12 43.562 4 -3 ^ 5 1 ^ 5 1 . . . . 2,94,411.0 11,08,62,013 8,83,41,144 2,25,208,69 +25.49 885 377 17.95 27.16 21.3725 T f s T R - ^ . . . . 88,752.0 5,45,80,647 4,43,12,011 1,02,68,636 +23.17 911 655 26.47 40.94 27.6126 ^ 8,249.0 1,88,741 1,15,133 73,608 +63.93 760 23 26.30 51.56 11.85
3mT5?¥.27 . . . . 114.0 4,51,610 2.57,251 1,94,359 +75.53 769 3,961 93.63 64.79 14.0928 ^ ^ ^ . . 491.0 1,03,676 74,170 29,506 + 39.78 974 211 6,67 26.67 80.7929 , . . . 1,483.0 62,20,406 40,65,698 21,54,708 + 53.00 808 4,194 92.73 61.54 18.0330 . . . . . 32.0 40,249 31,810 8,439 +26.53 975 1,258 46.28 55.07 03.8231 . . . . 492.0 6,04,471 4,71,707 1,32,764 +28.15 985 1,229 52.28 55.85 15.9>9
A ndhra Pradesh AssamArunachal PiadeSh Bihar GujratG oa, D am an and Div H aryanaHimachal Piad^sh Jammu & K ashm ir K arnataka K eralaM adhya Pradesh M aharashtra M anipur Meghalaya J/lizoram Nagaland Orissa Punjab R ajasthan Sikkim Tamil Nadu Tripura U ttar Pradesh West Bengal Andam an & Nico-
bar Island. Chandigarh
D adra & Nagar H avdi DelhiLakshadweepPondicherry
o
inter . . 32,08,825.0 68,51,84,692 54,81,59,652 13,70,25.040 +25.00 934 216 23.70 36.23 22.82 India
N. A.— ?TT^ ;/Not Available. »ri%irr m Population Census of India, 1981, Series II B, P art O’).
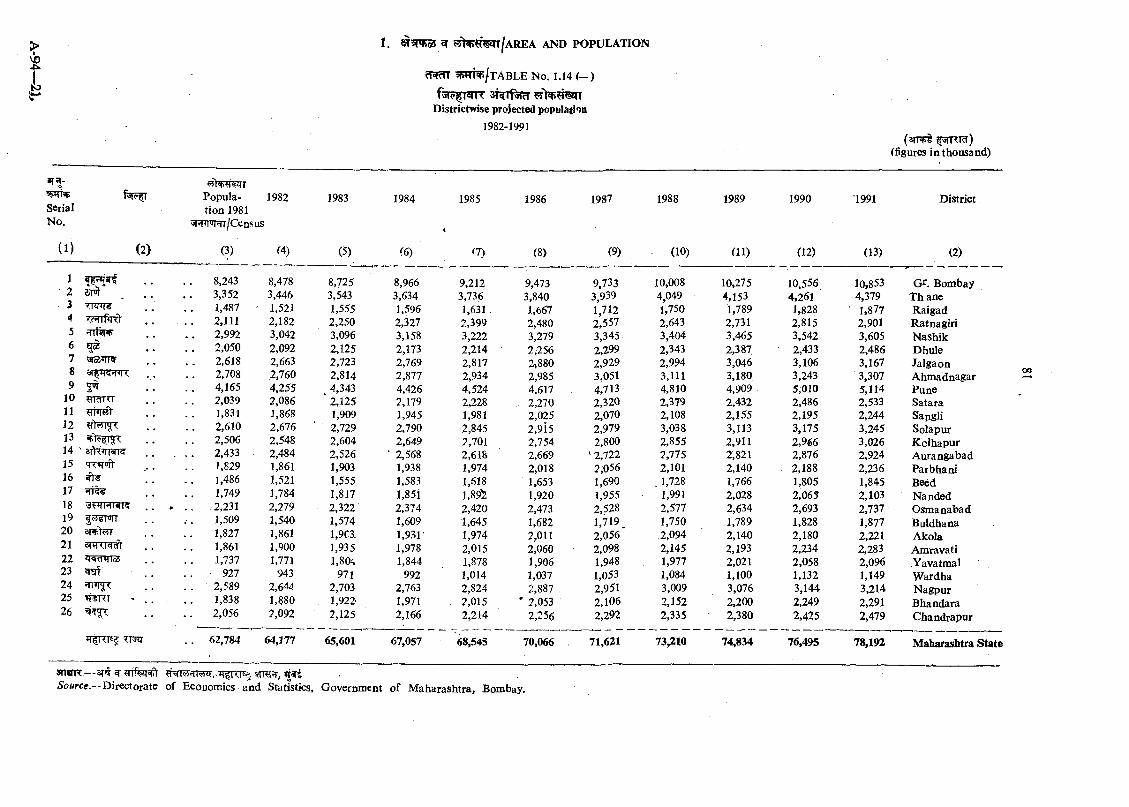
W ^ / t A B L E No, 1.J4 ( ~ )
fvHV^I^TT SRTfsiW ?5>^?T^T Districtwise projected population
1982-1991(srnrl ^stRTcT)
(■figures in thousand)
’P»TR>SerialNo.
( 1) (2)
IPopulation 1981
^ n w /C e n s u s
(3)
1982
1c m '
9 ^1011 m w l'121314 ' sfV^^TT^1516 ^3-17 ^18 BFTHTRR19 ^55^Frrr20 anptfJT21 22232425 ififTRT26
TTx?r
8,2433,3521,4872,1112,9922,0502,6182,7084,1652,0391,8312,6102,5062,4331,8291,4861,7492,2311,5091,8271,8611,737
9272,5891,8382,056
^4)
8,4783,4461.521 2,182 3,0422.092 2,663 2,760 4,255 2,086 1,868 2,676 2,548 2,484 1,8611.521 1,784 2,279 1,540 1,861 1,900 1,771
9432 ,6 ^1,8802.092
1983
(5)
8,7253,5431.555 2,250 3,0962.125 2,723 2,814 4,343
* 2,125 1,909 2,729 2,604 2,526 1,9031.555 1,817 2,322 1,574 1,9G1 1,935 1,80^
9712,7031,922-2.125
62,784 64,177 65,601
1984
(6)
8,9663,6341,5962,3273,1582,1732,7692,8774,4262,1791,9452,7902,6492,5681,9381,5831,8512,3741,6091,9311,9781,844
9922,7631,9712,166
67,057
1985 1986 1987 1988 1989 1990 1991 District
(1) (8) (9) (10) (11) (12) (13) (2)
9,212 9,473 9,733 10,008 10,275 10,556 10,853 G^. Bombay3,736 3,840 3,939 4,049 4,153 4,261 4,379 T h ane1,631 . 1,667 1,712 1,750 1,789 1,828 1,877 Raigad2,399 2,480 2,557 2,643 2,731 2,815 2,901 Ratnagiri3,222 3,279 3,345 3,404 3,465 3,542 3,605 Nashik2,214 2,256 2,299 2,343 2,387 2,433 2,486 Dhule2,817 2,880 2,929 2,994 3,046 3,106 3,167 Jalgaon2,934 2,985 3,051 3,111 3,180 3,243 3,307 A hm adnagar4,524 4,617 4,713 4,810 4,909 5;010 5,114 Pune2,228 , 2,270 2,320 2,379 2,432 2,486 2,533 Satara1,981 2,025 2,070 2,108 2,155 2,195 2,244 Sapgli2,845 2,915 2,979 3,038 3,113 3,175 3,245 Solapur2,701 2,754 2,800 2,855 2,911 2,966 3,026 K olhapur2,61S 2,669 ' 2,722 2,775 2,821 2,876 2,924 Aurangabad1,974 2,018 2,056 2,101 2,140 2,188 2,236 Patbhani1,618 1,653 1,690 . 1,728 1,766 1,805 1,845 Beedl,89l2 1,920 1,955 1,991 2,028 2,065 2,103 Nanded2,420 2,473 2,528 2,577 2,634 2,693 2,737 O sm anabad1,645 1,682 1,719 _ 1,750 1,789 1,828 1,877 Buldhana1,974 2,011 2,056 2,094 2,140 . 2,180 2,221 Akola2,015 2,060 2,098 2,145 2,193 2,234 2,283 Amravati1,878 1,906 1,948 1,977 2,021 2,058 2,096 .Yavatmal1,014 1,037 1,053 1,084 1,100 1,132 1,149 W ardha2,824 2,887 2,951 3,009 3,076 3,144 3,214 N agpur2,015 ' 2,053 2,106 2,152 2,200 2,249 2,291 B handara2,214 2,256 2,292 2,335 2,380 2,425 2,479 C handrapur
68,545 70,066 . 71,621 73,210 74,834 76,495 78,192 Maharashtra State
3nOR.— a[ 5TTOFT,SoMrce.—Directorate of Economics and Statistics, Government of M aharashtra, Bombay.
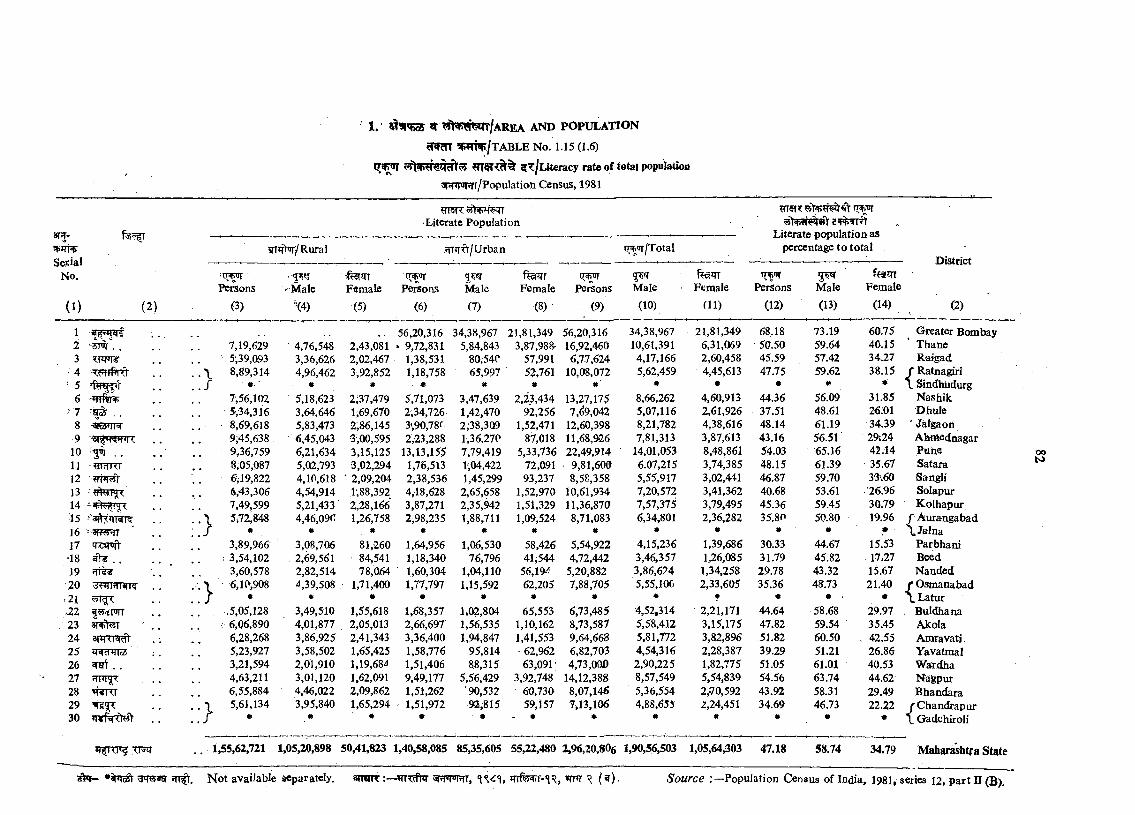
1. «?iq>o5 ^ Ht’spfNrr/AREA a n d p o p u l a t i o n
5»WTt*p/TABLE No. 1.15 (1.6)
5?:/Literacy rate of total popuIaUon
^liTipinTr/Populatioli Census, 1981
ar^.
SetialNo.
( 1)
Literate Population
?n*r>w/Rural ?n»Tft/Urban tr^^/T otal
2#3rrh Literate papulation as
percentage to to tal
■ITJ^P ^ o n s
District
(2) (3)
'Male
■(4)
F«male
(5)
Persons
(6)
q wMale(7)
Female(8)
12 \ .3
• 4' 5
6 4 f l f ^' 7 . .
8 ^ i ( < f9
10 . ,11 5!n?rRT12131415 -'3^111^16 ’■'»(W*iT17 cR3(nft- !l8 . .19 ^20 ^ H N K
.21^22 |5ytFrT23 !|?r55T24 anRRd)25 BRcnTT5526 ^ ra t. .2728 %f¥RT2930 i r g ^ T ^
s h l — >3'T5?36l
}
}
}
7,19,629 5i39,093 8,89,314
■ *. ■ 7,56,102 5^34,316 S,69,618 9;45,638. 9,36,759 S;05,087 6,19,822 6,43,306 7,49,599 5s72,848
’ • 3,89,966
3,54,102 3,60,578 6,10,908
. * ,5,05,128 6,06,890 6,28,268 5,23,927 3,21,594 4,63,211 6,55,884 5,61,134
4,76,5483,36,6264,96,462
*5,18,6233,64,6465,83,4736,45,0436,21,6345,02,7934,10,6184,54,9145,21,4334,46,090
*3,08,7062,69,5612,82,5144,39,508
#3,49,5104,01,8773,86,9253,58,5022,01,9103,01,1204,46,0223,95,840
*
2,43,0812,02,4673,92,852
#2-37,4791;69,6702,86,1453,00,5953,15,1253.02.294 2,09,204 1,88,392 2,28,166 1,26,758
*81,26084,54178,064
1,71,400m
1,55,6182,05,0132,41,3431,65,4251,19,6841,62,0912,09,8621.65.294
*
56,20,316 • 9,72,831
1,38,531 1,18,758
’ * 5,71,073 2',34,726 3<,90,78f 2,23,288
13,13,155 1,76,513 2,38,536 4,18,628 3,87,271 2,98,235
' * 1,64,956 1,18,340 1,60,304 1,77,797
•1,68,3572,66,6973,36,4001,58,7761,51,4069,49,1771,51,2621,51,972
•
34,38,9675,8.4,S43
80,54C65,997
*3;47,639 1,42,470 2,'38,309 1,36,270 7,79,419 l',04,422 1,45,299 2,65,658 2,35,942 1,88,711
*1,06,530
76,7961,04,1101,15,592
*1,02,8041,56,5351,94,847
95.814 88,315
5,56,42990,53292.815 ■■ *
21,81,3493,87,988^
57,9915^,761
*2,23,434
9^2561,52,471
87,0185,33,736
72,09193,237
1,52,9701,51,3291,09,524
*58,42641,544
56,19^62,205
*65,553
1,10,1621,41,553
62,96263,091-
3,92,74860,73059,157
#
IT<IT 5 ^ ffaqrPersons Male Female Persons Male Female
(9) (10) (11) (12) (13) (14) (2)
56,20,316 34,38,967 21,81,349 68.18 73.19 60.75 Greater Bombay16,92,460 10,61,391 6,31,059 50.50 59.64 40.15 ’ Thane6,77,624 4,17,166 2,60,458 45.59 57.42 34.27 Raigad
10,08,072 5,62,459 4,45,613 47.75 59.62 38.15 r Ratnagiri* # « • # *■ \ SindhUdurg
13,27,175 8,66,262 4,60,913 44.36 56.09 31.85 N ashik7,^9,042 5,07,116 2,61,926 37.51 48.61 26.01 Dhule
12,60,398 8,21,782 4,38,616 48.14 61.19 34.39 ‘ Jalgaon11,68,926 7,81,313 3,87,613 43.16 56.51 29i24 Ahmednagar22,49,914 14,01,053 8,48,861 54.03 65.16 42.14 Ptttie9,81,600 6.07,215 3,74,385 48.15 61.39 35.67 Satara8,58,358 5,55,917 3,02,441 46.87 59.70 33^60 Sangli
10,61,934 7,20,572 3,41,362 40.68 53.61 26.96 Solapxir11,36,870 7,57,375 3,79,495 45.36 59.45 30.79 K olhapur8,71,083 6,34,801 2,36,282 35.80 50.80 19.96 /A u ra n g a b a d
* * * * • \ J a ln a5,54,922 4,15,236 1,39,686 30.33 44.67 15.53 Parbhani4,72,442 3,46,357 1,26,085 31.79 45.82 17.27 Beed
5,20,882 3,86,624 1,34,258 29.78 43.32 l l 6 7 Nanded7,88,705 5,55,10c 2,33,605 35.36 48.73 21.40 r Osmanabad
* * f « w « \ L a t u r6,73,485 4,52,314 2,21,171 44.64 58.68 29.97 . Buldhana8,73,587 5,58,412 3,15,175 47.82 59.54 35.45 Akola9,64,668 5,81,772 3,82,896 51.82 60.50 , 42.55 A m ravati,6,82,703 4,54,316 2,28,387 39.29 51.21 26.86 Yavatmal4,73,000 2,90,225 1,82,775 51.05 61.01 40.53 W ardha
14,12,388 8,57,549 5,54,839 54.56 63.74 44.62 Nagpur8,07,146 5,36,554 2,70,592 43.92 58.31 29.49 B handara7,13,106 4,88,655 2,24,451 34.69 46.73 22.22 /C h an d rap u r
* * « * « • t Gadchiroli
2,96,20.806 1,90,56,503 1,05,64,303 47.18 58.74 34.79 Maharaisbti-a State
ooN>
N o t available separately. amrR ssrwRT, 3Trfe5Frr-‘l^ , ^ R ( ^ ) . S o u rc e Population Census of India, 1981, series 13, p a r t l l (B).
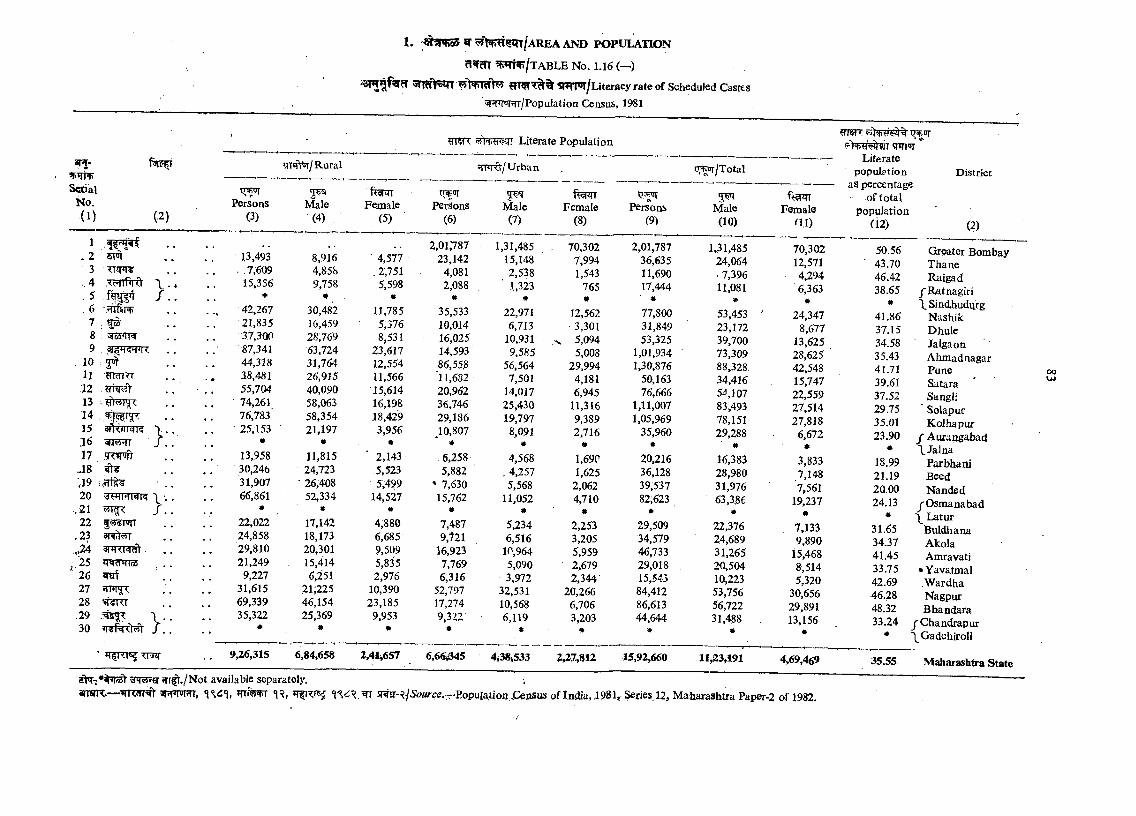
ar^-
ScECialNo.(1 ) {2)
12 5M3
. 4 T x^ rd5678
>::
1. WPR55 ^ ^>fm «llT/A REA AND POPULAW ON
^Pqi^/XABLE No. L16 (--)
»n?ftsairr snTn»r/Literacy ratexrf Scheduled CastesspHMFrr/PopuIation Census, 1981
HraR vrhWFir Literate Population
ynTt'sr/Rural
Persons(3)
Male(4)
13,493 . .7,609
15,356 *
42,26721,83537,300
8,9164,8589,758
*30,48216,45928,769
Female(5)
4,577 . 2,751
5,598 «
11,7855,3768,531
5Trrr6‘/U rb an i ^ / T o t a l
Persons(6)
2,01,78723,142
4,0812,088
«35,53310,01416,025
9 ygvreTTR . . ■ 87,341 63,724 23,617 14,593. 10 . yjr 44,318 31,764 12,554 86,55.8
U UMITT 38,481 26,915 11,566 '11,68212 . . 55,704 40,090 15,614 20,96213 • 74,261 58,063 16,198 36,7461 4 , , % ^ 76,783' 58,354 18,429 29,18615 v . . 25,153 21,197 3,956 ^10,80736 . # * • *17 , 7 1 : ^ 13,958 11,815 ■ 2,143 6,258
-18 ^ 30,246 24,723 5,523 5,88249 31,907 • 26,408 5,499 * 7,63020 \ ■.. 66,861 52,334 14,527 15,762
.21 / . . « # * #22 55y$Fn 22,022 17,142 4,880 7,487
, 23 3T^5JT 24,858 18,173 6,685 9,721„24 3nRT3Rft V 29,810 20,301 9,509 16,923. 25 21,249 15,414 5,835 7,76926 T d 9,227 6,251 2,976 6,31627 31,615 21;225 10,390 52,79728 'H«Kr 69,339 46,154 23,185 17,274
.29 \ . 35,322 25,369 9,953 9,322'30 / . , • * * *
9,26,315 6,84,658 2^i,657 6,66i345
Male(7)
Female(8)
t } ^Persons
(9)
1,31,48515,148 2,538
' 1,323 *
22,9716,713
10,9319,585
56,5647,501
14,01725,43019,7978^091
«4.568
, 4,2575.568
11,052#
5,2346,516
10,9645,0903,972
32,53110,5686.119
70,3027,9941,543
765*
12,562 3,301
. 5,0945,008
29,994 4,181 6,945
11,316 9,389 2,716
m1,69V 1,625
2,062 4,710
*2,2533,2055,9592,6792,344
20,2666,7063,203
2,01,78736,63511,69017,444
«77,80031,84953,325
1,01,9341,30,876
50,16376,666
1,11,0071,05,969
35,960•
20,21636,12839,53782,623
*29,50934,57946,73329,01815,54384,41286,61344,644
#
Male(10)
1,31,485 24,064 • 7,396 11,081
*53,45323,17239,70073,30988,328.34,41654,10783,49378,15129,288
*16,38328,98031,97663,3.86
«22,37624,68931,2652K1,50410,22353,75656,72231,488
*
Female
4,69,469
Literate population
as percentage of to tal
population
District
a i ) (12) (2)
70,302 50.56 Greater Boml12,571 ■ 43.70 Thane4,294 46.42 Raigad6,363 38.65 jR a tn a g ir i
* * 1, Sindhuditfg24,347 41.86 Nashik
8,677 37.15 Dhule13,625 34.58 Jalgaon28,625 ' 35.43 A hm adnagar42,548 41.71 Pune15,747 39.61 Satara22,559 37.52 Sangli27,514 29.75 Solapur27,818 35.01 K olhapur
6,672 23.90 / Auranga.bad# • \ Jalna
3,833 18.99 Parbhani7,148 21.19 Beed7,561 20.00 Nanded
19,237 24.13 jO sm an ab ad# « \ Latur
7,133 31.65 Buldhana9,890 34.37 Akola
15,468 41.45 Amravati8,514 33.75 • Yavatmal5,320 42.69 W ardha
30,656 46.28 Nagpur29,891 48.32 Bhandara13,156 33.24 f Chandrapur
# * \G ad ch iro li
oou»
35.55 Maharashtra State2^ - 5R ^a-frr^ ./N ot available separately.amirr?.— t(TroTT% a R w n , l W sr-^/i'c/wce.^Eopylation jCeaSus of India, 1981r Series M aharashtra Paper-2 of 1982.
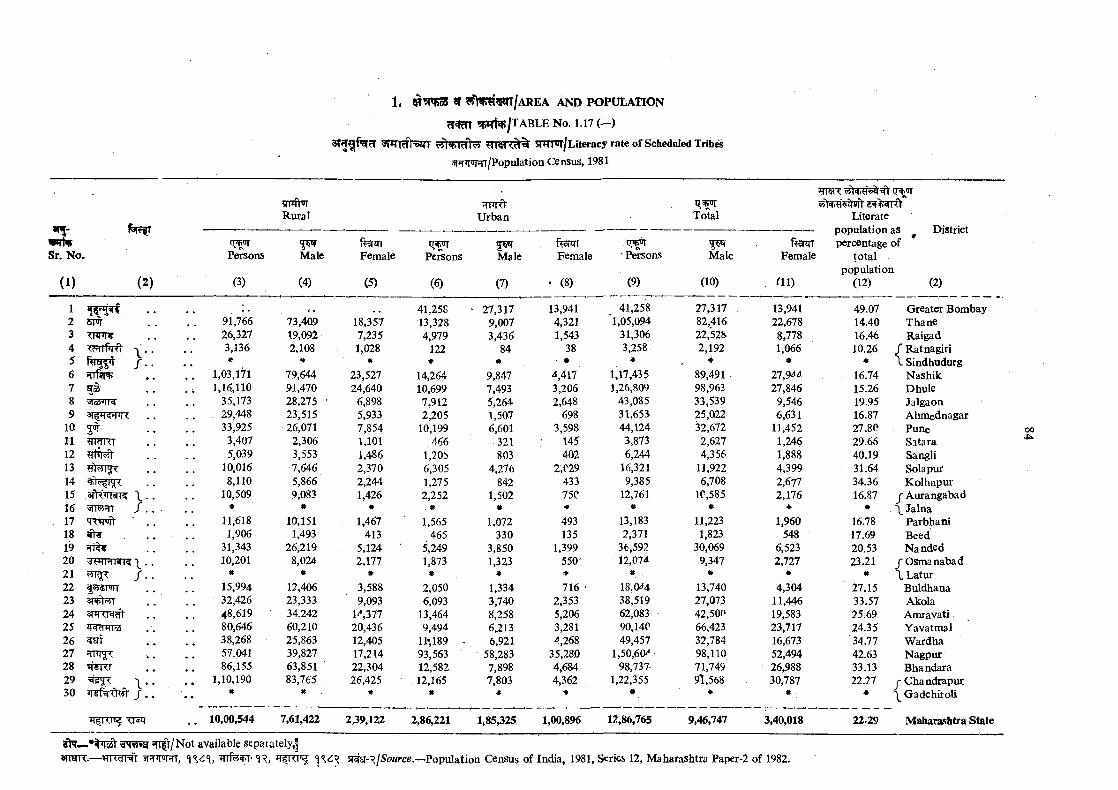
’WtWSr. No.
(1) (2 )
15TW T n m TrTrftft f t r ^ sTrfviV
}
/
7 ^89 <
10 5«r11 yTdRT12 ?rW55t131415 ,3tK ^ K \16 5rT5JTTT17 'R ipft18 ^19 ^20 ^3FTRIi|R\21 vJT^ /2223 SfiFt^24 3mrpi?ft25 ZT^W326 ^Erf27 ?fTiT^2829 ^ \30 /
’TfRTKI TF3T
1* ^5W b3 n 9 5 > t o ^ / a r e a a n d p o p u l a t i o n
ff fm W Sfj/T A B L E No. 1.17 ( - )
vitVlrfhy snTr»T/Literacy rate of Scheduled TribwspnniRT/Population Census, 1981
Persons
(3)
91,76626,3273,136e
1,03,1711,16,110
35,17329,44833,925
3,4075,039
10,0168,110
10,509#
11,6181,906
31,34310,201
*15,99432,42648,61980,64638,26857,04186,155
1,10,190
’onRfrwRural
Male
(4)
73,40919,0922,108
*79,64491,47028,27523,51526,071
2,3063,5537,6465,8669,083
*10,1511,493
26,2198,024
*12,40623,33334,24260,210^25,86339,82763,85183,765
Female
(5)
18,3577,2351,028
*23,52724,640
6,8985,9337,8541,1011,4862,3702,2441,426
*1,467
4135,1242,177
*3,5889,093
V,37720,43612,40517,21422,30426,425
JTFlft'U rban
Persons
(6)
41,25813,3284,979
122*
14,26410,6997,9122.205
10,199466
1.205 6,305 1,275 2,252. #1,565
4655,2491,873
*2,0506,093
13,4649,494
11-,18993,56312,58212,165
#
Male
(7)
27,3179,0073,436
84*
9,8477,4935,2641,5076,601.321803
4,276842
1,502«
1,072330
3,8501,323
*1,334 3,740 8,258 6,213 6,921
• 58,283 7,898 7,803
#
I O’Total Literate
population as District percentage of
to ta l population
(12) (2)
Female
• (8)
• Persons
(9)
Male
(10)
Female
. ( n )
13,941 41,258 27,317 13,941 49.07 Greater Bombay4,321 ‘1,05,094 82,416 22,678 14.40 T hane1,543 31,306 22,528 8,778 16.46 Raigad
38 3,258 2,192 1,066 10.26 f Ratnagiri■ • * * ■ • « \S in d h u d u rg
4,417 1,17,435 89,491 27,944 . 16.74 N ashik3,206 1,26,809 98,963 27,846 15.26 Dhule2,648 43,085 33,539 9,546 19.95 Jalgaon
698 31,653 25,022 6,631 16.87 Ahmednagar3,598 44,124 32,672 11,452 27.80 Pune
145 3,873 2,627 1,246 29.66 Satara402 6,244 4,356 1,888 40.19 Sangli
2,029 16,321 11,922 4,399 31.64 Sola pur433 9,385 6,708 2,677 34.36 K olhapur75C, 12,761 1C,585 2,176 16.87 j Aurangabad* * * * * \ Jalna493 13,183 11,223 1,960 16.78 Parbhani135 2,371 1,823 548 17.69 Beed
1,399 36,592 30,069 6,523 20.53 Nanded550^ 12,074 9,347 2,727 23.21 f Osmanabad# « . * * * \ Latur716 ' 18.0^4 13,740 4,304 27.15 Buldhana
2,353 38,519 27,073 11,446 33.57 Akola5,206 62,083 • 42,500 19,583 25.69 Amravati3,281 90,140 66,423 23,717 24.35 Yavatmal4,268 49,457 32,784 16,673 34.77 W ardha
35,280 1,50,60/* 98,110 52,494 42.63 Nagpur4,684 98,737 71,749 26,988 33.13 Bhandara4,362 1,22,355 91,568 30,787 22.27 j-C hand rapu r
* • * # . # \ GadchiroU
10,00,544 7,61,422 2,39,122 2,86,221 1*85,325 1,00,896 12,86,765 9,46,747 3,40,018
00
22.29 Maharashtra State
N ot available separately,^srmR.— W c fm w^Timr, iTfncr^ SR^-?./5'owrce.—Population Census of India, 1981, Series 12, Maharashtra Paper-2 of 1982.
^FP /T A B L E No. 1.18
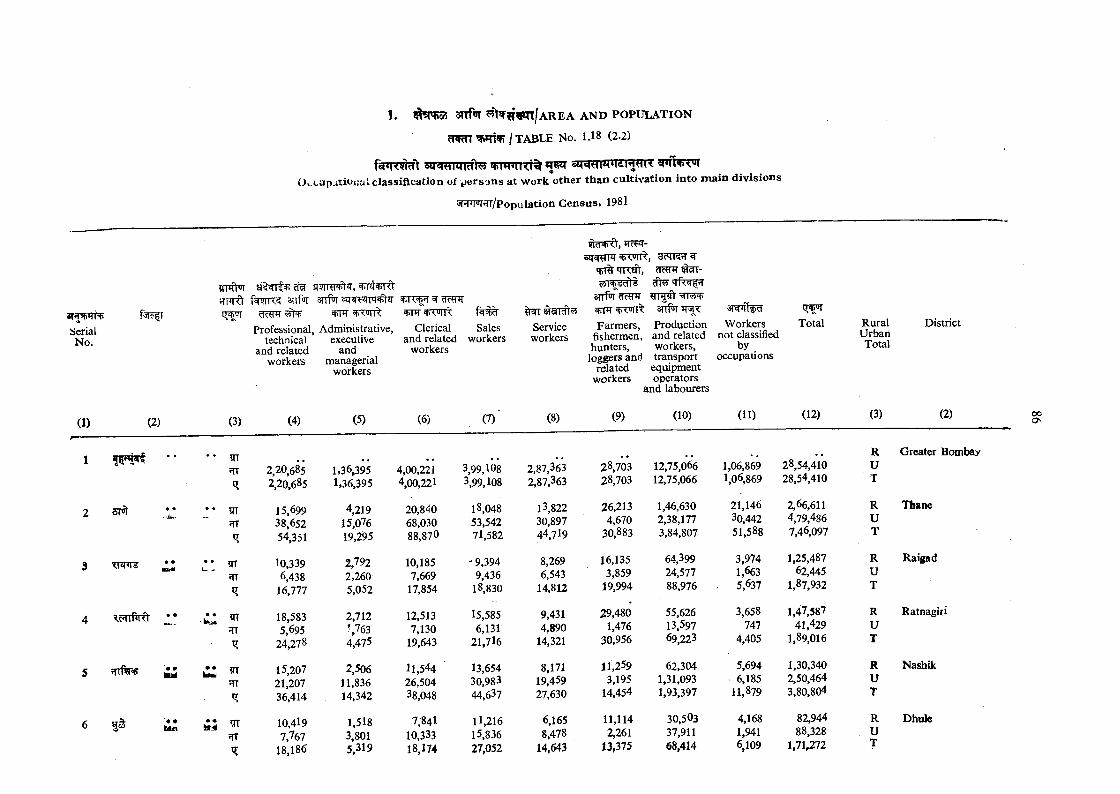
1. 3^Tfnr ?5> « w t / a r e a a n d p o p u l a t i o n
/ t a b l e No. 1.18 (2.2)
sqW iTR ftv? o<4c(«(l4»Tffl^^RO ..t a p jtiO iiuI c la ss if ica tio n of p e rso n s a t w o rk o th e r th a n cu ltiv a tio n in to m a in d iv is io n s
snrW ^rr/Population Census* 1981
SerialNo.
f5T? r
tm fH si9th^ , =*>i4't)iO?[TJRt arifw
cRTfTProfessional, Administrative,
technical executiveand related and
workers managerialworkers
Clerical and related
workers
Salesworkers
Serviceworkers
sq ^TPT'TK^, Wc HT ^ -
3TTf>r
Farmers, fishermen, hunters, loggers and
related workers
Production and related workers, transport
equipment operators
and labourers
Workers not classified
byoccupations
Total RuralUrbanTotal
District
(1) (2) (3) (4) (5) (6) (7)' (8) (9) (10) (11) (12) (3) (2)
r ........
1 •• m2.20.6852.20.685
1.36.3951.36.395
4.00.2214.00.221
3.99.1083.99.108
2.87.3632.87.363
28.70328.703
12.75.06612.75.066
1.06.8691.06.869
28.54.41028.54.410
RUT
Greater Bombay
2 s m • ♦ • « ?JT 15,69938,65254,351
4,21915,07619,295
20,84068,03088,870
18,04853,54271,582
13,82230,89744.7I9
26,2134,670
30,883
1,46,6302,38,1773,84,807
21,14630,44251,588
2,66,6114,79,4867,46,097
RUT
Thane
3 • • • # ?TT 10,3396,438
16,777
2,7922,2605,052
10,1857,669
17,854
- 9,394 9,436
18,830
8,2696,543
14,812
16,1353,859
19,994
64,39924,57788,976
3,9741,6635,637
1,25,48762,445
1,87,932
RUT
Raigad
4 ?.c7irfirf)‘ • • • •'
m18,5835,695
24,278
2,712^7634,475
12,5137,130
19,643
15,5856,131
21,716
9,4314,890
14,321
29,4801,476
30,956
55,62613,59769,223
3,658747
4,405
1,47,58741,429
1,89,016
RUT
Ratnagiri
5 tttii• •kaaJ ?rr
JTT15.20721.207 36,414
2,50611,83614,342
11,54426,50438,048
13,65430,98344,637
8,17119,45927,630
11,2593,195
14,454
62,3041,31,0931,93,397
5,6946,185
11,879
1,30,3402,50,4643,80,804
RUT
Nashik
6 '• • • •
fIT10,4197,767
18.186
l,5 l83,8015.319
7,84110,33318,174
11,21615,83627,052
6,1658,478
14,643
11,1142,261
13,375
30,50337,91168,414
4,1681,9416,109
82,94488,328
1,71,272
RUT
Dhule
oo0\
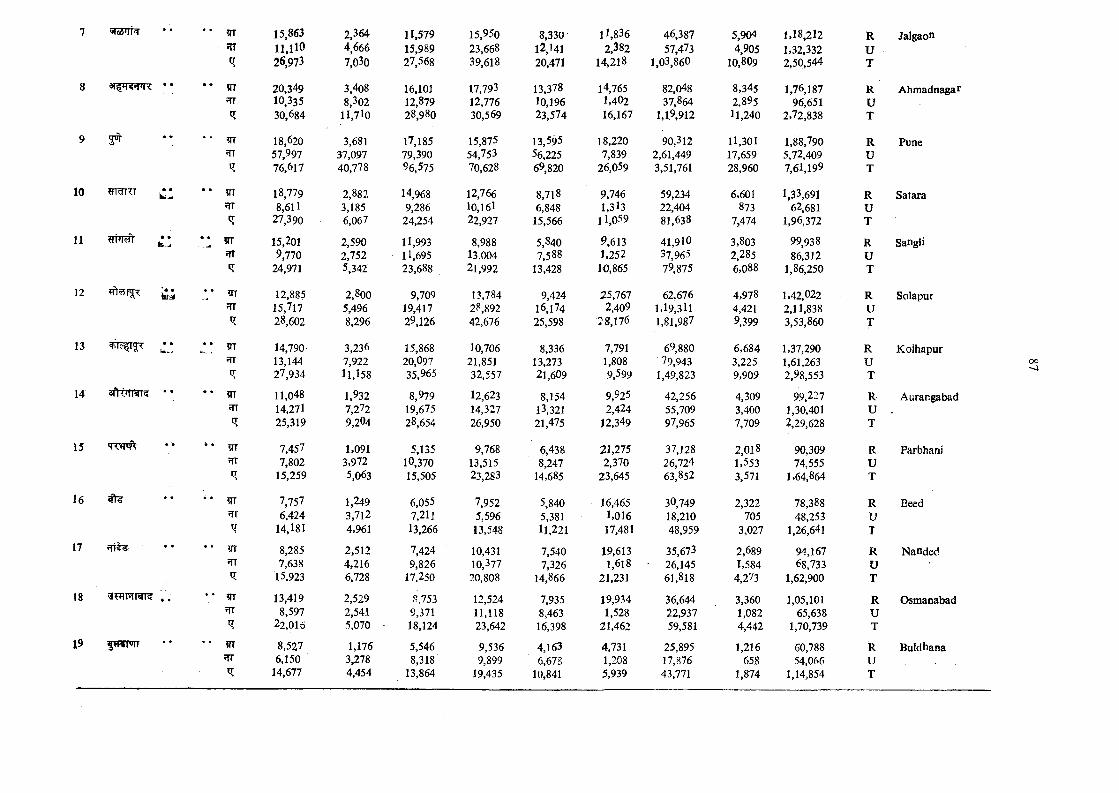
7 • • ITT 15,863 2.364 11,579 15,950 8.330- 11,836 46,387 5.904 1,18,212 R Jalgaon5TT n . i i o 4,666 15,989 23,668 12,141 2,382 57,473 4,905 1,32,332 Uq 26,973 7,o3o 27,568 39,618 20,471 14.218 1,03,860 10,809 2,50,544 T
8 • « ?n 20,349 3,408 16,101 17,793 13,378 14,765 82,048 8,345 1,76,187 R Ahmadnagar?TT 10,335 8,302 12,879 12,776 10,196 1,402 37,864 2,895 96,651 U
30,684 ll,7 lO 28,980 30,569 23,574 16,167 1,1.9,912 11,240 2,72,838 T
9 2^ ?rr 18,620 3,681 17,185 15,875 13,595 18,220 90,312 11,301 1,88,790 R PuneflT 57,997 37,097 79,390 54,753 56,225 7,839 2,61,449 17,659 5,72,409 U
76,617 40,778 96,575 70,628 69,820 26,059 3,51,761 28,960 7,61,199 T
10 • • irr 18,779 2,882 14,968 12,766 8,718 9,746 59,234 6,601 1,33,691 R SataraJTT 8,611 3,185 9,286 10,16l 6,848 1,313 22,404 873 62,681 U
27,390 6,067 24,254 22,927 15,566 11,059 81,638 7,474 1,96,372 T
11 • • HT 15,201 2,590 11,993 8,988 5,840 9,613 41,910 3,803 99938 R Sanglijfr 9,770 2,752 11,695 13,004 7,588 1,252 37,965 2,285 86,312 U
24,971 5,342 23,688 21,992 13,428 10,865 79,875 6,088 1,86,250 T
12 15 ♦ • ?rr 12,885 2,800 9,709 13,784 9,424 25,767 62,676 4,978 1,42,022 R Solapur15,717 5,496 19,417 28,892 16,174 2,409 1,19,311 4,421 2,11,838 U28,602 8,296 29,126 42,676 25,598 28,176 1,81,987 9,399 3,53,860 T
13 rr fT J.* • •46-. .. 14,790 3,236 15,868 10,706 8,336 7,791 69,880 6,684 1,37,290 R Kolhapur
fTT 13,144 7,922 20,097 21,851 13,273 1,808 79,943 3,225 1,61,263 u27,934 ll,l5 8 35,965 32,557 21,609 9,599 1,49,823 9,909 2,98,553 T
14 arWmR • • « • ?rr 11,048 1,932 8,979 12,623 8,154 9,925 42,256 4,309 99,227 R Aurangabad14,271 7,272 19,675 14,327 13,321 2,424 55,709 3,400 1,30,401 U25,319 9,204 28,654 26,950 21,475 12,349 97,965 7,709 2,29,628 T
15 SR>TWk • * 'an 7,457 1,091 5,135 9,768 6,438 21,275 37,128 2,018 90,309 R Parbhani7,802 3,972 10,370 13,515 8,247 2,370 26,724 1,553 74,555 U
15,259 5,063 15,505 23,283 14,685 23,645 63,852 3,571 1,64,864 T
16 ?1T 7,757 1,249 6,055 7,952 5,840 16,465 30,749 2,322 78,388 R Beed?TT 6.424 3,712 7,211 5,596 5,381 1,016 18,210 705 48,253 U
14,181 4,961 13,266 13,548 11.221 17.481 48,959 3,027 1,26,641 717 T its •• m 8,285 2,512 7,424 10,431 7,540 19,613 35,673 2,689 94,167 R Nanded
fn 7,638 4,216 9,826 10,377 7,326 1,618 • 26,145 1,584 68,733 U15.923 6.728 17,250 20,808 14,866 21,231 61,818 4,273 1,62,900 T
18 ?TT 13,419 2,529 R,753 12,524 7,935 19,934 36,644 3,360 1,05,101 R Osmanabad-?n 8,597 2,541 9,371 11,118 8,463 1,528 22,937 1,082 65,638 U
22,016 5,070 ■ 18,124 23,642 16,398 21,462 59,581 4,442 1,70,739 T
19 w<fr«u ?fT 8,527 1,176 5,546 9,536 4,163 4,731 25,895 1,216 60,788 R Buldhana6,150 3,278 8,318 9,899 6,673 1,208 17,876 658 54,066 U
14,677 4,454 13,864 19,435 10,841 5,939 43,771 1,874 1,14,854 T
op
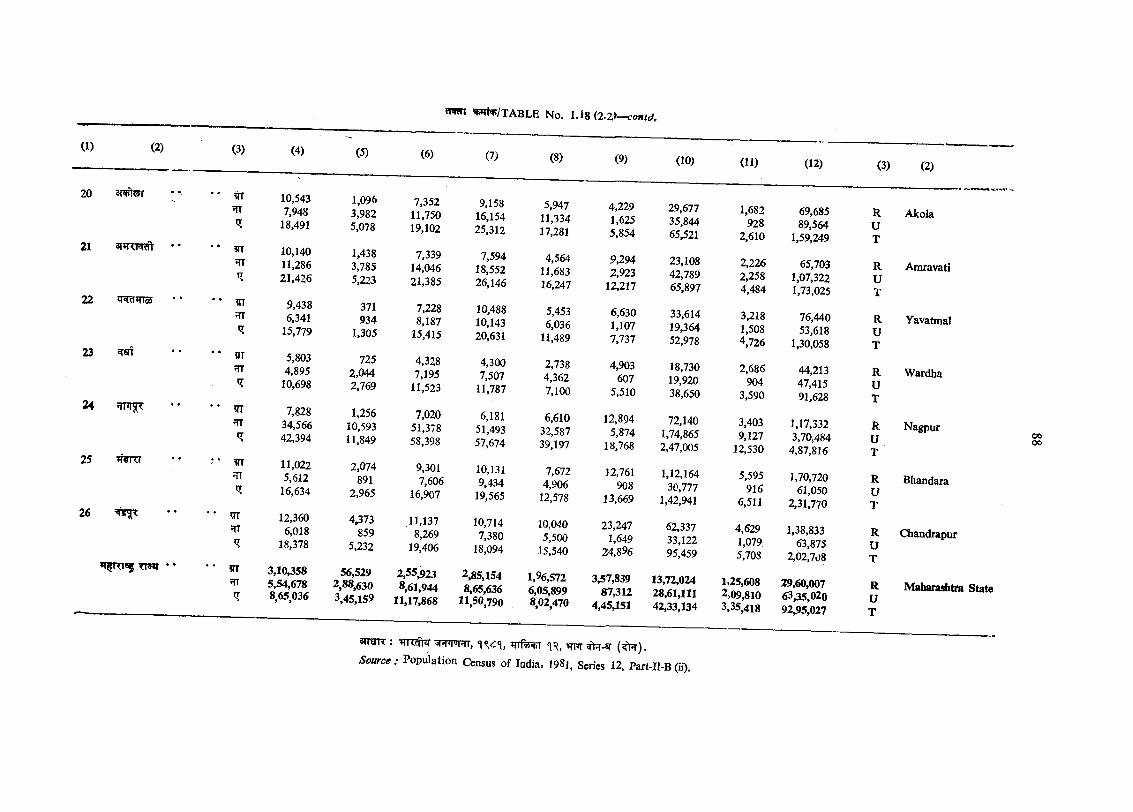
CD (2)
21 •
22 q^lTToS
24
25 »RnT
26
*T^«5?T3II “
(3) (4)
«PRn «l3?f^/TABLE No, l . l8 (2 .1 't^o n td ,
(5) (7) (8) (9) (10) (11) (12)
a n a r r : ^ H w rr, ^ ( ^ ) -
5o«rctf ; Population Census o f India, 1981, Series 12, Part-Il-B (ii).
(3) (2)
m 10,5437,948
18,491
1,0963,9825,078
7,35211,75019,102
9,15816,15425,312
5,94711,33417,281
4,2291,6255,854
29,67735,84465,521
1,682928
2,610
69,68589,564
1,59,249
RUT
Akola
mJTT
10,14011,28621,426
1,4383,7855,223
7,33914,04621,385
7,59418,55226,146
4,56411,68316,247
9,2942,923
12,217
23,10842,78965,897
2,2262,2584,484
65,7031,07,3221,73,025
RUT
Amravati
?IT?IT
9,4386,341
15,779
371934
1,305
7,2288,187
15,415
10,48810,14320,631
5,4536,036
11,489
6,6301,1077,737
33,61419,36452,978
3,2181,5084,726
76,44053,618
1,30,058
RUT
Yavatmal
inmR
5,8034,895
10,698
7252,0442,769
4,3287,195
11,523
4,3007,507
11,787
2,7384,3627,100
4,903607
5,510
18,73019,92038,650
2,686904
3,590
44,21347,41591,628
RUT
Wardha
?TTJTT'I
7,82834,56642,394
1,25610,59311,849
7,02051,37858,398
6,18151,49357,674
6,61032,58739,197
12,8945,874
18,768
72,1401,74,8652,47,005
3,4039,127
12,530
1,17,3323,70,484
4,87,816
RUT
Nagpur
m 11,0225,612
16,634
2,074891
2,965
9,3017,606
16,907
10,1319,434
19,565
7,6724,906
12,578
12,761908
13,669
1,12,16430,777
1,42,941
5,595916
6,511
1,70,72061,050
2,31,770
RUT
Bhandara
m?TT
12,3606,018
18,378
4^73859
5,232
11,1378,269
19,406
10,7147,380
18,094
10,0405,500
15,540
23,2471,649
24,896
62,33733,12295,459
4,6291,0795,708
1,38,83363,875
2,02,708
RUT
Chandrapur
?IT 3,10,3585,54,6788,65,036
56,5292,88,6303,45,159
2,55,9238,61,944
11,17,868
2,85,1548,65,636
11,50,790
1,96,5726,05,8998,02,470
3,57,83987,312
4,45,151
13,72,02428,61,11142,33,134
1,25,6082,09,8103,35,418
29,60,00763,35,02092,95,027
RUT
Maharaditra State
00oo
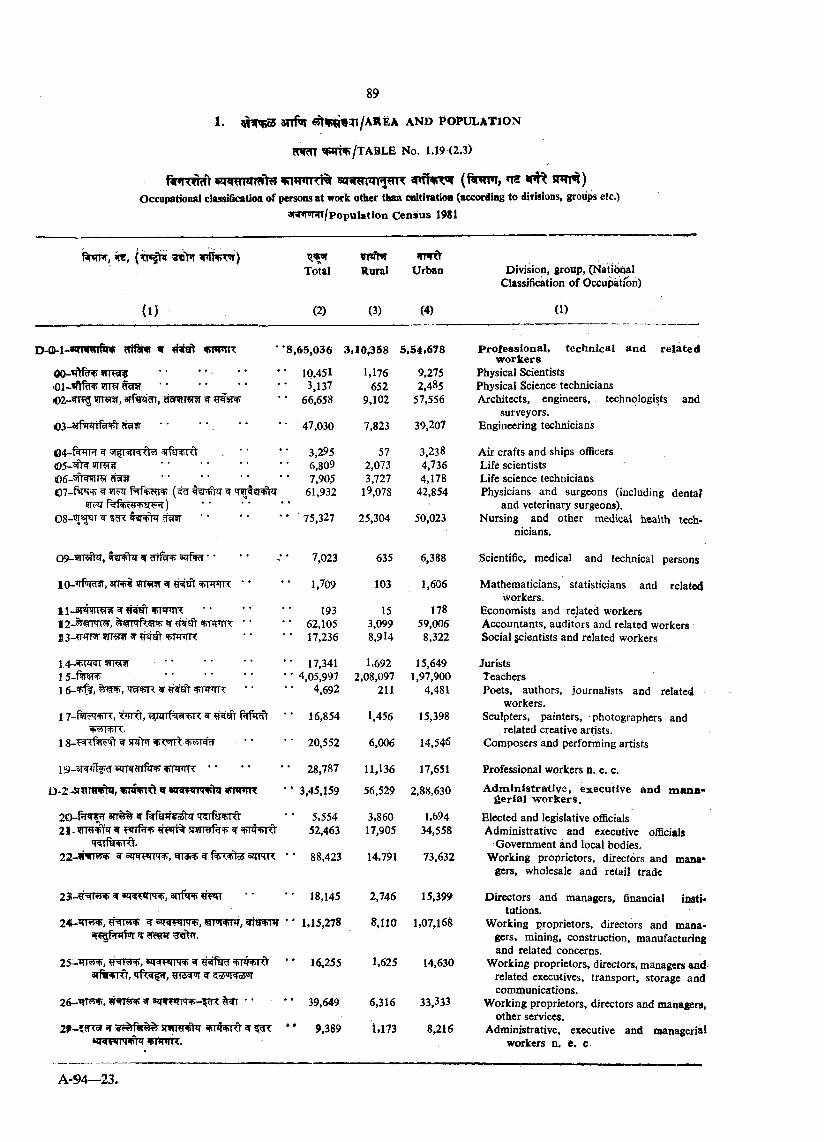
1. a n fn « tH fij«7 i/A R E A a n d i^b iPU L A T ioN
?fiRn ?WTV/TABLE No. 1.19 <2.3)
f v R i h f t »T<rormm>s sq ^ ^ T r^ ffiT v f f v r v ( f tm m , m s m m )OccupatioB«l classification of persons at work other than coltiTatioa (accarding to dirisions, groujpis etc.)
^W^'PRT/Population C en iu s 1981
»te, ( x ! ^ ^ > T snffvr»r)
(1 )
Total
(2)
1T*fhTRurkl
(3)
U rb in
(4)
Division, groiljp, (National Classification of Occupation)
(1)
*8.65.036 3,10.358 5 ,54,678 P ro fe ss io n a l, te ch n ica l a n d r e la te dw o rk e rs
10,451 1,176 9,275 Physical ScientistsOi-'*Afir+'>?rrar flysT 3.137 652 2,485 Physical Science technicians02-^T?5 ifTi ji, arftpjcTT, c f^ ra?r W MeffV 66,658 9,102 57,556 Architects, engineers, technologists and
surveyors.0 3 -3 i fw % ^ 5ra?r 47,030 7,823 39,207 Engineering technicians
©4~r=<^n 5i^r5nTd?5 arfsRTRt 3,295 57 3,238 A ir crafts and ships officers(05-^^tw Jfirwir 6,809 2,073 4,736 Life scientists
d«a 7,905 3,727 4,178 Life science technicians61,932 19,078 42,854 Physicians and surgeons (including dentaf
♦ • and veterinary surgeons).0 8 -^ ^ T ^ cf95T ‘ ' * * • * 75,327 25,304 50,023 Nursing and other medical health tech
nicians.
09 -^T F ^, if g r tf^ ozrf^ • • V 7.023 635 6,388 Scientific, medical and technical persons
10-'*if«id5), a rrrt VJW5! ^ +R ^I1 * * 1,709 103 1,606 Mathematicians, statisticians and relatedworkers.
1 ^ inrat v m R • • 193 15 178 Economists and related vi^orkers12— ^^rprf^5T ^ ' F trt’ttt • • 62,105 3,099 59,006 Accountants, auditors and related workers
ijn^n ^ ftsjsft <f>rM<iT< * * 17,236 8,9U 8,322 Social scientists and related workers
14 -^ n r^ 9TT9iT *" * ■ ' ■ 17,341 1,692 15,649 Jurists- . 4,05,997 2,08,097 1,97,900 Teachers
1 6-^f;f, 'T w ^ w ^nrrrrTR • • 4,692 211 4,481 Poets, authors, journalists and relatedworkers.
16,854 1,456 15,398 Sculpters, painters, photographers and, related creative artists.
1 ;8-^Rxfvr^ w snfH 5FF5T^ * * 20,552 6,006 14,546 Ck)mposers and performing artists
l5-3Tw ffiifl’ ezn5r(rffiTW> vnrmx 28,787 11,136 17,651 Professional workers n. e. c.
D -2 -S U W ^ , lTO«FTd 9 NJiffsnq»t«| iRTWr 3,45,159 56,529 2,88,630 A d m in is tra tiv e , execu tive a n d m an a>g e r ia l w o rk e rs .
20-^® i*i 3TT % w ^fa^rg^hr 'T^rftr^r^ 5,554 3,860 1,694 Elected and legislative officials21-vmri'lfq- ^ ?«nf?Tw> «re«n% srsrraPi 52,463 17,905 34,558 Administrative and executive officials
'Rrfk+T^t. Government and local bodies.22-W‘<Tr5y- > y <«i«<wi'r+, sr nf.<< 'ld5 szmR • * 88,423 14,791 73,632 Working proprietors, directors and mana
gers, wholesale and retail trade
23-«VT«-(» 5| SiTfWrT-P, 3TTf^ 18,145 2,746 15,399 Directors and managers, financial institutions.
24-*rr«<f>, '4 <am+r*f, srre^Fr • • 1,15,278 8,110 1,07,168 Working proprietors, directors and m anaaR ^ ^ f^ r sr ?Tc?nT ^ r» r. gers, mining, construction, manufacturing
and related concerns.25~*ir<jyif;, s!TifV!n7+ ar flwfijcf • • 16,255 1,625 14,630 Working proprietors, directors, managers and-
arfinrRt, w related executives, transport, storage andcommunications.
26-»?r555f>, fr-i(T«+' ar sznmnw-Fn ?r • * * * 39,649 6,316 33,333 W orking proprietors, directors and managers,
ff snrRWtsr v i^ v rrt ^ f?R • • 9,389VTWrt.
other services.1,173 8,216 Administrative, executive and managerial
workers n. e. c
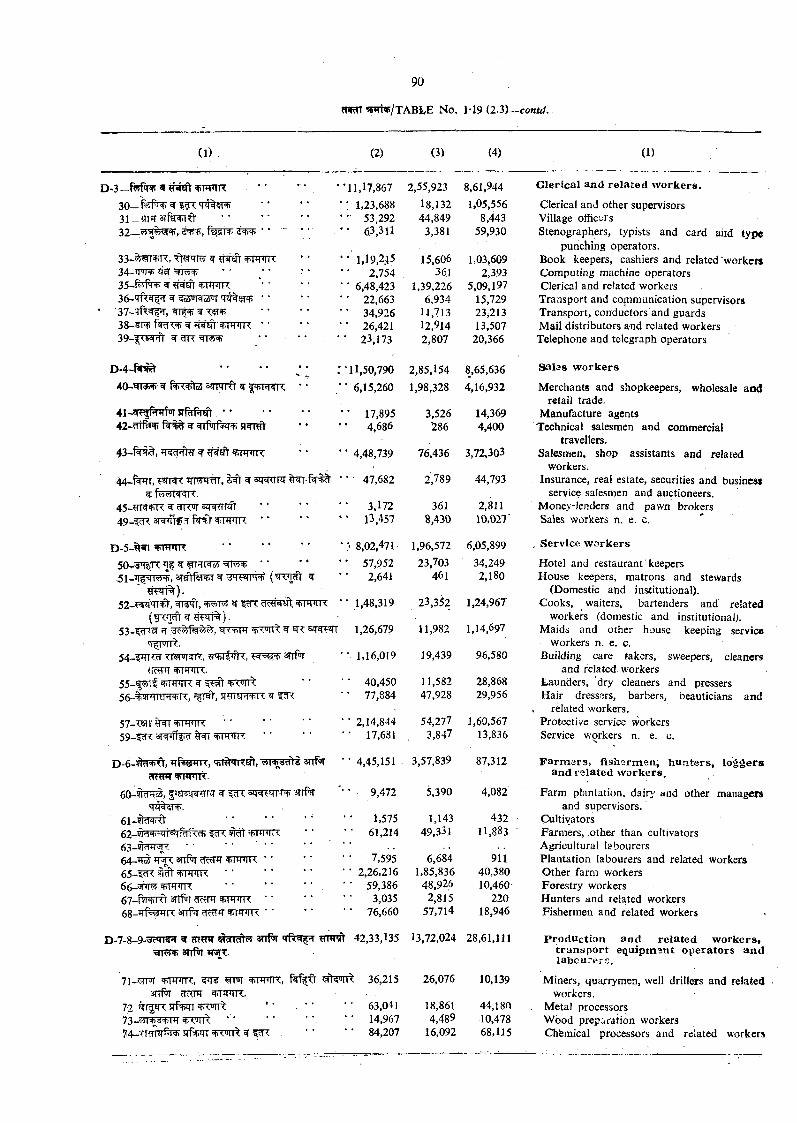
(1) (2) (3) (4) (1)
►-3_f5rfcnpgr^'tw!T?niR ” *• “ 11,17,867 2,55,923 8,61,944 C le ric a l an d r e la te d w o rk e rs .
30—fe fw ^ 'PT%5T *•1,23,688 18,132 1.05,556 Clerical and other supervisors31—?TFr arfk^rrd • ' 53,292 44,849 8,443 Village officers32— f STW) 3 ^ “ 63,311 3,381 59,930 Stenographers, typists and card and type
punching operators.33-^W T ^, W c( ifTW< • •' 1,19,215 15,606 1,03,609 Book keepers, cashiers and related workers34~wnw 4 ^ WT 4> ’ ■ •• • ' 2,754 361 2,393 Computing machine operators35 -f? jf^ 5T •• 6,48,423 1,39,226 5,09.197 Clerical and related workers36-'TirW^ ^ 5 3 ^0 5 ^ 'T?T%§T ’ ‘ • • 22,663 6,934 15,729 Transport and cofnmunication supervisors
■37-TfT^, W T*a'5F • • 34,926 11,713 23,213 Transport, conductors'and guards3 8 - ^ W 4w^-^TWfl< • • • • 26,421 12,914 13,507 Mail distributors and related workers39-|<K5<'-?l' ^ ^ •• •• • • 23,173 2,807 20,366 Telephone and telegraph operators
D .4~n< ^ • ' • • j ; : ’11,50,790 2,85,154 8,65,636 S a is s w o rk e rs
40-’5rT3?P w <i <f • • • • 6,15,260 1,98,328 4,16,932 Merchants and shopkeepers, wholesale andretail trade.
41~4<^I^*iT''i ’ ’ ■' * * 3,526 14,369 Manufacture agents42-^ni^^ w ^Tpirf^^Ri * * • • 4,686 286 4,400 Technical salesmen and commercial
travellers.4 3 - ^ ^ , W ?REft ^JTWT * • 4,48,739 76,436 3,72,303 Salesmen, shop assistants and related
workers.•44-f^r, Trmwr, s4t ^ stRPFTR 47,682 2,789 44,793 , Insurance, real estate, securities and business
service salesmen and auctioneers.45-^rra^^ ^ rnx’H' • • 3,172 361 2,811 ' Money-lenders and pawn brokers4 9 -? ^ arwifiw^ f'l’l'l ^tFPTR 8,430 10,021 ■ Sales workers n. e. c.
D -5 -^ ^ ................................ • :* 8,02,471 1,96,572 6,05,899 , S erv ice w o rk e rs
50-^^3^'n: ^ 23,703 34,249 Hotel and restaurant keepers5 l-T T |xn^ , ^ gmTFTFR? ^ 2,641 461 2,180 House keepers, matrons and stewards
fnF«n%).52-H^qrs^, ^Titfr, ^ cR^i^, EfilHM'K * ■ 1,48,319
53-1^:^ ^ 5ir^?n 1,26,67?
54_fjTT?^ ? r^ T f^ , 'W'”'si=t)' srrf^ 1,16,019
(Domestic and institutional).23,352 1,24,967 Cooks, waiters^ bartenders and related
workers (domestic and institutional). 11,982 1,14,697 Maids and other house keeping service
Workers n. e. c.19,439 96,580 Building care takers, sweepers, cleaners
and related workers55 -^ l^ f 'MfTHK ^ V W t 40,450 11,582 28,868 Launders, dry cleaners and pressers56~%WEFn^K, 5 ^ , 5|?nsT?T i<- =1 77,884 47,928 29,956 Hair dressers, barbers, beauticians and
related workers.57-T5ir ^ ........................................... 2,14,844 54,277 1,60,567 Protective service workers59-%^T. ............................. 17,681. 3,847 13,836 Service workers n. e. c.
D -6-w v< t, arrPiT 4,45,151 3,57,839 87,312 F a rm e r s , f ish e rm e n , h u n te r s , lo g g e rsdcHflT a n d re la te d w o rk e rs .
6 0 -w ^ ii, ^ snfcrr 9,472 5,390 4,082 Farm plantation, dairy and other managersand supervisors.
6i-yji^+'<t ........................................... 1,575 1,143 432 Cultivators62- ici°b-'Mi''i !%fcfT> ^ ‘ ‘ ’ 61,214 49,331 11,883 Farmers, other than cultivators63_yid^'f ................................ ' ■ Agricultural labourers64—T55 3TTPt 7,595 6,684 911 Plantation labourers and related workers65-fen: = h r H < ir ^ ............................. 2,26,216 1,85,836 40,380 Other farm workers66-5FI« +T*T’Tr • ■ ■ ■ ■ ' ' ' 59,386 48,926 10,460 Forestry workers67-ftraKt 3Ttfw cR?PT ^ rnriT R * ' 3,035 2,815 220 Hunters and related workers.68-+1 1 < anpT dc^H 76,660 57,714 18,946 Fishermen and related workers
3.7-8-9-^cMr^ ^ m m anfii «iHyl 42,33,135 13,72,024 28,61,111 P ro d u c tio n a n d re la te d w o rk e rs .3Trf®T *T^T. t r a n s p o r t e q u ip m sn t o p e ra to rs a n d
labourt^rs.
7i-?jrRr ^ +w<ir<, : 36,215 26,076 10,139 Miners, quarrymea, well drillers and relatedsrTfuT =hm^ri<. workers.
72 '■ . 63,041 18,861 44,180 Metal processors73^^ ;<»'^=t)R» ' * '• ‘ V 14,967 4,489 10,478 Wood preparation workers74_XT9Tin^ 5T%qT +<OTT^ ^ ^ d < . 84,207 16,092 68,115 Chfemical processors and related workers
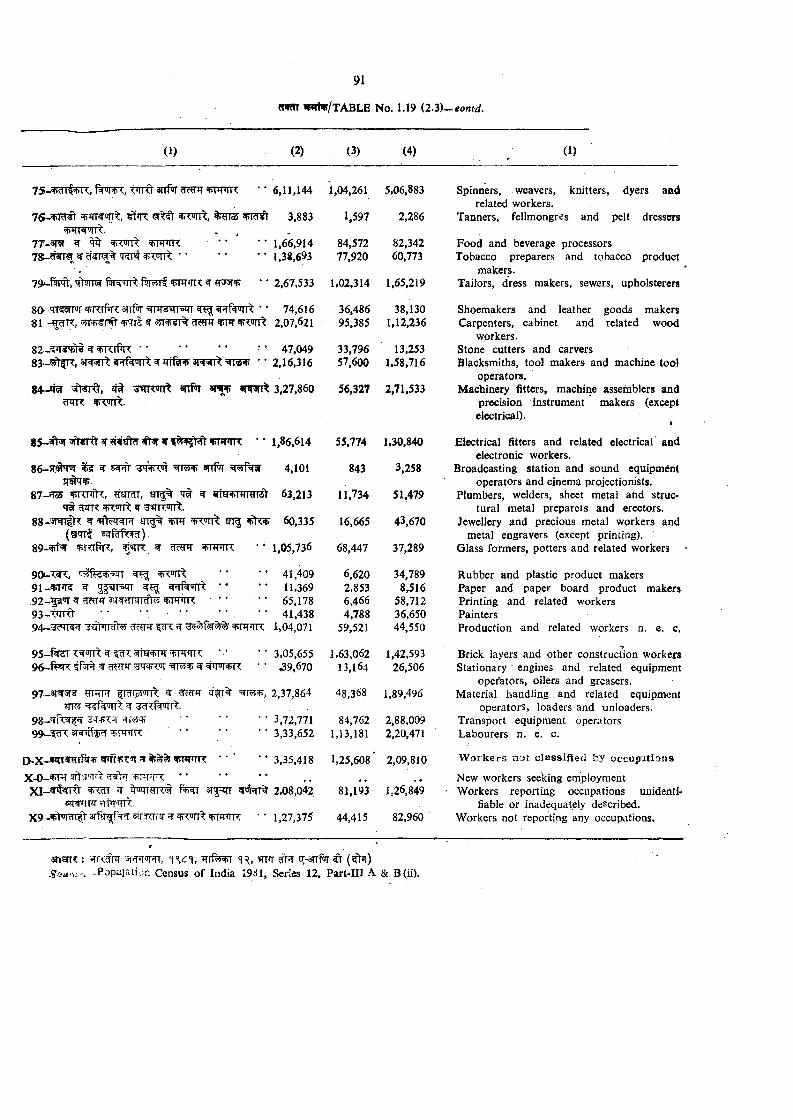
W tv/TA B LB No. 1.19 {2.Z)~eonid.
75-'P rr +T<, tnrr tanf^r*t>wn< • * 6, ii , i44 i , 04,261 5,06,883
^;w^, ^mo3 TRPft 3,883 1,597 2,286+ m n 'J|A.
77_3T5t 2T ^ ^>mn: ..................... 1,66,914 84,572 82,3427»-?fWM 9T 'TTI + luirt •* *• •• 1,38,693 77,920 60,773
79^ W , f^on^ fir yrS ^TIWX W • ; 2,67,533 1,02,314 1,65,219
80f ^rfin: arrPT = mw52TT ^ ^^nirr^ • * 74,616 36,486 38,1308 1 - ^ R , 5T cRym ^ IvCTrrt 2,07,621 95,385 1,12,236
8 2 - ^ 3 ^ ^ R rp R ................................................................ '• 47,049 33,796 13,25383-^jtfR , 3r^5jT ^nrfwin^ ^ * n f^ snrsrr^ =srrar • * 2,16,316 57,600 1,58,716
84-*ra ^ 3nf»T 3T^ arwm 3,27,860 56,327 2,71,533?RR T W t.
8 5 - * ^ ^ ^ ^ vnTTR • • 1,86,614 55,774
86-5W nr ^ ^ 5 ^ arrpii
87-==fo5 vnrtfh:, htrh, 'Tt irn
SS-'sfwifVr ^ ETT^ ^ ^(s'Trt s^rRrfw).
90 i-T ^ , =:^fer^^r 5TF9 l_ ^ P R w 5f5ir3qT =r!F ••
93 -tfrR t ' • • ' • •
irr^ ^
9 9 - ^ ^ iW T • •
D-x-«narafH7i5 !T • • '
X-0-^*T Fftti’JTr < :r'T'rR * *XI-^nWRt ?r zrozTRnX# STJ n-
SIR’TFT rnriTTT.
4,101 843
63,213 11,734
60,335 16,665
,05,736 68,447
41,409 6,62011,369 2,85365,178 6,46641,438 4,788
.04,071 59,521
(,05,655 1,63,062^9,670 13,164
,37,864 48,368
i,72,771 84,762S,33,652 1,13,181
1,35,418 1,25,608
',08,042 81,193
,27,375 44,415
1,30,840
3,258
51,479
43,670
37,289
34,7898,516
58,71236,65044,550
1,42,59326,506
1,89,496
2,88,0092,20,471
2,09,810
1,26,849
82,960
Spinners, weavers, knitters, dyers aod related workers.
Tanners, fellmongres and pelt dressers
Food and beverage processors Tobacco preparers and tobacco product
makers.Tailors, dress makers, sewers, upholsterers
Shoemakers and leather goods makers Carpenters, cabinet and related wood
workers.Stone cutters and carvers Blacksmiths, tool makers and machine too!
operators.Machinery fitters, machine assemblers and
precision instrument makers (except electrical). #
Electrical fitters and related electrical and electronic workers.
Broadcasting station and sound equipment operators and cinema projectionists.
Plumbers, welders, sheet metal atid structural metal prepareis and erectors.
Jewellery and priecious metal workers and metal engravers (except printing).
Glass formers, potters and related workers
Rubber and plastic product makers Paper and paper board product makers Printing and related workers PaintersProduction and related workers n. e. c.
Brick layers and other construction workers Stationary ' engines and related equipment
operators, oilers and greasers.Material handling and related equipment
operators, loaders and unloaders. Transport equipment operators Labourers n. e. c.
Workers not classified by occupatians
New workers seeking employment Workers reporting occupations unidenti*
fiable or inadequately described.Workers not reporting any occupations.
-ii «T3TTT, WT q-3rrfor (?>?).Sc>u-i- .. Census of India 1981, Series 12. Part-IU A & B(ii).

1. 3nfrr a n d p o p u l a t io n
1R./TABLE No. 1-20 (24)
A - ^ 4 r - 2 4 .
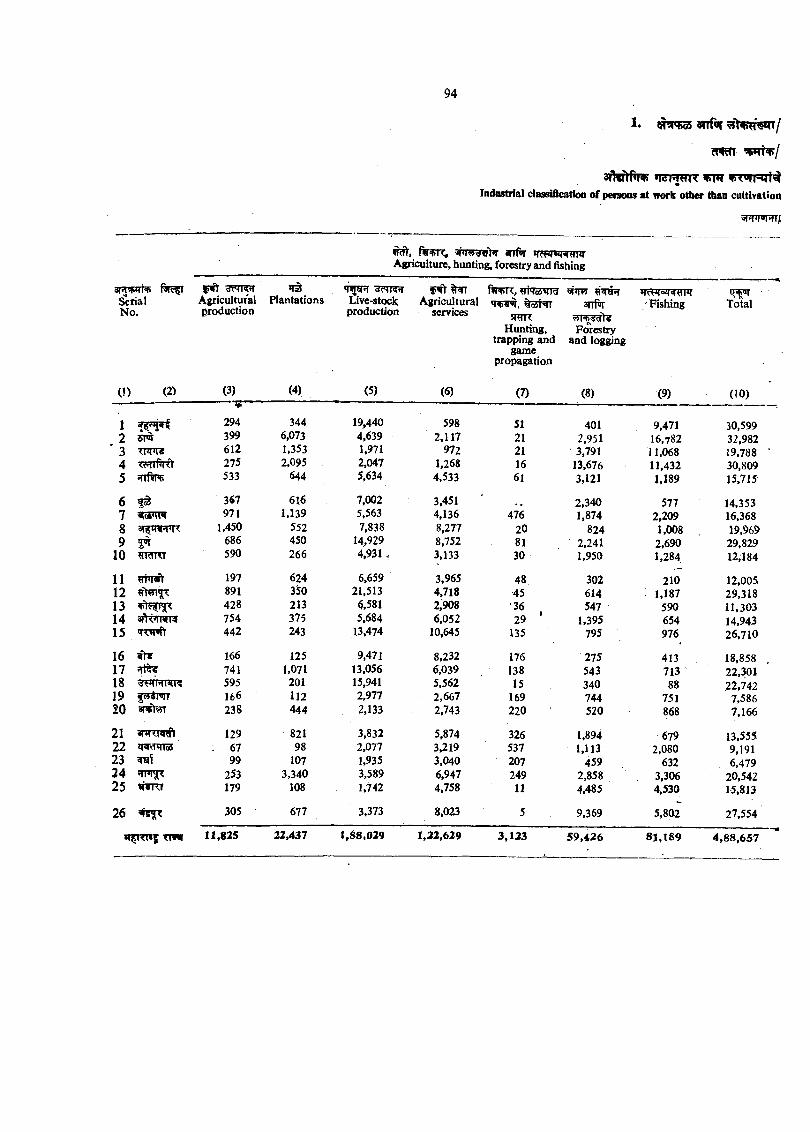
1 . itm ia i s n f tr
cw m
a d l f t f w »TgHHTT ^Indastrial classification of persons at work other than cultivation
5npn»m/
ftm x , 5hT9wg>r an%Agriculture, hunting, forestry and fishing
-
Plantations
(4)
Agriculturalservices
(6)
arrfiT
Forestry and logging
(8)
Total
(10)
& rialNo.
(1) (2)
Agriculturalproduction
(3)
Live-stockproduction
(5)
fWR,%o5t^r
Hunting, trapping and
game propagation
(7)
Fishing
(9)
294 344 19,440 598 51 401 9,471 30,5992 5T^ 399 6,073 4,639 2,117 21 2,951 16,782 32,9823 612 1.353 1,971 972 21 3,791 i 1,068 19,788 '4 tcttM 275 2,095 2,047 1,268 16 13,676 11,432 30.8095 533 644 5,634 4,533 61 3,121 1,189 15,715
6 ^ 367 616 7,002 3,451 2,340 577 14,3537 971 1,139 5,563 4,136 476 1,874 2,209 16,3688 1,450 552 7,838 8,277 20 824 1,008 19,9699 5^ 686 450 14,929 8,752 81 2,241 2,690 29,829
10 n?fra 590 266 4,931 , 3,133 30 1,950 1,284 12,184
11 HPTWt 197 624 6,659 3,965 48 302 210 12,00512 891 3'50 21,513 4,718 45 614 1,187 29,31813 428 213 6,581 2,908 •36 547 590 11,30314 <<fti»nwii5 754 375 5,684 6,052 29 ' 1,395 654 14,94315 442 243 13,474 10,645 135 795 976 26,710
16 ^ 1^6 125 9,471 8,232 176 275 413 18,858 .17 ^ 741 1,071 13,056 6,oy9 138 543 713 22,30118 595 201 15,941 5,562 15 340 88 22,74219 166 112 2,977 2,667 169 744 751 7,58620 238 444 2,133 2,743 220 520 868 7,166
21 a n n ^ 129 821 3,832 5,874 326 1,894 679 13,55522 *nw<Tio5 : 67 98 2,077 3,219 537 1,113 2,080 9,19123 99 107 1,935 3,040 207 459 632 6,47924 253 3,340 3,589 6,947 249 2,858 3,306 20,54225 wr<7 179 108 1,742 4.758 11 4,485 4,530 15,813
26 305 677 3,373 8,023 5 9,369 5,802 27,554
x m 11 ,825 22,437 1,^ 8 ,029 1 ,3 2 ,6 2 9 3,123 5 9 ,4 2 6 8 1 ,1 8 9 4 ,8 8 ,6 5 7
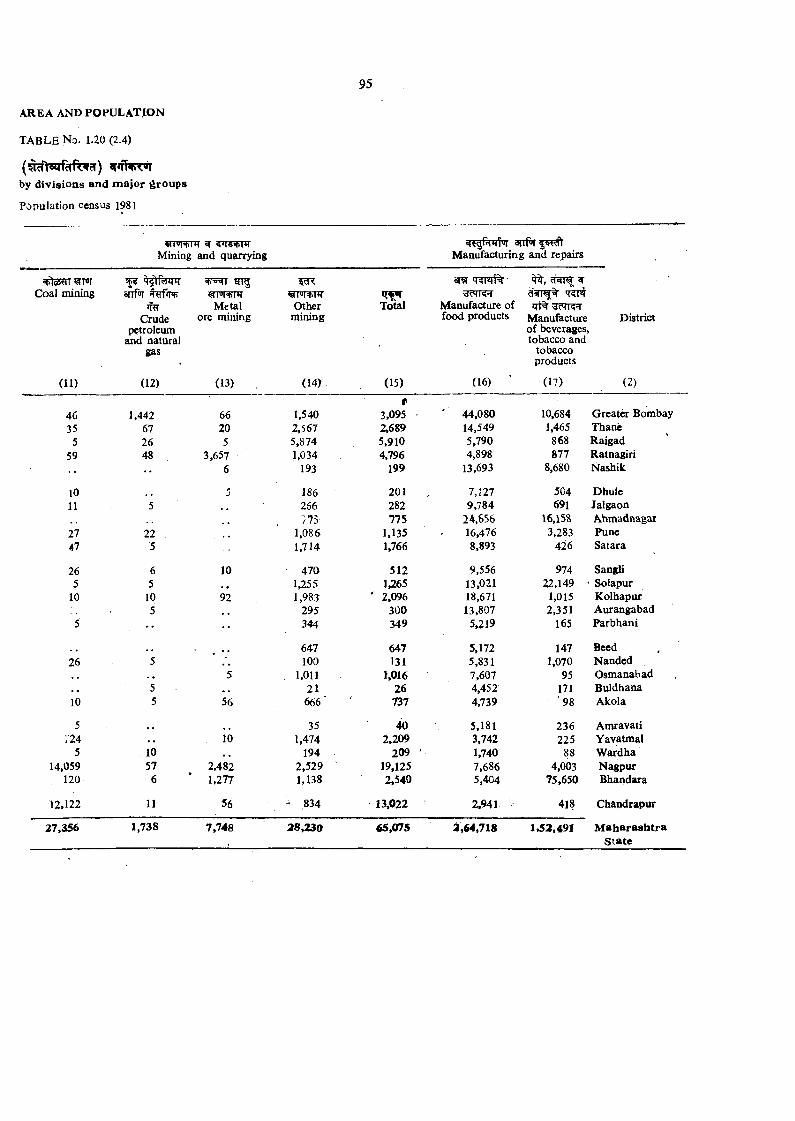
AREA AND PO PU LA TIO N
t a b l e N o. 1.20 (2.4)
by divisions and major groups
Population census 1981
ypiRrnr w Mining and quarrying Mandfacturing and repairs
v te y rm rr Coal mining
(U )
airf^
Crude petroleum
and natural gas
(12)
4.'HIqvirTotal
(15)
3RryTon)TiT
Metal ore mining
(13)
Othermining
(14).
Manufacture of food products
(16) ’
Manufacture of beverages, tobacco and
tobacco products
(17)
District
(2)
46 1,442 66 1,540#
3,095 ' 44,080 10,684 Greater Bombay35 67 20 2,567 2,689 14,549 1,465 Thane
5 26 5 5,874 5,910 5,790 868 Raigad59 48 3,657 1,034 4,796 4,898 877 Ratnagiri•• •• 6 193 199 13,693 8,680 Nashik
10 5 186 201 7,127 504 Dhule11 5 .. 266 282 9,784 691 Jalgaon
.. 111 775 24,656 16,158 Ahmadtiagat27 22 , 1,086 1,135 16,476 3,283 Pune47 5 1,714 1,766 8,893 426 Satara
26 6 10 470 512 9,556 974 Sangli5 5 1,255 1 3 5 13,021 22,149 '• Solapur
10 10 92 1,983 ' 2,096 18,671 1,015 Kolhapur5 295 300 13,807 2,351 A urangabad
5 •• 344 349 5,219 165 Parbhani
■ . •• 647 647 5,172 147 Beed26 5 100 131 5,831 1,070 Nanded
.. 5 1,011 1,016 7,607 95 Osmanabad5 . * 21 26 4,452 171 Buldhana
10 5 56 666 ' 737 4,739 '9 8 Akola
5 • • 35 40 5,181 236 Amravati•/24 10 1,474 2,209 3,742 225 Yavatmal
5 10 , » 194 209 1,740 88 W ardha14,059 57 2.482 2,529 19,125 7,686 4,003 Nagpur
120 6 1,277 1,138 2,540 5,404 75,650 Bhandara
12,122 11 56 - 834 13,022 2,941 418 C handrapur
27,356 1,738 7,748 28,230 65,075 2,64,718 1,52,491 M a h a r a s h tr aS ta te
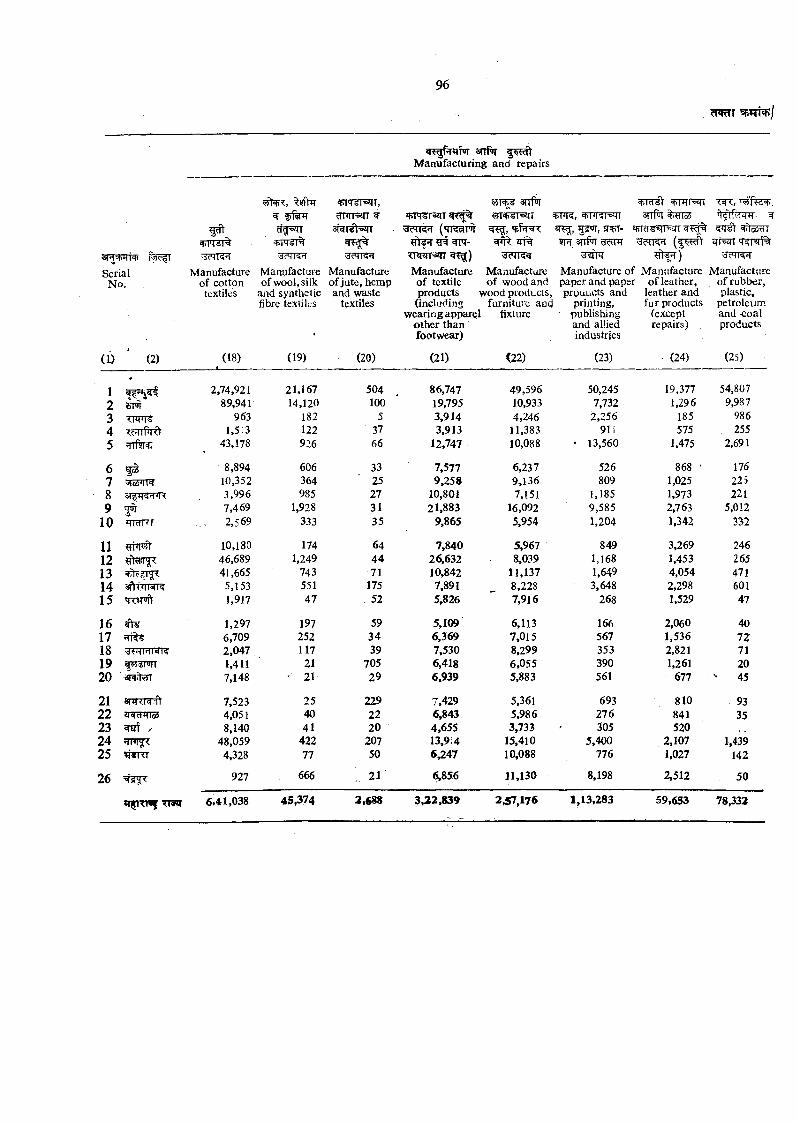
snfwManufacturing and repairs
+m (-si4r,dlM|T»4l W
sRifhan
arrfarrPni
■T i . / i . . rv qiWT tTOTrf%
Manufacture , of rubber,
plastic, petroleum and -coal products
(25)
('n^FT <4 , ^
Manufacture of paper and paper prouucts and
printing, publishing and allied industries
(23)
'IsH =rrr-
Manufacture of textile products V (including
wearing apparel o ther than footwear)
(21)
'JcMl'iH til'S'1)
Manufacture of leather,
leather and fur products
("except repairs)
(24)
SerialNo.
( 6 ‘ (2)
vdcMK'-iManufacture
of cx)tton textiles
(18)
'dCMK'lManufacture of wool, silk
and synthetic fibre textiles
(19)
Manufacture of jute, hemp and waste
textiles
(20)
Manufacture of wood and
vood products, furniture and
fixture
C22)
1 2,74,921 21,167 504 86,747 49,596 50,245 19,377 54,8072 SFT 89,941 14,120 100 19,795 10,933 7,732 1,296 9,987
3 <w^ 963 182 5 3.914 4,246 2,256 185 9864 <cHlPld 1,5'3 122 37 3,913 11,383 91 i 575 2555 'iinft't. 43,178 926 66 12,747 10,088 • 13,560 1.475 2,691
6 ^ 8,894 606 33 7,577 6,237 526 868 • 1767 v!ia5<iN 10,352 364 25 9,258 9.136 809 1,025 2258 3,996 985 27 10,801 7,151 1,185 1,973 2219 ^ 1A ^9 1,928 31 21,883 16,092 9,585 2,763 5,012
10 'TFclHT - 2,569 333 35 9,865 5.954 1,204 1,342 332
U 10,180 174 64 7.840 5,967 849 3,269 24612 46,689 1,249 44 26.632 8.039 1,168 1,453 26513 41,665 743 71 10,842 11,137 1,649 4,054 47114 3 ^ ttwr 5,153 551 175 7,891 8,228 3,648 2,298 60115 t o MV 1,917 47 52 5.826 7,916 268 1,529 47
16 1,297 197 59 5,109 6,113 166 2,060 4017 6,709 252 34 6,369 7.015 567 1,536 7218 2,047 117 39 7,530 8,299 353 2,821 7119 <|<?5?I«II t ,4 l l 21 705 6,418 6,055 390 1,261 2020 7,148 ■ 21 29 6.939 5,883 561 677 ' 45
21 3)ii<r -n 7,523 25 229 7,429 5,361 693 810 9322 4,051 40 22 6.843 5,986 276 841 3523 wsrf / 8,140 41 20 4.655 3.733 305 52024 48,059 422 207 13.9;4 15.410 5,400 2,107 1.43925 4,328 77 50 6.247 10,088 776 1,027 142
26 927 666 ' 21 6.856 11,130 8,198 2.512 50
6,41,038 45,374 2,688 3,22,839 2,57,176 1,13,283 59,653 78,332
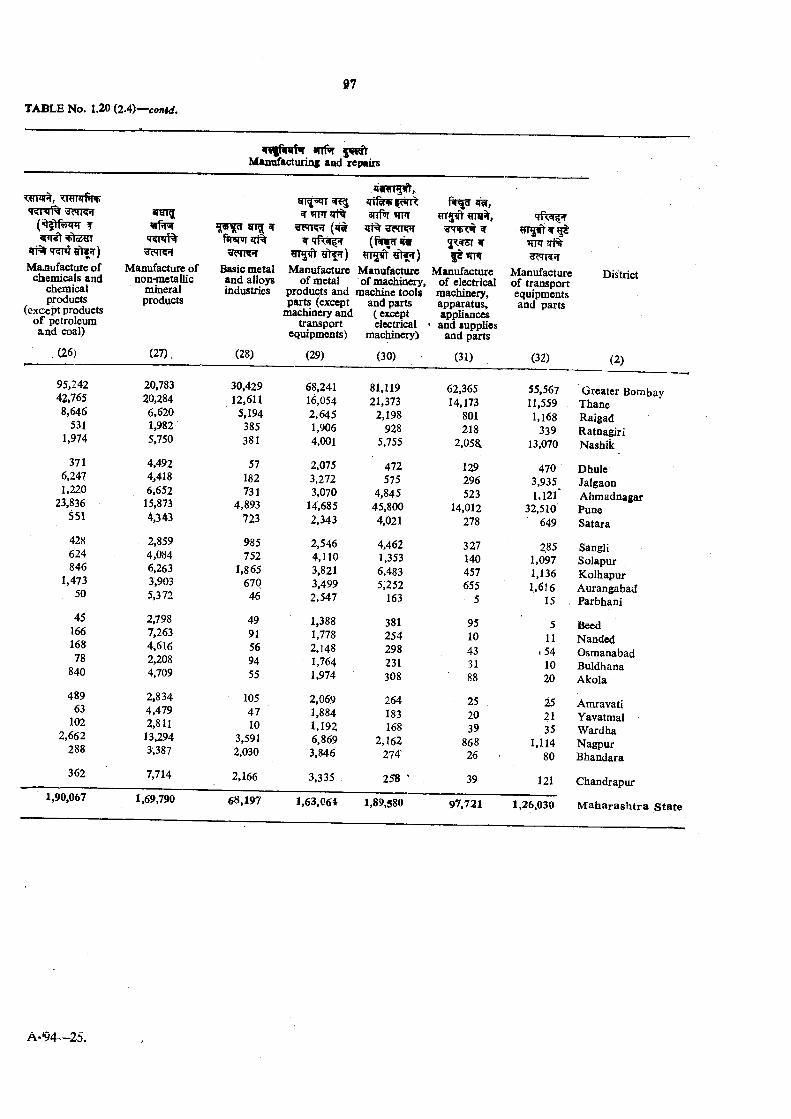
TABLE No. 1.20 (2A)--conid.
arrt^ 5ii«^ Man^acturins aod repsirs
TmRfiRr
^ T ? r P T ^ q r )Majiufacture of
chiemicals and chemical products
(except products o f petroleum an d coal)
(26)
95,24242,7658,646
5311,974
3716,2471,220
23,836551
428624846
1,47350
4516616878
840
48963
1022,662
288
362
Manufacture of non-metallic
mineral products
(27).
20,78320,2846,6201,9825,750
4,4924,4186,652
15,8734,343
2,8594,0846.263 3,903 5,372
2,7987.263 4,616 2,208 4,709
2,8344,4792,81113,2943;387
7,714
qt%
Basic metal and alloys industries
(28)
30,42912,611
5,194385381
57182731
4,893723
985752
1,86567046
4991569455
10547 10
3,5912,030
2,166
Manufacture of metal
products and parts (except
machinery and transport
equipments)
(29)
3rrf^ «rnr *rt%(f WcT w
Manufacture of machinery,
machine tools and parts
( except electrical
machinery)
(30)
fs^ rn rManufacture
of electrical machinery, apparatus, appliances
' and supplies and parts
(31)
68,24116,0542,6451,9064,001
2,0753,2723,070
14,6852,343
2.546 4,110 3.821 3,4992.547
1,3881,7782.1481,7641,974
2,0691,8841,1926,8693,846
3,335
81,11921,373
2,198928
5,755
472575
4,84545,8004,021
4,4621,3536,4835;252
163
381254298231308
264183168
2,162274'
258
62,36514,173
801218
2,05a
129296523
14,012278
327140457655
5
95104331
252039
86826
39
wrJTi%
Manufacture o f transport equipments and parts
District
(32) (2)
1,90,067 1,69,790 68,197 1,63.064 1,89,580 97,721
55,567 G reater Bombav 11,559 Thane 1,168 Raigad
339 Ratnagiri 13,070 Nashik
470 Dhule 3,935 Jalgaon 1,121 Ahmadnagar
32,510 Pune 649 Satara
285 Sangli 1,097 Solapur 1,136 Kolhapur 1,616 Aurangabad
15 . Parbhani
5 Beed 11 Nanded
• 54 Osmanabad 10 Buldhana20 Akola
25 Amravati21 Yavatmal 35 W ardha
1,114 Nagpur 80 Bhandara
121 Chandrapur
1,26,030 Maharashtra State
A-‘94^-25.
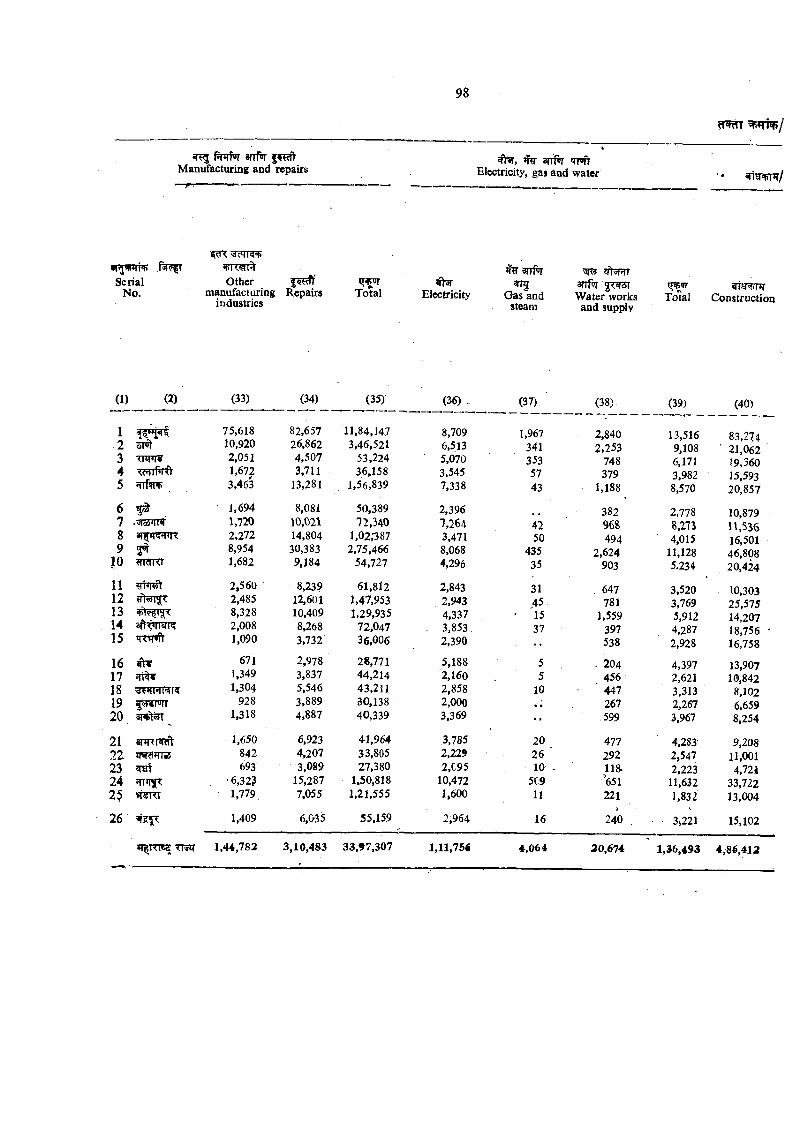
^ ffnrf«r 8iTfw f Manufacturing and repairs
^ 3rrPnr Tm)' Electricity, gas and water
SerialNo.
cl'< '3cTR^»frrw%Other | ^ ‘
manufacturing Repairs industries
Total Electricity
w anf'T WT5
Gas'and steam
aTTpJrW ater works
and supplyTotal Construction
(1) (2) (33) (34) (35) (36).
1 75,618 82,657-2 10,920 26,8623 2,051 4,5074 1,672 3,7115 'HftnF 3,463 13,281
6 1,694 8,0817 -yToS’Trtr 1,720 10,0218 2,272 14,8049 8,954 30,383
10 m?rr<r 1,682 9,184
1112 fllHTJT13 •*>W^14 8ft<»rMK15
16 ifrtr17 ^18 Wi'i1920 3 1 ^
■s
21 annR?ft 22.23 ^2425
26 ’WsTS
2,5602,4858,3282,0081,090
6711,3491,304
9281,318
1,650 842 693
• 6,32? 1,779
1,409
8,239
11,84,1473,46,521
53,22436,158
1,56,839
50,389 72,340
1,02,*3 87 2,75.466
54,727
61,81212,601 1,47,95310,409 1,29,9358,268 72,0473,732 36,006
2,978 28,7713,837 44,2145,546 43,2113,889 30,1384,887 40,339
6,923 41,9644,207 33,8053,089 27,380
15,287 1,50,8187,055 1,21,555
6,035 55,159
8,7096,5135,0703,5457,338
07 )
1,9673413535743
(38) ^
2.8402,253
748379
1,188
(39)
13,5169,1086,1713.9828,570
(40)
83,27421,06219,36015,59320,857
»T RT8S7T3H 1,44,782 3,10,483 33,f7 ,307
2,396 382 2,778 10,8797,264 42 968 8,273 11,5363,471 50 494 4,015 16,5018,068 435 2,624 11,128 46,8084,296 35 903 5.234 20,424
2,843 31 . 647 3,520 10,3032,943 45 781 3,769 25,5754,337 15 1,559 5,912 14,207
. 3,853. 37 397 . 4,287 18,7562,390 . . 538 2,928 16,7585,188 5 - 204 4,397 13,9072,160 5 456 2,621 10,8422,858 10 ■ 447 3.313 8,1022,000 . . 267 2,267 6,6593,369 •• 599 3,967 8,254
.3,785 20 477 4,283 9,2082,229 26 ' 292 2,547 11,0012,C95 1 0 - 118. 2,223 4,721
10,472 5C9 ^651 11,632 33,7221,600 11 221 1,832 13,004
2,964 16 240 3i221 15,102
1,11,75« 4,064 20,674 1,36,493 4,86,412
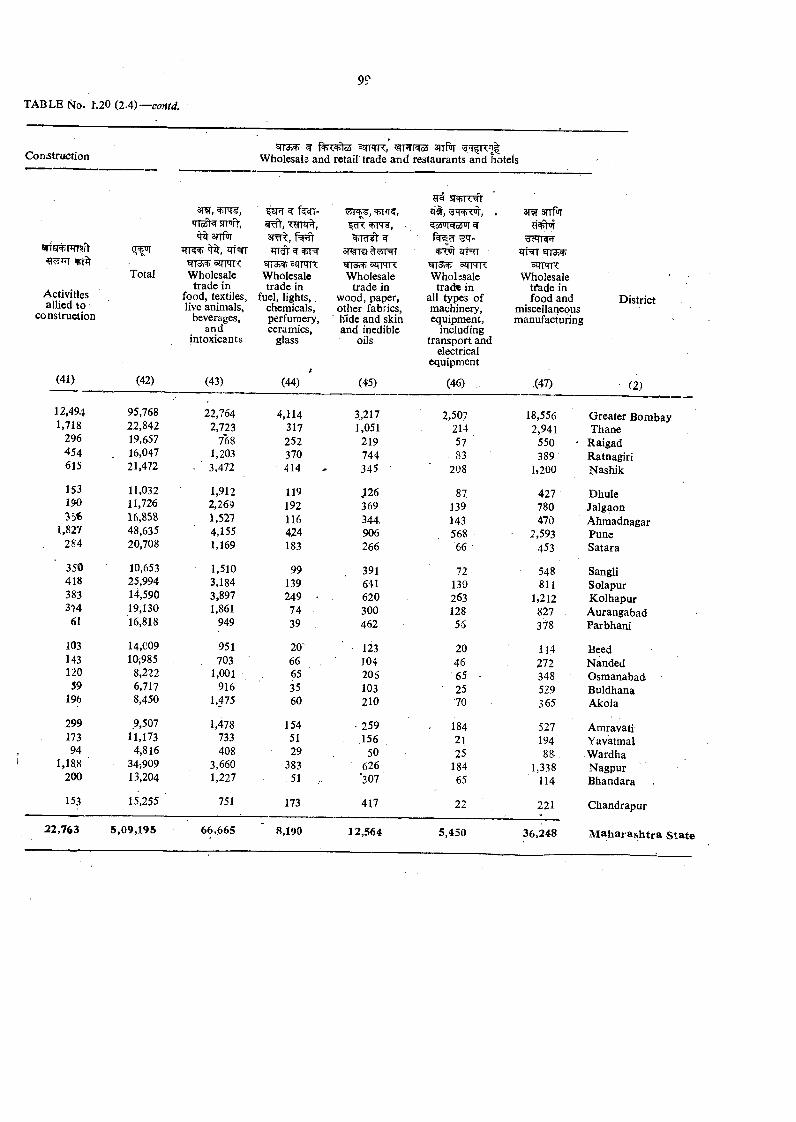
Construction^ smqrr, sttPt
Wholesals and retair trade and restaurants and hotels
Activities allied to
construction
(41)
Total
(42)
3T , ^TN ,ticsN'sr®jY, ^ anfrr
trr5^=zrPTR Wholesale
trade in food, textiles, live animals,
beverages, and
intoxicants
(43)
i-cTT sr f ^ - q‘3, » 3TW srrfw■ <?o4w1«1c6W| W
3TrTt, ft-3cT*rr^ «rT3^
W^5£TPTR TTSSFToZTRR oSTRK oZTTTRWholesale Wholesale W hohsale Wholesaletrade in trade in tracte in ti^de in
fuel, lights. wood, paper, all types of food andchemicals, other fabrics, machinery. miscellaneousperfumery, hide and skin equipment, manufacturingceramics, and inedible including
glass oils transport andelectrical
tequipment
(44) (45) (46) . (47)
District
12,494 95,768 22,764 4,114 3,217- 2,507 18,5561,718 22,842 2,723 317 1,051 214 2,941
296 19,657 768 252 219 57 550454 16,047 1,203 370 744 83 389615 21,472 - 3,472 414 345 ■ 208 1,200
153 11,032 1,912 119 J126 87 427190 11,726 2,269 192 369 139 780356 16,858 1,527 116 344 143 470
1,827 48,635 4,155 424 906 568 2,593284 20,708 1,169 183 266 66 453
350 10,653 1,510 99 391 72- 548418 25,994 3,184 139 641 130 811383 14,590 3,897 249 - 620 263 1»212374 19,130 1,861 74 300 128 827
61 16,818 949 39 462 56 378
103 14.C09 951 20' 123 20 114143 10,985 . 703 66 104 46 272120 8,222 1,001 65 205 65- - 34859 6,717 916 35 103 25 529
196 8,450 1,475 60 210 70 365
299 9,507 1,478 154 259 184 527173 11,173 733 51 156 21 19494 4,816 408 29 50 25 88
1,188 34;909 3,660 383 626 184 1,338200 13,204 1,227 51 ‘307 65 114
153 15,255 751 173 417 22 221
22,763 5 ,09,195 66,665 8,190 12,564 5,450 36,248
■ (2)
G reater Bombay Thane
Raigad Ratnagiri Nashik
DhuleJalgaonAhmadnagarPuneSatara
SangliSolapurK olhapurAurangabadParbhani
BeedNandedOsmanabadBuldhanaAkoJa
AmravatiYavatmalW ardhaNagpurBhandara
Chandrapur
M a h a r a s h tr a S ta te
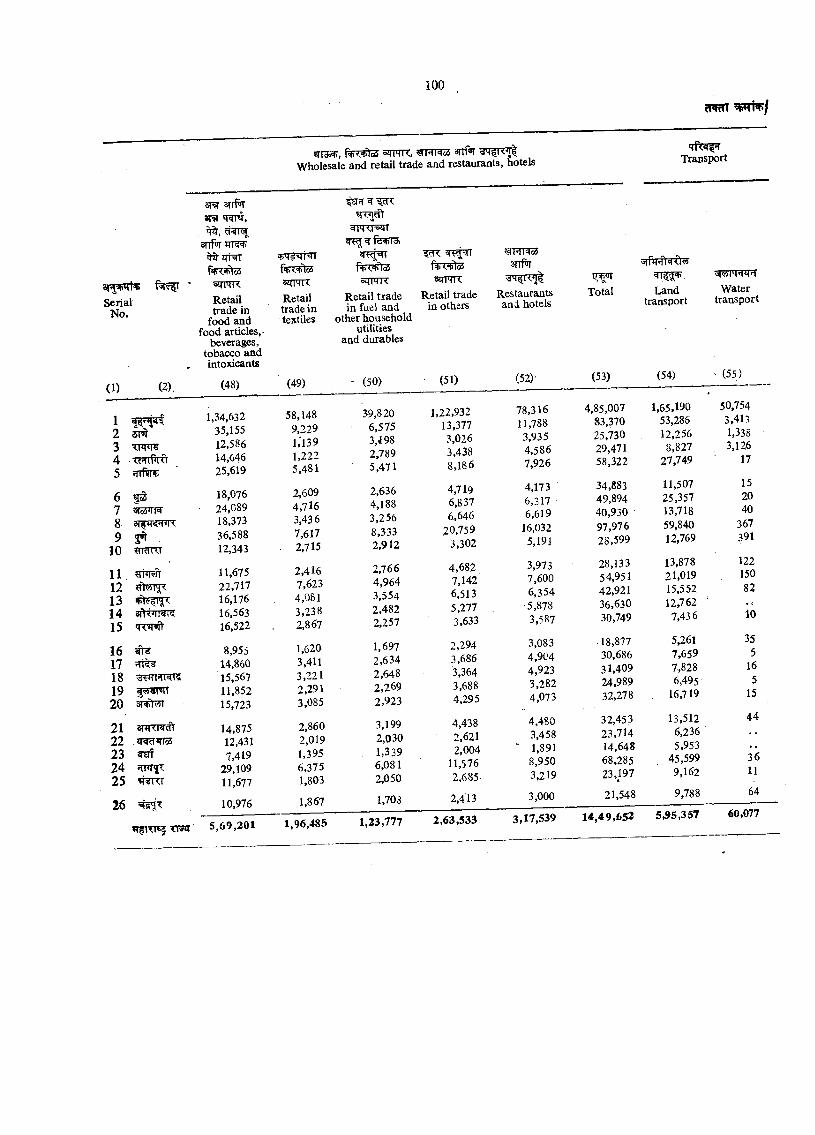
^rrai^, sqrTR, <#hnos anf^Wholesale and retail trade and restaurants, hotels Transport
a r^ W ^Serial
No.
(1) (2),
STTfw m * 1 ^ ,
anfoT ^ JTRT
a m RRetail trade in
food and food articles,
beverages, tobacco and intoxicants
(48)
1 1,34,632
2 5FI' 35,155
3 ■wm 12,5864 14,6465 25,619
6 qS 18,0767 SJaFW 24,0898 3ffiT??nn: 18,373
9 36,58810 ?jTar<i 12,343
11 11,67512 22,71713 16,17614 16,56315 16,522
16 8,95517 14,86018 15,56719 5<?4<H«1T 11,85220 15,723
21 14,87522 JRcT*rTo5 12,43123 ify? 7,41924 ?rnT^^ 29,10925 lilRT 11,677
26 10,976
W ^ T f^
szTTTTTRetail trade in textiles
(49)
58,1489,2291.1391,2225,481
2,6094,7163,4367,6172,715
2,4167,6234,0813,2382,867
1,6203,4113,2212,2913,085
2,8602,0191,3956,3751,803
'O
5zmKRetail trade in fuel and
other household utilities
and durables
- (50)
1,867
39,8206,5753,i982,7895,471
2,6364,1883,2568,3332,912
2,7664,9643,5542,4822,257
1,6972,6342,6482,2692,923
3,1992,0301,3396,0812,050
1,703
nfi<+To5sqTTR
Retail trade in othsrs
(51)
1,22,93213,3773,0263,4388,186
4,7196,8376,646
20,7593,302
4,6827,1426,5135,2773,633
2.294 3,686 3,364 3,6884.295
4,4382,6212,004
11,5762,685-
2,413
3TTfWvdMI
R e s ta u r a n ts a n d h o te ls
(52)'
78,31611,7883,9354,5867,926
4,1736,3176,619
16,0325,191
3,9737,6006,354
•5,8783,587
3,0834,9044,9233,2824,073
4,480 3,458
' 1,891 8,950 3,219
3,000
Total
(53)
Landtransport
(54)
4,85,00783,37025,73029,47158,322
34,88349,89440,93097,97628,599
28,13354,95142,92136,63030,749
18,87730,68631.40924,98932,278
32,45323,71414,64868,28523,197
21,548
1,65,19053,28612,256
8,82727,749
11,50725,35713,71859,84012,769
13,878 21,019 15,552 12,762
7,43 6
5,2617,6597,8286,495
16,719
13,5126,2365,953
45,5999,162
9,788
Watertransport
(55)
50,7543,4131,3383,126
17
152040
367391
12215082
10
355
165
15
44
3611
64
5 .69 ,201 1,96,485 1,23,777 2,63,533 3,17,539 14,49,652 5^95,357 60,077
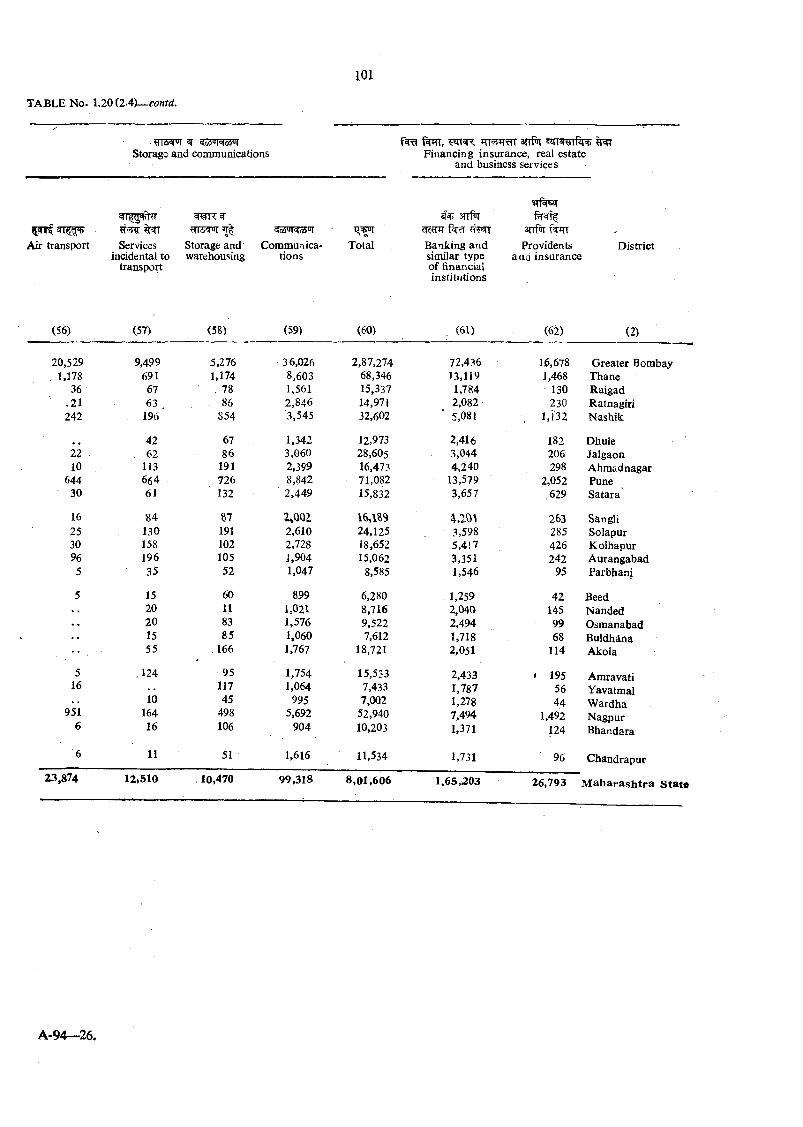
Storage and communicationsarrfoT e rrsrarfiR)
Financing insurance, real estate and business services
iprrf <o4'JNc6'Jt snfrr m r -
Air transport Services storage and' Commuriica- Total Banking and Providents Districtincidental to warehousing tions similar type and insurance
transport of financialinstitutions
(56) (57) (58) (59) (60) . (61) (62) (2)
20,529 9,499 5,276 36,026 2,87,274 72,436 16,678 G reater Bombay. 1.178 691 1,174 8,603 68,346 13,119 1,468 Thane
36 67 ,7 8 1,561 15,337 1,784 130 Raigad.21 63 . 86 2,846 14,971 2,082 230 Ratnagiri242 19l5 854 3,545 32,602 5,081 . 1,132 Nashik
.. 42 67 1.342 12,973 2,416 182 Dhule22 • 62 86 3,060 28,605 - 3,044 206 Jalgaon10 113 191 2,399 16,473 4,240 298 Ahraadnagar
644 664 726 8,842 71,082 13,579 2,052 Pune30 61 132 2,449 15,832 3,657 .629 Satara
16 84 &7 2»QQ2 \ ^ m 4,20i 263 SangVi25 130 191 2,610 24,125 3,598 285 Solapur30 158 102 2,728 18,652 5,417 426 K olhapur96 196 105 1,904 15,062 3,351 242 Aurangabad5 35 52 1,047 8,585 1,546 95 Parbhaai
5 15 60 899 6,280 1,259 42 Seed20 11 1.021 8,716 2,040 145 Nanded20 83 1,576 9,522 2,494 99 Osraanabad15 85 1,060 7,612 1,718 68 Buldhana
•• , 55 166 1,767 18,721 2,051 114 Akola
5 .124 95 1,754 15,533 2,433 * 195 Amravati16 117 1,064 7,433 1,787 56 Yavatmal
10 45 995 7,002 1,278 44 W ardha951 164 498 5,692 52,940 7,494 1,492 Nagpur
6 16 106 904 10,203 1,371 124 Bhandara
6 11 51 1,616 11,534 1,731 96 Chandrapur
Z3,874 12,510 10,470 99,318 8 ,01,606 1,65,303 26,793 M a h a r a s h tr a S ta te
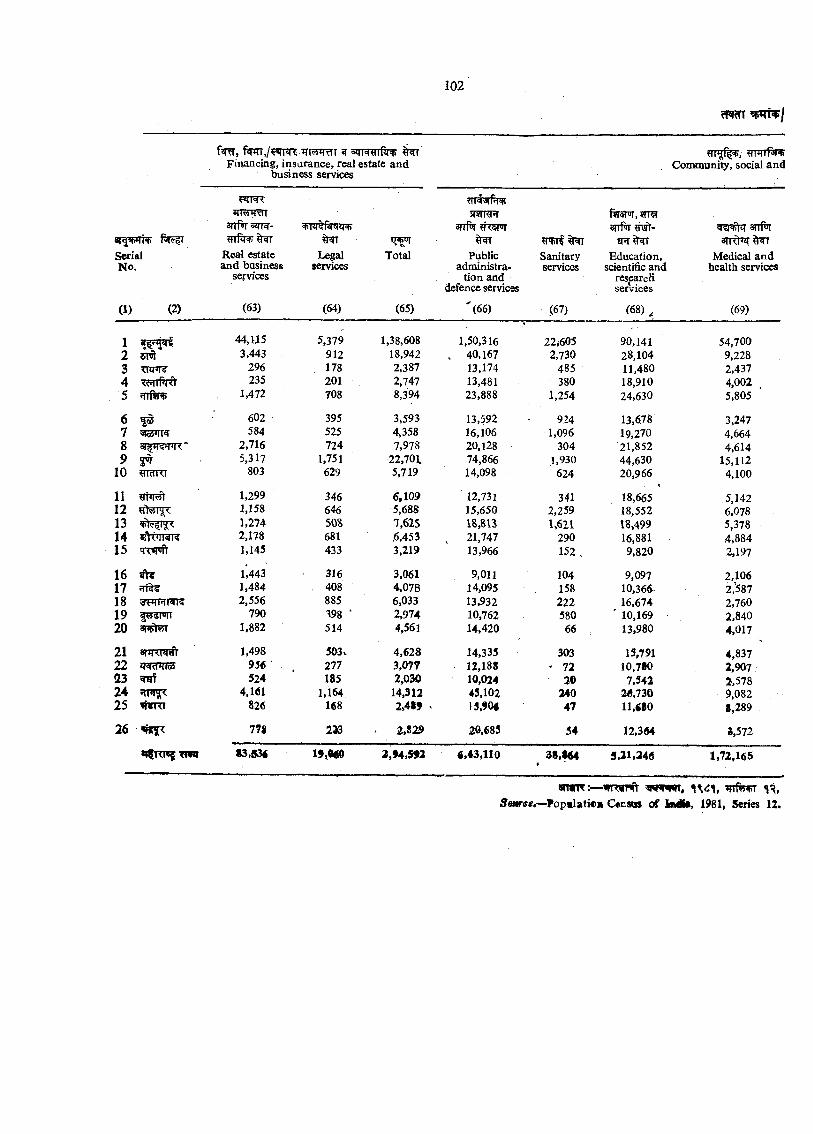
Financing, insurance, real estate and Cotrm unity, social andbusiness services
+»RHfir 5Rrr?R ffTSfruT, 9RQ3n-r»l SZTT* #> W 51«»0|'!<<<> <SIir«I HWt-
ar^*PTT Pv>I?|T q^«jr ?TSTf sntt^zrSerial Real estate Legal Total Public Sanitary Education, Medical andNo. and business services administra services scientific and health services
services tion and resprcHdefence services services
(1) (2) (63) (64) (65) '(6 6 ) (67) (68)^ (69)
1 44, U 5 5,379 1,38,608 1.50,316 22,605 90,141 54,7002 51^ 3,443 912 18,942 , 40,167 2,730 28,104 9,2283 Tni’T? 296 . 178 2,387 13,174 485 11,480 2,4374 235 201 2,747 13,481 380 18,910 4,002 .5 1,472 708 8,394 23,888 1,254 24,630 5,805
6 f s 602 395 3,593 13,592 924 13,678 3,2477 584 525 4,358 16,106 1,096 19,270 4,6648 2,716 724 7,978 20,128 304 21,852 4,6149 ^ 5,317 1,751 22,701. 74,866 1,930 44,630 15,112
10 «rdKi 803 629 5,719 14,098 624 20,966 4,100
11 1,299 346 6,109 12,731 341 18,665 5,14212 1,158 646 5,688 15,650 2,259 18,552 6,07813 1,274 508 7,625 18,813 U621 18»499 5,37814 sfVn i ^ 2,178 681 .6,453 , 21,747 290 16,881 4,88415 qwft 1,145 433 3,219 13,966 152 . 9,820 2,197
16 ^ 1,443 316 3,061 9,011 104 9,097 2,10617 i!Tt^ 1,484 . 408 4,078 14,095 158 10,366 2,’58718 2,556 885 6,033 13,932 222 16,674 2,76019 f^smr 790 398 ■ 2,974 10,762 580 ■ 10,169 2,8402 0 apptwi 1,882 514 4,561 14,420 66 13,980 4,017
2 1 3(4 <m,n 1,498 5&3. 4,628 14,335 303 13,791 4,8372 2 ^cTHfSS 9J6 277 3,077 12,188 - n 10,7*0 2,907a s TOf 524 185 2,030 10,024 2© 7,542 2,57824 srni^ 4,161 1,164 14,312 45,102 240 20,730 9,08225 tf«RT 826 168 2,4*9 . 13,904 47 11,480 8,289
26 m 2 ^ 2 ,8 ^ 20,685 54 12,364 *,572
S3,53« I9ym 2,94,592 €,43,110 38,S«4♦ 5,21,246 1,72,165
-W R iT^ w r w , i v n , irrfevT <i i, >Fopmlati«M Cer-aus c€ bnM$, 1981, Series 12.
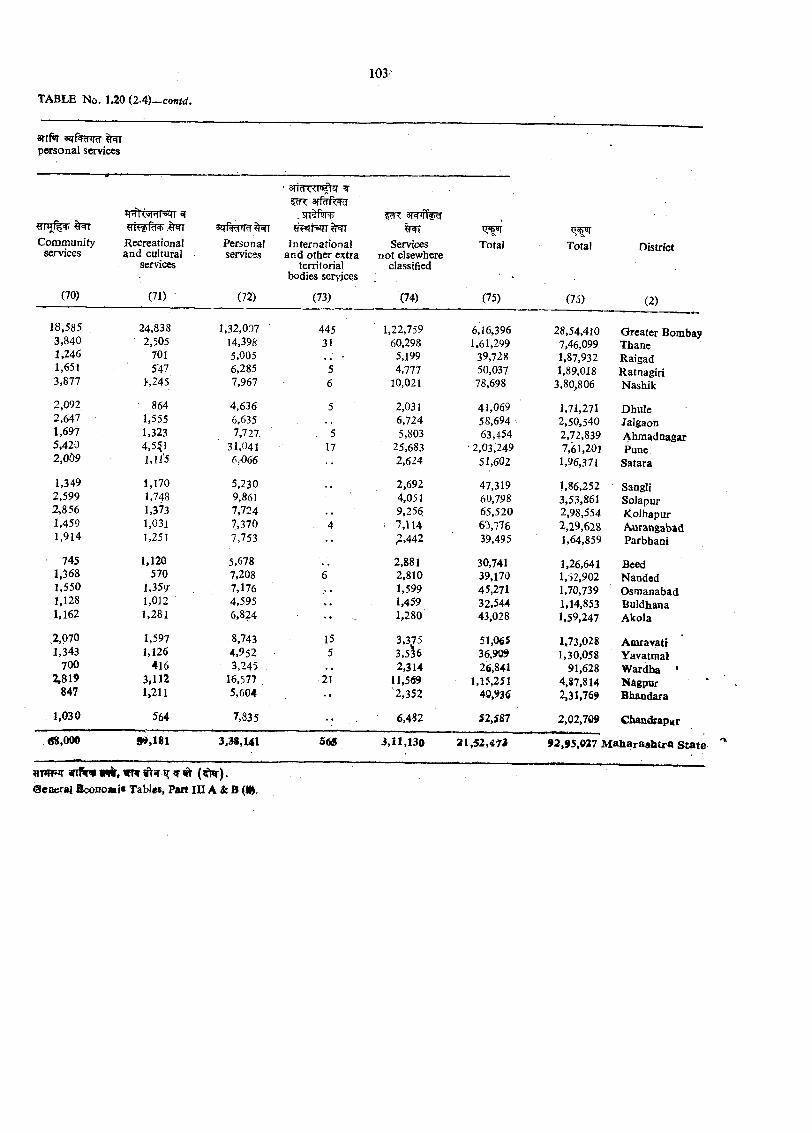
personal services
Communityservices
(70)
18,5853,8401,2461,6513,877
2,0922,6471,6975,4202,O09
1,3492,5992,8561,4591,914
■ 7451,368 1,550 1,128 1,162
,2,0701,343
7002,819
847
1,030
Reweational and cultural
services
(71)
24,8382,505
7015'47
>,245
8641,5551,3234,5^1i , i i s
1,1701,7481,3731,03J1,251
1,120570
1,3591,0121,281
1,5971,126
4163,1121,211
564
Personalservices
(72)
1,32,03714,3985,0056,2857,967
4.6366,6357,727
31,0416^066
5,2309,8617,7247,3707,753
5,6787,2087,1764,5956,824
8,7434,9523,245
16,5775,604
7,835
‘ 3TRl«n^i| 3T fcR 3ffMkW
.sn M w
International and other extra
territorial bodies seryices
(73)
44531
56
517
155
21
Services not elsewhere
classified
(74)
1,22,75960,2985,1994,777
10,021
2,0316,7245,803
25,6832,624
2,6924,0519,2567,1142,442
2,8812,8101,5991,4591,280
3,3753,5362,314
11,569'2,352
6,482
Total
(75)
6,16,3961.61,299
39,72850,03778,698
41,069 58,694 < 63,454
■ 2,03,249 51,602
47,31960,79865,5206^77639,495
30,74139,17045,27132,54443,028
51,06536,90926,841
1,15,25140,936
Total
(76)
28,54,4107,46,0991,87,9321,89,018
3,80,806
1,71,2712,50,5402,72,8397,61,2011,96,371
1,86,2523,53,8612,98,5542,29,6281,64,859
1,26,6411,-52,9021,70,7391,14,8531,59,247
1,73,0281,30,058
91,6284,87,8142,31,769
District
(2)
G reater BombayThaneR aigadRatnagiriNashik
DhuleJalgaonAhraadnagarPune
Satara
SangliSolapurK olhapurAurangabadParbhani
BeedNandedOsraanabadBuldhanaAkola
Amravatr Yavatmai W ardba * Nagpur Bhandara
S2,S87 2,02,709 C handrapar
08,000 3,38,U 1 56S 3,11,130 21 ,52 ,473 92,95,037 M a h a ra sh tra S ta te
(Beaeral Bcoooiiii« Tables, Fait i n A & B (H$.
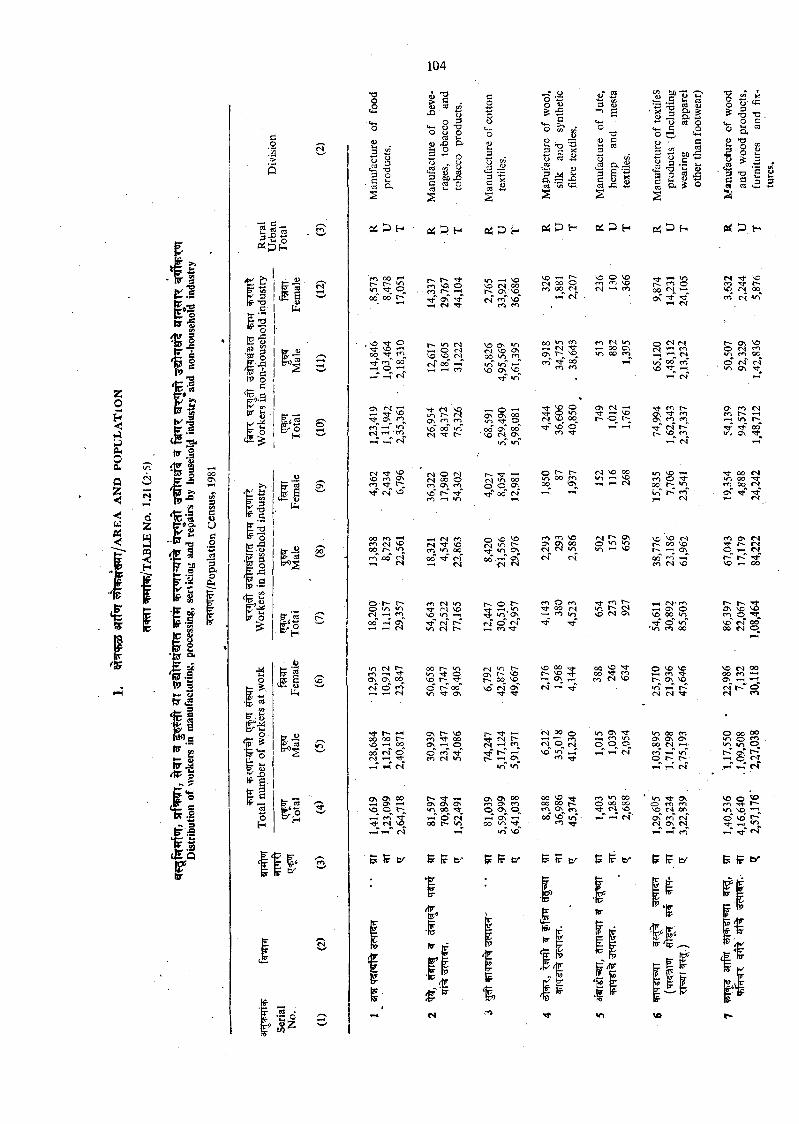
• oo.o
>0 , o
ao' . S
P
‘E5
% I s
S '
CS o.
Tj- r ~00 00 t~- V£> »-< 0000 <S Q <vi ^—T « s
o\ o\ 0 0 ^ 0>. '—'
®—r rn Tt n VO , ^ “ <1 “ CS
^ c .lu cS COt J
O 3 t*-< 0 "Oo o ort I-<0 X ) o , h o
e c X ) o
—T O O '*3I I ^ °O CO5-4 ^P gO c 3 i j
cS </l '*1
r< COt-. r- c ^
00' oo' r
■ ^ S 2» ^ tn r t r o '' CO ^ O ^
^ CS
TJ- ON <tT w-T ^fv) T-f^ r-T <S
(S)VO m On r f (Sf SO
0 0 r o m < s VOMrrT 0 0 0 ^ ^ fS
o r ~ r - o >o<N T-i ro
r -m NO O ro r~;3 ?5 ?
r - > 0 r 4 ^ : 0V£> NO <N
° 2r-< '—I m
■ct <N NOr ~Os r-i m
fM O M fN) 00 O<r> ON CO
—< <N fO f S Tl- VO <n in 00 00 Tf Cvf« «s
rri fNj >0 NONO 10 »-(
i r i VO NO C 4 0 0r- on no
NO O '<N( NO ON00 <0
—, o '-I<?v 0 \ 90
O ^, 00 o C Op NO C4 0\
i rT >0 '
1fM »o ^o 00 fN
O VO VO<N) 10
<N| CM
O ^ rt- ONr i o '»-i m
0 \ NO r*i r f 00 On ^ O
On On ON VT', 00 ^
o ' r i00 r~ VO
r- r-iTf fN '~iTt^ -1 01in «o
0\ o\ ccrr\ a\O OS O—T os' ^ 00 <o
>0 VO
tr t r
\0 '—CS 00 O CT) 00 CS
r f
°° ICi 2CS ^cn r- 'OCD fO
TJ- VD O>4 O *0 CN ^ CO
o
fO VO CT\ On 00fS CS m
f<i O fo 00 <N[ ~ ro >n
'"t'
<N t r 00 in rs »n VO 00
2CO u-> rt* 0 . OS r- NO r- soOs OS 00 NO r-* 00 VO On
<N c ? cn c ? 00'' so <N oC 1—<CS r f ON rt
N M o c3 o^ ?5VO >0 cn ^
00 VO ,* ce 00 (< ca <> tn 00 ^ <oro Tf
VO O NO fT) ro VO CS CO
ro N >0T-< 00 C n «n op CO
On CS Tf —' VOt^ o r^
<s VO 00
^ M
r-j ON Oi o r - , VO
Tf cn t~- ^NO CS On
00 VO Tf 00 rr cn
CS VO
m ON ^ rn iri 0 0 ^ 0 ^ r-T CS"
m *n 00o 00 00 CS NO^ « cm"
c/3 6fl« G
■ I Io<*H C0
1 -Iy 3
‘3 0 g S .
C3 o>a- ft; a -ccS O
. 0
&0,s rM us e§ o
■§o o «
pi^D H e iP lH la iD H P iD H
IT)^ ro O 00 M ’- '
o CS
00 fONO ’-J_^ cm"
cn t~2 ^ SPOS rn p*jTf" cs"O VO cn
r-^ CS"
r~ 10
VO VO f S r - 00 VOr-' ON
*-i CS' cn -H ON O VO po <oT t 0 “ <n '10 m 00
2 . ^ ^ 0 VO <0 ^ rC es
to 00 fn On Os Cn 00COo i>
»o OS o m fn so tS <xv
t /
T ' fc» cc
JmId c
i*
l i
1^1
3
I«
aT3 8 i ^ B .•--• 09
s H§ 5 3
erf; J:) H
CM VO cn rr r~ VO CN oo_ cn CS
r- Ov VO O CS CO IT) cn 00
O' cn CS cn —ITt 00«/ . ON rf-
rt 00 «S <0 00 m 00 «s
2
cn On r s
VO »i e»
r~ r^ "Tj-ON NO V£>rn O VO «s' 0000 CN o
VO CS 0000 cn —’-H '~l CS t - '* O CS m
o 00 22 «n o 22<0 <n Ot f g ' R
<N
VO o Sm -ct- t~- »n AOo " Vo"-3- —1
r f CN
tr
f
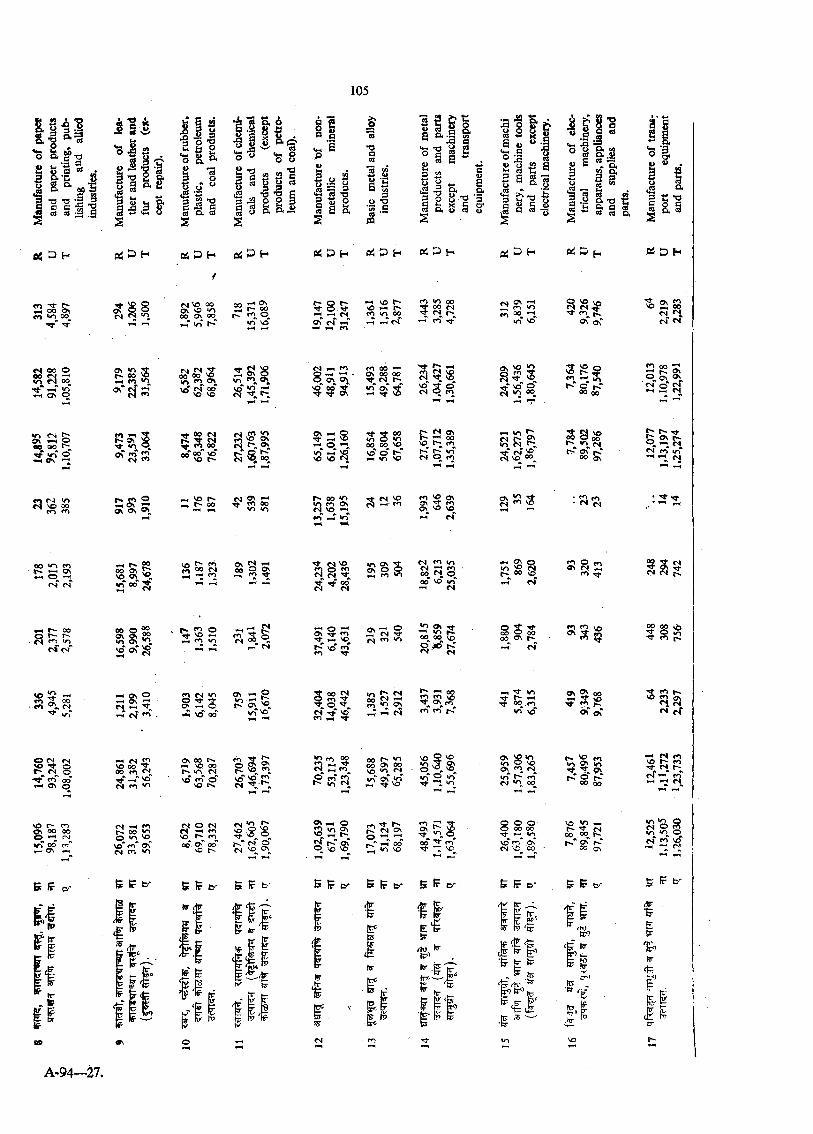
P i D H etf P H
<2 13 -§ 2 "S o§ a a 2
2 s i ’BQ M
1 -S n
O S ^ D H O ^ P H Pfi D H
S:v-H oo<rj UO 00_«M\o ooos ^ <o 00 oo ,-T •o'
M On S P- 00 fo O <o VO
8oC r f CO
.-I \oVO T-i t^ fO <o 00 M ^cvT
ro in oo3 : 00 r 4rj r~o VO ^srj- fn
oT o f» S |
rvf <N
<S oo Oe ? ? : |S^ ‘ o f s
n .-I fo
8 . 0 ) , ^ ' r f tv| r~ >n o \ :<£y-i
Nt E:-aS‘ 5 S '
o, « 2
s * s »«n K-j
S 00 00
*D &Ov ^ Ooo oc t~2-H o^ Oq OO VO
fo fO <n fO '£ O ' CS t~. o>
c5^ o « io%-T« VO VO
r f -a- 00 <o O ^00 00 VO
r- M o\t^ r^ 00 VO t~-_ ror-J" C; «n «S O ro
Tt ^ VOoo O oo
r> ov p.*00 b\
t^ TfB . 2 S
fo u-TfS
<*» >oCO
5 ? 2 »-< 0\ ^ 0 \ ON oj,
fsl ON *-<K fio
r>. 00 ^«o cn 0 \ n VO
Tf r4 VO^ ^ fO m ^ o\ON 7j Ov ^ VO -T M
SS ^n f s
Vh ofS fS
l£) c-' rrj ^ 22 £? ^
O' S S 00 S 2fo Tf
(S «N
fs CO in00 S O
ON O ^f . 00 VO
21 SW> fS r-H fO Tf
o<>| fT) W->r^Tcs"
®o ® S? 5 § 5 S?
- H - ? !cn o
r» VO CO '<4-
OS O^ <NI isj cn in•« Os Tf ’- ' »n ^00 oo VO p " j o r>rn CM
O ^ ''t §§^?2 r-i r i
'ocn X CO *n ' « CM '«■ vrT
•-< OS o—I Os fN-T rf ^
ON VO m VO
^ 00 fNI s ? .
^ 00 j2 s j VO
cn cn
^ rt ir%*4
rT VCO ' O ' oo'? ?. |S
ov oCs fo
s g j«s ri
O <N (NIP ^ OtN O■V S2 oo*t> i ON O
M fS fOVO 00 ®®.TJ- VO(M CO *n
2'^ 'oSt' lTN tN VO CO o ' VO t>.
Tfo> Ovn,
vo'S C22
;9 JOt^ m cs
00 "n 'o 2o <H.in ' J^ CO <M <n 00
* 9n.o r>T 00 00
r-l <N fOVO t~ CO■<i- rj r~
<N COt< 00 «n O in vo VO* CO* oC <S CO in
cs| O <N N -H CO <0 COOO. 0\ oo vO
fo in r» Ov ^ oSCf r~“ oCo VO VO
ftJ <N ONo
« oo ^ in VO
inVO co"" ,o^<SI \ t CO 00 OS
"a 22 S2 in <n o(S' «0 Vif 1-H ^ C'T
5 It B/- 5 Sr S I? b- B B ty- S t r D ' 5 l r t y E Jf?e^
Z9
V
I
I IuSr
rft.1 i f e fe*' 1 ^
SJ fr
(r
hr
I'I
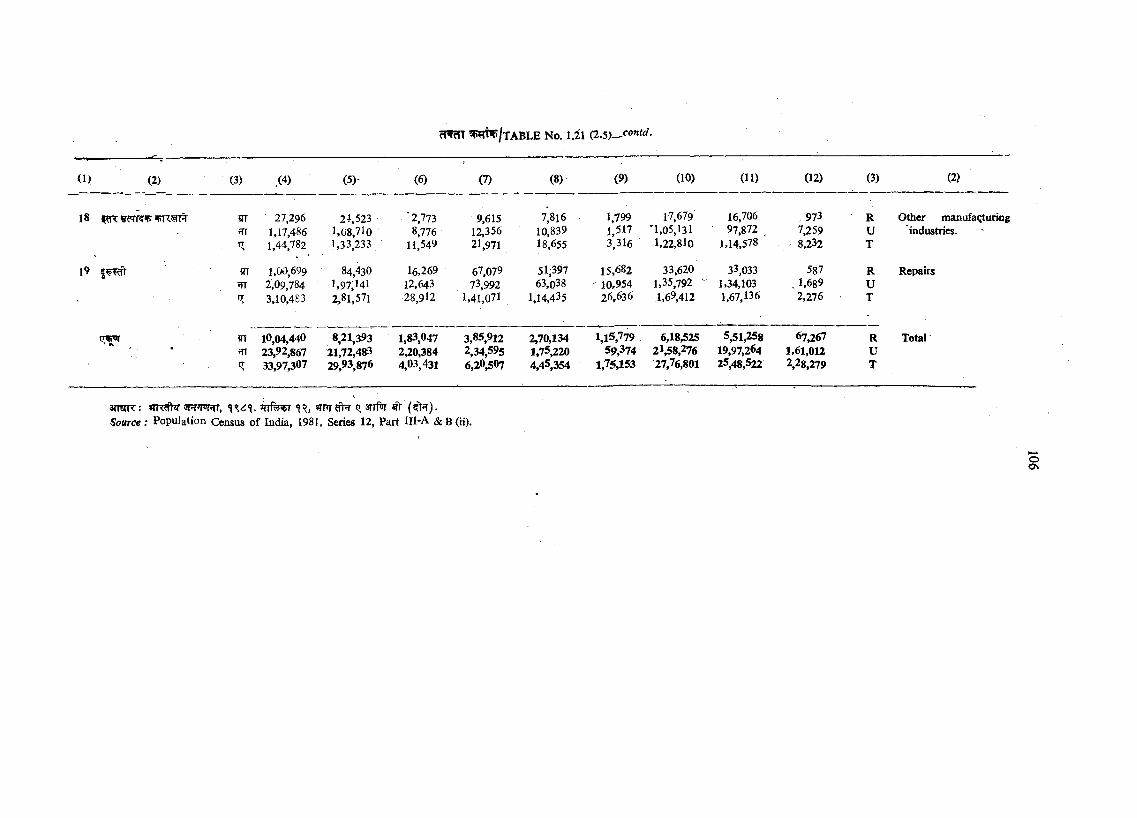
0 )
_ _ _ _
(2) (3) ,(4) (5)- (6) (7) (8) (9) (10) (11) (12) (3) (2>
18 iJT 27,296 24,523 ' 2,773 9,615 7,Bl6 1,799 17,679 16,706 .973 R Other manufaqturing1,UAB6 1,08,710 8,776 12,356 10,839 1,517 '1.05,131 • 97,872 ^ 7,259 U 'industries.1,44,782 1,33,233 11,549 21,971 18,655 3,316 1,22,8lO 1,14,578 8,232 T
I9 ifT 1,00,699 84,430 16,269 67,079 51,397 15.682 33,620 33,033 587 R Repairs2,09,784 1,97,141 12,643 73,992 63,o38 ' 10,954 1,35,792 - 1,34,103 1,689 U3,10,483 2,81,571 28,912 1,41,071 1,14.435 26,636 1,69,412 1,67,136 2,276 T
iJT 10,04,440 8,21,393 1,83,047 3,85,912 2,70,134 1,15,779 6,18,525 5,51,258 67,267 R Total?n 23,92,867 21,72,483 2,20,384 2,34,595 1,75,220 59,374 21,58,276 19,97,264 1,61,012 U
33,97,307 29,93,876 4,03,431 6,20,507 4,45,354 1,75,153 27,76,801 25,48,522 2,28,279 T
31TOTT: sFTJiw, ?rrfe^ «?pt # t ?? arrftJi ^ (?>^).Source: Population Census o f India, 1981, Series 12, Part Ill-A &]B (ii).
o0 \
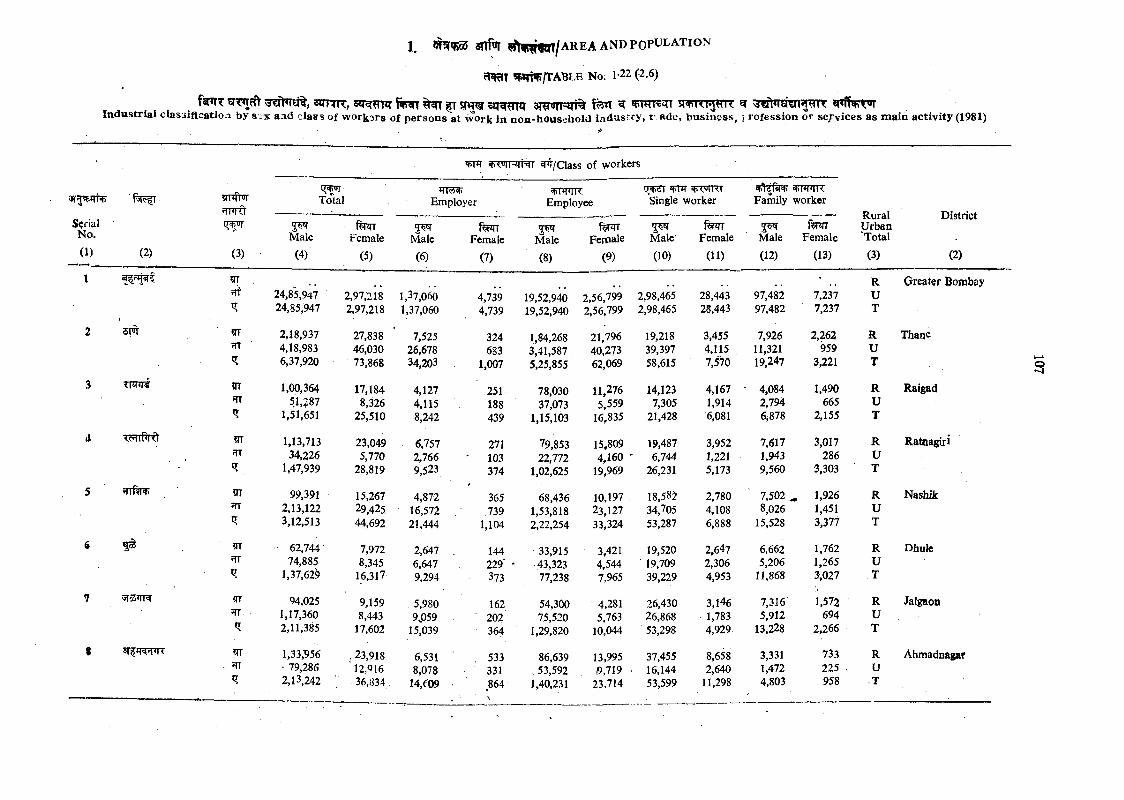
1. anf®r a r e a A ND p o p ^ I 'A t i o n
ctWT «Wi»f»/TABLE No; 1-22 (2.6)
a u H R , ^ ^ ^ s i ^ 3mon=m% ^ ^Industrial clasiiflcation by S ix and class of work2rs of persons at work in non-household industry, t ade, business, irofession or services as main activity (1981)
irnrtw Total Employer Employee)PT sfix^nxr
Single worker^rrw T
Family worker
SerialNo.
(1) (2)
IJchUI
(3)Male
(4)
' ftmi Female
(5)
5WMale
(6)
ftfiTTFemale
(7)
5 ^Male
(8)
Female
(9)
Male'
(10)
Female
(11)
Male
(12)
t oFemale
(13)
RuralUrbanTotal
(3)
District
(2)
I . . R Oreater Bombay?TT 24,85,947 2,97,218 1,37,060 4,739 19,52,940 2,56,799 2,98,465 28,443 97,482 7,237 U
24,85,947 2,97,218 1,37,060 4,739 19,52,940 2,56,799 2,98,465 28,443 97,482 7,237 T
2 sm 37 2,18,937 27,838 7,525 324 1,84,268 21,796 19,218 3,455 7,926 2,262 R Thane4,18,983 46,030 26,678 633 3,41,587 40,273 39,397 4,115 11,321 959 U6,37,920 73,868 34,203 1,007 5,25,855 62,069 58,615 7,570 19,247 3,221 T
.3 TRW 1,00,364 17,184 4,127 251 78,030 11,276 14,123 4,167 • 4,084 1,490 R RaigadfTT 51,287 8,326 4,115 188 37,073 5,559 7,305 1,914 2,794 665 U
1,51,651 25,510 8,242 439 1,15,103 16,835 21,428 6,081 6,878 2,155 T
4 TFirfirft ?rr 1,13,713 23,049 6,757 271 79,853 15,809 19,487 3,952 7,617 3,017 R RatnagiriffT 34,226 5,770 2,766 ' 103 22,772 4,160 ' 6,744 1,221 1,943 286 U
1,47,939 28,819 9,523 374 1,02,625 19,969 26,231 5,173 9,560 3,303 T
5 m 99,391 15,267 4,872 365 68,436 10.197 18,582 2,780 7,502 , 1,926 R Nashik2,13,122 29,425, 16,572 739 1,53,818 23,127 34,705 4,108 8,026 1,451 U3,12,513 44,692 21,444 1,104 2,22,254 33,324 53,287 6,888 15,528 3,377 T
6 m ■ 62,744 7,972 2,647 . 144 • 33,915 3,421 19,520 2,647 6,662 1,762 R Dhule5TT 74,885 8,345 6,647 229' - 43,323 4,544 19,709 2,306 5,206 1,265 U
1,37,62^ 16,317 9,294 , 373 77,238 7,965 39,229 4,953 11,868 3,027 T
7 <rr 94,025 9,159 5,980 162 54,300 4,281 26,430 3,146 7,316 1,572 R Jalgaon'TT 1,17,360 8,443 9J)59 ‘ 202 75,520 5,763 26,868 1,783 5,912 694 U
2,11,3^5 17,602 15,039 364 1,29,820 10,044 53,298 4,929 13,228 2.266 T
% 3rf?r?^TrT 1,33,956 , 23,918 6,531 533 86,639 13,995 37,455 8,658 3,331 733 R AhmadnagarfTI • 79,286 ' 12,916 8,078 331 .. 53,592 i9,719 16,144 2,640 1,472 225 < U
2,13,242 36,834 . 14,f09 864' \
1,40,231 23,714 53,599 11,298 4,803 958 T
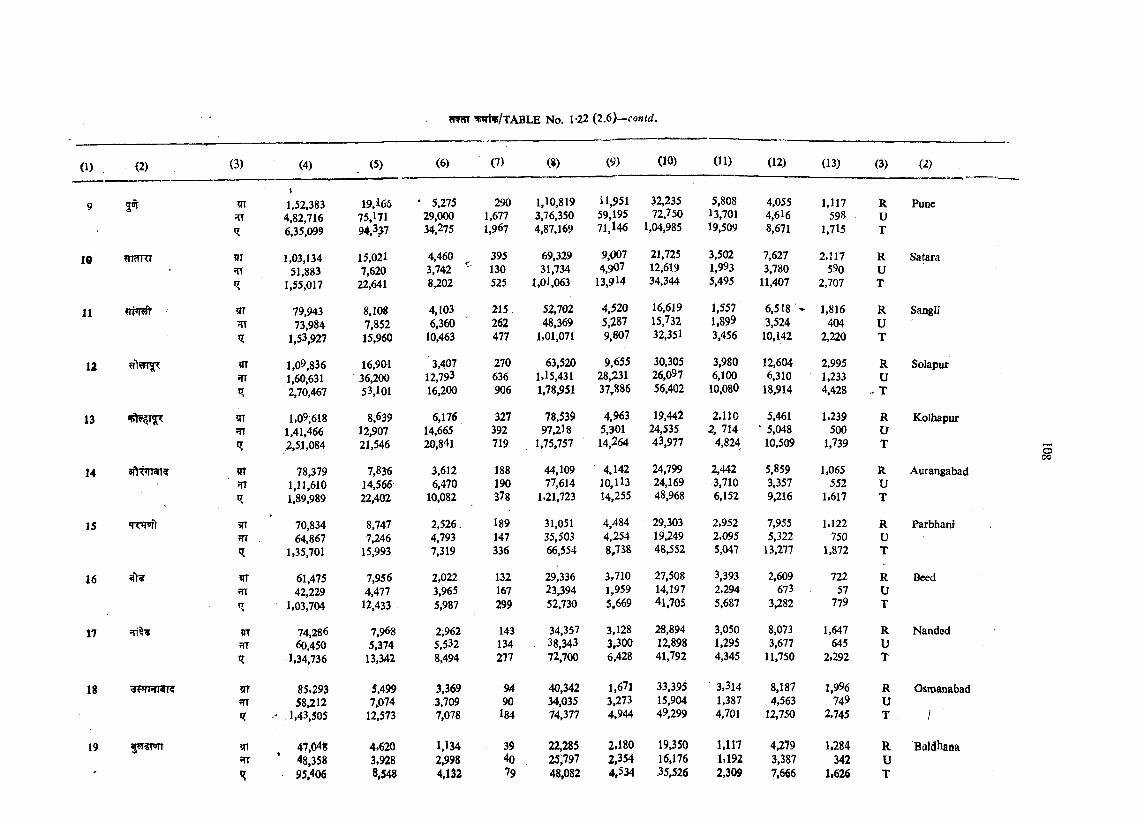
(1)
10
11
12
13
14
15
16
17
18
(2) (3) (4) (5) (6) (7) (8) (9) (10) (11) (12) (13) (3) (2)
qoti1,52,383 19,165 • 5,275 290 1,10,819 i 1,951 32,235 5,808 4,055 1,117 R PuneO
?TT 4,82,716 75.171 29,000 1,677 3,76,350 59,195 72,750 13,701 4,616 598 U6,35,099 94,3^7 34,275 1,967 4,87,169 71,146 1,04,985 19,509 8,671 1,715 T
?rrdKi ?n 1,03,134 15,021 4,460 ^ 395 69,329 9,007 21,725 3,502 7,627 2,117 R Satara51,883 7,620 3,742 • 130 31,734 4,907 12,619 1,993 3,780 590 U
1,55,017 22,641 8,202 525 1,01,063 13,914 34,344 5,495 11,407 2,707 T
iTT 79,943 8,108 4,103 215 52,702 4,520 16,619 1,557 6,518 - 1,816 R Sangliqr 73,984 7,852 6,360 262 48,369 5,287 15,732 1,899 3,524 404 U
1,53,927 15,960 10,463 477 1,01,071 9,807 32,351 3,456 10,142 2,220 T
?IT 1,09,836 16,901 3,407 270 63,520 9,655 30,305 3,980 12,604 2,995 R Solapur?TT 1,60,631 36,200 12,793 636 1,15,431 28,231 26,097 6,100 6,310 1,233 U
2,70,467 53,101 16,200 906 1,78,951 37,886 56,402 10,080 18,914 4,428 - T
yr 1,09,618 8,639 6,176 327 78,539 4,963 19,442 2,110 5,461 1.239 R Kolhapur1,41,466 12,907 14,665 392 97,218 5,301 24,535 2, 714 ' 5,048 500 U2,51,084 21,546 20,841 719 1,75,757 14,264 43,977 4,824 10,509 1.739 T
m 78,379 7,836 3,612 188 44,109 4,142 24,799 2,442 5,859 1,065 R Aurangabad1,11,610 14,566 6,470 190 77,614 10,113 24,169 3,710 3,357 552 U1,89,989 22,402 10,082 378 1,21,723 14,255 48,968 6,152 9,216 1,617 T
70,834 8,747 2,526. 189 31,051 4,484 29,303 2,952 7,955 1,122 R Parbhanifrr . 64,867 7,246 4,793 147 35,503 4,254 19,249 2,095 5,322 750 U
1,35,701 15,993 7,319 336 66,554 8,738 48,552 5,047 13,277 1,872 T
tnr 61,475 7,956 2,022 132 29,336 3,710 27,508 3,393 2,609 722 R Beed42,229 4,477 3,965 167 23,394 1,959 14,197 2,294 673 57 U
1,03,704 12,433 5,987 299 52,730 5,669 41,705 5,687 3,282 779 T
vn 74,286 7,968 2,962 143 34,357 3,128 28,894 3,050 8,073 1,647 R Nandsd?TT 60,450 5,374 5,532 134 38,343 3,300 12,898 1,295 3,677 645 U
1,34,736 13,342 8,494 277 72,700 6,428 41,792 4,345 11,750 2,292 T
gwrifwre ?n 85.293 5,499 3,369 94 40,342 1.671 33,395 3,314 8,187 1,996 R Osmanabad?n 58,212 7,074 3,709 90 34,035 3,273 15,904 1,387 4,563 749 U<? - 1.43,505 12,573 7,078 184 74,377 4,944 49,299 4,701 12,750 2,745 T /
5553^1 ?n 47,048 4.620 1,134 39 22,285 2.180 19,350 1,117 4,279 1,284 R Buldhaoa’ 48,358 3,928 2,998 40 2SP91 2.354 16,176 1.192 3,387 342 U
95,406 8,549 4,1S2 79 48,082 4,534 -35,526 2,309 7,666 1.626 T
o00
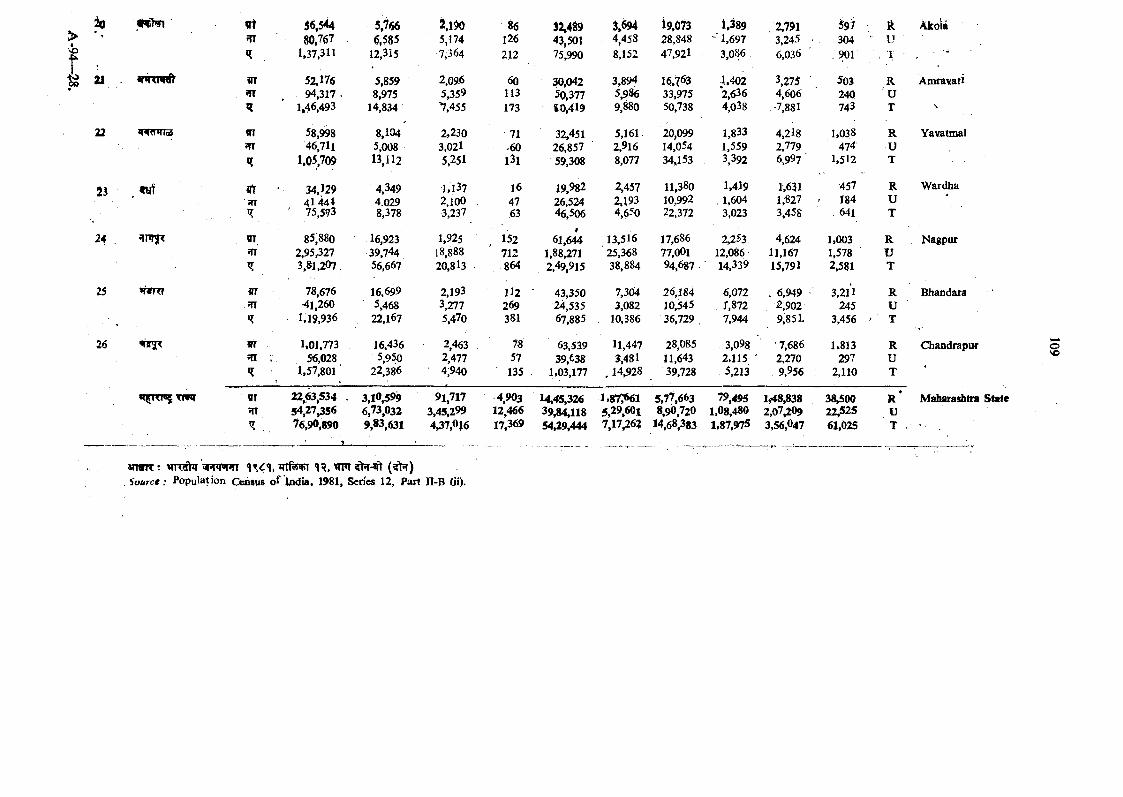
> •VO
fft 56,544 5,766 2,i$o 86 i M 19,073 1.389 2,791 597 ft Akoiii80,767 . 6,585 5,174 126 43,501 . 4,453 28.848 1,697 3.245 . 304 ' U
1.37,311 12,315 7,364 212 75,990 8,152 47,921 , 3,086 6,036 901 ' . 1: '
21 VT 52,176 5,859 2,09-6 60 30,042 3,894 16,763 1.402 3.275 ■ 503 R Amravati94,317 . 8,975 5,359 113 50,377 5,986 33,975 2,636 4,606 240 U
1,46.493 14,834 '7,455 173 «0,419 9 . ^ 50.738 4,038 •7,881 743 T \
22 q^rnnoj AT 58.998 8.104 2.230 71 32,451 5,161 20,099 1,833 4,218 1.038 R Yavatmal?n 46,711 5,008 3,021 .60 26,857 2,916 14,054 1,559 2.779 474' U
1,05,709 13,112 5,251 l3 l 59,308 8,077 34,153 , 3,392 6,997 1.512 T
23 itf 34,129 4.349 1,137 16 19,982 2,457 11,380 1.419 1.631 457 R Wardha.
m 4144* 4.029 2,100 , 47 26,524 2.193 10,992 , 1.604 1,«27 - 184 U«? ' 75,573 8,378 3,237 63 46,506 4,650 22,372 3,023 3.458 641 T
24 . Jin r^ ffi 85.880 16,923 1,925 152 61,6^ 13,516 17.686 2,253 4.624 1.003 R Nagpursn 2,95,327 39.744 18,888 712 1,88,271 25,368 77.OO1 12,086 11.167 1,578 U
3,81,207 56,667 20,813 864 2.49,915 38,884 94.687 14,339 15,791 2.581 T
25 V9JV m 78,676 16.699 2,193 H 2 43,350 7,304 26,184 6,072 . 6,949 - 3,211 R BhandaraffT 41,260 5,468 3,277 269 24,535 3,082 10,545 , r.872 -2,902 245 U
. «? 1.19.936 22,167 5,470 381 67,885 . 10,386 36,729 7,944 9,851. 3,456 ■ T
26 1,01,773 16.436 • 2,463 18 63,539 11,447 28,085 3,098 7,686 1,813 R Chandrapuf56,028 5.950 2,477 57 39,638 3,481 11,643 2,115 ' 2,270 297 U
1,57,801 ■ 22,386 4,940 135 1.03,177 , 14,928 39,728 5,213 , 9,956 2,110 T
*TI5m®5 T i^ «r 22(63,534 . 3,10,599 91,717 4,903 14,45,326 1 .87 :^1 5,77,663 79,495 1^48,838 38,500*
R Maharashtra State?n 54,27,356 6,73,032 3,45,299 12,466 39,84,118 5,29,601 8,90,720 1.08,480 2,07,209 22,525 V^ . 76,90,g90
.... . i. .9,83,631 4,37,016 17,369 54,29,444 7,17,262 14,68,383 1,87,975 3,56,047 61,025 T
o>o
VTWK: ( ? k )Source: Population Census o f India, 1981, Series 12, Part II-B (ii).
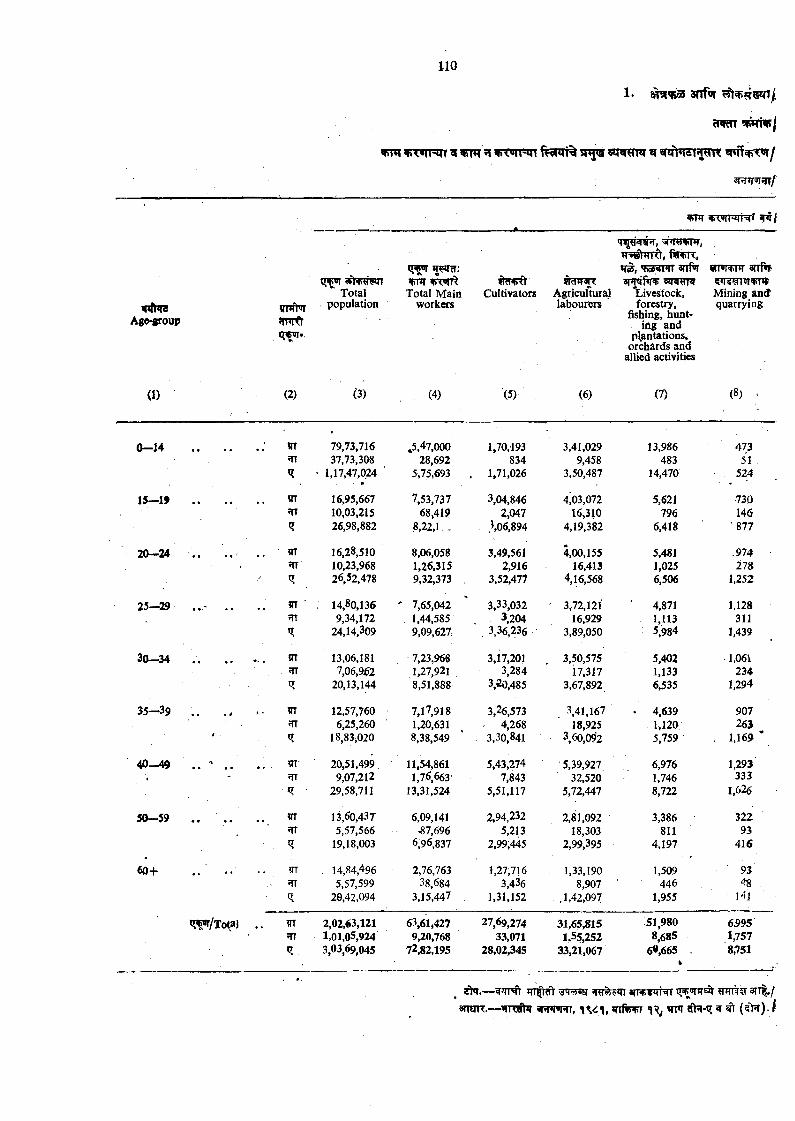
snT pn’*!?/
V#hl8Age-poup
flniHsfmft
»l4>«wrTotal
population
^ 5 T :sprjrTotal M ain
workersCultivators Agricultural
labourers
q^sfWfT, shravnT, T’s^t’TRt, finnx,
»ra, '+W44UII anf^ a i^ fW
Livestock, forestry,
fishing, hunting and
plantations^ orchards and
allied activities
«roi<filH 3TTf«t
Mining an d quarrying
(1) (2) (3) (4) (5) (6) (7) (8) .
0 -1 4 . ST 79,73,716 .5,47,000 1,70,193 3,41,029 13,986 47337,73,308 28,692 834 9,458 483 51
1,17,47,024 ' • •
5,75,693 , 1,71,026 3,50,487 14,470 524
15-1> in 16,95,667 7,53.737 3,04,846 4^03,072 5,621 730?n 10,03,215 68,419 2,047 16,310 796 146
26,98,882 8,22,L - .^06,894 4,19,382 6,418 ■ 877
2 0 -2 4 • m 16,28,510 8,06,058 3,49,561 4,00,155 5,481 .974?n 10,23,968 1,26,315 2,916 16,413 1,025 278
/ 26,52,m 9,32,373 . 3,52,477 4,16,568 6,506 1,252
2 5 -2 9 , ?n ' : 14,80,136 " 7,65,042 3,33,032 ' 3,72,121 4,871 1,1289,34,172 1,44,585 3,204 16,929 1,113 311
«? 24,14,309 9,09,627: , 3.36,236 3,89,050 • 5,984 1,439
30—34 ?n 13,06,181 7,23,968 3,17,201 3,50,575 5,402 1,0617,06,9^2 1,27,921 3,284 17,317 1,133 234
20,13,144 8,51,888 3,20,485 3,67,892 6,535 1,294
35—39 ITT 12,57,760 7,17,918 3,26,573 3,41,167 • 4,639 9075TT 6,25,260 1,20,631 4,268 18,925 1,120 263
* ^ . 18,83,020 8,38,549 3,30,841 3,60,092 5.759 . 1,169 *
4 0 -4 9 20,51,499 11,54,861 5,43,274 5,39,927 6,976 1,293• - 9,07,212 1,7.6,663 7,843 32,520' 1.746 333
29,58,711 13,31,524 5,51,117 5,72,447 8,722 1 ,62^ '
50—59 13,60,437 6,09,141 2,94,232 2,81,092 3,386 3^2m 5,57,566 ^7,696 5,213 18,303 811 93
19,18,003 6,96,837 2,99,445 2,99,395 4,197 416
60+ • • * • . 14,84,496 2,76,763 1,27,716 1,33,190 1,509 935TT 5,57,599 38,684 3,436 8,907 ■ 446 48
20,42,094 3,15,447 , 1,31,152 .1,42,097 1,955 l4 l
«?^/T otai .. TT 2,02,63,121 63,61^427 27,69,274 31,65,815 51,980 6995fTT 1,01,05,924 9,20,768 33,071 1,55,252 8,685 1,757
3,03,69,045 72,82,195 28,02,345 33,21,067 60,665 . %
8,751
srtq.— 3IT TTTftcft 3TT|,/3TOT7.— w ijftir w jn rw , irnr ^ ^ (?> t) J
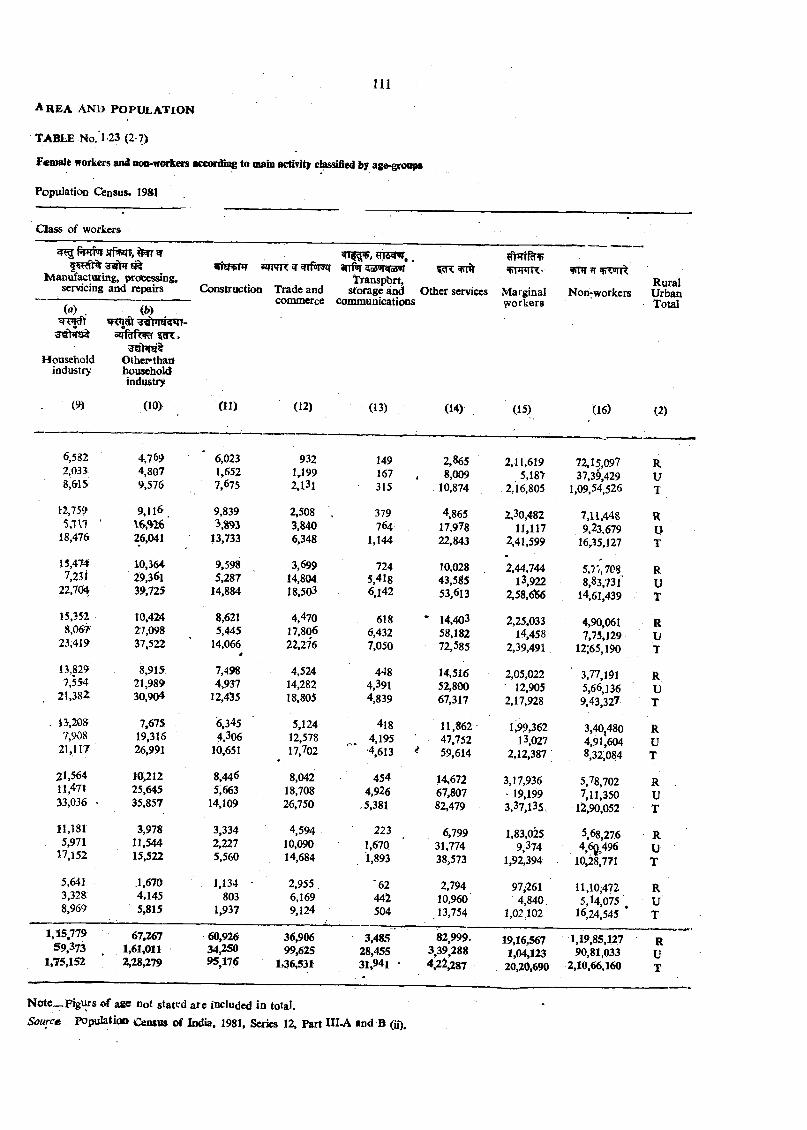
A r e a a n d p o p u l a t i o n
TABLE No.1-23 (2-7)
Femaie workers and non-workmi accorffii^ to main actiTitj classified b ; age-groaps
Population Census, 19*1 .
Class of workers
M aniSacturmg, accessing, servicing and repairs
(a) .
Householdindustry
{b}^sThT8'5*n-
O thepthattbousehokiindustry
5 T l^ ,a r r j R ^ ^ i f ^ arrfir^*>Noa»f
_ , Transpbrt,CcMistructioD Trade and storage and O ther services Marginal
commerce communications \vorkersNon-workers
N <rte_Figurs o f age not stated a re included in total.
Source Populatioo Census o f India, 1981, Series 12, Part and B (ii).
RuralUrbanT o td
(9) (io> (11) (12) (13) (14) (15) (16) (2)
6,582 4,769 6,023 932 149 2,865 2,11,619 72,15,097 R2,033 4,807 1,652 1,199 167 8,009 5,18> 37,39,429 u8,frl5 9,576 7,675 2,l3l 315 , 10,874 2,16,805 1,09,54,526 T
12,75? 9,11^ 9,839 2,508 . 379 4,865 2,30,482 7,11,448 . R5,7 n ■ \ W 6 ' 3,^93 3,840 764 17,978 11,117 9,23.679 U18,476 26,041 13,733 6,348 1,144 22,843 2,41,599 16,35,127 T
15,474 10,364 9,598 3,699 724 10,028 2,44,744 5,7',, 7C8 R7,231 29,361 5,287 14,804 5,418 43,5g5 13,922 8,83,731 U22,704 39,725 14,884 18,503 6,142 53,613 2,58,6156 14,61,439 T
15,552 10,424 8,621 4,470 618 • 14,403 2,25,033 4,90,061 R8,067 27,098 5,445 17,806 6,432 58,182 14,458 7,73,129 u23,419 37,522 14,066 * •
22,276 7,050 72,585 2,39,491 12;65,190 T
13,829 8,915 7,498 4,524 448 14,515 2,05,022 3,77,191 R7,554 21,989 4,937 14,282 4,391 52,800 ■ 12,905 5,66,136 u21,382 30,904 12,435 18,805 4,839 67,317 2,17,928 9,43,327 T
. 1S.20S 7,675 6,345 5,124 418 11,862 1,9 ,362 3,40,480 R7,908 19,316 4.306 12,578 4,195 47,752 13,027 4,91,604 u21,117 26,991 10,651 17,702 4,613 ^ 59,614 2,12,387 8,32,084 T
21,564 10,212 8,446 8,042 454 14,672 3,17,936 5,78,702 R11,471 25,645 5,663 18,708 4,926 67,807 ■ 19,199 7,11,350 u33,036 ■ 35,857 14,109 26,750 .5,381 82,479 3,37,135,7
12,90,052 T
11,181 3,978 3,334 4,594 223 6,799 1,83,025 5,68,276 R5,971 11,544 2,227 10,090 1,670 31,774 9,374 4 6Q496 U17,152 15,522 5,560 14,684 . 1,893 38,573 1,92,394 10,2S’771 T
5,641 .1,670 1,134 • 2,955 '62 2,794 97,-261 11,10,472 R3,328 4,145 803 6,169 442 10,960 4,840. 5, 14,075 , u8,969 5,815 1,937 9,124 504 .13,754 1,02 m 16,24,545 * T1,15,779 67,267 60,926 36,906 3,485 82,999. 19,16,567 1,19,85,127 R59,373 1,61,011 34,250 99,625 28,455 3,39,288 1,04,123 90,81,033 u1.75,152 2,28,279 95,176 1,36,531 31,941 ' 4,2^,287 20,20*690 2,10,66,160 T
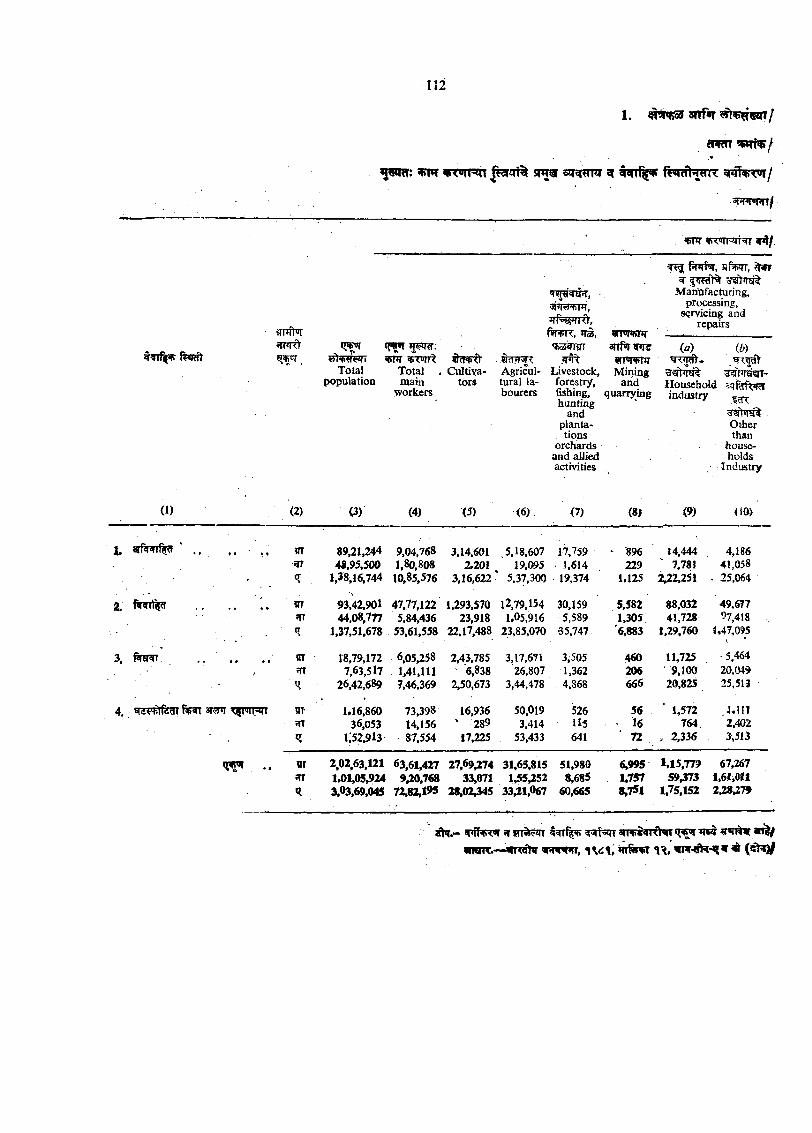
1. 3rrf*r
w!m w ^ ^ r m smtar ^
3rT»r>pn/
55R * <011-4 i ^
anfW jmrfy ^ .
Totalpopulation
W5RT w vm ^ Total main
workers
Cultivators
?nT?f^ Agricultural labourers
(1) (2) (3) (4) (3) (6)
ftRiR,
Livestock, forestry, fishing, hunting
and plantations
orchards and allied activities
(7)
<rm$nr3nfwflw5
Miningarid
quarrying
^ Onifar, 5 jfw , ^ ^ P « ll% ^W sf^
Manittfacturing, processing,
s<;rvicing and repairs
(81
(a) m
Householdindustry
Otherthan
households
Industry
(9) <10)
1. . . m 89,21,244 9,04,768 3,14,601 ^5,18,607 17,759^ 48,95,500 1,80,808 2,201 19,095 1,614<l 1,38,16,744 10,85,576 3,16,622' 5.37,300 19,374
2. . . . . 93,42,901 47.77,122 1,293,570 12,79,154 30,159*TT 44.08,777 5,84,436 23,918 1.05,916 5,589
. ^ 1,37,51,67a 53,61,558 22,17.488 23.85,070 35,747
3. fira?tT. . . . . . . ^ 18,79,172 6,05,258 2,43,785 3,17,671 3,505^ 7,63,517 . M l . l l l 6,838 26,807 1.362^ 26,42,689 7,46,369 2,50,673 3,44,478 4,868
896 1 4,444 . 4,186229 ' 7,781 41,058
1.125 2,22,25! . 25,064
5,582 88,0i32 49,6771,305 41,728 97,418
'6,883 1,29,760 1«47,095
460 11,725 5,464206 9,100 20,049666 20,825 25.513
4. fiRT ^griTFn 1.16,86036,053
i;52,9l3
73,39814,15687,554
16,936 • 28917,225
50,019 5263,414 ll5
53,433 641
561672
1,572764.
2,336
I J l l2,4023,513
UT 2,02,63,121 63,61,427 31,65,815 51,9801,01,05,924 9,20,768 33,071 1,55,252 8,685
q 3,03,69,045 7232,1^ 28,02,345 33,21,067 60,665
6,995 1,15,779 67,2671,757 59,373 1,61,011«.7Sl 1,75,152 2,28,27»
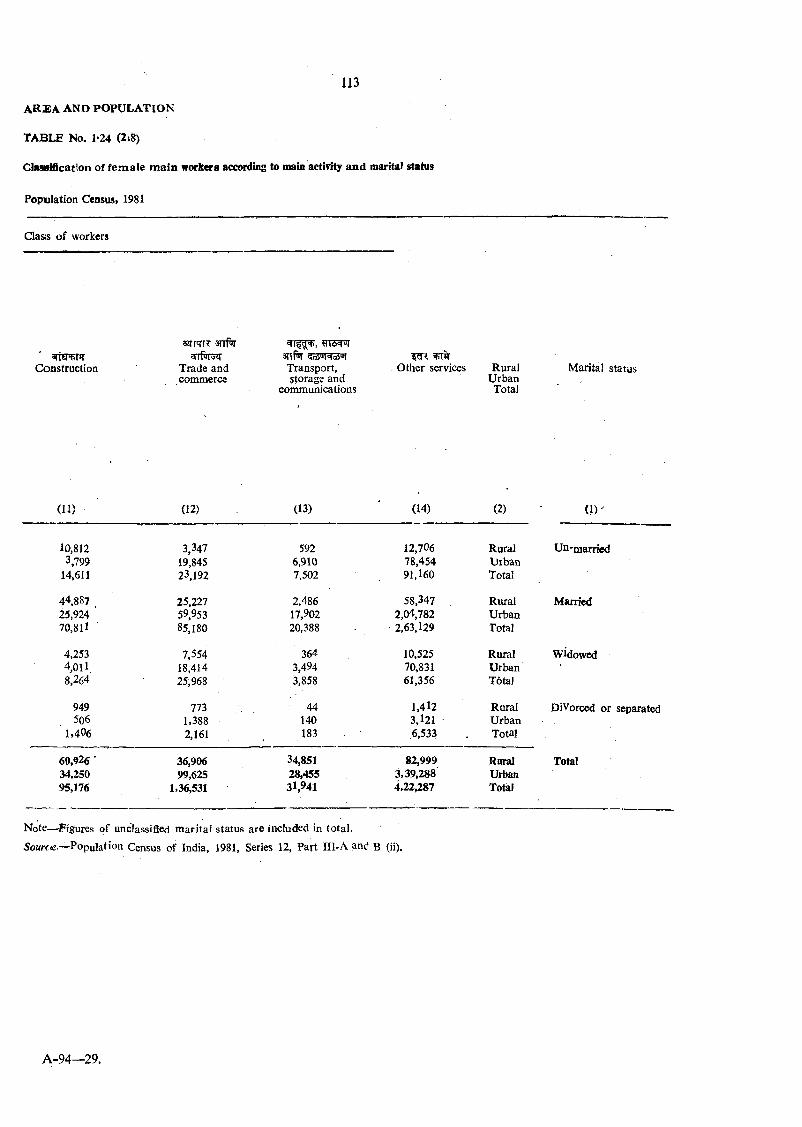
a r e a a n d p o p u l a t i o n
TABLE No. 1*24 (2i8)
Glaflsification of fem a le m a in workers according to main activity a n d marital status
Population Census. 1981
Claas of workers
Construction
ssrrrrT arrf^
Trade and commerce
srrf^Transport, storage and
communications
Other services RuralUrbanTotal
Marital status
(11) (12) (13) (14) (2) (1)
10,812 3,347 592 12,706 Rural U n-m arri^3,799 19,845 6,910 78,454 Urban
14.611 23,192 7,502 91,160 Total
44,887 25,227 2,486 58,347 Riural Married25,924 ' 59,953 17,902 2,04,782 Urban70,811 85,180 20,388 2,63,129 Total
4,253 7,554 364 10,525 Rural widowed4^011 18,414 3,494 70,831 Urban8,264 25,968 3,858 61,356 Total
949 773 44 1,412 Rural Divorced or separated506 1,388 140 3,121 Urban
1,406 2,161 183 6,533 Total
6 0 ^ 2 6 ' 36,906 34,851 82,999 Rural Total34,250 99,625 28,455 3,39,288 Urban95,176 1,36,531 31,941 4,22,287 Total
Note—•Figures of unclassified m arital status are included in total.
Source-—Population Census of India, 1981, Series 12, Part IIl-A and B (ii).
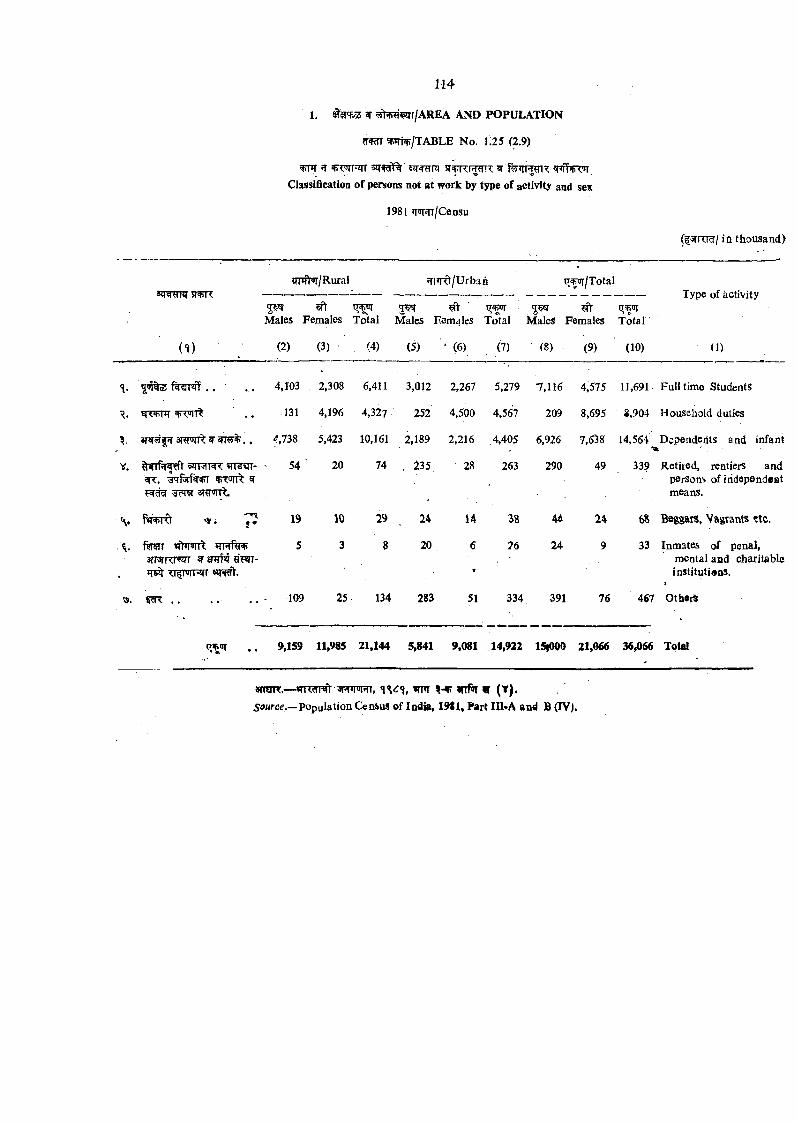
5Tf^ ^ ^ /T A B L E No. ll25 (2.9)
^ JT 5?Tf5fl% ^q-fg-ra ^^T<iTClassification of persons not at work by type of activity and sex
1981 W ^/C ensu
C^'^RTf/ ifl thousand)
i ^ )
^rmt^/Rural 5TI»Rt/Urban iT ^ /T o ta l
5 ^ ^ ^ ■ t^wr 5 ^ #Males Females Total Males Eamales Total Males Females T otal
(2) (3) (4) (5) ' (6) (7) (8) (9) (10)
Type of activity
(1)
<1. . . 4,103 . 2,308 6,411 3,Q12 2,267 5,279 7,116 4,575 11,691 Fulltim e Students
.131 4,196 4,327 252 4,500 4,567 209 8,695 8,904 Household duties
W #|fT3?W ^?r^rr5?%.. f,738 5,423 10,161 2,189 2,216 4,405 6,926 7,658 14,564 Dependents and infant
'SM( n=i+T ^3Rrmt.
S*
fipsTT3 m m w r ^ 3 ^ 4 qw t-
??TT ..
5 4 ' 20 74 . 235 28 263 290 49 339 Retired, rentiers andpersons of iridapendent means.
19 10 29 24 U 3S 44 24 6S BeggaiS, Vagtaivts ?tc.
5 3 8 20 , 6 26 24 9 33 Inmates of penal,mental and ch^ itab le
’ institutions,
109 25 134 283 51 334 391 76 467 O tberi
. . 9,159 11,985 21,144 5,841 9,081 14,922 ISfOOO 21,966 36fi66 Total
arreR.— 5 R w n , irnr irrfir tr ( t ) .
5<?Hrc .—population Census of India, 1911, Part IIl-A and B (TV).
^ § : r m lT A B L E 1 0 6
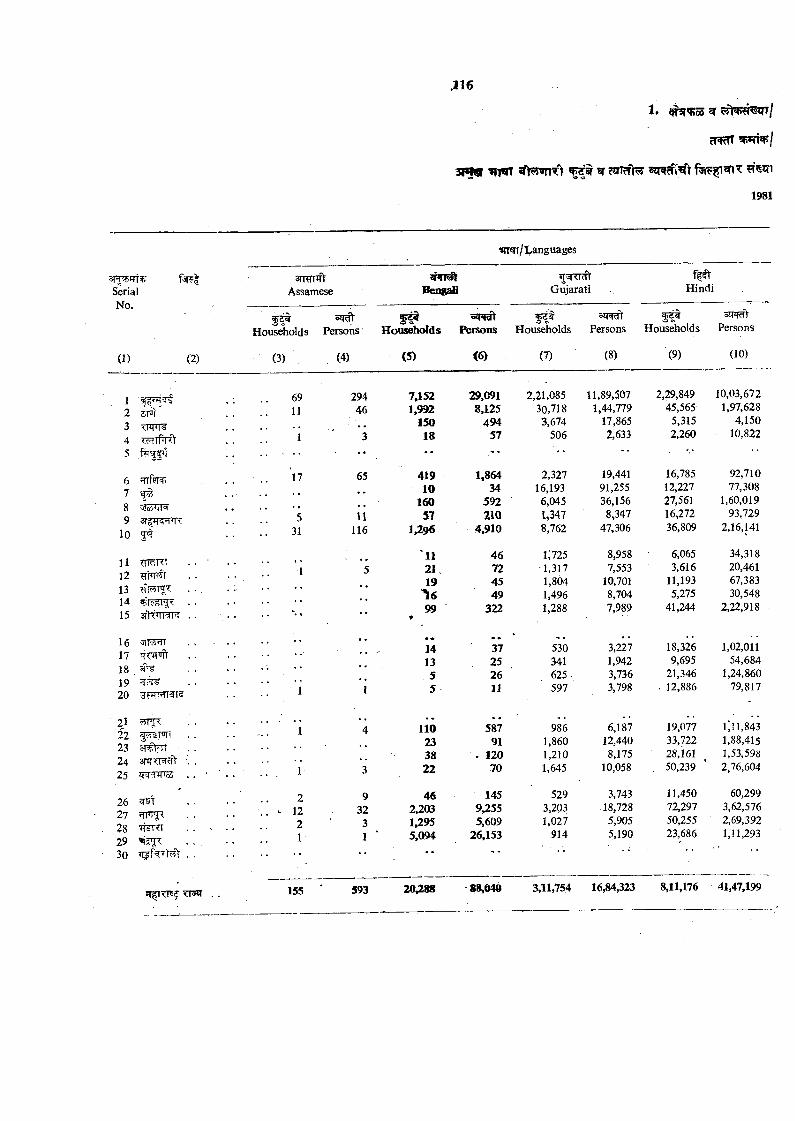
1 . sh 'fioS
5R W sr>5TinTV ^ ?srTH>5
.^qr/L anguages
3T iTT^?SerialNo.
(1)
r^r?! 3nw ftAssamese Bengali
^T^wlrGujarati Hindi
Households Persons
(2)
12 5W3 T F m4 Torrfrd5 % fi7
678 9
10
]1121314 ^ 'ic ^ T15 3?1TITT^
161718 .1920 ^FTRTSTR
21i2 i^ T 'in23 3T5ptfrr24 sr tTWtV25
r
26 ^ T27 5TFTP282930
Households Persons Households Persons Households3q^y
Persons
(3) . (4) (5) (6) (7) (8) (9) (10)
69 294 7.152 29,091 2,21,085 11,89,507 2,29,849 10,03,672
11 46 h992 8,125 30,718 1,44,779 45,565 1,97,628150 494 3,674 17,865 5,315 4,150
1 3 18 « •
57 506 2,633 2,260 10,822
17 65 419 1.864 2,327 19,441 16,785 92,71010 34 16,193 91,255 12,227 77,308
160 592 6,045 36,156 27,561 1,60,019
5 11 57 210 U347 8,347 16,272 93,729
31 116 U 9 6 4,910 8,762 47,306 36,809 2,16,141
11 46 i;725 8,958 6,065 34,318I 5 21 72 1,317 7,553 3,616 20,461
19 45 1,804 10,701 11,193 67,383^ 6 49 1,496 8,704 5,275 30,548
. . . , 99P322 1,288 7,989 41,244 2,22,918
« • , . .14 37 530 3,227 18,326 1,02,01113 25 341 1,942 9,695 54,6845 26 625 3,736 21,346 1,24,860
1 1 5 IJ 597 3,798 . 12,886 79,817
1 4 110 587 986 6,187 19,077 i;il,84323 91 1,860 12,440 33,722 1,88,41538 . 120 1,210 8,175 28,161 1,53,598
1 3 22 70 1,645 10,058 50,239 2,76,604
2 9 46 145 529 3,743 11,450 60,299
. - 12 32 2,203 9,255 3,203 18,728 72,297 3,62,576
2 3 1,295 5,609 1,027 5,905 50,255 2,69,392
1 1 ’ 5,094 26,153 914 5,190 23,686 1,11,293
155 593 20,288 88,049 3,11,754 16,84,323 8,11,176 41,47,199
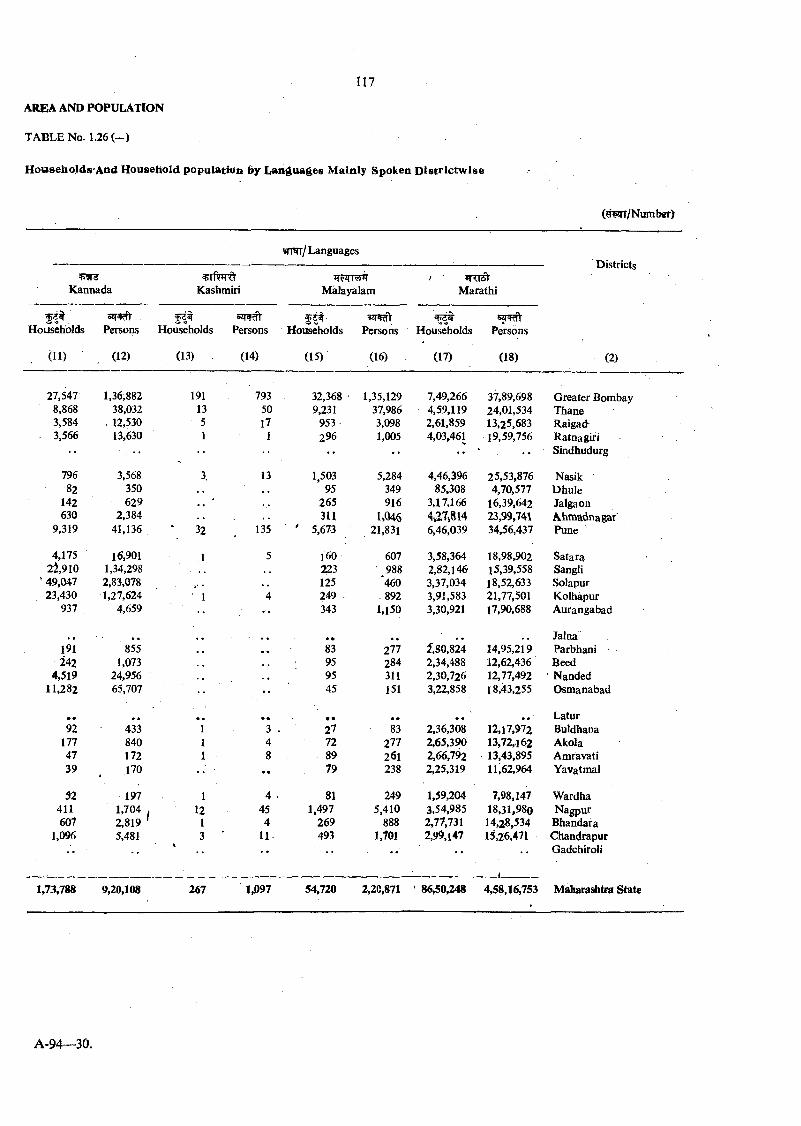
TABLE No. 1.26 (—)
Households'And Household population iiy Languages Mainly Spoken Districtwise
(?MT/Number)
vtwt/ LanguagesDistricts
/ W<I4)Kannada Kashmiri Malayalam Marathi
f i tHouseholds Persons Households Persons Households Persons Households Persons
(12) (13) (14) (15) (16) (17) (18) (2)
27,547 1,36,882 191 793 32,368 • 1,35,129 7,49,266 37,89,698 Greater Bombay8,868 38,032 13 50 9,231 37,986 4,59,119 24,01,534 Thane3,584 . 12,530 17 953- 3,098 2,61,859 13,25.683 R aigad
. 3,566 13,630 1 296 1,005 4,03,461 19,59,756 Ratnagiri•• •• •• •• ' Sindhudurg
796 3,568 3 13 1,503 5,284 4,46,396 25,53,876 Nasik ■82 350 95 349 85,308 4,70,577 Dhule
142 62^ 265 916 3,17,166 16,39,642 Jalgaon630 2,384 3U UQ46 4,27314 23,99,741 Ahmadnagar'
9,319 41,136 ‘ 32 135 ' 5,673 21,831 6,46,039 34,56,437 Pune
4,175 16,901 1, 5 l60 607 3,58,364 18,98,902 Satara21,910 1,34,298 223 988 2,82,146 15,39,558 Sangli
49,047 2,83,078 125 ‘460 3,37,034 18,52,633 Solapur23,430 1,27,624 ’ 1 4 249 . . 892 3,91,583 21,77,501 Kolhapur
937 4,659 *• 343 1,150 3,30,921 17,90,688 Aurangabad
. . « • Jalna191 855 . . • • 83 277 i , 80,824 14,95,219 Parbhani242 1,073 95 284 2,34,488 12,62,436 Beed
4,519 24,956 95 311 2,30,726 12,77,492 ' Nanded11,282 65,707 •• 45 151 3,22,858 18,43,255 Osmanabad
#« • • • • • • « • • • Latur92 433 1 3 27 83 2,36,308 12,17,972 Buldhana
177 840 1 4 72 277 2,65,390 13,72,162 Akola47 172 1 8 89 261 2,66,792 13,43,895 Amravati39 , 170 • • • 79 238 2,25,319 11,62,964 Yavatmal
52 197 1 4 81 249 1,59,204 7,98,147 Wardha411 1,704 , 12 45 1,497 5,410 3,54,985 18,31,980 Nagpur607 2,819 ' 1 4 269 888 2,77,731 14,2«,534 Bhandara
1,096 5,481 3 11- 493 1,701 2,90,l47 15,26,471 Chandrapur% Gadchiroli
1,73,788 9,20,108 267 1,097 54,720 2,2C,871 ' 8630,248 4,58,16,753 Maharashtra State
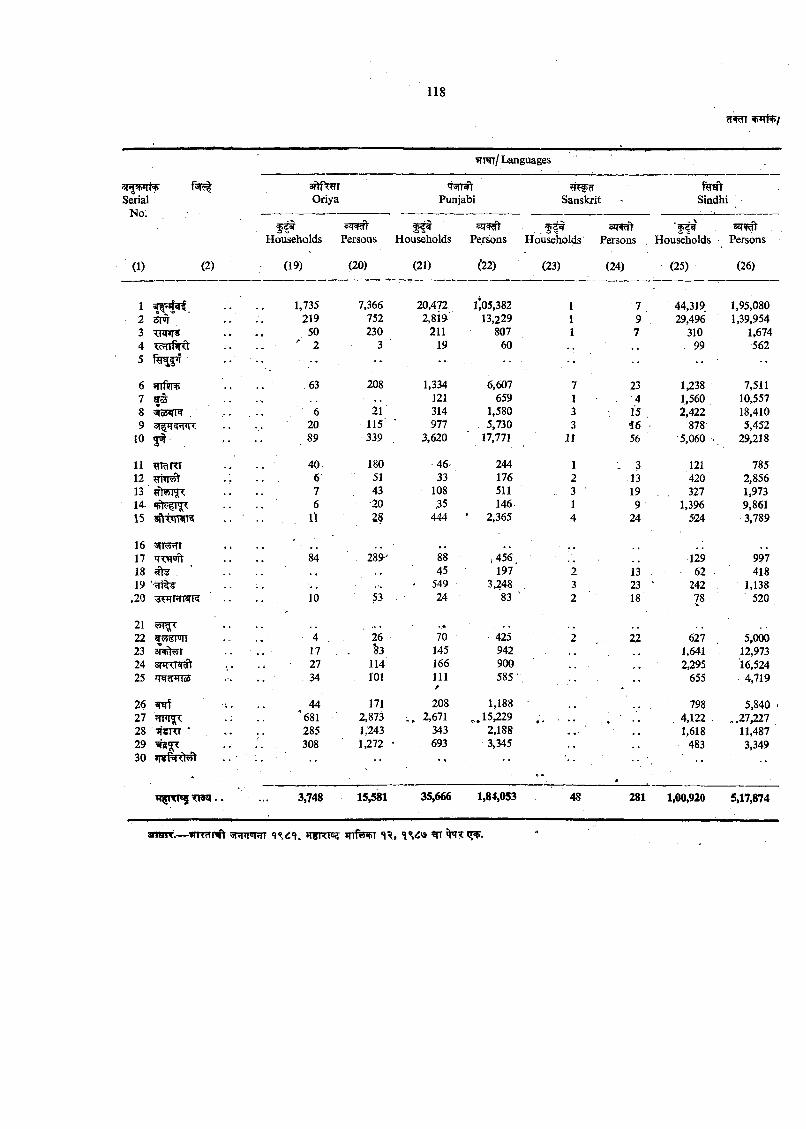
Languages
SerialNo.
(1)
a f t fwOriya
'tsTT^Punjabi Sanskrit Sindhi
czm J 5 * r^Households Persons Households Persons Households Peirsons . Households Persons
(2) (19) (20) (21) {22) (23) (24) (25)
snsit— wnrrnft ?ifRT5? JTif^ x^.
(26)
1 • ' •• 1,735 7,366 20,472 U05,382 1 7 44,319 1,95,0802 5T»i 219 752 2,8i9 13,229 1 9 29,496 1,39,9543 HT»T« . . . . 50 230 211 807 1 310 1,6744 ^^Tftrct . . . . " 2 3 19 60 , , , , 99 5625 . . . . ■ - . •• . . . . ■ ••
6 .63 208 1,334 6,607 7 23 1,238 7,5117 . . 121 659 1 4 1,560 10,5578 9Too<im ... . . . 6 21 314 1,580 3 . 15 , 2,422 18,4109 20 115 ■ 977 5,730 3 i 6 - 878- 5,452
10 89 339 3,620 17,771 J I 56 5,060 . 29,218
11 ’HRRI . . . . 40 180 46- 244 1 3 121 78512 g’Nr 'V . . . . 6 51 33 176 2 13 420 2,85613 7 43 - 108 511 3 ' 19 327 1,97314- 6 •20 .35 146 1 9 1,396 9,86115 U • 28 444 ' 2,365 4 24 524 3,789
16 [«?5rfF . .17 84 . 289- 88 , 456 129 9971 8 ^ , , 45 197 2 13 62 4181 9 ' TTt^ ' 549 3,248 . 3 23 ' 242 1,138
,20 ^^iTTfrRR 10 53 24 83 ’ 2 18 78% 520
21 ,.•«22 4 . 26 70 425 2 22 627 5,00023 . . . . • 17 "83 145 942 • 1,641 12,97324 ar*l<r^'^ 27 114 166 900 2,295 16,52425 A|<:<ci*Tro5 34 101 111
A585 • . . 655 .4,719
26 ^ 44 171 208 1,188 798 5,84027 '681 2,873 2,671 „J5 ,229 • . . 4,122 . ..27,22728 ■ . . . . 285 1,243 343 2.188 * 1,618 11,48729 308 1,272 • 693 3,345 . , 483 3,34930 »T8^<j55t • ’
.. ...
3,748 15,581 35,666 1,84,053 48 281 1,00,920 5,17,874
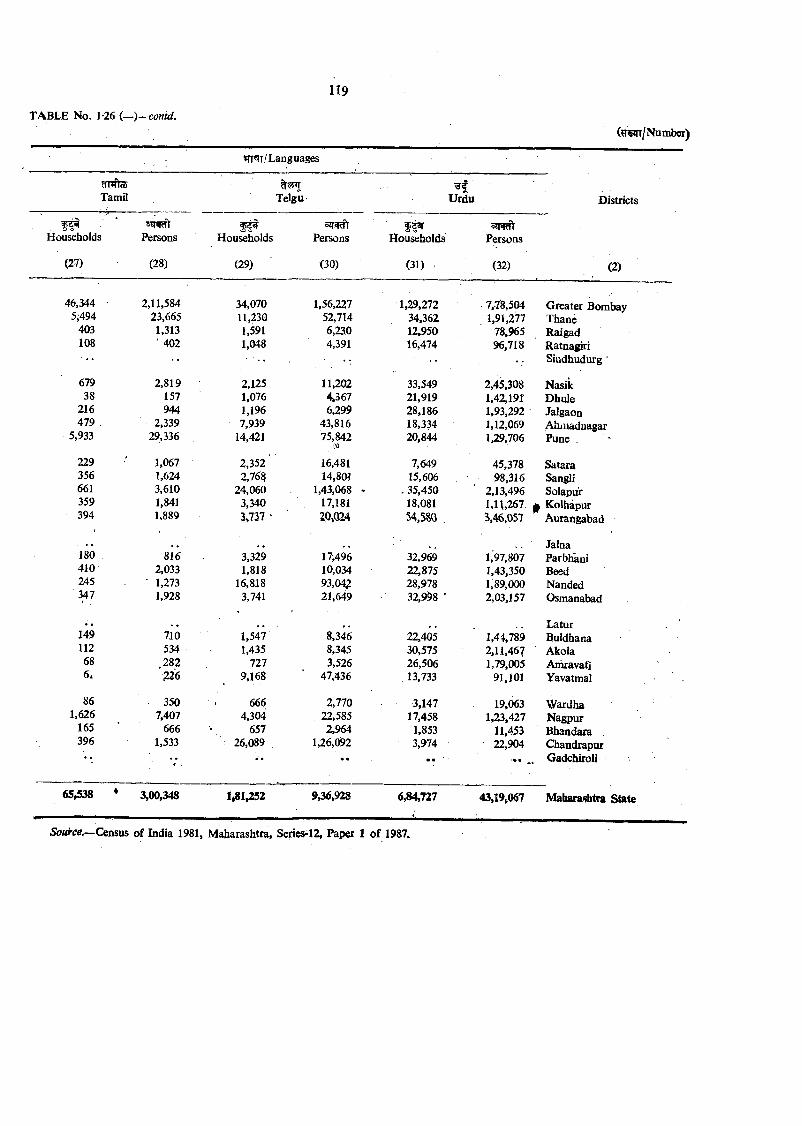
( reJTT/Number)
^<?T/Languages
Tamir Telgu Urdu Districts
f i tHouseholds Persons Households Persons Households Persons
(27) (28) (29) (30) (31) (32) (2)
46,344 5,-494
403 108
2,11,584 23,665
1,313 ' 402
34,07011,2301,5911,048
1,56,22752,7146,2304,391
1,29,27234,36212,95016,474
7,78,5041,91,277
78,96596,718
Greater Bombay Thane Raigad Ratnagiri Sindhudurg '
679 38
216 479 .
5,933
2,819157944
2,33929,336
2,1251,0761,1967,939
14,421
11,202 4,367 6,299
43,816 . 75,842
CV)
33,54921,91928,18618,33420,844
2,45,3081,42,1911,93,2921,12,0691,29,706
Nasik Dhule Jalgaon Ahiuadnagar Pune . -
229356661359394
1,0671,6243,6101,8411,889
2,352' 2,76^
24,060 3,340 3.737 ‘
16,481 14,80}
1,43,068 - 17,181z Q m
7,649 15,606
. 35,450 18,081 54,58(1 .
45,37898,316
2,13,4961,11,2673,46,051
Satara Sangli Solapur
0 Kolhapur Aurangabad
180410245347
816 2,033
' 1,273 1,928
3,3291,818
16,8183,741
17,49610,03493,04^21,649
32,969 22,875 28,978 32,9i»8 '
1,97,8071,43,3501,89,0002,03,157
JalnaParbhaniBeedNandedOsmanabad
149112686i
710534
.282226
1,5471,435
7279,168
8,3468,3453,526
47,436
22,40530,57526,50613,733
1,44,7892,11,4671,79,005
91,101
Latur . 'BuldhanaAkolaAimavafiYavatmal
861.626
165396
3507,407
6661,533
6664,304
65726,089
2,77022,5852,964
1,26,092
3,147 17,458
1,853 3,974
• •
19,0631,23,427
11,45322,904
Wardha Nagpur Bhandara Chandrapur
. Gadchiroli
65^38 • 3,00,348 1)81,252 9,36,928 6,84,727 43,19,067 Maharashtra State
Source.—Cex\sus o f India 1981, Maharashtra, Series-12, Paper 1 o f 1987.
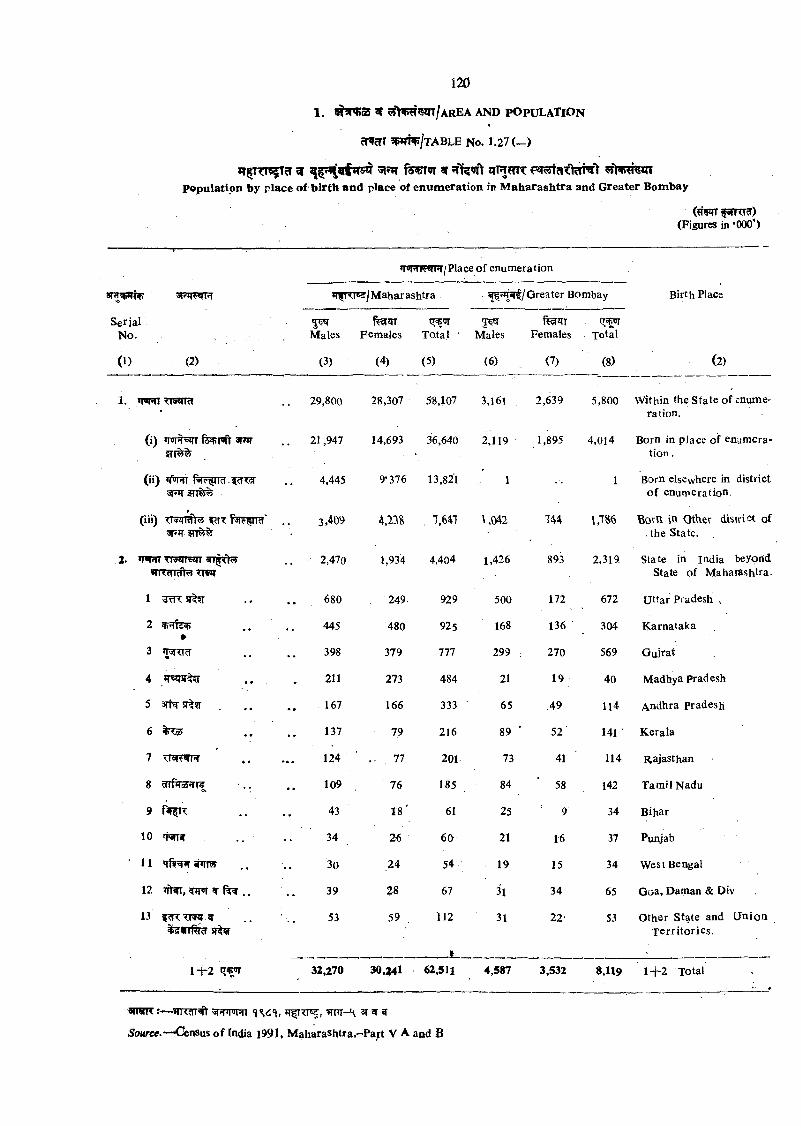
l a o
1 . 55>^?Sm /AREA AN D P O P U L A T IO N
cfWclT W ^ /tA B L E N o . 1.27 (—)
«r|TTT55Tcf ^ ^population by place of birth and place of enumeration in Maharashtra and Greater Bombay
(fTWT^arm^) (Figures in ‘000’)
8R?5ITi^
SerialNo.
(1)
3FqWH
, (2)
1. *r*RT TTsFTTtT
(i) »ru|^5qr 3FfTIT T ^
(ii) ’fJHT r»le^ici.fcr<'S'
J|«RF«JTH/Place o f enum eration
M ahar ashtra ^ ? # ^ /G r e a te r Bombay
5<5TMales Fem ales T o ta l Males
(3) (4) (5) (6)
Females
(7)
IT ^Total
(8)
Birth Place
(2)
29,800
21,947
4,445
28,307 58,107
14,693 36,640
9‘376 13,821
3,161
2,119
1
2,639
1,895
5,800
4,014
1
W ithin the S ta te of enumeration.
B o r n in p l a c e o f e n u m e r a t i o n .
BorD elsewhere in district o f enum eration
(lii) f s i ? ^ 3,409 4,238 I M l 1,042 744 1,186 BovH in Otlier district of . the State.
*n*IH7 TT»lTR!n »rrT?ncftw TT»a
2,470 1,934 4,404 1,426 893 2,319 State in India beyond State of M aharashtra.
1 . . 680 249. 929 500 172 672 U ttar Pradesh ,
2' »
445 480 925 168 136 • 304 K arnataka
3 398 379 111 299 270 569 G ujrat
4 211 273 484 21 19 40 M adhya Pradesh
5 arrar !T%?r 167 166 333 65 .49 114 A ndhra Pradesh
6 137 79 216 89 ‘ 52 141 K erala
7 124 . . . 77 201 73 41 114 R ajasthan
8 ' .. 109 76 185 84 58 142 T am il N adu
9 fWlK 43 1 8 ' 61 25 9 34 Bihar
10 ifsn^r 34 26 60 21 16 37 Punjab
11 3o 24 54 19 15 34 West Bengal
12 TfOT f . . 39 28 67 31 34 65 G oa, Daman & t)iv
1351^
53 59 112
t
31 22' 53 O ther S tate and U n io n T e rr ito r ie s .
1 + 2 32,270 30.141 62,511 4,587 3,532 8,119 1 + 2 Total
anw T:— ^mxgnNt mrr-K sr «r
S'o«rce."~C3enSus o f India 1991, Maharashtra,-Part V A and B
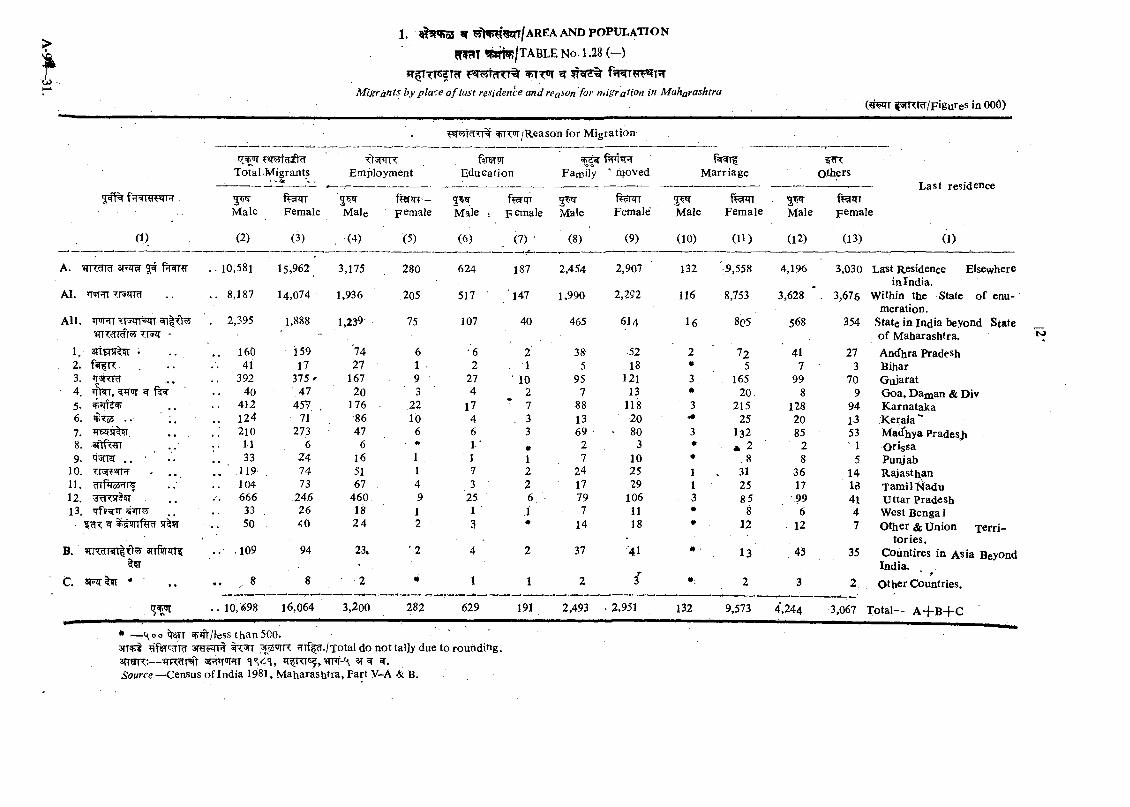
>
?oi
^S 5^ /T A B L E N o . 1.28 (—)
iT^TTCJTcT f«Tr5iHTT% ^Migrants by place o f last residence and reason for migration in Maharashtra
(?t^r f^TRm/Figufes in OOO)
^T W /R easonfo r M igration
T oralM igra jits■ 'tsnriT
Employment E ducationi^dsr f^rniR
Family ' nioved M arriage Others____ T
a )
M ale
(2)
Female
(3)
Male
, (4)
' F®male
(5)
Male :
(6)
ft^qrpem ale
(7) ■
3 ^Male
(8)
fw n 'Female
(9)
3 ^Male
(10)
Fem ale
(11)
Male
(12)
Fem ale
(13) (1)
A. ITRrrra' 3T?W 5# ..10 ,581 15,962 3,175 280 624 187 2,454 2,907 132 '9 ,558 4,196 3,030 La^t Residence Elsewhere in I ndia.
AI. (yMI TTS nW .. 8,187 14,074 1,936 .205 517 ■ 147 1,990 2,292 116 8,753. 3,628 . 3,676 W ithin the State o f enum eration.
A ll. • T JiTFiIT ^Ticrrdtsr "scrjir -
. 2,395 1,888 1,239 75 107 40 465 614 16 8c5 568 354 State in Ind ia beyond State o f M aharashtra.
1, i . . 160 159 74 6 6 2 38 •52 2 72 ' 41 27 A ndhra Pradesh2. f^TT 41 17 27 ■ 1 2 . 1 5 18 * 5 7 3 Bihar3. ’T'j|<fd . . 392 375 ' 167 9 27 ■ 10 95 121 3 165 99 70 G ujarat4. 5[5Frq- W . . 40 47 20 3 4 2 7 13 • 2 0 . 8 9 G oa, D ajnan & Div5. . , 412 457 , 176 ■ 22 17 7 88 118 3 215 128 94 K arna taka6 . . . ‘ ; . . . 124 ■ 71 86 10 4 . 3 13 20 1* 25 20 13 K erala "7. ?rEJT5i^_ . . , . : 210 273 47 6 6 3 69 ■ • 80 3 132 85 53 Ma(fhya F radesji8. sfrferr 11 6 6 . * 1 • • 2 3 * * 2 ' 2 1 O rissa9. . . ■ ' . . 1. 33 24 . 16 1 1 1 7 10 * 8 8 5 Punjab
10. . . . . . ‘ 119 74 51 1 7 2 24 25 1 . 31 36 14 R ajasthan11. . . 104 73 67 4 3 2 17 29 1 25 17 13 T am il l^adu12. ^T5T^!^ . . 666 24.6 460 9 25 6 . 79 106 3 85 99 41 U tta r Pradesh13, qfg^ir 5Trr?r 33 26 18 1 1 .1 7 11 • 8 6 4 West Benga 1
■ ^ 51^ 50 40 2 4 2 3 • 14 18 * 12 . 12 7 O ther & U nion T errito ries .
B, ^f?3RT|ft5y 3Tifirrzrn[ . . .109 94 23» ' 2 4 2 37 ■41 • ' 13 45 35 Coiintires in A sia Beyond India. .
C. •* . 8 8 2 m 1 1 2 i 2 3 2f
O ther Countries.
. . 10,698 16,064 3,200 282 629 191 2,493 . 2,951 132 9,573 4,244 3,067 Total— A + B + C
K>
-1^00 iSTT ^iJV/less thanSGO.3r r ^ ifsET' W , ^ ’iTR TTTf|cT./Total do nottaU y due to roundifig .3TTanR:— ^iiRcir^r sm irsn srwSource—Census o f India 1981, M aharashtra, Part V-A & B.

2 .
rTTiTR,3Tr% 9 W f t f ^ ^ TOW 3TTf^ f k f k ^5rc2T5TT?^^ qT3Rf * I T f ^ rP F v W 3 n | .
i
^ ^-sT+fr^i ^ rr% ft am st 3 r r | ^^ ^ f r f9 T W R ”T t^ r^ r ic f r^ ^ S i f i W r ^feiPT^ s r r ^ . ^rcr^Rt f%srr 'r r ^ ^ i f tf t qfR- ^ f e r 5m=rftcT ^ifR?r ^ sfc^r^r' T « ^ j $ rm rr® n s m t s w r t o r r 5 n s ^ s n | . f e ^ w = r r s f t ^ cmncT q ^ N r m w w r a t
?p if^ ^ ^ A f^ - 3TT^ s r ^ ^ ^ f ^ ' T j ^ n i T ?riw w R T % f t .
2. ENVIRONMENT STATISTICS2.1 Data on tempcrjiturc and relative humidity at
various centres and normal number of rainy days and rainfall and actual rainfall in different centres are presented in the following tables.
2.2 The Centres for which, data is presented are. generally the tahsil or district headquarters in the districts. The figures of average rainfall are worked out on the basis of actual figures for the periods ranging from a minimttm of five years to a maximum of eighty years. ^ <l?iy :jvaf treated as a rainy day if during tfhe twwity-fo^ r ^ours, the ra in ^ ^ e recorded a minimum of 2-5 ^f rainfall
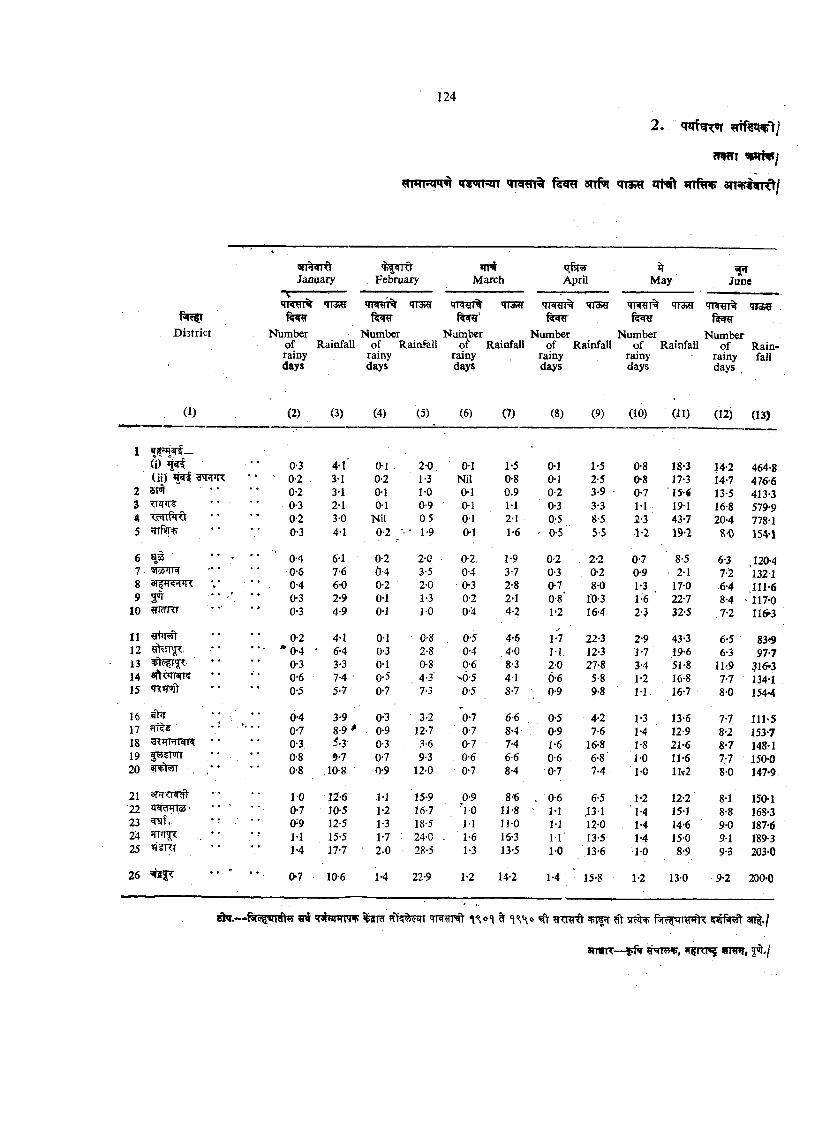
2 . 'mfwT«r
cWiT v i i v y
i m F m <TRm% s n f ^ i r H t ^nftrir
January February*rpt
March April May June
'TFRn% 'T i^ tmRn^ 'T im 'rra^r
District Number Number Nuinber Number Number Numberof Rainfall of Rainfall of Rainfall of Rainfall o f Rainfall of Rainrainy ramy rainy rainy rainy rainy falldays days days days days days
(1) (2) (3) (4) (5) (6) (7) (8) (9) (10) (11) (12) (13)
1 •
(i) 0-3 4-1 0-1 2-0, 01 1-5 01 1-5 0-8 18-3 14-2 464-8(ii) 3 ^ 'dw r^ “ • 0-2 . 31 0-2 1-3 Nil 0-8 01 2-5 0-8 17-3 14-7 4766
2 sm " • • 0-2 3-1 01 1 0 0-1 0.9 0-2 3-9 • 0-7 I5« 13-5 413-33 0-3 2-1 01 0-9 01 11 0-3 3-3 M 19-1 16-8 579-94 0-2 3 0 NU 05 01 2-1 0:5 8-5 2-3 43*7 20-4 778-15 0-3 4*1 0-2 ■• * 1-9 0-1 1-6 ' 0-5 5-5 ■1-2 19-2 S-0 154‘1
6 ^3 ' • ' . 0-4 61 0-2 2*0 0-2. 1-9 0-2 , 2-2 0-7 8-5 6-3 .120-47 3Ia5ilR 0-5 7-6 b-4 3-5 0-4 3-7 0-3 0-2 0-9 2-1 7-2 13218 * • . 0-4 6 0 0 2 2-0 0-3 2-8 0-7 8 0 1-3 17-0 6-4 111-69 5^ 0-3 2-9 0-1 1-3 0-2 2*1 0-8' ro-3 1-6 ' 22-7 8-4 • 117-0
10 HMIil 0-3 4-9 O-I i-o 0-'4 4-2 1‘2 16-4 2-3 32-5 .7-2 116*3
11 • • 0-2 41 01 0-8 0-5 4-6 1-7 22-3 2-9 43-3 6-5 83^12 • • • *0-4 • 6-4 0-3 2-8 0-4 4-0 M 12-3 1'7 ,19-6 6-3 97-713 w ftc^ . ■ • • 0-3 3-3 0-1 0-S 0-6 8-3 2 0 27-8 3-4 51-8 11:9 316*314 aftoiHK * • 0-6 7-4 ■ 0-5 4-3‘ v6-5 41 6-6 5-8 1-2 16-8 7-7 134-i15 qirtqTjfy 0-5 5-7 0-7 7-3 0-5 8-7 0-9 9-8 M 16-7 8-0 154-4
16 0-4 3-9 0-3 3-2 0-7 6-6 0-5 4-2 1-3 13-6 7-7 l l h S17 O'? 8-9 * . 0-9 12-7 0-7 8-4 0-9 7-6 1-4 12-9 8-2 153-718 ^ w r« fR • • 0-3, 5.3- 0-3 3-6 0-7 7-4 i-6 16-8 1-8 21-6 8-7 148-119 * • 0-8 9-7 0-7 9-3 0-6 6 6 0-6 6-8 10 II-6 7-7 150-020 SRfteT ., / • 0-8 .10-8 0-9 120 0-7 8-4 0-7 7-4 1 0 llv2 8 0 147-9
21 3TJ-J <l<=r«i) * * 1 0 126 M 15-9 0-9 8-T6 . 0-6 6-5 1*2 12-2 8-1 150-122 q^^*ircd • • • ' 0-7 10-5 1*2 16-7 *10 11-8 M .131 1-4 15-1 8-8 168-323 ^gf.. * •• . 0-9 12-5 1-3 18-5 M II-O 11 12-0 1-4 14-6 9-0 187-624 HUil< :. • • M 15-5 1-7 24-0 . 1-6 16-3 M 13-5 1-4 15-0 9-1 189-325 9JdKI 1-4 17-7 2.0 28-5 1-3 13-5 1-0 13-6 10 8-9 9-3 203-0
26 0-7 10-6 1-4 22-9 1-2 14-2 1-4 15-8 1-2 13-0 9-2 200-0
8TWIT— ipfv 5 frn « f vrw , ot./
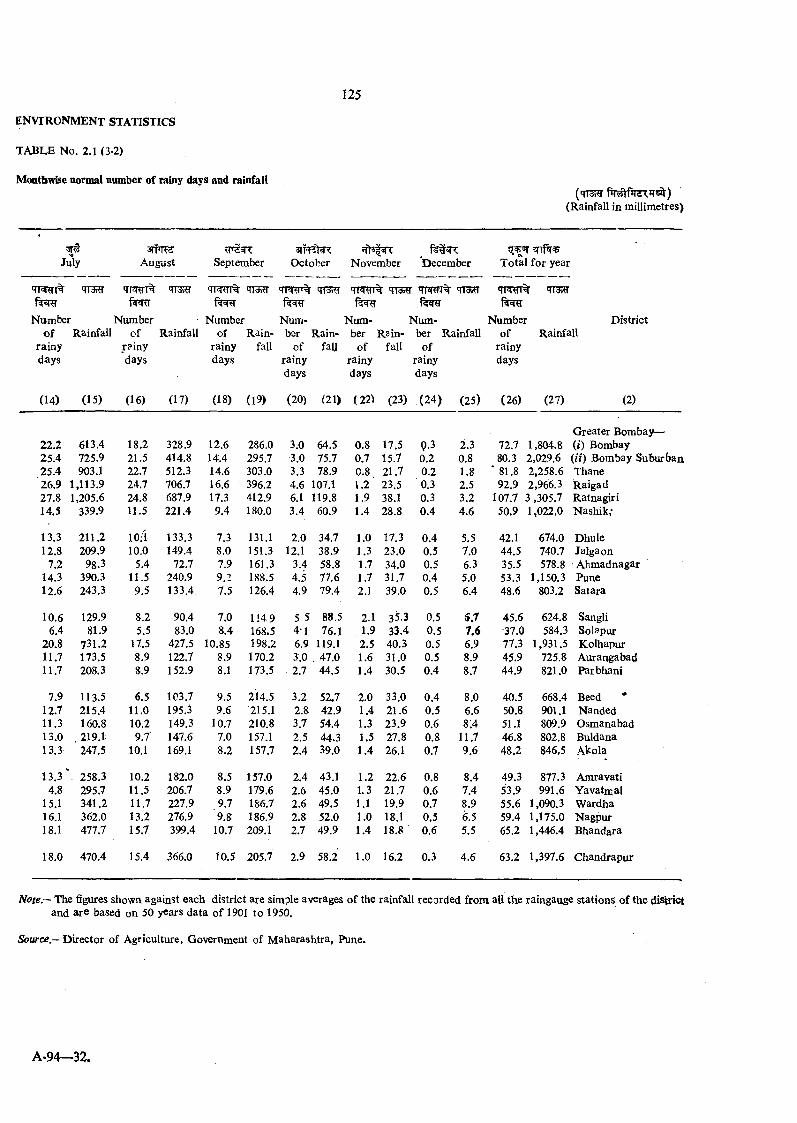
ENVIRONMENT STATISTICS
TABLE No. 2.1 (3-2)
M o n tb ^ e normal number of rainy days and rainfall
(Rainfall in millimetres)
Ja'ly3?if^
August September October November December T otal fo r year
'n ^ l% 'TT3?Er TisRn% <rra r'TT Rn% qTM qTS T
Number Number ■ Number Niun- Num- Num- Numbero f Rainfall of Rainfall of Rain- ber Rain- ber Rain- ber Rainfall of Rainfall
rainy rainy rainy fall of fay o f fall of rainydays days days rainy rainy rainy days
days days days
(14) (15) (16) (17) (18) (19) (20) (21) (22) (23) (2 4 ) (25) (26) (27)
D istrict
(2)
G reater Bombay—22.2 613.4 18.2 328.9 12.6 286.0 3.0 64.5 0.8 17.5 0.3 2.3 72.7 1.804.8 (0 Bombay25.4 725.9 21.5 414.8 14.4 295.7 3.0 75.7 0.7 15.7 0.2 0.8 80.3 2,029.6 (ii) Bombay Suburban25.4 903.1 22.7 512.3 14.6 303.0 3.3 78.9 0.8 21.7 0.2 1.8 * 81.8 2,258.6 Thane26.9 1,113.9 24.7 706.7 16.6 396.2 4.6 107.1 1.2 23.5 0.3 2.5 92.9 2,966.3 Raigad27.8 1,205.6 24.8 687.9 17.3 412.9 6.1 119.8 1.9 38.1 0.3 3.2 107.7 3 ,305.7 Ratnagiri14.5 339.9 11.5 221.4 9.4 180.0 3.4 60.9 1.4 28.8 0.4 4.6 50.9 1,022.0 Nashik,'
13.3 211.2 lOji 133.3 7.3 131.1 2.0 34.7 1.0 17.3 0.4 5.5 42.1 674.0 Dhule12.8 209.9 10.0 149.4 8.0 151.3 12.1 38.9 1.3 23.0 0.5 7.0 44.5 740.7 Jalgaon
7.2 98.3 5.4 72.7 7.9 161.3 3.4 58.8 1.7 34.0 0.5 6.3 35.5 578.8 Ahmadnagar14.3 390.3 11.5 240.9 9.2 188.5 4.5 77.6 1.7 31.7 0.4 5.0 53.3 1,150.3 Pune12.6 243.3 9.5 133.4. 7.5 126.4 4.9 79.4 2.1 39.0 0.5 6.4 48.6 803.2 Satara
10.6 129.9 8.2 90.4 7.0 1149 5 5 88.5 2.1 35.3 0.5 s . t 45.6 624.8 Sangli6.4 81.9 5.5 83.0 8.4 168.5 4-1 76.1 1.9 33.4 0.5 7.6 37.0 584.3 Solapur
20.8 731.2 17.5 427.5 10.85 198.2 6.9 119.1 2.5 40.3 0.5 6.9 77.3 1,931.5 Kolhapur11.7 173.5 8.9 122.7 8.9 170.2 3.0 . 47.0 1.6 31.0 0.5 8.9 45.9 725.8 Aurangabad11.7 208.3 8.9 152.9 8.1 173.5 2.7 44.5 1.4 30.5 0.4 8.7 44.9 821.0 Parbhani
7.9 113.5 6.5 103.7 9.5 214.5 3.2 52.7 2.0 33.0 0.4 8.0 40.5 668.4 Beed12.7 215.4 11.0 195.3 9.6 215.1 2.8 42.9 1.4 21.6 0.5 6.6 50.8 901.1 Nanded11.3 160.8 10.2 149.3 10.7 210.8 3.7 54.4 1.3 23.9 0.6 8.4 51.1 809.9 Osmanabad13.0 . 219.1 9.7 147.6 7.0 157.1 2.5 44.3 1.5 27.8 0.8 11.7 46.8 802.8 Buldana13.3 247.5 10.1 169.1 8.2 157.7 2.4 39.0 1.4 26.1 0.7 9.6 48.2 846.5 Akola
13.3 258.3 10.2 182.0 8.5 157.0 2.4 43.1 1.2 22.6 0.8 8.4 49.3 877.3 Amravati4.8 295.7 11.5 206.7 8.9 179.6 2.6 45.0 1.3 21.7 0.6 7.4 53.9 991.6 Yavatrcal
15.1 341.2 11.7 227.9 9.7 186.7 2.6 49.5 1.1 19.9 0.7 8.9 55.6 1,090.3 W ardha16.1 362.0 13.2 276.9 9.8 186.9 2.8 52.0 1.0 18.1 0.5 6.5 59.4 1,175.0 Nagpur18.1 477.7 15.7 399.4 10.7 209.1 2.7 49.9 1.4 18.8 0.6 5.5 65.2 1,446.4 Bhandara
18.0 470.4 15.4 366.0 10.5 205.7 2.9 58.2 1.0 16.2 0.3 4.6 63.2 1,397.6 C handrapur
Note.— The figures shown ag;ainst each district are simple averages o f the rainfall recorded from all the raingauge stations o f the district and are based on 50 years data o f 1901 to 1950.
Source — D irector of Agriculture, Government of M aharashtra, Pune.
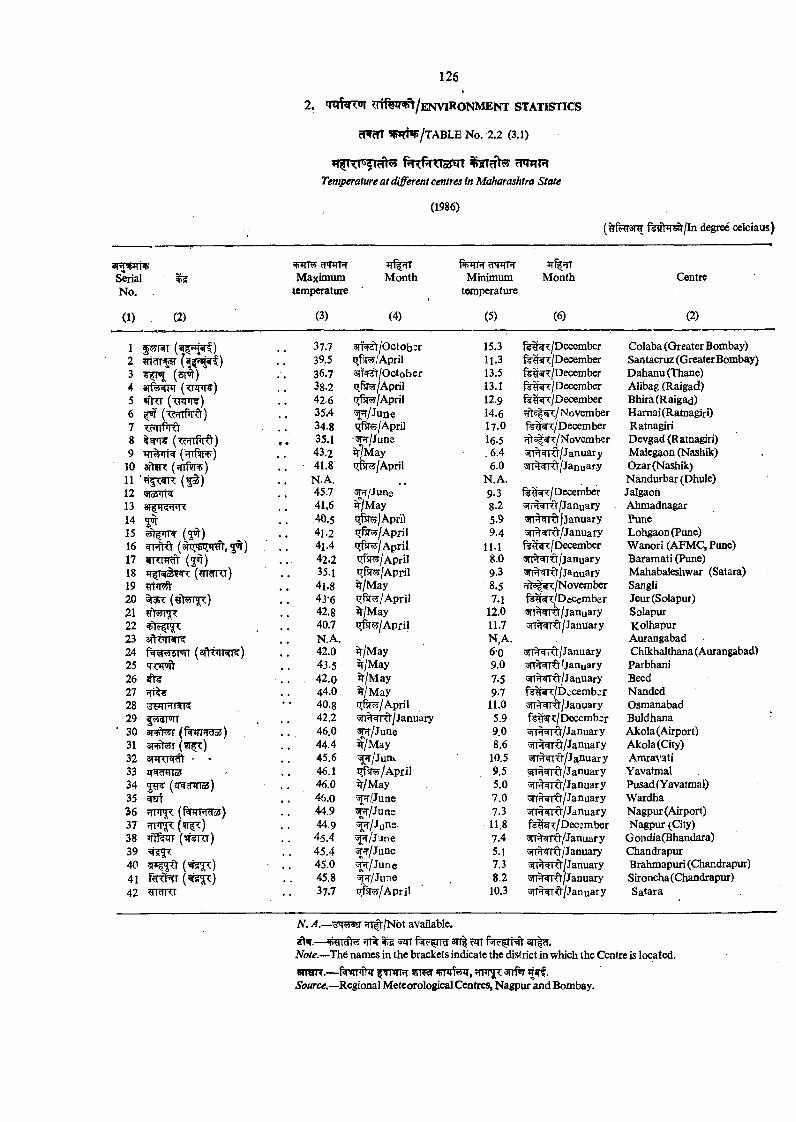
2. ^rffer^/ENVlRONMENT STATISTICS
cRcTT W ^ /T A B L E N o. 2.2 (3.1)
%TfHTT55^ %ST?rt^ cTTRRTemperature at different centres in Maharashtra State
(1986)
3|^W N iSerialNo.
(1) (2)
Maximumtemperature
(3)
M onth
(4)
ftniHcNiTRMinimum
temperature
(5)
Month
(6)
Centre
(2)
123 (srw)4 (WT¥)5 ( w i ^ )6 ^ ( w f i r ^ )7 <c*Tlf^8 ( ccdTfirft)9 Trr i? (;rrftR>)
10 sftiR ( rrfiFn!')11 ( f ^ )12 iilSCTriW1314 5«r15 ( g^)16 got)17 iTTWft (gor)18 (?rnrRr)1920 (?f>rr5p:)21 2223 30W 4R24 f nSHSFTT (artrnRT?)2526 4 k272829 i^rarnr30 anfWr (f^nHdsd)31 3W>yT32 snrTR ^ •33 zr^Rmr®34 (it<4d^loS)35 ^36 fm r^3738 I f f f ^ (^ff¥RT)39 ^ 5 ^404142 TRTfTT
37.7 a n ^ /O c to b s r39.5 qfer/A pril36.7 STT^^t/October 38.2 qftoy/April42-6 i#T5y/April35.4 ^ / J u n e34.8 i^Rby/April35.1 -^ /J u n a43.2 Jr/May41.8 trf^ /A pril
N.A.45.7 ^ / J u n e41.6 Jr/May40.5 April41-2 cjfsm/April41.4 qfsr^/April42.2 ^51^/April35.1 irfsr^jApril 4i.g ^/M ay43-6 qfir^/A pril42.8 %/May40.7 i^vy/A pril N.A.42.0 ?r/May43.5 %/May
. 42.0 %/May44.0 %/May40.8 April42.2 ^n^^rfl^/January46.0 '^ /J u n e44.4 ^/M ay45.6 ^ / J u m46.1 i^sr^/A pril46.0 %/May46.0 ^ / J u n e44.9 ^ / J u n e44.9 ^ / J u n e .45.4 ^ / J a n e45.4 ^ / J u n e45.0 ^ / J u n e45.8 9fr/June37.7 A pril
15.3 fe%wT/December11.3 fe ^ /D e c e m b e r13.5 f^ ^ /D e c e m b e r 13.1 f^ ^ /D e c e m b e r 12.9 fe%?r/December14.6 Tft^t^/Novem berI7.O fl:^-?[/December l6-5 7fr5|fT/November . 6.4 I /January6.0 5TT%frfl’/January
N.A.9.3 fe ^ /D e c e m b e r8.2 ^H ^ro /January5.9 sirtsTTfr I January9.4 ^ m f t / J a n u a r y
IM f¥^Nr/December8.0 3n%^rd/january9.3 5n%grtt/January8.5 ffto |^/N ovem ber7.1 f^ ^ /D e c e m b e r
12.0 5TT% ^/january11.7 5fT%^Td/January N.A,6-0 ^;rT%mft/January9.0 ^sTTRRl’ January7.5 5rr^t^6/January9.7 f¥% ^/i)ecem b^r
11.0 ^ in% ^/January5.9 f%%^?:/Decemb3r9.0 s n w d /J a n u a ry8.6 0 /January
10.5 ^sTT^ft/January9.5 s r m ^ /J a n u a ry5.0 srr^^rd/January7.0 ^ q - ^ / J a n u a r y7.3 ^H ^rd /Jan u ary11.8 f3%WT/December7.4 3rr%^rfl’/January5.1 5n%^nrfl'/January7.3 3n%^rtl’/January8.2 sn^snrft/January
10.3 5n% iff/January
Colaba (Greater Bombay) Santacruz (Greater Bombay) Dahanu (Thane)Alibag (Raigad)Bhira(Raigad)Hamai(Ratnagiri)RatnagiriDevgad (Ratnagiri) M aleg^n (Nashik) Ozar(Nashik)Nandurbar (Dhule)JalgaonAhmadnagarPuneLohgaonCPune)Wanori (AFMC, Pane) Baramati (Pune) Mahabaleshwar (Satara) SangljJeur(Solapur)SolapurKolhapurAurangabadChikhalthana (Aurangabad)ParbhaniBeedNandedOsmanabadBuldhanaAkola (Airport)Akola(City)AmravatiYavatmalPusadfYavatmal)WardhaNagpur (Airport)Nagpur (City)
Gondia(Bhandara) ChandrapurBrahmapuri (Chandrapur) Sironcha(Chandrapur) Satara
N. .<4.— ?n| t /Nbt available.
zW.— «TT% 3TI fJTTNote.—'Th& names in the brackets indicate the district in which the Centre is located.WTOR.— ^TTfnW WHI < 3Trf %*rf.Source.—Regional Meteorological Centres, Nagpur and Bombay.
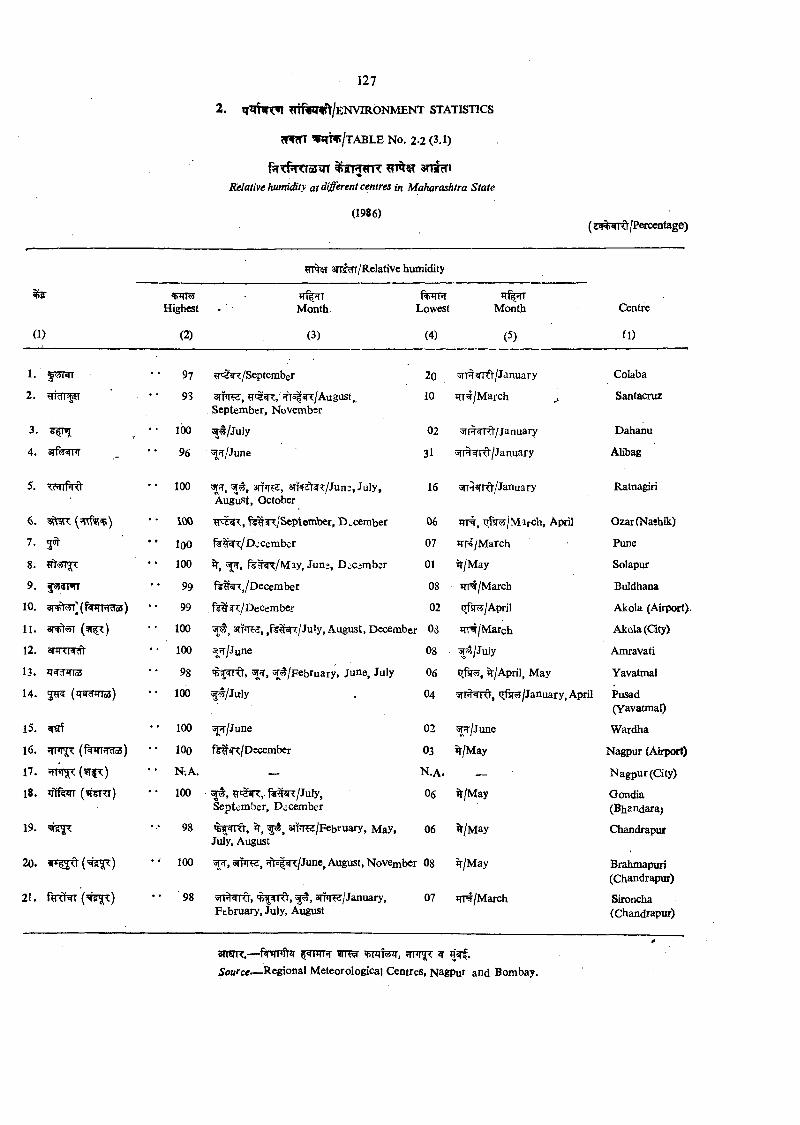
2. ^nf^*V /E N V IR O N M EN T STATISTICS
W V / t ABLE N o. 2-2 (3.1)
f^ T f^ m a n n 3nt?T»
Relative humidity at different centres in Maharashtra State
(1986)(s#^/Perccntage)
antcrr/Relative humidity
Highest Month Lowesttir vTl
Month Centre
(1) (2) (3) (4) (5) (1)
1. . . 97 ?r'^ /S ep tem b er 20 5TT#«ll<^/January Colaba
2. 9S arf’T??, August,, September, Noverabsr
10 ?TT^/March Santacniz
3. • • 100 ^T^/July 02 's r r t^ / ja n u a r y Dahanu
4. 3r^r«rm •• 96 ^^/June 3l sTRWRt/January Alibag
5. •• 100 3rf>T , an ^^ r^ /Ju n ;, July, August, October
16 ^ i^ rfr /Ja n u a ry Ratnagiri
6. •• m M T ^/Septem ber, December 06 t j ^ |M i r c h , April OzarfNashik)
7. 3^ ** loo DccQTttbcT 07 iTR/March Pune
8. 100 Jr, f e ^ / M a y , Jun^, D-c^mber 01 %/May Solapur
9. 99 /D ecem ber 08 HN/March Buldhana
10. 3 r4 fl^ r(^ n rp w ) 99 Fs^??:/December 02 irfsr^/April Akola (Airport).
11. *• 100 3n>Tfj, ,f^ ^ T /Ju ly , August, December 08 /March Akola (Qty)
12. •• 100 ^Tf/June 08 ^ / J u i y Amravati
13. 98 ^ /F e b ru a ry , June, July 06 trfsis?, ?r/April, May Yavatmal
14. 2?T5 (q ^TTToS) •• 100 ^ / J u l y 04 i^ftr^/January, April Pusad(Yavatmal)
15. ?rarf •• 100 ^ / J u n e 02 ^ / J une Wardha
16. frnrjT (f^HTTcra) •• 100 f^ ^ /D e c e m b e r 03 %/May Nagpur (Airpcwt)
17. ^TnT^(?T|T) ♦ • N-.A. — n .a . — N agpur (City)
18. nlffeTT (tpreni) 100 ? r < ^ , M «i</July, September, December
06 %/May Gondia(Bhandara;
19. ^S{^< 98 iJ, ajiiRcr/February, May, July, August
06 %/May Chandrapur
20. (W ) •• 100 iilkw , ;fr5 |^ /June , August, November 08 %/May Brahmapuri(Chandrapur)
21. •• 98 siTPT^/January, February, July, August
07 TTPt/March Sironcha(Chandrapur)
anw.—fw #T fiFr wSource-—Regional Meteorological Centres, Nagpur and Bombay.
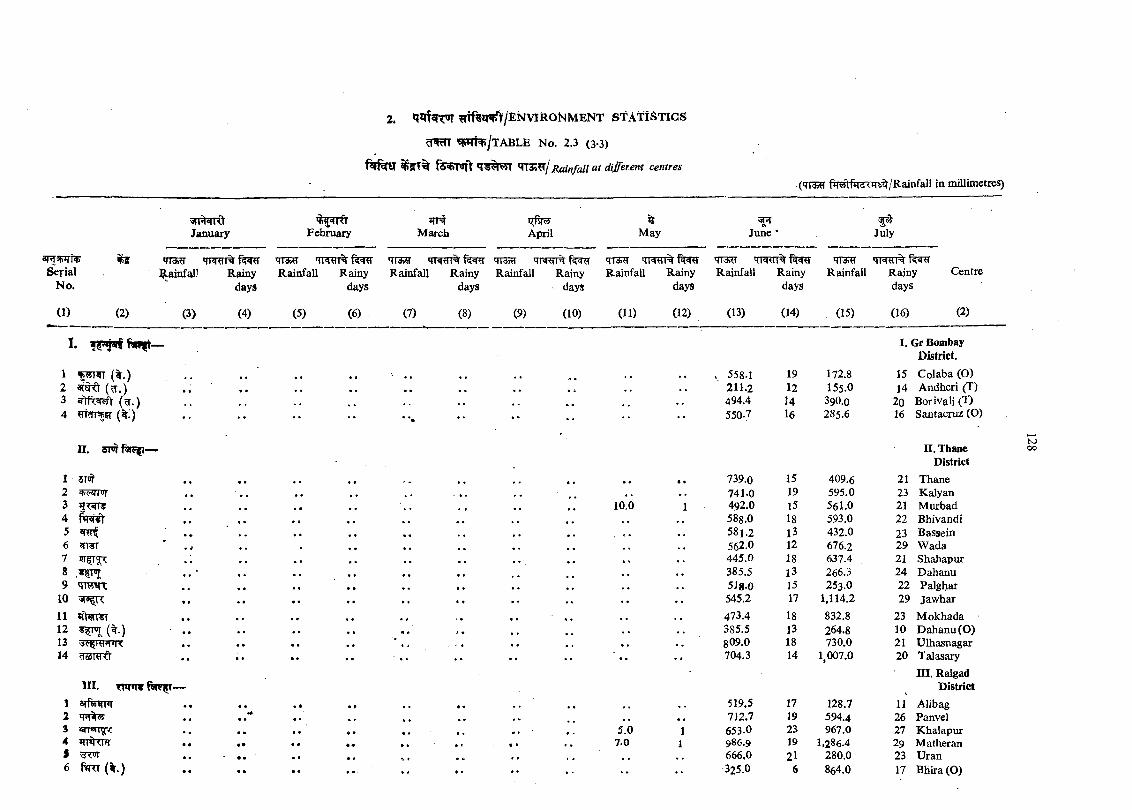
2* m f^ q ^ /E iS IV lR O N M E N T S T A T IS T IC S
cPRn W m jT A B L E N o. 2.3 (3-3)
^ T % fsvpoift *TT3;?r/ Rainfall at different centresin millimetres)
Januaiy February M arch April May June July
3nr FRTS>l^ r ia l
N o.
(1) (2)
m ^T 'T R H T % f^ *TTOT 'T F R n % f^ 'TT^ qTW% q iw % 'TTS r q rw m % f^ T r a ¥ i% f ^l^ainfal! Rainy Rainfall Rainy Rainfall Rainy Rainfall Rainy Rainfall Rainy
days days days days days
Sl'iiti ’TTWr%
(3) (4) (5) (6) (7) (8) (9) (10) (11) (12)
Rainfall Rainy Rainfall Rainy Centredays days
(13) (14) . (15) (16) (2)
I . Gr BombayDistrict.
. 558-1 19 172.8 15 C o la b a (0 )211.2 12 155.0 j 4 Andheri (T)494.4 u 390.0 2o Borivali ( 'b550.7 16 285.6 16 Santacruz (O)
I.
1 (%,)2 ( ^ . )3 ( ^ .)4 (%i)
II.
1 • « » • 739.0 15 409.6
n . Thane District
21 Thane2 ^i^znw . . • • . • . 741.0 19 595.0 23 Kalyan3 • • , ^ 10.0 492.0 15 561.0 21 M urbad4 » « , * 588.0 18 593.0 22 Bhivandi5 ^ , , • • , , , , 581.2 13 432.0 23 Bassein6 , 562.0 12 676.2 29 W ada7 • . • • . , , . 445.0 18 637.4 21 Shahapur8 • • • • .. 385.5 13 266.3 24 D ahanu9 ^ \m j . • • , , 5J8-0 15 253.0 22 Palghar
10 • • • • 545.2 17 1,114.2 29 jaw har
11 • w 473.4 18 832.8 23 M okhada12 • . . • • . . 385.5 13 264.8 10 D ahanu (O)13 • . • • • • • « • • • 809.0 18 730.0 21 Ulhasnagar14 ^661 <1 • • • • • • 704.3 14 1,007.0 20 Talasary
m . Tmnv —1 8Tf5innj| * • • « 519.5 17 128.7
in , Ralgad District
11 Alibag2 -#• • • 4 - . . , , 732.7 19 594.4 26 PanvelS i9TR5Tgf< • • < , * « • * . 5-0 1 653.0 23 967.0 27 K halapur4 Tn^rnr • • • • « • * * t • * , , 7.0 1 986.9 19 1,286.4 29 MatheranJ 'd<«r • • • • < s. # • c 666.0 21 280.0 23 U ran6 5 m (^ .) • • •« fl 325.0 6 864.0 17 B hira(O )
K)oo
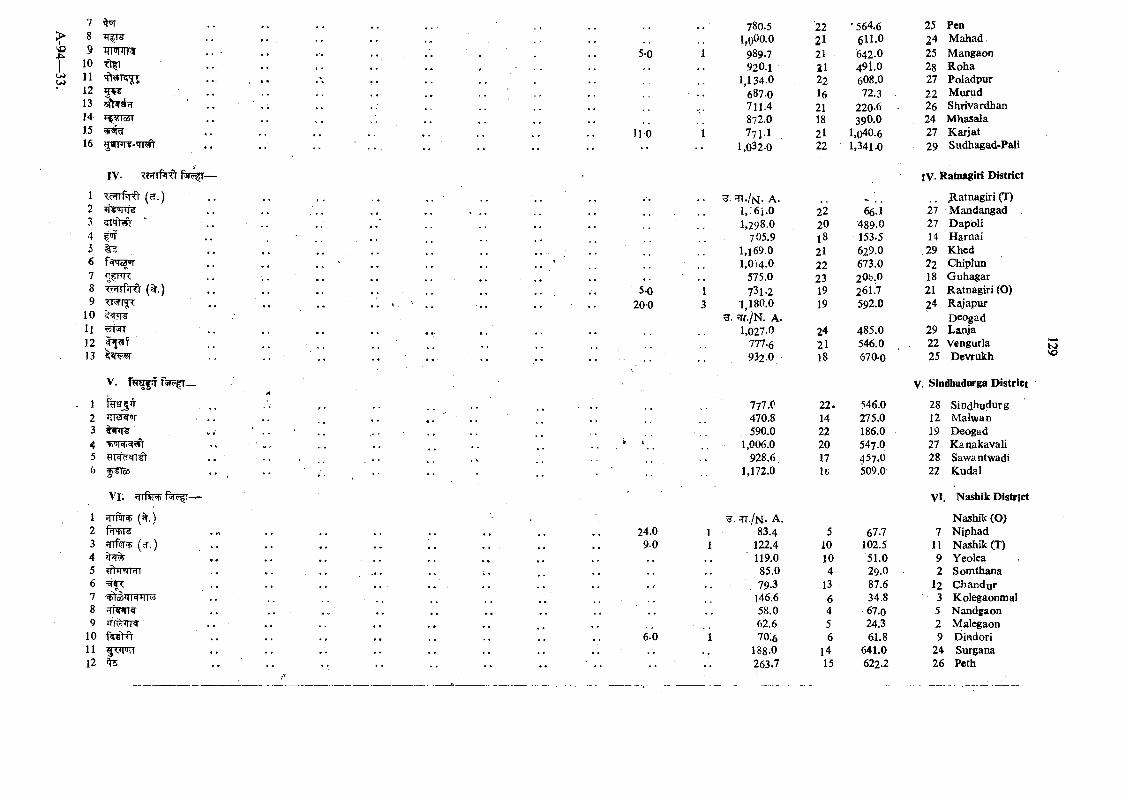
soJ5>.
UJ
789
1011i213141516
IV. Trfrrfird f ^ -
1 W pJ'O (cT.)2 JT C T R f?
3 crnrtwr -456 f^TTcJOT
78 (%.)9 TTsrr^
10U1213
V. f f r ^
i23456
Vl. Hfftlch —
1 JiTHfrsp (%.)2 f n>T53 HlP lsp (^ . )45 fhPTnTi67 'C o s 'll |e m i'•5
89 JTr rjTT«r
10 f« K t11 siTnill12
5 0
110
5k)200
24.09.0
6.0
780.5 '22 ' 564.6 25 Penl.oOO.O 21 6U .0 24 M ahad
989.7 21 642.0 25 Mangaon920.1 21 491.0 28 R oha
1,134.0 22 608.0 27 Poladpur687-0 16 72.3 . 22 M urud711.4 21 220.6 26 Shrivardban872.0 18 39O.O 24 M hasala771-1 . 21 1,040.6 27 K arjat
1,032.0 22 1,341.0 29 Sudhagad-Pali
m./M. A.
IV- Ratnagiri District
. . JR.atnagiri (T)i , ;6i .o 22 66.1 27 M andangad1,298.0 20 489-0 27 D apoli
705.9 18 153.5 14 H arnai1,169.0 21 629.0 29 K hed1,0)4.0 22 673.0 22 Chiplun
575.0 23 2O5.O 18 Guhagar731.2 19 261.7 21 Ratnagiri (O)
1,180.0 19 592.0 24 Rajapur^Tf./N. A. 1.027.0 24 485.0
Deogad 29 Lanja
777.6 21 546,0 22 Vengurla932.0 18 670-0 25 Devrukh
777.C 22. 546.0
V. Sindbudorga D istrict
28 Sindhudurg470.8 14 275.0 12 Malwan590.0 22 186.0 19 Deogad
1,006.0 20 547.0 27 K anakavali928.6 17 457.0 28 Savva ntwadi
1,172.0 li. 509.0 22 Kudal
;rr./N. A. 83.4 5 67.7
Vl. Nashik District
Nashik (O)7 Niphad
122.4 10 102.5 11 Nashik (T)119.0 10 51.0 9 Yeolea85.0 4 29.0 2 Somthana79.3 13 87,6 I2 C handur
146.6 6 34.8 3 Kolegaonmal58.0 4 67,0 5 N andjaon62.6 5 24.3 2 Malegaon10.6 6 61.8 9 Dindori
188.0 14 641.0 24 Surgana263.7 15 622.2 26 Pcth
tsJVO
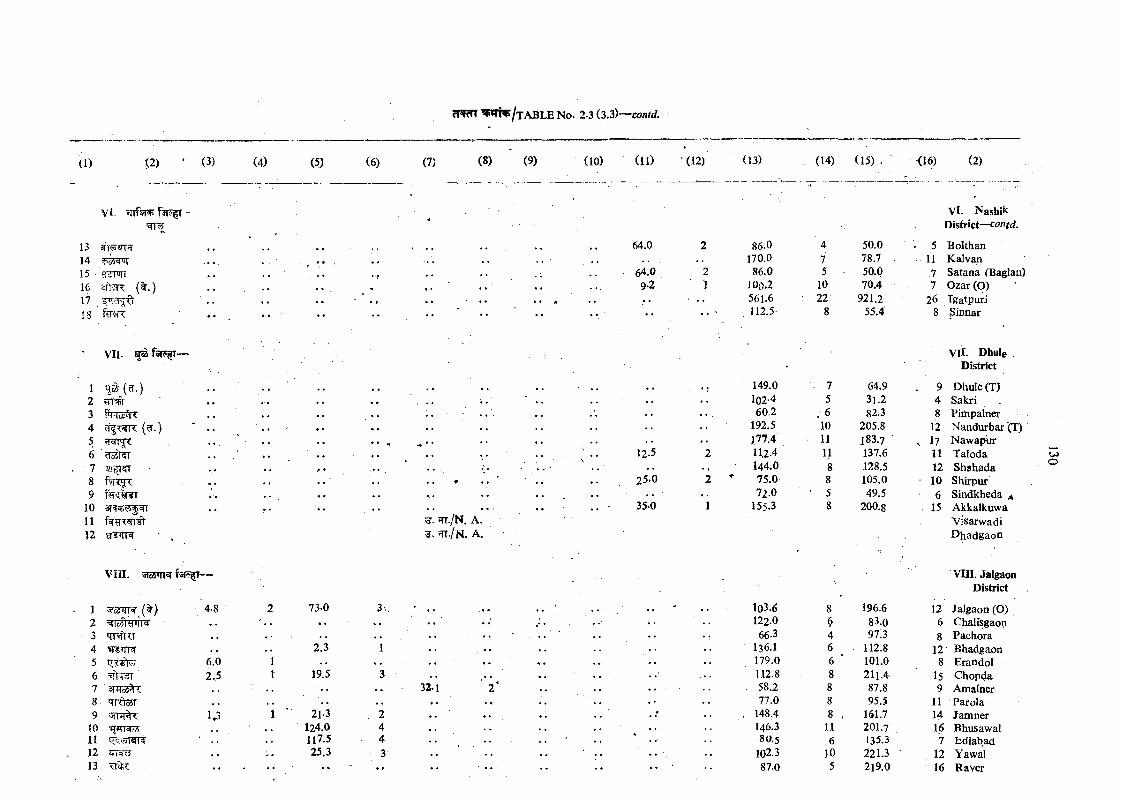
(1) (2) (3) (4) (5) (6) (7) (8) (9) (10) (11) (12) (13) (14) (15) . (16) (2)
Vl. fnf5!T
13 'T«i!!T r.1415 f rm i16 sftiaT (%.)17 fiTcr^-^IS f?r?fT
Vl. NashikDistrict—cowffi.
*■ VII.
12 ?n^r3456
- 7 2?ifRrr89
101112 • ,
^ ./N . A.^ • / n . a .
64.0 2 86.0 4 50.0 5 Bolthan170.0 7 78.7 . 11 Kalvan
64.0 2 86.0 5 • 50.0 7 Satana (Baglan)9-2 1 100.2 10 70.4 7 O zar(O )
• . . 561.6 : 22 921.2 26 Tgatpuri, 112.5 , 8 ' 55.4' 8 3innar
V ll. Dhule District
• . , . 149.0 . 7 64.9 . 9 Dhule (T)102-4 5 3].2 4 Sakri60.2 . 6 82.3 8 Pimpalner
192.5 10 205.8 12 Nandurbar (T). . 177.4 11 183.7 I7 N awapur
12.5 2 U2.4 11 137.6 11 Taloda. , 144.0 8 128.5 12 Shahada
25.0 .2 ^ 75.0 8 105.0 ■ 10 Shirpur. . - 72.0 " 5 49.5 6 Sindkheda j*
35.0 1 155.3 8 200.8 . 15 Akkalkuwa
u>o
VisarwadiDhadgaon
V III. sranrsi f3Tr^-
(%)
'mfr^T
678 qrr^T9 JifrsT
to11 f3??3wr?12 WP^13 m ? :
4-8
6.02.5
1,3
73-0
2.3
19.5
21.3 124.0 117.525.3
vm. Jalgaon District
. . ' . . 103.6 8 196.6 12 Jalgaon (O)122.0 6 83.0 6 Chalfegaoi.1
. . 66.3 4 97.3 8 Pachora. . •136.1 6 112.8 12 Bhadgaon. . 179.0 6 ' 101.0 8 Erandol
. . 112.8 8 2 I 1.4 I5 Chopda' 2* . . 58.2 8 87.8 9 Amalner
. . . f 77.0 8 95.5 11 Parola. 148.4 8 . 161.7 14 Jam ner
146.3 11 201.7 16 Bhusawal. . . . . . 80.5 6 135.3 7 EdJabad
. . 102.3 10 221.3 ' , 12 Yawal. . 87.0 5 219.0 16 Raver
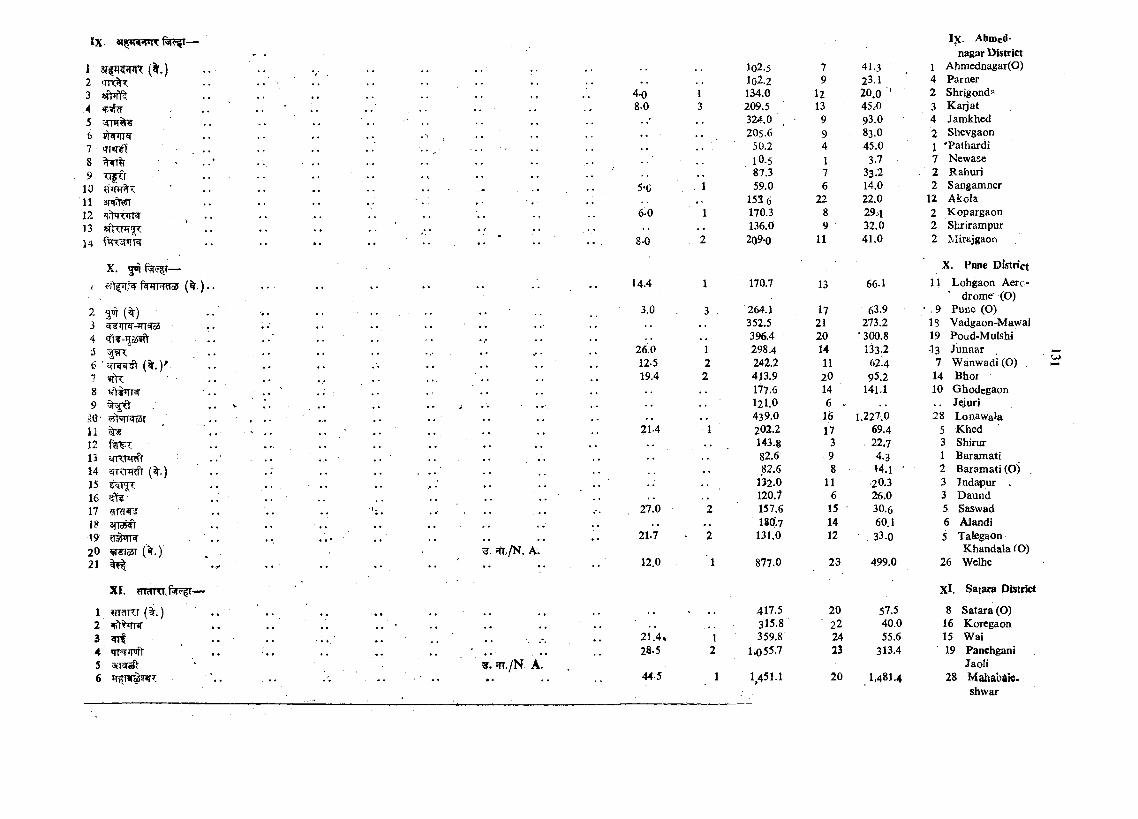
Ix- — IX- Ahmed- nagar District
1 3 f p l ^2 'TTXfT345 3iT*r%6 v rw ^7 - 'TTO 'f89 <tg<r
10111213 sftTW ^14
X. giiifsf^r—
i ( ^ .) .
2 (%)3 ^>TT^-?rT^45 . .6 ■ (%. )^7 ^8 9
SO' 5y!«iMar i l12 f ? r ^13 5nxnr?ft14 {%.)151617 ^T?r^18 anapfr19 ?ra?tiTar20 (^ .)21 l f |
XI. HTHTTI.f T —
1 «T^ni (%.)2 'fflfV’TR-3 ?rrt4 qT iPTt5 5 fT ^6 TT5?TW®?5T
i^T,/N. A.
?. ./N. A.
102.5 7 41.3 1 Ahmednagar(O)1o2.2 9 23.1 4 Parner
4-0 1 134.0 12 20.0 ' 2 Shrigonda8.0 3 209.5 13 45.X) 3 K aijat
, , 324.0 ^ 9 93.0 4 Jam khed. , 205.6 9 83.0 2 Shevgaon
,, • • 50.2 4 45.0 1 'Pathard i10.5 1 3.7 7 Newase87.3 7 33.2 2 Rahuri
5‘C , 1 59.0 6 14.0 2 Sangamner• - 152 6 22 22.0 12 Akola
6^0 1 170.3 8 29.vi 2 K opargaon. , 136.0 9 32.0 2 Slirirampur
8-0 2 209-0 11 41.0 2 Mirajgaon
X. Pune District
14.4 1 170.7 13 66.1 11 Lohgaon Aerodrome (O)
3.0 . 3 . 264.1 17 63.9 • , 9 Pune (O), . 352.5 21 273.2 18 Vadgaon-M awal, , 396.4 20 '300.8 19 Poud-Mulshi
26.0 1 298.4 14 133.2 -I3 Junnar12.5 2 242.2 11 624 7 Wanwadi (0 ) ,19.4 2 413.9 2O 95.2 14 Bhor
177.6 14 141.1 10 Ghodegaon121.0 6 . . . Jejuri439.0 16 1.227.0 28 Lonawala
214 1 202.2 17 69.4 5 Khed '143.8 3 22.7 3 Shirur82.6 9 4.3 1 Baramati82.6 8 14.1 ' 2 Baramati (O)
1*32.0 11 2O.3 3 Indapur .120.7 6 26.0 3 D aund
27.0 2 157.6 15 30.6 5 Saswad, , * * 18tf.7 14 60.1 6 Alandi
21.7 2 131.0 12 33.0 5 TalegaonKhandala (O)
12.0 1 877.0 23 499.0 26 Welhe
Xl. Satara District
, , 417.5 20 57.5 8 Satara (O)315.8 ' 22 40.0 16 Korcgaoa
21.4, I 359.8 24 55.6 15 Wai28.5 2 1,055.7 23 313.4 19 Panchgani
Jaoli44-5 1 1,451.1 20 1,481.4 23 Mahabdie.
U)
shwar
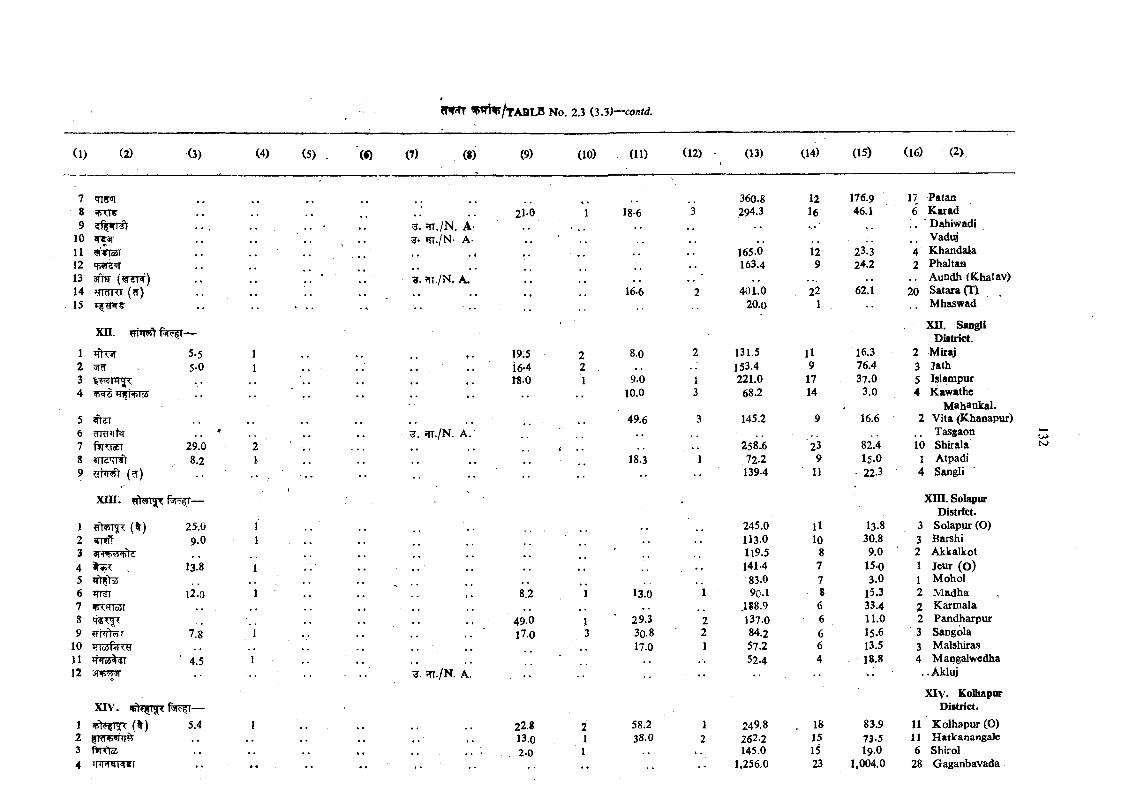
(1) (2) (3) (4) (5) (O (7) (8) (9) (10) (11) (12) (13) (14) (15) (16) (2>,
789 grffWT^
1011 wwmi12 •ti-wa'JT13 affsr14 »rr(TRr (?r)15 ••
X n.
1 5.52 5-034 , ^ 5 WSnfHoS
56 cmpiR7 ftraasT 29.08 8.29 {^)
X III. —
1 {^) 25.02 if l# 9.034 13.85 *Tl^oi6 »rr3T 12.07 VXiTTOT89 7.8
10 iTToZrfsmT11 WTo5 5T ‘ 4.512
XIV. —1 V W IT (^ ) 5.423 ftlKToi4
^./N. A- m./N- A-
A.
21-0 18-6
19.516-4n o
frr./N. A.'
8.2
49.017.0
5n./N- A.
22.813.02.0
16-6
8.0
9.010.0
49.6
18.3
13.0
29.330.817.0
58.238.0
360.8 12 176.9 17 Patan294.3 16 46.1 6 K arad
• , , ' . Dahiwadi. . Vaduj
165.0 12 23.3 4 K handala163.4 9 24.2 2 Phaltan
, , • .. . . Aundh (K hatav)401.0 . 22 62.1 20 Satara(T )
i20.o 1 .. Mhaswad
131.5 11 16.3
x n . Sangli District.
2 Miraj153.4 9 76.4 3 Jath221.0 17 37.0 5 Islampur
68.2 14 3.0 4 kaw athe
145.2 9 i6.6M ahankal.
2 Vita (Khanapur). . Tasgaon
25^6 23 82.4 10 Shirala72.2 9 15.0 1 Atpadi1394 11 - 22.3 4 Sangli
245.0 11 13.8
X in . Solapur District.
3 Solapur (O)113.0 10 30.8 3 Earshi119.5 8 9.0 2 Akkalkot1414 7 15.0 1 Jeur (O )
83.0 7 3.0 1 M ohol90.1 8 15.3 2 M adha
.1S8.9 6 33.4 2 K arm ala137.0 6 11.0 2 Pandharpur84.2 6 15.6 3 Sangola57.2 6 13.5 3 Malshiras52.4 4 18.8 4 Mangalwedha
,. . . Akluj
249.8 . 1» 83.9
XIv* Kolhapur District.
11 K olhapur (O)262.2 15 73.5 11 Hatkanangale145.0 15 19.0 6 Shirol
1,256.0 23 1,004.0 28 Gaganbavada
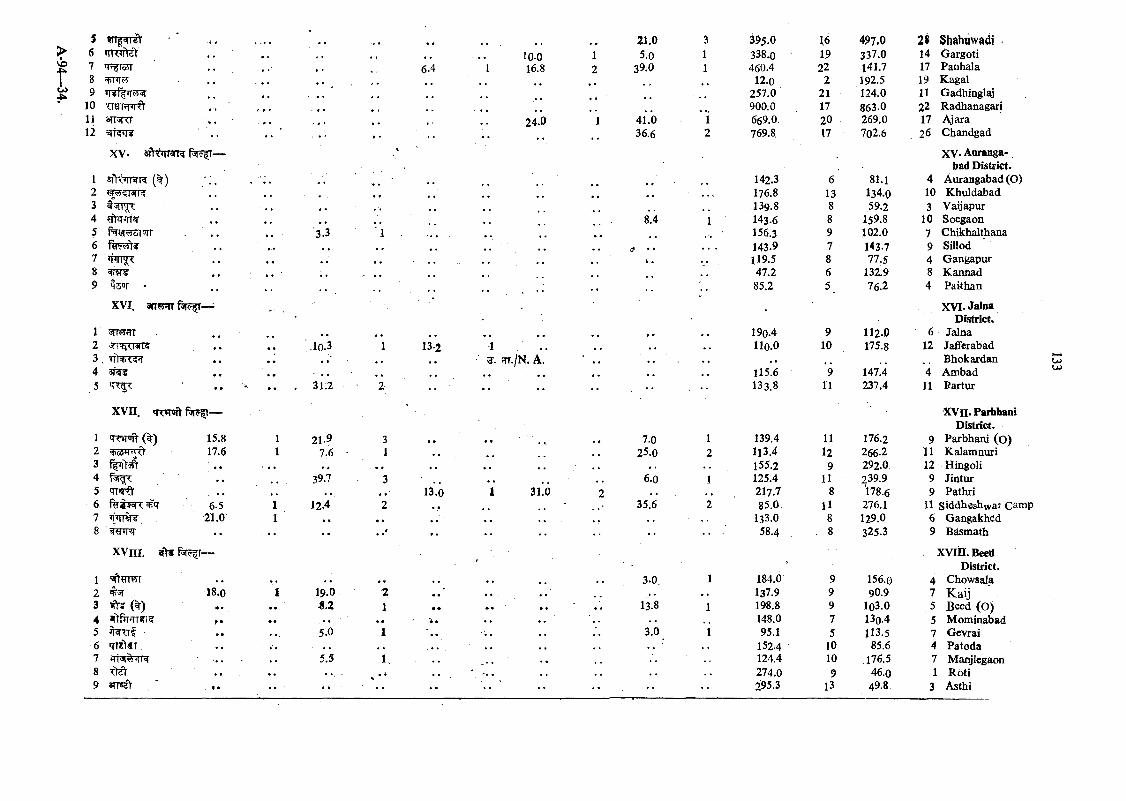
'FflcST
10 ^ s r m ^11 STpjRT12 =q[T? r?
XV. arttriTaR? f^r?^-
lo o 1 16.8
24.0
1 srttTTRR (%)2
tV rfc?T>riTR
89 q-$<3r -
■3.3
XVI^ 3TT RT filc’ t—
1 rMfTT2 5rrqirraT3 3 . t r W ^45 :
10.3
31.2
13.2^ ./N .A
21.0 3 ^95.0 1,6 497.0 2 i Shahuwadi .1 5.0 1 338.0 19 337.0 14 Gargoti2 39.0 1 460.4 22 141.7 17 Panhala
12.0 2 192.5 19 Kagal.. 257.0 21 124.0 11 Gadhinglaj
*v 900.0 17 863.0 22 Radhanagari1 41.0 *1 669.0 20 269.0 17 Ajara
36.6 2 769.8. 17 702.6 26 Chandgad
XV* Aurangabad District.
142.3 6 81.1 4 Aurangabad (0 )176.8 13 134.0 10 Khuldabad139.8 8 59.2 3 Vaijapur
8.4 1 143.6 8 159.8 10 Soegaon156.3 9 102.0 7 Chikhalthana
rf • • • . , 143.9 7 143.7 9 Sillod119.5 8 77.S 4 Gangapur47.285.2
132.976.2
8 K annad 4 Pakhan
XVI-JalnaDistrict.
190.4 9 112.0 6 Jalnaiio .o 10 175.8 12 JafiTerabad
. , Bhokardan115.6 9 147!4 4 Ambad133.8 11 237.4 11 Partur
U)U)
XVII. q rw ftftiT fi— XVn*ParbbanjDistrict.
1 TW’ift (%) 15.8 1 21.9 3 , , 7.0 1 139.4 11 176.2 9 Parbhani ( 0 )2 17.6 1 7.6 1 25.0 2 ll3 .4 12 266.2 11 Kalamnuri3 . . • ■A . . , . 155.2 9 292.0 12 Hingoli4 39.7 3 ‘ • • 6.0 1 125.4 11 239.9 9 Jintur5 qr<q^ . . . , 13.0 1 3 i !6 2 217.7 8 178.6 9 Pathri6 6.5 1 12.4 2 , , 35.6 2 85.0 U 276.1 11 siddheshw ar Camp7 21.0 1 . . , * 133.0 8 129.0 6 Gangakhed8 •• • • • • •• 58.4 . 8 325.3 9 Bdsmath
x v m .
1 wr . .
'3-0, 1 184.0 9 156.0
X V fflB eetf District.
4 Chowsala2 , 18.0 1 19.0 2 • • 137.9 9 9O.9 7 K a ij3 f r s (%) • 9 • • 8.2 1 • • • • 13.8 1 198.8 9 103.0 5 Beed (O)
f * • • . . . ■ ' • • • • 148.0 7 130.4 5 M omjnabad5 • • 5.0 1 • • 3.0 i 95.1 5 113.5 7 Gcvrai6 Tr«\«T • • ; . , . . ■ 152.4 10 85.6 4 Patoda7 5.5 1; 124.4 10 .176.5 7 Manjiegaon8 x \if .., . • • , , ' , 274.0 9 46.0 1 R oti9 sTpseV •• . . - - •• •• •• 2:95.3 13 49.8 3 Asthi
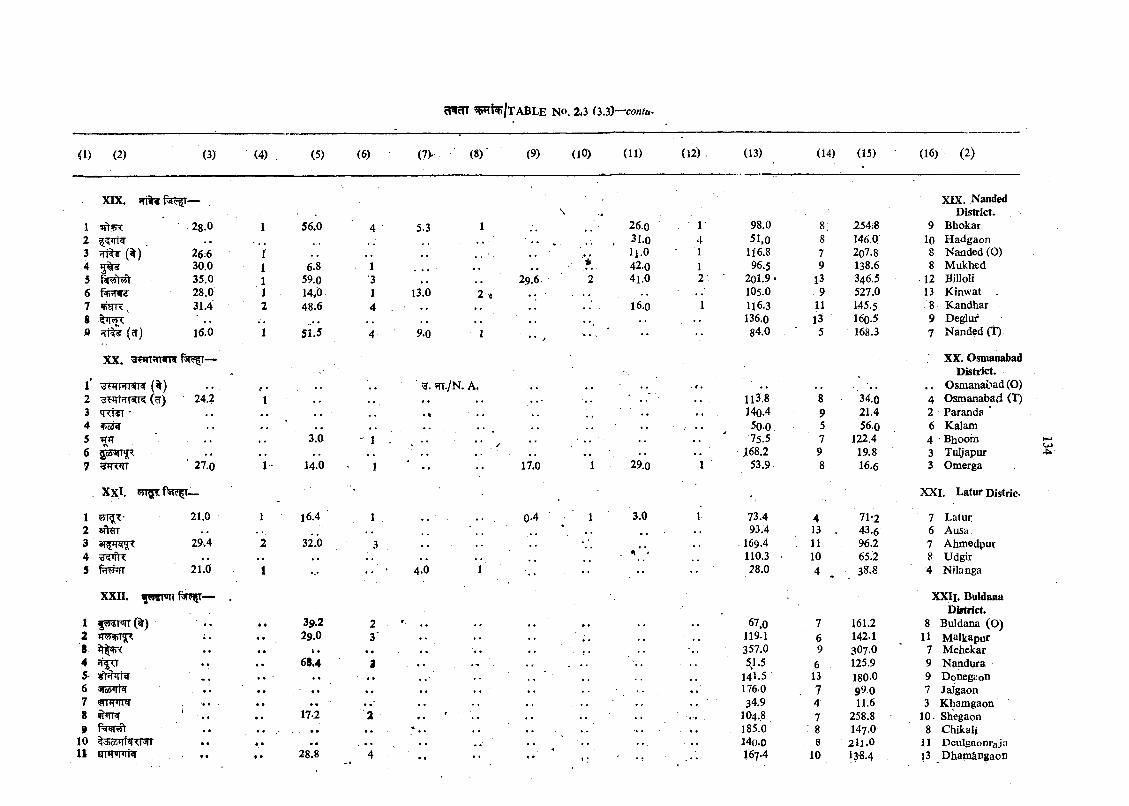
<1) (2) (3)
XIX, ,
28.0
{%)
f% T*rs,
?rit¥ ( ct)
26:630.035.028.0 31.4
15.0
1 w p n w m {%)2 (^ )3 <rO¥T '4 5Fo3¥
6 ToSimn:7 ^ HTTT
24.2
27.0
XXl. WTft
1 21.0
29.4
21.0
XXII. ^>r?i[r-
(4) . (5) (6)
56.0
6.859.014.0 48.6
51.5
14
l6.4
32.0
5.3
1329.6 .
2-,-
9.0
fn./N. A.
17.0
0.4
4.0
(lO) (11) (12) (13) (14) (15) ■ (16) (2)
-26.0 1 98.0 8; 254;8
XIX. Nanded District.
9 Bhokar31.0 4 51.0 8 146.0 lO H adgaon
• # ll.O 1 116.8 7 2o7.8 8 Nanded (O)42.0 1 96.5 9 138.6 8 Mukhed
2 4l.O 2 201.9 • 13 346.5 -12 Billoli•. 105.0 9 527.0 13 Kinwat• • 16.0 1 1.16.3 11 145.5 8 K andhar
136.0 13 160.5 9 Degluf•• 84.0 5 168.3 7 Nanded (T)
t .
XX, Osmanabad D istiict,
. . O sm anabad (O)■ . . ■ . . 113'8 8 34.0 4 Osmanabad (T)
. , . . 140.4 9 21.4 2 Paranda *50-0 5 56.0 6 Kalam
75.5 7 122.4 4 Bhootn. . 168.2 9 19.8 3 Tuljapur
1 29.0 1 53.9. 8 16.6 3 Omerga
1 3.0 1 73.4 4 71-2
XXL Latur Distrlc.
7 Latur. . 93.4 13 - 43.6 6 Ausa,. 169.4 . 11 96.2 7 Ahmedpur
. ' 110.3 ■ 10 65.2 8 Udgir•• •• 28.0 4 3S.8 4 Nilanga
-Cs.
XXIi. Buldana
1 555 1 «IT (%) . . • • 39,2 2 * . . .. 67,0 7 161.2 8 Buldana ( 0 )2 . . 29.0 3 • • . • . . .. ' .. 119.1 6 142.1 11 M alkapur8 . . . . i . . . . . . . . 357.0 9 3O7.O 7 M ehekar4 fffrr . . 68,4 . . . . . , . . . ' . . .. 5 1.5 6 125.9 9 N anduraS ' « • . . .. 141.5 13 180.0 9 Donegaon6 . . . . - . . . . . . . . .. • .. 176.0 , 7 99-0 7 Jaigaon7 t . . • « . . .. . . . . • . . . . ■ 34.9 4 11.6 3 Khamgaon8 1 -
. . 17-2 2 ' .. .. 104.8 7 258.8 10 • Shegaon9 . . • ♦ • • ., . . . . . . . 185.0 : 8 147.0 8 Chikalj
10 . . • • • • . . . . , . . . . . . . . 140-0 - 8 2 IJ .0 11 Deulgaonraja11 ■ '• »• 28.8 4 •• * . . . 167-4 10 13-8.4 13 Dhamangaon
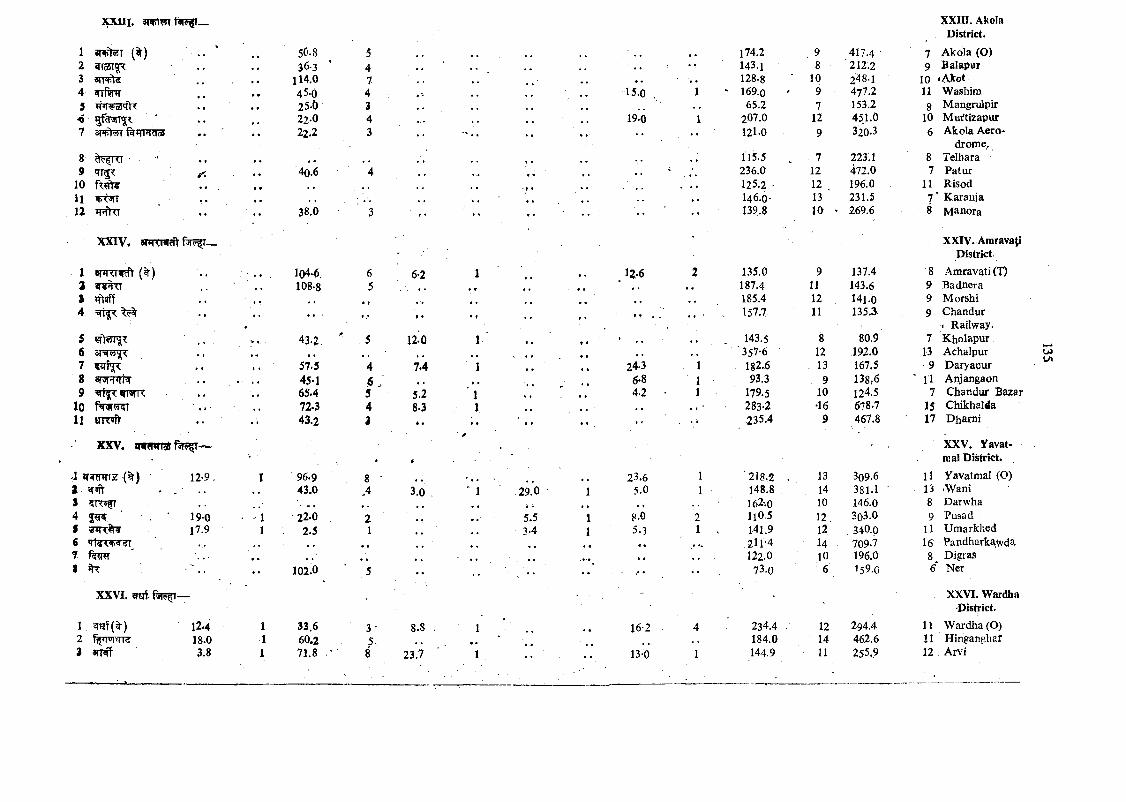
joL u i.
1 (^ ) ' 50.8 5 174.2 9 417.4
X X m . Akola District.
7 Akola (O)2 ^lcil^< 36-3 ' 4 • • 143.1 8 ■ 212.2 9 Balapur3 114.0 7 , , , , , 128.8 10 248-1 10 'Akot4 arrftnr • • 45-6 4 • « 15.0 . 1 ‘ 169.0 ^ 9 477.2 11 Washim5 * , • • 25.0 3 , , 65.2 7 153.2 8 M angrulpir•6 , , 22-0 4 , 19^0 1 207.0 12 451.0 10 M urtizapur
• • 22.2 3 , . 121-0 9 320.3 6 Akola Aero
8 • 115.5 7 223.1drome.
8 Tclbara9 • • 40.6 4 •. • .. ' 236.0 12 472.0 7 Patur
10 fw tff , • t • . . . 125.2 12 . 196.0 , 11 Risodl l , , , , . . 146.0 13 231.5 7 ’ Karaiija12 •• 38.0 3 '• *• ’ • . . 139.8 10 • 269.6 8 Manora
XXIV. anrrwcft
J BFRJlft (%) 1Q4.6: 6 6-2 1 12,6 Z 135.0 9 137.4
XXIV. Amravati District
8 Amravati(T)2 108.8 5 • r • ♦ • , . 187.4 11 143.6 9 BadneraS Htwf , , ... ■ • • . , 185.4 12 141.0 9 M orshi4 WT|X , , * * ■ f • • f ft . . . 157.7 11 135.3 9 Chandur
$•
43.2 . ' 5 12^0 1 f • * 143.5 8 80,9. Railway.
7 K holapur6 f -♦ , , , , • • , . ■357-6 12 192.0 13 Achalpur7 » ■ » « 51.5 4 7.4 1 24.3 1 182.6 13 167.5 9 Daryapur8 3n5PnrPT * . • • • 45-1 . 6 ; , , t * 6.8 1 93.3 9 138,6 l l Aiyangaon9 ^ftgr wiwrx , , , , 65.4 5 5.2 ' 1 , , 4 2 • 1 179.5 10 124.5 7 CJiatidur Bazar
lo 72.3 4 8.3 1 , , , . • 283-2 *16 678.7 15 ChikhaMaIJ f fR # 43.2 3 « « ; . ' , , , . . 235.4 9 467.8 17 Dharni
iKXV.
XXVI. Eraf-f3r?^—
1, sraf(%) 2
12.418.03.8
33.660.271.8
8.8
OJu>
XXV. Yavat- m a! District.
.1 (^ ) 12-9. I 96.9 8 • .. • • • ^ 23.6 1 ■ 218,2 . 13 309.6 l l Yavatmal (O)a > , , 43.0 ,4 3.0 1 29.0 1 5.0 1 ■ 148.8 . 14 381.1 . 15 -WaniS ?R3fT ■ ; * • • . , 162-.0 10 146.0 8 Darwha4 ' 190 ■ I 22.0 2 5.5 1 g.O 2 ll0 ,5 12, 303.O 9 Pusadf 17.9 1 2.5 1 ■ 3-4 1 5.3 1 . 141.9 12 , 340.0 l l Umarkhed€ T f s x v ^ • • * , • • 4 « 1* *• ,211-4 U 709.7 16 Pandharkawda7 f k m , . . • * • . 122.0 10 196.0 8 Digras8 flT 102^0 5 , , .. 73.0 6 159.0 6‘ Ner
XXVI.W ardha•District.
16-2 4 234.4 12 294.4 11 W ardha (Q)184.0 14 462.6 11 Hinganghaf
13^0 1 144.9 11 255.9 12 , Arvi
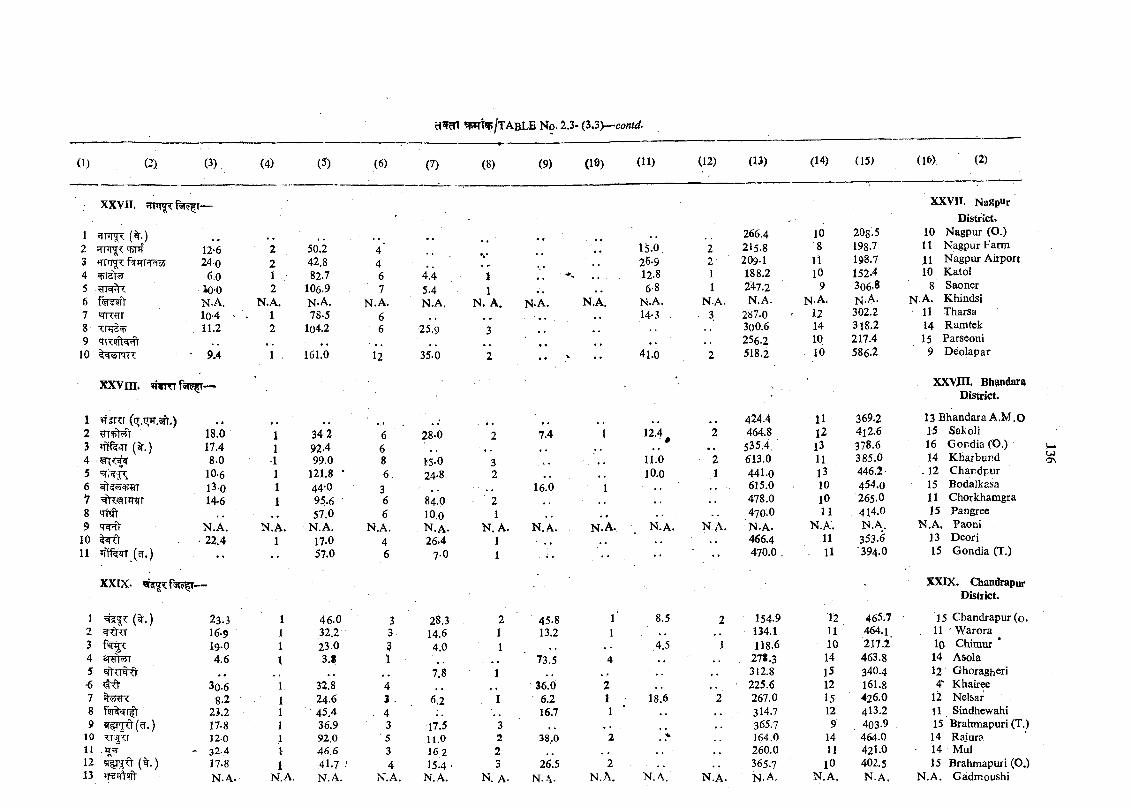
(1) (2) (3)
x x v i i .
(%.)' TR'
«TPT f^trnRcS
■iETm
«rn:?Tr8 x:nTs^9 qR RTt^
10 9.4
xxvm.
1 , .2 18.03 17.44 8.05 10.66 l3-o1 14-68 , .9 N .A .
10 22.411 (cT.)
XXIX- —
(4)
12-6 224-0 2
6.0 1lo-o 2N .a . N.A.10-4 - 111.2 2
111
N .A .1
(5)
50.2 42.8 82.7
106.9n .a .78.5
104.2
161.0
(6) (7)
4467
N .A .66
12
4.45.4 N .A.
25.9
35.0
(8)
11
N . A.
3
2
34 2 6 28-0 292.4 6 , , , .99.0 8 15-0 3
121.8 ' 6 24-8 244-0 395.6 6 84.0 257.0 6 10.0 1
N .A . N.A. . N .a . N .y17.0 4 26.4 157.0 6 7-0 1
(9) (10) (11)
N .A.
7.4
16.0
N .A .
(12) (13) (14) (15> (16) (2)
N .A .
1 23.3 1 46.0 3 28.3 2 45.8 12 16-9 1 ,32.2 3. 14.6 1 13.2 13 19-0 1 23.0 3 4.0 14 areWr 4.6 1 3.8 1 • • 73.5 45 , , 7.8 1 , ^•6 # d 3q.6 1 32.8 4 36.0 27 8.2 1 24.6 3 ^.2 I 6.2 18 ' 23.2 1 45.4 , 4 * , 16.7 19 17-8 1 36.9 3 17.5 3
10 12-0 1 92,0 5 11.0 2 38,0 211 . JT^ - 32.4 } 46.6 3 162 212 17.8 1 41.7 4 15.4 • 3 26.5 213 N.A. N.A. N .A. ' N.A. N .A. N. A. N.A. N .A .
XXVII. Nagpur District.
266.4 10 208.5 10 Nagpur (O.)15.0. 2 215.8 8 198.7 11 Nagpur Farm26-9 2 209-1 11 198.7 11 Nagpur Airport
. . . . 12.8 1 188.2 10 152.4 10 K atol6-8 1 247.2 9 306,8 8 Saoner
N.A. N.A. N.A. N.A. N .a . N .a . N .a . Khindsi14-3 . 3 287.0 ' 12 302.2 11 Tharsa
300.6 14 318.2 14 Ramtek256.2 10 217.4 15 Parseoni
V • • 41.0 2 518.2 10 586.2 9 D eolapar
X XVjn. Bhmidara District.
12.4^
11.010.0
n .a . N.A.
8.5
,4.5
18.6
N .A . N .a .
424.4 11 369.2 13 B handara A .M .O464.8 12 4i2.6 15 Sakoli
535.4 . ' 13 378.6 16 G ondia ('0.)613,0 11 385.0 14 K harbur.d441.0 l3 446.2 .12 C handpur615.0 10 454.0 ' 15 Bodalkasa478.0 10 265.0 11 Chorkhamgra470.0 11 414.0 15 PangreeN .A . N.A'. N .A . N .A . Paoni466.4 11 353.6 13 Deori470.0 . . 11 394.0 15 G ondia (T.)
XXIX. ChandrapurDistrict.
154.9 12 465.7 15 Chandrapur (0 .134.1 11 464.1 11 ' W arora118.6 10 217.2 lO Chimur *
278.3 14 463.8 14 Asola312.8 15 340.4 l2 Ghoragheri225.6 12 161.8 4' Khairee267.0 15 426.0 12 Nelsar314.7 12 4 I3.2 U Sindhewahi365.7 9 403.9 15 Brahmapuri (T.)164.0 14 464.0 14 Rajura260.0 11 421.0 - 14 Mul365.7 lO 402.5 15 Brahniapuri (0 .)N .a . N .A . N .a . N .A . Gadmoushi
Os
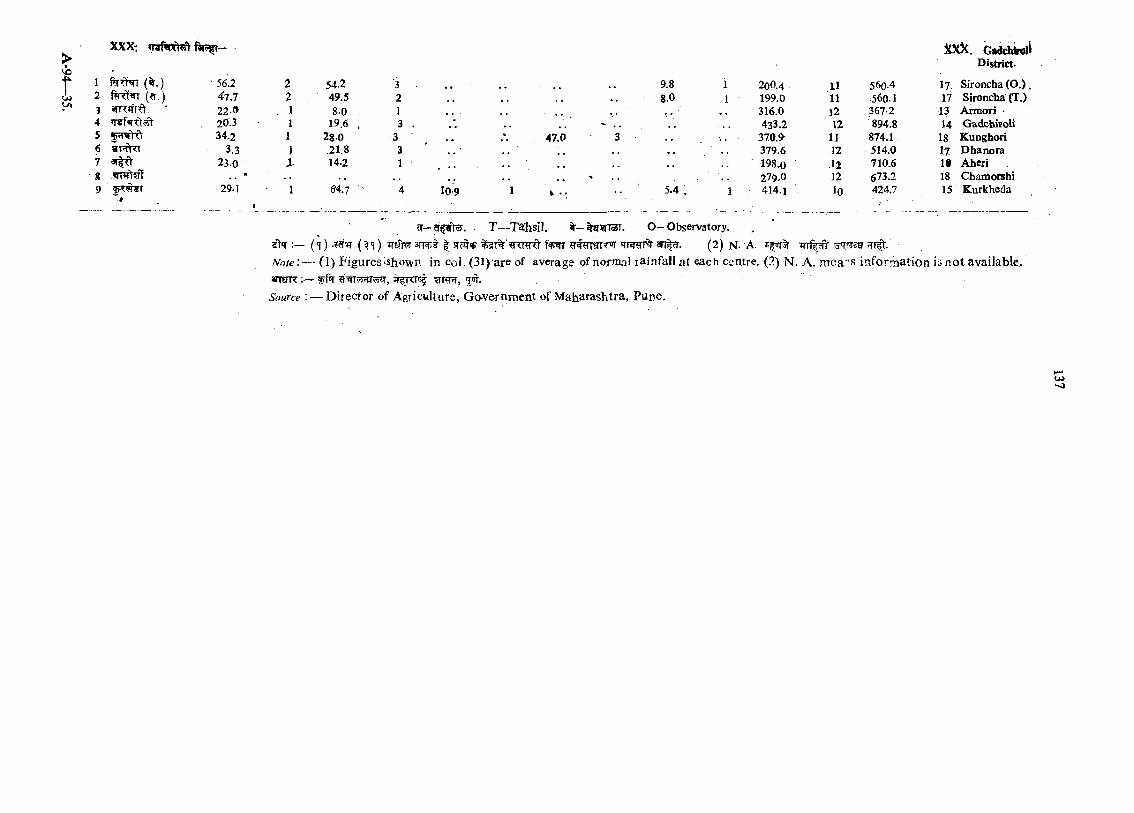
>vJd
IVA
(Jr.) ^r#«rr (?r.)STRjf)- *
srnt!a
>«r^5ff■5FT#*f
56.2 47.7 22-020.3 34.2
3.323.0
29.1
2 54.2 ■32 49.5 21 8.0 1I 19.6 . 3
1 28 0 3I 21.8 3
J 14.2 1
1 6-4.7 ■ 4
9.88.0
47.0
10-9 1 5.4 . 1
5tX ^. tkiddiirol^ District.
20O.4 11 560.4 17 Sironcha (O.)199.0 11 .560.1 17 Sironcha (T.)316.0 12 367-2 13 Armori ■433.2 12 894.8 14 G adchitoli
370.9 11 874.1 18 Kunghori379.6 12 514.0 17 D hanora198.0 12 710.6 16 Aheri279.0 12 673.2 18 Chamorshi414.1 10 424.7 15 Kurkheda
^T -crp t^ . T —^Tahsil. ^ - ^ u n s r . O -O bservatory . , *
s h :— («}) -JRT r (^ / i ) irah?' s r t^ t | ^ST^’^TTRrd f%wr rw^rarrroT «rrawi% 3rr|cr. (2 ) N- A. -mfgdlr .^ 3 ^ ^ ?nfr.N o te : — (,1) Figures’Shown in col. (3l)-are of average of no rm al rainfall a t each centre. (2) N. A. mca "'s information is not available. aneTR:— ^ ir^ rn ^ 5^ .Source :■— Director of Agriculture, Go.veriiment of Maharashtra, Pune,
U><1
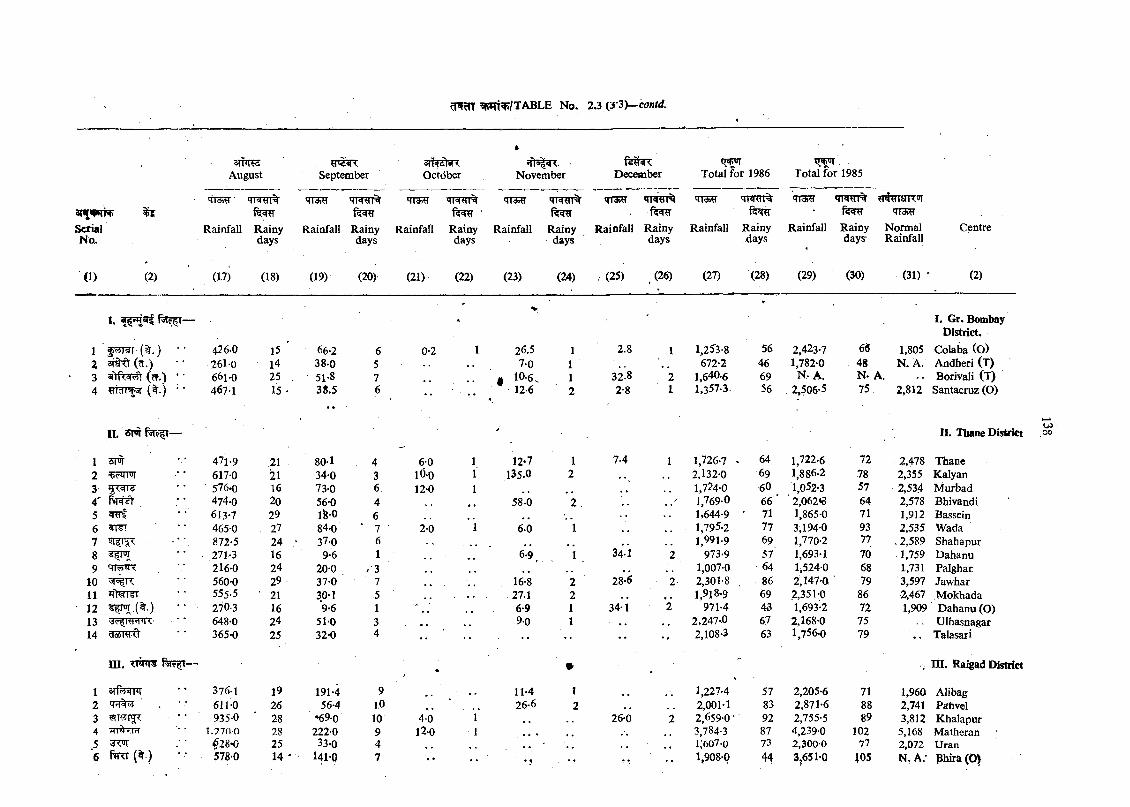
SerialNo.
arhfFsAugust
tn w %
Rainfall Rainy days
September
T ra r^
Rainfall Rainy days
amzt-rxOctober
'TT3^
Rainfall
TlwgT%
Rainydays
November
Rainfall
M a rrDecember
Rainy Rainfall Rainy days days
t r ^Total for 1986
Rainfall
tn3RTI%
Rainydays
Total for 1985
'Tra?!'
Rainfall
«nwt%
Rainydays'
NormalRainfall
Centre
(1) (2) (17) (18) (19) (20) (21) (22) (23) (24) (25) (26) (27) (28) (29) (30) (31) ' (2)
I. I. Gr. Bombay District.
1 (%.) •• 426.0 15 66-2 6 0-2 1 26.5 1 2.8 1 l,25-3-8 56 2,423-7 6(J 1,805 Colaba (O)2 261-0 l4 38-0 5: 7-0 1 672-2 46 1,782-0 48 N. A. Andheri (T)3 ( ^ .) ‘ • 661-0 25 . 51-8 7 i 10-6. 1 32.8 2 1,640-6 69 N -A . N- A. Borivali (T)4 ?rldi5j5r •• 467-1 15 ' 38.5 6 •• • 12-6 2 2-8 1 1,357-3 . 56 2,506-5 75 2,812 Santacruz (O)
n . 5T9T —'
/ II. Tbane District
1 471-9 21 80-1 , 4 6-0 1 12-7 1 7.4 1 1,726-7 * 64 1,722-6 72 2,478 Thane2 LOTI'S! 617-0 21 34-0 3 lO-O 1 135-0 2 2,132-0 69 1,886-2 78 2,355 Kalyan3 576.0 16 73-0 6 12-0 1 . . . . , * 1,724-0 60 1,052-3 57 2,534 M urbad4 ' 474-0 20 56-0 4 58-0 2 1.769-0 66* 2,O62»0 64 2,578 Bhivandi5 5RTf 613-7 29 1^0 6 1,644-9 ' 71 1,865-0 71 1,912 Bassein6 srrer 465-0 27 84-0 ‘ 7 2-0 i 6.0 1 • • 1,795-2 77 3,194-0 93 2,535 Wada7 872-5 24 • 37-0 6 _ 1,991-9 69 1,770-2 77 , 2,589 Shahapur8 271-3 16 9-6 1 ,, 6.9 , 1 34-1 2 973-9 57' 1,693-1 70 1,759 Dahanu9 216-0 24 20-0 . 3 , , , . 1,007-0 64 1^524-0 68 1,731 Palghar
10 560-0 29 37-0 7 . . 16-8 2 28-6 2 2,301-8 86 2,147*0 79 3,597 Jawhar11 555-5 . ‘ 21 30-1 .5 , 27.1 2 • • , , 1,918.9 69 2,351:0 86 2,467 Mokhada12 270-3 16 V-6 1 .. 6-9 1 34-1 2 971-4 43 1,693*2 72 1,909 Dahanu (O)13 648-0 24 51-0 3 • • 9 0 1 • • , , 2.247-.0 6.7 2,168-0 75 Ulhasnagar14 5!aira-(t 365-0 25 32-0 4 •- -- •• •- •• -- 2,108-3 63 1,756-0 79 •• Talasaii
ni. Ttnrs — ♦ • ....
in. Ralgad District
1 ®rfl5 FT 376-1 19 191-4 9 . .. 11-4 1 1,227-4 57 2,205-6 71 1,960 Alibag2 611-0 26 56-4 lO 26-6 2 2,OOM 83 2,871-6 88 2,741 Pahvel3 935-0 28 ■^9-0 10 4 0 1 , , 26-0 2 2,659-0 • 92 2,755-5 89 3,812 Khalapur4 ■■ 1.970-0 28 222-0 9 12-0 1 ., 3,784-3 87 4,239-0 102 5,168 Matheran5 ^<01 ^28-0 25 33-0 4 .. , , i;607-0 73 2,3000 77 2,072 Uran6 ( ^ ) '578-0 14 * 141*0 7 • • •? - - 1,908-0 44 3,651*Q 105 N. A.' B h ira (0 )
00
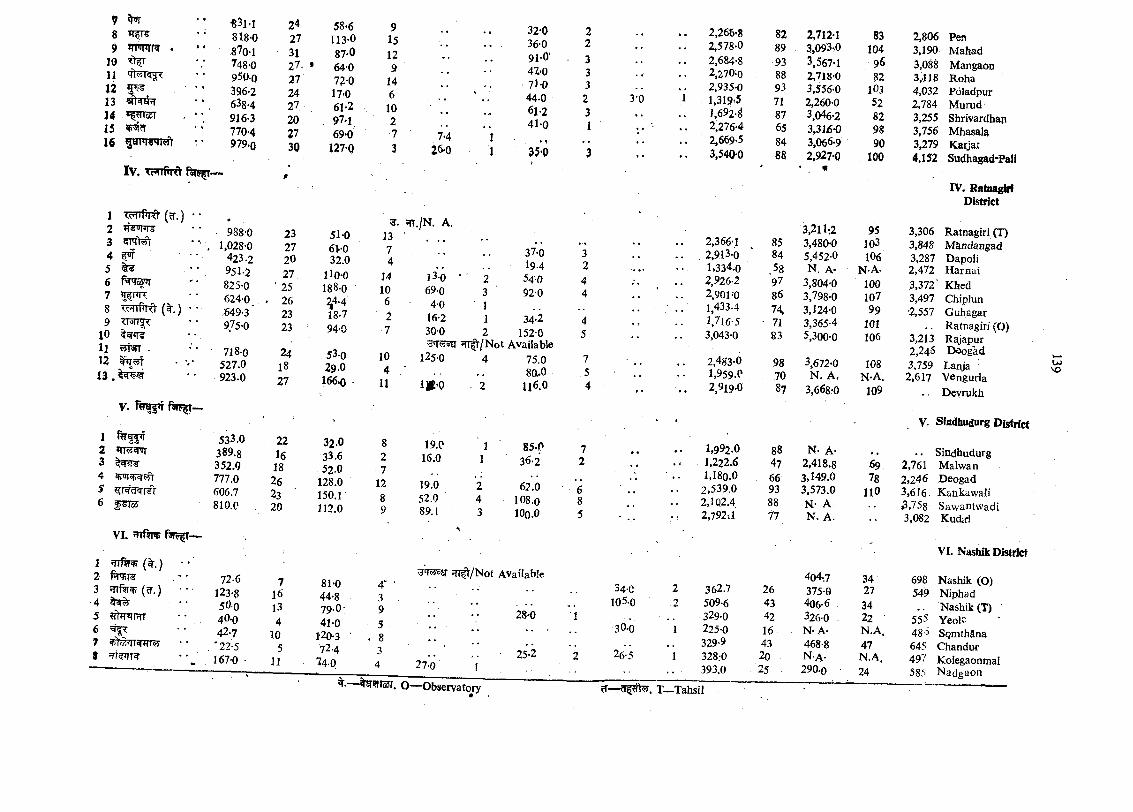
7 ^ *• -83m
8 * ' 818*09 JTmr? . “ g7o-i
JO ' . ’ 748-011 950-012 5 ^ * ' 396-213 « { t ^ ' • 638-414 916-315 ^ ' ' 770-416 • ’ 979.Q
I v . Tc nPiO
1 ToTrniO (cT.)234 ^5678 "^Frrfipct (%.)9 ^T3TT^
1011 55t^ ^12 13 ,
1 23456 7 I
988-0 1,028-0
423.2 951-2 825-0 624-0 J649-3'975-0
718-0 527.0, 923.0
V. rw ^«f fgrF^~
^tr^cR'fsT^¥Tq5
VI. 'nftrp
(%.) • •fJr?rr?
(?r.)
?f)3T«TnTr
24273127-272427202730
58*6113-087-064-072-017-061-297-169-0
127-0
915129
146
10273
7-426-0
32-036-091-0'4Z-071-044-061-241-0
35-0
533.0 22 32.0 8389.8 16 33.6 2352.0 18 52.0 1777.0 26 128.0 12606J 23 ' 150.1 8810.C 20 112.0 9
19.C16.0
19.052.089.1
85.P36-2
62.0108.0lOo.O
72-6 7 81-0 4- '123-8 16 44-8 35O0 13 79-0: 94O.0 4 41-0 542-7 10 12o-3 • . 8
, '22-5 5 72-4 3167-0 • 11 I 4.O 4
^W sET ^ / N o t A v a ila b le
27-0
28
25
^ m m r . O— Observatory
2233323I
g:. ^ ./N . A.23 51-0 132720
61-032.0
74
-• 37-0I9.4
32
27 iio-o 14 l3-o ’ ' 2 540 425 188-0 10 69-0 3 92-0 426 ^4.4 6 4-0 123 18.7 2 16-2 1 34-2 423 94-0 7 30-0 2 152-0 5
24 53-0^ l^ /N o t Available
10 125-0 4 75.0 718 29.0 4 *- 80.0 527 166.0 • 11 IJf'O 2 U 6.0 4
7 2
68 5
3-0
2,268-8 82 2,712-1 832,578-0 89 3,093^0 1042,684-8 93 3,567-1 962,270-0 88 2,718-0 822,935-0 93 3,556-0 103
. 1,319-5 71 2,260-0 521,692-^ 87 3,046-2 822,276-4 65 3,316-0 982,669-5 84 3,066-9 903,5400 88 2,927-0 1.00
3,211;2 952,366-1 85 3,480-0 103
. 2,913-0 84 5,452-0 IO61.334,0 58 N. A- N-A.2,926-2 97 3,804'0 1002,901-0 86 3,798-0 1071,433.4 74, 3,124-0 991,716-5 • 71 3,365-4 1013,043-0 83 5,300-0 106
2,483-0 98 3,672-0 1081,959.0 70 N . A. N-A.2,919-0 87 3,668-0 109
1,992.0 88 N. A-1,222.6 47 2,418.8 691,180.0 66 3,149.0 78
2,539.0 93 3,573.0 llO2.1Q2.4 88 N- A2,792:1 77 N . A.
4o4-.7 3434-0 2 362.7 26 375-9 27
105-0 .2 509-6 43 406-6 34■ . . 329-0 42 326 0 . 22 •
30-0 1 225-0 16 N-A- N-A.329-9 43 468-8 47
26-5 1 328:0 20 n -a - N.A.393.0 '25 290-0 24
2,8063,1903,0883,1184,0322,7843,2553,7563,2794,152
3,3063,8483,2872,4723,372’3,497•2,557
3,2132,2483,7592,617
PenMahadM angaanRohaPoladpurM urudShrivardhaoMhasalaKarjatSudhagad*Pali
IV. Ratnagiri District
Ratnagiri (T)MSndaugadDapoliH arnaiKhedChiplunGuhagarRatnagiri (O)RajapurDeogad
LanjayenguriaDevrakh
OJso
y . Sfndhudurg District
. . Sindhudurg 2,761 M alwan 2,246 Deogad 3,616. Kankawall ^,758 Sawantwadi 3,082 Kudai
VI. Nasbik District
698 Nashik (O)549 Niphad . . Nashik (T) ^
555 Yeoic 48'5 SQmthdna 645 Chandur 497 Kolegaonmai 585 N adgaon
T _T ahsil
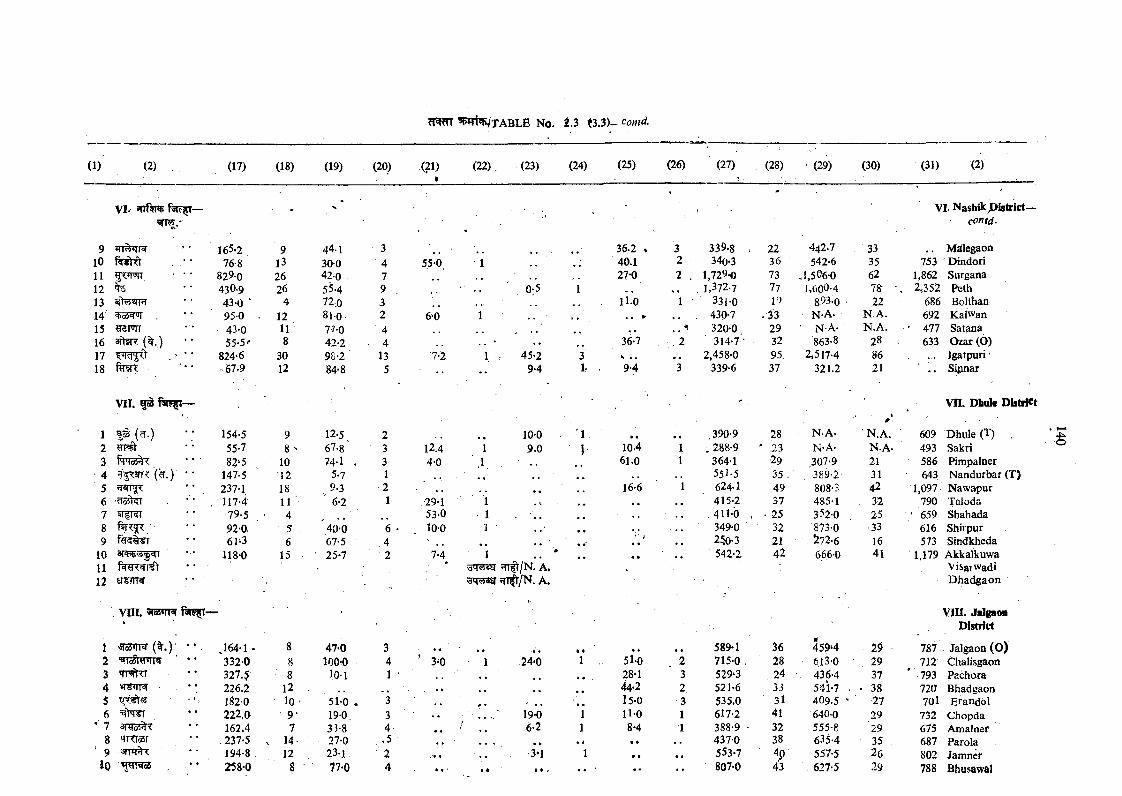
(17) (18) (19) (20) (21) (22), (23) (24) (25) (26) (27) (28) (29) (30) (31) (2)« - r. , ■
VI- f3T^- = T?5,'
VI. N ashikpistrict-contd.
9101112 %13 «rt^*Tpr141516 3fl5n: (%/1718
165-2 . 76-8
829-0 430-9 43-0 ' 95-0 43-0 55-5^
824-6 - 67.9
9132626
412118
3012
44-130042-055-472,081-071-042-298-284*8
3479 .3 2 .44
135
55-0 1
6-0 1
0-5 1
7-2 1 .. 45-2 39-4 1?
35.2 » 3 339-8 , 22 442.7 33 Ma^legaon40.1 2 340-3 36 542-6 35 753 Dindori27*0 2 . 1,729-0 73 ,1,506-0 62 1,862 Surgana
, , , 1,372-7 77 i ,600-4 78- 2,352 Pethn o 1 331-0 19 893-0 22 686 BQlthan
. 430-7 .3 3 N-A. N.A. 692 Kalwari,, 3200 29 • N-A- ■ N.A. ' 477 Satana
36-7 .2 314*7 • - 32 ‘863-8 28 633 Ozar (O)S • • 2,458-0 95. 2,517-4 86 Igalpuri'9-4 3 339-6 37 321-2 21 Sipnar
VII. ^ v n . Dbult District
1 154-5 9 12.5 2 10-02 55-7 8 ' 67-8' 3 12.4 1 9.03 82‘5 10 74-1 . 3 4-0 ,1 , ,4 (?•) ■■ 147-5 12 5-7 1 , ,
' 5 • • 237-1 18 9.3 ■26 . 117-4 11 ' 6 - 2 1 29-1 1 . V7 VI KI " 79.5 . 4 - - .. 53-0 1 • •8 - 92-0. ■ 5 , 40-0 6 ' 10-0 1 •9 61-3 6 67-5 ,4 • •
10 118-0 15 ' 25-7 2 7-4 I • •11 •
r- ^ / N . A,12 ETW5r '3*T5y5sr a .
10.461.0
16-6
390-9 28 N-A- •n .a . ■ 609 Dhiile (T)288-9 ' .23 N-A- N-A- ■ 493 Sakri364-1 ■29 307-9 21 586 Pimpalner553-5 35 . ; 389-2 ■ 31 643 Nandurbar624-1 49 808-3 42 1,097 Nawapur415-2 37 485-1 . 32 790 Taloda411-0 , 25 352-0 25 • 659 Shahada349-0 32 873-0 33 616 Shirpiir250-3 21 . ^72-6 16 573 Sindkheda542-2. 42 666-0 41 1,179 Akkalkuwa
Visaiwadib h ad g ao n
vni. — VIU. JidgaoB District
1 (It.) ’ ‘ J64-1 - 8 47-0 3 • 4 • • • ft 589-1 36 459‘4 2§ 787 Jalgaon(O )2 332-0 8 loo-o 4 ' 3-0 1 24-0 1 51-0 \ 2 715-0 , 28 613-0 . 29 712 Chalisgaon3 327 .f 8 lO-l 1 • , • 28-1 3 529^3 24 ■ 436-4 37 ' 793 Pachora4 '•mrar • • 226.2 12 , * , 44-2 2, 521-6 33 541-7 - • 38 720 Bhadgaon
, 5 182-0 10 ' 51-0 . 3 ' • • l5-0 3 535.0 31 4O9-5 ' 27 701 Erandol6 222.0 9 . 190 3 19-0 1 n -0 1 617-2 41 640-0 29 732 Chopda
* 7 * • 162.4 7 3 5-8 4f 6‘2 1 8-4 1 388:9 32 555-8 '29 675 Amalnef
8 TPtr55r . 237-5 V 14 27-0 -5 • • . 1 • * 437-0 38 635-4 35 . 687 Parola' 9 194-8 . 12 , 23-1 ' 2 • • 3*1 1 , , 553-7 4p 557-5 26 802 Jamnef
258-0 8 77-0 4 • * t • . . . • • * . . . 807*0 43 627-5 29 788 Bhusawal
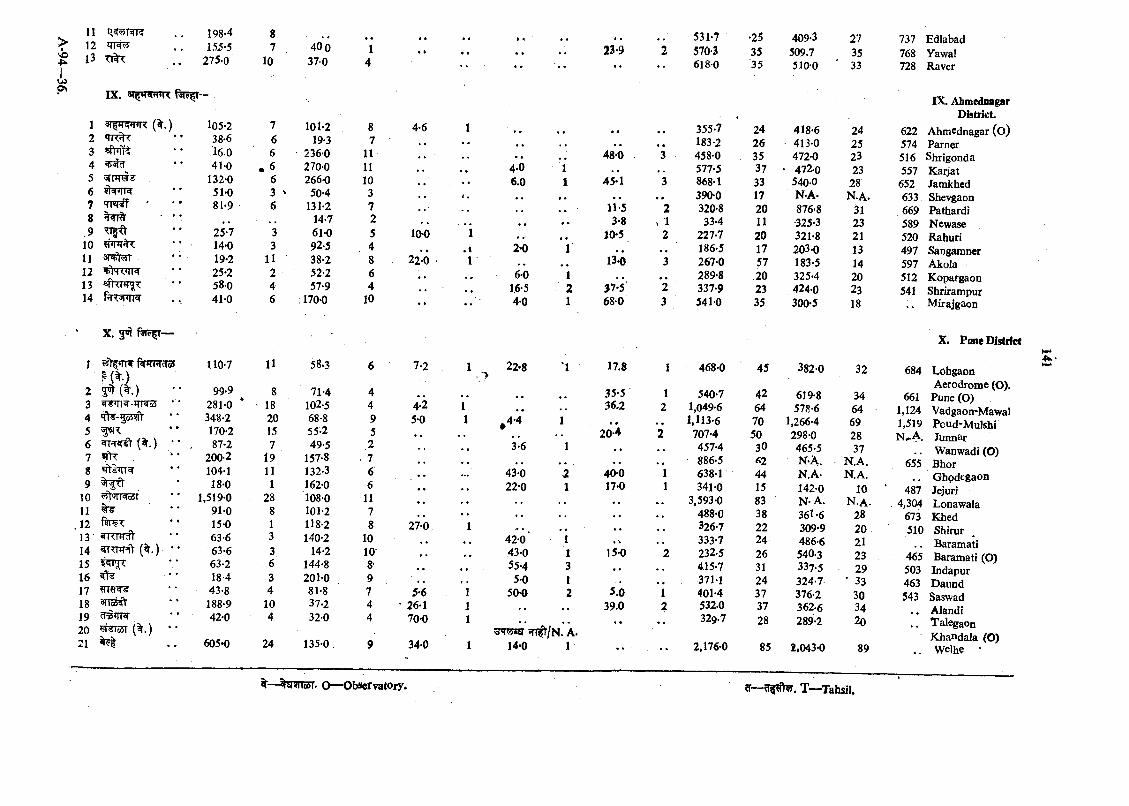
VO4a-IU)
ON IX.
I (%.)'T R ^
TT«nff 8 %2n%
.91011 3R?t5yT1213 «TkTR T14 ffT snn
X. g ^ f ^ —
198-4 8 • r155-5 7 40 0 1
275-0 10 370 4
105-2 7 101-2 838-6 6 19-3 716.0 6 236-0 1141-0 . 6 270-0 11
132-0 6 2660 1051-0 3 V 50-4 381-9 ■ 6 131-2 7
, , 14-7 225-7 3 61-0 514-0 3 92.5 419-2 11 38-2 825-2 2 52-2 6580 4 57-9 4410 6 ; 1700 10
23-9
4-6
10-0
22*0
J f *THdo5 UO-7 11 58.3 6 7-2
2 3 ^ (% .) 99-9 8 71-4 43 ^¥^n^-iTr4aJ * ' 281-0 * 18 102-5 4 4-24 348-2 20 68-8 9 5-05 170-2 15 55-2 56 •• 87-2 7 49-5 ,27 . 200-2 19 157-8 . 78 «rti:5Tr^ 104-1 11 132-3 69 18-0 1 162-0 6
to 'HT^oST * ' 1,519-0 28 1080 1111 91-0 8 101-2 712 15-0 1 118-2 8 27-013' 63-6 3 140-2 1014 ^KT^'V ( k . ) • ' 63-6 3 14-2 1015 63-2 6 144-8 8-16 ^ 18-4 3 201-0 917 ^ 9 43-8 4 81-8 7 5-618 188-9 10 37-2 4 ' 26-119 42-0 4 32-0 4 70-020 ( t . ) • •21 605-0 24 135-0 , 9 34-0
,4-4
3-6
43-022-0
42-043-0 55-4
5 050-0
531-7 •25 409-3 27 737 Edlabad570-3 35 509.7 35 768 Yawal618-0 35 5100 33 728 Raver
IX. Abmednagar D btrict.
■ .. . . . . 355-7 24 418-6 24 622 Abmednagar (O). . . . 183-2 26 413-0 25 574 Parner
• • 48-0 3 458-0 35 472-0 23 516 Shrigonda4.0 1 577-5 37 • 472-0 23 557 K aijat6.0 1 45*1 3 868-1 33 540-0 28 652 Jamkhed
, . . . 390-0 17 N.A. N.A. 633 Shevgaonn -5 2 320-8 20 876-8 31 669 Pathardi
. . - - 3-8 > 1 33-4 11 325-3 23 589 Newase.. , . 10-5 2 227-7 20 321-8 21 520 Rahuri
2-0 1 186-5 17 203-0 13 497 Sangaraner13-0 3 267-0 57 183-5 14 597 Akola
6-0 1 289-8 20 325-4 20 512 Kopargaon1,6-5 2 37-5 2 337-9 23 424-0 23 541 Shrirampur4-0 1 68-0 3 541-0 35 300-5 18 •• Mirajgaon
X. PuneDistrfi
22-8 *1 17.8 1 468-0 45 382-0 32 684 Lobgaon
35-536.2
20-’
40-017-0
15*0
5.039.0
2
2
qn^/N . A. 14-0 1
540-71,049-61,113-6
707-4457-4886-5638-1341-0
3,593-0488-0326-7333-7232-5415-737M401-4532-0329.7
2,176-0
4264705030 62 44 15 83 38 22 24 2631 24 37 37 28
619-8 578-6
1,266-4 298-0 465-5 N-A. N.A- 142-0 N- A. 36lt6 309-9 486^6 540-3 337-5 324-7 376-2 362-6 289-2
85 2,043-0
3464692837
N.A.N.A.
10N.A.
2820212329
• 33303420
89
6611,1241,519N ^A.
655
4874,304
673510
465503463543
Aerodrome (O).Pune(O )Vadgaon-MawalPcud'M uIshiJunnarWanwadi (O)
BhorGhpdegaon Jejuri Lonawala Khed Shirur Baramati Baramati (O) Indapur Daund Saswad Aiandi Talegaon Khandala (O) Weihe •
X— Tahsil.
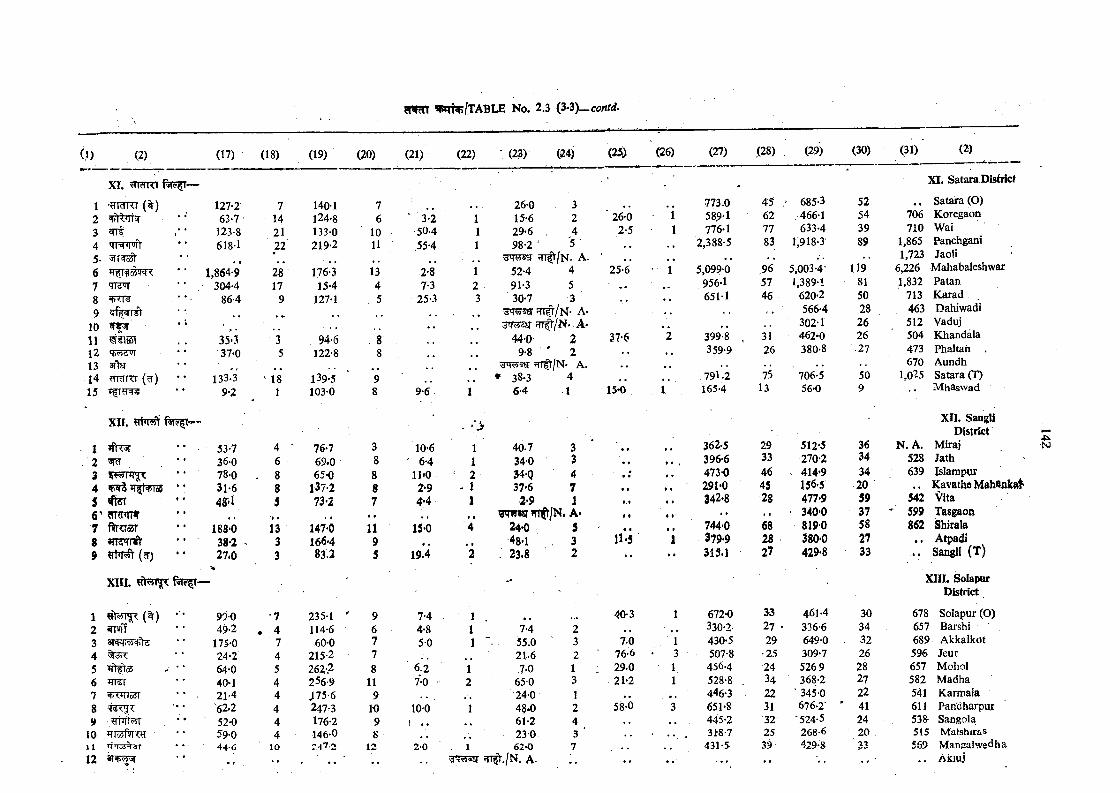
0 ) (2) (17) (18) (19) (20) (21) (22) ',(23) (24) <2^
XL TnTRT
1 TRTRT (^ ) 127-2 7 140-1 7 26-0 32 • • 63-7 14 124-8 6 ' 3-2 1 15-6 23 ^ 123-8 21 133-0 10 50-4 1 29-6 44 618-1 22 219-2 11 55-4 1 98-2 ^ 55-< .. * . ^ , , hi^ / n . a .6 *l5J'5la5‘<^^ 1,864-9 28 176-3 13 2-8 1 52-4 47 mi«l " . 304-4 17 15-4 4 7-3 2 91-3 58 t.<l^ . • • • 86-4 9 127-1 , 5 25-3 3 30-7 39 ■ * ^ s a r ^ / N - A.
10 *• . • , , si<f«j'5sr r7^/N» a *11 ^ilST 35-3 3 94-6 8 44-0 212 «+i<rfdt7r • ♦ 37-0 5 122-8 8 9-8 ' 213 31% • . * , ^^5 g r ^rft/N . A.14 yidRI ( cT) 133-3 ‘ 18 139-5 9 • 38-3 415 9-2 1 103-0 8 9-6 1 6-4 1
XII.‘
I *ftT3f 53-7 4 ' 76-7 3 106 1 40-7 3. '2 ^ ■ ; • ’ 36-0 6 69.0 8 ' 6-4 1 34’0 3
3 78-0 . 8 65-0 8 l l ’O 2 34-Q 44 V^i^iWToS * • 31-6 8 137«2 8 2*9 - 1 37-6 7s ^ • * 48vl 5 73*2 7 4.4 1 2-9 1
m m n , , , , • • «. , , , , m fr/N . a -7 ftWoSf 188*0 13 147-0 11 15*0 4 24*0 5g anOTJft •• 38*2 ^ 3 166-4 9 . . , , 4g.l 39 {^) 27.0 3 83.2 5 19.4 2 . 23.8 2
XIII. ^F^T— -
1 (%) * • 990 *7 235-1 " 9 7-4 1 .2 49-2 • 4 114-6 6 4-8 1 7-4 23 175-0 7 60-0 7 5 0 1 . . 55.0 34 c >< ■ ' 24*2 4 215-2 7 21-6 25 *rt?1-o5 • • 64-0 5 262-2 8 6.2 1 .7-0 16 lif 40‘1 4 256-9 11 7-0 2 650 37 T TFoST * * 21-4 4 J75-6 9 * . 24-0 18 4<i<yt 62.2 4 247-3 10 10-0 1 4§.0 29 -.^rFTiw . * * 52-0 4 176-2 9 61-2 4
10 ^TosftiT r 59-0 4 146-0 8 , \ 23 0 3 ■11 Hn^t^ssr •• 44-6 10 - 47.2 12 2-0 1 62-0 712 ’ * ., . . . . . . ?IT|t./N. A-
<251) (26) (27) ,(28) (29) <30) (31) (2)
773.0 45 .' 685-3 52
XI. Satara Distric
. . Satara (O)' 2 6 0 i 58^-1 62 466-1 54 706 Koregaon
2-5 1 776-1 77 633-4 39 710 Wai2,388-5 83 1,918-3 89 1,865 Panchgani
25-6 1 5,099-0 96 5.003-4 1191,723 Jaoli
6,226 Mahabaleshwar956-1 57 1,389-1 81 1,832 Patan651-1 46 620-2 50 713 Karad
, , • 566-4 28 463 Dahiwadi302-1 26 512 Vaduj
37-6 *2 399-8 . 31 462-0 26 504 Khandala. . .. 359-9 26 380-8 27 473 Phaltah ,
670 Aundh791.2 73 706-5 50 1,025 Satara (T)
15-0 1 165-4 13 56-0 9 Mhaswad
362-5 29 512-5 36
XII. SangU District
N . A. Miraj
'396-6 33 270-2 34 528 Jath473-0 46 . 414-9 34 639 Islaropur
t » 291*0 45 156*5 20 . , KavatheMahSali342-8 28 477*9 59 542 Vita
• • • • ., , , ' 340*0 37 ' 599 Tasgaon• • • 9 744*0 68 8190 58 862 iShirala
n -5 1 379*9 28 380*0 27 . . Atpadi
•• •• 315.1 27 429*8 33 . . Sangli (T )
40-3 1 672-0 33 461-4 30
XIII. Solapnr District
678 Solapur (O)330-2 27 • 336-6 34 657 Barshi
7.0 1 430-5 29 649-0 . 32 689 Akkalkot76-6 3 507-8 '25 309-7 26 596 Jeur29-0 1 456-4 24 526 9 28 657 Mohol21-2 1 528-8 . 34 368-2 27 582 Madha
446-3 22 ■ 345-0 22 541 Karmaia58-0 3 651-8 31 676-2' • 41 611 Pan'dharpur
• • 445-2 32 '524-5 24 538- Sangola• • 318-7 25 268-6 20 , 515 Malshiras
• . , , 431-5 39 429-8 33 569 Mangalv/fidha• » ¥ ", , . . Akiuj
•N
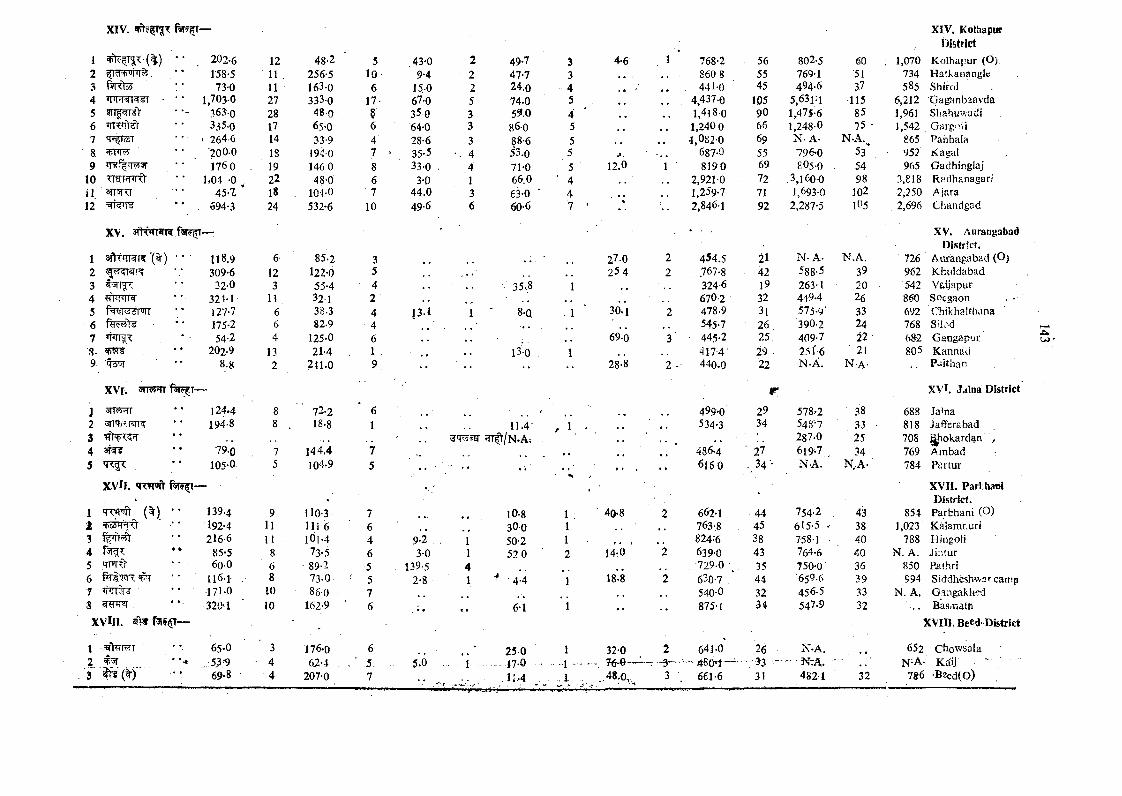
1
XIV. ^ ^ T -
202-6 12 48-2 5 ,43-0 2 49-7 y 4-6 1 " 768-2 56 802-5 60 ; 1,070
XIV. Kolhapur District
Kolha{)ur (O)2 , * * 1-58-5 11 . 256-5 10 9-4 2 47-7 3 • • • • . 860 8 55 769-1 51 734 Halkanaoylc3 ftrd55 : • 73-0 11 163-0 6 15.0 2 24.0 4 9 • *■ • • 441-0 45 494-6 37 585 Shirol4 1,703-0 27 333-0 17- 67-0 5 74.0 5 4,437-0 105 5,63i;i 115 6,212 GagSnbaavda5 WTprit 363-0 28 48-0 § 350 3 59.0 4 l,4 l8 o 90 1,47§.6 85 1,961 Shahuwadi6 TIKTOt 335-0 17 650 6 64-0 3 86-0 5 , , 1,240 0 66 1,248-0 75 • 1,542 Gfjrg'ni7 <264 6 14 33-9 4 28-6 3 88-6 5 , , •1,0820 69 N- A- N-A. 865 Panhala& '2000 18 1940 7 35-5 4 53.0 5 687-0 55 796-0 53' 952 Kagal9 1760 . 19 146 0 8 33-0 . .4 71-0 5 12.0 1 8190 69 805-0 54 965 Gadhinglaj
10 TTsrw^rd 1.04 0 , 22 48-0 6 3-0 1 66.0 ' 4 2,9210 72 .3,1600 98 3,818 Radhanagarli l arr TTT 45-7. ’ 18 104-0 7 44.0 3 63-0 ' 4 • • 1,259-7 71 1,693-0 102 •2,250 Ajara12 = n Tfi- ‘ • 694-3 24 532-6 10 49-6 6 60-6 7 ‘ -- 2,846-1 92 2,287-5 IO5 2,696 Chandgsd
1
XV. 3TK*TTan f3T?5T
3ftT»iRr^'(%) • • 118.9 6 85-2 3 27.0 2 454.5 21 N- A- N.A. • 726
XV. Aurangabad DisfrEct.
Aui'angabad (O)2 309-6 12 122-0 5 25 4 2 .767-8 42 588-5 39 962 Kb u Ida bad3 32-0 3 55-4 • 4 ■ 35.8 1 3246 19 263-1 20 542 Vaiiapur4 321-1 11 . 32-1 2 . , , . 670-2 32 449-4 26 860 SoQgaon . •5 f%l^5TiTT 127-7 6 38.3 4 13-1 1 ' 8.Q . 1 30.1 2 478-9 3l 575-9' 33 692 Chikhalthana6 * ■ 175-2 6 82-9 4 545-7 26 390-2 24 768 SJk'-d7 54-2 4 125-0 6 . , 69.0 3 • 445.2 25, 409-7 22 682 Gangapur
202-9 13 21-4 1 . . l3-0 1 4174 • 29 . 25 f 6 ■ 21 805 Kanniid9 •ijiUl 8.8 2 2tl.O 9 -• •• -- 28-8 2 -• 440.0 '22 n -A. n -a - P-iithan
J
XVl. s n ^ R T f^ T -
124.4 8 ■■ 72-2 6 499-0
r
29 578.-2 38 688
XVl. J.ilna District
Ja’na2 STRjTRK 194-8 8 . 18-8 1 .. 11.4 , 1 . , , 534-3 34 54S‘-7 33 • 818 Jafferabad3 vrr|y/N.A; .
. • 287-0 25 708 ^hokardan ,4 79-0 7 144.4 7 , . 486-4 ■ 27 619-7 „ 34 769 Arabad5 ^<i< . 105-0 5 104-9 5 . f ' . . . . . 616 0 , 34 ' ,N-A. n , a -' 784 Paitur
1
X vH. "mrwft
TWiit (^ ) * • 139.4 9 no-3 7 lO-8 1 40-8 2 662-1 44 754-2 . 43 854
XVII. Parlvhaiii District.Parbhani (0 )
2 192-4 11 111 6 6 3OO 1 763-8 45 615-5 . 38 1,023 Kalamr.uri3 216-6 11 l0 |-4 4 9-2 1 50-2 1 . . 824-'6 38 758-1 40 788 HinsoH4 85-5 8 73.5 6 3-0 1 52 0 2 14-0 2 639-0 43 764-6 40 N. A. Jir.tur5 TT?Tff • • . 60-0 6 ' 89-2 5 139.5 4 729-0 ; 35 750-0 36 850 Palhri6 felW T #T ■ ' 116-1 . 8 73-0 ' 5 2-8 1 4-4 1 18*8 ’2 630-7 44 659-6 39 994 Siddheshwar camp7 171-0 10 86-0 7 540-0 32 456-5 33 N. A. Gangakked8 320-1 10 162-9 6 6-1 i , , 875'I 34 547-9 32 Basmatftx v i i i .
1 65-0 3 176-0 6 2 5 0 1 32-0 2 641-0 26 N-A.
XVIIl. Beed- District
652 Cfiowsala2 w.^ ...... “ *. . . _:53-'9 4. 6>4 . / . . 5 , . 5*.0 1 . . 17.0 . ■ -1 >7-ir, A.. 1./t3 V ^~ 48e-t— ' n -A- Kaij3 (%) 69-8 4 207-0 7 li-4 -.1 ..4 8 A v 3 661-6 31 482-1 32 786 •Beed(O)
' 1*
OJ
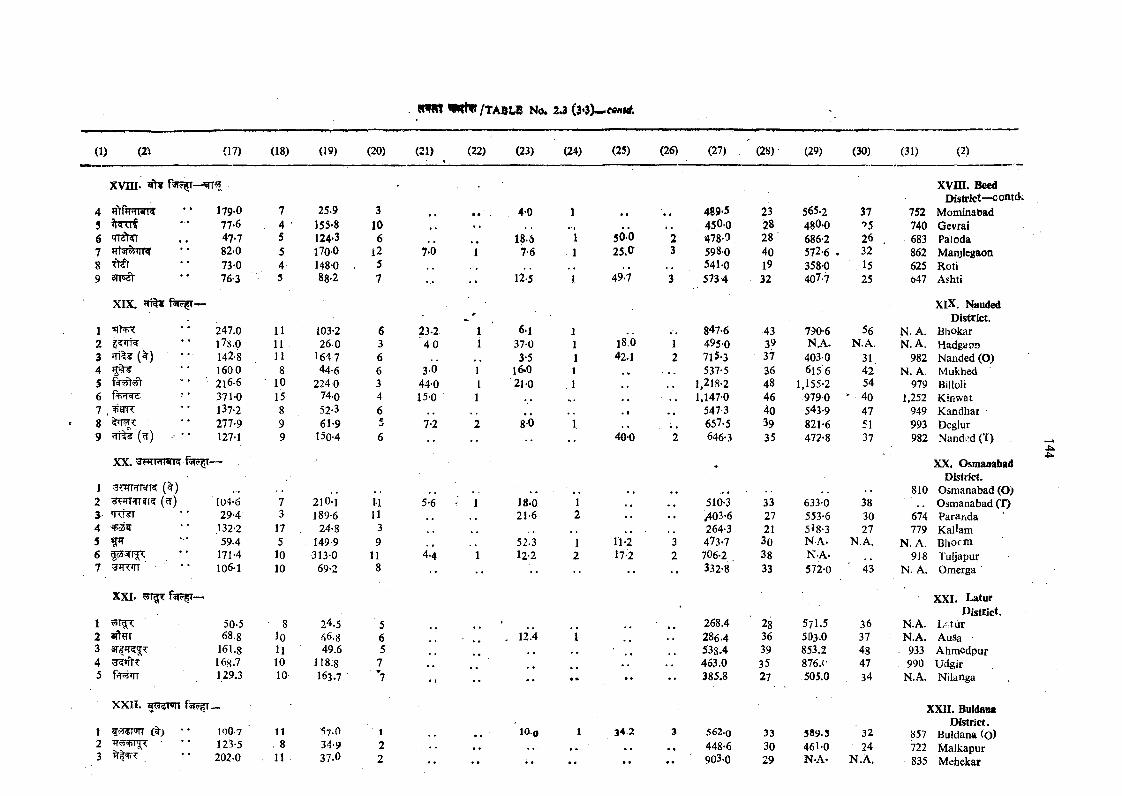
(1) (2^ (17) (18) (19) (20) (21) ^ (22) (23) (24)
x v m . fafrjrr—
4 RtfVTTVT 179.0 7 25.9 3 4-0 15 77-6 4 • 155-8 10 • • , , #•5 47-7 5 124-3 6 • • 18.6 17 )fft'jf?5»Tr<T 82.0 5 1700 l 2 7-0 1 7-6 18 Ti€r 73-0 4 148-0 59 3TF?t 76-3 5 88-2 7 • • 12.5 1
XIX. *TT f5T5f! —
1 'HH< 247.0 11 103-2 6 23-2 1 6-1 12 l7S.O 11 2 6 0 3 4 0 1 37-0 13 (%) 142-8 11 164 7 6 3-5 14 ** 160 0 8 44-6 6 3 O 1 16.0 1S 216-6 10 2240 3 44-0 I 210 .16 371-0 15 74-0 4 15-0 17 , 137-2 8 52-3 6 ..8 277*9 9 61-9 e 7-2 2 8-0 19 JTi^ (w) 127-1 9 150-4 6 • •
(25) (26) (27) (28) (29) (30) (31) (2)
489-5 23 565.2 37
XVffl. Beed District—c
752 Mominabad• t , , 450-0 28 480-0 ->5 740 Gevrai
5O.O 2 478-0 28 686-2 26 , 683 Paioda25.CT 3 598-0 40 572-6 . 32 862 Manjlegaon
541-0 19 358-0 15 625 Roti49-7 3 573-4 32 407.7 25 047 Ashti
XlX. Nauded District.
18.042.1
400
847-6 43 790-6 56 N. A. Bhokar495-0 39 N.A. N.A. N. A. HadgaoD715.3 37 403 0 31 982 Nanded (O)537-5 36 615 6 42 N. A. Mulched
1.218-2 48 1,155-2 54 979 Billoli1,1470 46 9790 ' 40 1,252 Kinwat
547-3 40 543-9 47 949 Kandhar657.5 39 821-6 51 993 Deglur646-3 35 472-8 37 982 Nandfd (T)
XX. ^^FTHRTR —
y^TCfMRK {^)(rf)
'TTTTT
XXI. .
104-6 7 210-1 1-1 5-6 1 18-0 1 .. .. 510-3 33 633-0 3829-4 3 189-6 11 21-6 2 . . /♦03-6 27 553-6 30 674
132-2 17 24-8 3 • • 264-3 21 5l8-3 27 77959.4 5 149-9 9 . 52.3 1 n -2 3 473-7 30 N-A. N.A. N. A.
171-4 10 313-0 11 4.4 1 12-2 2 17-2 2 7O6-2 . 38 N-A- 91S106-1 10 69-2 8 • • , , 332-8 33 572-0 43 N. A.
XX. Osmaoabad District.
Osmanabad (O) Osmanabad (T)
4ii.4^
XXI. Latur District.
1 50-5 8 24.5 52 68.8 lo f»6.8 63 161.8 11 49.6 54 168.7 10 118.8 75 f ;m r 129.3 10 I63.7 ’7
XXII. 5^gTon
1 fOT'HT • • IQO.7 I t 57.0 1123-5 . 8 34-9 2
3 ^1^+^ 202-0 . 11 37.0 2
■ .. 268.4 28 571.5 36 N.A. U tu r12.4 i 286.4 36 503.0 37 N.A. AuSa -
• • 533.4 39 853.2 48 933 Ahmedpur. . 453.0 35 876.(' 47 990 Udgir
• • • • • • 385.8 27 505.0 34 N.A. Nilanga
XXII. Buldaiu District.
10-0 1 34.2 3 562-0 33 389.3 32 857 Buldana Co. . 448-6 30 461-0 24 722 Malkapur
. . . . 903-0 29 N-A- N .A . 835 Mehekar
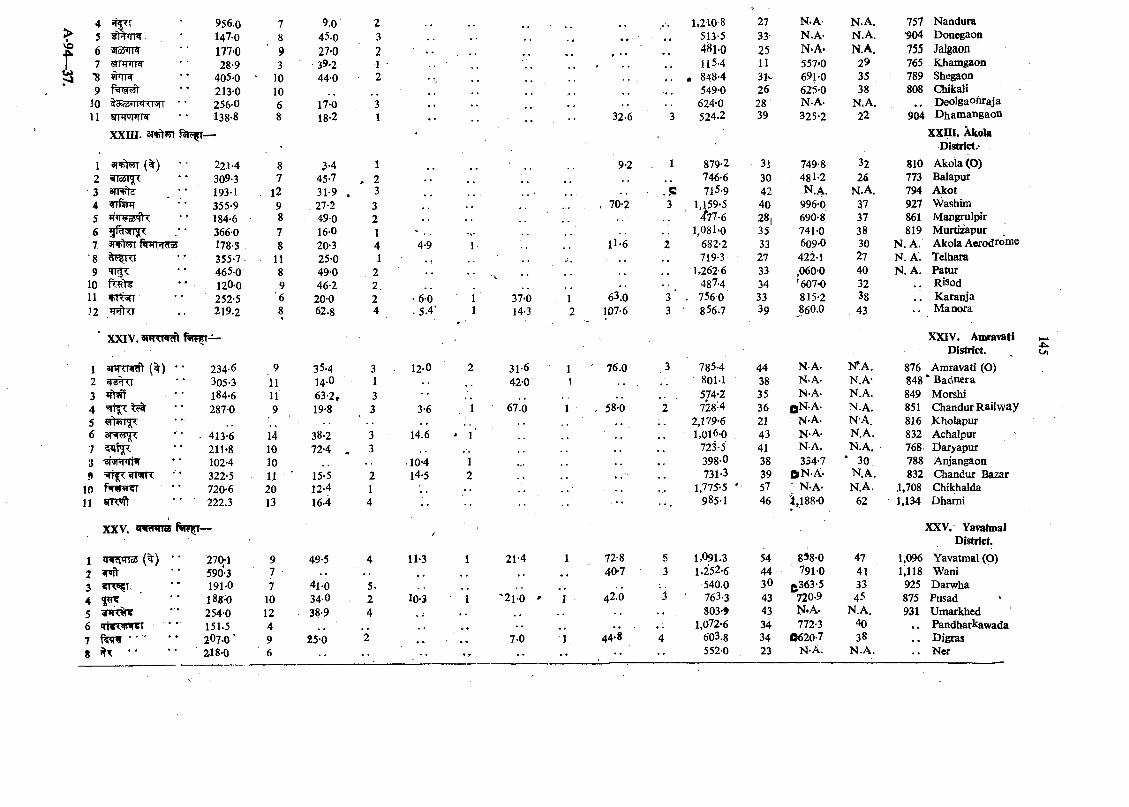
>vb
456 7 *8 9
1011
• 956.0si%qiar • 147-0m m • • i77‘0QTJRPT ’ ■ 28’9
• V 405-0• • 213-0
m w r R • • 1.3 8-8
x x n i. 3 T ^
789 3
10 10 6 8
9.045-027*039-244-0
17-018-2
1 (^ ) 221-4 8 3-4 1 , ,2 *neai|3 < 309-3 7 45-7 . 2 . , ,.3 arppt? / ' * 193-1 12 31-9 , 34 4ir?UT 355-9 9 . 27-2 35 ' 184-6 8 49-0 26 366-0 7 16-0 1 ■x-
7 spFhTT 178-3 8 20-3 4 4-9 1■ 8 <1 355-7 - 11 25-0 1 ,,9 465-0 8 49-0 2 . •
10 120-0 9 46-2 2. ,,11 VK3TI 252-5 '6 200 2 • 6-0 1 37-012 WTTT 219.2 8 62.8 4 . 5.4; 1 14-3
* XXIV. aWTWcft
1 anrxR ^ (^ ) •* 234-6 9 35.4 3 12-0 2 31-62 305-3 11 14.0 1 42-03 • • • 184-6 11 63-2* 3 ,,4 ^ 287-0 9 19-8 3 3-6 1 67.05 ^"t55F^6 ’ ■ 413-6 14 38-2 3 14.6 * 17 211-8 10 72-4 . 3i -3iaiH<rR 102-4 10 •10-4 19 •• 322-5 11 ■ 15-5 2 14-5 2
10 720-6 20 12-4 111 SJT 'iiV ' ’ 222.3 13 16-4 4 -- •*
’•
XXV. O IW oS R iF T- /
1 iTir^mcs (%) ' • 270;1 9 49-5 4 11-3 1 21-42 «pft ■ * 590-3 ■ 7 , ,3 <TT«?T 191-0 7 4 l0 5.4 1 ^ 1880 10 34-0 2 10-3 1 '21-05 254-0 12 38-9 46 <n¥Kvm • • 151-5 47 fe iv ■ ■ ” 2O7.O ‘ 9 25-0 2 ,, 7-0t " 218-0 6 ..
. . 1,210 8 27 N.A- N.A. 757 Nandura. . . . 513-5 33’ N;A- N.A. •904 Donegaon
481-0 25 ■ N.A. N.A. 755 Jalgaon< , , 115-4 11 557-0 29 765 Khamgaon
, 848-4 31- 691-0 35 789 Shegaon549-0 26 62^0 38 808 Chikali
• ^ 624-0 28 N-A-- N.A. Deolgaonraja32-6 3 524-2 39 325-2 22 904 D ham angaon
x x m . Xkola District.'
9-2 1 879-2 3] 749-8 32 810 A kola(0 )746-6 30 481-2 26 773 fialapur
• P 715-9 42 n .a . N.A. 794 Akot, 70-2 3 1,159-5 40 996-0 37 927 Washim
^77-6 28| 690-8 37 861 Mangrulpir1,081‘0 35 741-0 38 819 Murtizapur
11-6 2 682-2 33 6o9-0 30 N. A. Akola Aerodrome719-3 27 422-1 27 N .A . Telhara
• c. 1.2626 33 ,060-0 40 N. A. Patur487-4 34 ‘607-0 32 Risod
1 63.0 3 ' . 7560 33 815-2 38 K aranja2 107-6 3 856-7 39 860.0 43 M anora
XXIV. A m ra^ ti District.
1 76.0 3 785-4 44 N-A- K A . 876 Amravati (O)1 80M 38 N-A- N.A- 848 * Badnera
574-2 35 N-A. N.A. 849 Morshi1 . 58-0 2 728-4 36 ON-A- N.A. 851 Chandur Railway
• • , , 2,179-6 21 N-A- N-A. 816 K holapur1,016-0 43 n -a . N.A. 832 Achalpur
, , 723-5 41 N-A. N.A. • 768 Daryapur398-0 38 334-7 * 30 788 Anjangaon
. , • 731-3 39 ON-A- N .a . 832 C3iandur Bazar• • 1,775-5 * 57 ■ N-A- N.A. 1,708 Chikhalda
985-1 46 }^88-0 62 1,134 Dhami
XXV. Yavalmal District.
1 72-8 5 1,091,3 54 858-0 47 1,096 Yavatmal (O)-• • 40-7 3 1,252-6 44 791-0 41 1,118 Wani.. 540.0 30 ^363-5 33 925 DarwhaI 42.0 3 763-3 43 720-9 45 875 Pusad
803-5 43 N*A. N.A. 931 Umarkhed• • , 1,072-6 34 772-3 40 Pandharkawada
1 44*8 4 603.8 34 0620-7 38 , ^ Digras•• •• •• 5520 23 n -a . N .A . •• N et
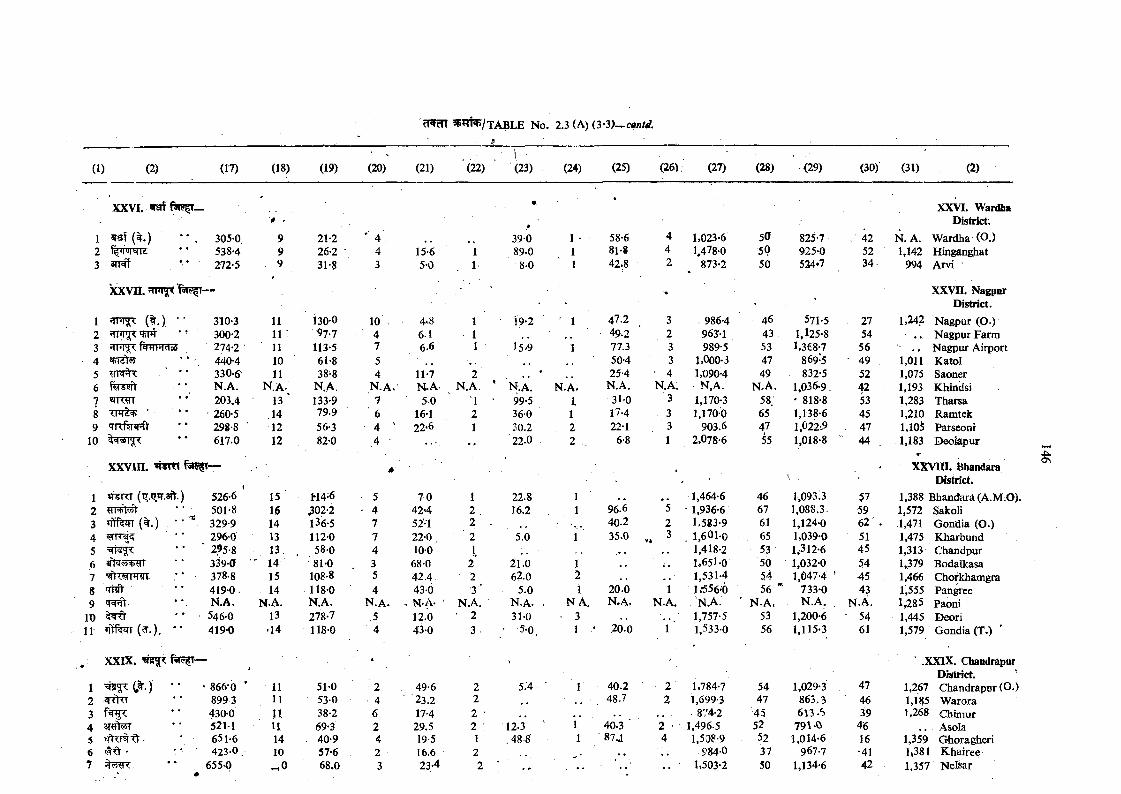
fPFcn t a b l e No. 2.3 (A) (3*3>-^con/</. __ _____L_
XXVI. Wardba District.
1 waf (%.)2 3
3050538-4272*5
5 S v n . f n n ^ f ^ —
1 ;rnT^ ( t . ) " 310-32 * ■ 300-23 •TPT^ fq+iHdoi 274-24 rr?r?y • * 440-45 ' * * 330-66 ‘ N .A,7 «JRgr **’ 203.48 ' • • 260-59 ITRftrwqV •* 298-8
10 • * 617.0
x x v in .
1 vr TTT2
4 ■56
8 'Tnfl' * *9 ’ V
1011 (^ .) , • •
. XXIX.
1 w C ^ - ) •*
526-6501-8329-9296-0295-8339-0378-8419-0 <N.A.546-0419-0
' 866-0 8993 430-0 52M 651-6423-0
6550
11 11 : 11 10 11
N.A. 13
.14 12 12
151614 1313
' 141514
N.A.13•14
1111nu1410^ 0
21-226-231-8
i30-0^ 7 -7113-561-838-8
N.A.133-979.956-382-0
M4-6 302-2 136-5 112-0 58-0 81-0
108-8 118-0 N.A. 278-7 118-0
51-053-038-269-340-957-668.0
104 75 4
N.A.-764 ' 4 ■
5' 4
7 74354
N .A .5 4
2462423
15-65-0
4*86-16.6
11-7N.A-5 0
16-122-6
7 0 42'4 52-1 22-0 ,
10-0 68 0 42.4. 430 N-A- 12.0 43-0
49-623.217-4
29.5 19-516.6 23-4
111
2N.A.
121
1 2 . 2
‘ 2 1
2 23 '
N.A.• 2
3 .
39089-08-0
5-0.
5.'4
' i9-2 ’ 1
l5 '9 1
N.A. N.A.99-5 1.36-0 130.2 222.0 2
22.8 116.2 1
5.0 1
21.0 16?.0 2
5.0 iN.A. . N .31.0 - 3
58-681-842-8
1,023-6 50 825-7 42 N. A. Wardha (O.)1,478-0 50 925-0 52 1,142 Hinganghat
873-2 50 524*7 34- 994 Arvi
XXVn. Nagpnr District.
12.3. 4 88
47.2 3 . 986-4 46 571-5 27 1,242 Nagpur (O.)49-2 2 963--1 43 1,125-8 54 . . Nagpur Farm77.3 3 989-5 53 1,368-7 56 . . Nagpur Airport50-4 3 1,000-3 47 869-5 • 49 , 1,011 Katol25-4 • 4 1,090-4 49 832-5 52 1,075 Saoner
N.A. N.A. • N,A. N .A . 1,036-9. 42 1,193 Khindsi31-0 3 1,170-3 58. ' 818-8 53 1,283 Tharsa17-4 3 1,1700 65 1,138-6 45 1,210 Ramtek22-1 3 903.6 47 l,022-i> . 47 1,10^ Parseoni
6-8 1 2,078-6 55 1,018-8
\
44 1,183 Deolapur
XXV ni. Bbandara District.
r « , , 1,464-6 46 1,093;3 57 1,388 Bhandarjl(A.M.O).96.6 5 • 1,936-6 67 1,088.3- 59 1,572 Sakoli40-2 2 1,583-9 61 1,124-0 62 . 1,471 Gondia (O.)35.0 3 . 1,601-0 65 1,039-0 51 1,475 Kharbund
1,418-2 53 1,312-6 45 1,313 Chandpurl.,65l -0 50 1,032-0 54 1,379 Bodalkasa
. , 1,531-4 54 1,647-4 ' 45 1,466 Chorkhamgra20.0 1 1,■556-6 56 * 733-0 43 1,555 PangreeN.A. N.A. . 'N.A. ’ N .A . N .A . N.A. 1,285 Paoni
1,757-5 53 1,200-6 ■ 54 1,445 Deori.20-0 1 ' 1,533-0 56 1,115-3 61 1,579 Gondia (T.) '
.XXIX. Chandrapur District.
40.2 2 1,784-7 54 1,029-3 47 1,267 Chandrapur (0 .)48.7 2 1,699-3 47 863.3 46 1,185 Warora
• . 874-2 45 6\3 .<5 39 ,1,268 Chirnur40-3 ■ 2 ' 1,496.5 52 791-0 46 . . Asola87.J 4 1,508-9 52 1,014-6 16 1,359 Ghoragheri
,, * , 984-0 .37 967-7 •41 1*381 K hairee. . ' 1,503-2 50 1,134-6 42 1,357 Nelsar
ON
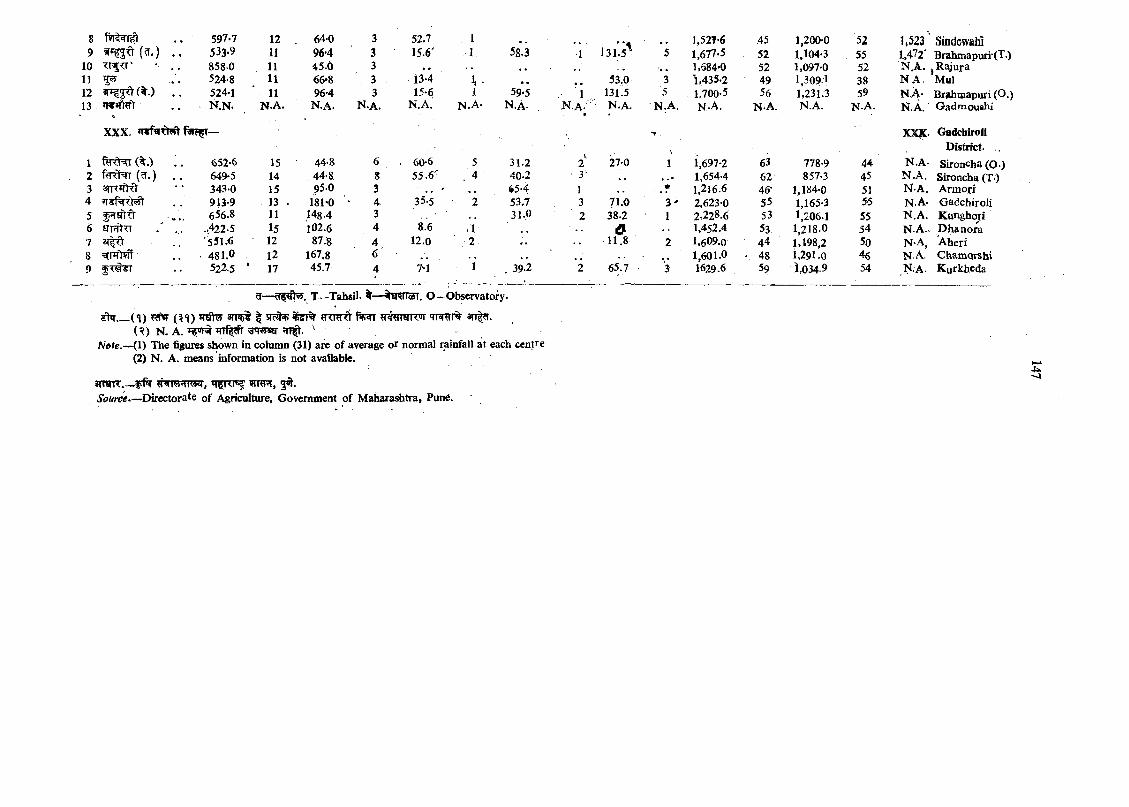
910111213
(w.)TrfTT'
(%.)*w*%1r
597.7533-9858.0524-8524-1n .n .
XXX. fai5fT—
1 (%.)2 (W.)3 3rr?»fKt45 f'TU'tft6 ETRtTT7 ^8 =3[rRWf9
11111111
N .A.
96-445.666*896-4
N,A.
3333
N.A.
52,715.6'
13-415-6
N.A.1
N.A-
58.3
59-5N.A.
1N .A .'
131.5^
33.0131.5N.A.
3'5
N .A.
l,52T-6 .45 1,200-0 52 1,523 Sindewahi1.677.5 52 1,104.3 . 55 1,472' Brahmapuri (T.)1,684.0 52 1,097-0 52 N.A. j Rajura1,435.2 49 1,309.1 38 N A . Mul1.700.5 56 1,231.3 59 N A - Brahaaapuri (O.)N.A. N.A. N.A. N.A. N.A. G adm oushi
XXK. GadcbiroliDistrict-
652-6 15 44-8 6 . 60*6 5 31.2y
2 27-0 1 1,697-2 63 778-9 44 N.A. Sironcha (0-)649-5 14 44.8 8 55.6" . 4 40.2 ■ 3- 1,654.4 62 857-3 45 N ,A . Sironcba (T.)343-0 15 95.0 3 .. ' S5-4 1 • 1,216.6 46- 1,184-0 51 N-A. Armori913-9 13 . 181-0 ' 4 35.5 • 2 53.7 3 71.0 2,623-0 55 1,165-3 55 N.A. Gadcbiroli656.8 11 ,148.4 3 31.0 2 38.2 1 2,228.6 53 1,206.1 55 N .A . Kunghori
-.422.5 15 IO2.6 4, 8.6 / r i y 1,452.4 53 1,218.0 54 N.A.. p h a n o ra531.6 12 87.8 4 . 12.0 2 11.8 2 1,609.0 44 1,198,2 50 N-A, A heri481.0 12 167,8 6 , * .. 1,601.0 < 48 1,291.0 46 N.A. Cham orshi522.5 ’ 17 45.7 4 7-1 1 . 39.2 2 65.7 • '3 1629.6 59 1,034.9 54 N.A. Kurkheda
?>T.-
?I— T—Tahsil. %~%Rn3T. O -O bservatory .
(S ) (^1) TOh? I src^^5T% f%5iT m w i% ^T|?r.(^ ) N . A. »=farw*TT%fr 5rr|t. '
Note.—(1) The figures shown in column (31) are of average or normal rainfall at each centre (2) N . A. means information is not available.
w xtK __Hfrcns? ifrRRf, 50 .Source.—^Directorate o f Agriculture, Government of M ah a ra^ ^ a , Pun6.
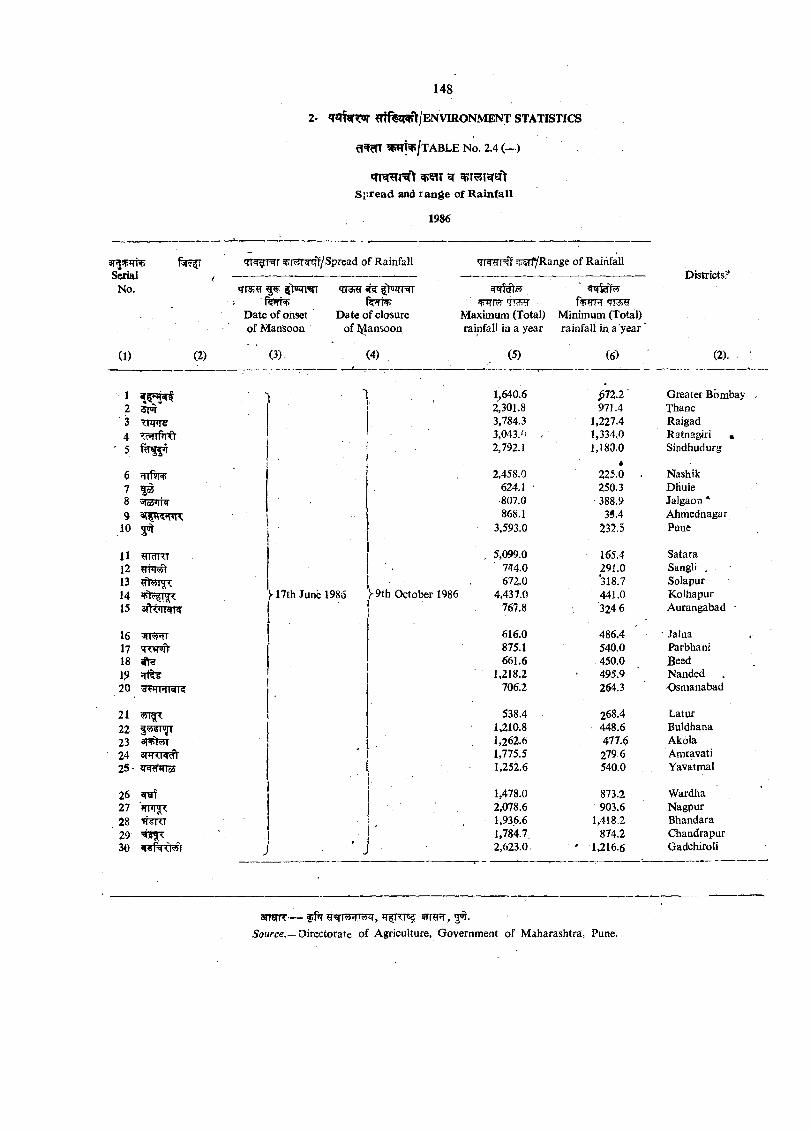
2* «T*7f5T??>r m f^lW t/EN V IR O N M EN T STATISTICS
S^cTT W W »/t ABLE No. 2.4 (—)
S p re a d and ra n g e of R a in fa ll
1986
ar^snrnpSerial
No.
^[^^sff/Spread of Rainfall
crraj r i|>RrRT i ferrNr
Date of onsetof Mansooa
qi3?Er ifs ^2TRT
Date o f closureof l^ansoon
(1) (2) (3)*
(4) (5)
1 1 1,640.62 51# 2,301.83 3,784.34 ^HTpl'O 3,043,0
' 5 2,792.1
6 «iin(icfi 2,458.0
7 5® 624.18 '»|aJJii«» 807.09 868.1
10 3,593.0
11 ^IcfRT , 5,099.012 7^4.013 672.014 )■ 17th June 1986 }-9th October 1986 4,437.015 3fK»rwi<« 767.8
16 3Ti^r 616.017 875.118 ^ 661.61? ?ri^¥ 1,218.220 706.2
21 '\ 538.422 |553T<gT 1,210.823 1,262.624 SHRRRft 1 1,775.525 ' JT3RT*fl«5 1,252.6
26 1,478.027 2,078.628 '«Vr<I 1,936.629 ' I 1,784.7,30 j ' ■ • . ■ J 2,623.0,
^sriyRange of Rainfall
Tr^*r f^TTRMaximum (Total) Minimum (Total) rainfall in a year rainfall in a year
(6)
Districts;’
^72 .2 '971.4
1,227.41.334.01.180.0
*225.0250.3
- 388.936.4
232.5
165.4291.0 318.7441.0 324 6
486.4540.0
. 450.0495.9264.3
268.4448.6477.6279.6540.0
873.2903.6
1,418.2874.2
1,216.6
(2).
Greater BbmbayThaneRaigadRatnagiri , Sindhudurg
Nashik Dhule Jalgaon * Ahmednagar Pune
Satara Sangli ,Solapur Kolhapur Aurangabad -
JalnaParbhaniBeedNandedOsmanabad
LaturBuldhanaAkolaAmravatiYavatmal
WardhaNagpurBhandaraChandrapurGadchiroli
3!TsrR— f Pt H=Ern5rTT , 5'»r.Sowrce.—Directorate o f Agriculture, Government o f Maharashtra, Pune.
3.
s n r ^ ^rt'JT T^^R w w
3T^.
^ f^p rn r igr f « ^ r ^ l A e n n r m?irre*rrarT ^ r m «Pt®zn^ a r r ^ f t ? r r :—
(H ) ? T 3 ( ? i r ? T — - ^ X l ® o o
( ^ ) ? T 3 R T ^ ^ 'H «V r*f|3 t ? | ^ ? r ^ = ~ X *l®oo
!3 f5T 5 r= f^^?zrT ^Vi'\f^'+' ^ h « # ^ frr%5?n
lT=f5%?5nf >lVnn?J^ 3TT%? Tr
^ = : c q r ^ JT^qr^rsr
fl^;?ErT %?Wrfe^ f^ ^ * iT c ft^^^rTE®fT
TT^=^ ? f^T .
( ^ )? O T ^aT ^5T
5Tf¥r^crifT ^5T^?N t« w r .
^ ^ r m i r r f ^ 3rrT>3TT=^r 3ti| .
f^m^UcT ^sfir^^rfW rv arr^ rt^ rrtt j f f ^ p ^ ic irN rfT »fto5T ^ rw R T ?n: frr»iTt ^ < r ^ ^ ^ r < T i f ^^ «fijTMTf^+T^ ^rrfsrfii^ JFpi sfi^.
a -^T 5{?Tr^?:^ JT?JTg[<
TTTf 'V a rm l 3tt| .
5T^^T 5fi. TTs^ snj^^ Jflf? %%ezrr jr r^ = ^3tt| .
ir s ^ f^* r ^ %%%
?!;. a rr^y ij^ ifT ^ vrRrrfirszrv
3TT|?r.
VITAL STATISXrCS
3'1 The following tables give data on birth rate, death rate, infant mortality rate, number of deaths according to principal causes in Maharashtra.
3*2 While presenting tables in this section the following definitions were adopted ;—
1. Birth rate per thousand estimatedB
p o p u la t io n = ~ x 1000 N2. Death rate per thousand estiimted
Dp o p u la t io n = r -x 1000 N
Where, B=N o. of live births which occurred among the population of the given geographical area during the year under reference, D =N o. of deaths which occurred among the population of given geographical area during the year under reference and N = estimated Mid-year population.
No. of deaths under one year of age which occurred in the given geographical Area
X ^ 0 o o 3 Infant Mortality rate:No. of live births
which occurred among the population in th^ same geographical area.
X 1000
Infant mortality rate is a good indicator of social health.
3*3 The data on vital statistics was collected through revenue agency in rural area and for urban area, it is a statuto^ function of Municipalities and Municipal Corporations.
Table 3.1 to 3.3 give the infor-mation regarding birth rates and death rates.
Table 3.4 gives number of registered deaths by principal causes.
Table 3.5 gives number of registered deaths by age and sex.
Table 3.6 gives registered infant mortality rate and registefred maternal mortality rate.
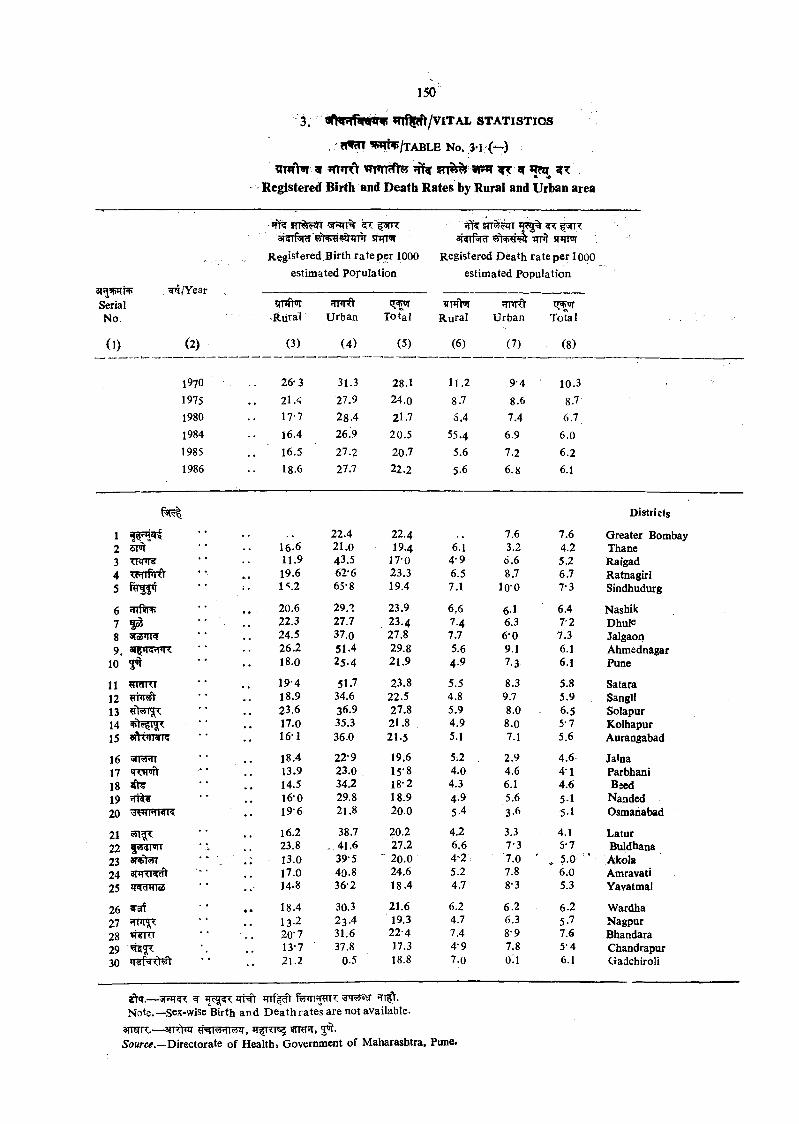
3. mf|pfy/VlTAL STATISTICS
x(m\w at m *R t s f k s n ^ 5iwr ^ h? »mi« ^Registered Birth and Deatli Rates by Rural and Urban area
sfq%irNi ^^ Y ear
' 5ff? s n % ^ ■ =*0% %T !3Tr : s R i f ^ srirm
R egistered B irth ra te per 1000
estim ated Population
jff? STT^^T «TT 3?^Tf^ wl+yV) TTR sf*rror
Registered D eath ra te per lOOOestim ated population
0Serial •THiO H+ui 9iffN Hi»r<VNo. R ufal U rban T otal R ural U rban Total
( 1) (2) (3) (4 ) (5) (6) (7) (8)
1970 26-3 31.3 28.1 11.2 9-4 10.3
1975 21 27.9 24.0 8.7 8.6 8.71980 17-7 28.4 21.7 5.4 7.4 6.71984 16.4 26.9 20.5 55.4 6.9 6.01985 16.5 27.2 20.7 5.6 7.2 6.21986 18.6 n . i 22.2 5.6 6.8 6.1
Districts
1 21A 22.4 7.6 7.6 Greater Bombay2 sm 16.6 21.0 19.4 6.1 3.2 4.2 Thane3 TT w 11.9 43.5 17-0 4.9 6.6 5.2 Raigad4 Tenift-d 19.6 62-6 23.3 6.5 8.7 6.7 Ratnagiri5 r«^iM •• l ‘J.2 65-8 19,4 7.1 lo-o 7-3 Sindhudurg
6 HtfJH't.- 20.6 29.2 23.9 6.6 6.1 6,4 Nashik7 " , , 22.3 27.7 , 23.4 7.4 6.3 7-2 Dhuie8 '*ld6<rR 24.5 37.0 27.8 7.7 6-0 7.3 Jalgaon9. 26.2 51.4 29.8 5.6 9.1 6.1 Ahmednagar
10 5^ •• 18.0 25.4 21.9 4.9 7.3 6.1 Pune
11 ^ n r 19-4 51.7 23.8 5.5 8.3 5.8 Satara12 18.9 34.6 22.5 4.8 9.7 5.9 Sangli13 23.6 36.9 27.8 5.9 8.0 6.5 Solapur14 “ 17.0 35.3 21.8 4.9 8.0 5-7 Kolhapur15 iflVW R - 16-1 36.0 21.5 5.1 7.1 5.6 Aurangabad
16 'sir-aHi 18.4 22-9 19.6 5;2 2.9 4.6 Jalna17 'T T ^ 13.9 23.0 15-8 4.0 4.6 4 1 Parbhani18 9 ^ 14.5 34.2 18-2 4.3 6.1 4.6 Bjed19 5TT^ 16-0 29.8 18.9 4.9 5.6 5.1 Nanded20 . . 19-6 21.8 20.0 5-4 3-6 5-1 Osmanabad
21 16.2 38.7 20.2 4.2 3.3 4.1 Latur22 ‘ - 23.8 , 4 1 . 6 27.2 6.6 7-3 0-7 Buldhana23 * * - 13.0 39-5 " 20.0 4-2 7.0 ' . 5 .a • Akola24 17.0 40.8 24.6 5.2 7.8 6.0 Amravati25 14-8 36-2 18.4 4.7 8-3 5.3 Yavatmal
26 • • 18.4 30.3 21.6 6.2 6.2 6.2 Wardha27 HWI < 13-2 23.4 19.3 4.7 6.3 5.7 Nagpur28 ■ , ^ 20-7 31.6 22-4 7.4 8-9 7.6 Bhandara29 13-7 37.8 17.3 4.9 7.8 5-4 Chandrapur30 •• 21.2 0.5 18.8 7.0 0.1 6.1 Gadchiroli
N ote.—sex-wise Birth an d D ea th rates are not available.
siwR.— 3TRtnr 5fRnT, 5^.Source.—Directorate of Health* Government of Maharashtra, Pune.
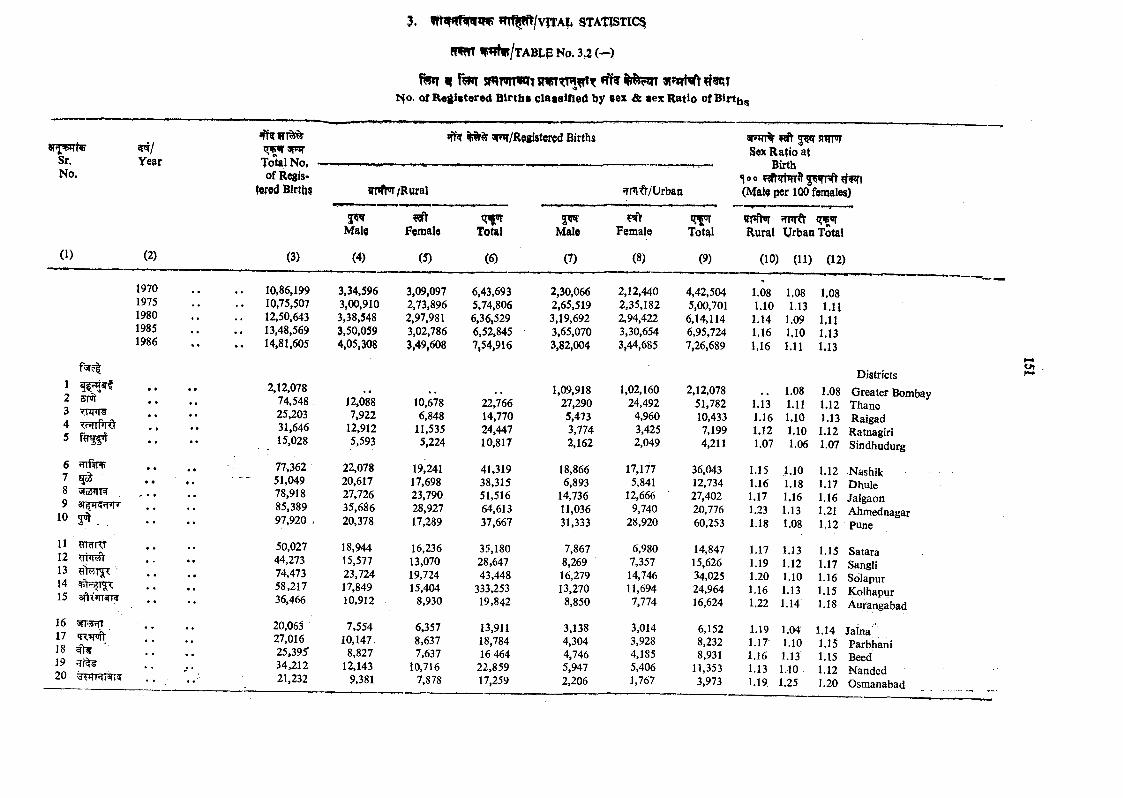
3 . mftffft/viTAip STATISTICS
?W?fT W f^ lT A B tB Np. 3,2 (—)
lS[o. of Registered B lrtbt classified by sex ^ sex Ratio of Blrt^^
Sr. Year
ITI%
Total No. -
sfiN aRT/Registered BirthsSex Ratio at
No. of Registered Birtljs /Rural ffr^fl’/Urban
Uutn
(Male per 100 females)
y wMale
?5ftFemale Total Male Female Total
srnrft Rural Urban Total
(1) (2) (3) (4) (5) (6) (7) (8) (9) (10) (11) (12)
19701975198019851986
• • 10,86,19910,75,50712,50,64313,48,56914,81,605
3,34,5963,00,9103,38,5483,50,0594,05,308
3,09,0972,73,8962,97,9813,02,7863,49,608
6,43,6935,74,8066,36,5296,52,8457,54,916
2,30,0662,65,5193,19,6923,65,0703,82,004
2,12,4402,35,1822,94,4223,30,6543,44,685
4,42,5045,00,7016,14,1146,95,7241,26,6%9
1.08 1,08 1.08 1.10 1.13 l.U 1.14 1.09 l.U 1.16 1.10 1.13 1,16 1.11 1.13
123 <Ri|«4 ^ rP rfl'5
• ♦ • • • «
• •
• • 2,12,07874,54825,20331,64615,028
12,0887,922
12,9125,593
10,6786,848
11,5355,224
22,76614,77024,44710,817
1,09,91827,2905,4733,7742,162
1,02,16024,492
4,9603,4252,049
2,12,07851,78210,4337,1994,211
Districts1.08 1.08 G reater Bombay
1.13 1.11 1.12 Thane 1.16 1.10 1.13 Raigad 1.12 1.10 1.12 Ratnagiri 1.07 1.06 1.07 Sindhudurg
6 -iinirif78 ufiZTflW9 3rgq 5T»R
10 yif
» • • «
■ i>‘ • • * ♦ • •
• • 77,362 51,049 78,918 85,389 97,920 .
22,07820,61727,72635,6^620,378
19,24117,69823,79028,92717,289
41,31938,31551,51664,61337,667
18,8666,893
14,73611,03631,333
17,1775,841
12,6669,740
28,920
36,04312,73427,40220,77660,253
1.15 1.10 1.12 Nashik1.16 1.18 1.17 Dhule1.17 1.16 1.16 Jalgaon 1.23 1.13 1.21 Ahmednagar1.18 1.08 1.12 Pune
11 ?n^rnT12 nvRTt13 '1415 3fti»n<fT5
• • • • • •
• •
50.02744,27374,47358,21736,466
18,94415,57723,72417,84910,912
16,23613,07019,72415,404
8,930
35,18028,64743,448
333,25319,842
7,8678,26916,27913,270
8,850
6,9807,35714,74611,6947,774
14,84715,62634,02524,96416,624
1.17 1.13 1.15 Satara1.19 1.12 1.17 Sangli1.20 1.10 1.16 Solapur 1.16 1.13 1.15 Kolhapur 1.22 1.14 1.18 Aurangabad
16 'Jil'rtrll17 «R (roit18 ^1920 ^<TRRT?
• • • • * »
••
20,06327,01625,395"34,21221,232
7,55410,147
8,82712,143
9,381
6,3578.6377.637
10,7167,878
13,911 18,784 16 464
22,859 17,259
3,1384,3044,7465,9472,206
3,0143,9284,1855,4061,767
6,1528,2328,931
11,3533,973
1.19 1.04 1.14 Jaina ’1.17 1.10 1.15 Parbhani 1.16 1.13 1.15 Beed 1.13 1.10 1.12 Handed1.19 1.25 1,20 Osmanabad
o»
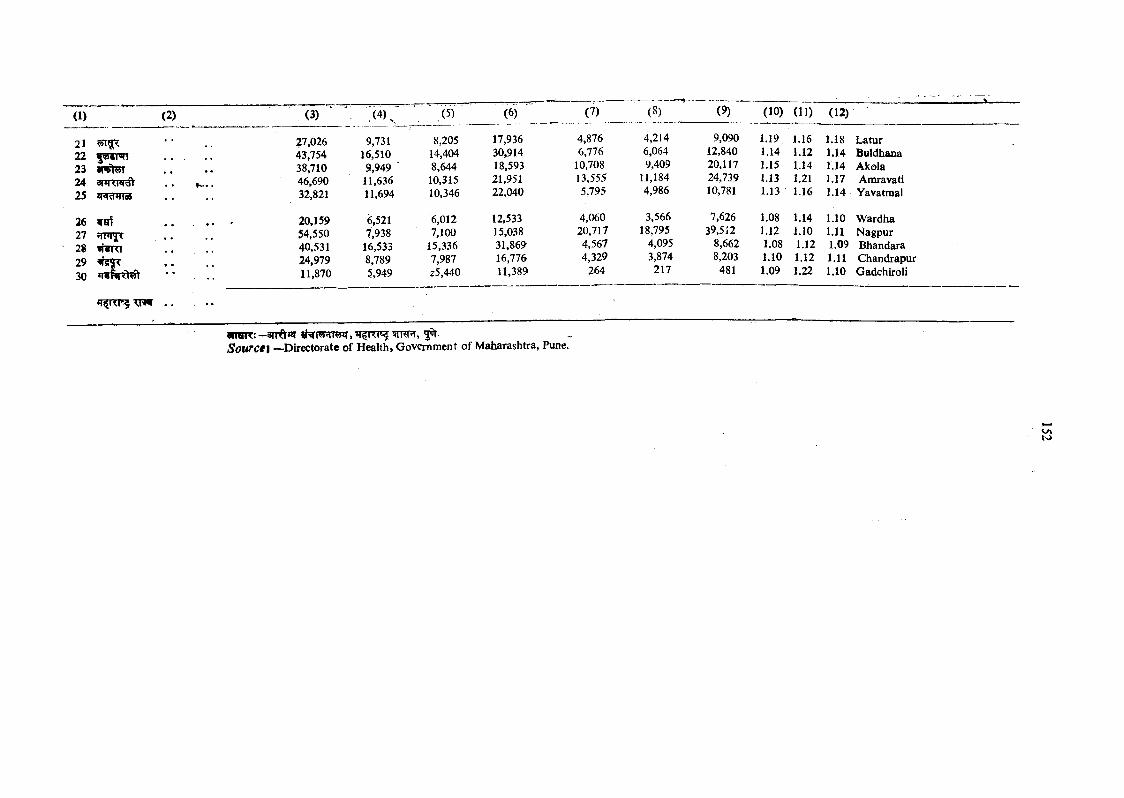
21222324 a m w d t25 iRRmra
26 JTW2728 vw m2930
(3) (6) (7) (8) (9) (10) (11) (12)
27,026 9,731 8,205 17,936 4,876 4,214 9,090 1.19 1.16 1.18 Latur45,754 16,510 14,404 30,914 6,776 6,064 12,840 1.14 1.12 1.14 Buldhana38,710 9,949 ■ 8,644 18,593 10,708 9,409 20,117 1.15 1.14 1.14 Akola46,690 11,636 10,315 21,951 13,555 11,184 24,739 1.13 1.21 1.17 Amravati32,821 11,694 10,346 22,040 5,795 4,986 10,781 1.13 1.16 1.14 Yavatmal
20,159 6,521 6,012 12,533 4,060 3,566 7,626 1.08 1.14 1.10 Wardha54,550 7,938 7,100 15,038 20,717 18,795 39,512 1.12 1.10 1.11 Nagpur40,531 16,533 15,336 31,869 4,567 4,095 8,662 1.08 1.12 1.09 Bhandara24,979 8,789 7,987 16,776 4,329 3,874 8,203 1.10 1.12 1.11 Chandrapur11,870 5,949 z5,440 11,389 264 217 481 1.09 1.22 1.10 Gadchiroli
atran:;—3nft«i ^ •Source} —Directorate of H ealth, Government of Maharashtra, Pune.
vy*
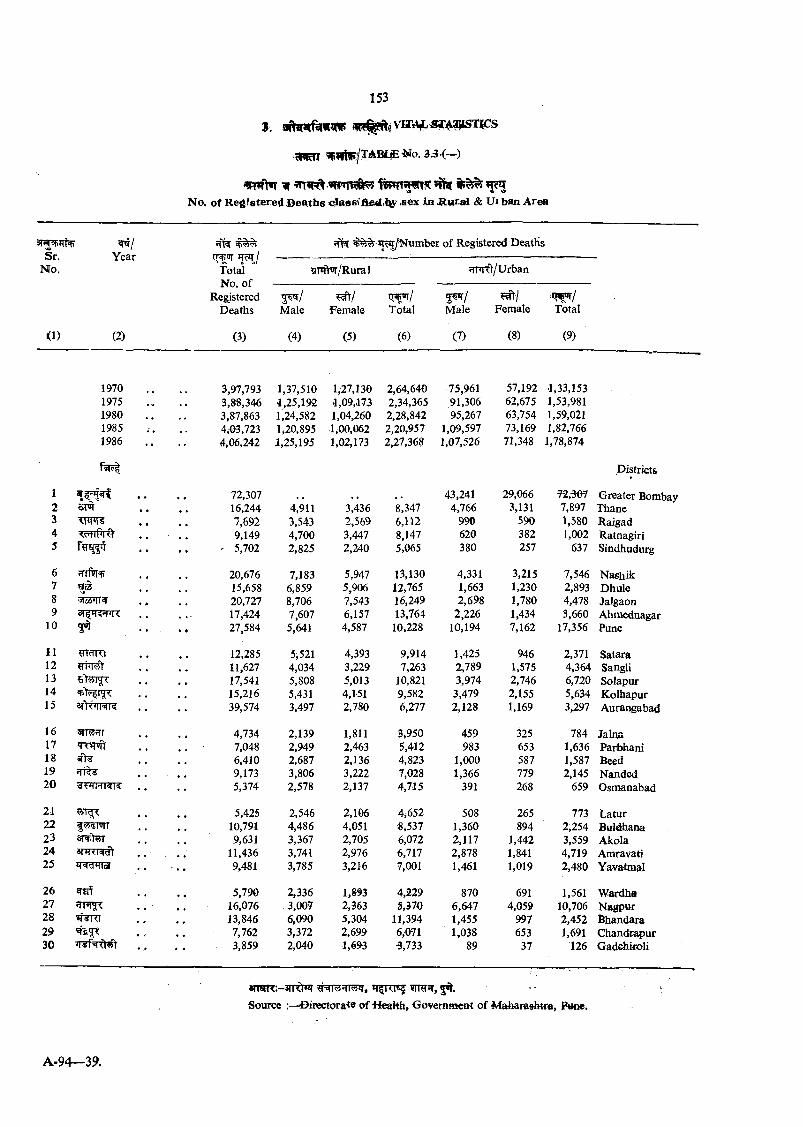
^ 9 I ! ^ / T A M ^ N o .a 3 < - )
^ > T W »W 1TO^ ^ ?Jc^N o. of R egi8teE e^ .0eaths «ta«8ified.i]|y<8ex j^ JElur,al & Urban Area
Sr. Year N o.
<1) (2)
fft?M /
Total No. of
Registered Deaths
(3)
?fR 4 lr5% ^/N um ber of Registered Deaths
?iI'»ft«l/RuraI ?rt»r^/Urban
5 ^ /Male
(4)
Female
(5)
t r ^ lTotal
(6)
5 ^ /Male
(7)
Female
(8)
Total
(9)
1970 3,97,793 1,37,510 1,27,130 2,64,640 75,961 57,192 •1,33,1531975 3,88,346 1,25,192 1,09,173 2,34,365 91,306 62,675 1,53,9811980 3,87,863 1,24,582 1,04,260 2,28,842 95,267 63,754 1,59,0211985 4i03,723 1^20,895 1,00,062 2,20,957 1,09,597 73,169 1,82,7661986 4,06,242 1,25,195 1,02,173 2,27,368 1,07,526 71,348 1,78,874
Districts
1 72,307 . . .. 43,241 29,066 72,307 Greater Bombay2 16,244 4,911 3,436 8,347 4,766 3,131 Thane3 7,692 3,543 2,569 6,112 990 590 1,580 Raigad4 9,149 4,700 3,447 8,147 620 382 1,002 Ratnagiri5 ' 5,702 2,825 2,240 5,065 380 257 637 Sindhudurg
6 ?Tff?r ., 20,676 7,183 5,947 13,130 4,331 3,215 7,546 Nashtk7 15,658 6,859 5,906 12,765 1,663 1,230 2,893 Dhule8 20,727 8,706 7,543 16,249 2,698 1,780 4,478 Jalgaon9 17,424 7,607 6,157 13,764 2,226 1,434 3,660 Ahmedoagar
10 27,584 5,641 4,587 10,228 10,194 7,162 17,356 Pune
11 HTcfTO 12,285 5,521 4,393 9,914 1,425 946 2,371 Satara12 11,627 4,034 3,229 7,263 2,789 1,575 4,364 Sangli13 17,541 5,808 5,013 10,821 3,974 2,746 6,720 Solapur14 15,216 5,431 4,151 9,582 3,479 2,155 5,634 Kolhapur15 3TYnTRT . , 39,574 3,497 2,780 6,277 2,128 1,169 3,297 Aurangabad
16 4,734 2,139 1,811 3,950 459 325 784 Jalrgi17 7,048 2,949 2,463 5,412 983 653 1,636 Parbhani18 6,410 2,687 2,136 4,823 1,000 587 1,587 Bead19 9,173 3,806 3,222 7,028 1,366 779 2,145 Nanded20 5,374 2,578 2,137 4,715 391 268 659 Osmanabad
21 5,425 2,546 2,106 4,652 508 265 773 Latur22 f ^ w r 10,791 4,486 4,051 «,537 1,360 894 2,254 Buldhana23 anfter 9,631 3,367 2,705 6,072 2,117 1,442 3,559 Akola24 STRTTsr . . : 11,436 3,741 2,976 6,717 2,878 1,841 4,719 Amravati25 9,481 3,785 3,216 7,001 1,461 1,019 2,480 Yavatm^l
26 5,790 2,336 1,893 4,229 870 691 1,561 W ardha27 16,076 3,007 2,363 5,370 6,647 4,059 10,706 Nagpur28 ^■^Kl 13,846 6,090 5,304 11,394 1,455 997 2,452 Bhandara29 7,762 3,372 2,699 6,071 1,038 653 1,691 Chandrapur30 3,859 2,040 1,693 5,733 89 37 126 G ad ^ iro li
8rraR;-3rRhiT *t r i«5 inTST, 5« .
Source :-^E>irectora<9 of ffcalth , <3overnflient o f M aharashtra, Pune.
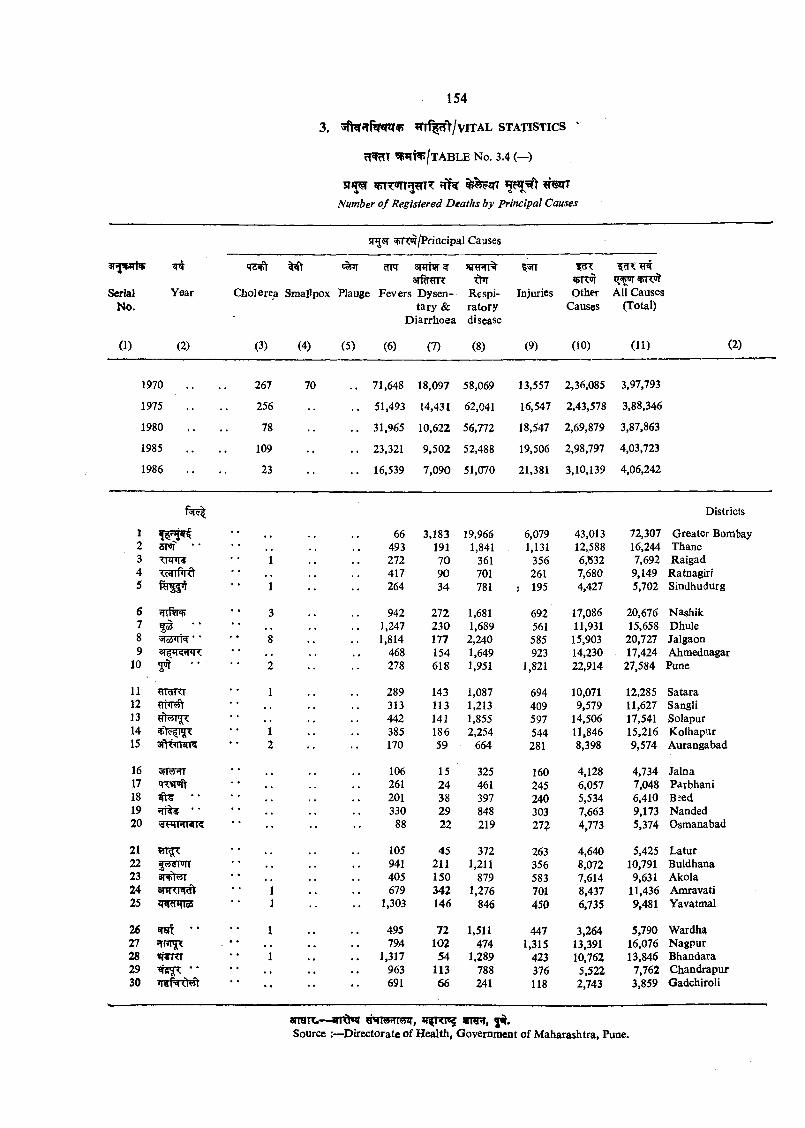
3. m % r> /v iT A L STATISTICS "
cf«WT ^T (t^ /T A B L E N o. 3.4 (—)
^ #5?TTNumber o f Registered Deaths by Principal Causes
^ ^ /P r in c ip a l Causes
grrr3rfcT n'< VR”?
Serial Year Cholerea Smallpox Plauge Fevers D ysen- Respi Injuries Other All CausesNo. tary & ratory Causes (Total)
D iarrhoea disease
(1) (2) (3) (4) (5) (6) (7) (8) (9) (10) (11) (2)
1970 267 70 . . 71,648 18,097 58,069 13,557 2,36,085 3,97,793
1975 256 . . 51,493 14,431 62,041 16,547 2,43,578 3,88,346
1980 78 . . 31,965 10,622 56,772 18,547 2,69,879 3,87,863
1985 109 . . 23,321 9,502 52,488 19,506 2,98,797 4,03,723
1986 23 •• . . 16,539 7,090 51,070 21,381 3,10,139 4,06,242
Districts
1 * • , . 66 3,183 19,966 6,079 43,013 72,307 Greater Bombay2 5T«I • • * * , , 493 191 1,841 1,131 12,588 16,244 Thane3 1 272 70 361 356 6,^532 7,692 Raigad4 Tc^rf^Rl * * 417 90 701 261 7,680 9,149 Ratnagiri5 1 264 34 781 ; 195 4,427 5,702 Sindhudurg
6 ■'fllftT'P 3 942 272 1,681 692 17,086 20,676 Nashik7 * * , . 1,247 230 1,689 561 11,931 15,658 Dhule8 8 1,814 177 2,240 585 15,903 20,727 Jalgaon9 468 154 1,649 923 14,230 17,424 Ahraednagar
10 5^ 2 278 618 1,951 1,821 22,914 27,584 Pune
11 W!iJKT 1 289 143 1,087 694 10,071 12,285 Satara12 313 113 1,213 409 9,579 11,627 Sangli13 ' ' 442 141 1,855 597 14,506 17,541 Solapur14 1 385 186 2,254 544 11,846 15,216 Kolhapur15 3f\i^n«iR 2 170 59 664 281 8,398 9,574 Aurangabad
16 106 15 325 160 4,128 4,734 Jalna17 * * 261 24 461 245 6,057 7,048 Parbhani18 ^ • * ’ ’ 201 38 397 240 5,534 6,410 B :ed19 • • 330 29 848 303 7,663 9,173 Nanded20 * * 88 22 219 272 4,773 5,374 Osmanabad
21 • • ^ 105 45 372 263 4,640 5,425 L atur22 |^ < > n ’ * 941 211 1,211 356 8,072 10,791 Buldhana23 * * 405 150 879 583 7,614 9,631 Akola24 STRTI^ 1 679 342 1,276 701 8,437 11,436 Amravati25 1 1,303 146 846 450 6,735 9,481 Yavatmal
26 ^ ’ • 1 495 72 1,511 447 3,264 5,790 W ardha27 ?rrn^ * * 794 102 474 1,315 13,391 16,076 Nagpur28 »r«Ki 1 . . 1,317 54 1,289 423 10,762 13,846 Bhandara29 * • 963 113 788 376 5,522 7,762 Chandrapur30 ' * 691 66 241 118 2,743 3,859 Gadchiroli
ansR*— «MmT553T, ? rm ,Source :—D irectorate of H ealth, Government o f Maharash tra, Pune.
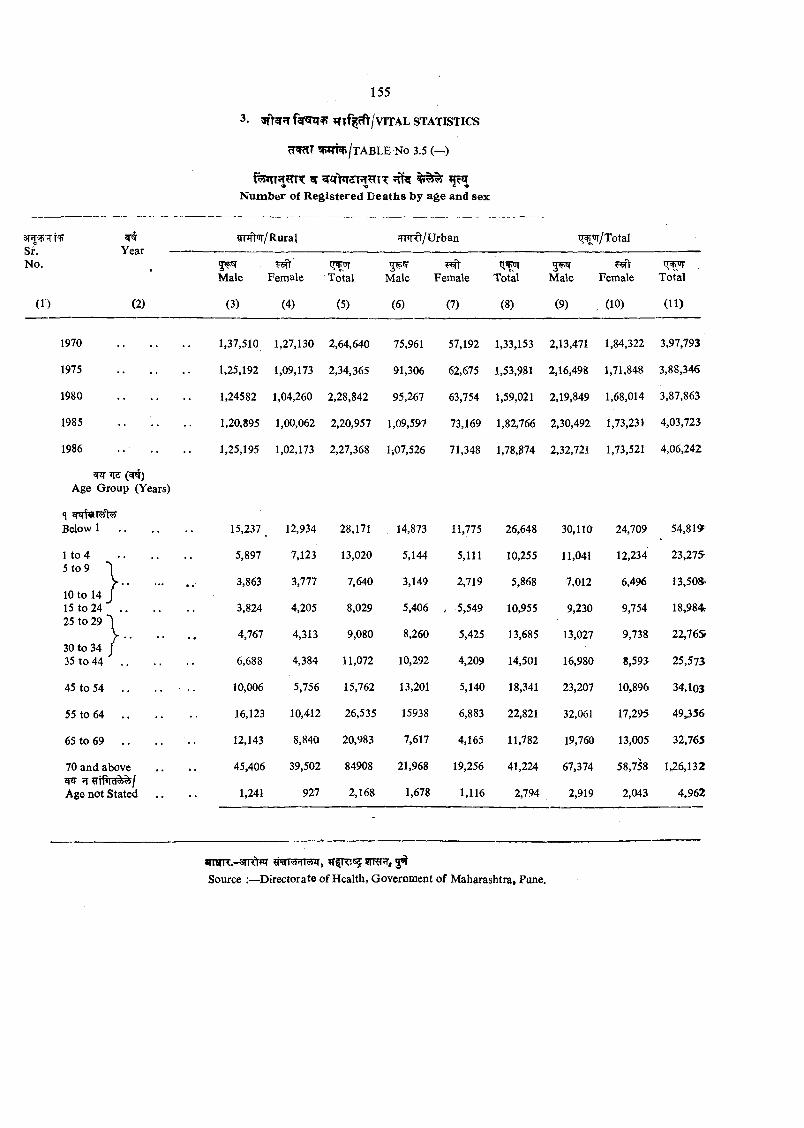
cT m 5piri^ /tab le No 3.5 (—)
^ sr€r>TffT?f?ni: ^>9 9 C >9Number of Registered Deaths by age and sex
3^15(5^1^S hN o.
Year^TPf^r/Rural ?m ft/U rban «r^»Jr/Total
5 ^Male Female
1 ^ 5Total
p:>TMale
?E^Female
11+5Total
gTPrMale Female Total
(1) (2) (3) (4) (5) (6) (7) (8) (9) , (10) (11)
1970 1,37,510 1,27,130 2,64,640 75,961 57,192 1,33,153 2,13,471 1,84,322 3,97,793
1975 •• 1,25,192 1,09,173 2,34,365 91,306 62,675 1,53,981 2,16,498 1,71,848 3,88,346
1980 •• 1,24582 1,04,260 2,28,842 95,267 63,754 1,59,021 2,19,849 1,68,014 3,87,863
1985 1,20,895 1,00,062 2,20,957 1,09,597 73,169 1,82,766 2,30,492 1,73,231 4,03,723
1986 1,25,195 1,02,173 2,27,368 1,07,526 71,348 1,78,374 2,32,721 1,73,521 4,06,242
Age G roup (Years)
Below 1 15,237 12,934 28,171 14,873 11,775 26,648 30,110 24,709 54,81^
1 to 4 5 to 9 1
•• 5,897 7,123 13,020 5,144 5,111 10,255 11,041 12,234 23,275
10 to 14 J•• 3,863 3,777 7,640 3,149 2,719 5,868 7,012 6,496 13,50».
15 to 24 . . 25 to 29 ■)
•• 3,824 4,205 8,029 5,406 , 5,549 10,955 9,230 9,754 18^84.
30 to 34 / 35 to 44 . .
•• 4,767 4,313 9,080 8,260 5,425 13,685 13,027 9,738 22,765
6,688 4,384 11,072 10,292 4,209 14,501 16,980 8,593 25,573
45 to 54 10,006 5,756 15,762 13,201 5,140 18,341 23,207 10,896 34,103
55 to 64 . . 16,123 10,412 26,535 15938 6,883 22,821 32,061 17,295 49»356
65 to 69 . . 12,143 8,840 20,983 7,617 4,165 11,782 19,760 13,005 32,765
70 and above •• 45,406 39,502 84908 21,968 19,256 41,224 67,374 58,758 1,26,132
Age not Stated 1,241 927 2,168 1,678 1,116 2,794 2,919 2,043 4,962
a n H R .-3 rr^ TTfrocj vrnnT, 30^
Source :—^Directorate of Health, Government o f M aharashtra, Pune,
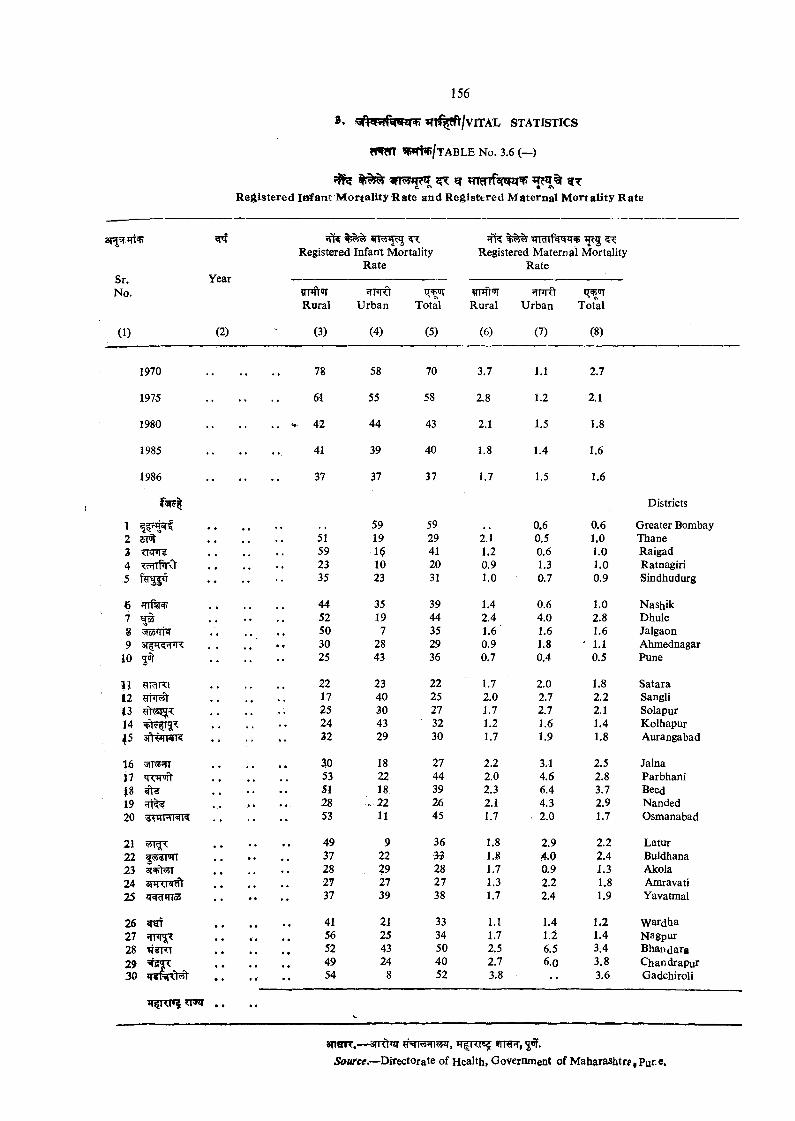
S. I T l f ^ /v iT A L STATISTICS
^a#p /T A B L E No. 3.6 (—)
Registered Infant Mortality « ate and Registered Maternal Mortality Rate
Registered Infant M ortality Registered M aternal Mortality
Sr.No.
(1)
Year
(2)
Rate Rate
Rural
(3)
U rban
(4)
ll + UjTotal
(5)
¥TJft’JrRural
(6)
JTTJTftU rban
(7)
Total
(8)
1970 , , . , 78 58 70 3.7 1.1 2.7
1975 •• •• 61 55 58 2.8 1.2 2.1
1980 •• 42 44 43 2.1 1.5 1.8
1985 41 39 40 1.8 1.4 1.6
1986 37 37 37 1.7 1.6
Districts
1 59 59 0.6 0.6 Greater Bombay2 sm 51 19 29 2.1 0.5 1.0 Thane3 <1A|<1 59 16 41 1.2 0.6 1.0 Raigad4 <(HTfcCt 23 10 20 0.9 1.3 1.0 Ratnagiri.5 35 23 31 1.0 0.7 0.9 Sindhudurg
6 44 35 39 1.4 0.6 1.0 Nashik7 ^ , , 52 19 44 2.4 4.0 2.8 Dhule8 50 7 35 1.6 1.6 1.6 Jalgaon9 • • 30 28 29 0.9 1.8 ' 1.1 Ahmednagar
10 5W 25 43 36 0.7 0.4 0.5 Pune
11 ?!TgTO 22 23 22 1.7 2.0 1.8 Satara12 17 40 25 2.0 2.7 2.2 Sangli43 25 30 27 1.7 2.7 2.1 Solapur14 , * 24 43 32 1.2 1.6 1.4 Kolhapur|5 ai^MwrK 32 29 30 1.7 1.9 1.8 Aurangabad
16 5lT rfT 30 18 27 2.2 3.1 2.5 Jalna17 53 22 44 2.0 4.6 2.8 ParbhaniJ8 ^ 51 18 39 2.3 6.4 3.7 Beed19 ^ » • • • 28 22 26 2.1 4.3 2.9 Nanded20 53 11 45 1.7 • 2.0 1.7 Osmanabad
21 49 9 36 1.8 2.9 2.2 Latur22 4-?J<il«rT • • 37 22 •39 l.S 4-0 2.4 Buldhana23 28 29 28 1.7 0.9 1.3 Akola24 27 27 27 1.3 2.2 1.8 Amravati25 iJctdmoS 37 39 38 1.7 2.4 1.9 Yavatmal
26 wgf 41 21 33 1.1 1.4 1.2 W ardha27 5TFI < 56 25 34 1.7 1.2 1.4 Nagpur28 52 43 50 2.5 6.5 3.4 Bhandara29 49 24 40 2.7 6.0 3.8 Chandrapur30 • • • 4 •• 54 8 52 3.8 •• 3.6 Gadchiroli
ana??.— anrh^T h ^ k t^ ^rRnr, 50?.Source.—Directorate of Health, Government of M aharashtrp, Pur.e.
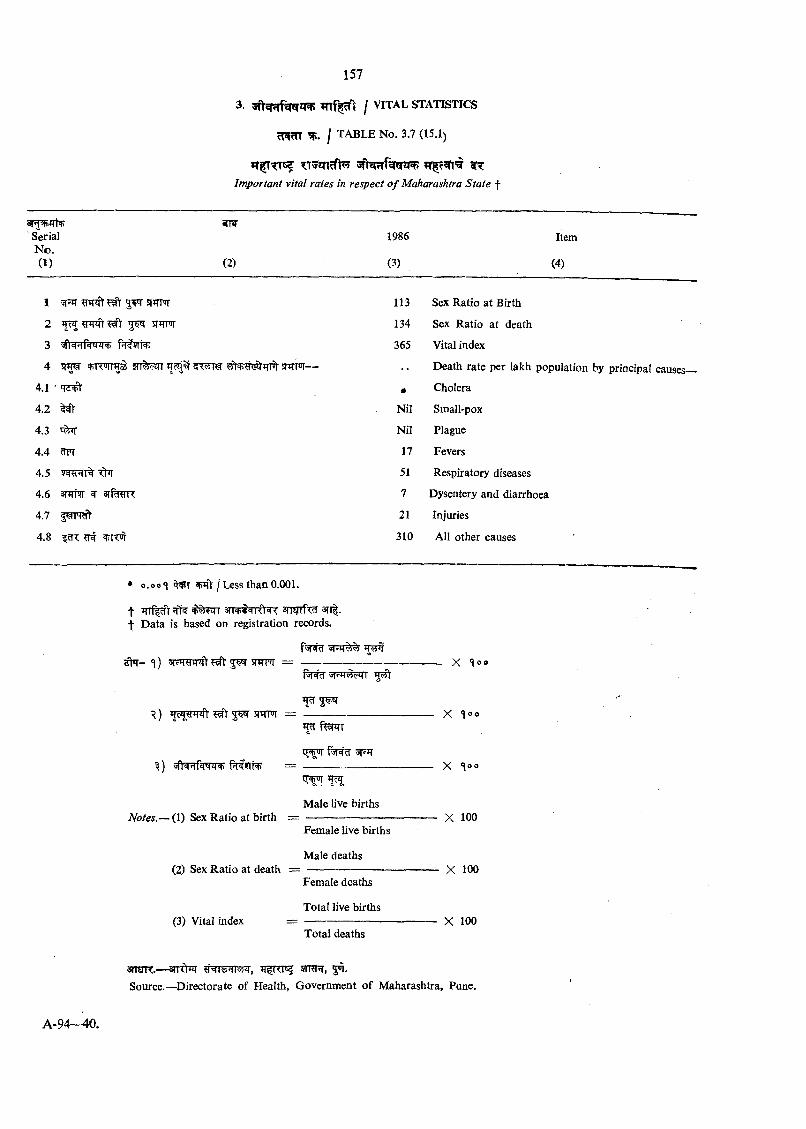
3. I VITAL STATISTICS
I t a b l e N o. 3.7 (15.1)
Important vital rates in respect o f Maharashtra Sta te f
aiH'ite+ii'i) ' Serial
N o . (1) (2)
1986
(3)
Item
(4)
1 «r?iT ^ 113 Sex Ratio at Birth
2 ^ 5 ^ 5 1 ^ 134 Sex Ratio at death
3 f?rf5it^ 365 Vital index
4 =t)r<u|l*|Q6 5TT%i?!rr $TRTOT— • • Death rate per lakh population by principal causes—
4.1 ' ifd+) • Cholera
4.2 ^ Nil Small-pox
4.3 Nil Plague
4.4 ^ 17 Fevers
4.5 ^5^1% 51 Respiratory diseases
4.6 srfmrR 7 Dysentery and diarrhoea
4.7 21 Injuries
4.8 cTT ^ 310 All other causes *
• 0.00 <\ I Less than 0.001.
t 3 n ^T 3 3T l | .
t D ata is based on registration records.
^ 5W SPPTTJI =
^ ) ^cJlW ff ^ JW RTTPir =
M t i f f =
Notes.— (1) Sex Ratio at birth =
(2) Sex R atio at death =
(3) Vital index
^ u r
M ale live births
Female live births
Male deaths
Female deaths
Total live births
Total deaths
X lo o
X *loo
X 100
X 100
X 100
sm nr.— s r r ^ u rm , jq .Source.—Directorate of Health, Government o f Maharashtra, Pune.
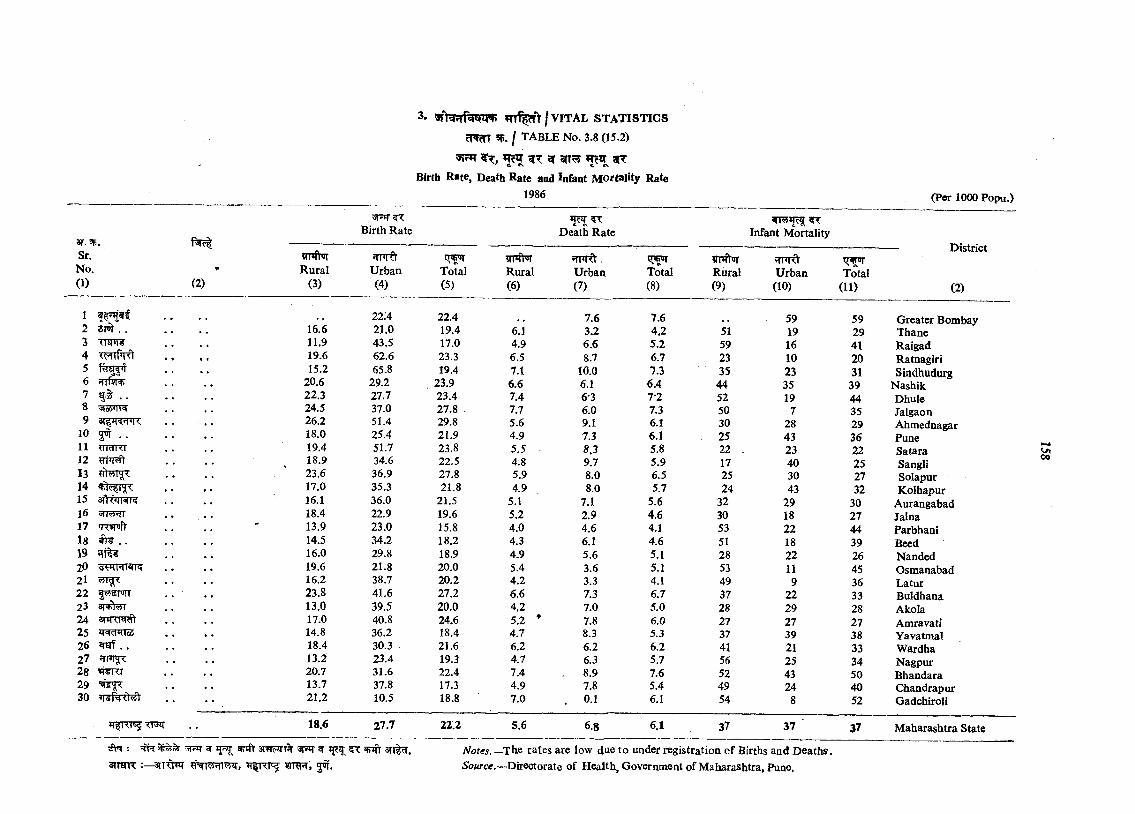
3. VITAL s t a t i s t i c s
rTWm ’P. I t a b l e No. 3.8 (15.2)
^ ^ 3(T?5 arcBirth Rate, Death Rate and Infant M ortality Rate
1986
3T.^.Sr.
No.(1) (2)
12 a w ..3 m m456 Jfrfsrt't.7 . .8 di>*\\49
10 5W ..11121314151617 'rr*p>iVl81920 'jitm'iWK212223 3T^«T242526 ^ . .2728 VSXT2930
R ural(3)
16.611.919.615.2
20.622.324.526.2 18.019.418.923.617.016.118.413.914.5 16.019.6 16.2 23.813.017.0 14.8 18.413.220.713.721.2
18.6
Birth Rate D eath R ate
U rban(4)
22.4 21.043.562.665.8
29.227.737.051.425.451.734.636.935.336.022.923.034.229.821.838.7 41.639.540.836.230.323.431.637.810.5
27.7
Total(5)
Rural(6)
fTFTft.U rban(7)
22.419.417.023.319.4
23.923.427.8 .29.821.923.822.527.821.8
21.519.615.8 18.218.920.0 20.227.2 20.024.6 18.421.619.322.4 17.3 18.8
22.2
6.14.96.57.16.67.47.75.64.95.54.85.94.9
5.15.24.04.34.95.44.26.64.25.24.76.24.77.44.97.0
Total(8)
Infant M ortality
Rural(9)
fTFRtU rban(10)
Total(11)
District
(2)
5.6
7.6 7.6 59 59 G reater Bombay3.2 4.2 51 19 29 Thane6.6 5.2 59 16 41 Raigad8.7 6.7 23 10 20 Ratnagiri
10.0 7.3 35 23 31 Sindhudurg6.1 6.4 44 35 39 Nashik6-3 7-2 52 19 44 Dhule6.0 7.3 50 7 35 Jalgaon9.1 6.1 30 28 29 Ahmednagar7.3 6.1 25 43 36 Pune8.3 5.8 22 . 23 22 Satara9.7 5.9 17 40 25 Sangli8.0 6.5 25 30 27 Solapur8.0 5.7 24 43 32 K olhapur
7.1 5.6 32 29 30 Aurangabad2.9 4.6 30 18 27 Jalna4.6 4.1 53 22 44 Parbhani6.1 4.6 51 18 39 Beed5.6 5.1 28 22 26 Nanded3.6 5.1 53 11 45 Osmanabad3.3 4.1 49 9 36 Latur7.3 6.7 37 22 33 Buldhana7.0 5.0 28 29 28 Akola7.8 6.0 27 27 27 Amravati8.3 5.3 37 39 38 Yavatmal6.2 6.2 41 21 33 W ardha6.3 5.7 56 25 34 Nagpur8.9 7.6 52 43 50 Bhandara7.8 5.4 49 24 40 Chandrapur0.1 6.1 54 8 52 Gadchiroli
6.8 6.1 37 37 ■ 37 M aharashtra State
00
Notes.—T h t ra tes are low due to under registration o f Births and D eaths. Source.—Directorate of H ealth, Government of M aharashtra, Pune.
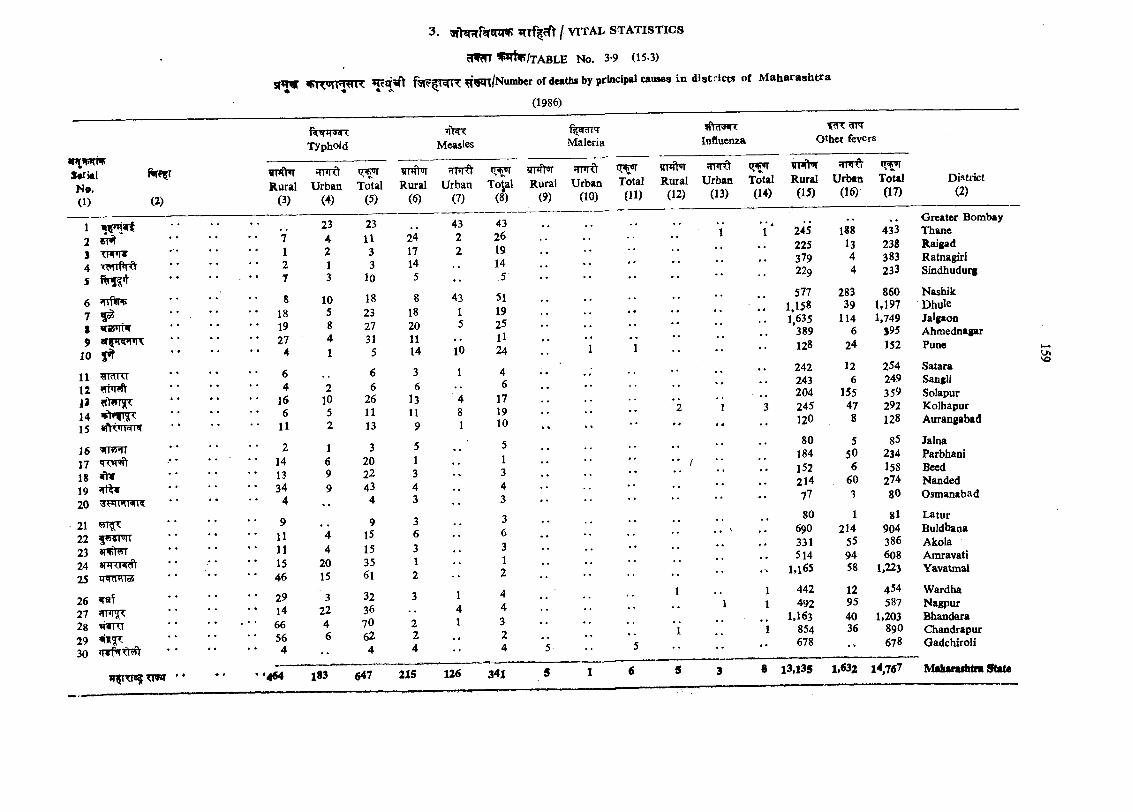
S«rkl
(1)
fiR p
(2)
123 T m r4 xmrftrft5
6 ^Trfiw7 ^S Mi6'<Tty 9
10 y»r
11 W TO1213 «tWT5[T
1415 sft'wra’T
1617 «Tw>fr18 ^19 5rft»20
21 m g r22 5W3FIT23 » r ^24 ann iv fr25 lT«fWo5
262728 WTO2930
3 . 5fV2nfr2r«T«W? *TTf^^ I VITAL STATISTIC S
cTfm ^*rtv/TABLE No. 3-9 (15-3)
SIHW ‘wr/Number of deaths by principal causes in districts of Maharashtra
(1986)
f^r^TaRTyphoid Measles
f srcTT'TMaleria lofluenza
f?fT rVTT Other fevers
?TPRW JTFrft ^Rural Urban Tota]
(5)(3)
;TPRt ?TT»R)‘ural Urban Total Rural Urban Total(6) (7) (8) (9) (10) (11)
5T*fhr JTPrft t?T"T vrtWRural Urban Total Rural Urban Total
(12) (13) (14)Diatrict
mpxT8$Tmr
23 23 43 43 . .7 4 11 24 2 26 ••1 2 3 17 2 192 1 3 14 ,. 147 3 10 5 • • 5 ••
8 10 18 8 43 51 • •• 18 5 23 18 1 19 ••• 19 8 27 20 5 25 •• * •• 27 4 31 11 11 • •
4 1 5 14 10 24 1
6 6 3 1 4 ••4 2 6 6 6 ••
• 16 10 26 13 4 17 • •6 5 11 11 8 19 2
• 11 2 13 9 1 10 "
2 1 3 5 5 • •• 14 6 20 1 1 ••• 13 9 22 3 3• 34 9 43 4 .. 4 ••
4 4 3 • • 3
9 9 3 .. 3 • •• 11 *4 15 6 6• 11 4 15 3 3• 15 20 35 1 1• 46 15 61 2 •• 2
• 29 3 32 3 1 4 1
• 14 22 36 4 4 • •
• 66 4 70 2 1 3• 56 6 62 2 . « 2 •• 1
4 •• 4 4 4 5 5
l83 647 215 126 341 5 1 6 5
(15) (16) (17) (2)
, , . . Greater Bombay245 188 433 Thane225 13 238 Raigad379 4 383 Ratnagiri229 4 233 Sindbudurg
577 283 860 Nashik1,158 39 1,197 Dhulc1,635 114 1,749 Jalgaon
389 6 395 Ahmednagar128 24 152 Pune
242 12 254 Satara243 6 249 Sangli204 155 359 Solapur245 47 292 Kolhapur120 8 128 Aurangabad
80 5 85 Jalna184 50 234 Parbhani152 6 158 Beed214 60 274 Nanded77 3 80 Osmanabad
80 1 8l Latur690 214 904 Buldbana331 55 386 Akola514 94 608 Amravati
1.165 58 1.223 Yavatmal
442 12 454 Wardha492 95 587 Nagpur
1,163 40 1,203 Bhandara854 36 89O Chandrapur678 , . 678 Oadchiroli
KJ\VO
4 i 3,i35 1*032 i 4,7$7 Maharaihfni Steta
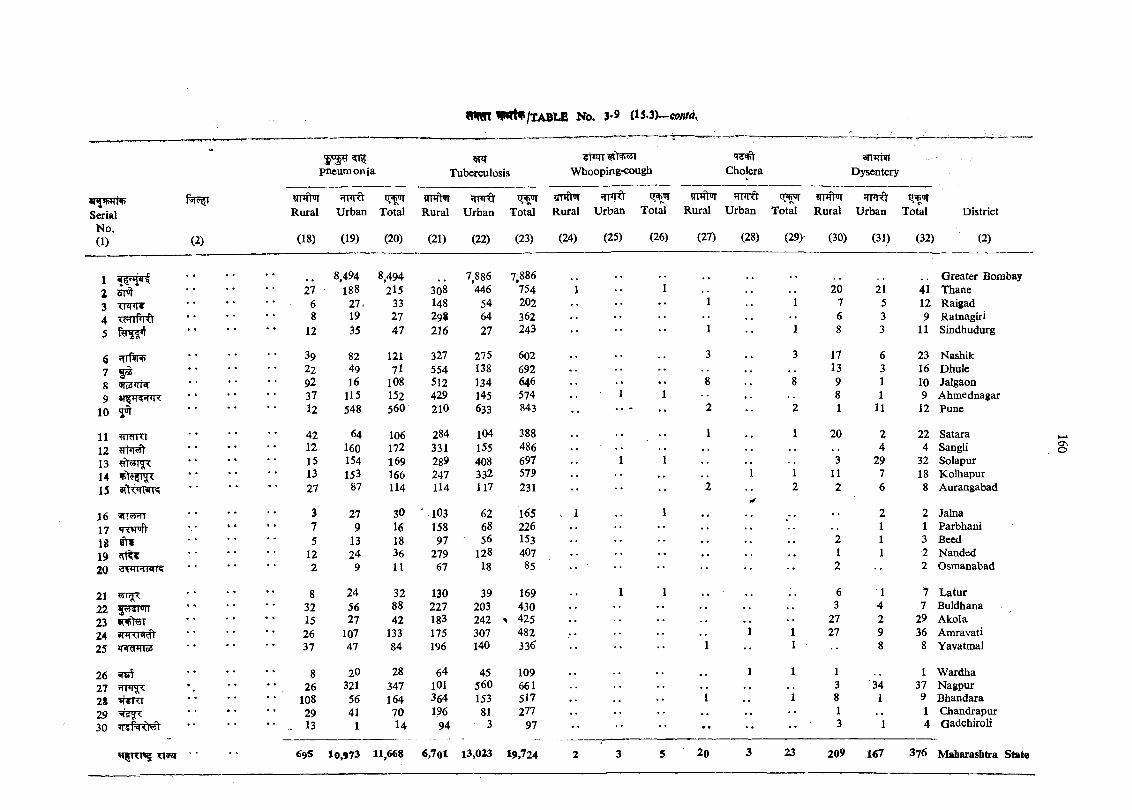
>- an TTHpneum onia Tuberculosis Whooping-cough Cholera Dysentery
vwvrIv «W>I n m t utrH ?rr*T t r ^ ?ri4iui qpiO
Serial Rural Urban Total Rural Urban Total Rural U rban T o t^ Rural Urban Total Rural Urban Total DistrictNo.(1) (2) (18) (19) (20) (21) (22) (23) (24) (25) (26) (27) (28) (29)' (30) (31) (32) (2)
1 8,494 8,494 7,886 7,886 . . . . Greater Bombay2 27 188 215 308 446 754 1 1 20 21 41 Thane3 xnTirv • • 6 27. 33 148 54 202 1 1 7 5 12 Raigad4 8 19 27 298 64 362 6 3 9 Ratnagiri
5 12 35 47 216 27 243 1 1 8 3 11 Sindhudurg
6 TTf’fPP 39 82 121 327 275 602 3 3 17 6 23 Nashik7 5 3 22 49 7I 554 138 692 13 3 16 Dhule8 ^ ^ rh r 92 16 108 512 134 646 8 8 9 1 10 Jalgaon9 ai iT rtfiR 37 115 152 429 145 574 •• 8 1 9 Ahmednagar
10 5^ 12 548 560 210 633 843 2 •• 2 1 11 12 Pune
11 ^mi<r 42 64 106 284 104 388 1 1 20 2 22 Satara12 «m <?n 12 160 172 331 155 486 4 4 Sangli13 15 154 169 289 408 697 3 29 32 Solapur14 13 153 166 247 332 579 1 1 11 7 18 Kolhapur13 sftt’INK 27 87 114 114 117 231 2 2 2 6 8 Aurangabad
16 3 27 30 ' 103 62 165 X 1 ,, 2 2 Jalna17 ‘TOToJV 7 9 16 158 68 226 1 1 Parbhani
18 ^ 5 13 18 97 ' 56 153 2 1 3 Beed
19 12 24 36 279 128 4O7 I 1 2 Nanded20 2 9 11 67 18 85 •• 2 2 Osmanabad
21 8 24 32 130 39 169 1 1 , , 6 1 7 Latur22 32 56 88 227 203 430 3 4 7 Buldhana23 15 27 42 183 242 425 27 2 29 Akola24 amxHcft 26 107 133 175 307 482 1 1 27 9 36 Amravati25 i( 5TlTT«5 37 47 84 196 140 336 1 1 8 8 Yavatmal
26 ^ 8 20 28 64 45 109 1 1 1 1 W ardha27 26 321 347 101 560 661 3 34 37 Nagpur28 H«KJ 108 56 164 364 153 517 I 1 8 1 9 Bhandara29 29 41 70 196 81 277 1 1 Chandrapur30 TiT^nchTf •• . 13 1 14 94 3 97 •• •• 3 1 4 Gadchiroli
»qini«5 X l^ 69S 10373 11,668 6,70l 13,023 19,724 2 3 5 20 3 23 209 167 376 Mabarashtra State
aso
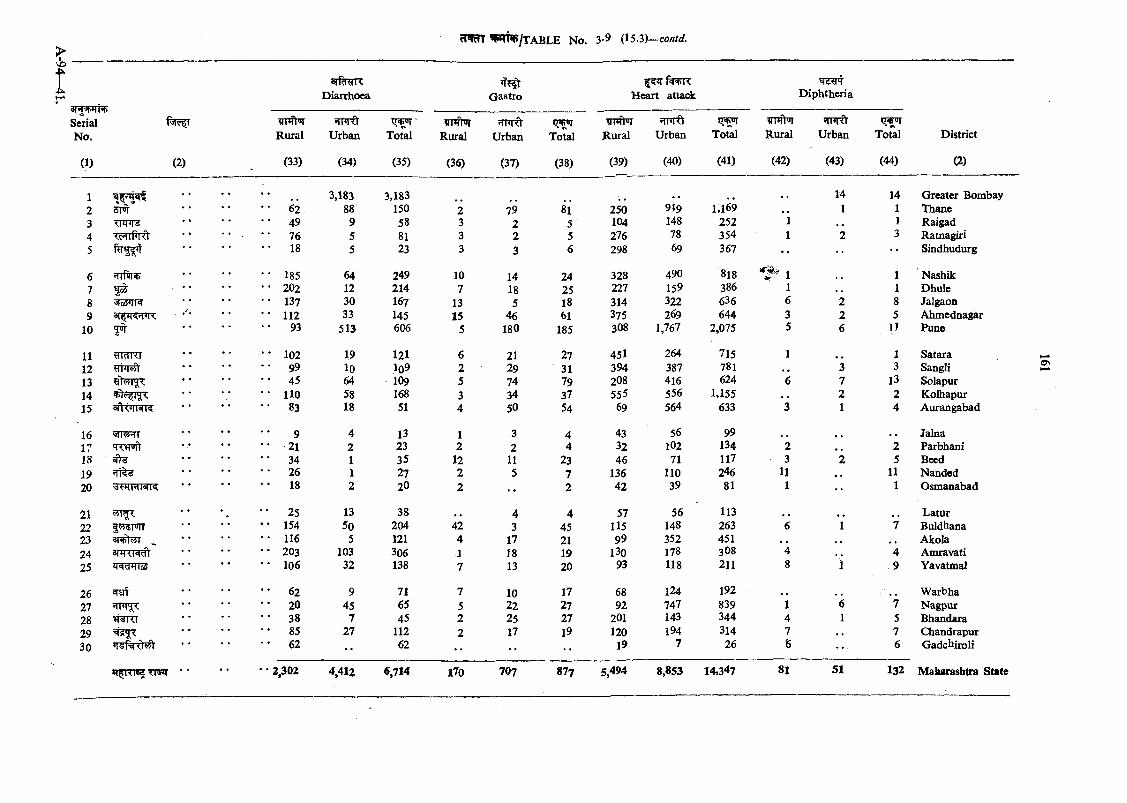
VO
I3TT' i rN>SerialNo.
(1) (2)
arf^RTRDiarrhoea G astro H eart attack D iphtheria
District
(2)
Rural
(33)
Urban
(34)
Total
(35)
Rural
(36)
rfM<lUrban
(37)
Total
(38)
Rural
(39)
Urban
(40)
tT ^T o ^
(41)
Rural
(42)
Urban
(43)
Total
(44)
1 3.183 3,183 .. .. 14 14 Greater Bombay2 5p>r " 62 88 150 2 79 81 250 919 1,169 , . 1 1 Thane3 •• 49 9 58 3 2 5 104 148 252 1 1 Raigad4 • • 76 5 81 3 2 5 276 78 354 1 2 3 Ratnagiri5 • • 18 5 23 3 3 6 298 69 367 •• •• •• Sindhudurg
6 hiRiisf • • 185 64 249 10 14 24 328 490 818 1 1 Nashik7 • • 202 12 214 7 18 25 227 159 386 1 1 DhuleS '3jo5 nw • • 137 30 167 13 5 18 314 322 636 6 2 8 Jalgaon9 • • 112 33 145 15 46 61 375 269 644 3 2 5 Ahmednagar
10 yjl- •• 93 513 606 5 180 185 308 1,767 2,075 5 6 IJ Pune
11 ^IdRI •* 102 19 121 6 21 27 451 264 715 1 1 Satara12 yUtw)' • • 99 10 l09 2 29 31 394 387 781 3 3 Sangli13 •• 45 64 109 5 74 79 208 416 624 6 7 13 Solapur14 S5?L • • no 58 168 3 34 37 555 556 1,155 2 2 Kolhapur15 SfV ’TTafK •• 83 18 51 4 50 54 69 564 633 3 1 4 Aurangabad
16 9 4 13 1 3 4 43 56 99 Jalna17 qxqrjft •• 21 2 23 2 2 4 32 102 134 2 2 ParbhanI18 * • 34 1 35 12 11 23 46 71 117 3 2 5 Beed19 ’]\^4 •• 26 1 27 2 5 7 136 110 246 11 11 Nanded20 ^FTRRT^C •• 18 2 20 2 •• 2 42 39 81 1 •• 1 Osmanabad
21 •• 25 13 38 4 4 57 56 113 .. L atur22 •• 154 50 204 42 3 45 115 148 263 6 1 7 Buldhana23 •• 116 5 121 4 17 21 99 352 451 , , , . Akola24 srn'-CMd) •• 203 103 306 1 18 19 130 178 3O8 4 4 Amravati25 *1^155 • • 106 32 138 7 13 20 93 118 211 8 1 9 Yavatmal
26 •• 62 9 71 7 10 17 68 124 192 .. W arbha27 •• 20 45 65 5 22 27 92 747 839 I 6 '7 Nagpur28 •• 38 7 45 2 25 27 201 143 344 4 1 5 Bhandara29 W 85 27 112 2 17 19 120 194 314 7 7 Chandrapur30 •• 62 •• 62 •• •• •• 19 7 26 •• 6 Gadchiroli
• • • • 2,302 4,412 6,714 170 707 877 5,494 8,853 14,347 81 51 132 Maharashtra Stafe
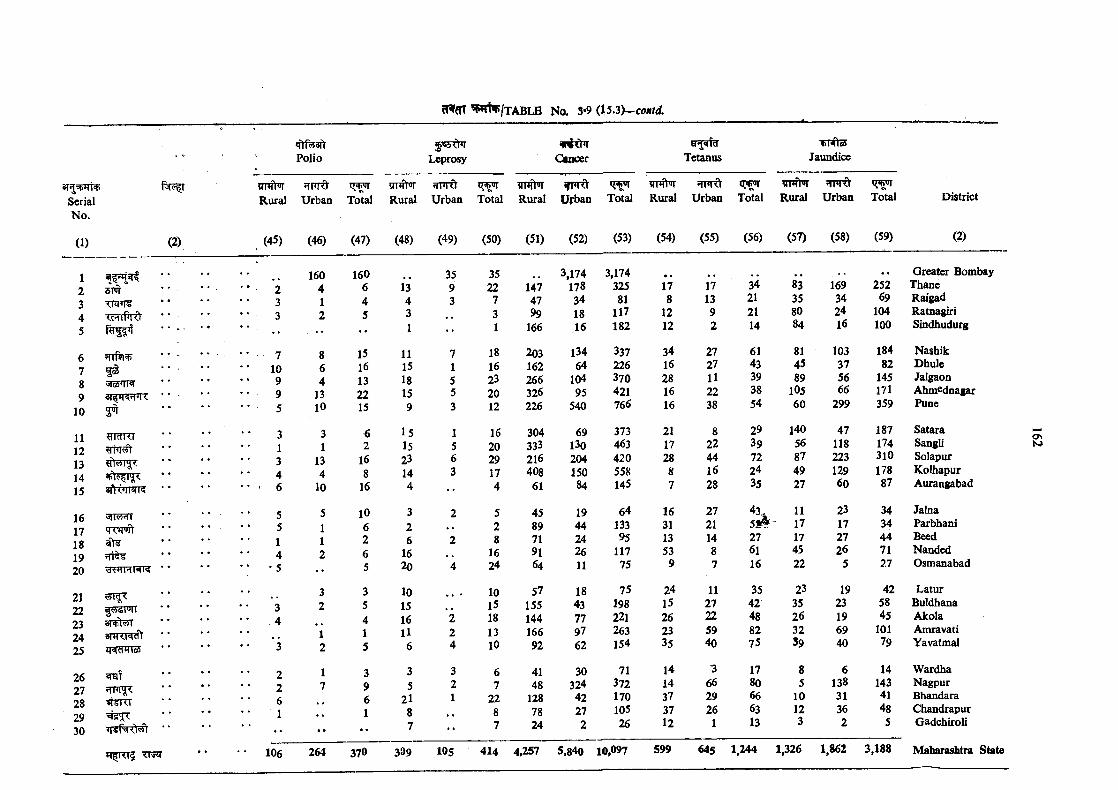
SerialNo.
(1)
12345
678 9
10
1112131415
1617181920
2122232425
2627282930
Polio Leprosyv i t h r
Cancer Tetanus Jaundice
f ^ t HTtrW 5TnrftRural Urban Total
(2) . (45) (46) (47)
160 160sm * •• 2 4 6
3 1 4iHl ** 3 2 5
“ ••
• • 7 8 15
I® •• 10 6 16'Jiajmw 9 4 13
. . 9 13 22
2^ • • 5 10 15
^IdKI • • 3 3 6rnT55V 1 1 2
3 13 16' • 4 4 8
. 6 10 16
5 5 10qxsimt 5 1 6
1 1 24 2 6
^FTFTTifR • • -5 •• 5
^ \i< . , 3 33 2 5
•• 4 4s n m ^ , , 1 1il«JdMTd5 3 2 5
2 1 32 7 96 6
*• 1 •• 1' ' . . . .
fTPRt ifrn^ ffPRt s n rd ^Rural Urban Total Rural Urban Total Rural Urban Total Rural U rban Total
(48) (49) (50) (51) (52) (53) (54) (55) (56) (57) (58) (59)
District
(2)
106 264 370
13 43 1
111518159
1515 23144
326
16 20
101516 U6
35
2187
309 105
3593
35 3,174 3,174 . . G reater Bombay22 147 178 325 17 17 34 83 169 252 Thane
7 47 34 81 8 13 21 35 34 69 Raigad3 99 18 117 12 9 21 80 24 104 Ratnagiri1 166 16 182 12 2 14 84 16 100 Sindhudurg
18 203 134 337 34 27 61 81 103 184 Nashik16 162 64 226 16 27 43 45 37 82 Dhule23 266 104 370 28 11 39 89 56 145 Jalgaon20 326 95 421 16 22 38 105 66 171 Ahmcdnagar12 226 540 766 16 38 54 60 299 359 Pune
16 304 69 373 21 8 29 140 47 187 Satara20 333 130 463 17 22 39 56 118 174 Sangli29 216 204 420 28 44 72 87 223 310 Solapur17 408 150 558 8 16 24 49 129 178 Kolhapur4 61 84 145 7 28 35 27 60 87 Aurangabad
5 45 19 64 16 27 43.^ 11 23 34 Jalna2 89 44 133 31 21 5 # 17 17 34 Parbhani8 71 24 95 13 14 27 17 27 44 Beed
16 91 26 117 53 8 61 45 26 71 Nanded24 64 11 75 9 7 16 22 5 27 Osmanabad
10 57 18 75 24 11 35 23 19 42 Latur15 155 43 198 15 27 42 35 23 58 Buldhana18 144 77 221 26 22 48 26 19 45 Akola13 166 97 263 23 59 82 32 69 101 Amravati10 92 62 154 35 40 75 39 40 79 Yavatmal
6 41 30 71 14 3 17 8 6 14 W ardha7 48 324 372 14 66 80 5 138 143 Nagpur
22 128 42 170 37 29 66 10 31 41 Bhandara8 78 27 105 37 26 63 12 36 48 Chandrapur7 24 2 26 12 1 13 3 2 5 Gadchuroli
»14 4.257 5,840 10,097 599 645 1,244 1,326 1,862 3,188 Maharashtra Stal
ONN>
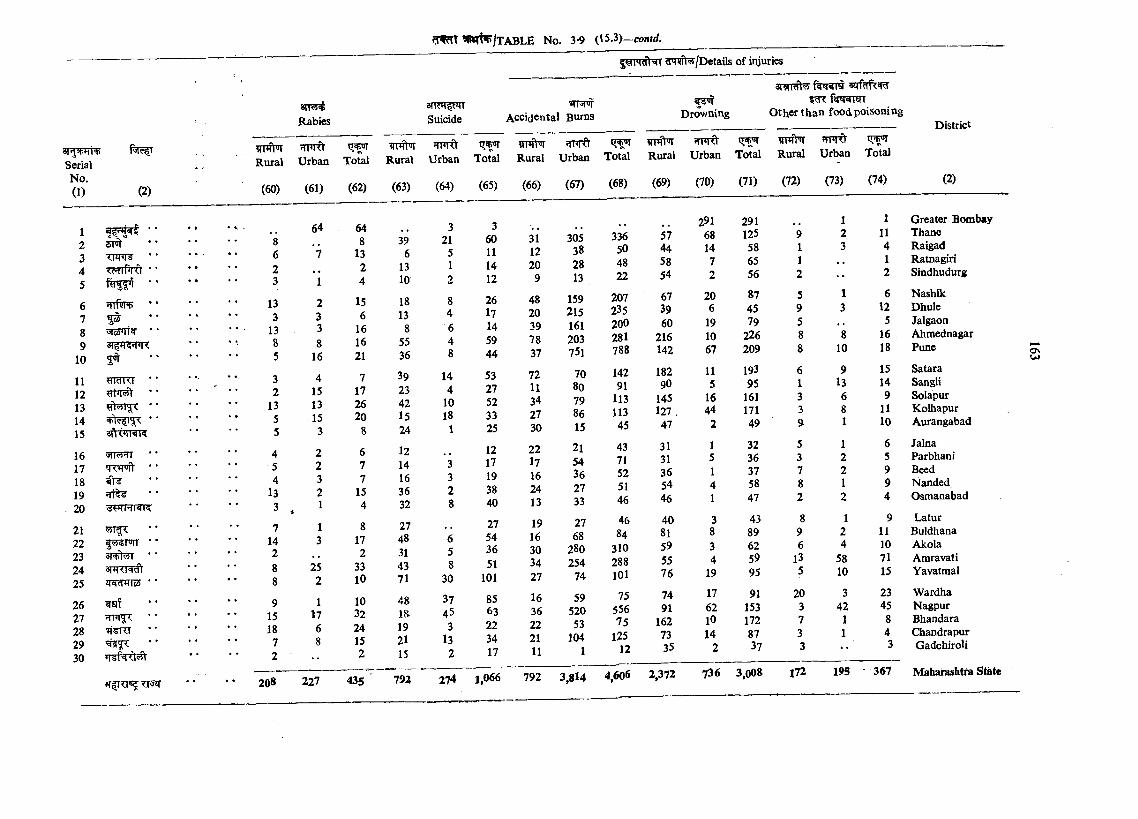
pfrq^fNr ^<nh^/Details of injuries
SerialNo.(1)
12345
678 9
10
1112131415
1617181920
2122232425
2627282930
f T5fT
(2)
TTtni^v!c?nMt
vnftTsp
3T lT5pnR3 ^
?IWRT
qxwTl’
^ST^TTsr fft JTsnrowcftzRcTRTo?
9i¥RT
BTT5yRabies Suicide
«rnrifAccidental Bums
3RTRft^ fk^grd wRrfksRi fksrwTET
Drowning O ther th a n food poisoning
TTfft ’TPRt R ural U rban Total
?toW ^ ^ ^ ^Rural Urban Total Rural Urban Total Rural Urban Total Rural Urban Total
(60) (61) (62) (63) (64) (65) (66) (67) (68) (69) (70) (71) (72) (73) (74)
623
133
13
3 2
1355
45 4
13 3
714 28 8
915 1872
64
2338
16
4 15 13 153
22321
13
252
1176
648
1324
15 6
16 16 21
7 17 26 208
677
154
8 172
3310
103224152
396
1310
1813
85536
3923421524
121416 36 32
27483143 71
4818192115
3 21
5 1 2
846 48
144
1018
1
3328
658
30
37453
132
3 291 291
60 31 305 336 57 68 125 9
11 12 38 50 44 14 58 1
14 20 28 48 58 7 65 1
12 9 13 22 54 2 56 2
26 48 159 207 67 20 87 5
17 20 215 235 39 6 45 9
14 39 161 200 60 19 79 5
59 78 203 281 216 10 226 8
44 37 751 788 142 67 209 8
53 72 70 142 182 11 193 6
27 11 80 91 90 5 95 1
52 34 79 113 145 16 161 3
33 27 86 113 127 . 44 171 3
25 30 15 45 47 2 49 9
12 22 21 43 31 1 32 5
17 17 54 71 31 5 36 3
19 16 36 52 36 1 37 7
38 24 27 51 54 4 58 8
40 13 33 46 46 1 47 2
27 19 27 46 40 3 43 8
54 16 68 84 81 8 89 9
36 30 280 310 59 3 62 6
51 34 254 288 55 4 59 13
101 27 74 101 76 19 95 5
85 16 59 75 74 17 91 20
63 36 520 556 91 62 153 3
22 22 53 75 162 10 172 7
34 21 104 125 73 14 87 3
17 11 1 12 35 2 37 3
13
810
9136
12212
124
5810
342
11
1114 1 2
612
5 16 18
1514 9
1110
6 59 9 4
91110 7115
2345843
District
(2)
Greater BombayThaneRaigadRatnagiriSindhudurg
NashikDhuleJalgaonAhmednagarPune
SataraSangliSolapurKolhapurAurangabad
JalnaParbhaniBeedNandedOsmanabad
LaturBuldhanaAkolaAmravatiYavatmal
W ardhaNagpurBhandaraChandrapurGadchiroU
ON
208 227 435 792 274 1,066 792 3 8 l4 4,606 2,372 736 3,008 l72 195 ‘ 367 Maharashtra State
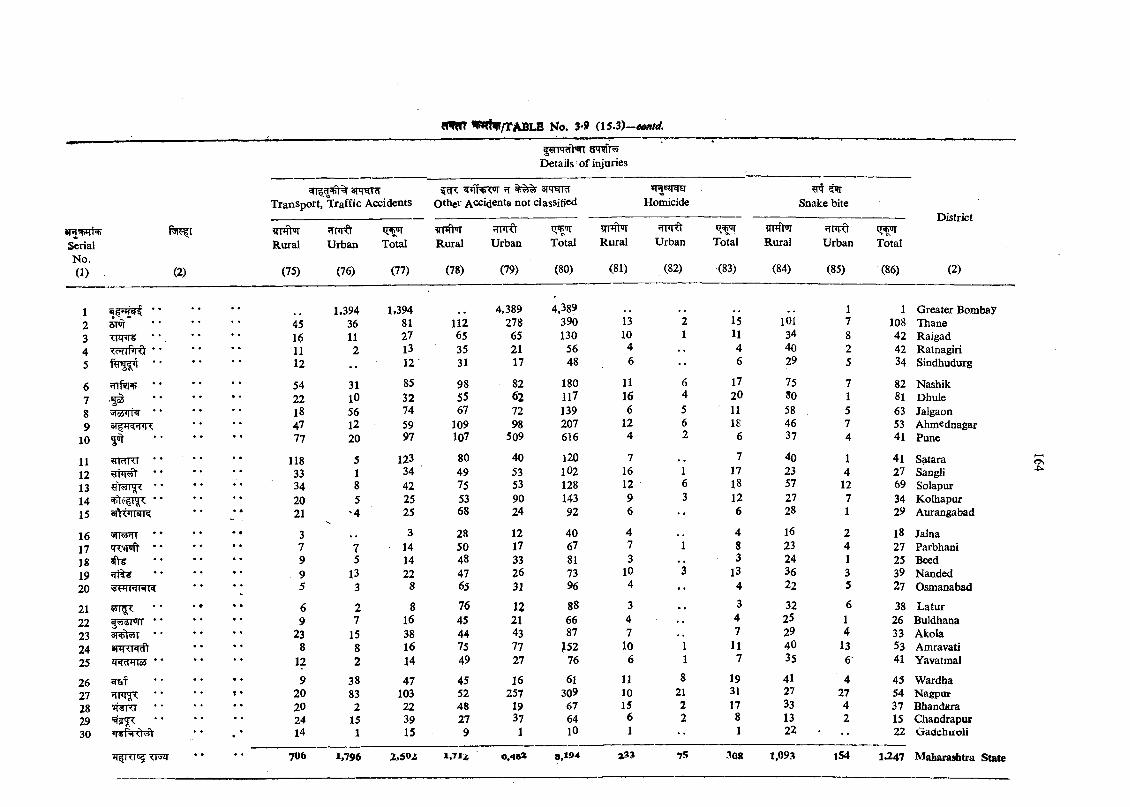
Details o f injuries
a m r^Transport, Traffic Accidents Other Accidents not classified Homicide Snake bite
apl'FTTSF ^iT*Tbn' iT^rSerial Rural Urban Total Rural Urban Total Rural Urban Total Rural Urban TotalNo.(1) (2) (75) (76) (77) (78) (79) (80) (81) (82) (83) (84) (85) (86)
1 • 1.394 1,394 4,389 4,389 1 12 jjpit 45 36 81 112 278 390 13 2 15 161 7 1083 TT5FT5 • • 16 11 27 65 65 130 10 1 11 34 8 424 ^oTTf’R t * * 11 2 13 35 21 56 4 4 40 2 425 f % ^ r • • 12 12 31 17 48 6 •• 6 29 5 34
6 jrrfin^ * • 54 31 85 98 82 180 11 6 17 75 7 827 ,5 3 22 10 32 55 62 117 16 4 20 80 1 818 * * * * 18 56 74 67 72 139 6 5 11 58 5 639 47 12 59 109 98 207 12 6 18 46 7 53
10 jtir 77 20 97 107 509 616 4 2 6 37 4 41
11 « C d K I '• 118 5 123 80 40 120 7 7 40 1 4112 * * 33 1 34 ' 49 53 102 16 1 17 23 4 2713 34 8 42 75 53 128 12 6 18 57 12 6914 * * * ’ 20 5 25 53 90 143 9 3 12 27 7 3415 3j V ^ * t r r 21 '4 25 68 24 92 6 •• 6 28 1 29
16 grr<jj?fT • • 3 3 28 12 40 4 4 16 2 1817 * • 7 7 14 50 17 67 7 1 8 23 4 2718 9 5 14 48 33 81 3 3 24 1 2519 9 13 22 47 26 73 10 3 13 36 3 3920 5 3 8 65 31 96 4 •• 4 22 5 27
21 <A\^< •• 6 2 8 76 12 88 3 3 32 6 3822 * * 9 7 16 45 21 66 4 4 25 1 2623 • • 23 15 38 44 43 87 7 7 29 4 3324 en rcR rft 8 8 16 75 77 ?52 10 1 11 40 13 5325 i<««d*no5 *• 12 2 14 49 27 76 6 1 7 35 6 41
26 9 38 47 45 16 61 11 8 19 41 4 4527 20 83 103 52 257 309 10 21 31 27 27 5428 ^ifgrci * ' 20 2 22 48 19 67 15 2 17 33 4 3729 * • 24 15 39 27 37 64 6 2 8 13 2 1530 14 1 15 9 1 10 1 1 22 ' 22
T T ^ * * 706 i,796 2,50a l , 7 1 z 0 ,4 0 2 8 ,1 0 4 2 3 3 7i? 308 t,093 154 1»247
District
(2)
Greater Bombay
a\4^
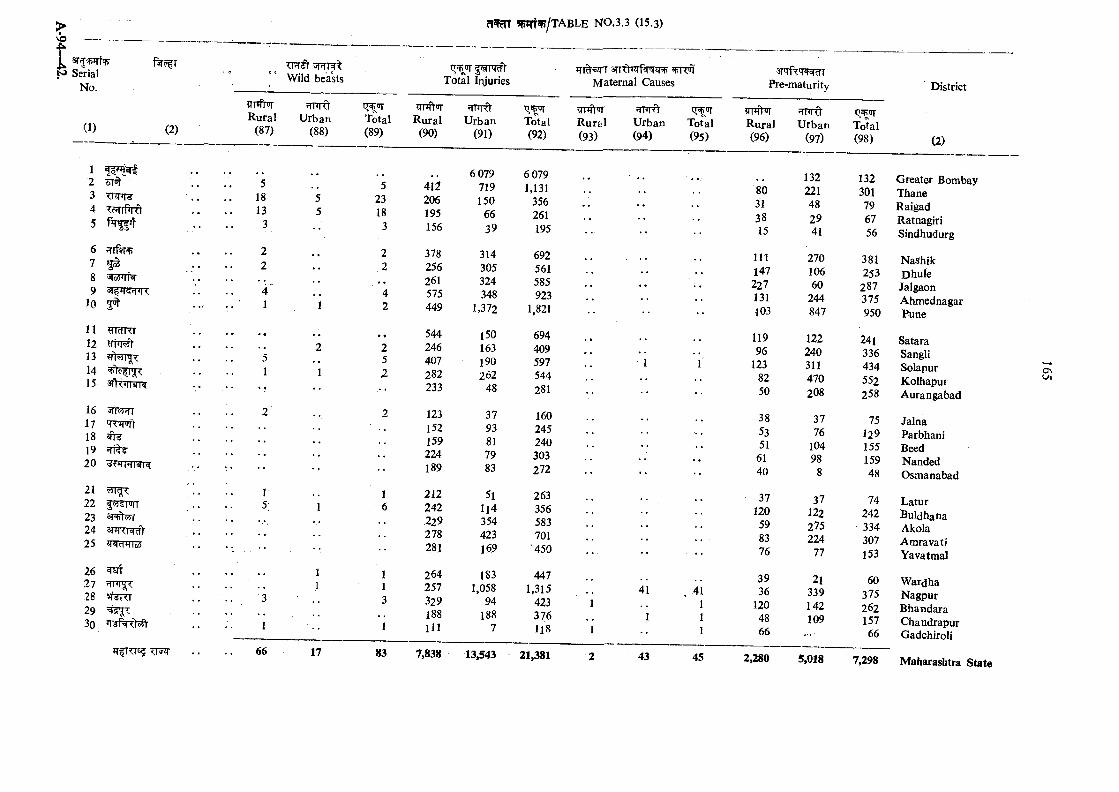
SerialNo.
(1) (2)
<Hd)'Wild beasts
?rr*fhjrR ural
(87)
frnrfrU rban
(88)Total(89)
1 • • • •2 5 53 Tnr»f¥ 18 5 234 13 5 185 3 . . 3
6 . . 2 27 ^ . . 2 289 . . 4~ 4
10 3^ 1 1 2
11 TRTRT12 2 213 5 514 1 1 215 srWlNK ••
16 Mik-i rr 2 2171819 hR ? !!20 ••
21 1 122 5 123 3nft?yT24 STTRR^ ..25 T cHTIoS
26 ^ . . 1 127 .. 128 ^t¥RT . 3293o 1 1
. . 66 17 83
Total Injuries
?TT*fl’’TR ural
(90)
412206195156
378256 261 575 449
544246407282233
123152159224189
212242,229278281
264257 329 188 111
U rban(91)
Total(92)
JTT siTT ^TR^’M aternal Causes
fTPRtR ural U rban(93) (94)
6 079 719 150
66 39
314305324348
1,372
150163190262
48
3793 81 79 83
51l l4354423169
1831,058
94 188
7
60791,131
356261195
692561585923
1,821
694409597544281
160245240303272
263356583701
■450
4471,315
423376U 8
41
1
Pre-maturity District
7,838 13,543 21,381 43
Total(95)
?rnft’irR ural(96)
HHi'O'U rban
(97)
q tJTTotal(98) (2)
132 132 Greater Bombay80 221 301 Thane31 48 79 Raigad38 29 67 Ratnagiri15 41 56 Sindhudurg
111 270 381 NaShik• • 147 106 253 Dhule• • 227 60 287 Jalgaon
131 244 375 Ahmednagar103 847 950 Pune
119 122 241 Satara96 240 336 Sangli
1 123 311 434 Solapur82 470 552 Kolhapur50 208 258 A urangabad
38 37 75 Jalna53 76 129 Parbhani51 104 155 Beed
•• 61 98 159 Nanded40 8 48 Osmanabad
37 37 74 L atur120 122 242 Buldhana59 275 334 Akola
.. . 83 224 307 Amravati■ • • 76 77 153 Yavatmal
39 21 60 Wardha, 41 36 339 375 Nagpur
1 120 142 262 B handara1 48 109 157 C handrapur1 66 66 Gadchiroli
45 2,280 5,018 7,298 Maharashtra State
ON
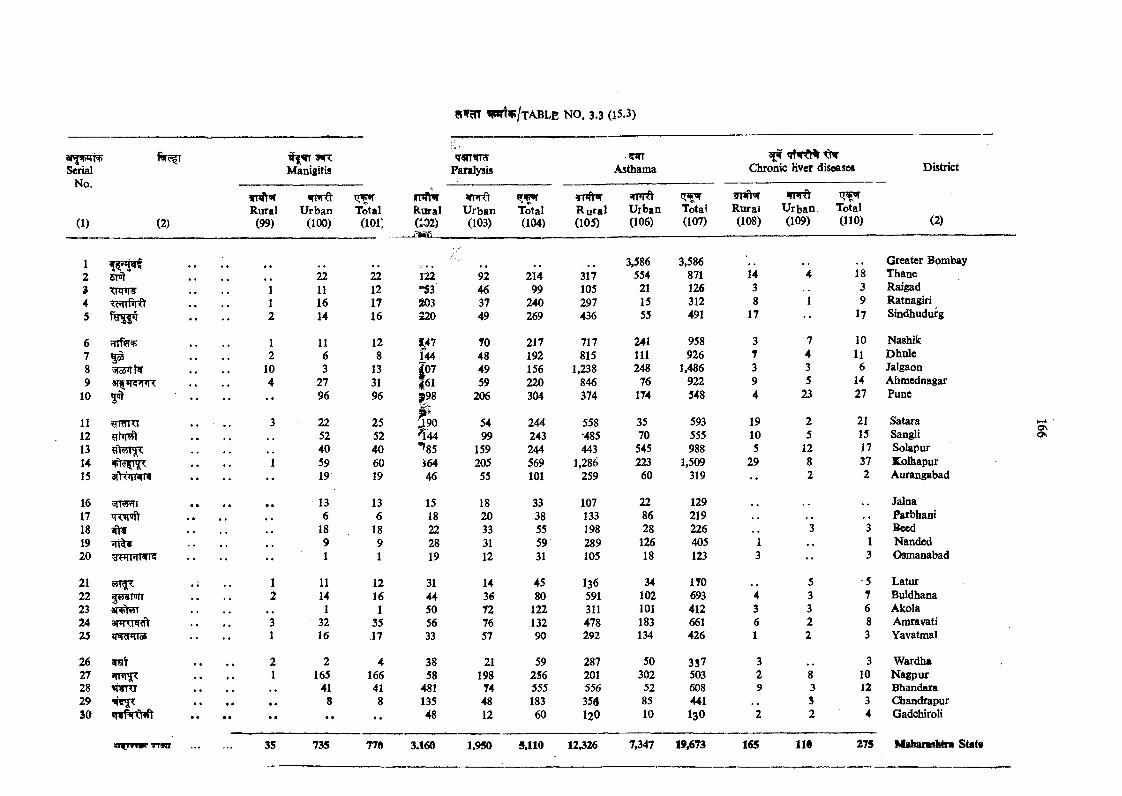
SerialNo.
(1) (2)
wrcManigitis
T T ^Rural
(99)U rban
(100)Total
(101]
'TfrT«rrarParalysis
irNVwKoral U rbanC4>2) (103)
jSSiG__________
Total(104)
?irrAsthama
?rmV«rR u ra l(105)
U rban(106)
Total(107)
Chronic Kver diseases
5T*fWR ural(108)
wnrdU rban(109)
Total(110)
District
(2)
12345
678 9
10
1112131415
•wfirOr
8ii|»T<?rR
wi nxT
3fVT»rWTJI
112
12
104
22111614
1163
2796
2252405919
22121716
128
133196
2552406019
122•^3203S20
|4 7144|0 7|61|9 8
590^4 4■ 85m46
. . 3,586 3,586 Greater Bombay92 214 317 554 871 14 4 18 Thane46 99 105 21 126 3 3 Raigad37 240 297 15 312 8 1 9 Ratnagiri49 269 436 55 491 17 •• 17 Sindhudurg
70 217 717 241 958 3 7 10 Nashik48 192 815 111 926 7 4 11 Dhole49 156 1,238 248 1,486 3 3 6 Jalgaon59 220 846 76 922 9 5 14 Ahmednagar
206 304 374 174 548 4 23 27 Pune
54 244 558 35 593 19 2 21 Satara99 243 •485 70 555 10 5 15 Sangli
159 244 443 545 988 5 12 17 Solapur205 569 1,286 223 1,509 29 8 37 Kolhapur55 101 259 60 319 . , 2 2 Aurangabad
16 m m i • * 13 13 15 18 33 107 22 129 Jalna17 ,. 6 6 18 20 38 133 86 219 Parbhani18 ,. 18 18 22 33 55 198 28 226 3 3 Seed19 9 9 28 31 59 289 126 405 1 1 Nanded20 •• •• 1 1 19 12 31 105 18 123 3 •• 3 Osmanabad
21 «l<A< .; 1 11 12 31 14 45 136 34 ITO 5 5 Latur22 2 14 16 44 36 80 591 102 693 4 3 7 Buldhana23 ar+tw .. 1 1 50 72 122 311 101 412 3 3 6 Akola24 3 32 35 56 76 132 478 183 661 6 2 8 Amravati25 •• 1 16 17 33 57 90 292 134 426 1 2 3 Yavatmal
26 2 2 4 38 21 59 287 50 337 3 3 Wardha27 ,. 1 165 166 58 198 256 201 302 503 2 8 10 N agpur28 .. .. 41 41 481 74 555 556 52 608 9 3 12 Bhandara29 ,, • • S 8 135 48 183 35d 85 441 S 3 O iaadrapur30 • • •• •• •• 48 12 60 120 10 I3O 2 2 4 Gadchiroli
u^Tirtf TTaw ... 35 735 770 3.160 1.950 5,110 12326 7347 19,673 165 l i e 275 Mahantshtra State
o\ON
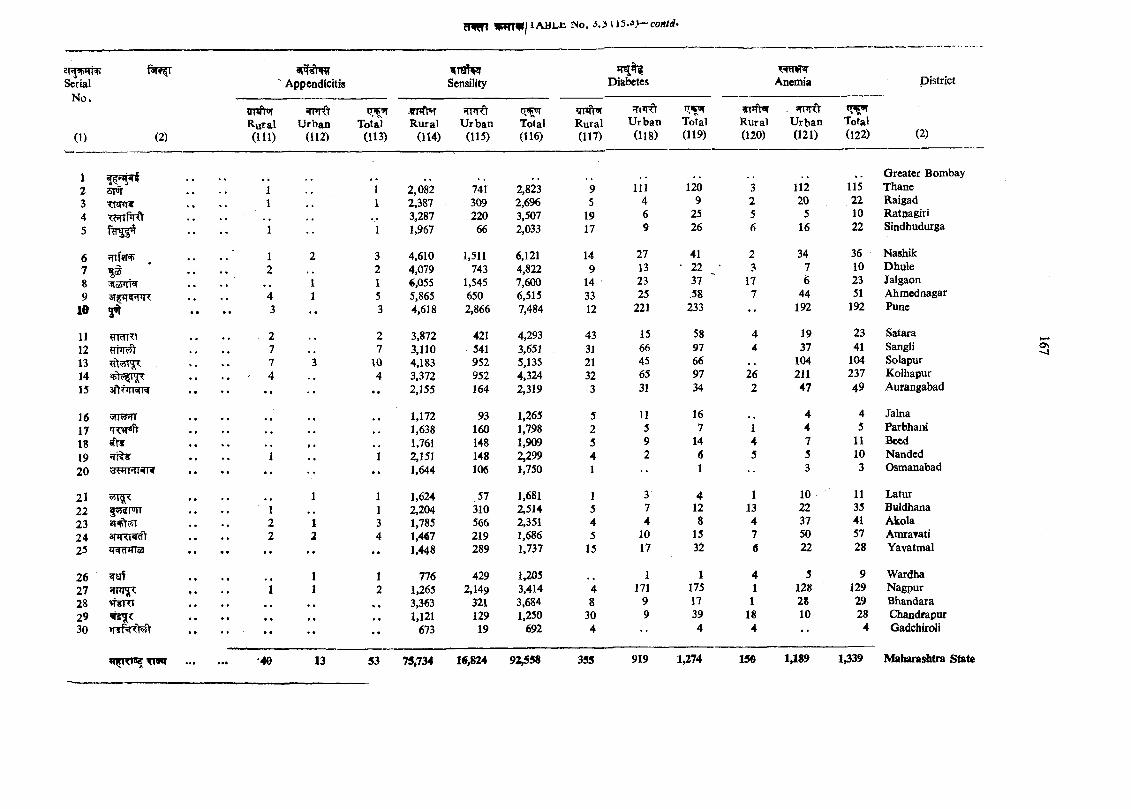
ePTViTHSerial
N o .
(I) (2)
sm
<cHTpRt
Appendicitis^T13 WSensility Diabetes
x^iwmAnemia
fTPfVor JTTfrO"R ural U rban(111) (112)
Total(113)
.?TFf T 5TmtR ural U rb an
(114) (115)Total(116)
rnfV«rR ural U rb an Total(117) (118) (119)
R ural U rban (120) (121)
Total(122) (2)
TTW
2,0822,3873,2871,967
741309220
66
2,8232,6%3,5072,033
95
1917
111469
1209
2526
11220
516
115221022
Greater BombayThaneRaigadRatnagiriSindhudurga
6 JTTf?TSF 1 2 3 4,610 1,311 6,121 14 27 41 2 34 36 Nashik
7 . . 2 2 4,079 743 4,822 9 13 • 22 • 3 7 10 Dhule
8 . . .. 1 1 6,055 1,545 7,600 14 23 37 17 6 23 Jalgaon9 .. 4 1 5 5,865 650 6,515 33 25 -58 7 44 51 Ahmed nagar
l e • • • • 3 •• 3 4,618 2,866 7,484 12 221 233 •• 192 192 Pune
11 2 2 3,872 421 4,293 43 15 58 4 19 23 Satara12 7 7 3,110 541 3,651 31 66 97 4 37 41 Sangli13 7 3 4,183 952 5,135 21 45 66 104 104 Solapur14 4 . , 4 3,372 952 4,324 32 65 97 26 211 237 Kolhapur15 3ftt rTWR • • •• •• • • 2,155 164 2,319 3 31 34 2 47 49 Aurangabad
16 « • 1,172 93 1,263 5 11 16 4 4 Jalna
17 TW«fV 1,638 160 1,798 2 5 7 1 4 5 Parbhani18 1,761 148 1,909 5 9 14 4 7 11 Becd19 1 1 2,151 148 2,299 4 2 6 5 5 10 Nanded
20 •• •• •• •• • • 1,644 106 1,750 1 •• 1 3 3 Osmanabad
21 1 1 1,624 57 1,681 1 3 4 1 10 11 Latur
22 ^vjipnr 1 1 2,204 310 2,514 5 7 12 13 22 35 Buldhana23 3r^v5T , 2 1 3 1,785 566 2.351 4 4 8 4 37 41 Akola24 snm ^'V 2 2 1,467 219 1,686 5 10 15 7 50 57 AmraTati25 • « • • •• •• t ♦ 1,448 289 1,737 15 17 32 6 22 28 Yavatmal
26 1 1 776 429 1,205 1 1 4 5 9 Wardha27 ♦ • 1 1 1,265 2,149 3,414 4 171 175 1 128 129 Nagpur28 • • « « 3,363 321 3,684 8 9 17 1 28 29 Bhandara29 • • • ■ 1,121 129 1,250 30 9 39 18 10 28 Chandrapur30 • ♦ . . • • . . t • 673 19 692 4 4 4 •• 4 Gadchiroli
o\
•40 13 53 75,734 16,824 92^58 355 919 1^74 150 1,189 1,339 Maharashtra State
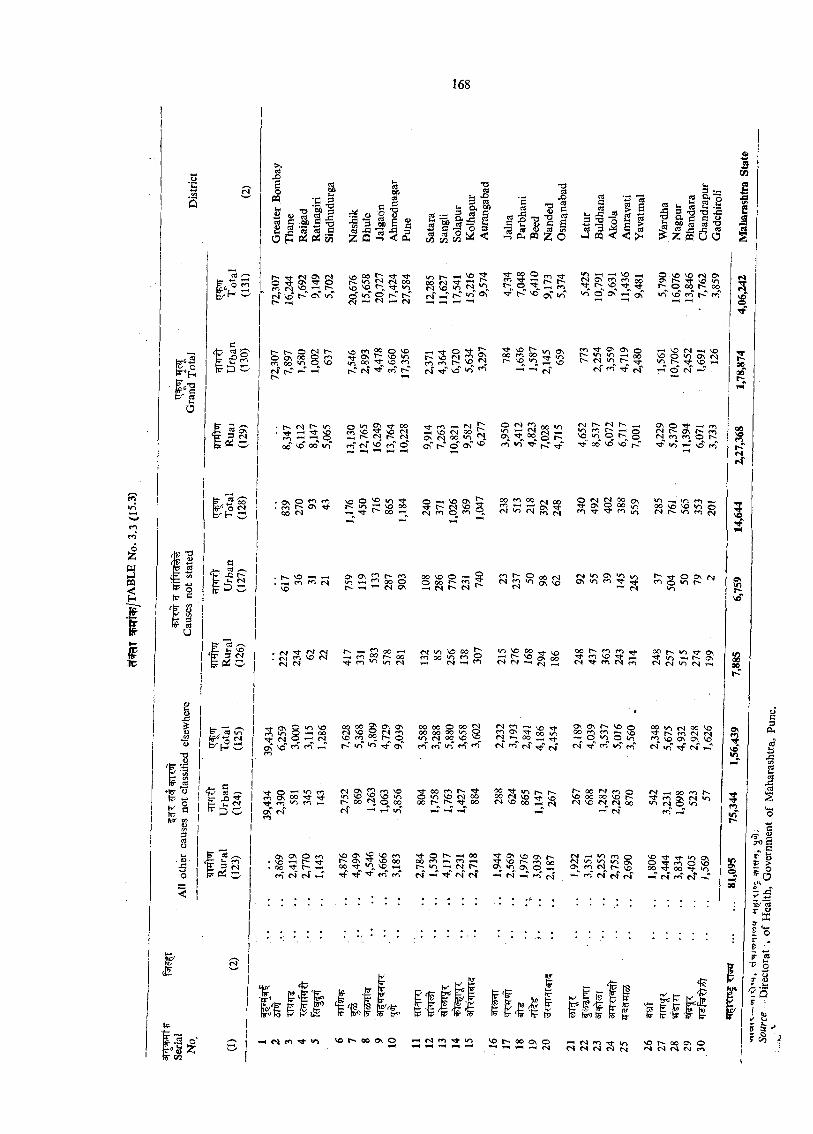
•n<«(5
Is
•C 5
«8 ccl C
. . I l11 Z Q ^ <
J3
TJ j- -2
V- g, §,3 C t | f Srt cS O ^
cd
w wxn x/1^ ^ p : m o J m < < > :
a 60 H ca TS ^ J3 X! «s^ Z m O O
^ M 2;o o\ 2: or o <sjr t VO 0\ »Ti
»-K
^ °o JT:r C <o ( S 00^ ^ * '1O < o ' o r-T K ~
v o m o o o v oT i-0 \ t '^ > /^ r - v o fS fo g i i r i o o ' ^ v o f * ^tC r i K' r 4 ''^ 'iT ‘o ^
Q IT) S i 0®rn VO ^ r> ^ f; ra p: Mfrf <nT 'O rrT o '
VO o ^ <o '>a-<ri ; : r VO oo—, Tj- r^ 00 -<
—< VO <S OO ON CM 00 « o ^oT o ' c T ^
oo VO o ’-< SO oo S '
<N « s
Tt- VO
O ^ V-1 OVOO CO 00 ^ K1 VO >o 2; vS
<n 1-H VO ^£2 S' 52 J!2 oo "y- VO ri- Tt>n O oC
rn ON Ov Orv. <n VI oo<N <0 ^r4~ rf
l o c o r ; '—< oON 00 s p, VO >n or f o o v o v o j ^
m O oo <M «N jq «0 ^ S
O rj pj 00 ov 2i 2 2STr “ “ i/
»N Ov >0ON <ri t n ' i t ^
«M
t> OO ^'-i .°? fv) VI VO 00 5 m Qo l o m Q_ *^;p°®T^vo
r - i v i - - « ' v ^ m o o 'o r '^ S i r t ^ ’ o v o o • r f f n '^ io w ■r-i (si-HfOoo m r ^oo Tj- cn VO ^S <N m cvi ro
O .VO VO M 0 \ On Tf VO *or-^ o 00 00• rT VO r n r C f o
-H MD <N <-H VOVO O lO Ov fv)</ •'^ VO T«Hr^ C> r f M
ON O Tj- —I r>i ON COCO fo o r '
Tj- lo « VO rn
<n _ i r i CO —M00 VO VO *r> orj h' <o CO «N
0©aor-
5O Os (M «o t^
00 sj. On^ in —< 0\<N (M <0 (N r~<
00 00 55 ON 0\ <N VO O «s rr,VO CO oo r~ oK <rT *0 ^ os'
<N ON CO VO>n VO VO <n00 fi, O 00
« »rr<N
OO OO O oo00 OO 00 V-1 O «n ra 00 VO VO CO CO «n CO CO
lo ;p <Ni oo 00
fO ^ ^ ^S 2 s ^ ^r>J « o o ^ ^
«N Tf (N
22 S t^2S VO i t VO <S VO 00 ?4
^ O N f ^ V O o O O v N f M O O V O
• ^ O V O O t n f ^ V O O v O N V O <N ';fcoioco'' r'TirTTtCN'-r
VO Ov VO VO COON ,'5' VO QO
“'i ^ *1,r t T t '*■ CO ccT
■5j - o t ^ > - H o o 5 ' O N V D O N r - 'O O C O —< C O ; ^ 3 ’ V O I ^ C O O O
N fS r i -4“ fs ro" (s
o o fM ccj QVO 00 00 VO«N VO M <N 00
«N VO CO O fN lO W1 lo S o^ CO ^ VO '-T rn c-f fsf r i
OO CO CO On <N «n<n <N o v->
VO ^ t:*- ^ ONO Tt CO O VO0 0 T t o o lO« CM CO (s ~T
‘i f . l r s .'or'OOONO •-Hr^roTfiri ^ ^ ^ »“< ^ t ^ o o o v o —<racoTa->o—< ,-n f s t s < s n « N
b<cs f eVO r~ 00 o\ ocs» <S <S «N c»»
HOUSING
V . m f^^TFTTcT ^ ^ =5zn- q ^ jp ir# f^ rTif te r 3T i% ^ i r r f f ^ 3it| .
v . ' ^ 3 T ^ T ^ % f ^ r f j R m -^Tf, ^ T ? r , I^ T rT ^ (#f?T5r) f s ^ T q - ^ir ^ ^ T a S l T ^ ^ ^ T S t tr<IT^ ^ST^T^T f ^ T ^SZfT^T " ^ rZ T R ^ , ^ ’W ^ n r^ f^ T ^ T T ^ f%^T Ws.^
^ ^ z m r r ^ s r ^ w r ’?: 3Tt|, s t^ ciwT TO=5zn ^ r r c n j ^ T
srt^ ^ ^ fe rf%rff FT 3Tt| I r o 2# arrsTrf 3rr|. 'Vr'?:
^ s r ^ sr%9TfrT 3 i r | sr ifT ^ q r^ r s r r ^ i^^ c T ^ ^ X t^J3r^3T9TT ^ ?T
? 5 q ^ , 5E W T rin^ , >TTmr ^ftsr f e r^irr srm ^ ^ x ^ ^§tt ^ 3TT| srwt ^ f tf ffW?T T O f t ^ ^ J= fT ^ . 5 z r ^ 3T9TTc^Tlft ST tW r T 3T^?rq^% ? r i^ . ' ' f T i^q -B rrs rrf^ f ^ m T r^rsR’ t fT R rr ? r f^ ,f ^ T ^ ^'tnrc?Tr^ s iR ^ fT ^fr^rr'5Tr=5q'T f ? r ^ ^5R2T cirr sq-^cfV^ czri f i ^ r a ^
^^:rr?r65f, 5#<T,
3JTT^^ 3?^r^T a 'f t c3Tr^ ?!TT ^m%?T ^ ’Jq'Trf ^ r | t .
4-1 This section ^ves data on housing collected through 1981 population Census.
4-2 In the 1981 Census “ House ” was defined as a structure or part of a structure (inhabited or vacant) or a dwelling, a shop, a shop-cww-dwelling or a place of business, workschool, etc. with a separate entrance whether that separate entrance led directly to the street or to a common staircase, court-yard or a gate. The classification of houses according to the purpose for which they were used and the distribution of 1,000 census house-holds by the number of rooms occupied is given in Table No. 25.2 which is based on 20 per cent sample. A room has four walls with a door way and a roof overhead and of at least 6 'x 6' dimensions. Unenclosed verandah, kitchen, store, garage and cattle- shed or places of sizes smaller than 6' x 6' are not treated as rooms. Households residing in any one of such places are treated as having no regular room. A ‘ household ’ is a group of persons who commonly live together in the same house and take their meals from a common mass unless exigencies of work prevent any of them from doing so. Material presented here is restricted only to the family type of households. Institutional households, i. e. groups of persons residing in hostels, boardings, prisons, hospitals, etc. vyho otherwise satisfy the definition of household are not included here.
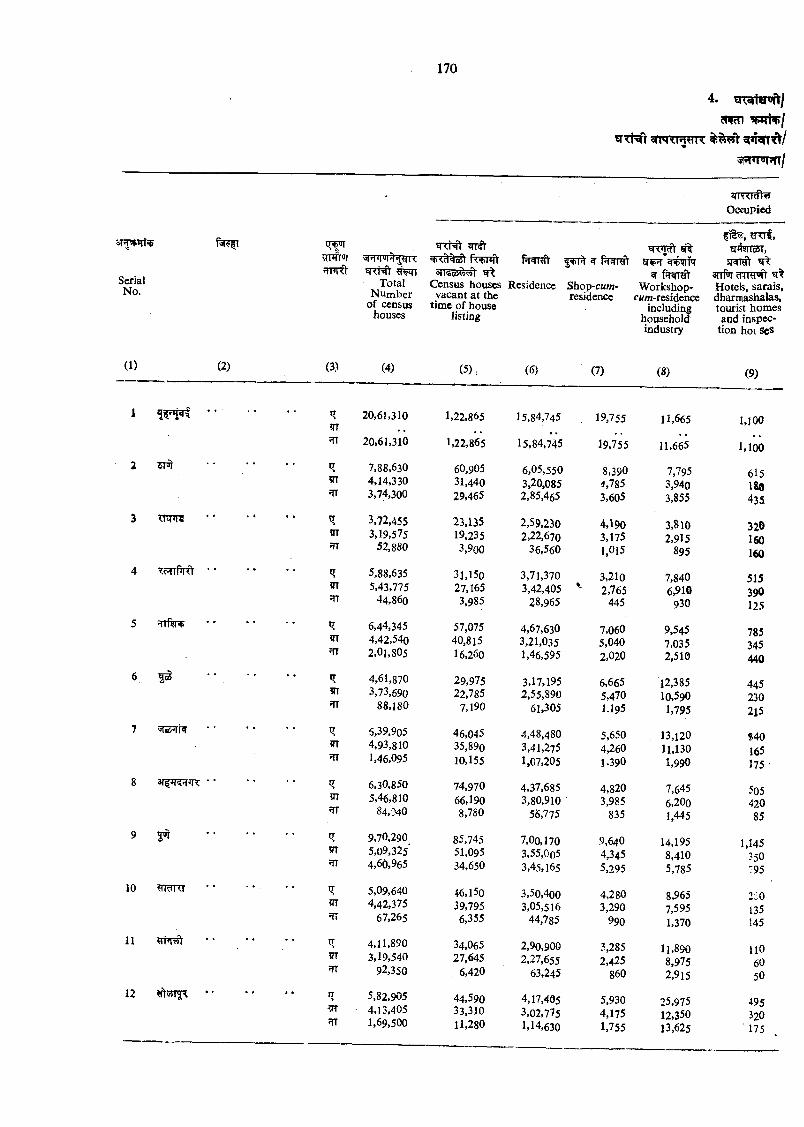
3Tf*^Ti^
SerialNo.
(1)
■ r>l<r l
(2)
14*U|
‘OccuPicd
Census houses vacant at the
time of house listing
(5),
si%PjeTRft
Shqp-c«w- Workshop- residencc cww-residence
including household industry
(7) (8)
fllr:, y<lf, yfl!<ir(2T,
snf^xTTRn’h' Hotels, sarais, dharmashalas, tourist homes and inspec
tion hoi SeS
(9)
i(i*iniiHHI'O
(3)
flfqi Total
N um ber of census
houses
(4)
Residence
(6)
1 'Im
20,61,310 1,22,865 15,84,745 . 19,755 11,665 u o o
fTT 20,61,310 1,22,865 15,84,745 19,755 11,665 1,100
2 'I 7,88,630 60,905 6,05,550 8,390 7,795 6I54,14,330 31,440 3,20,085 4,785 3,940 ISO3,74,300 29,465 2,85,465 3,605 3,855 435
3 w r e 3,72,455 23,135 2,59,230 4,190 3,810 320m 3, 19,575 19,235 2,22,670 3,175 2,915 160m 52,880 3,900 36,560 1.015 895 1604 T oTrf^ • ■ 5,88,635 31,150 3,71,370 3,210 7,840 515m 5,43,775 27,165 3,42,405 ^ 2,765 6,910 390
44,860 3,985 28,965 445 930 125
5 6,44,345 57,075 4,67,630 7,060 9,545 785m 4,42,540 40,815 3,21,035 5,040 7,035 345flT 2,01,805 16,260 1,46,595 2,020 2,510 4406 4,61,870 29,975 3,17,195 6,665 12,385 445in 3,73,690 22,785 2,55,890 5,470 10,590 230
88,180 7,190 61,305 1.195 1,795 215
7 vrs N' 5,39.905 46,045 4,48,480 5,650 13,120 «40m 4,93,810 35,890 3,41,275 4,260 11,130 165?TT 1,46,095 10,155 1,07,205 I .39O 1,990 175 •8 sfl^R^nR ‘ ■ 6,30,850 74,970 4,37,685 4,820 7,645 505m 5,46,810 66,190 3,80,910 3,985 6,200 420•TT 84,040 8,780 56,775 835 1,445 85
9 5®r 9,70,290 85,745 7,00,170 9,640 14,195 1,1455TT 5,09,325 51,095 3,55,0o5 4,345 8,410 350JTT 4,60,965 34,650 3,45,165 5,295 5,785 795
10 yidi<r 5,09,640 46,150 3,50,400 4,280 8,965 2iO?TT 4,42,375 39,795 3,05,516 3,290 7,595 135?f7 67,265 6,355 44,785 990 1,370 145
11 4,11,890 34,065 2,90,900 3,285 11,890 llO3, 19,540 27,645 2,27,655 2,425 8,975 60•n 92,350 6,420 63,245 860 2,915 50
12 ft55T§[\ •• 5,82,905 44,590 4,17,405 5,930 25,975 4954,13.405 33,310 3,02,775 4,175 12,350 320
—.—--------------
■Tr 1,69,500 11,280 1,14,630 1,755 13,625 175
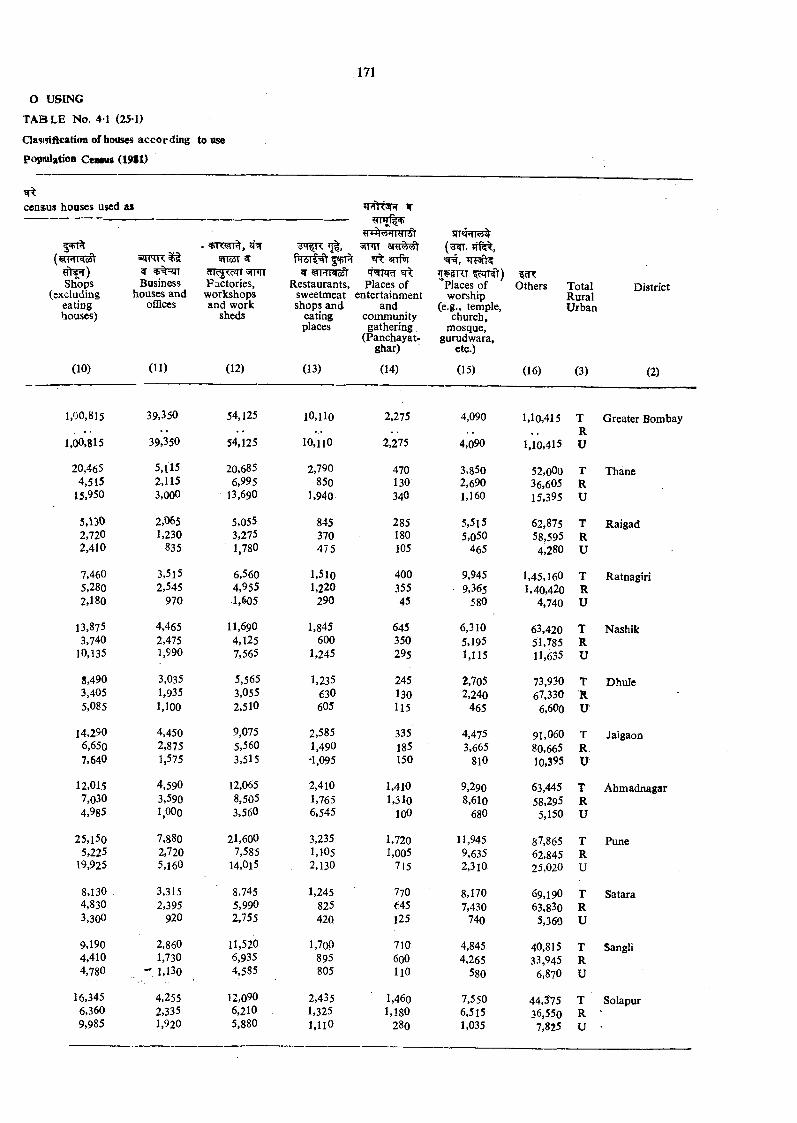
O USING
T A B L E No. 41 (25-1)
Clasisiftcation of houses according to use
popnilatioQ Cemus ( 1 9 il )
census houses used as
(<aHNaJl
Shops(excluding
eatingbouses)
Business houses and
oflSces
5TTo5T 2T
Factories, workshops and work
sheds
Restaurants, sweetmeat shops and
eating places
"T W d ^ Places of
entertainment and
community gathering,
(Panchayat- ghar)
^¥5TTT '“places of
worship (e.g., temple,
church, mosque,
gurudwara, etc.)
Others TotalRuralUrban
District
(10) (11) (12) (13) (14) (15) (16) (3) (2
1,00,815 39,350 54,125 lO,Uo 2,275 4,090 1,10,415 T Greater Be. .. R
1,00,815 39,350 54,125 10,110 2,275 4,090 1,10,415 U
20,465 5 ,ll5 20,685 2,790 470 3,850 52,000 T Thane4,515 2,115 6,995 850 130 2,690 36,605 R
15,950 3,000 13,690 1,940 340 1,160 15,395 U
5,130 2,065 5,055 845 285 5,515 62,875 T Raigad2,720 1,230 3,275 370 180 5,050 58,595 R2,410 835 1,780 475 105 465 4,280 U
7,460 3,5l5 6,560 1,510 400 9,945 1,45,160 T Ratnagiri5,280 2,545 4,955 1,220 355 9,365 1,40,420 R2,180 970 .1,605 290 45 580 4,740 U
13,875 4,465 11,690 1,845 645 6,310 63,420 T Nashik3,740 2,475 4,125 600 350 5,195 51,785 R
10,135 1,990 7,565 1,245 295 1,115 11,635 U
8,490 3,035 5,565 1,235 245 2,705 73,930 T Dhule3,405 1,935 3,055 630 130 2,240 67,330 R5,085 1,100 2,510 605 115 465 6,600 U
14,290 4,450 9,075 2,585 335 4,475 91,060 T Jalgaon6,650 2,875 5,560 1,490 185 3,665 80,665 R7,640 1,575 3,515 •1,095 150 810 10,395 U
12,015 4,590 12,065 2,410 1,410 9,290 63,445 T Ahmadnai7,030 3,590 8,505 1,765 1,310 8,610 58,295 R4,985 1,000 3,560 6,545 100 680 5,150 U
25,l5o 7,880 21,600 3,235 1,720 11,945 87,865 T Pune5,225 2,720 7,585 1,105 1,005 9,635 62,845 R
19,925 5,160 14,015 . 2,130 715 2,310 25,020 U
8,130 3,315 8,745 1,245 770 8,170, 69,190 T Satara4,830 2,395 5,990 825 ^45 7,430 63,830 R3,300 920 2,755 420 125 740 5,360 U
9,190 2,860 11,520 1,700 710 4,845 40,815 T Sangli4,410 1,730 6,935 895 600 4,265 33,945 R4,780 -'1 ,1 3 0 4,585 805 110 580 6,870 U
16,345 4,255 12,090 2,435 1,460 7,550 44,375 T Solapur6,360 2,335 6,210 1,325 1,180 6,515 36,550 R '9,985 1,920 5,880 1,110 280 1,035 7,825 U
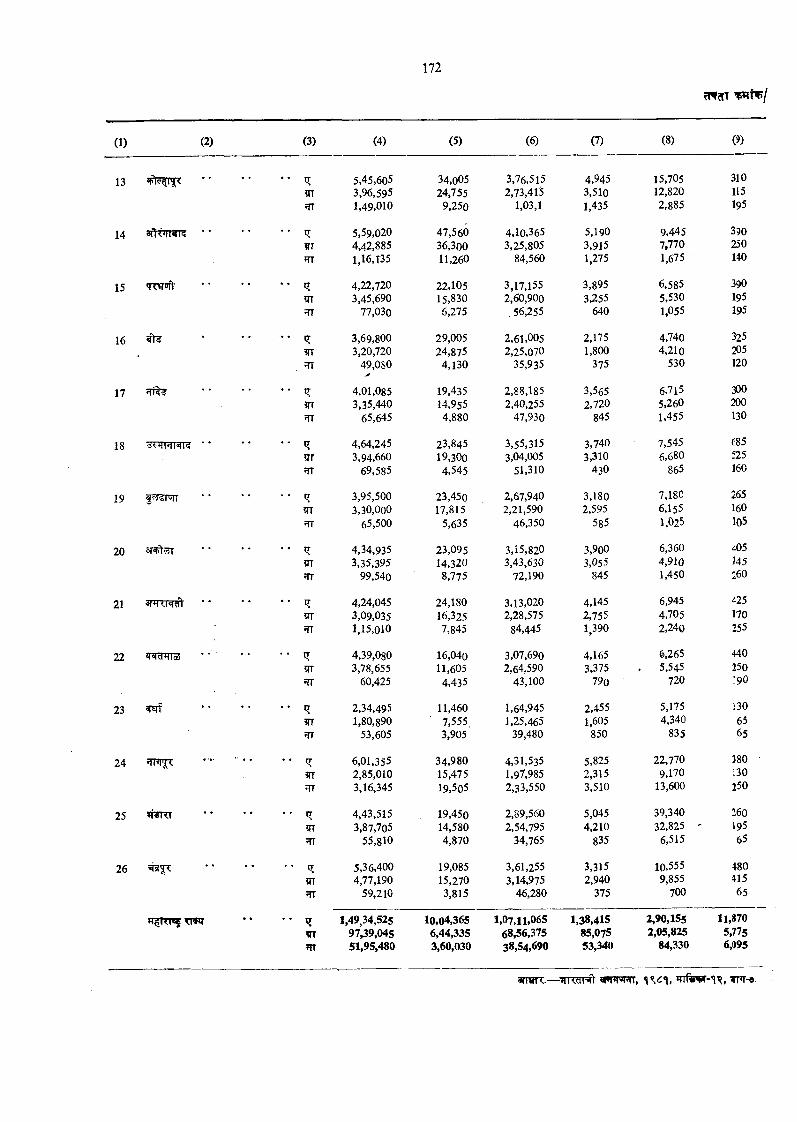
(1) (2) (3) (4) (5) (6) (7) (8) (?)
13, .
*• 5,45,605 34,005 3,76,515 4,945 15,705 3105TT 3,96,595 24,755 2,73,415 3,510 12,820 115
1,49,010 9,250 1,03,1 1,435 2,885 195
14 •• 5,59,020 47,560 4,10,365 5,190 9,445 390m 4,d2,885 36,300 3,25,805 3,915 7,770 250
1,16,135 11,260 84,560 1,275 1,675 140
15 *• 4,22,720 22,105 3,17,155 3,895 6,585 390?TT 3,45,690 15,830 2,60,900 3,255 5,530 195?rr 77,030 6,275 56,255 640 1,055 195
16 gV¥ •• I? 3,69,800 29,005 2,61,005 2,175 4,740 3253,20,720 24,875 2,25,070 1,800 4,210 205
49,080 4,130 35,935 375 530 120
17 ♦• IT 4,01,085 19,435 2,88,185 3,565 6,715 300?rr 3,35,440 14,955 2,40,255 2,720 5,260 200?rr 65,645 4,880 47,930 845 1,455 130
18 •* q: 4,64,245 23,845 3,55,315 3,740 7,545 685?TT 3,94,660 19,300 3,04,005 3,310 6,680 525?TT 69,585 4,545 51,310 430 865 160
19 ^5^1 UiT • • ^ 3,95,500 23,450 2,67,940 3,180 7,180 265m 3,30,OoO 17,815 2,21,590 2,595 6,155 160m 65,500 5,635 46,350 585 1,025 105
20 3T ?5T •• 4,34,935 23,095 3,15,820 3,900 6,360 ^05m 3,35,395 14,320 3,43,630 3,055 4,910 145?n 99,540 8,775 72,190 845 1,450 260
21 3PT\Wd1 *• 4,24,045 24,180 3,13,020 4,145 6,945 ^25?TT 3,09,035 16,325 2,28,575 2,755 4,705 170ffT 1,15,010 7,845 84,445 1,390 2,240 255
22 *i'id+iio(5 * • 4,39,080 16,040 3,07,690 4,165 6,265 440?TT 3,78,655 11,605 2.64,590 3.375 . 5,545 250?TT 60,425 4,435 43,100 79o 720 190
23 *• 2,34,495 11,460 1,64,945 2,455 5,175 130m 1,80,890 7,555, 1,25,465 1,605 4,340 65ffT 53,605 3,905 39,480 850 835 65
24 ’iW 'ii • • 6,01,355 34,980 4,31,535 5,825 22,770 380?rr 2,85,010 15,475 1,97,985 2,315 9,170 130?rr 3,16,345 19,505 2,33,550 3,510 13,600 250
25 «T¥T<1 •• tr 4,43,515 19,450 2,89,560 5,045 39,340 260?TT 3,87,705 14,580 2,54,795 4,210 32,825 ' 195
55,810 4,870 34,765 835 6,515 65
26 5,36,400 19,085 3,61,255 3,315 10.555 4804,77,190 15,270 3,14,975 2,940 9,855 415
59,210 3,815 46,280 375 700 65
7TCJT • • q 1,49,34,525 10)04,365 1,07,11,065 1,38,415 2,90,155 11,87097,39,045 6,44,335 68,56,375 85,075 2,05,825 5,775
m 51,95,480 3,60,030 38,54,690 53,340 84,330 6,095
arrgn:.--7irid R > ^ n w r r , *[^6% Tnr-«
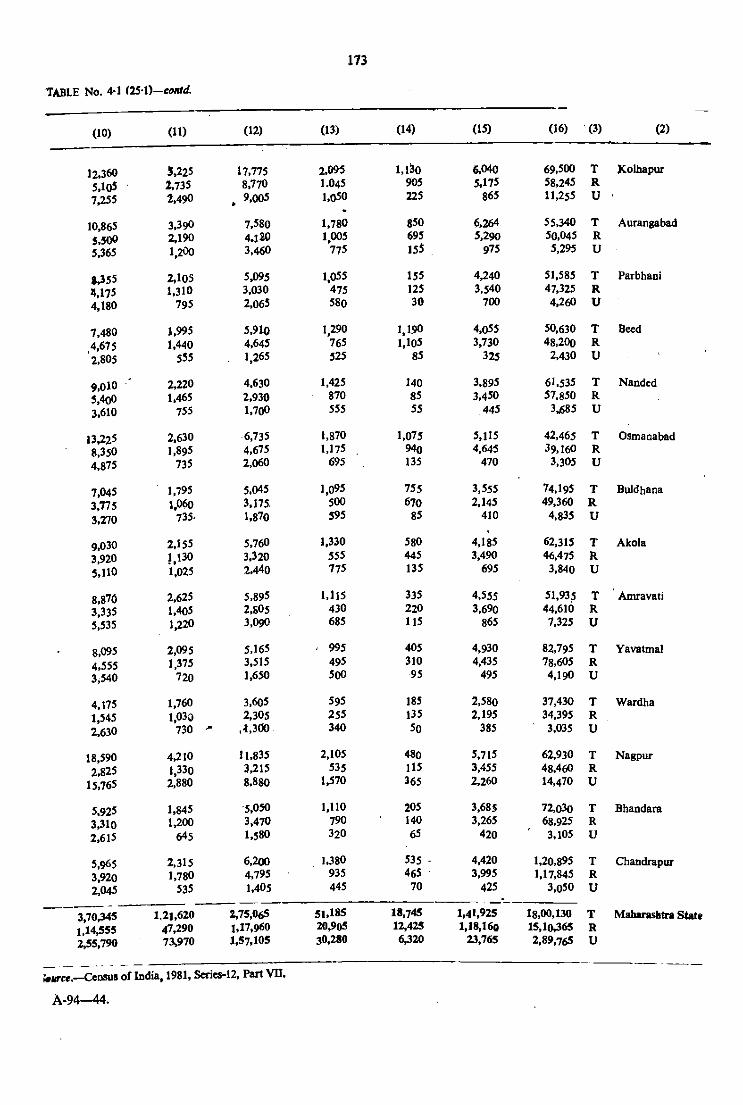
(10) (11) (12) (13) (14) (15) (16) (3) (2)
12.360 5,225 17,775 2,095 1,1^0 6,040 69.500 T Kolhapur5,1o5 2,735 8,770 1.045 905 5.175 58,245 R7,255 2,490 , 9,005 1,050 225 865 11.255 U *
10,865 3,390 7,580 1,780 850 6,264 55.340 T AurangabadS.500 2,190 4»l20 1,005 695 5,290 50.045 R5,365 1 ^ 3,460 775 15i 975 5.295 U
8>355 2,105 5,095 1,055 155 4,240 51,585 T Parbhaoi4,175 1,310 3,030 475 125 3.540 47,325 R4,180 795 2,065 580 30 700 4,260 U
7,480 1,995 5,910 1,290 1.190 4,055 50,630 T Beed4,675 1,440 4,645 765 1,105 3.730 48,200 R’2,805 555 1,265 525 85 325 2,430 U
9,0l0 2,220 4,630 1.425 140 3,895 61.535 T Nanded5,4o0 1,465 2,930 870 85 3,450 57.850 R3,610 755 1,700 555 55 445 3,685 U
13.225 2.630 6,735 1.870 1,075 5,115 42.465 T Osmaaabad8,350 1.895 4.675 1,175 940 4,645 39,160 R4,875 735 2,060 695 135 470 3.305 U
7,045 1,795 5.045 1,095 755 3.555 74,195 T Buldhana3,775 1.060 3,175. 500 670 2,145 49,360 R3,270 735- 1,870 595 85 410 4.835 U
9.030 2,155 5,760 1,330 580 4,185 62.315 T Akola3.920 1,130 3,320 555 445 3,490 46,475 R5,110 *1,025 2.440 775 135 695 3,840 U
8.870 2,625 5,895 1,115 335 4.555 51,935 T Amravati3,335 1,405 2,805 430 220 3,690 44,610 R5,535 1,220 3,090 685 115 865 7,325 U
8,095 2,095 5,165 995 405 4,930 82.795 T Yavatmal4,555 1,375 3,515 495 310 4,435 78.605 R3,540 720 1,650 500 95 495 4.190 U
4,175 1,760 3.605 595 185 2.580 37.430 T Wardha1,545 1,030 2,305 255 135 2,195 34,395 R2.630 730 -- ,4,300 340 50 385 3,035 U
18,590 4,210 11,835 2.105 480 5JI5 62,930 T Nagpur2,825 1,330 3,215 535 115 3,455 48,460 R
15,765 2,880 8.880 1,570 365 2,260 14.470 U
5,925 1,845 5,050 1,110 205 3,681 72,030 T Bbandara3,310 1,200 3,470 790 140 3,265 68,925 R2,615 645 1,580 320 65 420 ■ 3,105 U
5,965 2,315 6,200 1.380 535 - 4,420 1,20.895 T Chandrapur3.920 1,780 4,795 935 465 3,995 1,17,845 R2,045 535 I.4 O5 445 70 425 3.050 U
3,70><5 1.2],620 2,75,065 51,185 18,745 1,41,925 18,00,130 T Mahirashtra State1.14,555 47,290 1,17,960 20,905 12,425 1,18,160 15,10365 R2,55,790 73,970 1,57,105 30,280 6,320 23,765 2,89,765 U
Census of India, 1981, Series-12, Part VH.
A-94—44.
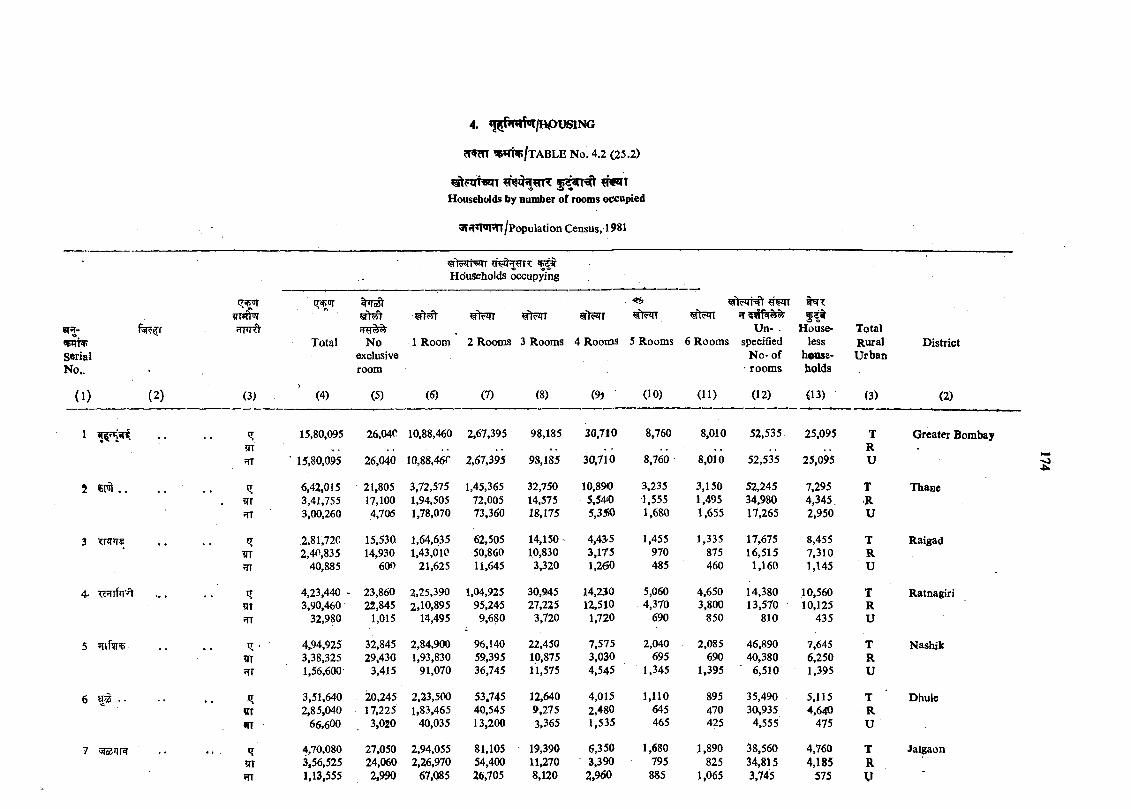
4. »jl5^5T(rt«r/HpuSlNG
^ ^ / t ABLE N o. 4.2 (25.2)
Households by number o f rooms occupied
«J»I*T'*r«TT/population Census, 1981
'teSTTSTT ^Households occupying
• ^
8?^- r>J<r r JTPRt Un- - House TotalTotal N o 1 Room 2 Rooms 3 Rooms 4 Roonos 5 Rooms 6 Rooms specified less Rural District
serial exclusive No* of house U rbanNo.. room • room s holds
(1 ) (2) (3) (4) (5) (6) (7) (8) (9) (10) (11) (12) (13) (3) (2)
1 15,80.095 26,04C 10,88,460 2,67,395 98,185 30,710 8,760 8,010 52.535 25,095 T G reater BombayR
• 15,80,095 26,040 10,88,46C 2,67,395 98,185 30,710 8,760 8,010 52,535 25,095 U
2 . . 6,42,015 21,805 3,72,575 1,45,365 32,750 10,89(0 3,235 3,150 52,245 7,295 T Thane?rr 3,41,755 17,100 1,94,505 72,005 14,575 5,54*0 1,555 1,495 34,980 4,345. RRT 3,00,260 4,706 1,78,070 73,360 18,175 5,350 1,680 1,655 17,265 2,950 U
3 2,81,720 15,530 1,64,635 62,505 14,150 - 4,435 1,455 1,335 17,675 8,455 T Raigad?rr 2,40,835 14,930 1,43,010 50,860 10,830 3,175 970 875 16,515 7,310 R?rr 40,885 600 21,625 11,645 3,320 1,260 485 460 1,160 1,145 U
4- <c lf>rfV 4,23,440 - 23,860 2,25,390 1,04,925 30,945 14,230 5,060 4,650 14,380 10,560 T Ratnagiri3,90,460 22,845 2,10,895 95,245 27,225 12,510 4,370 3,800 13,570 10,125 R
’TT 32,980 1,015 14,495 9,680 3,720 1,720 690 850 810 435 U
5 ?Tlf5T 4,94,925 32,845 2,84,900 96,140 22,450 7,575 2,040 2,085 46,890 7,645 T Nashik3,38,325 29.430 1,93,830 59,395 10,875 3,030 695 690 40,380 6,250 R
ITT 1,56,600 3,415 91,070 36,745 11,575 4,545 1,345 1,395 6,510 1,395 U
6 ^ 3,51.640 20,245 2,23,500 53.745 12,640 4,015 1,110 895 35,490 5,115 T Dhulcc>ffT 2,85,040 17,225 1,83,465 40,545 9,275 2,480 645 470 30,935 4,640 R*rr 66,600 3,020 40,035 13,200 3,365 1,535 465 425 4,555 475 U
7 5fcSflr^ q 4,70,080 27,050 2,94,055 81,105 19,390 6,350 1,680 J.890 38,560 4,760 T Jalgaon?TT 3,56,525 24,060 2,26,970 54,400 11,270 3,390 795 825 34,815 4,185 RfTT 1,13,555 2,990 67,085 26,705 8,120 2,960 885 1,065 3,745 575 V
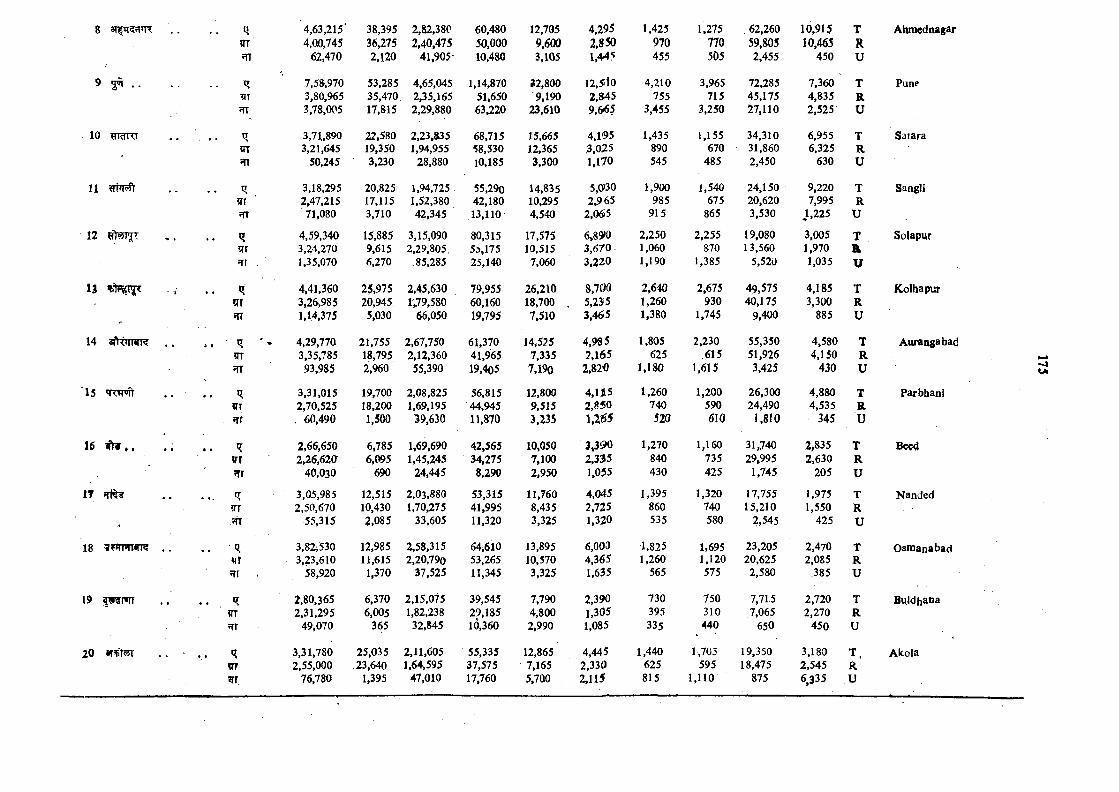
8 q 4,63,215’ 38,395 2,82,380 60,480 12,705 4,295 1,425 1,275 62,260 10,915 T Ahmednagarirr 4,Q0,745 36,275 2,40,475 50,000 9,600 2,850 970 770 59,805 10,465 RfTT 62,470 2,120 41,905 10,480 3,105 1,44'J 455 505 2,455 450 U
9 56T . . 7,5&,970 53,285 4,65,045 1,14,870 92,800 12,5i0 4,210 3,965 72,285 7.360 T Punerr 3,80,965 35,470 2,35,165 51,650 9,190 2,»45 755 715 45,175 4,835 R
frr 3,78,005 17,815 2,29,880 63,220 23,610 9,6^5 3,455 3,250 27,110 2.525 U
10 «WKI . . . ^ 3,71,890 22,580 2,23,835 68,715 15,665 4,1<95 1.435 1,155 34,310 6,955 T SataraiTT 3,21,645 19,350 1,94,955 58,530 12,365 ,3,025 890 670 31,860 6,325 Rm 50,245 3,230 28,880 10,185 3,300 1,170 545 485 2,450 630 U
11 3,18,295 20,825 1,94,725 55,290 14,835 5,0>30 1,900 1,540 24,150 9,220 T Sangli?TT 2,47,215 17,115 1,52,380 42,180 10,295 2,965 985 675 20,620 7,995 R
71,080 3,710 42,345 13,110 4,540 2,065 915 865 3.530 i,2 2 5 U
12 . . ^ 4,59,340 15,885 3,15,090 80,315 17,575 6,89>0 2,250 2,255 19,080 3,005 T Solapur?rr 3,24,270 9,615 2.29,805 55,175 10,515 3,670 1,060 870 13,560 1,970 R?rr . 1,35,070 6,270 85,285 25,140 7,060 3,220 1,190 1,385 5,520 1,035 U
13 4,41,360 25,975 2,45,630 79,955 26,210 8,700 2,640 2,675 49,575 4,185 T KolhapurITT 3.26,985 20,945 1,79,580 60,160 18,700 . 5,235 1,260 930 40,175 3,300 RHI 1,14,375 5,030 66,050 19,795 7,510 3,4^5 1,380 1,745 9,400 885 U
14 aAiMTilT?? . . 4,29,770 21,755 2,67,750 61,370 14,5;?5 4,985 1,805 2,230 55,350 4,580 T Auraagabad?TT 3,35,785 18,795 2,12,360 41,965 7,335 2,165 625 .615 51,926 4.150 RflT 93,985 2,960 55.390 19,4o5 7,190 2,820 1,180 1,615 3,425 430 U
15 TClTofr 3,31,015 19,700 2,08,825 56,815 12,800 4,115 1,260 1.200 26.300 4,880 T ParbhanIiir 2,70,525 18,200 1,69,195 44,945 9,515 2,850 740 590 24,490 4,535 R?rf , 60,490 1,500 39,630 11,870 3,235 1,265 520 610 1.810 345 U
16 * f t l . . 2,66,650 6,785 1,69,690 42,565 10,050 3,390 1,270 1,160 31,740 2,835 T Seedffr 2,26,620 6,095 1,45,245 34,275 7,100 2,335 840 735 29,995 2,630 RSTT 40,030 690 24,445 8,290 2,950 1,055 430 425 1,745 205 U
17 ?Ti^^ 3,05,985 12,515 2,03,880 53,315 11,760 4,045 1.395 1,320 17,755 1,975 T Nanded?TT 2,50,670 10,430 1,70,275 41,995 8,435 2,725 860 740 15,210 1,550 RffT 55,315 2,085 33,605 11,320 3,325 1,320 535 580 2,545 425 U
J8 ?¥<1WWR . , . . R 3,82^530 12,985 2,58,315 64,610 13,895 6,000 1,825 1,695 23,205 2,470 T O sm anabad3,23,610 11,615 2,20,790 53,265 10,570 4,365 1,260 1,120 20,625 2,085 R
?rr 58,920 1,370 37.525 11,345 3,325 1,635 565 575 2,580 .385 U
19 |W5r»TT . . 2,80,365 6,370 2,15,075 39,545 7,790 2,390 730 750 7,715 2,720 T Buldhana2,31,295 6,005 1,82,238 29,185 4,800 1,305 395 310 7,065 2,270 R
JTT 49,070 365 32,845 10,360 2,990 1,085 335 440 650 450 U
20 »T5|it5yr 3,31,780 25,035 2,11,605 55,335 12,865 4,445 1,440 1,705 19,350 3,180 T , Akola2,55,000 .23,640 1,64,595 37,575 7,165 2,330 625 595 18,475 2,545 R
76,7B0 1,395 47,010 17,760 5,700 2,115 815 1,110 875 6,335 U
Ok
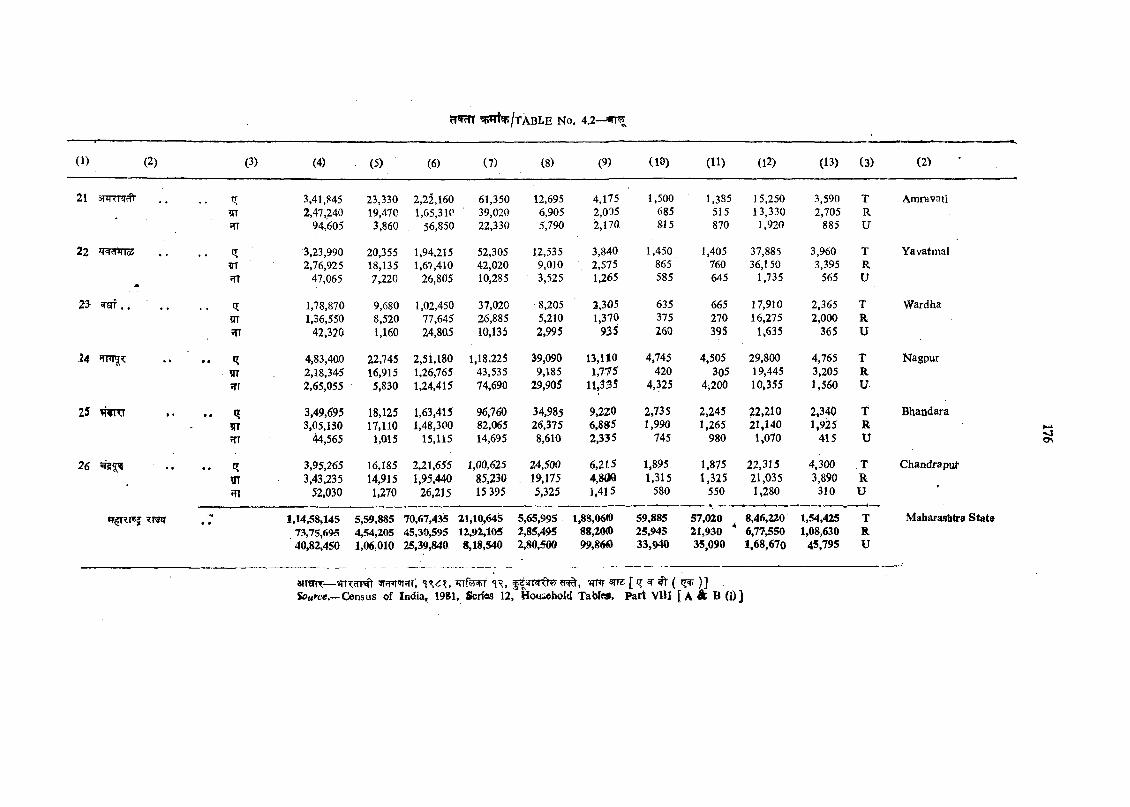
(1) (2) (3) (4) (5) (6) (7) (8) (9) (10) (11) (12) (13) (3) (2)
21 3r*TTT ffr . . 3,41,845 23,330 2,22,160 61,350 12,695 4,175 1,500 1,385 15,250 3,590 T Amravati2,47,240 19,470 1,65,310 39,020 6,905 2,005 685 515 13,330 2,705 R
94,605 3,860 56,850 22,330 5,790 2,170 815 870 1,920 8.85 U
22 3,23,990 20,355 1,94,215 52,305 12,535 3,840 1,450 1,405 37,885 3,960 T Yavatinalvn 2,76,925 18,135 1,67,410 42,020 9,010 2,575 865 760 36,150 3,395 R
* HI 47,065 2,220 26,805 10,285 3,525 1,265 585 645 1,735 565 U
23 ^arf. . ' . . 1,78,870 9,680 1,02,450 37,020 8,205 2,305 63.5 665 17,910 2,365 T Ward ha1,36,550 8,520 77,645 26,885 5,210 1,370 375 270 16,275 2,000 R
5TI 42,320 1,160 24,805 10,135 2,995 935 260 395 1,635 365 U
U . . q 4,83,400 22,745 2,51,180 1,18,225 39,090 13,110 4,745 4,505 29,800 4,765 T Nagpur2,18,345 16,915 1,26,765 43,535 9,185 1,775 420 305 19,445 3,205 R
?rr 2,65,055 5,830 1,24,415 74,690 29,90^ 11,335 4,325 4,200 10,355 1,560 U
IS . . q 3,49,695 18,125 1,63,415 96,760 34,985 9,220 2,735 2,245 22,210 2,340 T Bhandaram 3,05,130 17,110 1,48,300 82,065 26,375 6,88!5 1,990 1,265 21,140 1,925 R
44,565 1,015 15,115 14,695 8,610 2,335 745 980 1,070 415 U
26 tr 3,95,265 16,185 2,21,655 1,00,625 24,500 6,215 1,895 1,875 22,315 4,300 T Chandraput3,43,235 14,915 1,95,440 85,230 . 19,175 4,800 1,315 1,325 21,035 3,890 R
m 52,030 1,270 26,215 15 395 5,325 1,415 580 550 1,280 310 U
• • 1,14,58,145 5,59,885 70,67,435 21,10,645 5,65,995 1,88,06(0 59,885 57,020 , 8,46,220 1,54,425 T Maharashtra S tate73,75,6^ 4,54,205 45,30,595 12,92,105 2,85,495 88,20(0 25,945 21,930 6,77,550 1,08,630 BL40,82,450 1,06,010 25,39,840 8,18,540 2,80,500 99,S6& 33,940 35,090 1,68,670 45,795 u
-aos
afTETTT— Tfpr rrfn', ?, iTif =PT 'JR, wf»T srre: [ ^ ^ )]&>«rctf.-Census of India, 1981, Senes 12, Household Tabf«5. P a rt VUI [ A & B (i)]
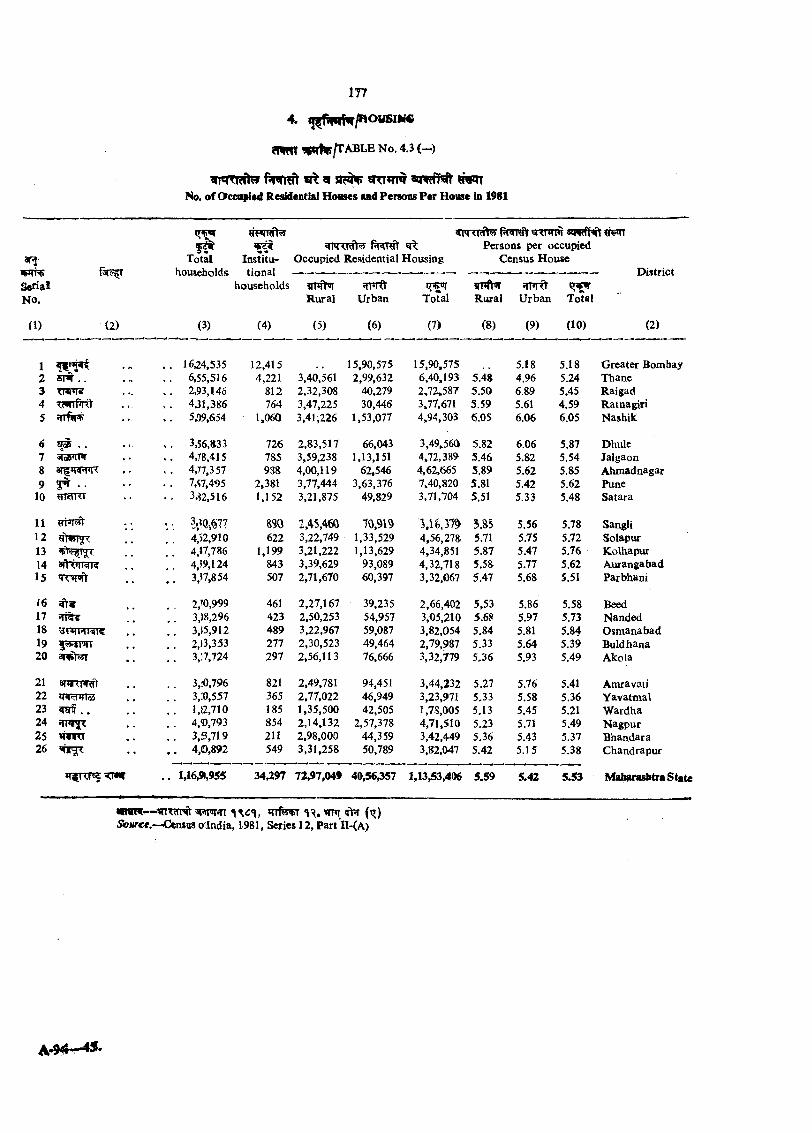
fiw rcft *1^ ^ s r< ^ ‘ 9T T in^ ®urwTsft # w tNo. of Occupied Resddeotial Howes asd Persons Per House in 1981
^ 4 Pf TtlV 'MiRPiPersons per occupied
arj- Total Institu Occupied Residential Housing Census H ouseW 'p households tional DistrictSerial households «T»i>rNo. R ural Urban Total Rural U rban Total
(1) (2) (3) (4) (5) (6) (7) (8) (9) (10) (2)
1 . . 16^4,535 12,415 15,90,575 15,90.575 5.18 5.18 G reater Bombay2 5TW . . 6,55,516 4,221 3,40,561 2,99,632 6,40,193 5.48 4.96 5.24 Thane3 TTU'»r8‘ . . 2,93,146 812 2,32,308 40,279 2,72*587 5.50 6.89 5.45 Raigad4 <.WTpT<y , . 431,386 764 3,47,225 30,446 3,77,671 5.59 5.61 4.59 Ratnagiri5 . . 509,654 1.060 3,41,226 1,53,077 4.94,303 6.05 6.06 6.05 N ashik
6 W2 , , . . . . . 3,56,S33 726 2,83,517 66,043 3,49,560 5.82 6.06 5.87 Dhulc7 '»id5M'R . . 4,78,415 785 3,59,238 1,13,151 4,72,389 5.46 5.82 5.54 JalgaonS . . 4,77,357 9S8 4,00,119 62*546 4,62,665 5.89 5.62 5.85 Ahmad nagar9 yir . . . . 7,S7,495 2,381 3,77,444 3,63,376 7.40,820 5.81 5.42 5.62 Pune
10 ^rwKi . . 3,^2,516 1,152 3,21,875 49,829 3,71,704 5.51 5.33 5.48 Satara
11 • , 3;^q.§77 S90 i A s , m 10,919 \Y b ,-m 5.8S 5.56 5.78 SangU12 , . 4,52,910 622 3,22,749 1,33,529 4,56,278 5.71 5.75 5.72 Solapur13 . . 4,^7,786 1,199 3,21,222 1,13,629 4,34,851 5.87 5.47 5.76 Kolhapur14 afH^WK . . 4,J9,124 843 3,39,629 93,089 4,32,718 5.58 5.77 5.62 Aurangabad15 . . 3,^7.854 507 2,71,670 60,397 3,32,067 5.47 5.68 5.51 Parbhani
16 2,^0,999 461 1X1, 39,235 2,66,402 5,53 5.86 5.58 Beed17 *Ti^ . . 3,)8,296 423 2,50,253 54,957 3,05,210 5.68 5.97 5.73 Nanded18 . . 3,}5,912 489 3,22,967 59,087 3,82,054 5.84 5.81 5.84 O sm anabad19 . . 2,»3,353 277 2,30,523 49,464 2,79,987 5.33 5.64 5.39 Buldhana20 . . 3,!7,724 297 2,56,113 76,666 3,32,779 5.36 5.93 5.49 Akola
21 aiwWr . . 3,!0,796 821 2,49,781 94,451 3,44,232 5.27 5.76 5.41 Amravati22 iT RiHrGd . . 3,:0,557 365 2,77,022 46,949 3,23,971 5.33 5.58 5.36 Y avatm al23 . . . . 1,2,710 185 1,35,500 42,505 i ,78,005 5.13 5.45 5.21 W ardha24 'I I^ T . . 4,50,793 854 2,14,132 2,57,378 4,71,510 5.23 5.71 5.49 N agpur25 n»im . . 3,3,719 211 2,98.000 44,359 3,42,449 5.36 5.43 5.37 B handara26 , . 4,0,892 549 3,31,258 50,789 3,82,047 5.42 5.15 5.38 Chandrapur
IT^RHC ^:ni| . . 1,16,91,955 34,297 72,97,049 40,56,357 1,13,53,406 5.59 5.42 5.53 Mabarasbtra State
« WR — W F n y\6% , ^ i ^ )S!pwc#.~CensttS o!lndia, 1981, Series 12, Part II-(A)
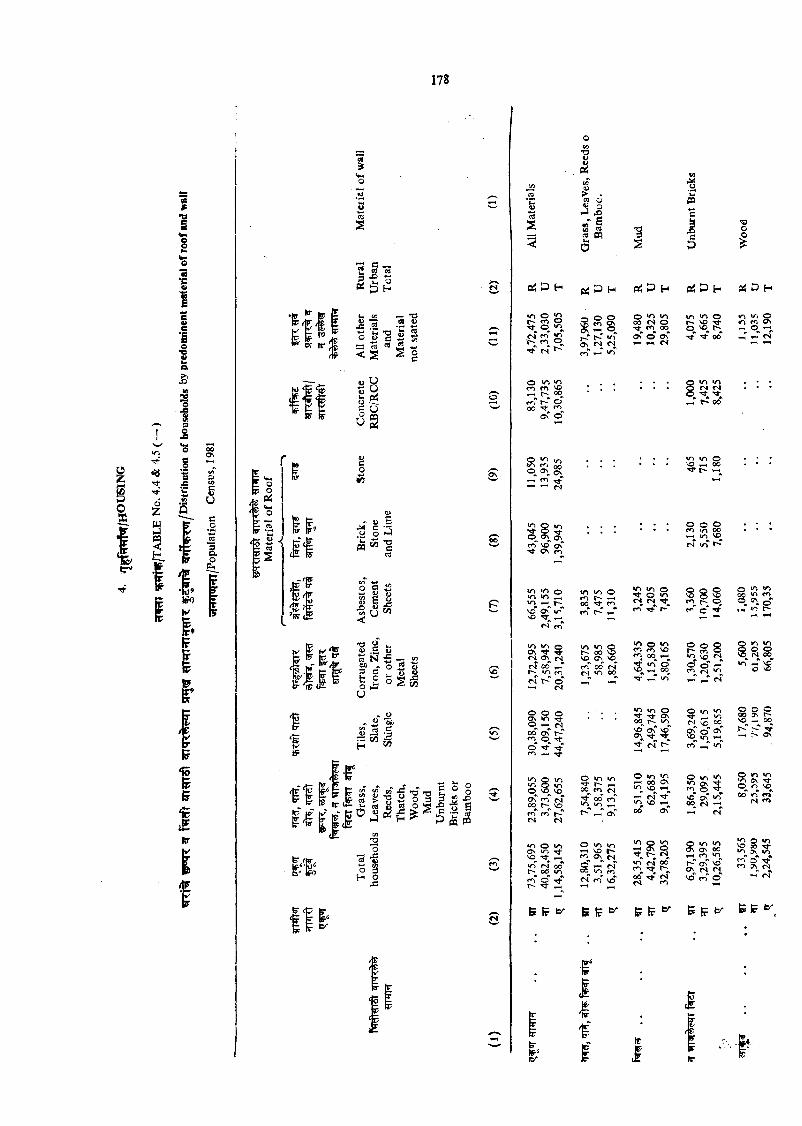
6%
IH
I
C«S
I I -5 o ei H
s « u 9
go
f « »? §.
r
c o o— r - r t l s j j ' i o ’s
/te
‘te p
■5
® Sro O O, >««S ro Or f ts'
O r < i m ^-H t~ 00m''t-‘' O 00 T}-
cT o
.9 5 oo R, ®V On- fO ’- ' ' ^ <N
• r t O r t O ^ o \ o \rn VO ON m
«n </ O IT) in i:,*- n\0 0\ ir VO ■>d- ^M crT>0 VI Q ON T f ^ «S 0\ (NJ oo yj' in c<-)ri r'*' o
s
oCO*S&
^ . J oiJ Xi“ i g mo I
m■5I5
C ^t^H p ; P h PShP h p ilD H siS O h
o o SVO S' o\ « ®, t-r 1Os ra ri r < i — "
O00 <S o Tj- m 00oT o* oT « n
m >r Om r~ i-H 00 -* m
in m O r~- 00 vD VO o\ VO
O M- O >n<N tN Tj-r<r Tt' l~“
m o >nCO cr> VO
00*0 q"
0 1 *• » '■ ^ r.• ' ^ T j- ^ m
n-' (s
II
ii-1 o S>r~ VO xf iTt m o\o ? -H q _ - -Ta-' Tj- 00' -T >-
§m «n
■" t^ 00
in «n O VO _ i 00 r- ^
o o o cn m 00 r-H in VOfN in
8 S STO t=- O, rr" c '<*■
VO cs o" - '— or o
< S
O i n ^ ^ ^
VO c c On cT On
m
0^8VO
»n 00r -m
<ri 000NO«v
inOn
0meri
ms
1/1
On*"00
rn cT *0 oo''»n s
n-" Vo"00 oC
C4vT
ro' r-'* K * oC 00 Os r f
toOnVO
0 «n 0fo
mVO®V
m(N
>0 0i
0o\ mONfO<n00m
fS00 00* o '00 in (Smincn <s 00r- Ol oTts
vo"fSrn'r o'Tt fS cn VO 0fS r iro vo"m*' 0
& I? t>- & If ty !? tr 5 Ir br
o ^00®. o ', a r ~
mo oN 00
0 0 000 ONVO —1 00
O m m !£ ) ON T f O m VO
£1?
I®,,r
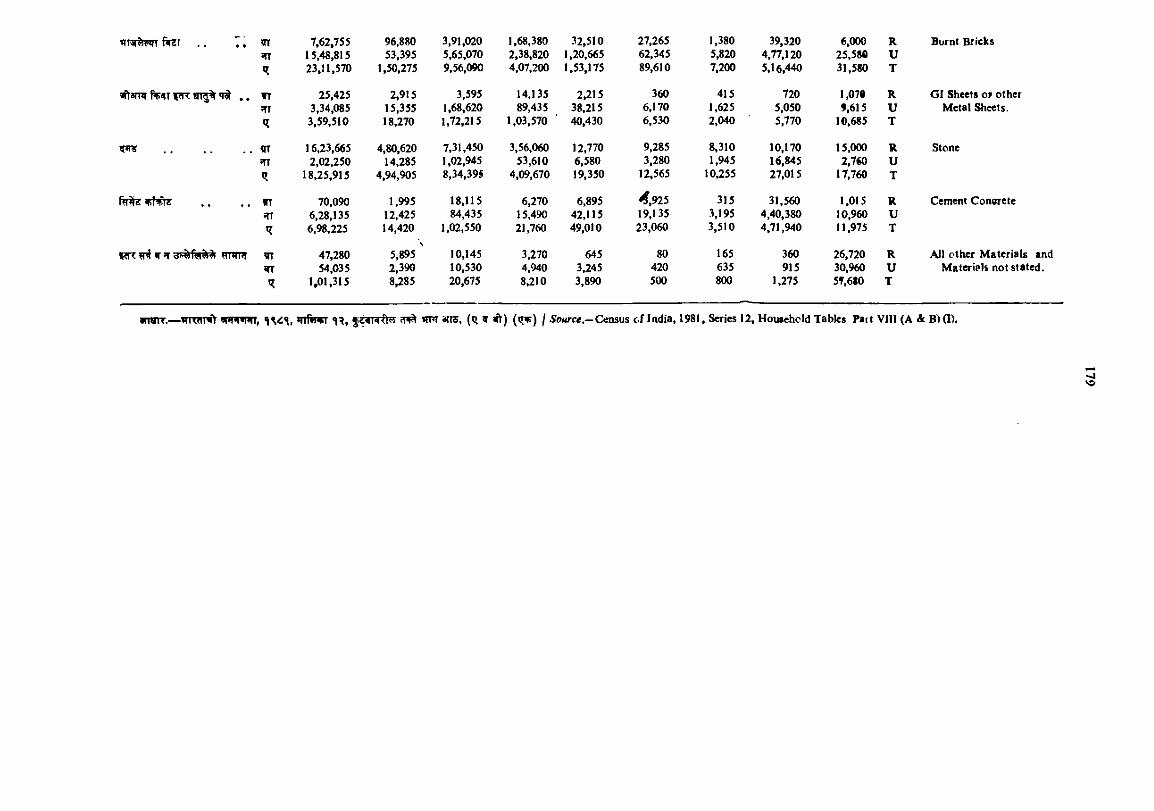
tiTir rwT ftrar . . , » ’irr 7.62.755 96,880 3,91,020 1,68,380 32,510 27,265 1,380 39,320 6,000 R Burnt BricksSIT 15,48,815 53,395 5,65,070 2,38,820 1,20,665 62,345 5,820 4,77,120 25,58fi UR 23,11,570 1,50,275 9,56,090 4,07,200 1,53,175 89,610 7,200 5,16,440 31,580 T
*ftOT*r fVfll f?TT eii^ •« IT 25,425 2,915 3,595 14,135 2,215 360 415 720 1,070 R GI Sheets oi> other!Tr 3,34,085 15,355 1,68,620 89,435 38,215 6,170 1,625 5,050 9,615 U Metal Sheets.<? 3,59,510 18,270 1,72,215 1,03,570 40,430 6,530 2,040 5,770 10,685 T
AT 16,23,665 4,80,620 7,31,450 3,56,060 12,770 9,285 8,310 10,170 15,000 R StoneTT 2,02,250 14,285 1,02,945 53,610 6,580 3,280 1,945 16,845 2,760 U<? 18,25,915 4,94,905 8,34,39$ 4,09,670 19,350 12,565 10,255 27,015 17,760 T
. . . . IT 70,090 1,995 18,115 6,270 6,895 ^,925 315 31,560 1,015 R Cement Concrete!n 6.28,135 12,425 84,435 15,490 42,115 19,135 3,195 4,40,380 10,960 U
6,98,225 14,420 1,02,550 21,760 49,010 23,060 3,510 4,71,940 11.975 T
«T 47,280 5,895 ' 10,145 3,270 645 80 165 360 26,720 R All other Materials andWT 54,035 2,390 10,530 4,940 3,245 420 635 915 30,960 U Materials not stated.
1,01,315 8,285 20,675 8,210 3,890 500 800 1,275 5T.6I0 T
inrnr,— ennmWT, mftrvr gcwRttw ?r^ «nr sro, (q ^ (t^v) / 5o«rc<.—Census of India, 1981, Series 12, Househcld Tables Part Vlll (A & B>(I).
‘‘j
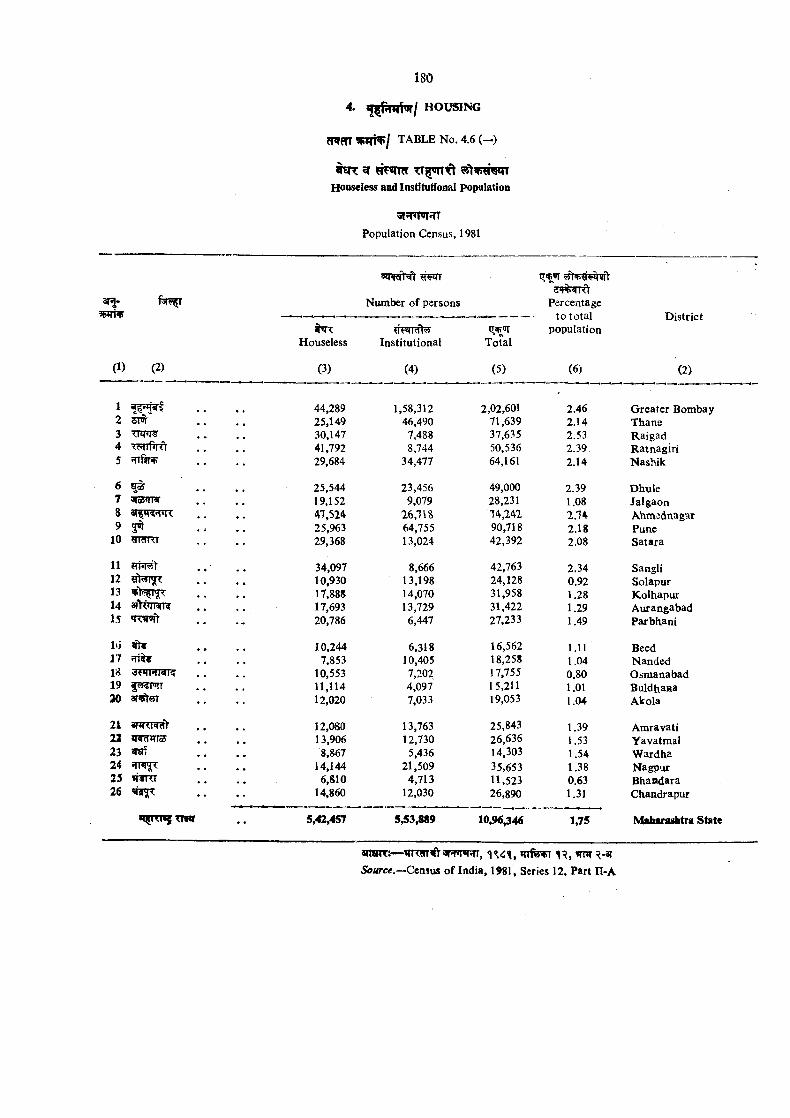
t a b l e No. 4.6 (—)
#«IT ^Houseless and Institutional population
H»T*r>r»TT
Population Census, 1981
(1) (2)
12 !5Tor345 5 n f ^
6 &5I7 iTOTTRr
9 2«r10 rrannr
11 ?TFR^121314 slYoTRrr?15 'RlTJft
l<i171« ^f«tWWK 19 55!5Frr 30
21 anRRcft22 iR iTToS23 ^24 JTR^2526
TTW
5qwhft
Number of persons
Houseless
(3)
44,28925,14930,14741.79229,684
25,54419,15247.52425,96329,368
34,09710,93017,88817,69320,786
10,2447,853
10,55311,11412,020
12,08013,906
8,86714,144
6,81014,860
5,42,457
Institutional
(4)
Percentage-------------- to to tal
populationTotal
(5) (6)
1,58.31246.490
7,4888,744
34,477
23,456 9,079
26,1 \S 64,755 13,024
8.66613,19814,07013.729
6,447
6,31810,4057,2024,0977,033
13,76312.730
5,43621,509
4,71312,030
5^53,889
2,02.60171.63937.635 50,536 64,161
49,00028,23114,14290,71842,392
42,76324,12831,95831,42227,233
16,56218,25817,75515,21119,053
25,84326.636 14,303 35,653 11,523 26,890
104H5^46
2.462.142.532.392.14
2.39 1.082.14 2.18 2.08
2.340.921.281.291.49
1.111.04 0.80 1.011.04
1.391.531.54 1.38 0.63 1.31
1,75
D istrict
(2)
G reater BombayThaneRaigadR atnagiriNashik
D huleJalgaonAhmadnagarPuneSatara
SangliSolapurK olhapurA urangabadParbhani
BeedNandedOsmanabadB uldhaaaAkola
AraravatiYavatmalW ardhaN agpurB handaraChandrapur
Muharashtra State
« WR: — qi feVT ITHT Source.-^Ccmxis o f India, 1981, Scries 12, Part Il-A
srrftfr 5iw fWr^ ^1 =^ m%ft5 ^ cf^^rra- 3 r | .
?r»ff^PTor I ftrarJTrsqT c n f f ^ T J r i ^^ ^ 3 3 t t | . g ^ q r w r 5RTsiifiT^ 5 n « rf t^
f w r ^ r ^T T T Szd^ f W T W r c T ^^ n tr f i r^ ^ ^ r r e r f ^ ^ f^^jr«Tf=^ ^ fr t? f^ '5 C^ n r n i t ^ ^ I q r ^ ^
f % ^ i ^ H f ^ O a f W ^ r ^^TcT. 5TT«rf?r^f f w r f W ^ fJTfTT ^ f%^T q % ^ t
^ ^ T 3Tt5 ^ f % ^ ^T |?T ^ ^ iT t^ T S T ^ I ^ m sr f%^T*rr% s r v q t g ^ « rr^ .inszrfirsp ^frr Srrs a r q r ^ /^ ^
^ T ^T^rszrr ^ f ^ W T ^ f fW9T^ f w ^ j:|oi% m ’s z r f w w r^ fc f 5rRT< f<T 'm r
iTPFJ^HcfC^ ' T ^ fsp^n 'Kf^spT s p t tn W T ^>T. ^T f<5ri«rr f?m?rrf^«?jflr s r r ^ t q r ^ ^■ .
51 D ata on institutions according to type of education, students, teachers, and results of major examiaations are presented in the following tables.
5.2 The classification of institutions according to type is slightly diflferent from stages o f education. TJiere are many secondary schools which also im part education in^ ‘primary’ courses. Nevertheless, the entire enrolment of students is included under secondary education. The break up of the total enrolment of students in pre-primary, primary and secondary schools according to standards m ^ perhaps give the realistic picture. Childraa between ages three and five attend pre-primary institutions. These are generally known as kindergarten, montessory etc. Primary institutions provide education for pre-primary and standards I—IV or standards I—VII/VIII o«’ less and teaches the curriculum approved by the Education Department; whereas secondary institutions coach students for standard VIII to X or XI/XII with or without lower standard. Higher education is education after passing secondary school certificate examinatioa which le^ds to a degree /diploma examination. The statistic about examination results is also presented.
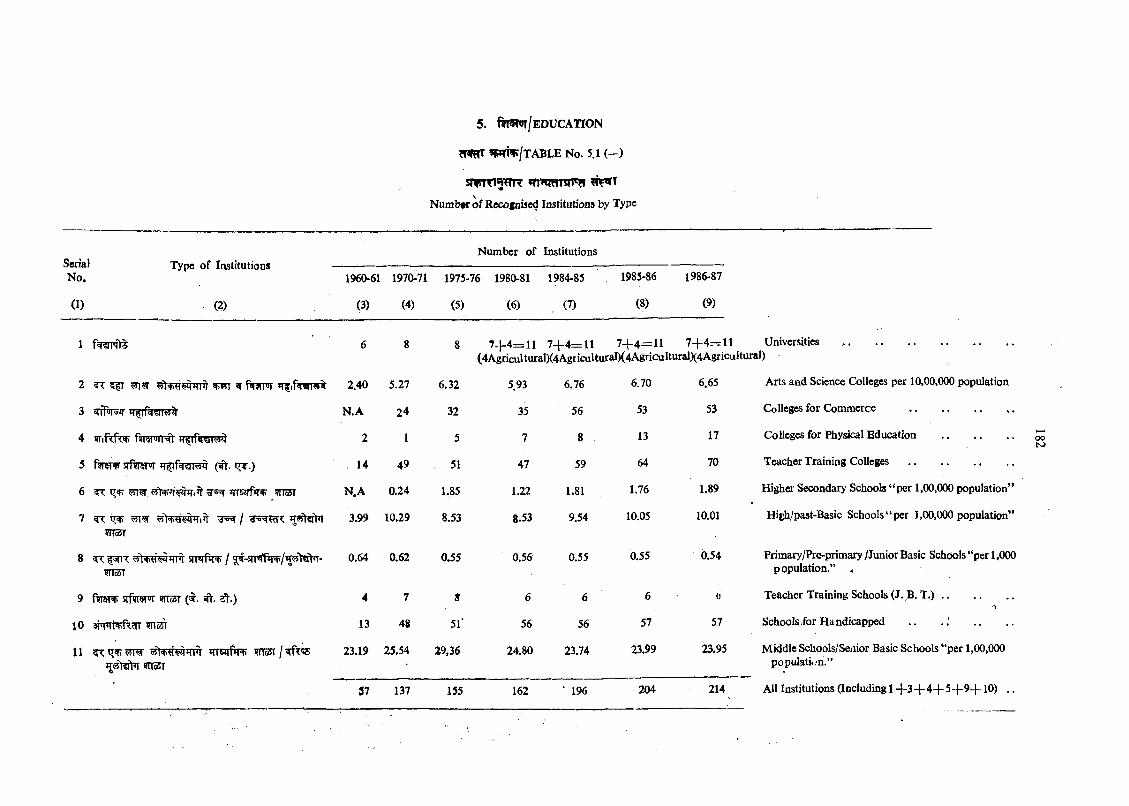
5 . fifWnr/EDUCATION
?Tf5rT ?WTV/t ABLE N o. 5.1 (—)
s n r r t i W R m »«m Tsn^
Number o f Rccogniacd Institutioas by Type
SerialNo.
(1)
Number of InstitutionsType of Institutions
(2)
1 f«rarqV3
2 ^ f«i?rrJi *r?tf«WT^ 2.40 5.27
4 jjtiM w ftrsfrJTRt
5 fwsnr s r fw ^ (^ .
6 ^ JfTsqfrnT ttoSt
m s r
8 ^ 5n«rrH -1^nar
1960-61 1970-71 1975-76 1980-81 1984-85 1985-86 1986-87
(3) (4) (5) (6) . (8) (9)
6 8 8 7 + 4 = 1 1 7 + 4 = 1 1 7 + 4 = 1 1 7 + 4 = 1 1 Universities .............................................................(4AgriculturalX4AgriculturalX4AgriculturalX4AgricuItural)
2.40 5.27 6.32 593 6.76 6.70 6.65 Arts and Science Colleges per 10,00,000 population
N.A 24 32 35 56 53 53 Colleges for Commerce .......................................
2 1 5 7 8 13 17 Colleges for Physical Education
14 49 51 47 59 64 70 Teacher Training C o l l e g e s .......................................
N .A 0.24 1.85 1.22 1.81 1.76 1.89 Higher Secondary Schools “ per 1,00,000 population”
3.99 10.29 8.53 8.53 9.54 10.05 10.01 Hij5h/past-Basic Schools “ per 1,00,000 population”
0.64 0.62 0.55 0.56 0.55 0.55 0.54 Primary/I*re-primary /Junior Basic Schools “per 1,000
9 ftrew srf?T«rjr m m ( t . €t.) 4 7 8 6 6 6 0
10 ^o5T 13 48 51' 56 56 57 57
11 23.19 25.54 29,36 24.80 23.74 23.99 23.95?Tlo5T
57 137 155 162 ‘ 196 204 214
population.” *
Teachcr Training Schools (J. B. T . ) ...........................i
Schools for Handicapped . .
Middle Schools/Seiiior Basic Schools “ per 1,00,000 populatii.n.”
All Institutions (Including 1 + 3 + 4 + 5 + 9 + 1 0 ) . .
ooN>
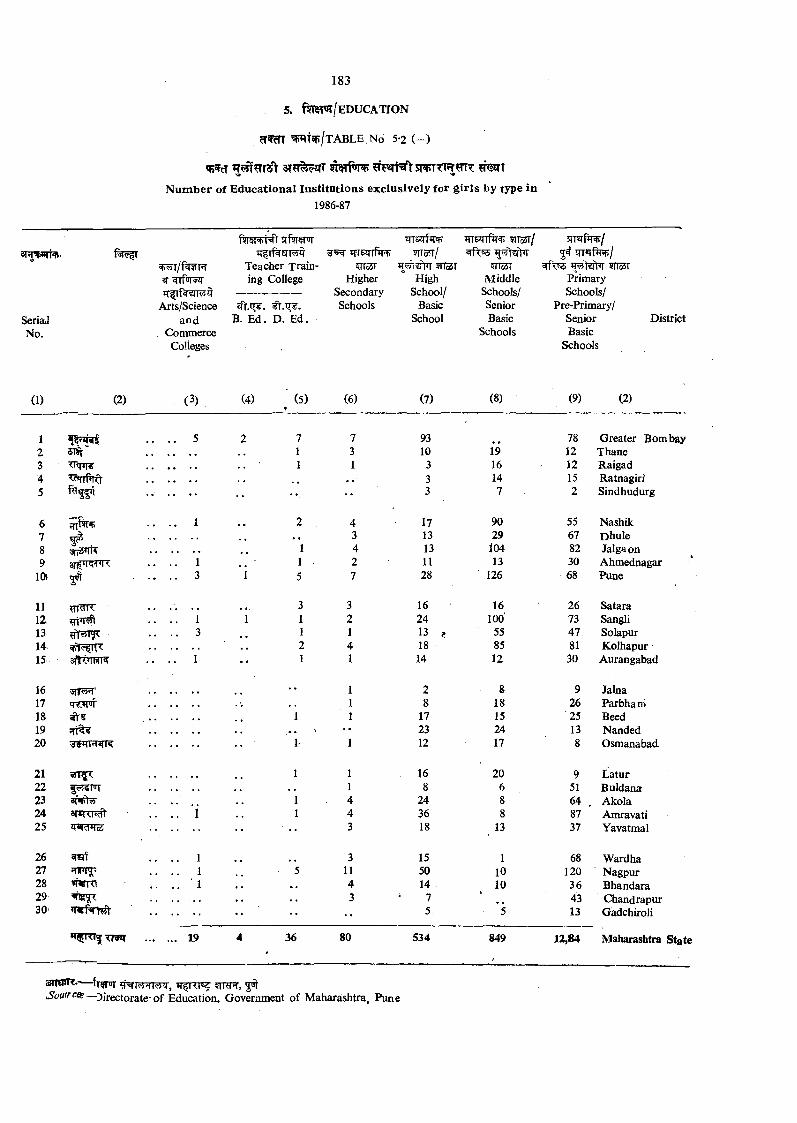
183
5. f^ o r /E D U C A lT O N
^T f» /T A B L E ,N o 5-2 (—)
3 T ?# ^ T 5R»TTTST^ ?t t
Number of Educational Institutions exclusively for girls by type in1986-87
SeriailNo.
^ /fS R T R
Arts/Scienceand
CommerceColieges
srf^^trr
Teacher Training College
B. Ed . D. E d .
JTrsqrt^Ri5rT55T
HigherSecondarySchools
m"sqfFRT WTOT/
Hwi^Vl ?TTo5T High
School/ Basic
School
5TT3T/
^narMiddle
Schools/SeniorBasic
Schools
5iT«rfinr/5# snqfriW/
51X551PrimarySchools/
Pre-Primary/SeniorBasic
Schocds
District
(1) (2) (3) (4) (5)»
(6) (7) (8) (9) (2)
7 7 93 78 Greater Bombay1 3 10 19 12 Thane1 1 3 16 12 Raigad
. . 3 14 15 Ratnagin'•• •• 3 7 2 Sindhudurg
2 4 17 90 55 Nashik• • 3 13 29 67 Dhule
1 4 13 104 82 Jalgaon1 2 11 13 30 Ahmednagar5 7 28 126 68 Pune
3 3 16 16 26 Satara1 2 24 100‘ 73 Sangli1 1 13 ^ 55 47 Solapur2 4 18 85 81 Kolhapur1 1 14 12 30 Aurangabad
1 2 8 9 Jalna1 8 18 26 Parbham
1 1 17 15 25 Beed•• 23 24 13 Nanded
P 1 12 17 8 Osmanabad
1 1 16 20 9 L atur1 8 6 51 Buldana
1 4 24 8 64 „ Akola1 4 36 8 87 Amravati
•• 3 18 13 37 Yavatmal
. . 3 15 1 68 Wardha5 11 50 10 120 N agpur
» • 4 14 10 36 Bhandara3 7 43 Chandrapur
•• 5 5 13 Gadchiroli
36 80 534 849 12,84 Maharashtra State
12345
678 9
lOl
1617IS1920
2122232425
262728 29 30'
1112,131415. 3f)rt»iwR
»rt^^-i^+iWcjK
5553FT
3T«TO^qWcPTcS
WTO
19
smUR.-— fT5jTT 5TRR, 5<irSouircBi—^Directorate-of Education, Government of Maharashtra, Pune
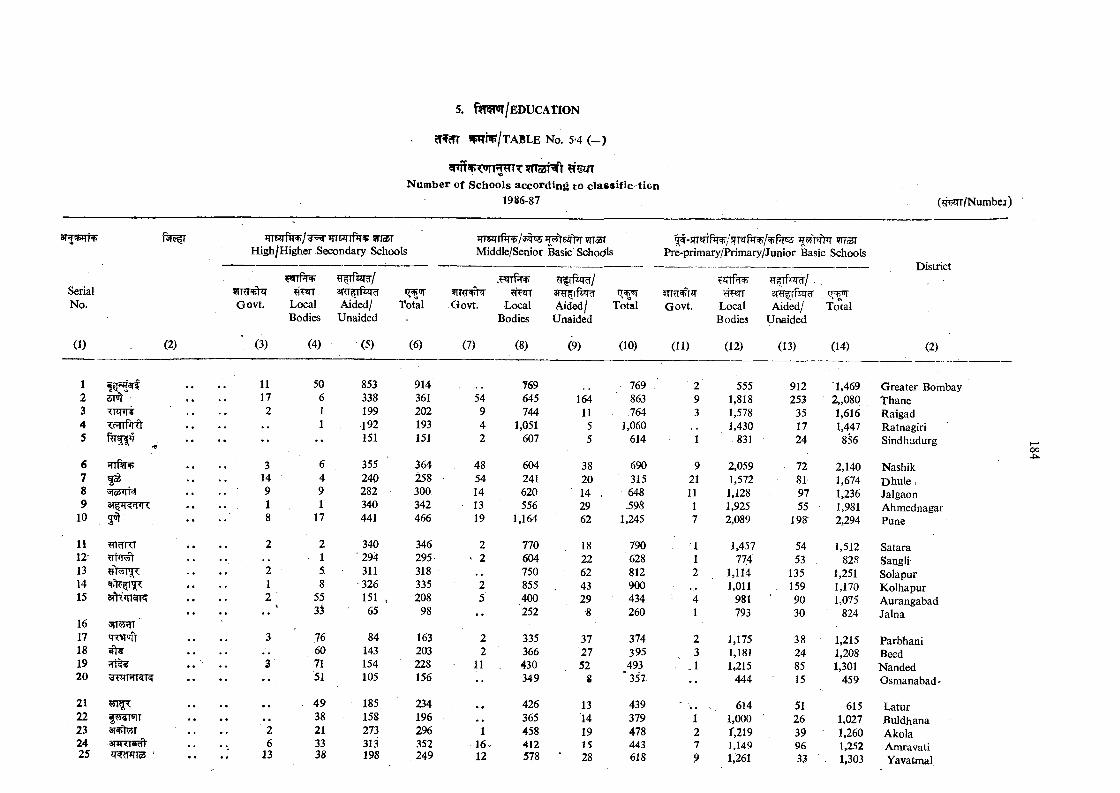
5. / e d u c a t i o n
?Tf?Tr W J '^ I t A BLE No. 5-4 ( - )
N u m b er of S choo ls a cc o rd in g to c la s s if ic tio n 1986-87 (?P?irT/Numbej)
SerialNo.
r>fc r
(1)
iTTsqfir^/g^ irrsJTrf^^: ?ti3 t H igh/Higher Secondary Schools
wtF 4> ^T rFz nr/
G ovt. Local Aided/ Total Bodies Unaided
(2)
12 41 «134 w P i d5
6 HTftpp78 5io3»ira9
10 5^
11 ^HdKI12131415
1617 T W lt181920
212223 3T jt T24 3TIRT3ra25
TTrwrfiT^/s^ ?na5tMiddle/Senior Basic' Schools
. pErrf T ' ^ r f ^ /
Govt. Local Aided/ Total Bodies Unaided
| # - s n ’* ? t f iT ^ / jT T 2 T f w / ^ f ^ 9JTOT
Pre-primary/Priniary/Junior Basic Schools
5Tm^ir tT^qrGovt. Local
BodiesAided/ Total
Unaided
District
[3) (4) (5) (6) (7) (8) (9) (10) (11) (12) (13) (14) (2)
11 50 853 914 769 769 2 555 912 1,469 Greater Boinbay17 6 338 361 54 645 164 863 9 1,818 253 2„080 Thane2 1 199 202 9 744 11 J6 4 3 1,578 35 1,616 Raigad
1 192 193 4 1,051 5 1,060 1,430 17 1,447 Ratnagiri•• •• 151 151 2 607 5 614 1 831 24 856 Sindhudurg
3 6 355 364 48 604 38 690 9 2,059 72 2,140 Nashik14 4 240 258 • 54 241 20 315 21 1,572 81 1,674 Dhule 19 9 282 300 14 620 14 . 648 11 1,128 97 1,236 Jalgaon1 1 340 342 13 556 29 .598 1 1,925 55 1,981 Ahmednagar8 17 441 466 19 1,164 62 1,245 7 2,089 198 2,294 Pune
2 2 340 346 2 770 18 790 1 1,457 54 1,512 Satara1 ' 294 295 ' 2 604 22 628 1 774 53 . 828 Sangli-
2 5 ■ 311 318 750 62 812 2 1,114 135 1,251 Solapur1 8 326 335 2 855 43 900 ... 1,011 159 1,170 Kolhapur2 55 151 , 208 5 400 29 434 4 981 90 1,075 Aurangabad
3^ 65 98 •• 252 8 260 1 793 30 824 Jalna
3 76 84 163 2 335 37 374 2 1,175 38 1,215 Parbhani. . 60 143 203 2 366 27 395 3 1,181 24 1,208 Beed3 71 154 228 11 430 52 493 ,1 1,215 85 1,301 Nanded
51 105 156 •• 349 8 ‘ 357 •• 444 15 459 Osmanabad-
.. - 49 185 234 • • 426 13 439 614 51 615 Latur38 158 196 365 14 379 1 1,000 26 1,027 Buldhana
2 21 273 296 1 458 19 478 2 r,219 39 1,260 Akola6 33 313 352 16^ 412 15 443 7 1,149 96 1,252 Amravati
13 38 198 249 12 578 • 28 618 9 1,261 33 . 1,303 Yavatmal
oo
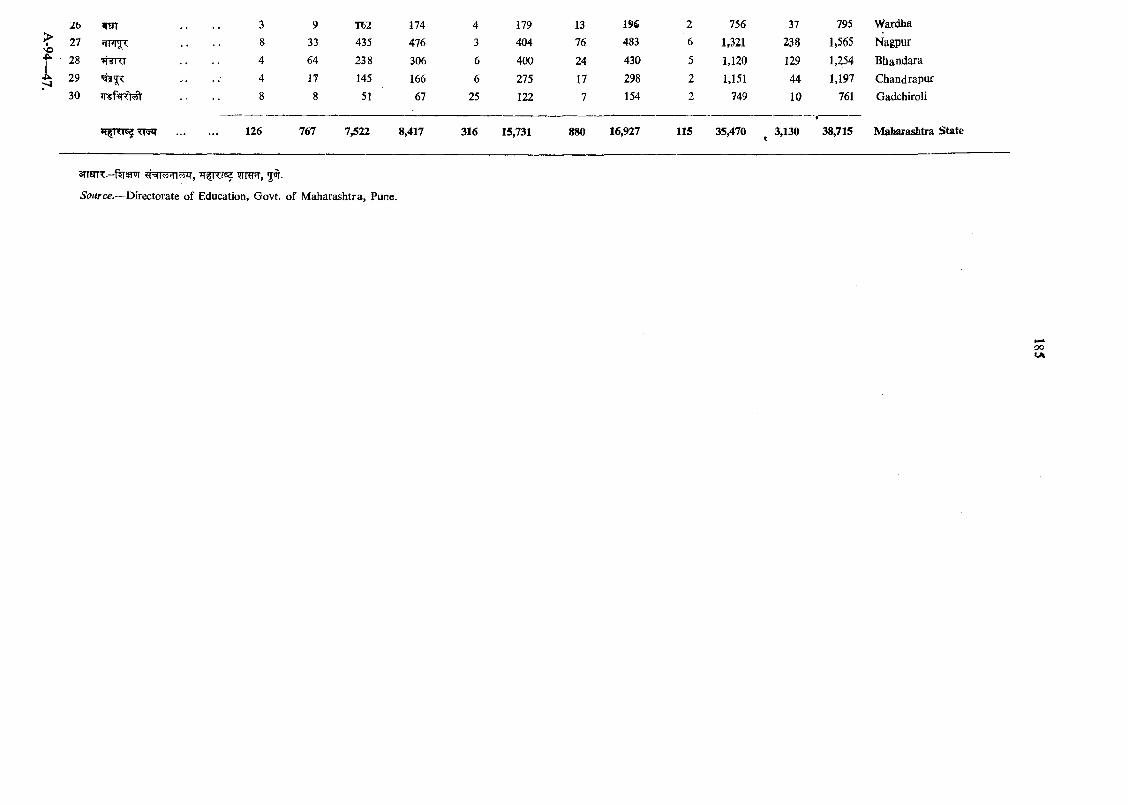
VO
i
J.b fm27
28 WsJKT29
30
126
9
33
64
17
767
T^2435
238
145
51
174476
306
166
67
43
6
625
179
404
400
275
122
1376
24
17
7
196
483
430
298154
756
1,321
1,120
1,151749
37
238
129
4410
795 Wardha
1,565 Nagpur
1,254 Bhandara
1,197 Chandrapur
761 Gadchiroli
7,522 8,417 316 15,731 880 16,927 115 35,470 3,130 38,715 Maharashtra State
5<jt.
Source.—Directorate of Education, Govt, of M aharashtra, Pune.
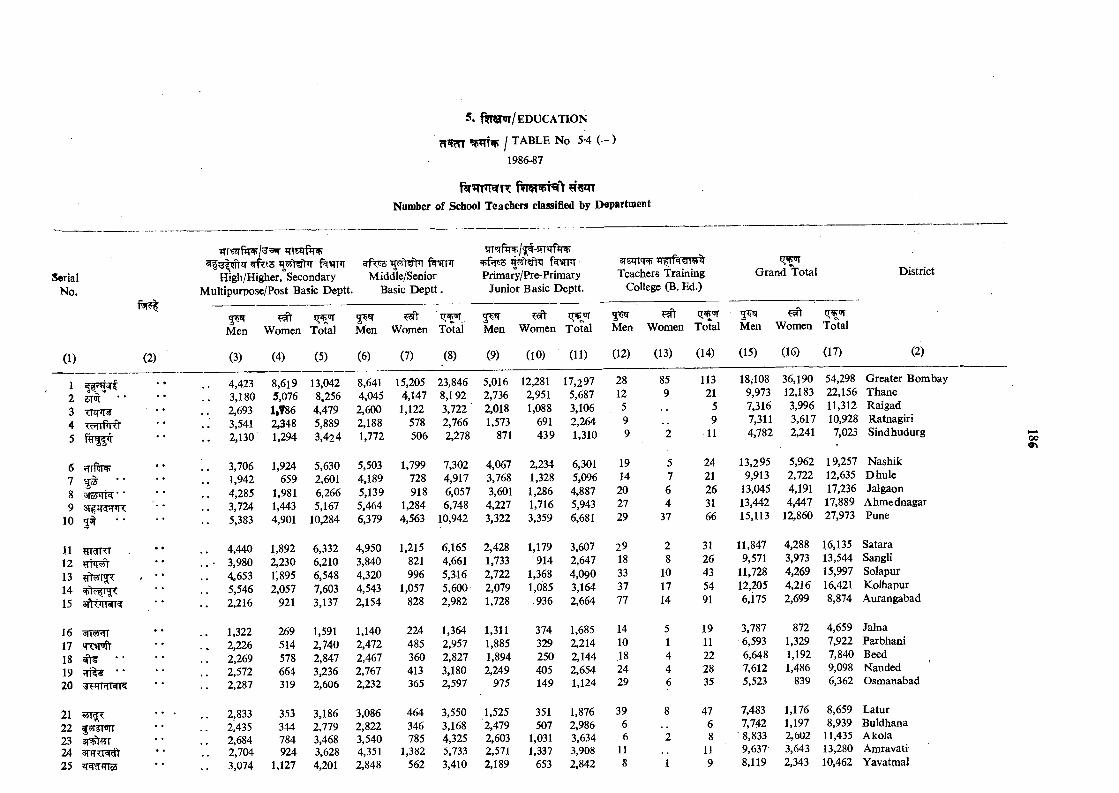
ipTtiF I t a b l e No 5-4 ( - )
1986-87
fTOTSRT *Number of School Teachers classified by Department
SerialNo.
(1) (2)
TTrs?rf^/^«*r msqfir^f ivTiTr
Higli/Higher, Secondary Multipurpose/Post Basic Deptt.
Middle/Senior Basic D ep tt.
Primary/Pre-Primary Junior Basic Deptt.
arwn<T^Teachers Training
College (B. Ed.)G rand Total District
*TFnnrTvTlMt
6 ^rftnp7 ^ "8 M ”9 3T|itcPT’R
10 5 ^ * •
11 rraKT12 g iw r131415 arttiM R
16 3TRRT17 TWift18 i t s * •19 5Ti%¥ • •20 ^H rnw R
21 ^rg;T22 <?4si>j((2324 3TJTTr^25 q^TOS
5^^ 5 ^ 5 ^oMen Women Total Men Women Total Men Women Total Men Women Total Men Women Total
(3) (4) (5) (6) (7) (8) (9) (10) (11) (12) (13) (14) (15) (16) (17) (2)
4,423 8,6l9 13,042 8,641 15,205 23,846 5,016 12,281 17,297 28 85 113 18,108 36,190 54,298 Greater Bom
3,180 5,076 8,256 4,045 4,147 8,192 2,736 2,951 5,687 12 9 21 9,973 12,183 22,156 Thane
2,693 1,786 4,479 2,600 1,122 3,722 ‘ 2,018 1,088 3,106 5 5 7,316 3,996 11,312 Raigad
3,541 2,348 5,889 2,188 578 2,766 1,573 691 2,264 9 9 7,311 3,617 10,928 Ratnagiri
2,130 1,294 3,424 1,772 506 2,278 871 439 1,310 9 2 11 4,782 2,241 7,023 Sindhudurg
3,706 1,924 5,630 5,503 1,799 7,302 4,067 2,234 6,301 19 5 24 13,295 5,962 19,257 Nashik
1,942 659 2,601 4,189 728 4,917 3,768 1,328 5,096 14 7 21 9,913 2,722 12,635 D hule
4,285 1,981 6,266 5,139 918 6,057 3,601 1,286 4,887 20 6 26 13,045 4,191 17,236 Jalgaon
3,724 1,443 5,167 5,464 1,284 6,748 4,227 1,716 5,943 27 4 31 13,442 4,447 17,889 Ahmednagar
5,383 4,901 10,284 6,379 4,563 10,942 3,322 3,359 6,681 29 37 66 15,113 12,860 27,973 Pune
4,440 1,892 6,332 4,950 1,215 6,165 2,428 1,179 3,607 29 2 31 11,847 4,288 16,135 Satara
■ 3,980 2,230 6,210 3,840 821 4,661 1,733 914 2,647 18 8 26 9,571 3,973 13,544 Sangli
4,653 r,895 6,548 4,320 996 5,316 2,722 1,368 4,090 33 10 43 11,728 4,269 15,997 Solapur
5,546 2,057 7,603 4,543 1,057 5,600- 2,079 1,085 3,164 37 17 54 12,205 4,216 16,421 Kolhapur
2,216 921 3,137 2,154 828 2,982 1,728 .936 2,664 77 14 91 6,i75 2,699 8,874 Aurangabad
1,322 269 1,591 1,140 224 1,364 1,311 374 1,685 14 5 19 3,787 872 4,659 Jalna
2,226 514 2,740 2,472 485 2,957 1,885 329 2,214 10 1 11 6,593 1,329 7,922 Parbhani2,269 578 2,847 2,467 360 2,827 1,894 250 2,144 .18 4 22 6,648 1,192 7,840 Beed2,572 664 3,236 2,767 413 3,180 2,249 405 2,654 24 4 28 7,612 1,486 9,098 Nanded2,287 319 2,606 2,232 365 2,597 975 149 1,124 29 6 35 5,523 839 6,362 Osmanabad
2,833 353 3,186 3,086 464 3,550 1,525 351 1,876 39 8 47 7,483 1,176 8,659 Latur2^435 344 2,779 2,822 346 3,168 '2,479 507 2,986 6 6 7,742 1,197 8,939 Buldhana2,684 784 3,468 3,540 785 4,325 2,603 1,031 3,634 6 2 8 • 8,833 2,602 11,435 Akola2,704 924 3,628 4,351 1,382 5,733 2,571 1,337 3,908 11 11 9,637- 3,643 13,280 Amravati
3,074 1,127 4,201 2,848 562 3,410 2,189 653 2,842 8 1 9 8,119 2,343 10,462 Yavatmal
oo
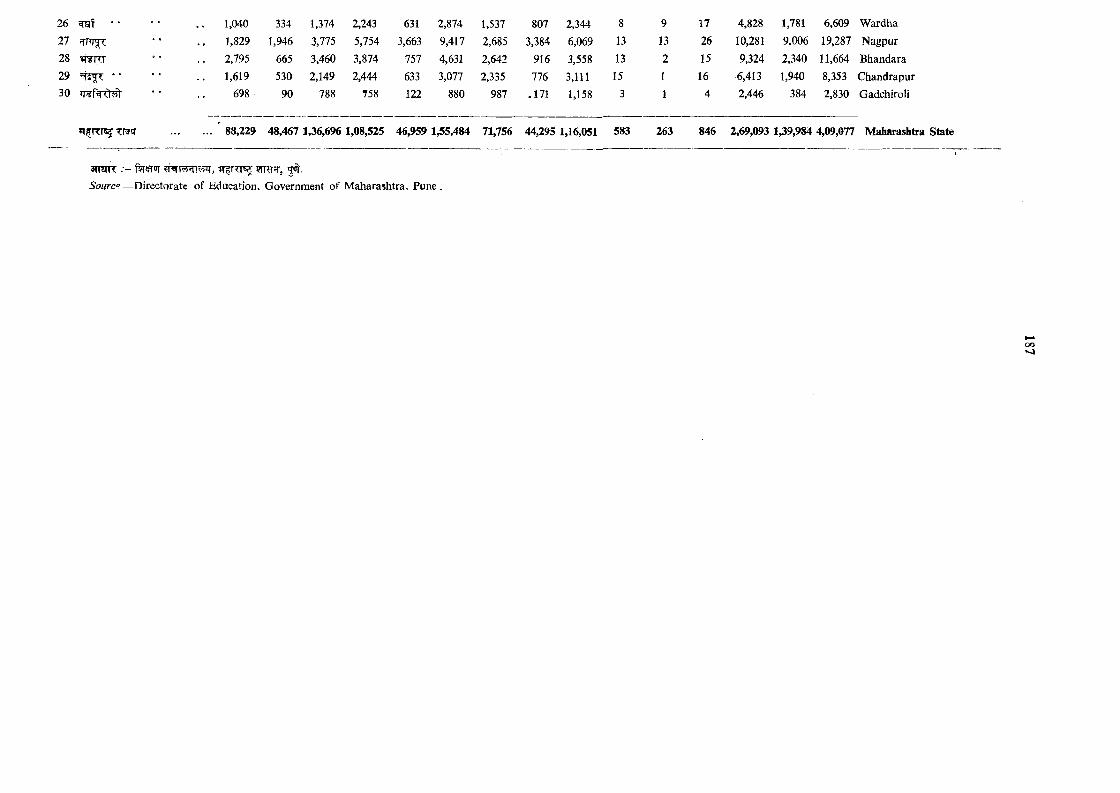
26 ^ • '27
28
29 • *30
1,040 3341,829 1,9462,795 665
1,619 530698 90
3,7753,460
2,149788
5,7543,874
2,444T58
631 2,874 1,537 807 2,344 8 9 17 4,828 1,781 6,609 W ardha
5,663 9,417 2,685 3,384 6,069 13 13 26 10,281 9,006 19,287 Nagpur757 4,631 2,642 916 3,558 13 2 15 9,324 2,340 11,664 Bhandara633 3,077 2,335 776 3,111 15 1 16 6,413 1,940 8,353 Chandrapur122 880 987 -171 1,158 3 1 4 2,446 384 2,830 Gadchiroli
............... 88,229 48,467 1,36,696 1,08,525 46,959 1,55,484 71,756 44,295 1,16,051 583 263 846 2,69,093 1,39,984 4,09,077 Maharashtra State
am nr w r?r,Sourc‘d —Directorate of Education, Government of Maharashtra, P u n e .
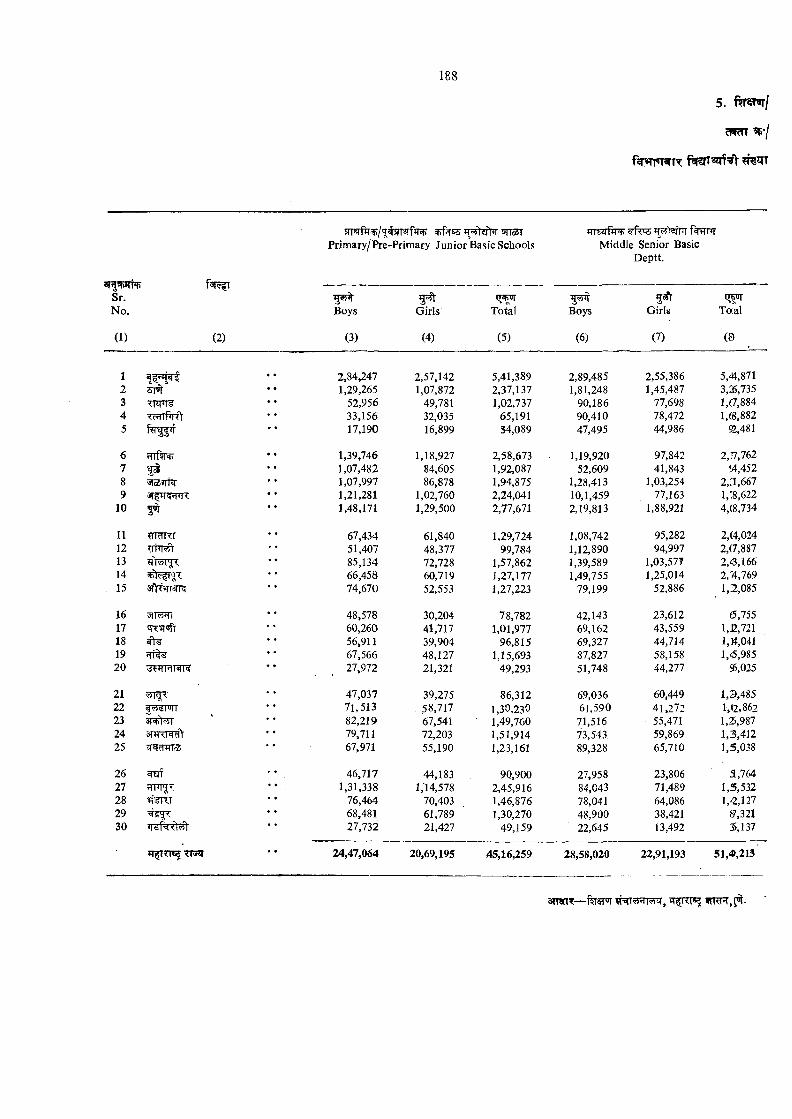
Sr.No.
(1) (2)
5rFTfiT /g;#5rT2rfrR) ?tt55tPrimary/Pre-Primary Junior Basic Schools
Boys
(3)
Girls
(4)
Total
(5)
f g - ^ s r t T
Middle Senior Basic Deptt.
Boys
(6)
5 ^Girls
(7)
q ;^To'al
(9
I234 <c»i 1 Pi5
6 fTTfro78 vilbd lici9
10
11 ??raT’<r12131415
1617181920
21222324 snTTT^25 JT RnriaJ
2627282930
TTHT
2,84,247 2,57,142 5,41,389 2,89,485 2,55,386 5,41,8711,29,265 1,07,872 2,37,137 1,81,248 1,45,487 3,:S,735
52,956 49,781 1,02,737 90,186 77,698 l,f7,88433,156 32,035 65,191 90,410 78,472 1,«,88217,190 16,899 34,089 47,495 44,986 S,481
1,39,746 1,18,927 2,58,673 1,19,920 97,842 2,]7,7621,07,482 84,605 1,92,087 52,609 41,843 9 ,4521,07,997 86,878 1,94,875 1,28,413 1,03,254 2,:l,6671,21,281 1,02,760 2,24,041 10,1,459 77,163 1,18,6221,48,171 1,29,500 2,77,671 2,19,813 1,88,921 4,(8,734
67,434 61,840 1,29,724 1,08,742 95,282 2,(4,02451,407 48,377 99,784 1,12,890 94,997 2,(7,88785,134 72,728 1,57,862 1,39,589 1,03,577 2,4,16666,458 60,719 1,27,177 1,49,755 1,25,014 2,'4,76974,670 52,553 1,27,223 79,199 52,886 1,2,085
48,578 30,204 78,782 42,143 23,612 6,75560,260 41,717 1,01,977 69,162 43,559 1,2,72156,911 39,904 96,815 69,327 44,714 1,M,04167,566 48,127 1,15,693 87,827 58,158 1,^,98527,972 21,321 49,293 51,748 44,277 55,025
47,037 39,275 86,312 69,036 60,449 1,3,48571,513 , 58,717 1,30,230 61,590 41,272 1,«2,86282,219 67,541 1,49,760 71,516 55,471 1,S,98779,711 72,203 1,51,914 73,543 59,869 1,3,41267,971 55,190 1,23,161 89,328 65,710 1,5,038
46,717 44,183 90,900 27,958 23,806 3,7641,31,338 1,14,578 2,45,916 84,043 71,489 1,5,532
76,464 70,403 1,46,876 78,041 64,086 1,^,12768,481 61,789 1,30,270 48,900 38,421 ^,32127,732 21,427 49,159 22,645 13,492 5,137
24,47,064 20,69,195 45,16,259 28,58,020 22,91,193 51,4>,213
31WT— fefHT
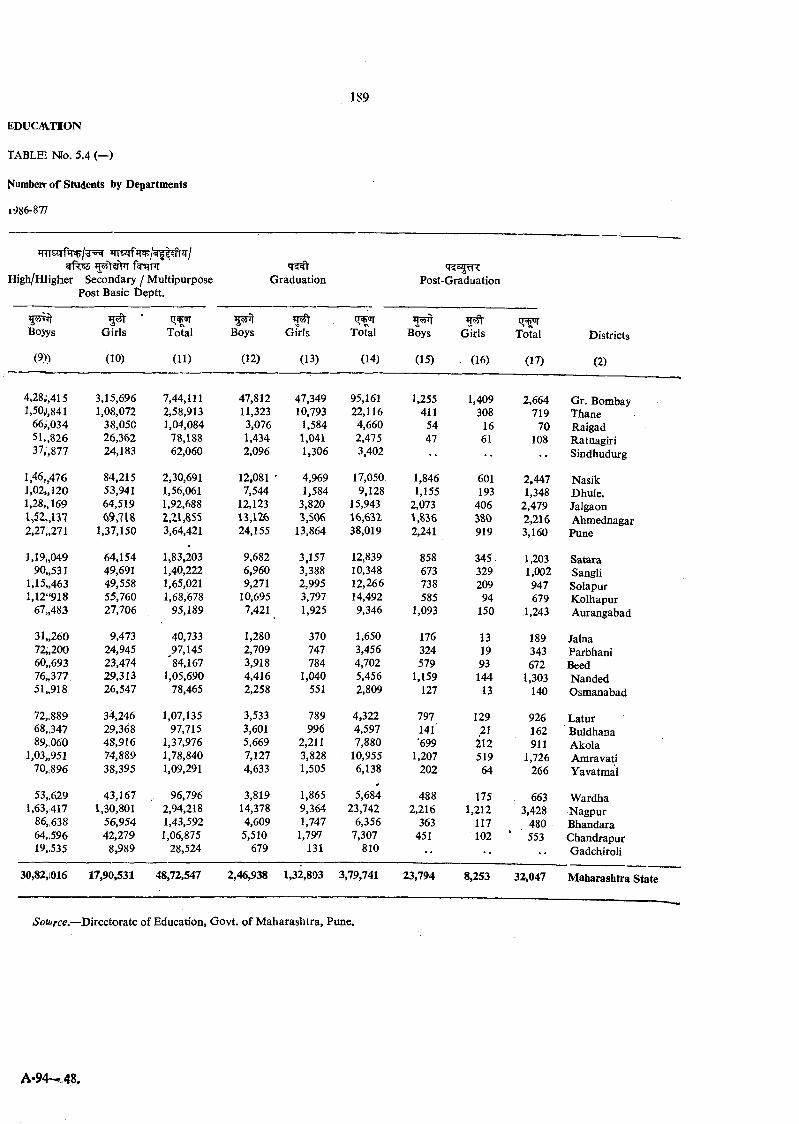
EDUCM.TION
TABLE Mo. 5.4 (—)
Numbeir o f Students by Departments
1986-877
^sqfjT^/^|55frir/f^nrnr
High/HIigher Secondary / Multipurpose Graduation Post-GraduationPost Basic D eptt.
Boyys Girls Total Boys Girls Total Boys Girls Total Districts
(9)) (10) (11) (12) (13) (14) (15) . (16) (17) (2)
4,28^,415 3,15,696 7,44,111 47,812 47,349 95,161 1,255 1,409 2,664 Gr, Bombay1,50^.841 1,08,072 2,58,913 11,323 10,793 22,116 411 308 719 Thane
66y,034 38,050 1,04,084 3,076 1,584 4,660 54 16 70 Raigad51„826 26,362 78,188 1,434 1,041 2,475 47 61 108 Ratnagiri37,',877 24,183 62,060 2,096 1,306 3,402 •• •• Sindhudurg
1.46„476 84,215 2,30,691 12,081 ' 4,969 17,050. 1,846 601 2,447 Nasikl,02„12O 53,941 1,56,061 7,544 1,584 9,128 1,155 193 1,348 Dhule.1,28,, 169 64,519 1,92,688 12,123 3,820 15,943 2,073 406 2,479 Jalgaonl,52.,U 7 49,718 2,21,855 13,126 3,506 16,632 1,836 380 2,216 Ahmednagar2,27„271 1,37,150 3,64,421 24,155 13,864 38,019 2,241 919 3,160 Pune
1,19„049 64,154 1,83,203 9,682 3,157 12,839 858 345- 1,203 Satara90„531 49,691 1,40,222 6,960 3,388 10,348 673 329 1,002 Sangli
1,15„463 49,558 1,65,021 9,271 2,995 12,266 738 209 947 Solapur1,12“918 55,760 1,68,678 10,695 3,797 14,492 585 94 679 K olhapur
67„4S3 27,706 95,189 7,421 1,925 9,346 1,093 150 1,243 Aurangabad
31„260 9,473 40,733 1,280 370 1,650 176 13 189 Jalna72„200 24,945 97,145 2,709 747 3,456 324 19 343 Parbhani60„693 23,474 '84,167 3,918 784 4,702 579 93 672 Beed76„377 29,313 1,05,690 4,416 1,040 5,456 1,159 144 1,303 Nanded51„918 26,547 78,465 2,258 551 2,809 127 13 140 Osmanabad
72„889 34,246 1,07,135 3,533 789 4,322 797 129 926 Latur68„347 29,368 97,715 3,601 996 4,597 141 21 162 Buldhana89„060 48,916 1,37,976 5,669 2,211 7,880 699 212 911 Akola
1,03„951 74,889 1,78,840 7,127 3,828 10,955 1,207 519 1,726 Amravati70,^896 38,395 1,09,291 4,633 1,505 6,138 202 64 266 Yavatmal
53„629 43,167 96,796 3,819 1,865*
5,684 488 175 663 W ardha1,63,417 1,30,801 2,94,218 14,378 9,364 23,742 2,216 1,212 3,428 Nagpur
86„638 56,954 1,43,592 4,609 1,747 6,356 363 117 480 Bhandara64„596 42,279 1,06,875 5,510 1,797 7,307 451 102 ' 553 Chandrapur19,.535 8,989 28,524 679 131 810 •• •• •• Gadchiroli
30,82,1016 17,90,531 48,72,547 2,46,938 1,32,893 3,79,741 23,794 8,253 32,047 M aharashtra State
.Sow/rc^.—D irectorate of Education, Govt, o f M aharashtra, Pune.
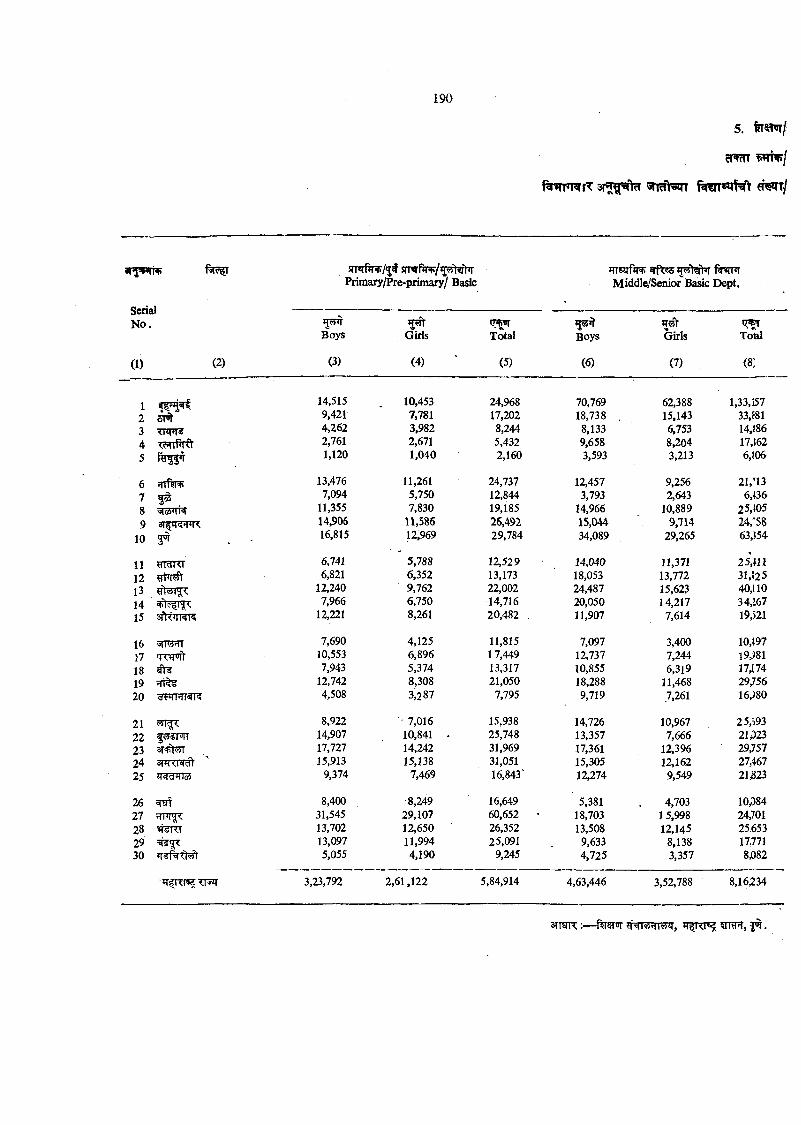
c m r
sTRfhsn ^ i l
v ^ v r tv s rr« r^ /^ # srm PTF/^tifhr Primary/Pre-primary/ Basic
m‘637fiTW) ?f^C5 Middle/Senior Basic Dept.
SenalN o .
(1) (2)
Boys
(3)
Girls
(4)
Total
(5)
Boys
(6)
Girls
(7)
Tofel
(8)
1 14,515 10,453 24,968 70,769 62,388 1,33,1572 9.421 7,781 17,202 18,738 . 15,143 33,»13 -u m i 4,262 3,982 8,244 8,133 6,753 14,1864 tmtM t 2,761 2,671 5,432 9,658 8,204 17,{625 f tr f i’T 1,120 1,040 2,160 3,593 3,213 6,506
6 q'tri(i+ 13,476 11,261 24,737 12,457 9,256 21,n37 f S 7,094 5,750 12,844 3,793 2,643 6,«68 11,355 7,830 19,185 14,966 10,889 25,505
14,906 n ,586 26,492 15,044 9,714 24,’5810 3^ . - 16,815 12,969 29,784 34,089 29,265 63,554
11 ^ndT<l 6,741 5,788 12,529 14,040 11,371 25,H112 6,821 6,352 13,173 18,053 13,772 31.J2513 12,240 9,762 22,002 24,487 15,623 40,11014 7,966 6,750 14,716 20,050 14,217 34,16715 3A <W ? 12,221 8,261 20,482 . 11,907 7,614 19,521
16 7,690 4,125 11,815 7,097 3,400 10,0717 tm rn t 10,553 6,896 17,449 12,737 7,244 19,?8118 ^ 7,943 5,374 13,317 10,855 6,3l9 17,17419 12,742 8,308 21,050 18,288 11,468 29,75620 4,508 3,287 7,795 9,719 7,261 16,)80
21 8,922 7,016 15,938 14,726 10,967 25,59322 fS$MT 14,907 10,841 - 25,748 13,357 7,666 21,32323 3T+I I 17,727 14,242 31,969 17,361 12.396 29,75724 STfRR^ 15,913 15,138 31,051 15,305 12,162 27,46725 9,374 7,469 16,843' 12,274 9,549 21323
26 8,400 8,249 16,649 5,381 4,703 10,38427 31,545 29,107 60,652 18,703 1 5,998 24,70128 13,702 12,650 26,352 13,508 12,145 25.65329 13,097 11,994 25,091 9,633 8,138 1777130 5,055 4,190 9,245 4,725 3,357 8^)82
3,23,792 2,61,122 5,84,914 4,63,446 3,52,788 8,16234
s rm R :— ftrsETir
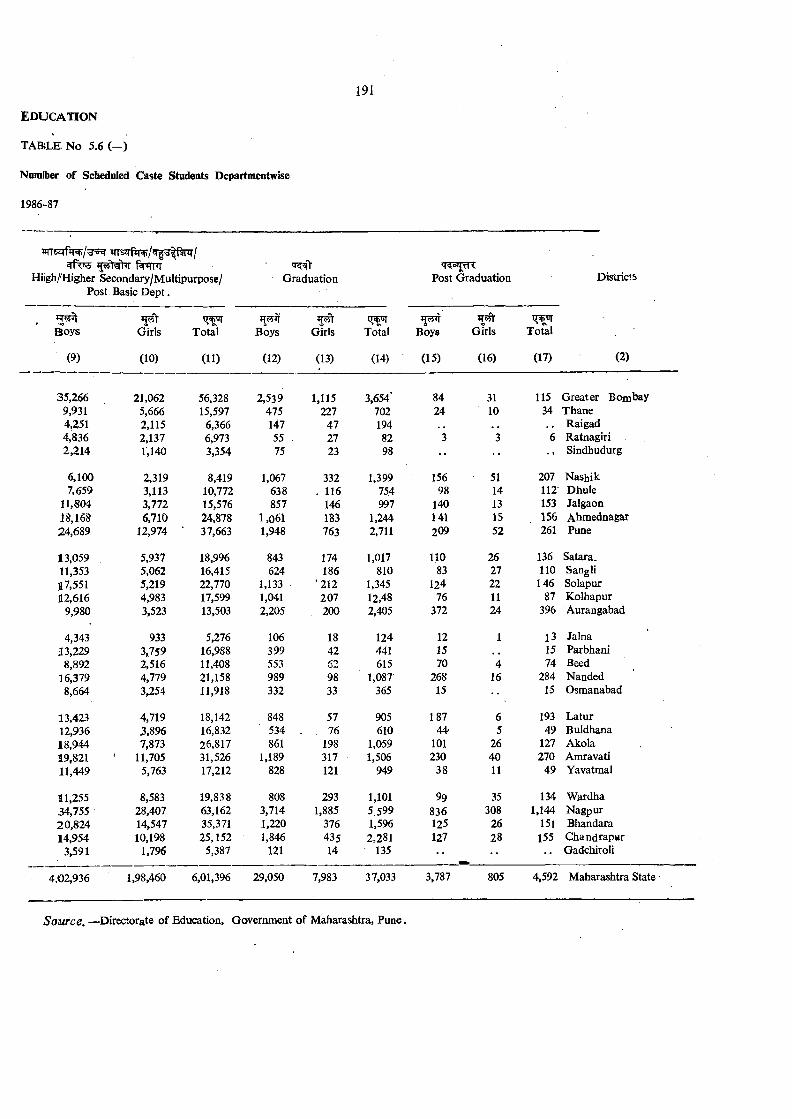
TA B L E N o 5.6 (—)
Numtber of Scheduled Caste Students Departmmtwise
1986-87
irrs!TfiTT/Wf7|f^/
Hiigh/'Higher Secondary/Multipurpose/ Post Basic D e p t.
Graduation Post Graduation Districts
m y IT#Boys Girls Total Boys Girls Total Boys Girls Total
(9) (10) (11) (12) (13) (14) (15) (16) (17) (2)
35,266 21,062 56,328 2,539 1,115 3,654' 84 31 115 G reater Bombay9,931 5,666 15,597 475 227 702 24 10 34 Thane4,251 2,115 6,366 147 47 194 Raigad4,836 2,137 6,973 55 - 27 82 3 3 6 Ratnagiri2,214 1,140 3,354 75 23 98 •• •• •• Sindhudurg
6,100 2,319 8,419 1,067 332 1,399 156 51 207 Nashik7,659 3,113 10,772 638 . 116 754 98 14 112- Dhule
11,804 3,772 15,576 857 146 997 140 13 153 Jalgaon18,168 6,710 24,878 1,061 183 1,244 141 15 156 Abmednagar24,689 12,974 ■ 37,663 1,948 763 2,711 209 52 261 Pune
13,059 5,937 18,996 843 174 1,017 110 26 136 Satara.11,353 5,062 16,415 624 186 810 83 27 110 Sanglia 7,551 5,219 22,770 1,133 *212 1,345 124 22 146 Solapur12,616 4,983 17,599 1,041 207 12,48 76 11 87 Kolhapur
9,980 3,523 13,503 2,205 200 2,405 372 24 396 Aurangabad
4,343 933 5,276 106 18 124 12 1 13 Jalna33,229 3,759 16,988 399 42 441 15 15 Parbhani
8,892 2,516 11,408 553 62 615 70 4 74 Beed16,379 4,779 21,158 989 98 1,087 268 16 284 Nanded
8,664 3,254 11,918 332 . 33 365 15 15 Osmanabad
13,423 4,719 18,142 848 57 905 187 6 193 Latur12,936 3,896 16,832 534 , 76 610 44. 5 49 Buldhana18,944 7,873 26,817 861 198 1,059 101 26 127 Akola19,821 ' 11,705 31,526 1,189 317 1,506 230 40 270 Amravati11,449 5,763 17,212 828 121 949 38 11 49 Yavatmal
11,255 8,583 19,838 808 293 1,101 99 35 134 Wardha34,755 28,407 63,162 3,714 1,885 5,599 836 308 1,144 Nagpur20,824 14,547 35,371 1,220 376 1,596 125 26 151 Bhandara14,954 10,198 25,152 1,846 435 2,281 127 28 155 C handrapar
3,591 1,796 5,387 121 14 135 •• •• Gadchiroli
4,02,936 1,98,460 6,01,396 29,050 7,983 37,033 3,787 805 4,592 Maharashtra State
S o u rc e . —Directorate of Education, Government of Maharashtra, P une.
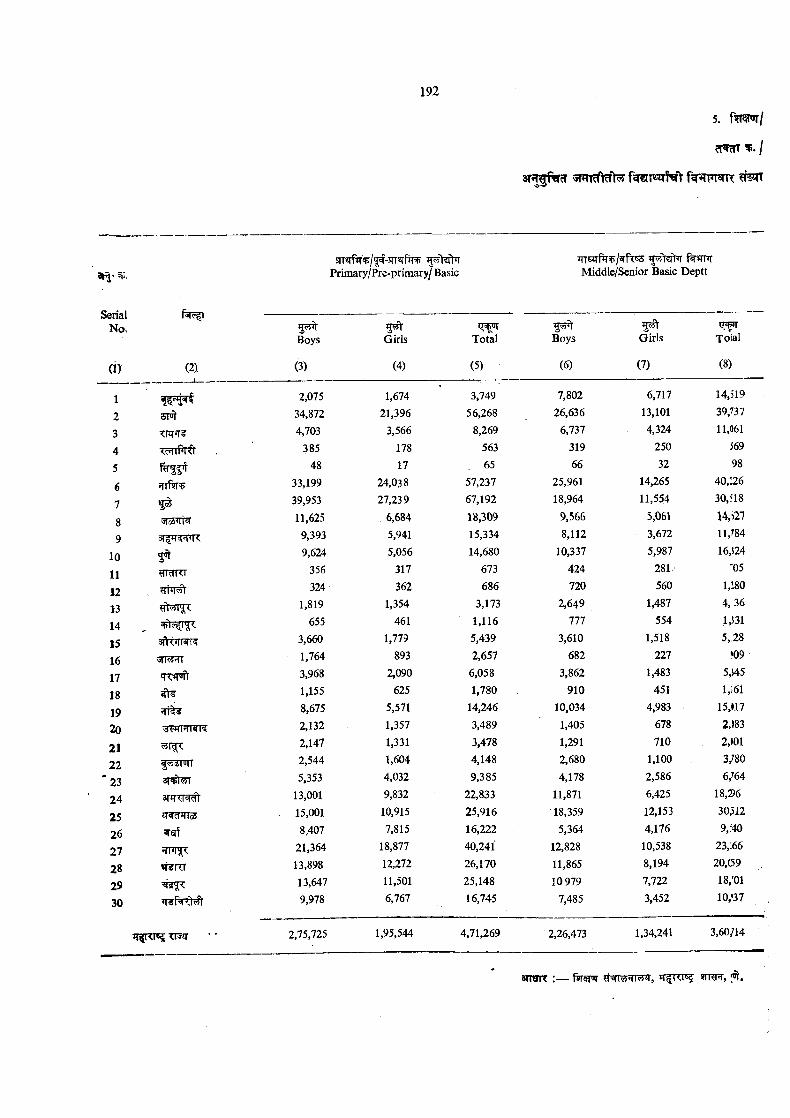
5. T m ^ l
cT ?TT I
3 T ^ ^ ? T ^
ail-srT«Tf^T' / -5rT«rf^
Primary/Pre-primary/ BasiciTTSiTfiT p/orflTSS f WT TMiddle/Senior Basic Deptt
SerialNo,
0 )
123
45
67
8 9
1011
121314
151617181920
21 22
'2324
252627282930
(2)
5 ^Boys
(3)
Giris
(4)
1 ^Total
(5)
Boys
(6)
Girls
(7)
Total
(8)
TnT»T5
<HrPTfr
?rrr?T^
I®srsmw
JOT
^ar^rnr#T55t
5TR5^
arvhTT
ZRcnTToS
?rnT^»T?nT
2,07534,8724,703
38548
33,199
39,95311,625
9,3939,624
356324
1,819655
3,6601,764
3,9681,1558,6752,1322,1472,5445,353
13.00115.001 8,407
21,36413,89813,6479,978
1,67421,396
3,566
17817
24,038 27,239
. 6,684 5,941 5,056
317
362 1,354
461 1,779
893 2,090
625
5,571 1,357
1,331I,604 4,032 9,832
10,9157,815
18,87712,272II,501 6,767
3,74956,268
8,269
56365
57,23767,192
18,30915,33414,680
673686
3,173
1,1165,4392,657
6,0581,780
14,2463,489
3,4784,1489,385
22,83325,91616,22240,24126,17025,14816,745
7,802 26,636
6,737 319 66
25,961
18,964 9,566
8,112 10,337
424 720
2,649 777
3,610 682
3,862 910
10,034 1,405
1,291 2,680
4,178 11,871 18,359
5,364 12,828
11,865 10 979
7,485
6,717
13,1014,324
25032
14,26511,554
5,0613,6725,987
281560
1,487554
1,518227
1,483451
4,983678710
1,1002,586
6,42512,1534,176
10,5388,1947,7223,452
14,51939,73711,061
569
9840,226
30,518
11,784
16,}24'05
1,!804 ,36
1,5315,28
♦095,545
l,i6115,U7
2,»832,»013/80
6,76418,36
30pl29 ,m
23,:66 20,(5918,'01
10,'37
2,75,725 1,95,544 4,71,269 2,26,473 1,34,241 3,60/14
snsnr :— ’T f T ^
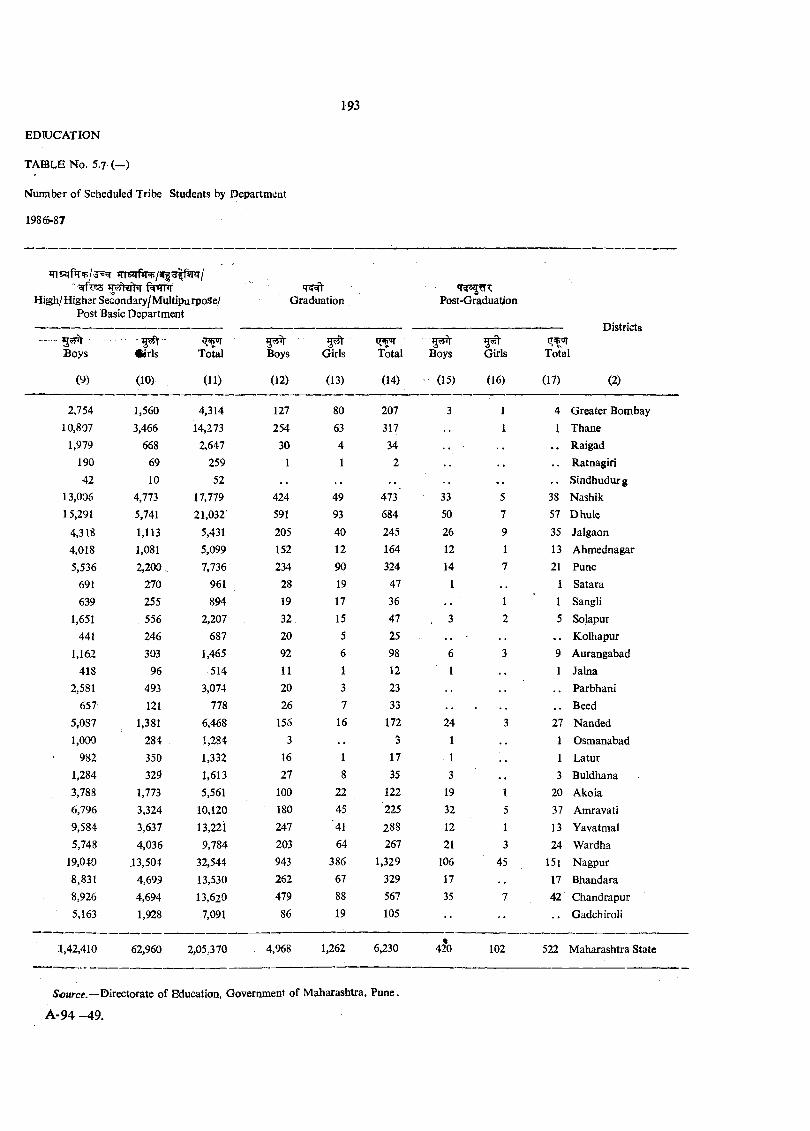
EDTUCATION
TA B LE No. 5.7 (—)
N um ber o f Scheduled Tribe Students by Department
1986-87
TTTszTfir /s^g' f^nT/■ fW nr
H igh/Higher Secondary/ MuUipu rpoSe/ Post Basic Department
Boys
(9)
- 5^Cirls
(10)
Total
(11)
Graduation
5 ^Boys
(12)
5 ^Girls
(13)
Total
(14)
Post-Graduation
5 ^Boys
(15)
5 #Girls
(16)
iT^orTotal
(17)
Districts
(2)
2,75410,807
1,97919042
1,5603,466
66869
10
4,31414,273
2,647259
52
127 80 207 3 1 4 Greater Bombay254 63 317 1 1 Thane
30 4 34 . . Raigad1 1 2 . . Ratnagiri
Sindhudurg13,006 4,773 17,779 424 49 473 33 5 3815,291 5,741 21,032' 591 93 684 50 7 57
4,318 1,113 5,431 205 40 245 26 9 35
4,018 1,081 5,099 152 12 164 12 1 13
5,536 2,200 7,736 234 90 324 14 7 21
691 270 961 28 19 47 1 1
639 255 894 19 17 36 1 11,651 556 2,207 32 15 47 3 2 5
441 246 687 20 5 25 . . -
1,162 303 1,465 92 6 98 6 3 9
418 96 514 11 1 12 1 1
2,581 493 3,074 20 3 23
657 121 778 26 7 335,087 1,381 6,468 156 16 172 24 3 271,000 284 1,284 3 A 1 1
982 350 1,332 16 1 17 1 11,284 329 1,613 27 8 35 3 33,788 1,773 5,561 100 22 122 19 1 206,796 3,324 10,120 180 45 225 32 5 379,584 3,637 13,221 247 '41 288 12 1 135,748 4,036 9,784 203 64 267 21 3 24
19,040 13,504 32,544 943 386 1,329 106 45 1518,831 4,699 13,530 262 67 329 17 178,926 4,694 13,620 479 88 567 35 7 425,163 1,928 7,091 86 19 105 •• •• ••
1,42,410 62,960 2,05,370 4,968 1,262 6,230 4I 0 102 522
SolapurKolhapur
AurangabadJalnaParbhaniBeed
Buldhana
Gadchiroli
522 Maharashtra State
Source.—Directorate of Education, Government of Maharashtra, Pune.
A-94 -49.
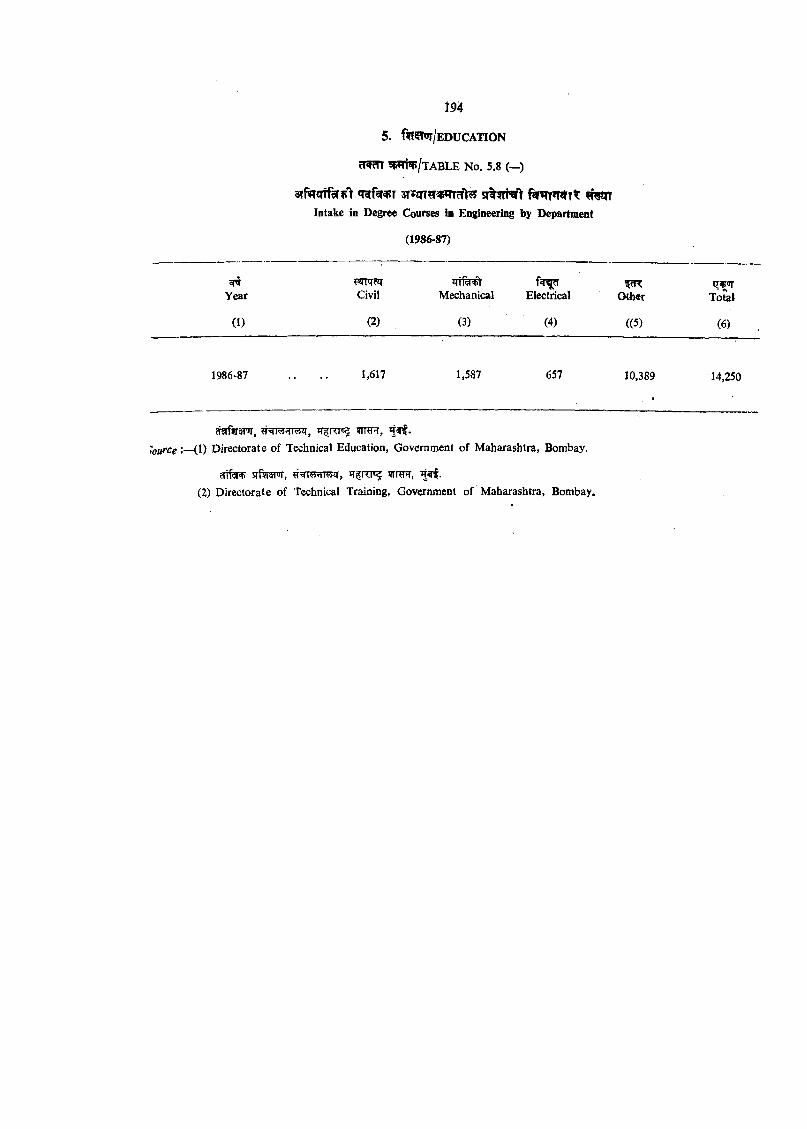
194
5 . f?T^/ED U C A TIO N
HWm ^W t^/XABLE No. 5.8 (—)
« n f ^ T f5»?rr*WTt #5<nIntake in Degree Courses in Engineering by Department
(1986-87)
FTPT?ZT 5^^Year Civil Mechanical Electrical Other Total
(1) (2) (3) (4) ((5) (6)
1986-87 1,617 1,587 657 10,389 14,250
ci?rftr5r»r, ?trr , # f f .Jource:—(1) Directorate of Technical Education, Government of M aharashtra, Bombay.
cTif^ srftrwoT, 9Trt^,(2) D irectorate of Technical Training, Government of Maharashtra, Bombay.
?PlTN>/TABtE No. 5.9 (14.1)
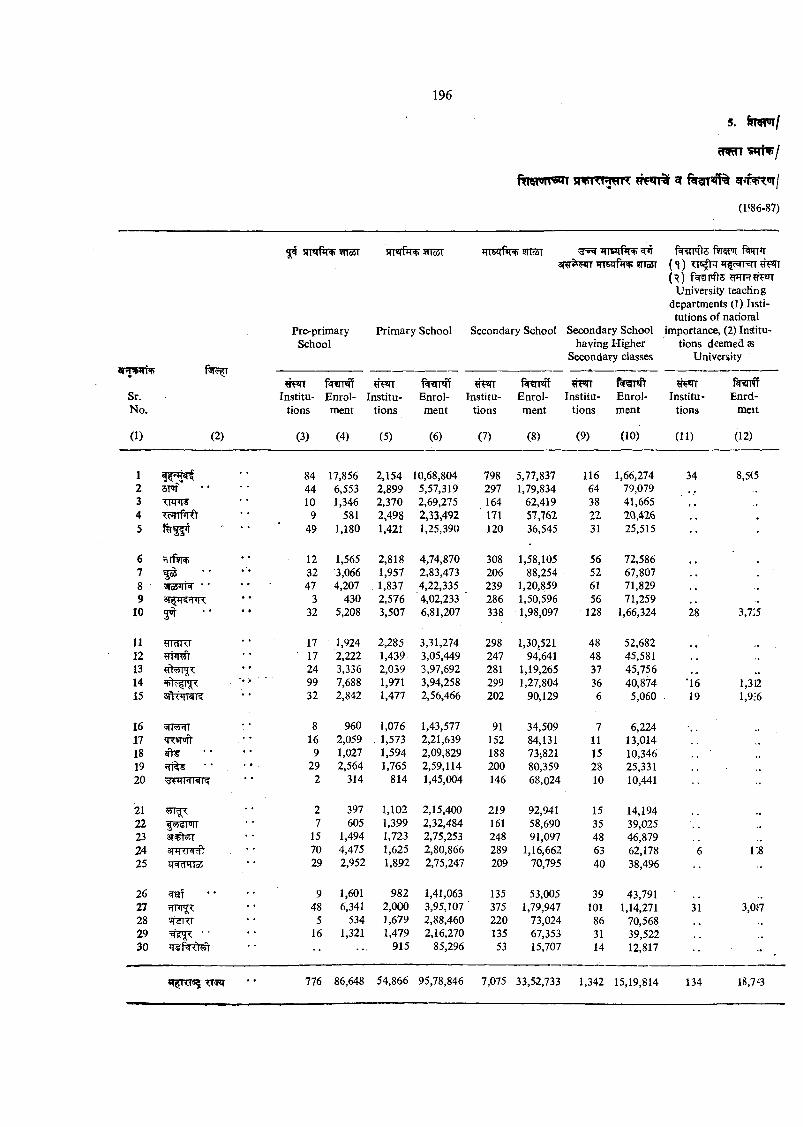
5. fu tm j
rTFTT
f w n W T s v m g m r sr
( l ‘86-87)
5*t srrtrfiRi srrar aWrH>*> ?TTo5T fk w fts ftrOT(T)
University teachngdepartments (1) Iisti-
tutions of natioralPre-primary Primary School Secondary School Secondary School importance, (2) Institu
School having Higher tions deemed »Secondary classes University
2flr*FKOT3rr ^ i4 f
»v N ■a I'llSr. InstitU' Enrol Institu Enrol- ;[nstitu- Enrol Institu Enrol Institu Enrd-No. tions ment tions ment tions ment tions ment tions meit
(1) (2) (3) (4) (5) (6) (7) (8) (9) (10) (11) (12)
1 84 17,856 2,154 10,68,804 798 5,77,837 116 1,66,274 34 8,5(52 3Ff 44 6,553 2,899 5,57,319 297 1,79,834 64 79,0793 <imii 10 1,346 2,370 2,69,275 164 62,419 38 41,6654 9 581 2,498 2,33,492 171 57,762 22 20,426 *5 • • 49 1,180 1,421 1,25,390 120 36,545 31 25,515 . .
6 12 1,565 2,818 4,74,870 308 1,58,105 56 72,5867 I S • • 32 3,066 1,957 2,83,473 206 88,254 52 67,8078 vHaJJir • ' 47 4,207 1,837 4,22,335 239 1,20,859 61 71,8299 3 430 2,576 4,02,233 286 1,50,596 56 71,259
10 5^ • * 32 5,208 3,507 6,81,207 338 1,98,097 128 1,66,324 28 3,7:5
11 ^IdKI 17 1,924 2,285 3,31,274 298 1,30,521 48 52,68212 ■ 17 2,222 1,439 3,05,449 247 94'641 48 45,58113 24 3,336 2,039 3,97,692 281 1,19,265 37 45,756 • .» ..14 '• > 99 7,688 1,971 3,94,258 299 1,27,804 36 40,874 '16 1,3J215 • * 32 2,842 1,477 2,56,466 202 90,129 6 5,060 19 1,9:6
16 'jiWdi 8 960 1,076 1,43,577 91 34,509 7 6,22417 'T T ^ 16 2,059 , 1,573 2,21,639 152 84,131 11 13,01418 9 1,027 1,594 2,09,829 188 73;821 15 10,34619 hR^ • • 29 2,564 1,765 2,59,114 200 80,359 28 25,33120 • • 2 314 814 1,45,004 146 68,024 10 10,441
21 2 397 1,102 2,15,400 219 92,941 15 14,19422 ^«<ol''ll 7 605 1,399 2,32,484 161 58,690 35 39,02523 15 1,494 1,723 2,75,253 248 91,097 48 46,87924 smxiw^ 70 4,475 1,625 2,80,866 289 1,16,662 63 62,178 6 i:825 At«icimo6 • • 29 2,952 1,892 2,75,247 209 70,795 40 38,496
26 9 1,601 982 1,41,063 135 53,005 39 43,79127 48 6,341 2,000 3,95,107 375 1,79,947 101 1,14,271 31 3,0f728 vf^TT 5 534 1,679 2,88,460 220 73,024 86 70,56829 16 1,321 1,479 2,16,270 135 67,353 31 39,52230 915 85,296 53 15,707 14 12,817 •• ,
»T ^65 776 86,648 54,866 95,78,846 7,075 33,52,733 1,342 15,19,814 134 18,7^3
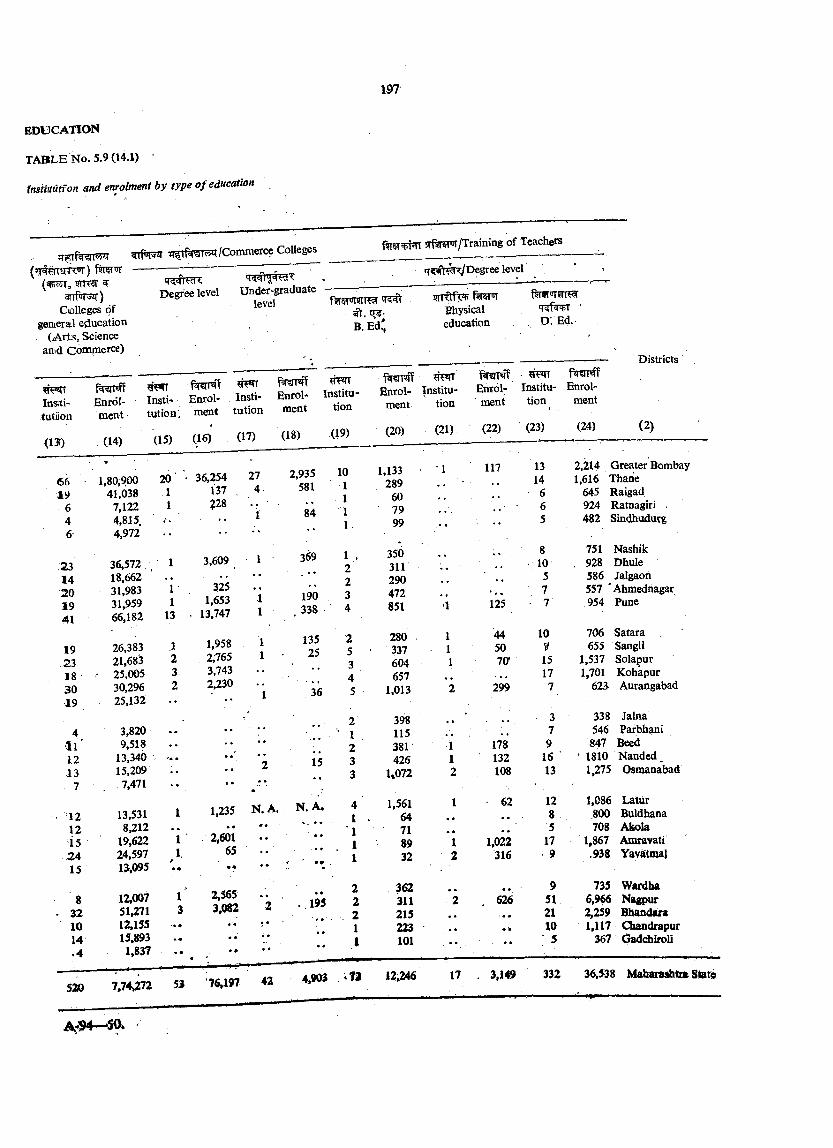
m
EDUCATION
TABLE No. 5.9 (14.1)
tnsiiaiition and enrolment b y type o f education
TT^lf^invni/Commerce Colleges
(sitr57T, 5 rr^ ^
^f?nfnT/Training of Teachers
Degree levelColleges of
gemeral ejiucation (A rts , Science
an>d Commerce)
Under-graduatelevel
<T?’4t^n;/Degree level
B. E d 'Ehysicaleducation
f^or^TT^S'if't+TD .E d .
^Rrr«fT #f?rT' f ^ p f fIns;ti- Enrol- Insti- Enrol- Tnsti- Enrol- Institu- Enrol- Institu- Enrol- Institu- Enrol-tutiion m ent * fution ment tion ment tion raent tion ment
(135) (14)
tution, ment tu tion ment
(15) (16) (17) (18) (19)
66 1,80,900 2019 41,038 1
6 7,122 14 4,815.6- 4.972
23 36,572.; 1
14 18,662 . .
2 0 31,983 119 31,959 141 66,182 13
19 26,383 123 21,68'3 2
18 ' 25.005 330 30,296 21 9 25,132 . .
36.254137?28
3.609
3251,653
13,747
1,9582.7653,7432,230
4 3,820 • •
1 1 ' 9,51812 13,34013 15.209 -
7 .7,471
12 13.531 112 8,212 . . .
15 19,622 124 24,597 115 13i095 • •
8 12,007 1♦ 32 51,271 3
10 12,155 '« •
14 15,893.4 1,837 « •
520 7.74,272 53
- 5 0 .
274
2,6016S
2,365 ..3,082 2
2,935581
84
369
190338
13525
36
15
1,235 N .A . N .A .
. 195
(20) (21) (22) (23) (24)
Districts
(2)
101111
1,133289
607999
1 117 1314
6 6 5
2,214 Greater Bombay 1,616 Thane
645 Raigad 924 Ratnagiri 482 Sindhudurg
1 i 350 8 751 Nashik>y 311 10 , 928 Dhule
2 290 5 586 Jalgaon
3 472 7 557 'Ahm ednagar
4 851 •1 125 • 7 954 Pune
2 280 . 1 44 10 706 Satara5 • 337 1 50 655 Sangli
3 604 1 7 a 15 1,537 Solapur4 657 17 1,701 Kohapur
5 ■ 1,013 2 299 7 623 Aurangabad
2 398 3 338 Jalna1 115 7 546 ParbhaniK2 381' 1 178 9 847 Beed
3 426 1 132 16 ■ 1810 N anded ,
3 1,072 2 108 13 1,275 Osmanabad
4 1,561 1 62 12 1,086 Latur1 64 • • 8 .800 Buldhana1 71 • • 5 708 Akola1 89 1 1,022 17 1,867 Amravati
I 32 2 316 9 .938 Yayjttmal
2 362 • • 9 735 Wardha2 311 2 . 626 51 6,966 Nagpur
. 2 215 • • ‘ • • 21 2,259 Bhandara1 223 « 10 1,117 Qiandiapur1 101 • 4 ' 5 367 Gadchirol]
4,!»J 1 2 , 1 7 . 3,149 332 36»538 Maluuashtm$tat<B
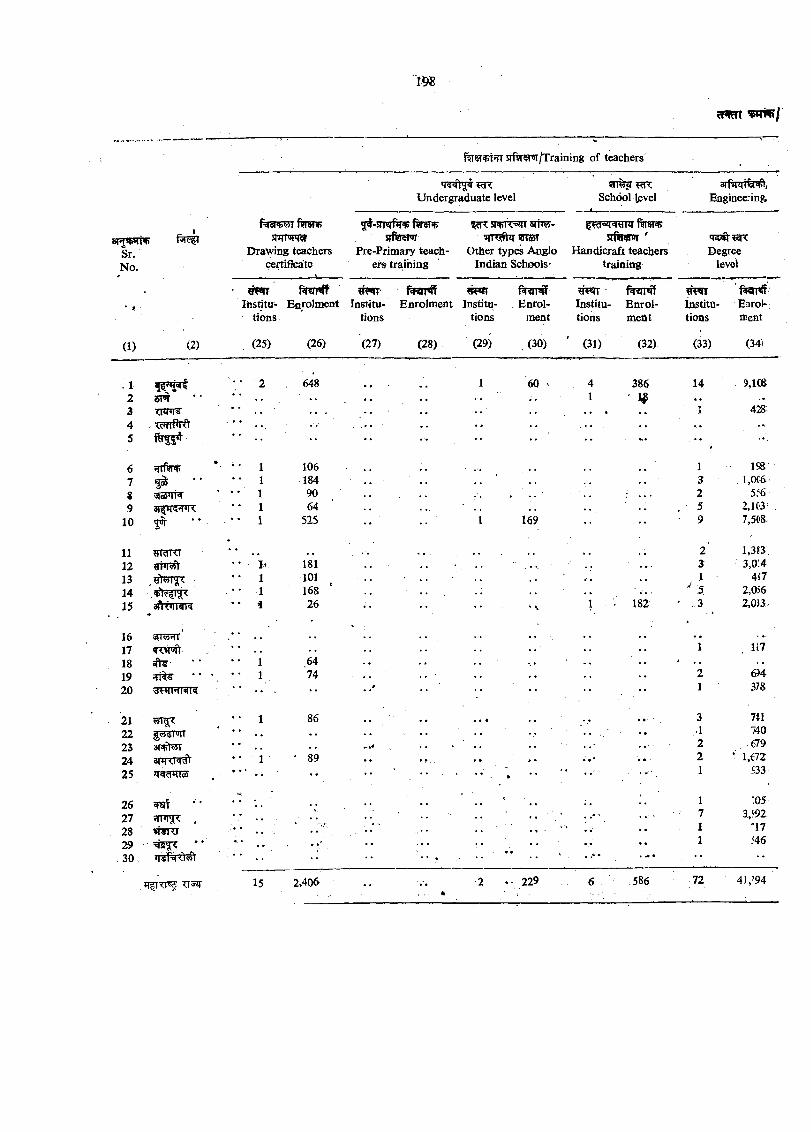
m
bTHW^;Sr.No.
f5T5ETW)TJTT xrf9r«r>r/Training of teachers
Undergraduate level School ievel
ftrer^im nnw
Drawing teachers certificate
5#-STreftH) fiiRR) sifeRpir
Pre-Primary teachers traiiiing
sRrncsEFT arhv?- ^RTOFhTnrrar
Other types Anglo Indian Schools^
^'kfsiiara w RltSR? srftisnr '
H andicraft teachers training
3rfW % ^,Engineeringi
Degreelevel
• #WT rwarrr wptr «'WI• * Institu Enrolment Institu Enrolm ent Institu Enrol Institu E nro l institu • Earo)-
tions tions tions ment tions ment tions nient
(1) (2) (25) (26) (27) (28) (29) .(30 ) ’ (31) (32) (33) (34>
. 1 2 . 6482 5T»r3 •• •4 . icHtPrd • •5 “ ••
6♦ • * 1 106
7 1 -184S stafTRT • ♦ 1 909 • ♦ 1 64
10 • * 1 525
11 HldKI12 • • I r 18113 * • 1 10114 . • • 1 16815 <iAWs|R 4 26
16 , ,17 <rw»fl18 1 6419 1 7420 . . .
21 1 8622 . <4T«1T23 ai=pt?5T « •
24 * • 1 ' 8925 ^eidura • • ••
2627 • • • • / > - 'v28 »i«Ki • •29 •. ♦ . . ■' ' • •'30. ■ • • • •
<1^ 15 2,406
60 386
I 169
1 > 182
229 586
14 9,1(». . . .
1 428-
... . . .
1 1983 1,0(62 5f65 2,1039 7,508:
2 ‘ 1,3S33 3,0:4
, 1 • 4^7' 5 2,056
3 2,033.
. . . . .
1 117
2 6)41 378
3 7 «.1 7402 6792 • 1,€721 S33
1 :o57 3,‘92.1 "171 <46
72 4 i , m
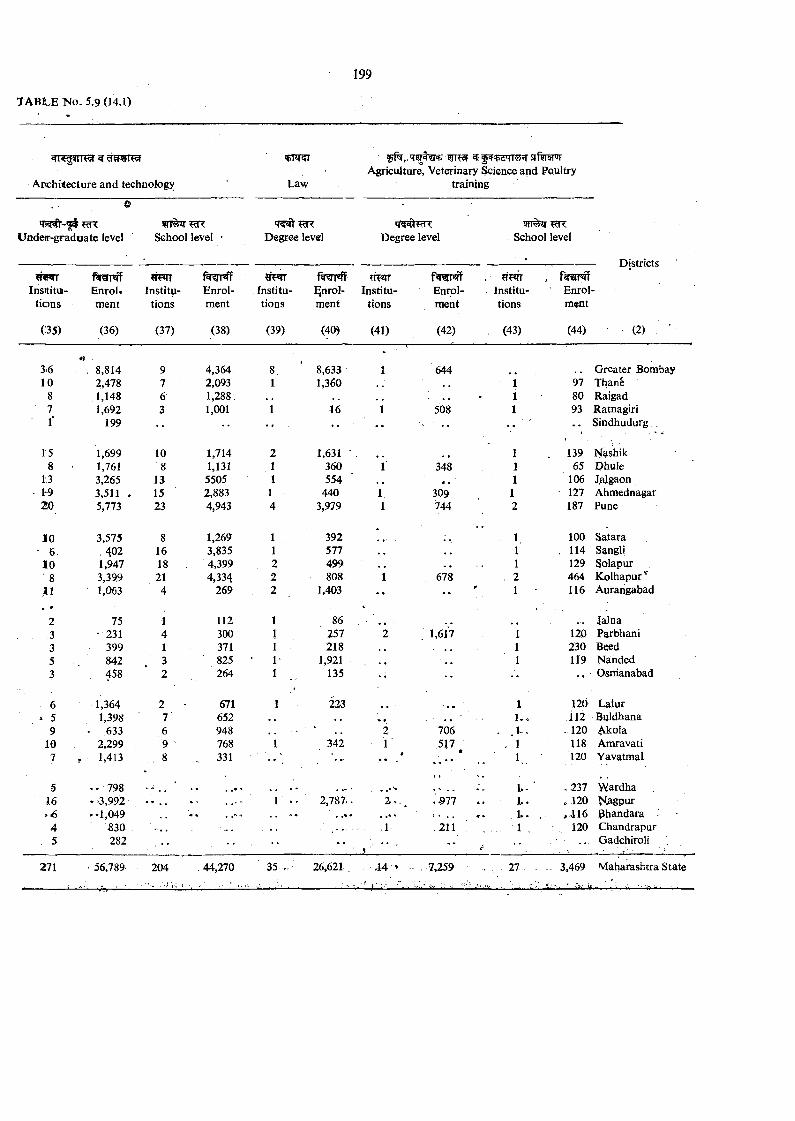
A rchitecture and technology
rPRT
Law
5j7^ ^ siftrerrAgriculture, Veterinary Science and Poultry
training
?cRUndeff-graduate level School level Degree level Degree level School level
« n rrInsititu-
tions
(35)
ftRrnffEnroKment
(36)
Institutions
(37)
Enrolment
(38)
«Fnr . Institu
tions
(39)
r«rar«ff rPiT^nrol- Institu-ment
(40)
tions
(41)
Enrolment
(42)
?TPn-Institutions
(43)
Enrolment
(44)
Districts
(2)
3i6 . 8,814 9 4,364 8 8,633 1 644 . . Greater Bombay10 2,478 7 2,093 1 1,360 1 97 Thane
8 1,148 6 1,288. .. 1 80 Raigad7 1,692 3 1,001 1 16 1 508 1 93 Ratnagiril‘ 199 •• .. . •* .• .. Sindhudurg .
15 1,699 10 1,714 2 1,631 .■
1 . 139 I^ashik8 1,761 8 1,131 1 360 1 348 1 65 Dhule
13 3,265 13 5505 1 554 , , » « 1 106 JAlgaon• 19 3,511 * 15 2,883 1 440 1 309 1 127 Ahmednagar
20 5,773 23 4,943 4 3,979 1 ■744 2 187 Pune
10 3,575 8 1,269 1 392* '• * .
1 100 Satara• B. ,402 16 3,835 1 577 « • 1 , 114 Sangli10 1,947 18 4,399 2 499 . . 1 129 Solapur
8 3,395 21 4,334 2 - 808 1 678 , 2 464 Kolhapur1,063 4 269 2 1,403 .. r 1 • 116 Aurangabad
-f2 75 1 112 1 86 ... lalna
, 3 • 231 4 300 1 257 2 . 1,617 1 120 Parbhani3 399 1 371 1 218 , , 1 230 Seed5 . 842 3 825 • 1' 1,921 1 1I9 Handed3 458 2 264 I 135 •• . . Osnianabad
6 1,364 2 671 1 223 1 120 Latur- 5 1,398 7 652 • • 1 ,, , i l2 Buldhana
9 633 6 948 • 2 706 . . k . . 120 Akoia10 2,299 9 768 1 342 1 517 . 1 118 Amravati7 f 1,413 , 8 , 331 » 9
1 120 Yavatmal
5 . • 7 9 8 a *i • ’ ♦
1.. . 237 W ardha16 ♦ ”3,992 . . . . 1 2,787. - ..977 . . 1.. . 120 Magpur
.-1,049 .. ’ . .... I- ’ .. ». 1.. ;.416 Bhandara4 ;530 -.. ■ ■ V. ■. h 211 . 1 . 120 Chandrapur5 282 •• •• ' 1 ' . V .. Gadchiroli
271 ■ 56,789
--- rt) ■' --204
■ 'i'i. 44,270 35 . 26,621 ; ,14 » . 7,259 27 - 3^469 Maharashtra State
' ■U'-‘ --V-. .....
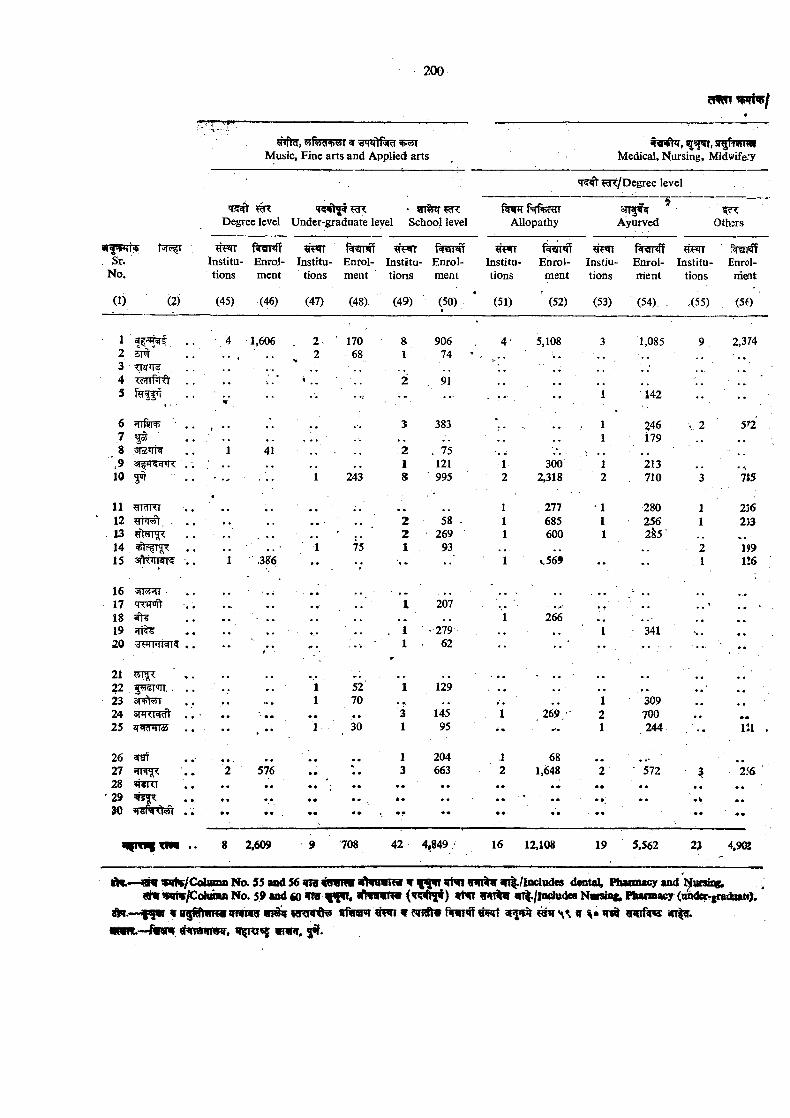
. St.
?nft^, wfog[+<fjr w ^ Music, Fine arts and Applied arts
T.?^ ^ V iltgpH X • i?n%q-?EcRDegree level Under-graduate level School level
ST fiWIWMedical, Nursing, Midwifery
Allopathy
'T ^ ^cTt/Degree level
Ayurved Others
iwmwf #PTr Institu- Enrol- Institu- Enrol- Institu- Enrol-
?re*TT fW rqf Institu- Enrol- Instiu- Enrol- Institu- Enrol-
No. tions ment tions ment tions ment tions ment tions nient tions meat
(2) (45) (46) (47) (48). (49) (50). (51) (52) (53) (54) . .(55) (50
1 1,606 . 2 . ■ 170 8 906 4- 5,108 3 1,085 9 2,3742 5T”T . • • t 2 68 1 . 74 •93 <k^lf • • ' . . ' : . . .4 , . • % 2 , 91 . . ■5
W* •• ■ ... - • ••■, •• 1 142 ••
6 HirjfT+' f . • 3 383 1 246 <. 2 5727 « . . ' . • •. 1 179 . , • »8 1 41 2 . 75 i . .
> 1 121 1 300 1 21310 3^ . • • • 1 243 8 995 2 2,318 2 710 3 7*5
11 ^MKI 1 ,2 7 7 • 1 280 1 23612 , . • * • • ' 2 58 . 1 685 i 256 1 2}3U 2 269 1 600 1 2§5' , , «k •14 , , * 1 75 1 93 . , 2 19915 ■siV IWl? . 1 386 •• •; 1 v569 • • . . I 1!6
16 -
17 q<^«n • ^ . • • • I 207 * • • • • • . . .18 • • , , , . 1 266 , ,19 ;r r^ . • . 1 • 279 . . 1 ■ 341 tf •20 / • 1
*•62 • • . . . • •
2122 .2324 s n m ^25
26 araf27 fTFf^282930
576
1 52 1 129 * • • • • • • •
1 70 . * . • 1 • 309» » • • 3 145 1 269, 2 700 « •
1 30 1 95 • ♦ . • '• 1 , 244 • • 111
» • • • 1 204 1 68 • • • •
» 9%• • 3 663 2 1,648 2 572 3 256♦ ♦
• • « «
• •
• • • «
# ^
• •
• •
• • !
• •
• •
• • • •
m m
8 2.609 708 42 4,849 16 12,108 19 5,562 23 4.9(K
v& flO im a i No. 55 and 56 t o ffw w aftw^rai W y^TT an|,/ladw ies dental, Phatmacy aodvrawv/CotitfBD No. 59 and €0 TO ^pfvr« 4lfHlFwr «li|./lndade8 Nvtsing, nuuiMK^ (tmder*gradoat*).
w a^fiheiM m TOer f5TOT<N? Rfiiram ^ firervf #!Fif a r | i ^ # 1 ir V 111* w t e an|5r.
v n f t H t a m vnnr.
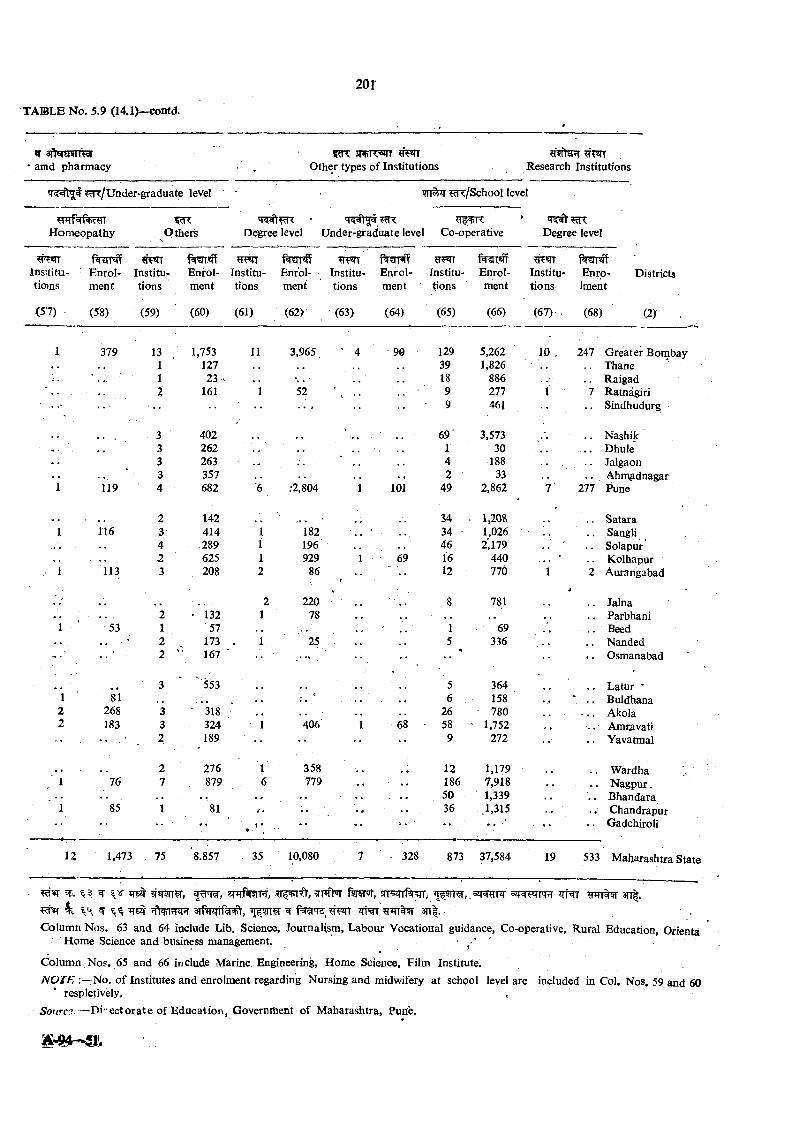
w aftefEnmw amd pharm acy
snpiTSTT O ther types o f Institutions Research Institutions
T 5 [^ # m r/U nder-graduate level ??n:/School level
H om eopathy Other's Degree level U nder-graduate level Co-operative Degree level
?tFn TFTT ?pf«rrIns’.titu- ■ E nrol Institu Enroll Institu Enrol Institu E nrol Institu Enrol Institu Enro- Districtstio)ns m ent tions ment tions ment tions ment tions ment tions Iment
(57) . (58) (59) (60) (61) (62> (63) (64) (65) (66) (67)- (68) (2) ,
1 379 13 1,753 11 3,965 ' 4 90 129 5,262 ' 10 . 247 G reater Bombay1 127 , . 39 1,826 Thane
* 1 23 18 886 Raigad2 161 1 52 \ .. 9 277 1 7 Ratnagiri
•• 9 461 •• Sindhudurg
^ , 3 402 69 3,573 Nashik3 262 1 30 Dhule
. . 3 263 4 188 Jalgaon. . 3 357 2 33 Ahm^dnagar
1 119 4 682 6 .•2,804 1 101 49 2,862 7 277 Pune
2 142 S4 ■ 1,208•
Satara1 116 3- 414 1 182 . ; ” 34 1,026 Sangli
4 - 289 1 196' 46 2,179 Solapur. . . 2 625 1 929 1 ■ 69 16 440 Kolhapur
. 1 113 3 208 2 86 , ' ■ • • 12 770 1 2 Aurangabad
« / ' . . . 2 220*
8 781 Jalna2 ' 132 1 78 Parbhani
1 •53 1 57 1 69 . . Seed- • . . 2 173 ' 1 25 5 336 , , Nanded
2 167 *• Osmanabad
3 553 5 364 L atur ■*1 81 . , . • • 6 158 Buldhana2 268 3 • 318 26 ' 780 Akola2 183 3 324 1 406 1 68 ■ 58 • 1,752 . , • ■ Amcavati
• • . ■ 2 189 ' • ' •* •• •• 9 272 •• Yavatmal
2 276 1 358 12 1,179 W ardha1 76 7 . 879 6 779 186 7,918 . . N agpu r.
. . . . . 50 1,339 Bhandara1 85 1 81 f • . . . . , 36 1,315 . . C handrapur
1 *9 ■ • • -• ’’ ' '• Gadchiroli
12 1,473 , 75 '8.857 35 10,080 7 ■ 328 873 37,584 19 533 M aharashtra State
^ iT«mT?r, snrRmrr, ?rpfV^ fw w , srr^if^^jr, ’TprT ,.52T2RTTJr jtN t 3tt|.^ 4 ^ s f fw f^ r^ , ^ w ? n n ^ 3n |. •
Colum ii Nos, 63 and 64 iaclude Lib. Science, Journalism , Labour Vocational guidance. Co-operative, Rural Education, Orienta ■ Hom e Science and business management. ' z ' '
C olum n Nos. 65 and 66 include Marine, Engineering, Home Science, Film Institute.
N O T E No. o f Institutes and enrolment regarding Nursing and midwifery at school level are included in Col. Nos, 59 and 60 resplctively. ,
5o«rc?.— Di- e c to ra te of E ducation , Government of M aharashtra, Pune.
A ’- 9 ^ 5 h
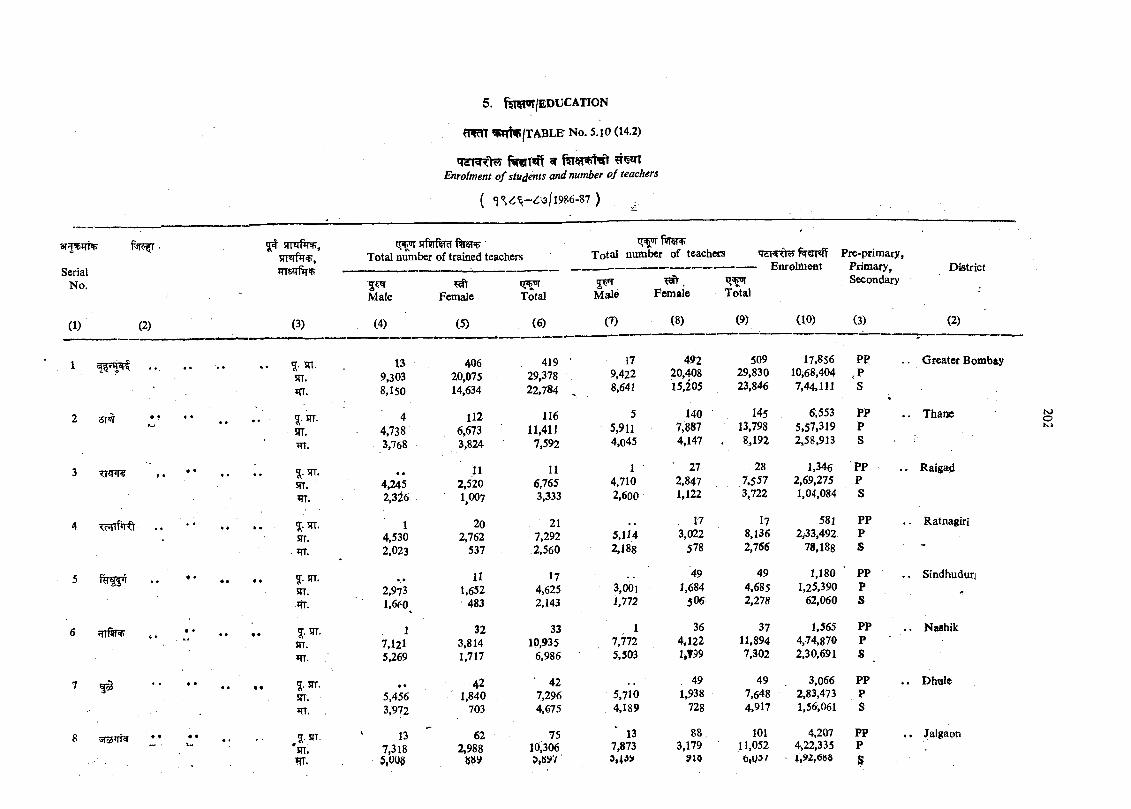
SerialNo.
(1) (2)
2 5T^
3 TnnT¥
Enrolment o f students and number o f teachers
( 1986-87 ) ^
g[# srr«rfiTfr, irap^ ftrenp Total number of trained teachers
ftRHiT otal number of teachers
Male Female Total5 ^Male Female
TdKRt^ Pre-prim ary,----------Enrolmefit Primary,
SecondaryTotal
District
6 rnfir^ , . */
(3) (4) (5) (6) (7) (8) (9) (10) (3) (2)
?• sn. 13 406 419 ■ 17 492 509 17,856 PP . . G reater Bombay
srr. 9,303 20,075 29,378 9,422 20,408 29,830 10.68.404
m . 8,150 14,634, 22,784 . 8,641 15,205 23,846 7,44.111 S
• • 9- ST. 4 112 116 5 140 145 6,553 PP . . Thame. .ST. 4.738 6,673 11,411 5,911 7,887 13,798 5,57,319 P
•RT. 3,768 3,824 7.592 4,045 4,147 . 8,192 2,58,913 S
• • 5- srr. • • 11 11 1 27 28 1,346 PP . . Raigadc5TT. 4,245 2,520 6,765 4,710 2,847 7,557 2,69,275 P
Wi. 2,3l6 1.007 3,333 2,600 1.122 3,722 1,04,084 S
?• 5IT. 1 20 21 .. 17 17 581 PP . . RatnagiriAsrr. 4,530 2,762 7,292 5,114 3,022 8,136 2,33,492 pITT. 2,023 537 2,560 2,188 578 2,166 78,188 s
•* • . •• g. STT. 11 17 49 49 1,180 ' PP . . Sindhudurjsrr. 2,973 1,652 4,625 3,001 1,684 4,685 1,25,390 p •>»
*TT. 1,660^ 483 2,143 1,772 5O6 2,278 62.060 s
** •• •• ?• srr. 1 32 33 1 36 37 1,565 PP . . N aihik• • • w
JTT. 7,121 3,814 10,935 7,772 4,122 11,894 4,74,870 Pm . 5,269 1,717 6,986 5,503 l.f99 7.302 2,30,691 s
• • 5;. srr. • • ' 42 ■ 42 .. . 49 49 3,066 PP . . DholeClsrr. 5,456 1,840 7,296 5,710 1,938 7,648 2,83,473 pm . . 3,972 703 4,675 4,189 728 4,917 1,56.061 s
# • 5- srt. 13 62 75 13 88 „ 101 4,207 pp . . Jalgaon• *JTT. 7,318 2,988 10,306 7,873 3,179 11,052 4,22.335 p*rr. 5,008 m 3,4 y 915 0,037 s
N)OK.1
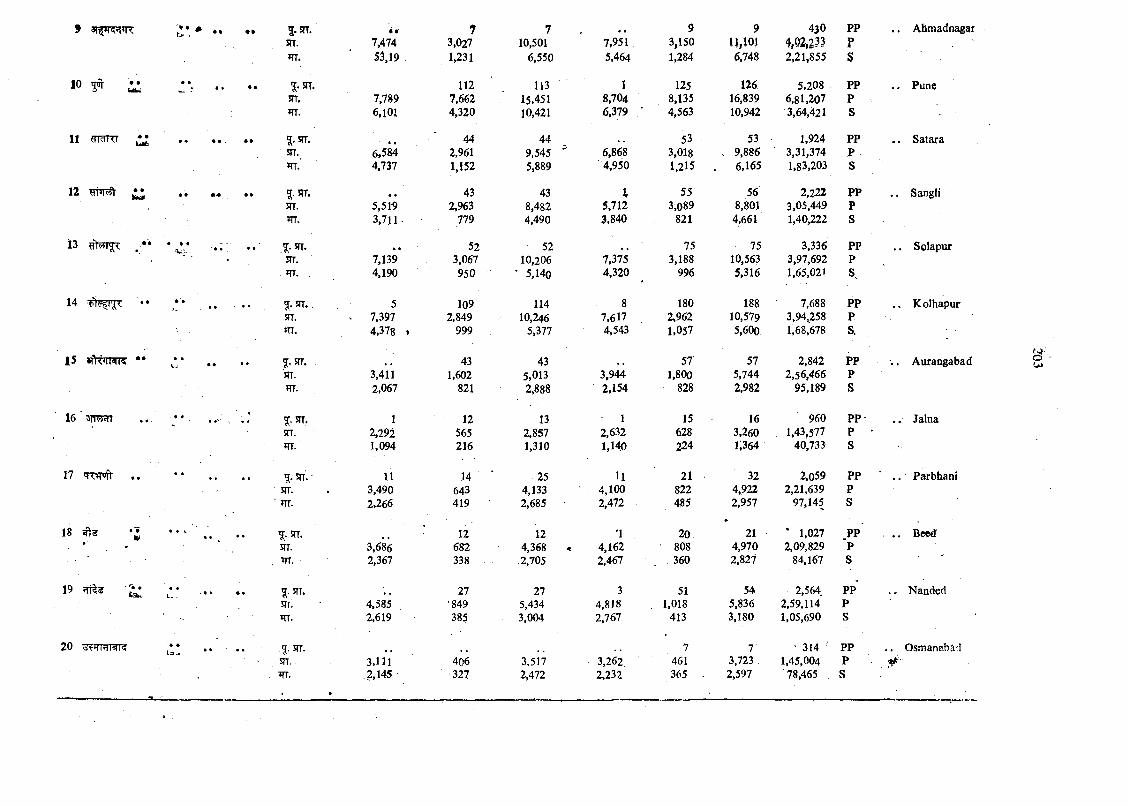
9 t .* * •• •• |.srr. i t 1 7 . < 9 9 430 PP . . Ahmadnagarsrr. IMA, 3,027 10,501 7.951 3,150 11,101 4,02,233 P*TT. 53,19 1,231 6,550 5.464 1,284 6,748 2,21,855 S
10 ^ # • ' ^.sn. 112 ll3 1 125 126 5,208 PP . . PuneST. 7.789 7,662 15,451 8,704 8,135 16,839 6,81.207 Pm. 6,101 4,320 10,421 6,379 ‘ 4,563 10,942 3,64,421 s
11 ^ •• •• «• 5. srr. 44 44 53 53 1,924 PP . . Satarasrr. 6.584 2,961 9,545 ’ 6,868 3.018 , 9,886 3,31,374 pm. 4.737 1,152 5,889 4,950 1,215 . 6,165 1,83,203 s
12 ^ ^.ST. 43 43 X 55 56 2,222 PP ;. Sanglisrr. 5,519 2,963 8,482 5,712 3,089 8,801 3,05,449 pTT. 3,711- 779 4,490 3,840 821 4,661 1,40,222 s
13 y't?n'x<. . • • • • • • • .1-^^ » • 52 52 75 75 3,336 PP . . SolapurSTT. 7,139 3,067 10,206 i ,y is 3,188 10,563 3,97,692 pJTT. . 4,190 950 ' 5,140 4,320 996 5,316 1,65,021 s.
14 ■T)'c r' < • • 5 109 114 8 180 188 7,688 PP . . Kolhapur5TT. 7,397 2,849 10,246 7.617 2,962 10,579 3,94,258 pm. 4,378 , 999 5,377 4,543 1,057 5,600 1,68,678 s. -
15 «n^w K •• • •• • • * 5.STT. 43 43 57' 57 2,842 PP . Aurangabad
srr. 3,411 1,602 5,013 3,944 1,800 5,744 2,56,466 pm. 2.067 821 2,888 2,154 828 2,982 95,189 s
16 sn -TI 1 12 13 1 15 16 960 PP . . Jalnasrr. 2,292 565 2,857 2,632 628 3,260 . 1.43,577 p ■ITT. 1,094 216 1,310 1,140 224 1.364 40,733 s
17 ** 5.5TT'.- 11 14 25 11 21 - 32 2,059 PP . . Parbhani■ SIT. 3,490 643 4,133 4.100 822 4,922 2,21,639 p' ITT. 2,266 419 2,685 ' 2,472 485 2,957 97,145 s
18 •• « • • * .STT.•
12 12 *1 20 21 ‘ 1,027 ,pp . . Bced5TT. 3,686 682 4,368 4,162 808 4,970 2,09,829 p
, JTT. 2,367 338 .2,705 2,467 . 360 2,827 84,167 s
L-. • ’ 5. 5rr. 27 27 3 51 54 2,564. PP . , NandedITT. 4,585 •849 5,434 4,818 1,018 5,836 2,59,114 p?rr. 2,619 385 3,004 2,767 413 3,180 1,05,690 s
20 \j i |rll«|l<; ■ •• •• . .SFT. 7 7 ' 314 pp . . OsmanabadSTT, 3,111 406 3,517 3,262 461 3,723 1,45,004 p .ITT. 2,145 •327 2,472 2,232 365 - 2,597 78,465 s
-■'-' .- ,i*. « » '
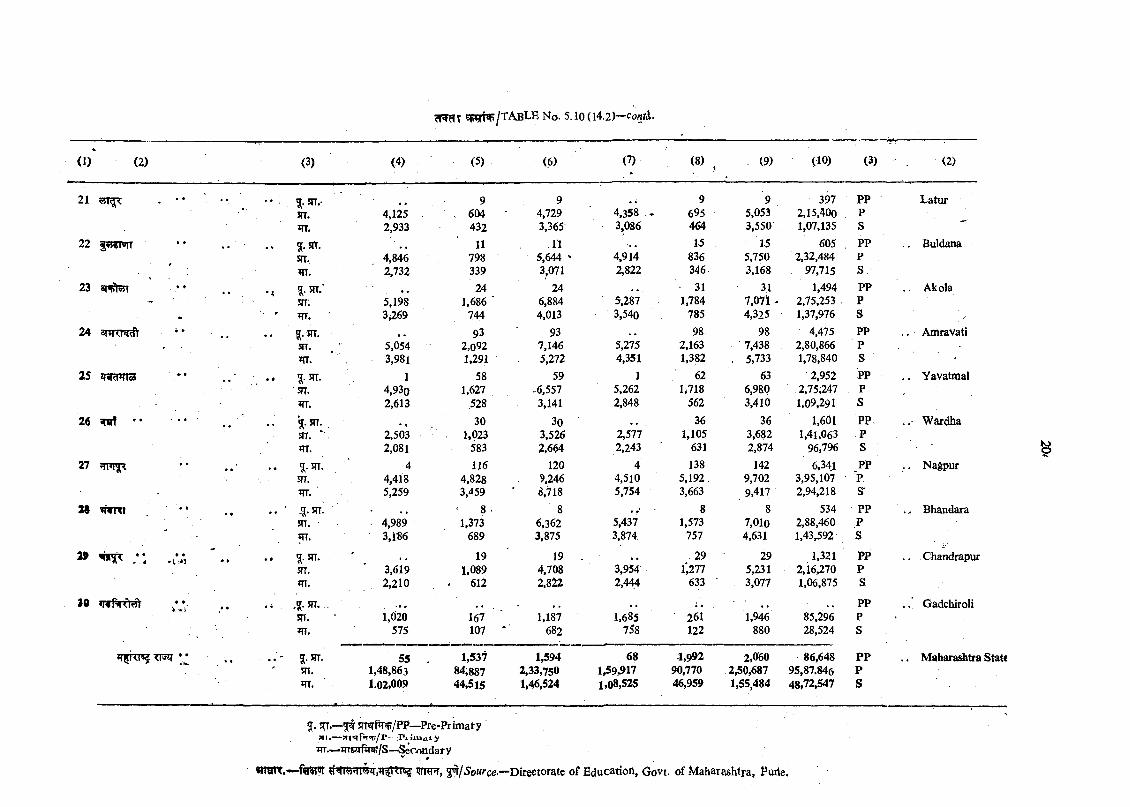
(I ) (2) (3) (4) (5) (6) (7) (8)' 1: . (9) (10) (3) (2)
21 . •* •• •• .5rT.- 9 9 9 9 397 PP LaturST. 4,125 . 604 4,729 ; 4,358 ^ 695 5,053 2,15,400 Pm. 2,933 432 3,365- 3,086 464 3,550 1,07,135 S
22 giKgnnr . . . . g. srr. 11 11 1>5 . 15 60S PP .. Buldanastt. 4,846 798 5,644 ' 4,914 836 5,750 2,32,484 P»IT. 2,732 339 3,071 2,822 346 3,168 97,715 s
23 a r ^ f a.STT.’ 24 24 • 31 31 1,494 PP . . Akolasn: 5,198 1,686 ■ 6,884 5,287 1,784 7,071 - 2,75,253 - P
- • ' TT. “ 3,269 744 4,013 3,540 785 4,325 1,37,976 s ,■24 anpTBRft 5.5IT. • « 93 93 98 98 4,475 PP .. Amravati
r srr. 5,054 2,092 7,146 5,275 2,163 7,438 2,80,866 P?n. 3,981 1,291 5,272 4,351 1,382 . 5,733 1,78,840 s ■
25 i|iIHT|Io3 . . • . . I-srr. 1 58 59 1 62 63 2,952 PP , . Yavatmal5TT. 4,93o 1,627 -6,557 5,262 1 7.18 6,980 .2,75,247 prn. 2,613 528 3,141 2,848 562 3,410 1,09,291 s
26 iwT * * • • S-STT. . 30 30 36 36 1,601 PP Wardha5TT. 2,503 1,023 3,526 2,577 1,105 3,682 1,41,063 p*TT. 2,081 583 2,664 2,243 631 2,874 96,796 s
27 . . ?.5rr. 4 116 120 4 138 142 6,341 PP . . NagpurJTT. 4,418 4.828 9,246 4,510 5,192. 9,702 3,95,107 pm. 5,259 3,459 8,718 5,754 3,663 9,417 2,94,218
^T»n? . . ' -5-stt! 8 • 8 . ,* 8 8 534 PP i, Bhandara5TT. • 4,989 1,373 6,362 5,437 1,573 7,010 2,88,460 pm. 3,iS6 689 3,875 3,874 757 4,631 1,43,592 s
» .u-A . . .5rr. - 19 19 . 29 29 1,321 PP . . ChandrapurSTT. 3,619 1,089 4,708 3,954 l‘,277 5,231 2,16,270 pm. 2,210 . 612 2,822 2,444 633 3,077 1,06,875 s
30 ? r r f W t j / . .. .'(•ST. . • • 0 • • PP . . GadchiroliSTT. 1,020 167 ' 1,187 1,685 261 1,946 85,296 p •
575 107 682 758 122 880 28,524 s
545RP TT5JT \ * ..* 5-STT. 55 . 1,537 1,594 68 1,992 2,060 S6,648 pp . . Maharashtra State5n. 1,48,863 84,887 2,33,750 1^9,917 90,770 2,50,687 95,87,846 pm. ' 1.02,009 44,515 1,46,524 1,08,525 46,959 1,55,484 48,72,547 s ,
% SH’*—^ snw ftr/P P—Pre-Prim aty ,s» I.—9H«trn'Tf/r- r j. Imai yTIT—.TTTSirfii^/S-^Serondafy
wraiT.— ftiW ?r^r??5TT^,»r^ttr«5 w rh , S’ /5o«^ce.-”Directorate o f Education, Govt. of M aharashtra, Puiie,
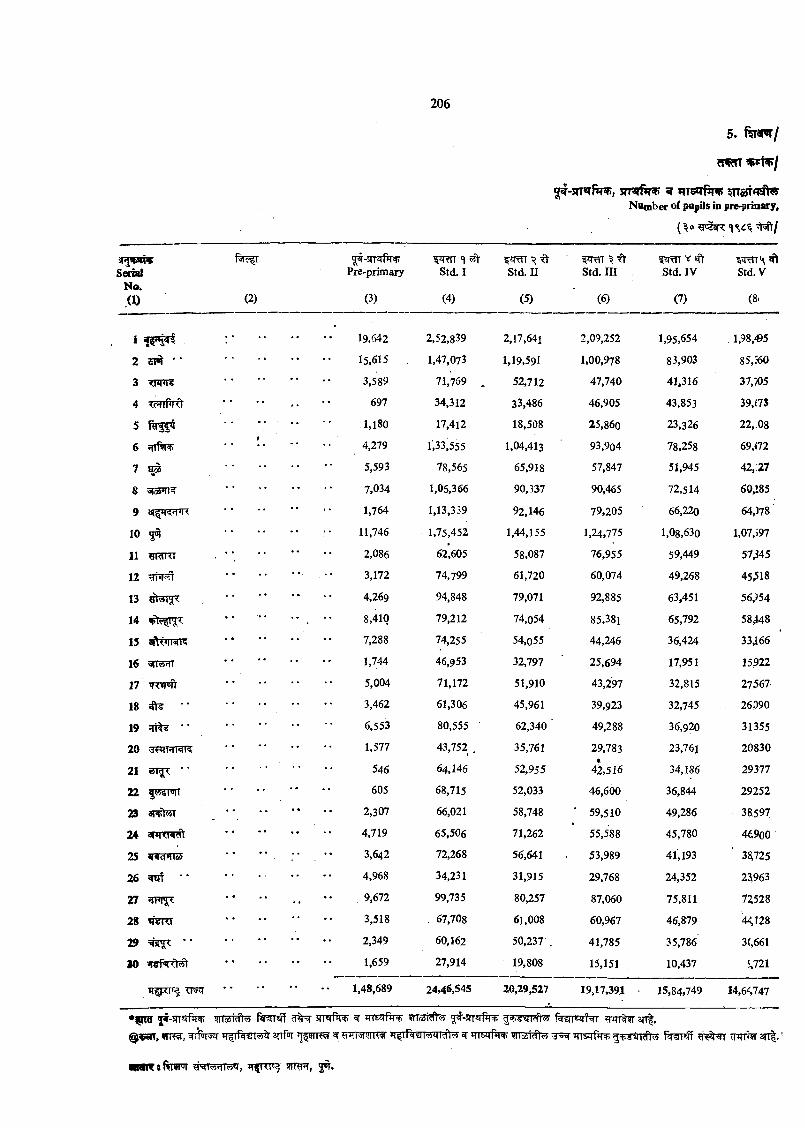
srrq ffw ^ ^nat^isN yNumber of papOs in prei>rinary»
SerialNo.(1)
1
2 zA "
3
4 xoiiPrfr
5
6 ^nii+
7
8
9
10 5^
11 IJJdKI
12 rri’T#
13
14
15
16
17 «RWofV
18 4k • •
19 • '
20
21 '•
22 f»- r<nT
23 3JV| «l
24
25
26 ^ • *
27 SIPl^
28
29 ••
30
(2)
|[t-5iT«Tftrw7re-primary
l ^ T T Std. I std.n
A^x\\ ^Std. in
^ ITII V?ftStd. IV Std.V
(3) (4) (5) (6) (7) (8-
19,642 2,52,839 2,17,641 2,09,252 1.95,654 1,98,^5
15,615 1.47,073 1.19,591 1.00,978 83,903 85,360
3,589 71,769 , 52.712 47,740 41,316 37,705
697 34,312 33.486 46,905 43,853 39,(73
1,180 17,412 18,508 25,860 23,326 22,:08
4,279 1',33'555 1.04,413 93,904 78,258 6 9 m
5,593 78,565 65,918 57,847 51,945 42,[27
7.034 1,06,366 90,337 90,465 72,514 60,»85
1.764 1,13,339 92,146 79,205 66,220 64,)78
11,746 1.75,452 1,44,155 1.24,775 1,08,630 l,07,i97
2,086 62,605 58,087 76,955 59,449 57345
3,172 74,799 61,720 60,074 49,268 45518
4,269 94,848 79,071 92,885 63,451 56,)54
8,410 79,212 74,054 85,381 65,792 58M8
7,288 74,255 54,055 44,246 36,424 33466
1,744 46,953 32,797 25,694 17,951 15922
5,004 71,172 51,910 43,297 32,815 27567
3,462 61,306 45,961 39,923 32,745 26090
6,553 80,555 62,340 ' 49,288 36,920 31355
1,577 43,752 , 35,761 29,783 23,761 20830
546 64,146 52,955 4^516 34,186 29377
605 68,715 52,033 46,600 36,844 29252
2,307 66,021 58,748 ■ 59,510 49,286 38597
4,719 65,506 71,262 55,588 45,780 46900
3,642 72,268 56,641 53,989 41,193 ' 3^725
4,%8 34,231 31,915 29,768 24,352 23i963
. 9,672 99,735 80,257 87,060 75,811 72528
3,518 . 67,708 61,008 60,967 46,879 44128
2,349 60,162 50,237 . , 41,785 35,786 3(,66l
1,659 27,914 19,808 15,151 10,437 S.721
1,48,689 24,46,545 20,29,527 19,17,391 15,84,749 14,6 ,747
• f n a 5#-5iT«4fiT !}iro4ttfl<?t ^ 5rr«rfq^ ^ jrrsjrfiT^ w M f e w % 9r 3n|.
WT^, TOST^^3^TnsqfTT°f?;|c ^ ^ T ^ f ^ « f f ¥iTI^3rT|.’
:9ftwnr n^[Rr^ ^mnr, jot.
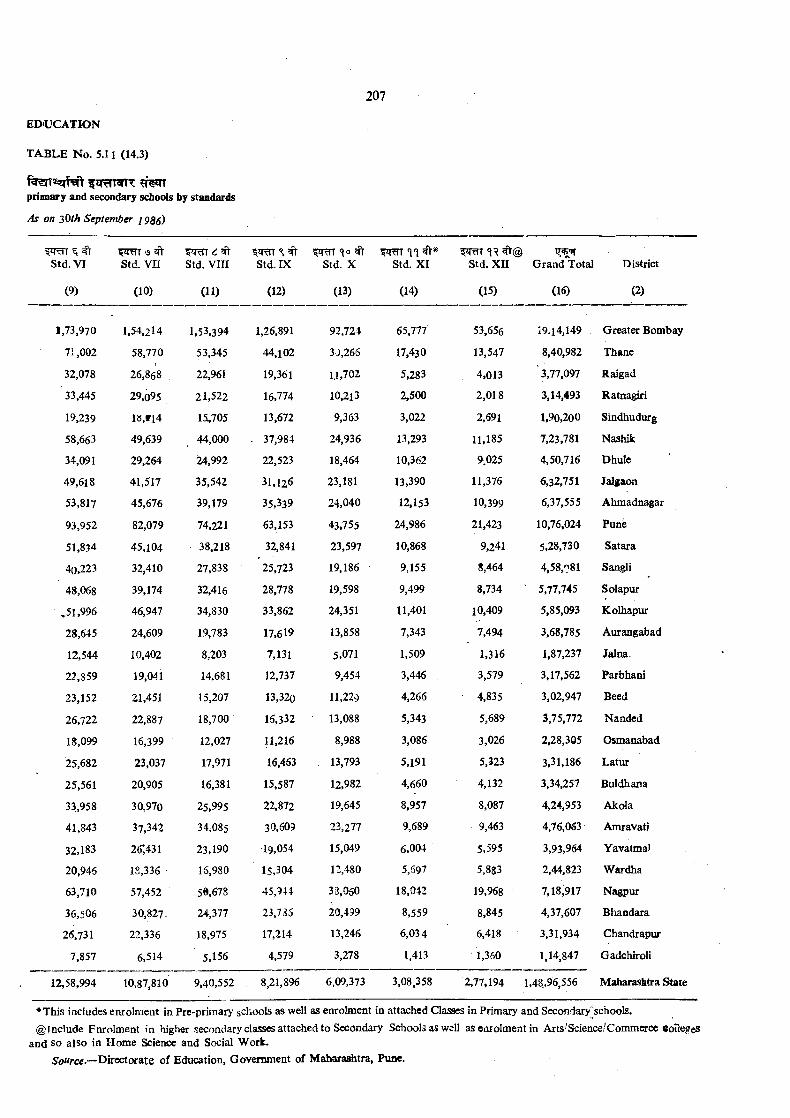
ED»UCATION
TA.BLE N o. 5.11 (14.3)
prim ary and secondary schools by standards
As on 30th September 7935)
Std. VI
(9)
std . v n std . v m std . IX std . X std . XI s td . XII G rand Total
(10) (11) (12) (13) (14) (15) (16)
District
(2)
1,73,970
7i,002
32,078
33,445
19,239
58,663
34,091
49,618
53,817
93,952
51,834
40,223
48,068
.51,996
28,645
12,544
22,859
23,152
26,722
18,099
25,682
25,561
33,958
41,843
32,183
20,946
63,710
36,506
26,731
7,857
1.54,214
58,770
26,868
29,095
I8,ri4
49,639
29,264
41,517
45,676
82,079
45,104
32,410
39,174
46,947
24,609
10,402
19,041
21.451
22,887
16,399
23,037
20,905
30,970
37,342
261431
18.336
57.452
30,827-
22.336
6,514
1,53,394
53,345
22,961
21,522
15,705
44,000
i24,992
35,542
39,179
74,221
38.218
27,838
32,416
34,830
19,783
8,203
14,681
15,207
18,700
12,027
17,971
16,381
25,995
34,085
23,190
16,980
5^,678
24,377
18,975
5,156
1,26,891
44,102
19,361
16,774
13,672
37,984
22,523
31,126
35,339
63,153
32,841
25,723
28,778
33,862
17,619
7,131
12,737
13,320
15,332
11,216
16,463
15,587
22,872
30,609
19,054
15,304
45,9U
23,735
17,214
4,579
92,724
30,266
I.1,702
10,213
9,363
24,936
18,464
23,181
24,040
43,755
23.597
19,186
19.598
24,351
13,858
5,071
9,454
II,229
13,088
8,988
. 13,793
12,982
19,645
23,277
15.049
12,480
38.050
20,499
13,246
3,278
65,777
17.430
5,283
2,500
3,022
13,293
10,362
13,390
12.153
24,986
10,868
9,155
9,499
11,401
7.343
1,509
3,446
4,266
5.343
3,086
5,191
4,660
8,957
9,689
6,004
5,597
18,042
8,559
6,034
1.413
53,656
13,547
4,013
2,018
2,691
11,185
9.025
11,376
10,399
21,423
9,241
8,464
8,734
10,409
7,494
1,316
3,579
4,835
5,689
3.026
5,323
4,132
8,087
9,463
5,595
5,883
19,968
8,845
6,418
1,360
19.14,149
8,40,982
' 3,77,097
3,14,493
1,90,200
7,23,781
4,50,716
6,32,751
6,37,555
10,76,024
5,28,730
4,58,981
5,77,745
5,85,093
3,68,785
1,87,237
3,17,562
3,02,947
3,75,772
2,28,305
3,31,186
3,34,257
4,24,953
4,76,063
3,93,964
2,44,823
7,18;917
4,37,607
3,31,934
1,14,847
Greater Bombay
Thane
Raigad
Ratnagiri
Sindhudurg
Na3hik
Dhule
Jalgaon
Ahmadaagar
Pune
Satara
Sangli
Solapur
Kolhapur
Aurangabad
Jalna.
Parbhani
Beed
Nanded
Osmanabad
Latur
Bui dh ana
Akola
Amravati
Yavatma)
Wardha
Nagpur
Bhandara
Chandrapur
Gadchiroli
12,58,994 10,87,810 9,40,552 8,21,896 6,09,373 3,08,358 2,77,194 1,48,96,556 Maharashtra State
*This includes enrolment in Pre-primary schools as well as enrolment in attached Classes in Primary and Secondary^schools*@Include Enrolment in higher secondary classes attached to Secondary Schools as well as enrolment in Arts/Science/Commerce CoHc^eS
and so also in Hom e Science and Social Work.Source.—D irectw ate of Education, Government of M a l^ ra ^ tra , Pune.
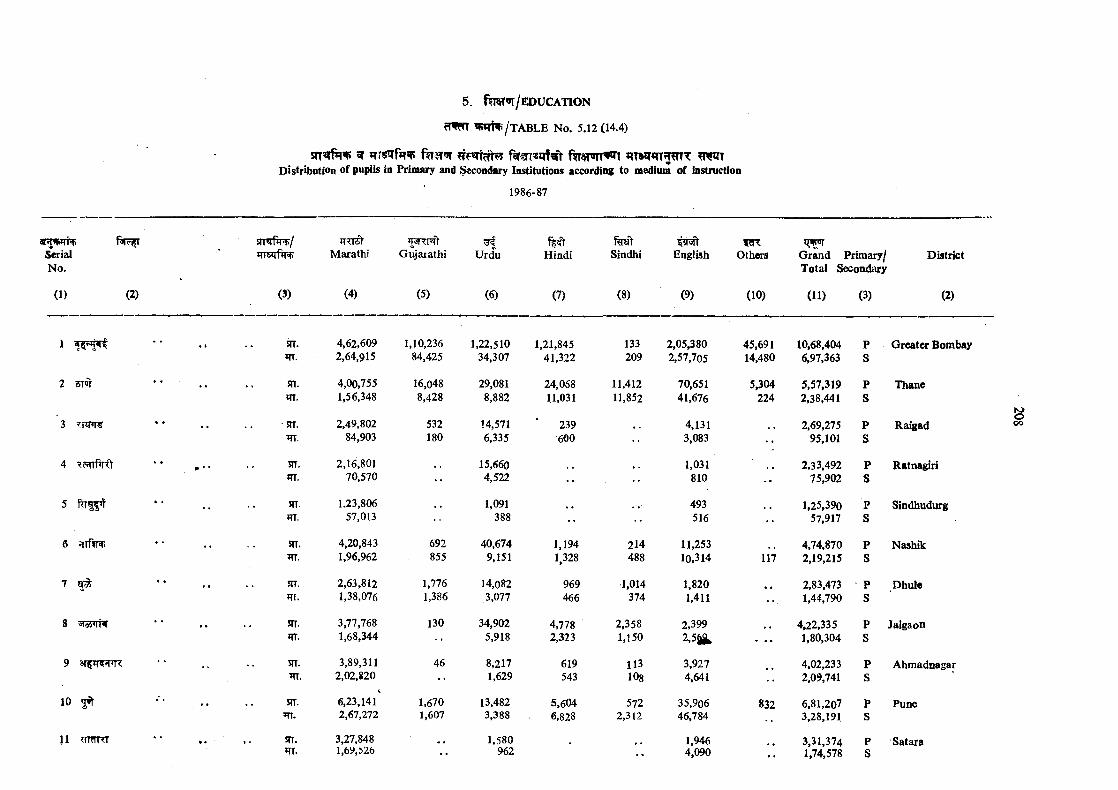
^ fir€n«q1^> f^jT^iTwr^rtDistribution of pupils in Primary and l^condary Institutions according to medium of instruction
1986-87
UTfffk^/ fk-^ mSerial TTSlrfiR) M arathi G ujaiathi Urdu Hindi Sindhi English Others G rand Primary/ DistrictNo. Total Secondary
(1) (2) (3) (4) (5) (6) (7) (8) (9) (10) (11) (3) (2)
1 ‘ ‘ srr. 4,62,609 1,10,236 1,22,510 1,21,845 133 2,05,380 45,691 10,68.404 P G reatw Bombaym . 2,64,915 84,425 34,307 41,322 209 2,57,705 14,480 6,97,363 S
2 STot ' • . . sn. 4,00,755 16,048 29,081 24,068 11,412 70,651 5,304 5,57,319 P ThaneHT. 1,56,348 8,428 8,882 11,031 11,852 41,676 224 2,38,441 S
3 STT. 2,49,802 532 14,571 239 4,131 2,69,275 P RaigadITT. 84,903 180 6,335 600 3,083 •• 95,101 s
4 • * . . . 5IT. 2,16,801 , , 15,660 .. 1,031 2.33.492 p Ratnagirim. 70,570 4,522 •• 810 -• 75,902 s
5 S(T- 1,23,806 1,091 493 . . 1,25,390 p Sindhudurg?TT. 57,013 388 •• •• 516 57,917 s
6 fnfira * ‘ SIT. 4,20,843 692 40,674 1,194 214 11,253 4,74,870 p Nashikm. 1,96,962 855 9,151 1,328 488 10,314 117 2,19,215 s
7 ^ • • m. 2,63,812 1,776 14,082 969 1,014 1,820 2,83,473 p Dhulem . 1,38,076 1,386 3,077 466 374 1,411 1,44,790 s
8 STT. 3,77,768 130 34,902 4,778 2,358 2,399 4,22,335 p Jalgaon<TT. 1,68,344 5,918 2,323 1,150 2 , 5 ^ 1,80,304 s
9 anpnnnT SIT. 3,89,311 46 8,217 619 113 3,927 4,02,233 p Ahmadnagarm. 2,02,820 •• 1,629 543 108 4,641 •• 2,09,741 s
10 5^t SIT. 6,23,141 1,670 13,482 5,604 572 35,906 832 6,81,207 p Punem. 2,67,272 1,607 3,388 6,828 2,312 46,784 3,28,191 s
}l ^rmnr * * . . sn. 3,27,848 1,580 1,946 3,31,374 p SataraHf. 1,69,526 •• 962 .. 4,090 . . 1,74,578 s
Ooo
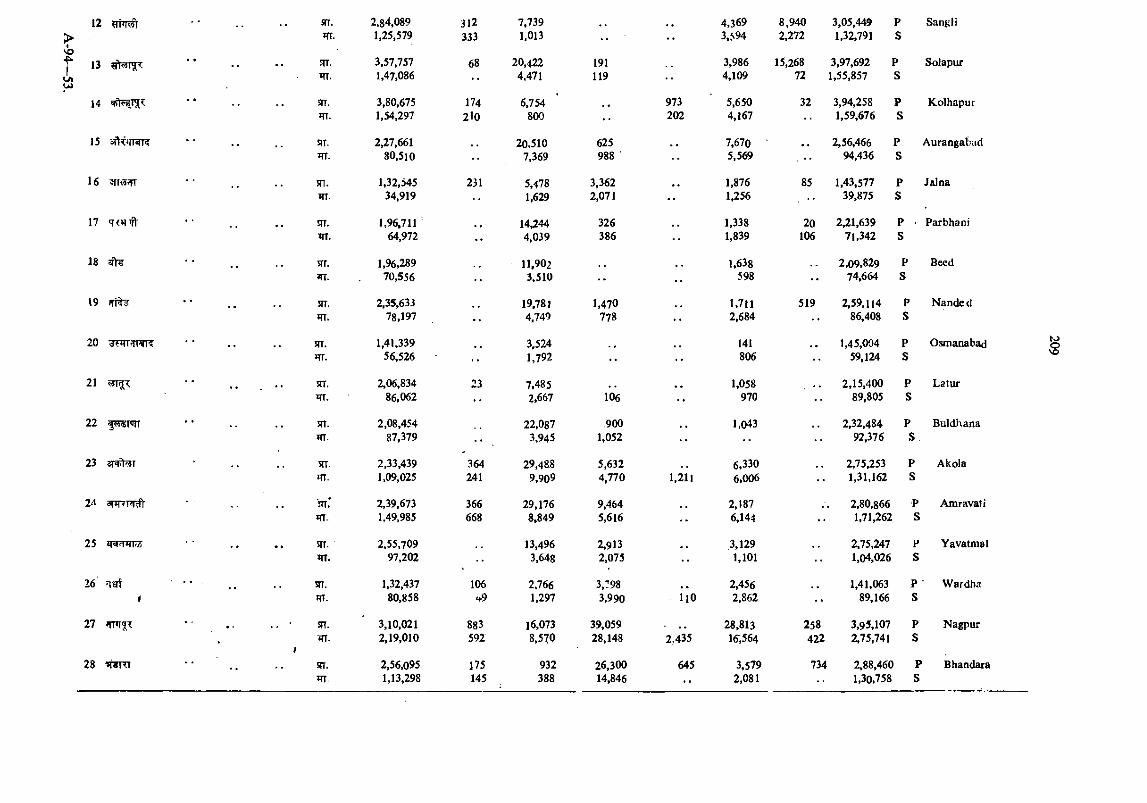
VO"1 13t
14
15
16
17 T<Hift
18 «fts
19 if f^
20
21 5IT T
22 ■ Misi'Jii
23 sr^T
2- «)*1
25
16«
27 Jim T:
28 IWTTT
an. 2.84,089 312 7,739 . , 4.369 8,940 3,05,449 P Sangli*TT. 1,25,579 333 1.013 •• •• 3,^94 2,272 1,32,791 S
!TT. 3,57,757 68 20,422 191 3,986 15,268 3,97,692 P Solapurm. 1,47,086 •• 4.471 119 4,109 72 1,55,857 S
STT. 3,80,675 174 6,754 973 5,650 32 3,94,258 P K olhapur*TT. 1,54,297 2l0 800 •• 202 4,167 1,59,676 S
ST. 2,27,661 20.510 625 . . 7.670 . . 2,56,466 P Aurangabadm. 80,510 7,369 988 ■ 5,569 94,436 S
50. 1,32,545 231 5,478 3,362 . . 1,876 85 1,43,577 P Jalna»rT- 34,919 1,629 2,071 •• 1,256 •• 39,875 S
sn. 1,96,711 14,244 326 1,338 20 2,21,639 P Parbhaoim. 64,972 •• 4,039 386 1,839 106 71,342 S
srr. 1,96,289 11,902 1.638 2,09.829 P Becd*TT. 70,556 •• 3.510 •• 598 •• 74,664 S
sn. 2,35,633 19,781 1.470 1.711 519 2.59.114 P N andedm. 78,197 •• 4.749 778 •• 2,684 •• 86,408 S
!n. 1,41,339 3,524 141 . . 1,45,004 P Osmanabad*rr. 56,526 • •• 1,792 •• 806 59,124 S
HT. 2,06,834 23 7.485 1.058 2,15.400 P LaturITT. 86,062 •• 2,667 106 970 89,805 S
m. 2,08,454 22,087 900 1,043 2,32,484 P Buldhanam. 87,379 •• 3.945 1,052 •• •• 92,376 S
STT. 2,33,439 364 29,488 5,632 6,330 2,75,253 P AkolaITT. 1,09,025 241 9,909 4,770 1,211 6,006 •• 1,31,162 S
m.' 2,39,673 366 29,176 9,464 2,187 2,80,866 P Amravafim. 1,49,985 668 8.849 5,616 •• 6,144 •• 1,71,262 S
STT. 2,55,709 13,496 2.913 3,129 2,75,247 P Yavatmalm. 97,202 3,648 2,075 1,101 1,04,026 S
sn. 1,32,437 106 2.766 3,798 2,456 1,41,063 P W ardham. 80,858 ‘*9 1,297 3,990 ilO 2,862 89,166 S
ST. 3,10,021 883 16,073 39,059 28,813 258 3,95,107 P Nagpurm. 2,19,010 592 8.570 28,148 2,435 16-,564 422 2,75,741 S
srr. 2,56,095 175 932 26,300 645 3,579 734 2,88,460 P BhandaraITT. 1,13,298 145 388 14,846 , * 2,081 1,30,758 S
tos
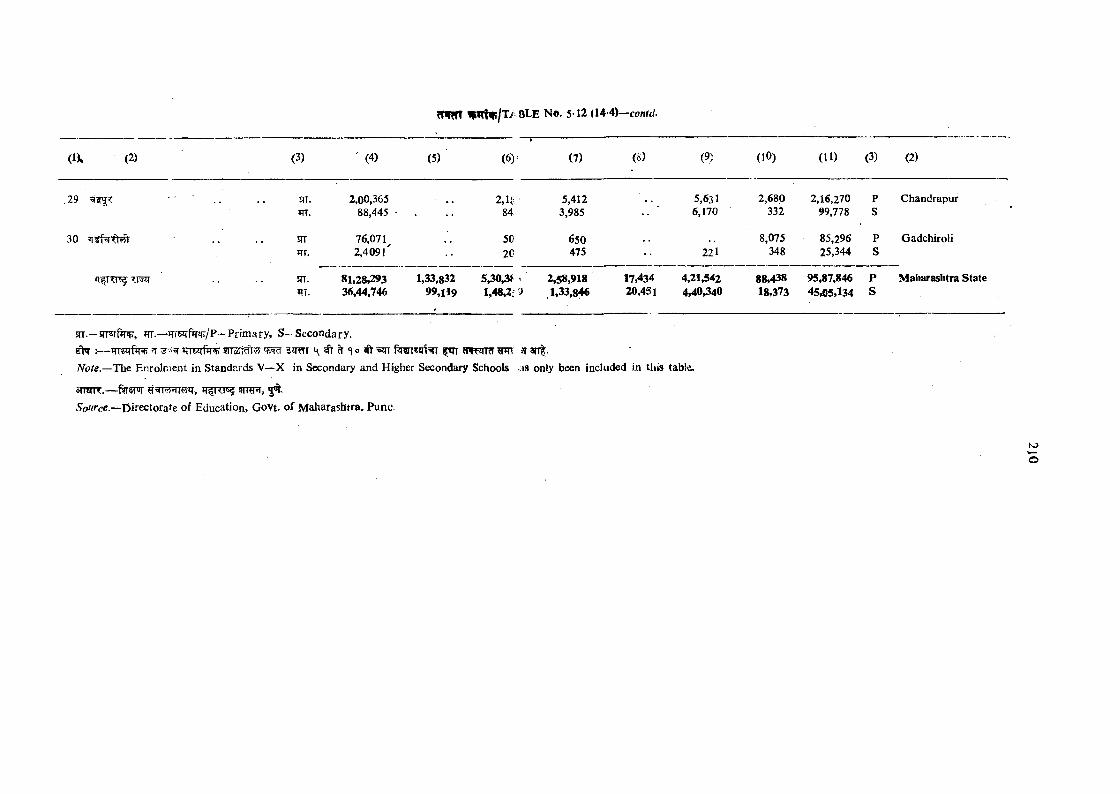
O k (2) (3) (4) (5) (6) (7)
. 29 =5|'s^
30
7rjq-
m.irr.
srrTTT.
sn.m .
2,00,36588,445
76,071^ 2,4091'
2,1s84
5020
5,4123,985
650475
81,28,29336,44,746
1,33,83299,119
5,30,3f * 1,48,2f 9
2,58,9181,33,S46
(g) (9) (lO) (11) (3) (2)
5,6316,170
221
2,680332
8,075348
2,16,27099,778
85,29625,344
Chandrapur
Gadchiroli
17,43420,451
4,21,5424,40,340
88,43818,373
95,87,846 P 45,05,134 S
Maliarasbtra State
srr.—srretfiRr, Prim ary, S -S eco n d a ry .^ 5iTo5T >y k ^ ^ v ^ ^ ^ tRfzrrcf m \ ^
Note.—The Enrolment in Standards V—X in Secondary and Higher Secondary Schools las only been included in this table.
srmrc. — smnr , y>r
Directorate of Education, Govt, of Maharashtra. Pune.
K>o
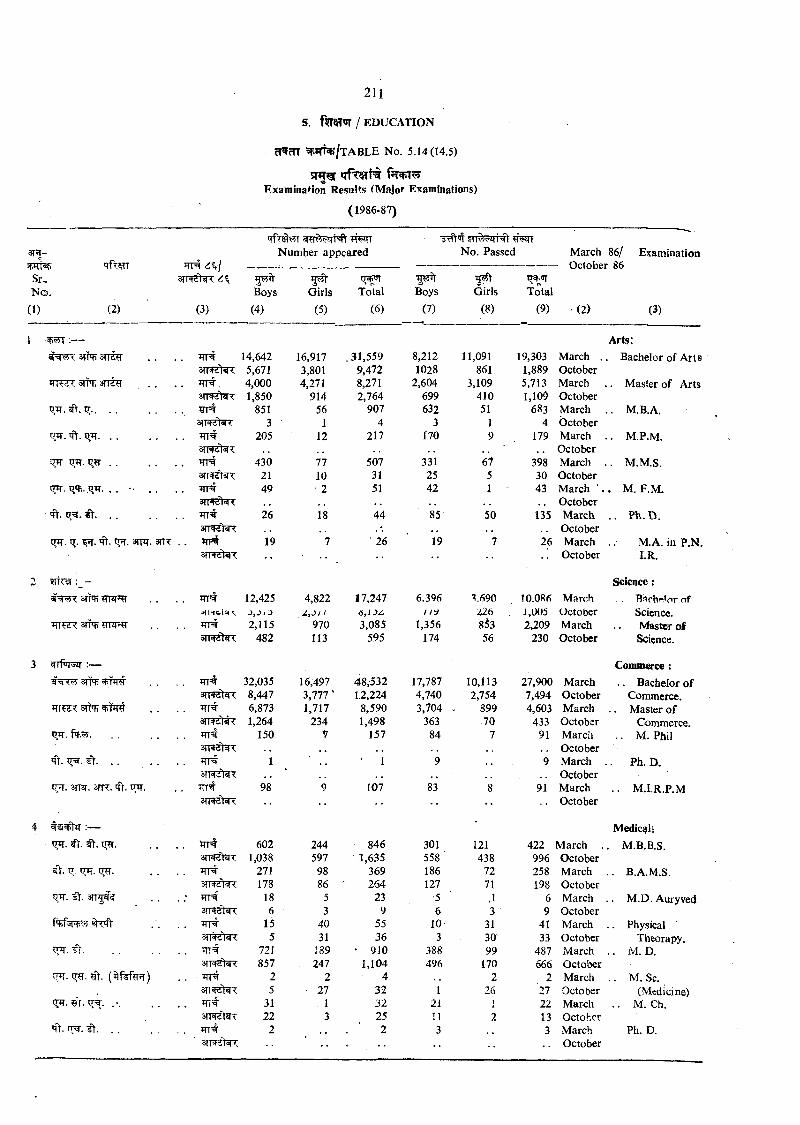
211
5. f3!T«Tor / EDUCATION
cT^m ?f.m ^/TA BLE No. 5.14(14.5)
Examination Results (Major Examinations)
(1986-87)
3TH-
Sr-N o .
(1) (2)
6%l
(3)
Number appearedcft’it fTT^^^rHt
No. Passed March---------------- ------ ------ f'\r*frvVs<ai
86/ Examinationr 86
(3)
Boys
(4)
Girls
(5)
Total
(6)
Boys
(7)
Girls
(8)
Total
(9) • (2)
1 ;— Arts;. 14,642 16,917 .31,559 8,212 11,091 19,303 March . . Bachelor of A rts
5,671 3,801 9,472 1028 861 1,889 Octoberin'^i < 3ri^ 3TT% . TTT#. 4,000 4,271 8,271 2,604 3,109 5,713 March . . Master of Arts
1,850 914 2,764 699 410 1,109 Octoberqir. IT., . . . yN 851 56 907 632 51 683 March . . M.B.A.
3)Rjt?T 3 1 4 3 1 4 October'ft. . . . 205 12 217 170 9 179 March . . M.P.M.
. . October^ . . *TT 430 77 507 331 67 398 March .. M.M.S.
srrfdl*)-!; 21 10 31 25 5 30 October, . '• . . . TTT# . 49 ■ 2 51 42 1 43 March . M. P.M .
. . October'ft. «t. . . TTT# 26 18 44 85 50 135 M arch . . P h .D .
STT tSR: .* , , . . Octoberq[iT. q. 'ft. arnr. anr 19 7 ■ 26 19 7 26 March M.A. in P.N.
sn w jt^ •• . . October I.R.
2 :_ - Science:. . TTT# 12,425 4,822 17,247 6.396 3.690 10.086 March B;ichf^*or of
j,j/D / , j / / / /y 226 1,005 October Sciencc.2,115 970 3,085 1,356 853 2,209 March Mastw <rf
3tl'+<il«(< 482 113 595 174 56 230 October Science.
3 ' if i'TAj :— Commerce:<« STT'T: VPT r . . 32,035 16,497 48,'532 17,787 10,113 27,900 March .. Bachelor of
an^tcR: 8,447 3,777 ' 12,224 4,740 2,754 7,494 October Commerce.3TFF . . . . ^ 6,873 1,717 8,590 3,704 899 4,603 March .. Master of
1,264 234 1,498 363 70 433 October Commerce... 150 V 157 84 7 91 March .. M. Phil
3TT'+d)«lT .. Octoberqt. .. . . •HI-» 1 • I 9 9 March Ph. D.
STWdlil?: .. Octobersrnr. otr. 'ft. . . 98 107 83 8 91 March .. M.I.R.P.M
Sll'+gl'sX •• •• .. October
4 ts^lTT :— Medical:t T. 4t. .. frr# 602 244 846 301 121 422 M arch . . M.B.B.S.
1,038 597 a ,635 558 438 996 October5t. . . TTT# 271 98 369 186 72 258 March .. B.A.M.S.
STITdl 'C 178 86 ■ 264 127 71 198 October. .' 18 5 23 •5 ,1 6 March .. M.D. Auryved
31TOt^< 6 3 9 6 3 9 October.. 15 40 55 10 31 41 March .. Physical
3) Kdlsl < 5 31 36 3 30' 33 October Theorapy.cnr. s'!. .. 721 189 • 910 388 99 487 March .. M. D.
857 . 247 1,104 496 170 666 Octoberrw. i^ . ?ft. (%f%f?r?r) .. 2 2 4 2 2 March .. M. Sc.
5 27 32 1 26 27 October (Medicine)t T. 9T. .-. . . 5?!=# 31 1 32 21 1 22 March .. M. Ch.
3nw2t^ 22 3 25 11 2 13 Octoberqt. rr^. f t . . . .. 2 . ■ 2 3 3 March Ph. D.
.. October
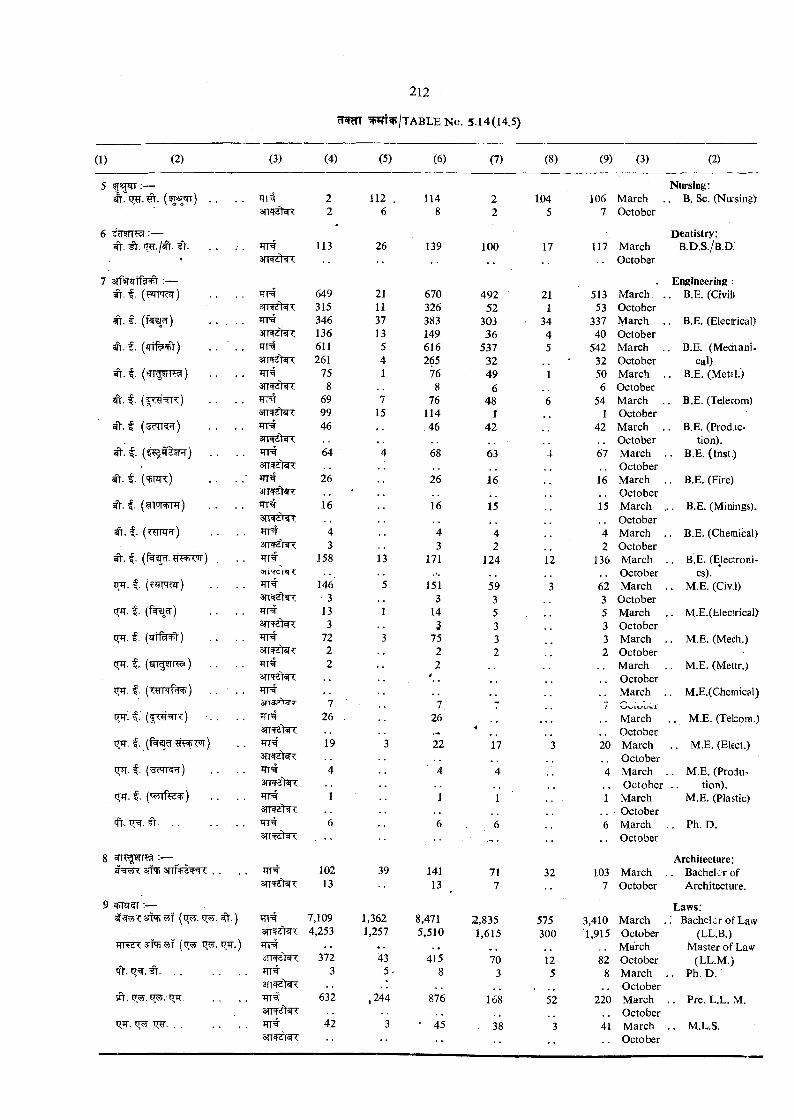
5 ;—
6 :—
7 s r f w f g ^ : — f. (?2rrr^)
wt. i.
t (JTtfespV)-
i . (?JT5?TT^)
^r. i
f . (3?TT^)
t
t ( 'f im )
f . ( iwwnTT)
f.
f . (f^W-'H>t><0T)
CHT. f . (^FKfrr^)
inr. f .
xr . f. (JTtf )
tnr. C )
f. (t trF ^ )
tTir. f.
inr.
iTrr. f.
ITTT. t
<ft. it . . .
8 :—snFB sTrf ff^T?: ..
9 :—
3TR?t^
22
113
1126
26
114
139 100
1045
17
106 March 7 October
117 March . . October
Nursing:. B. Sc. (Nu'sing)
Dentistry:B.D.S./B.D.
EngineeringJTf# 649 21 670 492 21 513 March .. B.E. (Civil)
315 11 326 52 1 53 OctoberJ l‘4• 346 37 383 303 • 34 337 March . . B.E. (Electrical)srr^ztiR 136 13 149 36 4 40 October
611 5 616 537 5 542 March .. B.E. (Mechani261 4 265 32 32 October cal)
ITT# 75 1 76 49 1 50 March . . B.E. (MetU.)8 8 6 6 October
69 7 76 48 6 54 March B.E. (Telecom)99 15 114 I 1 October -
TTT# 46 ,46 42 42 March .. B.E. (Prodac-3iKdls| <. . . October tion).TTT# 64 4 68 63 4 67 March . B.E. (Inst.)3TTJ)<N < .. October5TT# 26 26 16 16 March .., B.E. (Fire)3rr Jl«<T .. October
16 16 15 15 March ., . B.E. (Minings).3TTW t^ .. October
4 4 4 4 March ., B.E. (Chemical)3 3 2 2 October
qr# 158 13 171 124 12 136 March . . B.E. (Electronio t i^ f C iq ^ . . . . October cs).ITT# 146 5 151 59 3 62 March . . M.E. (Civil)
3 3 3 3 October+ ^ N 13 1 14 5 5 March . M.E.(Elecirical)
3 3 3 3 October72 3 75 3 3 March . . M.E. (Mech.)2 2 2 2 October
JTT=# 2 2 . . March . M.E. (Mettr.)arrwst^ f . . Octoberqr# , , , . March .,, M.E.(Chemical)3 T r ? f ^ t a T 7 ' • n 7 / w v t u u C i
26 . 26 , , « • • . . March . M.E. (Telcom.)•4 . . October
19 3 22 17 3 20 March .. M.E. (Elect.). . October
^=# 4 4 4 March . . M.E. (Produ-. . October tion).
ir r t 1 1 1 1 March M.E. (Plastic). . October
MM 6 6 6 6 March . Ph. D.3 T r ^ > ^ . . October
Architecture:TIT# 102 39 141 71 32 103 March . . Bachek r of5rr=t<i)«i< 13 13 7 7 October Architecture.
Laws;TT=# 7,109 1,362 8,471 2,835 575 3,410 March .;: Bachelor of Law
3fTO {rj^. qiT.)3TT cTt v; 4,253 1,257 5,510 1,615 300 '1,915 October (LL.B.)H\A March Master of Law
qV. ^ ................................372 43 415 70 12 82 October (LL.M.)
TTT# 3 5 . 8 3 5 8 March . . Ph. D.3TI4<ils|< • OctoberITT#smCTeR
632 ,244 876 168 52 220 March . October
. Pre. L.L. M.
. . in#s r r ^ ^
42 3 ‘ 45 . 38 3 41 March . October
. M.L.S.
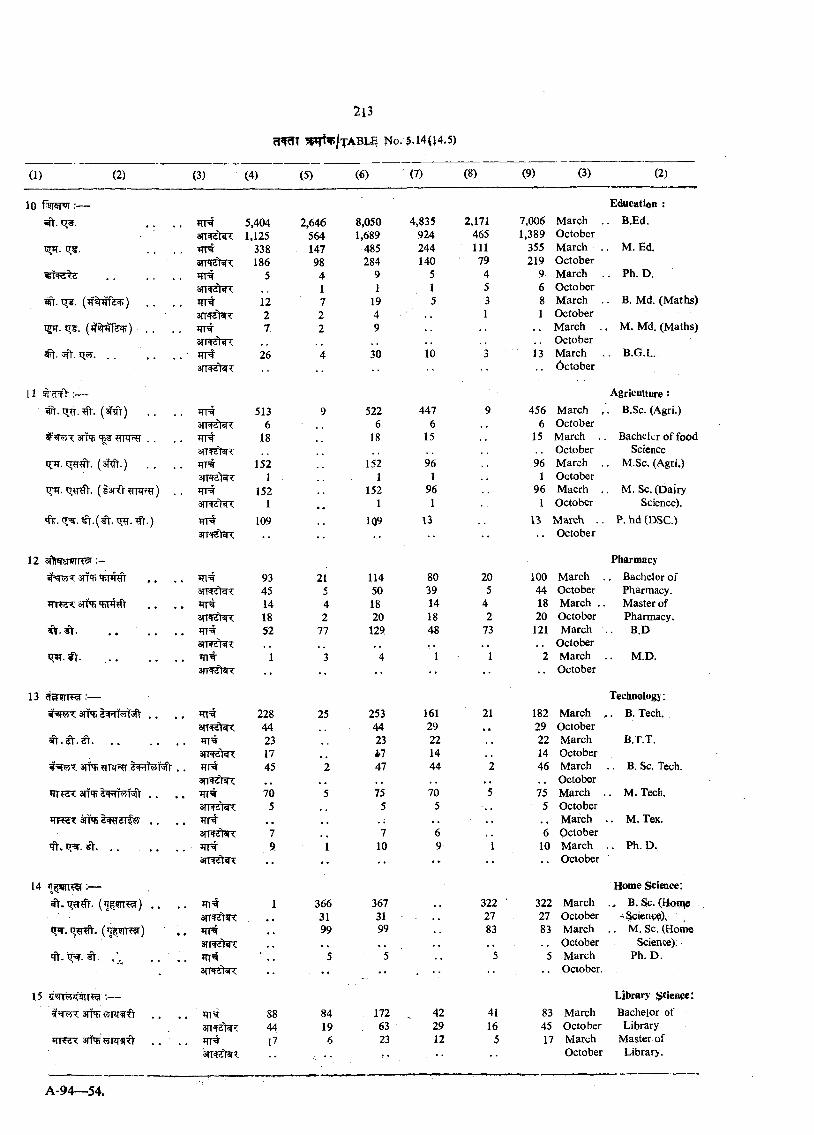
(1) (2) (3) (4) (5) (6) ' (7) (8) (9) (3) (2)
10 :—
q®.
m . q¥.
[1 —# . (aroV)
^^x3TTq5<|¥?TnTf?r . .
i?JT. q w r . (a?^.)
jpr. (isrx t
qfr.
12 3f |tsrenfrT : -
STT*?) ’TJHTHT , ,
3Tf'K qsm iV
. . . .
13 ci^?rT?^:—
3ji4Sl«r<.TTT
3Jl4d|s«<.JTT#a rR J t^HT#STTffftSfT
TTEfarr^VTTTT#3tl=t6)«Krrr#3) r^dt^T JTT#3TT^jt^
3TTf3t^
in ^3lV4dls»<,TTt
a r r ^ f ^
s m t t ^
snwztwc
5,4041,125
338186
5
1227,
26
5136
18
1521
1521
109
9345141852
SriNi . 22844
................................... TTT=t 23sim-dTisj < 17
arrs . . 453ri4dl«1 <.
* rr?^ an*s d«HT«i'j5Y . . , , JTT 703(l4dlq<. 5
*TFRTT sw srfw . . . ,7
JfT# 9••
:—
. . . . 1drr iftwT . ,
tt^r. ( ’jp rr^^) TTT#
. . . . *
■ . arFRrtwx ••
3TT'?5 55m fl' . . 88
3TfqJSnT«fV . . . .44
»rr^ l7
2,64656414798
41722
21542
77
25
2
5
3663199
8419
6
8,0501,689
485284
91
1949
4,835924244140
515
30 10
522 4476 6
18 15
152 961 1
152 961 1
109 13
114 8050 3918 1420 18
129 48
4 1
253 16144 2923 22*7 1447 44
75 705 5
7 610 9
3673199
5
> • •
172 , 4263 2923 12
2,1714651117945 3 1
7,006 March 1,389 October
355 March 219 October
9 March 6 October 8 March 1 October
. . March . . October 13 March . . 6ctober
Education :. B.Ed.
. M. Ed.
. Ph. D.
. B, Md. (M aths)
, M. Md. (Maths)
. B.G.L.
Agriculture:9 456 M arch , B.Sc. (Agri.)
6 October15 March .. Bachekr of food.. October Science96 March . . M.Sc. (Agri.)
1 October96 Macrh . M. Sc. (Dairy
1 October Science).13 M arch .. P. hd (DSC.)
• • . . October
Pharmacy20 100 March . . Bachelor of5 44 October Pharmacy.
4 18 March . . Master of2 20 October Pharmacy.
73 121 March . B.D, , . . October
1 2 March . . M.D.• • . . October
Technology:
21 182 March . B. Tech.29 October22 March B.T.T.14 October
2 46 March . . B. Sc. Tech., . . . October5 75 March . . M. Tech.
5 October, , . . March . . M. Tex.
6 October1 10 March .. Ph. p .
• • . . October
Home Science;
322 322 March B. Sc. (Hoiqe27 27 October •;.^cienc^).. ^83 83 March . . M. Sc. (Home, , . . October Science).
5 5 March Ph. D .. . October.
Juibrary science:41 83 March Bachelor of16 45 October Library
5 17 March Master ofOctober Library.
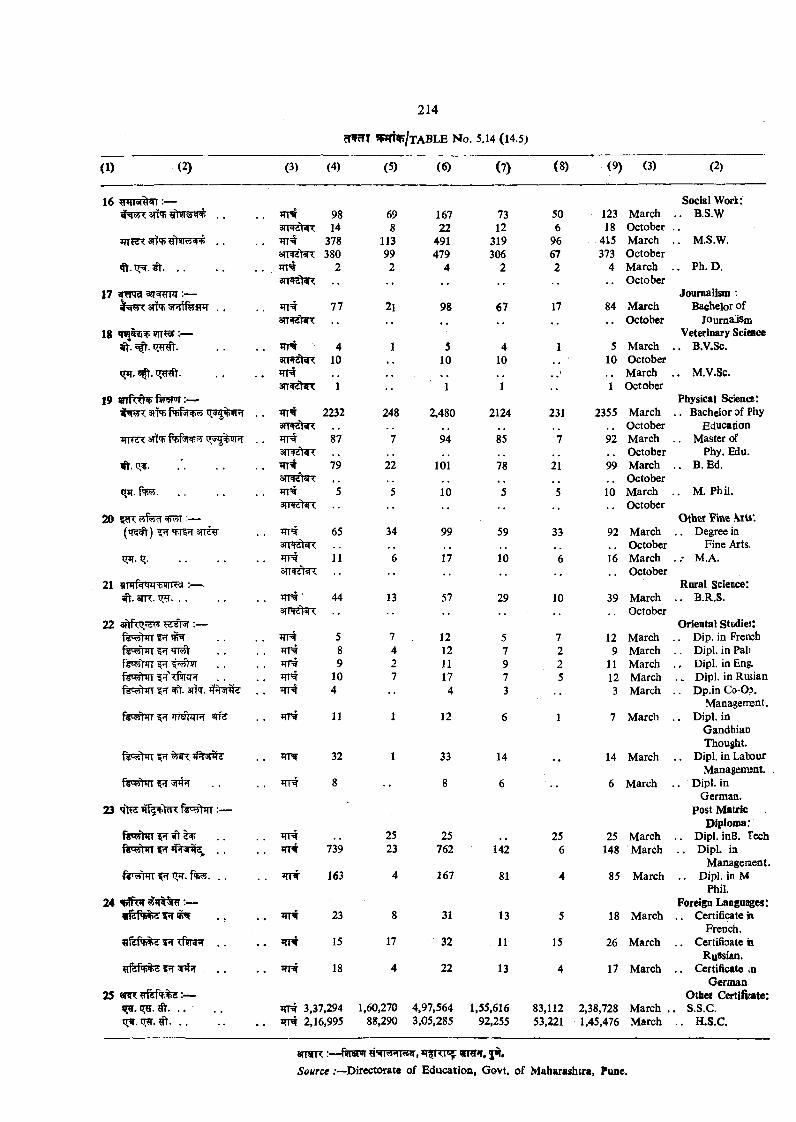
(1) (2) (3) (4) (5) (6) (7) (8) (9) (3) (2)
16 :— Social Work:3TTO . . . . ^ 98 69 167 73 50 123 March . . B.S.W
3TT 'ar< 14 8 22 12 6 18 October. . 378 113 491 319 96 415 March . . M.S.W.
3ll'fdl«<<. 380 99 479 306 67 373 Octoberqt. t t ....................... . . JTT# 2 2 4 2 2 4 March . . P h .D .
srrwzt^x , , , , , , . . October17 g^fra :— Journalism :
3n» ^sntfesTiT . . JTT 77 2l 98 67 17 84 M arch Bachelor of3TT5Rrt3R , * . . October JOumalism
18 —. . *TT
Veterinary Science4 1 5 4 1 5 March . . B.V.Sc.
3tl^Sl«l< 10 * , 10 10 10 October. . , , , , • • . . March . . M.V.SC.
1 1 1 , ^ 1 October19 Physical Science:
4-q« < 31TT! f'tif^'tiw . . 2232 248 2,480 2124 231 2355 M arch . . Bachelor of Phyarr^etsR: , , . . October Education
inH x STT'B . . 87 7 94 85 7 92 March .. Master ofsm rhn: , . October Phy. Edu.
4t. . . 79 22 101 78 21 99 March . . B .Ed.. , , , , . , , October
f w . . . 5 5 10 5 5 10 March . . M. PhU.smFTfwT . . October
20 :— O^eT ¥ine SxW.. . 65 34 99 59 33 92 March . . Degree ia
srrwYtsR , , . , October Fine Arts.............................. . . *TT 11 6 17 10 6 16 March M.A.
srr^TteR , ^ . . October21 :— Rural Science:
anr. iT . . . . . ^ r r t '3TNd')«J<
44 13 57 29 10 39 March . . October
. . B.R.S.
22 :— Oriental Studies:f'fT . . . . 5 7 12 5 7 12 March . . Dip. in French
fsratrrr ??r T i^ . . 8 4 12 7 2 9 March . . Dipl, in Pali. . 9 2 11 9 2 11 March . . Dipl, in Eng.
r«' 'i*Hi <0)1 . . JTT# 10 7 17 7 5 12 March . . Dipl, in Rusian^ 3tn. . . ^ 4 4 3 •• 3 March .. Dp.in Co-O?.
Management.f RfhTT W rziR SHJ 11 1 12 6 1 7 M arch . . Dipl, in
GandhianThought.
. . ITT? 32 1 33 14 •• 14 March . . Dipl, in Lahjur Managemsnt.
. . ^ 8 8 6 •• 6 March . . Dipl, in German.
23 »fK5 fWtiTT :— Post Matric Diploma:
. . # 25 25 , , 25 25 March . . Dipl. inB. TechIWftTT ^ . . 739 23 762 142 6 148 March . . Dipl, ia
Management.??T rT*r. f<B . . . ’TPT 163 4 167 81 4 85 March . , Dipl, in M
Phil.24 :— Foreign Languages:
. . ?TT’ 23 8 31 13 5 18 M arch . . Certificate h French.
flldf4Ad W xftnpT 15 17 32 11 15 26 March . . Certifioate in Russian.
flldHe^is ? T . . *rnr 18 4 22 13 4 17 March . . Certificate in German
25 anrr :■— Othei C ^ificate:C[?T. . . XTR 3,37,294 1,60,270 4,97,564 1,55,616 83,112 2,38,728 March . . s .s .c .
Ht. . . . . JTR 2,16,995 88,290 3,05,285 92,255 53,221 1,45,476 March . . H.S.C.
BOHR fw » r wmJT, |W.Source :—Directorate of Education, Govt, of Maharashtra, Pune.
I TABLE No. 5.15 (14*6)
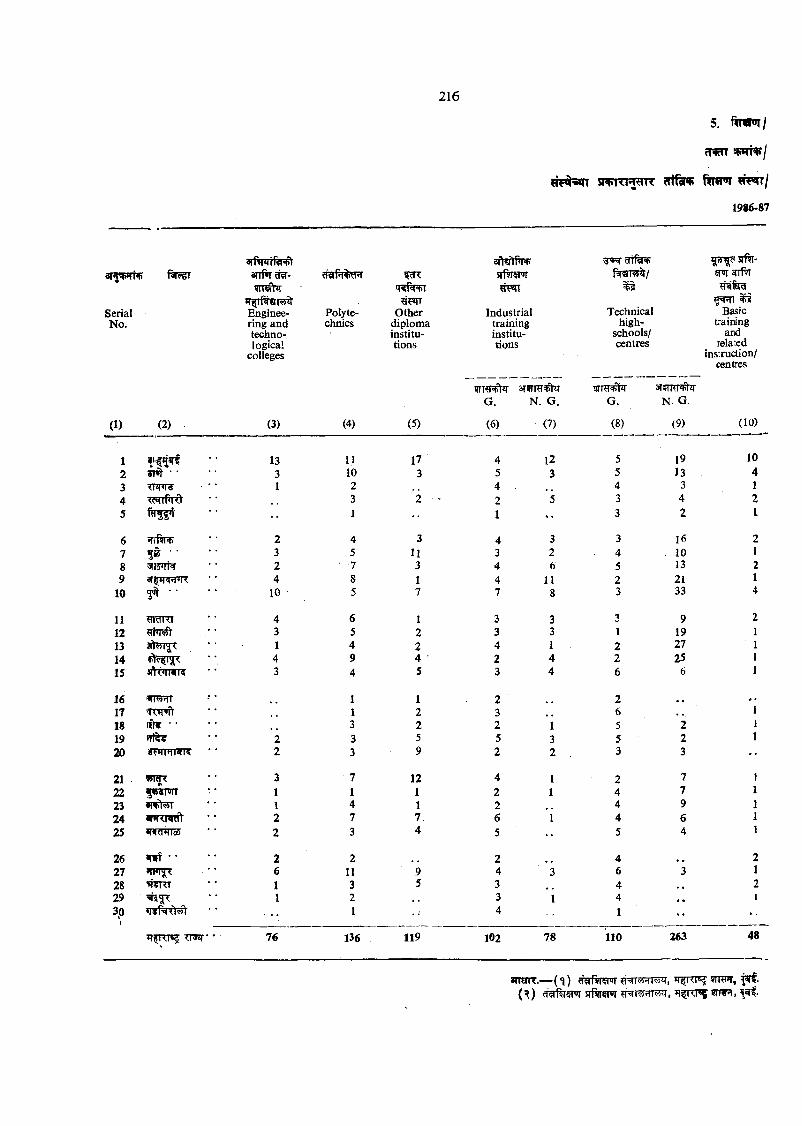
5. rwffO!/
sT v rc H m r ?rrtlw f t n m
1986-87
SerialNo.
(1) (2)
anf^ ?rw-
Engineering and technological
colleges
(3)
Polytechnics
(4)
Otherdiplomainstitutions
(5)
tWT
Industrialtraininginstitutions
ifTT-5T=Ftq- G . N. G.
(6) (7)
fW9T^/
Technicalhigh-
schools/centres
G.
(8)
N. G.
(9)
«p»r
Basictraining
andrelaxd
ins:ruction/centres
( 10)
12345
6789
10
1112131415
1617181920
2122232425
262728 29 3p
i
5T«t • •TT5m¥w f i R t
sf/ftnF; •
!3?nT¥
3^ ■ ■
ncTRT
jiYwi' c
sftrnmR
iTt^
5««'n»ir
q irw cs
f i t • •*n»i^IRRT
»T4rr^Cl
TR?r
1331
23 24
10
43 14 3
76
1,11023 1
45785
6 5 4 9 4
11333
714 7 3
211321
173
3113 17
12245
12259
12117.4
123
326
118
33 14 4
136 119 102 78 110
191334 2
1610132133
9192725
6
104
263 48
3TTOTT.— ( h) yxtfWHr JT, 91m,( ^ ) a f ^ a ^ siftrerT 9mR,
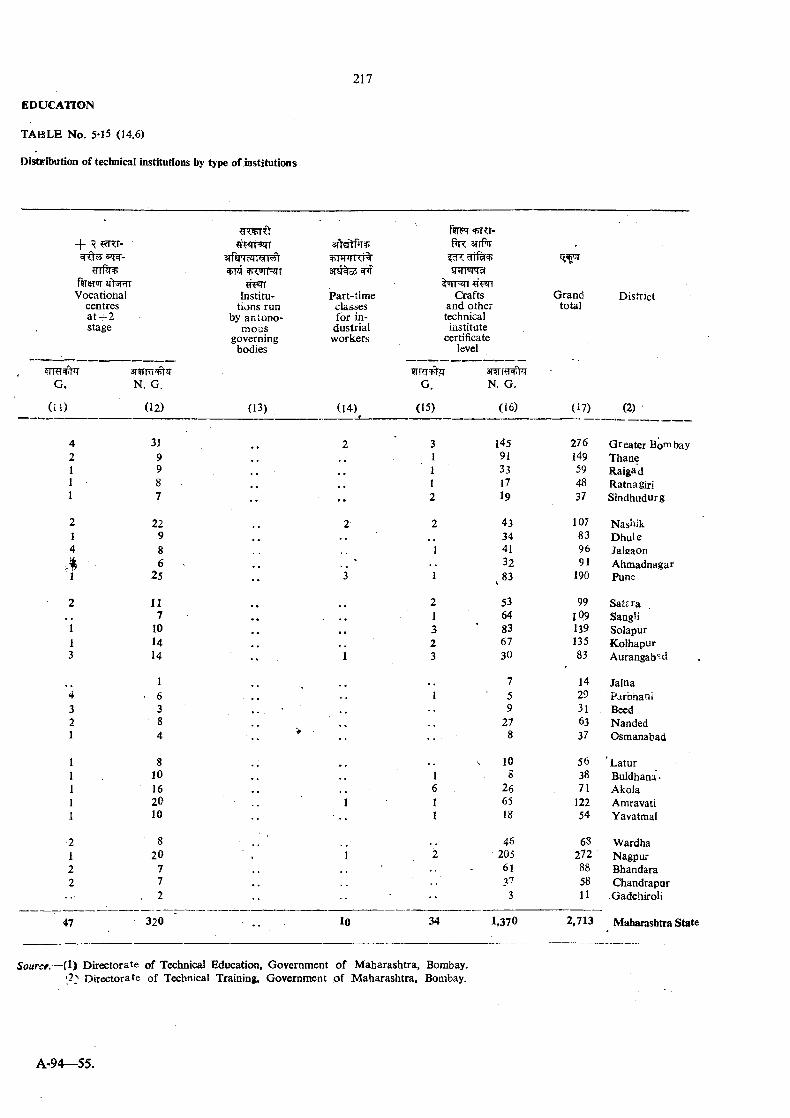
EDUCATION
TA B LE N o. 5-15 (14.6)
Distribution of tectoical institutions by type of institutions
+ R
fSTSTOT y>3RT
?rFrr52Tr 3iT[?frfw srrPT
snrPTTs
Source.—(1) Directorate of Technical Education, Government o f M aharashtra, Bombay.Directorate of Technical Training, Government o f M aharashtra, Bombay.
Vocational centres a t + 2 stage
Institutions run
by antono- m ous
governing bodies
Part-time classes for in
dustrial workers
Crafts and other technical institute
certificate level
Grandtotal
District
5TRT 2TG .
(11)
sr?Tra^ir N. G.
(12) (13) (14)*
5rRr#?T G. N. G.
(15) (16) (17) (2)
4 31 2 3 145 276 Greater Bombay2 9 1 91 149 Thane1 9 , , 1 33 59 Raigad1 8 • • 1 17 48 Ratnagiri1 7
• • • • 2 19 37 Sindhudurg
2 22 2 2 43 107 Nashik1 9 « • 34 83 Dhule4 8 1 41 96 Jaleaon
s 6 32 91 Ahmadnagar1 25 . . . 3 1 83 \ 190 Pune
2 11 2 53 99 Sat£ra. , 7 , , • * 1 64 l09 SangH1 10 . . • • 3 ’ 83 139 Solapur1 14 2 67 135 Kolhapur3 14 •• I 3 30 83 Aurangabad
1 7 14 Jalna4 6 ■ • . I 5 29 Parohani3 3 9 31 Beed2 8 27 63 Nanded1 4 *
•• 8 37 Osmanabad
1 8 10 56 ’ Latur1 10 . , 1 s 38 Buldhana*1 16 . , , , 6 . 26 71 Akola1 20 1 1 65 122 Amravati1 10 1 13 54 Yavatmal
•2 8 46 68 Wardha1 20 1 2 ■ 205 272 Nagpur2 7 61 88 Bhandara2 7 37 58 Chandrapur
. 2 3 11 GadchiroU
47 320 10 34 1,370 2,713 Maharashtra Stati
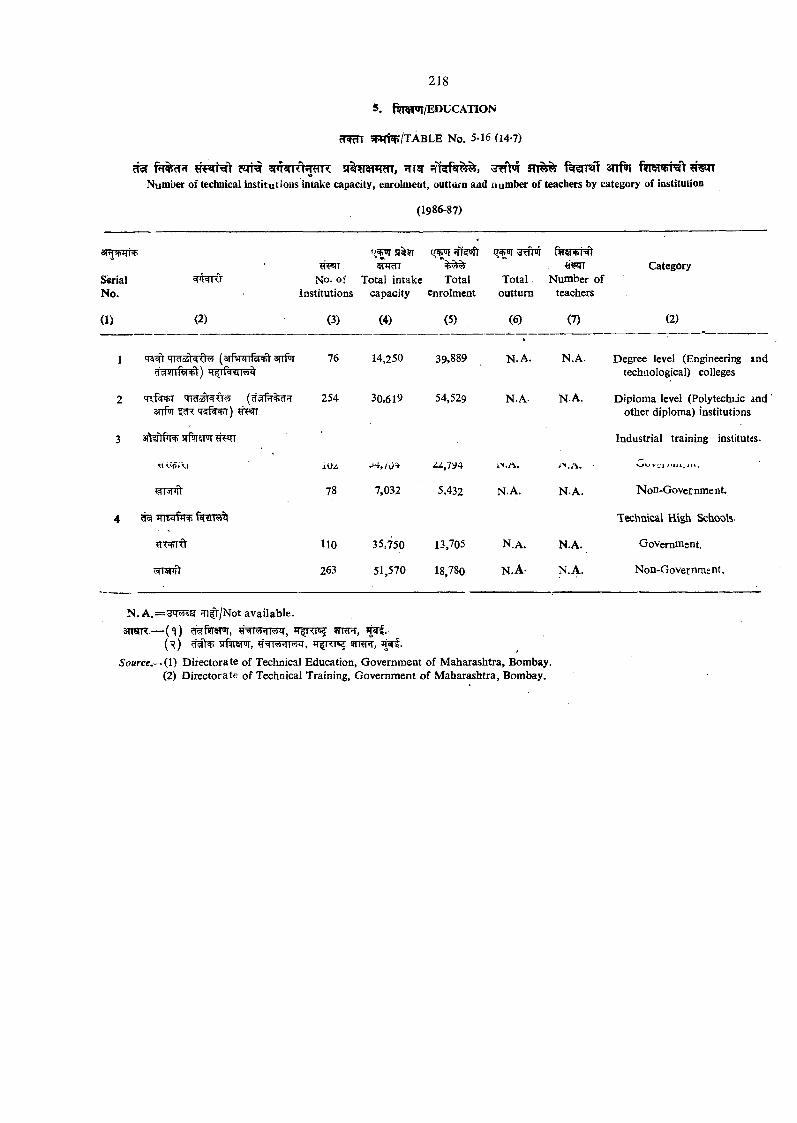
^ fq%cT?T 5i%?rewm, snf^iNumber of technical institutions intake capacity, enroiment, outtiirn and number of teachers by category of institution
(1986-87)
sfw^jfrRi
SerialNo.
?i?«rr No. of
InstitutionsTotal intake
capacityTotal
enrolment
5 ? ^ ^rflW
Totaloutturn
r?r?irFr^
Number of teachers
Category
(1) (2) (3) (4) (5) (6) (7) (2)
1 arrPif 76 14,250 39,889
*
n . a . N.A. Degree level (Engineering and technological) colleges
2 'nf^+r qidoii'^w snfT 4<f^+l) ?iFTT
254 30,619 54,529 N.A. N.A. Diploma level (Polytechiic and other diploma) institutions.
3 sfNrtfrRT s ife m * Industrial training institutes.
\^r<i jlU, -'‘+,7u4 ^^,794 iN.A. 1>.A. ■ V_IO Vii
78 7,032 5,432 N.A. N.A. N on-Gover nme nt.
4 Technical High Schools
llO 35,750 13,705 N.a . N.A. Government.
^ sn f t 263 51,570 18,780 N.A- N .A . Non-Government.
N. A.=^3W®£r !Tl^/Not available.
3nsR.— ('^) 9mnr,(^ ) afW ^r, 9rRnr,
Source.— il) D irecto rate of Technical Education, Government of M aharashtra, Bombay, (2) D irec to ra te of Technical Training, Government o f M aharashtra, Bombay.
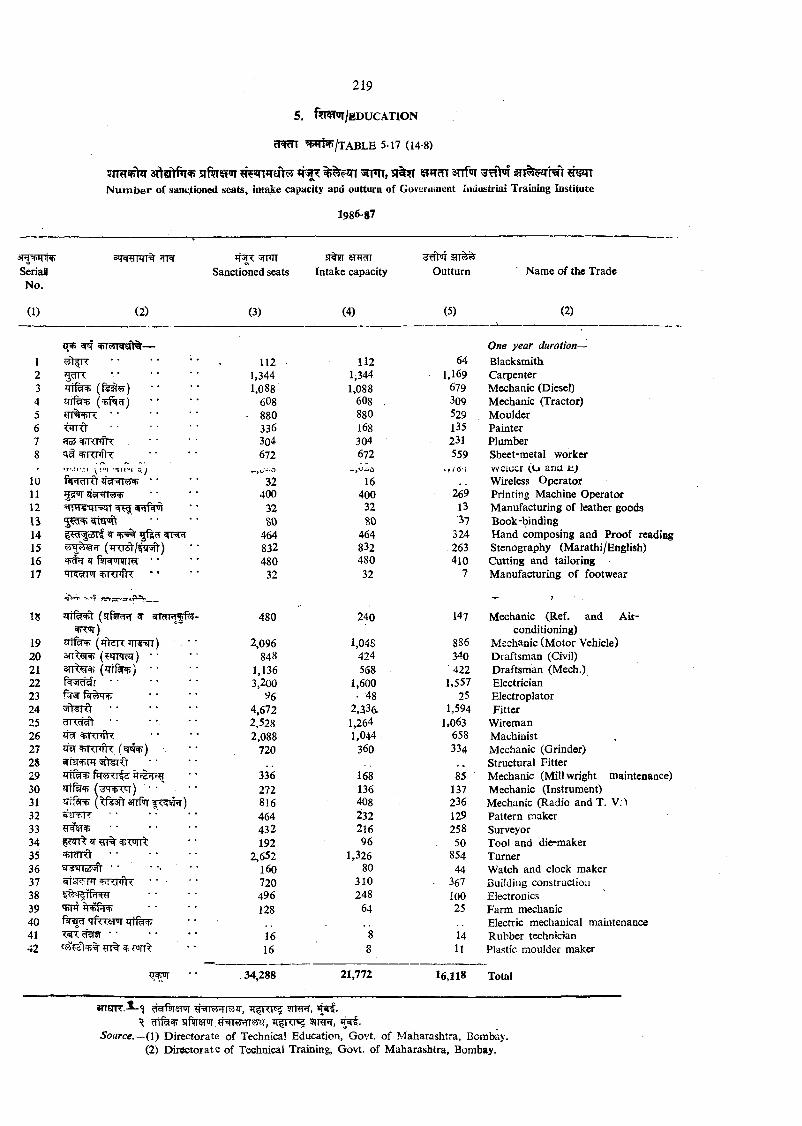
219
5. ftr^/EDUCATlON
cR m ^Pri^/TA BLE 5.17 (14-8)
3 ^ ' t f n ^ sif^ss^r * r ^ % ^? in «nm , r %?t ^ * rm srrf’JiN u m b e r of sanc^tioned seats, idtajke capacity and outturn of Guveruoieiit ladustriai Training Institute
1986-87
SeriaBNo.
5TFIT Sanctioned seats
Sf%3r Intake capacity Outturn Name of the Trade
(1) (2) (3) (4) (5) (2)
One year duration—1 ?5tfR 112 112 64 Blacksmith2 1,344 1,344 1,169 Carpenter3 1,088 1,088 679 Mechanic (Diesel)4 608 608 . 309 Mechanic (Tractor)5 frr%'f>r<:................................. - 880 880 529 Moulder6 tfrrft 336 168 135 Painter7 ^ =FRnflx 3o4 304 231 Plumber8 672 672 559 Sheet-metal worker
. ,,0. 0 x,JOr weiuer (u ana ti)10 fVTWRt * ' 32 16 Wireless Operator11 400 400 269 Printing Machine Operator12 anrfk^ 32 32 13 Manufacturing of leather goodsn SO 80 •37 Book-binding14 < 5{i'^ ^fs;^ 464 464 324 H and composing and Proof reading15 832 832 263 Stenography (Marathi/English)16 ^ ' * 480 480 410 Cutting and tailoring17 TR^TW 32 32 7 Manufacturing of footwear
■oVt -rrr-T J5rr;3: ST'iT' __ 'T’ 7 ■ .
18 ( srf9rd;T er P^- 480 240 147 Mechanic (Ref. and Air-conditioning)
19 lfc4=h (thZR >TTTm) . * * 2,096 1,048 886 Mechanic (M otor Vehicle)20 848 424 340 Draftsman (Civil)21 ( q t ^ ) • • 1,136 568 422 Draftsman (Mech.)22 3,200 1,600 1,557 Electrician23 f?5T ■ ' ^6 • 48 25 Electroplator24 5ft¥Rt •• 4,672 2,33d 1,594 Fitter25 2,528 1,264 1,063 Wireman26 ^nxnftx 2,088 1,044 658 Machinist27 zTW FRTifh: (snl^) 720 360 334 Mechanic (Grinder)2S Structural Fitter29 336 168 85 Mechanic (Mill wright maintenance)30 5Tff^ ( • • • • 272 136 137 Mechanic (Instrument)31 (^fesft arrfw 816 408 236 Mechanic (Radio and T. V:>32 «tl7WT • • • • * • 464 232 129 Pattern maker33 • ■ ’ • • • 432 216 258 Surveyor34 192 96 50 Tool and die-maker35 ^ i c n " < l ................................. 2,652 1,326 854 Turner36 160 80 44 Watch and clock maker37 ^nTXPftr * ■ ■ 720 310 367 Builditig construction38 496 248 100 Electronics39 'HHT 128 64 25 Farm mechanic40 ’Tfr^snir Electric mechanical maintenance41 • • • • • • 16 *8 14 Rubber technician42 16 8 n Plastic moulder maker
34,288 21,772 16,118 Total
s m n r .^ 'i ?Nrr^f^?T, 5mr?r,^ 5niFT,
Source.~ (\) Directorate of Technical Education, Govt, of Maharashtra, Bombay. (2) D iractorate of Technical Training, Govt, of Maharashtra, Bombay.
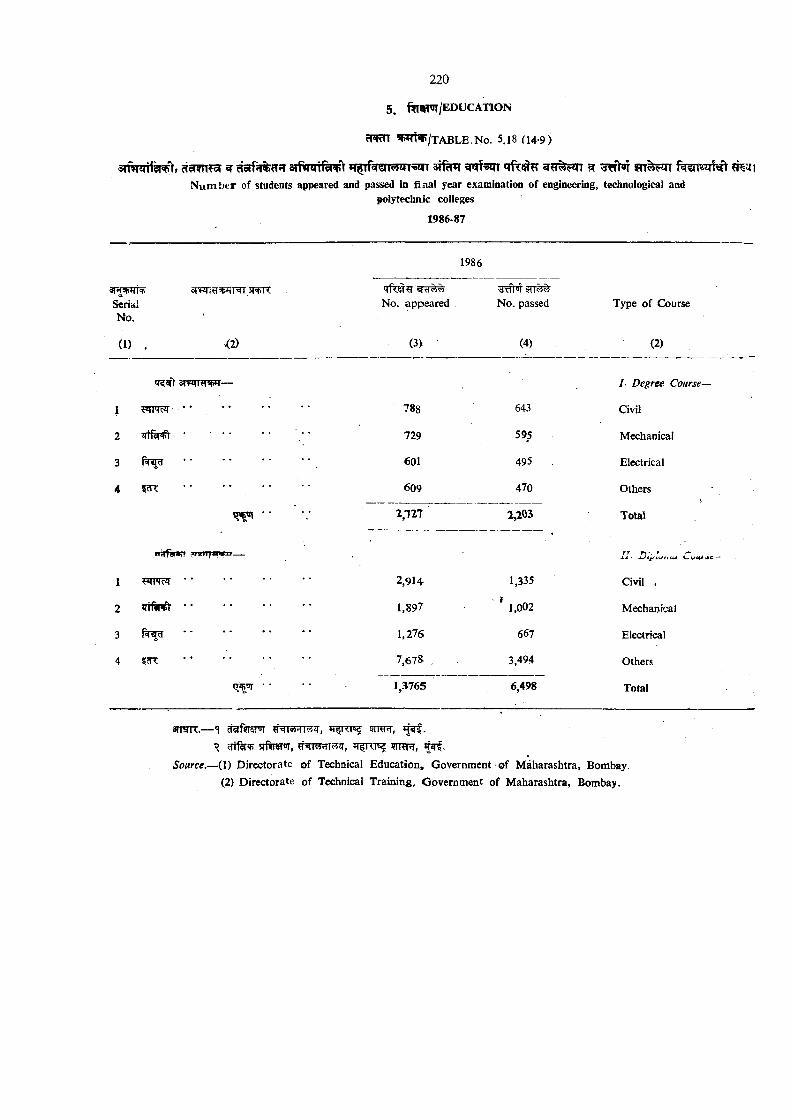
^ a r f k q t f ^ 't s r f ^ a ra f^ ri q rfr^H g g ^ F n ^ ^rfW r frT%5Jrr f k w o M t ?n§jfiN u m b e r of students appeared and passed in final year examination of engineering, technological and
polytechnic colleges
1986-87
1986
srjtt
SerialNo.
Tfksr^No. appeared
^rTt”T f iT ^ No. passed Type of Course
(1) . <2) (3) ' (4) (2)
aTFirrawtr— /• Degree Course—
1 • ................................ 788 643 Civil
2 i r t f ^ * • • 729 595 Mechanical
3 r = i^ < d ................................ 601 495 Electrical
4 5cR • ' " ‘ ■ 609 470 Others
W ' ’ 1,111 2,203 Tota\
?T*TiT*T« — II ' Hiynjniu v t/u<oe —
1 ............................................... 2,914 1,335 Civil ,
2 ............................................... 1,897 * 1,002 Mechanical
3 1,276 667 Electrical
4 id< 7,678 , 3,494 Others
1,3765 6,498 Total
afran.— *1 crafsraETiT <NfT5$m zr, ^mnr,^ cTtf ip srftreror, ^ r^ T e 5rnrr,
Source.— (X) D irecto rate of Technical Education, Government of M aharashtra, Bombay. (2) D irectorate of Technical Training, Government of M aharashtra, Bombay.
^•<1 ^ 5 ? ^ ^ 6-1 ,Data on printing presses and p^iodicals books?in% ^ Tffq[,'7;or JrT?f«rsft andpenodicafspublished and their classification accord-
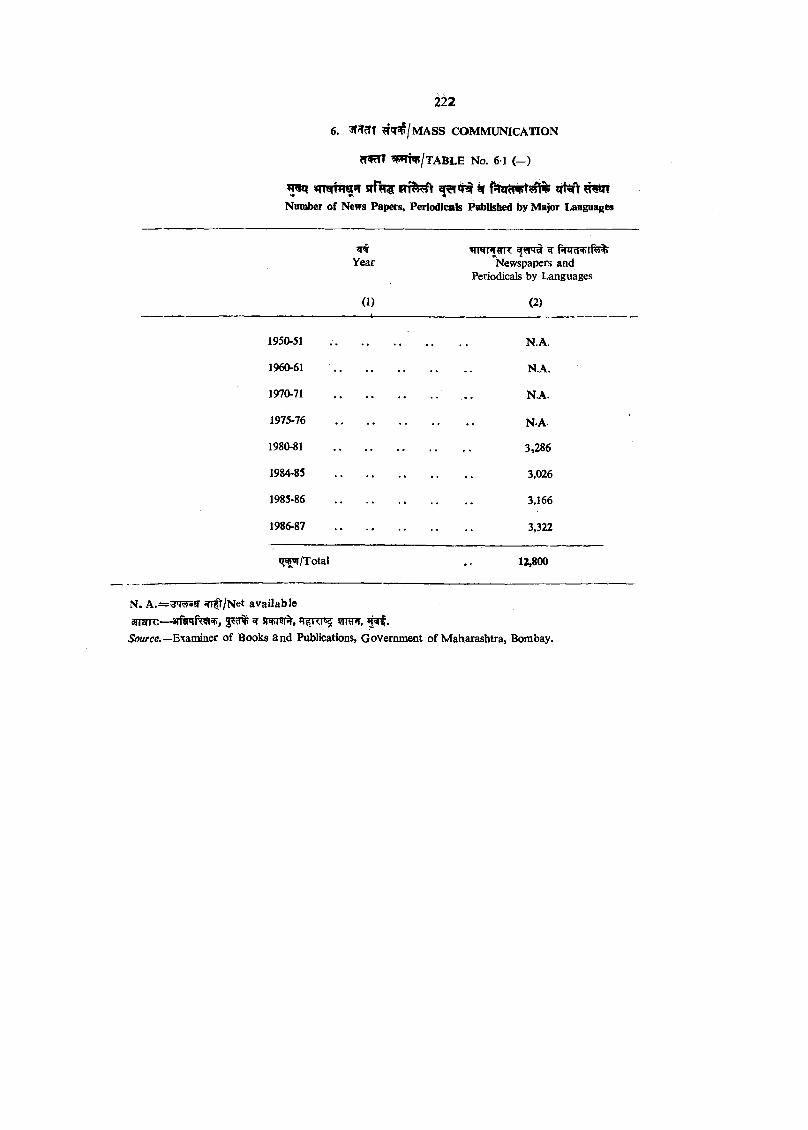
6. ^q^/M A SS COMMUNICATION
?TfcTT ?PTt¥/TABLE No. 61 ( - )
5 r l% f n ^ 'V ^Number of News Pap^s, Periodicals Published by Major Languages
irPTPTtTR ^Year Newspapers and
Periodicals by Languages
(1) (2)
1950-51
1960-61
1970-71
1975-76
1980-81
1984-85
1985-86
1986-87
N.A.
N.A.
N.A.
N.A.
3,286
3,026
3,166
3,322
12,800
N. A .= = 3 ^ s r ifl^ /N et availab le
SloMrce.—Examiaer of Books an d Publications, Government o f M aharashtra, Bombay.
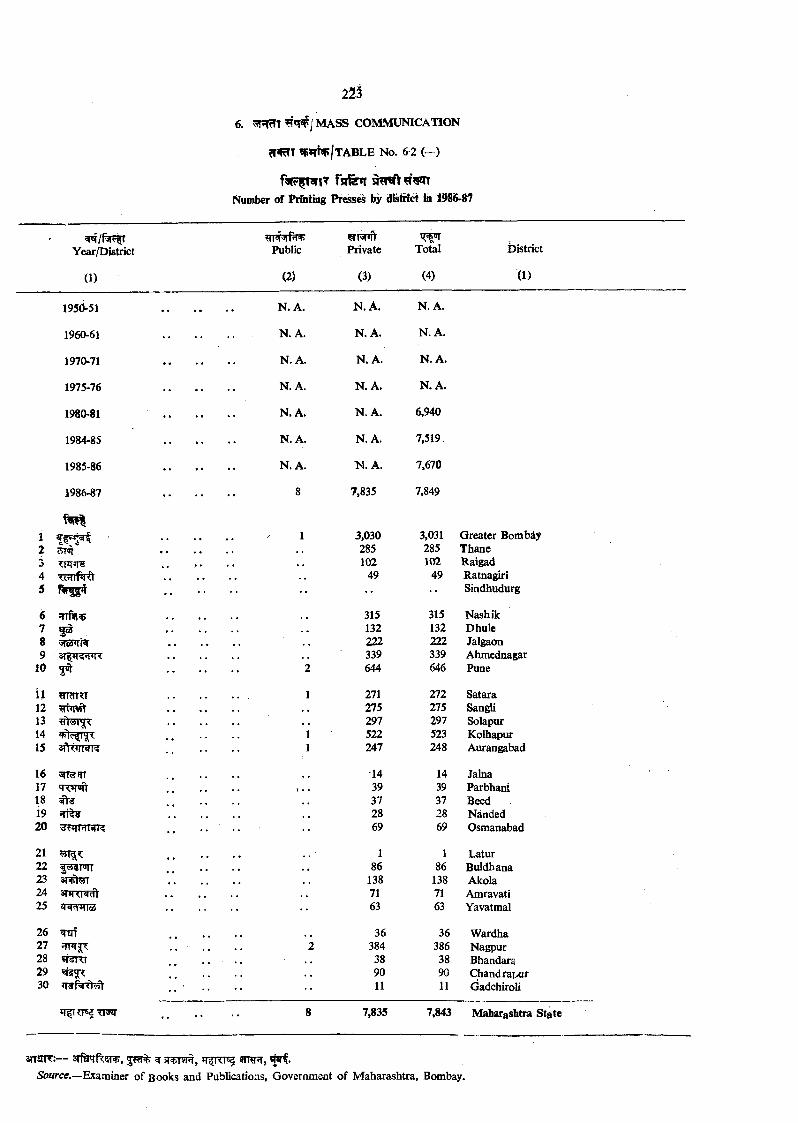
Year/District
(1)
6. M ASS COMMUNICATION
JfiRTT ?pqft^|TA B LE No. 6-2 (—)
fs ifenNumber of Printing Presses by district in 1986-8'?
Public
(2)
WT3T*f|'Private Total District
0 ) (4) (1)
N . A. N. A.
N. A. N. A.
N. A. N. A.
N. A. N. A.
N. A. 6,940
N. A. 7,519
N . A. 7,670
7,835 7,849
3,030 3,031 Greater Bombdy285 285 Thane102 102 Raigad
49 49 Ratnagiri. . Sindhudurg
315 315 Nash Ik132 132 Dhule222 222 Jalgaon339 339 Ahmednagar644 646 Pune
271 272 Satara275 275 Sangli297 297 Solapur522 523 Kolhapur247 248 Aurangabad
14 14 Jalna39 39 Parbhani37 37 Beed28 28 Nanded69 69 Osmanabad
1 1 Latur86 86 Buldhana
138 138 Akola71 71 Amravati63 63 Yavatmal
36 36 Wardha384 386 Nagpur
38 38 Bhandara90 90 Chandrai>ar11 11 Gadchiroli
195d-51
1960-61
1970-71
1975-76
1980-81
1984-85
1985-86
1986-87
1 •2J TFTJTS45 !% ^
67 ^8 !3i0?riw9 3TfiTcr?nR
10 5^^
11 ?ITcTT?I12131415 aftrniwra
16 ^ f n1718 ^19 JTf^20 3TWnTRT?
21 551^^22 f ^ m r2324 apTTI^25
2627282930
F»iT
N.
N.
N.
N.
N.
N.
N.
7,835 7,843 Maharashtra State
anm r:— 3rflrrfT5R), jrt% ^ st 5 r , wrtt,5o«rctf.—Examiner of Books and Publications, Government of M aharashtra, Bombay.
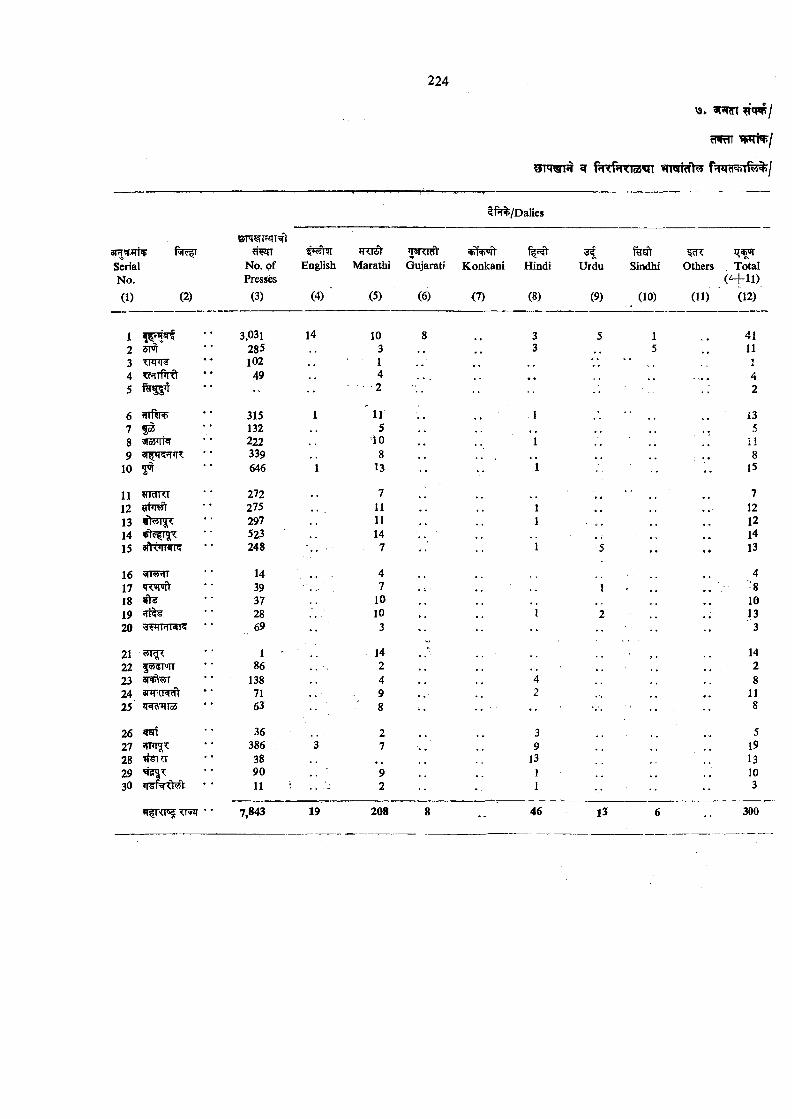
fF T hi/
tf^I%/Dalies
@TWi zrr=it3fq?f.»rkSerial No. of EnglishNo. Presses
(1) (2) (3) (4) '
1 3,03i 142 6I«I 2853 1024 TMrPTt)' 49 , ,5 1^51^ •'
6 *iiFki+ 315 17 1328 «lo4Mi=l 2229 339
10 5^ 646 1
11 27212 275131415 «A<<IMI<J
1617 'RW’ft18 ^19 JTits20
21 ^2223 3Rj\^r24 anrCRcft25
26 TOi27282930
297523248
143937 28 69
186
1387163
3638638 90 11
JTTTStMarathi
(5)
irsRRitGujarati
(6)
vN)”ftKonkani
(7)
Hindi
(8)
Urdu
(9)
103 14 2
115
108
13
7111114
7
47
10 10
3
1424 98
27
92
Sindhi Others Total(^+ 11)
(10) (11) (12)
1 415 • ' 11
1
1
4 2
135
i i8
15
7 12 1214 13
4-81013 3
14 28
11
51913103
7,843 19 208 46 13 300
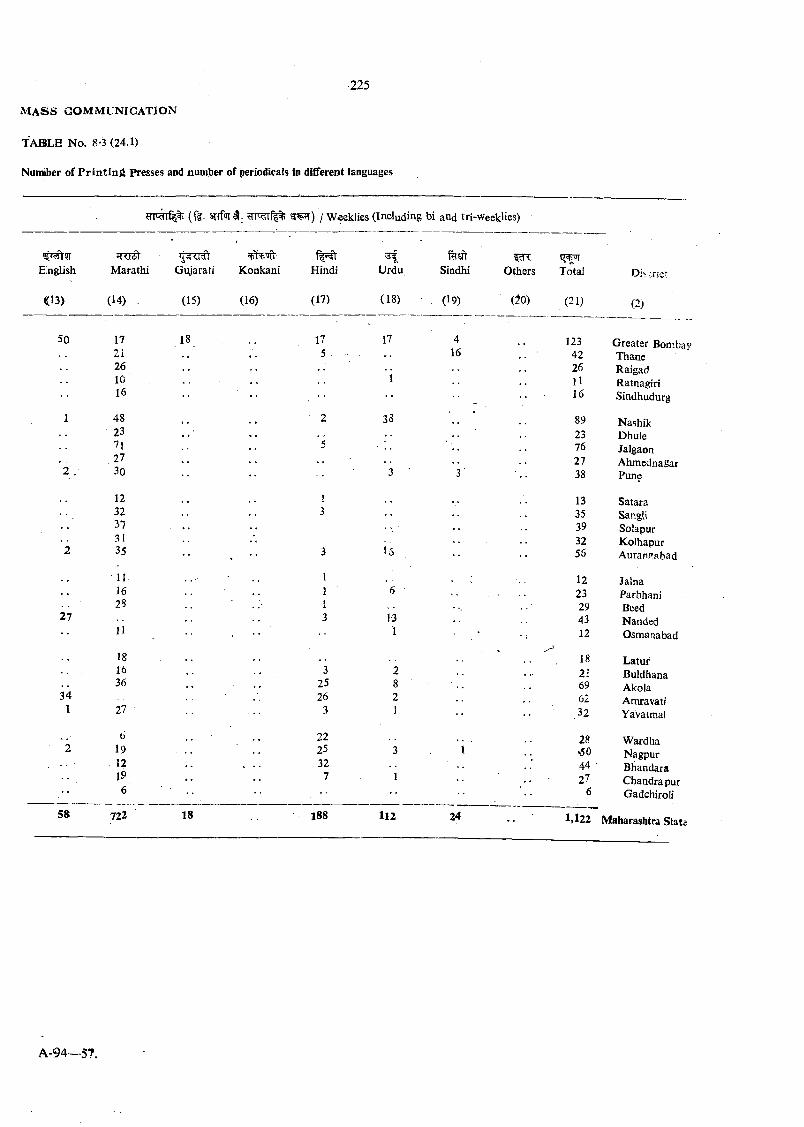
Numlber of P r in t in g Presses and number of periodicals in different languages
{%■ arrfoT ^ . sr^^r) / W ^klies (Including bi and tri-weeklies)
English
<(13)
50
2 .
27
341
Marathi
(U ) .
58
17 21 26 10 16
4823712730
1232373135
11 1628
11
18 1636
27
61912 196
722
'OGujarati Konkani
(15) (16)
18
Hindi
(17)
175
32526
3
222532
7
Urdu
(18)
17
38
1-31
Sindhi
09)
Others
(^0)
416
Total
(21)
;r!c^
(2)
123 Greater Bomb;42 Thane26 Raigadn Ratnagiri16 Sindhudurg
89 Nashik23 Dhule76 Jalgaon27 Ahmednagar38 Pune
13 Satara35 Sar.gli39 Solapur32 Kolhapur56 Aurangabad
12 Jalna23 Parbhani29 Beed43 Nanded12 Osmanabad
18 Latur2 i Buldhana69 Akola62 Amravati
.32 Yavatmaf
28 Wardha»50 Nagpur44 • Bhandara27 Chandrapur
6 Gadchiroli
18 188 112 24 1.122 Maharashtra State
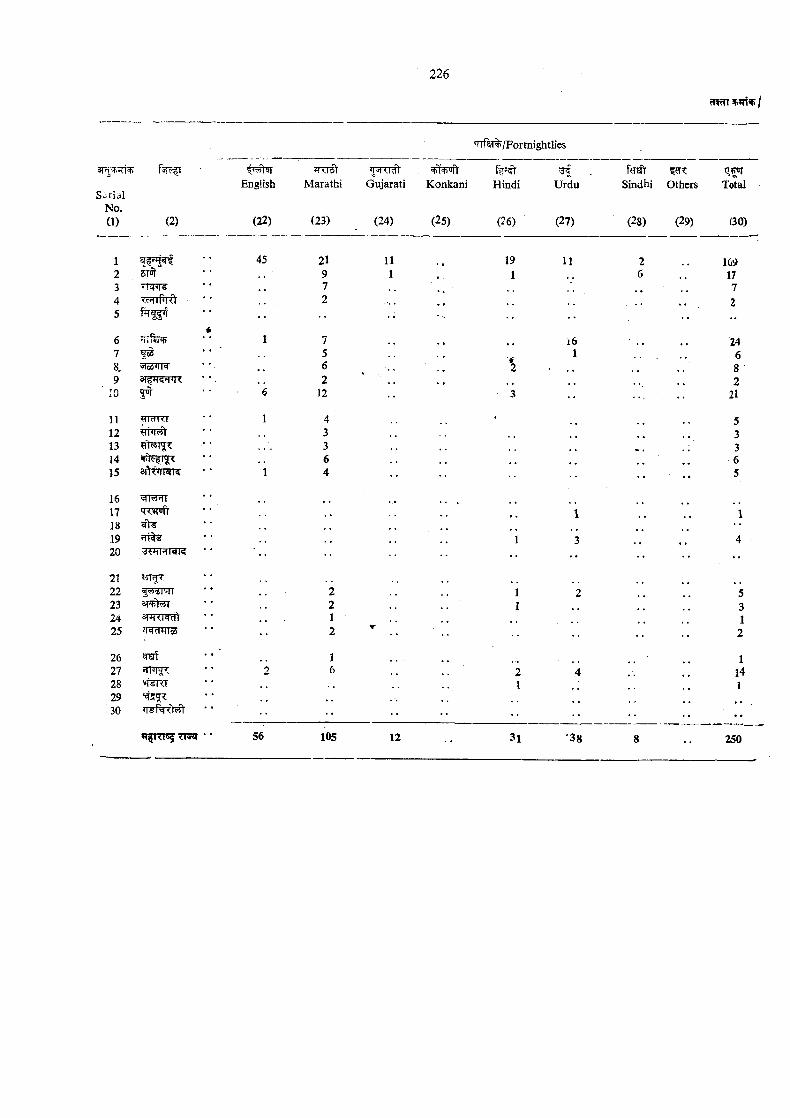
SerialNo.0 ) (2)
English
(22)
JTTTStMarathi
(25)
/For tnightlles
Gujarati
(24)
Konkani
(25)
Hindi
(^6)
Urdu
(27)
fcRSindhi Others Total
(28) (29) (30)
5MTnnr?
45 2197
111
191
11 1C917
4 '(-r’llPlO 2 25 f w *• •• •• •• •• ••
6 1 7 16 247 I® ' * ' , 5 . 1 68. 6 ' . . *2 , 89 2 W • , , 2
10 6 12 3 ■■ 21
It Wrfr<l 1 4 . 512 3 313 3 . . . . 314 6 615 sftTTrar? 1 4 •V •• ■ *. 5
16 WIBTTT17 ’TWit . . 1 11819 1 3 420 ;3FTRT^ •• •• •• •• •• ••
2122 2 1 2 523 Sl+lwi 2 I 324 3!J1'<7c(dl 0 • 1 125 <c=td'Hla5 •• 2 2
26 1 127 2 6 2 4 1428 1 12930 isp <1«1 ‘ * •• ••
56 105 12 •• 31 •38 8 250
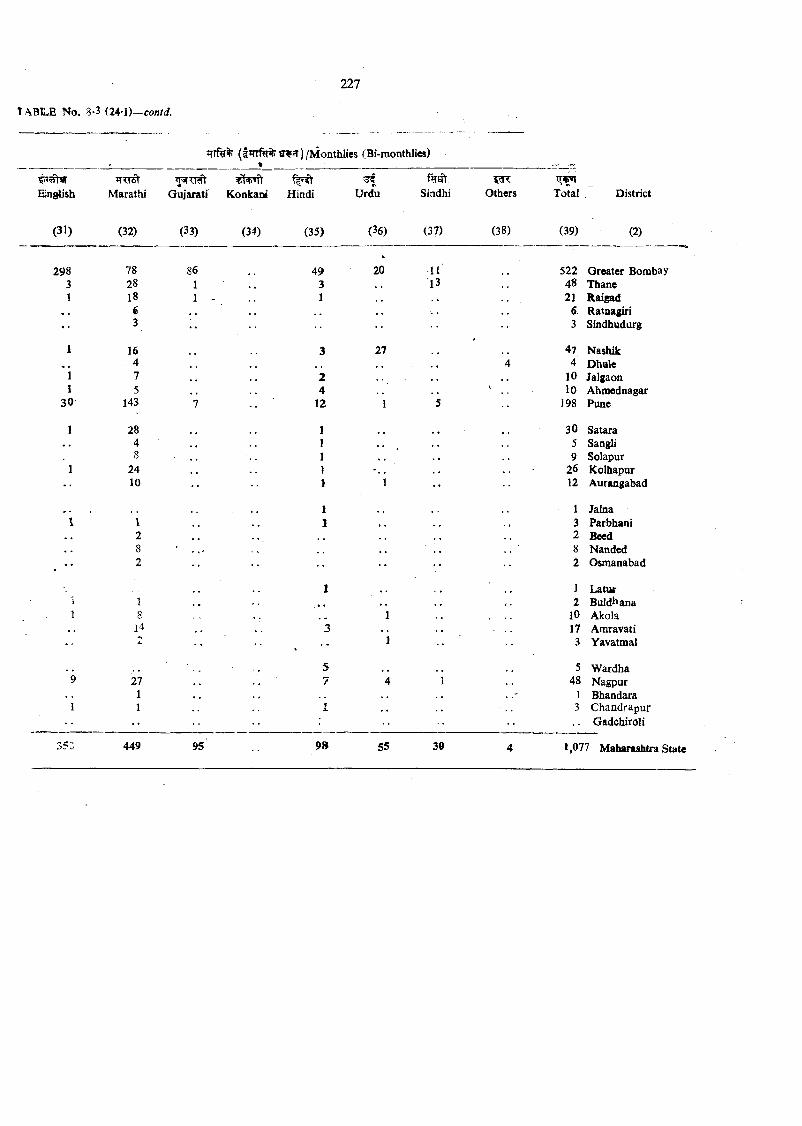
/Monthlies (Bi-monthlies)
fr4 tEnglish Marathi Gujarati Konkani Hindi Urdu Sindhi Others Total . District
(31) (32) (33) (34) (35) (36) (37) (38) (39) (2)
298 78 86 49 20 H 522 Qreater Bombay3 28 1 3 13 48 Thane1 18 1 ~ 1 21 Raigad
6 6. Ratoagiri•• 3 •• 3 Sindhudurg
1 16 3 27 47 Nashik,, 4 .. # • 4 4 Dhule
1 7 2 10 Jalgaon1 5 4 \ lO Ahmednagar
30 143 7 12 1 5 198 Pune
1 28 1 . . 30 Satara4 1 5 Saogli8 1 9 Solapur
1 24 1 26 Kolhapur*• 10 •• 1 1 •• 12 Aurangabad
. . i .. 1 Jalna1 \ 1 3 Parbhani
2 .. 2 Beed8 ■ 8 Handed2 •• •• •• 2 Osmanabad
1 1 Laturi 1 .. , ; , , 2 Buldhana1 8 , , 1 10 Akola
J4 3 17 Amravati- •• %
1 •• 3 Yavatmal
. . 5 5 W ardha9 27 7 4 1 48 Nagpur
1 .. 1 Bhandara1 1 1 3 C handrapur
•• Gadchiroli
35C. 449 95 98 55 30 4 1,077 Maharashtra State
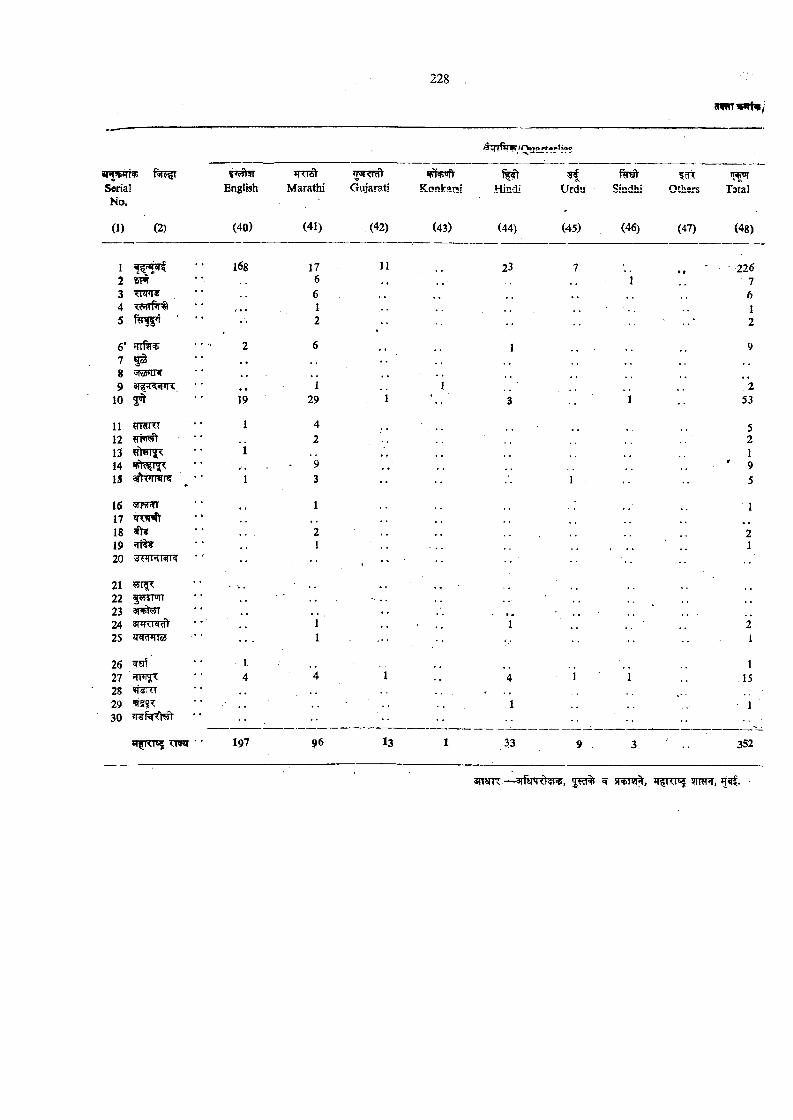
SerialNo.
(1) (2)
English
(40)
*RI^Marathi
(41)
Gujarati
(42)
K onkaai
(43)
Hindi
(44)
Urdu
(45)
m
(46)
5 ^Others
(47)
Tatal
(48)
1 168 17 112 sw 63 ^w<»« 64 . . . 15 ' •• 2
6’ 2 6 17 5 38 5>faimw , ,
9 at^^i^Rnrt . . i10 5^ 19 29 i 3
11 ^rrsRT 1 412 fiHW) 213 i • •14 . 9 * ,
13 a r h k i ^ • 1 3 • •
16 11718 5ft? 219 120 WTRIWT5r • • . •• ••
21 »l^<2223 ST'fil'rfl . .
24 1 125 1
26 127 4 "4 1 428 . .
29 , , 130
197 96 13 1 33
23 2267612
9
253
52195
2-i
115
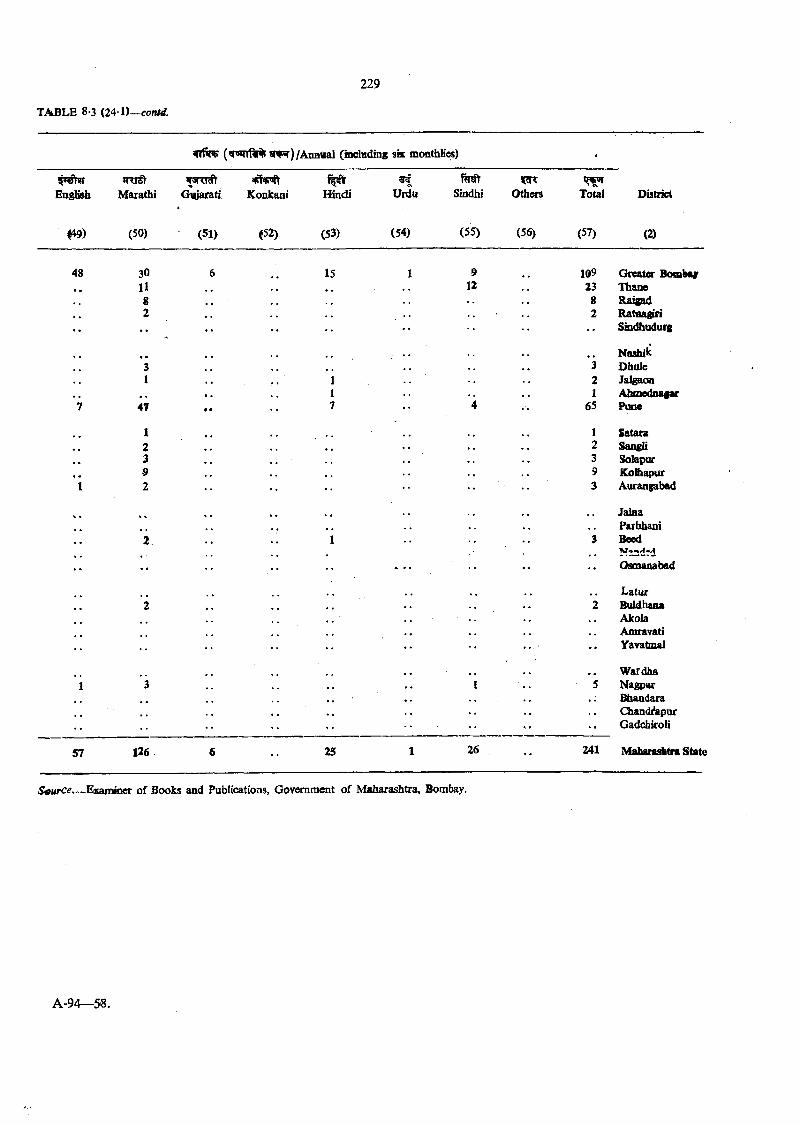
f l f w (viaiTfW /Annual Cmcluding sk monthHes) t
English Marathi Gujarati Konkani Hindi Urdu Sindhi Othm Total Distoict
0 9 ) (50) (51) (52) (53) (54) (55) (56) (57) (2)
4S 30 6 . . 15 1 9 109 Greater Bombajr11 • « • • • • 12 23 Thane8 • • • • • . 8 R a i ^
, * 2 .. 2 Ratnagiri•• •• .. .. •• Sindhodurg
Nashik3 .. *3 Dbule1 1 2 Ja^aoQ
, , . . 1 .. 1 Ahosednagar7 47 . . .. 7 4 65 Puoe
1 1 Satara2 2 Sangli3 3 Solapur9 9 KoBiapur
I 2 3 Aurangabad
JalaaParbhani
3 Heed
•• Osraaaabed
Latur2 Buldhaoa
, , AkolaAmravatiYavataal
Wardha5 Nagpur
BhandaraChandi*apur
•• Gadchiroli
57 126 6 .. 25 1 26 •• 241 MafaaraiAtni State
Source__EsanMier o f Books and Publications, Government o f Maharashtra, Bombay.
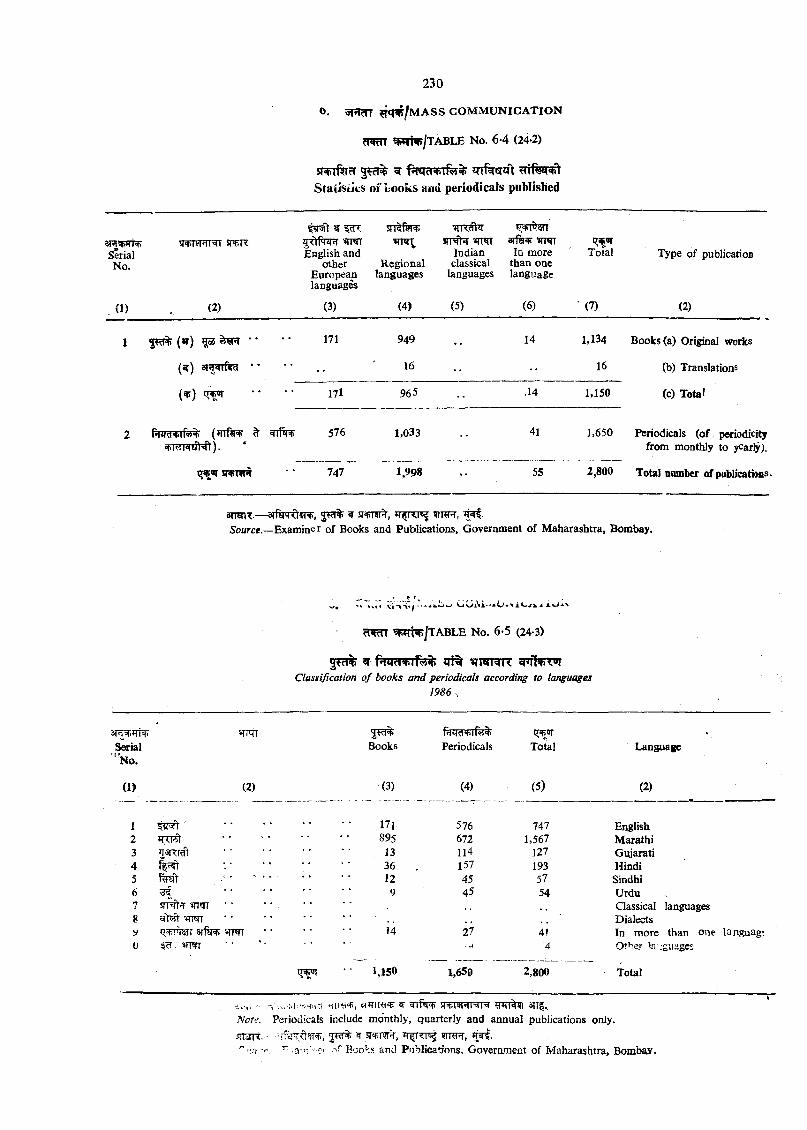
swrftTcT 3 ^ ^ fvTcriFT%%Staiisiics of Looks aud periodicals publislied
SerialNo.
. 0 )
snFTST TRT 5R?n:
<2)
'I' 5iT^r«'^ 5< tfw T English and
crther Regional European languages languages
(3) (4)
jrr# T «rrai Indian classical
languages
(5)
arfa^ wrtn In more
than one language
(6)
t> rnTotal Type of publication
' (7) (2)
1 5 ^ ^ ' («r) ^ ^ ■ ‘ 171 949 14 1,134 Books (a) Original worics
(ir) * * ' 16 •• 16 (b) Translations
( ^ ) l i w 17l 965 .14 1,150 (c) Total
2 Pt4d+ffo^> (^TTRRi ^ 576 1,033 41 1,650 Periodicals (of pwiodicityfrom monthly to yearly).
SRilfTH 747 1,998 •• 55 2,800 Total number of poblicatiims.
•MIHIT—-arfk'T^ST^i W SRf)T?r%, 5Tl€»f,Source. —Examiner of Books and Publications, Government of Maharashtra, Bombay.
?5?TT^/TABLE No. 6-5 (24-3)
^ qf% ^i«rrg[TT srfN fT arClassification o f books and periodicals according to languages
1986 ,
^rqrSerial Books Periodicals Total Language'N o .
(1) (2) (3) (4) (5) (2)
I W sft ' * ■ ................................ 171 576 747 English2 .............................. 895 672 1,567 Marathi3 irvRRft .............................. 13 114 127 Gujarati4 f^«ir • " • • 36 157 193 Hindi5 W - ; 12 45 57 Sindhi6 ^ • • ................................ 9 45 54 Urdu1 Qassical languages8 • Dialectsy q+!M*arT «rRT . . . . J4 27 4! In more than one language
;,o ’■4 4 Other Inuguages
* • 1,150 1,650 2,800 Total
k
Nof-.\ Periodicals include monthly, quarterly and annual publications only. m u t - 9IT?R," ‘if r Books and PublicadFons, Government of Maharashtra, Bombay.
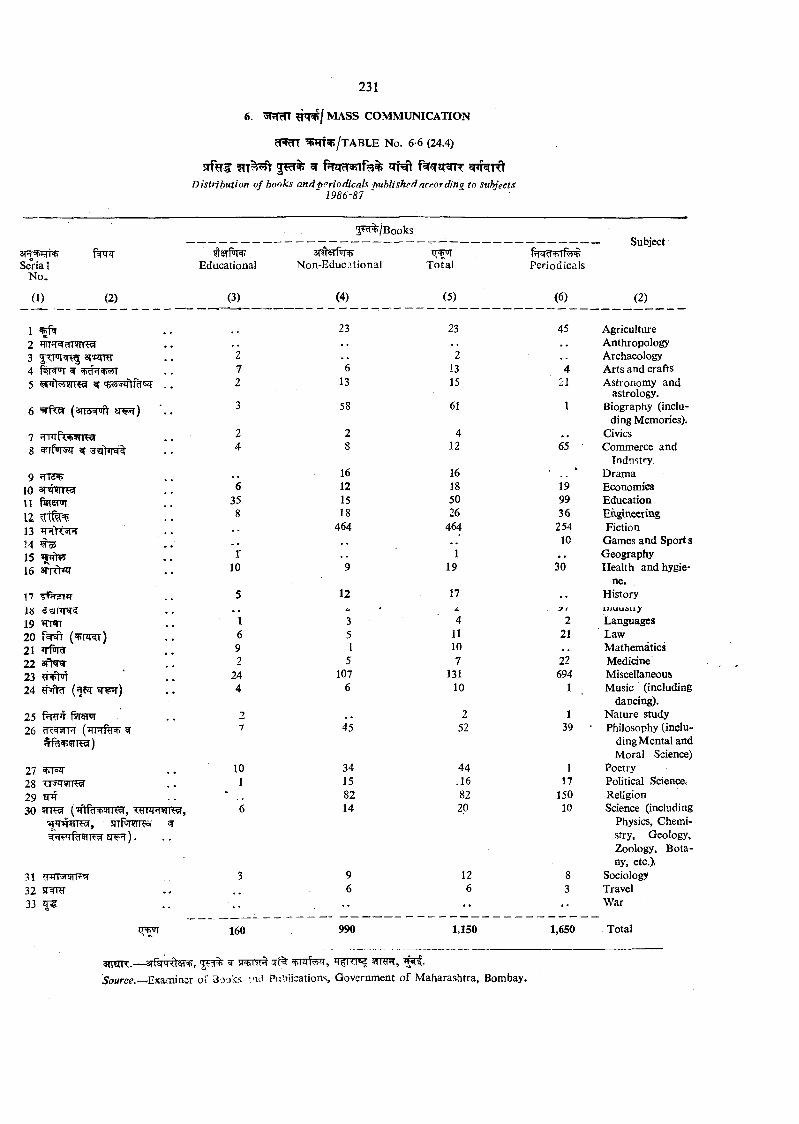
6. ^ ^ 1 m a s s c o m m u n i c a t i o n
c T ^ ^ ^ /T A B L E No. 6-6 (24.4)
5 ^ % ^ s rH tDistribution of books and periodicals f^uhlished
1986-87 ^ncrording to subjects
Educational
(3)
'i^ ^ /B o o k s
Non-Educ?.tional
(4)
iT i/rT otal
(5)
Periodicals
(6)
- Subject
(2)
23 23 45 AgricultureAnthropology
2 2 Archaeology7 6 13 4 Arts and crafts2 13 15 21 Astronomy and
astrology.3 58 61 1 Biography (inclu
ding Memories).2 2 4 .. Civics4 8 12 65 ■ Commerce and
Tndnstry., , 16 16 * Dram a6 12 18 19 Economics
35 15 50 99 Education8 18 26 36 Eivgitveetitig
464 464 254 Fiction• • , , 10 Games and Sport s1 1 Geography
10 9 19 30 Health and hygiene.
5 12 17 History* , >/ j-iiuuauy
1 3 4 2 Languages6 5 11 21 Law9 1 10 ,. Mathematics2 5 7 22 Medicine.
24 107 131 694 Miscellaneous4 6 10 1 Music (including
dancing).2 . , 2 1 N ature study7 45 52 39 ‘ Philosophy (inclu
ding M ental and Moral Science)
10 34 44 1 Poetry1 15 .16 17 Political Science,
•” 82 82 150 Religion6 14 20 10 Science (including
Physics, Chemistry, Geology, Zoology, Botany, etc.).
3 9 12 8 Sociology.. 6 6 3 Travel
•• •• •• War
160 990 1,150 1,650 Total
3TT^PqWSerial
No..
(1) (2)
1234 ^5 w^ftvTwr^ ^ '*'fi^'4lfir^
6 (s<i6qun £r¥*r)
7 T m fk v w sr8 ^
9 TT2^10 3r4i?nw11U C ttli^13 ^jfrtsnr1 4 ^
1516 3Trd»ir
17 ?%?n?T18 '3 « im ?19 «TWT20 (^^nr^)21 »rPfRr22 sfKsr2324
25 f % ’t ftrerr26 cTc^wpr (m^rftr^ ^
^ ■ f^ 5 n ^ )
2728 TI FWT^29 EHT30 ?n^
^^#5TT^, SfTtofT^'• s r ^ ) .
gj75(XT.— srfsPT tt^, ^ Sr«r?T ^rrqtsPT, 5 n ^ , #arf.5'oMrce.—Exaraiasr of Sooks I'ld Pii’Mications, Government o f Maharashtra, Bombay.

V9 . n- ^ 5TT?r?TT^, JTH'T'TTfe^T,^ ^Fsr^ft zrt^ft = 5 r r ^ f ^ ^
^ JTt=^ 3 n ^ w^% TT^r^ssTT3 T T ^ ^ STTfw 'TfT^^tWT f ^ F T r ’IT ^
5TT«rfiT^ STrd^q- frT f^ ^ > T c f ^TRTf^^S: 3TT|.
7.1. Information is given in the tables on number of hospitals and dispensaries of State and Central Government Institutions, institutions run by Municipalities and Local Bodies and also private aided institutions. The Primary Health Centres under control of the State’s Directorate of Public Health Services and under Zilla Parishads are also included in the data, *
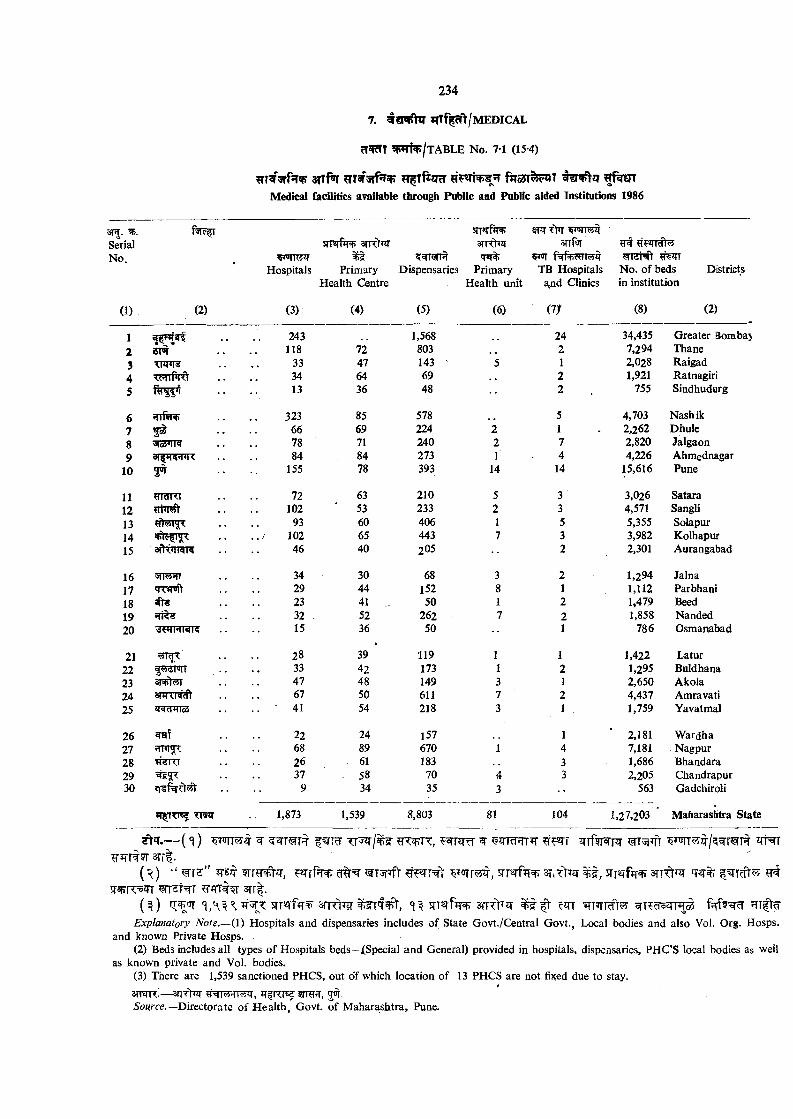
SerialNo.
(1)
STTfor ^I^TfzqrcT fiT cST ^TMedical facilities available through Public and Public aided Institutions 1986
(2)
Hospitals
(3)
STT rM't) aiT^^T
Primary Health Centre
(4)
Dispensaries
(5)
sTr^rf^
qtj% Primary
Health unit
(6)
ST3T Tt^srifw
TB Hospitals a^nd Clinics
No. of beds in institution
Districts
w (8) (2)
24 34,435 Greater Bombaj2 7,294 Thane1 2,028 Raigad2 1,921 Ratnagiri2 755 Sindhudurg
5 4,703 Nashik1 . 2,262 Dhule7 2,820 Jalgaon4 4,226 Ahmednagar
14 15,616 Pune
3 3,026 Satara3 4,571 Sangli5 5,355 Solapur3 3,982 Kolhapur2 2,301 Aurangabad
2 1,294 Jalna1 1,112 Parbhani2 1,479 Beed2 1,858 Nanded1 786 Osmanabad
1 1,422 Latur2 1,295 Buldhana1 2,650 Akola2 4,437 Amravati1 , 1,759 Yavatmal
1 2,181 W ardha4 7,181 Nagpur3 1,686 Bhandara3 2,205 Chandrapur
563 Gadchiroli
104 1,27,203 ‘ Maharashtra State
12345
678 9
10
1112131415
1617181920
2122232425
2627282930
am
3To5*tFr
m?TRT
sfhOTign
smHT
^FTRRT?
3RJt^snTTT^
5raf
RIJTTTE?
243118
3334 13
323667884
155
72102
9310246
34292332 15
28334767 41
2268 26 37
9
724764 36
8569718478
6353 606540
304441 52 36
394248 5054
2489615834
1,56880314369 48
578224240273393
210233406443205
6815250
26250
119173149611218
157670183
70 35
221
14
5217
1,873 1,539 8,803 81
( ^ ) “ m z * ’ ^T3r*fr ^ 1=^ 3T.t>et JTTqfjr^ ^sr^n:=5?rT 3 rr |.
( ^ ) iT^ay 5rT2rf?T^ 3nT>?T f e ' f STT^fiT^ 5|-R>3T ^ c TT ^TT|t^
Explanatory Note.—(1) Hospitals and dispensaries includes of State Govt./Central Govt., Local bodies and also Vol. Org. Hosps. and known Private Hosps.
(2) Beds includes all types of Hospitals beds—JJSpecial and General) provided in hospitals, dispensaries, PH C’S local bodies as well as known private and Vol. bodies.
(3) There are 1,539 sanctioned PHCS, out of which location of 13 PHCS are not fixed due to stay.
3ii?rTT'.— 3nT>tr #3iT???rT?rir, ?n¥fT, 5^- 'S'o^ -ce.—Directorate of H ealth , Govt, of M aharashtra, Pune.
8. FAMILY WELFARE
% 3 T ^ a n ^ ^ q iO ^ i f iR T ^ '3tt| . ^ ^ r ^ ^ f w r ,
^R rfkw ^ ^r?qTW ^TTarri^-Ni^dT^. ' 5 ^ T |unrR r
’JRTT . “ ^ 7 " |^n 'SR f ^ ^ z m r r ^ a r ^ c ? r r^ ^ q % r 'ttss^ f ^ T «TRfw’iqnR>f^T
8.1. The number of family welfare centres include Mobile Family Welfare Centres also. In these centres the Sterilisation, I U C D insertions and distribution of conventional contraceptives are done r^ularly. The sterilisation operation performed on male is called vasectomy and that on female is * called tubectomy. I U C D device is meant for women and is used for spacing as well as for stopping of births.
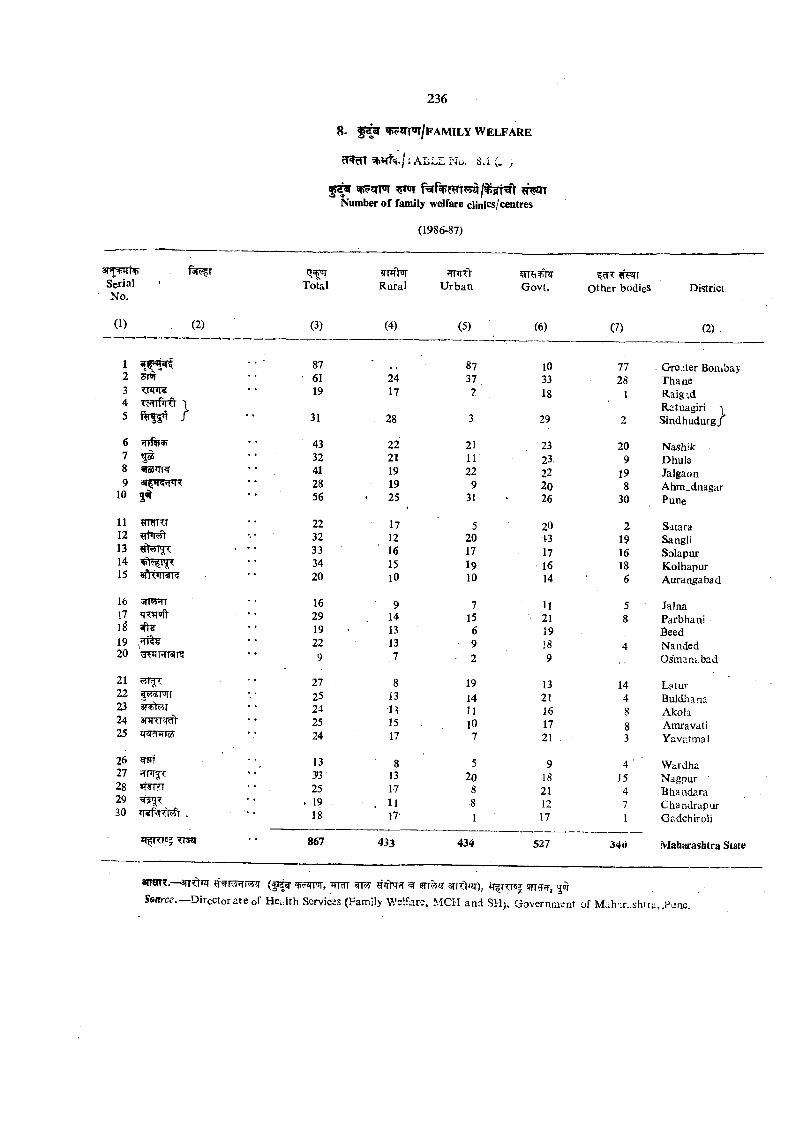
amsiTTVSerialNo..
(1) (2)
12 3m34 T c^ q rt \5
6789
10
11 «WK11213 9>5T^<1415 aflt'INK
16 WI iTF17 qpWif)-181920
21222324 3f*1<l=id)25
2627282930 »T5^r55t .
FI TTT62
iNo. 8 .i )
Number o f family w dfare clinics/centres
(1986-87)
?rr*fVw HUlO 5171 ?TF!TrTotal Rural U rban Govt. Other bodies District
(3) (4) (5) (6) (7) (2)
87 87 10 77 Greater Bombay61 24 37 33 28 Thane19 17 7 18 1 Raigad
Ratnagiri 'i31 28 3 29 2 Sindhudurgj
43 22 21 23 20 Nashik32 21 11 23. 9 Dhule41 19 22 22 19 Jalgaon28 19 9 20 8 Ahm_dnagar56 25 31 26 30 Pune
22 17 5 20 , 2 Satara32 12 20 1-3 19 Sangli33 16 17 17 16 Solapur34 15 19 16 18 Kolhapur20 10 10 14 6 Aurangabad
16 9 7 U 5 Jalna29 14 15 ■ 21 8 Parbhani19 13 6 19 Seed22 13 9 18 4 Nanded9 ,7 • 2 9 Osman?, bad
27 8 19 13 14 Latur25 13 14 21 4 Buldhana24 U 11 16 8 Akola25 15 10 17 8 Amravati24 17 7 21 , 3 Yavatmal
13 8 5 9 4 ' ' Wardha3'3 13 20 18 15 Nagpur25 17 8 21 •4 Bhandara
. 19 . 11 ■8 12 7 Chandrapur18 IT 1 17 1 Gadchiroli
867 433 434 527 340 Maharashtra State
ansn^.—3TT >nr ( | i ^ nFrr ?r ftTfT w arrTtiir), ir^rTnsj m^r^, 5<i*r
Searce.— Director a te of Health Services (Family Welfare, MCH and SH), Government of M ah ,r..shtru, JPane.
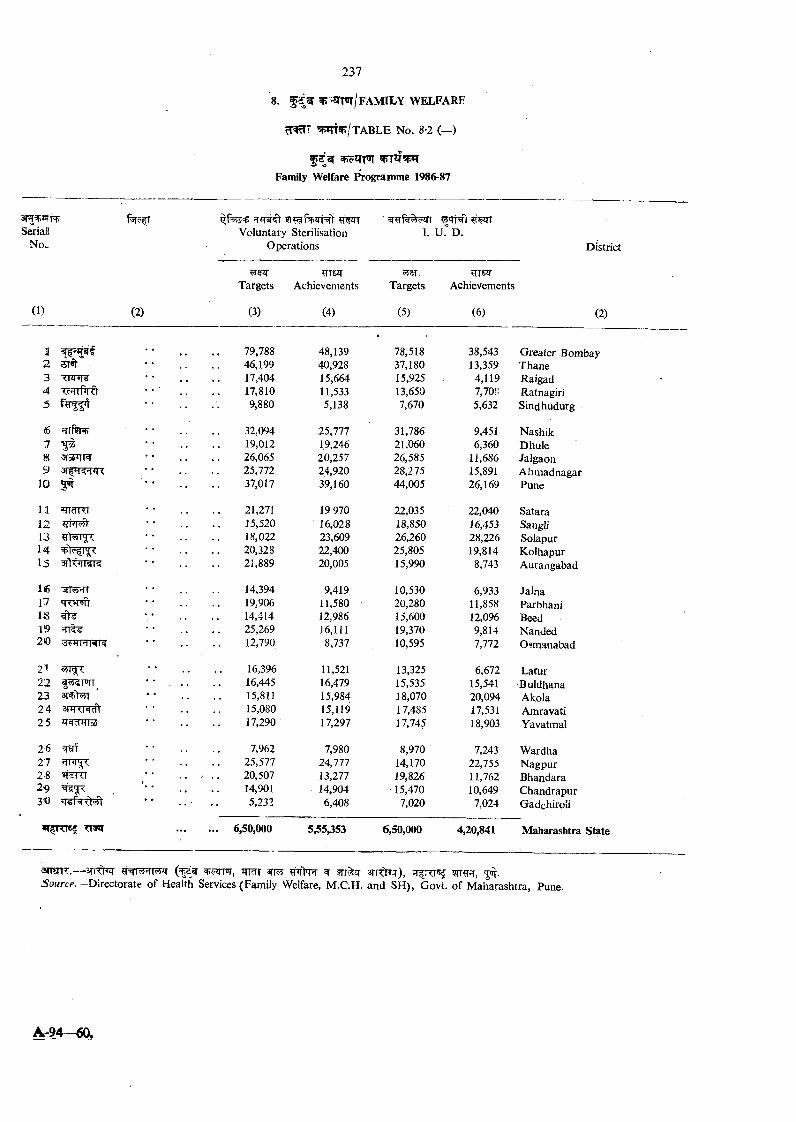
8. ^ ’Stft/ f a m i l y w e l f a r e
W f?/TABLE No. 8-2 (—)
f
Family Welfare Programme 1986-87
3RW hFSeriall
No~
(1) (2)
Voluntary Sterilisation Operations
Targets
(3)
?rrs3TAchievements
(4)
I. u r D.
Targets
(5)
grsjrAchievements
(6)
District
(2)
STwr<nr»i^
4 TcHTplCl5
11 »rrarRT121314 ^ I s
l<6 '3rr ?TT17 qT iT’ft18 ^ l!9 ? r t^
212223 *24 3 R T r ^ 2.5 zr^^nre
26 ^27 STFI^2 8 ^^TTT 29 =5f5^3<0
»R^RT6? TRU
79,788 48,139 78,518 38,543 Greater Bombay46,199 40,928 37,180 13,359 Thane17,404 15,664 15,925 4,119 Raigad17,810 11,533 13,650 7,70« Ratnagiri9,880 5,138 7,670 5,632 Sindhudurg
32,094 25,777 31,786 9,451 Nashik19,012 19,246 21,060 6,360 Dhule26,065 20,257 26,585 11,686 Jalgaon25,772 24,920 28,275 15,891 Ahmadnagar37,017 39,160 44,005 26,169 Pune
21,271 19970 22,035 22,040 Satara15,520 16,028 18,850 16,453 SangU18,022 23,609 26,260 28,226 Solapur20,328 22,400 25,805 19,814 Kolhapur21,889 20,005 15,990 8,743 Aurangabad
14,394 9,419 10,530 6,933 Jalna19,906 11,580 20,280 11,858 Parbhani14,414 12,986 15,600 12,096 Beed25,269 16,111 19,370 9,814 Nanded12,790 8,737 10,595 7,772 0?manabad
16,396 11,521 13,325 6,672 Latlir16,445 16,479 15,535 15,541 Buldhana15,811 15,984 18,070 20,094 Akola15,080 15,119 17,485 17,531 Amravati17,290 17,297 17,745 18,903 Yavatmal
7,962 7,980 8,970 7,243 Wardha25,577 24,777 14,170 22,755 Nagpur20,507 13,277 19,826 11,762 Bhandara14,901 14,904 15,470 10,649 Chandrapur5,232 6,408 7,020 7,024 GadchiroJi
6,50,000 5,55,353 6,50,000 4,20,841 Maharashtra State
anmT.— 3riTti2T ttrtt ^ ^rr^q” a rr^ ir) , jot.6'om/-cv’. - D irectorate of Health Services (Family Welfare, M.C.H. and SH), Govt, of Maharashtra, Pune.
A=94-€0*
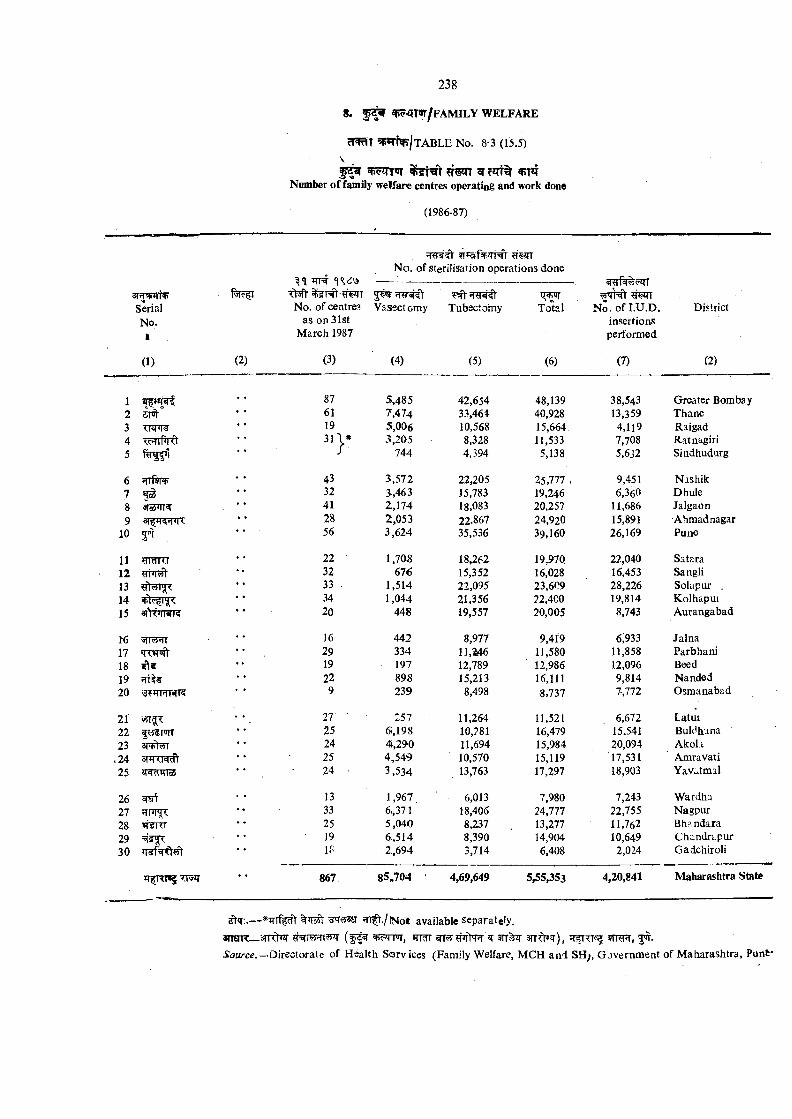
cT^T 5f5»TN/TABLE No. 8-3(15.5)\
Number of family welfare centres operating and work done
(1986-87)
?reirrN o. of sterilisation operations done
5W ?rer^'tSerial No. of centres Vasectomy Tubsctomy Total No. of LU.D. DistrictNo. as on 31st insertions« M arch 1987 performed
(1) (2) (3) (4) (5) (6) (7) (2)
1 87 5,485 42,654 48,139 38,543 Greater Bombay2 zm 61 7,474 33,46<1 40,928 13,359 Thane3 19 5,006 10,568 15,664 4,119 Raigad4 3 H * 3,205 8,328 11,533 7,708 Ratnagiri5 / 744 4,394 5,138 5,632 Sindhudurg
6 43 3.,572 22,205 25,777 . 9,451 Nashik7 32 3.,463 15,783 19,246 6,360 Dhule8 41 2,174 18,083 20,257 11,686 Jalgaon9 28 2,053 22,867 24,920 15,891 Ahmad nagar
10 56 3,624 35,536 39,160 26,169 Pune
11 yrdKT 22 1.70S 18,262 19,970 22,040 Satara12 32 676 15,352 16,028 16,453 Sangli13 ?fl55T^ 33 1,514 22,095 23,609 28,226 Solapur .14 34 1,044 21,356 ?2,4C0 19,814 Kolhapui15 3f!7<tWR 20 448 19,557 20,005 8,743 Aurangabad
1€ 16 442 8,977 9,419 6,933 Jalna17 29 334 n , m 11,580 11,858 Parbhani18 19 197 12,789 12,986 12,096 Beed19 22 89S 15,213 16,111 9,814 Nanded20 9 239 8,498 8,737 7-,772 Osmanabad
21 27 ' 257 11,264 11,521 6,672 Latut22 25 6,198 10,?81 16,479 15.541 Buldhana23 3TFt^ 24 4,290 11,694 15,984 20,094 A koh
.24 srq x m t 25 4,549 10,570 15,119 17,531 Amravati25 ®RT*no5 24 ■ 3,534 13,763 17,297 18,903 Yav^^tmal
26 13 1,967. 6,013 7,980 7,243 W ardha27 33 6,,371 18,406 24,777 22,755 Nagpur28 25 5,040 8,237 13,277 11,762 B handara29 19 6,514 8,390 14,904 10,649 Chandrapur30 U< 2,694 3,714 6,408 2,024 Gadchiroli
867 8 5 J0 4 ■ 4,69,649 5,55,353 4,20,841 Maharashtra State
'd'T'rfistj *11^7N o t available Ssp^rately.3 n aH _ a?rd ^ jftrtt ^?y?ni>T?r> 5 r r ^ srTdr^), strtt, jir.S’ozzr^g.—Directorate of H ealth Services (Family Welfare, MCH and SH_>, G jvernm eat of M aharashtra, Pun6*
V 9 . SOCIAL WELFARE SERVICES
^ information of loans and grants disbursed to ecoiio-
^ ^T S q T ^ S fr |. mlcally weaker sections by purpose and source are given.
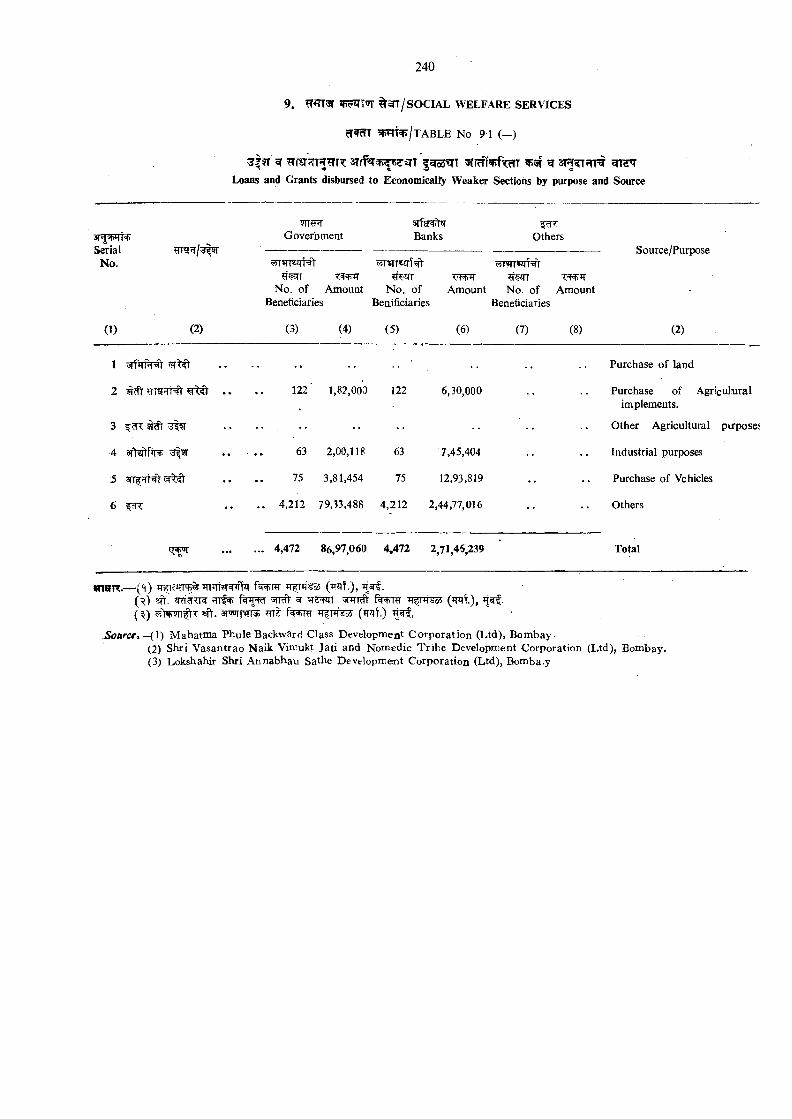
9. ^ I t J T SOCIAL WELFARE SERVICES
^FTT^/t ABLE No 91 (—)
^ |?T ^ f^oS^T 5ricr1i^fT?TT ^ s r ^ f T i ^Loans and Grants disbursed to Economically Weaker Sections by purpose and Source
SerialNo.
5TT?FTGovernment
a r fa r^Banks Others
Source/Purpose
No. of Amount Beneficiaries
N o. of Amount Benificiaries
No. of Amount Beneficiaries
( 0 (2) (3) (4) (5) (6) (7) (8) (2)
1 . . Purchase of land
2 ^ ^Errg rHt . . 122' 1,82,000 122 6,30,000 . . Purchase of Agricultural implements.
3 M . . •• •• • Other Agricultural ptrpose:
4 63 2,00,118 63 7,45,404 . . Industrial purposes
5 75 3,81,454 75 12,93,819 . . Purchase of Vehicles
6 ?.d-< . . 4,212 79,33,488 4,212 2,44,77,016 . . Others
... 4,472 86,97,060 4,472 2,71,46,239 Total
enCIR.— (<l) iT fT W ^ T T T f ^ R T TTfTlT^ (W it) ,(^ ) ^ ^ fkwrm iTfrrrssj (tpi?.),(^ ) wtvwrftT Ml', arrorprra; m z
uSoftrcfj —(1) M ahatm a Phule Backward Class Development C orporation (L td), Bombay(2) Shri V asantrao N aik Viniukt Jati and Nomcdic T ribe Development Corporation (Ltd), Bombay.(3) Lokshahir Shri A nnabhau Sathe Development C orporation (Ltd), Bomba.y
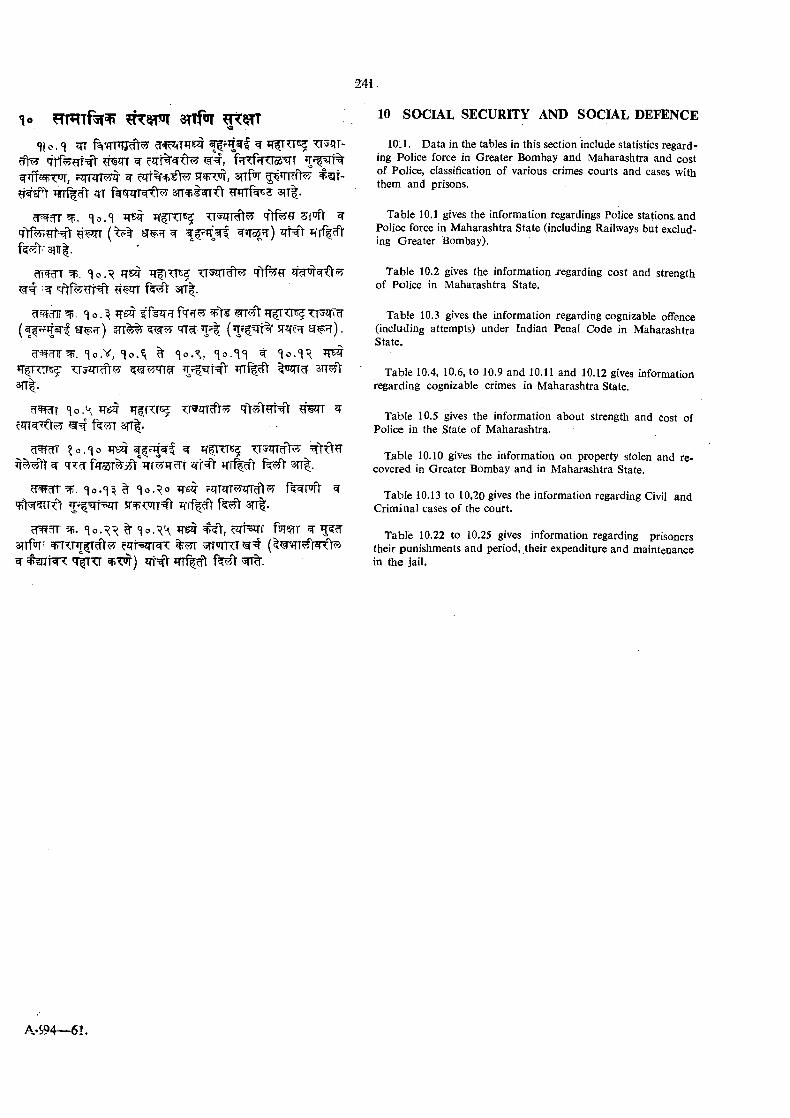
10 3Tlf«iT
^ qrtf^H t=^ ^^TT ^ fTTCf?RI^T^Tffc^TTW, ?qTifT^ij ^ ST^F^l', STlfW ^ ^ t -m ^ ' \ m f ^ € \ m s r r ^ i ^ T t ^ r r r r f^ s s i t | .
? fw r ^ ^TRt T iT f |^f5Tf^>3Ifi. '
^ = t ^ 'T t f ^ ^ = ^ 3 rr |.
cT ^ai %■ o . ^ TTS TT^TT^ TT ^T ^sr^?r) itt%% •
^^cTF T o .v , <^0.'^ ^ <\o.%, < \o A ^ ^ - imSTT 'Y
3 rr |.
' i o A w T T ^zrr^^ ^ m r ^3Tr|.
1 0 .^ 0 TTS ^ =^>6'^^ >T^^ fiT55T%55V?Tf^Tr^T ’RT^d'T f ^ ' t 3Tr|.
^ o .'^ o iTs^ ?qTilT^J2JTd^^ ^^r-^^t=5qrr f e ' t 3 n | .
?P. ^ w K ^ ( f w ^aiTfwr cirrsirR T ^ r ^ T ^ = #^ #?nT T ^ sf>T^) q-f=^ m ^ € \
10 SOCIAL SECURITY AND SO CU L DEFENCE
10,1. D ata in the tables in this section include statistics regarding Police force in Greater Bombay and M aharashtra and cost of Police, classification of various crimes courts and cases with them and prisons.
Table 10.1 gives the information regardings Police stations.and Police force in M aharashtra State (including Railways but excluding G reater Bombay).
Table 10.2 gives the information xegarding cost and strength of Police in M aharashtra State.
Table 10.3 gives the information regarding cognizable offence (including attempts) under Indian Penal Code in Maharashtra State.
Table 10.4, 10.6, to 1Q.9 and 10.11 and 10.12 gives information regarding cognizable crimes in M aharashtra State.
Table 10.5 gives the information about strength and cost of Police in the State of Maharashtra.
Table 10.10 gives the information on property stolen and recovered in Greater Bombay and in M aharashtra State.
Table 10.13 to 10.20 gives the information regarding Civil and Crim inal cases of the court.
Table 10.22 to 10.25 gives information regarding prisoners their punishments and period, their expenditure and maintenance in the jail.
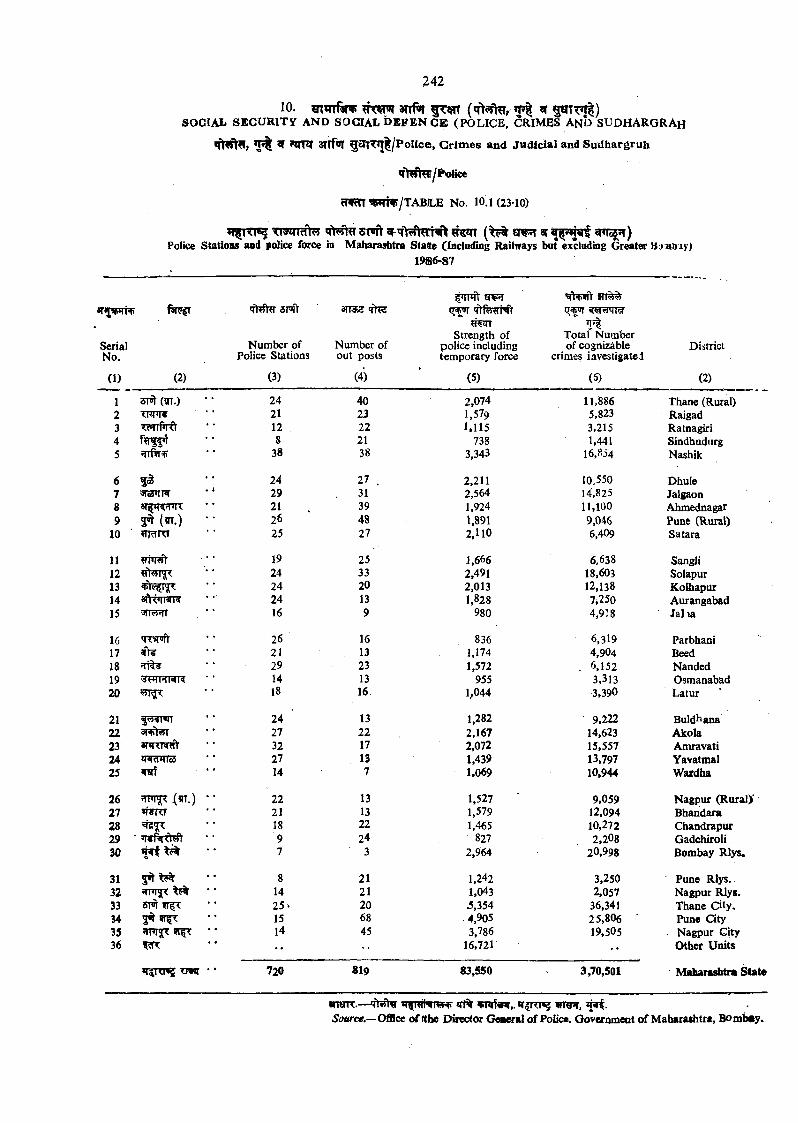
10. ^ g ^ r r ^ )SOCIAL SECURITY AND SOCIAL DEFEN CE (P O L IC E , CRIM ES AND S U D H A R G R A r
^ STTfoi gsrrT*T^/Police, Grimes and Judicial and Sudhargruh
cnRTT’BITTV/TABILE No. 10.1(23-10)
5r»ft 9F th^tw N l#5® rT B T ^ <19^5^4311 ^HcSfT)Police Stations and police force in Maharashtra State Concluding Railirays but excluding Greater Bjaaay)
1986-87
^r? |r
SerialNo.
(1) (2)
sr»i>
Number of Police Stations
Number of out posts
(3) (4)
5»TT?fr
Strength of police including temporary force
(5)
5TT^
Total Number of cognizable
crimes investigated
(6)
District
(2)
1 ^ (?TT.) 24 40 2,074 11,886 Thane (Rural)2 <m<r« 21 23 1,579 5,823 Raigad3 12 22 1,115 3,215 Ratnagiri4 8 21 738 1,441 Sindhudurg5 »rrftT3|i 38 38 3,343 I6,8i4 Nashik
6 24 27 . 2.211 10.550 Dhule7 v>ioa<iR * ‘ 29 31 2,564 14,825 Jalgaon8 21 39 1,924 11,100 Ahmednagar9 (ffT.) • • 26 48 1,891 9,046 Pune (Rural)
10 ^r^rra 25 27 2,110 6,409 Satara
11 19 25 1,666 6.638 Sangli12 24 33 2,491 18,603 Solapur13 24 20 2,013 12,138 Kolhapur14 24 13 1,828 7,250 Aurangabad15 dira^rr 16 9 980 4,918 Jal la
16 26 16 836 6,319 Parbhani17 aiV? 21 13 3,174 4,904 Beed18 29 23 1,572 . 6,152 Nanded19 14 13 955 3,313 Osmanabad20 18 16 1;044 3,390 Latur
21 fi55«T*n 24 13 1,282 9,222 Buld^ana22 anp>5yr 27 22 2,167 14,623 Akola23 32 17 2,072 15,557 Anvavati24 iT lTTaS 27 13 1,439 13,797 Yavatmal25 TOf 14 7 1,069 10,944 Wardha
26 22 13 1,527 9,059 Nagpur (Ruraiy27 »WRT 21 13 1,579 12,094 Bhandara28 18 22 1,465 10,272 Chandrapur29 9 24 827 2,208 Gadchiroli30 7 3 2,964 20,998 Bombay R lys.
31 8 21 1,242 3,250 Pune R lys..32 14 21 1,043 2,057 Nagpur Rlys.33 sm iTf^ 25 . 20 3,354 36,341 Thane City.34 5T5T 15 68 4,905 25,806 ' Pune City35 iiprgpc 14 45 3,786 19,505 Nagpur City36 •• 16,721 . . Other U nits
r m *• 720 819 83,550 3,70,501 Maharaditm State
w w < .— wr r ,Source.— O&ce o f (the Director OMcral o f Policft. Goveromeot o f Maharachtra, Bombay.
cTRn ?W r^ /T A B L E N o, 10 2 (23'1)
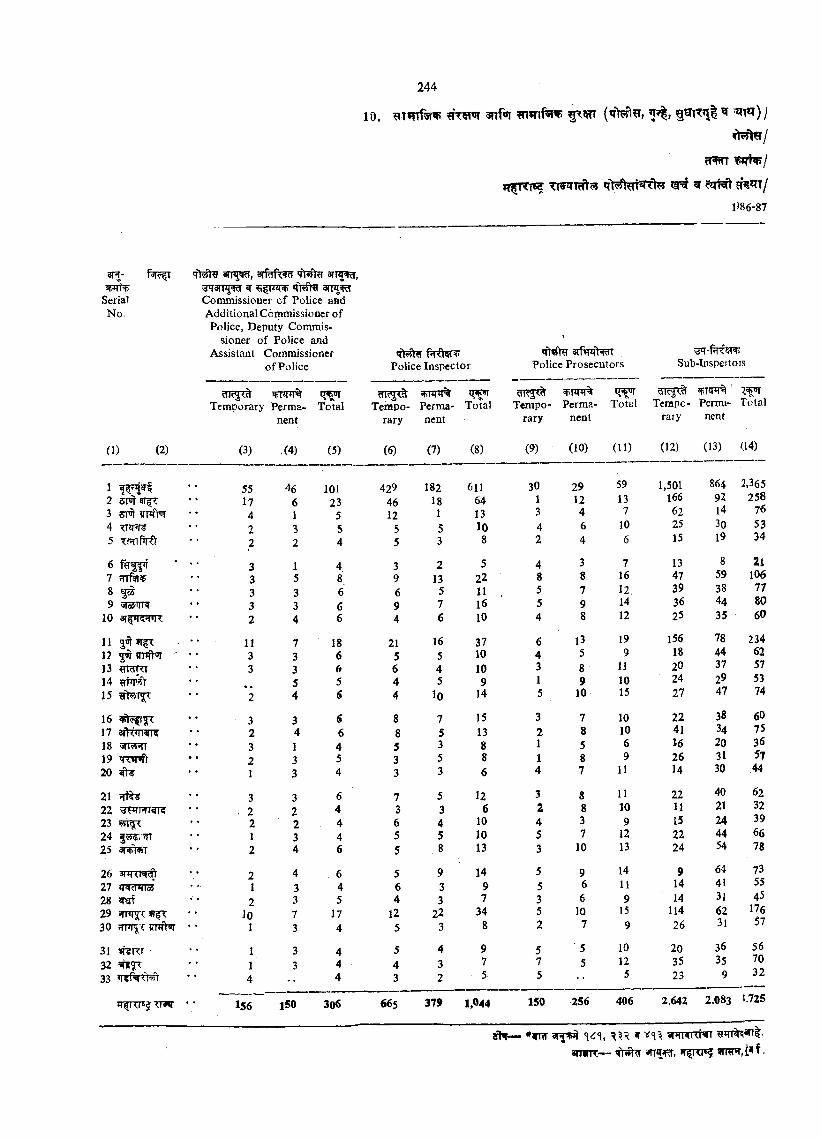
1 0 . ?iTmf3r«r; (*r>?T)?r, n ? | , g s r iT n | ^ m*T) /
0 ^ /
c m r firH p /
q|[TTitE TrPTTcft^ q > fh E rr^ 't^ n e t r i^ m ^ x /
P86-87
3T -
SerialNo.
f%cfr
(1) (2)
12 s r^ ?T|T3 SM ? n ^4 TFT*ir¥5 T f^ M t
6 f ? r ^7 qrftr^8 ^9 SfOTTW
10
11 fTf?:12 5 ^ 9TifhT ^13 m?rm14 ^fnrst15
161718 5rT5PTT19 T o m t20 ^
212223 55T^24 |?55-, »rT25 3nr>RT
26 a n r m ^27 JR?rWTo528 ^2930
31 W<T3233
lTfnTǤTTW
qt?fui a n ^ , s r M w 3tt , ?r an^f?r
Commissiouer c f Police and Additional Commissioner of Police, Deputy Commis
sioner of Police and Assistant Commissioner
o f Police
m ?5 ^ 5FTzm% Temporary Perma
nent
(3) .(4)
Total
C5)
Police Inspector
vnrtT%Tempo- Perma- Total
rary nent
Police Prosecutors
?TR5^Tempo- Perma-
rary nent
t r ^Total
Sub-Inspectois
Tempo- Perms- Total rary nent
(6) (7) (8) (9) (10) (11) (12) (13) (14)
55 46 101 429 182 611 30 29 59 1,501 864 2,365
17 6 23 46 18 64 1 12 13 l66 92 258
4 1 5 12 1 13 3 4 7 62 14 76
2 3 5 5 5 10 4 6 10 25 30 53
2 2 4 5 3 8 2 4 6 15 19 34
3 1 4 3 2 5 4 3 7 13 8 21
3 5 8 9 13 22 8 8 16 47 59 106
3 3 6 6 5 n , 5 7 12, 39 38 77
3 3 6 9 7 16 5 9 14 36 44 80
2 4 6 4 6 10 4 8 12 25 35 60
11 7 18 21 16 37 6 13 19 156 78 2343 3 6 5 5 10 4 5 9 18 44 623 3 6 6 4 10 3 8 11 20 37 57
5 5 4 5 9 1 9 10 24 29 53
2 4 6 4 lO 14 5 10 15 27 47 74
3 3 6 8 7 15 3 7 10 22 38 602 4 6 8 5 13 2 8 10 41 34 75
3 1 4 5 3 8 1 5 6 H 20 36
2 3 5 3 5 S 1 8 9 26 31 57
1 3 4 3 3 6 4 7 11 14 30 44
3 3 6 7 5 12 3 8 11 22 40 62
- 2 2 4 3 3 6 2 8 10 11 21 32
2 2 4 6 4 10 4 3 9 15 24 39
1 3 4 5 5 10 5 7 12 22 44 662 4 6 5 8 13 3 10 13 24 54 78
2 4 6 5 9 14 5 9 14 9 64 731 3 4 6 3 9 5 6 11 14 41 55
2 3 5 4 3 7 3 6 9 14 31 45
lO 7 17 12 22 34 5 10 15 114 62 1761 3 4 5 3 8 2 7 9 26 31 57
1 3 4 5 4 9 5 5 10 20 36 56
1 3 4 4 3 7 7 5 12 35 35 70
4 4 3 2 5 5 5 23 9 32
156 150 306 665 379 1,044 150 256 406 2,642 2,083 K725
ffH—- *?Rr 3 T ^ ^<C% f ^HKITTiTT
arnrrr— «rr jRr, *rfrrr«?
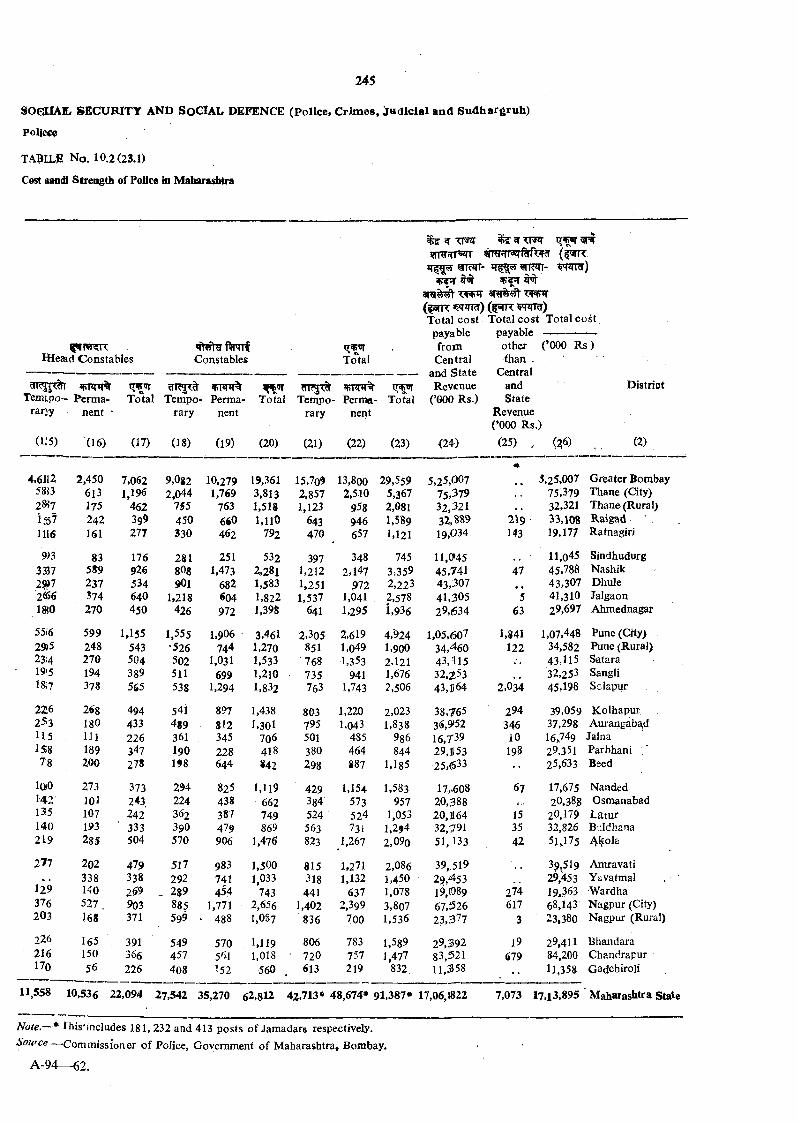
SOCUAIL SECURITY AND SoGtAL DEFENCE (Police, Crimes, Judicial and Sudhargruh)
Polictfe
TABILE N o . 10.2(23.1)
Cost aandi Strength of Police in MaUarashtra
Hlejad C onstables
Tem tpo- Perm a- rarvy nent ■
Constables
qvnrTotal Tempo
raryPerma
nent
Total
Total?TT?5^ vrqil%
Tempo- Permei- rary nent
Total
(1‘5) (16) (17) (18) (19) (20) (21) (22) (23)
isr w ^ ^imRfszTT 5TRnrr«r% f^
w ir a )
(faTR (|3TR WTRr)Total cost Total co st Total coSt
p a y a b le -------------- -other (’000 Rs ) than .
Central and State
Revenue (’000 Rs.)
(25) , (26)
payable from
C entral and State Revenue
(’000 Rs.)
<24)
District
(2)
4,6112 2,450 7,062 9,0*2 10,279 19,361 15,7q9 13,800 29,559 5.25,007 5,25,007 Grieater Bombay58J3 613 1,196 2,044 1,769 3.813 2,857 2,5-10 5,367 75,379 75,379 Thane (City)2»?7 175 462 755 763 1,518 1,123 958 2,081 32,321 32.321 Thane (Rural}1557 242 399 450 660 1,110 643 946 1,589 32,889 219 33,108 R aigad1116 161 277 330 462 792 470 657 1,121 19,034 143 19,177 Ratnagiri
9)3 83 176 281 251 532 397 348 745 11,0»45 11,045 Sindhudurg33J7 5S9 926 80s 1.473 2.281 1,212 2,147 3,359 45,741 47 45,788 Nashik29)7 237 534 9OI 682 1,583 1,251 972 2,223 43,307 43,307 Dhule2«6 574 640 1,218 604 1,822 1,537 1,041 2,578 41,305 5 41,310 Jalgaonm o 270 450 426 972 1,39ft 641 1,295 1,936 29,634 63 29,697 Ahmednagar
55i6 599 1,155 1,555 1,906 3,461 2,305 2,619 4,924 1,05,607 1,841 1.07.448 Pune (City)29>5 248 543 •526 744 1,270 851 1,049 1,900 34,460 122 34,582 Pune (Rural)2314 270 504 502 1.031 1.533 768 1,353 2,121 43,ni5 43,115 Satara19*5 194 389 511 699 1,210 - 735 941 1,676 32,253 ■32,253 SangliIS? 378 565 538 1,294 1,832 763 1,743 2,506 43,1164 2,034 45,198 Sclapur
226 268 494 541 897 1,438 803 1,220 2,023 38,765 294 39,059 K olhapur253 180 433 4*9 812 I,30l 795 1.043 1,838 36,9<52 346 37,298 Aurangaba,d115 111 226 36I 345 706 501 485 986 16,739 10 16,749 Jalna158 189 347 I 9O 228 418 380 464 844 29.1153 198 29,351 Parbhani ,'7'8 200 278 198 644 842 298 887 1,185 25,633 •• 25,633 Beed
1Q)0 273 373 294 825 1,119 429 1,154 1.583 17,-608 67 17,675 Nanded,142 lOl 243 224 438 662 384 573 957 20,388 . .. 20,388 Osmanabad13)5 107 242 362 387 749 524 524 1,053 20,1164 15 20,179 L atur140 193 333 39Q 479 869 563 731 1.2?4 32,791 35 32,826 Biildhana219 285 504 570 906 1,476 823 1.267 2,09o 51,133 42 51,175 4-l^ola
277 202 479 517 983 1,500 815 1.271 2,086 39,519 3?,519 Amravati338 338 292 741 1,033 318 1,132 1,450 • 29,453 29,453 Yavatmal
129 HO 269 _ 289 454 743 441 637 1,078 19,(089 274 19,363 •Wardha376 527. 903 885 1,771 2,656 1,402 2,399 3,807 67,526 617 68.143 Nagpur (City)203 J68 371 599 ' 488 I.O87 836 700 1,536 23,377 3 23,380 Nagpur (Rural)
226 165 391 549 570 1,119 806 783 1.589 29,392 19 29,411 Bhandara216 150 366 457 5'^! 1,018 ■ 720 757 1,477 83,f521 679 84,200 Chandrapur170 56 226 408 152 560 613 219 832 11,358 •• 11,358 Gadchiroli
11,558 10,536 22,094 27,542 35,270 62,812 42,713* 48,674* 91,387* 17,06,1822 7,073 17,13,895 M aharashtra Stal
Note.—* This'includes 181,232 and 413 posts o f Jamadars respectively. SoHfce — Com m issioner o f Police, Government o f M aharashtra, Bombay.
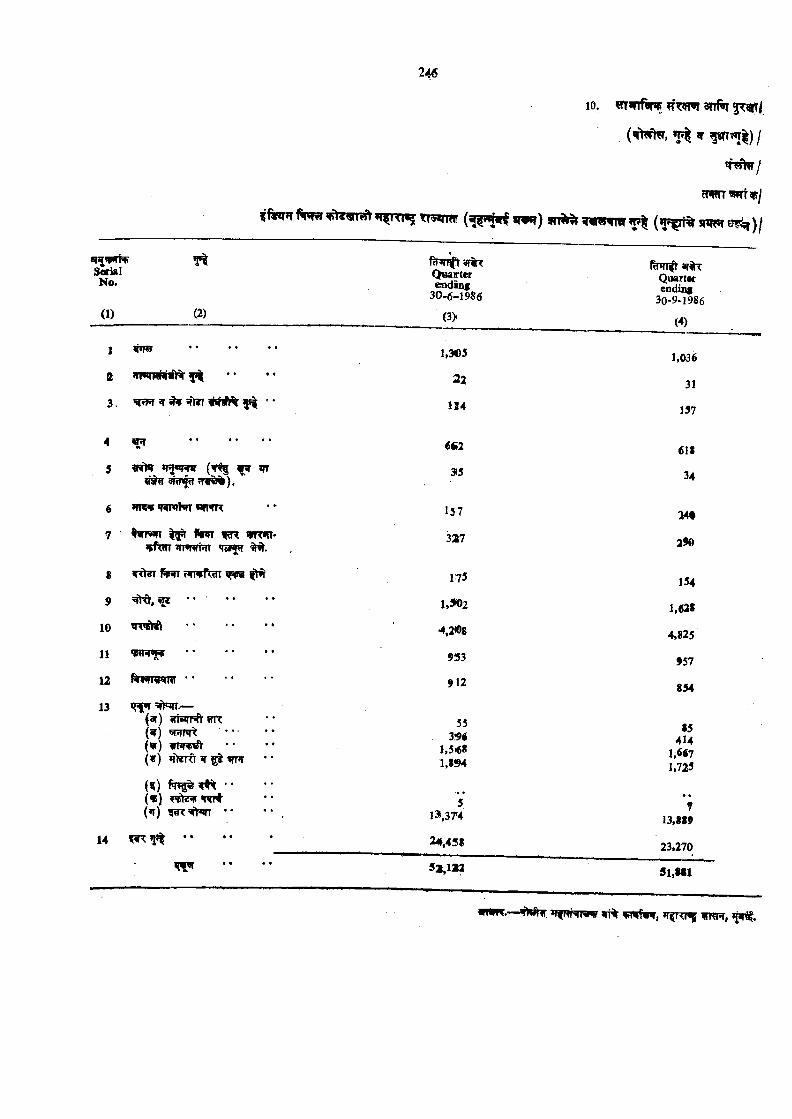
w r )
10. nT»nf«w 3rr%
( f W , g u T ^ I ) /
< r ^ /
cTWT WfT?p/
s n ^ ^ w r w f i w y ^ s w R s ^ ) ^
SerialN o.
(1) (2)
fir»nftar%TQuarterending
30-6-1986
(3>
»r%TQuartfrending
30-9-1986
(4)
1 HR? * * * * * * 1,3(05 1.036
2_2kWHHMWw • • 22 31
3. > VR ^ ' • 134 157
4 ^ .............................. 662 6It
5 (y jg fir irr siWtJiT rfW ^).
315 34
6 iFKv WAtenr wwwR 137 24»
7 ■ 1 ^ ftRT «»R1TI- ’f STT ?nwffi*TT ’racftf
327 29a
8 tvnfttfi ^spi 1^ 175 154
9 •• •; 1,902 1,62S
10 ................................. 4,2«8 4,825
11 ................................. 933 95712 912 854
13 ’TNTT.—(^ ) »rrc(ir) 5RT^ ..................(v ) IPRPUft’(y ) i?>ird ¥ ^ irr»r
553l9i
1,5*6Sl,l!94
85414
1M71,725
{%) •• (« )(»r) w<^<^ •*
5ia,374
713,889
14 *1 * • • * • 24,45* 23,270
53,122 5l,M l
w m — »h#Nr HfMhiwv ^ m fw w , itojt,
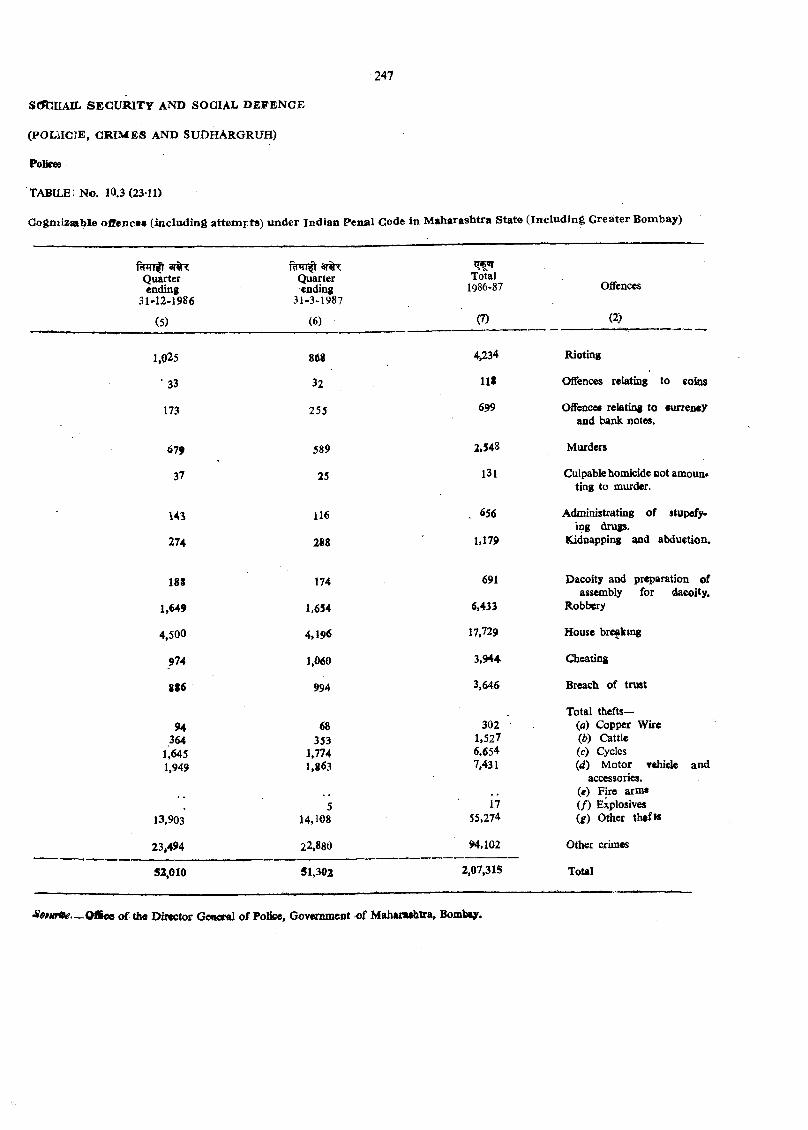
SCJtlllAIL S E C U R IT Y AND SO C IA L D E F E N C E
( p o L i i c jE , g r i m e s a n d SU D H A R G R U H )
Polieee
TABILE; N o. 10.3(23-11)
Oogmizaable ofFenccs (including attempts) under Indian Penal Code in Maharashtra State (Including Greater B om bay)
ariRQ uarterending
31-12-1986
(5)
Quarterending
31-3-1987
(6)
Total1986-87
(7)
Offences
(2>
1.025 868 4,234 Rioting
• 33 32 118 Offences relating to eoios
173 255 699 Offencet relating to eurreney and bank notes.
679 589 2,548 Murders
37 25 131 Culpable homicide not am ount ting to murder.
116 . 656 Administrating of stupefying drugs.
274 288 1,179 Kidnapping and abduetion.
188 174 691 Dacoity and preparation of assembly for dacoity.
1,649 1,654 6,433 Robbery
4,500 4,196 17,729 House breakmg
574 1,060 3,944. Cheating
886 994 3,646 Breach of trust
Total thefts—94 68 302 (a) Copi>er Wire
364 353 1,527 (6) Cattle1.645 1,774 6,654 (c) Cycles1,943 1,863 7,431 (</) M otor Y ehicle and
accessories.. , {e) Fire arm®
5 17 i f ) Explosives13,903 14,108 55,274 i g ) Other thefts
23,494 22,880 94,102 Other crimes
52,010 51,302 2,07,315 Total
SonffCe— O li«e o f Oie D irector General o f Police, Gov«mmcnt d M a h tn A lia , Bomb«y.
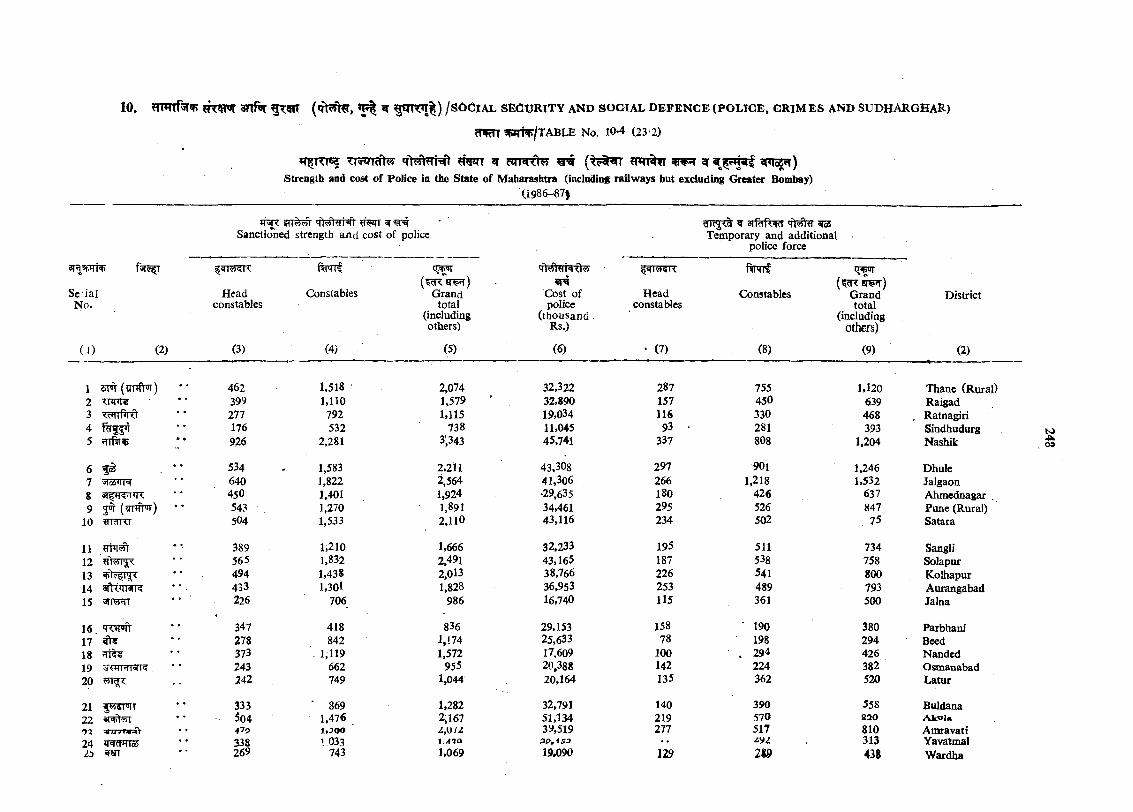
10 . 3nf«r g r w ^ ^ W ^ l ) /s^ > ^ ia jl s e c u r i t y a n d s o c i a l d e f e n c e ( p o l i c e , g r i m e s a n d s u b h a r g h a R )
cTiRTT ^ t m j l A B L E No. 10*4 (23-2)
^r^TTTc? TT^qTcft^ <T>yhrNt ^ grStreogtb and cost of Police ia tbe State of M^iarashtra (inclading railways but excluding Greater Bombay)
(1986-87|
SerialNo.
*T^ §T T ^ <Th$hrHt Sanctioned strength and cost of police
^ arfaft^W ^ Temporary and additional
police force
^qi74<4K
Headconstables
fsjnnf
Constables Grandtotal
(includingothers)
Cost of police
(thousand Rs.)
pT^«r<
Headconstables
ftPTTf
Constables Grandtotal
(includingOthers)
District
( 0 (2) (3) (4) ' (5) (6) ' (7) (8) (9) (2)
1 5T®t (^rnfK) 462 1,518 ‘ 2,074 32,322 287 755 1.120 Thane (Rural)2 399 1,110 1,579 32,890 157 45O 639 Raigad3 v^firPid 277 792 1,115 19,034 116 330 468 , Ratnagiri4 176 532 738 11,045 93 ‘ 281 393 Sindhudurg5 * * 926 2,281 3',343 45,741 337 808 1,204 Nashik
6 ^ . ** 534 1,583 2,211 43,308 297 901 1,246 Dhule7 640 1,822 2,564 41,306 266 1,218 1,532 Jalgaon8 450 1,401 1,924 •29.635 180 426 637 Ahmednagar .9 5^ (?rmtw) •• 543 1,270 1,891 34,461 295 526 847 Pune (Rural)
10 ?TldKl 504 1,533 2,110 43,116 234 502 . 75 Satara
11 389 1,210 1,666 32,233 195 511 734 Sangli12 565 1,832 2,491 43,165 187 538 758 Solapur13 494 1,438 2,013 38,766 226 541 800 Kolhapur14 cJiTiwr? 433 1,301 1,828 36,953 253 489 793 Aurangabad15 226 706 986 16,740 115 361 500 Jalna
16, 347 418 836 29,153 158 190 380 Parbhani17 278 842 1,174 25,633 78 198 294 Beed18 373 . 1,119 1,572 17,609 100 . 294 426 Nanded19 ‘ ' 243 662 955 20,388 142 224 382 Osmanabad20 242 749 1,044 20,164 135 362 520 Latur
21 f««T«IT 333 ■ 869 1,282 32,791 140 390 558 Buldana22 5o4 1,476 2,167 51,134 219 570 sao AkoU'yt yiTJTsr4V • • ■|79 UJOO A U // 39,519 277 517 810 Amravati24 ziWOTTO 338 1 033 1./130 zyz 313 Yavatmal23 ^srr 269 743 1»069 19.090 129 289 438 W ardha
09
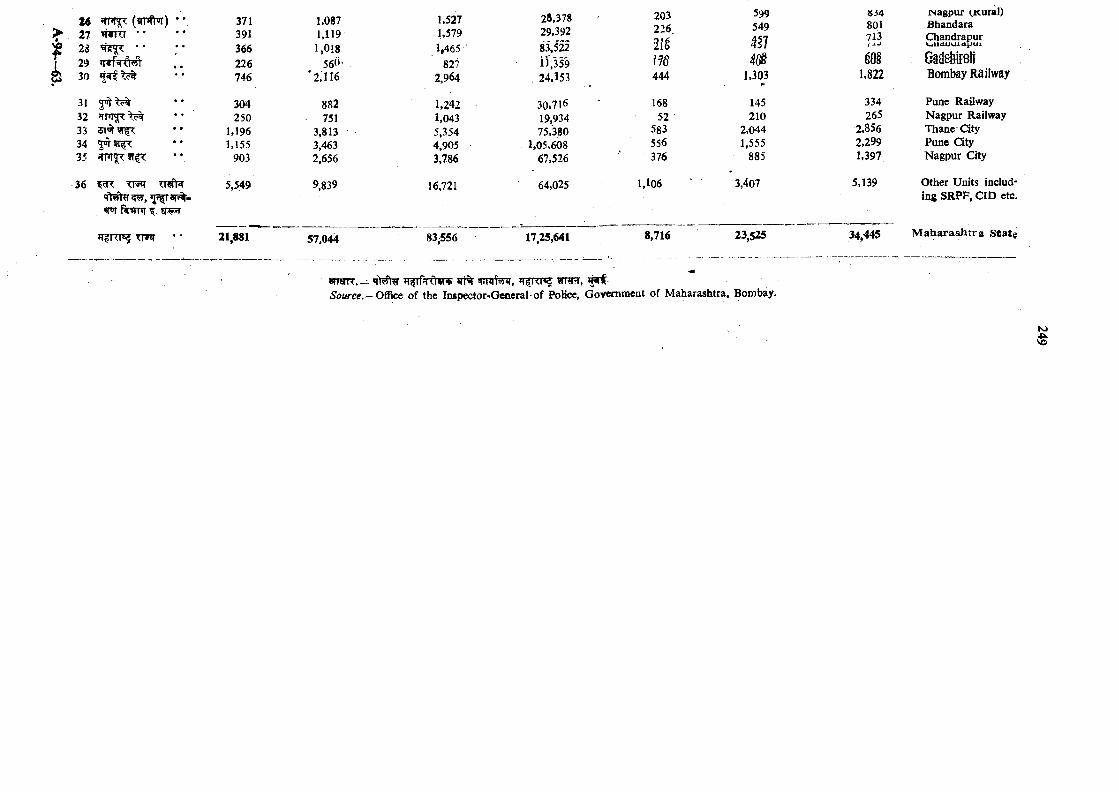
XL
U *rnr^ (irpft^r)27 ’WTTT ••28 ' •2930
3J3233 5I0r5T^3435 ?r
■36 TTSq•fhrhTs^, ^jn|T3i^« «niT
Jr^RPSf T i^ • •
371391366226746
304250
1.1961,155
903
5,549
21.881
1.087 1,119 1,0! 8
560- ’ 2,116
882751
3,813,3,4632,656
9,839
57.044
1,527 28,378 203 599
1,579 29.392 226. 549
1,465 • 83,522 m
827 i i ’,359 m m2,964 . 24,153 444 1,303
1,242 30.716 - 168 1451,043 19,934 52 2105,354 75,'380 583 2,0444,905 1,05.608 556 1,5553,786 67,526 376 885
16,721 64,025 1,106 3,407
83,556 17,25,641 8,716 23,525
834 rsagpur ^Kural)801 Bhandara713 Chandrapur
V ^ X l O U U K t p U lI X J
60§ : Gi^gMfeliU822 Bombay Railway
334 Pune Railway265 Nagpur Railway
2,856 Thane City2,299 Pune City1.397 Kagpur City
5.139 Other Units including SRPF, CID etc.
34,445 M a h a ra s h tr a Stat@
srwTT. — *ri% ^prafe^T, *rfRr«? wrarr, w f •Source.— Office of the Inspector^General of Policc, Govemtncnt of M aharashtra, Bombay.
K>
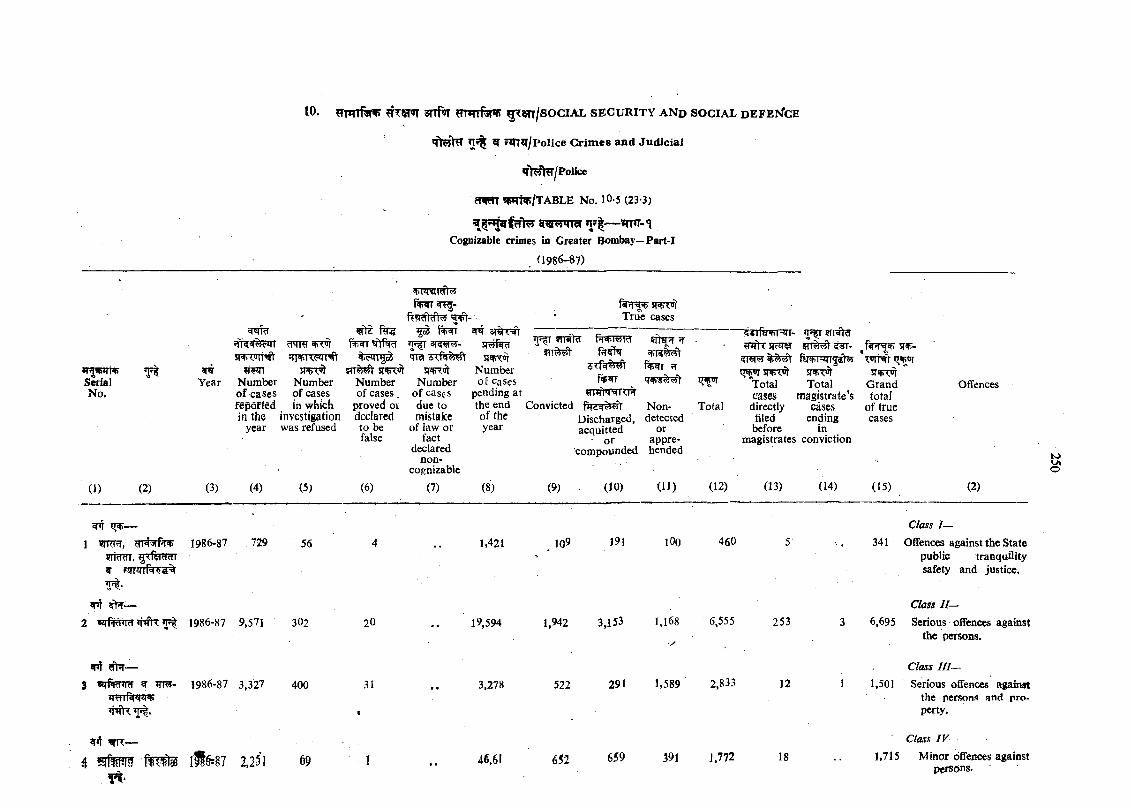
10. ? T T m f^ ?TTW»T 3TTft»T OTiTTftTV ^TW t/SO C IA L SE C U R IT Y A N D SO C IA L D EFE l^C E
'TtcStH ^ rlTx*T/Police C rim e s a n d J u d ic ia l
q>HtH/Police
?TWT «S*n^/TABLE No. 10-5 (23-3)
g<ggiqraf n f | — w r-* iCognizable crimes in Greater Bombay—Part-I
(1986-87)
fercftcfhy = ^ -fwqf^SRTTTir True cases
^ firs ^ 3T%T^frftcT 3 R ^ - awrsid'
SI+‘<'iT
SerialSTT i M «♦><,'*( Number
Year Number Number Number Number of CasesNo. o f cases of cases of cases. o f cases pending at
fepofted ill which proved or due to the endin the investigation declared mistake of the
year was refused to be of law or yearfalse fact
declarednon-
cognizable
(I) (2) (3) (4) (5) (6) (7) (8)
—*
1 1986-87 729 56 4 , , 1,421
Convicted
(9)
f^sFIW
5Tf^%55t
HTWt'T=rRFTfiT5^vR?r
Discharged,acquitted
o rcompounded
(10)
5ft ?T ?r +'raS<rii
fipm ?T
Nondetected
orapprehended
0 1 )
Total
i!{«ify+r=?ir- err^lfr?T*frT STrireT S^-
t r ^s r ^ srsFTW "Total Grand
fflagistfate’s total cavses of true
ending casesin
Total cases
directly filed
before magistrates conviction
Offences
toOio
(12) (13) (14) (15) (2)
?TT?TcfT, fTfifmWT ^ r2TRrf^3%!P|-
2 eqff^cT *nfh: ^ 1986-87 9,571
109 191 lOp 460
302 20 19,594 1,942 3,153 1,168 6,555 253
Class I—
341 Offences against the State public traaquility safety and justice.
Class II—
6,695 Serious offences against the persons.
400 31 3,278 522 291 1,589 2,833 12Class / / / -
1,501 Serious offences against the persons and property.
69 46,61 652 659 391 1,772 18
Class IV—1,715 M inor oflFences against
persons.
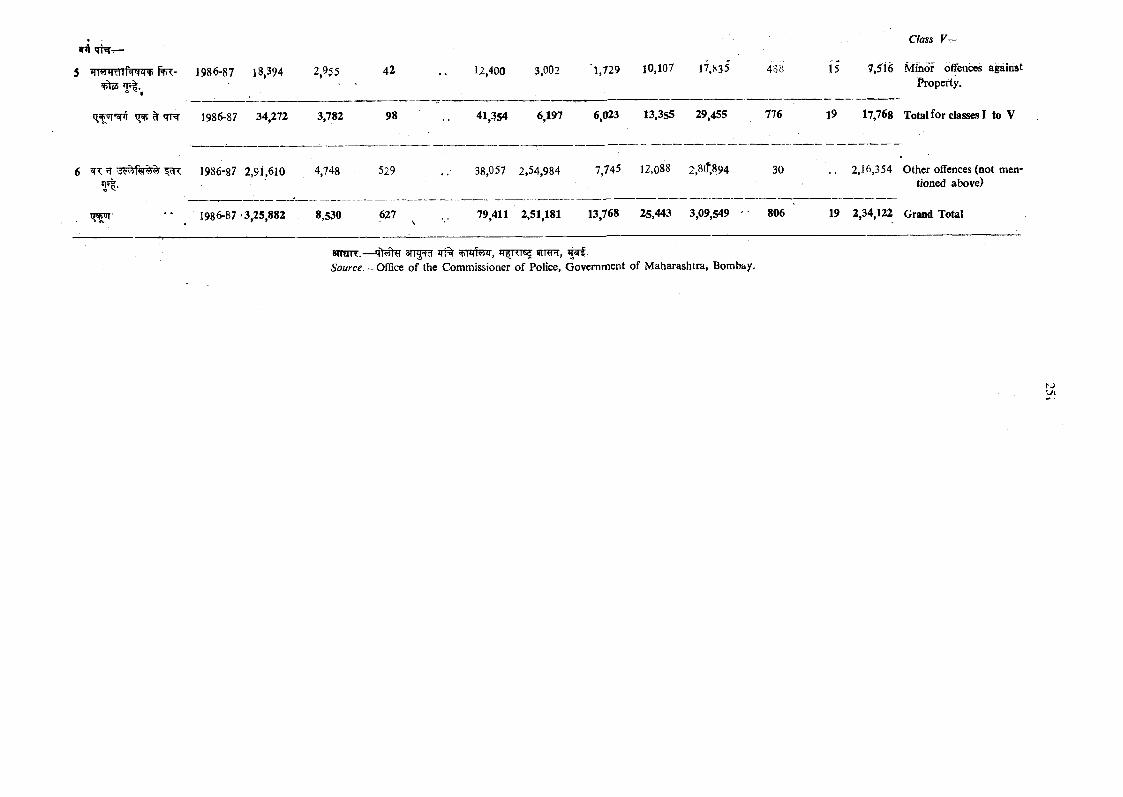
5 1986-87 18,394 2,955 42*1o5
15 7,516 Minor offences againstProperty.
^ cfT 1986-87 34,272 3,782 98 41,354 6,197 6,023 13,3s5 29,455 776 l9 l7,76g Total for classes I to V
6 ?r 37^ 9 ^ ^ 1986-87 2,91,610 4,748 529 38,057 2,54,984 7,745 12,088 2,8(f,894 30 2,16,354 Other offences (not mentioned above)
1986-87 -3,25,882 8,s30 627 79,411 2,51,181 13,768 25,443 3,09,549 ' 806 19 2,34,122 Grand Total
emnr.— q t ^ irt% ijmnr,Source.—Oihce of the Commissioner of Police, Government of Maharashtra, Bombay.
vyi
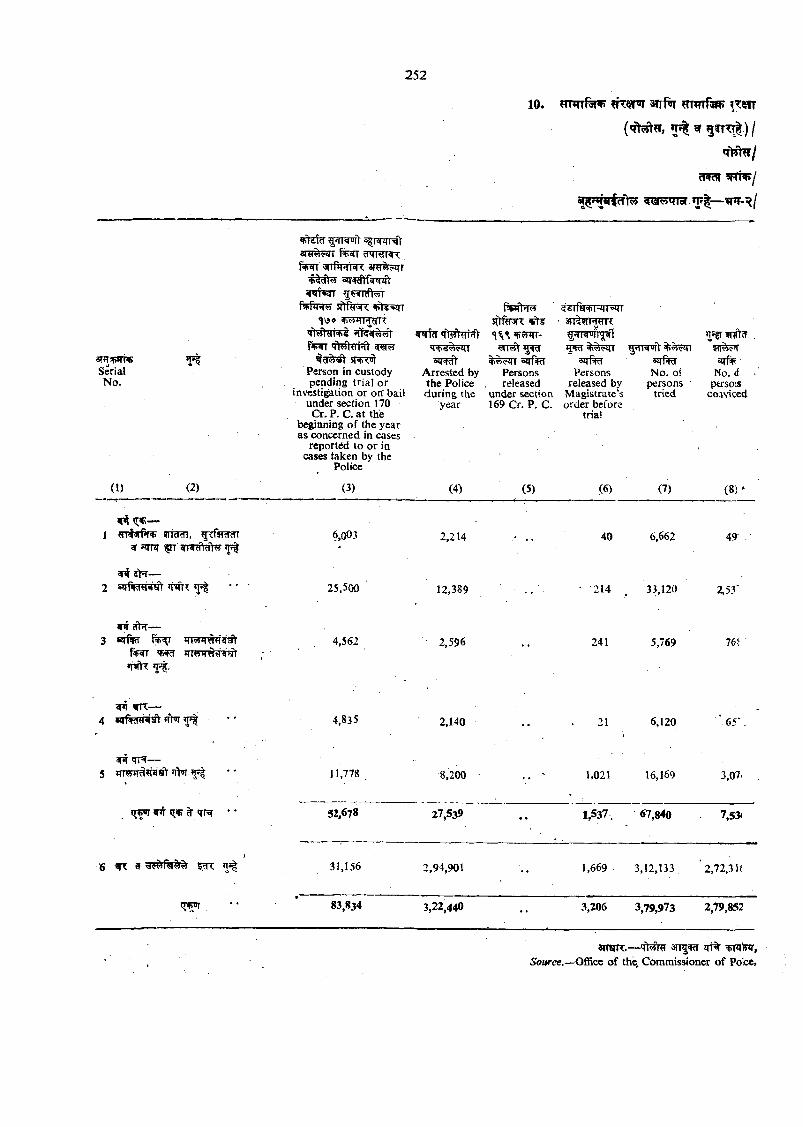
10. 3Trf^
^ sr g f T ^ . ) I
?R<v?Frtwr/
9^{rMt(|cO^ ^ w ^ n e r *p|]—
*pt2f?f gsTR^
^Fsrr ^nfirqW^ aror^f^r »M4cflT«t*44\
fafaHrt sjW n : vt?=KTT f v h ^ ^siftiwFzrrwT
snppnv 7 ^ Serial No.
V9o T9TTH5TR
ST XUI Person in custody pending trial or
investigation or on’ bail under section 170
Cr. P. C. a t the beginning o f the year as concerned in cases
reported to or in cases taken by the
Police
TBrhihftT+€?^qi
Arrested by the Police during the
year
Persons released
under section 169 Cr. P. C.
srr^WRmx
Persons released by
Magistrate’s order before
trial
sirPRr No. of
persons tried
WfftcT ,
arfif?No. (f ■
ptrsois cojviced
(1) (2) (3) (4) (5) (6) (7) (8}‘
1 ?i7craT,'JTR tjTT srrfcftdHr
6,003 2,214 40 6,662 49: .
^ ^ —25,500 ' 12,389 ' 214 , 33,120 2,53”
?fr!T—3 ®rfw insnrnwgrgY
F«rT *W5T trnynriw^^4,562 2,596 ... 241 5,769 7 6 r
4 ’frtw *' 4,835 2,140 . . 21 6,120 ' 6 5 '.
^ qr^—5 1TR5TTa?r# jfW ^ 11,778 . 8,200 •_• V 1,021 16,169 3,07. ,
qf«r 3R qfr ^ <Tnsr * * 52,678 27,539 •• 1,537, 67,840 7,53<
6 ^ ^ JT5| 31,156 2,94,901 •• 1,669 ^ 3,12,133 ' 2,72,3 U
83,834 3,22,440 •• 3,206 3,79,973 2,79,852
arruK.— ?tt%SoMTce.—OflSce o f the Commissioner of Poice,
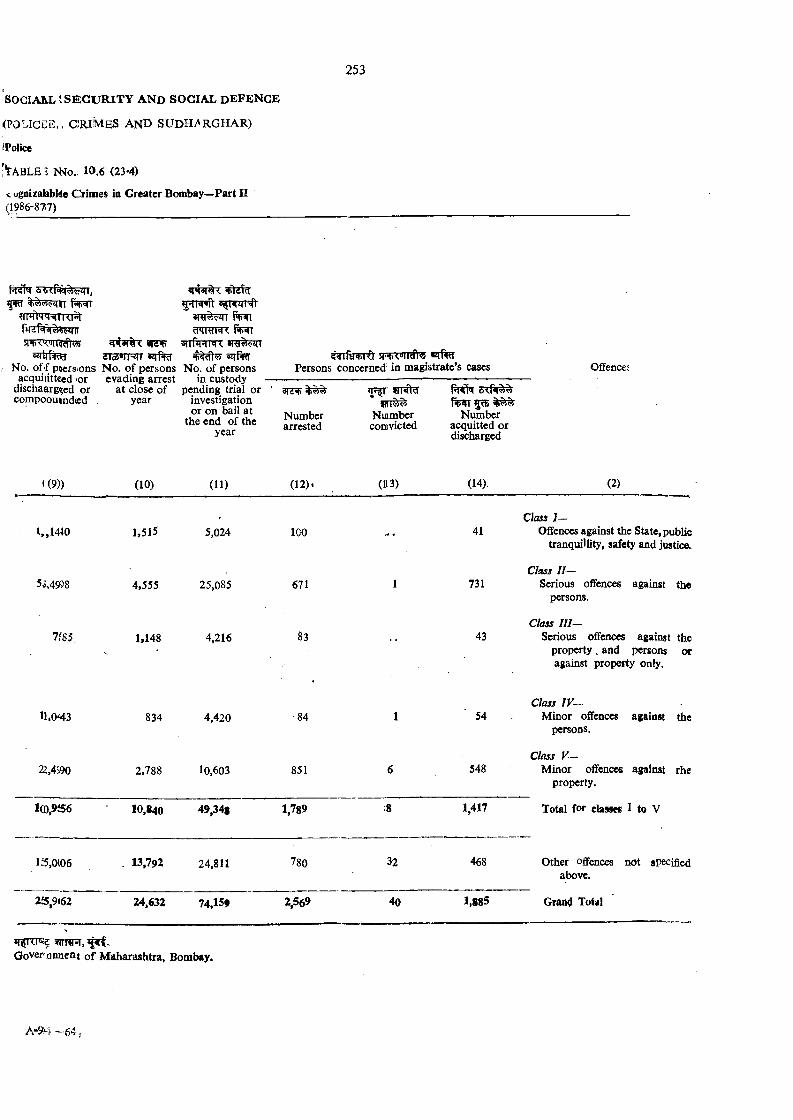
SOGIAKL {S E C U R IT Y A N D SOCIAL DEFENCE
<POLICEE,, C R JM e S A N B SU D H A R G H A R )
^Police
[VaBLE i Nvfo., 10.6 <23-4)
V ugnizaiablde Crim es in Greater Bombay—P art n(;1986-877)
No. o ff pocrsions acquiiitteed 'or
dischaarg?cd or compoouinded .
tn m rm
HT3*rFTT «jfRT 5^1%N o. of persons No. of persons evading arrest in custody
at close o f pending trial or year investigation
or on bail at the end of the
year
<i«ify«t>TO S‘+<®ridl«Persons concerned in magistrate’s cases
Numberarrested
^ i r r ^ * n n ^N um berconivicted
Number acquitted or discharged
Oflfences
((9)) (10) (11) (12). (113) (14) (2)
l„14tO
5;,49?8
1,515 5,024
4,555 25,085
100
671
Goverraimcnt o f M aharashtra, Bombay.
41
731
Class J—Oflfenccs against the State, public
tranquillity, safety and justice.
Class n—Serious offences
persons.
Class I I I -
against the
7j’S5V
1,148 4,216 83 43 Serious offences against the p roperty . and persons or against property only.
11,0^3 834 4,420 84 1 54Class IV—
M inor offences against the persons.
22.4S90 2,788 10,603 851 6 548Class V—
M inor offences against rhc property.
1(0,9*56 10,840 49,348 1,789 :8 1,417 Total for cktMes I to V
13,0(06 . 13.792 24,811 780 32 468 Other offences not specified above.
2S,9<62 24.632 74,159 2,569 40 1,885 Gran^ Tefal
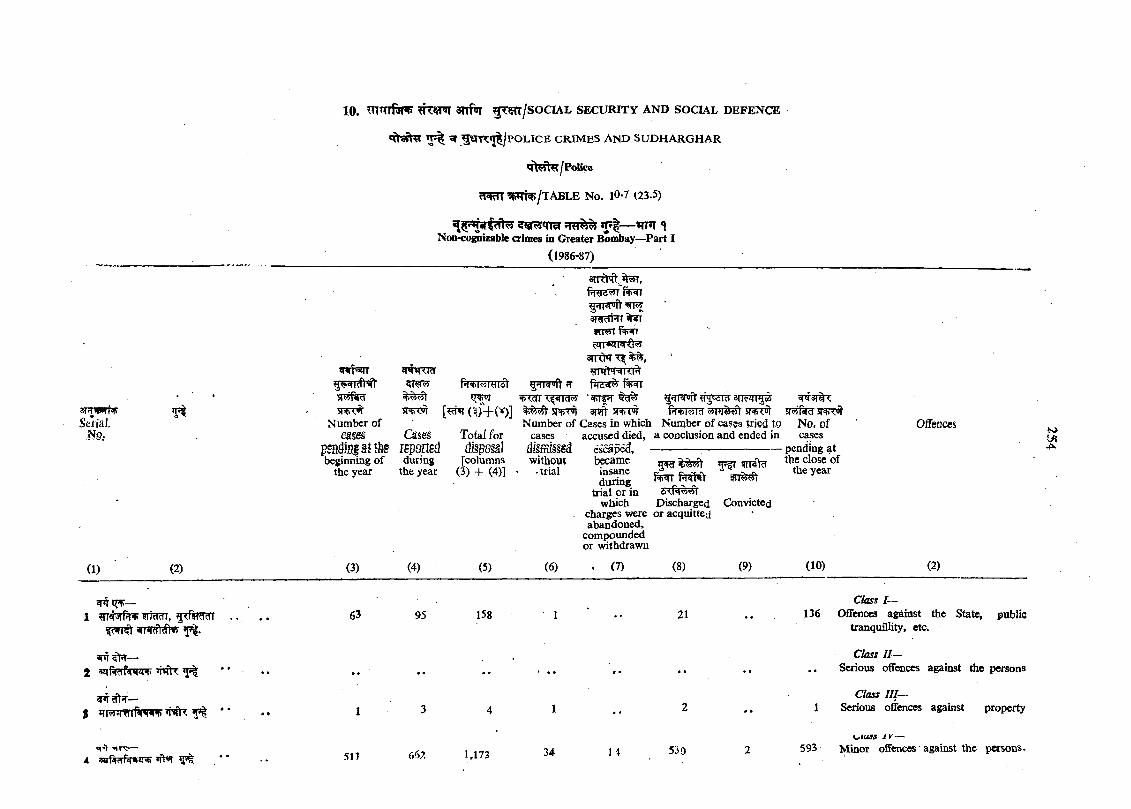
10 . snfor g r ^ / s o c i A L s e c u r i t y a n d s o c i a l d e f e n c e
^ ^ g « ip :n |/p o L ic E c r i m e s a n d s u d h a r g h a r
C(>5ft^j/PoUce
m ^ ^ m ^ l T A E L E No. 10-7 (23.5)
Non-cognizable crimes in Greater B ^ b a y —P art I
(1986-87)
3PT>WPITSfclial.
m .-
f tST jftRT
N um ber ofea§e§
psfi^isfaH fegbeginning of
the year
TTfTCRT
5 r ^ (^ )+ (^ ) ]
Casesreportedduring [columns
the year (3) + (4)]
pr=f«n ?T
Number ofTotal for cases
d k m is is i without
• trial
fiRT
SWRTT'TT %5T WT55T f%sTTezmzrmhT
sn rh T T ^ ^ ,?rm 1wo%
SR7W Cases in which accuscd died,
(1) (2) (3) (4) (5) (6)
eibecamc insane during
trial or in which
chargcs were abandoned,
compounded or withdrawn
. (7)
5'TT9Wl' anw rgsP<+l«ld SRRW n«f^d W W
Number of cases tried to No. of a conclusion and ended in cases:-------------;---------------------- pending at=p3r ’f f r
Offences ts>mj|i>
s r f k ^ ^ Discharged or acquitted
(8)
STT%
Convicted
(9)
the year
(10) (2)
1 9 7 ^ 3 1 ^ whrm',
'Tn 5t*T—' t 5qfiRrf rvTV ’Tfftr ^
$ JTT TTWrfkVIV ^
4, ^
63 95 158 21
511 667, 1.173 34 1 4 53a
Class I—136 OflFences against the State, public
tranquillity, etc.
Class I I - Serious offences against the persons
Class III—1 Serious offences against property
oforj iK —593 Minor offences against the persons.
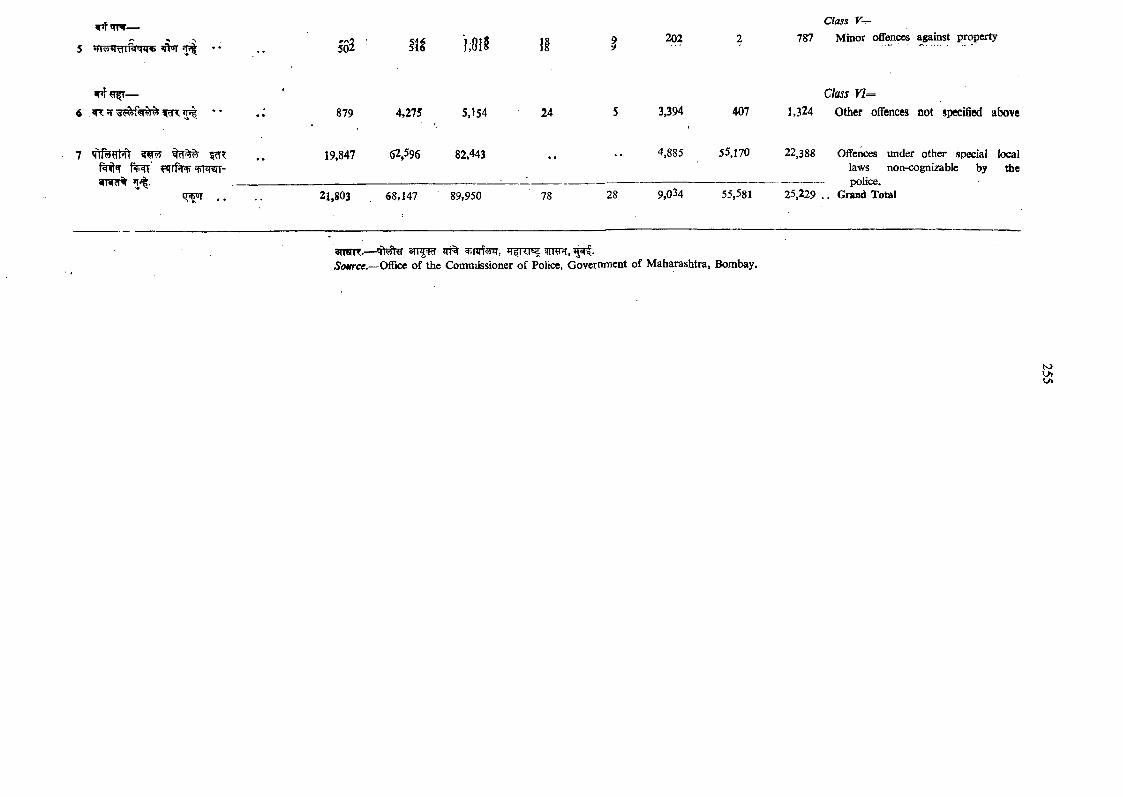
5o:;2 I l f i m 1§202
Class V—787 Minor ofiFences against property
879 4,275 5,154 24 3,394Class F/-
407 1,324 Other offences not specified above
7
. .
19,847 62,596 82,443
21,803 , 68,147 89,950 78 28
4,885 55,170
9,034 55,581
22,388 Offences under other special local laws non-cognizable by the
------------police.25,229 . . Grand Total
3nwT. — 5rnR,Sowrcff.—Office of the Commissioner of Police, Government of Maharashtra, Bombay.
K>u»
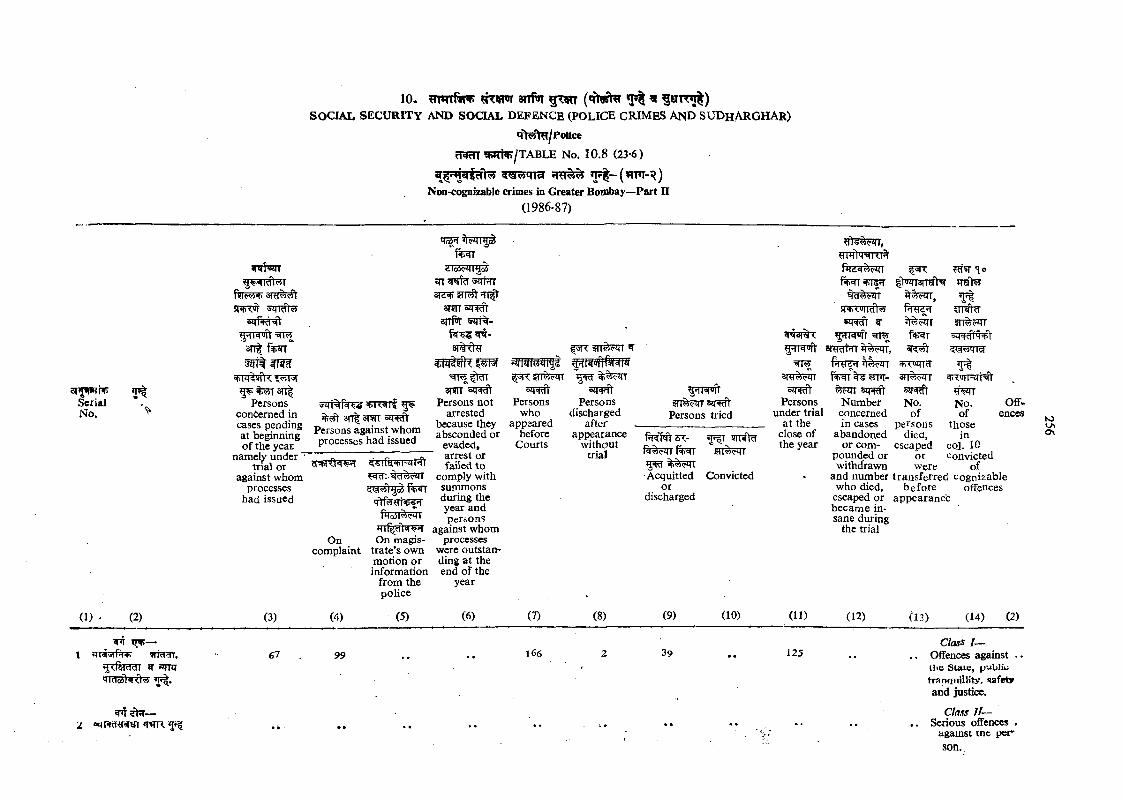
(1) (2)
10 . sn f tr g T wSO CIAL s e c u r i t y AND SOCIAL D EFEN CE (PO LICE CRIM ES AND SU D h ARGHAR)
qt?5tH/PoUce
5TW?n ?|WrR>/TABLE No. 10.8 (23*6)
Non-cognizable crimes in Greater Bombay—P art II (1986-87)
emfan
SRRor 5A|Rft«sAir-wxfr
an t^ n t fT lf
TPT WtX ^ %55T 3TT|
Persons conCerncd in cases pending a t beginning of the year
namely under • trial or
against whom processes
had issued
an t smr Persons against whom processes had issued
(3)
Oncomplaint
(4)
^^rfsRTRrMt
?^^fhgo5 f%WT<r\nriyi+«'f
On magistrate’s own motion or information
from the police
(5)
dfoieinijal?n 5zrNr
3Tsn<i{Tfw 5qr%-
4*4-
3RIT oiJ'kO '“Al'Kff s w f tPersons not Persons Persons
arrested who dischargedbecause they appeared afterabsconded or before appearance
evaded. Courts withoutarrest or trialfailed to
comply withsummonsduring theyear andpersons
in ^ w r <xi*wt Persons tried
5^- srraW5Tl%eJTT
•Acquitted Convicted or
discharged
W#3iI r
SJT#!' Persons
under trial a t the
close of the year
against whom processes
were outstanding at the end of the
year
(6)
sR pT in^
arotTHi
I+«il ?5T*r-^•kO
Number concerned in cases
abandoned or com
pounded or withdrawn
and number who died,
escaped or becam e insane during
the trial
fjp ; ??hT
' iNIcTSTT%?^
5 i r ^ ?rwrNo. No. Off-
of of enccspersons those
died, inescaped col. 10
or Convicted were of
transferred cognizable before offences
appearance
loo^
(7) (8) (9) (10) (11) (12) (13) (14) (2)
^ —■1 SjriHrTT,
^<fM?TdI er «TFT
®r*T —•2 *^PKf€wm ^
67 99 166 39 125Class / _
Offences against . tlic State, public trananillity. safety and justice.
Class IT— Serious offences .
against tnc per* son.,.
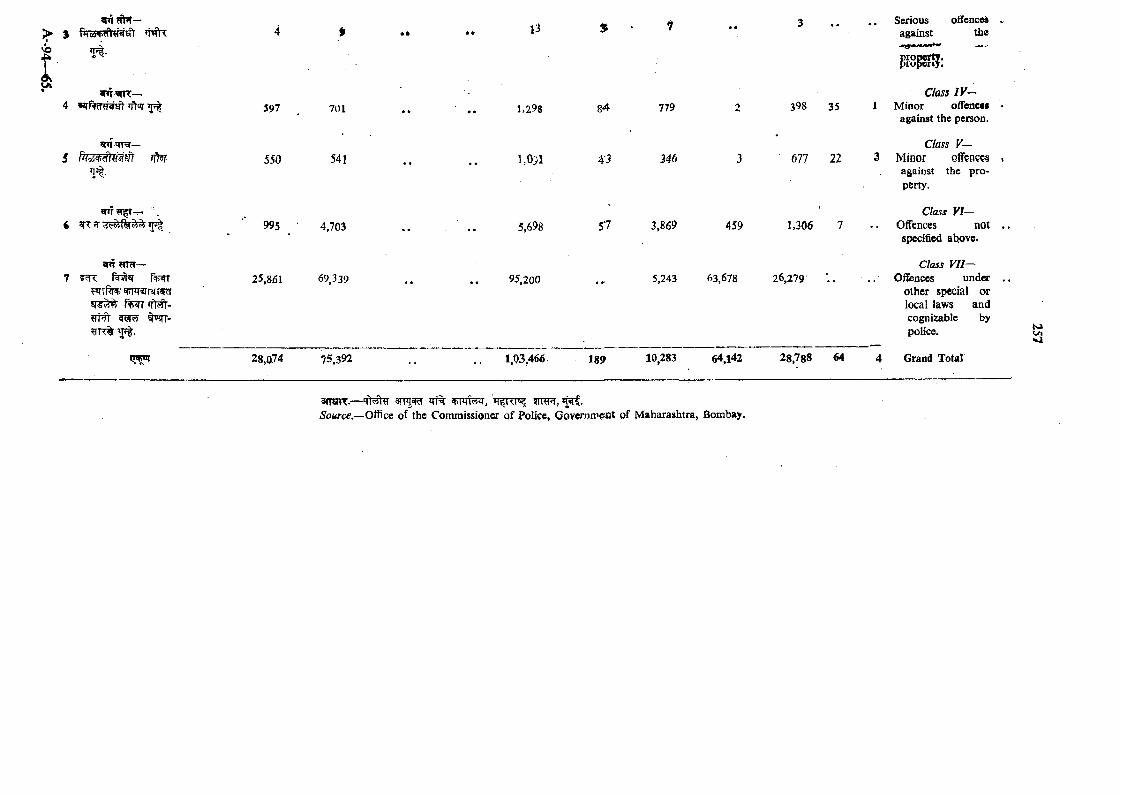
?nt *n^—5 jfPn
T t-
*rn OTrT—7 f%‘9w f% r
w r« rR f^ tf t^ -
^ ? w T O -
597
550
701
541
995 4,703
25,861 69,339
1,298
h ^ A
S,i
95,200
A-3
779
346
57 3.869 459
398 35
677 22
1,306 7
5,243 63,678 26,279 ’. .
Serious offenceiagainst the
2s,a74 75,392 1,03,466 189 10,283 64,142 28,788 64
Class IV— M inor offenc**
against the person.
Class V - Minor oflFenceiagainst the property.
Class V I - Offences not
specii&ed above-
Class VII— Offences under
Other special or local laws and cognizable by police.
Grand Total
NX
3TT^^ vmrr,Source.— of the Commissioner of Policc, Govcrno:’<?nt of Maharashtra, Bombay.
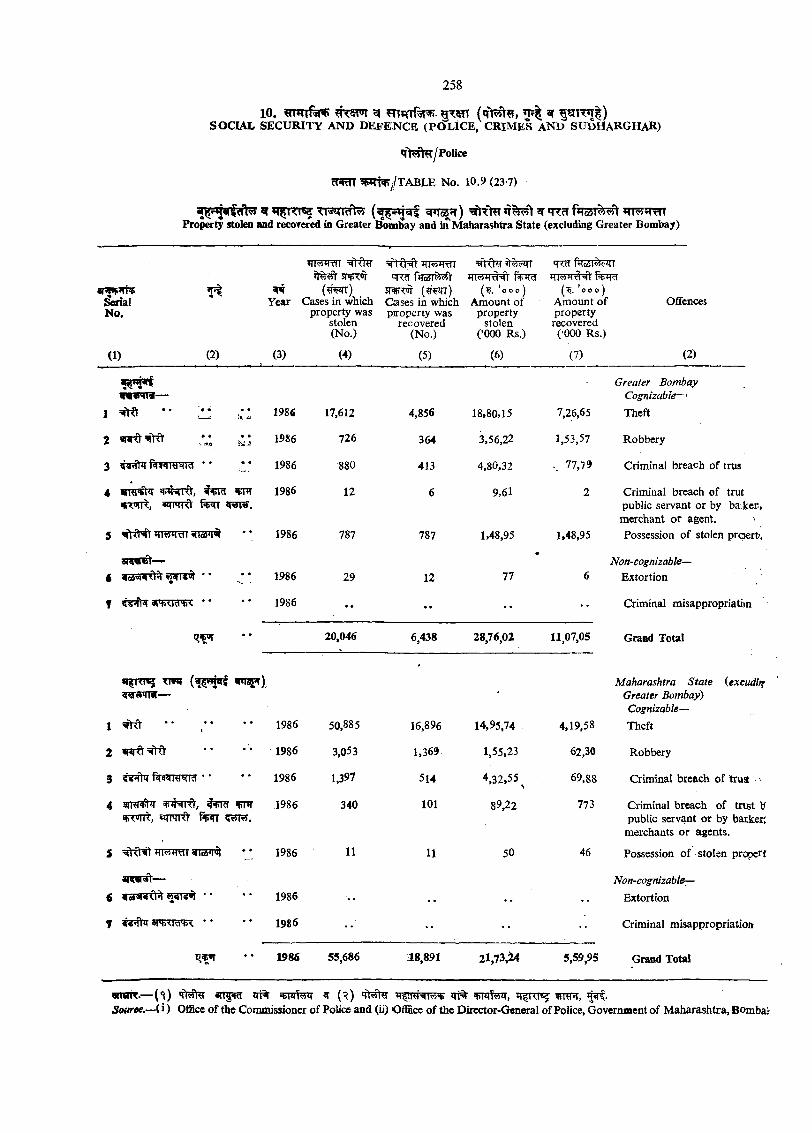
10. ^ n ? | ^S O C U L SE C U R IT Y AND D E FE N C E (P O L IC E , C R IM E S AND SUDHARGHAR)
* J> ^ /P o U ce
W ^ l l T A B L E No. 10.9 (23-7)
^ tr^TTpsz qrcT j t f j w tProperty stolen and recovered in Greater Bombay and in Maharashtra State (excluding Greater Bombay)
SerialNo.
(1) (2)
iTTwm =^itTNtiTT^wr5RT^ TtcT 5% ^
WS . 5T13Tor ( ? f ^ ) (^. ’ ooo)Year Cases in which Cases in which Amount of
property was piroperty was property stolen recovered stolen(No.) (No.) (’000 Rs.)
(3) (4) (5) (6)
('5. ’coo)Amount of property
recovered (’000 Rs.)
(7)
Oflfcnces
(2)
I •* 1986 17,612 4,856 18,80,15 7,26,65
2 1986 726 364 3,56,22 1,53,57
3 V5<fhT fWfTTWcf * * * * 1986 880 413 , 4,80,32 77,79
1986 12 6 9,61 2«n*rrd w i» .
5 W iRn wiapi 1986 787 787 1,48,95 1,48,95
—i io$3iaixlf * * ./ * 1986 29 12 77 6
f * * * * 1986 •• • # •• ••
20,046 6,438 28,76,02 11,07,05
1 ^ 1986 50,885 16,896 14,95,74 4,19,58
2 •• •• 1986 3,053 1,369 1,55,23 62,30
3 “ 1986 1,397 514 4,32.55^ 69,88
4 ipji’fnO', ^ 1986 340 101 89,22 773
5 'itxNt +<l<f4 riT * * 1986 11 11 50 46
aiwft—£ WeS RRtrf •• 1986 •• • • •• • •
7 SPfiXHSR ** ** 1986 •• •• •• ••
1986 55,686 38,891 2l,73,i4 5,59,95
Greater Bombay Cognizable—'Theft
Robbery
Criminal breach of trus
Criminal breach of trut public servant or by ba ker,
merchant or agent.Possession of stolen p roert.
Non-cognizable—Extortion
Criminal misappropriatiin
Grand Total
Maharashtra State {excudir? Greater Bombay)Cognizable—Theft
Robbery
Criminal breach of trust ■'
Criminal breach of tn s t \f public servant or by barker:
merchants or agents.
Possession o f stolen properf
Non-cognizable^Extortion
Criminal misappropriation
Grand Total
wwtT.— (*i) aiT5^ ^ (^ ) qi% vriW t,Source.—U ) Office of the Commissioner of Police and (ii) Office o f the Director-General of Police, Governiaent of M aharashtra, Bombai
W ^ / t ABLEN o. 10.10(23.8)
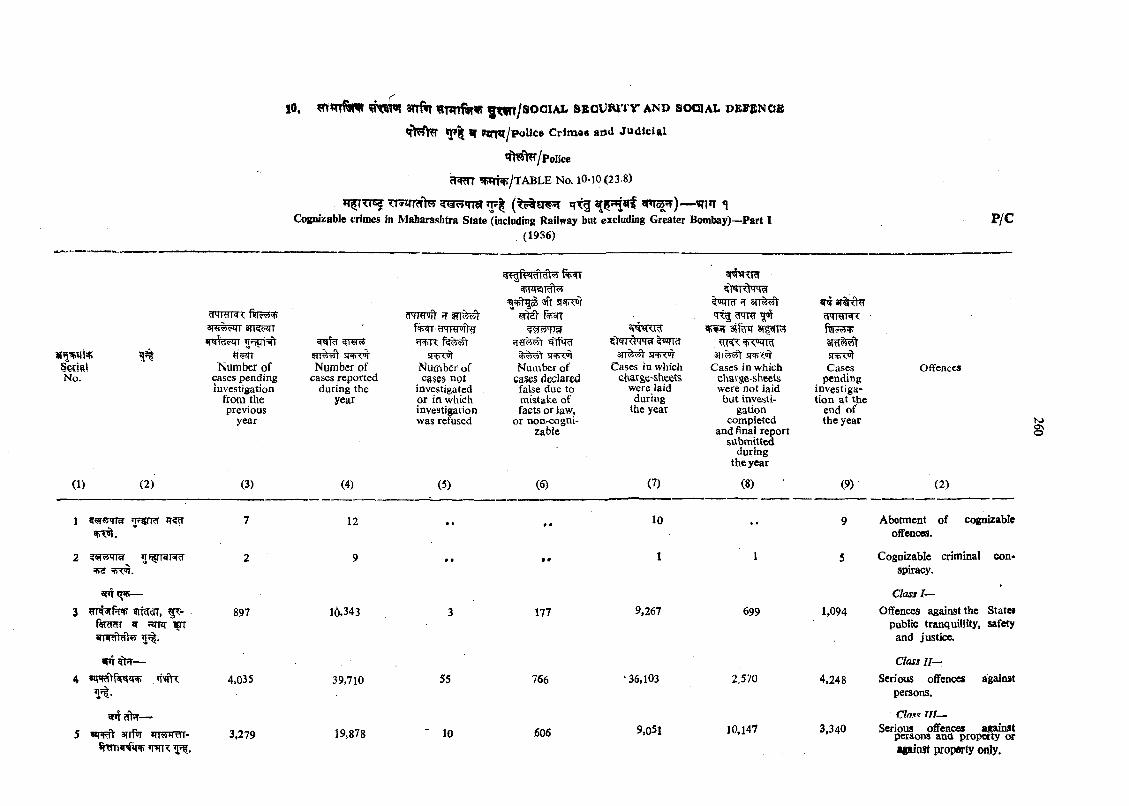
10. 5sn«rT%nr g t fr t /s o o iA L s E c v w T y a n d s o g ia l o e f b n o e
PlTT*f/PoUc« Crimes aod JudlcigX
« T t^ /P o U ce
cRm ?WT^/TABLE No. lO-lO (23 8)
’T^TTTW TTWrT>y ^W qieT — ?n*T *{Cognizable crimes in Maharasiitra State (including Railway but excluding Greater Bombay)—Part I
(1986)P/C
cTTraiT?:efrRe?rr
SRv?Tir *1 3[%thT
5TW ?TT^r sjcpT'Jr Number of
cases reported during the
year
'i 411 0) r*c<i rrraoTTfr
m i t
^t^nrl^riw %WRT s r r^ ^ jr^ or
Cases in which charge-sheets
were laid during
the year
dmy ^ w r 3j%iT
Cases pendiag
investigation at the
end of the year
SerialNo.
Number of cases pending investigation
from the previous
year
H+l< l<i<rt«i sr^R^r
Nufriber of cases not
investigated or in which investigation was refused
Number ofcases declared
false due to mistake of facts or law,
or noU'Cogni- zable
Cases in which chai'ge-sheets were not laid
but investigation
completed and final report
submitted during
the year
Offences
(1) (2) (3) (4) (5) (6) (7) (8) (9) (2)
7 12 • • •• 10 •• 9 Abetment of cognlzabic oflFences.
2 9 * • • • 1 1 5 Cognizable criminal conspiracy.
Sfrj
3 9itcrar, 5^- fipRmr w Sim WT
897 16,343 3 177 9,267 699 1.094
Class I—Offences against the Statei
public tranquilHty, safety and justice.
*nr ^ —
4,035 39,710 55 766 ‘ 36,103 2,570 4,248
Class II—Serious offences against
persons.
snrefhr—5 wiw> 3iTf«r *irwwr- 3,279 19*878 ' 10 .606 9,051 10,147 3,340
Clnji^ Uf-r—Serious offences asainst
persons ana propetty ot
N>s
against property only.
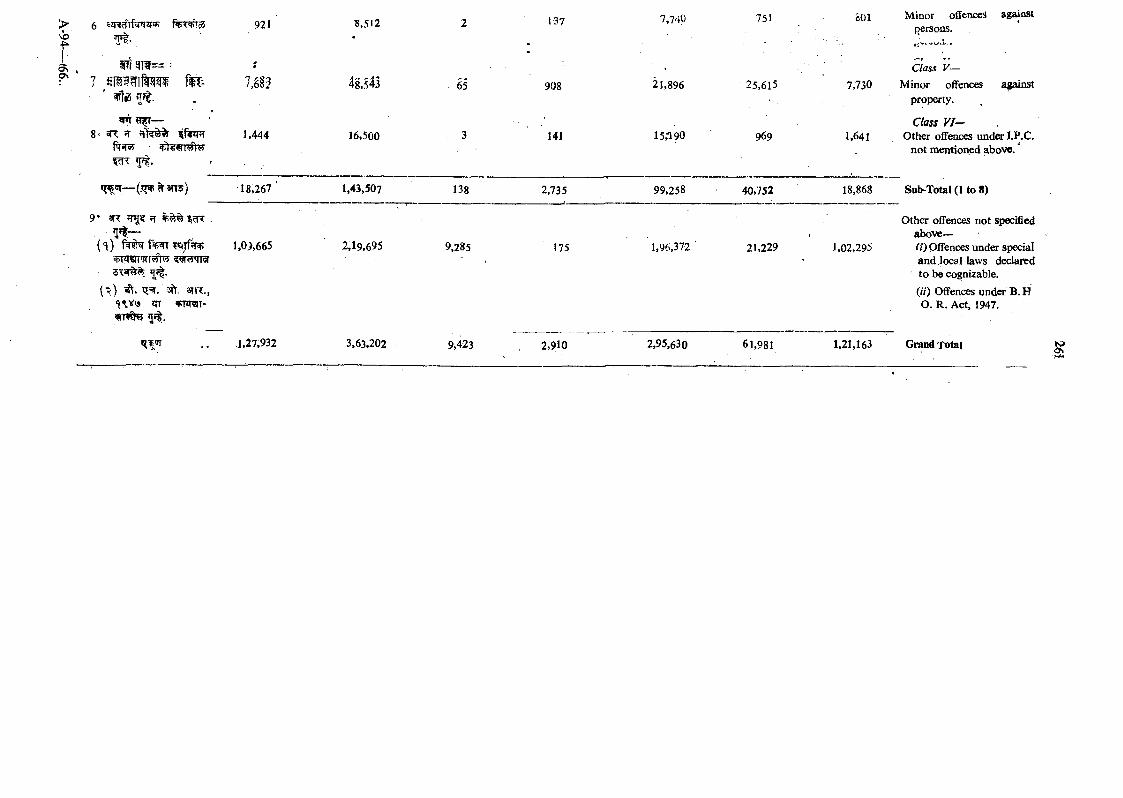
oo\
6 f%T^55 921
T t- ,
7 fm? l ,m
^ ?i|rf—8> ^ ff s f k ^ 1,444
Prsf^
q^sr— (.qifi ^ WS) 18,267
9 ’ 2R ^ ’ cT? ., ^ f ^ _
( ^ ) fspm cfTPrerwr^t^ swotiw5sS(^,
( ^ ) 5|\. 3f{. 3ir<.,'i^v\3 zrr JFTiraT- «8Tf&0 ’jfl.
1,0:),665
.1,27,932
16,500
1,43,507
2,19,695
3,63,202
65
138
9,285
9,423
908
141
2,735
175
2,910
21,896
15,190
99,258
1,96,372
2,95,630
25,615
969
40,752
21,229
61,981
gOl Minor offences againstpersons.
Class V ~7,730 Minor oflFences a ^ n s t
property.
Class V I - 1,6a \ Other offences under I.P.C.
not mentioned above. ‘
18,868
1,02,295
Sub-Total (1 to 8)
Other offences not specified above—0 ) Offences under special and local laws declared to be co^izable.
(//) Offences under B. H O. R . Act, 1947.
1,21,163 Grand Total
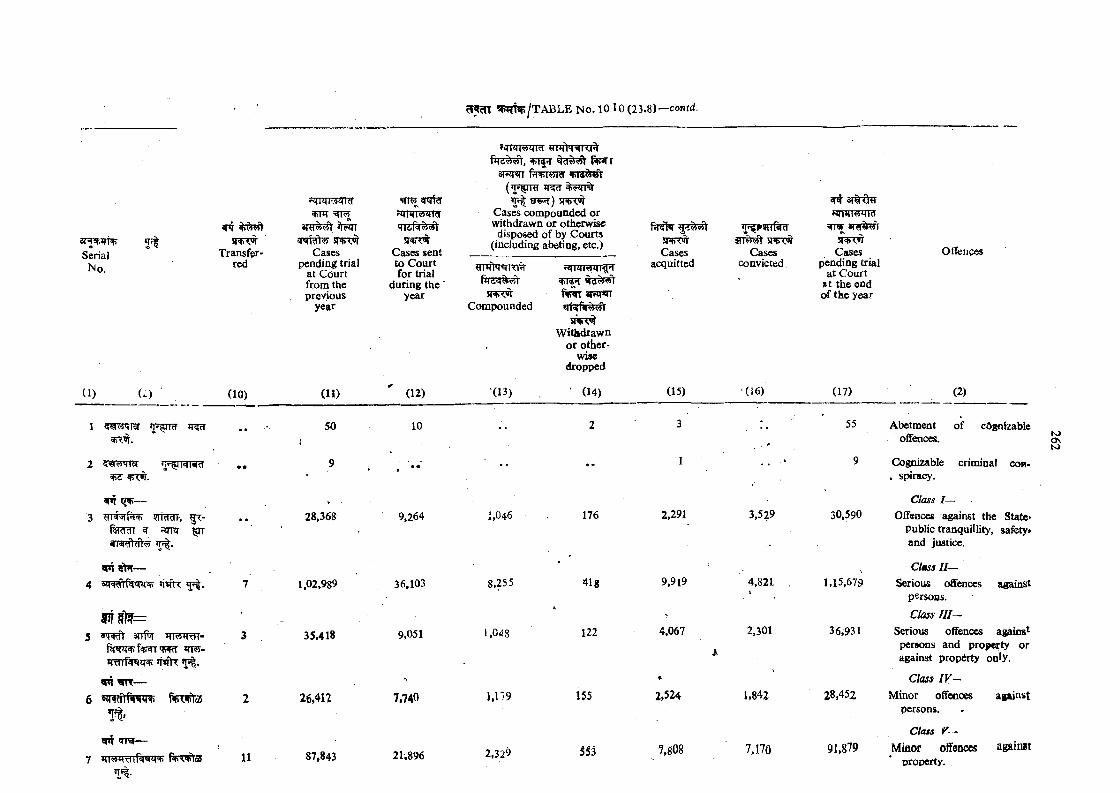
SerialNo.
!Tt?R
Transferred
(1) U )
1 <T9WIT9 ^ '^ Id
2 5 W n ^ ^ T »fWdms ^nyfr
ar»T —3 HT#5rt^ 9ricraT',
*ni —4 5z[s#1wTnT *Mtr Jpl.
W 9 l ? =5 anfiT iTRmm-
*TRy-*rtTTf^A)+ *nftr
*TT —
n >
fVTVtS
<Tra—
xn' rBfTrrf nsrsR) ftrrvt®
(10)
11
HmTFTZncTsfrnr
g^R«t Cases
pending trial at Court from the previous
year
(11)
50
28,368
1,02,989
35.418
26*417
87,843
=^9raf?r'4WI<jiA)ld
Cases sent to C ourt for trial
during the year
f JTRRsinw w ftrs rm ^ irni'i
^ ET^) SRTCO Cases compounded or withdrawn or otherwise
disposed of by Courts (including abeting, etc.)
(12)
10
9,264
36,103
9,051
7,740
21,896
. 9TlT>HnH
sR>T»rCompounded
(13)
f w a n w
snn:^W»tl>drawn
or otherwise
dropped
■ (14)
STPTtirCases
acquitted
STTvRlt SRvOT Cases
convicted.
(15) (16)
i,046
8,255
1,048
i,179
2,329
176
418
122
2,291
9,919
3,529
4,821
4,067 2,301
155
553
2.524 1,842
7.170
HTi=mmwi?r
iRT^vft
Cases pending trial
at Court at the end o f the year
(17)
55
9
30,590
1,15,679
36,931
28,452
91,879
Offences
(2)
Abetment of cdgnizable oflFences.
Cognizable criminal cob- . spiracy.
Class I—Offences against the State*
Public tranquilUty, safety* and justice,
Class H—Serious offences against
persons.
Class 1 1 1 - Serious offences agains^persons and property or against p ro p ^ y only.
Class I V - Minor offenccs against
persons.
Class V—Miaor offences
property.ap in st
K>Onto
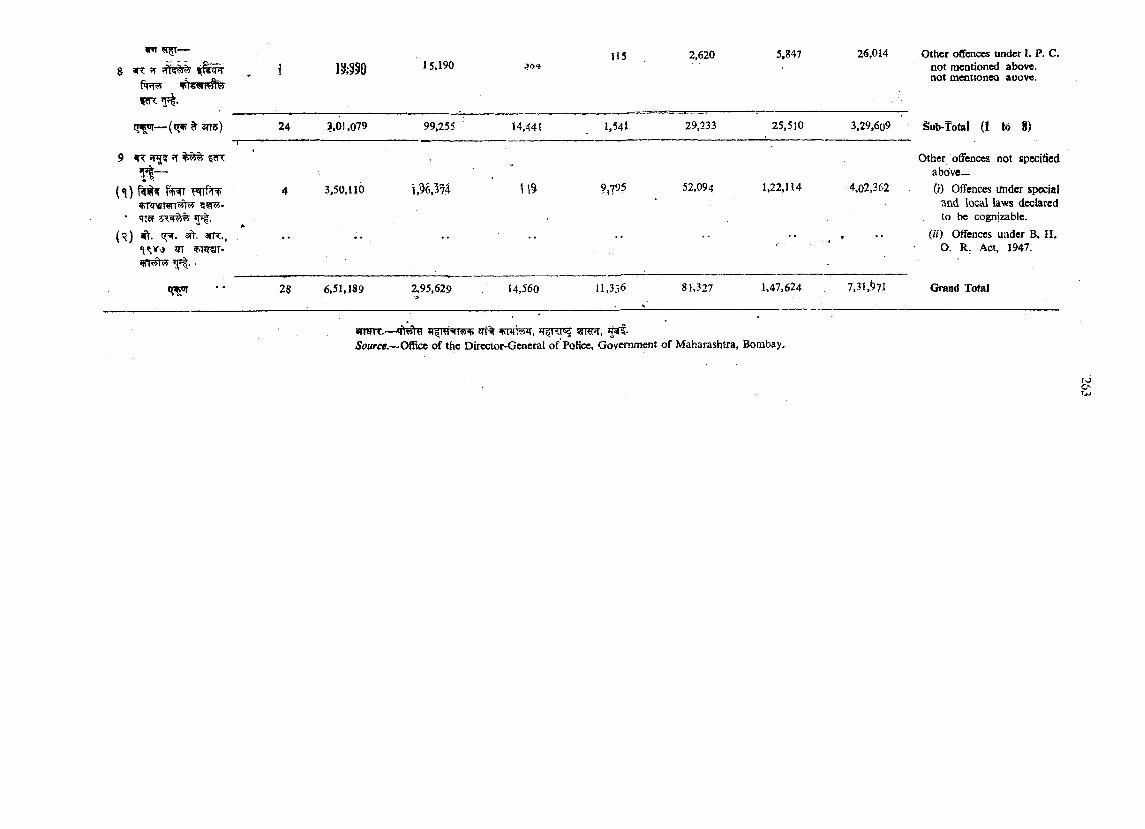
m ^ —
g 5T
»Tf|.
i I 3 ; 5 f 015.190 :>Oif
115 2,620 5,847 26,014 Other ofifences under I. P. C. not mentioned above, not mentionea aoove.
— ( q r v ^ s r r s ) 24 3.01.079 99,255 14,441 l,54 l 29,233 25,510 3,29,609 Sub-Total (1 to 8)"/ ■ ^
9 H T 5 T 5 ? 5T ^ Other offences not specifiedabove—
( ^ )
‘ ‘IT^F *TrS.^ A
4 3,50,110 1,96,574 \ \ % 9 ,7 9 5 52,094 1,22,114 4,02,362 (/ ) Offences under spccial and local laws declared to be cognizable.
{ \ ) i t . IT^ . s it . 3 T R .,
qr f.TJTSIT-• • * • • • • • . 4 • (h) Offences under B. H .
0 . R. Act, 1947.
q W 28 6,51,189 2,95,629 14.560 11,336 81,327 1.47,624 7,31,^71 Grand Total
«nmT. — sptrtt,5w rce.~O fficc of the Direaor-General of Poficc, Govcmment of Maharashtra, Bombay.
(Oo .
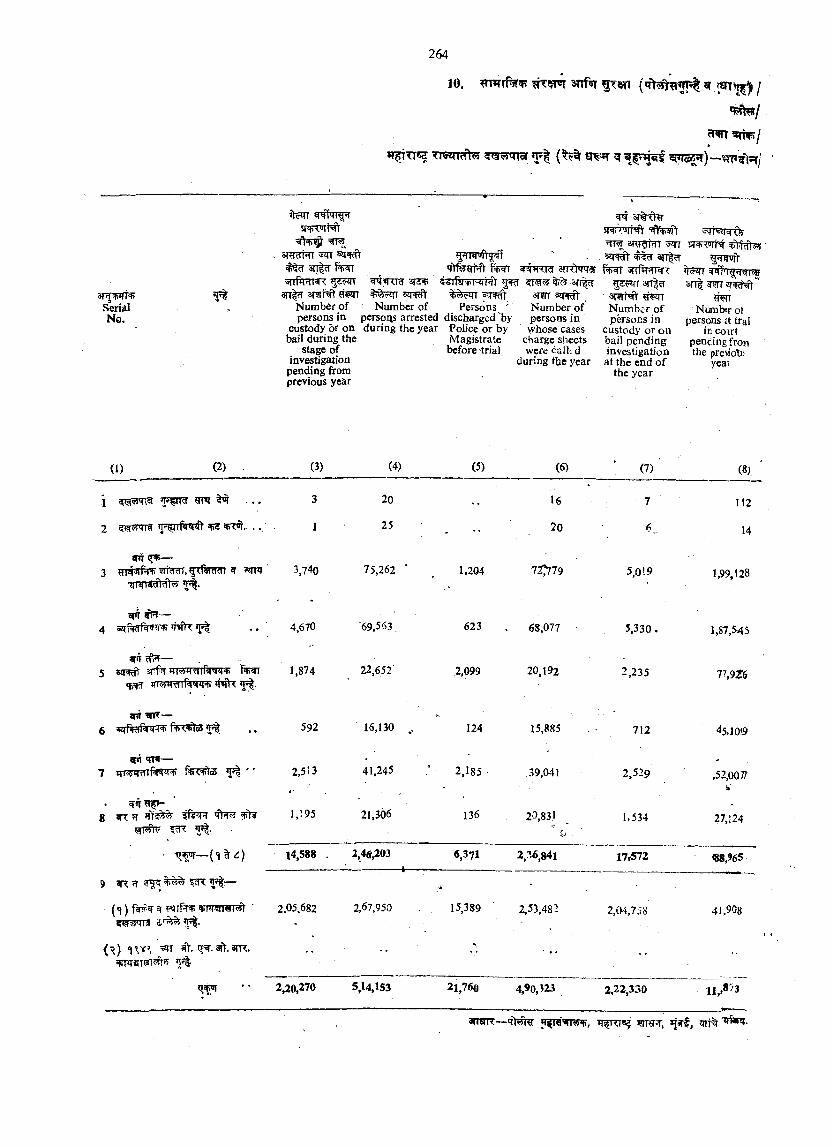
JO. sn f’JT g r w r ^ /
?TftTF5f TrwTM lw 5 w q i ^ * f | (^?% ^
a p r w ^SeriiilNo.
itFTTSRTTJlHt
- aregrhrr ^ f w .srTfVTR^ ^WUcf 3 J ^
^ 3it| ct amMt ? T ^ % '^in, Number of Number of
persons in persons arrested custody or on during the year bail during the
stage of investigation pending from previous year
prsRft Persona '
discharged'by Police or by Magistrate before trial
3r?rT ^<hft N umber of persons in whose cases
charge sheets were ca lk d
during the year
f t 3T% ^
^ srwrrTT ^ 3 n ^
yrrfwwx g ^ r a n l ^ r
3T9rHt fiwT N um ber of persons in
custody or on bail pending investigation
at the end o f the year
wfnr TFrrsR
w r Numbtr of
persons it tral ir coirt
pencingfron the preMoti>
yeai
(i) (2) . (3) (4) (5) (6) (7) (8).
1 ^ . . . 3
2 5WTTS ^ . . . . 1
tnr <ri»—3 HT#3rf7p> WTW.ftfiffcRTI «nzr ' 3,?40
^ —4 szifiRrf^ifw ^nftr ^
20
25
75,262
‘69,563,
22,652
1.204
623
2,099
16
20
72^779
68,077
20.192
7
6^
5,0! 9
5 ,330.
2,235
112
14
1,99,128
1,87,545
77,9Z6
srfl ^ —6 aqPwHl'ilT^ Pjx.+'lod’Tf| 592 16,130 124 15,885 712 45,1019
8 ^ 3,195
41,245
21,306
j 4,588 . 2,4®,203
9 5T ^ !p|:—
(<}) ^rfirarw ^ ■ 2.05.682 2,67.950.
(r) <0T . aft.3TR.JT?!'
2,20,270 5,14,153
2,185
136
39,041
20,831
«,371 2,36,841
15,389 2,53,48. .
21,760 4,90,323
2,529
1,534
17*572
2,04,758
2,22,330
,52,0077-i'
27,i24
<88,965 .
41.908
11,,8"3
arraR— q 1 ^ *jirf, >wt%
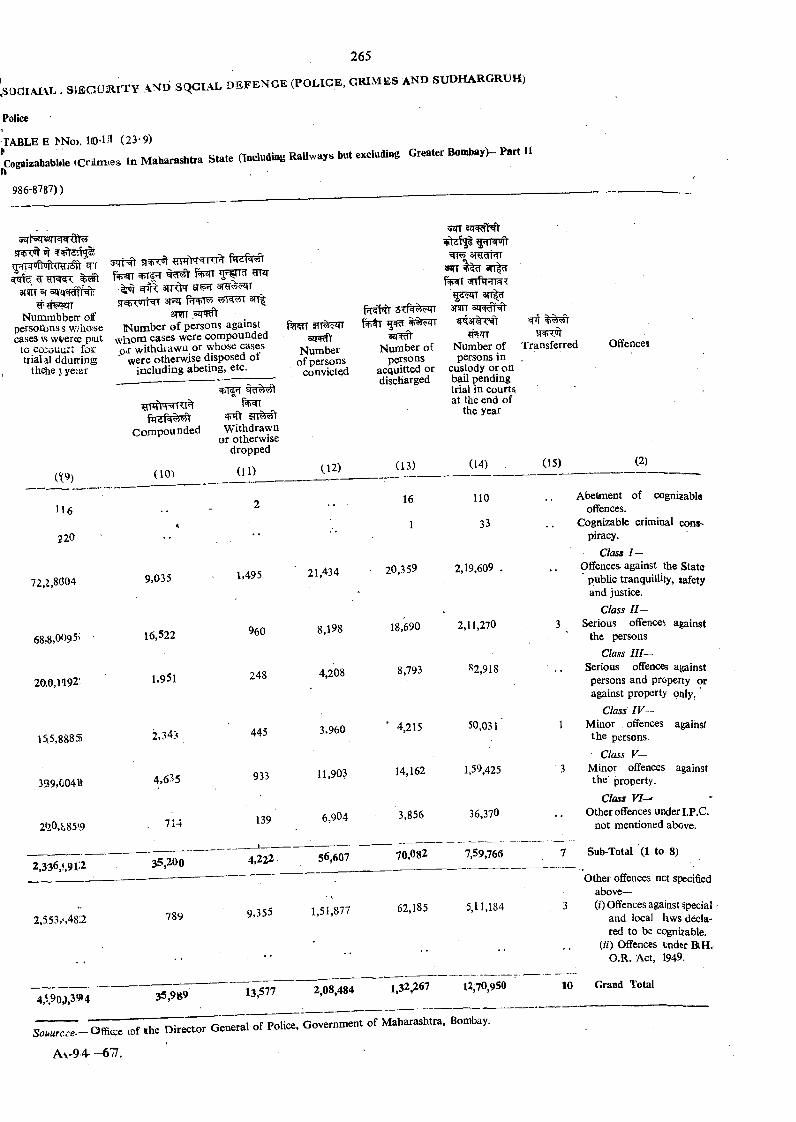
,SO aiA L\L
Police
, S IB O U S IT Y AND SqC IA L D E F E N C E (POLICE, CRIM ES AND SUDHARGRUH)
TABLE E ^No). KO-l l (23-9)
Cogni*ababl»le iCrnmses
986-8787))
in M aharashtra State (Includmg RaUways but excluding Greater Bombay)- Part n
s n m ot7fTpn>it'>it?Rri ri
3f?rf =f sqfwffNiT
Nummhberr off persorbnss w/hoise cases \s wveree piut
to co;ouurt foir trial al ddurring
th ^ e j yeiar
5irH t frrdW r
^ 3rrdq’31r3T r^+T55 3 n |
smriNumber o f persons against
w h o m cases were compounded 0,r w ithdiaw u or whose cases
were otherwise disposed ot including abeting, etc.
Number of persons
convicted
(^9)
^rnft’Twro^
C o m p o u n d e d
(10)
W ithdrawn or otherwise
dropped
(11)
116
220
72,2,8004
68-8,0P95i •
20.0,1192.
I5i5,8885
339,00411
2(20,ii859
2,336,‘,91;2
2.553,s48;2
4A90P,39>4
9,035
16,522
1,951
2,34:^
4,635
714
1,495
445
933
139
35,200
789
35,989
f%tr ^
Number of persons
acquitted or discharged
51TT*1 N'^n
5JHf%^r 5rrfTFnw7
3tt| w ann 5 iR # ^
«R3T%^
Number of persons in
custody or on bail pending trial in courts at the end of
the year
Transferred Offences
( 12) (13) (14)
21,434
16
1
20,359
110
33
2,19,609 .
960 8,198
248 4,208
18,690 2,11,270
8,793 82,918
3,960 '4 ,2 1 5 50,031
11,903
6,904
14,162 1,59,425
3,856 36,370
4,222 56,607 70,0s2 7,59,766
9,355 1,51,877 62,185 5,11,184
13,577 2,08,484 1,32,267 12,70,950
Souurcc.e-— C!>ffio:e lof th e D irector
A v -9 4 — 6 7 .
General of Police, Government of M aharashtra, Bombay.
(15) (2)
Abetment of cognizable offences.
Cognizable criminal conspiracy.
Class I —Offences- against the State ’ public tranquillity, jafety
and justice.Class I I —
Serious offences against the persons
Class I I I - Serious offence against persons and property or against property only. ‘
Class IV Minor offences againsr
the persons.
Class V—Minor offences against the property.
Class F / - Other offences under I.P.C.
not mentioned above.
Sub-Total (1 to 8)
Other offences net specified above—(i) Offences against special
and local kws do:la- red to be cognizable.
(») Offences vndcr B.H. O.R. Act, 1949.
10 Grand Total
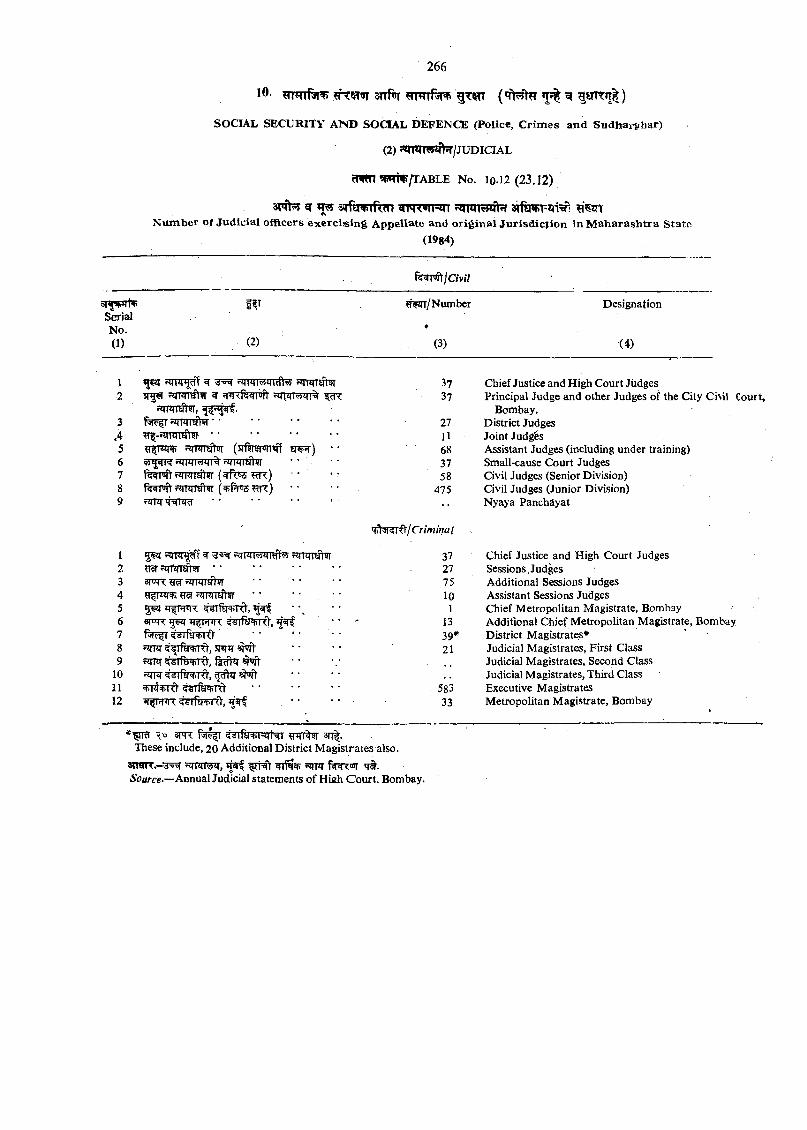
10. ( ' f t ^ ’T’t ^
SOCIAL SECURITY' A N D SOCIAL DEFENCE (Police, C rim es and Sudhai-jrhar)
(2) /JUDICIAL
^TfV/TABLE No. 10.12(23.12)
^ v m 3 !rfsnFT f^ ^ ‘ ITTNumber of Judicial officers exerc isin g Appellate and orig inalju risd iction in M aharashtra State
(1984)
Civil
SerialNo.(1)
MV
(2)
#§?IT/Nuinber
(3)
Designation
(4)
1 r^wiaYsfr 3^2 srg« wiTAiiw ui w H7n:f^Fft fcir 3?
” nm ra^,3 rtrthW ■ ■ ' ■ ■ * • • 27
,4 ‘ ■ ’ ■ * * * • U5 RmnfNr (sfifremKtf 5 [ ^ ) • • 686 rqiijitnvi • • • • 377 ■' . ■■ 588 ‘ * ' * 4759 T^fRgr
I Criminal
1 piT «r RTTWWiB fifTillsfliJI 372 HW ’ ■ * ■ • ' ' ’ 273 srcqr fJTPTT^ . . . . . .4 fJTnrnjt?r ** ■’ ■■ lo
6 8}tqx . . - j37 ■ ■ ' ' * ■ 39*8 fiTRT sfirfij^Td, ff*nr ^ •• •• 219 fJTnr fg#?T ^
10 jqw ^Tfa%T<l, ^11 '+i*)+iO c{€ify+r<Cl12 tr^THJK 55TfEmX>, ^
58.333
Ro 3m: f^ fT ^^ifewF^rNnr ar^.These include, 20 Additional District M agistrates also.
3ITOTT.— 3^ i^TFnWT, ' TPT f5RX™T 'IW.Source —Annual Judicial statements of High C ourt. Bombay.
Chief Justice and High Court Jixdges Principal Judge and other Judges of the City Civil Court,
Bombay,District Judges Joint JudgesAssistant Judges (including under training)Small-cause Court Judges Civil Judges (Senior Division)Civil Judges (Junior Division)Nyaya Panchiyat
Chief Justice and High Court JudgesSessions JudgesAdditional Sessions JudgesAssistant Sessions JudgesChief M etropolitan Magistrate, BombayAdditional Chief Metropolitan Magistrate, BombayDistrict Magistrates*Judicial Magistrates, First Class Judicial Magistrates, Second Class Judicial Magistrates, Third Class Executive Magistrates M etropolitan Magistrate, Bombay
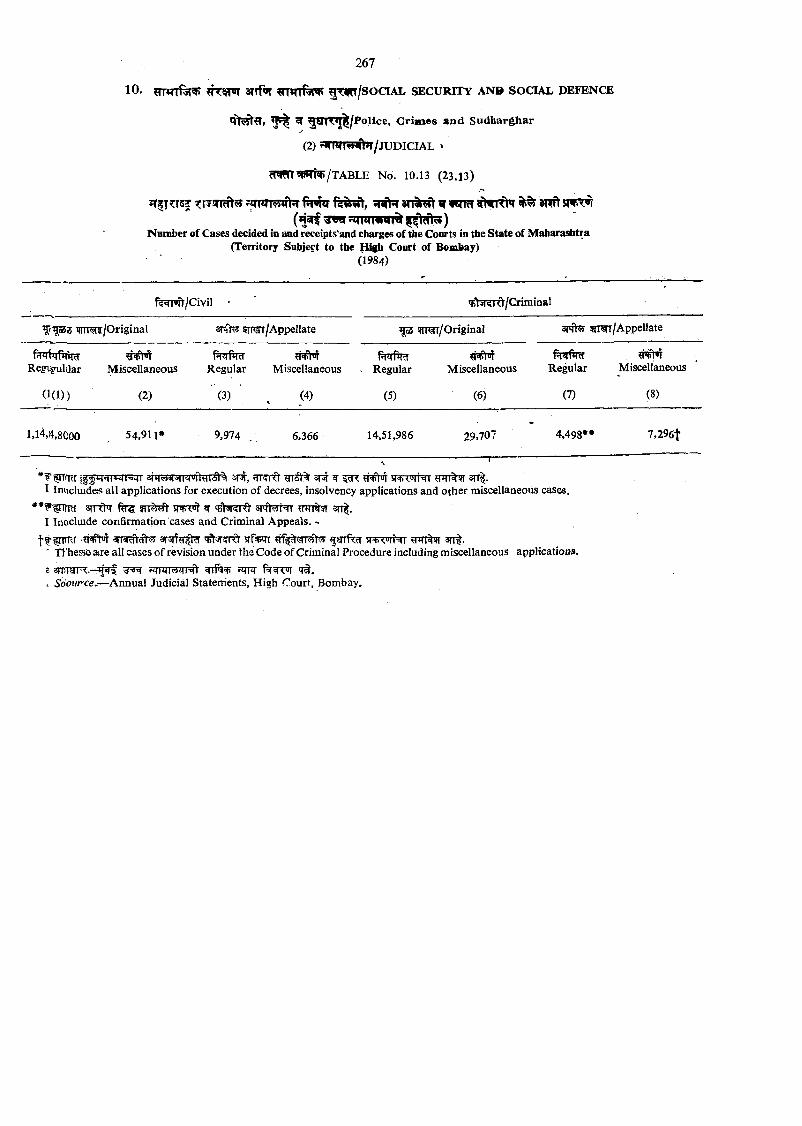
1 0 . sTTf T ^ r m r f ^ g T w /s o c iA L s e c u r i t y a n b s o c i a l d e f e n c e
^ gEnr^T^/PoUce, Grimes and Sudharghar
(2) riTW iw4)h / j u d i c i a l
cW m ^W W /TABLE No. 10.13 (23.13)
SHtRft ^ 1®TRT Sffft SHVX^(W'^C TWT r im n v ^ T ^ )
Number of Cases decided in and receipts'and charges of the Courts in the State of Maharashtra (Territory Subject to the fiigh Court of Bombay)
- ■ (1984)
f^WI^/Civil
Regvg-ulilar
0 (D )
Miscellaneous
(2)
3rvt^ 5rn^/AppelIate
f nrPT rRegular
(3)
Miscellaneous
(4)
'sV^RRt/Criminal
frnrfimRegular
(5)
Miscellaneous
(6)
3rft«y ^ i^ /A p p e lla te
Regular
(7)
Miscellaneous
(8)
1,14,4,8000 54,911* 9,974 6,366 14,51,986 29,707 4,498**
* ^ ' ^ f T 5 T i^ ^ ® T 'T T * ^ 9 T 5 z n 3 f 3 f , H K i O ? n s ) % s n r ^ ? n T T % ^ 3T T ^ .
I In<\clmde!s all applications for execution of decrees, insolvency applications and other miscellaneous cases.
arrdq- ftra e t ^ s f w t ^ srft^H r ^nrrt^r 3n |.I InQcluide confirmation cases and Crim inal Appeals. ^
f f ntrd k^rf^rftgr s r f w qarrf^ si^<urr^r arrl.' Tl’hesse a re all cases o f revision under the Code of Criminal Procedure including misx;ellaneouS appHcatioos.
8 srnra'R:.-^;^! 't# .. Sdource.—A nnual Judicial Statements, High Court, Bombay.
7,296f
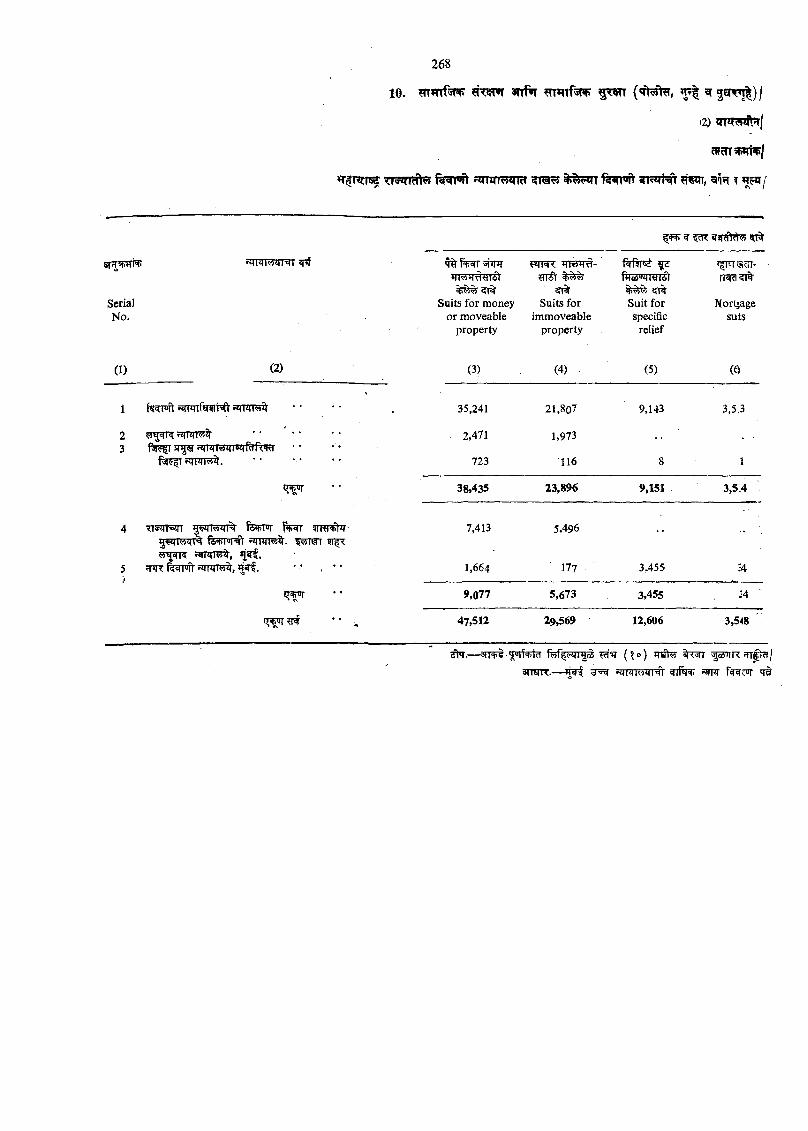
10. mmfsw? 3nf«r »Tf| 5^^) I'2) UT^'S4't»t|
? iTT »*TN»/
« T ^ r ! ^ <iyrqtcftH fiTTtTi^gn ^ ? T W ?r«qT, t ^5h /
^ ?T%
47,512 29,569 12,606
SerialNo.
t%f -<^T5i-inT
5T®rSuits for money
or moveable property
OTSt
Suits for immoveable
property
Suit for specific
relief
Nortjagesuts
(1) (2) (3) (4) (5) (Q
1 35,241 21,807 9,143 3,5.3
23
R rnrr^f <?§l «JTJ(T«5<<T fiff<W • •
f^T^fJTFfT^. ’ ■
2,471
723
1.973
116 8 1
38,435 23,896 9,151 3,5:4
4
5
T?g lT^T fe+Tir f T'fT 9rra%^jj' I6^T«n1 WITiTT li’. ?<?5rai ?)5"<
W^cjK w<Rr55i|, f«J«iFfl « NT<?4i), q irf. • ’ , • *
7,413
1,664
5,496
177 3,455 S4
9,077 5,673 3,455 34 '
3,548
ffh.— fef^^qpioi (? o ) q v te
arreTR.— ^ fJTTwqr# f rnr w
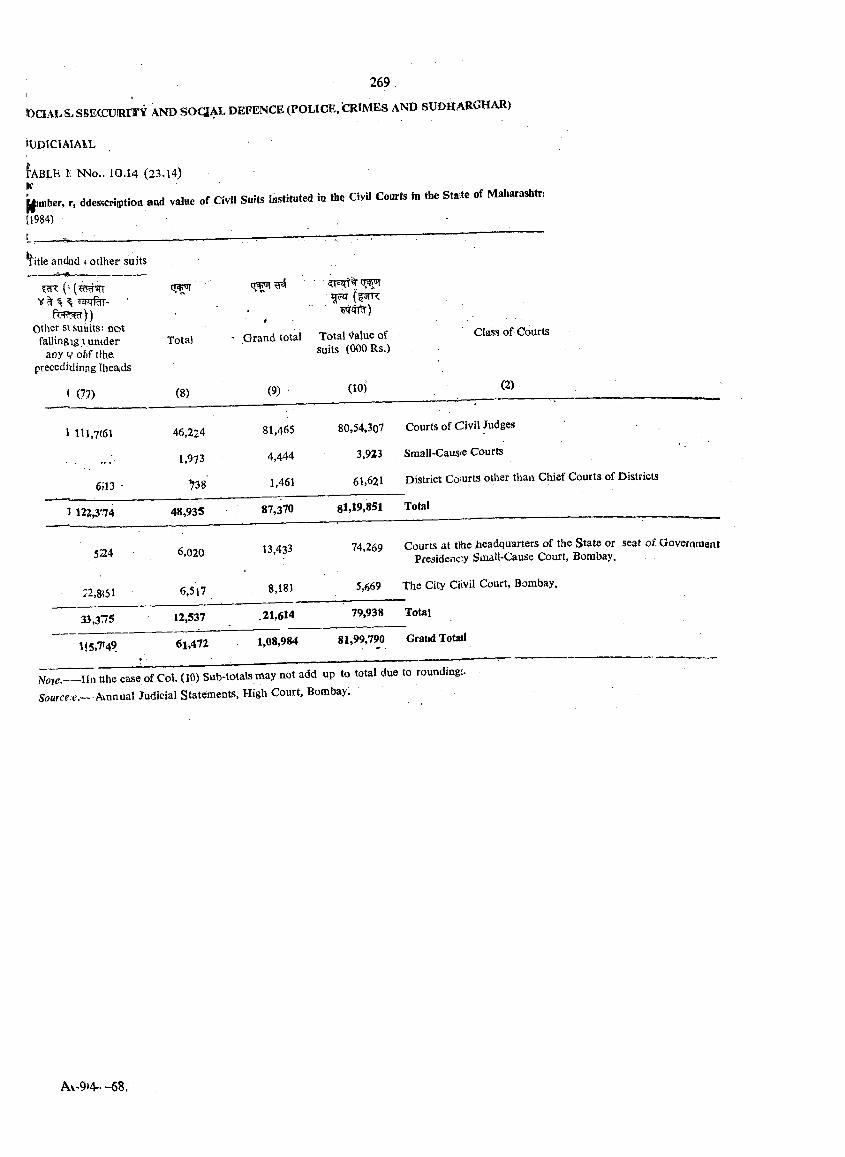
I 269
lOQAL SL SBECCUIRTTY AND S O Q A L DEFENCE (PO LIC E, CRIM ES AND SUDHARGHAR)
iUDICIAIAlL
fABLE I‘ W o .. 10.14 (23.14)WHumber, r, ddes^crijption and value o f Civil Suits instituted in the Ciyil Coarts in the Staite of Maharashtti
(1984) - .
itle andad t otJher suits
(■'V ^ ^ ^ ^wfirr-
other si suiiits'. not fallingig I untder
any 9 ofif tlhe prccedidinng Iheaids
< (77)
Total
(8)
1 111,7(61
6il3 -
46,224
1,973
^ 8
1 122,3'74 48,935
5224
:2,8551
6,020
6,517
33,3:75 12,537
Ij5,7f49 61,472
5Tsgft%^ (f3TR
m m )
G rand total Total value of suits (000 Rs.)
(9) (10)
Class of Gfourts
(2)
81,465 80,54,307 Courts o f C ivil Judges
4,444 3,923 Small-Caus<e Courts
1,461 61,621 District C ourts other than Chief Courts of Districts
87,370 81,19,851 Total
13,433
8,181
74,269 Courts a t tlhe Jieadquarters o f the S tate or seat o f Government Presidenc-y Small-Cause Court, Bombay.
5,669 The City Ciivil Court, Bombay.
.21,614 79,938 Total
1,08,984 81,99,790 Grand Totail
IVote.-----lln tthe case of Col. (10) Sub-totals may not add up to total due to rounding;.
A innual Judicial S tatem ents, High C ourt. Bombay.
Av-9J4- -6 8 .
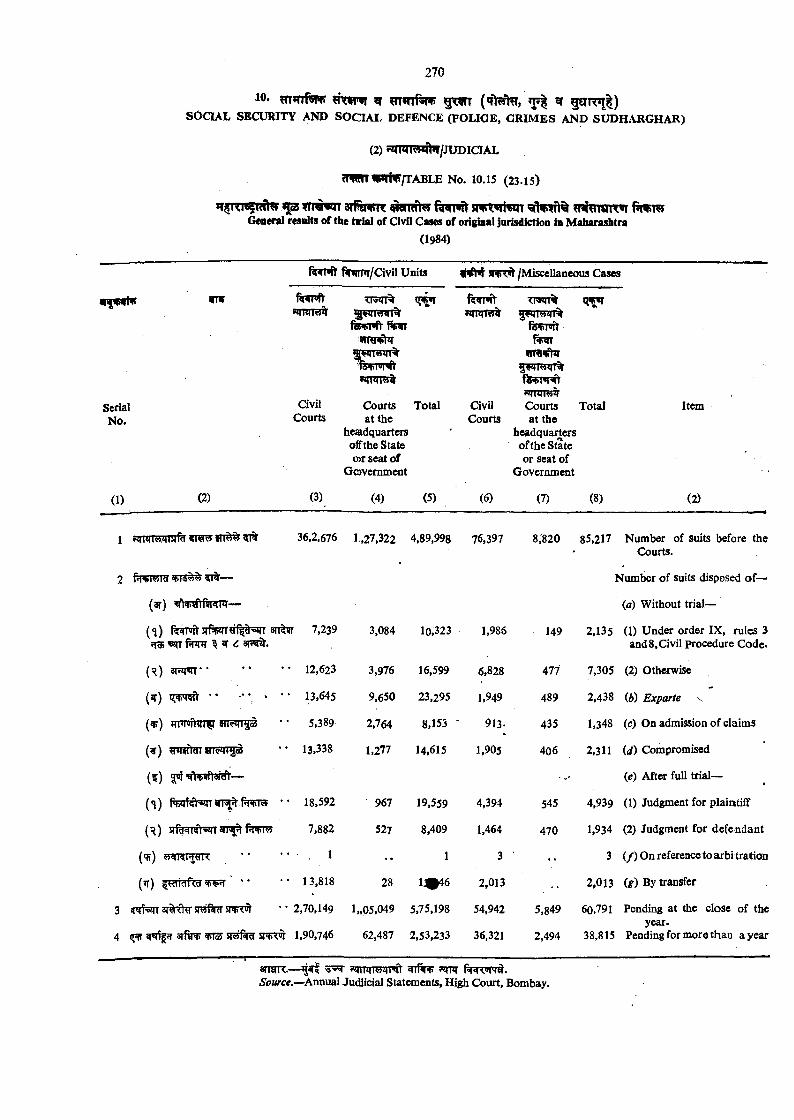
w - ^ ar g s r R q l )SOCIAL SECURITY AND SOCIAL DEFENCE (POLICE, GRIM ES AND SUDHARGHAR)
(2) 5min?wft»r/JUDiciAL
JWWT IWtV/TABLE No. 10.15 (23.15)
i m N n s d w R f tw n f t s m « r i ^General resalts of the tvial of Civil Cases of origiaal jurisdiction in Maharashtra
(1984)
Hf^swtv w n
S m alN o.
(1) (2)
fiswrift fttqiHT/Civil Units irtSH /Miscellaneous Cases
7r5zn%
fs v n ft
HFlT6Rn%%Civil
CourtsCourts Total a t the
headquarters off the State o r seat of
GcDvernment
5JjPira% 5< inw % fevm tf%WT
fisvT^nit « m rs ^
Civil Courts Courts a t the
headquarters o f the State or seat of
Government
Total
(3) (4) (5) (6) (7) (8)
Item
(2)
1 RTTinvWirf < IW H T ^
(9r) ^W fiinrnT—
(«j) a n ^ 7,2395T5 «5IT fWT ^ ^ 315^.
36,2.676 1.,27,322 4,89,998 76,397
{'^) 3nq«iT“
(^ ) ’
(w!) *<nr°n«Tir n rc m fs
(¥ ) yiTsftmr HRingd
(5 ) ^ ■
(«j) fqsiM hs^Tm ^frnn^
(<?))
(*t) ^ 9rf(Tfef
3 f (|f«TT STiif cr
12,623
13,645
5,389
13.338
18,592
7,882
1
13,818
3,084 10,323
3,976
9,650
2,764
1,277
967
527
28
16,599
23,295
8,153
14,615
19,559
8,409
1
iaP 4 6
2,70,149 1„05,049 5,75,198
4 3 r f ^ ^ 5 1 ^ 1,90,746 62,487 2,53,233
1,986
6,828
1,949
913.
1,905
4,394
1,464
3
2,013
54,942
36,321
8,’820 85,217 Number of suits before theCourts.
N um ber o f suits disposed o f—
(a) W ithout t r i a l -
149 2,135 (1) U nder order IX, rules 3and 8, Civil procedure Code.
477 7,305 (2) Otherwise
489 2,438 (6) Exparte v
435 1,348 (c) On admission of claims
406 2,311 id ) Compromised
(e) After full trial—
545 4,939 (1) Judgment for plaintiff
470 1,934 (2) Judgment for defendant
3 ( / ) On reference to arbi tration
2,013 ig) By transfer
5,849 60,791 Pending a t the close of theyear.
2,494 38,815 Pending for m ore than a year
anWT.—iSiparce.—Annual Judiicial Statements, High Court, Bombay.
tWai WriSf/ TABLE No. 10-16 (23 l6)
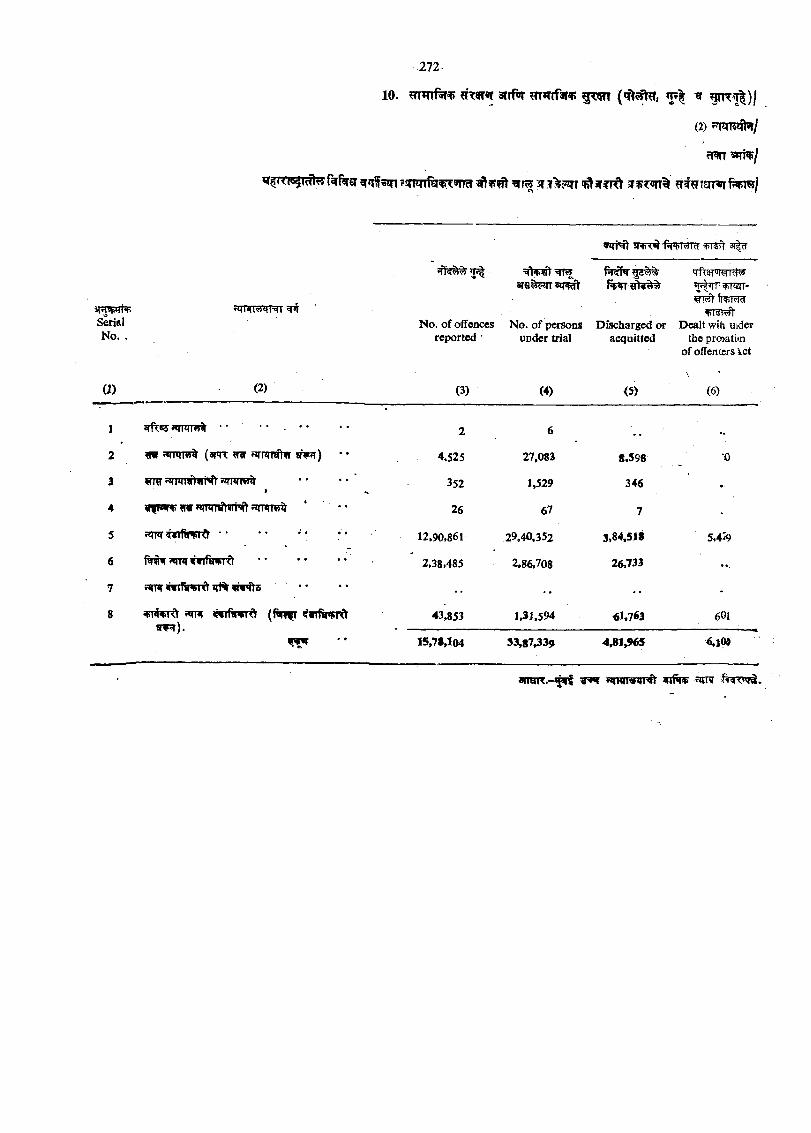
10 . aiffor HTirifsrtJ § ? s n ^ W l D I
(2) 7 n m < ^l
f « r f f ^ ?sn®nrfsr5f^«ncr w r s 3ii%?iyT srir^«rT% ?t#?TTarm fN nn/
3pmht>>3Serial N o. ,
5lfNt 3?|cr
«l4cO r )F2rr- <s(l^ W wti
N o. of offences N o. o f persons D ischarged w Dealt wih uider reported ; under trial acquitted theproatitn
of offentcrs ic t
(X) (2) (3) (4) <5)
\ ’
(6)
1 ^ * 5 «rnrmilr * * • • - * • 2 6
2 fw a n tn ^ (apR «?r HTnrrahr « M ) •• 4,525 27,083 8,598 '0
3 ww wiRnftnWl HTf*rW '5 <•
352 1,529 346
4 26 67 7 .
5 r'Tw <s<iRwi di * * * * ■ 12,90,861 29,40,352 3,84.518 5 .4^
6 *rnr tirftrvTft 2,38.485 2,86,708 26,733 ...
7 fSTT*r *rt% ?iw^5 •• . . -
8 vT*iiTfr «nw (f^rffr 5Wi1infrft 43.853 1,31,594 €1,763 601
15,78,104 33,87^39 4,81,965 A l09
aBTOR.-^^ isTrt np J?rR
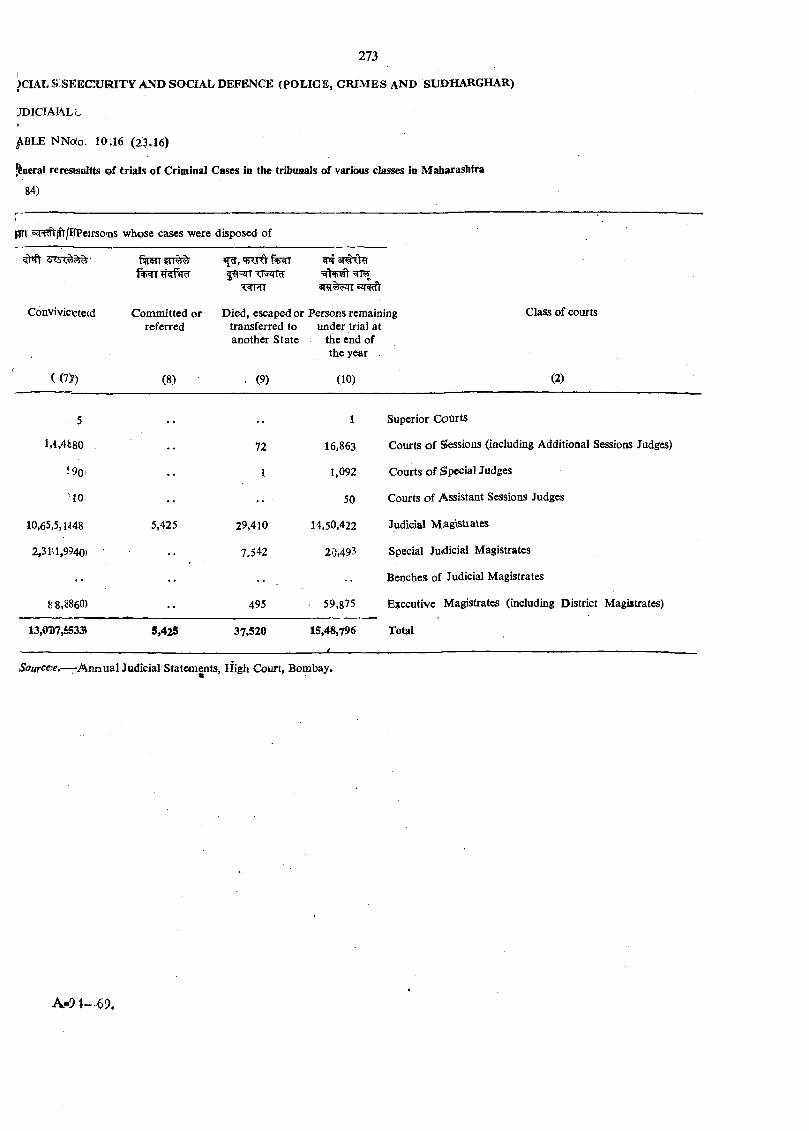
)CIAL S SEECX JRITY A ND SO C IA L DEFENCE (P O L IC E , C R IM E S AND SUDHARGHAR)
JD IC IA I\L L
^BLE NNofo. 10.16 (23.16)
^neral rerestsuHts o f tria ls o f Criminal Cases in the tribunals of various classes in Mahairashtra
84)
|?TT 5q^/ft/]^Peirso'ns whose cases were disposed of
fSRTT iTT%^
■«RJ
Convivicttecd Com m itted or referred
Died, escaped or Persons remaining Class of courts transferred to under trial at another S tate the end of
the year
( (7 » (8) . (9) (10) (2)
5 1 Superior C ourts
1.4,4^80 • • 72 16,863 Courts o f Sessions (including Additional Sessions Judges)
^90. 1 1,092 Courts o f Special Judges
^10 • • •• 50 Courts o f A ssistant Sessions Judges
10,65,5,1448 5,425 29,410 14,50,422 Judicial M;agistiales
2,3111,9940) •• 7,542 20,493 Special Judicial Magistrates
... . . . •. Benches of Judicial Magistrates
8 8,8860) •• 495 59,875 Executive Magistrates (including District Magistrates)
13,01)7,£533 5,425 37,520 15,48,796
t
Total
Source:e.—-A n n u a l Judicial Statements, High Court, Bombay.
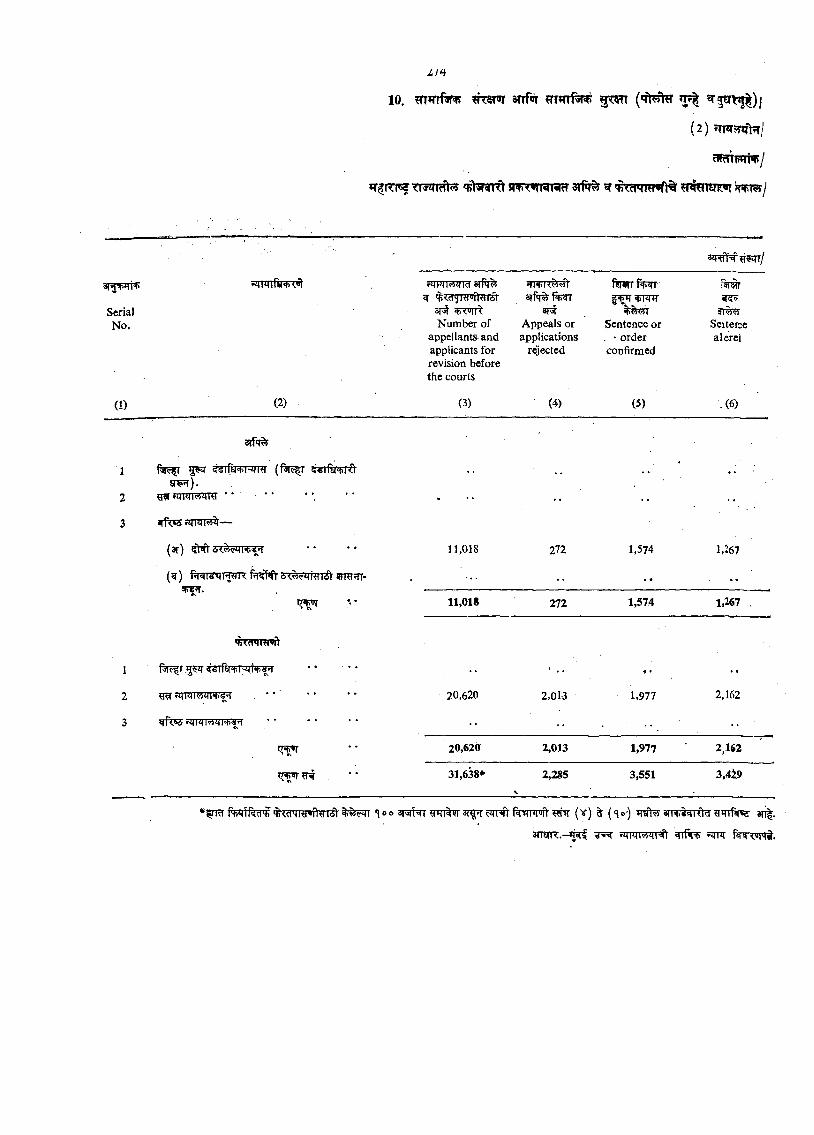
10, 3nf»r »t? | ^ f a r > : i | |) |
( 2 ) fw ?y ji> r/
cffcTTPtnV jjgr^R pgTtT sri^ g ? q^iRfTfr 5nfr<*TWiiiH ^ ^ th /
SerialNo.
(1)
w<Fnrw«P'i ’»i
(2)
riTPTHirrgr 3rf r% ^ '^■<d'JI'ff«nyi6)
3T ^Number of
appellants and applicants for revision before the courts
3 lf ^ Pf)c||
Appeals or applications
rejected
f t r * r r f ^l ^ ^ i F n r
^%55T , Sentence or
, ‘ order confiriiied
Seitersealerel
(3) • (4) (5) .(6)
»h • •
11,018 272 1,574 1,267
11,018 272 1,574 1,267 ,
20,620 2,01-3
t •
1,977 2,162
20,620 2,013 1,977 2,162
5 ^ ) .* *
5wrfiRiTfl‘
(^f) f TWrS T HTX fn 'WV i 1(5) 5)R|fTT-
’RT?T?ro'fft
5EI '
^fc55 f? rraR q i^^
31,638* 2,285 3,551 3,4i9
V o 3 T 3 f^ ? iJ n % ? r3 r^ ? q T ^ f^ m n ^ ^ (v ) ^ ( ‘jc-)
a n s n R . - ^ RTPTTW^ Tf5n> f^Fr feTH.um-j r.
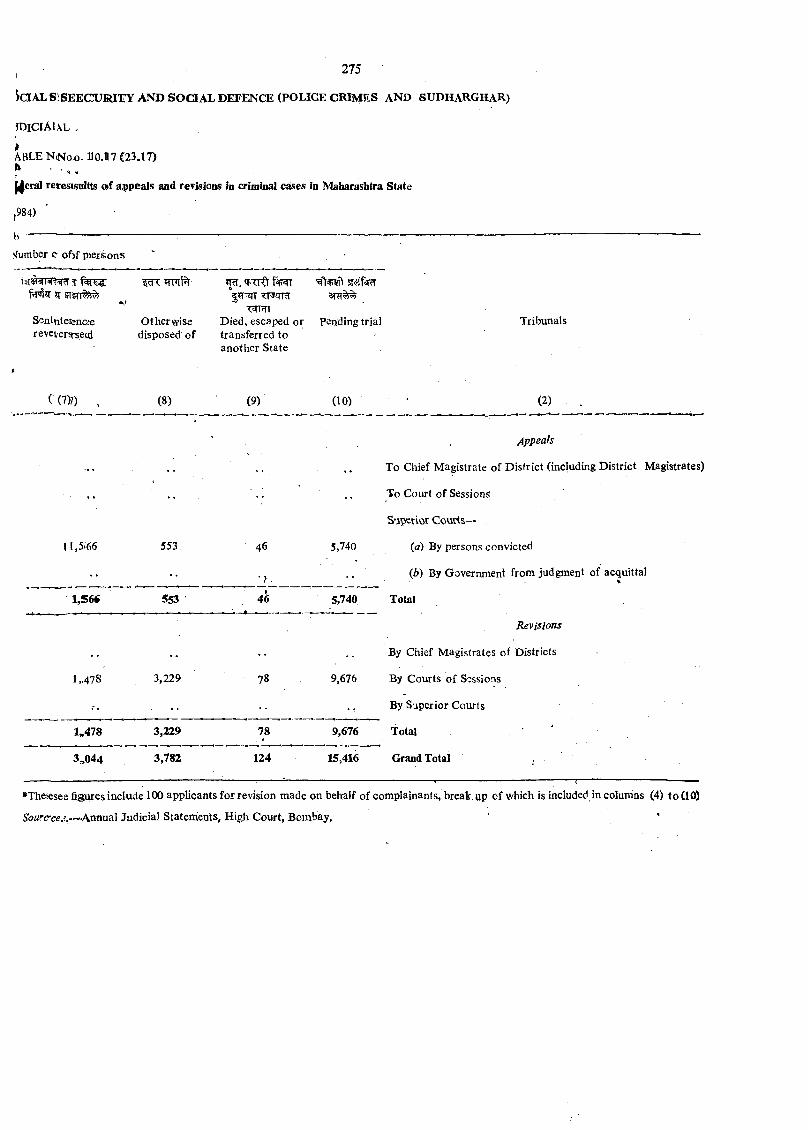
, 275
ia A L S !S E E C U R IIY A N D SOCIAL DEFENCE (POLICE CRIMES AND SUDHARGHAR)
JDICIAL^L .
ABLE N(Noo. U0.H7 C23.17) ft^ e ra l reresiisaltts o»f appeals and revisions in criiminal cases in Maharashtra State
984)
'lumber c oftf piefsons
* ‘
O therwise disposed of
Pending trialSentftteiencjereveversrsecd
<i'»<4id ? T?TT
Died, escaped or transferred to another State
Tribunals
( (7)7) , (8) (9) (10) (2) .
' Appeals
. . . . . To Chief M agistrate of D istrict (including District Magistrates)
. . . . •• To Court o f Sessions
S’ipetior C ourts-*
11,5.66 553. 46 5,740 (a) By persons convicted
•• • J .(b) By Government from judgment of acquittal
1,56# 553 46 5,740 Total
Revisions
. . •• •• By Chief M agistrates of Districts
1,478 3,229 78 9,676 By Courts of Sessions
•• By Superior Courts
1»478 3,229 78 9,676 Total
3,044 3,782 124 15,416 Grand Total
»Thesesee figures include lOO applicants for revision made on behalf of complainants, break, up of which is included in columns (4) to Cl03
Annual Judicial Statements, High Court, Bombay. ‘ •
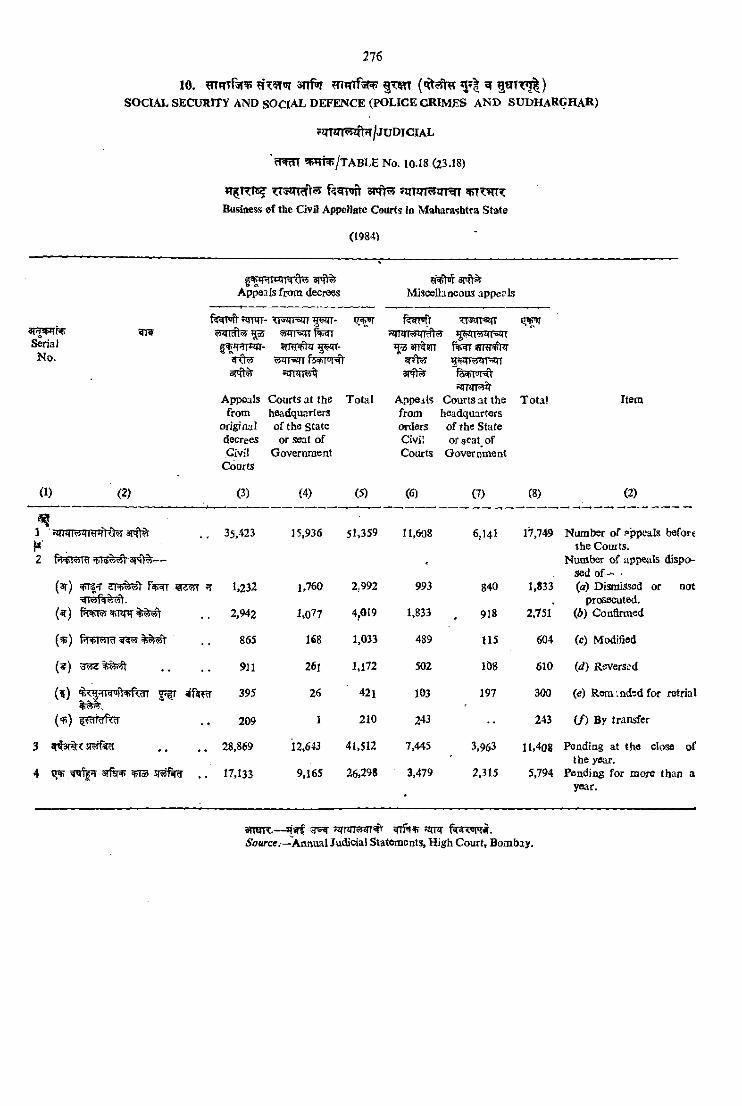
SerialN o.
10. anf^T ?nm f3T^ % T m ^SOCIAL S E C U R iry AND SOCIAL DEFENCE (PO LICE C R !M j:S A N D SUDHARGHAR)
fJT T in ^ lT /JU D IC U L
'?fw m ^ m ^ /T A B L E No. 10-18 (23.18)
Business of the Civil Appellate Courts io M aharashtra State
(1984)
Ap^-iLs from decrees
fSWToft »?nm- ’ilwijl-ei]!*(35 5TBiT5CfT Pfn l
g T TRTT-
3Pft^
9vtiir apft^ Miscelhneoua appeals
TTSttTsn
sTF siT ?n?r^I?
3T7r ^ 5 ^ 7 ^Rzmrr^
Appeals Courts a t the T otal Appeals Courts a t the T o ta l Itemfrom headquarters from headquarters
original of the sta te orders of the Statedecrees or seat of Civil orgcat ofCivii Government Courts Government
Courts
(1) (2) (3) (4) (5) (6) (7) (8) (2)
1 RmTMZTRnftCt 3iqt% 35,423 15,936 51,359 11,608 6,U1 17,749 N um ber o f appeals befottthe Courts.
Number of appeals disposed of-^ •
(sr) <pT5'f F^gr s'i'rtt ^ 1,232 1,760 2,992 993 840 1,833 (a) Dismissed or notTjlwlqwoi. prosecuted.
( ? ) T<fM 2,942 1,077 4,019 1,833 918 2,751 (A) Confirmed
( ^ ) . . 865 168 1,033 489 115 604 (c) Modified
(? ) -dwd . . . . 911 261 1,172 502 108 610 id) Raverst'd
(? ) ^ 395 26 421 103 197 300 (e) Reni -.aded for retrial^ w“ .
( ’fi) ^«iiar<.!i . . 209 I 210 243 243 i f ) By transfer
3 y^’( ^ 28,869 12,643 41,512 7,445 3.963 11,408 Peadiag a t the ciose ofthe j^ar.
4 3rfsR) 'fiioo y«?jf«in , . 17,133 9,165 26,298 3,479 2,315 5,794 Pending for more than ayear.
« ro n .— «?wf 5Ts RTPTTs rNV «tpt fk^xeprjr.<y«7wctf.—Aflnual Judicial Statements, H igh C ourt, Bombay.
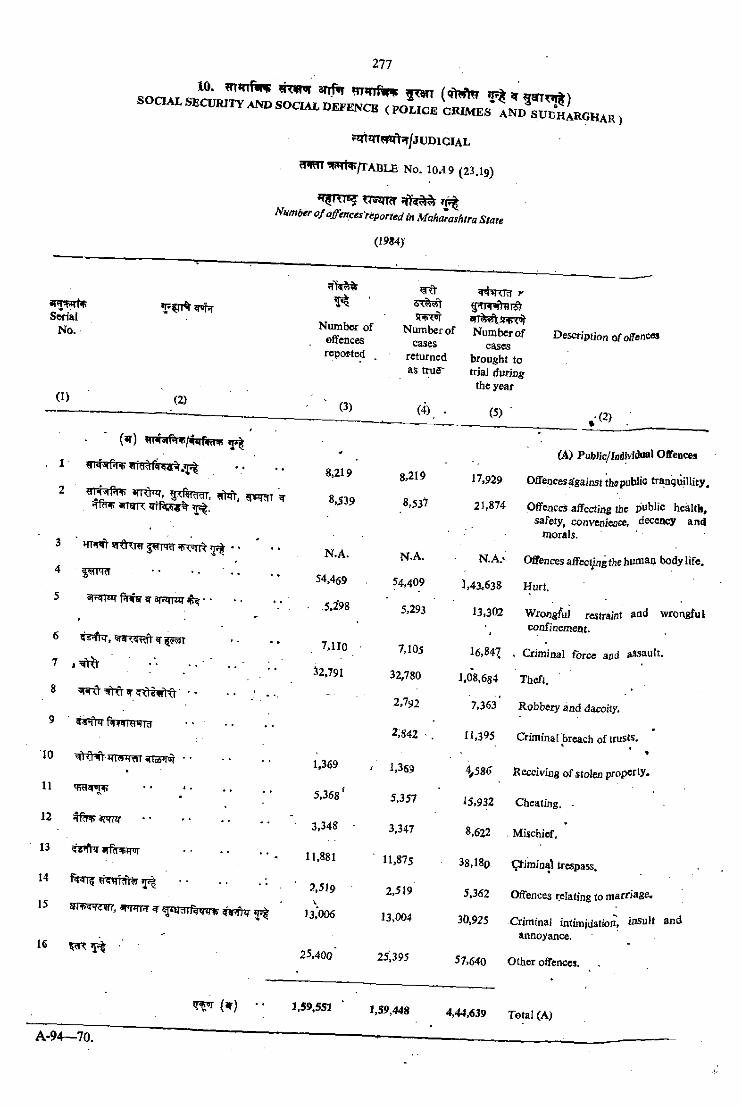
S O a A t SECURITY S O C U l DEFENCE ( PO L IC E C R IM E s ' A N D ^ ^ I r g H a r ,
^m W B ftjT /JU D lG lA L
tWtli ^ w /T A B L E N o. 10.19 (23.19)
Number o f offences reported in MohZashtra State
(1984)-
SerialNo.
(I) (2)
(ar)
■ I ft
^ ? r ^ T
3 ^r^TRT ij r | • • * . .
^ • • • • ■ . , . .
5 sp W i Imhr g arsBTRZT -
7 , ^ ■■■ ; .
8 ^ • - - . ■ . . .
9 ffwmwTtT
JO *m R m ^Ta^rq ••
H • • * •
12
13 5Y*frr eri^nnrrr
5?|
15 ® « 5 T O irr,3 m H ?g iH 5 n ftw *
16 ii?n: ^ •
sfN r^n '
Number of oflfences reported
5T%e$t SRHiiT
Number of cases
returned as trug“
y h l Urt r
a n ^ . J T p ^ Number of
cases brought to trjaJ duriij^'
the year
Description of offences
■ ' (3) C4) (5).-f2> .
(A) Public/JjidivldaAl Offences
8,219 8,219 17,929 Offeocesa’gainst th^public tranquillity.
8,539 8,537 21,874 Offences affecting ibc public health, safety, convenience, decency ao(i
morals.
N .A. N.A. N.A.V Offences affectjng the humaij body life.
54,469 54,409 1,43,638 Hurt.
■ 5.298 5,293 13,302 Wrongful restraiat wrongful confinement.
7,110 7,105 16,84^ . Criminal force aad assault.
32,791 32,780 J.08,6s4 Tlicfi.
2,792 7,363' Robbery and dacoity.
2.S42 - . n .395 Criminal breach of trusts.’ ,
1,369 ' 1,369 %586 Receiving of stolen property.
5,368 ^ 5,357 iS.932 Cheating. •
3,348 ■ 3,347 8,622 - Mischief.
11,881 ‘ 11,875 38.180 ^ jm in a l trespass.
3,5J9V
2,519 5,362 Offences relating to marriage.
13.006 13,004 30.925 Crimfnaj intinjjdation, annoyance.
25,40o ' 25,395 57,640 O ther offences.
1,59,448 4,44,639 Total (A)
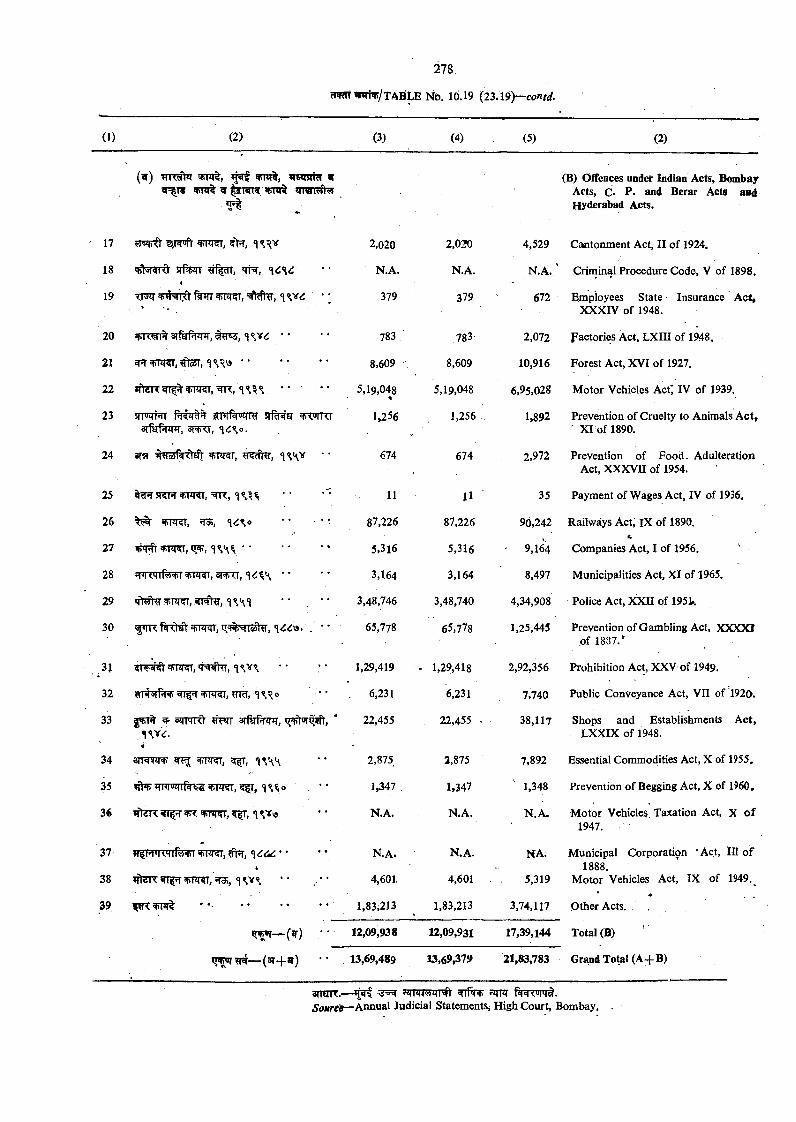
17 5 P 5 ^ ^rnr^, 2r>r, ^
18 q j t w d srftjrr ?f%rT, 'tt^ , %6\6I
19 TF^ &fTT ^TtRT, =Ef\^,
20 s r M m , I w , ••
21 w?rwrm^, ?f!o5T, ' •
22 *f)dl<^T^ «tiW<T, ^R , **
23 STTWRT f^rtiT^ 8 T * z m r J T f ^ srfsrfJiinT, 3IW , <\6%o.
24 «rs p t w ,
25 %?ffr 5T5H ^ w r , T ^
26 \!5 <\6%0
27 ^rrw , "
28 H^Rm f^T ^rpq^, 3 1 ^ , <i6f^\ • •
30 fJR>^ OTKT, tr^VtTSlT'H, »
3J 5T¥5[^^RRT,<Nfto,-iVs;
32 «(t^d +W«il, TRT, ■* *
33 ^ szTPTRt a r M m , i»sFt5rq?ft,
34 aTR?w ^rpRt,
35 tft^^Rrnn'zrrf^'s^FRT, ?fr, <j%^o *•
36
37 nfFurarfespT d k , "i
38 VtZR WI TT VRRT, iT$, <1 V% *• •■
39
C^} ••
(3T+ar)
2,020
N.A.
379
783
8.609
5,19,048%
1.256
674
1 1
87,226
5,316
3,164
3,48,746
65,778
1,29,419
6,231
22,455
. 2,875
1,347 .
N.A.
n .a .
4,601.
1,83,213
12,09,938
2,020
N.A.
379
783
8,609
5,19,048
1,256
674
11
87,226
5,316
3,164
3,48,740
65,778
1,29,418
6,231
22,455
3,875
1,347
N.A.
N.A.
4,601
1,83,213
(B) Offences under Indian Acts, Bombay Acts, C. P . and Berar Acts and Hyderabad Acts.
4,529 Cantonment Act, II of 1924.
N.A. ' Criminal Procedure Code, V of 1898.
672 Employees State Insurance A ct,XXXIV of 1948.
2,072 Factories Act, L X m of 1948.
10,916 Forest Act, XVI of 1927.
6,95,028 M otor Vehicles Act* IV of 1939.
1,892
2,972
Prevention of Cruelty to Animals A ct, ' X I of 1890.
Prevention of Food . Adulteration Act, XXXVII of 1954.
12,09,931
35 Payment of Wages Act, IV of 1936,
96,242 Railways Act, iX of 1890.>, *"
9,164 Companies Act, I of 1956.
8,497 Municipalities Act, X I of 1965.
4,34,908 Police Act, XXU of 195k
1,25,445 Prevention of Gambling Act, XXKXJof 1887."
2,92,356 Prohibition Act, XXV of 1949.
7,740 Public Conveyance Act, VII of 1920.
38,117 Shops and Establishments Act,LXXIX of 1948.
7,892 Essential Commodities Act, X of 1955.
1,348 Prevention of Begging Act, X of 1960.
N .A . M otor Vehicles Taxation Act, X o f1947.
NA. Municipal Corporati9n * Act, ID o f 1888,
5,319 M otor Vehicles Act, IX of 1949.
3,74,117 O ther Acts. ,
17,39,144 Total (B)
13,69,489 13,69,379 21,83,783 Grand Total (A-j-B)
anETfT.— ^ ^ fllFTiSoMrcJf—Annual Judicial StatementSj High Court, Bombay.
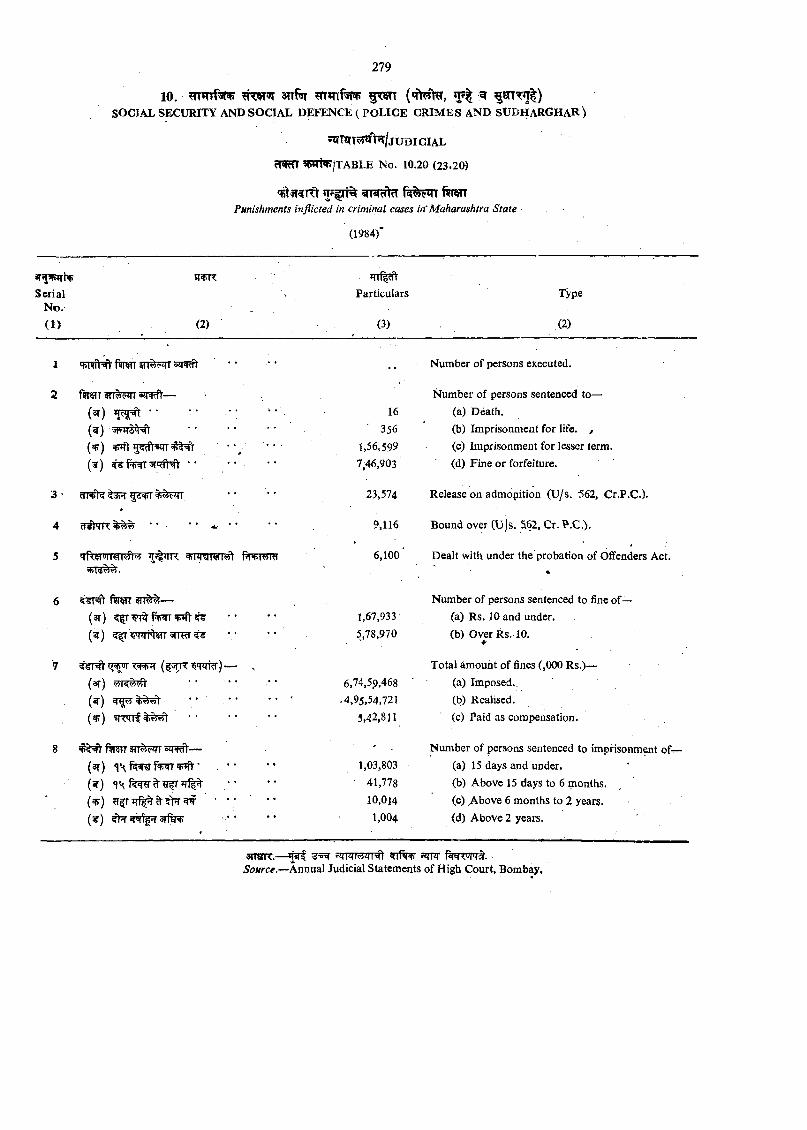
10 , sTtfoT » rf | ^SOCIAL SECURITY AND S O O A L DEFENCE (P O L IC E G RIM ES AND SU DH ARGH A R)
?m m HCft5r/jU DIClAL
?f?Rn ?l»»Ti^/TABLE No. 10.20 (23.20)
srracftcT f wPunishments inflicted in criminal cases in' Maharashtra State
(1984)"
3T^?i»rNjSerial
N o.
( I ) (2)
Particulars
(3)
Type
(2)
I sninWV finw § n ^ w 5 z r^ . . Number of persons executed.
2 ftrefT — Number of persons sentenced to—
(3t) ^ •• • • •• 16 (a) Death.
(d ) • ■ • ■ ' 356 (b) Imprisonment for life. ,
( ^ ) ^ • *• 1,56,599 (c) Imprisonment for lesser term.
{¥) ^ PfiiT •• • ' 7,46,903 (d) Fine or forfeiture.
3 ■ 23,574 Release on admopition (U /s. 562, Cr^P.C.).
4 cTsH r ' ' * * ^ * 9,116 Bound over (\3)s. S62, Cr. P .C .).
5 T f o r r r m ^ ’Tit^irc P^+i^yrti 6,100 ■ Dealt with under the probation of Offenders Act.♦
6 sriTRt ftren i n ^ — Number of persons sentenced to fine of—(ar) 1,67,933 (a) Rs. 10 and under.
(5 ) sf^ 4 <i tsrT '»i('W ^ 5,78,970 (b) Over Rs. 10. *■
7 ( |% R ^ R W )— ^ Total amount of fines (,000 Rs.)—
(ar) ■ ' * ' 6,74,59,468 ' (a) Imposed.,
(5T) * * * • ' • ' . 4,95,54,721 (b) Realised.
(wr) ? r w f % ^ ................................. 3,42,811 (c) Paid as compensation.
8 - . Number of persons sentenced to imprisonment of-r-
(3r) . •• 1,03,803 (a) 15 days and under.
(^ ) TK 41,778 (b) Above 15 days to 6 months.
( ^ ) ifT d ? ? f ' *; 10,014 (c) A bove 6 months to 2 years.
(¥ ) ^ 3 T ^ •• * ’ 1,004 <d) Above 2 years.
3nwR.— ^ nrnr .Source.—Annual Judicial Statements of High Court, Bombay.
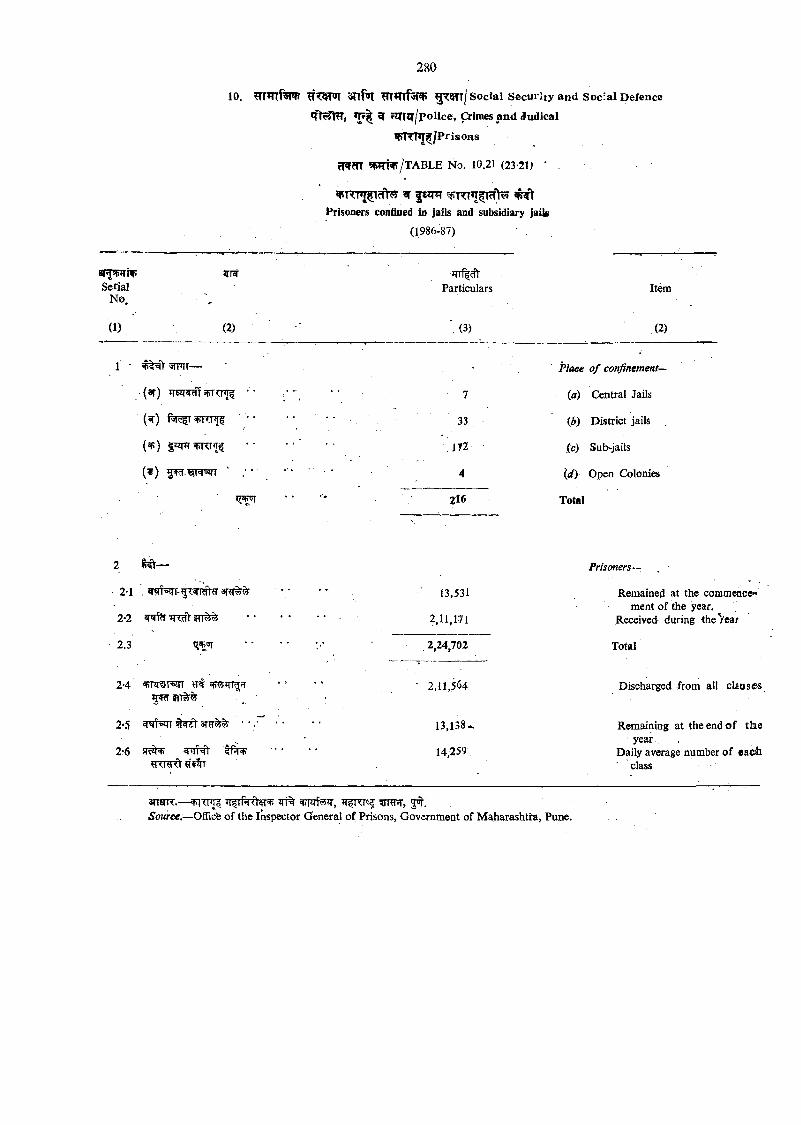
10. soc ia l Security and Social Defence
^ riTTtr/police, Crimes jind Judical
^TITTIJ^/Prisons
fT^m 5PTf5Pr/TABLE No. 10.21 (23-21) ' ,
Prisoners confined in jails and subsidiary jaiU
(1986-87)
3 [ ^ ^ ivSerial
N o.
(1) (2)
Particulars
(3)
Item
(2)
1 ■ 5rnfT—
(ar) ••
(«r) f^RgTVRT^
{ ^) |«nT5pTO»r^
7
33
172
4
216
Place o f confinement—
(a) Central Jails
{b) District jails
(c) Sub-jails
{d) Open Colonies
Total
2
• 2*1 .
2-2 «R5tV ITT^
2.3
2*4 sFHrar TT 5fT55qT
2*5 • •
2*6 s r ^ tf?r^
PHsoners-
13,531
2,11,171
2,11,5^4
13,138*
14,259
Remained at the commence- ment of the year.
Recdved- during thel^ear
Total
Discharged from all clauses
Remaining at the end o f th e year.
Daily average number o f each ■ Class
anaK. — itt% i>pTf5y2T, fffnTEs ^ rpt, 2^.Source,—Office of the Inspector General of Prisons, Government of M aharashtra, Pune.
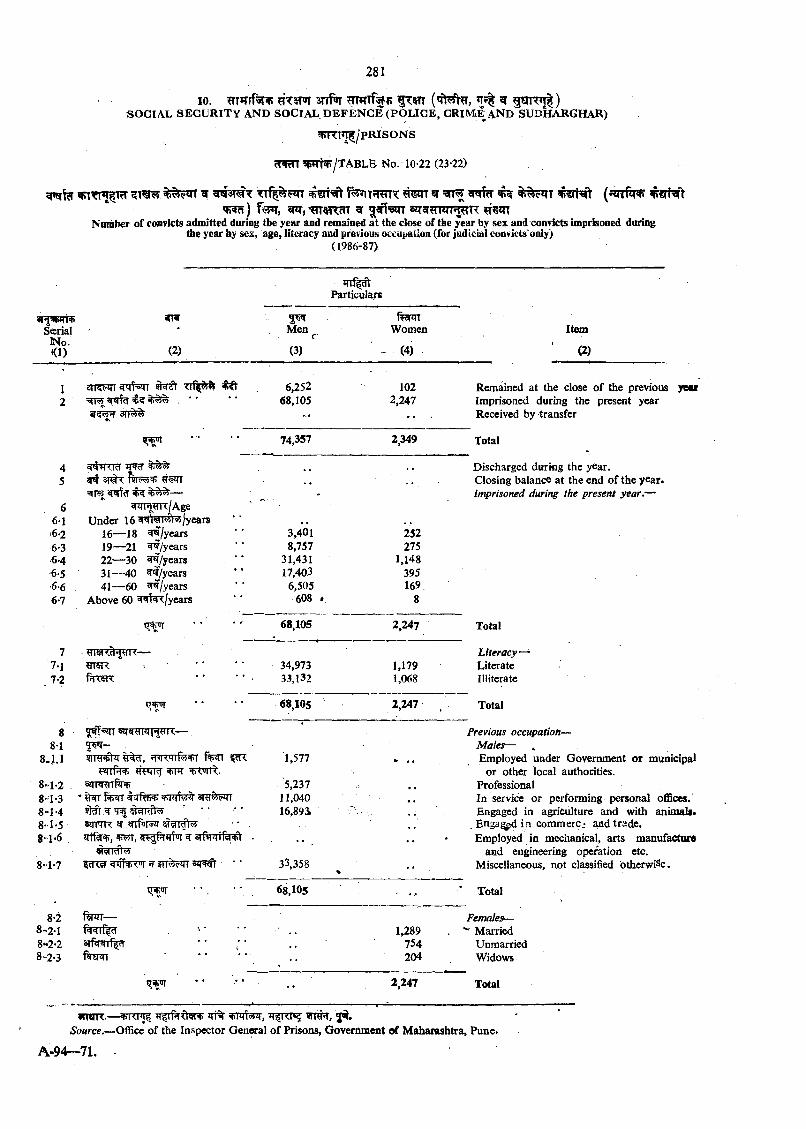
10. m m 3TTf^ n ? | ^ § « r R ^ )SO CIA L s e c u r i t y AND SO CIAL D E F E N C E (P O L IC E , C R IM E AND SUDHARGHAR)
W TRin^/pRISO N S
/TA BLE No. 10-22 (23-22)
WTTTT^m ^ f^»lT?THTT ^ ^«rfcT ^i w ) f < ^ , ^ ,-m « T c fT gr igzTT
Number of convicts admitted during tbe year and remained a t the close of tbe year by sex and convicts imprisoned during tbe year by sex, age, literacy and previous occupation (for judicial convicts only)
0986-87)
Particulars
ifW
(2)
Item
m
4 1 ^ W Serial
INo. <1)
Men ^
(3)
TWifTWomen
(4)
1 6,252 102 Remained at the close of the previous y o u2 68,105 2,247 Imprisoned during the present year
--• . . . Received by transfer
.................. 74,357 2,349 Total
4 Discharged during the year.5 ^ sntT T'lfJTT Closing balance at the end of the year.
■ Iw --- - Imprisoned during the present year.—6 w^T^mx|Aes
6-1 Under 16 /years . ,.6-2 16— 18 ^ /y e a rs 3,401 2526-3 19— 21 ^ /y e a rs 8,757 2756.4 22— 30 ^ /y e a rs 31,431 1,1486.5 31— 40 ^^/years 17,403 395
41— 60 W^/years ’ ‘ 6,505 1696-7 Above 60 «4< I' <./years 608 » 8
68,105 2,24? Total
7 Literacy—7-1 34,973 1,179 Literate
. 7*2 f^Rsrc 33,132 1,068 Illiterate
(T ur 68,105 2,247 Total
8•
Previous occupation—8-1 Males— .
8-J .l 1,577 • • Employed under Government or municipalFnfT«P +1H or other local authorities.
8-1-2 5,237 .. Professional8-1-3 * 11,040 In service or performing personal offices.8-1-4 16,89i ■ • • Engaged in agritulture and with animal*.8-1-5 5AJ|-qi<. •• . , E n g a^ d i n commerce ^ d trade.8-1-6 • • Employed in mechanical, arts manufacture
and engineering operation etc.8-1-7 ?tR?r ^ ®*n^ 33,358 % •• . Miscellaneous, not classified otherwise.
■' • ' ■ 68,105 - ... ‘ Total
8-2 %irr— Females—8-2-1 1,289 **' Married8-2-2 , , 754 Unmarried8-2-3 ft fet'd * * 204 Widows
* • • * 2,247 Total
Araic— snxnr^ ^r^rfN'thnv iri% ^nrqf^, ^ rr^ , '
Source.—Office of the Inspector General of Prisons, Goveniment of Maharashtra, Pune.
A -94-71.
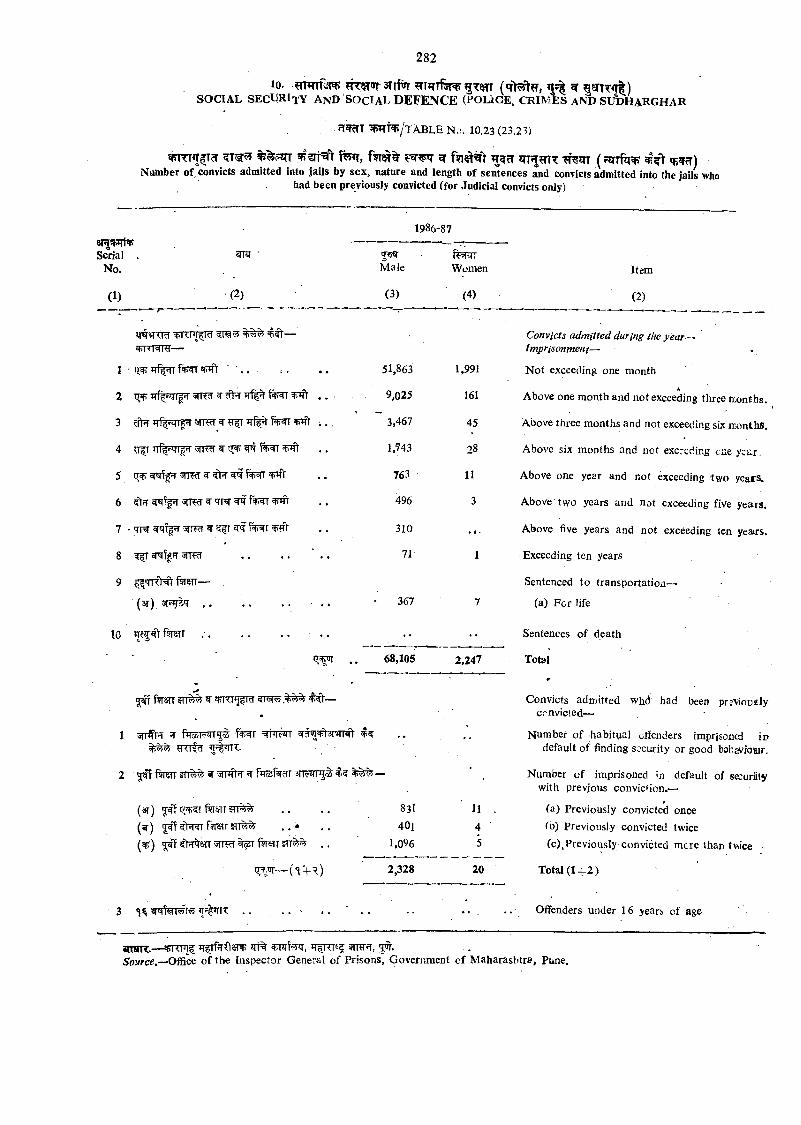
SO CIAL SE C IJR JtY A n d s o c i a l DEFENCE ( p o l i c e , c r i m e s a n d S L ^H A R G H A R
FTWcTT W ^ / t ABLE N c. 10.23(23.23)
5fnTT<!^T^ % ^?q7 ^ h ? c t m m ( ? i r T f ^ ^3r> qjwcr)Number of convicts admitted into jails by sex, nature and length of sentences and convicts admitted into the jails who
bad been previously convicted (for Judicial convicts only)
1986-87
Serial . No.
(1)____
T«r
(2)
5WMale
(3)
Women
(4)
Item
(2)
WC'CRT ^TRPTfRT — Convicts admitted during the year—■ Imprisonment^
1 ■ JT%fT WV ■ . . . 51,863 1,991 N ot exceeding one month
. 9,025 161h
Above one month and not exceeding three months.
3 JTf5f2TT|w 3 ti^ ^ ?ffr i r f ^ ~ 3,467 45 Above three months and not exceeding six ironths.
4 Trf|?qTfT ^ ^ f w ^ 1,743 28 Above six months and not exceeding cne year.
5 tr ) tifgVT ^ ^ ^ ^ 763 11 Above one year and not exceeding tw o years.
496 3 Above" two years and not exceeding five yeairs.
7 . crrgr ^ f%wr ^Fjft 310 ♦ • - Above five years and no t exceeding ten yeatrs.
8 ^ ^fgJT 5fT . . . . * . . 71 1 Exceeding ten years
9 — Sentenced to transportation—
(3t) . .
10 fwsn . .
367
68,105 2,247
^ AfifrSTT ^ ^ —
1 fT ftfSTFTT^ ^ # 3 r s n ^
2 f t r ^ ^ ^rnftw •t ftrosftrcrr
(3t) r / ^ i ftrffTT . . . . 831(^ ) p f ftrar fTT^ . . • . . 40](^■) ^HRT ^ ftiiJTr i n ^ . , i,o96
1145
2.328 20
(a) F c r life
Sentences a f death
Total
Convicts admitted whd had been previnufsly ccnvicfed—-
Number of -habitual oiienders imprisoned in default of finding security or good behavioair.
Number o f imprisoned in default of securfity with previous convic<ion.'—
(a) Previously convicted once
(b) Previously convicted twice
(c),Previously convicted more than twice
Total (1 + 2 )
Offenders under 16 years of age
ararr.— in rp ij 3tt% irfn if? ?iW'fT, i^r. , .Sowfce.—Office of the Inspector General of Prisons, Government of M aharashtra, Pune.
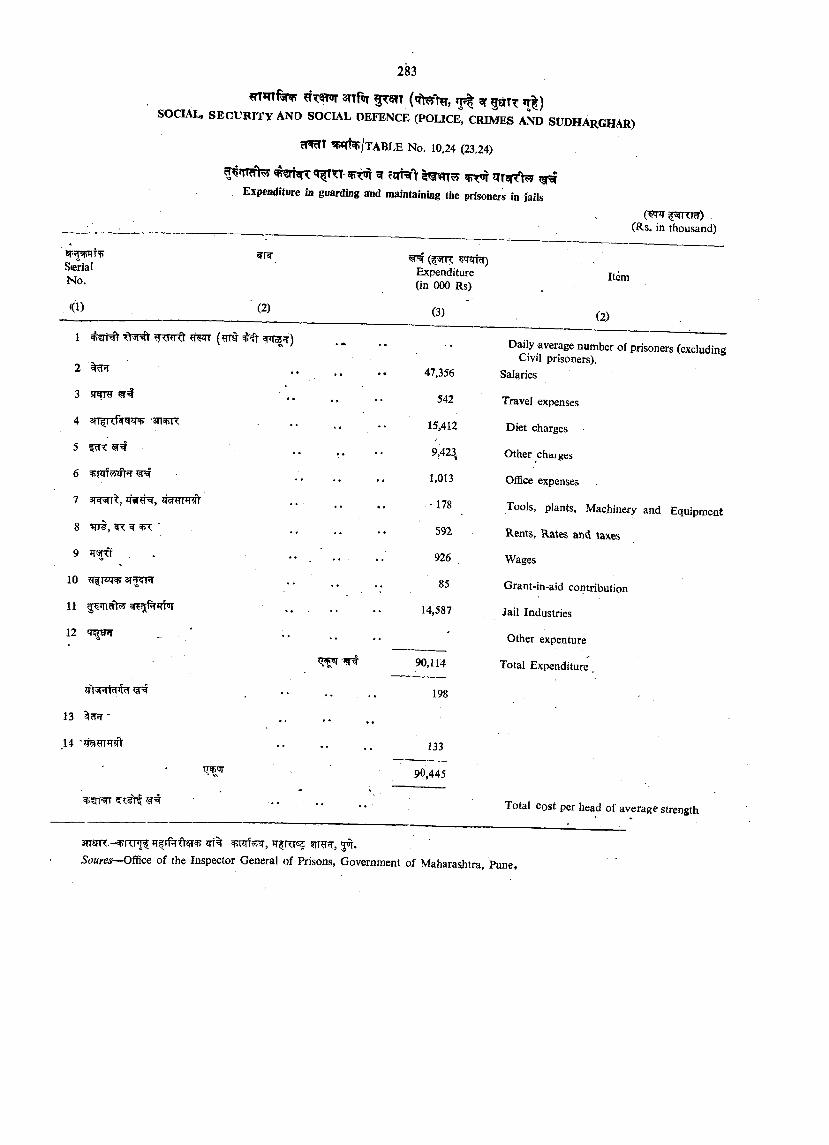
sn fn r g re s ? ar *t| )SOCIAL, SE C U R IT Y AND SOCIAL DEFENCE (POLICE, CRIMES AND SUDHAr GHAR)
cT^T W ^ / t ABLE N o; 10,24 (23.24)
^ cifNrV
Expenditure in guarding afnd maintaining the prisoners in jails
(^^W RTcT) (Rs. in thousand)
SterialN o.
<(1) (2)
^ (fsrn: ^w m ) Expenditure (in 000 Rs)
(3)
Item
1
2
3 JT frar^^
4 an^Rf^cnr^ grwR
5 fcTT
6 ^
7 3T^T^,
8 W , ^ ^ '
9 .V3
10
11 ..12 ._ ■
13 ^cHT*
14
47,356
542
15,412
9,423
1,013
. ' 178
592
926
85
14,587
90,114
198
133
l^tJT 90,445
(2)
Daily average number of prisoners (excluding Civil prisoners).
Salaries
Travel expenses
Diet charges
Other c h a rg e s
Office expenses
Tools, plants. Machinery and Equipment
Rents, 1 .aies and taxes
Wages
Grant-in-aid contribution
Jail Industries
Other expenture
Total Expenditure .
Total C o st per head of average strength
3TTSn^.-^fTFT| iT|Tf fys?T 3Tt% 5 1 ^ , 5^ . '
Soures-^Office of the Inspector General of Prisons, Government of Maharashtra, Pune,
Tr lT ^ 'i^V9o-V3‘ ITTgrrt?ft?y cJT f^
s r r f ^ 2Tt Ix^nTrRr ^ arr^ . |3 rq T ^ " ’( ' j ) ^ r ^ r W 1 '^ 3 r f ? ? ^ ^ 5 T ^ ;jq^7«sr s n ^ ^ T sr (^?) 3T«f ^ y ^ R T ^ t r , ? r l ^ ^ ?nrJmsTrfor sE?TT ^ x ^ ^ c T ^ tt r r ^ ^ ar^i?T TTf^ rr * fW % ^Jfr, s*tt w
jn flcft^ fT arrsTTfVa- a r r ^ .
T f?fT 3»rarfT^ t r j t ^^cq-^r aTTPr c?rr% fH ^9rr^ ^Tm) Trrf^cft |n^,-nT aiT^fl
31T|.
? m r !fi. 1 *1. H iTis^ ’s ^ r k r airg-ifT^f ^ fspiTcfr-f^ r s ^ Tr7!T o r r m ' f s t f e 3 i t | .
atT^rPc^TfFirt f?»Tcft~ ^7?T5rr^"t 3 } r |.
I T - V 3^ra■f^tcT5^5^^c^ t v^
f j ^ 'I *1. H jn^fV^ ^?^5Trf?«TT 3ir5JT3,T|.
f?«rT f*FtmV^?tT‘ ^R ift%^ ^nrrf^T ?r s rW % B?T5r .
11.1. In this section the estimates Oi State incorne a t current and constant (1970-71) prices, its percentage distribution, sectoral distribution etc. are given. These estimates a re prepared on the basis o f comprehensive statistical material which has become available from official r^ o rd s and afso collected through sample surveys and type studies conducted by this Directorate, C entral Statistical Organisation an<J o ther agencies over the past few yea rs .
Tabte U . l gives jnforroatio® regarding S tate and per capita domestic product a t factor cost and their indices.
Table 1U2 gives information regarding net State domestic product at- factor cost by sectors a t curren t prices.
Table 11.3 gives information regarding net State domestic p roduc^at factor cost by sectors a t constant prices.
Table 11.4 gives information regarding indices o f net State domesr/c product a t factor cost by m ajor sectors.
T able 11.5 gives infoTmation regarding percentage in net State 3omestic product over the previous year a t current prices.
Table U ,6 gives information regarding per capita incomff in selected States, U nion territories o f India a t constant prices.

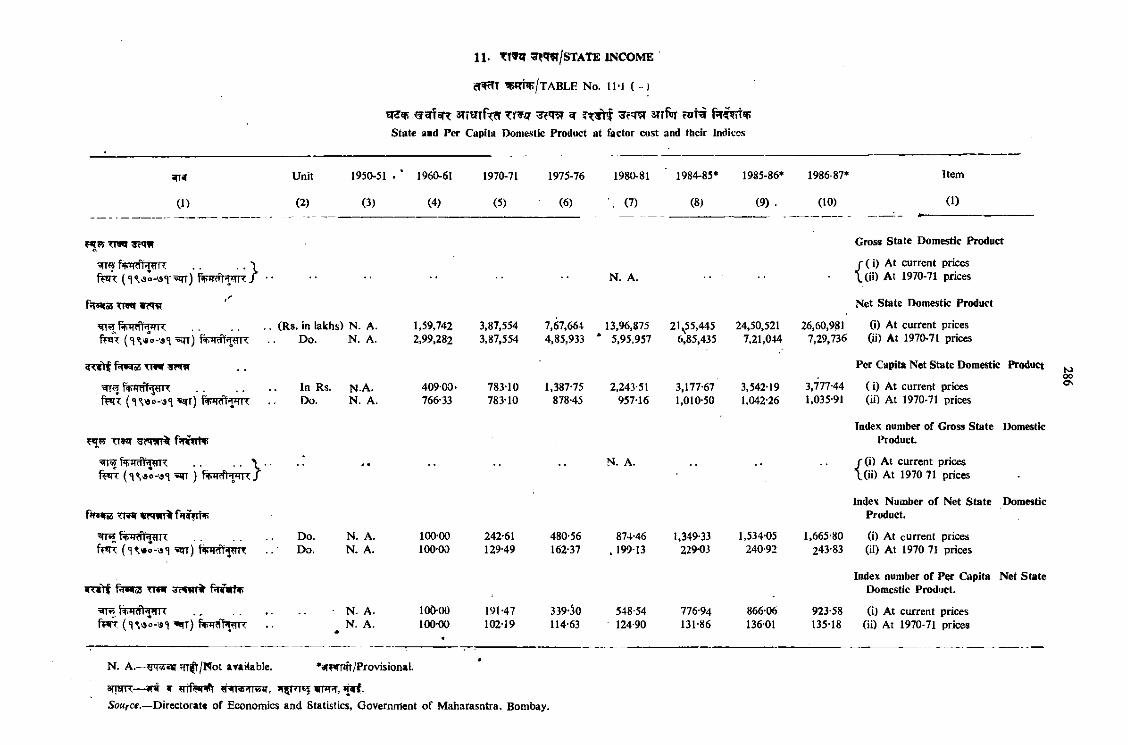
iTTiT
(1)
3T T m r^ ^ f=T5T srrftr f o mState aad Per Capita Oomestic Product a t factor cost and their Ini^iccs
Unit
(2)
1950-51
(3)
1960-61
(4)
1970-71
(5)
1975-76 1980-81 1984-85* 1985-86* 1986-87*
(6) (7) (8) (9 ) . (10)
Item
(1)
f?T*rrft!j?rrT . . • • \fF*n: («i^s3o-i3«j-^) ft>*T?ff!T’Tp:j ••
F»T5*ra TTWf
fnjT
TTW 'sHw . .
’srr<=5
TTW fw il«h
5in )
T iw «FraT%f*w?rf>F
«qr)
?T¥tf r WlcS TT»W 3T^frrit fMlltV
(Rs, In lakhs) N . A. Do. N. A.
In Rs. n .A. Do. N. A.
Do.Do.
N. A. N. A.
N. A. N. A.
1,59,7422,99,282
40903» 766-33
100 00 100-00
lOOOO100-00
3.87.5543.87.554
783-10783-10
242-61129-49
191-47102-19
7,67,6644,85,933
1,387-75878-45
480-56162-37
339-50114-63
N. A.— ffT^/Not araiiable. *3R«rnfr/Provisional.
N. A.
13,96,875 2\55,4455,95,957 6,85,435
2,243-51 3,177-67957-16 1,010-50
N. A.
874-46199-13
548-54124-90
1,349-33229-03
776-94131-86
24,50,5217,21,044
3,542-191,042-26
1,534-05240-92
866-06136-01
26,60,9817,29,736
3,777-441,035-91
1,665-80243-83
923-58135-18
Gross State Domestic Product
{ ( i) At current prices (ii) At 1970-71 prices
Met State Domestic Product
(i) At current prices(ii) At 1970-71 prices
Per Capita Net State Domestic Product
( i) At current prices(ii) At 1970-71 prices
fndex number of Gross State Domestic Product.
{ (i) At current prices (ii) At 1970 71 prices
Index Number o f Net S tate Domestic Product.
(i) At current prices(ii) At 1970 71 prices
Index number of Per Capita Net State Domestic Product.
(i) At current prices (ii) At 1970-71 prices
hJ00Ov
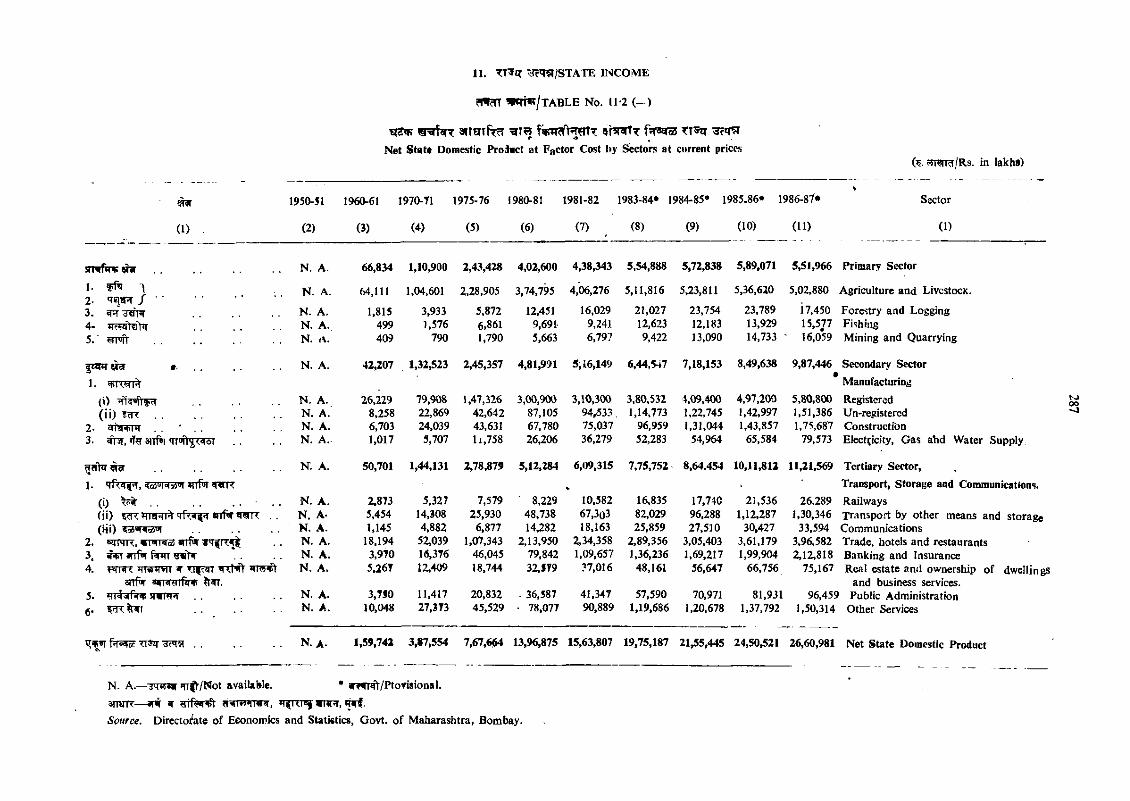
IHmir/TABLE No. 11-2 ( - )
^rariF 3itotPj:h f i n r ^ O ^ T TT^trNet State Domestic ProJact at Factor Cost l>y Sectors at current prices
( . «nard/Rs. in lakha)
1950-51 1960-61 1970-71 1975-76 1980-81 1981-82 1983-84* 1984-85* 1985.86* 1986-87*%
Sector
(1) . (2) (3) (4) (5) (6) (7) (8) (9) (10) (U) (1)
smfftnuOT N. A. 66,834 1,10,900 2,43,428 4,02,600 4,38,343 5,54,888 5,72,838 5,89.071 5,51,966 Primary Sector
1. frfti \ N. A. 64,111 1,04,601 2,28,905 3,74,795 4,06,276 5,11,816 5,23,811 5,36,620 5,02,880 Agriculture and LivcstocK.2. Tsia^ / ...............................3. ^ "HVTV N. A. 1,815 3,933 5,872 12,451 16,029 21,027 23,754 23,789 17,450 Forestry and Logging4- Jl'rWl'latn’ N. A. 499 ),576 6,861 9,69V 9,241 12,623 12,183 13,929 15,577 Fishing5. ■ ............................... N. 409 790 1,790 5,663 6,797 9,422 13,090 14,733 ■ 16,059 Mining and Quarrying
|*WT «?r » . ............................... N. A. 42,207 1,32,523 2,45,357 4,81,991 5,16,149 6,44,547 7,18,153 8,49,638 9,87,446 Secondary SectorManufacturiog
(i) N. A. 26,229 79,908 1,47,326 3,00,900 3,10,300 3,80,532 4,09,400 4,97,200 5,80,800 Registered(ii) ............................................. N. A. 8,258 22,869 42,642 87,105 94,533. 1,14,773 1,22,745 1,42,997 1,51,386 Un-registered
2. iaiia+iH N. A. 6,703 24,039 43,631 67,780 75,037 96,959 1,31,044 1,43,857 1,75,687 Constructibn3. anfof N. A.. 1,017 5,707 li,758 26,206 36,279 52,283 54,964 65,584 79,573 Electricity, Gas alid Water Supply
WeT ............................................. N. A. 50,701 1,44,131 2,78,879 5,12,284 6,W,315 7,75,752 8,64.454 10,11,812 11,21,569 Tertiary Sector,1. <o5U|<<aJOI «nf*>T . Transport, Storage and Communication<}.
(ij ^ ................................ . . N. A. 2,873 5,327 7,579 ‘ 8,229 10,582 16,835 17,740 21,536 26,289 Railways(ii) * m n n ^ s r f v v n r N. A. 5,454 14,308 25,930 48,738 67,3o3 82,029 96,288 1,12,287 1,30,346 Transport by other means and storage(hi) N. A. 1,145 4,882 6,877 14,282 18,163 25,859 27,510 30,427 33,594 Communications
2. «>J4rHri, Ulfur N. A. 18,194 52,039 1,07,343 2,13,950 2,34,358 2,89,356 3,05,403 3,61,179 3,96,582 Trade, hotels and restaurants3. irrf f TTT N. A. 3,970 16,376 46,045 79,842 1,09,657 1,36,236 1,69,217 1,99,904 2,12,818 Banking and Insurance4. llfrflr *il«^ N. A. 5,267 12,409 18,744 32,579 ?7,016 48,161 56,647 66,756 75,167 Real estate and ownership of dwellings
anfr and business services.5- STWIW N. A. 3,750 11,417 20,832 - 36,587 41,347 57,590 70,971 81,931 96,459' Public Administration
10,048 27,373 45,529 • 78,077 90,889 1,19,686 1,20,678 1,37,792 1,50,314 Other Services
N. A. 1»59,742 3,87,554 7,67.664 13,96,875 15,63,807 19,75,187 21,55,445 24,50,521 26,60,981 Net State Domestic Product
tsioo
N . A.—TTwnr TT|^/Not avaiUWe. • T?rr^/PtoYi8iona!.
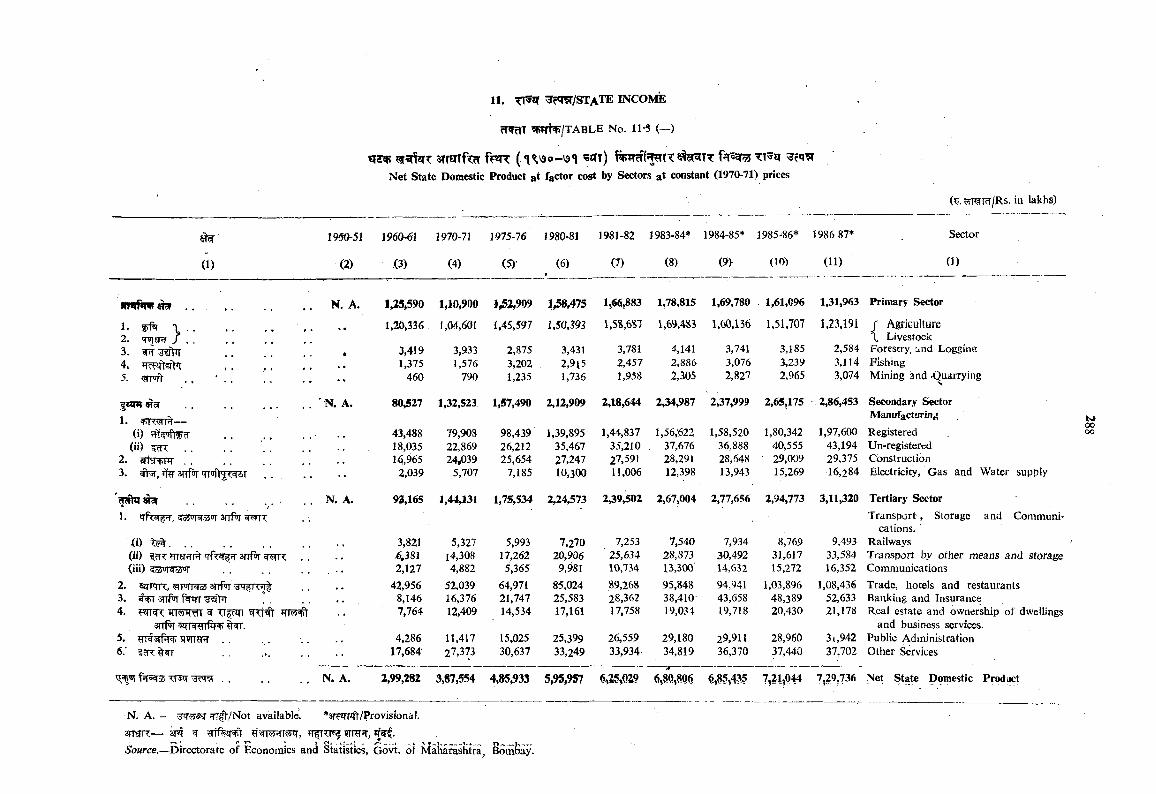
11. trSJI !3r?W/STATE INCOlVffi
fTWcTT 5f»rt^/TABLE No. U S (—)
3|T0fTfT5T f ^ T ( ‘l%\9o-\3«l 'S«IT) ftf»?Trff5T?nT Net State Domestic Product at factor cost by Sectors at constant (1970-71) prices
(^. la lakhs)
m
(1)
1960-51
(2)
1960^1
(3)
1970-71
(4)
1975-76
(5)-
1980-81
(6)9
1981-82
(7)
1983-84*
(8)
1984-85*
(9)
1985-86*
(10)
1986 87*
(11)
Sector
(1)
. . N. A. U 5,590 1,10,900 1^2,909 ljS»A75 1,66,883 1,78,815 1,69,780 1,61,096 1,31,963 Primary Sector
1,20,336 . 1,04,601 U4S,S97 l,S0,393 1,SS,6S7 1,69,483 1,60,136 1,51,707 1,23,191 / Agriculture2. . X Livestock3. . . • 3,419 3,9.33 2,875 3,431 3,781 4,141 3,741 3,185 2,584 Forestry, and Loggina4, 1,375 1,576 3,202 2,915 2,457 2,886 3,076 3,239 3,114 I^ishing
460 790 1,235 1,736 1,958 2,305 2,827 2,965 3,074 Mining and jC^uarrying
ISTO W3T . . ' N . A. 80,527 1,32,523 1,57,490 2,12,909 2,18,644 2,34,987 2,37,999 2,65,175 2,86,453 Secondary Sector
1 • 'T>K<3 1 — Manufacturing
(i) • • 43,488 79,908 98,439 1,39,895 1,44,837 1,56;622 1,58,520 1,80,342 1,97,600 Registered(») f?R . . 18,035 22,869 26,212 35,467 35,210 , 37,676 36,888 40,555 43,194 Un-registered
2. TSr TPT 16„965 24J039 25,654 27,247 27,591 28,291 28,648 29,009 29,375 Construction3. #5T, srrfnr qrift . . 2,039 5,707 7,185 10,300 11,006 12,398 13,943 15,269 16,284 Electricity, Gas and Water
93,165 1,44431 1,75,534 2,24,573 239,502 2,67,004 2,77,656 2,94,773 3,11,320 Tertiary Sector
K>oooo
T ransport, Storage and Communis cations.
(i) ^ ......................................................... 3,821 5,327 5,993 7,270 7,253 7,540 7,934 8,769 9,493 Railways(ii) ?rrgrfTr . . 4381 l4,308 17,262 20,906 25,634 28,873 30,492 31,617 33,584 Transport by other means and storage(iii) 2,127 4,882 5,365 9,981 10,734 13,300 14,632 15,272 16,352 Communications
2. SiTFTR-, anfiT 42,956 52,039 64,971 85,024 89,268 95,848 94,941 1,03,896 1,08,436 Trade, hotels and restaurants3. 4+13nf*iT f%®rr . . . . . . 8,146 16,376 21,747 25,583 28,362 38,410 43,658 48,389 52,633 Banking and Insurance4. WWT ^ XT^I w # 7,764 12,409 14,534 17,161 17,758 19,034 19,718 20,430 21,178 Real estate and ownership of dwellings
and business services.5. mi 5ffNTS«iiw .. 4,286 11,417 15,025 25,399 26,559 29,180 29,911 28,960 3i,942 Public Administration6.' 17,684' 27,373 30,637 33,249 33,934- 34,819 36,370 37,440 37,702 Other Services
. . , . . , N. A. 2,99,282 3,«7,554 4,85,933 5,95,957 6,85,435 7,215044 7,29,736 Net State Domestic Product
N. A. - ?rr|)'/Not avaifable. *3r^r4t/Provisiona?.
3rr9TT— sm ^ frra^r,Source.—Directorate of Economics and Statistics, Govt, of Maharashtra, Bomfeay.
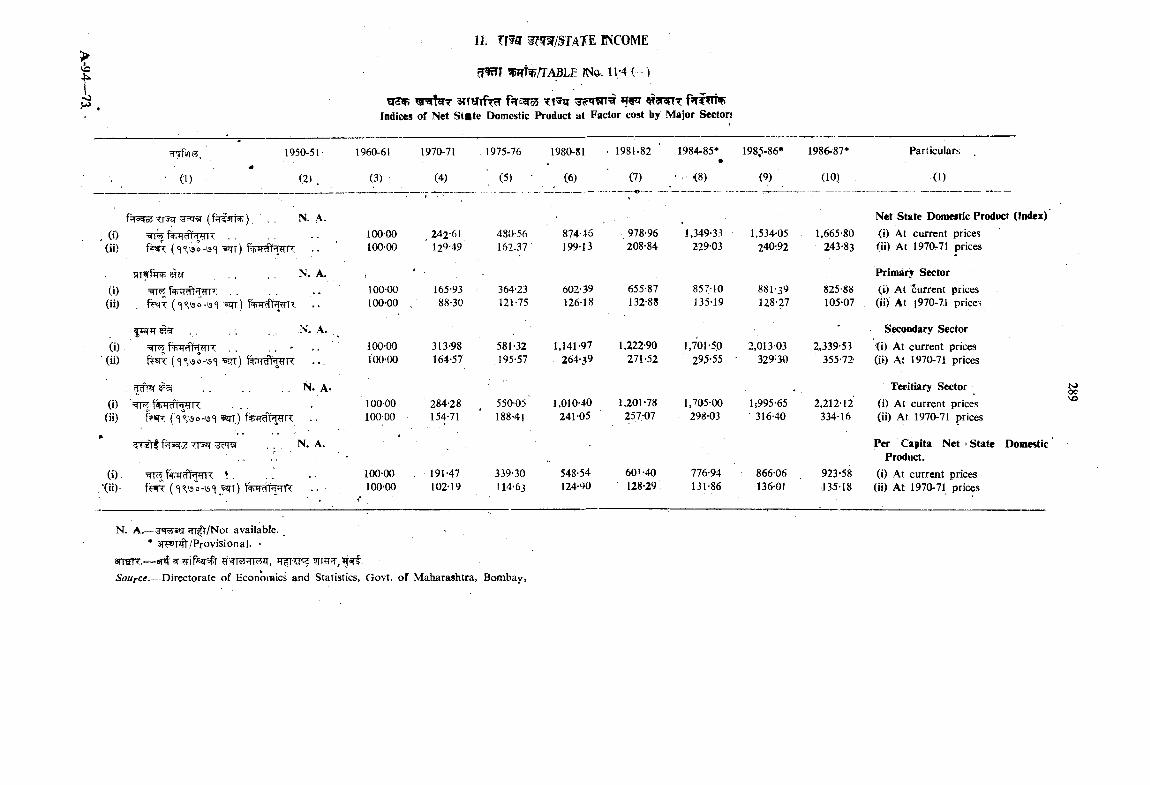
VO
t
11 T m if?W/§TA7iE INCOME
cT^i /tab le mQ: 11-4 ( )
^ r T^T STTSTTfTrT ffT^^oS ^RF«7?n^Indices of Net State Domestic Product at Factor cost by Major Secton
rTrfsfT ,
CD
1950-51
(2) .
TT^ . . N. A,, (i) =517 . .(ii) f*«R (S ” 'S0-\3<1 ^ t)
saiS" . . . . . N. A.(i) ^ fq^rr^wn: . ,
(ii) . (c|<? s;.vsc| f%ira1f^R . .
f u p T ^ . . . ; , ... .N. A. ,(i) . fwrrRf^TR . . •• "
(ii) ft«R ( f%rrdt TOR . . .
. . . . . . . . N. A-(i) ' WFl f%TTcff^R
(ii) f?>RT (■ 'i\'3 0-\3< ^ t) . .
f?T5 rZ TT5ir . . . N. A.
(i). ’aiT^JifnTdi^sWR ‘ ., ‘(ii)- fW ?: (l<?.V9 0 - \s '^ ^ ^ r )
1960-61
(3)
1970-71
(4)
1975-76
(5)
1980-81
(6)
1981-82
(7)
1984-85* 198^-86* 1986-87*
' ■ <8) (9) (10)
Particulars
(I)
Net State Domeitic Product (Index)100-00 242-61 480-56 874-45 978-96 1,349-33 1,534-05 1,665-80 (i) At current prices100-00 ' 129-49 162.37 199-13 208-84 229-03 240:92 243-83 (ii) At 1970-71 prices
\ ' Primary Sector100-00 165-93 364-23 602-39 655-87 857-10 881-39 825-88 . (i) At Surrcnt prices100-00 , 88-30 121-75 126-18 132-88 135-19 128-27 105-07 (ii) At i970-7J prices
Secondary Sector100-00 313-98 581-32 1,141-97 1,222-90 1,701-50 2,013-03 2,339-53 ti) At current prices100-00 164-57 195-57 264-39 271-52 295*55 329-30 355-72- (ii) At 1970-71 prices
. Teritiary Sector100 00 284-28 550-05’ 1,010-40 1,201-78 1,705-00 1,-995-65 2,212-12 (i) At current prices100 00 15^71 ' 188-41 241-05 257-07 298-03 316-40 334-16 (ii) At 1970-71 prices
Per Capita Net * State Domestic Product.
100-00 , 1 9 1 - 4 7 339-30 548-54 601-40 776-94 866-06 923-58 (i) .At current prices100-00 102-19 114-63 124-90 128-29 131-86 136-01 13-5-18 (ii) At 1970-71 prices
N>oc
N. A. — ^ ^ / No t available. _ '* 3lT «T2Tt/Provisional. -
srraR. — 5 r m, w«rf.SowrCtf.— Directorate of Economics and Statistics, Govt, of Maharashtra, Bombay,
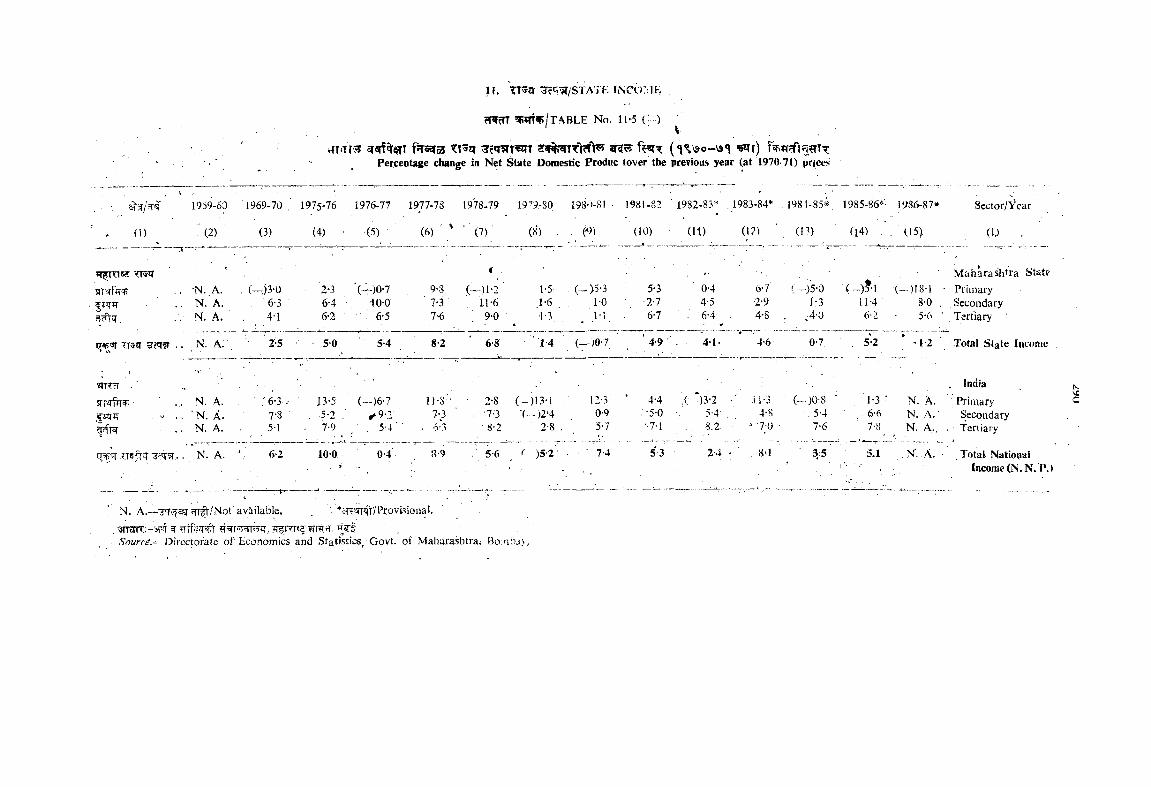
H. ^?cJWSTATE LSCt JrilE
rfwm W ^ /tA B L E No. 11-5 { )
fJT52Jo3 tJcCr TT T S«f%^TTV^ («i \&o-V9<l Wf)Percentage change in Net State Domestic Produc lover the prcTious year (at 1970-71) prices
1959-60 1969-70 , 1975-76 1976-77 1977-78 1978-79 19^9-80 198* 1-81 1981-82 1982-83’ . 1983-84'“ 1981-85*, 1985-S6^ 1986-87* Sector/Year
- (1) ■ (3) (4) • (5) (6) ' ' ' (7) (8) . ) (10) (11) (I?) (1 ’) (14) - (15) ( 1.)■* ir- * *■ .... ’ ~ "'
f .. Maharashtfa State-N.,A. . (-,)3-0 2-3 '(-)0 -7 9-8, ( ~ ) i -2 ■ 1-5 , (—>5-3 5 3 0-4 ii-1 (—)5-0 (- )? • ! (-)18-1 • PrimaryN. A. 6-3 6-4 -lO-O 7-3 Ll-6 ,1-6 ; 1-0 •2-7 4-5 2-9 1-3 il-4 8-0 . SecondaryN. A. 4-1 6-2 6-5 7'6 ; 9-0 •1-3 ' m 6-7 . -6-A' * 4-S . ,4-0 6-2 5-6 ' Tertiary
q<pjjr ■?;T«q’ ec»i?r . . _ iV. a : _ '2-5 5 0 5-4 8-2 6-8 14 (--)0-7 4-9 41 • 4-6 0-7 . 5-2 t2 Total State Income
’mTcT ■ ■■
, India
srf'Srftif: ■ N. A. ; ,'6-3-/ 13-5 (l.)6 .7 11-3 • 2-8 ( - ) ! 3 - i i:-3 4-4 .(■ ‘ )3-2 ,il-3 (- m ' 1 -3 ' N. A. Primary■N. A. 7-8" , ' 5-2 .,' ^9-2 7-3 " . ■7-3 ■( -)2‘4. 0-9 . -5-0 5-4' 4-8 5-4 , 6-6 N. A .' SecondaryN. A. 5-1 . 7-9 '. ■ 5-4' - 6*3 : 8-2 2-8 . 5-7 '■7-1 .. 8.2 , 7-0 7-6 7-8 N. A., • Tertiary
:?;icfrir . N. A. 6 2 100, 0-4 3-9 . 5-6 r 1 )5 .2 ' - ■ ' 7-4 5-3 2-4 8'1 3:5 5.1 , NT. . A. • Total National1 '• ■ ■ / Income (N. N. P. i
N. A.—•JTvjigiTTfr/Not available. , . Provisional.
Source.- Directorate o f Economics and Statistics, Govt, of Maharashtrai Bo:abav.
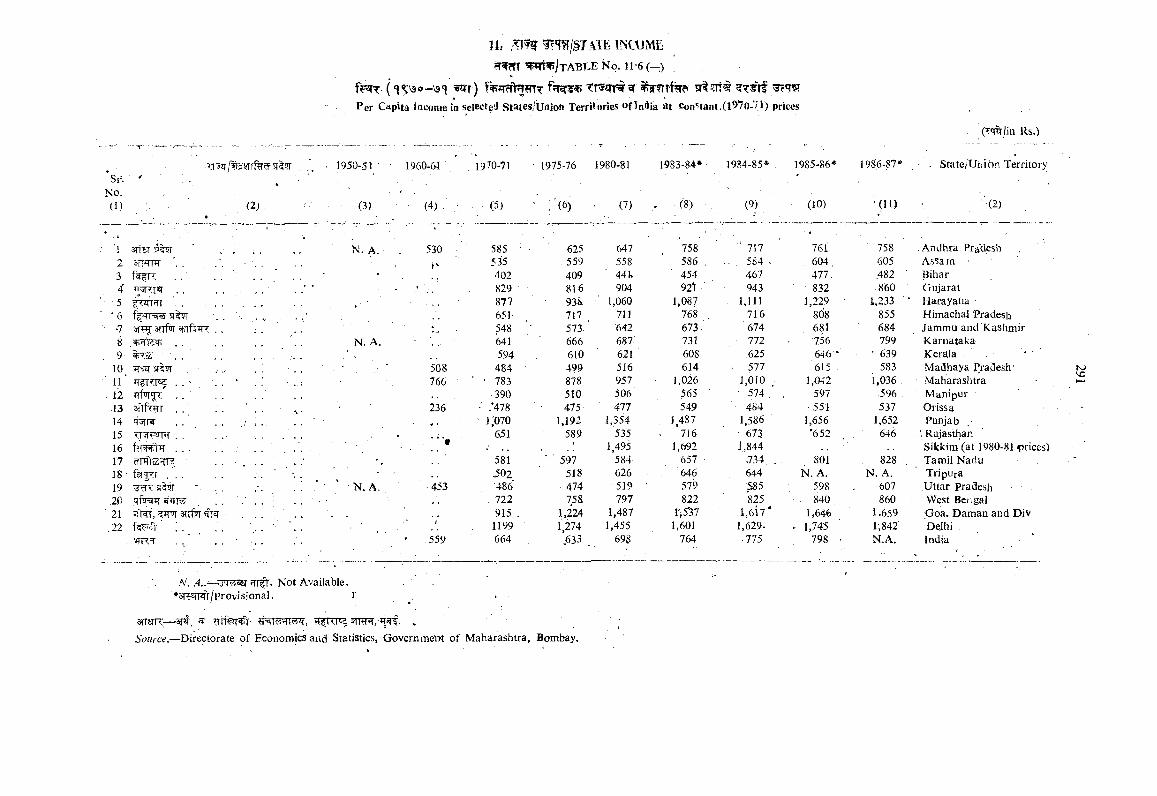
11: m m mrfafm TOSR/t ABTvE N o. 11-6 (—)
Per Capita Income in Selected States/U/iioft Territories of 111 13 at Constant.(1970-7^) Prices
Sr.No.(1)
*
*1 rr%i?T• . . . . .34 jprriqf . .
■ ■ 5 . . . .' 6
- ‘7 SWT . .8
, 910 ■qsq / , ,
■ n ‘ . . ' . .. 12
13 sfrf^T . . ’14 TSfR . . '1516 fe'HH . . .17 vrroicZ'Trs . .18 ■19
.2C .. . .
21 ’IRT', STffrT'fr T.22 r<C'";l , .
(2)
1950-51 ■
(3)
. N. A.
N. A.
N. A.
(Tq[%|in Rs.)
0-61 1970-71 1975-76 1980-81 1983-84* 1984-85* . 1985-86* 19^6-87* . State/Union Territory
(4 ) ; / • (5) • ; ' ( 6) (7) - ■ (8) • (9) (10) (11) ''(2)
530 585 ' 625 647 758 ■' 737 761 758 Andhra Pradeshf*- 535 559 558 5 8 6 : 584 - 604, 605 Assam -
402 409 ' 441s ■ 454 467 477. 482 Bihar829 816 904 92i ■ ' 943 ■ 832 860 Gujarat877 938 1,060 1,087 1,111 1,229 i,233 ■’ Harayana -651 717 , 711 768 716 808 855 Himachal Pradesh548 573.' ■642 673 674 681 684 Jammu and Kashmir641 666 687. 731 772 756 799 Karnataka594 610 621 60S 625 646 ' • 639 Kerala * '
508 484 • 499 516 614 577 615 . 583 Madhaya Pradesh766 , ' ' 783 878 957 1,026 1,010 1,042 1,036 Maharashtra
■ 390 510 506 565 • 574.' 597 596 Manipur236 • .‘478 475; 477 549 484 ■ 551 , , 537 Orissa
• i:o7o 1,192 1,354 , 1,487 1,586 1,656 1,652 Punjab. . . 651 589 535- 716 • 673 ’652 646 i Rajasthan
• 1,495 1,692 1,844 Sikkim (at 1980-81 prices)581 ' 597 584 657 .734 . 801 828 Tamil Nadti^02 518 626 646 644 N. A. N. A. Tripiira
453 486 ■ 474 519 579 .585 598 607 Uttar Pradesh722 758 797 822 825 - 840 860 - West Bci igal915 , 1,224 1,487 1',5'37 1,617* 1,646 1.659 Goa. Daman and Div
/ 1199 1,274 1,455 1,601 1,629. . 1,.74'5 1,842 Delhi ,559 664 .633 693 .764 775 798 • N.A. India
to'O
iV. ..-^Tq^eH" ?TTfV. Not Available.*3TFlT!fr/provisional. r
srrsrR—-3i4, ^ r^riw smR/ sr . .i'oH/'ce.—Directorate of Economics and Statistics, GovernmeW of Maharashtra, Bombay.
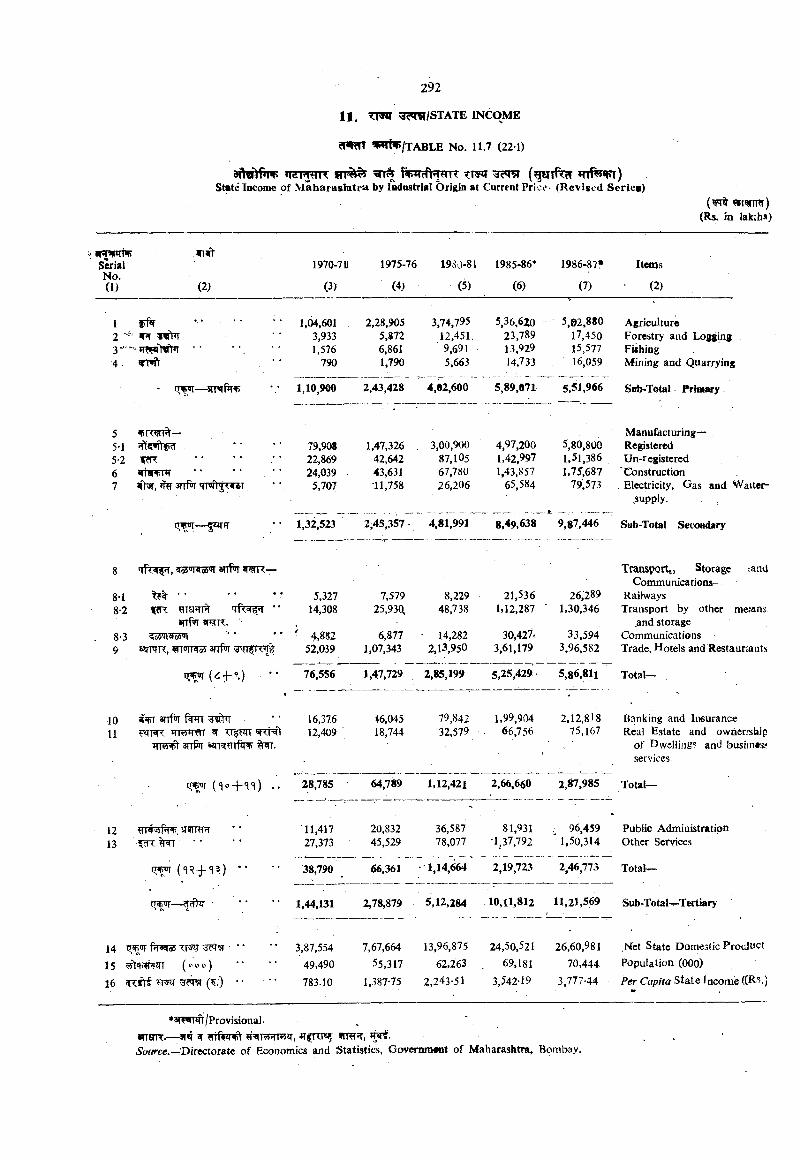
cWm ^»riV/TABLE No. U J (22-1)
ng if^r-c m r ^ (g«TTf^ *n y«ffT)State Income of Maharaslatra by Industrial Origin at Current Price- (Revised Seriea)
(Rs. in Iak:b9)
areppnv jn*fr Serial No.(1) (2)
1970-711
(3)
1975-76
(4)
1930-81
(5)
1985-86*
(6)
1986-87f
(7)
Items
■
1 frf*r •2 «i>i
4
1,04,6013,9331,576
790
2,28,9055,8726,8611,790
3,74,79512,451.9,6915,663
5,36,62023,78913,92914,733
“ ■ ■ ......
5,02,88017,45015,57716,059
AgricultureForestry and LoggingFiihiogMining and Quarrying
' cn^— 1,10,900 2,43,428 4,02,600 5,89,071 5,51,966 Sob-Total Primary -
5 «i5iwr%—5’15*2 FIT6 ftWPT • • * • ' •7 ^ 3TTfor <m»h TV$r
79,90822,86924,0395,707
1,47,326 , 42,642 43,631 -11,758
3,00,90087,10567,78026,206
4,97,2001,42,9971,43,857
65,584
5,80,8001,51,3861,75;687
79,573
Manulacturing—RegisteredUn-registcred
IConstruction. Electricity, Gas and Watter-
.supply.
1,32,523 2,45,357- 4,81,991 8,49,638 9,87,446 Sub-Total Secondary
8 'Tir rfT, <?3'iraOT anH
8-i ^8-2 Tt3fTI% • •
jnf'JT vinx.8‘3 ' ' * *9 «n^rc, m rui j oS anfw
5,32714,308
' 4,882 52,039
7,57925,93(\
6,8771,07,343
8,22948,738
- 14,282 2,13,950
21,5361,12,287
30,427.3,61,179
26,289 ■ 1,30,346
33,5943,96,582
Transportt, Storage :anU Communications—
RailwaysTransport by other mefans
.and storage Communications Trade, Hotels and Restaurants
ii+«i 76,556 1,47,729 2,85,199 5,25,429 5,86,811 T otal-
10 snf T U ITO'HtlT A Tr??q7
WTR’I 3T#T eZTRmftv %WT.
16,37.612,409
46,04518,744
79,84232,579
1,99,90466,756
2,12,81875,167
Banking and Insurance Real Estate and owner.'ship
of Dwelling? and busiin«s? services.
ir^ (<io4-< <)) . . 28,785 64,789 1,12,421 2,66,660 2,87.985 T otal-
12 frphrf^. nimFT13 • .
11,41727,373
20,83245,529
36,58778,077
81,931•1,37,792
96,459 ' 1,50,314
Public Administration Other Services
38,790 66,361 1 ,14 ,^ 2,19,723 2,46,773 Total—
1,44,131 2,78,879 5,12,284 10,11,812 11,21,569 Sub-Total-r-T^iar>
14 f TiToS TTSg" '15 vftWTWTT (coo)16 srrrtt ( ;) • •
3,87,55449,490783.10
7,67,66455,317
1,387-75
13,96,87562,263
2,243-51
24,50,52169,181
3,542-19
26,60,98170,444
3,777.44
.Net State Domestic Product Population (000)Per Capita State Income ((Rs.)
*3?FTTifl /Provisional. .msrn:.-—3 4 ?r wr%n *TfiTr5? frrFfjr, ’pri.Sotfrce.— Directotate of Economics and Statistics, GovemnMDt of Maharashtra, Bombay,
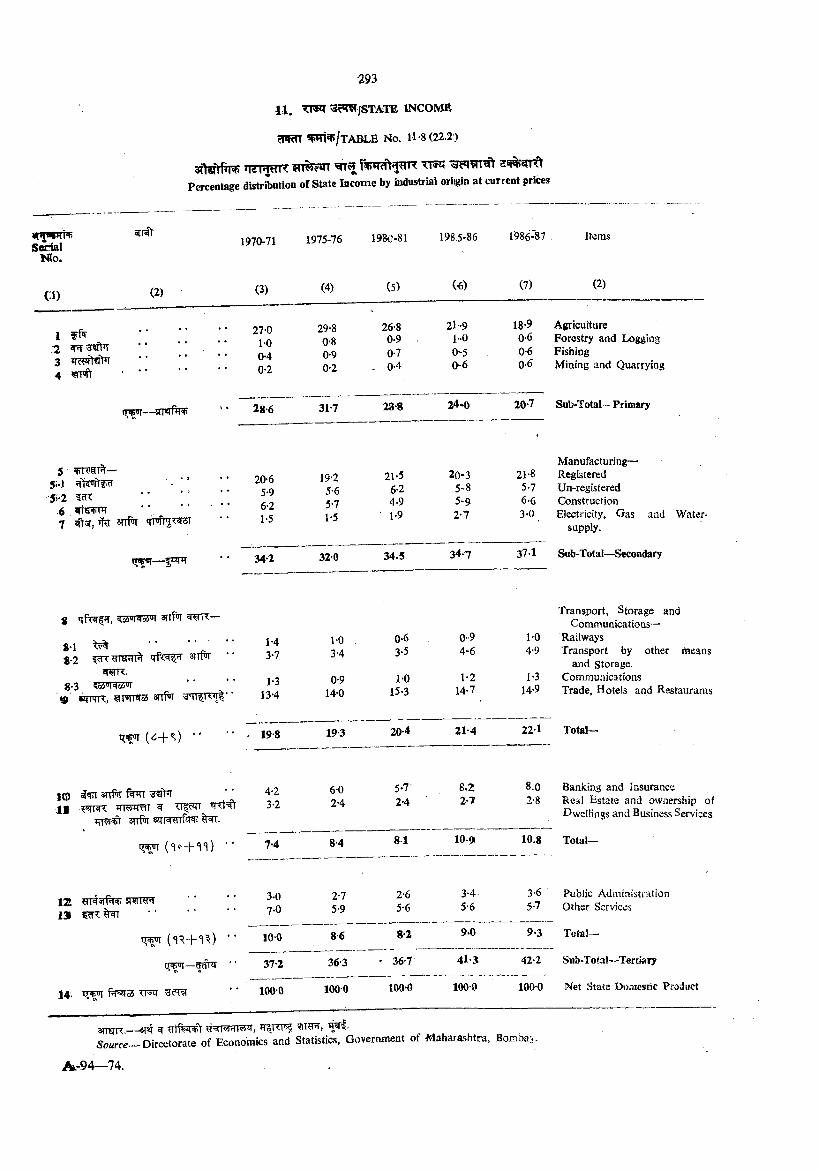
11. 3t«m/STATO INCOME
cWm ^ 5p /xA B L E No. M -8 (22.2 )
sftgftfipp 5n^e*n !%ir?fNmx TfnjPercentage distribution of State Income by industrial (M-iigin at current prices
W HFTPliSerfial
Nto.1970-71 1975-76 1980-81 198,5-86 1986-87 Items
€1) (2) (3) (4) (5) (•6) (7) (2)
I ":2 *TT3 ' ' ’ * ’ [4 rr>rt ...............................
27-010040-2
29-80-80-90-2
26-8 0-9 . 0-7
. 0-4
21-9l-O0~50-6
18-90-60-60-6
AgricultureForestry and LoggingFishingMining and Quarrying
(T^— apfrfw 28-6 31-7 28-8 24-0 20-7 Sub-Total - Primary
55i-l ‘ *5i-2 '" *' ]
6 7
20-65-96-2 1-5
19-25-65-71-5
21-56-24-91-9
20-35-85-92*7
21-85.76-63-0
Manufacturing—RegisteredUn-registeredConstructionElectricity, Gas and Water-
supply.
34-2 320 34.5 34-7 37.1 Sub-Total—Secondary
S 3TTrwf
«*1 ^ ___ ■ _ ■ ■S-2 'TTf:^ 3TTm
«-3 ?[amWS'’T ____^ «JTTR, r>TWa5 *i?ir«T
1-43-7
1-313-4
10 . 3-4
0-914-0
0-63-5
1-015-3
0“94-6
1*214-7
1-04.9
1-314-9
Transport, Storage and Communications—
RailwaysTransport by other means
a n d S to rag e .CommunicationsTrade, Hotels and Restaurants
qsFi { 6 - { - % ) " - 19-8 19-3 20-4 21-4 22-1 Total-
10 3TCf11 5Fqm iTTW^r ^
srrfw sq-tw rf^ ^rar.
4-23-2
6-02-4
5-72*4
8.22-7
8.02-8
Banking and Insurance Real Estate and ownership of Dwellings and Business Services
{n° + ‘l ‘i) ■ ■ 7-4 8-4 81 10-9 10.8 Total-
12 SW RR13 ...............................
3-07-0
2-75-9
2-65*6
3-45-6
365-7
Public Administration Other Services
^ * ‘ 100 86 8-2 9-0 9-3 Total—
■ ■ 37-2 36-3 - 36-7 41-3 42-2 Sub-Total-Tertiary
I4 ‘< 1000 100 0 1000 1000 1000 Net State I>o.iicstic Product
Source— Directorate of Economics and Statistics, Govermnent of Maharashtra, Botnbay,
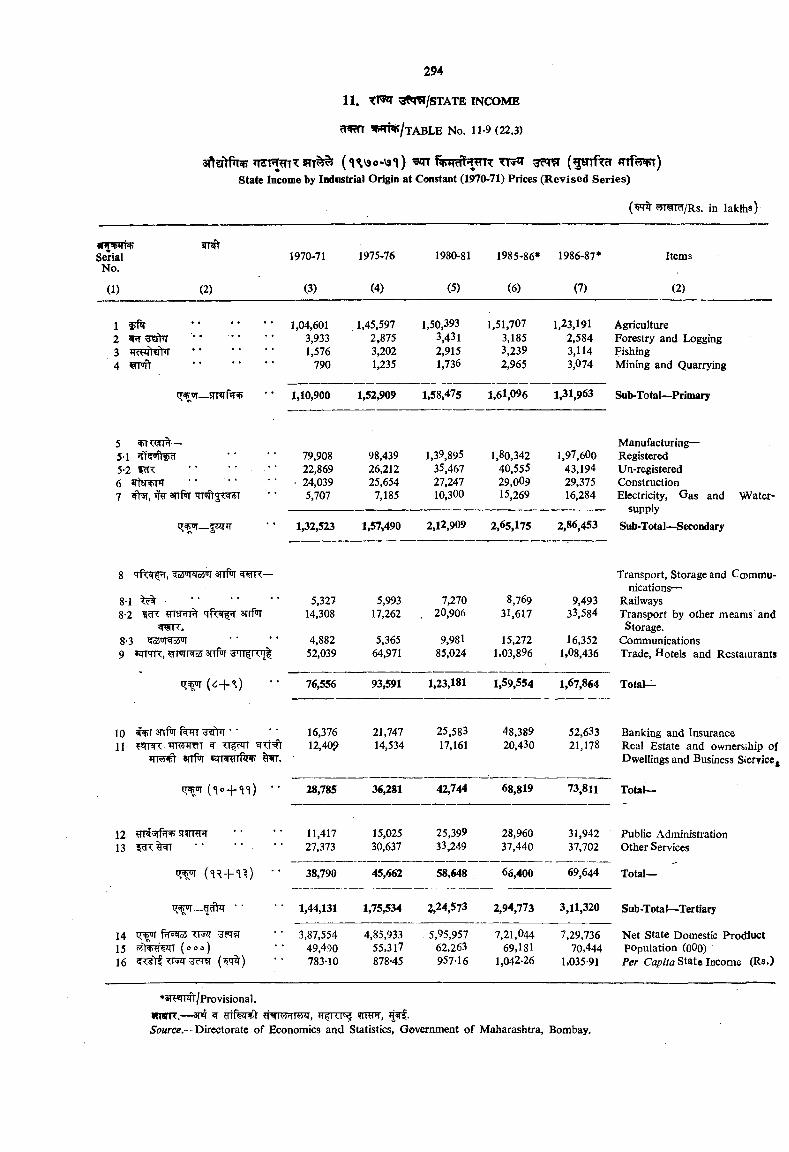
state Income by Industrial Origin at Conistant (1970-71) Prices (Revised Series)
5yraM/Rs, in lakths)
SerialNo.
1970-71 1975-76 1980-81 1985-86* 1986-87* Items
(1) (2) (3) (4) (5) (6) (7) (2)
1 .............................23 .............................4 «s«i«n .............................
1,04,6013,9331,576
790
1,45,5972,8753,2021,235
1,50,3933,4312,9151,736
1,51,7073,1853,2392,965
1,23,1912,5843,1143,074
AgricultureForestry and LoggingFishingMining and Quarrying
iT tiT—5TT«TfW 1,10,900 1,52,909 1,58,475 1,61,096 1,31,963 Sub-Total—Primary
55-15-2 •' • ’67 ’TO' 3rrfwr Tmt^T^T
79,908 22,869
. 24,039 5,707
98,43926,21225,654
7,185
1,39,89535,46727,24710,300
1,80,34240,55529,00915,269
1,97,60043,19429,37516,284
Manufacturing—RegisteredUn-registeredConstructionElectricity, Gas and Water-
supplySub-Total—Secondary1,32,523 1,57,490 2,12,909 2,65,175 2,86,453
8 <io(j'JNc6«i 3nfn' W R —
8-1 ^ ‘ '8-2 ?rrEnn% q'Fcsr 'f 3rrf*jr
spjiTT.8-3 ?r«5'«l OT9 ailNTi, 3hR ’aP^R’Tl
5,32714,308
4,88252,039
5,99317,262
5,36564,971
7,270 , 20,906
9,98185,024
8,76931,617
15,2721,03,896
9,49333,584
16,3521,08,436
Transport, Storage and Ccommu- nications—
RailwaysTransport by other meams’and Storage.
CommunicationsTrade, Hotels and Restaiuranis
76,556 93,591 1,23,181 1,59,554 1,67,864 T otal-
10 ^ an T f w * ■11 ^qicK £|' TT?^ '5rTr=)'
16,37612,40?
21,74714,534
25,58317,161
48,38920,430
52,63321,178
Banking and InsuranceReal Estate and ownersship ofDwellings and Business Stervice,
tr ur ( ‘|0 + < <l) •• 28,785 36,281 42,744 68,819 73,811 T otal-
13 ■ ‘ ' ■11,41727,373
15,02530,637
25,39933,249
28,96037,440
31,94237,702
Public Administration Other Services
+''1 ■■ 38,790 45,662 58,648 66,400 69,644 Total—
1,44,131 1,75,534 2,24,573 2,94,773 3,11,320 Sub-Total—Tertiary
15 (ooo)16 ttht'dic y ( q?r)
3,87,55449,490783-10
4,85,93355,317878-45
5,95,95762.263957-16
7,21,04469,181
1,042-26
7,29,73670,444
1,035-91
Net State Domestic Prodiuct population (oOo)Per Ca/?/7a State Income (Rs.)
*3R«rrat,/Provisional. wnm.—3pt ^ grfw^V WRTfT,Source.—Directorate of Economics and Statistics, Government of Maharashtra, Bombay.
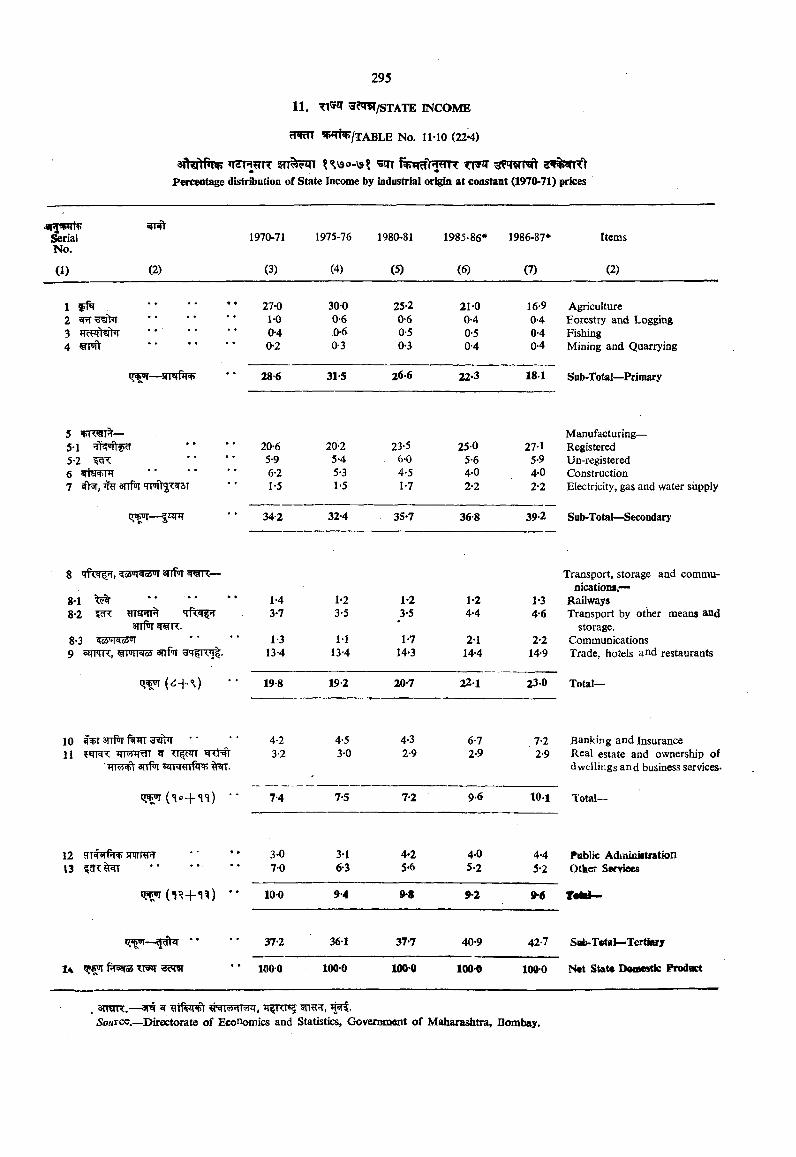
cfWcn ^m^/TABLE No. IMO (22*4)
t%\9o.\9l ^ TT^ ^3mT3ftPercentage distribution of State Income by industrial origin at constant (1970-71) prices
1970-71
(3)
1975-76
(4)
1980-81
(5)
1985-86*
(6)
1986-87*
(7)
Items
(2)
SerialNo.
(1) (2)
1 ............................... 27-0 300 25-2 21-0 16-9 Agriculture2 «tHi 10 0-6 0 6 0-4 0-4 Forestry and Logging3 0-4 .0-6 0-5 0-5 0-4 Fishing4 ............................... 0-2 0-3 0-3 0-4 0-4 Mining and Quarrying
28-6 315 26*6 22*3 181 Sub-Total—Primary
5 — Manufacturing—5-1 20-6 20-2 23-5 250 27-1 Registered5-2 ^ 5-9 5-4 6-0 5-6 5-9 Un-registered6 “lltt'M'H 6*2 5-3 4-5 4-0 4-0 Construction7 'Vsr, ’H’ srrpJi qroftjrHrsT 1-5 1-5 1-7 2-2 2-2 Electricity, gas and water supply
— |iq44 34-2 32-4 35*7 36-8 39-2 Sub-Total—Secondary
8 'Tfc'i?; , 5o5”i o3w arifw Transport, storage and communication!.—
8*1 1-4 1-2 1-2 1-2 1-3 Railways8*2 3-7 3-5 3-5 4*4 4-6 Transport by other means and
3fl1W * storage.8-3 <c6*JMcg'n' 1-3 M 1-7 21 2*2 Communications9 sjTFTT , anfyf 13-4 13-4 14-3 14-4 14-9 Trade, hotels and restaurants
198 19-2 20-7 22-1 230 Total—
10 3TTfw 4-2 4-5 4-3 6-7 7-2 Banking and Insurance11 FTR’?: ^ Ti cqr 3-2 3-0 2-9 2-9 2-9 Real estate and ownership of
dwellings and business services-
7-4 7-5 7*2 9 6 lO l Total-
12 TT45rf + SMRPT * ■ * * 3-0 3-1 4*2 4-0 4.4 Public AdininittntioD13 7-0 6-3 5-6 5-2 3-2 Otkcr Senrioes
W ** 100 9-4 9-8 9-2 9-6
q ^ ~ * • 37-2 361 37-7 40-9 42-7 Si^-T«tal—Tertiary
f oqoi 1000 1000 100*0 100-0 1090 Net Stat* Domestic Prodoct
. SntJR.—ara ^5o«rce.—Directorate of Econoinics and Statistics, Government of Maharashtra, Bombay.
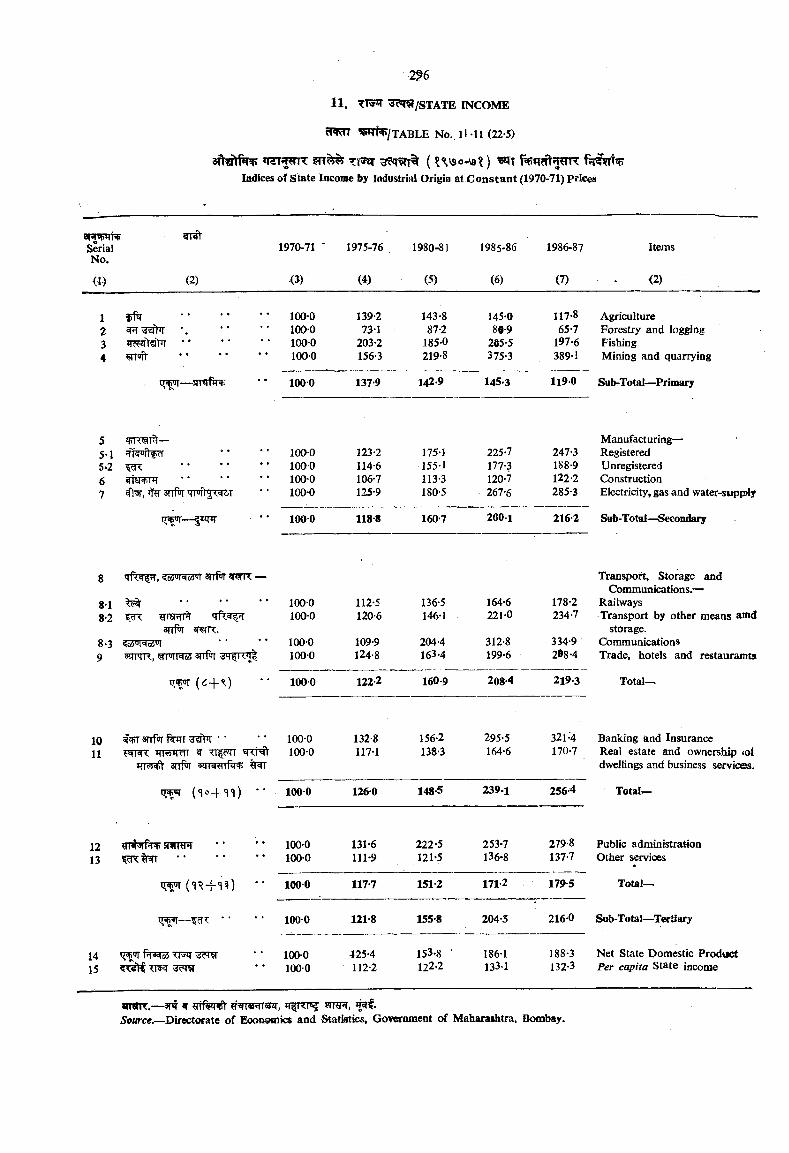
»R:TfJTTT § n ^ x m ^ 3 ^ % ( UV3o-\0? )Indices of State Income by Industrial Origin at Constant (1970-71) prices
0R W ^ ^Serial 1970-71 * 1975-76 1980-81 1985-86 1986-87 ItemsNo.
m (2) a ) (4) (5) (6) 0 ) <2)
1 1000 139-2 143-8 145-0 117-8 Agriculture2 1000 73-1 87-2 80-9 65-7 Forestry and logging3 1000 203-2 185-0 295-5 197-6 Fishing4 1000 156-3 219-8 375-3 389-1 Mining and quarrying
1000 137-9 1429 1453 119-0 Sub-Total— Primary
5 Manufacturing—53 1000 123-2 175-1 225-7 247-3 Registered5.2 fcR ............................... 1000 114-6 155-1 177-3 188-9 Unregistered6 1000 106-7 113-3 120-7 122-2 Construction7 1000 125-9 180-5 267-6 285-3 Electricity, gas and water-supply
tri ui:— |IITIT 1000 118-8 160-7 200-1 2162 Sub-Total—Secondary
8 M R'j '11 rrfw wwfT —- Transport, Storage andCommunications.—
81 ^ ............................... 1000 112-5 136-5 164-6 178-2 Railways8-2 ?rraRn qlxw^ 1000 120-6 146-1 221-0 234-7 Transport by other means amd
anfw g TT. storage.8-3 <o4«i«rc4'n 1000 109-9 204-4 312-8 334-9 Communications9 BiiiMR, yiwir^ arrf'n 'dM Rnl 1000 124-8 163-4 199-6 208-4 Trade, hotels and restauramts
^ (^ + ^ ) 1000 122-2 160-9 208-4 2193 Total—.
10 anfoT 1 w • ■ 100-0 132-8 156-2 295-5 321-4 Banking and Insurance11 ^ Tifcqr «n:Ht 1,000 117-1 138-3 164-6 170-7 Real estate and ownership <ol
anfoi dwellings and business services.
100-0 126-0 1485 239.1 256-4 Totair—>
12 ¥I#5rf% SWRR 100-0 131-6 222*5 253-7 279-8 Public administration13 100-0 111-9 121*5 136-8 137-7 Other services
100-0 117-7 151-2 1712 1795 Total—
• • 100-0 121*8 155-8 204*5 216-0 Sab-Total—Twtlary
14 fn^ai TT»!T 100-0 425-4 153-8 • 186-1 188-3 Net State Domestic Product15 100-0 112-2 122*2 1331 132-3 Per capita State income
m«R.—aw «r mfervt ’Tfirrs? strr,Source.—DirKtoratt of EooQoujics and Statistics, Government of Mahara«htra, Bombay.
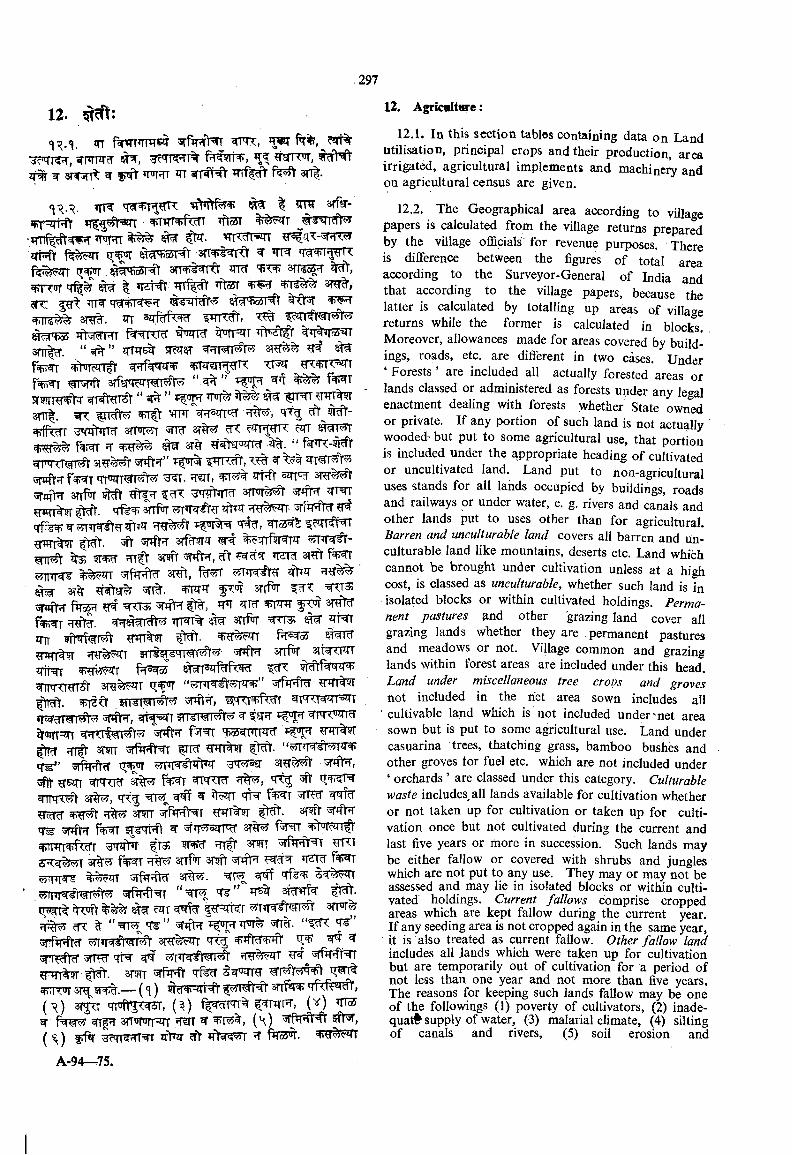
srr’TPT ^ 'T r^i% f rf rN?, ^ s trw , % > rt ^ w srwin^ W nrRT ITT 5TT#^ ^Tff 'V 3TT|.
*\R-\ ^ ^ I OT srfsr-TT =jil i t e % ^ t
•TTT%ftW^ ^ >TT l=^T ^qT-^5m?TJTRft f ^ ^ T sTT^rt^ft srf^r^qr iT ^ <?N)o5i-cft 3rr«pt r<1r qr?f snsoS T ^ o f m I ’T2M TTTf^ ’Tt^ 3T^,<5f J <s<‘MiciV' §f<?i^o5r^
ll<s ' 3T^. ^ «M,RTr<'td' frnrdt,^OT55 TftWPTT f^’srrW tnqfT ^mi^T ^T>^1fr sn%r. qriTsJr sr?cr«sT ^f%7^ ^Ff'WTT cfH'f^iT^ "RTJT JWrnC TT^ tf' .'tiK'® '!f ^ T WR»ft arfl^^T W r^ f^ T5T?nw ^ m ^ T ^ “ ^ ^rq% ^3TTt| , ^ ^ vrnr\?r5qT'^ ?i% , q t^ ^^rff^T 3’ iftqT SfTWT ^ 3T^ ^ cqtOTT ^ ^^TT^ 5Fw ^ ^ ^ 3T%4rH\T<a!'^ 'jf flf’T” ^Tfrcdt, ^5TOt^f^^r ?T?rT, rt ft ®tt'^smftfT srrf^ ^ ^?r>rr^^FTT^ qi%^ arrftir ^
^ 5 5 ^ ^cCTT KT^ srf^^T %^qTfePT
^ 3T5ft ^ TcTRT 31^ fsp^?JTPT ^ i^ T ^ 3RTt, ^^iT^?T q JT ?T?r^ '
3? m n fx>^ arrf T =^t3;5Twft?r f i i ^ =ErTTi; m 3t?t1^fsfn T 3nf^ ^ ^rt^^nt 9Trr%9T ft^rt. j t tq t f^r^ssw r ^ JW^^T 5 n tq ^ q w r^ ^ arrfq’ s ir h t4ii'<i I 14^=1 o4 ^<5(l°Midr<'Kf
^ T m m ^ m ^ T t r ^®FT3f1r SHI'S 1^1^'^ '5Tr1^i wKT+r<,^i ^rrrr^RTT^T
2r<nrr=irT ^ccvnwH’ f = ^^ s m 5 ffW ^ FRT ^rm%^T ^ ' srM t^ ^3^?r a ig - ^3f)t ^fsqr m ro r 5 ^ f ^ r q t^ # i r^ ? ^^ r r q ^ 3 % , = rR7 ^ qH f ^ r vTT^
s p ^ arm ^ M N t ^1^. 31^q ^ snfR f% T iT^Tnft ^ ^ q ^ sq r^ s r ^ sf7>ji f|)-rrrrrr pferT 5>3 ^51^ ^ ami
31% ?r% srrf'T sr ft r rcr f ^ rWinK- 'jff^’llld' 3T^. qi%^ 33T^r^
s^mf^ f ) ^ . m i^FTRr srrw^
?r%5: ^ ^ “ = ^ q ^ "^rfipfta' ^ ^TPFcft qtw ^ 'jr%'fNT
^ n n % ^ - ^ . 3mr 'rfef t r ^rrroJT s r^ w ^ .— ( <i) WcTrtt^ vmrNt s r r f e q f d i ^ ,( ^ ) 3 t ^ »i(qf1 c fgr, (^ ) ^ ^ r w , {'^) n m^ srTdTirFTT T rr ^ { \ ) fft^,( ^ ) f f^ ^3?n^=^rt zrt JT eft T t e ^ .
12.1. In this scction tables containing data on Land utilisation, principal crops and their production, area irrigated, agricultural implements and machinery and on agricultural census are given.
12.2. The Geographical area according to village papers is calculated from the village returns prepared by the village oflBicials for revenue purposes. There is difference between the figures of total area according to the Surveyor-General of India and that according to the village papers, because the latter is calculated by totalling up areas of village returns while the former is calculated in blocks. Moreover, allowances made for areas covered by buildings, roads, etc. are different in two cases. Under ‘ Forests ’ are included all actually forested areas or lands classed or administered as forests under any legal enactment dealing with forests whether State owned or private. If any portion of such land is not actually wooded- but put to some agricultural use, that portion is included under the appropriate heading of cultivated or uncultivated land. Land put to non-agricultural uses stands for all lands occupied by buildings, roads and railways or under water, e. g. rivers and canals and other lands put to uses other than for agricultural. Barren and unculturable land covers all barren and Un- culturable land like mountains, deserts etc. Land which cannot be brought under cultivation unless at a high cost, is classed as unculturable, whether such land is in isolated blocks or within cultivated holdings. Permanent pastures and other grazing land cover all grazing lands whether they are permanent pastures and meadows or not. Village common and grazing lands within forest areas are included under this head. Land under miscellaneous tree croDs and groves not included in the net area sown includes all
• cultivable land which is not included under'net area sown but is put to some agricultural use. Land under casuarina trees, thatching grass, bamboo bushes and other groves tor fuel etc. which are not included under ‘ orchards ’ are classed under this category. Cullurable waste includes, all lands available for cultivation whether or not taken up for cultivation or taken up for cultivation once but not cultivated during the current and last five years or more in succession. Such lands may be either fallow or covered with shrubs and jungles which are not put to any use. They may or may not be assessed and may lie in isolated blocks or witlun cultivated holdings. Current fallows comprise cropped areas which are kept fallow during the current year. If any seeding area is not cropped again in the same year, it is also treated as current fallow. Other fallow land includes all lands which were taken up for cultivation but are temporarily out of cultivation for a period of not less than one year and not more than five years. The reasons for keeping such lands fallow may be one of the followings (1) poverty of cultivators, (2) inadequate supply of water, (3) malarial climate, (4) silting of canals and rivers, (5) soil erosion and
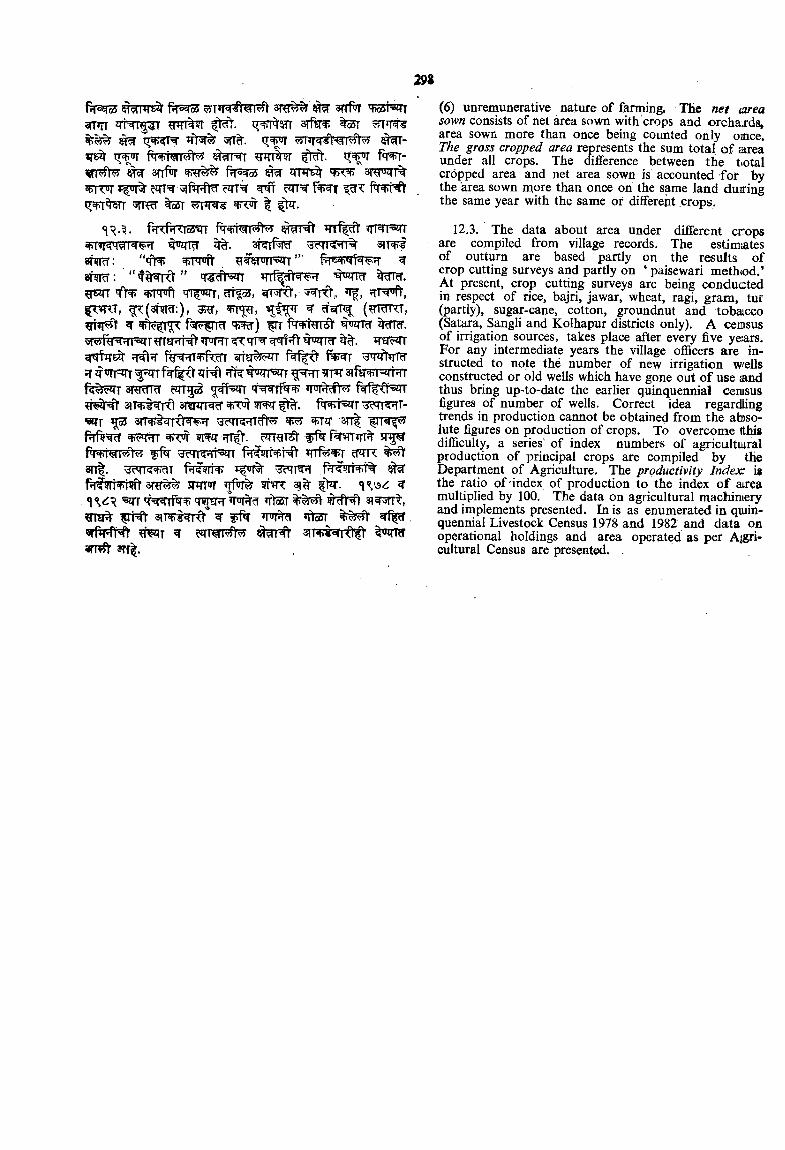
frf qoS f T®o5 3RT% 3TTfW 'ftooi ' 'T5TT qt=^i^4i ^nn%?r a r t e ^
IT P pq* jft 5I% 5(T , ^WT-«T6 fq ^ -
m sTif ir ^rnrsir 3towt%^T^T ^ cqr^ t e r f t
'jfTt oSr ^ ^hr.
fqrioS^ ^RT%ft m^I'sqrah rrf^ 3?TT5TT% 31T^
‘ ‘ ‘ T ^8TO:afw
. ^^wraqfT”'" ” 'T4‘ -«ri ? n f^ fr^ ^
g w ^rpFft qT^T, mfo5, ^TsrO’, »if, f W J , f^(3f?r^:), fTNjB, % f f ^ ^ (mmxT,
^ ^ l y : fv»f<y^l w ) FT tWTW
?r^5Frs f w r r # ^ t%^r5T q tjrpqTT 5 ^ ?fk 3lteT=zmTf^ ls^ T cJTT^s g;#5!rT qN ^rfw ^
s iT ^ r i^ sR W T ^ ^ ^ f W ^ T ^cqr^T -•31TT ^ srrcbt ciKl^ ? ^ 31T| ^ t r ^
??T?n ^ 5 m m^t. ^ f^«rr»r^^•< fi<H'i’5qrr f^fsit^Pr^ Trrf f>T ^ i r ^
3 n |. ^ a w r^ T M w p f^rfsm rr^ ^f W i W ts R T ^ sniT»JT ’r f ^ ?nn: pot. ^
'sirr qT arJT rq^^^ H t ^ fJosr ^% r
5 rfW ^ ^i^T ^ ?cnW t^ s iw s^rO ^ W ? rajTvft ?rr|.
(6) unremunerative nature of farming. The net areasown consists of net area sown with crops and orchards, area sown more than once being counted only omce. The gross cropped area represents the sum total o f area under all crops. The difference between the t.otal cropped area and net area sown is accounted for by the area sown more than once on the same land duiring the same year with the same or different crops.
12.3. The data about area under different crops are compiled from village records. The estimiates of outturn are based partly on the results of crop cutting surveys and partly on ‘ paisewari meth«od.’ At present, crop cutting surveys are being conducted in respect of rice, bajri, jawar, wheat, ragi, gram, tur (partly), sugar-cane, cotton, groundnut and tobaicco (Satara, Sangli and Kolhapur districts only). A cemsus of irrigation sources, takes place after every five ye:ars. For any intermediate years the village officers are instructed to note the number of new irrigation w'ells constructed or old wells which have gone out of use jand thus bring up-to-date the earlier quinquennial cemsus figures of number of wells. Correct idea regardling trends in production cannot be obtained from the absolute figures on production of crops. To overcome tthis difficulty, a series' of index numbers of agricultiural production of principal crops are compiled by the Department of Agriculture. The productivity Index is the ratio of-index of production to the index o f airea multiplied by 100. The data on agricultural machiniery and implements presented. In is as enumerated in quiin- quennial Livestock Census 1978 and 1982 and data on operational holdings and area operated as per Aigri- cultural Census are presented.
TABLE 12.1 (4-1)
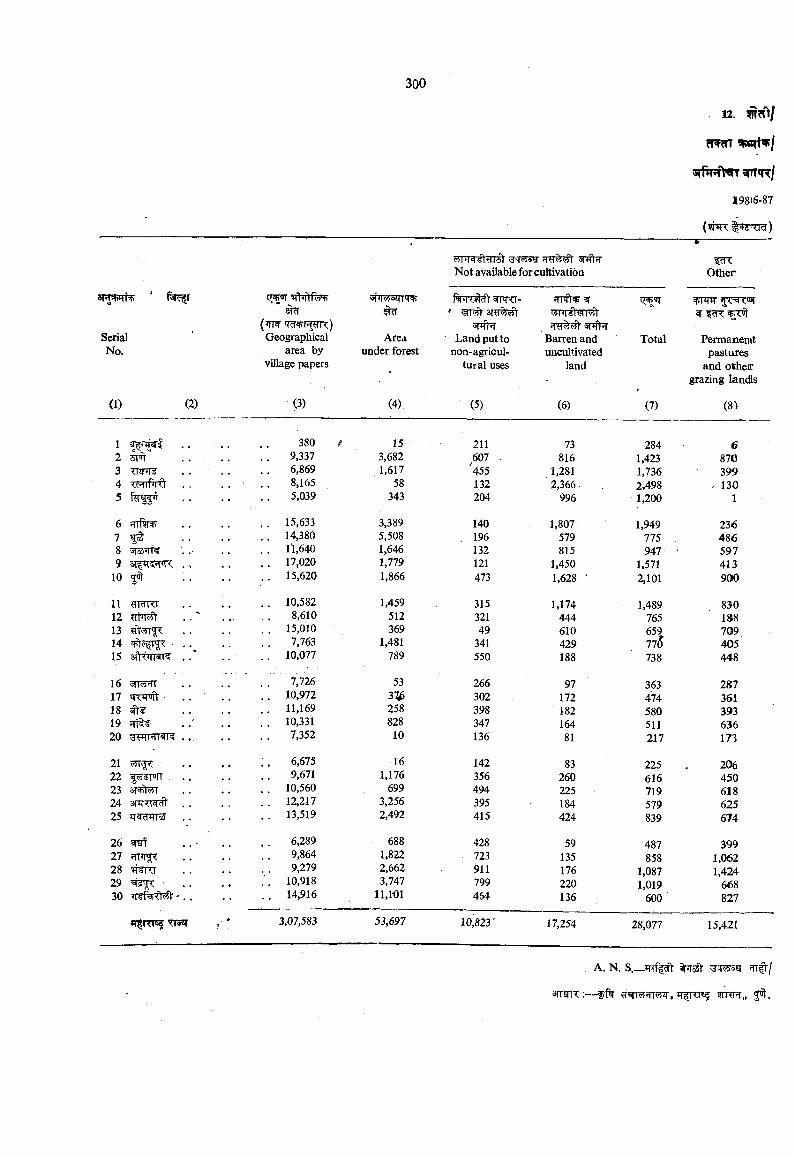
Not available for cultivation
SerialNo.
(1)
12 5T r34 T Trf rft5
6 HIP1H+789
10 5^
11 HT nrr12131415
1617181920
21222324 SfJTTT ^25
2627 frm^28 #§Kr2930
(2)
(■HN TcTPTOTX) Geographical
area by village papers
(3)
3IWoJTT*T*l>
Area under forest
(4)
Land put to non-agricul
tural uses
(5)
3809,3376,8698,1655,039
15,63314,38011,64017,02015,620
10,5828,610
15,0107,763
10,077
7,72610,97211,16910,3317,352
6,6759,671
10,56012,21713,519
6,2899,8649,279
10,91814,916
Barren and uncultivated
land
(6)
Total
(7)
3rT«R/
198(6-87
(w c
Other
Permanemt pastures
and otheir grazing lands
(8)
3,07,583
15 211 73 284 63,682 607 . 816 1,423 8701,617 '455 1,281 1,736 399
58 132 ‘ 2,366 2,498 - 130343 204 996 1,200 1
3,389 140 1,807 1,949 2365,508 . 196 579 775 48 61,646 132 815 947 5971,779 121 1,450 1,571 4131,866 473 1,628 • 2,101 900
1,459 315 1,174 1,489 830512 321 444 765 138369 49 610 659 709
1,481 341 429 770 405789 550 188 738 448
53 266 97 363 28731^ 302 172 474 361258 398 182 580 393828 347 164 511 63610 136 81 217 173
16 142 83 225 2061,176 356 260 616 450
699 494 225 719 6183,256 395 184 579 6252,492 415 424 839 674
688 428 59 487 3991,822 723 135 858 1,0622,662 911 176 1,087 1,4243,747 799 220 1,019 668
11,1-01 464 136 600 827
53,697 10,823' 17,254 28,077 15,421
. A. N. S._ rrf ?fV ^ To5t ^q^saf
sTTgiT:— TTfrae? 5^.
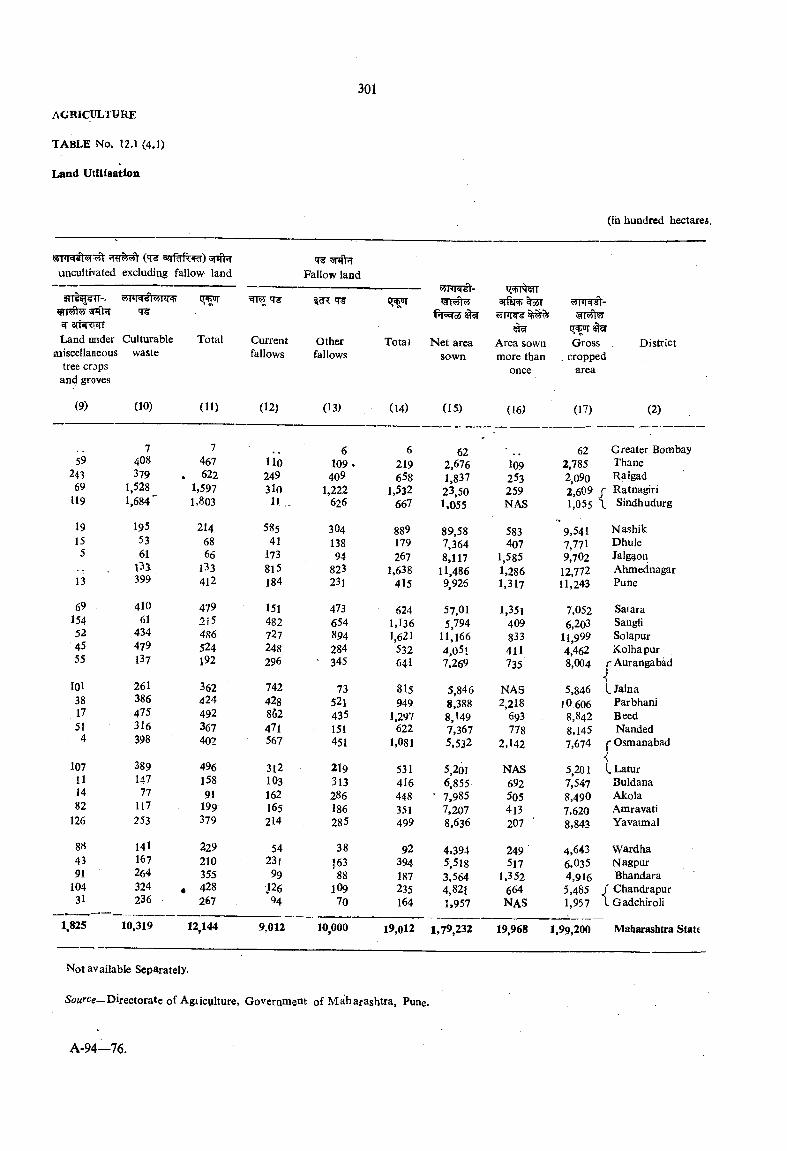
AGRICULXyRE
TABLE No. 12.1 (4.1)
Land Utilisation
TRfMt (<T odMkiRr) sfrftvr uncultivated excluding fallow land
snrhr Fallow land
^1^55 'T^ strtfttLand under Culturable
miscellaneous waste tree craps
and groves
(9) (10)
Total
(11)
5924369
119
19155
13
69154524555
lOl 38
, 17 51
107111482
126
884391
10431
7408379
1,5281,684'
1955361
m399
41061
4344?913?
261386475316398
38914777
117253
141167264324236
7467622
1,5971,803
2146866
133412
4792x5486524l92
362424492367402
49615891
199379
229210355428267
1825 10,319 12.144
Currentfallows
(12)
llO 249 3lO
11 ,
58541
173815184
151482727248296
742428862471567
312103162165214
54 231 99
126 94
otherfallows
(13)
6109409
1,222626
30413894
823231
473654894284 345
7352l435151451
219313286186285
3816388
IO970
9,012 10.000
Total
(14)
6219658
1.532667
889179267
1,638415
6241.1361,621
532641
815949
1.297622
1.081
531416 448 351499
92394187235164
0(^06 ^
Net area sown
(15)
622,6761,83723,50I.055
89,587,3648,117
II,486 9,926
57.015,794
11,1664,05i7.269
5,8468,3888,1497.3675.532
5,2016,8557.9857,2078.636
4,3945,5183,5644,8211,957
(in hundred hectares.
srfsRi o5T
Area sown more than
once
(16)
l09253259NAS
583407
1,5851,2861,317
1.351 409 833 411735
NAS2,218
693778
2,142
NAS692505413207
249517
1.352 664 NAS
Grosscropped
area
(17)
District
(2)
62 Greater Bombay2,785 Thane2,090 Raigad 2,609 J Ratnagiri 1,055 \ Sindhudurg
9,5417,7719,702
12,77211,243
7.0526.203
11,9994,4628,004
5,8461O6O6
8.8428,1457,674
5,2017.5478,4907.6208.843
4,6436,0354,9165.4851,957
NashikDhuleJalg^onAhmednagarPune
Safara Sangli Solapur Kolhapur
jT Aurangabad
I. Jalna Parbhani Beed Nanded
I' Osmanabad
L Latur Buldana Akola Amravati Yavatmal
Wardha Nagpur Bhandara
J Chandrapur \ Gadchiroli
l9,ol2 1.79,232 19,968 1,99,200 Maharashtra State
Not available Separately.
5oMrce—Directorate of Agticvilture, Governmem of Maiharashtra, Pune.
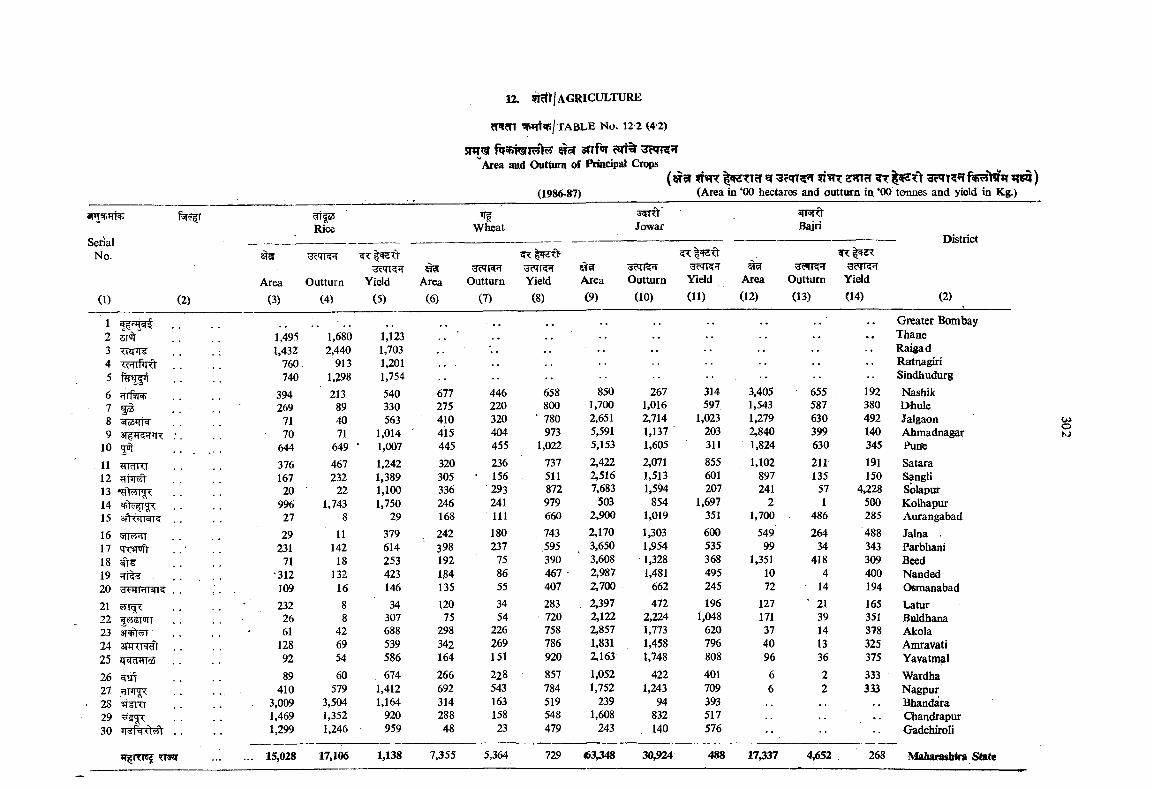
TABLE No. 12-2 (4 2)
snr?f ^ awfor cm% ;3cqr?;rArea and Outturn of Principal Crops
(1986-87)( W5I ^TTcT ^ c«TT55T 5T »?6$)
(Area in ‘00 hectares and outturn in ‘00 tonnes and yield in Kg.)
SerialNo.
(1)
TTfsZ;Rice Wheat Jowar Bajri
(2)Area Outturn Yield
(3) (4) (5)Area(6)
Outturn(7)
3?Ti??rYield(8)
Area(9)
^IcFTOutturn
(10)Yield(11)
5TWArea(12)
RVTcFTOutturn(13)
Yield(14)
District
(2)
123 Tnr r?4
1,4951,432
760740
1,6802,440
9131,298
1,1231,7031,2011,754
Greater BombayThaneRaigadRartnagiriSindhudurg
6 rirl icf) . _ 394 213 540 677 446 658 850 267 314 3,405 655 192 Nashik7 5JS . . 269 89 330 275 220 800 1,700 1,016 597 1,543 587 380 Dfauleo • •8 'j)oi'i|ic| _ _ 71 40 563 410 320 ‘ 780 2,651 2,714 1,023 1,279 630 492 Jalgaon9 3i^?r^iR ;. 70 71 1,014 415 404 973 5,591 1,137 203 2,840 399 140 Ahmadnagar
10 5 r . . 644 649 • 1,007 445 455 1,022 5,153 1,605 311 1,824 630 345 Purfe
11 376 467 1,242 320 236 737 2,422 2,071 855 1,102 211 191 Satara12 167 232 1,389 305 ' 156 511 2,516 1,513 601 897 135 150 Sangli13 20 22 1,100 336 293 872 7,683 1,594 207 241 57 4,228 S'olapur14 . . 996 1,743 1,750 246 241 979 503 854 1,697 2 1 500 Kolhapur15 sn tw r? . . 27 8 29 168 111 660 2,900 1,019 351 1,700 486 285 Aurangabad16 . . 29 11 379 . 242 180 743 2,170 1,303 600 549 264 488 Jalna17 t r c ^ 231 142 614 398 237 595 3,650 1,954 535 99 34 343 Parbhani18 71 18 253 192 75 390 3,608 1,328 368 1,351 418 309 Beed19 '312 132 423 1.84 86 467 - 2,987 1,481 495 10 4 400 Nanded20 . . 109 16 146 135 55 407 2,700 662 245 72 • 14 194 Osmanabad21 ' 232 8 34 120 34 283 , 2,397 472 196 127 ■ 21 165 LaturC\22 |5JST'irT 26 8 307 75 54 720 2,122 2,224 1,048 171 39 351 Buldhana23 ' 61 42 688 298 226 758 2,857 1,773 620 37 14 378 Akola24 3nRR9> . . 128 69 539 342 269 786 1,831 1,458 796 40 13 325 Araravati25 JTTTRT® 92 54 586 164 151 920 2,163 1,748 808 96 36 375 Yavatmal26 89 60 674 266 228 857 1,052 422 401 6 2 333 Wardha27 410 579 1,412 692 543 784 1,752 1,243 709 6 2 333 Nagpur28 ■*4 Kl 3,009 3,504 1,164 314 163 519 239 94 393 Bhandara29 5C < 1,469 1,352 920 288 158 548 1,608 832 517 Chandrapur30 . . 1,299 1,246 959 48 23 479 243 140 576 •• Gadchiroli
»?fTTr<sj ... 15,028 17,106 1,138 7,355 5,364 729 <63,348 30,924 488 17,337 4,652 . 268 Mabarasbtra
«*»o
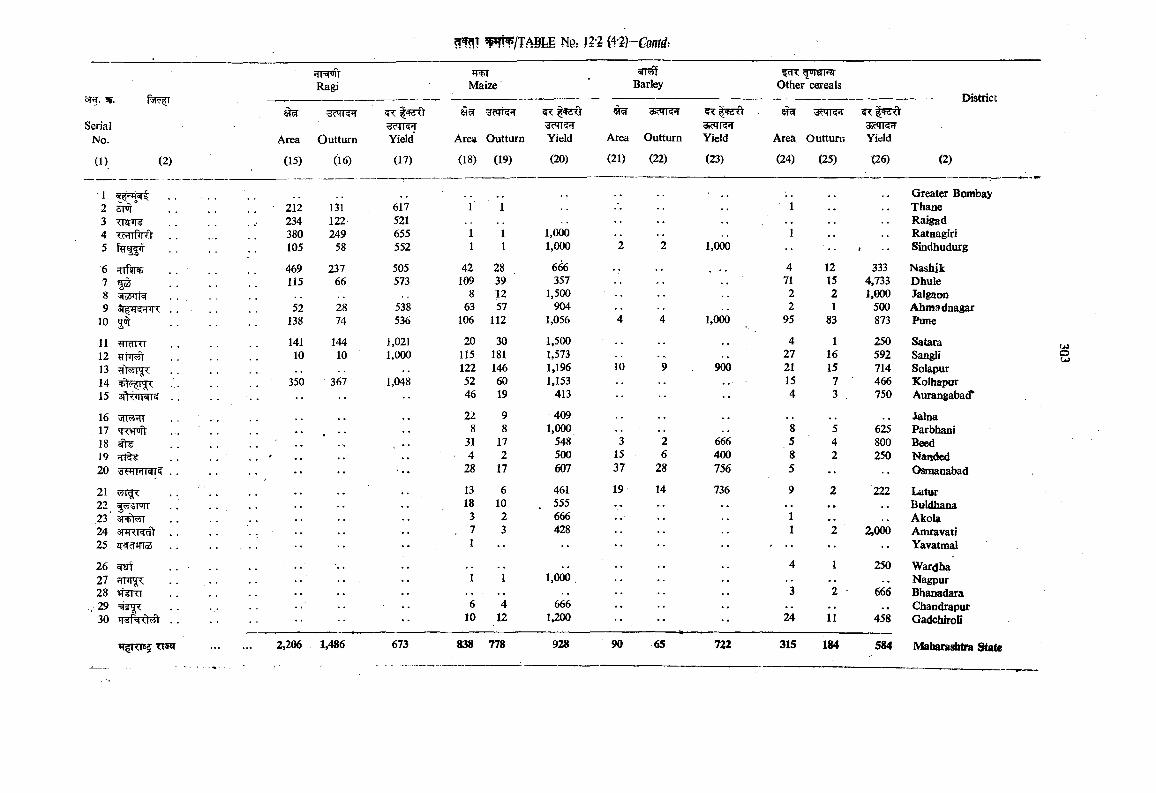
3T.
SerialNo.
(1) (2)
frrspiftRagi
w rMaize
<sii«TBarley Other cereals
Districtm xd'eTi H
Area Outturn
(15) (16)
ffHTt^?TT^Yield
(17)
Area Outturn
(18) (19)
'icMi'S'lYield
(20)Area Outturn
(2 1) (22)
Yield
(23)
djCSK'fArea Outturn Yield
(24) (25) (26) (2)
Greater Bombay2 i|U| . . 212 131 617 1 1 1 Thane3 XRTT? 234 122 521 Raigad4 ................. 380 249 655 1 1 1,000 1 Ratnagiri5 105 58 552 1 1 1,000 2 2 1,000 t . • Sindhudurg
6 ?TTf?T . . 469 237 505 42 28 666 4 12 333 Nashik7 ^ 115 66 573 109 39 357 71 15 4,733 Dhule8 . . 8 12 1,500 2 2 1,000 Jalgaon9 3f rr?jpn; ! ! 52 28 538 63 57 904 2 1 500 Ahmadnagar
10 jq 138 74 536 106 112 1,056 4 4 1,000 95 83 873 Pune
11 ?TRfRT . . 141 144 1,021 20 30 1,500 4 1 250 Satara12 10 10 1,000 115 181 1,573 27 16 592 Sangli13 122 146 1,196 900 21 15 714 Solapur14 ... . . 350 367 1,048 52 60 1,153 15 7 466 Kolhapur15 . . • • 46 19 413 4 3 750 Aurangabad^
16 51F3f1T * . 22 9 409 , , Jalna17 8 8 1,000 8 5 625 Parbhani18 ^ • • , , 31 17 548 3 2 666 5 4 800 Beed19 fit^ ■ 4 2 500 15 6 400 8 2 250 Naodcd20 >d<-H|rl|(St|? . . . . •• 28 17 607 37 28 756 5 •• Osnaanabad
21 l.^< . . . . , , 13 6 461 19 14 736 9 2 222 Latur22 «co|u|i . . 18 10 . 555 .. Buldhana,23 3 2 666 1 Akola24 . . 3 428 1 2 2,000 Amravati25 iT'=)d'Hlai •• •• 1 •• •• , .. •• Yavatmal
26 Srf . . 4 1 250 Wardha27 ?niT^ 1 1 1,000 . Nagpur28 w a . . ' . . . . - 3 2 • 666 Bhanadara
, 29 6 4 666 Chandrapur30 *T¥f^TM . . • • 10 12 1,200 24 11 458 GadchiroU
TTSI 2,206 1,486 673 838 778 928 90 65 722 315 184 584 Maharashtra State
u>
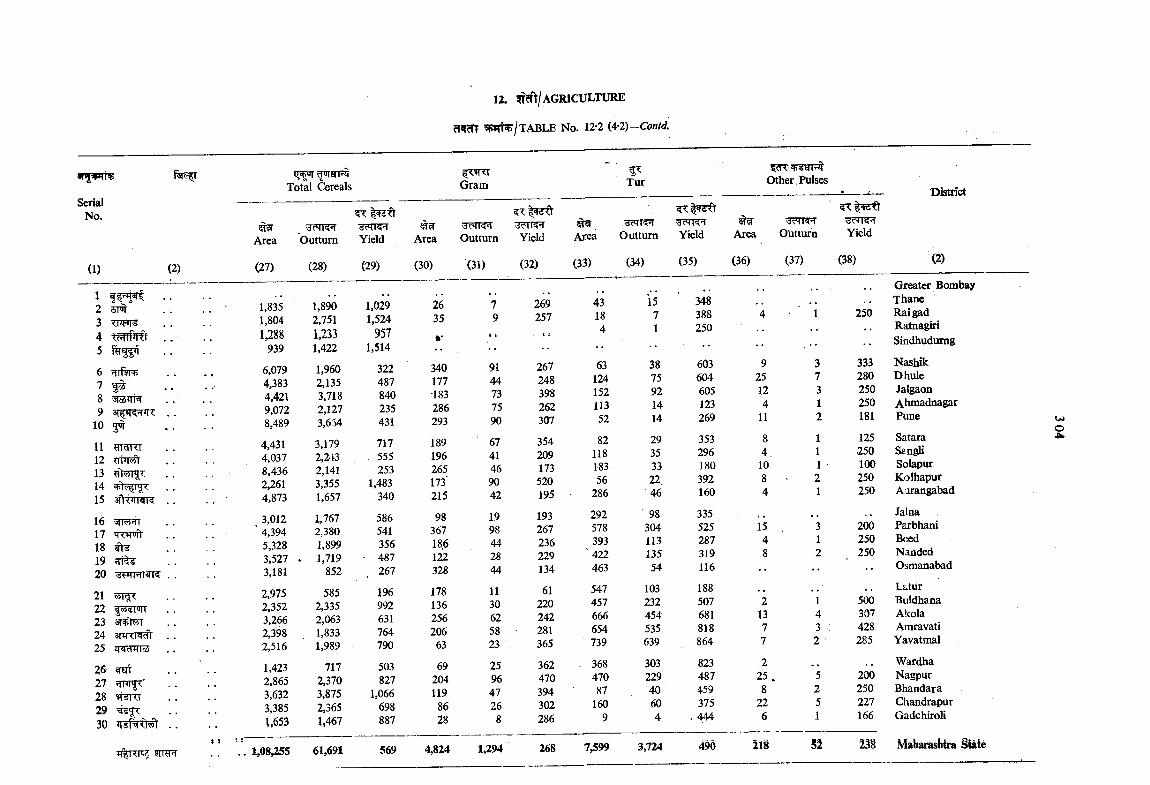
ai VThF
SerialNo.
(1)
Total Areals
(2)
12 5FT34 - 1t^*KT5
6 JTTftn>7 ^8 vfloOHiicj9 3T TR5=nn:
10 j q
11 12131415 sfrtiTraT?
16 3fT5517 M <Mun18 ^19 5Tt^
21 yrg;T22 «<el«ll23 3T>5?T24 STTRRRf)"25 ?T<iPTT55
2627 ?TFT '28 #§1T[T2930
WRPT
Area
(27)
1,8351,8041,288
939
6,0794,3834,4219,0728,489
4,4314,0378,4362,2614,873
3,012 ' 4,394
5,328 3,527 3,181
2,9752,3523,2662,3982,516
1,4232,8653,6323,3851,653
Outturn
(28)
Yield
(29)
1,8902,7511,2331,422
1,9602,1353.718 2,127 3,6o4
3,1792,2432,1413,3551,657
1.7672,3801,8991.719
852
5852,3352,0631,8331,989
7172,3703,8752,3651,467
1,0291,524
9571,514
Gram3^Tur Other. Pulses
5T3Area
(30)
Outturn Yield
(31) (32)
Area
(33)
Outturn Yield
(34) (35)
Area
(36)
T<;>T 'dcHK'iOutturn Yield
(37) (38)
District
(2)
2635
269257
1,08^55 61,691
322 340 91 267 63 38 603 9 3 333
487 177 44 248 124 75 604 25 7 280
840 -183 73 398 152 92 605 12 3 250
235 286 75 262 113 14 123 4 1 250
431 293 90 307 52 14 269 11 181
717 189 67 354 82 29 353 8 1 125. 555 196 41 209 118 35 296 4 1 •250
253 265 46 173 183 33 180 10 1001,483 173' 90 520 56 22, 392 8 - 250
340 215 42 195 286 46 160 4 250
586 98 19 193 292 98 335 ..
541 367 98 267 578 304 525 15 . 200356 186 44 236 393 113 287 4 1 250
• 487 122 28 229 ^422 135 319 8 250
267 328 44 134 463 54 116 ••
196 178 11 61 547 103 188992 136 30 220 457 232 507 2 1 500631 256 62 242 666 454 681 13 4 307
764 206 58 281 654 535 818 7 3 ; 428790 63 23 365 739 639 864 7 2 285
503 69 25 362 - 368 303 823 2827 204 96 470 470 229 487 25 . 5 200
1,066 119 47 394 87 40 459 8 2 250
698 86 26 302 160 60 375 22 5 227887 28 8 286 9 4 . 444 6 1 166
569 4,824 1,294 268 7,599 3,724 490 2l8 52 238
Greater Bombay43 is 348 • • Thane18 7 388 4 1 250 Raigad4 1 250 Ratnagiri
Sindhudumg
NashikDhuleJalgaonAhmadnagarPune
SataraSsngliSolapurKolhapurAurangabad
JalnaParbhaniBcedNandedOsmanabad
LatiirBuldhanaAlcolaAraravatiYavatmal
WardhaNagpurBhandaraChandrapurGadchiroli
Mahar^bira Siaie
u»o4k>
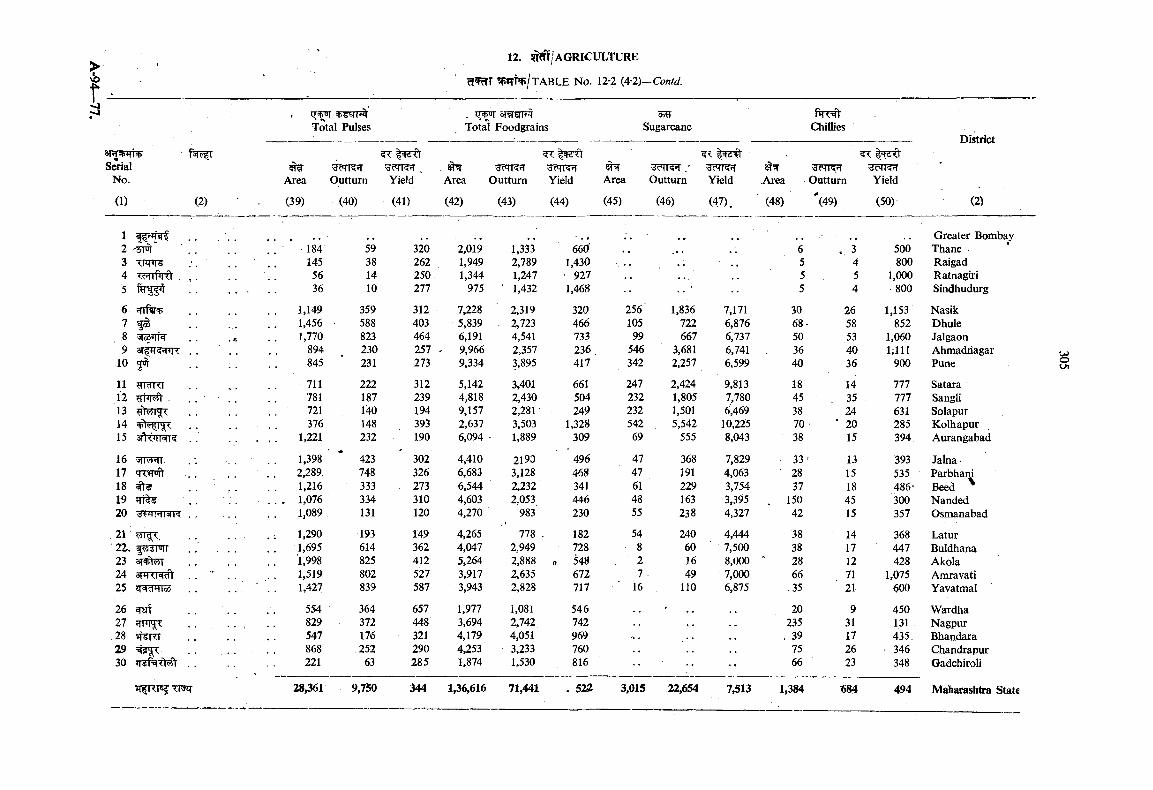
Total Puljies Total Foodgrains SugarcanefiR^
ChilliesDistrict
SerialNo.
(1) (2)
Area
(39)
Outturn
(40)
Area
(42)
Yield
(44)
Area
(45)
.Area
(48) (2)
'dcMK’1 Yield '
(41)
Outturn
(43)
Outturn
(46)
'jJcMK'lYield
(47).
Outturn
"(49)
Yield -
(50)
1 . . . . . Greater Bombay2 ' 'ir . • 184 59 320 2,019 J,333 660’ 6 * 3 500 Thane3 145 38 262 1,949 2,789 1,430 5 4 800 Raigad4 . , . 56 14 250 1,344 1,247 ' 927 • . 5 5 1,000 Ratnagiri5 . . . . . . 36 10 277 975 * 1,432 1,468 5 4 800 Sindhudurg
6 JTTftRT 1,149 359 312 7,228 2,319 320 256' 1,836 7,171 30 26 1,153 Nasik7 IS . . . 1,456 588 403 5,839 . 2,723 466 105 722 6,876 68- 58 852 Dhule.8 '3io6'*iic) . . . „ 1,770 823 464 6,191 4,541 733 99 667 6,737 50 53 1,060 Jalgaon9 3TfTT HI< . . . . 894 230 257 9,966 2,357 236 . 546 3,681 6,741 36 40 1;111 Ahmadriagar
10 5^ . . 845 231 273 9,334 3,895 417 342 2,257 6,599 40 36 900 Pune
11 yidKI 711 222 312 5,142 3,401 661 247 2,424 9,813 18 14 777 Satara12 . . . . 781 187 239 4,818 2,430 504 232 1,805 7,780 45 35 777 Sangli13 721 140 194 9,157 2,281 249 232 1,501 6,469 38 24 631 Solapur14 . . 376 148 393 2,637 3,503 1,328 542 5,542 10,225 70 ' 20 285 Kolhapur15 sfttrrRT . . 1,221 232 190 6,094 1,889 309 69 555 8,043 38 15 394 Aurangabad
16 SfTffT . . 1,398 423 302 4,410 2190 496 47 368 7,829 33 13 393 Jalna17 w w ft . 2,289. 748 326 6,683 3,128 468 47 191 4,063 28 15 535 Parbham18 _ . 1,216 333 273 6,544 2,232 341 61 229 3,754 37 18 486- Beed '19 ^ . - 1,076 334 310 4,603 2,053 446 48 163 3,395 . 150 45 300 Nanded20 . . 1,089 131 120 4,270 983 230 55 238 4,327 42 15 357 Osmanabad
21 1,290 193 149 4,265 778 182 54 240 4,444 38 14 368 Latur22x 1 . , . . . . 1,695 614 362 4,047 2,949 728 8 60 7,500 38 17 447 Buldhana23 ar 't^ . 1,998 825 412 5,264 2,888 n 548 2 16 8,000 28 12 428 Akola24 sp R I^ . . ■ . . 1,519 802 527 3,917 2,635 672 7 49 - 7,000 66 71 1,075 Amravati25 q< dHlo6 . . . . 1,427 839 587 3,943 2,828 717 16 110 6,875 .35 21 600 Yavatmal
26 . . . . 554 364 657 1,977 1,081 546 • 20 9 450 Wardha27 829 372 448 3,694 2,742 742 ■ 235 31 131 Nagpur28 TIKT 547 176 321 4,179 4,051 969 . 39 17 435. Bhandara29 868 ,252 290 4,253 3,233 760 75 26 346 Chandrapur30 . . 221 63 285 1.874 1.530 816 •• 66 23 348 Gadchiroli
tf RPSf TTiir 28 J61 9,750 344 1,36,616 71,441 . 522 3,015 22,654 7,513 1,384 ?>84 494 Maharashtra State
U)a
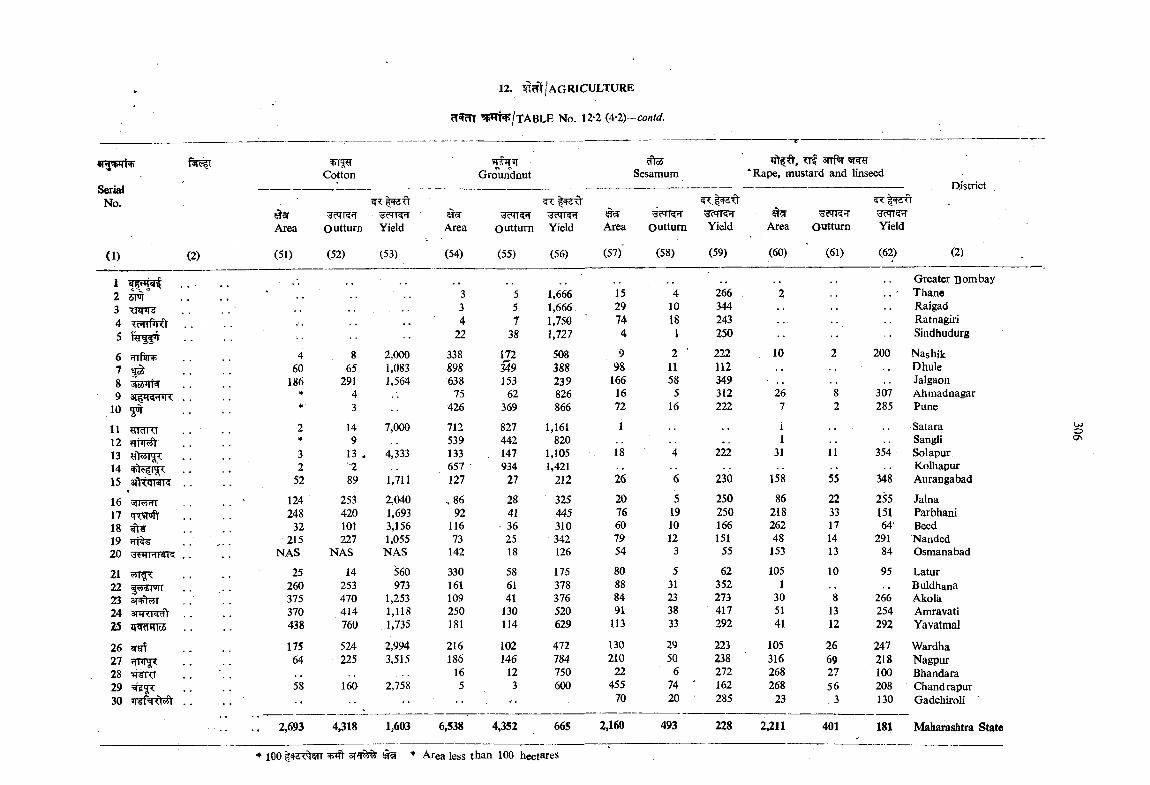
Cotton Sesamuraarrfqr
“"Rape, mustard and linseedDistrict
«Tf!Wl+
SerialNo.
(1) (2)
Groundnut
Area
(51)
Outturn
(52)
Yield
(53)
Area
(54)
outturn
(55)
Area
(57)'
WH'Outturn
(58)
Yield
(59)
Area
(60)
outturn
(61)
Yield
(56)
Yield
(62) (2)
i .. , , Greater Bombay2 sm • 3 5 1,666 15 4 266 2 Thane3 ■•CRT 3 5 1,666 29 10 344 Raigad4 4 7 1,750 74 18 243 Ratnagiri5 22 38 1,727 4 1 250 Sindhudurg
4 8 2,000 338 172 508 9 2 ■ 222 . 10 2 200 Nashik7 60 65 1,083 898 349 388 98 11 112 Dhule8 186 291 1,564 638 153 239 166 58 349 ■ .. Jalgaon9 st tR^nix * 4 75 62 826 16 5 312 26 8 307 Ahmadnagar
10 JOT * 3 426 369 866 72 16 222 7 2 285 Pune
11 2 14 7,000 712 827 1,161 1 i Satara12 g-PT^ * 9 539 442 820 1 Sangli13 ?fl<?4iy< 3 13 . 4,333 133 147 1,105 18 4 222 31 11 354 SolapurCN.14 2 •'2 657 934 1,421 Kolhapur15 3i^wi «il<s 52 89 1,711 127 27 212 26 6 230 158 55 348 Aurangabad
16 5JT«-fT 124 253 2,040 ,8 6 28 325 20 5 250 86 22 255 Jalna17 tT' VToft 248 420 1,693 92 41 445 76 19 250 218 33 151 Parbhani18 32 101 3,156 116 36 310 60 10 166 262 17 64' Beed19 JTi ^ 215 227 1,055 73 25 342 79 12 151 48 14 291 Nanded20 vd< HMr<fK NAS NAS NAS 142 18 126 54 3 55 153 13 84 Osmanabad
21 25 14 ^60 330 58 17-5 80 5 62 105 10 95 Latur22 260 253 973 161 61 378 88 31 352 1 Buldhana23 ar tOT 375 470 1,253 109 41 376 84 23 273 30 8 266 Akola24 3 * <l=rd> 370 414 1,118 250 130 520 91 38 417 51 13 254 Amravati25 i m m i 438 760 ,1,735 181 114 629 113 33 292 41 12 292 Yavatmal
26 grsrf 175 524 2,994 216 102 472 130 29 223 105 26 247 Wardha27 64 225 3,515 186 146 784 210 50 238 316 69 218 Nagpur28 w n , . 16 12 750 22 6 272 268 27 100 Bhandara29 =ETS 58 160 2,758 5 3 600 455 74 ' 162 268 56 208 Chandrapur30 70 20 285 23 3 130 Gadchiroli
.. 2,693 4,318 1,603 6,538 4,352 665 2,160 493 228 2,211 401 181 Maharashtra State
u>
* lOO ^ * Area less than 100 hectares
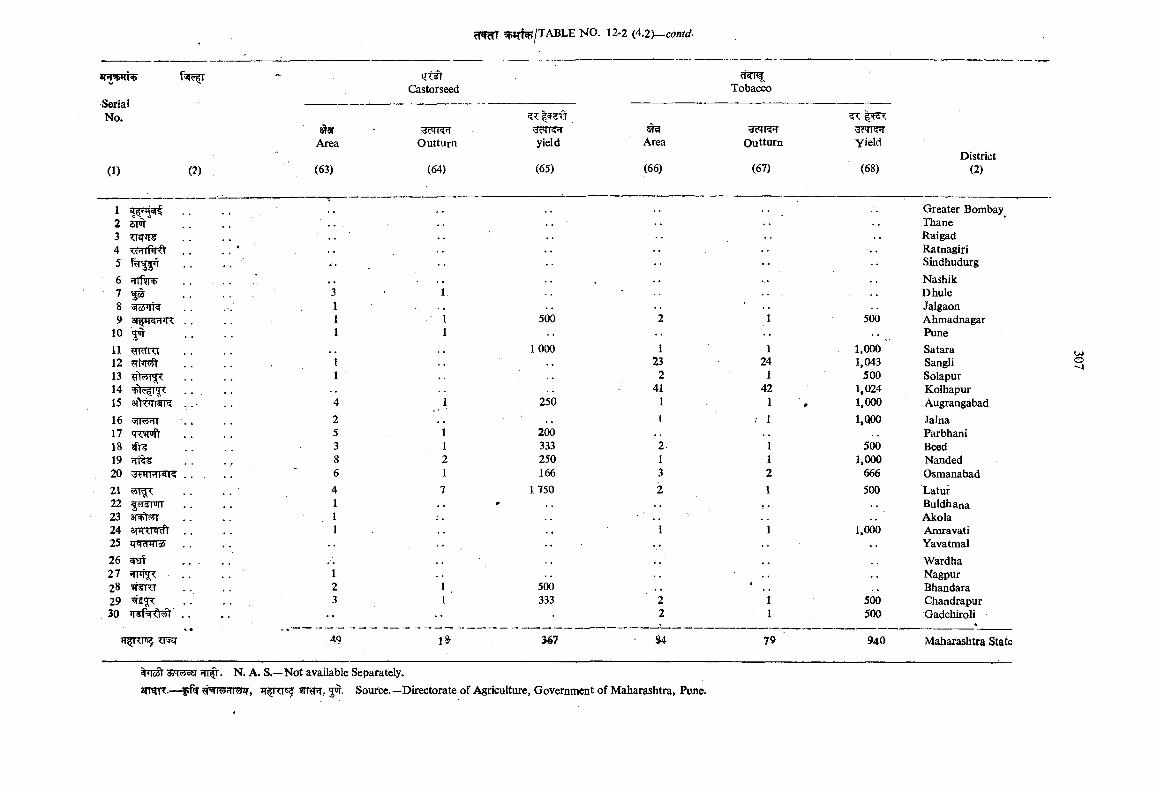
8R’FTTv
SerialNo.
-Castorseed Tobacco
5^Area
(66)
Outturn
(67)(1) (2)
«TgTArea
(63)
vjchKHOutturn
(64)
yield
(65)
yield
(68)District
(2)
1■ -------- T '' ■
, * Greater Bombay2 sm Thane3 TRPI5: Raigad4 ?xiTrfir . . * Ratnagiri5 •• Sindhudurg6 Nashik7 ^ ' • • .. Dhule8 'ifos rw Jalgaon9 ar tRTfR . . 500 2 1 500 Ahmadnagar
10 JW , . 1 1 •• Pune11 1000 1 1 1,000 Satara12 23 24 1,043 Sangli13 2 1 500 Solapur14 . . 41 42 1,024 Kolhapur15 3A </ii<fr5 . . 4 1 250 1 1,000 Augrangabad16 ^mri\ 2 1 ? 1 1,000 Jalna17 q w ft 5 200 Parbhani18 ^ 3 1 333 1 500 Beed19 8 250 1 1,000 Nanded20 vd MHra'I? . . . 6 1 166 3 2 666 Osmanabad21 4 7 1 750 2 1 500 Latur22 g SFTT 1 ,. Buldhana23 ar ftOT . . 1 Akola24 1 1 1 1.000 Amravati25 41^^35 .. Yavatmal26 waf , . . . . Wardha27 frntg;T . . 1 Nagpur28 «T‘cr 2 500 Bhandara29 3 1 ’ 333 2 1 500 Chandrapur30 . . •• 2 1 500 Gadchiroli
• ♦*!fr<nsa crsij 49 1^ 367 S4 79 940 Maharashtra State
%Ic5t OT 5®8( '11 .iHitiK.— frft' ?r rsr!
N. A. S.—Not available Separately.TTSTJr, yiWH, 5^. Source.—Directorate of Agriculture, Government of Maharashtra, Pune.
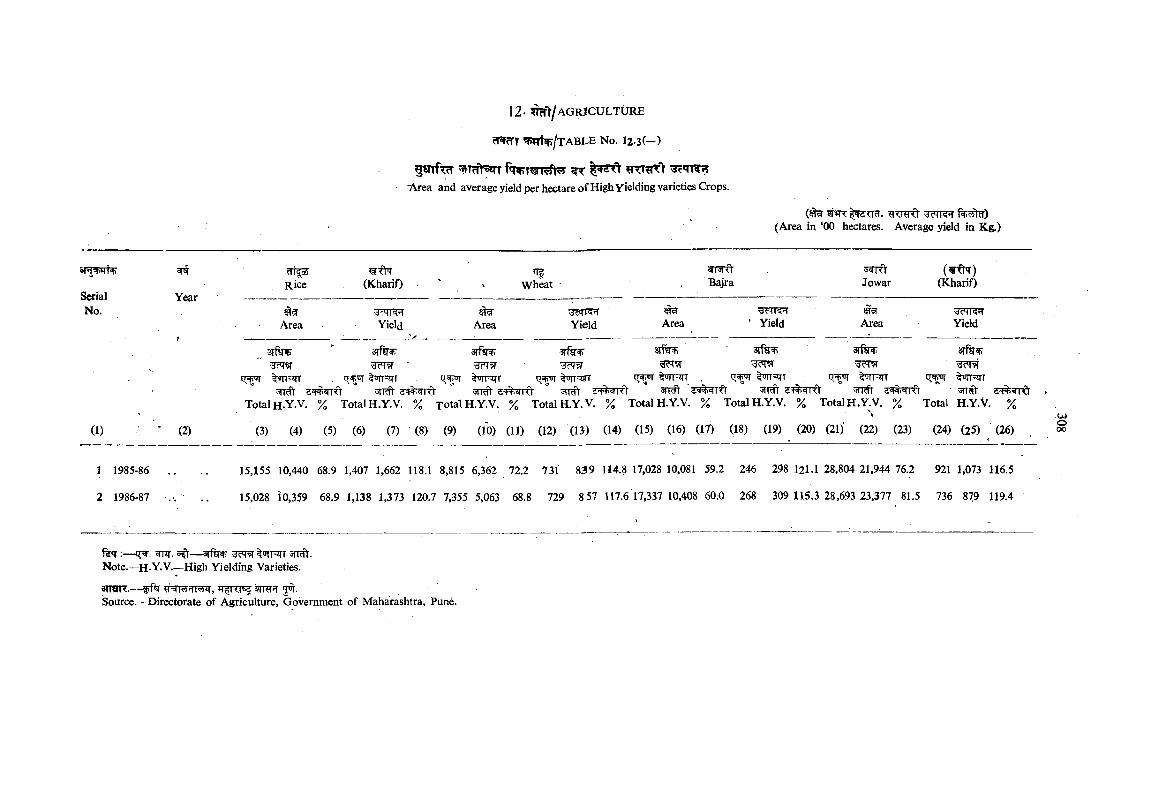
1 2 -% > /a g r ic u l t u r e
cT arr ^Wfr/TABLE No. l2-3(--)
TrryejTT ^«n?¥r■Area and average yield per hectare of High Yielding varieties Crops.
5IWT 'dcHlS’1 1+^^)(Area in ‘00 hectares. Average yield in Kg.)
SerialNo.
Year
(1) (2)
1 1985-86
2 1986-87
Rice
Area
(Kharif) Wheat«IM<\Bajra Jowar
(¥t<T)(Kharif)
Yield Area Yield Area Yield Area Yield
arfsnF . * arfsr r stTsrt srfg^ srfa^^5T ■ ??TW ?T?r
«n=trr . WT=qr ^wnrr «rr-ijT , ^=3tt %wpqr ’jtrtt5TT ^ 5#WRt " ^ ^ 3:^F% SfRft STRTT STTV
Total h .Y.V. % Total H.Y.V. % Total H.Y.Y. % Total H.Y. V. % Total H.Y.V. % Total H.Y.V. % Total H.Y.V. % Total H.Y.V, %
(3) (4) (5) (6) (7) (8) (9) (10) (11) (12) (13) (14) (15) (16) (17) (18) (19) (20) (21) (22) (23) (24) (25) (26)
15,155 10,440 68.9 1,407 1,662 118.1 8,815 6,362 72.2 7 31 839 114.8 17,028 10,081 59.2 246 298 I2I.I 28,804 21,944 76.2 921 1,073 116.5
15,028 i0,359 68.9 1,138 1,373 120.7 7,355 5,063 68.8 729 8 57 117.6 17,337 10,408 60.0 268 309 115.3 28,693 23,377 81.5 736 879 119.4
OJo00
:— 5^—arf^ ^ ? r 'JTRrr Note.—h Y.V.—High Yielding Varieties.
STTOTT.— tt TTT JTRT'T J’H'.iSource. -Directorate of Agriculture, Government of Maharashtra, Pune.
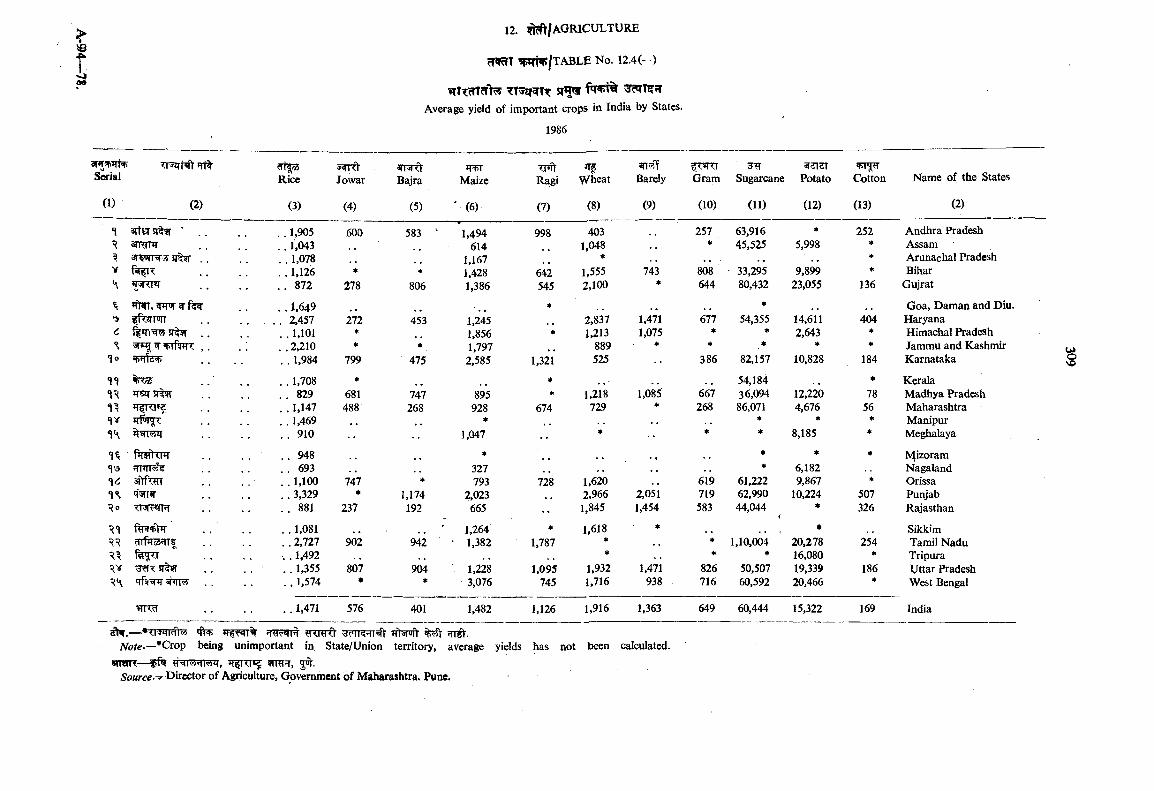
12. ^ /A G R IC U L TU R E
?r«RTT 5f!Tn^/TABLE No. 12.4(—)
^TTrTTfT^Average yield of important crops in India by States.
1986
aT*r TWSj TFnrHtfTf% dko5 «IN<1 THit 7'^Serial Rice Jowar Bajra Maize Ragi Wheat Barely Gram Sugarcane Potato Cotton Name of the States
(1) (2) (3) (4) (5) * (6) (7) (8) (9) (10) (11) (12) (13) (2)
artw ■ . . . . 1,905 600 583 " 1,494 998 403 257 63,916 * 252 Andhra PradeshamrR .....................1,043 614 1,048 * 45,525 5,998 ♦ Assam
. . 1,078 1,167 ♦ ' . . ♦ Arunachal PradeshV . . 1,126 * * 1,428 642 1,555 743 808 33,295 9,899 * Bihar
v ncT’T . . 872 278 806 1,386 545 2,100 * 644 80,432 23,055 136 Gujrat
. . 1.649 * . . * Goa, Daman and Diu.i|fW0TT ............... 2,457 272 453 1,245 2,837 1,471 677 54,355 14,611 404 Haryana
3 ^ . . . . 1,101 >K 1,856 * 1,213 1,075 * * 2,643 * Himachal Pradeshw vrfim , . . ; . . 2,210 * * 1,797 .. 889 * * * * Jammu and Kashmir
V . . 1,984 799 475 2,585 1,321 525 386 82,157 10,828 184 Karnataka
•n ■'<o4 . . 1,708 * * . . . .. 54,184 .. * KeralaJT55Ef sr^ . . 829 681 747 895 * 1,218 1,085 667 36,094 12,220 78 Madhya Pradesh
. . 1,147 488 268 928 674 729 ♦ 268 86,071 4,676 56 Maharashtra«)V jrtoT^ . . 1.469 , . * * * * Manipur
. . 910 1,047 * •• * * 8,185 * Meghalaya
. . . . 9 4 8 * . . * ♦ » Mizoram. . 693 . , 327 * 6,182 Nagaland
3Tir<«» . . 1,100 747 ♦ 793 728 1,620 619 61,222 9,867 * Orissaq^sr . . 3,329 ♦ 1,174 2,023 2,966 2,051 719 62,990 10,224 507 Punjab
Ro Tnrp FT . . 881 237 192 665 1,845 1,454 583 44,044 <* 326 Rajasthan
. . . . 1,081 .. ' 1,264 * 1.618 * . . * Sikkimcrrfjra T? . . 2,727 902 942 ' 1,382 1,787 * * 1,10,004 20,278 254 Tamil Nadu
. . 1,492 * * * 16,080 * Tripura
..1 ,355 807 904 1,228 1,095 1,932 1,471 826 50,507 19,339 186 Uttar Pradeshnrrsf . . 1,574 * * 3,076 745 1,716 938 716 60,592 20,466 * West Bengal
. . 1,471 576 401 1,482 1,126 1,916 1,363 649 60,444 15,322 169 India
€t^.--- *TT'»‘1lrl)« •!)+ *Tf^% rCRRt vffg .Note-—*Crop being unimportant in State/Union territory, average yields has not been calculated.
u>
smnr—fftr inTO?T,5o«rce-^ Director of Agriculture, Government of Maharashtra. Pune.
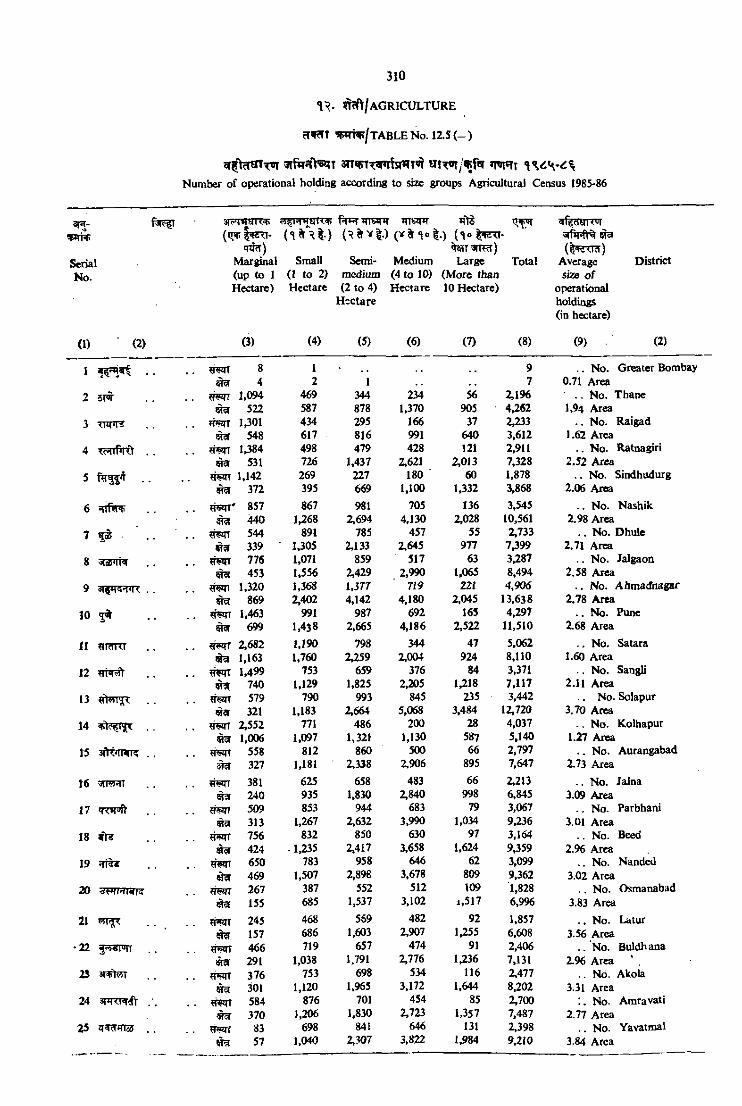
310
*1 . ^ / a g r ic u l t u r e
cTWT ?rnTTT[TABLENo. 1 2 .5 ( - )
an^^;^Trhj»(T '^ m v n j v f n nflm t
Number of operational holding acceding to si% groups Agricultural Census 1965*86
31 .w w
SerialNo.
SFTITHTT^
q ?5T) Marginal (up to 1 Hectarc)
fn**i inW*T( ^ ^ Y | . ) (V % n « |.) (1® 1 ^ -
^ T ir m r )Small Semi- Medium Large Total
(1 to 2) mediuffl (4 to 10) (More than Hectarc (2 to 4) Hectare 10 Hectare)
Hectare
3Tfipft^da
Average size o f
operational holdings (in hectare)
District
(1) (2) (3) (4) (5) (6) (7) (8) (9) (2)
1 ■. 8 1 9 .. No. Greater Bombay4 2 1 , , 7 0.71 Area
2 1,094 469 344 234 56 2,196 . , No. ThaneSRI 522 587 878 1,370 905 4,262 1.94 Area
3 ^m*r? 1,301 434 295 166 37 2,233 . . No. Raigad548 617 816 991 640 3,612 1.62 Area
4 «WI 1,384 498 479 428 121 2,911 .. No. Ratna^i531 726 1,437 2,621 2,013 7,328 2.52 Area
5 1,142 269 227 180 60 1,878 . . No. Sindhudurg372 395 669 1,100 1,332 3,868 2.06 Area
6 . . 857 867 981 705 136 3,545 . . No. Nashik4lS 440 1,268 2,694 4,130 2,028 10,561 2.98 Area
7 ^ 544 891 785 457 55 2,733 . . No. Dhule339 1,305 2,133 2,645 977 7,399 2.71 Area
8 ^i£*m 776 1,071 859 517 63 3^87 .. No. Jalgaon453 1,556 2,429 2,990 1,065 8,494 2.58 Area
9 1,320 1.368 1,377 7i9 22f 4,906 . . No. AbmadnagBT869 2,402 4,142 4,180 2,045 13,638 2.78 Area
10 1.463 991 987 692 16S 4,297 . . No. Pune699 1.438 2,665 4,186 2,522 11,510 2.68 Area
!I ftldUl Mmi 2,682 1,190 798 344 47 5,062 No. Satara1,163 1,760 2059 2,004 924 8,110 1.60 Area
12 . . 1.499 753 659 376 84 3,371 .. No. Sangliwjr 740 1,129 1,825 2,205 1,218 7,117 2.11 Area
13 ?T5Jn 579 790 993 845 235 3,442 No. Solapur321 1.183 2,6^ 5,068 3,484 12,720 3,70 Area
14 2,552 771 486 200 28 4,037 . . No. Kolhapur1,006 1,097 1,321 1,130 587 5,140 1.27 Area
15 558 812 860 500 66 2,797 . . No. Aurangabad327 1,181 2.338 2,906 895 7,647 2.73 Area
t6 381 625 658 483 66 2,213 . . No. Jalna240 935 1,830 2,840 998 6,845 3.09 Area
17 509 853 944 683 79 3,067 . , No. Parbhani313 1,267 2,632 3,990 1,034 9,236 3.01 Area
18 «WI 756 832 850 630 97 3,164 .. No. Beed424 -1,235 2,417 3,658 1,624 9,359 2.96 Area
19 650 783 958 646 62 3,099 .. No. Nandedffw 469 1,507 2,898 3,678 809 9,362 3.02 Area
20 267 387 552 512 109 1,828 .. No. Osmanabad155 685 1,537 3,102 i,517 6,996 3.83 Area
21 245 468 559 482 92 1,857 . . No. Latur157 686 1,603 2,907 1,255 6,608 3.56 Area
22 466 719 657 474 91 2,406 .. No. Buldhana291 1,038 1.791 2,776 1,236 7,131 2.96 Area
23 3nft55T 376 753 698 534 116 2,477 .. No. Akola301 1,120 1,965 3,172 1,644 8,202 3.31 Area
24 . . 584 876 701 454 85 2,700 No. Amravati370 1,206 1,830 2,723 1.357 7,487 2.77 Area
25 JT3T *(rc5 . . 83 698 84i 646 131 2,398 .. No. Yavatnial57 1,040 2,307 3,822 1,984 9,2i0 3.84 Area
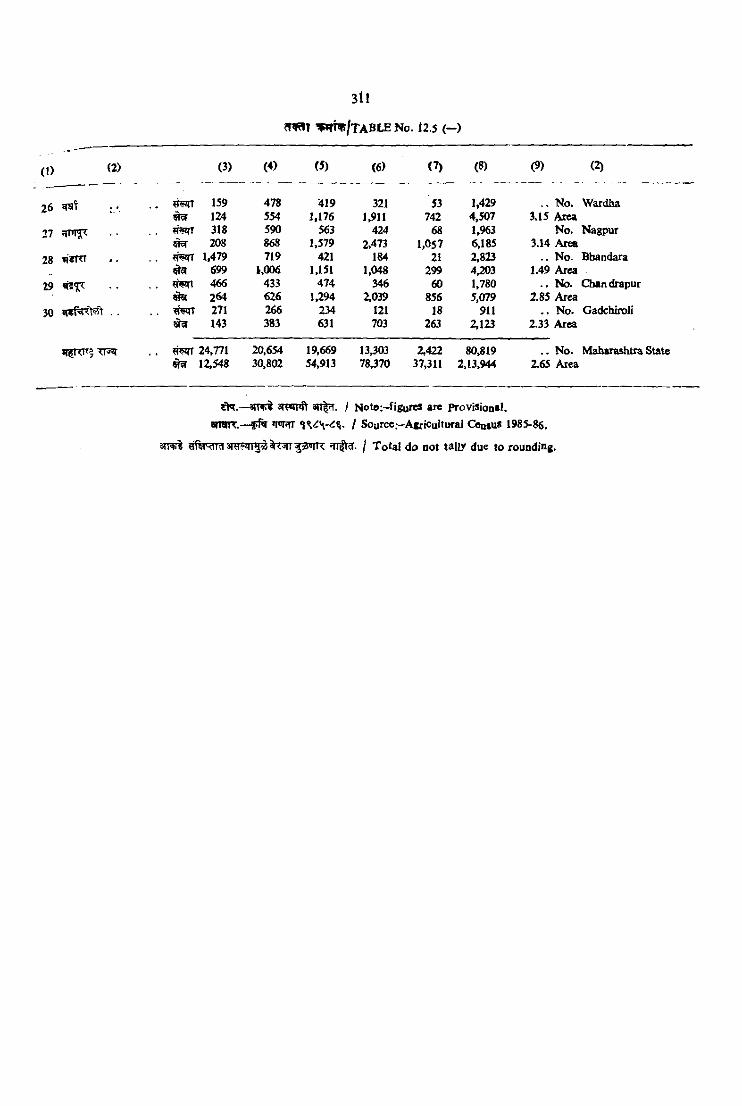
(1) (2) (3) ( > (5) (6) (7) (8) (9) (2)- --------- - - - — - —--------- ------------ ------------- ---------- - --—- — — ............. ....................... .
26 159 478 *419 321 53 1,429 . . No. Wardha124 554 J,176 1,911 742 4,507 3.15 Area
V 318 590 563 424 68 1,963 No. Nagpur5T 208 868 1,579 2>473 1,057 6,185 3.14 Arce
28 1,479 719 421 184 2i 2,823 .. No. Bbandaraera 699 1,006 1,151 1,048 299 4,203 1.49 Area
29 . . 466 433 474 346 60 1,780 . . No. Cban drapurtm 264 626 1,294 2,039 856 5,079 2.85 Area
30 -«<WT 271 266 234 121 18 911 . . No. Gadchiroli«T9 143 383 631 703 263 2,123 2.33 Area
r m . . ^ 24,771 ^ 12,548
20,65430,802
19,66954,913
13,30378,370
2,42237,311
80,8192,13,944
. . No. Maharashtra 2.65 Area
sivmft an|?T. / NotoMigurtf arc provision*!, anrnr:.— I Sourcc.—AjricultufaJ Census 1985-86.
/ To ai do Qot t Iiy due to rouadiiig.
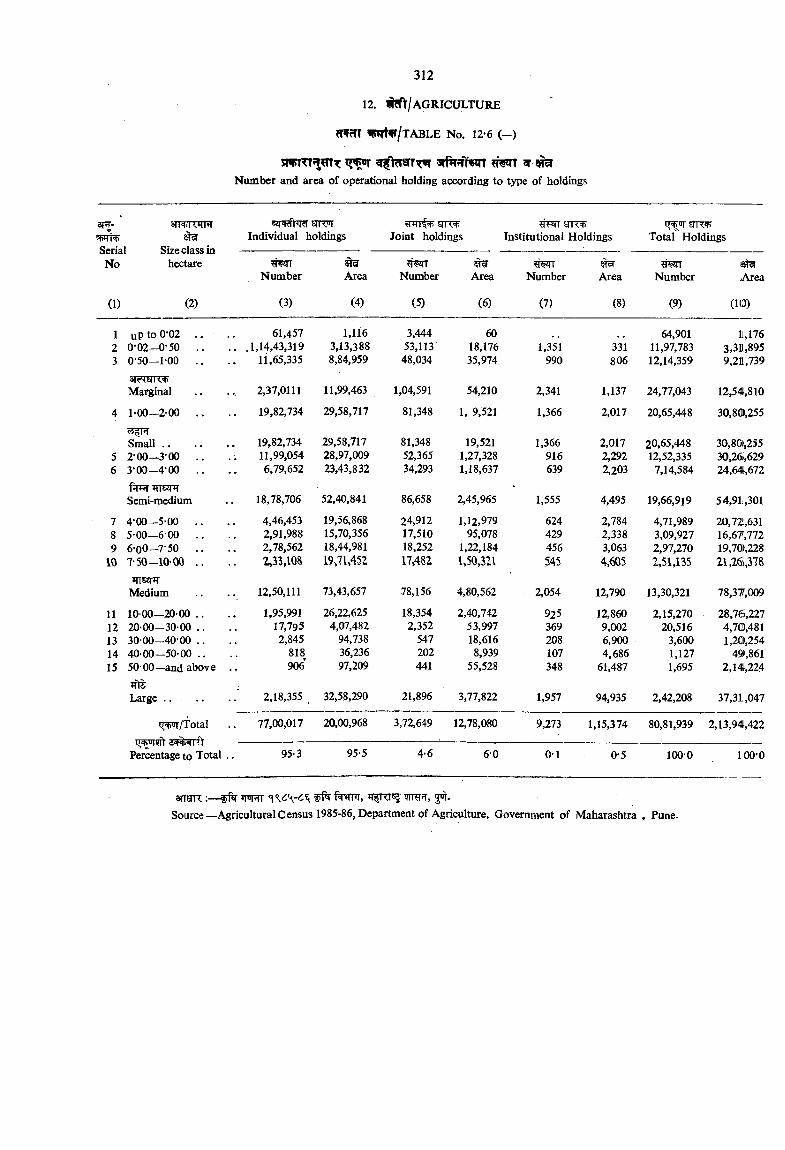
312
12. ^ / a g r ic u l t u r e
5W5TT lR1?tv/TABLE No. 12-6 ( - )
Number and area of operational holding according to type of holdings
3T - sTT nT rnrIndividual holdings
fei 1Joint holdings
TFTT yr<+ Institutional Holdings Total Holdings
No hectareNumber
5T5Area Number Area Number Area Number Area
(1) (2) (3) (4) (5) (6) (7) (8) (9) (10)
123
uP to 0*02 . . 0*02—0-50 . . 0-50—1 00 ..
61,457.1,14,43,319
11,65,335
1,1163,13,3888,84,959
3,44453,11348,034
6018,17635,974
1,351990
331806
64,90111,97,78312,14,359
11,1763,311,8959,211,739
Marginal 2,37,0111 11,99,463 1,04,591 54,210 2,341 1,137 24,77,043 12,54,810
4 1*00—2-00 ., 19,82,734 29,58,717 81,348 1, 9,521 1,366 2,017 20,65,448 30,80,255
56
Small . . . . 2*00—3-00 . . 3-00-4-00 ..
19,82,73411,99,0546,79,652
29,58,71728,97,00923,43,832
81,34852,36534,293
19,5211,27,3281,18,637
1,366916639
2,0172,2922,203
20,65,44812,52,335
7,14,584
30,80.25530,26i,62924,64,672
fjTRT SinTSemi-medium 18,78,706 52,40,841 86,658 2,45,965 1,555 4,495 19,66,919 54,9L,301
78 9
10
4-00—5 00 ..5-00—6 00 ..6-00-7-50 ..7-50-10-00 ..
4,46,4532,91,9882,78,5622,33,108
19,56,86815,70,35618,44,98119JU452
24,91217,51018,25217,482
1,12,97995,078
1,22,1841,50,321
624429456545
2,7842,3383,0634,605
4,71,9893,09,9272,97,2702,51,135
20,72,63116,67,77219,70),22821,26,378
JTTKHTMedium 12,50,111 73,43,657 78,156 4,80,562 2,054 12,790 13,30,321 78,37,009
1112131415
10 00—20 00 .. 20-00—30-00 ..30 00 40 00 ..40 0 0 -5 0 -0 0 ..50 00—and above ..
1,95,99117,7952,845
818906
26,22,6254,07,482
94,73836,23697,209
18,3542,352
547202441
2,40,74253,99718,6168,939
55,528
925369208107348
12,8609,0026,9004,686
61,487
2,15,27020,516
3,6001,1271,695
28,76,2274,70,4811,20,254
49,8612,14,224
Large . . .. 2,18,355 32,58,290 21,896 3,77,822 1,957 94,935 2,42,208 37,31,047
i^ /T o ta l 77,00,017 20,00,968 3,72,649 12,78,080 9,273 1,15,374 80,81,939 2,13,94,422
Percentage to Total .. 95-3 95-5 4-6 6 0 0-1 0-5 100-0 100-0
3n9K:— WTT ftnm, wRfjr, 5^.Source—Agricultural Census 1985-86, Department of Agriculture, Government of Maharashtra , Pune.
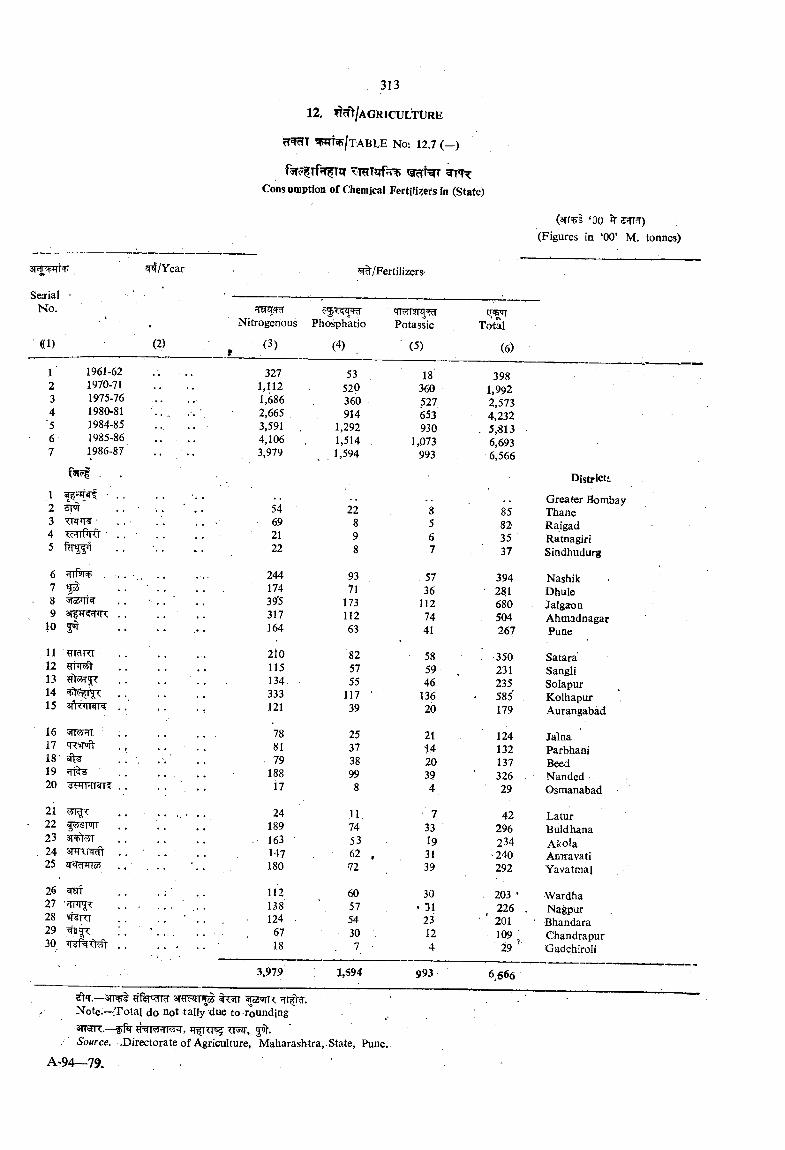
3 1 3
12. ^^'t/AGRICULTURE
W ^ / tABLE No; 12.7 (--)
f5T? Tf5I TBr TTOTirfnCons umption of Chemical Fertilizers in (State)
(srr^i ‘00 ^(Figures in ‘00’ M. tonnes)
3Tr vRT
Seirial - No.
((1)
^/Year
(2)
^/Fertilizers-
Nitrogenous Phosphatio
(3)
1 1961-622 1970-713 1975-764 1980-81
■5 1984-856 1985-867 1986-87
■ST' r
■^ c rrPRt ■
10 ^
11 ?TTciro12131415 3iWrr«iT?
16 5n ;=fi1718' ^19 ?lt^
2122 i^swr23 arqft^24 snTTT^25 iT ?mTSJ
26 ^27282930
3,979
(4)
1,594
'TT rTTRPotassic
( 5 )
Total
(6)
327 53 18 3981,112 520 360 1,9921,686 360 527 2,5732,665 914 653 4,2323,591 . 1,292 930 . 5,«134,106 1,514 1,073 6,6933,979 1,594 993 6,566
993 6566
Districts
. Greater Bombay54 22 8 85 Thane69 8 5 82' Raigad21 9 6 35 Ratnagiri22 8 7 37 Sindhudurg
244 93 . 57 394 Nashik174 7l 36 ■ 28.1 Dhule39(5 173 112 680 Jalgaion317 112 74 504 Ahmadnagar164 63 41 267 Pune
2i0 '82 58 350 Satara115 57 59 . 231 Sangli134 55 46 235 Solapur333 117 ' 136 • 585 . Kolhapur121 39 20 179 Aurangabad
78 25 21 124 Jalna81 37 •14 132 Parbhani79 38 20 . 137 Beed
188 99 39 326 . Nanded17 8 4 ■ 29 Osmanabad
24 11 7 42 Latur189 74 . 33 ■ 296 Buldhana163 ■ 53 19 234 Akoia147 62 , 31 240 Amravati180 72 39 292 Yavatma]
112 60 30 . 203 • ■Wardha138 . 57 0 1 226 , Nagpur124 54 23 ■ ' 201 • Bhandara
67 30 12 109 ^ Chandrapur18 . 7 . 4 29 Gadchiroli
Note;~TotaI do not tally due to rounding siTarR.— iriTTT Tim, 5 .
. ‘S'o«rce.—.Directorate of Agriculture, Maharashtra, . State, Pune.

r m x w ^ / T A B L E N o .12.8
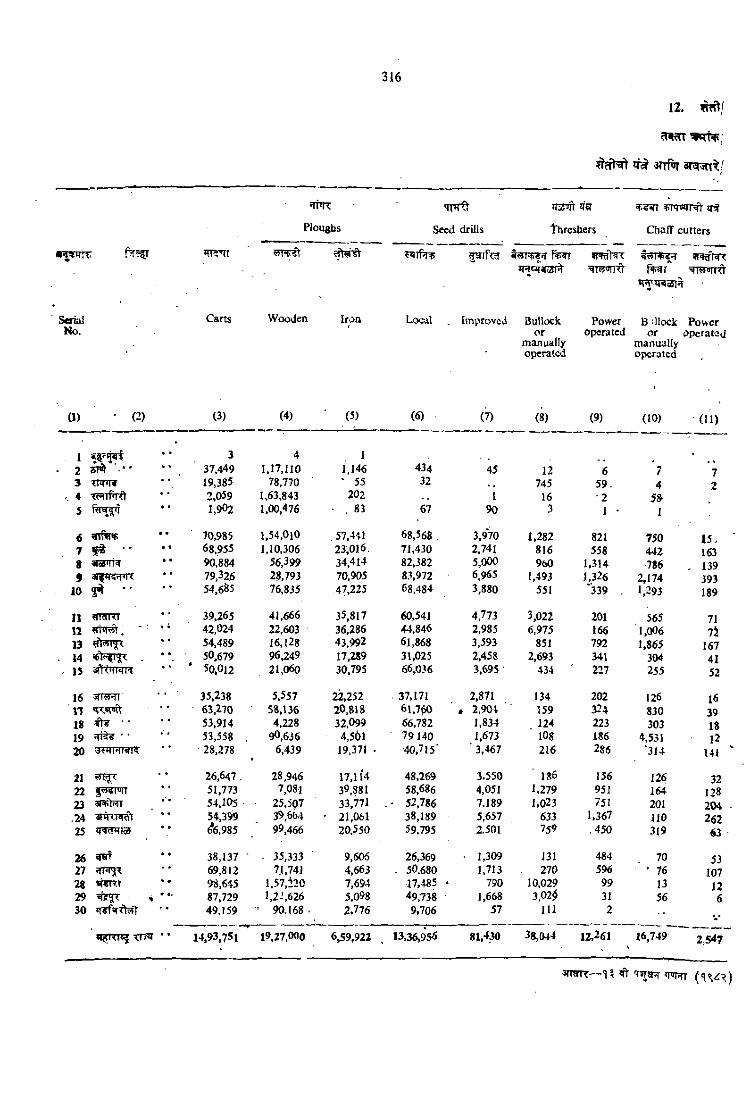
*rRr^t
'T m
Ploughs
? w n
^?fN ^ 3 n f^ sT T in t/
‘Trrft
Seed drills
H 3 # ifir
threshers
^ qwrr-<t irf
Chaff cutters
V i i f ^ 5Sifc3 t5 n ^ iT vfgYrc*Rc?4cJf% 7?rOTR f%^r ^THorm
SeriuiNo.
Carts Wooden Iroa Local . Imptovcvi QuHock Power B Olock Poweror operated or operatau
manually manuallyoperated operated
Cl) ■ (2) C3) (4) ■ (5) (6) (7) (8) (9) (fO) (ID
1 W ' ^■ 2 ^ • "
337.449
41.17,110
11,146 434 45 12 6 7 7
3 <W<I< 19,385 78,770 ‘ 55 32 745 59. 4 24 Tc51lf*r<l 2,059 1,63,843 202 I 16 •2 5»5 1,902 1,00,476 . 83 67 90 3 1 • 1
70,985 1,54,OiO . 57.4^1 68,568 3,970 1,282 821 750 15.7 " 68.955 1,10,306 23,016, 71,430 2,741 816 558 442 163V «ed‘li4 90.884 56,399 34.414 82,382 5,000 960 1,314 786 . 1399 4J|*KH<R 79,326 28,793 70,905 83,972 6.965 1,493 1,326 2,174 393
10 3^ " 54,685 76,835 47,225 68.484 3.880 551 339 . 1,293 189
IJ aWKI 39.265 41,666 35.817 60,541 4,773 3,022 201 565 7111 . ■ ' • * 42,024 22,603 36,286 44.846 2,985 6,975 166 1,006 7 i13 54,489 16,128 43,992 61.868 3,593 851 792 1.865 167
. 14 . **. 50,679 96,249 17,289 31,025 2,458 2,693 341 304 41. 15 ' 50.012 21,060 30.795 66,036 3,695 • 434 ' 227 255 52
16 35.238 5,557 22,252 37,171 2,871 134 202 126 16n 63,270 • 58.136 20.818 6\.760 * 2,904 159 334 830 3918 ^ 53,914 4,228 32,099 66,782 1,834 124 223 303 1819 ;ri%? • • 53,558 90,636 4,501 79140 1,673 lOS 186 4,531 1220 •• 28,278 6,439 19,371 . 40,715' 3,467 216 286 '314 141
21 26,647 . 28,946 17,114 48,269 3.550 1X6 156 126 3222 51,773 7,081 39,881 58,686 4,051 1.279 951 164 12823 aniW 54,105 25.507 33.771 - 52,786 7,189 1.023 751 201 204. 24 54,399 39,6t>4 • 21,061 38,189 5,657 633 1,367 110 26225 ’ * ^6,985 99.466 20.550 59.795 2.501 759 ,450 319 63
26 ^ 38,137 • 35,333 9,606 26,369 • 1,309 J31 484 70 5327 69,812 71.741 4,663 . 50.680 1,713 270 596 * 76 10728 9d,645 1.57,220 7,694 17,485 • 790 10,029 99 13 1229 , '• • 87,729 1,2’,626 5.098 49,738 1,668 3,02^ 31 56 630 ilTfsrxWT 49,159 ■ 90.168 ' 2.776 9,706 57 111 2 '«•
TT^ ’ * 14.93,751 19,27,000 6^9,922 13,36,956 81.4m 38, (M4 12,261 16,749 2,547
^TWR— l ? ^ T^a?r <npTT
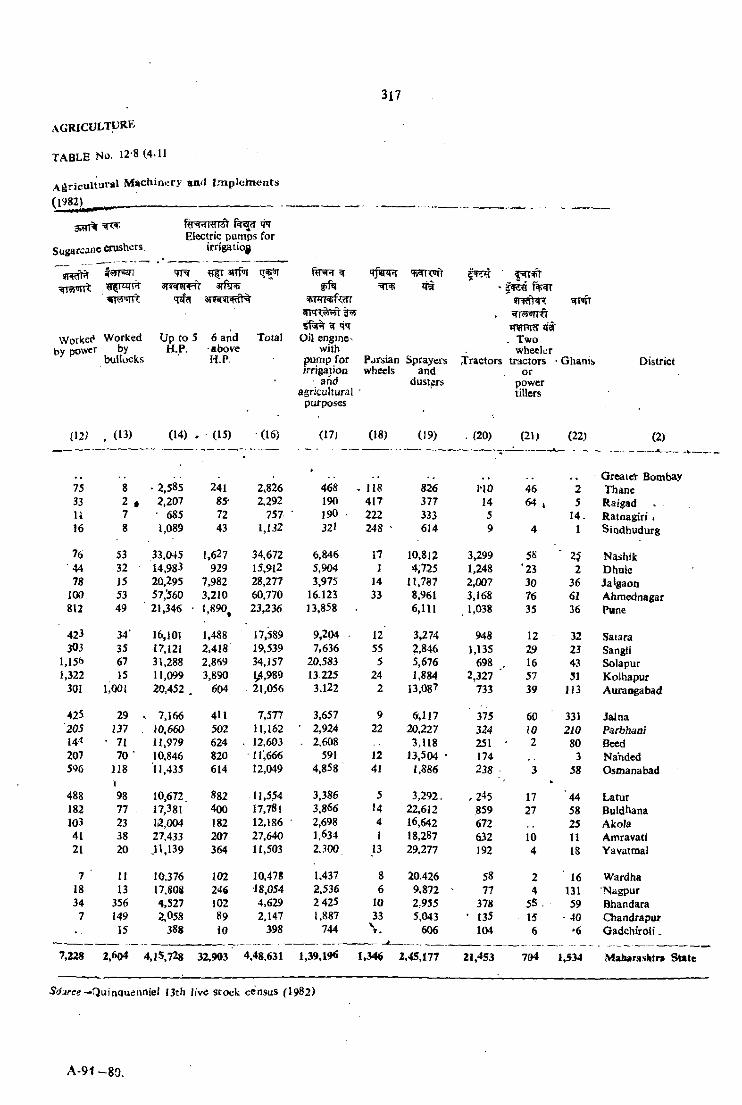
TABLE No. 12-8 (4-11
^agricultural Machinery aa<l Im plotoeuts
(1982)^^____________________________________
Sugarcane crushers
f r^TfRTTst w Electric pumps for
irrigation
'ijW T ■j'MlW'sreeRPFTr -
^rwRifcrr.
^ mflRiiT ir#Workcc* Worked Up fo 5 6 and Total Oil engine' . Two
by power by H.P. • above with wheelerbullocks H.P. punfip for Persian Sprayers Tractors tTdciors • Ghanjs
irrigation wheels and orand d usi^s power
agricultural ’ tillerspurposes
L W . (13) (14) . (15) (16) (17j (18) (19) . (20) (21) (22)
75 8 • 2,585 241 2,826 468 , 118 826 1-10 46 233 2 • 2,207 85- 2.292 190 4IT 377 14 64 , 5U 7 • 685 72 757 190 . 222 333 5 14.16 8 1,089 43 1,132 321 248 • 614 9 4 1
76 53 33,045 1,627 34,672 6,846 17 10,812 3,299 5S ■ 2544 32 14,983 929 15,912 5,904 1 4,725 1,248 '23 278 J5 20,295 7,982 28,277 3,975 14 11,757 2,007 30 36
100 53 57,’560 3,210 60.770 16-123 33 8,961 3,168 76 61S12 49 21,346 ' *,890^ 23,236 13,858 6,111 . 1,038 35 36
423 34' 16,J0I 1,488 17,589 9,204 • 12' 3,274 948 12 32303 35 17,121 2,418 19,539 7,636 55 2,846 1,135 29 23
1,15& 67 31,288 2,869 34,157 20,583 5 5,676 698 16 431,322 15 11.099 3,890 ^4,989 13 225 24 1,884 2,327 ' 57 31
301 1,00{ 20,452 . 604 21,056 3.122 2 13,087 733 39 113
425 29 ^ 7.166 411 7,577 3,657 9 6,117 375 60 331205 137 . 10.660 502 11,162 • 2,924 22 20,227 3Z4 10 210144 • 71 11.979 624 . 12,603 . Z608 3,118 251 2 80207 70 • 10,846 820 11,666 591 12 13,504 ■ 174 3596 118 11,435 614 12,049 4,858 41 1,886 238 3 58
488198 10,672 882 11.554 3,386 5 3,292. , 245 17 ■44
182 77 17,381 400 17,78! 3,866 M 22,612 859 27 58103 23 12.004 182 12,186 2,698 4 16,642 672 2541 38 27,433 207 27,640 1,634 1 18,287 632 10 n21 20 .11,139 364 11,503 2.300 13 29,277 192 4 18
7 11 10.376 102 10,478 1.437 8 20.426 58 2 1618 13 17,80S 246 18,054 2,536 6 9,872 ■ 77 4 13134 356 4,527 102 4,629 2 425 10 2.955 378 5 5 . 59
7 149 2,058 89 2,147 1,887 33 5,043 • 135 15 • 4015 388 10 398 744 \*.
. j606 104 6 •6
7,228 2,6o4 4.15,728 32,903 4.48,631 1,39,196 1,346 2.45,177 21,453 794 1,534
Quinqueimiel I3th IiVe stock census (ls>82)
District
(2)
Greai«\- Bombay Thane Raigad Rataagiri < SiDdhudurg
NashtkDhuicJaigaoQAhmednagarPune
Saiara Sangii Solapur Kolhapur Aura oga bad
JainaParbhaafBeedNandedOsinanabad
LaturBuldhanaAkotaAmravatiYavatmal
Wardha 'Nagpur Bhandara Chandrapur G adchiro ii.
Mabarasfctr* State
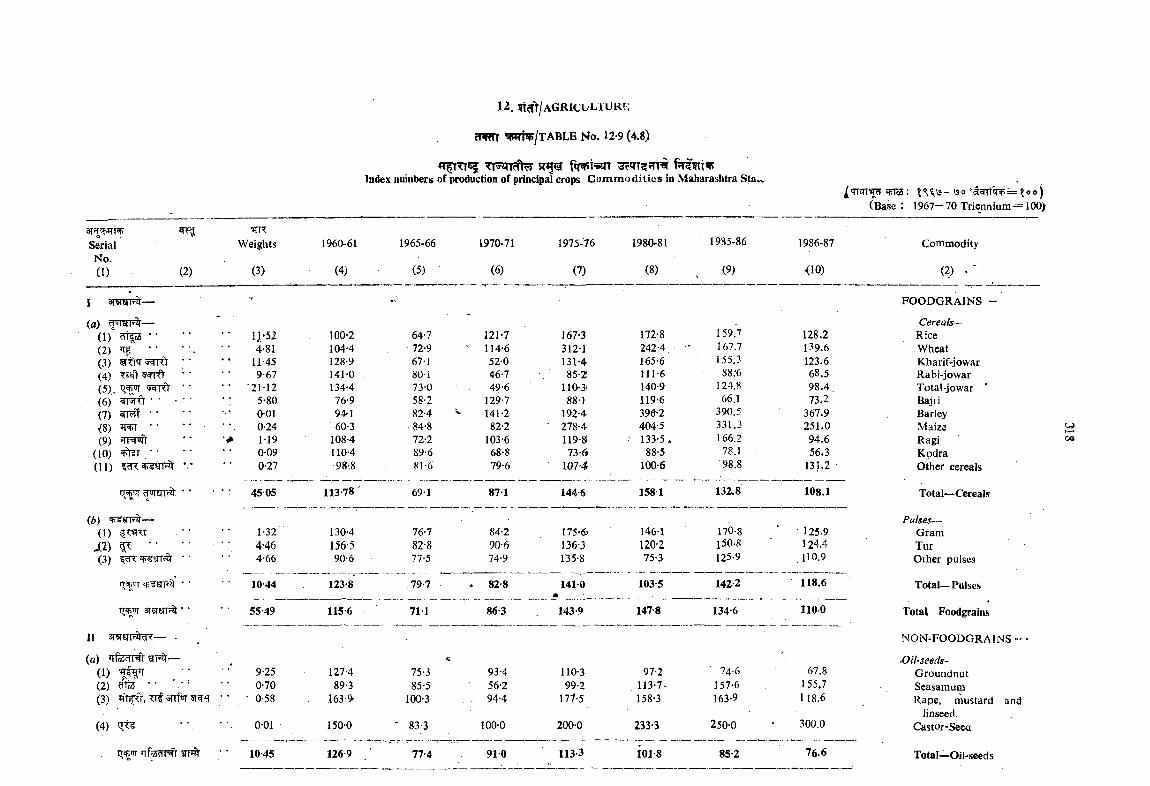
Index numbers of production of principal crops Com m odities in Maharashtra Sta>
(Basel 1967“ 70 Triennium=100)
SerialNo.(1) (2)
«TRWeights
(3)
1960-61
(4)
1965-66
(5)
1970-71
(6)
1975-76
(7)
1980-81
(8)
1985-86
(9)
1986-87
<10)
Commodity
(2) ‘ ■
i 3twn%-
di cA • • • • U-52 100*2 64-7 121 >7 167-3 172-8 159.74-81 104-4 72-9 114-6 312-1 242-4. 167.7
g-%q’'xciKT •• 11-45 128-9 67-1 52-0 131-4 165-6 155.39-67 141-0 80-1 46-7 85-2 Hl-6 88:6
sciiO- • • • • 2M 2 134-4 73-0 49-6 110-3' 140-9 124.8WRXt ■ ■ - ■ ■ • ; 5-80 76-9 58-2 129-7 88-1 119-6 66.1
• • 001 94-1 82-4 141-2 192-4 390-2 390.5• • • * 0-24 60-3 84-8 82-2 ■ 278-4 404-5 331.3
rfV uH M9 108-4 72-2 103-6 119-8! 133-5. 166.20-09 110-4 89-6 68-8 73-6 88-5 78.1
*-' 0-27 98-8 81-6 79-6 107-4 100-6 98.8
' • • 45 05 113-78 69-1 871 1446 1581 132.8
128.2139.6123.668.5 98.473.2
367.9251.094.656.3
131.2
108.1
II srsftrrral^— -
(a) ’Tfe^r^sjT^—
FOODGRAINS -
Cereals-RiceWheatKharif-jowarRabi-jowarTotal-jowarBajiiBarleyMaizeRagi'KpdraOther cereals
Total—Cereals
Pulses—
UJ0 9
(1) 1-32 130-4 76-7 84-2 175-6 146-1 170-8 125-9 Grami2 ) ^ 4-46 156-5 82-8 90-6 J36-3 120-2 150-8 124.4 Tur(3) •• 4-66 90-6 77-5 74-9 135-8 75-3 125-9 ,110.9 Other pulses
10 44 123-8 .79-7 . 82-8 141 0____ « __ ;____
103-5 142 2 118.6 Total—Pulses
3TvTOTt • • 55-49 1156 711 86-3 1439 147-8 134-6 1100 Total Foodgrains
NON-FOODGRAINS - •
-Oil'seeds-(1) ^ 9-25 127-4 75-3 93-4 110-3 97-2 74-6 67.8 Groundnut(2) «lo4 • • 0-70 89-3 85-5 56-2 99-2 113-7^ 157-6 1 55.7 Seasamum(3) ” 0 58 163-9 100-3 94-4 177-5 158-3 163-9 1 18.6 Rape, mustard
linseed.(4) 0-01 150-0 ' 83-3 100-0 200-0 233-3 250-0 300.0 Castor-Seea
irflvidN'l 10-45 1269 77-4 91-0 1133 i o l s 85-2 76.6 Total—Oil-seeds
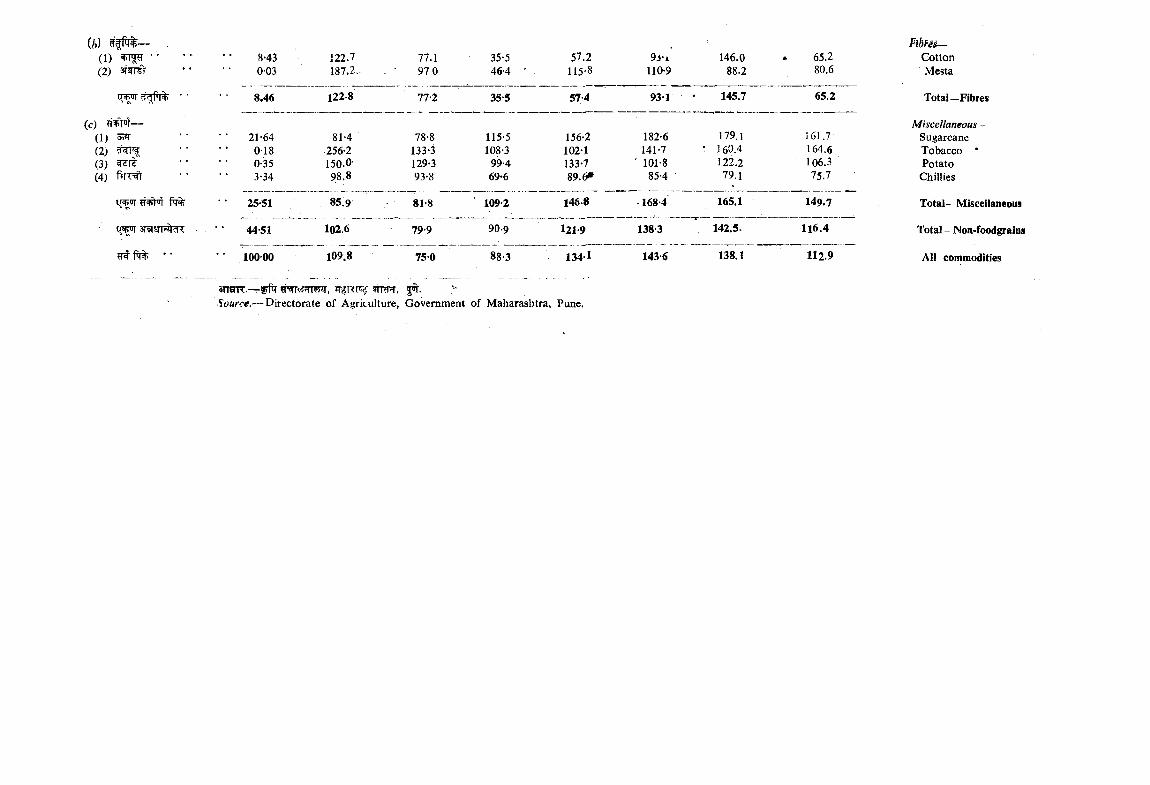
ih)(1) ^ • • (2) 3T^
(c) ?r^r-8.46
122.7187.2-
1228
77.1 97 0
77-2 35-5 57-4
93-i 110-9
146.088.2
931 145.7 65.2
anaiT.— 5TRnT, 5 .Source.— Directorate of Agriculture, Government of Maharashtra, Pune,
Fibm—GottonMesta
Total—Fibres
Miscellaneous-(1) 21-64 81-4 78-8 115-5 156-2 182-6 179,1 161.7 Sugarcane(2) 0-18 .256-2 133-3 108-3 102-1 141-7 • 160.4 164.6 Tobacco •(3) 0-35 150.0 129-3 99-4 133-7 ' 101-8 122.2 106.3 Potato(4) 3-34 98.8 93-8 69*6 89.6» 85-4 79.1 75.7 Chillies
Pr% 25-51 85.9 81-8 109-2 146-8 168 4 165.1 149.7 Total- Miscellaneous
44-51 102.6 79-9 90-9 121-9 138-3 142.5- H6.4 Total - Non-foodgrains
'• 100-00 109.8 75-0 88-3 134-1 143-6 138.1 112.9 Ail commodities
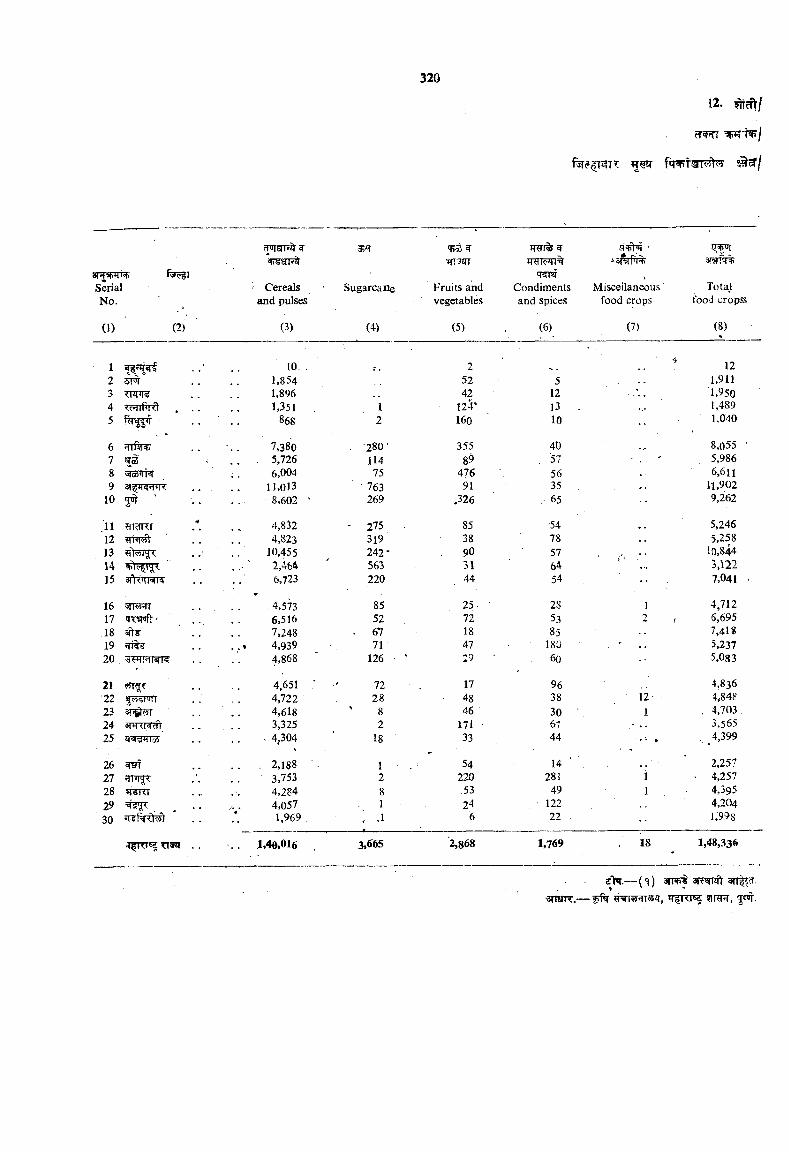
12- m ^ l
WfW)/
a r^ WSerialNo.
(1) (2)
(TWSrF
Cereals and pulses
(3)
3?T
Sugarcane
(4)
Fruits and vegetables
(5)
Condiments and spices
(6)
Miscellaneous food crops
(7)
iT3pjr
Total food cropss
(8)
1 10. . 2 ' 122 4!U| 1,854 52 5 1,9113 1,896 , ^ 42 12 1,9504 . . . 1,351 1 125* 13 . 1,4895 868 2 I60 10 1.040
6 Hlfsfliifi 7,380 . 2 8 0 ' 355 40 8,0557 ‘ 5,726 114 89 . 57 ✓ 5,9868 vHoJqi'il 6,004 75 476 56 6,6119 . . . 11,013 ■ 763 91 35 11,902
10 5^ ' 8,602 269 ,326 . 65 9,262
11 ^idKT / . 4,832 - 2 7 5 85 •54 5,24612 4,823 319 ■ 38 78 5,25813 10,455 242' 90 57 * * 10,84414 2,464 563 31 64 3,12215 3rtt^!NK 6,723 220 44 54 •• 7,041
16 . 4,573 85 25- • 28 1 4,71217 TT T'ift' . . 6,516 52 72 53 2 , 6,69518 7,248 . 67 18 85 7,41819 *ri . . . .« 4,939 71 47 180 5,23720 4,868 126 • 29 60 5,083
21 4,651 ' 72 17 96 4,83622 4,722 28 48 38 ' 12- ■ 4,84823 3<^«l 4,618 ' 8 46 30 1 . 4,70324 3TIR1^ 3,325 2 171 • 67 3,56525 • 4,304 is 33 44 . 4,399
26 . . . 2,188 1 . 54 14 ■ , .. 2,25?27 3,753 2 220 281 1 ‘ 4,25728 5RKT 4,284 8 .53 49 1 4,39529 4,057 - 1 ■24 , ■ 122 4,20430 1.969 1 .1 6 22 1.998
■. . 1>40,O16 3,665 2,868 1,769 . 18 1,48,336
■anaR.—(<i) arnpt 3iT«rraV arrli .
9IRFT,
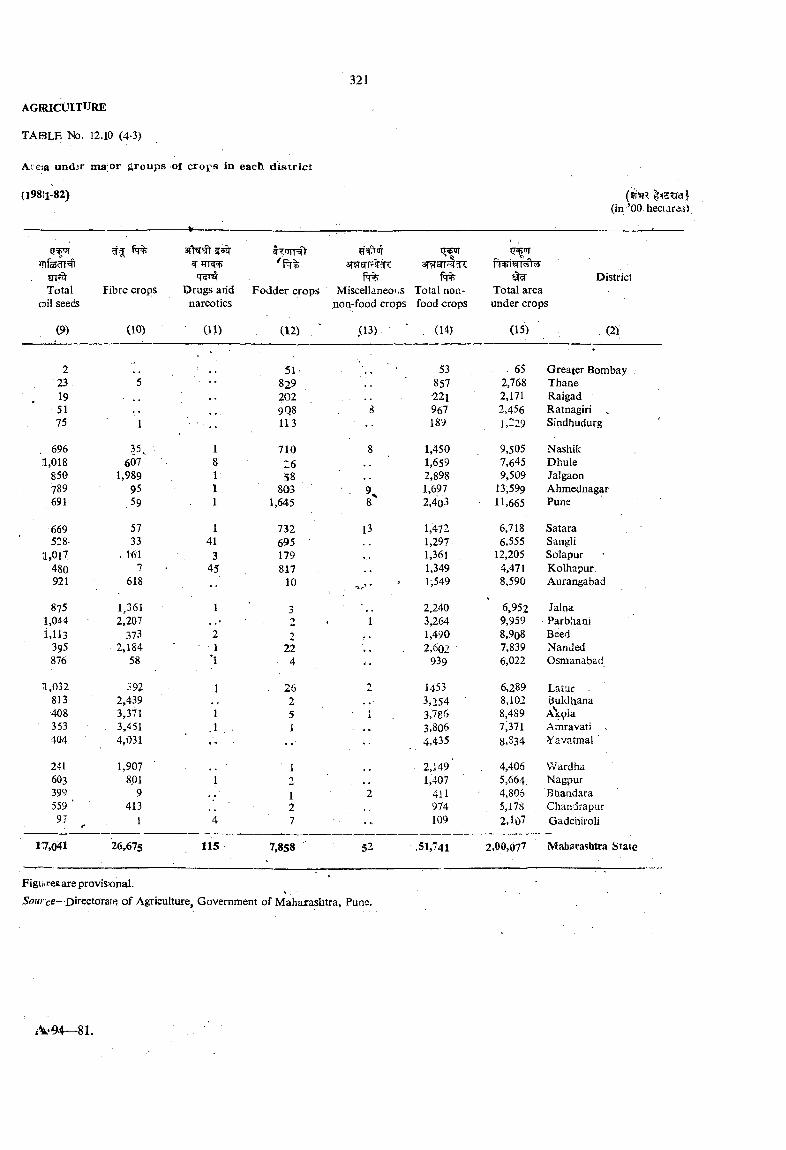
AGRICUITJJRE
Ai esa undir
(l98ii-82)
ma;or groups of crops in each di&trict
(in ’00
' m£TT? fq% fr% DistrictTotal Fibre crops Drugs arid Fodder crops Miscellaneous Total non Total area
oil seeds narcotics non-food crops food crops under crops
(9) (10) (U) (12) / .(13) (14) (15) (2).
2 51- 53 65 Greater Bombay ,23, 5 829 857 2,768 Thane
■ . 19 202 22i 2,171 Raigad51 9Q8 8 967 2,456 Ratnagiri ^
. . 75 1 113 ■ '• 189 1,229 Sindhudurg
, 696 35, 1 710 8 1,450 9,505 Nashik1,018 607 26 1,659 7,645 Dhule
850 1,989 58 . . 2,898 9,509 Jalgaon789 95 803 ■ K 1,697 13,599 Ahmednagar691 ,59 1,645 8 2,4o3 11,665 Pune
669 57 1 732 13 1,472 6,718 Satara528- 33 41 695 ' 1,297 6,555 Sangli
1,017 . 161 179 1,361 12,205 Solapur480 7 - 817 1,349 4.471 Kolhapur.921 618 10 l-,549 8,590 Aurangabad
875 1,361 • 3 2.240 6,952 Jalna1,044 2,207 * ^ 1 3,264 9,959 Parbhani1,113 373 2 1,490 8,9o8 Beed
395 2,184 22 ». 2,602 7,839 Nanded876 58 *1 4 939 6,022 Osmanabad
1,032 392 - 26 2 1453 6,289 Latur813 2,439 2 3,254 ' 8,102 yuldhana408 3,371 5 i . 3,786 8,489 A\9ia
• 353 . 3,451 1 .. 3,806 7,371 Araravati404. 4,031 4,435 8,834 Yavatmal
241 1,907 1 ■ 2,149' 4,406 VVardha603 801 1 2. ., 1,407 5,664. Nagpur399 9 1 2 411 4,806 Bhandara559 ■ 413 2 974 , 5,178 Chandrapur97 < 1 4 7 109 2,l07 Gadchiroli
17,041 26,675 115 7,858 52 .51,741 2,00,077 Maharashtra State
Figujres are provisional.5o«r-ce—DireetoTare, of Agriculture, Government of Maharashtra, Puns.
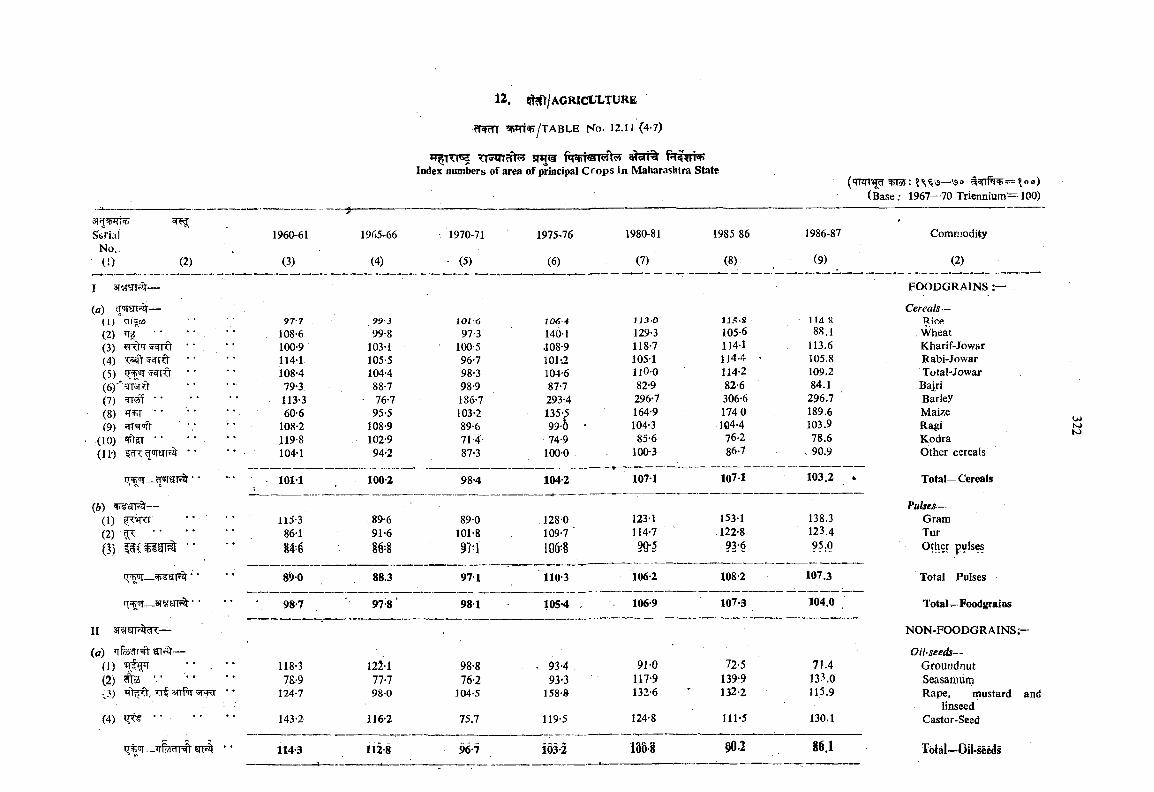
SerialNo.(0 (2)
I
(a) ^’’T9Ti%-U)(2) • •(3)C4) ■?;5(5)(6)' ’■gT5f(7) =TT# • •(8) JTW • •(9)
(10) ^ST ••(11') ^[5% • •
(b)(1) fWT • •(2) •• ••{V) 1^?
Cn^_^£rT^ • •
n ir._3T'Km • •
II 3ra’fe(i< d<—-
(a) Trfe^r^ar^r—(1) ^ " ■(2) ^ '■'\3) anfoT
ti%Tr _TTfe TT ETF
1960-61
W TTS? f im S rT ^ MsHWIndex numbers of area of principal Crops in Maharashtra State
(TTm^ 'ao ^^Tf^=^oo)(Base; 1967—70 Triennium^lOO)
1965-66 1970-71 1975-76 1980-81 1985 86 1986-87 Commodity
(3) (4) - (5) (6) (7) (8) (9) (2)
97-7 99-3 101<> 106 4 1130 JJ5-8 • 114 S
FOODGRAINS:—
Cereals ~Rire
108-6 99-8 97-3 140-1 129-3 105-6 88.1 . Wheat100-9 103-1 100-5 .108-9 118-7 114-1 113.6 Kharif-Jow«r114-1. 105-5 96-7 101-2 105-1 114.4 • 105.8 Rabi-Jowar108-4 104-4 98-3 104-6 IlO-O 114-2 109.2 Total-Jowar79-3 88-7 98-9 87-7 82-9 82-6 84.1 Bajri113-3 • 76-7 186-7 293-4 296-7 306-6 296.7 Barley60-6 95-5 103-2 135-5 164-9 1740 189.6 Maize
108-2 108-9 89-6 99-5 * 104-3 104-4 103.9 Ragi119-8 . 102-9 71-4’ 74-9 85-6 76-2 78.6 Kodra104-1 94-2 87-3 100-0 100-3 86-7 , 90.9 Other cereals
: 101-1 100-2 98-4 104-2 107-1 107-1 103.2 * Total—Cereals
115-3 89-6 89-0 1280 123-1 153-1 138.3Pulses—
Gram86-1 91-6 101-8 109-7 114-7 . 122-8 123.4 Tur%H %m m 106 § 9Q-5 ?3'6 95 ;Q Other pulses
8 -0 88.3 97-1 110-3 106-2 108-2 107.3 Total Pulses
98-7 97 8 ’ 981 105-4 , 106-9 107-3 104.0 Total-^ Foodgrains
118-3 12M 98-8 . 93-4 91-0 72-5 71.4
NON-FOODGRAINS;-
Oil-seeds—Groundnut
7S--9 77-7 76*2 93-3 117-9 139-9 133.0 Seasamunj124-7 98-0 104-S 158-a 132-6 132-2 115.9 Rape, mustard and
143-2 116-2 75.7 119-5 124-8 111-5 130.1linseed
Castor-Sesd
114-3 112-8 96-7 i03-2 m% 90.2 §6.1 Total—Oii-se^s
u>toto
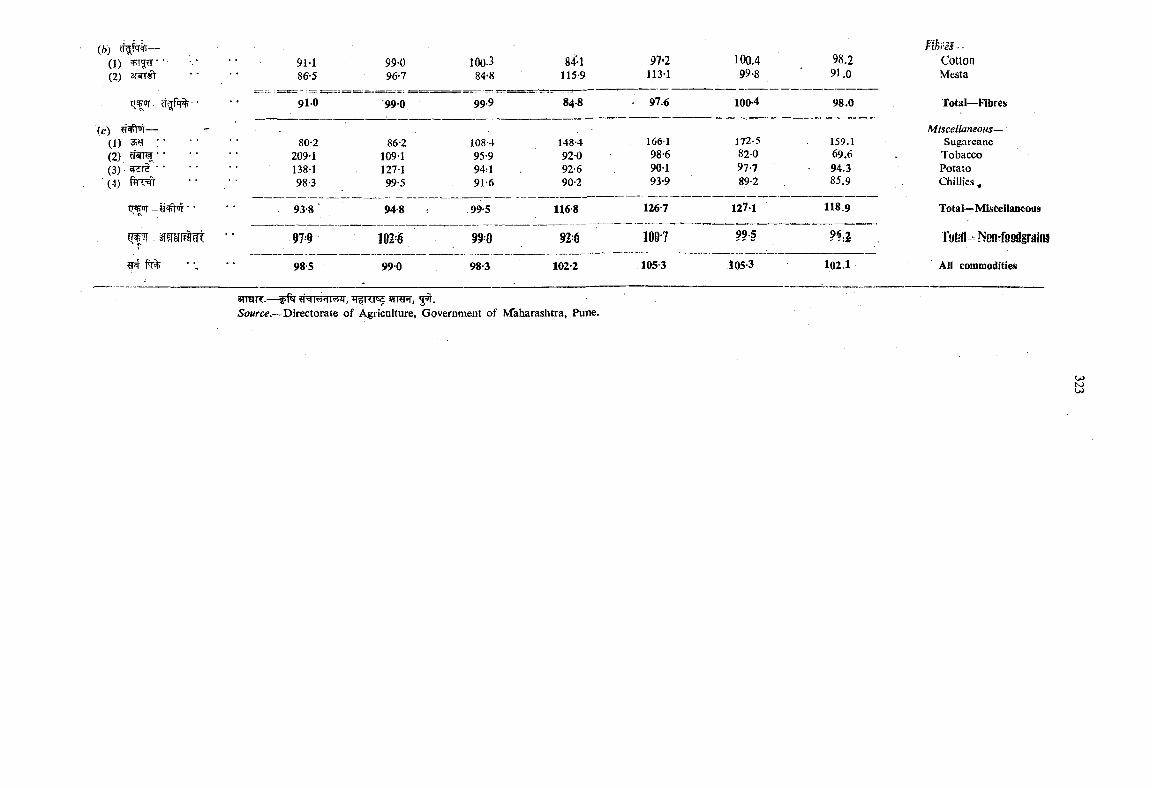
ib) ^fqifr— (1)(2)
(c) —(1) m y(2) cf rw • •
(4)
IToFT -^^’IT •
99-096-7
910
80-2209-1138-198-3
93-8
9 7 9
985
99-0
86'2109-1127-199-5
948
102-6
99-0
100-384-8
99-9
108 4 95-9 94rl 91-6
99-5
9 9 0
98-3
84-1115-9
84-8
148-492-092,-690-2
H68
92=6
102-2
97*2113-1
97.6
166198-690-193-9
126-7
1 0 9 - 7
105-3
100.499-8
100-4
172-582-097-789-2
1271
995
105-3
98.2 91.0
98.0
159.169.694.385.9
118.9
?«;2
102.1
FibfeS - - Cotton Mesta
Total—Fibres
Miscellaneous— Sugarcanc
Tobacco Potato Chillies ,
Total—Miscellaneous
r»riJl^NeB^99fliralflS
All commodities
BTnjTT.—IFft’ SiRFT, J#,iSoi/rce.—Directorate of Agriculture, Government of IVfaharashtra, Pune.
U)U)
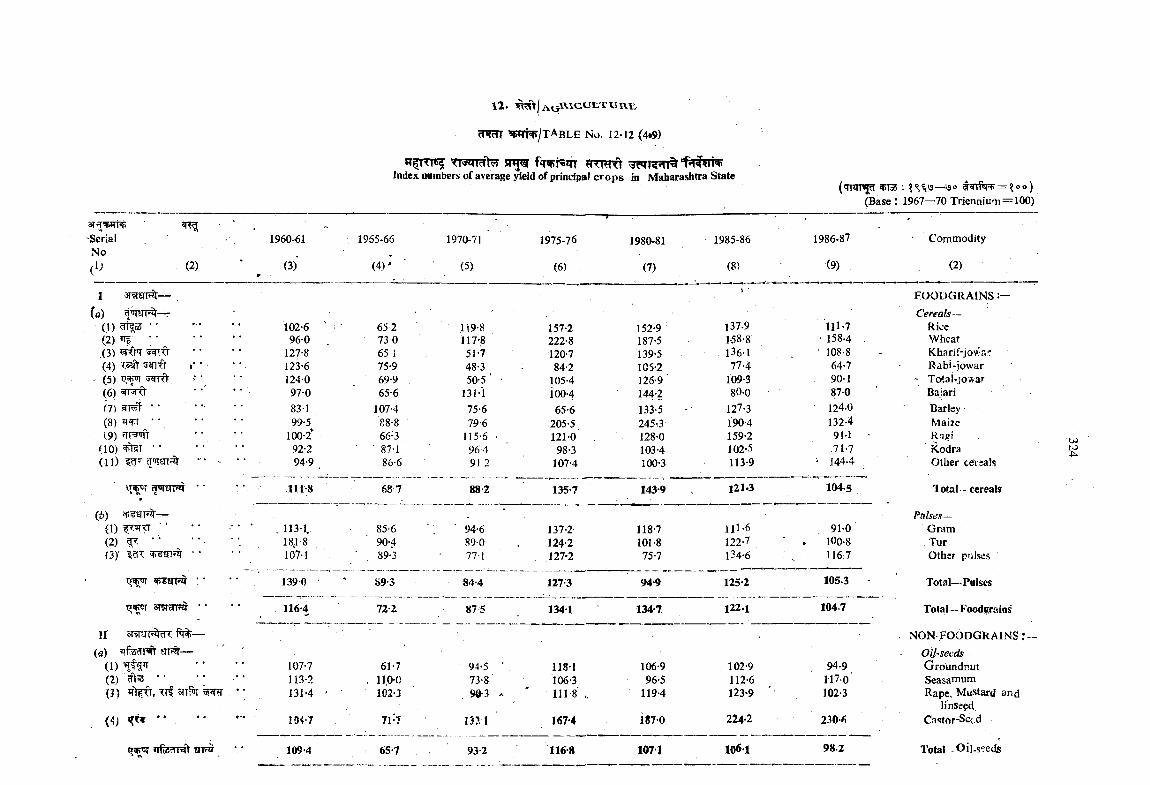
'SerialNo.
(2)
1 —(a) r-
0 )(2) • •(3)(4) ^
' (5) 'swrft'(6)(7) .^T# • •(8) • '(9)
(10) ^ T • •(U) q w ^
q^T 0TT!
T m r ^ s r ^ fq^ts^jIndex numbers of average yield of principal crops in Maharashtra State
(MHi d >ra ; 9^rf^=?oo)(Base : 1967—’70 Triennium = 100)
1960-61
(3)
1965-66
(4) '
1970-71
(5)
1975-76
(6)
1980-81
(7)
1985-86
(8)
1986-87
(9)
* • • • 102-6 65 2 1198 157-2 152-9• • • • 96-0 730 117-8 222-8 187-5• • • * 127-8 65 1 51-7 120-7 139-5r * • • . 123'6 75-9 48-3 84-2 lOS-2
* • 1240 69-9 50-5 ■ • 105-4 126-9• • 97-0 65-6 131-1 100-4 144-2
• •' 831 , 107-4 75-6 65-6 133-5• * 99-5 88-8 196 205-5 245-3
• • 100-2' 66-3 115-6 . 121-0 128-0• • 92-2 87-1 96-4 98-3 103-4
94-9 86-6 91 2 107-4 100-3
1118 68-7 88-2 135-7 143-9
137.91-58-8136-177-4
109-380-0
127-31904159-2102-5113-9
111-7 158-4 108-8 64-790-1 87-0 124-0 132-491-1 .71-7 144-4
121.3 1045
Commodity
(2)
FOOpGRAlNSCereals ~
RiceWheatKharif-jowa.'’Rabi-jowarTo<al-joAarBajariBarleyMaizeRn iKodraOther ceveals
Total - cereals
to
(6) —(1) " * ■ ■' ■ . 113-t 85-6 ' : 94'6 137-2 118-7 m -6 91-0
Pulses—<jram
(2) ^ • ' 18-1-8 90-4 89-0 124-2 101-8 122-7 ■ . 100-8 Tur(3)' • • 107-1 • 89-3 771 127*2 75-7 134-6 116 7 Other pulses
* r\ 1390 89 3 84-4 127-3 94-9 125-2 105.3 • Total—Pulses
116-4 72-2 87 5 134-1 134*7 122.1 1047 Total—Foodgrains'
ir 3TWI' '3< ft%—(fl) ’ifeciT^ «TP%—
(1) 107-7 61-7 94-5 • 118-1 106-9 , 102-9 94-9
. NON FOODGRAINSOiJ'SecdsGroundnut
(2) • ’ 113-2 , 1100 73-8 106-3 96-5 112-6 117-0 Seasamum(3) ’fMr, Trf 3iT?ii ' • I3I-4 ' 102-3 90-3 in -8 . 119-4 123*9 102-3 Rape, Mustard and
(4) 104-7 71-7 i n t 167*4 187-0 224*2 230-6linSeed.
Castor-Sccd
rfe rp sfp® 109-4 65-7 93-2 116-8 107-1 106-1 982 Total -Oil-sceds
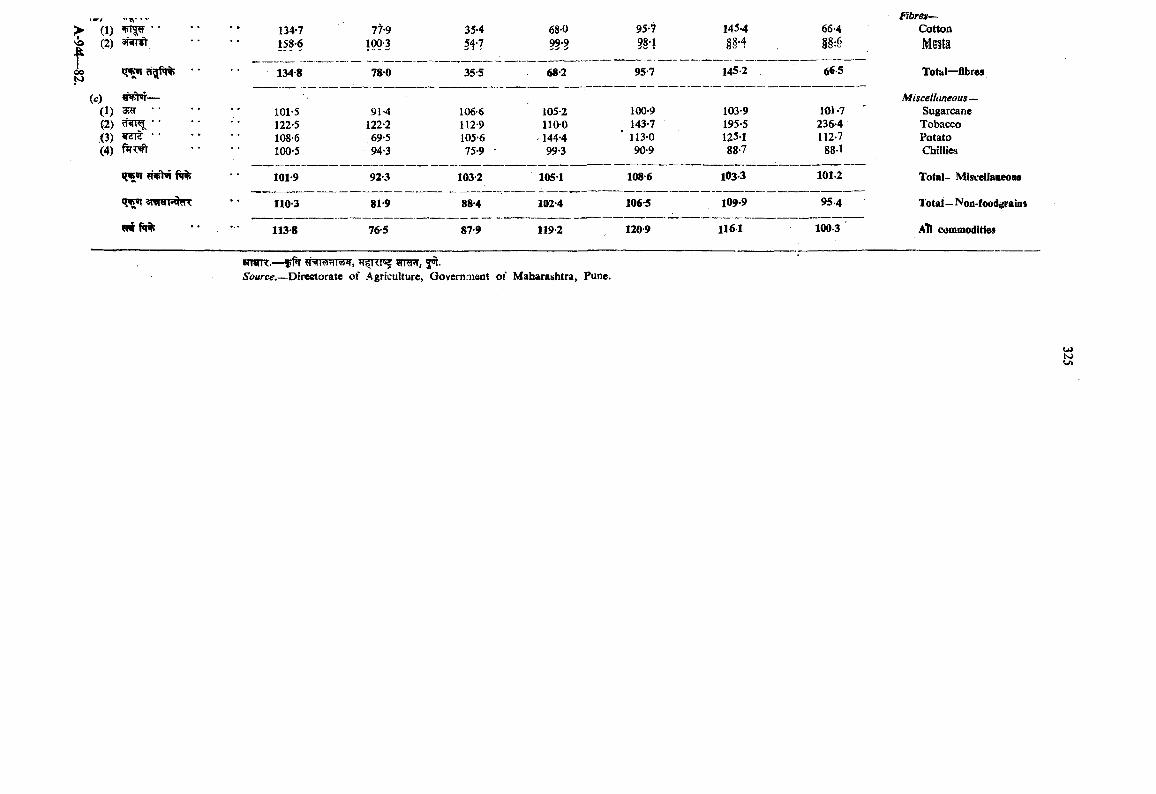
VO&ooN>
^(1) •• 77-9(2) 158-6 100-3
T '"134-8 78-0
(c)0 ) 3J?T 101-5 91-4(2) ■ * 122-5 122-2(3) 108-6 69-5(4) 100-5 94-3
101-9 92-3
110-3 81-9
w# f«r% 113-8 76-5
35454*?
35-5
106-6112-9105-675-9
103-2
88-4
68-099*9
68-2
105-2110-0144-499-3
1051
102-4
95-7?§*}
95-7
100-9143-7113-090-9
108-6
106-5
145-4§§•4
145-2
103-9195-5125-188-7
1033
87-9 119-2 1209
109-9
1161
66-4m
665
101-7236-4112-7
88-1
1012
954
100-3
Fibres—CottonMsita
Total—flbreii
Miscelltmeous— Sugarcane Tobacco Potato Chillies
Total—Miscellaoeoas
Total—Non-food^aloa
ATI commodities
wrerrr.— vrm,Sowrce.—Directorate of Agriculture, Government of Maharaithtra, Pune.
ls>V>l
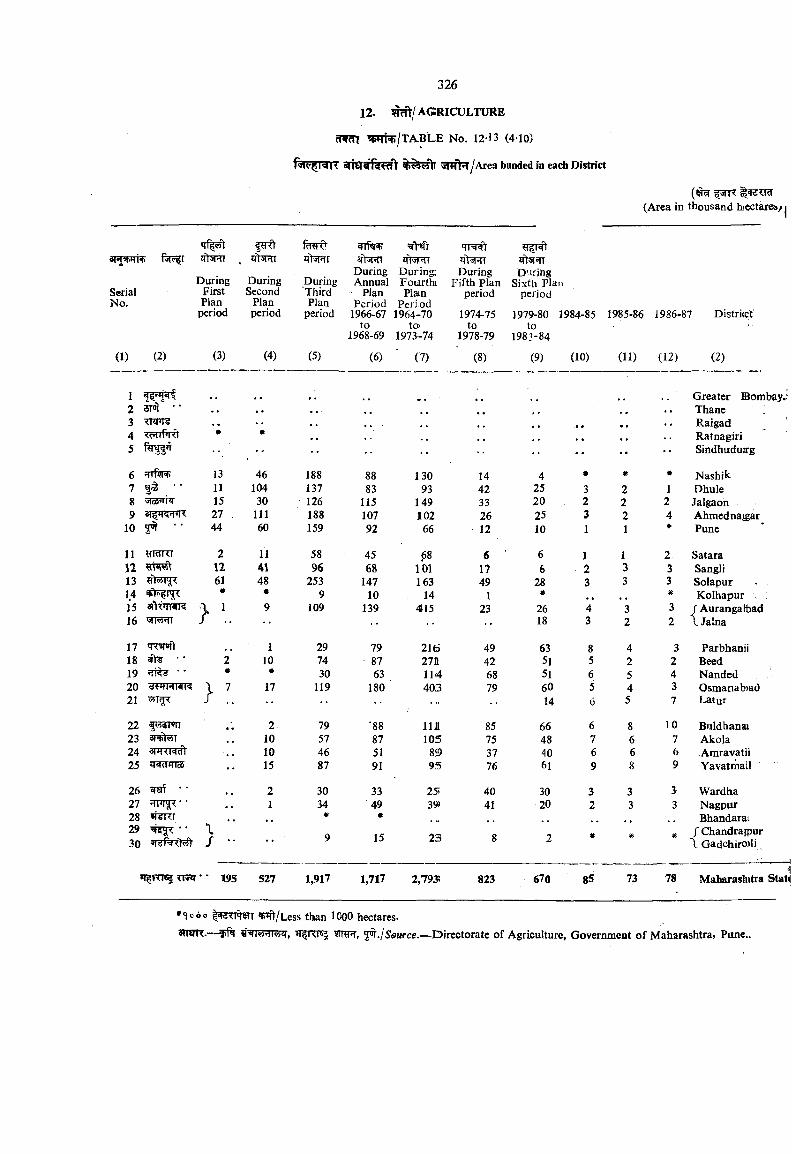
326
12. ^ ' t / a g r ic u l t u r e
cfSRH W ^ /T A B L e No. 12-13 (410)
STfft^r/Area bunded in each District
fjrn:(Area in thousand hiectarei»/j
SerialNo.
(1) (2)
DuringFirstPlanperiod
(3)
DuringSecond
Planperiod
(4)
«<irq+iTl'Jifii
During During; During D’lringDuring Annual Foiarthi Fifth Plan Sixth planThird Plan Plan period periodPlan Period Period
period 1966-67 1964-70 1974-75 1979-80 1984*85 1985-86 1986-87 Distri(ctto tO) to to
1968-69 1973-74 1978-79 1983-84
(5) (6) (7) (8) (9) (10) (11) (12) (2)
1 •• •’ Greater Bombay.2 3T ■ ‘ . . ' . . • » Thane3 .. • • .. . . . . Raigad4 « • ., Ratnagiri5 " •• •• •• •• •• Sindhudujrg
6 fuftl't. 13 46 188 88 130 14 4 • * * Nashik7 I® • ' 11 104 137 83 93 42 25 3 2 1 Dhule8 'j|a5<ii4 15 30 126 115 149 33 20 2 2 2 Jalgaon9 27 111 188 107 102 26 25 3 2 4 Ahmed nagar
10 yfr •• 44 60 159 92 66 12 10 1 1 * Pune
11 fRTRT 2 11 58 45 68 6 6 1 1 2 Satara12 12 41 96 68 101 17 6 2 3 3 Sangli13 61 48 253 147 163 49 28 3 3 3 Solapur14 • • 9 10 14 1 * # Kolhapur ,15 , 9 109 139 415 23 26 4 3 3 / AurangatbadJ6 / .. •• 18 3 2 2 \ Jalna
17 M <M<»n 1 29 79 216 49 63 8 4 3 Parbhanii18 '• 2 10 74 87 2711 42 51 5 2 2 Beed19 ■ ’ « . • 30 63 114 68 51 6 5 4 Nanded20 ^WRraK \ 7 17 119 180 403 79 60 5 4 3 Osmanab>ad21 J .. ••• 14 6 5 7 Latur
22 f 5TWr .. 2 79 '88 111 85 66 6 8 10 Buldhanai23 3f feT , . 10 57 87 105 75 48 7 6 7 Akola24 3rrr<Ncft • , , 10 46 51 89 37 40 6 6 6 Amravatii25 JRcTJfnS •• 15 87 91 95 76 61 9 8 9 Yavatrhall
26 ^ * .. 2 30 33 25 40 30 3 3 3 Wardha27 1 34 49 39 41 20 2 3 3 Nagpur28 'H KI .. , , * « , , Bhandarat29 • • \ o 1 < o # # / Chandrafpur30 / •• y 1*> 23 O 2 \ Gadchiro)li
Tf»lT • • 195 527 1,917 1,717 2,7935 823 670 85 73 78 Maharashitra Stal
•Tooo |Wcrn 5fT ^wt/Less than lOOO hectares.STTOR.—fif^ H RPsa ifTT , Source.—Directorate of Agriculture, Government of Maharashtra. Pune..
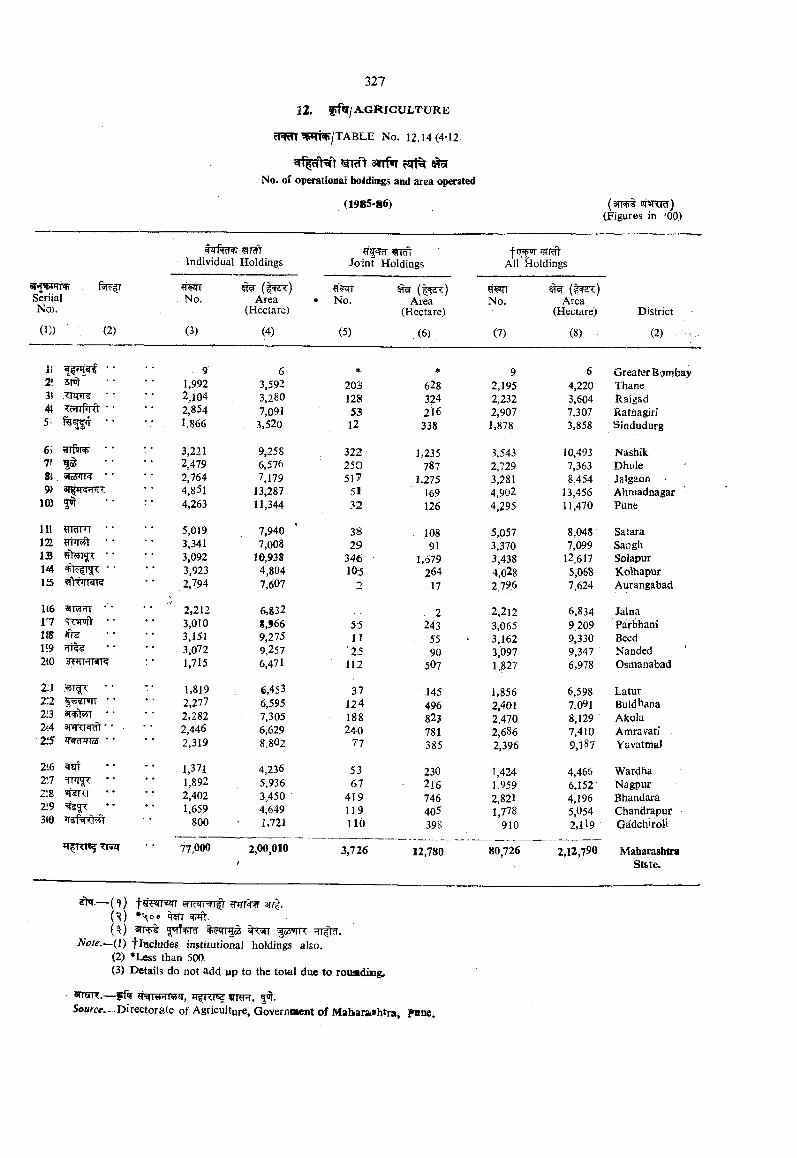
SeriialNoj.
(D) (2)
c l ^ ^rSTW/TABLE No. 12.14 (4-l2»
sirf^ c?ri% ^No. of op^tional hoildiags and area operated
(1985-86)
<sjldlIndividual Holdings
TcTT Joint Holdings
No.
(3)
^ ( 1 ^ ) Area
(Hectare)
(4)
?fwrNo.
(5)
^ ( 1 ^ ) Area
(Hectare)
(6)
21 sm 1,992 3,592 203 6283 2,104 3,280 128 32444 Twifiiil ■ ’ 2,854 7,091 53 2165: • • 1,866 , 3.520 12 338
6) ■' * 3,221 9,258 322 1,235T 1® 2,479 6,576 250 7878i 2,764 7,179 517 1,2759) 4,851 13,287 51 169
I© 5^ • • : 4,263 11,344 32 126
I I I «wi<i • • 5,019 7,940 38 . 108122 3,341 7,008 29 91I S 3,092 10,938 346 1,579
. ’ ■ 3,923 4,804 m 26415 2,794 7,607 2 - 17
1(6 Sfra TT 2,212 6,832 2r? 3,010 1,966 55 2431 8 3,151 9,275 11 551‘9 3,072 9,257 '25 902(0 1,715 6,471 112 507
2:1 • • 1,819 6,453 37 .1452:2 2,277 6,595 124 4962:3 ar >5iT • • 2,282 7,305 188 8232/4 3(4ixM;dl * * 2,446 6,629 24.0 7812:S • * 2,319 8,802 77 385
2'.6 1,371 4,236 53 2302\1 1,892 5,936 67 216218 2,402 3,450 419 746219 1,659 4,649 119 405310 800 1,721 l ib 398
*T KIW TT^ 77,000 2,00,010 3,726 12,780
(siRjt ?rWTRT) (Figures in ’00)
fAll Holdings
?IWTNo.
(7)
^ ( 1 ^ ) Area
(Hectare)
(8)
District
(2)
92,1952,2322,9071,878
3,5432,7293,2814,9U24,295
5,0573,3703,4384,o282,796
2,2123,0653,1623,0971,827
1.8562,4012,4702,6862,396
1,4241,9592,8211.778
910
80726
64,2203,6047,3073,858
10,4937,3638,454
13,45611,470
8,0487,099
12.6175,0687,624
6,83492099,3309,3476,978
6,5987.0918,1297,4109,187
4,4666,1524,1965,0542,119
2,12,790
Greater BombayThanekaigadRatnagiriSindudurg
Nashik Dhule Jalgaon • Ahtnadnagar Pune
SataraSangliSolapurKolhapurAurangabad
JalnaParbhaniHeedNandedOsmanabad
Latur Buld^ana Akola Amravati - YavatmaJ
WardhaNagpurBhandaraChandrapurGa'dchiroli
MabarashtraStete.
—('J) w w 3fr|.(^) ^{i) ?TT|tgr.
Note.—(l) fIncludes institutional holdings also.(2) *Less than 500.(3) Details do not add up to the total due to roiudimg.
snsrnr.—frfcr JifRF? jor.Source.—Directorate of Agriculture, Governi»ent of Maharashtra, PWiw.
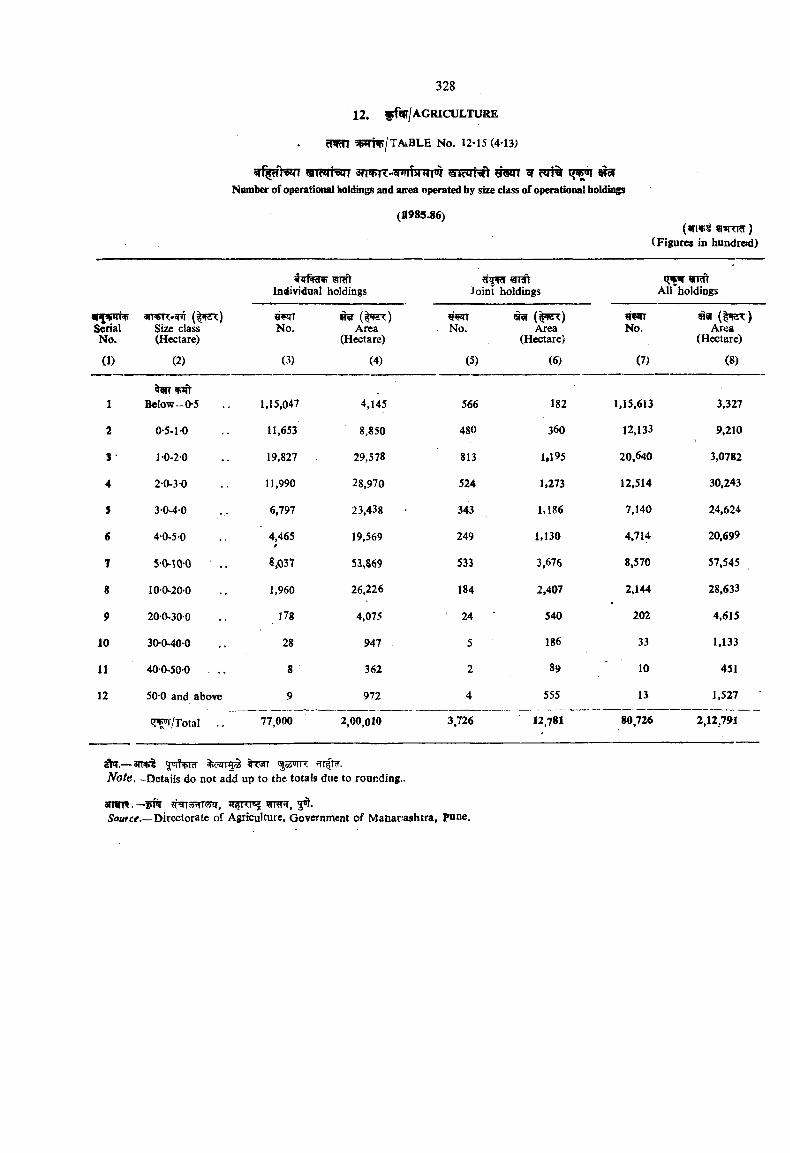
c m ?5»Tnr/TAiBLE No. 12-15 (4-13)
<aiwigjT 3nvR-3Pirf$nTm m?zrNt ^ c*ri% ^Number of operational holdings and airea operated by size class of operational holdings
(H985-86)(an«i fl«RT5r J
(Figures in hundrcid)
aimr-anr ( | ^ ) Serial Size classNo. (Hectare)
(1) (2)
Individual holdings Joint holdings
No.
(3)
Area(Hectare)
(4)
No.
(5)
^ (1=^) Area
(Hectare)
(6)
All holdings
WRITNo.
(7)
Area(Hectare)
(8)
1
2
S
4
5
6
7
8
9
10
11
12
^ Jinit Below—0-5
0-5-1 0
1-0-20
2-0-3 0
3-0-4-0
4-0-5-0
5-0-10-0
10-0-20-0
200-300
30-0-40-0
40 0-50-0 . ..
50-0 and above
'T^/Total
1,15,047
11,653
19,827
11,990
6,797
4,465
8,037
1,960
l7g
28
8
9
77.000
4,145
8,850
29,578
28,970
23,438
19.569
53.569
26,226
4,075
947
362
972
566
480
813
524
343
249
533
184
24
5
2
182
360
1.195
1,273
1,186
1,130
3,676
2,407
540
186
89
555
2,00,010 3726 12,781
1,15,613
12,133
20,640
12,514
7,140
4,714
8,570
2,144
202
33
10
13
80.726
3,327
9,210
3,0782
30.243
24,624
20,699
57,545
28,633
4,615
1,133
451
1,527
2.12.791
3n «5 «TTtW.-Details do not add up to the totals due to rounding..
a n w .—FW 5^.Source__Directorate of Agriculture, Government of Maharrashtra, pune.
1 3 . IRKIiGATlON
?rmnj?TR f w 3 ^ f^r^trm ^ irrrm l- w i t gr
JTT f ^ l T ^ 3n |.
13.. 1 Data on irrigated area according to various sourices, cropwise irrigated area and irrigation welly are presented in the tables in this sfection.
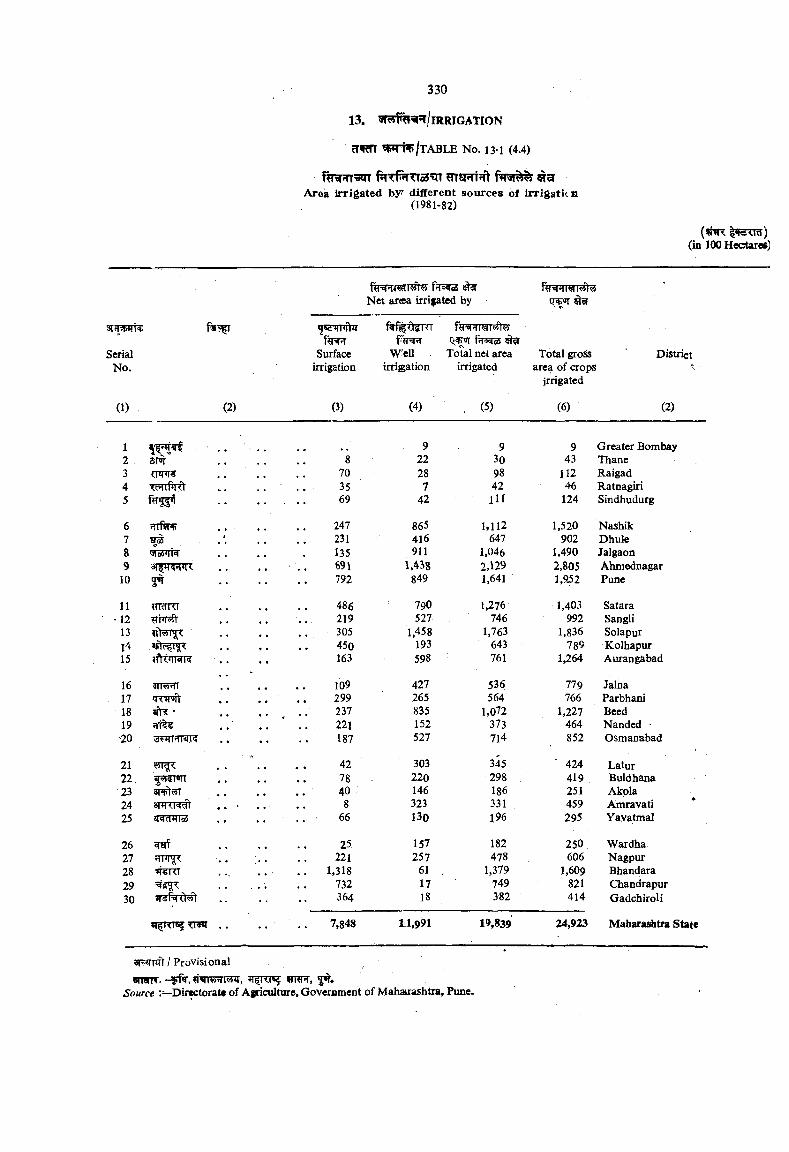
13. iT5yf% 5T/lRRJGATION
cTfm ??5frfwr/TABLE No. 13-1 (4.4)
f?R ?n«n f5TTf%TTfl3 wgrAreia irrigated by" different sources of irrlgatica
(1981-82)
(jpn: IfcT^ra) (in 100 Hectares)
Net arcea irrigated by
3Trl l=h
SerialNo.
(1) (2)
Y rrq-Surface
irrigation
(3)
W'ellirriggation
(4)
Total net area irrigated
(5)
ISra
Total groK area of crops
irrigated
(6)
District
(2)
12 sr®r34 T.'MTftiTt5
678 aurr9
10 5^
11 HldKI1213l415
16 ail'ji'ff1718 ^ •19-20
2122232425 i|e|d*ITo3
262728 'H KI2930
*T RT«?TTWr . .
9 9 9 Greater Bombay8 22 30 43 Thane
70 28 98 112 Raigad35 7 42 46 Ratnagiri69 42 H I 124 Sindhudurg
247 865 1,112 1,520 Nashik231 416 647 902 Dhule135 911 1,046 1,490 JalgaoD691 1,438 2,129 2,805 Abmodnagar792 849 1,641 1,952 Pune
486 790 1,276 1,403 Satara219 527 746 992 Sangli305 1.458 1,763 1,836 Solapur450 193 643 789. Kolhapur163 598 761 1,264 Aurangabad
109 427 536 779 Jalna299 265 564 766 Parbhani237 835 1,072 1,227 Beed221 152 373 464 Nanded •187 527 714 852 Osmanabad
42 303 345 ■ 424 Latur78 .. 220 298 419 Buldhana40 146 186 251 Akola8 323 331 459 Amravati
66 130 196 295 Yavatmal
25 157 182 250 Wardha221 257 478 606 Nagpur
1,318 61 , 1,379 1,609 Bhandara732 17 749 821 Chandrapur364 18 382 414 GadchiroH
7,848 11,991 19,839 24,923 Maharasfatra State
3Tf«n?ft / Provisional«nwTf. “ffftr. irre r,
Source '.—Directorate of Agriculture, Government of Maharashtra, Pune.
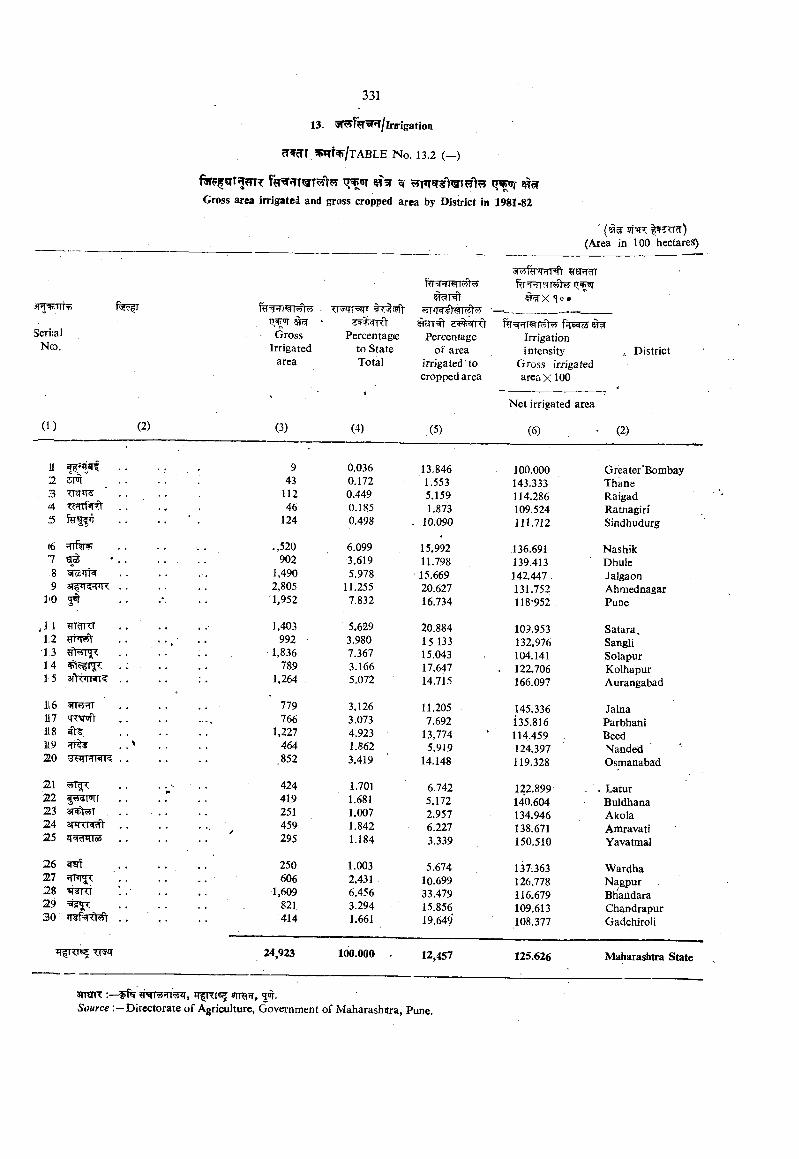
Gross area irrigated and gross cropped area by District in 1981-82
' 5T¥FT (Area in 100 hectares)
. Tr3=!Tf|wl« frloqcfi
Seriial Gross Percentagfe Percentage IrrigationNra. Irrigated to State of area i ntensity » District
area Total irrigated' to Gross irrigatedcropped area area X 100
Net irrigated area
(1) (2) (3) (4) (5) (6) . • (2)
11 9 0.036 13.846 100.000 Greater'Bombay2 ii«i ............................ 43 0.172 1.553 143.333 Thane3 112 0.449 5.159 114.286 Raigad4 46 0.185 1.873 109.524 Ratnagiri
124 0.498 . 10.090 111.712 Sindhudurg
<6 .,520 6.099 15.992 ,136.691 Nashik1 93 ' . . . . .■d 902 3.619 11.798 139.413 Dhule8 «r2'<ii4 1,490 5.978 J 5.669 142.447 . JaJgaon9 2,805 11.255 20.627 131.752 Ahmednagar
liQ 5^ 1,952 7.832 16.734 118-952 Pune
,11 TcnTT . . . . 1,403 5.629 20.884 109.953 Satara.1.2 . . . . . - 992 3.980 15 133 132.976 Sangli13 ylwi'jT 1,836 7.367 15.043 104.141 Solapur14 2FT?fr .;. . . 789 3.166 17.647 . 122.706 Kolhapur15 3fl<tii^K . . . . : . 1,264 5.072 14.715 166.097 Aurangabad
116 'j||n^ . . . . 779 3.126 11.205 145.336 Jalna117 'TWift 766 3.073 7.692 i35.816 Parbhani118 ^ . . . . . . 1,227 4.923 13,774 114.459 Seed1L9 464 1.862 5.919 124.397 Nanded20 .852 3.419 14.148 119.328 Osmanabad
21 424 1.701 6.742 122.899 Latur22 419 1.681 5.172 140.604 Buldhana23 3T^T ...................... 251 1.007 2.957 134.946 Akola24 aF no^ 459/ 1.842 6.227 138.671 Amravati25 zrwnTToS 295 1.184 3.339 150.510 Yavatmal
26 250 1.003 5.674 137.363 Wardha27 ............................... 606 2.431 10.699 126.778 Nagpur28 ■ RT 1,609 6.456 , 33.479 116.679 BHaiSdara29 821 3.294 15.856 109.613 Chandrapur30 414 1.661 19.64? 108.377 Gadchiroli
24,923 100.000 . 12,457 125.626 Maharashtra State
STTETTT ;— ITRT'SE STRt'T,Source :—Directorate of Agriculture, Government of Maharashtra, Pune.
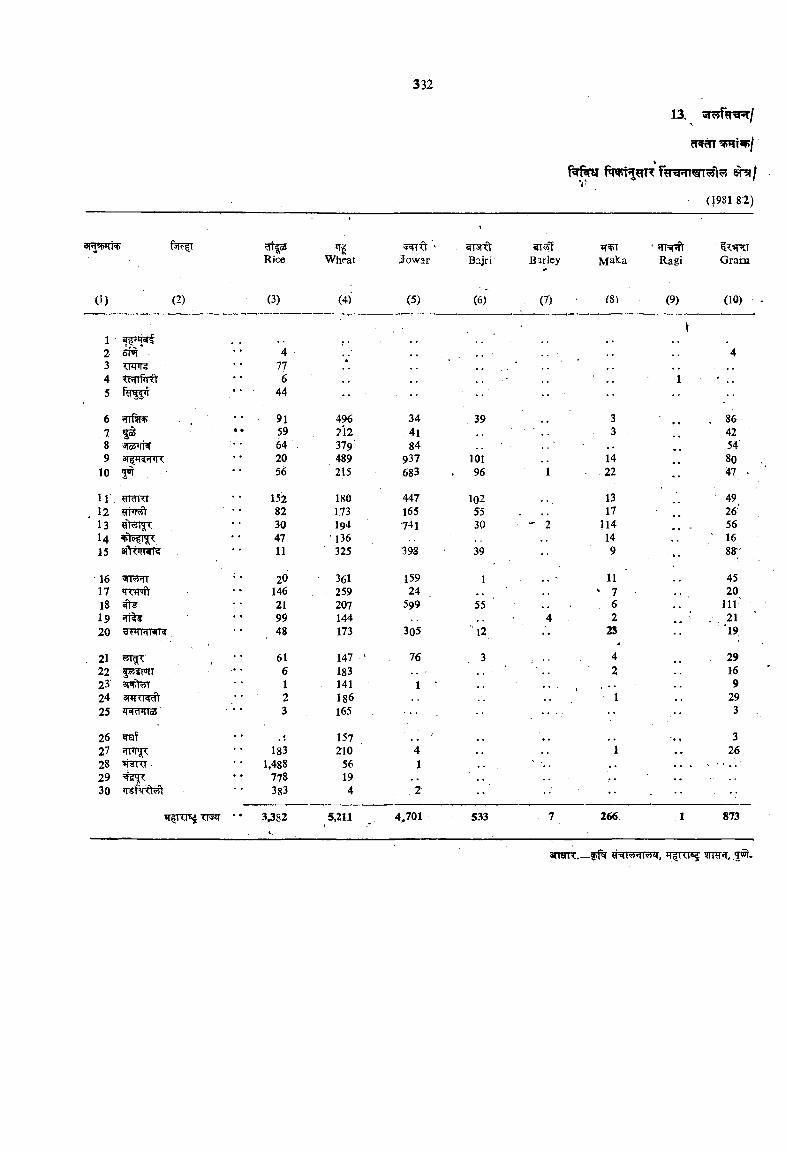
**' ,
(|981 82)
oiW)*ii't) r-»t<r lRice Wheat iJowar
- «tN<l Bajri Barley
tT TMalta Ragi Gram
0) (2) (3) (4) (5) (6) . (7) rs) (9) (10)
12345
5m<W<1'€ • •<HiniO
4776
44
;■1
4
678 9
10
Hinii+
o4»(l<
915964 , 20 56
496212379489215
344i84
937683
. 39
101. 96
•• 33
1422
•• . 86 42 54’ 8047 -50T 1
• *
n12131415
IdKI
aftt IRTS
15282304711
180 173 194 136
■ 325
447165741
398
1025530
39
' 2
13 17
11414 9
. . -
4926'561688'-
1617181920
'vifl l 20146219948
- 361 259207144173
159 24 .
599
305
1
55 '
124
11 ' 7
6 2
23. .
45 20
in ' . 21
'19
212223'2425
|;?5 |U|T3»--f?t-«TSTiHBRft * ' q dHIoS
616123
147 ’ 183
. 141 186 165
76
1
3
••
42
1 ' ••
29169
293
2627282930
ifFP^ • • V I T-
«183
1,488778383
157210
56194
41
2
•• 1 . . .
326
* * 3,382 5,211 4,701 533 7 266 1 873
3TTOTC__^ #^T5y?n^, TT RTS? 9mr , 2 # .
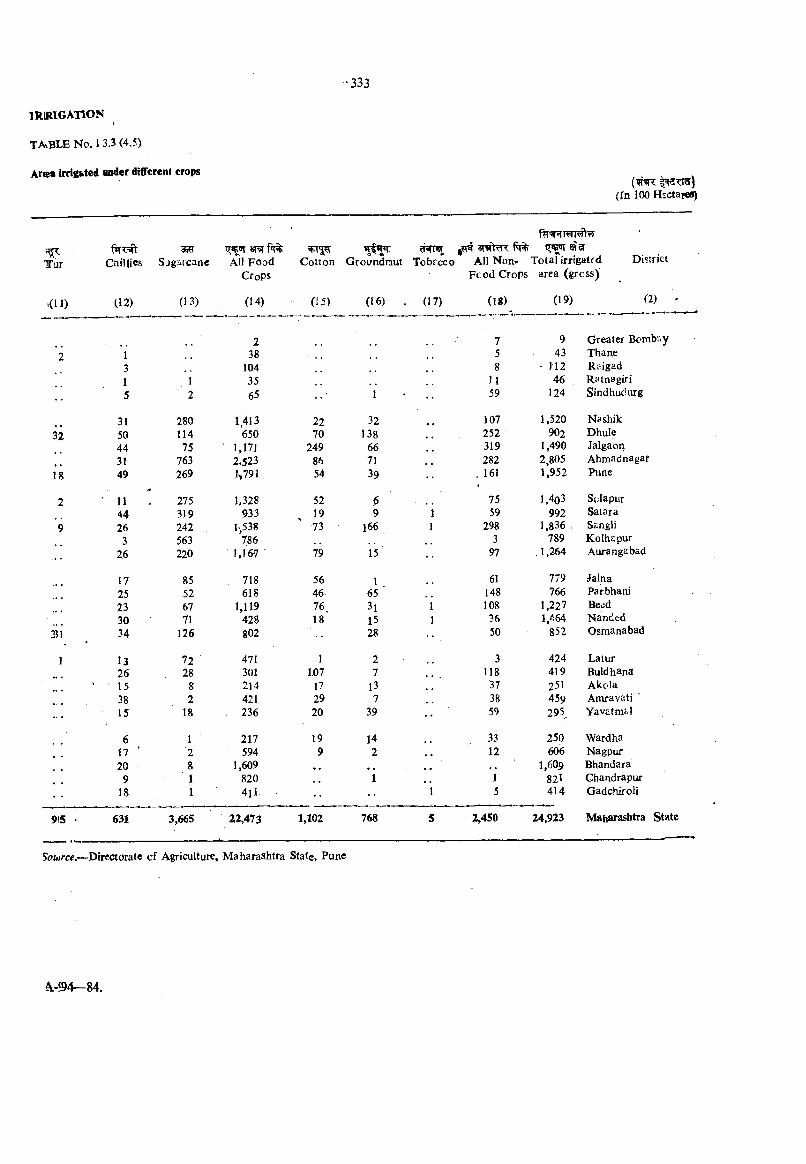
IRlRlGAltON
Area irrig&ted ander different crops
TTur
<U)
(ijnsnc (In 100 Hectafes)
Chillies
(12)
35Sjgatcanc
(13)
3RT fBT% All Food
Crops
(14)
Cotton
(15)
gifra fq%Groundmut Tobrcco All Non-- Total irrigated
Feed Crops area (gross)
(16) (17) (18) (19)
District
(2)
2 7 9 Greater Boinbay2 1 38 5 43 Thane
3 104 8 • 112 • Raigad1 1 35 11 46 Ratnagiri5 2 65 1 • 59 124 Sindhudurg
31 280 1,413 22 32 107 1,520 Nashik32 50 114 650 70 138 252 902 Dhule
44 75 1,171 249 66 319 1,490 Jalgaon31 763 2,523 86 71 282 2,805 Ahmadnagaf
18 49 269 1>791 54 39 , 161 1,952 Pune
2 11 275 1,328 52 75 1.403 Solapur44 319 933 19 9 1 59 992 Satara
9 26 242 l',53g 73 166 1 298 1.836 . Sangli3 563 786 3 789 Kolhspur
26 220 ■ 1,167 ■ 79 15 97 . 1,264 Aurangabad
17 85 , 718 56 1 61 779 Jalna25 52 618 46 65 148 766 Parbhani23 67 1,119 76. 3l 1 108 1,227 Becd30 71 428 18 15 1 36 1,464 Nanded
31 34 126 g02 28 50 852 Osmanabad
1 13 72 471 1 2 3 424 Latur26 28 301 1.07 7 118 419 Buld hana
' 15 8 214 17 13 37 251 Akola38 2 421 29 7 38 459 Amravati15 18 . 236 20 39 •• 59 295 Yavatmi 1
6 1 217 19 14 33 250 Wardha17 ' 2 594 9 2 12 606 Nagpur20 8 1,609 . . ' • • 1,609 Bhandara
9 1 820 1 1 82l Chandrapur18 1 4 il •• 1 5 414 Gadchiioli
9'5 > 631 3,665 22,473 1,102 768 5 2,450 24,923 Maharashtra State
SoiMrctf.—Directorate cf Agriculture, Maharashtra State, Pune
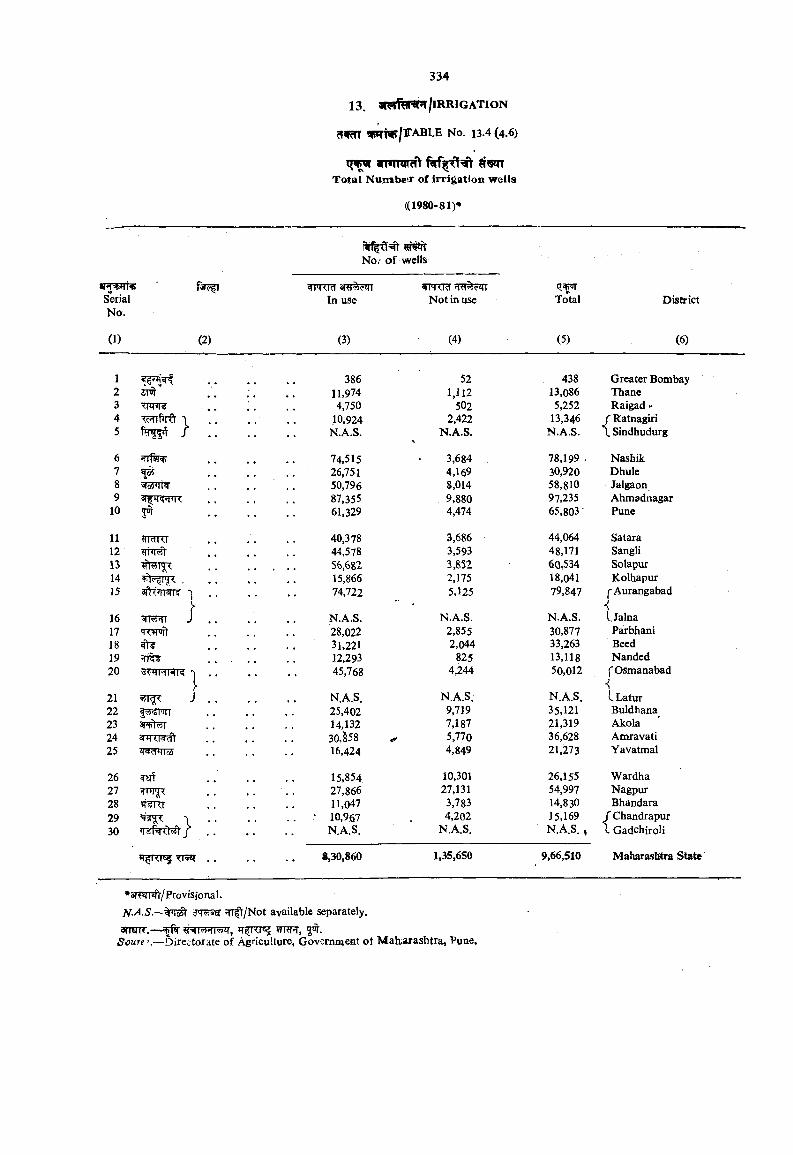
334
13. iFSfW^/lRRIGATlON
?|5ITtv/TABLE No. 13.4 (4.6)
Total Numbeir of irrigation w ells
((1980-81)»
(2)
mNo.- o f wells
. Not in use
(4)
To*tal
(5)
District
(6)
SerialNo.
(1)
4i>n,Td In use
(3)
1 386 52 438 Greater Bombay2 11,974 1,U2 13,086 Thane3 4,750 502 5,252 Raigad»4 10,924 2,422 13,346 r Ratnagiri5 N.A.S. N.A.S. N.A.S. L Sindhudurg
6 74,515 3,684 78,199 . Nashik7 26,751 4,169 30,920 Dhule8 50,796 8,014 58,810 Jalgaon9 87,355 9,880 97,235 Ahmadnagar
10 61,329 4,474 65,803 Pune
11 IdKr 40,378 3,686 44,064 Satara12 44,578 3,593 48,171 Sangli13 56,6S2 3,852 60,534 Solapur14 15,866 2,175 18,041 Kolhapur15 3n<J|Nic; 1 74,722 5,125 79,847 pAurangabad
16 N.A.S. N.A.S. N.A.S. tJalna17 28,022 2,855 30,877 Parbhani18 ^ . . 31,221 2,044 33,263 Beed19 12,293 825 13,118 Nanded20 45,768 4,244 50,012 f Osmanabad
J21
rJ . , N.A.S. N.A.S. N.A.S, I Latur
22 f5ysi'Jii 25,402 9,719 35,121 Buldhana23 14,132 7,187 21,319 Akola24 3nTTR?ft 30,§58 5,770 36,628 Amravati25 16,424 4,849 21,273 Yavatmal
26 srf 15,854 10,301 26,155 Wardha27 27,866 27,131 54,997 Nagpur28 M IU 11,047 3,783 14,830 Bhandara29 \ . . ‘ 10,967 4,202 15,169 / Chandrapur30 N.A.S. N.A.S. N.A.S. ^ \ Gadchiroli
• 8,30,860 1,35,650 9,66,510 Maharashtra State
*3?TqTsf)'/Provisional.AT. .5'.—%J]o5t JTT t/Not available separately,amnr.— ^ ?mnT, 3^.
Soure ’.—Directorate of Agriculture, Government ot Mabarashtra, Pune.
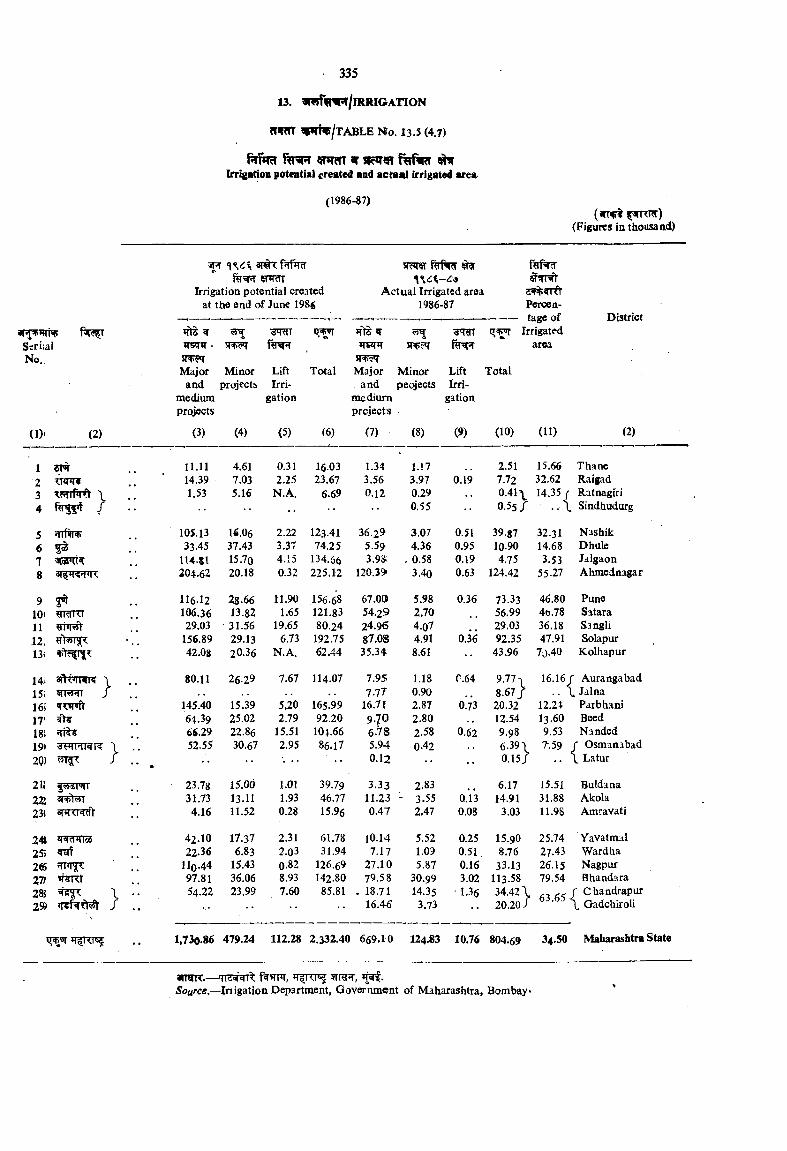
335
13. inrffllR/lRRIGATION
W?nf o t i s / t a b l e N o . 13.5 (4.7)
?rom ITIrrigation potratlal created aad actaal irrigated area
(1986-87)(irrvt
(Figures ia thoimnd)
iprvimvSsriialNo.,
(1)' (2)
5R '\%6%5FRTr
Irrigation potential created at the end of June 1986
*fts JTSqTT-
Major
mediumprojects
snr?T
Minorprojects
(3) (4)
^3W
LiftIrri
gation
(5)
Total
(6)
5ic*rar %fT?T ^
Actual Irrigated area 1986-87
jfts
SRTMajor Minor
and peojects medium projects
f%?r
LiftIrri
gation
shTT^
Perce a---------- tage of
Irrigatedarea
Total
(7) (8) (9) (10) (11)
District
(2)
1 2 ^ 11.11 4.61 0.31 16.03 1.34 l.!7 2.51 15.66 Thane2 14.39 7.03 2.25 23.67 3.56 3.97 0.19 7.72 32.62 Raigad3 \ 1.53 5.16 N.A. 6.69 0.12 0.29 0.41 \ 14.35 / Ratnagiri4 / •• •• •• 0.55 0.55/ . . i Sindhudurg
5 105.13 16.06 2.22 123.41 36.29 3.07 0.51 39.87 32.31 Nashik6 fS 33.45 37.43 3.37 74.25 5.59 4.36 0.95 10.90 14.68 Dhule7 lU -Sl 15.70 4.15 134.66 3.98: . 0.58 0.19 475 3.53 Jdlgaon8 204.62 20.18 0.32 225.12 120.3^ 3.40 0.63 124.42 55.27 Ahmednagar
9 3^ 116.12 28.66 11.90 156.68 67.00 5.98 0.36 73.33 46.80 Pune10) ?rtdi<r 106.36 13.82 1.65 121.83 54.29 2.70 56.99 4578 Satara11 29.03 31.56 19.65 80.24 24.96 4.07 . . 29.03 36.18 Sangli12; 156.89 29.13 6.73 192.75 87.08 4.91 0.36 92.35 47.91 Solapur13i 42.08 20.36 N.A. 62.44 35.34 8.61 43.96 70.40 Kolhapur
14i aftWFfK L •• 80.11 26.29 7.67 114.07 7.95 1.18 r.64 9.77 16.16 f Aurangabad15: 5n?y?rr J> 1.17 0.90 8 .6 7 / \ Jalna16i *rw>ft 145.40 15.39 5,20 165.99 16.71 2.87 0.73 20.32 12.24 Paibhani17' 64.39 25.02 2.79 92.20 9.70 2.80 . , 12.54 13.60 Heed18i 66.29 22.86 15.51 104.66 6.^8 2.58 0.62 9.98 9.53 Nanded19) 52.55 30.67 2.95 86.17 5.94 0.42 6 .39 \ 7.59 j" Osmanabad2Q) / . . « •• 0.12 • V 0.15 / •• \ Latur
211 23.78 15.00 1.01 39.79 3.33 2.83 6.17 15.51 Buidana22 31.73 13.11 1.93 46.77 11.23 - 3.55 Q.1’3 14.91 31.88 Akola235 4.16 11.52 0.28 15.96 0.47 2.47 0.08 3.03 11.9S Amravati
2 4 42.10 17.37 2.31 61.78 10.14 5.52 0.25 15.90 25.74 Yavatmal255 22.36 6.83 2.03 31.94 7.17 1.09 0.51 876 27.43. Wardha2(8 II0.44 15.43 0.82 126.69 27.10 5.87 0.16 33.13 26.15 Nagpur277 97.81 36.06 8.93 142.80 79.58 30.99 3.02 113.58 79.54 Bhandara285 \ •• 54.22 23.99 7.60 85.81 . 1871 14.35 1.36 34,421 J Chandrapur2© / . . ■ 16.46 3.73 •• 20.20/ Oj .Oj \ Gadchiroli
•• 1,730.86 479.24 112.28 2.332.40 669.10 124.83 10.76 804.69 34.50 Maharashtra
aiTOR.—Source.—Inigation Department, Government of Maharashtra, Bombay*

3TTf^ 14. ANIMAL HUSBANDRY AND DAIRYING
^C^A- ^ r ^ J T T ^ c m r » r ^ Twar r^ JT i% f^ift S T T ^ t^ 't 3T.T|.
sr TR% w ^ srr rrsrrt- (Goncepts) ^ t o t t
m j q ^ ifM ^ w* n » r^ q^yvfi^ if^ ^nrflcft sr ? ^ ?ii3n'
q ^ , srnin^^^ i m r
14.1. Data on Livestock Census, Veterinary facilities provided and slaughterhouses are given in the tables in this section.
14,2i The data on number of livestock and poultry presented is as enumerated in the State at the time- of 1987 Livestock Censuses. These are quin<^uennial censuses conducted throughout the country on the basis of uniform concepts and method of enumeration. At these censuses all the livestock is enumerated by house to house enquiry. Particular care is taken to enumerate livestock in the slaughter homes, stray animals and animals in transit.
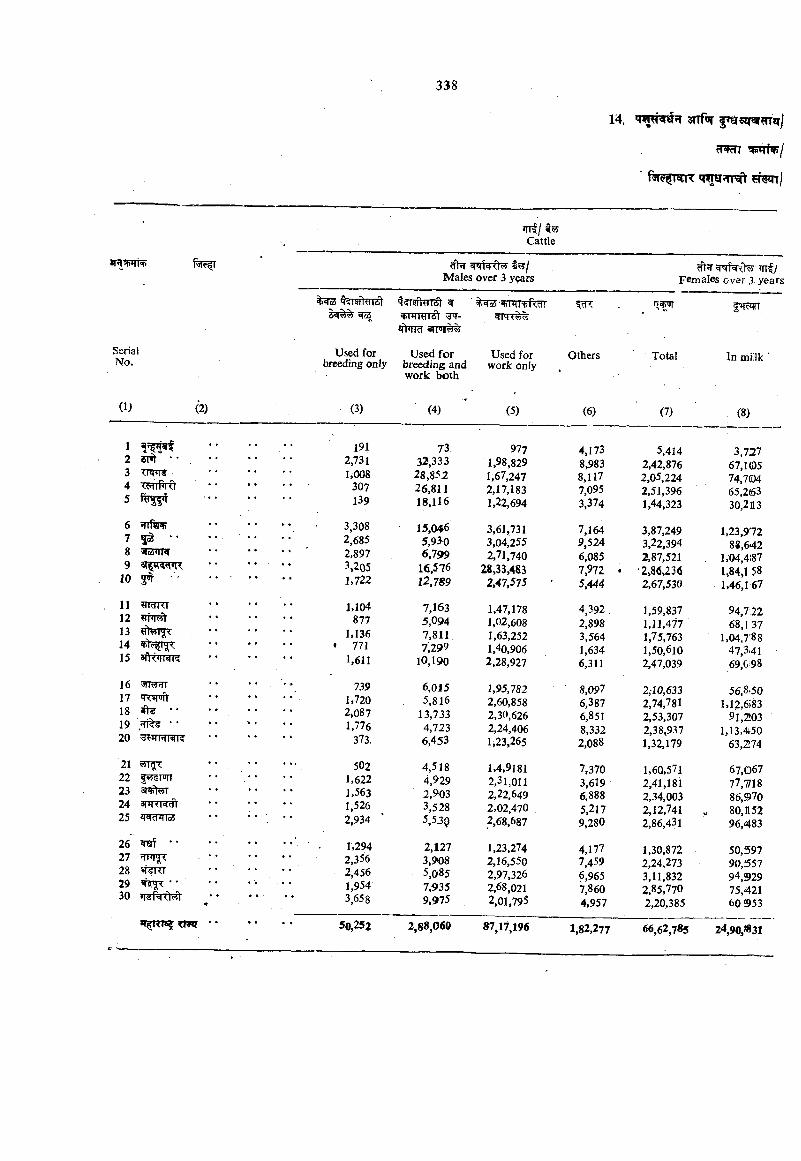
' f^5^KT< m t n j
m i/Cattle
SPI STtS? cfhrMales over 3 y^rs
SerialNo.
5 %% c|q6
Used for breeding only
1*1 W
*rt^ srpji^
Used for breeding and work both
Used for work only
W '
Others
TrrfyFemales over 3 years
Total In mivlk '
(1)
12 5T» ■ *34 -- rs
TcHIHKr5
67 ^ "89
10 3^
11 IdKI12131415
161718 ^ • •1920
2122 lesion23 3?!iitrtT2425
26 'rot ’ *2728 W>KF2930
V
(2) (3) (4) (5) (6) (7) (8)
’T KI«5 TWJ
191 73. 977 4,173 5,414 3,7272,731 32,333 1,98,829 8,983 2,42,876 67,1051,008 28,852 1,67,247 8,117 2,05,224 74,7(04
307 26,811 2,17,183 7,095 2,51,396 65.263139 18,116 1,22,694 3,374 1,44,323 30,2fl3
3,308 15,046 3,61,731 7,164 3,87,249 1,23,9722,685 5,93 0 3,04,255 9,524 3,22,394 88,6422,897 6,799 2,71,740 6,085 2,87,521 1,04,41873»205 16,576 28,33,483 7,972 ♦ ■2,86,236 1,84,1 581,722 12.789 2,47,575 5,444 2,67,530 1,46,1 67
1,104 7,163 1,47,178 4,392. 1,59,837 94,7:22877 5,094 1,02,608 2,898 1,11,477 68,137
1,136 7,811 1,63,252 3,564 1,75,763 1.04,7'88♦ 771 7,299 1,40,906 1,634 1,50,610 47,3-41
1,611 10,190 2,28,927 6,311 2,47,039 69,C98
739 6,015 1,95,782 8,097 2ilO,633 56,8-501,720 5,816 2,60,858 6,387 2,74,781 l,12,6i832,087 13,733 2,30,626 6,851 2,53,307 91,21031,776 4,723 2,24,406 8,332 2,38,937 1,13,450
373. 6,453 1,23,265 2,088 1,32,179 63,2>74
502 4,518 1,4,9181 7 370 1,60,571 67,0671,622 4,929 2,31,011 3,619 2,41,181 77,77181,563 2,903 2,22.649 6,888 2,34,003 86,9701,526 3,528 2,02,470 5,217 2,12,741 80,11522,934 ’ 5.53Q 2,68,687 9,280 2,86,431 96,483
1,294 2,127 1,23,274 4,177 1,30,872 50,5972,356 3,9-08 2,16,550 7,459 2,24,273 90,5572,456 5,085 2,97,326 6,965 3,11,832 94,9291,954 7,935 2,68.021 7,860 2,85,770 75,4213,658 9.975 2,01,795 4,957 2,20,385 60 953
50,252 2,88,060 87,17,196 1,82,277 66,62,785 24,90,«31
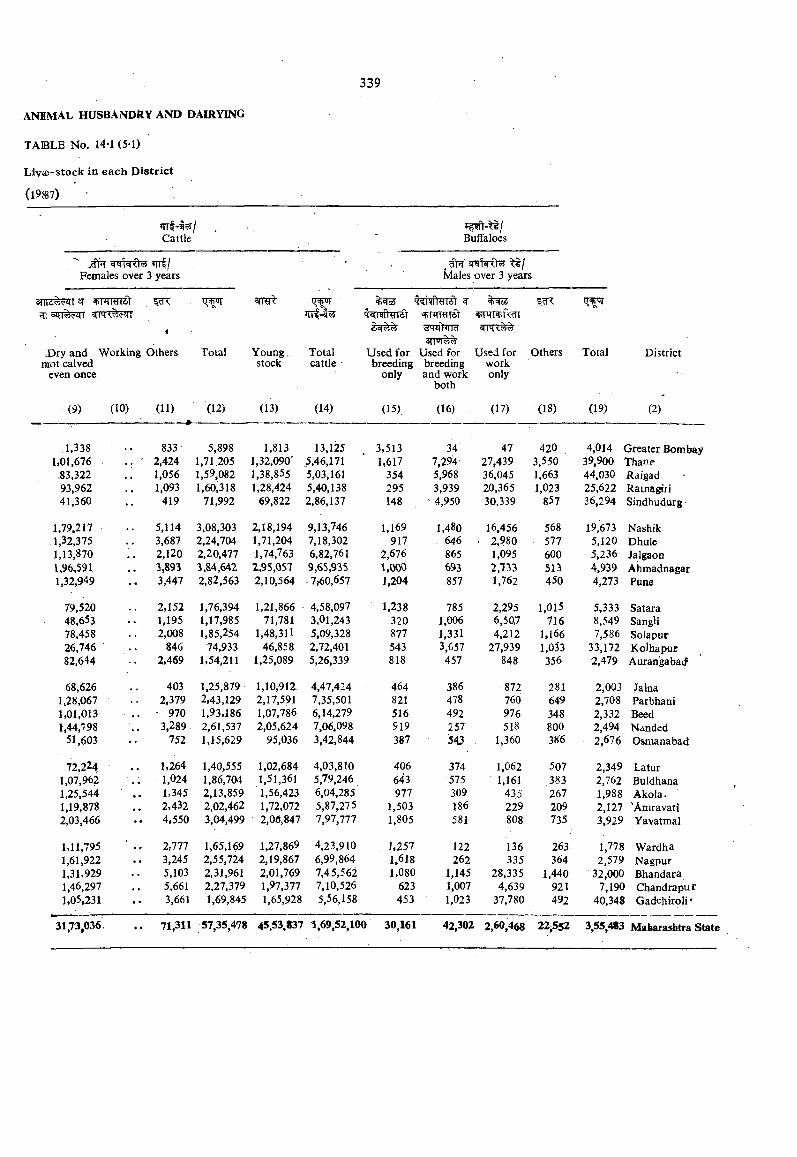
ANHMAL h u s b a n d r y AND DAIRYING
TABLE No. 14-1 (5-1)
Liv<e-stock in each District
(l9ffi7)
Cattle Buffaloes
Females over 3 years, ?ft?r =1Nlales over 3 years
jDry and Working Others Total mot calved
even once
(9)
Young, Totalstock cattle
q iwhErret f T Twhrrst nTRTTsr
Used for Used for Used for Others Total breeding breeding work
only and work onlyboth
(10) (11) (12) (13) (14) (15) (16) (17) (18) (19)
District
(2)
1,3381.01,676
.83,32293,96241,360
833 5,898 1,813 13,125 . 3,513 34 47 420 4,014 Greater Bombay2,424 1,71 205 1,32,090' ,M6,171 ' 1,617 7,294 27,439 3,550 39,900 Thane1,056 1,59,082 1,38,855 5,03,161 354 5,968 36,045 1,663 44,030 Raigad1,093 1,60,318 1,28,424 5,40,138 295 3,939 20,365 1,023 25,622 Ramagiri
419 71,992 69,822 2,86,137 148 4,950 30,339 85? 36,294 Sindhudurg
1,79,217 5,114 3,08,303 2,18,194 9,13,746 1,169 1,480 16,456 568 19,673 Nashik.1,32,375 3,687 2,24,704 1,71,204 7,18,302 917 646 . 2,980 577 5,120 Dhule1,13,870 2,120 2,20,477 1,74,763 6,82,761 2,676 865 1,095 600 5,236 JalgaonU96,59l , * 3,893 3,84,642 2,95,057 9,65,935 i,ooo 693 2,733 513 4,939 Ahmadnagar1,32,949 •• 3,447 2,82,563 2,10,564 7f60,657 1,204 857 1,762 450 4,273 Pune
79,520 2,152 1,76,394 1,21,866 4,58,097 1.238 785 2,295 1,015 5,333 Satara48,653 1,195 1,17,985 71,781 3,01,243 320 1,006 6,50,7 716 8,549 Sangli78,458 2,008 1,85,254 1,48,311 5,09,328 877 1,331 4,212 1.166 7,586 Solapur26,746 846 74,933 46,858 2,72,401 543 3,657 27,939 1,033 33,172 Kolhapur82.644 2.469 1,54,211 1,25,089 5,26,339 818 457 848 356 2,479 Aurangaba<f
68,626 403 1,25,879 1,10,912 4,47,424 464 386 872 281 2,003 Jalna1,28,067 2,379 2,43,129 2,17,591 7,35,501 821 478 760 649 2,708, Parbhani1,01,013 ,. - 970 1,93.186 1,07,786 6,14,279 516 492 976 348 2,332 Seedt,44,'98 3,289 2,61,537 2,05,624 7,06,098 919 257 518 800 2,494 Nanded
51,603 •• 752 1,15,629 95,036 3,42,844 387 ■543 . 1,360 386 2,676 Osnianabad
72,224 1.264 1,40,555 1,02,684 4,03,810 406 374 1,062 507 2,349 Latur1,07,962 , , 1,024 1,86,704 1,51,361 5,79,246 643 575 1,161 383 2,762 Buldhana1,25,544 ,, 1,345 2,13,859 1,56,423 6,04,285 977 309 435 267 1,988 Akola.1,19,878 •. 2,432 2,02,462 1,72,072 5,87,275 1,503 186 229 209 2,127 'Amravati2,03,466 •• 4,550 3,04,499 2,06,847 7,97,777 1,805 581 808 735 3,929 Yavatmal
1.11,795 2,777 1,65,169 1,27,869 4,23,910 1,257 122 136 263 1,778 Wardha1,61,922 • • 3,245 2,55,724 2,19,867 6,99,864 1,618 262 335 364 2,579 Nagpur1,31,929 5,103 2,31,961 2,01,769 7,45,562 1,080 1,145 28,335 1,440 32,000 Bhandara1,46,297 , , 5,661 2,27,379 1,97,377 7,10,526 623 1,007 4,639 921 7,190 Chandrapur1,05,231 •• 3,661 1,69,845 1,65,928 5,56,158 453 1,023 37,780 492 40,348 Gadchiroli •
31,73,0.16 •V 71,311 57,35,478 45,53,837 1,69,52,100 30,161 42,302 2,60,466 22,552 3,55,483 Maharashtra State
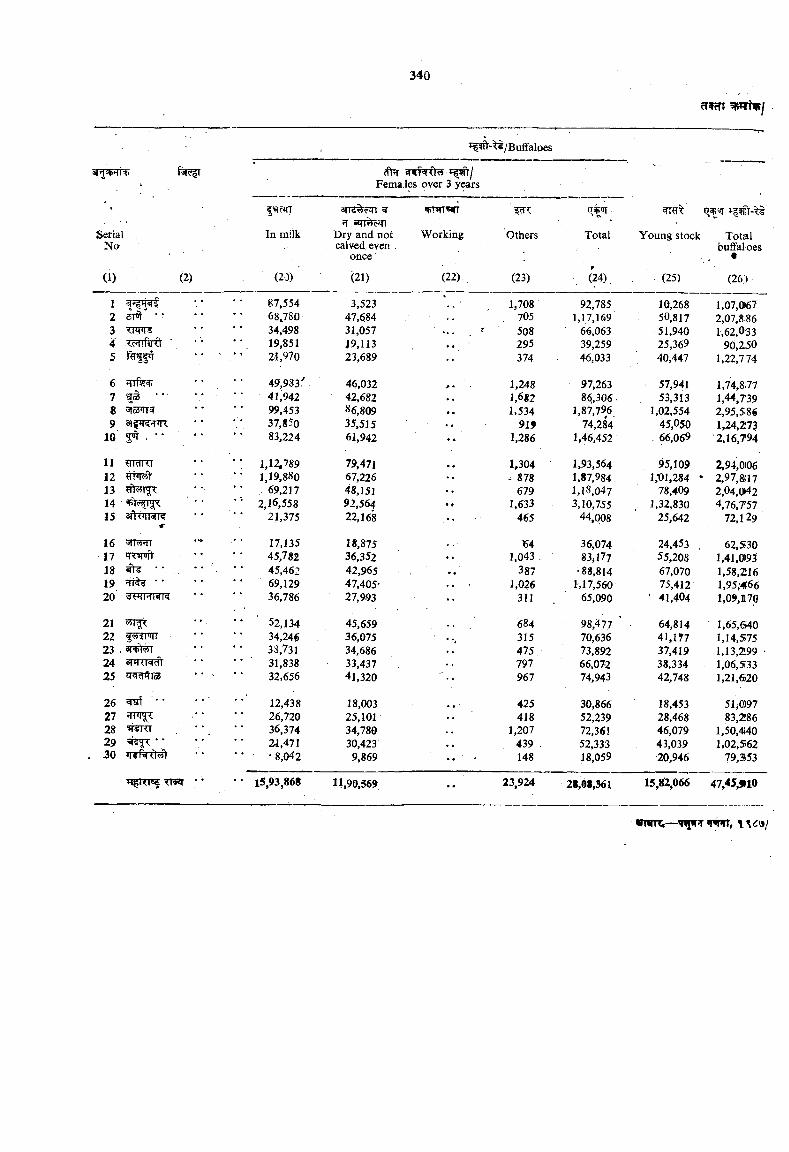
SerialNo
ft?r W wttw 1 ^ / Femaies over 3 years
In milkiT •MIwq’
Dry and not calved even .
once
rmrarr
Working Others
tTipoT
Total Young Stock Totalbuffaloes
(1) (2) (20) (21) (22)^ (23) (24), (25) (26)
1 87,554 3,523 *1,708 92,785 10,268 1,07,0'67
2 . $T ' ■ 6SJ80 47,684 705 1,17,169 50,817 2,07,8863 34,498 31,057 508 66,063 51,940 1,62,0334 19,851 19,113 , , 295 39,259 25,369 90,2505 24,970 23,689 374 4€,033 40,447 1,22,7 74
6 Hiryi+ 49,983' 46,032 * • 1,248 97,263 ’ 57,941 1,74,8:777 g s •• ' ■ 41,942 42,682 . . 1,6*2 8^,306 53,313 1,44,7398 99,453 86,809 . . 1,534 1,87,796 1,02,554 2,95,5869 3ipiiriJi< 37,850 35.515 919 74,284 45,050 1,24,273
10 5^ . ’ • ' * 83.224 61,942 •• 1,286 1,46,452 66,069 2,16,794
11 •• 1,12,789 79,471 , , 1,304 1,93,564 95,109 2,94,0(0612 • • 1,19,880 67,226 - 878 1.87,984 l,m ,284 • 2,97,811713 " 69,217 48,151 679 1,18,047 78,409 2,04,04214 2,16,558 92,564 1,633 3,10,755 1,32,830 4,76,75715 afttinirR 21,375 22,168 •• . ' 465 44,008 25,642 72,129
16 17,135 18,875 64 36,074 24,453 . 62,53017 ' R ^ 45,782 36,352 .. 1,043 83,177 55,208 1,41,09318 ^ " •• • 45,462 42,965 .. 387 •88,814 67,070 1,58,21619 * • 69,129 47,405- .. 1,026 1,17,560 75,412 1,95,-46620 36,786 27,993 •• 311 65,090 ' 41,404 1,09,1170
21 52,134 45,659 684 98,477 ’ 64,814 1,65,64022 •' 34,246 . 36,075 ’ . 315 70,636 41,177 1,14,57523 . 38,731 34,686 475 73,892 37,419 1,13,29924 3TH<HdY 31,838 33,437 797 66,072 38,334 1,06,53325 iT^WoS * • ' 32,656 41,320 967 74,943 42,748 1,21,620
26 * • 12,438 18,003 . . . 425 30,866 18,453 51i0)9727 26,720 25,101 .. 418 52,239 28,468 83,28628 36,374 34,780 1,207 72,36! 46,079 1,50,44029 2J,47I 30,423 439 . 52,333 43,039 1,02,56230 • ' • 8,042 9,869 148 18,059 20,946 79,353
TRflT • * • * 15,93,868 11,90,569 •* 23,924 28,08,361 15,82,066 47,45,J»10
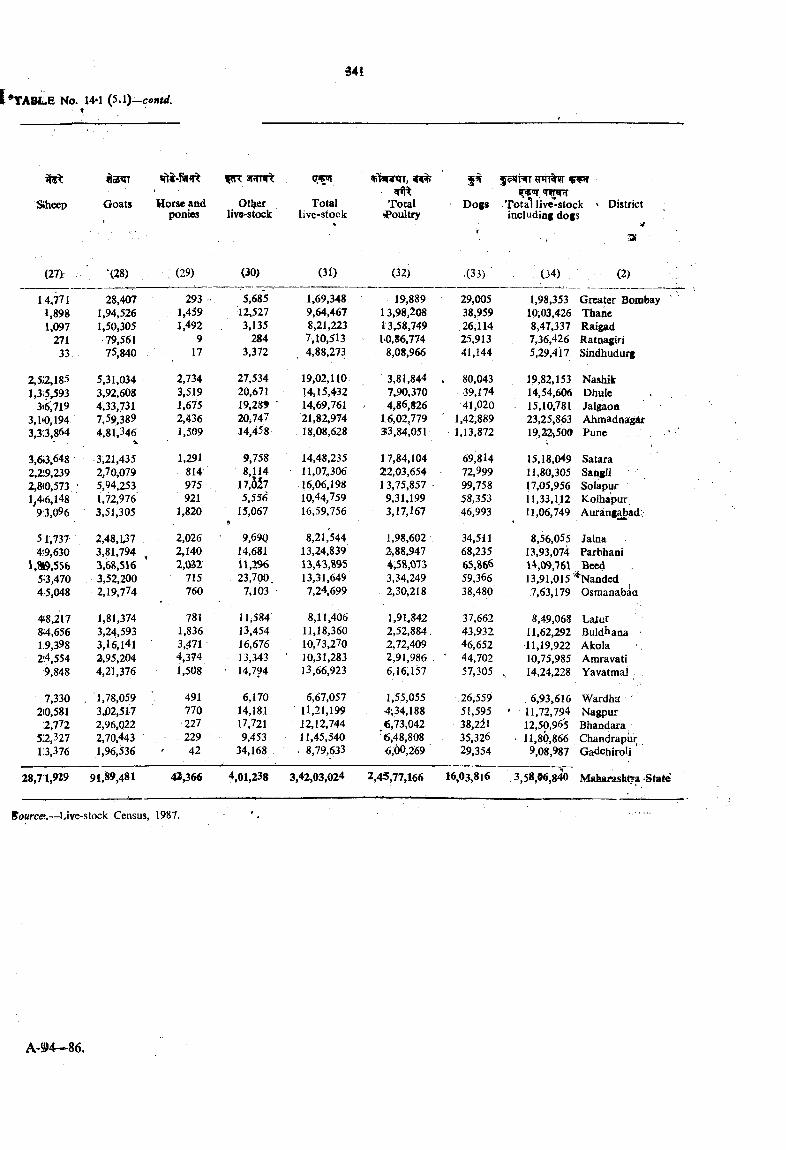
Stheep Goats
f?n: 3Frrar
Horse and ponies
Otljerlive-stock
cr^
Totallive-stock
ar»iTotal
•Poultry
5^ f ? tan ?PTT%?r
Dogs Total live-stock includinj dogs
District
(27> (28) : (29) (30) (31) (32) •(33) (34) (2)
14,771 28,407 293 = 5,685 1,69,348 19,889 29,005 1,98,353 Greater Bombay1,898 1,94,526 1,459 12,527 9,64,467 13,98,208 38,959 10,03,426 Thane1,097 1,50,305 1,492 3,135 8,21,223 13,58,749 26,114 8,47,337 Raigad
271 79,561 9 284 7,10,513 10,86,774 25,913 7,36,426 Ratnagiri33 75,840 , 17 3,372 . 4,88,273 8,08,966 41,144 5,29,417 Sindhudurg
2,512,185 5,31,034 2,734 27,534 19,02,110 3,81,844 . 80,043 19,82,153 Nashikl,3i5,593 3,92,608 3,519 20,671 14,15,432 7,90,370 39,174 14,54,606 Dhule
3.6,719 4,33,731 1,675 19,289 • 14,69,761 4,86,826 41,020 15,10,781 Jalgaon3,1*0.194 7,59,389 2,436 20J47 21,82,974 16,02,779 1.42,889 23,25,863 Ahmadoagdt3,3:3,864 4,81,346
•1.1,509 14,458 18,08,628 33,84,051 1,13,872 19,22v500 Pune , • ‘
3,6;3,64« 3,21,435 1,291 9,758 14,48,235 17,84,104 69^814 15,18,049 Satara2,2:9,239 2,70,079 814 8,114 11,07,306 22,03,654 72,999 11,80,305 Sangli2,8(0,573 ■ 5,94,253 975 , 17,b h 16,06,198 13,75,857 99,758 17,05,956 Solapur1 4*6,148 1,72,976' 921 5,556 10,44,759 9,31,199 58,353 11,33,1.12 Kolhapur
93,096 3,51,305 1,820 15,067 16,59,756 3,17,167 ,46,993 11,06,749 Aurang^ad :
5 1,737 2,48,137 2,026 9,690 8,21,544 1,98,602 34,511 8,56,055 Jalna4!9,630 3,81,794 2,140 14,681 13,24,839 3,88,947 68,235 13,93,074 Parbhani
\,W ,5SS 3,68,516 ' 2 , m H,2% 13,43,895 4,5S,073 65,866 14,09,761 Beed5*’3,470 3,52,200 715 . 23,700. 13,31,649 3,34,249 59,366 13,91,015‘%anded45,048 2,19,774 760 7,103 • 7,24,699 2,30,218 38,480 7,63,179 Osnianabaa
48,217 1,81,374 781 11,584 8,11,406 1,9M42 37,662 8,49,068 Laiur8i4,656 3,24,593 1,836 13,454 11,18,360 2,52,884. 43,932 11,62,292 Buldhana1 9,398 3,16,141 3,471 16,676 10,73,270 2,72,409 46,652 11,19,922 Akola2'4,554 3,95,204 4,374 13,343 ■ 10,31,283 2,91,986 . 44,702 10,75,985 Amravati
9,848 4,21,376 1,508 ■ 14,794 13,66,923 6,16,157 57,305 , 14,24,228 Yavatmal
7,330 , 1,78,059 491 6,170 6,67,057 1,55,055 .26,559 6,93,616 Wardha!2(0,581 3J52,51-7 770 14,181 11,21,199 4;34,188 51,595 ' 11,72,794 Nagpur:2,772 2,96,022 227 17,721 12,12,744 6,73,042 38,2il 12,50,965 Bhandara
5 '2 ,m 2,70,443 • 229 9,453 11,45,540 *6,48,808 35,326 • 11,80,866 Chandrapur13,376 1,96,536 ' 42 34,168 . 8,79,633 6,00,269 29,354 9,08,987 Gadchiroli ' '
28,71,929 91,89,481 42,366 4,01,238 3,42,03,024 2,45,77,166 16,03,816 3,58,96,840 Mafaarashtra State
Eource.—Live-stock Census, 1987.
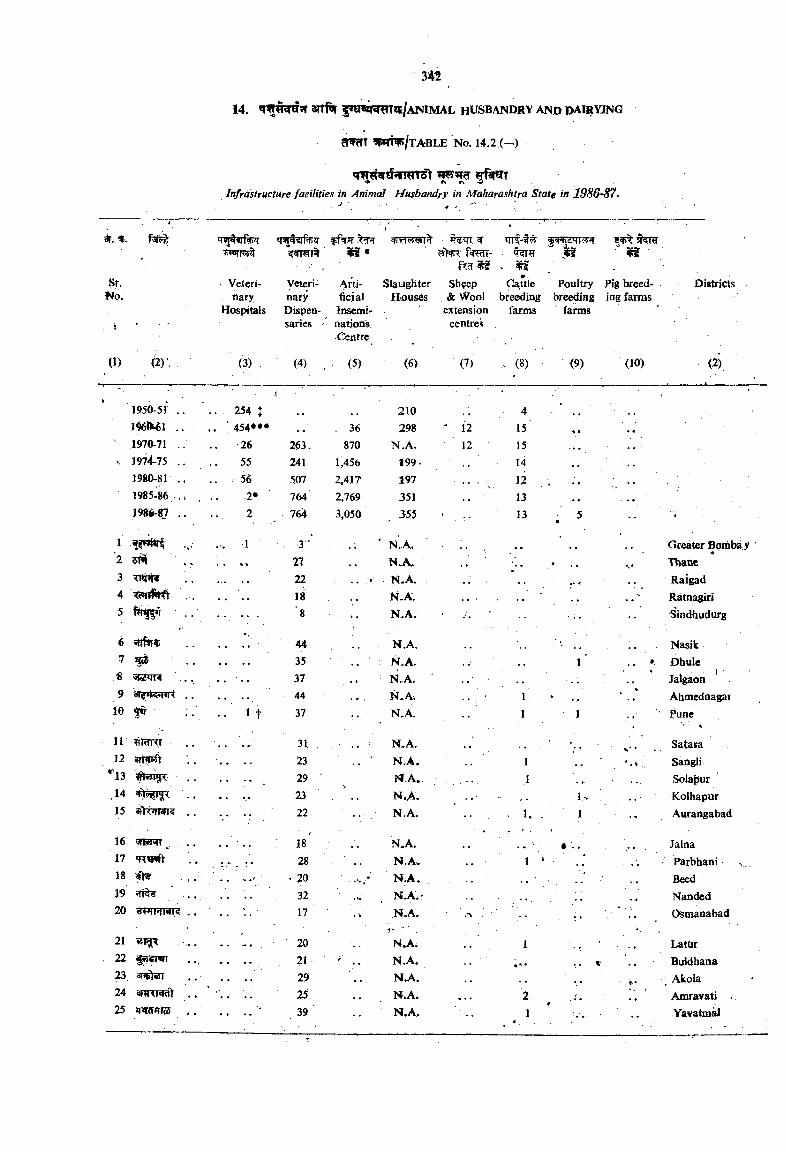
14. |»a«^ T lt/A N IM A L HUSBANDRY AND DAIRYING
er^T w ^ / t a b l e n o . 14.2 (—)
Infrastructure facilities in Animal Husbandry in Maharashtra State in 1986~87.
Sr.i4o.
ipT|-?rPf>ir fBr*r <«i w 1% ^ •
¥ ’irf-w# a'?Rr^ ^
■ ■ , ■ ^ /Veteri- Veteri- Arti- Slaughter Sh^p Ca.rtle Poultry Pig breed- Districtsnary nary ficial Houses & Wool breeding breeding ing farms
Hospitals Dispen- Insemi- extension farms farmssaries ' nations centres
Centre
(10)0 ) P ) '. (3) (4) . • (5) (6) (7) . (8) (9)
V1950-51 ..
.1. . 254 t 210 4 •
lf566M51 .. . . ■ 454**« . 36 298 ' 12 15' \ •1970-71 . . . 26 2<53. 870 N.A. 12 15 • • •
... 1974-75 .. 55 241 1,456 199. 141980-81 .. .. 56 507 2,417 197 12 *1985-86 2* 764 2,769 351 i . 13198#-^ ,. . . 2 . 764 3,050 . 355 ' . .. 13 5
1 -1 ' .. -3'‘ ' N..A.'2 . . 27 N.A. .3 22 - N .A. .. . ..4 • • • • 18 K.A.5 . . .. 8 • N.A. • ••
6 44 N.A.7 ^ . . . . 35 . * N.A. 1 '« . . . . 37 . i N.A. . •9 , . . . . . 44 . • . N.A. 1 • -»
IG . . I t 37 N.A. •• 1 1
n ^nntr 31 N.A. '■ ■ \ .
12 23 N .A . 1> 1 3 29 M.A. 1
.14 23 N .A . 1>15 8iht*rfiiT5 . . 22 ■ N.A. • 1. 1
16 18 N.A.17 28 • • N.A* 118 • 20 . . . . N A .19 32 .t. N .A .'20 3'fHHWK 17 . ’fc* ,N.A. ••
21 ^ ... * • • ■ 20I" .
N.A. 1. 22 ip«FT •• 21 N.A. *•• • - -
23, . . 29 n j i . . .
24 25 N J i. . . . 225 39 •V N.A, 1
V* • * • \
Greater Bomba y ^ ■ThaneRaigadRatnagiriSindfaudurg
NasikDhulcJalgaonAhmednagaiPune
t
SatacaSangliSolajJurKolhapurAurangabad
JalnaParbhaniBeedNandedOsmanabad
LatUr Buldbaha
; Akola Amravati Yavatmal
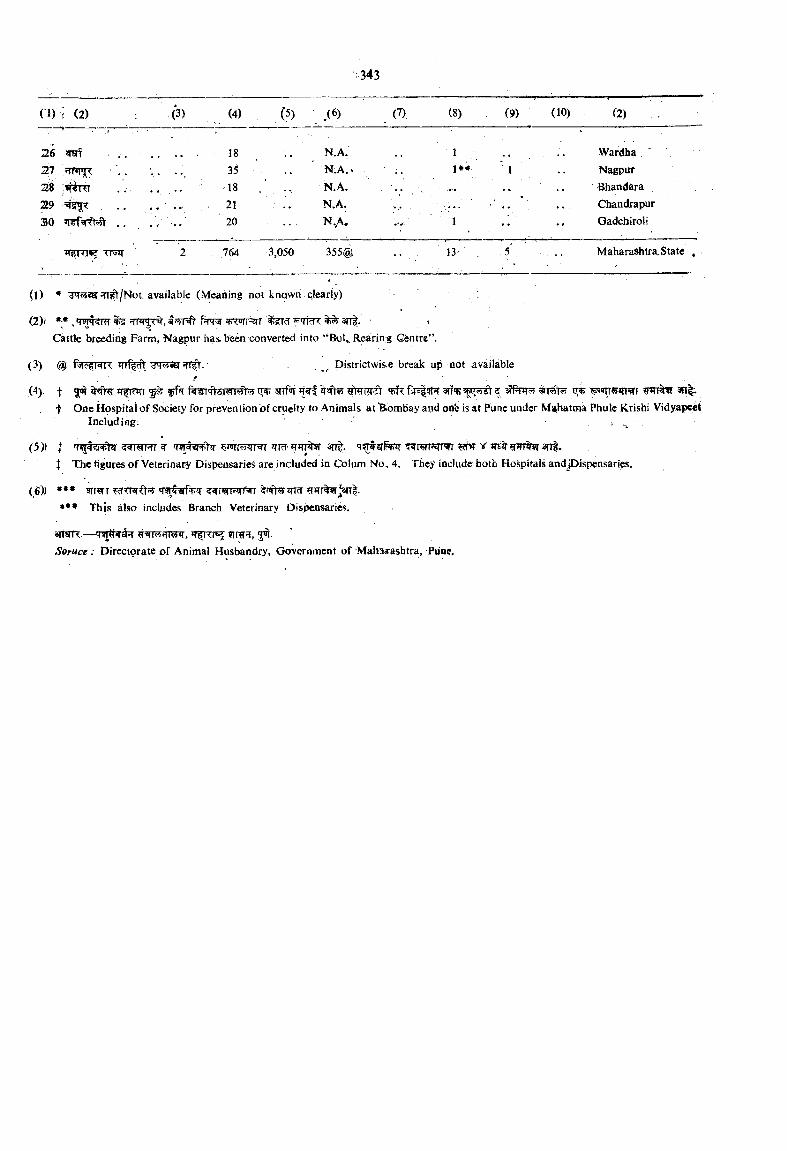
18 N.A. Wardha27 ■ . . • • • • 35 " N.A.. 1#*, ' I Nagpur
* * • • 18 N.A. Bhandara29 21 N.A. ;•■ . . . . Chandrapur
30 . . 20 N,A. ■ ..... ■ 1 •• Gadchiroli
2 764 . ,050 355@ 13 . 5 . Maharashtra. State ^
(1) * available (Meaning not known c.learly)
(2)> *:* , q^ ? R T ^ c<><ufj r ^ 3Tt| . »
Cattle breeding Farm, Nagpur has been converted into “Bul Rearin g Centre”.
(3) Districtwis.e break up not available
(4). t fkwr-ftdsiwi^ 3rt arf'c z ^eir«in=^F w i v an .f One Hospital of Society for prevention of cruelty to Animals at ‘Bombay and on'e is at Pune under Miihatma Phule Krishi Vidyapect
Including. ■ > -
(5)) I wrgPTT w an|. W>rI The figures of Veterinary Dispensaries are included in Colum No, 4. Tbey include both Hospitals andjDispensaries.
(,6)) **• wi^w]3iT|.*•♦ This also incUides Branch Veterinary Dispensaries.
artsrnc.— Hvrtf4^ t t r r , 5®f.Soruce : Directorate of Animal Husbandry, Government of Maharashtra, Piioc.
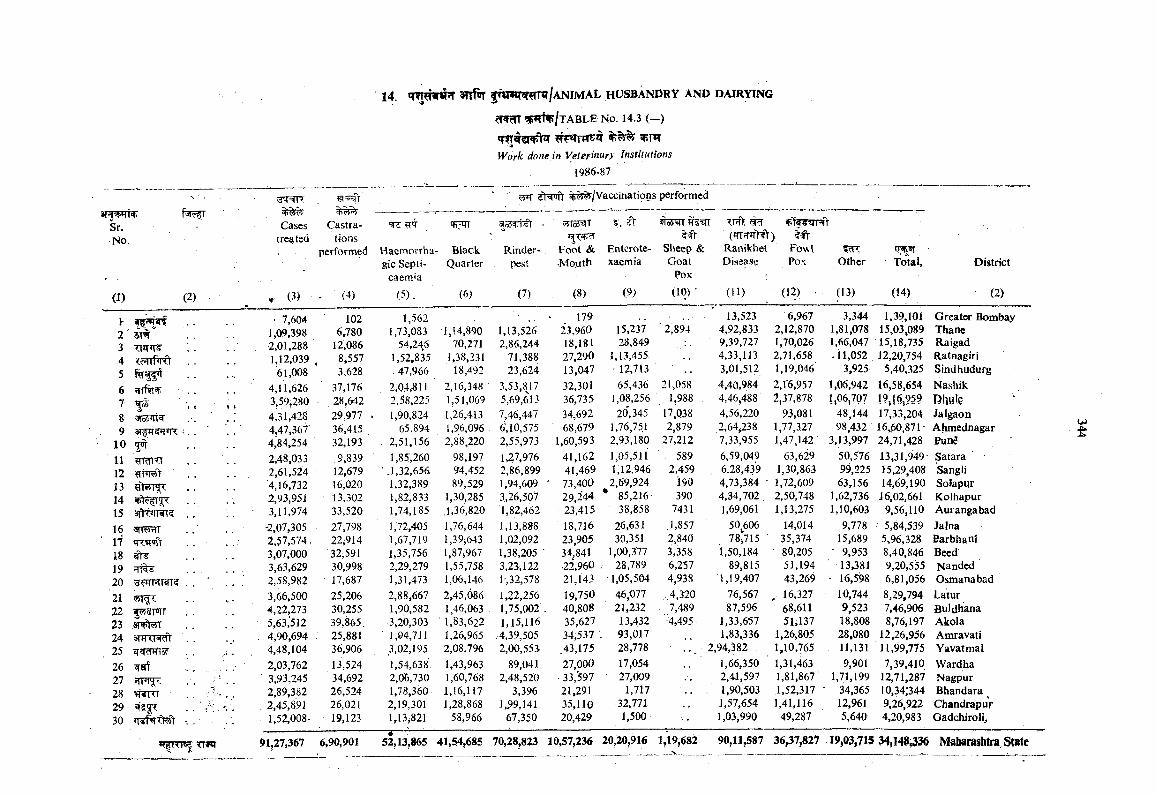
Sr.No.
(i) (2)
1- 2'34 TMTl fV5
14. 3TTfnr fW m m /A N IM A L HUSBANDRY AND DAIRYING
^pmv/lABLE No. 14.3 (—)
'S»
Work done in Veterinary Institutions 19B6-87
3fT5TR
Cases Castra-tregitsd tions
performed
^ ffNwr %?y^/Vaccinations performed
<?FTr
(3) (4)
Haemorrba- Black Rinder-gic SepU- Quarter pest
caerti'a
(6)(5). (7)
Foot & •Mo.uth
(8)
S’, it
Entcrote-xaehnia
(9)
Sheep & Goat
Pox
(10)'
7R>, ^
RanikhetDisease
(11)
Fowl ^Pox Other
(12) (13)
Total,
(14)
District
(2)
• 7,604 1,09,398 2,01,288 1,12,039
61,008
1026J80
12,0868,5573,628
1,5621,73,083
54,2461,52,835. 47,966
J,I4,890 70,271
1,38,231 18,492
1,13,5262,86,244
71,38823,624
17923,96018,18127,29013,047
15,237 28,849
1,13,455 • 12,713
2,89413,523
4,92,8339,39,7274,33,1133,01,512
6,9672,12,8701,70,0262,71,6581,19,046
3,3441,81,0781,66,047.11,052
3,925
1,39,10115,03^08915,18,73512,20,754
5,40,325
Greater BombayThaneRaigadRatnagiriSindhudurg
6 JTffiPP . . 4,11,626 37,176 2,04,811 2,16,348 3,53,8J7 32,301 65,436 21,058 4,40,984 2,16,957 1,06,942 16,58,654 Nashik7 \ . .
. . .3,59,280 • , 28,642 2,58,225 1,51,069 5,69,613 36,735 1,08,256 1,988 4,46,488 2,37,878 1,06,707 19,I§,?§9 Dhule
8 4,31,428 29,977 . 1,90,824 1,26,413 7,46,447 34,692 20', 345 17,038 4,56,220 93,081 48,144 17,33,204 Jalgaon9 4,47,36T 36,415 65,894 1,96,096 6,10,575 68,679 1,76,751 2,879 .2,64,-238 1,77,3.27 98.432 16,60,871- Ahmednagar
10 4,84,254 32,193 2,51,156 2,88,220 2,55,973 1,60,593 2,93,180 27,212 7,33,955 1,47,142 3,13,997 24,71,428 Pun5
110
2,48,033 .9,839 1,85,260 98,197 1,27,976 41,162 1,05,511 589 6,59,049 63,629 50,576 13,31,949 Satara12 2,61,524 12,679 ■ .1,32,656- 94,452 2,86,899 41,469 1,12,946 2,459 6.28,439 1,30,863 99,225 15,29,408 Sangli13 4,16,732 16,020 1,32,389 89,529 1,94,609 • 73,400 2,69,924 190 4,73,384 - 1,72,609 63,156 14,69,190 Solapur14
c • •2,93,951 .13,302 1,82,833 1,30,285 3,26,507 29,244 • 85,216 390 4,34,702, 2,50,748 1,62,736 16,02,661 Kolhapur
15Vl.' .
sfttfim? . . :. 3,11,974 33,520 1,74,185 ,1,36,820 1,82,462 23,415 38,858 7431 1,69,061 1,13,275 1,10,603 9,56,110 Aurangabad
16 *2,07,305 27,798 1,72,405 1,76,644 1,13,888 18,716 26,631 .1,857 50 606 14,014 9,778 5,84,539 Jalna17 . 2,57,574, 22,914 1,67,719 1,39 643 1,02,092 23.905 30,351 2,840 78J15 35,374 15,689 5,96,328 Parbhanl18 3,07,000 32,591 1,35,756 1,87,967 1,38,205 • 34;841 1,00,377 3,358 1,50,184 80,205 ■ 9,953 8,40,846 Beed19 . . . 3,63,629 30,998 2,29,279 1,55,758 3,23,122 ■22,960 -• 28,789 6,257 89,815 51,194 13,381 9,20,555 Nandcd20 M w r? . . 2,58,982 ' 17,687 1,31,473 1,06,146 l-,32,578 21,143 1,05,504 4,938 1,19,407 43,269 16,598 6,81,056 Osmanabad
21 «I<J< 3,66,500 25,206 2,88,667 2,45,086 1,22,256 19,750 46,077 .4,320 76,567 , 16,327 10,744 8,29,794 Latur22
,8T ?5T4,22,273 30,255 1,90,582 1,46,063 1,75,002 40,808 21,232 7,489 87,596 68,611 9,523 7,46,906 Buldhana
23 5,63,’5I2 39,865. 3,20,303 ■ 1,83,622 1,15,116 35,627 13,432 ■4,495; 1,33,657 51,137 18,808 8,76,197 Akola24 . 4,90,694 25,881 J,94,711 1,26,965 .4,39,505 . 34,537 . 93,017 1,83,336 1,26,805 28,080 12,26,956 Amravati25 4,48,104 36,906 3,02,195 2,08,796 2,00,55S .43,175 28,778 2,94,382 . 1,10,765 11,131 11,99,775 Yavatmal
26 2,03,762 13,524 1,54,638 1,43,963 89,041 27,000 17,054 1,66,350 1,31,463 9,901 7,39,410 Wardha27 . . : ; ■. . 3,93,245 34,692 2,06,730 1,60,768 2,48,520 33,597 27,009 2,41,597 1,81,867 ' 1,71,199 12,71,287 Nagpur28 . . 2,89,382 26,524 1,78,360 1,16,117 3,396 21,291 1,717 1,90,503 1,52,317 • 34,365 10,34;344 Bhandara ^29 . 2,45,891 26,021 2,19,301 1,28,868 1,99,141 35,110 32,771 1,57,654 1,41,116 12,961 9,26,922 Chandrapur30 1,52,008- 19,123 1,13,821 58,966 67,350 20,429 1,500 1,03,990 49,287 5,640 4,20,983 Gadchiroli,
9lj27,367 6,90,901 52,13,865 41,54,685 70,28,823 10,57,236 20,20,916 1,19,682 90,11,587 36,37,827 19j03,715 34,148,336 Mabarashtra, State
u>
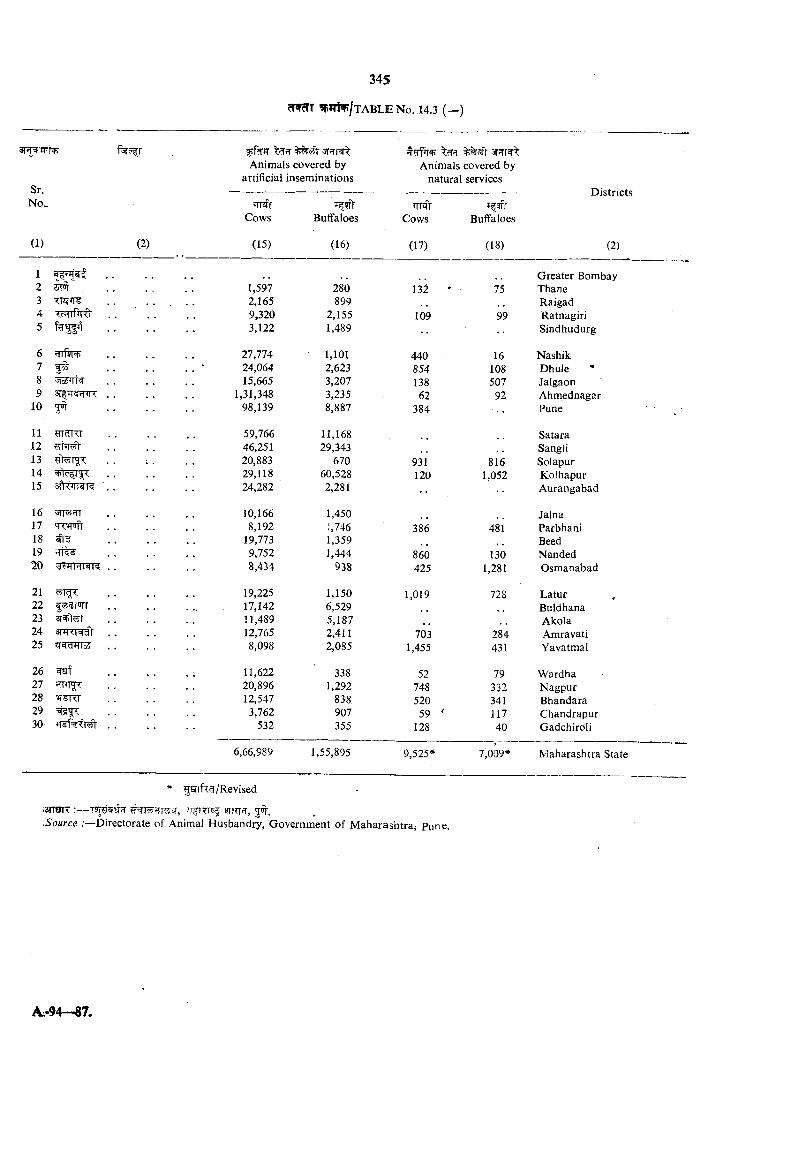
345
rT^T ^^TNt/ t ABLE No. 14.3 {—)
f5T? r
Sr.No..
(1) (2)
12 5TW34 'Cc Tf lCl5
1112131415
16 5fT55-17 q-?:^1819 vTt^20 flTFrnTRTS
2122 i sTorr23 3T > r24 anTTT 'V25 JT cTfn'
2627 ?frn^28 «T¥Rr2930
Animals covered by artificial inseminations
5nrr ^Animals covered by
natural services
TTJfrCows
(15)
Buffaloes
(16)
Cows
(17)
1,597 280 1322,165 8999,320 2,155 1093,122 1,489
27,774 1,101 44024,064 2,623 85415,665 3,207 138
1,31,348 3,235 6298,139 8,887 384
59,766 11,16846,251 29,34320,883 670 93129,! 18 60,528 12024,282 2,281
10,166 1,4508,192 1,746 386
19,773 1,3599,752 1,444 8608,434 938 425
19,225 1,150 1,01917,142 6,52911,489 5,18712,765 2,411 7038,098 2,085 1,455
11,622 338 5220,896 1,292 74812,547 838 520
3,762 907 59532 355 128
6,66,989 1,55,895 9,525*
if9frBuffaloes
(18)
Districts
(2)
Greater Bombay75 Thane
Raigad99 Ratnagiri
Sindhudurg
16 Nashik108 Dhule507 Jaigaon
92 AhniednagarPune
SataraSangli
816 Solapur1,052 Koihapur
Aurangabad
Jalna481 Parbhani
Beed130 Nanded
1,281 Osmanabad
728 LaturBuldhanaAkola
284 Amravati431 Yavatmal
79 Wardha332 Nagpur341 Bhandara117 Chandrapur40 Gadchiroli
7,009* Maharashtra State
* gsrif^ri/Revised
:3mnT :— i fnm,.Source /—Directorate of Animal Husbandry, Government of Maharashtra, Pune.
A..94-87.
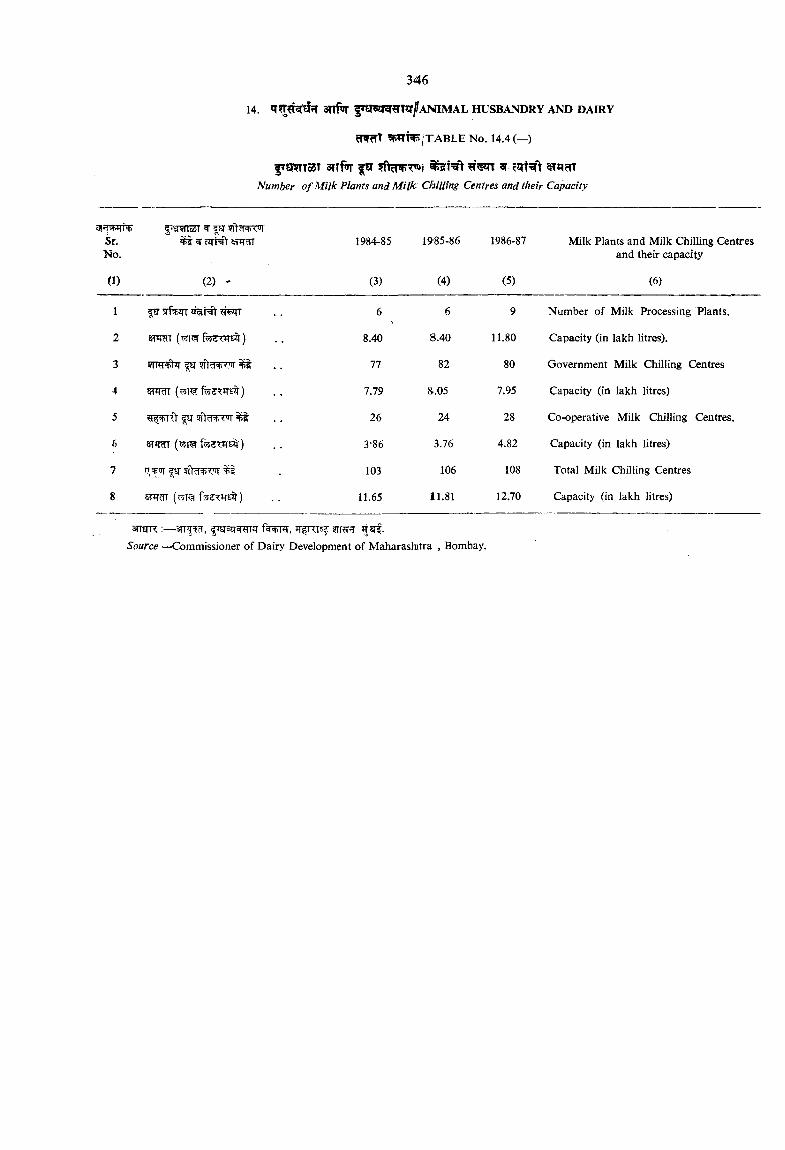
14. anf^r a n i m a l h u s b a n d r y a n d d a ir y
5T rTT ?P»TT^/TABLE No. 14.4 (—)
f»SRTT55T SITftiT fST ^Number o f Milk Plants and M ilk Chilling Centres and their Capacity
Sr.No.
£r5TTo5T ^ Wf cRFiTW^ W cJTT SvJTcTT 1984-85 19'85-86 1986-87 Milk Plants and Milk Chilling Centres
and their capacity
(1) (2) ' (3) (4) (5) (6)
1 ^ sfferr 6 6 9 Number of Milk Processing Plants.
2 BFRn («l<=i . . 8.40 8.40 11.80 Capacity (in lakh litres).
3 WRT#ir ^ 77 82 80 Government Milk Chilling Centres
4 7.79 S.05 7.95 Capacity (in lakh litres)
5 |sr ^ 26 24 28 Co-operative Milk Chilling Centres.
6 5TWT («K4 3-86 3.76 4.82 Capacity (in lakh litres)
7 ?Sr ^5 103 106 108 Total Milk Chilling Centres
8 SFTcTT ( w M fWd<, £ ) . . 11.65 11.81 12.70 Capacity (in lakh litres)
3TTsnr:— TTfRT*e wra?rSource —Commissioner of Dairy Development of Maharashtra , Bombay.
^ ^ j T A S L E 14.5
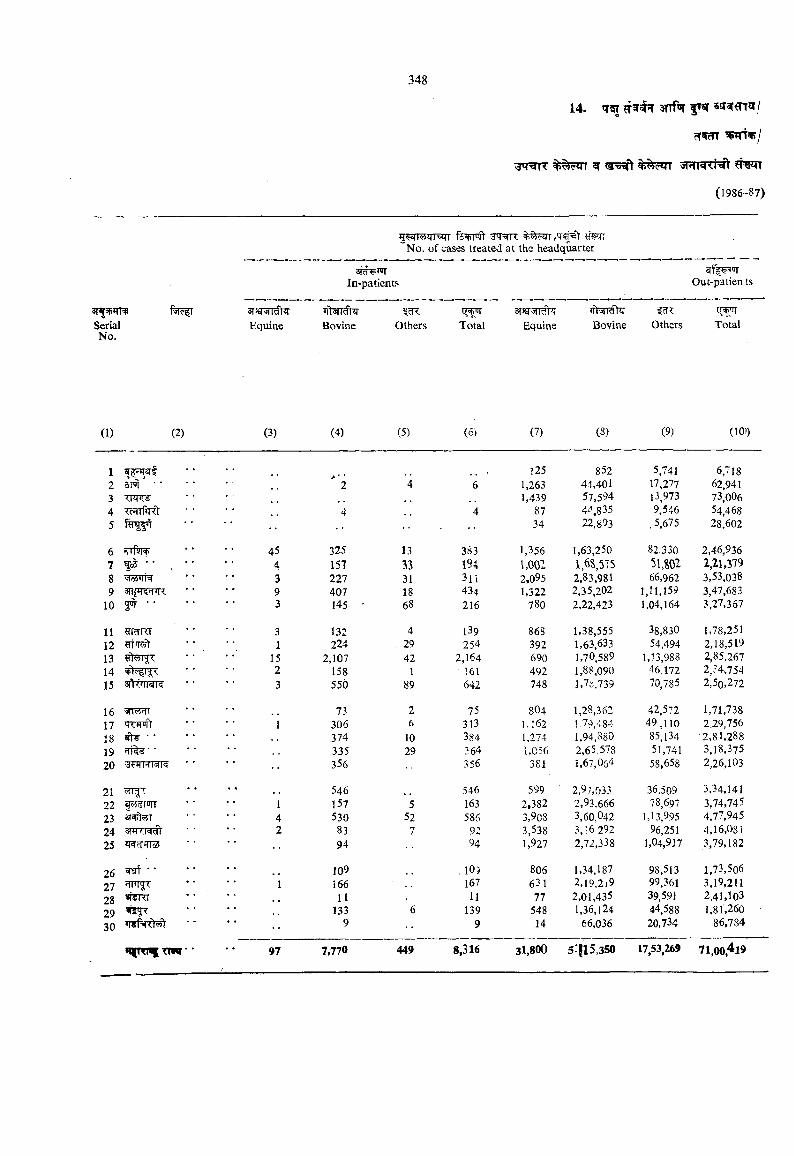
14. qr 3TTfi»r |»sr
cT^T
^ ^T3^ ^^crm 5RT^Thft
(1986-87)
ar^Rt^SerialNo.
Equine
fs^rr^ TSTR fw:”No. of cases treated at the headquarter
a TOTIn-patients
*ff3TraBovine
cROthers Total
SfJUlTRTkEquine
Out-patien ts
jft rrakBovine Others
l UTTotal
(1) (2) (3) (4) (5) (6) (7) (8) (9) ( 10>)
1 125 852 5,741 6,7182 s m ' • * ' 2 4 6 1,263 44,401 17,277 62,9413 TPPT 1,439 57,594 13,973 73,0064 f Rl 4 4 87 4^,835 9.546 54,4685 34 22,893 , 5,675 28,602
6 •vlftl'f) 45 325 13 383 1,356 1,63,250 82.330 2,46,9367 • • . • • <t 157 33 194 i.o o : 1,6S,5T5 5l,S02 2,21,3798 3 227 31 311 2,095 2.83,981 66,962 3,53,0389 3n{TR?nR 9 407 18 434 1.322 2.35,202 1,11,159 3.47,683
10 5^ •• 3 145 - 68 216 780 2,22,423 1,04,164 3,27,367
11 ?rrani 3 132 4 139 868 1,38,555 38,830 1,78,25112 rtfRTT 1 224 . 29 254 392 1,63,633 54,494 2,18,51913 15 2,107 42 2,164 690 1,70,589 1,13,988 2,85,26714 2 158 1 161 492 1,88,090 •6,172 2,?4,754
3 550 89 642 748 1,7^,739 70,785 2,50,272
16 73 2 75 804 1,28,362 42,572 1,71,73817 'TT'Wl' 1 306 6 313 1.162 1.79,484 49,110 2.29,75618 T¥ • * 374 10 384 1,274 1,94,880- 85,134 2 ,81,28819 ■ ■ 335 29 364 1,056 2,65,578 51,741 3,18,37520 SFTRTWR •• 356 356 381 1,67,064 58,658 2,26,103
21 546 546 599 2,97,033 36,509 3.34,14122 ^ (o(on 1 157 5 163 2,382 2,93.666 78,697 3,74,74523 4 530 52 586 3,908 3,60.042 1,13,995 4.77,945
24 anTTHdl 2 83 7 92 3,538 3, •.6 292 96,251 4,16,08125 *m ino3 94 94 1,927 2,72,338 1,04,917 3,79,182
26 ^ * 109 , 10? 806 1,34,187 98,513 1,73,506
27 1 166 167 631 2,19,219 99,361 3,19,21128 . . 11 11 77 2,01,435 39,591 2,41.10329 ^ 133 6 139 548 1,36,124 44.588 1,81,26030 l«f 0<?4l 9 9 14 66,036 20.734 86,784
<i|r<ii Twi ‘ * 97 7,770 449 8,316 31.800 5 115,350 17,53,269 71,00.4i9
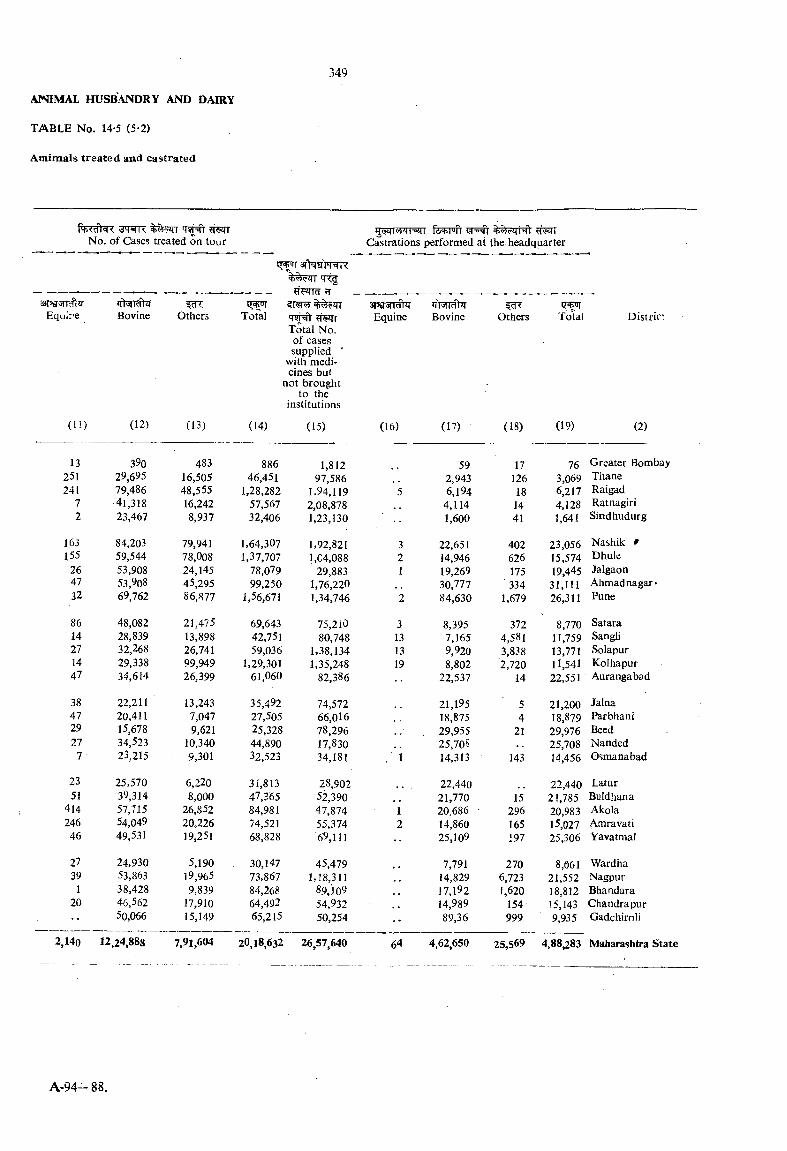
AJSIMAL HUSBANDRY AND DAIRY
TABLE No. 14-5 (5-2)
Amimals treated and castrated
No. of Cases treated on tour
(H)
13251241
72
sapgvTT^Equire Bovine Others
(12)
3 %
29,69579,48641,31823,467
( 13)
Total
(14)
H5T
Total No. of cases supplied ■
with medicines but
not brought to the
institutions
( 15)
pqW TTsqr fewoit % ?zrNt Castrations performed at the headquarter
48316.50548,55516.2428,937
88646,451
1,28,28257.56732,406
1,81297,586
1.94,1192,08,8781,23,130
3Pij;?T#q-Equine
(16)
’Tl'JiidYJTBovine
(17)
592,9436,194
4,1141,600
Others Totai Distric
(18) (19) (2)
17 12618 14 41
763,0696,2174.1281,641
Greater BombayThaneRaigadRatnagiriSindhudurg
163 84,203 79,941 1,64,307 1,92,821 3 22,651 402 23,056 Nashik #155 59.544 78,008 1,37,707 l.C4,088 2 14,946 626 15,574 Dhule
26 53,908 24,145 78,079 29,883 1 19,269 175 19,445 Jalgaon47 53,908 45,295 99,250 1,76,220 30,777 ■ 334 31,111 Ahmad nagar32 69,762 86,877 1,56,671 1,34,746 2 84,630 1,679 26,311 Pune
86 48,082 21,475 69,643 75,210 3 8,395 372 8,770 Satara14 28,839 13,898 42,751 80,748 13 7,165 4,581 11.759 Sangii27 32,268 26,741 59,036 1,38,134 13 9,920 3,838 13,771 Solapur14 29,338 99,949 1,29,301 1,35,248 19 8,802 2,720 11,541 Kolhapur47 34,614 26,399 61,060 82,386 22,537 14 22,551 Aurangabad
38 22,211 13,243 35,492 74,572 21,195 5 21,200 Jalna47 20,411 7,047 27,505 66,016 18,875 4 18,879 Parbhani29 15,678 9,621 25,328 78,296 . 29,955 21 29,976 Beed27 34,523 10,340 44,890 17,830 25,708 25,708 Nanded
7 23,215 9,301 32,523 34.181 , 1 14,313 143 14,456 Osmanabad
23 25,570 6,220 31,813 28,902 22,440 22,440 Latur51 39,314 8,000 47,365 52,390 21,770 15 21,785 Buldhana
414 57,715 26,852 84,981 47,874 1 20.686 296 20,983 Akola246 54,049 20,226 74,521 55,374 2 14,860 165 15,027 Amravati
46 49,531 19,251 68.828 69,111 •• 25,109 197 25,306 Yavatmal
27 24,930 5,190 30,147 45,479 7,791 270 8,061 Wardha39 53,863 19,965 73,867 1,18.311 14,829 6,723 21,552 Nagpur
1 38,428 9,839 84,268 89,'] 09 17,192 1,620 18,812 Bhandara20 46,562 17,910 64,492 54,932 14,989 154 15,143 Chandrapur•• 50,066 15,149 65,215 50,254 •• 89,36 999 9,935 Gadchiroli
,140 12,24,888 7,91,604 20,18,632 26,57,640 64 4,62,650 25,569 4,88,283 Maharashtra J_ . ---- ---- ______________ , .... : __ _ . - .
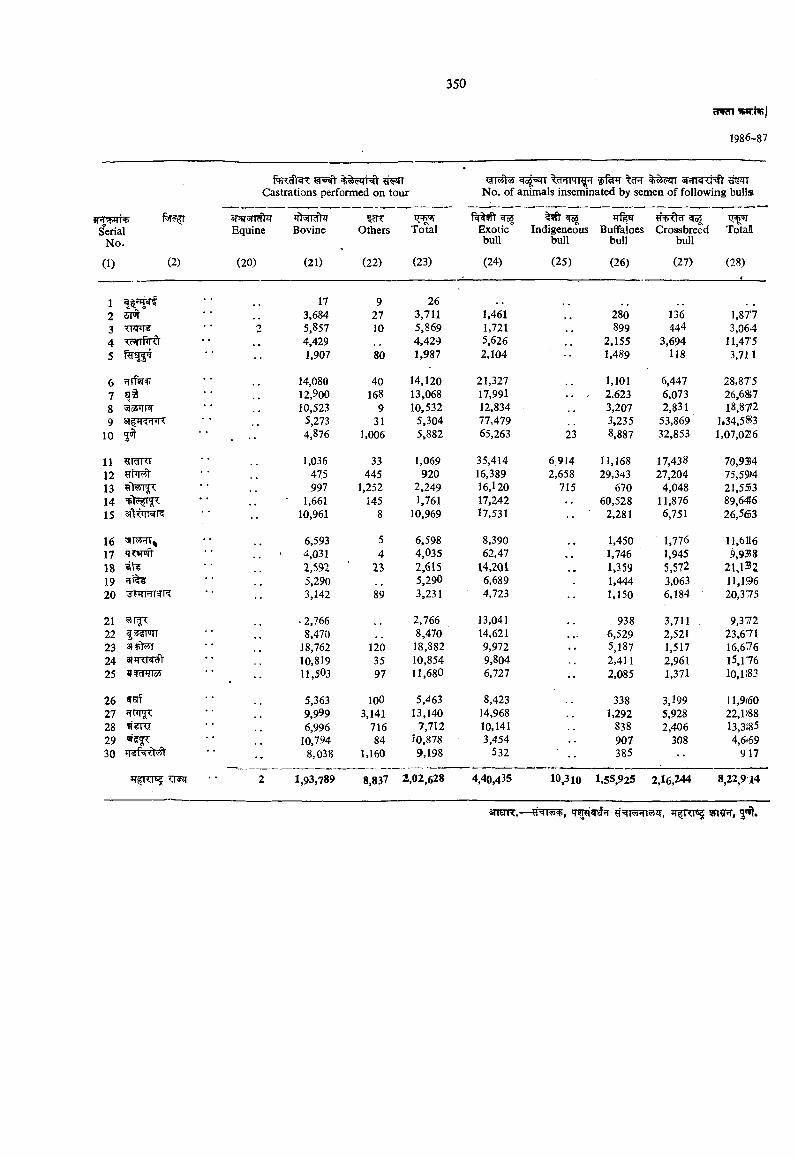
1986-87
_ . c____
%%7zrNt <<Vfi Castrations performed on tour No. of animals inseminated by semen of following bulls
3r5g3fIciW iflWRfUf Equine Bovine
(20) (21)
?cROthers
(22)
Total
(23)
f5i%?Fr ^ Exotic bull
(24)
qcflIndigeneous
bull
(25)
Crossbreedbull
(27)
To'tal
(28)
SerialNo.
(1) (2)
Buffaloesbull
(26)
1 17 9 262 5T®r 3,684 27 3,711 1,461 280 136 1,8773 2 5,857 10 5,869 1,721 899 444 3,0644 ixVrpRt 4,429 4,429 5,626 2,155 3,694 11,4755 1,907 80 1,987 2,104 1,489 118 3,711
6 ?il%^ 14,080 40 14,120 21,327 1,101 6,447 28,8757 12,900 168 13,068 17,991 .. « 2,623 6,073 26.6S78 3lo2nTR' 10,523 9 10,532 12,834 3,207 2,831 18,8729 3?|q ?nrK 5,273 31 5,304 77,479 3,235 53,869 1.34,583
10 • 4,876 1.006 5,882 65,263 23 8,887 32,853 1,07,026
11 IMKI 1,036 33 1,069 35,414 6914 11,168 17,438 70,935412 475 445 920 16,389 2,658 29,343 27,204 75,59)413 997 1,252 2.249 16,120 715 670 4,048 21,55314 ■ 1,661 145 1,761 17,242 60,528 11,876 89,64615 10,961 8 10.969 17,531 •• 2,281 6,751 26,563
16 6,593 5 6.598 8,390 1,450 1,776 11,611617 'JWJft' .. * 4,031 4 4,035 62,47 1,746 1,945 9,93818 2,592 23 2,615 14,201 1,359 5,572 21,13219 5,290 5,290 6,689 1,444 3,063 11,19620 FrPTTWR 3,142 89 3,231 4,723 1.150 6,184 20,375
21 . 2,766 2,766 13,041 938 3,711 9,37222 iJSciluil 8,470 8,470 14,621 • ♦- 6,529 2,521 23,67123 18,762 120 18,882 9,972 5,187 1,517 16,67624 10,819 35 10,854 9,804 2,411 2,961 15,17625 JIWHIoJ 11,503 97 11,680 6,727 •• 2,085 1,371 10.1i83
26 5,363 100 5,«163 8,423 338 3,199 11,9(6027 9,999 3,141 13,140 14,968 1.292 5,928 22,lf8828 6,996 716 7,712 10,141 838 2,406 13,318529 10,794 84 10,878 3,454 907 308 4,6<6930 8,038 1,160 9,198 532 •• 385 •• 917
2 1,93,789 8,837 2,02,628 4,40,435 10,310 1,55.925 2,16,244 8,22,914
3TOK. — IT RT 9n?R, 5 ^ .
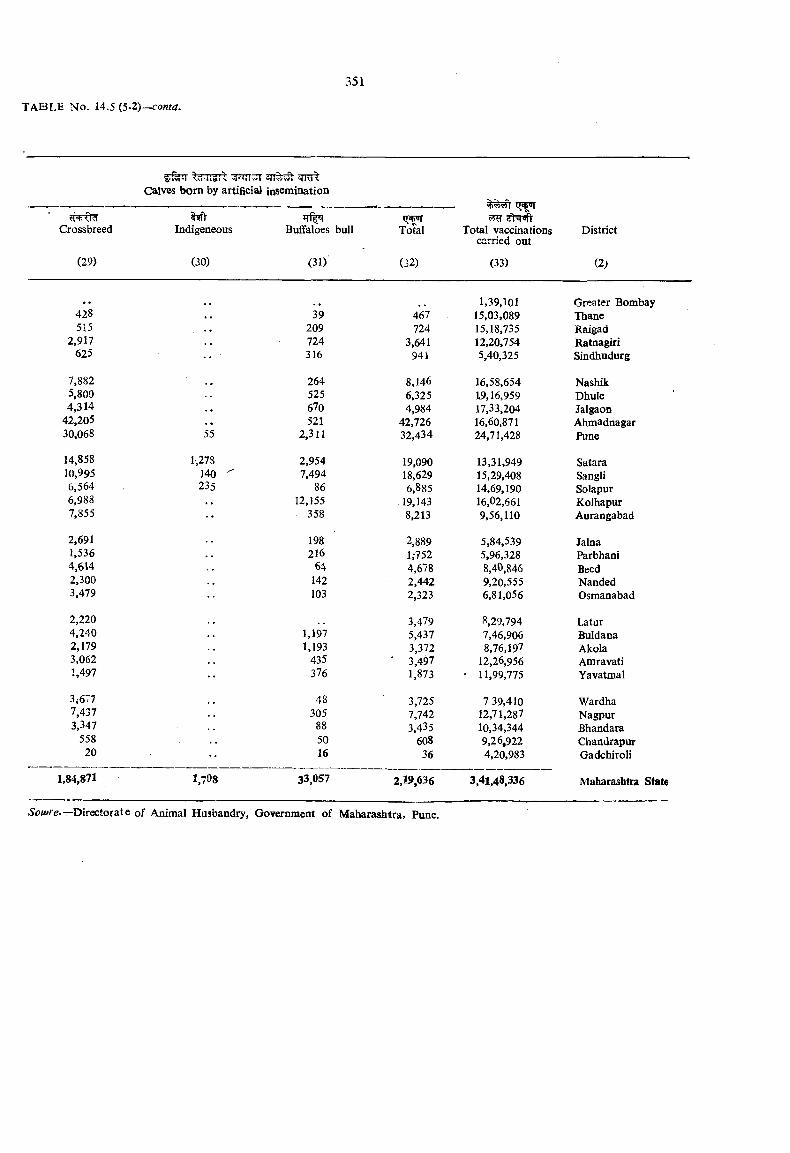
Calves bom by artificial insemination
District
(2j
Crossbreed
(29)
Indigeneous
(30)
Buffaloes bull
(31)
i»+urTotal
(32)
Total vaccinations carried out
(33)
1,39,101 Greater Bombay428 39 467 15,03,089 Thane515 209 724 15,18,735 Raigad
2,917 724 3,641 12,20,754 Ratnagirl625 •• ■ 316 941 5,40,325 Sindhudurg
7,882 264 8,146 16,58,654 Nashik5,800 525 6.325 19,16,959 Dhule4,314 670 4,984 17,33,204 Jalgaon
42,205 .. 521 42,726 16,60,871 Ahmadnagar30,068 55 2,311 32,434 24,71,428 Pune
14,858 1,278 2,954 19,090 13,31,949 Satara10,995 140 7,494 18,629 15,29,408 Sangli6,564 235 86 6,885 14,69,190 Solapur6,988 12,155 19,143 16,02,661 Kolhapur7,855 358 8,213 9,56,110 Aurangabad
2,691 198 2,889 5,84,539 Jalna1,536 216 l,-752 5,96,328 Parbhani4,614 64 4,678 8,40,846 Beed2,300 142 2,442 9,20,555 Nanded3,479 103 2,323 6,81,056 Osmanabad
2,220 3,479 8,29,794 Latur4,240 1,197 5,437 7,46,906 Buldana2,179 1,193 3,372 8,76,197 Akola3,062 435 ‘ 3,497 12,26,956 Amravati1,497 376 1,873 ■ 11,99,775 Yavatmal
3i677 48 3,725 7 39,410 Wardha7,437 305 7,742 12,71,287 Nagpur3,347 88 3,435 10,34,344 Bhandara
558 50 608 9,26,922 Chandrapur20 16 36 4,20,983 Gadchiroli
1,84,871 1,708 33.057 2,19,636 3,41,48,336 Maharashtra State
Directorate of Animal Husbandry, Government of Maharashtra, Pune.
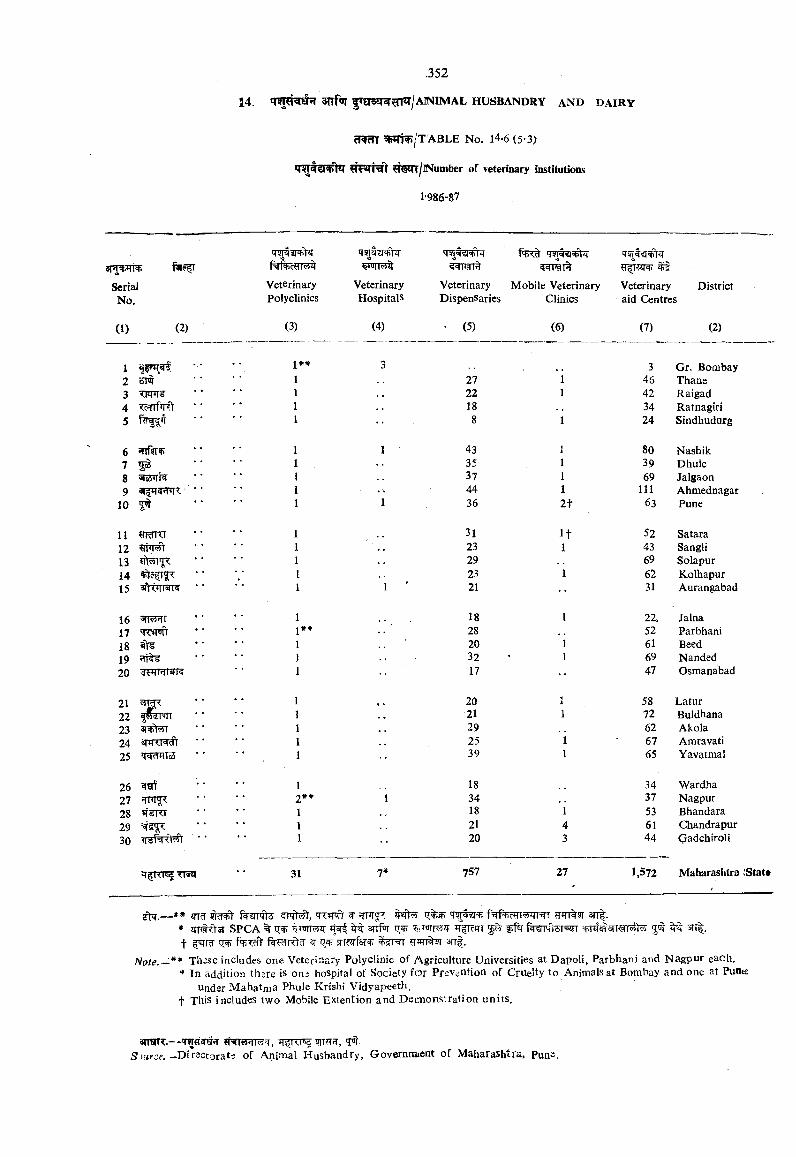
14. sn fq |»ars?7^^n^/AiNiMAL h u s b a n d r y a n d d a ir y
cTWm ?WT^/T ABLE No. 14-6 (5-3)
^f<sm/lNumber of veterinary institutions
l'986-87
4S!Vt?l q
Serial Veterinary Veterinary Veterinary Mobile Veterinary Veterinary DistrictNo. Polyclinics Hospitals Dispensaries Clinics aid Centres
(1) (2) (3) (4) ' (5) (6) (7) (2)
1 I** 3 3 Gr. Bombay2 -sm 27 1 46 Thane3 22 1 42 Raigad4 • • 1 18 34 Ratnagiri5 8 1 24 Sindhudurg
6 1 43 1 80 Nashik7 35 1 39 Dhule8 5?ssirrf 37 1 69 Jalgaon9 ■ ■ 44 1 111 Ahmednagar
10 1 36 2 t 63 Pune
11 ?nmT;r 1 31 I f 52 Satara12 ? it ^ * ■ 1 23 1 43 Sangli13 29 69 Solapur14 I 23 1 62 Kolhapur15 1 21 31 Aurangabad
16 ' «v>4T 1 18 I 22, Jalna17 1 ** 28 52 Parbhani18 20 1 61 Beed19 32 69 Nanded20 1 17 47 Osmanabad
21 20 58 Latur22 21 1 72 Buldhana23 31^^ 29 62 Akola24 3|H<T <ifr 25 1 67 Amravati25 *f ^Tc3 39 1 65 Yavatma!
26 18 34 Wardha27 2** I 34 37 Nagpur28 nsnr 18 1 53 Bhandara29 21 4 61 Chandrapur30 ■' 20 3 44 Qadchiroli
31 7# 757 27 1,572 Maharashtra fStat*
— *• qr 5 f ^ i%?rr'ffe ?rqtc5t, wt?r^ fgf^rfTi^in^r T»rr%9r 3tt| .* zrrtftsi SPCA % > 'irr ?T ^RJTT ^ %TTir|-5T=S!TT 5’ir 3Tt|.t ^RT sTTr rfer srrl.
Note.—** Tli3se includes one Veterinary Polyclinic of Agriculture Universities at Dapoli, Parbhani and Nagpur each.* In addition th^re is oni hospital of Society for Prevention of Cruelty to Animals at Bombay and one at Pun<e
Under Mahatma Phule Krishi Vidyapeeth, t This includes two Mobile Extention and Demonstration units.
s n s r r ^ . - t h r r e p w t r ,5 —Directorate of Animal Husbandry, Governnnent of Maharashtra, Pun-
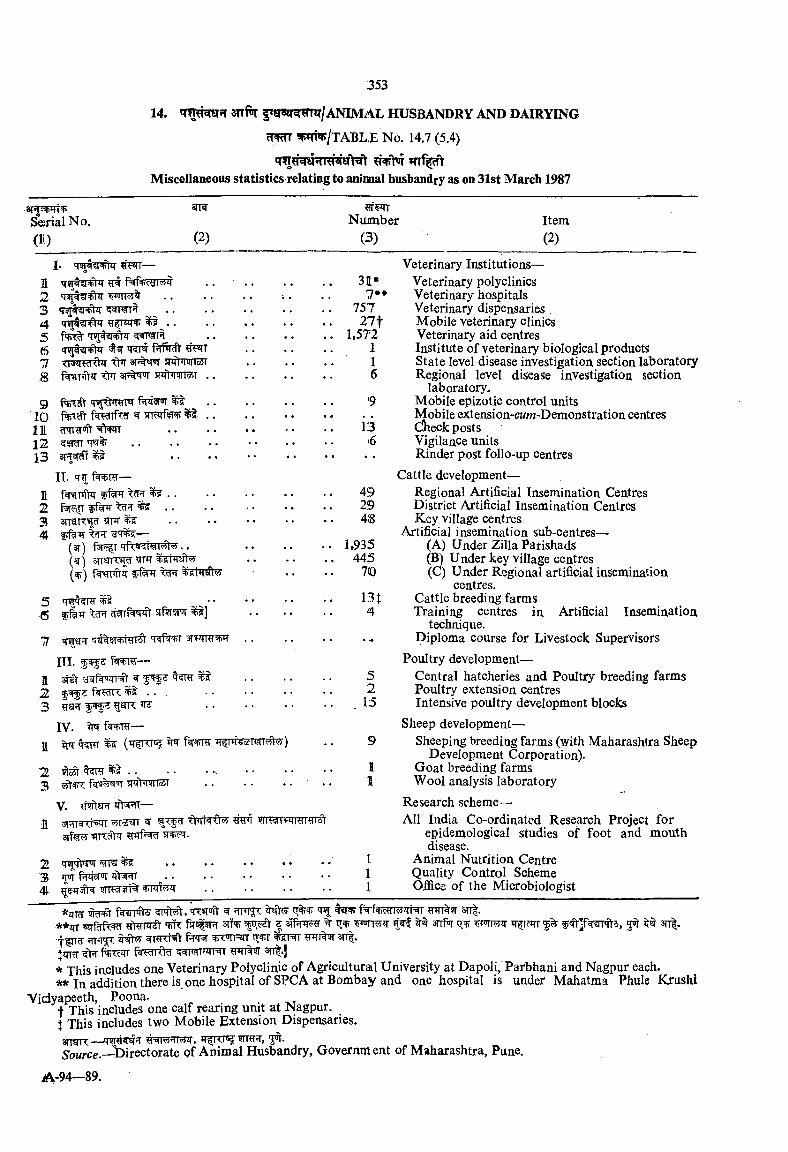
Miscellaneous statistics relating to animal husbandry as on 3Ist March 1987
& i a l N o .
(10 (2)Num ber
(3)Item(2)
II2345678
91 01111213
I- ?TPTr—. . . . . . . . 31*
. . . . . . . . . 7*#.. . . . . . . . . 757............................................ 27 f
......................... 1,572*1^ f riwl" ?np!iT
snfmwTtlr»T $?qtWc5T .
(+<SV T JTtTOFT fk 9PJT %sT . .f^Tfc?r w srrarftnr ^ . .
.........................^ . . . .
II. f^RT—1 fsmPT . .2 f el?T "tcPT ^ . .3 arran:^ m4 IfR ^ # 5 —
( 3T ) f T T 'rf<.’S<il<f|j«t<?i'. .(^) srTsrp: ttft (^) f^nn^ir
13i6
5
7 <T?TSr?T '7q% n rT5t 'T f^T ST RTRT
23
III. f fw ^ —3j^ ^ J 75TRr
fanRTn: ^ . . .g?jn: ^ ....................................
IV. ^ —
^ ...........................................................snfrwsT .......................... ..
V. —^^=njwT ttirmhv Rnr wir^rvzmrrm^3Tfe 5j FT.
4929418
1,935445
7(0
I3t4
52
15
9
2 ^ 3 5JIT 4
Veterinary Institutions—Veterinary polyclinics Veterinary hospitals Veterinary dispensaries .Mobile veterinary clinics Veterinary aid centres Institute of veterinary biological products State level disease investigation section laboratory Regional level disease investigation section
laboratory.Mobile epizotic control unitsMobile extension-cr«m-Demonstration centresC5ieck postsVigilance unitsKinder post follo-up centres
Cattle development—Regional Artificial Insemination Centres District Artificial Insemination Centres Key village centres
Artificial insemination sub-centres—(A) Under Zilla Parishads(B) Under key village centres(C) U nder Regional artificial insemination
centres.Cattle breeding farmsTraining centres in Artificial Insemination
technique.Diploma course for Livestock Supervisors
Poultry development—Central hatcheries and Poultry breeding farmsPoultry extension centresIntensive poultry development blocks
Sheep development—Sheeping breeding farms (with Maharashtra Sheep
Development Corporation).Goat breeding farms Wool analysis laboratory
Research scheme—All India Co-ordinated Research Project for
epidemological studies of foot and mouth disease.
Animal Nutrition Centre Quality Control Scheme Office of the Microbiologist
*zTT?r 5 1 ^ 'TW W%9T ant-**zjx 'SK sfTO ^ srrfq i rcirr g# 3rr|.
wnrxHt f¥r»r %sr^ ^ i%3t stt .|iiT ^ fw r r* This includes one Veterinary Polyclinic of Agricultural University at Dapoli, Parbhani and Nagpur each.** In addition there is one hospital of SPCA at Bombay and one hospital is under Mahatma Phule Krushi
Yidyapeeth, Poona.t This includes one calf rearing unit at Nagpur.I This includes two Mobile Extension Dispensaries.angrn:— 5Trft, 5 .S'owrce.—Directorate of Animal Husbandry, Government of Maharashtra, Pune.

^ j ^ sThrtmtr JTT fe"f 3tt|.
WITTWT^ f ^ r 3n |.«9WT% T r#^, ST fffcT 31% TF?%?ft'<' d-Mr
%w 3n|. ^FTrW'fTi^^ ^%^\3'^T ^ %% 3Tt|.
Wxf =52TT ^ ^ 1 % ^^qK?T ^Tt^cT % _ 3T ^ f e i m m ^ ^ 'TWPf)’ ^ '
^rri)'. 3itR r?Tir ittM ? i ^ ?TiTffc[
s rsp ff^ 5»TtT f% T 3T3qrt W W H?n^T% ?«rrf?R7 ^?rr^T^ ^rsr^fr
sq-^W Frm r^ s f i ^ ^q r fq ifTTTTTTS 3TT r?qT STT^t^tft ^
f^ rw rm ^ ^ m " irr stt -410' fV 'Joi'JiK 'TT . ^ *T)^ +1 <Wi o4 R'^d' :—
{ \ ) ^ ^ f m»TT=szTT srfsrr^ -^^nfr ^ 3Tr=5^K%^T m
3 ^ ? r m 1 ^ 1 ^ ^T% 5Rq^ ^rvm-
(^ ) ^ ^TT%ft f ^ f w 5T O T ^ ^rpTirr-^ ttt 3Tf 'iq'r=5qT
^«rt \=5ctT S5 2Sf>fr I frf^ ic -1=3ifT f5T^ q r5|T% 3rr| ^
( ) ^ f -^Tqrfi* 5Tr%ff 3TTf«T jq SfT^ »fVw
s i t ^ r ! ’ ^ f m TT'sjTr sifij^Tcqwr^ 3Tr|.
15-1. Data on area under forest and major and minor forest produce are given in the tables in this section.
15.2. Information regarding forests under the control of the State’s Forest Department and those under the control of the State’s Revenue Department is shown separately. The areas under forests are classified according to legal status into reserved forests, protected forests and unclassed forests. The legal status refers to the classification of forests under the Indian Forest Act, XVI of 1927. Reserved forests are those that are intended mainly for timber producti<» and in which rights of grazing and cultivation are seldom allowed. In protected forests, the restrictions are not so rigid as grazing or cultivation is allowed btit certain limitations and restrictions are imposed. The unclassed forest refers to the inaccessible forest or unoccupied waste. The forests which are taken by Government from local bodies or private individuals for management on lease basis are called ‘ leased forests ’. The forest area shown in Tables in this sector may not tally with the area under “ forest ” shown in tabic on land utilisation in agriculture section. The two sets of figures differ due to the following reasons:—
(/) In the Indian Forests Statistics the whole area including non-wooded area under the control of Forest Department is taken as area under forests while in Agricultural Statistics, it is classified according to its actual utilisation.
(«) The Forest Department Returns are meant to serve a definite administrative purpose and indicate the ownership of the forest area; the actual utilisation of these areas is not so important from their point of view as it is in the land utilisation statistics for Agricultural Department.
{Hi) The Forest Department returns relate to financial years and Agricultural Statistics relate to the agricultural years. The figures of production of major and minor forest produce refer to the areas under the control of Forest Department only.
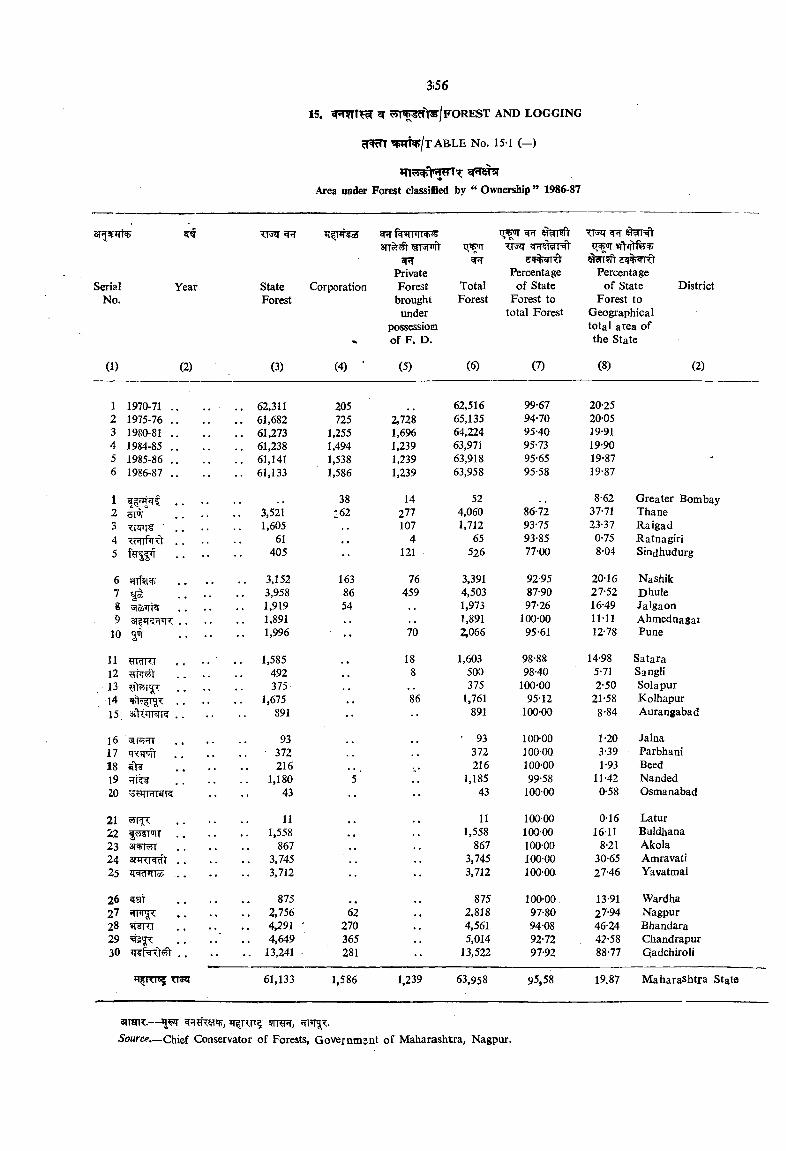
15. ^ ^5T^S5ft^|FOREST AND LOGGING
?TWcTT ?r N?/t ABLE No. 15-1 (—)
Area under Forest classified by “ Ownership ” 1986-87
SR??;jrR7
SerialNo.
Year
5Fr
StateForest
Corporation
3TT 3T5FTt iTT
Private Forest
brought under
possession of F. D.
TotalForest
SR
Percentage of State
Forest to total Forest
Percentage of State
Forest to Geographical total area of the State
District
(1) (2) (3) (4) ‘ (5) (6) (7) (8) (2)
1 1970-71 .. . . 62,311 205 62,516 99-67 20-252 1975-76 .. . , 61,682 725 2,728 65,135 94-70 20-053 19iiO-81 .. . . 61,273 1,255 1,696 64,224 95-40 19-914 1984-85 .. . . 61,238 1,494 1,239 63,971 95-73 19-905 1985-86 .. . . 61,141 1,538 1,239 63,918 95-65 19-87 '6 1986-87 .. . . 61,133 1,586 1,239 63,958 95-58 19-87
1 . . . . . . 38 14 52 8-62 Greater Bombay2 im '' 3,521 2 62 277 4,060 86-72 37-71 Thane
1,605 107 1,712 93-75 23-37 Raigad4 , , .. 61 , , 4 65 93-85 0-75 Ratnagiri5 . . .. 405 •• 121 526 77-00 8-04 Sindhudurg
6 .. 3,152 163 76 3,391 92-95 20-16 Nashik7 3,958 86 459 4,503 87-90 27-52 Dhule8 1,919 54 1,973 97-26 16-49 Jalgaon9 Sf tT qTK . . .. 1,891 1,891 100-00 11-11 Ahmednagai
10 . . .. 1,996 ■ •• 70 2,066 95-61 12-78 Pune
11 IdRT ' . . 1,585 18 1,603 98-88 14-98 Satara12 . . .. 492 , , 8 500 98-40 5-71 Sangli
.1 3 375 375 100-00 2-50 Solapurl4 . . .. . 1,675 86 1,761 95-12 21-58 Kolhapur15; ai iqRT? . . 891 •• 891 100-00 8-84 Aurangabad
16 93 • 93 100-00 1-20 Jalna17 T<?pr?t . . . . 372 372 10000 3-39 Parbhani18 5 k 216 , , . , 216 100-00 1-93 Seedl9 1,180 5 ’ 1,185 99-58 11-42 Nanded20 43 •• •• 43 100-00 0-58 Osmanabad
21 11 11 100-00 0-16 Latur22 5 ^ ’ilT . . . . 1,558 • . 1,558 100-00 16-11 Buldhana23 3T >T 867 , , 867 100-00 8-21 Akola24 3 n ro ^ . . . . 3,745 3,745 100-00 30-65 Amravati25 . . . . 3,712 •• 3,712 100-00 27-46 Yavatmal
26 gaf 875 875 100-00. 13-91 Wardha2^ . . 2,756 62 2,818 97-80 27-94 Nagpur28 270 4,561 94-08 46-24 Bhandara29 4,649 365 5,014 92-72 , 42-58 Chandrapur30 . . 13,241 281 •• 13,522 97-92 88-77 Qadchiroli
61,133 1,586 1,239 63,958 95,58 19.87 Maharashtra State
3»TEnT.— ?TT?FT,Source,—Chief Conservator of Forests, Governm3nt of Maharashtra, Nagpur.
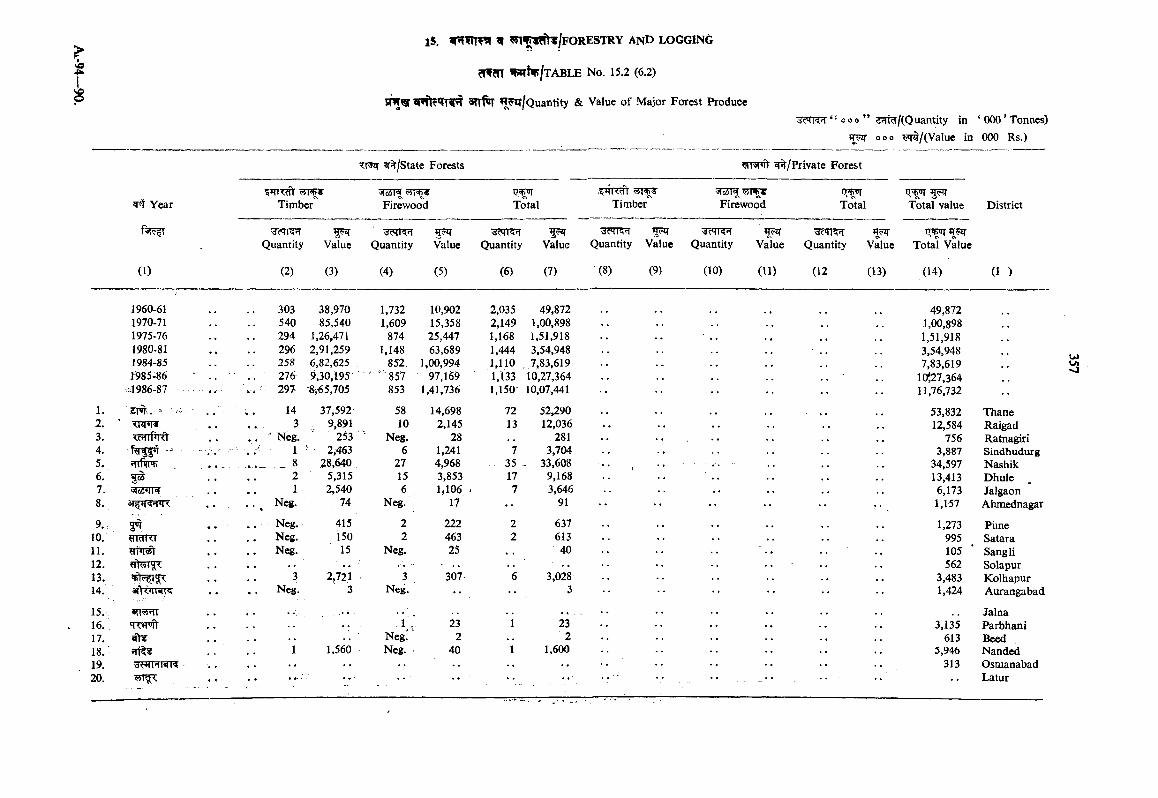
?Tf?TT ^tir/T A B L E No. 15.2 (6.2)
5PJ^ 3Trf W?ij/Quantity & Value of Major Forest Producetlc’TTSPT “ o 0 o ” s?rt^/(Quantity in ‘ 000 ’ Tonnes)
ooo 5gq /(Value in 000 Rs.)
^/Statc Forests ^/Private Forest
1 'SfoSTYear Timber Firewood Total Timber Firewood Total Total value District
T lT<=f i^K 'i <TT??TQuantity Value Quantity Value Quantity Value Quantity Value Quantity Value Quantity Value Total Value
(1) (2) (3) (4) (5) (6) (7) (8) (9) (10) (11) (12 (13) (14) (1 )
1960-61 303 38,970 1,732 10,902 2,035 49,872 49,8721970-71 540 85,540 1,609 15,358 2,149 1,00,898 1,00,8981975-76 294 1,26,471 874 25,447 1,168 1,51,918 ' . t .. 1,51,9181980-81 296 2,91,259 1,148 63,689 1,444 3,54,948 .. 3,54,9481984-85 258 6,82,625 852 1,00,994 1,110 7,83,619 .. 7,83,6191985-86 276 9,30,195 ' '■ “ ■ 857 ■ 97,169 1,133 10,27,364 .. • • 10*27,364:.1986-87 \ . - 297 8-,^5,705 853 1,41,736 1,150 10,07,441 11,76,732
1. 14 37,592 58 14,698 72 52,290 .. • • 53,832 Thane2. 3 9,891 10 2,145 13 12,036 12,584 Raigad3. . . ^ Neg. 253 '■ Neg. 28 281 • • 756 Ratnagiri4. - ■ 1 ^ 2,463 6 1,241 7 3,704 3,887 Sindhudurg5. , ..._____ 8 28,640 27 4,968 35 - 33,608 34,597 Nashik6. 2 5,315 15 3,853 17 9,168 .. 13,413 Dhule7. 5fc2 IT 1 2,540 6 I4O6 * 7 3,646 .. 6,173 Jalgaon8. , . Neg. 74 Neg. 17 91 •• .. 1,157 Ahmednagar
9. 501 . . Neg. 415 2 222 2 637 .. 1,273 Piine10. ?ridi<i Neg. 150 2 463 2 613 .. 995 Satara11. . . Neg. 15 Neg. 25 . . 40 .. 105 Sangli12, . . ' . . - ■ .. 562 Solapur13. 3 2,721 3 307 6 3,028 .. 3,483 Kolhapur14. afK*IRT? Neg. 3 Neg. *• 3 .. 1,424 Aurangabad
15. , , i . .. Jalna16. 4<'Hun 1 ’ 23 1 23 3,135 Parbhani17. • • Neg.‘ ■' 2 2 .. 613 Beed18. 1 1.560 Neg. 40 1 1,600 .. 5,946 Nanded19. 'dWHI'sfT? •• 313 Osmanabad20. • • • • - • • • • • • • •
■■* * - .... _. * • • • • • • Latur
u>U\
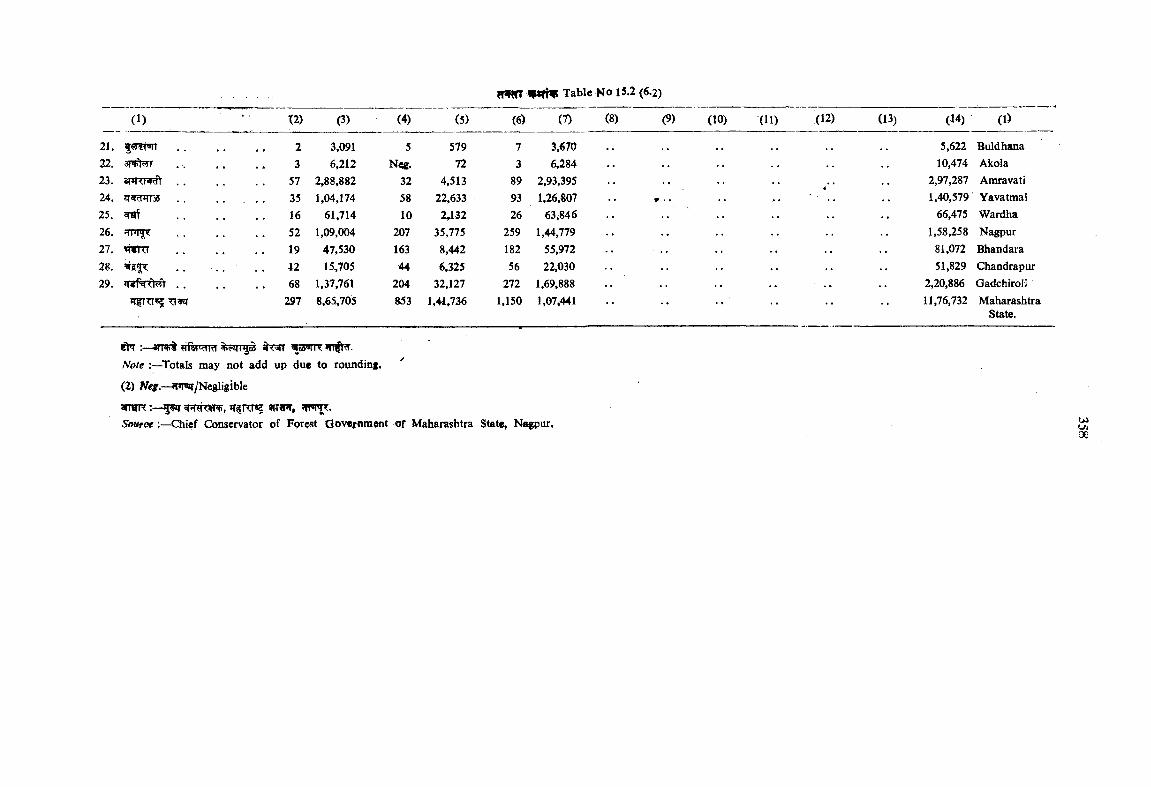
21.22.23. anrowcfV24.25. ^26. r*T <27. »nem28.29.
^TT«5 T1W
2 3,091 5 579 7 3,6703 6,212 N«g. 72 3 6,284
57 2,88,882 32 4,513 89 2,93,39535 1,04,174 58 22,633 93 1,26,S0716 61,714 10 2432 26 63,84652 1,09,004 207 35,775 259 1,44,77919 47,530 163 8,442 182 55,97212 15,705 44 6,325 56 22,03068 1,37,761 204 32,127 272 1,69,888
297 8,65,705 853 1,41,736 1,150 1,07,441
ct*T —3TTWNote :—Totals may not add up due to rounding.
(2) JV( r.—^»TBr/NegIigible
sfrerrc5^ 5fPT .Source:—Chief Conservator of Forest Oovcfnment of Maharashtra State, Nagpur,
5,62210.474
2,97,287 1,40,579
66.475 1,58,258
81,07251,829
2,20,886
11,76,732
BuldhanaAkolaAmravatiYavatmai!WardhaNagpurBhandaraChandrapurGadchiroliMaharashtra
State.
□G
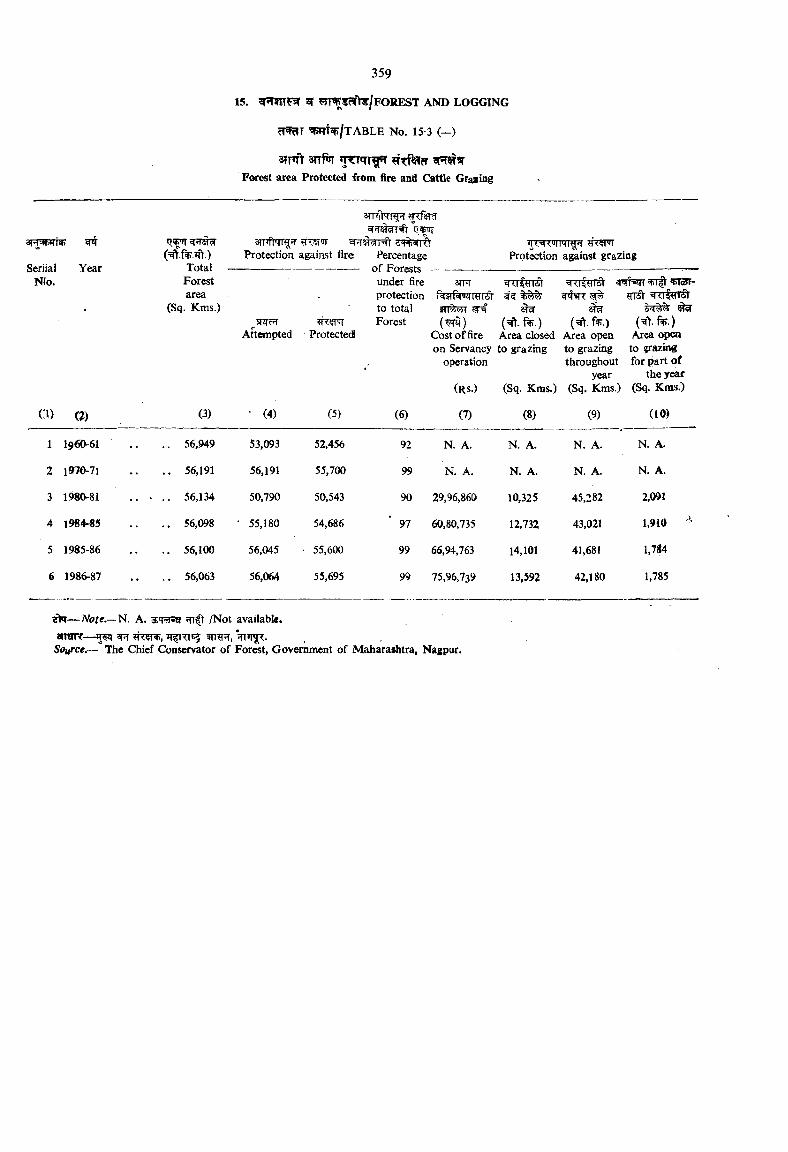
15. ^ ?5T^3?f>5/FOREST AND LOGGING
?TWclT W ^ / t ABLE No. 15-3 (—)
3iT»ft arrf TForest area Protected *om fire and Cattle Gracing
o
Serrial Year NIo.
Total Forest area
(Sq. Kms.)
3iTjf)qT?rProtection against fire Percentage Protection against grazing
Attempted Protected
3TFT
of Forests - under fire protection to totalForest
^ ?rr^
( m ) (^ . f%.) (^ . f .)Cost of fire Area closed Area open Area opaa on Servancy to grazing to grazing to grazing
operation throughout for part ofyear the year
(Rs.) (Sq. Kms.) (Sq. Kms.) (Sq. Kms.)
CD (2) (3) ‘ (4) (5) (6) (7) (8) (9) ( 10)
1 I96P-6I •• . . 56,949 53,093 52,456 92 N. A. N. A. N. A. N. A.
2 1970-71 •• . . 56,191 56,191 55,700 99 N. A. N. A. N. A. N. A.
3 1980-81 •• * .. 56,134 50,790 50,543 90 29,96,860 10,325 45,282 2,091
4 1984-85 . . 56,098 • 55,180 54,686 97 60,80,735 12,732 43,021 1,910
5 1985-86 •• . . 56,100 56,045 55,600 99 66,94,763 14,101 41,681 1,7«4
6 1986-87 •• . . 56,063 56,064 55,695 99 75,96,739 13,592 42,180 1,785
jrh— Note.— l^. A. /Not available.anOK—^ SPT JTfTTlc? nSTT,Soi^ce.— The Chief Conservator of Forest, Government of Maharashtra, Nagpur.
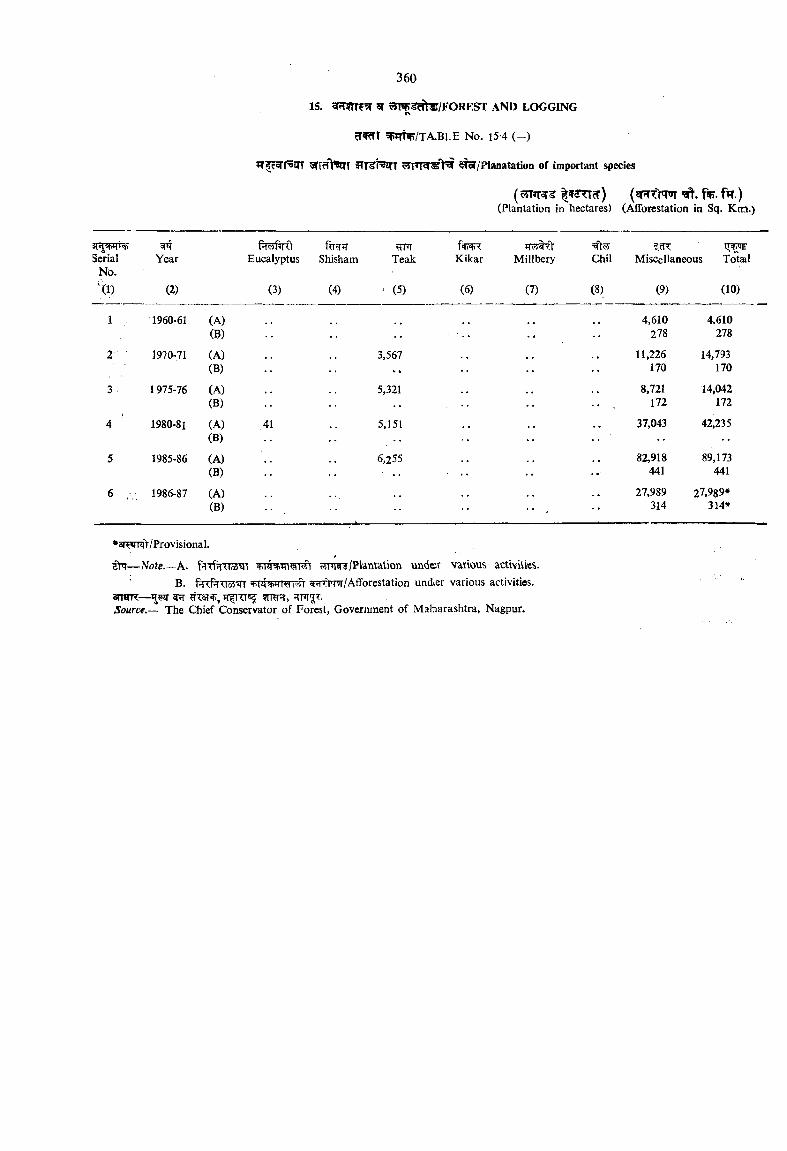
15. W?T9TT?5r W ^T^3cft3T/FOREST AND LOGGING
cT^r W^P/TA.BLE No. 15-4 ( - )
STT rsiTT ^5I/Planatation of important species
( 5THT^ l^iTTer) f^ . f»T.)(Plantation in hectares) (Afforestation in Sq. Km.)
r'i«Ri<?r fepT y'Hi I'+uilSerial Year Eucalyptus Shisham Teak Kikar Millbery Chil Miscellaneous Totail
No.‘(I) (2) (3) (4) ' (5) (6) (7) (8) (9) (10)
1 1960-61 (A) 4,610 4.610(B) 278 278
2 1970-71 (A) 3,567 11,226 14,793(B) 170 170
3 . 1975-76 (A) 5,321 8,721 14,042(B) 172 172
4 1980-81 (A) 5,151 37,043 42,235(B)
5 1985-86 (A) 6,255 82,918 89,173(B) ■ . • 441 441
6 . 1986-87 (A) .. 27,989 27,989*(B)
___ ________ i_314 314*
•ar iTPff/Provisional.
^ — N o te .— A. ^Ti^Tnwr^ ^?rwi/PVantalion under various activities.B. f?R%TT55 w^RTTir/Atforestatlon undier various activities.
anarR— sr 5mR, rnig;!.Source.— The Chief Conservator of Forest, Government of Mahiarashtra, Nagpur.
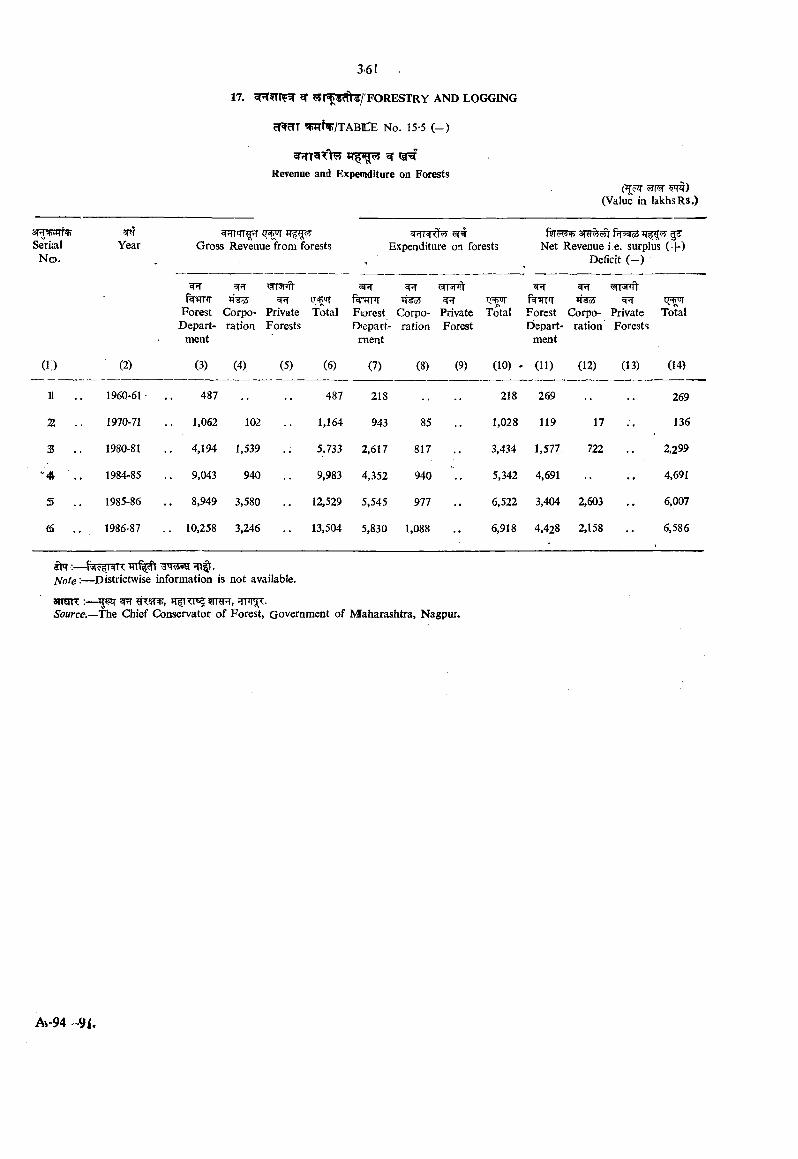
SerialN o .
Year
17. gr jt s^ / f o r e s t r y a n d l o g g in g
cT rTT 5J^T /TAB]C:e No. 15-5 ( - )
Revenue and Expemditure on Forests
(Value in lakhs Rs.)
(7^Gross Revenue from forests Expenditure on forests
3TEr% ^Net Revenue i e. surplus (-|-)
Deficit (—)
ForestDepart
ment
ForestDepart
ment
W5TN'*!!cr^Total TotalCorpo
rationPrivateForests
fETflTTF(orestDiepart-
ment
Corporation
PrivateForest
Corporation
5FTPrivateForests
iJ+uITotal
(1) (2) (3) (4) (5) (6) (7) (8) (9) (10) - (11) (12) (13) (14)
11 196Q-61 487 487 218 .. 218 269 269
2 1970-71 1,062 102 1,164 943 85 1,028 119 17 •• 136
3 1980-81 .. 4,194 1,539 5,733 2,617 817 • • 3,434 1,577 722 •• 2,299
" 4 •• 1984-85 .. 9,043 940 9,983 4,352 940 • • 5,342 4,691 •• •• 4,691
5 1985-86 . . 8,949 3,580 12,529 5,545 977 • • 6,522 3,404 2,603 •• 6,007
65 1986-87 .. 10,258 3,246 13,504 5,830 1,088 •• 6,918 4.428 2,158 •• 6,586
fft'T ■—r'JiQ’ NK .
Note'-— Districtwise information is not available.
amnr :—^ ^Source.—The Chief Conservator of Forest, Government of Maharashtra, Nagpur.
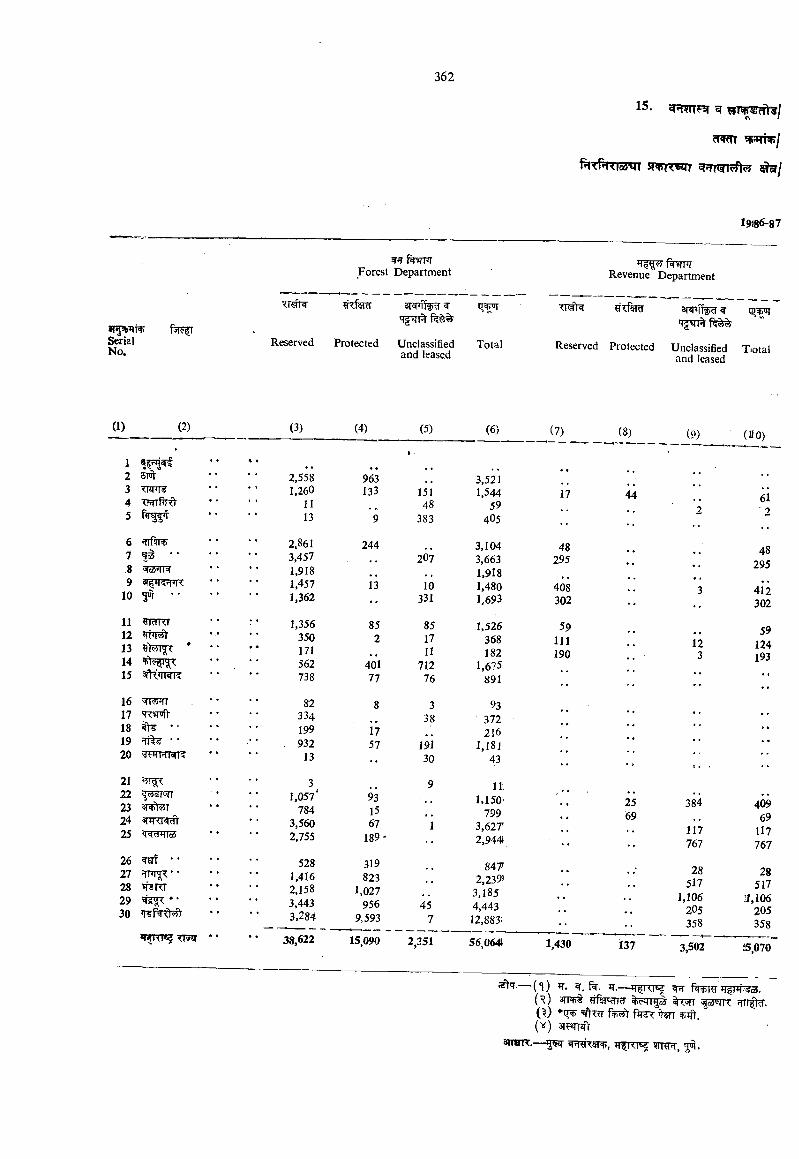
^ r s H T ^ 1
19)86-87
wiTfwmn Forest Department Revenue Department
<K=fm
SerialNo.
Reserved Protected Unclassified and leased
Total Reserved Protected Unclassified and leased
Tiotal
(1) (2) (3) (4) (5) (6) (7) (8) (9) (UO)
12 5Tq3 TRTiH4 sfrPrO5
2,5581,260
1113
963133
9
»
15148
383
3,5211,544
594O5
17 44 61 ■ 2
67 ' • *.8 ^oS^
10 yr • •
2.8613.457 1,9181.4571,362
244
13
2O7
10331
3,1043,6631,9181,4801,693
48295
408302
••48
295
41*2302
11 ^IdKf12 llM«l *13 i')v}i5 : '1415 sfK IRR
1,356350171
, • * 562738
852
40177
851711
71276
1,526368182
1,675891
59111190
1259
124193
1617 'mmV18 • •19 *fi 5 ' •20 wmrRK
82334199932
13
8
1757
338
19130
93372216
1,18143
••
2122 <?i<il'irT23 5h+1<?jt2425 Midi lca
31,057'
7843,5602,755
93]567
189-
9
1
1111.1501
1993,6272,944
25 384 69
117767
40969
117767
26 tjf ••27 * •28 ^ncr29 • •30
5281,4162,1583,4433,284
319823
1,027956
9,59345
7
8472,239>
3,1854,44312,883:
28517
1,106205358
28517
il,I06205358
»fifrrr«5 tt»?t * 38,622 15,090 2,351 56,064J 1,430 137 3,502 '5,070
stq.-{^) 3TT %T3|7 o5WTT JTTf .(^) r ^ ^ ?iTTi ) 3i^!fr
anrnr.—5^ mwj, 5^.
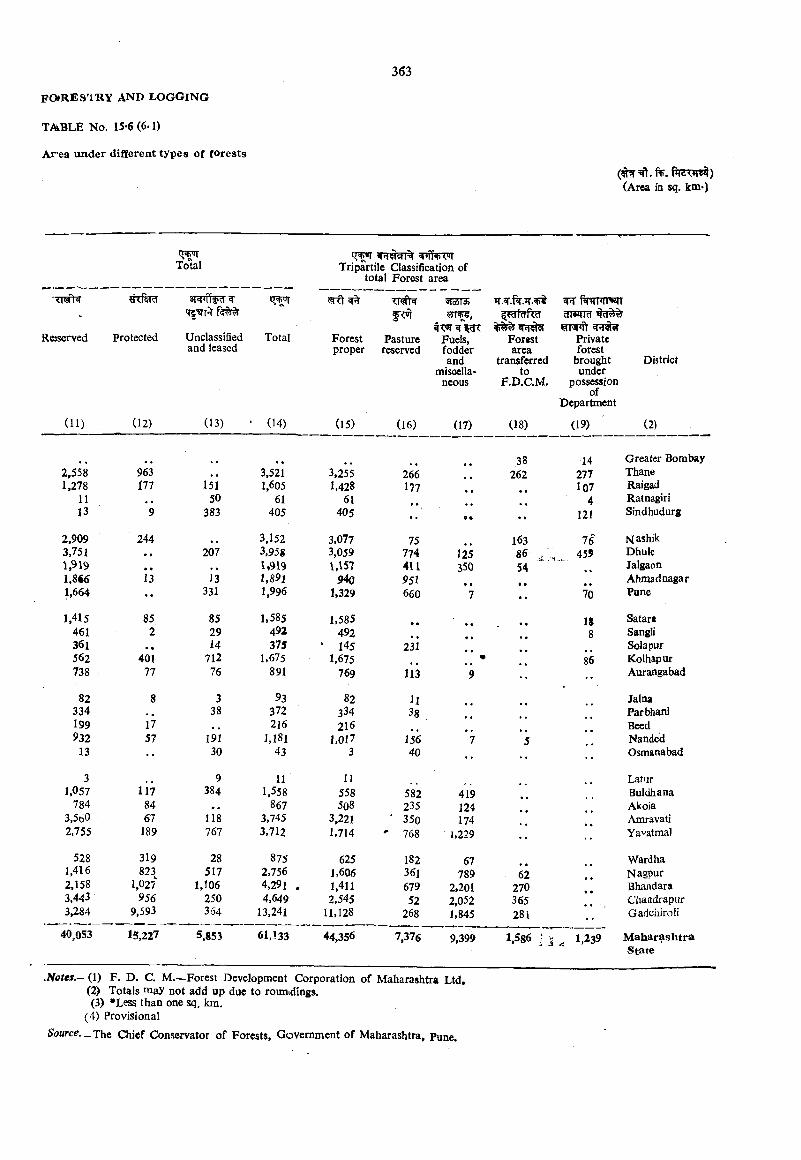
Ar'ea under different types of forests
(Area ia sq. km»)
Totol Tripartile Classification of total Forest area
Reserved Protected Unclassified Totaland leased
Forestproper
Pasturereserved
Fuels,fodderand
miscclla*neous
Forestarea
transferredto
F.D.C.M.
aTBITcT
Privateforest
broughtunder
possessionof
Department
District
(11) . (12) (13) • (14) (15) (16) (17) (18) (19) (2)
38 14 Greater Bombay2,558 963 3,521 3,255 266 262 277 Thane1,278 i n 151 1,605 1,428 177 l07 Raigad
11 . . 50 61 61 4 Ratnagiri13 9 383 405 405 .. • • . . 121 Sindhudurg
2,909 244 .. 3,152 3.077 75 163 76 Mashik3.751 . . 207 3,958 3.059 774 125 86 459 Dhule1,^19 • « 1,919 1,157 4U J50 54 Jalgaon1,8€6 13 13 l,89l 940 951 • • Ahmad nagar1,664 •• 331 1,996 1,329 660 7 70 Pune
1,415 85 85 1.585 1.585 • • 18 Satart461 2 29 492 492 8 Sangli361 . , 14 375 ‘ 145 231 Sola pur562 401 712 1.675 1,675 • 86 Kolhapur738 77 76 891 769 113 9 •• .. Aurangabad
82 8 3 93 82 U Jalna334 38 372 334 38 ParWiani199 17 • • 216 216 Seed932 57 191 l.lS l 1,017 156 ’7 Nanded
13 •• 30 43 3 40 .. .. Osmanabad
3 9 11 11 Latur1,057 117 384 1,558 558 582 419 Buldhana
784 84 . . 867 5o8 235 124 Akoia3.560 67 118 3.745 3,221 ' 350 174 Amravati2,755 189 767 3.712 1.714 ' 768 1,229 . . Yavatmal
528 319 28 875 625 182 67 Wardha1.416 823 517 2.756 1,606 361 789 62 Nagpur2,158 1,027 1,106 4.291 . 1,411 679 2,201 270 Bhandara3.443 956 250 4.649 2,545 52 2.052 365 Chattdiapur3,284 9,593 364 13.241 11.128 268 1.845 281 GadciiiroH
40,053 15,227 5,853 61,133 44,356 7,376 9,399 1.586 i 1.239 MaharashtraState
.Netes.— (1) F. D. C. M— Forest Development Corporation of Maharashtra Ltd,(2) Totals may not add up due to roxmdings.(3) •Less than one sq, km,
(4) Provisional
Source. The Chief Conservator of Forests, Government of Maharashtra, Pune.

’Tr?T55t= i' 16.1. Data regarding fish catch, disposition of fishTTT?Tt= TTcFT T{c?3T33T 'HWjitn6t and fish brought for curing, marine fishery and fishing
^I'TT^r 3T|ct> ofift JTT f^wnTi^ craft are presented in the tables in this section.3Tl|.
\-94t—92.
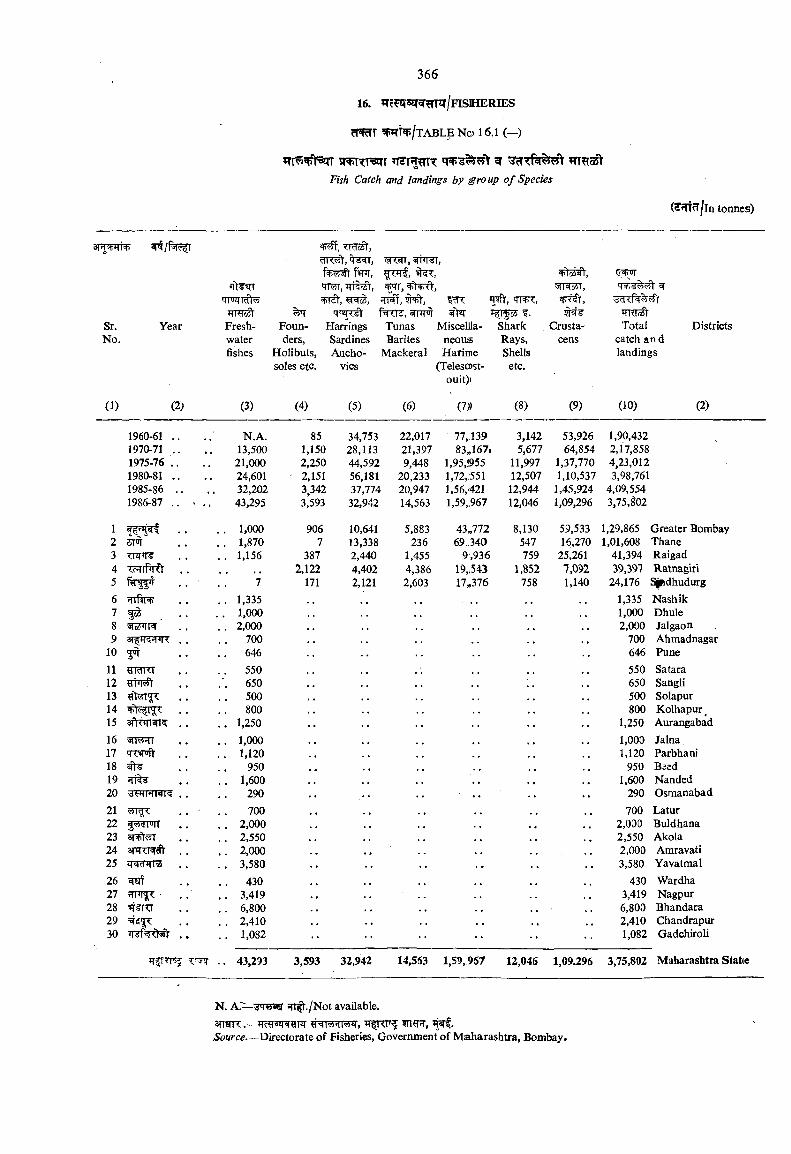
366
16. ^T??^5^^^m/FISHERIES
W ^ / t ABLE No 16.1 (—)
?Tr?5 V5qT M+k i '^T *T?T ?TT7 ^Fish Catch and landings by Sroup o f Species
Sr. YearNo.
(1) (2)
crm i^TTT^Freshwaterfishes
(3)
?5q[ Founders,
Holibuts, soles etc.
(4)
=F ,TRT ,cTR55t, W,
r€t,'TT rft
HarringsSardinesAncho-
vics
(5)
^Rf,F <id, wnrn’
Tunas Barites
Mackeral
(6)
Miscelila-neousHarime
(Telesost-ouit)i
(7))
’pft, TITT,w TTO’oSt
Shark Crusta- TotalRays, cens catch andShells landings
etc.
(8) (9) (10)
' 3,142 53,926 1,90,4325,677 64,854 2,17,858
11,997 1,37,770 4,23,01212,507 1,10,537 3,98,761
12,944 1,45,924 4,09,55412,046 1,09,296 3,75,^02
Districts
(2)
1960-61 . 1970-71 . 1975-76 . 1980-81 .1985-861986-87 .
12 sm3456 rrftr7 538
10 jot
11 ^IdKl121314151617 1 wiV18 ^1920 FTHT9T2122 f rapiIT2324 apTTTWfft2526 ^27 ^rni^282930 <isP>?<J»i
N.A.13,50021,00024,60132,20243,295
1,0001,8701,156
71,3351,0002,000
700646550650500800
1,2501,0001,120
9501,600
290700
2,0002,5502,0003,580
4303,4196,8002,4101,082
851.150 2,2502.151 3,342 3,593
9067
3872,122
171
34,75328,11344,59256,18137,77432,942
10,64113,3382,4404,4022,121
22,01721,3979,448
20,23320,94714,563
5,883236
1,4554,3862,603
77,13983„167
1,95,9551.72..-551 1,56,4211.59..967
43^77269.340
9,93619„54317„376
8,130547759
1,852758
59,53316 270
25,2617,0921,140
1,29,8651,01,608
41,39439,397
24,1761,3351,0002,000
700
Greater BombayThaneRaigadRatnagiriSpdhudurgNashikDhuleJalgaonAhmadnagar
646 Pune550650500800
1,2501,0001,120
9501,600
290700
2,0302,5502,0003,580
4303,4196,8002,4101,082
SataraSangliSolapurKolhapur^AurangabadJalnaParbhaniBsedHandedOsmanabadLaturBuldhanaAkolaAmravatiYavatmalWardhaNagpurBhandaraChandrapurGadchiroli
JTfrrrsj .. 43,233 3,593 32,942 14,553 1,59,967 12,046 1,09.296 3,75,802 Maharashtra Stat(e
N. Ar^^q^su sm^./Not available.STTSTR: .— ?Tl nT,Source.—Directorate of Fisheries, Government of Mahajashtra, Bombay.
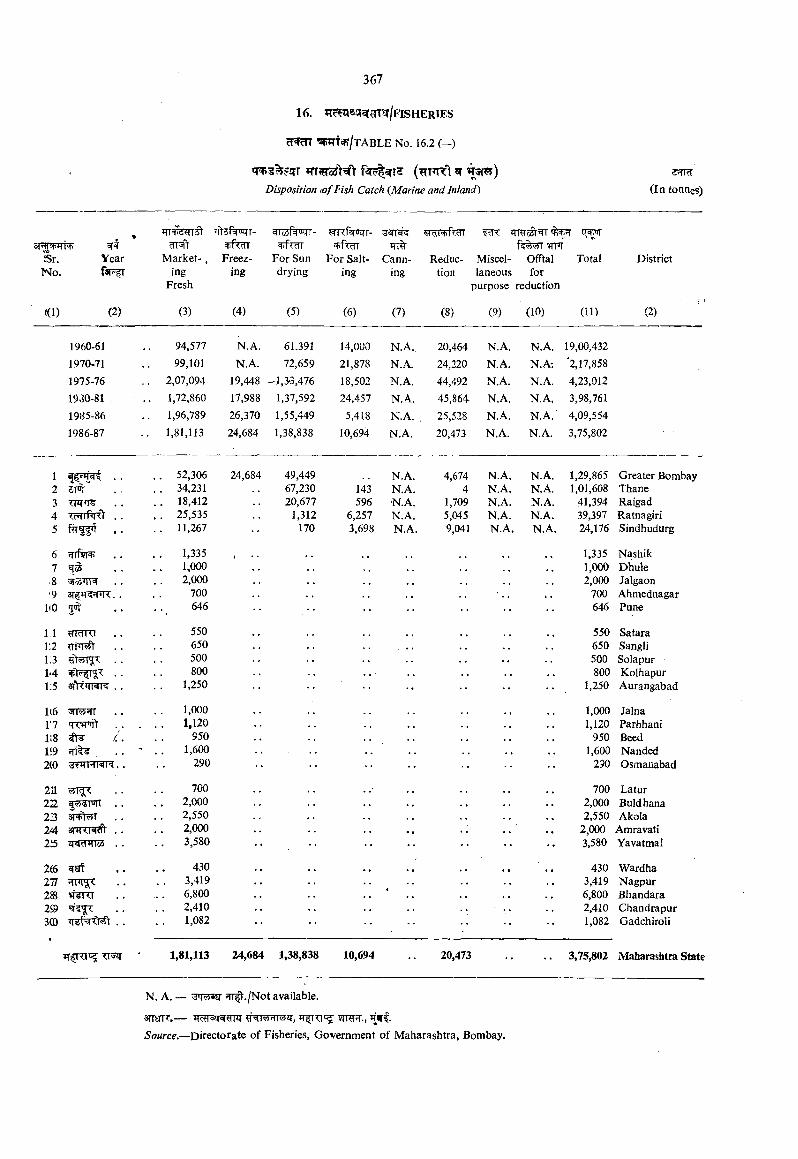
{mn<\ ^Disposition (of Fish Catch {Marine and Inland^ (In tonnes)
3RTW^ir .No.
wt cTFfrYear Market-,f3T?fr ing
Fresh
(d)
gToSf WT- TT%<n:rr-
Freez- For Sun ing drying
For Salting
TTTCann
ing
lTRT55tTPT
Reduc- Miscel- Offtal Total tion laneous for
purpose reduction
(2) (3) (4) (5) (6) (7) ■ (8) (9) (10) (11)
1960-61 94,577 N.A. 61.391 14,000 N.A., 20,464 N.A. N.A. 19,00,4321970-71 99,101 N.A. 72,659 21,878 N.A. 24,220 N.A. N.A*. 2,17,8581975-76 .. 2,07,094 19,448 -1,3-3,476 18,502 N.A. 44,492 N.A. N.A. 4,23,0121930-81 .. 1,72,860 17,988 1,37,592 24,457 N.A. 45,864 N.A. N.A. 3,98,76119)35-86 .. 1,96,789 26,370 1,55,449 5,418 N.A. , 25,528 N.A. N.A.’ 4,09,5541986-87 .. 1,81,113 24,684 1,38,838 10,694 N.A. 20,473 N.A. N.A. 3,75,802
District
(2)
1 . 52,306 24,684 49,449 N.A. 4,674 N.A. N.A. 1,29,865 Greater Bombay2 . 34,231 67,230 143 N.A. 4 N.A. N.A. 1,01,608 Thane3 <.IM . . . 18,412 20,677 596 •N.A. 1,709 N.A. N.A. 41,394 Raigad4 . 25,535 1,312 6,257 N.A. 5,045 N.A. N.A. 39,397 Ratnagiri5 . . . 11,267 170 3,698 N.A. 9,041 N.A. N.A. 24,176 Sindhudurg
6 ?rrfirR> 1,335 , .. 1,335 Nashik7 1.000 1,000 Dhule8 . . . 2,000 2,000 Jalgaon‘9 700 700 Ahmednagar
1(0 3 ' 646 646 Pune
11 mdKi 550 550 Satarai;2 650 650 Sangli1.3 . . 500 500 Solapur14 800 800 Kolhapurl;5 1,250 1,250 Aurangabad
1(6 . . 1,000 1,000 Jalna17 TWft 1,120 1,120 Parbhani1!8 41 /.. 950, 950 Beed1‘9 ' 1,600 1,600 Nanded2(0 290 290 Osmanabad
211 700 700 Latur22 , . 2,000 2,000 Buldhana23 3(+!<?> [ . . . 2,550 2,550 Akola24 STTRI^ . . 2,000 2,000 Amravati2 5 . . 3,580 •• 3,580 Yavatmal
266 430 ., 430 Wardha277 . 3,419 3,419 Nagpur28 TSTTT . 6,800 6,800 Bhandara2» • • . 2,410 2,410 Chandrapur3(D 1,082 1,082 Gadchiroli
1,81,113 24,684 1,38,838 10,694 20,473 •• 3,75,802 Maharashtra Stat
N. A. — 3W«ET ^ . / N o t available.
STTIinT.— ?TRT-,Source.—Directorate of Fisheries, Government of Maharashtra, Bombay.
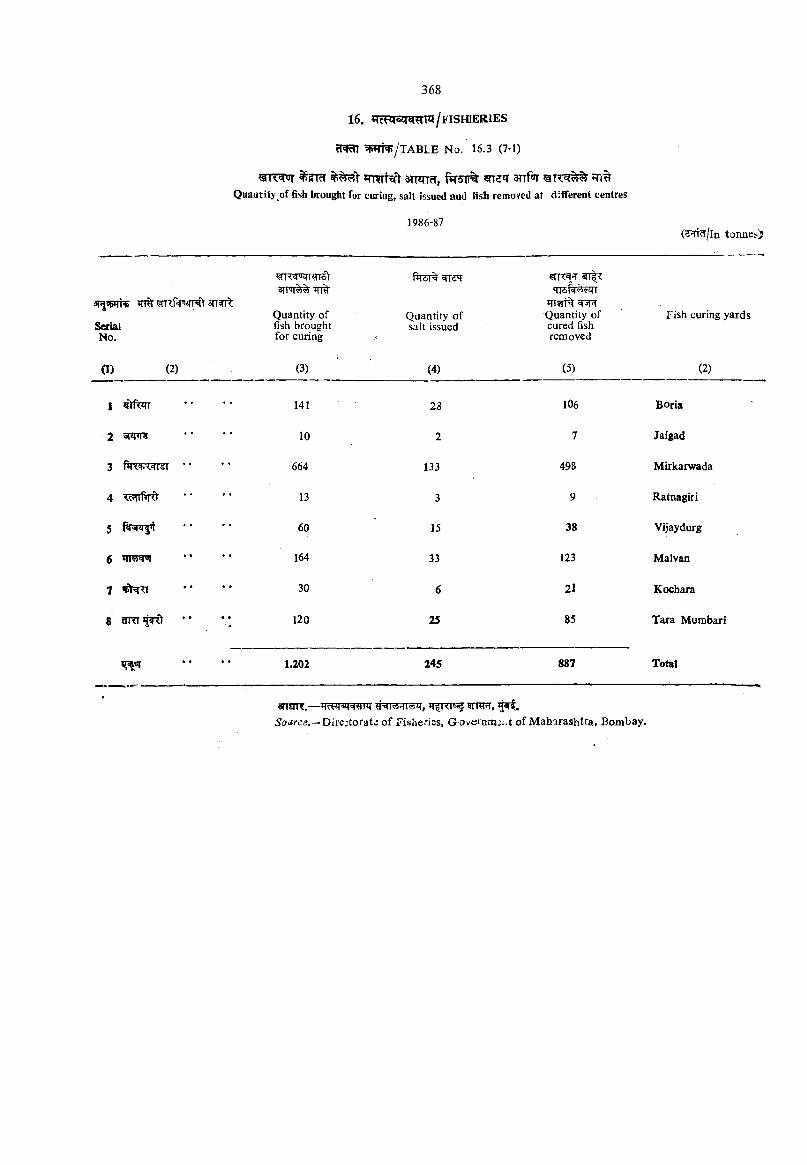
368
16. /fISM ERIES
cfWm ?FTf^/TABLE No. 16.3 (7-1)
(IT T ^ ?TcT TRTTift STRTcT, f TSTT snf«»T ♦Tli% Quantity of fish brought for curuig, salt issued and fish removed at different centres
1986-87(s^rt /ln tonnes)
TTr JT 't 3TT^
SerialNo.
srrn' ■Hiti
Quantity of fish brought for curing
ftrST%
Quantity of salt issued
Quantity of cured fish removed
Fish curing yards
a ) (2) (3) (4) (5) (2)
1 141 28 106 Boria
2 10 2 7 Jaigad
3 • ' 664 133 498 Mirkarwada
4 W M 13 3 9 Ratnagiri
5 60 15 38 Vijaydurg
6 164 33 123 Malvan
7 30 6 21 Kocbara
8 ’ • *• 120 25 85 Tara Mumbari
1,202 245 887 Total
anSTTT.— *r5RT<55 5TRFT,Directorate of Fishe'iss, G-overniujr.t of Maharashtra, Bombay.
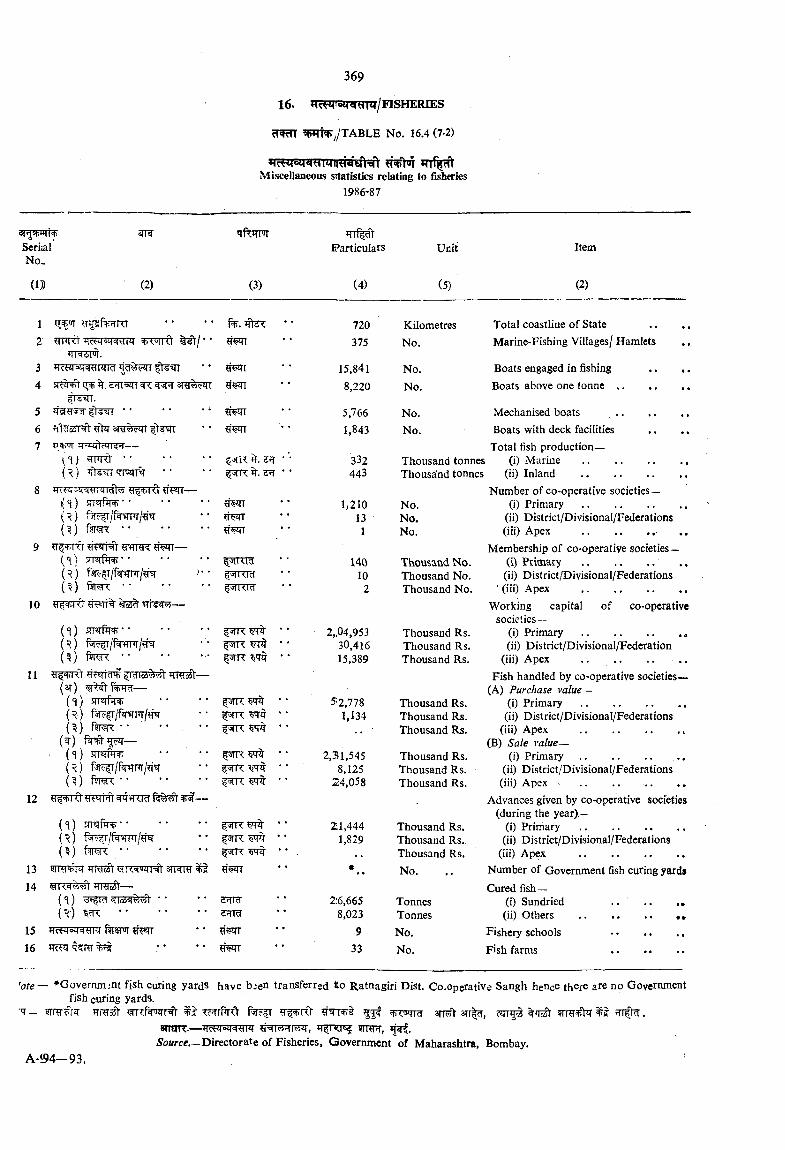
W ^ yX A B L E No. 16.4 (7-2)
?T >JT *n%ftMiscellaneous sitatistics relating to fisheries
1986-87
em iiW 3TRSerial Particulars Unit ItemNo„
(D) (2) (3) (4) (5) (2)
1 tT^ g’pfe^TRT f^. 720 Kilometres Total coastline of State2 HFRt i ?FT«q'WPT WTRt * ’ ? iw 375 No. Marine-Fishing Villages/ Hamlets
15,841 No. Boats engaged in fishing . . . .4 ?T. d'll'oqi ^ TjpT ?fwr 8,220 No.
5 ............................... 5,766 No.6 filciasr l ylii 1,843 No. Boats with deck facilities7 rWfr?>Tr'?fT— Total fish production—
('i) ................................... ^.2:^ • • 332 Thousand tonnes (i) Marine . . . . . .( ^ T r n i T % • • 443 Thousa'nd tonnes (ii) Inland ......................................
8 'EIFTT— Number of co-operative societies—('i) srr2rRi+............................... ?fwr 1,210 No. (i) P r im a r y .....................................( ^ 13 No. (ii) District/Divisional/Federations{ ^) r^r^fjx............................... 1 No. (iii) Apex ..........................
9 y^4-Ki — Membership of co-operative societies—( 'I) 5rrs£rpT=t;' * 140 Thousand No. (i) Primary(^) fJF /ftmTT/^pr >•• 10 Thousand No. (ii) District/Divisional/Federations{^) PiiK=1<............................... 2 Thousand No. ' (iii) Apex ................................... ..
Working capital of co-operativesocieties —
(T) ' 3JR ' • 2„04,953 Thousand Rs. (i) P r im a r y ................................... ..{^) r /fT'flTT/ fW 30,416 Thousand Rs. (ii) District/Divisional/Federation(? ) f W T ............................ .. 15,389 Thousand Rs. (iii) Apex ..........................
11 i Fish handled by co-operative societies—
(*1) |STR • • 52,778 Thousand Rs. (i) P r im a r y .....................................(^) ^ R ’ ‘ 1,134 Thousand Rs. (ii) District/Divisional/Federations(? ) • • * • • • Thousand Rs. (iii) Apex ................................... .
(^) — (B) Sale value—(< ) ^ ’ • 2,31,545 Thousand Rs. (i) P r im a r y ..........................( R) 8,125 Thousand Rs. (ii) District/Divisional/Federations(? ) ............................... 'jfR • • 24,058 Thousand Rs. (iii) Apex ~
12 Advances given by co-operative societies(during the year).—
( ‘ ) 5rr^m+............................... 2:1,444 Thousand Rs. (i) Primary .. .........................( r ) f'SlR ^ • • 1,829 Thousand Rs. (ii) District/Divisional/Federations(? ) f^ reR ............................... ^ R Wif • ' . Thousand Rs. (iii) Apex .....................................
13 5TR#nT iwdJi ^R^wrfr s n ^ ^ E rr * No. Number of Government fish curing yards14 Cured fish—
('l) =llobq<rt«l d ld 2:6,665 Tonnes (i) Sundried . . . .i^ ') ............................... d W 8,023 Tonnes
15 ?iwT * * 9 No. Fishery schools ..........................16 Q?m' 1 33 No.
hte— *Governmjnt fish curing yards have b;en transferred tto Ratnagiri Dist. Co.operative Sangh hetice there are no Government fish curing yards.
rqf_ ?fTT t 55? 3tt > 3rr|?r, cqr^ .smnr.—itcptsirfpt srra , if^.
Source__Directorate of Fisheries, Government of Maharashtra, Bombay.A-194—93.
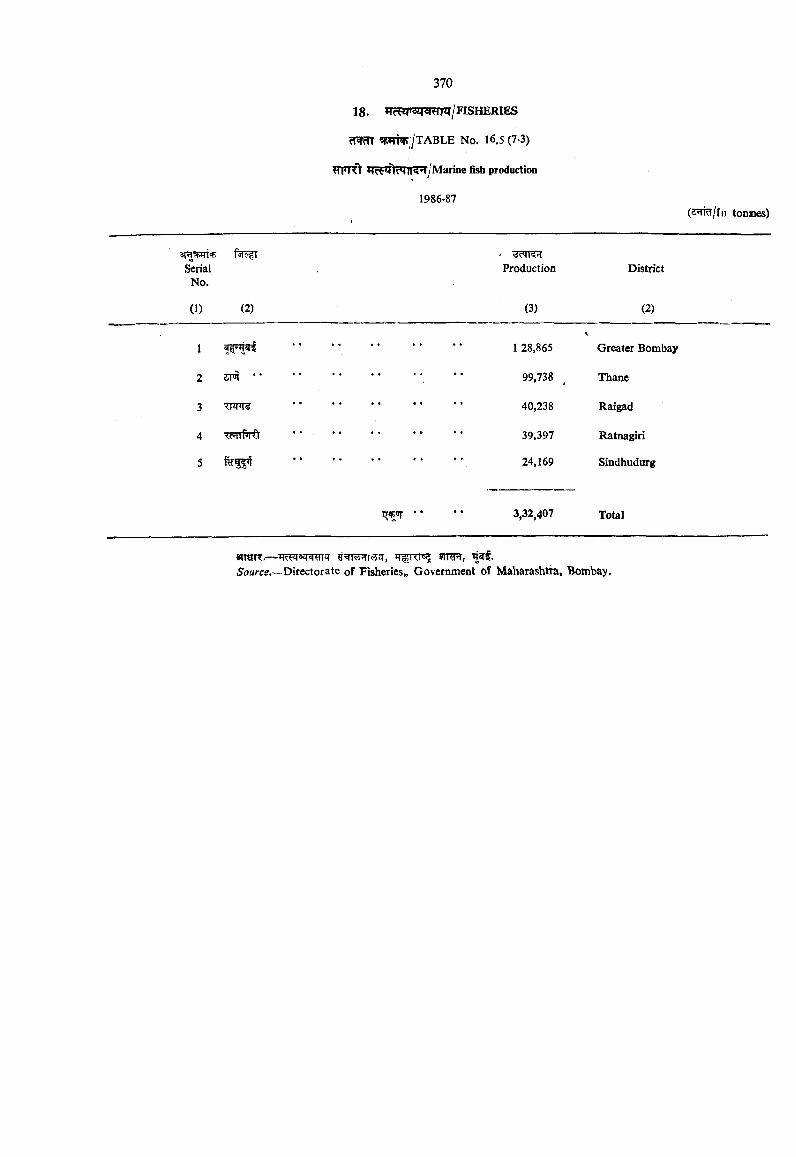
370
18. WcWSM^ ^T /FlSHERlES
/TABLE No. 16.5 (7-3)
Marine fish production
1986-87(2:?ri /ln tonmes)
SerialNo.
Production District
(1) (2) (3) (2)
1 4 ^ 1 . . . 1 28,865 Greater Bombay
2 sm ' * 99,738 Thane
3 40,238 Raigad
4 <HTniM 39,397 Ratnagiri
5 24,169 Sindhudurg
IT^ * * •• 3,32,407 Total
«n«TT.— g=R7VTT?T, 91!^,.S'oMrce.—Directorate of Fisheries,, Government of Maharashtra, Bombay.
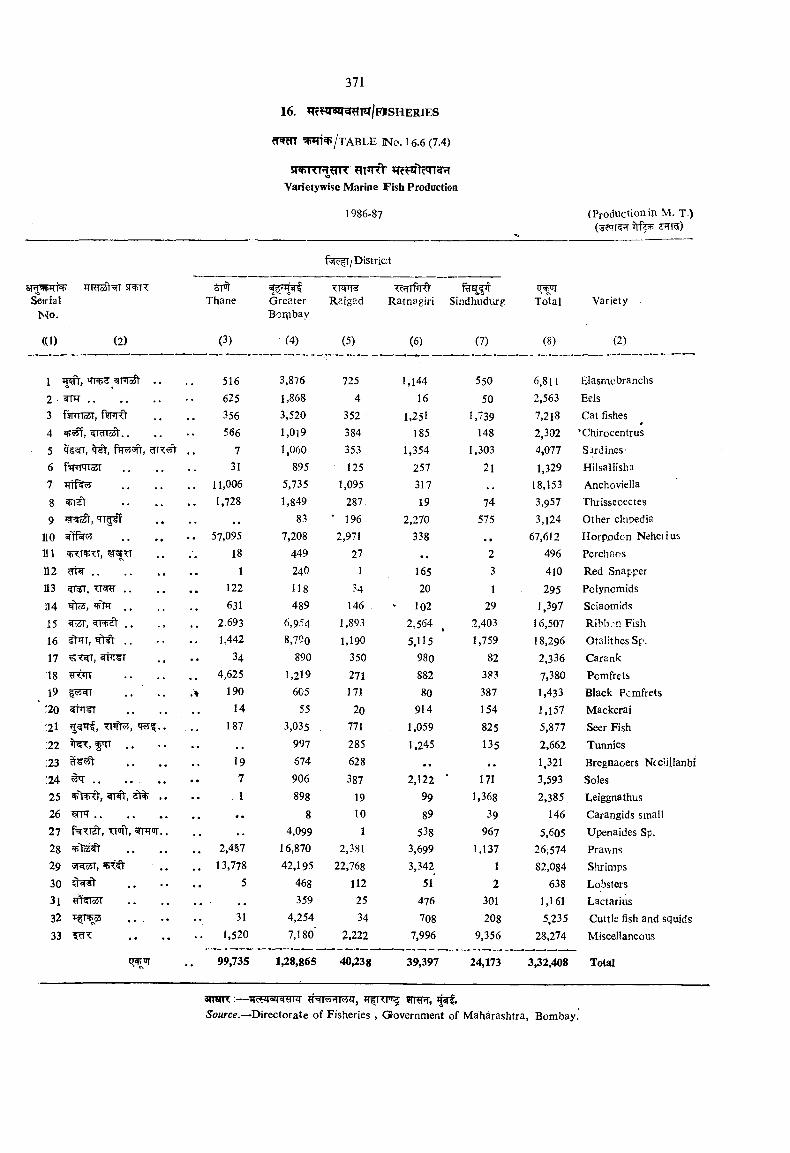
ST^Ttt TTRToSt Senrial
N o.
(d) (2)
Thane
(3)
fRm TOfS/TABLE INo. 16-6 (7.4)
5R>TTR TR 5RR?ift?in?»TVarietywisc Marine Fish Production
1986-87
District
(Productionin M. T.)
Greater Raigad Bonibay
(4) (5)
Ratnagiri Sindhudvirg
(6) C7)
ITCT]"Total
(8)
Variety
(2)
1 WY,'TT^? <=<1 . . 516 3,876 725 1,144 550 6,811 Elasmobranchs2 • «)rH.......................... 625 1,868 4 16 50 2,563 Eels3 f nTToST, f w d 356 3,520 352 1,251 1,739 7,218 Cat fishes4 T IToS)-.. 566 1,019 384 185 148 2,302 ’Chirocentrus5 . . 7 1,060 353 1,354 1,303 4,077 Sardines-6 f^*l^odl 31 895 125 257 21 1,329 Hilsallisha7 11,006 5,735 1,095 317 18,153 Anchoviella
8 .......................... 1,728 1,849 287 19 74 3,957 Thrisseoectes9 . , , , 83 ‘ 196 2,270 575 3,124 Other chipedia
no 5ftr«i^ 57,095 7,208 2,971 338 67,612 Horpfldcn Neheiius111 18 449 27 . . 2 496 Perch r> os112 ^ ..................................... 1 240 1 165 3 410 Red Snappern3 4r<fT, .......................... 122 118 34 20 1 295 Polynomids114 ^loi, Jf>>T.......................... 631 489 146 . ' 102 29 1,397 Sciaomids15 .. 2,693 6,954 1,893 2,564 , 2,403 16,507 Rihb-'n Fish16 5t^T, . , • • • • 1,442 8,790 1,190 5,115 1,759 18,296 Otalithes Sp.17 ^T^T, ^ ¥ T . . . . 34 890 350 980 82 2,336 Carank18 y< ir ......................... 4,625 1,219 271 882 383 7,380 Pcmfrets\9 cri<\\ ........................% 190 605 171 80 387 1,433 Black Pcmfrets
:2o .................................. 14 55 20 914 154 1,157 Mackerai;2 l 187 3,035 771 1,059 825 5,877 Seer Fish.22 . . 997 285 1,245 135 2,662 Tunnies23 .................................. 19 674 628 M • . . 1,321 Bregnaoers Nccliilanbi:24 ^ . . . . . . 7 906 387 2,122 ‘ 171 3,593 Soles25 . . 1 898 19 99 1,368 2,385 Leiggnathus26 ^ ................................................. . . 8 10 89 39 146 Carangids small27 TTofV, ^ i r . . 4,099 1 538 967 5,605 Upenaides Sp.28 .......................... 2,487 16,870 2,381 3,699 1,137 26,574 Prawns29 13,778 42,195 22,768 3,342 1 82,084 Shrimps30 5 468 112 51 2 638 Lobsters3l ylcTTST .......................... . . 359 25 476 301 1,161 Lactarius
31 4,254 34 708 208 5,235 Cuttle fish and squids1,520 7,180' 2.222 7,996 9,356 28,274 Miscellaneous
99,735 1,28,865 40,238 39,397 24,173 3,32,408 Total
aninT:— rmrr,Source.—Directorate of Fisheries , Government of Maharashtra, Bombay.
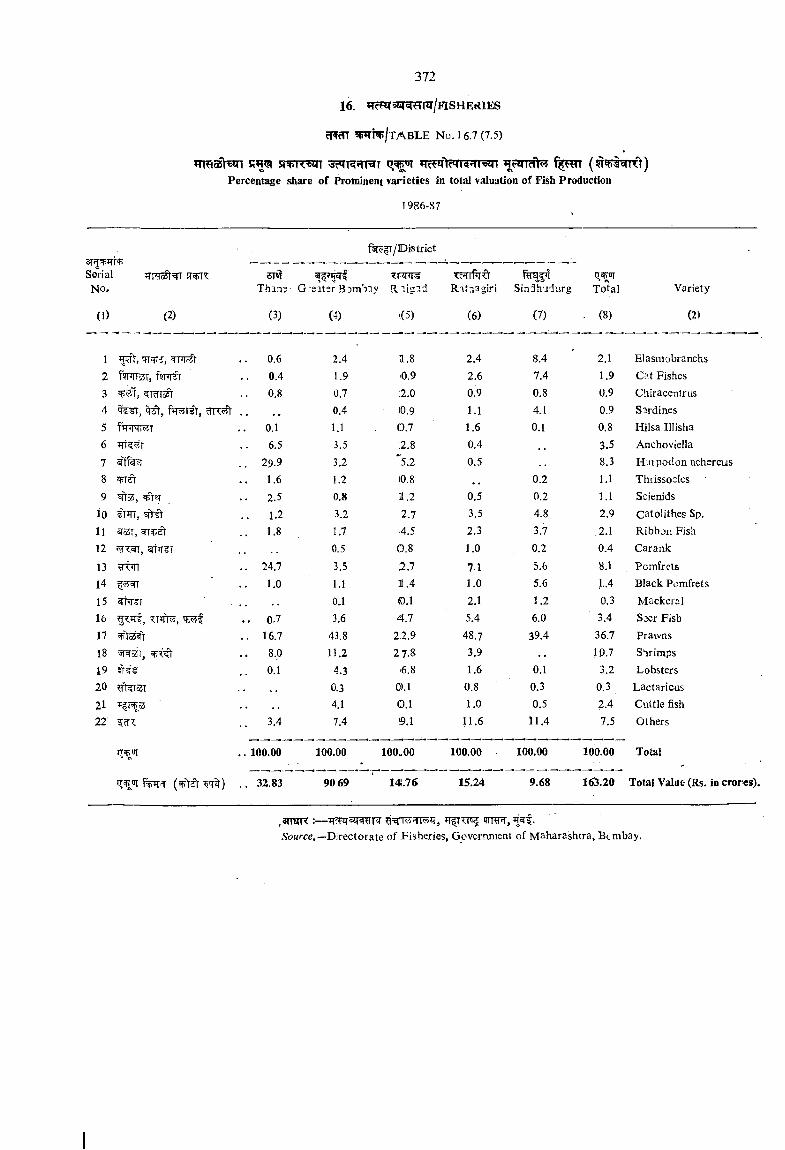
16. T^^fSf^m lFlSH EtilES
ffwm ^ p p / t a b l e No. 1 6.7 (7.5)
R'ttK'oiilT 3r'TR?TRT ’Tr^ tt’TR'TT’eZn FOTTcft f RTT (^®FtWT^)Percentage share of Prominent varieties in total valuation of Fish Production
1986-87'
3T^Hi+SerialNO.
f^e^l/lDistrict
smThin:
TFiprsG;eater Bombay R^igad R'\taagu'i Sindhudiirg
CTOTToUl Variety
(1) (2) (3) (4) ((5) (6) (7) ■ (8) (2)
1 PTF?t .. 0.6 2.4 1.8 2.4 8.4 2.1 Elasmobranchs2 fWiST, f? l^ .. 0.4 1.9 -0.9 2.6 7.4 1.9 Cat Fishes3 0.8 0.7 .2.0 0.9 0.8 0.9 Chiracentrus4 ^5t, r^rs), cTTT • ■ • • 0.4 (0.9 1.1 4.1 0.9 Sardines5 fWTMT .. 0.1 1.1 0.7 1.6 0.1 0.8 Hilsa Illisha6 Trr??!t 6.5 3.5 ;2.8 0.4 , , 3.5 Anchoviella7 sfff Fv .. 29.9 3.2 .5.2 0.5 8.3 H^iipodon nehereus8 . . 1.6 1.2 (0.8 , , 0.2 1.1 Thiisso"les9 ^53, . . 2.5 0.8 1.2 0.5 0.2 1.1 Scienids
io 3T^, .. 1.2 3.2 2.7 3.5 4.8 2.9 Catolithes Sp.11 .. 1.8 1.7 4.5 2.3 3.7 2.1 Ribbon Fish12 ^ir^r 0.5 0.8 1.0 0.2 0.4 Carank
13 ^b\] . . 24.7 3.5 2.7 7.1 5.6 8.1 Pomfrctsl4 .. 1.0 1.1 11.4 1.0 5.6 1..4 Black Pomfrets15 dUi r 0.1 ©.1 2.1 1.2 0.3 Mackeral16 . . 0.7 3.6 4.7 5.4 6.0 3.4 Sser Fish17 .. 16.7 43.8 2;2.9 48.7 39.4 36.7 Prawns18 3 551, .. 8.0 11.2 2 7.8 3.9 19.7 Shrimps19 .. 0.1 4.3 ■6.8 1.6 0.1 3.2 Lobsters20 ?r1i S5T 0.3 0.1 0.8 0.3 0.3 Lactaricus21 • • 4.1 0.1 1.0 0.5 2.4 Cuttle fish22 %^x .. 3.4 7.4 ‘9.1 11.6 11.4 7.5 Others
XT Jl .. 100.00 100.00 100^00 100.00 100.00 100.00 Total
feTTcT (^tfr q- ) . . 32.83 9069 14t.76 15.24 9.68 16"3.20 Total Value (Rs. in cror es).
,3mnr:— ?NT ?rTwJ), 5mnr,5t>Hrce.—Directorate of Fisheries, Government of Maharashtra, Bcmbay.
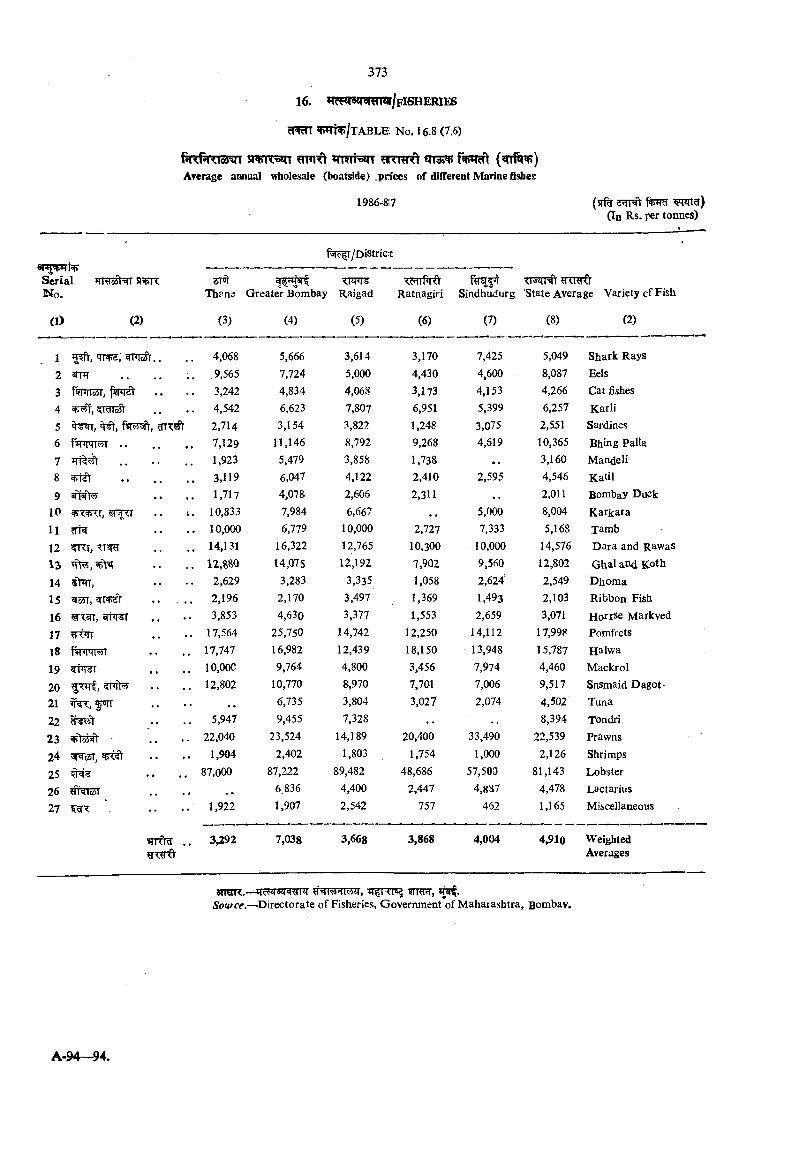
373
16. / f i s h e r ie s
^S^TT^/tABLE No. 16-8 (7.6)
snnR=Btn «n3^A?mge annual wholesale (boatside) .prices of different Marine fishes
1986-8!7 (5rf% wn?r)(In Rs. per tonnes)
^t^/DiStric;t
SerialN o.
(1)
*TRfc5Nr S'Pf?.
(2)
sTrThfsna Greater Bombay Raigad
<c»iiniO Tr JTTI' yxnrcl’Ratnagiri Sindhudurg ‘State Average Variety cf Fish
(3) (4) (5) (6) (7) (8) (2)
21
'TT ,
fsfrrriosr, ftnisV
fWTT^ . .
8 9
10 ^rr^r,11 cTR12 ?TTT,1314 3>TT,151617 ^18 fWTMT19 WFT T20
2223 ^1o5^24 ^dST,252627 \
4,068.9,5653,242
4,5422,7147,1291,9233,1191,717
10,83310,00014,13112,S80
2,6292,1963,853
17,56417,74710,00012,802
5,94722,040
1,90487,000
1,922
5,666 7,724 4,834 6,623 3,154
11,146 5,479 6.047 4,078 7,984 6,779
16,322 14,075
3,283 2,170 4,630
25,750 16,982 9,764
10,770 6,735 9,455
23,524 2,402
87,222 6 836 1,907
3,6145.000 4,068 7,807 3,822 8,792 3,858 4,122 2,606 6,667
10.000 12,765 12,192
3,3353,4973,377
14,74212,4394,8008,9703,8047,328
14,1891,803
89,4824,4002,542
3,1704,4303,1736,9511,2489,2681,7382,4102,311
2,72710,3007,9021,0581,3691,553
12,25018,1503,4567,7013,027
20,4001,754
48,6862,447
757
7,4254,6004,1535,3993,0754,619
2,595
5.000 7,333
10.000
9,560 2,624' 1,493 2,659
14,11213,9487,9747,0062,074
33,4901,000
57,5004,887
462
5,049 8,087 4,266 6,257
2,551 10,365 3,160 4,546 2,011 8,004 5,168
14,576 12,802 2,549 2,103 3,071
17,998 15,787 4,460 9,517 4,502 8,394
22,539 2,126
81,143 4,478 1,165
Shark Rays EelsCat fishes Karl!
Sardines Bhing Palla Mandeli KatilBombay DuckKarjiarajambDara a n d R a w a s
Ghal and KothDhomaRibbon FishH o r r s e M a r k v e d
PomfretsHalwa
MackrolSnsmaid DagotTunaTondriPrawnsShrimpsLobsterLacfariusMiscellaneous
3,292 7,038 3,668 3,868 4,004 4,91q WeightedAverages
iTfTTTSI ifmHT,Directorate of Fisheries, Government of Maharashtra, B o m b a y .

^FTT, w ^q-R^ ?r «TT,JTT r TTTTo 3Tt| .
f ^ s r ^ q r ,#55^ TTT%ft mf^-WTT^ fel" 3Tt|. “ ” | ^tw t^ w f^ . ^T ^T^?TS S^Tf^ ^Tsms^ I7. q-
^ ^ T m i ^ srri- "TTT 3tt| .
ZTT^ W k 't ^ ^ s r f e^ TfrflcfHT ^ f r m
3Tr|b ^ T TR«Tr=5ft q wloS sr^?r STc375T ^ T %% 5TTlt STlfn' 'T^^=5qr
T?: JT7ft ^pm^T 3{feT=iTFTlr 3tt| anrtr ^ r qr - ?nn%9r 3tt| .
.17.1. The information on Agricultural and non- agricultural co-operative credit societies. Multipurpose Co-operative Societies, Marketing Societies, Productive Societies etc. is presented in this section.
17.2. The information on number of various co-operative societies, membership, working capital, fixed capital, loans advanced, overdues etc. is presented in this section. Owned capital shows the paid-up capital. Borrowing denotes the total borrowings outstanding at the end of the period. Working capital includes paid-up capital, deposits and borrowings. Loans outstanding includes outstandings in respect of loans, cash credits and overdrafts and the amount of outstanding bills purchased and discounted. Oyer" dues refer to the amount of loans or instalments wMch was due for collection but which was not actually collected and for the repayment of which no extension has been granted by a competent authority.
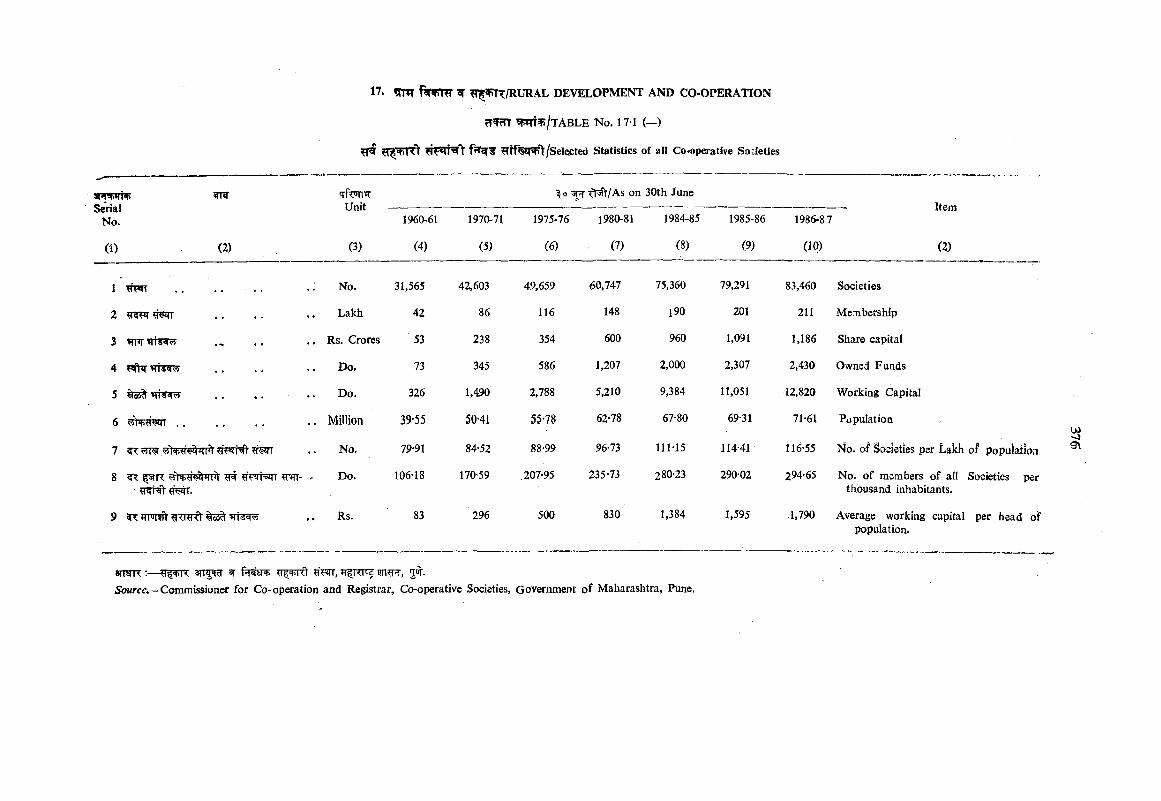
SerialNo.
(1) (2)
17. 5C ^3PTT/RURAL DEVELOPMENT AND CO-OPERATION
?Twm w ?;/t a b l e n o . i 7-i (—)
^ /Selected Statistics of all Co-operative Societies
<Tp??inTUnit
(3)
o tjpT ft^ /A s on 30th June
1960-61
(4)
1970-71
(5)
1975-76
(6)
1980-81
(7)
1984-85
(8)
1985-86
(9)
1986-87
(10)
Item
(2)
1 No. 31,565 42,603 49,659 60,141 75,360 79,291 83,460 Societies
2 Lakh 42 86 116 148 l90 201 211 Me:Tibership
3 Rs. Crores 53 238 354 600 960 1,091 1,186 Share capital
4 . . Do. 73 345 586 1,207 2,000 2,307 2,430 Owned Funds
5 %53% . . « . • • Do. 326 1,490 2,788 5,210 9,384 11,051 12,820 Working Capital
6 , , Million 39-55 50-41 55-78 62-78 67*80 69-31 71*61 Population
No. 79*91 84-52 88-99 96-li 111*15 114-41 116-55 No. of Societies per Lakh of population
8 ^ yPThzTT - «i^T.
Do. 106-18 170-59 207*95 235-73 280-23 290-02 294*65 No. of members of all Societies per thousand inhabitants.
9 iRTimt TRRt %o5% ^isq« Rs. 83 296 500 830 1,384 1,595 1,790 Average working capital per head of population.
U)
m n x ^ jot.iToMrfi'.—Commissioner for Co-operation and Registrar, Co-operative Societies, Government of Maharashtra, Pune,
^5TOjTABI.E No. 17-2
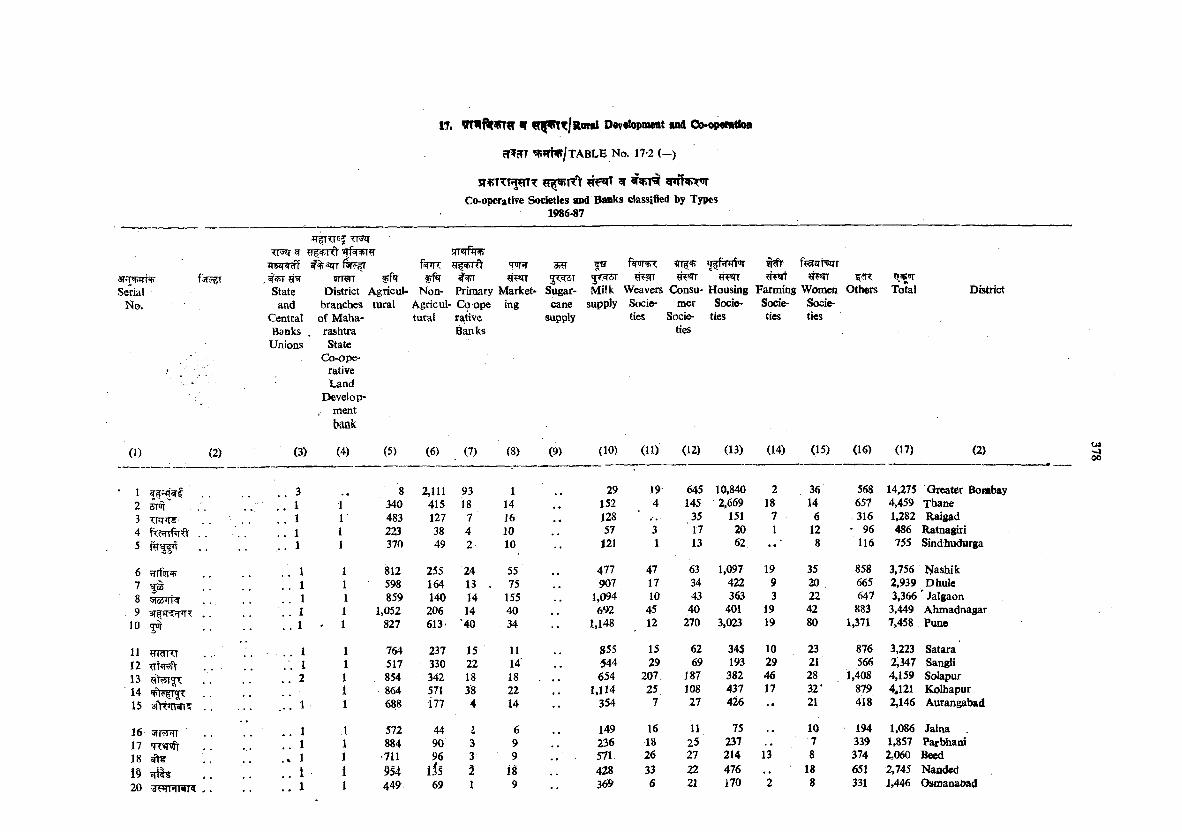
17. n fff« tt|R aral Dev«loptteiit osd Go-opwttloa
ar^TTRmr ^Co-operative Sodeiies and Banks classified by Types
1986*87
3T*h-M(+Serial
No.
TT5q-TFq- wf+TTl jrr«rfiT
Stateand
CentralBanksUnions
?rraT District
branches of Maharashtra State
Co-operative Land
Develop- . ment
bank
'TtlpT
Agricul- Non- Primary Market- tural Agricul- Co ope ing
tural ra.tive Banks
5^TSugarcane
supply
JTWSr BW ?IT«TTMilk Weavers Consu- Housing Farming Women
supply Socle- met Socie- Socie- Societies Socie- ties ties ties
ties
Others Total Destrict
(1) (2) (3) (4) (5) (6) (8) (9) (10) (11) (12) (13) (14) (15) (16) (17) (2)
12
. . 3 . . . 1 1
8340
2,111415
9318
114
•• 29152
194
645145
10,8402,669
218
3614
568657
14,275 Greater Boail 4,459 Thane
3 . . . . . . 1 1 483 127 7 16 m 35 151 7 6 316 1,282 Raig»d4 fw frO ' . . . . 1 1 223 38 4 10 57 3 17 20 1 12 * 96 486 Raitnagiri5 . . . . 1 1 370 49 2 10 •• 121 1 13 62 8 116 755 Sindhudurga
6 ?rin)i+ . . . . 1 1 812 255 24 55 477 47 63 1,097 19 35 858 3,756 Nashik7
Sfbi rr . .. . 1 1 598 164 13 . 75 907 17 34 422 9 20 . 665 2,939 Dhule
8 . . 1 1 859 140 14 155 1,094 10 43 363 3 22 647 3,366 ' Jalgaon9 3Ti|JT [?nTT . . 1 1,052 206 14 40 692 45 40 401 19 42 883 3,449 Ahmadnagar
10 ^ .. / . 1 - 1 827 613- '40 34 •• 1,148 12 270 3,023 19 80 1,371 7,458 Pune
11 1 764 237 15 11 855 15 62 345 10 23 876 3,223 Satara12 . . . . 1 1 517 330 22 14' , , 544 29 69 193 29 21 566 2,347 SangH13 ?ft55T . .
. .. . 2 1 . 854 342 18 18 « • 654 207, 187 382 46 28 1,408 4,159 Solapur
14 i 864 571 38 22 1,114 25 108 437 17 32* 879 4,121 Kolhapur15 1 688 177 4 14 •V 354 7 27 426 •• 21 418 2,146 Aurangabad
16 1 572 44 j 6 149 16 11 75 10 194 1,086 Jalna17 1 1 884 90 3 9 236 18 25 237 7 339 1,857 Parbhani18 .» 1 1 711 96 3 9 • • 571. 26 27 214 13 8 374 2,060 Beed19 i 954 i i s 2 18 .. 428 33 22 476 18 651 2,745 Nanded20 JFTRTWT . . ” 1 1 449 69 1 9 369 6 21 170 2 8 331 1,446 Osmanabad
UJ00
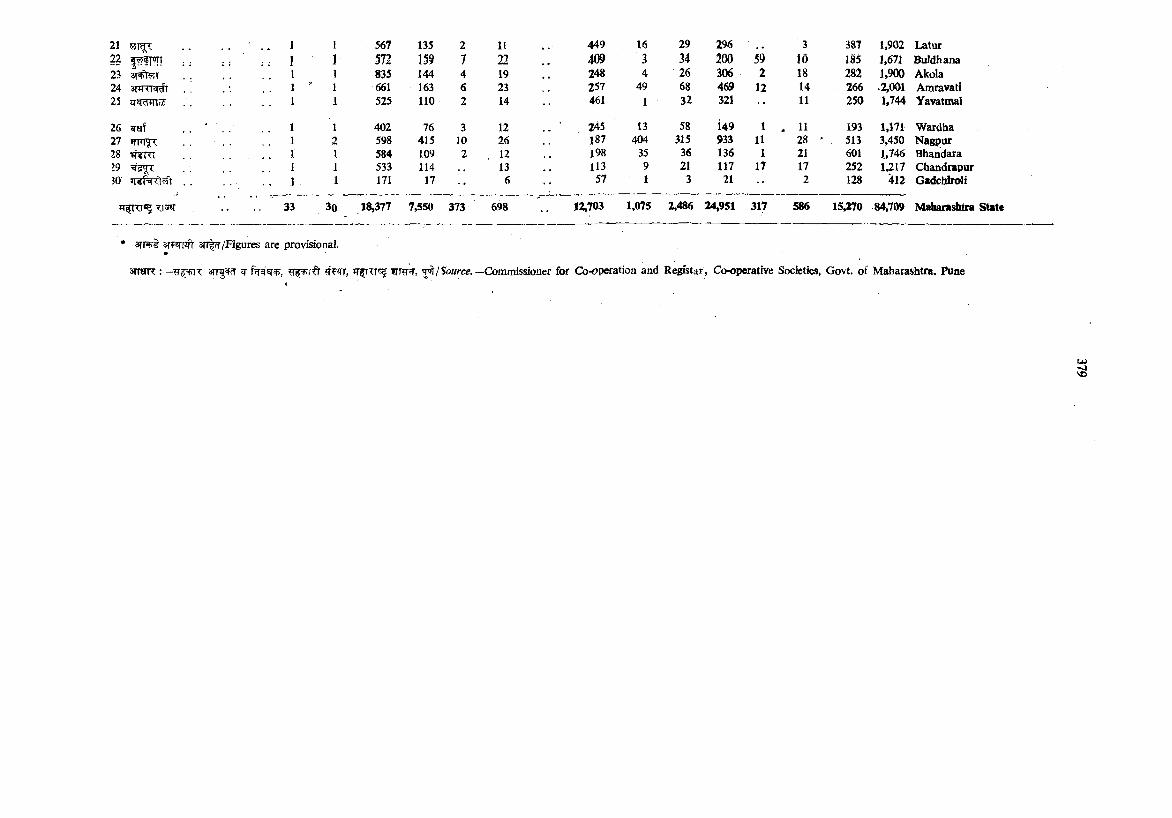
212223 3T^T24 arrrawt25
26 ^ a f272829 =5T5:?0‘
irfTO ■?;i 33
567572835661525
402598584533171
135159144163110
7641510911417
27462
3102
3o 18,377 7,550 373
1122192314
122612136
698
449 16 29 296 . . 3 387 1,902 Latur409 3 34 200 59 15 I85 1,671 BuJdhana248 4 26 306 2 18 282 1,900 Akola257 49 68 469 12 14 266 .2.001 Amravati461 1 32 321 . . 11 250 1,744 Yavatmal
245 ' 13 58 149 1 . 11 193 lil71 Wardha187 404 315 933 11 28 ' 513 3,450 Nagpur198 35 36 136 1 21 601 1,746 Bhandara113 9 21 117 17 17 252 1,217 Chandrapur57 1 3 21 .. 2 128 412 Gadchiroli
12,703 1,075 2,486 24,951 317 586 15,270 84,709 Maharashtra State
* 3TRrl' 3n|cr/Figures are provisional.
sniTTT ’TfrTT'sj ?rr?TfT, ^jSource. —Commissioner for Co-operation and Registar, Co-operative Societies, Govt, of Maharashtra, Pune
UJ<1VO
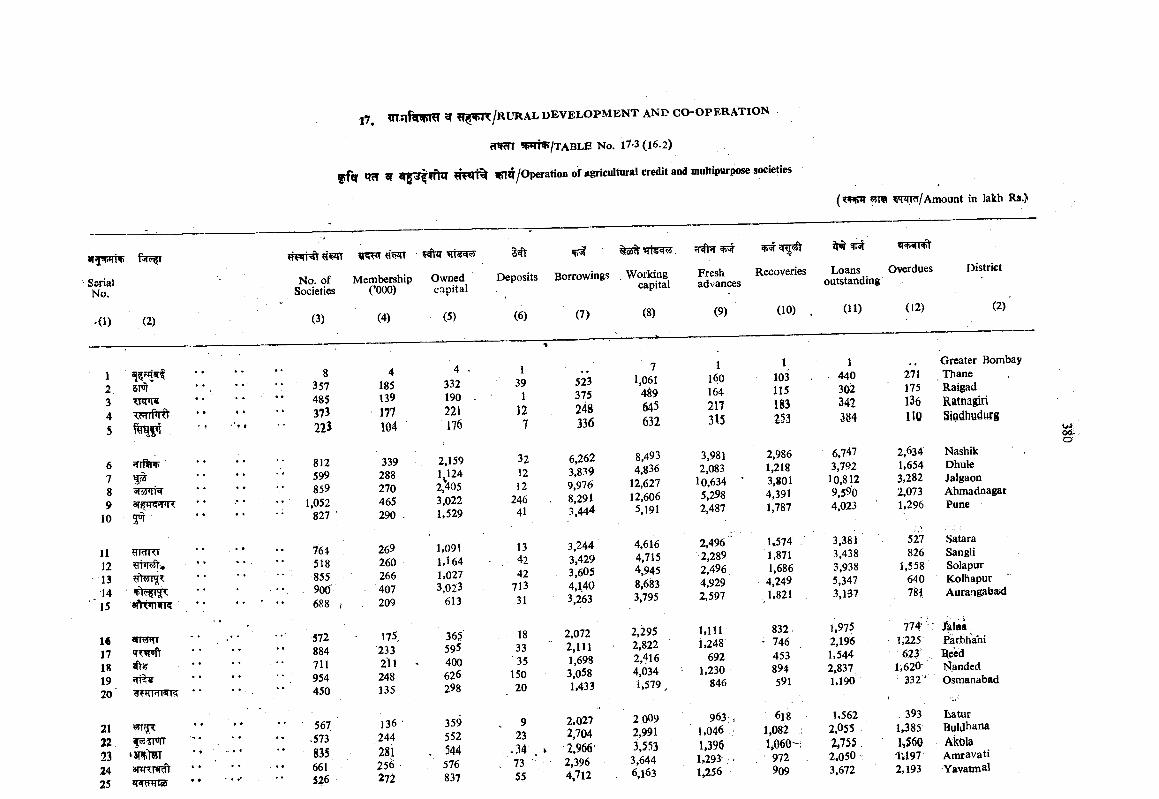
tRT ^ ^^yoperation of iigricultural credit and multipurpose societies
SerialNo.
•d) (2)
12 5M345
67 I®8 «fo3lTR9
10 5^
11 TRnTT121314
' 15 sftvnwR
1« anawr171819 5TT20
2132232425
No. of Membership Owned Societies (’000) capital
(3) (4) (5)
357485373225
812599859
1.052827
764518855900'688
572884711954450
567.573835661526
4185139177104
339288270465290
269260266407209
175233211248135
136 244 281 256 272
4332190221176
2,159 1 124 2,4053.022 1,529
1,0911,1641.0273.023
613
365595400626298
359552544576837
Deposits Borrowings , Working capital
(6)
1391
127
321212
24641
134242
71331
1833
'3515020
923
,347355
(7)
523375248336
6,2623,8399,9768,2913,444
3,2443,4293,6054,1403,263
2,0722,1111,6983,0581,433
2,027 2.704 2,966‘ 2,396 4,712
(8)
71,0614§9645632
8,4934,836
12,62712,6065,191
4,6164,7154,9458,6833,795
2,2952,8222,4164,0341,579
2 009 2,991 3,553
3,644 6,163
Freshadvances
(9)
1160164217315
3,9812,083
10,6345,2982,487
2.496 2,2892.496 4,929 2,597
1.1111,248
6921.230
846
963-1,0461,3961,2931 256
Recoveries
( 55T« WTRT/Amount in lakh Rs.)
Loans Overdues outstanding
District
(10) . (11) (12) (2)
1 1 Greater Bombay103 . 440 271 Thane115 302 175 Raigad183 342 136 Ratnagiri253 384 110 SiQ4hydurg
2,986 6,747 2,634 Nashik1,218 3,702 1.654 Dhule3,801 10,812 3,282 Jalgaon4,391 9,590 2,073 Ahmadnagar1,787 4,023 1.296 Pune
U574 3,381 527 Satara1,871 3,438 826 Sangli1,686 3,938 1,558 Solapur
4,249 5,347 640 Kolhapur1,821 3,1-37 781. Aurangabad
832- 1,975 774- ■ Jalaa' 746 2,196 1,225 Piarbhahi
453 1.544 623 Beed894 2,837 1,620 Jjandcd591 1,190 ■ 331 ' Osraanabad
6i 8 1,562 393 tatur1,082 1 2,055 1,385 Buldhana1*060"; 2,755 1,560 AkOla
972 2.050 t 1U97 Amtavati909 3,672 2,193 Yavatmal
OOr ■O
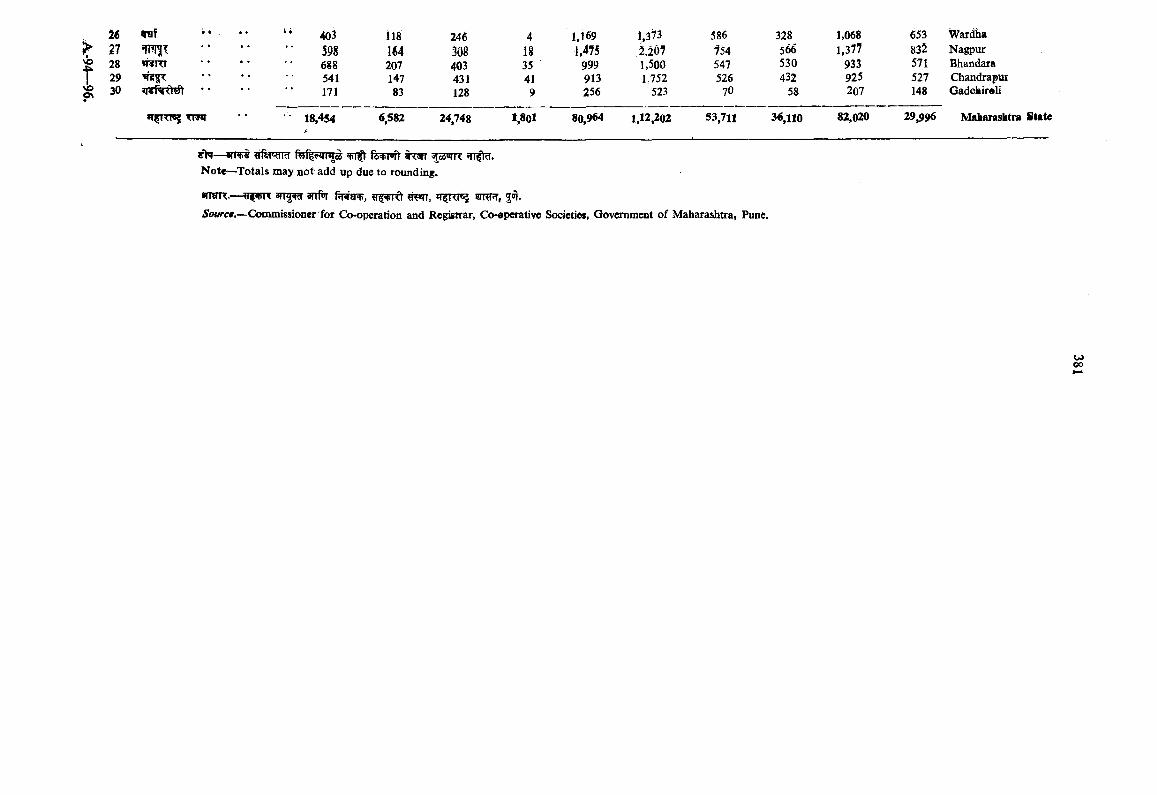
VOON
27282930
3986gg541171
18,454
m20714783
6.582
308403431128
24,748
4 1,169 1,373 586 32 1,068 653 Wardha18 1,475 2.207 754 566 1,377 832 Nagpur35 999 1,500 547 530 933 571 Bhandara41 913 1,752 526 432 925 527 Chandrapur9 256 523 70 58 207 148 Gadokir®li
53,711 36,110 82,020 29,996 Maharashtra State1,801 80,964 1,12,202
Note—^Totals may not add up due to rounding.
armR.— 3fTg anf T ?iwr, ^mnr, 5«ir.5cwrc«.—Commissioner for Co-operation and Registrar, Co-aperative Societies, Government of Maharashtra, Pune.
u>oo
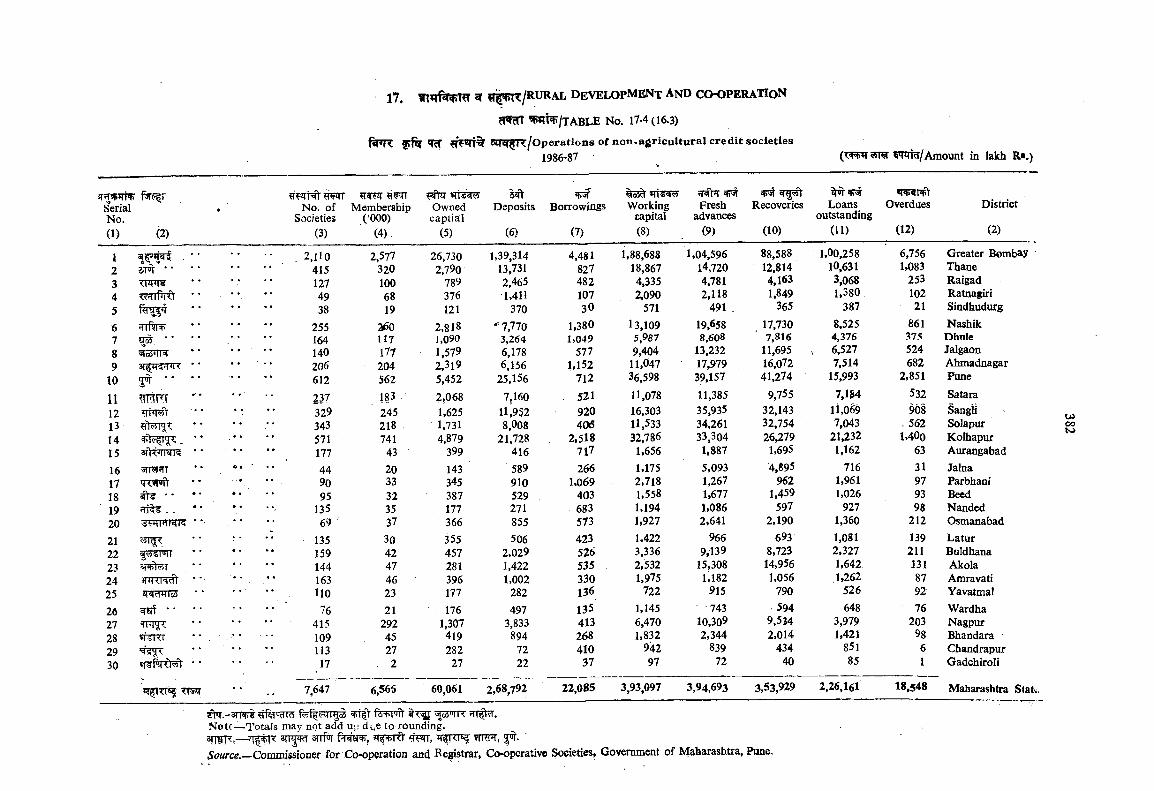
SerialNo.
17. ^ ? t 5 ^ /R U R a l D e v e lo p m e n t a n d c o - o p e r a t i o n
rTWm ^ R T /t ABLE No. 17-4 (16.3)
^srr% Sirar^R/Operations of non-agricultwral credit societies1986-87 id/Amount in lakh R«.)
(1) (2)
1 ' ■2 sm • * ‘ • • • • •345 • • •«
6 ••7 • • • •8 <»iM5Tr3t • •9 * • • •
10 jTf •• • •
11121314 **15 siV'tiiyi? * * ♦ • • •
16 5f1WTT ’ * «* c
17 • ♦
18 ^ ' • * ■ • «
19 «TT . . * ' • •
20 * •
21 • •22 v75TWr23 3i h r • • •«
24 *• • •25 *?=RnTTo526 wsrf ' ■27 • * • •
28 • • .29 • • • •30
TTSir • •
w srHt rarFTNo. of Membership Owned
Societies (’000) captial(3) (4), (5)
2.1104151274938
255164140206612237329343571177449095
13569
13515914416311076
41510911317
7 647
2,5773201006819
260117177204562183245218741
4320 33 32 35 37304247462321
29245272
26,7302,790
789376121
2,8181,0901,5792,3195,4522,0681,6251,7314,879
399143345387177366355457281396177
' 1761,307 419 282 27
5^Deposits
(6)
1,39,31413,7312,4651,411
3707,7703,2646,1786.156
25.1567,160
11,9528,008
21,728416589910529271855506
2,0291,4221,002
282497
3,833894
7222
Borrowings
(7)
Working Freshcapital advances(8) (9)
«i «V 4»'*1Recoveries Loans Overdues District
outstanding(10) (11) (12) (2)
6,566 60,061 2,68,792
4,481 1,88,688 1,04,596 88,588 1,00,258 6,756 Greater Bombay827 18,867 14,720 12,814 10,631 1,083 Thane482 4,335 4,781 4,163 3,068 253 Raigad107 2,090 2,118 1,849 1,380 102 Ratnagiri30 571 491 . 365 387 21 Sindhudurg
1.380 13,109 19,658 17,730 8,525 861 Nashik1,049 5,987 8,608 7,816 4,376 375 Dhole
577 9,404 13,232 11,695 6,527 524 Jalgaon1,152 11,047 17,979 16,072 7,514 682 Ahmadnagar
712 36,598 39,157 41,274 15,993 2,851 Pune
521 11,078 11,385 9,755 7,134 532 Satara920 16,303 35,935 32,143 li,069 908 Sangii40(5 11,533 34,261 32,754 7,043 . 562 Solapur
2,518 32,786 33,304 26,279 21,232 1,400 Kolhapur717 1,656 1,887 1,695 1,162 63 Aurangabad266 1,175 5,093 4,895 716 31 Jalna
1,069 2,718 1,267 962 1,961 97 Parbhani403 1,558 1,677 1,459 1,026 93 Beed683 1,194 1,086 597 927 98 Nanded573 1,927 2,641 2,190 1,360 212 Osmanabad423 1,422 966 693 1,081 139 Latur526 3,336 9,139 8,723 2,327 211 Buldhana535 2,532 15,308 14,956 1,642 131 Akola330 1,975 1,182 1,056 1,262 87 Amravati136 722 915 790 526 92 Yavatmal135 1,145 743 594 648 76 Wardha413 6,470 10,309 9.534 3,979 203 Nagpur268 1,832 2,344 2,014 1,421 98 Bhandara410 942 839 434 851 6 Chandrapur
37 97 72 40 85 1 Gadchiroli
22,085 3,93,097 3,94,693 3,53,929 2,26,161 18,548 Maharashtra Stat
U)ooK>
Note—Totals may not add up due to rounding.3|7ifR,—?T|#rR; 3TTW snfoT imw, 'Source._Commissioner for Co-op$rati<?n and I^e^strar, Co-operative Societies, Government of Maharashtra, Pune,
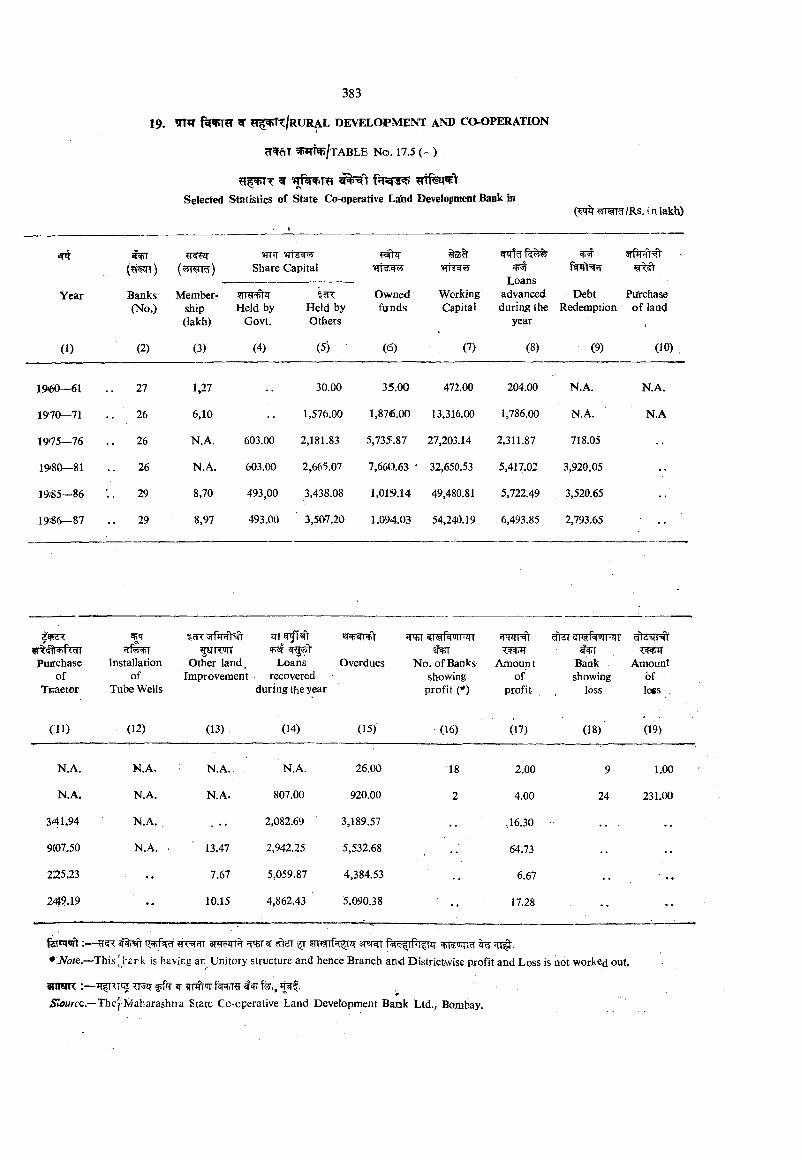
Year
(1)
^ 3TW>T’fI f?T?srgSelected Statistics of State Co-operative Laihd Deveiopment Bank in
•Isfil(m»qi)
^ir «Ti <?5' Share Capital
?#tq- %oS
Loans advanced duriiig the
year
Banks(No.)
Membership(lakh)
Held by Govt.
Held by Others
Ownedfunds
WorkingCapital
DebtRedemption
Putchase of land
(2) (3) (4) (5) (6) (7) (8) (9) (10)
1 9 ^ —61 27 1,27 30.00 35.00 472.00 204.00 N.A. N.A.
19>70_71 26 6,10 •• 1,576.00 1,876.00 13,316.00 1,786.00 N.A. N.A
1975—76 26 N.A. 603.00 2,181.83 5,735.87 27,203.14 2,311,87 718.05
1980—81 26 N.A. 603.00 2,665.07 7,660.63 • 32,650.53 5,417.02 3,920.05 ••
19)85—86 ’. 29 8,70 493,00 3,438.08 1,019.14 49,480.81 5,722.49 3,520.65 ••
19,86-87 29 8,97 493.00 3,507.20 1.094.03 54,240,19 6,493.85 2,793.65
Puirchaseof
Tpaetor
hHs+iInstallation
ofTube Wells
cK' lF+iHT-ql gsrrwr
Other land. Improvement
Loans recovered
during the year
Overdues No. of Banks showing
profit (*)
c
Amountof
profit
Bankshowing
loss
Amountoflo«s .
(11) (12) (13) (14) (15) (16) (17) (18)' (19)
N.A. N.A, N.A. . N.A. 26.00 18 2.00 9 1.00
N.A. N.A. N.A. 807.00 920.00 2 4.00 24 231.00
341.94 N.A. . 2,082.69 3,189.57 ,16.30 . . . • •
9(07.50 N.A. . 13.47 2,942.25 5,532.68 64.73 . .
225.23 . . 7.67 5,059.87 4,384.53 6.67
24?.19 •• 1015 4,862.43 5.090.38 17.28 . .
*:NotQ.—This [l-£rk is having ar Unitcry structure and hence Branch and Districtwise profit and Loss is not worked out.
airan :— ^5i<7WKe.—Thef Maharashtra State Cc-cperative Land Development Bank Ltd., Bombay.
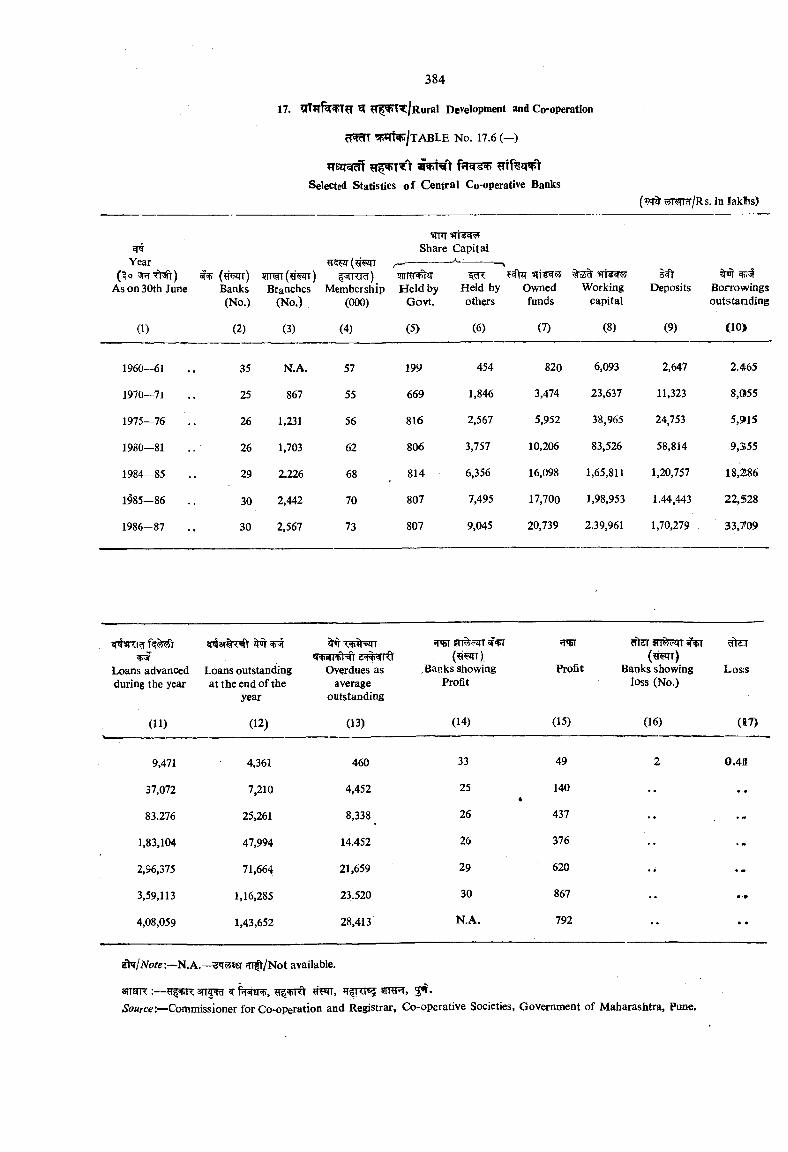
Year
?Tstr^Selected Statistics o f Central Co-operative Banks
Share Capital_____ A—____
(?f^r) 5iwr(?iwr) ^ ^ kict) %5sAs on 30th June Banks Branches Membership Held by Held by Owned Working
(No.) (No.) (000) Govt. others funds capital
(1) (2) (3) (4) (5) (6) (7) (8) (9)
ipoTDeposits Borrowings
outstanding
(10>
1960—61 35 N.A. 57 199 454 820 6,093 2,647 2.465
1970—71 25 867 55 669 1,846 3,474 23,637 11,323 8,055
1975—76 26 1,231 56 816 2,567 5,952 38,965 24,753 5,9»15
1980—81 26 1,703 62 806 3,757 10,206 83,526 58,814 9,3155
1984-85 29 2.226 68 814 6,356 16,098 1,65,811 1,20,757 18,286
1985—86 30 2,442 70 807 7,495 17,700 1,98,953 1.44,443 22,528
1986—87 30 2,567 73 807 9,045 20,739 2.39,961 1,70,279 33,709
Loans advanced during the year
Loans outstanding at the end of the
year
Overdues as average
outstanding
.Banks showing Profit
Profit
dldl SHT%c T («wt)
Banks showing loss (No.)
5ftCT
Losis
(11) (12) (13) (14) (15) (16) (17)
9,471 4,361 460 33 49 2 0.41
37,072 7,210 4,452 25*
140 •• • >•
83.276 25,261 8,338 26 437 •• •-
1,83,104 47,994 14.452 26 376 ••
2,96,375 71,664 21,659 29 620 •• • -
3,59,113 1,16,285 23.520 30 867 ••
4,08,059 1,43,652 28,413 N.A. 792 •• • •
Eh/A^o/c:—N. A.— 'T^sr qT|t/Not available.
STTR :— 3TIf ^ 5TRR, 3<T.5o«rce:—Commissioner for Co-operation and Registrar, Co-operative Societies, Government of Maharashtra, Pune.
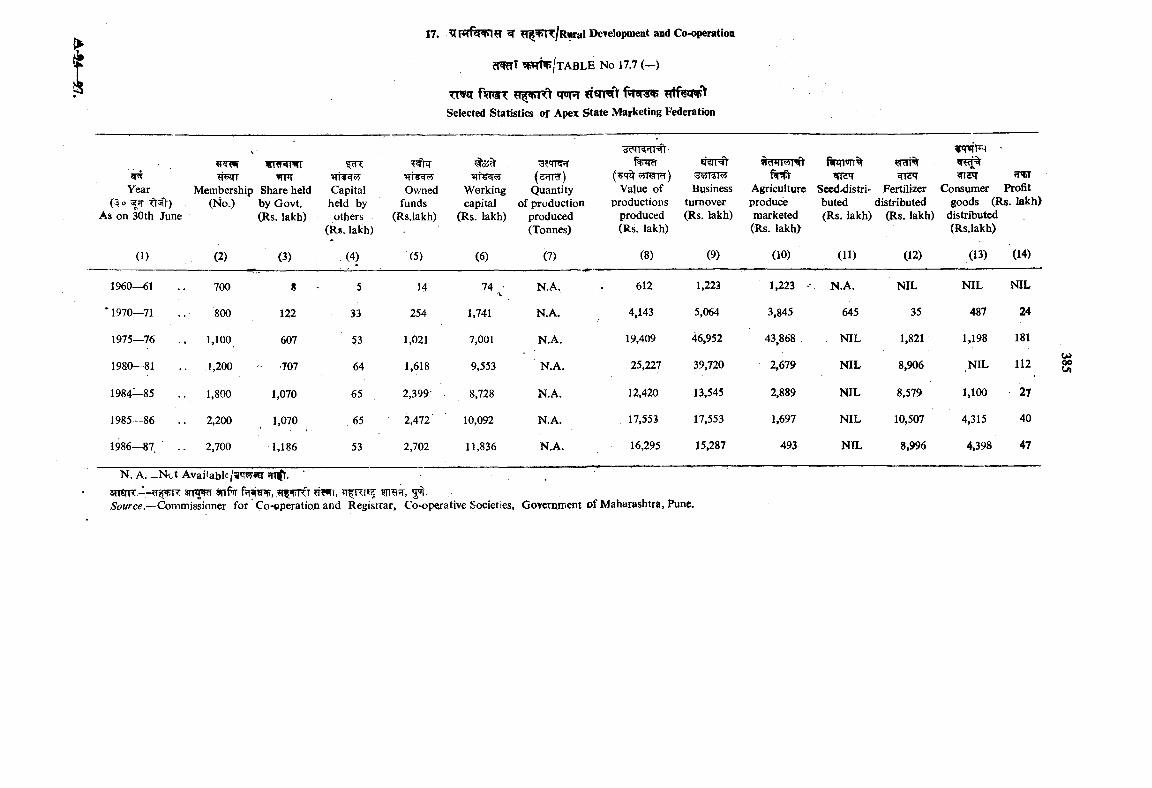
s
TT ir fW T 'T'R f«T^^Selected Statistics of Apex State Marketing Federation
V
Ownedfunds
(Rs.lakh)
finn'nT% qidM
Secd^istri- buted (Rs. lakh)
Year(. 0
As on 30th June
WIWBfTTfT'T
Membership Share held (No.) by Govt.
(Rs. lakh)
Capital held by
others (Rs. lakh)
<3;d5d
Working capital
(Rs. lakh)
(ff TTW) (Quantity
of production produced (Tonnes)
Value of productions
produced (Rs. lakh)
Business turnover (Rs. lakh)
Agriculture produce marketed (Rs. lakh>
^'T Fertilizer
distributed (Rs. lakh)
Consumer Profit goods (Rs. lakh)
distributed (Rs.lakh)
(2) (3) (4) (5) (6) (7) (8) (9) (10) (11) (12) (13) (14)
1960—61 700 8 5 14 74 • N.A. 612 1,223 1,223 N.A. NIL NIL NIL
'1970—71 : 800 122 33 254 1,741 N.A. 4,143 5,064 3,845 645 35 487 24
1975—76 1,100 607 53 1,021 7,001 N.A. 19,409 46,952 43,868 . NIL 1,821 1,198 181
1980—81 1,200 •707 64 1,618 9,553 ■ N.A. 25,227 39,720 2,679 NIL 8,906 NIL 112
1984—85 1,800 1,070 65 2,399- 8,728 N.A. 12,420 13,545 2,889 NIL 8,579 1,100 27
1985—86 .. 2,200 1,070 65 ; 2,472' 10,092 N.A. 17,553 17,553 1,697 NIL 10,507 4,315 40
1986—87 .. 2,700 1,186 53 2,702 11,836 N.A. 16,295 15,287 493 NIL 8,996 4,398 47
u»00Ut
N. A. -N e t Avaiiabk/^^9^ TnfT. smnr.— f vrfr rwr, 5n ?r, 3^.5£>Mrce.—Commissioner for Co-operation and Registrar, Co-opcsrative Societies, Govcrmrjcnt of Maharashtra, Pune.
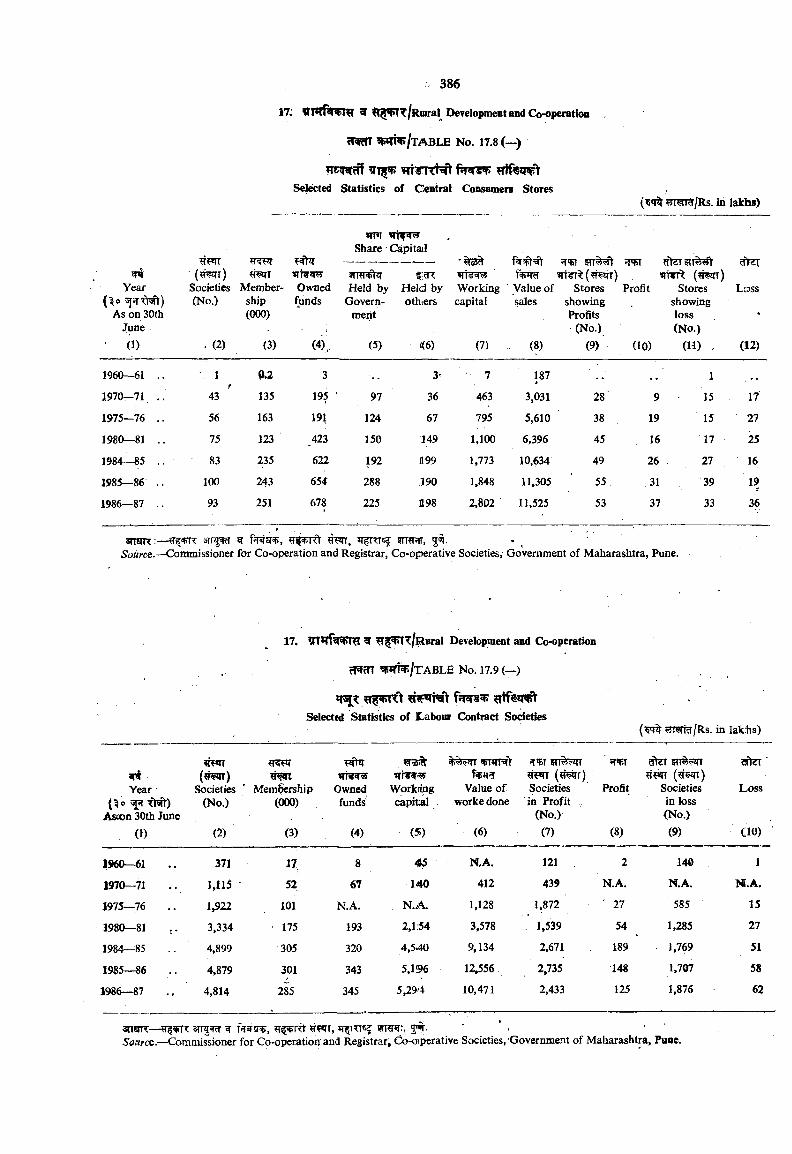
vm rrtN tSelected Statistics of Central Consumers Stores
5Tnm /Rs. in lalchs)
Year(^o
tf«rr( ^ r ) 9Tt9T9r
Societies Member- Owned(No.) ship funds
«rnr ittwwh Share Capitail
Held by Held by Woricing Value of StoresGovern- othiers capital sales showing
{ ?twt)Profit
Bt3T5TT%?ft
Storesshowing
Loss
As on 30th June
(000) merit ProiSts(No.)
loss(NO.) ■
’ (1) . (2) (3) (4), (5) m (7) (8) (9) do) (H) , (12)
1960—61 .. - 1 0.2 3 3 7 187 1 , .
1970—71 .. 43 135 195 97 36 463 3,031 28 9 15 17
1975—76 .. 56 163 191 124 67 795 5,610 38 19 15 27
1980—81 .. 75 123 ,423 150 149 1,100 6,396 45 16 17 25
1984—85 .. 83 235 622 192 H99 1,773 10,634 49 26 27 16
1985—86 .. 100 243 654 288 190 1,848 11,305 ‘ 55 31 39 1?
1986—87 .. 93 251 678 225 198 2,802 11,525 53 37 33 36
t , ‘ arraK:— 3 t t ^ f?rwaRi, wrmw, 5^. ' ^
Source.—Commissioner for Co-operation and Registrar, Co-op)erative Societies,' Government of Maharashtra, Pune.
17. ^ ^^^^/Rural Development and Co-operation
. cT fn ?Pm^/TABLE No. 17.9 (^-)
?nf«iwjySelected Statistics of E.abour Contract Societies
T TcT/Rs. in lalchs)
Societies(No.)
rv dter 5Ti ??JTi t w (? f^ )
Societies in loss (No.)
WtCT ’
LossiWYear
( 0Ascon 30th June
Memt»<ership(000)
Ownedfunds
Working Value of capital worke done
(« ^ f)Societies Profit in Profit
(No.)
(1) (2) (3) (4) (5) (6) (7) (8) (9) CIO)
1960—61 371 17 8 45 N,A, 121 , 2 140 1
1970—71 1,115 52 67 140 412 439 N.A. N.A. N.A.
J975—76 1^22 101 N.A. . N.A. 1,128 1,872 ' 27 585 15
1980—81 3.334 • 175 193 2,1;54 3,578 1,539 54 1,285 27
1984—85 4,899 305 320 4,540 9,134 2,671 189 1,769 51
1985—86 4,879 301 343 5,196 12,556 2,735 148 1,707 58
1986—87 4,814 285 345 5,294 10.471 2,433 125 1,876 62
anOTT— sTTfSRT ^ fiTopifr, rwr, ' ' ' ‘5<?«rce.—Commissioner for Co-operation and Registrar, Co-qjpcrative Societies, Government of Maharashtra, Pune.
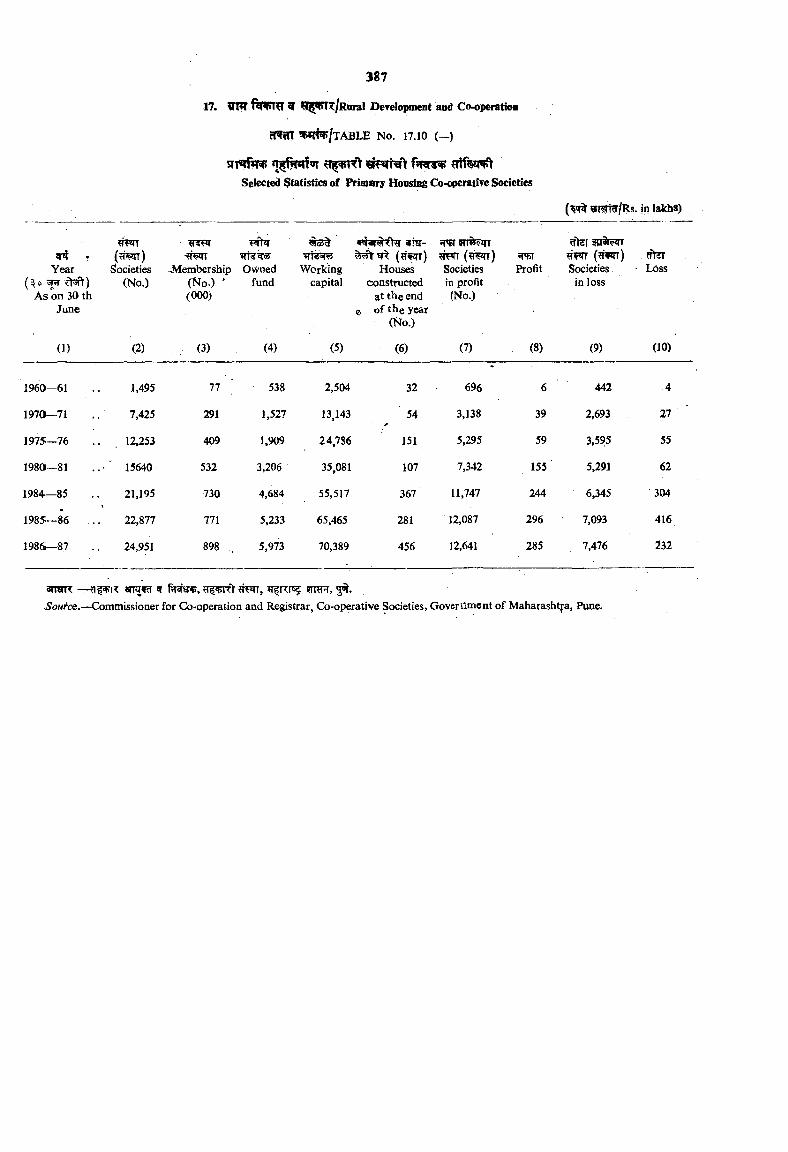
spf ? Year
' OAs on 30 th
June
Selected $tatistics of Priioary Housing Co<operative Societies
9fWRT/Rs. in l ^ S )
?TWT(^T^) -?fW
Sipcieties .Membership Owned(No.) (?^o.) ' fund
(000)
#«5% itsr- !TEi sn%^T(?r^)
Working Houses Societies Profitcapital constructed in profit
at the end (No.) e of the year
(1 0.)
r f te r io ^TFTT (?ff*n) ffteT Societies - Loss
in loss
(1) (2) (3) (4) (5) (6) (7) (8) (9) (10)
1960—61 1,495 77 ' 538 2,504 32 696 6 442 4
1970—71 7,425 291 1,527 13,143 54 3,138 39 2,693 27
1975—76 .. .12,253 409 1,909 24,786 151 5,295 59 3,595 55
1980-81 15640 532 3,206 35,081 107 7,342 155 5,291 62
1984—85 21,195 730 4,684 55,517 367 11,747 244 6,345 304m
1985—86 22,877 771 5,233 65,465 281 12,087 296 7,093 416
1986^87 24,951 898 5,973 70,389 456 12,641 285 , 7,476 i32
arrenr a r r ^ ^ ^n ;rs$ y t.Sow^ce.—Commissioner for Co-operation and Registriar, Co-operative Societies, Government of Maharashtra, Pune.
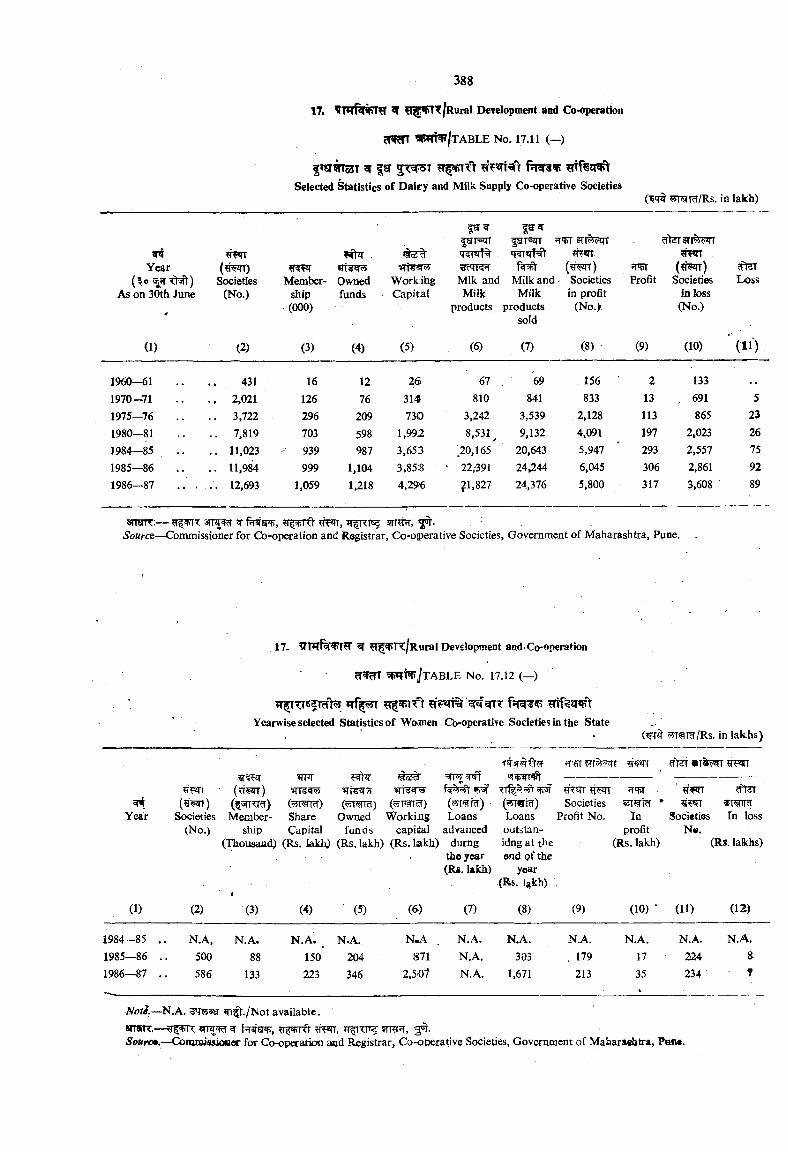
Selected Statistics of Dairy and Milk Supply Co-operative Societies
|gT5JTr farsiiT ?T'Br 5TTr?irr cffern'i%5?n'TFIT ^ . <ao4% T5T8rf% ?TF*n
Year («>4|l) ?nrPT *rt5^ SerrTRT r?T5 ( ^ r ) <TOr (?f¥7T) cfrsT(^0 <1sk1) Societies Member Owned Working Mlk and Milk and - Societies Profit Societies Loss
As on 30th June (No.) ship funds Capital Milk Milk in profit in loss(000) products products (No.), (No.)
sold
(1) (2) (3) (4) (5) (6) (7) (8) • (9) (10) ' (11)
1960—61 ............... 431 16 12 26 67 69 . 156 ' 2 1331970—71 . , 2,021 126 76 314 810 841 833 13 691 51975—76 .. 3,722 296 209 730 3,242 3,539 2,128 113 865 231980—81 .. 7,819 703 598 1,992 8,531 9,132 4,091 197 2,023 261984—85 .. 11,023 939 987 3,653 '20,165 20,643 5,947 293 2,557 751985—86 .. 11,984 999 1,104 3,85;8 22,-391 24^44 6,045 306 2,861 921986—87 .. . . . 12,693 1,059 1,218 4,29'6 ?1.S27 24,376 5,800 317 3,608 89
snmr:— ^ , ?T5=f)Rt ^ •Source—^Commissioner for Co-operation and Registrar, Co-operative Societies, Government of Maharashtra, Pune.
17, ^ H^^T7;/RuraI Development and Co-operation
rTWcTT ^ T ^ / t ABLE No. 17.12 (—)
Yearwise selected Statistics of Wosnen Cb-operative Societies in the iState^ m n lR s . in lakhs)
Year Societies Member- (No.) ship
Id)Owned
funds(Thousand) (R . lakh) (Rs. lakh) (Rs. lakh) durng
the year
( ilWRT)ShaxeCapital
( MT 3’)Working
capitalLoans
advanced
?f^T#!TT JT'BT . Societies *
Loans Profit No. In outstan- profitidng at the (Rs. lakh)end of the
?fl T
Societies In loss • N«.
(Rs. lakhs)
(R*. lakh) year (Rs. ijikh)
(1) (2) (3) (4) (5) (6) (7) (8) (9) (10) • (11) (12)
1984—85 .. N.A, N.A. N.A. ^ N.A. N ^ N.A. N.A. N.A. N.A. N.A. N.A.1985—86 .. 500 88 150 204 871 N.A. 303 . 179 17 224 81986—87 .. 586 133 223 346 2,5<01 N.A. 1,671 213 35 234 ' T
N.A. 3TO5!T m ^./Not available. enasR.—gpnx ar f^ar^, ^mr r, ^ - ■
Soitrc*.—Coainaisaioficr for Co-operation and Registrar, Co-operative Societies, Government of Maharaiehtra, Ph««.
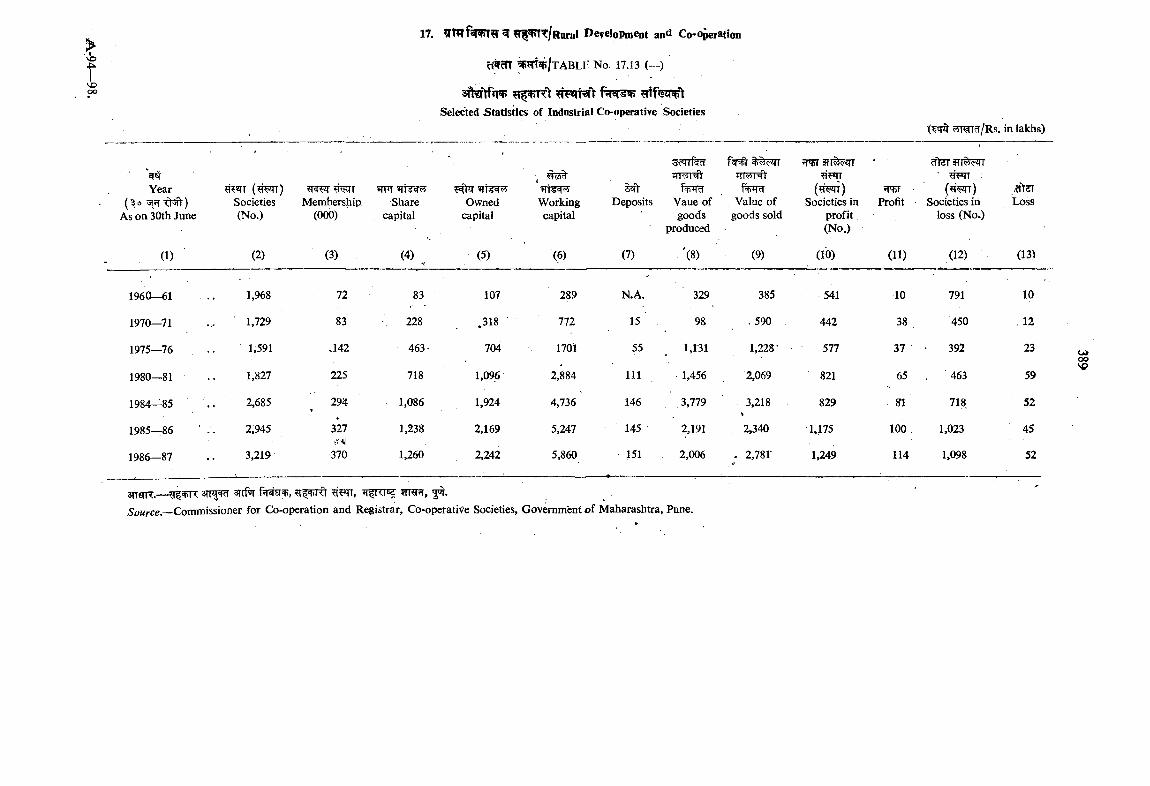
VOoo
17. ^ ^®RTT/Raral Development an<i Co-o^ration
Hjf?n W ^ / t ABLK No. 17.13 (—)
3Tkftf*RJSelected ^Statistics of Industrial Co-operative Societies
yrarar/Rs. in lakhs)
(?rw)Societies(No.)
Membership.(000)
WTShare
capitalOwned
capitalDeposits
r* TTMHtrv- (#wr)
Societies in profit (No.)
' cfter sTT wr ■
( T’jqT) Societies in
loss (No.)
.fftsrLoss
Year ( 0 ^5 )
As on 30th JuneWorkingcapital
Vaue of goods
produced
Value of goods sold
H4ilProfit
(1) (2) (3) (4) (5) (6) (7) '(8) (9) (10) (11) (12) (13)
1960—61 1,968 72 83 107 289 N.A. 329 385 541 10 791 10
1970—71 1,729 83 228 .318 772 15 98 .590 442 38 , 450 . 12
1975—76 1,591 J42 463- 704 1701 55 1,131 1,228' 577 37 392 23
1980—81 1,827 225 718 1,096 2,884 111 1,456 2,069 821 65 463 59
1984—85 2,685 294 1,086 1,924 4,736 146 3,779 . 3,218 %
829 81 718 52
1985—86 2,945 327cV-'lJ
1,238 2,169 5,247 145 2,191 2,340 1,175 100 1,023 45
1986—87 3,219 370 1,260 2,242 5,860 • 151 2,006 - 2,781 1,249 114 1,098 52
gnapR.— 3Tif ?|Fn, 3^.Source.—Commissioner for Co-operation and Registrar, Co-operative Societies, Government of Maharashtra, Pune.
u>00
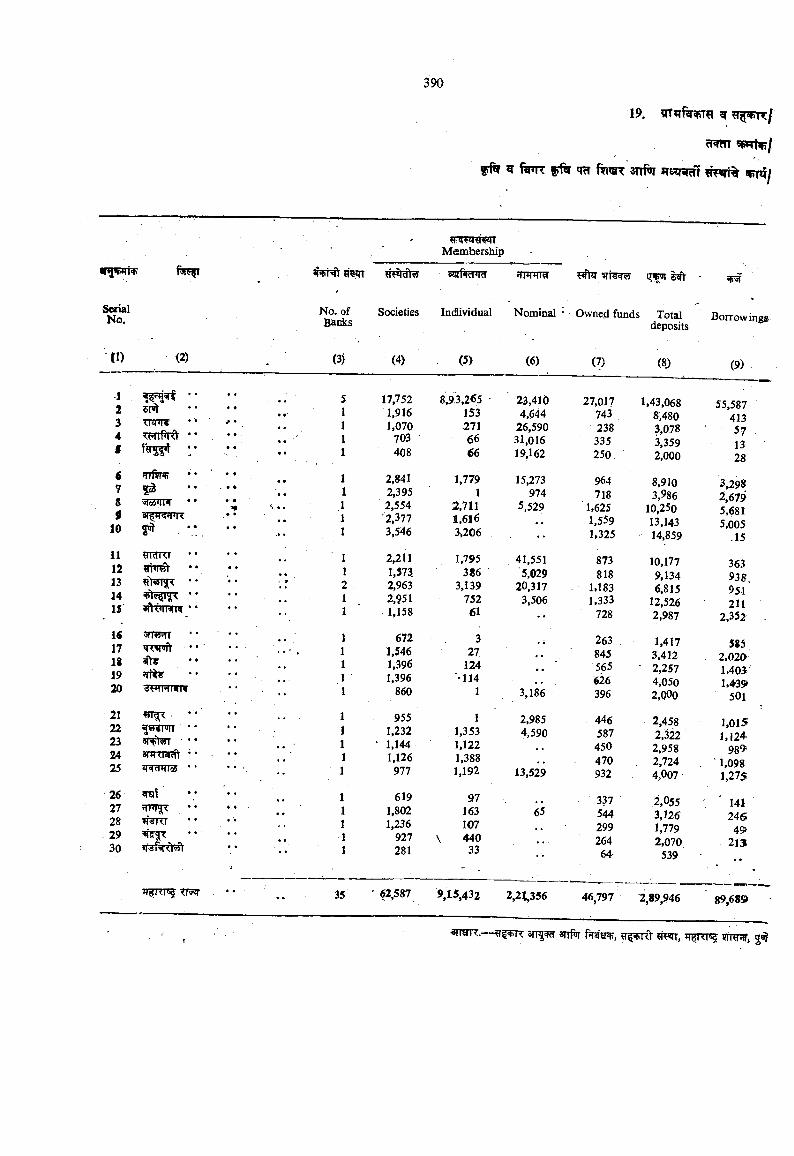
fftr ^ ftPT? # f qcT ftnsR anfri irs^njcff
Membership
H^cf^ sqrfiRTirgr fnrnrra i apur 5 «F3f
SerialNo.
No. of Bat&s
Societies Individual Nominal Owned funds Total deposits
Borrowings
(I) <2)
1 **2 51 • •3 . <R<T*S .* •4 TwiPrd •• *•f */ • •
6 • •7 5^ . • #8 sTbsmir • • •' •$ • •
10 5^
11 <jWKr •• « «12 !fF!^ • •13 • *14IS * *
1C 'jfl'HRI ■ . .17 'RtfTort • •18 « •19 • •20 TWWHIf • •
21 ••22 « •23 sppWr * • * «24 3Tfl7r4ci1 ••25 • *
2627 ...282930
(3ji
^TfRT TR5T 35
(4) (5) (6) (7) (8; (9)
17,752 8,9:3,265 23,410 27,017 1,43,068 55,5871,916 153 4,644 743 8,480 4131,070 271 26,590 238 3,078 57
703 66 31,016 335 3,359 13408 66 19,162 250 2,000 28
2,841 1,779 15,273 964 8,910 3,2982,395 1 974 718 3,986 2,6792,554 2,711 5.529 1,625 10,250 5,681
'2,377 a,6i6 . . 1,559 13,143 5,0053,546 3,206 . . 1,325 14,859 .15
2,211 1,795 41,551 873 10,177 3631,57a 386 ' 5,029 818 9,134 9382,963 3,139 20,317 1.183 6,815 951'2,951 752 3.506 1,333 12,526 211
. 1,158 61 •• 728 2,987 2,352'
672 3 263 1,417 5851,546 27 .. 845 3,412 2,0201,396 124 .. 565 ' 2,257 1,403;1,396 •114 626 4,050 1,439
860 1 3,186 396 2,000 501955 1 2,985 446 2,458 1,015
1,232 1,353 4,590 587 2,322 1,1241,144 1,122 450 2,958 9891,126 1,388 470 , 2,724 . ' 1,098977 1,192 13,529 932 4,007 1,275
619 97 .. 337 2,055 1411,802 163 65 544 3,126 2461,236 107 . . 299 1,779 49927 A 440 264 2,070 2l3t
281 33 • • 64- 539
62.587 9,15,432 2,2i,356 46,797 2,89,946 89,689
srraR .— ??pTR arrfw O r ^ , «rra?ff, ,
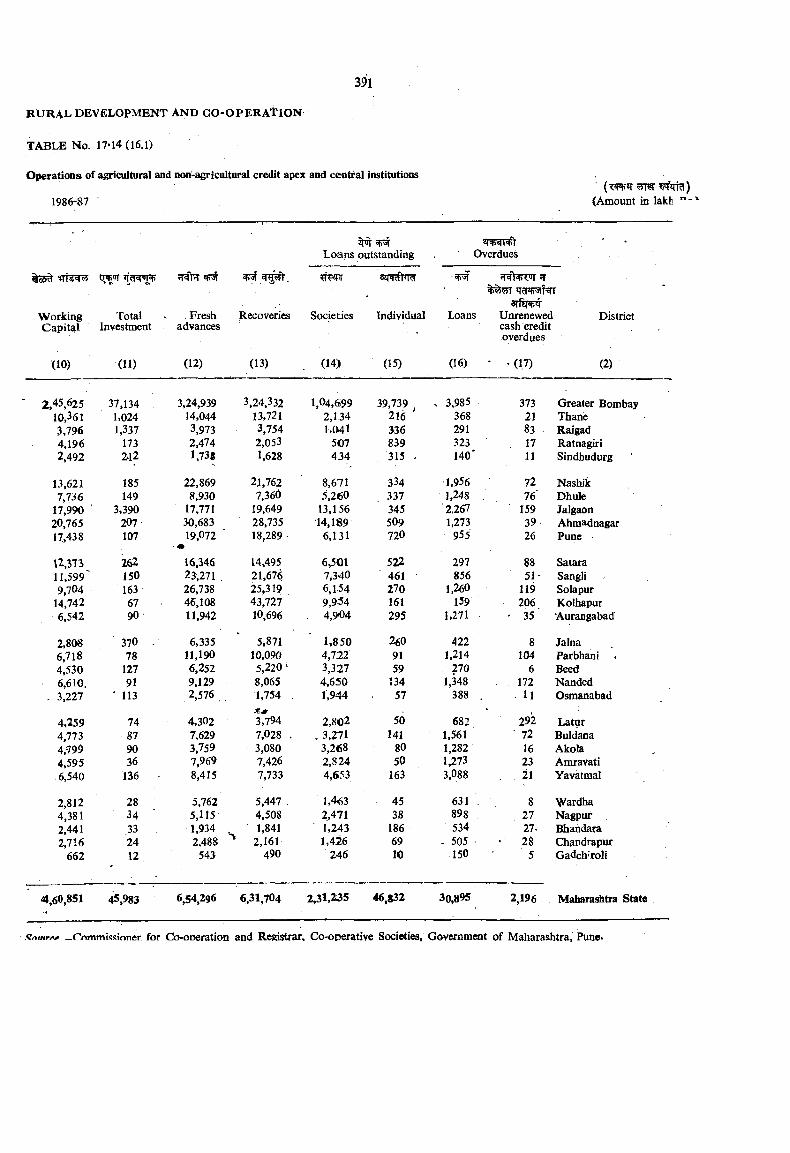
Operations of agricultural and non-agricultural credit apex and central institutions
1986-87
Loans outstanding Overdues
?TFfI SiRcTtW
WorkingCapital
(10)
TotalInvestment
(11)
. Fresh advances
(12)
P.ecoveries
(13)
Societies
. (14)
Individual
(15)
Loans
(16)
Unrenewed Districtcash creditoverdues
* • (17) (2)
2,45,625 37,134 3,24,939 3,24,332 1,04,699 39.739 V 3,985 373 Greater Bombay10,361 1.024 14,044 13,721 2,134 216 368 21 Thane3,796 1,337 3,973 3,754 1,041 336 291 83 Raigad4,196 173 2,474 2,053 507 839 323 , 17 Ratnagiri2,492 2.12 1,738 1,628 434 315 - 140' 11 Sindhudurg
13,621 185 22,869 . 21,762 8,671 334 1,956 72 Nashik7,736 149 8,930 7,360 5,260 337 1,248 76 Dhule
17,990 3,390 17,771 19,649 13,156 345 Z267 159 Jalgaon20,765 207- 30,683 28,735 14,189 509 1,273 39 Ahmadnagar17,438 107 19,072 18,289 6,131 720 955 26 Pune •
12,373 2)62 16,346 14,495 6,501 522 297 88 Satara11,599' 150 23;271 . 21,676 7,340 461 856 51' Sangli9,704 163 26J3S 25,319 6,134 270 1,260 119 Solapur
14,742 67 45,108 43,727 9,954 161 159 206 Kolhapur6,542 90- 11,942 10,696 . 4,904 295 1,271 V 35 “Aurangabad
2,808 370 6,335 5,871 1,850 260 422 8 Jalna6,718 78 11,190 10,090 4,722 91 1,214 104 Parbhani .4,530 127 6,252 5,220' 3,327 59 270 6 Beed6,610. 91 9,129 8,065 4,650 134 1,348 172 Nanded
, 3,227 ‘ 113 2,576 1,754 . 1,944 57 388 . 11 Osmanabad
4,259 74 4,302 3,794 2,802 5() 682 292 Latur4,773 87 7,629 7,028 - , 3,271 141 1,561 • 72 Buldana4,-799 90 3,759 3,080 3,268 80 1,282
1,27316 Akola
4,595 36 1,969 7,426 2,824 50 23 Amravati,6,540 136 8,415 1,733 4,653 163 3,088 . 21 Yavatmal
2,812 28 5,762 5,447 . 1,463 45 631 : 8 Wardha4,381 34 ' 5,115 4,508 2,471 38 898 27 Nagpur2,441 33 1,934 1,841 1,243 186 534 27 Bharidara2,716 24 2,488 2,161 1,426 69 - 505 • 28 Chandrapur
662 12 543 490 246 10 150 5 Gadch'toli
4,60,851 45,983 6,54,296 6,31,704 2,31,235 46,832 30,895 2,196 Maharashtra State
.C/iuir/>« _rrwnm issioner for Co-ooeration and Renstrar, Co-operative Societies, Governm^t of Maharashtra, Pune-
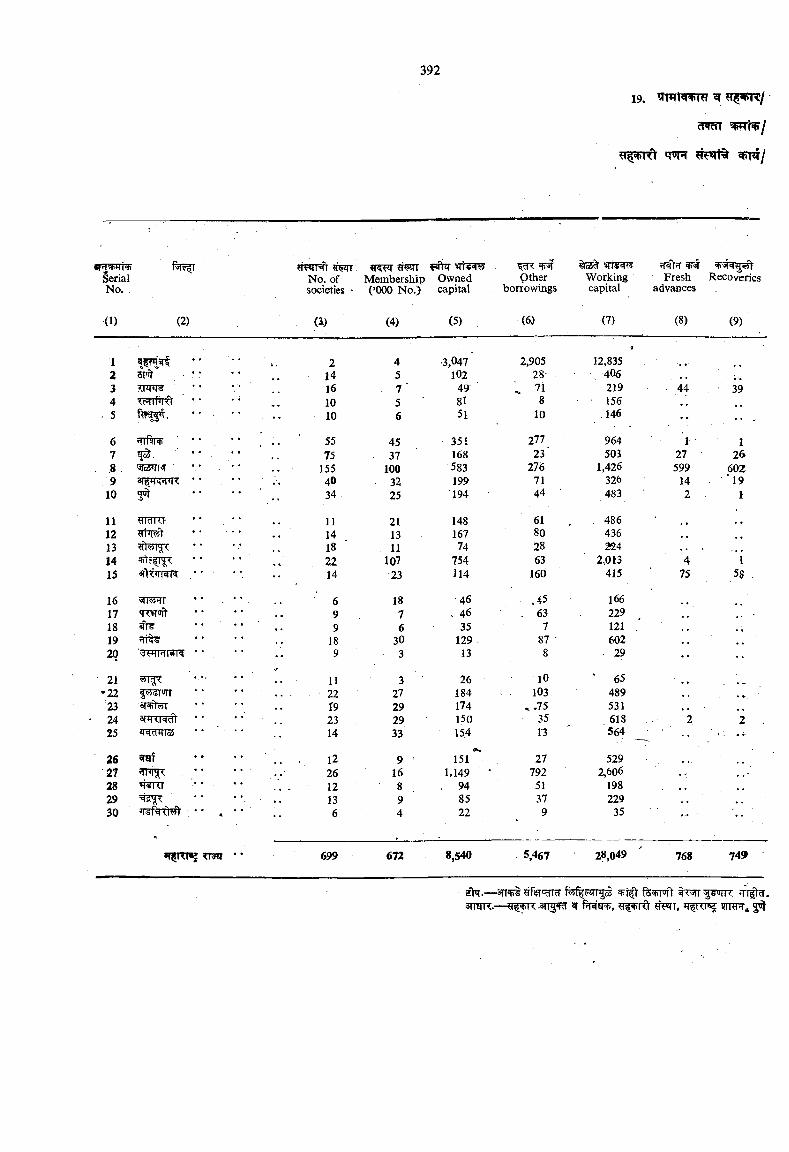
»5n»R ^ 4 /
r*
No. of societies •
(i)
Ownedcapital
(5)
•«r %55 whr^ Working capital
(7)
Freshadvances
(8)
«r *ii=b'SerialNo.
•d)
Nty T
(2)
fT«{ Membership COOO No.)
(4)
Otherborrowings
(6)
Recoveries
(9)
1 2 4 ■3,047 2,905;#
12,8352 3Fit • • 14 5 102 28- , 4063 - l€ 7 ■ 49 . 71 219 • 44 394 ^rfrrCr • * 10 5 81 8 156
■ 5 10 6 51 10 .146
6 JTTfeib' • • . * • 55 45 351 277 964 ' ' l - 17 '■ •• •• 75 37 168 23 503 27 26
. 8 . '3ioo<lm * ’ . ■ ’ , , 155 100 583 276 1,426 599 6029 • • • • 40 32 199 71 326 14 '19
10 jq •• • • > • 34 25 194 44 ' 483 2 1
11 . . 11 21 148 61 48612 . « 14 13 167 80 436 ..13 18 11 74 28 224 • . . .
H ’ * 22 107 754 63 2,013 4 115 •• 14 23 il4 160 415 75
16 'Jll HT • • . • • 6 18 46 .45 l6617 T^drt • • *' 9 7 . 46 . 63 229 ,18 ^ • • • • • • 9 6 35 7 121 , , , ^
19 rfi ^ 18 30 129 87 ' 602 , ,
20 '^FTRrai * • •• 9 3 13 8 29 ••
21 11 3 26 10 ‘ 65•22 . - . 22 27 184 103 489 • ♦*.
23 3T+15T •• '• , , 19 29 174 ^.75 531 • •
24 8fi|<Ndl 23 29 150 35 618 2 225 il'tOHlaJ * * ■ * 14 33 154 n 564 _
26 12 9 151 27 529 '27 26 16 1,149 ' 792 2,60628 »i Kr •• . • •*. 12 8 . 94 51 19829 13 9 85 37 229 . .
30 . • * , • • 6 4 22 9 35 ••
’CTarlJ * * 699 672 8,540 5,467 28,049 768 749
S 7.—3n^ 'FffST' TRf fS^P’fl' i' Tf3TOR.— -snj^ 5T ?rp»rft ?rFn, Tfrrrs? strtt
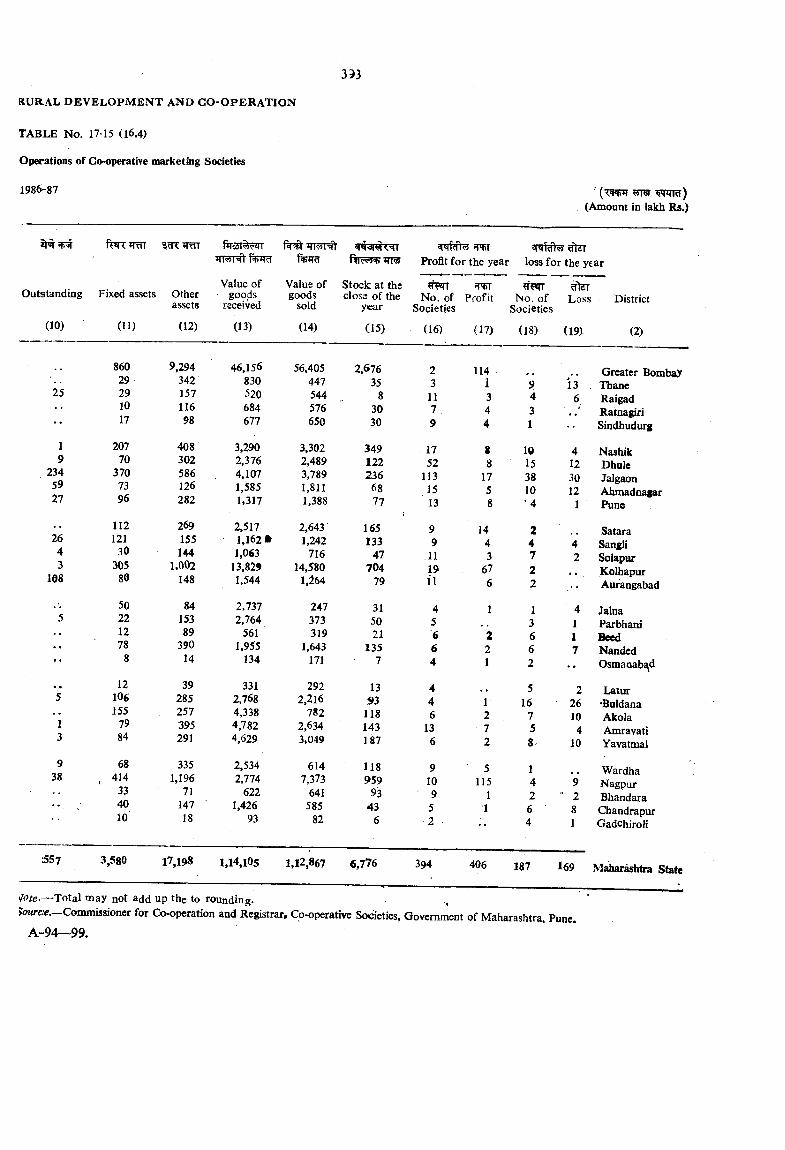
TABLE No. 17-15 (16.4)
Operations of Co-operative marketing Societies
1986-87 ' WTRT)(Amount in lakh Rs.)
Outstanding Fixed assets
(10) (11)
25
19
2345927
2643
108
13
938
8602929 10 17
20770
3707396
112121
30 305
80
50221278
12106155
79
68414
334010
Otherassets
(12)
9.29434215711698
408302586126282
269155144
1,002148
8415389
39014
39285257395291
3351,196
7114718
Value of ■ goods
received
(13)
46,156830520684677
3,2902,3764,1071,5851.317
2,517 1,162 • 1,063
13,821 1,544
2,7372,764
5611,955
134
3312,7684,3384,7824,629
2,5342,774
6221,426
93
Value of Stock at thegoods close of the
sold year
(14) (15)
»TrProfit for the year loss for the year
56,405447544576650
3,3022,4893,7891,8111,388
2.643 1,242
71614,580
1,164
247373319
1.643 171
2922,216
7822,6343»049
6147,373
641585
82
No. of Profit Societies
No. of Societies
2,67635
83030
349122236
6877
165133
47704
79
31 50 21
1357
1393
118143187
118959
9343
6
(16)
2 3
11 7 . 9
1752
1131513
99
1119
(17) (18)
Loss
(19)
District
(2)
114134 4
1758
1443
67
9 43 1
10153810 ‘ 4
2472
136
4123012
1
Greater BombayThaneRaigadRatnagiriSindhudurg
NashikDhuleJalgaonAhmadnagarPune
Satara Sangli Solapur Kolhapur
11 6 2 •• Aurangabad
4 1 1 4 Jalna5 3 1 Parbhani6 2 6 1 Beed6 2 6 7 Nanded4 1 2 •• Osmanabad
4 5 2 Latur4 1 16 26 ^Buldana6 2 7 10 Akola
13 7 5 4 Amravati6 2 8 10 Yavatmai
9 5 1 Wardha10 115 4 9 Nagpur9 1 2 - 2 Bhandara5 1 6 8 Chandrapur2 4 1 Gadchiroli
557 3,580 17,198 1,14,105 1,12,867 6,776 394 406 187 l69 Maharashtra State
^ote-— Total niay not add up the to rounding. ,Commissioner for Co-operation and Registrar. Co-operative Societies, Government of Maharashtra, Pune.
A-94—99.
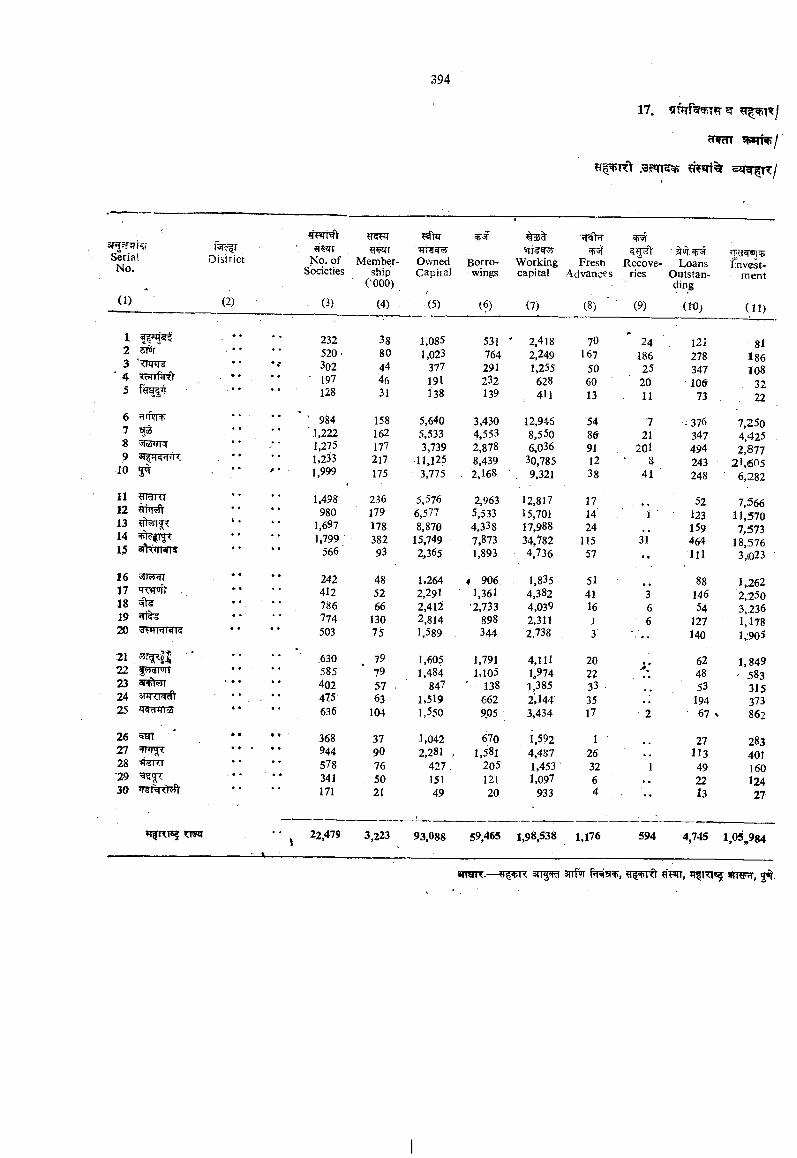
^?n%
SerialNo.
(1)
District
(2)
12 51%3 'TIW?45
67 nss
10 5^11 ?mrRr12131415 shT TRFf
16 3rr^17 ‘mrJTt1819 ^20
21 5 ^ 'i l22 S ysFn23 3J t5fT24 STRXR25 5RWB5
26 ^ '27 rnrjT28 '29 30
TlfRPS?
FTFTRt
No. of Societies
(3)
?f?irrMember
ship( ‘000)
(4)
Owned Borrp- Capital wings
Working Fresh Recove- Loans capital Advances ries Outstan
ding
(5) (6) (7) (8) (9) (10)
L n v e k -ment
(11)
232 38 1,085 531 ' 2,418 70 24 121 81520- 80 1,023 764 2,249 167 186 278 186302 44 377 291 1,255 50 25 347 108
■ 197 46 191 232 628 60 20 ' 106 32128 31 138 139 411 13 11 73 , 22
‘ 984 158 5,640 3,430 12,946 54 7 -376 7,2501,222 162 5,533 4,553 8,550 86 21 347 4,4251,275 177 3,739 2,878 6,036 91 20I 494 2,8771.233 217 11,12^ 8,439 30,785 12 8 243 21,6051,999 175 3,775 . 2,168 9,321 38 41 248 ■ 6,282
1,498 236 5,576 2,963 12,817 17 52 7,566980 179 6,577 5,533 15,701 14 1 ' 123 11,570
1,697 178 8,870 4,338 17,988 24 , , 159 7,5731,799 382 15,749 7,873 34,782 115 31 464 18,576
566 93 2,365 1,893 4,736 57 •• 111 3,(023
242 48 1,264 ♦ 906 1,835 51 88 1,262412 52 2,291 1,361 4,382 41 3 146 2,250786 66 2,412 *2,733 4,039 16 6 54 3,236774 130 2,814 898 2,311 1 6 127 1,178503 75 1,589 344 2,738 . 3 140 l,:905
,630 79 1,605 1,791 4,111 20 62 1,849585 79 1,484 1,105 1„974 22
'48 ' 583
402 57 . 847 ' 138 1,385 33 53 315475 63 1,519 662 2,144- 35 194 373636 104 1,550 9,05 3,434 17 2 67 > 862
368 37 1,042 670 1,592 1 27 283944 90 2,281 > 1,581 4,487 26 113 401578 76 427, 205 1,453- 32 1 49 160341 50 151 121 1,097 6 22 124171 21 49 20 933 4 . . 13 27
22,479 3,223 93,088 59,465 1,98,538 1,176 594 4,745 1,05,984
ansTK.— 3TT5 STTfw fjrqSRr, y ^ ift g'w, wrai?r, g i.
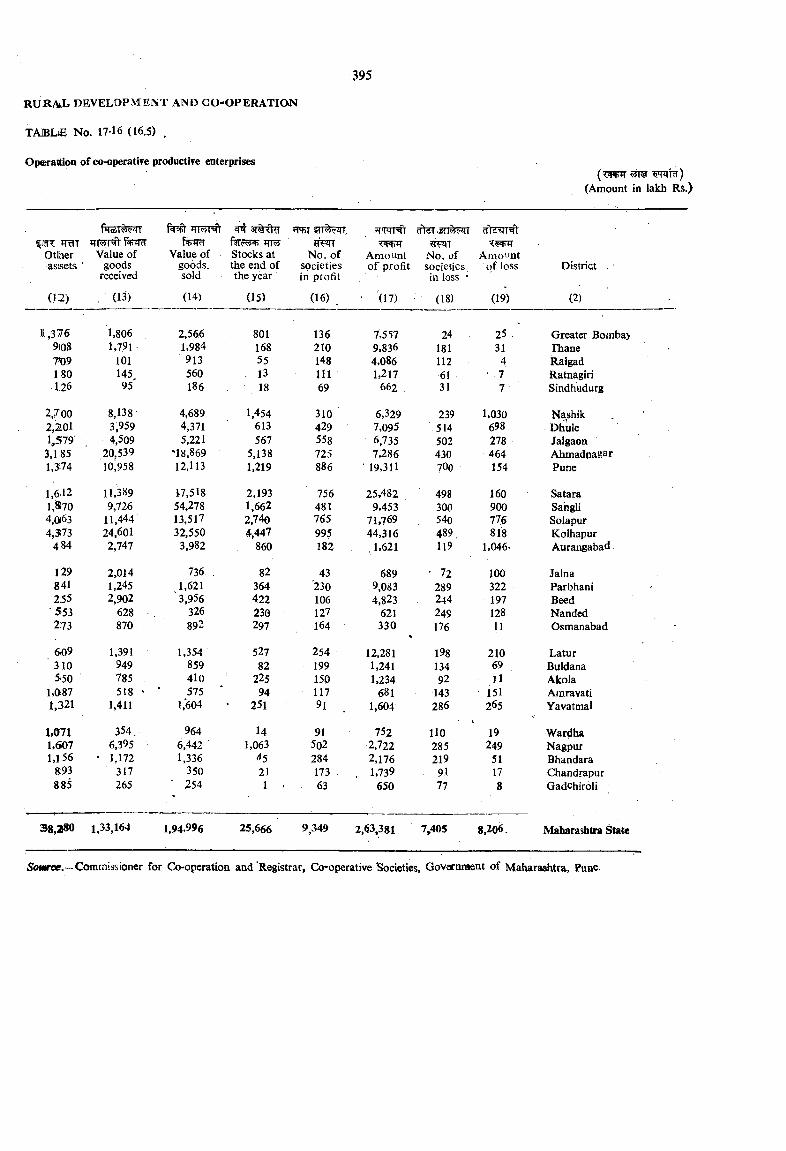
RURA».L d e v e l o p m e n t AND CO-OPERATIQN
TABLiE No. 17-1« (16.5) .
Operattion of co-operative productive enterprises
(Amount in lakh Rs.}
Trai Otlher assets '
(12)
Value of goods
received
. (13)
f%iRr Value of
goods, sold
(14)
TITS Stocks at the end of the year
(15)
No. ofsocieties in profit
(16)
STWRt <441+1
Amount of profit
' (17)
No. of societies in loss *
(18)
Amount of loss
(19)
District
(2)
11,3769(08?r09180U 6
1,8061J91
10114595
2,5661.984913560186
801168551318
1362101481 1 169
7,5579,8364,0861,217
662
241811126131
2531
4-77
Greater BombayrhaneRaigadRatnagiriSIndhudurg
2,700 8,138 • 4,689 1,454 310 6,329 239 1,030 Nashik2,201 3,959 4,371 613 429 7,095 .514 698 Dhule1 579' 4,509 5,221 567 558 6,735 502 278 Jalgaon3,185 20,539 '18,869 5,138 725 7,286 430 464 Ahmadnagarl,3i74 10>58 12,113 1,219 886 ' 19,311 7OO 154 Pune
1,6,12 11,389 17,518 2,193 756 25,482 498 160 Satara1,870 9,726 54,278 1,662 481 9,453 300 900 Sangli4,0(63 11.444 13,517 2,740 765 71.769 540 776 Solapur4,3(73 24,601 32,550 4,447 995 44,316 489 818 Kolhapur
484 2,747 3,982 - 860 182 , 1,621 119 1,046- Aurangabad
129 2,014 736 . 82 43 689 ' 72 100 Jalna841 1,245 1,621 364 '230 9,083 289 322 Parbhani2.55 2,902 3,956 422 106 4,823 244 197 Beed
• 553 628 326 230 127 621 249 128 Nandcd273 870 892 297 164 330
%176 11 Osmanabad
609 1,391 1,354 527 254 12,281 198 210 Latur■ 310 949 859 82 199 1,241 134 69 Buldana
550 785 . 410 225 150 1,234 92 11 AkolaL0>87 518 • 575 94 117 681 143 151 Amravati1,321 1,411 1,*604 251 1,604 286 265 Yavatmal
1,071 354, 964 14 91 752 HO 19 Wardha1,607 6,395 6,442 ■ 1,063 502 •2,722 285 249 NagpurU 5 6 • 1,172 1,336 45 284 2,176 219 51 Bhandara
893 317 350 21 173 , 1,739 91 17 Chandrapur885 265 254 1 ^ 63 650 77 8 Gadchiroli
38,280 1,33,164 1,94,996 25,666 9,349 2,63,381 7,405 8,206. Maharashtra State
5<M«rce.--Commissioner for Co-operation and Registrar, Co-operative 'Societies, Govarament of Maharashtra, Pune.
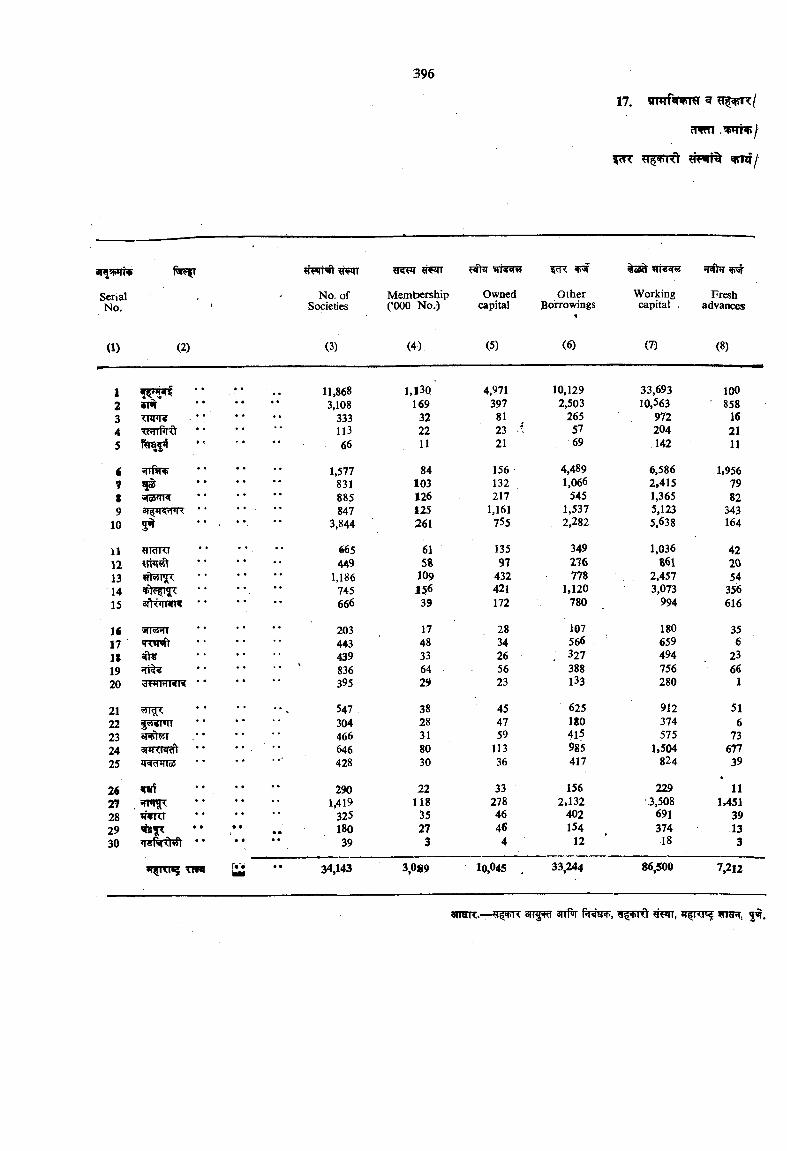
fcR ?T?lri% Jl?f I
sw p*riit
SerialNo.
trpfHt #F!TT
No, of Societies
Membership (‘000 Ko.)
Ownedcapital
OtherBorrowings
Working capital .
Freshadvances
(1) (2) (3) (4) (5) (6) (7) (8)
1 ** • • , , 11,868 1.13Q 4,971 10,129 33,693 1002 «T • * •• 3,108 169 397 2,503 10,563 ■ 8583 • * • • •• 333 32 81 265 972 164 • * • • 113 22 23 t 57 204 215 e • * * 66 11 21 69 142 11
i STTftl • • 1,577 84 156 4,489 6,586 1,9567 • • 831 103 132 1,066 2,415 79t « • 885 126 217 545 1,365 829 * • 847 125 1,161 1,537 5,123 343
10 3^• • * • 3,844 261 755 2,282 5,638 164
il WIdKI • « •• 665 61 135 349 1,036 4212 • • •• 449 58 97 276 861 2013 • • 1,186 109 432 778 2,457 5414 • • 745 156 421 1,120 3,073 35615 • * • • 666 39 172 780 994 616
It • • •• 203 17 28 107 180 3517 «rw«it • • 443 48 34 566 659 6It • • 439 33 26 . 327 494 2319 :n^ ♦ ♦ • • ' 836 64 56 388 756 6620 >dwwwr< * • • • • • 395 29 23 133 280 1
21 • • 547 38 45 625 912 5122 ^ <n»rr • • 304 28 47 180 374 623 • • 466 31 59 415 575 7324 ' * ♦ f 646 80 113 985 1,504 67725 JR’THIoS • 0 428 30 36 417 824 39
26 Wtfi • « •• 290 22 33 156 229 1127 • • 1,419 118 278 2,132 3,508 1,45128 WRI 325 35 46 402 691 3929 • • • • 180 27 46 154 374 1330 *• • • • • 39 3 4 12 18 3
»f5iTH5 xm r« •kMI• • 34,143 3,0*9 10,045 , 33,244 86,500 7,212
3ira«.— srrPir fWa^, 5^.
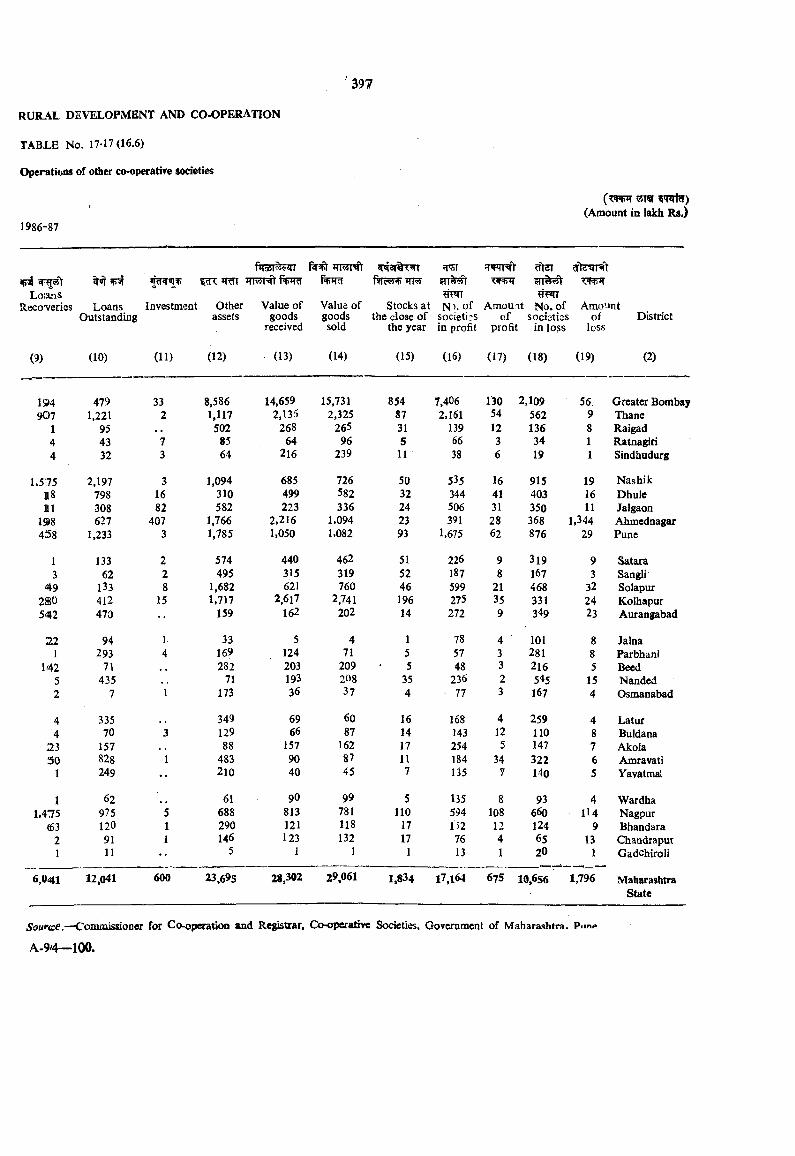
Operatibns of other co-operatiTe societies
1986-87
^ ^ 5TT^ TiRHT 5TT%v?tLoianS ?R*TT
Rsco'veries Loans Investment Other Value of Value of Stocks at N i-o f Amount No. of AmountOutstanding assets goods goods the close of societies of societies of
received sold the year in profit profit in loss lossDistrict
(9) (10) (11) (12) (13) (14) (15) (16) (17) (18) (19) (2)
194 479 33 8,586 14,659 15,731 854 7,406 130 2,109 56 Greater Bombay907 1,221 2 1,117 2,136 2,325 87 2,161 54 562 9 Thane
1 95 . . 502 268 265 31 139 12 136 8 Raigad4 43 7 85 64 96 5 66 3 34 1 Ratnagiri4 32 3 64 216 239 11 38 6 19 1 Sindhudurg
U575 2,197 3 1,094 685 726 50 535 16 915 19 Nashik118 798 16 310 499 582 32 344 41 403 16 Dhule111 308 82 582 223 336 24 506 31 350 11 Jalgaon
198 627 407 1,766 2.216 1.094 23 391 28 368 1,344 Ahmednagar458 1,233 3 1,785 1,050 1,082 93 1.675 62 876 29 Pune
1 133 2 574 440 462 51 226 9 319 9 Satara3 62 2 495 315 319 52 187 8 167 3 Sangli
49 133 8 1,682 621 760 46 599 21 468 32 Solapur280 412 15 1,717 2,6l7 2,741 196 275 35 331 24 Kolhapur542 470 •• 159 162 202 14 272 9 349 23 Aurangabad
22 94 i. 33 5 4 1 78 4 101 8 Jalna1 293 4 169 124 71 5 57 3 281 8 ParbhanI
142 71 282 203 209 5 43 3 216 5 Seed5 435 71 193 208 35 236 2 5^5 15 Nanded2 7 1 173 36 37 4 77 3 167 4 Osmanabad
4 335 349 69 60 16 168 4 259 4 Latur4 70 3 129 66 87 14 143 12 110 8 Buldana
23 157 88 157 162 17 254 5 147 7 Akola30 828 1 483 90 87 11 184 34 322 6 Amravati
1 249 •• 210 40 45 7 135 7 140 5 Yavatmal
1 62 61 90 99 5 135 8 93 4 Wardha1,475 975 5 688 813 781 110 594 108 660 H4 Nagpur
63 120 1 290 121 118 17 152 12 124 9 Bhandara2 91 1 146 123 132 17 76 4 65 13 Chandrapur1 11 •• 5 1 1 1 13 1 20 1 Gadchiroli
6,0<41 12,041 600 23,695 28,302 29,061 1,834 l7,i64 675 10,656 1,796 MaharashtraState
Source .—Comaiisaoner for Co-operation and Re^trar, Co-operative Societies, Government of Maharashtra. Pnn«
A-9^4— 100.

^6 * ^ : 18 MINING AND QUARRYING
^6 .^ . WPIW ^ c?Tt% STRrt^rff 18.1. Data on mineral production and their valueTr 3Tr|. are presented in this section.
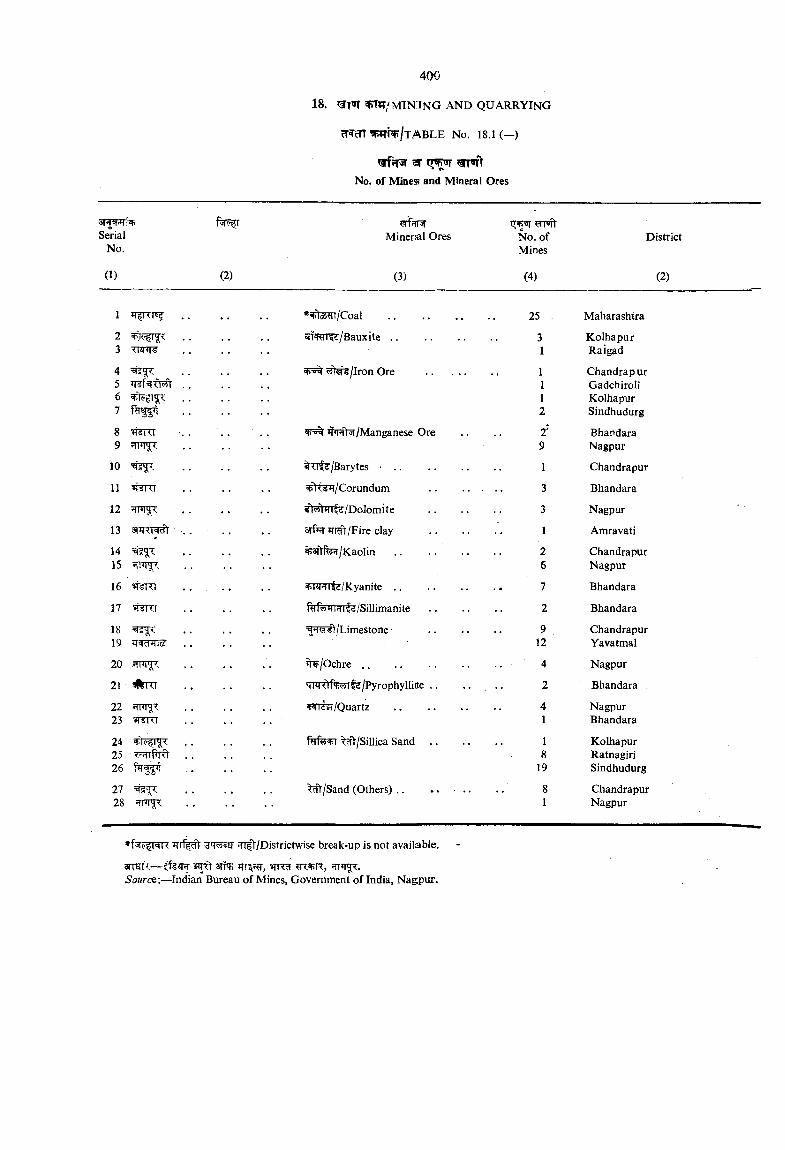
^?f3» ar grrwft No. of Mines and Mineral Ores
SerialNo.
Mineral Ores No. of Mines
District
(1) (2) (3) (4)
1 . . *+lo6^:/Coal .......................... 25 . Maharashtra
2 . . stT+H 1 4/Bauxite .. 3 Kolhapur3 T \^ ^ . . , . 1 Raigad
4 'tj’H ^«si^/Iron Ore . . . .. 1 Chandrapur5 'Rf TT T . . 1 Gadchiroli6 , 1 Kolhapur7 2 SindhUdurg
8 'HiSKl JT’Rt^/Manganese Ore 2' Bhandara9 9 Nagpur
10 ^<lid/Barytes • .. 1 Chandrapur
11 n iK l /Corundum 3 Bhandara
12 WIJiy,< ^I^rrmfj/Dolornite . . . 3 Nagpur
13 arrpnwt . . 3Tf>7T JTRfr/Fire clay . . . 1 Amravati
14 %3ftfe^/Kaolin 2 Chandrapur15 6 "Nagpur
16 'M KI ^TPFn^/Kyanite........................ 7 Bhandara
17 !f¥Rr Hs Pfiii m li/Sillimanite 2 Bhandara
18 ^H<=<«)/Limestone 9 Chandrapur19 . . 12 Yavatmal
20 ?n T t /Ochre .. 4 Nagpur
21 M 0 Phw 1 i i /Pyrophyllitte . . 2 Bhandara
22 4<fld /Quartz 4 Nagpur23 W5[T 1 Bhandara
24 M/Sillica Sand .. 1 Kolhapur25 . . 8 Ratnagiri26 19 Sindhudurg
27 ^ /S an d (Others) .. . . . . 8 Chandrapur28 1 Nagpur
(2)
irrf|^ 'T ssr rrift/Districtwise break-up is not available.
aiTtiT— 3#s ?r^R, tt .Source:— Indian Bureau of Mines, Government of India, Nagpur.
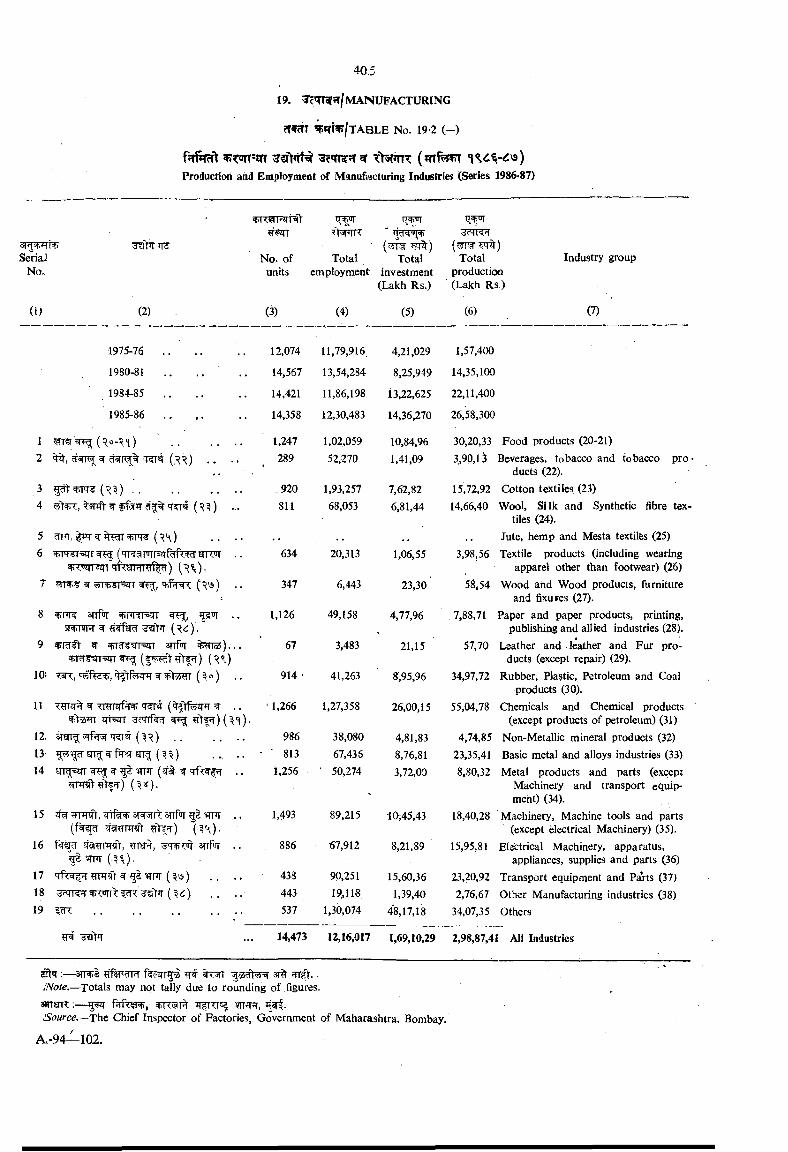
Production and Employment of Manufacturing Industrie;! (Series 1986^87)
SerialNo-
(U (2)
'>1 kmHV
No. of units
(3)
li + UITt sPTR
Totalemployment:
(4)
Total investment
(Lakh Rs.)
(5)
Total Industry group production
■ (Lakh Rs )
(6) (7)
1975-76 . . . . ..
1980-81 ..
1984-85 .............................
1985-86
12,074
14,567
14,421
14,358
11,79,916
13,54,284
11,86,198
12,30,483
4,21,029
8,25,949
13,22,625
14,36,270
1,57,400
14,35,100
22,11,400
26,58,300
1 ......................... 1,247 1,02,059 10,84,96 30,20,33 Food products (20-21)2 ^ 73[t4 (.^^) 289 52,270 1,41,09 3,90,13 Beverages, tobacco and tobacco pro
ducts (22).3 ........................................................................... ,920 1,93,257 7,62,82 15,72,92 Cotton textiles (23)4 ^ ) . . . 811 68,053 6,81,44 14,66,40 Wool, Silk and Synthetic fibre tex
tiles (24).5 miT.. |PT w ^ it.-1'q- ' ( r \ ) .. . . Jute, hemp and Mesta textiles (25)6
Tv??’qT5qi
634
347
20,313
6,443
1,06,55
23,30'
3,98,56
5^,54
Textile products (including wearing apparel other than footwear) (26)
Wood and Wood products, furniture and fixures (27).
8 arrpT ^HRT qr^ ^>T (^<i).
1,126 49,158 4,77,96 7,88,71 Paper and paper products, printing, publishing and allied iridustries (28).
9 ^ra'it ^ sttPt ^ ^ ) . . . 67 3,483 21,15 57,70 Leather and leather and Fur products (except repair) (29),
10> TIT, cwfef?, irfrf qTr ^ tfitrzy 1 ( 0) .. 914 • 41,263 8,95,96 34,97,72 Rubber, Plastic, Petroleum and Coal products (30).
11 T¥izr W TTOTirfhw M<il ^ ^^55 AjrsiiT -ie-rrrcfd
'1,266 1,27,358 26,00,15 55,04,78 Chemicals and Chemical products (except products of petroleum) (31)
12, ......................... 986 38,080 4,81,83 4,74,85 Non-Metallic mineral products (32)13 •.. •• ■ ■ 813 67,436 8,76,81 23,35,41 Basic metal and alloys industries (33)14 srrg;^ ^ ^ ^ . . 1,256 ' 50,274 3,72,00 8,80,32 Metal products and parts (except
Machinery and transport equipment) (34).
15 qwmTnft,q1^3i^'^r^3nf'rrg5 .. (f^r^ JT Fnft {^ \ ) .
1,493 89,215 •10 45,43 18,40,28 Machinery, Machine tools and parts (except electrical Machinery) (35).
16 f^fr T T'ir arrfcT . . 886 67,912 8,21,89 15,95,81 Elsfctrical Machinery, apparatus, appliances, supplies and parts (36)
17 9r gd irm (^ts) , . . . 438 90,251 15,60,36 23,20,92 Transport equipment and Pajts (37)18 ) . . . , 443 19,11« 1,39,40 2,76,67 Other Manufacturing industries (38)19 ................................................................................................. ... 537 1,30,074 48,17,18 34,07,35 Others
14,473 12,16,017 1,69,10,29 2,98,87,41 All Industries
^«T:— si% ;n ^ . .
INote.—Totals may not tally due to rounding of figures, a m m ^ .
Source— The Chief Inspector of Factories, Government of Maharashtra, Bombay.
A -9 4 — 102.
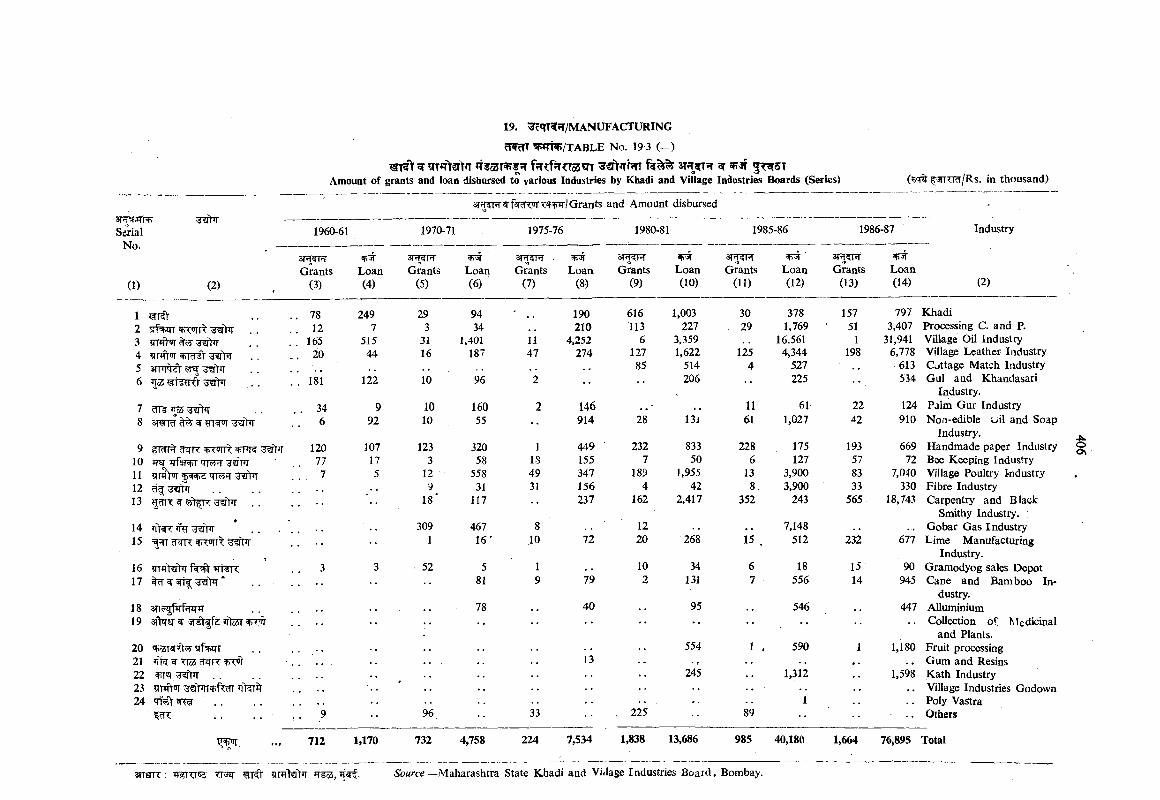
^ !im>art<T *T553R7f5T fjT fJTCToSm ^ 5T^5TAmount of grants and loan disbursed to various Industries by Khadi and Village Industries Boards (Series) ^ T m /R s. in thousand)
3R?nTWf=rar'<.'or Grants and Amount disbursed3T=5fiiTTSerial
No.1960-61 1970-71 1975-76
3PT?T>T rSrGrants Loan Grants Loan
(1) (2) (3) (4) (5) (6)
3fW?TfTGrants
(7)Loaa
(8)
fTTorr ^ 't ’T
WTTcrit ^ 't’T
55 'S fPT
7 cTT¥ 5 fhr . .8 apirra’ ^ ^ 3' ftJT
9 cTJTR10 iT jtTst TieR' sr>r11 ^4+2 'Tr?5fT1213 . .
14 ^WK %15 cPTR tjiftrr
16 ?rrtit?r>T WT¥TT17 * . .
18 m^^fiTfwr19 aftqa- ^ 3T^ffe ifter aprw
20 qio5T 7t?y sfl^T21 flr? ^ TlcS ^FT WT f22 . .23 ?iTifw ^>TT 7f%r24 ql iV ^ . .
^ . . . . ■
7812
16520
181
346
120777
712
2497
51544
122
992
107175
1,170
293
3116
10
1010
1233
129
18*
3091
■ 52
9434
1,401187
96
16055
32058
55831
117
46716'
581
78
96
732 4,758
1147
]IS4931
10
19
33
224
190210
4,252274
146914
449155 347156 237
72
79
40
13
7,534
1980-81
3iH'4MGrants
(9)
616113
612785
28
2327
1894
162
1220
102
225
afTsrLoan(10)
1,003227
3,3591,622
514206
13j
83350
1,95542
2,417
268
34131
95
554
245
1,838 13,686
1985-86
Grants(11)
3029
1254
1161
2286
138,
352
15
89
1986-87 Industry
Loan(12)
3R5TRGrants
(13)Loan(14) (2)
378 157 797 Khadi1,769 51 3,407 Processing C. and P.
16,561 1 31,941 Village Oil Industry4,344 198 6,778 Village Leather Industry
527 , , 613 Cuttage Match Industry225 534 Gul and Khandasari
Industry.61 22 124 Palm Gur Ind^istry
1,027 42 910 Non-edible o il and Soap Industry.
175 193 669 Handmade paper Industry127 57 72 Bee Keeping Industry
3,900 83 7,040 Village Poultry Industry3,900 33 330 Fibre Industry
243 565 18,743 Carpentry and Black Smithy Industry. ;
7,148 . . Gobar Gas Industry512 232 677 Lime Manufacturing
Industry.18 15 90 Gramodyog sales Depot
556 14 945 Cane and Bamboo Industry.
546 447 AlluminiumCollection of Medicinal
and Plants.590 1 1,180 Fruit processing
, . Gum and Resins1,312 1,598 Kath Industry
Village Industries GodownPoly VaStraOthers
985 40,180 1,664 76,895 Total
an-jjR ; T m m il •S’oMW—Maharashtra State Khadi and ViJage Industries Board, Bombay.
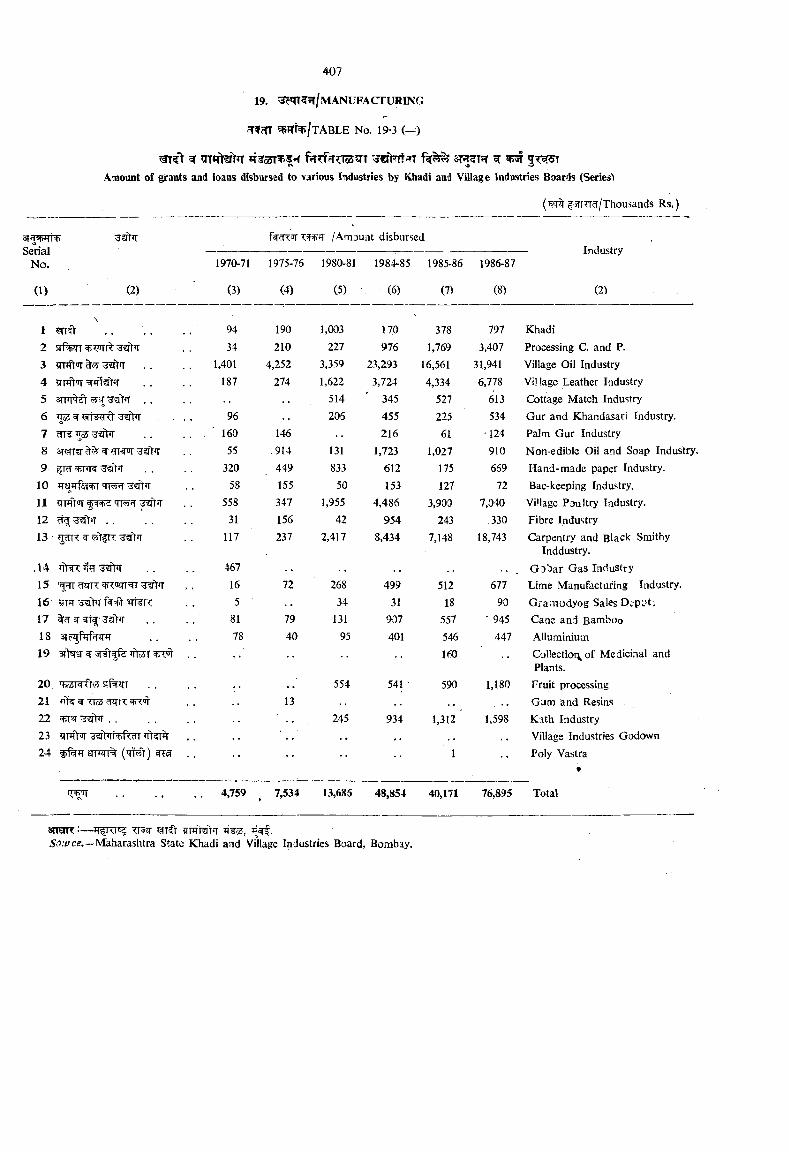
^ ?im>?rr»T ?T3:55T fr( f?r?f?ino3^T ^ ^Amount of grants aad loans disbursed to various Industries by Khadi and Village Industries Boards (Series'
sr T vinSerial
No.
(1) (2)
fwcR /Amjuiit disbursed
1970-71 1975-76 1980-81 1984-85 1985-86 1986-87
(3) (4) (5) (6) (7) (8)
(^^fWrTRf/Thousands Rs.)
Industry
(2)
1 ............................ 94 190 1,003 170 378 797 Khadi2 34 210 227 976 1,769 3,407 Processing C. and P.3 ’ETWt' T . 1,401 4,252 3,359 23,293 16,561 31,941 Village Oil Industry4 187 274 1,622 3,724 4,334 6,778 Village Leather Industry5 , . 514 345 527 613 Cottage Match Industry6 ^ <511 ' <1 96 206 455 225 534 Gur and Khandasari Industry.7 dl ^ 160 146 216 61 ■124 Palm Gur Industry8 ^ 55 .914 131 1,723 1,027 910 Non-edible Oil and Soap Industry.
320 449 833 612 175 669 Hand-made paper Industry.10 JTajrfsf r q r^ €ftTT 58 155 50 153 127 72 Bac-keeping Industry.I t 'TTJT 558 347 1,955 4,486 3,900 7,040 Village Poultry Industry.12 ctg; . . 31 156 42 954 243 330 Fibre Industryl3^dK^wtfn:^€ftT[ 117 237 2,417 8,434 7,148 18,743 Carpentry and Black Smithy
Inddustry..14 467 G^bar Gas Industry15 ' TTT nrr 16 72 268 499 512 677 Lime Manufacturing Industry.16 y in 5 34 31 18 90 Gfamodyog Sales Depot;17 81 79 131 907 557 • 945 Cane and Bamboo18 3|?^firfWT 78 40 95 401 546 447 Alluminium19 3fks[ ^ %5T . 160 Collection of Medicinal and
Plants.20 . . 554 541 ' 590 1,180 Fruit processing21 ^fk ^ <I«J ^ 13 Gam and Resins22 qrr T ^ > r ............................ 245 934 1,312 1,598 Kath Industry23 jraVir ^>ii<+.r<dT . Village Industries Godown24 sn’irr% . 1 Poly Vastra
•
4,759 7,534 13,685 48,854 40,171 76,895 Total
anofR:— Trjq- tTFrMir ii¥55, ^sci.Maharashtra State Khadi and Village Industries Board, Bombay.
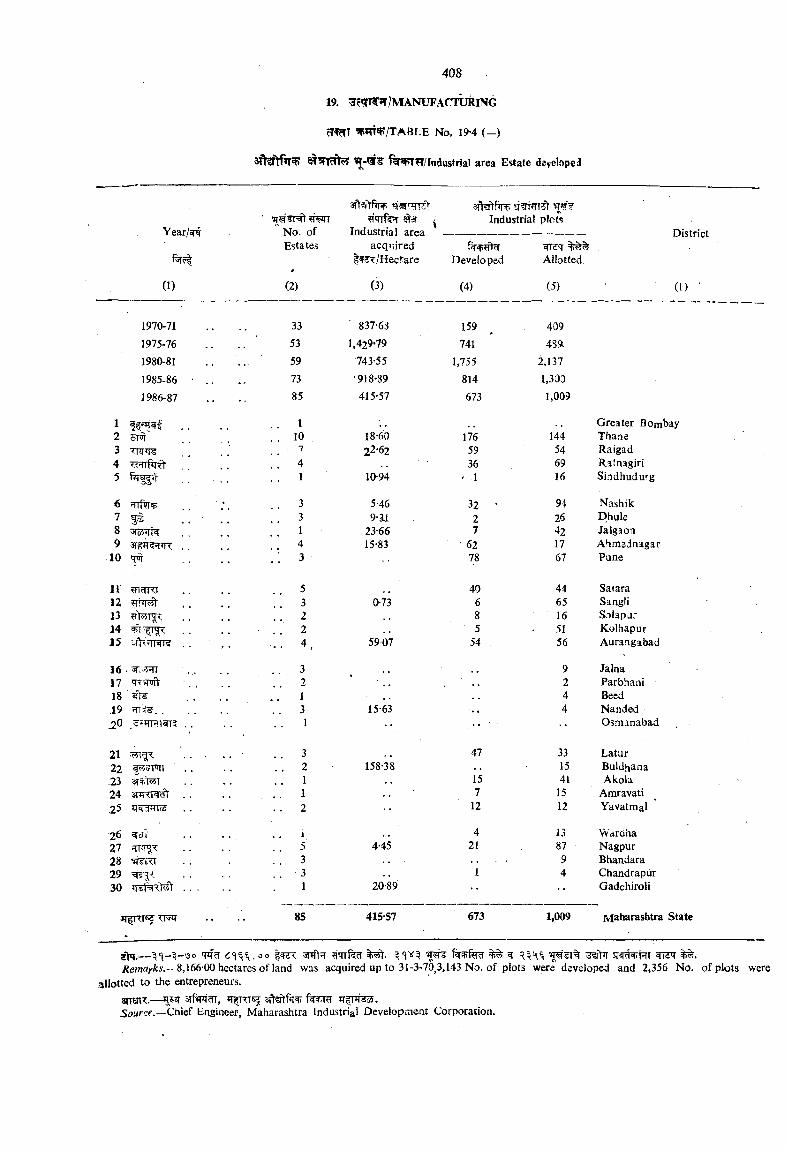
19. ^r«rT?5T/MANUFACrURlNG
n^T W ^ /T A B L E No. 19-4 ( - )
3fhrM»T f i^Pi^r/industriai area Estate developed
Year/^
(1)
No. ofEstate.s
m
(2)
«i«rrqT3t
Industrial area acquired /Hectare
(3)
Industrial plots
^<TDeveloped Allotted
(4) (5)
District
(1) •
1970-71 33 837-63 159 4091975-76 53 1,429-79 741 489.1980-81 59 743-55 1,755 2,1371985-86 • .. 73 •918-89 814 1,303
1986-87 85 415-57 673 1,009
1 Greater Bombay2 5Tct' . . 10 18-60 176 144 Thane3 TRiT _ . 7 22 62 59 54 Raigad4 ................ ’ ' 4 36 69 Ratnagiri
. . 1 10-94 ' 1 16 Sindhudurg
6 ?nf?RT . . 3 5-46 32 • 94 Nashik7 . . . . 3 9-3J 2 26 Dhule8 «(o4<ii=( ] ] 1 23-66 7 42 Jalgaoa^ STfWl^R . . 4 15-83 62 17 Ahmeinagar
10 <FT .; 3 78 67 Pune
11 ?ndKi 5 40 44 Satara12 ?TT^ . . 3 0-73 6 65 Sangli13 . . 2 8 16 Solapur14 . . 2 5 51 Kolhapur15 ;ft : Trar? . . ... • • 4 ^ 5907 54 56 Aurangabad
16 . . . 3 9 Jalna17 'rr'sToft- . . 2 . , 2 Parbhani18 1 4 Beed.19 .......................... . . 3 15-63 4 Nanded_20 . . 1 •• .-- ' •- Osmanabad
21 . . . . . ■ . . 3 47 33 Latur22 . . 2 158-38 15 Buldhana
1 15 41 Akola.24 SPRTW . . 1 .. 7 15 Amravati.25 zr=TFn3 . . 2 -- 12 12 Yavatmal
2^ ^dt . . . . i 4 13 Vvardha27 . . 5 4-45 21 87 Nagpur28 ^ kT . . 3 . . 9 Bhandara29 . . 3 1 4 Chandrapur30 ................ . 1 20-89 .. Gadchiroli
85 415-57 673 1,009 Maharashtra State
2)t(.— Wf e r ^ R ^ \ \ ^¥1% SR^HT/{emfitrfcs.—8,166-00 hectares of land was acquired up to 31-3-70^3,143 No. of plots were developed and 2,356 No. of plots were
allotted to the entrepreneurs.3IT€nT.— 3fP*FI?TT, r=(+(y Tf^PT .Sourcf.—Chief Engineer, Maharashtra Industrial Development Corporation.
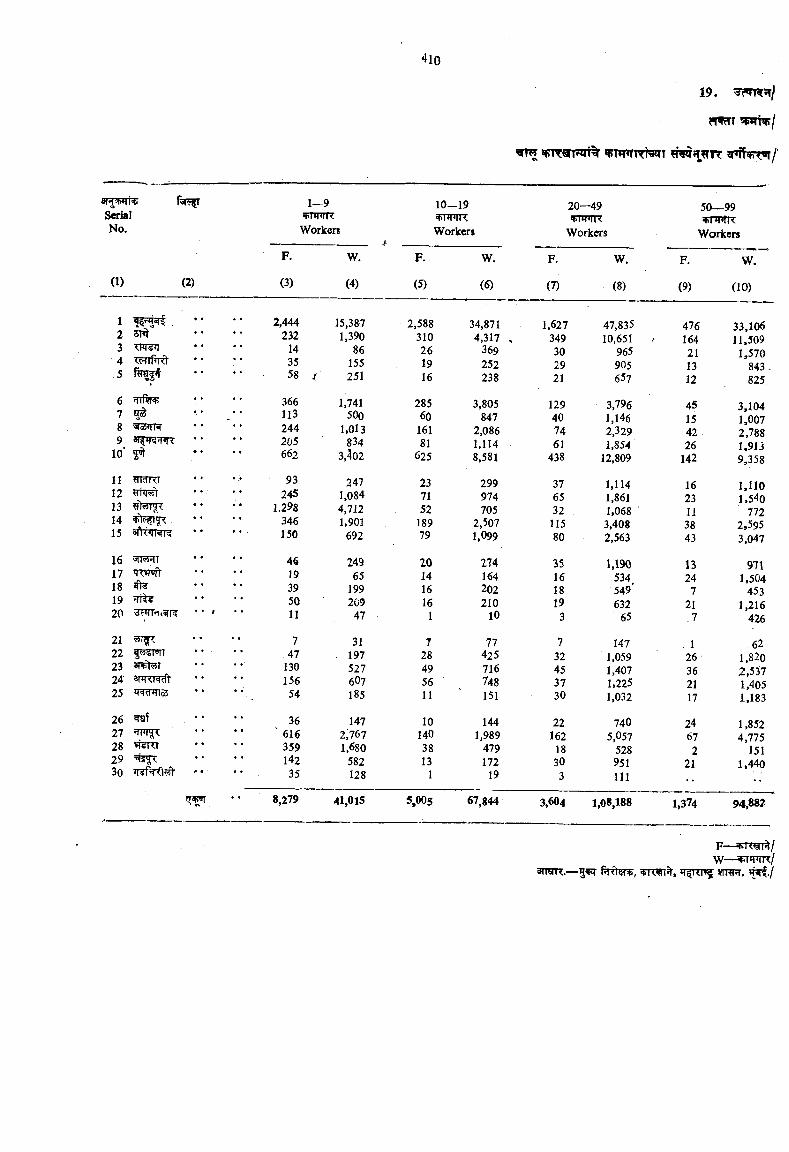
T O «PTT«TWn% ^WTTTWT ^»fN?T«r/
S ^alNo.
(1) (2)
1—9«ti|*IM(<.
Workers
F.
(3)
1 • • • 2,4442 5TIT • ♦ ♦ 2323 <W T • • * 144 • • • 35
.5 ♦ • ♦ 58
6 • • ♦ 3667 • • * 1138 *21551 R • * • 2449 • * • 205
10’ * * • 662
11 * 9312 24513 ♦ « • 1.29814 • • • 34615 150
16 '»ii«nT • 0 * 4^17 TWJff * « • 1918 • « • 3919 • • • 5020 'slWl'liWR • 1 • • 11
21 • « • 722 4723 3Tft55T • • • 13024 • « « 15625 • • • 54
26 • • * 3627 • • • ' 61628 • • • 35929 • • • 14230 35
W.
(4)
8,279
15,3871,390
86155251
1,741500
1,013834
3,402
2471,0844,7121,901
692
24965
199209
47
3119752760?185
1472,7671,680
582128
41,015
10-19vr$nnxWorkers
F.
(5)
2,5883102619 16
28560
16181
625
237152
18979
20 14 16 16
1
728495611
101403813
1
5,005
W.
(6)
34,8714,317
369252238
3,805847
2,0861,1148,581
299974705
2,5071,099
274164202210
10
77425716748151
1441,989
479172
19
67,844
20—49'fiTWK
Workers
F.
(7)
1,6273493029 21
129407461
438
376532
11580
35161819
3
732453730
2216218303
W.
(8)
47,83510,651
965905657
3,7961,1462,3291,854
12,809
1,1141,8611,0683,4082,563
1,190534549632
65
1471,0591,4071,2251,032
7405,057
5289511 1 1
3,604 1,08,188
50— 99vnrfix
Workers
F.
(9)
476164211312
451542 26
142
1623 11 3843
1324
721.7
126362117
24672
21
1,374
W.
(10)
33,106 11,509
1,570 843 . 825
3,1041,0072,7881,9139,358
1,1101,540
7722,5953,047
9711,504
4531,216
426
621,8202,5371,4051,183
1,8524,775
1511,440
94,88^
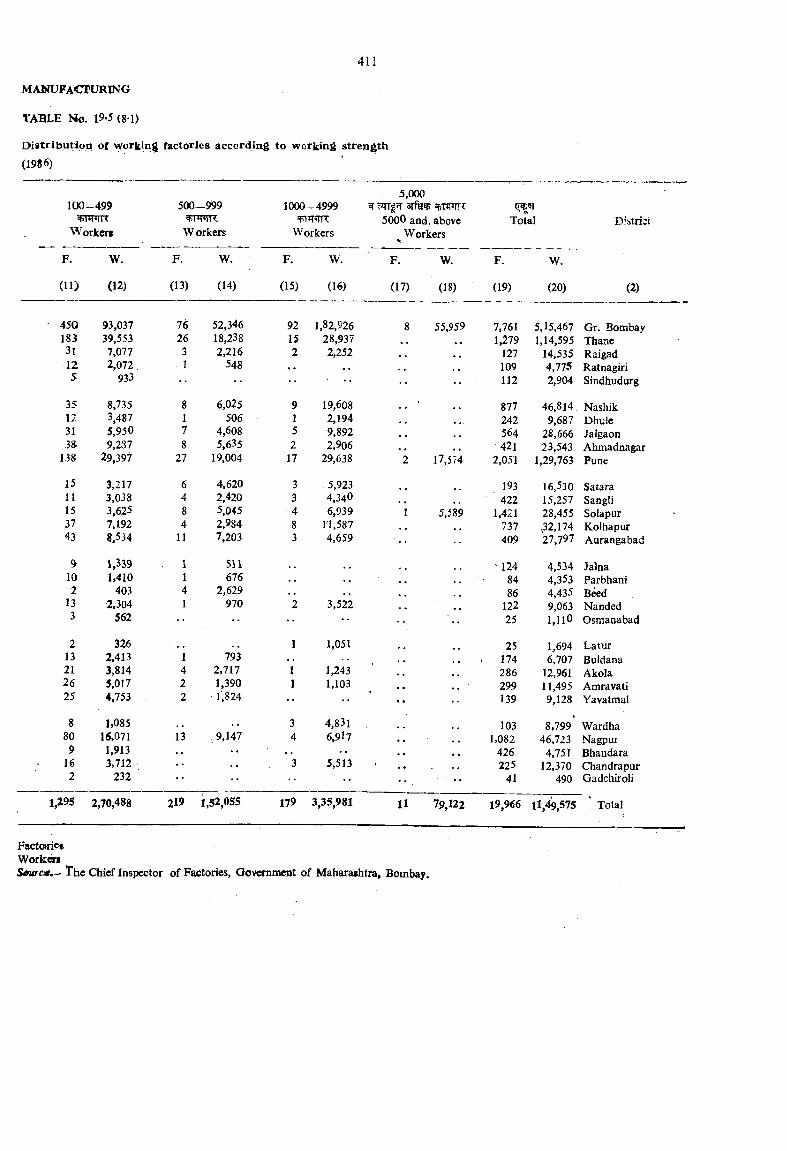
TABLE No. 19-5 (81)
D istribution of working factories according to working strength (1986)
100-499
Worker$
F. W.
(11) (12)
500-999
W orkers
5,0001000 -4999 W srf^ spTWC
5000 and, above Workers Workers
F. W.
(13) (14)
F. W.
(15) (16)
F. W.
(17) (18)
Total
F.
(19)
W.
(20)
D ’strici
(2)
450 93,037 76 52,346 92 1,82,926 8 55,959 7,761 5,15,467 Gr. Bombay183 39,553 26 18,238 15 28,937 1,279 1,14,595 Thane31 7,077 3 i2,216 2 2,252 4 » 127 14,535 Raigad12 2,072, 1 548 109 4,775 Ratnagirl5 933 .. 112 2,904 Sindhudurg
35 8,735 8 6,025 9 19,608 877 46,814 Nashik12 3,487 1 506 1 2,194 ... 242 9,687 Dhiile31 5,950 7 4,608 5 9,892 564 28,666 Jalgaon38 9,237 8 5,635 2 2,906 421 23,543 Ahmadnagar
1.38 29,397 27 19,004 17 29,638 2 17,574 2,051 1,29,763 Pune
15 3,217 6 4,620 3 5,923 193 16,530 Satara11 3,038 4 2,420 3 4,340 422 15,257 Sangli15 3,625 8 5,045 4 6,939 5,589 1,421 28,455 Solapur37 7,192 4 2,984 8 11,587 737 ,32,174 Kolhapur43 8.534 11 7,203 3 4,659 409 27,797 Aurangabad
9 1,539 1 511 , . 124 4,534 Jalna10 1,410 1 676 84 4,353 Parbhani2 403 4 2,629 86 4,435 Beed
13 2,304 1 970 2 3,522 122 9,063 Nanded3 562 25 1,110 Osmanabad
2 326 , , 1 1,051 25 1,694 Latur13 2.413 1 793 . 174 6,707 Buldana21 3,814 4 2,717 1 1,243 286 12,961 Akola26 5,017 2 1,390 1 1,103 299 11,495 Amravati25 4,753 2 - 1‘,824 •• •• •• 139 9,128 Yavatraal
8 1,085 3 4,831 103 8,799 Wardha80 16,071 13 - 9,147 4 6,9l7 1,082 46,723 Nagpui9 1,913 . •• 426 4,75T Bhandara
16 3,712 3 5,513 • • 225 12,370 Chandrapur2 232 •• 41 490 Gadchkoli
1,295 2,70,488 219 1,52,055 179 3,35,981 11 79,122 19,966 11,49,575 ‘ Total
FactoricfW wkenSeurcm,-' The Chief Inspector of Factories, Govmmaent of Maharashtra, Bombay.
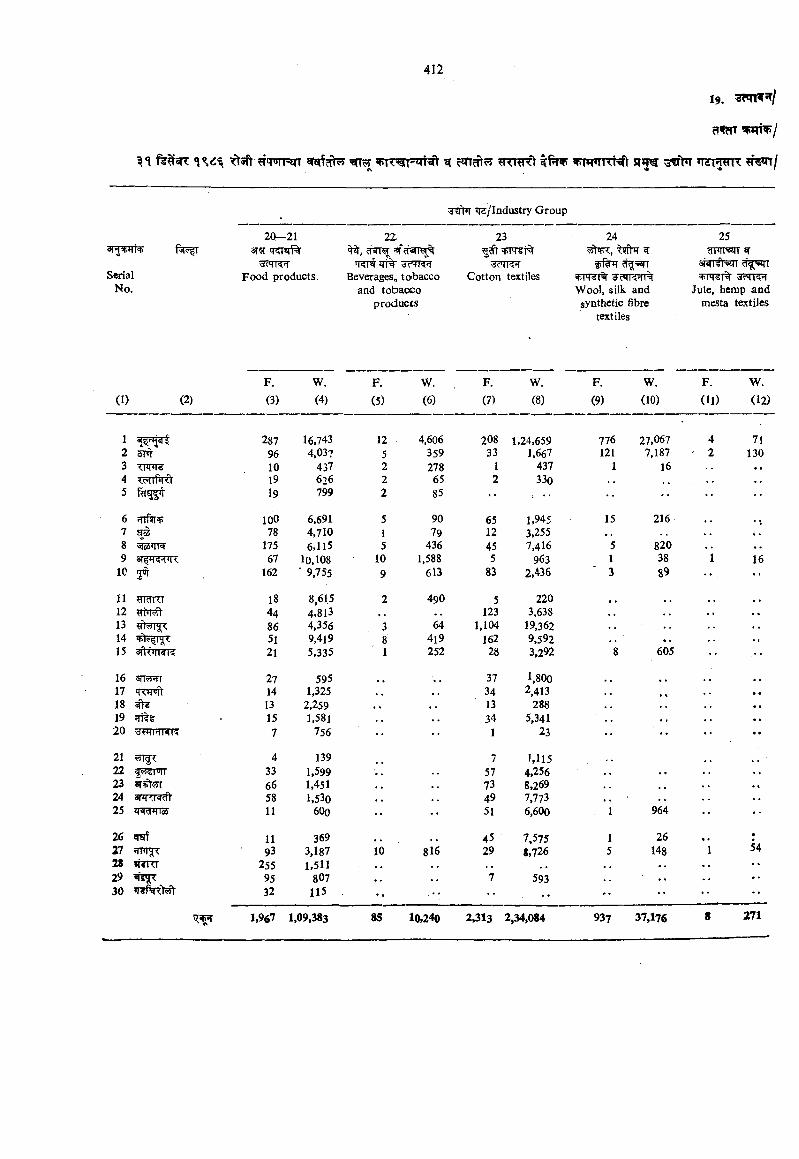
ftsft «PTTw=^^'t cm?f 55 fRTHft k ^ w i w m x H t Trcr^mr m ^ j
SerialNo.
Wf*T TfcT/Industry Group
20—21 3T T psrf
Food products
22
3Tt ?71TT Beverages, to>bacco
and tobacco products
23
c’TRVfCotton textiles
24M m ^
Wool, silk and synthetic fibre
textiles
25
3^4KH Jute, hemp and
mesta textiles
F. W. F. W. F. W. F. W. F. w .
(1) (2) (3) (4) (5) (6) (7) (8) (9) (10) (11) (12)
1 '« '-*{sl 287 16,743 12 4,606 208 1,24,659 776 27,067 4 712 5FT 96 4,03? 5 359 33 1,667 121 7,187 ' 2 1303 <[q<| 10 437 2 278 1 437 1 164 <cSiI'f<T 19 626 2 65 2 330 , ,5 |%gp 19 799 2 85 •• , .. •• •• •• ••
6 lOO 6.691 5 90 65 1,945 15 216 , ,7 TO 78 4,710 1 79 12 3,255 ..8 3To5 nW 175 6,115 5 436 45 7,416 5 8209 arp^rnn: 67 10,108 10 1,588 5 963 1 38 1 16
10 5<jr 162 ' 9,755 9 613 83 2,436 3 89 ••
11 yidKI 18 8,615 2 490 , 5 220 ..12 Mi<i^ 44 4,813 , , 123 3,63813 ?f)<rf| <. 86 4,356 3 64 1,104 19,36214 51 9,419 8 4i9 162 9,59215 3ftt<[Mr5 21 5.335 1 252 28 3,292 8 605 •• >•
16 'Jil riHIT 27 595 37 1,800 .. .. , ,17 14 1,325 , , , . 34 2,413 . .18 ^ 13 2,259 , , , , 13 28819 15 1.58] 34 5,34120 >JiWMNI'i 7 756 •• •• 1 23 •• •• ••
21 55if?: 4 139 7 1,11522 i<iTT 33 1,599 57 4,256 ..23 3T >?yr 66 1.451 73 8,269 ..24 3R?,l«Rft 58 1.530 49 7,77325 11 6O0 •• 51 6,600 , 1 964 •• ••
26 ^ 11 369 .. .. 45 7,575 1 26 •
27 93 3,187 10 816 29 S.726 5 148 1 5428 »i<Ki 255 1,511 ..29 ’4'sJ ?: 95 807 7 593 .. • •30 32 115 . . •• •• •• •• •• ••
1,967 1,09,383 85 10,240 2.313 2,34,084 937 37,176 S 271
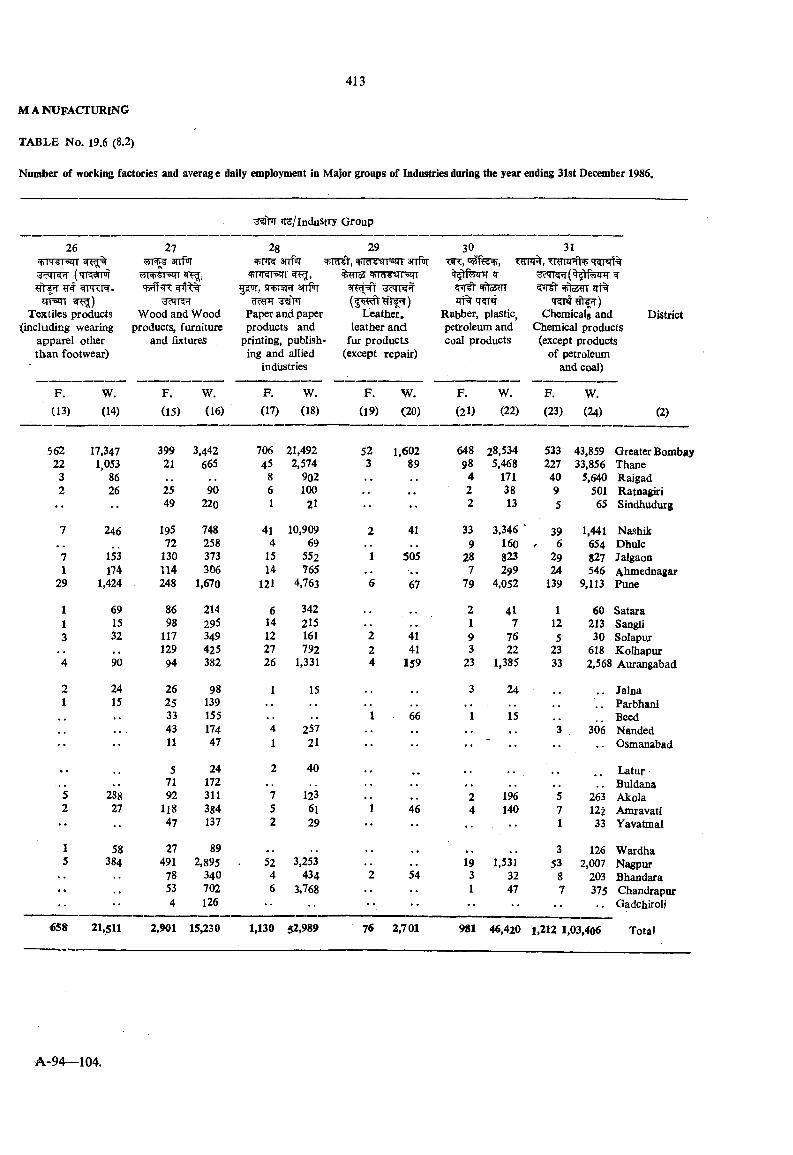
Number of working factories and averag e daily employment In Major groups of Industries during the year ending 31st December 1986,
^/industry Group
26 27 28 29 30 31TT 01+3 snfoT + M1 + Id 1 t sttPt
tftSjr <PRR- sjui, wwq" sttPt + od l ZTT%q[3[Tq
Textiles products Wood and Wood Paper and paper Leather, Rubber, plastic, Chemicals and District(including wearing products, furniture products and leather and petroleum and Chemical products
apparel other and fixtures printing, publish fur products coal products (except productsthan footwear) ing and allied (except repair) of petroleum
indiistries and coal)
F. W. F. W. F. W. F. W. F. W. F. W.(13) (14) (15) (16) (17) (18) (19) (20) (2l) (22) (23) (24) (2)
562 17.347 399 3.442 706 21,492 52 1,602 648 28,534 533 43,859 Greater Bombay22 1,053 21 665 45 2,574 3 89 98 5,468 227 33,856 Thane
3 86 8 902 4 171 40 5,640 Raigad2 26 25 90 6 100 2 38 9 501 Ratnagiri
•• 49 220 1 21 •• •• 2 13 5 65 Sindhudurg
7 246 195 748 41 10,909 2 41 33 3,346 ‘ 39 1,441 Nashik72 258 4 69 9 160 / 6 654 Dhule
7 153 130 373 15 552 1 505 28 823 29 827 Jalgaon1 174 114 306 14 765 7 299 24 546 Ahniednagar
29 1,424 248 1.670 121 4,763 6 67 79 4,052 139 9,113 Pune
1 69 86 214 6 342 .. 2 41 1 60 Satara1 15 98 295 14 215 1 7 12 213 Sangli3 32 117 349 12 161 2 41 9 76 5 30 Solapur
129 425 27 792 2 41 3 22 23 618 Kolhapur4 90 94 382 26 1,331 4 159 23 1,385 33 2,568 Atarangabad
2 24 26 98 1 15 3 24 . . Jalna1 15 25 139 , , . . Parbhani
33 155 1 66 1 15 .. Beed. . , 43 174 4 257 , , 3 306 Nanded
• • •• 11 47 1 21 •• •• •• •• .. Osmanabad
5 24 2 40 ., . . Latur71 172 * , . . Buldana
5 288 92 311 7 123 2 196 5 263 Akola2 27 H8 384 5 6l 1 46 4 140 7 122 Amravati
•• •• 4? 137 2 29 •• •• •• •• 1 33 Yavatmal
1 58 27 89 , . .. 3 126 Wardha5 384 491 2,895 52 3,253 19 1,531 53 2,007 Nagpur
78 340 4 434 2 54 3 32 8 203 Bhandara. . 53 702 6 3,768 1 47 7 375 Chandrapur
4 126 , •• •• •• •• .. Gadchiroli
658 21,511 2,901 15,230 1,130 52,989 76 2,701 981 46,420 1,212 1,03,406 Total
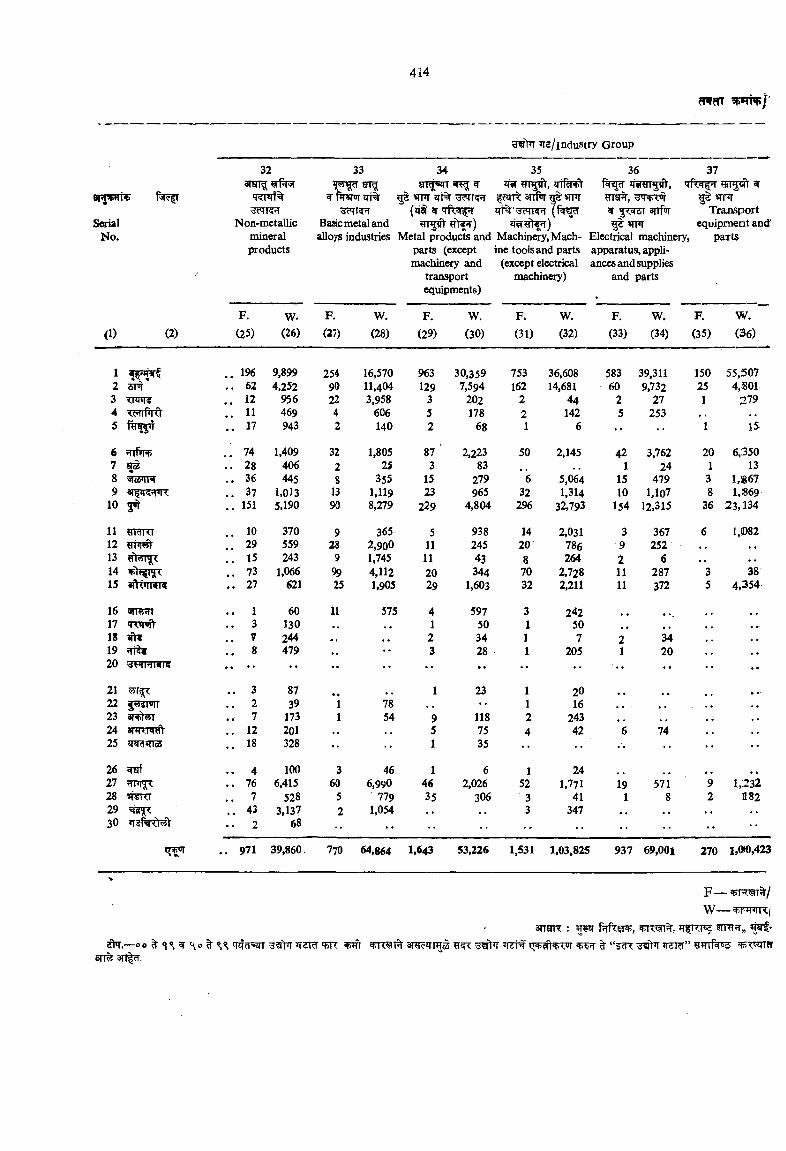
?TW?TT
8rfl«i>*ir4. Pvir?
SffialNo.
/
’TJ/induStry Group
32araig;
Non-mctallicmineralproducts
33
^ftr«nriri% j
Ba^c metal and alloys industries
34 35 tlld^l' SR ^ JjfT ?TT5!lV, ilif^+1
g2 ^ q1% ^iiR aiT ga:>TFr (jra ^
Metal products and Machinery, Mach- parts (except ine tools and parts machinery and (except electrical
transport machinery) equipments)
36 371 grrgifl- w
^ «rPT^ 5 ^ T anfw Transport g s «rnr equipment and'
Electrical machinery, paits apparatus, appliances and supplies
and parts
F. w . F. W. F. W. F. W. F. W. F. W.
(1) (2) (25) (26) (27) (28) (29) (30) (31) (32) (33) (34) (35) (36)
1 . , 196 9,899 254 16,570 963 30,359 753 36,608 583 39,311 150 55,5072 5TW .. 62 4.252 90 11,404 129 7,594 162 14,681 60 9,732 25 4,S01.3 TFUT4 . . 12 956 22 3,958 3 202 2 44 2 27 1 2794 T??lir»Ri- . . 11 469 4 606 5 178 2 142 5 2535 ftrfl’il . . 17 943 2 140 2 68 1 6 •• 1 15
6 . . 74 1,409 32 1,805 87 ' 2.223 50 2,145 42 3,762 20 6,3507 S3 .. 28 406 2 25 3 83 .. 1 24 1 138 . . 36 445 8 355 15 279 6 5,064 15 479 3 1,8679 3T|H5-lTn: . . 37 l,0l3 13 1.119 23 965 32 1,314 10 1,107 8 1,!869
10 yr . . 151 5.190 90 8,279 229 4,804 296 32,793 154 12.315 36 23,134
11 «ldl?:F .. 10 370 9 365 5 938 14 2,031 3 367 6 1,08212 .. 29 559 28 2,900 11 245 20 786 9 252 , , , ,13 .. 15 243 9 1,745 11 43 8 264 2 614 .. 73 1,066 99 4,112 20 344 70 2,728 11 287 3 38IS afH'iRre . . 27 621 25 1,905 29 1,603 32 2,211 11 372 5 4,354
16 -ill'iRt . . 1 60 ii 575 4 597 3 24217 . . 3 130 1 50 1 50 , , , , , ,18 iftl . . 7 244 ., ,, 2 34 1 7 2 3419 «ii ¥ . . 8 479 .. •• 3 28 1 205 1 2020 y(wnwi« . . . . •• •• •• •• •• •• •• •• •• •• ...
21 . . 3 87 1 23 1 20 . . • •22 . . 2 39 i 78 •• 1 16 . ,23 3T OT . . 7 173 1 54 9 118 2 243 * *24 anro^tit . . 12 201 .. 5 75 4 42 6 7425 jf^tnds . . 18 328 •• •• 1 35 •• •• •• •• -
26 . . 4 100 3 46 1 6 1 24 . .27 HHI < . . 76 6,415 60 6,990 46 2,026 52 1,771 19 571 9 1,;23228 v^icr . . 7 528 5 779 35 306 3 41 1 8 2 118229 . . 43 3,137 2 1,054 , . , , 3 347 , , , , . .30 . . 2 68 •• •• •• •• ••
. . 971 39,860 770 64,864 1,643 53,226 1,531 1,03,8251 937 69,001 270 1,OK),423
. F —W —
ansn : ^ fvrirsT , ¥RT^„sh .—0 0 q3T =5jn ?r>r tt^rt qii? ^ snET irms sr?: ^ 't ’T ^ TTcr” ETTnf
eri 3Tf|w.
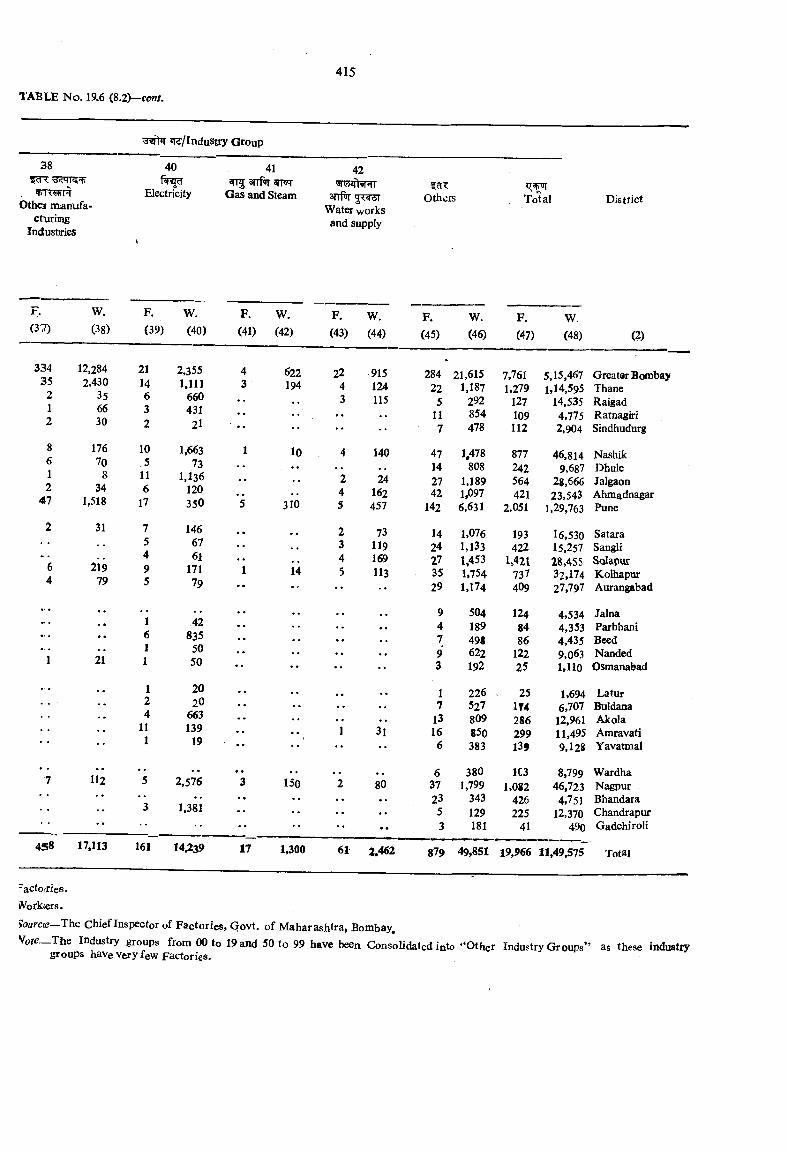
38 cTT •ti ] <.<3) H
Other mianufa- cturimg
Industaies
»T3:/Industiy Group
40
Electricity
41^ anf T
Gas and Steam
42
3TTfw 5?;cjS| Water works
and supply
Others Total District
F.(37)
W.(38)
F.(39)
W.(40)
334 12,284 21 2.35535 2,430 14 1,111
2 35 6 6601 66 3 4312 30 2 2l
8 176 10 1,6636 70 .5 731 8 11 1,1362 34 6 120
47 1,518 17 350
2 31 7 1465 674 61
6 219 9 1714 79 5 79
, ,1 42
... • • 6 8351 50
1 21 1 50
112
124
111
2020
663139
19
2,576
1,381
F.(41)
W.(42)
F.(43)
W.(44)
F.(45)
W.(46)
F.(47)
W.(48) (2)
4 622 22 915 284 21,615 7,761 5.15,467 Greater Bomb3 194 4 124 22 1.187 1,279 1,14.595 Thane
3 115 5 292 127 14,535 Raigad•• "• 11 854 109 4.775 Ratnagiri
• • •• 7 478 112 2.904 Sindhudurg
1 10 4 140 47 1,478 877 46,814 Nashik. •• • • 14 808 242 9,687 Dhule
2 24 27 1,189 564 28,666 Jalgaon• • 4 162 42 1,097 421 23.543 Ahmadnagar5 310 5 457 142 6,631 2,051 1,29,763 Pune
. . 2 73 14 1.076 193 16,530 Satara3 119 24 1.133 422 15,257 Sangli
•• 4 169 27 1,453 1,421 28.455 Solapur1 14 5 113 35 1,754 737 32,174 Kolhapur
• • 29 1.174 4O9 27,797 Aurangabad
. . .. 9 504 124 4,534 Jalna•• •• • • 4 189 84 4,353 ParbhanI•• •• • • . . 7 498 86 4.435 Seed•• • • • • . . 9 622 122 9.063 Nanded
•• •• •• 3 192 25 1.110 Osmanabad
• • ,, ,. 1 226 25 1,694 Latur•• •• • • 7 527 1T4 6,707 Buldana
•• . . 13 809 286 12,961 Akola•• • • 1 31 16 850 299 11,495 Amravati
•• •• 6 383 139 9,128 Yavatmal
. . ,, 6 380 1C3 8,799 Wardha3 ISO 2 80 37 1.799 1,082 46,723 Nagpur•• •• • • • • 23 343 426 4,751 Bhandara
•• • • . . 5 129 225 12.370 Chandrapur•• •• •• . . 3 181 41 490 Gadchiroli
458 17,113 161 14,239 17 1,300 61 2.462 879 49,851 i9,966 11,49,575 Total
i^actories.iVorkcers.
Source— The Chief Inspector of Factories, Govt, of Mahar ashtra, Bombay.
'^ote— The Industry groups from 00 to 19 and 50 to 99 have been Consolidated into “Other Industry Groups” as these industry groups have vtry few Factories.
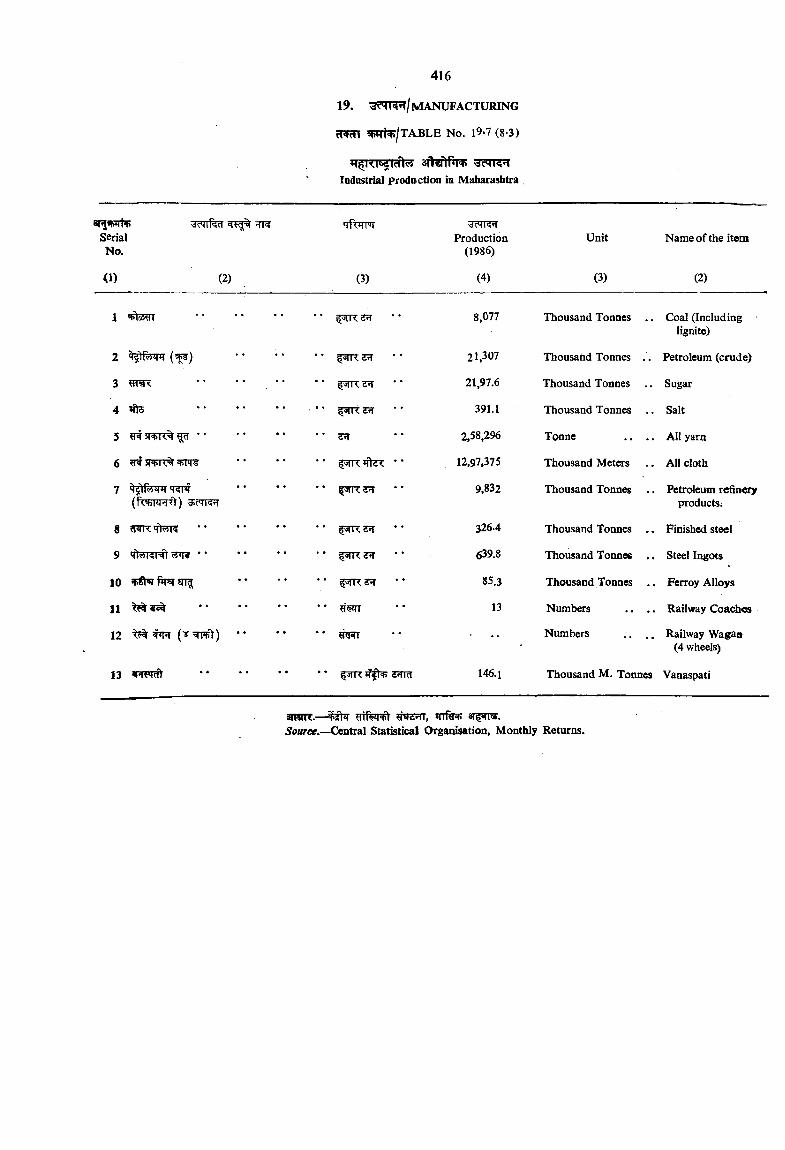
Industrial produ ction in Maharashtra
R'Tlfer "TRSerialNo.
cMKHProduction
(1986)Unit Name of the item
<1) (2) (3) (4) (3) (2)
1 ............................... 8,077
21,307
Thousand Tonnes .. Coal (Including lignite)
• • f'5rr ffiT • * Thousand Tonnes .. Petroleum (crude)
3 •• v,ir<.s?r 21,97.6 Thousand Tonnes .. Sugar
4 »fte ............................... 391.1 Thousand Tonnes Salt
5 ’BW WR% ^ ’ ‘ ■ sw 2,58.296 Tonne . . . . All yarn
6 ^5R>R% rPT¥ • • fsrr< • * 12,97,375 Thousand Meters All cloth
7 'T^3J?'TRfr
9,832 Thousand Tonnes Petroleum refinery products.
3264 Thousand Tonnes . . Finished steel
9 55^ * • 639.8 Thousand Tonnes . . Steel Ingots
10 ^ 85.3 Thousand Tonnes . . Ferroy Alloys
11 ............................... * * 13 Numbers . . . . Railway Coaches
12 ^ #»R (' w t ) • • . . Numbers Railway Wagaa (4 wheels)
13 VRtRTt ............................... 'Jil<. iffhp dHia 146.1 Thousand M. Tonnes Vanaspati
3!WR.-^5t^ HTfinF ar sn .Jaaroe.—Central Statistical Orgamsation, Monthly Returns.
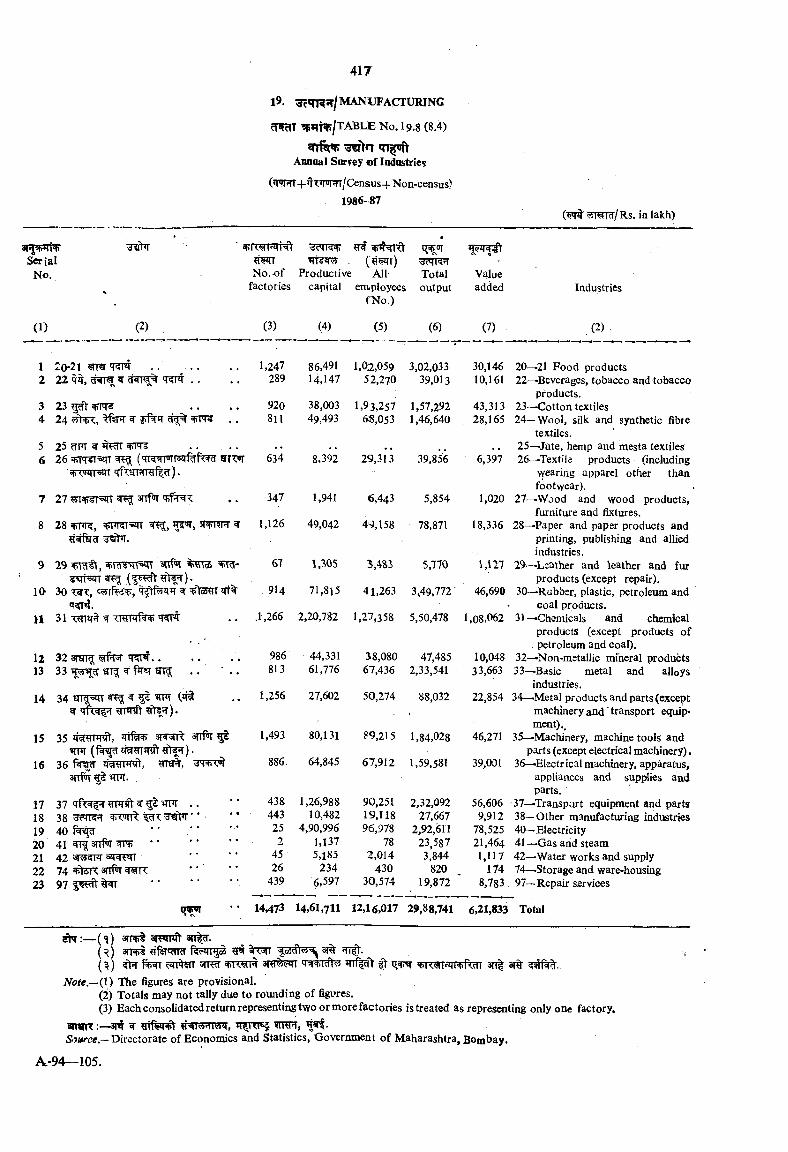
i9. m a n u f a c t u r in g
cnmr ^ p jr t^ /ta b le n o . 19.8 (8.4)
Annual Survey of Industries
(’r>RT+TrTnw/Census+Non-census) 1986-87
W(^T^/Rs. in lakh)
SerialNo.
. ( e ^ t ) ‘ ■No.-of Productive All- Total Value
factories capital employees output addedCNo.)
Industries
(1) (2) (3) (4) (5) (6) (7) , (2)
1 20-21 ............................ .. 1,247 86,491 1,02,059 3,02,033 30,146 20—21 Food products2 22 qq, ^ 'KT«I . . 289 14,147 52,270 39,013 10,161 22—Beverages, tobacco and tobacco
products.3 23 ^ 920 38,003 1,93,257 1,57,292 43,313 23-—Cotton textiles4 24 ^ . . 811 49,493 68,053 1,46,640 28,165 24—Wool, silk and synthetic fibie
textiles.5 25 g-FT 7nT¥ , , 25—Jute, hemp and mesta textiles6 26 4>TTyr=5 ^ irrTw
.fi-<qqT 'TfTSnW^gr).634 8,392 29,313 39,856 6,397 26—Textile products (including
wearing apparel other than footwear).
7 27 ^^=3irT ^ 3TTfq <#1^5 347 1,941 6,443 5,854 1,020 27—Wood and wood products, furniture and fixtures.
8 28 TFR, ST+TOK ^ 1,126 49,042 49,158 78,871 18,336 28—Paper and paper products and printing, publishing and allied industries.
9 29 ^M\tA ^■* 67 1,305 3,4S3 5,770 1,127 29—Leather and leather and fur products (except repair).
10 30 c55Tf^, W ¥te?TT qt% .914 71,815 41,263 3,49,772' 46,690 30—Rubber, plastic, petroleum and coal products.
n 31 sf TRTT Tf <7^ .1,266 2,20,782 1,27,358 5,50,478 1,08,062 31—Chemicals and chemical products (except products of petroleum and coaj).
12 32 3T ^ 4<|q. . 986 44,331 38,080 47,485 10,048 32—N on-metallic mineral products13 33 ^ f «r 9Tg; . . ‘ . . 813 61,776 67,436 2,33,541 33,663 33—Basic metal and alloys
industries.14 34 «JTf5trr ^ ^ (5? 1,256 27,602 50,274 88,032 22,854 34—Metal products and parts (except
machinery and' transport equipment)..
15 35 3T f^ arrf ^ RTT (f^r^ € t |^ ) .
1,493 80,131 89,215 1,84,028 46,271 35—Machinery, machine tools and parts (except electrical machinery).
16 36 JT rnnrt, 886. 64,845 67,912 1,59,581 39,001 36—Electrical machinery, apparatus, appliances and supplies and parts.
17 37 ?rnT?ft ^ ^ ^ . . 438 1,26,988 90,251 2,32,092 56,606 37—Transport equipment and parts18 38 icTT * * ■ 443 10,482 19,118 27,667 9,912 38—Other manufacturing industries19 40 fT'^ ’ ’ 25 4,90,996 96,978 2,92,611 78,525 40—Electricity20 41 WTf anR = H 4> ............................... 2 1,137 78 23,587 21,464 41 —Gas and steam21 42 45 5,185 2,014 3,844 1,117 42—Water works and supply22 74 3ttP>t 26 234 430 820 174 74—-Storage and ware-housing23 97 ............................... 439 6,597 30,574 19,872 ' 8,783. 97—Repair services
qv<>r 14,473 14,61,711 12,16,017 29,88,741 6,21,833 Total
€t^:— (n) 3TRjt aiwpft an|^.{ r ) arryt ^ 3i% nfr.{ \ ) ^ 5p iw t aro^qr yR €T i r<dfi ani ar%
Note.— {\) The figures are provisional.(2) Totals may not tally due to rounding of figures.(3y Each consolidated return representing two or more factories is treated as representing only one factory.
anWT 3T$ ^ «’ST5rTR$TT, TTCPSJSource.— Directorate of Economics and Statistics, Government of Maharashtra, Bombay.

^Jcqr^ ^arrfw f^crl^Tnr srr^^t rr% w JTf%ft m
f ^ ^ T ^ f e y t 3 n |.
20.1. Information on installed capacity, production and consumption of electricity and towns and villages electrified in the State is given in this Section.
( r ) ^ (^ ) rnqT 3TT ?srr^^5rf^3 n |. jf^55j%
^ cft ^rpfw=5q7«5nr^«f^5j^r 3it -^ F' pfy ?TT% ^ ? r ^ TraETT
3{r|.
20.2. The figures of (/) installed capacity, (ii) output and (Hi) consumption of electricity given in table relate only to public utilities. The data on progress of electrification under Maharashtra State Electricity Board also includes villages and towns which are electrified by the private agencies.
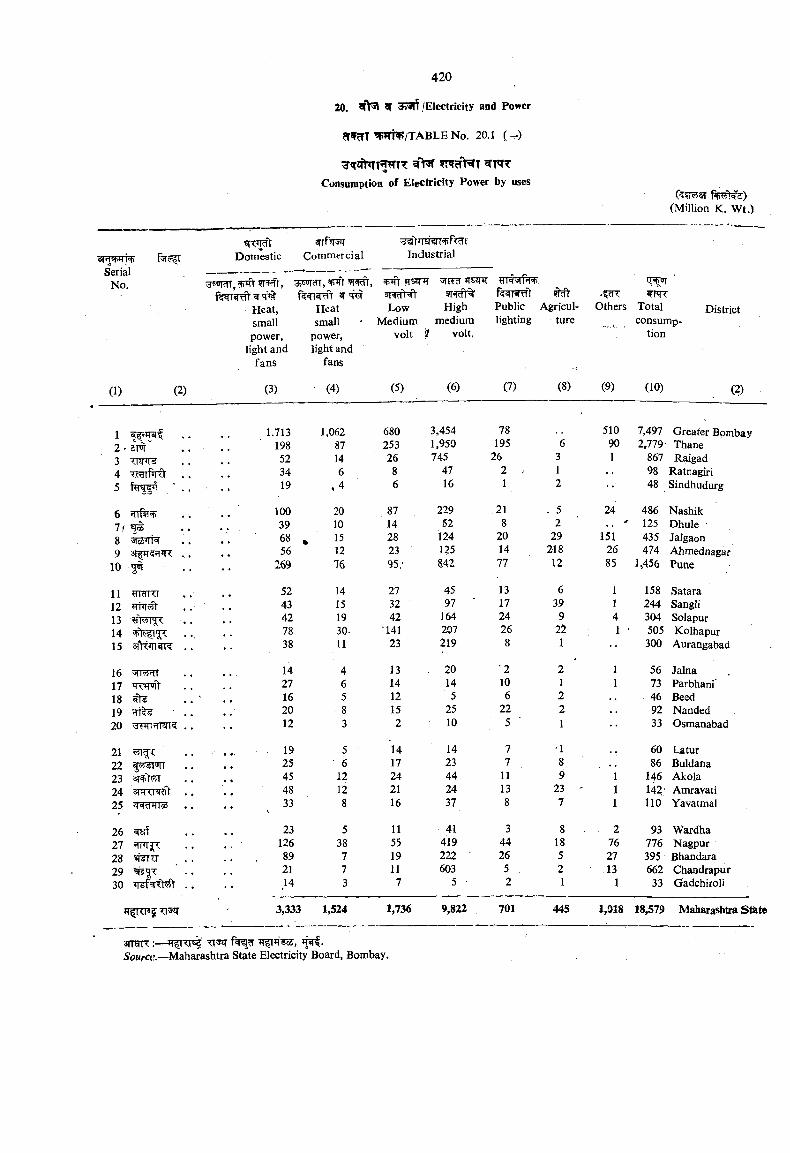
crf5TT ^ ^ /T A B L E No. 20.1 (-^)
Consumption of Electricity Power by uses
(Million K. Wt.)
sfPTiTrrcpSerial
No.
Domestic Commercial Industrial
^CTTtTT,=Fft?r , 3?snrcfT, ^ ^ JTSqTT JTSZHT
Heat, Heat Low High Public Agricul-small small ■ Medium medium lighting ture power, power, volt volt,
light and light and fans fans
V•?cR
Others Totalconsump
tion
District
(1) (2) (3) (4) (5) (6) (7) (8) (9) (10) (2)
1.713 1,062 680 3,454 78 510 7,497 Greater Bombay198 87 253 1,950 195 6 90 2,779- Thane52 14 26 745 26 3 1 867 Raigad34 6 8 47 2 . 1 98 Ratnagiri19 »4 6 16 1 2 48 Sindhudurg
100 20 87 229 21 - 5- 24 486 Nashik39 10 14 52 8 2 j#- 125 Dhule68 . 15 28 124 20 29 151 435 Jalgaon56 12 23 125 14 218 26 474 Ahmednagar
269 16 95,’ 842 77 12 85 1,456 Pune
52 14 27 45 13 6 1 158 Satara43 15 32 97 ■ 17 39 1 244 Sangli42 19 42 164 24 9 4 304 Solapur78 so 141 207 26 22 1 • 505 Kolhapur38 il 23 219 8 1 •• 300 Aurangabad
14 4 13 . 20 '2 2 1 56 Jalna27 6 14 14 10 1 1 73 Parbhani'16 5 12 5 6 2 46 Bead20 8 15 25 22 2 92 Nanded12 3 2 10 5 1 •• 33 Osmanabad
19 5 14 14 7 '1 .. 60 Latur25 6 17 23 7 8 86 Buldana45 12 24 44 11 9 1 146 Akola48 12 21 24 13 23 ' 1 142- Amravati33\ 8 16 37 8 7 1 110 Yavatmal
23 5 11 41 3 8 2 93 Wardha126 38 55 419 44 18 76 776 Nagpur89 7 19 222 ■ 26 5 27 395 Bhandara21 7 11 603 5 2 13 662 Chandrapur,14 3 7 5 • 2 1 1 33 Gradchiroli
3,333 1,524 1,736 9,822 701 445 1,018 18,579 Maharashtra Sti
12 • zm ''345
11 12131415
161718 ^19 ^20 ^OT-TR15
2122 f ^ ’HT23 3I ?rr2425 q- rwos
26 ^27 ?TFrjT282930
3TT9K ;-— TI'jJTSource.—Maharashtra State Electricity Board, Bombay.
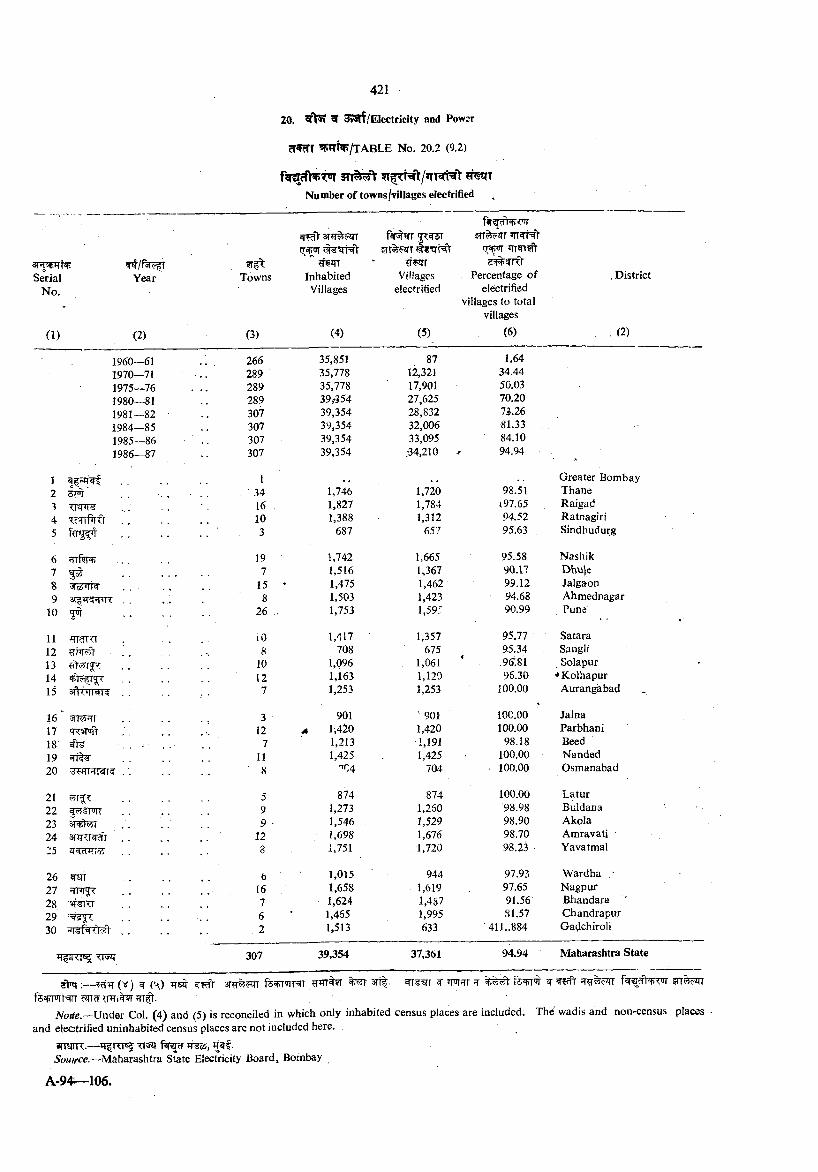
SerialNo,
(1)
Year
(2)
TpTTE
Number of towns/villages electrified
Towns
(3)
't3T?i%eirr
InhabitedVillages
(4)
nT^T?Tfirr
Villageselectrified
(5)
FTT zrr rr^ iTTfWfy
. Percentage of electrified
villages to total villages
(6)
, District
. (2)
1960—61 266 35,851 87 1.641970—71 289 35,778 12,321 34.441975—76 289 35,778 17,901 50.031980—81 289 39,-554 27,625 70.201981—82 307 39,354 28,832 73.261984—85 . ■ 307 39,354 32,006 81.331985—86 307 39,354 33,095 84.101986—87 307 39,354 ;34,210 -f 94;94 1
1 . . 1 , , Greater Bombaj2 5FT . . . 34 1,7.46 1,720 98.51 Thane3 TrniTr§' 16 1,827 1,784 i97.65 Raigad4 . . 10 1,388 1,312 94.52 Ratnagiri5 . 3 687 657 95.63 Sindhudurg
6 19 1,742 1,665 95.58 Nashik7 7 1,516 U367 90.17 Dhwk8 STtZ iJ 15 1,475 1,462 99.12 Jalgaon9 8 1,503 1,423 94.68 Ahmednagar
10 26 1,753 1,595 90.99 Pune
11 firai-a . . . iO 1,417 1,357 95.77 Satara12 ¥TR??f . , 8 708 ' 675 95.34 Sangli13 t 5T J'C 10 1,096 , 1,061 ' ,9(j.81 Solapur14 . . 12 1,163 1,120 96.30 -»Kolhapur15 7 1,253 1,253 100.00 Aurangabad
16 ' , ■ 3 901 ' 901 100.00 Jalna17 'R^T . . . 12 4 l',420 1,420 100.00 Parbhani18 ^ - . . 7 1,213 1,191 98.18 Beed19 11 1,425. 1,425 100.00 Nanded20 ■ 8 ^04 704 100.00 Osmanabad
21 5 874 874 100.00 Latur22 55'31'Jtl 9 1,273 1,260 98.98 Buldana23 9 • 1,546 1,529 98.90 Akola24 12 1,698 1,676 98.70 Amravati25 T cFTiS' 8 1,751 1,720 98.23 ■ Yavatmal
26 STT G 1,015 944 97.93 Wardha -27 TPI . . 16 1,658 1,619 97.65 Nagpur28 7 - 1,624 1,487 91.56' Bhandara29 6 1,465 1,995 81.57 Chandrapur30
(S *’jrsfT’rM .. .2 1,513 633 411..884 Gadchiroli
307 39,354 37,361 94.94 Maharashtra State
('*^) ^ (H) 3Rr^?3Ti 3Tt|. ^ ^nirfTr jt ^ ? R r^ c ^fs^ M T qr t. .
iVotfe.—Under Col. (4) and (5) is reconciled in which only inhabited census places are included. Th^ wadis and non-census places and electrified uninhabited census places are not included here.
anarn:.— f^cr #«rf.
Sou tree.—Maharashtra State Electricity Board, Boinbay
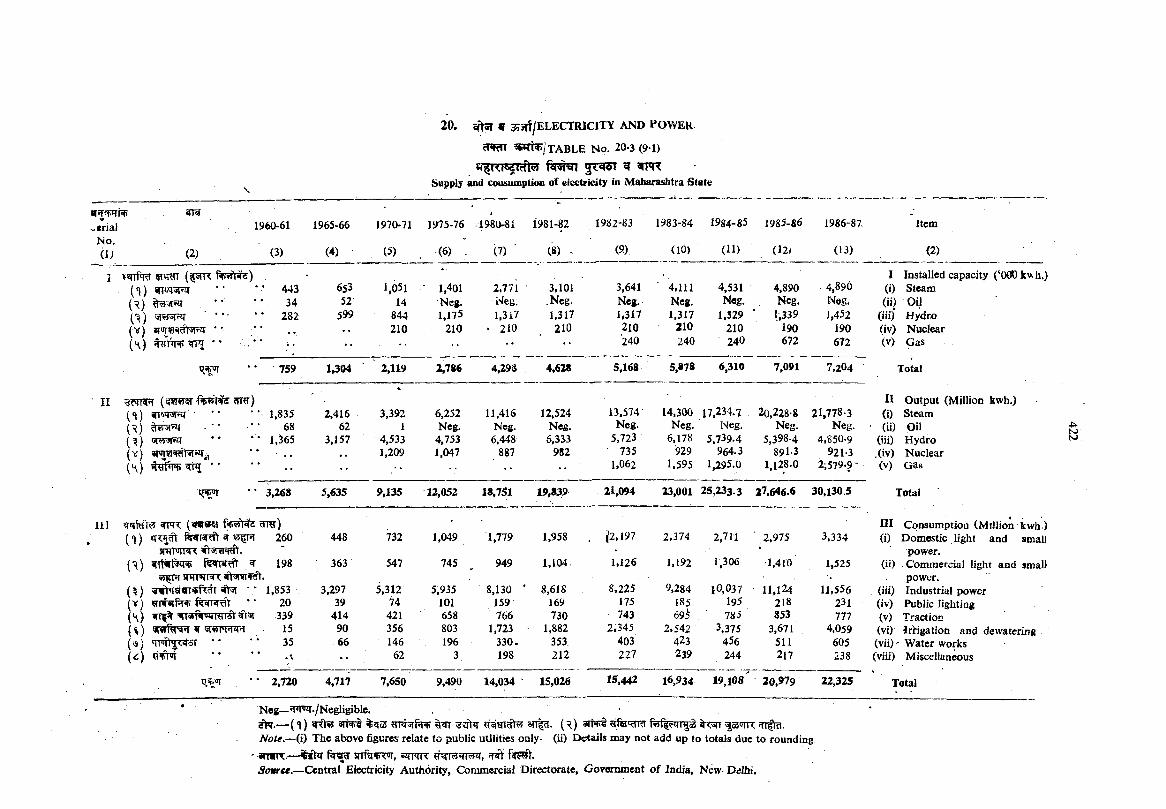
5TiRn t a b l e N o. 20-3 (91)
^ «rmSupply and cwsumptkm of eicctricity in Maharashtra State
,-erialNo.(i)
R> . ^1960-61
(2) (3)
1965-66
(4)
1970-71
C5)
1975-76
(6) .
1980-81
(7)
1981-82
(8) -
1982-83
(9)
1983-84
(10)
1984-85
(11)
1985-86
(l2i
1986-8Z
(13)
Item
(2)
vsTTfq ?PRn (?5rR f-n»1sre) .( ‘ • ‘ * 443 653 1,051 • 1,401 2,771 3,101 3,641 4,111 4,531 4,890 4,890
I Installed capacity (‘000 k\vh.) (i) Steam
(^) ' • ’ * 34 52 14 Ncg. Neg, ,Neg. Neg. Neg. Neg. Ncg. Neg. (ii). Oil................. 282 599 844 1,175 1,317 1,317 U3U 1,317 1,329 * 1,339 1,452 (Hi) Hydro
(V) '• 210 210 • 210 210 210 210 210 190 190 (iv) Nuclear( \ ) # TfTr «rrr •• , •'* •• •• •• •• 240 240 240 672 672 (V) Gas
• * 759 1^04 2,119 2,786 4,298 4,628 5,168 5,878 6,310 7,091 7,204 Total
:??qT5?T fsp^Nf? ?mT)(H) " ■ ■' 1,835 2,416
%
3,392 6,252 11,416 12,524 13.574' 14,300 17,234.7 . 20,228-8 21,778-3II Output (Million kwh.) (i) Steam
(^) • - 68 62 1 Neg. Neg. Neg. Neg. Ncg. Neg. Neg. Neg. (ii) Oil(^) ersrarHT • * • • 1,^65 3,157 4,533 4,753 6,448 6,333 5,723 6.178 5.739.4 5,398-4 4,850-9 (iii) Hydro(V) »PW5RTt5r«f (K) "
1,209 1,047 887 982 • 735 929 964.3 891-3 921-3 .(iv) Nuclear•• •• •' 1,062 1.595 1 95.0 1,128.0 2;579-9' (V) Gas
• ’ 3,268 5,635 9,135 12,052 18,751 19,839 21,094 23,001 25,233.3 27,646.6 30,130 5 Total
srm (w » «( 1 *i?!H 260 448 732 1,049 1,779 1,958 . ^2,197 2,374 2,711 .2,975 3,334
n i Consumption (Million kwh ) (i) Domestic light and small
(■H) ^ 198 363 547 745 949 1,104 1,126 1,192 1,306 •1,410 1,525power.
(ii) Commercial light and smallsnrmm
( ^) ¥^ 6r«T ^^ I 5fl •" 1,853 3,297 5,312 5,935 8,130 ' 8,618 8,225 9,284 10,037 11,124 11,556power.
(iii) Industrial power(V) jrT*if5T •• 20 39 74 101 159 169 175 185. 195 218 231 (iv) Public lighting{ \ ) VT5$fv««Rrret9>5T 339 414 421 658 766 730 743 69i 785 853 777 (v) Traction(^) 15('a) ’TT®ft35 5T *‘ '* 35
90 356 803 1,723 ■ 1,882 2,345 2,542 3,375 3,671 4,059 (vi) irHgation and dewatering66 146 196 330 » 353. 403 423 456 511 605 (vii) • Water works
(C) '•• 62 3. 198 212 227 239 244 217 238 (viii) Miscellaneous
• • 2,720 4,717 7,650 9,490 14,034 15,026 15,442 16.934 19,108 20,979 22,325 Total
45*NiS>
Ncg— nTWT-/ ®Sligi*5lc.— (<i) %go5 gT#5ii T an|a:. (^) 3 ii^ ?ife'crra fe^^nr^a 55>itr fn ^ .
Note.-^(i) The above figures relate to public utilities only- (ii) X>t?tails may not add up to totals due to rounding. ' irtwnc.— %5t?T srrf?Rn7Jr, sq-mr ^Nr^frr^, ^
5(>«rc«.—Central Electricity Authority, Comnwrcial Directorate, Govermnent of India, New Dalbi.
Z l . n m r t 21. TRADE
cf% «rtnr«? 2i.l.- information on import® and exports in Bombay 3»=fv taTTTTsr Port and imports and exports of selected commodities
^ in Maharashtra State by Rail and River is given in this?rr T^T section.
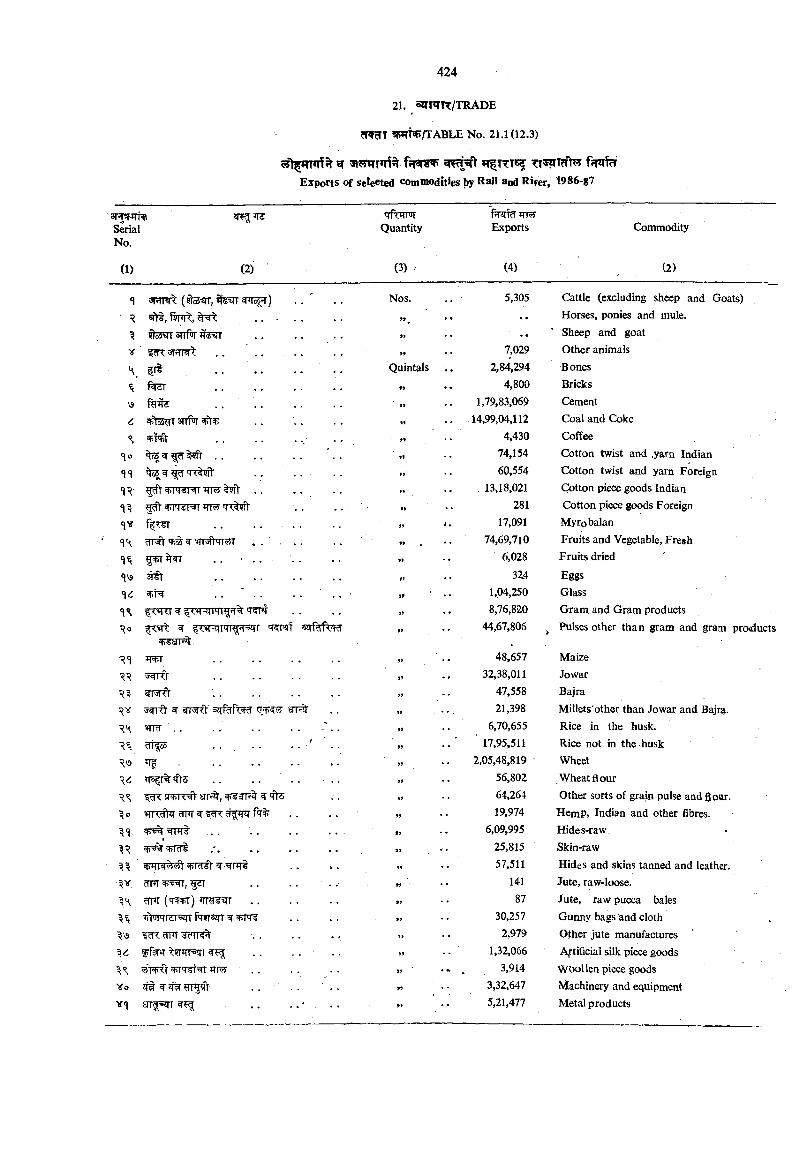
^ g f ? r ^ TT' fTTffV y fjmfcTExports of selected commodities by Rail and River, t986-g7
ar 'iThiSerialNo.
Quantity Exports Commodity
(1) (2) (3) (4) (2)
^1*)^ (yioi ir, *i« i =( ioi ) Nos. 5,305 Cattle (excluding sheep and Goats)
■ ■R sftt, Fjfr i , . . . . . • . Horses, ponies and mule.
dosgr snfiJT • • Sheep and goat
V , . , . . . . . 7,029 Other animals
K, ir t . . . . •• •• Quintals 2,84,294 Bones
. . . . . . . . #» 4,800 Bricks
\3 . . ............................... 1,79,83,069 Cement
6 anPiT ............................... 14,99,04,112 Coal and Coke
% w;t 4,430 Coffee<\o ^ ^ 5fV . . . . . . >» 74,154 Cotton twist and .yarn Indian
n . . . . . . 60,554 Cotton twist and yarn Foreign
'\R- rrTsrrr wr . . . 13,18,021 Cotton piece goods Indian
'T’? 5rft . . . . 281 Cotton piece goods Foreign<jv ft<«i . . . . . . 9» 17,091 Myrobalan
dM'V'iHs^m^TrOT . . . . . 74,69,710 Fruits and Vegetable, Fresh
^+1 . . ' . . ■ H 6,028 Fruits dried
'l\9 ^ ............................................. fi 324 Eggs. . ■ . . . . ■ . . ■ 1,04,250 Glass
^ fRTTqr 'KT’t ................... 8,76,820 Gram and Gram productsHo f wtTT'Tnj rsiTr 'T?r?i1 3?T%fe^ 99 44,67,806 Pulses other than gram and gram products
Jf+I 99 48,657 Maizea^rO 99 32,38,011 Jowar
99 47,558 Bajra^ «rNTt 17, ? STF 21,398 Millets'other than Jowar and Bajra.
R\ WRT . . . , . . . . -' . . ,9 6,70,655 Rice in the husk.. . . . . . •' 99 17,95,511 Rice not in the husk
■<s ^ ■ •• ............................... »f 2,05,48,819 • Wheel
tT5 r%<ft5 . . . . . . . . 99 56,802 Wheat flour^ srri%, w ^3 99 64,264 Other sorts of grain pulse and flour.
^ ^ • • 99 19,974 HemP, Indian and other fibres.
. ... . . . . . . 99 6,09,995 Hides-raw.
n 9> 25,815 Skin-raw99 57,511 Hides and skins tanned and leather.
141 Jute, raw-loose.rrm ( w r ) jtri ^t . . . . . 99 87 Jute, raw pucca balesrtJlHldl- l PnFT®irT ^ 99 30,257 Gunny bags and cloth
\3 ?fTn '. . 99 2,979 Other jute manufactures '^ T’fTFMT . . . . 99 1,32,066 Artificial silk piece goods
99 3,914 Woollen piece goodsYo ^ • • • • • • 99 3,32,647 Machinery and equipmentv<i srrgjsirr . . . . • , . . 5,21,477 Metal products
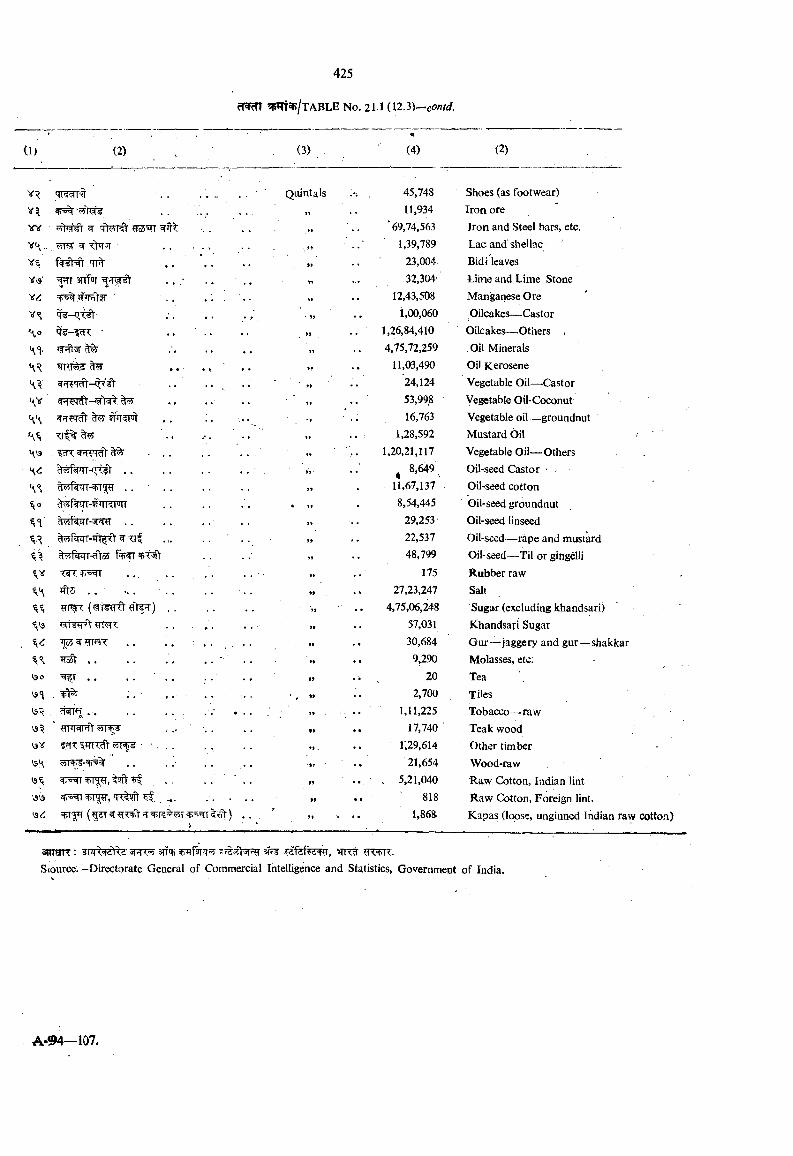
(1) (2) . •
«(4) (2)
. . ................ ' Quintals 45,748 Shoes (as footwear)
4i"<A . . . . . . . 55 11,934 Iron orevv 3! ?T3 T ‘69,74,563 Iron and Steel bars, etc.v \. . ^ . . . . •. 1,39,789 Lac and'shellac
fffN t ............................ . 23,004 Bidi leaves
3nf«r . . ; , . . . ... 32,304' Lime and Lime Stonev<i cti-o flfirnlriT - . ................ )» 12,43,508 Manganese Ore
.‘. . . . .. » i ,00,060 Oilcakes— Castor>» . . 1,26,84,410 Oilcakes— Others .
.'. ,. , , 4,75,72,259 Oil Minerals^ . . . , . , , » . . 11,03,490 Oil Kerosene
»> ' 24,124 Vegetable Oil— Castor* . . • • . »> 53,99.8 Vegetable Oil-Coconut
ST’T M . , . . ■ . . •* ■ . . 16,763 Vegetable oil— groundnut, ' . . . - . ' . . ' 99 1,28,592 Mustard Oil
?cn: ^ TFRTt ^ • . . . . . . it 1,20,21,117 Vegetable Oil— Others. , . . . . . . 4 8.649 Oil-seed Castor ■ .
it . 11,67,137 Oil-seed cottonfsnTT- <ii<i*jir * it . 8,54,445 Oil-seed groundnut
it 29,253 Oil-seed linseed
. . . . . . . . . 22,537 Oil-seed— rape and mustard■ v flPTT-^o5 f'ti'il ii 48,799 Oil-seed—Til or gingdli
. . . . . . . . . tt 175 Rubber raw. . . •• . »» 27,23,247 Salt
?rnf?: . . ti 4,75,06,248 Sugar (excluding khandsari). . . . . tt 57,031 Khandsari Sugar
. , . , ■ . . . . . . . 30,684 Gur—jaggery and gut— shakkarMoil' , . . . . , . . ■ . . 9,290 Molasses, etc;
V30 -1 1 . . . . • . . It 20 TeaV3<\ . ^ ; . ■ . . . . . . . ' , ♦» . . 2,700 TilesV9 , . . . . . . . . . ' • . . 1,11,225 Tobacco— raw
WRpft ... . . ft • • 17,740 ‘ Teak wood\ 3 X ti . . . r,29,614 Other timber
. . 21,654 Wood-raw. . . 5,21,040 Raw Cotton, Indian lint
\3\3 . . . . . »» . . 818 Raw Cotton, Foreign lint.'S6
> ■ V. . 1,86S Kapas (loose, unginned Indian rav
amaR: sn'?; dPdfe r, ?n?TTT.S(Ource.—Directorate Geaeral of Commercial Intelligence and Statistics, Government of India.
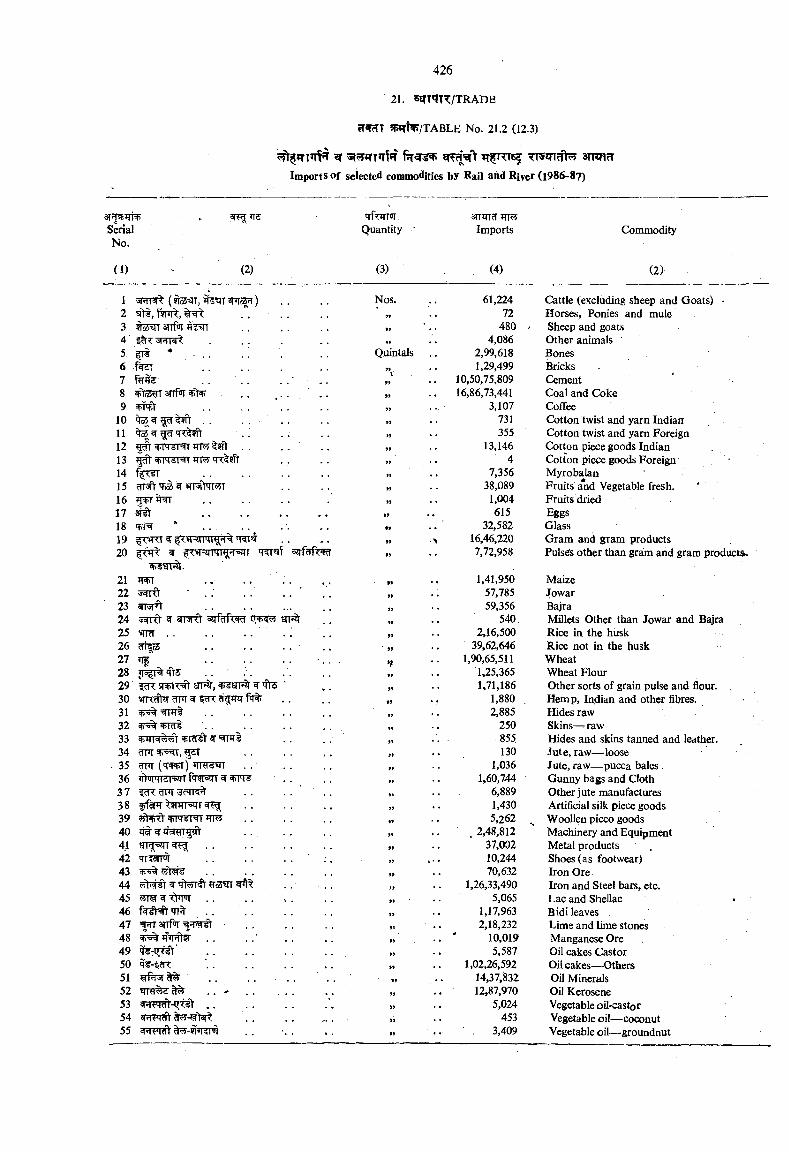
^mfJ/TABLE No. 21.2 (12.3)
^ 3»5y<TT f?T ^ ^ i m s STT RfTImports of selected commodities by Rail and Riyer (1986-87)
3T^.qi+ ,.SerialNo.
(1) (2)
'rfornn’.Quantity •
(3)
3Tnn TTRy Imports
, (4)
Commodity
(2)
1 (iiloi'MT, H'i'MT <ISh) Nos. 61,224 Cattle (excluding sheep and Goats) •2 . . . . 99 72 Horses, Ponies and mule3 ?Tc5 arifn 99 . 480 Sheep and goats4 . 99 4,086 Other animals5 ^ Quintals 2,99,618 Bones6 fWr . . . . 1,29,499 Bricks7 Ma: . . . . . . ‘ . . 99 10,50,75,809 Cement8 sTrprr . . , . . . . 99 16,86,73,441 Coal and Coke9 #F> ............................... 99 3,107 Coffee
10 . . . . . . „ 731 Cotton twist and yarn Indian11 M < i)n . . 99 355 Cotton twist and yarn Foreign12 gdt TrT5y' ?ft 99 13,146 Cotton piece goods Indian13 sfntrgT TTM qx gft . . „ . . 4 Cotton piece goods Foreign •14 ............................................. 99 7,356 Myrobalaa15 'TiS ^ WR>TT55r 99 38,089 Fruits and Vegetable fresh.16 sfrri «(T 99 1,004 Fruits diied17 3t^ . . .4 99 615 Eggs18 ' . . . . . ^ 99 32,582 Glass19 w ^^FtfTTTg;^ 99 •> 16,46,220 Gram and gram products20 ^ 'T rrqf 99 7,72,958 Pulsds other than gram and gram productSi.
21 T\^\ • , 1,41,950 Maize22 • . ; ............................... 99 57,785 Jowar23 99 59,356 Bajra24 'S rrt ^ 9T5rft oJr%f<*w . , 99 540. Millets Other than Jowar and Bajra25 mcT . . . . . . . . . , 99 2,16,500 Rice in the husk26 dko4 . • • • • • ' 99 39,62,646 Rice not in the husk21 ^ .............................. ' . . . 9f 1,90,65,511 Wheat28 JT%T%qt5 . . :. 99 , , 1,25,365 Wheat Flour29 fWT snpiT r ^ qts ' 99 1,71,186 Other sorts of grain pulse and flour.30 iRcihT ^ rrg;*nT Pt% 99 1,880 Hemp, Indian and other fibres.31 T5% xfTTT¥ 99 2,885 Hides raw32 +ldi . . . . . . . . 99 250 Skins— raw33 =Md «1 99 855 Hides and skins tanned and leather.34 ?TPT+’= m ,^ ............................... 99 130 Jute, raw— loose
- 35 ^ (t^^) . . . . 99 1,036 Jute, raw— pucca bales.36 ifhJmTr^qrfwsTT W4>N 99 1,60,744 Gunny bags and Cloth37 ............................... 99 6,889 Other jute manufactures38 ^ . . „ 1,430 Artificial silk piece goods39 +R T T 99 5.262 Woollen picco goods40 W 99 . 2,48,812 Machinery and Equipment41 yi' '^r . . 99 37,002 Metal products42 .............................. . . 10,244 Shoes (as footwear)43 . . . . . . 99 , , 70,632 Iron Ore44 ■•sf ?T£3tfT ^ „ . , 1,26,33,490 Iron and Steel bars, etc.45 ?5M ^ 5,065 Lac and Shellac •46 fwfNt TT . . 99 1,17,963 Bidi leaves47 arrfwr 99 2,18,232 Lime and lime stones48 . . 99 10,019 Manganese Ore49 , . . . . . . . „ 5,587 Oil cakes Castor50 q -'icR: >9 1,02,26,592 Oilcakes—Others51 ^ . . . . . . 14,37,832 Oil Minerals52 ^ . . > . . . . 99 , , 12,87,970 Oil Kerosene53 . . »9 , , 5,024 Vegetable oil-castor54 cj-iWol *> 453 Vegetable oil— coconut55 ^-9nr?T^ 99 3,409 Vegetable oil—’groundnut
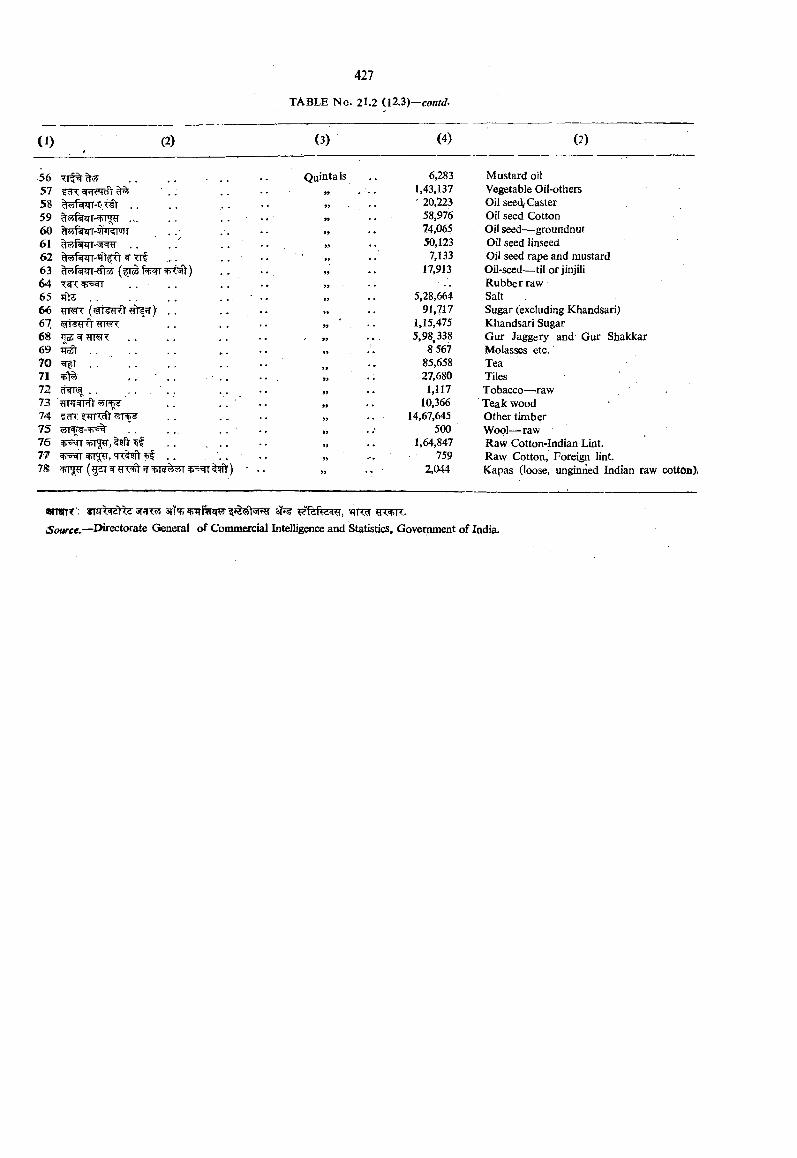
(1 ) (2) (3) (4) (2)
56 . . . . ■ . . Quintals 6,283 Mustard oil57 HcTT STdFTcft ^ 99 * • • 1,43,137 Vegetable Oil-others58 . . 99 ' 20,223 Oil seed Caster59 .... . . . . • 99 • • 58,976 Oil seed Cotton60 99 • • 74,065 Oilseed— groundnut61 . . . . 99 • • 50,123 Oil seed linseed62 ^-^rf ... . . ' 7,133 Oil seed rape and mustard63 . . 17,913 Oil-seed—-til or jinjili64 w < . . . . 99 ■ • • Rubber raw65 iftS . . „ 5,28,664 Salt66 yKN< . . 99 • « 91,717 Sugar (excluding Khandsari)67 m m " . . >9 • • 1,15,475 Khandsari Sugar68 ^ ^ 99 5,98,338 Gur Jaggery and Gur Siiakkar69 ^ . . . . 9y 8 567 Molasses etc. ‘70 = T . . . . . , . . 99 • • 85,658 Tea71 , . • . . . • . . 99 • • 27,680 Tiles72 . . . . . . 99 • • 1,117 Tobacco— raw73 " . . . . ■ ■ . 99 • • 10,366 Teak wood74 ^1+^ 99 • - 14,67,645 Other timber75 . . . . . . . . " $9 • •' 500 Wool—'raw76 tStTT ^ . . . . . J? 1,64,847 Raw Cotton-Indian Lint.77 ^rr^, T?:%9ft . . . . . • „ 759 Raw Cotton, Foreign lint.7S »-i y ■ .. 99 • • ' 2,044 Kapas (loose, unginried Indian raw cottoa),
WTOTT': 5nTT an'fi 'rtct
iScwrce.—Directorate General of Commercial Intelligwice and Statistics, Government of India.
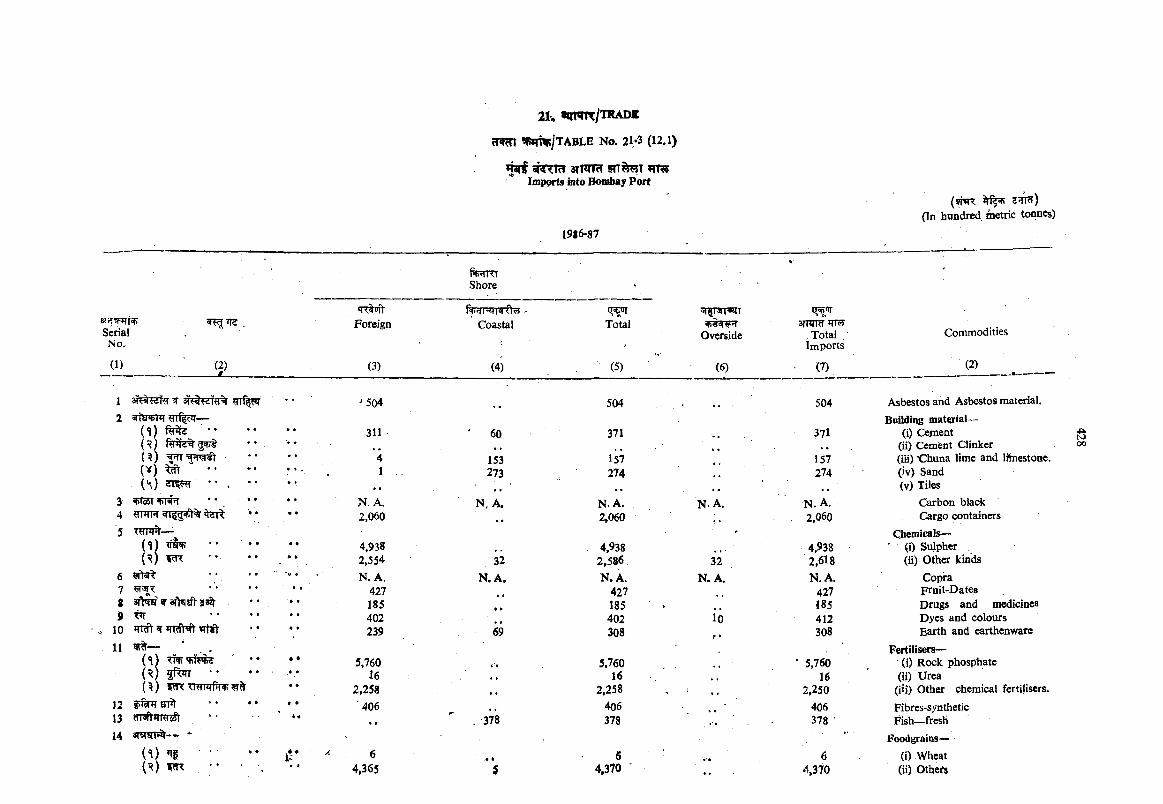
2 h «qrWTT/TRADE
?Rm ?PiTW/TABLE No. 21;*3 (12.1)
^ 3TWiti s n ^ ilmiK>rts into Bombay Port
19*6.87
( nfR(In hundred metric tonnes)
Shore
ei?!FJTTSerialNo.
(1)
67S9
10
(1 )( ^ )( ^ ) =fTTWTTWt(V) ^ • .( \ ) " .
To5T HTRTT
(1)(^) '•
3T>TO^3T>|^S3Jr T»Tirmt ?r »nfr
11 ^
(<l) TTNr'Blf ( V fferr ••{^) 1WT TmPTfrpF
J2 fr%*T£n13 cTT JTRToSt * '14 — *
('I) »lf 'W m -
Foreign
(3)
■*504
311
41
N. A. 2,060
4,938 2,554 N. A.
427 185 402 239
5,76016
2,258'406
64»365
Coastal
(4)
60
153273
N, A.
32N .A .
69
378
Total
(5)
504
.371
157274
N. A. 2,060
4,9382,586N .A .
427185402308
5,76016
2,258406378
64,370 ■
l TiTrRTT
Overside
(6)
N. A.
32 N. A.
lO
t OT
Total ' Imports
(7)
504
371
157274
N. A.2,060
4,938 2,618 N, A.
427 185 412 308
5,76016
2,250406 378 •
64,370
Commodities
(2)
Asbestos and Asbestos mateirial.Building material—
(i) Cement(ii) Cement Clinker(iii) 'Chuna lime and lihiestone.(iv) Sand(v) Tiles
Carbon black Cargo containers
Chemicals—' (i) Sulphcr
(ii) Other kindsCoprapTuit-DateaDrugs and medicines Dyes and colours Earth and earthenware
Fertilisers—(i) Rock phosphate
(ii) Urea(iii) Other chemical fertilisers.Fibres-synthetic Fish—fresh
Foodgrains—(i) Wheat(ii) Others
oo
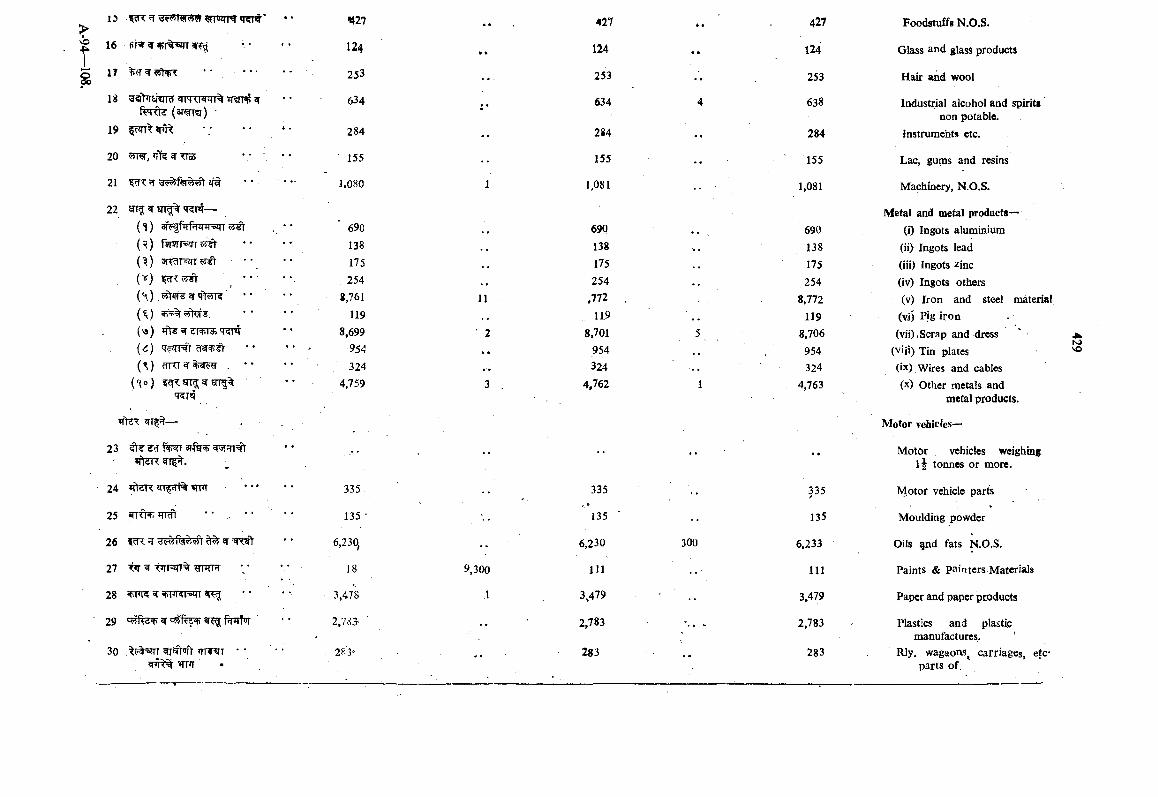
p>VO
ri
13
16 frar^^i^p«n^
I T ^ • • . . -
ft»T^ (ancfRr) •19
20 ’Tk^TIoS • • '
21 ?cr?: ^ Ef# •*
22 ®r s n ^ —
{ r )(^) 5T ^ r^ 5? ••(Y)
( h) ”(^)(« ){ 6 ){%) fiKTqr%^ . * •
(<^o) ?<|;T STT ^ OT5%'RT
jftHT —
23 f w a^^^
24 *ft^R ?n 5Tt% Wf * "
25 ' ' . * •
26 ^ ^ er
27 t»r ^ tiTT=irT% gmTR
28 5r stnwsqi
■ 29 w t a f ^ 5Rg;
30 . »TT« T *'^nr •
H27
124
253
634
284
155
1,080
690138175254
8,761119
8,699954324
4,759
335 .
135 ■
6,230,
18
3,478
2,7.i3-
283'>
11
' 2
9,300
I
427
124
253
634
284
155
1,081
690138175254
,772
11.98.701
954324
4,762
335
135
6,230
Jll
3.479
2,783
283
300
427
124
253
638
284
155
1,081
690138175
,2548,772
1198,706954324
4,763
^35
135
6,233
111
3,479
2,783
283
Foodstuffs N.O.S.
Glass and glass products
Hair and wool
industrial alcohol and spirits non potable.
Instruments etc.
Lac, gums and resins
Machinery, N.O.S.
Metal and metal products—(i) Ingots aluminium
(ii) Ingots lead(iii) Ingots zinc(iv) Ingots others(v) Iron and steel material.
(vi) Pig iron(vii), Scrap and -dress
(viii) Tin plates(ix) Wires and cables (x) Other metals and
metal products.
Motor vehicles—
Motor vehicles weighing tonnes or more.
Motor vehicle parts
Moulding powder
Oils gnd fats N.O.S.
Paints & painters Materials
Paper and paper products
Plastics and plastic manufactures. '
Rly. wagaons, carriages, etc- parts of.
N>VO
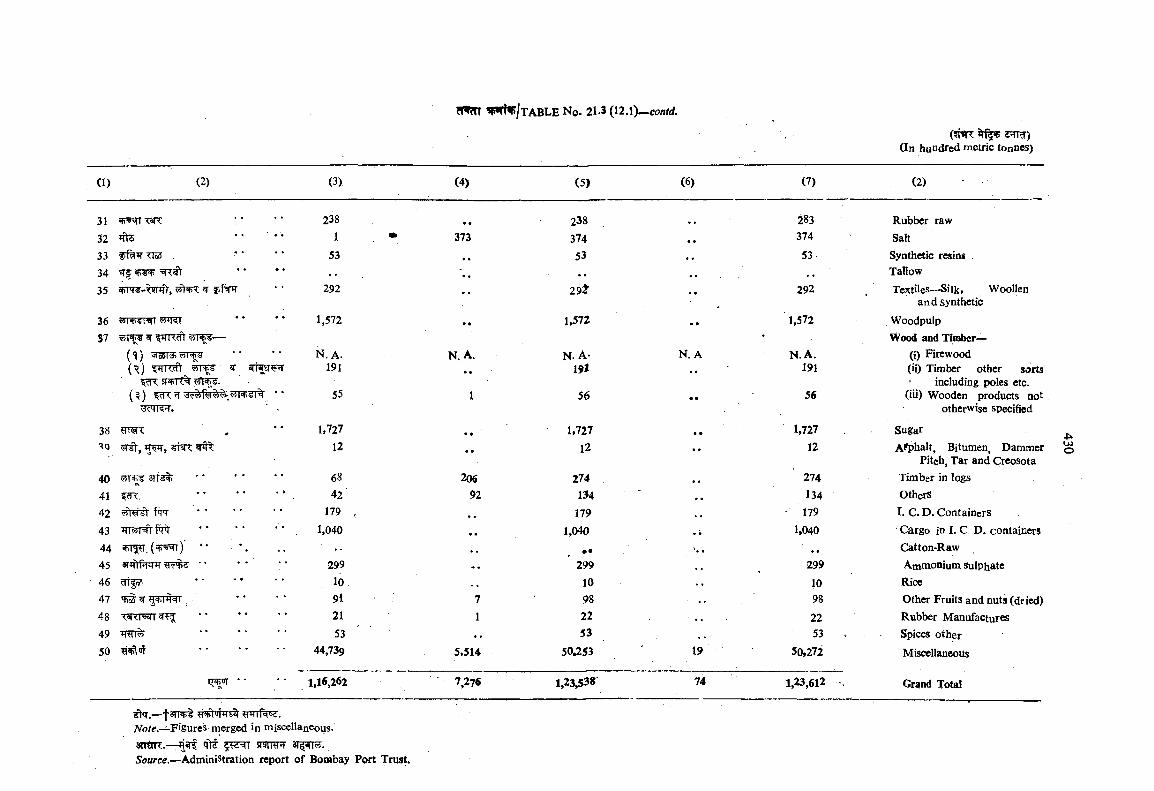
(5i<n: s TRT)(In hundred metric tonnes)
(2) (3) (4) (5) (6) (7) (2) -
31 <«r< 238 • • 238 283 Rubber raw32 1 , • 373 374 , , 374 Salt33 <I«J * * 53 , , 53 , , 53- Synthetic resins34 , • • Tallow
35 292 •• 2 9 t •• 292 Textiles—-Silk, Woollen and synthetic
36 «ln)€t^l 1,572 • • 1.572 . . 1,572 Woodpulp37 • Wood and Timber—
( ^) 51^3; rti' s n . a . N .A . N. A- N .A N .A . (i) Firewood(^) ^MKdl ^ 191 • • i9 i 191 (ii) Timber other sorts
fcTT 5r<t)K including poles etc.(^) •• 55 1 56 • • 56 (iii) Wooden products not
viicqRfi'. otherwise specified
38 \ , W • • 1,727 • • 1,727 Sugar-<q JTw, 12 » • 12 • • 12 Asphalt, Bitumen, Dammer
Pitch, Tar and Creosota40 3rts% 68 206 274 , . 274 Timber in logs41 ^nt, ............................... ... 42 92 134 « • 134 Others
42 179 , ,, 179 179 I. C. D. Containers43 JTTwr fq * * ' * * * , 1,040 , , 1,040 , i 1,040 Cargo Id I. C D. containers44 * ’ *, •• . , Catton-Raw45 . Wtrtf FFT ' ’ 299 ♦ . 299 299 Ammonium sulphate46 10 10 10 Rice47 9i 7 98 ■ . . 98 Other Fruits and nuts (dr ied)48 <<lf<| [ • • • • 21 1 22 22 Rubber Manufactures49 ............................... 53 . . 53 53 Spices other50 *' 44,739 5,514 50^53 19 50,272 Miscellaneous
* • 1,16,262 7,276 1,23,538 74 1,23,612 . Grand Total
u>o
stq,—fs iw tNbre,—Figures merged in miscellaneous.3TT«HT.— ^ SRmRSource.—Administration report of Bombay Port Trust.
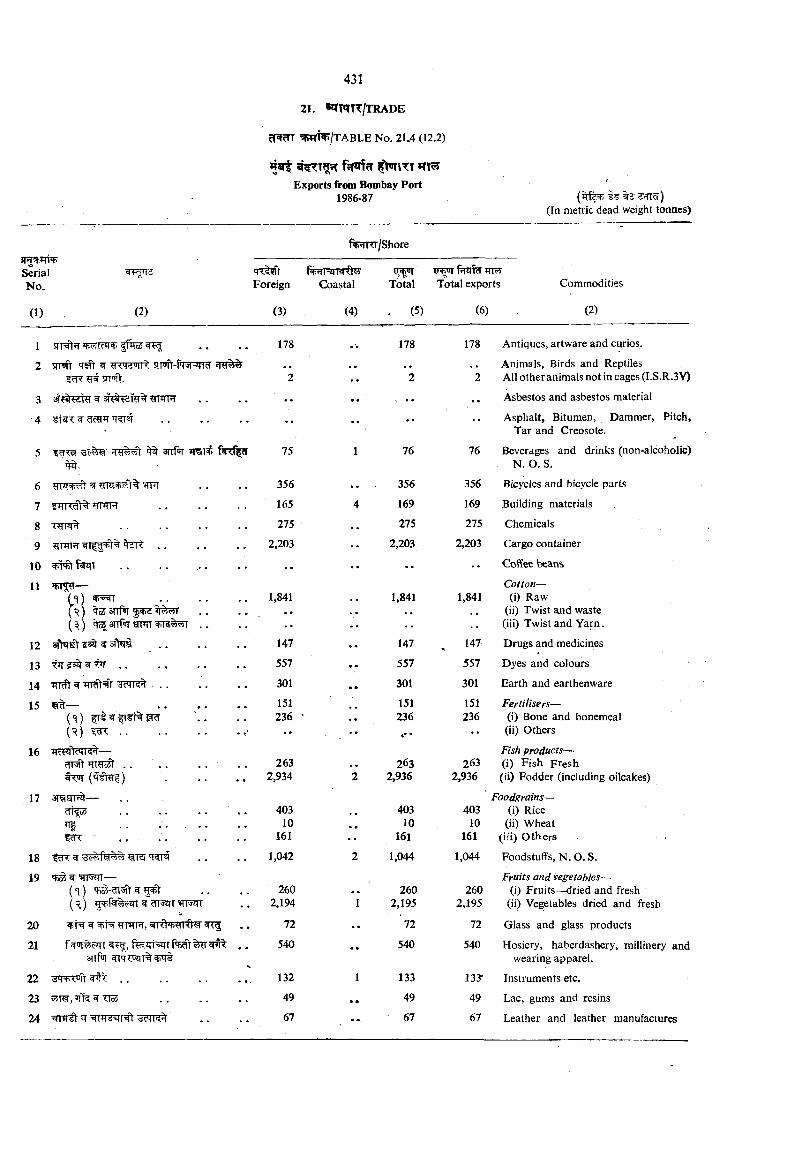
SerialNo.
Exports from Bombay Port1986-87
Foreign
ftj TRT/Shore
Coastal-hi«
Total Total exports
(Jrf^ s TTcr)(In metric dead weight tonnes)
Commodities
(1) (2) (3) (4) > (5) (6) (2)
1 STT T # r S ^ . . 178 178 178 Antiques, artware and curios.
2 srnift 'isft ^ amt-fjrsnTRT * • Animals, Birds and Reptiles?rT?: ?rt srrnrlr. 2 2 2 All other animals not in cages (I.S.R.3V)
3 . . . . . . . . Asbestos and asbestos material
4 . . . , Asphalt, Bitumen, Dammer, Pitch,Tar and Creosote.
5 ?cT^ ^ snfT f T%T 75 1 76 76 Beverages and drinks (non-alcoholic)N. 0 . S.
6 ^ 1TFT . . . 356 356 356 Bicycles and bicycle parts
7 ?-H 1 <dt% ¥r*TFT 165 4 169 169 Building materials
8 275 275 275 Chemicals
9 2,203 •• 2,203 2,203 Cargo container
10 . . . . ... • • • • Coffee beam
11 Cotton—h ) +-HI ............................ .. 1,841 1,841 1,841 (i) Raw( ^) o5 srrf . . . . (ii) Twist and waste(^ ) srrpT STFTT FTS'fi'rfl • • • • (iii) Twist and Yarn.
12 sfh ^ ^ . . . . . . 147 . . 147 147 Drugs and medicines
13 557 • • 557 557 Dyes and colours
14 TTTcft ^ y MK . . 301 • • 301 301 Earth and earthenware
15 ^ — ................................ 151 151 151 Fertilisers—(< ) ^ 236 ■ 236 236 (i) Bone and bonemeal(R) . . •• «.*• •• (ii) Others
16 IRFTR’TT — Fish products—n ' Tnyoil . . . . . . 263 . . 263 263 (i) Fish Fresh
2,934 2 2,936 2,936 (ii) Fodder (including oilcakes)
17 3T?iy|ril— Foodgrains—didaJ . . . . . . 403 , * 403 403 (i) Rice^ ... . . . . 10 • « 10 10 (ii) Wheat^ ■ . . ............................... 161 •• 161 161 (iii) Others
18 ^ ^ 'T?m . . . . 1,042 2 1,044 1,044 Foodstuffs, N. 0 . S.
19 ^ WIWT— Fruits and vegetables^260 260 260 (i) Fruits—dried and fresh
2,194 1 2,195 2,195 (ii) Vegetables dried and fresh
20 ^ ^RhrorfW 72 . . 72 72 Glass and glass products
21 f f e i r t ^ r fm \ gi^ . . 540 « • 540 540 Hosiery, haberdashery, millinery and3TTpiT wearing apparel.
22 «1'*K . . . . . . . . . 132 1 133 133- Instruments etc.
23 ^ <rai . . 49 • • 49 49 Lac, gums and resins
24 ^ 'TT??r . . 67 • • 67 67 Leather and leather manufactures
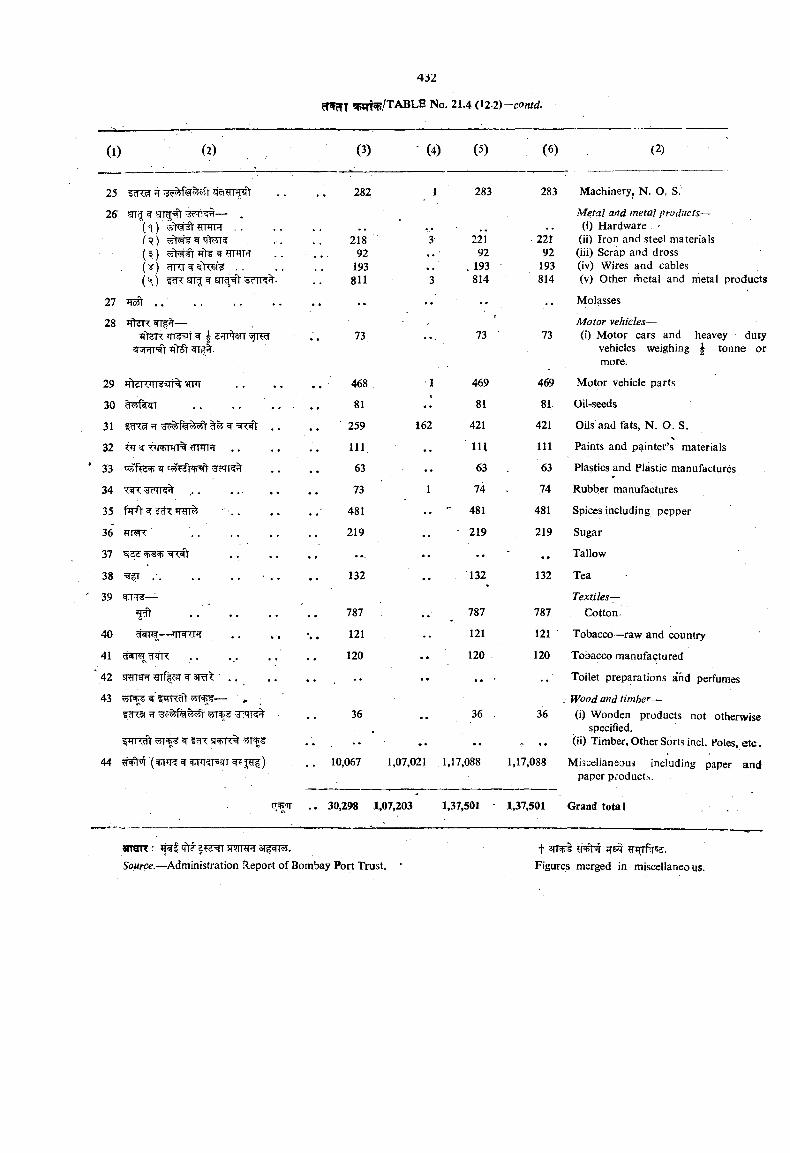
(1) (2) (3)
25 ^ 4ci?rr^
26' srrg ^ STT^ — .( 'i ) . . .
(^) ^?rmR
(H) stt 5tsrrf^
27 . . .............................
28 ’ftaR —iftHTT TT^t ^ ^
^ 3TTRt Jfrst Tf -
29 fft'iT< ITg t% WT
30
31 ^ ^ .,
32 ^ ^ twmr% ?rmT?r . .
33 ^
34 I ,. . . . ■ . <
35 ftrV 5T wi%
36 frranc
37 ^5^
38 ,-. . .
39 fTT5—^ , . ■ . .
40 cf^--^T|TWJ|
41 #5|W
42 srarsFT ¥rr^^ ^ ara ' . .
43 — ' , ;
fTTRcft ^ sf nr%
44 ?T '>T (^TR^^»ra[r5iTT^J?T5)
ITOT
282
21892
193811
73
468
81
259
111
63
73
481
219
132
787
121
120
36
(4) (5)
162
283
221 92
. 193 814
73
469
81
421
lU
63
74
481
219
132
787
121
120
36
(6)
30,298 1,07,203
22192
193814
73
469
81
421
111
63
74
481
219
132
787
121
120
36
10,067 1,07,021 1,17,088 1,17,088
(2)
283 Machinery, N. O. S.
Metal and metal products—(i) Hardware '
(ii) Iron and steel materials(iii) Scrap and dross(iv) Wires and cables(v) Other metal and rtietal products
Molasses
Motor vehicles—(i) Motor cars and heavey duty
vehicles weighing ^ tonne or more.
Motor vehicle parts
Oil-seeds
Oijs and fats, N. O. S.-X
Paints and painter’s materials
Plastics and Plastic manufactures
Rubber manufactures
Spices including pepper
Sugar
Tallow
Tea
Textiles—Cotton
Tobacco—raw and country
Tobacco manufactured
Toilet preparations arid perfumes
Wood and timber—(i) Wooden products not otherwise
specified,(ii) Timber, Other Sorts incl. Poles, ctc.
Misceliansous including paper and paper products.
1,37,501 - 1,37,501 Grand total
iarraRr if?rf sr^nfR-3i|^.Source.—Administration Report of Bombay Port Trust.
13iT ^Figures merged in miscellaneous.
✓
3T?i% ^ ^ 7 ^ srrf^ w r t r f x ^ ^ ir q-RT sfr srr^^'R t feT ' 3tt| . •
f e r m r w3fr^rl^r6' TT^fsq’T g-tsr^nr f^wi?r, f^fe|r ’rfrf^ i^ ^riTTqrfe^r ^ j ^ m srTsTq jriRin 'r sn f.
g; ^ sr^Rft -t ^ ^rars^r ^ w n r w ^^ ’itrI' Trif^cft ^r
r^-TFinT 3TT|, , .
\R > '. f e r c t ^i^rt-s n |. frwncV % JTPJTit^
3Tr^4R'V % ^ o 5 t 31T|.
22.1. Information on railway length, length and classification of roads, vehicles in use in the State and operation of State Transport Corporation is given in this Section.
22.2. Districtwise railway length is approximate as given by the respective Railway authorities. Figures of road length relate to roads maintained by the State’s Public Works Department, Zilla Parishads and by Municipal Authorities.
22.3. Data presented in this section are about vessels in Bombay docks, passengers and cargo in Bombay port and other minor ports and passengers and freight traflBc by air.
22.4. The figures shown against minor ports are mostly those of coastal traffic. In the case of Bombay Port, figures of overseas traffic and coastal traffic are shown separately.
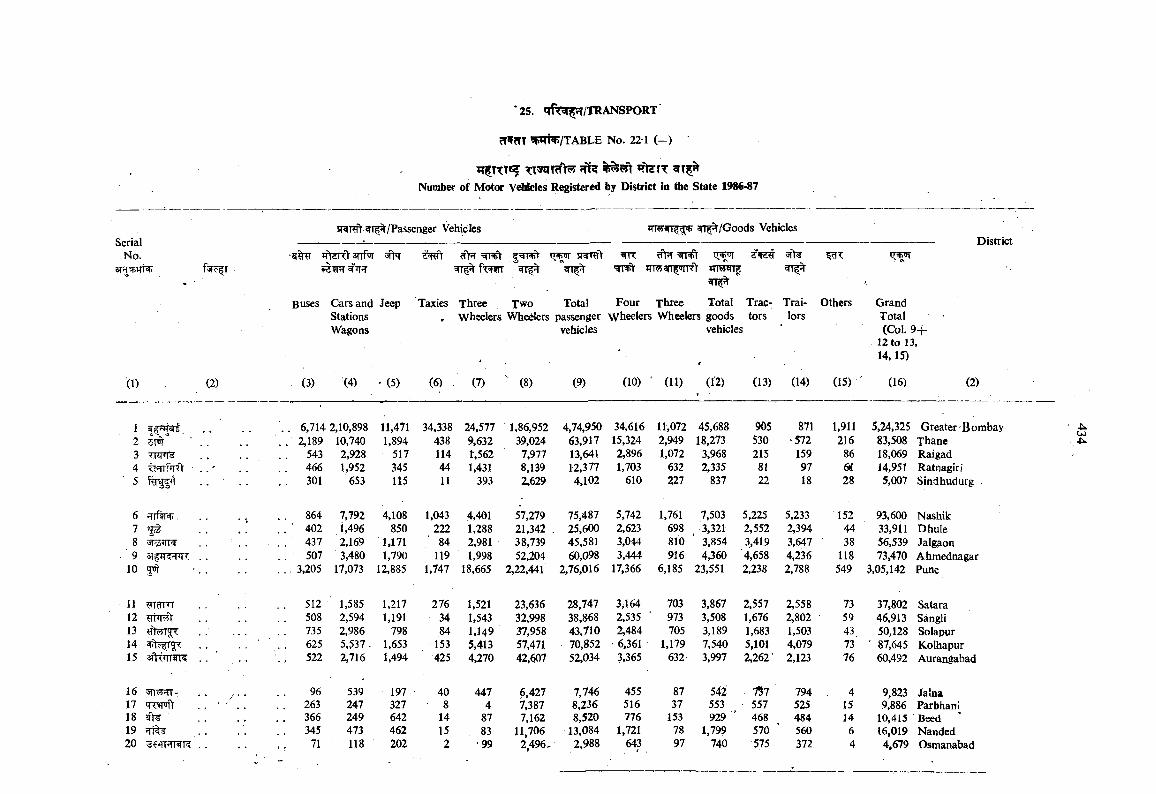
cT cTT W P/T A B L E No. 22-1 ( - ) ’
^ ^ r flr »?teTT Number of Motor Vdilcles Registered by District in the State 1986-87
SerialNo.
sranft^T^/Passenger Vehicles qf^/Goods Vehicles
anf'JT
Buses Cars and Jeep Stations Wagons
=5rr''^T^ 'STFFt *rT55wr rrA
3n^
Taxies Three Two Total Four Three Total Trac- Trai- Others , wheelers Wheelers passenger wheelers Wheelers goods tors lots
vehicles vehicles
District
Grand Total (Col. 9 +
12 to 13, 14.15)
(1) (2) (3) (4) * (5) (6) (7) ' (8) (9) (10) ‘ (11) (1'2) (13) (14) (15) (16) (2)
1 .............. ' 6,714 2,10,898 11,471 34,338 24,577 1,86,952 4,74,950 34,616 11,072 45,688 905 871 1,911 5,24,325 Greater Bon2 5FT ' . . 2,189 10,740 1,894 438 9,632 39,024 63,917 15,324 2,949 18,273 530 -572 216 83,508 Thane3 . . 543 2,928 517 114 t,562 7,977 13,641 2,896 1,072 3,968 215 159 86 18,069 Raigad4 tc TTfiRl' . . ' . . ■ . . 466 1,952 345 44 1,431 8,139 1-2,377 1,703 632 2,335 81 97 6i 14,951 Ratnagiri
■ 5 . . 301 653 115 11 393 2,629 4,102 610 227 837 22 18 28 5,007 Sindhudurg
6 •rrfw . . . . . . 864 7,792 4,108 1,043 4,401 57,279 75,487 5,742 1,761 7,503 5,225 5,233 152 93,600 Nashik7 ^ . . . * . ’ 402 i,496 850 222 1,288 21,342 . 25,600 2,623 698 3,321 2,552 2,394 44 33,911 Dhule8 5Tc5 . . . . . ■ 437 2,169 1,171 84 2,981 38,739 45,581 3,044 810 3,854 3,419 3,647 38 56,539 Jalgaon9 . 507 3,480 1,790 119 1,998 52,204 60,098 3,444 916 4,360 4,658 4,236 118 73,470 Ahmednagar
10 5'n' • . . . .. 3,205 17,073 12,885 1,747 18,665 2,22,441 2,76,016 17,366 6,185 23,551 2,23S 2,788 549 3,05,142 Pune
11 ?rraTTr . 512 1,585 1,217 276 1,521 23,636 28,747 3,164 703 3,867 2,557 2,558 73 37,802 Satara12 . 508 2,594 1,191 34 1,543 32,998 38,868 2,535 ■ 973 3,508 1,676 2,802 59 46,913 Sangli13 . 735 2,986 798 84 1,149 37,958 43,710 2,484 705 3,189 1,683 1,503 43 50,128 Solapur14 . 625 5,537 - 1,653 153 5,413 57,471 70,852 6,361 1,179 7,540 5,101 4,079 73 ' 87,645 Kolhapur15 . 522 2,716 1,494 425 4,270 42,607 52,034 3,365 632 3,997 2,262 2,123 76 60,492 Aurangabad
16 96 539 197 • 40 447 6,427 7,746 455 87 542 757 794 4 9,823 Jalna17 . 263 247 327 8 4 7,387 8,236 516 37 553 557 525 15 9,886 Parbhani18 ^ ..................... . 366 249 642 14 87 7,162 8,520 776 153 929 ' 468 484 14 10,415 Beed19 . 345 473 462 15 . 83 11.706 13,084 1,721 78 1,799 570 ' 560 6 16,019 Nanded20 71 118 202 2 •99 2,496, 2,988 643 97 740 575 372 4 4,679 Osmanabad
4U)4:
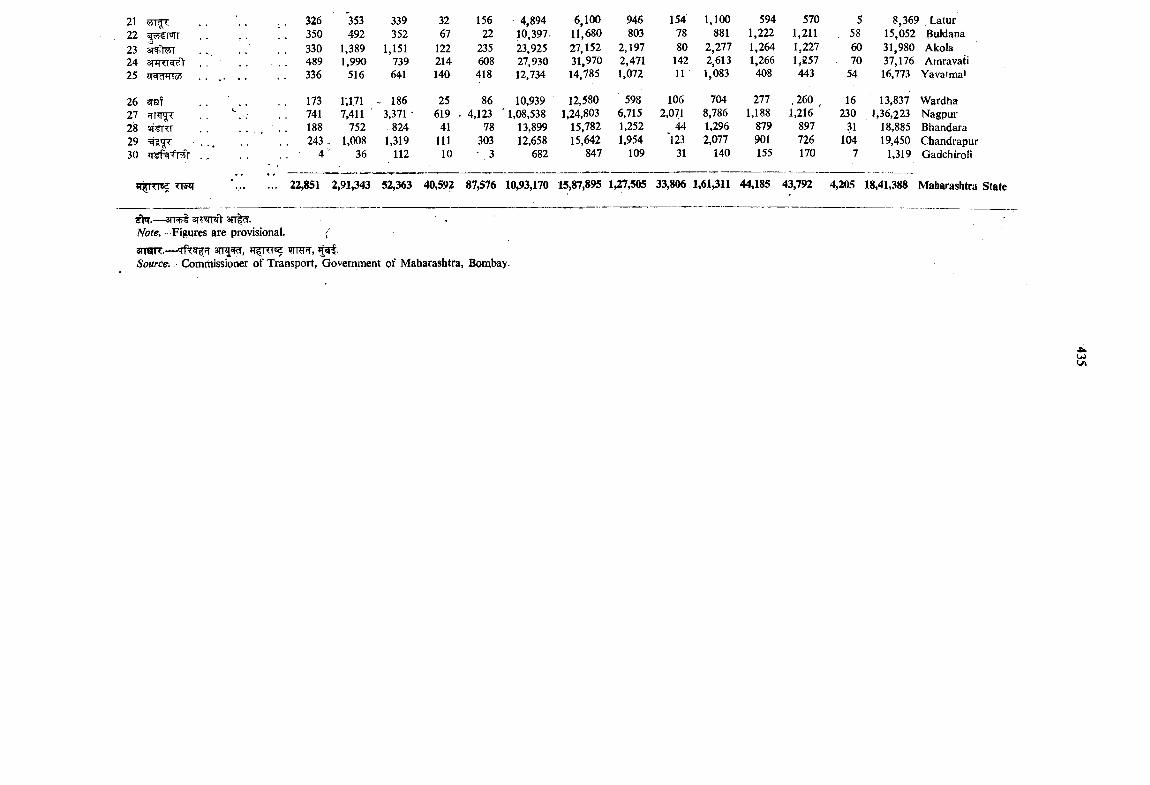
212223 3T >5n’2425 zTWcFTTo?
26 ^2728 «T^ni2930
HTTTC? T m
326350330489336
353492
1,3891,990
516
339352
1,151739641
173 1,1,71 - 186741 7,411 3,371 •188 752 824243. 1,008 1,319
4" 36 112
3267
122214140
25619
4111110
15622
235608418
86 4,123
78 303 ‘ 3
4,89410,397.23,92527,93012,734
10,9391,08,538
13,89912,658
682
6,10011,68027,15231,97014,785
12,5801,24,803
15,78215,642
847
946803
2,1972,4711,072
5986,7151,2521,954
109
1547880
14211
1062,071
44j23
31
1,100881
2,2772,6131,083
7048,7861,2962,077
140
5941,2221,2641,266408
2771,188
879901155
5701,2111,2271,257443
.260 1,216 '
897 726 170
5. 58
60 . 70
54
16230
31104
7
8,369 Latur 15,052 BuWana 31,980 Akola 37,176 Amravati 16,773 Yavatma*
13,837 Wardha 1,36,223 Nagpur
18,885 Bhandara 19,450 Chandrapur
1,319 Gadcbiroli
... 22,851 2,91,343 52,363 40,592 87,576 10,93,170 15,87,895 1,27,505 33,806 1,61,311 44,185 43,792 4,205 18,41,388 Maharashtra State
ah.— 3 n ^ 3T?sTFTt 3n|^. •iVbre.—Figures are provisional. {siron:.— 'Tfr^?rSource.- Commissioner of Transport, Government of Maharashtra, Bombay.
.uu>
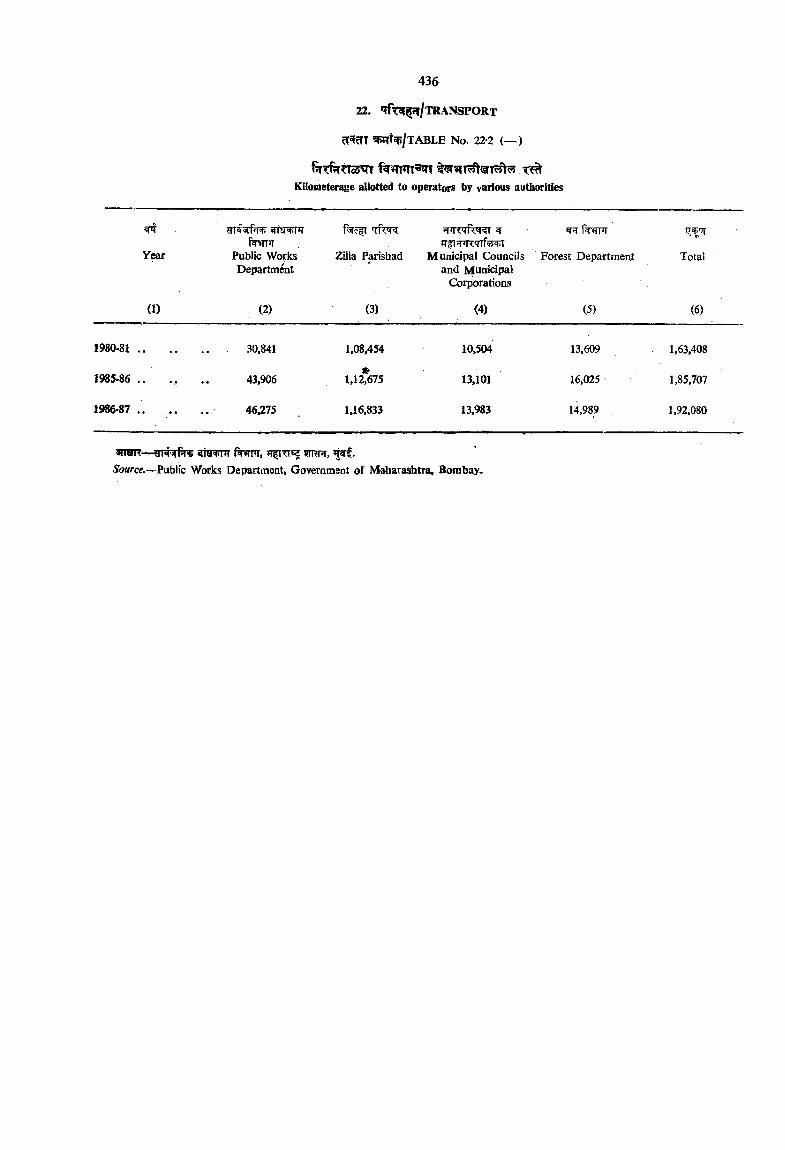
436
22. 'TTt^ ^ / t RANSPORt
^ f^ /T A B L E No. 22-2 (— )
t?TTf?TtTo3 T 7?^Kllometerage allotted to operators by various authorities
Year Public Works Department
Zilla Parishad
iTircrfk^ ^
Municipal Councils and Municipal
Corporations
Forest Department Total
(1) (2) (3) (4) (5) (6)
1980-81 1,08,454 10,504 13,609 1,63,408
1985-86 •• 43,906 1,12?675 13,101 16,025 1,85,707
1986-87 46,275 1,16,833 13,983 14,989 1,92,080
tSRiTiT f RT’I,iSoMrcff,—Public Works Department, Goverament of Maharashtra, Bombay.
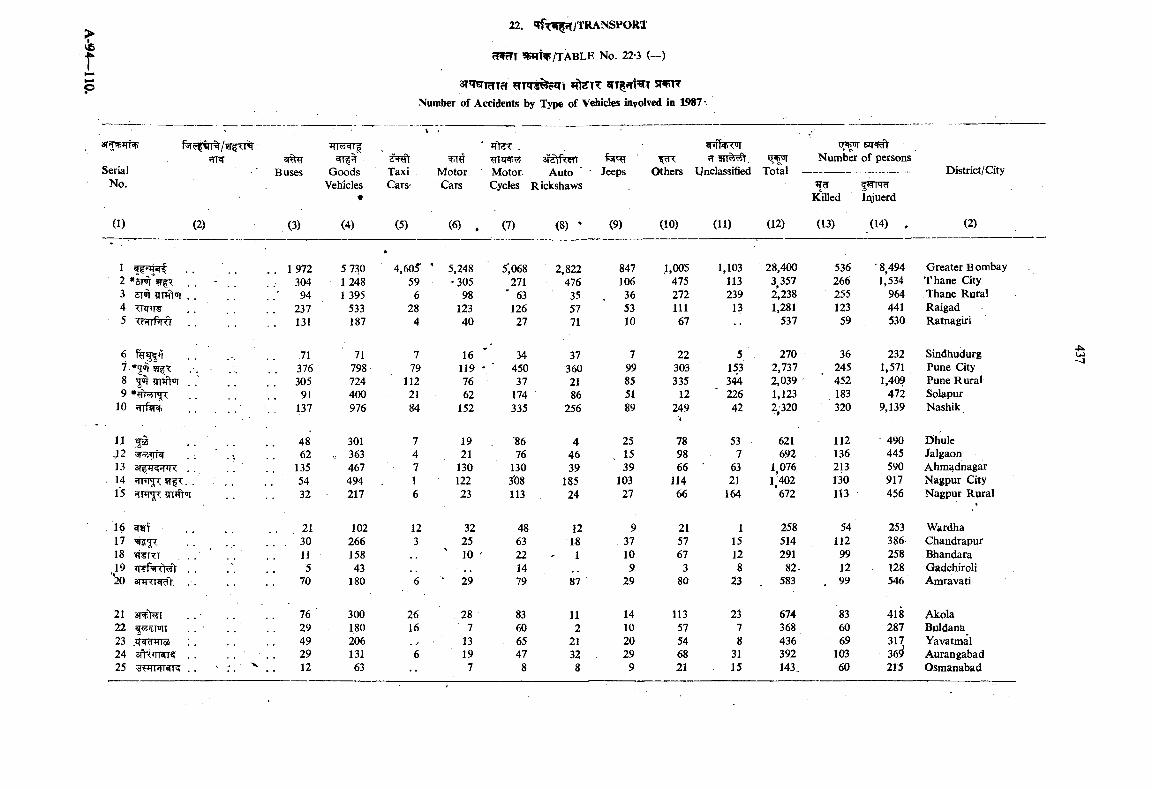
Ir
3T«mi^Tcf SWHTNumber of Aceidents by Type of Vehicles involved in 1987 •
TaxiCars-
•
3iZtfxtRrTAuto
RickshawsJeeps Others 'X'ot&l
EJTRftNumber of persons
SerialNo.
Buses GoodsVehicles
•
MotorCars
Motorcycles
?T 911WW1,Uncl^sified District/City
Killed Injuerd
(1) (2) (3) (4) (5) (6) . (7) (8) ‘ (9) (10) (11) (12) (13) (14) . (2)
1 . .2 *5m . . - . .3 m liwt'ri . .45 . .
. . 1 972
. . 304 94
. . 237 . . 131
5 730 1248 1 395
533 187
4,605" ' 59 6
28 4
5,248-305
9812340
5',068 271
’ 63 126 27
2,822476
355771
847 106
. 36 53 10
1,00547527211167
1,103113239
13
28,400 3 357 2,238 1,281
537
53626625512359
• 8,494 1,534
964 441 530
Greater Bombay Thane City Thane Rural Raigad Ratnagiri
67 *56r?r5T ■ .'. ■ . .8 3^ . .'9 . .
10 HiT?! .................
71. 376 . 305
91 137
71798724400976
779
1122184
161197662
152
34• ■ 450
37 174 335
373602186
256
799855189
22303335
12249'•
515334422642
2702,7372,0391,1232,320
36245452183320
2321,5711,40?
4729,139
Sindhudurg Pune City Pune Rural Solapur Nashik
11 . ..}2 . . ' . •.
■ ?Tf . . . . 15
4862
. 135 54 32
301 . 363
467 494 217
74716
19 21
130 ' 122
23
‘8676
1303t)8113
44639
18524
251539
J0327
789866
11466
537
6321
164
621692
1,0761,402’672
112136213130113
490445590917456
Dhule Jalgaon Ahm^dnagar Nagpur City Nagpur Rural
16 ^17 =^5 . . . .18 . . . ’ . .
20 SfTRT 'V . .
21. . . 30
11 5
70
10226615843
180
123
6
32 25
' 10
' 29
4863221479
12181
87
937109
29
215767
380
115128
23
258514291
82-583
54 112 99 12
. 99
253386258128546
WardhaChandrapurBhandaraGadchiroliAmravati
21 3T?F?r2223 :.24 5fN;JTRT5[ . . . .25 . . ' r.
7629492912
30018020613163
26 16 . 6
287
13197
83606547
8
112
2132S
14102029
9
11357546821
2378
31 15
674368436392143.
836069
10360
41828731736^215
AkolaBuldanaYavatmalAurangabadOsmanabad
u>--1
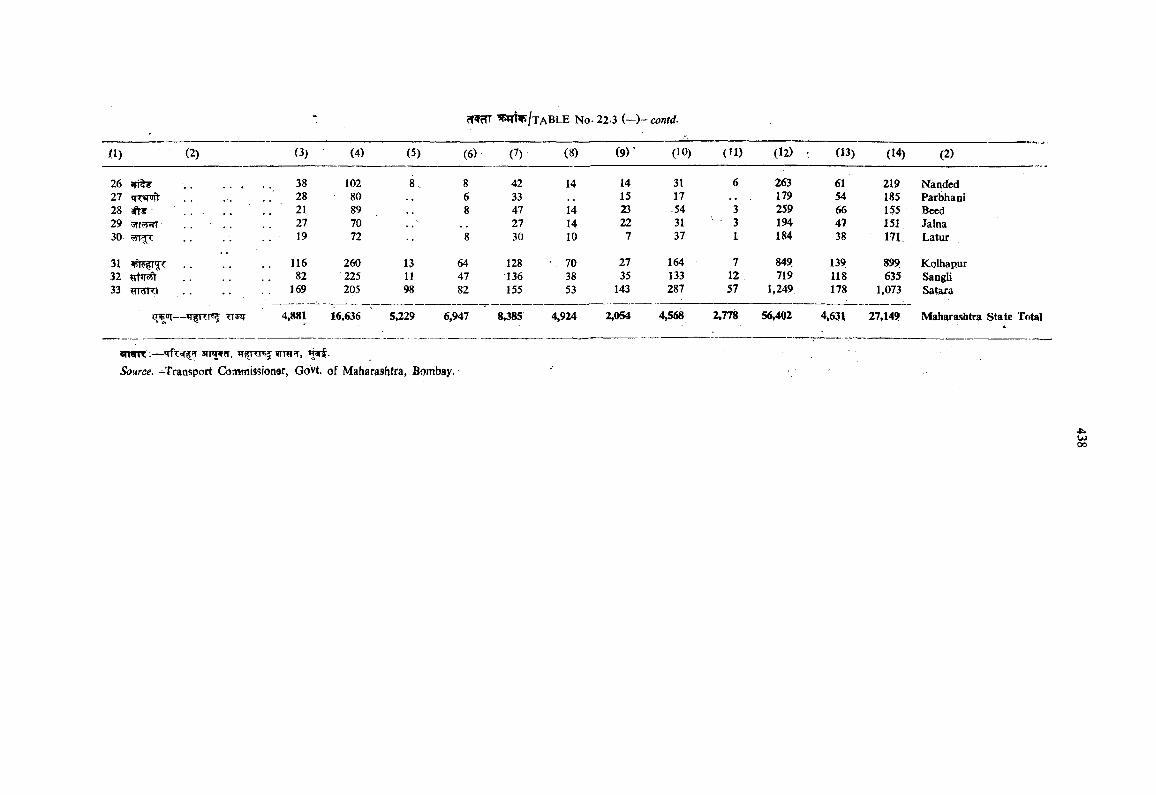
0 ) (2) (3; (4) (5) (6) (7) (8) (9 ) ’ (10) (»I) (12) (13) (14) (2)
26 38 102 8 . 8 42 14 14 31 6 263 61 219 Nanded27 28 80 , , 6 33 15 17 179 54 185 Parbhani2S sjYy 21 89 , , 8 47 14 23 .54 3 259 66 155 Beed29 3j7?y 27 70 27 14 22 31 • 3- 194 47 151 Jalna30 19 72 8 30 10 7 37 l 184 38 171 Latur
31 . 116 260 13 64 128 . 70 27 164 7 849. 139 899 Kolhapur32 82 225 11 47 136 38 35 133 12 719 118 635 Sangli33 rraro .. . 169 205 98 82 155 53 143 287 57 1,249 178 1,073 Satara
{T^q- 4,881 16,636 5,229 6,947 8,385 4,924 2,054 4,568 2,778 56,402 4,631 27,149 Maharashtra State To(
amnr;— 3TRf?r. »T5rTT55 wm r,Source. -^Transport Conwiissioner, Govt, of Maharashtra, Bombay.
•fiku>00
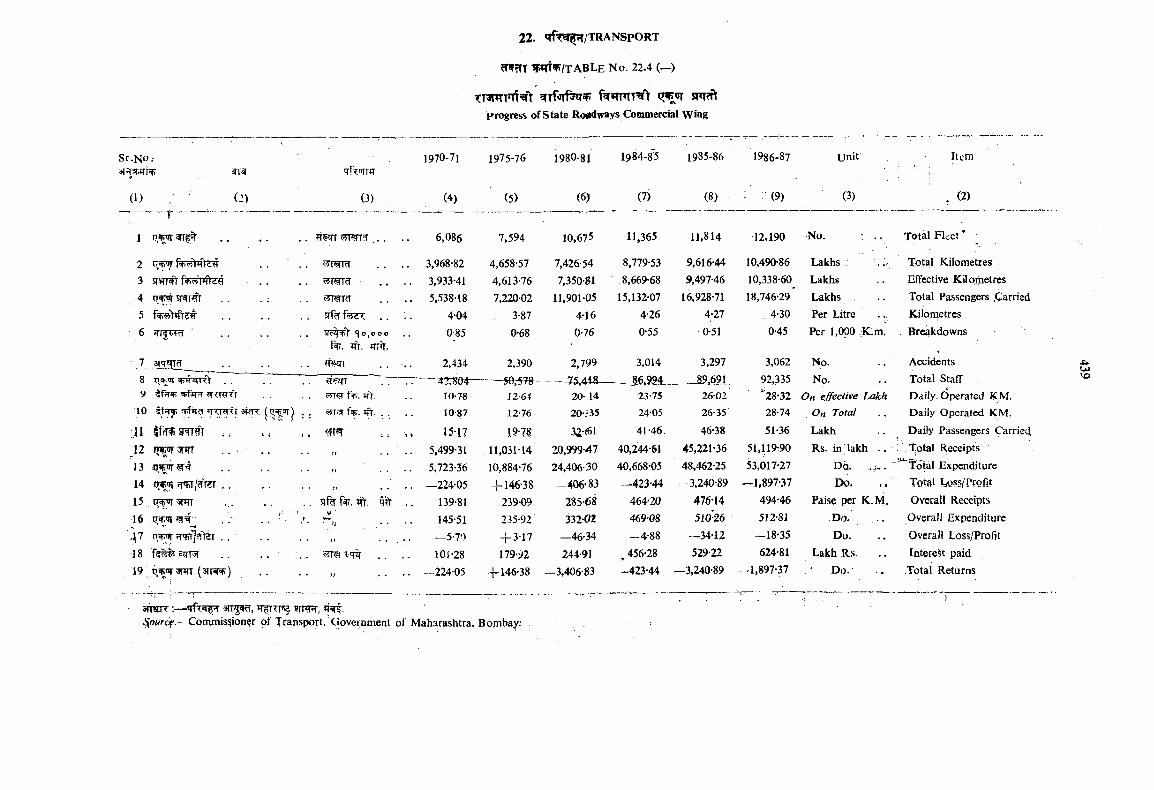
Sr.No.-
0 ) (2)T
1
3 sr»n^4 5r3rr*fl'56 qr?T?cr
78 iisyji ;*>4*rTft . .9 tfff^ ^TTmfr
10 tf sjp 5 fna 3¥^
:11 If Tf WT fr ; ;
12 1 ^ jrT . . , .1314 q oT ^/^>2T . .15 , . . . .16 . ." . . *
.47 ci.^ rr’TTr7?i> j i . . . .
18 eilN , . ...
f »TTnTW'tprogress of State Roadways Commercial Wing
'TPwiT1970-71 1975-76 1980-81 1984-85 1985-^6 1986-87 Unit Item
(3) (4) (5) (6) (7) (8) (9) (3) *
. . ?i^r <rJKi?l!T . . . 6,086 7,594 10.675 11,365 11,814 12,190 No. .. Total Fleet’
4,658-57 7,426-54 8,779-53 9,616-44 10,490-86 Lakhs :: : Total Kilometres .
. . IWTfl' , . . . 3,933-41 4,613-76 7,350-81 8,669-68 9,497-46 10,338-60 Lakhs Effective Kilometres
.. 5,538-18 7,220-02 11,901*05 15,132-07 16,928-71 18,746-29* Lakhs Total Passengers .Cariried. . s?% . . 4-04 3:87 4-16 4-26 4-27 4-30 Per Litre .. Kilonietres. • 0,0 0 0
%. *fr. ttft.0-85 0-68 0-76 0-55 0-51 0-45 Per 1,000 .;K.ra, Breakdowns
»2,434
— --------- ----------i ri on 12,390
_____ £rr\ c” i f r t
2,799AiQ
3,014 3,297on /;qi
3,06292,335^28*32
No.No.
On effective Lakh
AccidentsTotal StaffDaily. Operated KM.wr<3' fsp. jfr.
42^0410-78 12-64 20- 14 23-75
- —o^jpyi 26 02
. . T<3- %. JJt. . . 10-87 12-76 20-:'35 24-05 26-35’ 28-74 On Total Daily Operate KM.
. . i m 19-7§ 32-61 41-46 46-38 51-36 Lakh Daily Passengers Carried
J f .. 5,499-31 11,031-14 20,999-47 40,244-61 45,221-36 51,119-90 Rs. in lakh . . ? Total Receipts
Tt . . 5,723-36 10,884-76 24,406-30 40,668-05 48,462-25 53,017-27 Dd. ’ ^Totol Expenditure
) i .. —224-05 -i-146-38 -406-83 _-423-44 -3,240-89 —1,897-37 Do. .. Total Loss/Profit
. . 51% ftr. ift. 139-81 239-09 285-68 464*20 476 14 494-46 Paise per K.M. Overall Receipts' V"
J j . . 145-51 235-92' 332-02 469-08 510-26 512-81 -Do. . . Overall Expenditure
—5-70 + 3-17 —46-34 -4-88 —34-12 —18-35 Do. Overall Loss/Profit
... , . 101-28 179-92 244-91 , 456-28 529-22 624-81 Lakh Rs. Interest paid
I) .. —224-05 + 146-38 —3,406-83 —423-44 —3,240-89 —1,897*37 • Do. .Total Returns
x»u>to
3ffOTT :— 31T55»?T, TI TTsa ?ir5rT, *5' .^our(f.~ Cotnmis ion^r of Transport, Government of Maharashtra, Bombay;
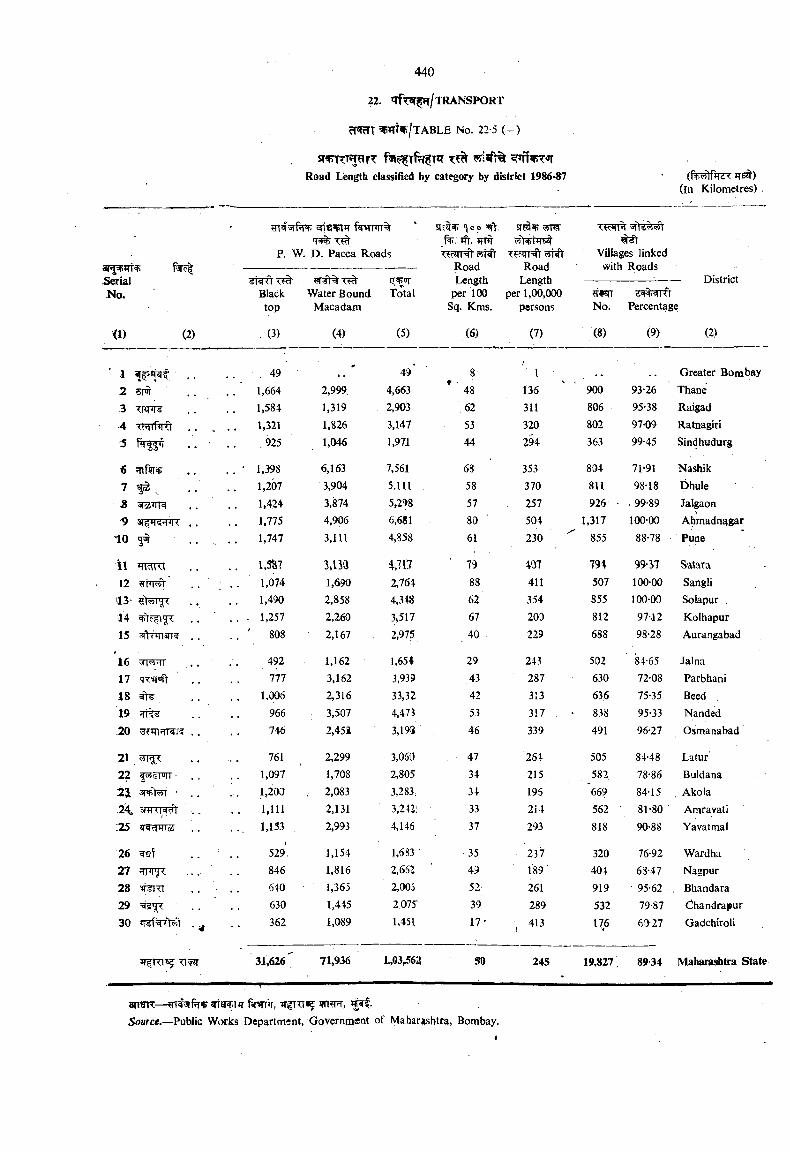
440
22. trfT^ffr/TRANSPORT
cT^T ^mf>/TABLE No. 22-5 ( - )
Road Length classified by category by district 1986-87 (Mf?T2T iTSt) (in Kilometres) ,
i»erialNo.
ftr PTT%'T5f%
p. W. D. Pacca Roads
^op*fy. irnt
■ clTT STT Road Length
per 100 Sq. Kms.
T??irT= ^ Road
Length per 1,00,000
persons
Villages linkedtxiith
Blacktop
Water Bound Macadam
IT^Total
No. Percentage
<1) (2) (3) (4) (5) (6) (7) (8) (9) (2)
1 . . . . . 4 9' 49* 8 ' 1 Greater Bombay
2 sm . . 1,664 , 2,999 4,663 48 136 900 93-26 Thane.3 TRnT¥ 1,584 1,319 2,90X 62 311 806 95-38 Raigad
4 , . . 1,321 1,826 3,147 53 320 802 97-09 Ratnagiri
5 . . ■ .925 1,046 1,971 44 z n 363 99-45 Sindhudurg
6 . . ’ 1,398 6,163 7,561 68 353 804 71-91 Nashik
7 ^ _ 1,207 3,904 5.111 58 370 811 98-18 Dhule«8 'jloi'illq , . 1,424 3,874 5,298 57 257 926 • . 99-89 Jalgaon■9 at TT vi < , . 1,775 4,906 6,681 80 504 1,317 100-00 Ahmad nagar
1 0 5®r . . 1,747 3,111 4,858 61 230 855 88-78 ■ Pune
'l l . . 1,3 7 3,no i,Tl7 79 407 794 99-37 Satava12 . . 1,074 1,690 2,764 88 411 507 100-00 Sangli
113" 1,490 2,858 4,348 62 354 855 100-00 Solapur .14 , . . . • 1,257 2,260 3*517 67 20D 812 97-12 Kolhapur15 3ftT4iNK . . . . ' 808 2,167 2,975 40 229 688 98-28 Aurangabad
16 <r5Hl 492 1,162 l,65i 29 243 502 84-65 Jalna17 q r ^ 777 3,162 3,939 43 287 630 72-08 Parbhani18 1,006 2,316 33,32 42 313 636 75-35 Beed19 966 3,507 4,473 53 317 . • 838 95-33 Nanded-20 . . 746 2,45i 3,19S 46 339 491 96-27 Osmanabad
21 761 2,299 3,050 . ' 47 261 505 84-48 Latur'22 I STJIT • . . 1,097 1,708 2,805 34 215 582 78-86 Buldana25. 3f >55t ’ . . 1,200 . 2,083 3,283., 34 195 *669 84-15 Akola24> sd ttr^ 1,111 2,131 3,242: • 33 214 562 • 81-80 Amravati:25 -MldloA . . . . . 1,133 2,993 4,146 37 293 818 90-88 Yavatmal
26 waf 529. 1,154 1,683 ■ • 35 237 . 320 76-92 Wardha27 JTHTj?: . . , 846 1,816 2,662 49 189 404 63-47 Nagpur28 9T¥RT . . ‘ 640 1,365 2,005 52 261 919 95-62 . Bhandara29 630 1,445 2.075' 39 289 532 79-87 Chandrapur30 . .^ 362 1,089 1,451; 17* , 413 176 60-27 GadchiroU
31,626' 71,936 1.,03 *5621 50 245 19,827 89-34 Maharashtra State
arrerr— ?n?rT,Source.—Public Works Departm?nt, Government of Maharashtra, Bombay.
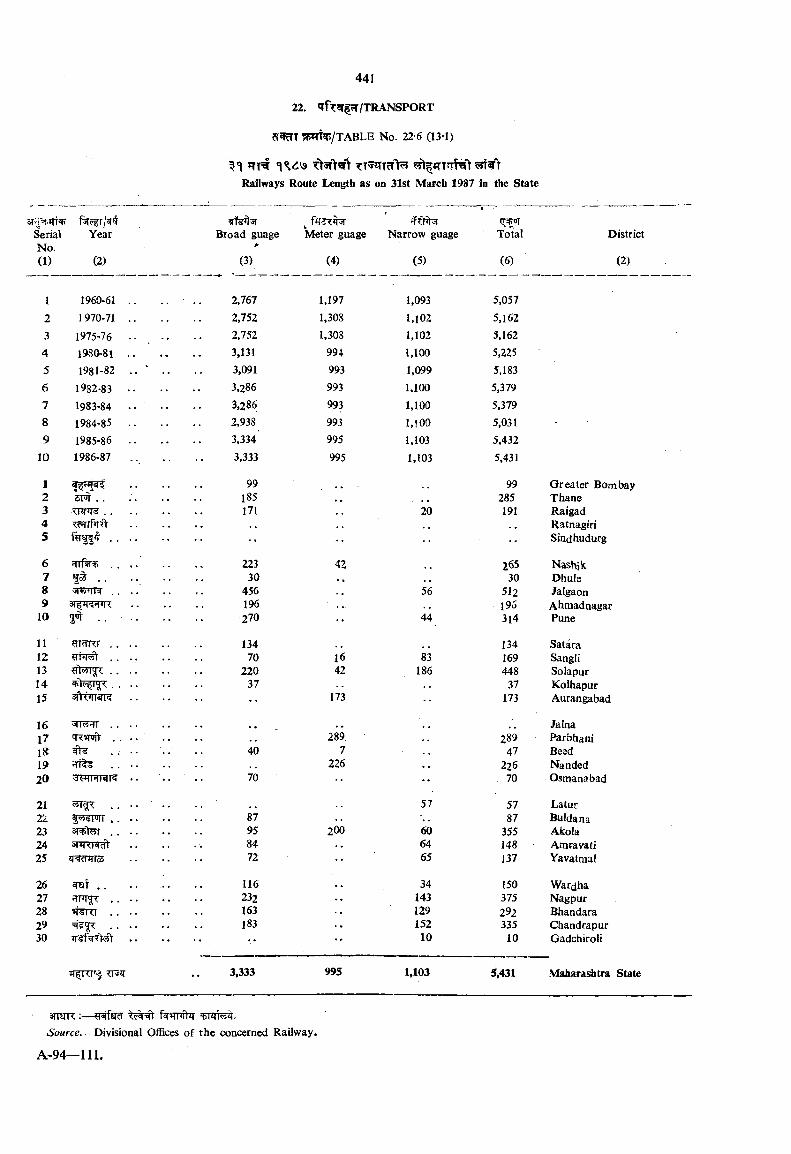
?pm^/TABLE No. 22-6 (13-1)
Railways Route Length as on 31st March 1987 in the State
Serial YearNo.(1) (2)
Broad guage 0
(3)
Meter guage
(4)
Narrow guage
(5)
Total
(6)
District
(2)
1 1960-61 . . . . 2,767 1,197 1,093 5,0572 1 970-71 .. 2,752 1,308 1,102 5,1623 1975-76 .. .. 2,752 1,308 1,102 5,1624 19S0-81 .. 3,131 994 1,100 5,2255 1981-82 ' .. 3,091 993 1,099 5,1836 1982-83 .. 3,286 993 1,100 5,3797 1983-84 . . . . 3,286 993 1,100 5,3798 1984-85 .. 2,938 993 1,100 5,0319 1985-86 .. 3,334 995 1,103 5,432
10 1986-87 . , 3,333 995 1,103 5,431
1 99 .. . 99 Greater Bombay2 5T . . 185 . . . 285 Ttiane3 TRFT5............................................. 171 20 191 Raigad4 , , Ratnagiri5 ..................... •• •• Sindhudurg
6 . . . . 223 42 265 Nashik7 30 . . . , 30 Dhuls8 'jfwTO ........................................ 456 . . 56 512 Jalgaon9 • • • . 196 ■ . . . 195 Ahraadnagar
10 2^ . . . . 270 •• 44 314 Pune
11 ??r^TnT........................................ 134 .. 134 Satara12 . . . . 70 16 83 169 Sangli13 ........................................ 220 42 186 448 Solapur14 ....................................... 37 37 Kolhapur15 . . 173 173 Aurangabad
16 s n w ........................................ .. Jalna17 'Kmfr . . • • 289, 289 Parbhani18 ^ . . . . 40 7 47 Beed19 . . . . 226 226 Nanded20 • • • • 70 70 Osmanabad
21 . . . . • . • • 57 57 Latur22 . . . . 87 87 Buldana23 3n>>yr . . . . 95 200 60 355 Akola24 84 64 148 Amrav iti25 72 •• 65 137 Yavatmal
26 . . 116 34 150 Wardha27 . . . . 232 . . 143 375 Nagpur28 5T RT . . . . . . 163 129 292 Bhandara29 . . . . 183 . . 152 335 Chandrapur30 . . 10 10 Gadchiroli
TT ir 3,333 995 1,103 5,431 Maharashtra Stat<
aiTErn:;—,5o«rce.—Divisional Offices of the concerned Railway.
A -9 4 ~ lll .
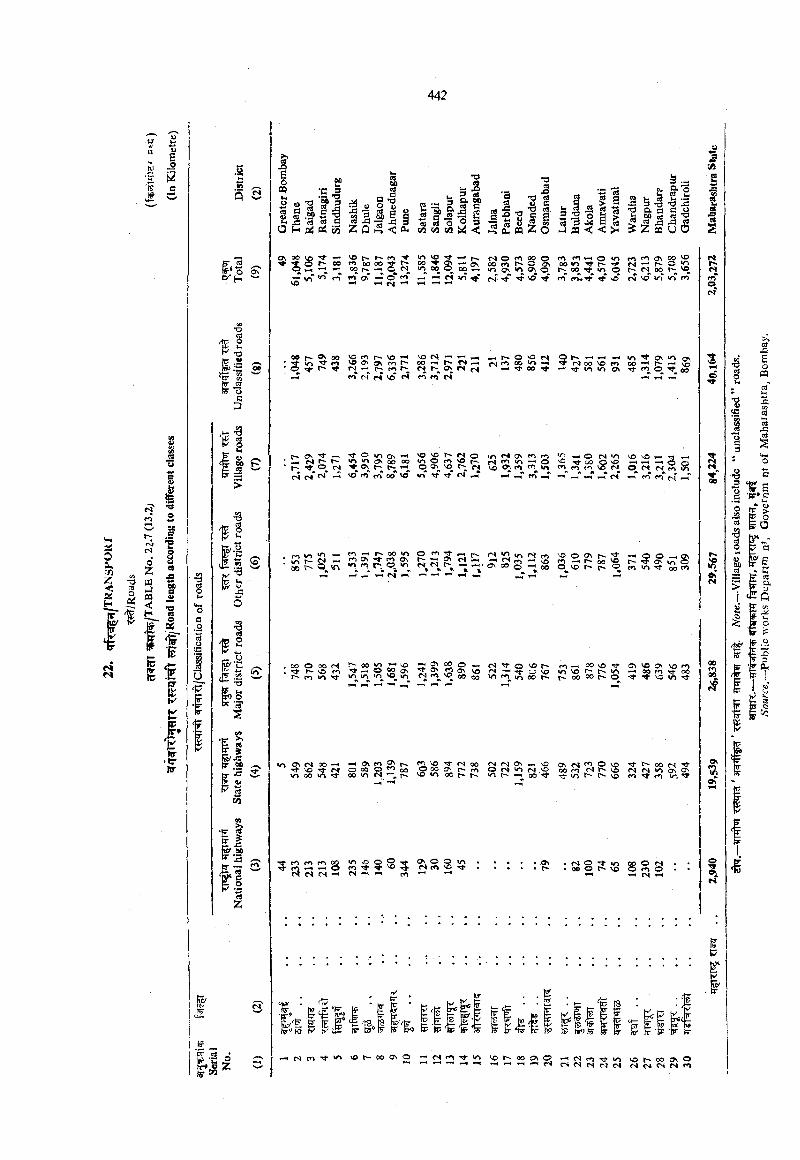
o
3a
tc
.a
nS
I■s
r -f l ®p h
0
1 f !
a i . | ^
^ s
^ 5;
I *i ”!
3wi
cT. 2
Z
iPP>HU uc3 a’-' sO H
atS'
« ° g x .
• ^11 i P l i;3 p^S5 Z Q ^ ^ c I
•ofa
§ l l l l « J3 o o 3 CO CO c/3 ^ <
«
2 « c .• 5 ^ *0 s*. h^ c g 2
CT\ 00 vp >«■^ S 2 c:
-- VO jN. pi«> 'srK- CO ro 00 60 ^ r~ 00 O
VO r -00 ^ — Jj,,<n 00 O 00 ^t-T <n 1/^
a - r S S g • S ^ o a >3 £ l z o
fS) o rn 00 o m o wioO for^O oN 00 m Tfio o s « o o \ o r 00 Tj- in orsT •' \0 Tf fntn.TfTtvo
rf CO os 22<M -H Ot- M 00 VO pT VO 1/ * «n fO
O0t-.9|00 VOf*%l~~VO’~' vots*-*'—' t-iTt" (y-i n '~0 (T\ cfi rn f" 00 ’—I r- (N ^ fN forn r ir^ v o M r i (n (s
-- I'-^ «n Q o Tt^ r ~ o v o ( s i<-s) ro 00 ■—< -^rsioovOro^ T f i r t i o o s
^ r ' r- >ox^i3\oooots (S* <0* cn pa 00“ VO v> rf Tt M ^
ly fM 0\ '^T-iOfSW ^fsj m in — 1 O v o ^ c x j o v o f’l r o r o v o c ' l ^ r- ro ^ t-T ^ -T M
VO vO ^ rr -H O ri
c< m fsf
CO VI ^I/-, t~- JS M00 'Ti- ^ t ^ O O < r > . 0 < ^ 3 ’ * - ' r ^ < N * < ^ < r > n r r ^ ' OiOs-«tcnON ^
ON 00 S ^ - ; S o^ —' 00 “o t~-<a"os>oov O t ~ p ~ C3 r r j i n T t 00 r o
ooO oof^ I2 S 5 S ® '- ' <N'^ovor~ m — oovo^f osvocy,vof»>c- \£> m ■ —. O On IT. — .? ? ® ' vo * N -^ - « a -o v o > n v o ^ ~ r ^ v > — < 00 m rf c«m >n >3- VI VO in rj o 00 00 v^<^<ooot~ t~ .oooor~ o '.o m
1/1 Os fN 00 '—' ^ ^ *2.■ vO Tj- (v| o 00 o ^ 00 o m 00 vri 00 in <s '—' i>. VO^ 2 " » N o o ^(NOs — VO O S < S < ^ O V O ' ^ t l ^ O O t N ' S ' O tS'O f'l,^ 00 ro <N \o tSIfNinOsOS v^ocr^t^ 'rtr~>—iQOTt in 'O m t*s in ■'f
r r r O c f > c n O O ' ^ : 2 0 0 ' s f < > 0 0 ^■ '—I O ^ Tt CSc<>vO'>4' :?• >n r>- VO O rj m O <N ^
tr’•■- '■B' ' T [f io K i£i: I &il I
VO 00 OS o'-I ^ ’-I —I <"1 ■- <N n in«N <s cs r-j c<
ICA
I
Isvtn
rnocf
>n Os <n os00 **< f ’-< soTf ^ ® . '^ , 00
sOs*<s
90
s
OSfnV)
I
VO 00 os of'l <N» CN <s »n
aoW
a
I
1 ‘I f s2 v p
oiaCS• acdO
>oO
60 fr «
Q
JO3
T• 6
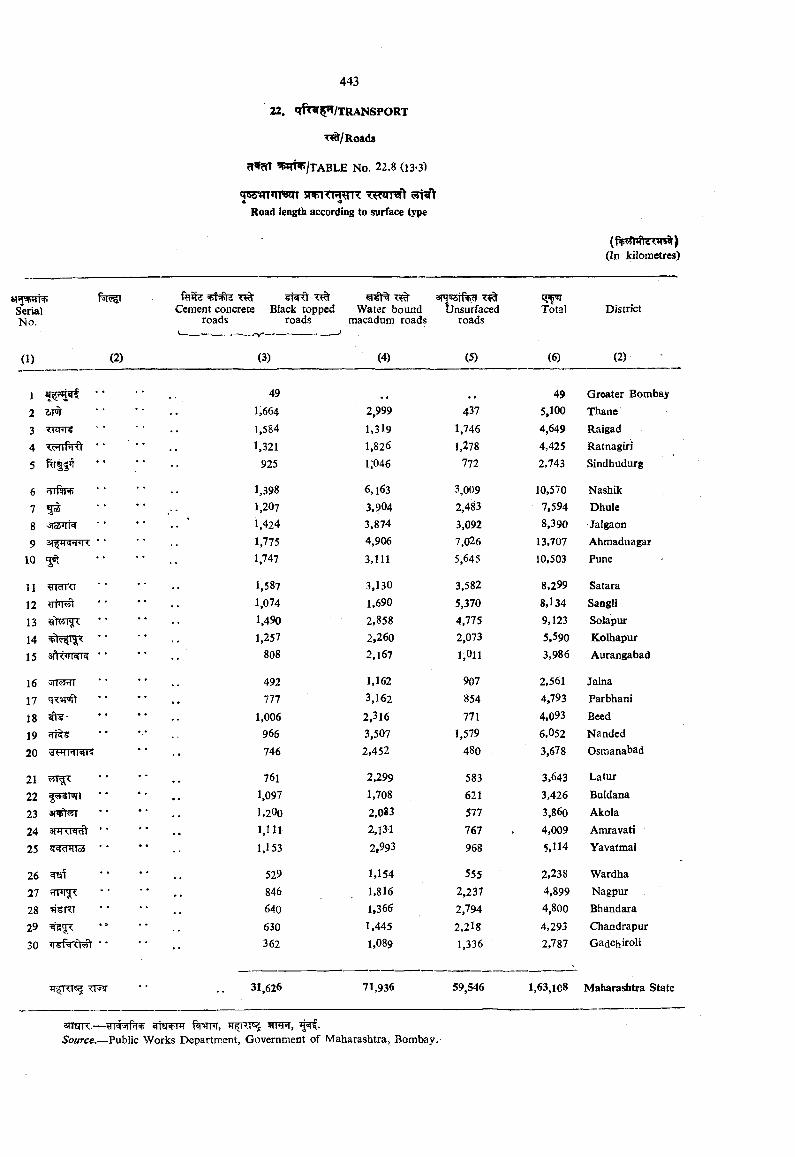
22. qf^^/TR A N SPO R T
Roads
’W ^/TABLE No. 22.8 (l3-3)
Misi'MrnrsMTc «Road length according to surface type
(In kilometres)
SerialNo.
(1) (2)
Cement concrete roads
Black topped roads
Water bound macadum roads
arj'saiGti.aUnsurfaced
roads
123 ■<iinrg
4 ?.iHrpRt * *
5 fHf I’T • •
6 JTTftpP789
10
11 ¥RnTT
12131415 sfttnwK * * ■
16171819 fTT20
2122232425 • *
2637282930
TT^ •
(3)
491,6641,5841,321
925
1,3981,2071,4241,7751,747
1,5871,0741,4901,257
808
492777
1,006966746
7611,0971,2001,111
1,153
529846640630362
Total District
31,626 71,936 59,546
(4) (5) (6) (2)
49 Greater Bombay2,999 437 5,100 thanel,3 l9 1,746 4,649 Raigad1,826 1,278 4,425 Ratnagiril;046 772 2,743 Sindhudurg
6.163 3,009 10,570 Nashik3,904 2,48'3 7,594 Dhule3,874 3,092 8,390 Jalgaon4,906 7,026 13,707 Ahmaduagar3,111 5,645 10,503 Pune
3,130 3,582 8,299 Satara1,690 5,370 8,134 Sangli2,858 4,775 9,123 Solapur2,260 2,073 5,590 Kolhapur2,167 1,011 3,986 Aurangabad
1,162 907 2,561 Jalha3,162 854 4,793 Parbhani2,316 771 4,093 Beed3,507 1,579 6,052 Nanded2.452 480 3,678 Osmanabad
2,299 583 3,643 Latur1,708 621 3,426 Buldana2,083 577 3,860 Akola2,131 767 4,009 Amravati2.993 968 5,114 Yavatmal
1,154 555 2,238 Wardha1,816 2,237 4,899 Nagpur1,366 2,794 4,800 Bhandara1,445 2,2l8 4,293 Chandrapur1,089 1,336 2,787 Gadchiroli
1,63,1C8 Maharashtra State
amiR.— r#5rfk5f7Source.—Public Works Department, Government of Maharashtra, Bombay,
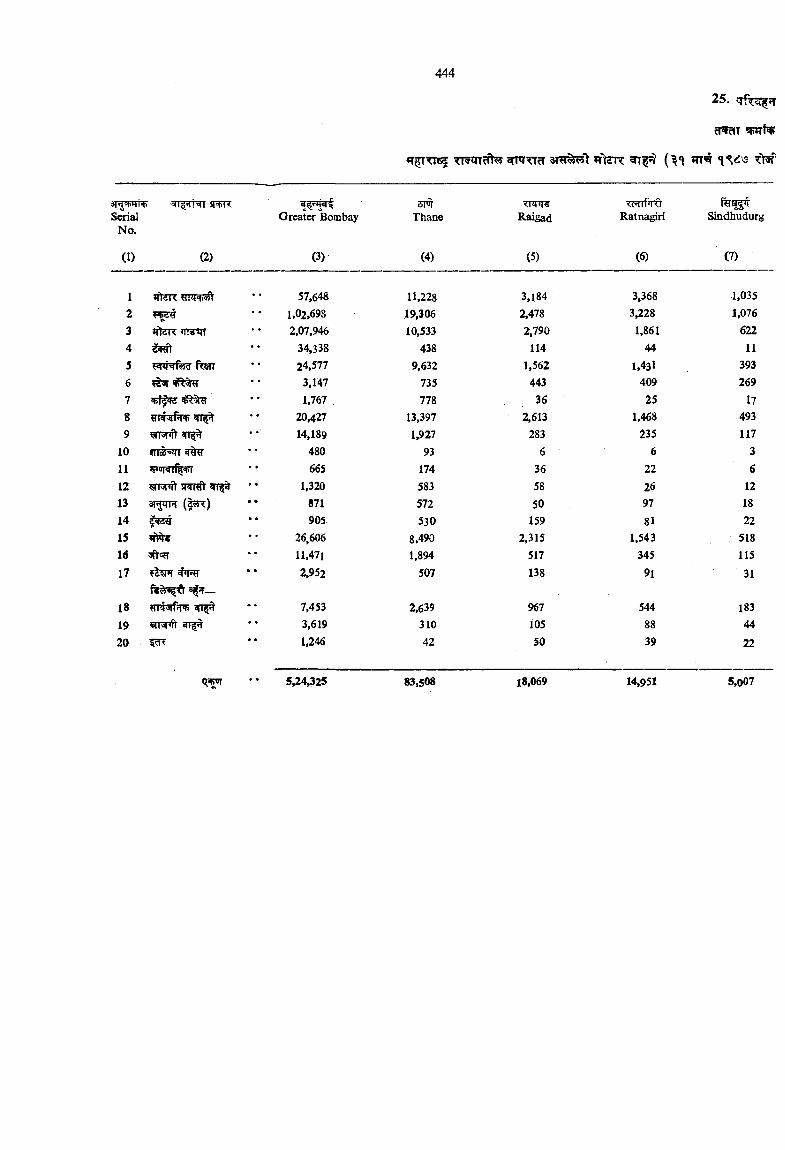
25. « r f ^ ^
cT^T
3T^3^'t «fteR (^«i Ttsfl
ar^TW^S^ial
No.
(1) (2)
Greater Bombay
(3)
5MThane
(4)
miT5Raigad
(5)
Ratnagiri
(6)
Sindhudurg
(7)
1 57,648 11,228 3,184 3,368 1,0352 <*hd« • # 1,02,698 19,306 2,478 3,228 1,0763 Tmr iT 2,07,946 10,533 2.790 1,861 6224 34,338 438 114 44 115 fosT 24,577 9,632 1,562 1,431 3936 3,147 735 443 409 2697 1,767 . 778 36 25 178 20,427 13,397 2,613 1,468 4939 yranfl «ri^ 14,189 1,927 283 235 117
10 480 93 6 6 311 665 174 36 22 612 9T3nft snrnsf)’ • • 1,320 583 58 26 1213 • • 871 572 50 97 1814 • • 905 530 159 81 2215 26,606 8,490 2,315 1,543 51816 » • 11,471 1,894 517 345 11517 • • 2,952 507 138 91 31
18 Hplsrfhv 7,453 2,639 967 544 183
19 ^arspfr ♦ • 3,619 310 105 88 4420 ♦ • 1,246 42 SO 39 22
• • 5,24,325 83,508 18,069 14,951 5,007
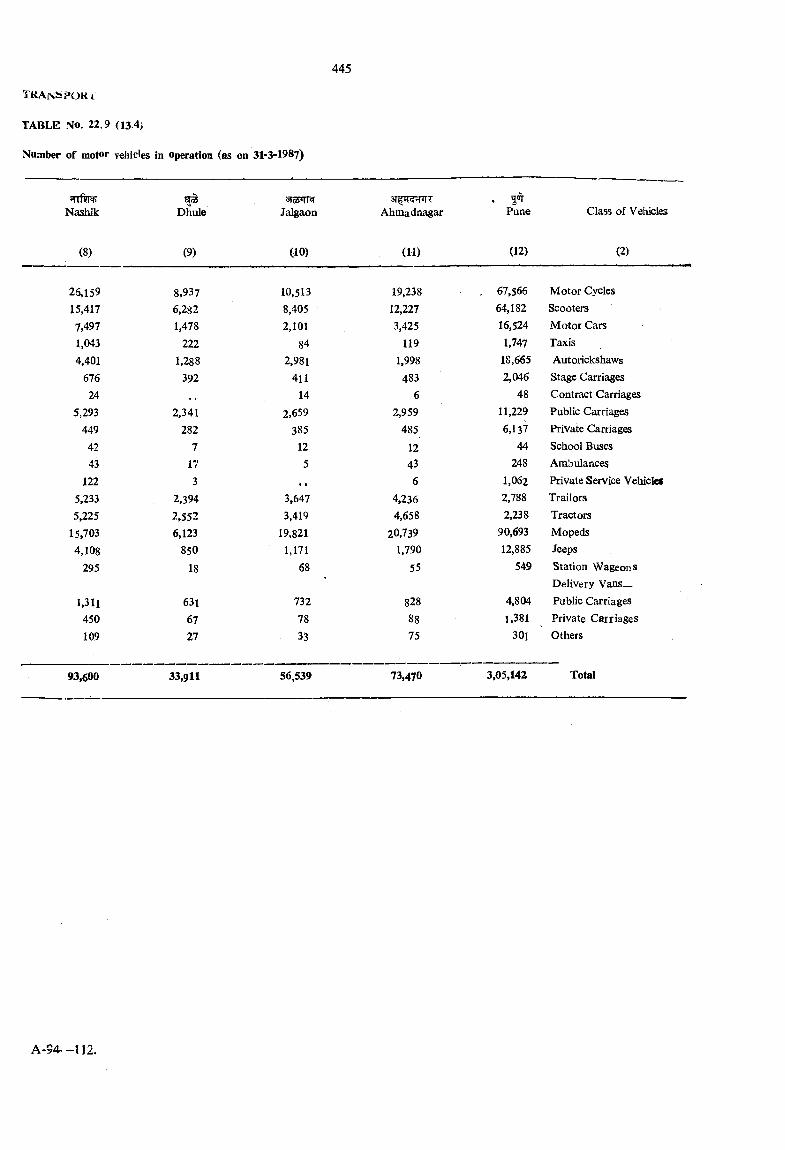
TKANbPORi
TABLE NO. 22.9 (13.4)
HlPsil'tiNashik
yo5Dhule Jalgaon Ahmadnagar
gorPune Class of Vehicfcs
(8) (9) (10) (11) (12) (2)
26,159 8,937 10,513 19,238 , 67,566 Motor Cycles15,417 6,282 8,405 12,227 64,182 Scooters7,497 1,478 2,i01 3,425 16,524 Motor Cars1,043 222 84 119 1,747 Taxis4,401 1,288 2,981 1,998 18,665 Autorickshaws
676 392 411 483 2,046 Stage Carriages24 14 6 48 Contract Carriages
5,293 2,341 2,659 2,959 11,229 Public Carriages449 282 385 485 6,137 Private Carriages
42 7 12 12 44 School Buses43 17 5 43 248 Ambulances
122 3 6 1,062 Private Service Vehicles5,233 2,394 3,647 4,236 2,788 Trailors5,225 2,552 3,419 4,658 2,238 Tractors
15.703 6,123 19,821 20,739 90,693 Mopeds
4,108 850 1,171 1,790 12,885 Jeeps
295 18 68 55 549 Station Wageons Delivery Vans_
1,311 631 732 828 4,804 Public Carriages450 67 78 88 1,381 Private Carriages109 27 33 75 301 Others
93,600 33,911 56,539 73,470 3,05,142 Total
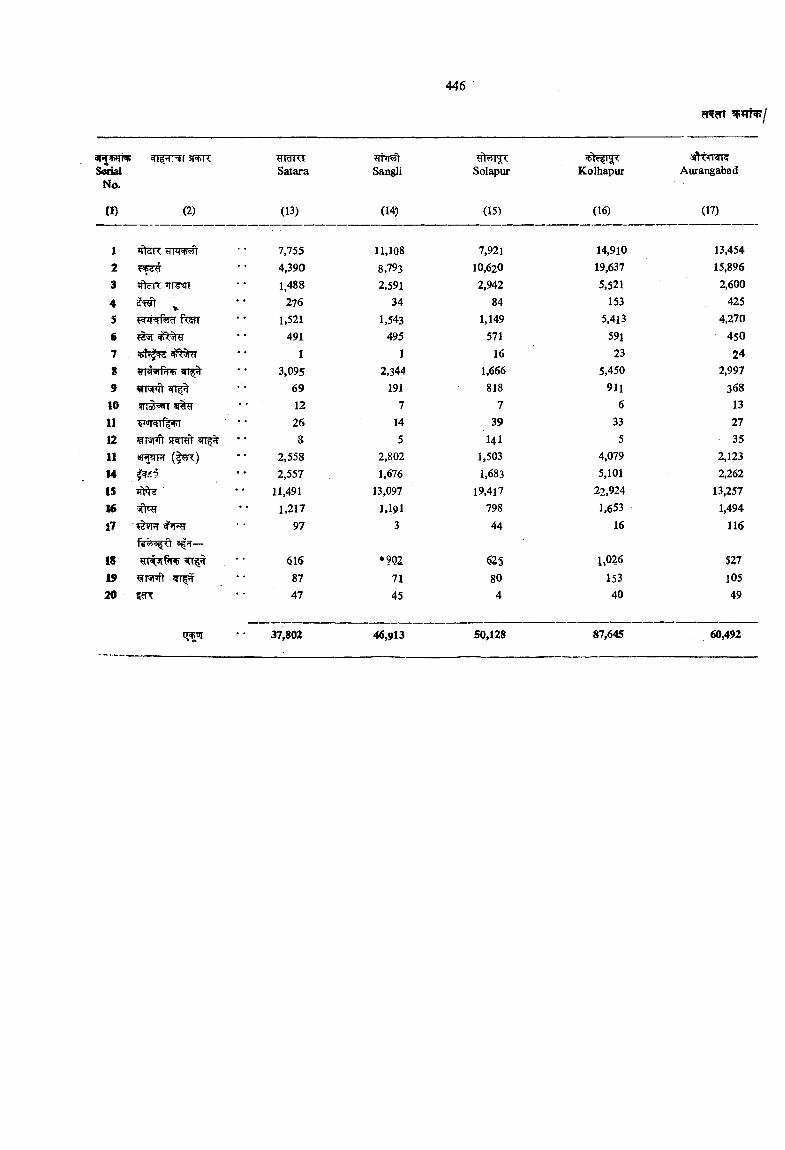
No.
(I)
SRiR
(2)
ncfRTSatara
(13)
?rni^Sangli
(14)
Solapur
(15)
Kolh^ur
(16)
sftr TTsTRAurangabad
(17)
123
45678910 11 12 II14151617
181920
♦TldK y
qkn:
ftssT
9T5nft
FSPft JRTHt ar^pH ( 1 ^ )
fewofft 5^^—
t i ^
7,7554,3901,488
2761,521
4911
3,0956912268
2,5582,557
11,4911,217
97
6168747
37,802
11,108
8,7932,591
341,543
4951
2,344191
7145
2,8021,676
13,097l,l9 l
3
#9027145
46,913
7,921 14,910 13,45410,620 19,637 15,8962,942 5,521 2,600
84 153 4251,149 5,413 4,270
571 591 45016 23 24
1,666 5,450 2,997818 911 368
7 6 1339 33 27
141 5 351,503 4,079 2,1231,683 5,101 2,262
19,417 22,924 13,257798 1,653 1,49444 16 116
625 1.026 52780 153 1054 40 49
50,128 87,645 60,492
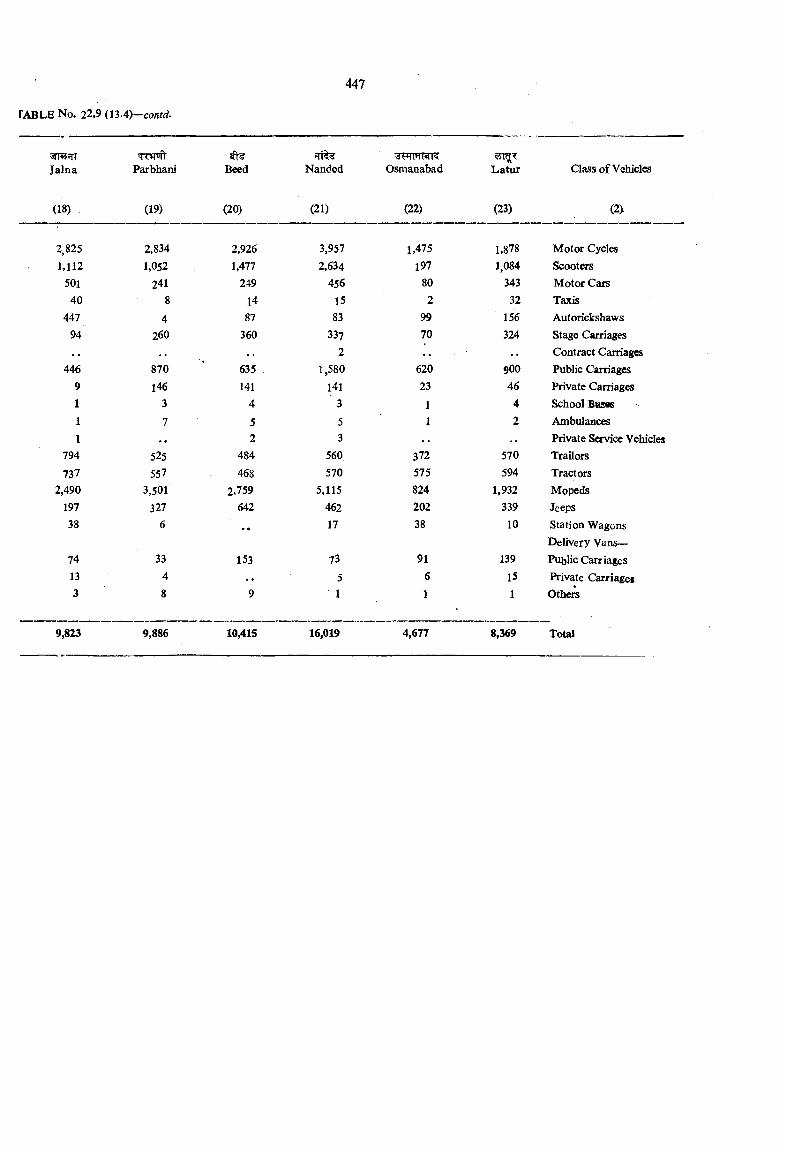
TABLE No. 22.9 (13.4)—con/c/.
Jalna Parbhani Seed Nanded Osmanabad Latur Class of Vehicles
(18) (19) (20) (21) (22) (23) (2>
2,825 2,834 2,926 3,957 1,475 1,878 Motor Cycles1,112 1,052 1,477 2,634 197 1,084 Scooters
501 241 249 456 80 343 Motor Cars40 8 14 15 2 32 Taxis
447 4 87 83 99 156 Autorickshaws94 260 360 337 70 324 Stage Carriages
2 . . Contract Carriages446 870 635 1,580 620 900 Public Carriages
9 l46 141 141 23 46 Private Carriages1 3 4 3 1 4 School Bbsss
1 7 5 5 1 2 Ambulances1 . . 2 3 . . ' Private Scrvice Vehicles
794 525 484 560 372 570 Trailers737 557 468 570 575 594 Tractors
2,490 3,501 2,759 5,115 824 1,932 Mopeds197 327 642 462 202 339 Jeeps38 6 17 38 10 Station Wagons
Delivery Vans—74 33 153 73 91 139 Public Carriages13 4 . . 5 6 15 Private Carriaget3 8 9 1 1 1 Others
9,823 9,886 10,415 16,019 4,677 8,369 Total
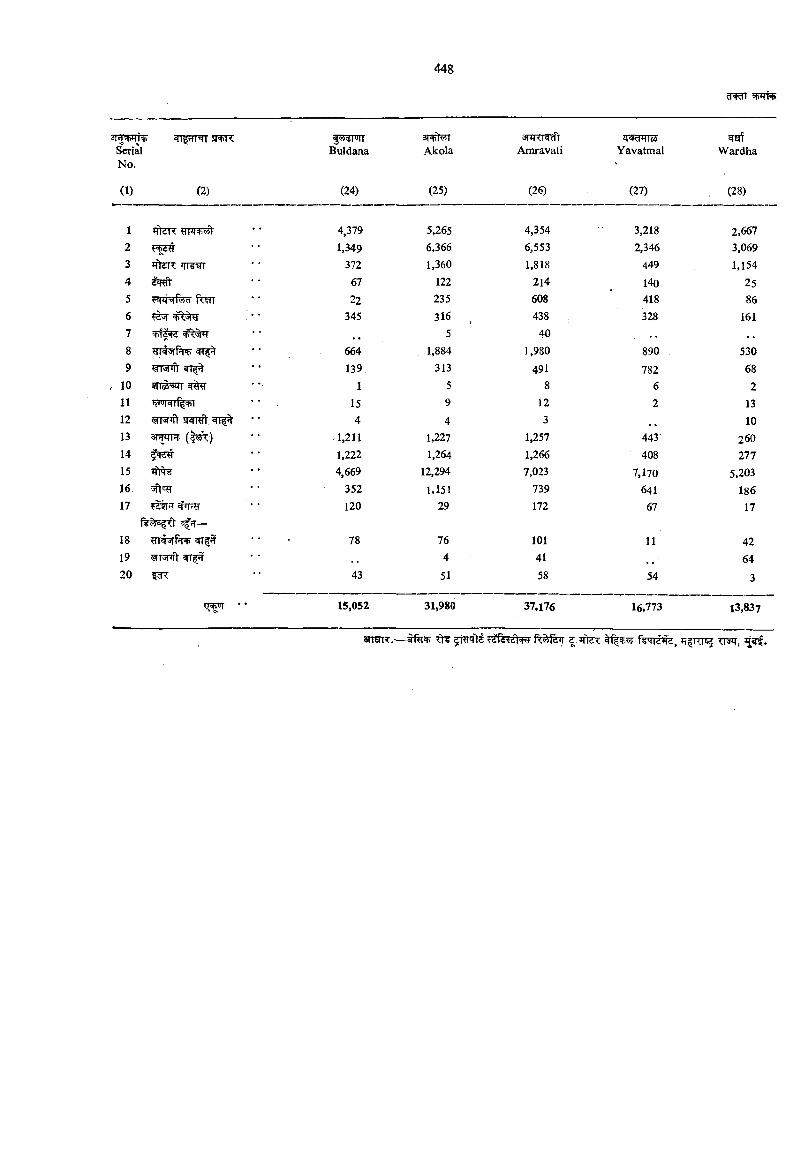
448
d«WI
«TT|TrHr s r ^
(2)
Amravati
(26)
Wardha
(28)
aH J=hSerialNo.
(1)
1 51 uri Buidana
(24)
Akola
(25)
Yavatmal
(27)
1 *f)7R y 4,379 5,265 4,354 3,218 2,6672 1,349 6,366 6,553 2,346 3,0693 *ftdri <rr¥q'T 372 1,360 1,818 449 1,1544 67 122 214 l4o 255 ^4-^f^d fe n 22 235 608 418 866 ^ '4 345 316 ^ 438 328 1617 . , 5 408 664 1,884 1,980 890 5309 139 313 491 782 68
, 10 9rro8»rr %?r 1 5 8 6 211 ■ «r=irf +i • • . 15 9 12 2 1312 4 4 3 1013 ( 1 ^ ) -1,211 1,227 1,257 443 26014 1,222 1,264 1,266 408 27715 ITl^ 4,669 12,294 7,023 7,170 5,20316 352 1,151 739 641 18617 120 29 172 67 17
ns?>o^18 78 76 101 11 4219 4 41 6420 5 ^ 43 51 58 54 3
15,052 31,980 37,176 16,773 13,83?
:ir z. iriT?: x m ,
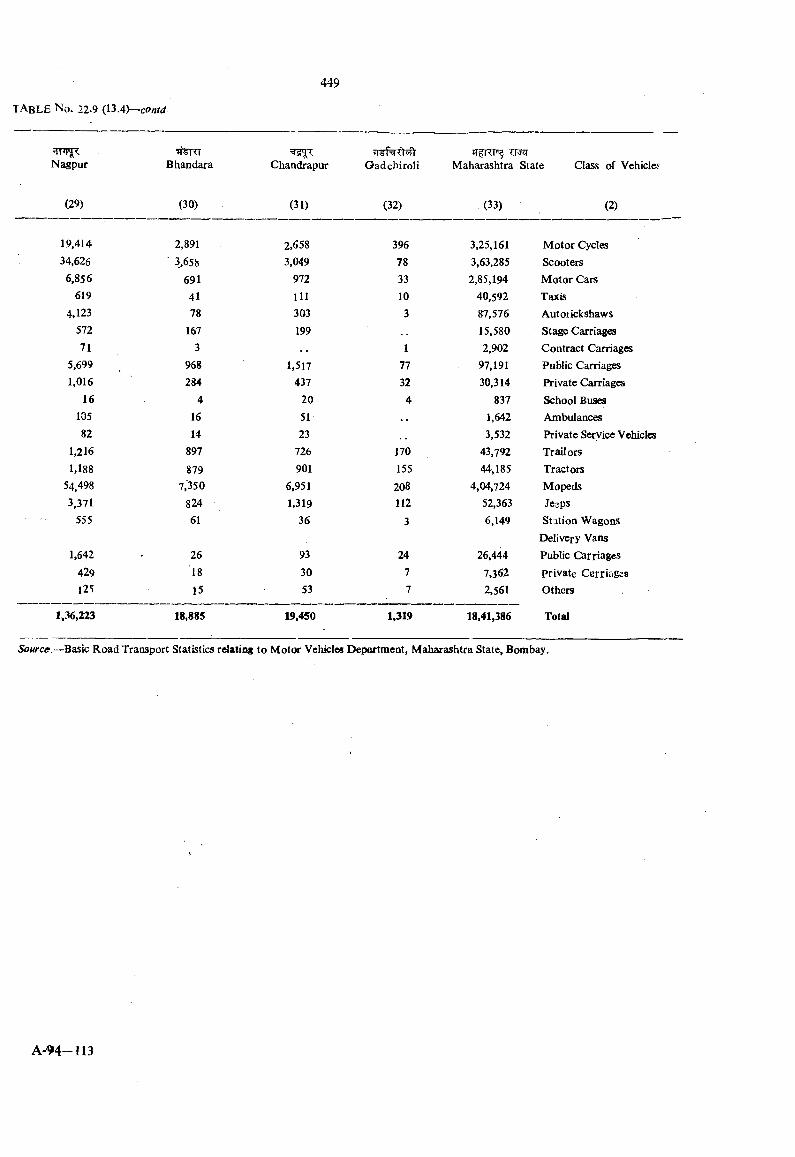
Nagpur Bhandara Chandrapur OadchiroliTFiZT
Maharashtra State Class of Vehicles
(29) (30) (31) (32) (33) (2)
19,414 2,891 2,658 396 3,25,161 Motor Cycles34,626 ■ 3.658 3,049 78 3,63,285 Scooters
6,856 691 972 33 2,85,194 Motor Cars619 41 111 10 40,592 Taxis
4,123 78 303 3 87,576 Autorickshaws572 167 199 15,580 Stage Carriages71 3 1 2,902 Contract Carriages
5,699 968 1,517 77 97,191 Public Carriages1,016 284 437 32 30,314 Private Carriages
16 4 20 4 837 School Buses105 16 51 1,642 Ambulances82 14 23 3,532 Private Service Vehicles
1,216 897 726 170 43,792 Trailers1,188 879 901 155 44,185 Tractors
54,498 7,350 6,951 208 4,04,724 Mopeds3.371 824 1,319 112 52,363 Jeeps
555 61 36 3 6,149 Station Wagons
1,642429125
261815
933053
2477
26,4447,3622,561
1,36,223 18,885 19,450 1,319 18,41,386
Delivery Vans Public Carriages Private Cerriages Others
Total
Source.-—Basic Road Transport Statistics relating to Motor Vehicles Department, Maharashtra State, Bombay.
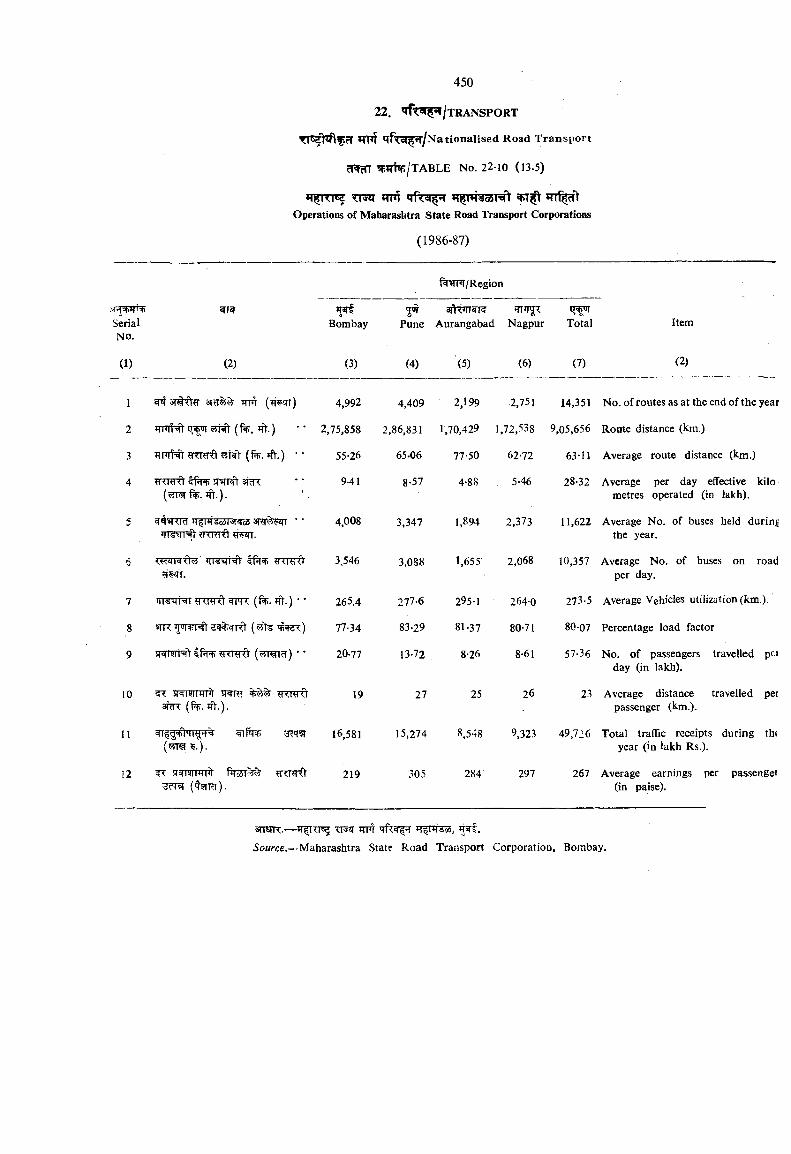
450
22. ®lfT^/TRANSPORT
<7fr^»f/Nationalised Road Transport
cTfcn ^m^/TABLE No. 22-10 (13.5)
Operations of Maharashtra State Road Transport Corporations
(1986-87)
f%wr/Region
SerialNo.
Bombay2^
PuneaTIW l?
Aurangabad Nagpur Total Item
(1) (2) (3) (4) (5) (6) (7) (2)
1 JTPT (BW ) 4,992 4,409 2,199 2,751 14,351 No. of routes as at the end of the year
2 5F(Frt qSCT ^ ift. ) 2,75,858 2,86,831 1,70,429 1,72,538 9,05,656 Route distance (km.)
3 JinTHt?RRrfr55t (f%. jft.) •* 55-26 65-06 77-50 62-72 63-11 Average route distance (km.)
4 TTRRt SHTRI’ 31^ (^K'l %. ift.).
9-41 8-57 4-88 5-46 28-32 Average per day effective kilo metres operated (in lakh).
c-?TTrafr
4,008 3,347 1,894 2,373 11,622 Average No. of buses held during the year.
6 ?TTRrd*iwr.
3.546 3,088 1,655 2,068 10,357 Average No. of buses on road per day.
7 'il -MNF y TFR (f%. Tft.) ■ ■ 265.4 277-6 295-1 264-0 273-5 Average Vehicles utilization (km.).
8 «TR ’P’RTRt 77-34 83-29 81-37 80-71 80-07 Percentage load factor
9 M4fSin l (?5raicT) • • 20-77 13-72 8-26 8-61 57-36 No. of passengers travelled pci day (in lakh).
10 ^ SRTWTWt 5Rm ?TWft sicR (1%. ift.).
19 27 25 26 23 Average distance travelled pei passenger (km.).
11 ^T5t 16,581 15,274 8,548 9,323 49,726 Total traffic receipts during th( year (in lakh Rs.).
12 3R ar T9rPTP> 219 305 284 297 267 Average earnings per passengei (in paise).
3rretTT.— JTPT HfR^ca,Source.—'Maharashtra State Road Transport Corporation, Bombay.
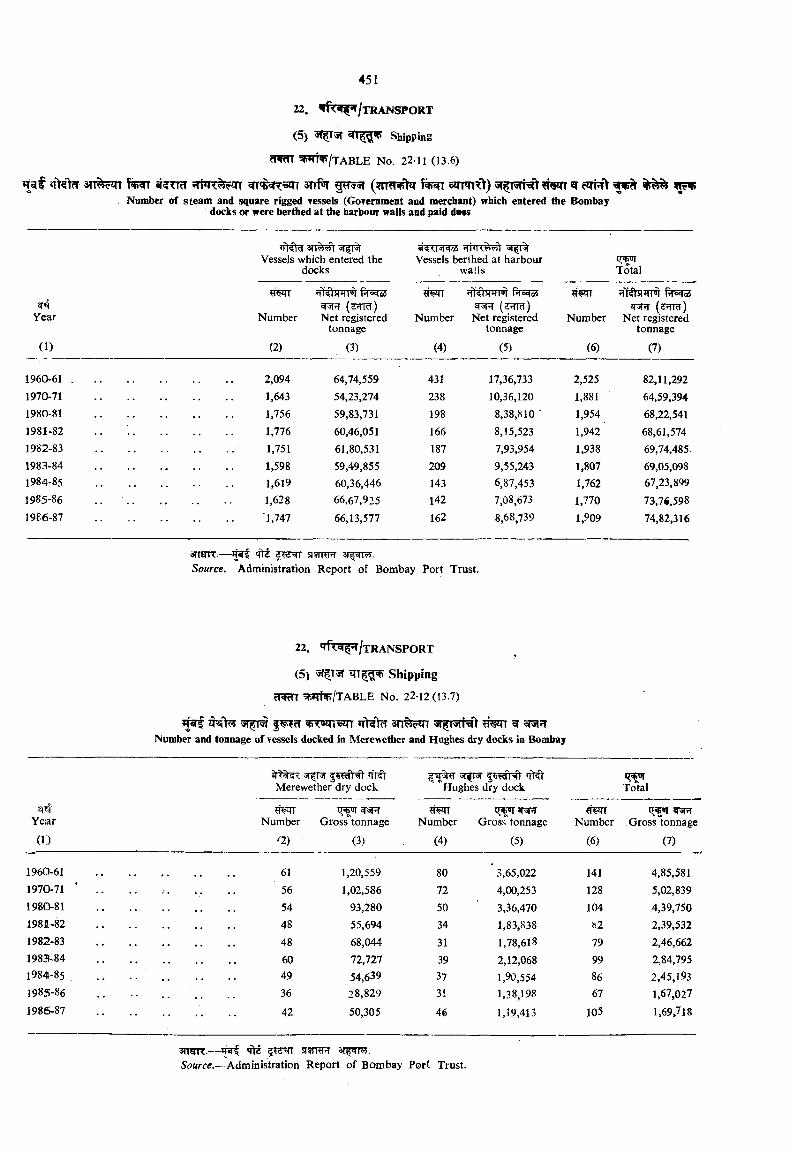
n>5>cf 3TT%^ ^?TTfr (jrrm^'k sirrm y) sr^rsrNV ^ cJtrI ^. Number of steam and square rigged vessels (GoTernment and merchant) which entered the Bombay
docks or were berthed at the harbour walls and paid dMS
iffitcfVessels which entered the
docks
5<4<.N< 66 ' 1Vessels berthed at harbour
walls Total
Year
(1)
«V I
Number
(2)
Fft hmrat (s-im)
Net registered tonnage
(3)
Number
(4)
fHo«<o4 (SHW)
Net registered tonnage
(5)
Number
(6)
qiifhRlTT T'^oi (2HM)
Net registered tonnage
(7)
196061 ...................... 2,094 64,74,559 431 17,36,733 2,525 82,11,2921970-71 1,643 54,23,274 238 10,36,120 1,881 64,59,3941980-81 1,756 59,83,731 198 8,38,810 ■ 1,954 68,22,5411981-82 1,776 60,46,051 166 8,15,523 1,942 68,61,5741982-83 1,751 61,80,531 187 7,93,954 1,938 69,74,4851983-84 1,598 59,49,855 209 9,55,243 1,807 69,05,0981984-85 1,619 60,36,446 143 6,87,453 1,762 67,23,8991985-86 1,628 66,67,925 142 7,08,673 1,770 73,74,5981986-87 1,747 66,13,577 162 8,68,739 1,909 74,82,316
ansTTT.— ^ sf rrew 3t ^ .Sowrcc. -Administration Report of Bombay Port Trust,
22. /t r a n s p o r t
(5) Shipping
rT ^ W P/T A B L E No. 22-12 (13.7)
^ l ^ c f 3n%??n grNumber and tonnage of vessels docked in Merewether and Hughes dry docks in Bombay
5r T5TMerewether dry dock Hughes dry dock Total
Year
(1)
Numbera )
Gross tonnage
(3)
Number
(4)
Gross' tonnage
(5)
Number
(6)
Gross tonnage
(7)
1960-61 .......................... 61 1,20,559 80 ’ 3,65,022 141 4,85,5811970-71 ' .. .. 56 1,02,586 72 4,00,253 128 5,02,8391980-81 .......................... 54 93,280 50 3,36,470 104 4,39,750198B-82 .......................... .. 48 55,694 34 1,83,838 82 2,39,5321982-83 48 68,044 31 1,78,618 79 2,46,6621983-84 .......................... 60 72,727 39 2,12,068 99 2,84,7951984-85 ....................... 49 54,639 37 1,90,554 86 2,45,1931985-86 36 28,829 31 1,38,198 67 1,67,0271986-87 .......................... 42 50,305 46 1,19,413 105 1,69,718
ansiK.— #9^ Tfs rstrpt 3)^qi«,5o«rcff.— Administration Report of Bombay Port Trust.
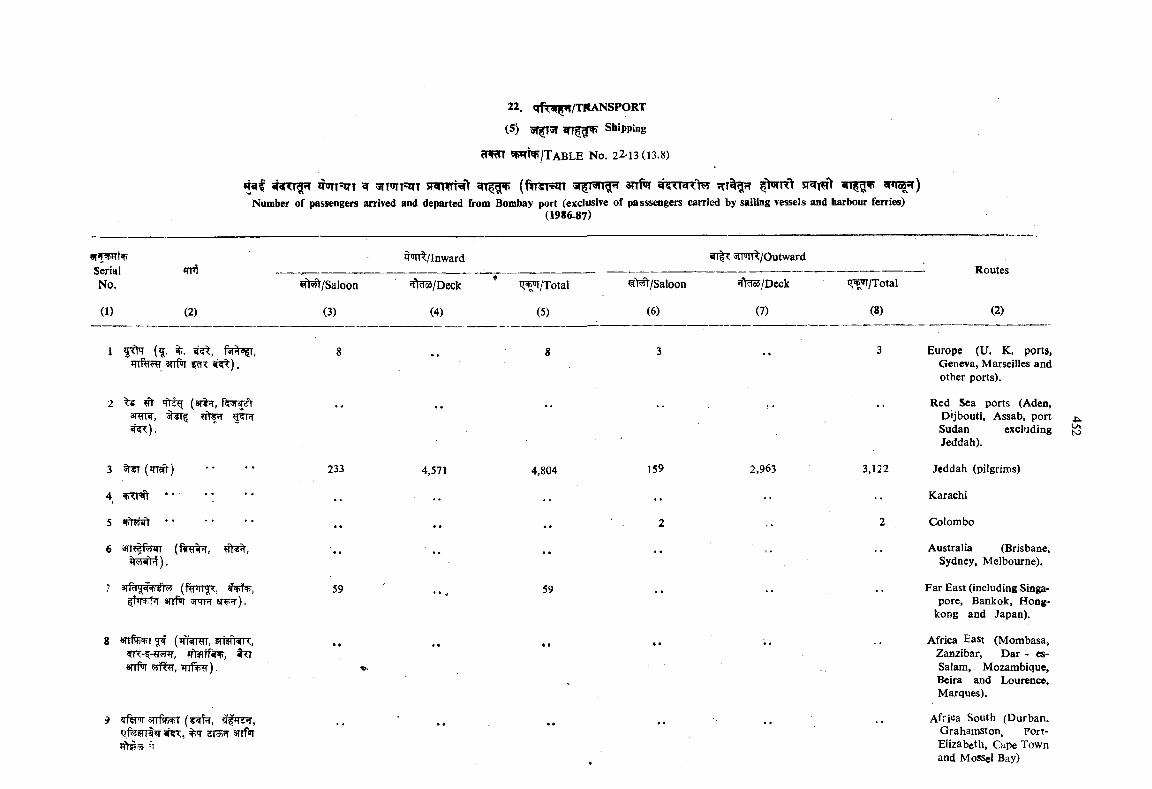
22. qfnnjir/TItANSPORT
(5) 3T 3T Shipping
cWm ^ W / T a BLE No. 22-13(13.8)
iN r r ^ ^T=tTT ^ 3TmT=arT swrnHV ( f t r r r ^ ssr^R i^ snfrr ^^rrgrO^ sr rmV ^»rafT)Number of passengers arrived and departed from Bombay port (exclusiye of passsengers carried by sailing vessels and harbour ferries)
(1986.87)
IT'TFTT'PSerialNo.
(1) (2)
^ /S a lo o n
(3)
q'’JTTt/Inward 5TFmt/Outward
HW/Deck
(4)
'J^ IT o ta l
(5)
^^/Saloon
(6)
Ht5lo5/Deck
(7)
i?^/Total
(8)
Routes
(2)
3TTf «T ) .
2 ^ (anhr, f rsr 'taraw,
3 (JTT 't) ’ •
4 w f r • • ■
5 ...............................
6 3Ti |feirr (firetff,
7 (fMr$7, fsFiNr, anfir 5TTR ST¥ ).
8 snfifi r (iffwRn, Figfr^ ,?R-f- r55?r, #TTarrfT 55T%, *TTf%?r).
9 ?fw'rr srrfifj^Qfeiri sET SRR:, %7 2T3?T 3TTf»T
8 8
233
59
4,571 4,804 159 2,963
59
3 Europe (U. K. ports,Geneva, Marseilles and other ports).
Red Sea ports (Aden, Dijbouti, Assab, port Sudan excluding J:3 Jeddah).
3,122 Jeddah (pilgrims)
Karachi
2 Colombo
Australia (Brisbane, Sydney, Melbourne).
Far East (including Singapore, Bankok, Hong
kong and Japan).
Africa East (Mombasa, Zanzibar, Dar - es- Salam, Mozambique,Beira and Lourence, Marques).
Africa South (Durban. Grahamston, Pori- Elizabeth, Cape Town and Mosscl Bay)
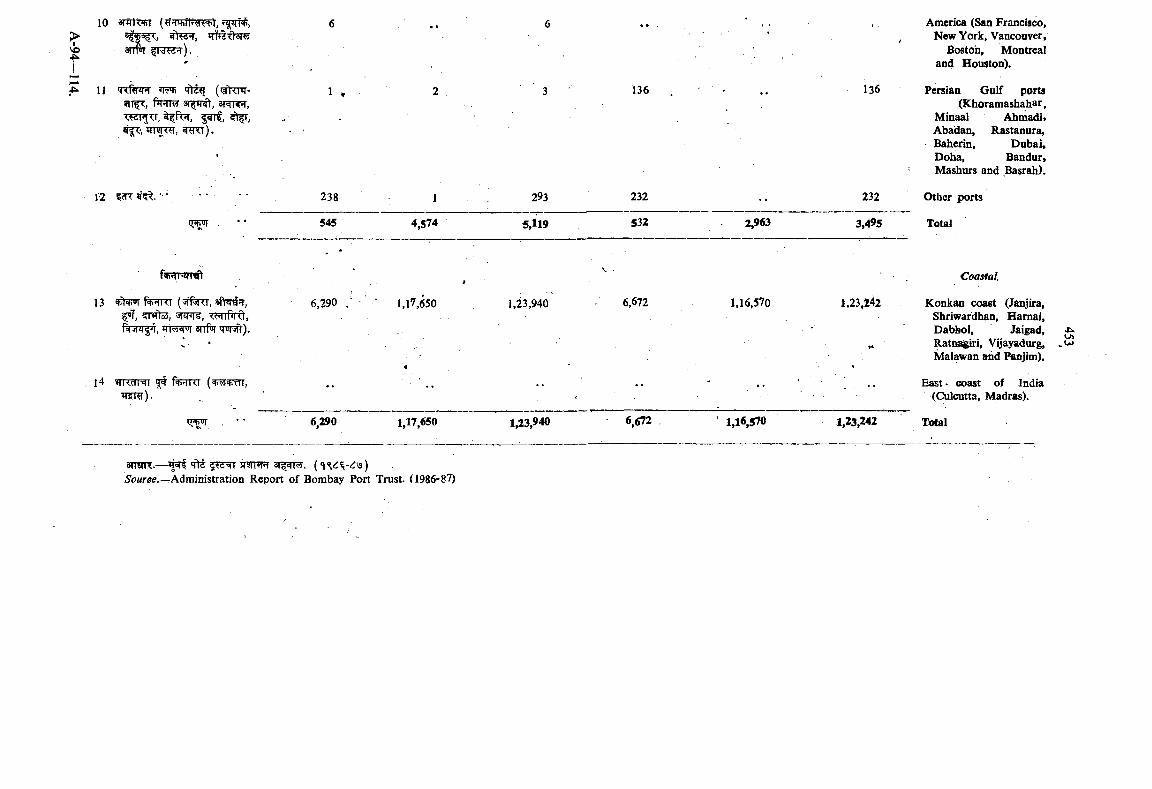
sTlW'l, 31^ ) .
11 TxftnrT (??ftTriT-?iT , f rmy arp^, aRnrr, <wi TT, 5i r<>i,
136
America (San Francisco, , New York, Vancouver,
Boston, Montrealand Houston).
136 Persian Gulf ports(Khoramashahar,
Minaal Ahmadi>Abadan, Rastanura,Baherin, Dubai,Doha, Bandur,
> Mashurs and Basrah).
12 • ' • • • . 238 1 293 232 •• 232 Other ports
545 4,574 5,119 532 2,963 3,495 Total
m
* ■V ■
Coastal.
1 3 fW n ( 'JIT <1 ,annate, mrPRt,
Ti«'sfui srrf iT 'rn^).
6,290 1,17,650
4
1,23,940 6,672 1,16,570 1,23.242
■H
Konkan coast (Janjira, Shriwardhan, Hamai, Dabhol, Jaigad, Ratt»^iri, Vijayadurg, . »*» Malawan and Pimjim).
l4 vTi<ffNi fcwr<i ( ^ w r , . •• . . •• ' East- ooast of India (Culcutta, Madras).
6,290 1,17,650 1,23,940 6,672 ' 1,16,570 1,23,242 Total
amiR.— ^ Ttt sr?iwfr5o«rffe.—Administration Report of Bombay Port Trust. (1986-87)
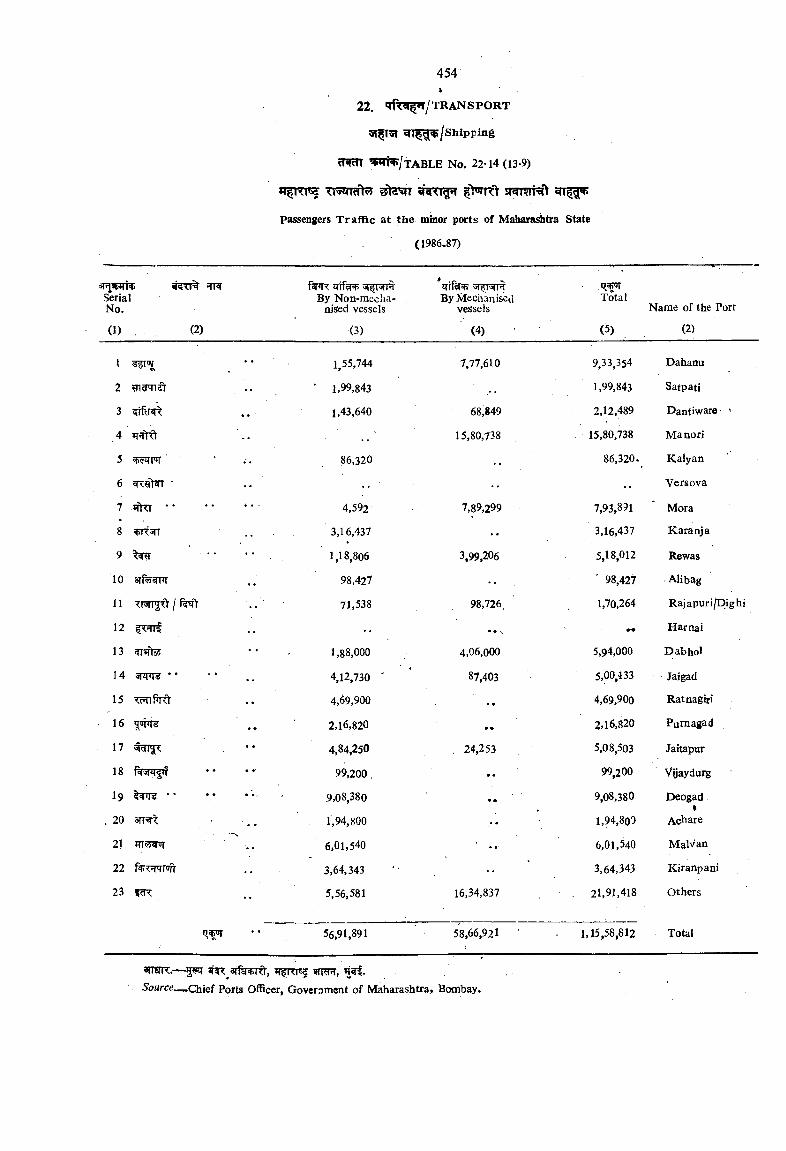
454*
22. qfTgi^/TR A NSPO R T
^ T ^ ^ /S h ip p in g
cRcn ^Wt^/TABLE No, 22-14 (13-9)
#taSTT ST^T^ft
passengers Traffic at the minor ports of Maharashtra State
(1986.87)
By Mechanised vessels
'
SerialNo.
By Non-raeeha- nised vessels
TotalName of the Port
(1) . (2) (3) (4) (5) (2)
1 1,55,744 7,77,610 9,33,354 Dahanu
2 ?nw'Ti€t • • ’ 1,99,843 1,99,843 Satpati
3 srifif^ 1,43,640 68,849 2,12,489 Dantiware • >
4 JTJfrd 15,80,738 15,80,738 Manori
5 i^FT • • 86,320 86,320, Kalyan
6 • • . Versova
7 sftTT • • 4,592 7,89,299 7,93,891 Mora
8 ^5TT 3,16,437 3,16,437 Karanja
9 ^ 1,18,806 3,99,206 5,18,012 Rewas
10 sr f^ ^ 98,427 •• ’ 98,427 Alibag
11 71,538 98,726, 1,70,264 Rajapuri/Dighi
12 • • Harnai
13 1,88,000 4,06,000 5,94,000 Dab hoi
14 •• 4,12,730 ' 87,403 5,00,133 Jaigad
15 .. 4.69,900 • • 4,69,900 Ratnagiri
16 ^ 0 ^ • • 2,16,820 • • 2,16,820 Pumagad
17 • ♦ 4,84,250 , 24,253 5,08,503 Jaitapur
18 f?T5ni|»T • «' 99,200 , • • 99,200 Vijaydurg
I9 $cnr •• 9,08,380 • • 9,08,380 Deogad1
. 20 3H=^ 1,94,800 • • 1,94,800 Acl^are
21 6,01,540 6,01,540 Malvan
22 3,64,343 •• 3,64,343 Kiranpani
23 ^ 5,56,581 16,34,837 21,91,418 Others
. . 56,91,891 58,66,921 ' 1,15,58,812 Total
msK.— 5 ^ ^^srfgRTRt, vmR,iS'oMrc5._Chief Ports Officer, Government of Maharashtra» Bombay,
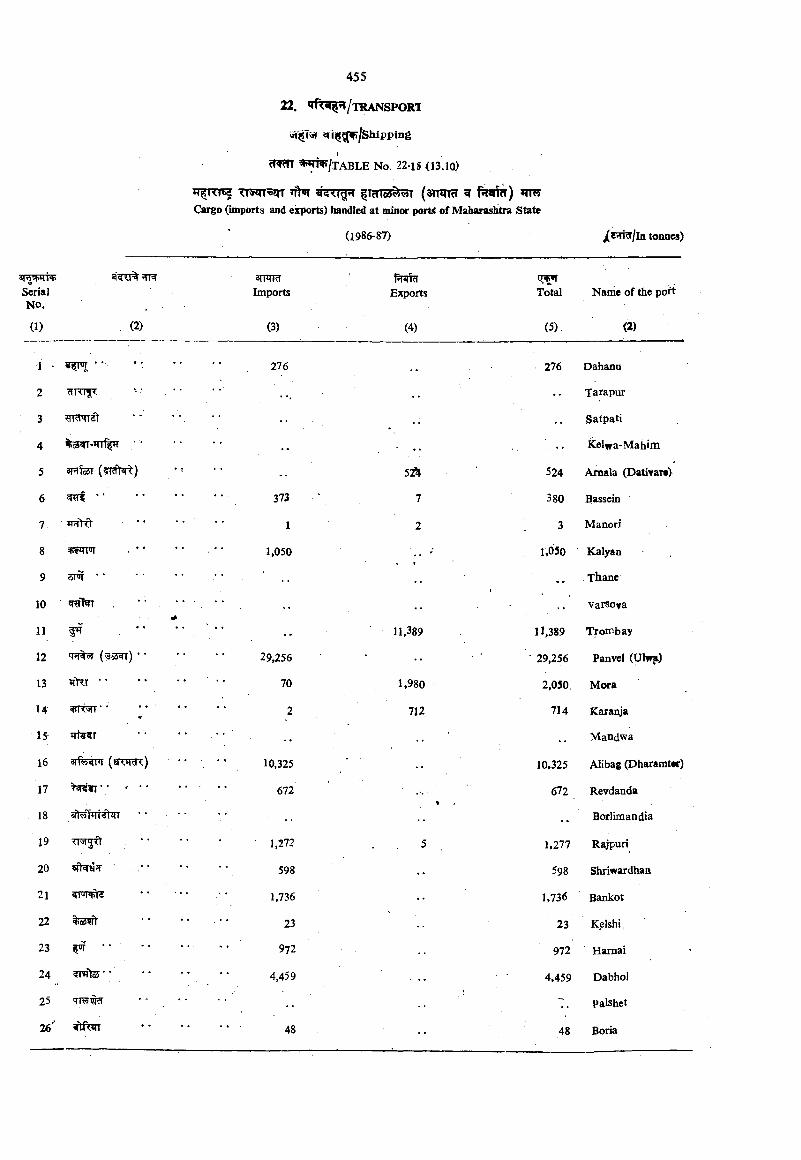
22. ''TfR^/TRANSPORl
cTlj^^/Shipping
^ « !^ /tABLE No, 22-lS (13.10)
#5TT ^ |mTo3^^T (snm?! ^ fiwfcr) Cargo (imports and exports) handled at minor port of Maharashtra State
(1986-87) tonnes)
SerialNO.
(1) (2)
STPTTImports
(3)
fjprfcfExpoits
(4)
Total
(5)
Name of the port
(2)
•1 -
2
3
4 %o5WT* Trf *T
5 arifer (?mM )
6 ^
7.
8 ssrzmr • ' '
9 51W • •
10 WHkr .
11 ^ •'
12 Tfr ar { oS IT) * •
13 *iKt *•
14 =RTt5rr • *
15
16 srfe fni (axifSR)
17 sRnrr’; ' "
18 ••
19
20
21
22 %o5#
23 ^ •*
24 srrote •;
25
26"
276
373
1
1,050
29,256
70
2
10,325
672
1,272
598
1,736
23
972
4,459
48
5A
7
2
11,389
1,980
712
276 Dahanu
Tarapur
. . Satpati
Kelwa-Mahim
524 Amala (Dativar*>
380 Bassein
3 Manori
l,05o Kalyan
Thane
Varso^a
11,389 Tr embay
29.256 Panvel (Ulwsi)
2,050. Mora
714 Karanja
Mandwa
10,325 Alibag (Dharamtec)
672 Revdanda
Borlimandia
1,277 Rajpuri
598 Shriwardhaa
1,736 Bankot
23 Kelshi,
972 Hamai
4,459 Dabhol
Palshet
48 Boria
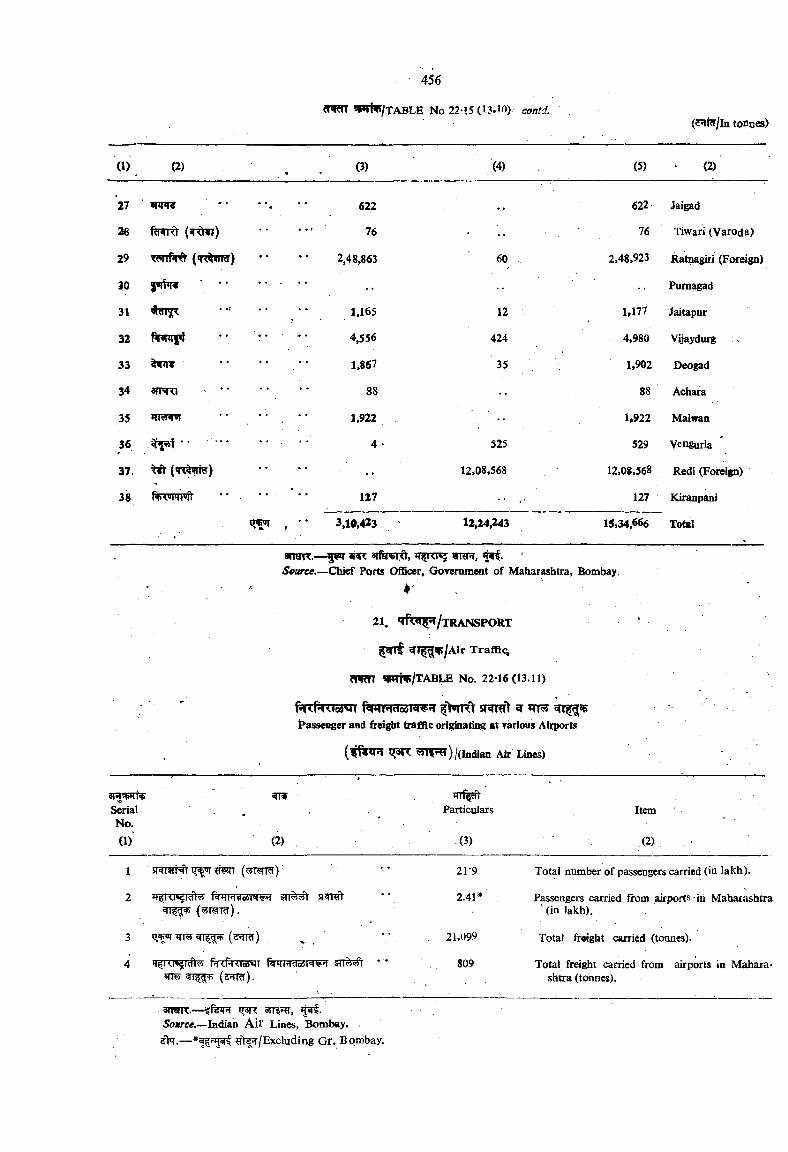
(J?IM/lh tocces)
(1) (2) . • (4) (5) (2)
27 *• • 622 ,. 622 Jaigad
76 ' ■ . 76 ' Tiwari (Varoda)
29 (•n JirRr) 2,48,863 60 2.48,923 Ratnagiri (Foreign)
30 • • • • • •• Pumagad
31 * • 1,165 12 1,177 Jaitapur
32 ftirayf r 4,556 424 4,980 Vijaydurg
33 1,867 35 1,902 Deogad
34 arr Ti * * •• 88 88 Achara
35 1,922 •• 1.922 Malwan
36 • ’ • * ‘ ■ 4 ' 525 529 Vengurla
37. (4i^«Td) ** 12.08.568 12,08,568 Redi (Foreign)
38 127 127 Kiranpani
, •* 3,10,423 12*24,243 15,34,666 Total
.
arranrr.— g w arfimd, »r ncn? wrpt, 'Source.—Chief Ports Officer, Govemni«at of Maharashtra, Bombay.
k' . •
21, «?f<^5*l/TRANSPORT ‘
^ T ^ /A ir Traffic;
cfiRn i|Wiv/TAB][£ No. 22-16(13.11)
f^«Cf^lo4^T ftfRT5ftTo3R^ SRTEft ^
.
t^assei^er aad freight traffic originating at various Airports
) /(Indian Air Lines)
am FTf rrffcftSerial , Particulars ItemNo.
(1) (2) , (3) (2)
1 21*9 Total number of passengers carried (in lakh).
2 5T frr? 5€r 2.41* Passengers carried from airports in Maharashtra
3 ttHS (d'Jl ) 21,099
' (in Jakh).
Total froight carried (tonnes).
4 fd fd' TotfVll 809 Total freight carried from airports in Mahara-(s TTcr).
Ishtra (tonnes).
3TOTT.— qSRSource.—Indiao Air Lines, Bombay.s h. — Excl udi ng Gr. Bombay.
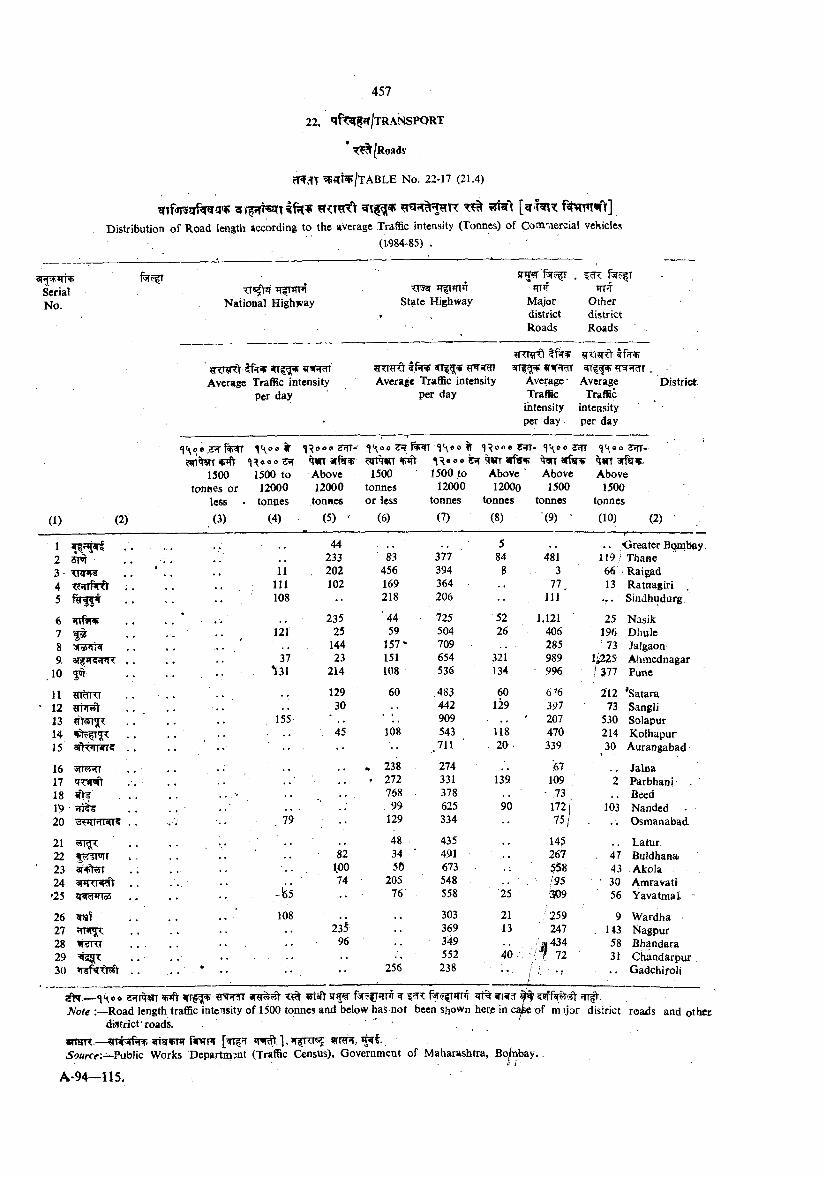
22. *»fC^5?j/TRANSP0RT
[Roads
rTfsfT 55irnF/TABLE No. 22-17 (21.4)
^ T fo fsirf^ w ?mft f ^ m 1 f ]Distribution of Road length according to the average Traffic intensity (Tonnes) of Com"Aercial vehicles
(1.984-85) .
SerialNo. National Highway State Highway
ST^TTTr
MajordistrictRoads
JTT’fOtherdistrictRoads
Average Traffic intensity Per day
Tfg;5pAverage Traffic intensity
per dayAverage ■ Traffic
intensity per day
Average Traffic
intensity per day
District
(1) (2)
<J« oe ,5P?r I'
1500 1500 totonnes or 12000
less . tonaes(3) (4)
^^ooo 2T!Tr-' ^ ^ <J^ooe CH7- ' ' oo Jrf|^ ??TTWT 'imrarftj^Above12000
tonnes(5)
1500 tonnes or less
(6)
1500 to 12000
tonnes(7)
Above12000
tonnes(8)
Above1500
tonnes(9) ‘
?rirT arftrv- Above
1500 tonnes
(10) (2)
1 . . 44 5 .. /Greater Bqmbay2 sm . . . . , , 233 83 377 84 481 119/ Thane3 11 . 202 456 394 8 3 66 Raigad4 111 102 169 364 77 13 Ratnagiri .5 . . . . .. 108 218 206 111 Sindhudorg,
6 . . . . .. , , 235 44 725 52 1,121 25 Nasik7 S3 . . •• , 121 25 59 504 26 406 196 Dhule8 1 . . . . • • , 144 157' 709 285 ' 73 Jalgaon9, . . . . 37 23 151 654 321 989 1/225 Ahmednagar
10 5^ . . . . . . . 131 214 108 536 134 996 : / 377 Pune
11 aidlTI , , 129 60 ,483 60 6^6 212 ’Satara12 . . . 30 442 129 397 73 Sangli13 . . . . . • 155 909 ■ .. ' 207 530 Solapur14 . . . . ■. 45 108 543 118 470 214 Kolhapur15 ■ . . . •• 711 . 20 . 339 30 Aurangabad
16 • 238 274 67 .. Jalna17 .. « 272 331 139 109 2 Parbhani18 Wtf . . . . . 768 378 - 73., Beed1’9 ■ . . ... 99 625 90 1721 103 Nanded •20 . . . . ••- 79 129 334 .. .. Osmanabad.
21 v i \n . . . . . . . , , 48 435 145 Latur22 ^?r^T . . . . . . 82 34 ' 491 267 . 47 Buidhana23 ar^^T 100 50 673 558 43 Akola24 snnjiRft . . . .. .. 74 205 548 . /95 ’ 30 Amravati
•25 - i s •• 76' 558 '25 ^ 9 56 Yavatmat '
26 . . . . . . 108 , , 303 21 ; 259 9 Wardha27 2 3 i 369 13 247 , U3 I^agpur28 . . . . . 96 • • 349 'a 434 58 Bhandara29 552 40 ' 0 72 ■ 31 Chandarpur30 ... . . “ . . . . 256 238 ' . . . /' y ' ’ • Gadchiroli
— (jt^oo ^ s r w %?^r»rnT iriwa"Mote :—Road length traffic intensity of 1500 tonnes and below has not been shown herje in -
district roads. " *wrarr.—^ n h r^ ftnvpi sfrra , #5ri
Public Works Departmint (Traffic Census), Government of Maharashtra, Bo
of m ijor district roads and other

qotff ^ : 23. MARKETING AND STORAGE:
?rr f ^TfTlcf .gr^rrT^t'ft Rn rr- 23.1. in this section data on number of regulated^T2^T/Tr^ ft TT rr3 «T«p markets and . an authorised ration/fair price shops
3rr|.' storage capacity in Government warehouses are
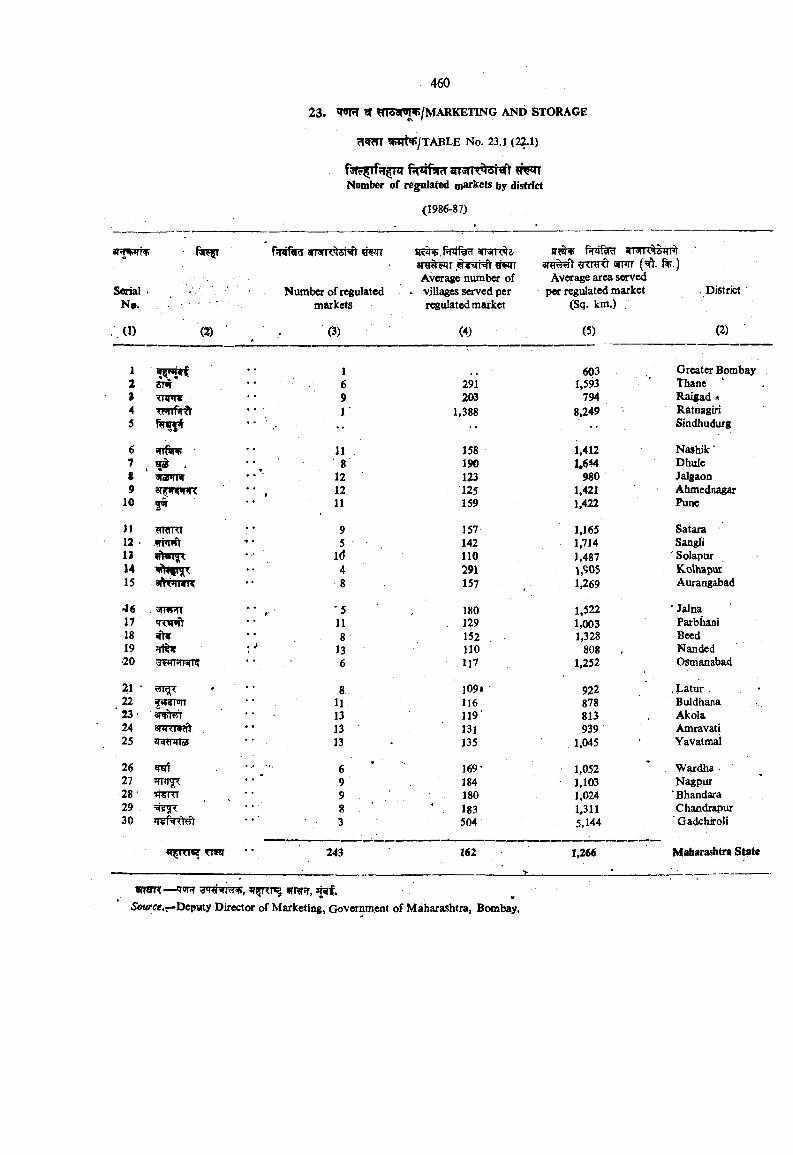
23. WT ^ fn^JTnW/MARKETING AND STORAGE
rl^T ISTNt/TABLE N o. 23.1 (22.1)
9T5rTT^ ?T^Number of regulated markets by district
(1986-87).
fn4l^a y^m R^T.fvTflRr aii'jiK'id sr?^ fW W 5JT1% '#PTT rCRRi STRT (^ . %.)
Average number of Average area servedSerial > ■ '■/■'. ■■ Number of regulated * villages served per per regulated market District
N®. markets regulated market (Sq. km.) .
(I) (2) , (S) (4) (5) (2)
1 1 603 Greater Bombay2 6 291 1.593 Thane9 Tnmr 9 203 794 Raigad s4 TWTf*|-?l 1 1,388 8.249 Ritnagiri5 •• ' •• ■ Sindhudurg
6 srrfwiF 11 158 1,412 Nashik ‘7 . . . ■ -g' 190 1,644 Dhule8 ?>raj*rR 12 123 980 Jalgaon9 si^wwrt , 12 125 1,421 Ahmednagar
10 gwr 11 159 1.422 Pune
]] mrnrr 9 157 1,165 Satara12 WWW) 5 , . 142 1,714 Sangli13 thm ^ Id 110 1,487 ' Solapur14 4 291 1,505 Kolhapvff15 aft »rrfTg 8 157 1.269 Aurangabad
46 <in5JRT '5 180 1.522 ■ Jalna17 11 . 129 1,003 Parbhani18 tir • • 8 152 1,328 Beed19 5Tt^ 13 110 808 Nanded■20 6 117 1,252 Osmanabad
21 * 8 109* 922 .Latur22 11 116 878 Buldhana
' 23 • •• - 13 119 813 Akola24 13 131 939 Amravati25 •* 13 135 1,045 Yavatmai
26 ' 6 169’ 1,052 Wardha27 9 184 1,103 . Nagpur28' W«KI •' ■ ■ ■ 9 „ '. ■ • 180 1,024 ‘ Bhandara29 8 ■ * 183 1,311 Chandrapur30 3 504 5,144 Gadchiroii
• • 24i 162 1,266 Maharashtra State
trmnr—•I'JR wrpt, jfif.jSowrtff.—Deputy Director of Marketing, Government of Maharashtra, Bcmibay.
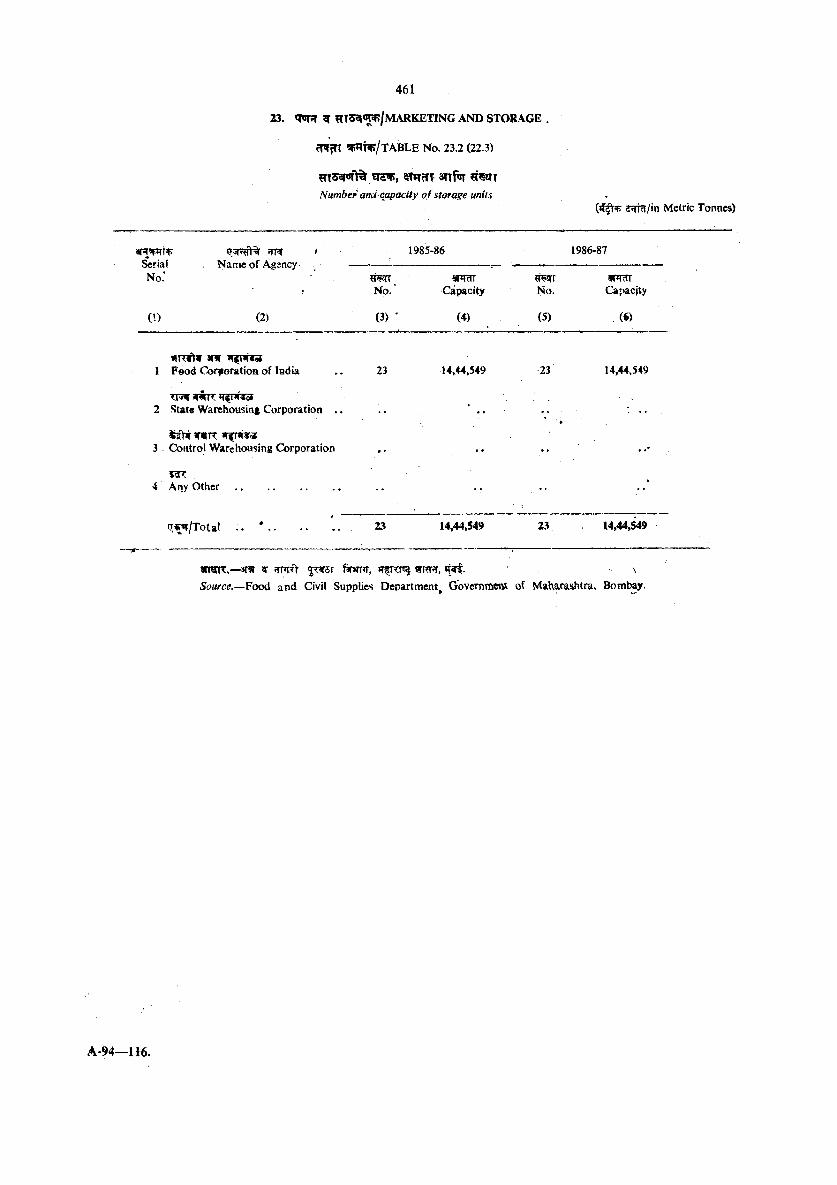
23. ar HT53T»^/mARKETING a n d s t o r a g e .
cT jn ^ j ^ / T A B L E No. 23.2 (22.3)
«»T?TT SflfjTNumbep and capacity o f storage units
z ^ t 'm Metric Tonnes)
1985-86 1986-87
No: ■No.*
«rqmCapacity
ij^rNo. Capacity
(1) (2) (3) ' (4) (5) (6)
HRitw snr ^fnris1 Faod Corjtoration of India 23 14»44,549 23 14,44,549
TT5ir JT nnfoJ 2 State Warehousinf Corporation . . ,, ..
W«R3 . Control Warehousing Corporation ..
4 Any O t h e r ..................................... •• ••
ir r<ir/Total •• . . . . , 23 14,44,549 23 14,44,^9
WWR.—3Tfr ?r 5 ^ r fiwr»r, w ixr i ?rnFr, \Source.—Food and Civil Supplies Denartment^ GovemToenH of M&hacashtra, Bombay.
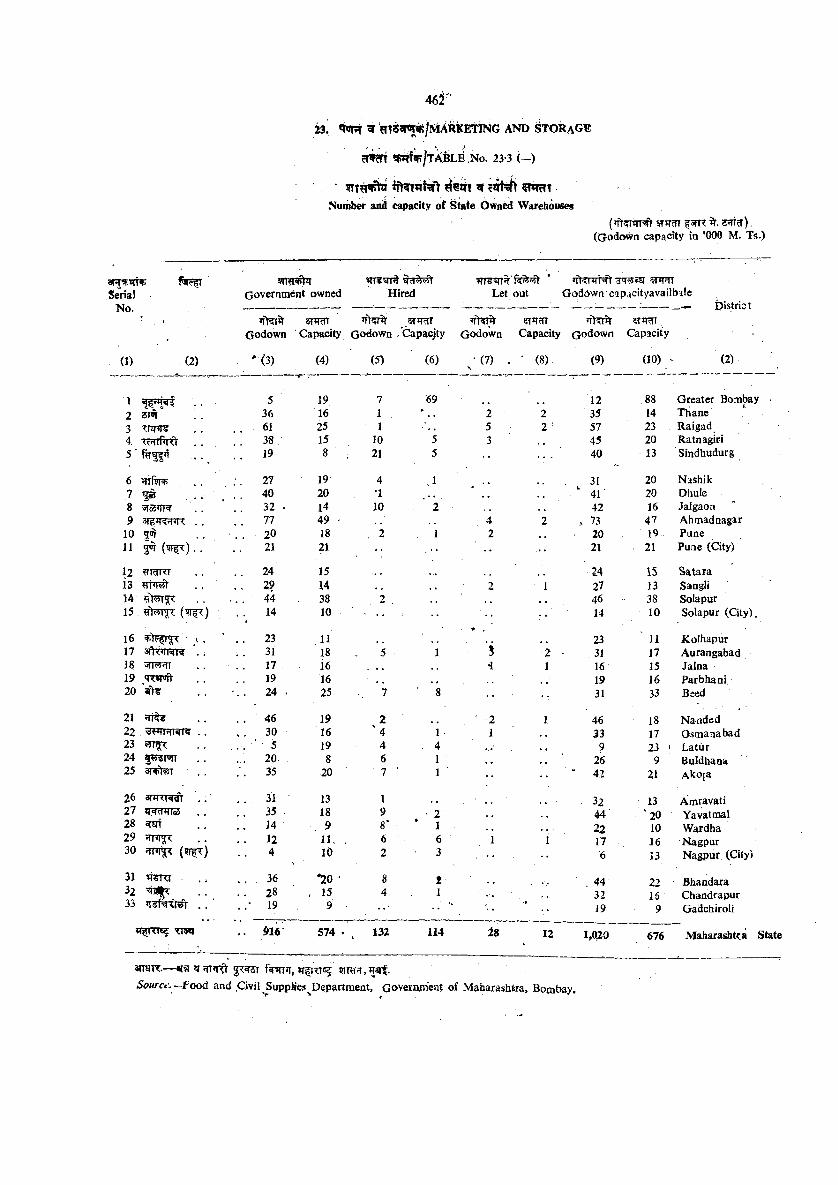
23 ^ ^TS^r^/i'iiARKEtiNG AND ^TORa G®
cTRTT tl^^fXABLE No. 23-3 ( - )
^««rt «fNumber anid capacity of §taie Owned Warehouses
( ^ i n ^ ^ w r Jr. ?m?r), (Godown capacity in '000 M. Ts.)
SerialNo.
5n ? i^ Governmdni owned Hired
fTT¥?TT Tft TRT ^^*51 SfTRTTLet out Godown capdcityavailbale
t rrJr s ’frcrrSTWGodown Capacity Godown Capacity Godown Capacity Qodown Capacity
(1) (2) "(3) (4) (5) (6) - (7) . ‘ (8). (9) (10) (2)
1 | . . 5 19 7 69 12 88 Greater Bombay •f.2 sm . . 36 16 1 2 2 35 14 Thane3 TPEPTS . . 61 25 1 5 2 ’ 57 23 Raigad4. rx^jT^iS' . . 38 15 10 5 3 , , 45 20 Ratnagici
19 8 21 5 •• 40 13 Sindhudurg
6 ?IT% ; . 27 19 4 ,1 31 20 Nashik• • 40 20 •1 , * . , 41 20 Dhule
8 SToSTTT . . 32 - 14 10 . ‘ 2 , , , , 42 16 Jalgaon9 3TM<«»i'‘l< . , 77 49 ■ 4 2 . 73 47 Ahmadnagar
10 5<ir . . 20 18 , 2 1 2 20 19 Pune11 ( ^ ) . . 21 21 •• 21 21 Pune (City)
12 TcTRT . . 24 15 Z4 15 Satara13 ?TT<l55t • . 2? 14 , , 2 1 27 13 Sangli14 ?5>5T . . ' . . . 44 38 2 , , , 46 38 Solapur15 , 14 10 •• 14 10 Solapur (City).
l6 ■ >. . . . 23 11 23 ' 11 Kolhapur17 aftTJTRr? ‘. . 3i 18 5 1 5 2 • 31 17 Aurangabad ,18 'jTT'TT 17 16 • • . , i 1 16 15 Jalna19 ,MTiTof 19 16 19 16 Parbhani,20 •. . 24 ,. 25 7 8 31 33 Beed
21 . . 46 19 2 ■ 2 1 46 18 Nanded22 , ^Frnrm? . . . . 30 16 ' 4 1 1 33 17 Osmanabad23 ??Tg;T . . . •■ ' 5 19 4 4 9 23 ' Latur24 . . 20 8 6 1 , ^ 26 9 Buldhana25 3T^r 35 20 7 ^ 1 •• •• " 42 21 Akoja
26 . . . . 31 13 1 32 13 Amravati27 . , . . 35 . 18 9 • 2 . • , . 44 ‘ 20 Yavatmal28 ^ . . 14 . 9 8* * 1 . , 22 10 Wardha29 ^7 1^ . . 12 11. . 6 6 1 i 17 16 Nagpur30 (9i^<) . . 4 10 2 3 • •• •• 6 13 Nagpur (City)
31 . . 36 *20 • 8 2 44 22 Bhandara32 ^ . . 28 ' , 15 4 I 32 16 Chandrapur33 . . ' . 19 9 • • ■ • • 19 9 Gadchirolr
x m . . 016 574 . , 132 114 i s 12 1,020 676 Maharashtra State
ansR.— w 5?35T f^ J i , JT m<s5 5TT?f?r,Sourcc. - f o o d and .Civil Supphes^Department, Government of Maharashtra, Bombay.
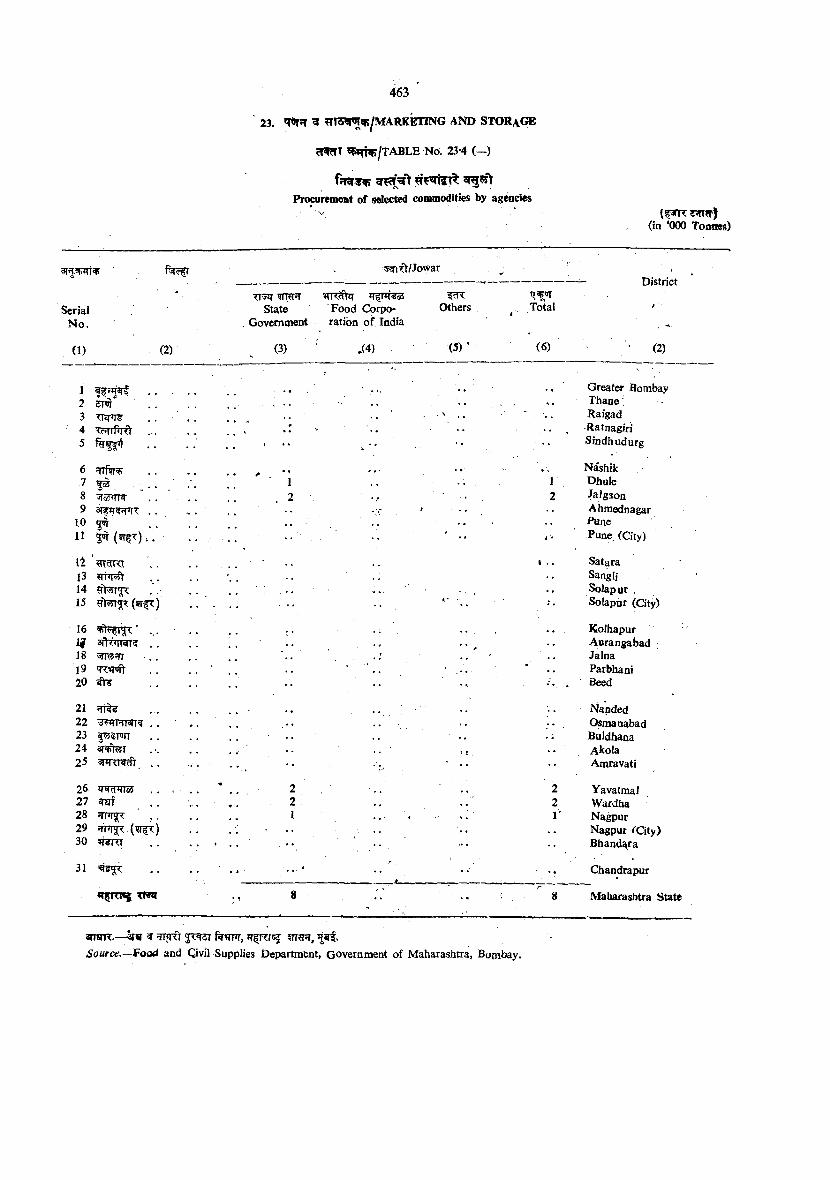
cWclT ^ f ^ j T A B L B No. 23-4 ( - )
^55>Procurement of selected commodities by agencies
5^ift/Jowar
■ - . TI^ WRT’TSerial State Food Corpo Others Total
4t •
N o. Government ration of India
(1) (2) (3) ' ,(4) (5) ‘ (6) • ’ (2)
1 . . .
7-
Greater Bombay2 ST’JT ■’ . , s . Thane3 . . .
Raigad4 TcJTli^ . .
* Ratnagiri5 •• '• Sindh udurg
6 • • >• * * # * • • Nashik7 Hoi . . . 1 1 Dhule8 . . . . 2 . o 2 Jalgaon9 Ahmednagar
10 3^ . . Pune11 3^ (?r^^). . . ■ ' • • 4 '• Pune, (City)
l l 1 . . Satara13 ¥hrsft Sangli14 . . . . . . . Solapur .15 • • •
ft" “ •• Solapur (City)
16 • • • • KolhapurI? . . . , A^urangabad18 T??!Tr . . ' Jalna19 * . , ■ Parbhani20 •• •'v . Beed
21 . • Nanded22 ^WT«cr^ . . ■ , . . • • Osmanabad23 f SPJIT . ; Buldhana24 ar^T Akola25 3nr<Nd) , . •V. •• Aqjravati
26 zrwcFirs . . . . 2 2 Yavatmal27 ^af . . 2 2 Wardha28 1 1 Nagpur29
• • Nagpur YCity)30 . . . •• Bhand^ra
31 ■ . . . • • - Chandrapur
. , 8-
• « ; . . ' 8 Maharashtra State
ansR.—kw ^ ^ itr, €?r,Source.—Fooii and Qivil Supplies Department, Government of Maharashtra, Bombay.
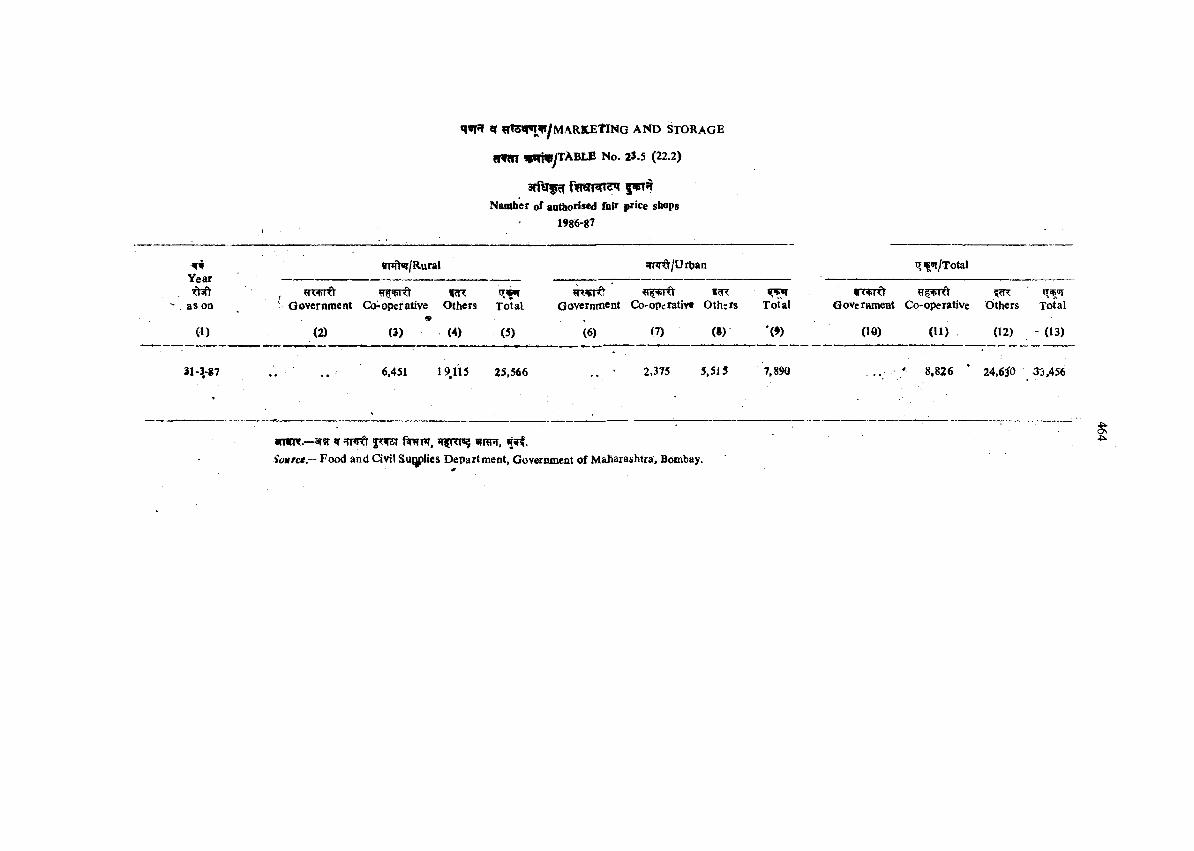
Year
as on
(I)
^ HtS^r^TV/MARHEtlNG AND STORAGE
nw m VTtvyXABLE No. 2J.5 (22.2)
3Tfsrfi?f fwpsTR^ 5 ^ ^Namber of authorised fair price sbops
1986-87
»T*ft«r/Rural
HwrftGovernment G>operative Others Total
(2) (3) (4) (5)
JTPT?y/Urljaa
fcRGovernment Co-operativ* Others
(6) (7) W
Total
'W
»?«|«r/Total
Govcrament Cq-operative Others Total
(Id) (11) (12) - (13)
31-3,-87 6,451 19115 25.566 2.375 5,515 7,890 8.826 24,6i0 33,456
m m .—aw w jTfST f^ n r , Hfncpsj wnnr,Source — Food and Civil S u ll ie s Department, Gov^nment of Maharashtra, Bombay.
4a.
2 4 . COMMUNICATIONS
^ ■ TT PT, ^ ?rr 24.1, Statistics bn post and telegraph offices, radioJTT f^r^ncT 3TT . sets and television sets are given in this section.
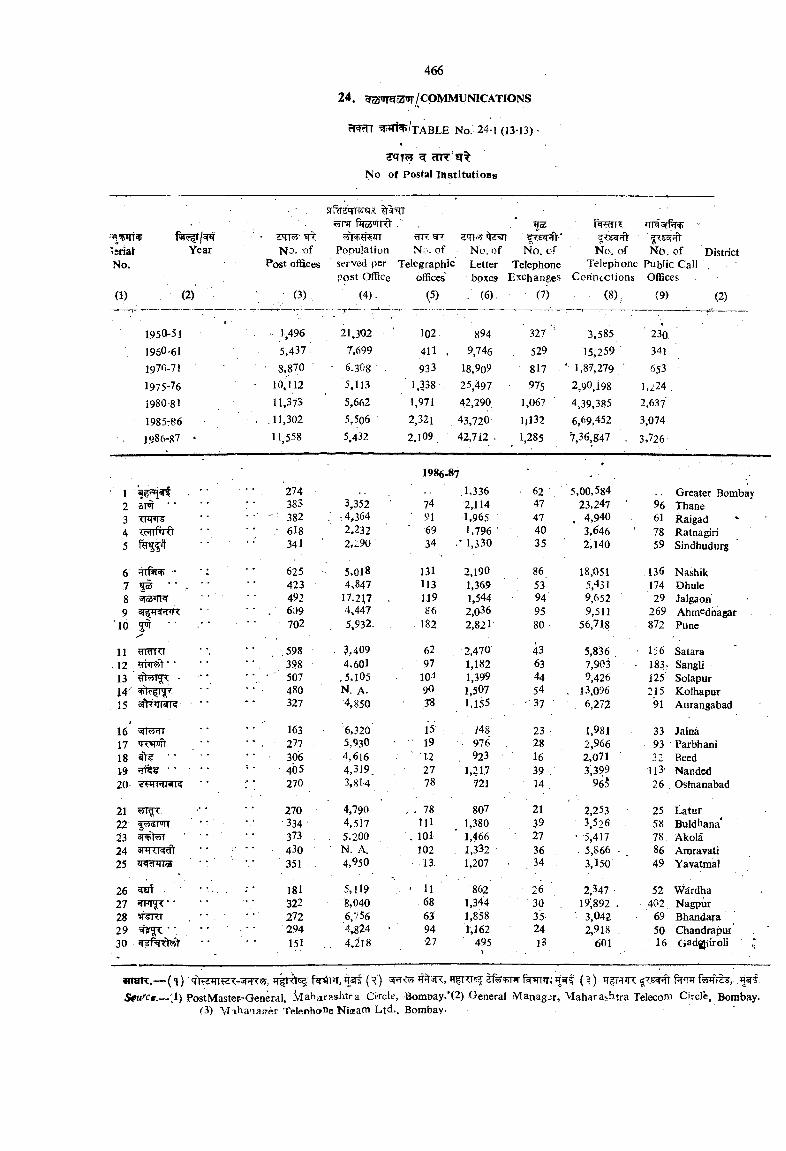
SqT?J ^ rHT isrNo of Postal Institutions
No.
(1)
Year
(2)
No. -of Post offices
(3)
r»r ftswRt .’tiK WT
Population No. ofserved per Telegraphic post Office offices
(4). (5)
t e nNo. of No. of Letter Telephone boxes Exchanges
. (6), (7)
No. of No. of DistrictTelephone Public Call
Corintclions Offices(8). (9) (2)
1950-51 1,496 21,302 102. 894 327 ' 3,585 2301950'61 5,437 - 7,699 411 . 9,746 529 15,259 3411970.71 • 8,870 ’ 6.308 ■ 933 l8,9o9 817 . '■ 1,87,279 ■ 6531975-76 ■ 10,112 5,113 ■ 1,338 25,497 975 2,90,198 1,224 ,1980-81 11,373 5,662 1,971 42,290. 1,067 4,39,385 2,6371985:86 . .11,302 5,506 2,321 43,720 I5I32 6,69,452 3,0741986-87 • 11,558 5,432 2,109 42,712 . 1,285 7,36,847 . 3,726
1986-87'
1 • * * ■ . 274 .1,336 62 ' 5,00,584 - - Greater Bomba)’2 sm ' " ■ * 383 3,352 74 2,114 47 23,247 ' 96 Thane3 ■ • - ' 382 . -.4,364 ‘ 91 1,965 47 4,940 61 Raigad '4 • ‘ ; 618 2,232 ' 69 1,796 ' 40 * 3,646 78 Ratnagiri5 341 ' 2,29U 34 1,330 35 2,140 59 Sindhudurg
6 HTf»r * ■; 625 ■ 5.018 131 2,190 86 18,051 136 Nashik7 f s • • . ■ ■ 423 4,847 113 1,369 53' 5,431 174 Dhule8 sRS’rnr 492 17,2^7 119 1,544 94 9,652 29 Jalgaon9 3TffKJT»R • • . 609 4,447 86 2,o36 95 9,511 269 Ahmednagar
'10. 5^ 702 5»932. 182 2,821 80 • 56,718 872 Pune
11 «WK1 * •. •• 598 3,409 62 2,470 43 5,836 . ■ 156 Satara12 ■ ■ 398 4,601 97 1,182 63 7,903 183> Sangli13 - ' - . ' 507 .5,105 101 1,399 44 9,426 125 SolapurJ4 480 N. A- 90 1,507 54 . 13,096 215 Kolhapur15 <*lV<I W<i ■ '• 327 4,850 38 1,155 '-37 6.272 91 Aurangabad
16 • • ' 163 6,320 15 . /48 23 ' 1,981 33 Jalna17 Tcwifr _ ‘ ‘ 277 5,930 19 . 976 28 2,966 93 Parbhani18 • • • 306 . 4,616 ' 12 . 923 16 2,071 32 Beed19 •; • •• ■ 405 4,319 27 1,217 3 9 , 3,399 113' Nanded20- • • : ; 270 3,814 78 721 14 965 26 , Osfnanabad
21 • • 270 4,790 . . 78 807 21 2,253 - 25 Latur22 ' • •334 4,517 111 1,380 39 3,526 58 Buldhana*23 snhvTT ‘ • 373 . 5.200 . 101 ' 1,466 ' 27 ' 5,417 78 Akola24 • • 430 N. A. 102 , 1,332 36 5,866 ■ , 86 Anjravati25 WRToS ■ ’ 351 4,950 13. 1,207 34 3,150' 49 Yavatmal
26 ^ ••- 181 5,119 . • n 862 26 , 2,347 ■ 52 Wardha27 • • 322 ^,040 - 68 1,344 30 19;S92 . 402, Nagpur28 , ’ • 272 6,756 63 1,858 35' ' 3,042 69 Bhandara29 ‘ ■ 294 4,824 - 94 1,162 24 2,918 . 50 Chandrapur30 151 .. 4,:ii8 ■27 495 13 601 . 16 Gad^iroli
9nwR.— (i f ^ r ^ , ( R) sfe'sfrrw f^»r; ^ .SIPM'''!:’*.—;i) PostMaster-General, Maharashtra Ci'i'cle, Bomt)ay/(2) General Managj;r, Maharashtra Telecom Circle, Bombay.
(3) Mahanasrer TeleDhoDe Niaam Ltd., Bombay-
2 5 . ^ TOURISM AND CIVIL AVIATION
q f e r t ^ ? r ^ srr^t^ 25.1. Data on foreign tourists disembarked at arr^T 3n|. ' - Bombay.are given in this section. . ^
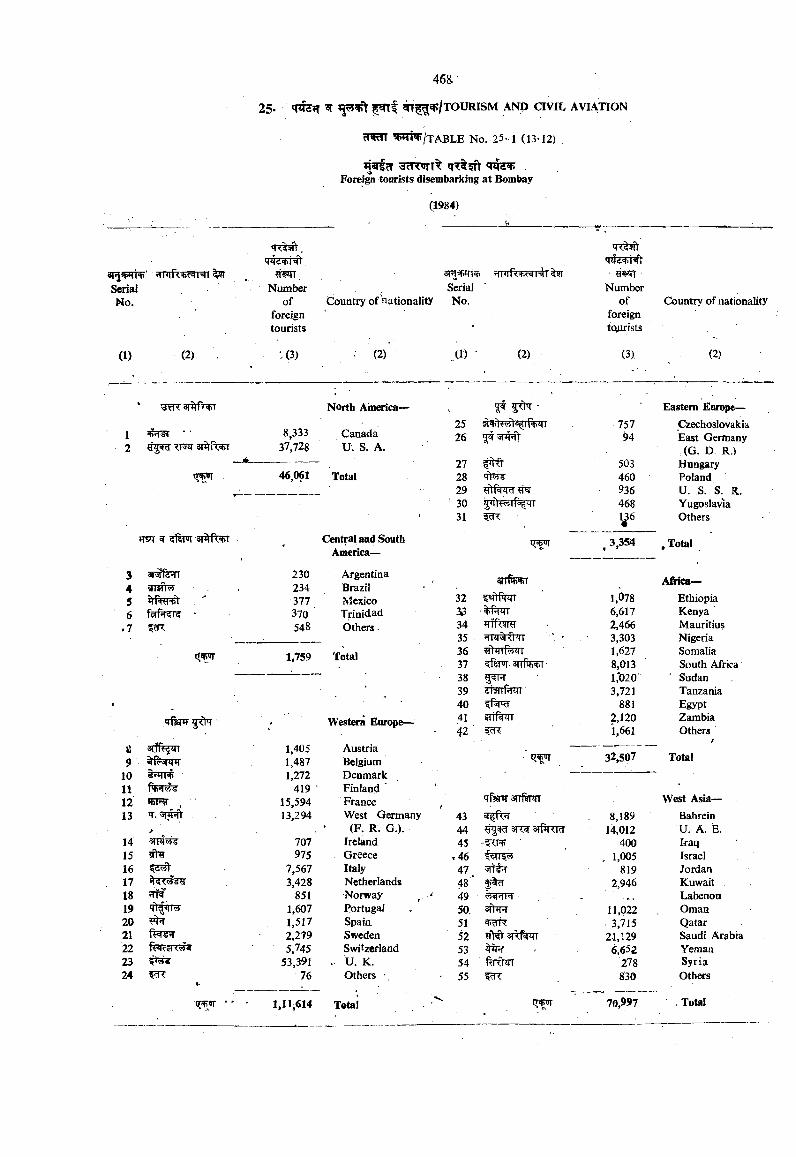
SerialNo.
WWT/t a BLE No. 25- 1 (13-12)
^srf cT 3H7otTForei^ tourists disembarking at Bomtoy
(1984)
(1) (2)
Numberof
foreigntourists
(3)
SerialCountry of nationality No.
(2) (1) • (2)
'r MhjSs+KI
Numberof
foreigntourists
(3)
Country of nationality
(2)
1 * ■
(T^
3 ar ferr4 ?nfr555 rf RT6 •
.7
IT^
North Ainerica—
8,333 Canada37,728 U. S. A.
46,061 Total
230234377370548
Central and South America—
ArgentinaBrazilMexicoTrinidadOthers
1,759 Total
Western Europe
s 3trftf!TT 1.405 Austria9 1,487 Belgium
10 1,272 Denmark11 419 ' Finland '12 «bT»€ . 15,594 France13 7. 13,294 West Germany
(F. R. G,).14 3fm^ 707 Ireland15 975 Greece16 7,567 Italy17 3,428 Netherlands18 851 Norway19 1,607 Portugal20 1,517 Spain21 2,279 Sweden22 f^csi <•«* 5,745 Switzerland23 53,391 . U. K.24 i 76 Others
* * ' 1,11,614 Totai
5# 5 ^ ■2526 ^
75794
Eastern Europe—Czechoslovakia East Germany
( a D R.)27 p fr 503 Hungary28 460 Poland29 936 U. S. S. R.30 468 Yugoslavia31 y 6 Others
, 3,354 .Total
Africa—32 1.078 Ethiopia3 6,617 Kenya34 *TffT5RT 2,466 Mauritius35 3,303 Nigeria36 1,627 Somalia37 8,013 South Africa38 1,*020’ Sudan39 di lPlAll 3,721 Tanzania40 881 Egypt41 STifcTTT 2,120 Zambia
1,661 Others
>prr 32,507 Total
*Tfenr 311 filial: West Asia—
43 8,189 Bahrein44 3T< arfir T ' 14.012 U. A. E.45 400 Iraq
.46 , 1,005 Israel47 819 Jordan48* 2,946 Kuwait49 Labenon50, sfrrnr 11,022 Oman51 *di< . 3,71-5 Qatar52 2.1,129 Saudi Arabia53 6,652 Yeman54 %fhTT 278 Syria
• 55 8'30 Others
.■V. 70,997 Total
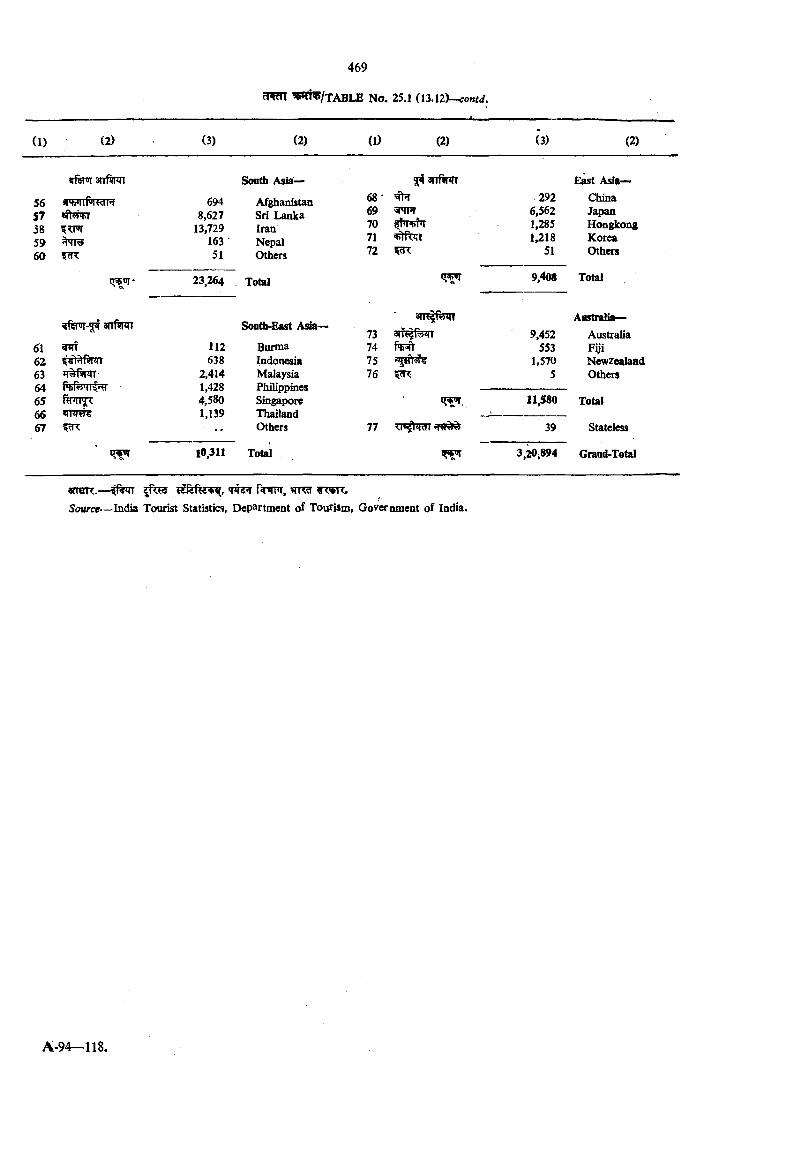
anfinn
56 insnfriHH57 385960
6948,627
13,72916351
Sooth Asia^
Afghanistan Sri Lanka Iran Nepal Others
^ anftnrr East Asia—6 8 ’ 292 China69 5PTR 6,562 Japan70 1,285 Hongkong71 1,218 Korea72 51 Others
23,264 . Total
an fw Soatfa-East Asia—73
61 112 Burma 7462 638 Indonesia 7563 2,414 Malaysia 7664 1,428 Philippines65 4,580 Singapore66 1,139 Thailand67 •• Others 77
10,311 Total
3TR|fW
9,408 Total
9,452553
1,5705
11.580
39
3,20^894
Australia—AustraliaFijiNewzealaadOthers
Total
Stateless
Grand-Total
arraK. — Hnrnr, vver.Source— India Tourist Statistics, Department of Tourism, Government of India.

l a b o u r a n d e m p l o y m e n t
f ^ T ’TriTs TFrq’ ^ sTfsrf^qTTi^r^^ ^t^TrrT, T t^rT ,
5TTft^l-, PTiT rr srrforTTr%ft f k ^ 3Tr|.
+r«4 i^ rd W q-<^O ^r a n ^ R ^ ^^Th o ifTTCorr as ht% ^ t
3 tt|. m , 273^ ^ ^ r r ^+T*f|c»'<f'!T +<"T +K«li^05 ffl5?e<fT
^nwnrr 3r%ft^iT <\%^63fTt cJiWT ?nrT%w 3rr|. qr^
3ET^5q| cf^Tin^ f ^ T ^Trr q t ^3fcT^ ^ rfw R , qiw f TErft ^ y<urT t T(5TFT s n ^ t e r srrqirRHr irr%?r ?tt ) w I w
^rm RTsqr ^ .^ r R i sMT rnrr'BirrTToPThstrT ^ ^ H w fw ^ n w rh sq rqToS rN)* ^ 3tt|. sft?rtte ^rrfer-^ irrf|cft i t o sjW w stt? ^nr’T T ^ T[T?m?JT »T2T% 3Trq^
sn « r ^ f^r^ arni^ srrot f ^ r irq? srfar^OT»TTTR!^ ^ «dq ?T %. srar m rm jmcr I ^ d 'jfin :, tosH TR s m r ? n ^ T ?Rffirs^3('T<soicr*iT ai M'RR cfl'^aS I HtW ^ 35 TRkTT .
55rra^n% ‘y ^ ^snrrt JTT srr^rt^T^ ^rirrfir^ 3n |^ , q-ra*
^ 7(T^. qr SfTspt-? r r ^ ^ %n%irsm an fr^ ^ i <?j ^rnr^,W ( ^ , ^T?m»T ^ T , JTT <10 ^?TT viT Rf ^TIT-
%$y^‘ 3jt| ^ 3T9rr ^^tsrr 3rr|. | ^rnFr st r w ^3TTt ^ q’ cqnrs^ jcr% ^rrrprn: ^rrsqT 3rn?7t-
?iT q r f e sTRTtmthfi: JiT%ft ?rr^, I sqTfrr ?rrr^ w m -^ fT i:^ J T f^ q r ^ stRtsf ^ i n ^ .
26.1. Data on State Government Employees, employment under shops andl establishments employment market information, absenteesm in industries, trade unions and other information about labour are given in this section.
26.2. The absenteeism statistics relate to only voluntary absenteeism defined as absence due to reasons which are personal to the individuals concerned. As such, absence of a worker on account of strike, lock-out 'or lay-off is not considered. They cover ‘workers’ as defined by the Factories Act, 1948, but exclude persons holding position of supervision or management or employed in confidential position. Moreover, only regular workers (excluding casual and substitute workers) are considered. The absenteeism rate is the ratio of number of man shifts lost due to absences to the number of man shifts scheduled to work. For the purpose of statistics regarding industrial disputes, an industrial dispute is taken to be a temporary stoppage of work by a group of employees to express a grievance or enforce a demand or temporary withholding of work from a group of employees by one employer (or a group of employers) in connection with matters relating to employment or non-employment or terms or conditions of employment. Thus, both the types of work stoppages, popularly known as “ strike’* and “ lock-out ” respectively are covered. Political strikes, sympathetic demonstrations and the like are howeVer, excluded. The statistics cover such disputes in which the number of workers involved is ten or more in all the sectors of economic activity such as factories, plantations, mines, transport, construction services, etc. It must also be mentioned that the monthly figures of number of strikes and number of workers involved are not additive to form annual figures because of the fact that the period or duration of the strike may have spread over more than one month.
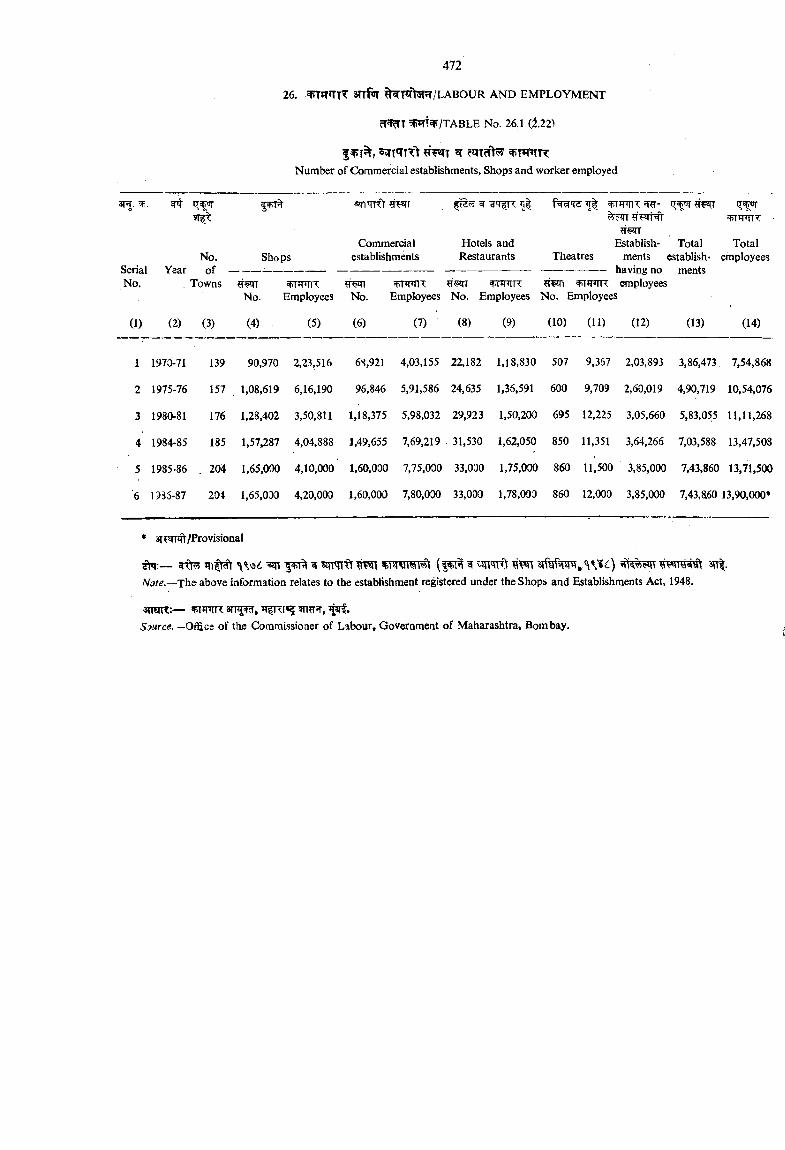
26. 3TTf«T ^T^T>3R/LABOUR AND EMPLOYMENT
cT^T W ^ /T A 3L E No. 26.1 (1.22)
|^T%, n ?srTcfVNumber of Commercial establishments, Shops and worker employed
3T . ain'ITft W f^ 'T ?’j l fTT- WIT
Commercial Hotels and Establish- Total TotalNo. Shops establishments Restaurants Theatres ments establish- employees
;rialfo.
Year of - Towns
No. Employees No. Employees No. Employees
----------------- having noffin employees
No. Employees
ments
'[
(1) (2) (3) (4) (5) (6) (7) (8) (9) (10) (11) (12) (13) (14)
1 1970-71 139 90,970 2,23,516 68,921 4,03,155 22,182 1,18,830 507 9,357 2,03,893 3,86,473 7,54,868
2 1975-76 157 1,08,619 6,16,190 96,846 5,91,586 24,635 1,36,591 600 9,709 2,60,019 4,90,719 10,54,076
3 1980-81 176 1,28,402 3,50,811 1,18,375 5,98,032 29,923 1,50,200 695 12,225 3,05,660 5,83,055 11,11,268
4 1984-85 185 1,57,287 4,04,888 1,49,655 7,69,219 31,530 1,62,050 850 11,351 3,64,266 7,03,588 13,47,508
5 1985-86 . 204 1,65,000 4,10,000 1,60,000 7,75,000 33,000 1,75,000 860 11,500 3,85,000 7,43,860 13,71,500
6 19SS-87 204 1,65,030 4,20,000 1,60,000 7,80,000 33,000 1,78,000 860 12,000 3,85,000 7,43,a60 13,90,000*
* /Provisional
fn : — ^ ^ m m fi ^ ^Note.—The above information relates to the establishment registered under the Shops and Establishments Act, 1948.
anmr:— s r i^ ,Source. —OeSiCs of the Commissioner of Labour, Goverameat of Maharashtra, Bombay.
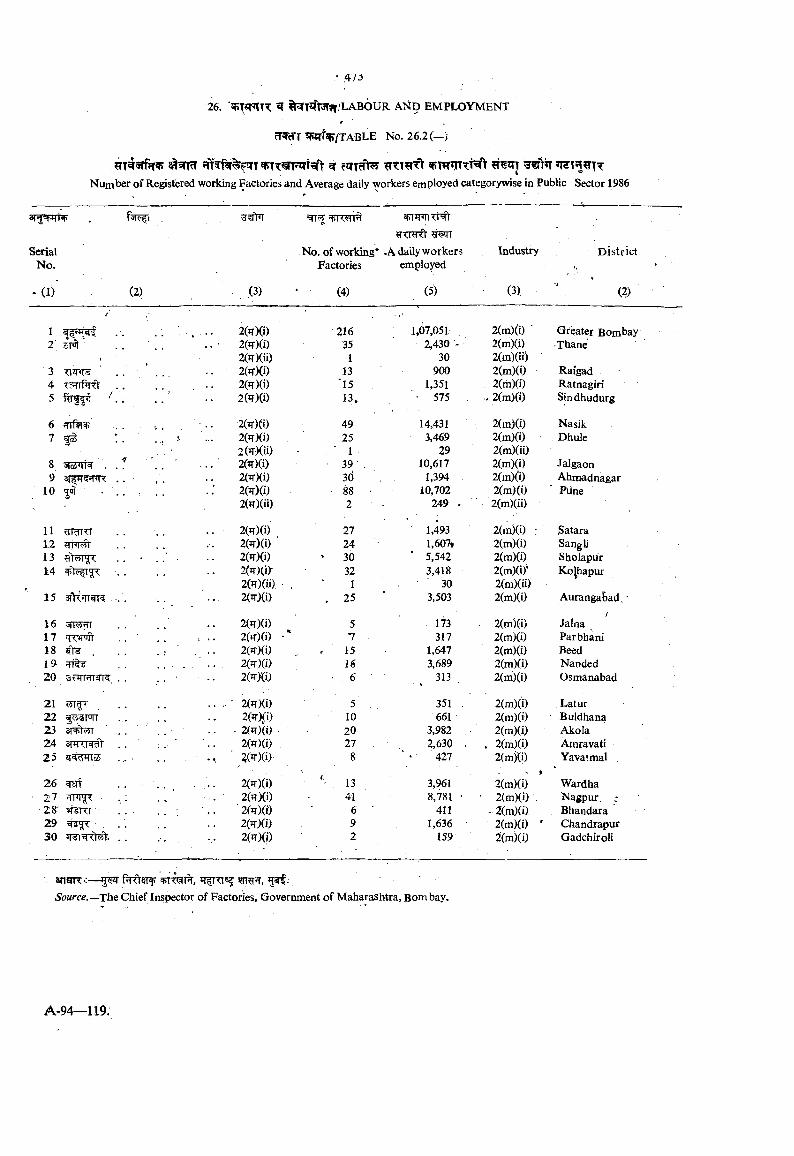
cT c F Wi|>/TABLE No. 2 6 .2 (-)
?TT 5rfiT prf?f%%?irT ^ r«rTcf^ »ra:t ?fTTNumber of Registered working Factories and Average daily workers employed categorywise in Public Sector 1986
No. of working' Pactories
•A daily workers employed
SerialNo.
Industry DistrictIf *
* (1) (2) , (3) (4) (5) (3). (2)
/12' sm
345
2(TT)(i).. ■ 2(q-)(0
W i i i ) 2(q-)(i)
. . . 2(jr)(i) 2(TT)(i)
21635
113
'1513.
1,07,051. 2,430 -
30 900
1,351 • 575
2(m)(i) • 2(mXi) 2(m)(ii) ' 2(m)(i) 2(m)(i)
. 2(m)(i)
Greater Bombay 'Thane
RaigadRatnagiriSindhudurg
6 JTTfifi7
8 .
10 501
■f •' ■
• . . 2(ir)(i)2(TT)(i)2(JT)(ii)
. . . 2(ir)(i) 2(iT)(i) 2(ir)(i)2(TT)(ii)
4925
139 • . 3d88 ■ 2
14,431 3,469
29 10,617
1,394 10,702
. 249 .
2(m)(i)2(m)(i)2(m)(ii)2(m)(i)2(m)(i)2(m)(i)2(m)(ii)
NasikDhule
JalgaonAhmadnagarPiine
11 rnrrTT 1.2 y'PMt 13 1.4
15 sfWirr^? ,.
2(ir)(i) 2(ir)(i) ' 2(»r)(i)2(TT)(i)' 2(JT)(i.i), ■ . 2(iT)(i)
27243032
1. 25
■ 1,493 1,607*
‘ 5,542 3,418
• 30. 3,503
2(m)(i) :2(m)(i)2(m)(i)2(mXi/2(mXii)2(m)(i)
SataraSangliSholapurKolhapur
Aurangabad,'
16 3i'i«fri17 q7:w'ift18 ^ .1920
• • • • .2(ir)(i) 2(ir)(i)
. . . 2(TT)(i), .. m o )
2( r)(i)
5 7
' 1 5166
173317
1,6473,689
313
2(m)(i)2(mXi)2(m)(i)2(mXi)2(m)(i)
/JalnaParbhaniBeedNandedOsmanabad
•21 ?5I<3T22 |<rt(4pirr23 3)=t>1<7ir .2425 im'dMlES
■. •• ' 2(frXi)2mxi)
. . - 2(ir)(i) 2(tr)(i)
. . ■ W ( i)
5 . 10 20 278
351 . 661
3,982 2,630 .
' • '427
2(m)(i) 2(m)(i) 2(m)(i)
. 2Cm)Ci) 2(mXi)
, Latur Buldhana Akola Amravati Yavatmal
26 W?rf27 ?rnT ■ 28' T fRT29 .30
2(ir)(i) 2(^)(i)
. . 2(^)m 2 ^ )0 ) 2(w)(i)
1341
692
3,961 8,781 •
411 1,636
159
2(m)(i)2(mX0 -
-2(mXi)2(m)(i) ' 2{m)(i)
Wardha Nagpur, -
. Bhandara Chandrapur Gadchiroli
anoR*:— 5^ ?rra?T, 55 .Source— Tlie Chief Inspector of Factories, Government of Maharashtra, Bombay.
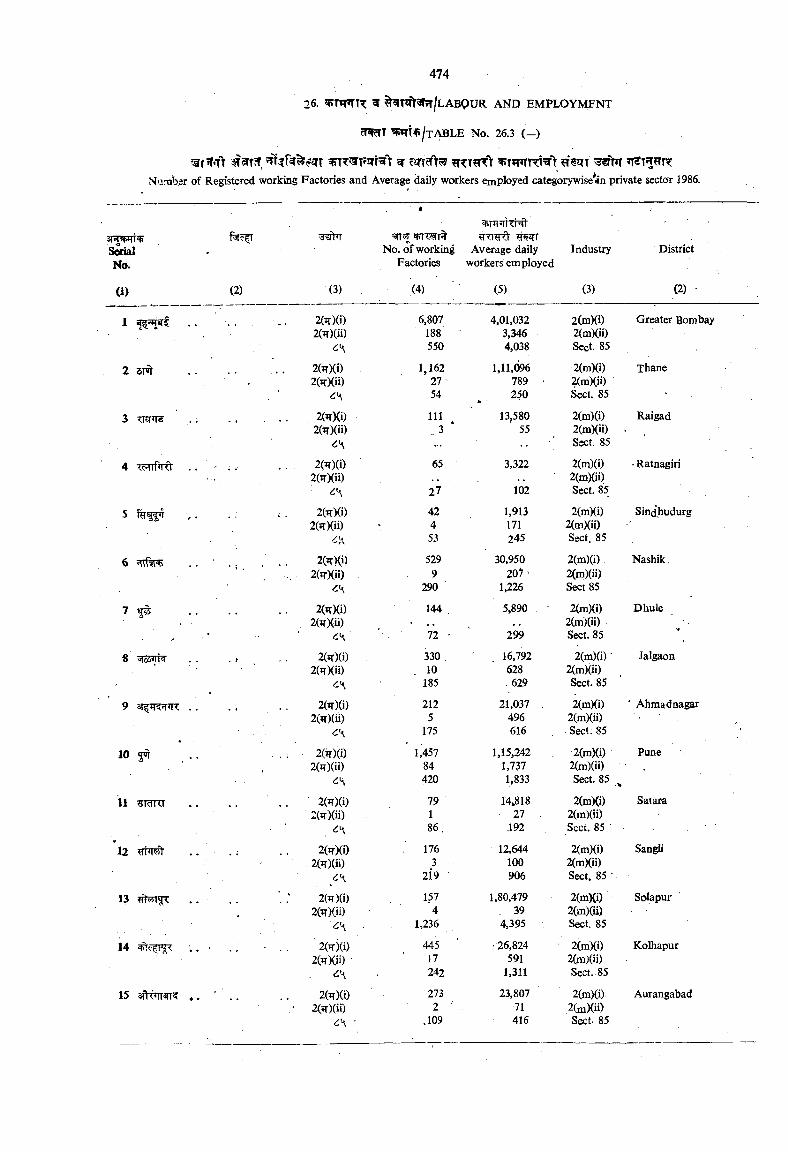
w ??i?rfy55 ^ i ^ m xNumbsr of Registered working Factories and Average daily workers employed categorywise^dn private sector 1986.
' «
ierial No. of working Average daily Industry DistrictNo. Factories workers employed
(1) (2) (3) (4) (5) (3) (2) •
1 • • . . ►. 2(ir)(i) 6,807 4,01,032 2(m)(i) Greater Bombay2(TT)(ii) 188 3,346 2(mXii)
550 4,038 Sect. 85
2 sm . . . . • • 2(irXi) 1,162 1,11,096 2(mXi) Thane2(iT)(ii) 27- 789 ■ 2(m)(ii)
54 250« • Sect. 85
3 <FA|*T5 . . • . 2(jtX0 111 13,580 2(m)(i) Raigad2(ir)(ii) 3 ‘ 55 2(mXii) •
... •• Sect. 85
4 iMinrft . . . . . . 2(?r)(i) 65 3,322 2(m)(i) • Ratnagiri2(iT)(ii) 2(mXii)
27 102 Sect. 85
5 . • • > • 2(^Ki) 42 1,913 2(m)(i) Sindhudurg2(TT)(ii) 4 171 2(m)(ii)
53 245 Sect. 85
6 . . . . 2 m ) 529 30,950 ' 2(m)(i) Nashik,2(;rXii) 9 207’ 2(mXii)
290 1,226 Sect 85
7 fS 2(TTXi) 144 , 5,890 2(mXi) Dhule. 2(jrXii) ■ 2(m)(ii)
72 299 Sect. 85
8 'j1o6'‘iH . . . ? ^ 2(*T)(i) 330 . 16,792 2(m)(i) • Jalgaon2(TT)(ii) . 10 628 2(m)(ii)
185 . 629 Sect. 85
9 . . . . . . 2(JrXi) 212 21,037 2(mXi) ' Ahmadnagar2(*l)(ii) 5 496 2(mXii)
175 616 Sect. 85 *
10 gnr . . , 2( t)(1) 1,457 1,15,242 2(mX0 Pune2(?r)(ii) 84 1,737 2(mXii)
420 1,833 Sect. 85 ^
11 2( r)(i) 79 14,818 2(m)(i) Satara2(TrXii) 1 27 2(mXii)
, 86. J92 Sect. 85
l2 ; 2(*r)(i) 176 12,644 2(m)(i) SangU2(TTXii) 3 100 2(mXii)
2i9 906 Sect. 85 •
13 . . . . 2(?r)(i) 157 1,80,479 2(mXi) Solapur2(TT)(ii) 4 39 2(m)(ii)
• 1,236 4,395 : Sect. 85
14 . . • . . • . . 2(ir)(i) 445 •26,824 2(m)(i) Kolhapur2(^)(ii) 17 591 2(m)(ii)
242 1,311 Sect. 85
15 . . ■ . . 2(irXi) 273 23,807 2(m)(i) Aurangabad2(ir)(ii) 2 ' 71 2(mXii>
- .109 416 Sect. 85
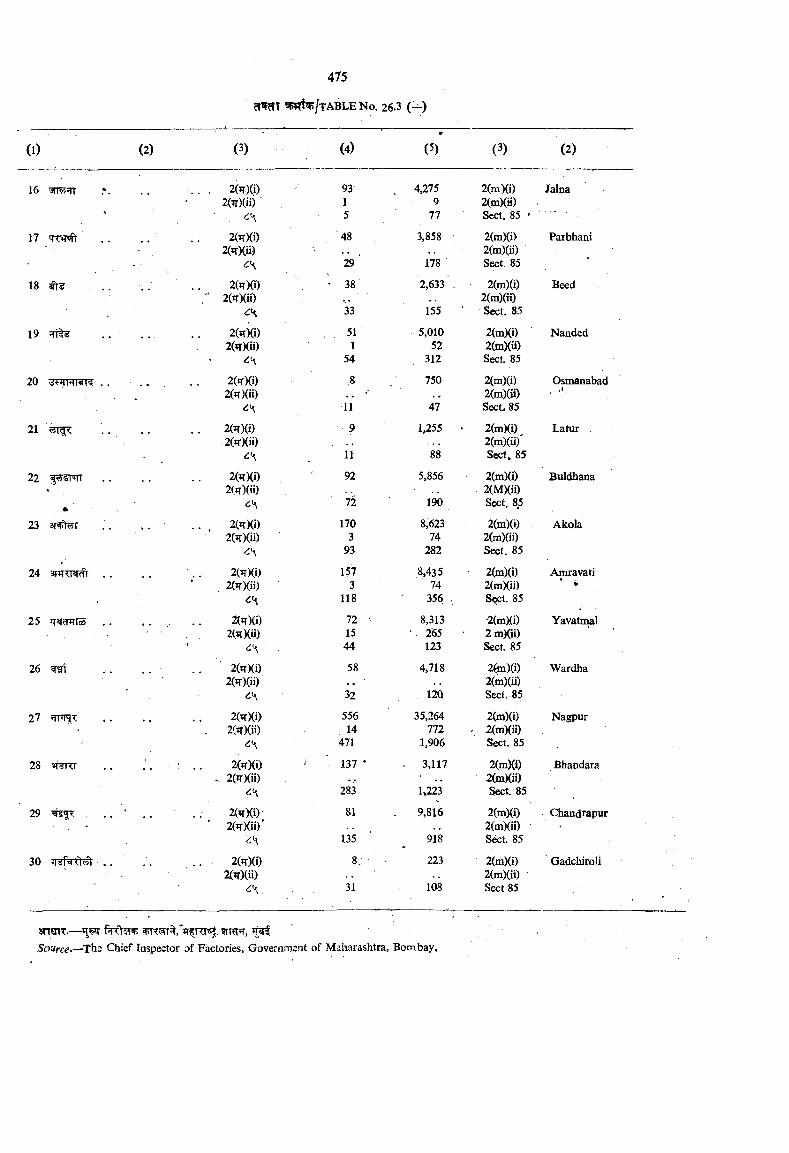
475
^ T ^ / tABLENo. 26-3 ( ^ )
(1) (2) (3) (4)*
(5) (3) (2)
16 . . . 2(JT)(i) 93 4,275 2(m)(i) Jalna2(TT)(ii) ■ 1 9 2(m)(H)
5 77 Sect. 85 *
17 2(;rXi) '48 3,858 2(m)(i> Parbhani2( T)(ii) 2{m)(ii)
29 ‘ 178 Sect. 85
18 2(ii)(i) * 38 2,633 . 2(m)(i) Beed2(TT)(ii) 2(m)(ii)
, 33 155 • Sect. 85
19 . . 2(H)(i) 51 5,010 2(mX0 Nanded2(nXii) 1 52 2(mXii)
, 54 312 Sect. 85
20 Nd *ini<aii<4 . . . . 2(iT)(i) ,8 750 2(m)(i) Osmanabad2(iT)(ii) . . ' 2(m)(ii)
11 47 Sect. 85
21 . . m n ) 9 1,255 ‘ 2(m)(i) Latur2(q-Xii) 2(mXii)'
11 88 Sect, 85
22 fpWTT 2(^Xi) 92 5,856 2(m)(i) Buldhana. 2(^)(ii) 2(MXii)
72 190 Sect. 85
23 aT«t>twi . . . . . . , 2(»TXi) 170 8,623 2(m)(i) Akola2(TT)(ii) 3 74 2(m)(ii)
93 282 Sect. 85
24 . . 2(^X0 157 8.435 - 2(m)(i) Amravati2(TTXii) 3 74 2(m)(ii) >
118 356 , Sect. 85
25 . . . . m m 72 8,313 -2(mXi) Yavatmali m m 15 265 2 m)(ii)
44 123 Sect. 85
26 ^ . . . . ■ . . ' 2(iT)(i) 58 4,718 2(m)(i) Wardha2(^)(ii) . . ‘ 2(m)(ii)
32 12Q Sect. 85
27 ffFT . . 2(^)(i) 556 35,264 2(m)(i) Nagpur. 2(TT)(ii) 14 772 - 2(m)(ii)
471 1,906 Sect. 85
28 2(H)(1) ' 137 • - 3,117 2(mXi) Bhandara. 2(w)(ii) . . 2(mXii)
283 1,223 Sect. 85
29 ' . . 2(^)(i) 81 9,816 2(m)(i) Chandrapur' 2(TrXii>' 2(m)(ii) ■
135 918 S^t. 85
30 . . . . 2(Tr)(i) 8. 223 2(mXi) Gadchiroli2(?r)(ii) 2(mXii)
31 108 Sect 85
snOTT.— wr fJT, #«[t-S'o«rce«—The Chief Inspector of Factories, Government of Maharashtra, Bombay.
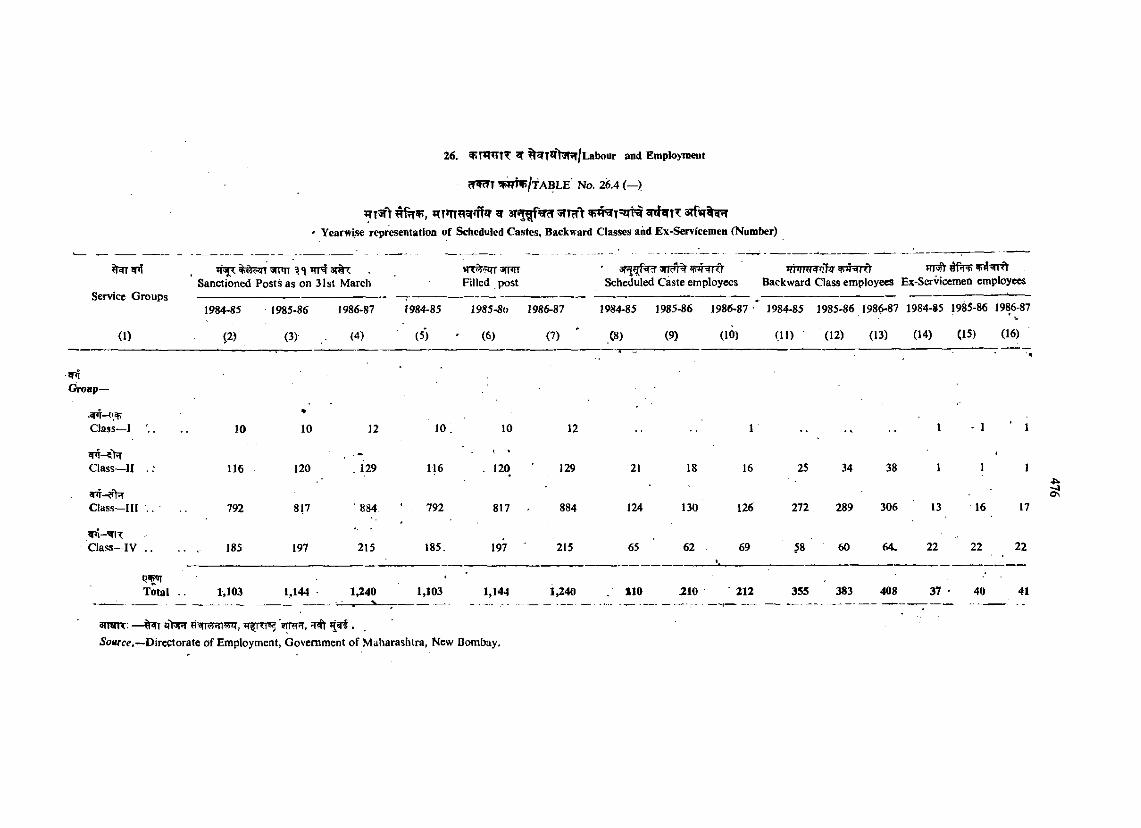
^ 3 T * jg f^ 5fTcTt 3 T f» T ^
Ycarwise rcpresentatioo of Scheduled Castes, Backward Classes and Ex-Servicemen (Number)
Service Groups
(1)
^m r ^ 3i%7:Sanctioned Posts as on 31st March
'iT^rirr ^i<ti Filled post
' TTPmr^vhScheduled Caste employees Backward Class employees Ex*Servicemeo employees
1984-85 1985-86 1986-87 !984-85 1985-So 1986-87
(2) (3) .. (4) (5) ' (6) (7)
1984-85 1 985-86 1986-87 1984-85 1985-86 1986-87 198-4-85 1985-86 1986-87
(8) (9) (10) (11) • (12) (13) (14) (15) (16)
■VflOronp-
Class—I . . . 10 10 12 10 . 10 12 1 •• 1 - 1 ■ 1
Class—II . ; 116 120 . 129 116 . 120 129 21 18 16 25 34 38 1 1 1
*nr-0^ Class—III . . 792 817 ' 884. 792 817 884 124 130 126 272 289 306 13 16 17
Class—I V .................... 185 197 215 185. 197 215 65 62%
69 58 60 64, 22 22 22
Total . . 1,103 1,144 1,240 1,103 1,144 1,240 110 210 212 355 383 408 37 - 40 41
3TnnT- — t r^rr r^ .
5ow ce.~D irectorate o f Employment, Government o f M aharashtra, New Bombay.
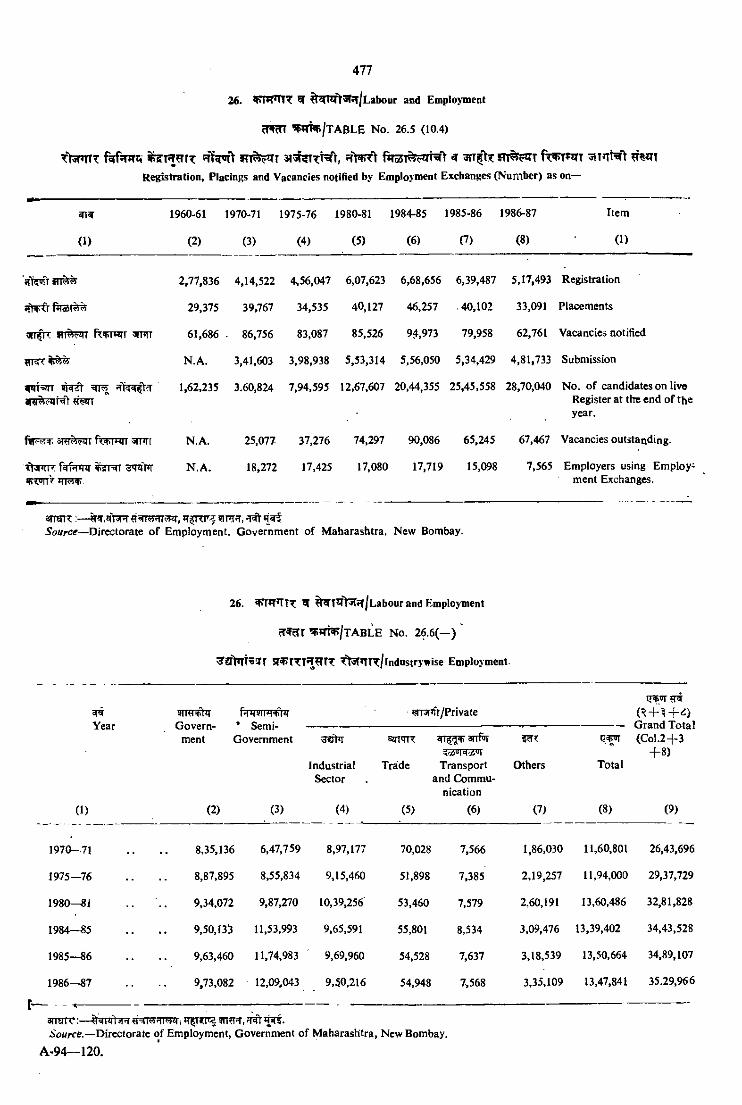
^ j t t ^ t f ^ u r r s i n r i ^ f re m
Registration, Placings and Vacancies notified by Employment Exchanges (Number) as on—
1960-61 1970-71 1975-76 1980-81 1984-85 1985-86 1986-87 Item
0 ) (2) (3) (4) (5) (6) 0 ) (8) (1)
2.77,836 4,14,522 4,56,047 6,07,623 6,68,656 6,39,487 5,17,493 Registration
jfpFfr 29,375 39,767 34,535 40,127 46,257 .40,102 33,091 Placements
<ST^ m v W ft+IW<! '<Hll 61,686 . 86,756 83,087 85,526 94,973 79,958 62,761 Vacancies notified
N.A. 3,41,603 3,98,938 5,53,314 5,56,050 5,34,429 4,81,733 Submission
1,62,235 3.60,824 7,94,595 12,67,607 20,44,355 25,45,558 28,70,040 No. o f candidates on live Register a t the end o f the year.
3lt1«P«4T > M|[ N.A. 25,077 37,276 74,297 90,086 65,245 67,467 Vacancies outstanding.
fl-n’ii*. %3T^ 3’TOPr «t><«iiTTn^
N .A . 18,272 17,425 17,080 17,719 15,098 7,565 Employers using Employ* ment Exchanges.
srraTT:—Source—Directorate o f Employment. Governm ent o f M aharashtra. New Bombay.
arranr
26. ^ ^T*Tt^f?r/Labour and Employment
cff?rr ^m 5p/TA B LE No. 2 f 6(—) '
Sr^rTT*T^T7 ^*t5T*TTT/lndastrywise Employment-
s r r f f ^ QT^’f^/PrivateYear Govern- * Semi-
ment Government
IndustrialSector
sjim r
Trade
arftl
Transport and Commu
nication
Others Total
G rand Total (C o l.2+ 3
+ 8 )
CD (2) (3) (4) (5) (6) iV (8) (9)
1970—71 8,35,136 6,47,759 8,97,177 70,028 7,566 1,86,030 11,60,801 26,43,696
1975—76 8,87,895 8,55,834 9,15,460 51,898 7,385 2,19,257 11,94,000 29,37,729
1980—8i 9,34,072 9,87,270 10,39,256 53,460 7,579 2,60.191 13,60.486 32,81,828
1984—85 9,50,135 11,53,993 9,65,591 55,801 8,534 3,09,476 13,39,402 34,43,528
1985—86 9,63,460 11,74,983 9,69,960 54,528 7,637 3,18,539 13,50,664 34,89,107
1986—87 9,73,082 12,09,043 9,50,216 54,948 7,568 3,35,109 13,47,841 35.29,966
Ti w n r , 'N t ’p t .Source.—Directorate o f Employment, Government o f M aharashtra, New Bombay.
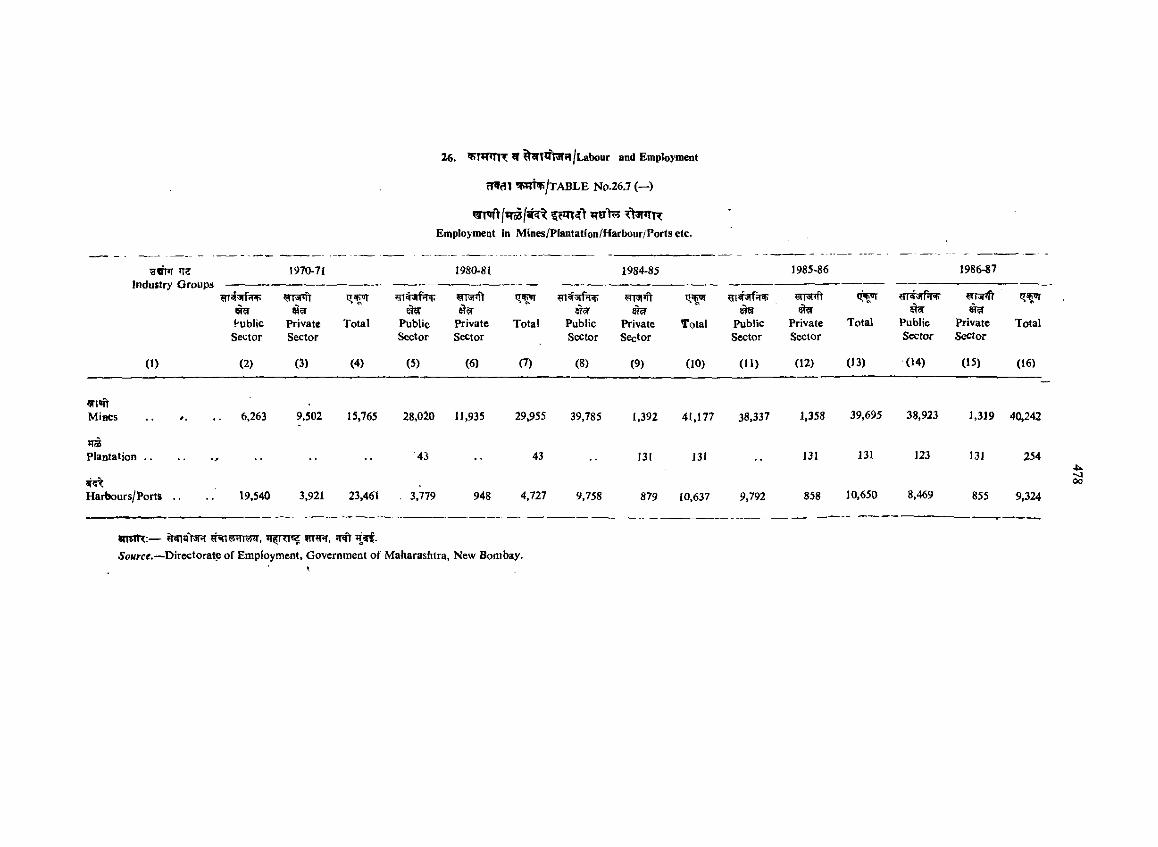
Employment in Mines/Plantation/Harbour/Portscfc.
^tfm Industry Groups
1970-71 1980-81 1984-85 1985-86 1986-87
i-ublicSector
PrivateSector
I T ^
Totalem
PublicSector
McTPrivateSector
t r ^
Total PublicScctor
PrivateSector
Total
i<4»irsnp
I»ublicSector
s r s i^
PrivateSector
Total PublicSector
WdPrivateSector
Total
(1) (2) (3) (4) (5) (6) (7) (8) (9) (10) (11) (12) (13) (14) (15) (16)
«n'ftMines *. . 6,263 9,502 15,765 28,020 11,935 29.955 39,785 1,392 41,177 38.337 1,358 39,695 38,923 1,3J9 40,242
JTflSPlantation . . . . , , 43 , . 43 131 131 .. 131 131 123 13] 254
H arbours/Ports . . 19,540 3,921 23,46! . 3,779 948 4,727 9,758 879 10,637 9,792 858 10,650 8,469 855 9,324
WWfT:— w'^imiwq, ?TTW*T, *T^5o«rce.—D irectorate o f Employment, Government o f M aharashtra, New Bombay.
.tk.
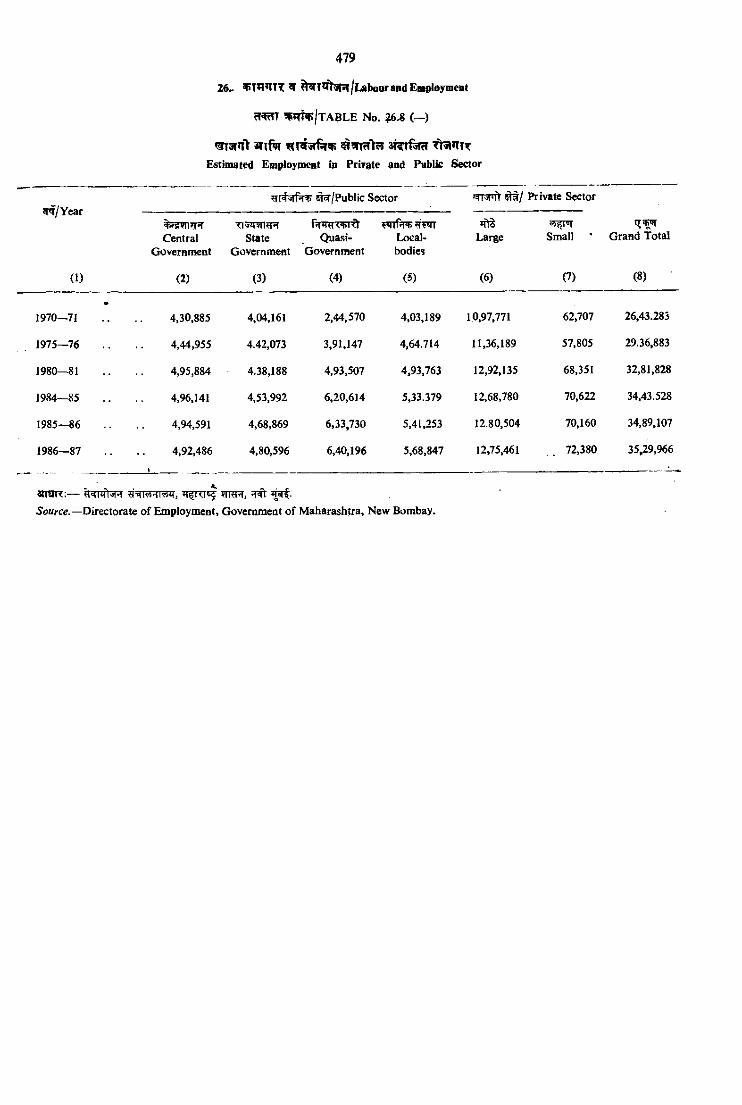
mgrnV w iP n «?TT?fts a h r r f ^ ftsw T T
Estimated Employoient id Private and Public Sector
^ /Y e a r^ /P u b l ic Sector f^T3nft Private Sector
CentralGovernment
Ti^qsil^TTState
GovernmentQuasi-
Government
w rr^> tF iTLocal*bodies
Large Small G rand Total
(1) <2) (3) (4) (5) (6) (7) (8)
1970—71 4,30,885 4,04,161 2,44,570 4,03,189 10,97,771 62,707 26,43.283
1975—76 4,44,955 4.42,073 3,91,147 4,64.714 11,36,189 57,805 29.36,883
1980—81 4,95,884 4.38,188 4,93,507 4,93,763 12,92,135 68,351 32,81,828
1984—85 4,96.141 4,53,992 6,20,614 5,33.379 12,68,780 70,622 34,43.528
1985—86 4,94,591 4,68,869 6,33,730 5,41,253 12.80,504 70,160 34,89,107
1986—87 4,92,486 4,80,596 6,40,196 5,68,847 12,75,461 72,380 35^9,966
« raR :— y=9TvRT^, TTW , TTTSource.— Directorate o f Employment, Government o f M aharashtra, New Bombay.
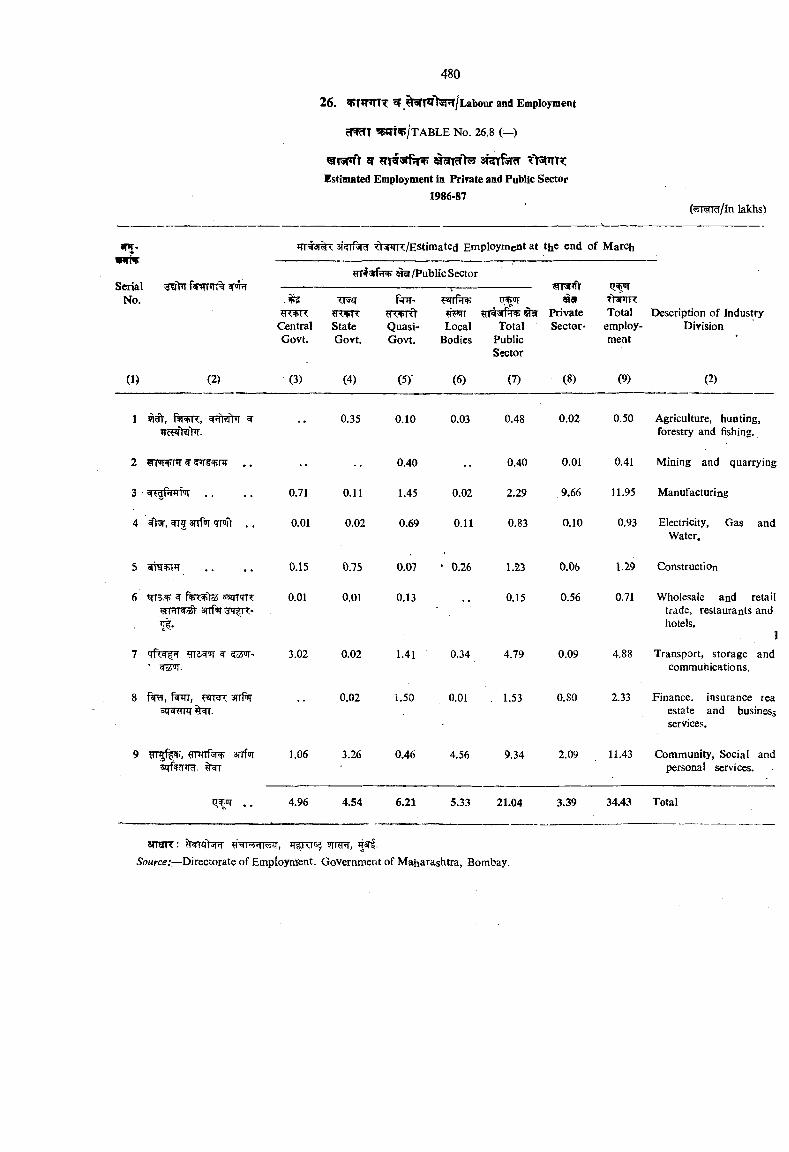
26. ^^T5ft«y»r/Labour and Employment
cTffTT ^T^/T A B LE No. 26.8 (—)
5T SRTfefcTEstimated Employment in Private and Public Sector
1986-87(^rmr /ln lakhs)
ir^-w iv
SerialNo.
rr#3i% ■djnK/EStimated Employment at the end of March
HT#3rfjr ^ /P u b lic Sector^Tsnft
^ 9PrivateSector-
flW TTotal
employment
CentralGovt.
«<*KStateGovt.
r^ -y<+i<YQuasi-Govt.
?«rrFrj*«>«(iLocal
Bodies
IT^
TotalPublicSector
Description of Industry Division
(1) (2) (3) (4) (5)- (6) (7) (8) (9) (2)
1 iRtfr, n»w<., gFfm>r ^ •• 0.35 0.10 0.03 0.48 0.02 0.50 Agriculture, hunting, forestry and fishing.
2 •• 0.40 •• 0.40 0.01 0.41 Mining and quarrying
3 • 0.71 0.11 1.45 0.02 2.29 ,9.66 11.95 Manufacturing
4 srrg anR qrpiiV .. 0.01 0.02 0.69 0.11 0.83 0.10 0.93 Electricity, Gas and Water.
5 0.15 0.75 0.07 • 0.26 1.23 0.06 1.29 Construction
6 ^ f+<+lo5 ssqi'TR <ai'ii< ooi 3 n f ^ <-’It-
O.OI 0.01 0.13 _ 0.15 0.56 0.71 Wholesale and retail trade, restaurants and hotels.
1
7 5OTT'' srOT".
3.02 0.02 1.41 0,34 4.79 0.09 4.88 Transport, storage and commuhications.
8 r Tri, wwK snfw =ij=i N ^ r.
0.02 1.50 0.01 . 1.53 0.80 2.33 Finance, insurance rea estate and business services.
9 3nf<iToqf cTW-
1.06 3.26 0.46 4.56 9.34 2.09 11.43 Community, Social and personal services.
. . 4.96 4.54 6.21 5.33 21.04 3.39 34.43 Total
anSTTT: , ?TRnT,Source:—Directorate of Employnient. Government of Maharashtra, Bombay.
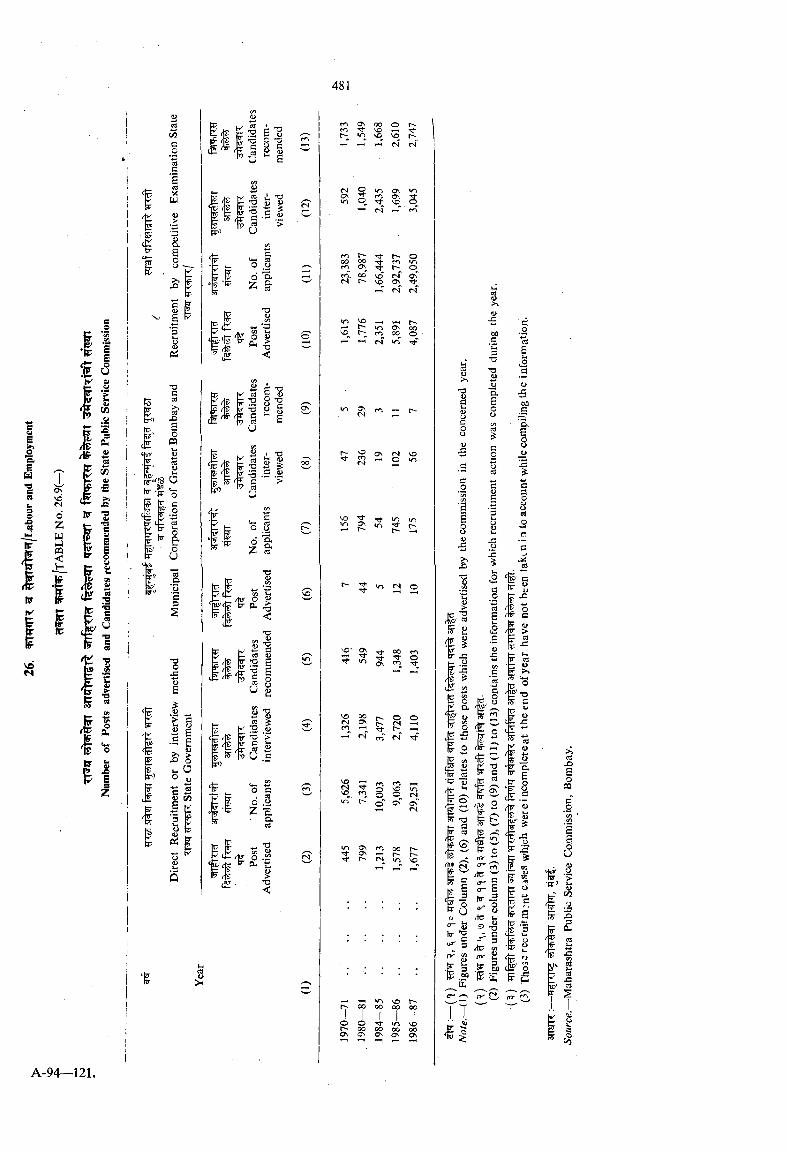
It- n
I MCO
^ (2 w <
m ON 00 OfOt-; <n sOt-T 1-T <s
o Tt rf
fo r om <n Or o C> T f
CO. 00 VD (s" ON fS \0 0 rtci fN
tt ON r i >0Sn ’-' o m
Ti- >n l o v> rf-r~ -H
'O* o\ ^ >o
Tt 00Tl- Oo\
q or > f s T-H
1^r n r i
^ t s s ^^ O o M" o ' <3n o C
^ <s
NO r*1
1/1 CT\ ro 00 t^ CT\ »—I■ri- r~ es in VO
O O Ti- / NOr~ 00 00 oo 00C s O n ON ON CTn
«
■tp
/tur*l .(P 60
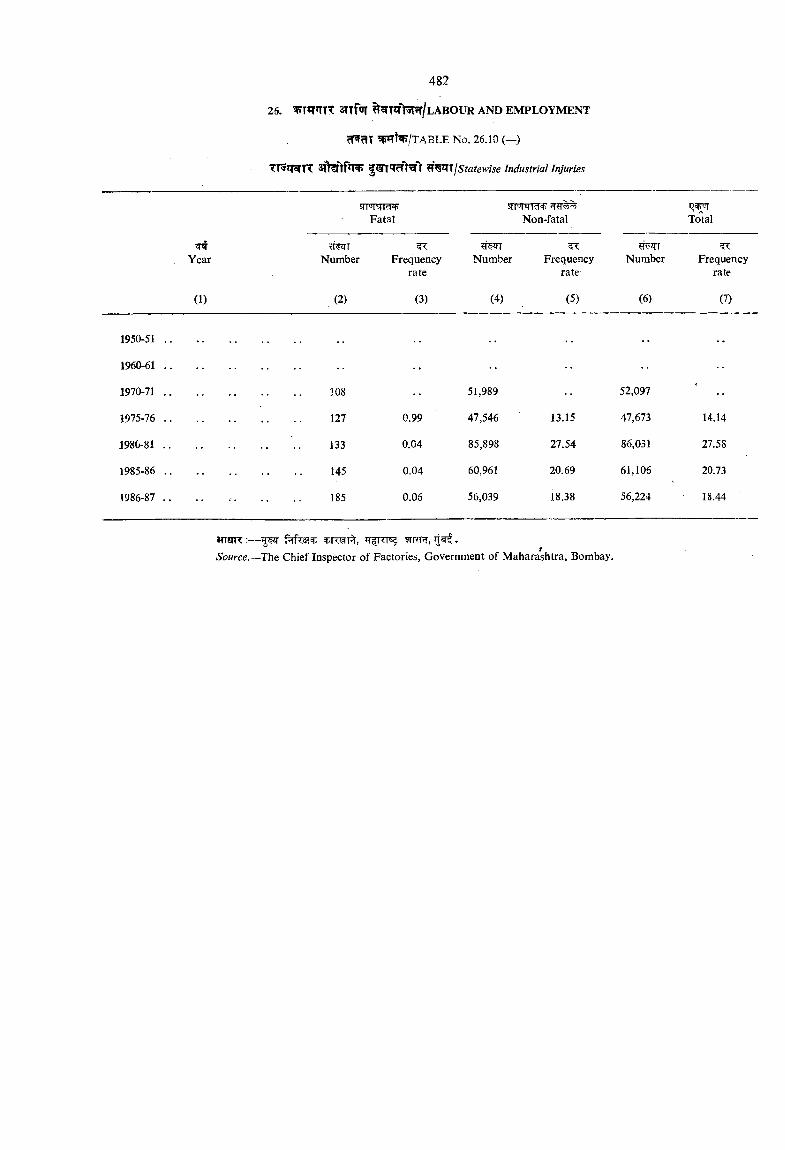
26. T*T*TTT STTfnt ^WTST^R/lABOUR AND EMPLOYMENT
^ t^ /T A B L E No. 26.10 (—)
7T5?T TT ^^'^JjStatewise Industrial Injuries
STT'WrrFatal
$rrwT?R7Non-fatal Total
Year Number Frequencyrate
Number Frequencyrate
?r qTNumber Frequency
rate
(1) (2) (3) (4) (5) (6) (7)
1950-51 ..
1960-61 .. •• •• •• ••
1970-71 .. 108 51,989 52,097 *
1975-76 .. 127 0.99 47,546 13.15 M ,m 14.14
1980-81 .. 133 0.04 85,898 27.54 86,031 27.58
1985-86 .. 145 0.04 60,961 20.69 61,106 20.73
1986-87 . . 185 0.06 56,039 18.38 56,224 18.44
snsnT:— g w ^r r , .
Source.—ThQ Chief Inspector of Factories, Government of Maharashtra. Bombay.
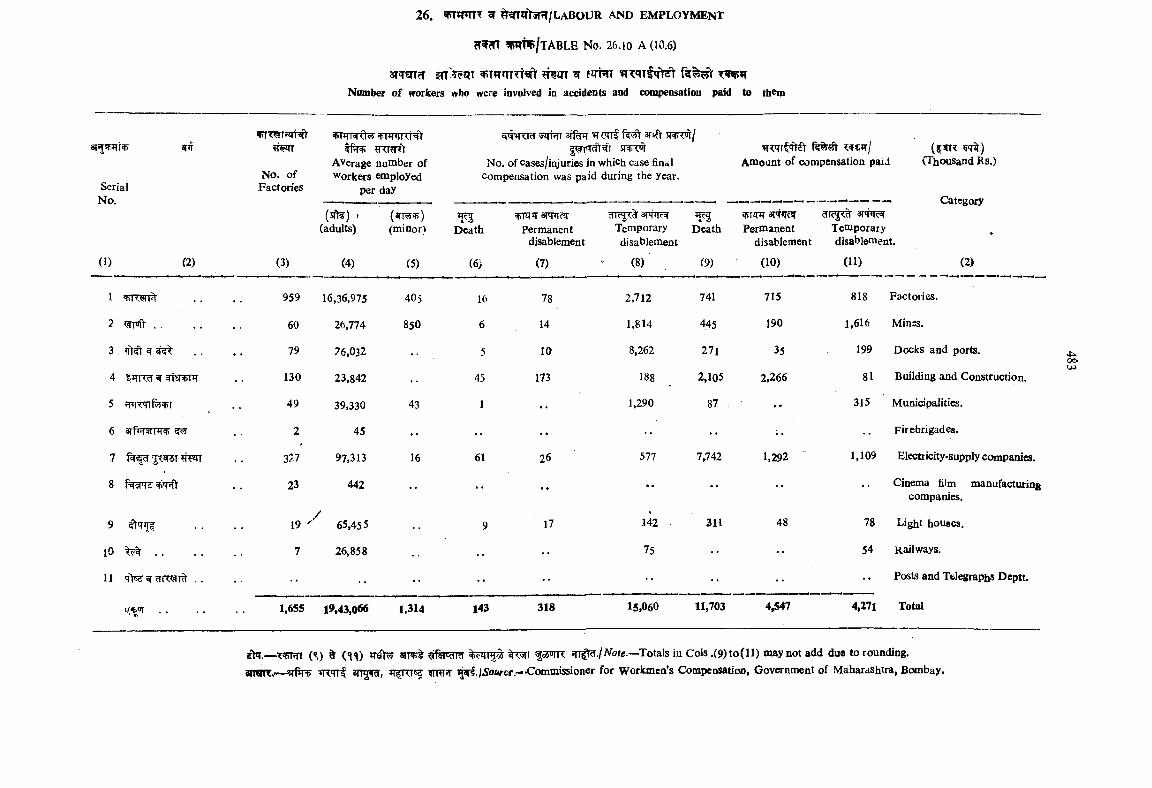
26. ^ ^5rni>3R/LABOUR AND EMPLOYMEKF
<T m ^ W F /tABLE N o. 26.10 A (10,6)
3fcrm?T ^ f rmTNumber of workers who were involved In accidents and compensation paid to th m
SerialNo.
No. of Factories
vnrRRte ^nrinT^ ?Rwft
Average number of Workers employed
per day
ETWWcT 5JTRT STfiw fe if 3T«fV SHTT /
No. of Cases/injuries in which case final Compensation was paid during the year.
Amount of compensation paid(fSTR ^q )
1 (Thousand Rs.)
Category
♦t.
(sfte) • (adults)
( ^ ^ )(minor) Death Permanent
disablement
3TFRTemporarydisablement
^ 3Death Permanent
disablement
?ric!i<cl smcsf Temporary disablemen
(1) (2) (3) (4) (5) (6) (7) (8) (9) (10) (11) (2)
1 959 16,36,975 405 16 78 2,712 741 715 818 Factories.
2 <sirifV . . 60 26,774 850 6 14 1,814 445 190 1,616 Minss.
3 >it?t 5T 79 ?6,032 5 10 8,262 271 35 199 Docks and ports.
4 .JTRcT ^ . . 130 23,842 45 173 188 2,105 2,266 81 Building and Construction.
5 49 39,330 43 1 • • 1,290 87 •• 315 Municipalities.
6 STfi TTFR <i<?5 2 45 • • • • •• • • •• Firebrigades.
7 TFtT 3?-7 97,313 16 61 26 577 7,742 1,292 1,109 Electricity-supply companies.
8 23 442 •• •• •• •• •• •• Cinema film manufacturing companies.
9 19 ' 65,455 9 17 142 . 311 48 78 Light houses.
lO 7 26,858 75 •• •• 54 Railways.
11 q>sj ^ . . . . •• •• •• •• •• •• •• Posts and Telegraphs Deptt
1,655 19,43,066 1.314 143 318 15,060 11,703 4,547 4,271 Total
4oo.
sh. — ( ) ^ (*l^) STRfrt oPTR I Note.—Totais in Cols .(9 )to (ll) may not add duo to rounding.an fcT, 9rnr?r wrtJiS'oftrcf.—Comtnlssloncr for workmen’s Compensation, Government of Maharashtra, Bombay.
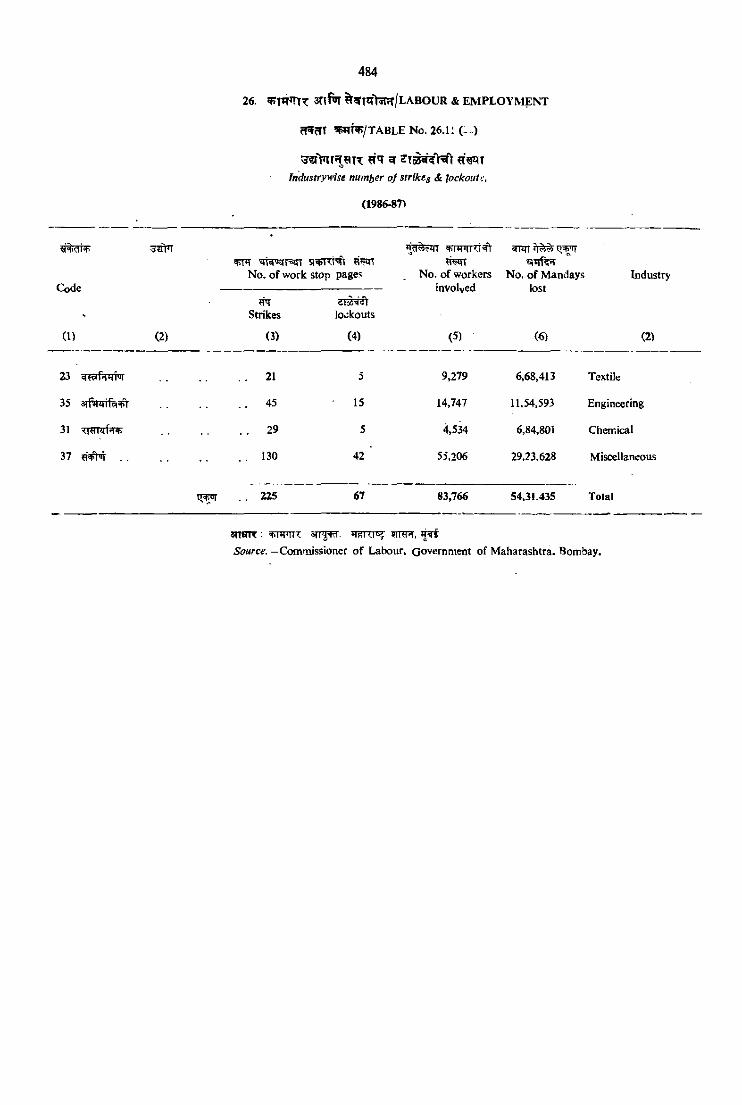
^ «SBiIfndiistrywise number o) strikes & lockout.':,
(1986-87^
•^nn
No. o f work stop pages No. o f workers No. o f Mandays IndustryCode --------------------- involved lost
m' Strikes lookouts
CD (2) (3) (4) (5) (6) (2)
23 21 5 9,279 6,68,413 Textile
35 a r fW f^ ^ . . 45 15 14,747 11.54,593 Engineering
31 xnTprfiTV . . 29 5 4,534 6,84,801 Chemical
37 . . 130 42 55.206 29,23,628 Miscellaneous
225 67 83,766 54.3i.435 Tolal
3HOTT : SllHd, ^Source. —Commissioner o f Labour. Government of M aharashtra. Bombay.
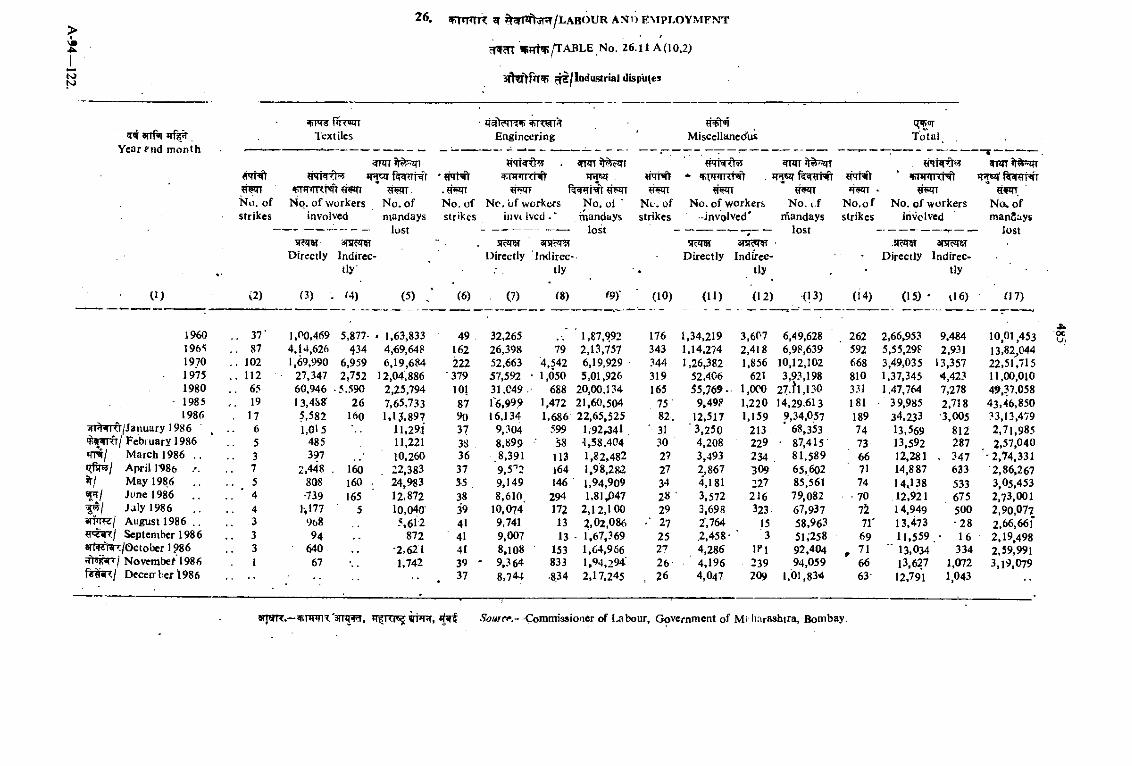
N)N)
^ *TTYear fn d m onth
^/lodu-strial disputes
PRWTT 1 extiles Engineering Miscellanec^us
C^q-T otai
N o. of strikes
No. o f workers involved
^PJ7
?r??TT. N o. o f mandays
lust
N o. o f strikes
TFTT N c. o f workers
inv( Ivcd
I>ir-:ctlyinrww
Indirectly
ST?JT5TDirectly
N o. ol inanduys
--------- lost3ra^5!
fndircc--tiy
w H t
N l-. of strikes
N o . o f workers -invo lved '
!TcWDirectly
N o. I.f rflandays
lost
*TOTT *N o .o f strikes
m h r fN v t w t N^
?nsqT No. o f workers
involved
^ 141
JT ^ fe r frh r r «WT.
N o. o f manflays
lost3fiR«nT •
Indirectly
.a?*r5TDirectly
anRJRIIndirec
tly
{1) (2) (3) . M) (5) / (6) (7) f8) f9)' (10) (11) (12) (13) (14) (15J * iI6) fJ7)
1960 . . 37 ■ 1,00,469 5,877- » 1,63,833 49 32,265-
' 1.87.992 176 1.34,219 3,607 6,49,628 262 2,66,953 9,484 10 ,01,4 53196‘> . . 87 4.14,626 434 4,^9,648 162 26,398 79 2,13,757 343 1,14,274 2,418 6,98,639 592 5,55,298 2,931 13,82^0441970 . . 102 1,69,990 6,959 6,19,684 222 52,663 '4,542 6,19.929 344 1,26,382 1,856 10,12,102 668 3,49,035 13,357 22,51.7151975 .. 112 27,347 2,752 12,04.886 •379 57,592 • 1.050 5,01,926 319 52,406 621 3,93,198 810 1,37.345 4,423 11,00,0101980 . . 65 60,946 5..‘'90 2,25,794 101 31.C49 . 688 20,00.134 165 55,769. l.OCO 27.tl,130 33J 1.47,764 7,278 49.37,058
- 1985 , . 19 13.45>8' 26 7,65,733 87 16.999 1,472 21,60,504 75 ' 9.49? 1,220 14,29.613 181 • 39,985 2.718 43.46,8501986 . 17 5,582 160 l .l j .8 9 7 90 16,134 1.686 22,65,525 82. 12,517 1.159 9,34,057 189 34,233 •3,005 33,13,479
jfl^^ld /January 1986 6 1,015 11,291 37 9. .104 599 1.92,341 ■ 31 '3 .2 5 0 213 ‘ 68,353 74 13,569 812 2,71,985VinrTfr/ Febiuary 1986 5 485 11,221 3S 8.899 58 4,58.404 30 4,208 229 • 87,415 73 13,592 287 2 ,57.040*rw/ M arch 1986 .. 3 397 10,260 36 8,391 113 1,82,482 27 3,493 234 81,589 66 12,281 . 347 ‘-2,74.331t ^ I April 1'986 7 2,448 . 160 22,383 37 9,5'’2 164 1.98,282 27 2,867 309 65,602 71 14,887 633 2,86,267*r/ May 1986 .. 5 808 160 24,983 3-5 , 9,149 146 1,94.909 34 4,181 227 85,561 74 14.138 533 3 ,05.453
June 1986 .. 4 •739 165 12.872 38 8,610 294 1,81/547 2« 3,572 216 79,082 • 70 12.921 675 2,73.0 0 1Jaly 1986 4 h!77 5 10,040 39 10, 074' 172 2.12,100 29 3,698 323. 67,937 72 14,949 500 2,90,077
arm ?/ August 1986 .. 3 968 5.612 41 9,741 13 2.02,086 27 2,764 15 58.963 71' 13,473 •28 2,66,661^T'^7/ September 1986 . 3 94 872 41 9.007 13 . 1,67,369 25 .2,458- 3 51.258 69 11.559 • 16 2,19,498ar^Rrnrr/October 1986 . 3 640 ■2,621 41 8.108 153 1,64,966 2- 4,286 IM 92,404 r 71 ■' 13.034 334 2,59,991
Novembef‘1986 1 67 1,742 39 ' 9,364 833 1.94,294' 26- 4,196 239 94.059 66 13.627 1,072 3,19,079U^4<j Decen"ter 1986 * 37 8.744 •834 2.17,245 . 26 4.047 209 1,01,834 63 12,791 1,043
WJHR.—Jprn^T'sTT^W, JTgrac? VPTT, •S'o«f(v«.--ComnTis9ioner of I.^bour, Government o f Mi iKtrashtra, Bombay,
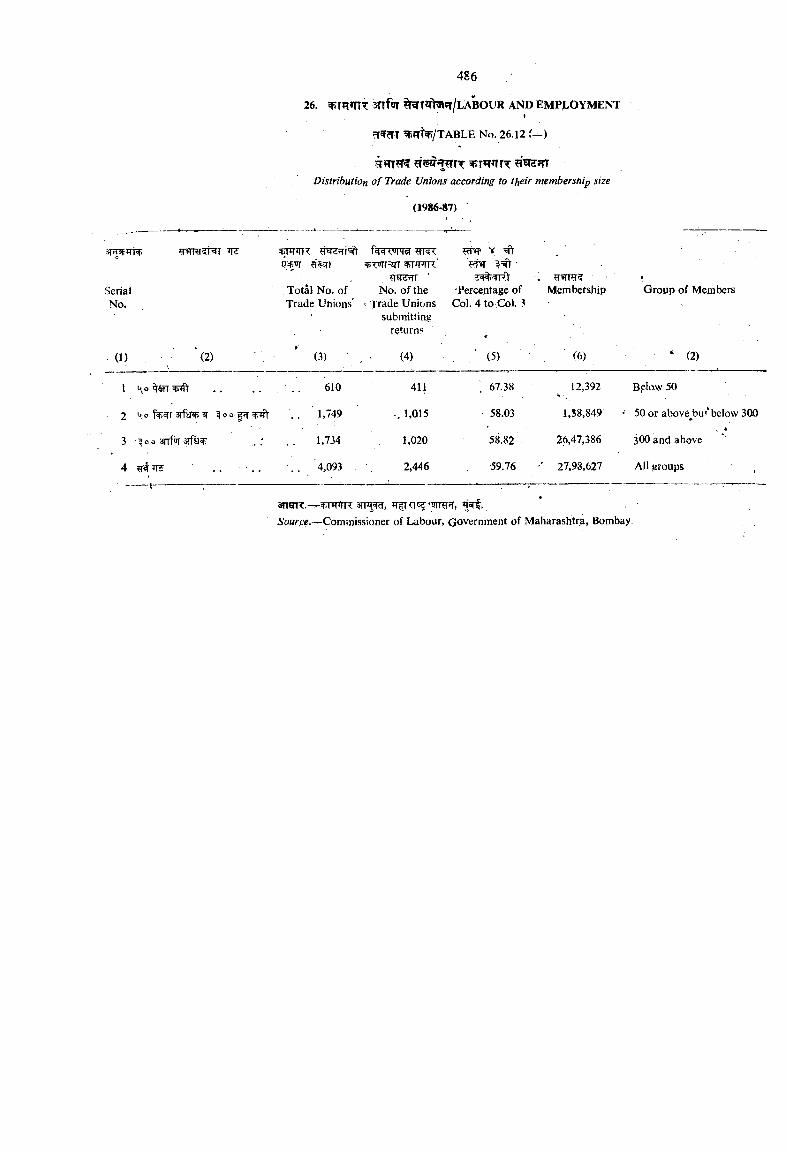
26. snfwr ^ x ^ I l a b o v r a n d e m p lo y m e n tf
fcTT ^?|T5P/TABLE No. 26.12 (—)
Distribution o f Trade Unions according to their membership size
(1986-87)
3npAii+
SerialNo.
HWI
, Total No. of Trade Unions'
rcvrnrr ^ twtr ?ryd i '
No. of the * Trade Unions
submitting returns
X■
•Percentage of Col. 4 to Col. 3
Membership Group of Members
(1) \ 2 ) (3) , •■ (4) , ' (5) (6) ■ * 2)
1 \o ^$n,+4l . . . . ' . . 610 411 . 67.38 12,392 B,elaw 50
2 . . 1,749 1,015 58.03 1,58,849 • 50 or above bu*‘ below 300
3 •^oo aarrprarfsi 1,734 1,020 58.82 26,47,386•.
300 and above
4 . . 4,093 2,446 59.76 •' 27,93,627 All groups ,
ansR. — ijarf.Source.—Comraissioner of Labour, Government of Maharashtra, Bombay.
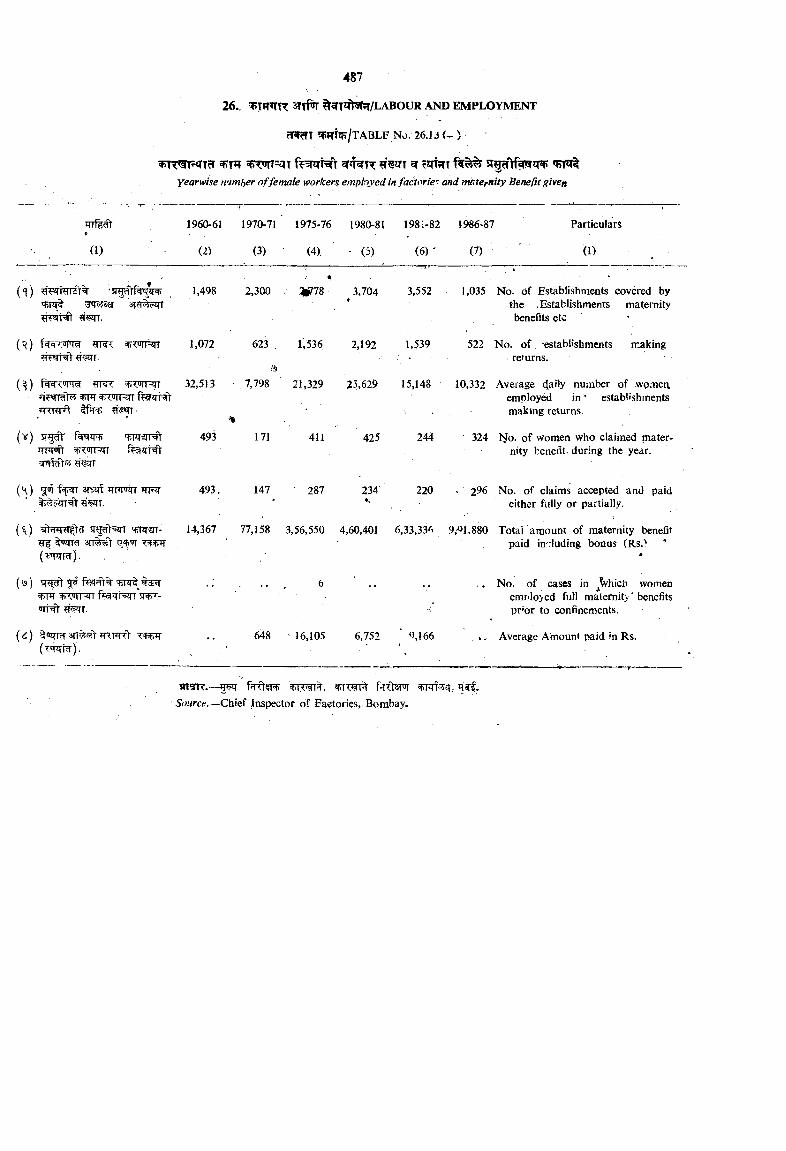
TT fiwiTTcr T sTT ^ sr^cftfawiw 'em!:yearwise number o f female workers employed in factories and maternity Benefit given
1960-61 1970-71 1975-76 1980-81 198i-82 1986-87 Particulars
0 ) (2) (3) (4). • (5) (6) ' (7) ' ' (1)
, , = * i - - - . ' - ■ •{<l) 1,498 2,300 . 7gll% 3,704 3,552 1,035 No. of Establishments covered by
q5Tq% . * the .Establishments maternity#I5TT. benefits etc '
(^) WKl ^Tornrr 1,072 623 . 1,536 2,192 1,539 522 No. of •establ'‘shments rnaking'fw r# ffWf- - returns.
(^) ?TRT 32,513 - 7,798 21,329 25,629 15,148 10,332 Average 4aily number of wp.Tiea^ + employed in" establishments
yravrft ?rw.- ^ • makmg returns. ,
(v) 493 1 71 411 425 244 ' 324 l^o. of women who claimed mater-qwrt nity henent. during the year.
?iWT.
(H) 01 3T6?rf TTFTRrr qFJT 493. 147 ’ 287 234' 220 . 296 No. of claims accepted and paid?iWT. • ■ •' either fully or partially.
(^) qjRar- 14,367 77,158 3,56,550 4,60,401 6,33,336 9,-91,880 Total amount of maternity benefit3n%«V • paid in' luding bonus (Rs.''
(wrrw). •
( ^ ^ , 6 . . . . , . No. of cases in ^^hich womenftgirhqi W ’:- ' emr>loyed full maternity' benefits
?i^T. pr'or to confinements.
(<i) RrarfV . . 648 16,105 6,752 ,166 Average Amount paid in Rs.
Source.—ChiQ Inspector of Factories, Bombay.
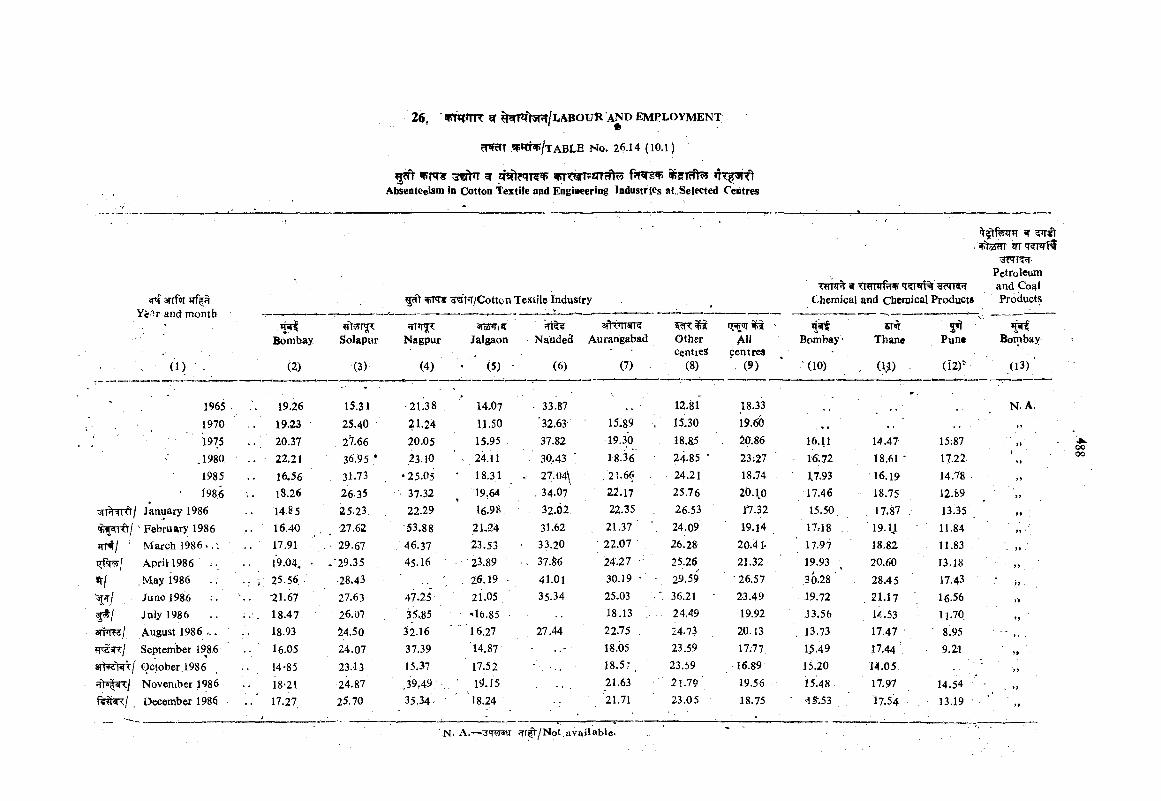
g?T> ?P m ^ » T ST ?»TT^T?iTrfft^Absenteeism in Cotton Textile and Engineering Industries at.Selected Centres
^ 3rffq Y'c^-r and month
)TT¥ ^W /Cotton Textile Industry
rte?TT JTT'TTnrf
Petroleum^ <wwfH4t <Kmf% wrnPT and Co^l
Chemical and chenjical Products Products
Bombay. Solapur?rnT^
Nagpur5rar«IlW
JalgaonafVwrar?
Nande^ Aurangabad OtherCentres
Allcentres
Bombay *5M
Thane2^
Pun* Bombay
(1) . (2) (3) (4) • (5) (6) (7) (8) (9) ‘ (10) . ( y ) (1"2) (13)
1965 19.26 15.31 - 21.38 , 14.07 33.87 12.81 18.33 N. A.1970 .. 19.23 25.40 21.24 11.50 '32.63 15.89 . 15.30 19.60 • • ..
■ ,1975 .. 20.37 27.66 20.05 15.95 37.82 19.30 18.a5 . 20.86 16.11 14.47 15;87 f).1980 • .. 22.21 36.95 * 23.10 ’ - 24.11 30,43 " 18.36 24.85 • 23;27 16.72 18.61* 17.22 f
1985 .. 16.56 31.73 ‘ 25.05 * 18.31 27.04\ 21.66 24.21 18.74 - U.93 16.19 14.78 . ,,• 1986 18.26 26.35 37.32 19.64 . 34.07 22.17 25.76 20.10 17.46 18.75 12.89
grr^ rft/ January 1986 .. 14.85 25.23, 22.29 16.98, . 32.02 ' 22.35 . 26.53 n .32 15.50 17.87 , 1335 M' February 1986 .. ■ 16.40 , , 27.62 •53.88 2L24 31.62 21.37' '. 24.09 19.14 17.48 19. U 11.84 M-'
^T^| ■ March 1986-.'. . . 17.91 • 29.67 46.37 23.53 • 33.20 22.07 26.28 20.4 1- ' 17.97 18.82 11.83 - >JqfsT y/ ApriU986 19.04, ' .•29.35 45.16 23.89 ■- 37.86 '24.27 ■ 25,26 21.32 ' 19.93 „ 20.60 13.18 ■ ,,
. May 1986 ... V 25.56 -28.43 , 26.19 - 41.01 30.19 • • 29.59 -26.57 30.28 ' 28.45 17.43 h ■June 198.6 ; • . . -21.67 27.63 47.25" 21.05 35.34 25.03 36.21 - 23.49 19.72 . 21.17 16.56
# / Jaiyl986 . . . 18.47 26.07 35.85 ■ ^16.85 ■ 18.13 24.49 19.92 J3.56 14.53 n .70 >»3TFTF5/ August 1986 ... 18.93 14.50 32.16 ■ '1 6 .2 7 27.44 22.75 , 24.73 20.13 ; 13.73 17.47 8.95wzsmj September 198.6 .. 16.05 24.07 37.39 ’14.87 1«.05 23,59 17.77 1,5.49 17.44 ■ 9.21 »»arNFStifT/ October. 198 6 14-85 23.13 15.37 17.52 18.5;. 23.59 16.89 15.20 14.05 , ,
iTt&|NX/ November 1986 • • is-21 24.87 ,39,49 , ‘ 19.15 21.63 21.79' 19.56 15 48 17.97 14.54 ■ . >>December 1986 . . ' 17.27 25.70 35.34- 18.24 21.71 23.05 18.75 • ^f.53 17.54 13.19 .
oo00
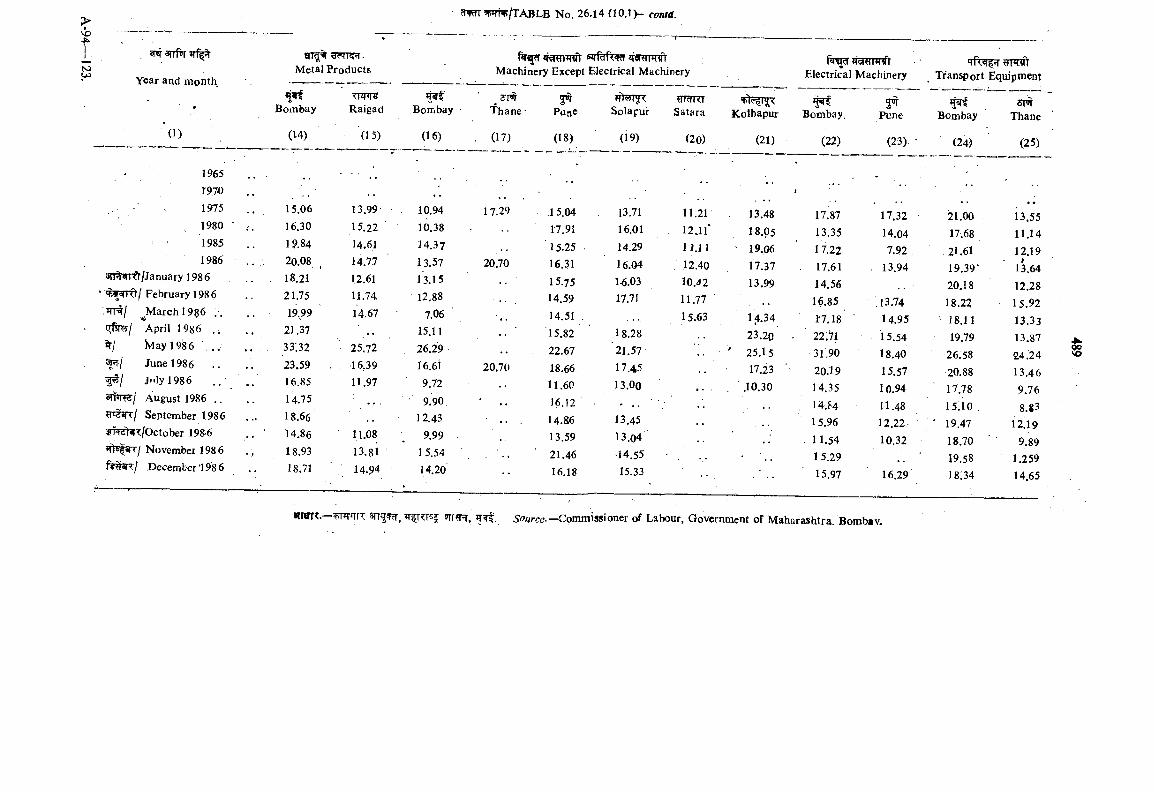
U) Year and month
'(1)
1965T9701975198019851986
sn^Tjrfr/January 1986 TVWRt/ February 198 6 wr^j ^Marchl986
April 1986 Jr/ May 1986 . . .
June 1986 July 1986
snro:/ August 1986 ..September 1986
5PiN?t«r‘ /October 198-6 *ft®|3R:/ November 1986 fWen:/ December'198 6
£rrg|% •
Metal Products
Bombay
(U)
15.0616.3019.84 20.08 18.21
21.75 19.99
21.37 33:32 23.5916.8514.75 18.66
14.86 18.93 18.71
13.9915.2214.61 14.7712.61 11.74 14.67
25.7216,3911.97
11.0813.8114.94
Raigad
(1 5)
VsRTTWrMachinery Except Electrical Machinery
f t w iRRTnnft Electrical Machinery Transport Equipment
Bombay •
(16)
3m Thane•
. (17)
5^Pun©
(18)
Solapur
(19)
WIcJRTSatara
(20)
Kolhapur
(21)
Bombay.
(22)
5^Pune
(23) ■
^ , Bombay
(24)
smThane
(25)
10.94 17.29 .15.04 13.71 11.21 13.48 17.87 17.32 izi.oo 13.5510.38 17.91 16.01 . i2 a r 18.05 13.35 14.04 17.68 11.1414.37 15.25 . 14.29 11.11 ' 19.06 1 7.22 7.92 21.61 12.1913.57 20.70 16.31 16.04 12.40 17.37 . 17.61 - 13.94 19.39’ 13.6413.15 15.75 1-6.03 10.42 13.99 14.56 20.18 12.28
' 12,88 14.59 17.71 11.77 16,85 .13.74 18.22 15.927.06 14.51 . 15.63 14.34 1*7.18 ' 1 4.95 : 18.11 13.33
15.11 15.82 18.28 23.20 . ' 22.71 15.54 19.79 13.8726.29 • •• 22.67 21.57 ' 25.15 31.90 18.40 26.58 24.2416.61 20.70 18.66 17.45 17.23 ■- 20.19 15.57 20.88 13.469.72 •• 11.60 13.00 • • ' .10.30 14.35 10.94 . 1778 9769.90 16.12 14.f4 11.48 15!10 8.83
12.43 14.86 13.45 15.96 12.22 ' 19.47 12.199.99 13.59 13.04 11.54 10.32 18.70 9.89
1 5.54 21.46 14.55 1 5.29 ' 19.58 1.25914.20 • • 16.18 15.33 15.97 16.29 •18:34 14.65
ooso
werr .— 9Tf?PT, 5<!»«rce.—Commissioner of Labour, Government of Maharashtra. Bombay.
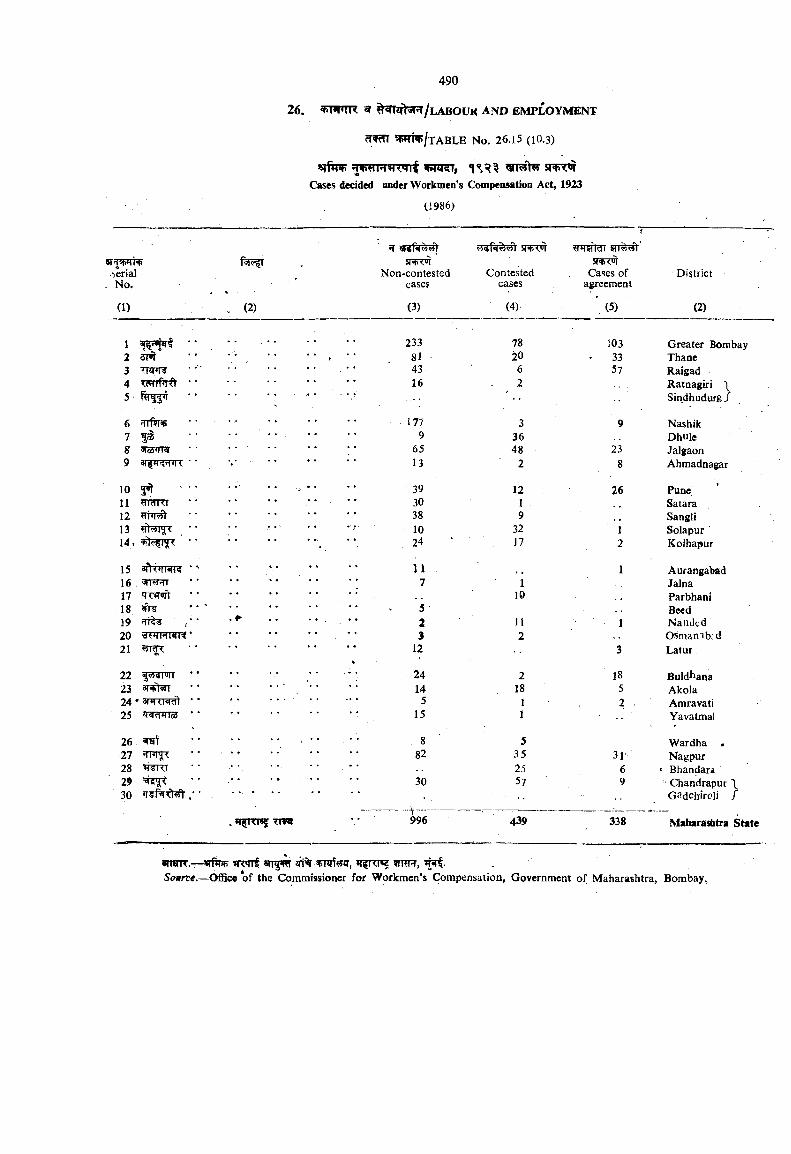
cT9Rn ^IPRW/tABLE No. 26.15 (1O.3)
iRXT , ^%'R^ 5R>T^Cases decided under Workmen’s Compensation Act, 1923
(1986>
ttW v sr*<«iicrial Non-contested Contested Cases of DistrictNo. case? cases agreement
(1) . (2) (3) (4) *.(5) (2)
1 • . 233 78 103 Greater Bombay2 sm * * . 81 - 20 - 33 Thane3 TTq»l • • 43 6 57 Raigad4 • • • • • • 16 2 Ratnagiri \5 |>T • • •• • Sindhudurgj
6 Hlf?!-* ■ 177 3 9 Nashik7 fS . . * * • • 9 36 Dhuleg 3r<2<j7ir • • • • 65 48 23 Jalgaon9 3 T f • • 13 2 8 Ahmadnagar
10 5»f • • •• •• 39 12 26 Pune11 «MI<[ . . • • 30 1 Satara12 • • 38 9 Sangli13 • • • * •■ .* ' 10 32 1 Solapur14 f ' ' . .
“ • 24 17 2 Kolhapur
15 sfhTTRR ‘ ' •• 11 • 1 Aurangabad16 , ^5^ ! 7. 1 Jalna17 • • • • 10 . , Parbhani1 8 ^ . . • • • * 5 Bccd19 • • ‘ . • • 2 M 1 Nandtd20 WWW . . • • • • 3 2 Os'rnamb. d21 I<1< • • - • • • • • 12 3 Latur
22 f^3T^r 24 2 18 Buld^ana23 3Hft5TT • • • * • 14 18 5 Akola24'3»^<Ndl •• * • . . • • • • 5 1 2 Amravati25 ' * • • • •
" 15 1 Yavatmal
26 srat 8 5 Wardha ,27 82 35 31 Nagpur28 «tSTTT , ■• * 25 6 • Bhandara29 • • . . • • • • • • 30 57 9 Chandrapur \30 ' " " Gadchircli /
. F RT8$ 7TTO V 996 439 338 Maharashtra State
amm.— isfhip irm t s n ^ zri% spTiTf , tfTRPT, .Source.—Office of the Commissioner for Workmen’s Compensation, Government of Maharashtra, Bombay,
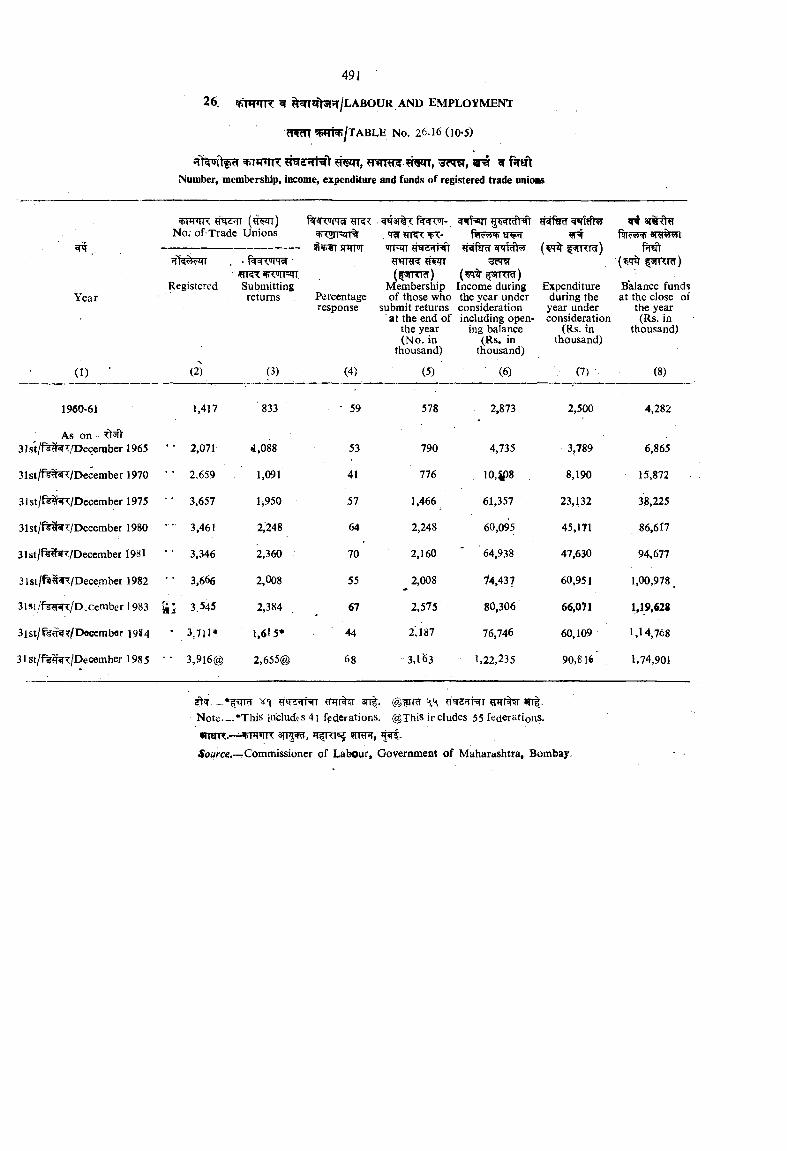
?mi5f!*n^/TABLE No. 26.16(10-5)
?t?SilT, fWRR ?rWT, ^Number, membership, income, expenditure and funds of registered trade unioas
't>rtT<rr< (^'^i) No; of-Trade Unions . qW«l<{<¥T-
'iiT=jn hrs rNtHnc'«'s
farRTrr) felt
Balance funds at the close of
the year (Rs. in
thousand)
RegisteredYear
• H Kums ■
Submittingreturns Percentage
response
( viJKld) Membership of those who
submit returns at the end of
the year (No. in
thousand)
pTRRi) Income during the year under consideration including open
ing balance (Rs. in
thousand)
Expenditure during the year under consideration
(Rs. in thousand)
(I) ■ (2> (3) (4) (5) (6) . (7) (8)
1960-61 1,417 833 • 59 578 - 2,873 2,500 4,282
As on - ’ ^ 3Ist/f^VI>eceraber 1965 •• 2,071 4,088 53 790 4,735 3,789 6,865
31st/f^^RT/December 1970 • • 2,659 1,091 41 776 10,|p8 8,190 15,872
31st/f^^/Dccember 1975 • ' 3,657 1,950 57 1,466 61,357 23,132 38,225
31st/r«tl<(T/December 1980 •• 3,461 . 2,‘248 64 2,248 60,095 45,171 86,617
31st/f^VDecem ber 1981 • • 3,346 2,360 70 2,160 ' 64,938 47,630 94,677
31st/f«^^/December 1982 ' • 3,666 2,008 55 2,008 14,4^7 60,951 1,00,978,
3lst/f%iW?:/D-Ccmber 1983 3,545 2,384 67 2,575 80,306 66,071 1,19,628
3ist/f^ff^?/Dacerab<ir 1984 * 3,711* l,dl 5* ‘ 44 2'187 76,746 60,109 1,14,768
31 st/f%?WT/December 198 5 • • 3,916@ 2,655@ 68 3,1^3 1,22,235 90,«16 1,74,901
?t*T. v'j ant- \ \ *n|.N ote— *ThiS includts 4i federations. @This includes 55 federations, •rnsnr.— fTtniR ?rnnT,
^o«rce.~Commissioner of Labour, Government of Maharashtra, Bombay
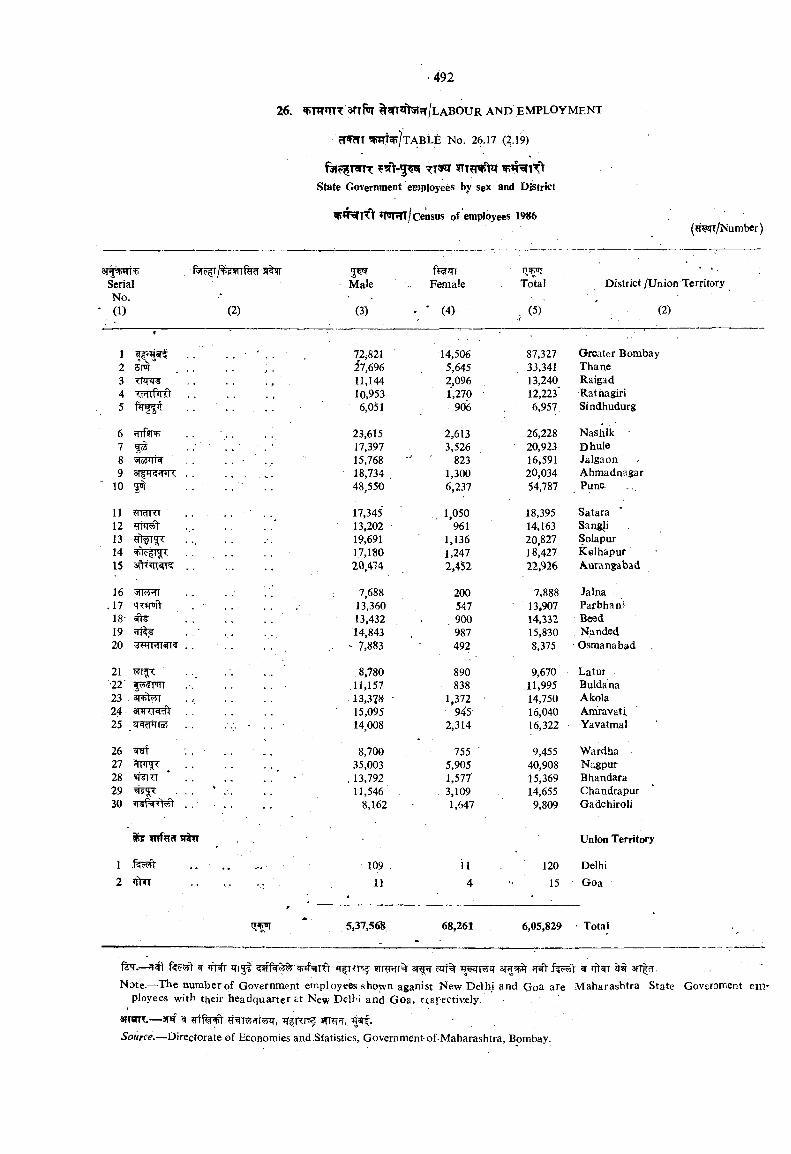
State Government employed by sex and District
*TUMT/census of employcjes 1986(?T^T/Number)
ftr /%??TTl%cT 5f%?rSerialNo.(1) (2)
Male
(3)
Female
• (4)
Total
(5)
District/Union Territory
" (2)
»
1 . . . . ‘ . 72,821 14,506 87,327 Greater Bombay2 , . . . . . i7,696 5,645 33,341 Thane3 W I^ . . . . . , . 11,144 2,096 13,240 Raigad4 -iHinrO . . 10,953 1,270 12,223' Ratnagiri5 . . ' . . . . 6,051 906 '6,957. Sindhudurg
6 'Trf RT . . ' ; . . . 23,615 2,613 26,228 Nashlk7 • - . • 17,397 3,526 20,923 Dhule8 5IoOTTW . . . . • 15,768 823 16,591 Jalgaon9 . . . . 18,734 . 1,300 20,034 Ahmadnagar
10 . . . . ■ . . 48,550 6,237 54,787 Pune.
11 ?rraTTT . . . . 17,345 . 1,050 18,395 Satara12 . . . . 13,202 961 14,163 Sangji13 19,691 1,136 20,827 Solapur14 . . . . 17,180 1,247 18.427 kelhapur15 3 f\7T rr^ ............................... 20,474 2,452 22,926 Aurangabad
16 vHWrfl ................ , 7,688 200 7,888 Jalna. 17 ' 13,360 547 13,907 Parbhani18 ............................... 13,432 . 900 14,332 Beed19 14,843 987 15,830 Nanded20 . . . . . . . ' 7,883 492 8,375 Osmanabad
21 . . 8,780 890 9,670 Latur'22 .-. . . . . .11,157 838 11,995 Buldana23 anil T . . 13,378 • 1,372 14,750 Akola24 a r R T T ^ ............................... ' 15,095 945 16,040 Arriravati25 . . . ■ 14,008 2,314 16,322 Yavatmal
26 ^ . . . . . . 8,700 755 ■ 9,455 Wardha27 . . 35,003 5,905 40,908 N?.gpur28 iffTiTr * . . . 13,792 1,577' 15,369 Bhandara29 . . . * . . 11,546 3,109 14,655 Chandrapur30 ‘ . . . 8,162 1,647 9,809 Gadchiroli
Union Territory
1 . . .............. 109 11 120 Delhi2 ., . . .. 11 4 •• ' 15 Goa
5,37,568 68,261 6,05,829 Total
fer.— q ljt ^=5fRt TT Rrsj 9TWVfr% 3?^ cqt% iT T q" W »ft^ 3fT| ,NDte.—The number of Government employees shown aganist New Delhi find Goa are Maharashtra State Governnr.ent em
ployees with their headquarter ^t New Delhi and Goa, rtspectiveJy.
arrOTT.— 3T«f ^ Nr iTt PT, ?n?r?r,Source,—Directorate of Economies and .Statistics, Government-of-Maharashtra, Bombay.
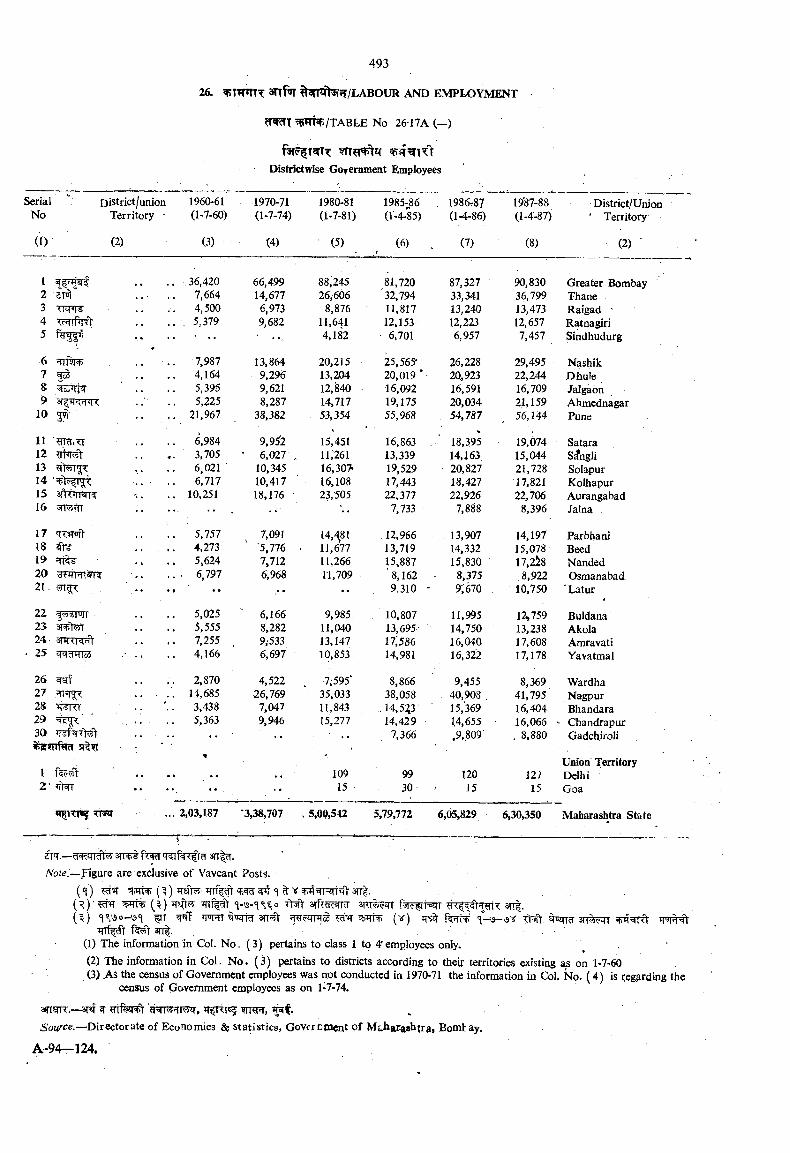
cT cTT ^m?P/TABLE No 2617A (—)
■ Districtwise Government Employees
SerialNo
( 0
District/union 1960-61Territory - (1-7-60)
(2) (3)
1970-71(1-7-74)
(4)
1980-81(1-7-81)
• (5)
1985- 86(l'«4-85)
(6)
1986rS7(1-4-86)
(7)
19'87-88(1-4-87)
(8)
District/Union ' Territory
(2) '
12345
67 ^8
10 3 -
11 ¥r?i.Tr12 15141516
1718 ^19
21.
22 •23 3T 'fet 24. SFRT 't 25 WiTra
26.27 5 1 ^28;2930^a?nr^d
I2* tiKt
TFST
36,4207,6644,5005,379
7,9874,1645,3955,225
21,967
6,9843,7056,0216,717
10,251
5,757 4,273 5,624 6 797
5,0255,5557,2554,166
2,87014,6853,4385,363
66,49914,677
6,9739,682
13,8649,2969,6218,287
38,382
9,9^26,027
10,34510,41718,176
7,0915,7767,7126,968
6,1668,2829,5336,697
4,52226,769
7,0479,946
88,24526,606
8,87611,6414,182
20,21513,20412,84014,71753,354
15,45111,26116,307*16,10823,505
14^8111,67711,26611,709
9,98511,04013,14710,853
7;595‘35,03311,84315,277
10915
81,72032,79411,81712,1536.701
25,565- 20, 019 ' 16,092 19,175 55,968
16,86313,33919,52917,44322,377
7,733
12,96613,71915,887'8,1629,310
10,80713,695ir,58614,981
8,86638,058
,14,5^314,429
7,366
9930
87,32733,34113,24012,2236,957
26,22820,92316,59120,03454,787
18,3.9514,16320,82718,42722,926
7,888
13.907 14,332 15,830
8,3759:670
11,99514,75016,04016,322
9,45540.908 15,369 14,655 ,9,809
12015
90,83036,79913,47312,6577,457
29,49522,24416,70921,15956,144
19,07415,04421,72817,82122,706
8,396
14,19715,07817,2^8
8,92210,750
12 75913,23817,60817,178
Greater Bombay Thane Raigad ' Ratnagiri Sindhudurg
Nashik Dhule ,JalgaonAhmednagarPune
SataraS^ngliSolapurKolhapurAurangabadJalna
ParbhaniBeedNandedOsraanabad
'Latur
BuldanaAkolaAmravat!Yavatmal
8,369 Wardha 41,795 Nagpur 16,404 Bhandara 16,066 - Chandrapur , 8,880 Gadchiroli
12;15
Union TerritoryDelhiGoa
2,03,187 '3,38,707 . 5,00,542 5,79.772 6,05,829 6,30,350 Maharashtra State
yVo/e.-—Figure are exclusive of Vavcant Posts.
(^) snt.(^) 5Fci (y )
’fTT ff 3Tf|.(1) The information in Col. No. (3) pertains to class 1 to 4'employees only.(2) The information in Col. N o. (3) pertains to districts according to their territories existing on 1-7-60(3) As the census of Government employees was not conducted in 1970-71 the information in Col. No. (4 ) is tegjirding the
census of Gavemment employees as on 1-7-74.
angiT.—3T«T ^S o u r c e . — Directorate of Economics & statistics, GoVercment of Mj.bar«8htra» Bonit ay.
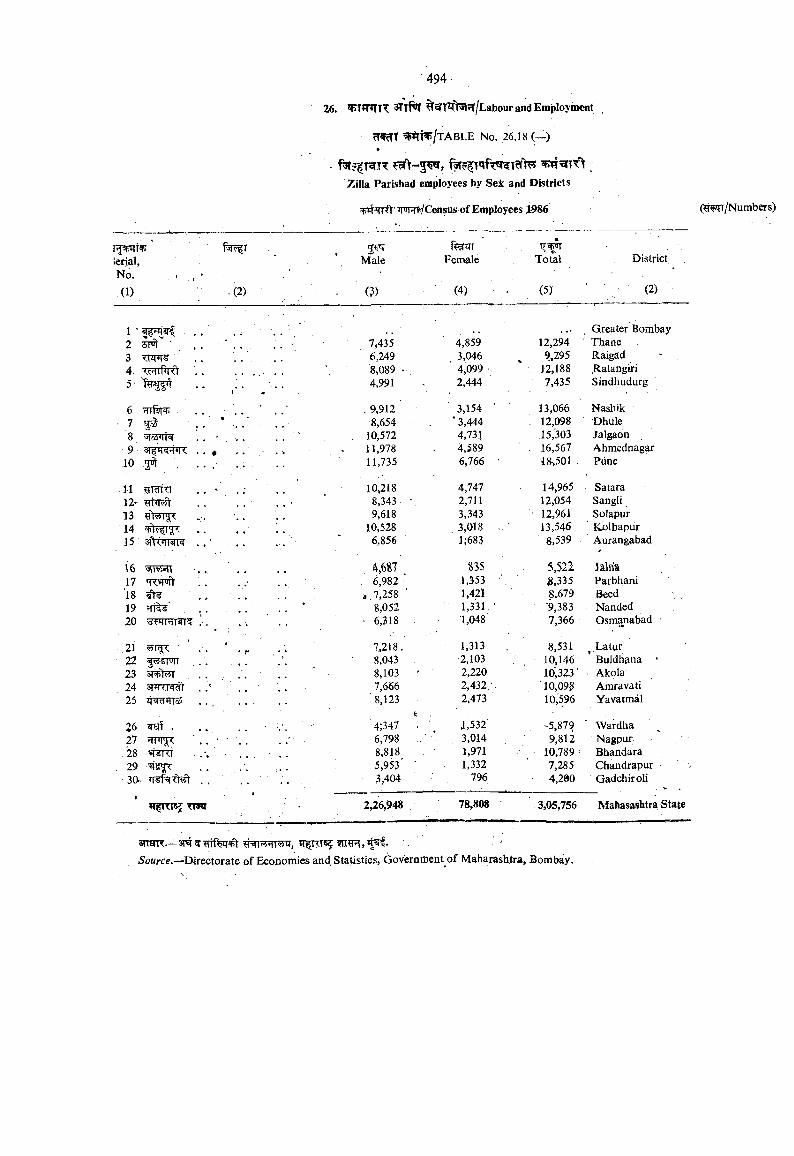
Zilla Parishad employees by S ei and Districts
jpFm/Census of Employees X986
lerial,No.
(1)
r>ic r
.(2)
3 ^Male
. - (?)
Female
(4)
« •
Total
(5)
Dist rict
■ (2)
1 ' , Greater Bombay2 ifJ! ■ „ , . 7,435 4,859 12,294 Thane3 WT¥ 6,249 3,046 9,295 Raigdd4. 8 ,089. ‘ 4,099 •, . 12,188 Ratangiri ,5' 4,991 2,444 7,435 Sindhudurg
6 .9,912. ' 3,154 ■ 13,066 Nashik• 7 ^ . . * 8,654 * 3,444 ' 12,098 Dhule
8 , siosq-i' r . . ; . 10,572 4,731 15,303 Jalgaon9 . . 0 . . ' • . ■• 11,978 4,589 ' 16,567 Ahmednagar
10 3^ . . . , 11,735 6,766 ■ 48>501 Piine
11 . . ' 10,218 4,747 ■ 14,965 Satara12- . . 8,343 ■ 2,711 12,054 Sangli13 9,618 3,343 12,961 Solapur14 . . ' ' . . . 10,528 3,018 .. 13,546 K.olhapiir15 . . ■ . . . 6,856 1,683 8,539 Aurangabad
16 4,687 S35 5,521 Jalria17 qT«nft . 6,982 ' 1,353 • ^,335 Parbhani18 ^ ' <. 7,258 ■ 1,421 8,679 Beed \ ,19 . . * 8,052 1,331 • . '9,383 Nanded20 3WRT9T’i . . 6,318 1,048 7,366 Osmanabad
2l 7,218. 1,313 8,531 Latur22 1^1 on , . . 8,043 2,103 . . 10,146 Buldtiana •23 8,103 ' 2,220 10,323' Akola24 3?Tr?T wt . .' 7,666 2,432.-. 10,09^ Amravati25 ii'=idMiS . . ................. 8,123 2,473 10,'596 Yavatmal
26 . . . 4;347 . 1,532 ■5,879 ■ Wardha27 ' <i * * •* ' 6,798 .. 3,014 9,812 Nagpur
. ’28 8,818 1,971 10,789^ Bhandara. 29 5,953’ ■ 1,332 7,285 Chandrapur -
30-. ’TSfEKivi) 3,404 796 • 4,290 GadchiroliI
»Ti iB5 Tn i 2,26,948 78,808 ’ 3,05,756 Mahasashtra State
snsTR.—31^ 'Source.—Directorate of Economies and. Statistics, Governtiieat of Matiarashtra, Bombay.
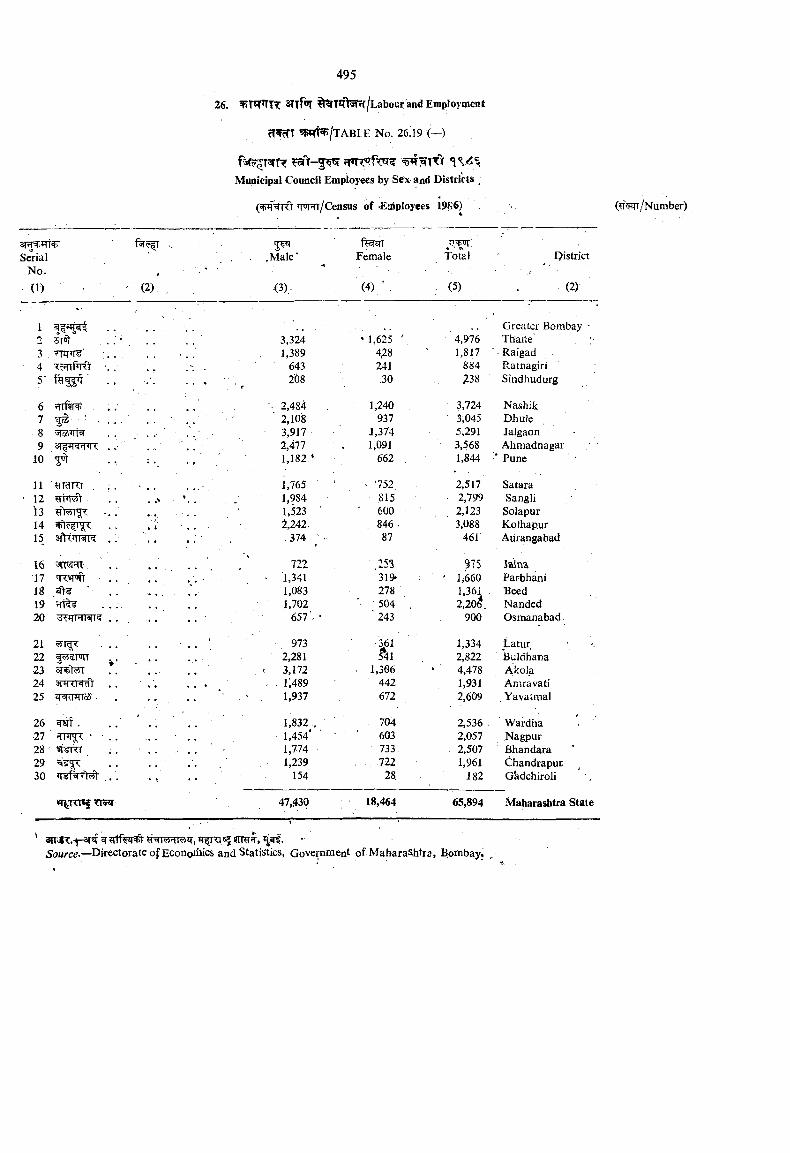
Municipal Council Employees by Sex and Districts
wrr/Census of J2aiployees 19S6)
srg^irtvSerial
No.(1) (2)
5W.Male'
<3),-
Female
(4) ’ .
Toral
(5)
l^istrict
(2)-
1o cOT3 . TTirn '45‘
6 Hiri*l+789 31 .
10
11 gidKI , ;12'131415
16171819 5Tt^20
212223 ^ #01 *2425 JTTWToS -
262728 fr§t?T2930
'PT|J T»5 TI»*r
Greater Bombay -3,324 ’ 1,625 ' 4,976 Thaile' , ;1,389 4^8 1,817 . Raigad
: 643 241 884 Ratnagiri208 ,30 238 Sindhudurg
’■ 2,484 1,240 3,724 Nasbik’ 2,108 937 3,045 Dhule
- 3,917 J,37'4 5,291 Jalgaon •2,477 1,091 3,568 Ahmadnagar1,182* 662 , 1,844 * Pune
1,765 ■ '752 2,517 Satara1,984 ,815 2,799 Sangli1.523 ' ' 600 2,123 Solapur2,242. , 846 . 3,088 Kolhapur,374 87 46r Aurangabad
722 m S75 Jalna• 1,341 319' ' 1 660 Parbhani
1,083 278 1,361 . Beed1,702 504 ' , 2,206. Nanded
657' • ■■ 243 900 Osmanabad
,9 7 3 361 1,334 Latur2,281 541 2,822 Buldhana
< 3*172 . 1,306 4,478 Ako(a. . i;489 442 1,931 Amravati
1,937 672 2,609 . Yavatmal
1,832,. 704 2,536 . Wardha1,454' ' • : ' 603 2,057 Nagpur1,774 • 733. . 2,507 Bhandara1,239 . . 722 1,961 Chandrapur
154 28 . 182 Gkdchiroli
47,430 18,464 65,894 Maharashtra State
5 oHrc .—Directorate of Economics and Statistics, Government of Maharashtra, Bombay;
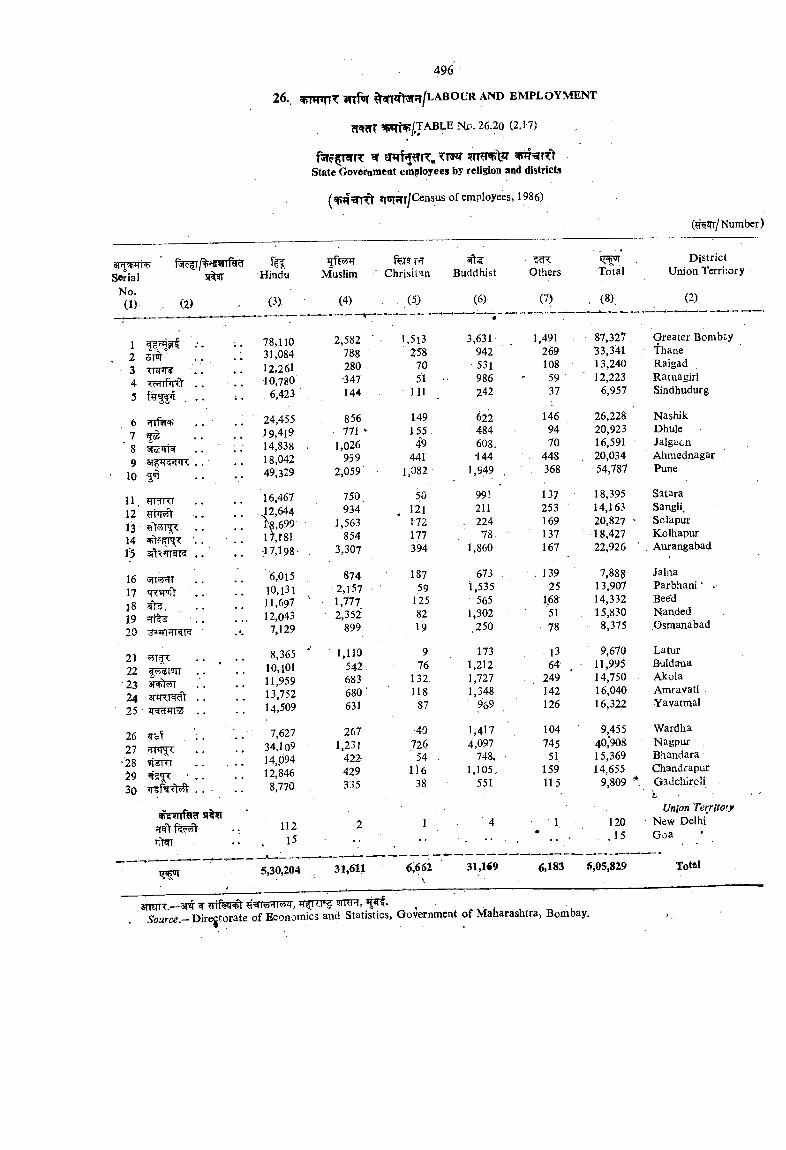
2f T m ^=^TTi’State Government employees by religion and districts
(^4^nnCt of employees, 1986)
SerialNo.(1) . (2)
1. 2 sm
34 -LrHlfilft .
5
67
89 3T fRT*n; .
■ 10 5^
11.1213 «Y55T .
14i;5
16 ■jnrTT17 q^^'Y .
18 , .1920
2122
■2324 3TRTR??t .
25
26 Tosf , '.27
■28 ■ KI29 W ' •30
f^r/%^5?nf?ra st^
District'C
'Hindu Muslim Chrisitan Buddhist Others Total Union Territory
(3) , (4) (5} (6) (7) . (8), (2)
78,110
— - - —r*
2,582 ' l,5 l3
•
3,631 : 1,491 87,327 Greater Bombay31,084 788 258 942 269 33,341 • Thane12,261 280 70 ■531 108 13,240 Raigad10,780 ■347 51 986 ' 59 12,223 Ratnagiri. 6,423 144 ■ 111 242 37 6,957 Sindhudurg
24,455 856 149 622 146 26,228 Nashik19,4i9 771 " 155 . 484 94 20,923 Dhule14,838 . 1,026 49 608: 70 16,591 Jalgaon18,042 959 441 i44 . 448 20,034 ' Ahmednagar49,329 2,059' 1,082 1,949 . . 368 54,787 Pune
16,467 750, 50 991 137 18,395 Satara.12,644 934 . 121 211 253 14,163 Sangli.1^^699 1,563 111 .. 224 169 20,827 • Solapur17,r81 854 177 78. 137 18,427 Kolhapur17,198- 3,307 394 1,860 167 22,926 ■ Aurangabad
6,015 674 187 673 ,139 7,888 Jalna10,131 2,1-57 ■ 59 1,535 25 13,907 Parbhani ’ >11,697 ■ 1,777 125 565 1.68 14,332 Seed12,043 2,352 82 1,302 51 , 15,830 Nanded7,129 899 19 ,250 78 8,375 Osmanabad
8,365 1,110 9 173 13 9,670 Latur10,101 542 76 1,212 64 . ■ 11,995 Buldana
11,959 683 132 1,727 249 14,750 Akola13,752 680 ' 118 1,348 142 16,040 Amravati14,509 631 87 969 126 16,322 Yavatmal
7,627 267 40 1,417 104 9,455 Wardha
34,109 1,231 726 4,097 745 40,'908 Nagpur14,094 422- 54 . 748. 51 15,369 Bhandara12,846 429 116 1,105, 159 14,655 Chandrapiir8,770 335 38 551 115 9,809 ^ Gadchircii
h . ■
Union Territory
112 2 1 ' 4 1 120 ' New Delhi
. 15 ••.15 Goa ‘
5,30,204 31,611 6,662\
31,1«9 6,183 6,05,829 Total
3mTT.—3T ^ ,
5o«rc^.-Diregtorate of Economics and Statistics, Government of Maharashtra, Bombay.
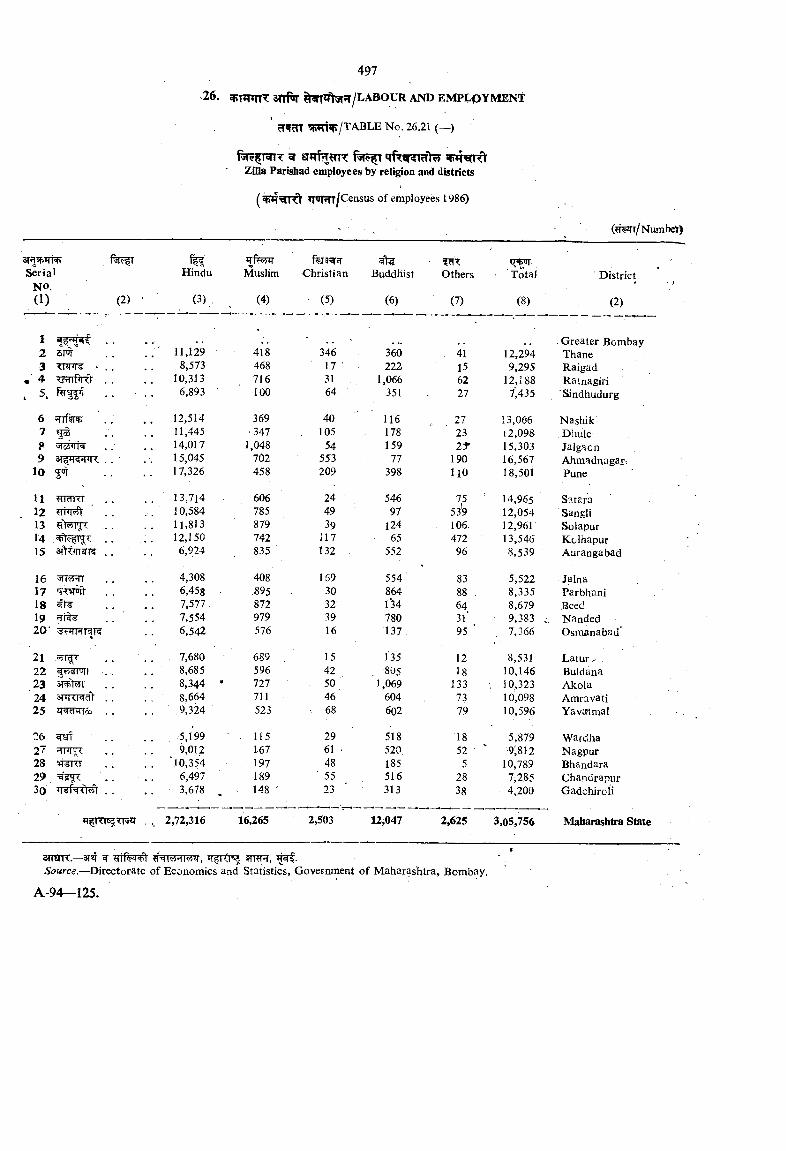
SerialNO.(1)
ABLE No. 26.21 (—)
^ qf i»?ncT>yZilla Parishad employees by religion and districts
*T®RT/Census of employees 1986)
(#^T/Nurabel-)
Hindu
(2) ■ (3)
Muslim
(4)
Christian
(5)
Buddhist
(6)
Others
(7)
Total
(8)
District
(2)
1 . .•
Greater Bombay2 5M .' 11,129 418 346 360 . 41 12,294 Thane3 • . . 8,573 468 17 ■ 222 15 9,295 Raigad4 1 Pi 0 . . 10,313 716 31 1,066 62 12,188 Rainagiri5. ■• 6,893 100 64 351 27 7,435 'Sindhudurg
6 ffrflFRi 12,514 369 40 116 27 13,066 Nashik7 11,445 ■347 . 105 178 23 12,098 Dhule^P 5Tc5 TH . .' 14,017 1,048 54 159 25- 15,303 Jalgacn9 SffFT qFiR . . 15,045 702 553 77 190 16,567 Ahmadnagart
10 17,326 458 209 398 HO 18,501 Pune
U HTmXT . . 13,714 606 24 ■ 546 V 14,965 Satera12 10,584 785 49 97 539 12,054 ' Sangli13 . . . 11,813 879 39 124 106 12,961 Solapurl4 . . 12,150 742 117 65 472 13,546 Kolhapur15 . . 6,924 835 132 . 552 96 8.539 Aurangabad
16 , 4,308 408 169 554 ' 83 5,522 Jalna17 6,458 .895 30 864 88 8,335 Parbhani18 7,577 . 872 32 134 , 64 8,679 Bced19 . . 7,554 979 39 780 3l' 9,383 Nanded20 6,542 576 16 137. 95 ' 7,366 Osmanabad’
2l 7,680 689 15 135 12 8,531 Latur-'22 ... 8,685 596 42 ■805 18 10,146 Buldana23 3^W 8,344 ' 727 50 1,069 133 . 10,323 Akola24 3TW^c5> . . 8,664 711 46 604 73 10,098 Amravati25 . . .9,324 ' 523 . 68 6o2 79 10,596 Yavartmal
^6 ^ . . 5,199 . 115 29 518 18 5,879 Wardha27 9,012 167 61 ■ 520 52 ■ ' 9;812 Nagpur28 fRRT . *10,354 197 48 185 5 10,789 Bhandara29 6,497 189 ■ 55 516 28 7,2,85 Chandrapur30 . . . • 3,678 148 23 ' 313 38 4,200 Gadchiroli
»T TTT5S 5*r . .. 2,72,316 16,265 2,503 12,047 2,625 3,05,756 Maharashtra State
amnr.—3T55 ^Directorate of Economics and Statistics, Government of Maharaslitra, Bombay.
A-94—125.
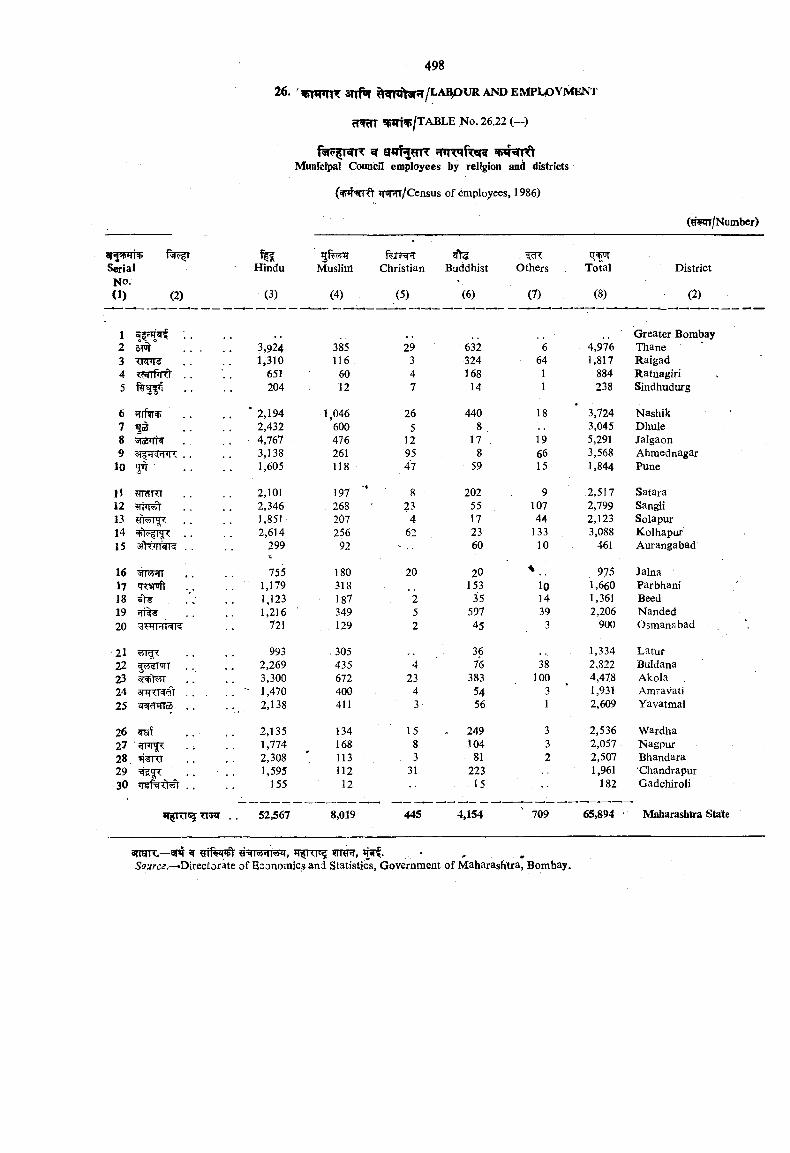
^ v iN ir tMunrdt>a1 Council employees by religion and districts '
ironrr/Census of employees, 1986)
. ^d<Serial Hindu Muslim Christian Buddhist Others Total District
NO. V(1) (2) (3) (4) (5) (6) (7) (8) (2)
1 . Greater Bombay2 51® 3,924 385 29 632 6 4,976 Thane3 1,310 116 . 3 324 64 1,817 Raigad4 . . 651 60 4 168 1 884 Ratriagiri5 . . 204 12 7 14 1 238 Sindhudurg
6 . . * 2,194 1,046 26 440 18 3,724 Nashik7 ^ . . 2,432 600 5 8 , 3,045 Dhule8 4,767 476 12 17 . 19 5,291 Jalgaon9 . . 3,138 261 95 8 66 3,568 Ahmednagar
10 OT 1,605 118 47 59 15 1,844 Pune
11 ^ R T 2,101 197 '* 8 202 9 2,517 Satara12 2,346 . 268 23 . 55 107 2,799 Sangli13 1,851 , 207 . 4 17 44 2,123 Solapur14 . . 2,614 256 62 23 133 3,088 Kolhapur15 . . 299
t92 60 10 461 Aurangabad
16 755 180 20 20 % 975 Jalna17 'RT'TV 1,179 318 153 10 1,660 Parbhani18 5Y¥ 1,123 187 2 35 14 1,361 Seed19 1,216 349 5 597 39 2,206 Nanded20 721 . 129 2 45 3 900 Osmanabad
21 . . . . 993 . 305 36 1,334 Latur22 .., 2,269 435 4 76 38 2,822 Buldana23 3,300 672 23 383 100 4,478 Akola24 3TW^r?V................. " 1,470 400 4 54 3 1,931 Amravati25 ■’iT ^ TIoc ■ . . 2,138 411 3' 56 1 2,609 Yavatmal
26 ^'r 2,135 134 15 249 3 2,536 Wardha27 ■ i FTfC 1,774 168 8 104 3 2,057 Nagpur28 ^IKT 2,308 113 3 81 2 2,507 Bhandara29 =E|I 1,595 112 31 223 1,961 Chandrapur30 . . 155 J2 .15 182 Gadchiroli
TT RTE TPiH . . 52,567 8,019 445 4,154 ' 709 65,894 Maharashtra State
arran—ant ^ ,
5oarc2.—DirecJtorate of Economics and Statistics, Government of Maharashtra, Bombay.
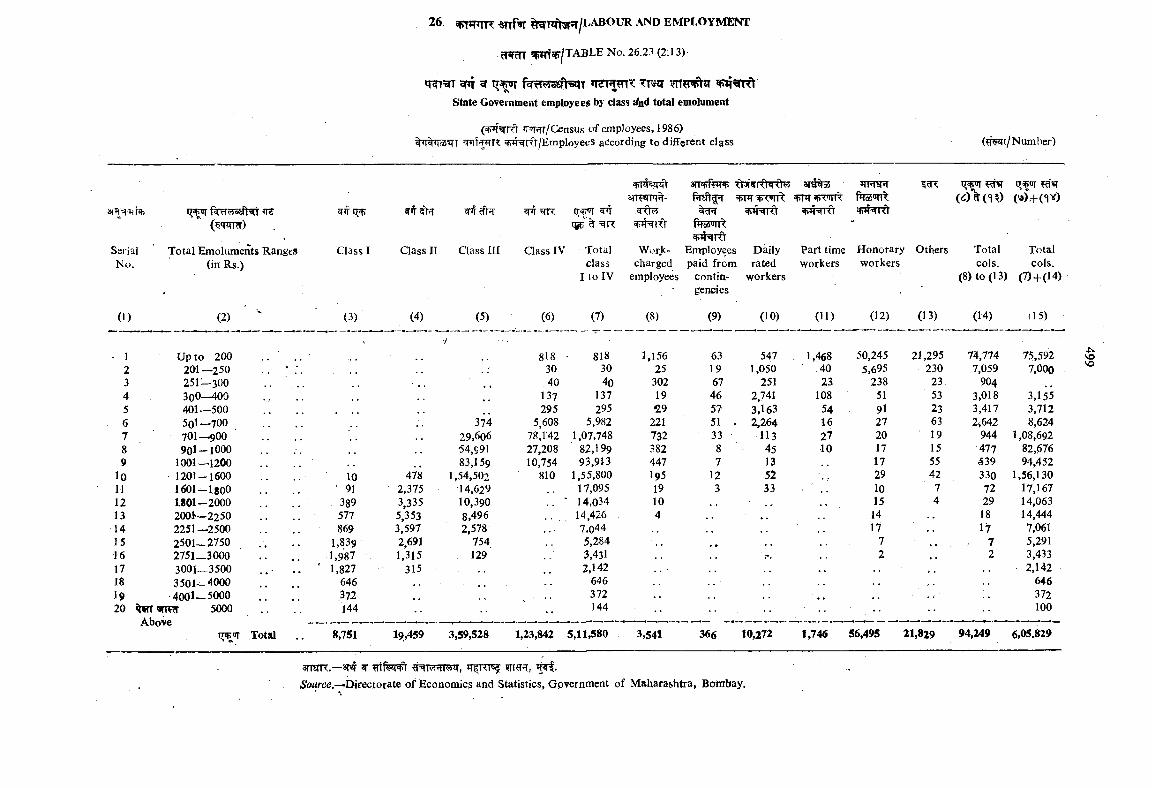
gfif ^ fsRT ystjHstT ntrmgrr?: tfht 5fTt?n?tiTstate Government employees by class £fnd total emolument
^'^^r/Census o f employees, 1986) ,% JTo5 T ^nNRt/Employe<iS atJcording to different class
SarialNo.
( 'nrm)
Total Emoluments Ranges (in Rs.)
Class I Class II Class III Class IV
cr^ ^
Total class
I to IV
arrPTTq -
^ ^ ifr
Worjc-chargcd
employees
3TRrf iTV fN^rftsRt^ ara%o5
fWiTTt
Employees paid from
contingencies
Dailyrated
workers
5Fm v w t
Part time workers
fiT55’>TT
Honotaryworkers
Others Total cols.
(8) to (13)
Totalcols.
(7)+(14)
(1) (2) (3) (4) (5) (6) (7) (8) (9) (10) (11) (12) (13) (14) (15)
- 1 Up to 200' •/
818 818 1,156 63 547 . 1,468 50,245 21,295 T4,774 75,5922 201 —250 • ; 30 30 25 19 1,050 40 5,695 230 7,059 7,0003 251-300 - , , 40 4o 302 67 251 23 238 23, 9044 300—400 137 137 19 46 2,741 108 51 53 3,018 3,1555 401—500 .. . . # .. 295 295 29 57 3,163 54 91 23 3,417 3,7126 501-700 374 5,608 5,982 221 51 . 2,264 16 27 63 2 642 8,6247 701—9OO 29,606 78,142 1,07,748 732 33 ■ 113 27 20 19 944 1.08,6928 901-1000 54,c91 27,208 82,199 382 8 45 10 17 15 477 82,6769 1001—1200 83,159 10,754 93,913 447 7 13 17 55 539 94,452
lO 1201-1600 10 478 1,54,502 810 1,55,800 195 12 52 29 42 330 1,56,130M 1601-1800 .. . . '9 1 2,375 14,629 17,095 19 3 33 10 7 72 17,16712 L801-2000 .3 8 9 3,335 10,390 14,034 10 15 4 29 14,06313 2001— 2250 .. 577 5,353 8,496 14,426 4 14 18 14,44414 2251—2500 869 3,597 2,578 7,044 17 17 7,06115 2501—2750 1,839 2,691 754 5,284 7 7 5,29116 2751—3000 1,987 1,315 129 3,431 2 2 3,43317 3001—3500 . . . . . ' 1,827 315 2,142 2,14218 3501—4000 646 646 64619 4001—5000 372 . . 372 * , 37220 ^ STPRr 5000 144 144 100
AboveIT<IT Total 8,751 19,459 3,59,528 1,23,842 5,11,580 3,541 366 10,272 1,746 56,495 21,829 94,249 6,05.829
.tvAOVO
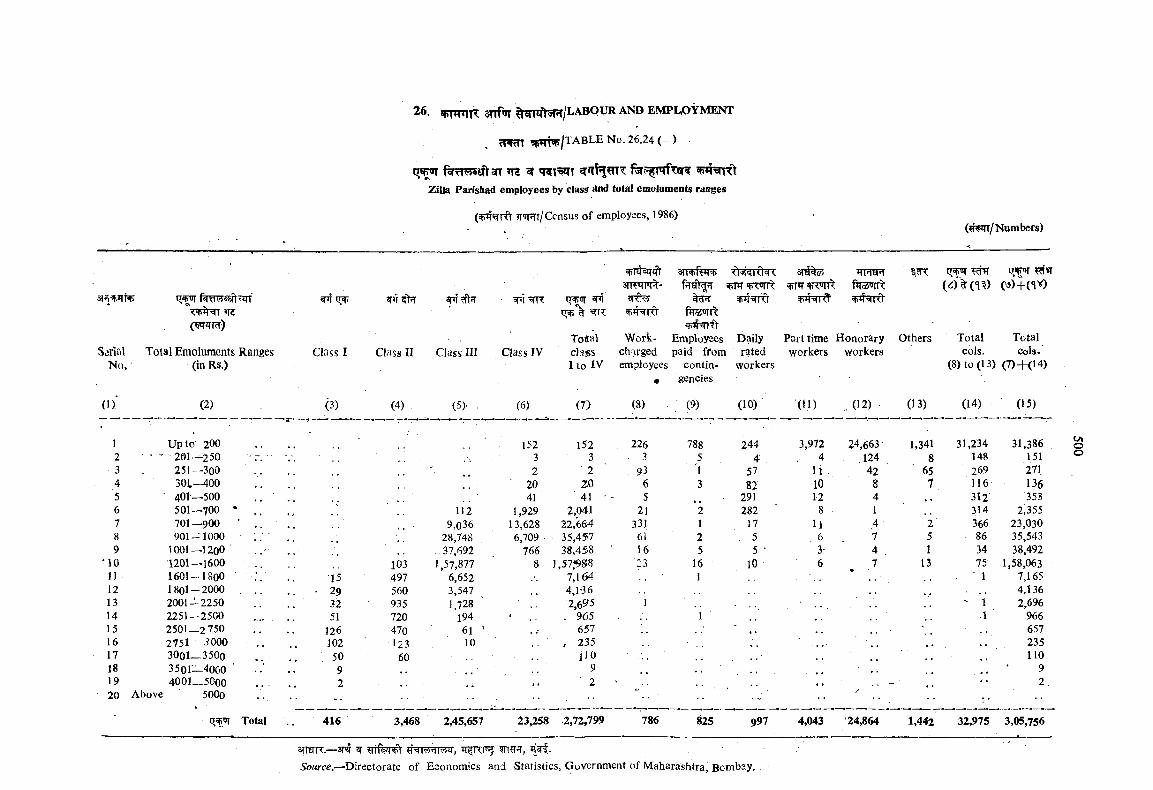
f rT555€f 5rT ^Zilla Parishad employees by class total emoluments ranges
(W^Rt TT'JRT/Census of employees, 1986)
\^'=siTl <iT ^
Total
snr TFT -
Work-
^ -
Employees
3 r fe PT w n t
TPTtJ
^nhiT^
IT^
Daily Part time Honorary Others Total TotalSanal Total Emoluments Ranges Class I Class II Class III Class IV class charged paid ffom rated workers workers cols. Cols.
No. (in RS.) Ito IV employees contin workers (8) to (13) (7)+(14)• gencies
(1) (2) 0 ) (4) (5)- - (6) (7) (8) . (10) (11) , (12) (13) (14) (15)
1 Up to 200 ' 152 152 226 788 244 3,972 24,663 1,341 31,234 31,3862 - — 201—250 ;-. ■ V 3 3 . 3 5 4 4 ,124 8 148 1513 251—300 .. . 2 2 93 'l 57 11 . 42 65 269 2714 3QL-400 20 20 6 3 82 10 8 7 , 116 1365 • 401—500 .. . 41 41 ■ ' 5 291 12 4 , , 312 3536 501—700 ‘ .. 112 1,929 2,041 21 *2 282 8 . 1 314 2,3557 701—900 ' . . . 9,036 13,628 22,664 33,1 1 17 U ,4 ' 2 366 23,0308 901-1000 :. . 28,748 6,709 35,457 61 2 . 5 6 7 5 86 35,5439 1001—1200 .. . .37,692 766 38,458 16 5 5 ■ 3‘ 4 . 1 34 38,492
*10 1201—1600 103 1,57,877 8 1,57,^8!8 -3 16 10 6 7 13 75 1,58,06311 1601-1800 :. . 15 497 6,652 7,164 ■ 1 7,16512 1801-2000 .. . ■ 29 560 3,547 4,1-36 4,13613 2001-2250 .. 32 935 1,728 2,695 1 ' 1 2,69614 2251-2500 ... , . 51 720 194 . 965 1 96615 2501—2 750 , . . 126 470 61 ' 657 , . 65716 2751 .?000 .. 102 123 10 , 235 » . , . 23517 3001—3500 . . . , 50 60 i io . . 11018 3501—4000 •• 9 , , ■ ■ 9 • • 919 4001—5000 . . . 2 , , 2 • • .. - -• 2 .20 Above 5000 /
Total .. 416 3,468 2,45,657 13,258 2,72,799 786 825 997 4,043 24,864 1,442 32,975 3,05,756
^ ? N n w ^ , ^TfTciS'oMrce.-—Directorate of Economics and Statistics, Government of Maharashtra, Bombay.
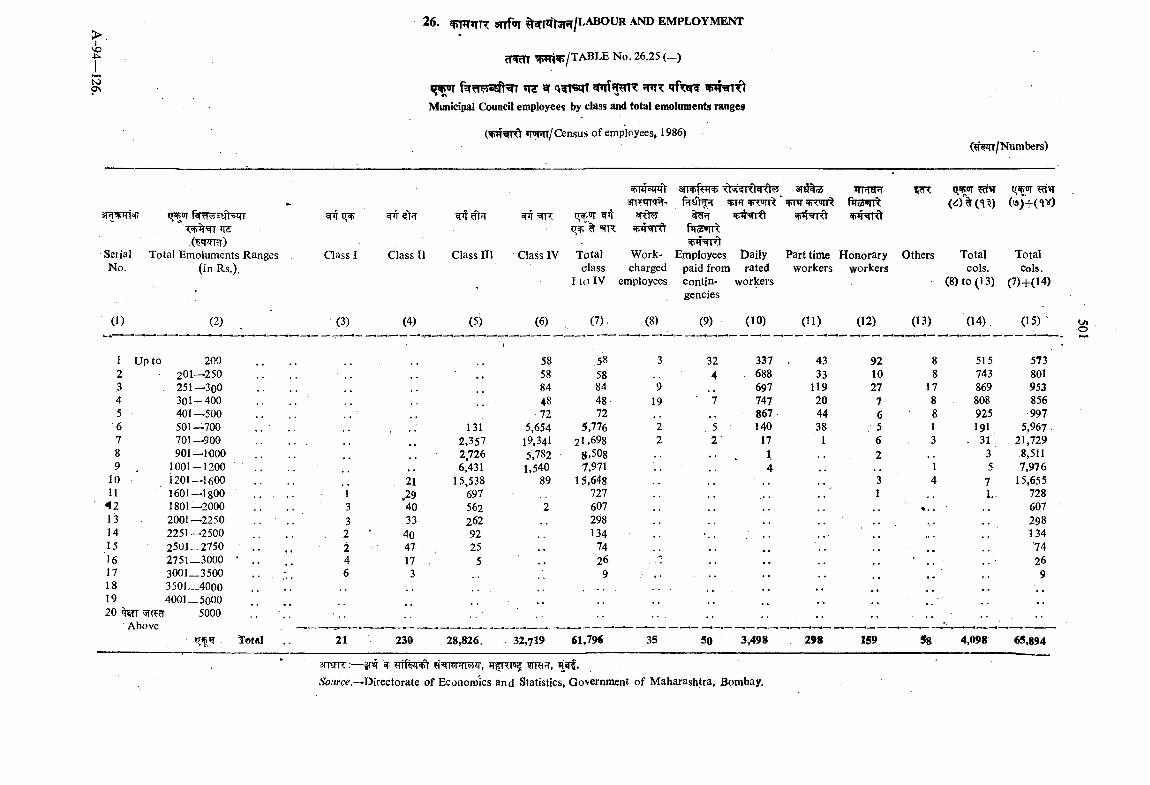
ON
rTfm ?Frt^/TABLE No. 26.25 ( _ )
ITJ ar q4t^T *Tfr5T5Municipal Council employees by class and total emoluments ranges
»WFn/Census of employees, 1986)
.( 'FTRT)Serial Total Emoluments Ranges No. (in Rs.).
(1) (2)
Class I
(3)
Class II
(4)
Class III
(5)
Class IV
(6)
IT .5 JT
Total class
I to IV
(7).
wrm zpftSH’f’TT'T -
Work-charged
employees
(8)
3TR)Rirvfvra%T
l o4«ll ^ TTTt
Employees paid from contingencies
(9)
^JT +7TiTr
Dailyrated
workers
3T€I%(j5
v^hrrft
ITHOT
(10)
Part time workers
(H)
Honoraryworkers
(12)
Others
(13)
Total cols.
(8) to (13)
(14),
TotalCols.
(7)-l-(14)
(15) o»o
1 up to 200 58 .58 3 32 337 . 43 92 8 515 5732 201—250 58 58 4 . 688 33 10 8 743 8013 . 251—300 84 84 9 697 119 27 17 869 9534 301-400 48 48- 19 ■ 7 747 20 7 8 808 8565 401 —500 .. ,. • •• 72 72 , , 867 44 6 8 925 9976 501—700 .. .. 131 5,654 5,776 2 5 140 38 5 1 191 5,9677 701—900 .. 2,357 19,341 2l .698 2 2 17 1 6 3 . 31 21,7298 901—1000 2,726 5,782 8,508 1 2 3 8,5119 1001-1200 .. . , 6,431 1,540 7,971 , . 4 , , , , 1 5 7,976
10 1201-1600 21 15,538 89 15,648 ,. 3 4 7 15,65511 1601—1800 .............. i ,29 697 727 1 1. 728
42 1801—2000 3 40 562 2 607 , , 60713 2001—2250 .. .. 3 33 262 298 29814 2251—2500 .. .. 2 40 92 134 13415 2501—2750 ■ 2 - 47 25 74 .. .. ‘7416 2751-3000 ' 4 17 . 5 26 2617 3001__3500 . . . . 6 3 9 , . , , 918 3501—4000 .. ., , .19 4001—500020 ^ 3Tf 5000
Ahn\/#i •• ••
iT*P«T Total 21 230 28,826. 32,719 61,79« 35 50 3 498 298 159 58 4,098 65,894- 5TRl?f,
5'<?//rce.-.Directorate of Economics and Statistics, Government of Maharashtra, Bombay.
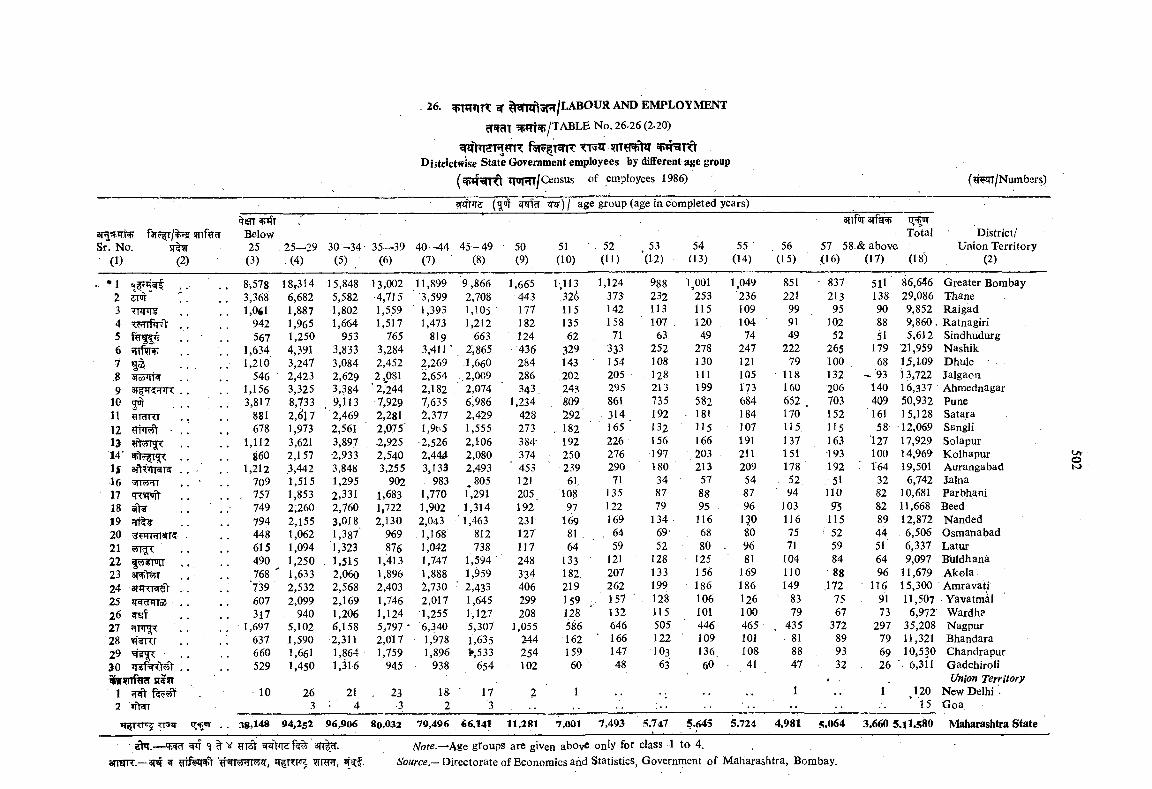
Diitcictwise State Government employees by different age group (^ x T R t TpiHT/Census of employees 1986)
^^^)| age group (age in completed years)
Sr. No. JT%?T(1) (2)
Below25(3)
3llplI3Tfsn> IT^Total District/
.(4) (5) (6) (7)45-49 • 50 51 . 52 53 54 55 • 56 57 58.& above Union Territory
(8), (9) (10) (11) ‘(12) (13), (14) (15) <16) (IV) (18) (2)
9,866 1,665 1,113 1,124 988 1,001 1,049 851 - 837 511 86,646 Greater Bombay2,708 443 32(3 371 232 253 '236 221 213 138 29,086 Thane1,105 ' 177 115 142 113 115 109 99 95 90 9,852 Raigad1,212 182 135 158 107 . 120 104 91 102 88 9,860 - Ratnagiri
663 124 62 71 63 49 74 49 52 51 5,612 Sindhxidurg2',865 436 329 333 252 278 247 222 265 179 21,959 Nashik.1,660 284 143 ■ 154 108 130 121 79 100 68 U,1.09 Dhule.2,009 286 202 205 . 128 111 105 • 118 132 93 13,722 Jalgaon2,074 343. 243 295 213 199 173 160 206 140 16,337 Ahmednagar6,986 1,234 809 861 735 582 684 652 . 703 409 50,932 Pune2,429 428 292' . 314 192 181 184 170 152 161 15,128 Satara1,555 273 , 182 165 132 115 107 115 115 58 12,069 Sangli2,106 384- 192 226 156 166 191 137 163 127 17,929 Solapur2,080 374 250 276 197 203 211 151 193 100 14,969 Kolhapur2,493 ■ 453 239 290 180 213 209 178 192 : 164 19,501 Aurangabad^805 121 61 71 34 57 54 . 52 51 32 6,742 Jalnar,291 205 108 135 87 88 87 94 110 82 10,681 Parbhani1,314 192 97 122 79 95 96 103 95 82 11,668 Beed
‘ 1,463 231 169 169 134 116 1^0 116 115 89 12,872 Nanded812 127 81 . . 64 69' , 68 80 75 ■ 52 44 6,506 Osmanabad738 117 64 59 52 80 96 71 59 51 6,337 Latur
1,594 248 133 121 128 125 81 104 84 64 9,097 Buldhana1,959 334 182. 207 133 156 169 110 88 96 11,679 .Akola
■ 2,433 406 219 262 199 186 186 149 172 116 15,300 Amravati1,645 299 159 / 157 ■ 128 106 126 83 75 91 11,507 Yavatmal1,127 208 128 132 115 101 100 79 67 73 6,972- Wardh?5,307 1,055 586 646 505 446 465 435 372 297 35,208 Nagpur1,635 244 162 ■ 166 122 109 101 81 89 79 11,321 Bhandara>,533 254 159 147 103 136. 108 88 93 69 10,530 Chandrapur
654 102 60 48 63 60 41 47 32 26 6,311 Gadchiroli Union Territory
17 2 1 I 1 120 New Delhi •3 . . * 15 Goa.
66,141 11,281 7,001 7.493 5.747 5.645 5.724 4.981 5.064 3.660 5.11.580 Maharashtra State
• 1234 ■=c??iWt567 ^.5 '»loo ll4 9 3i^5rPR
10 2 1 n ncTRT 12 '1314 Is -1617 qrfT'iTt1819 r|1%20 'i +ii>il«4l3r21 ?yTf?:222324 3T»RT 'V25 4ie(cfHl53262728 ?ilRr2930
Jit?i 12 nV n*T5m^ TTSiT <+'>r
8,578 3,368 1,061
942 567
1,634 1,210
546 1,156 3,817
881 678
1,112 860
1,212 709
. 757 749 794 448 615 490 768
■739607317
1,697637660529
10
18,3146,6821,8871,9651.250 4,391 3,247 2,423 3,325 8,733 2,6} 7 1,973 3,621 2,157 3,442 1,515 1,853 2,260 2,155 1,062 1,0941.250 1,633 2,532 2,099
. 940 5,102 1,590 1,661 1.450
263
15,848 5,582
■1,802 1,664
953 3,833 3,084
, 2,629 3,384 9,113 2,469 2,561 3,897 2,933 3,848 1,295 2,331 2,760 3,018 1,387' 1,323
. 1,515 2,060 2,568 2,169 1,206 6,158 2,311 1,864 1,316
21
13,002 4,715 1,559 1,517
765 3,284 2,452 2,081
' 2,'244 7,929 2,281 2,075 -2,925 2,540 3,255
902 1,683 1,722 2,130
969 876
1,413 1,896 2,403 1,746 1,124 5,797 * 2,017 1,759
945
. 233
11,899 ■ 3,599
1,393 1,473 . 8I93.41 r 2,269 2,654 2,182 7,635 2,377 1,9(15 2,526 2,44^ 3,133
983 1,770 1,902
. 2,043 1,1681.042 1,747 1,888 2,730 2,017 1,255 6,340 1,978 1,896
938
1&2
oK»
38,148 94,2s2 96,906 8o,032 79,406
Eh. — H t Wirl;iTJf ’3T%r.arrerrr.—3T# ytfervt ' r rM TT ,
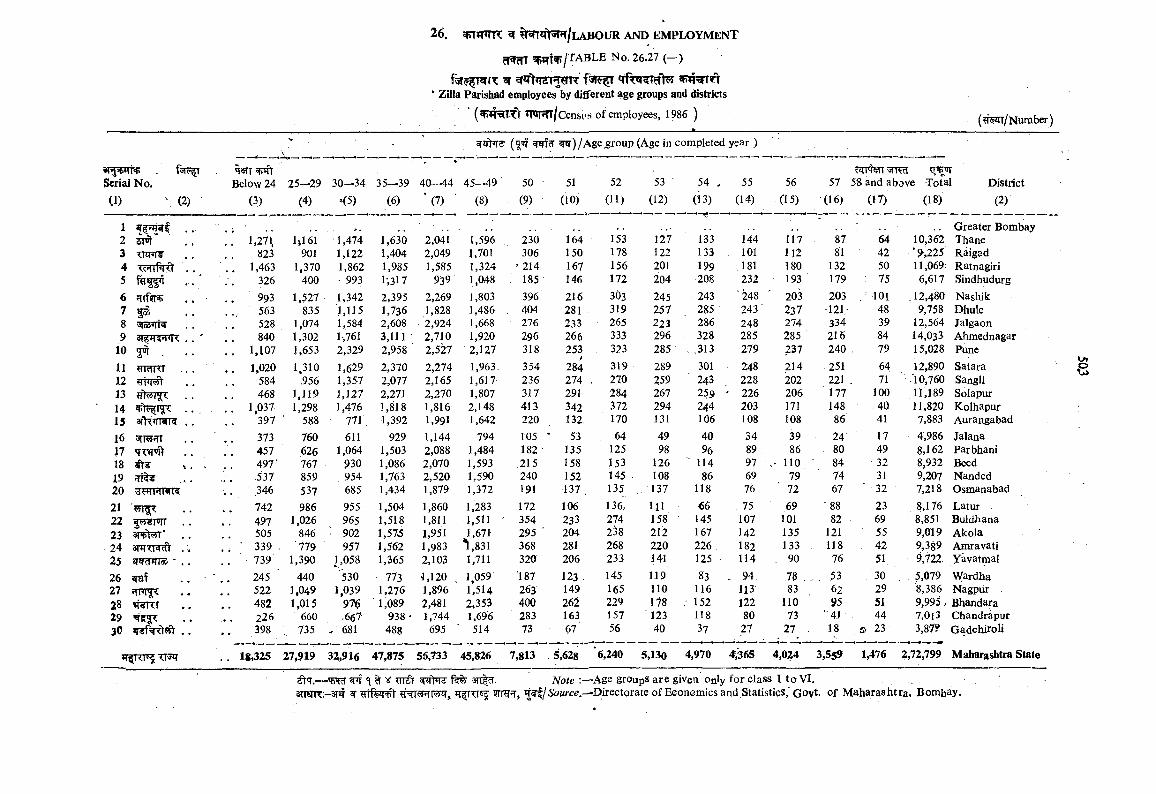
‘ Zilla Parishad employees by dififerent age groups and districts
■ (^=«T^R'y *nnTT/Censi-fi of employees, 1986 ) (?r^/Number)
Serial No.
(1> (2)
1 .23 TFFT4 w firfr .5 ..6 ?nfi?nT7 5®8 <sj3TITR9 ar iRqiR .
10 .
11 HMTT ..1213 .1415 afV<7TRra .16 5TM;rr1718 »
19 fTT2021 '5n^22 ..23 ai tsTT’24 . '.25 ' . .2627 ?[Hgx28 »i¥RT2930
IT RT TT5JT
(^’J? ^fcT ^)/A ge^roup (Age in completed year )
q«fTT ^Below 24 25—29 30—34 35—39 40—44 45—49
(3) (4) <5) (6) ‘ (7) ' (8)
1,271,823
1,463326993563528840
1,1071.020
584468
1,037397 373 457 497 ■ ,537 346742497505 339 . 739245 ' 522 482 226398
1>,161901
1,370400
1,527835
1,0741,3021,6531,310
.9561,1191,298
588760626767859537986
1,026846779
1,390440
1,0491,015
660735
•1,474 1,122 1,862 - 9931,3421,1151,5841-,7612,3291,629 1,357 1,127 1,476
771, 611
1,064 930
. 954 685955965902957
1,058530
1,039 97^ -667
/ 681
1,6301,4041,9851-,3172,3951,7362,6083,1112,958'2,370 2,077 2,271 1,818 1,392
9291.503 1,086 1,763 1,4341.504 1,518 1,573 1,562 1,365
' 773 1,276 1,089
938 ' 488
2,0412,0491,585
9392.269 1,828
■ 2,924 2,710 2,5272,2742,1652.270 1,816 1,9911,1442,0882,0702,5201,8791,8601,8111,9511,9832,1034,1201,8962,4811,744695
1,5961,7011,3241,0481,803 1,486 1,668 1,920
■ 2,127 1,963. 1,617 1,807 2,148 1,642
7941,4841,5931,5901,3721,2831,5111,671
1,8311,7111,0591,5142,3531,696'514
lg,325 27,919 32,916 47,875 56,733 45,826
50(9)
51(10)
52
01)
53 ■ (12)
54 . (13)
55(14)
56(15)
57(16)
58 and above Total District (17) (18) (2)
.. Greater Bombay230 164 153 127 133 144 117 87 64 10,362 Thane306 150 178 122 133 . 101 112 81 42 *9,225 Raigad
' 214 167 156 201 199 181 180 132 50 11,069 Ratnagiri185 146 172 204 208 232 193 179 . 75 6,617 Sindhudurg396 216 3O3 245 243 '248 203 203 101 J 2,480 Nashik404 281 319 257 285 243' 237 121,- 48 9,758 Dhule276 233 265 223 286 248 274 334 39 12,564 Jalgaon296 266 333 296 • 328 285 285 216 84 14,033 Ahmednagar318 253 . 323 285 .313 279 237 , 240 79 15,028 Pune354 284 319 289 301 248 214 .251 64 12,890 Satara236 274 , 270 259 243 228 202 221 71 .'10,760 Sangli317 291 284 267 259 226 206 ■ 177 100 11 >189 Sblapur413 342 372 294 244 203 171 148 40 11,820 Kolhapur220 132 170 131 106 108 108 86 41 7,883 Aurangabad105 53 64 49 40 34 39 24' 17 4,986 Jalana182 ■ 135 125 . 98 96 89 . 86 . 80 49 8,162 Parbhani215 158 J53 126 ' 114 97 - 110 84 • 32 8,932 Seed240 152 145 108 86 69 79 74 31 9,207 Nanded191 137 . 135 137 118 76 72 67 ■ 32 7,218 Osmanabad172 106 136, 111 66 75 69 ■ 88, 23 8,176 Latur354 233 274 158 145 107 101 82 69 8,851 Buldhana295 ‘ 204 238 212 167 142 135 121 55 9,019 Akola368 281 268 220 226 . 182 133 118 . 42 9,389 Amravati320 206 233 14-1 125 114 90 76 51 9,722 yavatmal187 123 145 119 83 . 94. 78 . . 53 30 5,079 Wardha263 149 165 110 116 113 83. 62 29 8,386 Nagpur400 262 229 178 ; 152 122 110 95 51 9,995 3 Bhandara283 163 157 123 118 80 73 ■ 41 44 7,0i3 Chandrapur73 67' 56 40 37 27 27 18 S’ 23 3,87? Gadchiroli
^8l3 .5,628 6,240 5,130 4,970 4,365 4,024 3,559 1,476 2,72,799 Maharashtra State
u»
€t<r.— spf % V ¥T<?1' 3T^. JVofe Age groupS are given only for class I to VI.3TTsnR:-3nf ^ ?rr?nT, #^/5'o«/'c^.--I)irectorate of Economics and Statistics,'Qoyt. of Maharashtra, Bombay.
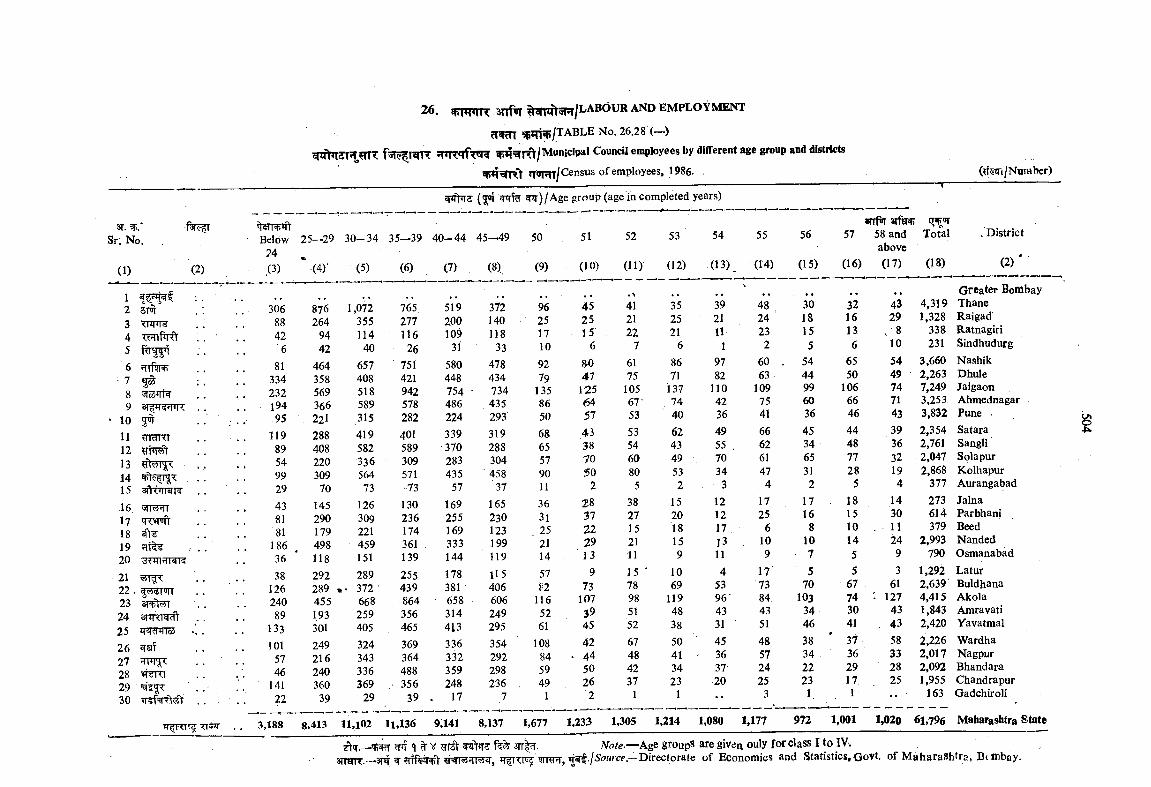
3T.Sr. No.
(1) (2)
123456 frrftRT
• 7 ^ :8 5To3 li=)9
• 10 5^11 rrar<i12 ?rni^13141516171819202122. 5^T’JIT232425 A|iT?I4TTc3 . .
26 £lf .
272829 . •30
26. frum R 3TTf»r ^ ^ sw / l a b o u r a n d e m p l o y m e n t
W 3R /J a b le No. 26.28 (->)
snrtqSTJtmT ^^arRt/Municipal CouncU employees by different age group and districts
^^)|A ge group (age in completed years)
Below24(3) (4)' (5)
3068842'681
33423219495
1198954992943 81 81
1863638
12624089
133101
5746
14122
876264
9442
46435856936622128840822030970
145290179498118
292289455193301249216240360
39
1,072355114
4065740851858931541958233656473
126309221459151289
. 372- 668 259 405324343336369
29
(6) (7)
765.277116
26751421942578282401589309571-73130236174361139255439864356465369364488356
39
519200109
31580448754486224339370283435
57169255169333144178381658314413336332359248
17
(8).
372140118
33478434 734435 293 319 288 304 458
37165230123199119115406606249295354292298236
7
TT HT' 3,188 8,413 11,102 l l , l3 6 9,141 8,137
50 51 52 53 54 55 56 57 58 and Total .Districtabove
(9) (10) (11) (12) (13), (14) (15) (16) (17) (18) (2)*
■' . . Greater Bombay96 45 41 35 39 48 30 32 43 4,319 Thane25 25 21 25 21 24 ‘ 18 16 29 1,328 Raigad'17 15 22 21 11 23 15 13 . 8 338 Ratnagiri10 6 7 6 1 2 5 6 10 231 Sindhudurg
92 8iO 61 86 97 60 . 54 65 54 3,660 Nashik79 47 75 71 82 63 44 50 49 2,263 Dhule
135 125 105 137 110 109 99 106 74 7,249 Jalgaon86 64 67- 74 42 75 60 66 71 3,253 Ahmednagar50 51 53 40 36 41 36 46 43 3,832 Pune
68 43 53 62 49 66 45 44 39 2,354 Satara65 38 54 43 55 . 62 34 48 36 2,761 Sangli57 70 60 49 70 61 65 77 32 2,047 Splapur90 50 80 53 34 47 31 28 19 2,868 Kolhapur11 2 5 2 3 4 2 5 4 377 Aurangabad
36 28 38 15 12 17 17 . 18 14 273 Jalna3l 37 27 20 12 25 16 15 30 614 Parbhani
. 25 22 15 18 17 - 6 8 10 . 1 1 379 Beed21 29 21 15 13 10 10 14 24 2,993 Nanded14 13 11 9 11 9 • 7 5 9 790 Osmanabad
57 9 15 ' 10 4 17 5 5 3 1,292 Laturf<2 73 78 69 53 73 70 67 61 2,639 Buldhana
116 107 98 119 96 84 103 74 127 4,415 Akola52 P 51 48 43 43 34 30 43 1,843 Araravati61 45 52 38 31 ‘ 51 46 41 , 43 2,420 Yavatmal
108 42 67 50 45 48 38 ' 37 58 2,226 Wardha84 . 44 48 41 36 57 34 36 33 2,017 Nagpur59 50 42 34 37 24 22 29 .28 2,092 Bhandara49 26 37 23 20 25 23 17 25 1,955 Chandrapur
1 2 1 1 •• 3 1 1 •• ' 163 Gadchiroli
1,677 1,233 1,305 1,214 1,080 1,177 972 1,001 1,020 61,796 Mabara^tra State
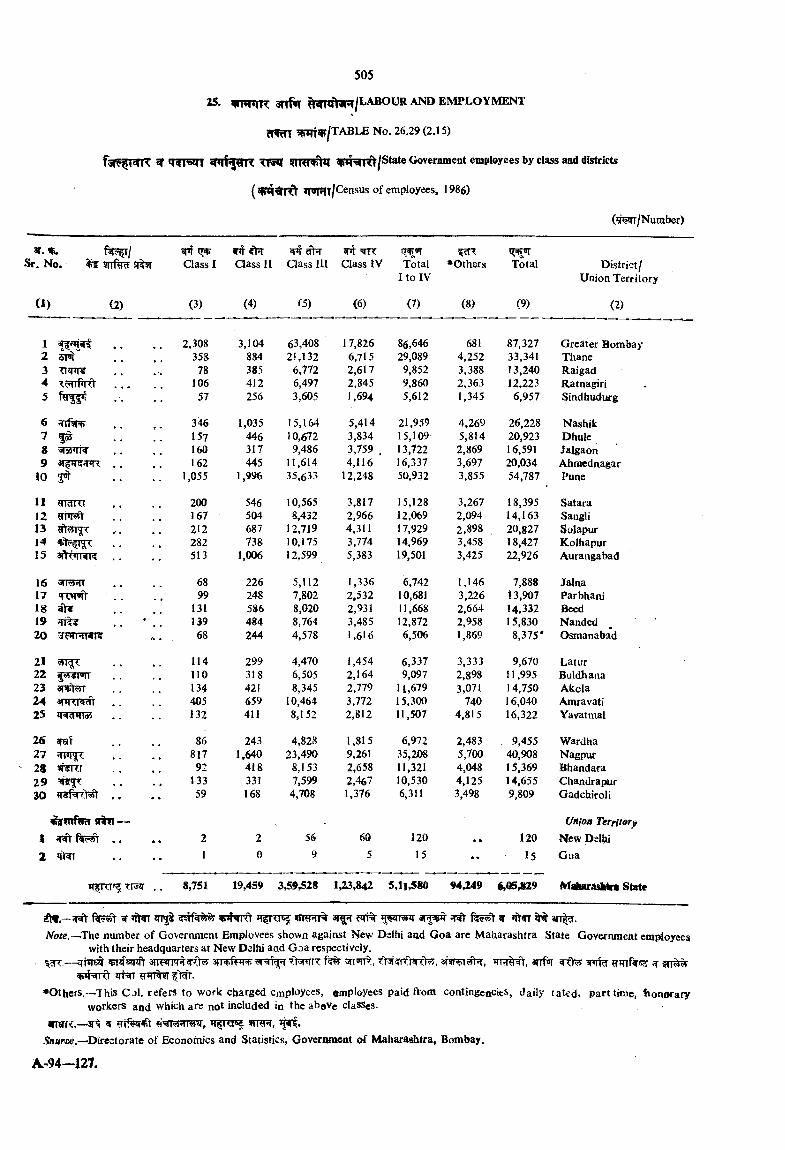
25. vm rn r anf^ a n d e m p l o y m e n t
cWm ?p?Ttv/TABLE No. 26.29 (2.15)
^ « R T ^ 5# 3n^/State GoverniBent employees by class aad districts
(^ < T R t ?T»rj|T/Census of employees, 1986)
3f. %. f k ^ l W cf T 3PT=^Sr No. Class I Class II Class III Class IV Total »Others Total District/
I to IV Union Territory
(1) (2) (3) (4) 5) (6) (7) (8) (9) (2)
5mTtinr?
67 ^8 srain^9
10 y»r
11 TTcITTT12 Enrst131415 afKwi-i
16 : M?rr17 TW»fV18 ^19 ^20
2 l22 55$ n»n23 3TFt^24 3Fnwft25
26 eraf2728 «f^ r2930
^fUfVtT SI Tf •t JfwV f e # , 2
2,30835878
10657
346157160162
1,055
200167212282513
6899
131 13968
114110134405132
86817
92133 59
3,104884385412256
1,035446317 445
1,996
546504687738
1,006
226248586484244
299318 421 659 411
2431,640
418331168
63,4082i,132
6,7726,4973,605
15,16410,6729,486
11,61435,633
10,5658,432
12,71910,17512,599
5,1127,8028,0208,7644,578
4,4706,5058,345
10,4648.152
4,82823,490
8.153 7,599 4,708
569
1 7,8266,7152,6172,8451,694
5,4143,8343,7594,116
12,248
3,8172.9664,3113,7745,383
1,3362,5322,9313,4851,616
1,4542,1642,7793,7722,812
1,8159,2612,6582,4671,376
605
86,64629,0899,8529,8605,612
21,95915,10913,72216,33750,932
15,12812,06917,92914,96919,501
6,742 10,681 11,668 12,872 6,506
6,3379,097
11,67915,30011,507
6,97235,20811,32110,5306,311
12015
6814,2523,3882,3631,345
4,2695.8142.869 3,697 3,855
3,2672,0942.898 3,458 3,425
1,1463,2262,6642,9581.869
3,3332.898 3,071
7404.815
2,4835,7004,0484,1253,498
87,327 33,341 i 3,240 12,223 6,957
26,22820,92316,59120,03454,787
18,39514,16320,82718,42722,926
7,88813.907 14,332 15,830
8,375*
9,670 11,995 14,750 16,040 16,322
9,45540.908 15,369 14,655 9,809
12015
Greater BombayThaneRaigadRatnagiriSindhudufg
NashikDhuleJalgaonAhraednagarPune
SataraSangliSolapurKolhapurAurangabad
JaJnaParbhaniBeedNandedOsmanabad
LaturBuldhanaAkolaAmravatiYavatmal
WardhaNagpufBhandaraChandrapurGadchiroli
Urtioa Territory New Delhi Goa
TTSSf 8,751 19,459 3^9,528 1,23,842 5,U ,580 9 4 ^ 9 $,05329 State
«r a i^ f*ri% fsW)" ar ^The number of Government Employees shown against New Delhi aad Goa are Maharashtra State Government etni^oyees
with their headquarters at New Delhi and Goa respecti vely.%W .— STRoTTt arrPTFR^ t f t ^ R Wrrf , anfnf fT TTi sa: sr
vihfRt trt TT•Others.--^This Col. refers to work charged employees, employees paid ftom contingencies, daily rated, parttitne, tionoraty
workers and which are not included in the aboVe classes-jfTfff'C.—ar sf *i rT$RT ,
S8«mr.—Directorate of Economics and Statistics, Goyermaeat of Maharashtra, Bombay.
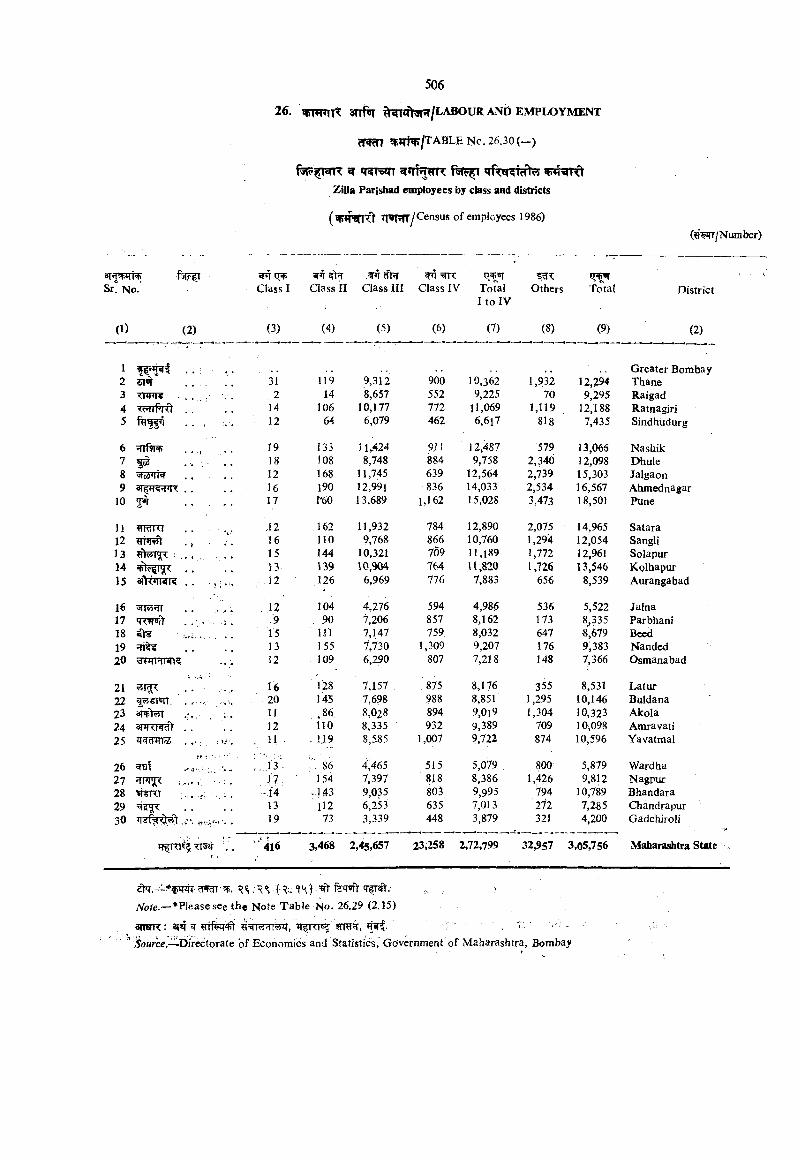
Sr! No.
(1) (2)
12 5T»r3 TFPn?45
67 fS8 9
10 w
11 flIdKt12 ^13 ; .. .14 . .15 . .
]617 «r^it18 ^1920 :gFRFnWt5
2122 f55iitin. ' . .23 .;.,24 anrowsY _,25 q tTRT® . ..
26 waf27 JTTTrgr282930 ,.'».
26. ^irmnTt srrfnr ^ « it5 R /LA B O u R a n d e m p l o y m e n t
rfwrn ?S;rtWJ/TABLENc. 26.30 ( - )
^ qgX T 5r*?T R Zilla Parisbad employees by class aod districts
(^jfarr'^ *r*T5Tr/Census of employees 1986)(«^/Number>
Class IcfW ?pit
Class II Class III Class IV Total Others I to IV
tr;^Total District
(3) (4) (5) (6) (7) (8) (9) (2)
Greater Bombay31 119 9,312 900 10,362 1,932 12,294 Thane2 14 8,657 552 9,225 70 9,295 Raigad
14 106 10,177 772 11,069 1,119 12,188 Ratnagiri12 64 6,079 462 6,6i7 818 7,435 Sindhiidurg
J9 133 ) 1,-424 9] 1 12,487 579 13,066 Nashik18 108 8,748 884 9,758 2,340 12,098 Dhule12 168 11,745 639 12,564 2,739 15,303 Jalgaon16 190 12,991 836 14,033 2,534 16,567 Ahmed na gar17 r*60 13,689 1,162 15,028 3,473 18,501 Pune
A 2 162 11,932 784 12,890 2,075 14,965 Satara16 n o 9,768 866 10,760 1,29'4 12,054 Sangli15 144 10,321 709 11,189 1,772 12,961 SolapurB i39 10,904 764 U,820 1,726 13,546 Kolhapur
,■ • 12 126 6,969 776 7,883 656 8,539 Aurangabad
,1 2 104 4,276 594 4,986 536 5,522 Jalna9 , 90 7,206 857 8,162 173 8^35 Parbhani
15 111 7,147 759 8,032 647 ^,679 Beed13 155 7,730 1,309 9,207 176 9,383 Nanded12 109 6,290 807 7,218 148 7,366 Osmanabad
16 128 7,157 875 8,176 355 8,531 Latur20 143 7,698 988 8,851 1,295 10,146 Buldana11 ,86 8,028 894 9,0i9 1,304 10,323 Akola12 110 8,335 932 9,389 709 10,098 AmravatiU -:,1.19 8,585 1,007 9,722 874 10,596 Yavatmal
, 13'. r, :86 4,465 515 5,079 800 5,879 Wardha1'7 J54 7,397 818 8.386 1,426 9,812 Nagpur
.14 .143 9,035 803 9,995 794 10,789 Bhandara13 H2 6,253 635 7,013 ' 271 7,285 Chandrapur19 73 3,339 448 - 3,879 321 4,200 Gadchiroli
4l6 3,468 2,45,657 23,258 2,72,799 32,957 3,05,756 Maliarashtra State
Note.—*Pleasc see the Note Table No. 26.29 (2.15)
antjR: m ^ ?rm, ^pri . 'i?o«rcc.—Directorate of Economics and Statistics, Government of Maharashtra, Bombay
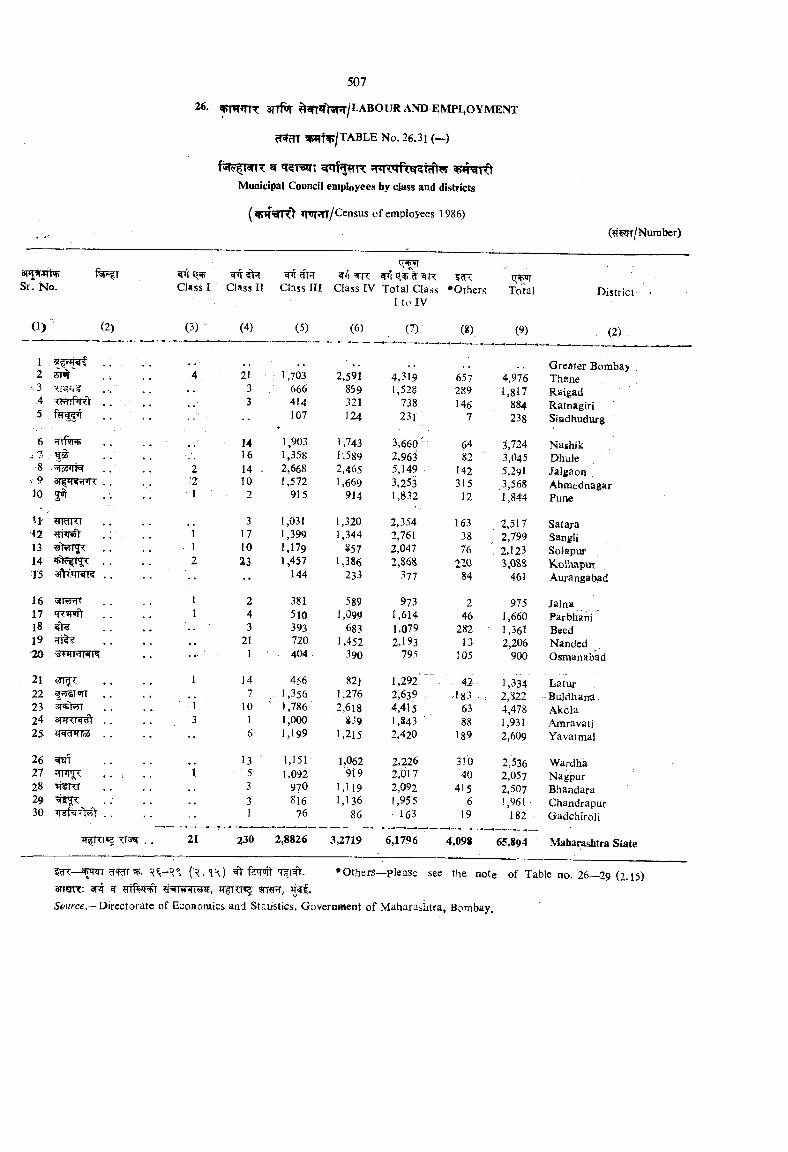
?f5fm TABLE No. 26.31 (—)
n «T?T3m 5 R f^ R ^ \x\Municipal Council employees by class and districts
Tprrqrr/Census of employees 1
am*n^ f^ T Sr. No.
(I) (2)
Class I
(3)
Class II
(4)
^ cft?r Class III
(5)
Class IV
(6)
Total Class I to IV
(7)
fcTT•Others
(*).
Total
(9)
District «
(2)
1 . . . . . . Greater Bombay ,2 sfwr . i. 4 21 1,703 2,591 4,319 657 4,976 Thane
’■3 .. 3 666 859 1,528 289 1,817 Raigad-4 CrftiPrCf . 3 414 321 738 . 146 884 Ratnagiri5 107 124 231 7 238 Siadhudurg
6 Hirsfl* , . 14 1,903 1,743 3,660' 64 3,724 Nashik .16 1,358 1,589 2,963 82 3,045 Dhule
'8 2 ■ 14 - 2,668 2,465 5,149 142 5,291 JalgaonV 9 . . . ‘2 10 1,572 1,669 3,253 315 ,3,568 Ahmednagar10 3 t 1 2 915 914 1,832 12 1,844 Pune
M mmii , . 3 1,031 i,320 2,354 163 2,517 SataxaM 4ii»r*Tl .: , i 17 1,399 1,344 2,761 38 2,799 Sangli13 Wlr5l'i< , . ■ 1 10 1,179 S57 2,047 76 . 2,123 Solapur14 . . 2 23 1,457 1,386 2,86S 220 3,OSS Kolhapur•15 3fK»IT?T? . . •• •• 144 233 377 84 461 Aurangabad
16 . . 1 2 381 589 973 2 975 Jalna17 qrw r 1 4 510 1,099 1,614 46 1,660 Parbhani18 ^ 3 393 683 1,079 282 1,361 Beedl9 21 720 1,452 2,193 13 2,206 Nanded•2a tfthrts ... ■ 1 404 390 795 105 900 Osmanabad
2l 1 14 456 82] 1,292 42- 1,334^ Latur22 ?^®ion . . 7 . 1,356 1,276 2,639 183 . . 2,822 -Buldhana23 as>5rr ' 1 10 1,786 2,618 4,415 63 4,478 Akola24 anrrr^ . . 3 1 1,000 S39 1,843 ■ 88 1,931 Amravati25 ZRRTWToS •• 6 1,199 1,215 2,420 189 2,609 Yavatmal
26 WHT 13 1,151 1,062 2,226 310 2,536 Wardha27 , i '.5'‘ 1,092 919 2,617 40 2,057 Nagpur28 >T¥nT 3 970 1,119 2,092 415 2,507 Bhandara29 3 816 1,136 1,955 6 1,961 • Chandrapur30 . . 1 76 86 163 19 182 ■ Gadchiroli—.— — — —-------- —1— . — ____
21 230 2,8826 3,2719 6,1796 4,098 65,894 Maharashtra State
♦Others—please see the note of Table no. 26—29 (2.15)^__^qrqr ^«TETR; ar ^5*«rce.—Directorate of Econoraics and Statistics, Government of Maharasiitra, Bombay.
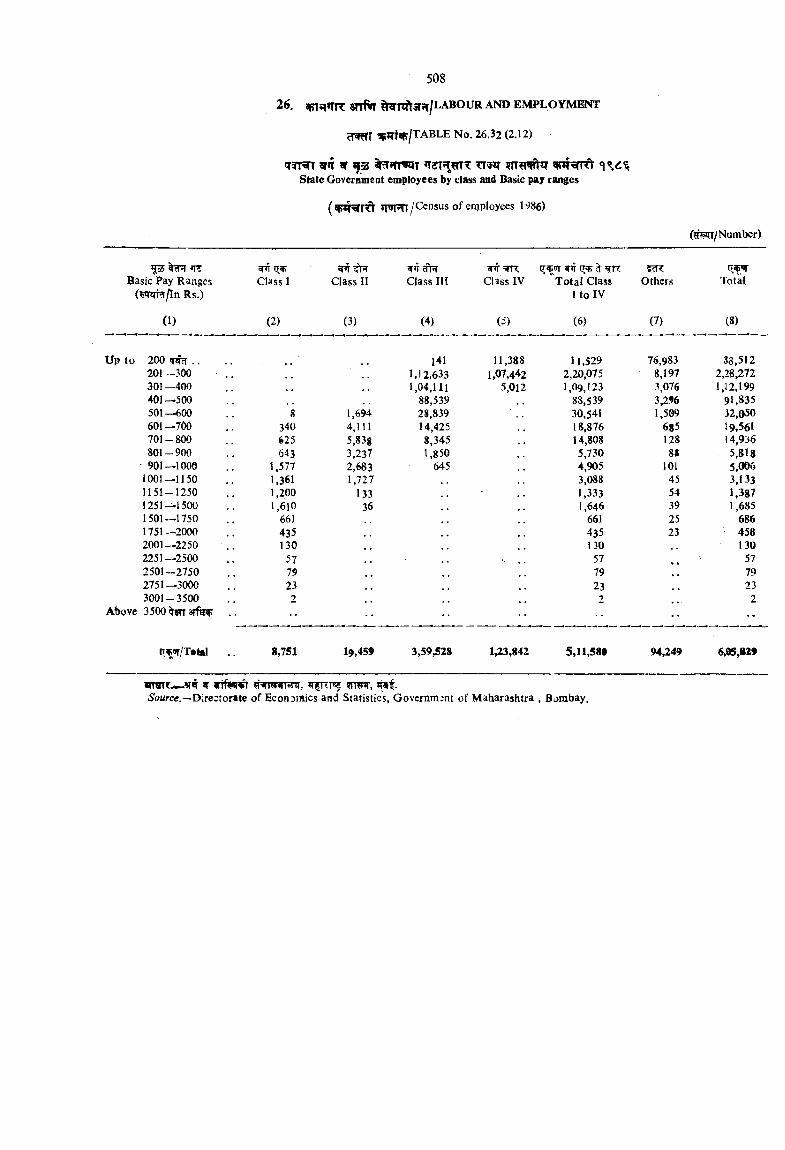
26 . ^ ^r^sfJT/LA B O U R AND E M P L O Y M ™ '
% ^ m | ^ a b l e No. 26.32 (2.12)
«T?T T sr f s ^trm^JTState Government employees by class and Basic pay ranges
Census of employees 1986)
(#^/Nuraber)
o5Basic Pay Ranges
( w m j ln Rs.)
(1)
^ ITJPClass 1
(2)
Class II
(3)
Class III
(4)
Class IV Total Class Othcis I to IV
(5) (6) (7)
Total
(8)
200 TTcT.............. • • 141 11,388 11,529 76,983 88,512201 -.100 1,12.633 1,07,442 2,20,075 8,197 2,28,272301—400 , , , , 1,04,111 5,012 1,09,123 3,076 1,12,199401—500 88,539 88,539 3,296 91,835501—600 8 1,694 28,839 30,541 1,509 32,050601—700 340 4,111 14,425 18,876 685 19.561701-800 625 5,83g 8,345 14,808 128 14,936801-900 643 3.23T 1,850 5,730 8S 5,818
• 901—1000 1,577 2,683 645 4,905 101 5,0061001—1150 1,361 1,727 3,088 45 3,1331151-1250 1,200 133 1.333 54 1,3871251—1500 l,6 l0 36 1,646 39 1,6851501—1750 661 661 25 6861751—2000 435 435 23 4582001—2250 130 130 1302251—2500 57 57 572501-2750 79 79 792751—3000 23 23 233001-3500 2 2 23500 «rr •• •• ••
rf (»r/T#tal 8,751 19,459 3,59,528 1,23,842 5,11,58# 94,249 6,QS,829
!T l i f w ^ TTfRpsf sr f.5oMr«,—Directorate of Economics and Statistics, Government of Maharashtra , Bombay.
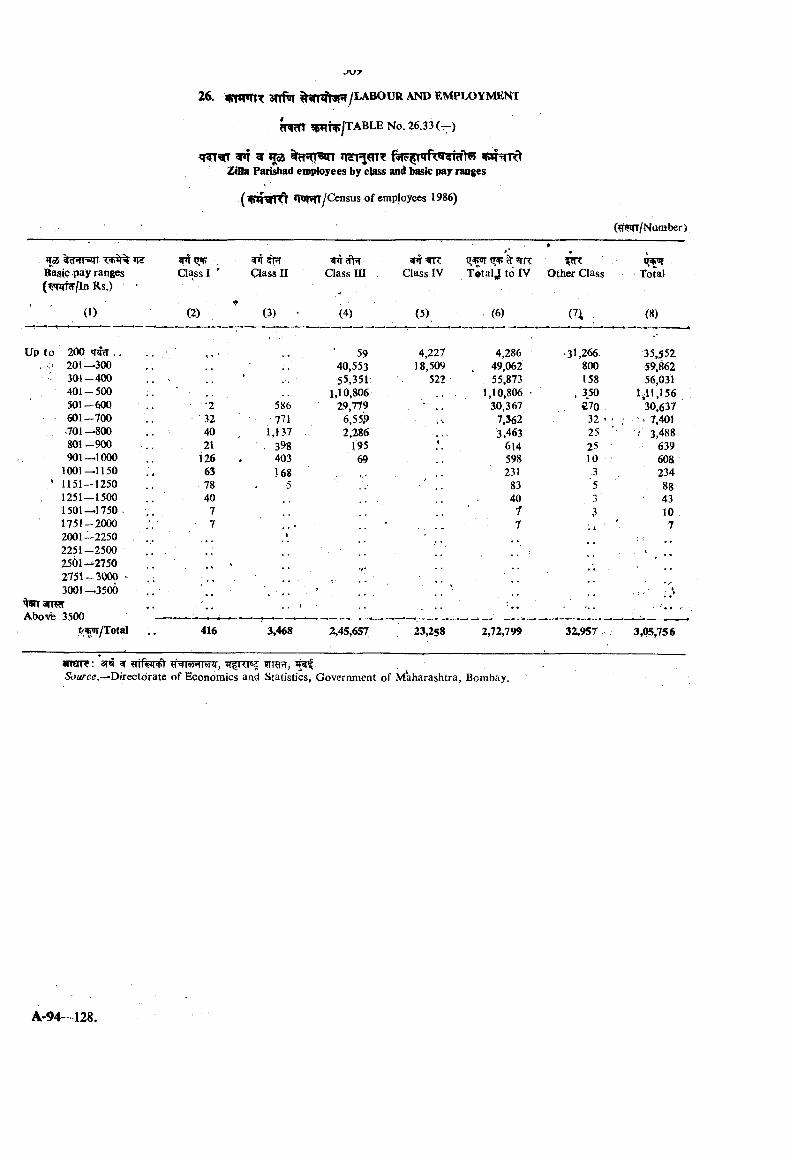
3f»f 5C TO %5T!T!^Zilla ParQiad employees by class and basic pay ranges
( tTT V *TWRIyCensus of employees 1986)
»To5 ^Basic pay ranges
Rs.)
■ ' (1)
^ ,Class I '
(2)
^ <flFf Class II
(3) •
Qass III
(4)
Class IV
(5)
Total j to rv
(6)
' i t .Other Class
(A ;
Total
(8)
Up to 200 cWcT .. 59 4,227 4,286 31.266. 35,552, 201—300 40,553 18,509 . 49,062 800 59,862
■ 3 0 i-400 ‘ 55,351: 522 . 55,873 158 56,031401-500 1,10,806 1,10,806 • , 350 1,11,156501-600 ’2 586 29,779 '* ... 30,367 . €70 30,637601-700 32 ■ 771 6,55^ 7,362 32 • ‘ : ’ 1 7,401.701 —800 40 l,i37 . 2,286 3,463 25 '• i 3,488801—900 21 . 398 195 614 25 639901—1000 .. 126 403 69 598 10 60S
1001—1150 63 168 231 .3 234' 1151-1250 78 5 83 88
1251—1500 40 40 3 431501—1750. 7 f 101751-2000 7 . . . 7 72001--2250 . .. . . . ' ■ ■ : ;2251-2500 , , . t2501-^27502751-3000 -3001—3500 ■ : i ■ ' »
Above 3500 —-.. ■ ■
c<^/TotaI . .
---------- ------- ;__________
416 3,468 2,45,657 23,258 2,72,799 32,957 ; 3,05,756
«narR: m ^^oarc .—Directorate of Economics and Statistics, Government of M^aharaslitra, Bombay.
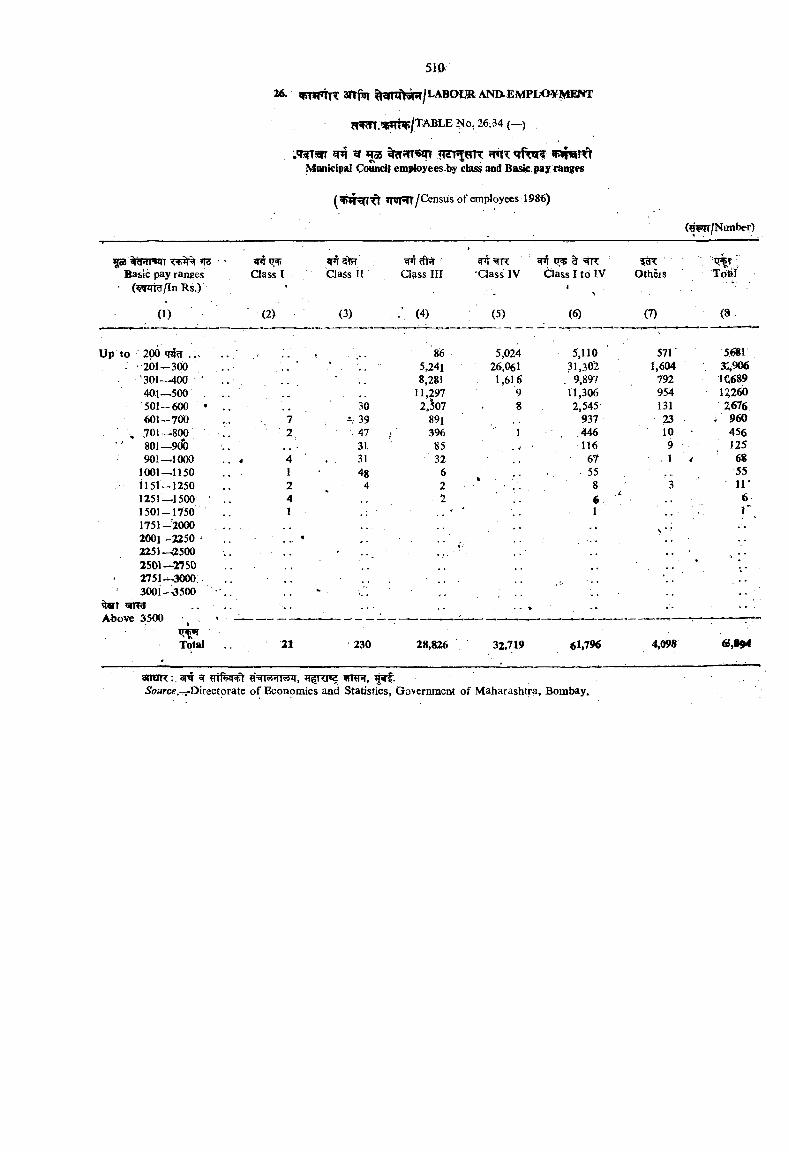
a ^ .tW t^ /T A B L E No, 26.34 (—)
%?f5iT'e!n «piN ! ^Municipal Council employees .by class and Basic pay ranges
( »(m /C ensus of employees 1986)
( ?*Tr/NDmber)
a rfHWI T'TT JR Baac pay ranees
(wrra/In Rs.)
(1)
Class I
(2)
5*1 #TClass II
(3)
Class n i
(4)
•Class IV
(5)
Class I to IV
(6)
Otheis
(7)
ITd^I
(»
Up to 200 qqw . . . 86 5,024 5,110 571' 5.^1: ' 201-300 .. • 5,241 26,061 31,30i 1,604 3:,906
301—400 ’ .. 8,281 1,616 . 9,897 792 iq68940.1—500 .. - 11,297 9 11,306 954 U260501-600 • . . , . 30 2,507 . 8 2,545 131 Z676601-700 7 ~ 39 891 937 - 23 • a 960
' 701—800 . . ' ' 2, ■■ 47 ■ 396 1 . 446 10 > 456801—9(5) 31. 85 116 9 125901—1000 . . 4 4 31 ■ 32 67 . 1 ^ 68
1001—1150 1 48 6 • 55 551151-1250 2 4 2
% 8 3 i r1251—1500 • .. 4 2 61501-1750 .. 1 1 r1751-2000 . .2001-2250 . . 42251 -^500 2501-2150 2751--3000 3001—3500
^WI STTRI Above 3500 - ^
Total 21 230 28,826 32,719 61.796 4,098 «,«94
anuTT:. am fSource.-^Dk&:tornte o f Economics and Statistics, GovernmetK of Maharashtra, Bombay.
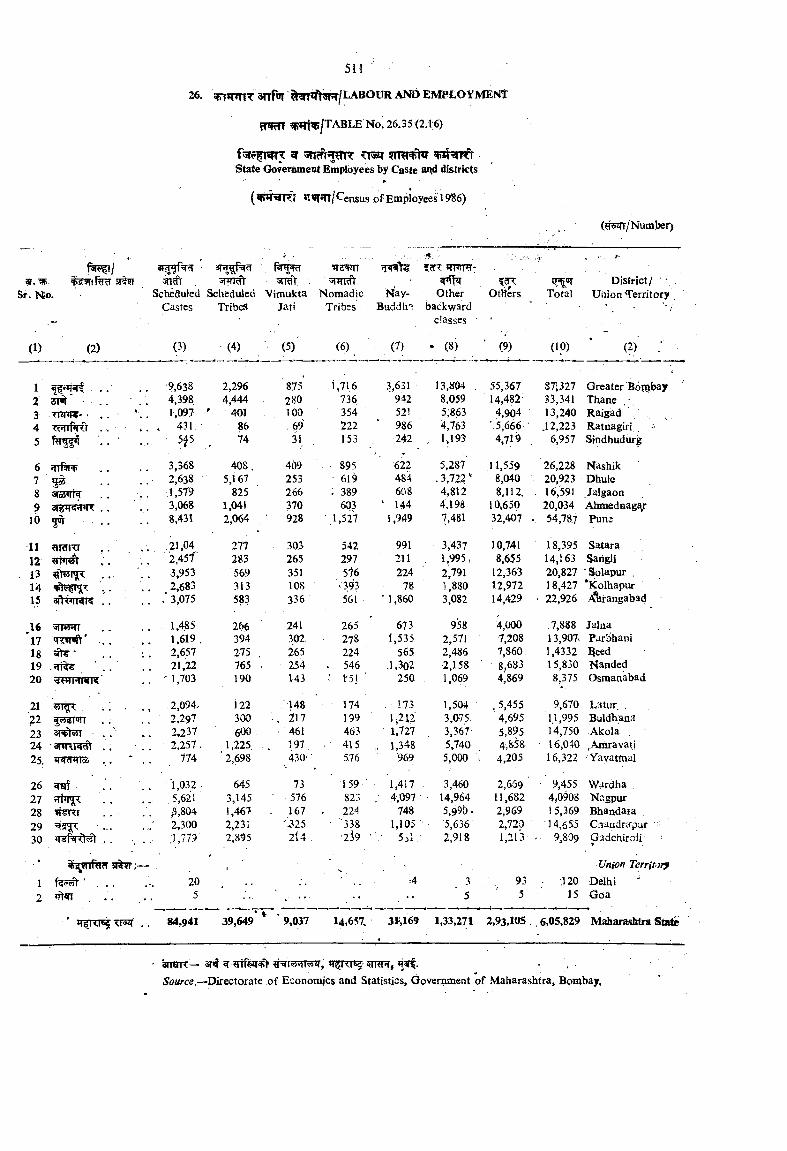
f ^ / ai. 3%9i
sf. n o .
(1) (2)
26- 9FTiTmT srrN %n®ft3r^ /l a b o u r a n d e m p l o y m e n t
? T ^ ?|3TT>ff/TABLE No. 26^5 (2,16)
5T 5n?ft5jmT State Government Employees by Caste and districts
• •
( VH-JR? n^iT^/Census of Employees 19S6)
5rrar nraV 4Hid)Scheduled Scheduled Vimukta Nomadic
Castes Tribes Jati Tribes
(3) (4) (5) (6)
?cTT
Other backward
classes
Nay-Buddh'
(7) (8)
?cROtHers
(9)
District/ • ■ Total Uiiion'Territory
(10) (2)
1 9,638 2,296 875 1,716 3,631 13,804 . 55,367 8T;327 Greater Bofnbay2 sM . . . . 4,398 4,444 . 280 736 , ‘ 942 8,059 14,482- 33,341 thane3 1,097 401 100 354 521 5;863 4,904 13,240 Raigad4 . . . . * 431, 86 ^ 9 222 ' 986 4,763 • 5,666 .12,223 Ratnagiri5 . . ■ . . ■ 5f5 74 31 153 242 1,193 4,719 6,957 Sfndhudurg
6 . . . . 3,368 408 . 409 895 '622' 5,28?' 11,559 26,228 Nashik '7 2,638 5,167 253 • 619 484 . 3,72?" 8,040 20,923 Dhule8 1,579 825 266 . 389 608 4,812 8,112. . 16,591 Jalgaon9 ar ’TtpniT . . 3,068 1,041 370 603 144 4,198 10,650 20,034 Ahmednagy
10 . . 8,431 2,064 ' 928 •1,527 1,949 7,481 32,407 . 54,787 Puni
11 .21,04 277 303 542 991 3,437 10,741 ■ 18,395 Satara12 2,45f 283 265 297 211 . 1,995, 8,655 14,163 Sangli13 3,953 569 351 5l6 224 ' 2,791 12,363 20,827 'Solapur .U 2,683 313 108 >393 78 1,880 12,972 18,427 ‘Kolhapur15 dft VIWK . . 3,075 583 336 561 ’ 1,860 3,082 14,429 • 22,926 ;^Sirangabad
16 1,485 2 ^ 241 265 673 958 4,000 ,7,888 Jalaa'l7 1,619 . 394 302 278 1,535 2,57J 7,208 13,907. Partihani18 ^ ' . . ; . 2,657 275 . 2’65 224 565 2,486 7,860 1,4332 5eed19 21,22 765 . 254 546 .1,302 2,158 8,683 1 5,830 Nanded20 ' 1,703 190 143 1:51 250 1,069 4,869 8,375 Osmanabad
21 . . . . . 2,094, 122 148 • 174 . 173 1,504 . 5,455 9,670 Latur .?2 2,297 300 . 217 199 1;212 3,075 4,695 1.1,995 Buldhana23 sroteT 2,237 600 461 463 1,727 3,367 5,895 14,750 Akola ,24 a m xr^ . . . . 2,257 . 1,225 .. 197. • ' 415 , 1,348 5,740 4,858 ■ 16,040 ^Amravatj25. 774 ' 2,698 430'■ 576 969 5,000 . 4,205 16,322 Yayatfnal
26 . . . . 1,032 : 645 73 159 1,417 3,4.60 2,669 ‘ - 9,455 W^rdha27 . 5,621 3,145 576 823 . 4,097 • 14,964 11,682 4,0908 Nagpur28 >i^Ki n 804 1,467 167 224 748 5.990 * 2,969 1 5,369 Bhandara29 2,300 2,231 '325 • 338 , 1,105 5,636 2,720 14,655 Cftandra'pur '30 . , . . 1,779 2,895 2i4 , •2 9 ■■/ 531,' 2,918 1,213 ' 9,809 Gadchirall
Union Territ try
1 . . . .-. 20 V 3 93 ,120 Delhi2 Tfrm 5 . •• ‘ 5 ■ ■■ ' 5 15 Goa
84,941 39,649*^ ' 9,037 14,657, 31-,169 1,33,271 2,93,105 , . 6,05,829 Maharashtra Stal
ansTT— 3t ^ ^mrr,iSoarce.—Directorate of Economics and Statistics, Goveriunent of Maharashtra, Bombay.
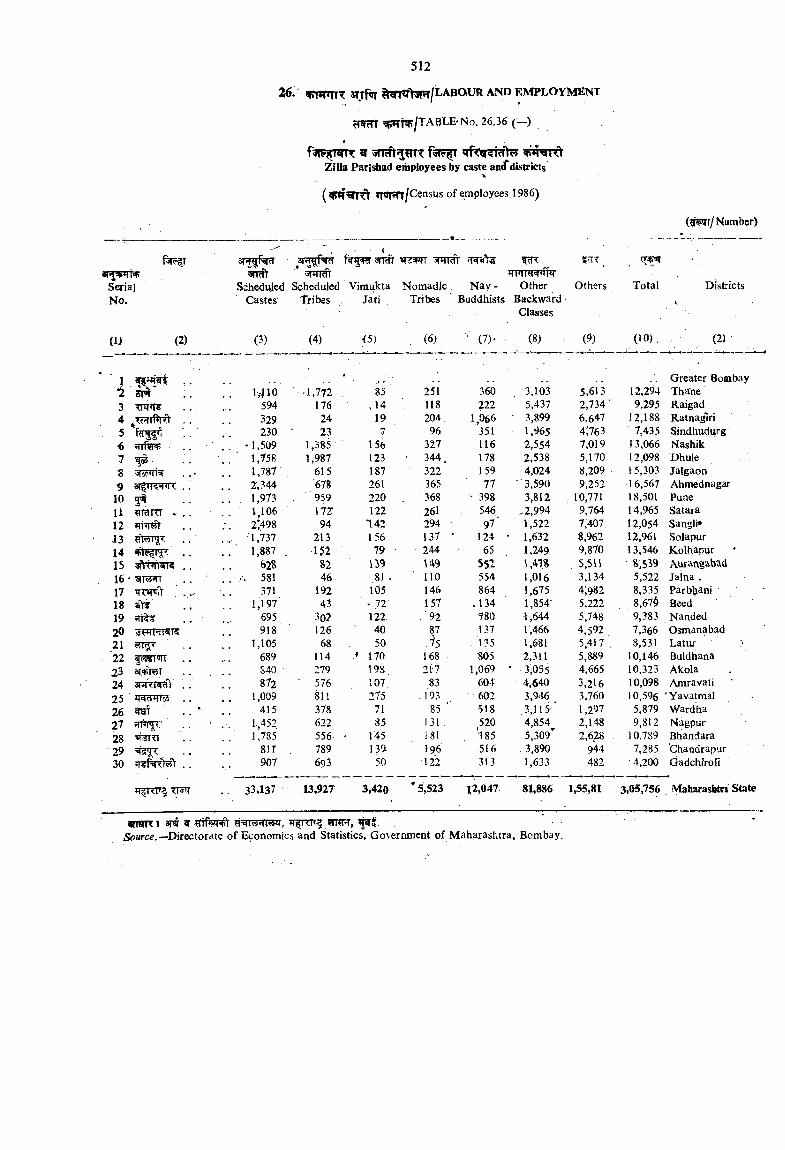
Zilla Parisbad employees by caste andTdistricts
Tpinn/Census of employees 1986)
BT r gr 3i’ ^ f^fRT 3n^ r^wr Frtcfr ,
<PTii»qi<ff 3TRfr * sriraV Trnrraw#rSerial Scheduled Scheduled Vimukta Nomadic N ay- Other OthersNo. Castes Tribes . Jati Tribes Buddhists Backward
Classes
(iM t/N umber)
Total Districts
(1> (2) (3) (4) <5) (6) • O h (8) (9) (10) , (2)
Greater Bombay*2 ivMO -1,772 . 85 251 360 3,103 5,613 12,294 Thane3 Tnw? . . 594 176 ,14 118 222 5,437 2,734 ' 9,295 Raigad4 329 24 19 204 1,066 3,899 6,647 12,188 Ratnagiri5 230 23 . 7 96 351 1,965 4:763 7,435 Sindhudurg6 jfTftnp . . . . '1,509 1,385 156 327 116 2,554 7,019 13,066 Nashik1 I® ■ .: ‘ 1,758 1,987 123 ■ 344, 178 2,538 5,170 12,098 Dhule8 ^ o?rnor . . 1,787 615 187 322 159 4,024 8,209 15,303 Jalgaon9 ar iRVTT . . 2; 344 678 261 365 77 '3,590 9,252 16,567 Ahmednagar
10 5^ • • 1,973 959 220 368 • 398 3,812 10,771 18,501 Pune11 ?!ranT . . . 1,106 171 • 122 261 546 .2,994 9,764 14,965 Satara12 ; . 2*498 94 142 294 97' 1,522 7,407. 12,054 Sangli*13 . . 1,737 213 156 137 • 124 * 1,632 8,962 12,961 Solapur14 . . . . ' 1.887 . -152 79 • • 244 65 1,249 9,870 13,546 Kolhapur15 3fmfrar? . , 62S U9 551 5,5Vl • S.539 Aurangabad16 • SiT TT , . . . 581 46 81 . 110 554 1,016 3,134 5,522 Jaina ,17 , . .. 371 192 105 ■ 146 864 1,675 4‘,982 8,335 Parbljani18 stir . . 1,197’ 43 ' * 72' 157 .134 1,854- 5,222 8,67^ Beed19 695 3o2 122 .'92 780 1,644 . 5,748 9,383 Handed20 918 126 40 87 137 r,466 4,592 7,366 Osmanabad21 1,105 68 50 . is 135 1,681 5,417 , 8,531 Latur22 689 114 .♦ 170 168 805 2,311 5,889 10,146 Buldhana23 3f >(5T , . S40 279 198 21-7 1,069 • 3,055 4,665 10,323 Akola24 872 ■ 576 107. 83 604 4.640 3,216 10,098 Amravati25 iR-^ra . . . . 1,009 811 275 .193 602 3,946 3,760 10,596 'Yavatmal26 415 378 71 85 ■ 518 ,3,115* 1,297 5,879 Wardha27 JfFT ' 1,452 622 85 131, 520 . 4,854-1 ^ 2,148 9,812 Nagpur28 . . 1,785 556 . 145 J81 185 5,309 2,628 . 10,789 Bhandara29 8ir 789 139 196 516 .3,890 944 7,285 'Chandrapur30 907 693 50 ■122 313 1,633 482 4,200 Gadchiroli
JTfTTI . . 33,137 13,927 3,420 *5,523 12,047 81,886 1,55,81 3,05,756 Maharasiitri!
aiTOR« ^ w ^=1^^iSoMrce.—Directorate of Economics and Statistics, Govermnent of Maharashtra, Bombay.
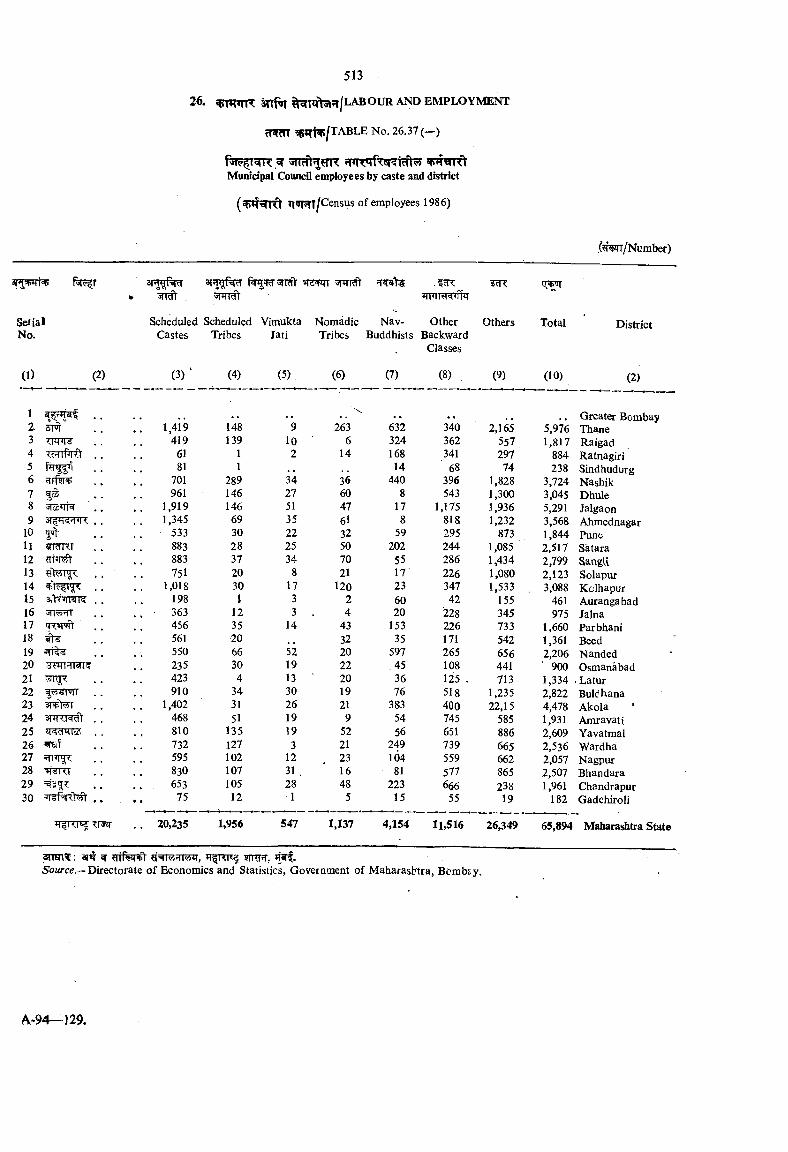
?T5Rn 55?rt^/TABLE No. 26.37 (—)
Municipal Council employees by caste and district
H«»HT/Census of employees 1986)
SerialNo.
(1) (2)
vnHlcil ??R, snmt ^RTW'iifir
Scheduled Scheduled Vitnukta Nomadic Nav- Other OthersCastes Tribes Jati Tribes Buddhists Backward
Classes
(3) (4) (5). (6) (7) (8) (9)
Total
(10)
District
(2)
1 . . • • • \ .. Greater BomI2. il l 1,419 148 9 263 632 340 2,165 5,976 Thane3 419 139 10 6 324 362 557 1,817 Raigad4 TvTTf Rt . . 61 1 2 14 168 341 297 884 Ratnagiri5 . . 81 1 14 68 74 238 Sindhudurg6 701 289 34 36 440 396 1,828 3,724 Nashik7 961 146 27 60 8 543 1,300 3,045 Dhule8 5TocMi=( 1,919 146 51 47 17 1,175 1,936 5,291 Jalgaon9 3| q-5HTr< . . 1,345 69 35 6l 8 818 1,232 3,568 Ahmednagar
10 5 ' 533 30 22 32 59 295 873 1,844 Pune11 IdKT 883 28 25 50 202 244 1,085 2,517 Satara12 883 37 34 70 55 286 1,434 2,799 SaugU13 751 20 8 21 17 226 1,080 2,123 Solapuf14 . . 1,018 30 17 120 23 347 1,533 3,088 Kolhapur15 3iY?7IWR , . 198 1 3 2 60 42 155 461 Aurangabad16 5IT5HT 363 12 3 4 20 '228 345 975 Jalna17 456 35 14 43 153 226 733 1,660 Parbhani18 561 20 32 35 171 542 1,361 Beed19 550 66 52 20 597 265 656 2,206 Nanded20 '3nrt’TRi5 235 30 19 22 .45 108 441 900 Osmanabad21 423 4 13 20 36 125 . 713 1,334 .Latur22 910 34 30 19 76 518 1,235 2,822 Buldhana23 3nrf T 1,402 31 26 21 383 400 22,15 4,478 Akola24 468 51 19 9 54 745 585 1,931 Amravati25 810 135 19 52 56 651 886 2,609 Yavatmal26 «T£if 732 127 3 21 249 739 665 2,536 Wardha27 595 102 12 23 104 559 662 2,057 Nagpur28 830 107 31 . 16 81 577 865 2,507 Bhandara29 653 105 28 48 223 666 238 1,961 Chandrapur30 75 12 1 5 15 55 19 182 Gadchiroli
. . 20,235 1,956 547 1,137 4,154 11,516 26,349 65,894 Maharashtra
ansn^: m ^5’o«/-ce.—Directorate of Economics and Statistics, Government of Maharashtra, Bcmb£y.
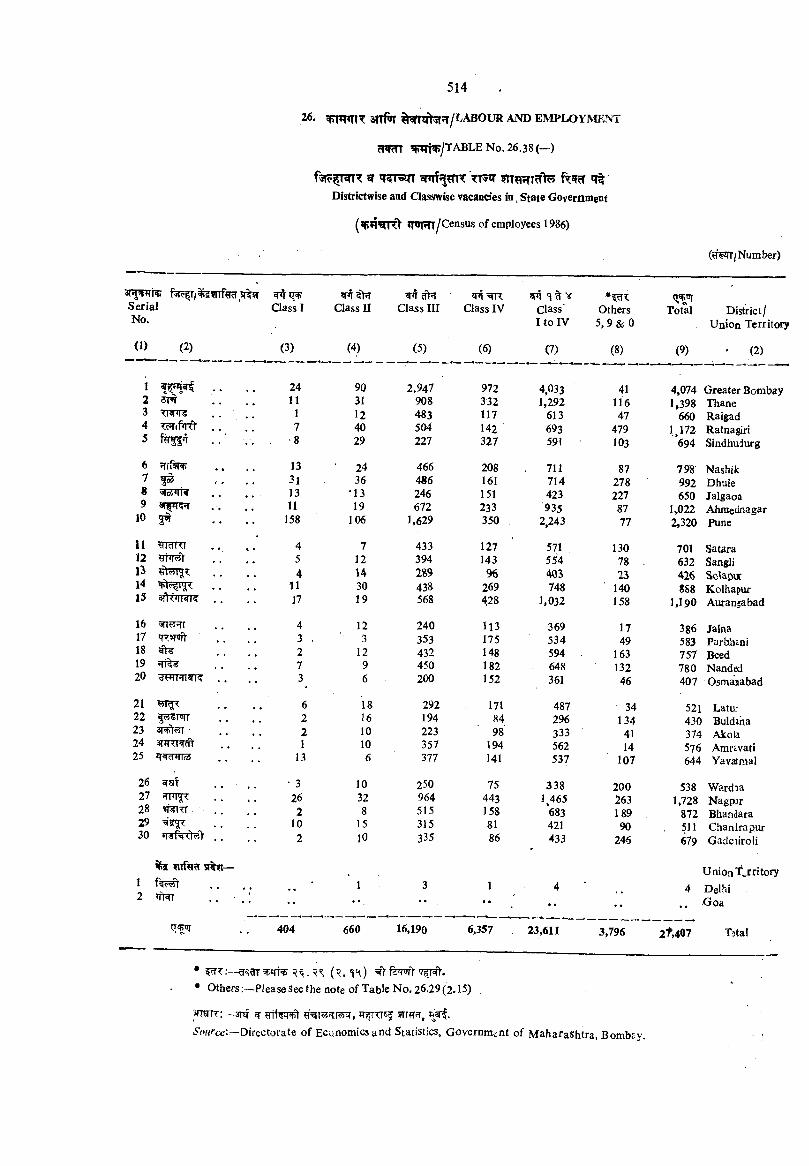
clWm 5FTlt^/TABLE No. 26.38(—)
^ Trs«T f WcT *?%Districtwise and Classwise vacancies ia , State Government
( P t rrfy *riRT/Census of employees 1986)
f3r55T/^^?ra,st^5r Serial Class I Class UNo.
ctVh Class III
^=5TR Class IV Class' Others Total District/
I to IV 5,9 & 0 Union Territory
(1) (2) (3) (4) (5) (6) (7) (8) (9) ' (2)
1 24 90 2,947 972 4.033 41 4,074 Greater Boinl2 5TW • • 11 31 908 332 1,292 116 1,398 Thane3 ■ RPTS . . . . . 1 12 483 117 613 47 660 Raigad4 . . 7 40 504 142 693 479 1,172 Ratnagiri5 ■8 29 227 327 591 103 694 Sindhudurg
6 Tfftnp ♦ * ♦ • 13 24 466 208 711 87 79'8 Nashik7 31 36 486 161 714 278 992 Dhule8 . . 13 '13 246 151 423 227 650 Jalgaon9 11 19 672 233 935 87 1,022 Ahmednagar
JO 158 106 1.629 350 2,243 77 2,320 Pune
11 WRT 4 7 433 127 571 130 701 Satara12 « * 5 12 394 143 554 78 , 632 Sangli13 . * 4 U 289 % m 23 426 Solapuc14 • * 11 30 438 269 748 140 888 Kolhapur15 afU’TRTsr . . 17 19 568 428 1.032 158 1.190 Auransabad
16 • • « « 4 12 240 U 3 369 17 386 Jalna17 . . 3 . 3 353 175 534 49 583 Parbhini18 2 12 432 148 594 163 757 Beed19 * • 7 9 450 182 648 132 780 Nandal20 3 6 200 152 361 46 407 Osmaiaabad
21 6 18 292 171 487 34 521 Latu:22 <?4<iprn’ . . 2 16 194 84 296 134 430 Buldiha23 • • 2 10 223 98 333 41 374 Akoti24 s n r o ^ 1 10 357 194 562 14 576 Amravati25 13 6 377 141 537 107 644 Yavatmal
26 • • • • • 3 10 250 75 338 200 538 Wardia27 . . 26 32 964 443 1465 263 1,728 Nagpjr28 ffSTTT 2 8 515 158 683 189 872 Bhandara29 10 15 315 81 421 90 511 Chanirapur30 . . 2 10 335 86 433 246 679 Gadciiroli
12 ftWT
404 660 16,190 6,357 23,611 3,796 2t,407
Union Territory DelhiGoa
T)ta!
• ffs'^ ( r. ' iH)• Others:—Please See the note of Table No. 26.29(2.15) ,
^rarr:—3Tsf ^5'<?«/-cet—Directorate of Economics and Statistics, Government of Maharashtra, Bomb£y.
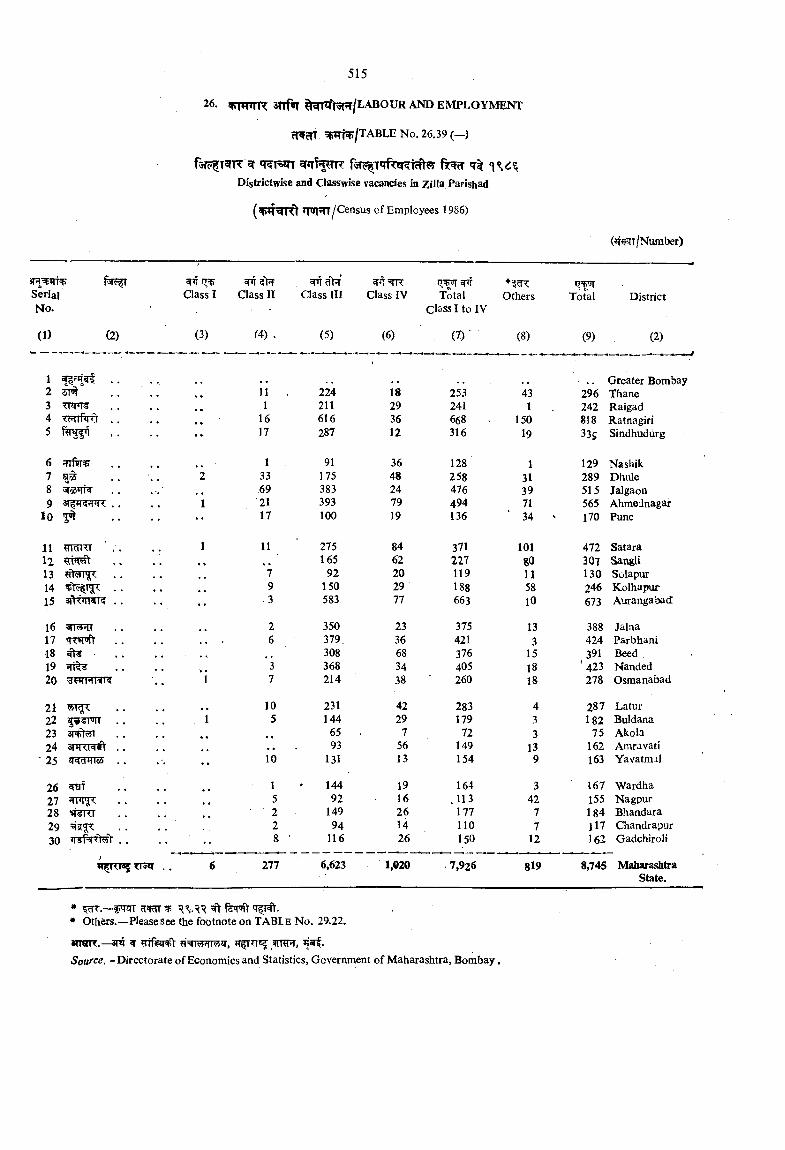
26. q iTnrrc 3nf»T ^arr^'t^/LABOUR a n d e m p l o y m e n t
?T ?TT ?(RTTt /TABLE No. 26.39 (—)
Districtwise and Cla^wise vacancies in ZiUa Parishad
(v4^rr^ THiT?Tr/Ce’’sus cf Employees 1986)
ST5| ?fTTSerialNo.
(1) (2)
Class I
(3)
^?>T Class n Class III Class IV
1 . .2 SFT34 Tc rrPrd . .5 ..
6 qrfw7 'a
8 55’rw9 . .
10 5^
11 nmTT ' . .121314 . .15 3n<<IKW . .
16 T5RT17 cr: ^18 ^1920
2122 , .23 3n?t?yT24 3TiRI<fift . .
' 25 zmiTlS . .
26 ^27282930 . .
ttjji
Total OthersClass I to IV
Total District
f4) , (5) (6) (7)' (8) (9) (2)
’. . Greater Bombay
11 . 224 18 253 43 296 Thane1 211 29 241 1 242 Raigad
16 616 36 668 150 818 Ratnagiri17 287 12 316 19 33g Sindhudurg
1 91 36 128 1 129 Nashik33 175 48 258 31 289 Dhule.69 383 24 476 39 515 Jalgaon21 393 79 494 71 565 Ahmednagar17 100 19 136 34 ' 170 Pune
11 275 84 371 101 472 Satara165 62 227 80 307 SangU
7 92 20 119 11 130 Solapur9 150 29 188 58 246 Kolhapur
.3 583 77 663 10 673 Aurangabad
2 350 23 375 13 388 Jalaa6 379. 36 421 3 424 Parbhani
308 68 376 15 391 Beed3 368 34 405 18 ' 423 Handed7 214 38 260 18 278 Osmanabad
10 231 42 283 4 287 Latur5 144 29 179 3 182 Buldana
. . 65 . 7 72 3 75 Akola93 56 149 13 162 Amravati
10 131 13 154 9 l63 Yavatraal
1 144 19 164 3 167 Wardha5 92 16 ,113 42 155 Nagpur2 149 26 177 7 184 Bhandara2 94 14 110 7 ll7 Chandrapur8 ' 116 26 150 12 162 Gadchiroli
277 6,623 1,020 7,926 819 8,745 MaharashtraState.
♦ ^ R%-RR 'TfT -* Others.—Please See the footnote on TABLE No. 29.22.
WWR.—3t4 ^ mfervt iTfrTf<!5 iflTOr,S'oarc .—Directorate of Economics and Statistics, Government of Maharashtra, Bombay,
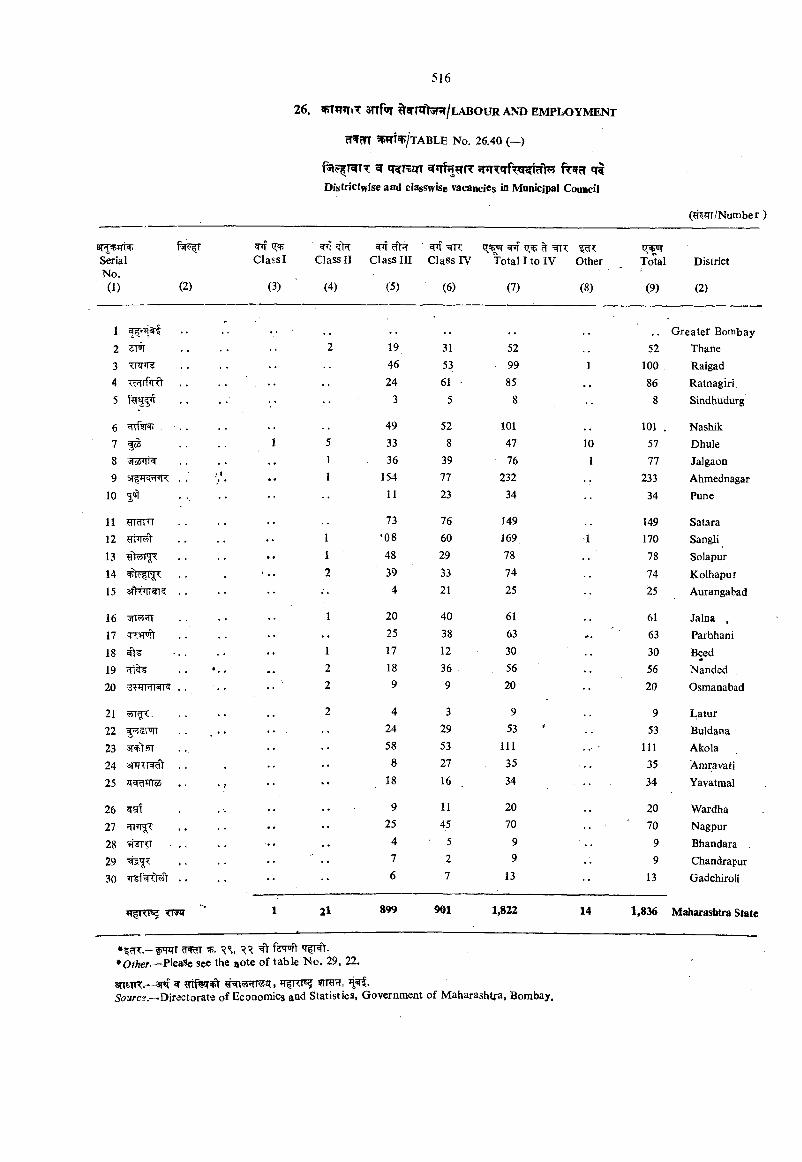
^ q^T^m H»TT«Tf [BRtrf\; fr^fT T? Districtwise and cla$swise vacancies in Municipal Council
(^JTT/Number )
^ 5>T ^ tr=F % H+uiSerial ClassI Class II Class III Class IV Total! to IV Other Total DistrictNo.(1) (2) (3) (4) (5) (6) (7) (8) (9) (2)
1'
Greater Bombay2 2 19 31 52 52 Thane3 'wr^ 46 53 99 1 100 Raigad4 Tc’Trf^ 24 61 • 85 86 Ratnagiri5 •• 3 5 8 8 Sindhudurg
6 49 52 101 ., 101 . Nashik7 ^ 5 33 8 47 10 57 Dhule8 vsl 0(511 1 36 39 76 1 77 Jalgaon9 sTfPfOT?: 1 154 77 232 233 Ahmednagar
10 5®r 11 23 34 34 Pune
11 nrnTT 73 76 149 149 Satara12 1 ‘08 60 169 1 170 Sangli13 1 48 29 78 78 Solapur1415
2 394
3321
7425
7425
KolhapurAurangabad
16 1 20 40 61 61 Jalna ,17 . . 25 38 63 . . . 63 Parbhani18 1 17 12 30 30 fieed19 *.. 2 18 36 56 56 Nanded20 2 9 9 20 •• 20 Osmanabad
21 2 4 3 9 9 Latur22 24 29 53 53 Buldana23 STfitST 58 53 111 111 Akola24 • • 8 27 35 35 Araravati25 •• 18 16 34 34 Yavatmal
26 9 11 20 20 Wardha27 . . •• 25 45 70 70 Nagpur28 . . 4 5 9 9 Bhandara29 • • 7 2 9 9 Chandrapur30 . . 6 7 13 •• 13 Gadchiroli
TRJT 1 2 l 899 901 1,822 14 1,836 Maharashtra State
f W ?RRTT ^ fSToft* Other.—PleaSc see the note of table No. 29, 22.
3ncnr.-~3P!f af trr,Si>iirc2.—Directorate of Economics and Statistics, Government of Maharashtra, Bombay.
aWT 26-41
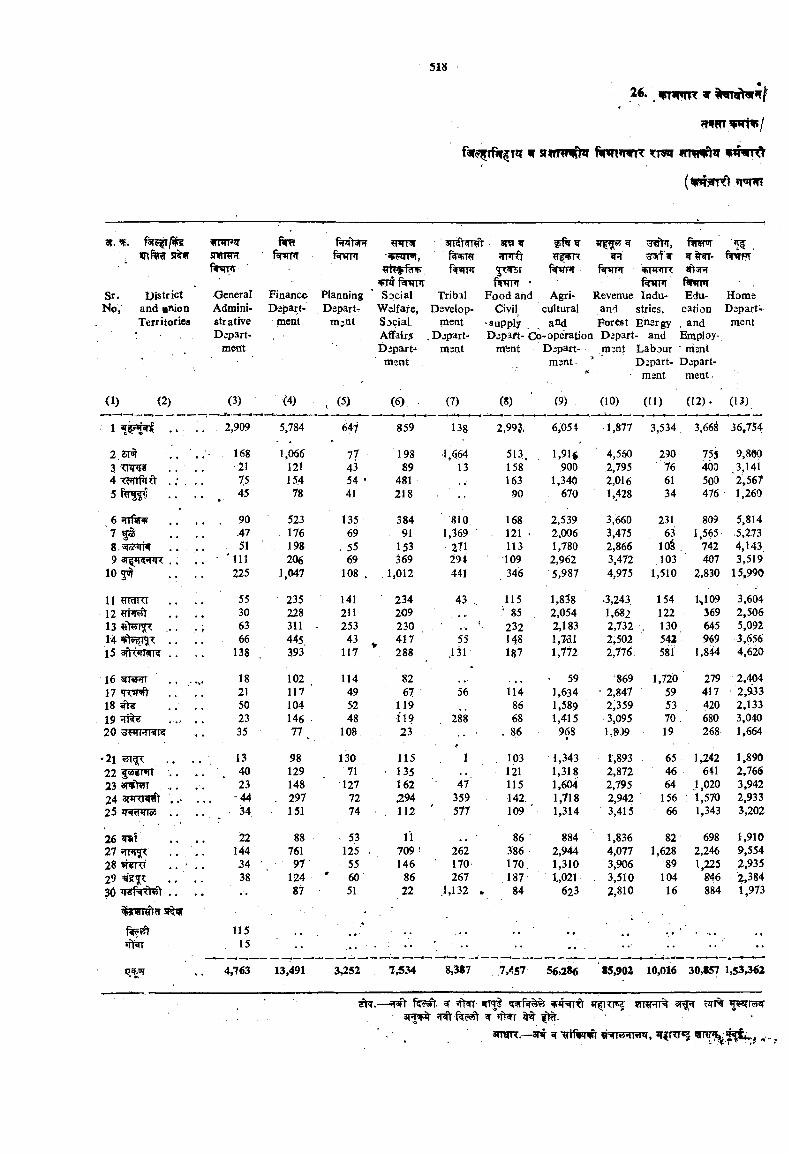
26. v rvT R n
?rwTVTt'is/
^ s t n m ^ f i n m m r r m
3T. W. ITWPiT ■ strV 'Vmftra a ir snrtra-iT f?m*T ^^T<n, f k ^
?ITT?f?T1T fspiTPr «hRnr<- PWHT fwum ’ ftWT*T
Sr. District Ocneral Finance Planning Social Tribal Food and Agri Revenue Indu Edu HomeNo, and nsioD Admini Depart Departr Wslfare, Dsvelop- Civil cultural and stries, cation Depart
Territories strative ment m^nt Social. ment •supply and Forest Energy , and mentDepart Affair i , Dipart- Dip art- Co-operation Dipart - and Employ-
ment D^part^ msnt m^nt Dspart- msnt Labour ■ msnt*. ment msnt * Dspart- Depart
■gi msnt ment .
(I) <2) (3) (4) . (5) (6) (7) (S) (9) (10) (H) (12) ^ (13)
1 f - . . 2,909 5,784 647 859 138 2,993, 6,0541 - - 1 T
1,877 3,534 3,66^ 36,754
2 ST , . ' . . 168 1,066 77 ■ 198 1 664 513, 1,916 4,560 290 753 9,8903 Tnm . , . . ■21 121 43 89 13 158 900 2,795 76 400 3,1414 <?frrf»i d . .* . . . 75 154 54 • 481 163 1,340 2,016 61 500 '2,5675 . . . . 45 78 41 218 •• 90 670 1,428 34 476 1,260
6 rrftr**; . . . . 90 ' 523 135 384 810 168 2,539 3,660 231 809 5,8147 ^ . . . . .47 176 69 91 1,369 . 121 * 2,006 3,475 63 1,565 5,2738.'i|a'<(rf . . . ,. . 51 198 . 55 153 271 113 1,780 2,866 10§ 742 4,1439 . , . . ' i l l 206 69 369 294 109 2,962 3,472 103 407 3,519
10 . . . . 225 1,047 108 . 1,012 441 346 5,987 4,975 1,510 2,830 15,990
11 IdKI . . . . 55 235 141 234 43 . 115 1,838 .3,243 154 M09 3,60412 ?TPR5t 30 228 211 209 • .• • 85 2,054 1,682 122 369 2,50613 «>55T . ,. , ; 63 311 253 230 f 232 2,183 2,732 . 130 645 5,09214 . . . . 66 445 43 * 417 55 148 1,7^1 2,502 542 969 3,65615 <»fl<*rT<IK . . 138 393 117 2S8 .131 187 1,772 2,776. 581 1,844 4,620
16 . . ..,. 18 102 114 82 • 59 ■869 1,720 279 2,40417 , . . . 21 117 ' 49 67 56 114 1,634 • 2,847 59 417 2,9l3318 . . . . 50 104 52 119 86 1,589 2,359 53 420 2,13319 ^ ..- . . 23 146 48 i l9 288 68 1,415 3,095 70 680 3,04020 JFTRRT? 35 77 ^ 108 23 . 86 968 1,»}9 19 268 1,664
'21 .............. 13 98 130 115 I 103 1,343 1,893 65 1,242 1,89022 . . . . 40 129 71 135 121 1,318 2,872 46 641 2,76623 arvhrr............. .. 23 148 127 162 47 115 1,604 2,795 64 1,020 3,94224 snRRift . .. . . . -44 . 297 72 294 359 142. 1,718 2,942 156 : 1,570 2,93325 . . . . 34 151 74 , 1 1 2 ' 577 109 ■ 1,314 3,415 66 1,343 3,202
26 . . . . 22 88 .5 3 11 86 884 1,836 82 698 1,91027 . • . • 144 761 125 709 ‘ 262 386 2,944 4,077 1,628 2,246 9,55428 ir«r<T . . ' . . 34 97 55 146 170 170, 1,310 3,906 89 1,225 2,93529 . . . . 38 124 ' 60 86 267 187 1,021 3,510 104 846 2,38436 . . . . 87 51 22 .1,132 . 84 623 2,810 16 884 1,973
fezwivhi '
115 ♦ » , , •: ... . .15 •• •• •V •• ••
4,763 13,491 3,252 7,534 8,387 .7,457 56,286 85,902 10,016 30,857 1,53362
zt^.— ^ ^ ^ w m sfirsTTft tffiTps? 5rrern% ar^ ??rT%3 1 ^ ar ^
" . amnr.—3pir ?~¥tfiw¥r iT^Rrg; *• ?
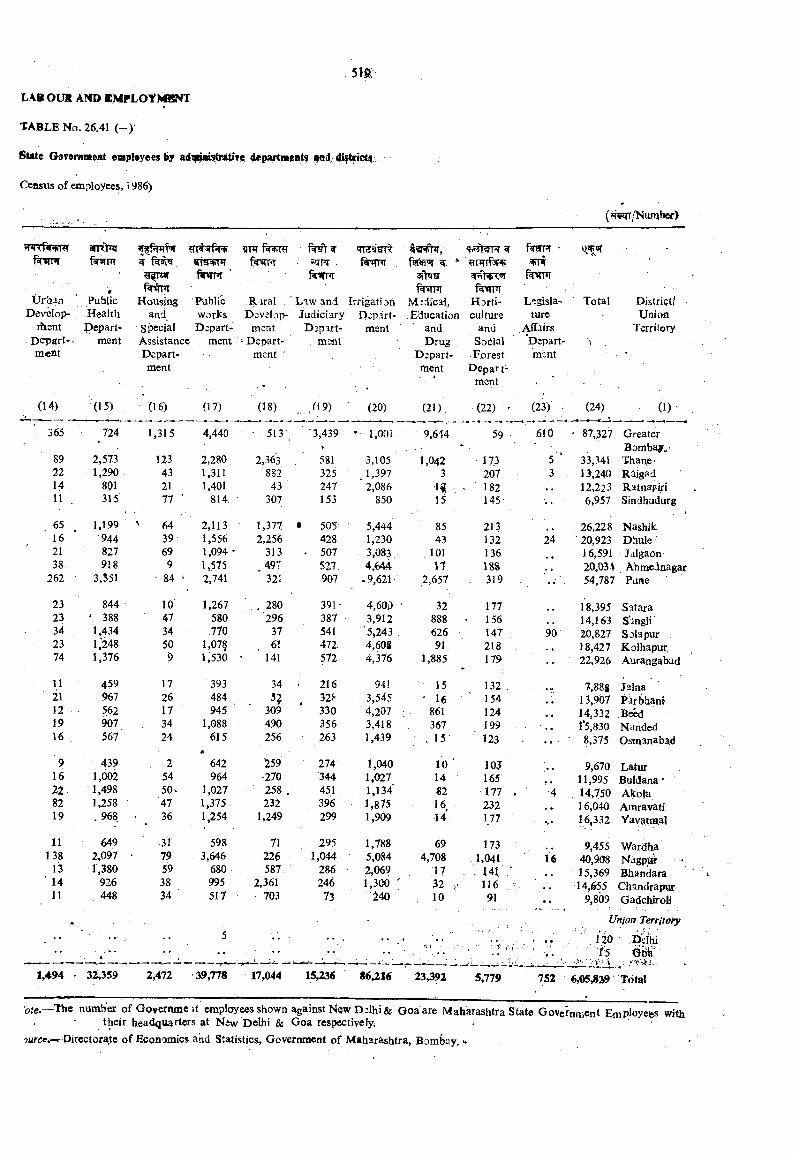
s m
6tate Gsvsrameiit emplsyees l»y adi|iiw^4|lT«; departmeBt^
Census of employees,, i 986)
arRNr n- ^ * S' STTT. W f STR •war ^^ foT^ : «r. * m i '
■ 3i>«isr WnTspTor* f flTPT f VTFT
Urban Public Housing Public R iral Law and Irrigation M;dica4, Horti Legisla Total District/Develop- Health and works Dsviilop- Judiciary D.;pirt- Education culture ture Union
ihent Pepart- Special Depart mant D3pirt- msnt and and Aflfairs TerritoryDepart-. ment Assistance ment - Depart m=nt Drug Social Depart .meat Depart ment ' Depart • Forest ment
ment ment Depart, ment
(14) (15) ■ (16) (17) (18) ri9) (20) (21). '(22) • (23) (24) (1) .
365 ' 724 1,315 4,440 ■ ■ 513 '3,439 * 1,001 9,614 59 610 • 87,327 GreaterBomba^^
8? 2,573 123 2,280 2,363 581 3,105 1,042 173 5 '‘ 33,341 Thane •22 1,290 43 1,311 882 325 .1,397 3 207 3 13,240 Raigad14 801 21 1,401 43 247 ' 2,086 n ■. 182 .. 12,223 Ratnapiri11 315' 77 * 814. - 307 153 850 15 145 6,957 Sindhudurg
65 1,199 64 2,113 1,377 • 505 5,444 85 213 26,228 Nashik16 944 39 1,556 2,256 428 1,230 43 132 24 ' 20,923 Dhule21. 827 69 1,094 ' 313 . 507 3,083 , 101 136 16,591 Jalgaon-38. 918 9 1,575 . 497 S ir 4,644 n . m 20,034 Abmeinagar
262 3,551 84 ' 2,741 321' 907 .9,621 2,657 . 319 54,787 Pune
23 844 10 1,267 .2 8 0 391- 4,600 32 177 18,395 Satara23 ? 388 47 580 296 387 3,912 888 - 156 14,163 Singli34 1,434 34 ,770 37 541 ‘5,243 626 14T 90 20,827 SMapur .23 1,248 50 1,07§ . 61 All. 4,608 91 218 • * 18,427 Kolhapur74 1,376 9 1,530 141 572 4,376 1,885 179 •• 22,926 Aurangabad
11 459 17 393 34 216 94! 15 132 . 7,888 Jalna21 967 26 484 32 . ,# 32?“ 3,545 * 16 154 13,907 Parbhant12 562 17 945 309 330 4,207 861 124 14,332 Beed19 907 34 . 1,088 490 356 3,418 367 199 1*5,830 Handed16 567' 24 615 256 263 1,439 ' 123 • 8,375 Osraanabad
9 439 2 642 259 274 1,040 10 ■ lOj 9,670 Latur16 1,002 54 964 ■270 344 1,027 14 165 11,995 Buldana *22. 1,498 50x 1,027 258 . 451 1,134 82 177 ■4 . 14,750 Akola82 1,258 47 1,375 232 396 • 1,875 16, 232 • •- 16,040 Amravati19 .968 36 1,254 1,249 299 1,909 .14 177 16,332 Yavatmal
11 649 31' 598 71 295 1,788 69 173 9,455 Wardha138 2,097 79 3,646 226 \,044 5,084 4,708 .1,041 16 40,908 Nagp ff -
13 1,380 59 680 587. 286 2,069 17 X41 • • 15,369 Bhandara14 926 38 995 2,361 246 1,300 32 116 14,655 Chandrapur11 , 448 34 517 703 73 240 , 10 91 •• 9,809 Gadchiroli
Union Territory. •• 5 • • • ' J 2 0 DUhi
i ' V- ' ■ f'5 • W '
1,494 32,359 2,472 39,778 17,044 15,236 86,216 23,392 5,779 752 6,05,8: 9 Total
The number of Governme it employees shown against New D;lhi& Goa are Maharashtra State Government Employees with their headquarters at New Delhi & Goa respectively; .
j«/'cer.-r'Pirectora,te of Economics aKd Statistics, Government of Maharashtra, Bombay. »
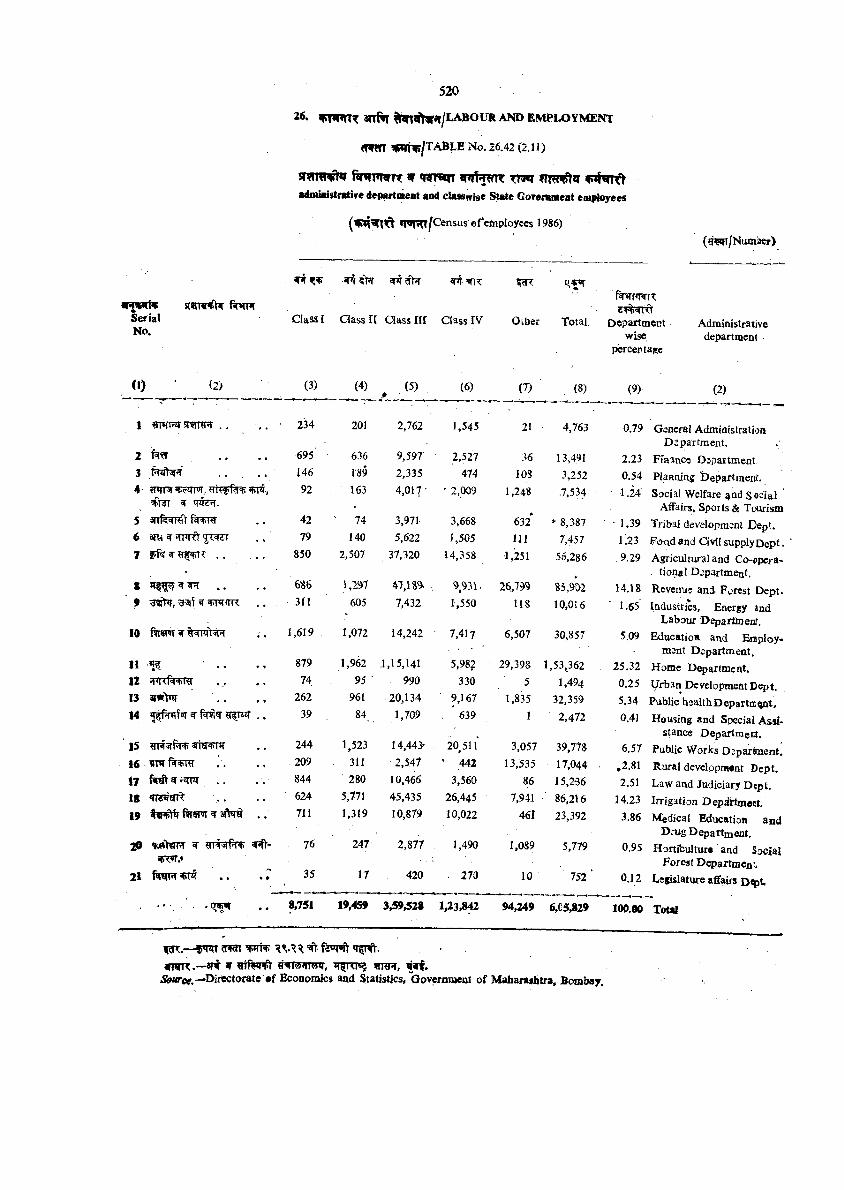
SerialN O .
i f w m t 3nf^ ^ p ^ t ^ 9 i j i ^ A B o m a n d e m p lo y m e n t
erfm ?|Wfv/TABLE No. 26.42 (2.11)
f in f m r r w q^rran t madiaiaistratife Atpartmeat and classwise State Goreranieiit eiaiHojrees
?riiT;n/Census ef‘etnployecs 1986)
-sr wn ?r>r aw fsnrnrsTfE#5nrt
Class I Class II Class III Class IV Other Total Departmentwise
pcrceptasc
Administrativedepartment
0 ) (2)
1 apfFJT sr TRR . .
2 iN^3 tvihnf4- iPTR Vemw,
’CtST ar crg^.5 anfs- rar6 aRi «r HfnrCl7 . .
* ^ ^ ‘ •9 3?fr»T, f
10 fwil<%^"WT
11 ' . .12 v n f g w13 armtnr14 ^
15 rm rtr
17 ^IS «nwm^19 ftr«PT>T ^ 3 ^
20 %«hn?f 2T 3pft-
21 f«WH’CT5? . .
(3) (4) (5).♦ ■
(6) (7) (8) (9) (2)
234 201 2,762 1,545 21 • 4,763 0.79 General Administration Dspartment.
695 636 9,597 2,527 36 13,491 2.23 Fiaanca Department.146 189 2,335 474 lOS 3,252 0.54 Planning t)epartment.92 163 4,017- ' 2,009 1,248 .7,534 1.24 Social Welfare ^nd Social
Affairs, Sports & Tourism42 74 3,971 3,668 632* » 8,387 • 1.39 Tribal developmenl Dept.79 140 5,622 1,505 111 7,457 1.23 FoQd and Civil supply Dept.
850 2,507 37,320 14,358 -1,251 56,286 ,9.29 Agricultural and Co-opcra- tional Department,
m 1 3 7 47,i»9. , 9,931. 26J99 85,902 14.18 Revenu® and. Forest Dept.31t 605 7,432 1,550 118 10,016 1.65 Industries, Energy md
Labour Departoent.1,619 1,072 14,242 7,417 6,507 30,857 5.09 Education and Employ
ment Dspartment.879 1,962 .1,15,141 5,98? 29,398 1,53,362 25.32 Home Department.74 95 ■ 990 330 5 1,494 0.25 yrban Development Dept.
262 961 20,134 ' 9,167 1,835 32,359 5.34 Public health Departrt^t,39 84 1,709 . 639 1 2,472 0.41 Housing and Special Assi
stance DepartmeEt.244 1,523 14,44> 20,511 3,057 39,77$ 6.57 Public Works D^parteaent.209 311 2,547 ' 442 13,535 17,044 . *2.81 Riiral development Dept.844 280 10,466 3,560 86 15,236 2.51 Law and Judiciary Dept.624 5,771 45,435 26,445 7,941 ■' 86,216 14.23 Irrigation Department.711 1,319 10,879 10,022 461 23,392 3.86 Medical Education and
Drug Department.76 247 2,877 1,490 1,089 5,779 0.95 Hortibultur® and Social
Forest Departmcni.35 17 420 - 270 10 752 ■ 0.12 Lcjislatureaflfairs D ^ t
8,751 19,459 3,59^28 i;i3,842 94,249 6,C5,829 100.00 Total
^ . - - r n n ?ron qwwW fR .—«ri V TT RTS? sffRR, W f,
&«r«e.^I>it«ctoratc > f Economics and Statistics, G o v ^ m cn t o f M abamhtra, Bombay.
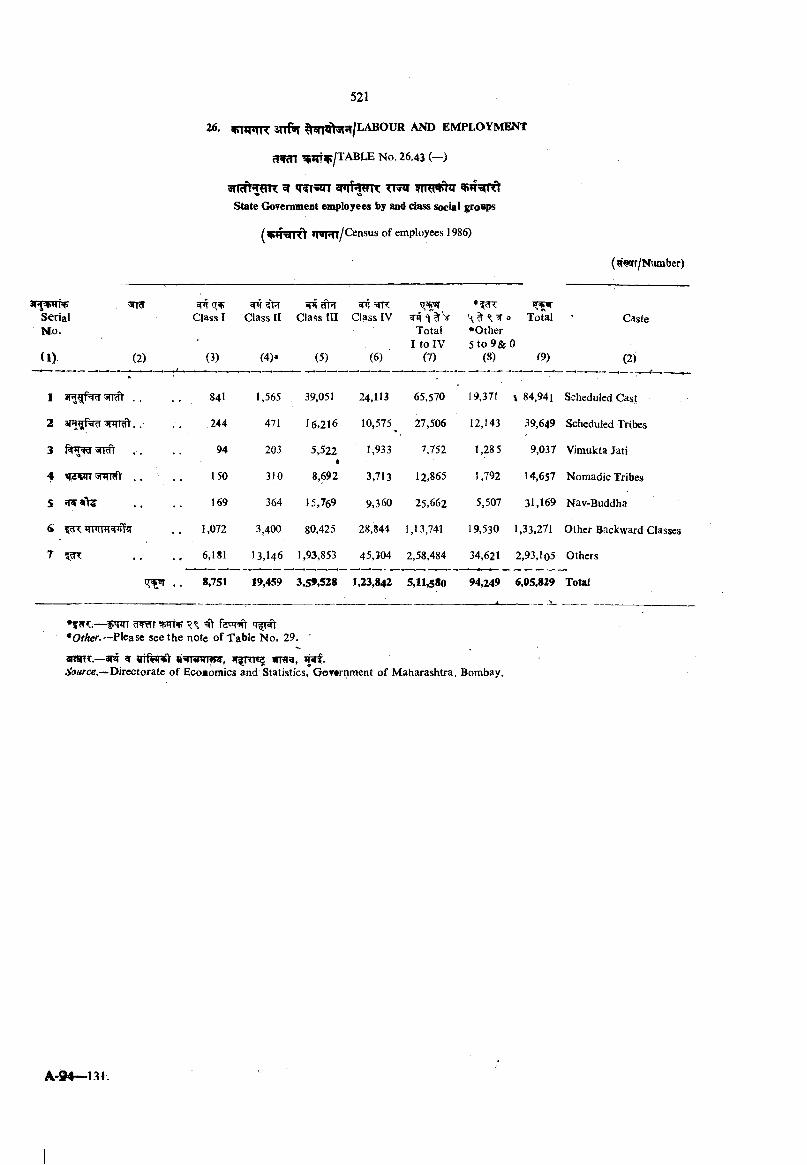
3r?ppmrSerialMo.
26- sTifir ^wt^rsr/LABOUR a n d e m p l o y m e n t
cwm ^W m jT A S L E No. 26.43 (—)
^ «T?T^State Government employees by and class social groups
( y # g ‘l'0 of employees 1986)
5nrc»3F ^f?>rClass ! Class II Class III Class IV V Total
Total * OtherI to IV 5 to 9& 0
( fforr/Numbcr)
Caste
(1) 2) (3) f4)* (5) (6) (7) (8) (9) (2)
1 ®Rg[f =RT 5IT . . 841 1,565 39,051 24,113 65,570 19,371 \ 84,941 Scheduled Cast
2 3n^[f^ . . ,244 471 16,216 10,575 ♦ 27,506 12,143 39,649 Scheduled Tribes
3 94 203 5.522$
1,933 7752 1,285 9,037 Vimukta Jati
4 150 310 8,692 3,713 12,865 1,792 14,657 Nomadic Tribes
S 169 364 15,769 9,360 25,662 5,507 31,169 Nav-Buddha
S 1,072 3,400 80,425 28,844 1,13,741 19,530 1,33,271 Other Backward Classes
7 . . . . 6,1 SI 13,146 1,93,853 45,304 2,58,484 34,621 2,93,105 Others
8,751 19,459 3,5f,528 1,23,842 5,11^80 94,249 6,05,829 Total
• ? c f c ~ f w•O^Aer.—Please see the note of Table No. 29.
anar :.—arr ^ e ’m Rrm , wra ,Source.—Dircctorntc of Ecoaoraics and Statistics, GoTwnraent of Maharashtra, Bombay.
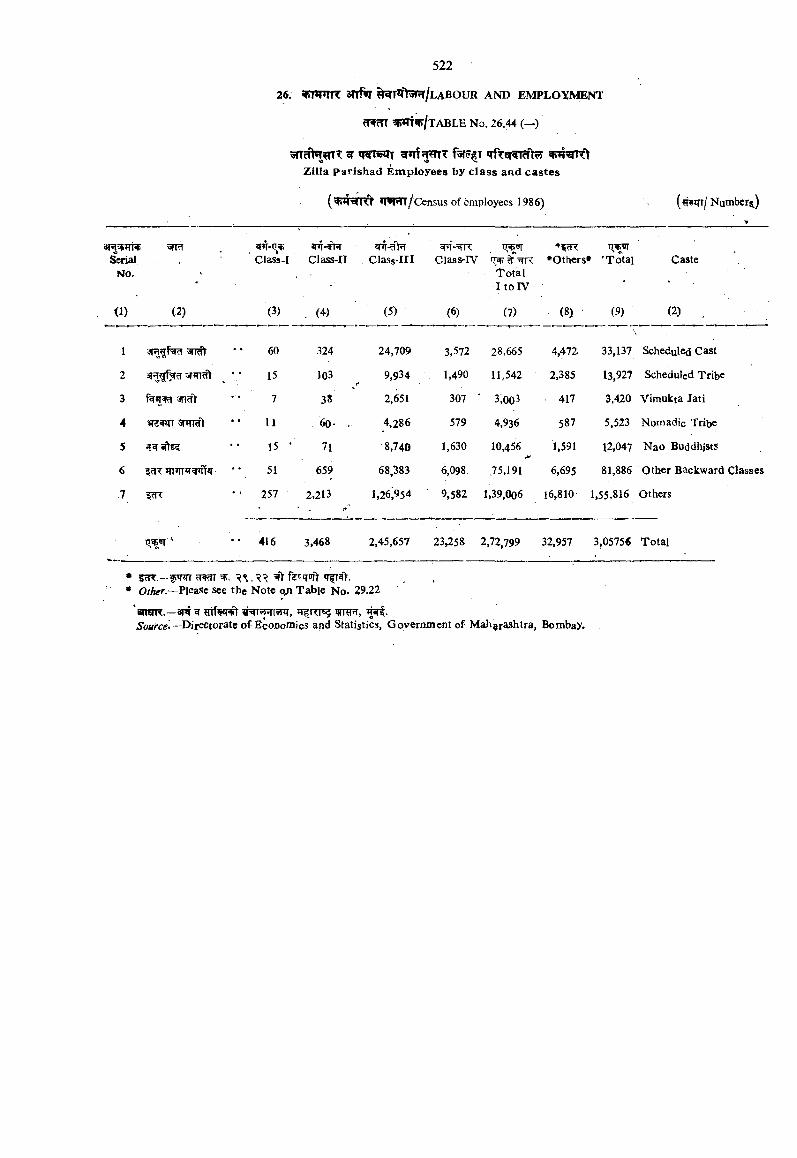
^ fsfe^T qfTcr?Tcfte v w OZ illa parish ad E m p loyees by c la s s and c a ste s
( »m?n/census of employees 1986)
SerialNo,
»T5F»ir * 5 ^ IT5P5ICliiss-I Class-II Class-III Class-IV *Othcrs» 'Total
T otalitorv
Caste
<i) (2) (3) , (4-) (5) (6) (7) (8) (9) (2) ^
1 60 324 24,709 3.572 28,665 4,472 33,137 Scheduled Cast
2 15 103 9,934r* 1,490 11,542 2,385 13.927 Scheduled Tribe
3 7 38 2,651 307 ■ 3,003 417 3,420 Vimukta Jati
4 11 60- 4,286 579 4,936 587 5,523 Nomadic Tribe
5 15 • 71 8,740 1,630 10^56 1,591 12,047 Nao Buddhists
6 51 659 68,383 6,098 75,191 6,695 81,886 Other Backward Classes
.7 257 2,213 1,26;954 9,582 1,39,006 16,810 1,55,816 Others
416 3,468 2,45,657 23^58 2,72,799 32,957 3,05756 Total
• 5HT.—f W .* Of/ier—Please see the Note Table No- 39.22
‘anfTR.—3W ^ 9rm?r,Source-—^Directorate of Economics and Statistics, Government of Maharashtra, Bombay.
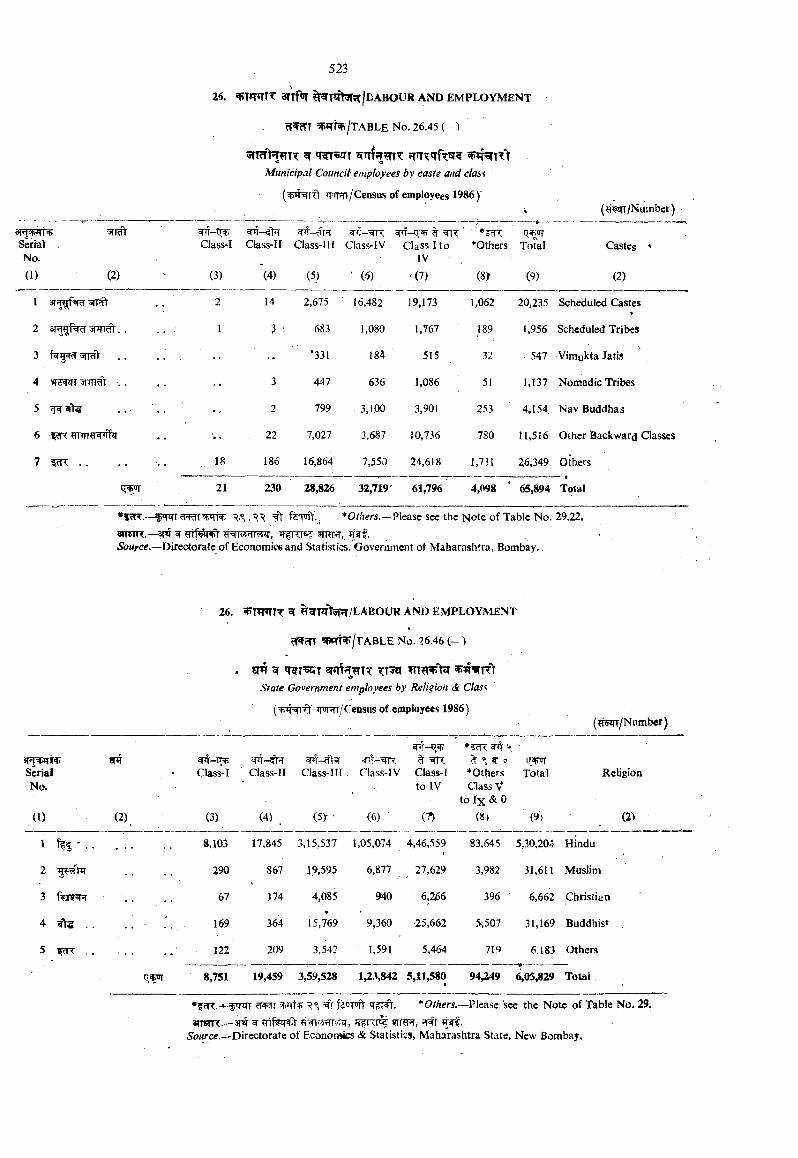
SerialNo.
^Rfr
3TT?ft^TT sr 'RT sfTMunicipal Council employees by caste and class
<TiRl/Census of employees 1986)'
^_tT^ ^-^>T sr’f-#T ^Class-I Class-II Class-IH Class-lV Class I to *Others Total
IVCastes
1) (2) (3) (4) (5) ' («) <(7) (8> (9) (2)
1 3T!Tgi%?T ' Trfl' 2 14 2,675 16,482 19,173 1,062 20,235 Scheduled Castes
2 3Rgf%?T . . . . 1 3 ■ 683 1,080 1,767 189 1,956 Scheduled Tribes
3 • • •• •• '331 184 515 32 . 547 Vimukta Jatis
4 3 447 636 1,086 51 1,137 Nomadic Tribes
5 •- 2 799 3,100 3,901 253 4,154, Nav Buddhas
6 igRWTTWffzr •• 22 7,027 3,687 10,736 780 11,516 Other Backward Classes
7 . . . . . . . 18 186 16,864 7,550 24,618 1,731 26,349 Others
21 230 28,826 32,719’ 61,796 4,098 65,8941
Total
Please see the Note of Table No. 29.22.dnnrr.— ^ ?mR,.Source.—Directorate of Economioeand Statistics, Goverument of Maharashtra, Bombay.
SerialNo.
?T*r
26. ^W niT ^WTjft^^/LABOUK AND EMPLOYMENT
WT^/TABLE No. 26.46 ( - )
. ^ 3fnf5?!ETTT x m wnHriryState Government employees by Religion & Class
^^r/Census of employees 1986)
SPT— cpt— WTT-ffT ^ ^ ^ ct CT5Class-I Class-lI Class-ITI. Class-IV Class-I *Others Total
to IV Class Vto Ix & 0
(JHW/Number)
ID (2) (3) (4) ^ (5)" (6) ■ (7) (8) (9),
I . . . 8.103 17,845 3,15,537 1,05,074 4,46,559 83,645 5,30,204 Hindu
2 290 867 19,595 6,877 27,629 3,982 31,611 Muslirn
3 67 174 4,085 940 6,266 396 6,662 Christian
4 . . 169 364 15,769 9,360 25,662 5i507 31,169 Buddhis»
5 WT . . 122 209 3,542 1,591 5,464 719 6.183 Others
l)+01 8,751 19,459 3,59,528 1,2.^842 5,11,580 94,249 6,05,829 Totai
Religion
(2
#5?i7 .^^qTrT facToft * Others.—IHen ie see the Note of Table No. 29.
awsnr.—3T wtrr,Source.—Directorate of Econotaics & Statistics, Maharashtra State, New Bombay.
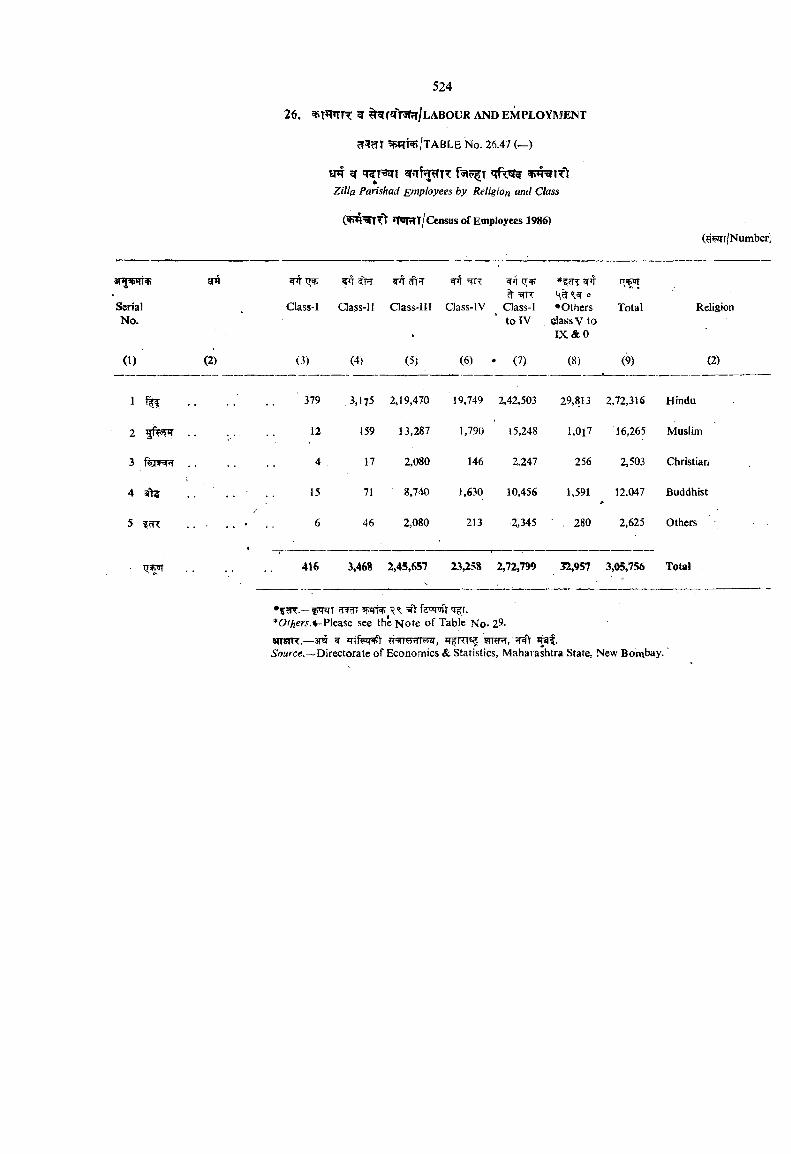
26. 5 ^Nrf^fr^ftr/LABOLR a n d em plo yinjent
aWcTt /t a b l e No. 26.47 (—)
Zilla Parishad Employees by Religion and Class
(W3^TT)T *TwrTI Census of Employees 1986)(g^rfNumber^
SerialNo.
Class-I Class-11 Class-ni Class-1 V
ITop^ =s|iT
Class-I to IV
0•Others
dassV to i x & o
risjrTf
Total Religion
(I) (2) O) (4) (5) (6) • (7) (8) (9) (2)
1 % . . 379 3,1?5 2,19,470 19,749 2,42,503 29,813 2,72,316 Hindu
2 . . . 12 159 13,287 1,790 15,248 l,0i7 16,265 Muslim
3 fenrepT 4 17 2,080 146 2,247 256 2.503 Christian
4 ^ . . . . . . 15 71 8,740 1,630 10,456 - 1,591 12,047 Buddhist
5 5CR . . • . • . . 6
«
46 2,080 213 2,345 , 280 2,625 Others
416 3,46S 2,45,657 23,258 2,72,799 32,957 3,05,756 Total
•537.— ?TRn w i^ =5tV fstipnlr tjfr.* Or hers.%-Pha.sc see the Note of Table No. 29.annu.—3m ^ JTfme w rr, ?rwV5(9Mrc«. —Directorate of Economics & Statistics, Maharashtra State, New Borabay.
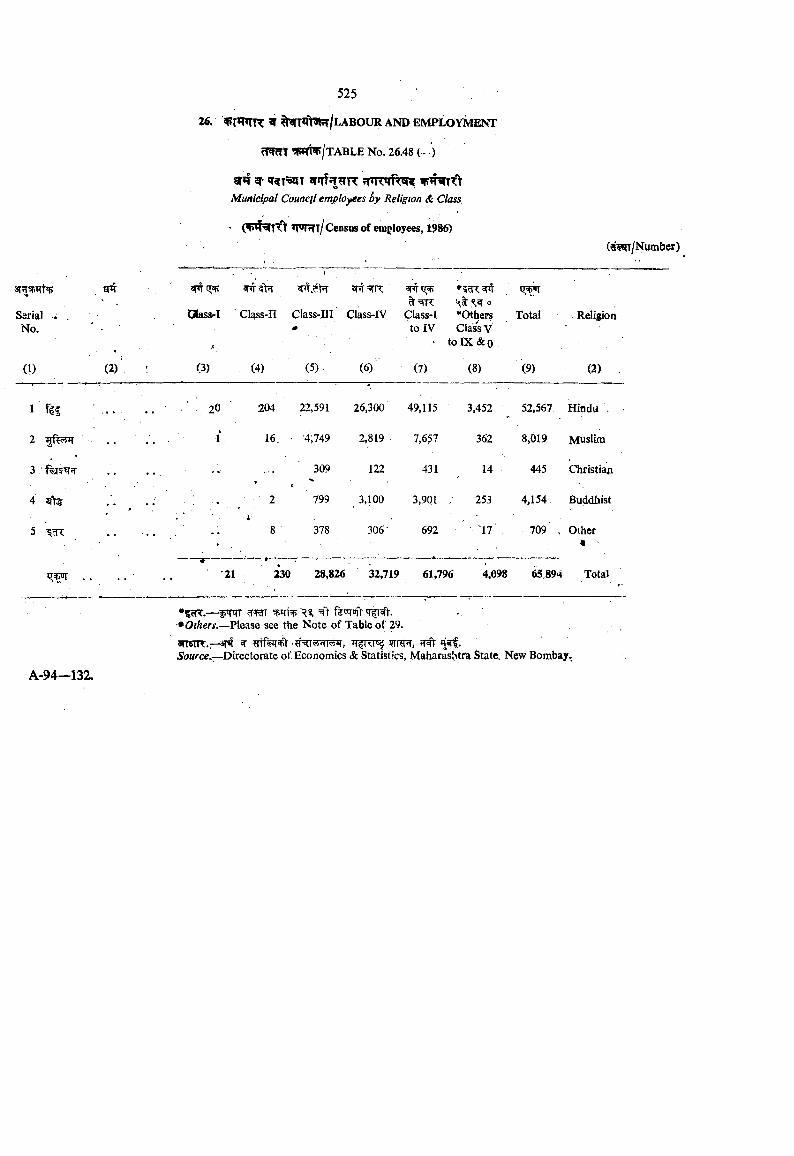
Municipal Council employees By Religion & Class
" ’F'TtTt/ Census of emj loyees, 1986)(?i^/Number)
Serial ; . No.
6R ^ Q[9[>
CBass«I
A-_
#T
Class-n Class-Ill Class-IV Class-I to IV
0♦Others Claiss V
to DC & 0
> +5
Total Religion
(1) (2 )‘ : (3) (4) (5) (6) (7) (8) (9) (2)
1 % ■ 20 ■ 204 22,591 26.300 49,115 3,452 52,567 Hindu .
2 1 16. • 4,749 2,819 7,657 362 8,019 Muslim
3. . . 309 122 431 14 445 Christian
4 . . . . ■ ■ 2 799 3,100 3,901 ; 253 4,154. Buddhist
5 . . ..r
i- ■8 378 306- 692 17 709 . Other
«
. . . . '21 230 28,826 32,719 61,796 4,098 65,894 Total
•?cR.— f w rwT . .
•OfAew.—Please see the Note of Table of 29.
snSTR-.r^ ^ WRR. ^ flsrf.Source,—Directorate of Economics & Statistics, Mafiarashtra State. New Bombay»

27. BAIWNG AM) INSURANCE
zTT f5nTT»rr?r ^^»fNT«r rr%? ^ F ?r,.3T ^<fflK r ^
M t a n |.
5? vTZTfvTZTNrr snfff^r, sm ffr ^ ^^n^qi ^r%5T srrl- ’zrrrrft
^T?rr eft ;rr^ f r ^3r<rr sNTf^^arr s r ? n ^ crr^ ^ f^rrof*rr^€TT arrl ^ ozrT^rft 5 ^ afrf^ ^T^riRr^« r r f ^ ^ sr^Txft 3tt| .
27.1. Data on . towns/village having i)anking offic^, ciassification of banks, scheduled, non-schedu- led and Co-operative banks are given in this section.
27.2. Number of bank oflaces by population raagles includes offices of scheduled, non-scheduled and Cooperative banks. The reference period of Comnjeircial Banks is as on 31st ' Marcli 1987, wherever available while- that regarding co-operative banks is as on the latest balance sheet or return. Deposits and advances of Commercijil Banks is June ending.
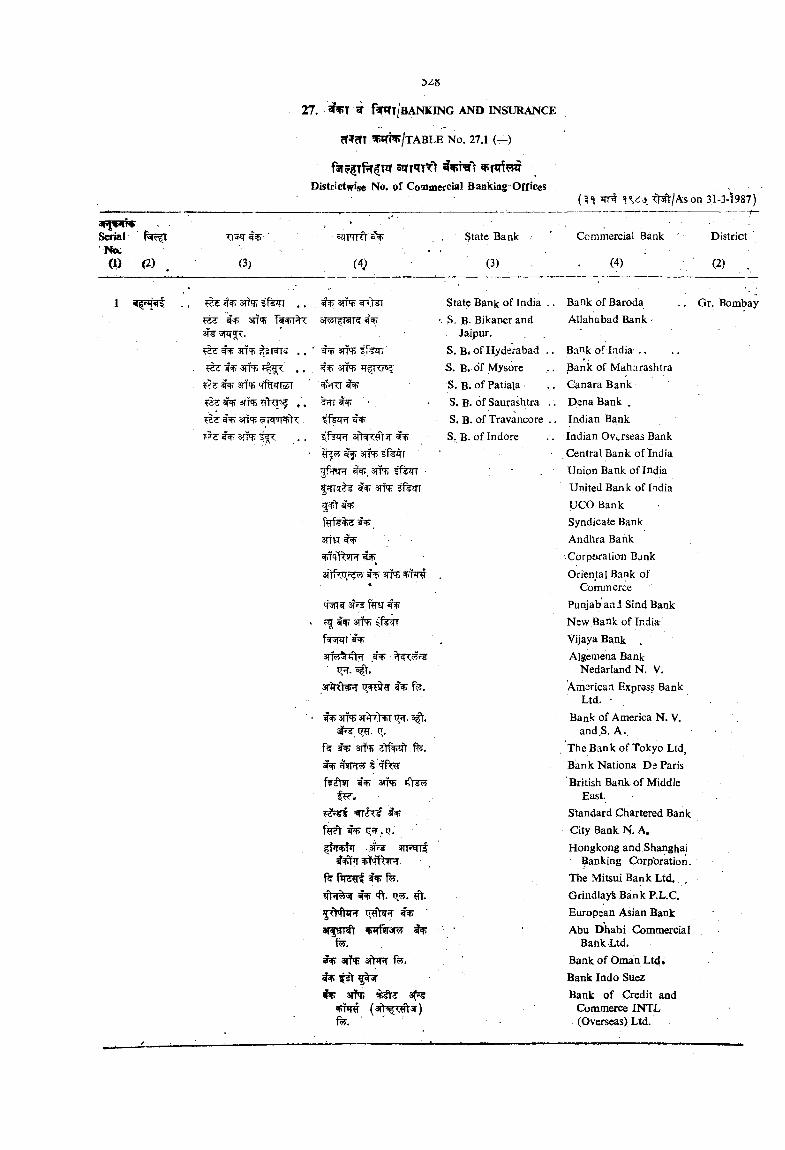
SerialNou(1> (2) . (3)
Districtwise No. of Commercial Banking Offices
sqFTTTt
(4
State Bank
(3)
(V*! ^ " ^ /A son 31-3-1987)
Commercial Bank
(4)
District
(2) .
1^ SIT'?; r^fTT
an ?; pR rs , . 3TTO . .sTT'fi >ifyirioii
^ iTT'R ,'.^ 3TT'
r?z ^ 3fTO ifK • . .
3TT3<<7H NT?
3TTOsliN? ’T^Ki'^
^ . .
t fw r 3ftT!:eV3r f ^ 3TTO '
3?TTOsn*?) ?ferf
3TtP^
t3 f ir < q f c J W t f r 3 T T W ^ T F T #4
%ET ^ % 3mjfcnsnrr'# .
3( 1 fe.
^ 35Tli 3T^"t t^. ofl'.q.
f? % arf'B 2t%ifr f^.a%%fT t'<TfeT f?!St9r 3TP?)
f?RY% q r .Q.^hiwT w q i i
f? fTCfff ^ %.
ffrfrsTT ar jjT fnrftrJF!’ 4%
fe.asriNj aftflFT ;
#?i 3#i; # sVe:(3Tt5^5r)
fe.
State Bank of India'. S. B- Bikaner and
Jaipur.S. Bi of HyderabadS. B. of MysoreS. B. of PatialaS. B. of SaurashtraS. B. of TravaneoreS, B. of Indore
Bank of Baroda Allahabad Bank
.. Gr. Bombay
Bank of lndia .. ..Bank of MaharashtraGanara BankDena Bank ,Indian BankIndian Overseas Bank
. Central Bank of IndiaUnion Bank of IndiaUnited Bank oflndiaUCOBankSyndicate BankAndhra BankCorporation BankOriental Bank of
CommercePunjab and Sind Bank New Bank of India Vijaya Bank >Aigemena Bank
Nedarland N. V.American Exprsss Bank
Ltd. ■ .Bank of America N. V.
and.S. A.The Bank of Tokyo Ltd, Bank Nationa De ParisBritish Bank of Middle
East.Standard Chartered BankCity Bank N. A,Hongkong and Shanghai
Banking Corporation.The Mitsui Bank Ltd.Grindlayk Bank P.L.C.European Asian BankAbu Dhabi Commercial
Bank Ltd,Bank of Oman Ltd.Bank Indo SuezBank of Credit and
Commerce INTL (Overseas) Ltd.
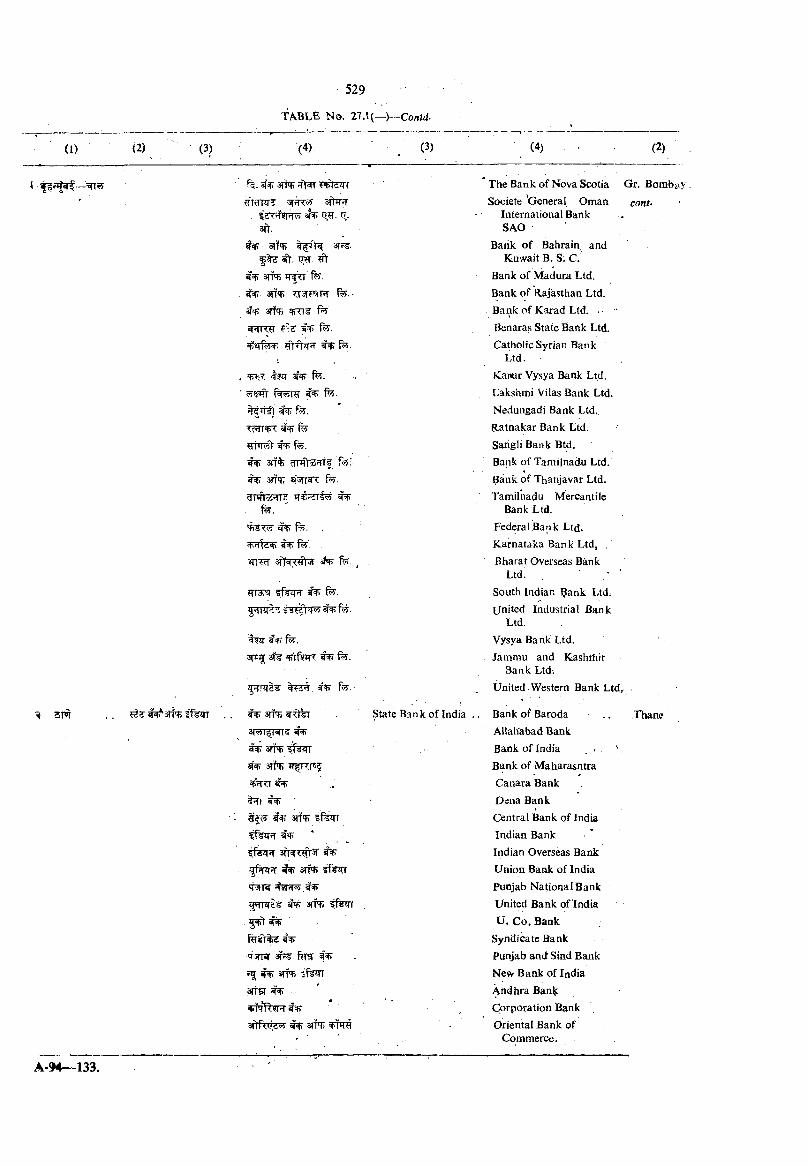
SFI . . if^qr
f . siTtfiafr TT
^ Q;..3ft.
% 3fT'B 3T?:?»7?T. #
iSfT arra- TT|Tf %■3fTf' TT3T?S|R fe.-
^ 3TTO
if-TTW fe-^«rfe^ #fV5T5T % fe.
, t?5f fe- ' f^RT fe.
#qr f?y.<cHI'T> < ^ fe
% fe.% ^TTtoS^Ttf f e ;
^ 3TTq> a^rm fe.dWlTi'll' TTf)f2T
fe.^ f^. .
feWITcF sNi fe- ,
TT3v ^ fe.^nr?jj f -
f?ir fe.5f^ STl' rfSTTX fe.
5?trI^ ^ fe-
^ an^3)«l l«i(? ^^ 3TTO f f e n
^ 3Tiro ^T^Rps?
<1 <1 ^1
aifTJ iferr
? f^ » T 3fr^ <. 3 ^
f TTTT ^ 3lf tfeJTT'Nr 'tsurt,#^q*TPT£ 3TTO
>T3rrar ^ %ar
srire i f m r
3rT5T ^ '
a f tfW ^ ? % sfTO
State Bank of tndia
The Bank of Nova ScotiaSociete Vjeneral Oman
Internaiional Bank SAO
Batik of Bahrain and Kuwait B. S; C.
Bank of Madura Ltd.Bank of Rajasthan Ltd.Bank of Karad Ltd. . ■ ’Benaras State Bank Ltd.Catholic Syrian Bank
Ltd.Kanur Vysya Bank Ltd.Lakshrtii Vilas Bank Ltd.Nedungadi Bank Ltd.Ratnakar Bank Ltd.Sarigli Bank Btd.Bank of Tami|nad.u Ltd.Bank of Thanjavar Ltd.Tamilnadu Mercantile
Bank Ltd.Federal Ban k Ltd.Karnataka Bank Ltd, .Bharat Overseas Bank
Ltd.south Indian ?ank Ltd.United Industrial Bank
Ltd.Vysya Bank Ltd.Jammu and Kashihir
Bank Ltd.United Western Bank Ltd,
Bank of BarodaAllahabad BankBank of India . < ■Bank of MaharasntraCanara BankDena BankCentral Bank pf IndiaIndian BankIndian Overseas BankUnion Bank of IndiaPunjab National BankUnited Bank of IndiaU. Co. Bank
Syndicate BankPunjab and" Sind BankNew Bank of IndiaAndhra BankCorporation BankOriental Bank of
Commerce.
Gr. Bombfi y cont-
Thane
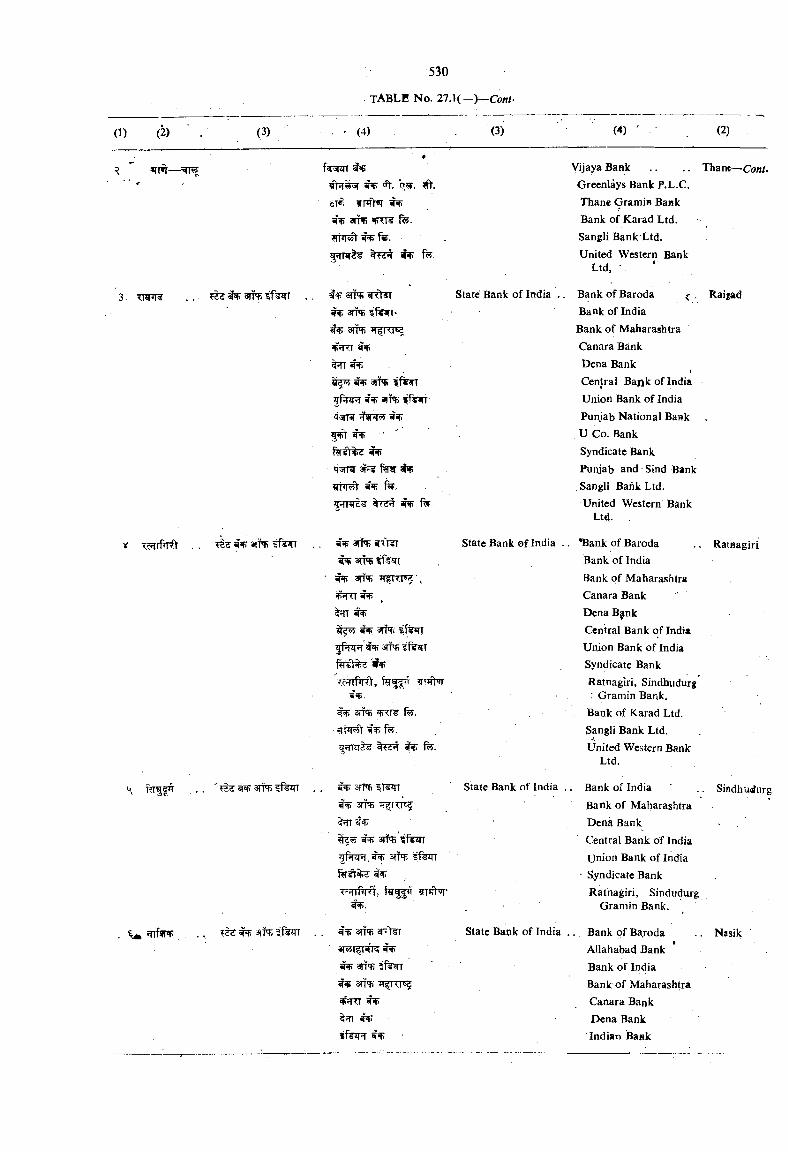
arro tfe n
3ITO ?f¥irr
¥5f> q^. wT.6W. fnrt«T ^
3n^ *PTT fe- fe.
fe
3TPB <! <1-S(^ ^ ififift'^ STTO T TTT3F5TTT ^
^ arrs ?f^r^f;r^ iiTO i f ^ -
f%5V%? ^ tj fleT %8f 3PF¥F7^ ?5f) f».
tdH iRi ftf-
i ire ^ 3 ^ tf% n
• ^ arf's ir^RT , SP5TTT#5P
^ ^ 5m»srKifejrr
Tf?nf»Rti WTjfWr
^ 3n<5 fe.*IFI^ fe.
TfrqZ %cHT ^ fe.
. STTO iTsqr 3TTO
^ an«H ? 1 w yPin^. 3?to sferr
#5f).
3TT'S ->ST STSi i^K ^^ 5?TO^ 3n<R iT riTB?4 ht[ ^
iferr W5F
State Bank of India
State Bank of India
State Bank of India .
State Bank of India .
Vijaya BankGreenlays Bank P.L.C.Thane Gramia BankBank of Karad Ltd.Sangli Bank Ltd.United Western Bank
Ltd, ■ ‘
BankofBaroda Bank of India Bank of Maharashtra Canara Bank Dena Bank \Central Bank of IndiaUnion Bank of IndiaPunjab National BankU Co. BankSyndicate BankPunjab and Sind Bank
.Sangli Bank Ltd.United Western Bank
Ltd.
. "Bank of BarodaBank of IndiaBank of MaharashtraCanara Bank ’Dena BginkCentral Bank of IndiaUnion Bank of IndiaSyndicate BankRatnagiri,. Sindhudurg : Gramin Bank.
Bank of Karad Ltd.Sangli Bank Ltd.United Western Bank
Ltd.
Bank of IndiaBank of MaharashtraDena BankCentral Bank of IndiaUnion Bank of India
• Syndicate BankRatnagiri, Sindudurg
Gramin Bank.
; Bank of B^oda Allahabad Bank Bank of India Bank of Maharashtra Canara Bank Dena Bank Indian Bank
Thane—Conr.
Rai^ad
Ratflagiri
Sindhudurg
Nasik
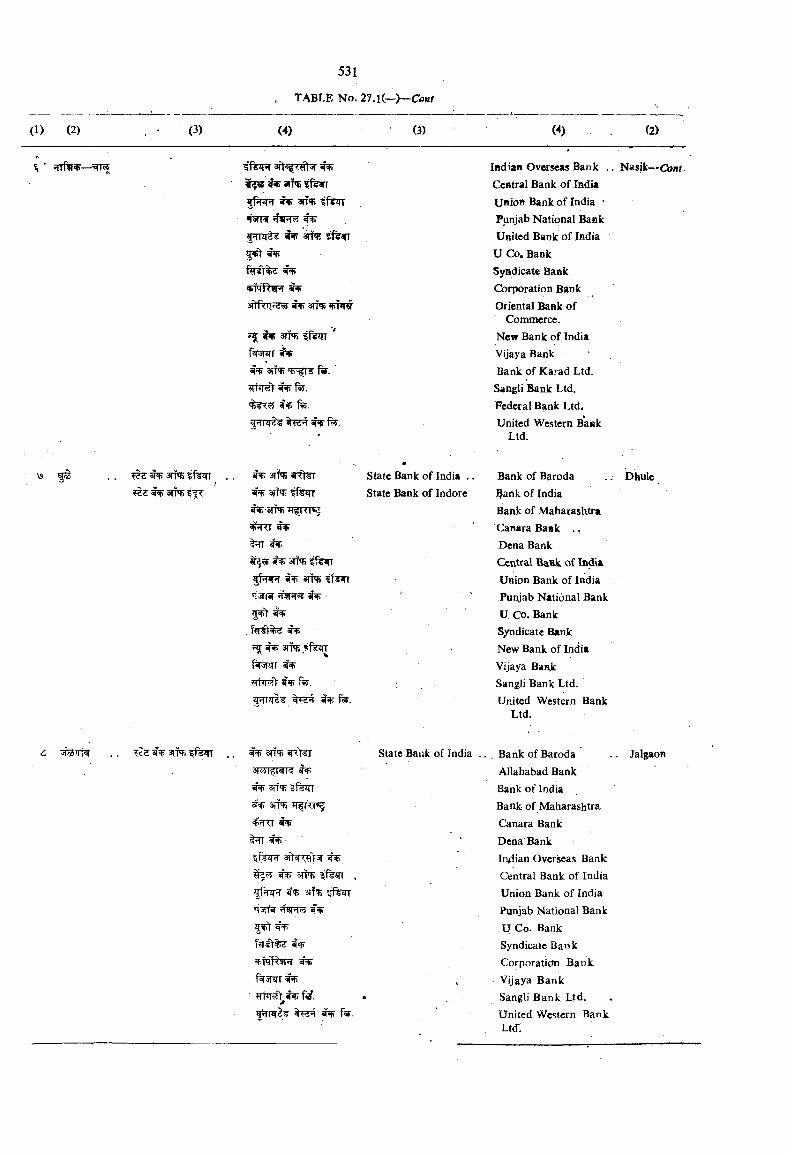
ffWT an*
fJTRT2 ^ srfq; il¥J(7
3ftr<i' s<rf 3rra
^ ainhK ' f rar iH*4m sfpN; fe. rni '1’
Indian Overseas Bank .Central Bank of IndiaUaioB Bank of India *Punjab National BankUnited Bank of India
U Co, BankSyndicate BankCorporation BankOriental Bank of
Commerce.New Bank of IndiaVijaya BankBank of Karad Ltd.Sangli Bank Ltd.Federal Bank Ltd.United Western Bank
Ltd.
Nasik—Co/ir
\9 "Wi «)+ 30*5 I •R) 3fP5 «ll il'SI ^ ajT'Ti fferr
3TTO 1T|TTT«J 5=RT ^
^ 55 5? arifq; ffvnpT STPB sffan
5T?nT?? fSFt ^
^ #TT anqj fenT fsTjnrr ^ gPRV 9!fr fe.
State Bank of India . State Bank of Indore
Bank of BarodaBank of IndiaBank of MaharashtraCanara Bank .,Dena BankCentral Bank, of IndiaUnion Bank of IndiaPunjab National BankU Co. BankSyndicate BankNew Bank of IndiaVijaya Banjk;Sangli Bank Ltd.United Western Bank
Ltd.
Dhule
6 ii.z % 3iTTi iferr 3TTTO
^ 3iiq; ^fejT 3Ti<s
^ ^ ;3Tt=(<,<lT5r ^
^ 3HtR ifesTF ,
5 ^ ^
"RlTSnT fw5Rrr ^
• frf.fw.
State Bank of India Bank of Baroda Allahabad Bank Sank of India Bank of Maharashtra Canara Bank Dena Bank Indian Overseas Bank Central Bank of India Union Bank of India Punjab National Bank U Co. Bank Syndicate Bank Corporaticm Bank Vijaya Bank Sangli Bank Ltd. United Western Bank Ltd:
Jalgaon
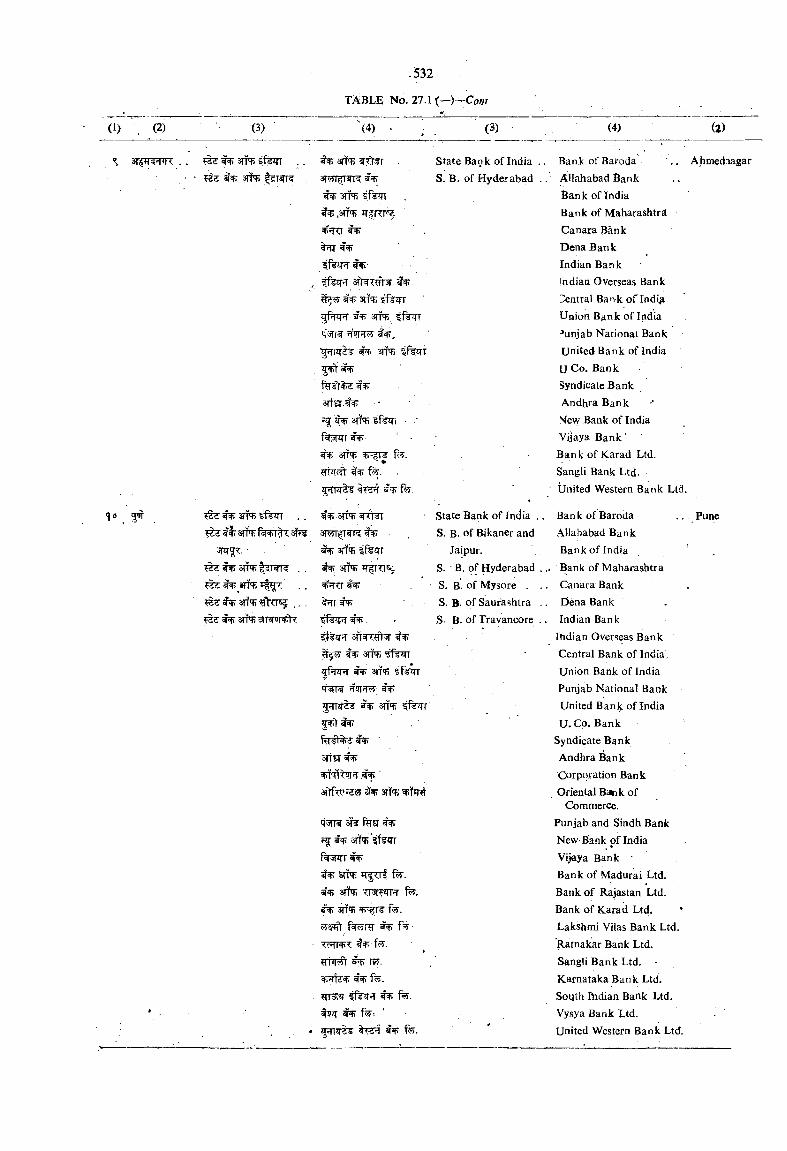
(3)
3n95 iffqr ^ arif'fi
<\6 giif
(4) (3) (4) (2)
^ ^ 33TW Ukrn , .^ f I: sttN;
5nr^. ■^ 3?TO |3Wf Hr ..
^ an!?; ..^ 3fTRi'?ftTr .. .
■di ’
aMT iwr ^W! ^ anre ife n %.3nq=nTfnr'^
^fepr% -
arre if^qr 3TTO ?f%qT
iTSFFT■ i-q-l STT'B ifeqr
3TT17t •^ 3TT'ii sfen ■
f iTT ^ ■ -anqj fe.
TFT f^.pfra'S¥ f%.
3TTO
% 3{ftfi ifejTr ^ 3#qfj
arire f zrr^IWT ^ 3TTOY'tsfT !T9T<T; ^ g ^ 2 ¥ 3TTtf> fferr5 ^ ^% %h: ^ ' artCT#
3frtTO??55 % SIT'S ^R #
q TR' ST3' %ST ^^ 3TTO if irr
fV nrr ^fe.
3TTN) TTjTWrfT fe. ^ 3rf*iB F rs’ f^. srarTft f^r?r % f^-
THT # )sr.fe-
?fer^ ^ f^.
t9?T ^ '%TFCT fly.
State Bank of India , S. B. of Hyderabad
State Bank of India . S. B. of Bikaner and
Jaipur.S. B. of Hyderabad S. B. of Mysore .S. B. of Saurashtra S. B. of Travancore
Bank of Baroda ' . . Allahabad Bank Bank of Irtdia Bank of Maharashtra Canara Bank Dena Bank Indian Bank [ndian Overseas Bank Central Bank of Indig Union Bjink of India Punjab l^ationai Bank United Bank of India U Co. Bank Syndicate Bank Andhra Bank ^ew Bank of India Vijaya Bank' ‘Bank of Karad Ltd.SangU Bank Ltd. •United Western Bank Ltd.
Bank of BarodaAllahabad BankBank of IndiaBank of MaharashtraCanara BankI5ena BankIndian Bank
Indian Overseas BankCentral Bank of India,Union Bank of IndiaPunjab National BankUnited Bank of IndiaU. Co. Bank
Syndicate BankAndhra BankCorporation BankOriental Bank of
ComiTierce.Punjab and Sindh BankNew Bank of IndiaVijaya Bank •Bank of Madurai Ltd.Bank of Rajastan Ltd.Bank of Karad Ltd. *Lakshmi Vilas Bank Ltd.'Ratnakar Bank Ltd.Sangli Bank Ltd. •Karnataka Bank Ltd.South Indian Bank Ltd.Vysya Bank Ltd.United Western Bank Ltd.
Ahmediagar
Pune
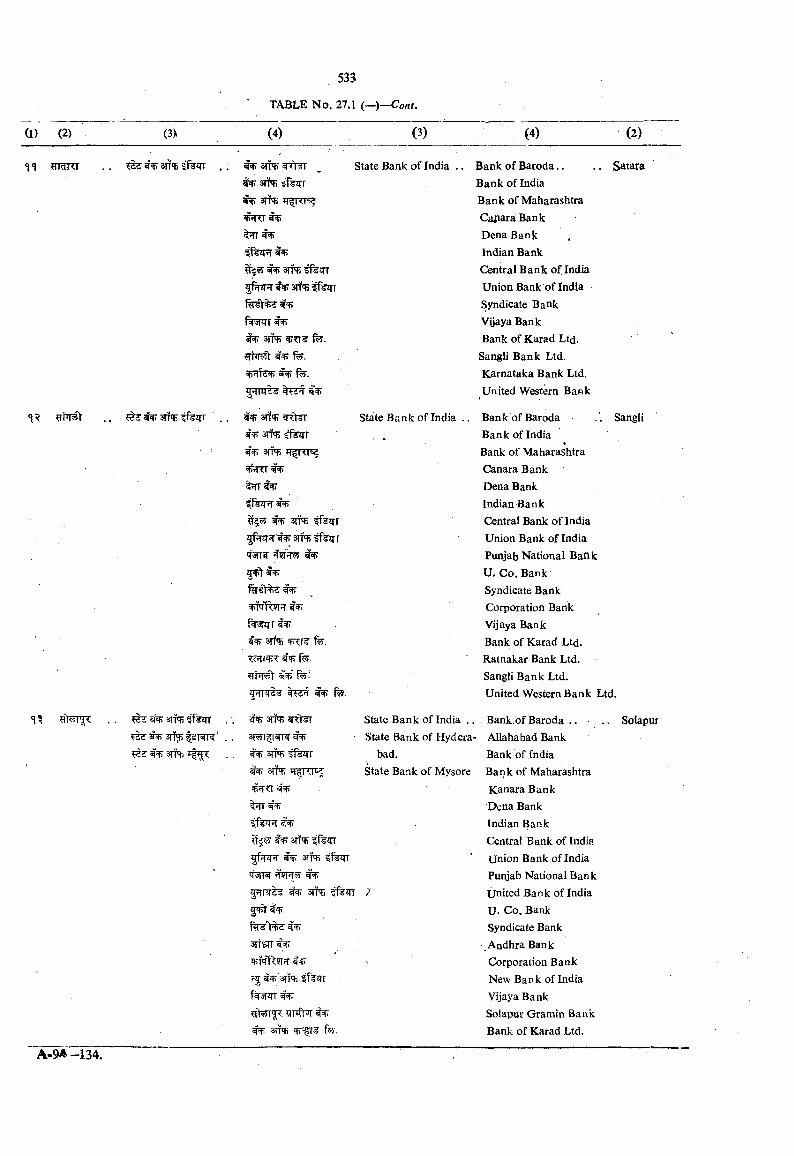
(3> (4) (3)
3n'B iferr
3n% Tfg;
^ 3#T>- ^ 3TTO sfeqr^ srra <ifs
f$3i ^ STTTE3if*fi ffen
f xjrtrr^ 3TFB f^- Hhr^ fe-'tiH?d'T> f^.
% ani)fr 3?TO ^ferr
sfpu T Tr>sa
»ifsfer^T ^
§55 ^ stTTs ^itrr ffrET T# snfq; ^^qr
T5TTW JfT«T?y
%«V%3: ^
f sTJriarfqi w ^ fe.
fe.??FI «! " f^-f^irt¥ ^ fe.
«!=h STTT) «(Ci ' lfT
^ 3ITO fferr ^ srre ^TfRJ^
^2^ ^ STTO iferrSTTO ifelT
M\JlN »T?nT5y ^»1li)<is 3TTO li%JTT
srriiTtt vpfR^nr ?2 %'3n'fi
^ arf'fi fe.
State Bank of India
State Bank of India
(4) (2)
State Bank of India .. State Bank of Hydera
bad.State Bank of Mysore
Bank of Baroda.. . . SataraBank of IndiaBank of MaharashtraCamara: BankDena BankIndian BankCentral B a n k of IndiaUnion Bank of IndiaSyndicate BankVijaya BankBank of Karad Ltd*
Sangli Bank Ltd.Karnataka Bank Ltd.United Western Bank
Bank of Baroda . '. SangliBank of IndiaBank of MaharashtraCanara BankDena BankIndian BankCentral Bank of IndiaUnion Bank of IndiaPunjab National BankU. Co. BankSyndicate BankCorporation BankVijaya BankBank of Karad Ltd.Ratnakar Bank Ltd.Sangli Bank Ltd.United Western Bank Ltd.
Bank.of Baroda . . .. SoiapurAllahabad Bank Bank of India Ba n k of Maharashtra Kanara Bank Dena Bank Indian Bank Central Bank of India Union Bank of India Punjab National Bank United Bank of India U- Co. Bank Syndicate Bank Andhra Bank Corporation Bank New Bank of India Vijaya Bank Soiapur Gramin Bank Bank of Karad Ltd.
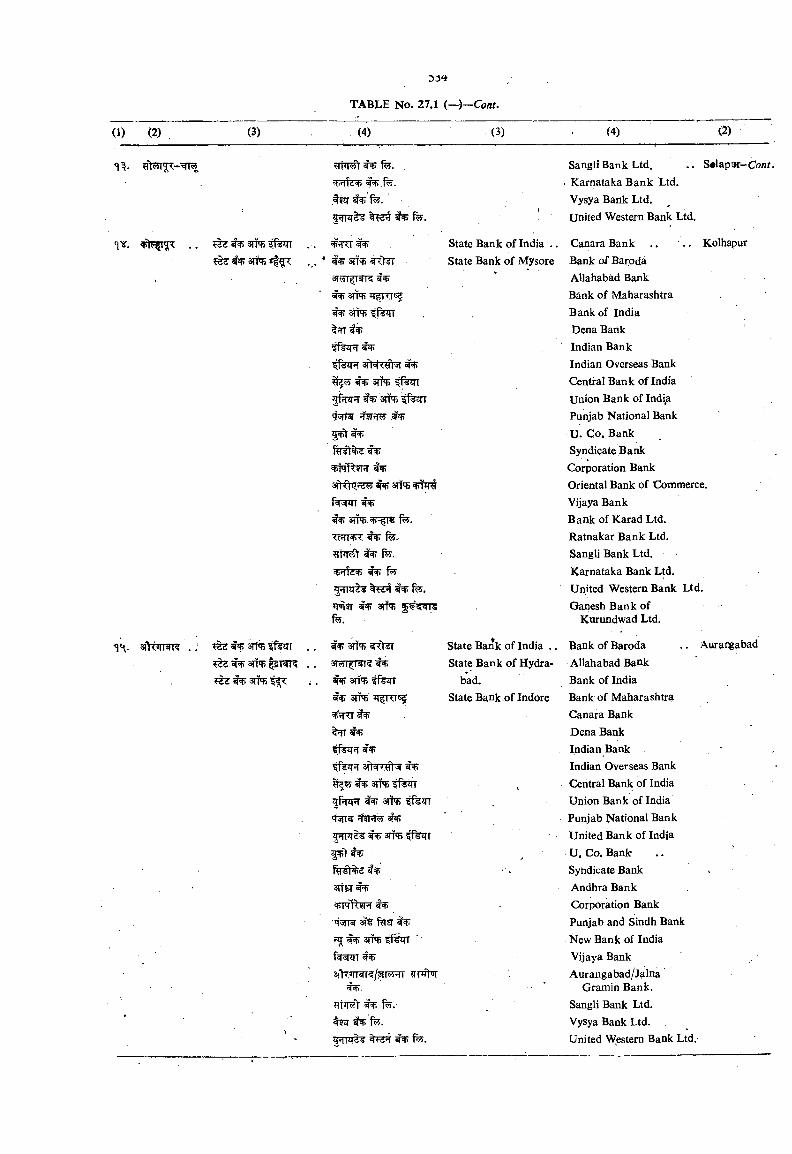
0 ) (2) (3) (4) (3) (4) (2)
■i l<?il fe. SangliBank Ltd. . . S#lapar-Con?.# fe. • Karnataka Bank Ltd.
. fif fe. Vysya Bank Ltd.f
United Western Bank Ltd.
'IV. ^ ^ SIT'S ife n State Bank of India .. Canara Bank .. . . Kolhapuranqj rfgr .,. * 317' ^fr^r State Bank of Mysore BankofBaroda
’ - , 4<t5 Allahabad Bank^3m;TT^TTG5 Bank of Maharashtra% ife n Bank of India5TT ^ Dena Bank
ifenr ^ Indian Banka r ttr ^ m Indian Overseas Bank
^ srre Central Bank of India^Pi hh 3rr?> fejTT Union Bank of India4wtW‘ 'i yi'l<?i M4> Punjab National Bank
U. Co. BankSyndicate BankCorporation Bank
^ sirs + H« Oriental Bank of Commerce.VijayaBank
3(i'fi 't>- i% fe. Bank of Karad Ltd.<cWI ^ fe. Ratnakar Bank Ltd.'Hkw't ^ f^. Sangli Bank Ltd.
^ fe. Karnataka Bank Ltd.W3¥ «(4> fe. United Western Bank Ltd.
’Pi?! 4N> I4i 5^<i«iis Ganesh Bank offe. Kurundwad Ltd.
sIK ih'i? , ; ^ ^ ?ferr 3n'T5 State Bank of India . . Bank of Baroda . . Auratgabad
3TTO |SNK State Bank of Hydra- Allahabad Bank^zz 5- srNi ; . ^ 3TTO ifeqr bad. Bank of India
State Bank of Indore Bank of Maharashtra■'fiJTTT ^ Canara Bank
Dena BankIndianBank
?f¥3T sftwr fhif Indian Overseas Bank^3jiTO?f%tn Central Bank of India
#Tznr ^ 3TTO Union Bank of India'T5TTW >T5R ^ Punjab National BankfTFT^ 3TTO iP itf United Bank of India
v’ U. Co. Bank• V Syndicate Bank
3TTCT#W? Andhra BankCorporation Bank
'T'jIN 3t ftrsT «i+ Punjab and Sindh Bank^ STTO irezTT New Bank of India
f PTT Vijaya Bank3) 77rrar?/i3r[ ?ri41ui Aurangabad/Jalna
^ ■ Gramin Bank.fTHRlr ^ f^. Sangli Bank Ltd.
■ ^ fe. VySya Bank Ltd.y
•11i)d' fe. United Western Bank Ltd.
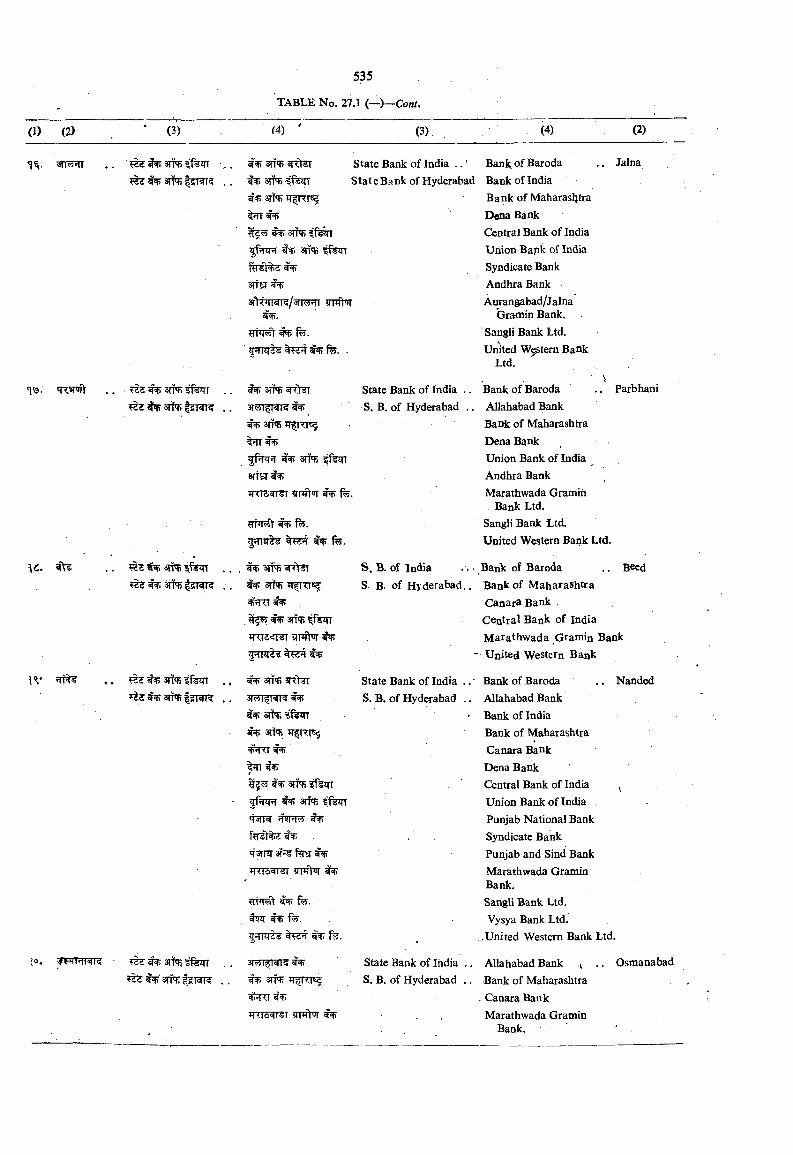
(1) (2) " (3) (4) ' (3) (4) (2)
^ 3rTR .... Sri'S State Bank of India . , ’ BankofBaroda . . Jalna^ STTC sn j State Bank of Hyderabad Bank of India
3TTO iTfRT'S Bank of MaharastjtraifT ^ Deoa Bank
^ sm; Central Bank of IndiaUnion Bapk of IndiaSyndicate Bank
arrsT T Andhra Bankafjjqiwr /'Jtr Hi i<w>f Aurangabad/Jalna
Gramin Bank.5R) fe. Sangli Bank Ltd.
JpTHTHS ^ dri ^ fe. , United Wgstem BankLtd.
'R rnt . , iz z ^ 3TTTO fferr ^ 3TTO State Bank of India ..V
BankofBaroda . . Parbhaniiz z ^ Slifqi fsTWT? 3)<?il NI? ^ S. B. of Hyderabad ., Allahabad Bank
^ 3TTO TTi|TTT<s| Bank of MaharashtraDenaBank
ajl4) Union Bank of India8 n ^ ^ Andhra Bank+i<i4^T^’trnft'n’^ fe. Marathwada Gramin
Bank Ltd.?rnr fe. Sangli Bank Ltd.
td»1 ^ fe„ United Western Bank Ltd.
S, B. of India Bank of Baroda .. Beed% 3liN) islNK . . ^ ami qfnr^ S. B. of Hyderabad/. Bank of Maharashtra
CanaraBank. ^ sits ^ferr Central Bank of IndiaJnT5<T vitoW ^ Marathwada Gramin Bank
- United Western Bank
IV . . ^ STTT) State Bank of India . . • BankofBaroda . . NandedSt^l^KK sR> S. B. of Hyderabad .. Allahabad Bank^ 31TO ?ferr ' Bank of India^ 31TO Bank of Maharashtra
Canara BankDenaBankCentral Bank of India ^
jf TiFT ^ 3TTO f fen Union Bank of India .H'Jll«< 'TiFF? ^ Punjab National Bank
Syndicate Bankqsnw 3?* ^ Punjab and Sind BankTRTBwr rrntw ^ Marathwada Gramin
Bank.Sangli Bank Ltd.
i(ii ^ Vysya Bank Ltd.55TTlf2 ^ dH %. . .United Western Bank Ltd.
>0, , IFfTRHK - . . 3|'rtl l«ll5 State Bank of liidia .. Allahabad Bank .. Osmanabad3TRi f5T3T , ^ sriNi W TTT S. B, of Hyderabad .. Bank of Maharashtra . ,
+H<1 % . Canara BankTRTS T trnfhr ^ > Marathwada Gramin
Bank. '
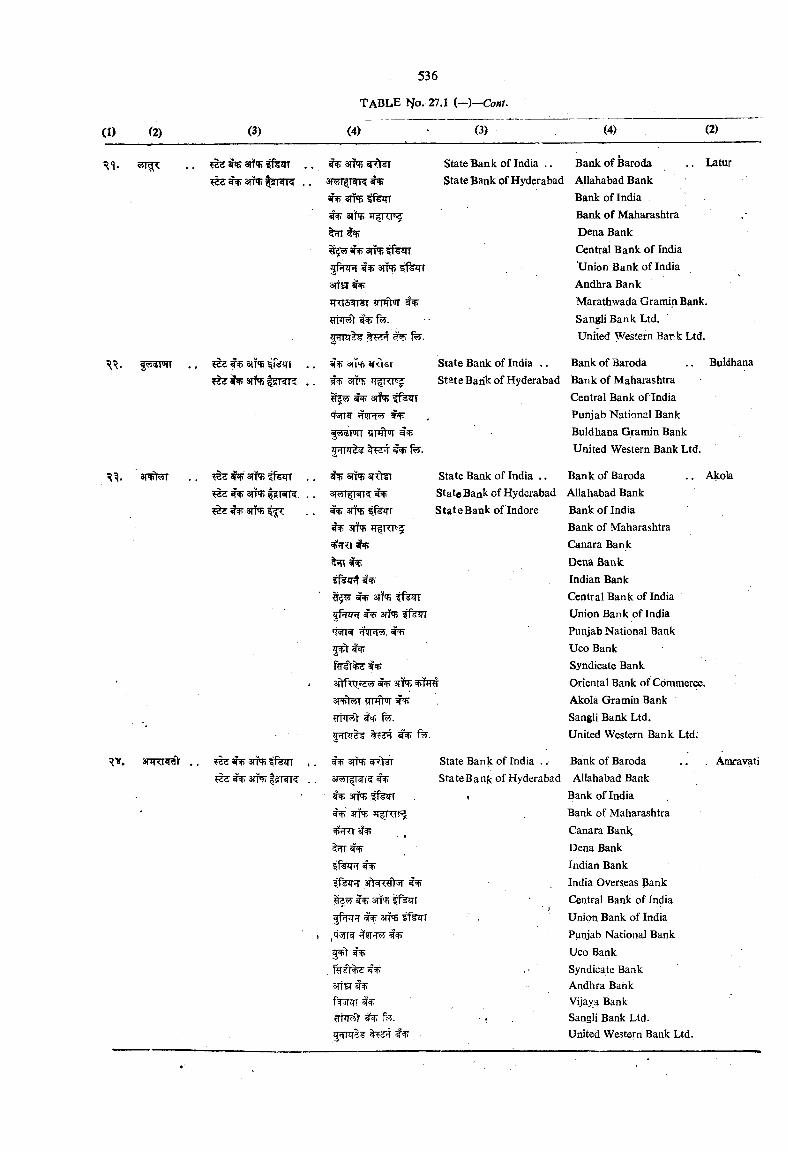
(I) (2) (3) (4) (3) (4) (2)
^ 3TFB ?fen ^ snq; si <1 1 State Bank of India .. Bank of Baroda . . Laturwd ^ am; sffii'K . . State Bank of Hyderabad Allahabad Bank
^ srN; ?feir Bank of India^ 3ITO ■H KI d Bank of Maharashtra
5»ii Dena Bank^ srfq; iffirr Central Bank of India
3TPR ( Mf Union Bank of India3TtHrl^ Andhra Bank
Marathwada Gramin Bank.Sangli Bank Ltd.
^rnr^ fe". Unhed Western Batik Ltd.
|5J3FIT . . an*fi . . m'4> afOsi State Bank of India . . Bank of Baroda .. Buldhana
^ SfTTR |5RT5 . . ^ sm; State Bank of Hyderabad Bank of MaharashtraIth ^ 3rre ^ferr Central Bank of India«T 5f Tin'll ^ Punjab National Bank^STwr 9TrW Buldhana Giramin Bank
'W'l «I4» fe. United Western Bank Ltd.
^ ^ 3mi f fe n . . «!#> 3TTO 9Tfer State Bank of India . . Bank of Baroda . . Akola?S3^3ITre|g|«JI<4 . . State Bank of Hyderabad Allahabad Bank
^ arra ?|[t anra fferr State Bank of Indore Bank of India^ 3iirfi rr?TTr*5 Bank of Maharashtra
Canara BankDeua BankIndian Bank
an’S Central Bank of IndiaPl'W'1 «l'fi 3{(*fi $f%TT Union Bank of India
*7^ »T5R55. ^ Punjab National BankUco Bank
«i't» Syndicate Bank3ftfrn.*’<i<?i 3ttN) 'bi'Hy Oriental Bank of Commerce.3(+'l«l yilfN' Akola Gramin Bank
fe. Sangli Bank Ltd.f5J- United Western Bank Ltd.
SPRIW . . ^ 3TTO i . ^ STTT) sl<l l State Bank of India . .■ Bank of Baroda . . . Amravati^ STTO . . 1 ?■ State B a nk of Hyderabad Allahabad Bank
3#?; df q-f % Bank of India‘ 3?lfqj TnPT? Bank of Maharashtra
Canara BankDena Bank
f fer r ^ Indian Bankffer T 3ff^x#3r India Overseas pank
3TT1i I'f qr Central Bank of India^ -ij- 3tt'5 f f^ r
tUnion Bank of India
J Punjab National BankUco BankSyndicate Bank
3rm% ' Andhra Bankf JTT #5F Vijaya Bank
f?5. Sangli Bank Ltd.United Western Bank Ltd.
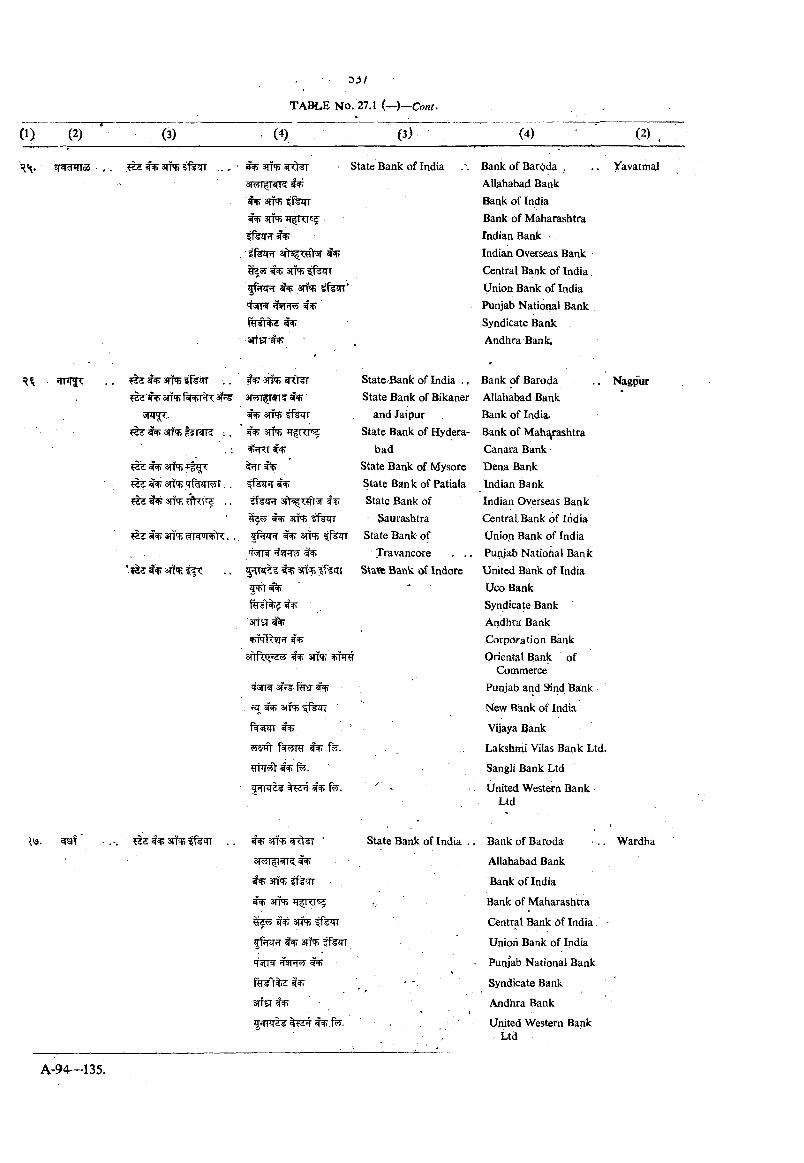
3TT' i
^ 3TX'B ?fefr 3TTO
tfezR 3(1« <«!'>< arrr* fferr
^ aiirs ifefT"
anww^
State Bank of India Bank of Barpda , AlUhabad Bank Baqk of India Bank of Maharashtra Indian Bank Indian Overseas Bank Central Bank of India: Union Bank of India Punjab National Bank Syndicate Bank Andhra Bank.
YavatmaJ
«r 3TTO lafK ; .
arftRffgr ^ ^ 3it'b 5%iri^T;. ^ ^ 3 n < r : ^ (r s - ..
^ Sri'S3J«I^NI? ^ '^ 3ntf) fferr ^ 3?ire q^RT^
«Tr «<v
ifsqvT 3ft^T#3f3rrs ifkirr
srrr;TwisT ^
3^1 ^
'3itCT^
sfrfrtT j 3TT'?; %iw#
qsrr 3ff¥ %sr
. «T ^ 3?ft{; fferr ■
f nrr
fk RT SRi fe'.
rnr l: 4% f%.
?I PT2 % fe.
State Bank of India ., State Bank of Bikaner
and Jaipur State Bank of Hydera
badState Bank of Mysore State Bank of Patiala State Bank of• Saurashtra
State Bank ofTravancore , . .
Sta«fc Bank of Indore
Bank of Baroda Allahabad Bank Bank of India- Bank of Maharashtra Canara Bank Dena Bank Indian Bank Indian Overseas Bank Central.Bank of India Union Bank of India Punjab National Bank United Bank of India Uco Bank Syndicate Bank Andhra Bank Corporation Bank Oriental Bank of
Commerce Punjab and Sind Bank
New Bank of India
Vijaya Bank
Lakshmi Vilas Bank Ltd.
Sangli Bank Ltd
United Western Bank > Ltd
Nagpur
I'a. m ’i ^ 3TT< ■
#5p .
^ 3rni
^ 3PNr
3n<p
q rrsr
State Bank of India . Bank of Baroda
Allahabad Bank
Bank of India
Bank of Maharashtra
Central Bank of India
Union Bank of India
Punjab National Bank
Syndk:ate Bank
Andhra Bank
United Western Bank Ltd
Wardha
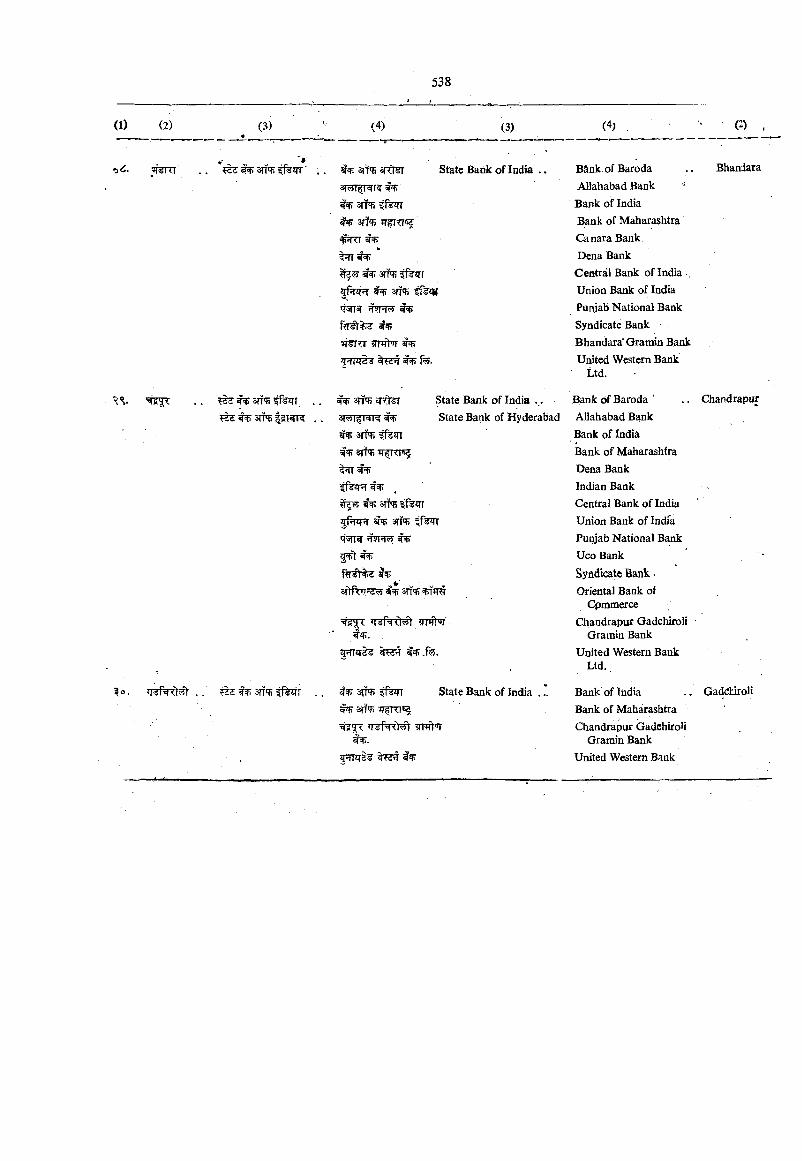
(1) (2) (>) (4) (3> (4;
•5<i.
?o. . . ari'B ffetr
3f7 ^ftlT
#«F 3TT5^ Sji'Ji J RTG?
»
•11 *l'=fi^ amj
f TZpT 3fT<J>'T5fT Hi M<?J ^
W' i ’i.i i)i+n«i^ fe.
State Baibk of India
arifqj grtST
^ 3fTO ff%m srni) TfTTT
?TT
^ 555 ^ 311 5 jf TpT ^ aiTO
3fir<vd« STTFfi
ir hrtRTt imfhr^#1.
State Bank of India . . State Bank of Hyderabad
State Bank of India . *
BSnk.of Baroda .. BhandaraAllahabad BankBank of IndiaBank of MaharashtraCanaraBankDena BankCentral Bank of India ,Union Bank of India Punjab National Bank Syndicate Bank Bhandara' Gramin Bank United Western Bank
Ltd.
Bank of Baroda ' . . ChandrapurAllahabad Ba.nkBank of IndiaBank of MaharashtraDena BankIndian BankCentral Bank of IndiaUnion Bank of IndiaPunjab National BankUco BankSyndicate B ank.Oriental Bank of
CpmmerceChandrapur Gadchiroli
Gramin BankUnited Western Bank
Ltd..
Bank of India .. GaddhiroliBank of MaharashtraChandrapur GadchkoU
Graraid BankUnited Western Bank
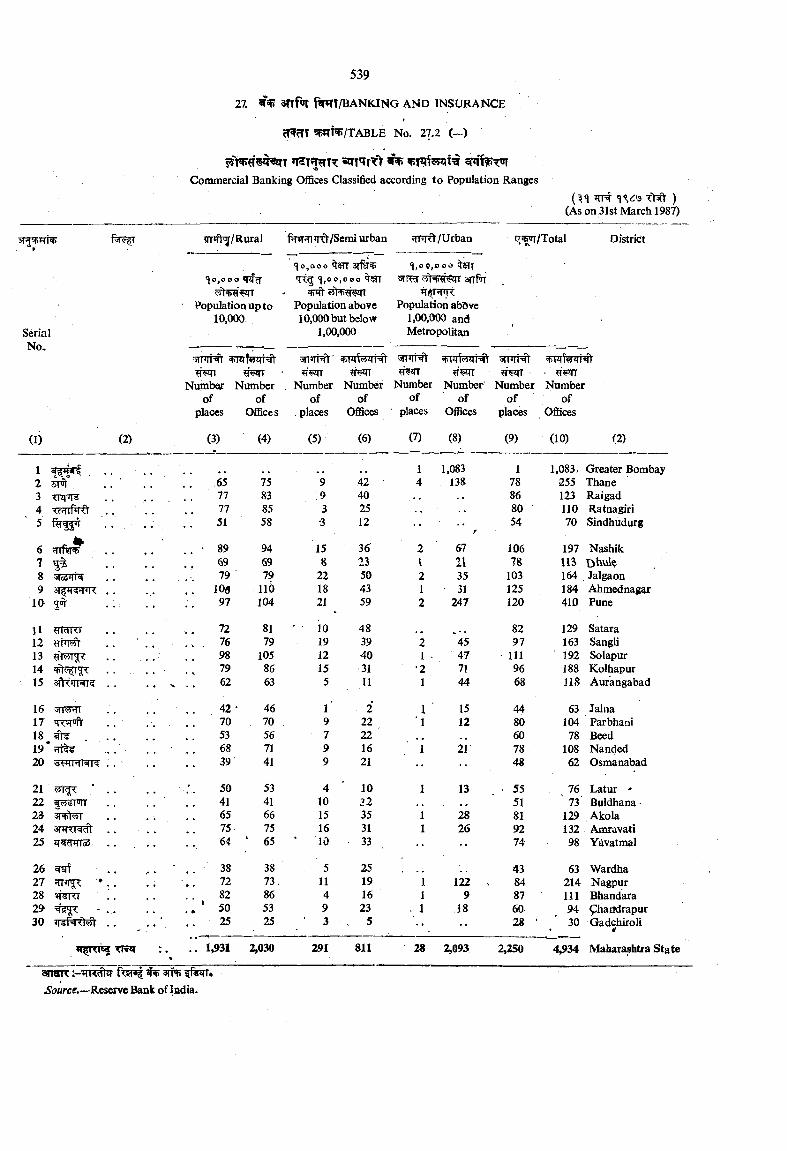
«iTT'TtT> S fT lff^Commercial Banking Offices Qassified according to Population Ranges
^r# TNt ) (As on 31st March 198'b
^rmt'j/Rural ffnT^n^^/Semi urban /Urban rr^/Total District
SerialNo.
«}o,ooo
Population up to 10,000
Numbcw: Number of of
places OflBces
<|o,ooo s r f ^cr^ <},00,000
Population above 10,000but below
1,00,000
<j, 0 0,000arrf
Population above1,00,000 and Metropolitan
Number Number Number Number Number Number of of of of of of
places Ofl5ces places OflSces places OflBces
(1) (2) (3) (4) (5) (6) (7) (8) (9) (10) (2)
1 1,083 1,083, Greater Bombay2 ST . . 65 75 9 42 4 138 78 255 Thane3 77 83 9 40 86 123 Raigad4 <cHinr<l . . • « ♦ 77 85 3 25 80 110 Ratnagiri5 • 51 58 3 12
r54 70 Sindhudurg
6 ' 89 94 15 36 2 67 106 197 Nashik7 '5% 69 69 8 23 I 21 78 IB Dtvvil^8 ■<>r3TR 79 79 22 50 2 35 103 164 . Jalgaon9 3Tftr^^ . . . log 110 18 43 1 31 125 184 Ahmednagar
10 3^ . . . . 97 104 21 59 2 247 120 410 Pune
11 ?rTWRr 72 81 10 48 82 129 Satara12 . . » . 76 79 19 39 2 '45 97 163 Sangli13 98 105 12 40 1 . 47 111 192 Solapur14 . ■ 79 86 15 31 '2 71 96 188 Kolhapur15 3fhi»iT3rR . . . . . 62 63 5 11 1 44 68 118 Aurangabad
16 42 ■ 46 1 2 1 ' 15 44 63 Jalna17 70 70 . 9 22 1 12 80 104 Parbhani18 , ^ . . . 53 56 7 22 ' , , , , 60 78 Beed19* . ... ♦ * 68 71 9 16 1 21' 78 108 Nanded20 . 39 41 9 21 •• 48 62 Osmanabad
21 ‘ . . . 50 53 4 10 1 13 ■ 55 76 Latur "22 « • • 41 41 10 32 . » 51 ' 73' Buldhana -23 . . 65 66 15 35 1 28 81 129 , Akola24 3»+i<,Ndl . . . . . 75 75 16 31 1 26 92 132 Amravati25 JT a;MIo5 . . • 64 • 65 ’ 10 33 •• 74 98 Yavatmal
26 ^ . . 38 38 5 25 43 63 Wardha27 72 73. 11 19 1 122 84 214 Nagpur28 82 86 4 16 1 9 87 111 Bhandara29 ‘ ... • • ' 50 53 9 23 1 18 60 94 ^haudrapur30 25 25 ’ 3 , 5 •• •• 28 ■ ’ 30 Gadchiroli4
TT5*I * *%1,931 2,030 291 811 28 2,093 2,250 4,934 Maharashtra
an«R am;Source.—Reserve Bank of India.
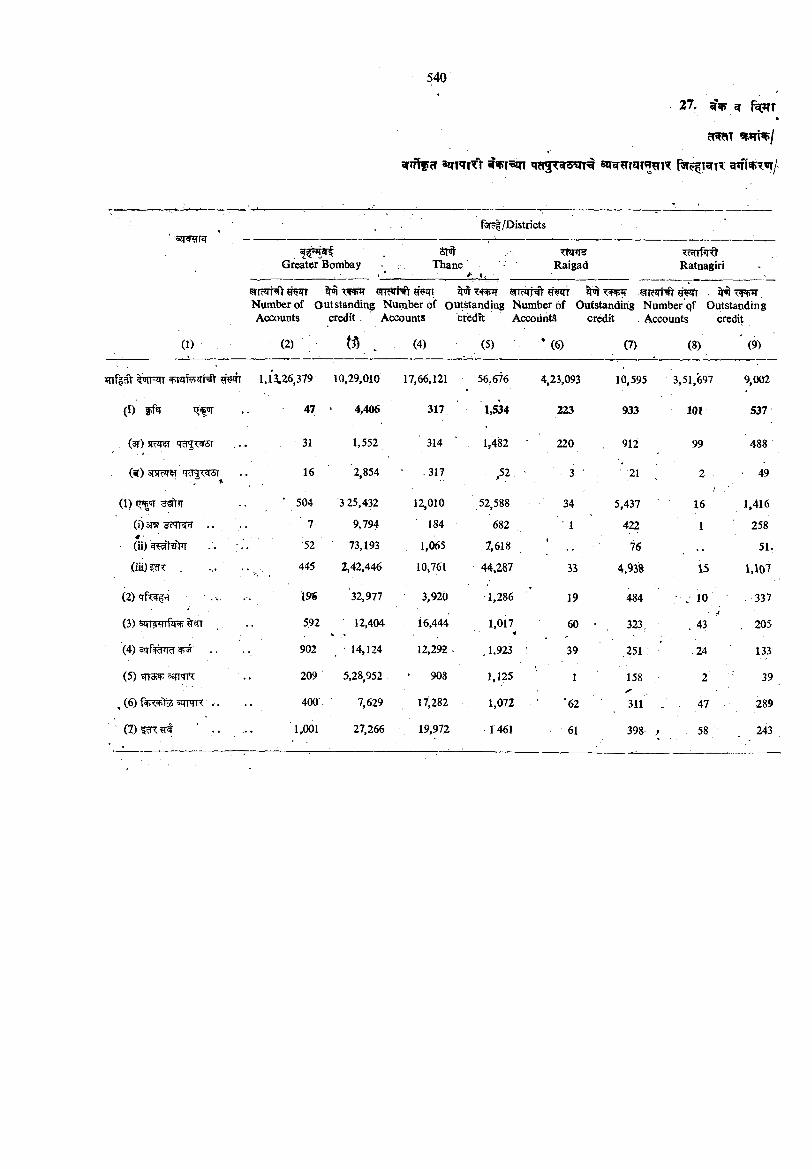
s r f f f cT 3m«TTTV 5i?^?TWT^?n?
f^/D istricts•3ipmnT
Greater BombayST#
Thane Raigad Ratnagiri
^ yrretrNt ?r!?n ^ ^riwNV ? r^ ^ ?r^ . ^Number of Outstanding Number of outstanding Number of Outstanding Number qf Outstanding Accounts credit. Accounts ctedit AccoiiritS credit . Accounts credit
(1) (2) (4) (5) (7) (8) (9)
’Rn% ^qf^^rNV 1.U26.379 10,29,010 17,66,121 56.676 4,23,093 10,595 ■ 3,51.697 9,002
(I) fr^ 47 4,406 317 1,534 223 933 101 537
. (sr) sic r q^<'N6i 31 1,552 314 1,482 220 912 99 488
(^) 3i Rzr« .. 16 2,854 ' .317 .52. ' .'3 • 21 ^ 2 ■ ■ 49
(1) Hiftrr ' 504 3 25,432 12,010 52,588 34 5,437/
16 1,416
(i) 3ra cTrtr? .. ' 7 9,794 184 682 • 1 422 1 ■ 258
(ii) ^"t?r>r •52 73,193 , 1,065 7,618t <
76 51.
(iii)fW . ... ..^ 445 2,42,446 10,761 44,287 33 4,938 15 1,107
(2 )q f^ ^ 196 '32,977 3,920 1,286 19 484 , 1 0 . 337
(3)6W W T ^W . .. 5,92 12,404 16,444 1,017 60 • 323, . 43 . 205
(4) sq’f gr ra' =fv3r 902 14,124 12,292 - ,1,923 39 .251 .■ .24 133
(5) ?rT^ .. 209 5,28,952 , 908 1,125\
1 158 2 39
\,(6)f3|v?3;>3 3qTcrn 400'. 7,629 17,282 1,072 '62 311 . 47 289
' (7) ^ ' . . ... 1,001 27,266 19,972 1 461 ' 61 398 ,r 58 243
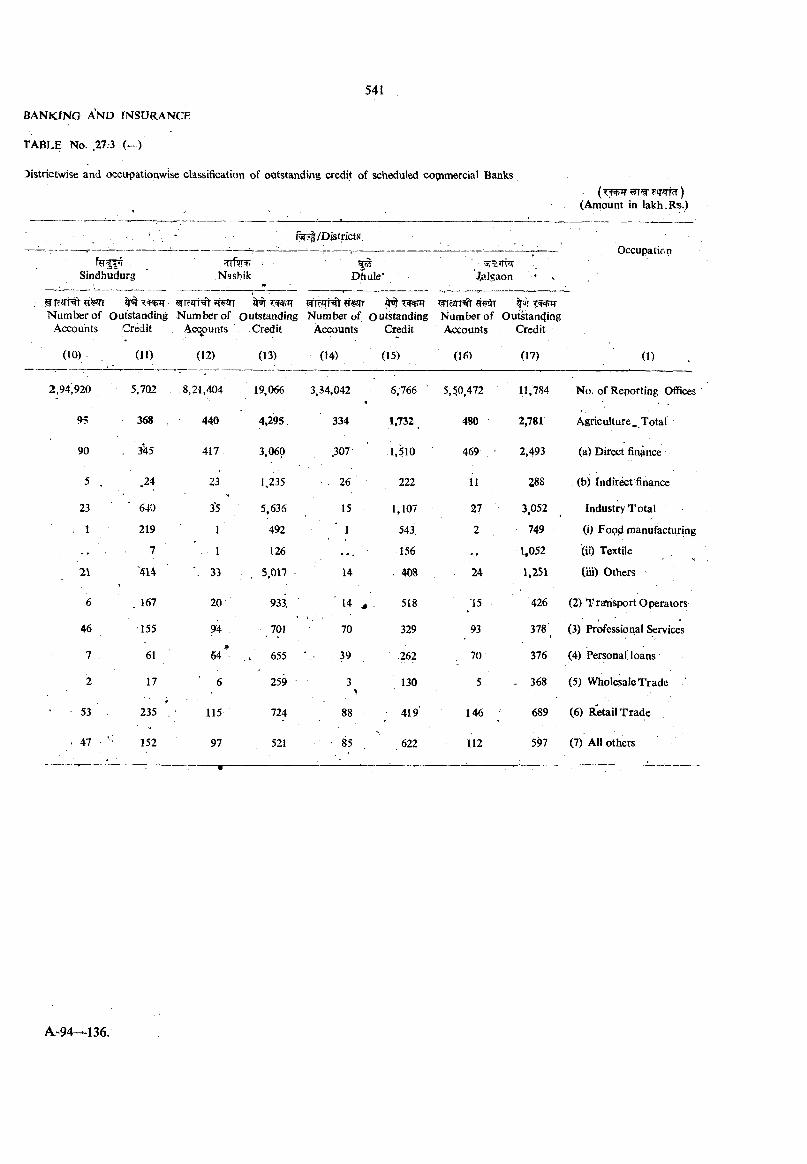
^istrictwise and occupationwise classification of outstanding credit of scheduled cotjimercial Banks
%?|/Districts,
Sindhudurg=TTftr
Nashik
Tsrtcf)(Anipunt in lakh.Rs.)
Occupation
Dhule' Jfalgaon
Number of Outstanding Accounts Credit
m
^ if Tc?rHt ^Number of Outstanding Number of Outstanding
Ao^punts Credit Accounts Credit
’ fctrNY #^TNumber of Outstanding Accounts Credit
(11) (12) (13) (14) (15) 06) (17) (1)
920 5,702 . . 8,21.404 19,066 3,34,042 6,766 ' 5,50,472 11,784 No. of Reporting Offices
95 368 , 440 4,295 334 1,732 480 2,781 Agriculture^ Total
90 , 31 5 417 3,060 .307- 1,510 469 ■ 2,493 (a) Direct finance
5 . .24 . 23 1,235 26 222 11 288 (b) Indir^t finance
23 640 35 5,636 15 1,107 27 ' 3,052 Industry Total
1 219 1 492 ■ 1 543 2 749 (i) Foo^i manufacturing
7 I 126 156 1,052 (ii) Textile
21 ’414 33 5,017 • 14 . 408 24 1,251 Oil) Others
6 . 167 20 933 ' 1 4 \ * . 518 '15 426 (2) Tramsport Operators
46 155 94 701 70 329 93 378 ■_ (3) Professional &rvices
7 , 61¥
64 655 .3 9 .262 70 376 (4) Personalloans
2 17 ' 6 259 3 130 5 - 368 (5) Wholesale Trade
53 . 235 ' 115 724 88 419 146 ‘ 689 (6) Retail Trade
47 ' 152 97 521 ■ 85 . 622 112 597 (7) All others
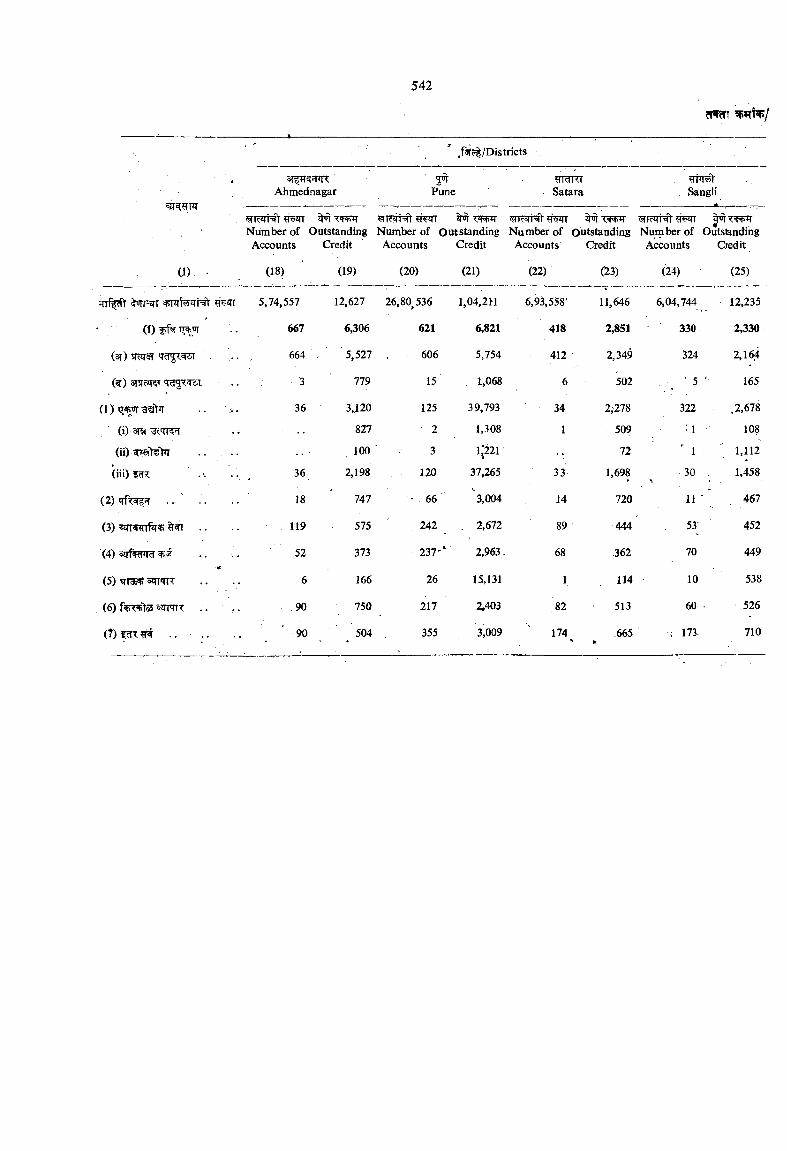
/^ /D is tr ic ts
4 ■ 3T^??nRAhmednagar
3^Pune
TT TTSatara Sangli
AWMRt ?re*n ^ Number of Outstanding
Accounts CreditHumber of Outstanding
Accounts CreditNumber of Outstanding Accounts Credit
Number of Accounts
OutstandingQedit
a ) • (18) (19) (20) (21) (22) C23) (24) (25)
;n%ft %ornTT 5,74,557 12,627 26,80,536 l,04,2tl 6,93,558’ 11,646 6,04,744 12,235
(I) $67 6,306 621 6,821 418 2,851 330 2,330
(sr) 5RJI5T . ... 664 , 5,527 606 5,754 412 2,349 324 2,164
SrJlcJTST 'TcTyC l . . ; - .3 779 15 . 1,068 6 502 ' 5 165
(1) ^?i>r 36 3,120 125 39,793 34 2,278 322 .2,678
/ (i) 3T« ('TRJr 827 1,308 1 509 1 108
(iO w t i j k . . . . . 100 3 1,;221 72 " 1 1,112
(iii) 5 ^ 36 2,198 120 37,265 33 1,698 30 1,458
(2)qft5rf5T .. ' .. 18 747 ’ 66 3,004 14 720 11 • ’ 467
(3) .. 119 575 242 . 2,672 89 444 53 452
(4) 5JTfjRr>m ■' 52 373 237-‘ 2,963 - 68 .362 70 449•4
(5) s nqiT 6 166 26 15,131 1 114 10 538
(6) sqRIT .. .. .90 750 217 2,403 82 513 60 526
(?)¥WT^ .. .. ’ 90 504 355 3,009 174^ .665 , 173. 710
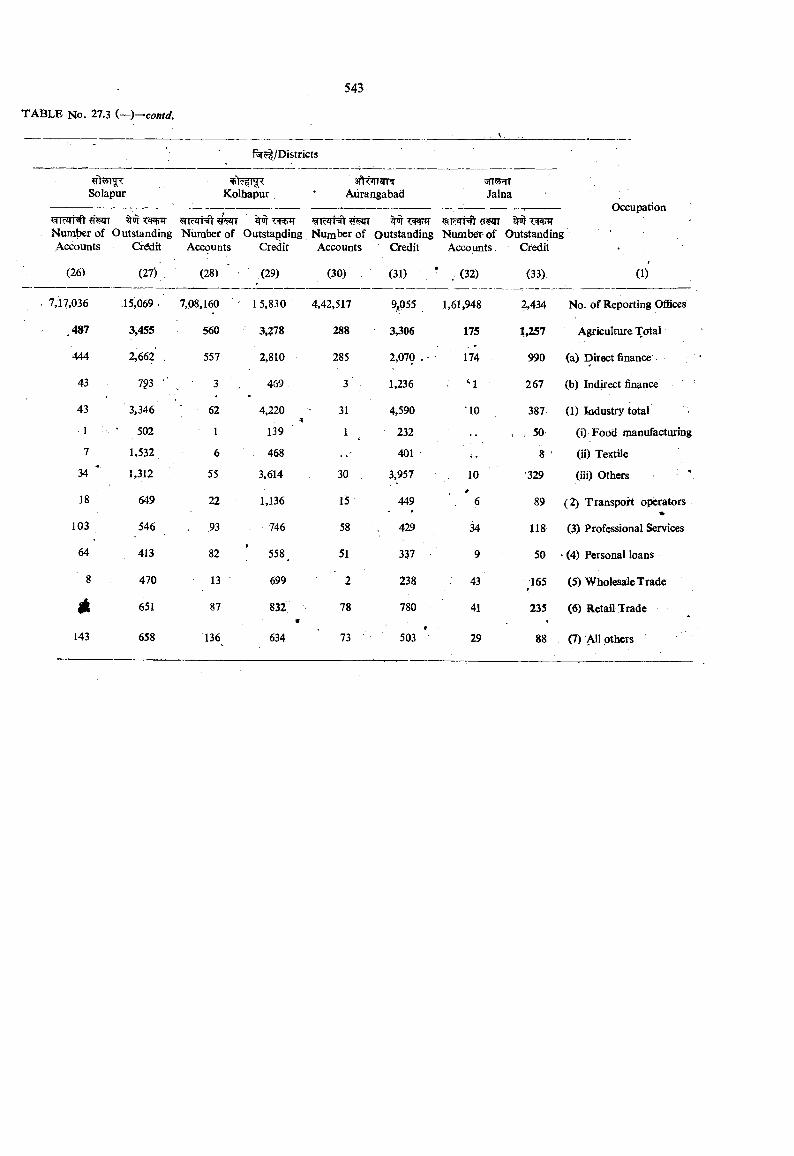
Solapur Kolhapxir Aurangabad Jalna
Number of Outstanding Accounts Credit
(26)
’STcqt^wrr ^icirHtcrw ^ 7 ^ = ^Number of Outstanding Number of Outstanding Numb* of Outstanding Accounts Credit Accounts Credit Accounts. Credit
(27) (28) (29) (30) (31) . (32) (33)
Occupation
(1)
7,17,036 15,069 . 7,08,160 1 5,83 0 4,42,517 S5,055 1,61,948 2,434 No. of Reporting Offices
.487 3,455 560 3,278 288 3,306 175 1,257 Agriculture Total
444 2,662 . 557 2,810 285 2,070 , 174 990 (a) Direct finance
43 7?3 ^ 3 469 3 ' ; 1,236 M 267 (b) Indirect finance
43 3,346 ; 62 4,220 31 4,590 10 387 (1) Industry total
1 ' 502 1 139 ' 1 232 , . 50 (i) Food manufactiyring
7 1,532 6 468 401 i . 8 ' (ii) Textile
34- ' 1,312 55 3,614 30 3,957 10 '329 (iii) Others
18 649 22 1,136 15 449 6 ,89 (2) Transport operators
103 546 93 746 58 429 34 118 (3) Professional Services
64 413 82 558 _ 51 337 9 50 ‘ (4) Personal loans
8 470 13 699 2 238 43 165 (5) Wholesale Trade
l l 651 87- 832«
78 780 41 235 (6) Retail Trade
143 658 136 634 73 503 * 29 88 (7) All others
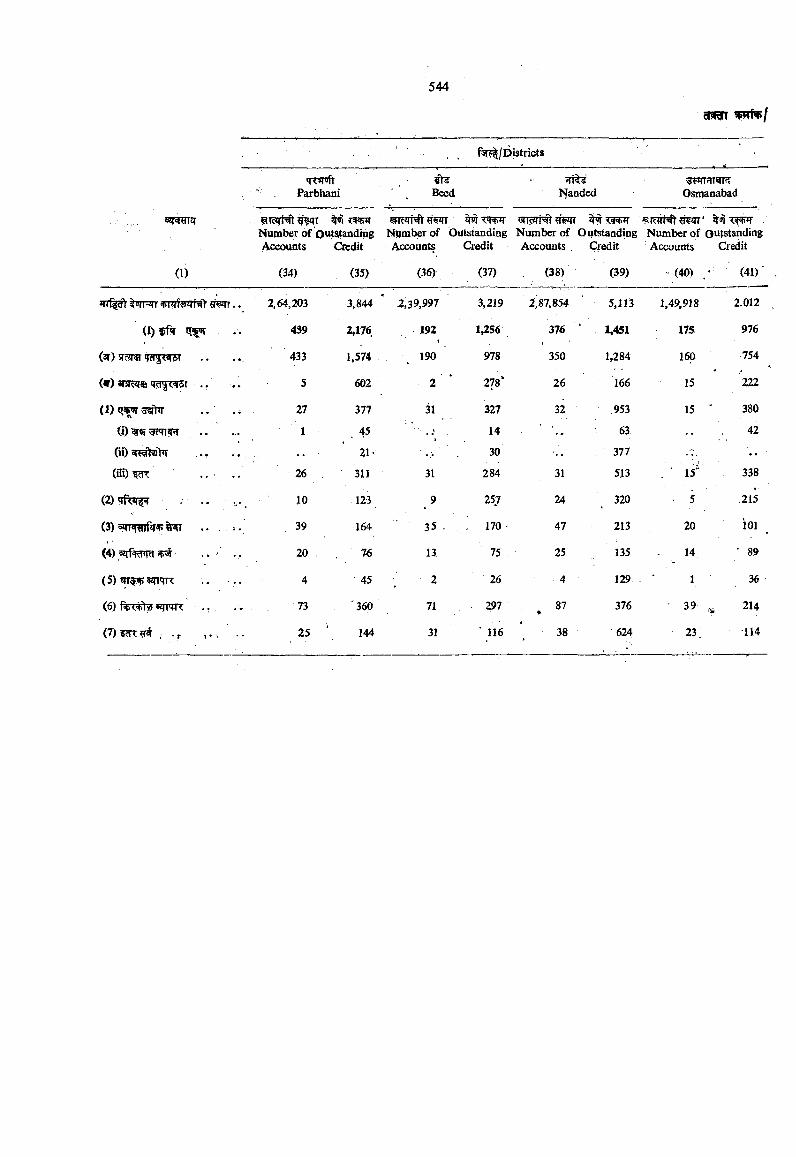
<R9rr
Parbhani Beed;rt^
Nanded Osmanabad
(1)
?TcirH1[ #IT ?=RnT Number of Qutataiiding Accounts Credit
9FRqNt ^ <^*1 TcSfwt' €FTT ^Number of Outstanding Number of Outstanding Accounts Credit Accounts , Credit
Number of outstanding Accounts Credit
(J4) (35) (36) (37) (38) (39) -(40) / (41)
(r) ffw iae»r
(3r) 5T5!r« ?d^<4gl'
( t ) 3T5T?2ift
(1) <?«pr3sr1ir
(i) m ??n?R Oi)
(iii) ^
(2)
(3)
(4)
(5) ETT^V^Tn:
(7)?^?TW . . f
2,64,203
439
433
5
27
1
26
10
39
20
4
73
25
3,844
2,176
1,574
602
377
45
21'
311
123
164
76
45
360
144
2,39,997
192
190
2
31
31
9
35
13
2
71
31
3,219
1^56
978
278*
327
14
30
284
25J
170
75
26
297
' 116
2,g7,854
376
350
26
32
31
24
47
25
4
87♦
38
5,113
1,451
1,284
166
.953
63
377
513
320
213
135
129
376
624
1.49,918
175
160
15
15
. ■ 15"
• 5
20
14
1
23
2.012
976
754
222
380
42
338
.215
iol
' 89
36
214
•114
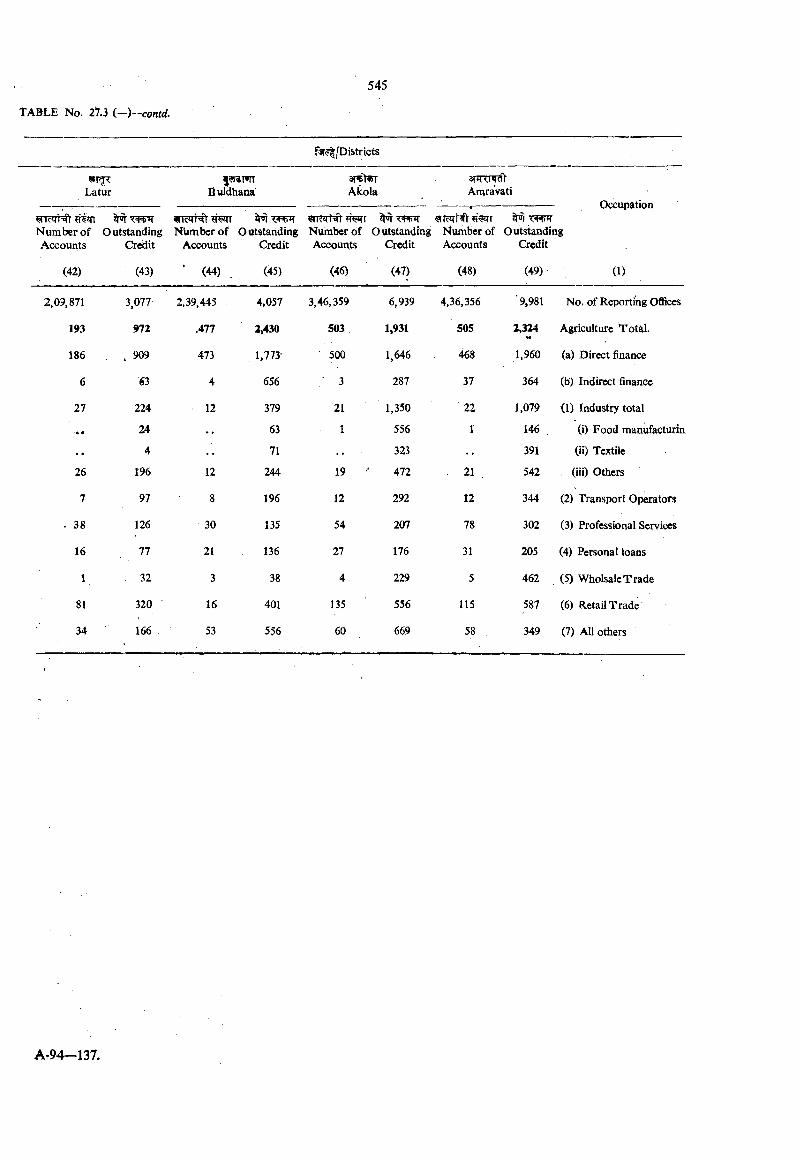
f^r^/Districts
Latur Buldhaaa AkolaSrTRPRn'Anaravati
Occupation
igNum ber of O utstanding Accounts Credit
Number of Accounts
OutstandingCredit
mczrNt ffwr twit Number of Outstanding Accounts Credit
•
Number of Outstandir Accountis Credit
(42) (43) * (44) . (45) (46) (47) (48) (49) (1)
2,09,871 3,077 2,39,445 4,057 3,46,359 6,939 4,36,356 '9,981 No. of Reporting OflSces
193 972 ,477 2,430 503 1,931 505 2,324*• Agriculture Total.
186 . 909 473 1,773- 500 1,646 468 1,960 (a) Direct finance
6 63 4 656 • 3 287 37 364 (b) Indirect finance
27 224 12 379 21 1,350 ■ 22 1,079 (1) Industry total
-• « 24 63 1 556 1 146 , (i) Food manufacturin
4 71 323 391 (ii) Textile
26 196 12 244 19 ' 472 21 . 542 (lii) Others
7 97 8 196 12 292 12 344 (2) Transport Operators
. 38 126 30 135 54 207 78 302 (3) Professional Services
16 77 21 136 27 176 31 205 (4) Personal loans
1 32 3 38 4 229 5 462 (5) WholsaleTrade
81 320 16 401 135 556 115 587 (6) Retail Trade
34 166 53 556 60 669 58 349 (7) All others
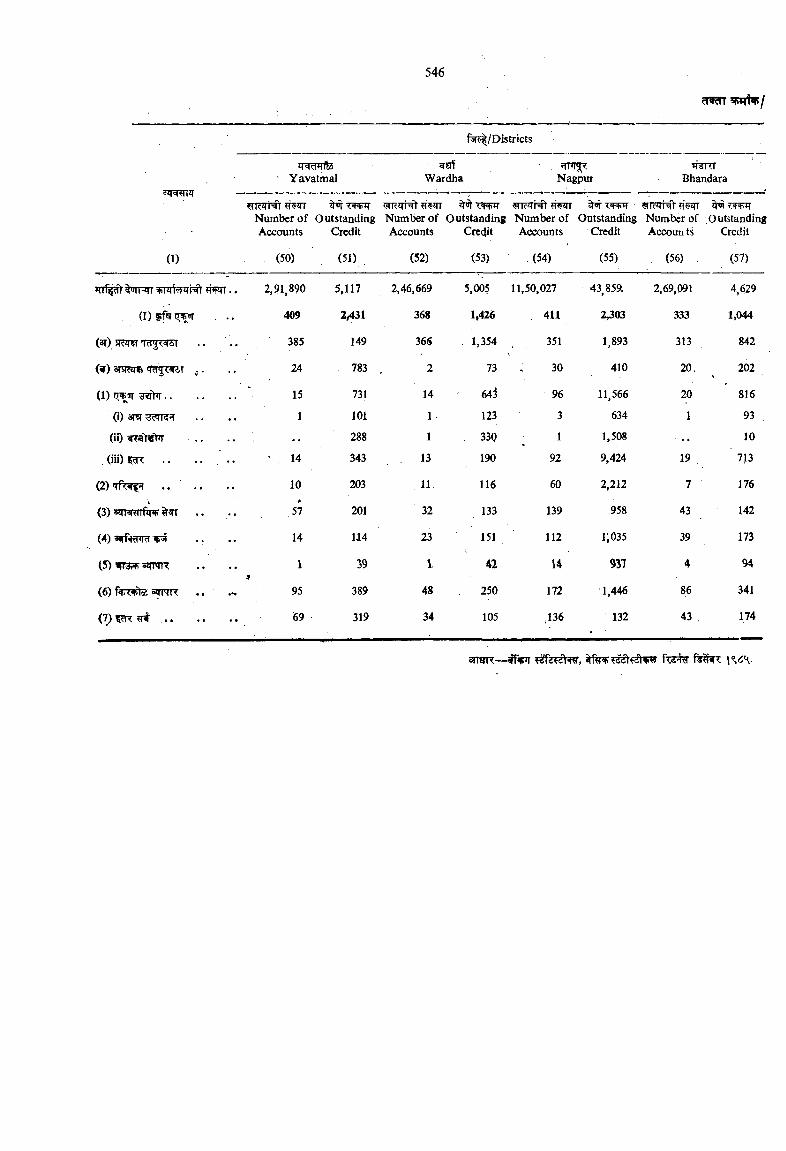
arw?rT
f>r^/Districts
Yavatmal Wardha Nagpur>nnTT
Bhandara
^R rHt ^ i'HiH Number of Outstanding Accounts Credit
Number of Outstanding Number of Accounts Credit Accounts
OutstandingCredit
’SIcilh'V ?i>qT Number of Accoun ts
OutstandingCredit
(1) (50) (51) (52) (53) (54) (55) (56) (57)
?rrf^ WFTT rnrf ^NV .. 2,91,890 5,117 2,46,669 5,005 11,50,027 43 859. 2,69,091 4,629
( I ) f f ^ ^ . .. 409 2^31 368 M 26 411 2,303 333 1,044
(ar) SIcTfT 385 149 366 , 1,354 351 1,893 313 842
<w) arsr^ ,,. 24 783 2 73 30 410 20, 202
(1) grgtiT.. . . 15 731 14 643 96 11,566 20 816
(i) 31 y<ru <i?f 1 101 1 123 3 634 1 93
(ii) i "hsW ................ 288 1 330 1 1,508 10
(n i)|d< . . . . . . ’ , 14 343 190 92 9,424 19 713
(2)«rfT^ . . . . 10 203 11 116 60 2,212 7 176
(3) 5Jn €Tfi|if>*
57 201 32 133 139 958 43 142
(4) 14 114 23 151 112 1,035 39 173
(5) WMW* eiTPTR 1'9
39 1. 42 U 937 4 94
(6) . . .*. 95 389 48 250 172 1,446 86 341
(7) cTC H # .......................... 69 319 34 105 ,136 132 43 . 174
arrerR— f c s % \%6\,
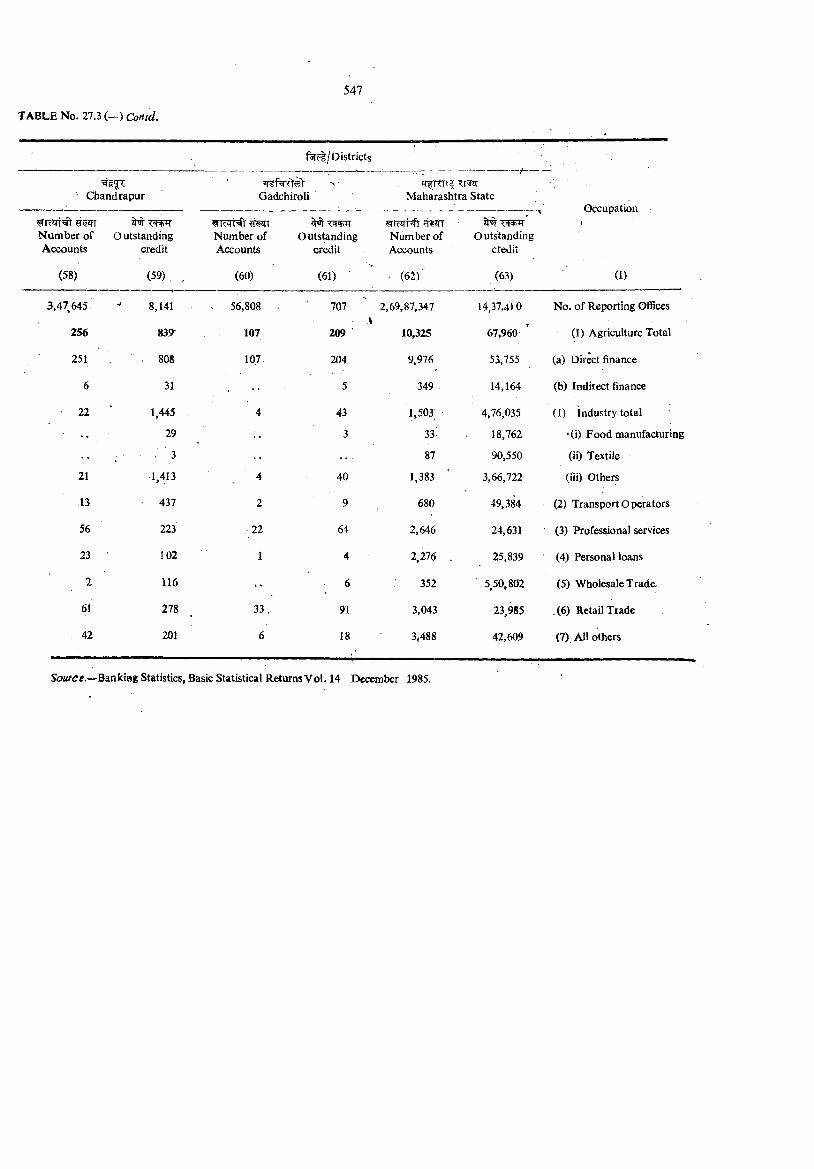
TABLE No. 27.3 ( - ) Contd.
ritc- /Districts/
Chandrapur
- • ■
Gadchiroli Maharashtra StateOccupation
\Number of Outstanding Accounts credit
Number of Accounts
Outstandingcredit
Number of Accounts
- - ■ r-...... «
Outstandingctedit
(58) (59) , (60) (61) ■ (62) (63) (1)
3,47 645 8,141 . 56,808 707 2,69,87,347 14,37,410 No. of Reporting Offices
256 839 107\
209 10,325 67,960 " (I) Agriculture Total
251 808 107. 204 . 9,976 53,755 (a) Direct finance
6 31 5 349 14,164 (b) Indirect finance
22 ■ 1,445 • . ' 4 ■ 43 1,503 4,76,035 (1) industry total
. . 29 3 33 18,762 '(i) Food manufacturing
3 . . . 87 90,550 (ii) Textile
21 1,413 4 40 1,383 3,66,722 (lii) Others
13 437 2 9 680 49,384 (2) Transport Operators
56 223 22 64 2,646 24,631 (3) Professional services
23 102 1 4 2,276 . 25,839 (4) Personal loans
2 116 •• 6 352 5,50,802 (5) Wholesale Trade
61 278 33 . 91 3,043 23,985 .(6) Retail Trade
42 201 6 18 3,488 42,609 (7) All others
Source.—Bankiag Statistics, Basic Statistical Returns Vol. 14 December 1985.
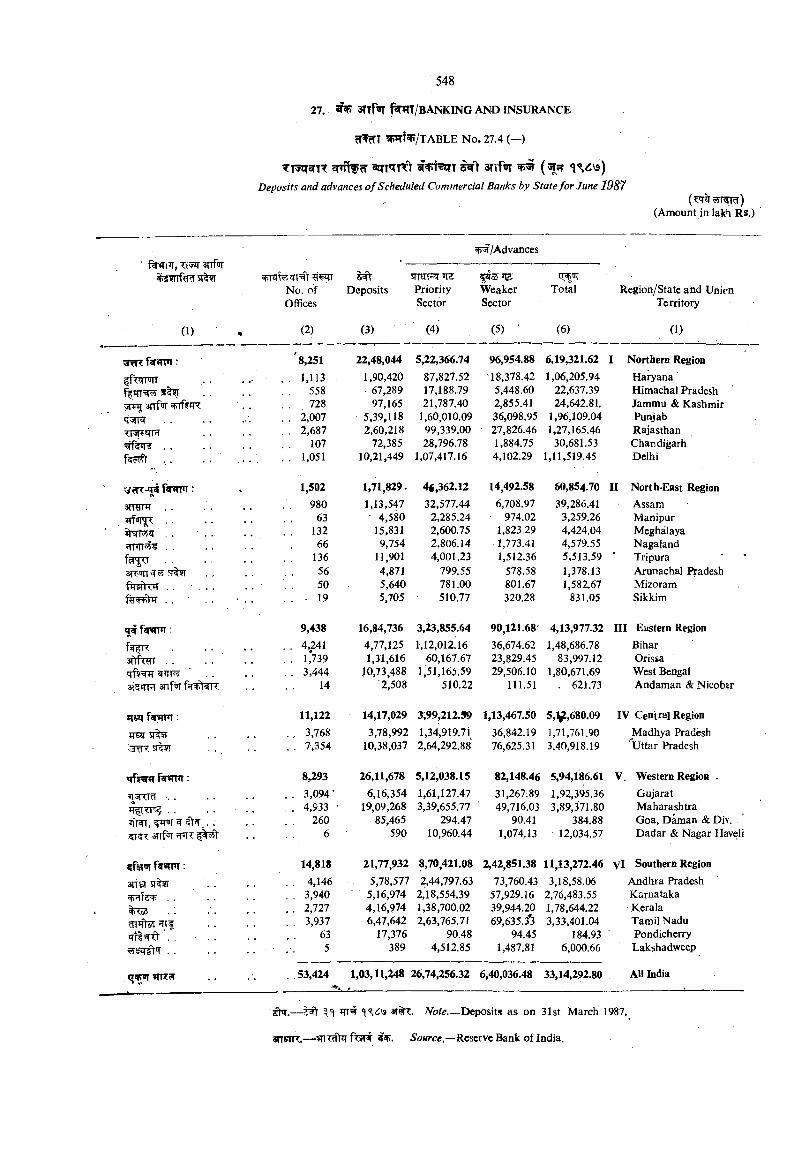
W ^ / t ABLE N o. 27.4 (—)
T T ^ cTTT Sin'TTTtDeposits and advances o f Scheduled Commercial Banks by State for June 1987
Ti'iir arrpjr^/Advances
No. of Offices
DepositssrT8[RT*T3PrioritySector
5 55 ^WeakerSector
Total Region/State and Unicn Territory
(1) (2) (3) (4) (5) ■ (6) (1)
;J?R : '8,251 22,48,044 5,22,366.74 96,954.88 6,19,321.62 I Northern Region
3rrf''T
TF3F«rm
. . 1,113
. . 558
. . 728
. . 2,007
. . 2,687
. . 107 , . . , • . 1,051
1,90,420 • 67,289
97,165 5,39,118 2,60,218
72,385 10,21,449
87,827.5217,188.7921,787.40
1,60,010.0999,339.0028,796.78
1,07,417.16
18,378.42 5,448.60 2,855.41 36,098.95
- 27,826.46 1,884.75 4,102.29
1,06,205.9422,637.3924,642.8L
1,96,109,041,27,165.46
30,681.531,11,519.45
Haryana'Himachal PradeshJammu & KashmirPunjabRajasthanChandigarhDelhi
fawm: 1,502 1,71,829- 4g,362.12 14,492.58 60,854.70 II North-East Region
<Hi«r*T . .
. . . .
f^%u . .
I TSftTfT . . . .
. . 980 63
. . 132 66
136 56 50
. . 19
1,13,547 • 4,580 15.831 9,754
11,901 4,871 5,640 5,705
32,577.442,285.242,600.752,806.144,001.23
799.55781.00510.77
6,708.97974.02
1,823.29■1,773.411,512.36
578.58801.67320.28
39,286.413,259.264,424.044,579.555,513.591,378.131,58Z67
831.05
■ Assam Manipur Meghalaya Nagaland TripuraArunachal PradeshMizoramSikkim
«T F ^ n ; 9,438 16,84,736 3,23,855.64 90,121.68 4,13,977.32 III Eastern Region
. . . .aftfw . .
aj TTH snf’iT
. . 4,241 . . 1,739 . . 3,444 . . 14
4,77,1251,J1,616
10,73,488'2,508
1,12,012J660,167.67
1,51,165.59510.22
36,674.6223,829.4529,506.10
111.51
1,48,686.78 83,997.12
1,80,671.69 . 621.73
Bihar Orissa West Bengal Andaman & Nicobar
wsir : 11,122 14,17,029 y,99,212.39 1,13,467.50 5,^,680.09 IV Central Region
*4W| 51^ .3= 7 a%9T
. , 3,768
. . 7,3543,78,992
10,38,0371,34,919.712,64,292.88
36,842.1976,625.31
1,71,761.903,40,918.19
Madhya Pradesh Uttar Pradesh
f^ n r : 8,293 26,11,678 5,12,038.15 82,148.46 5,94,li86.61 V. Western Region .
. .
arifon^K
. . 3,094’. . . . 4,933 ■
. . 260 6
6,16,35419,09,268
85,465590
1,61,127.473,39,655.77
294.4710,960.44
31,267.8949,716.03
90.411,074.13
1,92,395.363,89,371.80
384.8812,034.57
Gujarat Maharashtra Goa, Daman & Div. Dadar & Nagar Haveli
14,818 21,77,932 8,70,421.08 2,42,851.38 11,13,272.46 Vl Southern Region
artei . . .
« <o5gn*fto5 m f Tri=5rfr . . ■ . .
; . . . 4,146 . . . . 3,940
. . 2,727 . . . . 3,937
63. . . .'. 5
5,78,577 ' 5,16,974
4,16,974 6,47,642
17,376 389
2,44,797.632,18,554.391,38,700.022,63,765.71
90.484,512.85
73,760.4357,929.1639,944.2069,635.j'3
94.451,487.81
3,18,58.062,76,483.551,78,644.223,33,401.04
184.936,000.66
Andhra PradeshKarnatakaKeralaTamil NaduPondicherryLakshadweep
15 'iT insc^ . . 53,424•fti
1,03,11,248 26,74,256.32 6,40,036.48 33,14,292.80 All India..... •
— 3ff Note— Deposits as on 31st March 1987.
3ITCTR.— 5<?«rce.—Reserve Bank of India.
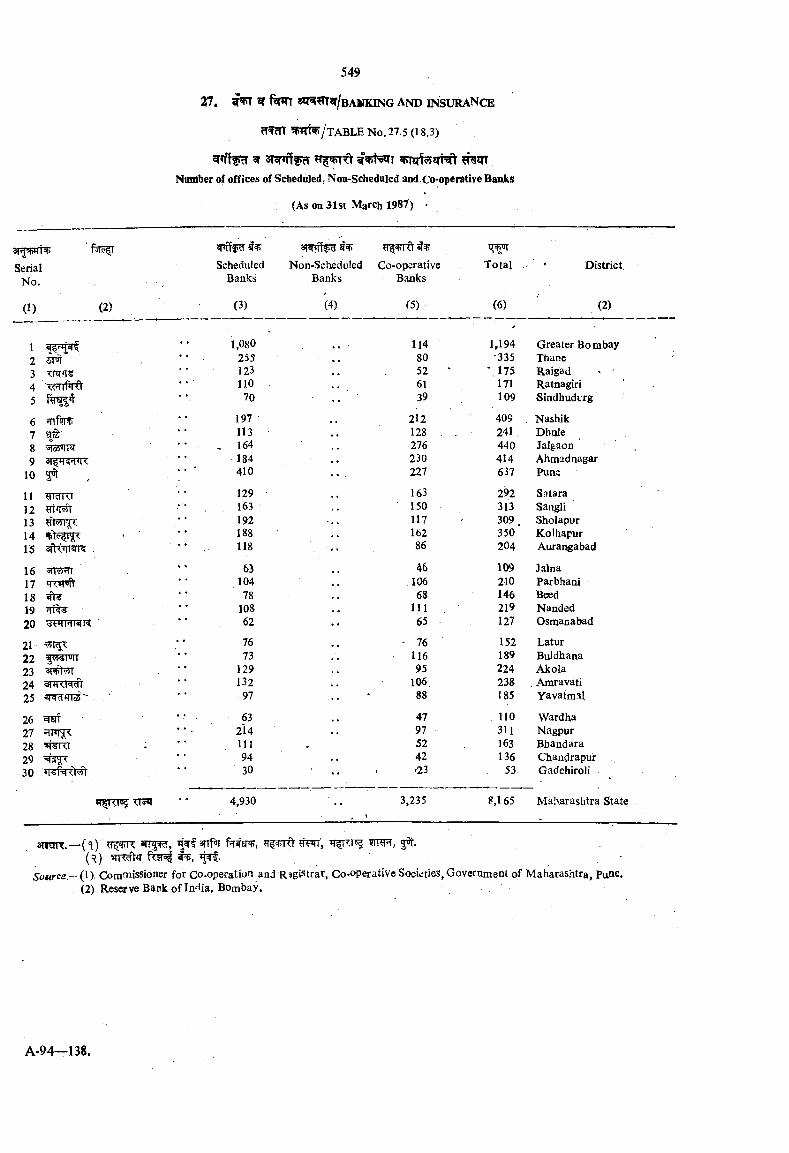
^ ^^nsm sRjrfcSJTRt # s mNumber of offices of Scbeduled, Non-Scheduled and Co-operative Banks
(As on 31 s< March 1987) •
SerialNo.
(1) (2)
ScheduledBanks
(3)
12 iiui3 xBnrs45
67 TO89
10
11 IdKT12131415
1617181920 TfTwrarr?
21222324 3TRXt^25 '« qa♦ [c6
2627282930
1,08025512311070
197 - 113 164 184 410
129163192188118
6310478
10862
7673
129132
97
632141119430
4,930
Non-Scheduled Co-operative Banks Banks
(4)
Total District.
(5) (6) (2)
114 1,194 Greater Bombay80 •335 Thane52 ' 175 Raigad * •61 171 Ratnagiri39 109 Sindhudcrg
212 409 , Nashik128 241 Dbule276 440 Jalgaon230 414 Ahmadnagar111 .637 Puns
163 292 Satara150 313 San^li117 309. Sholapur162 350 Kolhapur86 204 Aurai^abad
46 109 Jalna106 210 Parbhani63 146 Beed
111 219 Nanded65 127 Osmanabad
- 76 152 Latur116 189 Buldhana95 224 Akola
106 238 . Araravati88 185 Yavatraal
47 110 Wardha97 311 Nagpur52 163 Bhandara42 136 Chandrapur*23 53 GadchiroH
3,235 8,165 Maharashtra State
amiR.— (1) arrg^, anf^ 5mFT, jSr.{r )
Source — 0)s C o m m is s io n e r f o r C o - o p e r a t io n a n d R a g i s t r a r , C o - o p e r a t iv c Societies, Government o f Maharashtra, P u n e ,(2) Reserve Bank o f In ia, Bombay.

28. PUBLIC FINANCE
^ T ^ JT# zri%f’TTf%TT5S T 3TT^ 3TT f 'fl’mTar 3^T| .?rt^ ^T5?ft?^rT tr^^r s r ^ ^ q i ^fiTcS . cT ^ 3rq-^^¥r?qi^' 53T^TTr% 3vrf«T?r q - if fe q ft c rrci 3tt| . snf^f-p q#t7TW i^ q t^ l- ^ ^zrr-5R-s szt t h x 3TTsrr<^ 3it| .
^ T ^ qr sq-^n:. s r w ^ 'f t^
5q^TT% cffTorr #'i^i?rT5t STlfsmr ^ ~^OT ^1%. ^#f>7;’ T^ 3T#?f^?7t?7 s ?!-^ srrP-T 5?rfrW t ^ cq’i% %« 3tt| .I sft T 3r4^^eq-T=^T 3TTf2T R-)T'JiT=5 rT ^rNwt-Kq-M 3Tt| . c rr-TT srr^^JiT ^ sTmTf^^rTft^r ^citdfT^ T ?TTrr %^?qr srr rr3TT|fr. c rr cij srqsq-^^jTwt Tr r rr RT'- qrJT 3 e q ^ ^ r ^ r HT%ft ^T wNfTWT^iT
s r tfW s rq-HfTT ^ x w :- =q-r% ’T^r^tT 31T 3n-|.sTi'arfTT 5Tcq-T ? rwl'??5rTrr# q’T 'jqrcr q-^r^.(3T) tJlf^cTfT, (^ ) % f f i - , ( ^ ) 5q ?TTir ?STT,( ^ ) %^x, ( f ) ■ ^’ T; | tr^or^cT^rr^^r r sr^rtq- ^ 2: ^ 55 x \ f ^ ^
^'TW 3T T .
28.1. The receipt and revenue expenditure of State Government under diflferent heads is shown in this section. Further details will be found in the Civil Budget Estimates, of the State Government. The Economic Classification of the Budget is also given. The framework, of economic classification presented here is based on the delienatian of the Government transactions in a set of six accounts.
28.2, The Budget annually presented gives the transactions on account of receipts and expenditure of the State Government. In order to analyse the economic impact of these budgetary transactions, an economic classification of the Budget is undertaken. In this classification the transactions are regrouped and reclassified into meaningful economic categories. This classification follows closely the framework of economic classification adopted for the Central Budget. It eliminates all inter-account inter-departmental transfers including transfers to and from funds and brings out the genuine transactions of the State Government with the rest of the economy.
28.3. In this section classification cf the asscssses assessed to income tax according to range of income assessed to their income and tax payable for the assessment year 1986-87. The assessees are sub-divided into (i) Individuals, (ii) Hindu undivided families, (iii) Firm, (iv) Others, (v) Companies, Total income shown ill the table represents the income assessed to tax after deduction of setoff of losses and other admissible rebate and relief from gross income. • •
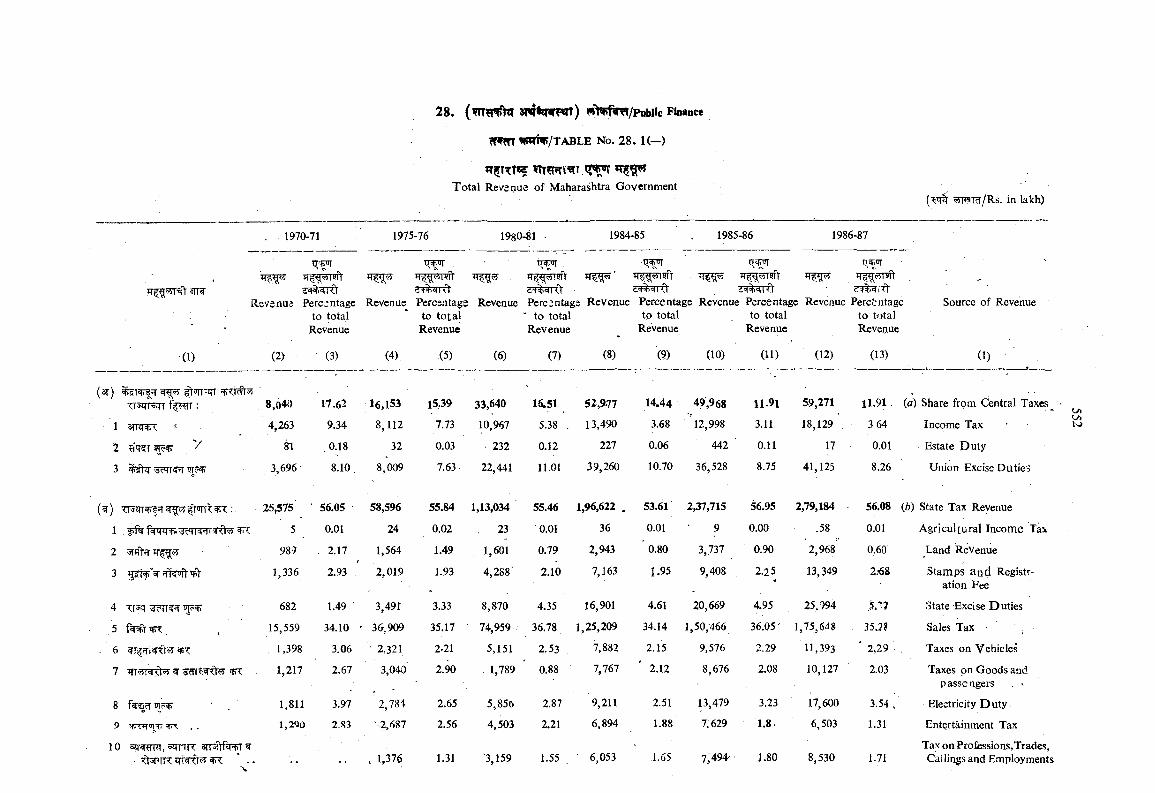
28. (¥TT1P[^ 3W«*Tir?«lT) wM^frl/Publlc Finance
WW % f^/T A B L E No. 28. 1(—)
?TT?FRIi TTotal Revenue of Maharashtra Government
^ ^ tw/R s. in lakh)
. 1970-71 1975-76 1980-81 • 1984-85 1985-86 1986-87
H+«i TTtJT■
0,^5
5TR d'Hx RTRev3nu3 Percentage
to total Revenue
Revenue10
Percsatage to total Revenue
Revenue Percentage Revenue ' to total Revenue
d<t'=nsi<iPercentage Revenue Pefcentagc Revenue Percentage to total to total to total
Revenue Revenue Revenue
Source of Revenue
(1) (2) (3) (4) (5) (6) (7) (8) (9) (10) (11) (12) (13) 0 )
(^) i|t*in=qT f^ T : 8,o40 17.62 16,153 15,39 33,640 1S.51 52,9.77 14.44 49,968 11.91 59,271 11,91 (a) Share from Central Taxes
1 STRRTT ‘ 4,263 9.34 8,112 • 7.73 10,967 5.38 . 13,490 3.68 '12,998 3.11 18,129 364 Income Tax
2 SI ,0.18 32 0.03 232 0.12 227 0.06 442 ■ 0.11 17 0.01 Estate Duty
3' % f5T 'dcMM'-l ?T? 3,696 8.10 8,009 7.63 22,441 11.01 39,260 10.70 36,528 8.75 41,125 8.26 Union Excise Duties
25,575' 56.05 58,596 55.84 1,13,034 55.46 1,96,622 , 53.61 2,37,715 56.95 2,79,184 56.08 (b) State Tax Revenue
1 fjft' W TT^ r^ xte ^ 5 0.01 24 0.02 23 0.01 36 0.01 9 0.00 .58 0.01 Agricultural Income Tax
2 989 . 2.17 1,564 1.49 1,601 0.79 2,943 0.80 3,737 0.90 2,968 0,60 Land Revenue
3 1,336 2.93 2,019 1.93 4,288' 2.10 7,163 1.95 9,408 2.25 13,349 2.-68 Stamps and Registration Fee
4 682 1.49 3,491 3.33 8,870 4.35 16,901 4.61 20,669 4.95 25,994 5 .V State Excise Duties
5 . . 15,559 34.10 • 36,909 35.17 74,959 36.78 1,25,209 34.14 1,50,466 36.05' 1,75,648 • 35.28 Sales Tax • .
. 6 WT 'li'=l <l<?i , 1,398 3.06 2,321 2.21 5,151 2.53 , 7,882 2.15 9,576 2.29 11,393 ' 2,29 . Taxes on Vehicles
7 1,217 2.67 3,040 2.90 1,789 0.88 7,767 2.12 8,676 2.08 10,127 2.03 Taxes on Goods and passengers . ^
8 f^SfT55f^■O 1,811 3.97 2,784 2.65 5,856 2.87 9,211 2.51 13,479 3.23 17,600 3.54. Electricity D u ty .
9 tfrCTTiHT TX . . 1,290 2.83 \2,687 2.56 4,503 2.21 6,894 1.88 7; 629 1.8- 6,503 1.31 Entertainment Tax
10 oir^^, ojthR: 3rr?rfrc<'t>j ^ , ■’d^TR JTT 5? . 1,376 1.31 3,159 1.55 . 6,053 1.65 7;494- ■ 1.80 8,530 1.71
Tax on Professions.Trades, Callings and Employment!
u>K)
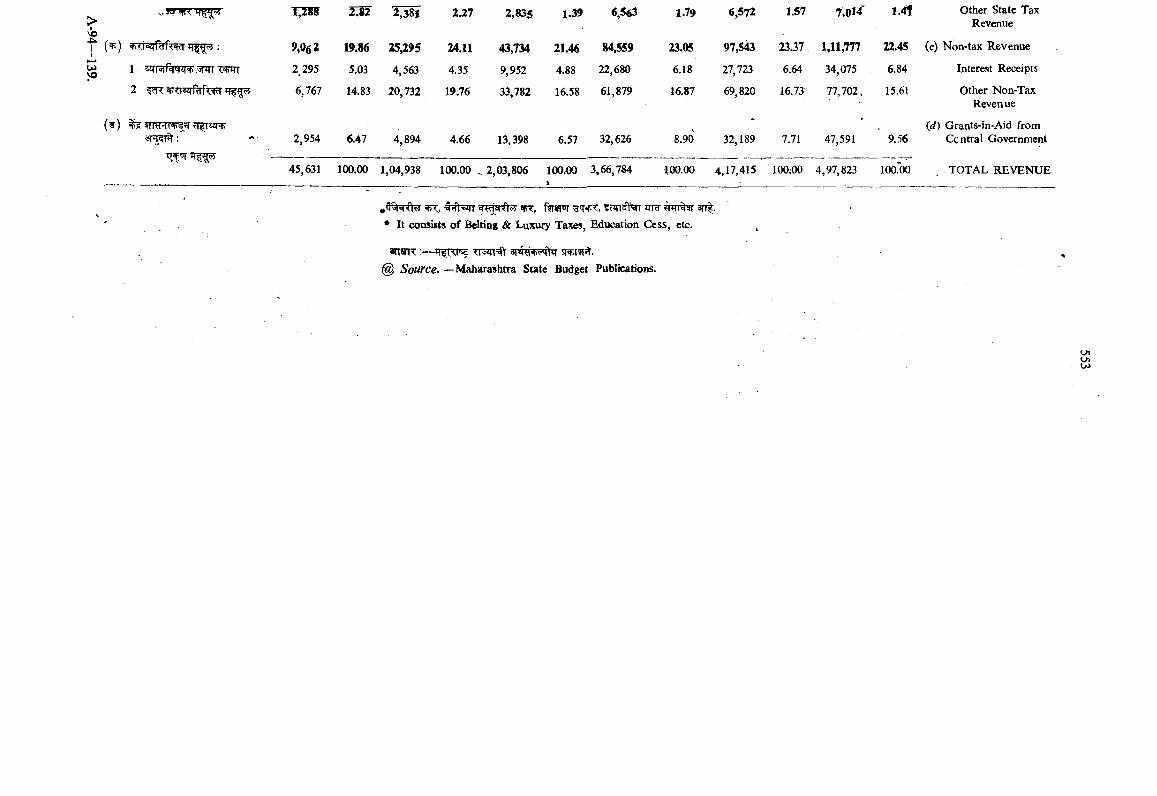
1 ®5Ti»rf¥i 5nrr w n
2 §d< =RT® iMk^
(?) ^ !<ii«'ii't>'S»T Hj|rWFf>8HST ; *■'
'JT
1,2*5 2.82 2,381 2.27 2,835 1.39 6,563 1.79 6,572 1.57 7,014' 1.41 Other State Tax Revenue
19.86 25,295 24.11 43,734 21.46 84359 23.05 97,543 23.37 1,11,777 22.45 (c) Non-tax Revenue
2 295 5.03 4,563 4.35 9,952 4.88 22,680 6.18 27,723 6.64 34,075 . 6.84 Interest Receipts
6,767 14.83 20,732 19.76 33,782 16.58 61,879 16.87 69,820 16.73 77,702, 15.61 Other Non-Tax Revenue
2,954 6.47 4,894 4.66 13.398 6.57 32,626 8.90 32,189 7.71 47,591 9.56{d) Grants-in-Aid from
Central Government
45,631 100.00 1,04,938 100.00 . 2,03,806 100.00%
3,66,784 100.00 4,17,415 100;00 4,97,823 100.00 TOTAL REVENUE
jttct ! i%9r 3rr|.• It consists of Belting & Luxury Taxes, Education Cess, etc.
ansTTT :— TJ TTTSC TRin^ snrowftq @ Source, —Maharashtra State Budget Publications.
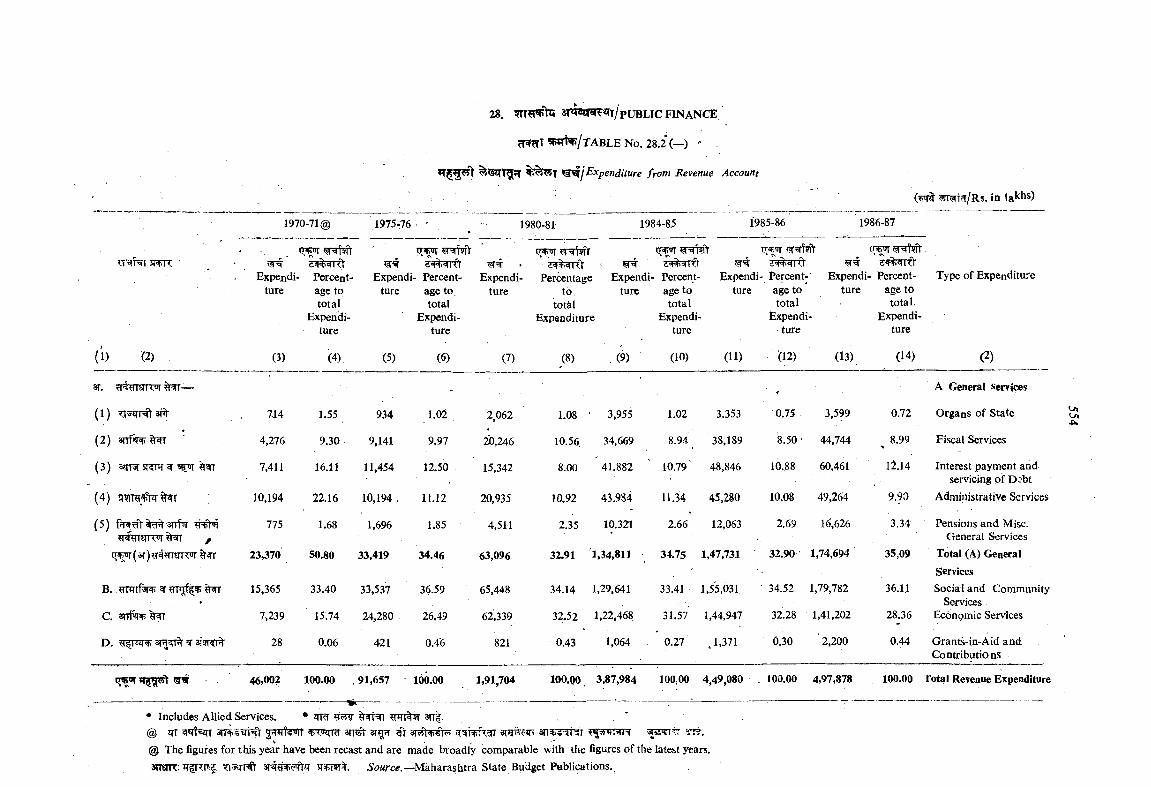
28. 3T ^ W ^ ^ /p UBLIC f in a n c e
^ 5 ^ / t ABLENo. 28.2(—) *
^^j£^xpenditure from Revenue Account
?5T^ct/R s. in lakhs)
1970-71@ 1975-76 • 1980-81 1984-8.5 1985-86 1986-87
? =art?iY ’ q^?3'=5rMi. i^^^srW t c^”r<r^M.
Expe.ndi- Percent- Expendi- Percent- Expendi- Per^ntage Expendi- Percent- Expendi- Percent- Expendi- Percent- Type of Expenditureture age to
total Expendi
ture
ture age to total
Expenditure
ture to ture totkl
Expenditure
age to total
Expendi ture
ture age to total
Expendi • ture
ture age to total,
Expenditure
(1) (2) (3) (4). (5) (6) (7) (8) (9) (10) (11) (12) (13) (14) (2)
3T. * A General services
( 1) TT^m^ant 7J4 1.55 934 1.02 2,062 1.08 * 3,955 1.02 3.353 0.75 3,599 0.72 Organs of State
(2) anf«T^^ 4,276 9.30 9,141 9.97 20,246 10.56, 34,669 8.94 38,189 8.50 ■ 44,744 8.99 Fiscal Services
(3) c5TF5r gr ^ ?TT 7,411 16.11 11,454 12.50 15,342 8.00 41.882 10.79' 48,846 10.88 60,461 12.14 Interest payment and servicing of Dobt
(4) w raW % ^ 10,194 22.16 10,194 . 11.12 20,935 10,92 43.984 11.34 45.280 10.08 49,264 9.90 Administrative Services
(5)T ersrTOT ^
775 1.68 1,696 1.85 4,511 2.35 10.321 2.66 12,063 2.69 16,626 3.34 Pensions and Misc. General Services
(ar) 23,370 50.80 33,419 34.46 63,096 32.91 1.34,811 34.75 1,47,731 ■ 32.90 1,74,694 35,09 Total (A) General Services
B .. yTRrf R) w
C. arrftr^^
15,365
7,239
33.40
15,74
33,537
24,280
36.59
26.49
65,448
62,339
34.14
32.52
1,29.641
1,22,468
33.41
31.57
1,55,031
1,44,947
■ 34.52
32.28
1,79,782
1,41,202
36.11
28.36
Social and Community Services
Econgmic Services
D. ^ af5T<?T% 28 0.06 421 0.4‘6 821 0.43 1,064 . 0.27 .1,371 0.30 2,200 0 .^ Grants-in-Aid and Contributions
46,002 100.00 91,657 160.00 1,91,704 100.00 3,87,984 100,00 4,49,080 100.00 4,97,878 100.00 Total Revenue Expenditure
U\•»k.
* Includes Allied Services. * nTT%5T@ ITT arr^i^rHt anst a t !?'3T^cn 3thh?jt» an+s^i'^r 55: ^ ^ t v ?.@ The figures for this year have been recast and are made broadly comparable with the figures of the latest years. 3nsrn::rr|rTr £ TI^TF 5l f5T%. 'owrcg.—Maharashtra state Budget Publications.
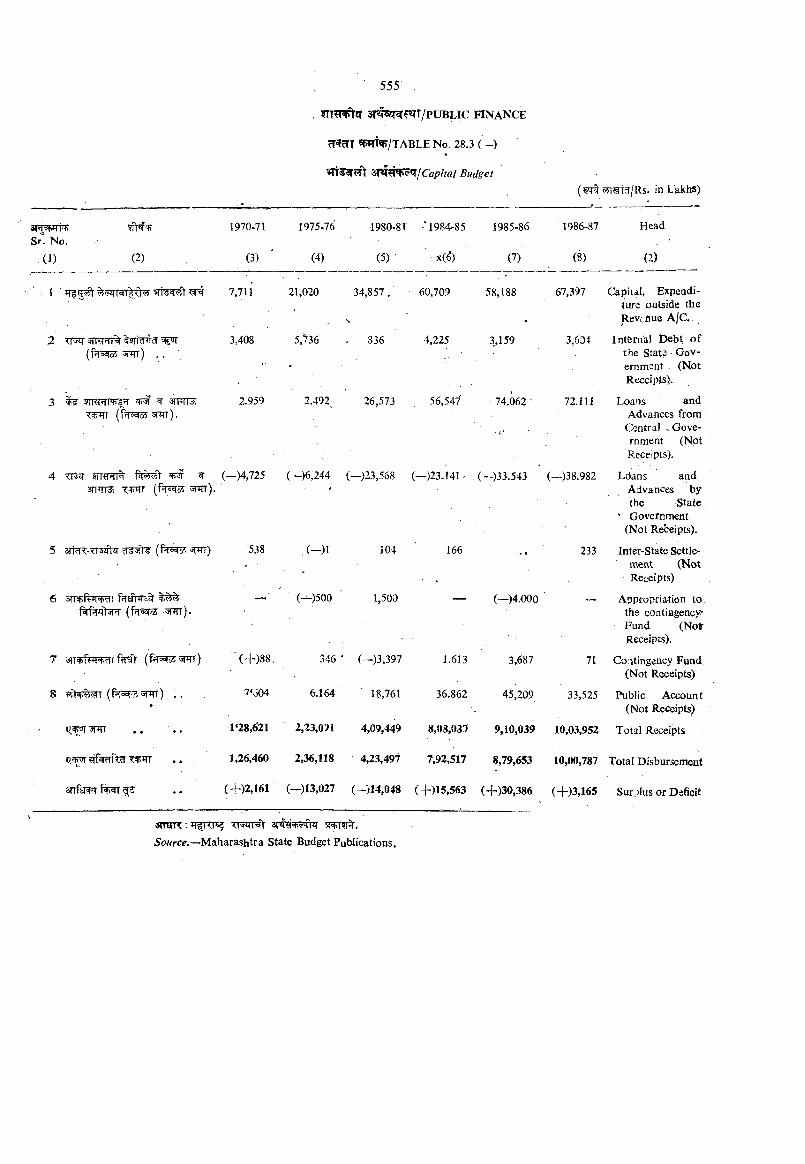
. sH ^f«(T/PU BLIC FINANCE
cT cTT «f5wt«P/TABLE No. 28.3 (—)
WT5ar^ Capital Budget
Sr. No.
( 1)
rn-<T
(2)
1
3 ^mrriwr ^ armr w tn snrr).
1970-71 1975-76 1980-81 -‘ 1984-85 1985-86
(3) ' (4) (5) ' x(^) (7)
7,711 21,020 34,857. ■ 60,709 58,188
1986-87
(8)
Head
(2)
67,397 Capital, Expeadi- ture outside the ReveHiue A/C.
3,408 5,*736 836 4,225 3,159
2.959 2.492 26,573 , 56,.547 74.062,
3,601
72.111
4 STT RFT ^ ^ (—)4,725 (—)6,244 (—)23,5o8 (—)23.141 - (—)33.543sn rra *
6 STT irrR fffSTN'oftrfq-qtsnr
7 3n^^^JTwf?r^
8 (fkssr?. 5jttt) . .ft
IT^ W
srrftm g;?
— C—)500
104
1,500
166
— (—)4.000
(—)38.982
233
Intfemal Debt of the State • Government . (Not Receipts).
Loans andAdvances from Central -.Government (Not P.ece-’pts).
Ldans and Advances by the State
' Government (Not Receipts).
Inter-State Settle- raetvt (Not Receipts)
Appropriation to the contiagency Fund (Not Receipts).
71 Comtingency Fund (Not Receipts)
33,525 Public Account (Not Receipts)
(+ )8 8 . 346 ' (—)3,397 1.613 3,687
7‘604 6.164 18,761 36.862 45,209
1‘28,^21 2,23,091 4,09,449 8,OS,035 9,10,039 10,03,952 Total Receipts
1,26,460 2,36,118 4,23,497 7,92,517 8,79,653
(+)2,161 (~)I3,027 (->14,048 (+)15,563 (+)30,386
10,00,787 Total Disbursement
(4-)3,165 Surplus or Deficit
smin:; TTJirrat5o«rc^.—Maharashtra State Budget Publications.
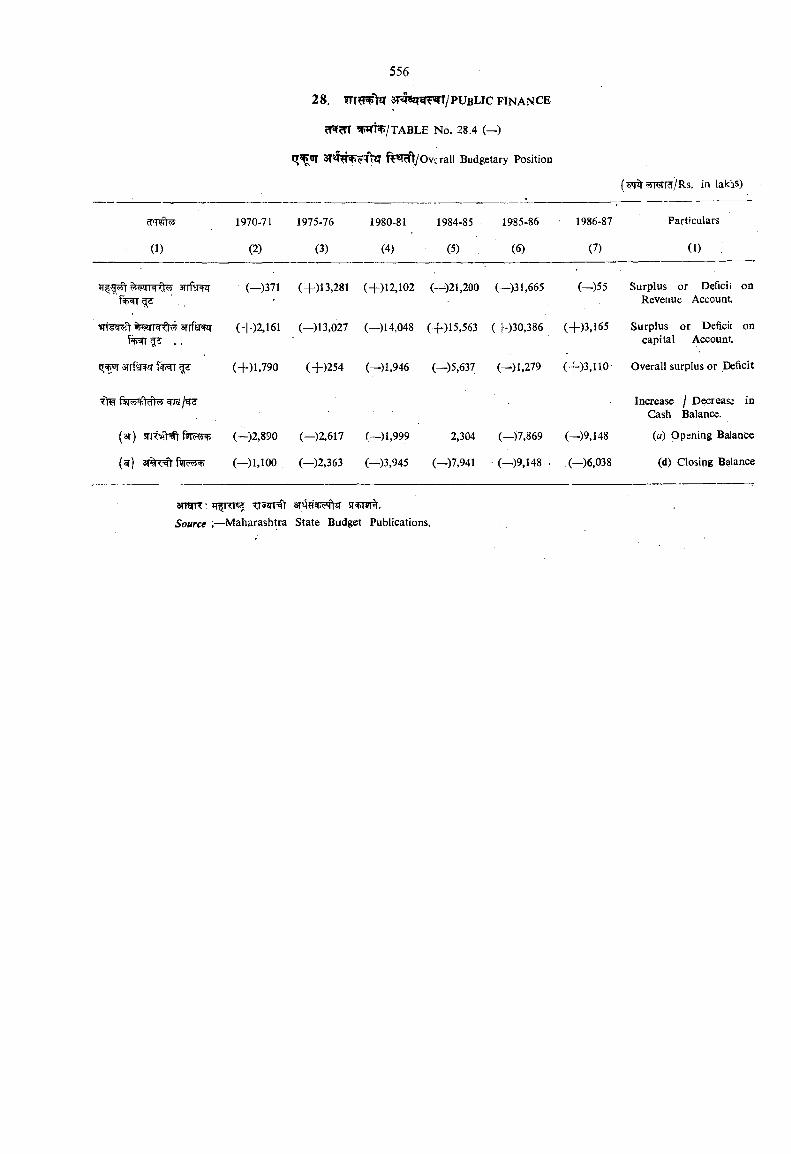
28. 3T5|«im«rT/PUBLIC FINANCE
TABLE No. 28.4 (—)
3 T ^ ^ 'T > f?«Bt/Ov crall Budgetary Position
(^o5mnT/Rs, in lakis)
1970-71 1975-76 1980-81 1984-85 1985-86 1986-87 Particulars
(1) (2) (3) (4) (5) (6) (7) (1) :
3rrfsm (-)371 ( + ) i 3,281 (+)12,102 (—)21,200 (—)31,665 (-)5 5 Surplus or Deficii on Revenue Account
^ . .
(+)2,161 (—)13,027 (—)14,048 (+)15,563 (+)30,386 C+)3,165 Surplus or Deficii on capital Account
anfim f+'m ^ (+)1,790 (+)254 (—)1,946 (—)5,637 (--) 1,279 (+)3,110 Overall surplus or Deficit
Increase / Decrease in Cash Balance.
(ar) (—)2,890 (-)2,617 (—)1,999 2,304 (—)7,869 (—)9,148 (a) Opening Balance
(—)1,100 (—)2,363 (—)3,945 (—)7,941 (—)9,148 . (—)6,038 (d) Closing Balance
arrarr: sr in?r .Source \—Maharashtra State Budget Publications.
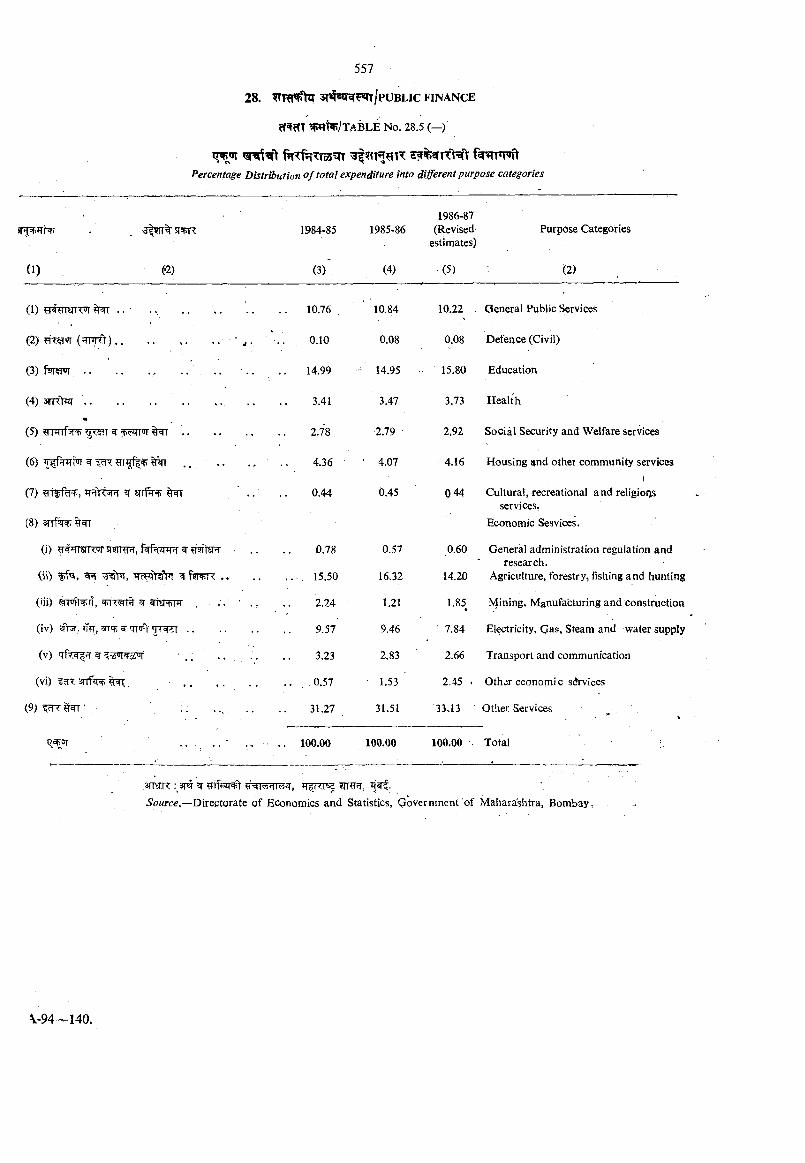
28. SrqSlT^ /PUBLIC FINANCE
TfrfTToS'STTPercentage Distribution o f total expenditure into different purpose categories
SRiR1986-87
1984-85 1985-86 (Revisedestimates)
Purpose Categories
(1) . (■2) (3) , (4) (5) (2)
(1) e%TSTR ^ . , , 10.76 . 10.84 10.22 . General Public Services
(2) . . •. • • • ■ - • . . 0.10 0.08 0.08 Defence (Civil)
(3) fwrem- . . . . . . . . . . 14.99 14.95 ■ 15.80 Education
(4) 3 m > ir ......................... .. 3.47 3.73 Health
(5) ^ 2.78 2.79 - 2.92 Social Security and Welfare services
(6) TI fqTTW ^ ^ ^ . . • . . 4.36 • 4.07 4.16 Housing and other community services
(7) ^ sriR't*
[8)3rTf?r^%^
0.44 0.45 0 441
Cultural, recreational and religions services,
Economic Sesvices.
(i> #frrsn“<'>jr5ri}nw, M-rjr pr ^ ?nfft£R .. 0.78 0.57 0.60 General administration regulation and research.
(h> ^> 1, vTcw't fni n fw p a . . . . . 15.50 16.32 14.20 Agriculture, forestry, fishing and hunting
(ill) ' . , 2.24 1.21 1.85 Mining, Manufa'cturing and construction
(iv) 5i?T, 31't; >TT<jfr .......................... 9.57 9.46 ' 7.84 Electricity, Gas, Steam and water supply
(v) 'TTt^JT ^ . . . . . ., 3.23 2.83 2.66 Transport and communication
(vi) sTTf r -4(, . . 1.53 2,45 . Other economi c services
(9) IrrT ’ . . . . . . . 31.27 31.51 33.13 Other Services
.............. ' . . 100.00 100.00 100.00 Total
.aTTcjTT - .m w ^ifKT# ^rwm^zr, ^Source.—Directorate of Economics and Statistics, Qovernment of Maharashtra, Bombay .
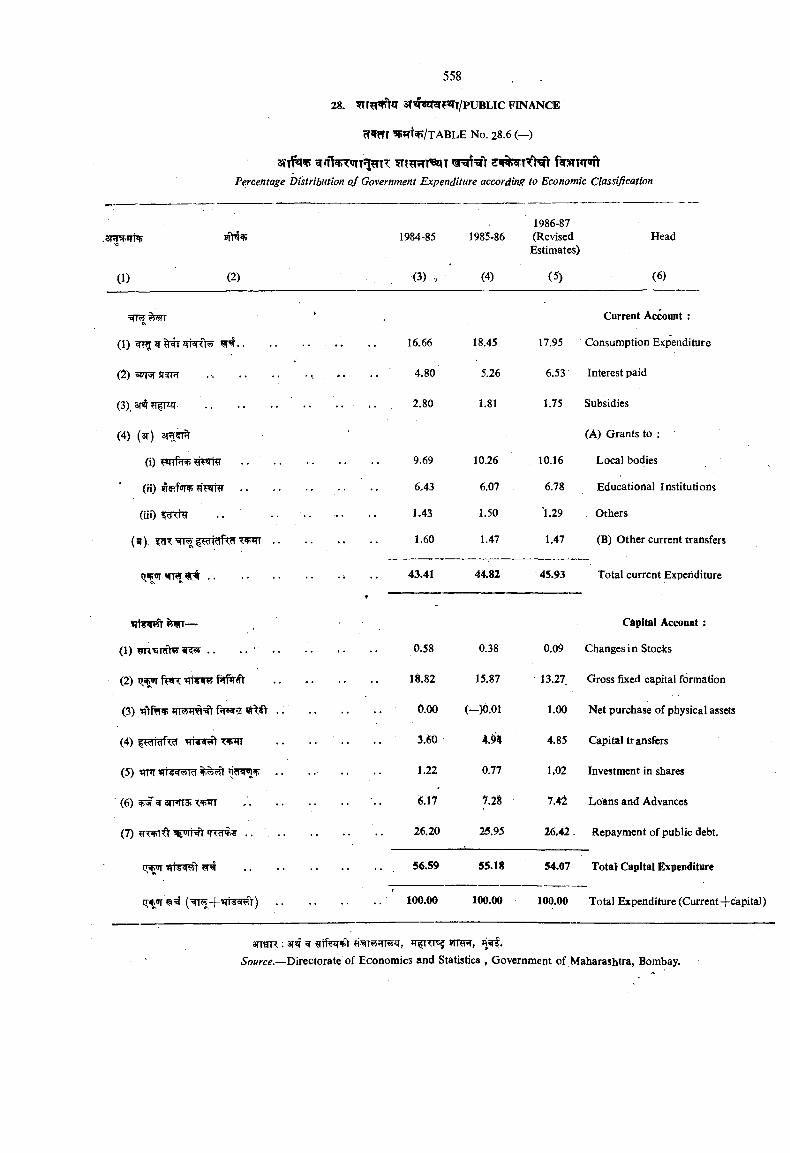
3!ld W»Percentage Distribution o f Government Expenditure according to Economic Classification
•3pT in^
(1) (2)
(2) szrrsr S3[r
(3). STT .. .. ..
(4) (ar)
(i) w if^- ?TP!mr .. ..
(ii) ?iwrpr ..
(iii)
(^) ’TTW ^tctidRd ••
..........................
(1) . . .. ■ ..
(2)
(3) f5T5 ..
(4)
(5) ..
(6) arpTTii
(7) .. .
tT^ »lis<(wl ^
(Tipwr ^ '
1986-871984-85 1985-86 (Revised
Estimates)
(3) V (4) (5)
Head
( 6)
Current Account :
16.66 18.45 17.95 Consumption Expenditure
4.80 5.26 6.53 Interest paid
7 80 1.81 1.75 Subsidies
(A) Grants to :
9.69 10.26 10.16 Local bodies
6.43 6.07 6.78 Educational Institutions
1.43 1.50 1.29 Others
1.60 1.47 1.47 (B) Other current transfers
43.41 44.82 45.93 Total currcnt Expenditure
-Cdpital Account :
0.58 0.38 0.09 Changes in Stocks
18.82 15.87 13.27 Gross fixed capital formation
0.00 (-)0.01 1.00 Net purchase of physical assets
3.60 4.04 4.85 Capital transfers
1.22 0.77 1.02 Investment in shares
6.17 7.28 7.42 Loiliiis and Advances
26.20 25.95 26.42. Repayment of public debt.
56.59 55.18 54.07 Total Capita) Expenditure
100.00 100.00 100.00 Total Expenditure (Current-f capital)
ansTR: 3T«f JTfrTT .
Source.—Directorate of Economics and Statistics , Government of Maharashtra, Bombay.
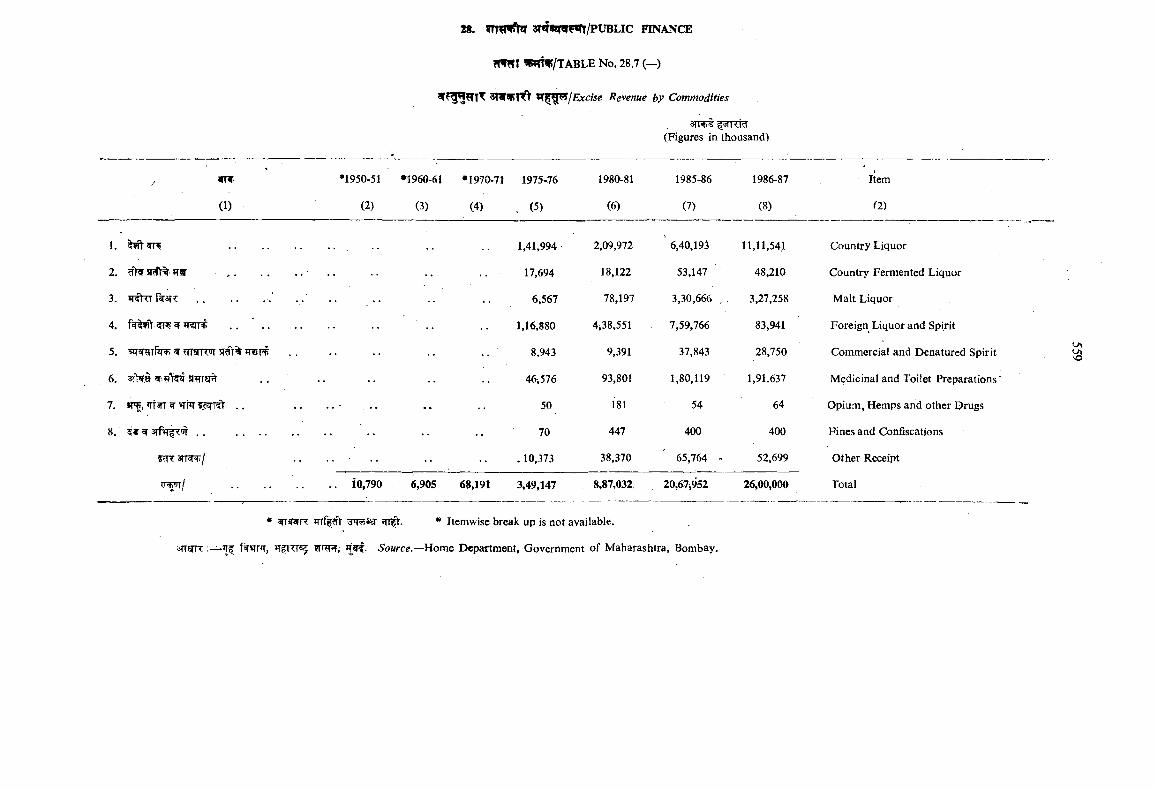
WHF
(1)
28. 3mWT«rf«rT/PUBLIC FINANCE
Ism v/TABLE No, 28.7 (—)
3T1ff»T Excise Revenue by Commodities
31 1 <.id(Figures in thousand)
*1950-51 ♦1960-61 •1970-71 1975-76 1980-81 1985-86 1986-87
(2) (3) (4) , (5) (6) (7) (8)
Item
(2)
1. 1,41,994 2,09,972 6,40,193 11,11,54.1 Country Liquor
2. JTff , . .. 17,694 18,122 53,147 48,210 Country Fermented Liquor
3. frfiTT ........................ 6,567 78,197 3,30,666 3,27,258 Malt Liquor
4. 1,16,880 4i38,551 7,59,766 83,941 Foreign Liquor and Spirit
5. ^ TTTTiT sr r% 8,943 9,391 37,843 28,750 Commercial and Denatured Spirit
6. 5¥iaFT 46i576 93,801 1,80,119 1,91.637 Medicinal and Toilet Preparations'
7. »PR, »rf w . . •• . . 50 181 54 64 Opium, Hemps and other Drugs
8. 5«^3Tf»TfT#......................... • • • . . 70 447 400 400 Fines and Confiscations
.. .10,373 38,370 65,764 - 52,699 Other Receipt
., i0,790 6,905 68,191 3,49,147 . 8,87,032. 20,67^952 26,00,000 Total
* ^sF lT JW*!=r * Iteniwisc break up is not available.
3rr?TTT strt T, Source.—Home Department, Government of Maharashtra, Bombay.
VO
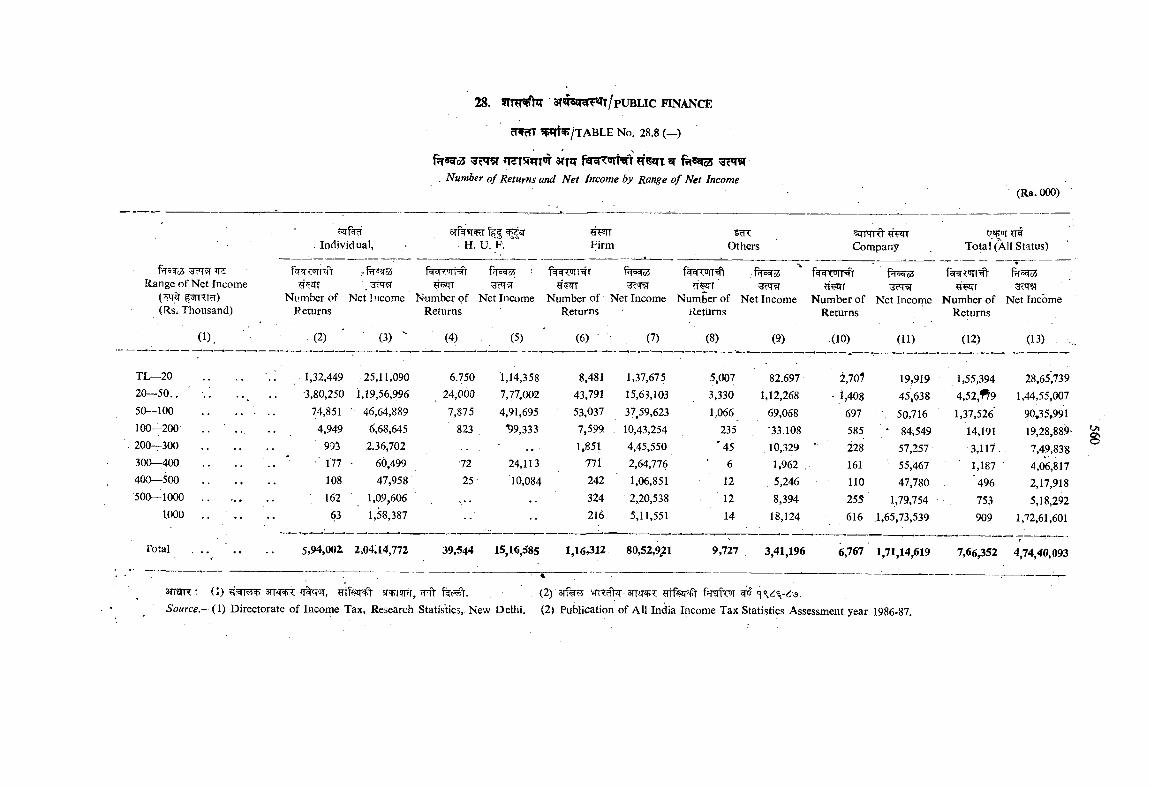
f?TS o3 TT TSJ TT 3TnT f^T q-R lf ^Number o f Returns and Net Income by Range o f Net Income
(Rs.OOO)
Individual, h . u . 'f . Firm OtherssjTTqrftHFnCompany
tr pq Total (All Status)
^ ? r ^ Range of Net Income
( MA|(Rs. Thousand)
^wr Number of
Returns
f T=Wo5 ■
Net Income
pclci
Number of Retiarns
r.
Number of Returns
f'foqS
Net Incorne Number of Returns
Net IncomeNumber of Returns
r
Net I ncome Number of Returns
Net Income
Hccloi
Net Income
(1), (2) (3) ^ (4) . (5) ' (6) • . (7) (8) (9) (10) (11) (12) (13) .
TL—20 .. .. .; .1,32,449 .25,11,090 6.750 ‘1,14,358 8,481 1,37,675 5,007 82.697 2,70? 19,919 1,55,394 28,65>3920—50.. ■ .. 3,80,250 1,19,56,996 24,000 7,77,002 43,791 15,63,103 3,330 1,12,268 ■1,408 45,^38 4,52,#9 1,44,55,00750—100 . . . 74,851 46,64,889 7,875. 4,91,695 ' 53,037 37,59,623 1,066 69,068 697 . 50,716 1,37,526 90,35,991100—200 .. .. 4,949 6,68,645 ' 823 *99,333 7,599 10,43,254 235 ■33.108 585 • 84,549 14,191 19,28,889-200—300 995 2.36,702 .. . 1,851 4,45,550 ‘ 45 . 10,329 ■ 228 57,257 3,117. 7,49,838300—400 .................. . . * 177 60,499 ■72 24,113 771 2,64,776 ■ 6 1.962 , 161 55,467 1,187 4,06,817400—500 108 47,958 25 10,084 242 1,06,851 12 5,246 110 47,780 ' 496 2,17,918500—1000 .. 162 1,09,606 324 2,20,538 12 8,394 255 1,79,754 753 5,18,292
. 1000 . . . . 63 1,58,387 216 5,11,551 14 18,124 616 1,65,73,539 ,909 1,72,61,601
Total . . , ’ . . 5,94,002 2.,04,14,772 39,544 15,16,585
- *
1,16,312 80,52,921 9,727 3,41,196 6,767 1,71,14,619 7,66,352 4,74,40,093
snmr : (I) aiTir^ T%Gfir, 5Rti?r , ^fr (2) ^rtfer^ f^rsif^ g’oSource.-{I) Directorate of Income Tax, Research Statistics, New Delhi. (2) Publication of All India Income Tax Statistics Assessment year 1986-87.
1/1s
2 8 ‘9
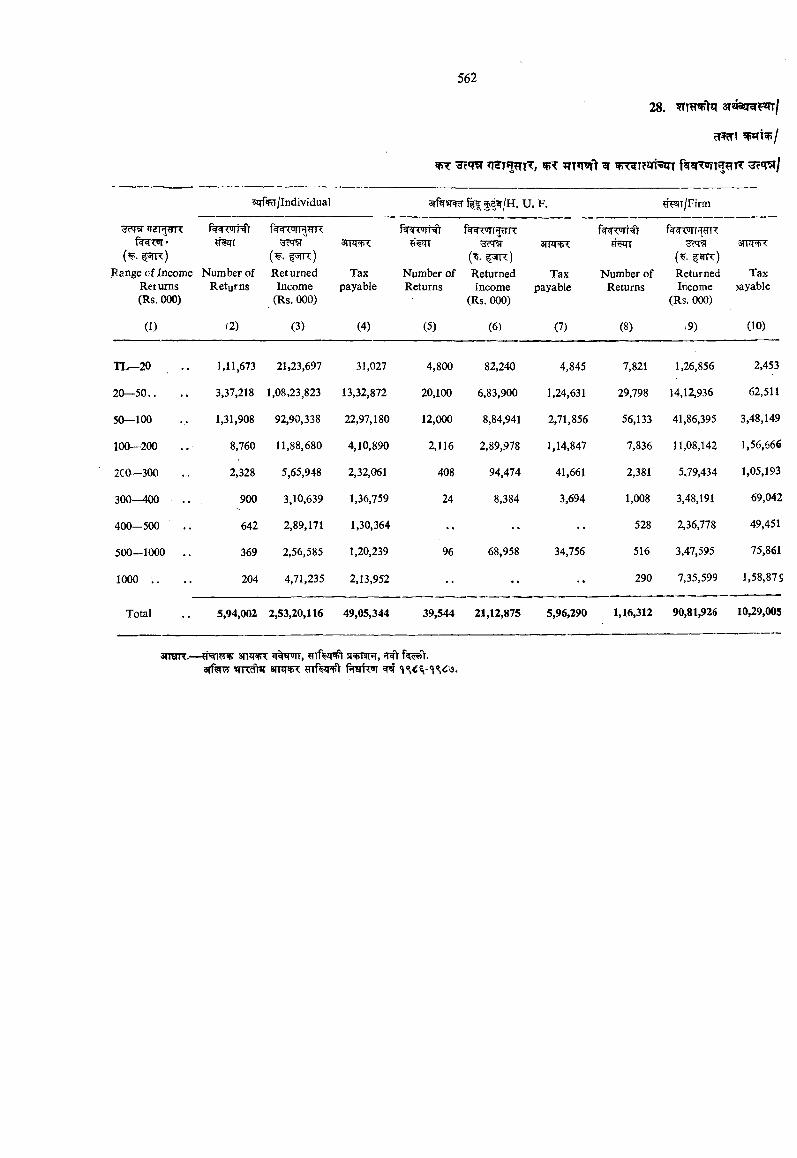
(¥. 1 ^ ) ange cf Incom
Returns (Rs. 000)
(1)
r(w?n
W!T ^ f^TUiTfT?|lT
sJTff^/lndividual 3TfwW U. F. y^T/Firm
f%TWT^ f4=i <.>jii-<fi f^i'iriWR3?75r snw?: HWT ■dcMl 3Tiq+<
(^. i< \<) ( . (^. fSiK)Number of Returned Tax Number of Returned Tax Number of Returned Tax
Returns Income payable Returns Income payable Returns Income jayablc(Rs. 000) (Rs. 000) (Rs. 000)
(2) (3) (4) (5) (6) (7) (8) ,9) (10)
XL—20 1,11,673 21,23,697 31,027 4,800 82,240 4,845 7,821 1,26,856 2,453
2 0 -5 0 .. 3,37,218 1,08,23,823 13,32,872 20,100 6,83,900 1,24,631 29,798 14,12,936 62,511
50—100 1,31,908 92,90,338 22,97,180 12,000 8,84,941 2,71,856 56,133 41,86,395 3,48,149
100—200 8,760 11,88,680 4,10,890 2,116 2,89,978 1,14,847 7,836 11,08,142 1,56,666
2C0—300 2,328 5,65,948 2,32,061 408 94,474 41,661 2,381 5.79,434 1,05,193
300—400 900 3,10,639 1,36,759 24 8,384 3,694 1,008 3,48,191 69,042
400—500 642 2,89,171 1,30,364 - •• •• 528 2,36,778 49,451
500—1000 . 369 2,56,585 1,20,239 96 68,958 34,756 516 3,47,595 75,861
1000 .. 204 4,71,235 2,13,952 •• •• •• 290 7,35,599 1,58,87 S
Total 5,94,002 2,53,20,116 49,05,344 39,544 21,12,875 5,96,290 1,16,312 90,81,926 10,29,005
3ntrrc.— anwr r%wr,3T% »<i'<d>K aiTii^ ?rrfen?t ^
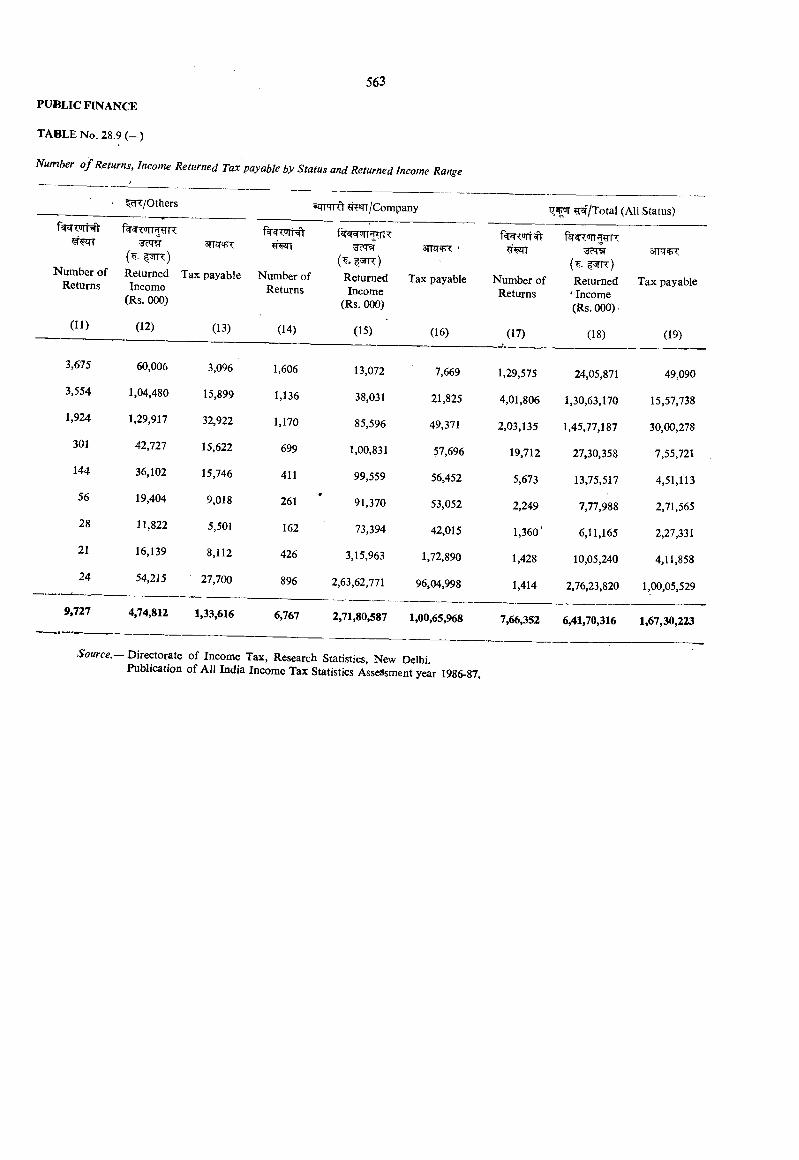
Number o f Returns, Income Returned Tax payable by Status and Returned Income Range
^T/Others /Company ^r€/Total (All Status)
f WTT rn:snw?:
{ . 1 ^ )Number of Returned Tax payable Number of
Returns Income Returns(Rs. 000)
Returned Tax payable Income
(Rs. 000)
Returned Tax payable ' Income (Rs. 000).
Number of Returns
(II) (12) (13) (14) (15) (16) (17)
9,727 4,74,812 1,33,616 6,767 2,71,80,587 1,00,65,968
.S'<?«/'ce.— Directorate of Income Tax, Research Statistics, New Delhi.Publication of All India Income Tax Statistics Assessment year 1986-87.
3,675 60,006 3,096 1,606 13,072 7,669 1,29,575 24,05,871 49,0903,554 1,04,480 15,899 1,136 38,031 21,825 4,01,806 1,30,63,170 15,57,7381,924 1,29,917 32,922 1,170 85,596 49,371 2,03,135 1,45,77,187 30,00,278
301 42,727 15,622 699 1,00,831 57,696 19,712 27,30,358 7,55,721144 36,102 15,746 411 99,559 56,452 5,673 13,75,517 4,51,11356 19,404 9,018 261 91,370 53,052 2,249 7,77,988 2,71,56528 11,822 5,501 162 73,394 42,015 1,360’ 6,11,165 2,27,33121 16,139 8,112 426 3,15,963 1,72,890 1,428 10,05,240 4,11,85824 54,215 27,700 896 2,63,62,771 96,04,998 1,414 2,76,23,820 1,00,05,529
7,66,352 6,41,70,316 1,67,30,223
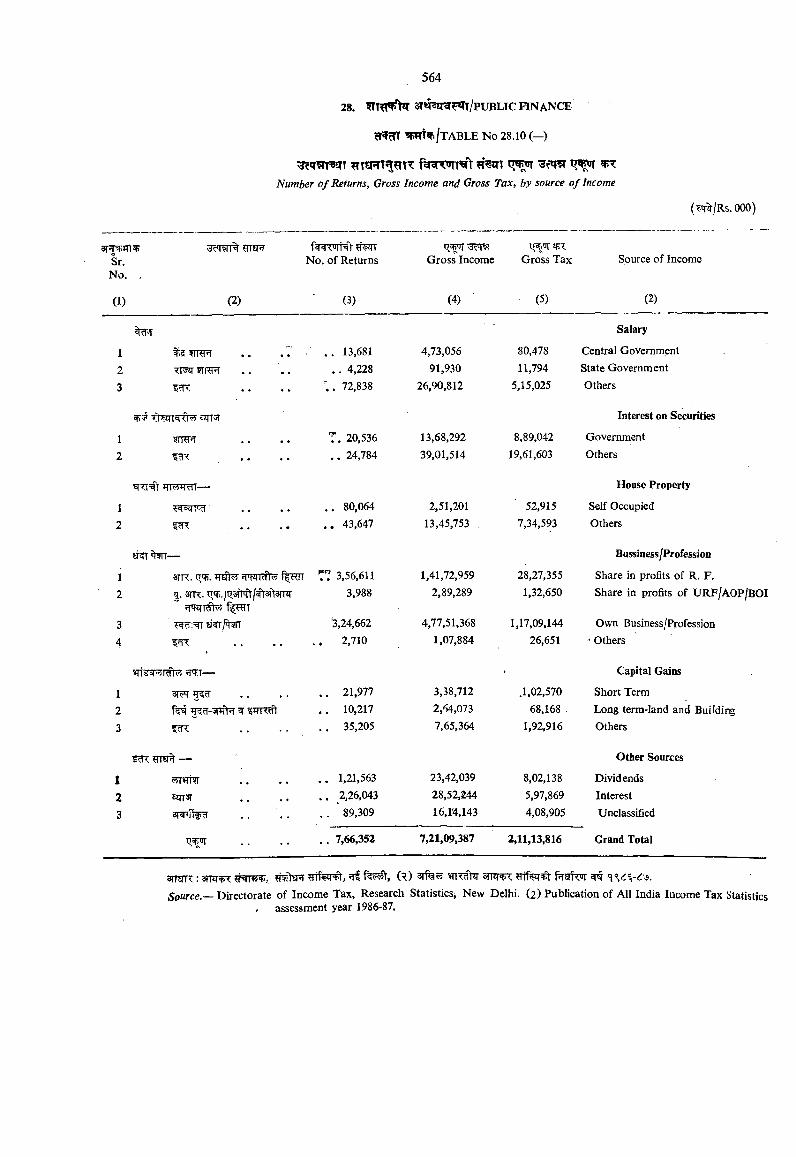
(T5rT !TT ^Number o f Returns, Gross Income and Gross Tax, by source o f Income
3T?m:rr1Sr.No. .
c<T9lT% ?TT«nTNo. of Returns Gross Income Gross Tax Source of Income
(I) (2) (3) (4) (5) (2)
Salary
1 5TRnr , . . . . . 13,681 4,73,056 80,478 Central Government
2 . . 4,228 91,930 11,794 State Government
3 72,838 26,90,812 5,15,025 Others
7 |*qlq Ovi clfT Interest on Securities
1 T. 20.536 13,68,292 8,89,042 Government
2 . . . . 24,784 39,01,514 19,61,603 Others
House Property
1 . . 80,064 2,51,201 52,915 Self Occupied
2 . . . . , 43,647 13,45,753 7,34,593 Others
£RT ^ — Bussiness /Profession
1 3TR. tTt?;. J T ^ w ir a W f^ w r T? 3,56,611 1,41,72,959 28,27,355 Share in profits of R. F.
2 g. a iR . q'K./^3I>ft/^3it3TT?I 3,988 2,89,289 1,32,650 Share in profits of URF/AOP/BOIrPTZTTcfW [^HIT
3 si^/^wr 3,24,662 4,77,51,368 1,17,09,144 Own Business/Profession4 . . 2,710 1,07,884 26,651 • Others
---- • Capital Gains
1 . . 21,977 3,38,712 .1,02,570 Short Term
2 . . 10,217 2,64,073 68,168 . Long term-land and Building3 . . 35,205 7,65,364 1,92,916 Others
Other Sources
1 . . 1,21,563 23,42,039 8,02,138 Dividends
2 oiTT r . . 2,26,043 28,52,244 5,97,869 Interest
3 89,309 16,1'4,143 4,08,905 Unclassified
. . 7,66,352 7,21,09,387 2,11,13,816 Grand Total
3TTOTT : 3TTzr ^ (R) 3rfg?J 3nW?: pTSrt ^Source.— Directorate of Income Tax, Research Statistics, New Delhi. (2) Publication of All India Income Tax Statistics
. assessment year 1986-87.
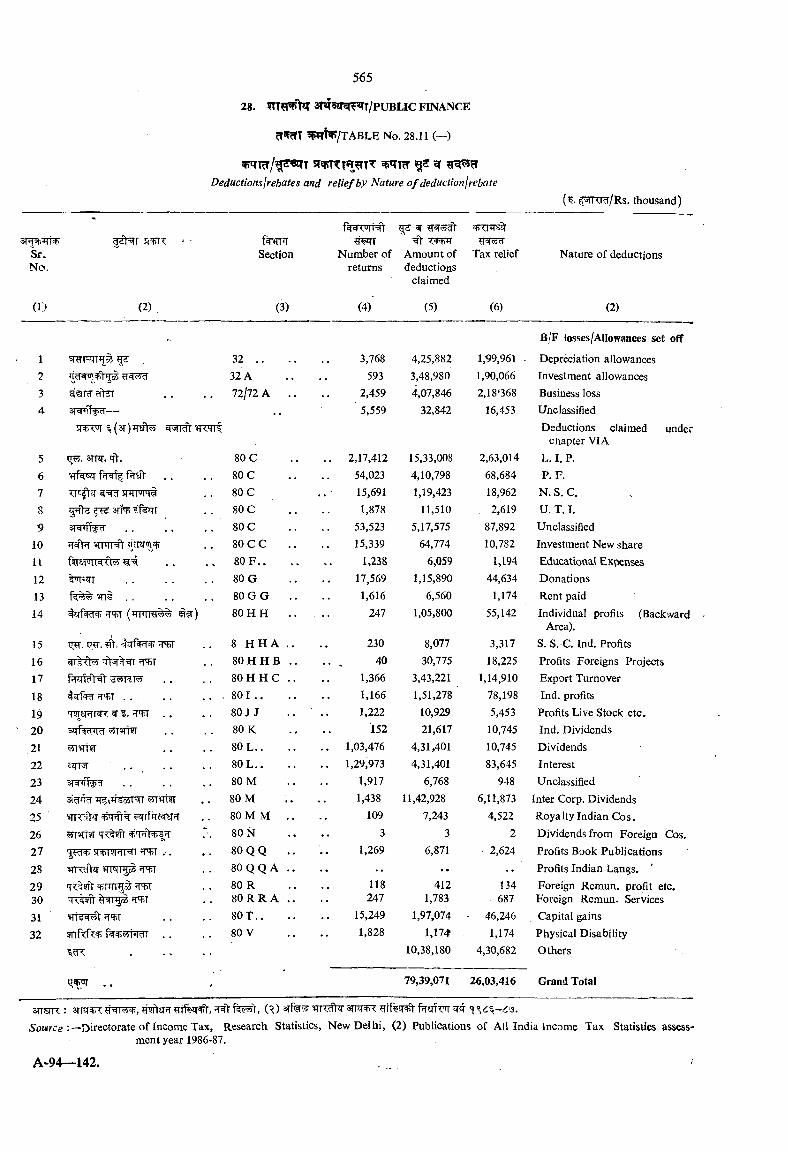
28. S fW ^r^/PU B L lC FINANCE
W ^ /T A B L E No. 28.11 (—)
srstrncT^^TT ^TrrDeductions jrebates and relief by Nature o f deduction I rebate
( . ^^K(ct/Rs. thousand)
Sr.No.
(1) (2)
Section
(3)
Number of returns
(4)
Amount of deductions
claimed
(5)
Tax relief
(6)
Nature of deductions
(2)
B/F losses/AlIowances set off
1 32 .. 3,768 4,25,882 1,99,961 . Depr^iation allowances2 32 A 593 3,48,980 1,90,066 Investment allowances3 !J?1T rl'Ur 72/72 A . . 2,459 4,07,846 2,18‘368 Business loss4 w H 'td— 5,559 32,842 16,453 Unclassified
<«i (s r ) ^ ^ j f T c f r Deductions claimed underchapter VIA
5 3TFT. 'ft. 80 C .. 2,17,412 15,33,008 2,63,014 L. I. P.6 ffT^ f ifr 80 C 54,023 4,10,798 68,684 P. F.7 TT ftq' snTTJFrt 80 C 15,691 1,19,423 18,962 N. S. C.8 5 ^ ^ iferr 80 C 1,878 11,510 2,619 U. T. I.9 3<«i<!Tt>d 80 C 53,523 5,17,575 87,892 Unclassified
10 ^nil'll . . 80 C C 15,339 64,774 10,782 Investment New shareU 8 0 F .. 1,238 6,059 1,194 Educational Expenses12 ............................... 80 G 17,569 1,15,890 44,634 Donations13 80 G G .. 1,616 6,560 1,174 Rent paid14 (ITFTRT^ 80 H H 247 1,05,800 55,142 Individual profits (Backward
Area).15 t^. qg-. H4il 8 H H A .. 230 8,077 3,317 S. S. C. Ind. Profits16 8 0 H H B .. 40 30,775 18,225 Profits Foreigns Projects17 8 0 H H C .. 1,366 3,43,221 1,14,910 Export Turnover
18 TTiT . . . . . . . 80 I . . 1,166 1,51,278 78,198 Ind. profits
19 TO nTRT ^ 1. ?nrr . . 80 J J 1,222 10,929 5,453 Profits Live Stock etc.20 =irf cFTcr T rt?T 80 K 152 21,617 10,745 Ind. Dividends
21 80 L .. .. 1,03,476 4,31,401 10,745 Dividends22 sq-M , , 80 L .. . . 1,29,973 4,31,401 83,645 Interest23 s M f l r l ............................... 80 M 1,917 6,768 948 Unclassified24 5n'wt?r SOM 1,438 11,42,928 6,11,873 Inter Corp. Dividends25 ■ 80 M M .. 109 7,243 4,522 Royalty Indian Cos.26 ?rr^t9r'T?:^ 80 N 3 3 2 Dividends from Foreign Cos.27 5^ ^ SRiT HRl 'HiT .'. 80 Q Q .. 1,269 6,871 • 2,624 Profits Book Publications28 rreftir ==pt>t 80 Q Q A .. . . •• . . Profits Indian Langs.29 80 R 118 412 134 Foreign Remun. profit etc.30 'TXWl" Iqi oO !TOT . . 8 0 R R A .. 247 1,783 687 Foreign Remun. Services31 15,249 1,97,074 ■ 46,246 Capital gains32 5nfTfT r< +rt'nr . . 80 V 1,828 1,17^ 1,174 Physical Disability
10,38,180 4,30,682 Others
. . / 79,39,071 26,03,416 Grand Total
- I I W I I N * I . .............................. .................................................. \ - - -
SoMrce Directorate of Income Tax, Research Statistics, New Delhi, (2) Publications of All India Income Tax Statistics assessment year 1986-87.
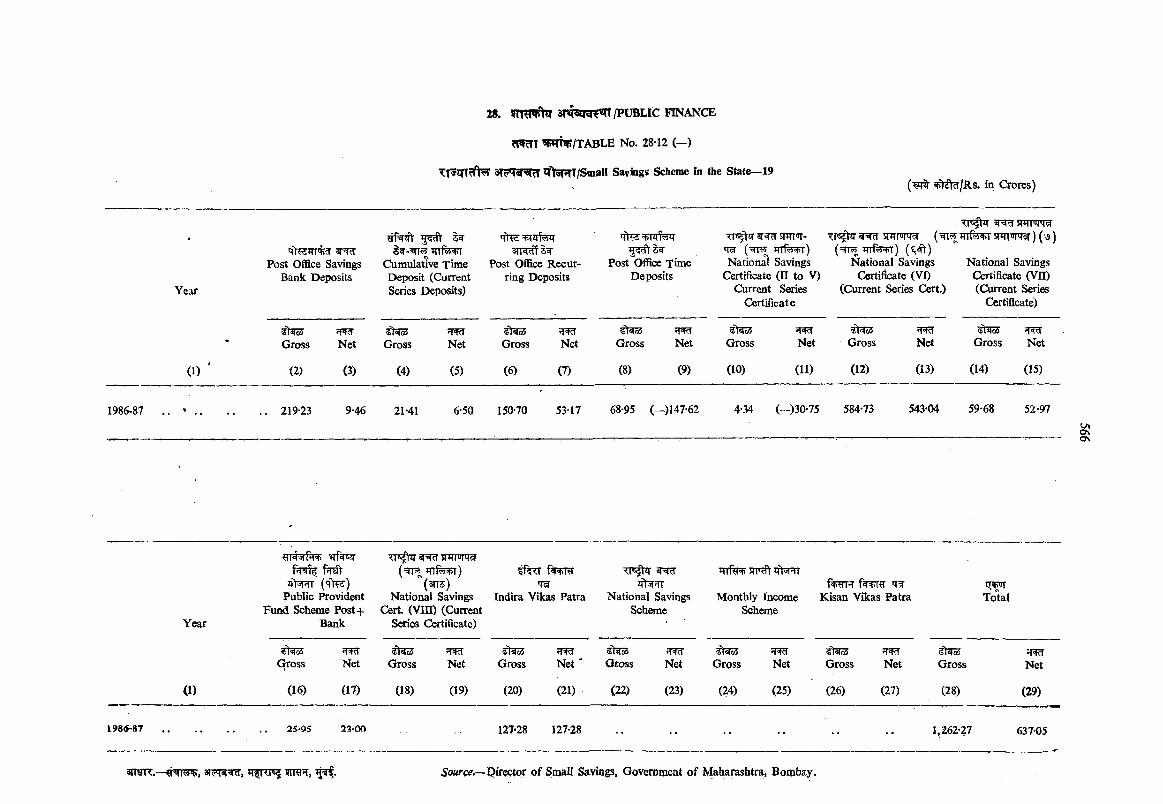
Year
?PRn W fJ/TABLE No. 28-12 (—)
^ftsRT/Small Sayings Scheme in the State—19|jtst?l/Rs. in Crores)
Post Office Savings Bank Deposits
l r infv4+T
Cumulative Time Deposit (Current Series Deposits)
s n ^ lw Post Office Recur
ring Deposits
TTilfeT
Post Office Time Deposits
SHTT'T- ( = ^ infe+T)
National Savings Certificate (II to V)
Current Series Certificate
r^snrnirM snriwrgr ) (^)
(=5TR5; Mlf +T)National Savings National Savings
Certificate (VI) Certificate (VH)(Current Series Cert.) (Current Series
Certificate)
<4l«lo4 W4d <i\ oS ’ltd (ilCciS 5t o5* Gross Net Gross Net Gross Net Gross Net Gross Net Gross Net Gross Net
( 1 ) ' (2) (3) (4) (5) (6) (7) (8) (9) (10) (11) (12) (13) (14) (15)
1986-87 . . ’ , 219-23 9-46 21-41 6-50 150-70 5317 68-95 (—)147-62 4-34 (-)30-75 584-73 543-04 59-68 52-97
o\
Year
jj>3pn (q FH:) Public Provident
Fund Scheme Post-f- Bank
(3TTS) National Savings
Cert (V in) (Current Series Certificate)
'T3Indira Vikas Patra
jftsr rr National Savings
Scheme
Trri% zft nr
Monthly Income Scheme
f rgrR *TWKisan Vikas Patra Total
it'W H4d <ils(o4 '1'=Kl -i'+d <i)«fo4 'f4d «(aiGross Net Gross Net Gross Net ‘ Gross Net Gross Net Gross Net Gross Net
(1) (16) (17) (18) (19) (20) (21) (22) (23) (24) (25) (26) (27) (28) (29)
198^87 . . . . 25-P5 23-00 127-28 127-28 -• •• -• -• -• •• 1,262-27 637-05
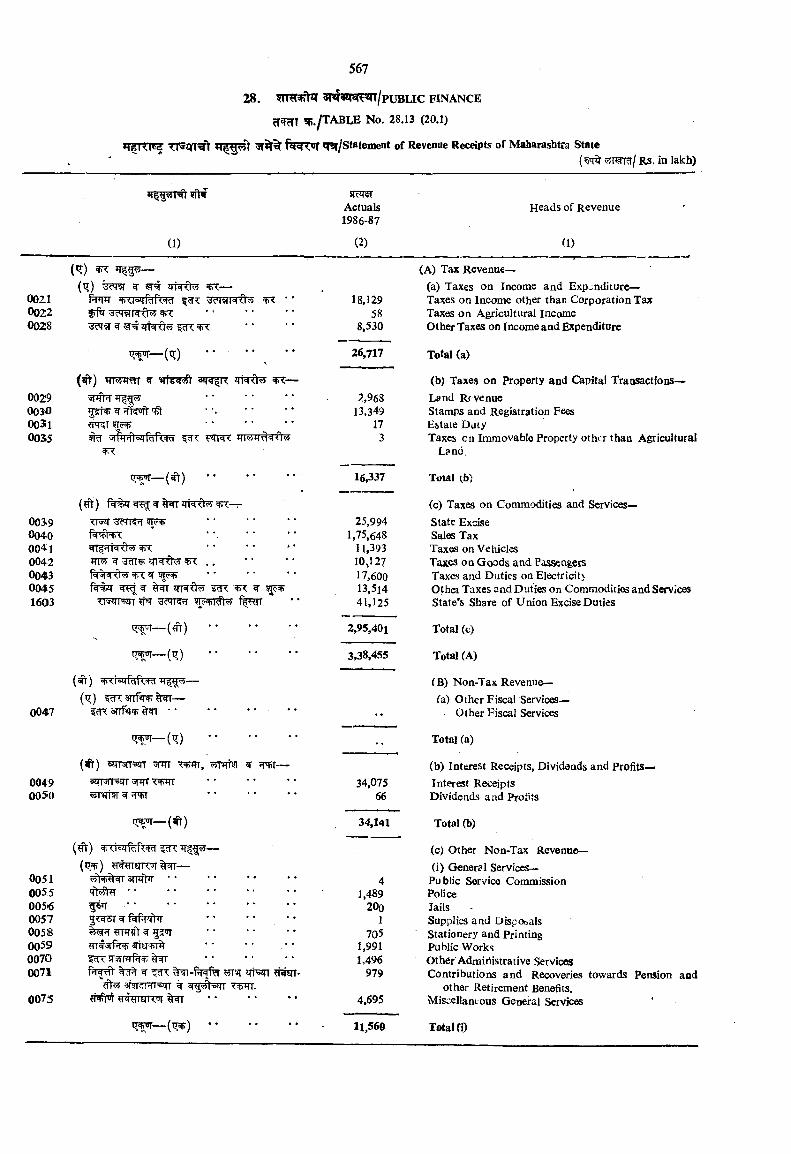
5T%% q^r/Statement of Revenue Receipts of Maharashtfa State( q% Rs. in lakh)
002100220028
0029003*0003il0035
003.90040004100420043 0045 1603
0047
(1)
(^) ^
rxj5irfMk=RT 3?T?rrT t ^ -ac viiqOw ^
^ 3^ ^ JTkfr$J 1?R ^
%
((T)
( ^ ) ^ —pfhr
5fii+ ^ nl'A'jfl 'rV ?TKT ?r^
--- (^ )
{?ft) WK—r<I'j4 3?TR5T 5TR>
T 'i N'O'rf ^
W SfpFT ^ I cH; ^
— (?fT)
t ^ _ ( l T )
..........................
(tr) ••
( ^ ) 53TMr 7 w WTT, w ?rw—
sTPTsa-Actuals1986-87
(2)
Heads of Revenue
(1)
(A) Tax Revenue—(a) Taxes on Income and Expwuditure—
18,129 Taxes on Income other than Corporation Tax58 Taxes on Agricultural Income
8,530 Other Taxes on Income and Expenditure
26,717 Total (a)
(b) Taxes on Property and Capital Transactions—2,968 Land Rrvenue
13,349 Stamps and Registration Fees17 Estate Duty
3 Taxes on Immovable Property other than AgriculturalLand.
16,337 Total
(c) Taxes on Commodities and Services—25,994 State Excise
1»75,648 Sales Tax11,393 Taxes on Vehicles10^127 Taxes oa Goods and Passeageis17,600 Taxes and Duties on Electricity13,5i4 Othei Taxes and Duties on Commoditi® and Services41,125 State’s Share of Union Excise Duties
2,95,401 Total (t)
3,38,455 Total (A)
(B) Non-Tax Revenue—(a.) Ocher Fiscal Services—
Other Fiscal Services
Total (a)
(b) Interest Receipts, Dividends and Profits—0049 ♦ • 34,075 Interest Receipis005'0 v5mT5rWH4)I * * 66 Dividends and Profits
— ( ^ ) 34,141 Total (b)
(c) Other Non-Tax Revenue—(i) General Services—
0051 STnft T ’ ' " * ' * 4 Public Service Commission0055 ............................................. 1,489 Police005*6 ............................................. 20o Jails0057 • • 1 Supplies and Dispobals0058 705 Stationery and Printing0059 1,991 Public Works0070 1,496 Other Administrative Services0071 Hcfm ^ wT'fl qtsqr 979 Contributions and Recoveries towards
cff ' <if!jr<!vri-««TI ^ WHT. other Retirement Benefits.0073 4,695 Miscellaneous General Services
^ — ( ^ ) • • 11,560 Total (i)
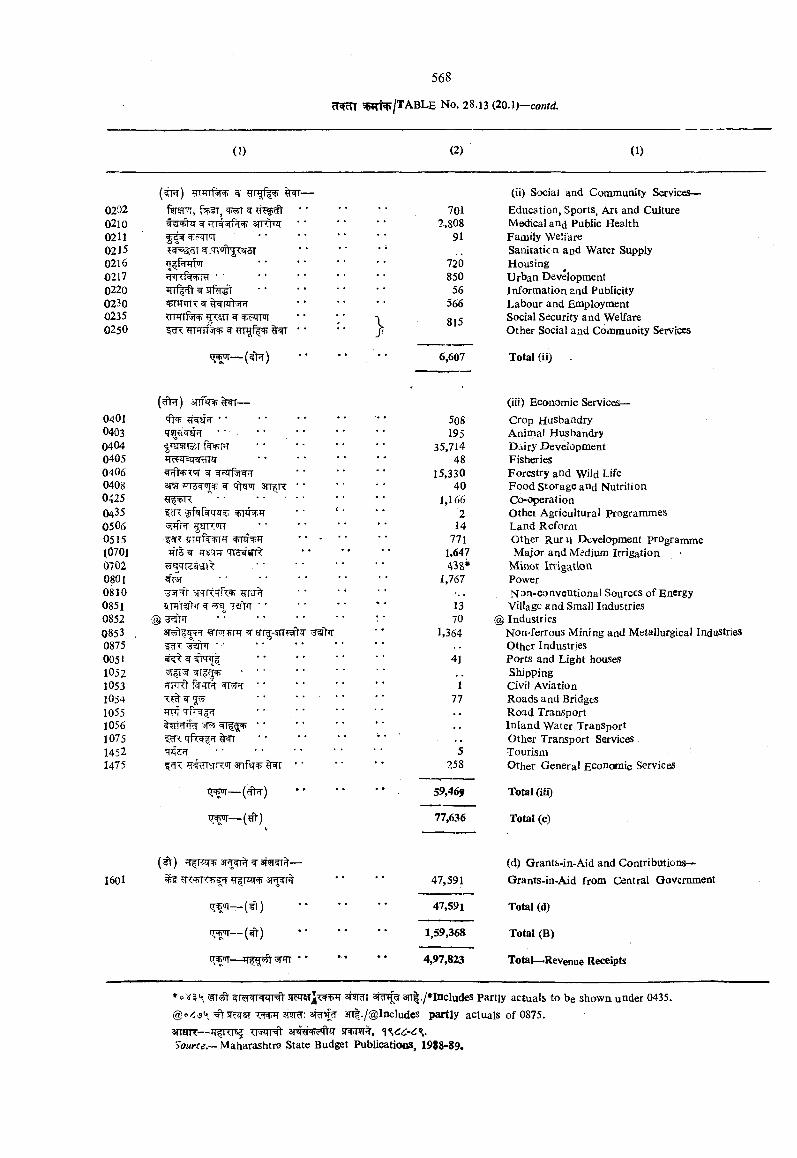
( 0 (2) (1)
(?w) ^ ^ — (ii) Social and Community Services—0202 f^T, +«?4I ^ y ficTt 701 Education, Sports, Art and Culture02lO ^ anrtiir •' 2,808 Medical an^ Public Health0211 91 Family Welfare0215 Sanitatio n and Water Supply0216 720 Housing0217 ■ ■ ............................... 850 Urban Development0220 ?rr%f)' srfirst ■ • • • • ‘ 56 Information znd Publicity0230 566 Labour and Employment0235 ^ iwniT * * * ’ \ 8l5 Social Security and Welfare0250 f
W 1 •'Other Social and Community Services
6,607 Total (ii)
( ^ ) 3 r f e ^ ~* '
(iii) Economic Services—0401 5oS Crop Husbandry0403 • •' ............................... 195 Animal Husbandry0404 I 'J TTST f rpT 35,714 Dairy Development0405 48 Fisheries0406 15,330 Forestry and Wild Life0408 3RT ^ qlTTiT air^R • • 40 Food S to r a g e a n d N u t r i t io n0425 ............................................. 1,166 Co-operation0435 ?cR f • '2 Other Agricultural Programmes0506 sTiftT gsTR'nr ' • * • 14 Land Reform0515 ?fTrrr=i-+ii?r ' • - • * 771 Other Rurii Development programmel070l Tfrs ^ ir m 'rr wsjrt 1.647 Major and Medium Irrigation0702 ^qTc5iji\ ............................... • • 43&* Miuoi Irrigation0801 1,767 Power0810 irTftTrw rrsT * • Nf^n-conventional Sources of Energy0851 13 Village and Small Industries0852 @ 70 @ Industries0853 , 1,364 Noa-ferrous Mining and Metallurgical Industries0875 ?fnT • • • • * Other Industries0051 ............................... 41 Ports and Light houses1052 ..................................... Shipping1053 'iMi'O f *n% ■'ti'rt'i • • 1 Civil Aviation1054 ^ ^ ............................... • * 77 Roads and Bridges1055 JTTIT Road Transport1056 5i,rirl ?r{ 5T55 ............................... • • Inland Water Transport1075 ■(. q fe f ?T Other Transport Services.1452 ............................... 5 Tourism1475 gwsjR'ir snfq- * • •' 258 Other General Economic Services
i +ui— ( ^ ) •• , 59,469 Total (iii)
y+«i— (?ft-) 77,636 Total (c)
( it) ^T|T2qii 3T i^ W 3f9KT^— (d) Grants-in-Aid and ContributioiK—1601 • • 47,591 Grants-in-Aid from Central Government
t oT— (sl) 47,591 Total (d)
(^ ) 1,59,368 Total (B)
• # 4,97,823 Total—Revenue Receipts
RearershnRTS sriW partly actuals to be shown under 0435.@0 (3 ^sr^5T 3TTt./@lncludes partly actuals of 0875.3mrR— iT^Ri^ <Mr^ 5Rrnr%, W 6 '6 % .Source.— Maharashtra State Budget Publications, 19S8-89.
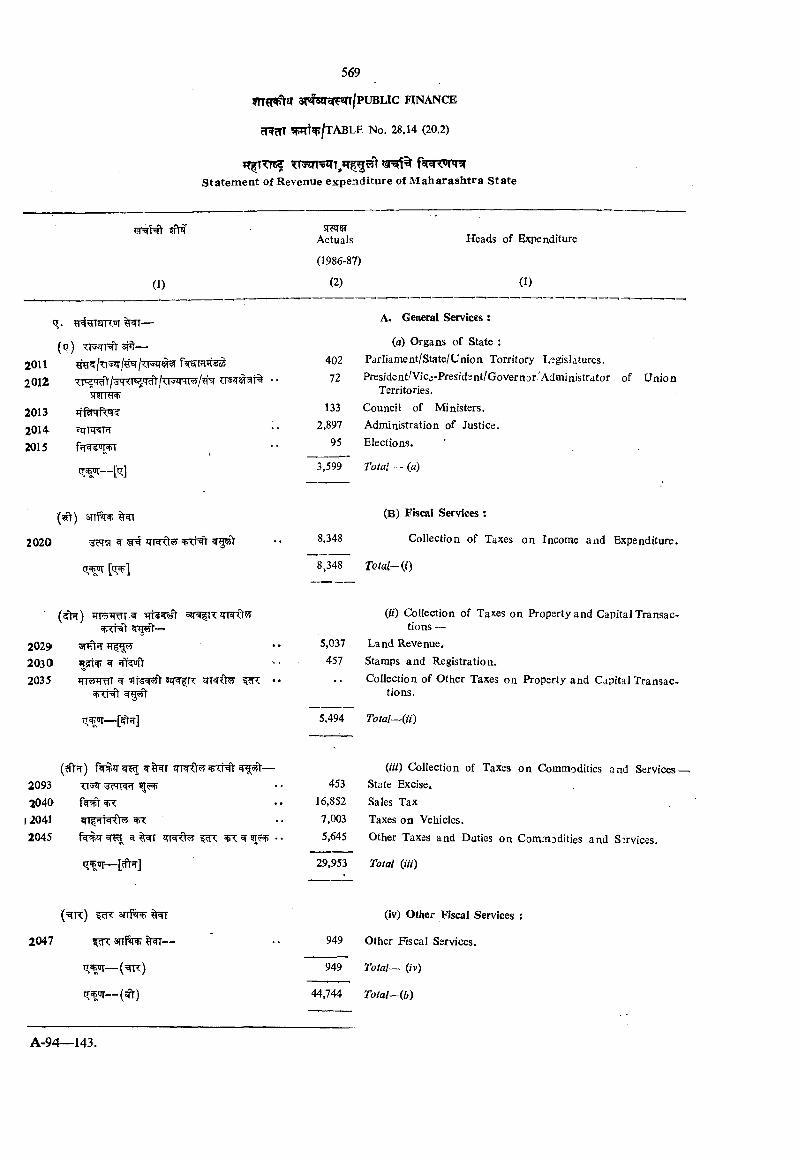
569
ST^SlT^^/PUBLtC FINANCE
?RcTT W ^/T A B L E No. 28.14 (20.2)
statem ent of Revenue expenditure of M aharashtra State
5RJT5TActuals Heads of Expenditure
(1986-87)
(1) (2) (1)
q. ^ —
(q) —2011 402
2012 72
2013 Ttf^rrf^ 133
2014 2,897
2015 95
3,599
■(^)
2020 8,348
( i ^ [q; ]
(5>r) SJTWR JTRflr y
20292030 ^2035 irmrar ^ sztwr
rr. 'ir— [ ^ ]
(cfV T) ^ —2093 ttW2040 fw 't ^
) 2041 WT rrMt ^2045 3R ^ ^ ^ •
A. General Services ;
(a) Organs of State :Parliament/State/Union Territory L-^gisIatures.President/Vica-Presidsnt/Governor'Administrator of Union
Territories.Council of Ministers.Administration of Justice.Elections.
(B) Fiscal Services :
Collection of Taxes on Income and Expenditure.
8,348 TQtal~(^)
(ii) Collection of Taxes on Property and Capital Transactions —
5,037 Land Revenue.457 Stamps and Registration.
Collection of Other Taxes on Property and Capital Transactions.
5.494 Total— iii)
45316,8527,0035,645
(w) Collection of Taxes on Commodities and Services State Excise.Sales Tax Taxes on Vehicles.Other Taxes and Duties on Commodities and Services.
29,953 Total (Hi)
(^R ) STTf ^
2047
IT^--
tr ur— (^ )
(iv) Other Fiscal Services
949 Other Fiscal Services.
949 Total— (iv)
44,744 Total—(b)
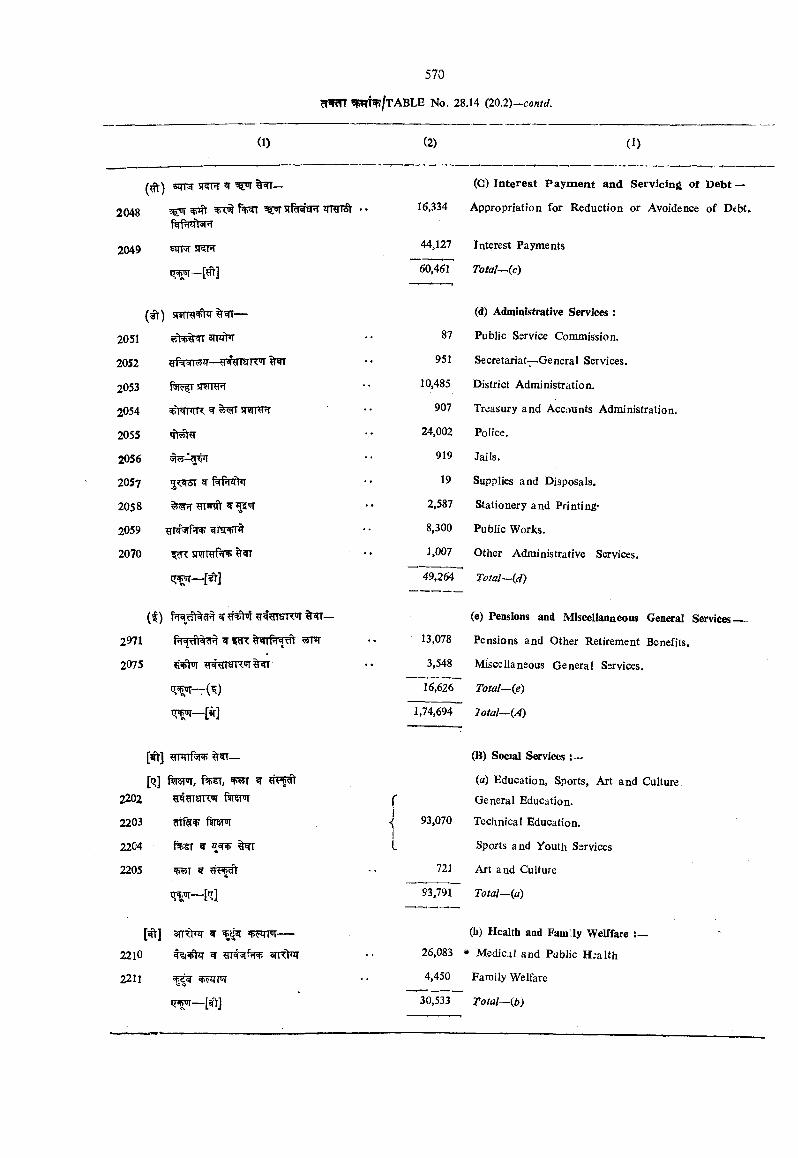
570
^*fcrr ?RT^/tABLE No. 28.14 {10.1)—contd.
(1) (2) (1)
( ^ ) ^ ^ (G) Interest Paym ent and Servicing of Debt —
2048 +<«i ^vrsf^spT irrai t . . 16,334 Appropriation for Reduction or Avoidence of Debt.
2049 5H75T SRTfT 44,127 Interest Payments
q.+ui—[ ft] 60,461 Total—(c)
\ ^ ) sT?rra^%^— (d) Administrative Services :
2051 3IWt»T 87 PubJic Service Commission.
2052 firar 951 Secretariat-^General Services.
2053 WTFT 10,485 District Administration.
2054 w w r ^ 907 Treasury and Accounts Administration.
2055 24,002 Police.
2056 919 Jails.
2057 5? :^ ^ fW it^ 19 Supplies and Disposals.
2058 2,587 Stationery and Printing-
2059 !5rT#3rr?R> ^ tsr^ 8,300 Public Works.
2070 ^ !i?rmf5n> 1,007 Other Administrative Services.
[ >] 49,264 Total~id)
( t ) ^ (e) Pensions and Miscellanaeous General Services__
2971 w W< ^ •• 13,078 Pensions and Other Retirement Benefits.
2075 ?i^q •• 3,548 Miscellaneous General Services.
(I) 16,626 Total~{e)
iT or— [^] 1,74,694 lotal— iA)
[^t] rmrfsR; (B) Social Services :—
[q] ^ (a) Education, Sports, Art and Culture2202 ftrerw r General Education.
2203 fw iri1 93,070 Technical Education.
2204 ^ r ^1I Sports and Youth Services
2205 ^ T W ?rt+di 721 Art and Culture
t TJT— [tT] 93,791 Total—(a)
[^] STTTtW ^ — (b) Health and Fam ly Welffare
221O tlt^zr ^ aTRtnj- 26,083 * Medical and Public H;alth
2211 • • 4,450 Family Welfare
30,533 Total~(Jb)
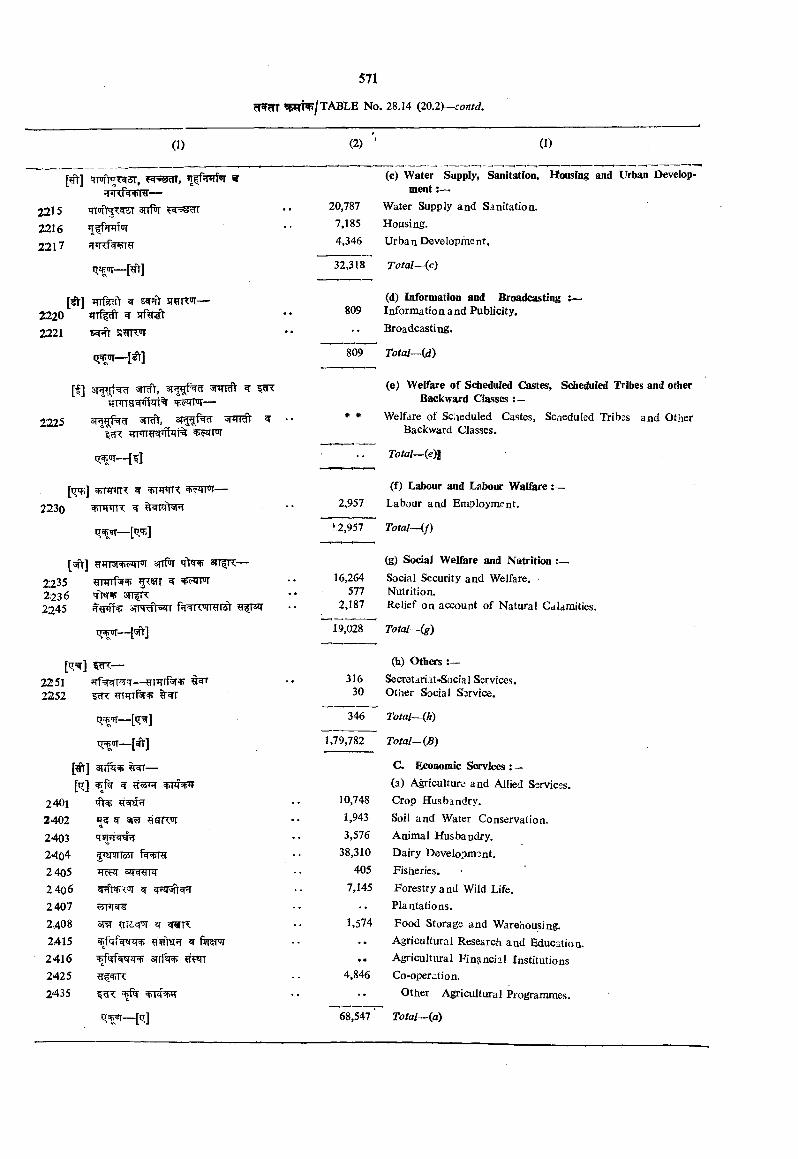
(1)
22152216 2217
[^ ] w-^dr, »rif5TiTf«r wrnrowvnr—•
srrfw
[^ ] infeft w 5 ^ sr^im—2220 TTif^ ^ srftr^2221 Rjft 5!WT
q^ur— [iV]
[f] 3T|\i;{^ 5TT , 3T g;f ^
2225 FT , ^
^r^'iT~[?l
[t^] T»nrTK ^ —2230 n %?TJfr3nT
[sft] JTTsnP FT anfw 'f t^ 3TT^—
2235 Tunf r ^isrr ^2;236 'ft^V SHIR2245 sfTT IrsqT f?mw9i5>
tT Of--- j sft]
[^W] ---2251 — ri’Tff^^2252 fnirrl^^ %' r
q^’ir— [(?=?]
t trr— [^]
[# ] ^T—[tr] ^ ? r ^ ^rpf^
(2)
809
809
2,957
31630
(1)
(c) Water Supply, Sanitation, Housing and Urban Development :—.
20,787 Water Supply and Sanitation.7,185 Housing.4,346 Urban Development.
32,318 Total— (c)
(d) Information and BroadcastingInformation and Publicity. Broadcasting.
Total-^id)
(e) Welfare of Sclieduled Castes, Scheduled Tribes and other Backward Classes : —
* * Welfare of Scheduled Castes, Sciieduled Tribss and Other Backward Classes.
Total— (e)l
(f) Labour and Ls bour Walfare :—Labour and Employment.
-2,957 Total—(f)
16,264577
2,187
(g) Social Welfare and Nutrition :—Social Security and Welfare.Nutrition.Relief on account of Natural Cdlamities.
19,028 Total~(g)
(h) Others :—Secretariat-Social Services. Other Social Ssrvice.
346 Total~(fi)
1,79,782 Total— {B)
C. Economic Services ; —(a) A^iculturc and Allied Services.
2401 qtsp 10,748 Crop Husbandry.
2402 c 1,943 Soil and Water Conservation.
2403 3,576 Animal Husbandry.
24o4 38,310 Dairy Development.
2 405 405 Fisheries.2 406 7,145 Forestry and Wild Life.2407 . . Plantations.2408 ^ ?ITo^ ^ 1,574 Food Storage and Warehousing.2415 Agricultural Research and Education.2416 3Trf«I • • Agricultural Finjincial Institutions2425 4,846 Co-oper.ition.2435 . . Other Agricultural Programmes.
[q] 68,547 ’ Total—{a)
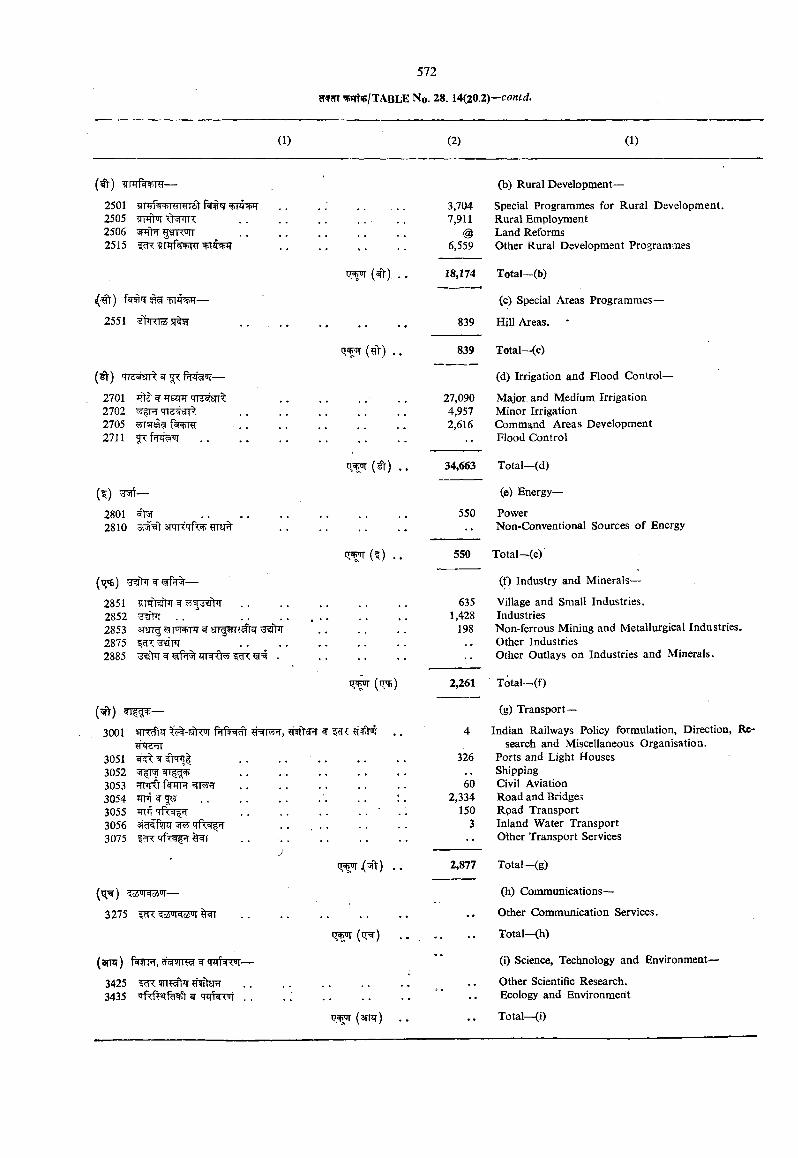
25012505 TITtTt I'lW?;25062515 ??TT
2551 ■*1 <,l«i
( ^ ) '773#srr ^ ftpraw—
2701 Ifts ^ JTeJW TCWErrt2702 ^5^ qTStSTT27052711 57
(^) ^ —
2801 ^2810 3#?t STTT qf
2851 9m>rhT W2852 ^ 3^ . .2853 srar i iw fn T ^ srT rr W ^whr 28752885 ^ W^ .
iT <ir (^).
q q- (gt)
(^ )
iT ^ (tni)
{ ^ ) W Tf^~
3001 ?r#ar
rnrft f^wR ’TPT n’t'Tf^^r
305130523053305430553056 3075
cr^ j( >)
3275 WK'
( i^ )
(arm) f ?TFr, —
3425 ^3435 Tfrf^fd't^ ^ . .
(b) Rural Development—
3,704 Special Programmes for Rural Development. 7,911 Rural Employment
@ Land Reforms6,559 Other Rural Development Programmes
18,174 Total—O)
(c) Special Areas Programmes—
839 Hill Areas. *
839 Total—(c)
(d) Irrigation and Flood Control-
27,090 Major and Medium Irrigation4,957 Minor Irrigation2,616 Command Areas Development
Flood Control
34,663 Total—(d)
(e) Energy—
550
550
6351,428
198
326
602,334
1503
2,877
PowerNon-Conventional Sources of Energy
Total—(e)
(f) Industry and Minerals—
Village and Small Industries.IndustriesNon-ferrous Mining and Metallurgical Industries. Other IndustriesOther Outlays on Industries and Minerals.
2,261 Total—(f)
(g) Transport-
Indian Railways Policy formulation, Direction, Research and Miscellaneous Organisation.
Ports and Light Houses Shipping Civil Aviation Road and Bridges Rpad Transport Inland Water Transport Other Transport Services
Total—(g)
(h) Commvmications—
Other Commimication Services,
Total—(h)
(i) Science, Technology and Environment—
Other Scientific Research.Ecology and Environment
( 3M) Total—(i)
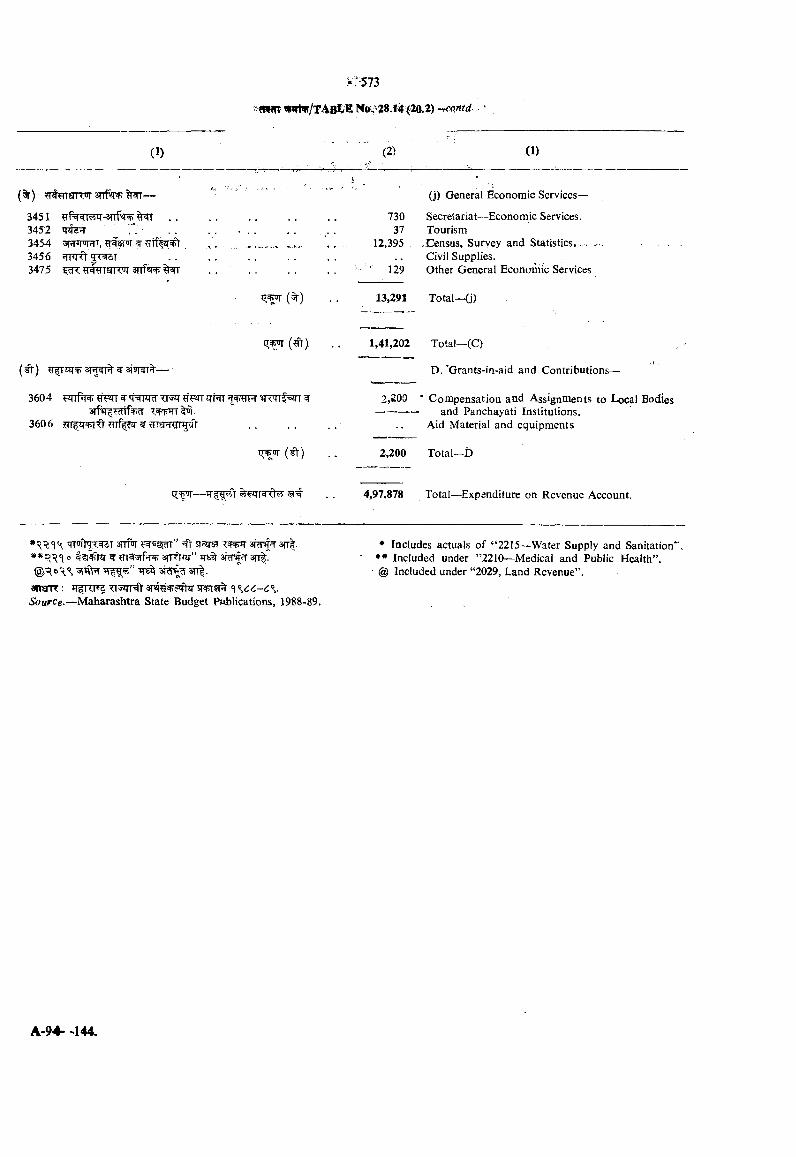
5^:573
’W tv/TABtE Now’28.14 ^
(1) (2) (1)
{%) s TtwiSTRnr 3n1% —
3451 r T?5 T-3nf«T % . .3452 q?T2 '."3454 vjUMuht, ^3456 ffPrft 5T^T3475 ?I%r?jrOT 3rTf«T
{%)
73037
129
(j) General Economic Services-
Secretariat—Economic Services. Tourism
12,395 Census, Survey and Statistics, . Civil Supplies.Other General Economic Services
13,291 Total—(j)
(?fr)
3604 ^ rFrr i ^
360 6 5T ^SFRTT it
( f t )
1,41,202 Total—(C)
D. 'Grants-in-aid and Contributions—
2,200 * Compensation and Assignments to Local Bodies —, and Panchayati Institutions.
Aid Material and equipments
2,200 Total—£)
4,97,878 Total—Expenditure on Revenue Account.
Tr'%T^T sniw ¥5T5w” argr^ 3rr|.o ^ 5 ^ ^ arrft^” ireir snt?
3n|.anSTK : ’TfRT^ Tt5irr^ 5rwsr% ^% 66-6\.Source.—Maharashtra State Budget Publications, 1988-89.
* Includes actuals of “ 2215—Water Supply and Sanitation* •* Included under ”2210—Medical and Public Health”,@ Included under “2029, Land Revenue”.
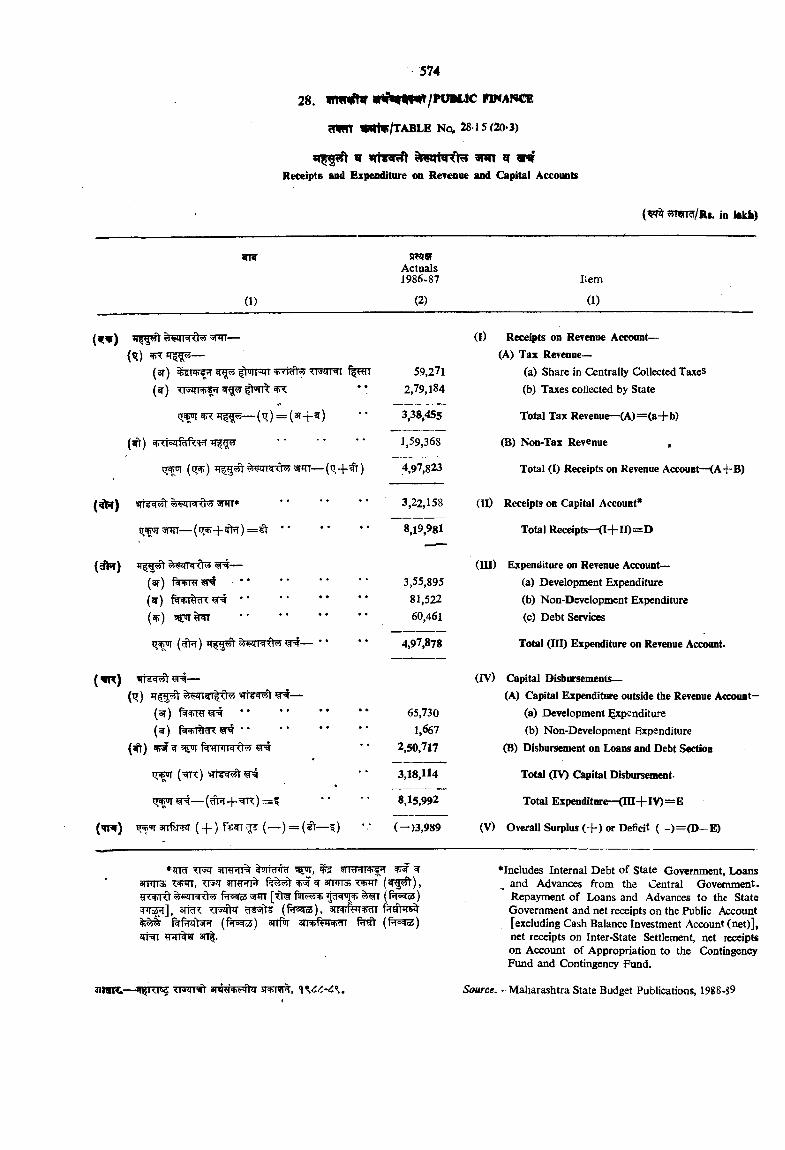
^ awT ^Receipts and Ezpeoditare od Retenue and Capital Accounts
(?#5JraTcT/Ri. in Iftkh)
^ SrJIWActuals1986-87
________________________ W__________________________ (2)
3RT—
(*?) —(3T) TT53TRT 59,271(«r) TT53m^ iN rt ^ • • 2,79,184
— (t ) = (3T+^) •• 3,38,455
(^ ) ............................... 1,59,368
tr^ ((T ) W — (q + 5t) 4,97,823
( ^ ) ............................... 3,22,158
iispiTW— ( t ^ + ^ ) = l t ............................... 8,19,981
( # f ) —(3t) i^JFRT^ • .............................................. 3,55,895(^) fer v id ^ ............................................ 81,522(2F) ............................................. 60,461
II5F0T (?f T) — * * * * 4,97,878
(SIR)
(sr) .............................................. 65,730(5 ) f g ^ ^ n : ^ * * •• •* *• 1,667
(^ ) ^ 5(iOT fwwrrwtN? ^ • • 2,50,717
iT^ ( ^ ) * • 3,18,114
— (#T + ’ ) = 5 •• ” 8,15,992
( ’*w) 3rrf^ ( + ) f w ^ (— ) = (sV— I) •.' ( —)3,989
*qM TIW WHI% ^ ^ Warnirs ttsjt wrhi^ ^ w amrs ( 5^ ) ,iER=FRt f «x4o4 'SHTT (Pl^oi )TT5gr], 3TtcfT CRAft'iT ( fr r ^ ) , aTT' jff’T'f IT fnaV TS
f frfqtsR ( fH ^ ) srrf arnpftJiw M t (f^rs^)JTRT 3IT|.
Hem
(1)
(I) Receipts on Revenue Account—(A) Tax Revenue—
(a) Share in Centrally Collected TaxeS(b) Taxes collected by State
Total Tax Revenue—(A )=(a+b)
(B) Non-Tax Revenue ,
Total (I) Receipts on Revenue Account—(A-j-B)
(II) Receipts on Capital Account*
Total Recdpts—( I + n ) = D
( in ) Expenditure on Revenue Account—(a) Development Expenditure(b) Non-Development Expenditure(c) Debt Services
Total (III) Expenditure on Revenue Accoont.
(IV) Capital Disbursements—(A) Capital Expoiditure outside the Revenue Accouat-
(a) Development ^penditure(b) Non-Development Expenditure
(B) Disbursement on Loans and Debt Section
Total (TV) Capital Disbursement-
Total Expenditure—(H I+IV )=E
(V) Overall Surplus ( + ) or Deffdt ( - )= (D —E)
♦Includes Internal Debt of State Government, Loans and Advances from the Central Govermnent. Repayment of Loans and Advances to the State Government and net receipts on the Public Account [excluding Cash Balance Investment Account (net)], net receipts on Inter-State Settlement, net receipts on Account of Appropriation to the Contingent Fund and Contingency Fund.
33iar&— TTsn^ Source. - Maliarashtra State Budget Publications, 1988-89
28.16
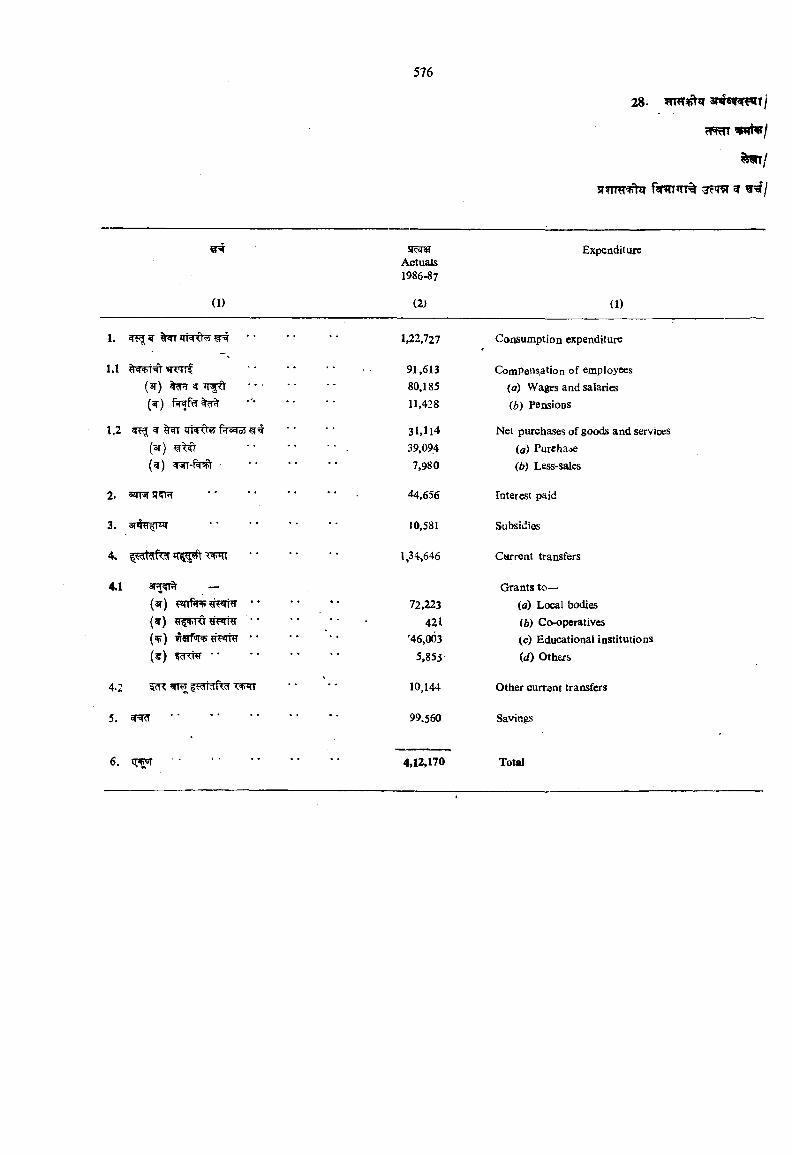
<fFcfT f ^ 1
«T#
(1)
SR<T5TActuals1986-87
(2)
Expenditure
(1)
I. ^ ir^ *' 1.22,727 Consumption expenditure
1.1 91,613 Compensation of employees(3T) 4 ................ 80,185 (o) Wages and salaries{^) 11,428 (b) Pensions
1.2 isi’J 31.114 Net purchases of goods and services(3T) 5?^ • • , 39,094 (a) Purchase{^) • • 7,980 (b) Less-sales
2. sr?R ............................... •• 44,656 Interest paid
3. arvH riir 10,581 Subsidies
4, l,34»646 Current transfers
4.1 — Grants to—(ar) wrfifsu ** 72,223 (a) Local bodies(^) ^^+1^ HWtf '* 421 (b) Co-operatives(^ ) ^5rfn:v Qt>iiiy ’ '46,003 (c) Educational institutions{^) ............................... • • 5,855 (d) Others
4.2 IcTT <+ J 10,144 Other current transfers
5. ............................................. 99.560 Savings
6. m L ''« ............................................. 4,12,170 Total
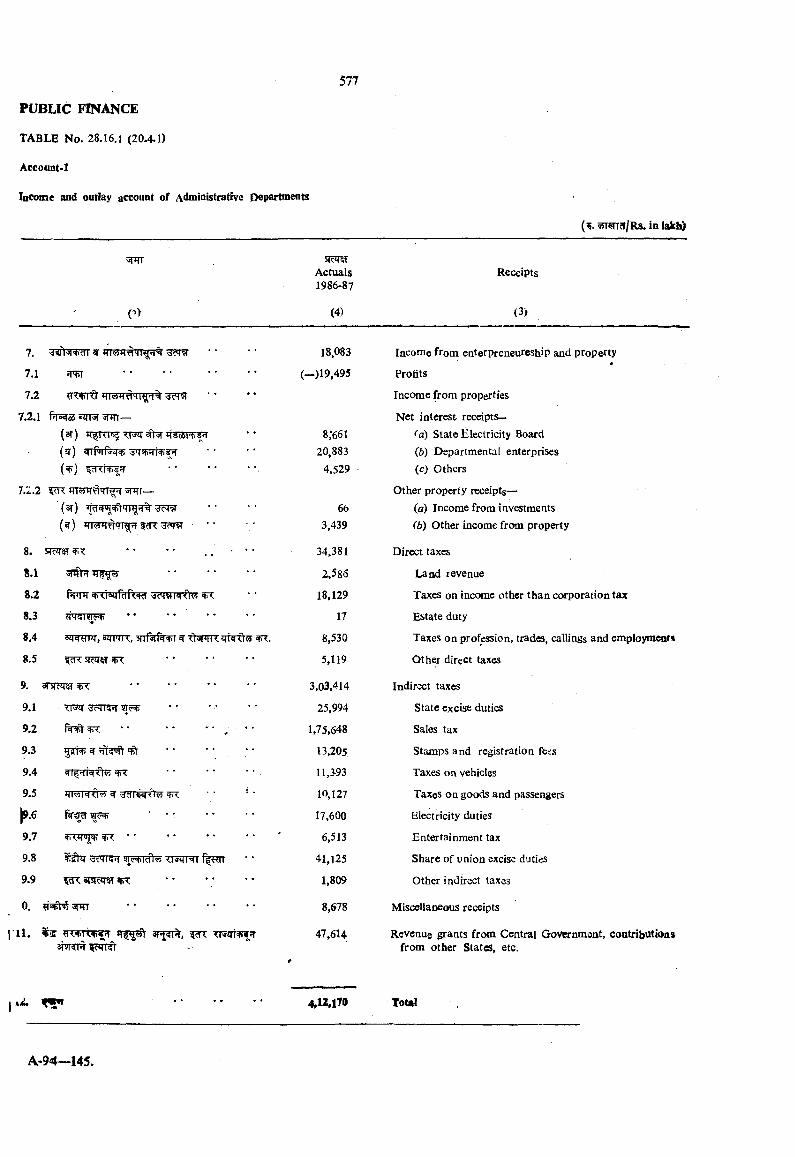
PUBLIC FINANCE
Accoiunt-1
Income and outlay account of Administrative Departments
C>
5 1 ^Actuals1986-87
(4)
Receipts
(3)
7. ^ >^dT ^
7.1 ^
7.2 <4>i0
7.2.1 f o«(bi5 5TR7—(3T) TX^ ^(^)
^ ^ r —(ar) 3?r?r(?) TTMH CTT
8.
8.1 sftnr^T ^
8.2
8.3
8.4
8.5
.............................................
®yw9w,ssrmr, srrf rfir w
srcq’ST
9. 3nrc r«5fp:
18,083
(-)19,495
8;66120,883
4.529
663,439
34,381
2,586
18,129
17
8.530
5,119
3,03,414
Income from enterpreneureship and property
Profits
Income from properties
Net interest receipts—^a) State Electricity Board(b) Departmental enterprises(c) Others
Other property receipts—(a) Income from investments(b) Other income from property
Direct taxes
Land revenue
Taxes on inccMne other than corporation tax
Estate duty
Taxes on profession, trades, callings and employmeort
Other direct taxes
Indirect taxes
9.1 'dcMl'i'l * * 25,994 State excise duties
9.2 ^ • ' • • • • , • • 1,75,648 Sales tax
9.3 »is{t+- ^ * • • • • • 13,205 Stamps and registration fees
9.4 11,393 Taxes on vehicles
9.5 10,127 Taxes on goods and passengers
P.6-O va 17,600 Electricity duties
9.7 ■?:ir3T+ ^ ............................................. 6,513 Entertainment tax
9.8 Tr5zrr=rr 41,125 Share of union excise duties
9.9 «<Scqt{T ^ 1,809 Other indirect taxes
0. 8,678 Miscellaneous receipts
3j?r?R47,614 Revenue grants from Central Government, contributioas
from other States, etc.
4.12,170 Total
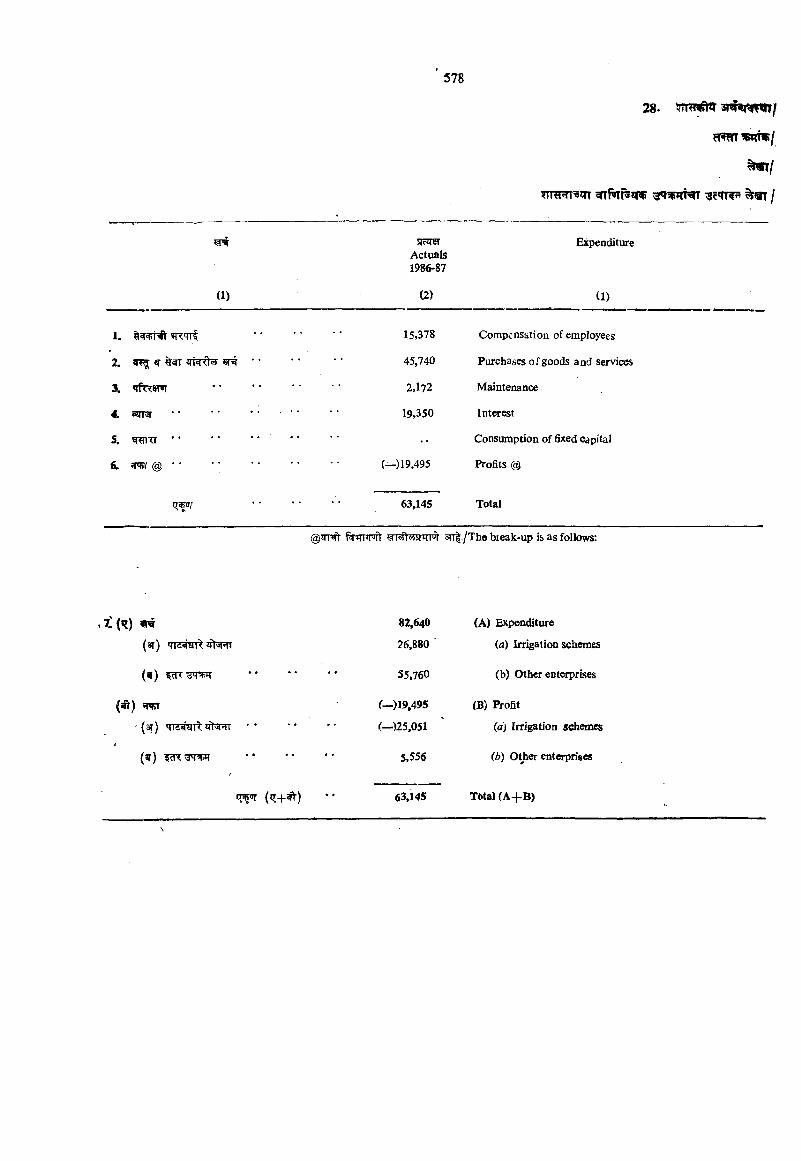
28» 3 r 5 w m /
5TnfRT 5rT ^ w h a r r %€t /
SRZRSTActuals1986-87
Expenditure
(1) (2) (1)
1. R'TTf • • 15,378 Compensation of employees
2. SR ^ ^ ‘ . . 45,740 Purchases of goods and services
3. qf^«m 2,172 Maintenance
4. c ^ M ............................. . . . 19,350 Interest
5. ^ T I ............................. . . •• Consumption of fixed capital
6u JTW @ • • . . (--)19,495 Profits @
q ^ r 63,145 Total
(ojiTH'l <3T5n?5sjifm iir^./The break-up is as follows:
i (^) ^ 82.640 (A) Expenditure
(ar) qidiiui 4t«nj ?6,880 {a) Irrigation schemes
( f ) W9R 3'T •• 55,760 (b) Other enterprises
{ it) *TOT f_)19,495 (B) Profit
(st) ifhiPTT ' * . . (—)25.051 (a) Irrigation schemes
5.556 (b) Other enterprises
t «TT (tr+^) 63,145 Tdtal (A +B )
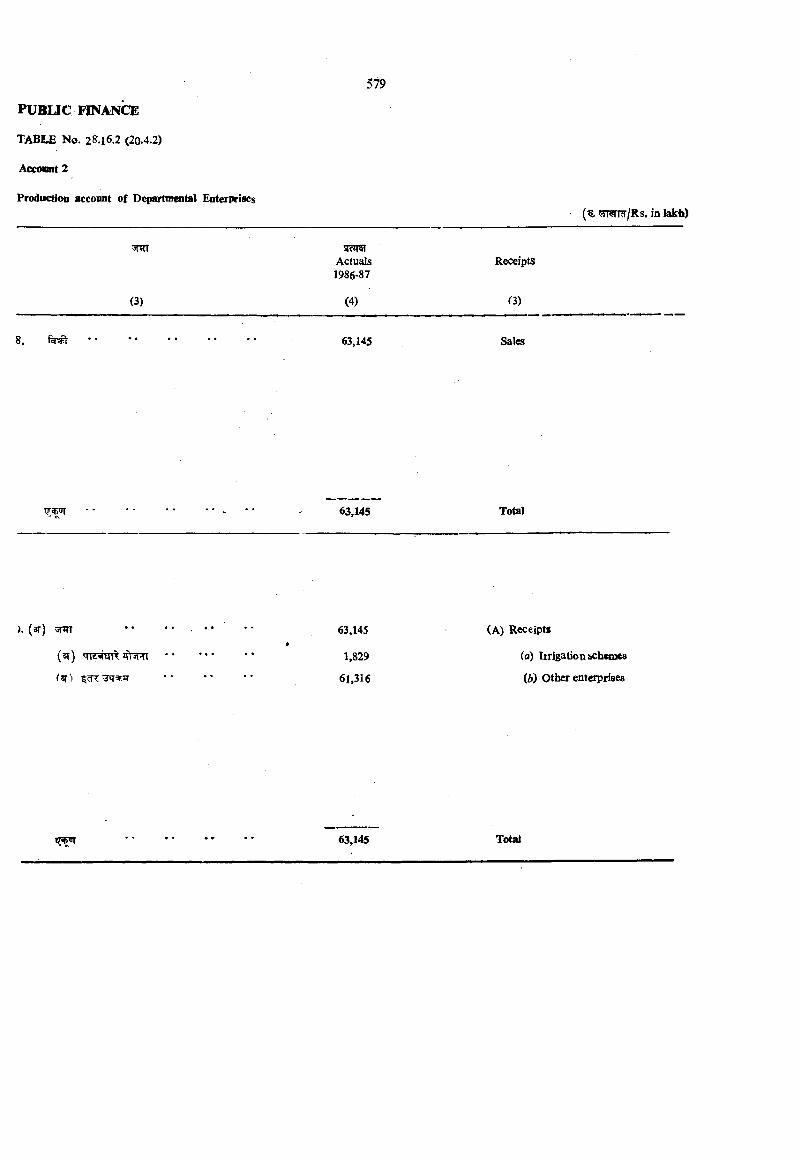
PUBLIC FINAJ^CE
T A B t£ No. 2846.2 (20.4.2)
Aocomit 2
Production acconnt of Departmoital Enterprises
5TITT
(3)
8. ^ ............................................................
• • • • • • • • w
>. (sr) ^ • * * • . • • • •
(3T) tfV sR T ...............................
...............................
..............................................
Actuals1986-87
(4)
Receipts
f3)
63,145
63,145
Sales
Total
63,145
1,829
61,316
(A) Receipts
(a) Irrigation schtmcs
ib) Other enterprises
63,145 Total
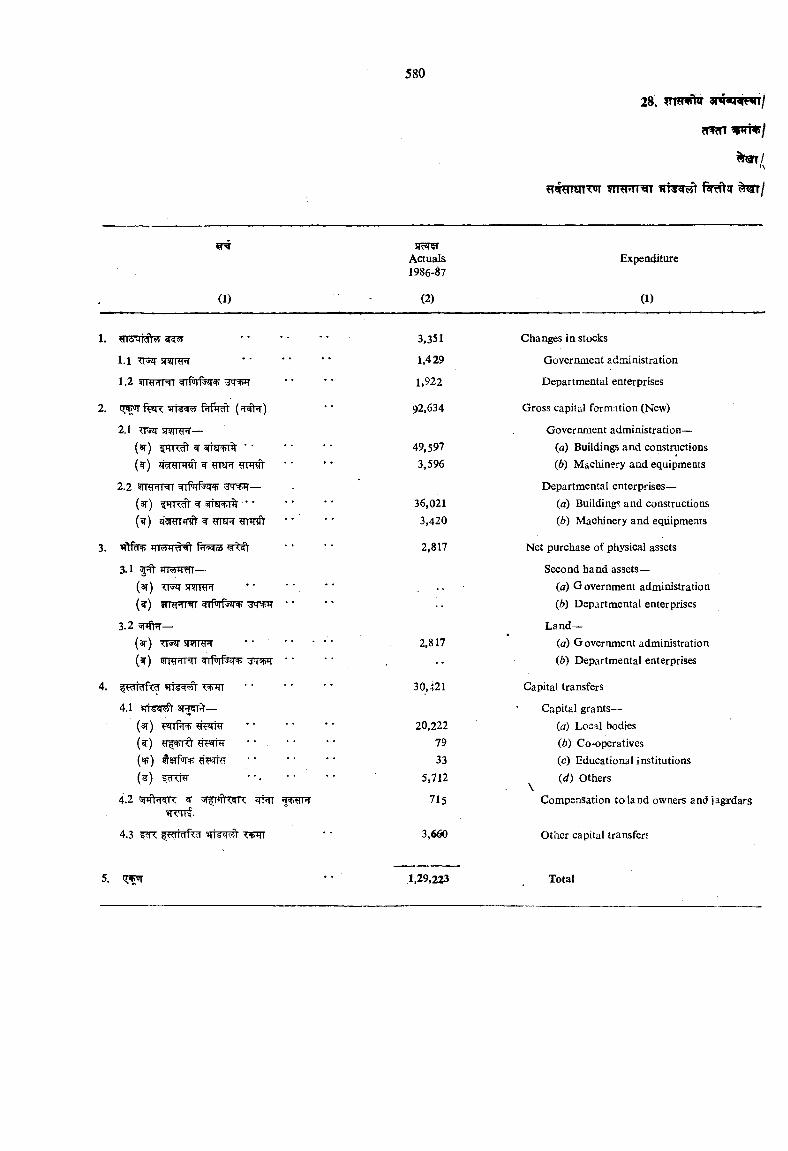
v n v /
SIc WActuals1986-87
Expenditure
(1) ' ^ 2 ) (1)
1. ?rr3 i<;n<fj s ( ^ • * • - . • 3,351 Changes in stocks
1.1 TFSPT SRTRPT 1,429 Government administration
1.2 srrw HT 1,922 Departmental enterprises
2. iT^fvT<; {T=n*f) 92.634 Gross capital form:ition (New)
2.1 TFHT SRTRPT— Government administration—(5n ) *iridl 4 ■ 49,597 (a) Buildings and constructions(^) W ?TT5rT 3,596 (b) Machinery and equipments
2.2 5 n w ^ =nMN^ — Departmental enterprises—(ar) ^ wiwi% ■ * 36,021 (a) Buildings and constructions(?) q<^«iq^ W nSTT TPniV “ " 3,420 (b) Machinery and equipments
3. >Afdi> wrSTTTcHt Pi®«Iq6 2,817 Net purchase of physical assets
3.1 'Tl TTnTtTT— Second hand assets—(ar) TT sr9rRrT (a) Government administration(w) wpTTwr wifnrf RTV ** (b) Departmental enterprises
3.2 Land—(3t) SRTIff ............................... 2,817 (a) Government administration(?) WrepTT" . (b) Departmental enterprises
4. Ti TT 30,421 Capital transfers
4.1 «rrs^ 3|iH<ii i— Capital grants—(3T) ’P n f^ fFTRT 20,222 (a) Local bodies(?) '• •; •• 79 (6) Co-operatives(^) ^ rpTRT g'FMitf ‘ ■ . . . . 33 (c) Educational institutions(s’) SCI ' ■« 5,712 ((/) Others
4.2 ^ l<n:!:'ir< W t ffJ¥R »rmf.
715 Compensation to land owners and jagrdars
4.3 ??p : ^fcrRci T+'irr 3,660 Other capital transfers
5. 1.29,2Z3 Total
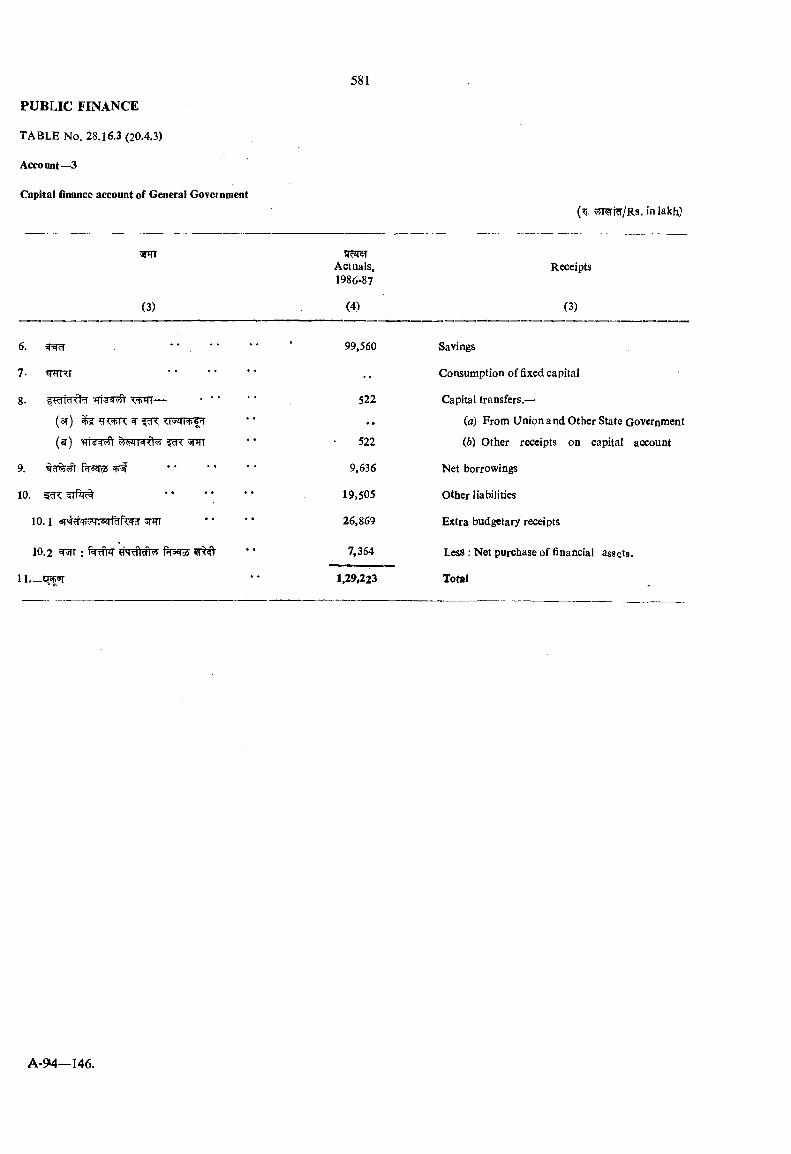
Account—3
Capital finance account of General Goyet nment
(3)
scJrarActuals,1986-87
(4)
Receipts
(3)
6. "
7* WRT
8. T W — - * '
(3t) ^ ^ ^ TTTzmrijT
(^) SHTT
9. ft-5^ ^
10.
10.2 : fWffhT #T#cft^
11— qsptrr
99,560
522
• •
522
9,636
19,505
26,869
7,354
1,29,223
Savings
Consumption of fixed capital
Capital transfers.—
(a) From Union and Other State Government
(b) Other receipts on capital account
Net borrowings
Other liabilities
Extra budgetary receipts
Less : Net purchase of financial assets.
Total
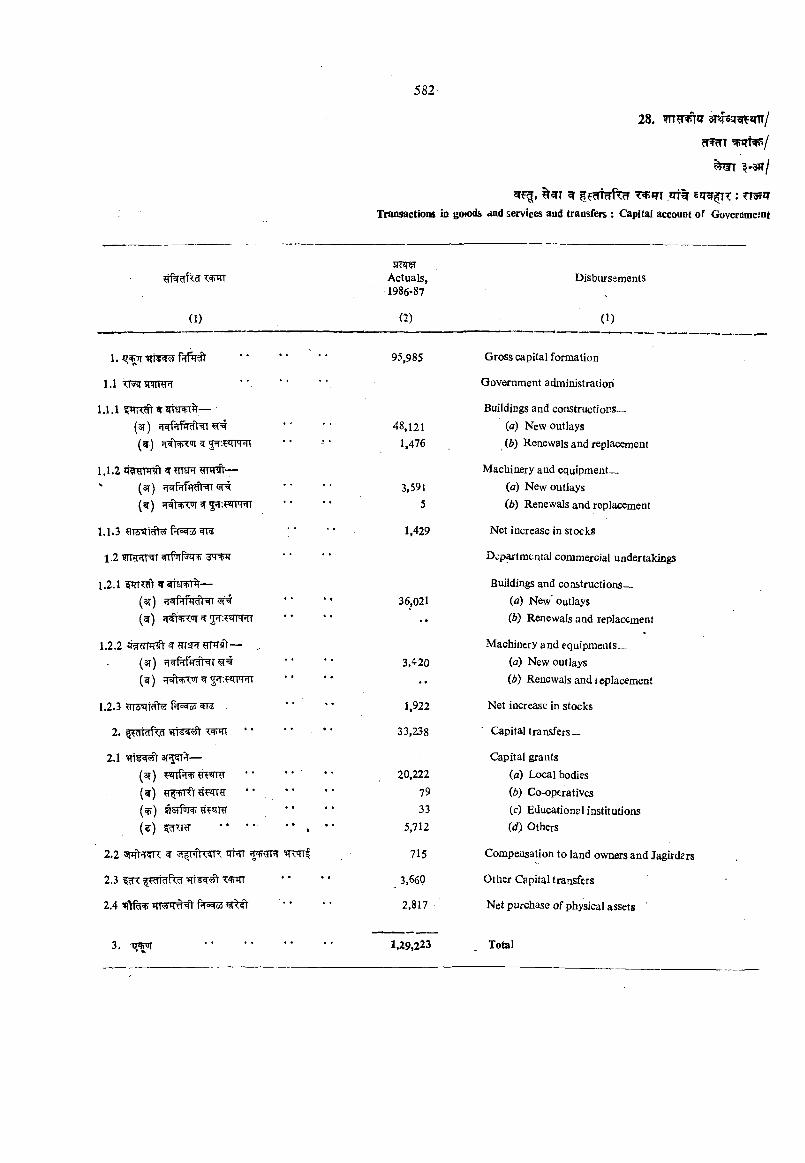
W fHTcTfCcT T^»TI .*Tt% : TT JTTransactions in goK>d& and services and transfers ; Capital account of Governmejnt
n )
ScorerActuals,1986-87
m
Disburssmsnts
0 )
1. 95,985 Gross capital formation
1.1 SrWR GovernmeBt administration
1.1.1 Buildings and constructions_(3l) H«iPlfflRft=sn 48,121 (a) New outlays(^) 5?r: «TFRT 1.476 (6) Renewals and replacement
1.1.2 ?iTwr—- Machinery and equipment_(ar) w k 3,59] (a) New outlays(^) fRV^T 5 :?«imT 5 (d) Renewals and replacement
1.1.3 ¥13^19^ flowed =1 lie 1,429 Net increase in stocks
1.2 '3wr Dcp^tmcntal commercial undertakings
1.2.1 ^ s j ^ — Buildings and constructions—(sr) 36,021 (a) New Outlays( f ) ^ 2 : «rFPTT •• (6) Renewals and replacement
1.2.2 ^ ., Machinery and equipments—(3t) ri#lf?rcfl^T 3,420 (a) New outlays{^) cn+<<3T 2T.FrpT?n •• (Z>) Renewals and leplacemerit
1.2.3 ?TT5^t^ 0t5 ^ 1,922 Net increase in stocks
2. • • • * . • • 33,238 Capital transfers—
2.1 — Capital grants(ar) ?2rrf^ *‘ ** 20,222 (a) Local bodies(^) • ‘ 79 (d) Co-operatives(^) 33 (c) Educational institutions(?) *• •* •* , •• 5,111 (d) Others
2.2 5prt?RR w ■ ■ [ rt'c R ^ ^ TPT ^mrt 715 Compensation to land owners and Jagirders
2.3 WTT 3,660 Other Capital transfers
2.4 2.817 Net purchase of physical assets
3. ............................................. 1,29,223 Total
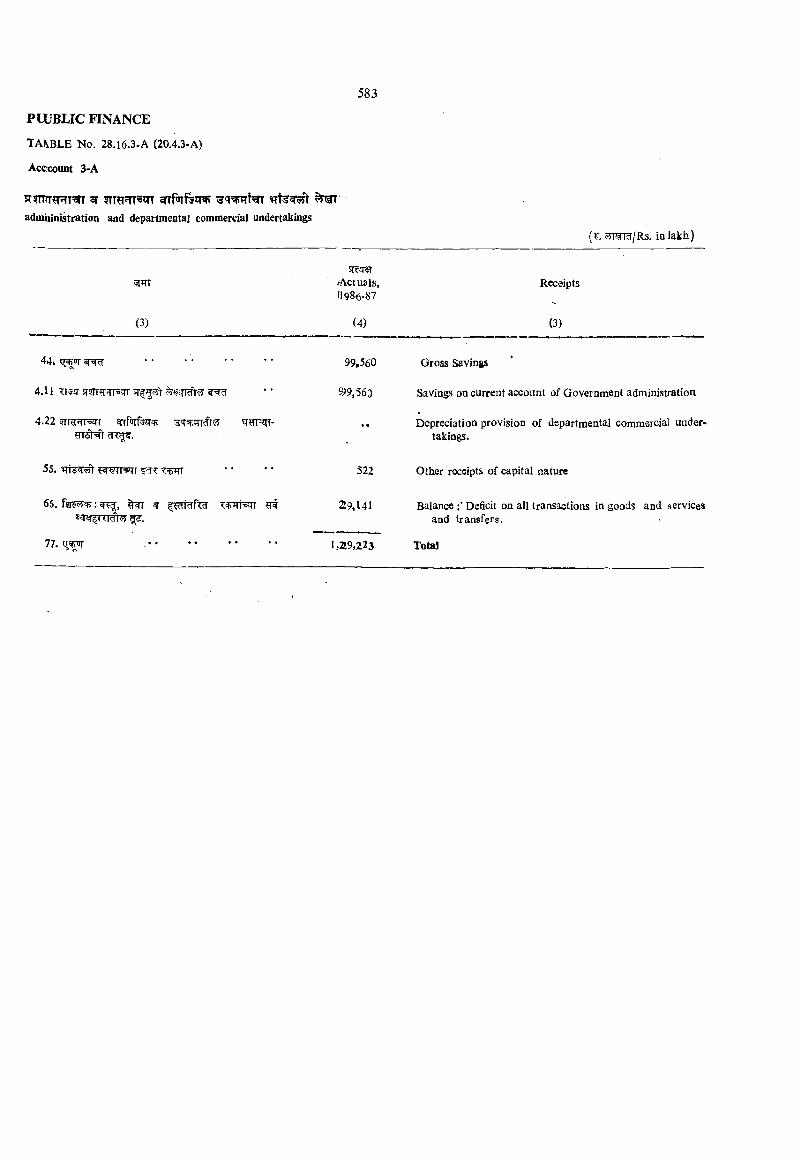
Acccount 3-A
3f ^admhinistration and departmental commercial undertakings
{ts. mrnHjRs. in lakh)
/Actuals,11986-87
Receipts
(3) (4) (3)
44» CTor 99,560 Gross Savings
4.11 ■5CT5£T sr5rr?r?rr55rr S99.563 Savings on current account of Government administration
4.22 ^Er=T- ?rr5)^ d
• • Depreciation provision of departmental commercial undertakings.
55. FWWsqr TW 522 Other receipts of capital nature
65. : wTf, ^ 29.141 Balance Deficit on all transactions in goods and services and transfers.
1,219,223- Total
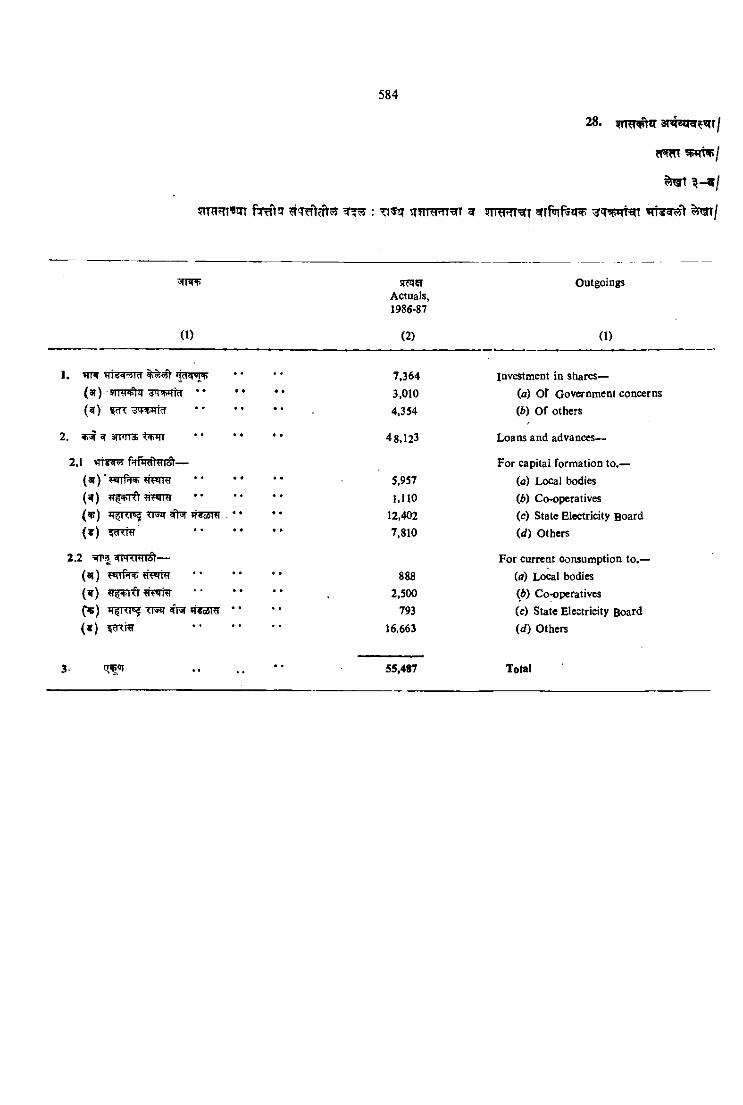
fTWt
^ \ - v j
7in?m ’3!Tr ?T7^<ft55 : T\^rn Y T w r w 9 T m rrr^T ^rf^nt^iRT ^ s m j
(I)
1. >11‘I WT¥ T?T Mnqx^ * * * *
(3i) s m r ^ T m h r .................................( ^ ) 5rfT * * * * * ‘
2. s» 3TT*n3. t w *• • • **
2.1 « r t s ^ —
( a r ) ' ?irTf^ fTFTra ** • • ••( ? ) ^T^Vrft CTFTTO ** '* **(«B) JT TTPS? rrsJT #3T *T?o5m . * •{t ) ??TTRT .................................
2.2 = ^ 3 ^ m R n 5 t—(ai) WTf»T^ ? l F T r a .................................( ? ) ^ 'g y ifi .................................( ^ ) TR*r zfra eresm * *
{ t ) 5fTTi¥ .................................
SliPICTActuals,1986-87
(2)
7.3643.0104,354
48.123
5,957
I.lIO12,4027,810
2,500
793
16,663
Outgoings
(1)
Investment in shares—(а) Of Government concerns(б) Of others
Loans and advances—
For capital formation to.—(а) Local bodies(б) Cooperatives(e) Stale Electricity Board (</) Others
For current consumption to.— {a) Local bodies (6) Co-operatives(c) State Electricity Board(d) Others
55,487 Total
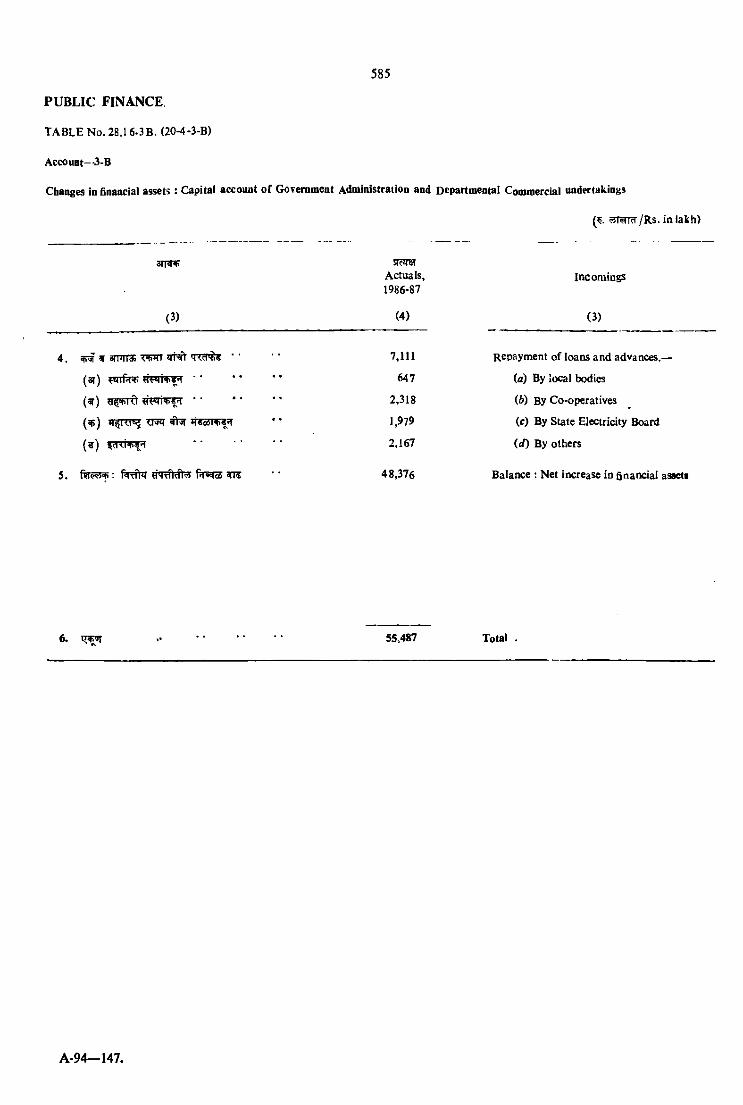
AccouBt--3-B
Changes in financial assets: Capital account of Goverament Administration and Departmeotal Commercial undertakings
(^. s r a i^ /R s . in lakh)
(3)
4. ^ arnrra *'
(ar) ‘
( ? ) ■ ■
( ? ) tTRT ^ ««a5l4*<5
(¥ )
5. arre
sR?raActuals,1986-87
(4)
7,111
647
2,318
1,979
2,167
48,376
Incomiags
(3)
Repayment o f loans and advances,—
(a) By local bodies
(W By Co-operatives
(c) By State Electricity Board
(d) By others
Balance : Net increase io financial assett
6. 55,487 Total .
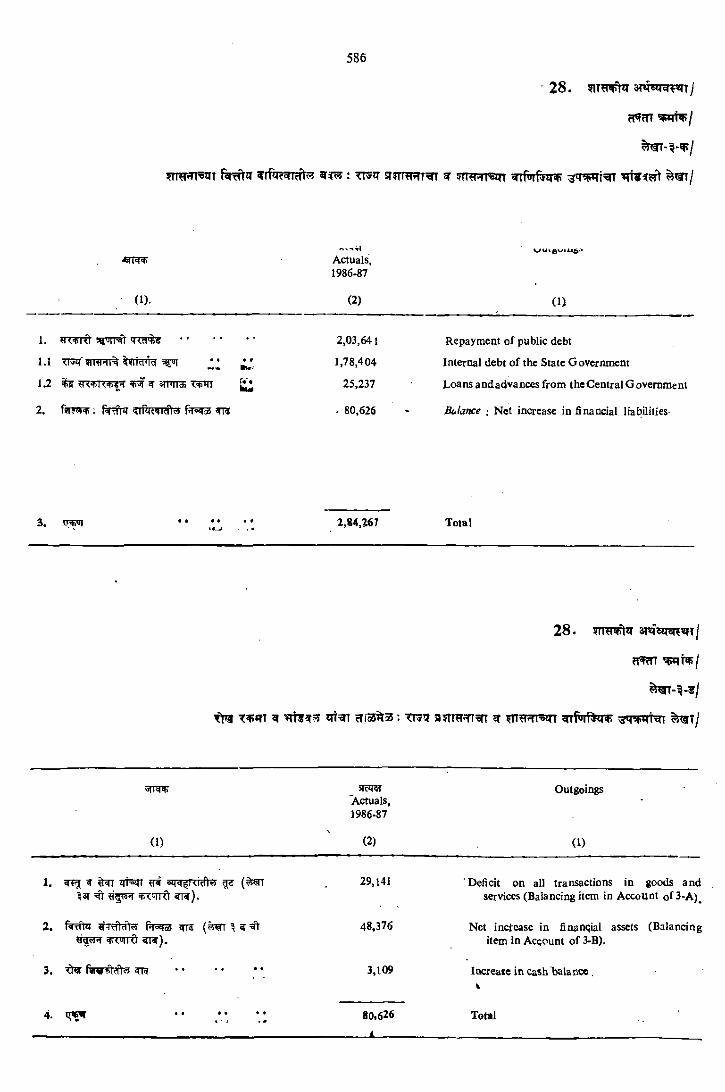
?m pTT^T f ^ a 9 ? ^ : t t ^ j t s r ? m R T ^ n ^ i n /
'.Nt'vlActuals,1986-87
(1). (2) (1)
1. ?TT TTf V ’TRT s <.«'♦)« * ' 2,03,641 Repayment o f public debt
l . I TFHI ^VlidJId ^ 1,78,404 Internal debt o f the State Government
12 ^ ^R«f)Tit+4-f A «IHII J> T«pi(l 25,237 Loans andadvances from theC entral G ovemmeni
2. f j r ? ^ ; 4iR4rtMl«» f?T5^ sn? . 80,626 Balance ; N et increase in financial liabilities
* V tg..J . « 1,84,067 Total
•
2 8 . 3TO5H^«JT 1
n ? m
t m ^ w ? r ? s ^TiS5^Ii5; TT»S 3 ? T W T r^ ^
5Rq«TActuals,1986-87
Outgoings
0 ) (2) ( 0
1. «<t<j <1 il<ll qM I *)4?3T ^ ^<'in<t ?T?).
29,141 Deficit on all transactions in goods and services (Balancing item in Account cf3-A)^
2 . HTtf1dT<!i' PHoilai WI« ^ ^ ^aw*! <pT™nrt 5iw).
48,376 Net increase in financial assets (Balancing item in Account o f 3-B).
3. 0 « Fww^ldlri m ................................. 3.109 lacrease in Cash "balance ,V
4_ . . . . . . 80.626
«
Total
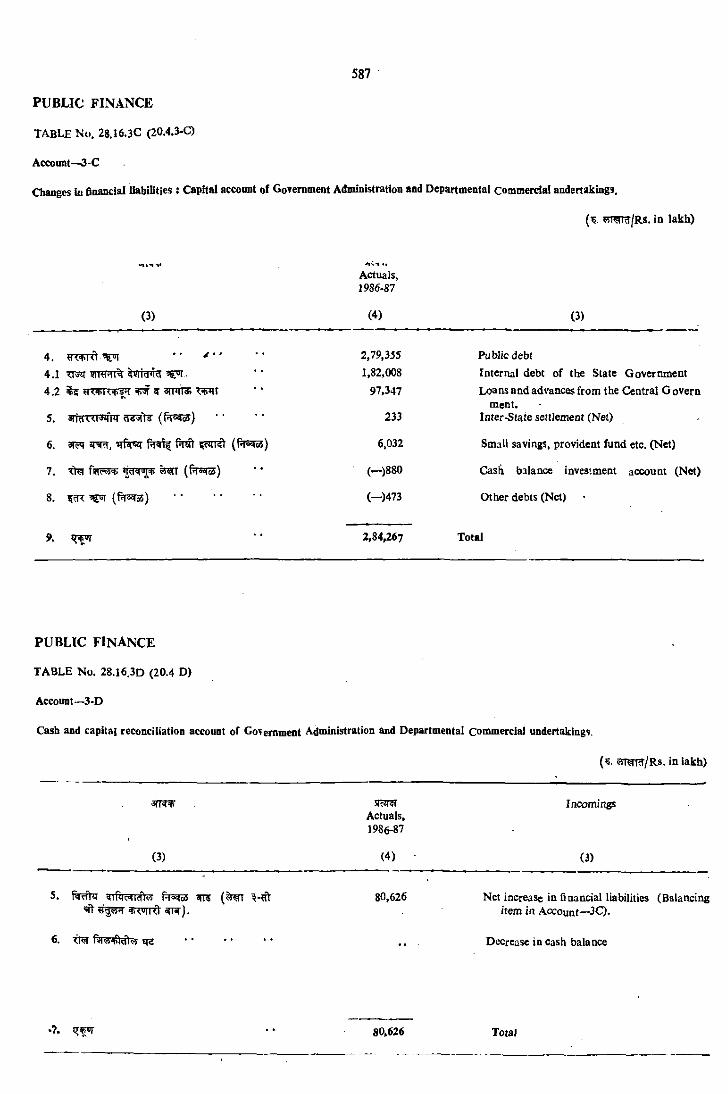
t a b l e N(». 28.16.3C (20.4.3-C)
Account—3*C
Cbaogos iii fioancial liabilities: Capital account of Government Administration and Departmental commercial andertakiogs,
(^. sn w /R s . in lakh)
Actuals,1986-87
(3) (4) (3)
4. 2.79,355 Public debt
4.1 1,82,008 Internal debt of the State Government97,347 Loans and advances from the Central Govern
ment.5. 233 later-State settlement (Net)
6. 31^ 6.032 Small savings, provident fund etc. (Net)
7. (—)880 Cash balance investment account (Net)
8. (-)473 Other debts (Net)
9. 2,84,267 Total
PUBLIC f i n a n c e
TABLE No. 28.16.3D (20.4 D)
Account—3*D
Cash and capital reconciliation account of Govemmeot Administration and Departmental Commercial undertakings.
( - « T ^ /R s . in iakh)
Actuals*1986-87
Incoming
(3) (4) ■ (3)
5.^ TW).
80,626 Net increase in financial liabilities (Balancing item in Account—3Q.
6. <W r?n?i+ldt?y qe . . . Decrease in cash balance
80.626 TotaJ

=qt^ crr^qr f^ d ^ ,W J T ^ ^ JTT^^ferr ^rr^
f^ r fW , 5t TTirtwfrffT O q-RT sfr TTTf^ 31 t| .
^<?,- . ^T^rn:% s r r f e ^re^^TTT qt^T^nrm'^ 5 f f e l>rr=qr ‘‘arq few I f f ^ arrasTT^g ^ if^JTT” ^m fc^ T T rf^ , ITT sr^rRHRf f^^rNrcfJTR nT»qT53TT ^T%aT 3Tr|.3TT5^> ?rr T T; 5T%5 ^ST^WS^TT 3 T ^ ^^TT 'tixTcf-^T^T fh^WR>p5qT ^
?rr%ft f e ' t 3Tt| ; ^ ^ ^m f | ? f t 3 i T | . 5^rq r f ^ sttNt 'sq-y STOT ^ ? ft^ ^ sftT^TRT?
'sifT 3 f ^ 3tt| .“i f e n r ^ ^ qr= , sf^ ‘ ‘i " ^ sr ^ n w ^f fTTRT ^JTJqTfr ^ ?TT^ 3iTTRft ^ T R ^
?TT%ft 3tt| .«rfir%id‘< ?nr^ f%rrcf)% M ttN t m K
n ^ o I qT3TT^ 3 t| .5' r ^ ffTir^ ^ srrf^.
gtfer^r s r f e a h ^ f ^ sriqj” in ^ ^ n W S ^ T ^STW ^ 3 i ^ f^9TT^
^ sn r r^ l' q ^ ^ ^m R sft FT^rhRyr 3 n |. 3T«f ^ T % w " ^ 5T JiPTT=5qT
anw^Nr—5T%5 sTT|.
29-1. Information on prices of agricultural and other commodities, gold and silver, All-India wholesale price index number, consumer price index numbers for workers, agricultural labour and non-manual employees and retail price index numbers for urban and rural Maharashtra is given in this section.
29 2. The details of the method of construction of the index is given in the “ Appendix to index number of wholesale prices in India ” revised series, issued by the office of the Economic Adviser to the Government of India. The details, regarding the scope and method of compilation of the new index for Bombay and Solapur are given in December 1965 issue, for Jalgaon and Nagpur in January 1966 issue, for Pune in August 1965 issue and for Nanded and Aurangabad in March 1966 issue, of the Labour Gazette issued by the Commissioner of Labour, Government of Maharashtra. The details of the method of construction and scope of the index is given in Indian Labour Journal, Vol. V, No. 11. Consumer price index number for non-manual employees is compiled by the Central Statistical Organisation. The year 1960 is adopted as base. For Maharashtra, index is worked put for Greater Bombay, Pune and Nagpur centres. The method and scope of the index is explained in ‘ Monthly Abstract of Statistics, August 1966 ’ published by the Central Statistical Organisation. The methodology has been published in the ‘ October—December 1979 issue ’ of the Maharashtra Quarterly Bulletin of Economics and Statistics.
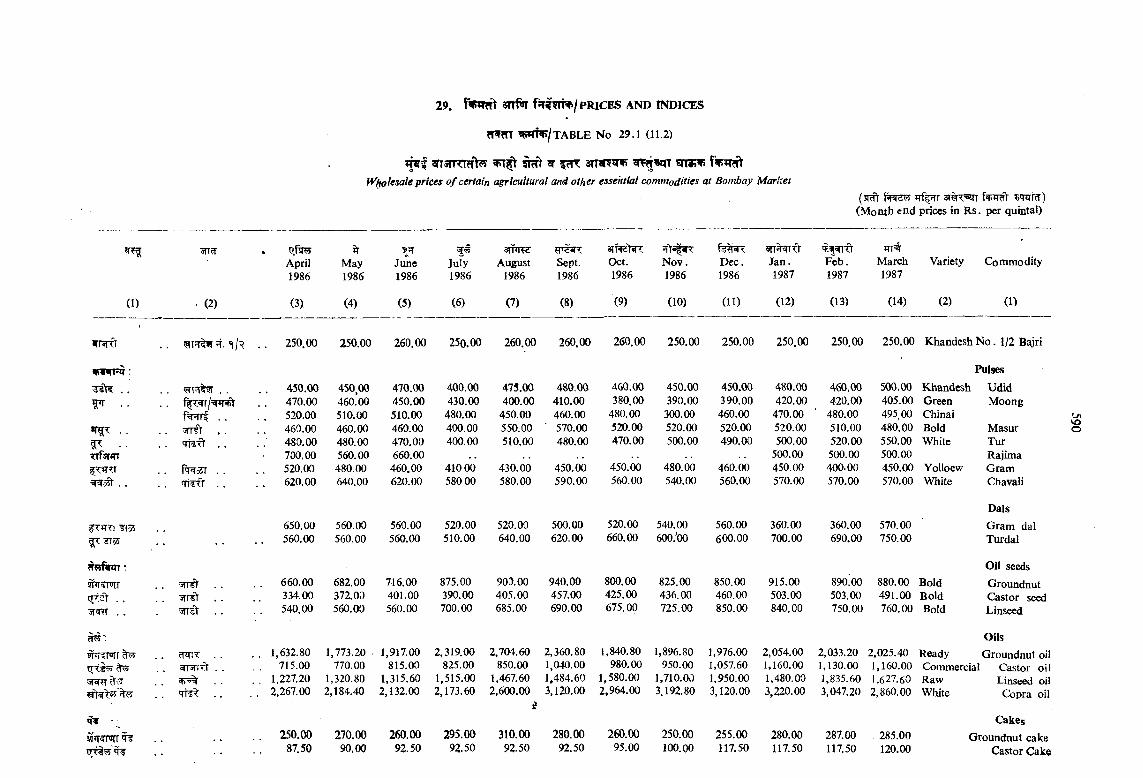
cT^m TABLE No 29.1 (11,2)
r ^ i 2rT3rm?r>5fV/tolesale prices o f certain agricultural and other essential commodities at Bombay Market
(xRft r-f=jdw irf^r 3r%T=5irr 'T rRr) (Month end prices in R s, per quintal)
3n?r ir 3?HfW p<r9RApril May June July August Sept. Oct. N ov. Dec. Jan. Feb. March Variety Commodity1986 1986 1986 1986 1986 1986 1986 1986 1986 1987 1987 1987
(1) ' (2) (3) (4) (5) (6) (7) (8) (9) (10) (11) (12) (13) (14) (2) (1)
WT3fTf «3T^?T. ^jR . . 250.00 250.00 260.00 250.00 260.00 260.00 260.00 250.00 250.00 250.00 250.00 250.00 Khandesh N o . 1/2 Bajri
WTRT: Pulses
. . . . 450.00 450.00 470.00 400.00 475.00 480.00 460.00 450.00 450.00 480.00 460.00 500.00 Khandcsh Udid. . 470.00 460.’00 450.00 430.00 400.00 410.00 380.00 390.00 390.00 420.00 420.00 405.00 Green Moong
f w | . . . . 520.00 510.00 510.00 480.00 450.00 460.00 480.00 300.00 460.00 470.00 480.00 495 00 ChinaiwrfV . . 460.00 460.00 460.00 400.00 550.00 ' 570.00 520.00 520.00 520.00 520.00 510.00 480.00 Bold Masur'TRft . . . ; 480.00 480.00 470.00 400.00 510.00 480.00 470.00 500.00 490.00 500.00 520.00 550.00 White Tur
rrFarm 700.00 560.00 660.00 500.00 500.00 500.00 RajimaT^rZl . . 520.00 480.00 460.00 410 00 430.00 450.00 450.00 480.00 460.00 450.00 400.00 450.00 Yolloew Gram
•<1=1 csl . . 'Tii'O' . . . . 620.00 640.00 620.00 580 00 580.00 590.00 560.00 540.00 560.00 570.00 570.00 570.00 White Chavali
DaisfTJTTi 650.00 560.00 560.00 520.00 520.00 500.00 520.00 540.00 560.00 360.00 360.00 570.00 Gram dal^ n s . . . . 560.00 560.00 560.00 510.00 640.00 620.00 660.00 600.'00 600.00 700.00 690.00 750.00 Turdal
Oil seeds9nT5FJir 660.00 682.00 716.00 875.00 900.00 940.00 800.00 825.00 850.00 915.00 890^00 880.00 Bold GroundnuttTTSt . . . . 334.00 372.00 401.00 390.00 405.00 457.00 425.00 436.00 460.00 503.00 503.00 491.00 Bold Castor seed3T^ . , . . ’ 540.00 560.00 560.00 700.00 685.00 690.00 675.00 725.00 850.00 840.00 750.00 760.00 Bold Linseed
Oils9PTxTirr . . ^IT . . . 1,632.80 1,773.20 - 1,917.00 2,319.00 2,704.60 2,360.80 1,840.80 1,896.80 1,976.00 2,054.00 2,033.20 2,025.40 Ready Groundnut oil
«rr5frft . . 715.00 770.00 815.00 825.00 850.00 1,040.00 980.00 950.00 1,057.60 1,160.00 1,130.00 1,160.00 Commercial Castor oil5T^ . . v5% . . 1,227.20 1,320.80 1,315.60 1,515.00 1,467.60 1,484.60 1,580.00 1,710.00 1,950.00 1,480.00 1,835.60 1,627.60 Raw Linseed oil
'TT3% . . . 2,267.00 2,184.40 2,132.00 2,173.60 2,600.00A
3,120.00 2,964.00 3,192.80 3,120.00 3,220.00 3,047.20 2,860.00 White Copra oil
^ _-V
CakesiflJTamiri ?fi . 250.00 270.00 260.00 295.00 310.00 280.00 260.00 250.00 255.00 280.00 287.00 285.00 Groundnut cake
87.50 90,00 92.50 92.50 92.50 92,50 95.00 100.00 117,50 117.50 117,50 120.00 Castor Cake
\oo
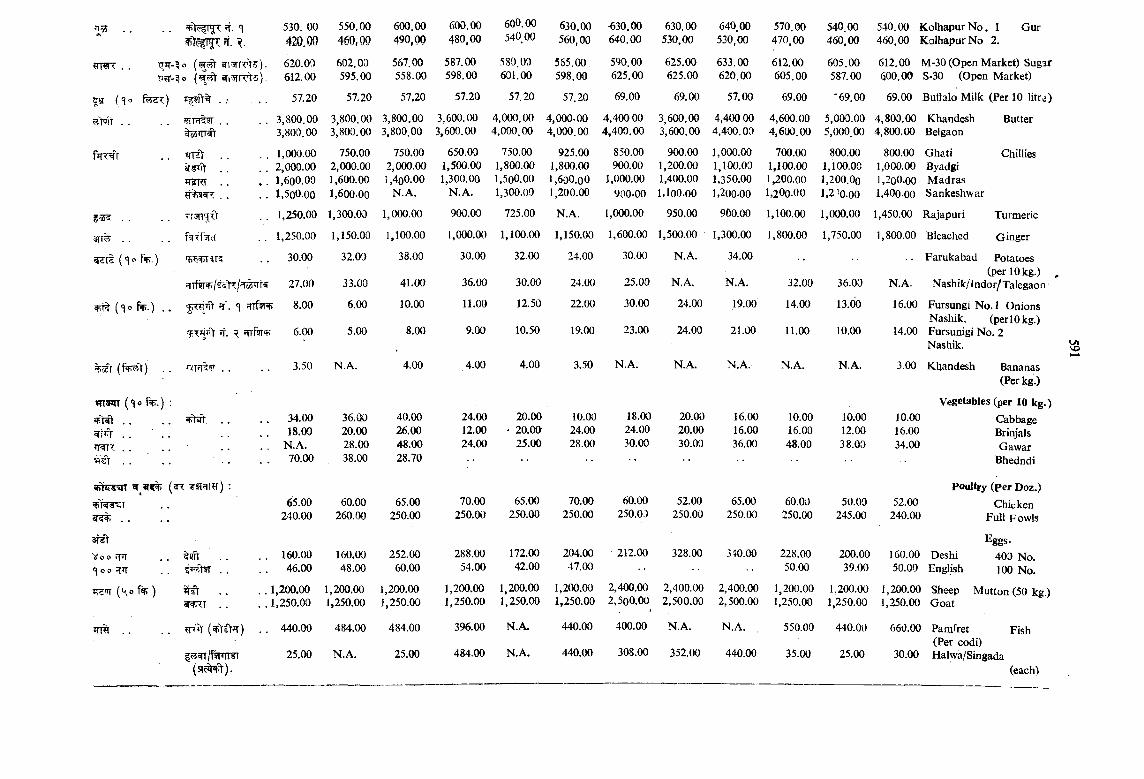
«s 530. 00 420.00
550.00460.00
600.00490,00
600.00480.00
600.00 540 00
630.00560.00
■630.00640.00
630.00530.00
640.00530.00
570.00470.00
540.00460.00
o |5frT75).620.00612.00
602.00595.00
567.00558.00
587.00598.00
580.00601.00
565.00598.00
590.00625.00
625.00625.00
633.00620.00
612.00605.00
605.00587.00
?sr 57.20 57.20 57.20 57.20 57,20 57.20 69.00 69.00 57.00 69.00 *69.00
. . 3.800.003.800.00
3.800.003.800.00
3.800.003.800.00
3.600.003.600.00
4.000.004.000.00
4,000-004,000.00
4,400 00 4,400.00
3.600.003.600.00
4,400004,400.00
4.600.004.600.00
5.000.005.000.00
. . . . 1T?W . .
1,000.002,000.001,600.001,500.00
750.002,000.001,600.001,600-00
750.00 2,000.00 ; ,4q0.00
N.A.
650.001.500.001.300.00
N.A.
750.001,800.001,500.001,300.09
925.00 1,800.00 1,600.00 1,200.00
850.00900.00
1,000.00900-00
900.001,200.001,400.001,100-00
1,000.001,100.001,350.001,200-00
700.00 1,100.00 1,200.00 1,200-00
800.00 1,100.00 1,200.00 1,2 ’0.00
f . . 1,250.00 1,300.00 1,000.00 900.00 725.00 N.A. 1,000.00 950.00 900.00 1,100.00 1,000.00
1,250.00 1,150.00 1,100.00 1,000.00 1,100.00 1,150.00 1,600.00 1,500.00 1,300.00 1,800.00 1,750.00
{ ^ 0 f^ .) 30.00 32.00 38.00 30.00 32.00 24.00 30.00 N.A. 34.00
27.00 33.00 41.00 36.00 30.00 24.00 25.00 N.A. N.A. 32.00 36.00
{ ^ 0 fe .) . . fT . T fTTf5I 8.00 6.00 10.00 11.00 12.50 22.00 30.00 24.00 19.00 14.00 13.oio
?T. ^ 6.00 5.00 8.00 9.00 10.50 19.00 23.00 24.00 21.00 11.00 10.00
( f ^ t ) . . 3.50 N.A. 4.00 ,4.00 4.00 3.50 N.A. N.A. N.A. N.A. N.A.
0 :
. .
. . ■ . .
. . . .
. . 34.0018.00
N.A.70.00
36.0020.00 28.00 38.00
40.0026.00 48.00 28.70
24.0012.00 24.00
20.00 * 20.00
25.00
10.0024.0028.00
18.0024.0030.00
20.0020.0030.00
16.0016.0036.00
10.0016.0048.00
10.0012.0038.00
65.00240.00
60.00260.00
65.00250.00
70.00250.00
65.00250.00
70.00250.00
60.00250.03
52.00250.00
65.00250.00
60.00250.00
50.00245.00
Vo 0 rpi . .O 0 JfTf _ .
^ifft. .
160.0046.00
160.0048.00
252.0060.00
288.0054.00
172.0042.00
204.0047.00
■ 212.00 328.00 340.00 228.0050.00
200.0039.00
PTjir { \ o % ) . . . .1 ,2 0 0 .0 0 . . , . 1,250.00
1,200.001,250.00
1,200.001,250.00
1,200.001,250.00
1,200.001,250.00
1,200.001,250.00
2.400.002.500.00
2.400.002.500.00
2.400.002.500.00
1,200.001,250.00
1,200.001,250.00
. . 440.00 484.00 484.00 396.00 N.A. 440.00 400.00 N.A. N.A. , 550.00 440.00
25.00 N.A. 25.00 484.00 N.A. 440.00 308.00 352.00 440,00 35.00 25.00
540.00 Kolhapur N o. 1 Gur460.00 Kolhapur No 2.
612.00 M-30 (Open Market) Sugar600.00 S-30 (Open Market)
69.00 Buffalo Milk (Per 10 litre)
4.800.00 Khandesh Butter4.800.00 Belgaon
800.00 Ghati Chillies1,000.00 Byadgi1.200.00 Madras 1,400-00 Sankeshwar
1.450.00 Rajapuri Turmeric
1.800.00 Bleached Ginger
.. Farukabad Potatoes(per 10 kg.) ,
N.A. Nashik/Indor/Talegaon
16.00 Fursungi No.l Onions Nashik. (perlOkg.)
14.00 Fursunigi No. 2 Nashik.
3.00 Khandesh Bananas(Per kg.)
Vegetables (per 10 kg.)10.00 Cabbage16.00 Brinjals34.00 Gawar
Bhedndi
poultry (per Doz.)52.00 Chicken
240.00 Full Fowls
160.00 Deshi50.00 English
* ggs- 400 No. 100 No.
660.00 Pamfret (Per codi)
30.00 Halwa/Singada
Fish
(each)
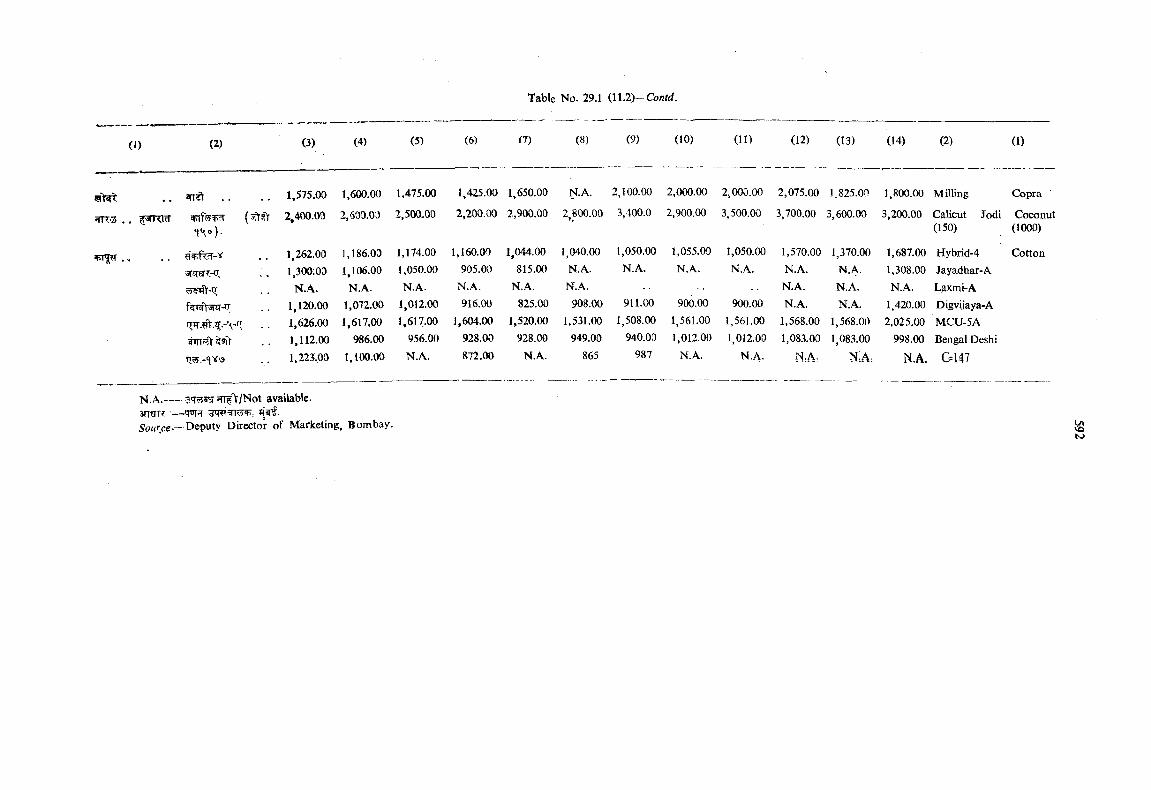
mr-:3
(2) (3) (4) (5) (6) r?) (8) (9) (10) (11) (12) (13) (14) (2) (1)
1,575.00 1,600.00 1,475.00 1,425.00 1,650.00 N.A. 2,100.00 2,000.00 2,000.00 2,075.00 1.825.00 1,800.00 Milling Copra
Tfi?y5p?r <1 0 ).
2,400.00 2,600.0a 2,500.00 2,200.00 2,900.00 2,800.00 3,400.0 2,900.00 3,500.00 3,700.00 3,600.00 3,200.00 Calicut Jodi Coconut (150) (1000)
1,262.00 1,186.03 1,174.00 1,160.00 1,044.00 1,040.00 1,050.00 1,055.00 1,050.00 1,570.00 1,370.00 1,687.00 Hybrid-4 Cotton1,300103 1,106.00 1,050.00 905.00 815.00 N.A. N.A. N.A. N.A. N.A. N.A. 1,308.00 Jayadhar-A
N.A. N.A. N.A. N.A. N.A. N.A. N.A. N.A. N.A. Laxmi-A1,120.00 1,072.00 1,012.00 916.00 825.00 908.00 911.00 900.00 900.00 N.A. N.A. 1,420.00 Digvijaya-A1,626.00 1,617,00 1.617.00 1,604.00 1,520.00 1,531.00 1,508.00 1,561.00 1,561.00 1,568.00 1,568.00 2,025.00 MCU-5A1,112.00 986.00 956.00 928.00 928.00 949.00 940.00 1,012.00 1,012.00 1,083.00 1,083.00 998.00 Bengal Deshi1,225.03 1,100.00 N.A. 872.00 N.A. 865 987 N.A. N.A. N:A, N:A; N.A. G=147
N.A.---- 5'T?55’j ^'V/Not available.3H jR •— m n .
■SoHf ce.—Oeputy Director of Marketing, Bombay. <-/>VDt-J
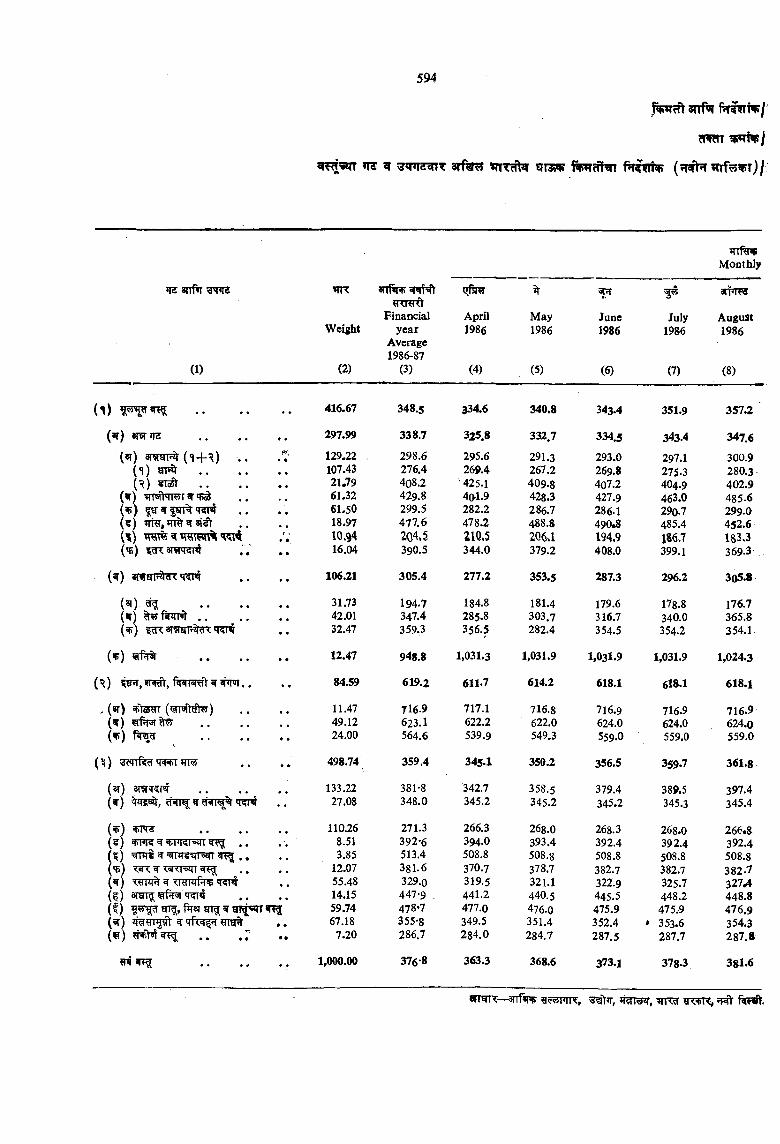
sn f^ fki^ETiv/
n z ^ srfigR? q ra^ l^ffrnp ( s r ^
anf^ 'd*j«ld WK
WeightFinancial
yearAverage1986-87
April1986
May1986
June1986
July1986
Monthly
5TFR3
August1986
(1) (2) (3) (4) (5) (6) (7) (8)
0 ♦ ♦ 416.67 348.5 334.6 340.8 343.4 351.9 357.2
{9f} 297.99 338.7 325.8 332.7 334.5 343.4 347.6(«r) (<14-:?) . . • • 129.22 . 298.6 295.6 291.3 293.0 297.1 300.9
(n) ^ 107.43 276.4 269.4 267.2 269.8 275.3 280.3I r ) <ros1 21.79 408.2 ' 425.1 409.8 407.2 404.9 402.9
{^) 61.32 429.8 4al.9 428.3 427.9 463.0 485.6(V) • • 61.50 299.5 282.2 286.7 286.1 290.7 299.0{^) * ^ 18.97 477.6 478.2 488.8 490.8 485.4 452.6\ \ ) • • 10v94 204.5 21Q.5 2Q6A 194.9 186.7 183.3('^) 3 w q ^ .', ♦ # 16.04 390.5 344.0 379.2 408.0 399.1 369.3
(^) *nrai*^rfi.'Kn . . • • 106.21 305.4 277.2 353.5 287.3 296.2 305.8
( 3 > ) ^ 31.73 194.7 184.8 181,4 179.6 178.8 176.7{^) . . 42.01 347.4 285.8 303.7 316.7 340.0 365.8(^) 3ram’’%?n:'RPt • • 32.47 359.3 356.5 282.4 354.5 354.2 354.1-
(^) ?ai^ 12.47 948.8 1,031.3 1,031.9 1,031.9 1,031.9 1,024.3
0 ?9 T,vi«hn, . ♦ ♦ 84.59 619.2 611.7 614.2 618.1 618.1 618.1
(«r) ?5)2Rn' (97'fRtte) 11.47 716.9 717.1 716.8 716.9 716.9 716.949.12 623.1 622.2 622.0 624.0 624.0 624.0
(t ) f^?r • • 24.00 564.6 539.9 549.3 559.0 559.0 559.0
\ ) ^ r fe r *1^ • ♦ 498.74 359.4 345.1 350.2 356.5 359.7 361.8
(ai) SRTT f# 133.22 381-8 342.7 358.5 379.4 389.5 397.4(ar) ciiTT ^ ?f3n % •• 27.08 348.0 345.2 345.2 345.2 345.3 345.4
(^) 110.26 271.3 266.3 268.0 268.3 268.0 266.8(¥) +R< ^ ipPrST T cf^ . . 8.51 392-6 394.0 393.4 392.4 392.4 392.4( f ) . , , » 3.85 513.4 508.8 508.8 508.8 508.8 508.8(*s) 7 ^ ^ ^ , , 12.07 381.6 370.7 378.7 382.7 382.7 382.7(^) ^ TRTFTPt •IRT*! * * 55.48 329.0 319.5 321.1 322.9 325.7 327.4(§) sraig; ijfiR 14.15 447-9 . 441.2 440.5 445.5 448.2 448.8( f ) ^ ^ aFb«JI ^ 59.74 478-7 477.0 476-0 475.9 475.9 476.9
^ ?fTg% • • 67.18 355-8 349.5 351.4 352.4 * 353.6 354.37.20 286.7 284.0 284.7 287.5 287.7 287.8
1,000.00 376-8 363.3 368.6 373.1 378.3 381.6
«TT T--3rTf<Rr #SreiT, ^
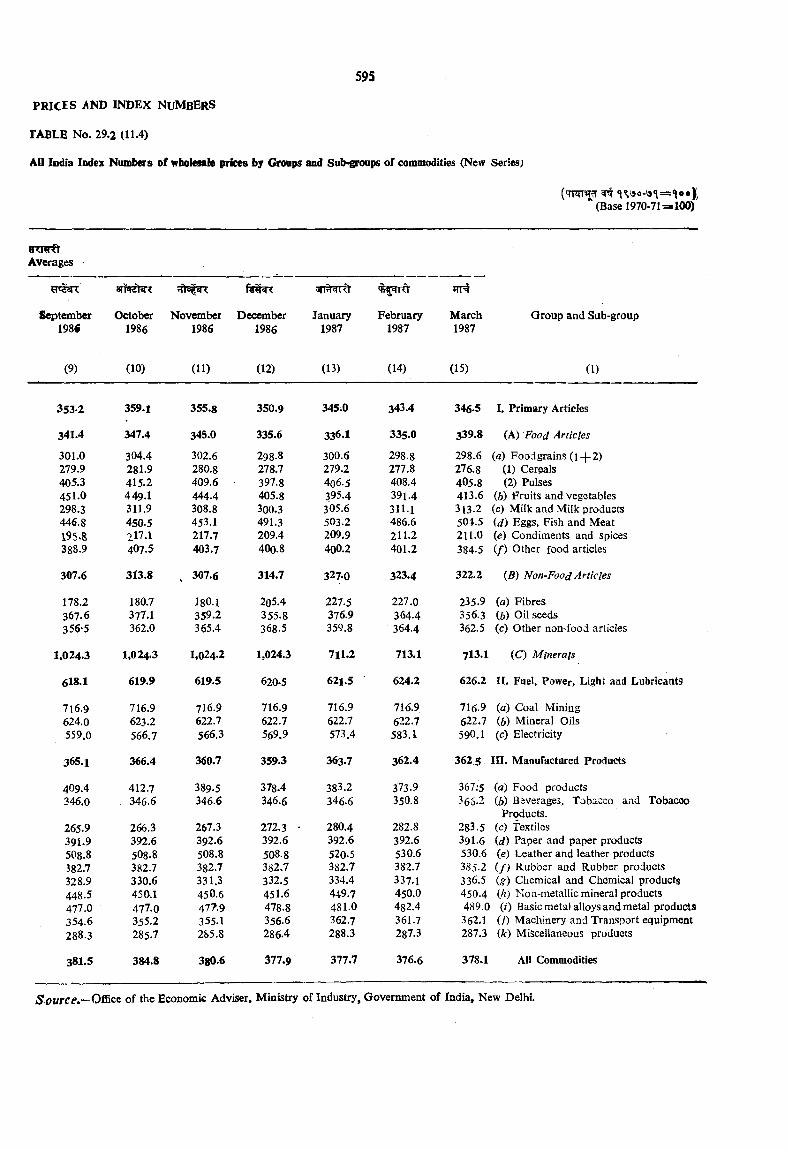
AU India Index Nmnbcrs of wholeisale prices by Groups and Sub-groups of commodities (New Series;
ERRRtAverages
September October November December January February March Group and Sub-group198« 1986 1986 1986 1987 1987 1987
(9) (10) (11) (12) (13) (14) (15) (1)
353-2 359.1 355.8 350.9 345;0 343.4 346.5 I. Primary Articles
341.4 347.4 345.0 335.6 336.1 335.0 339.8 (A) Food Articles
301.0 304.4 302.6 298-8 300.6 298.8 298.6 {a) Foodgrains (i-[-2)279.9 281.9 280.8 278.7 279.2 277.8 276.8 (1) Cereals405.3 415.2 409.6 397.8 406.5 408.4 4O5.8 (2) Pulses451.0 449.1 444.4 405.8 395.4 391.4 413.6 (6) Fruits and vegetables298.3 311.9 308.8 300.3 305.6 311.1 313.2 (c) Milk and Milk products446.8 450.5 453.1 491.3 503.2 486.6 504.5 id) Eggs, Fish and Meat195.8 217.1 217.7 209.4 209.9 211.2 2U.0 (e) Condiments and spices388.9 407.5 403.7 400.8 400.2 401.2 384.5 (/) Other food articles
307.6 313.8 , 307.6 314.7 327.0 323.4 322.2 {B) Non-Food Articles
178.2 180.7 180.1 205.4 227.5 227.0 235.9 (a) Fibres367.6 377.1 359.2 355.8 376.9 364.4 356.3 (6) Oil seeds356*5 362.0 365.4 368.5 359.8 364.4 362.5 (c) Other non-food articles
1,024.3 1,024.3 1,024.2 1,024.3 711.2 713.1 713.1 (C) Minerals
dl8.1 619.9 619.5 620.5 621.5 624.2 626.2 II. Fuel, Power, Light and Lubricants
716.9 716.9 716.9 716.9 716.9 716.9 716.9 (a) Coal Mining624.0 623.2 622.7 622.7 622.7 622.7 622.7 (6) Mineral Oils559.0 566.7 566.3 569.9 573.4 583.1 590.1 (c) Electricity
365.1 366.4 360.7 359.3 363.7 362.4 362.5 in . Manufactured Products
409.4 412.7 389.5 378.4 383.2 373.9 367/5 (a) Food products346.0 346.6 346.6 346.6 346.6 350.8 365.2 (6) Bsverages, Tobacco and Tobac«>
Products.265.9 266.3 267.3 272.3 ■ 280.4 282.8 283.5 (c) Textiles391.9 392.6 392.6 392.6 392.6 392.6 391.6 id) Paper and paper products508.8 508.8 508.8 508.8 520.5 530.6 530.6 (e) Leather and leather products382.7 382.7 382.7 382.7 382.7 382.7 385.2 i f ) Rubber and Rubber products328.9 330.6 331.3 332.5 334.4 337.1 336.5 (^) Chemical and Chemical products448.5 450.1 45O.6 451.6 449.7 450.0 450.4 {h) Noa-metallic mineral products477.0 477.0 47?.9 478.8 481.0 482.4 489.0 (?) Basic metal alloys and metal products354.6 355.2 355.1 356.6 362.7 361.7 362.1 (;) Machinery and Transport equipment288.3 285.7 2S5.8 286.4 288.3 287.3 287.3 (Ar) Miscellaneous products
38I.5 384.8 380.6 377.9 377.7 376.6 378.1 AU Commodities
S o u rc t\^ 0 & c Q of the Economic Adviser, Ministry of Industry, Government of India, New Delhi.
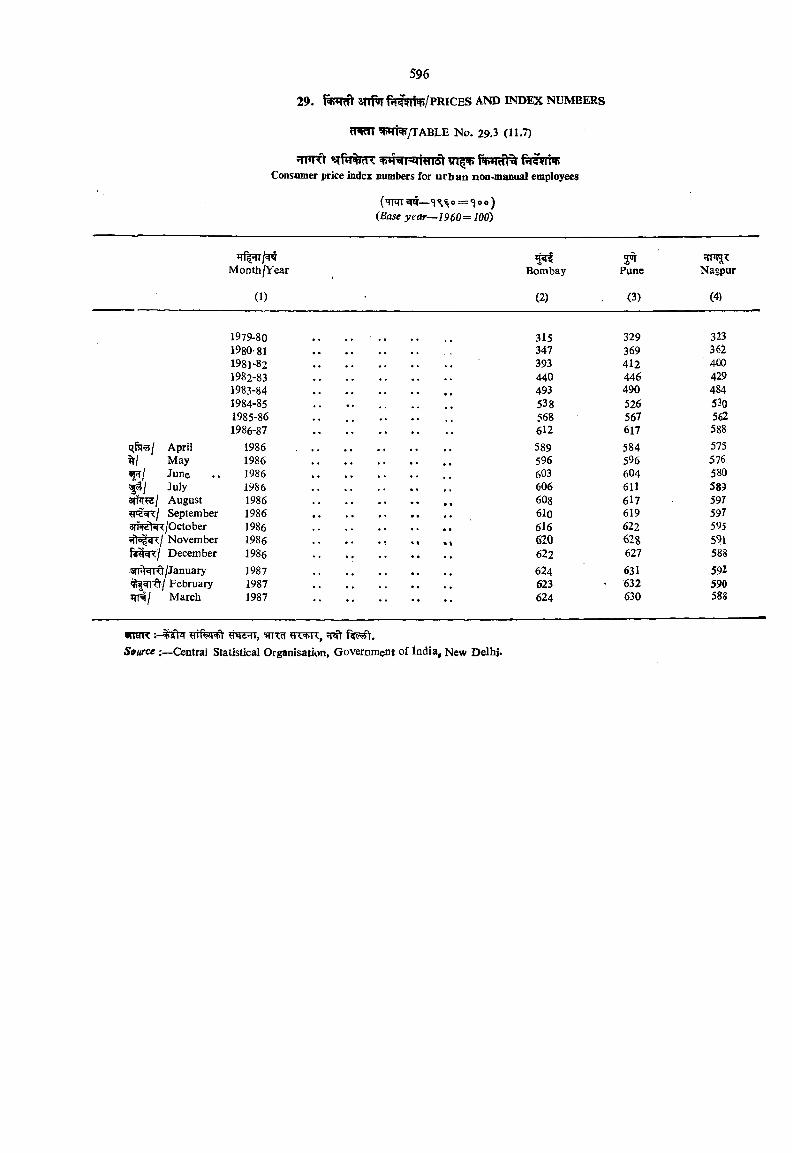
Consumer price index numbers for urban non-manual employees
(m r^w—‘j%^o=<}oo)(Base year~1960= WO)
Month/Year
(1)
3^Bombay Pune Nagpur
(2) (3) (4)
1979-80 . . . . . . 329 3231980-81 .......................... ,. , 347 369 3621981-82 .. . . . . 393 412 4001982-83 446 4291983-84 .......................... 493 490 4841984-85 526 5301985-86 . . . . 567 5621986-87 .......................... 612 617 588
April 1986 ............................... 584 575May 1986 .......................... . . . . 596 596 576June 1986 .......................... . . . . 603 604 580July 1986 .......................... 606 611 589
a r w / August 1986 .......................... 608 617 597September 1986 .......................... 619 597
siRRrVi/October 1986 .......................... 622 595ql^sn:/ November 1986 .......................... 628 591
December 1986 .......................... 627 588/January 1987 .......................... 631 592' February 1987 .......................... • 632 590
*tr/ March 1987 .......................... 630 588
u r a R ^ I ' f c i d H T , flTCTSource ;—Central Statistical Organisation, Government of India, New Delhi.
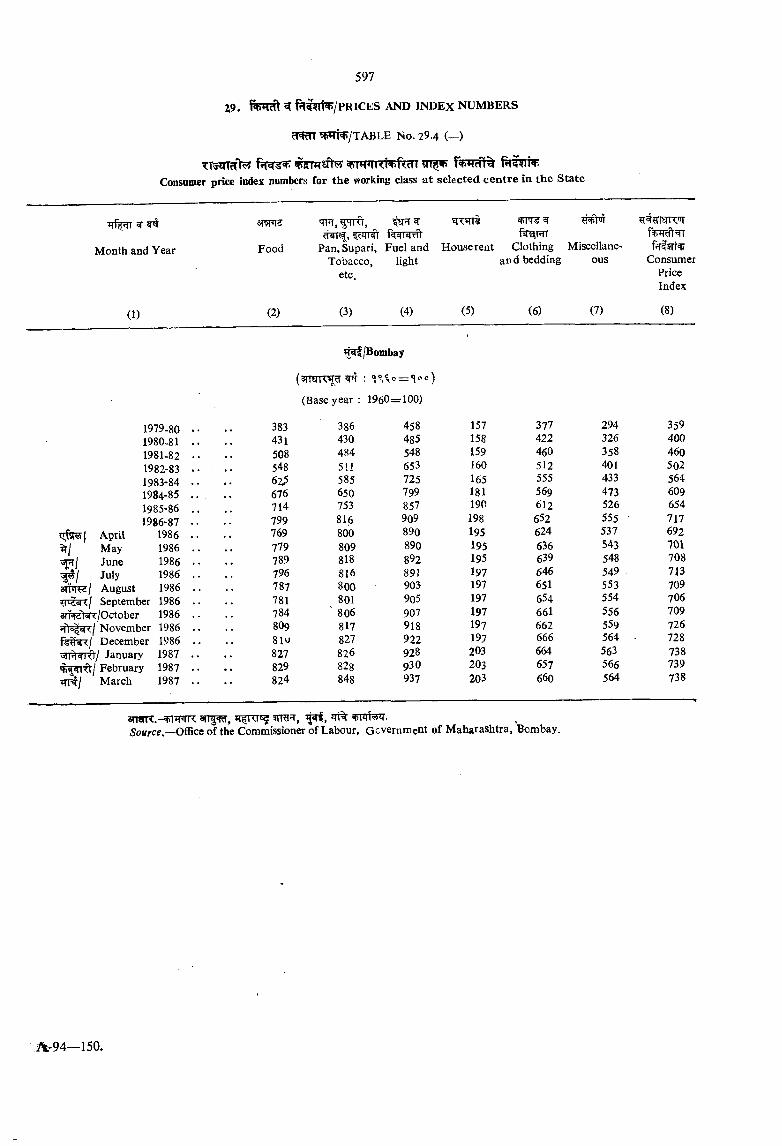
TT5tTTfr i=hiwr<i^f<cnConsumer price index numbers for the working class at selected centre in the State
Month and Year
(1)
1979-801980-811981-821982-831983-841984-851985-861986-87
vj.CH<rt( A.pril 1986May 1986June 1986
¥ 1 July 1986sm^El August 1986
September 1986amst^/October 1986
November 1986fg^5R/ December 1986T%wrft/ January 1987
February 1987March 1987
sRniz
Food
(2)
isnr^?rwM, flraiRT
Pan,Supari, Fuel and House rent Clothing Miscellane- Tobacco, light and bedding ous
etc.
(3) (4) (5) (6)
/Bombay
(Base year: 1960=100)
(7)
3naTT.-^?mR a n ^ ,Source.—Of&CQ of the Commissioner of Labour, Gcvemment of Maharashtra, Bombay.
?T ?rraK’3T
ConsumerPriceIndex
(8)
383 386 458 157 377 294 359431 430 485 158 422 326 400508 484 548 159 460 358 460548 511 653 160 512 401 50262.5 585 725 165 555 433 564676 650 799 181 569 473 609714 753 857 190 612 526 654799 816 909 198 652 555 717769 800 890 195 624 537 692779 809 890 195 636 543 701789 818 892 195 639 548 708796 816 891 197 646 549 713787 800 90S 197 651 553 709781 801 905 197 654 554 706784 ' 806 907 197 661 556 709809 817 918 197 662 559 726810 827 922 197 666 564 . 728827 826 928 203 664 563 738829 828 930 203 657 566 739824 848 937 203 660 564 738

(1) '(2) (3) (4) (5) (6) (7) (8)
?ftvn^/Solapur'
(arraTW ^ : *1^^0 = 100) (Base year : 1960=100)
1979-80 . . 390 349 440 206 404 291 372' 1980-81 . . 432 383 475 216 447 331 411
1981-82 .. 544 422 560 222 * 492 376 4991982-83 .. 544 444 662 236 531 405 5151983-84 .. 621 475 707 250 566 441 5791984-85 . . 665 532 729 265 578 465 612*1985-86 .. 698 616 741 280 633 508 6471986-87 . . 756 692 748 298 657 562 697
April 1986 . . 706 656 748 286 653 554 662Jr/ May 1986 . . 711 656 748 286 653 554 665
June 1986 • • 730 722 748 286 655 556 680July 1986 . . . . 738 722 748 292 655 558 685August 1986 . . 765 694 748 292 663 558 702September 1986 . . 778 681 746 292 663 558 710
3llf<rd1«T<./October 1986 . . . . 770 686 748 292 658 559 705 November 1986 . . . . 779 691 748 292 658 559 710December 1986 . . 779 692 748 292 658 559 710
/January 1987 . . 789 692 748 321 658 575 720February 1987 . . . . 762 702 750 321 657 579 704
qrt/ March 198? . . . 771 714 751 321 657 578 710
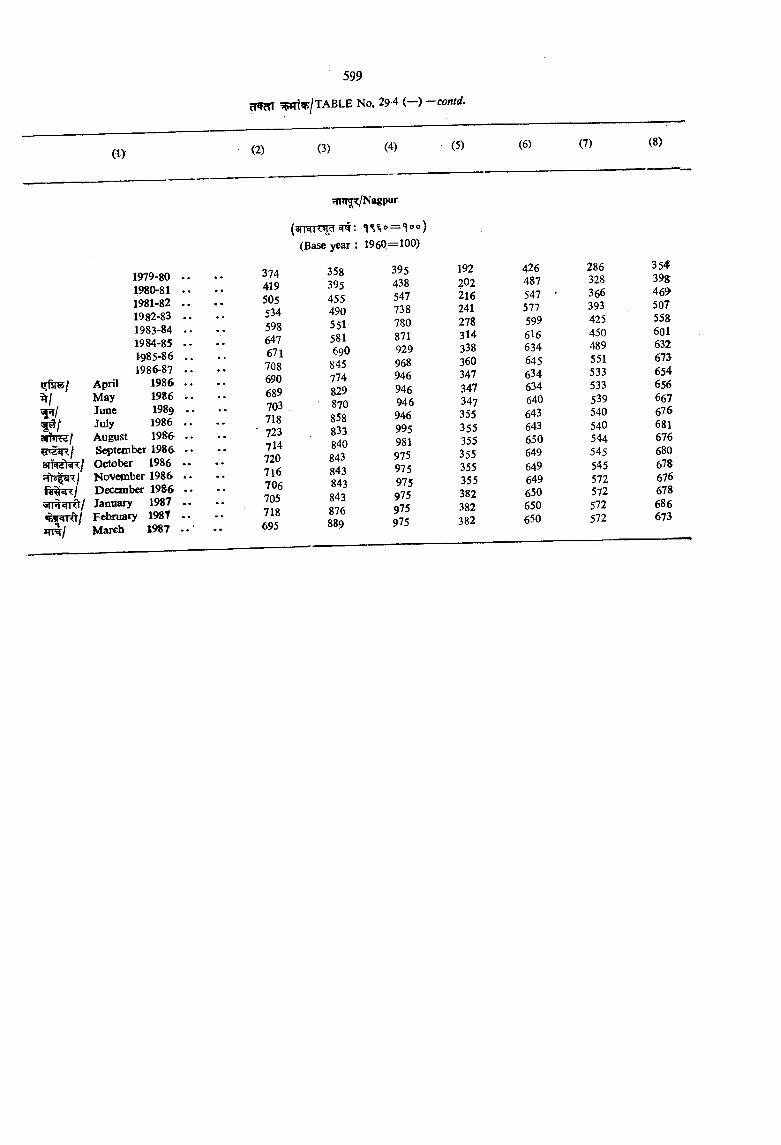
(1)
W ! ,
snNstsR/
^IRRt/*n^/
AprilMayJuneJulyAugust
1979-801980-811981-821982-831983-841984-851985-861986-87
1986 1986 198^ 1986 198&
September 1986 October 1986 November 1986 Deconber 1986 January 1987 February 198T March 1987
(2) (3) (4)
;n^/Nagpur
(Base year : 1960=100)
374419505534598647671708690689703718723714720716706705718695
358395455490551581690
845774829870858833840843843843843876889
395438547738780871929968946946946946995981975975975975975975
(5)
192202216241278314338360347347347355355355355355355382382382
(6)
4264875475775996l6634645634634640643643650649649649650 650 650
(7)
286328366393425450489551533533539540 540544545 545572572572572
(8)
35439^46^507558601632673654656667676681676680678676678686673

(!> (2) (3) (4) (5) (6) (7) (8)
2^/Punc
— « oo)(Base year : 1961 == 100)
1979-80 .. 367 430 131 369 269 3361980-81 .. 415 437 135 418 299 3751981-82 .. 490 458 138 492 332 4321982-83 .. 505 627 139 519 396 4681983-84 . . 609 686 143 517 445 5411984-85 .. 643 750 146 545 476 5731985-86 . . 662 809 150 600 509 6011986-87 .. 717 818 158 623 527 639
April 1986 700 824 153 619 515 626May J986 .. 719 824 153 620 515 637June 1986 .. 712 825 153 621 515 633July 1986 . . . 716 826 157 621 523 637
a n w / August 1986 .. 709 828 157 621 523 634W ^ x l September 1986 .. 696 828 157 621 524 6273mi\ixlOctohcT 1986 .. 693 823 157 625 525 625
November 1986 .. 738 807 157 625 530 650December 1986 .. 735 807 157 625 535 649
5n>)c(Rl/January 1987 . . 728 807 167 625 535 647February 1987 . . 730 807 167 625 541 649
^T ij March 1987 . . 731 809 167 625 545 650
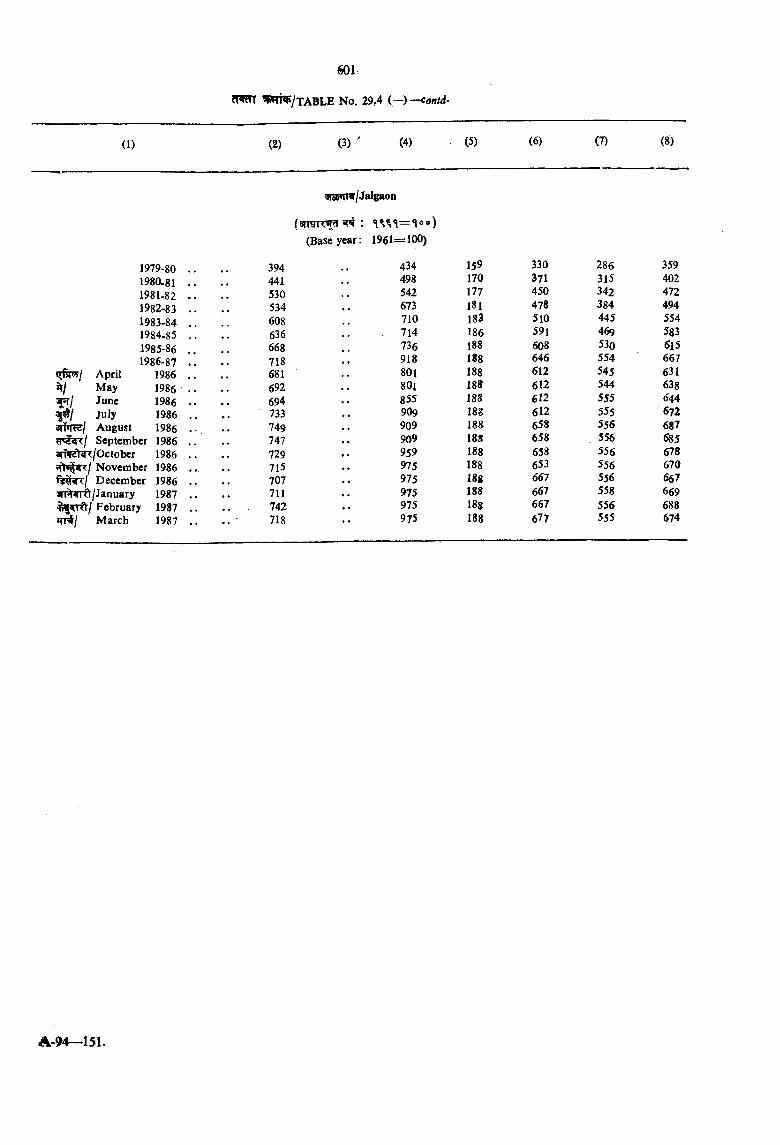
(1) (2) (3) ' (4) (5) (6) (7) (8)
^vsnrir/Jalgaon
(Base year: 1961:= 100)
1979-80 .. 394 434 159 330 286 3591980-81 .. 441 498 170 371 315 4021981-82 .. 530 542 177 450 342 4721982-83 .. 534 673 181 478 384 4941983-84 .. 608 710 183 510 445 5541984-85 .. 636 714 186 591 469 5831985-86 .. 668 736 188 608 530 6151986-87 .. 718 918 188 646 554 667
April 1986 . . 681 801 188 612 545 631May 1986 .. 692 801 188 612 544 638June 1986 .. 694 855 188 612 555 644
1^/ July 1986 .. 733 909 188 612 555 672August 1986 .. 749 909 188 658 556 687September 1986 .. 747 909 188 658 , 556 685
an^stwr/October 1986 .. 729 959 188 658 556 678^fr^WKl November 1986 .. 715 975 188 653 556 670
December 1986 .. 707 975 188 667 556 667/January 1987 .. 711 975 188 667 558 669February 1987 .. 742 975 18g 667 556 688
fJT^I March 1987 .. 718 975 188 677 555 674
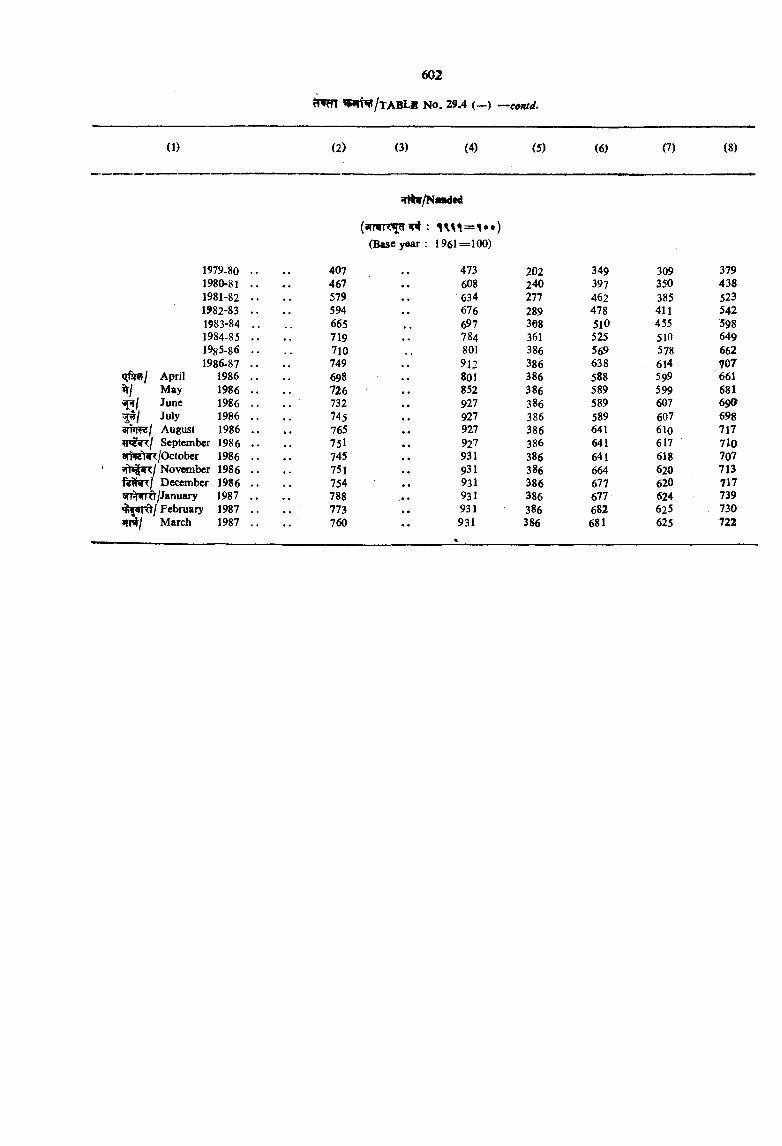
(1) (2) (3) (4) (5) (6) (7) (8)
1979-80 . . 407
qrltv/Naaded
(Base year: 1961=100)
473 202 349 309 3791980-81 . . 467 608 240 397 350 4381981-82 .. 579 634 277 462 385 5231982-83 .. 594 676 289 478 411 5421983-84 .. 665 697 308 510 455 5981984-85 . . 719 784 361 525 510 6491985-86 .. 710 801 386 569 578 6621986-87 .. 749 912 386 638 614 707
qfiiw/ April 1986 .. 698 801 386 588 599 661May 1986 . . 726 852 386 589 599 681June 1986 .. 732 927 386 589 607 69OJuly 1986 .. 745 927 386 589 607 698
arfnfe/ August 1986 .. 765 927 386 641 610 717September 1986 •• 75I 927 386 641 617 7lO
iTWrtir/October 1986 .. 745 931 386 641 618 7074t^WK/ November 1986 . . 751 931 386 664 620 713f k ^ f Decwnber 1986 .. 754 931 386 677 620 717< T WTft/January 1987 . . 788 931 386 677 624 739
Felmiary 1987 ,. 773 931 386 682 625 730HT4/ March 1987 .. 760 931 386 681 625 722
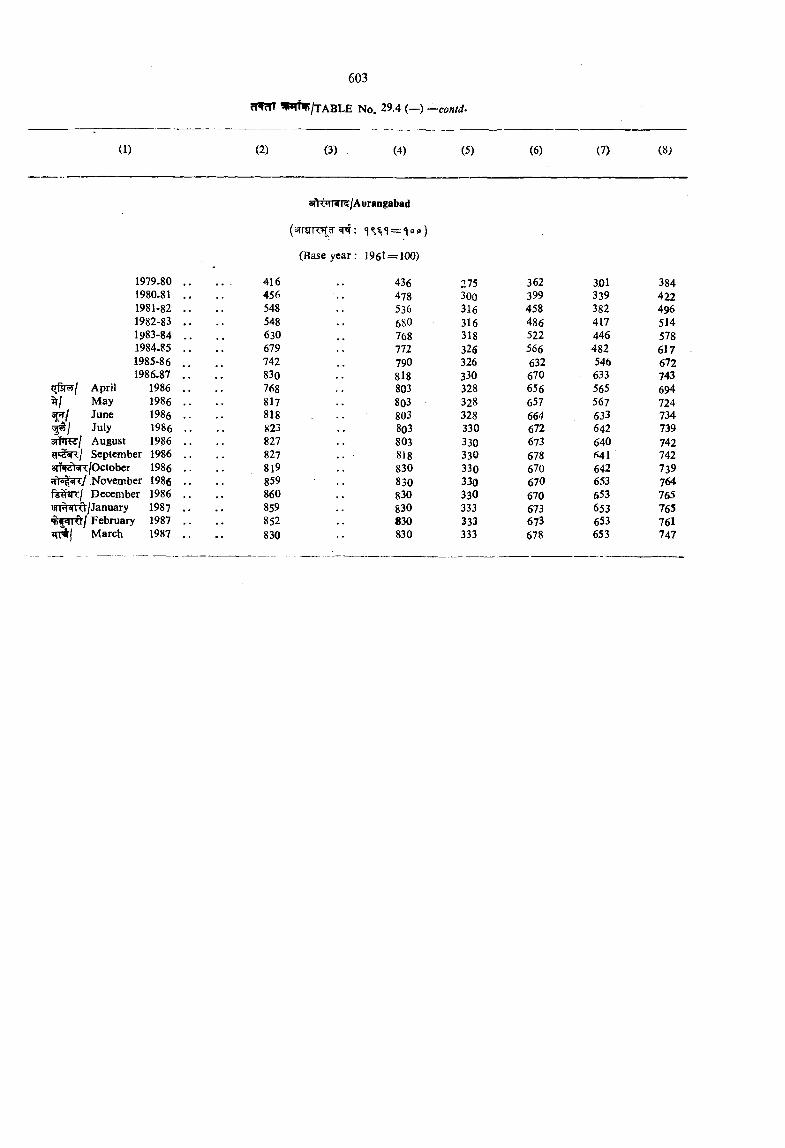
(1) (2) (3) (4) (5) (6) (7) (8;
1979.80 .. 416
Oil <4i N l<;/Aurangabad
(Base year: 1961 — 100)
436 275 362 301 3841980.81 .. 456 478 300 399 339 4221981-82 .. 548 536 316 458 382 4961982-83 . . 548 680 316 486 417 5141983-84 .. 630 768 318 522 446 5781984-85 .. 679 772 326 566 482 6171985-86 . . . 742 790 326 632 546 6721986.87 .. 830 818 330 670 633 743
April 1986 .. 768 803 328 656 565 694May 1986 .. 817 803 328 657 567 724June 1986 • • 818 803 328 664 633 734July 1986 .. 823 803 330 672 642 739
3n»TRr/ August 1986 .. 827 803 330 673 640 742September 1986 .. 827 818 330 678 641 742
STTOt^/October 1986 .. 8l9 830 330 670 642 739November 1986 . . . . 859 .. 830 33o 670 653 764
U^iT<j December 1986 .. 860 830 330 670 653 765'sn^^nft/January 1987 .. 859 830 333 673 653 765
February 1987 . . . . 852 . . 830 333 673 653 761March 1987 .. 830 830 333 678 653 747
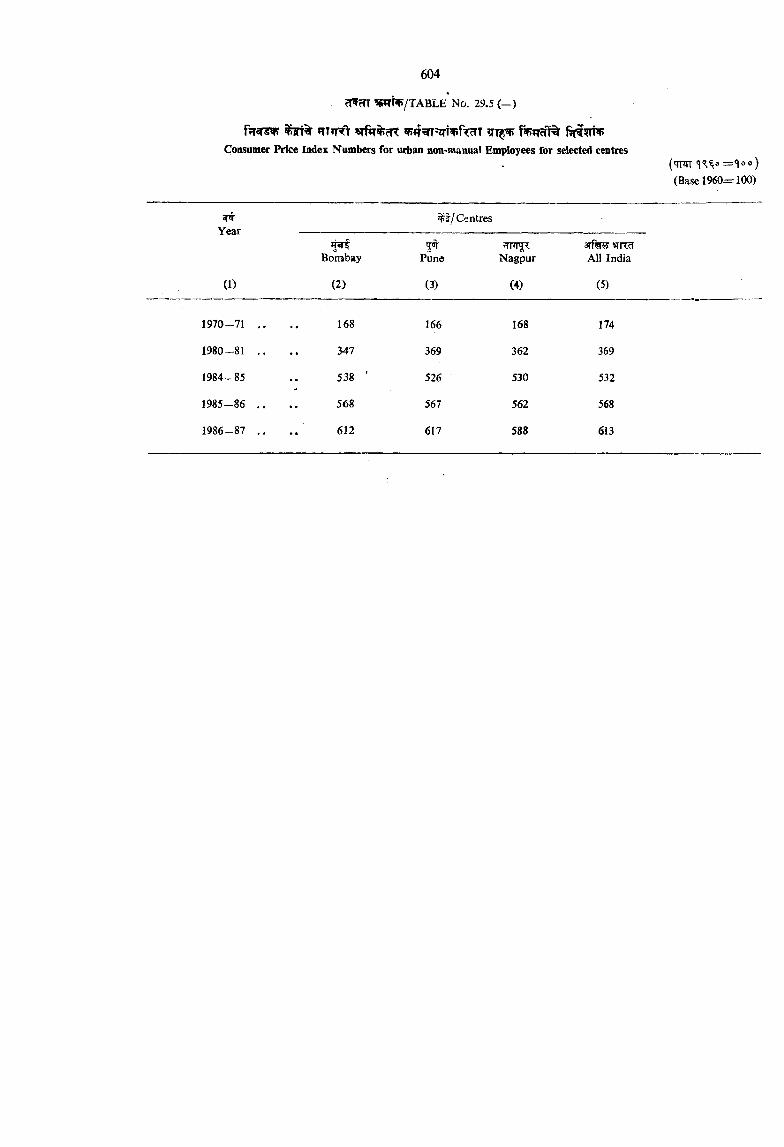
sfurO «rfir%cR 5f?»r =zTT fTcTT f^crl% f ? r i ^ Consumer Price Index Numbers for urban non-manual Employees for selected centres
('Tnn(Base 1960= 100)
Year
(1)
Bombay
(2)
Centres
jq-Pune
(3)
JTFTNagpur
(4)
3T%55¥fR All India
(5)
1970 -7 1 . . •• 168 166 168 174
1980-81 . . •• 347 369 362 369
1984-85 •• 538 ' 526 530 532
1985-86 . . •• 568 567 562 568
1986-87 . . 612 617 588 613
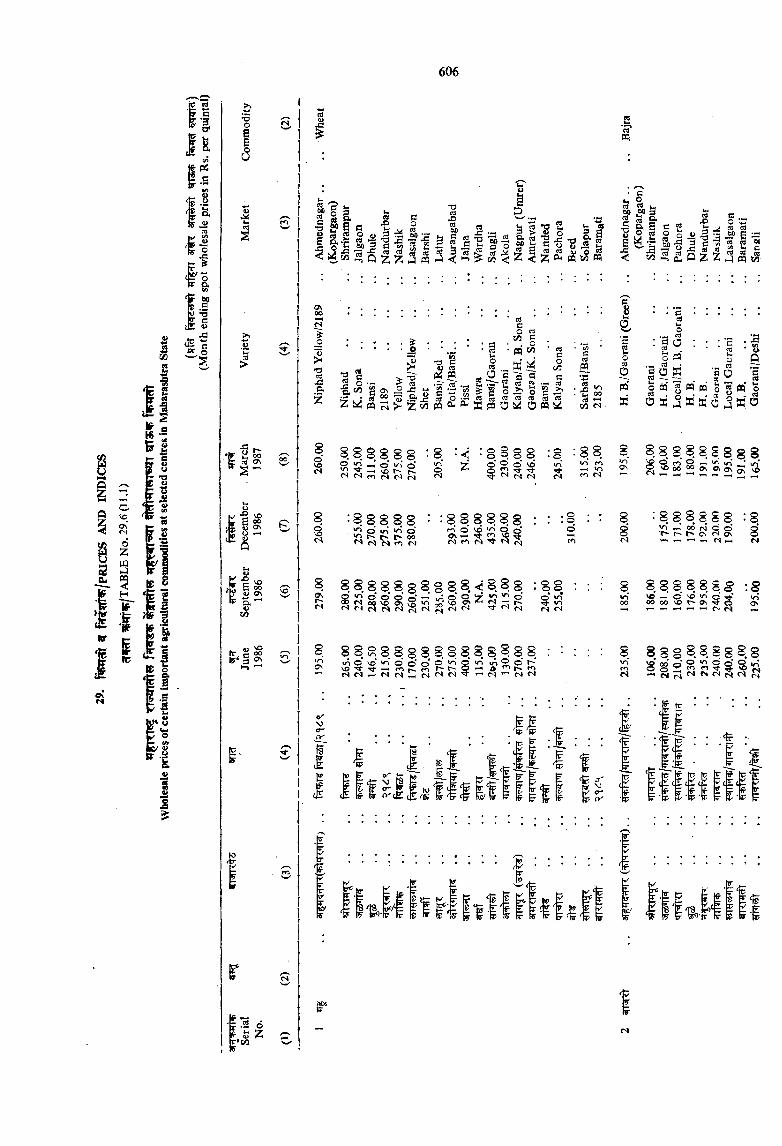
ic
13Oa Eu
a
C c '“' ^ 2U
1/3
IE.If
cS00cOa
•n§ 1§ aII
I C4
fSo
73caJ3a
oo0VO(N
\)
II
5 o 'a
■ • o
5
os o J3
H ^ *0 S
1 1 1 S p - g - S*S?c3-i^wSc«Cd<u
«}CO C3
§m w
2 &
l § m
I .
fl0,5 c o trc«
a o\&o ^0,1
c'oc« f25
*0*j2c^Jg«Jc«a3 c«ci— c«C *43
a
P.
OmK
§■
o n •
O K
C««"-2Ld
J3Q
S S S 8 8 S : So . ®.
® !2 -H 0 >0 0Ti- ^ ^ ^ r;m n <s d
oO ® O VOo•< <N <N
g : g : g 8 8 8 8 8 o 8 8 g g 8v« . - ^ ^ ‘ i ? § § S Bm fo
< <N
: S . 8 8 8 . 8*0 O <r> O ^ 00 r rS ro
: 8 S 8 8 8 8rW O vd ^ O 0N ro M '>*■ M
8 • ' 8 8 8 8 8 8 : 8^ ^ 00 r4 C C— t' 0\ «N o\ ^ ^ „ rj ,-,
S S 8 8 8 8 8 § 8 S . < o 8 8 ; B 8 : ; : 8 8 8 8 8 8 8 § : 8O <r> « ir-r rr>’ o o >7 r5 r-i lA vo _ o' >>D >0 <= ^' iXto (Ti M —oor^oOVO<7><5>n^-VO OJVO c ^ fS is <S <N
V© — O VO >0 c T t 00 00 VO r- cs Tt o —I ’-< c^n
8 g 8 s. S S 8 s. s s s S S I ^ S m
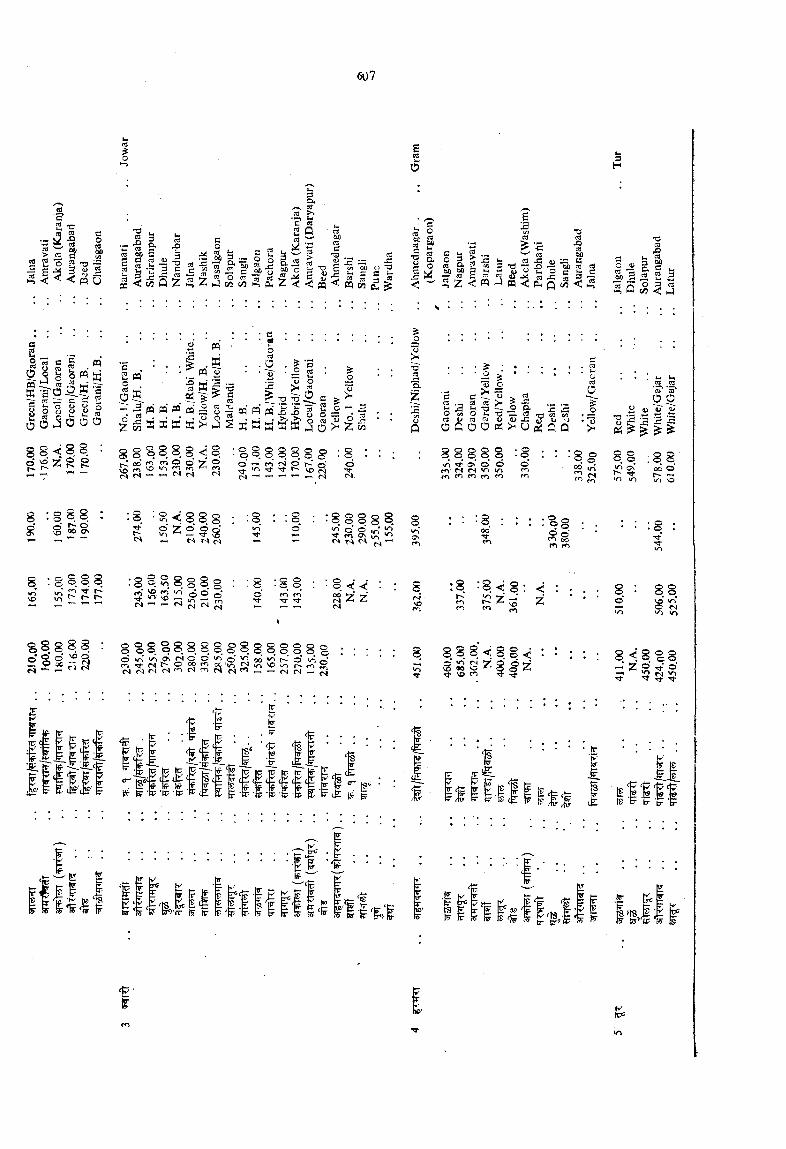
io
3H
a
S . «^ « ffl
« ^ S ffi -cri -H o arrf --- r-C3 C>O a o o>
c c v;ocS
5 o J O O O
8 S < ; S S : o ^ z g g
co^ S, i4 ss ^ S ;= o o I s
2 Q
g i eT3OJ
•“I
o
pqK
I ' "
o
I
g g S 8 8 8 < o
T r n <s r 4~" m’ <N p" 1' o>n rr VO (S—( ^ ^ r
o"!}•
^ -CUS
« -5o
a> ^ •X W) =3 c
c«
° i i o. “
(U J3s: 43 T3 »3 S'S
o
O
■ _W _c3‘c? 'co' 0 0
^ (U ^ 1>T3 -?5 .t; ■■« -ss rt u « Q 5 1) ^ 5> ^ "S 2 -s S 15
Q O f t O O P i : ^ U ( ^ Q Q ^
8 S o. . . . ®</ ■»4' 0\ O Orri ?SI r4 <o >n
r< m m f'l
:8© ■ s §
^'AS S ;8
00 O r- ’-I
8S
S 8 ® ■< 8 8 o^’ Z 2 o ^— rA r>
: 8 8 8 8 B ^ ^ g <H '^ —
8
: 8 § . ^ . S 8 8 g5 « 3 - o o o
<S «N ^O c ^S)z:‘ z
8 8 ■ § 8 : lo *7 ■^ ^ 3
8 8
S B2 * SN ’-’
8 S B^ Ti
8 % 8 S 8 8 8 8 § 8 8 8 8 8 8 g
ts«^ — —8 8 8 <■ 8 § < S S S^ (O ^ ,J.
8 < 8 % 8 - ^ ® 't Tt
ti*
i ' -S t r | ^ <
P t . i
1 - ^ 1 C5Tr
^ '! I -
ycrtr .t:;
r £ t? E ip S tS I 5 . r
^ K '!r 15 tr is ^ tr i!£ M FT
IT1C'
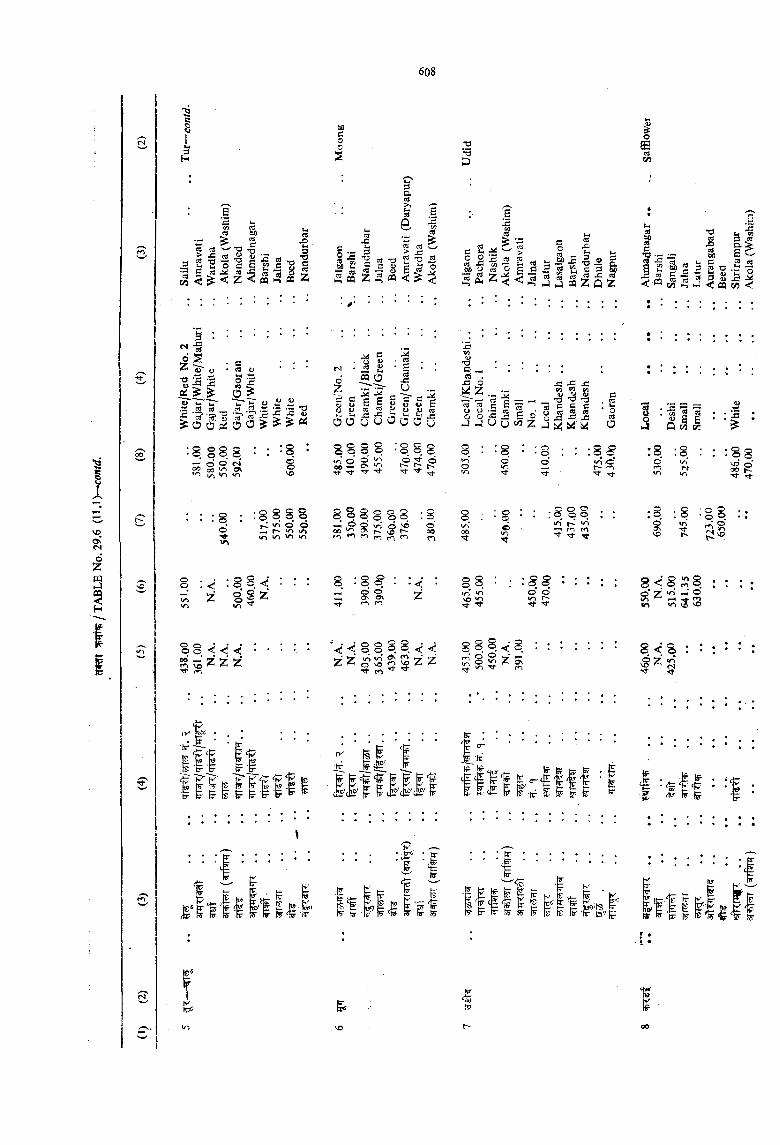
3H
60coos
•o■■B13
i2 . o cs x:-§
I I I- 3
3at3uaO
£ s:*?
s2c/5I
15 cs T3 £ "S i2
ffl < ^ <r
$ -C3.>_ rt ccE
l . „ sis ^ -o 5 S C 3
c3
a « S) «
TJ
aP ^ o
f £ 2 ^ 4 3 5 3 l l S l i a | | 5 l l
3 ^a, >a o2 ^
'C o-S ^(/5 <
- II ttJ -s ^ 0■2 J3 is. M W *♦j; ■
O 2«5O ^
1 , 5 ^ i ^ ^0 s < 0 0 ^ > ^ *
cso '2ce s sC8
. aJ‘ I
6 P 1) V £p CS JS
O O U < ^ ^ O O u
T)C ^ TO . X ! O
o o o o
■S'S ^
£ S « . ''1 £ £■?! 2 s o o 2u s ® z 5 S S 5
3 : -S1-3<5 ^ 6 E>-S Q »3 W!
•gI1
0 Z
1H
:S §S gs s ^>o v-> in
: gorrXT*
: g8VO
g S S S
in
o s. <i S | z
s 8 0 oS 2 S' s'rj- Tf Tf Tf
• O O o• o o So :? o 1Tf-
8 S §
* mm r~i § S ^r'-, f/ f<>
g : g ^O o a o\
o'oo
8 : :g ■ ' o . • o .»o o o'n
o . o . •q : : :S»W06 o >n
O R :in ft\ */l ^ rj-
: g § in -O'ro
-qr
o 2 o q«n r<i f<>
: g
:S :S
Vp o oo r rr
' o ® rn ®CjS
s < s s srt" 7 «n .-4 O^ ra<r» >n v6 ''O
p O^ Z 2 2Tt- m
8“ - 1 <■ 8 < a
rt
^ 8 P &IcF ^
I B f Ia!£'c!£' f cjl£'(]«'c i||&-||ll -'I
l i | i ^ ' !!*■ iw ^ tF’ SJ
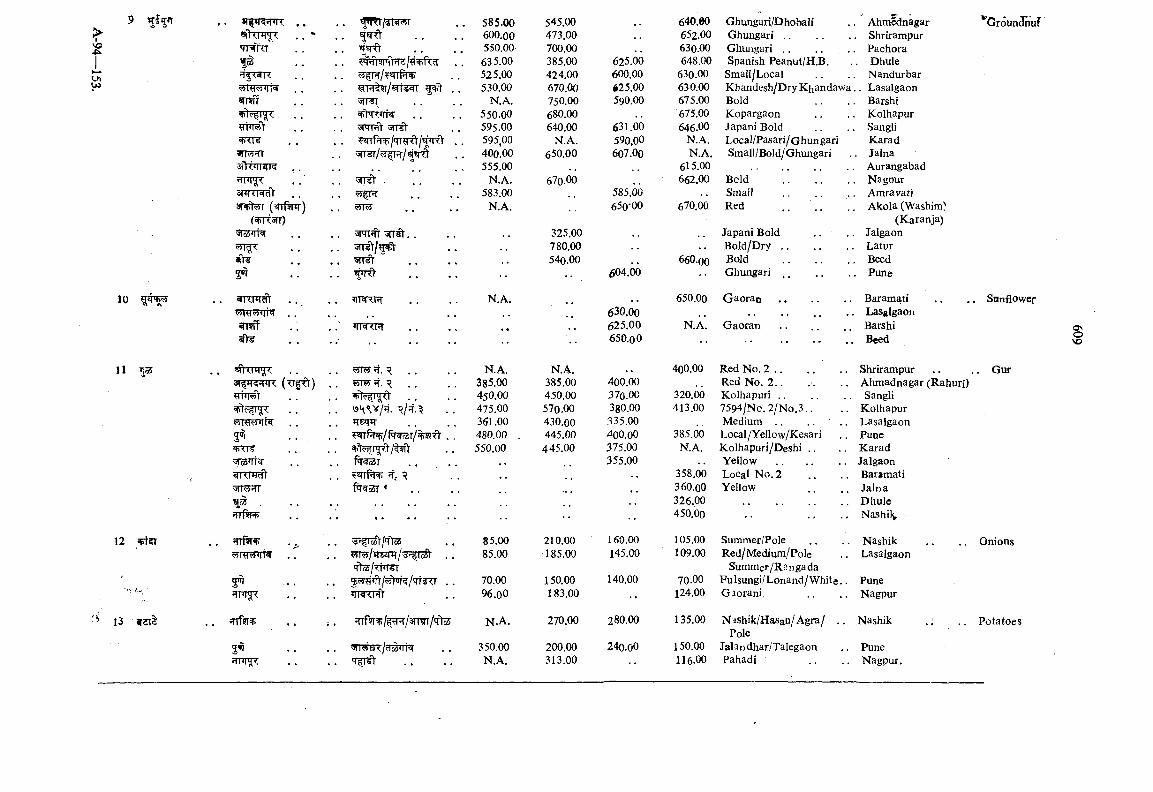
cnu>
10
11 TiS
12
«fkr*r <TTsftTTf®
'b<liTM?rr3?T<*iNI<<TFT . .
srtRRciV 3 T ^ (wrf^)
(^srr) Ws rhr . .
5^
. :
ani T jpn: (tt§^) y iM«V . .
v?RT^hr 5 1 . .
wrn3lo3^TTHTcfy
«J35Trf^
H ^
S'»5TT^
^3Tf)
fhrwlwsPTRt 5TTfr
^’STTOT'fi’ /qr rft srrsr/^r^/g’Br
5TT ■^fnr55T5y
'5m^ .,
STT
’imPT
vim ?f. ,.ft. , .
s!r*T■f ll rH“h/ft^ST/%71
?*<iPi'ti ft,. ^<
3 obt/'Tfo3
‘fts5/<i r if, ?!JTt/??>r?/'Tt?TT . . nTcJKlHl
?rrf5T /p;T/3mrT/'fte
<5rrwEp:/cTs
585.00 545.00 • • 640.00 Ghungari/Dhobali Ahmednagar600.00 473.00 , , 652.00 G hungari........................ . Shrirampur550.00 700.00 630.00 Ghungari .. .. ., Pachora635.00 385.00 625.00 648.00 Spanish Peanut/H.B. . Dhule525.00 424.00 600.00 630.00 Small/Loca] Nandurbar530.00 670.00 625.00 630.00 Kbandesh/Dry Khandawa.,. Lasalgaon
N.A. 750.00 590.00 675.00 Bold Barshi550.00 680.00 675.00 Kopargaon Kolhapur595.00 640.00 631.00 646.00 Japani Bold Sangli595,00 N.A. 590,00 N.A. Local/Pasari/Ghungari Karad400.00 650.00 607.00 N.A. Small/Bold/Ghungari . Jalna555.00 615.00 Aurangabad
N.A. 670.00 662.00 Bold ......................... Nagour583.00 585.00 Small ......................... Amravati
N.A. 650-00 670.00 Red Akola (Washim' (Karanja)
325.00 Japani Bold .. Jalgaon780.00 B o ld /D r y ......................... Latur540.00 660.00 Bold ......................... Beed
•• •• , 604.00 G h un gari......................... Pune
N.A. .. 650.00 G a o r a o .......................... Baramati630.00 . . Lasalgaon625.00 N.A. Barshi650.00 Beed
N.A. N.A. 400.00 Red No. 2 .. . . .. Shrirampur385.00 385.00 400.00 Red No. 2 .. Ahmadnagar (Rahurf)450.00 450.00 370.00 320.00 Kolhapuri.......................... Sangli475.00 570.00 380.00 413.00 7594/No. 2/No.3.. Kolhapur361.00 430.00 335.00 Medium .. .. • .. Lasalgaon480.00 . 445.00 400.00 385.00 Local/YeJlow/Kesari Pune550.00 445.00 375.00 N.A. Kolhapuri/Deshi .. Karad
355.00 Yellow ......................... Jalgaon358.00 Local No. 2 Baramati360.00 Yellow ................... Jalna326.00 Dhule450,00 . . Nashil^
85.00 210.00 160.00 105.00 Summer/Pole Nashik85.00 185.00 145.00 109.00 Red/Medium/Pole
Summer/RangadaLasalgaon
70.00 150.00 140.00 70.00 Fulsungi/Lonand/White.. Pune96.00 183.00 •• 124.00 Gaorani. Nagpur
N.A. 270.00 280.00 135.00 Nashik/Hasan/Agra/ .. Pole
Nashik .;
350.00 200.00 240.00 150.00 Jalandhar/Talegaon PuneN.A. 313.00 116.00 Pahadi . . . . Nagpur.
"(jroun^nuf
Sunflower
G ut
ONoVO
. . Onions
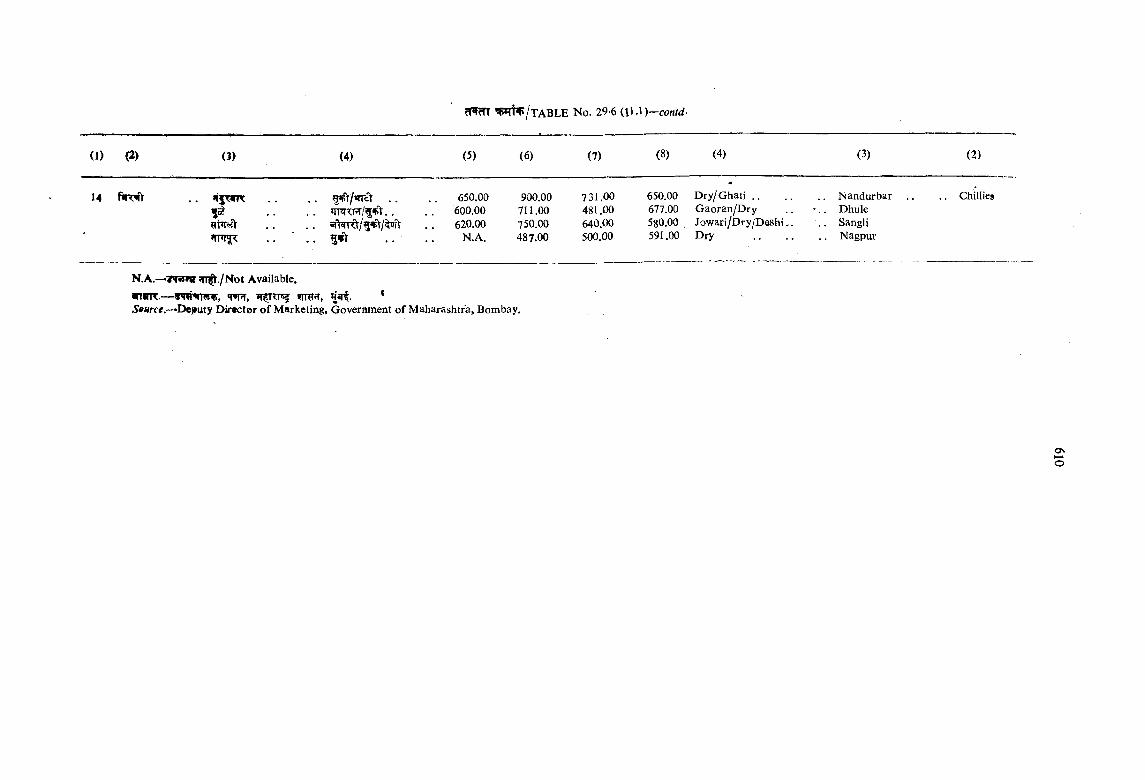
(1) (2) (3) (4) (5) (6) (7) (8) (4) (3) (2)
14 firr^I t • •
nm <
. . 5«Pt/srrcV . .
' . . . . . .
650.00600.00 620.00
N.A.
900.00711.00750.00487.00
731.00481.00640.00500.00
650.00677.00580.00 .591.00
Dry/Ghati .. Gaoran/Dry Jov/ari/Dry/Doshi. Dry .. . .
.. Nandurbar ■.. Dhule . . Sangli . . Nagpur
.. Chillies
N.A.—iTWnr !|T^./Not Available.Trnr, if?TTns *
5*«rce.—Deputy DWcter of Marketing, Government of Maharashtra, Bombay.
O n
o
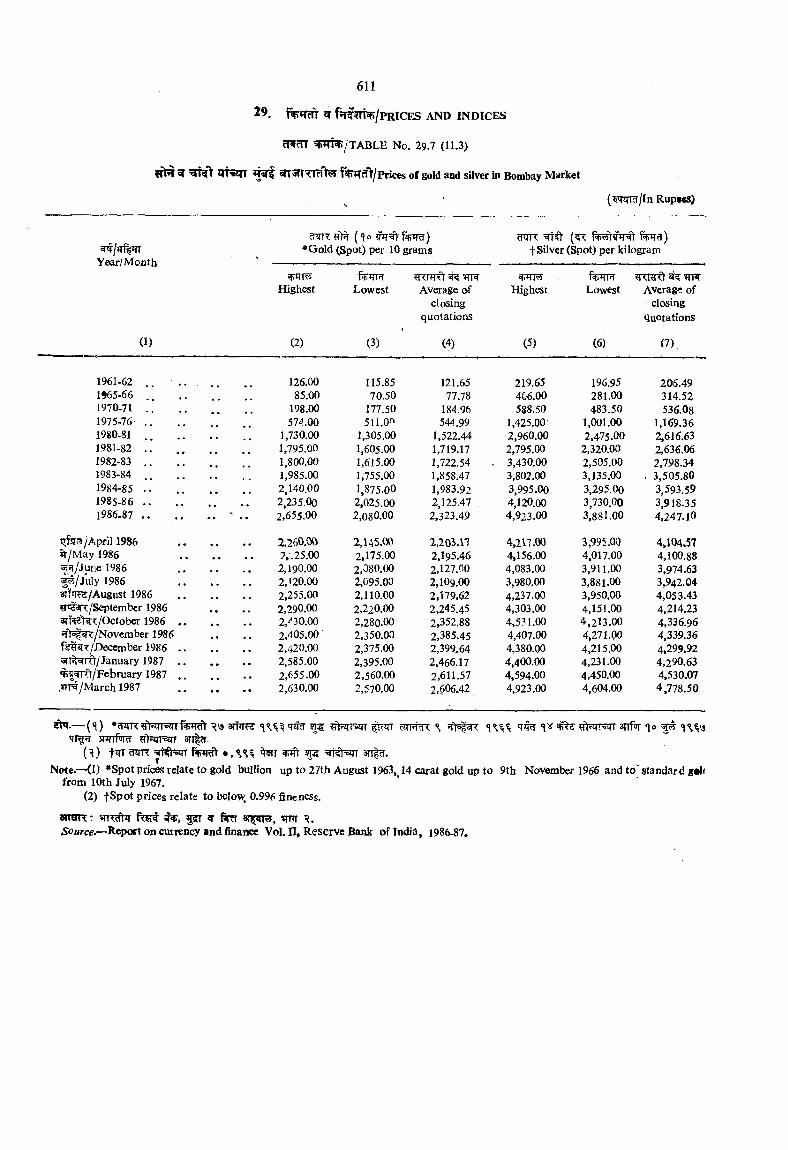
29. ^ f5r€?rt^/pRicES a n d in d ic e s
^15^/TABLE No, 29.7 (11.3)
^ JTTScrT sK'l f%?Tcf /Prices of gold and silver in Bombay Market
{^nnw/ln Rup«es)
Year/Month
cPTR («Jo ♦Gold (Spot) per 10 grams
cnTR (5Tt f%W3)t Silver (Spot) per kilogram
(1)
fiFTRHighest Lowest Average of Highest Lowest Average of
closing closingquotations quotations
(2) (3) (4) (5) (6) (7)
126.00 115.85 121.65 219.65 196.95 206.4985.00 70.50 77.78 406.00 281.00 314.52
198.00 177.50 184.96 588.50 483.50 536.0857^.00 511.0f 544.99 1,425.00 1,001.00 1,169,36
1,730.00 1,305.00 1,522.44 2,960,00 2,475.00 2,616.631,795.00 1,605.00 1,719.17 2,795.00 2,320.00 2,636.061,800.00 1,615.00 1,722.54 . 3,430.00 2,505.00 2,798,341,985.00 1,755.00 1,858.47 3,802.00 3,135.00 . 3,505.802,140.00 1,875.00 1,983.92 3,995.00 3,295.00 3,593.592,235.00 2,025.00 2,125.47 . 4,120.00 3,730.00 3,918.352,655.00 2,080.00 2,323.49 4,923.00 3,881.00 4,247.10
^260.00 2,145.00 2,203.17 4,217.00 3,995.00 4,104.572,175.00 2,195.46 4,156.00 4,017.00 4,100.88
2, 190.00 2,080.00 2,127.00 4,083.00 3,911.00 3,974.632, <20.00 2,095.00 2,109.00 3,980.00 3,881.00 3,942.042,255.00 2,110.00 2,179.62 4,237.00 3,950.00 4,053.432,290.00 2,220.00 2,245.45 4,303.00 4,151.00 4,214.232,^30.00 2,280.00 2,352.88 4,531.00 4,213.00 4,336.962,405.00 2,350.00 2,385.45 4,407.00 4,271.pO 4,339.362,420.00 2,375.(X) 2,399.64 4,380.00 4,215.00 4,299.922,585.00 2,395.00 2,466.17 4,400.00 4,231.00 4,290.632,655.00 2,560.00 2,611.57 4,594.00 4,450.00 4,530,072,630.00 2,570.00 2,606.42 4,923.00 4,604.00 4,778,50
1961-621965-661970-711975-761980-811981-821982-831983-841984-851985-861986-87
qfr^/^.pril 1986 %/May 1986 ^5/Jurie 1986 ^ /J u ly 1986 3nilT5/August 1986 ^ri25R/Septemb€r 1986
^/October 1986 JT>|^/Novcmb€r 1986 fk^^/D ecem ber 1986 sfTn^Rt/January 1987 •^IWRt/February 1987
/March 1987
— (H) V9 rVirrarT ^ ir r cirr%^ yiriii-fin 30% ^*?n5?T sr TTfw fh=3?TE3TT sn|5r.
(^) ?nrn: ^ ^ 3n|^.Note.—(I) *Spot prices relate to gold bullion up to 27th August 1963, 14 carat gold up to 9th November 1966 and to'standard g«l<
from lOth July 1967.(2) fSpot prices relate to belo\^ 0.996 fineness.
aiTsiR r p r T l5f arp^y, w r5to«rce.—Report on cuircncy and finance Vol. II, Reserve Bank of India, 1986-87.
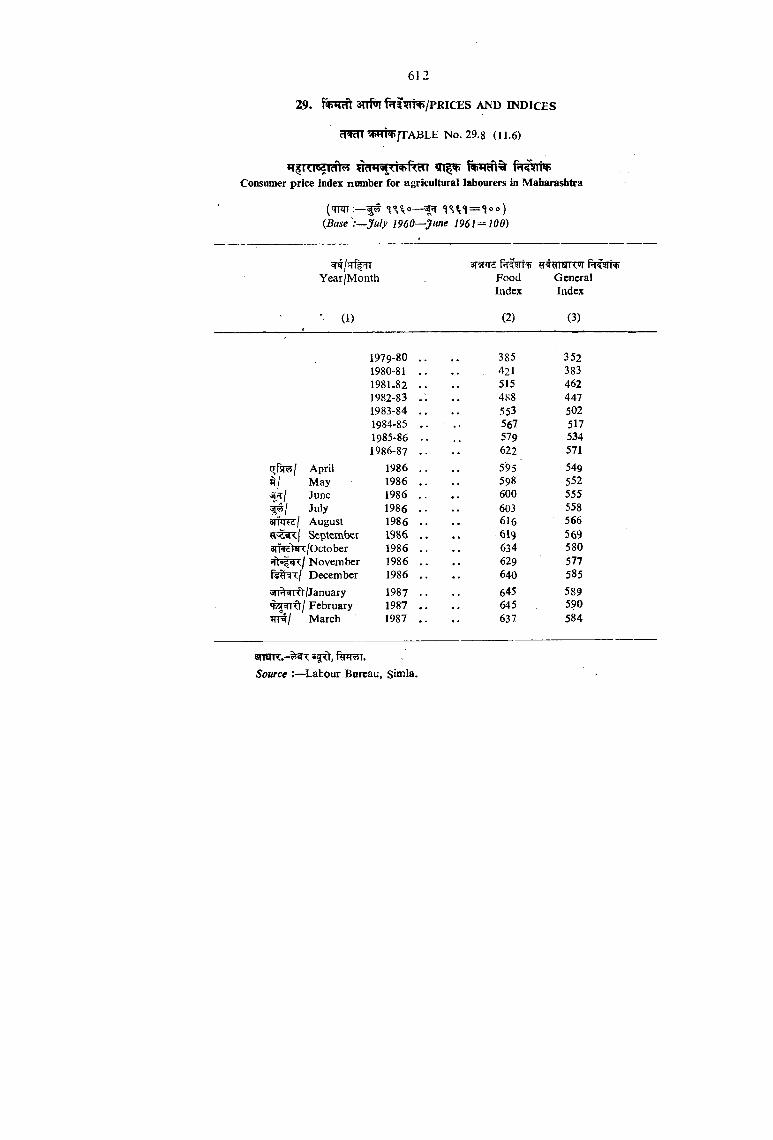
cT ^ OT^/TABLE No. 29.8 (11.6)
Consumer price index number for agricultural labourers in Maharashtra
('Tnn;—^ ^ ={Base :—July I960—June 1961 = 100)
Year/Month3T?TJrs Ffrfsrr ^rwranrw f rfsrt
Food General Index Index
' (1) (2) (3)
1979-80 . . 385 3521980-81 . . . 421 3831981-82 . . 515 4621982-83 . . 488 4471983-84 . . 553 5021984-85 . . . 567 5171985-86 . . 579 5341986-87 . . 622 571
April 1986 595 ' 549May 1986 . . 598 552June 1986 . . 600 555July 1986 . . 603 558
ajHlw/ August 1986 . . 616 566r 8R( September 1986 . . 619 569
3fipFSti /October 1986 . . 634 580ffV|9R/ November 1986 . . 629 577i4^'4xj December 1986 . . 640 5855n% TTl'/January 1987 . . 645 589^ ^ f f / February 1987 . . 645 590m-ij March 1987 . . 637 584
a n o R * -^ 55^ , ftrfT55T.Source :— Labour Bureau, sin^la.
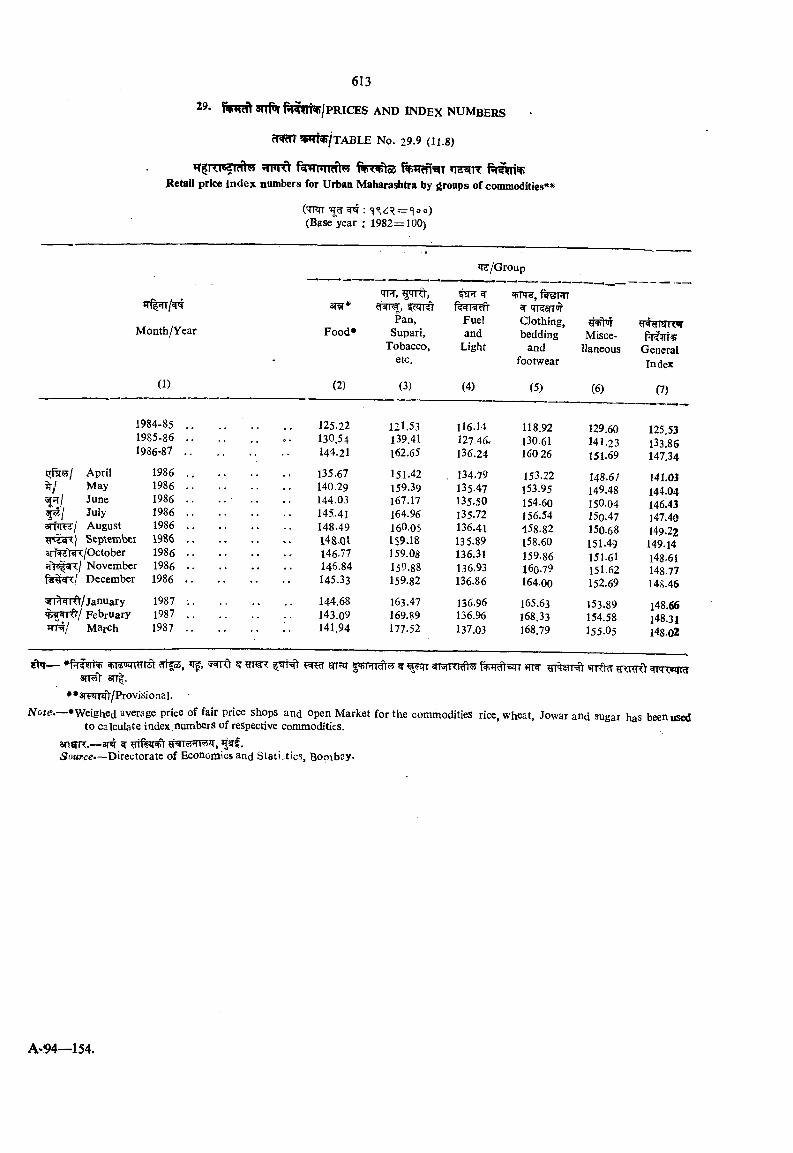
29. anl^^W fri^/PRICES AND i n d e x n u m b e r s
fntTT 5Flt^/TABLE No. 29.9 (H.8)
fvvihcsRetail price in d ex numbers for Urban Maharashtra by groups of commodities**
('TFn ^ :(Base year ; 1982=100)
^/Group
TR, ^Mld, Wanr*
Pan, Fuel Clothing, 'H+l-ifMonth/Year Food* Supari, and bedding Misce
Tobacco, Light and llaneous General* etc. footwear Index
(1) (2) (3) (4) (5) (6) (7)
1984-85 ,. 125.22 121.53 116.14 118.92 129.60 125.531985-86 .. . . - 130.54 139.41 127.46. 130.61 141.23 133.861986-87 .. 144.21 162.65 136.24 160 26 151.69 147.34April 1986 .. 135.67 151.42 134.79 153.22 148.67 141.03May 1986 .. 140.29 159.39 135.47 153.95 149.48 144.04June 1986 .. 144.03 167.17 135.50 154.60 150.04 146.43July 1986 .. 145.41 164.96 135.72 156.54 150.47 147.40
amsFz/ August 1986 .. 148.49 160.05 136,41 •158.82 150.68 149.22WIT.) Septembei 19S6 .. 14&,01 159.18 135.89 158.60 151.49 149.14sm^t^/October 1986 .. 146.77 159.08 136.31 159.86 15161 148.61
November 1986 .. 146.84 159.88 136.93 16Q.79 151.62 148.77Fgyer<( Decembei• 1986 . . 145.33 159.82 136.86 164.00 152.69 148.46'jfl^qiO/January 1987 .. 144.68 163.47 136.96 165.63 153.89 148.66
February 1987 .. 143.09 169.89 136.96 168.33 154,58 148.31’TF#/ M rch 1987 .. 141.94 177.52 137.03 168.79 155.05 148.Q2
3TT55V 3TT|.
* *3TF«rrjf)-/ProvisionaI.
iVote.—* Weighed average price of fair price shopS and open Market for the commodities rice, wheat, Jowar and sugar has been used to calculate i n d e x numbers of respective commodities.
ansR.—m ^Source-—Directorate of Economics and Statistics, Bombsy*
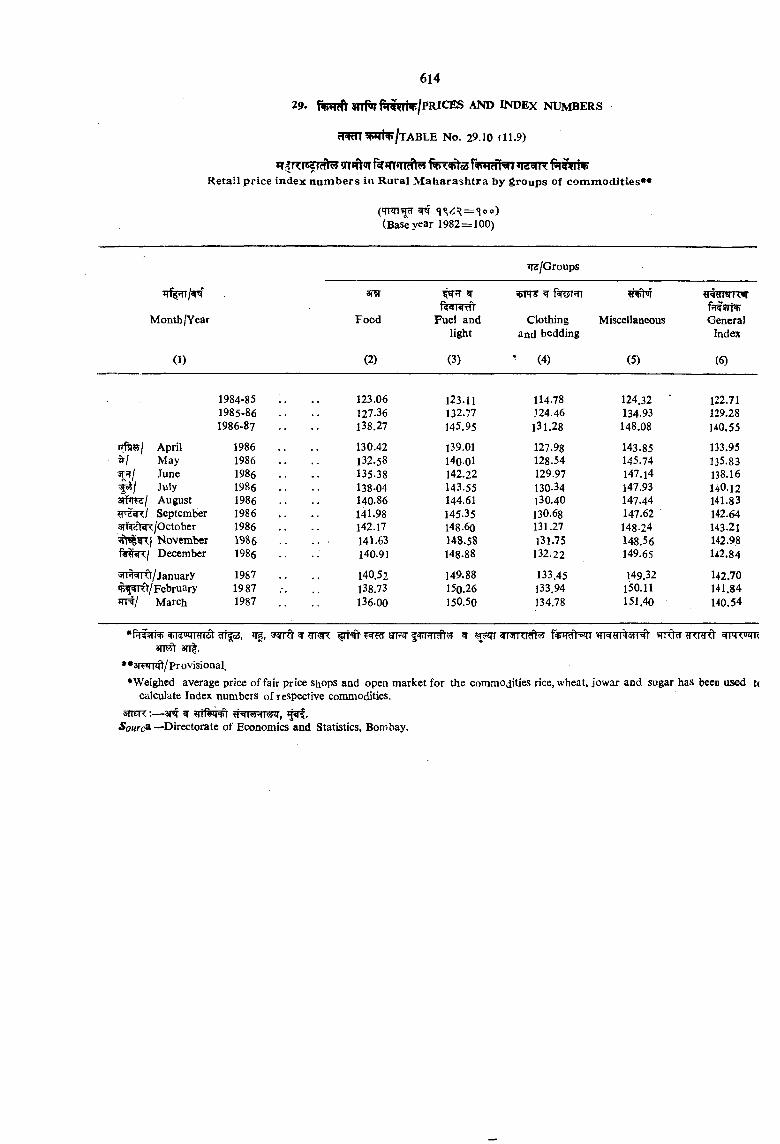
c ! i tn ^ » * r iw r / ta b le n o . 29.10 d i .9 )
iT tTnsTT# 1% r^s fvRtfhnR e ta i l p r i c e in d e x n u m b e r s in R u r a l M a h a r a s h t r a b y g r o u p s o f c o m m o d i t ie s * *
('TFTl ^ =(Base year 1982=100)
»I?/Groups
*T%rr/2nT srarrcSflraxil
Month/Year Food Fuel and Clothing Miscellaneous Generallight and bedding Index
(1) (2) (3) * (4) (5) (6)
1984-85 123.06 123.11 114.78 124.32 ‘ 122.711985-86 127.36 132.77 124.46 134.93 129.281986-87 138.27 145.95 131.28 148.08 140.55
April 1986 130.42 139.01 127.98 143.85 133.95&/ May 1986 132.58 140-01 128-54 145.74 135.83
June 1986 135.38 142.22 129.97 147.14 138.16^4/ July 1986 138.04 143.55 130-34 147.93 140.12aiPiVd/ August 1986 140.86 144.61 130.40 147.44 141.83^esR/ September 1986 141.98 145-35 130.68 147.62 142.64aTTOitaR/October 1986 142.17 148-60 131.27 148-24 143.21
November 1986 141.63 148.58 131.75 148.56 142.98fe^kx/ December 1986 14091 148.88 132.22 149.65 142.84
-jilHq 1-0/ January 1987 140.52 149.88 133.45 149.32 142.70^^=il<)/February 1987 138.73 150.26 133.94 150.11 141.84* l / March 1987 136-00 150.50 134.78 151.40 140.54
di aS, JTf, 'J'llO ^ 'H'W< ^rNt |=frRWh? ^ WIWn STTan .
**3R«rFft/Provisional.•Weighed average price of fair price shops and open market for the commodities rice, wheat, jowar and sugar has been used t<
calculate Index numbers of respective commodities.
^O. jftlFfT 30. FIVE-YEAR PLAN
^ ?ft’3f?n iTT?f#sft=Clf 30.1. Data on Stat? Plan and Centrally sponsoredTT?lf7^r ^ 3R t^ •rrf^a- ftsrnrm snt- Programmes in various Five-Year Plans are Statewise
presented m this section.
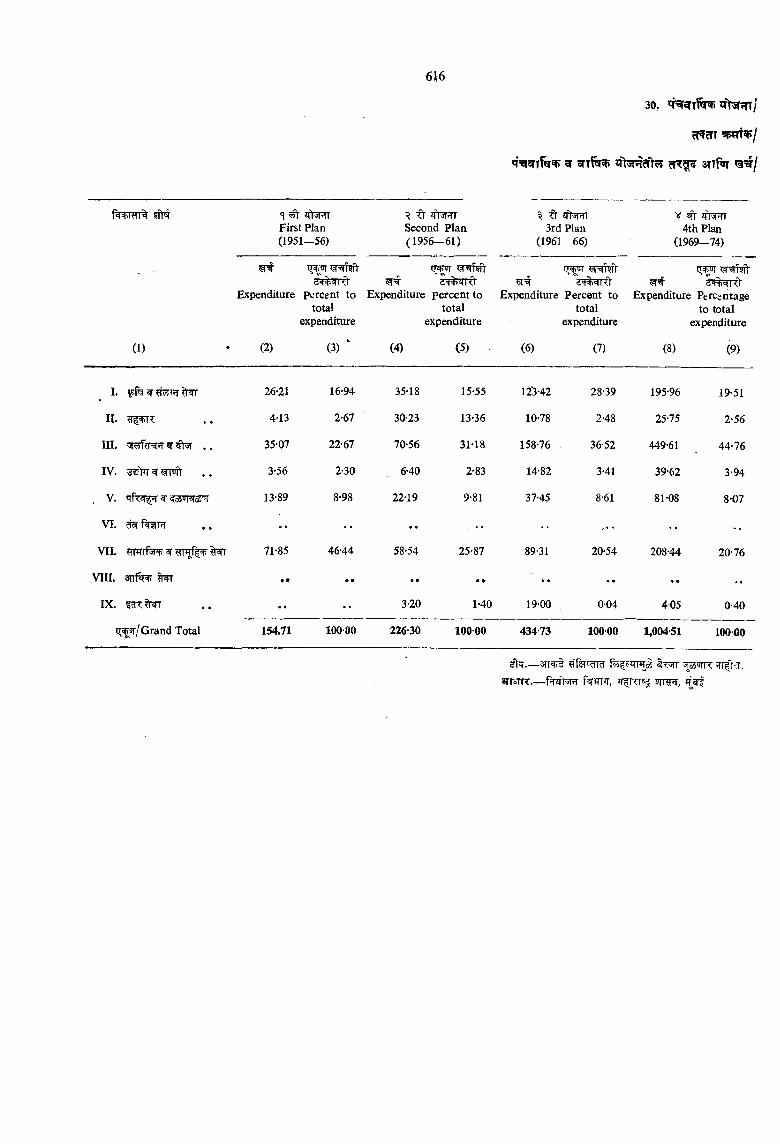
^ cT T ^ 3TTfoT ^ /
*1 ^ 3Tl^ First Plan (1951-56)
ft jfl jnrr Second Plan (1956-61)
ft zftsprr 3rd Plan
(1961—66)4th Plan
(1969-74)
i'W'i 10 <l't?>=l 10Expenditure pcrcent to Expenditure percent to
total totalexpenditure expenditure
y- Wi
Expenditure Percent to Expenditure Percentage total to total
expenditure expenditure
(1) (2) (3) " (4) (5) (6) (7) (8) (9)
I. 26-21 16-94 35-18 15-55 12‘3-42 28-39 195-96 19-51
II. 4-13 2-67 30-23 13-36 10-78 2-48 25-75 2-56
III. ^ . . 35-07 22-67 70-56 31-18 158-76 36-52 449-61 44-76
IV. ^>T ^ ?PTW)‘ 3-56 2-30 6-40 2-83 14-82 3-41 39-62 3-94
, V. 'Tf^^ -<?o5 srOT 13-89 8-98 22-19 9-81 37-45 8-61 81-08 8-07
VI. ^ ^F T •• •• •• . •• . . . •• *.
VII. w ^ 71*85 46-44 58-54 25-87 89-31 20-54 208-44 20-76
v m . 3nf% ^ • • • • • • • • • • • • ..
IX. •• •• 3-20 1-40 19-00 004 405 0-40
iT^ir/Grand Total 154.71 100-00 226-30 100-00 434-73 100-00 1,004-51 100-00
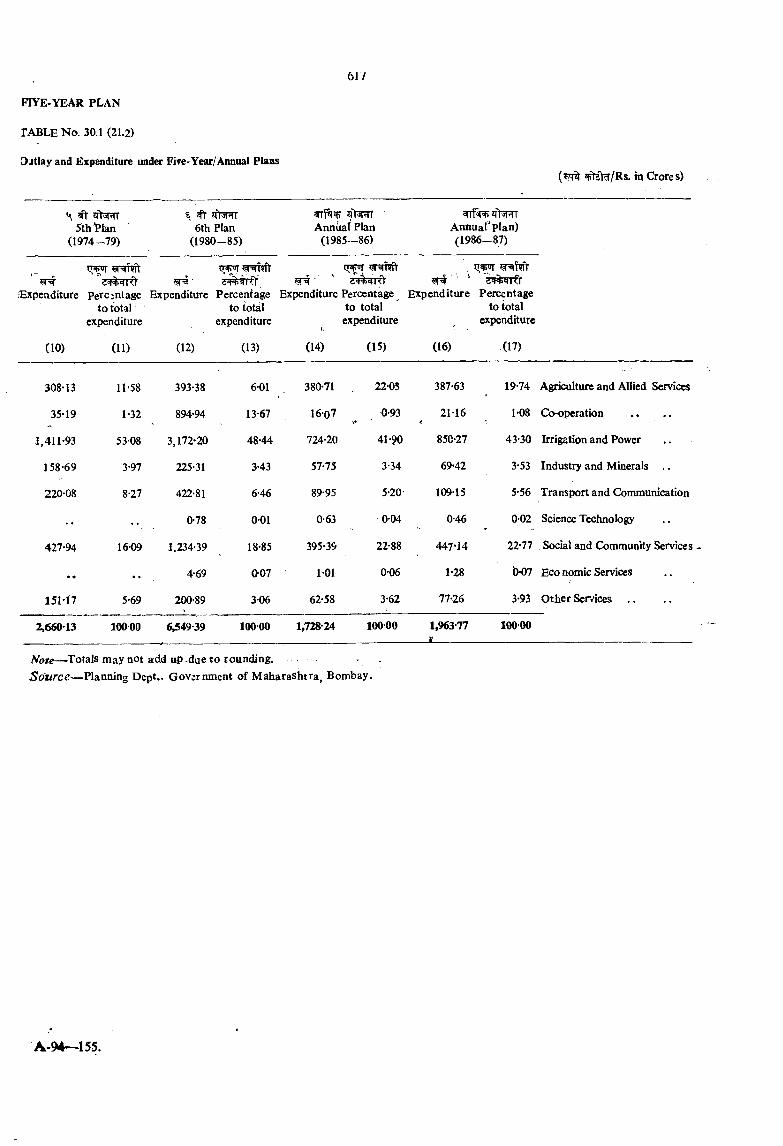
FIYE-YEAR PLAN
TABLE N o. 30.1 (21.2)
3iitlay and Expenditure under Five-Year/Annual Plans
^ ^ ziWrT Sthtlan
(1974 -7 9 )6th Plan
(1980-85)Annual Plan
(1985—86)
3rrf«( zr>3nn Annual'plan) (1986-87)
^ ww 2r##rrf ^ ^rExpeaditure Percentage Expenditure Percentage Expenditure Percentage Expenditure Percentage
to total ‘ to total to total to totalexpenditure expenditure expenditure expenditure
(10) (11) (12) (13) (14) (15) (16) (17)
308-13 11-58 393-38 6-01 380-71 22-03 387-63 19-74 Agriculture and Allied Services
35-19 1-32 894-94 13-67 16-07 0-93 21-16 1-08 Cooperation
1,411-93 53-08 3,172-20 48-44 724-20 41-90 850-27 43-30 Irrigation and Power
158-69 3-97 225-31 3-43 57-75 3-34 69-42 3-53 Industry and Minerals ..
220-08 8-27 422-81 6-46 89-95 5-20 109-15 5-56 Transport and Communication
0-78 0-01 0-63 0-04 0-46 0-02 Science Technology
427-94 16-09 1.234-39 18-85 395-39 22-88 447-14 22-77 Social and Community Services
• • . . 4-69 0-07 1-01 0-06 1-28 b-07 ECO nomic Services
151-17 5-69 200-89 3-06 62-58 3-62 77-26 3-93 Other Ser/ices ..
2,660-13 100 00 6,549-39 100-00 1,728-24 100-00 1,963-77- J___
100-00
Note— Totals may not add up -due to rounding.S o u rc e — Planning Dept.. Government of Maharashtra, Bombay.
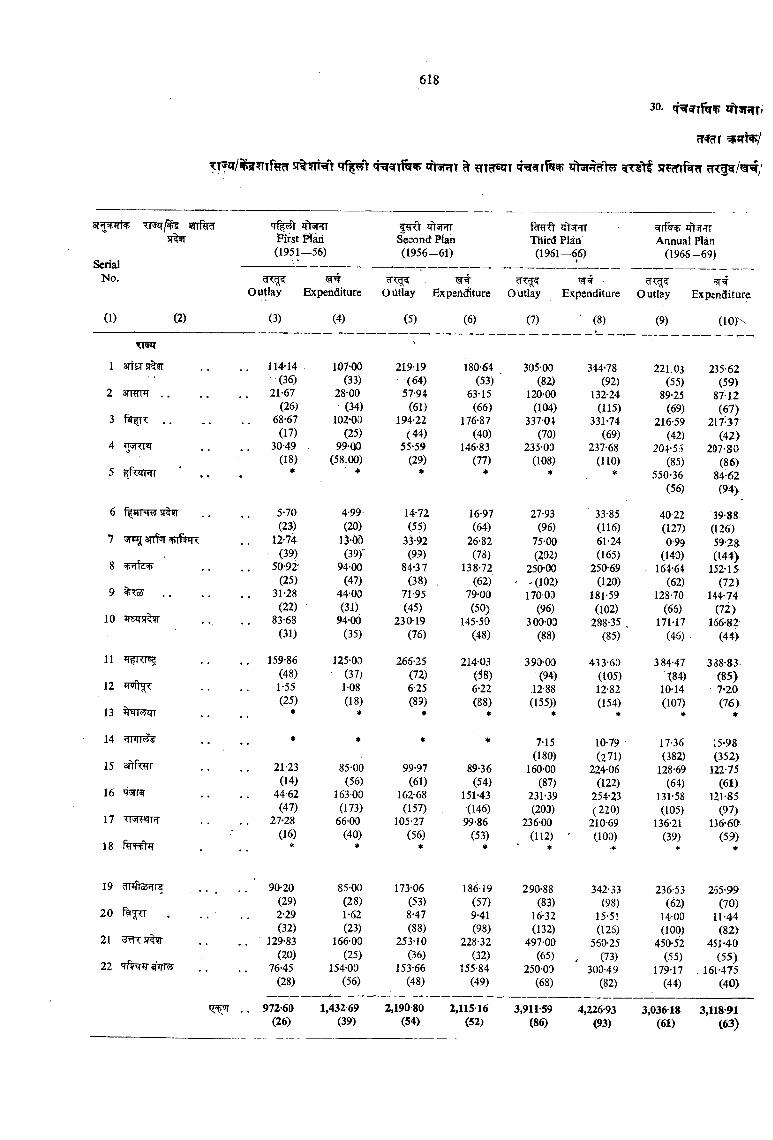
?Tf?Tr
^ ^ t5T55Tt snciH sr?mfw?T ? rc § 5 /^ ‘
sRW ^ ttht/ ^ ?rrf^51^
'Tf|#First Han
1 ^ iftSRT Second Plan
qtsffrr Third Plan
qtsTirr Annual Flan
SerialNo.
(1) (2)
(1951 -5 6 ) (1956 -61) (1961-6 6 ) (1966 -69)
Outlay
(3)
Expenditure
(4)
outlay
(5)
Expsriditure
(6)
outlay
(7)
’3’ - Expedditure
■ (8)
Outlay
(9)
Expenditure
(10 )\
1 aria sr 9T . 114*14 107-00 219-19 180-64 305-00 344-78 221.03 235-62(36) (33) (64) (53) (82) (92) (55) (59)
2 amrnr . . 21-67 28-00 57-94 63-15 120-00 132-24 89-25 87-12
3 r«» iT . .(26) (34) (61) (66) (104) (115) (69) (67)
68-67 102*00 194-22 176-87 337-04 331-74 216-59 217-37(17) (25) (44) (40) (70) (69) (42) (42)
4 Tpni r 30-49 99-00 55-59 146-83 235-Oa 237-68 204-5) 207-80
5 ffWrfl
6 f TiTsi 5r%9r
(18) (58.00) (29) (77) (108) (110> (85) (86)*
5-70
' ■ *
4-99
♦
14-72
*
16-97
♦
27-93
*
’ 33-85
550-36(56)
40-22
84-62(94>
39-88
1 3fT srrf'JT vrfw^(23) (20) (55) (64) (96) (116) (127) (126)
12-74 130D 33-92 26-82 75-00 61-24 0-99 59-28
8 'fi'nTd'h(39) (39) (99) (78) (202) (165) (140) (144)
50-92' 94-00 8A'37 138-72 250-00 250-69 164-64 152-15
9 ^<al(25) (47) (38) (62) ' K102) (120) (62) (72)
31-28 44-00 71-95 79-00 17003 181-59 128-70 144-74
10(22) (31) (45) (50) (96) (102) (65) (72)
83-68 94-00 230-19 145-50 300-00 2»8‘35 . 171-17 156-82(31) (35) (76) (48) (88) (85) (46) (4 4
11 *r T<itd . 159-86 125-00 266-25 214-03 390-00 433-60 384-47 388-83.
12 ^«n^<(48) • (37) (72) (58) (94) (105) X84) (85)1-55 1-08 6-25 6-22 12-88 12-82 1014 7*20
13(25) (18) (89) (88) (155)) (154) (107) (76).♦ * * * * * * *
14 * * * * 7-15 10-79 ■ 17-36 15-98
15 sftferr 21-23 85-00 99-97 89-36(180)
160-00(271)
224-06(382)
128-69(352)
122-75
16 W R(14) (56) (61) (54) (87) (122) (64) (61)
44-62 163 00 162-68 151-43 231-39 254-23 131-58 121-85
17 Tm«IR(47) (173) (157) (146) (203) (220) (105) (97)
27-28 66-00 105-27 99-86 236-00 210-69 136-21 m -6 0
18(16) (40) (56) (53) (112) (100) (39) (59)* * * * * ■* * *
19 cnijte^ra . . _ 90-20 85-00 173-06 186-19 290-88 342-33 236-53 255-99
20(29) (28) (53) (57) (83) (98) (62) (70)2-29 1-62 8-47 9-41 16-32 15-51 14-00 11-44
21 'dti<jrt9r(32) (23) (88) (98) (132) (125) (100) (82)
. 129-83 166-00 253-10 228-32 497-00 560-25 450-52 451-40
22 Tf^ir(20) (25) (36) (32) (65) . (73) (55) (55)
76-45 154-00 153-66 155-84 250-03 300-49 179-17 - 161-475(28) (56) (48) (49) (68) (82) (44) (40)
. . 972-60 1,43269 2,190-80 2,11516 3,91159 4,226-93 3,036-18 3,11891(26) (39) (54) (52) (86) (93) (61) (63)
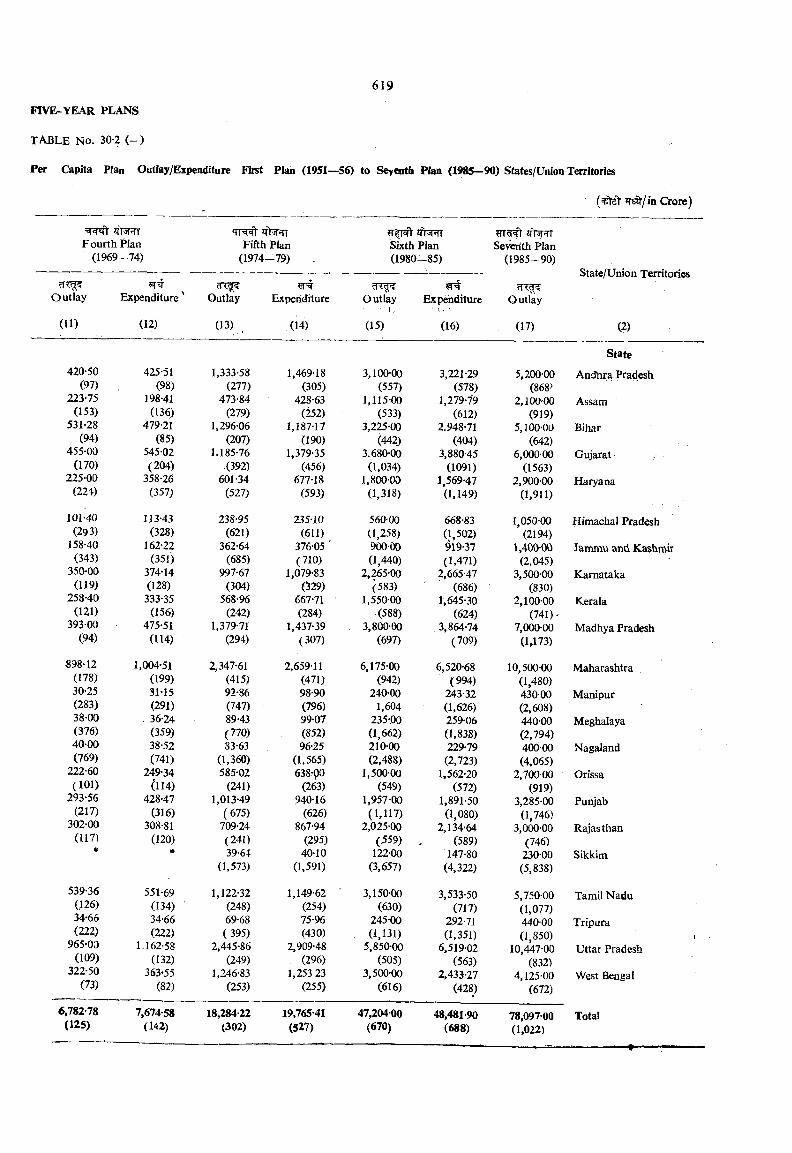
FIVE-YEAR PLANS
Per Capita Plan Outlay/Expenditure First Plan (1951—56) to Seyeoth Plan (1985—90) States/Union Territories
?re /in Crote)
F ourth Plan Fifth Plan Sixth Plan Sevieilth Plan(1969 -7 4 ) (1974--79) . (1980--85) (1985-90)
Outlay
(17)
State/Union Territories
(2)
Outlay
(11)
Expenditure'
(12)
Outlay
(13)
Expenditure
(14)
Outlay■ 1';
(15)
Expehditure■ I i ■
(16)
State420-50 425-51 1,333-58 1,469-18 3,100-00 3,221-29 5,200-00 Andtira Pradesh
(97) (98) (277) (305) (557) (578) (868>223-75 198-41 473-84 428-63 1,11500 1,279-79 2,100-00 Assam
(153) (136) (279) (252) (533) (612) (919)531*28 479-21 1,296-06 1,187-17 3,225-00 2.948-71 5,100^00 Bihar
(94) (85) (207) (190) (442) (404) (642)455-00 545-02 1.185-76 1,379-35 3.680-00 3,880-45 6,00000 Gujarat
(170) (204) (392) (456) (1,034) (1091) (1563)225-00 358-26 601-34 677*18 1,800-00 1,569-47 2,900-00 Haryana
(224) (357) (527) (593) (1,318) (1,149) (1,911)
101-40 113-43 238-95 235-10 560-00 668-83 1,050-00 Himachal Pradesh(293) (328) (621) (611) (1,258) (1,502) (2194)
158-40 162-22 362-64 376-05 ' 900-00 919-37 1,400-00 Jammu and Kashmir(343) (351) (685) (710) (1,440) (1,471) (2,045)
350-00 374*14 997-67 1,079-83 2,265-00 2,665-47 3,500-00 Karnataka(119) (128) (304) (329) (583) (686) (830)
258-40 333-35 568-96 667*71 • 1,550-00 1,645-30 2,100-00 Kerala(121) (156) (242) (284) (588) (624) (741)-
393-00 475-51 1,379-71 1,437-39 3,80000 3,864*74 7,000-00 Madhya Pradesh(94) (114) (294) (307) (697) (709) (1,173)
898-12 1,004-51 2,347-61 2,659-11 6,175-00 6,520-68 10,500-00 Maharashtra(178) (199) (415) (471) (942) (994) (1,480)30-25 3M5 92*86 98-90 240*00 243-32 430-00 Manipur(283) (291) (747) (796) 1,604 (1,626) (2,608)3S-00 . 36-24 89-43 99-07 235-00 259-06 440-00 Meghalaya(376) (359) (770) (852) (1,662) (1,838) (2,794)40-00 38-52 83-63 96-25 210-00 229-79 40000 Nagaland(769) - (741) (1,360) (1,565) (2,488) (2,723) (4,065)
222-60 249-34 585-02 638-pO 1,500-00 1,562-20 2,700 00 Orissa(101) (114) (241) (263) (549) (572) (919)
293-56 428-47 1,013-49 940-16 1,957-00 1,891-50 3,285-00 Punjab(217) (316) (675) (626) (1,117) (1,080) (1,746)
302-00 308-81 709-24 867-94 2,025-00 2,134-64 3,000-00 Rajasthan(117) (120) (241) (295) (559) (589) (746)* * 39-64 40-10 122-00 147-80 230 00 Sikkim
(1,573) (1,591) (3,657) (4,322) (5,838)
539-36 551-69 1,122-32 1,149-62 ■ 3,150-00 3,533-50 5,750-00 Tamil Nadu(.126) (134) (248) (254) (630) (717) (1,077)34-66 34-66 69-68 75-96 245-00 292-71 44000 Tripura(222) (222) ( 395) (430) (1,131) (1,351) (1.850) I
965-00 1.162-58 2,445-86 2,909-48 5,850-00 6,519-02 10,447-00 Uttar Pradesh(109) (132) (249) (296) (505) (563) (832)
322-50 363*55 1,246-83 1,253 23 3,500-00 2,433-27 4,125-00 West Bengal(73) (82) (253) (255) (616) (428) (672)
6,782-78 7,674-58 18,284-22 19,765-41 47,204-00 48,481-90 78,097*00 Total(125) (1^2) (302) (527) (670) (688) (1,022)
---------------- -■ . --------- ---------------
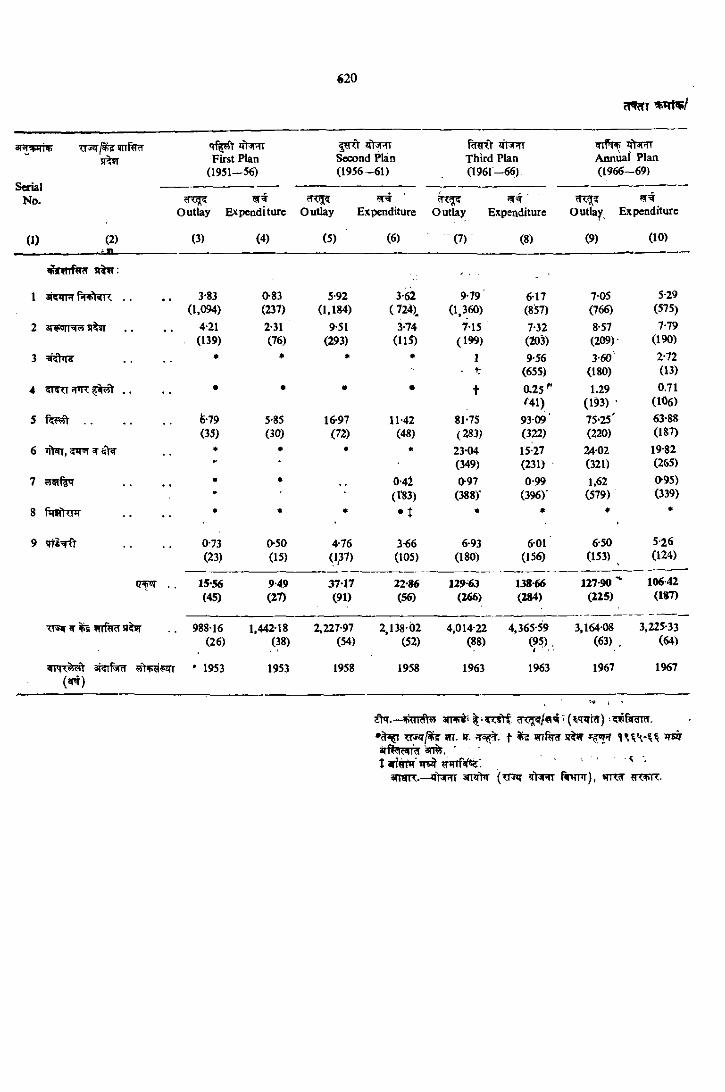
SerialNo.
»iiR(n51^ First Plan
(1951—56)Sccond Plan (1956-61)
R m t ?iTTTr Third Plan (1961-66)
Annual Plan (1966—69)
Outlay Expenditure Outlay Expenditure Outlay■
Expenditure Outlay Expenditure
0 ) (2) (3) (4) (5) (6) (7) (8) (9) (10)
, ,
1 •i4*ii'i fNvt TX . . 3-83 0-83 5-92 3-62 9-79 6-17 705 5-29(1,094) (237) (1.184) (724), (1,360) (8'57) (766) (575)
2 * i i 4 ^ « i . . . . 4-21 2-31 9-51 3-74 7-15 7-32 8-57 7-79(139) (76) (293) (US) (199) (203) (209)- (190)
3 * * * • 1 9-56 3-60 2-72- . 1; (655) (180) (13)
4 5TTTT'PTT . . • • • • t 0.25^ 1.29 0.71a i ) (193) ' (106)
5 ............................... 6*79 5-85 16-97 11-42 81*75 93-09 75-25' 63‘88(35) (30) (72) (48) (283) (322) (220) (187)
6 ?*r»r « • • « 23-04 15-27 24-02 19-829- * (349) (231) (321) (265)
1 5T«fg « • 0-42 0-97 0-99 1.62 0-95)• (V83) (388)' (396)' (579) (339)
8 fitfflOT • * * • t • • • *
9 ( i t i ^ 0-73 0-50 4-76 3-66 6-93 6-01 6-50 5-26(23) (15) (137) (105) (180) (156) (153) (124)
y+«j . . 15-56 949 3717 22-86 129-63 138-66 127-90 10642(45) (27) (91) (56) (266) (284) (225) (187)
988-16 1,44218 2,227-97 2,138-02 4.014-22 4,365-59 3,164-08 3,225-33(26) (38) (54) (52) (88) (95).4 ' (63) , (64)
3T?rf5rcT ' 1953 1953 1958 1958 1963 1963 1967 1967(«TT)
7 X ^ 1 ^ m . V. JT3 . t ^ ^an%.
I jfiffw' *T5 ■ . ■ < .arrarr.—*i 3nTT a n ^ ft nr ftxnr), ittot nTfrrr.
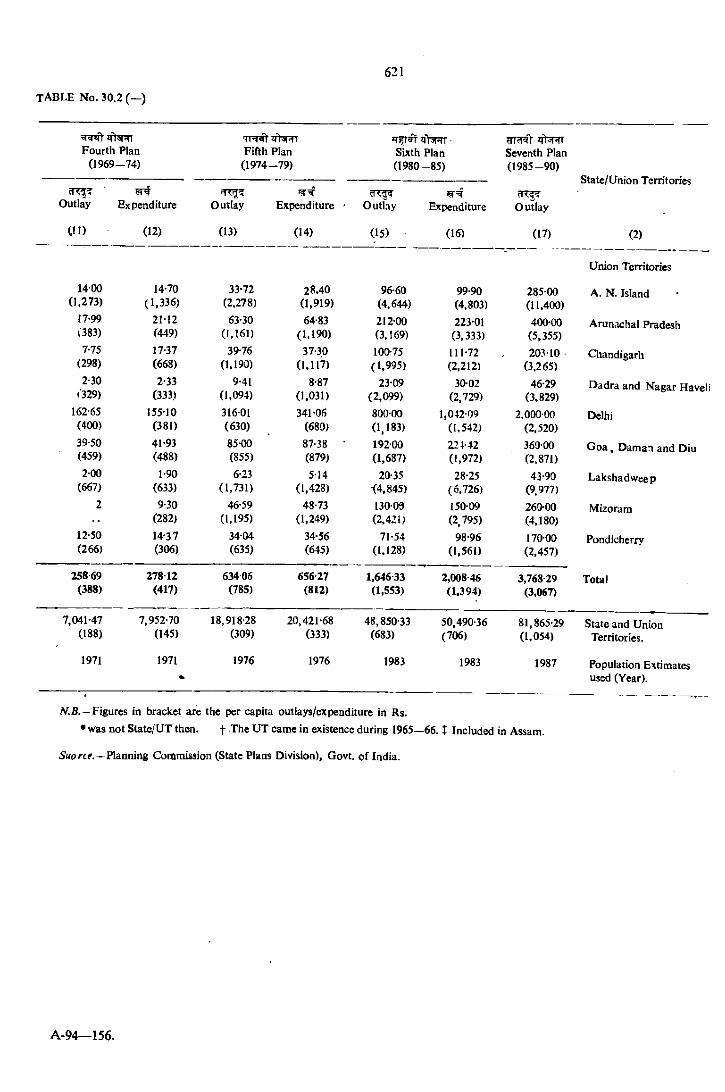
Fourth Plan (1969-74)
Fifth Plan (1974-79)
>T?r^q>3RT Sixth Plan (1980-85)
Seventh Plan (1985-90)
Outlay Expenditure Outlay Expenditure Outfay Expenditure
Slate/Union Territories
Outlav
C!l) (12) (13) (14) (15) (16) (IT) (2)
1400 14-70 33-72 28.40 96-60 99-90 285-00
Union Territories
A. N. Island(1,273) (1,336) (2,278) (1,919) (4,644) (4,803) (11,400)
17-99 2M 2 63-30 64-83 212-00 223-01 400-00 Arunachal Pradeshi383) (449) (I.I61) (1.190) (3,169) (3,333) (5,355)7-75 17-37 39-76 37-30 100-75 111-72 203-10 Chandigarh
(298) (668) (1,190) (1,117) (1,995) (2,212) (3.265)2-30 2-33 9-41 8-87 23-09 30-02 46-29 D adraand N agarHaveii
»329) (333) (1.094) (1,031) (2,099) (2,729) (3,829)162-65 155-10 316-01 341-06 800-00 1,042-09 2.000 00 Delhi
(400) (381) (630) (680) (1,183) (1,542) (2.520)39-50 41*93 85-00 87-38 • 192-00 224-42 36000 G o a , Daman and Diu(459) (488) (855) (879) (1,687) (1.972) (2.871)2-00 1-90 6-23 5-14 20-35 28-25 43-90 Lakshadw«;ep
(667) (633) (1,731) (1.428) (4.845) (6.726) (9,977)2 9-30 46-59 48-73 130-Od 150-09 260-00 Mizoram
(282) (1.195) (1,249) (2.421) (2.795) (4,180)12-50 14-37 34-04 34-56 71-54 98-96 170-00 Pondicherry(266) (306) (635) (645) (1.128) (1,561) (2.457)
258 69 278-12 6340S 656-27 1,64633 2,008 46 3,76829 Total(388) (417) (785) (812) (1,553) (1,394) (3,067)
7,041-47 7,952-70 18,918-28 20,421-68 48,850-33 50,490-36 81,865-29 State and UnionC188) (145) (309) (333) (683) (706) (1.054) Territories.
1971 1971 1976 1976 1983 1983 1987 Population Extimatesused (Year).
MS. —Figures in bracket are the per capita outlays/expeoditure in Rs.
• was not State/UT then. f The U T came in existence during 1965—66. X Included in Assam.
5wrc(>.—Planning Comraiision (State Plans Division), Govt, o f India.
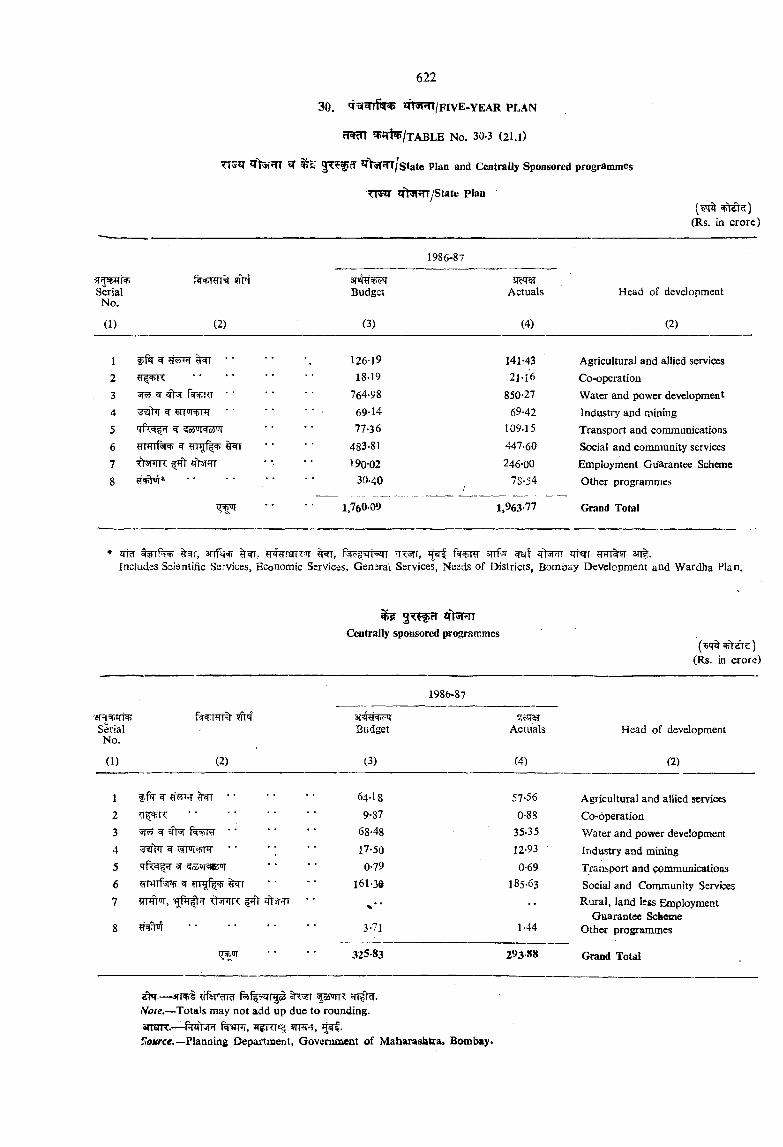
30. 41«IHI|f IVE-YEAR p l a n
cR m ^*«Ti^/TABLE No. 30-3 (21.l)
ffT ^ *rt«T5TT/ State Plan and Centrally Sponsored programmes
■Trm cft^ffT/State Plant€RT)
(Rs. in crorc)
1986-87
SerialNo.
(1)
9frt
(2)
Budget
3)
sRiraActuals
(4)
Head of development
(2)
1 12619 141-43 Agricultural and allied services2 18-19 2M'6 Co-operation3 515 ^ • ‘ 764-98 850-27 Water and power development4 69-14 69-42 Industry and mining5 77-36 109-15 Transport and communicatioas6 9T Tf l=f> ^ 9RT 483-81 447-60 Social and community services7 fhSFTR ^ q>3r^ 190-02 246-00 Employment Guarantee Scheme8 q#ot* 30-40 78-54 Other programmes
1,760-09 1,963-77 Grand Total
* JTM arrf in ’K rr, jsrf r>qrRr snfor ^yf irt^ i ifi=5rr rtTTwr ant.Includes Ssisntific Services, Economic Services, Gsnsral Services, Ncsds of Districts, Bombay Development and Wardha Plan.
^ sft^RTCentrally sponsored programmes
(Rs. in crore!
1986-87
5ft''? ST RRiFfSerial Budget Actuals Head of developmentNo.
(1) (2) (3) (4) (2)
1 f ft' ^ ^ • * 64-18 57-56 Agricultural and allied services2 ........................................... 9-87 0-88 Co-operation3 ^ ' • 68-48 35-35 Water and power development4 vd' l r ^ J prrsfrnr • • •; 17-50 12-93 Industry and mining5 0-79 0-69 Transport and communications6 161-30 185-63 Social and Conununity Services7 rrcfroT, < lw < zft5T?ri • * * Rural, land less anployment
Gaarantce Schcme8 3-71 1-44 Other programmes
rr oi 325-83 293-88 Grand Total
Note.—Totals may not add up due to rounding. arrafK.— f^ww,.tToKrce.—Planning Department, Governnaent of Maharaslatra. Bombay.
1. j o i n t s t o c k c o m p a n ie s
?f?5rKt m 31.1. Data on Joint Stock Companies are given^ g ^ . " in this section.
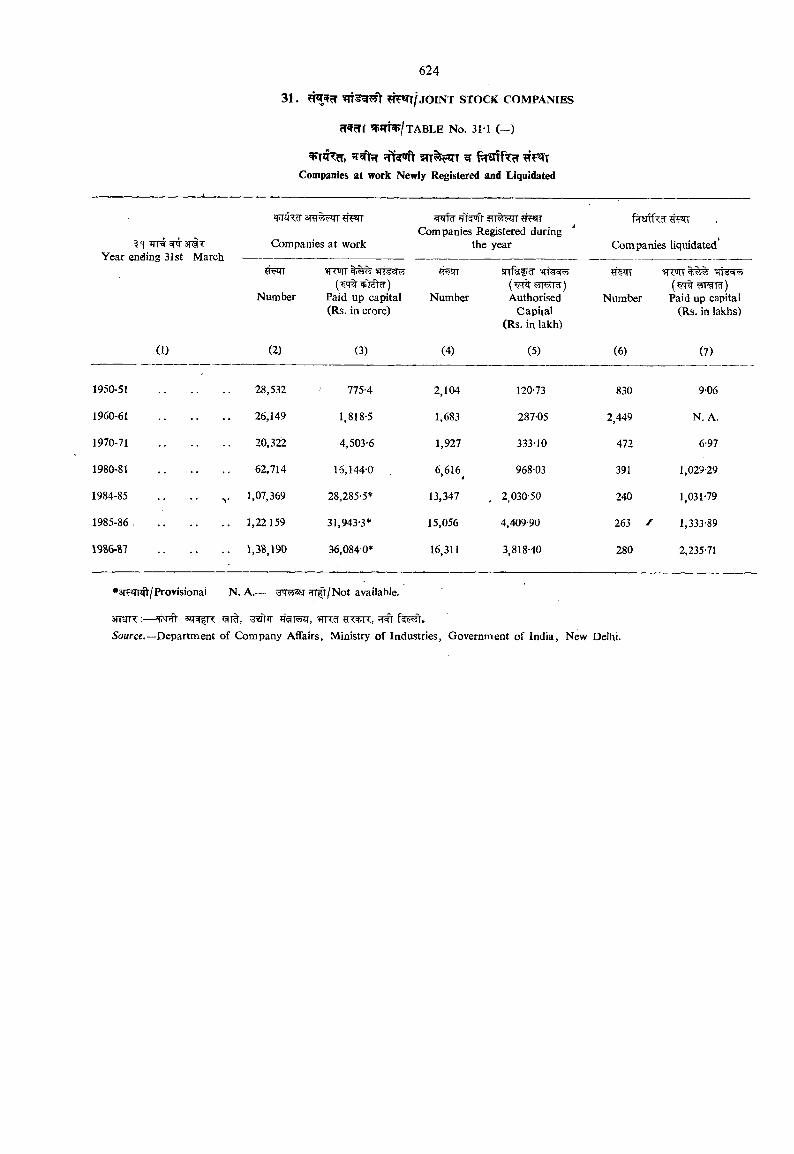
s fw t § n ^ T ^ 5Ef TCompanies at work Newly Registered and Liquidated
jqr^^3Ti?rT Year ending 31st March
sRT irr
Companies at work
?rr ?ziT ?r T Companies Registered during
the year Companies liquidated
Number Paid up capital (Rs. in crore)
Number(^5!T W ) Authorised
Capital (Rs. in lakh)
jnjTFT)Number Paid up capital
(Rs. in lakhs)
(I) (2) (3) (4) (5) (6) (7)
1950-51 28,532 775-4 2,104 120-73 830 9-06
1960-61 26,149 1,818-5 1,683 287-05 2,449 N. A.
1970-71 20,322 4,503-6 1,927 333-10 472 6-97
1980-81 62,714 16,144-0 6,616^ 968-03 391 1,029-29
1984-85 1,07,369 28,285-5* 13,347 , 2 030-50 240 1,031-79
1985-86 , .. 1,22159 31,943-3* 15,056 4,409-90 263 / 1,333-89
1986-87 .. 1,38,190 36,084 0* 16,311 3,818-40 280 2,235-71
Provisional N. A.— frr|t/Not available.
3TTSTTT :—Source.—Department of Company Affairs, Ministry of Industries, Government of India, New Delhi.
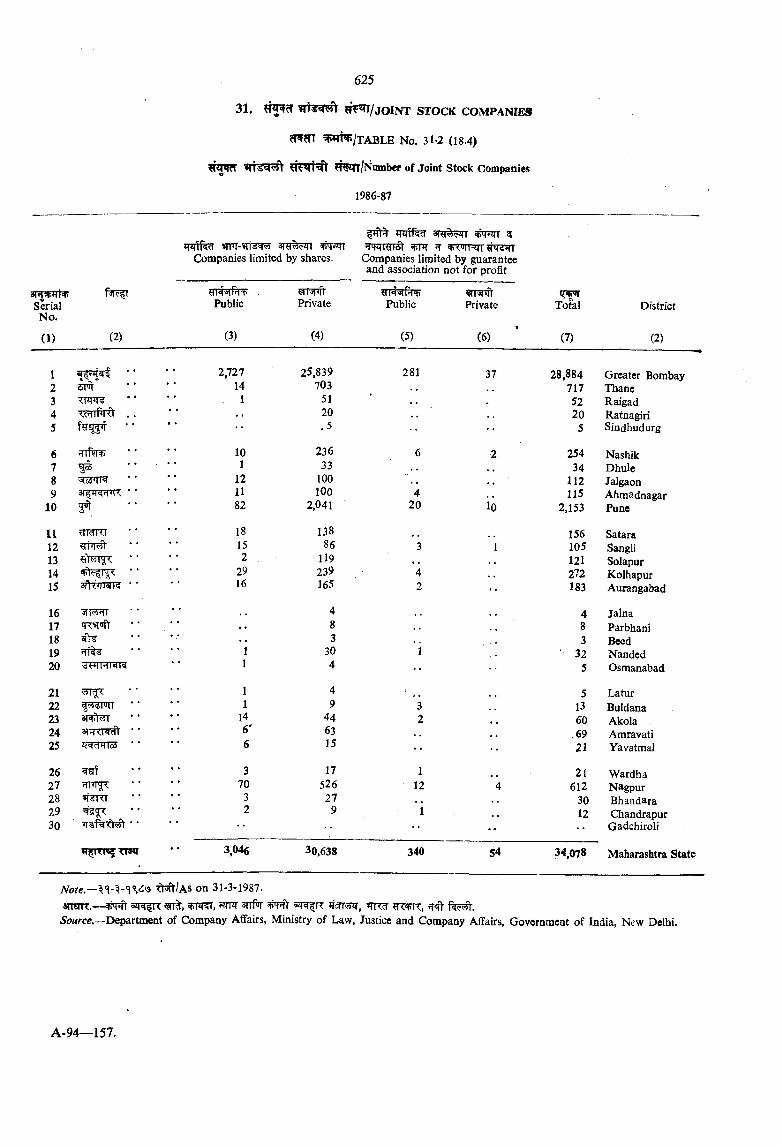
31. JOINT STOCK COMPANIES
cT^m W ^/T A B L E No. 31-2 (18 4)
rsRcT #®cn/Number of Joint Stock Companies
1986-87
Tri<?R{ T +'?«<! w’T'WRrra)- ^ 5T VTiTFiT
Companies limited by shares- Companies limited by guaranteeand association not for profit
<s(N n 9TinTtSerial Public Private Public Private Total DistrictNo.
(1) (2) (3) (4) (5) (6) (7) (2)
1 2,727 25,839 281 37 28,884 Greater Bombay2 5FI 14 703 717 Thane3 " 1 51 52 Raigad4 • * 20 20 Ratnagiri5 .5 5 Sindhudurg
6 ?rir?riti’ 10 236 6 2 254 Nashik7 • • 1 33 34 Dhule8 12 100 . , 112 Jalgaon9 11 100 4 115 Ahmadnagar
10 82 2,041 20 io 2,153 Pune
11 yidKI 18 138 156 Satara12 15 86 3 1 105 Sangli13 2 119 121 Solapur14 29 239 4 272 Kolhapur15 16 165 2 •• 183 Aurangabad
16 • • 4 4 Jalna17 q^afr ' * 8 8 Parbhani18 ' ■ 3 3 Beed19 1 30 I ' 32 Nanded20 ■d< HN!<4 1 4 •• 5 Osmanabad
21 1 4 5 Latur22 1 9 3 13 Buldana23 3|t>l'7iT 14 44 2 60 Akola24 * * 6* 63 69 Amravati25 Z)=ld*llQi 6 15 •• • • 21 Yavatmal
26 c)yl 3 17 1 21 Wardha27 riw^< • • 70 526 12 4 612 Nagpur28 3 27 30 Bhandara29 *• 2 9 1 12 Chandrapur30 iTsf^Tt5?t ' ' •• •• •• Gadchiroli
vr TTTS TT51T 3.046 30,638 340 54 34,078 Maharashtra State
iVo/e.— f t ^/ As on 31-3-1987.arrsTR.— anfr ^ 1 - sjr^fR ftmm, «tr^ ^ranr, jrY
5o«rce.—Department of Company Affairs, Ministry of Law, Justice and Company Affairs, Government of India, New Delhi.

32. 3 2 . P U B L IC U N D E R T A K IN G S
^?T1^ 32.1. Data on State Agro Industries, Housing and Area^ s r lf^ f f%r?T Development Board, State Finance Corporation are given 1b
^T f^U TT^ 3TT|. this Section.
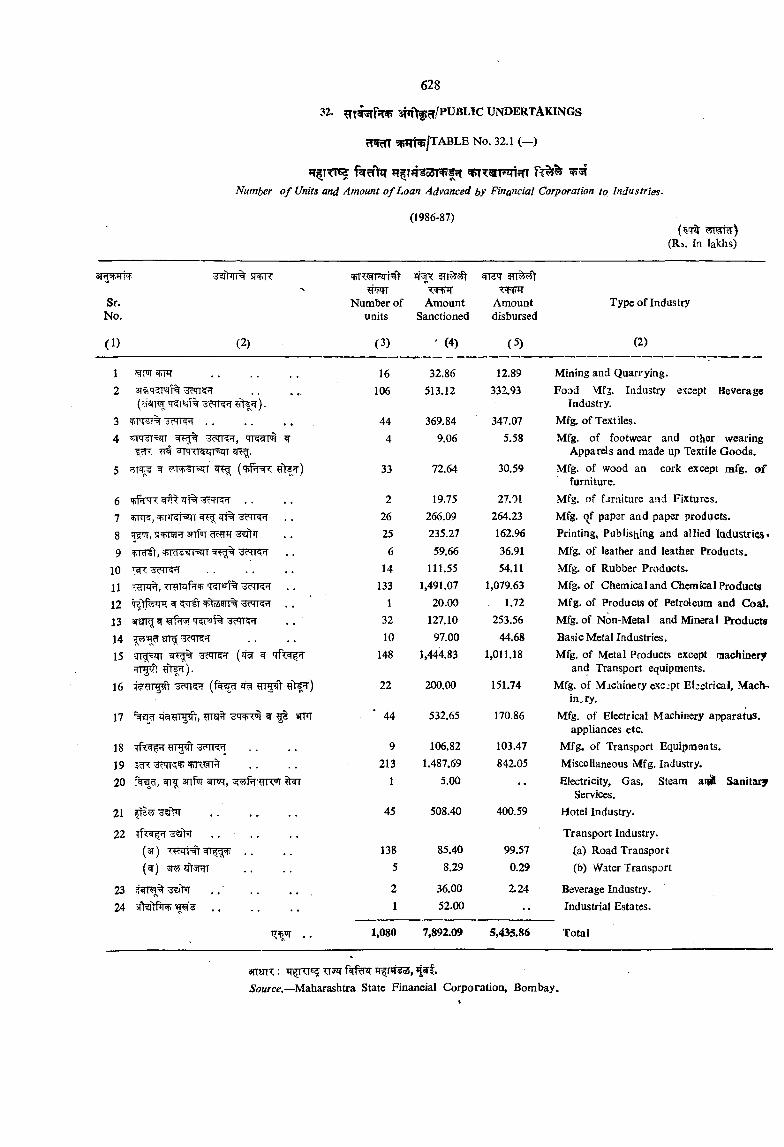
32. am^^^/PUBLlC u n d e r t a k in g s
rn m ^i^Ti^/TABLE No. 32.1 ( - )
?T T?T3o5T f?r ffNumber o f Units and Amount o f Loan Advanced by Financial Corporation to Industries-
(1986-87)
(Rs. in lakhs)
3|HW^O
Sr.No.
(1) (2)
§TT55t <\iHf qr TWH
Number of Amount Amountunits Sanctioned disbursed
1
>KTqT% .
3 WrST% . . . . . .4 3rrqiT=5qT TRgrm ^
^ ^ rq n w sjn ^ .5 ^ ^ g>f5)
6 ^ 3TT% ■'3?7RHI . .7 5TFR, +HKi' T lTt% 'dcMK'l8 5) Tm?r anf'iT9 nTciWPEZTT
10 3?'7T11 v^n^, ..12 ^ ^wr% ..13 ^14 3?rr?-T15 3?TRfT ^ 'T f t ^
16 q'^ frg# m rrpT- ^>fr)
17 %sr D'^^rrpl, ?TTsr% ^ g s ?rR
18 rtTT5FT19 5 ^ 'drM(< 'h +120 snf% ^
2122 ifWT
(3t)(^) ^ jft PTT
23 if Ti|%24 . .
(3) ' (4) (5)
Type of Industry
(2)
16 32.86 12.89 Mining and Quarrying.106 513.12 332.93 Food Mfj, Industry except Beverage
Industry.44 369.84 347.07 Mfg. of Textiles.
4 9.06 5.58 Mfg. of footwear and other wearingAppards and made up Textile Goods.
33 72.64 30.59 Mfg. of wood an cork except nafg. o ffurniture.
2 19.75 27.01 Mfg. of furniture and Fixtures.26 266.09 264.23 Mfg. of paper and paper products.25 235.27 162.96 Printing, Publishing and allied ladustcics^
6 59.66 36.91 Mfg. of leather and leather Products.14 111.55 54.11 Mfg. of Rubber Products.
133 1,491.07 1,079,63 Mfg. of Chemical and Chemical Products1 20.00 1.72 Mfg. of Products of Petroleum and Coal.
32 127.10 253.56 Mfg. of Non-Metal and Mineral Products10 97.00 44.68 Basic Metal Industries.
148 1,444.83 1,011.18 Mfg. of Metal Products except machineryand Transport equipments.
22 200.00 151.74 Mfg. of Machinery except Ebctrical, Machinery.
44 532.65 170.86 Mfg. of Electrical Machinery apparatus.appliances etc.
9 106.82 103.47 Mfg. of Transport Equipments,213 1.487.69 842.05 Miscellaneous Mfg. Industry.
1 5.00 . . Electricity, Gas, Steam aq^ SanitaryServices.
45 508.40 400.59 Hotel Industry.
Transport Industry.138 85.40 99.57 (a) Road Transport
5 8.29 0.29 (b) Water Transport
2 36.00 2.24 Beverage Industry.1 52.00 . . Industrial Estates.
1,080 7,892.09 5,435.86 Total
arrgrr :5oM/-ce.—Maharashtra State Financial Corporation, Bombay.
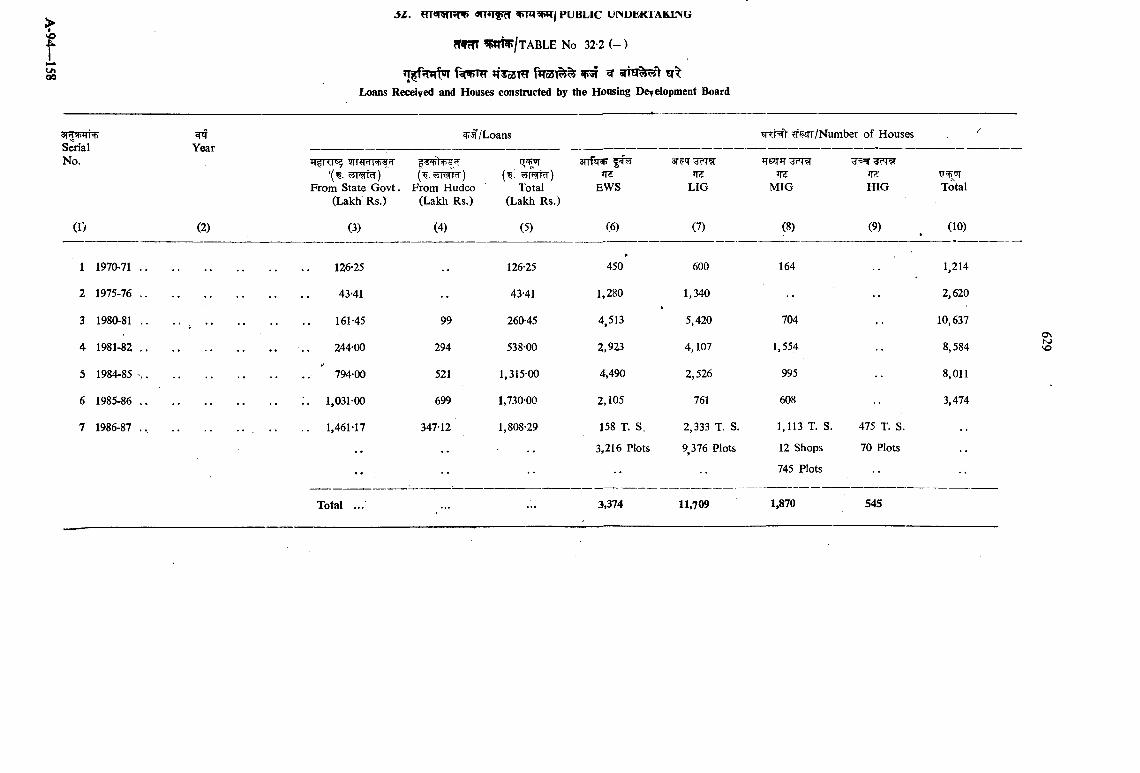
p u b l i c uiMUKKiAKUNCi
JT^osm f»To5i%% ^ ^Loans Receiyed and Houses constructed by the Housing Development Board
/
SerialNo.
Year^ /Loans ?TWT/JNumDer oi tiouses
(^. ^MTcT) From Hudco
(Lakh Rs.)
3TTf^ 5^^ir:
EWS
3T?'T c'TW
LIG HIG’(^. WR<id)
From State Govt. (Lakh Rs.)
try'll-(^ .
Total (Lakh Rs.)
T6q-*T
MIGtJsp'JTTotal
(1) (2) (3) (4) (5) (6) (7) (8) (9) (10)
1 1970-71 126-25 126-25 450 600 164 1,214
2 1975-76 43-41 •• 43-41 1,280 1,340 •• 2,620
3 1980-81 . . . . . . 99 260-45 4,513 5,420 704 10,637
4 1981-82 294 538-00 2,923 4,107 1,554 8,584
5 1984-85 794-00 521 1,315-00 4,490 2.526 995 8,011
6 1985-86 , ;. 1,031-00 699 1,730-00 2,105 761 608 3,474
7 1986-87 . . . . 1,461-17 347-12 1,808-29 158 T. S, 2,333 T. S. 1,113 T. S. 475 T. S.
. . . 3,216 Plots 9,376 Plots 12 Shops 70 Plots
-• •• 745 Plots
Total ... 3,374 11,709 1,870 545
<7\O
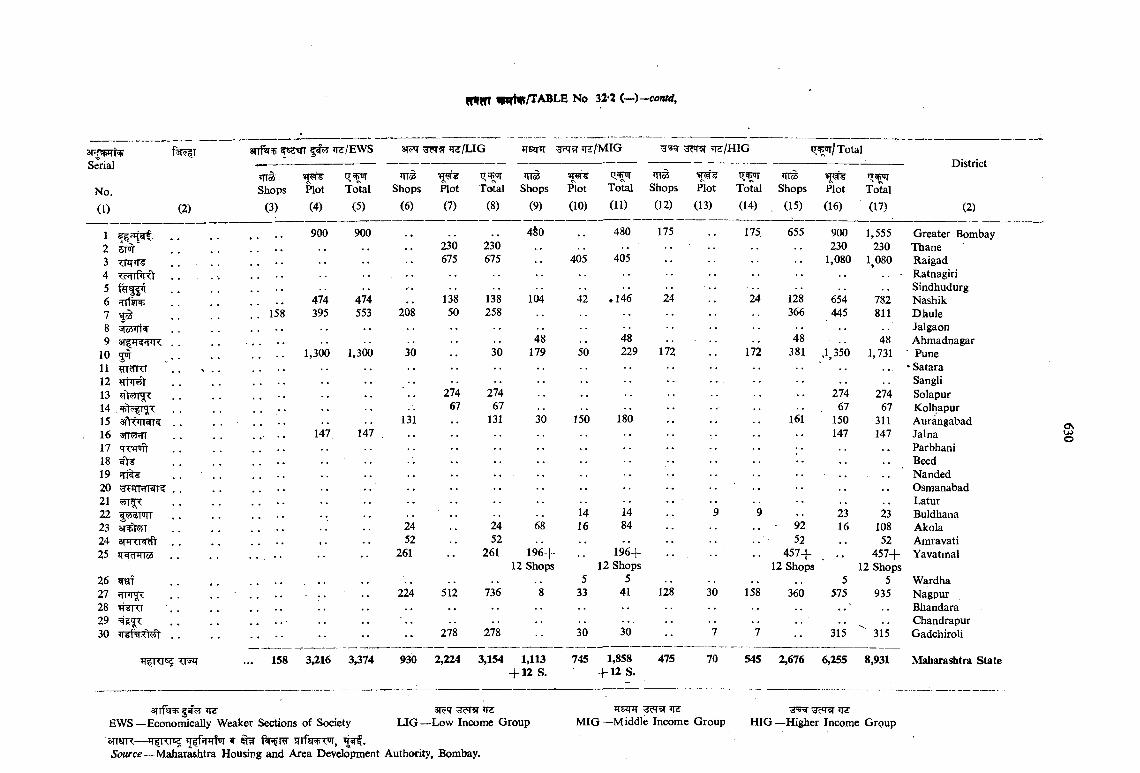
Serial
No.
(0 (2)
3|#r5p HZ/EWS 3T?q ^ ? r »1Z/LIG iTEJm irt/MIG ;3?T$r ^ /H IG iTspur/Total
na'Shops
(3)Plot(4)
Total(5)
mo5Shops
(6)Plot(7)
rio5Total Shops
(8) (9)Plot(10)
TT3STotal Shops Plot(11) (12) (13)
m3Total Shops Plot(14) . (15) (16)
”5^Total(17)
District
(2)
1 * • 900 900 4§0 480 175 175 655 900 1,555 Greater Bombay2 ST , , 230 230 ... 230 230 Thane3 TRT^ . . . • • 675 675 405 405 1,080 1,080 Raigad4 cHrnift . . . . . Ratnagiri5 . . Sindhudurg6 4inji+ • • 474 474 138 138 104 ♦ 146 24 24 128 654 782 Nashik7 IS . . . !! 158 395 553 208 50 258 366 445 811 Dhule8 o4 flW . . . . . . Jalgaon9 48 48
17248 48 Ahmadnagar
10 5^ 1,300 1,300 30 30 179 229 172 381 ,1,350 1,731 Pune11 mcTRr . . • Satara12 . . • • Sangli13 . . 274 274 274 274 Solapur14 67 67 67 67 Kolhapur15 . . 131 131 30 150 180 • • 161 150 311 Aurangabad16 147 147 , 147 147 Jalna17 . . Parbhani18 . . Beed19 . . Nanded20 • • Osmanabad21 . . • . - Latur22 14 14 23 23 Buldhana23 anit T 24 24 68 16 84 92 16 108 Akola24 SPRTW . . • • ,, 52 52 52 52 Amravati25 ir cnTToS . . •• 261 261 196+
12 Shops196+
12 Shops457+
12 Shops. •• 457+
12 ShopsYavatmal
26 sral • • , , 5 5 5 5 Wardha27 ^m < 224 512 736 8 33 41 128 158 360 575 935 Nagpur28 ’pfiRr Bhandara29 Chandrapur30 .. 278 278 30 30 7 7 315 315 Gadchiroli
TFJir
0\OJo
158 3^16 3,374 930 2,224 3,154 1,113+ 12 S.
745 1,858+ 12 S.
475 70 545 2,676 6,255 8,931 Maharashtra State
3TTf% arjq' ^EWS —Economically Weaker Sections of Society LIG —Low Income Group3TT«JR— iTfRTCS ’TffjTTjH ^ ^ R^lfsR^T^,Source —Maharashtra Housing and Area Development Authority, Bombay.
Tsjnr ^vT^rs MIG —Middle Income Group
^3^ 'TvT ^HIG—Higher Income Group
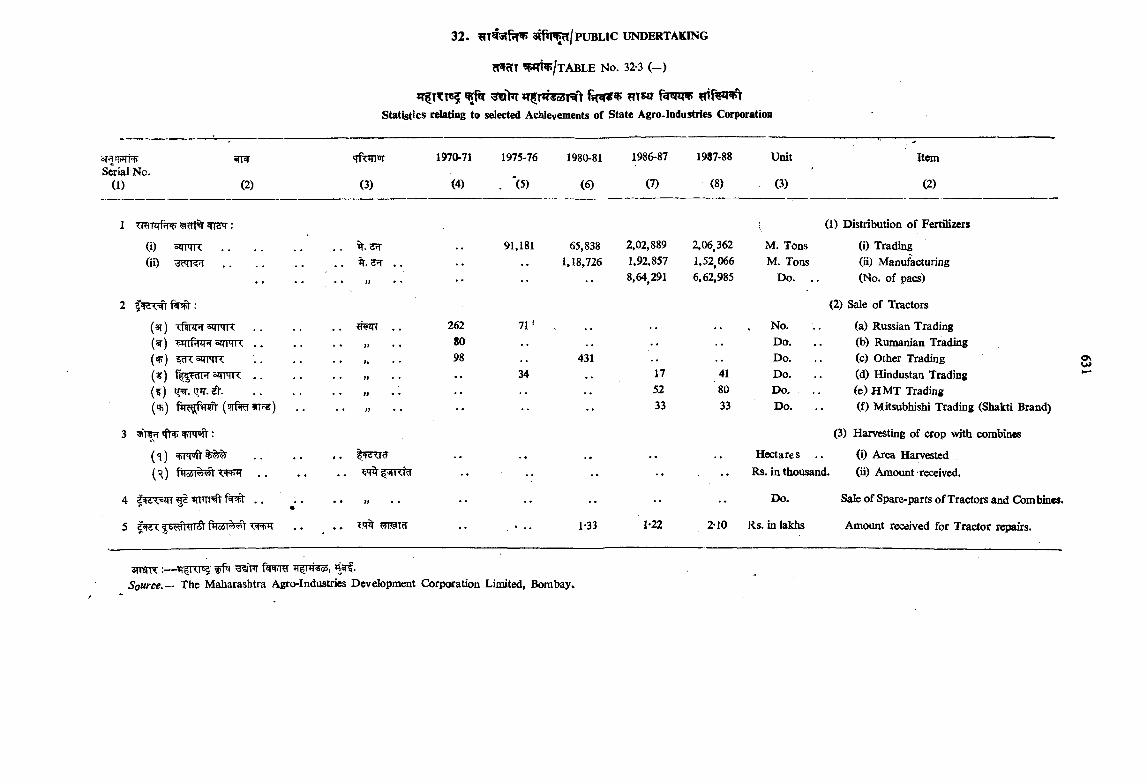
Statistics rdatiog to selected Achievemeots of State Agro.Industries Corporation
T«rSerial No.
(1) (2) (3)
m o-71
(4)
1975-76
. *(5)
1980-81
(6)
1986-87
(7)
1987-88
(8)
Unit
(3)
Item
(2)
(1) Distribution o f Fertilizers
(i) o ^ I M K .............................. 91,181 65,838 2,02,889 2,06,362 M. Tons (i) Trading(ii) 'dciK'i . . 2^ . . 1,18,726 1,92,857 1,52,066 M. Tons (ii) Manufacturing
* * II • • • • •• •• 8,64,291 6,62,985 Do. . . (No. of pacs)
(2) Sale of Tractors
(ar) Tftnrr «*TrTR , . * . 262 I V , No. (a) Russian Trading(^) 5ZTTTR . . ♦ • if ♦ • 80 Do. (b) Rumanian Trading(^ ) °MI4(< * • >* 98 431 Do. (c) Other Trading(^ ) <=iir>TR . . • * j) • • . . 34 17 41 Do. (d) Hindustan Trading( f ) qir.eT................................ w . . 52 80 Do. (e) H M T Trading(«fi) • ♦ jj « « • • • • 33 33 Do. (f) Mitsubhishi Trading (Shakti Brand)
3 *fl+ VFPiff '•
( . . (^) . .
4 ffSTsqr ^ fk^ . .
OSo>
t arrcT(3) Harvesting of crop with combines
Hectares . , (i) Area HarvestedRs. in thousand. (ii) Amount received.
1*33 1-22
Do.
2-10 Rs. in lakhs
Sale o f Spare-parts o f Tractors and Combines.
Amount received for Tractor repairs.
srraTT :— |Rfq fSRTRTSource.— The Maharashtra Agro-Industries Development Corporation Limited, Bombay.

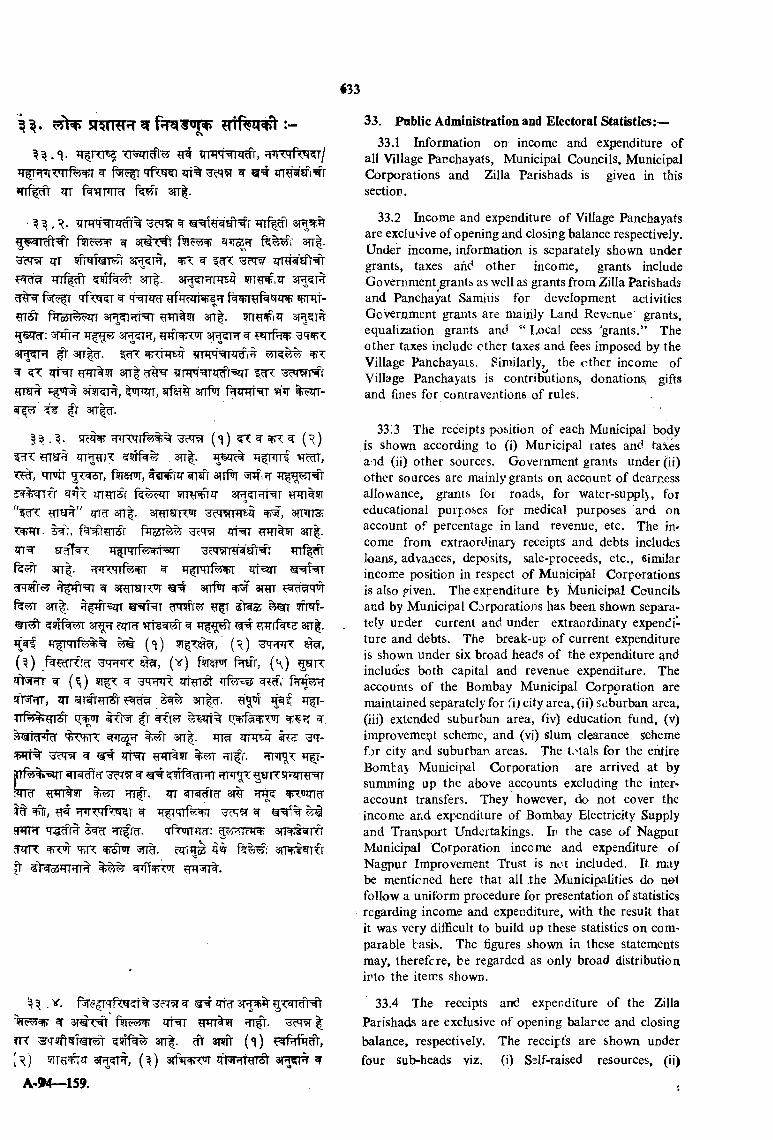
srtR H ^
. ‘i- JT^RT^ TTWcfl’ m irm^NRcfr, ti iiM^MiRri'M ^ zrr% ^ jn^sTi^r
m f^^TTO IWr 3rr|.
• . • . ?TFr'T ?T?fr% ^^ ^ %
m 9fi T<sjivTi snr^R, ^ ^ ^ctt m%fr ??if^w!' 3rr|. 3f^?rrTn>'$ arr^T#
q fw ^ ^ tf=qTiT yfqW ^iT ^ f -?TT f^TST^wr Sf’i^'i^rf'^ ?wr%9r an^. ?TT?T i2r sr F’T
3T^q[, w q rrw 3 tT 3PJ5T ^ sn"!^. fcTT <tr<iMSJT^ zTT FTT%5r 3rr| ??T>T'r TJ??f)‘'°JTT 3?crwrwr?TTSR m ^ , tjpizrT, aTTpir ffT??Trf w %?zrr- w ^ ' ^ fr 3n-|^.
5 R ^ ( i ) 5X^ vxw (^ )^ T grsr^ 3tt| . Ji^Frrf
'T l^ 5 T ^ , f9T^, snfq 5pff,;riw%rrfr mmsr wra^rq- 3{r|?T?Tr T ^nn^^T
?rra#" 3tt| . awFsrn:^ 3tt
5! nfrr. ^ 1 , fTO^ror f o r ^ ^ 'm atN t ?wr%5T 3tt| . sr^Nx TT^FTTfe rtw ^cWRf3fEi<r m%fr 3rr|. ^
^ s ra m i^ ^ anfir ^ ? f q ^3Tr|. fFfr=sqr ^ = ^ r ^iwr?? ^ s t o ^ wmf-
3 T ^ cqTrT ^ ^ 3TT|.»T^ jrfrqrfe%% ^ («i) (^)( 3 ) (v) f Ttfr, (^ ) 5?JRjft^niT ^ (^ ) 5T^ ^ ^ 3 ^ ^ trf?n^ irf^r^t I w , m ! F ^ ^ 3rr|^. m i tt^t-
v cw c 3Tr|. f m rrrre^Cv ^PTf% ^ 3 ^ ^ ?r# zrr^ ?rm%5r nifr. ?tr^^ tr^-
^ v T ?rm ^ g’lrsRmrerr?rRT%9r ?nfr. m ^ ^nr? ^ ’wrr
T # , JHT^TISRT ^ ^Tfl'TTf^ ^ ^fPTR 'T S ^ ^RT. qfwJTfr: sTRRiormjnrn: t o . m srRvlmfr
.V. f3refrqrf^?r%^cT?r^ ^qt^3ppfi%5<-^i#5fr 3T 3T#T^ f9 lc ^ q t ^ FfT . |
TFT 3rr|. ?fr awt (<i) E rfNftidt,[r ) ?rra^2r (^) srtl frTq j fm te r ^ 3t 51% ^
33. Pablic Administration and Electoral Statistics:—33.1 Information on income and expenditure of
all Village Parchayals, Municipal Councils, Municipal Corporations and Zilla Parishads is given in this section.
33.2 Income and expenditure of Village Panchaj^ats are exclusive of opening and closing balance respectively. Under income, information is separately shown under grants, taxes and other income, grants include Government grants as well as grants from Zilla Parishads and Panchayat Samiiis for development activities Government grants are mainly Land Revenue grants, equalization grants and “ Local cess 'grants,” The other taxes include ether taxes and fees imposed by the Village Panchayais. Similarly, the ether income of Village Panchayats is contributions, donations, gifts and fines for contraventions of rules.
33!3 The receipts position of each MunicipaLbody is shown according to (i) Municipal rates and taXes and (ii) other sources. Government grants under (ii) other sources are mainly grants on account of dearness allowance, grants for roads, for water-supply, for educational purposes for medical purposes and on account of percentage in land revenue, etc. The in come from extraordinary receipts and debts includes loans, adva,ices, deposits, sale-proceeds, etc., similar income position in respect of Municipal Corporations is also given. The expenditure by Municipal Councils and by Municipal Corporations has been shown separately under current and under extraordinary expenditure and debts. The break-up of current expenditure is shown under six broad heads of the expenditure and includes both capital and revenue expenaitare. The accounts of the Bombay Municipal Corporation are maintained separately for fi ) city area, (ii) suburban area,(iii) extended suburban area, 'iv) education fund, (v) improvement scheme, and (vi) slum clearance scheme f jr city and suburban areas. The t.>tals for the entire Bomtay Municipal Corporation are arrived at by summing up the above accounts excluding the interaccount transfers. They however, do not cover the income and expenditure of Bombay Electricity Supply and Transport Undertakings. In the case of Nagpur Municipal Corporation income and expenditure 0/ Nagpur Improvement Trust is not included. It may be mentioned here that all the Municipalities do not follow a uniform procedure for presentation of Statistics regarding income and expenditure, with the result that it was very difl&cult to build up these statistics on comparable basis. The figures shown in these statements may, therefore, be regarded as only broad distribution into the items shown.
33.4 The receipts and experditure of the Zilla Parishads are exclusive of opening balance and closing balance, respectively. The receipt’s are shown under four sub-heads viz. (i) Self-raised resources, (ii)
^Fmfe ^ w ^ , ^ ? T ^ ^ ^ f^?^r^<-tRTrTr T3T % ^ irf^ ?r*TT%9r srr^. sr^-JTRT 3 r^ ^ , arf^JT, anWTqT
ar-T r T, ST'T ’T, TTJ 3T^vT ^ca'if<= r w ^ 3rr|.msnROT 5T9IT , ( ^ ) f w ^ , ( ^ ) m \ ^
(V) ^ fHTwr ^ (h) l a r qr qr^ «rmrcr 3it|. w sT N rrm ^r^ i ^ p r ”qr 9iNf9#t <s(^Tt, i Tfft. fT ^
srr^, ctrt ?nf?Tsp t e R r ^r^nrr, srfw jrzhvnrranfn ^rtgrmr'i zft^prr 3rr|.
A- f n ^ fW ff-;?nTT wrfrm arrfw §tt % ^cJTr^l-c> • «\
^^rer 3Tt| .
Government grants, (iii) grants for agency schemes and(iv) debt section, Selfraised resources are mainly land revenue cess, local cess, local revenues, other taxes and fees imposed by the Zilla Parishads. While Government grants are mainly land revenue grants, purposive grants, establishment grants, plan grants, block grants etc. The expenditure is likevvise shown under five broad heads, viz. (i) General administration, (ii) education, (iii) community development, (iv) debt section and (v) others. The expenditure under community development is exclusive of expenditure under the head miscellaneous departmenti>. It is also restricted to revenue expenditure and does not include capital expenditure and loans and advances. However, it includes revenue expenditure under local development works, agency schemc, training scheme and other general schemes.
33.5 Results o f General election of Lok Sabha & Vidhan Sabha party wise votes polled etc. are given this section.
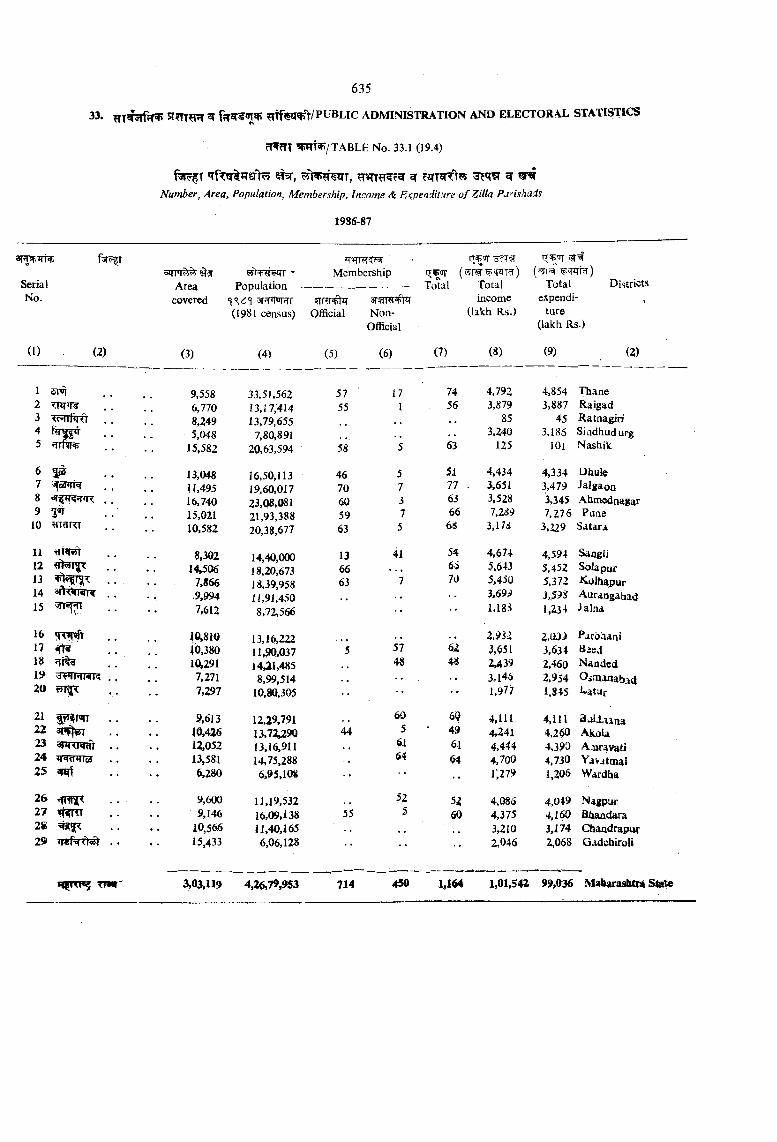
^ cm5TT\ ^q?r ^ ^Number, Area, Population, Membership, Income & EKpeniiture o f Zilla Parishais
1986-87
SerialNo.
(1)
5irTT^#3 • Membership q^orArea P op u la tion -------------- -------- ----- Total Totalcovered 5rr?r zT arww#^ income
(1981 census) Official Non- (Ukh Rs.)Official
(2) (3) (4) (5) (6) (7) (8)
fT ur (^i'^ qRT r)
Total expendi
ture (lakh Rs.)
(9)
Districts
(2)
1 9,558 33,51,562 57 17 74 4,792 4,854 Thane2 6,770 13,17,414 55 1 56 3,879 3,887 Raigad3 ^ r P i ^ 8.249 13,79,655 85 45 Ratnagiri4 r-H 4T 5,048 7,80,891 3,240 3,185 Siadhudurg5 15,582 20,63,594 58 5 63 125 lOi Nashik
6 ^ 13,048 16,50,113 46 5 51 4,434 4,334 Dhute7 11,495 19,60,017 70 7 77 . 3,651 3,479 Jalgaon8 , . 16,740 23,08,081 60 3 63 3,528 3,345 Ahmednagar9 3'»T 15,021 21,93,388 59 7 66 7,289 7,276 Pari3
10 «T«n:r 10,582 20,38,677 63 5 68 3,1 3.Z29 Satara
11 8,302 14,40,000 13 41 54 4,674 4,594 Sdagli12 14,506 18,20,673 66 6 i 5,643 5,452 Sola pur13 . . 7,866 18,39,958 63 7 70 5,450 5,372 Kolhapur14 . . 9,994 U ,91,450 , , 3,69J 3,598 Aurangabad15 7,612 8,72,566 •• 1.18S 1,234 la ln a
16 10,810 13,16,222 . , 2 ,m 2.033 P.iroIiani17 10,380 11,90,037 5 57 62 3,651 3,634 Basd18 10,291 14^1,485 4S 4S 2,439 2,460 Mandcd19 . , l a n 8,99,514 3,146 2.954 05maxiaba,420 7,297 10,80,305 •• 1,977 1,845 1-atUr
21 fi??r«rr . . 9,613 12,29,791 60 69 4,111 4 ,11122 dH 'juT 40,426 13,72,290 44 5 ‘ 49 4.241 4,260 Akola23 3 |u ^ 'V , . 12,052 13,16,911 61 6-1 4,444 4,3?0 Ajiravati2 4 . . 13,581 14,75,288 64 H 4.700 4,730 Yavatmai25 6,280 6,95,108 •• •• l ‘,279 1,206 Wardha
2 6 9,600 11,19,532 .. 52 54 4,086 4,049 Nagpur2 7 ^^rtT 9,146 16,09,138 55 5 60 4,375 4,160 fiiiaadara28 10,566 11,40,165 3,210 3,174 Oiaadrapur2 9 . • 15,433 6,06,128 2,046 2,068 Qadchiroli
Tra’f ' 3,03,119 4 ^ 7 9 ,9 5 3 714 450 1464 1 ,01,5^ 99,036 MabarashtTii Stsito
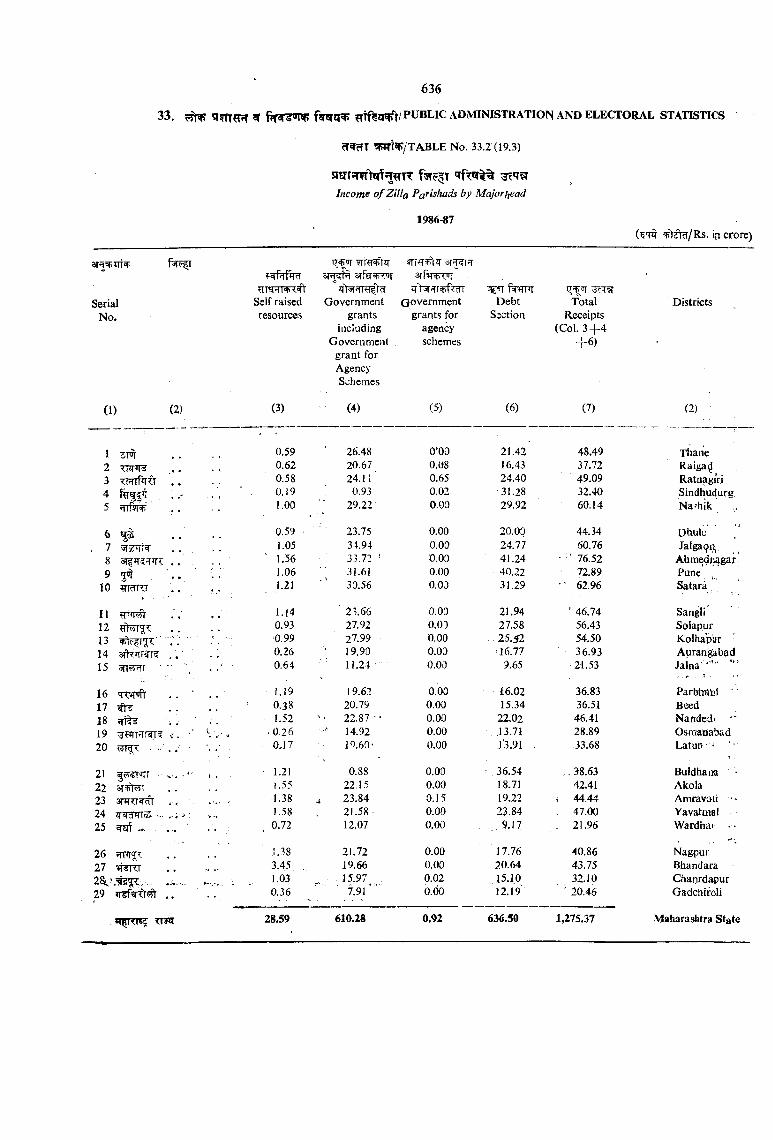
cT cTT ^ W /T A B L E No. 33.2 (19.3)
srsrrjmW5T?TTTIncome o f Zilla Pa^ishads by Major head
1986-87^>€t^/Rs. ip crore)
SerialNo.
(1) (2)
9Tr?T ir3Tfwwr"
DebtSsction
(6)
Total Receipts
(Col. 3 + 4+ 6 )
(7)
Districts
(2)
dTT FT
Government grants
including Government
grant for Agency Schemes
(4)
TT?ni+<5ft Self raised resources
(3)
Government grants for
agency schemes
(5)
1 5M 0.59 26.48 O’OD 21.42 48.49 Thane2 THT’Tl . . . , 0.62 20.67 0.08 16.43 37.72 Raigai^3 wT^rfr ,* 0.58 . 24.11 0.65 24.40 49.09 Rataagiri4 . . .- . , ' 0.19 0.93 0.02 31.28 32.40 Sindhudurg5 rrrfsfT 1.00 29.22' 0.09 29.92 60.14 Na 'hik
6 ^ 0.59 23.75 0.00 20.00 44.34 Dhulc. 7 . . , . . 1.05 34.94 0.00 24.77 60.76 Jalga ii,
8 3Tfir?;TTr?: . . . . . ' 1.56 33.72 ' 0.00 41.24 ■ ' 76.52 Ahme^n^gar9 5^ 1.06 31.61 0.00 40.22 72.89 Pune ,
10 JTRTRT 1.21 30.56 0.00 31.29 • 62.96 Satara
11 ^ w r 1.14 ■ 23.66 0.00 21.94 '46.74 Sangli12 . . 0.93 27.92 0.03 27.58 56.43 Soiapur13 : . ; 0.99 27.99 0.00 . . 25.52 54.50 Kolhapur14 arKirm? . . ' ' . . 0.26 ‘ 19.90 0.00 16.77 36.93 Aurangabad15 5rr?j r ' ” 0.64 11.24- 0.00 9.65 21.53 Jaina'
16 q w ft . . ' . . 1.19 19.62 0.00 1.6.02 36.83 Parbhaiil '17 ^ 0.38 20.79 0.00 15.34 36.51 Beed18 1.52 '• 22.87-- 0.00 22.02 46.41 Nanded-19 -r. '■ V.-« 0.26 ■' 14.92 0.00 .13.71 28.89 Osmababad20 . . 0.J7 10.60' 0.00 J'3.91 33.68 Latup <
21 ■ . -"■ i .■ • 1.21 0.88 0.00 ■ 36.54 .38.63 Buldhana22 3T^T i.55 22.15 0.00 .18.71 42.41 Akola23 apTTT dt ^ 1.38 u, 23.84 0.15 19.22 , 44.44 Amravati ■ -24 - .-• 1.58 21.58 - 0.00 23.84 47.00 Yavatnial25 WElf U . : . : . . : , 0.72 12.07 0.00 9.17 . 21.96 Wardhai --
26 J.38 21.72 0.00 17.76 40.86 Nagpur27 3.45 19.66 0.00 20.64 43.75 Bhandara
1.03 15.97. . 0.02 15.10 ,32.10 Chanrda.pur29 irsfErCt^ . . . . 0.36 7.91'’ o.do 12.19 ' 20.46 Gadchiroli
TTSa 28.59 610.28 0.92 636.50 1,275.37 Maharashtra State
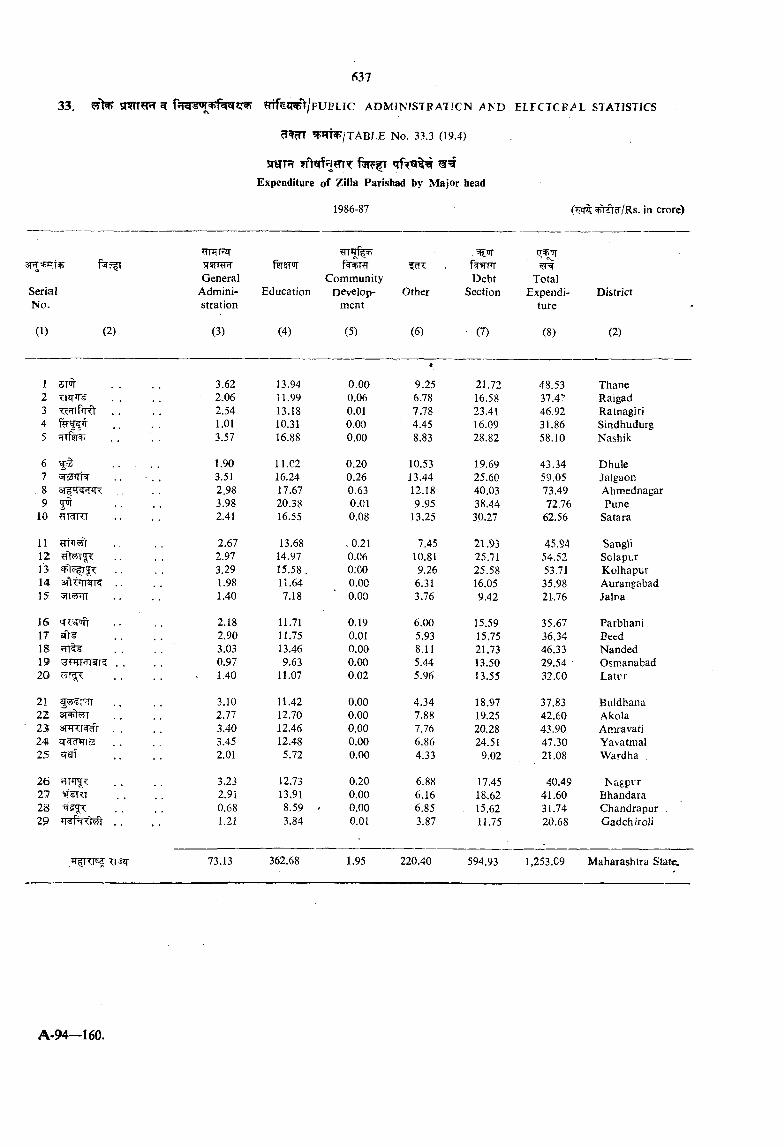
33. ^ ^ ^igJWl'/pUBLIC ADMJNISTFATICN y^ND ELFCTCE/L STATISTICS
sraT?rExpenditure of Zilla Parishad by Major head
SerialNo.
(1) (2)
mTTFzr5T5TRRGeneral
Administration
(3)
Education
(4)
r +f'eCommunity
Development
(5)
Other
(6)
. <IT
DebtSection
(7)
TotalExpendi
ture
(8)
District
(2)
1 ST' f2 Trq-^34 fepJT5
6 ^7 Wos m89 jiif
10 HTcTRT
1112 ^ l'31415
16 Tr iiTt1718 ?Tt^1920
2122 3r >TT23 sriRTwr2425
262728 29
3.622.062.541.013.57
1.90 3.512.983.98 2.41
2.672.97 3.291.981.40
2.182.90 3.03 0.971.40
3.102.773.40 3.45 2.01
3.232.91 0.68 1.21
13.9411.9913.1810.3116.88
11.0216.2417.67 20.38 16.55
13.68 14.97 15.58 . 11.647.18
11.7111.7513.46 9.63
11.07
11.4212.7012.46 12.485.72
12.7313.918.593.84
0.000.060.010.000.00
0.200.260.630.010.08
. 0.21 0.06 0.00 0.00 0,00
0.190.010.000.000.02
0.000.000.000.000.00
0.20 0.00 0.00 0.01
9.256.787.78 4.45 8.83
10.5313.4412.189.95
13.25
7.4510.819.26 6.313.76
6.005.938.115.445.96
4.347.887.76 6.86 4.33
6.88 6.16 6.85 3.87
21.7216.58 23.41 16.09 28.82
19.6925.6040.0338.4430.27
21.9325.7125.58 16.059.42
15.5915.7521.7313.50 13.55
18.9719.2520.2824.51
9.02
17.45 18.62 15.6211.75
48.53 37.4: 46.92 31.86 58.10
43.34 59.0573.49 72.76
62.56
45.9454.5253.7135.9821.76
35.6736.34 46.3329.54 32.CO
37,8342.60 43.90 47,30 21.08
40.4941.60 31.7420.68
ThaneR igadRatm giriSindhudurgNasbik
DhvieJ^Jgaon‘ bmednagarPune
Satara
SangUScJaptrKolhapur^ ran abadJaJna
P^rbhaniBeedNandedOsmanabadLatvr
BuidhanaAkoJaAmravatlVavatnialWardha
NagprrBhandaraChandrapurGadchkoU
73.13 362,68 1.95 220.40 594.93 1,253.09 Maharashtra State.
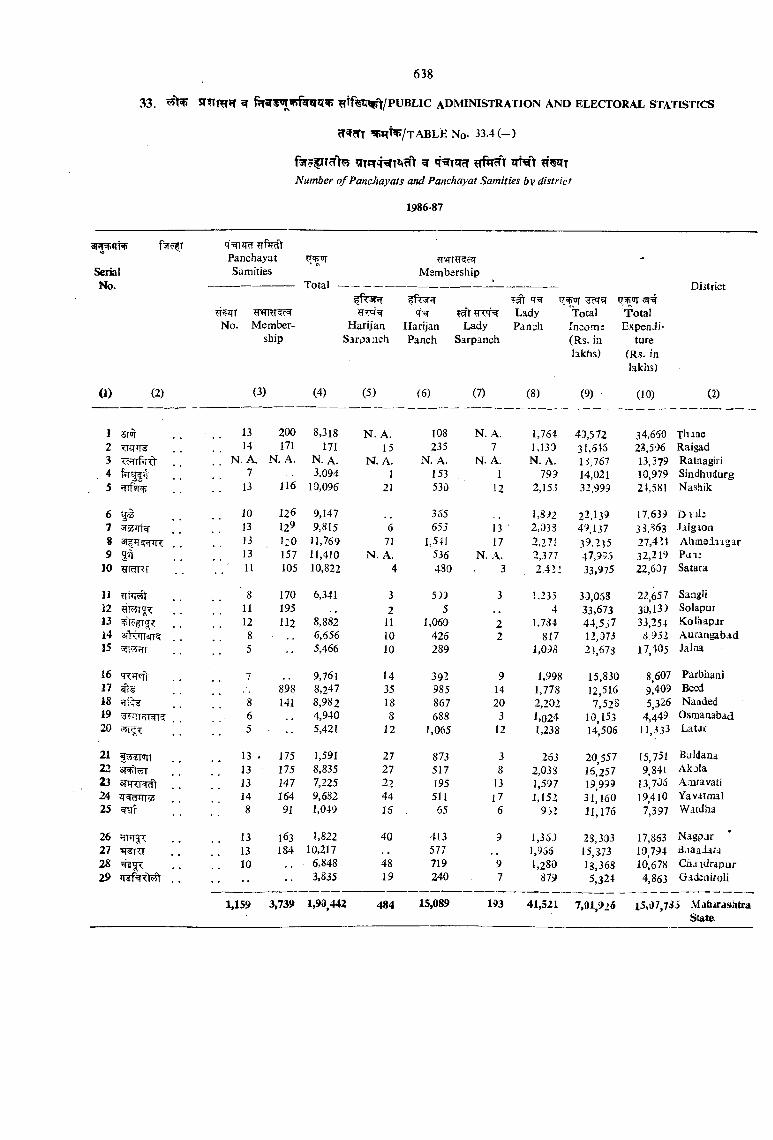
33, ^ ??tf^tI^'^/PUBLIC a d m in is t r a t io n a n d e l e c t o r a l st a t ist ic s
^^t^/TABLE No. 33.4 ( - )
f3T?frT?r>?5 ^ »r= t(r! ?r^cfT BrmtNumber o f Panchayats and Panchayat Samities by district
1986-87
SerialNo.
fsT r
(1) (2)
PanchayatSamities
No. Membership
(3)
Msmbership Total ----------------------------------
(4)
T3TfT 3?T?T?Rcf=5r Lady Total Total
Harijan Harijan Lady Pansh Incoma ExpendiSarpaiich Panch Sarpanch (Rs. in ture
lakhs) (Rs. inlakhs)
(5) (6) (7) (8) (9) (10)
District
(2)
1 51 13 200 8,318 N. A. 108 N. A. 1,764 40,572 34,650 Thane2 TIJT’T? 14 171 171 15 235 7 1,139 31,645 23,596 Raigad3 ]' n . a . N. A. n . a . N. A. n . a . N. A. N. A. IS,767 13,379 Ratnagiri4 7 3.094 1 153 1 799 14,021 10,979 Sindhudurg5 ! ! 13 116 10,096 21 530 12 2,153 32,999 24,581 Nashik
6 W 10 126 9,147 355 1,8 >2 22,139 17,639 D u b7 13 129 9,815 6 655 13 • 2,033 49 lj7 3 3.363 ■laigionS 13 1:0 11,769 71 I,5;i 17 2,27'l 39,2^5 27,4’ 4 Ah me di agar9 13 157 11,410 N. A. 536 N. A. 2,377 47,955 32,219 Paij
10 TRTRT '..' 11 105 10,822 4 480 3 2,4’ 2 33,975 22,607 Satara
IJ 8 170 6,341 3 599 3 1.235 33,058 22,657 Sangli12 11 195 . , 2 5 . , 4 33,673 30,139 Solapur13 12 112 8,882 11 1,060 2 1.734 44.5j7 33,254 Kolhapur14 8 6,656 10 426 2 817 n ,0 7 i 8,952 Aurangabad35 . . 5 •• 5,466 10 289 1,098 23,673 17,405 Jalna
16 'n vrcfj- 7 9,761 14 392 9 1,998 15,830 8,607 Parbhani17 898 8,247 35 985 14 1,778 12,516 9,409 Beed18 8 141 8,982 18 867 20 2,202 7,528 5,326 Naaded19 6 . , 4,940 8 688 3 1.024 10,153 4,449 Osmaaabad20 5 5,421 12 1,065 12 1,238 14,505 11,333 Latar
21 13 • 175 1,591 27 873 3 253 20,557 15,751 Buldana22 13 175 8,835 27 517 8 2,03S 16,257 9,841 Akola23 ®W<i=idl 13 147 7,225 22 J95 13 1,597 19999 13,706 Amravati34 14 164 9,682 44 511 17 1,152 31,’160 19410 Yavitmal25 8 91 1,049 16 65 6 952 11,176 7,397 Wardha
26 13 163 1,822 40 413 9 l,3oJ 23,303 17,863 Nagpur27 . . 13 184 10,217 577 , , l,9o5 15,373 10,794 3aaaiara28 10 6,848 48 719 9 1,280 13,368 10’678 Caaidrapur29 . . •• 3,835 19 240 7 879 5,324 4,863 Gadcniroli
1,159 3,739 1,90,442 484 15,089 193 41,521 7,91,926 15,07,73 5 iMahirasiitraState.
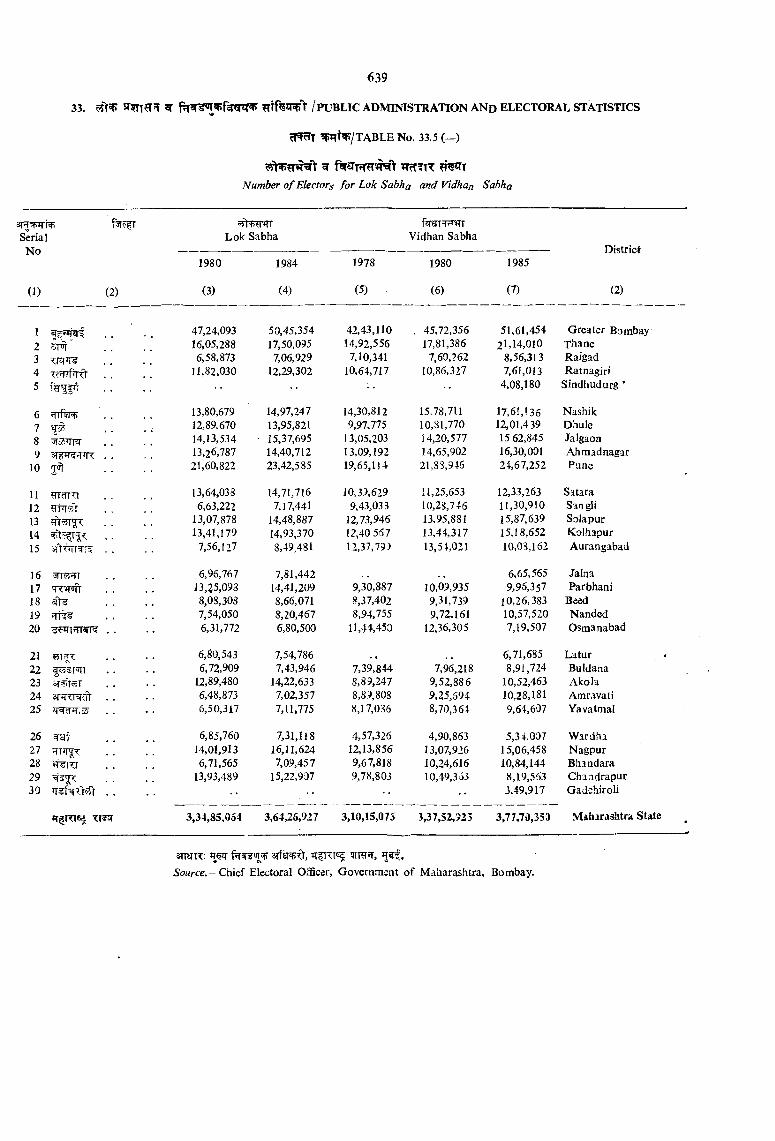
of ?r «rTNumber o f Electors for Lok Sabha and Vidhan Sabha
SerialNo
(1) (2)
Lok Sabha Vidhan Sabha
1980
(3)
1984
(4)
1978
(5)
1980
(6)
1985
(7)
District
(2)
1 47,24,093 50,45,354 42,43,110 . 45,72,356 51,61,454 Greater Bombay2
c'- . ’5FT 16,05,288 17,50,095 14,92,556 17,81,386 21,14,010 Thane
3 6,58,873 7,06,929 7,10,341 7,60,262 8,56,313 Raigad4 T TrfirO' . . 11,82,030 12,29,302 10,64,717 10,86,327 7,61,013 Ratnagiri5 i%f 4,08,180 Sindhudurg *
6 ?rifi?T5F 13,80,679 14,97,247 14,30,812 15.78,711 17,61,136 Nashik7 ^ .: 12,89.670 13,95,821 9,97.775 10,81,770 12,01,439 Dhule8
t * • •35»rr 14,13,534 ■ 15,37,695 i 3,05,203 14,20,577 15 62,845 Jalgaoa
9 153*1'?’I*!< . . 13,26,787 14,40,712 13,09,192 14,65,902 16,30,001 Ahmadnagar10 21,60,822 23,42,585 19,65,114 21,83,916 24,67,252 Pane
11 13,64.038 14,71,716 10,3:), 629 11,25,653 12,33,263 Satara12 6,63,222 7,17,441 9,43,033 10,23,746 11,30,910 Sangli13 13,07,878 14,48,887 12,73,946 13,95,881 15,87,639 Solapur14 13,41,179 14,93,370 12,40 557 13,44,317 15,18,652 Kolhapur15 7,56,127 8,49,481 12,37,79) 13,54,021 10,03,162 Aurangabad
16 . . 6,96,767 7,81,442 6,65,565 Jalna17 13,:J5,098 14,41,209 9,30,887 10,09,935 9,95,357 Parbhani18 8,08,308 8,66,071 8,37,402 9,31,739 10,26,383 Beed19 7,54,050 8,20,467 8,94,755 9,72,161 10,57,520 Nanded20 3 Tirr«rR .. 6,31,772 6,80,500 11,44,450 12,36,305 7,19,507 Osmanabad
21 6,80,543 7,54,786 .. 6,71,685 Latur22 6,72,909 7,43,946 7,39,844 7,96,218 8,91,724 Buldana23 STSffrST 12,89,480 14,22,633 8,89,247 9,52,886 10,52,463 Akola24 6,48,873 7,02,357 8,89,808 9,25,694 10,28,181 Amravati25 'H'ld+iiS 6,50,317 7,11,775 8,17,036 8,70,364 9,64,607 Yavatraal
26 6,85,760 7,31,118 4,57,326 4,90,863 5,34.007 Wardha27 TPT 14,01,913 16,11,624 12,13,856 13,07,926 15,06,458 Nagpur28 vT i r 6,71,565 7,09,457 9,67,818 10,24,616 10,84,144 Bhandara29 13,93,489 15,22,937 9,78,803 10,49,353 8,19,553 Chandrapur30 r5f5r<t0> . . •• •• 3.49,917 Gadchiroli
3,34,85,064 3,64,26,927 3,10,15,075 3,37,52,923 3,77,70,35a Maharashtra State
ansrn; ’tw Tr TTCf 5irafT,Source.- Chid Electoral Officer, Government of Maharashtra, Bombay.
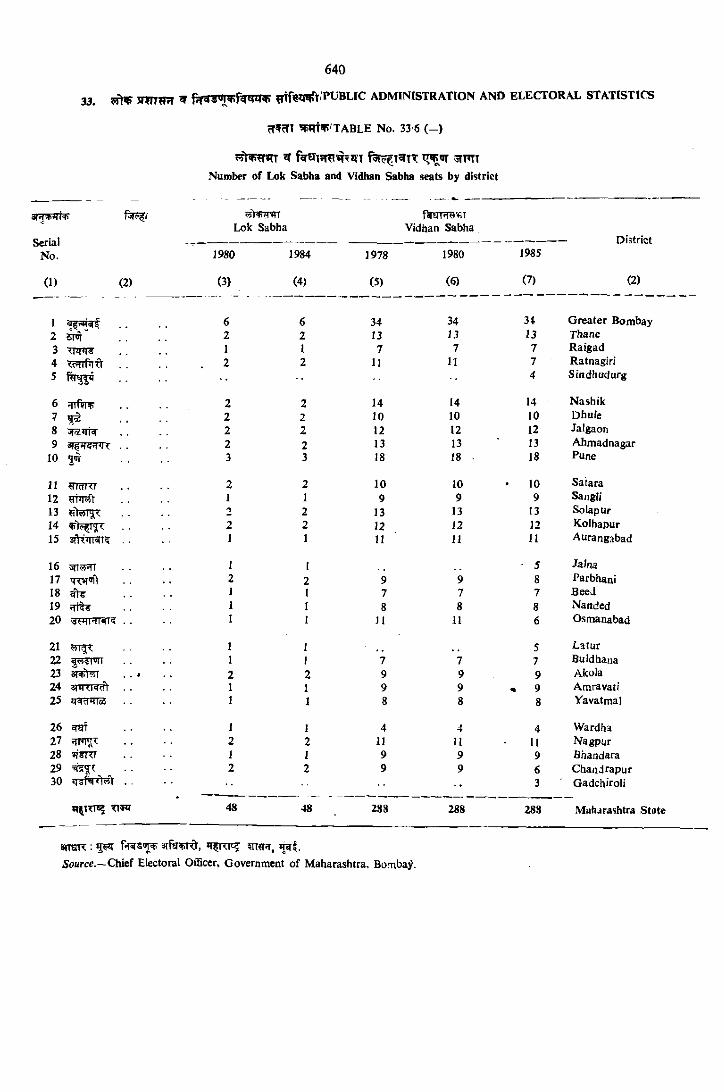
33, 5 m r?R ^ f r r f ^ q ^ /P U B u c a d m i n i s t r a t i o n a n d e l e c t o r a l s t a t i s t i c s
cT^cn l^lTfT/TABLE No. 33-6 ( - )
^ f^eri5T^i^ti?T stftt
Number of Lok Sabha and Vidhan Sabha seats by district
3j*T tJrRT
SerialNo.
(1) (2)
Lok SabhafwaT5TOViT
Vidhan Sabha
J980
(3)
1984
(4)
1978
(5)
1980
(6)
1985
(7) (2)
1 6 6 34 34 3* G reater Bombay2 5m " 2 2 13 13 13 Thane3 1 1 7 7 7 Raigad4 TrHlHlO . 2 2 11 11 7 Ratnagiri5 4 Sindhudurg
6 qrftlT 2 2 14 14 14 N ashik7 ^ 2 2 10 10 10 Dhufe8 ^cc«|iq . . 2 2 12 12 12 Jalgaon9 . . 2 2 13 13 13 Ahmadnagar
10 gw 3 3 18 18 . 18 Pune
11 «icnTT 2 2 10 10 10 Satara12 HHIrtI 1 1 9 9 9 Sangli13 2 2 13 13 13 So lap Ur14 2 2 12 12 12 Kolhapur15 s fh W R . - I 11 11 11 Aurangabad
16 Mii«nl . . 1 • 5 Jalna17 TT^rnr 2 2 9 9 8 Parbhaai18 1 7 7 7 Beed19 : n ^ 1 8 8 8 Nanded20 ;j?rn’TRT? . . 1 J1 11 6 Osmanabad
21 571^ 1 1 5 Z-atur22 1 I 7 7 7 Buldhana23 i{+Vj . . * 2 2 9 9 9 Akola24 . . 1 9 9 « 9 AmravatJ25 i^qqHIOi • • I 1 8 8 8 Yavatmai
26 ^ 1 4 4 4 Wardha27 2 2 11 U 11 N agpur28 STim 1 9 9 fihandara29 2 2 9 6 C handrapur30 ^ i s r ^ . . 3 Oadchiroli
n w 48 48 288 288 288 M utijrashtra Sta
SnSK : *T?ITTt? 5TRR,Sourctf.—Chief Electoral OCBcer* Government o f M aharashtra, Bombay.
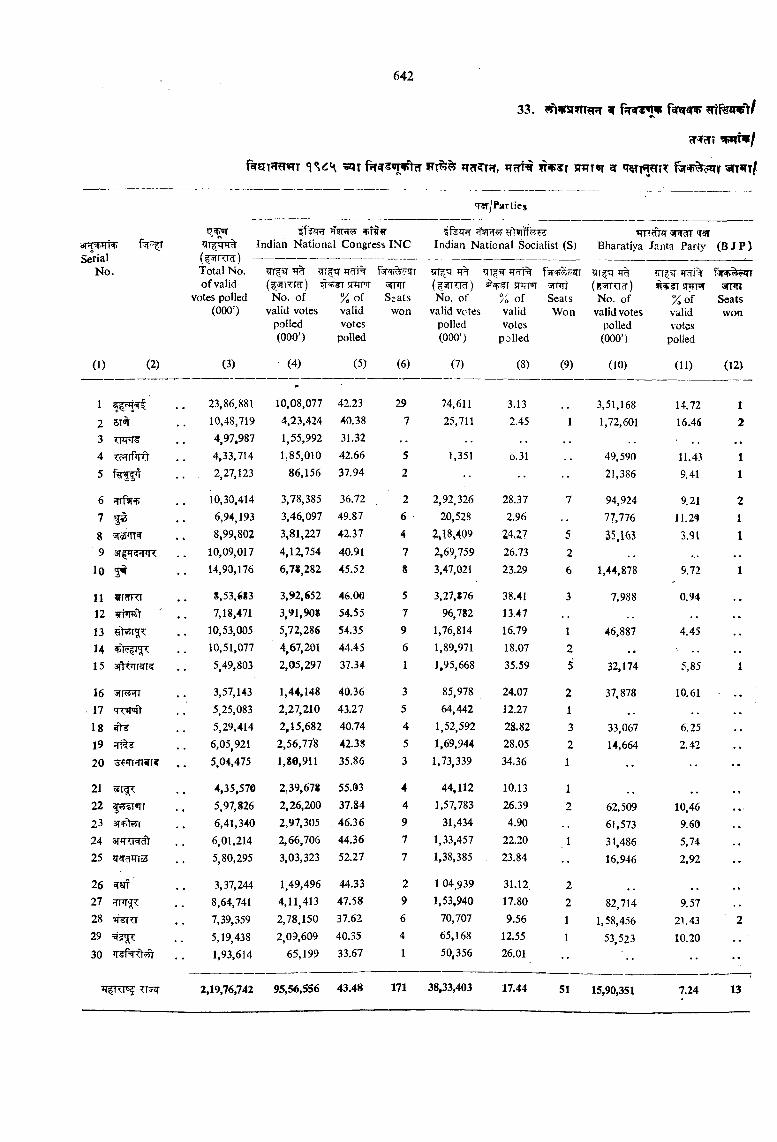
tT cTi '*f**fW/
r !JT?THtPTT WfT?!?!, ST17T9T 3T f5r ?; ??TT T*TT/
q-?T/Parties
ifer^ RTcTTJr T3T
Serial (f^TUd) - Total No. of valid
votes polled (000’)
ndian National Congress INC Indian National Socialist (S) Bharatiya Janta Party (B J P )
r' I
( f 5 n w ) No. of
valid votes polled (000’)
(SSTTTTW) No. of
valid votes polled (000’)
% ofvalidvotes
polled
^nnSeatswon
N o. r\(?5fuid) 5^^^5nrm No. of % of
valid votes valid polled votes (000’) polled
Seatswon
% of valid votes
polled
SeatsWon
(1) (2) (3) (4) (5) (6) (7) (8) (9) (10) (11) (12)
1 23,86,881 10,08,077 42.23 29 74,611 3.13 3,51,168 14.72 12 5T^ 10,48,719 4,23,424 40.38 7 25,711 2.45 1 1,72,601 16.46 23 W T¥ 4,97,987 1,55,992 31.32 ,,4 -?: ifirft 4,33,714 1,85,010 42.66 5 1,351 0.31 49,590 11.43 15 , 2,27,123 86,156 37.94 2 •• 21,386 9.41 1
6 rfsirip 10,30,414 3,78,385 36.72 2 2,92,326 28.37 7 94,924 9.21 27 f g 6,94,193 3,46,097 49.87 6 20,528 2.96 77,776 11.2(1 1
8 %2'TT 8,99,802 3,81,227 42.37 4 2,18,409 24,27 5 25,163 3.91 19 3TffT??TTn: . 10,09,017 4,12,754 40.91 7 2,69,759 26.73 2
10 5^ 14,90,176 6,78,282 45.52 8 3.47,021 23.29 6 1,44,878 9.72 1
11 ¥imrr S,53,683 3,92,652 46.00 5 3,27,876 38.41 3 7,988 0.9412 ?ftwt ' . 7,18/71 3,91,908 54.55 7 96,782 13.47 ,
13 10,53,005 5,72,286 54.35 9 1,76,814 16.79 1 46,887 4.45 * ,
U 10,51,077 ' 4,67,201 44.45 6 1,89,971 18.07 2 .,15 3fK^r^5 5,49,803 2,05,297 37.34 1 1,95,668 35.59 i 32,174 5,85 1
16 I^HI 3,57,143 1,44,148 40.36 3 85,978 24.07 2 37,878 10.6117 'TTW'jft 5,25,083 2,27,210 43.27 5 64,442 12.27 1 , ,
18 ^ 5,29,414 2,15,682 40.74 4 1,52,592 28.82 3 33,067 6.2519 6,05,921 2,56,778 42.38 5 1,69,944 28.05 2 H,664 2.42
20 ^FTT irr . 5,04,475 1,86,911 35.86 3 1,73,339 34.36 1
21 4,35,570 2,39,678 55.03 4 44,112 10.13 122 |^T«rr 5,97,826 2,26,200 37.84 4 1,57,783 26.39 2 62,509 10,4623 3T+lrJ'l 6,41,340 2,97,305 , 46.36 9 31,434 4.90 61,573 9.6024 arq-n^ 6,01,214 2,66,706 44.36 7 1,33,457 22.20 1 34,486 5,7425 q- OTra 5,80,295 3,03,323 52.27 7 1,38,385 . 23.84 •• 16,946 2,92
26 srf 3,37,244 1.49,496 44.33 2 1 04,939 31.12, 227 8,64,741 4,11,413 47.58 9 1,53,940 17.80 2 82,714 9.5728 ?T¥rTT 7,39,359 2,78.150 37.62 6 70,707 9.56 1 1,58,456 21.4329 =5fs^ 5,19,438 2,09,609 40.35 4 65,168 12.55 1 53,523 10.2030 1,93,614 65,199 33.67 1 50,356 26.01 ••
2,19,76,742 95,56,556 43.48 171 38,33,403 17.44 51 15,90,351 7.24 13
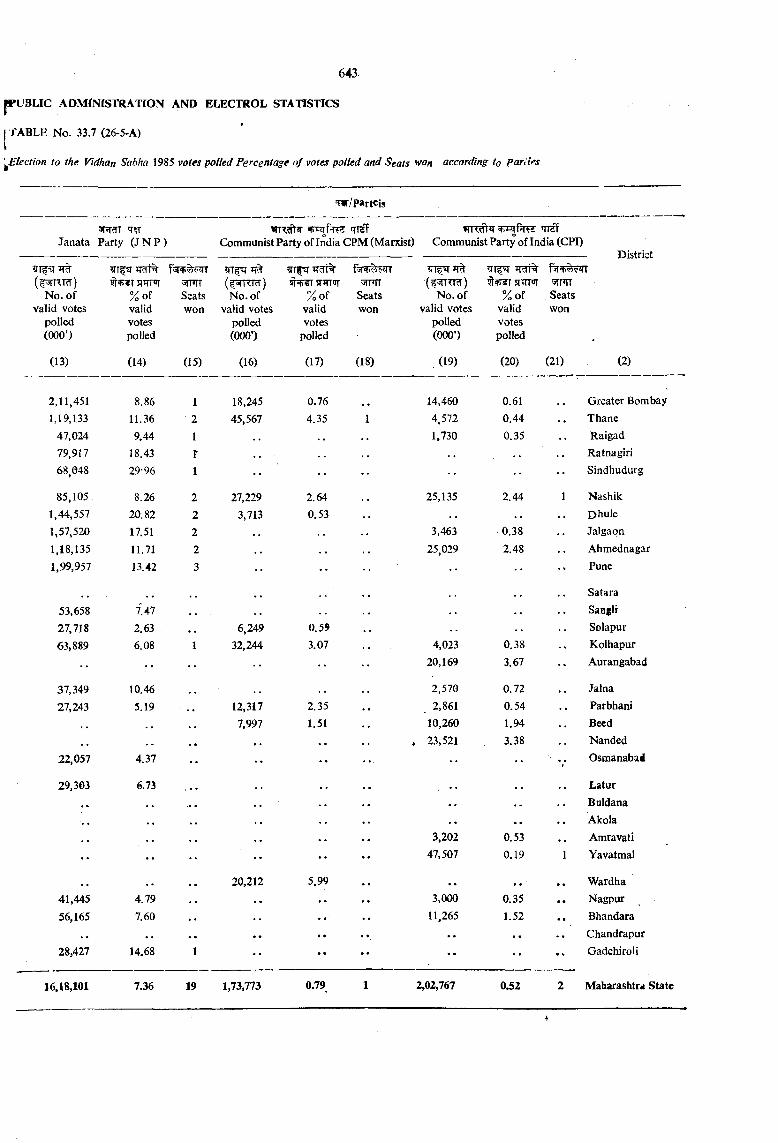
jFUSLIC ADMtiNISTRATION AND ELECTROL STATISTICS
J'ABLE No. 33.7 (26-5-A)
’Election to the Vidhan Sahha 1985 votes polled Percentage o f votes polled and Seats won according to Parii*’s
w /partcis
3PTTT 'T 'Trcf 'TT2fJanata Party (J N P ) Communist Party of India CPM (Marxist) Communist Party of India (CPI)
fTcTT%(^^RTcT) SJJTTir 3TPn ■at Mil (^^n’Tra') sirM 5Tnrr
N o. of % of Seats No. of % of Seats No. of % of Seatsvalid votes valid won valid votes valid won valid votes valid won
polled votes polled votes polled votes(000’) polled (000’) polled (000’) polled •
(13) (14) (15) (16) (17) (18) (19) (20) (21) (2)
2,11,451 8.86 1 18,245 0.76 14,460 0.61 Greater Bombay
1,19,133 11.36 2 45,567 4.35 4,572 0.44 Thane
47,024 9.44 1 1,730 0.35 Raigad79,917 18.43 r Ratnagiri68,048 29-96 1 •• •• •• •• Sindhudurg
85,105 8.26 2 27,229 2.64 25,135 2.44 1 Nashik
1,44,557 20.82 2 3,713 0.53 Dhule
1,57,520 17.51 2 3,463 0.38 Jalgaon
1,18,135 11.71 2 25,029 2.48 Ahmednagar
1,99,957 13.42 •• •• •• •• Pune
. . . . .. • « Satara
53,658 7.47 Sanglt
27,718 2.63 . 6,249 0.59 Solapur
63,889 6.08 1 32,244 3,07 4,023 0.38 Kolhapur
•• •• •• •• 20,169 3.67 Aurangabad
37,349 10.46 , , 2,570 0.72 Jalna
27,243 5.19 12,317 2.35 2,861 0.54 Parbhani
• • 7,997 1.51 10,260 1,94 Becd, * • • * 23,521 3.38 Nanded
22,057 4.37 •• •• •• Osmanabad
29,303 6.73 . , . . . . , . Latur
BaldanaAkola
3,202 0.53 Amravati
•• •• • • •• •• 47,507 0.19 1 Yavatmal
, . • • 20,212 5.99 • « * ^ • • Wardha41,445 4.79 • • . . 3,000 0.35 • • Nagpur
56,165 7.60 • • . . 11,265 1.52 • • Bhandara
• • . . . . • • Chandrapur
28,427 14.68 1 •• •• • • • • • h Gadchiroli
16.18,101 7.36 19 1,73,773 0.79 1 2,02,767 0.52 2 Maharashtra State
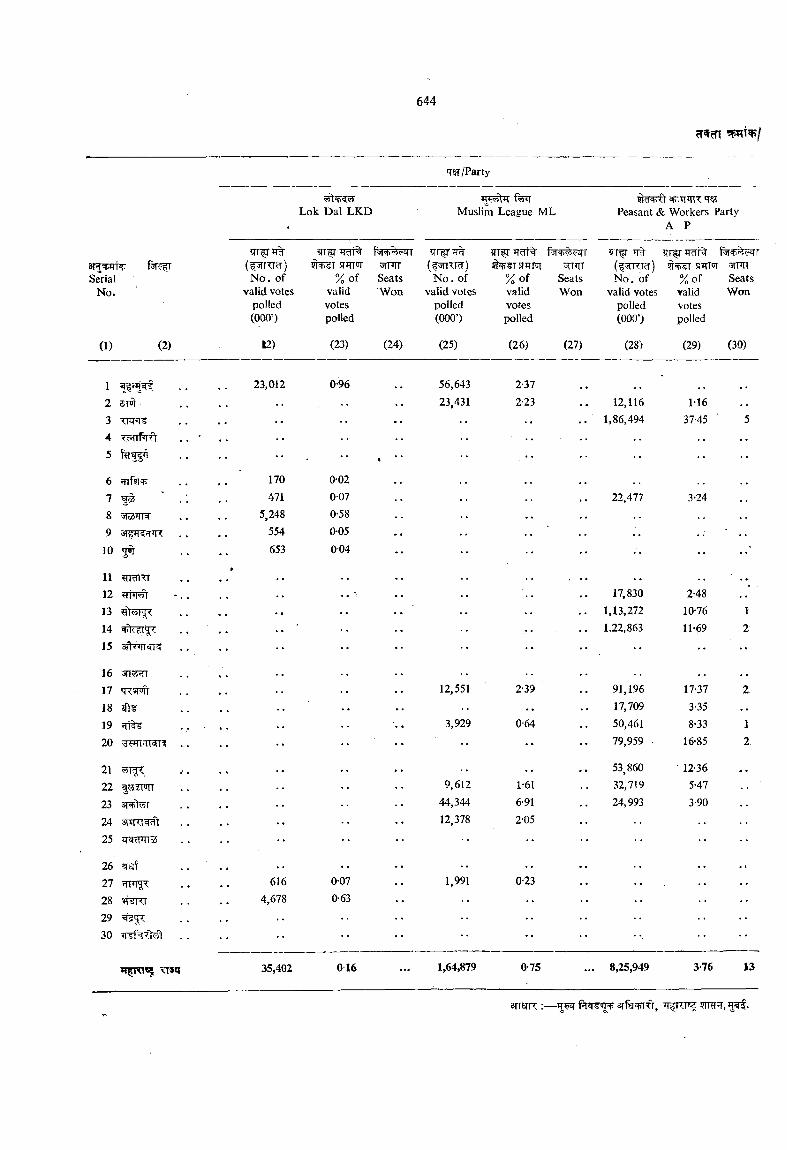
SerialNo.
(1) (2)
12 sm34 w M t5
Lok Dal LKD
trsT/Party
Muslim League ML( +■■0 spiTfinT TO
Peasant & Workers Party A P
11 TTcnTT12131415 3fhr i^5
1617 T?: roit1819 STIES'20
21 ^51^2223 31 'fer24 spfTOoRl:25 IR W 5
2627282930 *T§1%7t
(f [TTrT) N o . of
valid votes polled (000’)
sr’TT'JT% of
validvotespolled
fai+?i<>qT■'Jil-'llSeatsWon
(f5 n w ) N o . of
valid votes polled (000’)
?TTirJTdR
% ofvalidvotespolled
SeatsWon
?!Tfr(55rRT?r) No. of
valid votes polled (000’)
?rrir
%of▼alidvotespolled
m mSeatsWon
12) (23) (24) (25) (26) (27) (28) (29) (30)
23,012 0-96 56,643 2-3723,431 2-23 12,116 M6
1,86,494 37-45
170 0-02
•
471 007 22,477 3-245,248 0-58
554 005653 004 ••
17,830 2-481,13,2721.22,863
10-7611-69
12
•• 12,551 2-39 91,19617,709
17-373-35
2
3,929 0-64 50,461 8-33 1
•• •• 79,959 16*85 2
••9,612 1-61
53 860 32,719
12-365-47
44,34412,378
6-912-05
24,993 3-90
616 007 1,991 0-234,678 0-63
35,402 0 16 1,64,879 0-75 ... 8,25,949 3-76 13
arrsnr :— ?rRTfT,
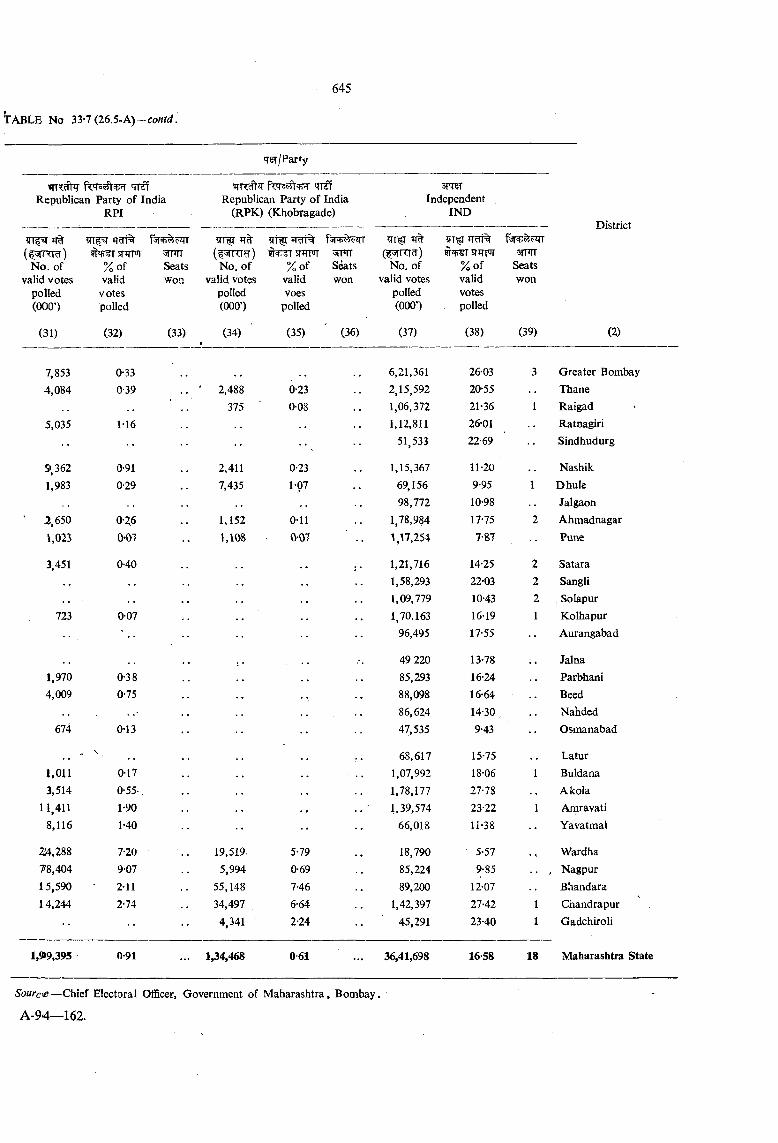
T^f/Party
qr€fRepublican Party of India
RPIRepublican Party of India
(RPK) (Khobragade)Independent
IND
(^TT^) N o. of
valid votes polled (0000
TrcTT%
% of Seatsvalid won
votes polled
f5R ?qT
No. of % of Seats valid votes valid won
polled voes(000’) polled
JT%
No. of valid votes
polled (000’)
Rq-T' r rniT% of Seatsvalid wonvotes polled
(31) (32) (33) (34)I
(35) (36) (37) (38) (39) (2)
7,853 0-33 6,21,361 26-03 3 Greater Bombay
4,084 0-39 . . ' 2,488 0-23 2,15,592 20-55 Thane375 ' 0-08 1,06,372 21-36 1 Raigad
5,035 M 6 . . 1,12,811 26-01 Ratnagiri
. . •• 51,533 22-69 Sindhudurg
St, 362 0-91 2,411 0-23 1,15,367 11-20 Nashik
1,983 0-29 7,435 1-07 69,156 9-95 1 Dhule98,772 10-98 Jalgaon
2,650 0-26 1,152 0-11 1,78,984 17-75 2 Ahmadnagar
1,023 0-07 1,108 0-07 •• 1,17,254 7-87 -- Pune
3,451 040 1,21,716 14-25 2 Satara1,58,293 22-03 2 Sangli1,09,779 10-43 2 Solapur
723 007 1,70.163 16-19 1 Kolhapur96,495 17-55 •• Aurangabad
. , 49 220 13-78 Jalna1,970 0-38 85,293 16-24 Parbhani4,009 0-75 88,098 16-64 Beed
86,624 14-30 , Nahded674 0-13 47,535 9-43 Osmanabad
\ 68,617 15-75 . , Latur1,011 0-17 1,07,992 18-06 1 Buldana3,514 0-55- 1,78,177 27-78 A kola
11,411 1*90 1.39,574 23-22 1 Amravati8,116 1-40 •• 66,018 11-38 -• Yavatmal
24,288 7-20 19,519. 5-79 18,790 ' 5-57 Wardha?8,404 9-07 5,994 0-69 85,224 9-85 , Nagpur15,590 2-11 55,148 7-46 89,200 12-07 Bhandara14,244 2-74 34,497 6-64 1,42,397 27-42 1 Chandrapur
•• •• 4,341 2-24 •• 45,291 23-40 1 Gadchiroli
1,99,395 0-91 ... 1,34,468 0-61 . . . 36,41,698 16-58 18 Maharashtra State
Sourcie—Chief Electoral Officer, Government of Maharashtra, Bombay.
A-94—162.
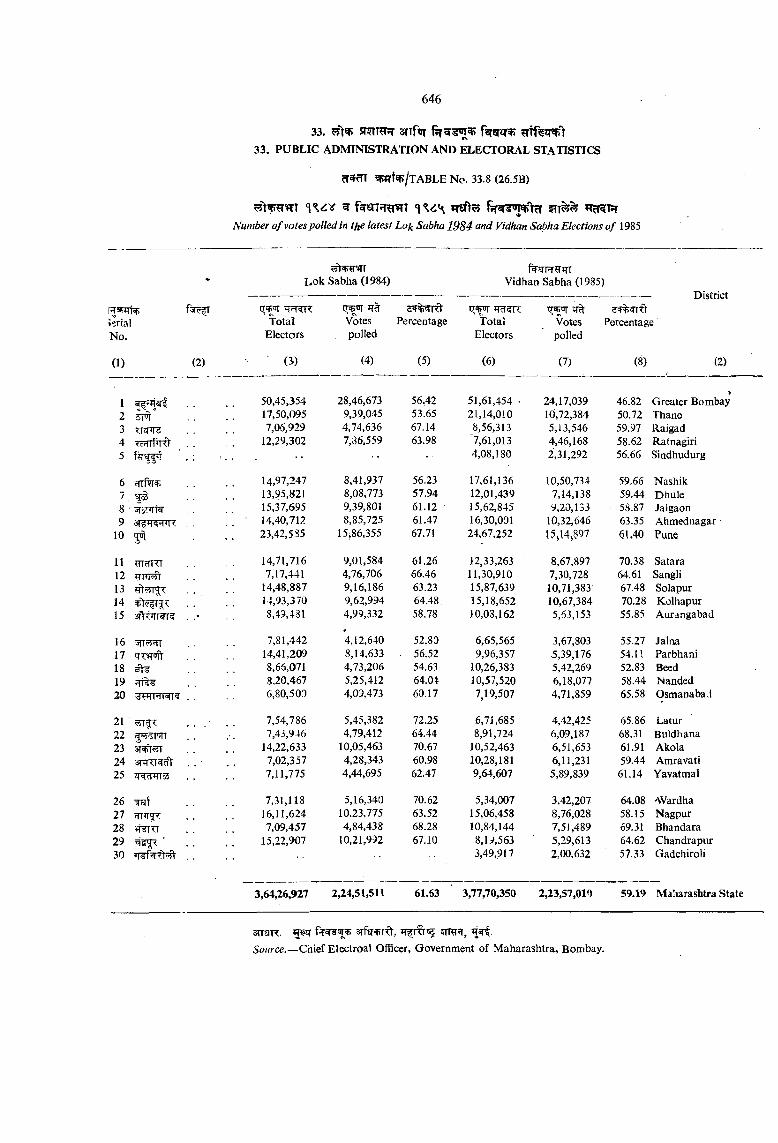
33. SRTTHff 3TTfoi ?Ttf?§irryCN
33. PUBLIC ADMINISTRATION AND ELECTORAL STATISTICS
cT^m ^ T ^ / tABLE No. 33.8 (26.5B)
^ f srT?T?lWT fsrsr^ '^rl 5IT % »T?f5TfrNumber o f votes polled in the latest Lok Sabha 1984 and Vidhan Sabha Elections o f 1985
>erialNo.
Lok Sabha (1984)
TotalElectors
Votespolled
Percentage
f TRHiTT Vidhan Sabha (1985)
TotalElectors
Votespolled
District
Percentage
(1) (2) (3) (4) (5) (6) (7) (8) (2)
1 50,45,354 28,46,673 56.42 51,61,454 • 24,17,039 46.82»
Greater Bombay2 17,50,095 9,39,045 53.65 21,14,010 10,72,384 50.72 Thane3 7,06,929 4,74,636 67.14 8,56,313 5,13,546 59.97 Raigad .4 12,29,302 7,36.559 63.98 7,61,013 4,46,168 58.62 Ratnagiri5 . 4,08,180 2,31,292 56.66 Sindhudurg
6 frrftr 14,97,247 8,41,937 56.23 17,61,136 10,50,734 59.66 Nashik7 13,95,821 8,08,773 57.94 12,01,439 7,14,138 59.44 Dhule8 15,37,695 9,39,801 61.12 15,62,845 9,20,133 5S.87 Jalgaon9 14,40,712 8,85,725 61.47 16,30,001 10,32,646 63.35 Ahmednagar •
10 23,42,585 15,86,355 67.71 24,67,252 15,14,897 61.40 Puae
11 ^mTT 14,71,716 9,01,584 61.26 12,33,263 8,67,897 70.38 Satara12 7,17,441 4,76,706 66.46 11,30,910 7,30,728 64.61 Sangli13 14,48,887 9,16,186 63.23 15,87,639 10,71,383 67.48 Solapur14 14,93,370 9,62,994 64.48 15,18,652 10,67,384 70.28 Kolhapur15 8,49,431 4,99,332 58.78 10,03,162 5,63,153 55.85 Aurangabad
16 7,81,442*4,12,640 52.83 6,65,565 3,67,803 55.27 Jalna
17 'TTSToft’ 14,41,209 8,14,633 56.52 9,96,357 5,39,176 54.U Parbhani18 8,66,071 4,73,206 54.63 10,26,383 5,42,269 52.83 Beed19 8,20,467 5,25,412 64.04 10,57,520 6,18,077 58.44 Nanded20 'dt-HMNI? . . 6,80,503 4,09,473 63.17 7,19,507 4,71,859 65.58 Osmanabavi
21 . . . 7,54,786 5,45,382 72.25 6,71,685 4,42,425 65.86 Latur22 7,43,946 4,79,412 64.44 8,91,724 6,09,187 68.31 Buldhana23 14,22,633 10,05,463 70.67 10,52,463 6,51,653 61.91 Akola24 7,02,357 4,28,343 60.98 10,28,181 6,11,231 59.44 Amravati25 jRcTFrroS . . 7,11,775 4,44,695 62.47 9,64,607 5,89,839 61.14 Yavatmal
26 7,31,118 5,16,340 70.62 5,34,007 3,42,207 64.08 'Wardha27 16,11,624 10,23,775 63.52 15,06,458 8,76,028 58.15 Nagpur28 7,09,457 4,84,438 68.28 10,84,144 7,51,489 69.31 Bhandara29 15,22,907 10,21,992 67.10 8,1^,563 5,29,613 64.62 Chandrapur30 3,49,917 2,00.632 57.33 Gadchiroli
3,64,26,927 2,24,51,511 61.63 3,77,70,350 2,23,57,010 59.19 Maharashtra State
sngR. — ^?r ,Source.—Chief Electroal Officer, Government of Maharashtra, Bombay.
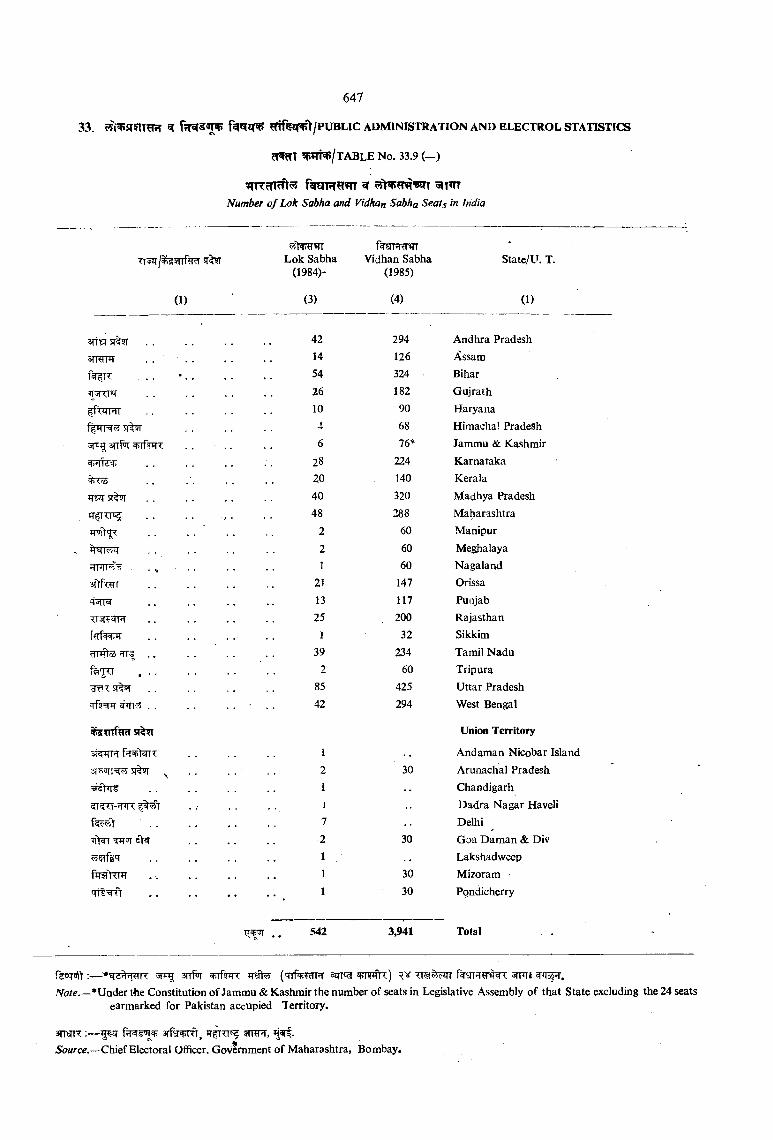
33. ^ ^?Sfl>>/PUBLIC ADMINISTRATION AND ELECTROL STATISTICS
cTWcfT ^»TNj/ t ABLE N o. 33.9 ( - )
^T75rnf ?y ftrsrTfr^wr ^Number of Lok Sabha and Vidhon Sabha Seats in India
5T%?T
(1)
Lok Sabha (1984)*
(3)
Vidhan Sabha (1985)
(4)
State/U. T.
(1)
3TTa Rt5T . . 42 294 Andhra Pradesh
sTRTnr . . . . ♦ . • . 14 126 Assam54 324 ■ Bihar26 182 Gujrath
ffTiTFTT 10 90 Haryana4 68 Himacha! Pradesh
3TTfW 6 76* Jammu & Kashmir
28 224 Karnataka20 140 Kerala
qgJT 5f^ 40 320 Madhya Pradesh48 288 Maharashtra
2 60 Manipur
2 60 Meghalaya
JTFTT'n . . , • . . 1 60 Nagaland
3iir<yr 21 147 Orissa
q<HH . . 13 117 Punjab
■?j3i <TnT 25 200 Rajasthan
rnPHiH 1 32 Sikkim
dl41Si ^ 3 39 234 Tamil Nadu
fey a 2 60 Tripura85 425 Uttar Pradesh42 294 West Bengal
Union Territory
1 Andaman Nicobar Island
3Twrn^ M! I ^ 2 30 Arunachal Pradesh1 Chandigarh1 Dadra Nagar Haveli7 Delhi2 30 Goa Daman & Div
5J5Trg<T . . 1 Lakshadweep1 30 Mizoram
'TTH il . . . . . . 1 30 Pqndicherry
542 3,941 Total
fjccnnt:— sfrfor ^?rn: wmk)Note.—*Under tile Constitution of Jammu & Kashmir the number of seats in Legislative Assembly of that State excluding the 24 seats
earmarked for Pakistan accupied Territory.
sminT;— arfsRTRt, 9mnT, .
Source.—Chief Electoral Officer, Govlrnment of Maharashtra, Bombay.
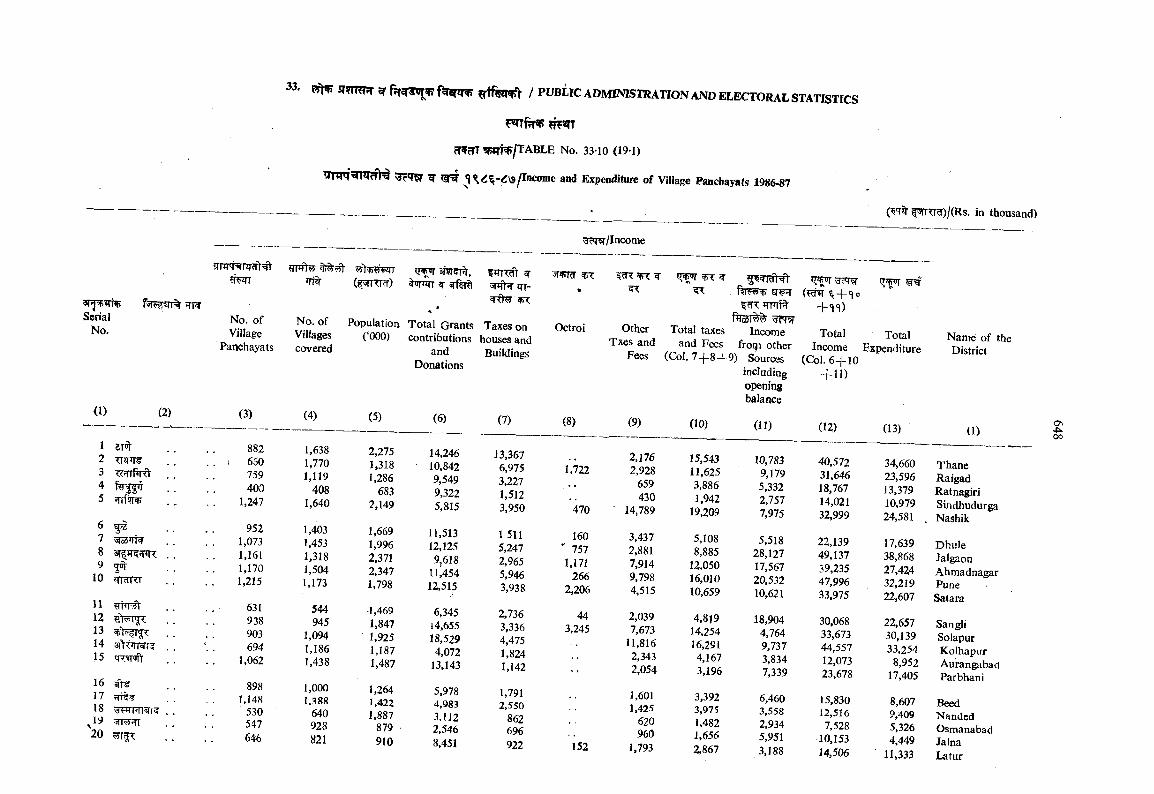
cTfcTT ?pjTt^/TABLE No. 33*10 (191)
^ ^ and Expenditure of Village Panchayats 1986-87
f3iTTT )/(Rs. in thousand)
3?T?r/Income
arpj rnpSerial
No.
fsT pTT 5TI
0) (2)
123 w f ir f t45 ?rrfifT
6 ^7 rZ*liW8 3( ;T5?m9 ^
10
1112131415
16 ^1718 19 20
9Tipt^qr^=<tHwr »ri% (^wrrr^)
s(M tff qr-
Hf>T• . sr T
No. of Village
Panchayats
No. of Villages covered
Population(‘000)
Total Grants contributions
and Donations
Taxes on houses and Buildings
Octroi Other Txes and
Fees
Total taxes Income and Fees froiji other
(Col. 7-|-8-f-9) Sources including opening balance
Total Income
(Col. 6 + 1 0 + 11)
TotalExpenditure
(3) (4) (5) (6) (7) (8) (9) (10) (11) (12) (13)
882. > 650
759 400
1,247
1,6381,7701,119
4081,640
2,2751,3181,286
6832,149
14,24610,8429,5499,3225,815
13,3676,9753,2271,5123,950
1,722
470
2,1762.928
659430
14,789
15,54311,6253,8861,942
19,209
10,7839,1795,3322,7577,975
40,57231,64618,76714,02132,999
34,66023,59613,37910,97924,581
9521,0731,1611,1701,215
1,4031,4531,3181,5041,173
1,6691,9962,3712,3471,798
11,51312,1259,618
11^45412,515
1 511 5,247 2,965 5,946 3,938
160 757 1,171
266 2,206
3,4372,8817,9149,7984,515
5,1088,885
12,05016,01010,659
5,51828,12717,56720,53210,621
22,13949,13739,23547,99633,975
17,63938,86827,42432,21922,607
631938903694
1,062
544945
1,0941,1861,438
1,469 1,847
' 1,925 1,187 1,487
6,34514,65518,529
4,07213,143
2,7363,3364,4751,8241,142
443,245
2,0397,673
11,8162,3432,054
4,819 14,254 16,291 4,167 3,196
18,9044,7649,7373,8347,339
30,06833,67344,55712,07323,678
22,65730,13933,254
8,95217,405
898 1.148
530 547 646
1,0001,388
640928821
1,264 1.422 1,887
879 ■ 910
5,9784,9833,1122,5468,451
1,7912,550
862696922 152
1,6011,425
620960
1,793
3,3923,9751.4821,6562,867
6,4603,5582.9345,9513,188
15,83012,5167,528
10,15314,506
8,607 9,409 5,326 4,449
' 11,333
Name of the District
(1)osOO
ThaneRaigadRatnagiriSindhudurgaNashik
DhuleJalgaonAhmadnagarPuneSatara
SangliSolapurKolhapurAurangabadParbhani
BeedNandedOsmanabadJalnaLatur
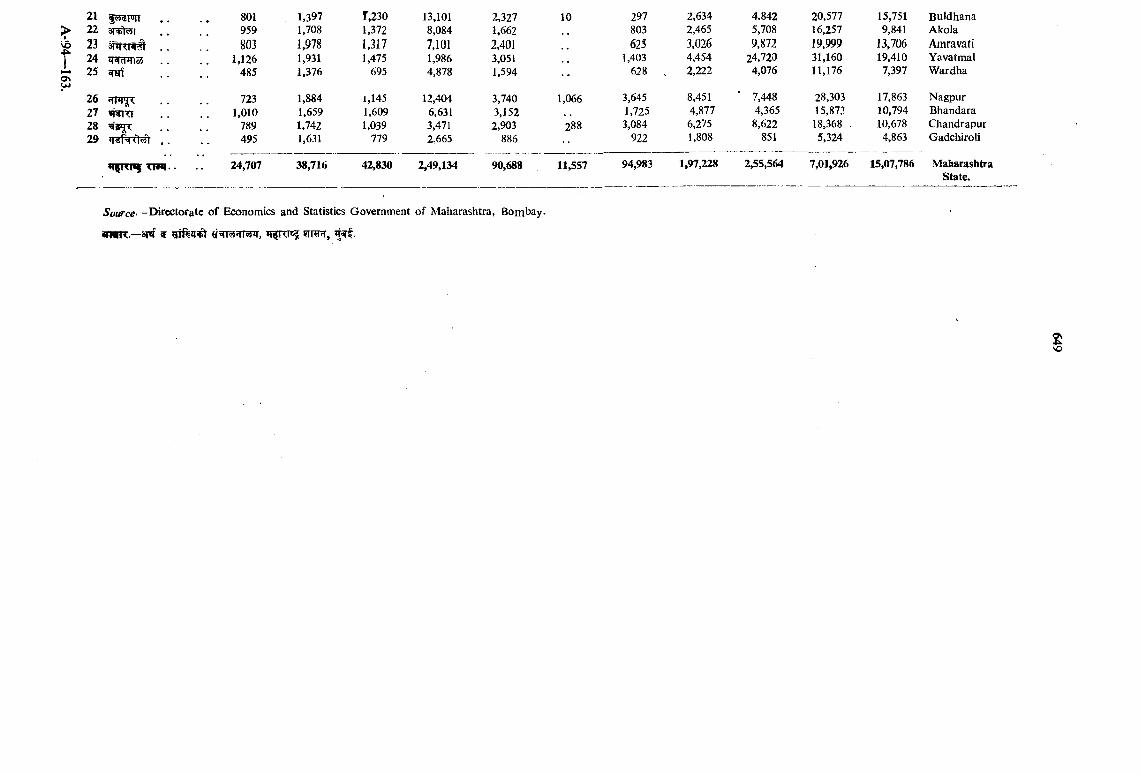
f>-*o\
21222324 w »n5525 ^
2627 W ? l28 ^^5?: 29
’Rfrnif
801959803
1,126485
7231,010
789495
24,707
1,3971,7081,9781,9311,376
1,8S41,6591,7421,631
38,716
r,2301,3721,3171,475
695
1,1451,6091,039
779
13,1018,0847,1011,9864,878
12,4046,6313,4712,665
42,830 2,49,134
2,3271,6622,4013,0511,594
3,7403,1522,903
886
90,688
10
1,066
288
11,557
Source- -Directorate of Economics and Statistics Government of Maharashtra, Bombay.
«rwit.—3T«f w jjtrr,
297 2,634 4,842 20,577 15,751 Buldhana803 2,465 5,708 16,257 9,841 Akola625 3,026 9,872 19,999 13,706 Amravati
1,403 4,454 24,720 31,160 19,410 Yavatmal628 . 2,222 4,076 11,176 7,397 Wardha
3,645 8,451 ’ 7,448 28,303 17,863 Nagpur1,725 4,877 4,365 15,873 10,794 Bhandara3,084 6,275 8,622 18,368 . 10,678 Chandrapur
922 1,808 851 5,324 4,863 Gadchiroli
94,983 1,97,228 2,55,564 7,01,926 15,07,786 MaharashtraState.
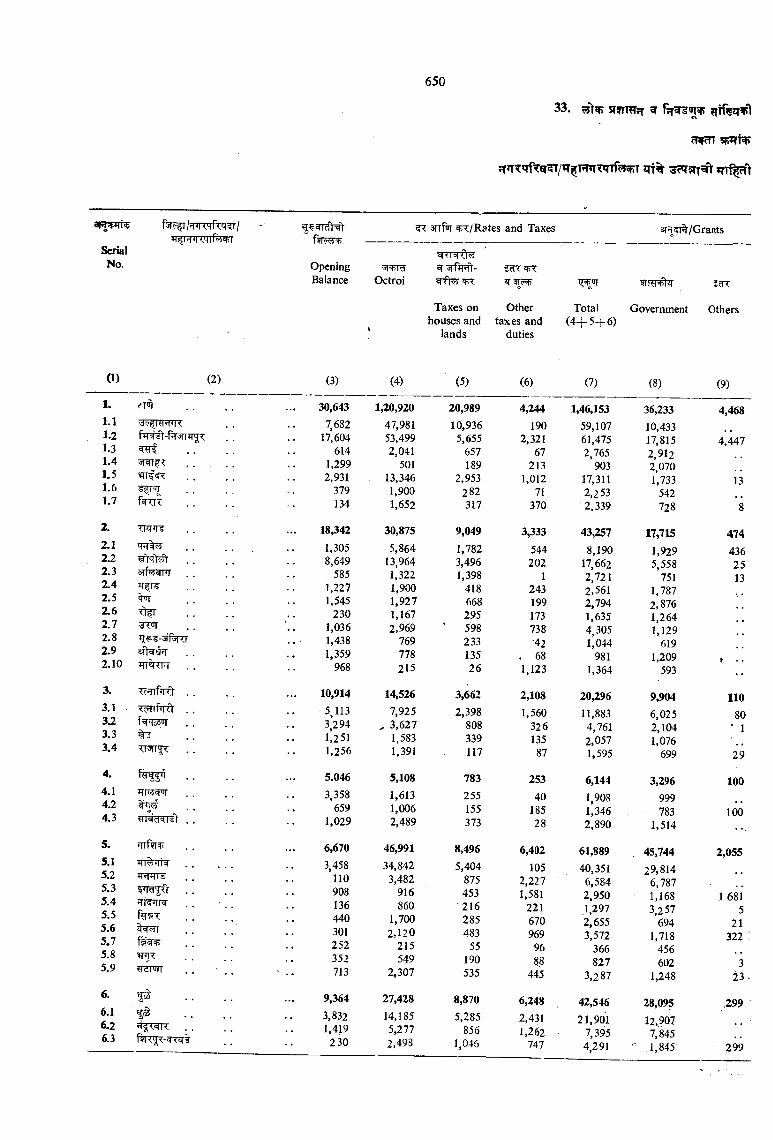
33. R?rm;T w
;T»TT'TfTBr?T/*T RnT«n% T tri% jttT^'^
a n w ^
SerialNo.
0) (2)
f?r?^
OpeningBalance
^ 3npT ^T/Rates and Taxes sr^i^/Grants
(3)
1. '■T' ... 30,6431.1 7,6821.2 f 'V-f?T3iTJTp 17,6041.3 6141.4 ................. 1,2991.5 2,9311.6 ^roT 3791.7 134
2. ... 18,3422.1 1,3052.2 8,6492.3 5852.4 1,2272.5 1,5452.6 2302.7 1,0362.8 1,4382.9 1,3592.10 ’TT TR- . . 968
3. <c’i(nii)' , . 10,9143,1 . 5,1133.2 3,294
1,2513.33.4 •• 1,256
4. • t. 5.0464.1 3,3584.2 6594.3 y'N'd< i«V . . 1,029
5. ... 6,6705.1 ................. . . 3,4585.2 ’TfT mr 1105.3 .. 9085.4 ni<i<!!=t . . . . 1365.5 4405.6 3015.7 .. 2525.8 3525.9 ?T?r>Jrr . . . . 713
6. .................... 9,3646.1 . . 3,8326.2 1,4196.3 230
<5l+ldOctroi
Taxes on Other Total Government Othershouses and taxes and (4 + 5 + 6 )
lands duties
(4) (5) (6) (7) (8) (9)
1,20,920 20,989 4,244 1,46,153 36,233 4,46847,981 10,936 190 59,107 10,43353,499 5,655 2,321 61,475 17,815 4,4472,041 657 67 2,765 2,912
501 189 213 903 2,07013,346 2,953 1,012 17,311 1,733 131,900 282 71 2,253 5421,652 317 370 2,339 728 8
30,875 9,049 3,333 43,257 17,715 4745,864 1,782 544 8,190 1,929 436
13,964 3,496 202 17,662 5,558 251,322 1,398 1 2,721 751 131,900 418 243 2,561 1,7871,927 668 199 2,794 2,8761,167 295 173 1,635 1,2642,969 598 738 4,305 1,129
769 233 ■42 1,044 619778 135 . 68 981 1,209 >215 26 1,123 1,364 593
14,526 3,662 2,108 20,296 9,904 1107,925 2,398 1,560 11,883 6,025 80
3,627 808 326 4,761 2,104 • 11,583 339 135 2,057 1,0761,391 117 87 1,595 699 29
5,108 783 253 6,144 3,296 1001,613 255 40 1,908 9991,006 155 185 1,346 783 1002,489 373 28 2,890 1,514
46,991 8,496 6,402 61,889 45,744 2,05534,842 5,404 105 40,351 29,8143,482 875 2,227 6,584 6,787
916 453 1,581 2,950 1,168 1 681860 216 221 1,297 3,257 5
1,700 285 670 2,655 694 212,120 483 969 3,572 1,718 322
215 55 96 366 456549 190 88 827 602 3
2,307 535 445 3,287 1,248 23
27,428 8,870 6,248 42,546 28,095 ,29914,185 5,285 2,431 21,901 12 9075,277 856 1,262 7,395 7,8452,498 1,046 747 4,291 '■ .1,845 299
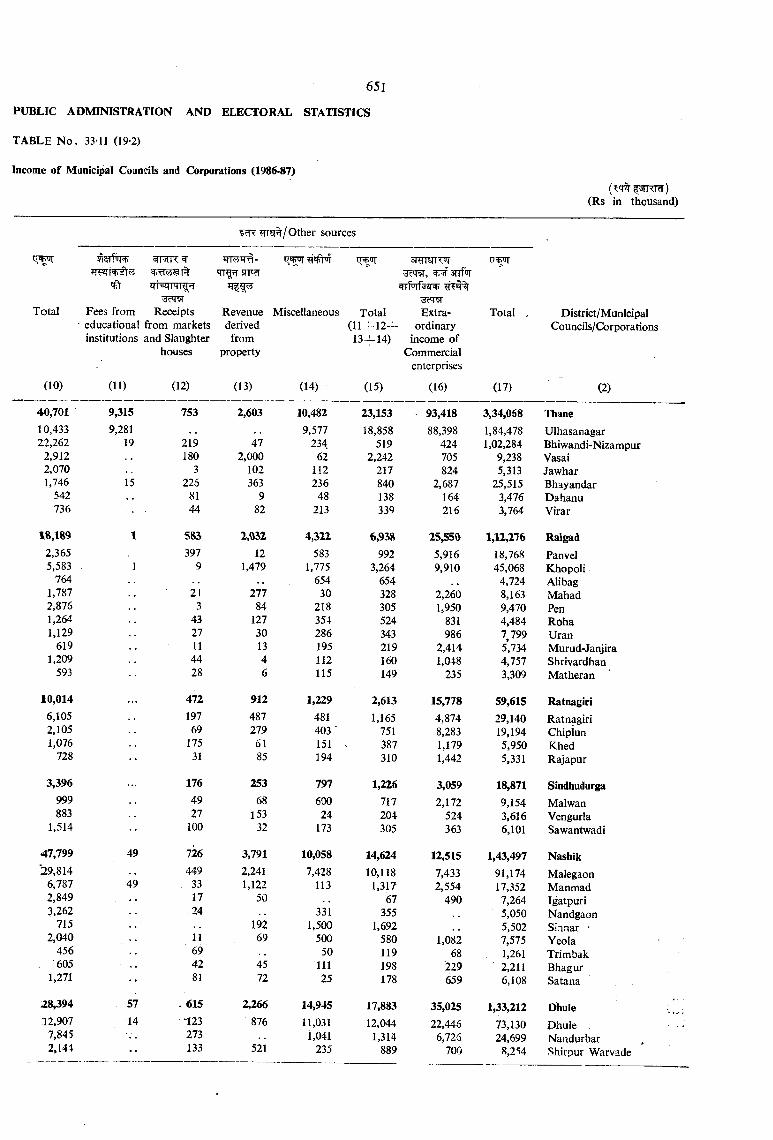
PUBLIC ADMINISTRATION AND ELECTORAL STATISTICS
?TTS!%/Other sources
Total
(10)
40,70110,43322,262
2,9122,0701,746
542736
18,1892,3655,583
7641.787 2,876 1,264 1,129
6191,209
593
10,0146.1052.105 1,076
728
3,396999883
1,514
47,79929,814
6.787 2,849 3,262
715 2,040
456 . 605
1,271
28,39412,9077,8452,144
<N|v>1K srarsiTTW
zrhzTPTT
Fees from Receipts Revenue Miscellaneous Total Extra Total , District/Municipaleducational from markets derived (1 1 + 1 2 + ordinary Councils/Cbrporationsinstitutions and Slaughter from 13+14) income of
houses property Commercialenterprises
(11) (12) (13) (14) (15) (16) (17) (2)
9,315 753 2,603 10,482 23,153 93,418 3,34,068 Thane9,281 9,577 18,858 88,398 1,84,478 Ulhasanagar
19 219 47 234. 519 424 1,02,284 Bhiwandi-Nizampur180 2,000 62 2,242 705 9,238 Vasai
3 102 112 217 824 5,313 Jawhar15 226 363 236 840 2,687 25,515 Bhayandar
81 9 48 138 164 3,476 Dahanu44 82 213 339 216 3,764 Virar
1 S83 2,032 4,322 6,93H 25,550 1,12,276 Raigad397 12 583 992 5,916 18,768 Panvel
1 9 1,479 1,775 3,264 9,910 45,068 Khopoli654 654 4,724 Alibag
2! 111 30 328 2,260 8,163 Mahad3 84 218 305 1,950 9,470 Pen
43 127 354 524 831 4,484 Roha27 30 286 343 986 7 799 Uran11 13 195 219 2,414 5,734 Murud-Janjira44 4 112 160 1,048 4,757 Shrivardhan28 6 115 149 235 3,309 Matheran
472 912 1,229 2,613 15,778 59,615 Ratnagiri197 487 481 1,165 4,874 29,140 Ratnagiri69 279 403' 751 8,283 19,194 Chipiun
175 61 151 387 1,179 5,950 Khed31 85 194 310 1,442 5,331 Rajapur
176 253 797 1,226 3,059 18,871 Sindhudurga49 68 600 717 2,172 9,154 Malwan27 153 24 204 524 3,616 Vengurla
100 32 173 305 363 6,101 Sawantwadi
49 726 3,791 10,058 14,624 12,515 1,43,497 Nashik449 2,241 7,428 10,118 7,433 91,174 Malegaon
49 33 1,122 113 1,317 2,554 17,352 Manmad. •• 17 50 67 490 7,264 Igatpuri
24 331 355 5,050 Nandgaon192 1,500 1,692 , , 5,502 Sinnar •
11 69 500 580 1,082 7,575 Yeola69 50 119 68 1,261 Trimbak42 45 111 198 229 2,211 Bhagur81 72 25 178 659 6,108 Satana
57 - ^15 2,266 14,945 17,883 35,025 1,33,212 Dhuie14 123 876 11,031 12,044 22,446 73,130 Ohule •
273 1,041 1,314 6,726 24,699 Nandurbar133 521 235 889 700 8,254 Shirpur Warvade
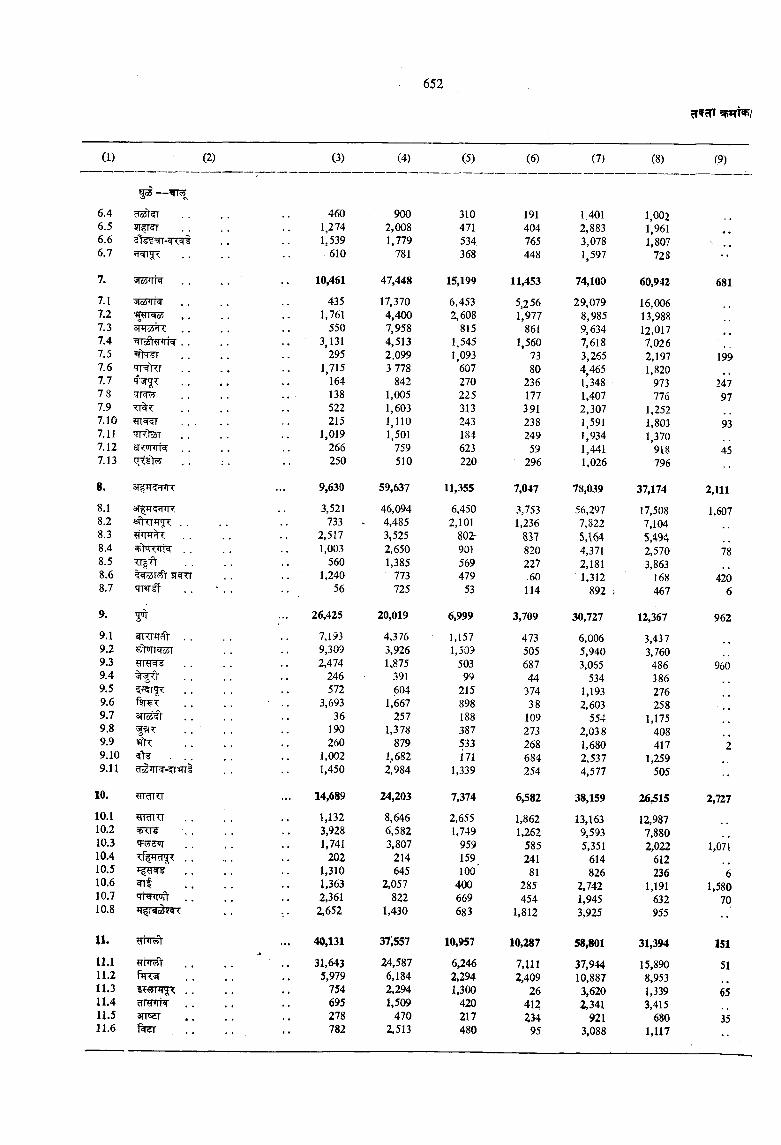
(t) (2) (3) (4) (5) (6) (7) (8) (9)
6.4 'dcdl<iT 460 900 310 191 1,401 1,0026.5 5r T3T 1,274 2,008 471 404 2,883 1,9616.6 3lss-^l-=| <c| . » 1,539 1,779 534 765 3,078 1,8076.7 610 781 368 448 1,597 728
7. '3|c6Ml=( 10,461 47,448 15,199 11,453 74,100 60,942 681
7.1 435 17,370 6,453 5,256 29,079 16,0067.2 . . 1,761 4,400 2,608 1,977 8,985 13.9887.3 550 7,958 815 861 9,634 12,0177.4 3,131 4,513 1,545 1,560 7,618 7,0267.5 295 2,099 1,093 73 3,265 2,197 1997.6 'TT rrr * * 1,715 3 778 607 80 4,465 1,8207.7 •. * , 164 842 270 236 1,348 973 24778 5rMrf' 138 1,005 225 177 1,407 776 977.9 522 1,603 313 391 2,307 1.2527.10 . . . 215 1,110 243 238 1,591 1,803 937.11 'TTTter 1,019 1,501 184 249 1,934 1,3707.12 ar^iTR . . 266 759 623 59 1,441 918 457.13 250 510 220 296 1,026 796
8. 3T TT? FR 9,630 59,637 11,355 7,047 78,039 37,174 2,111
8.1 3,521 46,094 6,450 3,753 56,297 17,508 1,6078.2 «ftTTTT T . . 733 4,485 2,101 1,236 7,822 7,1048.3 2,517 3,525 802r 8^7 5,164 5,4948.4 . . 1,003 2,650 901 820 4,371 2,570 788.5 TT|ft 560 1,385 569 227 2,181 3,8638.6 <c!o4T^ STTO 1,240 773 479 .60 1,312 168 4208.7 'TT«T¥f 56 725 53 114 892 , 467 6
9. 5^ 26,425 20,019 6,999 3,709 30,727 12,367 9629.1 Rr TffV . . 7,193 4,376 1,157 473 6,006 3,4379.2 9,309 3,926 1,509 505 5,940 3,7609.3 2,474 1„875 503 687 3,065 486 9609.4 ^'i<r 246 391 99 44 534 3869.5 572 604 215 374 1,193 2769.6 3,693 1,667 898 38 2,603 2589,7 STIoj?)' 36 257 188 109 554 1,1759.8 190 1,378 387 273 2,038 4089.9 260 879 533 268 1,680 417 29.10 . . . . . 1,002 1,682 171 684 2,537 1,2599.11 1,450 2,984 1,339 254 4,577 505
10. ?rr^Tr 14,689 24,203 7,374 6,582 38,159 26,515 2,72710.1 , 1,132 8,646 2,655 1,862 13,163 12,98710.2 3,928 6,582 1,749 1,262 9,593 7,88010.3 1,741 3,807 959 585 5,351 2,022 1,07110.4 202 214 159 241 614 61210.5 , . 1,310 645 lOO' 81 826 236 610.6 . . 1,363 2,057 400 285 2,742 1,191 1,58010.7 TTWift . . 2,361 822 669 454 1,945 632 7010.8 2,652 1,430 683 1,812 3,925 955 ••
XI. 40,131 37;S57 10,957 10,287 58,801 31,394 151
11,1 31,643 24,587 6,246 7,111 37,944 15,890 5111.2 firrsr 5,979 6,184 2,294 2,409 10,887 8,95311.3 754 2,294 1,300 26 3,620 1,339 6511.4 cTRHTtW 695 1,509 420 412 2,341 3,415U .5 Sll di , , 278 470 217 234 921 680 3511.6 782 2,513 480 95 3,088 1,117
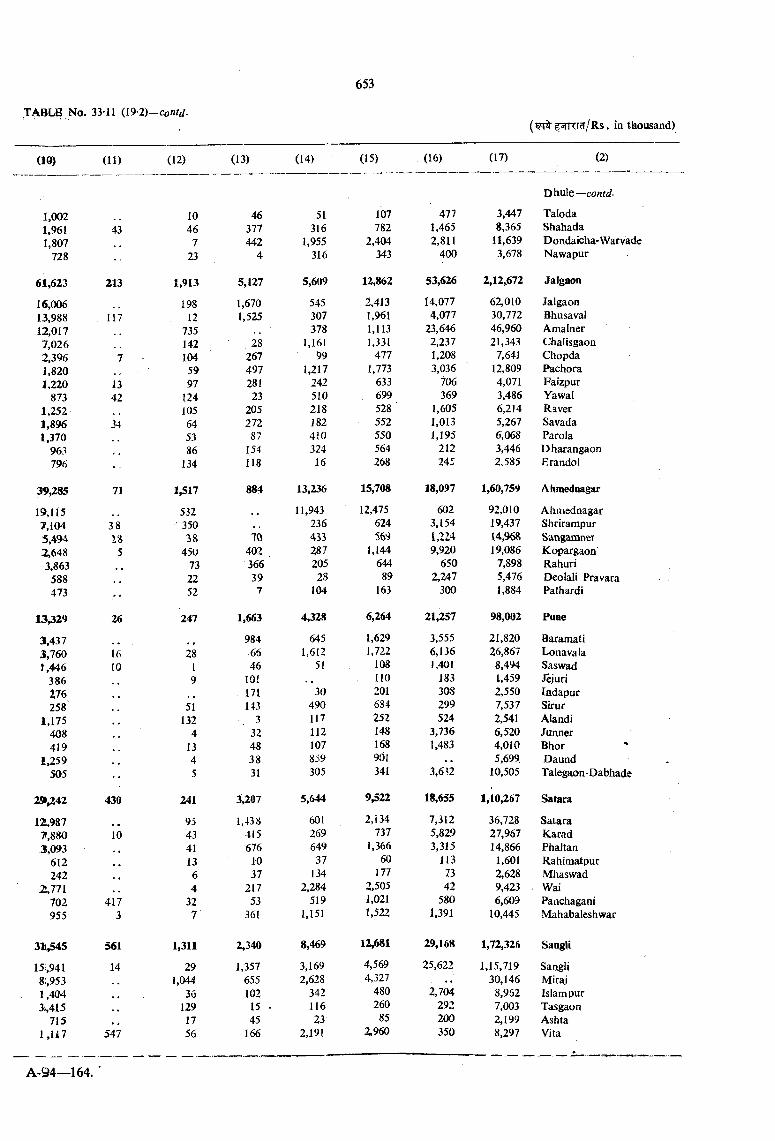
TABLE No. 33-11 (19-2)-—contd.f3TRr^/Rs. in thousand)
(10) (11) (12) (13) (14) (15) (16) (17) (2)
1,002 10 46 51 107 477 3,447
Dhule—co«r</-
Taloda1,961 43 46 377 316 782 1,465 8,365 Shahada1,807 7 442 1,955 2,404 2,811 11,639 Dondaicha-Warvade
728 23 4 316 343 400 3,678 Nawapur
61,623 213 1,913 5,127 5,609 12,862 53,626 2,12,672 Jalgaon
16,006 198 1,670 545 2,413 14,077 62,010 Jalgaon13,988 117 12 1,525 307 1,961 4,077 30,772 Bhusaval12,017 735 378 1,113 23,646 46,960 Amalner7,026 142 28 1,161 1,331 2,237 21,343 Chalisgaon2,396 7 104 267 99 477 1,208 7,641 Chopda1,820 59 497 1,217 1,773 3,036 12,809 Pachora1,220 13 97 281 242 633 706 4,071 Faizpur
873 42 124 23 510 699 369 3,486 Yawal1,252 105 205 218 528 ' 1,605 6,214 Raver1,896 34 64 272 182 552 1,013 5,267 Savada1,370 53 87 410 550 1,195 6,068 Parola
963 86 154 324 564 212 3,446 Dharangaon796 134 118 16 268 245 2,585 Erandol
39,285 71 1,517 884 13,236 15,708 18,097 1,60,759 Ahmedaagar
19,115 532 .. 11,943 12,475 602 92,010 Ahinednagar7,104 38 350 236 624 3,154 19,437 Shrirampur5,494 1% 38 70 433 569 1,214 14,968 Sangamnct2,648 5 45U 402 287 1,144 9,920 19,086 Kopargaon3,863 73 366 205 644 650 7,898 Rahuri
588 22 39 28 89 2,247 5,476 Deolali Pravara473 •• 52 7 104 163 300 1,884 Pathardi
13,329 26 247 1,563 4,328 6,264 21,257 98,002 Pune
3,437 984 645 1,629 3,555 21,820 Baraniati3,760 16 28 66 1,612 1,722 6,136 26,867 Lonavalaf,446 10 1 46 51 108 1,401 8,494 Saswad
386 9 101 . . 110 183 1,459 Jejurim 171 30 201 308 2,550 Indapur258 51 143 490 684 299 7,537 Sirur
11,175 132 •. 3 117 252 524 2,541 Alandi408 4 32 112 148 3,736 6,520 Junner419 13 48 107 168 1,483 4,010 Bhor '
11,259 4 38 839 901 5,699 Daund505 •• 5 31 305 341 3,6^2 10,505 Talegaon-Dabhade
251^42 430 241 3,207 5,644 9,522 18,655 1,10,267 Satara
12*,987 95 1,438 601 2,134 7,312 36,728 Satara?,880 10 43 415 269 737 5,829 27,967 Karad3,093 .. 41 676 649 1,366 3,315 14,866 Phaltan
612 13 10 37 60 113 1,601 Rahimatpur242 6 37 134 177 73 2,628 Mhaswad
2,771 4 217 2,284 2,505 42 9,423 Wai702 417 32 53 519 1,021 580 6,609 Panchagani955 3 7 361 1,151 1,522 1,391 10,445 Mahabaleshwar
311^5 561 1,311 2,340 8,469 12^81 29,168 1,72,325 Sangli
15;,941 14 29 1,357 3,169 4,569 25,622 1,15,719 Sangli8;,953 1,044 655 2,628 4,327 30,146 Miraj1,404 36 102 342 480 2,704 8,962 Islam pur3i,415 129 15 . 116 260 292 7,003 Tasgaon
715 17 45 23 85 200 2,199 Ashta1,117 547 56 166 2,191 2,960 350 8,297 Vita
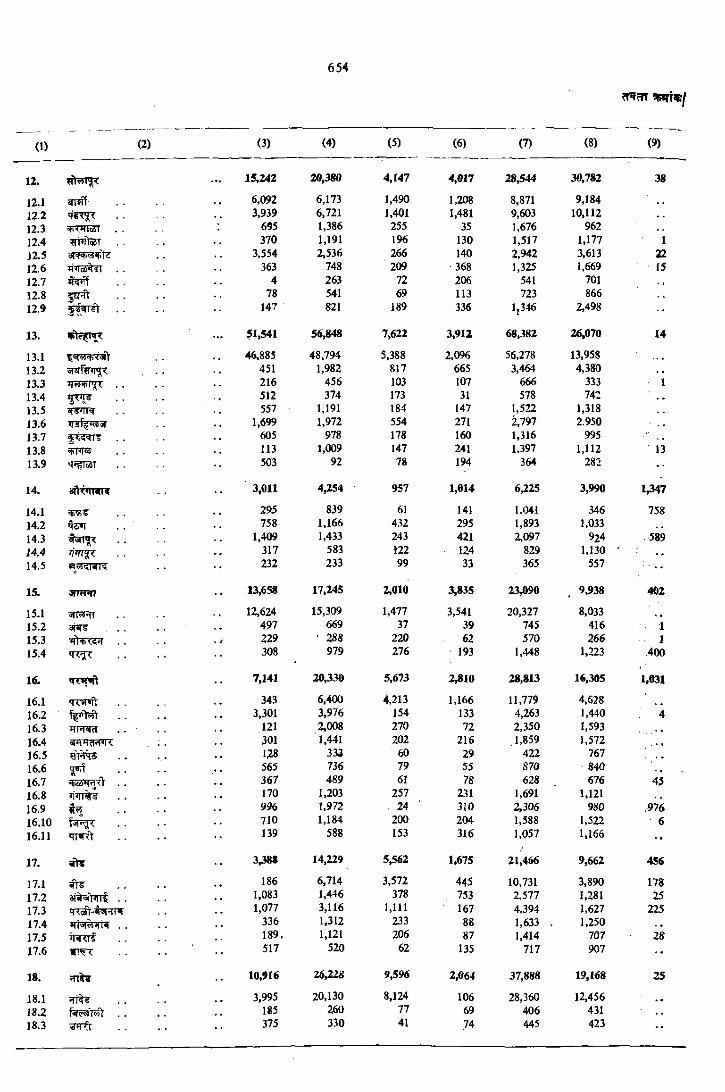
(1) (2) (3) (4) (5) (6) (7) (8) (9)
12. 15,242 20,380 4,147 4,017 28,544 30,782 38
12.1 snnf 6,092 6,173 1,490 1,208 8,871 9,18412.2 3,939 6,721 1,401 1,481 9,603 10,11212.3 695 1,386 255 35 1,676 96212.4 370 1,191 196 130 1,517 1,177 112.5 3,554 2,536 266 140 2,942 3,613 2212.6 363 748 209 368 1,325 1,669 1512.7 4 263 72 206 541 701 , ,12.8 78 541 69 113 723 866 , ,12.9
. .147 821 189 336 1,346 2,498
13. 51,541 56,848 7,622 3,912 68,382 26,070 14
13.1 46,885 48.794 5,388 2,096 56,278 13,95813.2 451 1,982 817 665 3,464 4,38013.3 216 456 103 107 666 333 113.4 512 374 173 31 578 74213.5 557 1,191 184 147 1,522 1,318J3.6 jj 1,699 1,972 554 271 ^797 2,950 , .13.7 605 978 178 160 1,316 99513.8 113 1,009 147 241 1,397 1,112 1313.9 503 92 78 194 364 282 •-
14. 3,011 4,254 957 1,614 6,225 3,990 1 ^ 7
14.1 295 839 61 141 1.041 346 75814.2 758 1,166 432 295 1,893 1,03314.3 1,409 1,433 243 421 2,097 924 589J4.4 317 583 t22 124 829 1,130 '14.5 232 233 99 33 365 557
15. 13,658 17,245 2,010 3,835 23,090 9,938 402
15.1 12,624 15,309 1,477 3,541 20,327 8,03315.2 497 669 37 39 745 416 115.3 w tn :^ . . 229 ■ 288 220 62 570 266 115.4 308 979 276 193 1,448 1,223 400
16. •Trvft 7,141 20,330 5,673 2^10 28,813 16,305 1,031
16.1 343 6,400 4,213 1,166 11,779 4,62816.2 3,301 3,976 154 133 4,263 1,440 416.3 ^Tinsa . . ' 121 2,008 270 72 2,350 1,59316.4 301 1,441 202 216 1,859 1,572 , 16.5 128 333 60 29 422 767 . *
16.6 565 736 79 55 870 84016.7 ;66*nrfy . . 367 489 62 78 628 676 4516.8 170 1,203 257 231 1,691 1,121 . ,
16.9 996 1,972 24 ' 310 2,306 980 97616.10 710 1,184 200 204 1,588 1,522 616.11 'TT'R't 139 588 153 316 1,057 1,166 '■
17. 3,38* 14,229 5,562 1,675 21,466 9,662 456
17.1 186 6,714 3,572 445 10,731 3,890 17817.2 1,083 1,446 378 753 2,577 1,281 2517.3 iTToSt-l JTT’? 1,077 3,116 1,111 ■ 167 4.394 1,627 22517.4 irr^^TTR . . 336 1,312 233 88 1,633 . 1,250 . ,
17.5 189, 1,121 206 87 1,414 707 2817.6 517 520 62 135 717 907 ••
18. 10,916 26,22S 9,596 2,064 37,888 19,168 25
18.1 * rt^ . . 3,995 20,130 8,124 106 28,360 12,456 . .
IS.2 185 260 77 69 406 431 , *
18.3 375 330 41 74 445 423
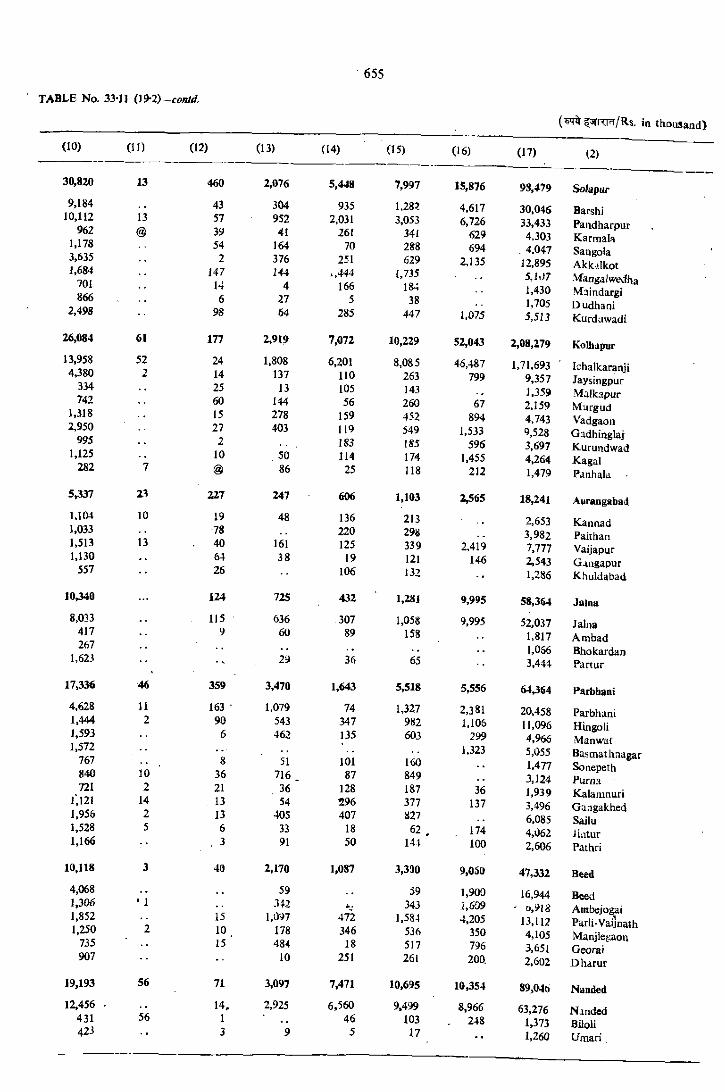
(10) (H ) (12) (13) (14) 05 ) (16)
30,820 13 460 2.076 5,448 7,997 15,8769,184 43 304 935 1,28? 4,617
10,112 13 57 952 2,031 3,053 6,726962 @ 39 41 26f 341 629
1,178 54 164 70 288 6943,635 2 376 251 629 2,1351,684 147 144 .,444 i,735
701 14 4 166 184866 6 11 5 38
2,498 98 64 285 447 1,075
26,084 61 177 2,919 7,072 10,229 52,04313,958 52 24 1,808 6,201 8,085 46,4874,380 2 14 137 110 263 799
334 25 13 105 143742 60 144 56 260 67
1,318 15 278 159 452 8942,950 27 403 119 549 1,533
995 2 m 185 5961,125 10 . 50 114 174 1,455
282 7 86 25 118 212
5,337 23 227 247 606 1,103 2,5651.104 10 19 48 136 2131,033 78 220 2981,513 13 40 161 125 339 2,4191,130 64 38 19 121 146
557 26 106 132
10340 124 725 432 1,281 9,995
8,033 115 636 307 1,058 9.995417 9 60 89 158267
1,623 • ' 29 36 65
17336 46 359 3,470 1,643 5,518 5,556
4,628 n 163 • 1,079 74 1,327 2,3811,444 2 90 543 347 982 1.1061,593 6 462 135 603 2991,572 i.323
767 S 51 101 160840 10 36 716 87 849721 2 21 36 128 187 36
J'.l2i 14 13 54 296 377 1371,956 2 13 405 407 S271,528 5 6 33 18 62 , 1741,166 3 91 50 141 100
10,118 3 40 2,170 1,087 3,390 9,050
4,068 59 59 1,900J,306 • J 342 343 1,6091,852 15 1,097 472 1,584 4,2051,250 2 10 178 346 536 350
735 15 ‘ 484 18 517 796907 •• 10 251 261 200.
19,193 56 71 3,097 7,471 10,695 10354
12,456 . 14, 2,925 6,560 9,499 8,966431 56 1 , ^ 46 103 248423 3 9 5 17
(17)
30.046 33,433 4.303
. 4.047 12,895 5,iiJ7 1,430 1,705 5,513
1,71,6939,3571,3592,1594,7439,5283,6974,2641,479
2,6533,9827.7772,5431.286
52.0371,8171,0563,444
20.45811,0964,9665,0551,4773,1241.9393,4966,0854,0622,606
16,9440,918
13,1124,1053,6512,602
63,2761,3731,260
(2)
98,479 Solapur
BarshiPaiidharpurKarmaUSangolaAkk-ilkot.\fanga/wedhaMaindargiDudhaniKurdawadi
2,08,279 Kolhapur
IchalkaranjiJaysingpurM alkapurMurgudVadgaonGadhinglajKurundwadKagalPatihak
18,241 Auraagabati
KanaadPaithanVaijapur04ngapurKhuldabad
58,364 Jaina
JaijiaAmbadBhokardanPartur
64^64 Parbhaai
ParbhaniHingoliMansvafBascnathnagarSouepethPurnaKalamnuriGangakhedSailuJiiiturPathri
47,332 Beed
BeedAmbejogaiParli-VaijnaihManjle^aonGeoraiD harur
89,046 Nandei
NandedBiioliUmari
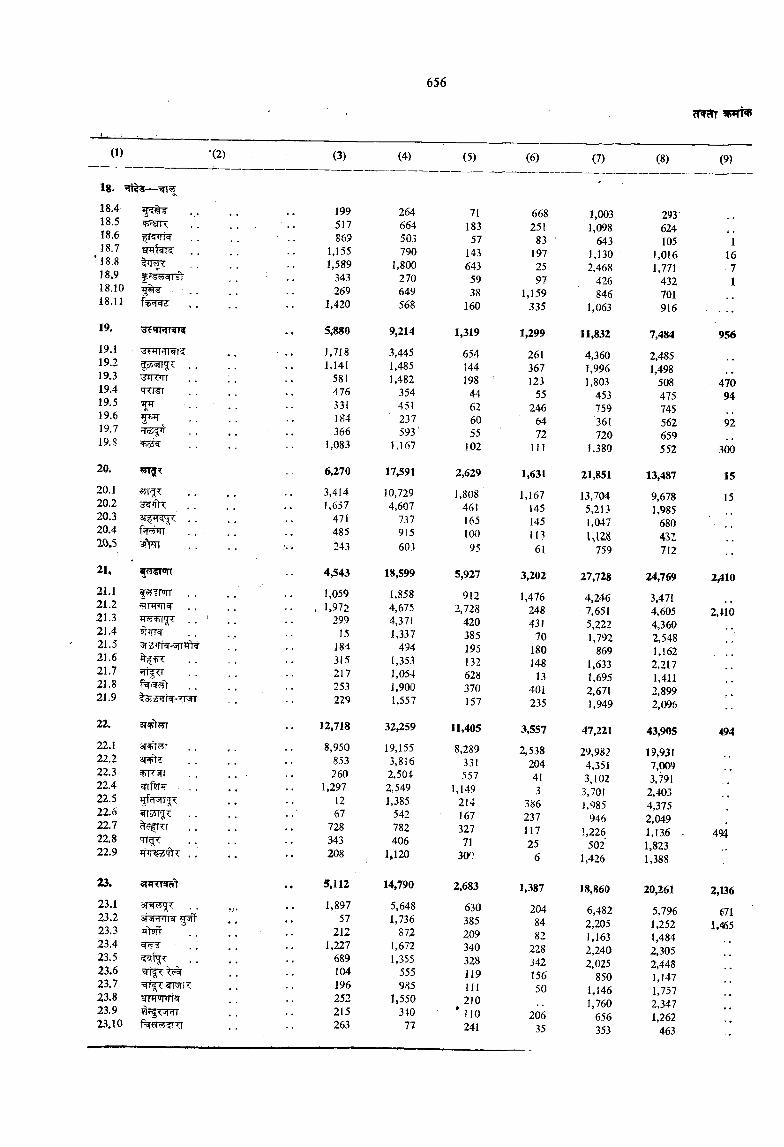
(1)
l8 .
•(2)
19.
19.119.219.319.419.519.619.7 19.S
20.20.120.220.320.420.5
21,21.121.221.321.421.521.621.721.821.9
22,22.122.222.322.422.522.622.722.822.9
23.123.223.323.423.523.623.723.823.923.10
r'TTirr ?riT ; iT
wM
va
’ pPT'Tl
ts zJ rra’-TFsrr
3T>37dffn'arrsRfrs.^3rrWlfiJPT
r firr'TTgr
23. srwTT 't
3twrr^5pTifrwf
STFTOprN"f|T5RT
f% TITT
(3) (4) (5) (6) (7) (8) (9)
199 264 71 668 1,003 293517 664 183 251 1,098 624S69 503 57 83 643 105 1
1,155 790 143 197 1,130 1,016 161,589 1,800 643 25 2,468 1,771 7
343 270 59 97 426 432 1269 649 38 1,159 846 701
1,420 568 160 335 1,063 916
5,880 9,214 1,319 1,299 11,832 7,484 9561,718 3,445 654 261 4,360 2,4851,141 1,485 144 367 1,996 1,498
581 1,482 198 123 1,803 508 470476 354 44 55 453 475 94331 451 62 246 759 745184 237 60 64 361 562 92366 593' 55 72 720 659
1,083 1,167 102 111 1,380 552 300
6,270 17,591 2,629 1,631 21,851 13,487 153,414 10,729 1,808 1,167 13,704 9,678 151,657 4,607 461 145 5,213 1,985
471 737 165 145 1,047 680485 915 100 113 u m 431243 603 95 61 759 712
4,543 18,599 5,927 3,202 27,728 24,769 2,4101,059 1,858 912 1,476 4,246 3,4711.972 4,675 2,728 248 7,651 4,605 2,410
299 4,37! 420 431 5,222 4,36015 1,337 385 70 1,792 2,548
184 494 195 180 869 1,162315 1,353 132 148 1,633 2,217217 1,054 628 13 1,695 1,411253 J.900 370 401 2,671 2.899229 1,557 157 235 1,949 2,096
12,718 32,259 11,405 3,557 47,221 43,905 4948,950 19,155 8,289 2,538 29,982 19,931
853 3,816 331 204 4,351 7,009260 2.504 557 41 3,102 3,791
1,297 2,549 1,149 3 3,701 2,40312 1,385 214 386 1,985 4,37567 542 167 237 946 2,049
728 782 327 117 1,226 1,136 . m343 406 71 25 502 1,823208 1,120 300 6 1,426 1,388
5,112 14,790 2,683 1,387 18,860 20,261 2,1361,897 5,648 630 204 6,482 5,796 67157 1,736 385 84 2,205 1,252 1,465212 872 209 82 1,163 1,4841,227 1,672 340 228 2,240 2,305
689 1,355 328 342 2,025 2,448104 555 119 156 850 1,147196 985 111 50 1,146 1,757252 1,550 210 1,760 2,347215 3^0 * liO 206 656 1,262263 77 241 35 353 463
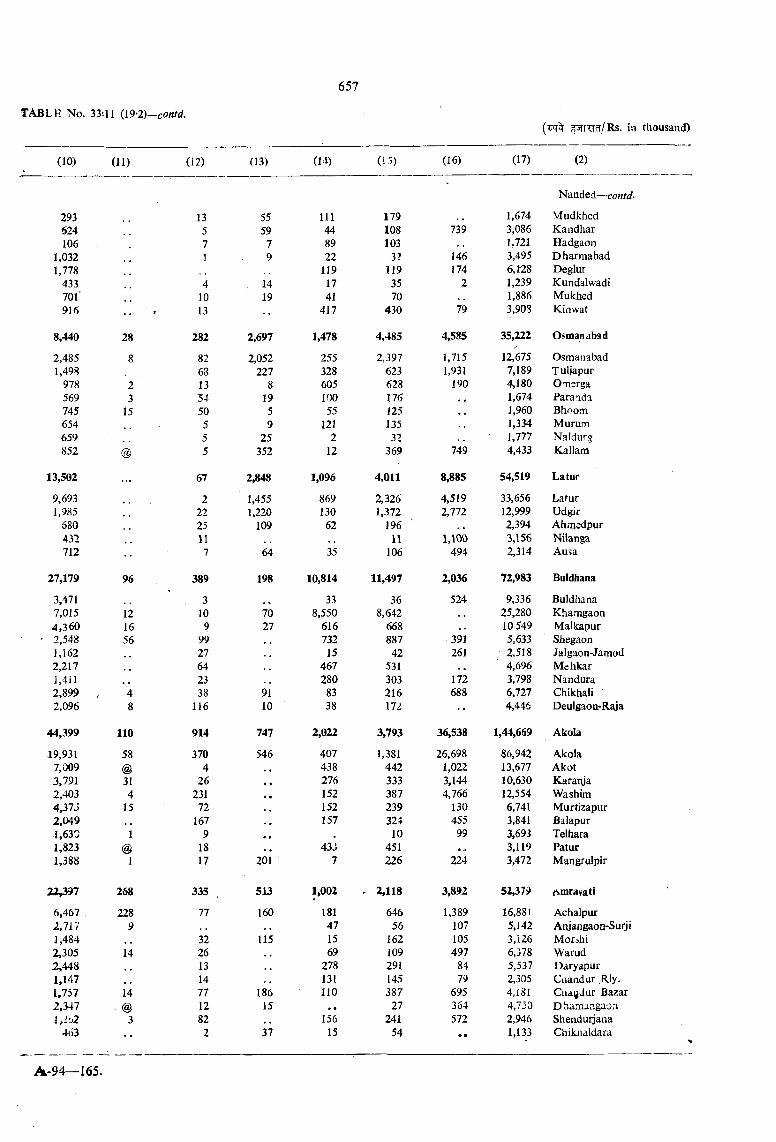
(10)
293624106
1,0321,778
433701’916
8,440
2,4851,498
978569745654659852
(11)
28
23
15
(12)
1357
4 10 13
282
82681354505 5 5
(13)
5559
79
1419
2,697
2,052227
81959
25352
(14)
111448922
1191741
417
1,478
25532860510055
1212
12
(!5)
179108103
3?119
3570
430
4,485
2,39762362817612513532
369
(16)
739
146174
2
79
4,585
1,7151,931
190
749
(17)
1,6743,0861,7213,4956,t281,2391,8863,908
12,6757,1894,1801,6741,9601,3341,7774,433
(2)
Nanded—contd-
MudkhedKandharHadgaonDharmabadDeglurKundalwadiMukhedKinwat
35,222 Osman aba d
OsmaiiabadTuljapurOmsrgaParandaBhoomMurumNaldurgKallam
13,502
9,6931,985
680432712
27,179
3,4717,0154,3602,5481,1622,217J,4il2,8992,096
96
121656
67
22225117
389
310
99927642338
116
2,848
1,4551,220
109
64
198
7027
9110
1,096
869130
62
35
10,814
338,550
61673215
467280
8338
4,011
2,3261,372
196n
106
11,497
368,642
668887
42531303216172
8,885
4,5192,772
1,100494
2,036
524
391261
172688
54,519 Latur
33,65612,9992,3943,1562,314
9,336 25,280 10 549 5,633 2,518 4,696 3,798 6,727 4,445
LaturUdgirAhiuedpurNilangaAusa
72,983 Buldhana
BuldhanaKhamgaonMalkapurShegaonJalgaon-JamodMehkarNanduraChikhali 'Deulgaon-Raja
44,399
19,9317,0093,7912,4034,37J2,M 9i,6301,8231,388
11058@314
15
1@1
914
3704
26231
72167
91817
747
546
201
2,022407438276152152157
43J7
3,793
1,38144233338723932410
451226
36,538 1,44,669 Akola
26,6981,0223,1444,766
130455
99
224
86,94213,67710,63012,5546,7413,8413,6933,1193,472
AkolaAkotKaraiyaWashimMurtizapurBalapurTelharaPaturMangrulpir
22,397
6,4672,71V1,4842,3052,4481,1471,7572,347l,2o2
463
268
2289
14
14@
3
335
77
32261314 77 12 822
513
160
115
18615
37
1,002181 47 15 69
278 131 110
• • 156
15
2,118
64656
162109291145387
27241
54
3,892
1,389107105497
8479
695364572
52,379 Amravati
16,88!5,1423,1266,3785,5372,3054,1814,7532,9461,133
AchalpurAnjangaon-SurjiMorihiWarudDaryapurCaandur ,Rly.Ciidftdur BazarDhamangaoaShendurjanaChikhaldara
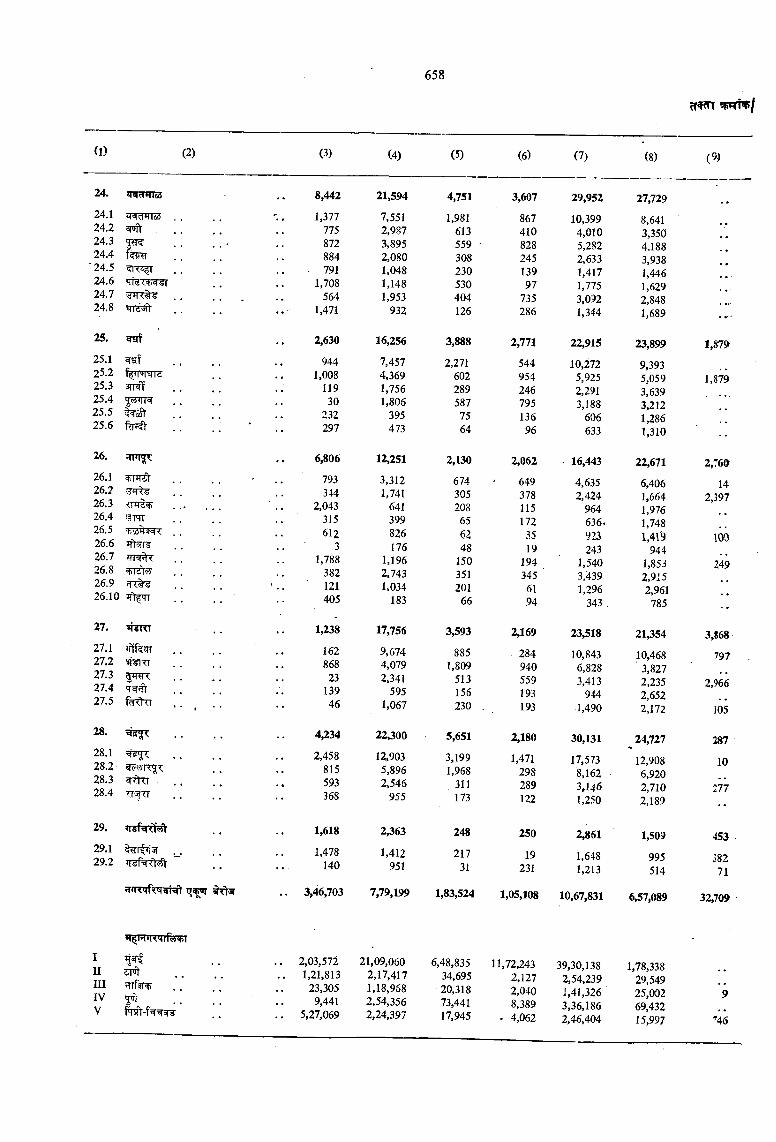
(1) (2) (3) (4) (5) (6) (7) (8) (9)
24. JTWfrmss
24.1 zRcrmoS24.224.324.4
‘24.524.624.724.8
25.
25.125.225.3 3TT25.425.525.6
26.
26.126.226.326.426.526.626.726.826.926.10 ’TtfTT
27.
27.127.227.327.4 TWiTt27.5
28.
28.128.228.328.4
29.
29.129.2
In SFT
8,442
1,377775872884791
1,708564
1,471
2,630
9441,008
11930
232297
6,806
793344
2,043315612
31,788
382121405
1,238
16286823
13946
21,594
7,5512,9873,8952,0801,0481,1481,953
932
16,256
7,4574,3691,7561,806
395473
12,251
3,3121,741
641399826176
1,1962,7431,034
183
17,756
9,6744,0792,341
5951,067
4,751
1,981613559308230530404126
3,888
2,2716022895877564
2,130
674305208
65 62 48
150 351 20166
3,593
8851,809
513156230
3,607
867410828245 13997
735286
2,771
544954246 795 13696
2,062
649378115172
3519
1943456194
2,169
■ 284 940 559 193 193
29,952
10,3994,0105,2822,6331,4171,7753,0921,344
22,915
10,2725,9252,2913,188
606633
16,443
4,6352,424
964636.923243
1,5403,4391,296
343
23,518
10,8436,8283,413
9441,490
27,729
8,6413,3504,1883,9381,4461,6292,8481,689
23,899
9,3935,0593,6393,2121,2861,310
22,671
6,4061,6641,9761,7481,41'9
9441,8532,9152,961
785
21,354
10,468 ' 3,827 2,235 2,652 2,172
III ?nf?TIV
4,234 22,300 5,651 2,180 30,131 24,7272,458 12,903 3,199 1,471 17,573 12,908
815 5,896 1,968 298 8,162 6,920593 2,546 311 289 3,146 2,710368 955 173 122 1,250 2,189
1,618 2,363 248 250 2,861 1,5091,478 1,412 217 19 1,648 995
140 951 31 231 1,213 514
3,46,703 7,79,199 1,83,524 1,05,108 10,67,831 6,57,089
2,03,572 21,09,060 6,48,835 11,72,243 39,30,138 1,78,3381,21,813 2,17,417 34,695 2,127 2,54,239 29,549
23,305 1,18,968 20,318 2,040 1,41,326 25,0029,441 2,54,356 73,441 8,389 3,36,186 69,432
5,27,069 2,24,397 17,945 - 4,062 2,46,404 15,997
1.879
1.879
2,760
142,397
100
249
3,868
797
2,966
105
287
10
277
453
38271
32,709
9
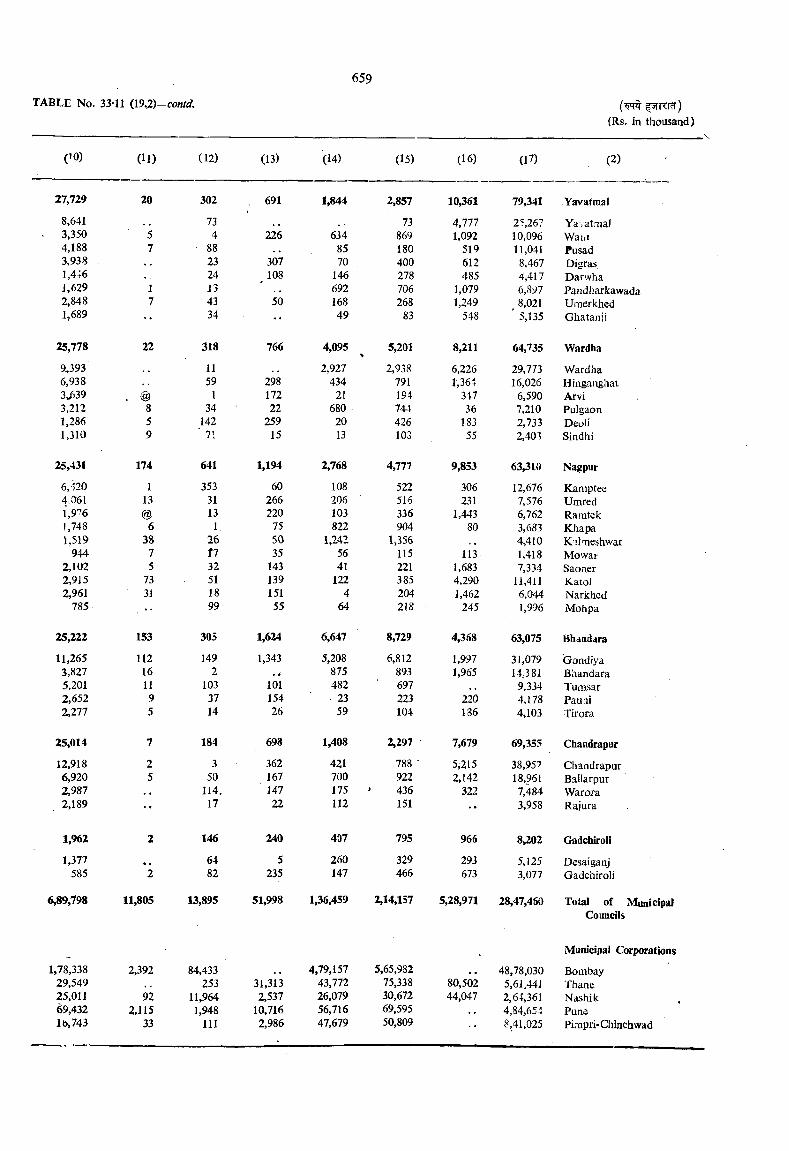
TABLE No. 33-11 (19.;2)- contd. f TKTcT) (Rs. in thousand)
(10) (11) (12) (13) (14) (15) (16) (17) (2)
27,729 20 302 691 1,844 2,857 10,361 79,341 Yavafmal
8,641 73 73 4,777 25,267 YavatniaJ. 3,350 5 4 226 634 869 1,092 10,096 Waiii
4,188 7 • 88 85 180 519 11,041 Pusad3,938 23 307 70 400 612 8,467 Digras1,446 24 108 146 278 485 4,417 Darwha1,629 1 13 692 706 1,079 6,897 Pandharkawada2,848 7 43 50 168 268 1,249 8,021 Umerkhed1,689 '♦ 34 •• 49 83 548 ' 5,135 Ghatanii
25,778 22 318 766 4,095 5,201% 8,211 64,735 Wardha
9,393 11 2,927 2,938 6,226 29,773 Wardha6,938 59 298 434 791 1,361 16,026 Hinganghat3,^39 . @ 1 172 21 194 347 6,590 Arvi3,212 8 34 22 680 744 36 7,210 Pulgaon1,286 5 142 259 20 426 183 2,733 Deoli1,310 9 ■ 71 15 13 103 55 2,401 Sindhi
25,431 174 641 1,194 2,768 4,777 9,853 63,310 Nagpur
6,420 1 353 60 108 522 306 12,676 Kamptee4.061 13 31 266 206 516 231 7,576 Utnred1,976 @ 13 220 103 336 1,443 6,762 Rarntek1,748 6 1 75 822 904 80 3,683 Khapa1,519 38 26 50 1,242 1,356 , * 4,410 Kal'-neshwar
944 7 t l 35 56 115 113. 1,418 Mowar2,102 5 32 143 41 221 1,683 7,334 Saoner2,915 73 51 139 122 385 4,290 11,411 Kaiol2,961 31 18 151 4 204 1,462 6,044 Narkhed
785 99 55 64 218 245 1,996 Mohpa
25,222 153 305 1,624 6,647 8,729 4,368 63,075 Bhandara
11,265 112 149 1,343 5,208 6,812 1,997 31,079 Gondiya3,827 16 2 . . 875 893 1,965 14,381 Bhandara5,201 11 103 101 482 697 9,334 Tumsar2,652 9 37 154 23 223 220 4,178 Pauai2,277 5 14 26 59 104 186 4,103 Tirora
25,014 7 184 698 1,408 2,297 • 7,679 69,355 Chandrapur
12,918 2 3 362 421 788 ■ 5,215 38,95? Chandrapur6,920 5 50 167 700 922 2,142 18,961 Ballarpur2,987 114. 147 175 436 322 7,484 Warora2,189 •• 17 22 112 151 •• 3,958 Rajura
1,962 2 146 240 407 795 966 8,202 Gadchiroli
1,377 64 5 260 329 293 5,125 Desaiganj585 2 82 235 147 466 673 3,077 Gadchiroli
6,89,798 11,805 13,895 51,998 1,36,459 2,14,157 5,28,971 28,47,450 Total of MunicipalCouncils
Municipal Corporations
1,78,338 2,392 84,433 4,79,157 5,65,982 48,78,030 Bombay29,549 253 31,313 43,772 75,338 80,502 5,61.441 Thane25,011 92 11,964 2,537 26,079 30,672 44,047 2,64,361 Nashik69,432 2.115 1,948 10,716 56,716 69,595 4,84,654 Punelb , 743 33 111 2,986 47,679 50,809 8,41.025 Pi.-Bpri-Chinchwad
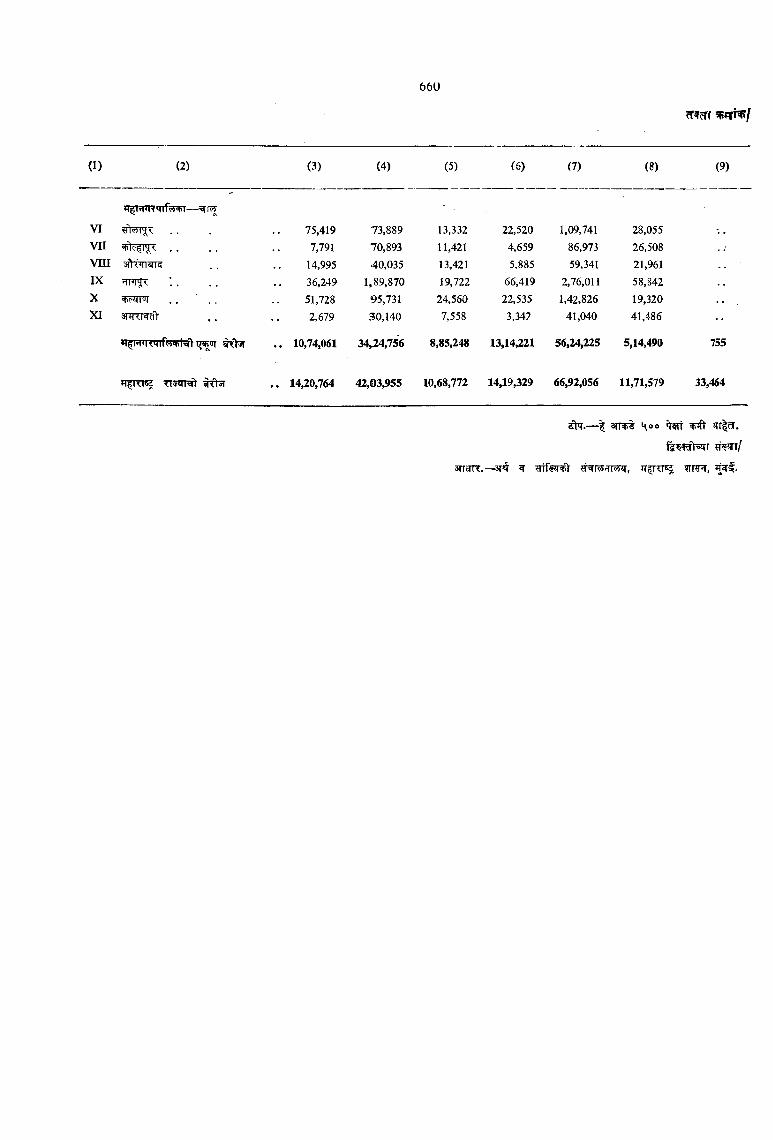
(1) (2) (3) (4) (5) C6) (7) (8) (9)
VI 75,419 73,889 13,332 22,520 1,09,741 28,055v n 7,791 70,893 11,421 4,659 86,973 26,508v m sftWWT^ 14,995 40,035 13,421 5,885 59,341 21,961IX 36,249 1,89,870 19,722 66,419 2,76,011 58,842X 51,728 95,731 24,560 22,535 1,42,826 19,320XI 2,679 30,140 7,558 3,34? 41,040 41,486 ••
l^FFR’TTf^ ri IT^ . . 10,74,061 34,24,756 8,85,248 13,14,221 56,24,225 5,14,490 755
»r^Riis5 . . 14,20,764 42,03,955 10,68,772 14,19,329 66,92,056 11,71,579 33,464
im.—I arnpl Koo ^ 2rr|cr.
aricTR.—3TST ^ ^Nr y r ir, trpt, jt^€-
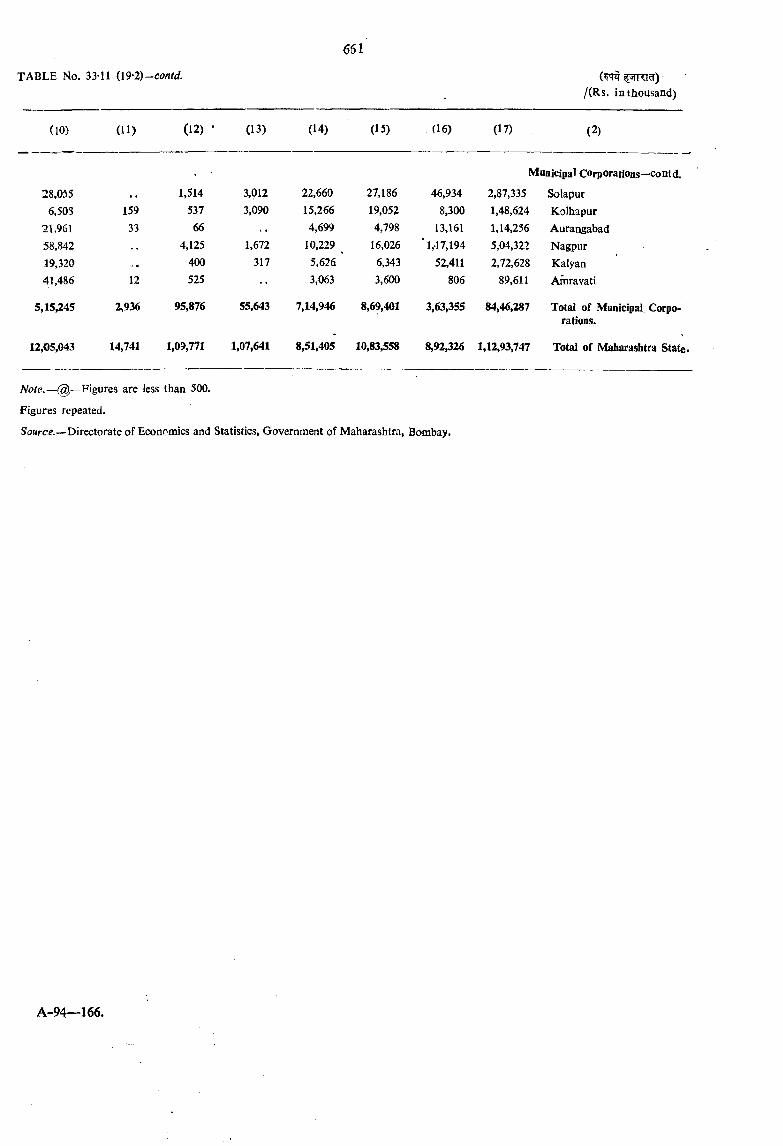
12,05,043
Muaicipal Corporations—contd.
28,035 1,514 3,012 22,660 27,186 46,934 2,87,335 Solapuc6,508 159 537 3,090 15,266 19,052 8,300 1,48,624 Kolhapur
21,961 33 66 4,699 4,798 13,161 1,14,256 Aurangabad58,842 4,125 1,672 10,229 ^ 16,026 ' 1,17,194 5,04,322 Nagpur19,320 : . 400 317 5,626 ' 6,343 52,411 2,72,628 Kalyan41,486 12 525 •• 3,063 3,600 806 89,611 Amravati
5,15,245 2,936 95,876 55,643 7,14,946 8,69,401 3,63,355 84,46,287 Total of Municipal Corpo-
14,741 1,0?,771 1,07,641 8,51,405 10,83,558
rations.
8,92,326 1,12,93,747 Total of Maharashtra State.
Note.— Figures are less than 500.
Figures repeated.
Source.—Directorate of Economics and Statistics, Government of Maharashtra, Bombay.
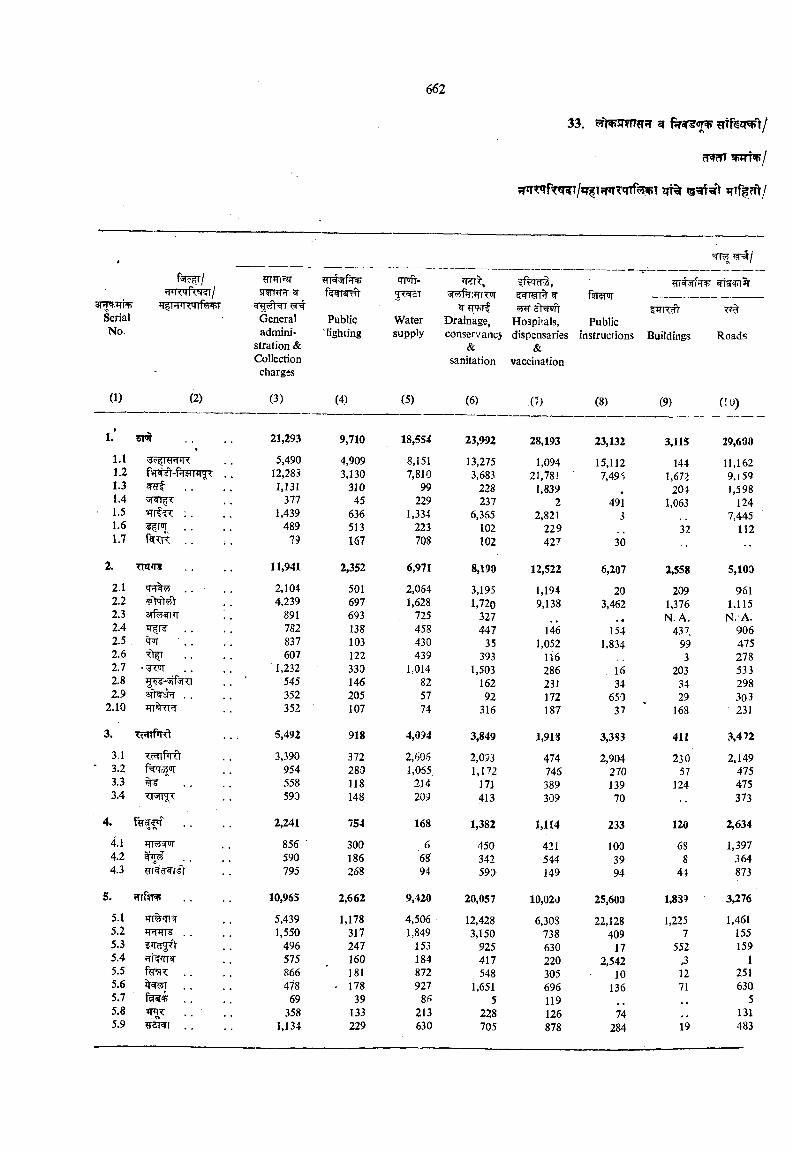
33. 5 sr?TT?TJT g
?T^ W N j/
s m .^SerialNo.
WRTT ^
General admini
stration & Collection charges
f WRrft
Publiqlighiing
'TFlt-5T^T
Watersupply
wmrfDrainage,conservancy
&
Hospitals,dispensaries
&
ftr^ —
Publicinstructions Buildings
sanitation vaccination
Roads
(1) (2) (3) (4) (5) (6) .0) (8) (9) (!0)
I.’ 21,293 9,710 18,554 23,992 28,193 23,132 3,115 29,6001.1 5,490 4,909 8,151 13,275 1,094 15,112 144 11,1621.2 12,283 3,130 7,810 3,683 21,78! ■ 7,495 1,671 9,1591.3 1,131 310 99 228 1,839 204 1,5981.4 377 45 229 237 2 491 1,063 1241.5 arc ; . 1,439 636 1,334 6,365 2,82 i 3 7,4451.6 . . 489 513 223 102 229 32 1121.7 . . 79 167 708 102 427 30
2. Tni*re 11,941 2,352 6,971 8,190 12,522 6,207 2,558 5,100
2.1 2,104 501 2,064 3,195 1,194 20 209 9612.2 4.239 697 1,628 1,720 9,138 3,462 1,376 1.1152.3 3Tfe i iT ; . 891 693 725 327 • • N. A. N .A .2.4 782 138 458 447 146 154 437 9062.5 837 103 430 35 1,052 1,834 99 4752.6 ■>11 607 122 439 393 116 3 2782.7 1,232 333 1,014 1,503 286 16 203 5332.8 545 146 82 162 231 34 34 2982.9 . . 352 205 57 92 172 650 29 303
2.10 352 107 74 316 187 37 168 231
3. 5,492 918 4,094 3,849 1,913 3,383 411 3,472
3.1 3,390 372 2,606 2,093 474 2,904 230 2,1493.2 f 55 ®r 954 280 1,065 1,172 746 270 57 4753.3 " . . 558 118 214 171 389 139 124 4753.4 590 148 209 413 309 70 •• 373
4. . . 2,241 754 168 1,382 1,114 233 120 2,634
4.1 856 300 6 450 421 100 68 1,3974.2 590 186 68' 342 544 39 8 3644.3 795 268 94 590 149 94 44 873
5. frrfjinp . . 10,963 2,662 9,420 20,057 10,020 25,600 1,839 3,276
5.1 *4i^qr^ 5,439 1,178 4,506 12,428 6,303 22,128 1,225 1,4615.2 1,550 317 1,849 3,150 738 409 7 1555.3 496 247 153 925 630 17 552 1595.4 jtNjik 575 160 184 417 220 2,542 J 15.5 ftraT . . 866 181 872 548 305 10 12 2515.6 478 - 178 927 1,651 696 136 71 6305.7 69 39 86 5 119 55.8 358 133 213 228 126 74 1315.9 1,134 229 630 705 878 284 19 483
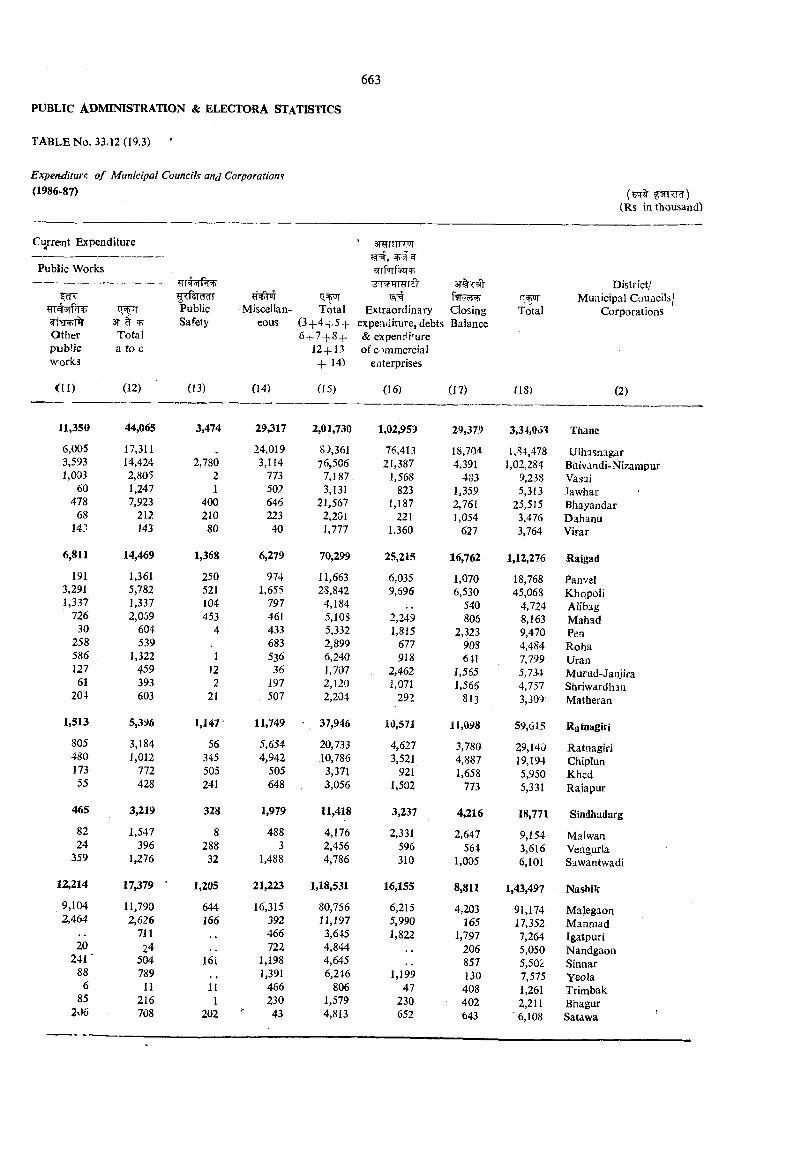
Expenditure, o f Municipal Councils and Corporations (1986-87)
Current Expenditure
Public Works
pR
SR7T%OtherpubUcworks
3T ^ ^ Total a to c
PublicSafety
Miscellaneous
' 3wr?in:>ir ^
Total Extraordinary Closing (34-4-}-5-f- expendiiure,debts Balance 6-f-7-f-8-f- & expenditure
J 2 -f 13 o f c om mercia 1+ 14) enterprises
r i^Total
District/ Municipal Councils|
Corporations
0 1 ) (12) (13) (14) 05) (16) (17) (18) (2)
11,350 44,065 3,474 29,317 2,01,730 1,02,959 29,379 3,34,00*? Thane6,005 17,311 24,019 8),361 76,413 IS,70-1 1,84,478 Ulhasnagar3,593 14,424 2,780 3,114 76,506 21,387 4,391 1,02,284 Bhivandi-Nizampur1,003 2,805 2 773 7,187. 1,568 483 9,238 Vasai
60 1,247 1 502 3,131 823 1,359 5,313 Jawhar478 7,923 400 646 21,567 1,187 2,161 25,515 Bhayandar
68 212 210 223 2,20! 221 1,054 3,476 Dahanu14T 143 80 40 1,777 1,360 621 3,764 Virar
6,811 14,469 1,368 6,279 70,299 25,215 16,762 1,12,276 Raigad191 1,361 250 974 11,663 6,035 1,070 18,768 Panvsl
3,291 5,782 521 1,655 28,842 9,696 6,530 45,068 Khqpoli1,337 1,337 104 191 4,184 , , 540 4,724 Aiibag
726 2,059 453 461 5,103 2,249 806 8,163 Mahad30 604 4 433 5,332 1,815 2,323 9,470 Pen
258 539 683 2,899 677 90S 4,484 Roha586 , 1,322 1 536 6,240 918 611 7,799 UranJ27 459 J2 36 1,707 2,462 1,565 5,734 Murud-Janjira61 393 2 197 2,120 1,071 1,566 4,757 Shriwardhan
204 603 21 507 2,204 292 813 3,309 Matheran
1,513 5,396 1,147 11,749 • 37,946 10,571 11,098 59,615 Ratnagirj805 3,184 56 5,654 20,733 4,627 3,780 29,140 Ratnagiri480 1,012 345 4,942 10,786 3,521 4,881 19,194 Chiplun173 772 505 505 3,371 921 1,658 5,950 Khed55 428 241 648 3,056 1,502 773 5,331 Rajapur
465 3,219 328 1,979 11,418 3,237 4,216 18,771 Sindhudurg82 1,547 8 488 4,176 2,331 2,647 9,154 Malwan24 396 288 3 2,456 596 564 3,616 Vengurla
359 1,276 32 1,488 4,786 310 1,005 6,101 Sa want wadi
12,214 17,379 ' 1,205 21,223 1,18,531 16,155 8,811 1,43,497 Nashik9,104 11,790 644 16,315 80,756 6,215 4,203 91,174 Malegaon2,464 2,626 166 392 11,197 5,990 165 17,352 Manrnad
711 466 3,645 1,822 1,797 7,264 Igatpuri20 24 722 4,844 206 5,050 Nandgaoa
241 ■ 504 161 1,198 4,645 857 5,502 Sinnar88 789 1,391 6,246 1,199 130 7,575 Yeola
6 11 11 466 806 47 408 1,261 Trimbak85 216 1 230 1,579 230 402 2,211 Bhagur
206 708 202 43 4,813 652 643 ' 6,108 Satawa
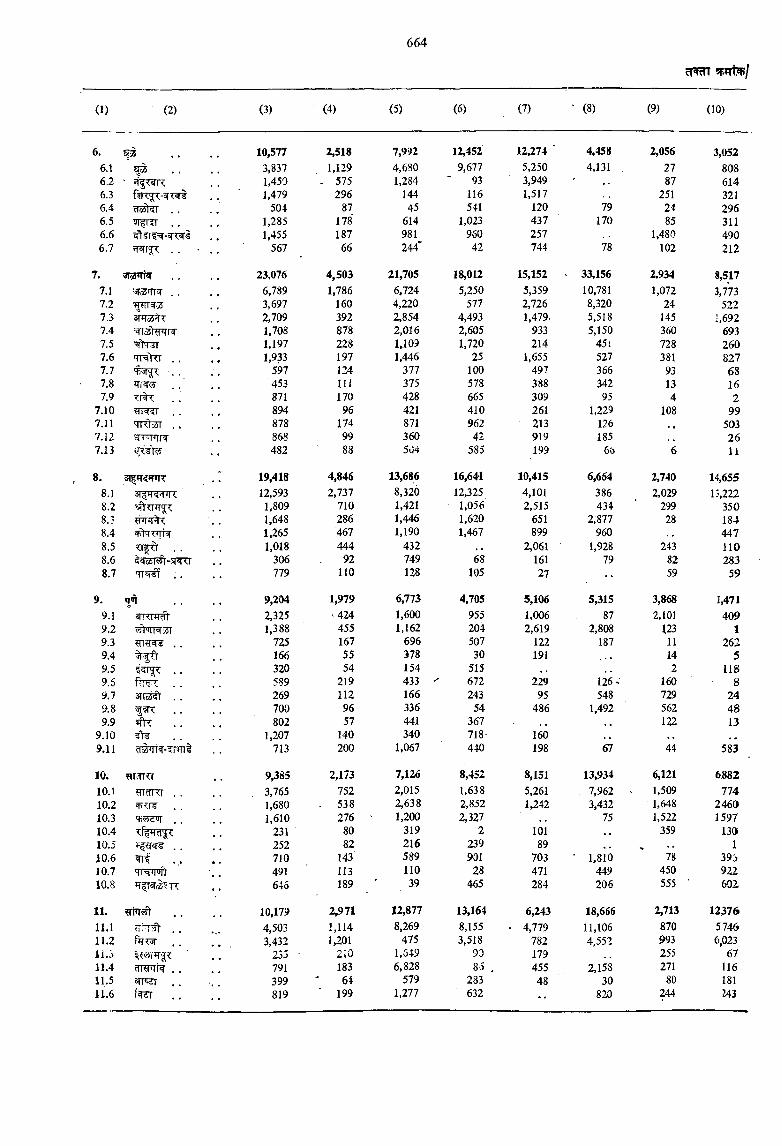
6. #6.1 ^6.2 -
6.36.4 ?fo5t?T . .6.5 . .6.66.7 . .
7.7.17.27.37.47.57.67.77.87.9
7.107.117.127.13
8.
9.
8.18.28.?8.48.58.6 8.7
'TKtTrTrSTi <A
TT%
qrdssTsrwTR-
TFftr ..^«to6( -5T 'TT«[ff . .
10,5773,8371,4501,479
5041,2851,455
567
23,0766,7893,6972,7091,7081,1971,933
597453871894878868482
19,41812,5931,8091,6481.2651,018
306779
9,204
2,5181,129
575296
87178187
66
4,5031,786
160392878228197124111170
96174
99
4,8462,737
710286467444
92110
1,979
7,9924,6801,284
14445
614981244"
21,7056,7244,2202,8542,0161.1091.446
377 375 428 421 871 360 504
13,6868,3201,4211.446 1,190
432749128
6,7739.1 2,325 424 1,6009.2 ?ft'T7^55T 1,388 455 1,1629.3 725 167 6969.4 166 55 3789.5 . . 320 54 1549.5 ... 589 219 4339.7 3IT5 . . 269 112 1669.8 . . 700 96 3369.9 802 57 441
9.10 . . . . 1,207 140 3409.11 713 200 1,067
10. marr^ 9,385 2,173 7,12610.1 fffdl <1 . . 3,765 752 2,01510.2 . . 1,680 . 538 2,63810.3 . . 1,610 276 1,20010.4 231 ■ 80 31910.5 252 82 21610.6 710 143 58910.7 qK'ifoi) 491 113 11010.8 646 189 39
11. 10,179 2,971 12,87711.1 . . 4,503 1,114 8,26911.2 . . . . . 3,432 1,201 47511.3 235 ' 210 1,64911.4 . . 791 183 6,82811,5 3TT^ . . 399 64 57911.6 819 199 1,277
(6) ‘ (8) (9) (10)
12,452 12,274 ' 4,458 2,056 3,0529,677 5,250 4,131 . 27 808
93 3,949 87 614116 1,517 251 321541 120 79 24 296
1,023 437 170 85 311960 257 1,480 490
42 744 78 102 212
18,012 15,152 33,156 2,934 8,5175,250 5,359 10,781 1,072 3,773
577 2,726 8,320 24 5224,493 1,479. 5,518 145 1,6922,605 933 5,150 360 6931,720 214 45i 728 260
25 1,655 527 381 827100 49? 366 93 68578 388 342 13 16665 309 95 4 2410 261 1,229 108 99962 213 m , ^ 50342 919 185 26
585 199 66 6 11
16,641 10,415 6,664 2,740 14,65512,325 4,101 386 2,029 13,222
1,056 2,515 434 299 3501,620 651 2,877 28 1841,467 899 960 447
2,061 1,928 243 11068 161 79 82 283
105 27 59 59
4,705 5,106 5,315 3,868 1,471955 1,006 87 2,101 409204 2,619 2,808 123 i507 122 187 11 26230 191 * * 14 5
515 2 118672 229 126. 160 • 8243 95 548 729 24
54 486 1,492 562 48367 , . 122 13718' 160 , *440 198 67 44 583
8,452 8,151 13,934 6,121 6,8821,638 5,261 7,962 1,509 7742,852 1,242 3,432 1,648 24602,327 , , 75 1,522 1597
2 101 359 130239 89 1901 703 • 1,810 78 39j
28 471 449 450 922465 284 206 555 ■ 602
13,164 6,243 18,656 2,713 123768,155 • 4,779 11,106 870 57463,518 782 4,552 993 6,023
90 179 255 6786 , 455 2,158 271 116
283 48 30 80 181632 •• 820 244 243
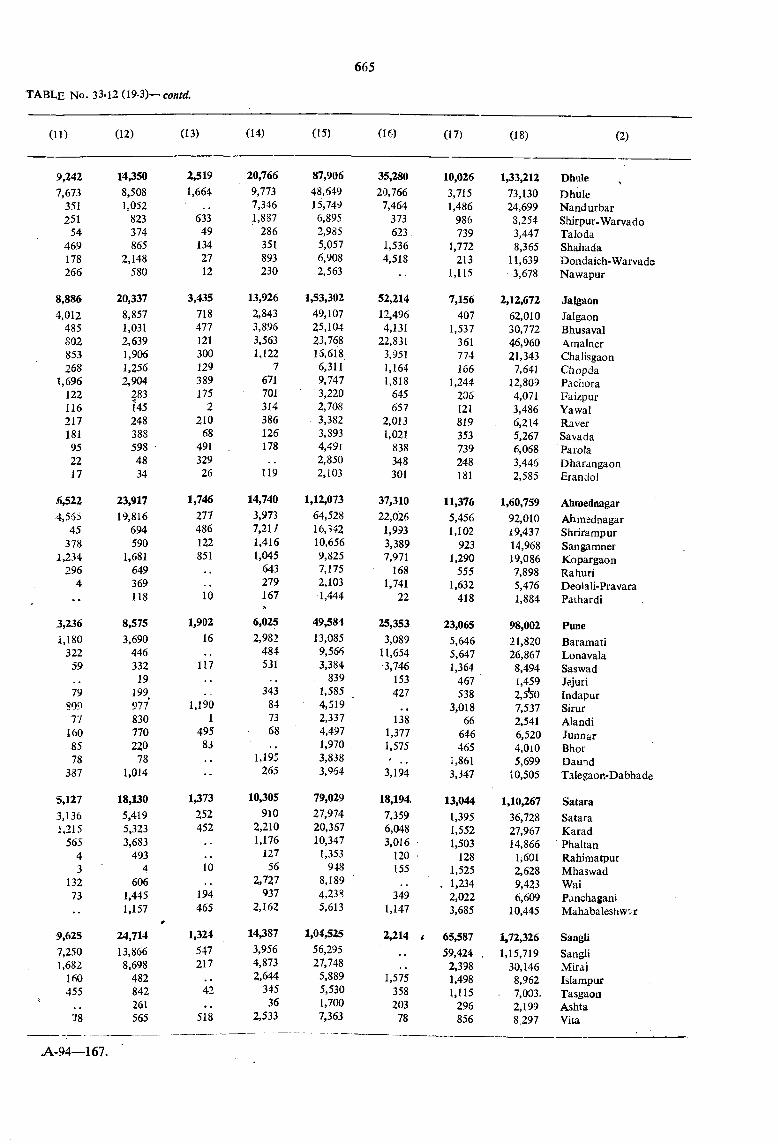
9,2427,673
351251
54469178266
8,8864,012
485S02853268
1,696122116217181952217
6^224,565
45378
i,234296
4
3,2361,180
32259
79809
77 1608578
387
.5,1273,1361,215
56543
13273
9,6257,2501,682
160455
78
14,3508,5081,052
823374865
2,148580
20,3378,8571,0312,6391,9061,2562,904
2831452483885984834
23,91719,816
694590
1,681649369118
8,5753,690
446332
19199977830770220
781,014
18,1305,4195,3233,683
4934
6061,4451,157
24,71413,8668,698
482842261565
2,5191,664
63349
1342712
3,435718477121300129389175
221068
49132926
1,746277486122851
10
1,90216
117
1,1901
49583
1,373252452
10
194465
1,324547217
42
518
20,7669,7737,3461,887
286351893230
13,9262,8433,8963,5631,122
7671701314386126178
119
14,7403,9737,2171,4161,045
643279167
6,0252,982
484531
343847368
1,195265
10,305910
2,2101,176
12756
2,727937
2,162
14,3873,9564,8732,644
34536
2,533
87,906 35,280 10,026 1,33,212 Dhule48,649 20,766 3,715 73,130 Dhule15,749 7,464 1,486 24,699 Nandurbar6,895 373 986 8,254 Shirpur-Warvado2>985 623. 739 3,447 Taloda5,057 1,536 1,772 8,365 Shahada6,908 4,518 213 11,639 Dondaich-Warvade2,563 . . 1,115 3,678 Nawapur
1,53,302 52,214 7,156 2,12,672 Jalgaon49,107 12,496 407 62,010 Jalgaon25,104 4,131 1,537 30,772 Bhusaval23,768 22,831 361 46,960 Araalner15,618 3,951 774 21,343 Chalisgaon6,311 1,164 166 7,641 Chopda9,747 1,818 1,244 12,809 Pachora3,220 645 206 4,071 Faizpur2,708 657 121 3,486 Yawal3,382 2,013 819 6,214 Raver3,893 1,021 353 5,267 Savada4,491 838 739 6,068 ParoJa2,850 348 248 3,446 Dharangaon2,i03 301 181 2,585 Erandol
[,12,073 37,310 11,376 1,60,759 Ahmednagar64,528 22,026 5,456 92,010 Ahmednagar16,342 1,993 1,102 19,437 Shrirampur10,656 3,389 923 14,968 Sangamner9,825 7,971 1,290 19,086 Kopargaon7,175 168 555 7,898 Rahuri2,103 1,741 1,632 5,476 Deolali-Pravara1,444 22 418 1,884 Pachardi
49,581 25,353 23,065 98,002 Pune13,085 3,089 5,646 21,820 Baramati
9,566 11,654 5,647 26,867 Lonavala3,384 ■3,746 1,364 8,494 Saswad
839 153 467 1,459 Jejuri1,585 427 538 2,5^0 Indapur4,519 ' « , 3,018 7,537 Sirur2,337 138 66 2,541 Alandi4,497 1,377 646 6,520 Junnar1,970 1,575 465 4,0l0 Bhor3,838 ' ., 1,861 5,699 Dauid3,964 3,194 3,347 10,505 Talegaon-Dabhade
79,029 18,194. 13,044 1,10,267 Satara27,974 7.359 1,395 36,728 Satara20,367 6,048 1,552 27,967 Karad10,347 3,016 1,503 14,866 Phaltan
1,353 120 128 li601 Rahiraatpur948 155 1,525 2,628 Mhaswad
8,189 . 1,234 9,423 Wai4,238 349 2,022 6,609 Panchagani5,613 1,147 3,685 10,445 Mahabaleshw^r
[,04,525 2,214 * 65,587 1,72,326 SangU56,295 59,424 , 1,15,719 Sangli27,748 2,398 30,146 Mirai
5,889 1,575 1,498 8,962 Islampur5,530 358 1,115 • 7,003, Tasgaon1,700 203 296 2,199 Ashta7,363 78 856 8297 Vita
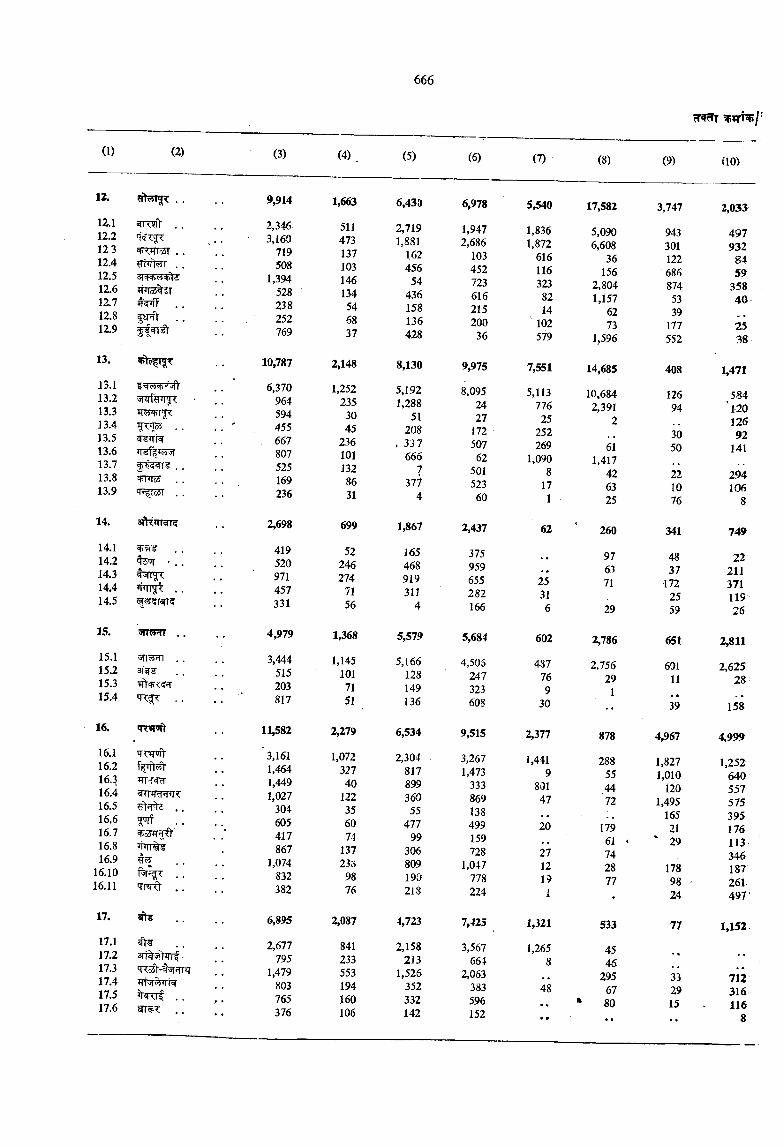
rTfrTr
(1) (2) (3) (4) (5) (6) (7) (8) (9) flO>
12.12.112.212.312.412.512.612.712.8 12.9
13.
13.113.213.313.413.513.613.713.813.9
4TI'o5T .
14.114.214.314.414.5
TIo2%ST
fSR)- .
^ ’TR-
.
'TTl'oST .
14. 3fKlTTTO
15. . . 4,979
15.1 3,44415.2 51515.3 20315.4 . . 817
16. 11,582
16.1 ’ 3,16116.2 1,46416.3 ’TUcid 1,44916.4 1,02716.5 . . 30416,6 60516.7 41716.8 86716.9 % 1,074
16.10 . . 83216.11 382
17. 6,895
17.1 2,67717.2 3Ti%3>5Trf 79517.3 1,47917.4 *TT3|%TN‘ 80317.5 . . f * 76517.6 T . . 376
9,914
2,3463,160
719508
1,394528238252769
10,787
6,370964594455667807525169236
2,698
419520971457331
1,663
511473137103146134546837
2,148
1,252235
30 45
236 101 132
8631
699
52246274
7156
1,368
1,1451017151
2,279
1,07232740
122356074
13723s
9876
2,087
841233553194160106
6,433
2,7191,881
162456
54 436 158 136 428
8,130
5,192 1,288
51 208
. 337 666
73l1
4
1,867
1654689193IJ
4
5,579
5,166128149136
6,534
2,30481789936055
47799
306809190218
4,723
2,158213
1,526352332142
6,978
1,9472,686
103452723616215200
36
9,975
8,0952427
172507
62501523
60
2,437
375959655282166
5,684
4,505247323608
9,515
3,2671,473
333869138499159728
1,047778224
7,425
3,567664
2,063383596152
5,540
1,836 1,872
616 116 323
82 14
' 102 579
7,551
5,113776
25252269
1,0908
171
62
25316
602
487769
30
2,377
1,4419
80147
20
271219
1,321
1,2658
48
17,582
5,0906,608
36156
2,8041,157
6273
1,596
14,685
10,6842,391
2
611,417
426325
260
976371
29
2,786
2,75629
1
878
288554472
17961742877
533
4546
2956780
3,747
9433011226868745339
177 552
40S
12694
3050
221076
341
4837
1722559
651
60111
39
4,967
1,827 1,010
120 1,495
165 21
' 29
178 98 24
77
332915
2,03:
497932
8459
35840
25 38
1,471
584‘l2012692
141
294106
8
149
2221137111926
2,811
2,62528
158
4,999
1,2526405575753951761133461872614 9 7 ’
1,152
712316116
8
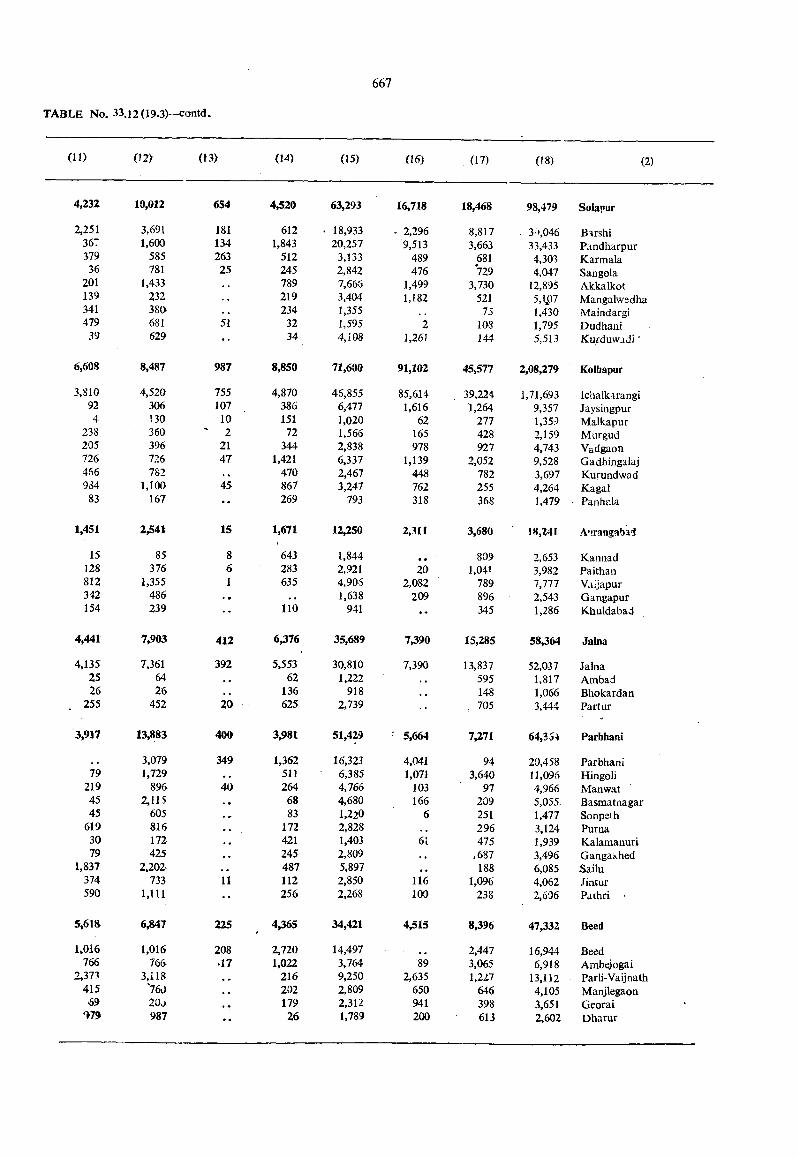
(11) (12) (13) (14) (15) (16) (17) (18) (2)
4,232
2,25136“379
36201139341 479
39
6,608
3,810924
238205726466934
83
1,451
15128812342 154
4,441
4,1352526
255
3,917
792194545
6193079
1,837374590
5,61&
1»016766
2,37341569
'm
10,012
3,6911,600
585781
1,4332323sa681629
8,487
4,520306130360396726782
1,100167
2,541
85376
1,355486239
7,903
7,3616426
452
13,883
3,0791,729
8962,115
605816172425
2,202.733
1,111
6,847
1,016766
3 ,il8'76020J987
654
181134263
25
51
987
755107102
2147
45
15
861
412
392
20
400
349
40
11
225
2084 7
4,520
6121,843
512245789219234
3234
8,850
4,87038615172
3441,421
470867269
1,671
643283635
110
6,376
5,55362
136625
3,981
1,362511264
6883
172421245487112256
4 ^
2,7201,022
216202179
26
63,293
18,93320,257
3,1332,8427,6663,4041,3551,5954,108
71,600
46,8556,4771,0201,5662,8386,3372,4673,247
793
12,250
1,8442,9214,9051,638
941
35,689
30,8101,222
9182,739
51,429
16,3236,3854,7664,6801,2202,8281,4032.809 5,897 2,850 2,268
34,421
14,4973,7649,2502.809 2,312 1,789
16,718
- 2,296 9,513
489 476
1,499 1,182
21,261
91,102
85,6141,616
62165978
1,139448762318
2,311
202,082
209
7.390
7.390
5,664
4,0411,071
103166
6
61
116100
4,515
892,635
650941200
18,468 98,479 Solapur
8,817 30,046 Barshi3,663 33,433 Pandharpur
681 4,303 Karmala729 4,047 Sangola
3,730 12,895 Akkalkot521 5,Ijp7 Mangalwedha
75 1,430 Maindargi108 1,795 Dudhani144 5,513 Kurduwadi'
45,577 2,08,279 Kolhapur
39,224 1,71,693 Ichalkarangi1,264 9,357 Jaysingpur
277 1,359 Malkapur428 2,159 Murgud927 4,743 Vadgaon
2,052 9,528 Gadhingakj782 3,697 Kurundwad255 4,264 Kagal368 1,479 Panhala
3,680 18,241 A'lrangabad
809 2,653 Kannadl,04t 3,982 Paithan
789 7,777 Vdijapur896 2,543 Gangapur345 1,286 Khuldabad
15,285 58,364 Jalna
13,837 52,037 Jalna595 1,817 Ambad148 1,066 Bhokardan705 3,444 Partur
7,271 64,354 Parbhani
94 20,458 Parbhani3,640 11,096 Hingoli
97 4,966 Manwat209 5,055. Basmatnagar251 1,477 Soxipeth296 3,124 Puma475 1,939 Kalamanuri
,687 3,496 Gangakhed188 6,085 Sailu
1,096 4,062 Jintur238 2,606 Pathri •
8,396 47,332 Beed
2,447 16,944 Beed3,065 6,918 Ambejogai1,227 13.112 Parli-Vaijnath
646 4,105 Manjlegaon398 3,651 Georai613 2,602 Dharur
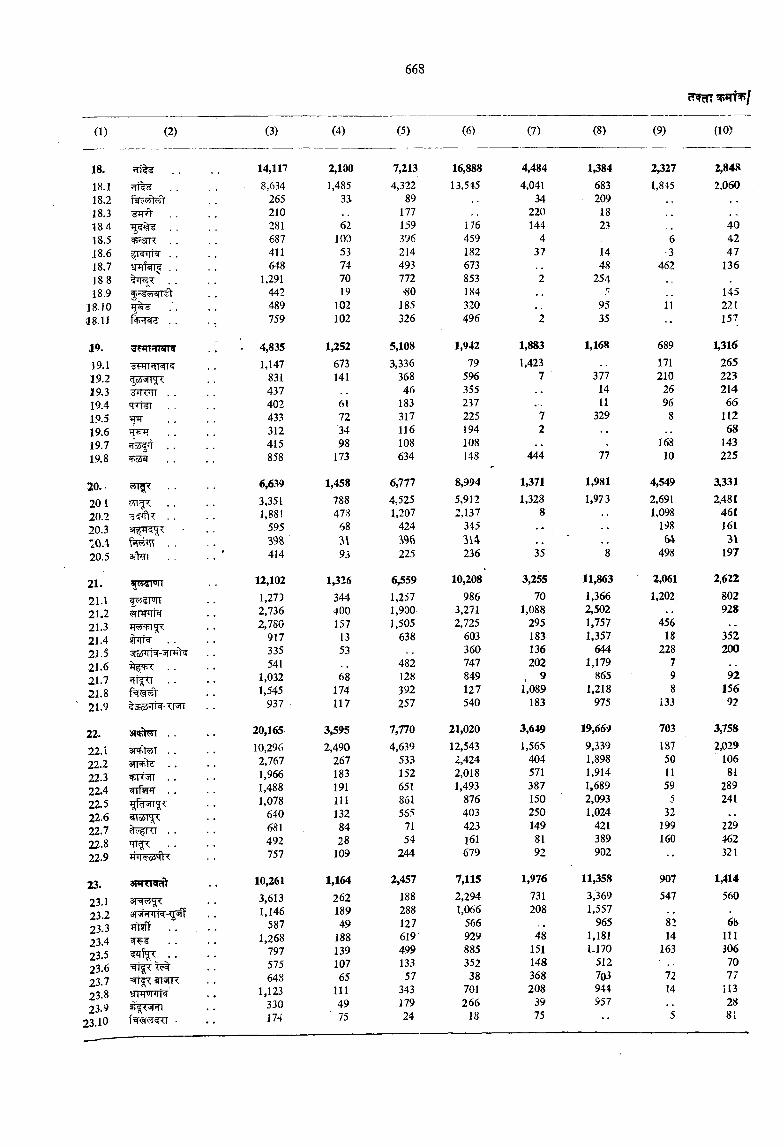
18.18.118.218.318418.5 ^STR . .
18.618.7 . .
188 . .
18.918.1018.1J
19. tarFTTFfT19.119.219,3 STTT’rr . .
19.4 M<i i19.519.619.7 Hr/dJT . .
19.8 4ioi«i . .
20.. . .
20120.2.20.3 ■:L0.420.5
21. >9
21.1 ?5SFTT21.221.321.4 y|J|N . .
21.521.621.7 Hirfil . .
21.821.9
22. . .
22.1 3T "t T . .
22.2 3TFfr . .
22.3 . .
22.4 . .
22.522.622.722.822.9
23. STFRra^
23.123.223.3 . .
23.423.5 . .
23.623.723.8 SimyHli423.9
23.10
(3) (4) (5) (6) (7) (8) (9) (10)
14,117 2,100 7,213 16,888 4,484 1,384 2,327 2,848
8,634 1,485 4,322 13,545 4,041 683 1,845 2,060265 33. 89 34 209 , ,210 177 220 18281 62 159 176 144 23 . ^ 40687 100 396 459 4 6 42411 53 214 182 37 14 •3 47648 74 493 673 . . 48 462 136
1,291 70 772 853 2 254442 19 '80 184 5 145489 102 185 320 95 11 221759 102 326 496 2 35 •• 157
4,835 1,252 5,108 1,942 1,883 1,168 689 1,316
1,147 673 3,336 79 1,423 171 265831 141 368 596 7 377 210 223437 46 355 14 26 214402 61 183 237 11 96 66433 72 317 225 7 329 8 112312 34 116 194 2 68415 98 108 108 168 143858 173 634 148 444 77 10 225
6,639 1,458 6,777 8,994 1,371 1,981 4,549 3,331
3,351 788 4,525 5,912 1,328 1,973 2,691 24811,881 47S 1,207 2,137 8 1,098 461
595 68 424 345 198 161398 3\ 1% 314 64 3\414 93 225 236 35 8 498 197
12,102 1,326 6,559 10,208 3,255 11,863 2,061 2,622
1,279 344 1,257 986 70 1,366 1,202 8022,736 400 1,900 3,271 1,088 2,502 9282,780 157 1,505 2,725 295 1,757 456
917 13 638 603 183 1,357 18 352335 53 360 136 644 228 200541 482 747 202 1,179 7
1,032 68 128 849 , 9 865 9 921,545 174 392 127 1,089 1,218 8 156
937 117 257 540 183 975 133 92
20,165 3,595 7,770 21,020 3,649 19,669 703 3,758
10,296 2,490 4,639 12,543 1,565 9,339 187 2,0292,767 267 533 2,424 404 1,898 50 1061,966 183 152 2,018 571 1,914 11 811,488 191 651 1,493 387 1.689 59 2891,078 111 861 876 150 2,093 5 241
640 132 565 403 250 1,024 32681 84 71 423 149 421 199 229492 28 54 161 81 389 160 462757 109 244 679 92 902 321
10,261 1,164 2,457 7,115 1,976 11,358 907 1,414
3,613 262 188 2,294 731 3,369 547 5601,146 189 288 1,066 208 1,557
587 49 127 566 965 82 6b1.268 188 619 929 48 1,181 14 I I I
797 139 499 885 151 1.170 163 306575 107 133 352 148 512 70648 65 57 38 368 703 72 77
1,123 111 343 701 208 944 14 il3330 49 179 266 39 957 28174 ' 75 24 18 75 5 8i
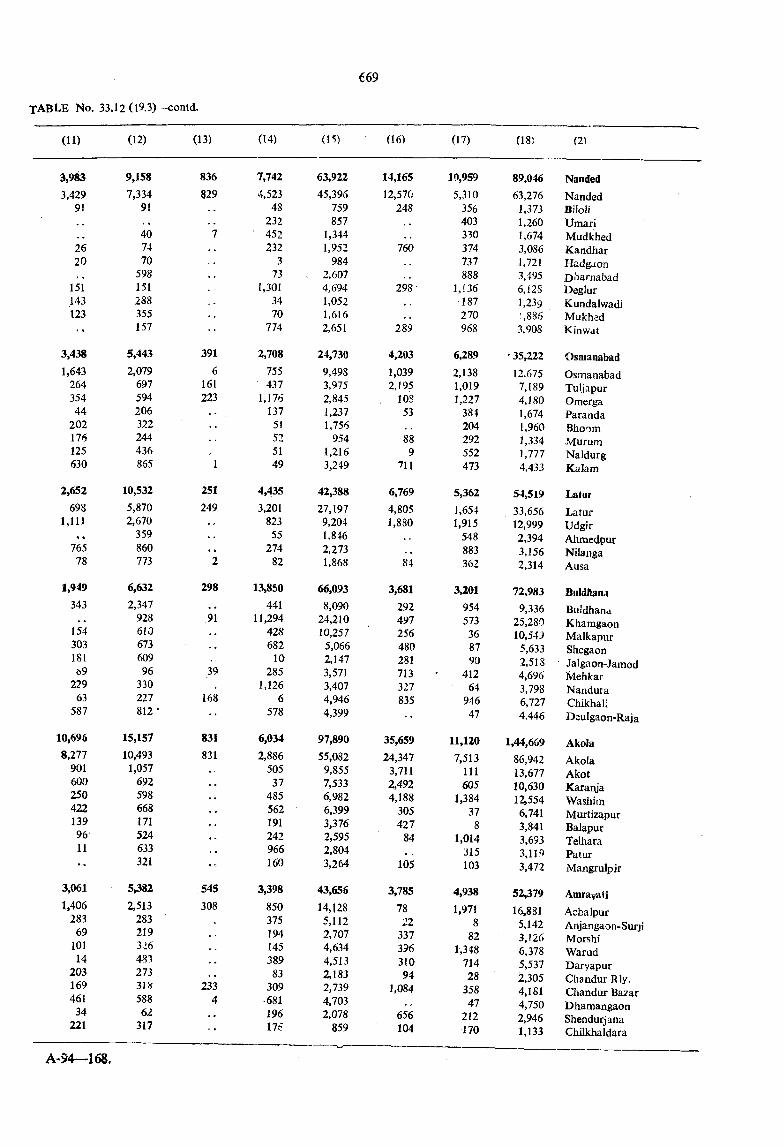
3,9833,429
91
2620
151143123
3,4381,643
26435444
202176125630
2,652698
1,111 « %
76578
1,949343
154303181
69229
63587
10,6968,277
9016002504221399611
3,061
1,406283
6910114
203169461
34221
9,1587,334
91
407470
598151288355157
5,4432,079
697594206322244436865
10,5325,8702,670
359860773
6,6322,347
928 610 673 609 96
330 227 812 •
15,15710,493
1,057692598668171524633321
5 ^ 22,513
28321932648327331858862
317
836829
3916
161223
1
251249
2
298
,91
39
168
831831
545308
2334
7,7424,523
48 232 452 232
373
1,3013470
774
2,708755437
1,176137
5152 5149
4,4353,201
82355
27482
13,850441
11,294428682
10285
1,1266
578
6,0342,886
50537
485562191242966160
3,39885037519414538983
309-681196176
63,92245,396
759857
1,3441,952
9842,6074,6941,0521,6162,651
24,7309,4983,9752.845 1,237 1,756
9541,2163,249
42,38827,1979,2041.846 2,273 1,868
66,0938,090
24,21010,257
5,0662,1473,5713,4074,9464.399
97,890
55,0829,8557,5336,9826.399 3,376 2,595 2,804 3,264
43,65614,1285,1122,7074,6344,5132,1832,7394,7032,078
859
14,165 10,959 89,046 Nanded12,570 5,310 63,276 Nanded
248 356 1,373 Biloli403 1,260 Umari330 1,674 Mudkhed
760 374 3,086 Kandhar737 1,721 Hadgaon888 3,495 Diiafnabad
298/ 1,136 6,128 Deglur187 1,239 Kundalwadi270 J,886 Mukhed
289 968 3,908 Kinwat
4,203 6,289 '35,222 Osmaaabad1,039 2,138 12,675 Osmanabad2,195 1,019 7,189 Tuljapur
108 1,227 4,180 Omerga53 384 1,674 Paranda
204 1,960 Bhoom88 292 1,334 Murum9 552 1,777 Naldurg
711 473 4.433 Kalam
6,769 5,362 54,519 Latur4,805 1,654 33,656 Latur1,880 1,915 12,999 Udgir
548 2,394 Ahraedpur•• 883 3,156 Nilanga84 362 2,314 Ausa
3,681 3,201 72,983 BiildRana292 954 9,336 Bui'dhanu497 573 25,280 Khamgaon256 36 10,549 Malkapur480 87 5,633 Shegaon281 90 2,518 Jalgaon-Jamod713 412 4,696 Mehkar327 64 3,798 Nandura835 946 6,727 Chikhali
47 4.446 Deulgaon-Raja
35,659 11,120 1,44,669 Akola24,347 7,513 86,942 Akola
3,711 111 13,677 Akot2,492 605 10,630 Karaiya4,188 1,384 12,554 Washim
305 37 6,741 Murtizapur427 8 3,841 Balapur
84 1,014 3,693 Telhara315 3,119 Patur
105 103 3,472 Mangrulpir
3,785 4,938 52,379 Amravuli78 1,971 16,831 Acbalpur
22 8 5,142 Aiyangaon-Surji337 82 3,126 Morshi396 1,348 6,378 Warud310 714 5,537 Daryapur94 28 2,305 Chandur RIy.
1,084 358 4,181 Chandur Bazar47 4,750 Dhamangaon
656 212 2,946 Shendurjana104 170 1,133 Chilkhaldara
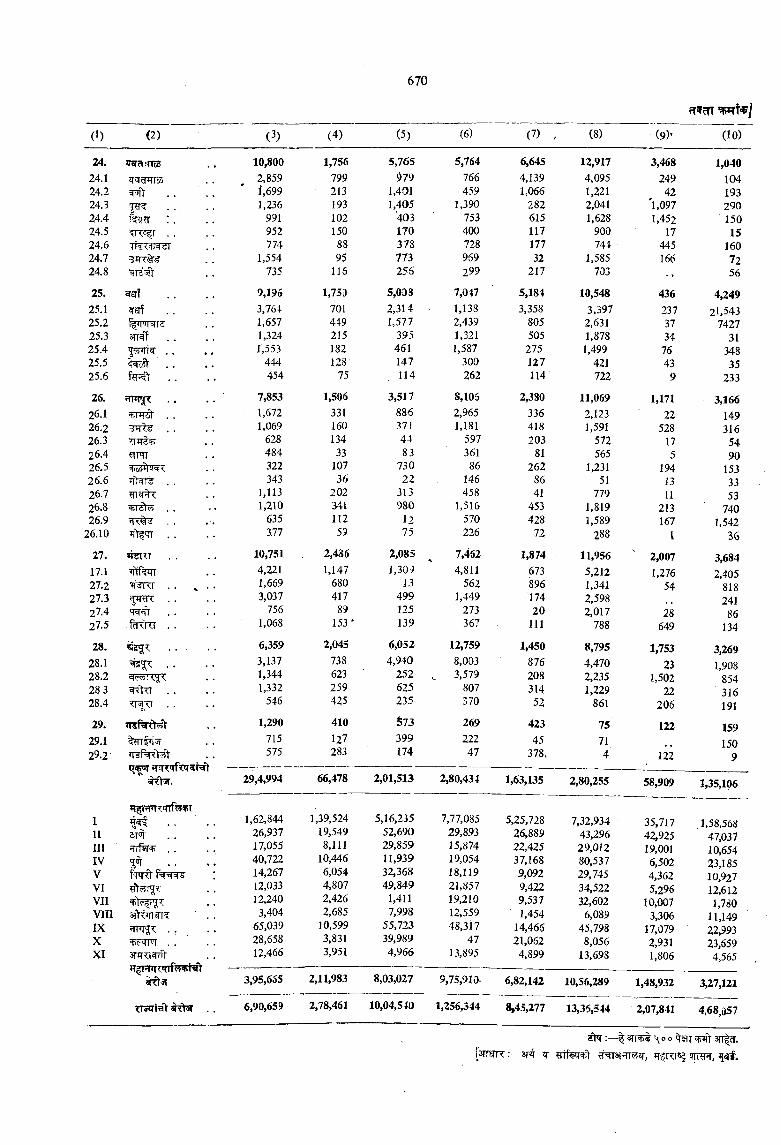
srf
srf 'f4|>?5<Ii . ?=ic5t
fimr
w frf^m
^ 31,
(3)
10,8002,8591,6991,236
991952774
1,554735
9,1953,7641,6571,324r,553
444454
7,8531,6721,069
628484322343
1,1131,210
635377
10,7514,2211,6693,037
7561,068
6,3593,1371,3441,332
546
1,290715575
29,4,994
670
(4) (5)
1,756 5,765799 979213 1,401193 1,405102 403150 17088 37895 773
116 256
1,75a 5,oas701 2,314449 1,577215 395182 461128 147
75 114
1,506 3,517331 886160 371134 44
33 83107 73036 22
202 313341 980112 1259 75
2,436 2,0851,147 1,309
680 13417 499
89 125153* 139
2,045 6,052738 4,940623 252 ,259 625425 235
410 §73127 399283 174
66,478 2,01,513
5,764 6,645 12,917 3,468 1,040766 4,139 4,095 249 104459 1,066 1,221 42 193
1,390 282 2,041 'l,097 290753 615 1,628 1,452. ■ 150400 117 900 17 15728 177 744 445 160969 32 1,585 166 72299 217 703 56
7,047 5,184 10,548 436 4,2491,138 3,358 3,397 237 21.5432,439 805 2,631 37 74271,321 505 1,878 34 311,587 275 1,499 76 348
300 127 421 43 35262 114 722 9 233
8,105 2,380 11,069 1,171 3,1662,965 336 2,123 22 1491,181 418 1,591 528 316
597 203 572 17 54361 81 565 5 9086 262 1,231 194 153
146 86 51 13 33458 41 779 11 53
1,516 453 1,819 213 740570 428 1,589 167 1,542226 72 288 1 36
7,462 1,874 11,956 2,007 3,6844,811 673 5,212 1,276 2,405
562 896 1,341 54 8181,449 174 2,598 241
273 20 2,017 28 86367 111 788 649 134
12,759 1,450 8,795 1,753 3,2698,003 876 4,470 23 1,9083,579 208 2,235 1,502 854
807 314 1,229 22 316370 52 861 206 191269 423 75 122 159222 45 71 15047 378. 4 122 9
,80,434 1,63,135 2,80,255 58,909 1,35,106
1,39,524 5,16,2351 . . • • 1,62,844 7,77,085 5,25,728 7,32,934 35,717 1,58,56811 *s
aroi' 26,937 19,549 52,690 29,893 26,889 43,296 42,925 47,037m . . . 17,055 8,111 29,859 15,874 22,425 29,012 19,001 10,654IV 5^ 40,722 10,446 11,939 19,054 37,168 80,537 6,502 23,185V 14,267 6,054 32,368 18,119 9,092 29,745 4,362 10,927VI 12,033 4,807 49,849 21,857 9,422 34,522 5,296 12,612VII 12,240 2,426 1,411 19,210 9,537 32,602 10,007 1,780VIII ■ . . 3,404 2,685 7,998 12,559 1,454 6,089 3,306 11,149IX . . . • • 65,039 10,599 55,723 48,317 14,466 45,798 17,079 22,993X 28,658 3,831 39,989 47 21,062 8,056 2,931 23,659XI 12,466 3,951 4,966 13,895 4,899 13,698 1,806 4,565
Eft'll 3,95,655 2,11,983 8,03,027 9,75,910 6,82,142 10,56,289 1,48,932 3,27,121
6,90,659 2,78,461 10,04,540 1,256,344 8,45,277 13,35,544 2,07,841 4,68,057
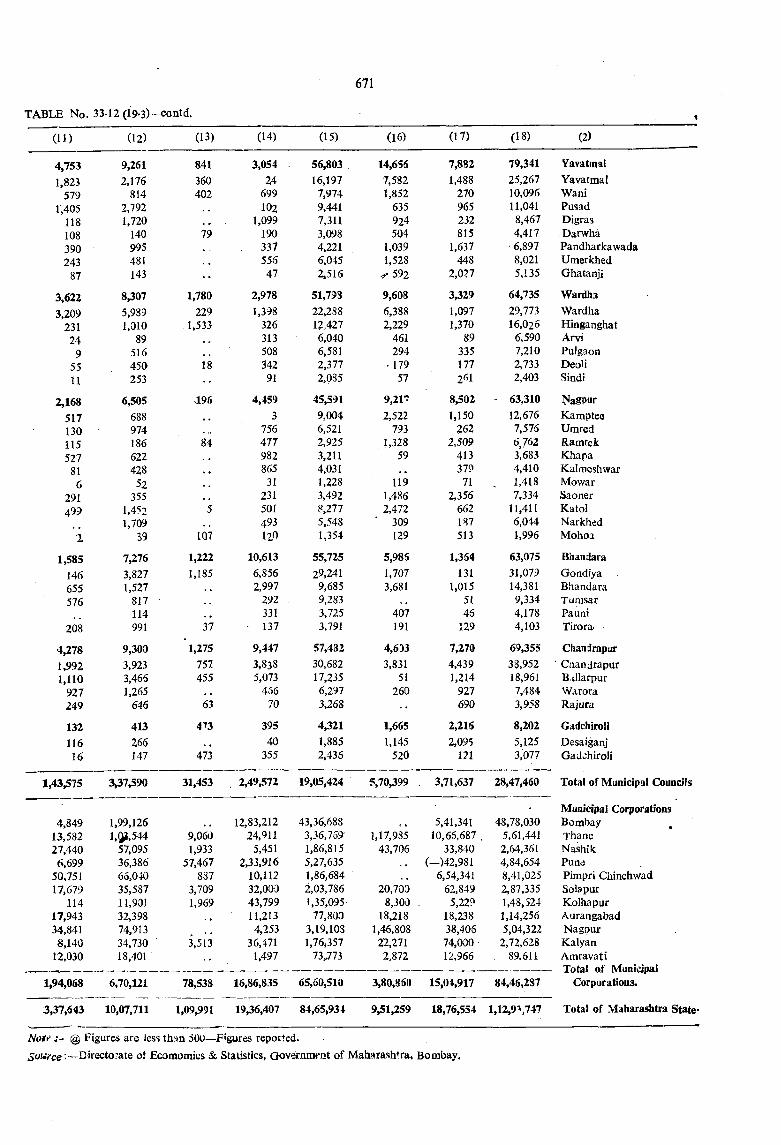
4,7531,823
5791,405
118108390243
87
3,6223,209
23124
95511
2,168517130115 527
816
291499
2
1,585146655576
208
4,2781,9921,110
927249
132116 16
9,2612,176
8142,7921,720
140995481143
8,3075,9891,010
89516450253
6,505688974186622428
52355
1,4521,709
19
7,2763,8271,527
817114991
9,3003,9233,4661,265
646
413266147
841360402
79
1,780229
1,533
18
196
84
107
1,2221,185
37
1,275757455
63
473
473
3,05424
699102
1,09919033755647
2,9781,398
32631350834291
4,4593
756477982865
31231501493120
10,6136,856 2,997
292 331
■ 137
9,4473,8385,073
46670
39540
355
56,80316,197
7,9749,4417,3113,0984,2216,0452,516
51,79322,28812.4276,0406,5812,3772,085
45,5919,0046,5212,9253,2114,0311,2283,4928,2775,5481,354
55,72529,241
9,6859,2833,7253,791
57,48230,68217,2356,2973,268
4,3211,8852,436
14,6567,5821,852
635924504
1,0391,528
^ 5 9 2
9,6086,388 2,229
461 294
• 179 57
9 ,2 n2,522
7931,328
59
119 1,486 2,472
' 309129
5,9851,7073,681
407191
4,6333,831
5i260
1,6651,145
520
7,8821,488
270965232815
1,637448
2,0^7
3,3291,0971,370
89335177261
8,5021,150
2622,509
413379
712,356
662187513
1,354131
1,0155146
129
7,2704,4391.214
927 690
2.2152,095
121
79,34125,26710,09611,041
8,4674.417 6,897 8,021 5,135
64,73529,77316,026
6,5907,2102,7332,403
63,31012,6767,5766J623,6834,4101.4187.334
11,4116,0441,996
63,07531,07914,3819.334 4,178 4,103
69,35538,95218,9617,4843,958
8,2025,1253,077
YavatraalYavatmalWaniPusadDjgrasDarwhaPandharkawadaUmerkhedGhatanji
WardhaWardhaHinganghatArviPulgaonDeoHSindi
NagpurKampteeUmredRamtekKhapaKalineshwarMowarSaonerKatolNarkhedMohoa
BhandaraGondiya Bhandara T u m s a r Pa uni Tirora-
ChandrapurCfiandrapurBillarpurWaroraRajura
GadchiroliDesaiganjGadchiroli
1,43,575 3,37,590 31,453 , 2,49,572 19,05,424 5,70,399 3,71,637 28,47,460 Total of Municipal Councils
‘ Municipal Corporations4,849 1,99,126 12,83,212 43,36,688 5,41,341 48,78,030 Bombay ,
13,582 l,a?,544 9,060 24,911 3,36,759' 1,17,985 10,65,687 . 5,61,441 Thane27,440 57,095 1,933 5,451 1,86,815 43,706 33,840 2,64,361 Nashik6,699 36,386 57,467 2,33,916 5,27,635 , , (—)42,981 4,84,654 Pun<}
50,751 66,040 887 10,112 1,86,684 . , 6,54,341 8,41,025 Pimpri Chinchwad17,679 35,587 3,709 32,000 2,03,786 20,700 62,849 2,87,335 Solapur
114 11,901 1,969 43,799 1,35,095 8,300 5,22? 1,48,524 Kolhapur17,943 32,398 . . 11,213 77,800 18,218 18,238 1,14,256 Aurangabad34,841 74,913 4,253 3,19,108 1,46,808 38,406 5,04,322 Nagpur8,140 34,730 3,513 36,471 l,76i357 22,271 74,000 2,72,628 Kalyan
12,030 18,401 •• 1,497 73„773 2,872 12,966 . 89.611 AmravatiTotal of Municipal
Corporations.1,94,068 6,70,121 78,538 16,86,835 65,60,510 3,80,860 15,04,917 84,46,287
3,37,643 10,07,711 1,09,991 19,36,407 84,65,934 9,51,259 18,76,554 1,12,9^ J47 Total of Maharashtra State
Noti* @ Figures are less than 50U—Figures reported.source ■—Directorate of Ecomomics Sc, Statistics, G o v eram t* Q t of Maharashtra, B o m b a y .

34. : 34. MISCELLANEOUS
fWTrgr %%3iTf5T T% ^
f -TT^SIT ^ 311?^ STi^i^rftfT TT 1%^^ 3TT|.
5p^it^ frw itt ^r^r- ^ ^ ?rT^nft ;j^T
^ ^T^Tf?TT7 5Fn^r-?:T^ s^r^wrr-m i\ T m r ^ 3tW c^tt^ ^ spjtt s rp ’ ^sqr 3r^5THrr^ r^rr^ s tt t^ t s^m pr arr^^"^ a r^ .
^. f!T f ^TFTFr ^ ? T , r ^ r^ ^R?rr?T^R3TM"t 3TT|. f^^lf Jff 'ift ^fJT^r, IT?rt ^im^TrnT^T, ^r^RTrf^r arrf^^hn srr^r 3tt|
34.1. In this section are given data on money- lending operations of Reserve Bank, classification of Income Tax, documents and marriages registered and No. of Rest house. Data on Economic Census are also given.
34.2. The transaction of money-lending in the State are controlled under the provisions of the Bombay Money Lenders Act, 1946. According to the Act, no money-lender is to carry on the business of money- lending except in the area for which he has been granted a licence and except in accordance with the terms and conditions of such licence.
34.3. In this section, the number of marriages registered in Maharashtra State under Bombay Marriages Act, Special Marriages Act, and other Acts is given. The Bombay Registration of Marriages Act, 1954, is applicable to all the corporation cities, municipal towns and headquarters of tahsils.
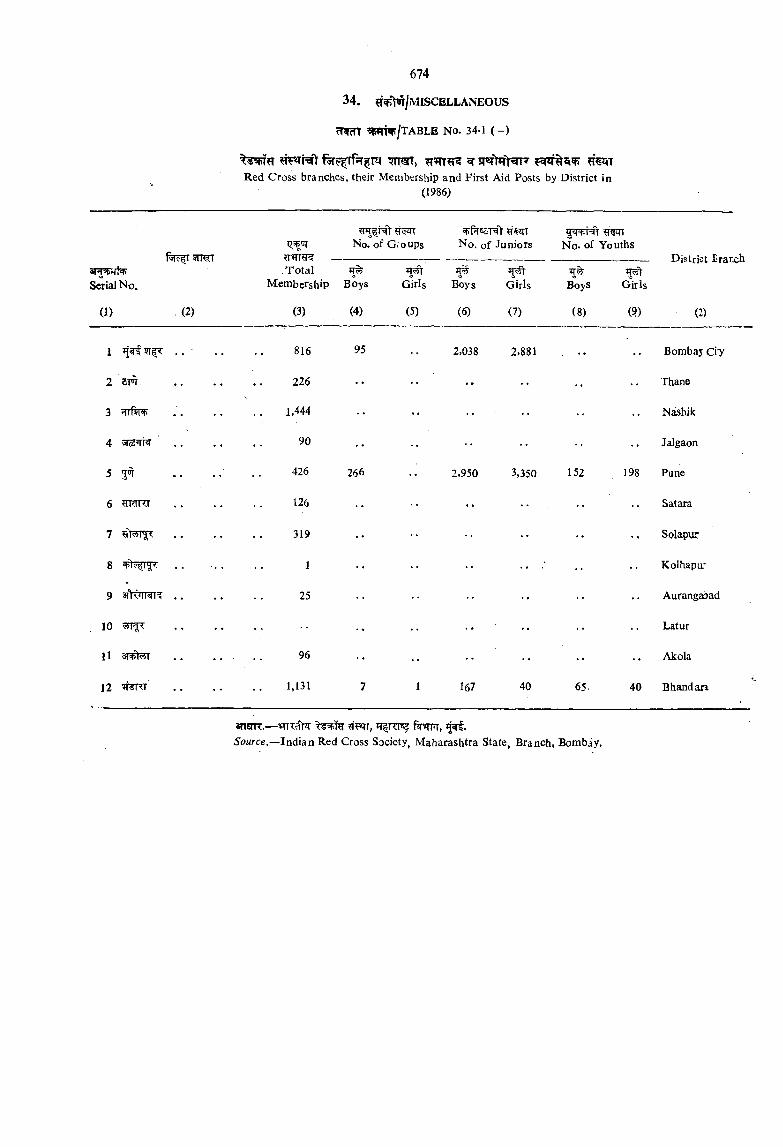
674
34, 5I^>!T/MISCELLANE0US
rTffn W W /TA BLE no . 34-1 (—)
^ S R > ft^ 7Red Cross branches, their Membership and First Aid Posts by District in
(1986)
No. of Groups No, of Juniors No. of Youths
Serial N o.Total
Membership Boys Girls Boys Girls3T%
BoyS Girls
(1) - (2) (3) (4) (5) (6) (7) (8) (?)
1 ■ 816 95 2,038 2,881 . •• ••
2 5m 226 •• . . •• - ••
3 frrftr^ 1,444 ••
4 90 •• •• ••
5 3 ^ 426 266 2,950 3,350 152 198
6 ^IdlU 126 •• •• •• ••
7 319 •• •• •• -
8 . . 1 •• . . ; ••
9 . . 25 •• ••
10 - Ti< •• •• •• ••
i i 96 •• •• •• •• ••
12 ’*i^Ki 1,131 7 1 167 40 65- 40
District Branch
(2)
Thane
Satara
Latur
Alcola
anfiTT.— «TTT^ JT|Rrs^5(?«rce.—Indian Red Cross Society, Maharashtra State, Branch, Bombay.
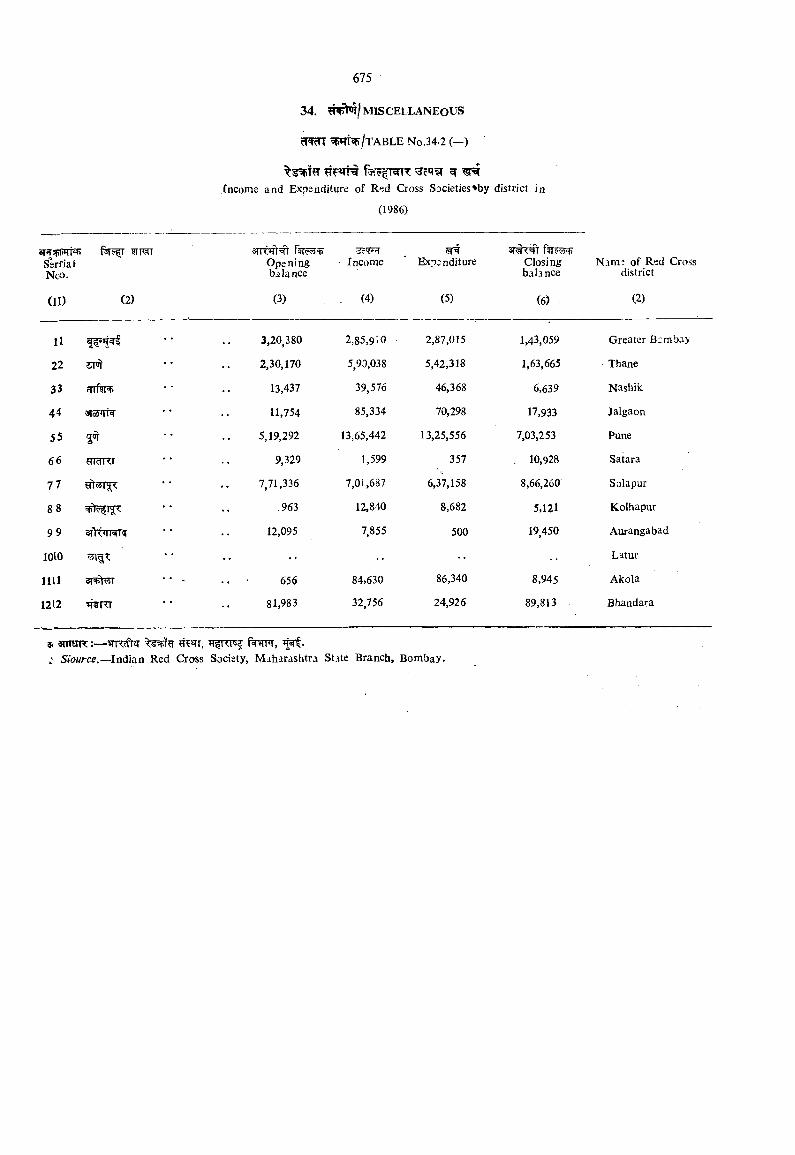
/t a b l e N o.34-2 (—)
Income and Expenditure of Red Cross Societies'by district in
(1986)
ar^spffri 5imrSerial;Nco.
3TR«ft=Openingbalance
Income Expdnditure Closingbalance
Nam^ of Red Cross district
(IJ) (2) (3) (4) (5) (6) (2)
11 3,20,380 2,85,9iO 2,87,015 1,43,059 Greater Bembay
22 ST®r 2.30,170 5,90,038 5,42,318 1,63,665 • Thane
33 Hlfsil't. 13,437 39,576 46,368 6,639 Nashiii.
44 3T55iri 11,754 85,334 70,298 17,933 Jalgaon
55 3^ 5,19,292 13,65,442 13,25,556 7,03,253 Pune
66 HIdKI 9,329 1,599 357 , 10,928 Satara
77 7,71,336 7,01,687 6,37,158 8,66,260 Solapur
88 ,963 12,840 8,682 5,121 Kolhapur
9 9 sfltinwR 12,095 7,855 500 19,450 Aurangabad
lOlO • • . . Latur
n i l ai 't55T • * - . . 656 84,630 86,340 8,945 Akola
1212 81,983 32,756 24,926 89,813 Bhandara
a s mt j R:— ^Tfnps?: Siource.—-Indian Red Cross Society, Maharashtra State Branch, Bombay.
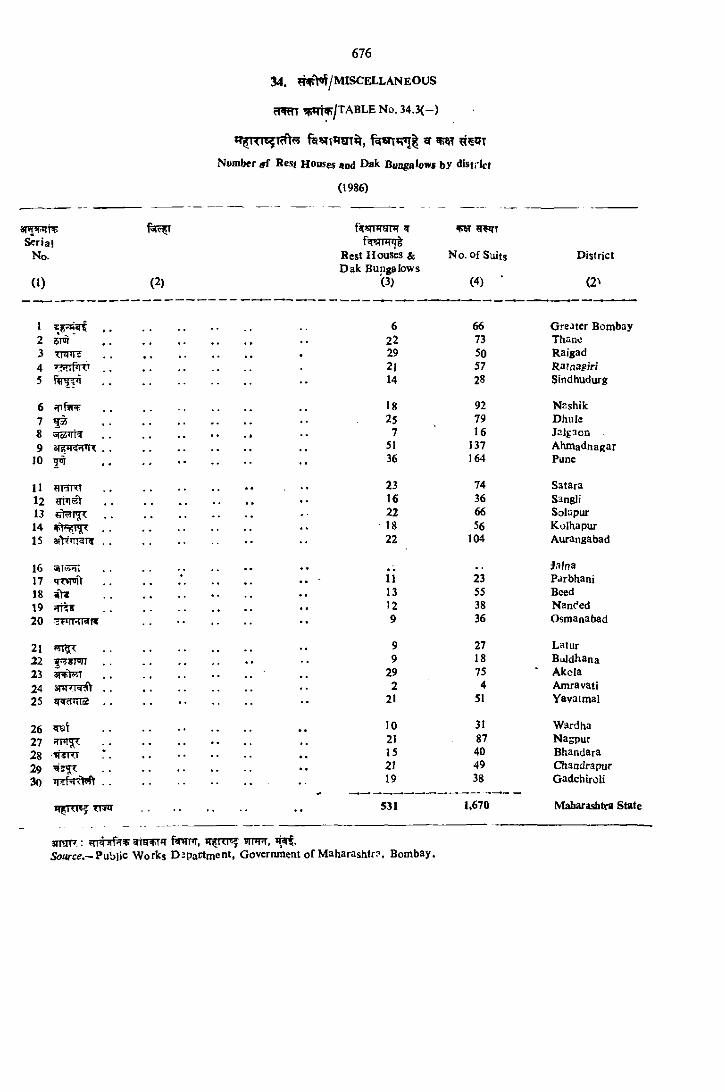
fe v T * rm ^ , fe«rr*;iT | sr ^
Number ^ Rest Houses and Dak Bungalows by district
(1986)
^ r i a iNo.
( 0
12 sm3 <iy<R4 T TTf TT’5
67S9
10 5 ^ ,
11 UTrtKl12131415
16 51Iw>ni17IS i n1920 TT TRT W
2122 5 757WT23 «lVlwF24 s m rR ^ .
25 H<ld»TT3 .
2627282930
(2)
fiwnrffnr w fvErmnt
Rest H o u s ^ & D ak Bungalows
N o. o f Suits
TT^a
District
(3) (4) ■ (2^
6 66 G reater Bombay22 73 Thano29 50 Raigad2l 57 Ratnagiri14 28 Sindhudurg
I8 92 Nnshik25 79 Dhule
7 16 Ja|g:«on51 137 A hm adnagar36 164 Pune
23 74 Satara16 36 Sangli22 66 Solapur18 56 Kolhapur22 104 Aurangabad
. . J.ilnai i 23 Parbhani13 55 Bced12 38 Nanc'ed9 36 Osmanabad
9 27 Latur9 18 Baldliana
29 75 ' Akcla2 4 Amravati
21 51 Yavatmal
10 31 Ward ha21 87 Nagpur15 40 Bhandara21 49 Chandrapur19 38 Gadchiroli
531 1,670 Maharashtra State
amiF-: mtirfiTT »raTT«r frm T, s r m ,Sowce.—Public W orks D 2partm ent, Government o f M aharashtr?, Bombay.
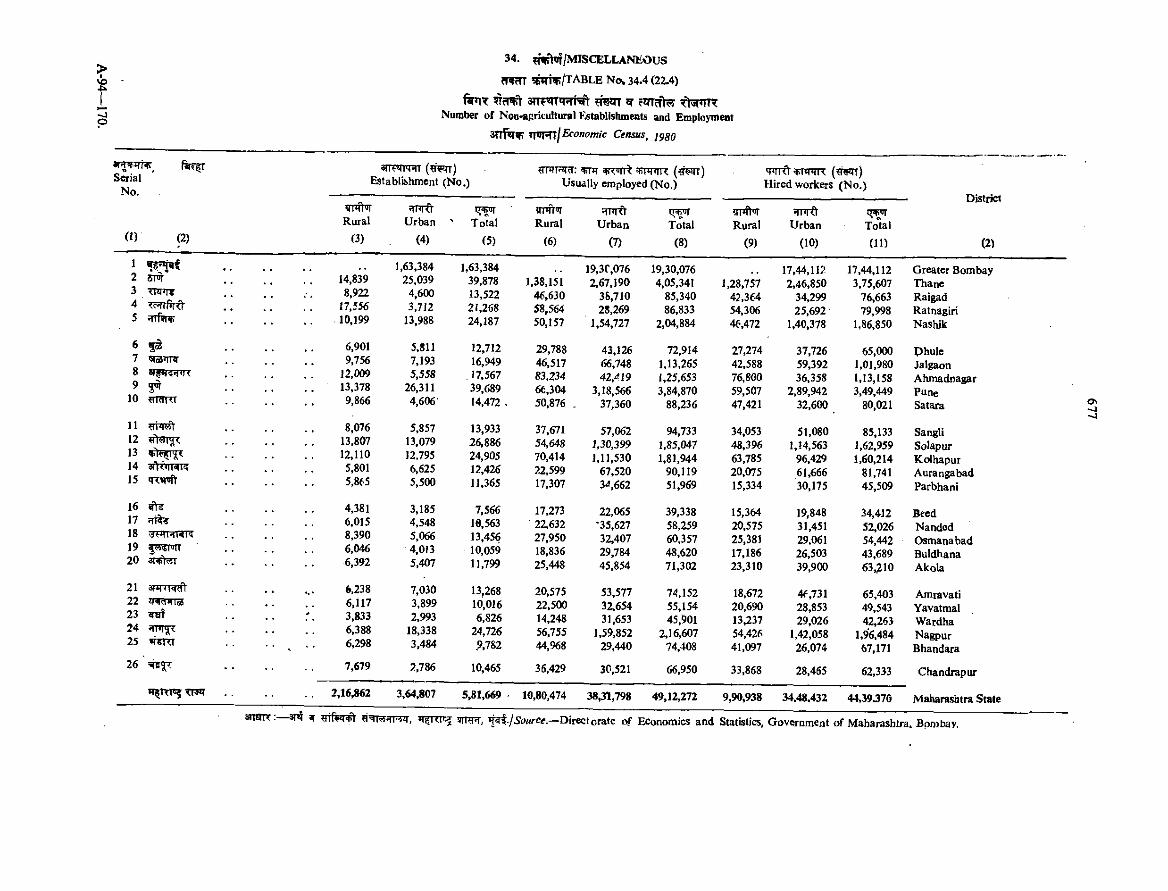
o
Serial
f e n t a rrF T T iR f^ h w t ^ rmjfiT? Ttsr^TTT Number of Noo«a};ricuitural Establishments and Employroeat
3TtPh^ T f v r ^ I C e n s u s , jpgg
3TT?m?lT (?r?!TT) Establishment (No.)
«TJ7T3T?r: ^ ^ i r r t ^mmR Usually employed (No.)
<FTTfrvrtRR ( ? ^ ) H ired workers (N o.)
( n (2)Rural
0 )
Urban
(4)
l^+ut ' Total
<5)
trnft'jrRural
(6)
HI*K>U rban
(7)
tt*U|Total
(8)
yifllyiRural
(9)
HMidU rban
(10)To*ta!
(11)
District
(2)
14,8391,63,384 1,63,384 19.3C.076 19,30,076 17,44,112 17,44,112 Greater Bombay2 i|U| 25,039 39,878 1,38,151 2.67.190 4,05,341 1,28,757 2.46,850 3,75,607 Thane
3 TTyJIT 8,922 4,600 13,522 46,630 3S,710 85,340 42,364 34,299 76,663 Raigad4 ^oTrfnft’ 17,556 3,7J2 2J.268 58,564 28,269 86,833 54,306 25,692 79,998 Ratnagiri5 HniH% 10,199 13.988 24,187 50,157 1.54,727 2,04,884 46,472 1,40.378 1,86,850 NasJuk
6 5 s . . . . 6,901 5,811 12,712 29,788 43,126 72,914 27,274 37,726 65,000 Phule7 Siei'il^ 9,756 7,193 16,949 46.517 66,748 1,13,265 42.588 59.392 1,01,980 Jatgaon
12,009 5,558 , 17,567 83,234 42,'^I9 1,25,653 76,800 36,358 1,13,158 Ahmadnagar9 5 ^ 13,378 26,311 39,689 66.304 3,18,566 3.84,870 59,507 2,89,942 3,49,449 Pune10 m rnrr 9,866 4,606 14,472 . 50,876 . 37,360 88,236 47,421 32,600 80,021 ^ ta r a
11 8.076 5,857 13,933 37,671 57,062 94.733 34.053 51,080 85.133 Sangli12 13,807 13,079 26.886 54,648 1,30.399 1,85,047 48.396 1.14,563 1,62.959 S o l^ u r13 12,110 12.795 24,905 70,414 1,11,530 1.81.944 63,785 96,429 1,60,214 Kolhapur14 5,801 6,625 12.426 22,599 67,520 90,119 20.075 61.666 81,741 Aurangabad15 q r n ^ 5,865 5,500 11,365 17,307 3^1,662 51,969 15,334 30,175 45.509 Parbhani
16 ^ 17
4,381 3,185 7,566 17,273 22,065 39,338 15,364 19,848 34,412 Beed6,015 4,548 18,563 22,632 '35,627 58,259 20,575 31,451 52.026 NandedIS . 8,390 5,066 13,456 27.950 32,407 60,357 25,381 29,061 54,442 Osmanabad19 6,046 4.0J3 10,059 18,836 29,784 48.620 17.186 26,503 43,689 Buldhana20 6.392 5,407 11,799 25,448 45,854 71,302 23,310 39,900 63,210 Akola
21 6,238 7,030 13,268 20,575 53,577 74,152 18,672 4<=,731 65,403 Amravati2223 ^
6,117 3,899 10,016 22,500 32.654 55,154 20,690 28,853 49,543 Yavatmal3,833 2,993 6,826 14,248 31,653 45,901 13,237 29,026 42.263 W atdha24 6,388 18,338 24,726 56,755 1,59,852 2,16,607 54,426 1,42,058 1,96,484 Nagpur25 reTTT 6,298 3,484 9.7S2 44,968 29,440 74,408 41,097 26,074 67,171 Bhandara
26 7,679 ?,786 10,465 36,429 3C.521 66,950 33,868 28,465 62,333 Chandrapur
*T5W«5 TTW 2 ,1 6 ^ 2 3,64,807 5,81,669 10,80,474 38,31,798 49,12.272 9,90,938 34.48,432 44.39 J7 0 Maharashtra State
ON
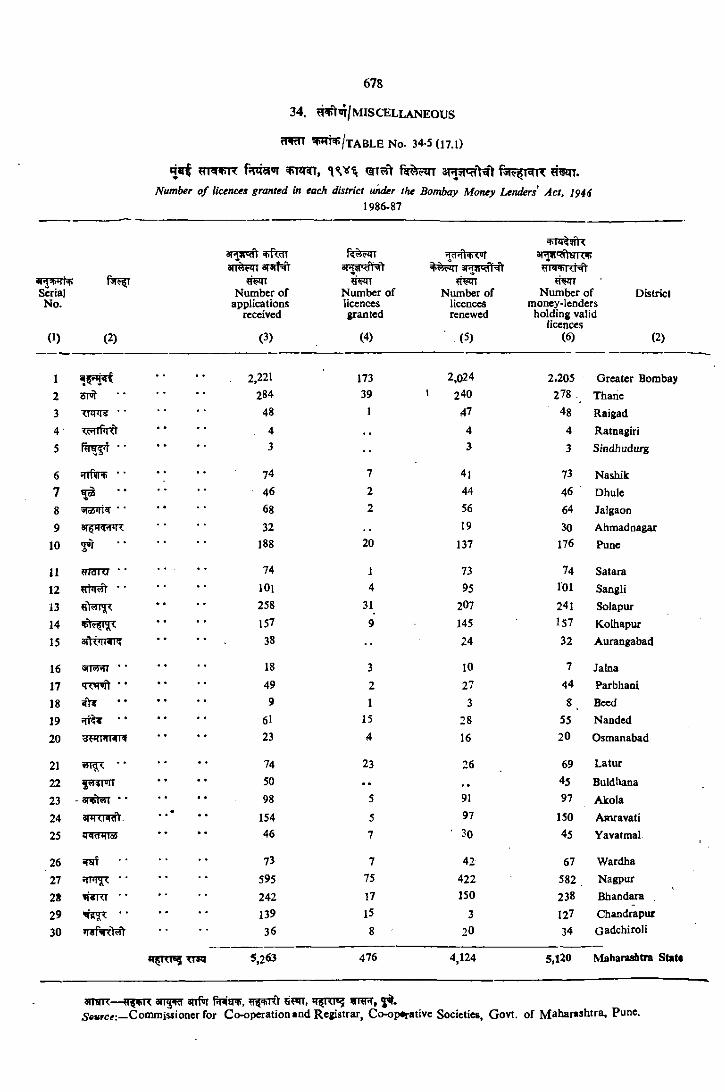
CTmvR ^*T2rr, f j^ gq r
Number o f licences granted in each district under the Bombay Money Lenders' Act, 19441986-87
SerialNo.
3 R V ^ ffTcTT 3n?5F*n a n r t^
<T¥in Number of
applications received
fs eZTT
?reiTT Number of licences granted
Number of licences renewed
ar^P<hHRV
Number of money-lenders
holding valid licences
Districi
0 ) (2) (3) (4) (5) (6) (2)
2,221 173 2,024 2.205 G reater Bombay
2 atol 284 39 I 240 278 . Thane
3 • • 48 1 47 48 Raigad
4- w iP iO , 4 4 4 Ratnagiri5 ' ' 3 •• 3 3 Siodhudurg
6 jnfvR! ■ 74 7 4l 73 Nashik7 ^ •• 46 2 44 46 Dhule
8 68 2 56 64 Jalgaon
9 32 19 30 Ahmadnagar
10 ji r 188 20 137 176 Pune
n WJdIU ' • 74 1 73 74 Satara
12 101 4 95 101 Sangli
13 258 31 2O7 241 Solapur
14 157 9 145 157 Kolhapur
15 38 ■■ 24 32 Aurangabad
16 • • 18 3 10 7 JaLna
17 * • 49 2 27 44 Parbhani
18 9 1 3 S Beed
19 * * 61 15 28 55 Naoded
20 23 4 16 20 Osmanabad
21 •• 74 23 26 69 L atur
22 50 • • . , 45 Buldhana
23 - * • 98 5 91 97 Akola
24«
154 5 97 150 Amravati
25 46 7 30 45 Yavatmal
26 73 7 42 67 Wardha
27 595 75 422 582 Nagpur
28 1»«Kt • • 242 17 150 238 Bbandara .
29 •• 139 15 3 127 Chandraput
30^ V -fV 36 8 20 34 Gadchiroli
*T^ni«5 ^rrq 5,263 476 4,124 5,120 Maharashtra S ta tt
aTTBTR— aiT^W 3Trf 5WT, H^RI«5 W m , 5^ .5 ®urc?:—Commissioner for Co-operation *nd Registrar, Co-op*rative Societies, Govt, of Mahar*shtra, Pune.
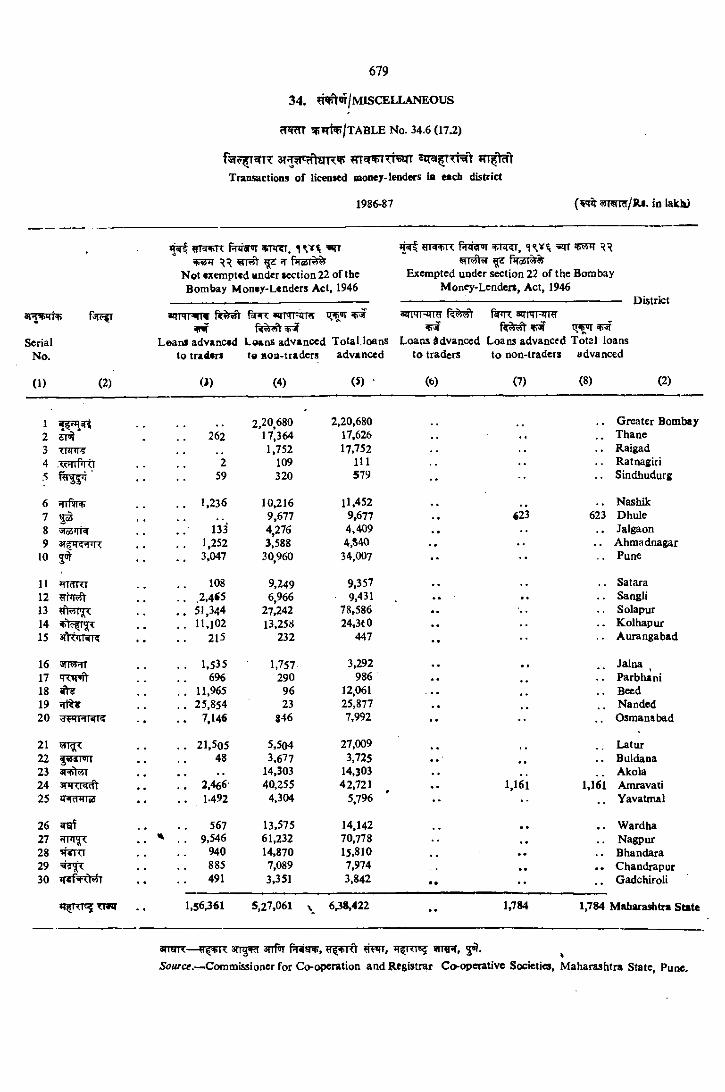
34. ?Wf^’n/M ISCELLANEOUS
^ m ^ /T A B L E No. 34.6 (17^)
« irar^T R y
Traosactions of licenaed looocy-lenders ia etch district
1986-87
PR5r»T Ttrrr. ^ « m+k rnyawi ■♦.liKi,H r*iedi 5'$y
Not exempted vndcr section 22 of the Exempted under section 22 of the BombayBombay Money-Lenders Act, 1946 Money-Lender*, Act, 1946
« - ~Mcsi k««l 1 <K
?fi3rSerial Leans advanced Loans advanced Total.loans Loans Advanced Loans advanced Total loans
No. to traders t« Hoa-tiaders advanced to traders to non-traders advanced
( 1) (2) (i) (4) (5) ■ (6) (7) (8) (2)
1 2,20,680 2,20,680 Greater Bombay2 ypii . . 262 17,364 17,626 . . Thane3 1,752 17,752 . . Raigad4 -TfHTfrO 2 109 111 . . Ratnagiri5 59 320 579 •• .. Sindhudurg
6 ?nf!rr+ . . 1,236 10,216 11,452 . . . . Nashik7 5 3 9,677 9,677 . . 623 623 DhuleS 133 4,276 4,409 . , . . Jalgaon9 . . 1,252 5,588 4,840 . . . . Ahmadnagar
10 5<ir . . 3,047 30,960 34,007 •* •• . . Pune
11 *TRTTTI 108 9,249 9,357 ,, . , . . Satara12 . . 2,4*5 6,966 9,431 . . . . Sangli13 . . 51,344 27,242 78,586 . . . . Solapur14 . . 11.102 13,258 24,3(0 . . . . Kolhapur15 215 232 447 •• Aurangabad
16 . . 1.535 1.757 3,292 , , , , . . Jalna17 TKM'>]\ 696 290 986 Parbhani18 . . 11,965 96 12,061 . . . . . Beed19 •ir « . . 25,854 23 25,877 . , . . Nanded20 . . 7,146 846 7,992 •• •• . . Osmanabad
21 . . 21,505 5,504 27,009 Latur22 48 3,677 3,725 . . ,, . . Buldana23 « « • ♦ • ♦ 14,303 14,303 . . Akola24 . . 2,466 40,255 42,721 1,161 1,161 Amravati25 . . 1-492 4,304 5,796 •• . . Yavatmal
26 Jiaf 567 13,575 14,142 • • . . Wardha27 . . ' . . 9,546 61.232 70,778 , Nagpur28 940 14,870 15,810 ,. • • . . Bhandara29 885 7,089 7,974 • • Chandrapur30 ifef'RhtT 491 3,351 3,842 • • •• . . Gadchiroli
*t^RT TTm 1,56,361 5,27,061 >. 6,38,422 • • 1,784 1,784 Maharashtra State
airarR— anf r f ? R ^ , 5»l. ^5ourctf.—Commissioner for Cooperation and Registrar Co-opCTativc Societies, Maharashtra State, Puoe.
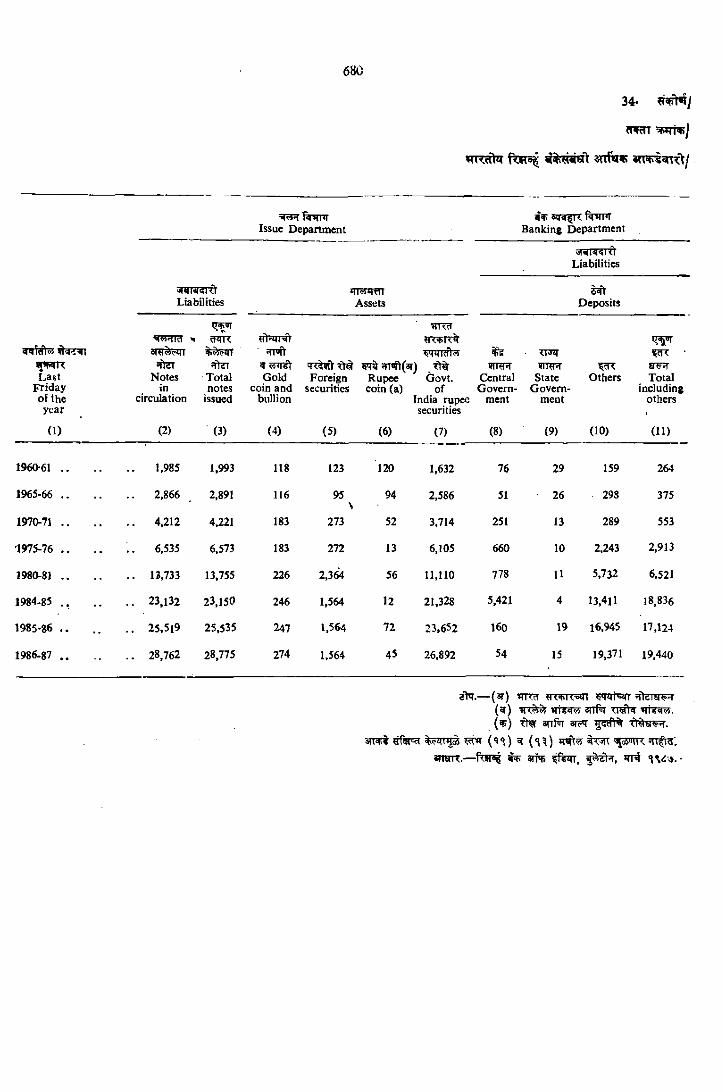
a rrfire a m i t ^ i u t /
T ninr Issue Department Banking Department
Liabilities
Liabilities*n *RTTAssets Deposits
'i^51 VKct
w<+r<%
%>si Last
Friday of the year
QHK
CentralGovern
ment
«ifeTNotes
incirculation
•fleiTotalnotes
issued
Hl«ll
Gold coin and
bullion
^ 5TTflft(3T) , ^ Foreign Rupee Govt,
securities coin (a) ofIndia rupee securities
<,|MqKIW-T
StateGovern
ment
\ri<Others
a¥?TTotal
includingothers
(1) (2) (3) (4) (5) (6) (7) (8) (9) (10) (11)
196061 . . !,985 1,993 118 123 120 1,632 76 29 159 264
1965-66 . . 2,866 2,891 116 95\
94 2,586 51 26 298 375
1970-71 . . 4,212 4,221 183 273 52 3,714 251 13 289 553
1975-76 . . 6,573 183 272 13 6,105 660 10 2,243 2,913
1980-8J . . 13,733 13,755 226 2,3W 56 11,110 778 11 5,732 6,521
1984-85 . . . . 23,132 23,150 246 1,564 12 21,328 5,421 4 13,411 18,836
1985-86 . . . . 25,519 25,535 247 1,564 72 23,652 160 19 16,945 17.124
1986-87 . . 28,762 28.775 274 1,564 45 26,892 54 15 19,371 19.440
2>T.— (ar) 1TTCT H<»K-«»tn wrt«jfT 5 f k r a ^ (^ ) vrr8‘f« 3rrPr Ti^tv *ii€«i«. ( ^ ) fr>?r anfw ^
^ (<\^) q^sorn;anarr .— ^ arro ffe n ,
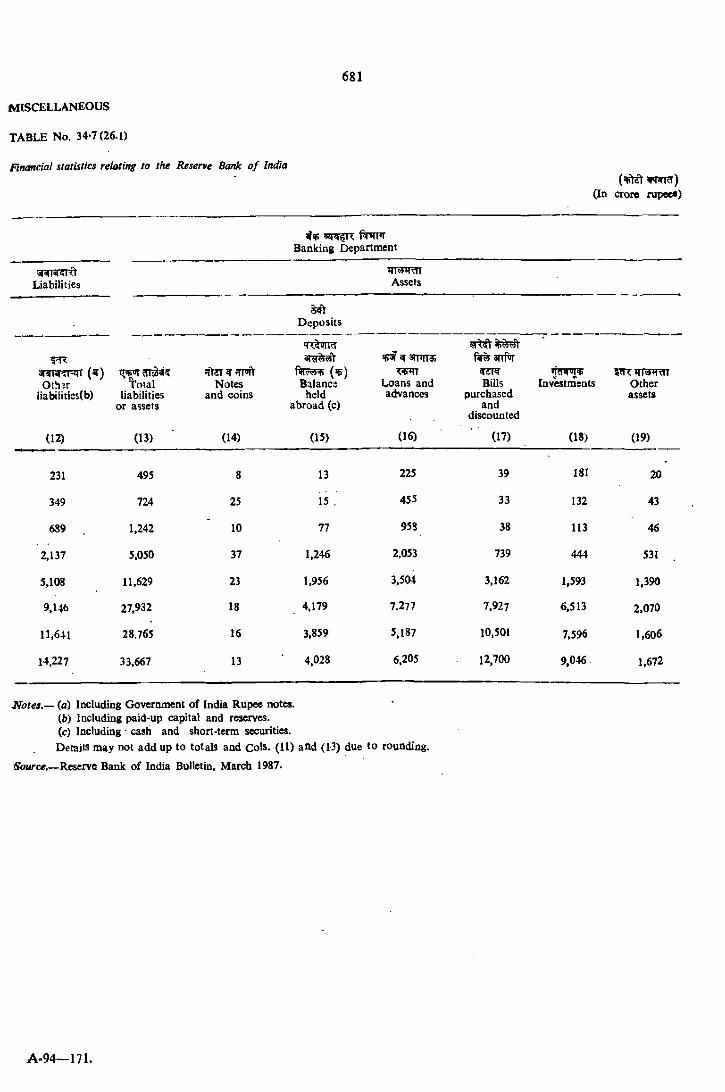
M ISCELLANEOUS
TABLE No. 34-7(26.1)
(In crore rupee*)
Banking Department
Liabilities Assets
D eposits
'jiqm'5i-*iT (^ )0 :h?r
liabiiities(b)
[4^ 4Tir«r
Otherassets
Toial liabilities
or assets
Notes and coins
(*p) Balancs
held abroad (c)
Loans and advances
Billspurchased
anddiscounted
Investments
(12) (13) (14) (15) (16) (17) (18) (19)
231 495 8 13 225 39 181 20
349 724 25 15 . 455 33 132 43
689 1,242 10 77 958 38 113 46
2,137 5,050 37 1,246 2,053 739 444 531
5,108 11,629 23 1,956 3,504 3,162 1,593 1,390
9,U6 27,932 18 4.179 7.277 7,927 6,513 2.070
11,641 28.765 16 3,859 5,187 10.501 7,596 i,606
14,227 33,667 13 ■ 4,028 6,205 12,700 9,046 1,672
N otes,— (a) Including Goveroment o f India Rupee notes.(^) iQCluding paid-up capital and reserves.(c) Including - cash and short<term securities.Details may not add up to totals and Cols. ( I I ) and (13) due to rounding.
Source.—Reserve Bank of India Bulletin, March 1987.
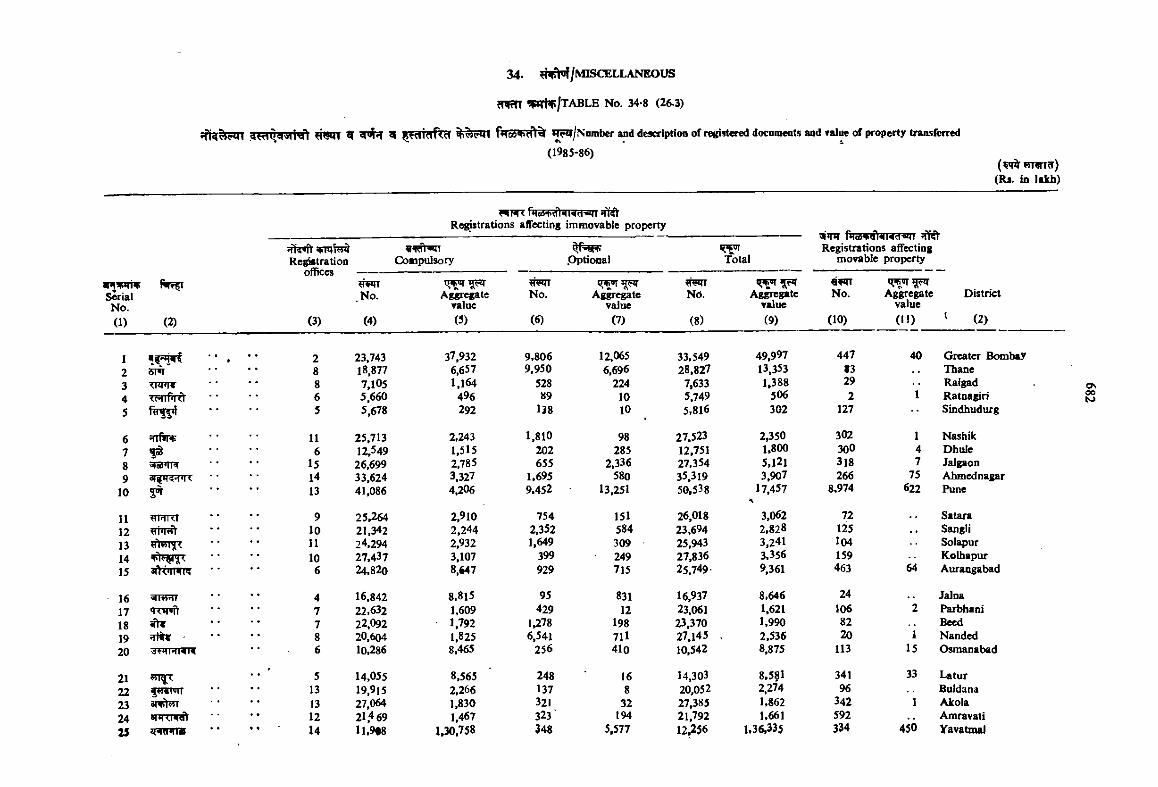
3 4 . H I^ /M IS C E L L A N E O U S
?TWT ^Prtv/TABLB No. 34-8 (26-3)
gw Q^T'SHivn ? w n ^ ^ ferc5Vfft% ^ ^ /N u m b e r and descripHoo of registered documents and valw of property transferred
(1985-86){ ^ w w T t r ) (Rs. io lakh)
Registrations affecting immovable property
OTvrfvSerialNo.(1) (2)
Re^trationoffices
(3)
Conpulsory Pptiooal Total
'9|imRegistrations affecting
movable property
T
District
(2)
.No.
(4)
Aggregatevalue(5)
No.
(6)
Agiregatevalue
(7)
Nd.
(8)
Ag^egatevalue(9)
««>nNo.
(10)
Aggregatevalue(II)
I 2 23,743 37,932 9.806 12,065 33.549 49,997 447 40 Greater Bombay2 6I«» 8 18,877 6,657 9,950 6,696 28,827 13,353 t3 Thane3 <N<lf 8 7,105 1,164 528 224 7,633 1,388 29 Raigad4 6 5,660 496 89 10 5,749 506 2 1 Ratoagiri5 5 5,678 292 138 10 5,816 302 127 Sindhudurg
6 11 25,713 2,243 1,810 98 27.523 2,350 302 1 Nashik7 <5 " ■ 6 12,549 1,515 202 285 12.751 1,800 300 4 Dhule8 SRZTTW 15 26,699 2,785 655 2,336 27,354 5.121 318 7 Jalgaon9 14 33,624 3,327 1,695 580 35,319 3,907 266 75 Ahmednagar
10 15 13 41,086 4,206 9.452 13,251 50,538 17,457 8,974 622 Pune
11 «Mi<r 9 25.264 2,910 754 151 26,018 3,062 72 Satara12 10 21,342 2,244 2,352 584 23,694 2,828 125 Sangli13 11 24,294 2,932 1.649 309 25,943 3,241 l04 Solapur14 10 27,437 3,107 399 249 27,836 3,356 159 Kolhapur15 6 24.820 8,647 929 715 25,749- 9,361 463 64 Aurangabad
16 4 16,842 8.815 95 831 16,937 8.646 24 Jaloa17 TTV»ft 7 22.632 1.609 429 12 23,061 1,621 106 2 Parbhani18 7 22,092 1,792 1,278 198 23,370 1.990 82 Beed19 nrH ■ 8 20,604 1,825 6,541 711 27,145 2,536 20 i Nanded20 6 10.286 8.465 256 410 10,542 8.875 113 15 Osmanabad
21 5 14,055 8,565 248 16 14,303 8.5$1 341 33 Latur22 13 19,915 2,266 137 8 20,052 2,274 96 Buldana23 «i+'l«i 13 27,064 1,830 321 32 27,385 1.862 342 1 Akola24 12 21,469 1,467 323 194 21,792 1.661 592 Amravati25 im nne 14 11.9f8 1,30,758 348 5,577 12,256 1.36,335 334 450 YavatmaJ
ONooto
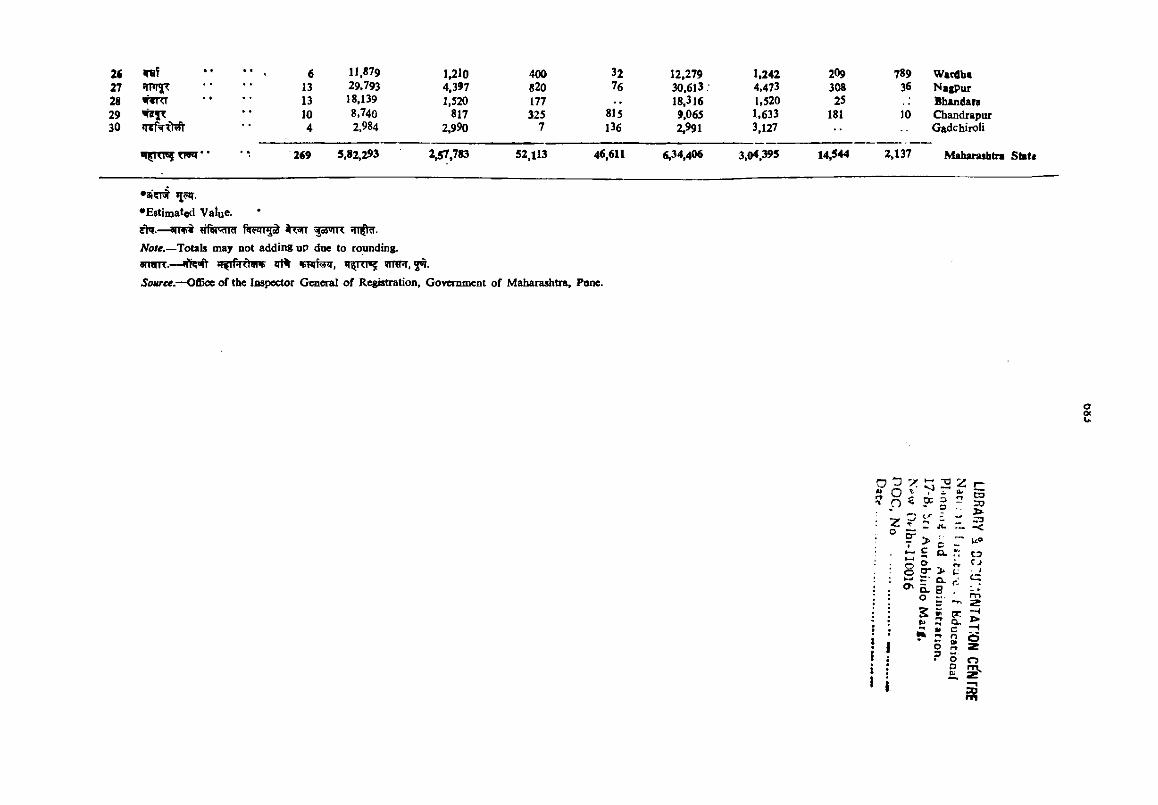
2( w f • , 6 11.879 U lo 400 32 12,279 1.242 209 789 Wac4b«27 ^nr^< * 13 29,793 4,397 820 76 30,613 4.473 308 36 NagPur28 13 18.139 1,520 177 18,316 1,520 25 Bhandaia29 • 10 8.740 817 325 815 9,065 1,633 181 10 Chandrapur30 ’ ■ 4 2.984 2,990 7 136 2.991 3,127 GadchiroH
• « 2«9 5.82,293 2^ .783 52,113 46,611 6,34,406 3,04.395 14,544 2,137 Maharaaht
•E stim ated Value.— a n v t %T3fT :|a»TR * n ^ .
Note.—Totals may Dot adding up doe to rounding. wwR. — JTfTfrrrtnir Jrt% V R f ^ , 3^.
Source.—Office of the laspector General of Registration, Goveromeot of Maharashtra, Pone.
o v: o ^
V o ^
Zo
D
r > =c ^oo O*X! =■ ®-Q. B o
2 I
• i K59
COa?>-<k®C3
J> —<
O
$
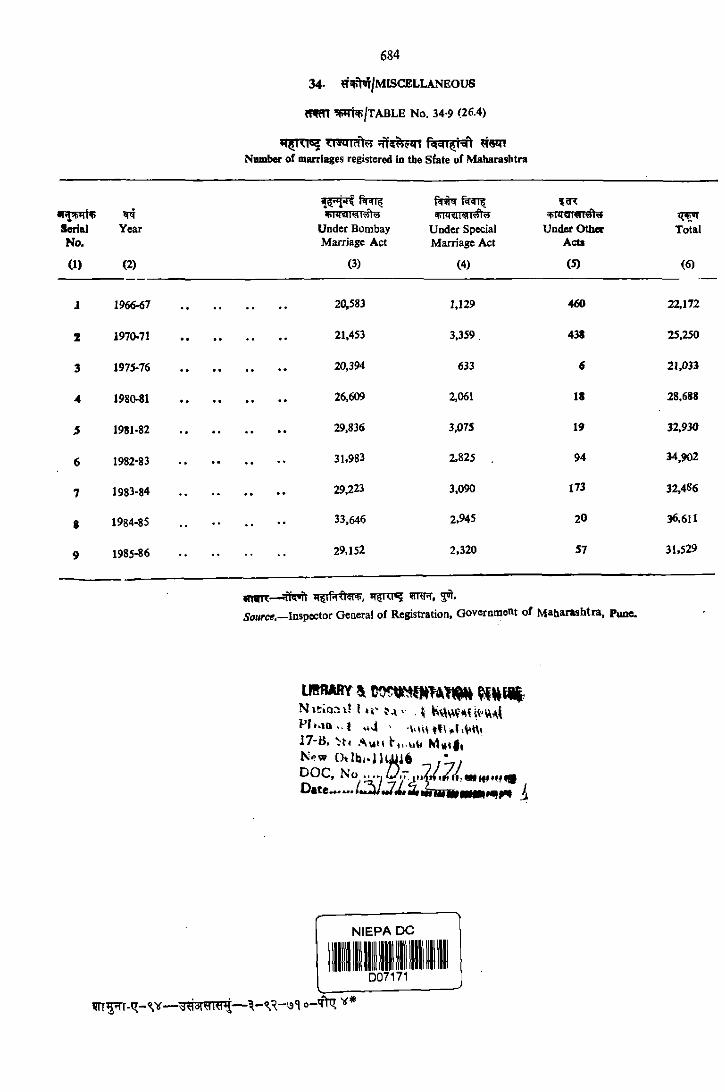
684
34- ?f^ /M ISC E L L A N E O U S
(W m W ^ /T A B L E N o. 34-9 (26.4)
TTRTTrftB fOTTNumber of marriages registered in the Sfate of Maharashtra
SerialNo.
Year Under Bombay Marriage Act
Under Special Marriage Act
Under Other Acts
Total
0 ) (2) (3) (4) (5) <6)
i 1966-67 . . 20,583 1,129 460 22,172
X 1970.71 , . 21,453 3.359 , 438 25.250
3 1975-76 20,394 633 6 21,033
4 198<V8i 26,609 2.061 18 28,688
5 1981-82 29.836 3,075 19 32.930
6 1982-83 31,983 2,825 . 94 34,902
7 1983-84 29,223 3,090 173 32.486
8 1984-85 33.646 2.945 20 36,611
9 1985-86 29,152 2,320 57 31,529
mr r t — ’r m. 5^*5oHreff.—Inspector Geaeral of Registration, Qoverament of Maharashtra, Puoe.
URBARY \ DOfWfKTATIW m mN ic;cc ii* t u ' V ^
17-B, AuM MtitfiN > w .DOC, No
NIEPA DC
I I ID07171
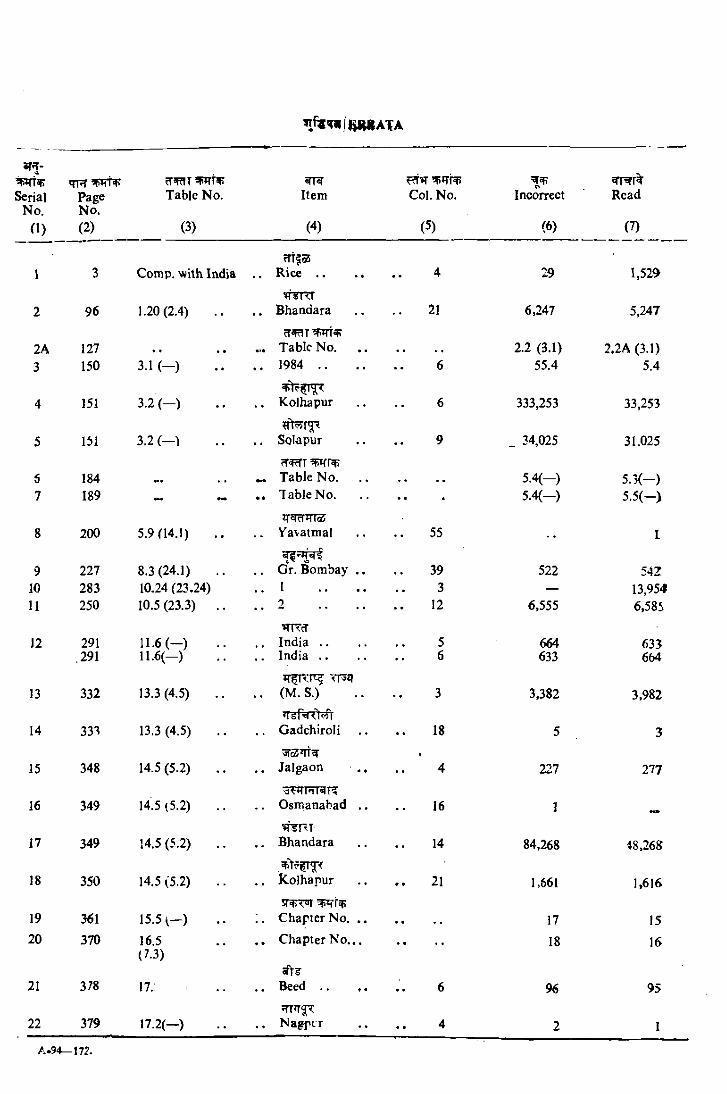
«r T-
SerialNo.
0 )
Tl-TPageNo.(2)
’WTV Table No.
(3)
"INItem
(4)
Col. No.
(5)
Incorrect
(6)
Read
(7)
1 3 Comp, with IndiacTtfaS
R i c e ......................... 4 29 1,52^
2 96 1.20(2.4) Bhandara 21 6,247 5,247
2A 127 «<•cf«H 1
Table No..................... 2.2 (3.1) 2.2A (3.1)3 150 3.1 ( - ) 1984 ......................... 6 55.4 5.4
4 151 3.2 ( - ) Kolhapur 6 333,253 33,253
5 151 3.2 ( - ) Solapur 9 _ 34,025 31.025
6 184 • > Table No..................... 5 .4 (-) 5 .3 (-)7 189 - « • • Table No..................... • 5 .4 (-) 5 .5 (-)
8 200 5.9(14.1) Yavatmal 55 I
9 227 8.3 (24.1) Gr. Bombay .. 39 522 54210 283 10.24 (23.24) .. I ......................... 3 — 13,95411 250 10.5 (23.3) .. 12 6,555 6,585
12 291 11.6 ( - )»TTTd-I n d ia ......................... 5 664 633
,291 11.6 ( - ) I n d ia ......................... 6 633 664
13 332 13.3 (4.5) (M.S.) 3 3,382 3,982
14 333 13.3(4.5) Gadchiroli 18 5 3
15 348 14.5 (5.2) . . Jalgaon 4 227 27?
16 349 14.5(5.2) Osmanabad .. 16 I
17 349 !4.5 (5.2) Bhandara 14 84,268 48,268
18 350 14.5 (5.2) . . KoJhapur 21 1,661 1,616
19 361 15.5 i - ) .. Chapter No................. 17 1520 370 16.5 . . Chapter N o... . . 18 16
21 3/8
(7.3)
17.; Beed .. 6 96 95
22 379 17.2(-) NagfiT 4 2 I
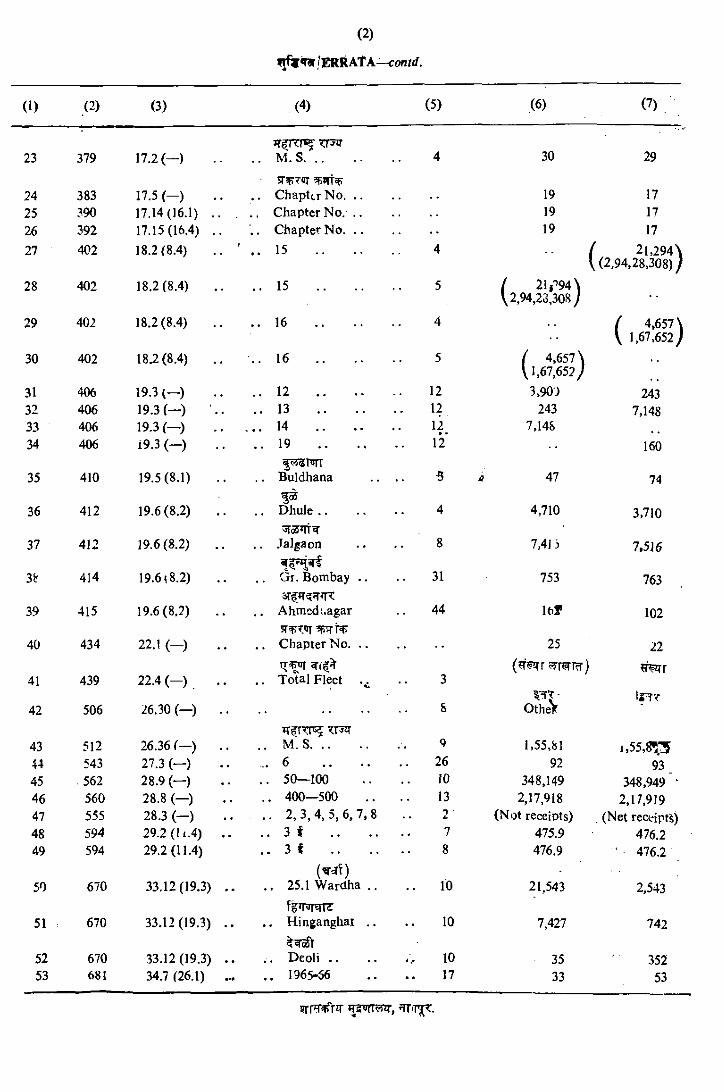
/ERRATA—con/ff.
0 ) (2) (3) (4) (5) (6) (7)
3023 379 17.2 (—) .. M .S .................
sr TTOT
4 29
24 383 17.5 ( - ) .. Chapter No. .. .. 19 1725 390 17.14(16.1) .. .. Chapter No. .. 19 1726 392 17.15(16.4) .. . Chapter No. .. .. 19 1727 402 18.2(8.4) . . ' . . 15 4 I 21,294\
' (2.94,28,308) /
28 402 18.2(8.4) . . 15 5 / 2 ! r9 4 \\ 2,94,23,308 /
29 402 18.2(8.4) . . 16 4 { 4.657 \ \ 1.67,652 J
30 402 18.2(8.4) . . 16 5 / 4.657 \V 1,67,652/
31 406 19.3 ( - ) .. . . 1 2 12 3,900 24332 406 19.3 (—) .. . . 13 12 243 7,14833 406 19.3 (—) . . . 14 12 7,14834 406 i9.3 ( - ) .. . . 19 12 160
35 410 19.5(8.1) .. Buldhana ^ 47 74
36 412 19.6(8.2) . . Dhule .. 4 4,710 3,710
37 412 19.6(8.2) . . Jalgaon 8 7,413 7,516
3ir 414 19.6i8.2) . . Gr. Bombay .. 31 753 763
39 415 19.6(8.2) .. Ahmed;.agar 44 I tT 102
40 434 22.1 ( - ) . . . . Chapter No. . . 25 22
41 439 22.4 ( - ) . . . . Total Fleet 3
42 506 26.30 (—) .. & OtheV
43 512 26.36 (—) .. .. M. S................. 9 1,55,81 1 ,5 5 ,8 ^44 543 27.3 (—) . . 6 26 92 9345 .562 28.9 (—) .. 50—100 10 348.149 348,949' ‘46 560 28.8 (—) .. 400—500 13 2,17,918 2,17,91947 555 28.3 (—) .. 2 ,3 ,4 ,5 ,6 ,7 ,8 *> • (Not receipts) . (Net receipts)48 594 29.2(11.4) . . . . 3 # 7 475.9 476.249 594 29.2 (11.4) . . 3 f 8 476.9 476.2
50 670 33.12(19.3) . . 25.1 Wardha .. 10 21,543 2,543
51 670 33.12(19.3) . . . . Hinganghat .. 10 7,427 742
52 670 33.12(19.3) . . 35 35253 681 34.7 (26.1) ... . . 1965-56 17 33 53
Hswrrwjr,